UNITED STATES
SECURITIES AND EXCHANGE COMMISSION
Washington, D.C. 20549
FORM N-CSR
CERTIFIED SHAREHOLDER REPORT OF REGISTERED
MANAGEMENT INVESTMENT COMPANIES
Investment Company Act file number 811-08361
Goldman Sachs Variable Insurance Trust
(Exact name of registrant as specified in charter)
71 South Wacker Drive, Chicago, Illinois 60606-6303
(Address of principal executive offices) (Zip code)
Caroline Kraus
Goldman Sachs & Co. LLC
200 West Street
New York, NY 10282
Copies to:
Stephen H. Bier, Esq.
Dechert LLP
1095 Avenue of the Americas
New York, NY 10036
(Name and address of agents for service)
Registrant’s telephone number, including area code: (312) 655-4400
Date of fiscal year end: December 31
Date of reporting period: December 31, 2021
| ITEM 1. | REPORTS TO STOCKHOLDERS. |
| | The Annual Report to Shareholders is filed herewith. |
Goldman
Sachs Variable Insurance Trust
Goldman Sachs Multi-Strategy Alternatives Portfolio
Goldman Sachs Trend Driven Allocation Fund*
| * | | Effective after the close of business on December 31, 2021, the Goldman Sachs Global Trends Allocation Fund was renamed the Goldman Sachs Trend Driven Allocation Fund and changed its principal investment strategy effective after the close of business on January 31, 2022. |
Annual Report
December 31, 2021

Goldman Sachs Variable Insurance Trust
| ∎ | | GOLDMAN SACHS VIT MULTI-STRATEGY ALTERNATIVES PORTFOLIO |
| ∎ | | GOLDMAN SACHS VIT TREND DRIVEN ALLOCATION FUND |
| | | | |
| | | |
| NOT FDIC-INSURED | | May Lose Value | | No Bank Guarantee |
MARKET REVIEW
Goldman Sachs Variable Insurance Trust Funds — Goldman Sachs VIT Multi Asset Strategies Funds
Market Review
The capital markets and the Funds were most influenced during the 12 months ended December 31, 2021 (the “Reporting Period”) by the distribution of COVID-19 vaccines, improving economic conditions, rising inflation, higher interest rates, and continued fiscal stimulus and accommodative monetary policies from central banks and governments.
When the Reporting Period began in the first quarter of 2021, global equities added to their 2020 calendar year gains, while spread, non-government bond, and sector performance was largely negative. Rising bond yields and value-led equity markets dominated during these months. Two key drivers of performance were continued fiscal stimulus, notably the authorization of $1.9 trillion in additional COVID-19 relief spending in the U.S., and progress in the COVID-19 vaccine rollout. The accelerating rollout of COVID-19 vaccines boosted investors’ hopes of a sustainable reopening of the global economy. To varying degrees, central banks around the world leaned against market expectations for earlier than previously expected policy normalization, indicating their policies would remain accommodative despite improvements in economic growth given weak underlying inflation dynamics.
During the second calendar quarter, global equities and spread sectors recorded positive returns overall. Discussions during these months centered on the central bank liquidity tailwind, fiscal stimulus, COVID-19 vaccine rollout progress, economic reopening momentum and strong corporate profits. In May, remarkably strong U.S. inflation data, coupled with the release of a disappointing April U.S. jobs report, suggested that pandemic-related dynamics, such as temporary supply shortages, were likely to continue distorting economic data in the near term. This led to a recalibration in investors’ economic growth expectations, though the reassessment may also have reflected their concerns about the spreading Delta variant and the potential of a sooner than consensus anticipated withdrawal of U.S. Federal Reserve (“Fed”) policy support. Indeed, during June, Fed officials indicated they were mindful of increases in inflation and inflation expectations.
The third quarter of 2021 was a mixed time for risk assets. Market sentiment was broadly supported by reassuring comments from central bank officials and by strong corporate earnings. However, growing concerns about the spread of the more infectious Delta variant in numerous countries and a regulatory crackdown in China led to a large equity sell-off in September. While developed equity markets posted modest gains for the quarter, emerging markets equities were down significantly. In the fixed income markets, spread sectors were challenged by ongoing concerns about the spread of the Delta variant, especially in countries with low levels of vaccination, and its potential impact on the global economic recovery. Emerging markets debt was hurt further by worries about potential contagion from a debt crisis at one of China’s largest property developers.
During the fourth quarter of 2021, global equities broadly advanced, led by double-digit gains in the U.S. equity market. Despite a sharp increase in infections from the Omicron variant and persistent elevated inflation due to a multitude of COVID-19-related factors, U.S. economic growth continued to track well above trend. Meanwhile, corporate earnings consistently surprised to the upside, and U.S consumption of goods and services remained strong into the end of the Reporting Period. In the fixed income markets, spread sector returns were muted. Interest rates were volatile, as investors shifted forward their expectations about the withdrawal of the Fed’s accommodative policies amid a series of upside inflation surprises. Indeed, the Fed’s narrative on inflation shifted from “transitory” to “more persistent” during the fourth calendar quarter. In December, policymakers began to scale back the Fed’s $120 billion a month asset purchase program. They subsequently announced they would accelerate the pace of tapering starting in January 2022 and indicated they might hike interest rates three times in 2022.
Looking Ahead
At the end of the Reporting Period, we noted that market behavior across asset classes supported the notion that the worldwide economy was in a mid-cycle phase. Decisive action and coordination from global policymakers had successfully put many economies back on track after the COVID-19 shock. However, unprecedented levels of liquidity and the “Great Inflation Debate” were likely, in our view, to remain key drivers of macro uncertainty in 2022. Given that price stability had become the Fed’s top policy priority amid labor market improvement in 2021, we expected any Fed action in the near term to be highly data dependent and for uncertainty about that policy to add to overall market volatility.
GOLDMAN SACHS VARIABLE INSURANCE TRUST MULTI-STRATEGY ALTERNATIVES PORTFOLIO
INVESTMENT OBJECTIVE
The Portfolio seeks long-term growth of capital.
Portfolio Management Discussion and Analysis
Effective July 29, 2021, the Goldman Sachs Variable Insurance Trust — Goldman Sachs Multi-Strategy Alternatives Portfolio’s (the “Portfolio”) benchmark index changed from the ICE BofAML U.S. Dollar Three-Month LIBOR Constant Maturity Index to the ICE BofA 3-Month U.S. Treasury Bill Index. No modifications were made to the Fund’s investment objective, strategy and policies in connection with this change. Below, the Goldman Sachs Multi-Asset Solutions (“MAS”) Group discusses the Portfolio’s performance and positioning for the 12-month period ended December 31, 2021 (the “Reporting Period”).
How did the Portfolio perform during the Reporting Period?
During the Reporting Period, the Portfolio’s Institutional, Service and Advisor Shares generated average annual total returns of 5.03%, 4.84% and 4.66%, respectively. These returns compare to the 0.05% average annual total return of the Portfolio’s benchmark, the ICE BofA 3-Month U.S. Treasury Bill Index during the same period.
Please note that the Portfolio’s benchmark being the ICE BofA 3-Month U.S. Treasury Bill Index is a means of emphasizing that the Portfolio has an unconstrained strategy. That said, this Portfolio employs a benchmark agnostic strategy and thus comparisons to a benchmark index are not particularly relevant.
What key factors were responsible for the Portfolio’s performance during the Reporting Period?
The Portfolio’s performance is driven by three sources of return: 1) long-term strategic asset allocation; 2) medium-term and short-term dynamic allocations; and 3) excess returns from investments in Underlying Funds. Long-term strategic asset allocation is the process by which the Portfolio’s assets are allocated across underlying asset classes and strategies in a way that considers the risks of each underlying asset class and strategy. Medium-term dynamic allocation is the process by which we adjust the portfolio for changes in the business or economic cycle, while short-term dynamic allocation is the implementation of tactical market views with the goal of improving the Portfolio’s risk-adjusted return. The risk-adjusted return on an investment takes into account the risk associated with that investment relative to other potential investments. Excess returns from investments in Underlying Funds is by how much the Underlying Funds outperform or underperform their respective benchmark indices.
During the Reporting Period, the Portfolio generated positive absolute returns, largely because of strategic asset allocation. Short-term dynamic allocations also added to the Portfolio’s performance, though this was partially offset by medium-term dynamic allocations, which hurt the Portfolio’s results. Security selection within the Underlying Funds had a positive impact overall on performance.
Strategic asset allocation added to the Portfolio’s performance during the Reporting Period. Within equities, the Portfolio was helped by a strategic allocation to global equities, which broadly posted gains. A strategic allocation to emerging markets equities also added slightly to performance. Although emerging markets stocks declined in the second half of the Reporting Period because of their greater sensitivity to COVID-19-induced economic slowdowns, investor concerns about possible contagion from a debt crisis at one of China’s largest property developers and fears of a regulatory crackdown in China, the Portfolio’s exposure was advantageous, primarily because of positive security selection in the Goldman Sachs Emerging Markets Equity Insights Fund. As for fixed income, the Portfolio’s strategic allocations generated mixed results. The Portfolio was aided by its strategic allocations to high yield corporate bonds and bank loans, as risk assets broadly recorded positive returns during the Reporting Period. However, the Portfolio was hampered by its strategic allocation to emerging markets debt, which detracted as the sector sold off in the second half of the Reporting Period. Additionally, our U.S. interest rate options strategy, through which we seek to profit if interest rates fall, remain constant or rise less than anticipated, hurt the Portfolio’s performance, as U.S. Treasury yields rose during the Reporting Period. (Our long U.S. interest rate options strategy is a macroeconomic hedge that buys put options on short-term interest rates. A put option is an option contract giving the owner the right, but not the obligation, to sell a specified amount of an underlying asset at a specified price within a specified time.) Regarding liquid alternatives strategies, all but two of the Portfolio’s strategic allocations produced positive returns. A strategic allocation to the Goldman Sachs Managed Futures Strategy Fund added most to the Portfolio’s performance, followed by strategic allocations to the Goldman Sachs Absolute Return Tracker Fund and the Goldman Sachs Long Short Credit Strategies Fund. However, a strategic allocation to the Goldman Sachs Alternative Premia Fund, which posted negative returns, and our volatility selling strategy detracted from the Portfolio’s performance during the Reporting
GOLDMAN SACHS VARIABLE INSURANCE TRUST MULTI-STRATEGY ALTERNATIVES PORTFOLIO
Period. (Our volatility selling strategy seeks to benefit from changes in the level of market implied volatility (i.e., expectations of future volatility) in equity markets.)
Medium-term dynamic allocations hurt the Portfolio’s performance. When the Reporting Period began, the Portfolio expressed our medium-term dynamic view that it have decreased exposure to our long U.S. interest rate options strategy and increased exposure to 10-year U.S. Treasury futures. We modified this view over the course of the Reporting Period by adding exposure to the long U.S. interest rate options strategy and decreasing exposure to 10-year U.S. Treasury futures. Overall, this positioning had a negative impact on the Portfolio’s performance, as interest rates rose during the Reporting Period.
Short-term dynamic allocations bolstered the Portfolio’s results during the Reporting Period. The MAS Team expressed its short-term dynamic views through an allocation to the Goldman Sachs Tactical Tilt Overlay Fund (the “Underlying Tactical Fund”), which generated positive returns during the Reporting Period.
Overall, security selection within the Underlying Funds added to the Portfolio’s returns, led by those focused on liquid alternative strategies. During the Reporting Period, the Goldman Sachs Absolute Return Tracker Fund and the Goldman Sachs Long Short Credit Fund outperformed their respective benchmark indices. Within equity Underlying Funds, the Goldman Sachs Emerging Markets Equity Insights Funds and the Goldman Sachs Dynamic Global Equity Fund outperformed their respective benchmark indices. Among fixed income Underlying Funds, the Goldman Sachs Emerging Markets Debt Fund and the Goldman Sachs High Yield Bond Fund underperformed their respective benchmark indices during the Reporting Period.
How was the Portfolio positioned at the beginning of the Reporting Period?
At the beginning of the Reporting Period, the Portfolio was positioned, in terms of its total net assets, with 63.6% in liquid alternative strategies, 32.0% in real assets/satellite asset classes and 4.4% in cash. Liquid alternatives strategies generally include, but are not limited to, momentum or trend trading strategies (investment decisions based on trends in asset prices over time), hedge fund beta (long term total returns consistent with investment results that approximate the return and risk patterns of a diversified universe of hedge funds), managed risk investment strategies (which seek to manage extreme risk scenarios by implementing daily and monthly risk targets across a diversified mix of asset classes), emerging markets debt and unconstrained fixed income strategies (which have the ability to move across various fixed income sectors). Real assets generally include, but are not limited to, commodities, global real estate securities, infrastructure and master limited partnerships. The strategic asset allocation of the Portfolio reflects a risk-based allocation approach to increase diversification across the Portfolio. The Portfolio had 11.8% of its total net assets invested in tactical exposures at the beginning of the Reporting Period. This above sector breakout is inclusive of derivative exposure across all asset classes.
How did you manage the Portfolio’s allocations during the Reporting Period?
During the Reporting Period, we made some changes to the Portfolio’s strategic allocations. We consider the Portfolio’s strategic asset allocation and underlying active security selection strategies the largest drivers of risk and performance. In March 2021, we added a strategic allocation to traditional equities through an investment in the Goldman Sachs Dynamic Global Equity Fund, added a strategic allocation to global infrastructure securities through an investment in the Goldman Sachs Global Infrastructure Fund and eliminated the Portfolio’s strategic allocation to real estate securities. In addition, we removed the Portfolio’s exposure to the volatility selling strategy. Overall, we adjusted the Portfolio’s risk exposures so that it would be biased toward equities and alternatives and have smaller strategic allocations to fixed income.
Within the medium-term dynamic allocation, we adjusted the Portfolio’s exposure to reflect our views on medium-term changes to the business or economic cycle. In February 2021, we adopted a pro-cyclical view and added a long position in U.S. small cap equities, which we expressed through equity index futures. We removed this view in November. In May, we increased the Portfolio’s exposure to our long U.S. interest rate options strategy by reducing its holdings of 10-year U.S. Treasury futures. During December, we reduced the Portfolio equity risk overall by decreasing its holdings of emerging markets equity index futures.
The Goldman Sachs Dynamic Global Equity Fund and the Goldman Sachs Global Infrastructure Fund were added as Underlying Funds of the Portfolio in March 2021.
How was the Portfolio positioned at the end of the Reporting Period?
At the end of the Reporting Period, the Portfolio was positioned, in terms of its total net assets, with 56.6% in liquid alternative strategies, 8.0% in traditional equity classes, 30.4% in real assets/satellite asset classes and 5.0% in cash. The Portfolio had 7.8% of its total net assets invested in tactical exposures. This above sector breakout is inclusive of derivative exposure across all asset classes.
GOLDMAN SACHS VARIABLE INSURANCE TRUST MULTI-STRATEGY ALTERNATIVES PORTFOLIO
How did the Portfolio use derivatives and similar instruments during the Reporting Period?
During the Reporting Period, derivatives were used primarily to express our views across developed and emerging markets equities. More specifically, the Portfolio employed equity index futures to effect long exposures in U.S. large-cap equities (positive impact on performance), U.S. small-cap equities (positive impact) and emerging markets equities (negative impact). Within fixed income during the Reporting Period, the Portfolio used interest rate futures, specifically U.S. Treasury futures, to express views on the U.S. Treasury yield curve (negative impact). Finally, the Portfolio used interest rate options in a macroeconomic hedge that seeks to profit if interest rates fall, remain constant or rise less than anticipated (negative impact).
Additionally, some of the Underlying Funds used derivatives during the Reporting Period to apply their active investment views with greater versatility and potentially to afford greater risk management precision. As market conditions warranted during the Reporting Period, some of these Underlying Funds engaged in forward foreign currency exchange contracts, financial futures contracts, options, swap contracts and structured securities to attempt to enhance portfolio return and for hedging purposes.
Were there any changes to the Portfolio’s portfolio management team during the Reporting Period?
Effective May 24, 2021, Christopher Lvoff no longer served as a portfolio manager for the Portfolio. Neill Nuttall remained a portfolio manager for the Portfolio. By design, all investment decisions for the Portfolio are performed within a team structure, with multiple subject matter experts. This strategic decision making has been the cornerstone of our approach and ensures continuity in the Portfolio.
What is the Portfolio’s tactical view and strategy for the months ahead?
At the end of the Reporting Period, we maintained a cautiously positive view of risk assets, anticipated choppy markets in the near term and continued to believe that a dynamic investment approach and careful risk management could help us navigate potentially treacherous market conditions ahead.
FUND BASICS
Multi-Strategy Alternatives Portfolio
as of December 31, 2021
OVERALL UNDERLYING FUND AND ETF WEIGHTINGS1
Percentage of Net Assets
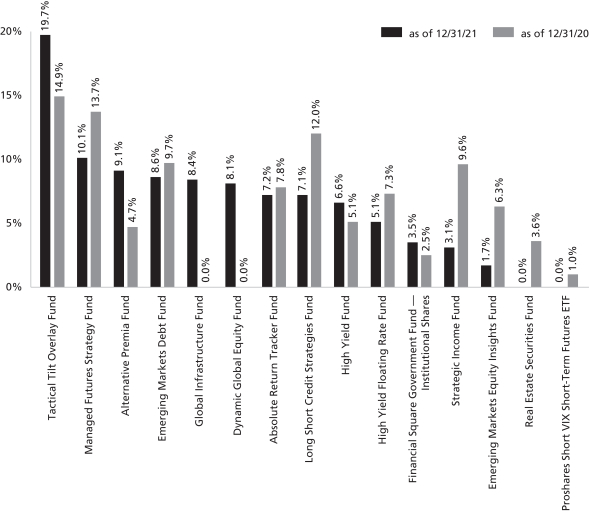
| 1 | The Portfolio is actively managed and, as such, its composition may differ over time. The percentage shown for each Underlying Fund and exchange traded fund (“ETF”) reflects the value of that Underlying Fund or ETF as a percentage of net assets of the Portfolio. Figures in the graph above may not sum to 100% due to rounding and/or exclusion of other assets and liabilities. Underlying sector allocations of exchange traded funds and investment companies held by the Portfolio are not reflected in the graph above. The graph depicts the Portfolio’s investments but may not represent the Portfolio’s market exposure due to the exclusion of certain derivatives, if any, as listed in the Additional Investment Information section of the Schedule of Investments. |
For more information about your Fund, please refer to www.GSAMFUNDS.com. There, you can learn more about your Fund’s investment strategies, holdings, and performance.
GOLDMAN SACHS VARIABLE INSURANCE TRUST MULTI-STRATEGY ALTERNATIVES PORTFOLIO
Performance Summary
December 31, 2021
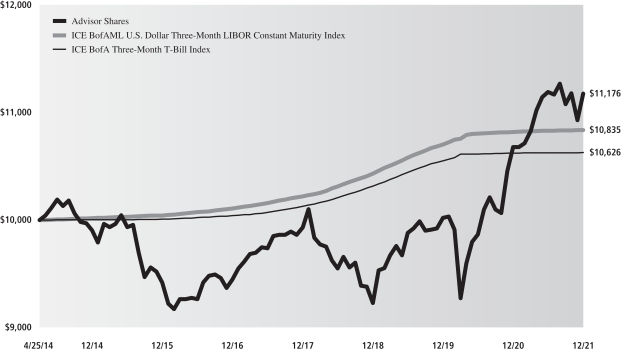
The following graph shows the value, as of December 31, 2021, of a $10,000 investment made on April 25, 2014 (commencement of the Portfolio’s operations) in Advisor Shares at NAV. For comparative purposes, the performance of the Portfolio’s current and former benchmarks are shown, ICE BofAML Three-Month T-Bill Index and ICE BofAML U.S. Dollar Three-Month LIBOR Constant Maturity Index, respectively. Performance reflects applicable fee waivers and/or expense limitations in effect during the periods shown and in their absence, performance would be reduced. Returns do not reflect the deduction of taxes that a shareholder would pay on Portfolio distributions or the redemption of Portfolio shares. The returns set forth below represent past performance. Past performance does not guarantee future results. The Portfolio’s investment return and principal value will fluctuate so that an investor’s shares, when redeemed, may be worth more or less than their original cost. Current performance may be lower or higher than the performance quoted below. Please visit our web site at www.GSAMFUNDS.com to obtain the most recent month-end returns.
Multi-Strategy Alternatives Portfolio’s Lifetime Performance
Performance of a $10,000 investment, with distributions reinvested, from April 25, 2014 through December 31, 2021.
| | | | | | |
| Average Annual Total Return through December 31, 2021 | | One Year | | Five Years | | Since Inception |
Institutional (Commenced April 25, 2014) | | 5.03% | | 3.86% | | 1.86% |
Service (Commenced April 25, 2014) | | 4.84% | | 3.61% | | 1.61% |
Advisor (Commenced April 25, 2014) | | 4.66% | | 3.42% | | 1.46% |
GOLDMAN SACHS VARIABLE INSURANCE TRUST TREND DRIVEN ALLOCATION FUND
INVESTMENT OBJECTIVE
The Fund seeks total return while seeking to provide volatility management.
Portfolio Management Discussion and Analysis
Below, the Goldman Sachs Quantitative Investment Strategies (“QIS”) Team discusses the Goldman Sachs Variable Insurance Trust Trend Driven Allocation Fund (the “Fund”) performance and positioning for the 12-month period ended December 31, 2021 (the “Reporting Period”).
How did the Fund perform during the Reporting Period?
During the Reporting Period, the Fund’s Institutional and Service Shares generated average annual total returns of 16.46% and 16.17%, respectively. These returns compare to the 13.10% average annual total return of the Fund’s blended benchmark, the Allocation Composite Index (the “Index”), during the same time period. The components of the Fund’s blended benchmark, which is comprised 60% of the MSCI World Index (Net, USD, Hedged) and 40% of the Bloomberg U.S. Treasury Composite Index (Total Return, Unhedged, USD), generated average annual total returns of 24.38% and -2.32%, respectively, during the same time period.
Importantly, during the Reporting Period, the Fund’s overall annualized volatility (which is measured versus the S&P 500® Index) was 6.44%, less than the S&P 500® Index’s annualized volatility of 10.57% during the same time period.
What key factors were responsible for the Fund’s performance during the Reporting Period?
The Fund primarily seeks to achieve its investment objective by investing in a global portfolio of equity and fixed income asset classes. Under normal market conditions, the Fund expects to invest at least 40% of its assets in equity investments and at least 20% of its assets in fixed income investments. The percentage of the Fund’s portfolio exposed to any asset class or geographic region will vary from time to time as the weightings of the Fund change, and the Fund may not be invested in each asset class at all times.
As part of the Fund’s investment strategy, the Investment Adviser seeks to manage volatility and limit losses by allocating the Fund’s assets away from risky investments in distressed or volatile market environments. Volatility is a statistical measurement of the magnitude of up and down fluctuations in the value of a financial instrument or index. In distressed or volatile market environments, the Fund may also hold significant amounts of U.S. Treasury, short-term or other fixed income investments, including money market funds and repurchase agreements or cash, and at times may invest up to 100% of its assets in such investments.
The Fund continued dynamically allocating across global asset classes during the Reporting Period, using a momentum-based methodology, as it sought total return while also seeking to provide volatility management. Momentum investing seeks growth of capital by gaining exposure to asset classes that have exhibited trends in price performance over selected time periods. In managing the Fund, we use a methodology that evaluates historical three-, six- and nine-month returns, volatilities and correlations across a range of nine global asset classes. Represented by indices, these asset classes include, within the equities category, U.S. large-cap and small-cap, European, Asian, emerging markets and U.K. stocks. Within the fixed income category, the Fund may allocate assets to the U.S., Europe and Japan. The analysis of these asset classes drives the aggregate allocations of the Fund over time. We believe market price momentum — either positive or negative — has significant predictive power.
During the Reporting Period, the Fund’s allocations to U.S. large-cap equities contributed most positively to absolute returns. In addition, the Fund benefited from allocations to European and U.K. equities and, to a lesser extent, Japanese stocks, emerging markets equities and U.S. small-cap equities. Conversely, an allocation to German government bonds detracted from the Fund’s absolute performance. The Fund’s allocations to Japanese government bonds and U.S. Treasury securities did not have a material impact on performance during the Reporting Period.
What was the Fund’s volatility during the Reporting Period?
As part of our investment approach, we seek to mitigate the Fund’s volatility. As mentioned earlier, for the Reporting Period overall, the Fund’s overall annualized volatility was 6.44%, less than the S&P 500® Index’s annualized volatility of 10.57%.
How was the Fund positioned during the Reporting Period?
During the Reporting Period, we tactically managed the Fund’s allocations across equity and fixed income markets based on the momentum and volatility of these asset classes. At the beginning of the Reporting Period, the Fund’s total assets were allocated
GOLDMAN SACHS VARIABLE INSURANCE TRUST TREND DRIVEN ALLOCATION FUND
80.0% to equities, 20.0% to fixed income and 0% to cash. (Many of these positions were implemented through the use of exchanged-traded index future contracts.) Within the equity category, the Fund had allocations to all six global equity asset classes. As for fixed income, the Fund had an allocation to German government bonds at the start of the Reporting Period. It did not have allocations to U.S. Treasury securities or Japanese government bonds.
In January 2021, we reduced the Fund’s allocation to German government bonds and added an allocation to Japanese government bonds. Within equities, we trimmed the Fund’s allocation to U.S. large-cap equities and increased its allocation to European equities. Because of elevated volatility in certain equity markets, we also added a small Fund position in cash.
In February, we reduced the Fund’s allocation to European equities and increased its allocation to U.S. large-cap equities. We also increased the Fund’s allocation to German government bonds and eliminated its allocation to Japanese government bonds.
In March, we removed the Fund’s allocation to German government bonds and added an allocation to Japanese government bonds. Within equities, we trimmed the Fund’s allocation to emerging markets equities and increased its allocations to European stocks and U.S. large-cap equities.
In April, we further reduced the Fund’s allocation to emerging markets equities. We also decreased the Fund’s allocation to Japanese stocks and increased its allocations to U.S. large-cap stocks and U.K. equities.
In May, the Fund’s allocations generally remained unchanged, though we eliminated the Fund’s small allocation to emerging markets equities and increased its allocation to European equities.
In June, we added an allocation to U.S. Treasury securities, reduced its allocation to Japanese government bonds and eliminated its position in cash. The Fund’s equity allocations remained relatively unchanged.
In July, we decreased the Fund’s equity allocations and increased its allocations to fixed income. Specifically, we reduced the Fund’s allocations to U.S. large-cap and European equities and eliminated its allocation to U.S. small-cap equities. We increased the Fund’s allocation to Japanese government bonds and added an allocation to German government bonds.
In August, we increased the Fund’s equities allocations and reduced its fixed income allocations. Within equities, we added to the Fund’s allocation to U.S. large-cap stocks. Within fixed income, we eliminated the Fund’s allocation to U.S. Treasury securities and trimmed its allocation to Japanese government bonds.
In September, we decreased the Fund’s allocation in Japanese government bonds and added an allocation to U.S. Treasury securities. The Fund’s equity allocations remained relatively unchanged.
In October, the Fund’s equity allocations remained comparatively unchanged. Within fixed income, we increased the Fund’s allocation to Japanese government bonds and eliminated its allocations to German government bonds and U.S. Treasury securities.
In November, we reduced the Fund’s allocation to Japanese government bonds and added an allocation to German government bonds. Within equities, we decreased the Fund’s allocations to European and U.K. equities and added a small allocation to U.S. small-cap equities.
In December, we increased the Fund’s allocations to European and U.K. equities, trimmed its allocation to Japanese equities and eliminated its allocation to U.S. small-cap equities. Within fixed income, we reduced the Fund’s allocation to German government bonds.
How did the Fund use derivatives and similar instruments during the Reporting Period?
During the Reporting Period, the Fund employed exchange-traded equity index futures to gain exposure to U.S. large-cap and small-cap stocks and to European, Japanese, U.K. and emerging markets equities. The use of these instruments had a positive impact overall on absolute returns. In addition, the Fund used bond futures to gain exposure to U.S., Japanese and German government bonds. On an absolute basis, the use of these instruments had a negative impact overall on the Fund’s performance.
Were there any changes to the Fund’s portfolio management team during the Reporting Period?
There were no changes to the Fund’s portfolio management team during the Reporting Period.
What is the Fund’s tactical asset allocation view and strategy for the months ahead?
At the end of the Reporting Period, the Fund’s total assets were allocated 80.0% to equities, 20.0% to fixed income and 0% to cash. (Many of these positions were implemented through the use of exchanged-traded index future contracts.) Within the equity allocation, the Fund continued to have significant exposure to U.S. large-cap stocks and, to a lesser extent, to European, U.K. and
GOLDMAN SACHS VARIABLE INSURANCE TRUST TREND DRIVEN ALLOCATION FUND
Japanese equities. It had no exposure to emerging markets equities or U.S. small-cap stocks at the end of the Reporting Period. Within the fixed income allocation, the Fund had exposure to Japanese and German government bonds. At the end of the Reporting Period, the Fund had no exposure to U.S. Treasury securities.
Going forward, we intend to position the Fund to provide exposure to price momentum from among nine underlying asset classes, while dynamically managing the volatility, or risk, of the overall portfolio. In general, the Fund seeks to maintain a strategic allocation of 60% of its assets in equity investments and 40% of its assets in fixed income investments. The Fund may deviate from these strategic allocations in order to allocate a greater percentage to asset classes with strong momentum and to reduce its allocation to assets with weak momentum. When volatility increases, our goal is to preserve capital by proportionally increasing the Fund’s cash exposure and reducing its exposure to riskier asset classes. There is no guarantee the Fund’s dynamic management strategy will cause it to achieve its investment objective.
Change in Fund Name and Investment Objective
After the end of the Reporting Period, the Fund’s name and principal investment strategy changed. The Fund’s investment objective and benchmark indices remained the same.
Effective after the close of business on December 31, 2021, the Fund’s name will changed to the Goldman Sachs VIT Trend Driven Allocation Fund.
The Fund’s principal investment strategy changed after the close of business on January 31, 2022. As of that time, the Fund primarily seeks to achieve its investment objective by investing in a portfolio of U.S. and non-U.S. equity securities and U.S. fixed income securities. The Fund may invest in one or a combination of the following securities and instruments: pooled investment vehicles, including exchange-traded funds (“ETFs”) and other investment companies; equity securities of U.S. and non-U.S. issuers; U.S. fixed income securities; and derivatives that provide exposure to a broad spectrum of asset classes and geographic regions. Under normal market conditions, the Fund expects to invest at least 50% of its assets in equity investments and at least 30% of its assets in fixed income investments.
Goldman Sachs Asset Management, L.P. (the “Investment Adviser”) makes investment decisions based upon its analysis of “trends” from around the world. Trends are used by the Investment Adviser to allocate the Fund’s relative weighting to equity and fixed income securities. The trends analyzed by the Investment Adviser are based on, but are not limited to, relative considerations around the prices and volatility of the underlying markets.
Further, as a result of the trends analysis, the Investment Adviser may allocate more of the Fund’s assets to investments with relatively strong recent trends and allocate assets away from investments with relatively poor recent trends. The percentage of the Fund’s portfolio exposed to any asset class or geographic region will vary from time to time as the weightings of the Fund change, and the Fund may not be invested in each asset class at all times. At times, the Fund may be heavily invested in certain asset classes or geographic regions, depending on the asset allocation of the strategy. The Fund may invest without restriction as to issuer capitalization, currency, maturity or credit rating.
As part of the Fund’s investment strategy, the Investment Adviser seeks to manage volatility and limit losses by allocating the Fund’s assets away from risky investments in distressed or volatile market environments. In this context, volatility is a statistical measurement of the magnitude of up and/or down fluctuations in the value of a financial instrument or index. In distressed or volatile market environments, the Fund may also hold significant amounts of U.S. Treasury, short-term, or other fixed income investments, including money market funds and repurchase agreements or cash, and at times may invest up to 100% of its assets in such investments. While the Investment Adviser attempts to manage the Fund’s volatility, there can be no guarantee that the Fund will be successful.
FUND BASICS
Trend Driven Allocation Fund
as of December 31, 2021
FUND COMPOSITION1
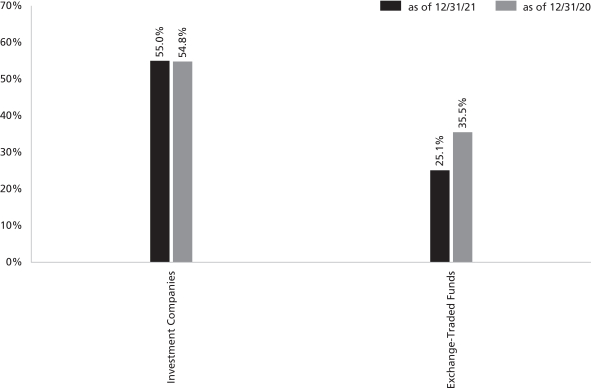
| 1 | The percentage shown for each investment category reflects the value of investments in that category as a percentage of net assets. Figures in the above graph may not sum to 100% due to the exclusion of other assets and liabilities. The underlying composition of exchange traded funds and investment companies held by the Fund are not reflected in the graph above. Consequently, the Fund’s overall composition may differ from the percentages contained in the graph above. The graph depicts the Fund’s investments but may not represent the Fund’s market exposure due to the exclusion of certain derivatives, if any, as listed in the Additional Investment Information section of the Schedule of Investments. |
For more information about your Fund, please refer to www.GSAMFUNDS.com. There, you can learn more about your Fund’s investment strategies, holdings, and performance.
GOLDMAN SACHS VARIABLE INSURANCE TRUST TREND DRIVEN ALLOCATION FUND
Performance Summary
December 31, 2021
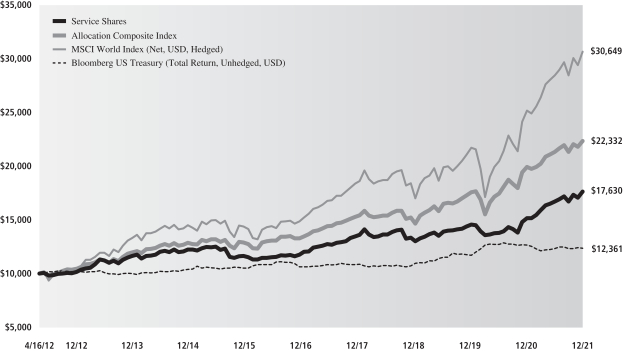
The following graph shows the value, as of December 31, 2021, of a $10,000 investment made on April 16, 2012 (commencement of the Fund’s operations) in Service Shares at net asset value (“NAV”). For comparative purposes, the performance of the Fund’s benchmark, the Allocation Composite Index, (comprised of the Morgan Stanley Capital International (MSCI) World Index (Net, USD, Hedged) (60%) and the Bloomberg U.S. Treasury Composite Index (Total Return, USD, Unhedged) (40%)) is shown. Performance reflects applicable fee waivers and/or expense limitations in effect during the periods shown and in their absence, performance would be reduced. Returns do not reflect the deduction of taxes that a shareholder would pay on Fund distributions or the redemption of Fund shares. The returns set forth below represent past performance. Past performance does not guarantee future results. The Fund’s investment return and principal value will fluctuate so that an investor’s shares, when redeemed, may be worth more or less than their original cost. Current performance may be lower or higher than the performance quoted below. Please visit our web site at www.GSAMFUNDS.com to obtain the most recent month-end returns.
Trend Driven Allocation Fund’s Lifetime Performance
Performance of a $10,000 investment, with distributions reinvested, from April 16, 2012 through December 31, 2021.
| | | | | | |
| Average Annual Total Return through December 31, 2021 | | One Year | | Five Years | | Since Inception |
Institutional (Commenced October 16, 2013) | | 16.46% | | 8.21% | | 5.69% |
Service (Commenced April 16, 2012) | | 16.17% | | 7.93% | | 6.01% |
GOLDMAN SACHS VARIABLE INSURANCE TRUST MULTI-ASSET STRATEGIES FUNDS
Index Definitions
ICE BofAML Three-Month T-Bill Index measures total return on cash, including price and interest income, based on short-term government Treasury Bills of about 90-day maturity, as reported by Bank of America Merrill Lynch.
ICE BofAML U.S. Dollar Three-Month LIBOR Constant Maturity Index is based on the assumed purchase of a synthetic instrument having three months to maturity and with a coupon equal to the closing quote for three-month LIBOR. That issue is sold the following day (priced at a yield equal to the current day closing three-month LIBOR rate) and is rolled into a new three-month instrument. The index, therefore, will always have a constant maturity equal to exactly three months.
MSCI ACWI Investable Market Index captures large, mid and small cap representation across 23 developed markets and 27 emerging markets countries.
MSCI Emerging Markets Index captures large-cap and mid-cap representation across 26 emerging markets countries. The index covers approximately 85% of the free float-adjusted market capitalization in each country.
Bloomberg U.S. Treasury Composite Index measures U.S. dollar-denominated, fixed-rate, nominal debt issued by the U.S. Treasury. Treasury bills are excluded by the maturity constraint.
Allocation Composite Index is comprised of 60% the MSCI World Index and 40% the Bloomberg U.S. Treasury Index.
MSCI World Index is a broad global equity index that represents large and mid-cap equity performance across 23 developed markets countries. It covers approximately 85% of the free float-adjusted market capitalization in each country.
S&P 500® Index is a U.S. stock market index based on the market capitalizations of 500 large companies having common stock listed on the New York Stock Exchange or NASDAQ. The S&P 500® Index components and their weightings are determined by S&P Dow Jones Indices.
It is not possible to invest directly in an unmanaged index.
GOLDMAN SACHS VARIABLE INSURANCE TRUST MULTI-STRATEGY ALTERNATIVES PORTFOLIO
Schedule of Investments
December 31, 2021
| | | | | | | | |
| Shares | | |
Description | | Value | |
|
| Underlying Funds (Class R6 Shares)(a) – 94.8% | |
| Equity – 36.7% | |
| | 569,129 | | | Goldman Sachs Tactical Tilt Overlay Fund | | $ | 5,839,260 | |
| | 103,370 | | | Goldman Sachs Dynamic Global Equity Fund | | | 2,391,987 | |
| | 217,371 | | | Goldman Sachs Absolute Return Tracker Fund | | | 2,125,889 | |
| | 51,581 | | | Goldman Sachs Emerging Markets Equity Insights Fund | | | 501,367 | |
| | | | | | | | |
| | | | Total Equity | | | 10,858,503 | |
| | |
| Fixed Income – 58.1% | |
| | 293,284 | | | Goldman Sachs Managed Futures Strategy Fund | | | 2,991,500 | |
| | 400,079 | | | Goldman Sachs Alternative Premia Fund | | | 2,688,531 | |
| | 213,128 | | | Goldman Sachs Emerging Markets Debt Fund | | | 2,551,140 | |
| | 186,254 | | | Goldman Sachs Global Infrastructure Fund | | | 2,503,260 | |
| | 237,741 | | | Goldman Sachs Long Short Credit Strategies Fund | | | 2,101,630 | |
| | 304,859 | | | Goldman Sachs High Yield Fund | | | 1,960,245 | |
| | 161,806 | | | Goldman Sachs High Yield Floating Rate Fund | | | 1,514,507 | |
| | 96,541 | | | Goldman Sachs Strategic Income Fund | | | 905,551 | |
| | | | | | | | |
| | | | Total Fixed Income | | | 17,216,364 | |
| | |
| | TOTAL UNDERLYING FUNDS (CLASS R6 SHARES) | |
| | (Cost $27,719,037) | | $ | 28,074,867 | |
| | |
| Shares | | Dividend
Rate | | | Value | |
|
| Investment Company – 3.5%(a) | |
Goldman Sachs Financial Square Government Fund — Institutional Shares | |
| 1,042,574 | | | 0.026 | % | | | 1,042,574 | |
| (Cost $1,042,574) | | | | | |
| |
| TOTAL INVESTMENTS – 98.3% | |
| (Cost $28,761,611) | | | $ | 29,117,441 | |
| |
OTHER ASSETS IN EXCESS OF
LIABILITIES – 1.7% | | | | 520,207 | |
| |
| NET ASSETS – 100.0% | | | $ | 29,637,648 | |
| |
| | |
| The percentage shown for each investment category reflects the value of investments in that category as a percentage of net assets. |
| |
| (a) | | Represents an affiliated issuer. |
| | |
| |
| Currency Abbreviations: |
| USD | | —United States Dollar |
ADDITIONAL INVESTMENT INFORMATION
FUTURES CONTRACTS — At December 31, 2021, the Fund had the following futures contracts:
| | | | | | | | | | | | | | | | |
| Description | | Number of
Contracts | | | Expiration
Date | | | Notional
Amount | | | Unrealized
Appreciation/
(Depreciation) | |
| | | | |
Long position contracts: | | | | | | | | | | | | | | | | |
| MSCI Emerging Markets E-Mini Index | | | 10 | | | | 03/18/22 | | | $ | 608,790 | | | $ | 4,359 | |
U.S. Treasury 10 Year Note | | | 17 | | | | 03/22/22 | | | | 2,198,592 | | | | 17,252 | |
| | | | |
| Total Futures Contracts | | | | | | | | | | | | | | $ | 21,611 | |
| | |
| The accompanying notes are an integral part of these financial statements. | | 13 |
GOLDMAN SACHS VARIABLE INSURANCE TRUST MULTI-STRATEGY ALTERNATIVES PORTFOLIO
Schedule of Investments (continued)
December 31, 2021
ADDITIONAL INVESTMENT INFORMATION (continued)
PURCHASED OPTIONS CONTRACTS — At December 31, 2021, the Portfolio had the following purchased options contracts:
| | | | | | | | | | | | | | | | | | | | | | | | | | | | |
| Description | | Exercise
Price | | | Expiration
Date | | | Number of
Contracts | | | Notional
Amount | | | Value | | | Premiums
Paid
by the
Portfolio | | | Unrealized
Appreciation/
(Depreciation) | |
|
Purchased options contracts: | |
| | | | | | | |
Calls | | | | | | | | | | | | | | | | | | | | | | | | | | | | |
3 Month Eurodollar | | | 99.00 USD | | | | 06/13/2022 | | | | 9 | | | $ | 2,250,000 | | | $ | 9,675 | | | $ | 9,471 | | | $ | 204 | |
3 Month Eurodollar | | | 98.25 USD | | | | 09/19/2022 | | | | 4 | | | | 1,000,000 | | | | 9,650 | | | | 9,559 | | | | 91 | |
3 Month Eurodollar | | | 99.00 USD | | | | 09/19/2022 | | | | 12 | | | | 3,000,000 | | | | 9,075 | | | | 9,178 | | | | (103 | ) |
3 Month Eurodollar | | | 98.00 USD | | | | 12/19/2022 | | | | 4 | | | | 1,000,000 | | | | 9,950 | | | | 9,959 | | | | (9 | ) |
3 Month Eurodollar | | | 98.75 USD | | | | 12/19/2022 | | | | 12 | | | | 3,000,000 | | | | 11,100 | | | | 11,128 | | | | (28 | ) |
3 Month Eurodollar | | | 97.75 USD | | | | 03/13/2023 | | | | 15 | | | | 3,750,000 | | | | 41,344 | | | | 52,830 | | | | (11,486 | ) |
3 Month Eurodollar | | | 97.75 USD | | | | 06/19/2023 | | | | 7 | | | | 1,750,000 | | | | 17,631 | | | | 28,547 | | | | (10,916 | ) |
3 Month Eurodollar | | | 99.00 USD | | | | 12/19/2022 | | | | 39 | | | | 9,750,000 | | | | 21,938 | | | | 55,537 | | | | (33,599 | ) |
| | | | | | | |
| TOTAL | | | | | | | | | | | | | | $ | 25,500,000 | | | $ | 130,363 | | | $ | 186,209 | | | $ | (55,846 | ) |
| | |
| 14 | | The accompanying notes are an integral part of these financial statements. |
GOLDMAN SACHS VARIABLE INSURANCE TRUST TREND DRIVEN ALLOCATION FUND
Schedule of Investments
December 31, 2021
| | | | | | | | |
| Shares | | |
Description | | Value | |
| |
| Exchange Traded Funds – 25.1% | | | |
| | 97,965 | | | iShares Core S&P 500 ETF | | $ | 46,728,325 | |
| | 98,800 | | | Vanguard S&P 500 ETF | | | 43,133,116 | |
| | |
| | TOTAL EXCHANGE TRADED FUNDS | |
| | (Cost $47,716,772) | | $ | 89,861,441 | |
| | |
| | | | | | | | |
| Shares | | | Dividend
Rate | | Value | |
| |
| Investment Companies(a) – 55.0% | | | |
| | 107,548,515 | | | Goldman Sachs Financial Square Government Fund — Institutional Shares 0.026% | | $ | 107,548,515 | |
| | 17,641,672 | | | Goldman Sachs Financial Square Treasury Instruments Fund — Institutional Shares 0.006% | | | 17,641,672 | |
| | 35,780,380 | | | Goldman Sachs Financial Square Treasury Obligations Fund — Institutional Shares 0.006% | | | 35,780,380 | |
| | 35,779,565 | | | Goldman Sachs Financial Square Treasury Solutions Fund — Institutional Shares 0.006% | | | 35,779,565 | |
| | |
| | TOTAL INVESTMENT COMPANIES | |
| | (Cost $196,750,132) | | | 196,750,132 | |
| | |
| | TOTAL INVESTMENTS – 80.1% | |
| | (Cost $244,466,904) | | $ | 286,611,573 | |
| | |
| OTHER ASSETS IN EXCESS OF
LIABILITIES – 19.9% | | | 71,041,128 | |
| | |
| | NET ASSETS – 100.0% | | $ | 357,652,701 | |
| | |
| | |
| The percentage shown for each investment category reflects the value of investments in that category as a percentage of net assets. |
| |
| (a) | | Represents an affiliated issuer. |
ADDITIONAL INVESTMENT INFORMATION
FUTURES CONTRACTS — At December 31, 2021, the Fund had the following futures contracts:
| | | | | | | | | | | | | | | | |
| Description | | Number of
Contracts | | | Expiration
Date | | | Notional
Amount | | | Unrealized
Appreciation/
(Depreciation) | |
| | | | |
Long position contracts: | | | | | | | | | | | | | | | | |
| EURO STOXX 50 Index | | | 603 | | | | 03/18/22 | | | $ | 28,449,216 | | | $ | 985,160 | |
| Euro-Bund | | | 234 | | | | 03/08/22 | | | | 46,485,126 | | | | (806,602 | ) |
| FTSE 100 Index | | | 307 | | | | 03/18/22 | | | | 29,765,041 | | | | 669,117 | |
| Japan 10 Year Bond | | | 31 | | | | 03/14/22 | | | | 40,954,776 | | | | (77,787 | ) |
| Russell 2000 E-Mini Index | | | 40 | | | | 03/18/22 | | | | 4,418,034 | | | | 67,566 | |
| S&P 500 E-Mini Index | | | 386 | | | | 03/18/22 | | | | 89,959,801 | | | | 1,879,249 | |
TOPIX Index | | | 137 | | | | 03/10/22 | | | | 29,765,041 | | | | 126,537 | |
| | | | |
| Total Futures Contracts | | | | | | | | | | | | | | $ | 2,843,240 | |
| | |
| The accompanying notes are an integral part of these financial statements. | | 15 |
GOLDMAN SACHS VARIABLE INSURANCE TRUST MULTI-ASSET STRATEGIES FUNDS
Statements of Assets and Liabilities
December 31, 2021
| | | | | | | | |
| | | Multi-Strategy
Alternatives Portfolio | | | Trend Driven
Allocation Fund | |
| | | | | | | | |
| Assets: | |
Investments in unaffiliated issuers, at value (cost $0 and $47,716,772, respectively) | | $ | — | | | $ | 89,861,441 | |
Investments in affiliated issuers, at value (cost $28,761,611 and $196,750,132, respectively) | | | 29,117,441 | | | | 196,750,132 | |
Purchased Options, at value (premiums paid $186,209 and $0, respectively) | | | 130,363 | | | | — | |
Foreign currency, at value (cost $462,562 and $60,903,234, respectively) | | | 462,562 | | | | 60,328,629 | |
Receivables: | | | | | | | | |
Collateral on certain derivative contracts | | | 38,607 | | | | 11,329,193 | |
Fund shares sold | | | 18,084 | | | | 122,049 | |
Reimbursement from investment adviser | | | 14,663 | | | | 20,984 | |
Securities lending income | | | — | | | | 1,408 | |
Dividends | | | — | | | | 462 | |
Other assets | | | 9,359 | | | | 90,115 | |
| | |
| Total assets | | | 29,791,079 | | | | 358,504,413 | |
| | | | | | | | |
| | | | | | | | |
| Liabilities: | |
Variation margin on futures contracts | | | 2,620 | | | | 368,033 | |
Payables: | | | | | | | | |
Management fees | | | 7,373 | | | | 237,192 | |
Distribution and Service fees and Transfer Agency fees | | | 21,757 | | | | 88,102 | |
Fund shares redeemed | | | 9,170 | | | | 37,582 | |
Accrued expenses | | | 112,511 | | | | 120,803 | |
| | |
| Total liabilities | | | 153,431 | | | | 851,712 | |
| | | | | | | | |
| | | | | | | | |
| Net Assets: | |
Paid-in capital | | | 29,148,394 | | | | 314,394,788 | |
Total distributable earnings | | | 489,254 | | | | 43,257,913 | |
| | |
| NET ASSETS | | $ | 29,637,648 | | | $ | 357,652,701 | |
Net Assets: | | | | | | | | |
Advisor | | $ | 20,585,273 | | | $ | — | |
Institutional | | | 2,514,644 | | | | 336,574 | |
Service | | | 6,537,731 | | | | 357,316,127 | |
| | |
Total Net Assets | | $ | 29,637,648 | | | $ | 357,652,701 | |
Shares outstanding $0.001 par value (unlimited number of shares authorized): | | | | | | | | |
Advisor | | | 2,115,197 | | | | — | |
Institutional | | | 257,351 | | | | 26,055 | |
Service | | | 669,610 | | | | 27,785,409 | |
Net asset value and offering price per share: | | | | | | | | |
Advisor | | | $9.73 | | | | $— | |
Institutional | | | 9.77 | | | | 12.92 | |
Service | | | 9.76 | | | | 12.86 | |
| | |
| 16 | | The accompanying notes are an integral part of these financial statements. |
GOLDMAN SACHS VARIABLE INSURANCE TRUST MULTI-ASSET STRATEGIES FUNDS
Statements of Operations
For the Fiscal Year Ended December 31, 2021
| | | | | | | | |
| | | Multi-Strategy
Alternatives
Portfolio | | | Trend Driven
Allocation Fund | |
| | | | | | | | |
| Investment income: | | | | | | |
Dividends — unaffiliated issuers | | $ | — | | | $ | 1,140,659 | |
Dividends — affiliated Underlying Funds | | | 672,975 | | | | 35,688 | |
Securities lending income — affiliated issuer | | | — | | | | 1,610 | |
| | |
| Total investment income | | | 672,975 | | | | 1,177,957 | |
| | | | | | | | |
| | | | | | | | |
| Expenses: | | | | | | |
Management fees | | | 39,904 | | | | 2,766,329 | |
Distribution and Service (12b-1) fees(a) | | | 41,875 | | | | 874,629 | |
Professional fees | | | 89,357 | | | | 118,615 | |
Transfer Agency fees(a) | | | 5,320 | | | | 70,029 | |
Custody, accounting and administrative services | | | 66,310 | | | | 67,661 | |
Printing and mailing costs | | | 55,884 | | | | 47,238 | |
Service fees — Advisor Shares | | | 47,768 | | | | — | |
Trustee fees | | | 19,283 | | | | 19,749 | |
Other | | | 4,605 | | | | 14,781 | |
| | |
| Total expenses | | | 370,306 | | | | 3,979,031 | |
| | |
Less — expense reductions | | | (216,995 | ) | | | (771,583 | ) |
| | |
| Net expenses | | | 153,311 | | | | 3,207,448 | |
| | |
| NET INVESTMENT INCOME (LOSS) | | | 519,664 | | | | (2,029,491 | ) |
| | | | | | | | |
| | | | | | | | |
| Realized and unrealized gain (loss): | | | | | | |
Net realized gain (loss) from: | | | | | | | | |
Investments — unaffiliated issuers | | | (5,599 | ) | | | 13,086,829 | |
Investments — affiliated Underlying Funds | | | 489,006 | | | | — | |
Futures | | | (49,098 | ) | | | 31,396,196 | |
Purchased options | | | 28,111 | | | | — | |
Foreign currency transactions | | | (2,091 | ) | | | (478,659 | ) |
Net change in unrealized gain (loss) on: | | | | | | | | |
Investments — unaffiliated issuers | | | — | | | | 10,111,641 | |
Investments — affiliated Underlying Funds | | | 242,438 | | | | — | |
Futures | | | 1,992 | | | | 837,234 | |
Purchased options | | | (112,175 | ) | | | — | |
Foreign currency translations | | | 5,241 | | | | (701,274 | ) |
| | |
| Net realized and unrealized gain | | | 597,825 | | | | 54,251,967 | |
| | |
| NET INCREASE IN NET ASSETS RESULTING FROM OPERATIONS | | $ | 1,117,489 | | | $ | 52,222,476 | |
| (a) | Class specific Distribution and/or Service and Transfer Agency Fees were as follows: |
| | | | | | | | | | | | | | | | | | | | |
| | | Distribution and/or
Service (12b-1) Fees | | | Transfer Agency Fees | |
Fund | | Advisor | | | Service | | | Advisor | | | Institutional | | | Service | |
Multi-Strategy Alternatives Portfolio | | $ | 29,322 | | | $ | 12,553 | | | $ | 3,854 | | | $ | 462 | | | $ | 1,004 | |
Trend Driven Allocation | | | — | | | | 874,629 | | | | — | | | | 63 | | | | 69,966 | |
| | |
| The accompanying notes are an integral part of these financial statements. | | 17 |
GOLDMAN SACHS VARIABLE INSURANCE TRUST MULTI-ASSET STRATEGIES FUNDS
Statements of Changes in Net Assets
| | | | | | | | | | | | | | | | |
| | | Multi-Strategy Alternatives Portfolio | | | Trend Driven Allocation Fund | |
| | | For the
Fiscal Year Ended
December 31, 2021 | | | For the
Fiscal Year Ended
December 31, 2020 | | | For the
Fiscal Year Ended
December 31, 2021 | | | For the
Fiscal Year Ended
December 31, 2020 | |
| | | | | | | | | | | | | | | | |
| From operations: | |
Net investment income (loss) | | $ | 519,664 | | | $ | 492,763 | | | $ | (2,029,491 | ) | | $ | (399,657 | ) |
Net realized gain | | | 460,329 | | | | 501,405 | | | | 44,004,366 | | | | 4,394,683 | |
Net change in unrealized gain | | | 137,496 | | | | 520,781 | | | | 10,247,601 | | | | 8,569,920 | |
| | | | |
| Net increase in net assets resulting from operations | | | 1,117,489 | | | | 1,514,949 | | | | 52,222,476 | | | | 12,564,946 | |
| | | | | | | | | | | | | | | | |
| | | | | | | | | | | | | | | | |
| Distributions to shareholders: | |
From distributable earnings: | | | | | | | | | | | | | | | | |
Advisor Shares | | | (268,995 | ) | | | (298,027 | ) | | | — | | | | — | |
Institutional Shares | | | (41,966 | ) | | | (30,659 | ) | | | (40,198 | ) | | | (5,497 | ) |
Service Shares | | | (96,854 | ) | | | (63,162 | ) | | | (43,019,719 | ) | | | (5,648,001 | ) |
| | | | |
| Total distributions to shareholders | | | (407,815 | ) | | | (391,848 | ) | | | (43,059,917 | ) | | | (5,653,498 | ) |
| | | | | | | | | | | | | | | | |
| | | | | | | | | | | | | | | | |
| From share transactions: | |
Proceeds from sales of shares | | | 9,602,512 | | | | 7,433,283 | | | | 16,311,964 | | | | 18,343,800 | |
Reinvestment of distributions | | | 407,815 | | | | 391,848 | | | | 43,059,917 | | | | 5,653,498 | |
Cost of shares redeemed | | | (3,772,014 | ) | | | (5,834,245 | ) | | | (46,955,103 | ) | | | (40,330,893 | ) |
| | | | |
| Net increase (decrease) in net assets resulting from share transactions | | | 6,238,313 | | | | 1,990,886 | | | | 12,416,778 | | | | (16,333,595 | ) |
| | | | |
| TOTAL INCREASE (DECREASE) | | | 6,947,987 | | | | 3,113,987 | | | | 21,579,337 | | | | (9,422,147 | ) |
| | | | | | | | | | | | | | | | |
| | | | | | | | | | | | | | | | |
| Net Assets: | |
| | | | |
Beginning of year | | | 22,689,661 | | | | 19,575,674 | | | | 336,073,364 | | | | 345,495,511 | |
| | | | |
End of year | | $ | 29,637,648 | | | $ | 22,689,661 | | | $ | 357,652,701 | | | $ | 336,073,364 | |
| | |
| 18 | | The accompanying notes are an integral part of these financial statements. |
GOLDMAN SACHS VARIABLE INSURANCE TRUST MULTI-STRATEGY ALTERNATIVES PORTFOLIO
Financial Highlights
Selected Share Data for a Share Outstanding Throughout Each Year
| | | | | | | | | | | | | | | | | | | | |
| | | Goldman Sachs Multi-Strategy Alternatives Portfolio | |
| | | Institutional Shares | |
| | | Year Ended December 31, | |
| | | 2021 | | | 2020 | | | 2019 | | | 2018 | | | 2017 | |
| | | | | | | | | | | | | | | | | | | | |
| Per Share Data | | | | | | | | | | | | | | | |
| | | | | |
Net asset value, beginning of year | | $ | 9.46 | | | $ | 9.02 | | | $ | 8.51 | | | $ | 9.39 | | | $ | 9.10 | |
| | | | | |
Net investment income(a)(b) | | | 0.23 | | | | 0.25 | | | | 0.30 | | | | 0.24 | | | | 0.21 | |
| | | | | |
Net realized and unrealized gain (loss) | | | 0.25 | | | | 0.39 | | | | 0.48 | | | | (0.87 | ) | | | 0.30 | |
| | | | | |
Total from investment operations | | | 0.48 | | | | 0.64 | | | | 0.78 | | | | (0.63 | ) | | | 0.51 | |
| | | | | |
Distributions to shareholders from net investment income | | | (0.17 | ) | | | (0.20 | ) | | | (0.27 | ) | | | (0.25 | ) | | | (0.22 | ) |
| | | | | |
Net asset value, end of year | | $ | 9.77 | | | $ | 9.46 | | | $ | 9.02 | | | $ | 8.51 | | | $ | 9.39 | |
| | | | | |
Total Return(c) | | | 5.03 | % | | | 7.05 | % | | | 9.11 | % | | | (6.74 | )% | | | 5.60 | % |
| | | | | |
Net assets, end of year (in 000’s) | | $ | 2,515 | | | $ | 1,520 | | | $ | 1,309 | | | $ | 745 | | | $ | 453 | |
| | | | | |
Ratio of net expenses to average net assets(d) | | | 0.22 | % | | | 0.21 | % | | | 0.25 | % | | | 0.22 | % | | | 0.21 | % |
| | | | | |
Ratio of total expenses to average net assets(d) | | | 1.02 | % | | | 1.39 | % | | | 1.60 | % | | | 1.57 | % | | | 1.47 | % |
| | | | | |
Ratio of net investment income to average net assets | | | 2.29 | % | | | 2.73 | % | | | 3.30 | % | | | 2.62 | % | | | 2.20 | % |
| | | | | |
Portfolio turnover rate(e) | | | 25 | % | | | 5 | % | | | 26 | % | | | 61 | % | | | 53 | % |
| (a) | Calculated based on the average shares outstanding methodology. |
| (b) | Recognition of net investment income by the Portfolio is affected by the timing of declaration of dividends by the Underlying Funds in which the Portfolio invests. |
| (c) | Assumes investment at the NAV at the beginning of the year, reinvestment of all dividends and distributions, a complete redemption of the investment at the NAV at the end of the year and no sales or redemption charges (if any). Total returns would be reduced if a sales or redemption charge was taken into account. Returns do not reflect the impact of taxes to shareholders relating to Fund distributions or the redemption of Fund shares. |
| (d) | Expense ratios exclude the expenses of the Underlying Funds in which the Portfolio invests. |
| (e) | The Fund’s portfolio turnover rate is calculated in accordance with regulatory requirements, without regard to transactions involving short term investments and certain derivatives. If such transactions were included, the Fund’s portfolio turnover rate may be higher. |
| | |
| The accompanying notes are an integral part of these financial statements. | | 19 |
GOLDMAN SACHS VARIABLE INSURANCE TRUST MULTI-STRATEGY ALTERNATIVES PORTFOLIO
Financial Highlights (continued)
Selected Share Data for a Share Outstanding Throughout Each Year
| | | | | | | | | | | | | | | | | | | | |
| | | Goldman Sachs Multi-Strategy Alternatives Portfolio | |
| | | Service Shares | |
| | | Year Ended December 31, | |
| | | 2021 | | | 2020 | | | 2019 | | | 2018 | | | 2017 | |
| | | | | | | | | | | | | | | | | | | | |
| Per Share Data | | | | | | | | | | | | | | | |
| | | | | |
Net asset value, beginning of year | | $ | 9.45 | | | $ | 9.02 | | | $ | 8.52 | | | $ | 9.41 | | | $ | 9.13 | |
| | | | | |
Net investment income(a)(b) | | | 0.20 | | | | 0.23 | | | | 0.32 | | | | 0.28 | | | | 0.27 | |
| | | | | |
Net realized and unrealized gain (loss) | | | 0.26 | | | | 0.38 | | | | 0.43 | | | | (0.93 | ) | | | 0.22 | |
| | | | | |
Total from investment operations | | | 0.46 | | | | 0.61 | | | | 0.75 | | | | (0.65 | ) | | | 0.49 | |
| | | | | |
Distributions to shareholders from net investment income | | | (0.15 | ) | | | (0.18 | ) | | | (0.25 | ) | | | (0.24 | ) | | | (0.21 | ) |
| | | | | |
Net asset value, end of year | | $ | 9.76 | | | $ | 9.45 | | | $ | 9.02 | | | $ | 8.52 | | | $ | 9.41 | |
| | | | | |
Total Return(c) | | | 4.84 | % | | | 6.70 | % | | | 8.82 | % | | | (6.93 | )% | | | 5.37 | % |
| | | | | |
Net assets, end of year (in 000’s) | | $ | 6,538 | | | $ | 3,472 | | | $ | 2,857 | | | $ | 811 | | | $ | 105 | |
| | | | | |
Ratio of net expenses to average net assets(d) | | | 0.47 | % | | | 0.46 | % | | | 0.51 | % | | | 0.47 | % | | | 0.46 | % |
| | | | | |
Ratio of total expenses to average net assets(d) | | | 1.28 | % | | | 1.65 | % | | | 1.86 | % | | | 1.95 | % | | | 1.73 | % |
| | | | | |
Ratio of net investment income to average net assets | | | 2.04 | % | | | 2.51 | % | | | 3.54 | % | | | 3.08 | % | | | 2.88 | % |
| | | | | |
Portfolio turnover rate(e) | | | 25 | % | | | 5 | % | | | 26 | % | | | 61 | % | | | 53 | % |
| (a) | Calculated based on the average shares outstanding methodology. |
| (b) | Recognition of net investment income by the Portfolio is affected by the timing of declaration of dividends by the Underlying Funds in which the Portfolio invests. |
| (c) | Assumes investment at the NAV at the beginning of the year, reinvestment of all dividends and distributions, a complete redemption of the investment at the NAV at the end of the year and no sales or redemption charges (if any). Total returns would be reduced if a sales or redemption charge was taken into account. Returns do not reflect the impact of taxes to shareholders relating to Fund distributions or the redemption of Fund shares. |
| (d) | Expense ratios exclude the expenses of the Underlying Funds in which the Portfolio invests. |
| (e) | The Fund’s portfolio turnover rate is calculated in accordance with regulatory requirements, without regard to transactions involving short term investments and certain derivatives. If such transactions were included, the Fund’s portfolio turnover rate may be higher. |
| | |
| 20 | | The accompanying notes are an integral part of these financial statements. |
GOLDMAN SACHS VARIABLE INSURANCE TRUST MULTI-STRATEGY ALTERNATIVES PORTFOLIO
Financial Highlights (continued)
Selected Share Data for a Share Outstanding Throughout Each Year
| | | | | | | | | | | | | | | | | | | | |
| | | Goldman Sachs Multi-Strategy Alternatives Portfolio | |
| | | Advisor Shares | |
| | | Year Ended December 31, | |
| | | 2021 | | | 2020 | | | 2019 | | | 2018 | | | 2017 | |
| | | | | | | | | | | | | | | | | | | | |
| Per Share Data | | | | | | | | | | | | | | | |
| | | | | |
Net asset value, beginning of year | | $ | 9.42 | | | $ | 8.99 | | | $ | 8.49 | | | $ | 9.36 | | | $ | 9.08 | |
| | | | | |
Net investment income(a)(b) | | | 0.18 | | | | 0.20 | | | | 0.24 | | | | 0.17 | | | | 0.17 | |
| | | | | |
Net realized and unrealized gain (loss) | | | 0.26 | | | | 0.39 | | | | 0.49 | | | | (0.83 | ) | | | 0.30 | |
| | | | | |
Total from investment operations | | | 0.44 | | | | 0.59 | | | | 0.73 | | | | (0.66 | ) | | | 0.47 | |
| | | | | |
Distributions to shareholders from net investment income | | | (0.13 | ) | | | (0.16 | ) | | | (0.23 | ) | | | (0.21 | ) | | | (0.19 | ) |
| | | | | |
Net asset value, end of year | | $ | 9.73 | | | $ | 9.42 | | | $ | 8.99 | | | $ | 8.49 | | | $ | 9.36 | |
| | | | | |
Total Return(c) | | | 4.66 | % | | | 6.56 | % | | | 8.60 | % | | | (7.09 | )% | | | 5.14 | % |
| | | | | |
Net assets, end of year (in 000’s) | | $ | 20,585 | | | $ | 17,698 | | | $ | 15,410 | | | $ | 13,460 | | | $ | 15,512 | |
| | | | | |
Ratio of net expenses to average net assets(d) | | | 0.62 | % | | | 0.61 | % | | | 0.64 | % | | | 0.62 | % | | | 0.61 | % |
| | | | | |
Ratio of total expenses to average net assets(d) | | | 1.44 | % | | | 1.79 | % | | | 2.01 | % | | | 1.93 | % | | | 1.88 | % |
| | | | | |
Ratio of net investment income to average net assets | | | 1.89 | % | | | 2.28 | % | | | 2.61 | % | | | 1.92 | % | | | 1.78 | % |
| | | | | |
Portfolio turnover rate(e) | | | 25 | % | | | 5 | % | | | 26 | % | | | 61 | % | | | 53 | % |
| (a) | Calculated based on the average shares outstanding methodology. |
| (b) | Recognition of net investment income by the Portfolio is affected by the timing of declaration of dividends by the Underlying Funds in which the Portfolio invests. |
| (c) | Assumes investment at the NAV at the beginning of the year, reinvestment of all dividends and distributions, a complete redemption of the investment at the NAV at the end of the year and no sales or redemption charges (if any). Total returns would be reduced if a sales or redemption charge was taken into account. Returns do not reflect the impact of taxes to shareholders relating to Fund distributions or the redemption of Fund shares. |
| (d) | Expense ratios exclude the expenses of the Underlying Funds in which the Portfolio invests. |
| (e) | The Fund’s portfolio turnover rate is calculated in accordance with regulatory requirements, without regard to transactions involving short term investments and certain derivatives. If such transactions were included, the Fund’s portfolio turnover rate may be higher. |
| | |
| The accompanying notes are an integral part of these financial statements. | | 21 |
GOLDMAN SACHS VARIABLE INSURANCE TRUST TREND DRIVEN ALLOCATION FUND
Financial Highlights (continued)
Selected Share Data for a Share Outstanding Throughout Each Year
| | | | | | | | | | | | | | | | | | | | |
| | | Goldman Sachs Variable Insurance Trust Trend Driven
Allocation Fund | |
| | | Institutional Shares | |
| | | Year Ended December 31, | |
| | | 2021 | | | 2020 | | | 2019 | | | 2018 | | | 2017 | |
| | | | | | | | | | | | | | | | | | | | |
| Per Share Data | | | | | | | | | | | | | | | |
| | | | | |
Net asset value, beginning of year | | $ | 12.61 | | | $ | 12.32 | | | $ | 11.65 | | | $ | 12.46 | | | $ | 11.33 | |
| | | | | |
Net investment income (loss)(a) | | | (0.04 | ) | | | 0.02 | | | | 0.15 | | | | 0.14 | | | | 0.06 | |
| | | | | |
Net realized and unrealized gain (loss) | | | 2.10 | | | | 0.52 | | | | 1.28 | | | | (0.64 | ) | | | 1.46 | |
| | | | | |
Total from investment operations | | | 2.06 | | | | 0.54 | | | | 1.43 | | | | (0.50 | ) | | | 1.52 | |
| | | | | |
Distributions to shareholders from net investment income | | | — | | | | (0.07 | ) | | | (0.22 | ) | | | (0.12 | ) | | | (0.07 | ) |
| | | | | |
Distributions to shareholders from net realized gains | | | (1.75 | ) | | | (0.18 | ) | | | (0.54 | ) | | | (0.19 | ) | | | (0.32 | ) |
| | | | | |
Total distributions | | | (1.75 | ) | | | (0.25 | ) | | | (0.76 | ) | | | (0.31 | ) | | | (0.39 | ) |
| | | | | |
Net asset value, end of year | | $ | 12.92 | | | $ | 12.61 | | | $ | 12.32 | | | $ | 11.65 | | | $ | 12.46 | |
| | | | | |
Total Return(b) | | | 16.46 | % | | | 4.35 | % | | | 12.29 | % | | | (4.08 | )% | | | 13.36 | % |
| | | | | |
Net assets, end of year (in 000’s) | | $ | 337 | | | $ | 289 | | | $ | 277 | | | $ | 247 | | | $ | 30 | |
| | | | | |
Ratio of net expenses to average net assets | | | 0.65 | % | | | 0.60 | % | | | 0.59 | % | | | 0.51 | % | | | 0.68 | % |
| | | | | |
Ratio of total expenses to average net assets | | | 0.87 | % | | | 0.90 | % | | | 0.89 | % | | | 0.86 | % | | | 0.86 | % |
| | | | | |
Ratio of net investment income (loss) to average net assets | | | (0.32 | )% | | | 0.13 | % | | | 1.18 | % | | | 1.13 | % | | | 0.46 | % |
| | | | | |
Portfolio turnover rate(c) | | | 12 | % | | | 168 | % | | | 61 | % | | | 60 | % | | | 64 | % |
| (a) | Calculated based on the average shares outstanding methodology. |
| (b) | Assumes investment at the NAV at the beginning of the year, reinvestment of all dividends and distributions, a complete redemption of the investment at the NAV at the end of the year and no sales or redemption charges (if any). Total returns would be reduced if a sales or redemption charge was taken into account. Returns do not reflect the impact of taxes to shareholders relating to Fund distributions or the redemption of Fund shares. |
| (c) | The Fund’s portfolio turnover rate is calculated in accordance with regulatory requirements, without regard to transactions involving short term investments and certain derivatives. If such transactions were included, the Fund’s portfolio turnover rate may be higher. |
GOLDMAN SACHS VARIABLE INSURANCE TRUST TREND DRIVEN ALLOCATION FUND
Financial Highlights (continued)
Selected Share Data for a Share Outstanding Throughout Each Year
| | | | | | | | | | | | | | | | | | | | |
| | | Goldman Sachs Variable Insurance Trust Trend Driven Allocation Fund | |
| | | Service Shares | |
| | | Year Ended December 31, | |
| | | 2021 | | | 2020 | | | 2019 | | | 2018 | | | 2017 | |
| | | | | | | | | | | | | | | | | | | | |
| Per Share Data | | | | | | | | | | | | | | | |
| | | | | |
Net asset value, beginning of year | | $ | 12.59 | | | $ | 12.30 | | | $ | 11.64 | | | $ | 12.45 | | | $ | 11.32 | |
| | | | | |
Net investment income (loss)(a) | | | (0.08 | ) | | | (0.01 | ) | | | 0.11 | | | | 0.08 | | | | 0.03 | |
| | | | | |
Net realized and unrealized gain (loss) | | | 2.10 | | | | 0.51 | | | | 1.28 | | | | (0.62 | ) | | | 1.46 | |
| | | | | |
Total from investment operations | | | 2.02 | | | | 0.50 | | | | 1.39 | | | | (0.54 | ) | | | 1.49 | |
| | | | | |
Distributions to shareholders from net investment income | | | — | | | | (0.03 | ) | | | (0.19 | ) | | | (0.08 | ) | | | (0.04 | ) |
| | | | | |
Distributions to shareholders from net realized gains | | | (1.75 | ) | | | (0.18 | ) | | | (0.54 | ) | | | (0.19 | ) | | | (0.32 | ) |
| | | | | |
Total distributions | | | (1.75 | ) | | | (0.21 | ) | | | (0.73 | ) | | | (0.27 | ) | | | (0.36 | ) |
| | | | | |
Net asset value, end of year | | $ | 12.86 | | | $ | 12.59 | | | $ | 12.30 | | | $ | 11.64 | | | $ | 12.45 | |
| | | | | |
Total Return(b) | | | 16.17 | % | | | 4.10 | % | | | 11.94 | % | | | (4.34 | )% | | | 13.11 | % |
| | | | | |
Net assets, end of year (in 000’s) | | $ | 357,316 | | | $ | 335,784 | | | $ | 345,219 | | | $ | 395,842 | | | $ | 406,867 | |
| | | | | |
Ratio of net expenses to average net assets | | | 0.92 | % | | | 0.85 | % | | | 0.84 | % | | | 0.81 | % | | | 0.93 | % |
| | | | | |
Ratio of total expenses to average net assets | | | 1.14 | % | | | 1.15 | % | | | 1.14 | % | | | 1.11 | % | | | 1.11 | % |
| | | | | |
Ratio of net investment income (loss) to average net assets | | | (0.58 | )% | | | (0.12 | )% | | | 0.91 | % | | | 0.63 | % | | | 0.21 | % |
| | | | | |
Portfolio turnover rate(c) | | | 12 | % | | | 168 | % | | | 61 | % | | | 60 | % | | | 64 | % |
| (a) | Calculated based on the average shares outstanding methodology. |
| (b) | Assumes investment at the NAV at the beginning of the year, reinvestment of all dividends and distributions, a complete redemption of the investment at the NAV at the end of the year and no sales or redemption charges (if any). Total returns would be reduced if a sales or redemption charge was taken into account. Returns do not reflect the impact of taxes to shareholders relating to Fund distributions or the redemption of Fund shares. |
| (c) | The Fund’s portfolio turnover rate is calculated in accordance with regulatory requirements, without regard to transactions involving short term investments and certain derivatives. If such transactions were included, the Fund’s portfolio turnover rate may be higher. |
| | |
| The accompanying notes are an integral part of these financial statements. | | 23 |
GOLDMAN SACHS VARIABLE INSURANCE TRUST MULTI-ASSET STRATEGIES FUNDS
Notes to Financial Statements
December 31, 2021
1. ORGANIZATION
Goldman Sachs Variable Insurance Trust (the “Trust” or “VIT”) is a Delaware statutory trust registered under the Investment Company Act of 1940, as amended (the “Act”), as an open-end management investment company. The following table lists those series of the Trust that are included in this report (collectively, the “Funds” or individually a “Fund”), along with their corresponding share classes and respective diversification status under the Act:
| | | | |
| Fund | | Share Classes Offered | | Diversified/ Non-diversified |
Multi-Strategy Alternatives | | Institutional, Service and Advisor | | Diversified |
Trend Driven Allocation | | Institutional and Service | | Diversified |
Goldman Sachs Asset Management, L.P. (“GSAM”), an affiliate of Goldman Sachs & Co. LLC (“Goldman Sachs”), serves as investment adviser to the Funds pursuant to management agreements (the “Agreements”) with the Trust.
The Multi-Strategy Alternatives Portfolio invests primarily in a combination of domestic and international equity and fixed income underlying funds (“Underlying Funds”) which are registered under the Act, for which GSAM acts as investment adviser. Additionally, the Multi-Strategy Alternatives Portfolio may invest a portion of its assets directly in other securities and instruments, including unaffiliated exchange traded funds (“Unaffiliated Funds”).
2. SIGNIFICANT ACCOUNTING POLICIES
The financial statements have been prepared in accordance with accounting principles generally accepted in the United States of America (“GAAP”) and require management to make estimates and assumptions that may affect the reported amounts and disclosures. Actual results may differ from those estimates and assumptions. Each Fund is an investment company under GAAP and follows the accounting and reporting guidance applicable to investment companies.
A. Investment Valuation — Each Fund’s valuation policy is to value investments at fair value.
B. Investment Income and Investments — Investment income includes interest income, dividend income, and securities lending income, if any. Interest income is accrued daily and adjusted for amortization of premiums and accretion of discounts. Dividend income is recognized on ex-dividend date or, for certain foreign securities, as soon as such information is obtained subsequent to the ex-dividend date. Non-cash dividends, if any, are recorded at the fair market value of the securities received. Investment transactions are reflected on trade date. Realized gains and losses are calculated using identified cost. Investment transactions are recorded on the following business day for daily net asset value (“NAV”) calculations. Investment income is recorded net of any foreign withholding taxes, less any amounts reclaimable. The Fund may file withholding tax reclaims in certain jurisdictions to recover a portion of amounts previously withheld. Any foreign capital gains tax is accrued daily based upon net unrealized gains, and is payable upon sale of such investments. Income distributions are recognized as capital gains or income in the financial statements in accordance with the character that is distributed.
For derivative contracts, realized gains and losses are recorded upon settlement of the contract.
C. Class Allocations and Expenses — Investment income, realized and unrealized gain (loss), if any, and non-class specific expenses of each Fund are allocated daily based upon the proportion of net assets of each class. Non-class specific expenses directly incurred by the Funds are charged to the Funds, while such expenses incurred by the Trust are allocated across the applicable Funds on a straight-line and/or pro-rata basis depending upon the nature of the expenses. Class specific expenses, where applicable, are borne by the respective share classes and include Distribution and Service and Transfer Agency fees. Expenses included in the accompanying financial statements reflect the expenses of the Funds and do not include any expenses associated with the Underlying Funds. Because the Underlying Funds have varied expense and fee levels and the Funds may own different proportions of the Underlying Funds at different times, the amount of fees and expenses incurred indirectly by the Funds will vary.
GOLDMAN SACHS VARIABLE INSURANCE TRUST MULTI-ASSET STRATEGIES FUNDS
2. SIGNIFICANT ACCOUNTING POLICIES (continued)
D. Federal Taxes and Distributions to Shareholders — It is each Fund’s policy to comply with the requirements of the Internal Revenue Code of 1986, as amended (the “Code”), applicable to regulated investment companies and to distribute each year substantially all of its investment company taxable income and capital gains to its shareholders. Accordingly, each Fund is not required to make any provisions for the payment of federal income tax. Distributions to shareholders are recorded on the ex-dividend date. Income and capital gains distributions, if any, are declared and paid at least annually.
Net capital losses, if any, are carried forward to future fiscal years and may be used to the extent allowed by the Code to offset any future capital gains. Losses that are carried forward will retain their character as either short-term or long-term capital losses. Utilization of capital loss carryforwards will reduce the requirement of future capital gains distributions.
The characterization of distributions to shareholders for financial reporting purposes is determined in accordance with federal income tax rules, which may differ from GAAP. The source of each Fund’s distributions may be shown in the accompanying financial statements as either from distributable earnings or capital. Certain components of the Funds’ net assets on the Statements of Assets and Liabilities reflect permanent GAAP/tax differences based on the appropriate tax character.
E. Foreign Currency Translation — The accounting records and reporting currency of a Fund are maintained in U.S. dollars. Assets and liabilities denominated in foreign currencies are translated into U.S. dollars using the current exchange rates at the close of each business day. The effect of changes in foreign currency exchange rates on investments is included within net realized and unrealized gain (loss) on investments. Changes in the value of other assets and liabilities as a result of fluctuations in foreign exchange rates are included in the Statements of Operations within net change in unrealized gain (loss) on foreign currency translation. Transactions denominated in foreign currencies are translated into U.S. dollars on the date the transaction occurred, the effects of which are included within net realized gain (loss) on foreign currency transactions.
3. INVESTMENTS AND FAIR VALUE MEASUREMENTS
U.S. GAAP defines the fair value of a financial instrument as the amount that would be received to sell an asset or paid to transfer a liability in an orderly transaction between market participants at the measurement date (i.e., the exit price); the Funds’ policy is to use the market approach. GAAP establishes a fair value hierarchy that prioritizes the inputs to valuation techniques used to measure fair value. The hierarchy gives the highest priority to unadjusted quoted prices in active markets for identical assets or liabilities (Level 1 measurements) and the lowest priority to unobservable inputs (Level 3 measurements). The level in the fair value hierarchy within which the fair value measurement in its entirety falls shall be determined based on the lowest level input that is significant to the fair value measurement in its entirety. The levels used for classifying investments are not necessarily an indication of the risk associated with investing in these investments. The three levels of the fair value hierarchy are described below:
Level 1 — Unadjusted quoted prices in active markets that are accessible at the measurement date for identical, unrestricted assets or liabilities;
Level 2 — Quoted prices in markets that are not active or financial instruments for which significant inputs are observable (including, but not limited to, quoted prices for similar investments, interest rates, foreign exchange rates, volatility and credit spreads), either directly or indirectly;
Level 3 — Prices or valuations that require significant unobservable inputs (including GSAM’s assumptions in determining fair value measurement).
The Board of Trustees (“Trustees”) has approved Valuation Procedures that govern the valuation of the portfolio investments held by the Funds, including investments for which market quotations are not readily available. The Trustees have delegated to GSAM day-to-day responsibility for implementing and maintaining internal controls and procedures related to the valuation of the Funds’ investments. To assess the continuing appropriateness of pricing sources and methodologies, GSAM regularly performs price verification procedures and issues challenges as necessary to third party pricing vendors or brokers, and any differences are reviewed in accordance with the Valuation Procedures.
GOLDMAN SACHS VARIABLE INSURANCE TRUST MULTI-ASSET STRATEGIES FUNDS
Notes to Financial Statements (continued)
December 31, 2021
3. INVESTMENTS AND FAIR VALUE MEASUREMENTS (continued)
A. Level 1 and Level 2 Fair Value Investments — The valuation techniques and significant inputs used in determining the fair values for investments classified as Level 1 and Level 2 are as follows:
Equity Securities — Equity securities traded on a United States (“U.S.”) securities exchange or the NASDAQ system, or those located on certain foreign exchanges, including but not limited to the Americas, are valued daily at their last sale price or official closing price on the principal exchange or system on which they are traded. If there is no sale or official closing price or such price is believed by GSAM to not represent fair value, equity securities will be valued at the valid closing bid price for long positions and at the valid closing ask price for short positions (i.e. where there is sufficient volume, during normal exchange trading hours). If no valid bid/ask price is available, the equity security will be valued pursuant to the Valuation Procedures approved by the Trustees and consistent with applicable regulatory guidance. To the extent these investments are actively traded, they are classified as Level 1 of the fair value hierarchy, otherwise they are generally classified as Level 2. Certain equity securities containing unique attributes may be classified as Level 2.
Unlisted equity securities for which market quotations are available are valued at the last sale price on the valuation date, or if no sale occurs, at the last bid price for long positions or the last ask price for short positions, and are generally classified as Level 2. Securities traded on certain foreign securities exchanges are valued daily at fair value determined by an independent fair value service (if available) under Fair Valuation Procedures approved by the Trustees and consistent with applicable regulatory guidance. The independent fair value service takes into account multiple factors including, but not limited to, movements in the securities markets, certain depositary receipts, futures contracts and foreign currency exchange rates that have occurred subsequent to the close of the foreign securities exchange. These investments are generally classified as Level 2 of the fair value hierarchy.
Underlying Funds (including Money Market Funds) — Underlying Funds include other investment companies and
exchange-traded funds (“ETFs”). Investments in the Underlying Funds (except ETFs) are valued at the NAV per share on the day of valuation. ETFs are valued daily at the last sale price or official closing price on the principal exchange or system on which the investment is traded. Because the Funds invest in Underlying Funds that fluctuate in value, each Fund’s shares will correspondingly fluctuate in value. Underlying Funds are generally classified as Level 1 of the fair value hierarchy. To the extent that underlying ETF’s are actively traded, they are classified as Level 1 of the fair value hierarchy, otherwise they are generally classified as Level 2. For information regarding an Underlying Fund’s accounting policies and investment holdings, please see the Underlying Fund’s shareholder report.
Derivative Contracts — A derivative is an instrument whose value is derived from underlying assets, indices, reference rates or a combination of these factors. A Fund enters into derivative transactions to hedge against changes in interest rates, securities prices, and/or currency exchange rates, to increase total return, or to gain access to certain markets or attain exposure to other underliers. For financial reporting purposes, cash collateral that has been pledged to cover obligations of a Fund and cash collateral received, if any, is reported separately on the Statements of Assets and Liabilities as receivables/payables for collateral on certain derivatives contracts. Non-cash collateral pledged by a Fund, if any, is noted in the Schedules of Investments.
Exchange-traded derivatives, including futures and options contracts, are generally valued at the last sale or settlement price on the exchange where they are principally traded. Exchange-traded options without settlement prices are generally valued at the midpoint of the bid and ask prices on the exchange where they are principally traded (or, in the absence of two-way trading, at the last bid price for long positions and the last ask price for short positions). Exchange-traded derivatives typically fall within Level 1 of the fair value hierarchy. Over-the-counter (“OTC”) and centrally cleared derivatives are valued using market transactions and other market evidence, including market-based inputs to models, calibration to market-clearing transactions, broker or dealer quotations, or other alternative pricing sources. Where models are used, the selection of a particular model to value OTC and centrally cleared derivatives depends upon the contractual terms of, and specific risks inherent in, the instrument, as well as the availability of pricing information in the market. Valuation models require a variety of inputs, including contractual terms, market prices, yield curves, credit curves, measures of volatility, voluntary and involuntary prepayment rates, loss severity rates and correlations of such inputs. For OTC and centrally cleared derivatives that trade in liquid markets, model inputs can generally be verified and model selection does not involve significant management judgment. OTC and centrally cleared derivatives are classified within Level 2 of the fair value hierarchy when significant inputs are corroborated by market evidence.
GOLDMAN SACHS VARIABLE INSURANCE TRUST MULTI-ASSET STRATEGIES FUNDS
3. INVESTMENTS AND FAIR VALUE MEASUREMENTS (continued)
i. Futures Contracts — Futures contracts are contracts to buy or sell a standardized quantity of a specified commodity or security. Upon entering into a futures contract, a Fund deposits cash or securities in an account on behalf of the broker in an amount sufficient to meet the initial margin requirement. Subsequent payments are made or received by a Fund equal to the daily change in the contract value and are recorded as variation margin receivable or payable with a corresponding offset to unrealized gains or losses.
ii. Options — When the Multi-Strategy Alternatives Portfolio writes call or put options, an amount equal to the premium received is recorded as a liability and is subsequently marked-to-market to reflect the current value of the option written. Swaptions are options on swap contracts.
Upon the purchase of a call option or a put option by a Fund, the premium paid is recorded as an investment and subsequently marked-to-market to reflect the current value of the option. Certain options may be purchased with premiums to be determined on a future date. The premiums for these options are based upon implied volatility parameters at specified terms.
B. Level 3 Fair Value Investments — To the extent that significant inputs to valuation models and other alternative pricing sources are unobservable, or if quotations are not readily available, or if GSAM believes that such quotations do not accurately reflect fair value, the fair value of a Fund’s investments may be determined under Valuation Procedures approved by the Trustees. GSAM, consistent with its procedures and applicable regulatory guidance, may make an adjustment to the most recent valuation prices of either domestic or foreign securities in light of significant events to reflect what it believes to be the fair value of the securities at the time of determining a Fund’s NAV. To the extent investments are valued using single source broker quotations obtained directly from the broker or passed through from third party pricing vendors, such investments are classified as Level 3 investments.
C. Fair Value Hierarchy — The following is a summary of the Funds’ investments and derivatives classified in the fair value hierarchy as of December 31, 2021:
| | | | | | | | | | | | |
| | | |
| MULTI-STRATEGY ALTERNATIVES PORTFOLIO | | | | | | | | | |
| Investment Type | | Level 1 | | | Level 2 | | | Level 3 | |
| | | |
| Assets | | | | | | | | | | | | |
Fixed Income Underlying Funds | | $ | 17,216,364 | | | $ | — | | | $ | — | |
Equity Underlying Funds | | | 10,858,503 | | | | — | | | | — | |
Investment Company | | | 1,042,574 | | | | — | | | | — | |
| | | |
| Total | | $ | 29,117,441 | | | $ | — | | | $ | — | |
| | | |
| Derivative Type | | | | | | | | | |
| | | |
| Assets | | | | | | | | | | | | |
| Futures Contracts(a) | | $ | 21,611 | | | $ | — | | | $ | — | |
| Purchased Options Contracts | | | 130,363 | | | | — | | | | — | |
| (a) | Amount shown represents unrealized gain (loss) at fiscal year end. |
GOLDMAN SACHS VARIABLE INSURANCE TRUST MULTI-ASSET STRATEGIES FUNDS
Notes to Financial Statements (continued)
December 31, 2021
3. INVESTMENTS AND FAIR VALUE MEASUREMENTS (continued)
| | | | | | | | | | | | |
| | | |
| TREND DRIVEN ALLOCATION FUND | | | | | | | | | |
| Investment Type | | Level 1 | | | Level 2 | | | Level 3 | |
| | | |
| Assets | | | | | | | | | | | | |
Exchange Traded Funds | | $ | 89,861,441 | | | $ | — | | | $ | — | |
Investment Companies | | | 196,750,132 | | | | — | | | | — | |
| | | |
| Total | | $ | 286,611,573 | | | $ | — | | | $ | — | |
| | | |
| Derivative Type | | | | | | | | | |
| | | |
| Assets(a) | | | | | | | | | | | | |
| Futures Contracts | | $ | 3,727,629 | | | $ | — | | | $ | — | |
| | | |
| Derivative Type | | | | | | | | | |
| | | |
| Liabilities(a) | | | | | | | | | | | | |
| Futures Contracts | | $ | (884,389 | ) | | $ | — | | | $ | — | |
| (a) | Amount shown represents unrealized gain (loss) at period end. |
For further information regarding security characteristics, see the Schedules of Investments.
4. INVESTMENTS IN DERIVATIVES
The following tables set forth, by certain risk types, the gross value of derivative contracts (not considered to be hedging instruments for accounting disclosure purposes) as of December 31, 2021. These instruments were used as part of the Funds’ investment strategies and to obtain and/or manage exposure related to the risks below. The values in the tables below exclude the effects of cash collateral received or posted pursuant to these derivative contracts, and therefore are not representative of the Funds’ net exposure.
Multi-Strategy Alternatives
| | | | | | | | | | | | | | |
| Risk | | | | Statements of Assets and Liabilities | | Assets | | | Statements of Assets and Liabilities | | Liabilities | |
| Equity | | | | Variation margin on futures contracts | | $ | 4,359 | (a) | | — | | $ | — | |
| Interest Rate | | | | Purchased options contracts, at value and
variation margin on futures contracts | | | 147,615 | | | — | | | — | |
| | | | | |
| Total | | | | | | $ | 151,974 | | | | | | — | |
Trend Driven Allocation
| | | | | | | | | | | | | | |
| Risk | | | | Statements of Assets and Liabilities | | Assets | | | Statements of Assets and Liabilities | | Liabilities | |
| Equity | | | | Variation margin on futures contracts | | $ | 3,727,629 | (a) | | — | | $ | — | (a) |
| Interest Rate | | | | — | | | — | (a) | | Variation margin on futures contracts | | | (884,389 | )(a) |
| | | | | |
| Total | | | | | | $ | 3,727,629 | | | | | $ | (884,389 | ) |
| (a) | Includes unrealized gain (loss) on futures contracts described in the Additional Investment Information sections of the Schedules of Investments. Only the variation margin as of December 31, 2021, is reported within the Statements of Assets and Liabilities. |
GOLDMAN SACHS VARIABLE INSURANCE TRUST MULTI-ASSET STRATEGIES FUNDS
4. INVESTMENTS IN DERIVATIVES (continued)
The following tables set forth, by certain risk types, the Funds’ gains (losses) related to these derivatives and their indicative volumes for the year ended December 31, 2021. These gains (losses) should be considered in the context that these derivative contracts may have been executed to create investment opportunities and/or economically hedge certain investments, and accordingly, certain gains (losses) on such derivative contracts may offset certain (losses) gains attributable to investments. These gains (losses) are included in “Net realized gain (loss)” or “Net change in unrealized gain (loss)” on the Statements of Operations:
Multi-Strategy Alternatives
| | | | | | | | | | |
| Risk | | Statement of Operations | | Net
Realized
Gain (Loss) | | | Net Change in
Unrealized
Gain (Loss) | |
| Equity | | Net realized gain (loss) from futures contracts/Net change in unrealized gain (loss) on futures contracts | | $ | 17,133 | | | $ | (14,432 | ) |
| Interest Rate | | Net realized gain (loss) from futures contracts and purchased options/Net change in unrealized gain (loss) on futures contracts and purchased options | | | (38,120 | ) | | | (95,751 | ) |
| | | |
| Total | | | | $ | (20,987 | ) | | $ | (110,183 | ) |
Trend Driven Allocation
| | | | | | | | | | |
| Risk | | Statement of Operations | | Net Realized
Gain (Loss) | | | Net Change in
Unrealized
Gain (Loss) | |
| Equity | | Net realized gain (loss) from futures contracts/Net change in unrealized gain (loss) on futures contracts | | $ | 32,201,836 | | | $ | 1,843,888 | |
| Interest Rate | | Net realized gain (loss) from futures contracts/Net change in unrealized gain (loss) on futures contracts | | | (805,640 | ) | | | (1,006,654 | ) |
| | | |
| Total | | | | $ | 31,396,196 | | | $ | 837,234 | |
For the fiscal year ended December 31, 2021, the relevant values for each derivative type were as follows:
| | | | | | | | |
| | | Average Number of Contracts(1) | |
| Fund | | Futures Contracts | | | Purchased Options | |
| Multi-Strategy Alternatives | | | 26 | | | | 42 | |
| Trend Driven Allocation | | | 1,818 | | | | — | |
| (1) | Amounts disclosed represent average number of contracts for futures and purchased options contracts, based on absolute values, which is indicative of volume of this derivative type, for the months that the Funds held such derivatives during the fiscal year ended December 31, 2021. |
5. AGREEMENTS AND AFFILIATED TRANSACTIONS
A. Management Agreement — Under the Agreement, GSAM manages the Funds, subject to the general supervision of the Trustees.
As compensation for the services rendered pursuant to the Agreement, the assumption of the expenses related thereto and administration of the Multi-Strategy Alternatives Portfolio and Trend Driven Allocation Fund business affairs, including providing facilities, GSAM is entitled to a management fee, accrued daily and paid monthly, equal to an annual percentage rate of each Fund’s average daily net assets.
GOLDMAN SACHS VARIABLE INSURANCE TRUST MULTI-ASSET STRATEGIES FUNDS
Notes to Financial Statements (continued)
December 31, 2021
5. AGREEMENTS AND AFFILIATED TRANSACTIONS (continued)
For the fiscal year ended December 31, 2021, contractual and effective net management fees with GSAM were at the following rates:
| | | | | | | | | | | | | | | | | | | | | | | | | | | | |
| Contractual Management Rate | | | | | | | |
| Fund | | First
$1 billion | | | Next
$1 billion | | | Next
$3 billion | | | Next
$3 billion | | | Over
$8 billion | | | Effective
Rate | | | Effective Net
Management
Rate^ | |
| Multi-Strategy Alternatives | | | 0.15 | % | | | 0.15 | % | | | 0.15 | % | | | 0.15 | % | | | 0.15 | % | | | 0.15 | % | | | 0.15 | %* |
| Trend Driven Allocation | | | 0.79% | | | | 0.71% | | | | 0.68% | | | | 0.66% | | | | 0.65% | | | | 0.79% | | | | 0.65%** | |
| ^ | Effective Net Management Rate includes the impact of management fee waivers of affiliated Underlying Funds, if any. |
| * | GSAM agreed to waive a portion of its management fees in order to achieve a net management rate, as defined in the Fund’s most recent prospectus. This waiver will be effective through at least April 30, 2022, and prior to such date GSAM may not terminate the arrangement without approval of the trustees. For the fiscal year ended December 31, 2021, GSAM waived $39,904 of its management fee. |
| ** | GSAM agreed to waive a portion of its management fees in order to achieve a net management rate, as defined in the Fund’s most recent prospectus. This waiver will be effective through at least April 30, 2022, and prior to such date GSAM may not terminate the arrangement without approval of the trustees. For the fiscal year ended December 31, 2021, GSAM waived $420,205 of its management fee. |
The Multi-Strategy Alternatives Portfolio invests in Institutional Shares of the Goldman Sachs Financial Square Government Fund and Trend Driven Allocation Fund invests in Institutional Shares of the Goldman Sachs Financial Square Government, Goldman Sachs Financial Square Treasury Instruments, Goldman Sachs Financial Square Treasury Obligations, and Goldman Sachs Financial Square Treasury Solutions Funds, which are affiliated Underlying Funds. GSAM has agreed to waive a portion of its management fee payable by the Funds in an amount equal to the management fee it earns as an investment adviser to the affiliated Underlying Fund in which the Funds invest, except those management fees it earns from the Funds’ investments of cash collateral received in connection with securities lending transactions in the Goldman Sachs Financial Square Government Fund. For the fiscal year ended December 31, 2021, GSAM waived $502 and $307,887 of the Multi-Strategy Alternatives Portfolio’s and Trend Driven Allocation Fund’s management fee, respectively.
B. Distribution and/or Service (12b-1) Plans — The Trust, on behalf of Service Shares of the Funds has adopted a Distribution and Service Plan subject to Rule 12b-1 under the Act. Under the Distribution and Service Plan, Goldman Sachs, which serves as distributor (the “Distributor”), is entitled to a fee accrued daily and paid monthly, for distribution services and personal and account maintenance services, which may then be paid by Goldman Sachs to authorized dealers, equal to, on an annual basis, 0.25% of the Funds’ average daily net assets attributable to Service Shares.
The Trust, on behalf of Advisor Shares of the Multi-Strategy Alternatives Portfolio, has adopted a Distribution Plan subject to Rule 12b-1 under the Act. Under the Distribution Plan, Goldman Sachs as Distributor is entitled to a fee accrued daily and paid monthly for distribution services, which may then be paid by Goldman Sachs to authorized dealers, equal to, on an annual basis, 0.15% of the Multi-Strategy Alternatives Portfolio’s average daily net assets attributable to Advisor Shares.
C. Service Plans — The Trust, on behalf of Advisor Shares of the Multi-Strategy Alternatives Portfolio, has adopted a Service Plan to allow Advisor Shares to compensate service organizations (including Goldman Sachs) for providing varying levels of personal and account maintenance and administration services to their customers who are beneficial owners of such shares. The Service Plans each provide for compensation to the service organizations equal to 0.25% of the average daily net assets attributable to Advisor Shares of the Multi-Strategy Alternatives Portfolio.
D. Transfer Agency Agreement — Goldman Sachs also serves as the transfer agent of the Funds for a fee pursuant to the Transfer Agency Agreement. The fees charged for such transfer agency services are accrued daily and paid monthly at an annual rate of 0.02% of the average daily net assets of Institutional, Service and Advisor Shares.
E. Other Expense Agreements and Affiliated Transactions — GSAM has agreed to reduce or limit certain “Other Expenses” of the Funds (excluding acquired fund fees and expenses, transfer agency fees and expenses, service fees and shareholder administration fees (as applicable), taxes, interest, brokerage fees, expenses of shareholder meetings, litigation and indemnification,
GOLDMAN SACHS VARIABLE INSURANCE TRUST MULTI-ASSET STRATEGIES FUNDS
5. AGREEMENTS AND AFFILIATED TRANSACTIONS (continued)
and extraordinary expenses) to the extent such expenses exceed, on an annual basis, a percentage rate of the average daily net assets of each Fund. Such Other Expense reimbursements, if any, are accrued daily and paid monthly. In addition, the Funds are not obligated to reimburse GSAM for prior fiscal year expense reimbursements, if any. The Other Expense limitations as an annual percentage rate of average daily net assets for the Multi-Strategy Alternatives Portfolio and Trend Driven Allocation Fund are 0.204% and 0.004%, respectively. These Other Expense limitations will remain in place through at least April 30, 2022, and prior to such date GSAM may not terminate the arrangements without the approval of the Trustees. In addition, the Funds have entered into certain offset arrangements with the custodian and the transfer agent, which may result in a reduction of the Funds’ expenses and are received irrespective of the application of the “Other Expense” limitations described above.
For the fiscal year ended December 31, 2021, these expense reductions, including any fee waivers and Other Expense reimbursements, were as follows:
| | | | | | | | | | | | |
| Fund | | Management
Fee Waiver | | | Other Expense
Reimbursement | | | Total
Expense
Reductions | |
| Multi-Strategy Alternatives | | $ | 40,407 | | | $ | 176,588 | | | $ | 216,995 | |
| Trend Driven Allocation | | $ | 526,905 | | | $ | 244,678 | | | $ | 771,583 | |
F. Line of Credit Facility — As of December 31, 2021, the Funds participated in a $1,000,000,000 committed, unsecured revolving line of credit facility (the “facility”) together with other funds of the Trust and certain registered investment companies having management agreements with GSAM or its affiliates. This facility is to be used for temporary emergency purposes, or to allow for an orderly liquidation of securities to meet redemption requests. The interest rate on borrowings is based on the federal funds rate. The facility also requires a fee to be paid by the Funds based on the amount of the commitment that has not been utilized. For the fiscal year ended December 31, 2021, the Funds did not have any borrowings under the facility. Prior to April 26, 2021, the facility was $700,000,000.
G. Other Transactions with Affiliates — The following table provides information about Goldman Sachs Variable Insurance Trust Trend Driven Allocation Fund’s investments in the Goldman Sachs Financial Square Government, Goldman Sachs Financial Square Treasury Instruments, Goldman Sachs Financial Square Treasury Obligations, and Goldman Sachs Financial Square Treasury Solutions Funds as of and for the year ended December 31, 2021.
| | | | | | | | | | | | | | | | | | | | | | | | |
| Investment Companies | | Beginning
Value as of
December 31,
2020 | | | Purchases at
Cost | | | Proceeds
from Sales | | | Ending Value
as of
December 31,
2021 | | | Shares as of
December 31,
2021 | | | Dividend
Income | |
Goldman Sachs Financial Square Government Fund | | $ | 100,915,798 | | | $ | 71,534,817 | | | $ | (64,902,100 | ) | | $ | 107,548,515 | | | | 107,548,515 | | | $ | 28,550 | |
Goldman Sachs Financial Square Treasury Instruments Fund | | | 16,674,108 | | | | 967,564 | | | | — | | | $ | 17,641,672 | | | | 17,641,672 | | | | 1,263 | |
Goldman Sachs Financial Square Treasury Obligations Fund | | | 33,348,216 | | | | 3,582,601 | | | | (1,150,437 | ) | | $ | 35,780,380 | | | | 35,780,380 | | | | 4,033 | |
Goldman Sachs Financial Square Treasury Solutions Fund | | | 33,348,216 | | | | 3,581,786 | | | | (1,150,437 | ) | | $ | 35,779,565 | | | | 35,779,565 | | | | 1,842 | |
| | | | | | |
| Total | | $ | 184,286,338 | | | $ | 79,666,768 | | | $ | (67,202,974 | ) | | $ | 196,750,132 | | | | | | | $ | 35,688 | |
As of December 31, 2021, The Goldman Sachs Group, Inc. was the beneficial owner of approximately 12% of the Institutional Shares of the Trend Driven Allocation Fund.
GOLDMAN SACHS VARIABLE INSURANCE TRUST MULTI-ASSET STRATEGIES FUNDS
Notes to Financial Statements (continued)
December 31, 2021
5. AGREEMENTS AND AFFILIATED TRANSACTIONS (continued)
The Multi-Strategy Alternatives Portfolio invests primarily in Class R6 Shares of the Underlying Funds. These Underlying Funds are considered to be affiliated with the Multi-Strategy Alternatives Portfolio. The tables below show the transactions in and earnings from investments in these Underlying Funds for the year ended December 31, 2021:
| | | | | | | | | | | | | | | | | | | | | | | | | | | | | | | | |
| | | Market Value
12/31/2020 | | | Purchases at
Cost | | | Proceeds from
Sales | | | Net
Realized
Gain (Loss) | | | Change in
Unrealized
Gain (Loss) | | | Market Value
12/31/2021 | | | Shares as of
December 31,
2021 | | | Dividend
Income | |
Goldman Sachs Absolute Return Tracker | | $ | 1,768,751 | | | $ | 718,884 | | | $ | (493,856 | ) | | $ | 185,130 | | | $ | (53,020 | ) | | $ | 2,125,889 | | | | 217,371 | | | $ | — | |
Goldman Sachs Alternative Premia Fund | | | 1,059,257 | | | | 1,700,000 | | | | — | | | | — | | | | (70,726 | ) | | | 2,688,531 | | | | 400,079 | | | | — | |
Goldman Sachs Dynamic Global Equity | | | — | | | | 2,325,398 | | | | (131,787 | ) | | | 131,787 | | | | 66,589 | | | | 2,391,987 | | | | 103,370 | | | | 145,563 | |
Goldman Sachs Emerging Markets Debt | | | 2,194,144 | | | | 641,756 | | | | (130,000 | ) | | | (6,892 | ) | | | (147,868 | ) | | | 2,551,140 | | | | 213,128 | | | | 89,391 | |
Goldman Sachs Emerging Markets Equity Insights | | | 1,440,267 | | | | 324,949 | | | | (1,279,140 | ) | | | 263,736 | | | | (248,445 | ) | | | 501,367 | | | | 51,581 | | | | 10,576 | |
Goldman Sachs Financial Square Government Fund | | | 564,202 | | | | 7,690,932 | | | | (7,212,559 | ) | | | — | | | | (1 | ) | | | 1,042,574 | | | | 1,042,574 | | | | 180 | |
Goldman Sachs Global Infrastructure Fund | | | — | | | | 2,160,994 | | | | (7,789 | ) | | | 7,789 | | | | 342,266 | | | | 2,503,260 | | | | 186,254 | | | | 38,178 | |
Goldman Sachs High Yield Floating Rate | | | 1,655,754 | | | | 349,098 | | | | (500,000 | ) | | | (16,805 | ) | | | 26,460 | | | | 1,514,507 | | | | 161,806 | | | | 48,678 | |
Goldman Sachs High Yield Fund | | | 1,160,971 | | | | 814,437 | | | | — | | | | — | | | | (15,163 | ) | | | 1,960,245 | | | | 304,859 | | | | 79,371 | |
Goldman Sachs Long Short Credit Strategies Fund | | | 2,734,018 | | | | 488,962 | | | | (1,100,000 | ) | | | (61,550 | ) | | | 40,200 | | | | 2,101,630 | | | | 237,741 | | | | 78,276 | |
Goldman Sachs Managed Futures Strategy | | | 3,113,123 | | | | 520,450 | | | | (762,385 | ) | | | 187,524 | | | | (67,212 | ) | | | 2,991,500 | | | | 293,284 | | | | 35,065 | |
Goldman Sachs Real Estate Securities Fund | | | 818,261 | | | | — | | | | (842,328 | ) | | | (186,397 | ) | | | 210,464 | | | | — | | | | — | | | | — | |
Goldman Sachs Strategic Income Fund | | | 2,179,357 | | | | 204,156 | | | | (1,400,000 | ) | | | (15,316 | ) | | | (62,646 | ) | | | 905,551 | | | | 96,541 | | | | 29,157 | |
Goldman Sachs Tactical Tilt Overlay Fund | | | 3,375,146 | | | | 2,242,574 | | | | — | | | | — | | | | 221,540 | | | | 5,839,260 | | | | 569,129 | | | | 118,540 | |
| | | | | | | | |
| | | $ | 22,063,251 | | | $ | 20,182,590 | | | $ | (13,859,844 | ) | | $ | 489,006 | | | $ | 242,438 | | | $ | 29,117,441 | | | | | | | $ | 672,975 | |
GOLDMAN SACHS VARIABLE INSURANCE TRUST MULTI-ASSET STRATEGIES FUNDS
6. PORTFOLIO SECURITIES TRANSACTIONS
The cost of purchases and proceeds from sales and maturities of long-term securities for the fiscal year ended December 31, 2021, were as follows:
| | | | | | | | | | |
| Fund | | | | Purchases | | | Sales and
Maturities | |
| Multi-Strategy Alternatives | | | | | 12,498,207 | | | | 6,298,321 | |
| Trend Driven Allocation | | | | | 12,431,959 | | | | 64,951,969 | |
7. SECURITIES LENDING
The Multi-Strategy Alternatives Portfolio may lend its securities through a securities lending agent, the Bank of New York Mellon (“BNYM”), to certain qualified borrowers. Pursuant to exemptive relief granted by the Securities and Exchange Commission (“SEC”) and the terms and conditions contained therein, the Trend Driven Allocation Fund may lend its securities through a securities lending agent, Goldman Sachs Agency Lending (“GSAL”), a wholly-owned subsidiary of Goldman Sachs, to certain qualified borrowers including Goldman Sachs and affiliates. In accordance with the Funds’ securities lending procedures, the Funds receive cash collateral at least equal to the market value of the securities on loan. The market value of the loaned securities is determined at the close of business of the Funds at their last sale price or official closing price on the principal exchange or system on which they are traded, and any additional required collateral is delivered to the Funds on the next business day. As with other extensions of credit, the Funds may experience delay in the recovery of their securities or incur a loss should the borrower of the securities breach its agreement with the Funds or become insolvent at a time when the collateral is insufficient to cover the cost of repurchasing securities on loan. Dividend income received from securities on loan may not be subject to withholding taxes and therefore withholding taxes paid may differ from the amounts listed in the Statements of Operations. Loans of securities are terminable at any time and as such 1) the remaining contractual maturities of the outstanding securities lending transactions are considered to be overnight and continuous and 2) the borrower, after notice, is required to return borrowed securities within the standard time period for settlement of securities transactions.
The Funds invest the cash collateral received in connection with securities lending transactions in the Goldman Sachs Financial Square Government Fund (“Government Money Market Fund”), an affiliated series of the Goldman Sachs Trust. The Government Money Market Fund is registered under the Act as an open end investment company, is subject to Rule 2a-7 under the Act, and is managed by GSAM, for which GSAM may receive a management fee of up to 0.16% on an annualized basis of the average daily net assets of the Government Money Market Fund.
In the event of a default by a borrower with respect to any loan, GSAL will, and BNYM may, exercise any and all remedies provided under the applicable borrower agreement to make the Funds whole. These remedies include purchasing replacement securities by applying the collateral held from the defaulting broker against the purchase cost of the replacement securities. If GSAL or BNYM are unable to purchase replacement securities, GSAL and/or BNYM will indemnify the Funds by paying the Funds an amount equal to the market value of the securities loaned minus the value of cash collateral received from the borrower for the loan, subject to an exclusion for any shortfalls resulting from a loss of value in such cash collateral due to reinvestment risk. The Funds’ master netting agreements with certain borrowers provide the right, in the event of a default (including bankruptcy or insolvency), for the non-defaulting party to liquidate the collateral and calculate net exposure to the defaulting party or request additional collateral. However, in the event of a default by a borrower, a resolution authority could determine that such rights are not enforceable due to the restrictions or prohibitions against the right of set-off that may be imposed in accordance with a particular jurisdiction’s bankruptcy or insolvency laws. The Funds’ loaned securities were all subject to enforceable Securities Lending Agreements and the value of the collateral was at least equal to the value of the cash received. The amounts of the Funds’ overnight and continuous agreements, which represent the gross amounts of recognized liabilities for securities lending transactions
GOLDMAN SACHS VARIABLE INSURANCE TRUST MULTI-ASSET STRATEGIES FUNDS
Notes to Financial Statements (continued)
December 31, 2021
7. SECURITIES LENDING (continued)
outstanding as of December 31, 2021, are disclosed as “Payable upon return of securities loaned” on the Statements of Assets and Liabilities, where applicable. The Funds did not have securities on loan as of December 31, 2021.
| | | | |
| For the fiscal year ended December 31, 2021 | |
Earnings of GSAL
Relating to
Securities
Loaned | | Amounts Received
by the Fund
from Lending to
Goldman Sachs | |
| $1,408 | | $ | — | |
The following table provides information about the Funds’ investment in the Government Money Market Fund for the fiscal year ended December 31, 2021.
| | | | | | | | | | | | | | | | |
| Fund | | Beginning
Value as of
December 31,
2020 | | | Purchases
at Cost | | | Proceeds
from Sales | | | Ending
value as of
December 31, 2021 | |
| Multi-Strategy Alternatives | | $ | 153,000 | | | $ | 174,250 | | | $ | (327,250 | ) | | $ | — | |
| Trend Driven Allocation | | | — | | | | 108,254,925 | | | | (108,254,925 | ) | | | — | |
8. TAX INFORMATION
The tax character of distributions paid during the fiscal year ended December 31, 2021 was as follows:
| | | | | | | | |
| | | Multi-Strategy
Alternatives | | | Trend Driven | |
| Distributions paid from: | | | | | | | | |
Ordinary income | | $ | 407,815 | | | $ | 27,527,213 | |
Net long-term capital gains | | | — | | | | 15,532,704 | |
| Total taxable distributions | | $ | 407,815 | | | $ | 43,059,917 | |
The tax character of distributions paid during the fiscal year ended December 31, 2020 was as follows:
| | | | | | | | |
| | | Multi-Strategy
Alternatives | | | Trend Driven
Allocation | |
| Distributions paid from: | | | | | | | | |
Ordinary income | | $ | 391,848 | | | $ | 4,050,503 | |
Net long-term capital gains | | | — | | | | 1,602,995 | |
| Total taxable distributions | | $ | 391,848 | | | $ | 5,653,498 | |
GOLDMAN SACHS VARIABLE INSURANCE TRUST MULTI-ASSET STRATEGIES FUNDS
8. TAX INFORMATION (continued)
As of December 31, 2021, the components of accumulated earnings (losses) on a tax-basis were as follows:
| | | | | | | | |
| | | Multi-Strategy
Alternatives | | | Trend Driven
Allocation | |
| Undistributed ordinary income — net | | $ | 643,447 | | | $ | 4,197,675 | |
| Undistributed long-term capital gains | | | — | | | | 6,691,805 | |
| Total undistributed earnings | | $ | 643,447 | | | $ | 10,889,480 | |
| Capital loss carryforwards: | | | | | | | | |
Perpetual Short-term | | | (207,367 | ) | | | — | |
Perpetual Long-term | | | (193,227 | ) | | | — | |
| Total Capital loss carryforwards | | | (400,594 | ) | | | | |
| Timing differences (Qualified late year ordinary loss deferral and Straddle loss deferral) | | | (22,106 | ) | | | (7,053,130 | ) |
| Unrealized gains — net | | | 268,507 | | | | 39,421,563 | |
| Total accumulated earnings — net | | $ | 489,254 | | | $ | 43,257,913 | |
As of December 31, 2021, the Funds’ aggregate security unrealized gains and losses based on cost for U.S. federal income tax purposes were as follows:
| | | | | | | | |
| | | Multi-Strategy
Alternatives | | | Trend Driven | |
| Tax cost | | $ | 29,002,041 | | | $ | 249,501,991 | |
| Gross unrealized gain | | | 871,475 | | | | 39,421,563 | |
| Gross unrealized loss | | | (602,968 | ) | | | — | |
| Net unrealized gain (loss) | | $ | 268,507 | | | $ | 39,421,563 | |
The difference between GAAP-basis and tax-basis unrealized gains (losses) is attributable primarily to wash sales, net mark to market gains (losses) on regulated futures and options contracts.
GSAM has reviewed the Funds’ tax positions for all open tax years (the current and prior three years, as applicable) and has concluded that no provision for income tax is required in the Funds’ financial statements. Such open tax years remain subject to examination and adjustment by tax authorities.
9. OTHER RISK
The Funds’ risks include, but are not limited to, the following:
Derivatives Risk — The Funds’ use of derivatives may result in loss. Derivative instruments, which may pose risks in addition to and greater than those associated with investing directly in securities, currencies or other instruments, may be illiquid or less liquid, volatile, difficult to price and leveraged so that small changes in the value of the underlying instruments may produce disproportionate losses to the Funds. Derivatives are also subject to counterparty risk, which is the risk that the other party in the transaction will not fulfill its contractual obligation. The use of derivatives is a highly specialized activity that involves investment techniques and risks different from those associated with investments in more traditional securities and instruments. Losses from derivatives can also result from a lack of correlation between changes in the value of derivative instruments and the portfolio assets (if any) being hedged.
GOLDMAN SACHS VARIABLE INSURANCE TRUST MULTI-ASSET STRATEGIES FUNDS
Notes to Financial Statements (continued)
December 31, 2021
9. OTHER RISK (continued)
Foreign and Emerging Countries Risk — Investing in foreign markets may involve special risks and considerations not
typically associated with investing in the U.S. Foreign securities may be subject to risk of loss because of more or less foreign government regulation; less public information; less stringent investor protections; less stringent accounting, corporate governance, financial reporting and disclosure standards; and less economic, political and social stability in the countries in which the Funds or an Underlying Fund invests. The imposition of exchange controls (including repatriation restrictions), confiscations of assets and property, trade restrictions (including tariffs) and other government restrictions by the U.S. or other governments, or problems with registration, settlement or custody, may also result in losses. Foreign risk also involves the risk of negative foreign currency rate fluctuations, which may cause the value of securities denominated in such foreign currency (or other instruments through which the Funds or an Underlying Fund has exposure to foreign currencies) to decline in value. Currency exchange rates may fluctuate significantly over short periods of time. To the extent that the Funds or an Underlying Fund also invests in securities of issuers located in, or economically tied to, emerging markets, these risks may be more pronounced.
Interest Rate Risk — When interest rates increase, fixed income securities or instruments held by a Fund will generally decline in value. Long-term fixed income securities or instruments will normally have more price volatility because of this risk than short-term fixed income securities or instruments. The risks associated with changing interest rates may have unpredictable effects on the markets and a Fund’s investments. Fluctuations in interest rates may also affect the liquidity of fixed income securities and instruments held by the Funds.
Investments in Other Investment Companies Risk — As a shareholder of another investment company, including an ETF, the Funds will indirectly bear its proportionate share of any net management fees and other expenses paid by such other investment companies, in addition to the fees and expenses regularly borne by the Fund. ETF’s are subject to risks that do not apply to conventional mutual funds, including but not limited to the following: (i) the market price of the ETF’s shares may trade at a premium or a discount to their NAV; and (ii) an active trading market for an ETF’s shares may not develop or be maintained.
Investments in the Underlying Funds Risk — The investments of the Multi-Strategy Alternatives Portfolio may be concentrated in one or more Underlying Funds (including ETFs and other registered investment companies) subject to statutory limitations prescribed by the Act or exemptive relief or regulations thereunder. The Multi-Strategy Alternatives Portfolio’s investment performance is directly related to the investment performance of the Underlying Funds it holds. The Multi-Strategy Alternatives Portfolio is subject to the risk factors associated with the investments of the Underlying Funds and will be affected by the investment policies and practices of the Underlying Funds in direct proportion to the amount of assets allocated to each. in direct proportion to the amount of assets allocated to each. If the Multi-Strategy Alternatives Portfolio has a relative concentration of its portfolio in a single Underlying Fund, it may be more susceptible to adverse developments affecting that Underlying Fund, and may be more susceptible to losses because of these developments. A strategy used by the Underlying Funds may fail to produce the intended results.
Large Shareholder Transactions Risk — A Fund may experience adverse effects when certain large shareholders, such as other funds, participating insurance companies, accounts and Goldman Sachs affiliates, purchase or redeem large amounts of shares of the Fund. Such large shareholder redemptions, which may occur rapidly or unexpectedly, may cause a Fund to sell portfolio securities at times when it would not otherwise do so, which may negatively impact a Fund’s NAV and liquidity. These transactions may also accelerate the realization of taxable income to shareholders if such sales of investments resulted in gains, and may also increase transaction costs. In addition, a large redemption could result in a Fund’s current expenses being allocated over a smaller asset base, leading to an increase in the Fund’s expense ratio. Similarly, large Fund share purchases may adversely affect a Fund’s performance to the extent that the Fund is delayed in investing new cash or otherwise maintains a larger cash position than it
ordinarily would.
Liquidity Risk — A Fund may make investments that are illiquid or that may become less liquid in response to market developments or adverse investor perceptions. Illiquid investments may be more difficult to value. Liquidity risk may also refer to the risk that a Fund will not be able to pay redemption proceeds within the allowable time period or without significant dilution to remaining investors’ interests because of unusual market conditions, an unusually high volume of redemption requests, or other
GOLDMAN SACHS VARIABLE INSURANCE TRUST MULTI-ASSET STRATEGIES FUNDS
9. OTHER RISK (continued)
reasons. To meet redemption requests, a Fund may be forced to sell investments at an unfavorable time and/or under unfavorable conditions. If a Fund is forced to sell securities at an unfavorable time and/or under unfavorable conditions, such sales may adversely affect the Fund’s NAV and dilute remaining investors’ interests. Liquidity risk may be the result of, among other things, the reduced number and capacity of traditional market participants to make a market in fixed income securities or the lack of an active market. The potential for liquidity risk may be magnified by a rising interest rate environment or other circumstances where
investor redemptions from fixed income mutual funds may be higher than normal, potentially causing increased supply in the market due to selling activity. Redemptions by large shareholders may have a negative impact on a Fund’s liquidity.
Market and Credit Risks — In the normal course of business, a Fund trades financial instruments and enters into financial transactions where risk of potential loss exists due to changes in the market (market risk). The value of the securities in which a Fund invests may go up or down in response to the prospects of individual companies, particular sectors or governments and/or general economic conditions throughout the world due to increasingly interconnected global economies and financial markets. Events such as war, acts of terrorism, social unrest, natural disasters, the spread of infectious illness or other public health threats could also significantly impact a Fund and its investments. Additionally, a Fund may also be exposed to credit risk in the event that an issuer or guarantor fails to perform or that an institution or entity with which the Fund has unsettled or open transactions defaults.
10. INDEMNIFICATIONS
Under the Trust’s organizational documents, its Trustees, officers, employees and agents are indemnified, to the extent permitted by the Act and state law, against certain liabilities that may arise out of performance of their duties to the Funds. Additionally, in the course of business, the Funds enter into contracts that contain a variety of indemnification clauses. The Funds’ maximum exposure under these arrangements is unknown, as this would involve future claims that may be made against the Funds that have not yet occurred. However, GSAM believes the risk of loss under these arrangements to be remote.
11. SUBSEQUENT EVENTS
Other than noted above, subsequent events after the Statements of Assets and Liabilities date have been evaluated, and GSAM has concluded that there is no impact requiring adjustment or disclosure in the financial statements.
Effective after the close of business on December 31, 2021, the Goldman Sachs Global Trends Allocation Fund was renamed the Goldman Sachs Trend Driven Allocation Fund.
Additionally, the Fund’s principal investment strategy changed after the close of business on January 31, 2022. At that time, the Fund will primarily seek to achieve its investment objective by investing in a portfolio of U.S. and non-U.S. equity securities and U.S. fixed income securities. The Fund may invest in one or a combination of the following securities and instruments: pooled investment vehicles, including exchange-traded funds (“ETFs”) and other investment companies; equity securities of U.S. and non-U.S. issuers; U.S. fixed income securities; and derivatives that provide exposure to a broad spectrum of asset classes and geographic regions. Under normal market conditions, the Fund expects to invest at least 50% of its assets in equity investments and at least 30% of its assets in fixed income investments.
GOLDMAN SACHS VARIABLE INSURANCE TRUST MULTI-ASSET STRATEGIES FUNDS
Notes to Financial Statements (continued)
December 31, 2021
12. SUMMARY OF SHARE TRANSACTIONS
Share activity is as follows:
| | | | | | | | | | | | | | | | |
| | | Multi-Strategy Alternatives Portfolio | |
| | | For the Fiscal Year Ended
December 31, 2021 | | | For the Fiscal Year Ended
December 31, 2020 | |
| | | Shares | | | Dollars | | | Shares | | | Dollars | |
| Institutional Shares | | | | | | | | | | | | | | | | |
| Shares sold | | | 154,388 | | | $ | 1,520,126 | | | | 44,537 | | | $ | 398,878 | |
| Reinvestment of distributions | | | 4,291 | | | | 41,966 | | | | 3,244 | | | | 30,659 | |
| Shares redeemed | | | (62,051 | ) | | | (611,039 | ) | | | (32,120 | ) | | | (288,931 | ) |
| | | | 96,628 | | | | 951,053 | | | | 15,661 | | | | 140,606 | |
| Service Shares | | | | | | | | | | | | | | | | |
| Shares sold | | | 428,346 | | | | 4,203,235 | | | | 123,578 | | | | 1,094,287 | |
| Reinvestment of distributions | | | 9,924 | | | | 96,854 | | | | 6,691 | | | | 63,162 | |
| Shares redeemed | | | (136,031 | ) | | | (1,336,716 | ) | | | (79,590 | ) | | | (709,770 | ) |
| | | | 302,239 | | | | 2,963,373 | | | | 50,679 | | | | 447,679 | |
| Advisor Shares | | | | | | | | | | | | | | | | |
| Shares sold | | | 396,642 | | | | 3,879,151 | | | | 670,463 | | | | 5,940,118 | |
| Reinvestment of distributions | | | 27,617 | | | | 268,995 | | | | 31,672 | | | | 298,027 | |
| Shares redeemed | | | (187,371 | ) | | | (1,824,259 | ) | | | (537,655 | ) | | | (4,835,544 | ) |
| | | | 236,888 | | | | 2,323,887 | | | | 164,480 | | | | 1,402,601 | |
| | | | |
| NET INCREASE | | | 635,755 | | | $ | 6,238,313 | | | | 230,820 | | | $ | 1,990,886 | |
| |
| | | Trend Driven Allocation Fund | |
| | | For the Fiscal Year Ended
December 31, 2021 | | | For the Fiscal Year Ended
December 31, 2020 | |
| | | Shares | | | Dollars | | | Shares | | | Dollars | |
| Institutional Shares | | | | | | | | | | | | | | | | |
| Shares sold | | | — | | | $ | — | | | | — | | | $ | — | |
| Reinvestment of distributions | | | 3,134 | | | | 40,198 | | | | 440 | | | | 5,497 | |
| Shares redeemed | | | — | | | | — | | | | — | | | | — | |
| | | | 3,134 | | | | 40,198 | | | | 440 | | | | 5,497 | |
| Service Shares | | | | | | | | | | | | | | | | |
| Shares sold | | | 1,197,442 | | | | 16,311,964 | | | | 1,538,326 | | | | 18,343,800 | |
| Reinvestment of distributions | | | 3,368,811 | | | | 43,019,719 | | | | 453,290 | | | | 5,648,001 | |
| Shares redeemed | | | (3,449,473 | ) | | | (46,955,103 | ) | | | (3,383,659 | ) | | | (40,330,893 | ) |
| | | | 1,116,780 | | | | 12,376,580 | | | | (1,392,043 | ) | | | (16,339,092 | ) |
| | | | |
| NET INCREASE (DECREASE) | | | 1,119,914 | | | $ | 12,416,778 | | | | (1,391,603 | ) | | $ | (16,333,595 | ) |
Report of Independent Registered Public Accounting Firm
To the Board of Trustees of Goldman Sachs Variable Insurance Trust and Shareholders of Goldman Sachs Multi-Strategy Alternatives Portfolio and Goldman Sachs Trend Driven Allocation Fund
Opinions on the Financial Statements
We have audited the accompanying statements of assets and liabilities, including the schedules of investments, of Goldman Sachs Multi-Strategy Alternatives Portfolio and Goldman Sachs Trend Driven Allocation Fund (two of the Funds constituting Goldman Sachs Variable Insurance Trust, referred to hereafter as the “Funds”) as of December 31, 2021, the related statements of operations for the year ended December 31, 2021, the statements of changes in net assets for each of the two years in the period ended December 31, 2021, including the related notes, and the financial highlights for each of the five years in the period ended December 31, 2021 (collectively referred to as the “financial statements”). In our opinion, the financial statements present fairly, in all material respects, the financial position of each of the Funds as of December 31, 2021, the results of each of their operations for the year then ended, the changes in their net assets for each of the two years in the period ended December 31, 2021 and each of the financial highlights for each of the five years in the period ended December 31, 2021 in conformity with accounting principles generally accepted in the United States of America.
Basis for Opinions
These financial statements are the responsibility of the Funds’ management. Our responsibility is to express an opinion on the Funds’ financial statements based on our audits. We are a public accounting firm registered with the Public Company Accounting Oversight Board (United States) (PCAOB) and are required to be independent with respect to the Funds in accordance with the U.S. federal securities laws and the applicable rules and regulations of the Securities and Exchange Commission and the PCAOB.
We conducted our audits of these financial statements in accordance with the standards of the PCAOB. Those standards require that we plan and perform the audit to obtain reasonable assurance about whether the financial statements are free of material misstatement, whether due to error or fraud.
Our audits included performing procedures to assess the risks of material misstatement of the financial statements, whether due to error or fraud, and performing procedures that respond to those risks. Such procedures included examining, on a test basis, evidence regarding the amounts and disclosures in the financial statements. Our audits also included evaluating the accounting principles used and significant estimates made by management, as well as evaluating the overall presentation of the financial statements. Our procedures included confirmation of securities owned as of December 31, 2021 by correspondence with the custodian, transfer agent and brokers; when replies were not received from brokers, we performed other auditing procedures. We believe that our audits provide a reasonable basis for our opinions.
/s/PricewaterhouseCoopers LLP
Boston, Massachusetts
February 23, 2022
We have served as the auditor of one or more investment companies in the Goldman Sachs Fund complex since 2000.
GOLDMAN SACHS VARIABLE INSURANCE TRUST MULTI-ASSET STRATEGIES FUNDS
| | |
| Fund Expenses —Six Month Period Ended December 31, 2021 (Unaudited) | | |
As a shareholder of Institutional, Service or Advisor Shares of the Funds, you incur ongoing costs, including management fees, distribution and/or service (12b-1) fees (with respect to Service and Advisor Shares) and other Fund expenses. This example is intended to help you understand your ongoing costs (in dollars) of investing in the Institutional Shares, Service Shares and Advisor Shares of the Funds and to compare these costs with the ongoing costs of investing in other mutual funds.
The example is based on an investment of $1,000 invested at the beginning of the period and held for the entire period from July 1, 2021 through December 31, 2021, which represents a period of 184 days of a 366 day year.
Actual Expenses — The first line under each share class in the table below provides information about actual account values and actual expenses. You may use the information in this line, together with the amount you invested, to estimate the expenses that you paid over the period. Simply divide your account value by $1,000 (for example, an $8,600 account value divided by $1,000=8.6), then multiply the result by the number in the first line under the heading entitled “Expenses Paid” to estimate the expenses you paid on your account during this period.
Hypothetical Example for Comparison Purposes — The second line under each share class in the table below provides information about hypothetical account values and hypothetical expenses based on the Funds’ actual net expense ratio and an assumed rate of return of 5% per year before expenses, which is not the Funds’ actual return. The hypothetical account values and expenses may not be used to estimate the actual ending account balance or expenses you paid for the period. You may use this information to compare the ongoing costs of investing in the Funds and other funds. To do so, compare this 5% hypothetical example with the 5% hypothetical examples that appear in the shareholder reports of the other funds.
Please note that the expenses shown in the table are meant to highlight your ongoing costs only. As a shareholder of the Funds you do not incur any transaction costs, such as sales charges, redemption fees, or exchange fees, but shareholders of other funds may incur such costs. The second line of the table is useful in comparing ongoing costs only and will not help you determine the relative total costs of owning different funds whose shareholders may incur transaction costs.
| | | | | | | | | | | | | | | | | | | | | | | | |
| | | Multi-Strategy Alternatives Portfolio | | | Trend Driven Allocation Fund | |
| Share Class | | Beginning
Account
Value
7/1/21 | | | Ending
Account
Value
12/31/21 | | | Expenses
Paid for the
6 months
ended
12/31/2021* | | | Beginning
Account
Value
7/1/21 | | | Ending
Account
Value
12/31/21 | | | Expenses
Paid for the
6 months
ended
12/31/2021* | |
| Institutional | | | | | | | | | | | | | | | | | | | | | | | | |
| | | | | | | |
Actual | | $ | 1,000.00 | | | $ | 1,000.57 | | | $ | 1.11 | | | $ | 1,000.00 | | | $ | 1,057.31 | | | $ | 3.37 | |
Hypothetical 5% return | | | 1,000.00 | | | | 1,024.10 | | | | 1.12 | | | | 1,000.00 | | | | 1,021.93 | | | | 3.31 | |
| Service | | | | | | | | | | | | | | | | | | | | | | | | |
| | | | | | | |
Actual | | | 1,000.00 | | | | 999.70 | | | | 2.37 | | | | 1,000.00 | | | | 1,055.27 | | | | 4.66 | |
Hypothetical 5% return | | | 1,000.00 | | | | 1,022.84 | | | | 2.40 | | | | 1,000.00 | | | | 1,020.67 | | | | 4.58 | |
| Advisor | | | | | | | | | | | | | | | | | | | | | | | | |
| | | | | | | |
Actual | | | 1,000.00 | | | | 998.85 | | | | 3.12 | | | | 1,000.00 | | | | N/A | | | | N/A | |
Hypothetical 5% return | | | 1,000.00 | | | | 1,022.08 | | | | 3.16 | | | | 1,000.00 | | | | N/A | | | | N/A | |
| | + | Hypothetical expenses are based on each Fund’s actual annualized net expense ratios and an assumed rate of return of 5% per year before expenses. | |
| | * | Expenses are calculated using each Fund’s annualized net expense ratio for each class, which represents the ongoing expenses as a percentage of net assets for the six months ended December 31, 2021. Expenses are calculated by multiplying the annualized net expense ratio by the average account value for the period; then multiplying the result by the number of days in the most recent fiscal half year; and then dividing that result by the number of days in the fiscal year. The annualized net expense ratios for the period were as follows: | |
| | | | | | | | | | | | |
| | | |
| Fund | | Institutional
Shares | | | Service
Shares | | | Advisor
Shares | |
| Multi-Strategy Alternatives Portfolio | | | 0.22% | | | | 0.47% | | | | 0.62% | |
| Trend Driven Allocation Fund | | | 0.65% | | | | 0.90% | | | | N/A | |
40
GOLDMAN SACHS VARIABLE INSURANCE TRUST MULTI-ASSET STRATEGIES FUNDS
Trustees and Officers (Unaudited)
Independent Trustees
| | | | | | | | | | | | |
| | | | | |
Name, Address and Age1 | | Position(s) Held with the Trust | | Term of
Office and
Length of
Time Served2 | | Principal Occupation(s) During Past 5 Years | | Number of
Portfolios in
Fund Complex
Overseen by
Trustee3 | | | Other Directorships Held by Trustee4 |
Jessica Palmer Age: 72 | | Chair of the Board of Trustees | | Since 2018 (Trustee since 2007) | | Ms. Palmer is retired. She was formerly Consultant, Citigroup Human Resources Department (2007-2008); Managing Director, Citigroup Corporate and Investment Banking (previously, Salomon Smith Barney/Salomon Brothers) (1984-2006). Ms. Palmer was a Member of the Board of Trustees of Indian Mountain School (private elementary and secondary school) (2004-2009). Chair of the Board of Trustees — Goldman Sachs Trust and Goldman Sachs Variable Insurance Trust. | | | 109 | | | None |
Dwight L. Bush Age: 64 | | Trustee | | Since 2020 | | Ambassador Bush is President and CEO of D.L. Bush & Associates (a financial advisory and private investment firm) (2002-2014 and 2017-present); Director of MoneyLion Inc. (an operator of a data drive, digital financial platform (2021-present); and was formerly U.S. Ambassador to the Kingdom of Morocco (2014-2017) and a Member of the Board of Directors of Santander Bank, N.A. (2018-2019). Previously, Ambassador Bush served as an Advisory Board Member of Goldman Sachs Trust and Goldman Sachs Variable Insurance Trust (October 2019-January 2020). Trustee — Goldman Sachs Trust and Goldman Sachs Variable Insurance Trust. | | | 109 | | | None |
Kathryn A. Cassidy Age: 67 | | Trustee | | Since 2015 | | Ms. Cassidy is retired. Formerly, she was Advisor to the Chairman (May 2014-December 2014); and Senior Vice President and Treasurer (2008-2014), General Electric Company & General Electric Capital Corporation (technology and financial services companies). Trustee — Goldman Sachs Trust and Goldman Sachs Variable Insurance Trust. | | | 109 | | | None |
Diana M. Daniels Age: 72 | | Trustee | | Since 2007 | | Ms. Daniels is retired. Formerly, she was Vice President, General Counsel and Secretary, The Washington Post Company (1991-2006). Ms. Daniels is a Trustee Emeritus and serves as a Presidential Councillor of Cornell University (2013-Present); former Member of the Legal Advisory Board, New York Stock Exchange (2003-2006) and of the Corporate Advisory Board, Standish Mellon Management Advisors (2006-2007). Trustee — Goldman Sachs Trust and Goldman Sachs Variable Insurance Trust. | | | 109 | | | None |
Joaquin Delgado Age: 61 | | Trustee | | Since 2020 | | Dr. Delgado is retired. He is Director, Hexion Inc. (a specialty chemical manufacturer) (2019- present); and Director, Stepan Company (a specialty chemical manufacturer) (2011-present); and was formerly Executive Vice President, Consumer Business Group of 3M Company (July 2016-July 2019); and Executive Vice President, Health Care Business Group of 3M Company (October 2012-July 2016). Previously, Dr. Delgado served as an Advisory Board Member of Goldman Sachs Trust and Goldman Sachs Variable Insurance Trust (October 2019-January 2020). Trustee — Goldman Sachs Trust and Goldman Sachs Variable Insurance Trust. | | | 109 | | | Hexion Inc. (a specialty chemical manufacturer); Stepan Company (a specialty chemical manufacturer) |
Eileen H. Dowling Age: 59 | | Trustee | | Since 2021 | | Ms. Dowling is retired. Formerly, she was Senior Advisor (April 2021- September 2021); and Managing Director (2013-2021), BlackRock, Inc. (a financial services firm). Trustee — Goldman Sachs Trust and Goldman Sachs Variable Insurance Trust. | | | 109 | | | None |
| | | | | | | | | | | | |
GOLDMAN SACHS VARIABLE INSURANCE TRUST MULTI-ASSET STRATEGIES FUNDS
Trustees and Officers (Unaudited) (continued)
Independent Trustees (continued)
| | | | | | | | | | | | |
| | | | | |
Name, Address and Age1 | | Position(s) Held with the Trust | | Term of
Office and
Length of
Time Served2 | | Principal Occupation(s) During Past 5 Years | | Number of
Portfolios in
Fund Complex
Overseen by
Trustee3 | | | Other Directorships Held by Trustee4 |
Roy W. Templin Age: 61 | | Trustee | | Since 2013 | | Mr. Templin is retired. He is Director, Armstrong World Industries, Inc. (a designer and manufacturer of ceiling and wall systems) (2016-Present); and was formerly Chairman of the Board of Directors, Con- Way Incorporated (a transportation, logistics and supply chain management service company) (2014-2015); Executive Vice President and Chief Financial Officer, Whirlpool Corporation (an appliance manufacturer and marketer) (2004-2012). Trustee — Goldman Sachs Trust and Goldman Sachs Variable Insurance Trust. | | | 109 | | | Armstrong World Industries, Inc. (a ceiling and wall systems manufacturer) |
Gregory G. Weaver Age: 70 | | Trustee | | Since 2015 | | Mr. Weaver is retired. He is Director, Verizon Communications Inc. (2015-Present); and was formerly Chairman and Chief Executive Officer, Deloitte & Touche LLP (a professional services firm) (2001-2005 and 2012-2014); and Member of the Board of Directors, Deloitte & Touche LLP (2006-2012). Trustee — Goldman Sachs Trust and Goldman Sachs Variable Insurance Trust. | | | 109 | | | Verizon Communications Inc. |
| | | | | | | | | | | | |
Interested Trustee*
| | | | | | | | | | | | |
| | | | | |
Name, Address and Age1 | | Position(s) Held with
the Trust | | Term of
Office and
Length of
Time Served2 | | Principal Occupation(s) During Past 5 Years | | Number of
Portfolios in
Fund Complex
Overseen by
Trustee3 | | | Other Directorships Held by Trustee4 |
James A. McNamara Age: 59 | | President and Trustee | | Since 2007 | | Advisory Director, Goldman Sachs (January 2018 — Present); Managing Director, Goldman Sachs (January 2000-December 2017); Director of Institutional Fund Sales, GSAM (April 1998- December 2000); and Senior Vice President and Manager, Dreyfus Institutional Service Corporation (January 1993-April 1998). President and Trustee — Goldman Sachs Trust; Goldman Sachs Variable Insurance Trust; Goldman Sachs Trust II; Goldman Sachs ETF Trust; Goldman Sachs ETF Trust II; Goldman Sachs MLP and Energy Renaissance Fund; Goldman Sachs Credit Income Fund; and Goldman Sachs Real Estate Diversified Income Fund. | | | 170 | | | None |
| | | | | | | | | | | | |
| * | Mr. McNamara is considered to be an “Interested Trustee” because he holds positions with Goldman Sachs and owns securities issued by The Goldman Sachs Group, Inc. Mr. McNamara holds comparable positions with certain other companies of which Goldman Sachs, GSAM or an affiliate thereof is the investment adviser, administrator and/or distributor. |
| 1 | Each Trustee may be contacted by writing to the Trustee, c/o Goldman Sachs, 200 West Street, New York, New York, 10282, Attn: Caroline Kraus. Information is provided as of December 31, 2021. |
| 2 | Subject to such policies as may be adopted by the Board from time-to-time, each Trustee holds office for an indefinite term, until the earliest of: (a) the election of his or her successor; (b) the date the Trustee resigns or is removed by the Board or shareholders, in accordance with the Trust’s Declaration of Trust; or (c) the termination of the Trust. The Board has adopted policies which provide that each Independent Trustee shall retire as of December 31st of the calendar year in which he or she reaches (a) his or her 75th birthday or (b) the 15th anniversary of the date he or she became a Trustee, whichever is earlier, unless a waiver of such requirements shall have been adopted by a majority of the other Trustees. These policies may be changed by the Trustees without shareholder vote. |
| 3 | The Goldman Sachs Fund Complex includes certain other companies listed above for each respective Trustee. As of December 31, 2021, Goldman Sachs Trust consisted of 92 portfolios (90 of which offered shares to the public); Goldman Sachs Variable Insurance Trust consisted of 17 portfolios (13 of which offered shares to the public); Goldman Sachs Trust II consisted of 18 portfolios (16 of which offered shares to the public); Goldman Sachs ETF Trust consisted of 39 portfolios (26 of which offered shares to the public); and Goldman Sachs ETF Trust II, Goldman Sachs MLP and Energy Renaissance Fund, Goldman Sachs Credit Income Fund and Goldman Sachs Real Estate Diversified Income Fund each consisted of one portfolio. Goldman Sachs ETF Trust II and Goldman Sachs Credit Income Fund did not offer shares to the public. |
| 4 | This column includes only directorships of companies required to report to the Securities and Exchange Commission under the Securities Exchange Act of 1934 (i.e., “public companies”) or other investment companies registered under the Act. |
Additional information about the Trustees is available in the Funds’ Statement of Additional Information, which can be obtained from Goldman Sachs free of charge by calling this toll-free number (in the United States of America): 1-800-526-7384.
GOLDMAN SACHS VARIABLE INSURANCE TRUST MULTI-ASSET STRATEGIES FUNDS
Trustees and Officers (Unaudited) (continued)
Officers of the Trust*
| | | | | | |
| | | |
| Name, Address and Age1 | | Positions Held with the Trust | | Term of Office and Length of Time Served2 | | Principal Occupation(s) During Past 5 Years |
James A. McNamara
200 West Street
New York, NY 10282 Age: 59 | | Trustee and President | | Since
2007 | | Advisory Director, Goldman Sachs (January 2018-Present); Managing Director, Goldman Sachs (January 2000-December 2017); Director of Institutional Fund Sales, GSAM (April 1998-December 2000); and Senior Vice President and Manager, Dreyfus Institutional Service Corporation (January 1993-April 1998). President and Trustee — Goldman Sachs Trust; Goldman Sachs Variable Insurance Trust; Goldman Sachs Trust II; Goldman Sachs ETF Trust; Goldman Sachs ETF Trust II; Goldman Sachs MLP and Energy Renaissance Fund; Goldman Sachs Credit Income Fund; and Goldman Sachs Real Estate Diversified Income Fund. |
Caroline L. Kraus
200 West Street New York, NY 10282 Age: 44 | | Secretary | | Since
2012 | | Managing Director, Goldman Sachs (January 2016-Present); Vice President, Goldman Sachs (August 2006-December 2015); Senior Counsel, Goldman Sachs (January 2020–Present); Associate General Counsel, Goldman Sachs (2012-December 2019); Assistant General Counsel, Goldman Sachs (August 2006-December 2011); and Associate, Weil, Gotshal & Manges, LLP (2002-2006). Secretary — Goldman Sachs Trust (previously Assistant Secretary (2012)); Goldman Sachs Variable Insurance Trust (previously Assistant Secretary (2012)); Goldman Sachs Trust II; Goldman Sachs BDC, Inc.; Goldman Sachs Private Middle Market Credit LLC; Goldman Sachs Private Middle Market Credit II LLC; Goldman Sachs Middle Market Lending Corp.; Goldman Sachs MLP and Energy Renaissance Fund; Goldman Sachs ETF Trust; Goldman Sachs ETF Trust II; Goldman Sachs Credit Income Fund; and Goldman Sachs Real Estate Diversified Income Fund. |
Joseph F. DiMaria
30 Hudson Street Jersey City, NJ 07302 Age: 53 | | Treasurer, Principal
Financial Officerand Principal
Accounting Officer | | Since
2017(Treasurer
and
Principal
Financial
Officer
since
2019) | | Managing Director, Goldman Sachs (November 2015-Present) and Vice President — Mutual Fund Administration, Columbia Management Investment Advisers, LLC (May 2010- October 2015). Treasurer, Principal Financial Officer and Principal Accounting Officer — Goldman Sachs Trust (previously Assistant Treasurer (2016)); Goldman Sachs Variable Insurance Trust (previously Assistant Treasurer (2016)); Goldman Sachs Trust II (previously Assistant Treasurer (2017)); Goldman Sachs MLP and Energy Renaissance Fund (previously Assistant Treasurer (2017)); Goldman Sachs ETF Trust (previously Assistant Treasurer (2017)); Goldman Sachs ETF Trust II; Goldman Sachs Credit Income Fund; and Goldman Sachs Real Estate Diversified Income Fund |
| | | | | | |
| * | Represents a partial list of officers of the Trust. Additional information about all the officers is available in the Funds’ Statement of Additional Information, which can be obtained from Goldman Sachs free of charge by calling this toll-free number (in the United States): 1-800-526-7384. |
| 1 | Information is provided as of December 31, 2021. |
| 2 | Officers hold office at the pleasure of the Board of Trustees or until their successors are duly elected and qualified. Each officer holds comparable positions with certain other companies of which Goldman Sachs, GSAM or an affiliate thereof is the investment adviser, administrator and/or distributor. |
Goldman Sachs Variable Insurance Trust — Tax Information (Unaudited)
For the year ended December 31, 2021, 4.02% and 6.19% of the dividends paid from net investment company taxable income by the Multi-Strategy Alternatives Portfolio and Trend Driven Allocation Fund, respectively, qualify for the dividends received deduction available to corporations.
For the year ended December 31, 2021, the Multi-Strategy Alternatives Portfolio has elected to pass through a credit for taxes paid to foreign jurisdictions. The total amount of income received by the Multi-Strategy Alternatives Portfolio from sources within foreign countries and possessions of the United States was $0.0169 per share, all of which is attributable to qualified passive income. The percentage of net investment income dividends paid by the Portfolio during the year ended December 31, 2021 from foreign sources was 4.89%. The total amount of foreign taxes paid by the Portfolio was $0.0028 per share.
Pursuant to Section 852 of the Internal Revenue Code, the Trend Driven Allocation Fund designates $15,532,704 or, if different, the maximum amount allowable, as capital gain dividends paid during the fiscal year ended December 31, 2021.
| | |
| TRUSTEES | | OFFICERS |
| Jessica Palmer, Chair | | James A. McNamara, President |
| Dwight L. Bush | | Joseph F. DiMaria, Principal Financial Officer, |
| Kathryn A. Cassidy | | Principal Accounting Officer and Treasurer |
| Diana M. Daniels | | Caroline L. Kraus, Secretary |
| Joaquin Delgado | | |
| Eileen H. Dowling | | |
| James A. McNamara | | |
| Roy W. Templin | | |
| Gregory G. Weaver | | |
GOLDMAN SACHS & CO. LLC
Distributor and Transfer Agent
GOLDMAN SACHS ASSET MANAGEMENT, L.P.
Investment Adviser
200 West Street, New York
New York 10282
Visit our web site at www.GSAMFUNDS.com to obtain the most recent month-end returns.
The reports concerning the Fund included in this shareholder report may contain certain forward-looking statements about the factors that may affect the performance of the Fund in the future. These statements are based on Fund management’s predictions and expectations concerning certain future events and their expected impact on the Fund, such as performance of the economy as a whole and of specific industry sectors, changes in the levels of interest rates, the impact of developing world events, and other factors that may influence the future performance of the Fund. Management believes these forward-looking statements to be reasonable, although they are inherently uncertain and difficult to predict. Actual events may cause adjustments in portfolio management strategies from those currently expected to be employed.
A description of the policies and procedures that the Fund uses to determine how to vote proxies relating to portfolio securities and information regarding how the Fund voted proxies relating to portfolio securities for the 12-month period ended June 30 is available (i) without charge, upon request by calling 1-800-621-2550; and (ii) on the Securities and Exchange Commission (“SEC”) web site at http://www.sec.gov.
The Fund will file its portfolio holdings information for each month in a fiscal quarter within 60 days after the end of the relevant fiscal quarter on Form N-PORT. Portfolio holdings information for the third month of each fiscal quarter will be made available on the SEC’s web site at http://www.sec.gov. Portfolio holdings information may be obtained upon request and without charge by calling 1-800-526-7384 (for Retail Shareholders) or 1-800-621-2550 (for Institutional Shareholders).
Views and opinions expressed are for informational purposes only and do not constitute a recommendation by GSAM to buy, sell, or hold any security. Views and opinions are current as of the date of this presentation and may be subject to change, they should not be construed as investment advice.
Goldman Sachs & Co. LLC (“Goldman Sachs”) does not provide legal, tax or accounting advice. Any statement contained in this communication (including any attachments) concerning U.S. tax matters was not intended or written to be used, and cannot be used, for the purpose of avoiding penalties under the Internal Revenue Code, and was written to support the promotion or marketing of transaction or matter addressed. Clients of Goldman Sachs should obtain their own independent tax advice based on their particular circumstances.
The website links provided are for your convenience only and are not an endorsement or recommendation by GSAM of any of these websites or the products or services offered. GSAM is not responsible for the accuracy and validity of the content of these websites.
Fund holdings and allocations shown are as of December 31, 2021 and may not be representative of future investments. Fund holdings should not be relied on in making investment decisions and should not be construed as research or investment advice regarding particular securities. Current and future holdings are subject to risk.
References to indices, benchmarks or other measures of relative market performance over a specified period of time are provided for your information only and do not imply that the portfolio will achieve similar results. The index composition may not reflect the manner in which a portfolio is constructed. While an adviser seeks to design a portfolio which reflects appropriate risk and return features, portfolio characteristics may deviate from those of the benchmark.
The portfolio risk management process includes an effort to monitor and manage risk, but does not imply low risk.
Shares of the Goldman Sachs VIT Funds are offered to separate accounts of participating life insurance companies for the purpose of funding variable annuity contracts and variable life insurance policies. Shares of the Fund are not offered directly to the general public. The variable annuity contracts and variable life insurance policies are described in the separate prospectuses issued by participating insurance companies. You should refer to those prospectuses for information about surrender charges, mortality and expense risk fees and other charges that may be assessed by participating insurance companies under the variable annuity contracts or variable life insurance policies. Such fees or charges, if any, may affect the return you may realize with respect to your investments. Ask your representative for more complete information. Please consider a fund’s objectives, risks and charges and expenses, and read the prospectus carefully before investing. The prospectus contains this and other information about the Fund.
This material is not authorized for distribution to prospective investors unless preceded or accompanied by a current prospectus or summary prospectus, if applicable. Investors should consider the Fund’s objective, risks, and charges and expenses, and read the summary prospectus, if available, and/or the prospectus carefully before investing or sending money. The summary prospectus, if available, and the prospectus contain this and other information about the Fund and may be obtained from your authorized dealer or from Goldman Sachs & Co. LLC by calling 1-800-621-2550.
This report is prepared for the general information of contract owners and is not an offer of shares of the Goldman Sachs Variable Insurance Trust — Goldman Sachs Global Trends Allocation Fund.
© 2022 Goldman Sachs. All rights reserved.
VITFOFAR-22 268095-OTU-1554694
Goldman
Sachs Variable Insurance Trust
Goldman Sachs Core Fixed Income Fund
Goldman Sachs High Quality Floating Rate Fund
Annual Report
December 31, 2021

Goldman Sachs Variable Insurance Trust
| ∎ | | GOLDMAN SACHS CORE FIXED INCOME FUND |
| ∎ | | GOLDMAN SACHS HIGH QUALITY FLOATING RATE FUND |
| | | | |
| | | |
| NOT FDIC-INSURED | | May Lose Value | | No Bank Guarantee |
MARKET REVIEW
Goldman Sachs Variable Insurance Trust Funds – Goldman Sachs VIT Fixed Income Funds
Market Review
During the 12 months ended December 31, 2021 (the “Reporting Period”), the performance of the fixed income markets was broadly influenced by the distribution of COVID-19 vaccines, improving economic and employment conditions, rising inflation, higher interest rates, and continued fiscal stimulus and accommodative monetary policies from central banks and governments.
In January 2021, when the Reporting Period began, the rollout of COVID-19 vaccines and the prospects for additional U.S. government fiscal stimulus pushed up U.S. interest rates. However, positive COVID-19 vaccine rollout news was somewhat counteracted by the emergence of variant coronavirus strains and uncertainty over global vaccine supply. In February, the rise in interest rates became global in nature, as markets responded to recovering economic growth amid COVID-19 vaccine rollouts and concerns around upside inflation risks. To varying degrees, global central banks leaned against market expectations for earlier than anticipated policy normalization, indicating policy would remain accommodative despite improvements in economic growth given weak underlying inflation dynamics. Although global interest rates continued to rise during March, central banks’ dovish stances helped to stabilize those rates. (Dovish tends to imply lower interest rates; opposite of hawkish.) In the U.S., the Federal Reserve (“Fed”) revised its economic growth and inflation projections higher but kept its median dot plot projection flat through 2023. (The dot plot shows interest rate projections of the members of the Federal Open Market Committee.) Fed policymakers also emphasized they would focus on inflation outcomes rather than inflation outlooks. In Europe, the European Central Bank (“ECB”) increased the pace of its asset purchases in an effort to preserve favorable financing conditions and noted it would review the pace of purchases in the context of fresh inflation projections every quarter. Meanwhile, the new U.S. President signed the American Rescue Plan Act into law in March 2021, with the overall cost of this fifth fiscal stimulus package amounting to nearly $1.9 trillion.
At its policy meeting in April 2021, the Fed was upbeat as economic data continued to improve, but it did not hint at tapering its monthly purchases of U.S. Treasury securities and mortgage-backed securities, saying policymakers still needed to see “substantial progress” on employment and inflation goals. In May, remarkably strong U.S. inflation data, coupled with the release of a disappointing April U.S. jobs report, suggested that pandemic- related dynamics, such as economic reopening, policy support and temporary supply shortages, were likely to continue distorting economic data in the near term. This led to a recalibration in the market’s economic growth expectations, though the reassessment may also have reflected investors’ concerns about the Delta variant and the potential of a sooner than anticipated withdrawal of Fed policy support. Indeed, during June, Fed officials began to discuss when it might be appropriate to start tapering its asset purchases. The Fed’s median dot plot projection also forecasts two interest rates hikes in 2023, sparking a hawkish market response that led to a flattening of the U.S. Treasury yield curve and a strengthening of the U.S. dollar. (Hawkish tends to imply higher interest rates. Yield curve is a spectrum of interest rates based on maturities of varying lengths. A flattening yield curve is one wherein the differential in yields between longer-term and shorter-term maturities narrows; opposite of a steepening yield curve.)
In July 2021, investors generally focused on the spread of the Delta variant, especially in countries with low levels of vaccination, and its potential impact on the global economic recovery. Technical factors (i.e., supply and demand) also bolstered spread sectors. The Fed kept its monetary policy unchanged but noted the U.S. economy was “making progress” towards its price stability and employment goals. In Europe, the ECB strengthened its forward guidance, cementing its dovish policy stance for the near term. The global economic recovery continued in August, though markets remained focused on concerns around the Delta variant. The main macro event was the Fed’s Jackson Hole symposium during which Fed Chair Jerome Powell gave a dovish speech. He noted that substantial progress had been made on the Fed’s labor market mandate and reiterated the Fed’s view that an uptick in U.S. inflation was largely driven by temporary factors. These comments eased market nerves about the pace of monetary policy normalization. During September, as inflationary trends continued, driven by a sharp rise in energy prices and persistent supply-chain bottlenecks, developed markets central banks delivered or hinted at sooner than previously expected policy normalization. In the U.S., the Fed stated it might start raising interest rates during 2022 and tapering of its asset purchases “may soon be warranted.”
Interest rates were volatile in October 2021 as investors shifted their expectations about the withdrawal of accommodative central bank monetary policies amid a series of upside inflation surprises. Higher inflation data was driven, in part, by rising energy prices, though it was also evident in cyclical and underlying measures, such as rent prices and wage growth. In this environment, the Fed’s
MARKET REVIEW
narrative on inflation shifted from “transitory” to “more persistent.” During November, macroeconomic data continued to challenge central bank views about the temporary nature of rising inflation. In the U.S., the Bureau of Labor Statistics reported that the Consumer Price Index, a measure of inflation, increased from an annualized rate of 5.4% in September to 6.2% in October, heights not seen in three decades. The Fed said it could be patient about raising interest rates but indicated it would not hesitate to act if inflation continued to rise. At the same time, policymakers began to scale back the Fed’s $120 billion a month asset purchase program. Meanwhile, the emergence of the Omicron variant introduced another source of uncertainty into the global outlook. In December, there were several notable central bank actions. As inflation remained elevated, the Fed announced it would accelerate the pace of its asset purchase tapering starting in January 2022 and said it might hike interest rates three times in 2022. In the U.K. and Norway, central bank officials raised policy interest rates, with the Bank of England citing strong labor and inflation data. The ECB unveiled a new dovish quantitative easing formulation, with the Pandemic Emergency Purchase Program scheduled to end in March 2022.
For the Reporting Period overall, spread sectors broadly posted gains. High yield corporate bonds significantly outperformed U.S. Treasury securities, followed at a distance by investment grade corporate bonds and commercial mortgage-backed securities. Sovereign emerging markets debt, asset-backed securities and agency securities each generated a rather flat return for the Reporting Period but outpaced U.S. Treasury securities. Mortgage-backed securities recorded a slightly negative, though relatively flat, return and outperformed U.S. Treasury securities. During the Reporting Period, the U.S. Treasury yield curve steepened, as yields on securities with maturities of three months and shorter fell and yields on securities with maturities of six months and longer rose. (A steepening yield curve is one wherein the differential in yields between longer-term and shorter-term maturities widens; opposite of a flattening yield curve.) The yield on the bellwether 10-year U.S. Treasury rose approximately 60 basis points to end the Reporting Period at 1.52% (A basis point is 1/100th of percentage point).
Looking Ahead
At the end of the Reporting Period, we believed the global economy had the potential to transition from a highly unusual pandemic recovery to a more normal expansion during 2022. In our view, growth was likely to remain above trend in major economies, with China a notable exception, as a recovery in services consumption and inventory rebuilding offset the impact of waning fiscal impulses.
Inflation, which had surprised sharply to the upside in 2021 due to excess demand for durable goods and a squeeze in labor supply, remained the biggest source of macro uncertainty at the end of the Reporting Period, in our opinion. Broadly speaking, we thought central banks would try to deliver a “Goldilocks” policy normalization, whereby they would tighten their accommodative policies to keep inflation in check while also seeking to support moderate economic growth. At the end of the Reporting Period, the persistence of high inflation, the breadth of price increases and the rise in wage growth had prompted global central banks to pull forward expectations for policy normalization. We expected the Fed to begin raising rates in June 2022, though we thought there was potential for an earlier hike. We also expected the Fed to accelerate the pace of its asset purchase tapering during 2022.
As for the financial markets, we believed near-term performance would depend on the balance between bearish and bullish factors. Bearish factors included the unwinding of accommodative macro policies, high inflation and uncertainty about COVID-19. In our view, these factors could be somewhat counterbalanced by bullish factors, such as positive economic and corporate earnings growth alongside healthy private sector balance sheets. Another bullish factor might be an acceleration in private sector efforts to advance the climate transition, which we thought could offer long-term investment opportunities.
At the end of the Reporting Period, we thought macro and corporate conditions were consistent with an early- to mid-cycle environment, but the unwinding of global liquidity and extended valuations could create a more challenging investment environment in 2022 in comparison to 2020 and 2021.
GOLDMAN SACHS VARIABLE INSURANCE TRUST CORE FIXED INCOME FUND
INVESTMENT OBJECTIVE
The Fund seeks a total return consisting of capital appreciation and income that exceeds the total return of the Bloomberg U.S. Aggregate Bond Index.
Portfolio Management Discussion and Analysis
Below, the Goldman Sachs Fixed Income Portfolio Management Team discusses the Goldman Sachs Variable Insurance Trust – Core Fixed Income Fund’s (the “Fund”) performance and positioning for the 12-month period ended December 31, 2021 (the “Reporting Period”).
How did the Fund perform during the Reporting Period?
During the Reporting Period, the Fund’s Institutional and Service Shares generated average annual total returns of -2.06% and -2.23%, respectively. This compares to the -1.54% average annual total return of the Fund’s benchmark, the Bloomberg U.S. Aggregate Bond Index (the “Bloomberg Index”), during the same time period.
What key factors were responsible for the Fund’s performance during the Reporting Period?
The Fund’s combined tactical duration and yield curve positioning detracted from its relative performance during the Reporting Period. (Duration is a measure of the Fund’s sensitivity to changes in interest rates. Yield curve is a spectrum of interest rates based on maturities of varying lengths.)
The Fund’s cross-sector strategy contributed positively to its relative returns. In our cross-sector strategy, we invest Fund assets across a variety of fixed income sectors, including some that may not be included in the Bloomberg Index. In addition, security selection, which capitalizes on our fundamental research capabilities, contributed positively to the Fund’s relative performance. Our currency strategy did not have a material impact on the Fund’s returns during the Reporting Period.
Which fixed income market sectors most affected Fund performance during the Reporting Period?
During the Reporting Period, the Fund benefited from its overweight positions relative to the Bloomberg Index in corporate credit, collateralized loan obligations (“CLOs”) and commercial mortgage-backed securities (“CMBS”) due to their yield advantage and tighter spreads, or yield differentials, versus duration-equivalent U.S. Treasury securities. The Fund’s underweight in mortgage-backed securities, which were hurt by rising interest rates and higher prepayment speeds, also added to relative performance.
As for individual issue selection, the Fund was helped by its down-in-quality bias within corporate credit, specifically its overweight versus the Bloomberg Index in BBB-rated corporate bonds. Lower quality issues generally outperformed higher quality issues during the Reporting Period. Also adding to performance was the Fund’s tactical positioning along the credit curve, wherein the Fund was overweight intermediate-maturity corporate bonds to capture carry and roll opportunities and underweight longer-maturity corporate bonds. (Carry is the yield advantage of holding an asset. Roll is the return that can be achieved by allowing a bond to “roll down” an upward sloping yield curve (i.e., its capital appreciation) over a period of time.) In the securitized sector, selection of specific tranches of CLOs and CMBS also bolstered relative returns. In the government sector, the Fund was aided by security selection among local government bonds, such as taxable municipal bonds, and U.S. Treasury securities.
Did the Fund’s duration and yield curve positioning strategy help or hurt its results during the Reporting Period?
During the Reporting Period, the Fund’s combined duration and yield curve positioning hurt performance. The main detractor was the Fund’s tactical positioning in the short-term ends of the Canadian and Australian yield curves, which hampered performance as interest rates rose in February and October 2021. The Fund’s U.K. yield curve steepening position also detracted from results. (A steepening position seeks to take advantage of a widening differential between yields at the shorter- and longer-term ends of a range of maturities.) In addition, the Fund’s long duration position compared to the Bloomberg Index, implemented as part of our credit-interest rate paired strategy, which we used to hedge the Fund’s overweight in corporate credit, had a negative impact on performance. More specifically, this positioning hurt performance as interest rates rose during the first quarter of 2021.
How did the Fund use derivatives and similar instruments during the Reporting Period?
As market conditions warranted during the Reporting Period, currency transactions were carried out using primarily over-the-counter (“OTC”) forward foreign exchange contracts. Currency transactions were used as we sought both to enhance
GOLDMAN SACHS VARIABLE INSURANCE TRUST CORE FIXED INCOME FUND
returns and to hedge the Fund’s portfolio against currency exchange rate fluctuations. OTC forward foreign exchange contracts did not have a material impact on Fund performance during the Reporting Period. In addition, futures contracts were employed as warranted to facilitate specific duration, yield curve and country strategies. During the Reporting Period, futures contracts overall had a negative impact on the Fund’s results.
Swaptions (options on interest rate swap contracts), which were used to express our interest rate views and to hedge volatility and yield curve risks in the Fund, did not have a meaningful impact on the Fund’s performance during the Reporting Period. Interest rate swaps, which were used to manage exposure to fluctuations in interest rates, had a negative impact on the Fund’s performance during the Reporting Period. Additionally, the Fund employed index credit default swaps as well as individual credit default swaps to implement specific credit-related investment strategies, including management of the Fund’s exposure to credit spreads, which collectively had a positive impact on the Fund’s results during the Reporting Period overall.
We employ derivatives and similar instruments to efficiently management of the Fund. Derivatives and similar instruments allow us to manage interest rate, credit and currency risks more effectively by allowing us both to hedge and to apply active investment views with greater versatility and to afford greater risk management precision than we would otherwise be able to implement.
Were there any notable changes in the Fund’s weightings during the Reporting Period?
During the Reporting Period, we reduced the Fund’s overweight in corporate credit, as spreads tightened due to ongoing economic recovery and strong corporate earnings. We also shifted the Fund from an overweight position versus the Bloomberg Index in pass-through mortgage securities to an underweight position because of the relative richness of that market segment and the Fed’s announcement it would taper its purchases of mortgage-backed securities. (Pass-through mortgage securities consist of a pool of residential mortgage loans in which homeowners’ monthly payments of principal, interest and prepayments pass from the mortgage servicer through a government agency or investment bank to investors.) In addition, during the Reporting Period, we increased the Fund’s holdings of U.S. government securities, though we maintained a modest underweight position relative to the Bloomberg Index, and decreased its holdings of quasi-government bonds.
Were there any changes to the Fund’s portfolio management team during the Reporting Period?
Effective October 1, 2021, Michael Swell no longer served as a portfolio manager for the Fund. At the end of the Reporting Period, Ashish Shah served as the portfolio manager for the Fund. By design, all investment decisions for the Fund are performed within a team structure, with multiple subject matter experts. This strategic decision making has been the cornerstone of our approach and ensures continuity in the Fund.
How was the Fund positioned relative to the Bloomberg Index at the end of the Reporting Period?
At the end of the Reporting Period, the Fund was overweight corporate credit and asset-backed securities compared to the Bloomberg Index. It was underweight pass-through mortgage securities. Additionally, the Fund was underweight U.S. government securities and quasi-government bonds. The Fund was relatively neutral versus the Bloomberg Index in CMBS, non-agency mortgage-backed securities and agency collateralized mortgage obligations and slightly overweight in emerging markets debt at the end of the Reporting Period.
FUND BASICS
FUND COMPOSITION1
As of December 31, 2021
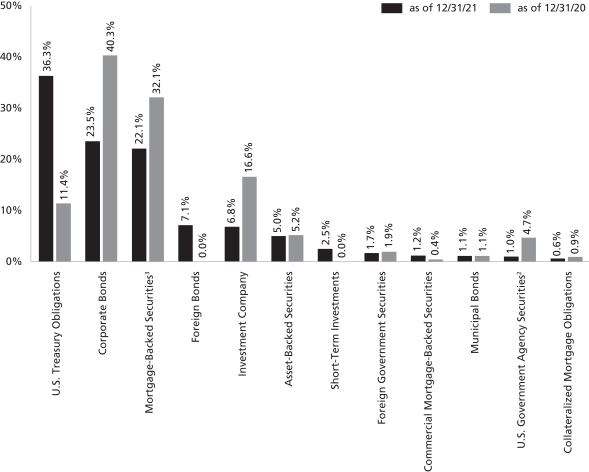
| 1 | The percentage shown for each investment category reflects the value of investments in that category as a percentage of net assets. Figures in the above graph may not sum to 100% due to the exclusion of other assets and liabilities. Short-Term Investments represent investments in commercial paper. Underlying sector allocations of investment companies held by the Fund are not reflected in the graph above. The graph depicts the Fund’s investments but may not represent the Fund’s market exposure due to the exclusion of certain derivatives, if any, as listed in the Additional Investment Information section of the Schedule of Investments. |
| 2 | “U.S. Government Agency Security” include agency securities offered by companies such as Federal Farm Credit Bank (“FFCB”) and the Federal National Mortgage Association (“FNMA”) which operate under a government charter. While they are required to report to a government regulator, their assets are not explicitly guaranteed by the government and they otherwise operate like any other publicly traded company. |
| 3 | Mortgage-backed securities guaranteed by the Government National Mortgage Association (“GNMA”), FNMA or the Federal Home Loan Mortgage Corp. (“FHLMC”). GNMA instruments are backed by the full faith and credit of the United States Government. |
For more information about your Fund, please refer to www.GSAMFUNDS.com. There, you can learn more about your Fund’s investment strategies, holdings, and performance.
GOLDMAN SACHS VARIABLE INSURANCE TRUST CORE FIXED INCOME FUND
Performance Summary
December 31, 2021
The following graph shows the value, as of December 31, 2021, of a $10,000 investment made on January 1, 2012 in Service Shares at NAV. For comparative purposes, the performance of the Fund’s benchmark, the Bloomberg U.S. Aggregate Bond Index, is shown. Performance reflects applicable fee waivers and/or expense limitations in effect during the periods shown and in their absence, performance would be reduced. Returns do not reflect the deduction of taxes that a shareholder would pay on Fund distributions or the redemption of Fund shares. The returns set forth below represent past performance. Past performance does not guarantee future results. The Fund’s investment return and principal value will fluctuate so that an investor’s shares, when redeemed, may be worth more or less than their original cost. Current performance may be lower or higher than the performance quoted below. Please visit our web site at www.GSAMFUNDS.com to obtain the most recent month-end returns.
Core Fixed Income Fund’s 10 Year Performance
Performance of a $10,000 investment, with distributions reinvested, from January 1, 2012 through December 31, 2021.
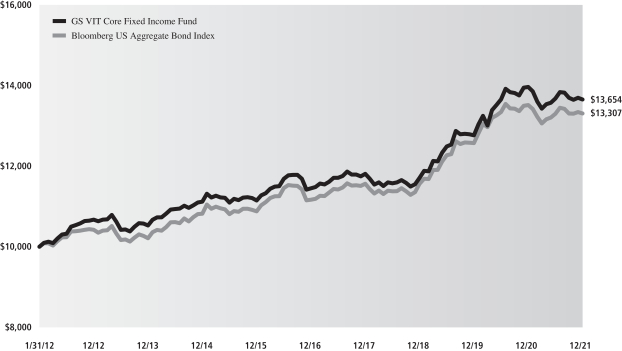
| | | | | | | | |
| Average Annual Total Return through December 31, 2021 | | One Year | | Five Years | | Ten Years | | Since Inception |
Institutional (Commenced April 30, 2013) | | -2.06% | | 3.83% | | N/A | | 3.00% |
Service | | -2.23% | | 3.58% | | 3.16% | | — |
GOLDMAN SACHS VARIABLE INSURANCE TRUST HIGH QUALITY FLOATING RATE FUND
INVESTMENT OBJECTIVE
The Fund seeks to provide a high level of current income, consistent with low volatility of principal.
Portfolio Management Discussion and Analysis
Below, the Goldman Sachs Fixed Income Portfolio Management Team discusses the Goldman Sachs Variable Insurance Trust - Goldman Sachs High Quality Floating Rate Fund’s (the “Fund”) performance and positioning for the 12-month period ended December 31, 2021 (the “Reporting Period”).
How did the Fund perform during the Reporting Period?
During the Reporting Period, the Fund’s Institutional, Service and Advisor Shares generated average annual total returns of 0.20%, -0.02% and -0.06%, respectively. These returns compare to the 0.05% average annual total return of the Fund’s benchmark, the ICE BofA Three-Month US Treasury Bill Index (the “ICE BofA Index”), during the Reporting Period.
We note that the Fund’s benchmark being the ICE BofA Index is a means of emphasizing that the Fund has an unconstrained strategy. That said, this Fund employs a benchmark agnostic strategy and thus comparisons to a benchmark index are not particularly relevant.
What key factors had the greatest impact on the Fund’s performance during the Reporting Period?
During the Reporting Period, the Fund’s combined tactical duration and yield curve positioning detracted from results. (Duration is a measure of the Fund’s sensitivity to changes in interest rates. Yield curve is a spectrum of interest rates based on maturities of varying lengths.)
Our cross-sector strategy contributed positively to relative performance. In our cross-sector strategy, we invest Fund assets based on a discipline of valuing each fixed income sector in the context of all investment opportunities within the Fund’s universe. Individual issue selection also added to relative returns.
Which fixed income market sectors helped or hurt Fund performance during the Reporting Period?
The Fund was helped by our cross-sector strategy, specifically its exposure to collateralized loan obligations (“CLOs”) and asset-backed securities (“ABS”). Exposure to the government/swaps sector also bolstered relative returns.
Individual issue selection contributed positively to the Fund’s relative performance during the Reporting Period. Within the securitized sector, selection of mortgage-backed securities added most to returns, while individual issue selection of ABS and CLOs also added slightly. Within the government sector, the Fund benefited from individual issue selection of U.S. government securities and U.S. agency securities during the Reporting Period.
Did the Fund’s duration and yield curve positioning strategy help or hurt its results during the Reporting Period?
During the Reporting Period, the Fund’s combined tactical duration and yield curve positioning detracted from relative performance. The Fund was hurt most by its smaller exposure than that of the ICE BofA Index to the three-month segment of the U.S. Treasury yield curve. The Fund’s comparatively smaller exposure to the three-year and seven-year segments of the U.S. Treasury yield curve also detracted from results.
Were there any notable changes in the Fund’s weightings during the Reporting Period?
During the Reporting Period, we decreased the Fund’s allocations to residential mortgage-backed securities and ABS. We increased its allocations to cash and U.S. government securities.
How did the Fund use derivatives and similar instruments during the Reporting Period?
As market conditions warranted, the Fund used U.S. Treasury futures to hedge interest rate exposure and to facilitate duration management. During the Reporting Period, the use of futures overall had a positive impact on performance. The Fund also employed fixed and floating interest rate swaps, as well as basis rate swaps, to manage interest risk, which collectively had a positive impact on performance during the Reporting Period.
GOLDMAN SACHS VARIABLE INSURANCE TRUST HIGH QUALITY FLOATING RATE FUND
How was the Fund positioned relative to the ICE BofA Index at the end of the Reporting Period?
At the end of the Reporting Period, the Fund had a modest allocation to U.S. government securities, which comprise 100% of the ICE BofA Index. The Fund had positions in ABS, commercial mortgage-backed securities, residential mortgage-backed securities, agency collateralized mortgage obligations and agency adjustable-rate mortgages, none of which are represented in the ICE BofA Index. In addition, the Fund had an allocation to cash at the end of the Reporting Period.
Liquidation of the VIT Goldman Sachs High Quality Floating Rate Fund
At a meeting held on December 14-15, 2021, upon the recommendation of Goldman Sachs Asset Management, L.P., the Board of Trustees (the “Board”) of the Goldman Sachs Variable Insurance Trust (the “Trust”) approved a proposal to liquidate the Fund. After careful consideration of a number of factors, the Board concluded that it is advisable and in the best interest of the Fund and its shareholders to liquidate the Fund. The Fund will be liquidated on or about April 27, 2022 (the “Liquidation Date”), pursuant to a Plan of Liquidation approved by the Board. The Liquidation Date may be changed without notice at the discretion of the Trust’s officers.
FUND BASICS
FUND COMPOSITION1
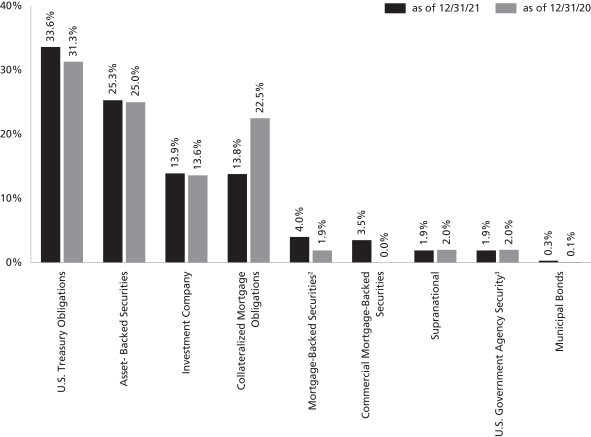
| 1 | The percentage shown for each investment category reflects the value of investments in that category as a percentage of net assets. Figures in the above graph may not sum to 100% due to the exclusion of other assets and liabilities. Short-Term Investments represent investments in commercial paper. Underlying sector allocations of investment companies held by the Fund are not reflected in the graph above. The graph depicts the Fund’s investments but may not represent the Fund’s market exposure due to the exclusion of certain derivatives, if any, as listed in the Additional Investment Information section of the Schedule of Investments. |
| 2 | “U.S. Government Agency Security” include agency securities offered by companies such as Federal Farm Credit Bank (“FFCB”) and the Federal National Mortgage Association (“FNMA”) which operate under a government charter. While they are required to report to a government regulator, their assets are not explicitly guaranteed by the government and they otherwise operate like any other publicly traded company. |
| 3 | Mortgage-backed securities guaranteed by the Government National Mortgage Association (“GNMA”), FNMA or the Federal Home Loan Mortgage Corp. (“FHLMC”). GNMA instruments are backed by the full faith and credit of the United States Government. |
For more information about your Fund, please refer to www.GSAMFUNDS.com. There, you can learn more about your Fund’s investment strategies, holdings, and performance.
GOLDMAN SACHS VARIABLE INSURANCE TRUST HIGH QUALITY FLOATING RATE FUND
Performance Summary
December 31, 2021
The following graph shows the value, as of December 31, 2021, of a $10,000 investment made on January 1, 2012 in Service Shares at NAV. For comparative purposes, the performance of the Fund’s benchmark, the ICE BofAML® Three-Month U.S. Treasury Bill Index, is shown. Performance reflects applicable fee waivers and/or expense limitations in effect during the periods shown and in their absence, performance would be reduced. Returns do not reflect the deduction of taxes that a shareholder would pay on Fund distributions or the redemption of Fund shares. The returns set forth below represent past performance. Past performance does not guarantee future results. The Fund’s investment return and principal value will fluctuate so that an investor’s shares, when redeemed, may be worth more or less than their original cost. Current performance may be lower or higher than the performance quoted below. Please visit our web site at www.GSAMFUNDS.com to obtain the most recent month-end returns.
High Quality Floating Rate Fund’s 10 Year Performance
Performance of a $10,000 investment, with distributions reinvested, from January 1, 2012 through December 31, 2021.
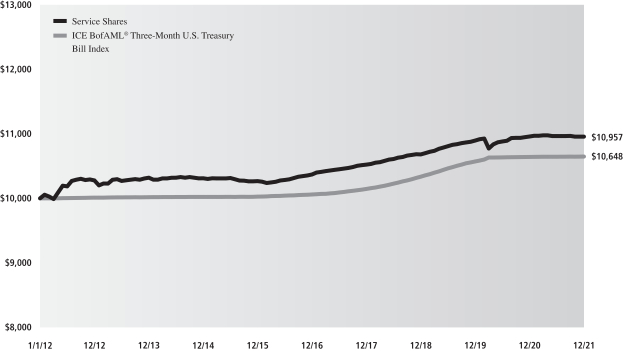
| | | | | | | | |
| Average Annual Total Return through December 31, 2021 | | One Year | | Five Years | | Ten Years | | Since Inception |
Institutional (Commenced April 30, 2013) | | 0.20% | | 1.34% | | N/A | | 0.98% |
Service | | -0.02% | | 1.11% | | 0.92% | | — |
Advisor (Commenced October 15, 2014) | | -0.06% | | 0.96% | | N/A | | 0.70% |
GOLDMAN SACHS VARIABLE INSURANCE TRUST FUNDS
Index Definitions
Bloomberg U.S. Aggregate Bond Index represents an unmanaged diversified portfolio of fixed income securities, including U.S. Treasuries, investment-grade corporate bonds and mortgage-backed and asset-backed securities.
ICE BofAML Three-Month U.S. Treasury Bill Index measures total return on cash, including price and interest income, based on short-term government Treasury Bills of about 90-day maturity, as reported by Bank of America Merrill Lynch.
It is not possible to invest directly in an unmanaged index.
GOLDMAN SACHS VARIABLE INSURANCE TRUST CORE FIXED INCOME FUND
Schedule of Investments
December 31, 2021
| | | | | | | | | | | | | | |
Principal
Amount | | | Interest
Rate | | | Maturity
Date | | | Value | |
|
| Corporate Bonds – 23.5% | |
| Aerospace/Defense – 0.6% | |
| | Boeing Co. (The)(a) | |
| $ | 50,000 | | | | 3.450 | % | | | 11/01/28 | | | $ | 52,480 | |
| | 25,000 | | | | 5.150 | | | | 05/01/30 | | | | 29,169 | |
| | 25,000 | | | | 3.250 | | | | 02/01/35 | | | | 25,196 | |
| | 100,000 | | | | 5.805 | | | | 05/01/50 | | | | 135,372 | |
| | Northrop Grumman Corp | |
| | 50,000 | | | | 2.930 | (a) | | | 01/15/25 | | | | 52,185 | |
| | 75,000 | | | | 3.250 | (a) | | | 01/15/28 | | | | 80,195 | |
| | 25,000 | | | | 4.750 | | | | 06/01/43 | | | | 31,582 | |
| | 50,000 | | | | 5.250 | (a) | | | 05/01/50 | | | | 70,179 | |
| | Raytheon Technologies Corp.(a) | |
| | 50,000 | | | | 3.950 | | | | 08/16/25 | | | | 54,207 | |
| | 50,000 | | | | 4.125 | | | | 11/16/28 | | | | 55,953 | |
| | 25,000 | | | | 4.050 | | | | 05/04/47 | | | | 29,089 | |
| | | | | | | | | | | | | | |
| | | | | | | | | | | | | 615,607 | |
| | |
| Agriculture – 0.0% | |
| | Archer-Daniels-Midland Co.(a) | |
| | 25,000 | | | | 3.250 | | | | 03/27/30 | | | | 27,149 | |
| | |
| Auto Manufacturers – 0.3% | |
| | General Motors Co. | |
| | 50,000 | | | | 5.400 | | | | 10/02/23 | | | | 53,548 | |
| | 25,000 | | | | 4.000 | | | | 04/01/25 | | | | 26,763 | |
| | General Motors Financial Co., Inc.(a) | |
| | 25,000 | | | | 4.300 | | | | 07/13/25 | | | | 26,951 | |
| | 125,000 | | | | 1.500 | | | | 06/10/26 | | | | 123,065 | |
| | 125,000 | | | | 2.350 | | | | 01/08/31 | | | | 121,389 | |
| | | | | | | | | | | | | | |
| | | | | | | | | | | | | 351,716 | |
| | |
| Banks – 3.7% | |
| | Bank of America Corp. | |
| | 75,000 | | | | 4.125 | | | | 01/22/24 | | | | 79,707 | |
| | 65,000 | | | | 4.200 | | | | 08/26/24 | | | | 69,652 | |
| | 45,000 | | | | 3.248 | (a) | | | 10/21/27 | | | | 47,974 | |
| | (3 Mo. LIBOR + 1.58%) | |
| | 75,000 | | | | 3.824 | (a)(b) | | | 01/20/28 | | | | 81,274 | |
| | (3 Mo. LIBOR + 1.37%) | |
| | 25,000 | | | | 3.593 | (a)(b) | | | 07/21/28 | | | | 26,908 | |
| | (3 Mo. LIBOR + 1.04%) | |
| | 85,000 | | | | 3.419 | (a)(b) | | | 12/20/28 | | | | 90,836 | |
| | (3 Mo. LIBOR + 1.31%) | |
| | 50,000 | | | | 4.271 | (a)(b) | | | 07/23/29 | | | | 55,739 | |
| | (3 Mo. LIBOR + 1.19%) | |
| | 50,000 | | | | 2.884 | (a)(b) | | | 10/22/30 | | | | 51,604 | |
| | (SOFR + 2.15%) | |
| | 175,000 | | | | 2.592 | (a)(b) | | | 04/29/31 | | | | 176,698 | |
| | (SOFR + 1.53%) | |
| | 50,000 | | | | 1.898 | (a)(b) | | | 07/23/31 | | | | 47,944 | |
| | (SOFR + 1.22%) | |
| | 110,000 | | | | 2.299 | (a)(b) | | | 07/21/32 | | | | 108,024 | |
| (US Treasury Yield Curve Rate T-Note Constant Maturity
5 Yr.+ 1.20%) |
|
| | 100,000 | | | | 2.482 | (a)(b) | | | 09/21/36 | | | | 96,786 | |
| | |
|
| Corporate Bonds – (continued) | |
| Banks – (continued) | |
| | Bank of America Corp., Series L(a) | |
| 25,000 | | | | 4.183 | | | | 11/25/27 | | | | 27,367 | |
| | Citigroup, Inc. | |
| | 220,000 | | | | 3.400 | | | | 05/01/26 | | | | 235,960 | |
| | 150,000 | | | | 4.450 | | | | 09/29/27 | | | | 167,251 | |
| | 25,000 | | | | 4.125 | | | | 07/25/28 | | | | 27,478 | |
| | (SOFR + 1.42%) | |
| | 75,000 | | | | 2.976 | (a)(b) | | | 11/05/30 | | | | 77,931 | |
| | Fifth Third Bancorp(a) | |
| | 30,000 | | | | 2.375 | | | | 01/28/25 | | | | 30,790 | |
| | Huntington Bancshares, Inc.(a) | |
| | 50,000 | | | | 4.000 | | | | 05/15/25 | | | | 53,809 | |
| | JPMorgan Chase & Co.(a) | |
| | (3 Mo. LIBOR + 0.73%) | |
| | 25,000 | | | | 3.559 | (b) | | | 04/23/24 | | | | 25,822 | |
| | (3 Mo. LIBOR + 0.89%) | |
| | 25,000 | | | | 3.797 | (b) | | | 07/23/24 | | | | 26,055 | |
| | (3 Mo. LIBOR + 1.00%) | |
| | 50,000 | | | | 4.023 | (b) | | | 12/05/24 | | | | 52,667 | |
| | (SOFR + 1.16%) | |
| | 125,000 | | | | 2.301 | (b) | | | 10/15/25 | | | | 127,777 | |
| | (3 Mo. LIBOR + 1.25%) | |
| | 100,000 | | | | 3.960 | (b) | | | 01/29/27 | | | | 108,258 | |
| | 15,000 | | | | 3.625 | | | | 12/01/27 | | | | 16,171 | |
| | (3 Mo. LIBOR + 1.34%) | |
| | 75,000 | | | | 3.782 | (b) | | | 02/01/28 | | | | 81,251 | |
| | (3 Mo. LIBOR + 0.95%) | |
| | 45,000 | | | | 3.509 | (b) | | | 01/23/29 | | | | 48,259 | |
| | (SOFR + 3.79%) | |
| | 25,000 | | | | 4.493 | (b) | | | 03/24/31 | | | | 28,942 | |
| | (SOFR + 2.04%) | |
| | 25,000 | | | | 2.522 | (b) | | | 04/22/31 | | | | 25,290 | |
| | (SOFR + 2.52%) | |
| | 25,000 | | | | 2.956 | (b) | | | 05/13/31 | | | | 25,872 | |
| | JPMorgan Chase & Co., Series HH(a) | |
| | (SOFR + 3.13%) | |
| | 100,000 | | | | 4.600 | (b) | | | 02/01/25 | | | | 102,218 | |
| | JPMorgan Chase & Co., Series Z(a) | |
| | (3 Mo. LIBOR + 3.80%) | |
| | 85,000 | | | | 3.932 | (b) | | | 11/01/21 | | | | 85,117 | |
| | Morgan Stanley | |
| | (3 Mo. LIBOR + 1.40%) | |
| | 50,000 | | | | 1.524 | (a)(b) | | | 10/24/23 | | | | 50,433 | |
| | (3 Mo. LIBOR + 0.85%) | |
| | 25,000 | | | | 3.737 | (a)(b) | | | 04/24/24 | | | | 25,874 | |
| | (SOFR + 1.15%) | |
| | 75,000 | | | | 2.720 | (a)(b) | | | 07/22/25 | | | | 77,310 | |
| | 25,000 | | | | 3.625 | | | | 01/20/27 | | | | 27,130 | |
| | 50,000 | | | | 3.950 | | | | 04/23/27 | | | | 54,984 | |
| | (3 Mo. LIBOR + 1.63%) | |
| | 25,000 | | | | 4.431 | (b) | | | 01/23/30 | | | | 28,468 | |
| | (SOFR + 1.14%) | |
| | 300,000 | | | | 2.699 | (b) | | | 01/22/31 | | | | 307,304 | |
| | |
| | |
| 12 | | The accompanying notes are an integral part of these financial statements. |
GOLDMAN SACHS VARIABLE INSURANCE TRUST CORE FIXED INCOME FUND
| | | | | | | | | | | | | | |
Principal
Amount | | | Interest
Rate | | | Maturity
Date | | | Value | |
|
| Corporate Bonds – (continued) | |
| Banks – (continued) | |
| | (SOFR + 3.12%) | |
| $ | 50,000 | | | | 3.622 | %(b) | | | 04/01/31 | | | $ | 54,543 | |
| | (SOFR + 1.03%) | |
| | 75,000 | | | | 1.794 | (b) | | | 02/13/32 | | | | 71,071 | |
| | (SOFR + 1.36%) | |
| | 150,000 | | | | 2.484 | (b) | | | 09/16/36 | | | | 144,386 | |
| | Morgan Stanley, Series F | |
| | 25,000 | | | | 3.875 | | | | 04/29/24 | | | | 26,525 | |
| | Morgan Stanley, Series G | |
| | 225,000 | | | | 3.700 | | | | 10/23/24 | | | | 239,680 | |
| | US Bancorp | |
| (US Treasury Yield Curve Rate T-Note Constant Maturity
5 Yr.+ 2.54%) |
|
| | 100,000 | | | | 3.700 | (a)(b) | | | 10/31/39 | | | | 100,324 | |
| | Wells Fargo & Co. | |
| | 25,000 | | | | 3.750 | (a)(b) | | | 01/24/24 | | | | 26,266 | |
| | 175,000 | | | | 3.000 | | | | 10/23/26 | | | | 184,060 | |
| | 50,000 | | | | 4.300 | | | | 07/22/27 | | | | 55,890 | |
| | (SOFR + 4.50%) | |
| | 25,000 | | | | 5.013 | (a)(b) | | | 04/04/51 | | | | 34,166 | |
| | | | | | | | | | | | | | |
| | | | | | | | | | | | | 3,815,845 | |
| | |
| Beverages – 0.2% | |
| | Constellation Brands, Inc.(a) | |
| | 50,000 | | | | 4.400 | | | | 11/15/25 | | | | 55,043 | |
| | 25,000 | | | | 3.700 | | | | 12/06/26 | | | | 27,104 | |
| | 50,000 | | | | 3.600 | | | | 02/15/28 | | | | 53,981 | |
| | 25,000 | | | | 3.150 | | | | 08/01/29 | | | | 26,337 | |
| | Keurig Dr Pepper, Inc.(a) | |
| | 26,000 | | | | 4.057 | | | | 05/25/23 | | | | 27,097 | |
| | 25,000 | | | | 5.085 | | | | 05/25/48 | | | | 32,674 | |
| | 25,000 | | | | 3.800 | | | | 05/01/50 | | | | 27,674 | |
| | | | | | | | | | | | | | |
| | | | | | | | | | | | | 249,910 | |
| | |
| Biotechnology – 0.1% | |
| | Amgen, Inc.(a) | |
| | 70,000 | | | | 3.125 | | | | 05/01/25 | | | | 73,693 | |
| | Royalty Pharma PLC(a) | |
| | 75,000 | | | | 1.200 | | | | 09/02/25 | | | | 73,669 | |
| | | | | | | | | | | | | | |
| | | | | | | | | | | | | 147,362 | |
| | |
| Building Materials – 0.4% | |
| | Carrier Global Corp.(a) | |
| | 150,000 | | | | 2.493 | | | | 02/15/27 | | | | 153,993 | |
| | 75,000 | | | | 2.722 | | | | 02/15/30 | | | | 76,624 | |
| | Martin Marietta Materials, Inc.(a) | |
| | 175,000 | | | | 3.200 | | | | 07/15/51 | | | | 177,248 | |
| | Masco Corp.(a) | |
| | 50,000 | | | | 1.500 | | | | 02/15/28 | | | | 48,425 | |
| | | | | | | | | | | | | | |
| | | | | | | | | | | | | 456,290 | |
| | |
| Chemicals – 0.5% | |
| | DuPont de Nemours, Inc.(a) | |
| | 25,000 | | | | 4.205 | | | | 11/15/23 | | | | 26,437 | |
| | 50,000 | | | | 4.493 | | | | 11/15/25 | | | | 55,248 | |
| | |
|
| Corporate Bonds – (continued) | |
| Chemicals – (continued) | |
| | Ecolab, Inc.(a) | |
| 4,000 | | | | 2.750 | | | | 08/18/55 | | | | 3,930 | |
| | Huntsman International LLC(a) | |
| | 25,000 | | | | 4.500 | | | | 05/01/29 | | | | 27,704 | |
| | 25,000 | | | | 2.950 | | | | 06/15/31 | | | | 25,281 | |
| | International Flavors & Fragrances, Inc.(a) | |
| | 75,000 | | | | 1.832 | (c) | | | 10/15/27 | | | | 73,825 | |
| | 150,000 | | | | 2.300 | (c) | | | 11/01/30 | | | | 147,266 | |
| | 50,000 | | | | 3.268 | (c) | | | 11/15/40 | | | | 51,098 | |
| | Sherwin-Williams Co. (The)(a) | |
| | 25,000 | | | | 3.450 | | | | 06/01/27 | | | | 27,092 | |
| | 50,000 | | | | 2.950 | | | | 08/15/29 | | | | 52,671 | |
| | | | | | | | | | | | | | |
| | | | | | | | | | | | | 490,552 | |
| | |
| Commercial Services – 0.7% | |
| | CoStar Group, Inc.(a)(c) | |
| | 100,000 | | | | 2.800 | | | | 07/15/30 | | | | 100,207 | |
| | Emory University, Series 2020(a) | |
| | 140,000 | | | | 2.143 | | | | 09/01/30 | | | | 141,937 | |
| | Global Payments, Inc.(a) | |
| | 50,000 | | | | 2.650 | | | | 02/15/25 | | | | 51,423 | |
| | IHS Markit Ltd.(a) | |
| | 75,000 | | | | 3.625 | | | | 05/01/24 | | | | 78,656 | |
| | 75,000 | | | | 4.250 | | | | 05/01/29 | | | | 85,219 | |
| | PayPal Holdings, Inc.(a) | |
| | 150,000 | | | | 1.650 | | | | 06/01/25 | | | | 151,853 | |
| | 125,000 | | | | 2.650 | | | | 10/01/26 | | | | 131,478 | |
| | | | | | | | | | | | | | |
| | | | | | | | | | | | | 740,773 | |
| | |
| Computers – 0.9% | |
| | Amdocs Ltd.(a) | |
| | 50,000 | | | | 2.538 | | | | 06/15/30 | | | | 49,731 | |
| | Apple, Inc.(a) | |
| | 325,000 | | | | 2.450 | | | | 08/04/26 | | | | 339,486 | |
| | Dell International LLC / EMC Corp.(a) | |
| | 18,000 | | | | 5.450 | | | | 06/15/23 | | | | 19,010 | |
| | 75,000 | | | | 5.850 | | | | 07/15/25 | | | | 85,072 | |
| | 100,000 | | | | 6.020 | | | | 06/15/26 | | | | 115,875 | |
| | 25,000 | | | | 5.300 | | | | 10/01/29 | | | | 29,367 | |
| | Hewlett Packard Enterprise Co.(a) | |
| | 150,000 | | | | 4.450 | | | | 10/02/23 | | | | 158,339 | |
| | 45,000 | | | | 4.900 | | | | 10/15/25 | | | | 49,939 | |
| | 25,000 | | | | 6.350 | | | | 10/15/45 | | | | 33,479 | |
| | | | | | | | | | | | | | |
| | | | | | | | | | | | | 880,298 | |
| | |
| Diversified Financial Services – 0.7% | |
| | Air Lease Corp.(a) | |
| | 75,000 | | | | 2.300 | | | | 02/01/25 | | | | 76,122 | |
| | 75,000 | | | | 3.375 | | | | 07/01/25 | | | | 78,394 | |
| | 75,000 | | | | 2.875 | | | | 01/15/26 | | | | 77,351 | |
| | Air Lease Corp., Series G(a) | |
| | 75,000 | | | | 3.750 | | | | 06/01/26 | | | | 79,934 | |
| | Ally Financial, Inc.(a) | |
| | 25,000 | | | | 1.450 | | | | 10/02/23 | | | | 25,087 | |
| | |
| | |
| The accompanying notes are an integral part of these financial statements. | | 13 |
GOLDMAN SACHS VARIABLE INSURANCE TRUST CORE FIXED INCOME FUND
Schedule of Investments (continued)
December 31, 2021
| | | | | | | | | | | | | | |
Principal
Amount | | | Interest
Rate | | | Maturity
Date | | | Value | |
|
| Corporate Bonds – (continued) | |
| Diversified Financial Services – (continued) | |
| | American Express Co.(a) | |
| $ | 20,000 | | | | 2.500 | % | | | 07/30/24 | | | $ | 20,659 | |
| | 25,000 | | | | 3.625 | | | | 12/05/24 | | | | 26,717 | |
| | Aviation Capital Group LLC(a)(c) | |
| | 50,000 | | | | 1.950 | | | | 01/30/26 | | | | 48,880 | |
| | Capital One Financial Corp. | |
| | 25,000 | | | | 3.500 | | | | 06/15/23 | | | | 25,908 | |
| | 45,000 | | | | 3.300 | (a) | | | 10/30/24 | | | | 47,436 | |
| | Discover Financial Services(a) | |
| | 75,000 | | | | 3.750 | | | | 03/04/25 | | | | 79,418 | |
| | Intercontinental Exchange, Inc.(a) | |
| | 50,000 | | | | 3.000 | | | | 06/15/50 | | | | 50,523 | |
| | Mastercard, Inc.(a) | |
| | 25,000 | | | | 3.300 | | | | 03/26/27 | | | | 27,036 | |
| | Nuveen LLC(a)(c) | |
| | 25,000 | | | | 4.000 | | | | 11/01/28 | | | | 27,774 | |
| | Raymond James Financial, Inc.(a) | |
| | 25,000 | | | | 4.650 | | | | 04/01/30 | | | | 28,969 | |
| | | | | | | | | | | | | | |
| | | | | | | | | | | | | 720,208 | |
| | |
| Electric – 1.4% | |
| | Alliant Energy Finance LLC(a)(c) | |
| | 25,000 | | | | 3.750 | | | | 06/15/23 | | | | 25,880 | |
| | American Electric Power Co., Inc.(a) | |
| | 50,000 | | | | 2.300 | | | | 03/01/30 | | | | 49,179 | |
| | Arizona Public Service Co.(a) | |
| | 45,000 | | | | 2.950 | | | | 09/15/27 | | | | 47,279 | |
| | Avangrid, Inc.(a) | |
| | 25,000 | | | | 3.200 | | | | 04/15/25 | | | | 26,303 | |
| | Berkshire Hathaway Energy Co.(a) | |
| | 25,000 | | | | 3.250 | | | | 04/15/28 | | | | 26,819 | |
| | 50,000 | | | | 3.700 | | | | 07/15/30 | | | | 55,515 | |
| | Dominion Energy, Inc., Step up | |
| | 50,000 | | | | 3.071 | | | | 08/15/24 | | | | 51,811 | |
| | Dominion Energy, Inc., Series C(a) | |
| | 25,000 | | | | 3.375 | | | | 04/01/30 | | | | 26,628 | |
| | Entergy Corp.(a) | |
| | 45,000 | | | | 2.950 | | | | 09/01/26 | | | | 47,072 | |
| | Exelon Corp.(a) | |
| | 45,000 | | | | 3.497 | | | | 06/01/22 | | | | 45,406 | |
| | 50,000 | | | | 4.050 | | | | 04/15/30 | | | | 55,718 | |
| | 25,000 | | | | 4.700 | | | | 04/15/50 | | | | 31,520 | |
| | FirstEnergy Corp.(a) | |
| | 100,000 | | | | 2.650 | | | | 03/01/30 | | | | 98,776 | |
| | FirstEnergy Corp., Series B(a) | |
| | 50,000 | | | | 2.250 | | | | 09/01/30 | | | | 48,164 | |
| | Florida Power & Light Co.(a) | |
| | 68,000 | | | | 4.125 | | | | 02/01/42 | | | | 81,234 | |
| | MidAmerican Energy Co.(a) | |
| | 25,000 | | | | 3.650 | | | | 04/15/29 | | | | 27,554 | |
| | NextEra Energy Capital Holdings, Inc.(a) | |
| | 70,000 | | | | 1.900 | | | | 06/15/28 | | | | 69,473 | |
| | NRG Energy, Inc.(a)(c) | |
| | 75,000 | | | | 3.750 | | | | 06/15/24 | | | | 78,370 | |
| | |
|
| Corporate Bonds – (continued) | |
| Electric – (continued) | |
| | Ohio Power Co., Series P(a) | |
| 25,000 | | | | 2.600 | | | | 04/01/30 | | | | 25,712 | |
| | Pacific Gas and Electric Co.(a) | |
| | 25,000 | | | | 2.100 | | | | 08/01/27 | | | | 24,177 | |
| | 50,000 | | | | 2.500 | | | | 02/01/31 | | | | 47,633 | |
| | 25,000 | | | | 3.300 | | | | 08/01/40 | | | | 23,262 | |
| | 25,000 | | | | 3.500 | | | | 08/01/50 | | | | 23,371 | |
| | Progress Energy, Inc. | |
| | 95,000 | | | | 7.000 | | | | 10/30/31 | | | | 128,846 | |
| | Southern California Edison Co., Series A(a) | |
| | 50,000 | | | | 4.200 | | | | 03/01/29 | | | | 55,839 | |
| | Southern Co. (The)(a) | |
| | 60,000 | | | | 3.250 | | | | 07/01/26 | | | | 63,581 | |
| | Virginia Electric and Power Co.(a) | |
| | 75,000 | | | | 2.450 | | | | 12/15/50 | | | | 69,024 | |
| | Vistra Operations Co. LLC(a)(c) | |
| | 125,000 | | | | 3.550 | | | | 07/15/24 | | | | 128,894 | |
| | | | | | | | | | | | | | |
| | | | | | | | | | | | | 1,483,040 | |
| | |
| Environmental Control – 0.2% | |
| | Republic Services, Inc.(a) | |
| | 75,000 | | | | 2.500 | | | | 08/15/24 | | | | 77,189 | |
| | 100,000 | | | | 1.750 | | | | 02/15/32 | | | | 94,322 | |
| | Waste Management, Inc.(a) | |
| | 50,000 | | | | 1.150 | | | | 03/15/28 | | | | 47,676 | |
| | | | | | | | | | | | | | |
| | | | | | | | | | | | | 219,187 | |
| | |
| Food – 0.2% | |
| | Kraft Heinz Foods Co.(a) | |
| | 25,000 | | | | 3.750 | | | | 04/01/30 | | | | 26,897 | |
| | Mars, Inc.(a)(c) | |
| | 25,000 | | | | 2.700 | | | | 04/01/25 | | | | 26,004 | |
| | 25,000 | | | | 3.200 | | | | 04/01/30 | | | | 26,997 | |
| | Sysco Corp.(a) | |
| | 25,000 | | | | 6.600 | | | | 04/01/50 | | | | 39,038 | |
| | Tyson Foods, Inc.(a) | |
| | 50,000 | | | | 3.900 | | | | 09/28/23 | | | | 52,275 | |
| | | | | | | | | | | | | | |
| | | | | | | | | | | | | 171,211 | |
| | |
| Gas – 0.2% | |
| | East Ohio Gas Co. (The)(a)(c) | |
| | 25,000 | | | | 1.300 | | | | 06/15/25 | | | | 24,673 | |
| | 25,000 | | | | 2.000 | | | | 06/15/30 | | | | 24,235 | |
| | NiSource, Inc.(a) | |
| | 95,000 | | | | 3.490 | | | | 05/15/27 | | | | 102,166 | |
| | 25,000 | | | | 3.600 | | | | 05/01/30 | | | | 27,007 | |
| | | | | | | | | | | | | | |
| | | | | | | | | | | | | 178,081 | |
| | |
| Hand/Machine Tools – 0.1% | |
| | Stanley Black & Decker, Inc.(a) | |
| | 50,000 | | | | 4.250 | | | | 11/15/28 | | | | 56,840 | |
| | |
| Healthcare-Products – 0.6% | |
| | Baxter International, Inc.(a)(c) | |
| | 100,000 | | | | 2.272 | | | | 12/01/28 | | | | 100,799 | |
| | 100,000 | | | | 2.539 | | | | 02/01/32 | | | | 101,028 | |
| | |
| | |
| 14 | | The accompanying notes are an integral part of these financial statements. |
GOLDMAN SACHS VARIABLE INSURANCE TRUST CORE FIXED INCOME FUND
| | | | | | | | | | | | | | |
Principal
Amount | | | Interest
Rate | | | Maturity
Date | | | Value | |
|
| Corporate Bonds – (continued) | |
| Healthcare-Products – (continued) | |
| | DENTSPLY SIRONA, Inc.(a) | |
| $ | 50,000 | | | | 3.250 | % | | | 06/01/30 | | | $ | 52,794 | |
| | DH Europe Finance II Sarl(a) | |
| | 75,000 | | | | 2.200 | | | | 11/15/24 | | | | 76,694 | |
| | 25,000 | | | | 2.600 | | | | 11/15/29 | | | | 25,809 | |
| | 75,000 | | | | 3.250 | | | | 11/15/39 | | | | 79,874 | |
| | STERIS Irish FinCo UnLtd Co.(a) | |
| | 75,000 | | | | 2.700 | | | | 03/15/31 | | | | 75,879 | |
| | Stryker Corp.(a) | |
| | 100,000 | | | | 1.950 | | | | 06/15/30 | | | | 97,752 | |
| | Thermo Fisher Scientific, Inc.(a) | |
| | 15,000 | | | | 3.650 | | | | 12/15/25 | | | | 16,107 | |
| | 25,000 | | | | 1.750 | | | | 10/15/28 | | | | 24,842 | |
| | | | | | | | | | | | | | |
| | | | | | | | | | | | | 651,578 | |
| | |
| Healthcare-Services – 0.5% | |
| | Adventist Health System/West(a) | |
| | 30,000 | | | | 2.952 | | | | 03/01/29 | | | | 31,357 | |
| | Banner Health(a) | |
| | 120,000 | | | | 2.338 | | | | 01/01/30 | | | | 121,470 | |
| | Baylor Scott & White Holdings, Series 2021(a) | |
| | 40,000 | | | | 1.777 | | | | 11/15/30 | | | | 38,603 | |
| | Centene Corp.(a) | |
| | 150,000 | | | | 4.250 | | | | 12/15/27 | | | | 156,914 | |
| | Rush Obligated Group, Series 2020(a) | |
| | 60,000 | | | | 3.922 | | | | 11/15/29 | | | | 67,008 | |
| | Stanford Health Care, Series 2020(a) | |
| | 40,000 | | | | 3.310 | | | | 08/15/30 | | | | 42,979 | |
| | Sutter Health, Series 20A(a) | |
| | 40,000 | | | | 2.294 | | | | 08/15/30 | | | | 39,942 | |
| | | | | | | | | | | | | | |
| | | | | | | | | | | | | 498,273 | |
| | |
| Insurance – 0.5% | |
| | American International Group, Inc.(a) | |
| | 125,000 | | | | 3.900 | | | | 04/01/26 | | | | 135,700 | |
| | 25,000 | | | | 4.200 | | | | 04/01/28 | | | | 27,967 | |
| | 25,000 | | | | 3.400 | | | | 06/30/30 | | | | 27,105 | |
| | Arch Capital Group US, Inc. | |
| | 36,000 | | | | 5.144 | | | | 11/01/43 | | | | 46,890 | |
| | Berkshire Hathaway Finance Corp.(a) | |
| | 75,000 | | | | 1.850 | | | | 03/12/30 | | | | 74,418 | |
| | Marsh & McLennan Cos., Inc.(a) | |
| | 50,000 | | | | 4.375 | | | | 03/15/29 | | | | 57,104 | |
| | Principal Financial Group, Inc.(a) | |
| | 50,000 | | | | 3.100 | | | | 11/15/26 | | | | 52,833 | |
| | 75,000 | | | | 2.125 | | | | 06/15/30 | | | | 74,170 | |
| | Willis North America, Inc.(a) | |
| | 25,000 | | | | 2.950 | | | | 09/15/29 | | | | 25,663 | |
| | | | | | | | | | | | | | |
| | | | | | | | | | | | | 521,850 | |
| | |
| Internet – 0.6% | |
| | Amazon.com, Inc.(a) | |
| | 335,000 | | | | 5.200 | | | | 12/03/25 | | | | 381,612 | |
| | 45,000 | | | | 4.800 | | | | 12/05/34 | | | | 57,500 | |
| | 15,000 | | | | 3.875 | | | | 08/22/37 | | | | 17,620 | |
| | |
|
| Corporate Bonds – (continued) | |
| Internet – (continued) | |
| | Expedia Group, Inc.(a) | |
| $ | 50,000 | | | | 3.600 | % | | | 12/15/23 | | | $ | 51,980 | |
| | 25,000 | | | | 4.625 | | | | 08/01/27 | | | | 27,938 | |
| | 35,000 | | | | 3.800 | | | | 02/15/28 | | | | 37,369 | |
| | 50,000 | | | | 2.950 | | | | 03/15/31 | | | | 50,015 | |
| | | | | | | | | | | | | | |
| | | | | | | | | | | | | 624,034 | |
| | |
| Iron/Steel – 0.1% | |
| | Steel Dynamics, Inc.(a) | |
| | 20,000 | | | | 2.400 | | | | 06/15/25 | | | | 20,518 | |
| | 50,000 | | | | 1.650 | | | | 10/15/27 | | | | 49,021 | |
| | | | | | | | | | | | | | |
| | | | | | | | | | | | | 69,539 | |
| | |
| Lodging – 0.1% | |
| | Hyatt Hotels Corp.(a) | |
| | 75,000 | | | | 1.800 | | | | 10/01/24 | | | | 75,090 | |
| | |
| Machinery-Diversified – 0.2% | |
| | Otis Worldwide Corp.(a) | |
| | 25,000 | | | | 2.293 | | | | 04/05/27 | | | | 25,491 | |
| | 150,000 | | | | 2.565 | | | | 02/15/30 | | | | 152,115 | |
| | | | | | | | | | | | | | |
| | | | | | | | | | | | | 177,606 | |
| | |
| Media – 1.1% | |
| Charter Communications Operating LLC / Charter
Communications Operating Capital(a) |
|
| | 320,000 | | | | 4.908 | | | | 07/23/25 | | | | 352,460 | |
| | Comcast Corp.(a) | |
| | 25,000 | | | | 3.700 | | | | 04/15/24 | | | | 26,568 | |
| | 45,000 | | | | 3.375 | | | | 08/15/25 | | | | 48,019 | |
| | 50,000 | | | | 3.950 | | | | 10/15/25 | | | | 54,664 | |
| | 25,000 | | | | 3.300 | | | | 02/01/27 | | | | 26,878 | |
| | 75,000 | | | | 3.300 | | | | 04/01/27 | | | | 80,783 | |
| | 225,000 | | | | 3.150 | | | | 02/15/28 | | | | 241,578 | |
| | 125,000 | | | | 4.150 | | | | 10/15/28 | | | | 141,850 | |
| | 25,000 | | | | 3.750 | | | | 04/01/40 | | | | 27,966 | |
| | 25,000 | | | | 4.700 | | | | 10/15/48 | | | | 31,995 | |
| | Fox Corp.(a) | |
| | 25,000 | | | | 4.030 | | | | 01/25/24 | | | | 26,406 | |
| | 25,000 | | | | 4.709 | | | | 01/25/29 | | | | 28,578 | |
| | Walt Disney Co. (The)(a) | |
| | 25,000 | | | | 3.700 | | | | 09/15/24 | | | | 26,482 | |
| | | | | | | | | | | | | | |
| | | | | | | | | | | | | 1,114,227 | |
| | |
| Mining – 0.1% | |
| | Newmont Corp.(a) | |
| | 75,000 | | | | 2.250 | | | | 10/01/30 | | | | 74,014 | |
| | |
| Oil & Gas – 0.3% | |
| | Continental Resources, Inc.(a) | |
| | 31,000 | | | | 4.500 | | | | 04/15/23 | | | | 31,969 | |
| | Devon Energy Corp.(a) | |
| | 29,000 | | | | 5.850 | | | | 12/15/25 | | | | 33,179 | |
| | Occidental Petroleum Corp.(a) | |
| | 100,000 | | | | 2.900 | | | | 08/15/24 | | | | 102,125 | |
| | |
| | |
| The accompanying notes are an integral part of these financial statements. | | 15 |
GOLDMAN SACHS VARIABLE INSURANCE TRUST CORE FIXED INCOME FUND
Schedule of Investments (continued)
December 31, 2021
| | | | | | | | | | | | | | |
Principal
Amount | | | Interest
Rate | | | Maturity
Date | | | Value | |
|
| Corporate Bonds – (continued) | |
| Oil & Gas – (continued) | |
| | Ovintiv Exploration, Inc. | |
| $ | 50,000 | | | | 5.625 | % | | | 07/01/24 | | | $ | 55,094 | |
| | Phillips 66 | |
| | 50,000 | | | | 3.700 | | | | 04/06/23 | | | | 51,714 | |
| | 25,000 | | | | 1.300 | (a) | | | 02/15/26 | | | | 24,543 | |
| | | | | | | | | | | | | | |
| | | | | | | | | | | | | 298,624 | |
| | |
| Packaging & Containers – 0.0% | |
| | Berry Global, Inc.(a) | |
| | 50,000 | | | | 1.570 | | | | 01/15/26 | | | | 48,938 | |
| | |
| Pharmaceuticals – 1.2% | |
| | AbbVie, Inc.(a) | |
| | 125,000 | | | | 4.050 | | | | 11/21/39 | | | | 143,288 | |
| | 200,000 | | | | 4.250 | | | | 11/21/49 | | | | 240,118 | |
| | Becton Dickinson and Co.(a) | |
| | 12,000 | | | | 3.363 | | | | 06/06/24 | | | | 12,565 | |
| | 40,000 | | | | 3.700 | | | | 06/06/27 | | | | 43,617 | |
| | 100,000 | | | | 2.823 | | | | 05/20/30 | | | | 103,548 | |
| | Bristol-Myers Squibb Co.(a) | |
| | 71,000 | | | | 3.875 | | | | 08/15/25 | | | | 76,866 | |
| | 25,000 | | | | 4.250 | | | | 10/26/49 | | | | 30,923 | |
| | Cigna Corp.(a) | |
| | 50,000 | | | | 2.400 | | | | 03/15/30 | | | | 50,345 | |
| | 150,000 | | | | 3.400 | | | | 03/15/50 | | | | 156,456 | |
| | CVS Health Corp.(a) | |
| | 25,000 | | | | 2.625 | | | | 08/15/24 | | | | 25,896 | |
| | 50,000 | | | | 3.875 | | | | 07/20/25 | | | | 53,781 | |
| | 25,000 | | | | 5.125 | | | | 07/20/45 | | | | 32,506 | |
| | Elanco Animal Health, Inc.(a) | |
| | 25,000 | | | | 5.272 | | | | 08/28/23 | | | | 26,481 | |
| | Pfizer, Inc.(a) | |
| | 75,000 | | | | 3.450 | | | | 03/15/29 | | | | 82,710 | |
| | Zoetis, Inc.(a) | |
| | 45,000 | | | | 3.000 | | | | 09/12/27 | | | | 47,587 | |
| | 150,000 | | | | 2.000 | | | | 05/15/30 | | | | 147,822 | |
| | | | | | | | | | | | | | |
| | | | | | | | | | | | | 1,274,509 | |
| | |
| Pipelines – 0.8% | |
| | Energy Transfer LP(a) | |
| | 15,000 | | | | 4.250 | | | | 04/01/24 | | | | 15,773 | |
| | 50,000 | | | | 2.900 | | | | 05/15/25 | | | | 51,664 | |
| | 25,000 | | | | 5.250 | | | | 04/15/29 | | | | 28,723 | |
| | 5,000 | | | | 6.000 | | | | 06/15/48 | | | | 6,253 | |
| | Energy Transfer LP, Series 5Y(a) | |
| | 75,000 | | | | 4.200 | | | | 09/15/23 | | | | 78,318 | |
| | MPLX LP(a) | |
| | 75,000 | | | | 2.650 | | | | 08/15/30 | | | | 74,869 | |
| | 35,000 | | | | 4.500 | | | | 04/15/38 | | | | 39,382 | |
| | 25,000 | | | | 5.500 | | | | 02/15/49 | | | | 31,971 | |
| | Plains All American Pipeline LP / PAA Finance Corp.(a) | |
| | 15,000 | | | | 3.650 | | | | 06/01/22 | | | | 15,070 | |
| | 35,000 | | | | 3.850 | | | | 10/15/23 | | | | 36,342 | |
| | 25,000 | | | | 3.800 | | | | 09/15/30 | | | | 26,317 | |
| | |
|
| Corporate Bonds – (continued) | |
| Pipelines – (continued) | |
| | Sabine Pass Liquefaction LLC(a) | |
| 75,000 | | | | 5.625 | | | | 03/01/25 | | | | 83,297 | |
| | 75,000 | | | | 5.000 | | | | 03/15/27 | | | | 84,412 | |
| | Western Midstream Operating LP(a) | |
| | 75,000 | | | | 4.350 | | | | 02/01/25 | | | | 78,187 | |
| | 25,000 | | | | 5.450 | | | | 04/01/44 | | | | 29,750 | |
| | 20,000 | | | | 5.300 | | | | 03/01/48 | | | | 24,100 | |
| | Williams Cos., Inc. (The)(a) | |
| | 25,000 | | | | 3.600 | | | | 03/15/22 | | | | 25,024 | |
| | 25,000 | | | | 3.900 | | | | 01/15/25 | | | | 26,637 | |
| | 35,000 | | | | 4.000 | | | | 09/15/25 | | | | 37,817 | |
| | | | | | | | | | | | | | |
| | | | | | | | | | | | | 793,906 | |
| | |
| Real Estate Investment Trusts – 2.1% | |
| | Alexandria Real Estate Equities, Inc.(a) | |
| | 25,000 | | | | 3.800 | | | | 04/15/26 | | | | 27,118 | |
| | 25,000 | | | | 3.375 | | | | 08/15/31 | | | | 27,041 | |
| | American Campus Communities Operating Partnership LP(a) | |
| | 95,000 | | | | 4.125 | | | | 07/01/24 | | | | 101,551 | |
| | American Homes 4 Rent LP(a) | |
| | 50,000 | | | | 4.900 | | | | 02/15/29 | | | | 57,913 | |
| | 30,000 | | | | 2.375 | | | | 07/15/31 | | | | 29,490 | |
| | American Tower Corp.(a) | |
| | 75,000 | | | | 3.375 | | | | 05/15/24 | | | | 78,387 | |
| | 100,000 | | | | 2.400 | | | | 03/15/25 | | | | 102,722 | |
| | 75,000 | | | | 2.100 | | | | 06/15/30 | | | | 72,377 | |
| | Crown Castle International Corp.(a) | |
| | 85,000 | | | | 3.150 | | | | 07/15/23 | | | | 87,581 | |
| | 60,000 | | | | 3.650 | | | | 09/01/27 | | | | 64,600 | |
| | 25,000 | | | | 3.300 | | | | 07/01/30 | | | | 26,418 | |
| | CubeSmart LP(a) | |
| | 45,000 | | | | 4.000 | | | | 11/15/25 | | | | 48,414 | |
| | 125,000 | | | | 2.500 | | | | 02/15/32 | | | | 124,749 | |
| | Duke Realty LP(a) | |
| | 25,000 | | | | 1.750 | | | | 07/01/30 | | | | 23,831 | |
| | Essex Portfolio LP(a) | |
| | 50,000 | | | | 3.000 | | | | 01/15/30 | | | | 52,391 | |
| | Healthcare Realty Trust, Inc.(a) | |
| | 25,000 | | | | 2.050 | | | | 03/15/31 | | | | 24,056 | |
| | Host Hotels & Resorts LP, Series J(a) | |
| | 75,000 | | | | 2.900 | | | | 12/15/31 | | | | 72,538 | |
| | Invitation Homes Operating Partnership LP(a) | |
| | 75,000 | | | | 2.300 | | | | 11/15/28 | | | | 74,245 | |
| | 195,000 | | | | 2.000 | | | | 08/15/31 | | | | 183,403 | |
| | Kilroy Realty LP(a) | |
| | 25,000 | | | | 4.750 | | | | 12/15/28 | | | | 28,697 | |
| | Mid-America Apartments LP(a) | |
| | 50,000 | | | | 1.700 | | | | 02/15/31 | | | | 47,739 | |
| | 100,000 | | | | 2.875 | | | | 09/15/51 | | | | 98,545 | |
| | National Retail Properties, Inc.(a) | |
| | 35,000 | | | | 3.900 | | | | 06/15/24 | | | | 36,991 | |
| | 45,000 | | | | 4.000 | | | | 11/15/25 | | | | 48,824 | |
| | Realty Income Corp.(a) | |
| | 50,000 | | | | 4.625 | | | | 11/01/25 | | | | 55,461 | |
| | 25,000 | | | | 3.950 | | | | 08/15/27 | | | | 27,747 | |
| | |
| | |
| 16 | | The accompanying notes are an integral part of these financial statements. |
GOLDMAN SACHS VARIABLE INSURANCE TRUST CORE FIXED INCOME FUND
| | | | | | | | | | | | | | |
Principal
Amount | | | Interest
Rate | | | Maturity
Date | | | Value | |
|
| Corporate Bonds – (continued) | |
| Real Estate Investment Trusts – (continued) | |
| | Realty Income Corp.(a) – (continued) | |
| $ | 25,000 | | | | 3.400 | % | | | 01/15/28 | | | $ | 26,983 | |
| | 50,000 | | | | 2.850 | | | | 12/15/32 | | | | 52,005 | |
| | Regency Centers LP(a) | |
| | 100,000 | | | | 2.950 | | | | 09/15/29 | | | | 103,727 | |
| | Spirit Realty LP(a) | |
| | 75,000 | | | | 3.400 | | | | 01/15/30 | | | | 78,773 | |
| | UDR, Inc.(a) | |
| | 25,000 | | | | 2.100 | | | | 08/01/32 | | | | 23,907 | |
| | 100,000 | | | | 1.900 | | | | 03/15/33 | | | | 92,624 | |
| | Ventas Realty LP(a) | |
| | 45,000 | | | | 3.500 | | | | 02/01/25 | | | | 47,473 | |
| | WP Carey, Inc.(a) | |
| | 20,000 | | | | 4.600 | | | | 04/01/24 | | | | 21,261 | |
| | 30,000 | | | | 4.000 | | | | 02/01/25 | | | | 31,982 | |
| | 25,000 | | | | 3.850 | | | | 07/15/29 | | | | 27,637 | |
| | 25,000 | | | | 2.400 | | | | 02/01/31 | | | | 24,789 | |
| | | | | | | | | | | | | | |
| | | | | | | | | | | | | 2,153,990 | |
| | |
| Retail – 0.7% | |
| | 7-Eleven, Inc.(a)(c) | |
| | 100,000 | | | | 1.300 | | | | 02/10/28 | | | | 95,132 | |
| | AutoNation, Inc.(a) | |
| | 25,000 | | | | 1.950 | | | | 08/01/28 | | | | 24,430 | |
| | Dollar Tree, Inc.(a) | |
| | 50,000 | | | | 4.000 | | | | 05/15/25 | | | | 53,738 | |
| | 50,000 | | | | 4.200 | | | | 05/15/28 | | | | 55,822 | |
| | Home Depot, Inc. (The)(a) | |
| | 25,000 | | | | 3.900 | | | | 12/06/28 | | | | 28,223 | |
| | 25,000 | | | | 4.250 | | | | 04/01/46 | | | | 30,735 | |
| | Lowe’s Cos., Inc.(a) | |
| | 75,000 | | | | 1.700 | | | | 09/15/28 | | | | 73,475 | |
| | 100,000 | | | | 1.700 | | | | 10/15/30 | | | | 95,001 | |
| | 25,000 | | | | 3.000 | | | | 10/15/50 | | | | 24,691 | |
| | McDonald’s Corp.(a) | |
| | 25,000 | | | | 4.200 | | | | 04/01/50 | | | | 30,351 | |
| | Starbucks Corp.(a) | |
| | 75,000 | | | | 3.800 | | | | 08/15/25 | | | | 81,023 | |
| | Tractor Supply Co.(a) | |
| | 50,000 | | | | 1.750 | | | | 11/01/30 | | | | 46,979 | |
| | Walgreens Boots Alliance, Inc.(a) | |
| | 41,000 | | | | 4.100 | | | | 04/15/50 | | | | 46,006 | |
| | | | | | | | | | | | | | |
| | | | | | | | | | | | | 685,606 | |
| | |
| Semiconductors – 0.6% | |
| | Applied Materials, Inc.(a) | |
| | 25,000 | | | | 1.750 | | | | 06/01/30 | | | | 24,526 | |
| | Broadcom, Inc.(a)(c) | |
| | 100,000 | | | | 3.419 | | | | 04/15/33 | | | | 104,397 | |
| | 199,000 | | | | 3.137 | | | | 11/15/35 | | | | 200,037 | |
| | 100,000 | | | | 3.500 | | | | 02/15/41 | | | | 101,827 | |
| | Intel Corp.(a) | |
| | 75,000 | | | | 3.050 | | | | 08/12/51 | | | | 76,924 | |
| | Lam Research Corp.(a) | |
| | 50,000 | | | | 1.900 | | | | 06/15/30 | | | | 49,152 | |
| | |
|
| Corporate Bonds – (continued) | |
| Semiconductors – (continued) | |
| | Micron Technology, Inc.(a) | |
| 50,000 | | | | 2.703 | | | | 04/15/32 | | | | 50,203 | |
| | Skyworks Solutions, Inc.(a) | |
| | 25,000 | | | | 3.000 | | | | 06/01/31 | | | | 25,154 | |
| | | | | | | | | | | | | | |
| | | | | | | | | | | | | 632,220 | |
| | |
| Software – 0.8% | |
| | Adobe, Inc.(a) | |
| | 50,000 | | | | 2.150 | | | | 02/01/27 | | | | 51,397 | |
| | 75,000 | | | | 2.300 | | | | 02/01/30 | | | | 76,674 | |
| | Fiserv, Inc.(a) | |
| | 100,000 | | | | 2.750 | | | | 07/01/24 | | | | 103,426 | |
| | 50,000 | | | | 3.200 | | | | 07/01/26 | | | | 52,924 | |
| | 25,000 | | | | 4.200 | | | | 10/01/28 | | | | 28,021 | |
| | Intuit, Inc.(a) | |
| | 25,000 | | | | 1.350 | | | | 07/15/27 | | | | 24,497 | |
| | Oracle Corp.(a) | |
| | 125,000 | | | | 2.875 | | | | 03/25/31 | | | | 125,626 | |
| | 25,000 | | | | 3.600 | | | | 04/01/40 | | | | 25,131 | |
| | 50,000 | | | | 3.850 | | | | 04/01/60 | | | | 49,476 | |
| | Roper Technologies, Inc.(a) | |
| | 50,000 | | | | 4.200 | | | | 09/15/28 | | | | 56,165 | |
| | ServiceNow, Inc.(a) | |
| | 125,000 | | | | 1.400 | | | | 09/01/30 | | | | 116,554 | |
| | VMware, Inc.(a) | |
| | 25,000 | | | | 1.800 | | | | 08/15/28 | | | | 24,348 | |
| | 100,000 | | | | 2.200 | | | | 08/15/31 | | | | 98,291 | |
| | | | | | | | | | | | | | |
| | | | | | | | | | | | | 832,530 | |
| | |
| Telecommunications – 2.8% | |
| | AT&T, Inc.(a) | |
| | 300,000 | | | | 2.300 | | | | 06/01/27 | | | | 305,748 | |
| | 150,000 | | | | 4.350 | | | | 03/01/29 | | | | 168,772 | |
| | 50,000 | | | | 2.750 | | | | 06/01/31 | | | | 50,988 | |
| | 128,000 | | | | 2.550 | | | | 12/01/33 | | | | 125,352 | |
| | 25,000 | | | | 4.900 | | | | 08/15/37 | | | | 30,084 | |
| | 60,000 | | | | 4.850 | | | | 03/01/39 | | | | 71,682 | |
| | 75,000 | | | | 3.500 | | | | 06/01/41 | | | | 77,176 | |
| | 25,000 | | | | 4.750 | | | | 05/15/46 | | | | 30,221 | |
| | 25,000 | | | | 5.150 | | | | 11/15/46 | | | | 31,825 | |
| | 25,000 | | | | 4.500 | | | | 03/09/48 | | | | 29,178 | |
| | 25,000 | | | | 5.150 | | | | 02/15/50 | | | | 32,068 | |
| | 25,000 | | | | 3.650 | | | | 06/01/51 | | | | 25,945 | |
| | 25,000 | | | | 3.500 | | | | 09/15/53 | | | | 25,269 | |
| | T-Mobile USA, Inc.(a) | |
| | 75,000 | | | | 3.500 | | | | 04/15/25 | | | | 79,480 | |
| | 75,000 | | | | 1.500 | | | | 02/15/26 | | | | 74,214 | |
| | 150,000 | | | | 3.750 | | | | 04/15/27 | | | | 162,418 | |
| | 175,000 | | | | 2.050 | | | | 02/15/28 | | | | 174,056 | |
| | 100,000 | | | | 3.875 | | | | 04/15/30 | | | | 109,427 | |
| | 75,000 | | | | 2.875 | | | | 02/15/31 | | | | 73,781 | |
| | 75,000 | | | | 3.500 | | | | 04/15/31 | | | | 77,752 | |
| | 25,000 | | | | 3.000 | | | | 02/15/41 | | | | 24,360 | |
| | |
| | |
| The accompanying notes are an integral part of these financial statements. | | 17 |
GOLDMAN SACHS VARIABLE INSURANCE TRUST CORE FIXED INCOME FUND
Schedule of Investments (continued)
December 31, 2021
| | | | | | | | | | | | | | |
| Principal Amount | | | Interest
Rate | | | Maturity
Date | | | Value | |
|
| Corporate Bonds – (continued) | |
| Telecommunications – (continued) | |
| | Verizon Communications, Inc. | |
| $ | 275,000 | | | | 2.100 | %(a) | | | 03/22/28 | | | $ | 275,840 | |
| | 145,000 | | | | 4.329 | | | | 09/21/28 | | | | 164,911 | |
| | 200,000 | | | | 3.875 | (a) | | | 02/08/29 | | | | 221,852 | |
| | 50,000 | | | | 3.150 | (a) | | | 03/22/30 | | | | 52,851 | |
| | 125,000 | | | | 2.550 | (a) | | | 03/21/31 | | | | 126,271 | |
| | 53,000 | | | | 2.355 | (a)(c) | | | 03/15/32 | | | | 52,273 | |
| | 100,000 | | | | 4.862 | | | | 08/21/46 | | | | 128,815 | |
| | 90,000 | | | | 2.987 | (a) | | | 10/30/56 | | | | 85,355 | |
| | | | | | | | | | | | | | |
| | | | | | | | | | | | | 2,887,964 | |
| | |
| Transportation – 0.2% | |
| | Burlington Northern Santa Fe LLC(a) | |
| | 25,000 | | | | 4.050 | | | | 06/15/48 | | | | 30,071 | |
| | FedEx Corp.(a) | |
| | 45,000 | | | | 3.400 | | | | 02/15/28 | | | | 48,594 | |
| | 75,000 | | | | 5.250 | | | | 05/15/50 | | | | 100,508 | |
| | | | | | | | | | | | | | |
| | | | | | | | | | | | | 179,173 | |
| | |
| | TOTAL CORPORATE BONDS | |
| | (Cost $23,332,641) | | | $ | 24,197,740 | |
| | |
| | | | | | | | | | | | | | |
|
| Mortgage-Backed Securities – 22.1% | |
| | FHLMC | |
| $ | 4,506 | | | | 7.500 | % | | | 12/01/29 | | | $ | 5,212 | |
| | 1,204 | | | | 5.000 | | | | 10/01/33 | | | | 1,340 | |
| | 1,858 | | | | 5.000 | | | | 07/01/35 | | | | 2,088 | |
| | 2,804 | | | | 5.000 | | | | 12/01/35 | | | | 3,132 | |
| | 546 | | | | 5.000 | | | | 03/01/38 | | | | 614 | |
| | 958 | | | | 5.000 | | | | 06/01/41 | | | | 1,076 | |
| | 727,781 | | | | 3.000 | | | | 09/01/49 | | | | 767,622 | |
| | 980,441 | | | | 2.500 | | | | 09/01/51 | | | | 1,006,521 | |
| | FNMA | |
| | 1,137 | | | | 5.500 | | | | 09/01/23 | | | | 1,162 | |
| | 1,730 | | | | 5.500 | | | | 09/01/23 | | | | 1,764 | |
| | 993 | | | | 5.500 | | | | 10/01/23 | | | | 1,014 | |
| | 576 | | | | 4.500 | | | | 07/01/24 | | | | 597 | |
| | 2,985 | | | | 9.000 | | | | 11/01/25 | | | | 3,189 | |
| | 15,531 | | | | 7.000 | | | | 08/01/26 | | | | 16,922 | |
| | 5,414 | | | | 8.000 | | | | 10/01/29 | | | | 6,136 | |
| | 957 | | | | 8.500 | | | | 04/01/30 | | | | 1,116 | |
| | 1,799 | | | | 8.000 | | | | 05/01/30 | | | | 1,934 | |
| | 3,748 | | | | 8.000 | | | | 08/01/32 | | | | 4,348 | |
| | 5,089 | | | | 4.500 | | | | 08/01/39 | | | | 5,588 | |
| | 8,677 | | | | 3.000 | | | | 01/01/43 | | | | 9,233 | |
| | 18,082 | | | | 3.000 | | | | 01/01/43 | | | | 19,240 | |
| | 25,666 | | | | 3.000 | | | | 03/01/43 | | | | 27,357 | |
| | 78,424 | | | | 3.000 | | | | 03/01/43 | | | | 83,447 | |
| | 10,289 | | | | 3.000 | | | | 03/01/43 | | | | 10,947 | |
| | 10,201 | | | | 3.000 | | | | 04/01/43 | | | | 10,873 | |
| | 22,255 | | | | 3.000 | | | | 04/01/43 | | | | 23,722 | |
| | 18,934 | | | | 3.000 | | | | 04/01/43 | | | | 20,182 | |
| | 97,163 | | | | 3.000 | | | | 04/01/43 | | | | 103,567 | |
| | |
|
| Mortgage-Backed Securities – (continued) | |
| | FNMA – (continued) | |
| 12,996 | | | | 3.000 | | | | 04/01/43 | | | | 13,852 | |
| | 53,204 | | | | 3.000 | | | | 05/01/43 | | | | 56,711 | |
| | 48,353 | | | | 3.000 | | | | 05/01/43 | | | | 51,541 | |
| | 12,272 | | | | 3.000 | | | | 05/01/43 | | | | 13,081 | |
| | 315,959 | | | | 4.500 | | | | 04/01/45 | | | | 349,892 | |
| | 38,829 | | | | 4.500 | | | | 05/01/45 | | | | 43,048 | |
| | 174,606 | | | | 4.000 | | | | 02/01/48 | | | | 189,128 | |
| | 215,914 | | | | 4.000 | | | | 03/01/48 | | | | 233,804 | |
| | 13,990 | | | | 4.000 | | | | 07/01/48 | | | | 15,221 | |
| | 4,163 | | | | 4.000 | | | | 07/01/48 | | | | 4,506 | |
| | 417,429 | | | | 4.500 | | | | 07/01/48 | | | | 448,530 | |
| | 234,960 | | | | 4.000 | | | | 08/01/48 | | | | 254,245 | |
| | 217,411 | | | | 5.000 | | | | 11/01/48 | | | | 241,161 | |
| | 2,000,000 | | | | 2.000 | | | | TBA-30yr | (d) | | | 1,995,188 | |
| | 2,000,000 | | | | 2.500 | | | | TBA-30yr | (d) | | | 2,041,740 | |
| | 2,000,000 | | | | 3.000 | | | | TBA-30yr | (d) | | | 2,072,734 | |
| | 1,000,000 | | | | 4.500 | | | | TBA-30yr | (d) | | | 1,071,700 | |
| | FNMA Series 2012-111, Class B | |
| | 6,843 | | | | 7.000 | | | | 10/25/42 | | | | 7,812 | |
| | FNMA Series 2012-153, Class B | |
| | 18,497 | | | | 7.000 | | | | 07/25/42 | | | | 21,886 | |
| | GNMA | |
| | 578 | | | | 7.000 | | | | 10/15/25 | | | | 582 | |
| | 2,419 | | | | 7.000 | | | | 11/15/25 | | | | 2,516 | |
| | 342 | | | | 7.000 | | | | 02/15/26 | | | | 345 | |
| | 808 | | | | 7.000 | | | | 04/15/26 | | | | 828 | |
| | 905 | | | | 7.000 | | | | 04/15/26 | | | | 963 | |
| | 853 | | | | 7.000 | | | | 03/15/27 | | | | 876 | |
| | 5,868 | | | | 7.000 | | | | 11/15/27 | | | | 5,911 | |
| | 385 | | | | 7.000 | | | | 11/15/27 | | | | 393 | |
| | 450 | | | | 7.000 | | | | 11/15/27 | | | | 451 | |
| | 1,953 | | | | 7.000 | | | | 11/15/27 | | | | 2,141 | |
| | 4,812 | | | | 7.000 | | | | 02/15/28 | | | | 5,116 | |
| | 1,212 | | | | 7.000 | | | | 03/15/28 | | | | 1,240 | |
| | 676 | | | | 7.000 | | | | 04/15/28 | | | | 691 | |
| | 89 | | | | 7.000 | | | | 05/15/28 | | | | 96 | |
| | 1,918 | | | | 7.000 | | | | 06/15/28 | | | | 2,061 | |
| | 2,118 | | | | 7.000 | | | | 07/15/28 | | | | 2,271 | |
| | 760 | | | | 7.000 | | | | 07/15/28 | | | | 823 | |
| | 7,837 | | | | 7.000 | | | | 09/15/28 | | | | 8,412 | |
| | 58,924 | | | | 6.000 | | | | 08/20/34 | | | | 67,604 | |
| | 46,014 | | | | 5.000 | | | | 06/15/40 | | | | 51,527 | |
| | 220,295 | | | | 4.000 | | | | 08/20/43 | | | | 238,015 | |
| | 85,498 | | | | 4.000 | | | | 10/20/45 | | | | 92,161 | |
| | 259,156 | | | | 3.500 | | | | 04/20/47 | | | | 272,002 | |
| | 328,222 | | | | 3.500 | | | | 12/20/47 | | | | 344,491 | |
| | 52,863 | | | | 5.000 | | | | 08/20/48 | | | | 56,547 | |
| | 158,960 | | | | 4.500 | | | | 09/20/48 | | | | 168,933 | |
| | 178,339 | | | | 5.000 | | | | 10/20/48 | | | | 190,710 | |
| | 511,094 | | | | 5.000 | | | | 11/20/48 | | | | 546,509 | |
| | 63,876 | | | | 5.000 | | | | 12/20/48 | | | | 68,292 | |
| | 377,740 | | | | 4.500 | | | | 01/20/49 | | | | 400,967 | |
| | 52,836 | | | | 4.500 | | | | 03/20/49 | | | | 56,056 | |
| | 948,094 | | | | 3.000 | | | | 08/20/49 | | | | 984,518 | |
| | |
| | |
| 18 | | The accompanying notes are an integral part of these financial statements. |
GOLDMAN SACHS VARIABLE INSURANCE TRUST CORE FIXED INCOME FUND
| | | | | | | | | | | | | | |
Principal Amount | | | Interest
Rate | | | Maturity
Date | | | Value | |
|
| Mortgage-Backed Securities – (continued) | |
| | GNMA – (continued) | |
| $ | 348,367 | | | | 4.500 | % | | | 10/20/49 | | | $ | 368,606 | |
| | 341,667 | | | | 4.500 | | | | 03/20/50 | | | | 362,301 | |
| | 1,000,000 | | | | 3.000 | | | | TBA-30yr | (d) | | | 1,033,364 | |
| | 937,544 | | | | 3.500 | | | | 02/20/51 | | | | 976,198 | |
| | 995,389 | | | | 3.000 | | | | 11/20/51 | | | | 1,033,621 | |
| | 1,000,000 | | | | 2.500 | | | | TBA-30yr | (d) | | | 1,024,720 | |
| | 2,000,000 | | | | 3.000 | | | | TBA-30yr | (d) | | | 2,070,400 | |
| | 1,000,000 | | | | 3.500 | | | | TBA-30yr | (d) | | | 1,041,432 | |
| | |
| | TOTAL MORTGAGE-BACKED SECURITIES | |
| | (Cost $22,709,119) | | | $ | 22,750,413 | |
| | |
| | | | | | | | | | | | | | |
|
| Foreign Bonds – 7.1% | |
| Agriculture – 0.1% | |
| | BAT Capital Corp. (United Kingdom)(a) | |
| $ | 25,000 | | | | 3.222 | % | | | 08/15/24 | | | $ | 26,003 | |
| | 100,000 | | | | 2.259 | | | | 03/25/28 | | | | 97,554 | |
| | 25,000 | | | | 4.540 | | | | 08/15/47 | | | | 26,137 | |
| | | | | | | | | | | | | | |
| | | | | | | | | | | | | 149,694 | |
| | |
| Banks – 2.8% | |
| | Banco Santander SA (Spain) | |
| | 200,000 | | | | 2.746 | | | | 05/28/25 | | | | 206,881 | |
| | Barclays PLC (United Kingdom)(a) | |
| | (SOFR + 2.71%) | |
| | 200,000 | | | | 2.852 | (b) | | | 05/07/26 | | | | 206,165 | |
| | BNP Paribas SA (France) | |
| | 200,000 | | | | 3.375 | (c) | | | 01/09/25 | | | | 210,284 | |
| | (SOFR + 1.00%) | |
| | 200,000 | | | | 1.323 | (b)(c) | | | 01/13/27 | | | | 194,594 | |
| | BPCE SA (France)(a)(c) | |
| | (SOFR + 1.73%) | |
| | 250,000 | | | | 3.116 | (b) | | | 10/19/32 | | | | 250,066 | |
| | Credit Suisse AG (Switzerland) | |
| | 250,000 | | | | 1.250 | | | | 08/07/26 | | | | 243,785 | |
| | Credit Suisse Group AG (Switzerland) | |
| | 250,000 | | | | 4.550 | | | | 04/17/26 | | | | 275,311 | |
| | Deutsche Bank AG (Germany)(a)(c) | |
| | (SOFR + 2.16%) | |
| | 150,000 | | | | 2.222 | | | | 09/18/24 | | | | 151,977 | |
| | HSBC Holdings PLC (United Kingdom)(a) | |
| | (SOFR + 1.54%) | |
| | 200,000 | | | | 1.645 | (b) | | | 04/18/26 | | | | 198,611 | |
| | ING Groep NV (Netherlands)(a)(c) | |
| | (US 1 Year CMT T-Note + 1.10%) | |
| | 200,000 | | | | 1.400 | (b) | | | 07/01/26 | | | | 197,758 | |
| | Macquarie Bank Ltd. (Australia)(a)(c) | |
| (US Treasury Yield Curve Rate T-Note Constant Maturity 5
Yr.+ 1.70%) |
|
| | 200,000 | | | | 3.052 | (b) | | | 03/03/36 | | | | 196,405 | |
| | Macquarie Group Ltd. (Australia)(a)(c) | |
| | (SOFR + 1.07%) | |
| | 50,000 | | | | 1.340 | (b) | | | 01/12/27 | | | | 48,670 | |
| | |
|
| Foreign Bonds – (continued) | |
| Banks – (continued) | |
| | NatWest Group PLC (United Kingdom) | |
| 200,000 | | | | 3.875 | | | | 09/12/23 | | | | 208,546 | |
| | Standard Chartered PLC (United Kingdom)(a)(c) | |
| | (3 Mo. LIBOR + 1.15%) | |
| | 200,000 | | | | 4.247 | (b) | | | 01/20/23 | | | | 200,289 | |
| | Westpac Banking Corp. (Australia)(a) | |
| | (US 5 Year Swap + 2.24%) | |
| | 25,000 | | | | 4.322 | (b) | | | 11/23/31 | | | | 27,047 | |
| (US Treasury Yield Curve Rate T-Note Constant Maturity
5 Yr.+ 2.00%) |
|
| | 25,000 | | | | 4.110 | (b) | | | 07/24/34 | | | | 26,967 | |
| | | | | | | | | | | | | | |
| | | | | | | | | | | | | 2,843,356 | |
| | |
| Beverages – 0.9% | |
| Anheuser-Busch Cos. LLC / Anheuser-Busch InBev Worldwide,
Inc. (Belgium)(a) |
|
| | 35,000 | | | | 4.700 | | | | 02/01/36 | | | | 42,278 | |
| | 210,000 | | | | 4.900 | | | | 02/01/46 | | | | 266,001 | |
| | Anheuser-Busch InBev Worldwide, Inc. (Belgium) | |
| | 175,000 | | | | 4.750 | (a) | | | 01/23/29 | | | | 203,761 | |
| | 25,000 | | | | 4.950 | | | | 01/15/42 | | | | 31,375 | |
| | 100,000 | | | | 4.600 | (a) | | | 04/15/48 | | | | 122,387 | |
| | 25,000 | | | | 5.550 | (a) | | | 01/23/49 | | | | 34,578 | |
| | 25,000 | | | | 4.500 | (a) | | | 06/01/50 | | | | 30,875 | |
| | JDE Peet’s NV (Netherlands)(a)(c) | |
| | 150,000 | | | | 1.375 | | | | 01/15/27 | | | | 144,765 | |
| | | | | | | | | | | | | | |
| | | | | | | | | | | | | 876,020 | |
| | |
| Commercial Services – 0.2% | |
| | DP World Crescent Ltd., Series E (United Arab Emirates) | |
| | 200,000 | | | | 3.875 | | | | 07/18/29 | | | | 212,937 | |
| | |
| Diversified Financial Services – 0.8% | |
| AerCap Ireland Capital DAC / AerCap Global Aviation Trust
(Ireland)(a) |
|
| | 250,000 | | | | 2.450 | | | | 10/29/26 | | | | 251,876 | |
| | 225,000 | | | | 3.000 | | | | 10/29/28 | | | | 228,374 | |
| | 150,000 | | | | 3.300 | | | | 01/30/32 | | | | 152,970 | |
| | Avolon Holdings Funding Ltd. (Ireland)(a)(c) | |
| | 25,000 | | | | 3.950 | | | | 07/01/24 | | | | 26,187 | |
| | 100,000 | | | | 2.875 | | | | 02/15/25 | | | | 102,085 | |
| | 25,000 | | | | 4.250 | | | | 04/15/26 | | | | 26,628 | |
| | | | | | | | | | | | | | |
| | | | | | | | | | | | | 788,120 | |
| | |
| Electric – 0.2% | |
| | Enel Finance International NV (Italy)(a)(c) | |
| | 200,000 | | | | 1.875 | | | | 07/12/28 | | | | 195,075 | |
| | |
| Engineering & Construction – 0.1% | |
| | Cellnex Finance Co. SA, Series E (Spain)(a) | |
| | 100,000 | | | | 1.250 | | | | 01/15/29 | | | | 108,480 | |
| | |
| Insurance – 0.0% | |
| | XLIT Ltd. (Bermuda) | |
| | 45,000 | | | | 4.450 | | | | 03/31/25 | | | | 48,843 | |
| | |
| | |
| The accompanying notes are an integral part of these financial statements. | | 19 |
GOLDMAN SACHS VARIABLE INSURANCE TRUST CORE FIXED INCOME FUND
Schedule of Investments (continued)
December 31, 2021
| | | | | | | | | | | | | | |
Principal
Amount | | | Interest
Rate | | | Maturity
Date | | | Value | |
|
| Foreign Bonds – (continued) | |
| Internet – 0.2% | |
| | Tencent Holdings Ltd. (China)(a) | |
| $ | 200,000 | | | | 3.595 | % | | | 01/19/28 | | | $ | 212,874 | |
| | |
| Machinery-Construction & Mining – 0.2% | |
| | Weir Group PLC (The)(United Kingdom)(a)(c) | |
| | 200,000 | | | | 2.200 | | | | 05/13/26 | | | | 196,250 | |
| | |
| Mining – 0.4% | |
| | Glencore Funding LLC (Australia)(c) | |
| | 75,000 | | | | 4.125 | (a) | | | 03/12/24 | | | | 78,885 | |
| | 25,000 | | | | 4.625 | | | | 04/29/24 | | | | 26,690 | |
| | 75,000 | | | | 1.625 | (a) | | | 04/27/26 | | | | 73,652 | |
| | 150,000 | | | | 2.625 | (a) | | | 09/23/31 | | | | 145,595 | |
| | Newcrest Finance Pty Ltd. (Australia)(a)(c) | |
| | 25,000 | | | | 3.250 | | | | 05/13/30 | | | | 26,247 | |
| | Teck Resources Ltd. (Canada)(a) | |
| | 25,000 | | | | 3.900 | | | | 07/15/30 | | | | 26,899 | |
| | | | | | | | | | | | | | |
| | | | | | | | | | | | | 377,968 | |
| | |
| Oil & Gas – 0.5% | |
| | Gazprom PJSC Via Gaz Capital SA (Russia) | |
| | 240,000 | | | | 4.950 | | | | 03/23/27 | | | | 259,440 | |
| | Lukoil Securities BV (Russia) | |
| | 200,000 | | | | 3.875 | | | | 05/06/30 | | | | 205,040 | |
| | Suncor Energy, Inc. (Canada) | |
| | 25,000 | | | | 2.800 | | | | 05/15/23 | | | | 25,588 | |
| | 50,000 | | | | 3.100 | (a) | | | 05/15/25 | | | | 52,325 | |
| | | | | | | | | | | | | | |
| | | | | | | | | | | | | 542,393 | |
| | |
| Pharmaceuticals – 0.2% | |
| | Bayer US Finance II LLC (Germany)(a)(c) | |
| | 200,000 | | | | 3.875 | | | | 12/15/23 | | | | 209,124 | |
| | |
| Pipelines – 0.3% | |
| | Enbridge, Inc. (Canada)(a) | |
| | 125,000 | | | | 2.500 | | | | 08/01/33 | | | | 122,972 | |
| | Galaxy Pipeline Assets Bidco Ltd. (United Arab Emirates) | |
| | 200,000 | | | | 2.940 | | | | 09/30/40 | | | | 199,000 | |
| | | | | | | | | | | | | | |
| | | | | | | | | | | | | 321,972 | |
| | |
| Semiconductors – 0.1% | |
| | NXP BV / NXP Funding LLC / NXP USA, Inc. (China)(a) | |
| | 25,000 | | | | 3.400 | (c) | | | 05/01/30 | | | | 26,658 | |
| | 125,000 | | | | 2.500 | (c) | | | 05/11/31 | | | | 125,336 | |
| | | | | | | | | | | | | | |
| | | | | | | | | | | | | 151,994 | |
| | |
| Transportation – 0.1% | |
| | Canadian Pacific Railway Co. (Canada)(a) | |
| | 25,000 | | | | 2.050 | | | | 03/05/30 | | | | 24,707 | |
| | 50,000 | | | | 2.450 | | | | 12/02/31 | | | | 50,888 | |
| | | | | | | | | | | | | | |
| | | | | | | | | | | | | 75,595 | |
| | |
| | TOTAL FOREIGN BONDS | |
| | (Cost $7,191,839) | | | $ | 7,310,695 | |
| | |
|
| Asset- Backed Securities – 5.0% | |
| Collateralized Debt Obligations – 0.2% | |
| Arbor Realty Commercial Real Estate Notes Ltd.,
Series 2018-FL1, Class A(b)(c) (1 Mo. LIBOR + 1.150%) |
|
| $ | 200,000 | | | | 1.260 | | | | 06/15/28 | | | $ | 199,937 | |
| | |
| Collateralized Loan Obligations – 4.8% | |
| Cathedral Lake VI Ltd., Series 2021-6A, Class B(b)(c)
(3 Mo. LIBOR + 1.950%) |
|
| | 300,000 | | | | 2.074 | | | | 04/25/34 | | | | 299,376 | |
| Cathedral Lake VIII Ltd., Series 2021-8A, Class C(b)(c)
(3 Mo. LIBOR + 2.620%) |
|
| | 200,000 | | | | 2.724 | | | | 01/20/35 | | | | 198,035 | |
| CBAM Ltd., Series 2018-5A, Class A(b)(c) (3 Mo. LIBOR
+ 1.020%) |
|
| | 525,000 | | | | 1.142 | | | | 04/17/31 | | | | 525,007 | |
| CFIP CLO Ltd., Series 2021-1A, Class A(b)(c) (3 Mo. LIBOR
+ 1.220%) |
|
| | 700,000 | | | | 1.334 | | | | 01/20/35 | | | | 700,283 | |
| CFIP CLO Ltd., Series 2021-1A, Class C1(b)(c) (3 Mo. LIBOR
+ 2.400%) |
|
| | 300,000 | | | | 2.514 | | | | 01/20/35 | | | | 299,760 | |
| Crown City CLO I, Series 2020-1A, Class A1AR(b)(c)
(3 Mo. LIBOR + 1.190%) |
|
| | 250,000 | | | | 1.322 | | | | 07/20/34 | | | | 249,860 | |
| Diameter Capital CLO 1 Ltd., Series 2021-1A, Class A1A(b)(c)
(3 Mo. LIBOR + 1.240%) |
|
| | 425,000 | | | | 1.363 | | | | 07/15/36 | | | | 425,302 | |
| Elmwood CLO IV Ltd., Series 2020-1A, Class A(b)(c)
(3 Mo. LIBOR + 1.240%) |
|
| | 600,000 | | | | 1.364 | | | | 04/15/33 | | | | 600,330 | |
| Halseypoint CLO 2 Ltd., Series 2020-2A, Class A1(b)(c)
(3 Mo. LIBOR + 1.860%) |
|
| | 300,000 | | | | 1.992 | | | | 07/20/31 | | | | 300,097 | |
| HalseyPoint CLO 3 Ltd., Series 2020-3A, Class A1A(b)(c)
(3 Mo. LIBOR + 1.450%) |
|
| | 250,000 | | | | 1.579 | | | | 11/30/32 | | | | 250,514 | |
| Jamestown CLO XV Ltd., Series 2020-15A, Class A(b)(c)
(3 Mo. LIBOR + 1.340%) |
|
| | 300,000 | | | | 1.464 | | | | 04/15/33 | | | | 300,148 | |
| Marble Point CLO XVII Ltd., Series 2020-1A, Class A(b)(c)
(3 Mo. LIBOR + 1.300%) |
|
| | 500,000 | | | | 1.432 | | | | 04/20/33 | | | | 500,121 | |
| Venture 39 CLO Ltd., Series 2020-39A, Class A1(b)(c)
(3 Mo. LIBOR + 1.280%) |
|
| | 275,000 | | | | 1.404 | | | | 04/15/33 | | | | 275,079 | |
| | |
| Home Equity – 0.0% | |
| GMACM Home Equity Loan Trust, Series 2007-HE3,
Class 2A1(b) |
|
| | 28,141 | | | | 7.000 | | | | 09/25/37 | | | | 28,295 | |
| | |
| | TOTAL ASSET-BACKED SECURITIES | |
| | (Cost $5,146,944) | | | $ | 5,152,144 | |
| | |
| | |
| 20 | | The accompanying notes are an integral part of these financial statements. |
GOLDMAN SACHS VARIABLE INSURANCE TRUST CORE FIXED INCOME FUND
| | | | | | | | | | | | | | |
Principal
Amount | | | Interest
Rate | | | Maturity
Date | | | Value | |
|
| Foreign Government Securities – 1.7% | |
| Sovereign – 1.7% | |
| | Abu Dhabi Government International Bond(c) | |
| $ | 220,000 | | | | 3.125 | % | | | 10/11/27 | | | $ | 235,950 | |
| | Indonesia Government International Bond | |
| | 200,000 | | | | 3.050 | | | | 03/12/51 | | | | 197,750 | |
| | Israel Government AID Bond(e) | |
| | 200,000 | | | | 5.500 | | | | 12/04/23 | | | | 217,776 | |
| | 100,000 | | | | 5.500 | | | | 04/26/24 | | | | 110,359 | |
| | Israel Government International Bond | |
| | 200,000 | | | | 3.250 | | | | 01/17/28 | | | | 216,912 | |
| | Mexico Government International Bond(a) | |
| | 400,000 | | | | 3.250 | | | | 04/16/30 | | | | 410,825 | |
| | 110,000 | | | | 1.450 | | | | 10/25/33 | | | | 116,469 | |
| | Peruvian Government International Bond(a) | |
| | 50,000 | | | | 3.230 | | | | 07/28/21 | | | | 43,009 | |
| | Romanian Government International Bond(c) | |
| | 10,000 | | | | 2.124 | | | | 07/16/31 | | | | 10,872 | |
| | 30,000 | | | | 2.625 | | | | 12/02/40 | | | | 30,278 | |
| | 10,000 | | | | 4.625 | | | | 04/03/49 | | | | 12,899 | |
| | Romanian Government International Bond, Series E | |
| | 70,000 | | | | 2.875 | | | | 03/11/29 | | | | 84,776 | |
| | Uruguay Government International Bond(a) | |
| | 50,000 | | | | 4.375 | | | | 01/23/31 | | | | 57,556 | |
| | | | | | | | | | | | | | |
| | | | | | | | | | | | | 1,745,431 | |
| | |
| | TOTAL FOREIGN GOVERNMENT SECURITIES | |
| | (Cost $1,751,024) | | | $ | 1,745,431 | |
| | |
| | | | | | | | | | | | | | |
|
| Commercial Mortgage-Backed Securities – 1.2% | |
| 3650R 2021-PF1 Commercial Mortgage Trust Series 2021-PF1,
Class AS |
|
| $ | 150,000 | | | | 2.778 | % | | | 11/15/54 | | | $ | 152,445 | |
| Banc of America Commercial Mortgage Trust Series 2016-UB10,
Class D(c) |
|
| | 100,000 | | | | 3.000 | | | | 07/15/49 | | | | 91,872 | |
| | BANK Series 2019-BN21, Class A5 | |
| | 150,000 | | | | 2.851 | | | | 10/17/52 | | | | 157,659 | |
| | BANK Series 2021-BN32, Class A5 | |
| | 150,000 | | | | 2.643 | | | | 04/15/54 | | | | 155,526 | |
| | BX Trust Series 2021-ARIA, Class C (1 Mo. LIBOR + 1.646%)(c) | |
| | 150,000 | | | | 1.756 | (b) | | | 10/15/36 | | | | 149,681 | |
| Cantor Commercial Real Estate Lending Series 2019-CF3,
Class A4 |
|
| | 100,000 | | | | 3.006 | | | | 01/15/53 | | | | 105,745 | |
| | DOLP Trust Series 2021-NYC, Class A(c) | |
| | 200,000 | | | | 2.956 | | | | 05/10/41 | | | | 208,054 | |
| EQUS Mortgage Trust Series 2021-EQAZ, Class A (1 Mo.
LIBOR + 0.755%)(c) |
|
| | 200,000 | | | | 0.865 | (b) | | | 10/15/38 | | | | 199,192 | |
| | |
| | TOTAL COMMERCIAL MORTGAGE-BACKED SECURITIES | |
| | (Cost $1,217,546) | | | $ | 1,220,174 | |
| | |
| | | | | | | | | | | | | | |
|
| Municipal Bonds – 1.1% | |
| Arizona – 0.0% | |
| | City of Tucson AZ COPS Series 2021 A | |
| $ | 25,000 | | | | 1.932 | % | | | 07/01/31 | | | $ | 24,557 | |
| | |
|
| Municipal Bonds – (continued) | |
| California – 0.5% | |
| | Bay Area Toll Authority RB Refunding Series 2021 F-1 | |
| 30,000 | | | | 1.633 | | | | 04/01/28 | | | | 29,594 | |
| California Statewide Communities Development Authority RB
Refunding for California Independent System Operator Corp.
Series 2021 |
|
| | 50,000 | | | | 1.877 | | | | 02/01/31 | | | | 49,028 | |
| Los Angeles Municipal Improvement Corp. RB Refunding for
City of Los Angeles Series 2021 A |
|
| | 35,000 | | | | 1.648 | | | | 11/01/28 | | | | 34,337 | |
| | 80,000 | | | | 2.074 | | | | 11/01/30 | | | | 79,322 | |
| | Port of Oakland RB Refunding Series 2020 R | |
| | 25,000 | | | | 2.199 | | | | 05/01/31 | | | | 24,837 | |
| San Francisco Municipal Transportation Agency RB Refunding
Series 2021 A |
|
| | 30,000 | | | | 1.302 | | | | 03/01/28 | | | | 29,242 | |
| San Jose Financing Authority RB for Civic Center Refunding
Project Series 2020 A |
|
| | 25,000 | | | | 1.812 | | | | 06/01/29 | | | | 24,737 | |
| | 25,000 | | | | 1.862 | | | | 06/01/30 | | | | 24,500 | |
| | | | | | | | | | | | | | |
| | | | | | | | | | | | | 295,597 | |
| | |
| Florida – 0.1% | |
| | State Board of Administration Finance Corp. RB Series 2020 A | |
| | 70,000 | | | | 2.154 | | | | 07/01/30 | | | | 69,835 | |
| | |
| Illinois – 0.2% | |
| | Chicago O’Hare International Airport | |
| | 85,000 | | | | 2.346 | | | | 01/01/30 | | | | 85,631 | |
| | Illinois State GO Bonds Pension Funding Series 2003 | |
| | 25,000 | | | | 5.100 | | | | 06/01/33 | | | | 28,897 | |
| | Illinois State GO Bonds for Build America Bonds Series 2010-5 | |
| | 100,000 | | | | 7.350 | | | | 07/01/35 | | | | 125,880 | |
| | State of Illinois GO Bonds | |
| | 105,000 | | | | 7.625 | | | | 03/01/40 | | | | 173,907 | |
| | | | | | | | | | | | | | |
| | | | | | | | | | | | | 414,315 | |
| | |
| Louisiana – 0.0% | |
| City of New Orleans LA Water System Revenue Refunding
Series 2021 |
|
| | 25,000 | | | | 1.008 | | | | 12/01/26 | | | | 24,075 | |
| | |
| New York – 0.1% | |
| | City of New York NY GO Bonds Series 2021 F-2 | |
| | 40,000 | | | | 1.940 | | | | 03/01/29 | | | | 40,097 | |
| Metropolitan Transportation Authority Dedicated Tax Fund RB
Series 2010 |
|
| | 25,000 | | | | 5.989 | | | | 11/15/30 | | | | 31,079 | |
| New York City Transitional Finance Authority Future Tax
Secured Revenue Series 2018 B-2 |
|
| | 10,000 | | | | 3.590 | | | | 08/01/27 | | | | 10,944 | |
| | | | | | | | | | | | | | |
| | | | | | | | | | | | | 82,120 | |
| | |
| Ohio – 0.1% | |
| American Municipal Power, Inc. RB Build America Bond
Series 2010 E RMKT |
|
| | 100,000 | | | | 6.270 | | | | 02/15/50 | | | | 142,909 | |
| | |
| | |
| The accompanying notes are an integral part of these financial statements. | | 21 |
GOLDMAN SACHS VARIABLE INSURANCE TRUST CORE FIXED INCOME FUND
Schedule of Investments (continued)
December 31, 2021
| | | | | | | | | | | | | | |
Principal
Amount | | | Interest
Rate | | | Maturity
Date | | | Value | |
|
| Municipal Bonds – (continued) | |
| Texas – 0.1% | |
| | City of Houston TX Airport System RB Refunding Series 2020 C | |
| $ | 30,000 | | | | 2.235 | % | | | 07/01/29 | | | $ | 30,118 | |
| | 40,000 | | | | 2.285 | | | | 07/01/30 | | | | 40,001 | |
| | | | | | | | | | | | | | |
| | | | | | | | | | | | | 70,119 | |
| | |
| | TOTAL MUNICIPAL BONDS | |
| | (Cost $997,440) | | | $ | 1,123,527 | |
| | |
| | | | | | | | | | | | | | |
|
| U.S. Government Agency Securities – 1.0% | |
| | Federal Home Loan Banks | |
| $ | 100,000 | | | | 3.375 | % | | | 12/08/23 | | | $ | 104,904 | |
| | Federal National Mortgage Association | |
| | 400,000 | | | | 1.875 | | | | 09/24/26 | | | | 410,977 | |
| | 400,000 | | | | 6.250 | | | | 05/15/29 | | | | 531,378 | |
| | |
| | TOTAL U.S. GOVERNMENT AGENCY SECURITIES | |
| | (Cost $987,314) | | | $ | 1,047,259 | |
| | |
| | | | | | | | | | | | | | |
|
| Collateralized Mortgage Obligations – 0.6% | |
| Alternative Loan Trust Series 2005-38, Class A1(b) (1 Year CMT
+ 1.500%) |
|
| $ | 49,851 | | | | 1.582 | % | | | 09/25/35 | | | $ | 48,071 | |
| Connecticut Avenue Securities Trust Series 2021-R01,
Class 1M2(b) (SOFR + 1.550%)(c) |
|
| | 44,000 | | | | 1.600 | | | | 10/25/41 | | | | 44,074 | |
| Connecticut Avenue Securities Trust Series 2021-R03,
Class 1M2(b) (SOFR + 1.650%)(c) |
|
| | 42,000 | | | | 1.700 | | | | 12/25/41 | | | | 42,034 | |
| Federal Home Loan Mortgage Corporation Series 2020-DNA3,
Class M2(b) (1 Mo. LIBOR + 3.000%)(c) |
|
| | 7,848 | | | | 3.103 | | | | 06/25/50 | | | | 7,859 | |
| Federal Home Loan Mortgage Corporation Series 2020-DNA5,
Class M2(b) (SOFR + 2.800%)(c) |
|
| | 25,505 | | | | 2.850 | | | | 10/25/50 | | | | 25,704 | |
| Federal Home Loan Mortgage Corporation Series 2021-DNA5,
Class M2(b) (SOFR + 1.650%)(c) |
|
| | 30,000 | | | | 1.700 | | | | 01/25/34 | | | | 30,120 | |
| Harben Finance PLC Series 2017-1X, Class A(b) (3-month GBP
LIBOR + 0.800%) |
|
| | 55,693 | | | | 0.914 | | | | 08/20/56 | | | | 75,414 | |
| | JPMorgan Mortgage Trust Series 2021-6, Class A3(b)(c) | |
| | 103,166 | | | | 2.500 | | | | 10/25/51 | | | | 103,093 | |
| Lehman XS Trust Series 2005-7N, Class 1A1A(b) (1 Mo. LIBOR
+ 0.540%) |
|
| | 91,779 | | | | 0.642 | | | | 12/25/35 | | | | 88,992 | |
| London Wall Mortgage Capital PLC Series 2017-FL1, Class A(b)
(3-month GBP LIBOR + 0.850%) |
|
| | 18,369 | | | | 0.952 | | | | 11/15/49 | | | | 24,889 | |
| Stratton Mortgage Funding PLC Series 2019-1, Class A(b)
(SONIA + 1.200%) |
|
| | 74,965 | | | | 1.250 | | | | 05/25/51 | | | | 101,769 | |
| Wells Fargo Mortgage Backed Securities Trust Series 2019-3,
Class A1(b)(c) |
|
| | 11,501 | | | | 3.500 | | | | 07/25/49 | | | | 11,585 | |
| | |
| | TOTAL COLLATERALIZED MORTGAGE OBLIGATIONS | |
| | (Cost $574,366) | | | $ | 603,604 | |
| | |
|
| U.S. Treasury Obligations – 36.3% | |
| | U.S. Treasury Bonds | |
| $ | 2,930,000 | | | | 2.375 | % | | | 11/15/49 | | | $ | 3,222,084 | |
| | 3,200,000 | | | | 2.000 | | | | 02/15/50 | | | | 3,254,000 | |
| | U.S. Treasury Notes | |
| | 3,030,000 | | | | 2.375 | | | | 03/15/22 | | | | 3,043,730 | |
| | 9,070,000 | | | | 0.125 | | | | 01/31/23 | | | | 9,038,822 | |
| | 720,000 | | | | 0.125 | | | | 03/31/23 | | | | 716,484 | |
| | 730,000 | | | | 0.125 | | | | 12/15/23 | | | | 721,616 | |
| | 4,650,000 | | | | 0.375 | | | | 04/15/24 | | | | 4,603,500 | |
| | 1,030,000 | | | | 0.375 | | | | 12/31/25 | | | | 998,537 | |
| | 4,050,000 | | | | 0.750 | | | | 03/31/26 | | | | 3,974,063 | |
| | 1,080,000 | | | | 1.250 | | | | 12/31/26 | | | | 1,079,241 | |
| | 900,000 | | | | 1.125 | | | | 02/29/28 | | | | 887,273 | |
| | 1,010,000 | | | | 1.250 | | | | 03/31/28 | | | | 1,001,399 | |
| | 970,000 | | | | 2.875 | | | | 05/15/28 | | | | 1,057,073 | |
| | 1,180,000 | | | | 1.250 | | | | 06/30/28 | | | | 1,168,292 | |
| | 1,440,000 | | | | 3.125 | | | | 11/15/28 | | | | 1,601,100 | |
| | 1,100,000 | | | | 1.375 | | | | 12/31/28 | | | | 1,095,359 | |
| | |
| | TOTAL U.S. TREASURY OBLIGATIONS | |
| | (Cost $37,773,520) | | | $ | 37,462,573 | |
| | |
| | | | | | | | | | | | | | |
| Shares | | | Dividend
Rate | | | Value | |
|
| Investment Company(f) – 6.8% | |
| Goldman Sachs Financial Square Government Fund —
Institutional Shares |
|
| | 7,004,192 | | | | 0.026% | | | $ | 7,004,192 | |
| | (Cost $7,004,192) | |
| | |
| | | | | | | | | | | | | | |
Principal
Amount | | | Interest
Rate | | | Maturity
Date | | | Value | |
|
| Short-Term Investments(b) – 2.5% | |
| Commercial Paper – 2.5% | |
| | AT&T, Inc. | |
| $ | 800,000 | | | | 0.183 | % | | | 02/14/22 | | | $ | 799,704 | |
| | Enel Finance America LLC | |
| | 500,000 | | | | 0.254 | | | | 02/16/22 | | | | 499,805 | |
| | Entergy Corp. | |
| | 300,000 | | | | 0.152 | | | | 01/12/22 | | | | 299,985 | |
| | VW Credit, Inc. | |
| | 500,000 | | | | 0.203 | | | | 01/06/22 | | | | 499,985 | |
| | 250,000 | | | | 0.203 | | | | 01/10/22 | | | | 249,987 | |
| | 250,000 | | | | 0.223 | | | | 02/16/22 | | | | 249,900 | |
| | |
| | TOTAL SHORT-TERM INVESTMENTS | |
| | (Cost $2,599,554) | | | $ | 2,599,366 | |
| | |
| | TOTAL INVESTMENTS – 108.9% | |
| | (Cost $111,285,499) | | | $ | 112,217,118 | |
| | |
| LIABILITIES IN EXCESS OF
ASSETS – (8.9)% |
| | | (9,171,166 | ) |
| | |
| | NET ASSETS – 100.0% | | | $ | 103,045,952 | |
| | |
| | |
| 22 | | The accompanying notes are an integral part of these financial statements. |
GOLDMAN SACHS VARIABLE INSURANCE TRUST CORE FIXED INCOME FUND
| | |
| The percentage shown for each investment category reflects the value of investments in that category as a percentage of net assets. |
| |
| (a) | | Securities with “Call” features. Maturity dates disclosed are the final maturity date. |
| |
| (b) | | Variable rate security. Except for floating rate notes (for which final maturity is disclosed), maturity date disclosed is the next interest reset date. Interest rate or distribution rate disclosed is that which is in effect on December 31, 2021. |
| |
| (c) | | Exempt from registration under Rule 144A of the Securities Act of 1933. |
| |
| (d) | | TBA (To Be Announced) Securities are purchased on a forward commitment basis with an approximate principal amount and no defined maturity date. The actual principal and maturity date will be determined upon settlement when the specific mortgage pools are assigned. Total market value of TBA securities (excluding forward sales contracts, if any) amounts to $9,237,403 which represents approximately 9.0% of the Fund’s net assets as of December 31, 2021. |
| |
| (e) | | Guaranteed by the United States Government. Total market value of $328,135, which represents 0.3% of net assets as of December 31, 2021. |
| |
| (f) | | Represents an affiliated issuer. |
| | |
| |
| Investment Abbreviations: |
| BA | | —Banker Acceptance Rate |
| BBR | | —Bank Bill Reference Rate |
| CLO | | —Collateralized Loan Obligation |
| EURIBOR | | —Euro Interbank Offered Rate |
| LIBOR | | —London Interbank Offered Rate |
| LP | | —Limited Partnership |
| Mo. | | —Month |
| NIBOR | | —Norwegian Interbank Offered Rate |
| PLC | | —Public Limited Company |
| SOFR | | —Secured Overnight Financing Rate |
| SONIA | | —Sterling Overnight Index Average |
| STIBOR | | —Stockholm Interbank Offered Rate |
| Yr. | | —Year |
|
| Currency Abbreviations: |
| AUD | | —Australian Dollar |
| CAD | | —Canadian Dollar |
| CHF | | —Swiss Franc |
| EUR | | —Euro |
| GBP | | —British Pound |
| JPY | | —Japanese Yen |
| NOK | | —Norwegian Krone |
| NZD | | —New Zealand Dollar |
| SEK | | —Sweedish Krona |
| USD | | —United States Dollar |
ADDITIONAL INVESTMENT INFORMATION
FORWARD FOREIGN CURRENCY EXCHANGE CONTRACTS — At December 31, 2021, the Fund had the following forward foreign currency exchange contracts:
FORWARD FOREIGN CURRENCY EXCHANGE CONTRACTS WITH UNREALIZED GAIN
| | | | | | | | | | | | | | | | |
| Counterparty | | Currency
Purchased | | | Currency
Sold | | | Settlement
Date | | | Unrealized
Gain | |
JPMorgan Bank | | USD | 577,036 | | | GBP | 419,031 | | | | 1/21/2022 | | | $ | 9,883 | |
Morgan Stanley Co., Inc. | | USD | 47,012 | | | NOK | 392,096 | | | | 1/25/2022 | | | | 2,508 | |
Bank of America | | EUR | 773,635 | | | USD | 874,595 | | | | 2/10/2022 | | | | 6,885 | |
JPMorgan Bank | | USD | 75,721 | | | JPY | 8,619,413 | | | | 2/16/2022 | | | | 763 | |
Morgan Stanley Co., Inc. | | USD | 189,325 | | | SEK | 1,623,002 | | | | 1/20/2022 | | | | 9,688 | |
Morgan Stanley Co., Inc. | | USD | 236,520 | | | CAD | 294,327 | | | | 1/31/2022 | | | | 3,849 | |
| | | |
| TOTAL | | | | | | | | | | | $ | 33,576 | |
FORWARD FOREIGN CURRENCY EXCHANGE CONTRACTS WITH UNREALIZED LOSS
| | | | | | | | | | | | | | | | |
| Counterparty | | Currency Purchased | | | Currency
Sold | | | Settlement
Date | | | Unrealized
Loss | |
Morgan Stanley Co., Inc. | | SEK | 1,653,000 | | | USD | 192,824 | | | | 1/20/2022 | | | $ | (9,867 | ) |
JPMorgan Bank | | GBP | 305,015 | | | USD | 420,028 | | | | 1/21/2022 | | | | (7,194 | ) |
Morgan Stanley Co., Inc. | | CAD | 258,925 | | | USD | 208,071 | | | | 1/31/2022 | | | | (3,386 | ) |
Morgan Stanley Co., Inc. | | USD | 1,157,910 | | | EUR | 1,024,401 | | | | 2/10/2022 | | | | (9,292 | ) |
Morgan Stanley Co., Inc. | | JPY | 11,613,101 | | | USD | 102,021 | | | | 2/16/2022 | | | | (1,028 | ) |
Morgan Stanley Co., Inc. | | USD | 99,308 | | | EUR | 87,135 | | | | 3/16/2022 | | | | (44 | ) |
| | | | |
| TOTAL | | | | | | | | | | | | | | $ | (30,811 | ) |
| | |
| The accompanying notes are an integral part of these financial statements. | | 23 |
GOLDMAN SACHS VARIABLE INSURANCE TRUST CORE FIXED INCOME FUND
Schedule of Investments (continued)
December 31, 2021
ADDITIONAL INVESTMENT INFORMATION (continued)
FORWARD SALES CONTRACTS — At December 31, 2021, the Fund had the following forward sales contracts:
| | | | | | | | | | | | | | | | | | | | |
| Description | | Interest
Rate | | | Maturity
Date(a) | | | Settlement
Date | | | Principal
Amount | | | Value | |
| Federal National Mortgage Association | | | 3.500 | % | | | TBA-30yr | | | | 12/13/2021 | | | $ | (1,000,000 | ) | | $ | (1,053,125 | ) |
| Federal National Mortgage Association | | | 3.500 | | | | TBA-30yr | | | | 11/10/2021 | | | | (1,000,000 | ) | | | (1,051,760 | ) |
Government National Mortgage Association | | | 2.000 | | | | TBA-30yr | | | | 10/14/2021 | | | | (1,000,000 | ) | | | (1,008,990 | ) |
| | | |
| Total (Proceed Receivable $3,112,109) | | | | | | | | | | | $ | (3,113,875 | ) |
| (a) | TBA (To Be Announced) Securities are purchased on a forward commitment basis with an approximate principal amount and no defined maturity date. The actual principal and maturity date will be determined upon settlement when the specific mortgage pools are assigned. |
FUTURES CONTRACTS — At December 31, 2021, the Fund had the following futures contracts:
| | | | | | | | | | | | | | | | |
| Description | | Number of
Contracts | | | Expiration
Date | | | Notional
Amount | | | Unrealized
Appreciation/
(Depreciation) | |
| |
Long position contracts: | | | | | |
| | | | |
| U.S. Treasury 10 Year Note | | | 25 | | | | 03/22/22 | | | $ | 3,233,072 | | | $ | 25,521 | |
| U.S. Treasury 10 Year Ultra Note | | | 8 | | | | 03/22/22 | | | | 1,171,937 | | | | (2,937 | ) |
| U.S. Treasury 2 Year Note | | | 36 | | | | 03/31/22 | | | | 7,860,948 | | | | (8,166 | ) |
| U.S. Treasury Long Bond | | | 26 | | | | 03/22/22 | | | | 4,133,167 | | | | 25,208 | |
U.S. Treasury Ultra Bond | | | 17 | | | | 03/22/22 | | | | 3,321,821 | | | | 12,304 | |
| | | | |
| Total Futures Contracts | | | | | | | | | | | | | | $ | 51,930 | |
SWAP CONTRACTS — At December 31, 2021, the Fund had the following swap contracts:
CENTRALLY CLEARED CREDIT DEFAULT SWAP CONTRACTS
| | | | | | | | | | | | | | | | | | | | | | | | | | | | | | |
Reference
Obligation/Index(a) | | Financing
Rate
Received
(Paid) by
the Fund | | | Credit
Spread at
December 31,
2021(b) | | | | | Termination
Date | | | Notional
Amount
(000’s) | | | Value | | | Upfront
Premium
(Recieved)
Paid | | | Unrealized
(Depreciation) | |
| Prudential Financial, Inc. | | | 1.000 | % | | | 1.799 | % | | | | | 06/20/2024 | | | | 75 | | | $ | 1,350 | | | $ | — | | | $ | 1,350 | |
| Republic of Indonesia | | | 1.000 | % | | | 1.564 | | | | | | 06/20/2024 | | | | 160 | | | | 2,503 | | | | — | | | | 2,503 | |
| Republic of Chile | | | 1.000 | % | | | 1.588 | | | | | | 06/20/2024 | | | | 20 | | | | 318 | | | | — | | | | 318 | |
| State of Qatar | | | 1.000 | % | | | 1.941 | | | | | | 06/20/2024 | | | | 20 | | | | 388 | | | | — | | | | 388 | |
| State of Qatar | | | 1.000 | % | | | 2.248 | | | | | | 12/20/2024 | | | | 10 | | | | 225 | | | | — | | | | 225 | |
| General Electric Co. | | | 1.000 | % | | | 1.605 | | | | | | 06/20/2026 | | | | 175 | | | | 2,808 | | | | — | | | | 2,808 | |
| Republic of Indonesia | | | 1.000 | % | | | 1.176 | | | | | | 12/20/2026 | | | | 230 | | | | 2,705 | | | | 2,809 | | | | (103 | ) |
| Nordstrom, Inc. | | | 1.000 | % | | | 1.689 | | | | | | 06/20/2024 | | | | 225 | | | | (3,800 | ) | | | (538 | ) | | | (3,262 | ) |
| United Russian States | | | 1.000 | % | | | 1.161 | | | | | | 12/20/2026 | | | | 10 | | | | (116 | ) | | | 65 | | | | (182 | ) |
| United Mexican States | | | 1.000 | % | | | 0.503 | | | | | | 12/20/2026 | | | | 20 | | | | 101 | | | | 46 | | | | 54 | |
| Markit CDX North America Investment Grade Index | | | 1.000 | % | | | 1.899 | | | | | | 06/20/2025 | | | | 3,500 | | | | 66,448 | | | | — | | | | 66,448 | |
| Markit CMBX North American | | | 3.000 | % | | | 4.716 | | | | | | 11/18/2054 | | | | 200 | | | | (9,431 | ) | | | (54,839 | ) | | | 45,408 | |
| Markit CDX North America Investment Grade Index | | | 1.000 | % | | | 2.385 | | | | | | 12/20/2025 | | | | 575 | | | | 13,712 | | | | — | | | | 13,712 | |
| Markit CMBX North American BBB- | | | 3.000 | % | | | 13.612 | | | | | | 10/17/2057 | | | | 100 | | | | (13,612 | ) | | | (26,600 | ) | | | 12,988 | |
| iTraxx Asia ex-Japan Investment Grade Index | | | 1.000 | % | | | 1.358 | | | | | | 06/20/2026 | | | | 170 | | | | (2,309 | ) | | | (875 | ) | | | (1,434 | ) |
| Markit CDX North America Investment Grade Index | | | 1.000 | % | | | 2.442 | | | | | | 06/20/2026 | | | | 7,025 | | | | 171,556 | | | | 86,571 | | | | 84,986 | |
| | |
| 24 | | The accompanying notes are an integral part of these financial statements. |
GOLDMAN SACHS VARIABLE INSURANCE TRUST CORE FIXED INCOME FUND
ADDITIONAL INVESTMENT INFORMATION (continued)
SWAP CONTRACTS (continued)
OVER THE COUNTER CREDIT DEFAULT SWAP CONTRACTS
| | | | | | | | | | | | | | | | | | | | | | | | | | | | | | |
Reference
Obligation/Index | | Financing
Rate
Received
(Paid) by
the Fund | | | Credit
Spread at
December 31,
2021(c) | | | Counterparty | | Termination
Date | | | Notional
Amount
(000’s) | | | Value | | | Upfront
Premium
(Recieved)
Paid | | | Unrealized
(Depreciation) | |
| Markit CMBX North American BBB-8(a) | | | 3.000 | % | | | 13.612 | % | | Morgan Stanley Co., Inc | | | 10/17/2057 | | | | 100 | | | $ | (13,612 | ) | | $ | (14,898 | ) | | $ | 1,286 | |
| ICE CDX Investment Grade Index(b) | | | 1.000 | % | | | 2.442 | | | Bank of America | | | 12/20/2026 | | | | 3,225 | | | | 78,749 | | | | 75,063 | | | | 3,686 | |
| | | | | | | | |
| TOTAL | | | | | | | | | | | | | | | | | | | | $ | 297,983 | | | $ | 66,804 | | | $ | 231,179 | |
| (a) | Payments received monthly. |
| (b) | Payments received quarterly. |
| (c) | Credit spread on the referenced obligation, together with the period of expiration, are indicators of payment/performance risk. The likelihood of a credit event occurring which would require a fund or its counterparty to make a payment or otherwise be required to perform under the swap contract is generally greater as the credit spread and term of the swap contract increase. |
CENTRALLY CLEARED INTEREST RATE SWAP CONTRACTS
| | | | | | | | | | | | | | | | | | | | | | | | |
Payments Made by the Fund | | Payments Received by the Fund | | | Termination
Date | | | Notional
Amounts
(000’s) | | | Value | | | Upfront
Premium
(Received)
Paid | | | Unrealized
Appreciation/
(Depreciation) | |
| 1.250%(a) | | | Bbalibor | | | | 12/15/2022 | | | NZD | 600 | | | $ | (1,609 | ) | | $ | 662 | | | $ | (947 | ) |
| 0.190(a) | | | 3 Month BBR | | | | 2/22/2023 | | | AUD | 4,550 | | | | (11,041 | ) | | | — | | | | (11,041 | ) |
| 1 Day SOFR(b) | | | 0.000% | | | | 3/16/2024 | | | USD | 720 | | | | 8,973 | | | | (6,724 | ) | | | 2,249 | |
| 0.500(a) | | | 3 Month STIBOR | | | | 3/16/2024 | | | SEK | 10,700 | | | | 2,709 | | | | (2,572 | ) | | | 137 | |
| 1.560(a) | | | 3 Month BA | | | | 8/22/2025 | | | CAD | 810 | | | | (6,866 | ) | | | (204 | ) | | | (7,070 | ) |
| 1 Day SOFR(b) | | | 1.000 | | | | 3/16/2027 | | | SEK | 1,240 | | | | (93 | ) | | | (855 | ) | | | (948 | ) |
| 3 Month BA(a) | | | 0.000 | | | | 3/16/2027 | | | USD | 1,700 | | | | 14,182 | | | | (11,518 | ) | | | 2,664 | |
| 0.750(a) | | | 3 Month STIBOR | | | | 3/16/2027 | | | NOK | 4,320 | | | | (2,070 | ) | | | 1,644 | | | | (426 | ) |
| 1.250(c) | | | 6 Month BBR | | | | 3/16/2027 | | | GBP | 480 | | | | 18,022 | | | | (12,334 | ) | | | 5,688 | |
| 3 Month BA(a) | | | 1.750 | | | | 3/16/2027 | | | CAD | 1,050 | | | | 4,714 | | | | (7,367 | ) | | | (2,653 | ) |
| 1 Day SONIA(b) | | | 0.000 | | | | 3/16/2027 | | | AUD | 3,630 | | | | (63,118 | ) | | | 62,291 | | | | (827 | ) |
| 3 Month BA(a) | | | 1.680 | | | | 8/22/2028 | | | CAD | 650 | | | | 8,155 | | | | 344 | | | | 8,499 | |
| 6 Month NIBOR(c) | | | 2.130 | | | | 5/11/2031 | | | NOK | 5,250 | | | | (4,660 | ) | | | 6,531 | | | | 1,871 | |
| 2.500(a) | | | 3 Month BA | | | | 10/14/2031 | | | CAD | 570 | | | | 7,530 | | | | (2,656 | ) | | | 4,874 | |
| 0.500(c) | | | 6 Month EURIBOR | | | | 11/26/2031 | | | EUR | 1,000 | | | | (4,516 | ) | | | (2,945 | ) | | | (7,461 | ) |
| 1.500(b) | | | 1 Day SOFR | | | | 3/16/2032 | | | AUD | 740 | | | | (1,704 | ) | | | (538 | ) | | | (2,242 | ) |
| Bbalibor(a) | | | 2.750 | | | | 3/16/2032 | | | USD | 520 | | | | 7,548 | | | | (10,151 | ) | | | (2,603 | ) |
| 2.000(c) | | | 6 Month NIBOR | | | | 3/16/2032 | | | CAD | 720 | | | | 336 | | | | (1,067 | ) | | | (731 | ) |
| 1.000(a) | | | 3 Month STIBOR | | | | 3/16/2032 | | | NOK | 2,240 | | | | 1,790 | | | | (7,184 | ) | | | (5,394 | ) |
| 3 Month BA(a) | | | 0.000 | | | | 3/16/2032 | | | NZD | 440 | | | | (1,799 | ) | | | 3,417 | | | | 1,618 | |
| 1 Day SOFR(b) | | | 0.000 | | | | 3/16/2032 | | | SEK | 6,040 | | | | (40 | ) | | | (10,638 | ) | | | (10,678 | ) |
| 2.000(c) | | | 6 Month BBR | | | | 3/16/2032 | | | GBP | 950 | | | | 25,862 | | | | 407 | | | | 26,269 | |
| 3 Month BA(a) | | | 2.000 | | | | 3/16/2032 | | | CHF | 350 | | | | 5,374 | | | | (5,044 | ) | | | 330 | |
| 1 Day SONIA(b) | | | 0.000 | | | | 3/16/2032 | | | EUR | 330 | | | | (3,094 | ) | | | (2,028 | ) | | | (5,122 | ) |
| 0.250(c) | | | 6 Month EURIBOR | | | | 3/16/2032 | | | JPY | 27,350 | | | | 2,001 | | | | (1,069 | ) | | | 932 | |
| 2.100(a) | | | 3 Month BA | | | | 12/18/2033 | | | CAD | 190 | | | | (600 | ) | | | (958 | ) | | | (1,558 | ) |
| 6 Month EURIBOR(c) | | | 0.750 | | | | 11/26/2041 | | | EUR | 510 | | | | 3,250 | | | | 4,239 | | | | 7,489 | |
| 2.250(a) | | | 3 Month BA | | | | 12/15/2051 | | | CAD | 270 | | | | 7,480 | | | | 2,328 | | | | 9,808 | |
| 1 Day SOFR(b) | | | 1.750 | | | | 3/16/2052 | | | USD | 170 | | | | (11,948 | ) | | | 15,107 | | | | 3,159 | |
| | | | | | |
| TOTAL | | | | | | | | | | | | | | $ | 4,768 | | | $ | 11,118 | | | $ | 15,886 | |
| (a) | Payments made quarterly |
| (b) | Payments made annually. |
| (c) | Payments made semi-annually. |
| | |
| The accompanying notes are an integral part of these financial statements. | | 25 |
GOLDMAN SACHS VARIABLE INSURANCE TRUST CORE FIXED INCOME FUND
Schedule of Investments (continued)
December 31, 2021
ADDITIONAL INVESTMENT INFORMATION (continued)
PURCHASED & WRITTEN OPTIONS CONTRACTS — At December 31, 2021, the Fund had the following purchased & written option contracts:
| | | | | | | | | | | | | | | | | | | | | | | | | | | | | | |
| Description | | Counterparty | | Exercise
Rate | | | Expiration
Date | | | Number of
Contracts | | | Notional
Amount | | | Value | | | Premiums
Paid (Received)
by Fund | | | Unrealized
Appreciation/
(Depreciation) | |
|
Purchased Option Contracts | |
|
Puts | |
6M IRS | | JPMorgan Bank | | | 0.30 | | | | 09/09/2022 | | | | 1,370,000 | | | $ | 1,370,000 | | | $ | 337 | | | $ | 2,662 | | | $ | (2,325 | ) |
6M IRS | | JPMorgan Bank | | | 0.28 | | | | 09/09/2022 | | | | 1,060,000 | | | | 1,060,000 | | | | 247 | | | | 2,022 | | | | (1,775 | ) |
6M IRS | | Morgan Stanley Co., Inc. | | | 0.54 | | | | 11/17/2022 | | | | 2,600,000 | | | | 2,600,000 | | | | 1,721 | | | | 6,113 | | | | (4,392 | ) |
6M IRS | | UBS AG | | | 1.16 | | | | 10/12/2022 | | | | 1,490,000 | | | | 1,490,000 | | | | 4,773 | | | | 5,838 | | | | (1,065 | ) |
| | | | | |
| Total Purchased Option Contracts | | | | 6,520,000 | | | | | | | | 7,078 | | | $ | 16,635 | | | $ | (9,557 | ) |
|
Written Option Contracts | |
|
Calls | |
6M IRS | | JPMorgan Bank | | | 0.40 | | | | 09/09/2022 | | | | (140,000 | ) | | $ | (140,000 | ) | | $ | (1,277 | ) | | $ | (2,636 | ) | | $ | 1,359 | |
6M IRS | | JPMorgan Bank | | | 0.36 | | | | 09/09/2022 | | | | (110,000 | ) | | | (110,000 | ) | | | (904 | ) | | | (2,033 | ) | | | 1,129 | |
6M IRS | | Morgan Stanley Co., Inc. | | | 0.60 | | | | 11/17/2022 | | | | (270,000 | ) | | | (270,000 | ) | | | (5,102 | ) | | | (6,144 | ) | | | 1,042 | |
6M IRS | | UBS AG | | | 0.85 | | | | 10/12/2022 | | | | (160,000 | ) | | | (160,000 | ) | | | (4,675 | ) | | | (6,503 | ) | | | 1,828 | |
| | | | | |
| Total Written Option Contracts | | | | (680,000 | ) | | | | | | | (11,958 | ) | | $ | (17,316 | ) | | $ | 5,358 | |
| | |
| 26 | | The accompanying notes are an integral part of these financial statements. |
GOLDMAN SACHS VARIABLE INSURANCE TRUST HIGH QUALITY FLOATING RATE FUND
Schedule of Investments
December 31, 2021
| | | | | | | | | | | | |
Principal
Amount | | | Interest
Rate | | Maturity
Date | | | Value | |
|
| Asset- Backed Securities – 25.3% | |
| AIG CLO LLC, Series 2021-1A, Class A(a)(b)
(3 Mo. LIBOR + 1.100%) |
|
| $ | 600,000 | | | 1.228% | | | 04/22/34 | | | $ | 596,735 | |
| Anchorage Capital CLO Ltd., Series 2014-4RA, Class A(a) (b)
(3 Mo. LIBOR + 1.050%) |
|
| | 350,000 | | | 1.186 | | | 01/28/31 | | | | 350,163 | |
| Anchorage Capital CLO Ltd., Series 2021-18A, Class A1(a) (b)
(3 Mo. LIBOR + 1.150%) |
|
| | 750,000 | | | 1.274 | | | 04/15/34 | | | | 750,095 | |
| Assurant CLO I Ltd., Series 2017-1A, Class AR(a)(b)
(3 Mo. LIBOR + 1.180%) |
|
| | 300,000 | | | 1.310 | | | 10/20/34 | | | | 299,925 | |
| Brazos Higher Education Authority, Inc., Series 2011-1,
Class A2(a) (3 Mo. LIBOR + 0.800%) |
|
| | 344,167 | | | 0.978 | | | 02/25/30 | | | | 344,167 | |
| BSPDF Issuer Ltd., Series 2021-FL1, Class A(a)(b)
(1 Mo. LIBOR + 1.200%) |
|
| | 250,000 | | | 1.310 | | | 10/15/36 | | | | 249,072 | |
| Carlyle US CLO Ltd., Series 2017-2A, Class A1R(a)(b)
(3 Mo. LIBOR + 1.050%) |
|
| | 1,000,000 | | | 1.184 | | | 07/20/31 | | | | 999,705 | |
| CBAM Ltd., Series 2018-5A, Class A(a)(b)
(3 Mo. LIBOR + 1.020%) |
|
| | 1,100,000 | | | 1.142 | | | 04/17/31 | | | | 1,100,014 | |
| CFIP CLO Ltd., Series 2021-1A, Class A(a)(b)
(3 Mo. LIBOR + 1.220%) (Cayman Islands) |
|
| | 750,000 | | | 1.334 | | | 01/20/35 | | | | 750,304 | |
| Citibank Credit Card Issuance Trust, Series 2017-A5, Class A5(a)
(1 Mo. LIBOR + 0.620%) (United States) |
|
| | 1,400,000 | | | 0.724 | | | 04/22/26 | | | | 1,415,298 | |
| Citibank Credit Card Issuance Trust, Series 2017-A7, Class A7(a)
(1 Mo. LIBOR + 0.370%) (United States) |
|
| | 500,000 | | | 0.474 | | | 08/08/24 | | | | 500,841 | |
| Dryden 64 CLO Ltd., Series 2018-64A, Class A(a)(b)
(3 Mo. LIBOR + 0.970%) (Cayman Islands) |
|
| | 600,000 | | | 1.092 | | | 04/18/31 | | | | 600,005 | |
| Edsouth Indenture No. 5 LLC, Series 2014-1, Class A(a)(b)
(1 Mo. LIBOR + 0.700%) (United States) |
|
| | 104,625 | | | 0.803 | | | 02/25/39 | | | | 104,107 | |
| Educational Funding of the South, Inc., Series 2011-1, Class A2(a)
(3 Mo. LIBOR + 0.650%) (United States) |
|
| | 202,633 | | | 0.774 | | | 04/25/35 | | | | 202,725 | |
| Ford Credit Auto Owner Trust, Series 2018-2, Class A(b)
(United States) |
|
| | 350,000 | | | 3.470 | | | 01/15/30 | | | | 363,614 | |
| Ford Credit Floorplan Master Owner Trust, Series 2020-1,
Class A2(a) (1 Mo. LIBOR + 0.500%) |
|
| | 750,000 | | | 0.610 | | | 09/15/25 | | | | 753,722 | |
| Halsey Point CLO I Ltd., Series 2019-1A, Class A2A(a)(b)
(3 Mo. LIBOR + 1.350%) |
|
| | 250,000 | | | 1.482 | | | 01/20/33 | | | | 250,019 | |
| Higher Education Funding I, Series 2014-1, Class A(a)(b)
(3 Mo. LIBOR + 1.050%) (United States) |
|
| | 587,666 | | | 1.230 | | | 05/25/34 | | | | 588,441 | |
| | |
|
| Asset- Backed Securities – (continued) | |
| Illinois Student Assistance Commission, Series 2010-1 A3
(3 Mo. LIBOR + 0.900%) |
|
| 122,083 | | | 1.024 | | | 07/25/45 | | | | 122,458 | |
| Jamestown CLO XV Ltd., Series 2020-15A, Class A(a)(b)
(3 Mo. LIBOR + 1.340%) (Cayman Islands) |
|
| | 300,000 | | | 1.464 | | | 04/15/33 | | | | 300,148 | |
| LCM XV LP, Series 15A, Class AR2(a)(b)
(3 Mo. LIBOR + 1.000%) (Cayman Islands) |
|
| | 1,000,000 | | | 1.132 | | | 07/20/30 | | | | 1,000,009 | |
| LCM XX LP, Series 20A, Class AR(a)(b) (3 Mo. LIBOR + 1.040%)
(Cayman Islands) |
|
| | 361,530 | | | 1.172 | | | 10/20/27 | | | | 361,574 | |
| Madison Park Funding XXX Ltd., Series 2018-30A, Class A(a)(b)
(3 Mo. LIBOR + 0.750%) (Cayman Islands) |
|
| | 1,094,153 | | | 0.874 | | | 04/15/29 | | | | 1,094,180 | |
| Marble Point CLO XXI Ltd., Series 2021-3A, Class A1(a)(b)
(3 Mo. LIBOR + 1.240%) (Cayman Islands) |
|
| | 800,000 | | | 1.369 | | | 10/17/34 | | | | 801,141 | |
| Montana Higher Education Student Assistance Corp.,
Series 2012-1, Class A2(a) (1 Mo. LIBOR + 1.000%)
(United States) |
|
| | 188,532 | | | 1.104 | | | 05/20/30 | | | | 188,532 | |
| Neuberger Berman Loan Advisers CLO 31 Ltd., Series 2019-31A,
Class AR(a) (b) (3 Mo. LIBOR + 1.040%) (Cayman Islands) |
|
| | 300,000 | | | 1.172 | | | 04/20/31 | | | | 300,109 | |
| Nissan Master Owner Trust Receivables, Series 2019-A,
Class A(a) (1 Mo. LIBOR + 0.560%) (United States) |
|
| | 850,000 | | | 0.670 | | | 02/15/24 | | | | 850,362 | |
| Octagon 54 Ltd., Series 2021-1A, Class A1(a)(b)
(3 Mo. LIBOR + 1.120%) (Cayman Islands) |
|
| | 300,000 | | | 1.253 | | | 07/15/34 | | | | 299,149 | |
| OHA Credit Funding 3 Ltd., Series 2019-3A, Class AR(a)(b)
(3 Mo. LIBOR + 1.140%) (Cayman Islands) |
|
| | 750,000 | | | 1.272 | | | 07/02/35 | | | | 749,999 | |
| Parallel Ltd., Series 2015-1A, Class AR(a)(b)
(3 Mo. LIBOR + 0.850%) (Cayman Islands) |
|
| | 14,324 | | | 0.982 | | | 07/20/27 | | | | 14,324 | |
| Pennsylvania Higher Education Assistance Agency,
Series 2006-1, Class A3(a) (3 Mo. LIBOR + 0.140%)
(United States) |
|
| | 284,743 | | | 0.264 | | | 10/25/35 | | | | 280,624 | |
| Pikes Peak CLO 2, Series 2018-2A, Class AR(a)(b)
(3 Mo. LIBOR + 1.190%) (Cayman Islands) |
|
| | 800,000 | | | 1.404 | | | 10/18/34 | | | | 799,795 | |
| SLM Student Loan Trust, Series 2005-5, Class A4(a)
(3 Mo. LIBOR + 0.140%) (United States) |
|
| | 412,214 | | | 0.264 | | | 10/25/28 | | | | 410,615 | |
| SLM Student Loan Trust, Series 2008-5, Class A4(a)
(3 Mo. LIBOR + 1.700%) (United States) |
|
| | 44,903 | | | 1.824 | | | 07/25/23 | | | | 45,107 | |
| SOUND POINT CLO XXII Ltd., Series 2019-1A, Class AR(a)(b)
(3 Mo. LIBOR + 1.080%) |
|
| | 500,000 | | | 1.212 | | | 01/20/32 | | | | 499,999 | |
| Trimaran Cavu Ltd., Series 2021-1A, Class A(a)(b)
(3 Mo. LIBOR + 1.210%) |
|
| | 500,000 | | | 1.334 | | | 04/23/32 | | | | 499,632 | |
| | |
| | |
| The accompanying notes are an integral part of these financial statements. | | 27 |
GOLDMAN SACHS VARIABLE INSURANCE TRUST HIGH QUALITY FLOATING RATE FUND
Schedule of Investments (continued)
December 31, 2021
| | | | | | | | | | | | |
Principal
Amount | | | Interest
Rate | | Maturity
Date | | | Value | |
|
| Asset- Backed Securities – (continued) | |
| Trysail CLO Ltd., Series 2021-1A, Class A1(a)(b)
(3 Mo. LIBOR + 1.320%) |
|
| $ | 400,000 | | | 1.452 % | | | 07/20/32 | | | $ | 400,000 | |
| Utah State Board of Regents, Series 2015-1, Class A(a)
(1 Mo. LIBOR + 0.600%) |
|
| | 197,128 | | | 0.702 | | | 02/25/43 | | | | 197,015 | |
| Wellfleet CLO X LTD, Series 2019-XA, Class A1R(a)(b)
(3 Mo. LIBOR + 1.170%) |
|
| | 900,000 | | | 1.302 | | | 07/20/32 | | | | 899,998 | |
| | |
| | TOTAL ASSET- BACKED SECURITIES | |
| | (Cost $20,277,174) | | | | | | $ | 20,333,722 | |
| | |
| | | | | | | | | | | | |
|
| Collateralized Mortgage Obligations(a) – 13.8% | |
| FHLMC REMIC Series 3049, Class FP(a)
(1 Mo. LIBOR + 0.350%) |
|
| $ | 109,465 | | | 0.460% | | | 10/15/35 | | | $ | 109,932 | |
| FHLMC REMIC Series 3208, Class FB(a)
(1 Mo. LIBOR + 0.400%) |
|
| | 57,423 | | | 0.510 | | | 08/15/36 | | | | 57,882 | |
| FHLMC REMIC Series 3208, Class FD(a)
(1 Mo. LIBOR + 0.400%) |
|
| | 85,560 | | | 0.510 | | | 08/15/36 | | | | 86,244 | |
| FHLMC REMIC Series 3208, Class FG(a)
(1 Mo. LIBOR + 0.400%) |
|
| | 344,537 | | | 0.510 | | | 08/15/36 | | | | 347,290 | |
| FHLMC REMIC Series 3307, Class FT(a)
(1 Mo. LIBOR + 0.240%) |
|
| | 536,813 | | | 0.350 | | | 07/15/34 | | | | 536,919 | |
| FHLMC REMIC Series 3311, Class KF(a)
(1 Mo. LIBOR + 0.340%) |
|
| | 1,021,080 | | | 0.450 | | | 05/15/37 | | | | 1,027,679 | |
| FHLMC REMIC Series 4320, Class FD(a)
(1 Mo. LIBOR + 0.400%) |
|
| | 183,564 | | | 0.510 | | | 07/15/39 | | | | 184,979 | |
| FHLMC REMIC Series 4477, Class FG(a)
(1 Mo. LIBOR + 0.300%) |
|
| | 186,154 | | | 0.399 | | | 10/15/40 | | | | 185,358 | |
| FHLMC REMIC Series 4508, Class CF(a)
(1 Mo. LIBOR + 0.400%) |
|
| | 176,475 | | | 0.510% | | | 09/15/45 | | | | 177,572 | |
| FHLMC REMIC Series 4631, Class GF(a)
(1 Mo. LIBOR + 0.500%) |
|
| | 917,090 | | | 0.610 | | | 11/15/46 | | | | 925,899 | |
| FNMA REMIC Series 2006-82, Class F(a)
(1 Mo. LIBOR + 0.570%) |
|
| | 55,113 | | | 0.672 | | | 09/25/36 | | | | 55,744 | |
| FNMA REMIC Series 2006-96, Class FA(a)
(1 Mo. LIBOR + 0.300%) |
|
| | 298,186 | | | 0.402 | | | 10/25/36 | | | | 299,530 | |
| FNMA REMIC Series 2007-33, Class HF(a)
(1 Mo. LIBOR + 0.350%) |
|
| | 47,583 | | | 0.452 | | | 04/25/37 | | | | 47,850 | |
| | |
|
| Collateralized Mortgage Obligations(a) – (continued) | |
| FNMA REMIC Series 2007-36, Class F(a)
(1 Mo. LIBOR + 0.230%) |
|
| 79,855 | | | 0.332 | | | 04/25/37 | | | | 79,822 | |
| FNMA REMIC Series 2007-85, Class FC(a)
(1 Mo. LIBOR + 0.540%) |
|
| | 244,052 | | | 0.642 | | | 09/25/37 | | | | 247,221 | |
| FNMA REMIC Series 2008-8, Class FB(a)
(1 Mo. LIBOR + 0.820%) |
|
| | 166,892 | | | 0.922 | | | 02/25/38 | | | | 170,152 | |
| FNMA REMIC Series 2011-63, Class FG(a)
(1 Mo. LIBOR + 0.450%) |
|
| | 200,902 | | | 0.552 | | | 07/25/41 | | | | 203,486 | |
| FNMA REMIC Series 2012-35, Class QF(a)
(1 Mo. LIBOR + 0.400%) |
|
| | 659,866 | | | 0.502 | | | 04/25/42 | | | | 665,103 | |
| FNMA REMIC Series 2016-1, Class FT(a)
(1 Mo. LIBOR + 0.350%) |
|
| | 421,671 | | | 0.452 | | | 02/25/46 | | | | 424,465 | |
| FNMA REMIC Series 2017-45, Class FA(a)
(1 Mo. LIBOR + 0.320%) |
|
| | 316,648 | | | 0.419 | | | 06/25/47 | | | | 316,393 | |
| FNMA REMIC Series 2017-96, Class FC(a)
(1 Mo. LIBOR + 0.400%) |
|
| | 645,273 | | | 0.502 | | | 12/25/57 | | | | 650,582 | |
| FNMA REMIC Series 2018-60, Class FK(a)
(1 Mo. LIBOR + 0.300%) |
|
| | 1,487,854 | | | 0.402 | | | 08/25/48 | | | | 1,494,236 | |
| Freddie Mac REMIC Series 3371, Class FA(a)
(1 Mo. LIBOR + 0.600%) |
|
| | 223,148 | | | 0.710 | | | 09/15/37 | | | | 226,897 | |
| Freddie Mac REMIC Series 4068, Class UF(a)
(1 Mo. LIBOR + 0.500%) |
|
| | 1,070,828 | | | 0.610 | | | 06/15/42 | | | | 1,081,419 | |
| Freddie Mac REMIC Series 4942, Class FA(a)
(1 Mo. LIBOR + 0.500%) |
|
| | 1,406,977 | | | 0.602 | | | 01/25/50 | | | | 1,417,800 | |
| Freddie Mac Multifamily ML Certificates(b), Series 2017-ML01 A
(1 Mo. LIBOR + 0.500%) |
|
| | 93,079 | | | 0.602 | | | 01/25/33 | | | | 93,302 | |
| | |
| | TOTAL COLLATERALIZED MORTGAGE OBLIGATIONS | |
| | (Cost $11,080,819) | | | | | | $ | 11,113,756 | |
| | |
| | | | | | | | | | | | |
|
| Mortgage-Backed Securities(a) – 4.0% | |
| Federal Home Loan Mortgage Corporation
(6 Mo. LIBOR + 2.110%) |
|
| | 93,417 | | | 2.288 | | | 12/01/36 | | | | 98,600 | |
| Federal Home Loan Mortgage Corporation
(US 1 Year CMT T-Note + 2.265%) |
|
| | 90,161 | | | 2.287 | | | 01/01/38 | | | | 94,923 | |
| | FHLMC (12 Mo. LIBOR + 1.903%) | |
| | 71,190 | | | 2.188% | | | 01/01/38 | | | | 75,148 | |
| | FHLMC (12 Mo. LIBOR + 1.750%) | |
| | 49,561 | | | 2.000 | | | 05/01/35 | | | | 52,153 | |
| | |
| | |
| 28 | | The accompanying notes are an integral part of these financial statements. |
GOLDMAN SACHS VARIABLE INSURANCE TRUST HIGH QUALITY FLOATING RATE FUND
| | | | | | | | | | | | |
Principal
Amount | | | Interest
Rate | | Maturity
Date | | | Value | |
|
| Mortgage-Backed Securities(a) – (continued) | |
| | FHLMC (12 Mo. LIBOR + 2.180%) | |
| $ | 27,624 | | | 2.555 % | | | 04/01/37 | | | $ | 29,255 | |
| | FHLMC Corporation (US 1 Year CMT T-Note + 2.250%) | |
| | 14,851 | | | 2.285 | | | 09/01/35 | | | | 15,636 | |
| | FNMA (12 Mo. LIBOR + 1.557%) | |
| | 200,031 | | | 1.807 | | | 11/01/35 | | | | 209,161 | |
| | FNMA (US 1 Year CMT T-Note + 2.158%) | |
| | 158,545 | | | 2.236 | | | 06/01/35 | | | | 166,095 | |
| | FNMA (12 Mo. LIBOR + 1.983%) | |
| | 84,431 | | | 2.264 | | | 03/01/37 | | | | 89,424 | |
| | FNMA (US 1 Year CMT T-Note + 2.208%) | |
| | 64,015 | | | 2.333 | | | 05/01/35 | | | | 67,349 | |
| | FNMA (12 Mo. LIBOR + 1.676%) | |
| | 24,447 | | | 1.961 | | | 12/01/35 | | | | 25,656 | |
| | FNMA (12 Mo. LIBOR + 1.325%) | |
| | 13,475 | | | 1.575 | | | 05/01/33 | | | | 13,966 | |
| | FNMA Series 2020-6347, Class BM (12 Mo. LIBOR + 1.734%) | |
| | 1,617,317 | | | 2.026 | | | 02/01/41 | | | | 1,704,617 | |
| | GNMA (US 1 Year CMT T-Note + 1.500%) | |
| | 103,243 | | | 1.875 | | | 04/20/33 | | | | 106,649 | |
| | GNMA Series 2005-48, Class AF (1 Mo. LIBOR + 0.200%) | |
| | 270,911 | | | 0.304 | | | 06/20/35 | | | | 270,458 | |
| | GNMA Series 2012-98, Class FA (1 Mo. LIBOR + 0.400%)
| |
| | 239,635 | | | 0.504 | | | 08/20/42 | | | | 241,537 | |
| | |
| | TOTAL MORTGAGE-BACKED SECURITIES | |
| | (Cost $3,275,407) | | | $ | 3,260,627 | |
| | |
| | |
|
| Commercial Mortgage-Backed Securities – 3.5% | |
| BX Commercial Mortgage Trust Series 2021-21M, Class A(a)
(1 Mo. LIBOR+ 0.730%) |
|
| $ | 200,000 | | | 0.840% | | | 10/15/36 | | | $ | 198,247 | |
| BX Commercial Mortgage Trust Series 2021-CIP, Class A(a)
(1 Mo. LIBOR + 0.921%)
|
|
| | 150,000 | | | 1.021 | | | 12/15/28 | | | | 149,953 | |
| | BX Trust Series 2021-ARIA, Class A(a) (1 Mo. LIBOR + 0.899%)
| |
| | 350,000 | | | 1.009 | | | 10/15/36 | | | | 350,952 | |
| BX Trust Series 2021-BXMF, Class A(a)
(1 Mo. LIBOR + 0.636%) |
|
| | 200,000 | | | 0.746% | | | 10/15/26 | | | | 197,613 | |
| BXHPP Trust Series 2021-FILM, Class A(a)
(1 Mo. LIBOR + 0.650%) |
|
| | 400,000 | | | 0.760 | | | 08/15/36 | | | | 396,708 | |
| CIM Retail Portfolio Trust Series 2021-RETL, Class A(a)
(1 Mo. LIBOR + 1.400%) |
|
| | 200,000 | | | 1.510 | | | 08/15/36 | | | | 199,634 | |
| ELP Commercial Mortgage Trust Series 2021-ELP, Class A(a)
(1 Mo. LIBOR + 0.701%) |
|
| | 200,000 | | | 0.811 | | | 11/15/38 | | | | 198,919 | |
| EQUS Mortgage Trust Series 2021-EQAZ, Class A(a)
(1 Mo. LIBOR + 0.755%) |
|
| | 150,000 | | | 0.865 | | | 10/15/38 | | | | 149,394 | |
| Freddie Mac Multifamily Structured Pass Through Certificates
Series KF32, Class A(a) (1 Mo. LIBOR + 0.370%) |
|
| | 205,713 | | | 0.464 | | | 05/25/24 | | | | 206,105 | |
| | |
|
| Commercial Mortgage-Backed Securities – (continued) | |
| Freddie Mac Multifamily Structured Pass Through Certificates
Series KF58, Class A(a) (1 Mo. LIBOR + 0.500%) |
|
| 307,567 | | | 0.594 | | | 01/25/26 | | | | 308,854 | |
| Freddie Mac Multifamily Structured Pass Through Certificates
Series KF60, Class A(a) (1 Mo. LIBOR + 0.490%) |
|
| | 235,587 | | | 0.584 | | | 02/25/26 | | | | 236,225 | |
| Great Wolf Trust Series 2019-WOLF, Class A(a)
(1 Mo. LIBOR + 1.034%) |
|
| | 200,000 | | | 1.144 | | | 12/15/36 | | | | 199,697 | |
| | |
| | TOTAL COMMERCIAL MORTGAGE-BACKED SECURITIES | |
| | (Cost $2,796,348) | | | $ | 2,792,301 | |
| | |
| | | | | | | | | | | | |
|
| Supranational(a)(b) – 1.9% | |
| | European Investment Bank (SOFR+ 0.290%) | |
| $ | 1,530,000 | | | 0.340% | | | 06/10/22 | | | $ | 1,531,282 | |
| | (Cost $1,530,000) | |
| | |
| | |
|
| U.S. Government Agency Security(a) – 1.9% | |
| | FFCB (SOFR + 0.170%) | |
| $ | 1,500,000 | | | 0.220% | | | 03/15/22 | | | $ | 1,500,128 | |
| | (Cost $1,500,000) | |
| | |
| | |
|
| U.S. Treasury Obligations – 33.6% | |
| | U.S. Treasury Bonds | |
| $ | 220,000 | | | 3.750% | | | 11/15/43 | | | $ | 291,088 | |
| | 170,000 | | | 3.375 | | | 05/15/44 | | | | 214,147 | |
| U.S. Treasury Floating Rate Note (3 Mo. U.S.T-Bill MMY
+ 0.154%) |
|
| | 600,000 | | | 0.274 | | | 01/31/22 | | | | 600,044 | |
| | U.S. Treasury Inflation Indexed Bond | |
| | 750,000 | | | 0.125 | | | 07/15/22 | | | | 924,144 | |
| | U.S. Treasury Notes (3 Mo. U.S.T-Bill MMY + 0.133%) | |
| | 120,000 | | | 1.875 | | | 02/28/22 | | | | 120,328 | |
| | 9,800,000 | | | 0.175 | | | 10/31/22 | | | | 9,803,908 | |
| | 8,800,000 | | | 0.169 | | | 01/31/23 | | | | 8,804,216 | |
| | 20,000 | | | 2.750 | | | 04/30/23 | | | | 20,583 | |
| | 3,900,000 | | | 0.149 | | | 07/31/23 | | | | 3,900,431 | |
| | 920,000 | | | 2.875 | | | 10/31/23 | | | | 956,225 | |
| | 1,020,000 | | | 1.125 | | | 02/28/25 | | | | 1,023,825 | |
| | 140,000 | | | 2.875 | | | 05/31/25 | | | | 148,455 | |
| | 10,000 | | | 3.000 | | | 09/30/25 | | | | 10,687 | |
| | 250,000 | | | 2.125 | | | 05/31/26 | | | | 259,746 | |
| | 20,000 | | | 1.375 | | | 08/31/26 | | | | 20,125 | |
| | |
| | TOTAL U.S. TREASURY OBLIGATIONS | |
| | (Cost $26,995,072) | | | $ | 27,097,952 | |
| | |
| | |
| The accompanying notes are an integral part of these financial statements. | | 29 |
GOLDMAN SACHS VARIABLE INSURANCE TRUST HIGH QUALITY FLOATING RATE FUND
Schedule of Investments (continued)
December 31, 2021
| | | | | | | | |
| Shares | | Dividend
Rate | | �� | Value | |
|
| Investment Company – 13.9%(c) | |
Goldman Sachs Financial Square Government Fund —
Institutional Shares | |
| 11,185,989 | | | 0.026 | % | | $ | 11,185,989 | |
| (Cost $11,185,989) | | | | | |
| |
| TOTAL INVESTMENTS – 97.9% | | | | | |
| (Cost $78,640,809) | | | $ | 78,815,757 | |
| |
OTHER ASSETS IN EXCESS OF LIABILITIES – 2.1% | | | | 1,702,059 | |
| |
| NET ASSETS – 100.0% | | | $ | 80,517,816 | |
| |
| | |
| The percentage shown for each investment category reflects the value of investments in that category as a percentage of net assets. |
| |
| (a) | | Variable rate security. Interest rate or distribution rate disclosed is that which is in effect on December 31, 2021. |
| |
| (b) | | Exempt from registration under Rule 144A of the Securities Act of 1933. |
| |
| (c) | | Represents an affiliated issuer. |
| | |
| |
| Investment Abbreviations: |
| CMT | | —Constant Maturity Treasury Index |
| FHLMC | | —Federal Home Loan Mortgage Corp. |
| FNMA | | —Federal National Mortgage Association |
| GNMA | | —Government National Mortgage Association |
| LIBOR | | —London Interbank Offered Rate |
| LP | | —Limited Partnership |
| Mo. | | —Month |
| SOFR | | —Secured Overnight Financing Rate |
ADDITIONAL INVESTMENT INFORMATION
FUTURES CONTRACTS — At December 31, 2021, the Fund had the following futures contracts:
| | | | | | | | | | | | | | | | |
| Description | | Number of
Contracts | | | Expiration
Date | | | Notional
Amount | | | Unrealized
Appreciation/
(Depreciation) | |
| |
Long position contracts: | | | | | |
| | | | |
| U.S. Treasury 10 Year Note | | | 9 | | | | 03/22/22 | | | $ | 1,160,270 | | | $ | 12,823 | |
| U.S. Treasury 10 Year Ultra Note | | | 1 | | | | 03/22/22 | | | | 143,951 | | | | 2,175 | |
U.S. Treasury 2 Year Note | | | 6 | | | | 03/31/22 | | | | 1,310,144 | | | | (1,347 | ) |
| | | | |
| Total | | | | | | | | | | | | | | $ | 13,651 | |
| |
Short position contracts: | | | | | |
| | | | |
| U.S. Treasury 5 Year Note | | | (33 | ) | | | 03/31/22 | | | $ | (3,975,002 | ) | | $ | (14,389 | ) |
| U.S. Treasury Long Bond | | | (6 | ) | | | 03/22/22 | | | | (948,260 | ) | | | (11,365 | ) |
U.S. Treasury Ultra Bond | | | (1 | ) | | | 03/22/22 | | | | (192,883 | ) | | | (3,242 | ) |
| | | | |
| Total | | | | | | | | | | | | | | $ | (28,996 | ) |
| | | | |
| Total Futures Contracts | | | | | | | | | | | | | | $ | (15,345 | ) |
| | |
| 30 | | The accompanying notes are an integral part of these financial statements. |
GOLDMAN SACHS VARIABLE INSURANCE TRUST HIGH QUALITY FLOATING RATE FUND
ADDITIONAL INVESTMENT INFORMATION (continued)
SWAP CONTRACTS — At December 31, 2021, the Fund had the following swap contract:
CENTRALLY CLEARED INTEREST RATE SWAP CONTRACT
| | | | | | | | | | | | | | | | | | | | |
Payments Made by the Fund(a) | | Payments
Received by
the Fund | | Termination
Date | | Notional
Amount
(000’s)(b) | | | Value | | | Upfront
Premium
Paid | | | Unrealized
Appreciation | |
| 1 Month LIBOR | | 3 Month LIBOR | | 7/25/2024 | | | USD 2,180 | | | $ | 4,530 | | | $ | — | | | $ | 4,530 | |
| (a) | Payments made quarterly. |
| (b) | Represents forward starting interest rate swaps whose effective dates of commencement of accruals and cash flows occur subsequent to December 31, 2021. |
| | |
| The accompanying notes are an integral part of these financial statements. | | 31 |
GOLDMAN SACHS VARIABLE INSURANCE TRUST FIXED INCOME FUNDS
Statements of Assets and Liabilities
December 31, 2021
| | | | | | | | |
| | | Core Fixed
Income Fund | | | High Quality
Floating Rate
Fund | |
| | | | | | | | |
| Assets: | | | | | | |
Investments in unaffiliated issuers, at value (cost $104,281,307 and $67,454,820, respectively) | | $ | 105,212,926 | | | $ | 67,629,768 | |
Investments in affiliated issuers, at value (cost $7,004,192 and $11,185,989, respectively) | | | 7,004,192 | | | | 11,185,989 | |
Cash | | | 751,065 | | | | 1,753,077 | |
Purchased Options, at value (premiums paid $16,635 and $—, respectively) | | | 7,078 | | | | — | |
Foreign currency, at value (cost $165,037 and $—, respectively) | | | 165,240 | | | | — | |
Receivables: | | | | | | | | |
Investments sold on an extended-settlement basis | | | 13,315,336 | | | | 38,294 | |
Interest and Dividends | | | 429,249 | | | | 63,803 | |
Fund shares sold | | | 121,479 | | | | 47,972 | |
Reimbursement from investment adviser | | | 40,638 | | | | 106,771 | |
Collateral on certain derivative contracts(a) | | | 638,660 | | | | 57,408 | |
Unrealized gain on swap contracts | | | 233,523 | | | | 4,530 | |
Upfront premiums paid on swap contracts | | | 161,634 | | | | — | |
Unrealized gain on forward foreign currency exchange contracts | | | 33,576 | | | | — | |
Variation margin on futures contracts | | | 76,034 | | | | — | |
Other assets | | | 842 | | | | 32,429 | |
| | |
| Total assets | | | 128,191,472 | | | | 80,920,041 | |
| | | | | | | | |
| | | | | | | | |
| Liabilities: | | | | | | |
Forward sale contracts, at value (proceeds received $3,112,109 and $—, respectively) | | | 3,113,875 | | | | — | |
Variation margin on swaps | | | 8,069 | | | | — | |
Variation margin on futures contracts | | | — | | | | 5,653 | |
Unrealized loss on swap contracts | | | 1,491 | | | | — | |
Upfront payments received on swap contracts | | | 97,213 | | | | — | |
Unrealized loss on forward foreign currency exchange contracts | | | 30,811 | | | | — | |
Written options, at value (premiums received $17,316 and $—, respectively) | | | 11,958 | | | | — | |
Payables: | | | | | | | | |
Investments purchased | | | 21,507,795 | | | | — | |
Management fees | | | 33,621 | | | | 20,323 | |
Distribution and Service fees and Transfer Agency fees | | | 16,765 | | | | 4,243 | |
Fund shares redeemed | | | 5,026 | | | | 106,108 | |
Accrued expenses | | | 318,896 | | | | 265,898 | |
| | |
| Total liabilities | | | 25,145,520 | | | | 402,225 | |
| | | | | | | | |
| | | | | | | | |
| Net Assets: | | | | | | |
Paid-in capital | | | 102,324,934 | | | | 81,970,621 | |
Total distributable earnings (loss) | | | 721,018 | | | | (1,452,805 | ) |
| | |
| NET ASSETS | | $ | 103,045,952 | | | $ | 80,517,816 | |
Net Assets: | | | | | | | | |
Advisor | | $ | — | | | $ | 4,522,059 | |
Institutional | | | 31,178,752 | | | | 8,024,577 | |
Service | | | 71,867,200 | | | | 67,971,180 | |
| | |
Total Net Assets | | $ | 103,045,952 | | | $ | 80,517,816 | |
Shares Outstanding $0.001 par value (unlimited number of shares authorized): | | | | | | | | |
Advisor | | | — | | | | 437,893 | |
Institutional | | | 2,800,179 | | | | 773,704 | |
Service | | | 6,458,362 | | | | 6,578,843 | |
Net asset value, offering and redemption price per share: | | | | | | | | |
Advisor | | $ | — | | | $ | 10.33 | |
Institutional | | | 11.13 | | | | 10.37 | |
Service | | | 11.13 | | | | 10.33 | |
(a) Segregated for initial margin and/or collateral on transactions as follows:
| | | | | | | | |
| Fund | | Futures | | | Swaps | |
Core Fixed Income | | $ | 267,225 | | | $ | 371,434 | |
| | |
High Quality Floating Rate | | | 57,408 | | | | — | |
| | |
| 32 | | The accompanying notes are an integral part of these financial statements. |
GOLDMAN SACHS VARIABLE INSURANCE TRUST FIXED INCOME FUNDS
Statements of Operations
For the Fiscal Year Ended December 31, 2021
| | | | | | | | |
| | | Core Fixed
Income Fund | | | High Quality
Floating Rate
Fund | |
| | | | | | | | |
| Investment income: | | | | | | |
Interest | | $ | 1,189,917 | | | $ | 411,208 | |
Dividends — affiliated issuers | | | 2,221 | | | | 2,838 | |
Dividends — unaffiliated issuers | | | 74,867 | | | | — | |
| | |
| Total investment income | | | 1,267,005 | | | | 414,046 | |
| | | | | | | | |
| | | | | | | | |
| Expenses: | | | | | | |
Management fees | | | 338,730 | | | | 239,030 | |
Professional fees | | | 179,888 | | | | 148,128 | |
Distribution and Service fees(a) | | | 148,468 | | | | 174,192 | |
Custody, accounting and administrative services | | | 98,952 | | | | 67,664 | |
Printing and mailing costs | | | 39,413 | | | | 33,465 | |
Trustee fees | | | 19,273 | | | | 19,267 | |
Transfer Agency fees(a) | | | 16,935 | | | | 15,420 | |
Service fees — Advisor Shares | | | — | | | | 12,059 | |
Other | | | 1,013 | | | | 28 | |
| | |
| Total expenses | | | 842,672 | | | | 709,253 | |
| | |
Less — expense reductions | | | (344,980 | ) | | | (256,815 | ) |
| | |
| Net expenses | | | 497,692 | | | | 452,438 | |
| | |
| NET INVESTMENT INCOME (LOSS) | | | 769,313 | | | | (38,392 | ) |
| | | | | | | | |
| | | | | | | | |
| Realized and unrealized gain (loss): | | | | | | |
Net realized gain (loss) from: | | | | | | | | |
Investments — unaffiliated issuers | | | 267,718 | | | | 49,000 | |
Futures | | | (314,867 | ) | | | 179,774 | |
Written options | | | 42,035 | | | | — | |
Purchased options | | | (24,758 | ) | | | — | |
Swap contracts | | | (339,625 | ) | | | (892 | ) |
Forward foreign currency exchange contracts | | | 12,433 | | | | — | |
Foreign currency transactions | | | (46,768 | ) | | | — | |
Net change in unrealized gain (loss) on: | | | | | | | | |
Investments — unaffiliated issuers | | | (2,315,002 | ) | | | (158,722 | ) |
Forward Sales Contracts | | | (1,766 | ) | | | — | |
Futures | | | 142,029 | | | | (28,670 | ) |
Swap contracts | | | 169,663 | | | | 7,120 | |
Purchased options | | | (8,178 | ) | | | — | |
Written options | | | 2,827 | | | | — | |
Forward foreign currency exchange contracts | | | 40,085 | | | | — | |
Foreign currency translations | | | 818 | | | | — | |
| | |
| Net realized and unrealized gain (loss) | | | (2,373,356 | ) | | | 47,610 | |
| | |
| NET INCREASE (DECREASE) IN NET ASSETS RESULTING FROM OPERATIONS | | $ | (1,604,043 | ) | | $ | 9,218 | |
(a) Class specific Distribution and/or Service and Transfer Agency fees were as follows:
| | | | | | | | | | | | | | | | | | | | |
| | | Distribution and/or
Service (12b-1) Fees | | | Transfer Agency Fees | |
Fund | | Advisor | | | Service | | | Advisor | | | Institutional | | | Service | |
Core Fixed Income | | $ | — | | | $ | 148,468 | | | $ | — | | | $ | 5,059 | | | $ | 11,876 | |
High Quality Floating Rate | | | 15,924 | | | | 158,268 | | | | 796 | | | | 998 | | | | 13,626 | |
| | |
| The accompanying notes are an integral part of these financial statements. | | 33 |
GOLDMAN SACHS VARIABLE INSURANCE TRUST FIXED INCOME FUNDS
Statements of Changes in Net Assets
| | | | | | | | | | | | | | | | |
| | | Core Fixed Income Fund | | | High Quality Floating Rate Fund | |
| | | For the Fiscal
Year Ended
December 31, 2021 | | | For the Fiscal
Year Ended
December 31, 2020 | | | For the Fiscal Year Ended
December 31, 2021 | | | For the Fiscal
Year Ended
December 31, 2020 | |
| | | | | | | | | | | | | | | | |
| From operations: | | | | | | | | | | | | |
Net investment income | | $ | 769,313 | | | $ | 915,856 | | | $ | (38,392 | ) | | $ | 350,099 | |
Net realized gain (loss) | | | (403,832 | ) | | | 2,388,092 | | | | 227,882 | | | | (347,852 | ) |
Net change in unrealized gain (loss) | | | (1,969,524 | ) | | | 2,128,274 | | | | (180,272 | ) | | | 323,668 | |
| | | | |
| Net increase (decrease) in net assets resulting from operations | | | (1,604,043 | ) | | | 5,432,222 | | | | 9,218 | | | | 325,915 | |
| | | | | | | | | | | | | | | | |
| | | | | | | | | | | | | | | | |
| Distributions to shareholders: | | | | | | | | | | | | |
From distributable earnings: | | | | | | | | | | | | | | | | |
Advisor Shares | | | — | | | | — | | | | (1,363 | ) | | | (28,527 | ) |
Institutional Shares | | | (368,886 | ) | | | (731,170 | ) | | | (9,649 | ) | | | (41,958 | ) |
Service Shares | | | (758,578 | ) | | | (1,177,796 | ) | | | (54,854 | ) | | | (438,573 | ) |
| | | | |
| Total distributions to shareholders | | | (1,127,464 | ) | | | (1,908,966 | ) | | | (65,866 | ) | | | (509,058 | ) |
| | | | | | | | | | | | | | | | |
| | | | | | | | | | | | | | | | |
| From share transactions: | | | | | | | | | | | | |
Proceeds from sales of shares | | | 46,513,298 | | | | 19,588,560 | | | | 15,980,422 | | | | 12,272,089 | |
Reinvestment of distributions | | | 1,127,464 | | | | 1,908,966 | | | | 65,866 | | | | 509,058 | |
Cost of shares redeemed | | | (13,688,105 | ) | | | (8,140,782 | ) | | | (10,119,709 | ) | | | (19,254,992 | ) |
| | | | |
Net increase (decrease) in net assets resulting from share transactions | | | 33,952,657 | | | | 13,356,744 | | | | 5,926,579 | | | | (6,473,845 | ) |
| | | | |
| TOTAL INCREASE (DECREASE) | | | 31,221,150 | | | | 16,880,000 | | | | 5,869,931 | | | | (6,656,988 | ) |
| | | | | | | | | | | | | | | | |
| | | | | | | | | | | | | | | | |
| Net assets: | | | | | | | |
| | | | |
Beginning of year | | | 71,824,802 | | | | 54,944,802 | | | | 74,647,885 | | | | 81,304,873 | |
| | | | |
End of year | | $ | 103,045,952 | | | $ | 71,824,802 | | | $ | 80,517,816 | | | $ | 74,647,885 | |
| | |
| 34 | | The accompanying notes are an integral part of these financial statements. |
GOLDMAN SACHS VARIABLE INSURANCE TRUST CORE FIXED INCOME FUND
Financial Highlights
Selected Data for a Share Outstanding Throughout Each Year
| | | | | | | | | | | | | | | | | | | | |
| | | Goldman Sachs Core Fixed Income Fund | |
| | | Institutional Shares | |
| | | Year Ended December 31, | |
| | | 2021 | | | 2020 | | | 2019 | | | 2018 | | | 2017 | |
| | | | | | | | | | | | | | | | | | | | |
| Per Share Data | | | | | | | | | | | | | | | |
| | | | | |
Net asset value, beginning of year | | $ | 11.53 | | | $ | 10.85 | | | $ | 10.20 | | | $ | 10.66 | | | $ | 10.61 | |
| | | | | |
Net investment income(a) | | | 0.12 | | | | 0.18 | | | | 0.26 | | | | 0.29 | | | | 0.23 | |
| | | | | |
Net realized and unrealized gain (loss) | | | (0.36 | ) | | | 0.86 | | | | 0.69 | | | | (0.37 | ) | | | 0.13 | |
| | | | | |
Total from investment operations | | | (0.24 | ) | | | 1.04 | | | | 0.95 | | | | (0.08 | ) | | | 0.36 | |
| | | | | |
Distributions to shareholders from net investment income | | | (0.14 | ) | | | (0.26 | ) | | | (0.30 | ) | | | (0.38 | ) | | | (0.31 | ) |
| | | | | |
Distributions to shareholders from net realized gains | | | (0.02 | ) | | | (0.10 | ) | | | — | | | | — | | | | — | |
| | | | | |
Total distributions | | | (0.16 | ) | | | (0.36 | ) | | | (0.30 | ) | | | (0.38 | ) | | | (0.31 | ) |
| | | | | |
Net asset value, end of year | | $ | 11.13 | | | $ | 11.53 | | | $ | 10.85 | | | $ | 10.20 | | | $ | 10.66 | |
| | | | | |
Total Return(b) | | | (2.06 | )% | | | 9.64 | % | | | 9.28 | % | | | (0.58 | )% | | | 3.40 | % |
| | | | | |
Net assets, end of period (in 000’s) | | $ | 31,179 | | | $ | 25,194 | | | $ | 17,421 | | | $ | 2,657 | | | $ | 241 | |
| | | | | |
Ratio of net expenses to average net assets | | | 0.41 | % | | | 0.41 | % | | | 0.44 | % | | | 0.42 | % | | | 0.42 | % |
| | | | | |
Ratio of total expenses to average net assets | | | 0.81 | % | | | 0.93 | % | | | 1.08 | % | | | 1.06 | % | | | 0.65 | % |
| | | | | |
Ratio of net investment income to average net assets | | | 1.09 | % | | | 1.61 | % | | | 2.41 | % | | | 2.88 | % | | | 2.18 | % |
| | | | | |
Portfolio turnover rate(c) | | | 513 | % | | | 501 | % | | | 556 | % | | | 406 | % | | | 229 | % |
| (a) | Calculated based on the average shares outstanding methodology. |
| (b) | Assumes investment at the NAV at the beginning of the year, reinvestment of all dividends and distributions, a complete redemption of the investment at the NAV at the end of the year and no sales or redemption charges (if any). Total returns would be reduced if a sales or redemption charge was taken into account. Returns do not reflect the impact of taxes to shareholders relating to Fund distributions or the redemption of Fund shares. |
| (c) | The Fund’s portfolio turnover rate is calculated in accordance with regulatory requirements, without regard to transactions involving short term investments. If such transactions were included, the Fund’s portfolio turnover rate may be higher. |
| | |
| The accompanying notes are an integral part of these financial statements. | | 35 |
GOLDMAN SACHS VARIABLE INSURANCE TRUST CORE FIXED INCOME FUND
Financial Highlights (continued)
Selected Data for a Share Outstanding Throughout Each Year
| | | | | | | | | | | | | | | | | | | | |
| | | Goldman Sachs Core Fixed Income Fund | |
| | | Service Shares | |
| | | Year Ended December 31, | |
| | | 2021 | | | 2020 | | | 2019 | | | 2018 | | | 2017 | |
| | | | | | | | | | | | | | | | | | | | |
| Per Share Data | | | | | | | | | | | | | | | |
| | | | | |
Net asset value, beginning of year | | $ | 11.53 | | | $ | 10.85 | | | $ | 10.21 | | | $ | 10.65 | | | $ | 10.60 | |
| | | | | |
Net investment income(a) | | | 0.09 | | | | 0.16 | | | | 0.25 | | | | 0.25 | | | | 0.21 | |
| | | | | |
Net realized and unrealized gain (loss) | | | (0.34 | ) | | | 0.85 | | | | 0.66 | | | | (0.34 | ) | | | 0.12 | |
| | | | | |
Total from investment operations | | | (0.25 | ) | | | 1.01 | | | | 0.91 | | | | (0.09 | ) | | | 0.33 | |
| | | | | |
Distributions to shareholders from net investment income | | | (0.13 | ) | | | (0.23 | ) | | | (0.27 | ) | | | (0.35 | ) | | | (0.28 | ) |
| | | | | |
Distributions to shareholders from net realized gains | | | (0.02 | ) | | | (0.10 | ) | | | — | | | | — | | | | — | |
| | | | | |
Total distributions | | | (0.15 | ) | | | (0.33 | ) | | | (0.27 | ) | | | (0.35 | ) | | | (0.28 | ) |
| | | | | |
Net asset value, end of year | | $ | 11.13 | | | $ | 11.53 | | | $ | 10.85 | | | $ | 10.21 | | | $ | 10.65 | |
| | | | | |
Total Return (b) | | | (2.23 | )% | | | 9.37 | % | | | 9.00 | % | | | (0.83 | )% | | | 3.14 | % |
| | | | | |
Net assets, end of period (in 000’s) | | $ | 71,867 | | | $ | 46,631 | | | $ | 37,524 | | | $ | 36,416 | | | $ | 108,948 | |
| | | | | |
Ratio of net expenses to average net assets | | | 0.66 | % | | | 0.66 | % | | | 0.68 | % | | | 0.67 | % | | | 0.67 | % |
| | | | | |
Ratio of total expenses to average net assets | | | 1.06 | % | | | 1.18 | % | | | 1.35 | % | | | 1.18 | % | | | 0.90 | % |
| | | | | |
Ratio of net investment income to average net assets | | | 0.85 | % | | | 1.39 | % | | | 2.33 | % | | | 2.46 | % | | | 1.95 | % |
| | | | | |
Portfolio turnover rate(c) | | | 513 | % | | | 501 | % | | | 556 | % | | | 406 | % | | | 229 | % |
| (a) | Calculated based on the average shares outstanding methodology. |
| (b) | Assumes investment at the NAV at the beginning of the year, reinvestment of all dividends and distributions, a complete redemption of the investment at the NAV at the end of the year and no sales or redemption charges (if any). Total returns would be reduced if a sales or redemption charge was taken into account. Returns do not reflect the impact of taxes to shareholders relating to Fund distributions or the redemption of Fund shares. |
| (c) | The Fund’s portfolio turnover rate is calculated in accordance with regulatory requirements, without regard to transactions involving short term investments. If such transactions were included, the Fund’s portfolio turnover rate may be higher. |
| | |
| 36 | | The accompanying notes are an integral part of these financial statements. |
GOLDMAN SACHS VARIABLE INSURANCE TRUST HIGH QUALITY FLOATING RATE FUND
Financial Highlights (continued)
Selected Data for a Share Outstanding Throughout Each Year
| | | | | | | | | | | | | | | | | | | | |
| | | Goldman Sachs High Quality Floating Rate Fund | |
| | | Advisor Shares | |
| | | Year Ended December 31, | |
| | | 2021 | | | 2020 | | | 2019 | | | 2018 | | | 2017 | |
| | | | | | | | | | | | | | | | | | | | |
| Per Share Data | | | | | | | | | | | | | | | |
| | | | | |
Net asset value, beginning of year | | $ | 10.34 | | | $ | 10.36 | | | $ | 10.37 | | | $ | 10.41 | | | $ | 10.40 | |
| | | | | |
Net investment income (loss)(a) | | | (0.02 | ) | | | 0.04 | | | | 0.19 | | | | 0.18 | | | | 0.10 | |
| | | | | |
Net realized and unrealized gain (loss) | | | 0.01 | | | | — | (b) | | | — | (b) | | | (0.04 | ) | | | 0.03 | |
| | | | | |
Total from investment operations | | | (0.01 | ) | | | 0.04 | | | | 0.19 | | | | 0.14 | | | | 0.13 | |
| | | | | |
Distributions to shareholders from net investment income | | | — | | | | (0.06 | ) | | | (0.20 | ) | | | (0.18 | ) | | | (0.12 | ) |
| | | | | |
Net asset value, end of year | | $ | 10.33 | | | $ | 10.34 | | | $ | 10.36 | | | $ | 10.37 | | | $ | 10.41 | |
| | | | | |
Total Return(c) | | | (0.06 | )% | | | 0.38 | % | | | 1.85 | % | | | 1.37 | % | | | 1.26 | % |
| | | | | |
Net assets, end of period (in 000’s) | | $ | 4,522 | | | $ | 3,703 | | | $ | 6,464 | | | $ | 7,184 | | | $ | 4,726 | |
| | | | | |
Ratio of net expenses to average net assets | | | 0.74 | % | | | 0.74 | % | | | 0.76 | % | | | 0.75 | % | | | 0.76 | % |
| | | | | |
Ratio of total expenses to average net assets | | | 1.08 | % | | | 1.09 | % | | | 1.05 | % | | | 1.05 | % | | | 1.12 | % |
| | | | | |
Ratio of net investment income (loss) to average net assets | | | (0.19 | )% | | | 0.39 | % | | | 1.86 | % | | | 1.69 | % | | | 0.96 | % |
| | | | | |
Portfolio turnover rate(d) | | | 50 | % | | | 35 | % | | | 20 | % | | | 36 | % | | | 38 | % |
| (a) | Calculated based on the average shares outstanding methodology. |
| (b) | Amount is less than $0.005 per share. |
| (c) | Assumes investment at the NAV at the beginning of the year, reinvestment of all dividends and distributions, a complete redemption of the investment at the NAV at the end of the year and no sales or redemption charges (if any). Total returns would be reduced if a sales or redemption charge was taken into account. Returns do not reflect the impact of taxes to shareholders relating to Fund distributions or the redemption of Fund shares. |
| (d) | The Fund’s portfolio turnover rate is calculated in accordance with regulatory requirements, without regard to transactions involving short term investments. If such transactions were included, the Fund’s portfolio turnover rate may be higher. |
| | |
| The accompanying notes are an integral part of these financial statements. | | 37 |
GOLDMAN SACHS VARIABLE INSURANCE TRUST HIGH QUALITY FLOATING RATE FUND
Financial Highlights (continued)
Selected Data for a Share Outstanding Throughout Each Year
| | | | | | | | | | | | | | | | | | | | |
| | | Goldman Sachs High Quality Floating Rate Fund | |
| | | Institutional Shares | |
| | | Year Ended December 31, | |
| | | 2021 | | | 2020 | | | 2019 | | | 2018 | | | 2017 | |
| | | | | | | | | | | | | | | | | | | | |
| Per Share Data | | | | | | | | | | | | | | | |
| | | | | |
Net asset value, beginning of year | | $ | 10.37 | | | $ | 10.37 | | | $ | 10.38 | | | $ | 10.42 | | | $ | 10.41 | |
| | | | | |
Net investment income(a) | | | 0.02 | | | | 0.07 | | | | 0.22 | | | | 0.24 | | | | 0.14 | |
| | | | | |
Net realized and unrealized gain (loss) | | | — | (b) | | | 0.02 | | | | 0.01 | | | | (0.06 | ) | | | 0.03 | |
| | | | | |
Total from investment operations | | | 0.02 | | | | 0.09 | | | | 0.23 | | | | 0.18 | | | | 0.17 | |
| | | | | |
Distributions to shareholders from net investment income | | | (0.02 | ) | | | (0.09 | ) | | | (0.24 | ) | | | (0.22 | ) | | | (0.16 | ) |
| | | | | |
Net asset value, end of year | | $ | 10.37 | | | $ | 10.37 | | | $ | 10.37 | | | $ | 10.38 | | | $ | 10.42 | |
| | | | | |
Total Return(c) | | | 0.20 | % | | | 0.86 | % | | | 2.27 | % | | | 1.75 | % | | | 1.62 | % |
| | | | | |
Net assets, end of period (in 000’s) | | $ | 8,025 | | | $ | 5,113 | | | $ | 4,877 | | | $ | 2,326 | | | $ | 57 | |
| | | | | |
Ratio of net expenses to average net assets | | | 0.34 | % | | | 0.34 | % | | | 0.37 | % | | | 0.34 | % | | | 0.36 | % |
| | | | | |
Ratio of total expenses to average net assets | | | 0.69 | % | | | 0.71 | % | | | 0.66 | % | | | 0.63 | % | | | 0.72 | % |
| | | | | |
Ratio of net investment income to average net assets | | | 0.21 | % | | | 0.68 | % | | | 2.15 | % | | | 2.28 | % | | | 1.33 | % |
| | | | | |
Portfolio turnover rate(d) | | | 50 | % | | | 35 | % | | | 20 | % | | | 36 | % | | | 38 | % |
| (a) | Calculated based on the average shares outstanding methodology. |
| (b) | Amount is less than $0.005 per share. |
| (c) | Assumes investment at the NAV at the beginning of the year, reinvestment of all dividends and distributions, a complete redemption of the investment at the NAV at the end of the year and no sales or redemption charges (if any). Total returns would be reduced if a sales or redemption charge was taken into account. Returns do not reflect the impact of taxes to shareholders relating to Fund distributions or the redemption of Fund shares. |
| (d) | The Fund’s portfolio turnover rate is calculated in accordance with regulatory requirements, without regard to transactions involving short term investments. If such transactions were included, the Fund’s portfolio turnover rate may be higher. |
| | |
| 38 | | The accompanying notes are an integral part of these financial statements. |
GOLDMAN SACHS VARIABLE INSURANCE TRUST HIGH QUALITY FLOATING RATE FUND
Financial Highlights (continued)
Selected Data for a Share Outstanding Throughout Each Year
| | | | | | | | | | | | | | | | | | | | |
| | | Goldman Sachs High Quality Floating Rate Fund | |
| | | Service Shares | |
| | | Year Ended December 31, | |
| | | 2021 | | | 2020 | | | 2019 | | | 2018 | | | 2017 | |
| | | | | | | | | | | | | | | | | | | | |
| Per Share Data | | | | | | | | | | | | | | | |
| | | | | |
Net asset value, beginning of year | | $ | 10.34 | | | $ | 10.35 | | | $ | 10.36 | | | $ | 10.40 | | | $ | 10.38 | |
| | | | | |
Net investment income(a) | | | — | (b) | | | 0.05 | | | | 0.21 | | | | 0.19 | | | | 0.11 | |
| | | | | |
Net realized and unrealized gain (loss) | | | — | (b) | | | 0.01 | | | | — | (b) | | | (0.03 | ) | | | 0.04 | |
| | | | | |
Total from investment operations | | | — | | | | 0.06 | | | | 0.21 | | | | 0.16 | | | | 0.15 | |
| | | | | |
Distributions to shareholders from net investment income | | | (0.01 | ) | | | (0.07 | ) | | | (0.22 | ) | | | (0.20 | ) | | | (0.13 | ) |
| | | | | |
Net asset value, end of year | | $ | 10.33 | | | $ | 10.34 | | | $ | 10.35 | | | $ | 10.36 | | | $ | 10.40 | |
| | | | | |
Total Return(c) | | | (0.02 | )% | | | 0.58 | % | | | 2.01 | % | | | 1.50 | % | | | 1.47 | % |
| | | | | |
Net assets, end of period (in 000’s) | | $ | 67,971 | | | $ | 65,832 | | | $ | 69,964 | | | $ | 72,784 | | | $ | 66,548 | |
| | | | | |
Ratio of net expenses to average net assets | | | 0.59 | % | | | 0.59 | % | | | 0.62 | % | | | 0.60 | % | | | 0.61 | % |
| | | | | |
Ratio of total expenses to average net assets | | | 0.91 | % | | | 0.95 | % | | | 0.90 | % | | | 0.91 | % | | | 0.97 | % |
| | | | | |
Ratio of net investment income to average net assets | | | (0.04 | )% | | | 0.46 | % | | | 2.00 | % | | | 1.82 | % | | | 1.08 | % |
| | | | | |
Portfolio turnover rate(d) | | | 50 | % | | | 35 | % | | | 20 | % | | | 36 | % | | | 38 | % |
| (a) | Calculated based on the average shares outstanding methodology. |
| (b) | Amount is less than $0.005 per share. |
| (c) | Assumes investment at the NAV at the beginning of the year, reinvestment of all dividends and distributions, a complete redemption of the investment at the NAV at the end of the year and no sales or redemption charges (if any). Total returns would be reduced if a sales or redemption charge was taken into account. Returns do not reflect the impact of taxes to shareholders relating to Fund distributions or the redemption of Fund shares. |
| (d) | The Fund’s portfolio turnover rate is calculated in accordance with regulatory requirements, without regard to transactions involving short term investments. If such transactions were included, the Fund’s portfolio turnover rate may be higher. |
| | |
| The accompanying notes are an integral part of these financial statements. | | 39 |
GOLDMAN SACHS VARIABLE INSURANCE TRUST FIXED INCOME FUNDS
Notes to Financial Statements
December 31, 2021
1. ORGANIZATION
Goldman Sachs Variable Insurance Trust (the “Trust” or “VIT”) is a Delaware statutory trust registered under the Investment Company Act of 1940, as amended (the “Act”), as an open-end management investment company. The following table lists those series of the Trust that are included in this report (collectively, the “Funds” or individually a “Fund”), along with their corresponding share classes and respective diversification status under the Act:
| | | | |
| Fund | | Share Classes Offered | | Diversified/ Non-diversified |
Core Fixed Income | | Institutional and Service | | Diversified |
High Quality Floating Rate | | Advisor, Institutional and Service | | Diversified |
Shares of the Trust are offered to a separate account of participating life insurance companies for the purpose of funding variable annuity contracts and variable life insurance policies.
Goldman Sachs Asset Management, L.P. (“GSAM”), an affiliate of Goldman Sachs & Co. LLC (“Goldman Sachs”), serves as investment adviser to the Funds pursuant to management agreements (the “Agreements”) with the Trust.
At a meeting held on December 14-15, 2021, upon the recommendation of Goldman Sachs Asset Management, L.P., the Board of Trustees (the “Board”) of the Goldman Sachs Variable Insurance Trust (the “Trust’) approved a proposal to liquidate the High Quality Floating Rate Fund. After careful consideration of a number of factors, the Board concluded that it is advisable and in the best interest of the Fund and its shareholders to liquidate the High Quality Floating Rate Fund. The High Quality Floating Rate Fund will be liquidated on or about April 27, 2022 (the “Liquidation Date”), pursuant to a Plan of Liquidation approved by the Board. The Liquidation Date may be changed without notice at the discretion of the Trust’s officers.
2. SIGNIFICANT ACCOUNTING POLICIES
The financial statements have been prepared in accordance with accounting principles generally accepted in the United States of America (“GAAP”) and require management to make estimates and assumptions that may affect the reported amounts and disclosures. Actual results may differ from those estimates and assumptions. Each Fund is an investment company under GAAP and follows the accounting and reporting guidance applicable to investment companies.
A. Investment Valuation — The Fund’s valuation policy is to value investments at fair value.
B. Investment Income and Investments — Investment income includes interest income, dividend income, and securities lending income, if any. Interest income is accrued daily and adjusted for amortization of premiums and accretion of discounts. Dividend income is recognized on ex-dividend date or, for certain foreign securities, as soon as such information is obtained subsequent to the ex-dividend date. Non-cash dividends, if any, are recorded at the fair market value of the securities received. Investment transactions are reflected on trade date. Realized gains and losses are calculated using identified cost. Investment transactions are recorded on the following business day for daily net asset value (“NAV”) calculations.
For derivative contracts, realized gains and losses are recorded upon settlement of the contract. Upfront payments, if any, are made or received upon entering into a swap agreement and are reflected in the Statements of Assets and Liabilities. Upfront payments are recognized over the contract’s term/event as realized gains or losses, with the exception of forward starting swap contracts whose realized gains or losses are recognized from the effective start date. For securities with paydown provisions, principal payments received are treated as a proportionate reduction to the cost basis of the securities, and excess or shortfall amounts are recorded as income. For treasury inflation protected securities (“TIPS”), adjustments to principal due to inflation/ deflation are reflected as increases/decreases to interest income with a corresponding adjustment to cost.
C. Class Allocations and Expenses — Investment income, realized and unrealized gain (loss), if any, and non-class specific expenses of each Fund are allocated daily based upon the proportion of net assets of each class. Non-class specific expenses directly incurred by a Fund are charged to that Fund, while such expenses incurred by the Trust are allocated across the applicable
GOLDMAN SACHS VARIABLE INSURANCE TRUST FIXED INCOME FUNDS
2. SIGNIFICANT ACCOUNTING POLICIES (continued)
Funds on a straight-line and/or pro-rata basis depending upon the nature of the expenses. Class specific expenses, where applicable, are borne by the respective share classes and include Distribution and Service, Transfer Agency and Service fees.
D. Federal Taxes and Distributions to Shareholders — It is the Fund’s policy to comply with the requirements of the Internal Revenue Code of 1986, as amended (the “Code”), applicable to regulated investment companies and to distribute each year substantially all of its investment company taxable income and capital gains to its shareholders. Accordingly, each Fund is not required to make any provisions for the payment of federal income tax. Distributions to shareholders are recorded on the ex-dividend date. Income and capital gains distributions, if any, are declared and paid according to the following schedule:
| | | | |
| Fund | | Income Distributions
Declared/Paid | | Capital Gains Distributions
Declared/Paid |
Core Fixed Income and High Quality Floating Rate | | Quarterly | | Annually |
Net capital losses, if any, are carried forward to future fiscal years and may be used to the extent allowed by the Code to offset any future capital gains. Losses that are carried forward will retain their character as either short-term or long-term capital losses. Utilization of capital loss carryforwards will reduce the requirement of future capital gains distributions.
The characterization of distributions to shareholders for financial reporting purposes is determined in accordance with federal income tax rules, which may differ from GAAP. The source of each Fund’s distributions may be shown in the accompanying financial statements as either from distributable earnings or capital. Certain components of the Funds’ net assets on the Statements of Assets and Liabilities reflect permanent GAAP/tax differences based on the appropriate tax character.
E. Foreign Currency Translation — The accounting records and reporting currency of a Fund are maintained in U.S. dollars. Assets and liabilities denominated in foreign currencies are translated into U.S. dollars using the current exchange rates at the close of each business day. The effect of changes in foreign currency exchange rates on investments is included within net realized and unrealized gain (loss) on investments. Changes in the value of other assets and liabilities as a result of fluctuations in foreign exchange rates are included in the Statements of Operations within net change in unrealized gain (loss) on foreign currency translation. Transactions denominated in foreign currencies are translated into U.S. dollars on the date the transaction occurred, the effects of which are included within net realized gain (loss) on foreign currency transactions.
3. INVESTMENTS AND FAIR VALUE MEASUREMENTS
U.S. GAAP defines the fair value of a financial instrument as the amount that would be received to sell an asset or paid to transfer a liability in an orderly transaction between market participants at the measurement date (i.e., the exit price); the Funds’ policy is to use the market approach. GAAP establishes a fair value hierarchy that prioritizes the inputs to valuation techniques used to measure fair value. The hierarchy gives the highest priority to unadjusted quoted prices in active markets for identical assets or liabilities (Level 1 measurements) and the lowest priority to unobservable inputs (Level 3 measurements). The level in the fair value hierarchy within which the fair value measurement in its entirety falls shall be determined based on the lowest level input that is significant to the fair value measurement in its entirety. The levels used for classifying investments are not necessarily an indication of the risk associated with investing in these investments. The three levels of the fair value hierarchy are described below:
Level 1 — Unadjusted quoted prices in active markets that are accessible at the measurement date for identical, unrestricted assets or liabilities;
Level 2 — Quoted prices in markets that are not active or financial instruments for which significant inputs are observable (including, but not limited to, quoted prices for similar investments, interest rates, foreign exchange rates, volatility and credit spreads), either directly or indirectly;
Level 3 — Prices or valuations that require significant unobservable inputs (including GSAM’s assumptions in determining fair value measurement).
GOLDMAN SACHS VARIABLE INSURANCE TRUST FIXED INCOME FUNDS
Notes to Financial Statements (continued)
December 31, 2021
3. INVESTMENTS AND FAIR VALUE MEASUREMENTS (continued)
The Board of Trustees (“Trustees”) has approved Valuation Procedures that govern the valuation of the portfolio investments held by the Funds, including investments for which market quotations are not readily available. The Trustees have delegated to GSAM day-to-day responsibility for implementing and maintaining internal controls and procedures related to the valuation of the Funds’ investments. To assess the continuing appropriateness of pricing sources and methodologies, GSAM regularly performs price verification procedures and issues challenges as necessary to third party pricing vendors or brokers, and any differences are reviewed in accordance with the Valuation Procedures.
A. Level 1 and Level 2 Fair Value Investments — The valuation techniques and significant inputs used in determining the fair values for investments classified as Level 1 and Level 2 are as follows:
Money Market Funds — Investments in the Goldman Sachs Financial Square Government Fund (“Underlying Fund”) are valued at the NAV per share of the Institutional Share class on the day of valuation. These investments are generally classified as Level 1 of the fair value hierarchy. For information regarding the Underlying Fund’s accounting policies and investment holdings, please see the Underlying Fund’s shareholder report.
Debt Securities — Debt securities for which market quotations are readily available are valued daily on the basis of quotations supplied by dealers or an independent pricing service approved by the Trustees. The pricing services may use valuation models or matrix pricing, which consider: (i) yield or price with respect to bonds that are considered comparable in characteristics such as rating, interest rate and maturity date or (ii) quotations from securities dealers to determine current value. With the exception of treasury securities of G7 countries, which are generally classified as Level 1, these investments are generally classified as Level 2 of the fair value hierarchy.
i. Mortgage-Backed and Asset-Backed Securities — Mortgage-backed securities represent direct or indirect participations in, or are collateralized by and payable from, mortgage loans secured by residential and/or commercial real estate property. Asset-backed securities include securities whose principal and interest payments are collateralized by pools of other assets or receivables. The value of certain mortgage-backed and asset-backed securities (including adjustable rate mortgage loans) may be particularly sensitive to changes in prevailing interest rates. The value of these securities may also fluctuate in response to the market’s perception of the creditworthiness of the issuers.
Asset-backed securities may present credit risks that are not presented by mortgage-backed securities because they generally do not have the benefit of a security interest in collateral that is comparable to mortgage assets. Some asset-backed securities may only have a subordinated claim on collateral.
Stripped mortgage-backed securities are usually structured with two different classes: one that receives substantially all interest payments (interest-only, or “IO” and/or high coupon rate with relatively low principal amount, or “IOette”), and the other that receives substantially all principal payments (principal-only, or “PO”) from a pool of mortgage loans. Little to no principal will be received at the maturity of an IO; as a result, periodic adjustments are recorded to reduce the cost of the security until maturity. These adjustments are included in interest income.
ii. Treasury Inflation Protected Securities — TIPS are treasury securities in which the principal amount is adjusted daily to keep pace with inflation, as measured by the U.S. Consumer Pricing Index for Urban Consumers. The repayment of the original bond principal upon maturity is guaranteed by the full faith and credit of the U.S. Government.
iii. When-Issued Securities and Forward Commitments — When-issued securities, including TBA (“To Be Announced”) securities, are securities that are authorized but not yet issued in the market and purchased in order to secure what is considered to be an advantageous price or yield to a Fund. A forward commitment involves entering into a contract to purchase or sell securities, typically on an extended settlement basis, for a fixed price at a future date. The purchase of securities on a when-issued or forward commitment basis involves a risk of loss if the value of the security to be purchased declines before the settlement date. Conversely, the sale of securities on a forward commitment basis involves the risk that the value of the securities sold may increase before the settlement date. Although a Fund will generally purchase securities on a when-issued or forward commitment basis with the intention of acquiring the securities for its portfolio, the Fund may dispose
GOLDMAN SACHS VARIABLE INSURANCE TRUST FIXED INCOME FUNDS
3. INVESTMENTS AND FAIR VALUE MEASUREMENTS (continued)
of when-issued securities or forward commitments prior to settlement, which may result in a realized gain or loss. For financial reporting purposes, cash collateral that has been pledged to cover obligations of a Fund and cash collateral received, if any, is reported separately on the Statements of Assets and Liabilities as receivables/payables for collateral on other investments. Non-cash collateral pledged by a Fund, if any, is noted in the Schedules of Investments.
iv. Commercial Paper — Commercial paper normally represents short-term unsecured promissory notes issued in bearer form by banks or bank holding companies, corporations, finance companies and other issuers. Commercial paper consists of direct U.S. dollar-denominated obligations of domestic or foreign issuers. Asset-backed commercial paper is issued by a special purpose entity that is organized to issue the commercial paper and to purchase trade receivables or other financial assets.
Derivative Contracts — A derivative is an instrument whose value is derived from underlying assets, indices, reference rates or a combination of these factors. A Fund enters into derivative transactions to hedge against changes in interest rates, securities prices, and/or currency exchange rates, to increase total return, or to gain access to certain markets or attain exposure to other underliers. For financial reporting purposes, cash collateral that has been pledged to cover obligations of a Fund and cash collateral received, if any, is reported separately on the Statements of Assets and Liabilities as receivables/payables for collateral on certain derivatives contracts. Non-cash collateral pledged by a Fund, if any, is noted in the Schedules of Investments.
Exchange-traded derivatives, including futures and options contracts, are generally valued at the last sale or settlement price on the exchange where they are principally traded. Exchange-traded options without settlement prices are generally valued at the midpoint of the bid and ask prices on the exchange where they are principally traded (or, in the absence of two way trading, at the last bid price for long positions and the last ask price for short positions). Exchange-traded derivatives typically fall within Level 1 of the fair value hierarchy. Over-the-counter (“OTC”) and centrally cleared derivatives are valued using market transactions and other market evidence, including market-based inputs to models, calibration to market-clearing transactions, broker or dealer quotations, or other alternative pricing sources. Where models are used, the selection of a particular model to value OTC and centrally cleared derivatives depends upon the contractual terms of, and specific risks inherent in, the instrument, as well as the availability of pricing information in the market. Valuation models require a variety of inputs, including contractual terms, market prices, yield curves, credit curves, measures of volatility, voluntary and involuntary prepayment rates, loss severity rates and correlations of such inputs. For OTC and centrally cleared derivatives that trade in liquid markets, model inputs can generally be verified and model selection does not involve significant management judgment. OTC and centrally cleared derivatives are classified within Level 2 of the fair value hierarchy when significant inputs are corroborated by market evidence.
i. Forward Contracts — A forward contract is a contract between two parties to buy or sell an asset at a specified price on a future date. A forward contract settlement can occur on a cash or delivery basis. Forward contracts are marked-to-market daily using independent vendor prices, and the change in value, if any, is recorded as an unrealized gain or loss. Cash and certain investments may be used to collateralize forward contracts.
A forward foreign currency exchange contract is a forward contract in which a Fund agrees to receive or deliver a fixed quantity of one currency for another, at a pre-determined price at a future date. All forward foreign currency exchange contracts are marked to market daily by using the outright forward rates or interpolating based upon maturity dates, where available. Non-deliverable forward foreign currency exchange contracts are settled with the counterparty in cash without the delivery of foreign currency.
ii. Futures Contracts — Futures contracts are contracts to buy or sell a standardized quantity of a specified commodity or security. Upon entering into a futures contract, a Fund deposits cash or securities in an account on behalf of the broker in an amount sufficient to meet the initial margin requirement. Subsequent payments are made or received by a Fund equal to the daily change in the contract value and are recorded as variation margin receivable or payable with a corresponding offset to unrealized gains or losses.
iii. Options — When a Fund writes call or put options, an amount equal to the premium received is recorded as a liability and is subsequently marked-to-market to reflect the current value of the option written. Swaptions are options on swap contracts.
GOLDMAN SACHS VARIABLE INSURANCE TRUST FIXED INCOME FUNDS
Notes to Financial Statements (continued)
December 31, 2021
3. INVESTMENTS AND FAIR VALUE MEASUREMENTS (continued)
Upon the purchase of a call option or a put option by a Fund, the premium paid is recorded as an investment and subsequently marked-to-market to reflect the current value of the option. Certain options may be purchased with premiums to be determined on a future date. The premiums for these options are based upon implied volatility parameters at specified terms.
iv. Swap Contracts — Bilateral swap contracts are agreements in which a Fund and a counterparty agree to exchange periodic payments on a specified notional amount or make a net payment upon termination. Bilateral swap transactions are privately negotiated in the OTC market and payments are settled through direct payments between a Fund and the counterparty. By contrast, certain swap transactions are subject to mandatory central clearing. These swaps are executed through a derivatives clearing member (“DCM”), acting in an agency capacity, and submitted to a central counterparty (“CCP”) (“centrally cleared swaps”), in which case all payments are settled with the CCP through the DCM. Swaps are marked-to-market daily using pricing vendor quotations, counterparty or clearinghouse prices or model prices, and the change in value, if any, is recorded as an unrealized gain or loss. Upon entering into a swap contract, a Fund is required to satisfy an initial margin requirement by delivering cash or securities to the counterparty (or in some cases, segregated in a triparty account on behalf of the counterparty), which can be adjusted by any mark-to-market gains or losses pursuant to bilateral or centrally cleared arrangements. For centrally cleared swaps the daily change in valuation, if any, is recorded as a receivable or payable for variation margin.
An interest rate swap is an agreement that obligates two parties to exchange a series of cash flows at specified intervals, based upon or calculated by reference to changes in interest rates on a specified notional principal amount. The payment flows are usually netted against each other, with the difference being paid by one party to the other.
A credit default swap is an agreement that involves one party (the buyer of protection) making a stream of payments to another party (the seller of protection) in exchange for the right to receive protection on a reference security or obligation, including a group of assets or exposure to the performance of an index. A Fund’s investment in credit default swaps may involve greater risks than if the Fund had invested in the referenced obligation directly. Credit events are contract specific but may include bankruptcy, failure to pay, restructuring and obligation acceleration. If a Fund buys protection through a credit default swap and no credit event occurs, its payments are limited to the periodic payments previously made to the counterparty. Upon the occurrence of a specified credit event, a Fund, as a buyer of credit protection, is entitled to receive an amount equal to the notional amount of the swap and deliver to the seller the defaulted reference obligation in a physically settled trade. A Fund may also receive a net settlement amount in the form of cash or securities equal to the notional amount of the swap reduced by the recovery value of the reference obligation in a cash settled trade.
As a seller of protection, the Fund generally receives a payment stream throughout the term of the swap, provided that there is no credit event. In addition, if a Fund sells protection through a credit default swap, a Fund could suffer a loss because the value of the referenced obligation and the premium payments received may be less than the notional amount of the swap paid to the buyer of protection. Upon the occurrence of a specified credit event, a Fund, as a seller of credit protection, may be required to take possession of the defaulted reference obligation and pay the buyer an amount equal to the notional amount of the swap in a physically settled trade. A Fund may also pay a net settlement amount in the form of cash or securities equal to the notional amount of the swap reduced by the recovery value of the reference obligation in a cash settled trade. Recovery values are at times established through the credit event auction process in which market participants are ensured that a transparent price has been set for the defaulted security or obligation. In addition, a Fund is entitled to a return of any assets, which have been pledged as collateral to the counterparty upon settlement.
The maximum potential amount of future payments (undiscounted) that a Fund as seller of protection could be required to make under a credit default swap would be an amount equal to the notional amount of the agreement. These potential amounts would be partially offset by any recovery values of the respective referenced obligations or net amounts received from a settlement of a credit default swap for the same reference security or obligation where a Fund bought credit protection.
A total return swap is an agreement that gives a Fund the right to receive or pay the appreciation or depreciation, as applicable, in the value of a specified security, an index, a basket of securities or indices or other instrument in return for a fee paid to the counterparty, which will typically be an agreed upon interest rate. If the underlying asset declines in value over the term of the swap, a Fund may also be required to pay the dollar value of that decline to the counterparty.
GOLDMAN SACHS VARIABLE INSURANCE TRUST FIXED INCOME FUNDS
3. INVESTMENTS AND FAIR VALUE MEASUREMENTS (continued)
B. Level 3 Fair Value Investments — To the extent that significant inputs to valuation models and other alternative pricing sources are unobservable, or if quotations are not readily available, or if GSAM believes that such quotations do not accurately reflect fair value, the fair value of a Fund’s investments may be determined under Valuation Procedures approved by the Trustees. GSAM, consistent with its procedures and applicable regulatory guidance, may make an adjustment to the most recent valuation prices of either domestic or foreign securities in light of significant events to reflect what it believes to be the fair value of the securities at the time of determining a Fund’s NAV To the extent investments are valued using single source broker quotations obtained directly from the broker or passed through from third party pricing vendors, such investments are classified as Level 3 investments.
C. Fair Value Hierarchy — The following is a summary of the Funds’ investments and derivatives classified in the fair value hierarchy as of December 31, 2021:
| | | | | | | | | | | | |
| | | |
| CORE FIXED INCOME FUND | | | | | | | | | |
| Investment Type | | Level 1 | | | Level 2 | | | Level 3 | |
| | | |
| Assets | | | | | | | | | | | | |
| Fixed Income | | | | | | | | | | | | |
U.S. Treasury Obligations | | $ | 37,462,573 | | | $ | — | | | $ | — | |
Corporate Obligations | | | — | | | | 24,197,740 | | | | — | |
Mortgage-Backed Securities | | | — | | | | 22,750,413 | | | | — | |
Foreign Corporate Debt | | | — | | | | 7,310,695 | | | | — | |
Asset- Backed Securities | | | — | | | | 5,152,144 | | | | — | |
Commercial Mortgage-Backed Securities | | | — | | | | 1,220,174 | | | | — | |
U.S. Government Agency Securities | | | — | | | | 1,047,259 | | | | — | |
Municipal Bonds | | | — | | | | 1,123,527 | | | | — | |
Foreign Government Securities | | | — | | | | 1,745,431 | | | | — | |
Collateralized Mortgage Obligations | | | — | | | | 603,604 | | | | — | |
Short-Term Investments | | | — | | | | 2,599,366 | | | | — | |
| Investment Company | | | 7,004,192 | | | | — | | | | — | |
| | | |
| Liability | | | | | | | | | | | | |
| Forward Sales Contracts | | $ | — | | | $ | (3,113,875 | ) | | $ | — | |
| | | |
| Total | | $ | 44,466,765 | | | $ | 64,636,478 | | | $ | — | |
| | | |
| Derivative Type | | | | | | | | | |
| | | |
| Assets | | | | | | | | | | | | |
| Credit Default Swap Contracts(a) | | $ | — | | | $ | 236,160 | | | $ | — | |
| Forward Foreign Currency Contracts(a) | | | — | | | | 33,576 | | | | — | |
| Futures Contracts(a) | | | 63,033 | | | | — | | | | — | |
| Interest Rate Swap Contracts(a) | | | — | | | | 75,587 | | | | — | |
| Purchased Options Contracts | | | — | | | | 7,078 | | | | — | |
| | | |
| Liabilities | | | | | | | | | | | | |
| Credit Default Swap Contracts(a) | | $ | — | | | $ | (4,981 | ) | | $ | — | |
| Forward Foreign Currency Contracts(a) | | | — | | | | (30,811 | ) | | | — | |
| Futures Contracts(a) | | | (11,103 | ) | | | — | | | | — | |
| Interest Rate Swap Contracts(a) | | | — | | | | (59,701 | ) | | | — | |
| Written Options Contracts | | | — | | | | (11,958 | ) | | | — | |
| | | |
| Total | | $ | 51,930 | | | $ | 244,950 | | | $ | — | |
| (a) | Amount shown represents unrealized gain (loss) at fiscal year end. |
GOLDMAN SACHS VARIABLE INSURANCE TRUST FIXED INCOME FUNDS
Notes to Financial Statements (continued)
December 31, 2021
3. INVESTMENTS AND FAIR VALUE MEASUREMENTS (continued)
Fair Value Hierarchy — The following is a summary of the Fund’s investments classified in the fair value hierarchy as of December 31, 2021:
| | | | | | | | | | | | |
| | | |
| HIGH QUALITY FLOATING RATE FUND | | | | | | | | | |
| Investment Type | | Level 1 | | | Level 2 | | | Level 3 | |
| | | |
| Assets | | | | | | | | | | | | |
| Fixed Income | | | | | | | | | | | | |
U.S. Treasury Obligations | | $ | 27,097,952 | | | $ | — | | | $ | — | |
Asset- Backed Securities | | | — | | | | 20,333,722 | | | | — | |
Mortgage-Backed Securities | | | — | | | | 3,260,627 | | | | — | |
Collateralized Mortgage Obligations | | | — | | | | 11,113,756 | | | | — | |
Commercial Mortgage-Backed Securities | | | — | | | | 2,792,301 | | | | — | |
U.S. Government Agency Security | | | — | | | | 1,500,128 | | | | — | |
Supranational | | | — | | | | 1,531,282 | | | | — | |
| Investment Company | | | 11,185,989 | | | | — | | | | — | |
| | | |
| Total | | $ | 38,283,941 | | | $ | 40,531,816 | | | $ | — | |
| | | |
| Derivative Type | | | | | | | | | |
| | | |
| Assets(a) | | | | | | | | | | | | |
| Futures Contracts | | $ | 14,998 | | | $ | — | | | $ | — | |
| Interest Rate Swap Contracts | | | — | | | | 4,530 | | | | — | |
| | | |
| Liabilities(a) | | | | | | | | | | | | |
| Futures Contracts | | $ | (30,343 | ) | | $ | — | | | $ | — | |
| | | |
| Total | | $ | (15,345 | ) | | $ | 4,530 | | | $ | — | |
| (a) | Amount shown represents unrealized gain at fiscal year end. |
For further information regarding security characteristics, see the Schedules of Investments.
4. INVESTMENTS IN DERIVATIVES
The following tables set forth, by certain risk types, the gross value of derivative contracts (not considered to be hedging instruments for accounting disclosure purposes) as of December 31, 2021. These instruments were used as part of the Funds’ investment strategies and to obtain and/or manage exposure related to the risks below. The values in the tables below exclude the effects of cash collateral received or posted pursuant to these derivative contracts, and therefore are not representative of the Fund’s net exposure.
GOLDMAN SACHS VARIABLE INSURANCE TRUST FIXED INCOME FUNDS
4. INVESTMENTS IN DERIVATIVES (continued)
Core Fixed Income Fund
| | | | | | | | | | | | | | |
| Risk | | | | Statements of Assets and Liabilities | | Assets | | | Statements of Assets and Liabilities | | Liabilities | |
| Interest Rate | | | | Purchased options at value, Variation margin on futures and swaps contracts | | $ | 70,111 | (a) | | Written options at value, variation margin on futures and swaps contracts | | $ | (23,061) | (a) |
| Credit | | | | Receivable for unrealized gain on swap contracts and variation margin on swap contracts | | | 309,110 | (a) | | Unrealized loss on swap contracts | | | (90,512) | (a) |
| Currency | | | | Receivables for unrealized gain on forward foreign currency exchange contracts | | | 33,576 | | | Payable for unrealized loss on forward foreign currency exchange contracts | | | (30,811) | |
| | | | | |
| Total | | | | | | $ | 412,797 | | | | | $ | (144,384) | |
High Quality Floating Rate Fund
| | | | | | | | | | | | | | |
| Risk | | | | Statements of Assets and Liabilities | | Assets | | | Statements of Assets and Liabilities | | Liabilities | |
| Interest Rate | | | | Variation margin on swap contracts | | $ | 4,530 | (a) | | Variation margin on futures contracts | | $ | (5,653) | (a) |
| (a) | Includes unrealized gain (loss) on futures contracts and centrally cleared swap contracts described in the Additional Investment Information sections of the Schedule of Investments. Only the variation margin as of December 31, 2021 is reported within the Statements of Assets and Liabilities. |
The following tables set forth, by certain risk types, the Funds’ gains (losses) related to these derivatives and their indicative volumes for the fiscal year ended December 31, 2021. These gains (losses) should be considered in the context that these derivative contracts may have been executed to create investment opportunities and/or economically hedge certain investments, and accordingly, certain gains (losses) on such derivative contracts may offset certain (losses) gains attributable to investments. These gains (losses) are included in “Net realized gain (loss)” or “Net change in unrealized gain (loss)” on the Statements of Operations:
Core Fixed Income Fund
| | | | | | | | | | |
| Risk | | Statement of Operations | | Net Realized
Gain (Loss) | | | Net Change in
Unrealized
Gain (Loss) | |
| Credit | | Net realized gain (loss) from swap contracts/Net change in unrealized gain (loss) on swap contracts | | $ | (339,625 | ) | | $ | 169,663 | |
| Currency | | Net realized gain (loss) from forward foreign currency exchange contracts/Net change in unrealized gain (loss) on forward foreign currency exchange contracts | | | 12,433 | | | | 40,085 | |
| Interest Rate | | Net realized gain (loss) from futures contracts, written option, and purchased options/Net change in unrealized gain (loss) on futures contracts, written option and purchased options | | | (297,590 | ) | | | 136,678 | |
| | | |
| Total | | | | $ | (624,782 | ) | | $ | 346,426 | |
GOLDMAN SACHS VARIABLE INSURANCE TRUST FIXED INCOME FUNDS
Notes to Financial Statements (continued)
December 31, 2021
4. INVESTMENTS IN DERIVATIVES (continued)
| | | | | | | | | | |
| | |
| High Quality Floating Rate Fund | | | | | | | | |
| Risk | | Statement of Operations | | Net Realized
Gain (Loss) | | | Net Change in
Unrealized
Gain (Loss) | |
| Interest Rate | | Net realized gain (loss) from futures contracts and swap contracts/Net change in unrealized gain (loss) on futures contracts and swap contracts | | $ | 178,882 | | | $ | (21,550 | ) |
For the fiscal year ended December 31, 2021, the relevant values for each derivative type were as follows:
| | | | | | | | | | | | | | | | | | | | |
| | | Average number of Contracts or Notional Amounts(1) | |
| Risk | | Futures Contracts | | | Forward Contracts | | | Swap Agreements | | | Purchased Options | | | Written Options | |
| Core Fixed Income Fund | | | 125 | | | $ | 5,847,413 | | | $ | 151,557,917 | | | $ | 5,358 | | | $ | 8,438 | |
| High Quality Floating Rate Fund | | | 51 | | | | — | | | | 2,502,500 | | | | — | | | | — | |
| (1) | Amounts disclosed represent average number of contracts for futures contracts, purchased options and written options, notional amounts for forward contracts and swap contracts, based on absolute values, which is indicative of volume of this derivative type, for the months that each Fund held such derivatives during the fiscal year ended December 31, 2021. |
5. AGREEMENTS AND AFFILIATED TRANSACTIONS
A. Management Agreement — Under the Agreement, GSAM manages the Funds, subject to the general supervision of the Trustees.
As compensation for the services rendered pursuant to the Agreement, the assumption of the expenses related thereto and administration of the Funds’ business affairs, including providing facilities, GSAM is entitled to a management fee, accrued daily and paid monthly, equal to an annual percentage rate of each Fund’s average daily net assets.
For the year ended December 31, 2021, contractual and effective net management fees with GSAM were at the following rates:
| | | | | | | | | | | | | | | | | | | | | | | | | | | | |
| | | Contractual Management Rate | | | | | | Effective Net
Management
Rate^(1) | |
| Fund | | First
$1 billion | | | Next
$1 billion | | | Next
$3 billion | | | Next
$3 billion | | | Over
$8 billion | | | Effective
Rate | |
| Core Fixed Income Fund | | | 0.40 | % | | | 0.36 | % | | | 0.34 | % | | | 0.33 | % | | | 0.32 | % | | | 0.40 | % | | | 0.40 | % |
| High Quality Floating Rate Fund | | | 0.31 | | | | 0.28 | | | | 0.27 | | | | 0.26 | | | | 0.25 | | | | 0.31 | | | | 0.29 | |
| ^ | Effective Net Management Rate includes the impact of management fee waivers of affiliated underlying funds, if any. The Effective Net Management Rate may not correlate to the Contractual Management Rate as a result of management fee waivers that may be in effect from time to time. |
The Core Fixed Income and High Quality Floating Rate Funds invest in Institutional Shares of the Goldman Sachs Financial Square Government Fund, which is an affiliated Underlying Fund. GSAM has agreed to waive a portion of its management fee payable by the Funds in an amount equal to the management fee it earns as an investment adviser to the affiliated Underlying Fund in which the Funds invest. For the fiscal year ended December 31, 2021, GSAM waived $3,349 and $11,644 of the Core Fixed Income and High Quality Floating Rate Funds’ management fees, respectively.
B. Distribution and/or Service (12b-1) Plans — The Trust, on behalf of Service Shares of the Funds, has adopted Distribution and Service Plans subject to Rule 12b-1 under the Act. Under the Distribution and Service Plans, Goldman Sachs, which serves as distributor (the “Distributor”), is entitled to a fee accrued daily and paid monthly for distribution services and personal and account maintenance services, which may then be paid by Goldman Sachs to authorized dealers, equal to, on an annual basis, 0.25% of the Fund’s average daily net assets attributable to Service Shares.
The Trust, on behalf of Advisor Shares of the High Quality Floating Rate Fund, has adopted a Distribution Plan subject to Rule 12b-1 under the Act. Under the Distribution Plan, Goldman Sachs as Distributor is entitled to a fee accrued daily and paid monthly
GOLDMAN SACHS VARIABLE INSURANCE TRUST FIXED INCOME FUNDS
5. AGREEMENTS AND AFFILIATED TRANSACTIONS (continued)
for distribution services, which may then be paid by Goldman Sachs to authorized dealers, equal to, on an annual basis, 0.15% of the Fund’s average daily net assets attributable to Advisor Shares.
C. Service Plan — The Trust, on behalf of Advisor Shares of the High Quality Floating Rate Fund, has adopted a Service Plan to allow Advisor Shares to compensate service organizations (including Goldman Sachs) for providing varying levels of personal and account maintenance and administration services to their customers who are beneficial owners of such shares. The Service Plan provides for compensation to the service organizations equal to 0.25% of the average daily net assets attributable to Advisor Shares of the Fund.
D. Transfer Agency Agreement — Goldman Sachs also serves as the transfer agent of the Funds for a fee pursuant to the Transfer Agency Agreement. The fees charged for such transfer agency services are accrued daily and paid monthly at an annual rate of 0.02% of the average daily net assets of Advisor, Institutional and Service Shares.
E. Other Expense Agreements and Affiliated Transactions — GSAM has agreed to reduce or limit certain “Other Expenses” of the Funds (excluding acquired fund fees and expenses, transfer agency fees and expenses, service fees and shareholder administration fees (as applicable), taxes, interest, brokerage fees, expenses of shareholder meetings, litigation and indemnification, and extraordinary expenses) to the extent such expenses exceed, on an annual basis, a percentage rate of the average daily net assets of each Fund. Such Other Expense reimbursements, if any, are accrued daily and paid monthly. In addition, the Funds are not obligated to reimburse GSAM for prior fiscal year expense reimbursements, if any. The Other Expense limitations as an annual percentage rate of average daily net assets for the Core Fixed Income and High Quality Floating Rate Funds are 0.004% and 0.034%, respectively. These Other Expense limitations will remain in place through at least April 30, 2022, and prior to such date GSAM may not terminate the arrangements without the approval of the Trustees. In addition, the Funds have entered into certain offset arrangements with the custodian and the transfer agent, which may result in a reduction of the Funds’ expenses and are received irrespective of the application of the “Other Expense” limitations described above.
For the fiscal year ended December 31, 2021, these expense reductions, including any fee waivers and Other Expense reimbursements, were as follows:
| | | | | | | | | | | | |
| Fund | | Management
Fee Waiver | | | Other Expense
Reimbursement | | | Total Expense
Reductions | |
| Core Fixed Income Fund | | $ | 3,349 | | | $ | 341,631 | | | $ | 344,980 | |
| High Quality Floating Rate Fund | | | 11,644 | | | | 245,171 | | | | 256,815 | |
F. Line of Credit Facility — As of December 31, 2021, the Funds participated in a $1,000,000,000 committed, unsecured revolving line of credit facility (the “facility”) together with other funds of the Trust and certain registered investment companies having management agreements with GSAM or its affiliates. This facility is to be used for temporary emergency purposes, or to allow for an orderly liquidation of securities to meet redemption requests. The interest rate on borrowings is based on the federal funds rate. The facility also requires a fee to be paid by the Funds based on the amount of the commitment that has not been utilized. For the fiscal year ended December 31, 2021, the Funds did not have any borrowings under the facility. Prior to April 26, 2021, the facility was $700,000,000.
G. Other Transactions with Affiliates — The following table provides information about the Funds’ investment in the Goldman Sachs Financial Square Government Fund as of and for the fiscal year ended December 31, 2021:
| | | | | | | | | | | | | | | | | | | | | | | | |
| Fund | | Beginning
Value as of
December 31,
2020 | | | Purchases
at Cost | | | Proceeds
from Sales | | | Ending
Value as of
December 31,
2021 | | | Shares as of
December 31,
2021 | | | Dividend
Income | |
| Core Fixed Income Fund | | $ | 11,891,553 | | | $ | 75,160,805 | | | $ | (80,048,166 | ) | | $ | 7,004,192 | | | | 7,004,192 | | | $ | 2,221 | |
| High Quality Floating Rate Fund | | | 10,161,321 | | | | 41,518,288 | | | | (40,493,620 | ) | | | 11,185,989 | | | | 11,185,989 | | | | 2,838 | |
GOLDMAN SACHS VARIABLE INSURANCE TRUST FIXED INCOME FUNDS
Notes to Financial Statements (continued)
December 31, 2021
6. PORTFOLIO SECURITIES TRANSACTIONS
The cost of purchases and proceeds from sales and maturities of long-term securities for the fiscal year ended December 31, 2021, were as follows:
| | | | | | | | | | | | | | | | | | | | |
| Fund | | | | | Purchases of U.S.
Government and
Agency Obligations | | | Purchases
(Excluding U.S.
Government and
Agency Obligations) | | | Sales and
Maturities of U.S.
Government and
Agency Obligations | | | Sales and
Maturities
(Excluding U.S.
Government and
Agency Obligations) | |
| Core Fixed Income | | | | | | $ | 182,102,769 | | | $ | 183,704,795 | | | $ | 155,804,750 | | | $ | 174,603,443 | |
| High Quality Floating Rate | | | | | | | 20,100,720 | | | | 16,932,940 | | | | 14,927,634 | | | | 17,675,730 | |
7. TAX INFORMATION
The tax character of distributions paid during the fiscal year ended December 31, 2021 was as follows:
| | | | | | | | |
| | | Core Fixed
Income Fund | | | High Quality
Floating Rate Fund | |
| Distributions paid from: | | | | | | | | |
Ordinary income | | $ | 1,127,464 | | | $ | 65,866 | |
| Total taxable distributions | | $ | 1,127,464 | | | $ | 65,866 | |
The tax character of distributions paid during the fiscal year ended December 31, 2020 was as follows:
| | | | | | | | |
| | | Core Fixed
Income Fund | | | High Quality
Floating Rate Fund | |
| Distributions paid from: | | | | | | | | |
Ordinary income | | $ | 1,908,966 | | | $ | 509,058 | |
| Total taxable distributions | | $ | 1,908,966 | | | $ | 509,058 | |
GOLDMAN SACHS VARIABLE INSURANCE TRUST FIXED INCOME FUNDS
7. TAX INFORMATION (continued)
As of December 31, 2021, the components of accumulated earnings (losses) on a tax-basis were as follows:
| | | | | | | | |
| | | Core Fixed
Income Fund | | | High Quality
Floating Rate Fund | |
| Undistributed ordinary income — net | | $ | 58,195 | | | $ | 27,407 | |
| Total undistributed earnings | | $ | 58,195 | | | $ | 27,407 | |
| Capital loss carryforwards:(1) | | | | | | | | |
Perpetual Short-Term | | $ | (353,719 | ) | | $ | (271,821 | ) |
Perpetual Long-Term | | | (65,428 | ) | | | (1,261,706 | ) |
| Total capital loss carryovers | | $ | (419,147 | ) | | $ | (1,533,527 | ) |
Timing differences (Late year ordinary loss deferral, post October loss deferral, and straddle loss deferrals) | | $ | (161,044 | ) | | $ | (124,878 | ) |
| Unrealized gains (losses) — net | | | 1,243,014 | | | | 178,193 | |
| Total accumulated earnings (losses) net | | $ | 721,018 | | | $ | (1,452,805 | ) |
| (1) | The High Quality Floating Rate Fund utilized $14,232 of capital losses in the current year. |
As of December 31, 2021, the Funds’ aggregate security unrealized gains and losses based on cost for U.S. federal income tax purposes were as follows:
| | | | | | | | |
| | | Core Fixed
Income Fund | | | High Quality
Floating Rate Fund | |
| Tax cost | | $ | 111,288,228 | | | $ | 78,626,749 | |
| Gross unrealized gain | | | 2,159,127 | | | | 257,877 | |
| Gross unrealized loss | | | (916,113 | ) | | | (79,684 | ) |
| Net unrealized gain (loss) | | $ | 1,243,014 | | | $ | 178,193 | |
The difference between GAAP-basis and tax-basis unrealized gains (losses) is attributable primarily to wash sales, net mark to market gains (losses) on regulated futures and foreign currency contracts, and differences in the tax treatment of market discount accretion and premium amortization and swap transactions.
GSAM has reviewed the Funds’ tax positions for all open tax years (the current and prior three years, as applicable) and has concluded that no provision for income tax is required in the Funds’ financial statements. Such open tax years remain subject to examination and adjustment by tax authorities.
8. OTHER RISKS
The Funds’ risks include, but are not limited to, the following:
Derivatives Risk — The Funds’ use of derivatives may result in loss. Derivative instruments, which may pose risks in addition to and greater than those associated with investing directly in securities, currencies or other instruments, may be illiquid or less liquid, volatile, difficult to price and leveraged so that small changes in the value of the underlying instruments may produce disproportionate losses to the Funds. Derivatives are also subject to counterparty risk, which is the risk that the other party in the transaction will not fulfill its contractual obligation. The use of derivatives is a highly specialized activity that involves investment techniques and risks different from those associated with investments in more traditional securities and instruments. Losses from derivatives can also result from a lack of correlation between changes in the value of derivative instruments and the portfolio assets (if any) being hedged.
GOLDMAN SACHS VARIABLE INSURANCE TRUST FIXED INCOME FUNDS
Notes to Financial Statements (continued)
December 31, 2021
8. OTHER RISKS (continued)
Floating and Variable Rate Obligations Risk— Floating rate and variable rate obligations are debt instruments issued by companies or other entities with interest rates that reset periodically (typically, daily, monthly, quarterly, or semiannually) in response to changes in the market rate of interest on which the interest rate is based. For floating and variable rate obligations, there may be a lag between an actual change in the underlying interest rate benchmark and the reset time for an interest payment of such an obligation, which could harm or benefit a Fund, depending on the interest rate environment or other circumstances. In a rising interest rate environment, for example, a floating or variable rate obligation that does not reset immediately would prevent a Fund from taking full advantage of rising interest rates in a timely manner. However, in a declining interest rate environment, a Fund may benefit from a lag due to an obligation’s interest rate payment not being immediately impacted by a decline in interest rates.
On March 5, 2021, the United Kingdom’s Financial Conduct Authority (“FCA”) and ICE Benchmark Authority formally announced that certain LIBOR will cease publication after December 31, 2021 while others will cease publication after June 30, 2023. The unavailability or replacement of LIBOR may affect the value, liquidity or return on certain Fund investments and may result in costs incurred in connection with closing out positions and entering into new trades. Any pricing adjustments to the Fund’s investments resulting from a substitute reference rate may adversely affect the Fund’s performance and/or NAV.
Interest Rate Risk — When interest rates increase, fixed income securities or instruments held by a Fund will generally decline in value. Long-term fixed income securities or instruments will normally have more price volatility because of this risk than short-term fixed income securities or instruments. The risks associated with changing interest rates may have unpredictable effects on the markets and a Fund’s investments. Fluctuations in interest rates may also affect the liquidity of fixed income securities and instruments held by the Funds.
Investments in Other Investment Companies Risk — As a shareholder of another investment company, a Fund will indirectly bear its proportionate share of any net management fees and other expenses paid by such other investment companies, in addition to the fees and expenses regularly borne by the Fund.
Large Shareholder Transactions Risk — A Fund may experience adverse effects when certain large shareholders, such as other funds, participating insurance companies, accounts and Goldman Sachs affiliates, purchase or redeem large amounts of shares of the Fund. Such large shareholder redemptions, which may occur rapidly or unexpectedly, may cause a Fund to sell portfolio securities at times when it would not otherwise do so, which may negatively impact a Fund’s NAV and liquidity. These transactions may also accelerate the realization of taxable income to shareholders if such sales of investments resulted in gains, and may also increase transaction costs. In addition, a large redemption could result in a Fund’s current expenses being allocated over a smaller asset base, leading to an increase in the Fund’s expense ratio. Similarly, large Fund share purchases may adversely affect a Fund’s performance to the extent that the Fund is delayed in investing new cash or otherwise maintains a larger cash position than it ordinarily would.
Liquidity Risk — A Fund may make investments that are illiquid or that may become less liquid in response to market developments or adverse investor perceptions. Illiquid investments may be more difficult to value. Liquidity risk may also refer to the risk that a Fund will not be able to pay redemption proceeds within the allowable time period or without significant dilution to remaining investors’ interests because of unusual market conditions, an unusually high volume of redemption requests, or other reasons. To meet redemption requests, a Fund may be forced to sell investments at an unfavorable time and/or under unfavorable conditions. If a Fund is forced to sell securities at an unfavorable time and/or under unfavorable conditions, such sales may adversely affect the Fund’s NAV and dilute remaining investors’ interests. Liquidity risk may be the result of, among other things, the reduced number and capacity of traditional market participants to make a market in fixed income securities or the lack of an active market. The potential for liquidity risk may be magnified by a rising interest rate environment or other circumstances where investor redemptions from fixed income mutual funds may be higher than normal, potentially causing increased supply in the market due to selling activity. Redemptions by large shareholders may have a negative impact on a Fund’s liquidity.
Market and Credit Risks — In the normal course of business, a Fund trades financial instruments and enters into financial transactions where risk of potential loss exists due to changes in the market (market risk). The value of the securities in which a Fund invests may go up or down in response to the prospects of individual companies, particular sectors or governments and/or general economic conditions throughout the world due to increasingly interconnected global economies and financial markets. Events such as
GOLDMAN SACHS VARIABLE INSURANCE TRUST FIXED INCOME FUNDS
8. OTHER RISKS (continued)
war, acts of terrorism, social unrest, natural disasters, the spread of infectious illness or other public health threats could also significantly impact a Fund and its investments. Additionally, a Fund may also be exposed to credit risk in the event that an issuer or guarantor fails to perform or that an institution or entity with which the Fund has unsettled or open transactions defaults.
9. SUBSEQUENT EVENTS
Subsequent events after the Statements of Assets and Liabilities date have been evaluated, and GSAM has concluded that there is no impact requiring adjustment or disclosure in the financial statements.
10. SUMMARY OF SHARE TRANSACTIONS
Share activity is as follows:
| | | | | | | | | | | | | | | | |
| | | Core Fixed Income Fund | |
| | | For the Fiscal Year Ended
December 31, 2021 | | | For the Fiscal Year Ended
December 31, 2020 | |
| | | Shares | | | Dollars | | | Shares | | | Dollars | |
| Institutional Shares | | | | | | | | | | | | | | | | |
| Shares sold | | | 1,500,925 | | | $ | 16,820,030 | | | | 789,803 | | | $ | 8,886,982 | |
| Reinvestment of distributions | | | 33,172 | | | | 368,886 | | | | 64,349 | | | | 731,170 | |
| Shares redeemed | | | (919,193 | ) | | | (10,321,960 | ) | | | (274,628 | ) | | | (3,114,896 | ) |
| | | | 614,904 | | | | 6,866,956 | | | | 579,524 | | | | 6,503,256 | |
| Service Shares | | | | | | | | | | | | | | | | |
| Shares sold | | | 2,646,702 | | | | 29,693,268 | | | | 930,205 | | | | 10,701,578 | |
| Reinvestment of distributions | | | 68,220 | | | | 758,578 | | | | 103,826 | | | | 1,177,796 | |
| Shares redeemed | | | (300,466 | ) | | | (3,366,145 | ) | | | (447,526 | ) | | | (5,025,886 | ) |
| | | | 2,414,456 | | | | 27,085,701 | | | | 586,505 | | | | 6,853,488 | |
| | | | |
| NET INCREASE | | | 3,029,360 | | | $ | 33,952,657 | | | | 1,166,029 | | | $ | 13,356,744 | |
GOLDMAN SACHS VARIABLE INSURANCE TRUST FIXED INCOME FUNDS
Notes to Financial Statements (continued)
December 31, 2021
10. SUMMARY OF SHARE TRANSACTIONS (continued)
| | | | | | | | | | | | | | | | |
| | | High Quality Floating Rate Fund | |
| | | For the Fiscal Year Ended
December 31, 2021 | | | For the Fiscal Year Ended
December 31, 2020 | |
| | | Shares | | | Dollars | | | Shares | | | Dollars | |
| Advisor Shares | | | | | | | | | | | | | | | | |
| Shares sold | | | 122,918 | | | $ | 1,271,125 | | | | 154,731 | | | $ | 1,599,106 | |
| Reinvestment of distributions | | | 132 | | | | 1,363 | | | | 2,796 | | | | 28,527 | |
| Shares redeemed | | | (43,139 | ) | | | (446,201 | ) | | | (423,220 | ) | | | (4,353,323 | ) |
| | | | 79,911 | | | | 826,287 | | | | (265,693 | ) | | | (2,725,690 | ) |
| Institutional Shares | | | | | | | | | | | | | | | | |
| Shares sold | | | 479,340 | | | | 4,971,423 | | | | 34,504 | | | | 355,000 | |
| Reinvestment of distributions | | | 930 | | | | 9,649 | | | | 4,100 | | | | 41,958 | |
| Shares redeemed | | | (199,770 | ) | | | (2,073,579 | ) | | | (15,562 | ) | | | (160,926 | ) |
| | | | 280,500 | | | | 2,907,493 | | | | 23,042 | | | | 236,032 | |
| Service Shares | | | | | | | | | | | | | | | | |
| Shares sold | | | 941,288 | | | | 9,737,874 | | | | 1,000,714 | | | | 10,317,983 | |
| Reinvestment of distributions | | | 5,301 | | | | 54,854 | | | | 42,991 | | | | 438,573 | |
| Shares redeemed | | | (734,790 | ) | | | (7,599,929 | ) | | | (1,434,565 | ) | | | (14,740,743 | ) |
| | | | 211,799 | | | | 2,192,799 | | | | (390,860 | ) | | | (3,984,187 | ) |
| | | | |
| NET INCREASE (DECREASE) | | | 572,210 | | | $ | 5,926,579 | | | | (633,511 | ) | | $ | (6,473,845 | ) |
Report of Independent Registered Public Accounting Firm
To the Board of Trustees of Goldman Sachs Variable Insurance Trust and Shareholders of Goldman Sachs Core Fixed Income Fund and Goldman Sachs High Quality Floating Rate Fund
Opinions on the Financial Statements
We have audited the accompanying statements of assets and liabilities, including the schedules of investments, of Goldman Sachs Core Fixed Income Fund and Goldman Sachs High Quality Floating Rate Fund (two of the Funds constituting Goldman Sachs Variable Insurance Trust, referred to hereafter as the “Funds”) as of December 31, 2021, the related statements of operations for the year ended December 31, 2021, the statements of changes in net assets for each of the two years in the period ended December 31, 2021, including the related notes, and the financial highlights for each of the five years in the period ended December 31, 2021 (collectively referred to as the “financial statements”). In our opinion, the financial statements present fairly, in all material respects, the financial position of each of the Funds as of December 31, 2021, the results of each of their operations for the year then ended, the changes in their net assets for each of the two years in the period ended December 31, 2021 and each of the financial highlights for each of the five years in the period ended December 31, 2021 in conformity with accounting principles generally accepted in the United States of America.
Basis for Opinions
These financial statements are the responsibility of the Funds’ management. Our responsibility is to express an opinion on the Funds’ financial statements based on our audits. We are a public accounting firm registered with the Public Company Accounting Oversight Board (United States) (PCAOB) and are required to be independent with respect to the Funds in accordance with the U.S. federal securities laws and the applicable rules and regulations of the Securities and Exchange Commission and the PCAOB.
We conducted our audits of these financial statements in accordance with the standards of the PCAOB. Those standards require that we plan and perform the audit to obtain reasonable assurance about whether the financial statements are free of material misstatement, whether due to error or fraud.
Our audits included performing procedures to assess the risks of material misstatement of the financial statements, whether due to error or fraud, and performing procedures that respond to those risks. Such procedures included examining, on a test basis, evidence regarding the amounts and disclosures in the financial statements. Our audits also included evaluating the accounting principles used and significant estimates made by management, as well as evaluating the overall presentation of the financial statements. Our procedures included confirmation of securities owned as of December 31, 2021 by correspondence with the custodian, transfer agent and brokers; when replies were not received from brokers, we performed other auditing procedures. We believe that our audits provide a reasonable basis for our opinions.
/s/PricewaterhouseCoopers LLP
Boston, Massachusetts
February 23, 2022
We have served as the auditor of one or more investment companies in the Goldman Sachs fund complex since 2000.
GOLDMAN SACHS VARIABLE INSURANCE TRUST FIXED INCOME FUNDS
| | |
| Fund Expenses — Six Month Period Ended December 31, 2021 (Unaudited) | | |
As a shareholder of Institutional, Service or Advisor Shares of the Funds, you incur ongoing costs, including management fees, distribution and/or service (12b-1) fees (with respect to Service and Advisor Shares) and other Fund expenses. This example is intended to help you understand your ongoing costs (in dollars) of investing in the Institutional Shares, Service Shares and Advisor Shares of the Funds and to compare these costs with the ongoing costs of investing in other mutual funds.
The example is based on an investment of $1,000 invested at the beginning of the period and held for the entire period from July 1, 2021 through December 31, 2021, which represents a period of 184 days of a 365 day year.
Actual Expenses — The first line under each share class in the table below provides information about actual account values and actual expenses. You may use the information in this line, together with the amount you invested, to estimate the expenses that you paid over the period. Simply divide your account value by $1,000 (for example, an $8,600 account value divided by $1,000=8.6), then multiply the result by the number in the first line under the heading entitled “Expenses Paid” to estimate the expenses you paid on your account during this period.
Hypothetical Example for Comparison Purposes — The second line under each share class in the table below provides information about hypothetical account values and hypothetical expenses based on the Funds’ actual net expense ratio and an assumed rate of return of 5% per year before expenses, which is not the Funds’ actual return. The hypothetical account values and expenses may not be used to estimate the actual ending account balance or expenses you paid for the period. You may use this information to compare the ongoing costs of investing in the Funds and other funds. To do so, compare this 5% hypothetical example with the 5% hypothetical examples that appear in the shareholder reports of the other funds.
Please note that the expenses shown in the table are meant to highlight your ongoing costs only. As a shareholder of the Funds you do not incur any transaction costs, such as sales charges, redemption fees, or exchange fees, but shareholders of other funds may incur such costs. The second line of the table is useful in comparing ongoing costs only and will not help you determine the relative total costs of owning different funds whose shareholders may incur transaction costs.
| | | | | | | | | | | | | | | | | | | | | | | | |
| | | Core Fixed Income Fund | | | High Quality Floating Rate Fund | |
| Share Class | | Beginning
Account
Value
07/01/21 | | | Ending
Account
Value
12/31/21 | | | Expenses
Paid for the
6 Months
Ended
12/31/21* | | | Beginning
Account
Value
07/01/21 | | | Ending
Account
Value
12/31/21 | | | Expenses
Paid for the
6 Months
Ended
12/31/21* | |
| Institutional | | | | | | | | | | | | | | | | | | | | | | | | |
| | | | | | | |
Actual | | $ | 1,000 | | | $ | 998.83 | | | $ | 2.12 | | | $ | 1,000 | | | $ | 1,000.78 | | | $ | 1.66 | |
Hypothetical 5% return | | | 1,000 | | | | 1,023.09 | + | | | 2.14 | | | | 1,000 | | | | 1,023.54 | + | | | 1.68 | |
| Service | | | | | | | | | | | | | | | | | | | | | | | | |
| | | | | | | |
Actual | | | 1,000 | | | | 998.23 | | | | 3.37 | | | | 1,000 | | | | 999.18 | | | | 3.02 | |
Hypothetical 5% return | | | 1,000 | | | | 1,021.83 | + | | | 3.41 | | | | 1,000 | | | | 1,021.77 | + | | | 3.06 | |
| Advisor | | | | | | | | | | | | | | | | | | | | | | | | |
| | | | | | | |
Actual | | | N/A | | | | N/A | | | | N/A | | | | 1,000 | | | | 999.03 | | | | 3.68 | |
Hypothetical 5% return | | | N/A | | | | N/A | | | | N/A | | | | 1,000 | | | | 1,021.08 | + | | | 3.72 | |
| | + | Hypothetical expenses are based on each Fund’s actual annualized net expense ratios and an assumed rate of return of 5% per year before expenses. | |
| | * | Expenses are calculated using each Fund’s annualized net expense ratio for each class, which represents the ongoing expenses as a percentage of net assets for the six months ended December 31, 2021. Expenses are calculated by multiplying the annualized net expense ratio by the average account value for the period; then multiplying the result by the number of days in the most recent fiscal half year; and then dividing that result by the number of days in the fiscal year. The annualized net expense ratios for the period were as follows: | |
| | | | | | | | | | | | |
| | | |
| Fund | | Institutional | | | Service | | | Advisor | |
| Core Fixed Income | | | 0.42 | % | | | 0.67 | % | | | N/A | |
| High Quality Floating Rate | | | 0.33 | | | | 0.60 | | | | 0.73 | % |
56
GOLDMAN SACHS VARIABLE INSURANCE TRUST FIXED INCOME FUNDS
Trustees and Officers (Unaudited)
Independent Trustees
| | | | | | | | | | | | |
| | | | | |
Name, Address and Age1 | | Position(s) Held
with the Trust | | Term of
Office and
Length of
Time Served2 | | Principal Occupation(s)
During Past 5 Years | | Number of
Portfolios in
Fund Complex
Overseen by
Trustee3 | | | Other
Directorships
Held by Trustee4 |
Jessica Palmer Age: 72 | | Chair of the Board of Trustees | | Since 2018 (Trustee since 2007) | | Ms. Palmer is retired. She was formerly Consultant, Citigroup Human Resources Department (2007-2008); Managing Director, Citigroup Corporate and Investment Banking (previously, Salomon Smith Barney/Salomon Brothers) (1984-2006). Ms. Palmer was a Member of the Board of Trustees of Indian Mountain School (private elementary and secondary school) (2004-2009). Chair of the Board of Trustees — Goldman Sachs Trust and Goldman Sachs Variable Insurance Trust. | | | 109 | | | None |
Dwight L. Bush Age: 64 | | Trustee | | Since 2020 | | Ambassador Bush is President and CEO of D.L. Bush & Associates (a financial advisory and private investment firm) (2002-2014 and 2017- present); Director of MoneyLion Inc. (an operator of a data drive, digital financial platform (2021-present); and was formerly U.S. Ambassador to the Kingdom of Morocco (2014-2017) and a Member of the Board of Directors of Santander Bank, N.A. (2018-2019). Previously, Ambassador Bush served as an Advisory Board Member of Goldman Sachs Trust and Goldman Sachs Variable Insurance Trust (October 2019-January 2020). Trustee — Goldman Sachs Trust and Goldman Sachs Variable Insurance Trust. | | | 109 | | | None |
Kathryn A. Cassidy Age: 67 | | Trustee | | Since 2015 | | Ms. Cassidy is retired. Formerly, she was Advisor to the Chairman (May 2014-December 2014); and Senior Vice President and Treasurer (2008-2014), General Electric Company & General Electric Capital Corporation (technology and financial services companies). Trustee — Goldman Sachs Trust and Goldman Sachs Variable Insurance Trust. | | | 109 | | | None |
Diana M. Daniels Age: 72 | | Trustee | | Since 2007 | | Ms. Daniels is retired. Formerly, she was Vice President, General Counsel and Secretary, The Washington Post Company (1991-2006). Ms. Daniels is a Trustee Emeritus and serves as a Presidential Councillor of Cornell University (2013-Present); former Member of the Legal Advisory Board, New York Stock Exchange (2003-2006) and of the Corporate Advisory Board, Standish Mellon Management Advisors (2006-2007). Trustee — Goldman Sachs Trust and Goldman Sachs Variable Insurance Trust. | | | 109 | | | None |
Joaquin Delgado Age: 61 | | Trustee | | Since 2020 | | Dr. Delgado is retired. He is Director, Hexion Inc. (a specialty chemical manufacturer) (2019- present); and Director, Stepan Company (a specialty chemical manufacturer) (2011-present); and was formerly Executive Vice President, Consumer Business Group of 3M Company (July 2016-July 2019); and Executive Vice President, Health Care Business Group of 3M Company (October 2012-July 2016). Previously, Dr. Delgado served as an Advisory Board Member of Goldman Sachs Trust and Goldman Sachs Variable Insurance Trust (October 2019-January 2020). Trustee — Goldman Sachs Trust and Goldman Sachs Variable Insurance Trust. | | | 109 | | | Hexion Inc. (a specialty chemical manufacturer); Stepan Company (a specialty chemical manufacturer) |
| | | | | | | | | | | | |
GOLDMAN SACHS VARIABLE INSURANCE TRUST FIXED INCOME FUNDS
Trustees and Officers (Unaudited) (continued)
Independent Trustees (continued)
| | | | | | | | | | | | |
| | | | | |
Name, Address and Age1 | | Position(s) Held
with the Trust | | Term of
Office and
Length of
Time Served2 | | Principal Occupation(s)
During Past 5 Years | | Number of
Portfolios in
Fund Complex
Overseen by
Trustee3 | | | Other
Directorships
Held by Trustee4 |
Eileen H. Dowling Age: 59 | | Trustee | | Since 2021 | | Ms. Dowling is retired. Formerly, she was Senior Advisor (April 2021- September 2021); and Managing Director (2013-2021), BlackRock, Inc. (a financial services firm). Trustee — Goldman Sachs Trust and Goldman Sachs Variable Insurance Trust. | | | 109 | | | None |
Roy W. Templin Age: 61 | | Trustee | | Since 2013 | | Mr. Templin is retired. He is Director, Armstrong World Industries, Inc. (a designer and manufacturer of ceiling and wall systems) (2016-Present); and was formerly Chairman of the Board of Directors, Con- Way Incorporated (a transportation, logistics and supply chain management service company) (2014-2015); Executive Vice President and Chief Financial Officer, Whirlpool Corporation (an appliance manufacturer and marketer) (2004-2012). Trustee — Goldman Sachs Trust and Goldman Sachs Variable Insurance Trust. | | | 109 | | | Armstrong World Industries, Inc. (a ceiling and wall systems manufacturer) |
Gregory G. Weaver Age: 70 | | Trustee | | Since 2015 | | Mr. Weaver is retired. He is Director, Verizon Communications Inc. (2015-Present); and was formerly Chairman and Chief Executive Officer, Deloitte & Touche LLP (a professional services firm) (2001-2005 and 2012-2014); and Member of the Board of Directors, Deloitte & Touche LLP (2006-2012). Trustee — Goldman Sachs Trust and Goldman Sachs Variable Insurance Trust. | | | 109 | | | Verizon Communications Inc. |
| | | | | | | | | | | | |
GOLDMAN SACHS VARIABLE INSURANCE TRUST FIXED INCOME FUNDS
Trustees and Officers (Unaudited) (continued)
Interested Trustee*
| | | | | | | | | | | | |
| | | | | |
Name, Address and Age1 | | Position(s) Held
with the Trust | | Term of
Office and
Length of
Time Served2 | | Principal Occupation(s)
During Past 5 Years | | Number of
Portfolios in
Fund Complex
Overseen by
Trustee3 | | | Other
Directorships
Held by Trustee4 |
James A. McNamara Age: 59 | | President and Trustee | | Since 2007 | | Advisory Director, Goldman Sachs (January 2018 — Present); Managing Director, Goldman Sachs (January 2000-December 2017); Director of Institutional Fund Sales, GSAM (April 1998- December 2000); and Senior Vice President and Manager, Dreyfus Institutional Service Corporation (January 1993-April 1998). President and Trustee — Goldman Sachs Trust; Goldman Sachs Variable Insurance Trust; Goldman Sachs Trust II; Goldman Sachs ETF Trust; Goldman Sachs ETF Trust II; Goldman Sachs MLP and Energy Renaissance Fund; Goldman Sachs Credit Income Fund; and Goldman Sachs Real Estate Diversified Income Fund. | | | 170 | | | None |
| | | | | | | | | | | | |
| * | Mr. McNamara is considered to be an “Interested Trustee” because he holds positions with Goldman Sachs and owns securities issued by The Goldman Sachs Group, Inc. Mr. McNamara holds comparable positions with certain other companies of which Goldman Sachs, GSAM or an affiliate thereof is the investment adviser, administrator and/or distributor. |
| 1 | Each Trustee may be contacted by writing to the Trustee, c/o Goldman Sachs, 200 West Street, New York, New York, 10282, Attn: Caroline Kraus. Information is provided as of December 31, 2021. |
| 2 | Subject to such policies as may be adopted by the Board from time-to-time, each Trustee holds office for an indefinite term, until the earliest of: (a) the election of his or her successor; (b) the date the Trustee resigns or is removed by the Board or shareholders, in accordance with the Trust’s Declaration of Trust; or (c) the termination of the Trust. The Board has adopted policies which provide that each Independent Trustee shall retire as of December 31st of the calendar year in which he or she reaches (a) his or her 75th birthday or (b) the 15th anniversary of the date he or she became a Trustee, whichever is earlier, unless a waiver of such requirements shall have been adopted by a majority of the other Trustees. These policies may be changed by the Trustees without shareholder vote. |
| 3 | The Goldman Sachs Fund Complex includes certain other companies listed above for each respective Trustee. As of December 31, 2021, Goldman Sachs Trust consisted of 92 portfolios (90 of which offered shares to the public); Goldman Sachs Variable Insurance Trust consisted of 17 portfolios (13 of which offered shares to the public); Goldman Sachs Trust II consisted of 18 portfolios (16 of which offered shares to the public); Goldman Sachs ETF Trust consisted of 39 portfolios (26 of which offered shares to the public); and Goldman Sachs ETF Trust II, Goldman Sachs MLP and Energy Renaissance Fund, Goldman Sachs Credit Income Fund and Goldman Sachs Real Estate Diversified Income Fund each consisted of one portfolio. Goldman Sachs ETF Trust II and Goldman Sachs Credit Income Fund did not offer shares to the public. |
| 4 | This column includes only directorships of companies required to report to the Securities and Exchange Commission under the Securities Exchange Act of 1934 (i.e., “public companies”) or other investment companies registered under the Act. |
Additional information about the Trustees is available in the Funds’ Statement of Additional Information, which can be obtained from Goldman Sachs free of charge by calling this toll-free number (in the United States of America): 1-800-526-7384.
GOLDMAN SACHS VARIABLE INSURANCE TRUST FIXED INCOME FUNDS
Trustees and Officers (Unaudited) (continued)
Officers of the Trust*
| | | | | | |
| | | |
| Name, Address and Age1 | | Positions Held
with the Trust | | Term of
Office and
Length of
Time Served2 | | Principal Occupation(s) During Past 5 Years |
James A. McNamara
200 West Street
New York, NY 10282 Age: 59 | | Trustee and
President | | Since 2007 | | Advisory Director, Goldman Sachs (January 2018-Present); Managing Director, Goldman Sachs (January 2000-December 2017); Director of Institutional Fund Sales, GSAM (April 1998-December 2000); and Senior Vice President and Manager, Dreyfus Institutional Service Corporation (January 1993-April 1998). President and Trustee — Goldman Sachs Trust; Goldman Sachs Variable Insurance Trust; Goldman Sachs Trust II; Goldman Sachs ETF Trust; Goldman Sachs ETF Trust II; Goldman Sachs MLP and Energy Renaissance Fund; Goldman Sachs Credit Income Fund; and Goldman Sachs Real Estate Diversified Income Fund. |
Caroline L. Kraus
200 West Street New
York, NY 10282 Age: 44 | | Secretary | | Since 2012 | | Managing Director, Goldman Sachs (January 2016-Present); Vice President, Goldman Sachs (August 2006-December 2015); Senior Counsel, Goldman Sachs (January 2020–Present); Associate General Counsel, Goldman Sachs (2012-December 2019); Assistant General Counsel, Goldman Sachs (August 2006-December 2011); and Associate, Weil, Gotshal & Manges, LLP (2002-2006). Secretary — Goldman Sachs Trust (previously Assistant Secretary (2012)); Goldman Sachs Variable Insurance Trust (previously Assistant Secretary (2012)); Goldman Sachs Trust II; Goldman Sachs BDC, Inc.; Goldman Sachs Private Middle Market Credit LLC; Goldman Sachs Private Middle Market Credit II LLC; Goldman Sachs Middle Market Lending Corp.; Goldman Sachs MLP and Energy Renaissance Fund; Goldman Sachs ETF Trust; Goldman Sachs ETF Trust II; Goldman Sachs Credit Income Fund; and Goldman Sachs Real Estate Diversified Income Fund. |
Joseph F. DiMaria
30 Hudson Street Jersey
City, NJ 07302Age: 53 | | Treasurer, Principal
Financial Officer
and Principal
Accounting Officer | | Since 2017
(Treasurer
and Principal
Financial
Officer
since 2019) | | Managing Director, Goldman Sachs (November 2015-Present) and Vice President — Mutual Fund Administration, Columbia Management Investment Advisers, LLC (May 2010- October 2015). Treasurer, Principal Financial Officer and Principal Accounting Officer — Goldman Sachs Trust (previously Assistant Treasurer (2016)); Goldman Sachs Variable Insurance Trust (previously Assistant Treasurer (2016)); Goldman Sachs Trust II (previously Assistant Treasurer (2017)); Goldman Sachs MLP and Energy Renaissance Fund (previously Assistant Treasurer (2017)); Goldman Sachs ETF Trust (previously Assistant Treasurer (2017)); Goldman Sachs ETF Trust II; Goldman Sachs Credit Income Fund; and Goldman Sachs Real Estate Diversified Income Fund |
| | | | | | |
| * | Represents a partial list of officers of the Trust. Additional information about all the officers is available in the Funds’ Statement of Additional Information, which can be obtained from Goldman Sachs free of charge by calling this toll-free number (in the United States): 1-800-526-7384. |
| 1 | Information is provided as of December 31, 2021. |
| 2 | Officers hold office at the pleasure of the Board of Trustees or until their successors are duly elected and qualified. Each officer holds comparable positions with certain other companies of which Goldman Sachs, GSAM or an affiliate thereof is the investment adviser, administrator and/or distributor. |
Goldman Sachs Variable Insurance Trust — Tax Information (Unaudited)
For the year ended December 31, 2021, the Core Fixed Income and High Quality Floating Rate Funds designate 100% and 19.76% of the dividends paid from net investment company taxable income as section 163(j) Interest Dividends.
| | |
| TRUSTEES | | OFFICERS |
| Jessica Palmer, Chair | | James A. McNamara, President |
| Dwight L. Bush | | Joseph F. DiMaria, Principal Financial Officer, |
| Kathryn A. Cassidy | | Principal Accounting Officer and Treasurer |
| Diana M. Daniels | | Caroline L. Kraus, Secretary |
| Joaquin Delgado | | |
| Eileen H. Dowling | | |
| James A. McNamara | | |
| Roy W. Templin | | |
| Gregory G. Weaver | | |
GOLDMAN SACHS & CO. LLC
Distributor and Transfer Agent
GOLDMAN SACHS ASSET MANAGEMENT, L.P.
Investment Adviser
200 West Street, New York,
New York 10282
Visit our web site at www.GSAMFUNDS.com to obtain the most recent month-end returns.
The reports concerning the Funds included in this shareholder report may contain certain forward-looking statements about the factors that may affect the performance of the Funds in the future. These statements are based on Fund management’s predictions and expectations concerning certain future events and their expected impact on the Funds, such as performance of the economy as a whole and of specific industry sectors, changes in the levels of interest rates, the impact of developing world events, and other factors that may influence the future performance of the Funds. Management believes these forward-looking statements to be reasonable, although they are inherently uncertain and difficult to predict. Actual events may cause adjustments in portfolio management strategies from those currently expected to be employed.
A description of the policies and procedures that the Funds use to determine how to vote proxies relating to portfolio securities and information regarding how the Funds voted proxies relating to portfolio securities for the 12-month period ended June 30 is available (i) without charge, upon request by calling 1-800-621-2550; and (ii) on the Securities and Exchange Commission (“SEC”) web site at http://www.sec.gov.
The Funds will file portfolio holdings information for each month in a fiscal quarter within 60 days after the end of the relevant fiscal quarter on Form N-PORT. Portfolio holdings information for the third month of each fiscal quarter will be made available on the SEC’s web site at http://www.sec.gov. Portfolio holdings information may be obtained upon request and without charge by calling 1-800-526-7384 (for Retail Shareholders) or 1-800-621-2550 (for Institutional Shareholders).
Views and opinions expressed are for informational purposes only and do not constitute a recommendation by GSAM to buy, sell, or hold any security. Views and opinions are current as of the date of this presentation and may be subject to change, they should not be construed as investment advice.
Goldman Sachs & Co. LLC (“Goldman Sachs”) does not provide legal, tax or accounting advice. Any statement contained in this communication (including any attachments) concerning U.S. tax matters was not intended or written to be used, and cannot be used, for the purpose of avoiding penalties under the Internal Revenue Code, and was written to support the promotion or marketing of transactions or matters addressed. Clients of Goldman Sachs should obtain their own independent tax advice based on their particular circumstances.
The website links provided are for your convenience only and are not an endorsement or recommendation by GSAM of any of these websites or the products or services offered. GSAM is not responsible for the accuracy and validity of the content of these websites.
Fund holdings and allocations shown are as of December 31, 2021 and may not be representative of future investments. Fund holdings should not be relied on in making investment decisions and should not be construed as research or investment advice regarding particular securities. Current and future holdings are subject to risk.
References to indices, benchmarks or other measures of relative market performance over a specified period of time are provided for your information only and do not imply that the portfolio will achieve similar results. The index composition may not reflect the manner in which a portfolio is constructed. While an adviser seeks to design a portfolio which reflects appropriate risk and return features, portfolio characteristics may deviate from those of the benchmark.
The Global Industry Classification Standard (“GICS”) was developed by and is the exclusive property and a service mark of Morgan Stanley Capital International Inc. (“MSCI”) and Standard & Poor’s, a division of The McGraw-Hill Companies, Inc. (“S&P”) and is licensed for use by Goldman Sachs. Neither MSCI, S&P nor any other party involved in making or compiling the GICS or any GICS classifications makes any express or implied warranties or representations with respect to such standard or classification (or the results to be obtained by the use thereof), and all such parties hereby expressly disclaim all warranties of originality, accuracy, completeness, merchantability or fitness for a particular purpose with respect to any of such standard or classification. Without limiting any of the foregoing, in no event shall MSCI, S&P, any of their affiliates or any third party involved in making or compiling the GICS or any GICS classifications have any liability for any direct, indirect, special, punitive, consequential or any other damages (including lost profits) even if notified of the possibility of such damages.
The portfolio risk management process includes an effort to monitor and manage risk, but does not imply low risk.
Shares of the Goldman Sachs VIT Funds are offered to separate accounts of participating life insurance companies for the purpose of funding variable annuity contracts and variable life insurance policies. Shares of the Funds are not offered directly to the general public. The variable annuity contracts and variable life insurance policies are described in the separate prospectuses issued by participating insurance companies. You should refer to those prospectuses for information about surrender charges, mortality and expense risk fees and other charges that may be assessed by participating insurance companies under the variable annuity contracts or variable life insurance policies. Such fees or charges, if any, may affect the return you may realize with respect to your investments. Ask your representative for more complete information. Please consider a fund’s objectives, risks and charges and expenses, and read the prospectus carefully before investing. The prospectus contains this and other information about the Funds.
This material is not authorized for distribution to prospective investors unless preceded or accompanied by a current prospectus or summary prospectus, if applicable. Investors should consider the Funds’ objective, risks, and charges and expenses, and read the summary prospectus, if available, and/or the prospectus carefully before investing or sending money. The summary prospectus, if available, and the prospectus contain this and other information about the Funds and may be obtained from your authorized dealer or from Goldman Sachs & Co. LLC by calling 1-800-621-2550.
This report is prepared for the general information of contract owners and is not an offer of shares of the Goldman Sachs Variable Insurance Trust Funds.
© 2022 Goldman Sachs. All rights reserved.
VITFIAR-22/268097-OTU-1554763
Goldman
Sachs Variable Insurance Trust
Goldman Sachs Equity Index Fund
Goldman Sachs Growth Opportunities Fund
Goldman Sachs International Equity Insights Fund
Goldman Sachs Large Cap Value Fund
Goldman Sachs Mid Cap Value Fund
Goldman Sachs Small Cap Equity Insights Fund
Goldman Sachs Strategic Growth Fund
Goldman Sachs U.S. Equity Insights Fund
Annual Report
December 31, 2021

Goldman Sachs Variable Insurance Trust
| ∎ | | GOLDMAN SACHS EQUITY INDEX FUND |
| ∎ | | GOLDMAN SACHS GROWTH OPPORTUNITIES FUND |
| ∎ | | GOLDMAN SACHS INTERNATIONAL EQUITY INSIGHTS FUND |
| ∎ | | GOLDMAN SACHS LARGE CAP VALUE FUND |
| ∎ | | GOLDMAN SACHS MID CAP VALUE FUND |
| ∎ | | GOLDMAN SACHS SMALL CAP EQUITY INSIGHTS FUND |
| ∎ | | GOLDMAN SACHS STRATEGIC GROWTH FUND |
| ∎ | | GOLDMAN SACHS U.S. EQUITY INSIGHTS FUND |
| | | | |
| | | |
| NOT FDIC-INSURED | | May Lose Value | | No Bank Guarantee |
MARKET REVIEW
Goldman Sachs Variable Insurance Trust Funds
Market Review
U.S. Equities
Representing the U.S. equity market, the S&P 500® Index returned 28.71% during the 12 months ended December 31, 2021 (the “Reporting Period”). The U.S. equity market rose in each of the four quarters of 2021, closing near its all-time high and posting its third consecutive year of double-digit gains.
In the first quarter of 2021, rising bond yields and a value-led equity market dominated. The two key drivers of this performance were the Democrat victory in Georgia in January, paving the way for massive additional U.S. fiscal stimulus and progress in the COVID-19 vaccine rollout. An increase in the 10-year U.S. Treasury yield benefited financials and value stocks. The accelerating rollout of COVID-19 vaccines boosted investors’ hopes of a sustainable reopening of the economy. Small-cap stocks, which tend to be more cyclical and domestically focused, performed particularly well. The passage of President Biden’s stimulus package led to upgrades in consensus forecasts for U.S. Gross Domestic Product (“GDP”) growth for the year. Some investors worried the size of the U.S. stimulus could provoke a pickup in inflation. However, despite upgrading its growth forecasts for the year and expecting unemployment to decline, the U.S. Federal Reserve (the “Fed”) did not believe inflation would be meaningfully above target and did not expect to raise interest rates before 2024.
Discussions throughout the second quarter of 2021 centered on the central bank liquidity tailwind, fiscal stimulus, COVID-19 vaccine progress, reopening momentum, strong corporate profits and robust equity inflows. While inflation concerns were fairly pervasive, the Fed remained consistent in its messaging around expectations that price pressures would be transitory. The peak inflation theme gained traction as the quarter progressed, even as economists suggested the transitory period may be longer than expected. Corporate earnings season brought a round of outsized beats over consensus estimates, along with corporate commentary highlighting some input pressure offset for companies with above-average pricing power or productivity initiatives. Despite a late-quarter agreement between the White House and a bipartisan group of Senators on the framework of a physical infrastructure package, the path to additional fiscal stimulus remained complicated.
The U.S. equity market increased only marginally in the third quarter of 2021, as measured by the S&P 500® Index. Other major U.S. equity indices posted negative returns for the quarter. In July and August, the second quarter’s rally continued, as the focus remained on easy financial conditions, accommodative monetary policy, pent-up consumer demand, positive earnings sentiment, resilient operating margins, corporate buybacks and retail inflows. Some economic indicators, including higher inflation and lower than consensus expected retail sales and manufacturing activity, were causes of concern among investors, through the market and the Fed remained largely optimistic. Sentiment deteriorated in September as the spread of the COVID-19 Delta variant dampened reopening momentum and the Fed signaled for a slowdown of asset purchases. A still complicated path to fiscal stimulus in the House of Representatives, the then-looming debt ceiling discussion, and global risk events, including supply-chain disruptions and input price pressures, all put a strain on the U.S. equity market. September also saw a global risk asset sell-off on the heels of Chinese real estate developers’ leverage concerns and a spike in energy prices. U.S. Treasury yields climbed, as the global bond market posted its weakest month since March 2020.
The U.S. equity market, as measured by the S&P 500® Index, then rose strongly, logging its best performing quarter in the fourth quarter of 2021 since the fourth quarter of 2020 on the heels of robust consumer spending, strong corporate earnings results and passage of the U.S. government’s infrastructure plan. There remained a few areas of concern still intact, including the Omicron variant of COVID-19, which emerged in late November, persistent inflation and supply-chain pressures, acceleration in the Fed’s asset purchase tapering, and the fate of the social spending bill in Congress. Strong corporate earnings in October propelled U.S. equities higher despite the overhanging supply-chain issues and persistently high inflation. More than 80% of the S&P 500® Index constituent companies reported upside surprises. The positive momentum continued into November, and the passage of the infrastructure bill boosted market sentiment until the World Health Organization announced Omicron as a variant of concern given its potentially heightened transmissibility. Increased case counts around the world and travel restrictions added pressure to the equities markets globally. Moreover, the fate of the social spending bill was punted into 2022. However, in December, studies showed the Omicron variant tends to cause less severe symptoms. The Fed also announced an accelerated timeline for tapering its asset purchases, doubling its pace from a decrease of $15 billion a month in corporate debt purchases to a decrease of $30 billion a
MARKET REVIEW
month. The U.S. equity market rallied in December on positive seasonality and improved sentiment, closing the year on a high note. On the economic data front, inflation remained high in the fourth quarter, though the “peak inflation” narrative gained traction with cooler consumer confidence and manufacturing readings.
For the Reporting Period overall, all 11 sectors in the S&P 500® Index posted double-digit positive absolute returns. Energy, real estate and financials were the best performing sectors in the S&P 500® Index, as measured by total return, while the weakest performing sectors in the S&P 500® Index during the Reporting Period were utilities, consumer staples and industrials.
Within the U.S. equity market, all capitalization segments posted positive returns, led by large-cap stocks, as measured by the Russell 1000® Index, followed by mid-cap stocks, as measured by the Russell Midcap® Index, and then small-cap stocks, as measured by the Russell 2000® Index. From a style perspective, growth-oriented stocks modestly outperformed value stocks in the large-cap segment of the U.S. equity market during the Reporting Period, but value stocks significantly outperformed growth stocks in the mid- and small-cap segments during the same time frame. (All as measured by the FTSE Russell indices.)
International Equities
International equities rallied, but underperformed the U.S. equity market, during the Reporting Period. The MSCI Europe, Australasia, Far East (EAFE) Index (Net, USD, Unhedged) (the “MSCI EAFE Index”) posted a return of 11.26%.*
International equity markets overcame bouts of volatility during the first quarter of 2021 to surge to new highs during March, driven by two key themes — the accelerating rollout of the COVID-19 vaccines globally and the ongoing commitment from central banks around the world to support the economic recovery. Accelerating GDP growth, normalizing inflation and steepening yield curves laid the foundation for the “reflation trade,” as investors started to price in a brighter future. (Reflation is the inflation that typically comes immediately after a low-point in the economic cycle — often after economic stimulus, and the reflation trade is the purchase of specific stocks or sectors believed to outperform in that type of environment.) Markets took a sharp turn away from momentum stocks and favored cyclical sectors, many of which tend to be more value oriented. European equities were less impacted by inflation fears, as reopening progress pushed travel and leisure stocks higher, and U.K. equities were additionally buoyed by gains in energy prices. Markets welcomed the European Central Bank’s (“ECB”) decision to increase the pace of its Pandemic Emergency Purchase Programme (“PEPP”) asset purchases in response to the bond sell-off there. Markets also overcame pressure as AstraZeneca vaccine safety concerns and new local lockdown measures in France dampened near-term recovery prospects. March’s Euro-area Manufacturing Purchasing Managers Index posted a historical high. Japanese equities rose during the quarter, rallying on the back of a sharp rotation from growth to value stocks. Investor sentiment was also supported by the consistent weakness of the yen against the U.S. dollar and the rally in U.S. equities.
The rotation from growth to value stocks took a breather in April 2021, with growth stocks outperforming their value counterparts. Starting in May 2021, equity markets across the world were impacted by rising commodity prices, which stoked fears of earlier than consensus expected interest rate hikes from central banks, particularly the U.S. Fed. In June, international equities rallied following a weaker than consensus expected U.S. payrolls report that eased concerns of a shift to tighter monetary policy. Overall, discussions during the quarter centered on central bank liquidity tailwinds, fiscal stimulus, COVID-19 vaccine progress, economic reopening momentum, strong corporate profits and robust equity inflows. While inflation concerns were fairly pervasive, the Fed remained consistent in its messaging around expectations that price pressures would be transitory. European equities advanced for the fifth straight quarter amid a sharp rebound in economic growth, an accelerating COVID-19 vaccine rollout and significantly better than consensus expected first quarter 2021 corporate earnings. Cyclical stocks generated the best returns, although sector performance was broadly positive. The ECB maintained its accommodative monetary policy stance, while also upgrading its GDP growth forecast and raising its inflation forecast for both 2021 and 2022. In the U.K., the Bank of England (“BOE”) raised its economic growth forecast for 2021 and tapered its pace of asset purchases. In Japan, state of emergency measures following a third wave of COVID-19 cases that had begun in March 2021 and slowing COVID-19 vaccine rollouts weighed on investor sentiment for the majority of the second calendar quarter. However, the Japanese equity market rallied strongly during the first half of June, likely driven by the increased pace of inoculations. This exuberance was short-lived, however, as the direction of the Japanese equity market again turned sharply down in the middle of June in step with the U.S. equity markets.
| * | All index returns are expressed in U.S. dollar terms. |
MARKET REVIEW
International equities fell during the third quarter of 2021 for the first time in six quarters. During the first half of the quarter, the international equity markets delivered strong returns, continuing the trend from the second calendar quarter along with an additional focus on positive corporate earnings as well as accommodative monetary policies. Pandemic-related pressures appeared to be easing, and economic activity appeared to be increasing. However, the markets receded in the second half of the third calendar quarter, primarily due to the Fed’s announcements around tapering of monthly asset purchase plans but also due to heightened worries around an increase in interest rates, global supply-chain concerns, COVID-19 Delta variant cases and China’s government regulations on Chinese technology stocks. Then, a debt crisis at one of China’s largest property developers destabilized markets. All that said, European equities advanced for the sixth straight quarter, as risk sentiment was bolstered by robust corporate earnings, solid economic growth and an accommodative policy environment. The ECB signaled it would maintain interest rates at record lows for a longer period to support the economic recovery and unveiled a new flexible inflation policy framework. In the U.K., the BOE left monetary policy unchanged but signaled it was moving closer to raising its interest rates. Japanese equities also advanced during the quarter, rebounding largely on the Tokyo Olympics that began in July 2021 and on the election of Fumio Kishida to be the nation’s next prime minister. Kishida was widely expected to compile a sizable fiscal package to shore up the Japanese economy. Bringing the MSCI EAFE Index into negative territory for the quarter were the equity markets of Germany and the Pacific Basin ex-Japan, which declined.
Many of the concerns that dominated the international equity markets in September 2021 ebbed somewhat in October, and the MSCI EAFE Index returned to positive territory, supported in Europe and the U.K. particularly by favorable third calendar quarter corporate earnings reports. The Japanese equity market declined in October as investors digested the prospects of new prime minister Kishida ahead of the general election that took place on October 31. Global news flow was generally negative in the first half of October, especially from China, but the sustained strength of U.S. equity markets provided some support for Japan. Equity markets in the Pacific Basin ex-Japan rose, rallying on both positive corporate earnings guidance and an ongoing decline in the number of new COVID-19 cases in many countries in the region. However, shares were weaker toward the end of the month with ongoing concerns around rising energy prices, higher inflation and ongoing tensions between the U.S. and China weighing on investment sentiment.
International equities then gave back its returns after a strong October, with the MSCI EAFE Index delivering a negative return in November 2021. The markets suffered over fears of the new Omicron variant of COVID-19 weighing on sentiment, led by Europe, which saw rising COVID-19 hospitalizations and varied restrictions. The emergence of the potentially more transmissible Omicron variant triggered a sell-off among global risk assets on the day after the U.S.’ Thanksgiving, as investors fled to safety. Travel restrictions were re-imposed to curtail the spread of the new variant, while lockdown measures in Europe amid rising cases and deaths sought to have the same effect. Persistently high inflation weighed on market sentiment as well. Japan’s equities underperformed the MSCI EAFE Index due both to inflation and supply-chain issues as well as to concerns round the spread of the new COVID-19 variant—the same narrative that affected their global counterparts. Following the sell-off in November, international equities saw a strong rebound in December 2021, as the initial scare of the Omicron variant dissipated. Studies of the variant showed that while it may be more contagious than other variants, it was likely not as severe as initially feared, with a smaller share of infections resulting in hospitalizations. This led to an improvement in investor sentiment, as widespread major restrictions became less likely. Value stocks outperformed growth stocks in December, which benefited international equities, due to their relatively high value/cyclical exposures.
For the Reporting Period overall, 10 of the 11 sectors of the MSCI EAFE gained, with energy leading the way, followed by information technology and financials. Communication services was the weakest performer on the basis of total return during the Reporting Period, followed by utilities and real estate.
From a country perspective, Austria was by far the strongest individual country constituent in the MSCI EAFE Index on a relative basis during the Reporting Period, followed by the Netherlands, Sweden, Norway and France. New Zealand and Hong Kong most significantly lagged the MSCI EAFE Index on a relative basis during the Reporting Period, each generating a negative total return. Portugal, Spain and Japan each posted a positive total return but also significantly underperformed the MSCI EAFE Index during the Reporting Period.
GOLDMAN SACHS VARIABLE INSURANCE TRUST EQUITY INDEX FUND
INVESTMENT OBJECTIVE
The Fund seeks to achieve investment results that correspond to the aggregate price and yield performance of a benchmark index that measures the investment returns of large capitalization stocks.
Portfolio Management Discussion and Analysis
Below, SSgA Funds Management, Inc. (“SSgA”), the Fund’s Subadvisor, discusses the Goldman Sachs Variable Insurance Trust — Goldman Sachs Equity Index Fund’s (the “Fund”) performance and positioning for the 12-month period ended December 31, 2021 (the “Reporting Period”).
How did the Fund perform during the Reporting Period?
During the Reporting Period, the Fund’s Service Shares generated an average annual total return of 28.20%. This compares to the 28.71% average annual total return of the Fund’s benchmark, the Standard & Poor’s 500® Index (with dividends reinvested) (the “S&P 500® Index”), during the same time period.
During the Reporting Period, which sectors and which industries in the S&P 500® Index were the strongest contributors to the Fund’s performance?
All 11 sectors in the S&P 500® Index generated double-digit gains during the Reporting Period. In terms of total return, the sectors that made the strongest positive contributions to the S&P 500® Index and to the Fund were energy, real estate and financials. The largest sector by weighting in the S&P 500® Index at the end of the Reporting Period was information technology at a weighting of 29.17%. The industries with the strongest performance in terms of total return were real estate management and development; construction and engineering; oil, gas and consumable fuels; automobiles; and distributors.
On the basis of impact (which takes both total returns and weightings into account), the strongest performing sectors were information technology, financials and health care. The strongest performing industries on the basis of impact were software; interactive media and services; semiconductors and semiconductor equipment; technology hardware storage and peripherals; and banks.
Which sectors and industries in the S&P 500® Index were the weakest contributors to the Fund’s performance?
In terms of total return, during the Reporting Period, the weakest performing sectors were utilities, consumer staples and industrials. The industries with the weakest performance in terms of total return were wireless telecommunication services; diversified telecommunication services; entertainment; airlines; and media.
On the basis of impact, the sectors that made the weakest contributions to the S&P 500® Index and to the Fund were utilities, materials and consumer staples. The industries with the weakest performance on the basis of impact were entertainment; diversified telecommunication services; wireless telecommunication services; leisure products; and gas utilities.
Which individual stocks were the top detractors, and which were the greatest positive contributors?
On the basis of impact, the stocks that made the strongest contribution during the Reporting Period were Alphabet Inc. Class A, Alphabet Inc. Class B, Apple, Microsoft and NVIDIA. The weakest performers were Walt Disney Company, Verizon Communications, PayPal Holdings, Moderna and Global Payments.
How did the Fund use derivatives and similar instruments during the Reporting Period?
During the Reporting Period, the Fund did not use derivatives as part of an active management strategy to add value to the Fund’s results. However, equity index futures were used to equitize the Fund’s cash holdings. In other words, we put the Fund’s cash holdings to work by using them as collateral for the purchase of equity index futures. We also used these equity index futures to provide liquidity for daily cash flow requirements. Equity index futures had a neutral impact on the Fund’s performance during the Reporting Period.
Were there any changes to the Fund’s portfolio management team during the Reporting Period?
Effective November 2, 2021, Daniel TenPas no longer served as a co-portfolio manager for the Fund, and Michael Finocchi, Principal and Portfolio Manager, became a co-portfolio manager for the Fund. Mr. Finocchi joined Michael Feehily, Senior Managing Director and Senior Portfolio Manager of SSgA, and Melissa Kapitulik, Vice President and Senior Portfolio Manager of
GOLDMAN SACHS VARIABLE INSURANCE TRUST EQUITY INDEX FUND
SSgA, both of whom have managed the Fund since 2014. By design, all investment decisions for the Fund are performed within a co-lead or team structure.
What changes were made to the makeup of the S&P 500® Index during the Reporting Period?
Twenty-six stocks were removed from the S&P 500® Index during the Reporting Period. Among them were Alexion Pharmaceuticals, Hanesbrands, Kansas City Southern, L Brands, Tiffany, Western Union and Xerox Holdings. There were 26 stocks added to the S&P 500® Index during the Reporting Period, including Bath & Body Works, Caesars Entertainment, FactSet Research Systems, Moderna, Signature Bank, Solar Edge Technologies and NXP Semiconductors.
The source of the data included in the above Portfolio Management Discussion and Analysis with respect to the Goldman Sachs Equity Index Fund is FactSet as of 12/31/2021.
Characteristics presented are calculated using the month end market value of holdings, except for beta and standard deviation, if shown, which use month end return values. Averages reflect the market weight of securities in the portfolio. Market data, prices, and dividend estimates for characteristics calculations provided by FactSet Research Systems, Inc. All other portfolio data provided by SSgA. Characteristics are as of the date indicated, are subject to change, and should not be relied upon as current thereafter.
Past performance is not a guarantee of future results.
Index returns are unmanaged and do not reflect the deduction of any fees or expenses. Index returns reflect all items of income, gain and loss and the reinvestment of dividends and other income.
SSgA may have or may seek investment management or other business relationships with companies discussed in this material or affiliates of those companies, such as their officers, directors and pension plans.
The views expressed in this material are the views of SSgA’s Global Equity Beta Solutions Team through the period ended December 31, 2021 and are subject to change based on market and other conditions. All information has been obtained from sources believed to be reliable, but its accuracy is not guaranteed. There is no representation or warranty as to the current accuracy, reliability or completeness of, nor liability for, decisions based on such information and it should not be relied on as such. This document contains certain statements that may be deemed forward-looking statements. Please note that any such statements are not guarantees of any future performance and actual results or developments may differ materially from those projected.
FUND BASICS
Equity Index Fund
as of December 31, 2021
TOP TEN HOLDINGS AS OF 12/31/211
| | | | | | | | |
| | | |
| Holding | | % of
Net Assets | | | Line of Business | | Country |
| Apple, Inc. | | | 6.9% | | | Technology Hardware & Equipment | | United States |
| Microsoft Corp. | | | 6.3 | | | Software & Services | | United States |
| Amazon.com, Inc. | | | 3.6 | | | Retailing | | United States |
| Alphabet, Inc., Class A | | | 2.2 | | | Media & Entertainment | | United States |
| Tesla, Inc. | | | 2.1 | | | Automobiles & Components | | United States |
| Alphabet, Inc., Class C | | | 2.0 | | | Media & Entertainment | | United States |
| Meta Platforms, Inc., Class A | | | 2.0 | | | Media & Entertainment | | United States |
| NVIDIA Corp. | | | 1.8 | | | Semiconductors & Semiconductor Equipment | | United States |
| Berkshire Hathaway, Inc., Class B | | | 1.4 | | | Diversified Financials | | United States |
| UnitedHealth Group, Inc. | | | 1.2 | | | Health Care Equipment & Services | | United States |
| 1 | The top 10 holdings may not be representative of the Fund’s future investments. |
FUND BASICS
FUND VS. BENCHMARK SECTOR ALLOCATIONS2
As of December 31, 2021
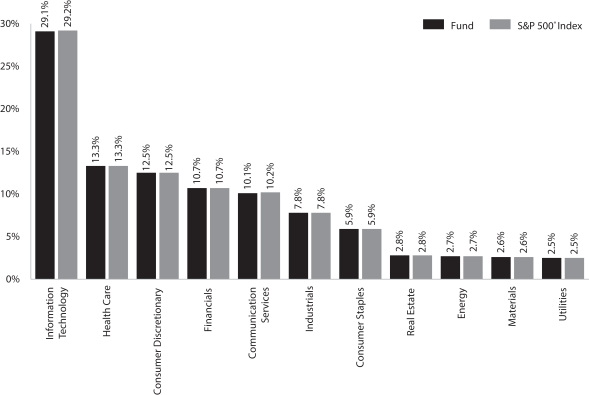
| 2 | The Fund is actively managed and, as such, its composition may differ over time. Consequently, the Fund’s overall sector allocations may differ from percentages contained in the graph above. The graph categorizes investments using Global Industry Classification Standard (“GICS”); however, the sector classifications used by the portfolio management team may differ from GICS. The percentage shown for each investment category reflects the value of investments in that category as a percentage of market value (excluding investments in the securities lending reinvestment vehicle, if any). The graph depicts the Fund’s investments but may not represent the Fund’s market exposure due to the exclusion of certain derivatives, if any, as listed in the Additional Investment Information section of the Schedule of Investments. |
For more information about your Fund, please refer to www.GSAMFUNDS.com. There, you can learn more about your Fund’s investment strategies, holdings, and performance.
GOLDMAN SACHS VARIABLE INSURANCE TRUST EQUITY INDEX FUND
Performance Summary
December 31, 2021
The following graph shows the value, as of December 31, 2021, of a $10,000 investment made in the Service Shares of Fund on January 1, 2012 at NAV. For comparative purposes, the performance of the Fund’s benchmark, the S&P 500® Index (with distributions reinvested), is shown. Performance reflects applicable fee waivers and/or expense limitations in effect during the periods shown and in their absence, performance would be reduced. Returns do not reflect the deduction of taxes that a shareholder would pay on Fund distributions or the redemption of Fund shares. The returns set forth below represent past performance. Past performance does not guarantee future results. The Fund’s investment return and principal value will fluctuate so that an investor’s shares, when redeemed, may be worth more or less than their original cost. Current performance may be lower or higher than the performance quoted below. Please visit our web site at www.GSAMFUNDS.com to obtain the most recent month-end returns.
Equity Index Fund’s 10 Year Performance
Performance of a $10,000 investment, with distributions reinvested, from January 1, 2012 through December 31, 2021.
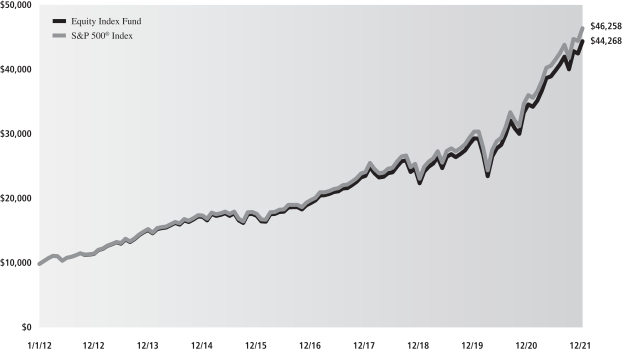
| | | | | | |
| Average Annual Total Return through December 31, 2021 | | One Year | | Five Years | | Ten Years |
Equity Index Fund | | 28.20% | | 17.93% | | 16.03% |
GOLDMAN SACHS VARIABLE INSURANCE TRUST GROWTH OPPORTUNITIES FUND
INVESTMENT OBJECTIVE
The Fund seeks long-term growth of capital.
Portfolio Management Discussion and Analysis
Below, the Goldman Sachs Growth Investment Team discusses the Goldman Sachs Variable Insurance Trust — Goldman Sachs Growth Opportunities Fund’s (the “Fund”) performance and positioning for the 12-month period ended December 31, 2021 (the “Reporting Period”).
How did the Fund perform during the Reporting Period?
During the Reporting Period, the Fund’s Institutional and Service Shares generated average annual total returns of 11.65% and 11.48%, respectively. These returns compare to the 12.73% average annual total return of the Fund’s benchmark, the Russell Midcap® Growth Index (with dividends reinvested) (the “Russell Index”), during the same time period.
What key factors were responsible for the Fund’s performance during the Reporting Period?
During the Reporting Period, the Fund generated double-digit positive absolute returns but underperformed the Russell Index. Both sector positioning and security selection detracted from relative returns.
Which equity market sectors helped and hurt Fund performance?
Our bottom-up approach focuses on security selection, and therefore, we do not make active sector-level investment decisions. The Fund’s sector positioning is a result of our stock selection. That said, on a sector level, stock selection in the health care, information technology and materials sectors detracted from relative performance. Stock selection in the consumer discretionary, communication services and energy sectors contributed positively.
Which individual stocks detracted from the Fund’s relative performance during the Reporting Period?
RingCentral, Danimer Scientific and Utz Brands detracted most from the Fund’s performance relative to the Russell Index during the Reporting Period.
The Fund’s top detractor was RingCentral, which provides global enterprise cloud communications and collaboration solutions. Its shares declined following a debt issuance in mid-March 2021. Its stock price fell further following the announcement that RingCentral had agreed to acquire the technology and engineering arm of Kindite. Later in the Reporting Period, the company endured a series of executive departures. Nevertheless, RingCentral continued to deliver strong quarterly results and offered a favorable risk/reward profile, in our opinion. At the end of the Reporting Period, we maintained our positive view on RingCentral because of its strong new customer acquisition, lower churn rate and growing partnerships with telecommunications companies, such as AT&T and Vodaphone. (The churn rate, also known as the rate of attrition, is the percentage of customers to a service who discontinue their subscriptions to that service within a given time period.)
Danimer Scientific is a bioplastics company focused on biodegradable materials. Its shares depreciated through much of the Reporting Period due to speculative sell-offs, reports of investors holding short positions in the stock, and an acquisition that was viewed unfavorably by the market. As the Reporting Period ended, we continued to monitor the Fund’s position closely but also believed Danimer Scientific could be a beneficiary of corporate and regulatory efforts to reduce the use of petrochemicals and single-use plastics. In our view, the company is one of the only commercially viable options in biodegradable plastics, and we saw a potentially compelling opportunity for it going forward.
Utz Brands manufactures, markets and distributes branded snacking products. Its stock declined after the company missed consensus expectations on both its top-line and bottom-line results in the first quarter of 2021—the second consecutive quarter in which Utz Brands had lost some share of its core market. However, the company reported sales that grew in line with the salty snacks market and continued to gain share as it expanded into the emerging markets. In addition, Utz Brands significantly revised its full year 2021 guidance due to the impact of higher inflation and subsequent input price pressures. At the end of the Reporting Period, we continued to like the stock given what we saw as the company’s pricing power, productivity, synergies in mergers and acquisitions, and distribution opportunities once near-term inflation pressures subside.
GOLDMAN SACHS VARIABLE INSURANCE TRUST GROWTH OPPORTUNITIES FUND
Which individual stocks added to the Fund’s relative performance during the Reporting Period?
During the Reporting Period, the Fund was helped most versus the Russell Index by investments in Marvell Technology, HubSpot and West Pharmaceutical Services.
Marvell Technology, which provides data infrastructure semiconductor solutions, was the Fund’s top contributor during the Reporting Period. Its shares appreciated in response to a second quarter 2021 earnings report that was better than consensus expectations. Then, in early December, the company delivered another strong quarter of performance, highlighted by its ability to better fulfill backlogged orders. Additionally, the backlog of business actually increased, signifying the further demand for Marvell Technology’s products. We remained positive on its stock at the end of the Reporting Period, given our view of its management’s history of execution and the company’s exposure to structural growth trends in cloud-based technology, automobile electronics and fifth-generation (“5G”) networks.
HubSpot is a developer of Internet marketing software solutions. Its stock price rose after the company announced the launch of Operations Hub, which aims to make the sales process more efficient, coordinated, automated and based on a synced set of customer data. The positive momentum continued through the end of the Reporting Period, with its earnings announcements fueling the progress. At the end of the Reporting Period, we remained optimistic that HubSpot would benefit from a shift in demand to front office software, as business activities continued to become more virtual.
West Pharmaceutical Services manufactures and markets pharmaceuticals, biologics, vaccines and consumer health care products. The company continued to benefit during the Reporting Period from an operating environment in which demand for its services was at a record high. The COVID-19 pandemic was also a catalyst for the adoption of West Pharmaceutical Services’ high-value products, sparking further production to meet demand. At the end of the Reporting Period, we continued to see material tailwinds for the company and believed in its ability to execute moving forward.
Did the Fund make any significant purchases or sales during the Reporting Period?
Among the positions initiated by the Fund during the Reporting Period was an investment in Zscaler. We have a positive view of the cloud-based information security company’s pipeline growth in an elevated threat environment, the secular shift toward cloud adoption and Zscaler’s continued investment in its platform to support increased growth.
We established a Fund position in Keysight Technologies, a communications, networking and electronics industries company. The deployment of 5G as well as a cyclical rebound in industrial spending leads us to believe its stock may outperform in the near term.
Conversely, during the Reporting Period, we sold the Fund’s position in U.S. cloud communications company Twilio. Because we did not expect our investment thesis to unfold in the near term, we eliminated the position and reallocated the capital to what we considered more attractive risk/reward opportunities.
We exited the Fund’s position in cloud services company Akamai Technologies. In February 2021, it became apparent to us that our investment thesis was unlikely to play out in the near term, which led us sell the position and reallocate the capital to what we saw as more attractive investment opportunities.
Were there any notable changes in the Fund’s weightings during the Reporting Period?
Changes to the Fund’s sector weightings relative to the Russell Index are due to our stock selection. As a result of these decisions during the Reporting Period, the Fund moved from an overweight versus the Russell Index in the consumer discretionary sector to an underweight position. In addition, it changed from rather neutral positions in consumer staples and health care to overweight positions and from rather neutral positions in financials and real estate to underweight positions. Compared to the Russell Index, the Fund shifted from an underweight in the communication services sector to an overweight position. Also, the Fund’s overweight positions in the industrials and materials sectors increased during the Reporting Period.
How did the Fund use derivatives and similar instruments during the Reporting Period?
The Fund did not use derivatives or similar instruments within its investment process during the Reporting Period.
Were there any changes to the Fund’s portfolio management team during the Reporting Period?
There were no changes to the Fund’s portfolio management team during the Reporting Period.
How was the Fund positioned relative to the Russell Index at the end of the Reporting Period?
As mentioned, the Fund’s sector positioning relative to the Russell Index is the result of our stock selection, as we take a pure bottom-up, research-intensive approach to investing. From that perspective, then, at the end of the Reporting Period, the Fund’s
GOLDMAN SACHS VARIABLE INSURANCE TRUST GROWTH OPPORTUNITIES FUND
portfolio was broadly diversified with overweight positions compared to the Russell Index in the industrials, health care, materials, consumer staples and communication services sectors. The Fund had smaller weightings than the Russell Index in the information technology, consumer discretionary, financials and real estate sectors. At the end of the Reporting Period, the Fund was relatively neutral compared to the Russell Index in the energy sector and had no exposure to the utilities sector.
What is the Fund’s tactical view and strategy for the months ahead?
The end of 2021 was cast with the development of the Omicron variant of COVID-19, which we expected at the end of the Reporting Period to remain a major focus of the U.S. equity markets in the first quarter of 2022, as entities around the world continued to navigate pockets of outbreaks and implement responses accordingly. Other major themes, such as the acceleration in the Fed’s winding down of its asset purchasing program and hiking of interest rates as well as inflation readings, supply-chain issues and the global energy shortage may test the markets again. The unclear future of the U.S. Administration’s social spending bill will likely also be in play in early 2022.
Regardless of market direction, we intend to stay true to our quality-first investment approach and seek to invest in businesses with healthy balance sheets, relatively stable cash flows and differentiated business models aligned to secular tailwinds. We continue to test our models and re-evaluate our assumptions with increasing information, remain focused on the long-term investment horizon and believe this fundamental approach can generate added value in the long run. As always, we maintain our focus on seeking companies that we believe will generate long-term growth in today’s ever-changing market conditions.
FUND BASICS
Growth Opportunities Fund
as of December 31, 2021
TOP TEN HOLDINGS AS OF 12/31/211
| | | | | | | | |
| | | |
| Holding | | % of
Net Assets | | | Line of Business | | Country |
| Palo Alto Networks, Inc. | | | 2.9% | | | Software & Services | | United States |
| Cadence Design Systems, Inc. | | | 2.6 | | | Software & Services | | United States |
| West Pharmaceutical Services, Inc. | | | 2.5 | | | Pharmaceuticals, Biotechnology & Life Sciences | | United States |
| Expedia Group, Inc. | | | 2.3 | | | Consumer Services | | United States |
| Lululemon Athletica, Inc. | | | 2.2 | | | Consumer Durables & Apparel | | United States |
| Verisk Analytics, Inc. | | | 2.2 | | | Commercial & Professional Services | | United States |
| Rockwell Automation, Inc. | | | 2.1 | | | Capital Goods | | United States |
| Old Dominion Freight Line, Inc. | | | 2.0 | | | Transportation | | United States |
| Etsy, Inc. | | | 2.0 | | | Retailing | | United States |
| Veeva Systems, Inc., Class A | | | 1.9 | | | Health Care Equipment & Services | | United States |
| 1 | The top 10 holdings may not be representative of the Fund’s future investments. |
FUND BASICS
FUND VS. BENCHMARK SECTOR ALLOCATIONS2
As of December 31, 2021
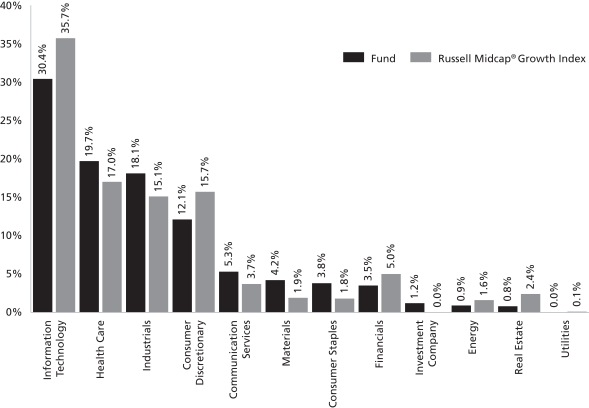
| 2 | The Fund is actively managed and, as such, its composition may differ over time. Consequently, the Fund’s overall sector allocations may differ from percentages contained in the graph above. The graph categorizes investments using Global Industry Classification Standard (“GICS”); however, the sector classifications used by the portfolio management team may differ from GICS. The percentage shown for each investment category reflects the value of investments in that category as a percentage of market value (excluding investments in the securities lending reinvestment vehicle, if any). Underlying sector allocations of exchange traded funds and investment companies held by the Fund are not reflected in the graph above. Investments in the securities lending reinvestment vehicle represented 0.9% of the Fund’s net assets at December 31, 2021. |
For more information about your Fund, please refer to www.GSAMFUNDS.com. There, you can learn more about your Fund’s investment strategies, holdings, and performance.
GOLDMAN SACHS VARIABLE INSURANCE TRUST GROWTH OPPORTUNITIES FUND
Performance Summary
December 31, 2021
The following graph shows the value, as of December 31, 2021, of a $10,000 investment made on January 1, 2012 in Institutional Shares at NAV. For comparative purposes, the performance of the Fund’s benchmark, the Russell Midcap® Growth Index (with distributions reinvested), is shown. Performance reflects applicable fee waivers and/or expense limitations in effect during the periods shown and in their absence, performance would be reduced. Returns do not reflect the deduction of taxes that a shareholder would pay on Fund distributions or the redemption of Fund shares. The returns set forth below represent past performance. Past performance does not guarantee future results. The Fund’s investment return and principal value will fluctuate so that an investor’s shares, when redeemed, may be worth more or less than their original cost. Current performance may be lower or higher than the performance quoted below. Please visit our web site at www.GSAMFUNDS.com to obtain the most recent month-end returns.
Growth Opportunities Fund’s 10 Year Performance
Performance of a $10,000 investment, with distributions reinvested, from January 1, 2012 through December 31, 2021.
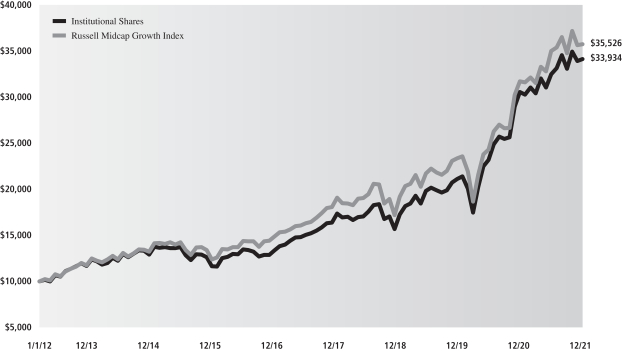
| | | | | | | | |
| Average Annual Total Return through December 31, 2021 | | One Year | | Five Years | | Ten Years | | Since Inception |
Institutional (Commenced April 30, 2013) | | 11.65% | | 21.42% | | N/A | | 15.12% |
Service | | 11.48% | | 21.22% | | 16.00% | | — |
GOLDMAN SACHS VARIABLE INSURANCE TRUST INTERNATIONAL EQUITY INSIGHTS FUND
INVESTMENT OBJECTIVE
The Fund seeks long-term growth of capital.
Portfolio Management Discussion and Analysis
Below, the Goldman Sachs Quantitative Investment Strategies Team discuss the Goldman Sachs Variable Insurance Trust — Goldman Sachs International Equity Insights Fund’s (the “Fund”) performance and positioning for the 12-month period ended December 31, 2021 (the “Reporting Period”).
How did the Fund perform during the Reporting Period?
During the Reporting Period, the Fund’s Institutional and Service Shares generated average annual total returns of 12.17% and 11.81%, respectively. These returns compare to the 11.26% average annual total return of the Fund’s benchmark, the MSCI Europe, Australasia, Far East (EAFE) Standard Index (net, USD, unhedged) (the “MSCI EAFE Index”), during the same time period.
What key factors were responsible for the Fund’s performance during the Reporting Period?
The Fund uses a quantitative style of management, in combination with a qualitative overlay, that emphasizes fundamentally-based stock and country/currency selection, careful portfolio construction and efficient implementation.
During the Reporting Period, the Fund posted double-digit absolute gains and outperformed the MSCI EAFE Index, with each of our quantitative model’s four investment themes contributing positively to results. Stock selection overall, driven by these investment themes, boosted relative performance.
Which investment themes helped and which hurt within the Team’s stock selection strategy?
In keeping with our investment approach, we use our quantitative model and four investment themes to take a long-term view of market patterns and look for inefficiencies, selecting stocks for the Fund and overweighting or underweighting the ones chosen by the model. Over time and by design, the performance of any one of the model’s investment themes tends to have a low correlation with the model’s other themes, demonstrating the diversification benefit of the Fund’s theme-driven quantitative model. The variance in performance supports our research indicating that the diversification provided by the Fund’s different investment themes is a significant investment advantage over the long term, even though the Fund may experience underperformance in the short term. Of course, diversification does not protect an investor from market risk nor does it ensure a profit.
As mentioned, during the Reporting Period, each of our investment themes contributed positively to the Fund’s relative returns. Sentiment Analysis added most, followed by Market Themes & Trends, Fundamental Mispricings and High Quality Business Models. Sentiment Analysis seeks to identify stocks experiencing improvements in their overall market sentiment. Market Themes & Trends seeks to identify companies positively positioned to benefit from themes and trends in the market and macroeconomic environment. Fundamental Mispricings seeks to identify high quality businesses trading at a fair price, which we believe may lead to strong performance over the long run. High Quality Business Models seeks to identify companies that are generating high quality revenues with sustainable business models and aligned management incentives.
How did the Fund’s sector and industry allocations affect relative performance during the Reporting Period?
In constructing the Fund’s portfolio, we focus on picking stocks rather than making sector or industry bets. Consequently, the Fund is similar to its benchmark, the MSCI EAFE Index, in terms of its sector and industry allocations and style. Relative performance is primarily driven by stock selection, not by sector or industry allocations.
Did stock selection help or hurt Fund performance during the Reporting Period?
We seek to outpace the MSCI EAFE Index by overweighting stocks that we expect to outperform and underweighting those that we think may lag. At the same time, we strive to maintain a risk profile similar to the MSCI EAFE Index. The Fund’s investments are selected using fundamental research and a variety of quantitative techniques based on our investment themes. For example, the Fund aims to hold a basket of stocks with better Fundamental Mispricings characteristics than the benchmark index.
During the Reporting Period, stock selection overall helped the Fund’s performance, with investments in the industrials, information technology and health care sectors contributing most positively to results relative to the MSCI EAFE Index. Holdings in the consumer discretionary, financials and materials sectors detracted most.
GOLDMAN SACHS VARIABLE INSURANCE TRUST INTERNATIONAL EQUITY INSIGHTS FUND
Which individual stock positions contributed the most to the Fund’s relative returns during the Reporting Period?
The Fund benefited most from overweight positions in Japan-based marine transportation services provider Nippon Yusen, Netherlands-based semiconductor machinery manufacturer ASM International and Japan-based marine transportation, warehousing and cargo handling services provider Mitsui OSK Lines. The overweight in Nippon Yusen was fueled mainly by our Market Themes & Trends and Fundamental Mispricings investment themes. The overweight in ASM International was based primarily on our Sentiment Analysis and Market Themes & Trends investment themes. Driven mostly by our Market Themes & Trends investment theme, the Fund benefited from its overweight in Mitsui OSK Lines.
Which individual positions detracted from the Fund’s results during the Reporting Period?
Detracting most from the Fund’s results relative to the MSCI EAFE Index were underweight positions in Japan-based electronics products manufacturer and distributor Sony Group, Switzerland-based packaged food company Nestle and Switzerland-based luxury goods manufacturer and retailer Compagnie Financiere Richemont. The underweight in Sony Group was implemented primarily because of our Market Themes & Trends investment theme. The underweights in Nestle and Compagnie Financiere Richemont were each based primarily on our High Quality Business Models investment theme.
What impact did country selection have on the Fund’s relative performance during the Reporting Period?
Compared to the MSCI EAFE Index, the Fund was helped most by its positioning in France, the Netherlands and Germany. Positioning in Switzerland, Japan and Sweden detracted most from the Fund’s relative results during the Reporting Period.
We made our picks using our proprietary models, which, during the Reporting Period, were based on five investment themes specific to our country/currency strategy — Valuation, Momentum, Risk Premium, Fund Flows and Macro. Valuation favors equity and currency markets that appear cheap relative to accounting measures of value and purchasing power. Momentum favors countries and currencies that have had strong recent outperformance. Risk Premium evaluates whether a country is overcompensating investors for various types of risk, while Fund Flows evaluates the strength of capital market inflows. Finally, Macro assesses a market’s macroeconomic environment and growth prospects.
Did you make any enhancements to your quantitative models during the Reporting Period?
We continuously look for ways to improve our investment process. During the first half of the Reporting Period, we introduced several new signals into our models. For example, we introduced new signals within our Sentiment Analysis investment theme, which were rolled out across the majority of regions, including the U.S., emerging markets, Japan and Europe. These signals are an extension to our existing suite of signals that focus on institutional positioning and capture sentiment associated with outstanding short-interest for specific names. The new signals focus on short positions by institutional investors and seek to identify which ones may have been covered prematurely or maintained beyond their optimal duration. Additionally, within our High Quality Business Models investment theme, we introduced another signal to our existing suite of alternative growth signals, also across multiple regions, including the U.S., emerging markets, Japan and Europe. This signal seeks to identify companies that exhibit elevated levels of demand for their products and services based on trends identified from consumer Internet activity data. While we believe these types of trends can help provide additional insight on the global demand for certain products and services, we have also closely focused on developing our own process to identify which individual companies are most highly exposed to specific trends.
During the second half of the Reporting Period, we introduced several new signals into our models, mostly in the fourth quarter of 2021. For example, within our Market Themes & Trends investment theme, we introduced a new signal, rolled out across all regions, that focused on macro market environments and assesses similarities between market events from the past and the current environment. The signal evaluates the historical performance of the stock in similar market conditions to predict future stock returns. Finally, we introduced two signals within our Sentiment Analysis investment theme. One signal, rolled out across all developed market regions, uses short sales transaction data to help identify potential sustained stock selloffs, expanding upon our existing factors that leverage short sales and short interest data. The other signal, introduced in the emerging markets region, analyzes flows from local versus foreign registered investors, and seeks to anticipate the stock price impact caused by these flows and their subsequent trading activity.
How did the Fund use derivatives during the Reporting Period?
During the Reporting Period, we used equity index futures contracts, on an opportunistic basis, to equitize the Fund’s cash holdings. In other words, we put the Fund’s cash holdings to work by using them as collateral for the purchase of stock futures. We also used forward foreign currency exchange contracts to avoid unintended local currency exposure when buying and selling stocks. The use of these derivatives did not have a material impact on Fund results during the Reporting Period.
GOLDMAN SACHS VARIABLE INSURANCE TRUST INTERNATIONAL EQUITY INSIGHTS FUND
What changes did you make to the Fund’s country weightings during the Reporting Period?
During the Reporting Period, we increased the Fund’s positions relative to the MSCI EAFE Index in Norway, Sweden, Germany, France and the U.K. We decreased the Fund’s positions relative to the MSCI EAFE Index in the Netherlands, Italy, Switzerland and Belgium.
What were the Fund’s sector and country weightings at the end of the Reporting Period?
As of December 31, 2021, the Fund was overweight the industrials and information technology sectors relative to the MSCI EAFE Index. The Fund was underweight consumer staples and health care and was rather neutral to the MSCI EAFE Index in communication services, consumer discretionary, materials, real estate, financials, energy and utilities on the same date.
In terms of countries, the Fund was overweight relative to the MSCI EAFE Index in Japan, France, Norway and Sweden at the end of the Reporting Period. Compared to the MSCI EAFE Index, the Fund was underweight in Switzerland and the U.K. and was relatively neutral compared to the MSCI EAFE Index in the remaining constituents of the MSCI EAFE Index at the end of the Reporting Period.
Were there any changes to the Fund’s portfolio management team during the Reporting Period?
In early 2021, Dennis Walsh, Managing Director and Senior Portfolio Manager, became a co-portfolio manager for the Fund. Mr. Walsh joined Len Ioffe, Managing Director and Senior Portfolio Manager, Osman Ali, Managing Director and Senior Portfolio Manager, and Takashi Suwabe, Managing Director and Senior Portfolio Manager, all of whom have managed the Fund since 2018. By design, all investment decisions for the Fund are performed within a co-lead or team structure.
What is your strategy going forward for the Fund?
Looking ahead, we continue to believe that less expensive stocks should outpace more expensive stocks, and stocks with good momentum are likely to outperform those with poor momentum. We intend to maintain our focus on seeking companies about which fundamental research analysts are becoming more positive as well as profitable companies with sustainable earnings and a track record of using their capital to enhance shareholder value. As such, we anticipate remaining fully invested with long-term performance likely to be the result of stock selection rather than sector or capitalization allocations.
We stand behind our investment philosophy that sound economic investment principles, coupled with a disciplined quantitative approach, can provide strong, uncorrelated returns over the long term. Our research agenda is robust, and we continue to enhance our existing models, add new proprietary forecasting signals and improve our trading execution as we seek to provide the most value to our shareholders.
FUND BASICS
International Equity Insights Fund
as of December 31, 2021
TOP TEN HOLDINGS AS OF 12/31/211
| | | | | | | | |
| | | |
| Holding | | % of
Net Assets | | | Line of Business | | Country |
| ASML Holding NV | | | 2.4% | | | Semiconductors & Semiconductor Equipment | | Netherlands |
| LVMH Moet Hennessy Louis Vuitton SE | | | 2.0 | | | Consumer Durables & Apparel | | France |
| Novo Nordisk A/S, Class B | | | 1.7 | | | Pharmaceuticals, Biotechnology & Life Sciences | | Denmark |
| Roche Holding AG | | | 1.6 | | | Pharmaceuticals, Biotechnology & Life Sciences | | Switzerland |
| Schneider Electric SE | | | 1.4 | | | Capital Goods | | United States |
| Commonwealth Bank of Australia | | | 1.3 | | | Banks | | Australia |
| AIA Group Ltd. | | | 1.3 | | | Insurance | | Hong Kong |
| Rio Tinto PLC ADR | | | 1.1 | | | Materials | | Australia |
| Nestle SA | | | 1.1 | | | Food, Beverage & Tobacco | | Switzerland |
| British American Tobacco PLC | | | 1.1 | | | Food, Beverage & Tobacco | | United Kingdom |
| 1 | The top 10 holdings may not be representative of the Fund’s future investments. |
FUND VS. BENCHMARK SECTOR ALLOCATIONS2
As of December 31, 2021
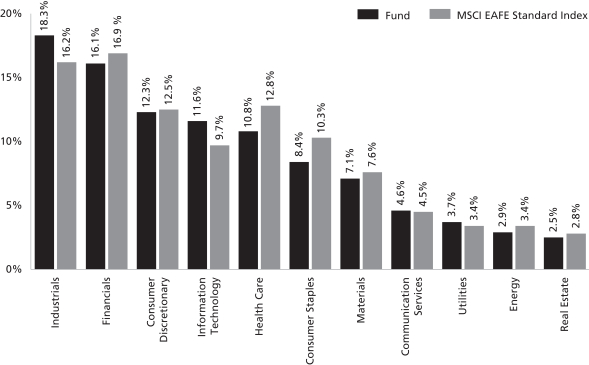
| 2 | The Fund is actively managed and, as such, its composition may differ over time. Consequently, the Fund’s overall sector allocations may differ from percentages contained in the graph above. The graph categorizes investments using Global Industry Classification Standard (“GICS”); however, the sector classifications used by the portfolio management team may differ from GICS. The percentage shown for each investment category reflects the value of investments in that category as a percentage of market value. The graph depicts the Fund’s investments but may not represent the Fund’s market exposure due to the exclusion of certain derivatives, if any, as listed in the Additional Investment Information section of the Schedule of Investments. |
For more information about your Fund, please refer to www.GSAMFUNDS.com. There, you can learn more about
your Fund’s investment strategies, holdings, and performance.
GOLDMAN SACHS VARIABLE INSURANCE TRUST INTERNATIONAL EQUITY INSIGHTS FUND
Performance Summary
December 31, 2021
The following graph shows the value, as of December 31, 2021, of a $10,000 investment made on January 1, 2012 in Institutional Shares at NAV. For comparative purposes, the performance of the Fund’s benchmark, the MSCI EAFE Standard Index (Net, USD, Unhedged), is shown. Performance reflects applicable fee waivers and/or expense limitations in effect during the periods shown and in their absence, performance would be reduced. Returns do not reflect the deduction of taxes that a shareholder would pay on Fund distributions or the redemption of Fund shares. The returns set forth below represent past performance. Past performance does not guarantee future results. The Fund’s investment return and principal value will fluctuate so that an investor’s shares, when redeemed, may be worth more or less than their original cost. Current performance may be lower or higher than the performance quoted below. Please visit our web site at www.GSAMFUNDS.com to obtain the most recent month-end returns.
International Equity Insights Fund’s 10 Year Performance
Performance of a $10,000 investment, with distributions reinvested, from January 1, 2012 through December 31, 2021.
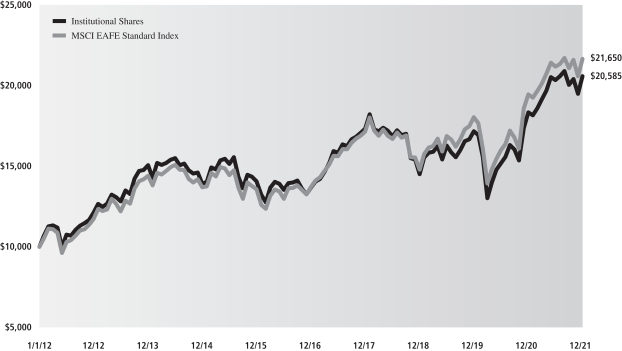
| | | | | | |
| Average Annual Total Return through December 31, 2021 | | One Year | | Five Years | | Ten Years |
Institutional | | 12.17% | | 8.50% | | 7.48% |
Service | | 11.81% | | 8.20% | | 7.20% |
GOLDMAN SACHS VARIABLE INSURANCE TRUST LARGE CAP VALUE FUND
INVESTMENT OBJECTIVE
The Fund seeks long-term capital appreciation.
Portfolio Management Discussion and Analysis
Below, the Goldman Sachs Fundamental Equity U.S. Equity Portfolio Management Team discusses the Goldman Sachs Variable Insurance Trust — Goldman Sachs Large Cap Value Fund’s (the “Fund”) performance and positioning for the 12-month period ended December 31, 2021 (the “Reporting Period”).
How did the Fund perform during the Reporting Period?
During the Reporting Period, the Fund’s Institutional and Service Shares generated average annual total returns of 24.13% and 23.93%, respectively. These returns compare to the 25.16% average annual total return of the Fund’s benchmark, the Russell 1000® Value Index (with dividends reinvested) (the “Russell Index”) during the same time period.
What key factors were responsible for the Fund’s performance during the Reporting Period?
The Fund posted solid absolute gains but underperformed the Russell Index during the Reporting Period due to a combination of stock selection and sector allocation decisions overall.
Which equity market sectors most significantly affected Fund performance?
Stock selection in the health care and utilities sectors detracted most from the Fund’s relative results during the Reporting Period. Having an underweight to financials, which outpaced the Russell Index during the Reporting Period, further dampened relative results. Partially offsetting these detractors was stock selection in the consumer discretionary and real estate sectors, which contributed positively to the Fund’s relative results during the Reporting Period. Having an underweight to communication services, which notably lagged the Russell Index during the Reporting Period, also helped.
Which stocks detracted significantly from the Fund’s performance during the Reporting Period?
Among those companies detracting most from the Fund’s results relative to the Russell Index were positions in Zimmer Biomet Holdings, Fidelity National Information Services and Splunk.
Musculoskeletal health care services company Zimmer Biomet Holdings was the top detractor from the Fund’s results during the Reporting Period. The spread of the COVID-19 Delta and Omicron variants limited hospital capacity and patient demand for orthopedics procedures. Despite its earnings per share consistently beating consensus estimates, the company’s hips and knees business segments missed expectations, and the company narrowed its full-year guidance to the lower end of its initial range. At the end of the Reporting Period, we remained confident in the company’s innovative robotic ROSA platform and its growth potential in the long run, especially with new products being introduced and procedure levels eventually increasing toward pre-COVID-19 levels.
Technology services provider Fidelity National Information Services detracted, largely because the competitive landscape shifted following recent merger and acquisition within the industry. This shift applied price pressure on the company’s stock as did talks around selling its capital markets business. Further, the company’s second quarter 2021 earnings release revealed smaller earnings per share guidance relative to consensus expectations and lower implied margin as a result of incremental incentive accruals and the upfront impact of new business wins. At the end of the Reporting Period, we believed Fidelity National Information Services’ global footprint and presence in the banking industry was well positioned to take advantage of accelerating payments innovations globally and felt the company should benefit from improving spending fundamentals.
Splunk engages in the development and marketing of software solutions. During the first quarter of 2021, its shares declined in line with the broad information technology sector and then further depreciated following the news of the departures of several senior company leaders. Later in the year, Splunk’s Chief Executive Office announced his retirement as well. Though headwinds remained, at the end of the Reporting Period, we were still confident in Splunk’s prospects given its transition to a subscription-based pricing model, its near-term upsell opportunity with its existing renewal base, and what we saw as its relatively inexpensive valuation.
What were some of the Fund’s best-performing individual stocks?
Relative to the Russell Index, the Fund benefited most from positions in Marvell Technology, Bath & Body Works and Alphabet.
GOLDMAN SACHS VARIABLE INSURANCE TRUST LARGE CAP VALUE FUND
Marvell Technology’s stock price appreciated along with an earnings report during the second quarter of 2021 that was better than consensus expectations. Then, in early December 2021, the company delivered another strong quarter of performance, highlighted by its ability to better fulfill backlogged orders. Additionally, the backlog of business actually increased, signifying the further demand for Marvell Technology’s products. At the end of the Reporting Period, we remained positive on Marvell Technology given our view of its management’s history of execution and the company’s exposure to structural growth trends in cloud, autos and fifth-generation (“5G”) technologies.
Bath & Body Works, a new purchase for the Fund during the Reporting Period, engages in the operation of retail stores, specializing in domestics merchandise and home furnishings. Its stock price rose significantly in the early months of 2021, largely due to the retail trading environment. However, the lack of fundamental drivers behind the price appreciation led us to be cautious. We ultimately decided to capture the Fund’s profits and exit the position in June 2021 in favor of what we saw as other more attractive risk/reward opportunities.
Alphabet is a holding company that engages in advertising, digital content, applications, cloud offerings and more through its subsidiaries, including its largest, Google. During the Reporting Period, the company benefited from a solid recovery in the search business as well as from significant growth in its YouTube and Cloud businesses. It had become clear to many that the broad advertising market was recovering, and virtually all of the major Internet players were benefiting — all while Alphabet continued to show real cost discipline, in our view. At the end of the Reporting Period, we remained optimistic about Alphabet, as advertising spending and travel were improving, which we believe could further benefit the company.
How did the Fund use derivatives and similar instruments during the Reporting Period?
During the Reporting Period, we did not use derivatives as part of an active management strategy.
Did the Fund make any significant purchases or sales during the Reporting Period?
During the Reporting Period, we initiated a Fund position in banking and nonbank financial services company Bank of America. We believe holding the name in the Fund’s portfolio will help maintain balance from an interest rate sensitivity and capital return perspective. We also believe Bank of America is generally well positioned with a strong deposit base over the long term.
We established a Fund position in cloud-based customer relationship management software provider salesforce.com during the Reporting Period. Despite its disappointing quarterly results in December 2021, we still see ample room for organic growth and believe its integration with Slack, the proprietary communication platform of Slack Technologies, will likely continue to benefit the company moving forward.
Conversely, we exited the Fund’s position in telecommunications company Verizon Communications during the Reporting Period. While we continue to like the long-term outlook for the company, we sold the position in favor of what we believed to be better risk/reward prospects within the industry.
We eliminated the Fund’s position in financial services company Wells Fargo & Co. as a result of concerns that the Federal Reserve’s (“Fed”) asset cap on the bank may create headwinds for longer than we previously anticipated. Despite these concerns, we intend to continue to monitor the stock, as we remained optimistic about some of the company’s efficiency efforts and believe there may be an opportunity for growth once the asset cap is removed.
Were there any notable changes in the Fund’s weightings during the Reporting Period?
In constructing the Fund’s portfolio, we focus on picking stocks rather than on making industry or sector bets. We seek to outpace the benchmark index by overweighting stocks that we expect to outperform and underweighting those that we think may lag. Consequently, changes in its sector weights are generally the direct result of individual stock selection or of stock appreciation or depreciation. That said, during the Reporting Period, the Fund’s exposure compared to the Russell Index to consumer staples, financials, health care and materials increased. The Fund’s allocations compared to the Russell Index in communication services, consumer discretionary and utilities decreased.
How was the Fund positioned relative to its benchmark index at the end of the Reporting Period?
At the end of December 2021, the Fund had overweighted positions relative to the Russell Index in the information technology, materials and consumer staples sectors. On the same date, the Fund had underweighted positions compared to the Russell Index in communication services and industrials and was rather neutrally weighted to the Russell Index in the consumer discretionary, energy, financials, health care, real estate and utilities sectors.
GOLDMAN SACHS VARIABLE INSURANCE TRUST LARGE CAP VALUE FUND
Were there any changes to the Fund’s portfolio management team during the Reporting Period?
There were no changes to the Fund’s portfolio management team during the Reporting Period.
What is the Fund’s tactical view and strategy for the months ahead?
The end of 2021 was cast with the development of the Omicron variant of COVID-19, which we expected at the end of the Reporting Period to remain a major focus of the U.S. equity markets in the first quarter of 2022, as entities around the world continued to navigate pockets of outbreaks and implement responses accordingly. Other major themes, such as the acceleration in the Fed’s winding down of its asset purchasing program and hiking of interest rates as well as inflation readings, supply-chain issues and the global energy shortage may test the markets again. The unclear future of the U.S. Administration’s social spending bill will likely also be in play in early 2022.
Regardless of market direction, we intend to stay true to our quality-first investment approach and seek to invest in businesses with healthy balance sheets, relatively stable cash flows and differentiated business models aligned to secular tailwinds. We continue to test our models and re-evaluate our assumptions with increasing information, remain focused on the long-term investment horizon and believe this fundamental approach can generate added value in the long run. As always, we maintain our focus on undervalued companies that we believe have comparatively greater control of their own destiny, such as innovators with differentiated products, companies with low cost structures or companies that have been investing in their own businesses and may be poised to gain market share.
FUND BASICS
Large Cap Value Fund
as of December 31, 2021
TOP TEN HOLDINGS AS OF 12/31/211
| | | | | | | | |
| | | |
| Holding | | % of
Net Assets | | | Line of Business | | Country |
| JPMorgan Chase & Co. | | | 3.5% | | | Banks | | United States |
| Procter & Gamble Co. (The) | | | 3.2 | | | Household & Personal Products | | United States |
| Bank of America Corp. | | | 2.9 | | | Banks | | United States |
| Johnson & Johnson | | | 2.6 | | | Pharmaceuticals, Biotechnology & Life Sciences | | United States |
| Cisco Systems, Inc. | | | 2.2 | | | Technology Hardware & Equipment | | United States |
| Chevron Corp. | | | 2.1 | | | Energy | | United States |
| NextEra Energy, Inc. | | | 2.0 | | | Utilities | | United States |
| salesforce.com, Inc. | | | 2.0 | | | Software & Services | | United States |
| AT&T, Inc. | | | 1.9 | | | Telecommunication Services | | United States |
| BlackRock, Inc. | | | 1.8 | | | Diversified Financials | | United States |
| 1 | The top 10 holdings may not be representative of the Fund’s future investments. |
FUND BASICS
FUND VS. BENCHMARK SECTOR ALLOCATIONS2
As of December 31, 2021
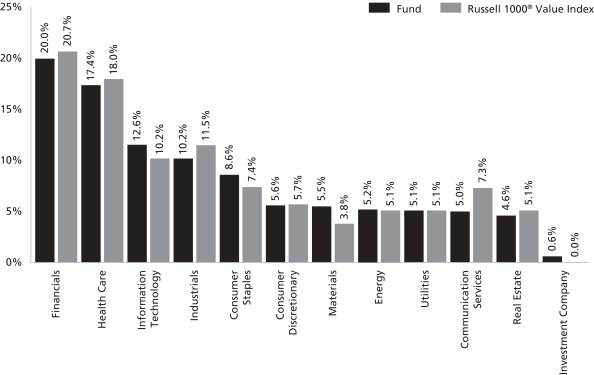
| 2 | The Fund is actively managed and, as such, its composition may differ over time. Consequently, the Fund’s overall sector allocations may differ from percentages contained in the graph above. The graph categorizes investments using Global Industry Classification Standard (“GICS”); however, the sector classifications used by the portfolio management team may differ from GICS. The percentage shown for each investment category reflects the value of investments in that category as a percentage of market value. Underlying sector allocations of exchange traded funds and investment companies held by the Fund are not reflected in the graph above. |
For more information about your Fund, please refer to www.GSAMFUNDS.com. There, you can learn more about your Fund’s investment strategies, holdings, and performance.
GOLDMAN SACHS VARIABLE INSURANCE TRUST LARGE CAP VALUE FUND
Performance Summary
December 31, 2021
The following graph shows the value, as of December 31, 2021, of a $10,000 investment made on January 1, 2012 in Service Shares at NAV. For comparative purposes, the performance of the Fund’s benchmark, the Russell 1000® Value Index (with distributions reinvested), is shown. Performance reflects applicable fee waivers and/or expense limitations in effect during the periods shown and in their absence, performance would be reduced. Returns do not reflect the deduction of taxes that a shareholder would pay on Fund distributions or the redemption of Fund shares. The returns set forth below represent past performance. Past performance does not guarantee future results. The Fund’s investment return and principal value will fluctuate so that an investor’s shares, when redeemed, may be worth more or less than their original cost. Current performance may be lower or higher than the performance quoted below. Please visit our web site at www.GSAMFUNDS.com to obtain the most recent month-end returns.
Large Cap Value Fund’s 10 Year Performance
Performance of a $10,000 investment, with distributions reinvested, from January 1, 2012 through December 31, 2021.
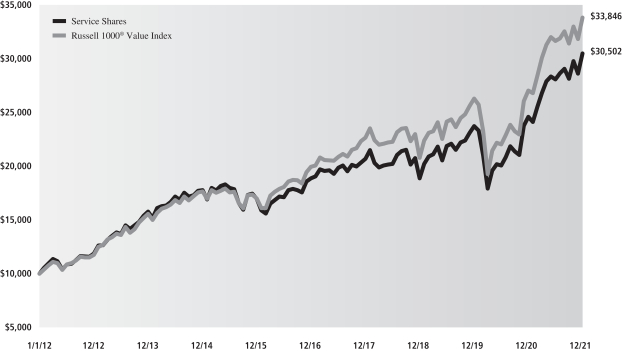
| | | | | | |
| Average Annual Total Return through December 31, 2021 | | One Year | | Five Years | | Ten Years |
Institutional | | 24.13% | | 10.32% | | 12.06% |
Service | | 23.93% | | 10.06% | | 11.79% |
GOLDMAN SACHS VARIABLE INSURANCE TRUST MID CAP VALUE FUND
INVESTMENT OBJECTIVE
The Fund seeks long-term capital appreciation.
Portfolio Management Discussion and Analysis
Below, the Goldman Sachs Fundamental Equity U.S. Equity Portfolio Management Team discusses the Goldman Sachs Variable Insurance Trust — Goldman Sachs Mid Cap Value Fund’s (the “Fund”) performance and positioning for the 12-month period ended December 31, 2021 (the “Reporting Period”).
How did the Fund perform during the Reporting Period?
During the Reporting Period, the Fund’s Institutional and Service Shares generated average annual total returns of 30.95% and 30.57%, respectively. These returns compare to the 28.34% average annual total return of the Fund’s benchmark, the Russell Midcap® Value Index (with dividends reinvested) (the “Russell Index”), during the same time period.
What key factors were responsible for the Fund’s performance during the Reporting Period?
The Fund posted double-digit absolute gains that outperformed the Russell Index during the Reporting Period due primarily to stock selection overall. Sector allocation as a whole also contributed positively, albeit more modestly, to the Fund’s performance relative to the Russell Index during the Reporting Period.
Which equity market sectors most significantly affected Fund performance?
Contributing most positively to the Fund’s relative results during the Reporting Period was effective stock selection in the information technology, financials and consumer discretionary sectors. Detracting most from the Fund’s relative results during the Reporting Period were the consumer staples, industrials and communication services sectors, wherein stock selection proved especially challenging.
What were some of the Fund’s best-performing individual stocks?
The Fund benefited most relative to the Russell Index from positions in ON Semiconductor, Old Dominion Freight Lines and Bath & Body Works.
ON Semiconductor engages in the design, manufacture and marketing of a portfolio of semiconductor components. The Reporting Period was a strong year for many semiconductor firms, and ON Semiconductor was no exception. Its results were also driven by strong quarterly earnings releases, featuring what we saw as impressive margins and top-line revenue amidst ongoing supply-chain constraints. At the end of the Reporting Period, we continued to view the company as one of our favorite semiconductor names in the mid-cap segment of the U.S. equity market.
Old Dominion Freight Lines provides less-than-truckload services. The operating environment that dominated the Reporting Period led to Old Dominion Freight Lines’ services being in high demand throughout. One reason it was able to keep up with the demand was the company culture that its senior management has built. As a result, the company has hardly been affected by the nationwide labor shortage. Its technological progress also improved its operational efficiency and margins while leaving room for technological growth. At the end of the Reporting Period, we continued to believe the company was the leading player in a capacity-constrained and structurally-growing less-than-truckload space.
Bath & Body Works engages in the operation of retail stores, specializing in domestics merchandise and home furnishings. Its stock price rose significantly in the early months of 2021, largely due to the retail trading environment. However, the lack of fundamental drivers behind the price appreciation led us to be cautious. Still, at the end of the Reporting Period, we continued to see positive momentum potential among consumer purchases, demonstrating loyalty to the Bath & Body Works product offering.
Which stocks detracted significantly from the Fund’s performance during the Reporting Period?
Detracting from the Fund’s results relative to the Russell Index were positions in Zimmer Bioment Holdings, Wynn Resorts and ViacomCBS.
Musculoskeletal health care services company Zimmer Biomet Holdings was the top detractor from the Fund’s results during the Reporting Period. The spread of the COVID-19 Delta and Omicron variants limited hospital capacity and patient demand for orthopedics procedures. Despite its earnings per share consistently beating consensus estimates, the company’s hips and knees
GOLDMAN SACHS VARIABLE INSURANCE TRUST MID CAP VALUE FUND
business segments missed expectations, and the company narrowed its full-year guidance to the lower end of its initial range. At the end of the Reporting Period, we remained confident in the company’s innovative robotic ROSA platform and its growth potential in the long run, especially with new products being introduced and procedure levels eventually increasing toward pre-COVID-19 levels.
High-end hotel and casino developer and operator Wynn Resorts saw its stock depreciate after missing earnings estimates during the Reporting Period. We exited the Fund’s position in Wynn Resorts, as new regulatory changes were proposed in Macau, including increases in government scrutiny around capital use and return, competition and enforcement, together hampering the company’s potential long-term growth, in our view.
Telecommunications company ViacomCBS was a new purchase for the Fund during the Reporting Period. Its shares declined, though much of its underperformance of the Russell Index was driven by technical rather than fundamental factors attributable to the end of the first calendar quarter and through the second quarter of 2021. We ultimately decided to exit the position, as we felt the competitive landscape was oversaturated in streaming services, and we believed there were better risk/reward opportunities elsewhere.
How did the Fund use derivatives and similar instruments during the Reporting Period?
During the Reporting Period, we did not use derivatives as part of an active management strategy.
Did the Fund make any significant purchases or sales during the Reporting Period?
We initiated a Fund position in pharmaceutical and business solutions provider AmerisourceBergen during the Reporting Period. The fundamental backdrop for drug distributors has dramatically changed after facing a series of headwinds during the past few years. We believe the company can now get back to focusing on earnings per share growth compounding, which should, in our view, lead to more favorable multiples, or price/earnings ratios.
We established a Fund position in oil and gas exploration and production company Devon Energy during the Reporting Period. We are optimistic about the company, as its management continues to emphasize the importance of free cash flow generation over the pursuit of volume growth, along with what we see as ample dividends being returned to shareholders. We will continue to carefully monitor 2022 production figures as well as the company’s debt reduction timeline.
Conversely, in addition to the sales already mentioned, we exited the Fund’s position in agriculture company Corteva during the Reporting Period. Corteva was, in our view, executing well on taking share across seed and crop protection and also was managing an effective cost savings plan. We simply preferred other names and decided to sell.
We sold the Fund’s position in payment transaction company Discover Financial Services during the Reporting Period. Even though we see spending trends as strong, we believe that view is already mostly priced in to the company’s stock valuation. Furthermore, credit conditions appear to us to have peaked and the competitive landscape is shifting with fintech names becoming a larger threat. (Financial technology, or fintech, is used to describe new technology that seeks to improve and automate the delivery and use of financial services.) Ultimately, we eliminated the position in favor of what we believe to be more attractive risk/reward opportunities.
Were there any notable changes in the Fund’s weightings during the Reporting Period?
In constructing the Fund’s portfolio, we focus on picking stocks rather than on making industry or sector bets. We seek to outpace the benchmark index by overweighting stocks that we expect to outperform and underweighting those that we think may lag. Consequently, changes in its sector weights are generally the direct result of individual stock selection or of stock appreciation or depreciation. That said, during the Reporting Period, the Fund’s exposure to energy, industrials and utilities increased and its exposure to consumer staples, financials, health care and information technology decreased compared to the Russell Index.
How was the Fund positioned relative to its benchmark index at the end of the Reporting Period?
At the end of December 2021, the Fund had overweighted positions relative to the Russell Index in industrials and utilities. On the same date, the Fund had underweighted positions compared to the Russell Index in real estate and consumer discretionary and was rather neutrally weighted to the Russell Index in communication services, consumer staples, energy, financials, health care, information technology and materials.
Were there any changes to the Fund’s portfolio management team during the Reporting Period?
In early 2021, co-lead portfolio manager Adam Agress left the firm. Sung Cho, managing director and portfolio manager for the Fund alongside Adam, assumed his portfolio management responsibilities for the Fund. Sung joined Goldman Sachs Asset
GOLDMAN SACHS VARIABLE INSURANCE TRUST MID CAP VALUE FUND
Management in 2004 and has 20 years of investment experience. He has been a lead portfolio manager for the U.S. Mid Cap Value strategy since 2015. Sung will continue to leverage the expertise of more than 20 investment professionals as part of the Fundamental Equity U.S. Equity team.
By design, all investment decisions for the Fund are performed within a team structure, with multiple subject matter experts. This strategic decision making has been the cornerstone of our approach and ensures continuity in the Fund.
What is the Fund’s tactical view and strategy for the months ahead?
The end of 2021 was cast with the development of the Omicron variant of COVID-19, which we expected at the end of the Reporting Period to remain a major focus of the U.S. equity markets in the first quarter of 2022, as entities around the world continued to navigate pockets of outbreaks and implement responses accordingly. Other major themes, such as the acceleration in the Fed’s winding down of its asset purchasing program and hiking of interest rates as well as inflation readings, supply-chain issues and the global energy shortage may test the markets again. The unclear future of the U.S. Administration’s social spending bill will likely also be in play in early 2022.
Regardless of market direction, we intend to stay true to our quality-first investment approach and seek to invest in businesses with healthy balance sheets, relatively stable cash flows and differentiated business models aligned to secular tailwinds. We continue to test our models and re-evaluate our assumptions with increasing information, remain focused on the long-term investment horizon and believe this fundamental approach can generate added value in the long run. As always, we maintain our focus on undervalued companies that we believe have comparatively greater control of their own destiny, such as innovators with differentiated products, companies with low cost structures or companies that have been investing in their own businesses and may be poised to gain market share.
FUND BASICS
Mid Cap Value Fund
as of December 31, 2021
TOP TEN HOLDINGS AS OF 12/31/211
| | | | | | |
| | |
| Holding | | % of Net Assets | | | Line of Business |
| Ball Corp. | | | 1.8% | | | Materials |
| United Airlines Holdings, Inc. | | | 1.8 | | | Transportation |
| Motorola Solutions, Inc. | | | 1.8 | | | Technology Hardware & Equipment |
| Marvell Technology, Inc. | | | 1.7 | | | Semiconductors & Semiconductor Equipment |
| Ashland Global Holdings, Inc. | | | 1.7 | | | Materials |
| M&T Bank Corp. | | | 1.7 | | | Banks |
| Advance Auto Parts, Inc. | | | 1.7 | | | Retailing |
| East West Bancorp, Inc. | | | 1.7 | | | Banks |
| AMETEK, Inc. | | | 1.6 | | | Capital Goods |
| ON Semiconductor Corp. | | | 1.6 | | | Semiconductors & Semiconductor Equipment |
| 1 | The top 10 holdings may not be representative of the Fund’s future investments. |
FUND vs. BENCHMARK SECTOR ALLOCATIONS2
As of December 31, 2021
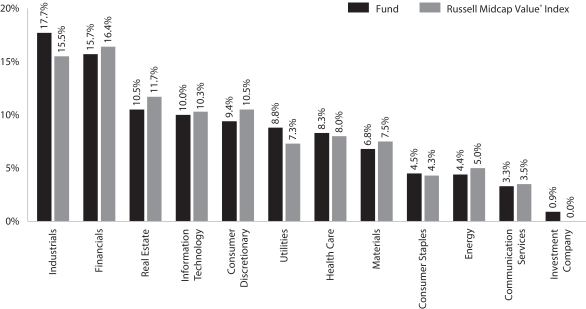
| 2 | The Fund is actively managed and, as such, its composition may differ over time. Consequently, the Fund’s overall sector allocations may differ from percentages contained in the graph above. The graph categorizes investments using Global Industry Classification Standard (“GICS”); however, the sector classifications used by the portfolio management team may differ from GICS. The percentage shown for each investment category reflects the value of investments in that category as a percentage of market value (excluding investments in the securities lending reinvestment vehicle, if any). Underlying sector allocations of exchange traded funds and investment companies held by the Fund are not reflected in the graph above. |
For more information about your Fund, please refer to www.GSAMFUNDS.com. There, you can learn more about your Fund’s investment strategies, holdings, and performance.
GOLDMAN SACHS VARIABLE INSURANCE TRUST MID CAP VALUE FUND
Performance Summary
December 31, 2021
The following graph shows the value, as of December 31, 2021, of a $10,000 investment made on January 1, 2012 in Institutional Shares at NAV. For comparative purposes, the performance of the Fund’s benchmark, the Russell Midcap Value® Index (with distributions reinvested), is shown. Performance reflects applicable fee waivers and/or expense limitations in effect during the periods shown and in their absence, performance would be reduced. Returns do not reflect the deduction of taxes that a shareholder would pay on Fund distributions or the redemption of Fund shares. The returns set forth below represent past performance. Past performance does not guarantee future results. The Fund’s investment return and principal value will fluctuate so that an investor’s shares, when redeemed, may be worth more or less than their original cost. Current performance may be lower or higher than the performance quoted below. Please visit our web site at www.GSAMFUNDS.com to obtain the most recent month-end returns.
Mid Cap Value Fund’s 10 Year Performance
Performance of a $10,000 investment, with distributions reinvested, from January 1, 2012 through December 31, 2021.
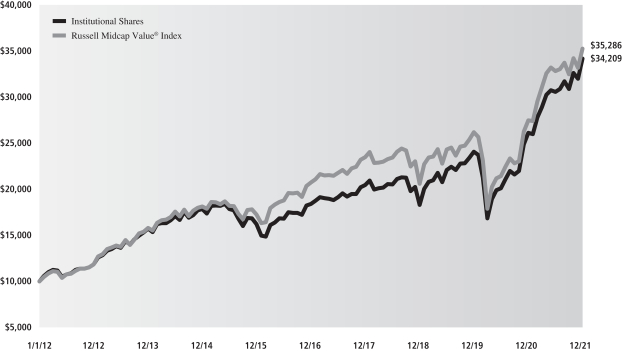
| | | | | | |
| Average Annual Total Return through December 31, 2021 | | One Year | | Five Years | | Ten Years |
Institutional | | 30.95% | | 13.17% | | 13.08% |
Service | | 30.57% | | 12.89% | | 12.79% |
GOLDMAN SACHS VARIABLE INSURANCE TRUST SMALL CAP EQUITY INSIGHTS FUND
INVESTMENT OBJECTIVE
The Fund seeks long-term growth of capital.
Portfolio Management Discussion and Analysis
Below, the Goldman Sachs Quantitative Investment Strategies Team discusses the Goldman Sachs Variable Insurance Trust — Goldman Sachs Small Cap Equity Insights Fund’s (the “Fund”) performance and positioning for the 12-month period ended December 31, 2021 (the “Reporting Period”).
How did the Fund perform during the Reporting Period?
During the Reporting Period, the Fund’s Institutional and Service Shares generated average annual total returns of 23.79% and 23.50%, respectively. These returns compare to the 14.82% average annual total return of the Fund’s benchmark, the Russell 2000® Index (with dividends reinvested) (the “Russell Index”) during the same time period.
What key factors were responsible for the Fund’s performance during the Reporting Period?
The Fund uses a quantitative style of management, in combination with a qualitative overlay, that emphasizes fundamentally-based stock selection, careful portfolio construction and efficient implementation. The Fund’s investments are selected using fundamental research and a variety of quantitative techniques based on certain investment themes, namely Fundamental Mispricings, High Quality Business Models, Sentiment Analysis and Market Themes & Trends.
During the Reporting Period, the Fund outperformed the Russell Index, with all four of our quantitative model’s investment themes contributing positively. Stock selection overall, driven by these investment themes, added to relative returns.
What impact did the Fund’s investment themes have on performance during the Reporting Period?
In keeping with our investment approach, we use our quantitative model and four investment themes to take a long-term view of market patterns and look for inefficiencies, selecting stocks for the Fund and overweighting or underweighting the ones chosen by the model. Over time and by design, the performance of any one of the model’s investment themes tends to have a low correlation with the model’s other themes, demonstrating the diversification benefit of the Fund’s theme-driven quantitative model. The variance in performance supports our research indicating that the diversification provided by the Fund’s different investment themes is a significant investment advantage over the long term, even though the Fund may experience underperformance in the short term. Of course, diversification does not protect an investor from market risk nor does it ensure a profit.
During the Reporting Period, each of our four investment themes contributed positively to the Fund’s relative performance. Sentiment Analysis and High Quality Business Models bolstered relative results most, followed at some distance by Fundamental Mispricings and Market Themes & Trends. Sentiment Analysis seeks to identify stocks experiencing improvements in their overall market sentiment. High Quality Business Models seeks to identify companies that are generating high quality revenues with sustainable business models and aligned management incentives. Fundamental Mispricing seeks to identify high quality businesses trading at a fair price, which we believe may lead to strong performance over the long run. Market Themes & Trends seeks to identify companies positively positioned to benefit from themes and trends in the market and macroeconomic environment.
How did the Fund’s sector and industry allocations affect relative performance?
In constructing the Fund’s portfolio, our quantitative model focuses on stock selection rather than making sector or industry bets. Consequently, the Fund is similar to its benchmark, the Russell Index, in terms of its sector and industry allocations and style. Relative performance is primarily driven by stock selection, not by sector or industry allocations.
Did stock selection help or hurt Fund performance during the Reporting Period?
We seek to outpace the Russell Index by overweighting stocks that we expect to outperform and underweighting those that we think may lag. At the same time, we strive to maintain a risk profile similar to the Russell Index. The Fund’s investments are selected using fundamental research and a variety of quantitative techniques based on our investment themes. For example, the Fund aims to hold a basket of stocks with better Fundamental Mispricings characteristics than the Russell Index.
During the Reporting Period, stock selection overall helped the Fund’s performance, with investments in the health care, financials and consumer discretionary sectors contributing the most to the Fund’s relative returns. Conversely, stock selection in industrials detracted—the only sector to detract from relative results during the Reporting Period.
GOLDMAN SACHS VARIABLE INSURANCE TRUST SMALL CAP EQUITY INSIGHTS FUND
Which individual stock positions contributed the most to the Fund’s relative returns during the Reporting Period?
The Fund benefited most from overweight positions in casino and entertainment properties developer and operator Red Rock Resorts, multi-family properties-focused real estate investment trust NexPoint Residential Trust and components producer for the semiconductor industry Axcelis Technologies. The overweight in Red Rock Resorts was established predominantly due to our High Quality Business Models investment theme. The overweight in NexPoint Residential Trust was driven by our Sentiment Analysis and High Quality Business Models investment themes. The Fund was overweight Axcelis Technologies largely because of our High Quality Business Models and Sentiment Analysis investment themes.
Which individual positions detracted from the Fund’s results during the Reporting Period?
Detracting most from the Fund’s results relative to the Russell Index were overweight positions in Editas Medicine, a clinical stage genome editing company, and Trupanion, a pet health insurance services provider. An underweight position in vehicle rental operator Avis Budget Group also detracted. The overweight in Editas Medicine was established primarily as a result of our Sentiment Analysis investment theme. Largely because of our Fundamental Mispricings and Market Themes & Trends investment theme, the Fund was overweight Trupanion. The Fund’s underweight in Avis Budget Group was driven primarily by our High Quality Business Models and Sentiment Analysis investment themes.
How did the Fund use derivatives during the Reporting Period?
During the Reporting Period, we used equity index futures contracts, on an opportunistic basis, to equitize the Fund’s cash holdings. In other words, we put the Fund’s cash holdings to work by using them as collateral for the purchase of futures contracts. The use of these derivatives did not have a material impact on the Fund’s performance during the Reporting Period.
Did you make any enhancements to your quantitative models during the Reporting Period?
We continuously look for ways to improve our investment process. During the first half of the Reporting Period, we introduced several new signals into our models. For example, we introduced new signals within our Sentiment Analysis investment theme, which were rolled out across the majority of regions, including the U.S., emerging markets, Japan and Europe. These signals are an extension to our existing suite of signals that focus on institutional positioning and capture sentiment associated with outstanding short-interest for specific names. The new signals focus on short positions by institutional investors and seek to identify which ones may have been covered prematurely or maintained beyond their optimal duration. Additionally, within our High Quality Business Models investment theme, we introduced another signal to our existing suite of alternative growth signals, also across multiple regions, including the U.S., emerging markets, Japan and Europe. This signal seeks to identify companies that exhibit elevated levels of demand for their products and services based on trends identified from consumer Internet activity data. While we believe these types of trends can help provide additional insight on the global demand for certain products and services, we have also closely focused on developing our own process to identify which individual companies are most highly exposed to specific trends. Lastly, we introduced, in the U.S., a proprietary methodology to enhance how we identify a company’s relevant peer group, as we believe that more common methods relying on country or industry classifications may be overly simplistic for companies operating in a complex business environment. This methodology is used to enhance our relative valuation signals within our Fundamental Mispricings investment theme that seek to identify companies that are currently trading at attractive valuations relative to their most relevant peers.
During the second half of the Reporting Period, we introduced several new signals into our models, mostly in the fourth quarter of 2021. For example, we introduced a new signal in the U.S. within our High Quality Business Models investment theme. The signal focused on the number of job postings by a company as we believe companies that are looking to expand their workforce are better positioned for growth in the long term. Additionally, we introduced two new signals within our Market Themes & Trends investment theme. The first signal, rolled out in the U.S. region, helps expand our library of economic linkages signals by identifying relationships between companies posting similar jobs in the same geographical regions. The second signal, rolled out across all regions, focuses on macro market environments and assesses similarities between market events from the past and the current environment. The signal evaluates the historical performance of the stock in similar market conditions to predict future stock returns. Finally, we introduced a signal within our Sentiment Analysis investment theme. Rolled out across all developed market regions, it uses short sales transaction data to help identify potential sustained stock selloffs, expanding upon our existing factors that leverage short sales and short interest data.
GOLDMAN SACHS VARIABLE INSURANCE TRUST SMALL CAP EQUITY INSIGHTS FUND
What was the Fund’s sector positioning relative to its benchmark index at the end of the Reporting Period?
As of December 31, 2021, the Fund was overweight the financials, health care, consumer discretionary and communication services sectors relative to the Russell Index. The Fund was underweight utilities, real estate, industrials and consumer staples and was rather neutrally weighted in information technology, materials and energy compared to the Russell Index on the same date.
Were there any changes to the Fund’s portfolio management team during the Reporting Period?
In early 2021, Takashi Suwabe, Managing Director and Senior Portfolio Manager, became a co-portfolio manager for the Fund. Mr. Suwabe joined Len Ioffe, Managing Director and Senior Portfolio Manager, Osman Ali, Managing Director and Senior Portfolio Manager, and Dennis Walsh, Managing Director and Senior Portfolio Manager, who have managed the Fund since 2011, 2012, and 2013 respectively. By design, all investment decisions for the Fund are performed within a co-lead or team structure.
What is your strategy going forward for the Fund?
Looking ahead, we continue to believe that less expensive stocks should outpace more expensive stocks, and stocks with good momentum are likely to outperform those with poor momentum. We intend to maintain our focus on seeking companies about which fundamental research analysts are becoming more positive as well as profitable companies with sustainable earnings and a track record of using their capital to enhance shareholder value. As such, we anticipate remaining fully invested with long-term performance likely to be the result of stock selection rather than sector or capitalization allocations.
We stand behind our investment philosophy that sound economic investment principles, coupled with a disciplined quantitative approach, can provide strong, uncorrelated returns over the long term. Our research agenda is robust, and we continue to enhance our existing models, add new proprietary forecasting signals and improve our trading execution as we seek to provide the most value to our shareholders.
FUND BASICS
Small Cap Equity Insights Fund
as of December 31, 2021
TOP TEN HOLDINGS AS OF 12/31/211,2
| | | | | | |
| | |
| Holding | | % of Net Assets | | | Line of Business |
| Atkore, Inc. | | | 0.8% | | | Capital Goods |
| Medpace Holdings, Inc. | | | 0.8 | | | Pharmaceuticals, Biotechnology & Life Sciences |
| National Storage Affiliates TrustREIT | | | 0.8 | | | Real Estate |
| American Equity Investment Life Holding Co. | | | 0.8 | | | Insurance |
| Ovintiv, Inc. | | | 0.7 | | | Energy |
| Texas Roadhouse, Inc. | | | 0.7 | | | Consumer Services |
| NexPoint Residential Trust, Inc.REIT | | | 0.7 | | | Real Estate |
| Stewart Information Services Corp. | | | 0.7 | | | Insurance |
| Halozyme Therapeutics, Inc. | | | 0.7 | | | Pharmaceuticals, Biotechnology & Life Sciences |
| Kinsale Capital Group, Inc. | | | 0.7 | | | Insurance |
| 1 | The top 10 holdings may not be representative of the Fund’s future investments. |
| 2 | The Fund’s overall top ten holdings differ from the table above due to the exclusion of the Goldman Sachs Financial Square Government Fund (a short-term investment fund) which represents 1.4% of the Fund’s net assets as of December 31, 2021. |
FUND BASICS
FUND VS. BENCHMARK SECTOR ALLOCATIONS3
As of December 31, 2021
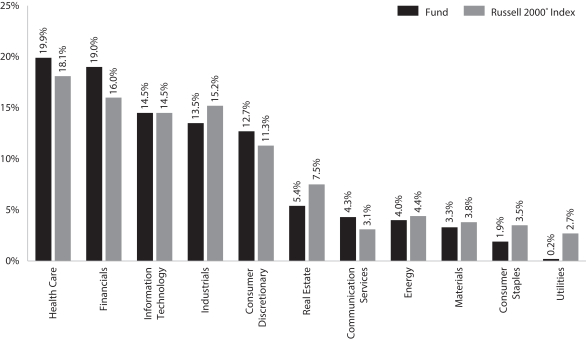
| 3 | The Fund is actively managed and, as such, its composition may differ over time. Consequently, the Fund’s overall sector allocations may differ from percentages contained in the graph above. The graph categorizes investments using Global Industry Classification Standard (“GICS”); however, the sector classifications used by the portfolio management team may differ from GICS. The percentage shown for each investment category reflects the value of investments in that category as a percentage of market value (excluding investments in the securities lending reinvestment vehicle, if any). Underlying sector allocations of exchange traded funds and investment companies held by the Fund are not reflected in the graph above. Investments in the securities lending reinvestment vehicle represented 1.4% of the Fund’s net assets at December 31, 2021. The graph depicts the Fund’s investments but may not represent the Fund’s market exposure due to the exclusion of certain derivatives, if any, as listed in the Additional Investment Information section of the Schedule of Investments. |
For more information about your Fund, please refer to www.GSAMFUNDS.com. There, you can learn more about your Fund’s investment strategies, holdings, and performance.
GOLDMAN SACHS VARIABLE INSURANCE TRUST SMALL CAP EQUITY INSIGHTS FUND
Performance Summary
December 31, 2021
The following graph shows the value, as of December 31, 2021, of a $10,000 investment made on January 1, 2012 in Institutional Shares at NAV. For comparative purposes, the performance of the Fund’s benchmark, the Russell 2000® Index (with distributions reinvested), is shown. Performance reflects applicable fee waivers and/or expense limitations in effect during the periods shown and in their absence, performance would be reduced. Returns do not reflect the deduction of taxes that a shareholder would pay on Fund distributions or the redemption of Fund shares. The returns set forth below represent past performance. Past performance does not guarantee future results. The Fund’s investment return and principal value will fluctuate so that an investor’s shares, when redeemed, may be worth more or less than their original cost. Current performance may be lower or higher than the performance quoted below. Please visit our web site at www.GSAMFUNDS.com to obtain the most recent month-end returns.
Small Cap Equity Insights Fund’s 10 Year Performance
Performance of a $10,000 investment, with distributions reinvested, from January 1, 2012 through December 31, 2021.
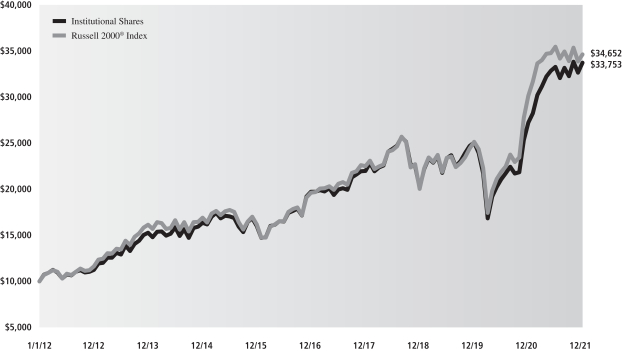
| | | | | | |
| Average Annual Total Return through December 31, 2021 | | One Year | | Five Years | | Ten Years |
Institutional | | 23.79% | | 11.33% | | 12.92% |
Service | | 23.50% | | 11.06% | | 12.65% |
GOLDMAN SACHS VARIABLE INSURANCE TRUST STRATEGIC GROWTH FUND
INVESTMENT OBJECTIVE
The Fund seeks long-term growth of capital.
Portfolio Management Discussion and Analysis
Below, the Goldman Sachs Fundamental Equity U.S. Equity Portfolio Management Team discusses the Goldman Sachs Variable Insurance Trust — Goldman Sachs Strategic Growth Fund’s (the “Fund”) performance and positioning for the 12-month period ended December 31, 2021 (the “Reporting Period”).
How did the Fund perform during the Reporting Period?
During the Reporting Period, the Fund’s Institutional and Service Shares generated average annual total returns of 21.93% and 21.56%, respectively. These returns compare to the 27.60% average annual total return of the Fund’s benchmark, the Russell 1000® Growth Index (with dividends reinvested) (the “Russell Index”), during the same time period.
What key factors were responsible for the Fund’s performance during the Reporting Period?
The Fund generated double-digit absolute gains but underperformed the Russell Index on a relative basis during the Reporting Period. Stock selection overall detracted most from the Fund’s relative results. Sector allocation as a whole also detracted, albeit modestly.
Which equity market sectors most significantly affected Fund performance?
Detracting most from the Fund’s relative results during the Reporting Period was weak stock selection in the information technology, consumer discretionary and health care sectors. Partially offsetting these detractors was effective stock selection in the communication services, industrials and financials sectors, which contributed positively to relative results during the Reporting Period.
Which stocks detracted significantly from the Fund’s performance during the Reporting Period?
Detracting from the Fund’s results relative to the Russell Index were overweight positions in C3.ai and Splunk and an underweight position in Microsoft.
C3.ai provides enterprise artificial intelligence software for digital transformation. In early March 2021, its shares depreciated following a mixed earnings report with below consensus revenues and margins along with lower than consensus billings results. As the year progressed, we no longer saw our investment thesis playing out, and we ultimately decided to exit the position in September 2021 in favor of other investment opportunities.
Splunk engages in the development and marketing of software solutions. During the first quarter of 2021, its shares declined in line with the broad information technology sector and then further depreciated following the news of the departures of several senior company leaders. Later in the year, Splunk’s Chief Executive Office announced his retirement as well. Though headwinds remained, at the end of the Reporting Period, we were still confident in Splunk’s prospects given its transition to a subscription-based pricing model, its near-term upsell opportunity with its existing renewal base, and what we saw as its relatively inexpensive valuation.
Microsoft engages in the development and support of software, services, devices and solutions. While its stock had a robust return during the Reporting Period, the Fund’s underweight positioning in the name caused it to be a major detractor from relative results. Microsoft’s performance can be attributed to an acceleration in its Azure business, ongoing strength in its Office and Windows products, and improved demand for on-premise products with customers continuing to make investments in their cloud environments. At the end of the Reporting Period, we continued to like the direction of the business moving forward and intended to carefully monitor both the stock’s valuation and the Fund’s positioning in the stock.
What were some of the Fund’s best-performing individual stocks?
Among those stocks the Fund benefited most from relative to the Russell Index were overweight positions in graphics processors, chipsets and multimedia software manufacturer NVIDIA, data infrastructure semiconductor solutions provider Marvell Technology and Google parent company Alphabet (Class A).
GOLDMAN SACHS VARIABLE INSURANCE TRUST STRATEGIC GROWTH FUND
Following its announcement of 2021 first quarter earnings, NVIDIA’s stock saw a substantial downturn due to concerns around margin expansion and data center revenue growth. However, the stock quickly rebounded through the rest of the Reporting Period, as the company beat consensus estimates and proved it could out-innovate its competitors. At the end of the Reporting Period, we believed NVIDIA was well positioned to continue to benefit from the strong secular growth themes of migration to the cloud and online entertainment along with ongoing strong performance versus its competitors.
Marvell Technology’s stock price appreciated along with an earnings report during the second quarter of 2021 that was better than consensus expectations. Then, in early December 2021, the company delivered another strong quarter of performance, highlighted by its ability to better fulfill backlogged orders. Additionally, the backlog of business actually increased, signifying the further demand for Marvell Technology’s products. At the end of the Reporting Period, we remained positive on Marvell Technology given our view of its management’s history of execution and the company’s exposure to structural growth trends in cloud, autos and fifth-generation (“5G”) technologies.
Alphabet is a holding company that engages in advertising, digital content, applications, cloud offerings and more through its subsidiaries, including its largest, Google. During the Reporting Period, the company benefited from a solid recovery in the search business as well as from significant growth in its YouTube and Cloud businesses. It had become clear to many that the broad advertising market was recovering, and virtually all of the major Internet players were benefiting — all while Alphabet continued to show real cost discipline, in our view. At the end of the Reporting Period, we remained optimistic about Alphabet, as advertising spending and travel were improving, which we believe could further benefit the company.
How did the Fund use derivatives and similar instruments during the Reporting Period?
During the Reporting Period, we did not use derivatives as part of an active management strategy.
Did the Fund make any significant purchases or sales during the Reporting Period?
We initiated a position in logistics and package delivery company United Parcel Services (“UPS”) during the Reporting Period. We believe the automation and capacity efforts of UPS are starting to yield benefits through improved margins. In addition, pricing has been strong broadly, as UPS has implemented surcharges as a result of high volumes.
We established a Fund position in cloud-based software solutions provider Bill.com Holdings during the Reporting Period. The secular theme of back office automation and efficiency improvement is growing in importance, in our view, and we believe the business is able to simplify and automate complex back office financial operations.
Conversely, in addition to the sale of C3.ai, we exited the Fund’s position in digital telecommunications company Qualcomm during the Reporting Period. We sold the position in April 2021 after numerous business risks were identified along with decreased business momentum being demonstrated through increased competition and what we saw as a valuation peak.
We eliminated the Fund’s position in Fidelity National Information Services, which provides technology solutions for merchants, banks and capital markets firms worldwide, during the Reporting Period. We believe its near-term growth could be inhibited by implied risks in its merchant solutions business. We also sold the position due to concerns about its long-term growth based on the disruptive competitive landscape.
Were there any notable changes in the Fund’s weightings during the Reporting Period?
In constructing the Fund’s portfolio, we focus on picking stocks rather than on making industry or sector bets. We seek to outpace the benchmark index by overweighting stocks that we expect to outperform and underweighting those that we think may lag. Consequently, changes in its sector weights are generally the direct result of individual stock selection or of stock appreciation or depreciation. That said, during the Reporting Period, the Fund’s exposure to communication services, health care and industrials increased compared to the Russell Index. The Fund’s allocations compared to the Russell Index in consumer discretionary and information technology decreased.
How was the Fund positioned relative to its benchmark index at the end of the Reporting Period?
At the end of December 2021, the Fund had overweighted positions relative to the Russell Index in the communication services, health care and materials sectors. On the same date, the Fund had underweighted positions compared to the Russell Index in information technology and consumer discretionary and was rather neutrally weighted to the Russell Index in consumer staples, financials, industrials and real estate. The Fund had no exposure to the utilities and energy sectors at the end of the Reporting Period.
GOLDMAN SACHS VARIABLE INSURANCE TRUST STRATEGIC GROWTH FUND
Were there any changes to the Fund’s portfolio management team during the Reporting Period?
There were no changes to the Fund’s portfolio management team during the Reporting Period.
What is the Fund’s tactical view and strategy for the months ahead?
The end of 2021 was cast with the development of the Omicron variant of COVID-19, which we expected at the end of the Reporting Period to remain a major focus of the U.S. equity markets in the first quarter of 2022, as entities around the world continued to navigate pockets of outbreaks and implement responses accordingly. Other major themes, such as the acceleration in the Fed’s winding down of its asset purchasing program and hiking of interest rates as well as inflation readings, supply-chain issues and the global energy shortage may test the markets again. The unclear future of the U.S. Administration’s social spending bill will likely also be in play in early 2022.
Regardless of market direction, we intend to stay true to our quality-first investment approach and seek to invest in businesses with healthy balance sheets, relatively stable cash flows and differentiated business models aligned to secular tailwinds. We continue to test our models and re-evaluate our assumptions with increasing information, remain focused on the long-term investment horizon and believe this fundamental approach can generate added value in the long run. As always, we maintain our focus on seeking companies that we believe will generate long-term growth in today’s ever-changing market conditions.
FUND BASICS
Strategic Growth Fund
as of December 31, 2021
TOP TEN HOLDINGS AS OF 12/31/211
| | | | | | | | |
| | | |
| Holding | | % of
Net Assets | | | Line of Business | | Country |
| Apple, Inc. | | | 9.5% | | | Technology Hardware & Equipment | | United States |
| Microsoft Corp. | | | 8.1 | | | Software & Services | | United States |
| Amazon.com, Inc. | | | 6.8 | | | Retailing | | United States |
| Alphabet, Inc., Class A | | | 5.0 | | | Media & Entertainment | | United States |
| NVIDIA Corp. | | | 4.0 | | | Semiconductors & Semiconductor Equipment | | United States |
| Meta Platforms, Inc., Class A | | | 3.8 | | | Media & Entertainment | | United States |
| Alphabet, Inc., Class C | | | 3.0 | | | Media & Entertainment | | United States |
| Netflix, Inc. | | | 2.2 | | | Media & Entertainment | | United States |
| Mastercard, Inc., Class A | | | 2.1 | | | Software & Services | | United States |
| Tesla, Inc. | | | 2.1 | | | Automobiles & Components | | United States |
| 1 | The top 10 holdings may not be representative of the Fund’s future investments. |
FUND BASICS
FUND vs. BENCHMARK SECTOR ALLOCATIONS2
As of December 31, 2021
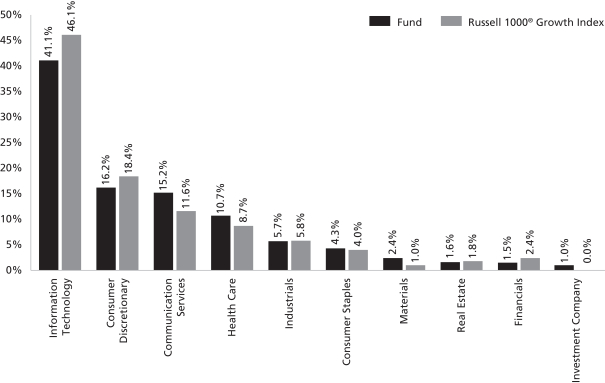
| 2 | The Fund is actively managed and, as such, its composition may differ over time. Consequently, the Fund’s overall sector allocations may differ from percentages contained in the graph above. The graph categorizes investments using Global Industry Classification Standard (“GICS”); however, the sector classifications used by the portfolio management team may differ from GICS. The percentage shown for each investment category reflects the value of investments in that category as a percentage of market value (excluding investments in the securities lending reinvestment vehicle, if any). Underlying sector allocations of exchange traded funds and investment companies held by the Fund are not reflected in the graph above. Investments in the securities lending reinvestment vehicle represented 0.2% of the Fund’s net assets at December 31, 2021. |
For more information about your Fund, please refer to www.GSAMFUNDS.com. There, you can learn more about your Fund’s investment strategies, holdings, and performance.
GOLDMAN SACHS VARIABLE INSURANCE TRUST STRATEGIC GROWTH FUND
Performance Summary
December 31, 2021
The following graph shows the value, as of December 31, 2021, of a $10,000 investment made on January 1, 2012 in Service Shares at NAV. For comparative purposes, the performance of the Fund’s benchmark, the Russell 1000® Growth Index (with distributions reinvested), is shown. Performance reflects applicable fee waivers and/or expense limitations in effect during the periods shown and in their absence, performance would be reduced. Returns do not reflect the deduction of taxes that a shareholder would pay on Fund distributions or the redemption of Fund shares. The returns set forth below represent past performance. Past performance does not guarantee future results. The Fund’s investment return and principal value will fluctuate so that an investor’s shares, when redeemed, may be worth more or less than their original cost. Current performance may be lower or higher than the performance quoted below. Please visit our web site at www.GSAMFUNDS.com to obtain the most recent month-end returns.
Strategic Growths Fund’s 10 Year Performance
Performance of a $10,000 investment, with distributions reinvested, from January 1, 2012 through December 31, 2021.
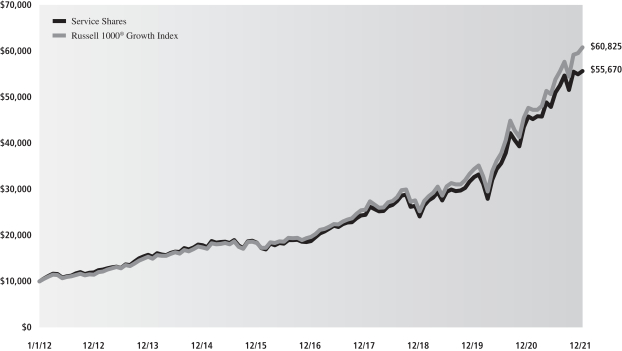
| | | | | | |
| Average Annual Total Return through December 31, 2021 | | One Year | | Five Years | | Ten Years |
Institutional | | 21.93% | | 24.58% | | 19.02% |
Service | | 21.56% | | 24.26% | | 18.71% |
GOLDMAN SACHS VARIABLE INSURANCE TRUST U.S. EQUITY INSIGHTS FUND
INVESTMENT OBJECTIVE
The Fund seeks long-term growth of capital and dividend income.
Portfolio Management Discussion and Analysis
Below, the Goldman Sachs Quantitative Investment Strategies Team discusses the Goldman Sachs Variable Insurance Trust—Goldman Sachs U.S. Equity Insights Fund’s (the “Fund”) performance and positioning for the 12-month period ended December 31, 2021 (the “Reporting Period”).
How did the Fund perform during the Reporting Period?
During the Reporting Period, the Fund’s Institutional and Service Shares generated average annual total returns of 29.41% and 29.11%, respectively. These returns compare to the 28.71% average annual total return of the Fund’s benchmark, the Standard & Poor’s 500® Index (with dividends reinvested) (the “S&P 500® Index”) during the same time period.
What key factors were responsible for the Fund’s performance during the Reporting Period?
The Fund uses a quantitative style of management, in combination with a qualitative overlay, that emphasizes fundamentally-based stock selection, careful portfolio construction and efficient implementation. The Fund’s investments are selected using fundamental research and a variety of quantitative techniques based on certain investment themes, namely Fundamental Mispricings, High Quality Business Models, Sentiment Analysis and Market Themes & Trends.
During the Reporting Period, the Fund outperformed the S&P 500® Index, with two of our quantitative model’s four investment themes contributing positively to results. Stock selection overall, driven by these investment themes, bolstered relative performance.
What impact did the Fund’s investment themes have on performance during the Reporting Period?
In keeping with our investment approach, we use our quantitative model and four investment themes to take a long-term view of market patterns and look for inefficiencies, selecting stocks for the Fund and overweighting or underweighting the ones chosen by the model. Over time and by design, the performance of any one of the model’s investment themes tends to have a low correlation with the model’s other themes, demonstrating the diversification benefit of the Fund’s theme-driven quantitative model. The variance in performance supports our research indicating that the diversification provided by the Fund’s different investment themes is a significant investment advantage over the long term, even though the Fund may experience underperformance in the short term. Of course, diversification does not protect an investor from market risk nor does it ensure a profit.
During the Reporting Period, two of our investment themes — Sentiment Analysis and High Quality Business Models —contributed positively to the Fund’s relative performance. Sentiment Analysis seeks to identify stocks experiencing improvements in their overall market sentiment. High Quality Business Models seeks to identify companies that are generating high quality revenues with sustainable business models and aligned management incentives.
Market Themes & Trends and Fundamental Mispricings detracted from the Fund’s relative performance during the Reporting Period. Market Themes & Trends seeks to identify companies positively positioned to benefit from themes and trends in the market and macroeconomic environment. Fundamental Mispricing seeks to identify high quality businesses trading at a fair price, which we believe may lead to strong performance over the long run.
How did the Fund’s sector and industry allocations affect relative performance?
In constructing the Fund’s portfolio, our quantitative model focuses on stock selection rather than making sector or industry bets. Consequently, the Fund is similar to its benchmark, the S&P 500® Index, in terms of its sector and industry allocations and style. Relative performance is primarily driven by stock selection, not by sector or industry allocations.
Did stock selection help or hurt Fund performance during the Reporting Period?
We seek to outpace the S&P 500® Index by overweighting stocks that we expect to outperform and underweighting those that we think may lag. At the same time, we strive to maintain a risk profile similar to the S&P 500® Index. The Fund’s investments are selected using fundamental research and a variety of quantitative techniques based on our investment themes. For example, the Fund aims to hold a basket of stocks with better Fundamental Mispricings characteristics than the benchmark index.
GOLDMAN SACHS VARIABLE INSURANCE TRUST U.S. EQUITY INSIGHTS FUND
During the Reporting Period, stock selection added to the Fund’s performance, with investments in the health care, real estate and industrials sectors contributing most positively to results relative to the S&P 500® Index. Stock selection in the information technology, energy and materials sectors detracted most from the Fund’s results relative to the S&P 500® Index during the Reporting Period.
Which individual stock positions contributed the most to the Fund’s relative returns during the Reporting Period?
The Fund benefited most from overweight positions in auto manufacturer Ford Motor, network security solutions provider Palo Alto Networks and Google parent company Alphabet. The overweight in Ford Motor was established primarily because of our Fundamental Mispricings and High Quality Business Models investment themes. The Fund was overweight Palo Alto Networks due mostly to our Sentiment Analysis and Market Themes & Trends investment themes. The Fund’s overweight in Alphabet was driven mainly by our Fundamental Mispricings investment theme.
Which individual positions detracted from the Fund’s results during the Reporting Period?
Detracting most from the Fund’s results relative to the S&P 500® Index was an underweight position in NVIDIA, which engages in the design and manufacture of computer graphics processors, chipsets and related multimedia software. Overweight positions in electronic signature solutions provider DocuSign and digital and mobile payments technology platform PayPal Holdings also hurt. The Fund had an underweight position in NVIDIA driven primarily by our Market Themes & Trends investment theme. The Fund’s overweight in DocuSign was largely due to our High Quality Business Models investment theme. The overweight in PayPal Holdings was established primarily because of our Sentiment Analysis investment theme.
How did the Fund use derivatives during the Reporting Period?
During the Reporting Period, we did not use derivatives as part of an active management strategy to add value to the Fund’s results.
Did you make any enhancements to your quantitative models during the Reporting Period?
We continuously look for ways to improve our investment process. During the first half of the Reporting Period, we introduced several new signals into our models. For example, we introduced new signals within our Sentiment Analysis investment theme, which were rolled out across the majority of regions, including the U.S., emerging markets, Japan and Europe. These signals are an extension to our existing suite of signals that focus on institutional positioning and capture sentiment associated with outstanding short-interest for specific names. The new signals focus on short positions by institutional investors and seek to identify which ones may have been covered prematurely or maintained beyond their optimal duration. Additionally, within our High Quality Business Models investment theme, we introduced another signal to our existing suite of alternative growth signals, also across multiple regions, including the U.S., emerging markets, Japan and Europe. This signal seeks to identify companies that exhibit elevated levels of demand for their products and services based on trends identified from consumer Internet activity data. While we believe these types of trends can help provide additional insight on the global demand for certain products and services, we have also closely focused on developing our own process to identify which individual companies are most highly exposed to specific trends. Lastly, we introduced, in the U.S., a proprietary methodology to enhance how we identify a company’s relevant peer group, as we believe that more common methods relying on country or industry classifications may be overly simplistic for companies operating in a complex business environment. This methodology is used to enhance our relative valuation signals within our Fundamental Mispricings investment theme that seek to identify companies that are currently trading at attractive valuations relative to their most relevant peers.
During the second half of the Reporting Period, we introduced several new signals into our models, mostly in the fourth quarter of 2021. For example, we introduced a new signal in the U.S. within our High Quality Business Models investment theme. The signal focused on the number of job postings by a company as we believe companies that are looking to expand their workforce are better positioned for growth in the long term. Additionally, we introduced two new signals within our Market Themes & Trends investment theme. The first signal, rolled out in the U.S. region, helps expand our library of economic linkages signals by identifying relationships between companies posting similar jobs in the same geographical regions. The second signal, rolled out across all regions, focuses on macro market environments and assesses similarities between market events from the past and the current environment. The signal evaluates the historical performance of the stock in similar market conditions to predict future stock returns. Finally, we introduced a signal within our Sentiment Analysis investment theme. Rolled out across all developed market regions, it uses short sales transaction data to help identify potential sustained stock selloffs, expanding upon our existing factors that leverage short sales and short interest data.
GOLDMAN SACHS VARIABLE INSURANCE TRUST U.S. EQUITY INSIGHTS FUND
What was the Fund’s sector positioning relative to its benchmark index at the end of the Reporting Period?
As of December 31, 2021, the Fund was overweight the information technology, health care, materials and real estate sectors relative to the S&P 500® Index. The Fund was underweight consumer staples, energy and financials and was rather neutrally weighted in communication services, consumer discretionary, utilities and industrials compared to the benchmark index on the same date.
Were there any changes to the Fund’s portfolio management team during the Reporting Period?
In early 2021, Takashi Suwabe, Managing Director and Senior Portfolio Manager, became a co-portfolio manager for the Fund. Mr. Suwabe joined Len Ioffe, Managing Director and Senior Portfolio Manager, Osman Ali, Managing Director and Senior Portfolio Manager, and Dennis Walsh, Managing Director and Senior Portfolio Manager, who have managed the Fund since 2011, 2012, and 2013 respectively. By design, all investment decisions for the Fund are performed within a co-lead or team structure.
What is your strategy going forward for the Fund?
Looking ahead, we continue to believe that less expensive stocks should outpace more expensive stocks, and stocks with good momentum are likely to outperform those with poor momentum. We intend to maintain our focus on seeking companies about which fundamental research analysts are becoming more positive as well as profitable companies with sustainable earnings and a track record of using their capital to enhance shareholder value. As such, we anticipate remaining fully invested with long-term performance likely to be the result of stock selection rather than sector or capitalization allocations.
We stand behind our investment philosophy that sound economic investment principles, coupled with a disciplined quantitative approach, can provide strong, uncorrelated returns over the long term. Our research agenda is robust, and we continue to enhance our existing models, add new proprietary forecasting signals and improve our trading execution as we seek to provide the most value to our shareholders.
FUND BASICS
U.S. Equity Insights Fund
as of December 31, 2021
TOP TEN HOLDINGS AS OF 12/31/211
| | | | | | | | |
| | | |
| Holding | | % of
Net Assets | | | Line of Business | | Country |
| Apple, Inc. | | | 5.9% | | | Technology Hardware & Equipment | | United States |
| Microsoft Corp. | | | 5.2 | | | Software & Services | | United States |
| Alphabet, Inc., Class C | | | 3.6 | | | Media & Entertainment | | United States |
| Amazon.com, Inc. | | | 2.7 | | | Retailing | | United States |
| Meta Platforms, Inc., Class A | | | 2.4 | | | Media & Entertainment | | United States |
| Tesla, Inc. | | | 2.2 | | | Automobiles & Components | | United States |
| NVIDIA Corp. | | | 1.8 | | | Semiconductors & Semiconductor Equipment | | United States |
| AbbVie, Inc. | | | 1.6 | | | Pharmaceuticals, Biotechnology & Life Sciences | | United States |
| Alphabet, Inc., Class A | | | 1.6 | | | Media & Entertainment | | United States |
| Intuit, Inc. | | | 1.4 | | | Software & Services | | United States |
| 1 | The top 10 holdings may not be representative of the Fund’s future investments. |
FUND BASICS
FUND vs. BENCHMARK SECTOR ALLOCATIONS2
As of December 31, 2021
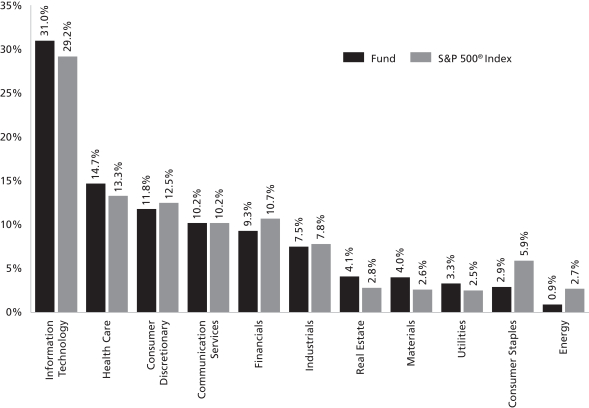
| 2 | The Fund is actively managed and, as such, its composition may differ over time. Consequently, the Fund’s overall sector allocations may differ from percentages contained in the graph above. The graph categorizes investments using Global Industry Classification Standard (“GICS”); however, the sector classifications used by the portfolio management team may differ from GICS. The percentage shown for each investment category reflects the value of investments in that category as a percentage of market value. |
For more information about your Fund, please refer to www.GSAMFUNDS.com. There, you can learn more about your Portfolio’s investment strategies, holdings, and performance.
GOLDMAN SACHS VARIABLE INSURANCE TRUST U.S. EQUITY INSIGHTS FUND
Performance Summary
December 31, 2021
The following graph shows the value, as of December 31, 2021, of a $10,000 investment made on January 1, 2012 in the Service Shares at NAV. For comparative purposes, the performance of the Fund’s benchmark, the S&P 500® Index, is shown. Performance reflects applicable fee waivers and/or expense limitations in effect during the periods shown and in their absence, performance would be reduced. Returns do not reflect the deduction of taxes that a shareholder would pay on Fund distributions or the redemption of Fund shares. The returns set forth below represent past performance. Past performance does not guarantee future results. The Fund’s investment return and principal value will fluctuate so that an investor’s shares, when redeemed, may be worth more or less than their original cost. Current performance may be lower or higher than the performance quoted below. Please visit our web site at www.GSAMFUNDS.com to obtain the most recent month-end returns.
U.S. Equity Insights Fund’s 10 Year Performance
Performance of a $10,000 investment, with distributions reinvested, from January 1, 2012 through December 31, 2021.
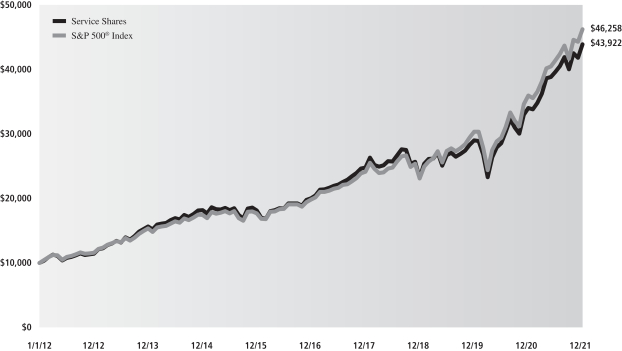
| | | | | | |
| Average Annual Total Return through December 31, 2021 | | One Year | | Five Years | | Ten Years |
Institutional | | 29.41% | | 17.25% | | 16.18% |
Service | | 29.11% | | 17.00% | | 15.94% |
GOLDMAN SACHS VARIABLE INSURANCE TRUST FUNDS
Index Definitions
S&P 500® Index is the Standard & Poor’s composite index of 500 stocks, an unmanaged index of common stock prices. The figures for the index do not include any deduction for fees, expenses or taxes.
Russell 2000® Index is an unmanaged index of common stock prices that measures the performance of the 2000 smallest companies in the Russell 3000® Index. The figures for the index do not include any deduction for fees, expenses or taxes.
Russell Midcap® Index measures the performance of the 800 smallest companies in the Russell 1000® Index, which represents approximately 25% of the total market capitalization of the Russell 1000® Index.
Russell 1000® Index measures the performance of the 1,000 largest companies in the Russell 3000® Index, which represents approximately 92% of the total market capitalization of the Russell 3000® Index.
The Russell 1000® Value Index is an unmanaged market capitalization weighted index of the 1000 largest U.S. companies with lower price-to-book ratios and lower forecasted growth values. The figures for the index do not include any deduction for fees, expenses or taxes.
Russell Midcap® Growth Index is an unmanaged index that measures the performance of those companies in the Russell Midcap® Index with higher price-to-book ratios and higher forecasted growth values.
The Russell Midcap Value® Index is an unmanaged index of common stock prices that measures the performance of those
Russell Midcap companies with lower price-to-book ratios and lower forecasted growth values. The index figures do not reflect any deduction for fees, expenses or taxes
The Russell 1000® Growth Index is an unmanaged market capitalization weighted index of the 1000 largest U.S. companies with higher price-to-book ratios and higher forecasted growth values. The figures for the index do not include any deduction for fees, expenses or taxes.
It is not possible to invest directly in an index.
GOLDMAN SACHS VARIABLE INSURANCE TRUST EQUITY INDEX FUND
Schedule of Investments
December 31, 2021
| | | | | | | | |
| Shares | | | Description | | Value | |
|
| Common Stocks – 99.9% | |
| Automobiles & Components – 2.7% | |
| | 1,507 | | | Aptiv PLC* | | $ | 248,580 | |
| | 1,305 | | | BorgWarner, Inc. | | | 58,816 | |
| | 21,736 | | | Ford Motor Co. | | | 451,457 | |
| | 8,034 | | | General Motors Co.* | | | 471,033 | |
| | 4,444 | | | Tesla, Inc.* | | | 4,696,330 | |
| | | | | | | | |
| | | | | | | 5,926,216 | |
| | |
| Banks – 4.0% | |
| | 39,295 | | | Bank of America Corp. | | | 1,748,235 | |
| | 10,899 | | | Citigroup, Inc. | | | 658,191 | |
| | 2,382 | | | Citizens Financial Group, Inc. | | | 112,549 | |
| | 774 | | | Comerica, Inc. | | | 67,338 | |
| | 3,872 | | | Fifth Third Bancorp | | | 168,626 | |
| | 939 | | | First Republic Bank | | | 193,913 | |
| | 8,072 | | | Huntington Bancshares, Inc. | | | 124,470 | |
| | 16,134 | | | JPMorgan Chase & Co. | | | 2,554,819 | |
| | 5,176 | | | KeyCorp | | | 119,721 | |
| | 700 | | | M&T Bank Corp. | | | 107,506 | |
| | 2,216 | | | People’s United Financial, Inc. | | | 39,489 | |
| | 2,300 | | | PNC Financial Services Group, Inc. (The) | | | 461,196 | |
| | 5,308 | | | Regions Financial Corp. | | | 115,714 | |
| | 333 | | | Signature Bank | | | 107,715 | |
| | 323 | | | SVB Financial Group* | | | 219,072 | |
| | 7,392 | | | Truist Financial Corp. | | | 432,802 | |
| | 7,338 | | | US Bancorp | | | 412,175 | |
| | 21,901 | | | Wells Fargo & Co. | | | 1,050,810 | |
| | 945 | | | Zions Bancorp NA | | | 59,686 | |
| | | | | | | | |
| | | | | | | 8,754,027 | |
| | |
| Capital Goods – 5.2% | |
| | 3,139 | | | 3M Co. | | | 557,581 | |
| | 728 | | | A O Smith Corp. | | | 62,499 | |
| | 503 | | | Allegion PLC | | | 66,617 | |
| | 1,268 | | | AMETEK, Inc. | | | 186,447 | |
| | 3,045 | | | Boeing Co. (The)* | | | 613,019 | |
| | 4,762 | | | Carrier Global Corp. | | | 258,291 | |
| | 2,971 | | | Caterpillar, Inc. | | | 614,224 | |
| | 787 | | | Cummins, Inc. | | | 171,676 | |
| | 1,537 | | | Deere & Co. | | | 527,022 | |
| | 774 | | | Dover Corp. | | | 140,558 | |
| | 2,211 | | | Eaton Corp. PLC | | | 382,105 | |
| | 3,322 | | | Emerson Electric Co. | | | 308,846 | |
| | 3,097 | | | Fastenal Co. | | | 198,394 | |
| | 1,985 | | | Fortive Corp. | | | 151,436 | |
| | 757 | | | Fortune Brands Home & Security, Inc. | | | 80,923 | |
| | 341 | | | Generac Holdings, Inc.* | | | 120,005 | |
| | 1,253 | | | General Dynamics Corp. | | | 261,213 | |
| | 6,068 | | | General Electric Co. | | | 573,244 | |
| | 3,757 | | | Honeywell International, Inc. | | | 783,372 | |
| | 2,222 | | | Howmet Aerospace, Inc. | | | 70,726 | |
| | 219 | | | Huntington Ingalls Industries, Inc. | | | 40,896 | |
| | 415 | | | IDEX Corp. | | | 98,073 | |
| | 1,567 | | | Illinois Tool Works, Inc. | | | 386,736 | |
| | 2,251 | | | Ingersoll Rand, Inc. | | | 139,269 | |
| | 3,833 | | | Johnson Controls International PLC | | | 311,661 | |
| | |
|
| Common Stocks – (continued) | |
| Capital Goods – (continued) | |
| | 1,085 | | | L3Harris Technologies, Inc. | | | 231,365 | |
| | 1,336 | | | Lockheed Martin Corp. | | | 474,828 | |
| | 1,342 | | | Masco Corp. | | | 94,235 | |
| | 808 | | | Northrop Grumman Corp. | | | 312,753 | |
| | 2,352 | | | Otis Worldwide Corp. | | | 204,789 | |
| | 1,891 | | | PACCAR, Inc. | | | 166,900 | |
| | 700 | | | Parker-Hannifin Corp. | | | 222,684 | |
| | 945 | | | Pentair PLC | | | 69,013 | |
| | 770 | | | Quanta Services, Inc. | | | 88,288 | |
| | 8,164 | | | Raytheon Technologies Corp. | | | 702,594 | |
| | 632 | | | Rockwell Automation, Inc. | | | 220,473 | |
| | 571 | | | Roper Technologies, Inc. | | | 280,852 | |
| | 297 | | | Snap-on, Inc. | | | 63,968 | |
| | 914 | | | Stanley Black & Decker, Inc. | | | 172,399 | |
| | 1,196 | | | Textron, Inc. | | | 92,331 | |
| | 1,301 | | | Trane Technologies PLC | | | 262,841 | |
| | 287 | | | TransDigm Group, Inc.* | | | 182,612 | |
| | 403 | | | United Rentals, Inc.* | | | 133,913 | |
| | 1,007 | | | Westinghouse Air Brake Technologies Corp. | | | 92,755 | |
| | 244 | | | W.W. Grainger, Inc. | | | 126,451 | |
| | 967 | | | Xylem, Inc. | | | 115,963 | |
| | | | | | | | |
| | | | | | | 11,416,840 | |
| | |
| Commercial & Professional Services – 0.8% | |
| | 478 | | | Cintas Corp. | | | 211,835 | |
| | 1,144 | | | Copart, Inc.* | | | 173,453 | |
| | 681 | | | Equifax, Inc. | | | 199,390 | |
| | 2,186 | | | IHS Markit Ltd. | | | 290,563 | |
| | 717 | | | Jacobs Engineering Group, Inc. | | | 99,828 | |
| | 768 | | | Leidos Holdings, Inc. | | | 68,275 | |
| | 1,932 | | | Nielsen Holdings PLC | | | 39,625 | |
| | 1,134 | | | Republic Services, Inc. | | | 158,136 | |
| | 604 | | | Robert Half International, Inc. | | | 67,358 | |
| | 1,137 | | | Rollins, Inc. | | | 38,897 | |
| | 876 | | | Verisk Analytics, Inc. | | | 200,368 | |
| | 2,115 | | | Waste Management, Inc. | | | 352,994 | |
| | | | | | | | |
| | | | | | | 1,900,722 | |
| | |
| Consumer Durables & Apparel – 1.1% | |
| | 1,823 | | | D.R. Horton, Inc. | | | 197,704 | |
| | 804 | | | Garmin Ltd. | | | 109,481 | |
| | 739 | | | Hasbro, Inc. | | | 75,215 | |
| | 1,490 | | | Lennar Corp., Class A | | | 173,078 | |
| | 326 | | | Mohawk Industries, Inc.* | | | 59,391 | |
| | 2,039 | | | Newell Brands, Inc. | | | 44,532 | |
| | 6,983 | | | NIKE, Inc., Class B | | | 1,163,857 | |
| | 17 | | | NVR, Inc.* | | | 100,451 | |
| | 1,387 | | | PulteGroup, Inc. | | | 79,281 | |
| | 425 | | | PVH Corp. | | | 45,326 | |
| | 249 | | | Ralph Lauren Corp. | | | 29,596 | |
| | 1,605 | | | Tapestry, Inc. | | | 65,163 | |
| | 933 | | | Under Armour, Inc., Class A* | | | 19,770 | |
| | 1,232 | | | Under Armour, Inc., Class C* | | | 22,226 | |
| | 1,740 | | | VF Corp. | | | 127,403 | |
| | 343 | | | Whirlpool Corp. | | | 80,488 | |
| | | | | | | | |
| | | | | | | 2,392,962 | |
| | |
| | |
| 50 | | The accompanying notes are an integral part of these financial statements. |
GOLDMAN SACHS VARIABLE INSURANCE TRUST EQUITY INDEX FUND
| | | | | | | | |
| Shares | | | Description | | Value | |
|
| Common Stocks – (continued) | |
| Consumer Services – 1.9% | |
| | 227 | | | Booking Holdings, Inc.* | | $ | 544,625 | |
| | 1,118 | | | Caesars Entertainment, Inc.* | | | 104,567 | |
| | 4,349 | | | Carnival Corp.* | | | 87,502 | |
| | 156 | | | Chipotle Mexican Grill, Inc.* | | | 272,727 | |
| | 700 | | | Darden Restaurants, Inc. | | | 105,448 | |
| | 195 | | | Domino’s Pizza, Inc. | | | 110,045 | |
| | 764 | | | Expedia Group, Inc.* | | | 138,070 | |
| | 1,506 | | | Hilton Worldwide Holdings, Inc.* | | | 234,921 | |
| | 1,811 | | | Las Vegas Sands Corp.* | | | 68,166 | |
| | 1,525 | | | Marriott International, Inc., Class A* | | | 251,991 | |
| | 4,072 | | | McDonald’s Corp. | | | 1,091,581 | |
| | 2,174 | | | MGM Resorts International | | | 97,569 | |
| | 2,072 | | | Norwegian Cruise Line Holdings Ltd.* | | | 42,973 | |
| | 848 | | | Penn National Gaming, Inc.* | | | 43,969 | |
| | 1,249 | | | Royal Caribbean Cruises Ltd.* | | | 96,048 | |
| | 6,422 | | | Starbucks Corp. | | | 751,181 | |
| | 596 | | | Wynn Resorts Ltd.* | | | 50,684 | |
| | 1,578 | | | Yum! Brands, Inc. | | | 219,121 | |
| | | | | | | | |
| | | | | | | 4,311,188 | |
| | |
| Diversified Financials – 4.9% | |
| | 3,446 | | | American Express Co. | | | 563,766 | |
| | 602 | | | Ameriprise Financial, Inc. | | | 181,599 | |
| | 4,108 | | | Bank of New York Mellon Corp. (The) | | | 238,593 | |
| | 10,025 | | | Berkshire Hathaway, Inc., Class B* | | | 2,997,475 | |
| | 779 | | | BlackRock, Inc. | | | 713,221 | |
| | 2,338 | | | Capital One Financial Corp. | | | 339,220 | |
| | 600 | | | Cboe Global Markets, Inc. | | | 78,240 | |
| | 8,179 | | | Charles Schwab Corp. (The) | | | 687,854 | |
| | 1,989 | | | CME Group, Inc. | | | 454,407 | |
| | 1,604 | | | Discover Financial Services | | | 185,358 | |
| | 207 | | | FactSet Research Systems, Inc. | | | 100,604 | |
| | 1,440 | | | Franklin Resources, Inc. | | | 48,226 | |
| | 1,861 | | | Goldman Sachs Group, Inc. (The)(a) | | | 711,926 | |
| | 3,065 | | | Intercontinental Exchange, Inc. | | | 419,200 | |
| | 1,729 | | | Invesco Ltd. | | | 39,802 | |
| | 209 | | | MarketAxess Holdings, Inc. | | | 85,955 | |
| | 886 | | | Moody’s Corp. | | | 346,054 | |
| | 7,885 | | | Morgan Stanley | | | 773,992 | |
| | 449 | | | MSCI, Inc. | | | 275,098 | |
| | 638 | | | Nasdaq, Inc. | | | 133,986 | |
| | 1,104 | | | Northern Trust Corp. | | | 132,050 | |
| | 973 | | | Raymond James Financial, Inc. | | | 97,689 | |
| | 1,310 | | | S&P Global, Inc. | | | 618,228 | |
| | 2,017 | | | State Street Corp. | | | 187,581 | |
| | 3,047 | | | Synchrony Financial | | | 141,350 | |
| | 1,212 | | | T. Rowe Price Group, Inc. | | | 238,328 | |
| | | | | | | | |
| | | | | | | 10,789,802 | |
| | |
| Energy – 2.7% | |
| | 2,202 | | | APA Corp. | | | 59,212 | |
| | 4,625 | | | Baker Hughes Co. | | | 111,277 | |
| | 10,585 | | | Chevron Corp. | | | 1,242,150 | |
| | 7,245 | | | ConocoPhillips | | | 522,944 | |
| | 4,439 | | | Coterra Energy, Inc. | | | 84,341 | |
| | 3,389 | | | Devon Energy Corp. | | | 149,285 | |
| | |
|
| Common Stocks – (continued) | |
| Energy – (continued) | |
| | 915 | | | Diamondback Energy, Inc. | | | 98,683 | |
| | 3,246 | | | EOG Resources, Inc. | | | 288,342 | |
| | 23,181 | | | Exxon Mobil Corp. | | | 1,418,445 | |
| | 4,950 | | | Halliburton Co. | | | 113,206 | |
| | 1,496 | | | Hess Corp. | | | 110,749 | |
| | 10,736 | | | Kinder Morgan, Inc. | | | 170,273 | |
| | 4,228 | | | Marathon Oil Corp. | | | 69,424 | |
| | 3,313 | | | Marathon Petroleum Corp. | | | 211,999 | |
| | 4,917 | | | Occidental Petroleum Corp. | | | 142,544 | |
| | 2,393 | | | ONEOK, Inc. | | | 140,613 | |
| | 2,358 | | | Phillips 66 | | | 170,861 | |
| | 1,248 | | | Pioneer Natural Resources Co. | | | 226,986 | |
| | 7,588 | | | Schlumberger NV | | | 227,260 | |
| | 2,270 | | | Valero Energy Corp. | | | 170,500 | |
| | 6,694 | | | Williams Cos., Inc. (The) | | | 174,312 | |
| | | | | | | | |
| | | | | | | 5,903,406 | |
| | |
| Food & Staples Retailing – 1.4% | |
| | 2,420 | | | Costco Wholesale Corp. | | | 1,373,834 | |
| | 3,729 | | | Kroger Co. (The) | | | 168,775 | |
| | 2,818 | | | Sysco Corp. | | | 221,354 | |
| | 3,972 | | | Walgreens Boots Alliance, Inc. | | | 207,179 | |
| | 7,751 | | | Walmart, Inc. | | | 1,121,492 | |
| | | | | | | | |
| | | | | | | 3,092,634 | |
| | |
| Food, Beverage & Tobacco – 2.9% | |
| | 10,000 | | | Altria Group, Inc. | | | 473,900 | |
| | 3,126 | | | Archer-Daniels-Midland Co. | | | 211,286 | |
| | 944 | | | Brown-Forman Corp., Class B | | | 68,780 | |
| | 1,039 | | | Campbell Soup Co. | | | 45,155 | |
| | 21,265 | | | Coca-Cola Co. (The) | | | 1,259,101 | |
| | 2,664 | | | Conagra Brands, Inc. | | | 90,976 | |
| | 887 | | | Constellation Brands, Inc., Class A | | | 222,610 | |
| | 3,256 | | | General Mills, Inc. | | | 219,389 | |
| | 803 | | | Hershey Co. (The) | | | 155,356 | |
| | 1,579 | | | Hormel Foods Corp. | | | 77,071 | |
| | 587 | | | J M Smucker Co. (The) | | | 79,726 | |
| | 1,408 | | | Kellogg Co. | | | 90,703 | |
| | 3,944 | | | Kraft Heinz Co. (The) | | | 141,590 | |
| | 809 | | | Lamb Weston Holdings, Inc. | | | 51,275 | |
| | 1,383 | | | McCormick & Co., Inc. | | | 133,612 | |
| | 1,037 | | | Molson Coors Beverage Co., Class B | | | 48,065 | |
| | 7,575 | | | Mondelez International, Inc., Class A | | | 502,298 | |
| | 2,045 | | | Monster Beverage Corp.* | | | 196,402 | |
| | 7,566 | | | PepsiCo, Inc. | | | 1,314,290 | |
| | 8,497 | | | Philip Morris International, Inc. | | | 807,215 | |
| | 1,564 | | | Tyson Foods, Inc., Class A | | | 136,318 | |
| | | | | | | | |
| | | | | | | 6,325,118 | |
| | |
| Health Care Equipment & Services – 5.8% | |
| | 9,705 | | | Abbott Laboratories | | | 1,365,882 | |
| | 241 | | | ABIOMED, Inc.* | | | 86,560 | |
| | 409 | | | Align Technology, Inc.* | | | 268,787 | |
| | 825 | | | AmerisourceBergen Corp. | | | 109,634 | |
| | 1,323 | | | Anthem, Inc. | | | 613,263 | |
| | 2,754 | | | Baxter International, Inc. | | | 236,403 | |
| | |
| | |
| The accompanying notes are an integral part of these financial statements. | | 51 |
GOLDMAN SACHS VARIABLE INSURANCE TRUST EQUITY INDEX FUND
Schedule of Investments (continued)
December 31, 2021
| | | | | | | | |
| Shares | | | Description | | Value | |
|
| Common Stocks – (continued) | |
| Health Care Equipment & Services – (continued) | |
| | 1,558 | | | Becton Dickinson and Co. | | $ | 391,806 | |
| | 7,907 | | | Boston Scientific Corp.* | | | 335,889 | |
| | 1,627 | | | Cardinal Health, Inc. | | | 83,774 | |
| | 3,250 | | | Centene Corp.* | | | 267,800 | |
| | 1,645 | | | Cerner Corp. | | | 152,771 | |
| | 1,821 | | | Cigna Corp. | | | 418,156 | |
| | 269 | | | Cooper Cos., Inc. (The) | | | 112,695 | |
| | 7,184 | | | CVS Health Corp. | | | 741,101 | |
| | 364 | | | DaVita, Inc.* | | | 41,409 | |
| | 1,188 | | | DENTSPLY SIRONA, Inc. | | | 66,279 | |
| | 538 | | | Dexcom, Inc.* | | | 288,879 | |
| | 3,455 | | | Edwards Lifesciences Corp.* | | | 447,595 | |
| | 1,315 | | | HCA Healthcare, Inc. | | | 337,850 | |
| | 742 | | | Henry Schein, Inc.* | | | 57,527 | |
| | 1,370 | | | Hologic, Inc.* | | | 104,887 | |
| | 714 | | | Humana, Inc. | | | 331,196 | |
| | 461 | | | IDEXX Laboratories, Inc.* | | | 303,550 | |
| | 1,942 | | | Intuitive Surgical, Inc.* | | | 697,761 | |
| | 515 | | | Laboratory Corp. of America Holdings* | | | 161,818 | |
| | 832 | | | McKesson Corp. | | | 206,810 | |
| | 7,417 | | | Medtronic PLC | | | 767,289 | |
| | 670 | | | Quest Diagnostics, Inc. | | | 115,917 | |
| | 791 | | | ResMed, Inc. | | | 206,040 | |
| | 555 | | | STERIS PLC | | | 135,093 | |
| | 1,858 | | | Stryker Corp. | | | 496,866 | |
| | 265 | | | Teleflex, Inc. | | | 87,047 | |
| | 5,142 | | | UnitedHealth Group, Inc. | | | 2,582,004 | |
| | 409 | | | Universal Health Services, Inc., Class B | | | 53,031 | |
| | 1,131 | | | Zimmer Biomet Holdings, Inc. | | | 143,682 | |
| | | | | | | | |
| | | | | | | 12,817,051 | |
| | |
| Household & Personal Products – 1.6% | |
| | 1,363 | | | Church & Dwight Co., Inc. | | | 139,708 | |
| | 676 | | | Clorox Co. (The) | | | 117,867 | |
| | 4,571 | | | Colgate-Palmolive Co. | | | 390,089 | |
| | 1,267 | | | Estee Lauder Cos., Inc. (The), Class A | | | 469,043 | |
| | 1,875 | | | Kimberly-Clark Corp. | | | 267,975 | |
| | 13,208 | | | Procter & Gamble Co. (The) | | | 2,160,565 | |
| | | | | | | | |
| | | | | | | 3,545,247 | |
| | |
| Insurance – 1.8% | |
| | 3,298 | | | Aflac, Inc. | | | 192,570 | |
| | 1,543 | | | Allstate Corp. (The) | | | 181,534 | |
| | 4,561 | | | American International Group, Inc. | | | 259,338 | |
| | 1,210 | | | Aon PLC, Class A | | | 363,678 | |
| | 1,156 | | | Arthur J Gallagher & Co. | | | 196,139 | |
| | 310 | | | Assurant, Inc. | | | 48,317 | |
| | 1,282 | | | Brown & Brown, Inc. | | | 90,099 | |
| | 2,366 | | | Chubb Ltd. | | | 457,371 | |
| | 805 | | | Cincinnati Financial Corp. | | | 91,714 | |
| | 227 | | | Everest Re Group Ltd. | | | 62,180 | |
| | 531 | | | Globe Life, Inc. | | | 49,765 | |
| | 1,853 | | | Hartford Financial Services Group, Inc. (The) | | | 127,931 | |
| | |
|
| Common Stocks – (continued) | |
| Insurance – (continued) | |
| | 991 | | | Lincoln National Corp. | | | 67,646 | |
| | 1,171 | | | Loews Corp. | | | 67,637 | |
| | 2,748 | | | Marsh & McLennan Cos., Inc. | | | 477,657 | |
| | 3,994 | | | MetLife, Inc. | | | 249,585 | |
| | 1,315 | | | Principal Financial Group, Inc. | | | 95,114 | |
| | 3,251 | | | Progressive Corp. (The) | | | 333,715 | |
| | 2,080 | | | Prudential Financial, Inc. | | | 225,139 | |
| | 1,340 | | | Travelers Cos., Inc. (The) | | | 209,616 | |
| | 768 | | | W R Berkley Corp. | | | 63,276 | |
| | 669 | | | Willis Towers Watson PLC | | | 158,881 | |
| | | | | | | | |
| | | | | | | 4,068,902 | |
| | |
| Materials – 2.6% | |
| | 1,228 | | | Air Products and Chemicals, Inc. | | | 373,631 | |
| | 646 | | | Albemarle Corp. | | | 151,015 | |
| | 8,269 | | | Amcor PLC | | | 99,311 | |
| | 446 | | | Avery Dennison Corp. | | | 96,590 | |
| | 1,790 | | | Ball Corp. | | | 172,323 | |
| | 604 | | | Celanese Corp. | | | 101,508 | |
| | 1,167 | | | CF Industries Holdings, Inc. | | | 82,600 | |
| | 3,929 | | | Corteva, Inc. | | | 185,763 | |
| | 4,012 | | | Dow, Inc. | | | 227,561 | |
| | 2,807 | | | DuPont de Nemours, Inc. | | | 226,750 | |
| | 756 | | | Eastman Chemical Co. | | | 91,408 | |
| | 1,383 | | | Ecolab, Inc. | | | 324,438 | |
| | 721 | | | FMC Corp. | | | 79,231 | |
| | 8,155 | | | Freeport-McMoRan, Inc. | | | 340,308 | |
| | 1,346 | | | International Flavors & Fragrances, Inc. | | | 202,775 | |
| | 2,167 | | | International Paper Co. | | | 101,806 | |
| | 2,815 | | | Linde PLC (United Kingdom) | | | 975,201 | |
| | 1,425 | | | LyondellBasell Industries NV, Class A | | | 131,428 | |
| | 331 | | | Martin Marietta Materials, Inc. | | | 145,812 | |
| | 1,883 | | | Mosaic Co. (The) | | | 73,983 | |
| | 4,392 | | | Newmont Corp. | | | 272,392 | |
| | 1,569 | | | Nucor Corp. | | | 179,101 | |
| | 542 | | | Packaging Corp. of America | | | 73,793 | |
| | 1,325 | | | PPG Industries, Inc. | | | 228,483 | |
| | 786 | | | Sealed Air Corp. | | | 53,031 | |
| | 1,323 | | | Sherwin-Williams Co. (The) | | | 465,908 | |
| | 1 | | | Sylvamo Corp.* | | | 28 | |
| | 703 | | | Vulcan Materials Co. | | | 145,929 | |
| | 1,495 | | | Westrock Co. | | | 66,318 | |
| | | | | | | | |
| | | | | | | 5,668,425 | |
| | |
| Media & Entertainment – 9.0% | |
| | 4,200 | | | Activision Blizzard, Inc. | | | 279,426 | |
| | 1,643 | | | Alphabet, Inc., Class A* | | | 4,759,837 | |
| | 1,527 | | | Alphabet, Inc., Class C* | | | 4,418,512 | |
| | 680 | | | Charter Communications, Inc., Class A* | | | 443,340 | |
| | 24,921 | | | Comcast Corp., Class A | | | 1,254,274 | |
| | 876 | | | Discovery, Inc., Class A* | | | 20,621 | |
| | 1,617 | | | Discovery, Inc., Class C* | | | 37,029 | |
| | 1,329 | | | DISH Network Corp., Class A* | | | 43,113 | |
| | 1,555 | | | Electronic Arts, Inc. | | | 205,104 | |
| | |
| | |
| 52 | | The accompanying notes are an integral part of these financial statements. |
GOLDMAN SACHS VARIABLE INSURANCE TRUST EQUITY INDEX FUND
| | | | | | | | |
| Shares | | | Description | | Value | |
|
| Common Stocks – (continued) | |
| Media & Entertainment – (continued) | |
| | 1,841 | | | Fox Corp., Class A | | $ | 67,933 | |
| | 729 | | | Fox Corp., Class B | | | 24,983 | |
| | 2,116 | | | Interpublic Group of Cos., Inc. (The) | | | 79,244 | |
| | 745 | | | Live Nation Entertainment, Inc.* | | | 89,169 | |
| | 1,518 | | | Match Group, Inc.* | | | 200,755 | |
| | 12,926 | | | Meta Platforms, Inc., Class A* | | | 4,347,660 | |
| | 2,424 | | | Netflix, Inc.* | | | 1,460,315 | |
| | 2,000 | | | News Corp., Class A | | | 44,620 | |
| | 566 | | | News Corp., Class B | | | 12,735 | |
| | 1,207 | | | Omnicom Group, Inc. | | | 88,437 | |
| | 652 | | | Take-Two Interactive Software, Inc.* | | | 115,873 | |
| | 4,289 | | | Twitter, Inc.* | | | 185,371 | |
| | 3,198 | | | ViacomCBS, Inc., Class B | | | 96,516 | |
| | 9,951 | | | Walt Disney Co. (The)* | | | 1,541,310 | |
| | | | | | | | |
| | | | | | | 19,816,177 | |
| | |
| Pharmaceuticals, Biotechnology & Life Sciences – 7.5% | |
| | 9,673 | | | AbbVie, Inc. | | | 1,309,724 | |
| | 1,655 | | | Agilent Technologies, Inc. | | | 264,221 | |
| | 3,072 | | | Amgen, Inc. | | | 691,108 | |
| | 804 | | | Biogen, Inc.* | | | 192,896 | |
| | 115 | | | Bio-Rad Laboratories, Inc., Class A* | | | 86,890 | |
| | 215 | | | Bio-Techne Corp. | | | 111,228 | |
| | 12,112 | | | Bristol-Myers Squibb Co. | | | 755,183 | |
| | 930 | | | Catalent, Inc.* | | | 119,068 | |
| | 279 | | | Charles River Laboratories International, Inc.* | | | 105,122 | |
| | 3,466 | | | Danaher Corp. | | | 1,140,349 | |
| | 4,339 | | | Eli Lilly & Co. | | | 1,198,519 | |
| | 6,811 | | | Gilead Sciences, Inc. | | | 494,547 | |
| | 859 | | | Illumina, Inc.* | | | 326,798 | |
| | 1,026 | | | Incyte Corp.* | | | 75,308 | |
| | 1,047 | | | IQVIA Holdings, Inc.* | | | 295,401 | |
| | 14,372 | | | Johnson & Johnson | | | 2,458,618 | |
| | 13,800 | | | Merck & Co., Inc. | | | 1,057,632 | |
| | 126 | | | Mettler-Toledo International, Inc.* | | | 213,848 | |
| | 1,942 | | | Moderna, Inc.* | | | 493,229 | |
| | 1,422 | | | Organon & Co. | | | 43,300 | |
| | 693 | | | PerkinElmer, Inc. | | | 139,335 | |
| | 30,711 | | | Pfizer, Inc. | | | 1,813,484 | |
| | 583 | | | Regeneron Pharmaceuticals, Inc.* | | | 368,176 | |
| | 2,154 | | | Thermo Fisher Scientific, Inc. | | | 1,437,235 | |
| | 1,379 | | | Vertex Pharmaceuticals, Inc.* | | | 302,828 | |
| | 6,562 | | | Viatris, Inc. | | | 88,784 | |
| | 325 | | | Waters Corp.* | | | 121,095 | |
| | 401 | | | West Pharmaceutical Services, Inc. | | | 188,073 | |
| | 2,579 | | | Zoetis, Inc. | | | 629,353 | |
| | | | | | | | |
| | | | | | | 16,521,352 | |
| | |
| Real Estate – 2.7% | |
| | 767 | | | Alexandria Real Estate Equities, Inc. REIT | | | 171,010 | |
| | 2,478 | | | American Tower Corp. REIT | | | 724,815 | |
| | 762 | | | AvalonBay Communities, Inc. REIT | | | 192,474 | |
| | 769 | | | Boston Properties, Inc. REIT | | | 88,573 | |
| | 1,878 | | | CBRE Group, Inc., Class A* | | | 203,782 | |
| | |
|
| Common Stocks – (continued) | |
| Real Estate – (continued) | |
| | 2,393 | | | Crown Castle International Corp. REIT | | | 499,515 | |
| | 1,547 | | | Digital Realty Trust, Inc. REIT | | | 273,618 | |
| | 2,097 | | | Duke Realty Corp. REIT | | | 137,647 | |
| | 490 | | | Equinix, Inc. REIT | | | 414,462 | |
| | 1,825 | | | Equity Residential REIT | | | 165,162 | |
| | 341 | | | Essex Property Trust, Inc. REIT | | | 120,110 | |
| | 729 | | | Extra Space Storage, Inc. REIT | | | 165,286 | |
| | 378 | | | Federal Realty Investment Trust REIT | | | 51,529 | |
| | 3,015 | | | Healthpeak Properties, Inc. REIT | | | 108,811 | |
| | 4,011 | | | Host Hotels & Resorts, Inc. REIT* | | | 69,751 | |
| | 1,557 | | | Iron Mountain, Inc. REIT | | | 81,478 | |
| | 3,468 | | | Kimco Realty Corp. REIT | | | 85,486 | |
| | 646 | | | Mid-America Apartment Communities, Inc. REIT | | | 148,218 | |
| | 4,021 | | | Prologis, Inc. REIT | | | 676,976 | |
| | 826 | | | Public Storage REIT | | | 309,387 | |
| | 2,992 | | | Realty Income Corp. REIT | | | 214,197 | |
| | 784 | | | Regency Centers Corp. REIT | | | 59,074 | |
| | 586 | | | SBA Communications Corp. REIT | | | 227,966 | |
| | 1,828 | | | Simon Property Group, Inc. REIT | | | 292,060 | |
| | 1,468 | | | UDR, Inc. REIT | | | 88,065 | |
| | 2,230 | | | Ventas, Inc. REIT | | | 113,998 | |
| | 862 | | | Vornado Realty Trust REIT | | | 36,083 | |
| | 2,332 | | | Welltower, Inc. REIT | | | 200,016 | |
| | 4,071 | | | Weyerhaeuser Co. REIT | | | 167,644 | |
| | | | | | | | |
| | | | | | | 6,087,193 | |
| | |
| Retailing – 6.8% | |
| | 344 | | | Advance Auto Parts, Inc. | | | 82,519 | |
| | 2,383 | | | Amazon.com, Inc.* | | | 7,945,732 | |
| | 113 | | | AutoZone, Inc.* | | | 236,892 | |
| | 1,479 | | | Bath & Body Works, Inc. | | | 103,219 | |
| | 1,218 | | | Best Buy Co., Inc. | | | 123,749 | |
| | 873 | | | CarMax, Inc.* | | | 113,691 | |
| | 1,264 | | | Dollar General Corp. | | | 298,089 | |
| | 1,253 | | | Dollar Tree, Inc.* | | | 176,072 | |
| | 3,372 | | | eBay, Inc. | | | 224,238 | |
| | 686 | | | Etsy, Inc.* | | | 150,193 | |
| | 1,099 | | | Gap, Inc. (The) | | | 19,397 | |
| | 752 | | | Genuine Parts Co. | | | 105,430 | |
| | 5,761 | | | Home Depot, Inc. (The) | | | 2,390,873 | |
| | 1,417 | | | LKQ Corp. | | | 85,062 | |
| | 3,803 | | | Lowe’s Cos., Inc. | | | 982,999 | |
| | 364 | | | O’Reilly Automotive, Inc.* | | | 257,068 | |
| | 221 | | | Pool Corp. | | | 125,086 | |
| | 1,913 | | | Ross Stores, Inc. | | | 218,618 | |
| | 2,681 | | | Target Corp. | | | 620,491 | |
| | 6,547 | | | TJX Cos., Inc. (The) | | | 497,048 | |
| | 604 | | | Tractor Supply Co. | | | 144,114 | |
| | 287 | | | Ulta Beauty, Inc.* | | | 118,342 | |
| | | | | | | | |
| | | | | | | 15,018,922 | |
| | |
| Semiconductors & Semiconductor Equipment – 6.3% | |
| | 6,596 | | | Advanced Micro Devices, Inc.* | | | 949,164 | |
| | 2,919 | | | Analog Devices, Inc. | | | 513,073 | |
| | 4,960 | | | Applied Materials, Inc. | | | 780,506 | |
| | |
| | |
| The accompanying notes are an integral part of these financial statements. | | 53 |
GOLDMAN SACHS VARIABLE INSURANCE TRUST EQUITY INDEX FUND
Schedule of Investments (continued)
December 31, 2021
| | | | | | | | |
| Shares | | | Description | | Value | |
|
| Common Stocks – (continued) | |
| Semiconductors & Semiconductor Equipment – (continued) | |
| | 2,246 | | | Broadcom, Inc. | | $ | 1,494,511 | |
| | 735 | | | Enphase Energy, Inc.* | | | 134,461 | |
| | 22,168 | | | Intel Corp. | | | 1,141,652 | |
| | 823 | | | KLA Corp. | | | 353,980 | |
| | 767 | | | Lam Research Corp. | | | 551,588 | |
| | 3,050 | | | Microchip Technology, Inc. | | | 265,533 | |
| | 6,095 | | | Micron Technology, Inc. | | | 567,749 | |
| | 228 | | | Monolithic Power Systems, Inc. | | | 112,479 | |
| | 13,655 | | | NVIDIA Corp. | | | 4,016,072 | |
| | 1,435 | | | NXP Semiconductors NV (China) | | | 326,864 | |
| | 627 | | | Qorvo, Inc.* | | | 98,057 | |
| | 6,152 | | | QUALCOMM, Inc. | | | 1,125,016 | |
| | 914 | | | Skyworks Solutions, Inc. | | | 141,798 | |
| | 288 | | | SolarEdge Technologies, Inc.* | | | 80,804 | |
| | 888 | | | Teradyne, Inc. | | | 145,215 | |
| | 5,031 | | | Texas Instruments, Inc. | | | 948,193 | |
| | 1,375 | | | Xilinx, Inc. | | | 291,541 | |
| | | | | | | | |
| | | | | | | 14,038,256 | |
| | |
| Software & Services – 14.0% | |
| | 3,445 | | | Accenture PLC, Class A | | | 1,428,125 | |
| | 2,610 | | | Adobe, Inc.* | | | 1,480,027 | |
| | 854 | | | Akamai Technologies, Inc.* | | | 99,952 | |
| | 472 | | | ANSYS, Inc.* | | | 189,329 | |
| | 1,221 | | | Autodesk, Inc.* | | | 343,333 | |
| | 2,295 | | | Automatic Data Processing, Inc. | | | 565,901 | |
| | 608 | | | Broadridge Financial Solutions, Inc. | | | 111,155 | |
| | 1,540 | | | Cadence Design Systems, Inc.* | | | 286,979 | |
| | 740 | | | Ceridian HCM Holding, Inc.* | | | 77,300 | |
| | 675 | | | Citrix Systems, Inc. | | | 63,848 | |
| | 2,882 | | | Cognizant Technology Solutions Corp., Class A | | | 255,691 | |
| | 1,390 | | | DXC Technology Co.* | | | 44,744 | |
| | 311 | | | EPAM Systems, Inc.* | | | 207,888 | |
| | 3,308 | | | Fidelity National Information Services, Inc. | | | 361,068 | |
| | 3,308 | | | Fiserv, Inc.* | | | 343,337 | |
| | 462 | | | FleetCor Technologies, Inc.* | | | 103,414 | |
| | 740 | | | Fortinet, Inc.* | | | 265,956 | |
| | 459 | | | Gartner, Inc.* | | | 153,453 | |
| | 1,615 | | | Global Payments, Inc. | | | 218,316 | |
| | 4,877 | | | International Business Machines Corp. | | | 651,860 | |
| | 1,549 | | | Intuit, Inc. | | | 996,348 | |
| | 396 | | | Jack Henry & Associates, Inc. | | | 66,128 | |
| | 4,745 | | | Mastercard, Inc., Class A | | | 1,704,973 | |
| | 41,033 | | | Microsoft Corp. | | | 13,800,219 | |
| | 3,235 | | | NortonLifeLock, Inc. | | | 84,045 | |
| | 8,859 | | | Oracle Corp. | | | 772,593 | |
| | 1,739 | | | Paychex, Inc. | | | 237,374 | |
| | 265 | | | Paycom Software, Inc.* | | | 110,025 | |
| | 6,422 | | | PayPal Holdings, Inc.* | | | 1,211,061 | |
| | 595 | | | PTC, Inc.* | | | 72,084 | |
| | 5,339 | | | salesforce.com, Inc.* | | | 1,356,800 | |
| | 1,094 | | | ServiceNow, Inc.* | | | 710,126 | |
| | 848 | | | Synopsys, Inc.* | | | 312,488 | |
| | |
|
| Common Stocks – (continued) | |
| Software & Services – (continued) | |
| | 218 | | | Tyler Technologies, Inc.* | | | 117,273 | |
| | 514 | | | VeriSign, Inc.* | | | 130,464 | |
| | 9,175 | | | Visa, Inc., Class A | | | 1,988,314 | |
| | | | | | | | |
| | | | | | | 30,921,991 | |
| | |
| Technology Hardware & Equipment – 8.8% | |
| | 3,239 | | | Amphenol Corp., Class A | | | 283,283 | |
| | 85,183 | | | Apple, Inc. | | | 15,125,945 | |
| | 1,188 | | | Arista Networks, Inc.* | | | 170,775 | |
| | 754 | | | CDW Corp. | | | 154,404 | |
| | 23,072 | | | Cisco Systems, Inc. | | | 1,462,073 | |
| | 4,120 | | | Corning, Inc. | | | 153,388 | |
| | 333 | | | F5, Inc.* | | | 81,488 | |
| | 7,290 | | | Hewlett Packard Enterprise Co. | | | 114,963 | |
| | 6,331 | | | HP, Inc. | | | 238,489 | |
| | 209 | | | IPG Photonics Corp.* | | | 35,977 | |
| | 1,798 | | | Juniper Networks, Inc. | | | 64,207 | |
| | 1,005 | | | Keysight Technologies, Inc.* | | | 207,543 | |
| | 944 | | | Motorola Solutions, Inc. | | | 256,485 | |
| | 1,216 | | | NetApp, Inc. | | | 111,860 | |
| | 1,109 | | | Seagate Technology Holdings PLC | | | 125,295 | |
| | 1,771 | | | TE Connectivity Ltd. | | | 285,733 | |
| | 251 | | | Teledyne Technologies, Inc.* | | | 109,659 | |
| | 1,357 | | | Trimble, Inc.* | | | 118,317 | |
| | 1,631 | | | Western Digital Corp.* | | | 106,357 | |
| | 291 | | | Zebra Technologies Corp., Class A* | | | 173,203 | |
| | | | | | | | |
| | | | | | | 19,379,444 | |
| | |
| Telecommunication Services – 1.2% | |
| | 39,003 | | | AT&T, Inc. | | | 959,474 | |
| | 4,795 | | | Lumen Technologies, Inc. | | | 60,177 | |
| | 3,253 | | | T-Mobile US, Inc.* | | | 377,283 | |
| | 22,628 | | | Verizon Communications, Inc. | | | 1,175,751 | |
| | | | | | | | |
| | | | | | | 2,572,685 | |
| | |
| Transportation – 1.7% | |
| | 699 | | | Alaska Air Group, Inc.* | | | 36,418 | |
| | 3,649 | | | American Airlines Group, Inc.* | | | 65,536 | |
| | 697 | | | C.H. Robinson Worldwide, Inc. | | | 75,018 | |
| | 12,065 | | | CSX Corp. | | | 453,644 | |
| | 3,380 | | | Delta Air Lines, Inc.* | | | 132,090 | |
| | 947 | | | Expeditors International of Washington, Inc. | | | 127,173 | |
| | 1,338 | | | FedEx Corp. | | | 346,060 | |
| | 467 | | | J.B. Hunt Transport Services, Inc. | | | 95,455 | |
| | 1,322 | | | Norfolk Southern Corp. | | | 393,573 | |
| | 503 | | | Old Dominion Freight Line, Inc. | | | 180,265 | |
| | 3,159 | | | Southwest Airlines Co.* | | | 135,331 | |
| | 3,531 | | | Union Pacific Corp. | | | 889,565 | |
| | 1,817 | | | United Airlines Holdings, Inc.* | | | 79,548 | |
| | 3,970 | | | United Parcel Service, Inc., Class B | | | 850,930 | |
| | | | | | | | |
| | | | | | | 3,860,606 | |
| | |
| Utilities – 2.5% | |
| | 3,755 | | | AES Corp. (The) | | | 91,246 | |
| | 1,324 | | | Alliant Energy Corp. | | | 81,386 | |
| | |
| | |
| 54 | | The accompanying notes are an integral part of these financial statements. |
GOLDMAN SACHS VARIABLE INSURANCE TRUST EQUITY INDEX FUND
| | | | | | | | |
| Shares | | | Description | | Value | |
|
| Common Stocks – (continued) | |
| Utilities – (continued) | |
| | 1,349 | | | Ameren Corp. | | $ | 120,074 | |
| | 2,683 | | | American Electric Power Co., Inc. | | | 238,707 | |
| | 988 | | | American Water Works Co., Inc. | | | 186,594 | |
| | 741 | | | Atmos Energy Corp. | | | 77,635 | |
| | 3,377 | | | CenterPoint Energy, Inc. | | | 94,252 | |
| | 1,628 | | | CMS Energy Corp. | | | 105,901 | |
| | 1,885 | | | Consolidated Edison, Inc. | | | 160,828 | |
| | 4,421 | | | Dominion Energy, Inc. | | | 347,314 | |
| | 1,045 | | | DTE Energy Co. | | | 124,919 | |
| | 4,178 | | | Duke Energy Corp. | | | 438,272 | |
| | 2,087 | | | Edison International | | | 142,438 | |
| | 1,074 | | | Entergy Corp. | | | 120,986 | |
| | 1,244 | | | Evergy, Inc. | | | 85,351 | |
| | 1,869 | | | Eversource Energy | | | 170,042 | |
| | 5,305 | | | Exelon Corp. | | | 306,417 | |
| | 2,868 | | | FirstEnergy Corp. | | | 119,280 | |
| | 10,690 | | | NextEra Energy, Inc. | | | 998,018 | |
| | 2,089 | | | NiSource, Inc. | | | 57,677 | |
| | 1,276 | | | NRG Energy, Inc. | | | 54,970 | |
| | 601 | | | Pinnacle West Capital Corp. | | | 42,425 | |
| | 4,128 | | | PPL Corp. | | | 124,088 | |
| | 2,697 | | | Public Service Enterprise Group, Inc. | | | 179,971 | |
| | 1,757 | | | Sempra Energy | | | 232,416 | |
| | 5,872 | | | Southern Co. (The) | | | 402,702 | |
| | 1,686 | | | WEC Energy Group, Inc. | | | 163,660 | |
| | 3,010 | | | Xcel Energy, Inc. | | | 203,777 | |
| | | | | | | | |
| | | | | | | 5,471,346 | |
| | |
| | TOTAL INVESTMENTS – 99.9% | |
| | (Cost $51,836,842) | | $ | 220,600,512 | |
| | |
| OTHER ASSETS IN EXCESS OF
LIABILITIES – 0.1% | | | 311,782 | |
| | |
| | NET ASSETS – 100.0% | | $ | 220,912,294 | |
| | |
| | |
| The percentage shown for each investment category reflects the value of investments in that category as a percentage of net assets. |
| |
| * | | Non-income producing security. |
| |
| (a) | | Represents an affiliated issuer. |
| | |
| |
| Investment Abbreviations: |
| PLC | | —Public Limited Company |
| REIT | | —Real Estate Investment Trust |
ADDITIONAL INVESTMENT INFORMATION
FUTURES CONTRACTS — At December 31, 2021, the Fund had the following futures contracts:
| | | | | | | | | | | | | | | | |
| Description | | Number of
Contracts | | | Expiration
Date | | | Notional
Amount | | | Unrealized
Appreciation/
(Depreciation) | |
| | | | |
Long position contracts: | | | | | | | | | | | | | | | | |
S&P 500 E-Mini Index | | | 5 | | | | 03/18/22 | | | $ | 1,175,722 | | | $ | 13,903 | |
| | | |
| Total Futures Contracts | | | | | | | | | | | $ | 13,903 | |
| | |
| The accompanying notes are an integral part of these financial statements. | | 55 |
GS VARIABLE INSURANCE TRUST GROWTH OPPORTUNITIES FUND
Schedule of Investments
December 31, 2021
| | | | | | | | |
Shares | | | Description | | Value | |
|
| Common Stocks – 98.8% | |
| Automobiles & Components – 1.2% | |
| | 5,744 | | | Aptiv PLC* | | $ | 947,473 | |
| | |
| Banks – 0.7% | |
| | 806 | | | SVB Financial Group* | | | 546,661 | |
| | |
| Capital Goods – 10.6% | |
| | 5,932 | | | AMETEK, Inc. | | | 872,241 | |
| | 29,695 | | | AZEK Co., Inc. (The)* | | | 1,373,097 | |
| | 3,426 | | | Cummins, Inc. | | | 747,348 | |
| | 10,595 | | | Fortive Corp. | | | 808,292 | |
| | 7,093 | | | ITT, Inc. | | | 724,834 | |
| | 4,589 | | | Rockwell Automation, Inc. | | | 1,600,873 | |
| | 6,121 | | | Trane Technologies PLC | | | 1,236,625 | |
| | 1,310 | | | TransDigm Group, Inc.* | | | 833,527 | |
| | | | | | | | |
| | | | | | | 8,196,837 | |
| | |
| Commercial & Professional Services – 4.8% | |
| | 17,567 | | | CoStar Group, Inc.* | | | 1,388,320 | |
| | 5,120 | | | TransUnion | | | 607,130 | |
| | 7,491 | | | Verisk Analytics, Inc. | | | 1,713,416 | |
| | | | | | | | |
| | | | | | | 3,708,866 | |
| | |
| Consumer Durables & Apparel – 2.3% | |
| | 4,388 | | | Lululemon Athletica, Inc.* | | | 1,717,683 | |
| | 2,266 | | | On Holding AG, Class A (Switzerland)* | | | 85,677 | |
| | | | | | | | |
| | | | | | | 1,803,360 | |
| | |
| Consumer Services – 2.9% | |
| | 9,845 | | | Expedia Group, Inc.* | | | 1,779,188 | |
| | 3,271 | | | Yum! Brands, Inc. | | | 454,211 | |
| | | | | | | | |
| | | | | | | 2,233,399 | |
| | |
| Diversified Financials – 2.1% | |
| | 7,266 | | | Ares Management Corp., Class A | | | 590,508 | |
| | 1,448 | | | MarketAxess Holdings, Inc. | | | 595,519 | |
| | 3,998 | | | Tradeweb Markets, Inc., Class A | | | 400,360 | |
| | | | | | | | |
| | | | | | | 1,586,387 | |
| | |
| Energy – 0.9% | |
| | 3,909 | | | Pioneer Natural Resources Co. | | | 710,969 | |
| | |
| Food, Beverage & Tobacco – 3.8% | |
| | 12,237 | | | Coca-Cola Europacific Partners PLC (United Kingdom) | | | 684,415 | |
| | 12,599 | | | McCormick & Co., Inc. | | | 1,217,189 | |
| | 65,550 | | | Utz Brands, Inc. | | | 1,045,523 | |
| | | | | | | | |
| | | | | | | 2,947,127 | |
| | |
| Health Care Equipment & Services – 7.8% | |
| | 943 | | | Align Technology, Inc.* | | | 619,721 | |
| | 9,867 | | | Guardant Health, Inc.* | | | 986,897 | |
| | 2,249 | | | IDEXX Laboratories, Inc.* | | | 1,480,876 | |
| | 5,323 | | | Insulet Corp.* | | | 1,416,291 | |
| | 5,893 | | | Veeva Systems, Inc., Class A* | | | 1,505,544 | |
| | | | | | | | |
| | | | | | | 6,009,329 | |
| | |
|
| Common Stocks – (continued) | |
| Insurance – 0.7% | |
| | 13,423 | | | Ryan Specialty Group Holdings, Inc., Class A* | | | 541,618 | |
| | |
| Materials – 4.2% | |
| | 3,806 | | | Ashland Global Holdings, Inc. | | | 409,754 | |
| | 14,292 | | | Ball Corp. | | | 1,375,891 | |
| | 17,684 | | | Danimer Scientific, Inc.* | | | 150,668 | |
| | 1,550 | | | Martin Marietta Materials, Inc. | | | 682,806 | |
| | 3,610 | | | PPG Industries, Inc. | | | 622,508 | |
| | | | | | | | |
| | | | | | | 3,241,627 | |
| | |
| Media & Entertainment – 5.3% | |
| | 7,437 | | | Bumble, Inc., Class A* | | | 251,817 | |
| | 14,165 | | | Discovery, Inc., Class A*(a) | | | 333,444 | |
| | 10,310 | | | Live Nation Entertainment, Inc.* | | | 1,234,004 | |
| | 9,149 | | | Match Group, Inc.* | | | 1,209,955 | |
| | 2,786 | | | Roku, Inc.* | | | 635,765 | |
| | 9,888 | | | Twitter, Inc.* | | | 427,360 | |
| | | | | | | | |
| | | | | | | 4,092,345 | |
| | |
| Pharmaceuticals, Biotechnology & Life Sciences – 12.0% | |
| | 8,540 | | | Adaptive Biotechnologies Corp.* | | | 239,632 | |
| | 7,354 | | | Agilent Technologies, Inc. | | | 1,174,066 | |
| | 3,449 | | | Alnylam Pharmaceuticals, Inc.* | | | 584,881 | |
| | 745 | | | Argenx SE ADR (Netherlands)* | | | 260,892 | |
| | 10,812 | | | Avantor, Inc.* | | | 455,618 | |
| | 10,052 | | | Catalent, Inc.* | | | 1,286,958 | |
| | 11,396 | | | Genmab A/S ADR (Denmark)* | | | 450,826 | |
| | 9,104 | | | Neurocrine Biosciences, Inc.* | | | 775,388 | |
| | 1,329 | | | Novavax, Inc.* | | | 190,140 | |
| | 5,831 | | | PerkinElmer, Inc. | | | 1,172,381 | |
| | 4,854 | | | Seagen, Inc.* | | | 750,428 | |
| | 4,136 | | | West Pharmaceutical Services, Inc. | | | 1,939,825 | |
| | | | | | | | |
| | | | | | | 9,281,035 | |
| | |
| Real Estate – 0.8% | |
| | 7,345 | | | Equity LifeStyle Properties, Inc. REIT | | | 643,863 | |
| | |
| Retailing – 5.6% | |
| | 2,669 | | | Burlington Stores, Inc.* | | | 778,040 | |
| | 6,917 | | | Etsy, Inc.* | | | 1,514,408 | |
| | 380 | | | O’Reilly Automotive, Inc.* | | | 268,367 | |
| | 1,356 | | | RH* | | | 726,735 | |
| | 2,608 | | | Ulta Beauty, Inc.* | | | 1,075,383 | |
| | | | | | | | |
| | | | | | | 4,362,933 | |
| | |
| Semiconductors & Semiconductor Equipment – 6.2% | |
| | 6,582 | | | Entegris, Inc. | | | 912,134 | |
| | 12,572 | | | Marvell Technology, Inc. | | | 1,099,924 | |
| | 4,783 | | | MKS Instruments, Inc. | | | 833,055 | |
| | 19,415 | | | ON Semiconductor Corp.* | | | 1,318,667 | |
| | 1,118 | | | SolarEdge Technologies, Inc.* | | | 313,677 | |
| | 2,958 | | | Wolfspeed, Inc.* | | | 330,616 | |
| | | | | | | | |
| | | | | | | 4,808,073 | |
| | |
| | |
| 56 | | The accompanying notes are an integral part of these financial statements. |
GS VARIABLE INSURANCE TRUST GROWTH OPPORTUNITIES FUND
| | | | | | | | |
Shares | | | Description | | Value | |
|
| Common Stocks – (continued) | |
| Software & Services – 20.8% | |
| | 3,992 | | | Affirm Holdings, Inc.* | | $ | 401,435 | |
| | 2,967 | | | ANSYS, Inc.* | | | 1,190,123 | |
| | 4,011 | | | Bill.com Holdings, Inc.* | | | 999,341 | |
| | 10,927 | | | Cadence Design Systems, Inc.* | | | 2,036,247 | |
| | 11,131 | | | Dlocal Ltd. (Uruguay)* | | | 397,265 | |
| | 6,631 | | | DocuSign, Inc.* | | | 1,009,968 | |
| | 16,544 | | | Dynatrace, Inc.* | | | 998,430 | |
| | 627 | | | EPAM Systems, Inc.* | | | 419,118 | |
| | 1,787 | | | HubSpot, Inc.* | | | 1,177,901 | |
| | 3,796 | | | Okta, Inc.* | | | 850,949 | |
| | 3,980 | | | Palo Alto Networks, Inc.* | | | 2,215,905 | |
| | 2,306 | | | Paycom Software, Inc.* | | | 957,428 | |
| | 3,738 | | | Procore Technologies, Inc.*(a) | | | 298,928 | |
| | 1,646 | | | RingCentral, Inc., Class A* | | | 308,378 | |
| | 9,428 | | | Splunk, Inc.* | | | 1,091,008 | |
| | 7,501 | | | UiPath, Inc., Class A* | | | 323,518 | |
| | 4,509 | | | Zscaler, Inc.* | | | 1,448,877 | |
| | | | | | | | |
| | | | | | | 16,124,819 | |
| | |
| Technology Hardware & Equipment – 3.4% | |
| | 14,448 | | | Amphenol Corp., Class A | | | 1,263,622 | |
| | 6,689 | | | Keysight Technologies, Inc.* | | | 1,381,345 | |
| | | | | | | | |
| | | | | | | 2,644,967 | |
| | |
| Transportation – 2.7% | |
| | 4,292 | | | Old Dominion Freight Line, Inc. | | | 1,538,167 | |
| | 1,712 | | | Saia, Inc.* | | | 576,995 | |
| | | | | | | | |
| | | | | | | 2,115,162 | |
| | |
| | TOTAL COMMON STOCKS | |
| | (Cost $52,412,741) | | $ | 76,546,850 | |
| | |
| | | | | | | | |
| Shares | | | Dividend
Rate | | Value | |
|
| Investment Company – 1.2%(b) | |
| Goldman Sachs Financial Square Government Fund —
Institutional Shares |
|
| | 933,690 | | | 0.026% | | | 933,690 | |
| | (Cost $933,690) | |
| | |
| TOTAL INVESTMENTS BEFORE SECURITIES LENDING
REINVESTMENT VEHICLE |
|
| | (Cost $53,346,431) | | $ | 77,480,540 | |
| | |
| | | | | | | | |
| Shares | | | Dividend
Rate | | Value | |
|
| Securities Lending Reinvestment Vehicle – 0.9%(b) | |
| Goldman Sachs Financial Square Government Fund —
Institutional Shares |
|
| | 688,836 | | | 0.026% | | $ | 688,836 | |
| | (Cost $688,836) | |
| | |
| | TOTAL INVESTMENTS – 100.9% | |
| | (Cost $54,035,267) | | $ | 78,169,376 | |
| | |
| LIABILITIES IN EXCESS OF
OTHER ASSETS – (0.9)% | | | (700,870 | ) |
| | |
| | NET ASSETS – 100.0% | | $ | 77,468,506 | |
| | |
| | |
| The percentage shown for each investment category reflects the value of investments in that category as a percentage of net assets. |
| |
| * | | Non-income producing security. |
| |
| (a) | | All or a portion of security is on loan. |
| |
| (b) | | Represents an affiliated issuer. |
| | |
| |
| Investment Abbreviations: |
| ADR | | —American Depositary Receipt |
| PLC | | —Public Limited Company |
| REIT | | —Real Estate Investment Trust |
| | |
| The accompanying notes are an integral part of these financial statements. | | 57 |
GOLDMAN SACHS VARIABLE INSURANCE TRUST INTERNATIONAL EQUITY INSIGHTS FUND
Schedule of Investments
December 31, 2021
| | | | | | | | |
| Shares | | | Description | | Value | |
|
| Common Stocks – 97.2% | |
| Australia – 9.1% | |
| | 3,740 | | | ASX Ltd. (Diversified Financials) | | $ | 252,765 | |
| | 47,906 | | | Australia & New Zealand Banking Group Ltd. (Banks) | | | 959,622 | |
| | 34,859 | | | BHP Group PLC (Materials) | | | 1,037,221 | |
| | 4,063 | | | Charter Hall Group REIT (Real Estate) | | | 60,782 | |
| | 19,595 | | | Commonwealth Bank of Australia (Banks) | | | 1,440,454 | |
| | 529 | | | Domino’s Pizza Enterprises Ltd. (Consumer Services) | | | 45,405 | |
| | 16,046 | | | Endeavour Group Ltd. (Food & Staples Retailing) | | | 78,743 | |
| | 49,768 | | | Glencore PLC (Materials)* | | | 253,582 | |
| | 50,536 | | | Goodman Group REIT (Real Estate) | | | 974,174 | |
| | 4,476 | | | Iluka Resources Ltd. (Materials) | | | 32,997 | |
| | 543 | | | Macquarie Group Ltd. (Diversified Financials) | | | 81,171 | |
| | 22,230 | | | Mineral Resources Ltd. (Materials) | | | 908,002 | |
| | 83,451 | | | Myer Holdings Ltd. (Retailing)* | | | 27,344 | |
| | 17,570 | | | Rio Tinto PLC ADR (Materials) | | | 1,176,136 | |
| | 5,426 | | | Sonic Healthcare Ltd. (Health Care Equipment & Services) | | | 184,030 | |
| | 248,815 | | | Telstra Corp. Ltd. (Telecommunication Services) | | | 756,199 | |
| | 77,213 | | | Treasury Wine Estates Ltd. (Food, Beverage & Tobacco) | | | 696,179 | |
| | 30,516 | | | Woolworths Group Ltd. (Food & Staples Retailing) | | | 843,571 | |
| | | | | | | | |
| | | | | | | 9,808,377 | |
| | |
| Canada – 0.1% | |
| | 27,179 | | | International Petroleum Corp. (Energy)* | | | 149,893 | |
| | |
| China – 0.4% | |
| | 178,200 | | | Chow Tai Fook Jewellery Group Ltd. (Retailing)* | | | 321,095 | |
| | 15,000 | | | SITC International Holdings Co. Ltd. (Transportation) | | | 54,250 | |
| | | | | | | | |
| | | | | | | 375,345 | |
| | |
| Denmark – 3.3% | |
| | 177 | | | AP Moller – Maersk A/S, Class A (Transportation) | | | 587,209 | |
| | 131 | | | AP Moller – Maersk A/S, Class B (Transportation) | | | 467,580 | |
| | 193 | | | Chemometec A/S (Pharmaceuticals, Biotechnology & Life Sciences) | | | 24,439 | |
| | 2,014 | | | Huscompagniet A/S (Consumer Durables & Apparel) | | | 36,506 | |
| | 15,891 | | | Novo Nordisk A/S, Class B (Pharmaceuticals, Biotechnology & Life Sciences) | | | 1,784,970 | |
| | 1,379 | | | Pandora A/S (Consumer Durables & Apparel) | | | 171,535 | |
| | |
|
| Common Stocks – (continued) | |
| Denmark – (continued) | |
| | 3,940 | | | Solar A/S, Class B (Capital Goods) | | | 479,528 | |
| | | | | | | | |
| | | | | | | 3,551,767 | |
| | |
| Finland – 1.6% | |
| | 17,559 | | | Kesko OYJ, Class B (Food & Staples Retailing) | | | 585,256 | |
| | 23,745 | | | Nokia OYJ (Technology Hardware & Equipment)* | | | 150,394 | |
| | 63,059 | | | Nordea Bank Abp (Banks) | | | 769,228 | |
| | 13,517 | | | Nordea Bank Abp (Banks) | | | 165,612 | |
| | 1,367 | | | Sampo OYJ, Class A (Insurance) | | | 68,416 | |
| | | | | | | | |
| | | | | | | 1,738,906 | |
| | |
| France – 11.0% | |
| | 759 | | | Air Liquide SA (Materials) | | | 132,373 | |
| | 11,061 | | | AXA SA (Insurance) | | | 329,212 | |
| | 93 | | | Capgemini SE (Software & Services) | | | 22,792 | |
| | 12,131 | | | Cie de Saint-Gobain (Capital Goods) | | | 853,375 | |
| | 15,170 | | | Dassault Systemes SE (Software & Services) | | | 900,270 | |
| | 13,358 | | | Electricite de France SA (Utilities) | | | 157,108 | |
| | 557 | | | Hermes International (Consumer Durables & Apparel) | | | 973,289 | |
| | 280 | | | Ipsen SA (Pharmaceuticals, Biotechnology & Life Sciences) | | | 25,623 | |
| | 1,571 | | | IPSOS (Media & Entertainment) | | | 73,592 | |
| | 1,357 | | | Kering SA (Consumer Durables & Apparel) | | | 1,088,793 | |
| | 7,670 | | | Legrand SA (Capital Goods) | | | 898,320 | |
| | 2,539 | | | LVMH Moet Hennessy Louis Vuitton SE (Consumer Durables & Apparel) | | | 2,098,317 | |
| | 4,042 | | | Pernod Ricard SA (Food, Beverage & Tobacco) | | | 972,417 | |
| | 11,004 | | | Publicis Groupe SA (Media & Entertainment) | | | 741,385 | |
| | 2,577 | | | Renault SA (Automobiles & Components)* | | | 89,397 | |
| | 35,739 | | | Rexel SA (Capital Goods)* | | | 723,804 | |
| | 1,437 | | | Sartorius Stedim Biotech (Pharmaceuticals, Biotechnology & Life Sciences) | | | 789,210 | |
| | 26,419 | | | Societe Generale SA (Banks) | | | 907,988 | |
| | | | | | | | |
| | | | | | | 11,777,265 | |
| | |
| Germany – 8.3% | |
| | 685 | | | Bayerische Motoren Werke AG (Automobiles & Components) | | | 68,529 | |
| | 7,793 | | | Brenntag SE (Capital Goods) | | | 703,739 | |
| | 8,776 | | | Covestro AG (Materials)(a) | | | 540,146 | |
| | 6,664 | | | Daimler AG (Automobiles & Components) | | | 509,158 | |
| | 4,057 | | | Daimler Truck Holding AG (Capital Goods)* | | | 149,144 | |
| | 10,295 | | | Deutsche Bank AG (Diversified Financials)* | | | 128,225 | |
| | 559 | | | Deutsche Boerse AG (Diversified Financials) | | | 93,339 | |
| | |
| | |
| 58 | | The accompanying notes are an integral part of these financial statements. |
GOLDMAN SACHS VARIABLE INSURANCE TRUST INTERNATIONAL EQUITY INSIGHTS FUND
| | | | | | | | |
| Shares | | | Description | | Value | |
|
| Common Stocks – (continued) | |
| Germany – (continued) | |
| | 17,757 | | | Deutsche Post AG (Transportation) | | $ | 1,142,145 | |
| | 26,536 | | | Deutsche Telekom AG (Telecommunication Services) | | | 490,319 | |
| | 3,911 | | | DWS Group GmbH & Co. KGaA (Diversified Financials)(a) | | | 157,715 | |
| | 66,113 | | | E.ON SE (Utilities) | | | 918,803 | |
| | 4,405 | | | Gerresheimer AG (Pharmaceuticals, Biotechnology & Life Sciences) | | | 423,537 | |
| | 912 | | | Hapag-Lloyd AG (Transportation)(a) | | | 286,748 | |
| | 1,442 | | | HUGO BOSS AG (Consumer Durables & Apparel) | | | 87,290 | |
| | 19,675 | | | Infineon Technologies AG (Semiconductors & Semiconductor Equipment) | | | 905,808 | |
| | 3,946 | | | Merck KGaA (Pharmaceuticals, Biotechnology & Life Sciences) | | | 1,015,138 | |
| | 582 | | | Rheinmetall AG (Capital Goods) | | | 54,772 | |
| | 3,024 | | | SAP SE (Software & Services) | | | 425,597 | |
| | 10,943 | | | Siemens Healthineers AG (Health Care Equipment & Services)(a) | | | 815,902 | |
| | | | | | | | |
| | | | | | | 8,916,054 | |
| | |
| Hong Kong – 2.2% | |
| | 133,200 | | | AIA Group Ltd. (Insurance) | | | 1,344,367 | |
| | 30,500 | | | CK Asset Holdings Ltd. (Real Estate) | | | 192,393 | |
| | 25,500 | | | CK Infrastructure Holdings Ltd. (Utilities) | | | 162,466 | |
| | 55,500 | | | Sun Hung Kai Properties Ltd. (Real Estate) | | | 673,451 | |
| | 1,000 | | | Techtronic Industries Co. Ltd. (Capital Goods) | | | 19,935 | |
| | | | | | | | |
| | | | | | | 2,392,612 | |
| | |
| Israel – 0.0% | |
| | 2,710 | | | Plus500 Ltd. (Diversified Financials) | | | 49,989 | |
| | |
| Italy – 0.5% | |
| | 3,828 | | | BFF Bank SpA (Diversified Financials)(a) | | | 30,782 | |
| | 4,041 | | | Moncler SpA (Consumer Durables & Apparel) | | | 292,037 | |
| | 14,700 | | | PRADA SpA (Consumer Durables & Apparel) | | | 94,128 | |
| | 549 | | | Reply SpA (Software & Services) | | | 111,506 | |
| | | | | | | | |
| | | | | | | 528,453 | |
| | |
| Japan – 25.2% | |
| | 93,700 | | | Acom Co. Ltd. (Diversified Financials) | | | 269,752 | |
| | 1,400 | | | Albis Co. Ltd. (Food & Staples Retailing) | | | 27,335 | |
| | 62,100 | | | Amada Co. Ltd. (Capital Goods) | | | 614,906 | |
| | 7,200 | | | Astellas Pharma, Inc. (Pharmaceuticals, Biotechnology & Life Sciences) | | | 117,184 | |
| | 2,900 | | | CAC Holdings Corp. (Software & Services) | | | 36,608 | |
| | |
|
| Common Stocks – (continued) | |
| Japan – (continued) | |
| | 7,000 | | | Canon, Inc. (Technology Hardware & Equipment) | | | 170,756 | |
| | 39,500 | | | Casio Computer Co. Ltd. (Consumer Durables & Apparel) | | | 508,623 | |
| | 15,400 | | | Citizen Watch Co. Ltd. (Technology Hardware & Equipment) | | | 66,658 | |
| | 3,100 | | | Concordia Financial Group Ltd. (Banks) | | | 11,258 | |
| | 21,600 | | | Daiwa House Industry Co. Ltd. (Real Estate) | | | 620,764 | |
| | 22,600 | | | Daiwa Securities Group, Inc. (Diversified Financials) | | | 127,532 | |
| | 7,600 | | | DTS Corp. (Software & Services) | | | 166,921 | |
| | 900 | | | Eizo Corp. (Technology Hardware & Equipment) | | | 31,628 | |
| | 19,900 | | | France Bed Holdings Co. Ltd. (Health Care Equipment & Services) | | | 159,495 | |
| | 100 | | | Fujitsu Ltd. (Software & Services) | | | 17,183 | |
| | 27,000 | | | Futaba Corp. (Capital Goods) | | | 164,102 | |
| | 900 | | | Hakuhodo DY Holdings, Inc. (Media & Entertainment) | | | 14,976 | |
| | 500 | | | Hamamatsu Photonics KK (Technology Hardware & Equipment) | | | 31,935 | |
| | 8,900 | | | Hino Motors Ltd. (Capital Goods) | | | 73,389 | |
| | 700 | | | Hisamitsu Pharmaceutical Co., Inc. (Pharmaceuticals, Biotechnology & Life Sciences) | | | 24,181 | |
| | 12,500 | | | Hokkaido Gas Co. Ltd. (Utilities) | | | 165,807 | |
| | 500 | | | Hoya Corp. (Health Care Equipment & Services) | | | 74,196 | |
| | 9,000 | | | Iida Group Holdings Co. Ltd. (Consumer Durables & Apparel) | | | 209,317 | |
| | 5,300 | | | I-PEX, Inc. (Technology Hardware & Equipment) | | | 90,187 | |
| | 22,500 | | | Isuzu Motors Ltd. (Automobiles & Components) | | | 280,046 | |
| | 2,200 | | | ITOCHU Corp. (Capital Goods) | | | 67,307 | |
| | 7,200 | | | J Front Retailing Co. Ltd. (Retailing) | | | 65,562 | |
| | 700 | | | Japan Petroleum Exploration Co. Ltd. (Energy) | | | 15,243 | |
| | 39,200 | | | Japan Post Holdings Co. Ltd. (Insurance)* | | | 305,379 | |
| | 6,100 | | | JDC Corp. (Capital Goods) | | | 29,702 | |
| | 6,000 | | | Kansai Electric Power Co., Inc. (The) (Utilities) | | | 56,082 | |
| | 12,500 | | | Kao Corp. (Household & Personal Products) | | | 654,679 | |
| | 1,000 | | | KDDI Corp. (Telecommunication Services) | | | 29,244 | |
| | 9,800 | | | Komatsu Ltd. (Capital Goods) | | | 229,183 | |
| | 7,600 | | | Komori Corp. (Capital Goods) | | | 45,457 | |
| | 6,300 | | | Konami Holdings Corp. (Media & Entertainment) | | | 302,397 | |
| | 12,600 | | | Kyocera Corp. (Technology Hardware & Equipment) | | | 787,828 | |
| | |
| | |
| The accompanying notes are an integral part of these financial statements. | | 59 |
GOLDMAN SACHS VARIABLE INSURANCE TRUST INTERNATIONAL EQUITY INSIGHTS FUND
Schedule of Investments (continued)
December 31, 2021
| | | | | | | | |
| Shares | | | Description | | Value | |
|
| Common Stocks – (continued) | |
| Japan – (continued) | |
| | 8,200 | | | Mars Group Holdings Corp. (Consumer Durables & Apparel) | | $ | 120,121 | |
| | 1,000 | | | Marui Group Co. Ltd. (Retailing) | | | 18,831 | |
| | 2,900 | | | Meiji Electric Industries Co. Ltd. (Capital Goods) | | | 31,885 | |
| | 3,000 | | | Mimasu Semiconductor Industry Co. Ltd. (Semiconductors & Semiconductor Equipment) | | | 69,138 | |
| | 4,400 | | | MINEBEA MITSUMI, Inc. (Capital Goods) | | | 125,020 | |
| | 23,700 | | | Mitsubishi Electric Corp. (Capital Goods) | | | 300,825 | |
| | 8,900 | | | Mitsubishi Estate Co. Ltd. (Real Estate) | | | 123,465 | |
| | 4,900 | | | Mitsubishi Gas Chemical Co., Inc. (Materials) | | | 83,062 | |
| | 133,900 | | | Mitsubishi HC Capital, Inc. (Diversified Financials) | | | 662,475 | |
| | 1,900 | | | Mitsubishi Shokuhin Co. Ltd. (Food & Staples Retailing) | | | 45,706 | |
| | 8,000 | | | Mitsui & Co. Ltd. (Capital Goods) | | | 189,583 | |
| | 9,400 | | | Mitsui OSK Lines Ltd. (Transportation) | | | 698,649 | |
| | 64,900 | | | Mizuho Financial Group, Inc. (Banks) | | | 824,311 | |
| | 400 | | | MS&AD Insurance Group Holdings, Inc. (Insurance) | | | 12,317 | |
| | 1,400 | | | Nakamoto Packs Co. Ltd. (Commercial & Professional Services) | | | 21,261 | |
| | 15,400 | | | NEC Corp. (Software & Services) | | | 712,091 | |
| | 7,200 | | | Nexon Co. Ltd. (Media & Entertainment) | | | 139,221 | |
| | 40,100 | | | NGK Insulators Ltd. (Capital Goods) | | | 678,693 | |
| | 21,900 | | | Nikon Corp. (Consumer Durables & Apparel) | | | 235,911 | |
| | 8,400 | | | Nippon Express Co. Ltd. (Transportation) | | | 502,697 | |
| | 17,400 | | | Nippon Telegraph & Telephone Corp. (Telecommunication Services) | | | 475,860 | |
| | 5,300 | | | Nippon Thompson Co. Ltd. (Capital Goods) | | | 31,419 | |
| | 5,800 | | | Nippon Yusen KK (Transportation) | | | 442,267 | |
| | 95,000 | | | Nissan Motor Co. Ltd. (Automobiles & Components)* | | | 457,572 | |
| | 9,300 | | | Nitto Denko Corp. (Materials) | | | 718,448 | |
| | 137,300 | | | Nomura Holdings, Inc. (Diversified Financials) | | | 598,031 | |
| | 40,900 | | | NTT Data Corp. (Software & Services) | | | 877,355 | |
| | 5,000 | | | Oji Holdings Corp. (Materials) | | | 24,226 | |
| | 11,700 | | | Olympus Corp. (Health Care Equipment & Services) | | | 269,419 | |
| | 1,900 | | | Optex Group Co. Ltd. (Technology Hardware & Equipment) | | | 27,130 | |
| | 43,000 | | | ORIX Corp. (Diversified Financials) | | | 877,552 | |
| | 5,400 | | | Osaka Gas Co. Ltd. (Utilities) | | | 89,312 | |
| | |
|
| Common Stocks – (continued) | |
| Japan – (continued) | |
| | 2,700 | | | Paramount Bed Holdings Co. Ltd. (Health Care Equipment & Services) | | | 45,801 | |
| | 2,600 | | | PHC Holdings Corp. (Health Care Equipment & Services)* | | | 47,127 | |
| | 2,200 | | | Renesas Electronics Corp. (Semiconductors & Semiconductor Equipment)* | | | 27,326 | |
| | 75,200 | | | Ricoh Co. Ltd. (Technology Hardware & Equipment) | | | 700,947 | |
| | 2,100 | | | Rion Co. Ltd. (Health Care Equipment & Services) | | | 42,986 | |
| | 1,500 | | | Round One Corp. (Consumer Services) | | | 17,785 | |
| | 700 | | | S Foods, Inc. (Food, Beverage & Tobacco) | | | 21,193 | |
| | 34,000 | | | Sekisui House Ltd. (Consumer Durables & Apparel) | | | 731,536 | |
| | 700 | | | Shimamura Co. Ltd. (Retailing) | | | 58,745 | |
| | 5,300 | | | Shinko Electric Industries Co. Ltd. (Semiconductors & Semiconductor Equipment) | | | 252,499 | |
| | 21,200 | | | Showa Denko KK (Materials) | | | 445,776 | |
| | 13,000 | | | SoftBank Group Corp. (Telecommunication Services) | | | 623,222 | |
| | 54,600 | | | Sumitomo Corp. (Capital Goods) | | | 808,047 | |
| | 4,000 | | | Sumitomo Dainippon Pharma Co. Ltd. (Pharmaceuticals, Biotechnology & Life Sciences) | | | 46,150 | |
| | 8,200 | | | Sumitomo Forestry Co. Ltd. (Consumer Durables & Apparel) | | | 158,517 | |
| | 6,900 | | | Sumitomo Heavy Industries Ltd. (Capital Goods) | | | 167,482 | |
| | 21,100 | | | Sumitomo Mitsui Financial Group, Inc. (Banks) | | | 720,508 | |
| | 11,100 | | | Suntory Beverage & Food Ltd. (Food, Beverage & Tobacco) | | | 401,964 | |
| | 25,500 | | | Takeda Pharmaceutical Co. Ltd. (Pharmaceuticals, Biotechnology & Life Sciences) | | | 696,362 | |
| | 6,100 | | | Tokio Marine Holdings, Inc. (Insurance) | | | 339,585 | |
| | 33,000 | | | Tokyo Gas Co. Ltd. (Utilities) | | | 592,362 | |
| | 15,200 | | | Tokyo Seimitsu Co. Ltd. (Semiconductors & Semiconductor Equipment) | | | 673,267 | |
| | 4,200 | | | Tokyotokeiba Co. Ltd. (Consumer Services) | | | 155,566 | |
| | 21,000 | | | TOPPAN, Inc. (Commercial & Professional Services) | | | 394,080 | |
| | 20,100 | | | Tosoh Corp. (Materials) | | | 298,616 | |
| | 5,700 | | | Toyota Motor Corp. (Automobiles & Components) | | | 105,351 | |
| | 15,400 | | | Toyota Tsusho Corp. (Capital Goods) | | | 709,890 | |
| | 1,100 | | | Ulvac, Inc. (Semiconductors & Semiconductor Equipment) | | | 68,808 | |
| | 2,900 | | | Ushio, Inc. (Capital Goods) | | | 48,182 | |
| | |
| | |
| 60 | | The accompanying notes are an integral part of these financial statements. |
GOLDMAN SACHS VARIABLE INSURANCE TRUST INTERNATIONAL EQUITY INSIGHTS FUND
| | | | | | | | |
| Shares | | | Description | | Value | |
|
| Common Stocks – (continued) | |
| Japan – (continued) | |
| | 20,300 | | | Yamaha Motor Co. Ltd. (Automobiles & Components) | | $ | 487,588 | |
| | 5,800 | | | Yamaichi Electronics Co. Ltd. (Semiconductors & Semiconductor Equipment) | | | 117,271 | |
| | | | | | | | |
| | | | | | | 27,151,194 | |
| | |
| Luxembourg – 0.7% | |
| | 6,361 | | | Eurofins Scientific SE (Pharmaceuticals, Biotechnology & Life Sciences) | | | 788,075 | |
| | |
| Netherlands – 5.7% | |
| | 1,984 | | | ASM International NV (Semiconductors & Semiconductor Equipment) | | | 875,773 | |
| | 3,260 | | | ASML Holding NV (Semiconductors & Semiconductor Equipment) | | | 2,611,330 | |
| | 738 | | | BE Semiconductor Industries NV (Semiconductors & Semiconductor Equipment) | | | 62,740 | |
| | 25,518 | | | Koninklijke Ahold Delhaize NV (Food & Staples Retailing) | | | 875,685 | |
| | 3,442 | | | OCI NV (Materials)* | | | 89,843 | |
| | 48,293 | | | Royal Dutch Shell PLC, Class A (Energy) | | | 1,056,402 | |
| | 7,076 | | | Royal Dutch Shell PLC, Class B ADR (Energy) | | | 306,745 | |
| | 4,369 | | | Signify NV (Capital Goods)(a) | | | 202,861 | |
| | | | | | | | |
| | | | | | | 6,081,379 | |
| | |
| New Zealand – 0.4% | |
| | 131,950 | | | Spark New Zealand Ltd. (Telecommunication Services) | | | 408,054 | |
| | |
| Norway – 2.1% | |
| | 18,152 | | | Aker BP ASA (Energy) | | | 558,149 | |
| | 6,662 | | | Equinor ASA (Energy) | | | 176,405 | |
| | 13,331 | | | Golden Ocean Group Ltd. (Transportation) | | | 119,937 | |
| | 1,299 | | | Kid ASA (Retailing)(a) | | | 16,609 | |
| | 5,032 | | | Nordic Semiconductor ASA (Semiconductors & Semiconductor Equipment)* | | | 168,757 | |
| | 97,096 | | | Norsk Hydro ASA (Materials) | | | 764,009 | |
| | 19,476 | | | Stolt-Nielsen Ltd. (Transportation) | | | 299,991 | |
| | 21,290 | | | Wallenius Wilhelmsen ASA (Transportation)* | | | 122,326 | |
| | | | | | | | |
| | | | | | | 2,226,183 | |
| | |
| Portugal – 0.2% | |
| | 16,773 | | | Galp Energia SGPS SA (Energy) | | | 162,751 | |
| | |
| Singapore – 1.0% | |
| | 97,300 | | | Oversea-Chinese Banking Corp. Ltd. (Banks) | | | 823,522 | |
| | |
|
| Common Stocks – (continued) | |
| Singapore – (continued) | |
| | 6,073 | | | STMicroelectronics NV (Semiconductors & Semiconductor Equipment) | | | 299,635 | |
| | | | | | | | |
| | | | | | | 1,123,157 | |
| | |
| South Africa – 0.9% | |
| | 24,581 | | | Anglo American PLC (Materials) | | | 1,011,073 | |
| | |
| Spain – 1.6% | |
| | 5,105 | | | Acerinox SA (Materials) | | | 65,695 | |
| | 68,666 | | | Banco Bilbao Vizcaya Argentaria SA (Banks) | | | 407,257 | |
| | 23,689 | | | Bankinter SA (Banks) | | | 120,699 | |
| | 3,451 | | | Grifols SA (Pharmaceuticals, Biotechnology & Life Sciences) | | | 66,406 | |
| | 88,636 | | | Iberdrola SA (Utilities) | | | 1,049,450 | |
| | | | | | | | |
| | | | | | | 1,709,507 | |
| | |
| Sweden – 4.1% | |
| | 6,911 | | | Getinge AB, Class B (Health Care Equipment & Services) | | | 301,196 | |
| | 980 | | | Industrivarden AB, Class A (Diversified Financials) | | | 31,139 | |
| | 677 | | | Investor AB, Class A (Diversified Financials) | | | 17,810 | |
| | 18,843 | | | Investor AB, Class B (Diversified Financials) | | | 472,833 | |
| | 18,591 | | | Lundin Energy AB (Energy) | | | 665,238 | |
| | 3,420 | | | New Wave Group AB, Class B (Consumer Durables & Apparel) | | | 63,509 | |
| | 5,993 | | | Sandvik AB (Capital Goods) | | | 167,046 | |
| | 19,216 | | | Svenska Handelsbanken AB, Class A (Banks) | | | 207,685 | |
| | 34,816 | | | Swedbank AB, Class A (Banks) | | | 699,657 | |
| | 79,394 | | | Telefonaktiebolaget LM Ericsson, Class B (Technology Hardware & Equipment) | | | 873,575 | |
| | 37,133 | | | Volvo AB, Class B (Capital Goods) | | | 858,757 | |
| | | | | | | | |
| | | | | | | 4,358,445 | |
| | |
| Switzerland – 7.5% | |
| | 30,463 | | | ABB Ltd. (Capital Goods) | | | 1,161,030 | |
| | 150 | | | Bachem Holding AG, Class B (Pharmaceuticals, Biotechnology & Life Sciences) | | | 117,457 | |
| | 370 | | | Baloise Holding AG (Insurance) | | | 60,389 | |
| | 2,349 | | | Kuehne + Nagel International AG (Transportation) | | | 756,513 | |
| | 1,257 | | | Lonza Group AG (Pharmaceuticals, Biotechnology & Life Sciences) | | | 1,046,564 | |
| | 8,394 | | | Nestle SA (Food, Beverage & Tobacco) | | | 1,171,948 | |
| | 828 | | | Novartis AG (Pharmaceuticals, Biotechnology & Life Sciences) | | | 72,758 | |
| | 4,249 | | | Roche Holding AG (Pharmaceuticals, Biotechnology & Life Sciences) | | | 1,762,745 | |
| | |
| | |
| The accompanying notes are an integral part of these financial statements. | | 61 |
GOLDMAN SACHS VARIABLE INSURANCE TRUST INTERNATIONAL EQUITY INSIGHTS FUND
Schedule of Investments (continued)
December 31, 2021
| | | | | | | | |
| Shares | | | Description | | Value | |
|
| Common Stocks – (continued) | |
| Switzerland – (continued) | |
| | 1,194 | | | Tecan Group AG (Pharmaceuticals, Biotechnology & Life Sciences) | | $ | 725,195 | |
| | 59,597 | | | UBS Group AG (Diversified Financials) | | | 1,069,724 | |
| | 139 | | | VAT Group AG (Capital Goods)(a) | | | 68,878 | |
| | | | | | | | |
| | | | | | | 8,013,201 | |
| | |
| United Kingdom – 8.6% | |
| | 143,425 | | | Aviva PLC (Insurance) | | | 799,477 | |
| | 7,836 | | | Barclays PLC (Banks) | | | 19,960 | |
| | 885 | | | Bellway PLC (Consumer Durables & Apparel) | | | 40,223 | |
| | 31,561 | | | British American Tobacco PLC (Food, Beverage & Tobacco) | | | 1,171,915 | |
| | 89,500 | | | CK Hutchison Holdings Ltd. (Capital Goods) | | | 576,239 | |
| | 4,100 | | | Clarkson PLC (Transportation) | | | 215,323 | |
| | 907 | | | DCC PLC (Capital Goods) | | | 74,250 | |
| | 12,387 | | | Diageo PLC (Food, Beverage & Tobacco) | | | 677,273 | |
| | 2,761 | | | GlaxoSmithKline PLC ADR (Pharmaceuticals, Biotechnology & Life Sciences) | | | 121,760 | |
| | 34,752 | | | Imperial Brands PLC (Food, Beverage & Tobacco) | | | 761,584 | |
| | 3,743 | | | Inchcape PLC (Retailing) | | | 46,078 | |
| | 5,658 | | | InterContinental Hotels Group PLC (Consumer Services)* | | | 365,785 | |
| | 6,155 | | | Legal & General Group PLC (Insurance) | | | 24,856 | |
| | 3,577 | | | London Stock Exchange Group PLC (Diversified Financials) | | | 336,489 | |
| | 58,078 | | | Man Group PLC (Diversified Financials) | | | 178,763 | |
| | 106,362 | | | Melrose Industries PLC (Capital Goods) | | | 231,315 | |
| | 5,841 | | | Next PLC (Retailing) | | | 646,033 | |
| | 4,815 | | | Persimmon PLC (Consumer Durables & Apparel) | | | 186,625 | |
| | 27,211 | | | Prudential PLC (Insurance) | | | 470,556 | |
| | 2,948 | | | Spectris PLC (Technology Hardware & Equipment) | | | 146,738 | |
| | 36,311 | | | SSE PLC (Utilities) | | | 811,740 | |
| | 2,402 | | | Tate & Lyle PLC (Food, Beverage & Tobacco) | | | 21,610 | |
| | 207,205 | | | Taylor Wimpey PLC (Consumer Durables & Apparel) | | | 494,004 | |
| | 39,115 | | | Vodafone Group PLC ADR (Telecommunication Services) | | | 583,987 | |
| | 16,623 | | | WPP PLC (Media & Entertainment) | | | 253,131 | |
| | | | | | | | |
| | | | | | | 9,255,714 | |
| | |
| United States – 2.7% | |
| | 2,200 | | | Ferguson PLC (Capital Goods) | | | 390,779 | |
| | 41,311 | | | Reliance Worldwide Corp. Ltd. (Capital Goods) | | | 188,767 | |
| | |
|
| Common Stocks – (continued) | |
| United States – (continued) | |
| | 7,528 | | | Schneider Electric SE (Capital Goods) | | | 1,479,973 | |
| | 46,582 | | | Stellantis NV (Automobiles & Components) | | | 879,403 | |
| | | | | | | | |
| | | | | | | 2,938,922 | |
| | |
| | TOTAL COMMON STOCKS | |
| | (Cost $95,700,636) | | $ | 104,516,316 | |
| | |
| | | | | | | | | | | | |
| Shares | | | Description | | Rate | | | Value | |
| |
| Preferred Stocks – 0.9% | | | | |
| Germany – 0.9% | | | | |
| | 2,004 | | | Bayerische Motoren Werke AG (Automobiles & Components) | | | 2.62% | | | $ | 166,185 | |
| | 4,176 | | | Volkswagen AG (Automobiles & Components) | | | 2.57 | | | | 838,889 | |
| | |
| | TOTAL PREFERRED STOCKS | | | | | |
| | (Cost $950,431) | | | | | | $ | 1,005,074 | |
| | |
| | TOTAL INVESTMENTS – 98.1% | | | | | |
| | (Cost $96,651,067) | | | | | | $ | 105,521,390 | |
| | |
| OTHER ASSETS IN EXCESS OF
LIABILITIES – 1.9% |
| | | 2,029,386 | |
| | |
| | NET ASSETS – 100.0% | | | $ | 107,550,776 | |
| | |
| | |
| The percentage shown for each investment category reflects the value of investments in that category as a percentage of net assets. |
| |
| * | | Non-income producing security. |
| |
| (a) | | Exempt from registration under Rule 144A of the Securities Act of 1933. |
| | |
| |
| Investment Abbreviations: |
| ADR | | — American Depositary Receipt |
| PLC | | — Public Limited Company |
| REIT | | — Real Estate Investment Trust |
| | |
| 62 | | The accompanying notes are an integral part of these financial statements. |
GOLDMAN SACHS VARIABLE INSURANCE TRUST INTERNATIONAL EQUITY INSIGHTS FUND
ADDITIONAL INVESTMENT INFORMATION
FUTURES CONTRACTS — At December 31, 2021, the Fund had the following futures contracts:
| | | | | | | | | | | | | | | | |
| Description | | Number of
Contracts | | | Expiration
Date | | | Notional
Amount | | | Unrealized
Appreciation/
(Depreciation) | |
| | | | |
Long position contracts: | | | | | | | | | | | | | | | | |
| FTSE 100 Index | | | 1 | | | | 03/18/22 | | | $ | 94,865 | | | $ | 1,919 | |
SPI 200 Index | | | 1 | | | | 03/17/22 | | | | 130,079 | | | | 869 | |
| | | |
| Total Futures Contracts | | | | | | | | | | | $ | 2,788 | |
| | |
| The accompanying notes are an integral part of these financial statements. | | 63 |
GOLDMAN SACHS VARIABLE INSURANCE TRUST LARGE CAP VALUE FUND
Schedule of Investments
December 31, 2021
| | | | | | | | |
| Shares | | | Description | | Value | |
|
| Common Stocks – 99.6% | |
| Automobiles & Components – 1.3% | |
| | 110,511 | | | General Motors Co.* | | $ | 6,479,260 | |
| | |
| Banks – 8.5% | |
| | 318,015 | | | Bank of America Corp. | | | 14,148,487 | |
| | 106,884 | | | JPMorgan Chase & Co. | | | 16,925,081 | |
| | 43,503 | | | M&T Bank Corp. | | | 6,681,191 | |
| | 59,934 | | | Truist Financial Corp. | | | 3,509,136 | |
| | | | | | | | |
| | | | | | | 41,263,895 | |
| | |
| Capital Goods – 5.4% | |
| | 30,895 | | | Eaton Corp. PLC | | | 5,339,274 | |
| | 82,979 | | | General Electric Co. | | | 7,839,026 | |
| | 8,894 | | | Honeywell International, Inc. | | | 1,854,488 | |
| | 19,630 | | | Illinois Tool Works, Inc. | | | 4,844,684 | |
| | 31,388 | | | L3Harris Technologies, Inc. | | | 6,693,177 | |
| | | | | | | | |
| | | | | | | 26,570,649 | |
| | |
| Commercial & Professional Services – 0.6% | |
| | 23,058 | | | Waste Connections, Inc. | | | 3,142,114 | |
| | |
| Consumer Services – 1.4% | |
| | 26,406 | | | McDonald’s Corp. | | | 7,078,656 | |
| | |
| Diversified Financials – 7.1% | |
| | 22,409 | | | American Express Co. | | | 3,666,113 | |
| | 17,466 | | | Berkshire Hathaway, Inc., Class B* | | | 5,222,334 | |
| | 9,756 | | | BlackRock, Inc. | | | 8,932,203 | |
| | 95,297 | | | Charles Schwab Corp. (The) | | | 8,014,478 | |
| | 88,820 | | | Morgan Stanley | | | 8,718,571 | |
| | | | | | | | |
| | | | | | | 34,553,699 | |
| | |
| Energy – 5.2% | |
| | 87,174 | | | Chevron Corp. | | | 10,229,869 | |
| | 97,435 | | | ConocoPhillips | | | 7,032,858 | |
| | 121,570 | | | Devon Energy Corp. | | | 5,355,158 | |
| | 35,619 | | | Hess Corp. | | | 2,636,875 | |
| | | | | | | | |
| | | | | | | 25,254,760 | |
| | |
| Food, Beverage & Tobacco – 5.5% | |
| | 36,869 | | | Archer-Daniels-Midland Co. | | | 2,491,976 | |
| | 90,924 | | | Coca-Cola Co. (The) | | | 5,383,610 | |
| | 20,908 | | | Constellation Brands, Inc., Class A | | | 5,247,281 | |
| | 63,275 | | | General Mills, Inc. | | | 4,263,469 | |
| | 38,847 | | | Lamb Weston Holdings, Inc. | | | 2,462,123 | |
| | 103,311 | | | Mondelez International, Inc., Class A | | | 6,850,552 | |
| | | | | | | | |
| | | | | | | 26,699,011 | |
| | |
| Health Care Equipment & Services – 6.8% | |
| | 149,735 | | | Boston Scientific Corp.* | | | 6,360,743 | |
| | 79,711 | | | CVS Health Corp. | | | 8,222,987 | |
| | 10,528 | | | Guardant Health, Inc.* | | | 1,053,010 | |
| | 13,534 | | | Humana, Inc. | | | 6,277,881 | |
| | 57,062 | | | Medtronic PLC | | | 5,903,064 | |
| | 42,272 | | | Zimmer Biomet Holdings, Inc. | | | 5,370,235 | |
| | | | | | | | |
| | | | | | | 33,187,920 | |
| | |
|
| Common Stocks – (continued) | |
| Household & Personal Products – 3.2% | |
| | 94,143 | | | Procter & Gamble Co. (The) | | | 15,399,912 | |
| | |
| Insurance – 4.5% | |
| | 35,162 | | | Chubb Ltd. | | | 6,797,166 | |
| | 38,822 | | | Globe Life, Inc. | | | 3,638,398 | |
| | 92,212 | | | MetLife, Inc. | | | 5,762,328 | |
| | 54,093 | | | Progressive Corp. (The) | | | 5,552,646 | |
| | | | | | | | |
| | | | | | | 21,750,538 | |
| | |
| Materials – 5.5% | |
| | 22,596 | | | Ashland Global Holdings, Inc. | | | 2,432,685 | |
| | 59,546 | | | Ball Corp. | | | 5,732,493 | |
| | 14,601 | | | Ecolab, Inc. | | | 3,425,249 | |
| | 76,113 | | | Freeport-McMoRan, Inc. | | | 3,176,195 | |
| | 14,918 | | | Linde PLC (United Kingdom) | | | 5,168,043 | |
| | 15,540 | | | Martin Marietta Materials, Inc. | | | 6,845,681 | |
| | | | | | | | |
| | | | | | | 26,780,346 | |
| | |
| Media & Entertainment – 3.1% | |
| | 2,514 | | | Alphabet, Inc., Class A* | | | 7,283,159 | |
| | 76,517 | | | New York Times Co. (The), Class A | | | 3,695,771 | |
| | 26,129 | | | Walt Disney Co. (The)* | | | 4,047,121 | |
| | | | | | | | |
| | | | | | | 15,026,051 | |
| | |
| Pharmaceuticals, Biotechnology & Life Sciences – 10.6% | |
| | 4,831 | | | Alnylam Pharmaceuticals, Inc.* | | | 819,241 | |
| | 3,225 | | | Argenx SE ADR (Netherlands)* | | | 1,129,363 | |
| | 69,647 | | | AstraZeneca PLC ADR (United Kingdom) | | | 4,056,938 | |
| | 63,905 | | | Avantor, Inc.* | | | 2,692,957 | |
| | 5,476 | | | Biogen, Inc.* | | | 1,313,802 | |
| | 134,105 | | | Bristol-Myers Squibb Co. | | | 8,361,447 | |
| | 18,884 | | | Eli Lilly & Co. | | | 5,216,138 | |
| | 74,424 | | | Johnson & Johnson | | | 12,731,714 | |
| | 14,503 | | | Neurocrine Biosciences, Inc.* | | | 1,235,220 | |
| | 28,172 | | | PerkinElmer, Inc. | | | 5,664,262 | |
| | 6,873 | | | Seagen, Inc.* | | | 1,062,566 | |
| | 11,083 | | | Thermo Fisher Scientific, Inc. | | | 7,395,021 | |
| | | | | | | | |
| | | | | | | 51,678,669 | |
| | |
| Real Estate – 4.6% | |
| | 21,026 | | | Alexandria Real Estate Equities, Inc. REIT | | | 4,687,957 | |
| | 19,432 | | | AvalonBay Communities, Inc. REIT | | | 4,908,329 | |
| | 29,939 | | | Boston Properties, Inc. REIT | | | 3,448,374 | |
| | 28,816 | | | Prologis, Inc. REIT | | | 4,851,462 | |
| | 11,584 | | | Public Storage REIT | | | 4,338,903 | |
| | | | | | | | |
| | | | | | | 22,235,025 | |
| | |
| Retailing – 2.8% | |
| | 11,357 | | | O’Reilly Automotive, Inc.* | | | 8,020,654 | |
| | 23,882 | | | Target Corp. | | | 5,527,250 | |
| | | | | | | | |
| | | | | | | 13,547,904 | |
| | |
| Semiconductors & Semiconductor Equipment – 4.0% | |
| | 9,904 | | | KLA Corp. | | | 4,259,809 | |
| | 70,051 | | | Marvell Technology, Inc. | | | 6,128,762 | |
| | |
| | |
| 64 | | The accompanying notes are an integral part of these financial statements. |
GOLDMAN SACHS VARIABLE INSURANCE TRUST LARGE CAP VALUE FUND
| | | | | | | | |
| Shares | | | Description | | Value | |
|
| Common Stocks – (continued) | |
| Semiconductors & Semiconductor Equipment – (continued) | |
| | 36,330 | | | ON Semiconductor Corp.* | | $ | 2,467,534 | |
| | 22,825 | | | Texas Instruments, Inc. | | | 4,301,828 | |
| | 21,591 | | | Wolfspeed, Inc.* | | | 2,413,226 | |
| | | | | | | | |
| | | | | | | 19,571,159 | |
| | |
| Software & Services – 6.3% | |
| | 63,369 | | | Cognizant Technology Solutions Corp., Class A | | | 5,622,098 | |
| | 34,949 | | | Fidelity National Information Services, Inc. | | | 3,814,683 | |
| | 60,660 | | | International Business Machines Corp. | | | 8,107,816 | |
| | 37,933 | | | salesforce.com, Inc.* | | | 9,639,913 | |
| | 32,507 | | | Splunk, Inc.* | | | 3,761,710 | |
| | | | | | | | |
| | | | | | | 30,946,220 | |
| | |
| Technology Hardware & Equipment – 2.2% | |
| | 167,606 | | | Cisco Systems, Inc. | | | 10,621,192 | |
| | |
| Telecommunication Services – 1.9% | |
| | 370,000 | | | AT&T, Inc. | | | 9,102,000 | |
| | |
| Transportation – 4.0% | |
| | 20,119 | | | Norfolk Southern Corp. | | | 5,989,628 | |
| | 33,277 | | | Union Pacific Corp. | | | 8,383,475 | |
| | 122,330 | | | United Airlines Holdings, Inc.* | | | 5,355,607 | |
| | | | | | | | |
| | | | | | | 19,728,710 | |
| | |
| Utilities – 5.1% | |
| | 47,542 | | | Ameren Corp. | | | 4,231,714 | |
| | 24,273 | | | Atmos Energy Corp. | | | 2,543,082 | |
| | 55,418 | | | CMS Energy Corp. | | | 3,604,941 | |
| | 103,807 | | | NextEra Energy, Inc. | | | 9,691,422 | |
| | 68,662 | | | Xcel Energy, Inc. | | | 4,648,417 | |
| | | | | | | | |
| | | | | | | 24,719,576 | |
| | |
| | TOTAL COMMON STOCKS | |
| | (Cost $362,219,381) | | $ | 485,337,266 | |
| | |
| | | | | | | | |
| Shares | | | Dividend
Rate | | Value | |
|
| Investment Company – 0.6%(a) | |
| Goldman Sachs Financial Square Government Fund —
Institutional Shares |
|
| | 2,751,464 | | | 0.026% | | | 2,751,464 | |
| | (Cost $2,751,464) | |
| | |
| | TOTAL INVESTMENTS – 100.2% | |
| | (Cost $364,970,845) | | $ | 488,088,730 | |
| | |
| LIABILITIES IN EXCESS OF
OTHER ASSETS – (0.2)% | | | (826,654 | ) |
| | |
| | NET ASSETS – 100.0% | | $ | 487,262,076 | |
| | |
| | |
| The percentage shown for each investment category reflects the value of investments in that category as a percentage of net assets. |
| |
| * | | Non-income producing security. |
| |
| (a) | | Represents an affiliated issuer. |
| | |
| |
| Investment Abbreviations: |
| ADR | | —American Depositary Receipt |
| PLC | | —Public Limited Company |
| REIT | | —Real Estate Investment Trust |
| | |
| The accompanying notes are an integral part of these financial statements. | | 65 |
GOLDMAN SACHS VARIABLE INSURANCE TRUST MID CAP VALUE FUND
Schedule of Investments
December 31, 2021
| | | | | | | | |
Shares | | | Description | | Value | |
|
| Common Stocks – 99.2% | |
| Automobiles & Components – 1.4% | |
| | 48,085 | | | Aptiv PLC* | | $ | 7,931,621 | |
| | |
| Banks – 6.7% | |
| | 111,413 | | | Citizens Financial Group, Inc. | | | 5,264,264 | |
| | 115,648 | | | East West Bancorp, Inc. | | | 9,099,185 | |
| | 60,005 | | | M&T Bank Corp. | | | 9,215,568 | |
| | 62,095 | | | Pinnacle Financial Partners, Inc. | | | 5,930,073 | |
| | 12,686 | | | Signature Bank | | | 4,103,540 | |
| | 4,853 | | | SVB Financial Group* | | | 3,291,499 | |
| | | | | | | | |
| | | | | | | 36,904,129 | |
| | |
| Capital Goods – 13.7% | |
| | 37,030 | | | Allegion PLC | | | 4,904,253 | |
| | 61,002 | | | AMETEK, Inc. | | | 8,969,734 | |
| | 40,128 | | | Cummins, Inc. | | | 8,753,522 | |
| | 103,868 | | | Fastenal Co. | | | 6,653,784 | |
| | 94,830 | | | Fortive Corp. | | | 7,234,581 | |
| | 17,189 | | | IDEX Corp. | | | 4,062,104 | |
| | 59,667 | | | ITT, Inc. | | | 6,097,371 | |
| | 30,991 | | | L3Harris Technologies, Inc. | | | 6,608,521 | |
| | 16,295 | | | Rockwell Automation, Inc. | | | 5,684,511 | |
| | 26,952 | | | Trane Technologies PLC | | | 5,445,112 | |
| | 10,596 | | | TransDigm Group, Inc.* | | | 6,742,023 | |
| | 41,387 | | | Woodward, Inc. | | | 4,530,221 | |
| | | | | | | | |
| | | | | | | 75,685,737 | |
| | |
| Commercial & Professional Services – 0.6% | |
| | 42,121 | | | Booz Allen Hamilton Holding Corp. | | | 3,571,440 | |
| | |
| Consumer Durables & Apparel – 1.4% | |
| | 60,995 | | | Capri Holdings Ltd.* | | | 3,959,185 | |
| | 31,136 | | | Lennar Corp., Class A | | | 3,616,758 | |
| | | | | | | | |
| | | | | | | 7,575,943 | |
| | |
| Consumer Services – 3.4% | |
| | 38,203 | | | Expedia Group, Inc.* | | | 6,904,046 | |
| | 68,881 | | | Royal Caribbean Cruises Ltd.* | | | 5,296,949 | |
| | 33,007 | | | Wyndham Hotels & Resorts, Inc. | | | 2,959,078 | |
| | 27,278 | | | Yum! Brands, Inc. | | | 3,787,823 | |
| | | | | | | | |
| | | | | | | 18,947,896 | |
| | |
| Diversified Financials – 2.5% | |
| | 78,551 | | | Carlyle Group, Inc. (The) | | | 4,312,450 | |
| | 50,168 | | | Raymond James Financial, Inc. | | | 5,036,867 | |
| | 47,011 | | | State Street Corp. | | | 4,372,023 | |
| | | | | | | | |
| | | | | | | 13,721,340 | |
| | |
| Energy – 4.4% | |
| | 164,714 | | | Devon Energy Corp. | | | 7,255,652 | |
| | 37,725 | | | Diamondback Energy, Inc. | | | 4,068,641 | |
| | 100,815 | | | Hess Corp. | | | 7,463,334 | |
| | 28,950 | | | Pioneer Natural Resources Co. | | | 5,265,426 | |
| | | | | | | | |
| | | | | | | 24,053,053 | |
| | |
| Food & Staples Retailing – 0.7% | |
| | 83,670 | | | Performance Food Group Co.* | | | 3,839,616 | |
| | |
|
| Common Stocks – (continued) | |
| Food, Beverage & Tobacco – 3.8% | |
| | 95,068 | | | Coca-Cola Europacific Partners PLC (United Kingdom) | | | 5,317,153 | |
| | 15,920 | | | Constellation Brands, Inc., Class A | | | 3,995,442 | |
| | 48,383 | | | Lamb Weston Holdings, Inc. | | | 3,066,515 | |
| | 30,895 | | | McCormick & Co., Inc. | | | 2,984,766 | |
| | 215,274 | | | Nomad Foods Ltd. (United Kingdom)* | | | 5,465,807 | |
| | | | | | | | |
| | | | | | | 20,829,683 | |
| | |
| Health Care Equipment & Services – 5.1% | |
| | 55,995 | | | AmerisourceBergen Corp. | | | 7,441,176 | |
| | 70,825 | | | Centene Corp.* | | | 5,835,980 | |
| | 11,330 | | | Cooper Cos., Inc. (The) | | | 4,746,590 | |
| | 23,877 | | | Guardant Health, Inc.* | | | 2,388,177 | |
| | 20,194 | | | Quest Diagnostics, Inc. | | | 3,493,764 | |
| | 34,092 | | | Zimmer Biomet Holdings, Inc. | | | 4,331,048 | |
| | | | | | | | |
| | | | | | | 28,236,735 | |
| | |
| Insurance – 6.5% | |
| | 3,765 | | | Alleghany Corp.* | | | 2,513,476 | |
| | 20,615 | | | American Financial Group, Inc. | | | 2,830,852 | |
| | 141,952 | | | Arch Capital Group Ltd.* | | | 6,309,766 | |
| | 28,320 | | | Arthur J Gallagher & Co. | | | 4,805,054 | |
| | 47,599 | | | Athene Holding Ltd., Class A* | | | 3,966,425 | |
| | 56,291 | | | Globe Life, Inc. | | | 5,275,593 | |
| | 2,196 | | | Markel Corp.* | | | 2,709,864 | |
| | 68,489 | | | Principal Financial Group, Inc. | | | 4,953,809 | |
| | 66,688 | | | Ryan Specialty Group Holdings, Inc., Class A* | | | 2,690,861 | |
| | | | | | | | |
| | | | | | | 36,055,700 | |
| | |
| Materials – 6.8% | |
| | 86,031 | | | Ashland Global Holdings, Inc. | | | 9,262,097 | |
| | 103,747 | | | Ball Corp. | | | 9,987,724 | |
| | 127,886 | | | Freeport-McMoRan, Inc. | | | 5,336,683 | |
| | 16,676 | | | Martin Marietta Materials, Inc. | | | 7,346,111 | |
| | 31,652 | | | PPG Industries, Inc. | | | 5,458,071 | |
| | | | | | | | |
| | | | | | | 37,390,686 | |
| | |
| Media & Entertainment – 3.3% | |
| | 258,673 | | | Discovery, Inc., Class C* | | | 5,923,612 | |
| | 69,222 | | | Live Nation Entertainment, Inc.* | | | 8,285,181 | |
| | 91,867 | | | Twitter, Inc.* | | | 3,970,492 | |
| | | | | | | | |
| | | | | | | 18,179,285 | |
| | |
| Pharmaceuticals, Biotechnology & Life Sciences – 3.2% | |
| | 10,675 | | | Alnylam Pharmaceuticals, Inc.* | | | 1,810,267 | |
| | 5,015 | | | Argenx SE ADR (Netherlands)* | | | 1,756,203 | |
| | 50,366 | | | Catalent, Inc.* | | | 6,448,359 | |
| | 21,599 | | | Neurocrine Biosciences, Inc.* | | | 1,839,587 | |
| | 28,222 | | | PerkinElmer, Inc. | | | 5,674,315 | |
| | | | | | | | |
| | | | | | | 17,528,731 | |
| | |
| Real Estate – 10.5% | |
| | 31,122 | | | Alexandria Real Estate Equities, Inc. REIT | | | 6,938,961 | |
| | |
| | |
| 66 | | The accompanying notes are an integral part of these financial statements. |
GOLDMAN SACHS VARIABLE INSURANCE TRUST MID CAP VALUE FUND
| | | | | | | | |
Shares | | | Description | | Value | |
|
| Common Stocks – (continued) | |
| Real Estate – (continued) | |
| | 108,220 | | | Americold Realty Trust REIT | | $ | 3,548,534 | |
| | 22,505 | | | AvalonBay Communities, Inc. REIT | | | 5,684,538 | |
| | 24,079 | | | Camden Property Trust REIT | | | 4,302,436 | |
| | 51,393 | | | CubeSmart REIT | | | 2,924,776 | |
| | 78,936 | | | Duke Realty Corp. REIT | | | 5,181,359 | |
| | 49,622 | | | Equity LifeStyle Properties, Inc. REIT | | | 4,349,864 | |
| | 11,258 | | | Essex Property Trust, Inc. REIT | | | 3,965,405 | |
| | 90,397 | | | Healthpeak Properties, Inc. REIT | | | 3,262,428 | |
| | 69,168 | | | Highwoods Properties, Inc. REIT | | | 3,084,201 | |
| | 96,945 | | | Invitation Homes, Inc. REIT | | | 4,395,486 | |
| | 41,897 | | | Ryman Hospitality Properties, Inc. REIT* | | | 3,852,848 | |
| | 123,142 | | | VICI Properties, Inc. REIT | | | 3,707,806 | |
| | 30,990 | | | Welltower, Inc. REIT | | | 2,658,012 | |
| | | | | | | | |
| | | | | | | 57,856,654 | |
| | |
| Retailing – 3.1% | |
| | 38,330 | | | Advance Auto Parts, Inc. | | | 9,194,600 | |
| | 32,019 | | | Bath & Body Works, Inc. | | | 2,234,606 | |
| | 11,502 | | | Burlington Stores, Inc.* | | | 3,352,948 | |
| | 4,902 | | | RH* | | | 2,627,178 | |
| | | | | | | | |
| | | | | | | 17,409,332 | |
| | |
| Semiconductors & Semiconductor Equipment – 4.3% | |
| | 106,464 | | | Marvell Technology, Inc. | | | 9,314,535 | |
| | 33,073 | | | MKS Instruments, Inc. | | | 5,760,325 | |
| | 131,836 | | | ON Semiconductor Corp.* | | | 8,954,301 | |
| | | | | | | | |
| | | | | | | 24,029,161 | |
| | |
| Software & Services – 1.2% | |
| | 20,758 | | | Cadence Design Systems, Inc.* | | | 3,868,254 | |
| | 23,399 | | | Splunk, Inc.* | | | 2,707,732 | |
| | | | | | | | |
| | | | | | | 6,575,986 | |
| | |
| Technology Hardware & Equipment – 4.5% | |
| | 34,095 | | | Keysight Technologies, Inc.* | | | 7,040,958 | |
| | 35,757 | | | Motorola Solutions, Inc. | | | 9,715,177 | |
| | 290,695 | | | Viavi Solutions, Inc.* | | | 5,122,046 | |
| | 89,460 | | | Vontier Corp. | | | 2,749,106 | |
| | | | | | | | |
| | | | | | | 24,627,287 | |
| | |
| Transportation – 3.4% | |
| | 226,658 | | | JetBlue Airways Corp.* | | | 3,227,610 | |
| | 9,074 | | | Old Dominion Freight Line, Inc. | | | 3,251,940 | |
| | 6,597 | | | Saia, Inc.* | | | 2,223,387 | |
| | 227,440 | | | United Airlines Holdings, Inc.* | | | 9,957,323 | |
| | | | | | | | |
| | | | | | | 18,660,260 | |
| | |
| Utilities – 8.7% | |
| | 312,415 | | | AES Corp. (The) | | | 7,591,684 | |
| | 83,530 | | | Ameren Corp. | | | 7,435,005 | |
| | 21,844 | | | American Water Works Co., Inc. | | | 4,125,458 | |
| | 39,788 | | | Atmos Energy Corp. | | | 4,168,589 | |
| | 100,350 | | | CMS Energy Corp. | | | 6,527,767 | |
| | |
|
| Common Stocks – (continued) | |
| Utilities – (continued) | |
| | 84,182 | | | Public Service Enterprise Group, Inc. | | | 5,617,465 | |
| | 48,628 | | | WEC Energy Group, Inc. | | | 4,720,320 | |
| | 120,815 | | | Xcel Energy, Inc. | | | 8,179,176 | |
| | | | | | | | |
| | | | | | | 48,365,464 | |
| | |
| | TOTAL COMMON STOCKS | |
| | (Cost $392,122,511) | | $ | 547,975,739 | |
| | |
| | | | | | | | |
| Shares | | | Dividend
Rate | | Value | |
|
| Investment Company – 0.9%(a) | |
| Goldman Sachs Financial Square Government Fund —
Institutional Shares |
|
| | 4,761,405 | | | 0.026% | | $ | 4,761,405 | |
| | (Cost $4,761,405) | |
| | |
| | TOTAL INVESTMENTS – 100.1% | |
| | (Cost $396,883,916) | | $ | 552,737,144 | |
| | |
| LIABILITIES IN EXCESS OF
OTHER ASSETS – (0.1)% | | | (139,521 | ) |
| | |
| | NET ASSETS – 100.0% | | $ | 552,597,623 | |
| | |
| | |
| The percentage shown for each investment category reflects the value of investments in that category as a percentage of net assets. |
| |
| * | | Non-income producing security. |
| |
| (a) | | Represents an affiliated issuer. |
| | |
| |
| Investment Abbreviations: |
| ADR | | —American Depositary Receipt |
| PLC | | —Public Limited Company |
| REIT | | —Real Estate Investment Trust |
| | |
| The accompanying notes are an integral part of these financial statements. | | 67 |
GOLDMAN SACHS VARIABLE INSURANCE TRUST SMALL CAP EQUITY INSIGHTS FUND
Schedule of Investments
December 31, 2021
| | | | | | | | |
Shares | | | Description | | Value | |
|
| Common Stocks – 98.6% | |
| Automobiles & Components – 0.3% | |
| | 4,849 | | | Patrick Industries, Inc. | | $ | 391,266 | |
| | |
| Banks – 10.1% | |
| | 3,259 | | | 1st Source Corp. | | | 161,646 | |
| | 2,767 | | | American National Bankshares, Inc. | | | 104,261 | |
| | 1,008 | | | Ameris Bancorp | | | 50,077 | |
| | 14,499 | | | Atlantic Union Bankshares Corp. | | | 540,668 | |
| | 14,504 | | | Bancorp, Inc. (The)* | | | 367,096 | |
| | 2,342 | | | Berkshire Hills Bancorp, Inc. | | | 66,583 | |
| | 1,425 | | | Bridgewater Bancshares, Inc.* | | | 25,208 | |
| | 2,064 | | | Business First Bancshares, Inc. | | | 58,432 | |
| | 5,469 | | | Byline Bancorp, Inc. | | | 149,577 | |
| | 1,983 | | | Cambridge Bancorp | | | 185,589 | |
| | 1,747 | | | Capital Bancorp, Inc. | | | 45,771 | |
| | 656 | | | Capital City Bank Group, Inc. | | | 17,318 | |
| | 9,708 | | | Central Pacific Financial Corp. | | | 273,474 | |
| | 5,973 | | | Columbia Banking System, Inc. | | | 195,437 | |
| | 1,112 | | | Community Bank System, Inc. | | | 82,822 | |
| | 1,459 | | | Community Trust Bancorp, Inc. | | | 63,627 | |
| | 32,206 | | | CVB Financial Corp. | | | 689,530 | |
| | 4,295 | | | Dime Community Bancshares, Inc. | | | 151,012 | |
| | 8,923 | | | FB Financial Corp. | | | 391,006 | |
| | 258 | | | Financial Institutions, Inc. | | | 8,204 | |
| | 59,574 | | | First BanCorp. (Puerto Rico) | | | 820,930 | |
| | 2,359 | | | First Bancorp, Inc. (The) | | | 74,073 | |
| | 5,443 | | | First Bank | | | 78,978 | |
| | 18,288 | | | First Commonwealth Financial Corp. | | | 294,254 | |
| | 9,435 | | | First Financial Bancorp | | | 230,025 | |
| | 5,745 | | | First Internet Bancorp | | | 270,245 | |
| | 6,787 | | | Fulton Financial Corp. | | | 115,379 | |
| | 8,614 | | | Guaranty Bancshares, Inc. | | | 323,714 | |
| | 1,684 | | | Hancock Whitney Corp. | | | 84,234 | |
| | 16,408 | | | Hanmi Financial��Corp. | | | 388,541 | |
| | 3,726 | | | HarborOne Bancorp, Inc. | | | 55,294 | |
| | 5,587 | | | Heritage Financial Corp. | | | 136,546 | |
| | 7,203 | | | Home Bancorp, Inc. | | | 298,997 | |
| | 7,939 | | | Home BancShares, Inc. | | | 193,315 | |
| | 6,731 | | | HomeStreet, Inc. | | | 350,012 | |
| | 1,181 | | | HomeTrust Bancshares, Inc. | | | 36,587 | |
| | 21,708 | | | Hope Bancorp, Inc. | | | 319,325 | |
| | 16,916 | | | International Bancshares Corp. | | | 717,069 | |
| | 12,139 | | | Macatawa Bank Corp. | | | 107,066 | |
| | 10,151 | | | Merchants Bancorp | | | 480,447 | |
| | 2,505 | | | MidWestOne Financial Group, Inc. | | | 81,087 | |
| | 1,310 | | | Northrim BanCorp, Inc. | | | 56,933 | |
| | 8,766 | | | OFG Bancorp (Puerto Rico) | | | 232,825 | |
| | 12,660 | | | Origin Bancorp, Inc. | | | 543,367 | |
| | 2,598 | | | Peoples Financial Services Corp. | | | 136,889 | |
| | 974 | | | QCR Holdings, Inc. | | | 54,544 | |
| | 4,598 | | | Republic First Bancorp, Inc.* | | | 17,105 | |
| | 2,574 | | | Sierra Bancorp | | | 69,884 | |
| | 730 | | | Silvergate Capital Corp., Class A* | | | 108,186 | |
| | 5,588 | | | South Plains Financial, Inc. | | | 155,402 | |
| | 1,781 | | | Southern First Bancshares, Inc.* | | | 111,295 | |
| | |
|
| Common Stocks – (continued) | |
| Banks – (continued) | |
| | 23,738 | | | Towne Bank | | | 749,883 | |
| | 1,389 | | | TrustCo Bank Corp. | | | 46,268 | |
| | 21,902 | | | Trustmark Corp. | | | 710,939 | |
| | 20,764 | | | United Bankshares, Inc. | | | 753,318 | |
| | 4,265 | | | United Community Banks, Inc. | | | 153,284 | |
| | 1,555 | | | Univest Financial Corp. | | | 46,526 | |
| | 1,107 | | | Walker & Dunlop, Inc. | | | 167,024 | |
| | | | | | | | |
| | | | | | | 13,197,128 | |
| | |
| Capital Goods – 8.1% | |
| | 1,167 | | | AAR Corp.* | | | 45,548 | |
| | 503 | | | Albany International Corp., Class A | | | 44,490 | |
| | 5,020 | | | Argan, Inc. | | | 194,224 | |
| | 9,578 | | | Atkore, Inc.* | | | 1,064,978 | |
| | 9,228 | | | Bloom Energy Corp., Class A* | | | 202,370 | |
| | 4,227 | | | Boise Cascade Co. | | | 300,962 | |
| | 637 | | | CIRCOR International, Inc.* | | | 17,314 | |
| | 1,914 | | | Douglas Dynamics, Inc. | | | 74,761 | |
| | 1,910 | | | Dycom Industries, Inc.* | | | 179,082 | |
| | 4,446 | | | Encore Wire Corp. | | | 636,223 | |
| | 246 | | | EnerSys | | | 19,449 | |
| | 3,520 | | | Evoqua Water Technologies Corp.* | | | 164,560 | |
| | 2,453 | | | Franklin Electric Co., Inc. | | | 231,956 | |
| | 1,248 | | | GMS, Inc.* | | | 75,017 | |
| | 24,471 | | | GrafTech International Ltd. | | | 289,492 | |
| | 8,867 | | | H&E Equipment Services, Inc. | | | 392,542 | |
| | 2,644 | | | Herc Holdings, Inc. | | | 413,918 | |
| | 1,292 | | | Hydrofarm Holdings Group, Inc.* | | | 36,551 | |
| | 1,555 | | | Insteel Industries, Inc. | | | 61,905 | |
| | 2,341 | | | JELD-WEN Holding, Inc.* | | | 61,709 | |
| | 20,485 | | | Kennametal, Inc. | | | 735,616 | |
| | 5,524 | | | Maxar Technologies, Inc. | | | 163,124 | |
| | 8,232 | | | McGrath RentCorp | | | 660,700 | |
| | 632 | | | Miller Industries, Inc. | | | 21,109 | |
| | 52,652 | | | MRC Global, Inc.* | | | 362,246 | |
| | 7,613 | | | Mueller Industries, Inc. | | | 451,908 | |
| | 772 | | | National Presto Industries, Inc. | | | 63,327 | |
| | 3,296 | | | Nikola Corp.*(a) | | | 32,531 | |
| | 19,138 | | | NOW, Inc.* | | | 163,438 | |
| | 9,945 | | | Primoris Services Corp. | | | 238,481 | |
| | 15,293 | | | Quanex Building Products Corp. | | | 378,961 | |
| | 1,683 | | | Stem, Inc.* | | | 31,926 | |
| | 10,162 | | | Sterling Construction Co., Inc.* | | | 267,261 | |
| | 15,455 | | | Terex Corp. | | | 679,247 | |
| | 9,821 | | | Thermon Group Holdings, Inc.* | | | 166,270 | |
| | 17,574 | | | Titan International, Inc.* | | | 192,611 | |
| | 17,979 | | | Titan Machinery, Inc.* | | | 605,712 | |
| | 4,924 | | | Triton International Ltd. (Bermuda) | | | 296,572 | |
| | 1,919 | | | UFP Industries, Inc. | | | 176,567 | |
| | 7,447 | | | Vectrus, Inc.* | | | 340,849 | |
| | | | | | | | |
| | | | | | | 10,535,507 | |
| | |
| Commercial & Professional Services – 3.0% | |
| | 1,118 | | | ASGN, Inc.* | | | 137,961 | |
| | 3,909 | | | Barrett Business Services, Inc. | | | 269,956 | |
| | |
| | |
| 68 | | The accompanying notes are an integral part of these financial statements. |
GOLDMAN SACHS VARIABLE INSURANCE TRUST SMALL CAP EQUITY INSIGHTS FUND
| | | | | | | | |
Shares | | | Description | | Value | |
|
| Common Stocks – (continued) | |
| Commercial & Professional Services – (continued) | |
| | 4,884 | | | BrightView Holdings, Inc.* | | $ | 68,767 | |
| | 786 | | | Brink’s Co. (The) | | | 51,538 | |
| | 361 | | | Casella Waste Systems, Inc., Class A* | | | 30,837 | |
| | 2,530 | | | CBIZ, Inc.* | | | 98,974 | |
| | 1,311 | | | Cimpress PLC (Ireland)* | | | 93,881 | |
| | 373 | | | CRA International, Inc. | | | 34,823 | |
| | 16,635 | | | Ennis, Inc. | | | 324,882 | |
| | 2,369 | | | Exponent, Inc. | | | 276,533 | |
| | 4,813 | | | Forrester Research, Inc.* | | | 282,667 | |
| | 655 | | | Franklin Covey Co.* | | | 30,366 | |
| | 12,395 | | | Heidrick & Struggles International, Inc. | | | 542,033 | |
| | 8,395 | | | Heritage-Crystal Clean, Inc.* | | | 268,808 | |
| | 11,827 | | | Korn Ferry | | | 895,659 | |
| | 483 | | | ManTech International Corp., Class A | | | 35,225 | |
| | 5,984 | | | Matthews International Corp., Class A | | | 219,433 | |
| | 105 | | | TriNet Group, Inc.* | | | 10,002 | |
| | 8,281 | | | US Ecology, Inc.* | | | 264,495 | |
| | | | | | | | |
| | | | | | | 3,936,840 | |
| | |
| Consumer Durables & Apparel – 5.0% | |
| | 9,839 | | | Acushnet Holdings Corp. | | | 522,254 | |
| | 3,814 | | | Beazer Homes USA, Inc.* | | | 88,561 | |
| | 1,135 | | | Century Communities, Inc. | | | 92,832 | |
| | 5,857 | | | Crocs, Inc.* | | | 750,984 | |
| | 1,976 | | | G-III Apparel Group Ltd.* | | | 54,617 | |
| | 2,412 | | | Installed Building Products, Inc. | | | 337,005 | |
| | 294 | | | iRobot Corp.* | | | 19,369 | |
| | 17,059 | | | KB Home | | | 763,049 | |
| | 9,247 | | | Latham Group, Inc.* | | | 231,452 | |
| | 5,081 | | | LGI Homes, Inc.* | | | 784,913 | |
| | 7,471 | | | M/I Homes, Inc.* | | | 464,547 | |
| | 4,643 | | | Meritage Homes Corp.* | | | 566,724 | |
| | 543 | | | Movado Group, Inc. | | | 22,714 | |
| | 1,442 | | | Oxford Industries, Inc. | | | 146,392 | |
| | 15,568 | | | Steven Madden Ltd. | | | 723,445 | |
| | 31,118 | | | Tri Pointe Homes, Inc.* | | | 867,881 | |
| | 1,589 | | | Vista Outdoor, Inc.* | | | 73,205 | |
| | | | | | | | |
| | | | | | | 6,509,944 | |
| | |
| Consumer Services – 3.4% | |
| | 134 | | | Biglari Holdings, Inc., Class B* | | | 19,104 | |
| | 21,633 | | | Bloomin’ Brands, Inc.* | | | 453,860 | |
| | 4,918 | | | Dave & Buster’s Entertainment, Inc.* | | | 188,851 | |
| | 533 | | | Dine Brands Global, Inc. | | | 40,407 | |
| | 18,664 | | | Drive Shack, Inc.* | | | 26,690 | |
| | 3,288 | | | Everi Holdings, Inc.* | | | 70,199 | |
| | 3,108 | | | International Game Technology PLC | | | 89,852 | |
| | 4,431 | | | Monarch Casino & Resort, Inc.* | | | 327,673 | |
| | 1,807 | | | Nathan’s Famous, Inc. | | | 105,511 | |
| | |
|
| Common Stocks – (continued) | |
| Consumer Services – (continued) | |
| | 3,817 | | | PlayAGS, Inc.* | | | 25,918 | |
| | 245 | | | RCI Hospitality Holdings, Inc. | | | 19,081 | |
| | 15,717 | | | Red Rock Resorts, Inc., Class A | | | 864,592 | |
| | 18,198 | | | Ruth’s Hospitality Group, Inc.* | | | 362,140 | |
| | 13,164 | | | SeaWorld Entertainment, Inc.* | | | 853,817 | |
| | 764 | | | Shake Shack, Inc., Class A* | | | 55,130 | |
| | 10,855 | | | Texas Roadhouse, Inc. | | | 969,134 | |
| | | | | | | | |
| | | | | | | 4,471,959 | |
| | |
| Diversified Financials – 4.2% | |
| | 963 | | | Associated Capital Group, Inc., Class A | | | 41,409 | |
| | 2,253 | | | Brightsphere Investment Group, Inc. | | | 57,677 | |
| | 24,257 | | | Dynex Capital, Inc. REIT | | | 405,334 | |
| | 5,892 | | | FirstCash Holdings, Inc. | | | 440,781 | |
| | 3,857 | | | Focus Financial Partners, Inc., Class A* | | | 230,340 | |
| | 12,277 | | | Great Ajax Corp. REIT | | | 161,565 | |
| | 1,736 | | | Houlihan Lokey, Inc. | | | 179,711 | |
| | 42,962 | | | Ladder Capital Corp. REIT | | | 515,114 | |
| | 3,732 | | | LendingClub Corp.* | | | 90,240 | |
| | 116,862 | | | MFA Financial, Inc. REIT | | | 532,891 | |
| | 12,661 | | | Moelis & Co., Class A | | | 791,439 | |
| | 990 | | | Oportun Financial Corp.* | | | 20,048 | |
| | 13,163 | | | Oppenheimer Holdings, Inc., Class A | | | 610,368 | |
| | 10,290 | | | Pzena Investment Management, Inc., Class A | | | 97,446 | |
| | 5,338 | | | Regional Management Corp. | | | 306,721 | |
| | 14,863 | | | TPG RE Finance Trust, Inc. REIT | | | 183,112 | |
| | 2,719 | | | Virtus Investment Partners, Inc. | | | 807,815 | |
| | | | | | | | |
| | | | | | | 5,472,011 | |
| | |
| Energy – 4.0% | |
| | 26,512 | | | Antero Resources Corp.* | | | 463,960 | |
| | 25,342 | | | Centennial Resource Development, Inc., Class A * | | | 151,545 | |
| | 5,958 | | | ChampionX Corp.* | | | 120,411 | |
| | 2,905 | | | DMC Global, Inc.* | | | 115,067 | |
| | 7,882 | | | Earthstone Energy, Inc., Class A* | | | 86,229 | |
| | 29,189 | | | Kosmos Energy Ltd. (Ghana)* | | | 100,994 | |
| | 340 | | | Laredo Petroleum, Inc.* | | | 20,444 | |
| | 16,241 | | | Magnolia Oil & Gas Corp., Class A | | | 306,468 | |
| | 19,287 | | | Matador Resources Co. | | | 712,076 | |
| | 2,702 | | | Murphy Oil Corp. | | | 70,549 | |
| | 372 | | | Nabors Industries Ltd.* | | | 30,166 | |
| | 2,230 | | | Oceaneering International, Inc.* | | | 25,221 | |
| | 10,410 | | | Oil States International, Inc.* | | | 51,738 | |
| | 28,877 | | | Ovintiv, Inc. | | | 973,155 | |
| | 4,327 | | | PDC Energy, Inc. | | | 211,071 | |
| | 16,671 | | | ProPetro Holding Corp.* | | | 135,035 | |
| | 44,802 | | | Range Resources Corp.* | | | 798,820 | |
| | 1,329 | | | REX American Resources Corp.* | | | 127,584 | |
| | 13,225 | | | SM Energy Co. | | | 389,873 | |
| | 9,241 | | | US Silica Holdings, Inc.* | | | 86,866 | |
| | |
| | |
| The accompanying notes are an integral part of these financial statements. | | 69 |
GOLDMAN SACHS VARIABLE INSURANCE TRUST SMALL CAP EQUITY INSIGHTS FUND
Schedule of Investments (continued)
December 31, 2021
| | | | | | | | |
Shares | | | Description | | Value | |
|
| Common Stocks – (continued) | |
| Energy – (continued) | |
| | 86,193 | | | W&T Offshore, Inc.* | | $ | 278,403 | |
| | | | | | | | |
| | | | | | | 5,255,675 | |
| | |
| Food & Staples Retailing – 0.7% | |
| | 726 | | | Chefs’ Warehouse, Inc. (The)* | | | 24,176 | |
| | 9,747 | | | Ingles Markets, Inc., Class A | | | 841,556 | |
| | | | | | | | |
| | | | | | | 865,732 | |
| | |
| Food, Beverage & Tobacco – 0.7% | |
| | 579 | | | B&G Foods, Inc. | | | 17,793 | |
| | 1,172 | | | Celsius Holdings, Inc.* | | | 87,396 | |
| | 506 | | | Coca-Cola Consolidated, Inc. | | | 313,310 | |
| | 2,695 | | | Sanderson Farms, Inc. | | | 514,960 | |
| | | | | | | | |
| | | | | | | 933,459 | |
| | |
| Health Care Equipment & Services – 8.6% | |
| | 1,073 | | | 1Life Healthcare, Inc.* | | | 18,853 | |
| | 488 | | | Accolade, Inc.* | | | 12,864 | |
| | 3,924 | | | AMN Healthcare Services, Inc.* | | | 480,023 | |
| | 8,195 | | | AngioDynamics, Inc.* | | | 226,018 | |
| | 448 | | | Apollo Medical Holdings, Inc.* | | | 32,919 | |
| | 979 | | | Apria, Inc.* | | | 31,915 | |
| | 7,410 | | | Avanos Medical, Inc.* | | | 256,905 | |
| | 7,440 | | | Aveanna Healthcare Holdings, Inc.* | | | 55,056 | |
| | 70,811 | | | Brookdale Senior Living, Inc.* | | | 365,385 | |
| | 31,109 | | | Castlight Health, Inc., Class B* | | | 47,908 | |
| | 26,611 | | | Community Health Systems, Inc.* | | | 354,192 | |
| | 7,640 | | | Computer Programs and Systems, Inc.* | | | 223,852 | |
| | 3,991 | | | Convey Health Solutions Holdings, Inc.* | | | 33,365 | |
| | 23,281 | | | Covetrus, Inc.* | | | 464,922 | |
| | 3,851 | | | Cross Country Healthcare, Inc.* | | | 106,904 | |
| | 2,967 | | | CryoLife, Inc.* | | | 60,378 | |
| | 664 | | | CryoPort, Inc.* | | | 39,289 | |
| | 205 | | | Fulgent Genetics, Inc.* | | | 20,621 | |
| | 14,935 | | | Hanger, Inc.* | | | 270,772 | |
| | 1,311 | | | Health Catalyst, Inc.* | | | 51,942 | |
| | 2,805 | | | Heska Corp.* | | | 511,884 | |
| | 6,706 | | | InfuSystem Holdings, Inc.* | | | 114,203 | |
| | 1,414 | | | Inspire Medical Systems, Inc.* | | | 325,305 | |
| | 5,400 | | | Integer Holdings Corp.* | | | 462,186 | |
| | 17,846 | | | Invacare Corp.* | | | 48,541 | |
| | 732 | | | iRadimed Corp.* | | | 33,826 | |
| | 8,058 | | | Joint Corp. (The)* | | | 529,330 | |
| | 7,927 | | | LeMaitre Vascular, Inc. | | | 398,173 | |
| | 2,048 | | | LivaNova PLC* | | | 179,057 | |
| | 2,207 | | | Meridian Bioscience, Inc.* | | | 45,023 | |
| | 5,269 | | | Merit Medical Systems, Inc.* | | | 328,259 | |
| | 239 | | | Mesa Laboratories, Inc. | | | 78,413 | |
| | 19,153 | | | Natus Medical, Inc.* | | | 454,501 | |
| | 14,753 | | | Neogen Corp.* | | | 669,934 | |
| | 15,141 | | | NextGen Healthcare, Inc.* | | | 269,358 | |
| | 24,437 | | | Patterson Cos., Inc. | | | 717,226 | |
| | 1,827 | | | Progyny, Inc.* | | | 91,989 | |
| | |
|
| Common Stocks – (continued) | |
| Health Care Equipment & Services – (continued) | |
| | 1,454 | | | R1 RCM, Inc.* | | | 37,062 | |
| | 3,169 | | | Retractable Technologies, Inc.*(a) | | | 21,961 | |
| | 14,070 | | | Select Medical Holdings Corp. | | | 413,658 | |
| | 41,845 | | | Sharps Compliance Corp.* | | | 298,355 | |
| | 158 | | | Simulations Plus, Inc. | | | 7,473 | |
| | 1,838 | | | Stereotaxis, Inc.* | | | 11,396 | |
| | 2,967 | | | Surgery Partners, Inc.* | | | 158,467 | |
| | 7,477 | | | Surmodics, Inc.* | | | 360,018 | |
| | 9,883 | | | Tenet Healthcare Corp.* | | | 807,342 | |
| | 88 | | | US Physical Therapy, Inc. | | | 8,408 | |
| | 2,273 | | | Utah Medical Products, Inc. | | | 227,300 | |
| | 15,871 | | | Varex Imaging Corp.* | | | 500,730 | |
| | | | | | | | |
| | | | | | | 11,263,461 | |
| | |
| Household & Personal Products – 0.6% | |
| | 14,729 | | | Energizer Holdings, Inc. | | | 590,633 | |
| | 4,235 | | | Oil-Dri Corp. of America | | | 138,611 | |
| | | | | | | | |
| | | | | | | 729,244 | |
| | |
| Insurance – 4.7% | |
| | 25,217 | | | American Equity Investment Life Holding Co. | | | 981,446 | |
| | 3,432 | | | AMERISAFE, Inc. | | | 184,744 | |
| | 13,879 | | | Argo Group International Holdings Ltd. | | | 806,509 | |
| | 20,905 | | | BRP Group, Inc., Class A* | | | 754,879 | |
| | 5,542 | | | Crawford & Co., Class A | | | 41,510 | |
| | 5,673 | | | Donegal Group, Inc., Class A | | | 81,067 | |
| | 121,083 | | | Genworth Financial, Inc., Class A* | | | 490,386 | |
| | 5,567 | | | Goosehead Insurance, Inc., Class A | | | 724,155 | |
| | 887 | | | Investors Title Co. | | | 174,872 | |
| | 3,884 | | | Kinsale Capital Group, Inc.(b) | | | 923,965 | |
| | 170 | | | National Western Life Group, Inc., Class A | | | 36,455 | |
| | 11,885 | | | Stewart Information Services Corp. | | | 947,591 | |
| | | | | | | | |
| | | | | | | 6,147,579 | |
| | |
| Materials – 3.3% | |
| | 3,387 | | | AdvanSix, Inc. | | | 160,036 | |
| | 6,636 | | | Century Aluminum Co.* | | | 109,892 | |
| | 9,655 | | | Constellium SE* | | | 172,921 | |
| | 2,289 | | | FutureFuel Corp. | | | 17,488 | |
| | 25,596 | | | Hecla Mining Co. | | | 133,611 | |
| | 6,057 | | | Innospec, Inc. | | | 547,189 | |
| | 496 | | | Intrepid Potash, Inc.* | | | 21,194 | |
| | 5,391 | | | Livent Corp.* | | | 131,433 | |
| | 6,982 | | | Minerals Technologies, Inc. | | | 510,733 | |
| | 44,332 | | | Novagold Resources, Inc. (Canada)* | | | 304,118 | |
| | 534 | | | Olympic Steel, Inc. | | | 12,549 | |
| | 1,629 | | | Orion Engineered Carbons SA (Germany)* | | | 29,909 | |
| | 14,110 | | | Summit Materials, Inc., Class A* | | | 566,375 | |
| | 30,962 | | | SunCoke Energy, Inc. | | | 204,040 | |
| | 31,743 | | | Tronox Holdings PLC, Class A | | | 762,784 | |
| | 857 | | | United States Lime & Minerals, Inc. | | | 110,570 | |
| | |
| | |
| 70 | | The accompanying notes are an integral part of these financial statements. |
GOLDMAN SACHS VARIABLE INSURANCE TRUST SMALL CAP EQUITY INSIGHTS FUND
| | | | | | | | |
Shares | | | Description | | Value | |
|
| Common Stocks – (continued) | |
| Materials – (continued) | |
| | 18,003 | | | Warrior Met Coal, Inc. | | $ | 462,857 | |
| | | | | | | | |
| | | | | | | 4,257,699 | |
| | |
| Media & Entertainment – 2.8% | |
| | 21,862 | | | AMC Entertainment Holdings, Inc., Class A*(a) | | | 594,646 | |
| | 4,953 | | | Cargurus, Inc.* | | | 166,619 | |
| | 36,995 | | | Cinemark Holdings, Inc.* | | | 596,359 | |
| | 130 | | | Daily Journal Corp.* | | | 46,375 | |
| | 7,283 | | | Eventbrite, Inc., Class A* | | | 127,016 | |
| | 2,315 | | | fuboTV, Inc.*(a) | | | 35,929 | |
| | 2,986 | | | Hemisphere Media Group, Inc.* | | | 21,708 | |
| | 25,897 | | | IMAX Corp.* | | | 462,002 | |
| | 2,182 | | | John Wiley & Sons, Inc., Class A | | | 124,963 | |
| | 12,641 | | | Liberty TripAdvisor Holdings, Inc., Class A* | | | 27,431 | |
| | 3,742 | | | Lions Gate Entertainment Corp., Class B* | | | 57,589 | |
| | 10,641 | | | Magnite, Inc.* | | | 186,218 | |
| | 17,211 | | | Marcus Corp. (The)*(a) | | | 307,388 | |
| | 16,825 | | | QuinStreet, Inc.* | | | 306,047 | |
| | 3,019 | | | TechTarget, Inc.* | | | 288,798 | |
| | 6,644 | | | Thryv Holdings, Inc.* | | | 273,268 | |
| | 10,110 | | | TrueCar, Inc.* | | | 34,374 | |
| | | | | | | | |
| | | | | | | 3,656,730 | |
| | |
| Pharmaceuticals, Biotechnology & Life Sciences – 11.3% | |
| | 5,237 | | | Aeglea BioTherapeutics, Inc.* | | | 24,876 | |
| | 12,945 | | | Affimed NV (Germany)* | | | 71,456 | |
| | 20,595 | | | Alkermes PLC* | | | 479,040 | |
| | 2,206 | | | Allakos, Inc.* | | | 21,597 | |
| | 5,570 | | | Allogene Therapeutics, Inc.* | | | 83,104 | |
| | 1,559 | | | Allovir, Inc.* | | | 20,173 | |
| | 578 | | | ALX Oncology Holdings, Inc.* | | | 12,421 | |
| | 31,654 | | | Amicus Therapeutics, Inc.* | | | 365,604 | |
| | 38,698 | | | Amneal Pharmaceuticals, Inc.* | | | 185,363 | |
| | 32,110 | | | Amphastar Pharmaceuticals, Inc.* | | | 747,842 | |
| | 7,140 | | | AnaptysBio, Inc.* | | | 248,115 | |
| | 7,588 | | | Antares Pharma, Inc.* | | | 27,089 | |
| | 919 | | | Applied Molecular Transport, Inc.* | | | 12,848 | |
| | 1,553 | | | Arcus Biosciences, Inc.* | | | 62,850 | |
| | 3,023 | | | Arena Pharmaceuticals, Inc.* | | | 280,958 | |
| | 2,536 | | | Arrowhead Pharmaceuticals, Inc.* | | | 168,137 | |
| | 2,441 | | | Arvinas, Inc.* | | | 200,504 | |
| | 3,930 | | | Avid Bioservices, Inc.* | | | 114,677 | |
| | 1,892 | | | Avidity Biosciences, Inc.* | | | 44,973 | |
| | 2,595 | | | Berkeley Lights, Inc.* | | | 47,177 | |
| | 10,932 | | | BioCryst Pharmaceuticals, Inc.* | | | 151,408 | |
| | 3,137 | | | Bridgebio Pharma, Inc.* | | | 52,325 | |
| | 13,284 | | | Cardiff Oncology, Inc.*(a) | | | 79,837 | |
| | 3,317 | | | CareDx, Inc.* | | | 150,857 | |
| | 985 | | | Cassava Sciences, Inc.*(a) | | | 43,044 | |
| | 1,750 | | | ChemoCentryx, Inc.* | | | 63,718 | |
| | 16,172 | | | Chimerix, Inc.* | | | 103,986 | |
| | 4,313 | | | Codexis, Inc.* | | | 134,868 | |
| | |
|
| Common Stocks – (continued) | |
| Pharmaceuticals, Biotechnology & Life Sciences – (continued) | |
| | 4,073 | | | Collegium Pharmaceutical, Inc.* | | | 76,084 | |
| | 9,071 | | | Denali Therapeutics, Inc.* | | | 404,567 | |
| | 3,115 | | | Design Therapeutics, Inc.*(a) | | | 66,692 | |
| | 16,843 | | | Dynavax Technologies Corp.*(a) | | | 236,981 | |
| | 5,833 | | | Eagle Pharmaceuticals, Inc.* | | | 297,016 | |
| | 11,430 | | | Editas Medicine, Inc.* | | | 303,467 | |
| | 10,962 | | | Eiger BioPharmaceuticals, Inc.* | | | 56,893 | |
| | 1,084 | | | Emergent BioSolutions, Inc.* | | | 47,121 | |
| | 28,051 | | | Endo International PLC* | | | 105,472 | |
| | 3,435 | | | Fluidigm Corp.* | | | 13,465 | |
| | 1,865 | | | Frequency Therapeutics, Inc.* | | | 9,567 | |
| | 6,025 | | | Global Blood Therapeutics, Inc.* | | | 176,352 | |
| | 23,463 | | | Halozyme Therapeutics, Inc.* | | | 943,447 | |
| | 1,247 | | | Harvard Bioscience, Inc.* | | | 8,791 | |
| | 17,921 | | | Heron Therapeutics, Inc.* | | | 163,619 | |
| | 8,562 | | | Homology Medicines, Inc.* | | | 31,166 | |
| | 2,515 | | | Ideaya Biosciences, Inc.* | | | 59,455 | |
| | 10,157 | | | ImmunoGen, Inc.* | | | 75,365 | |
| | 3,589 | | | Inhibrx, Inc.* | | | 156,732 | |
| | 3,543 | | | Innoviva, Inc.* | | | 61,117 | |
| | 4,751 | | | Insmed, Inc.* | | | 129,417 | |
| | 2,680 | | | Intellia Therapeutics, Inc.* | | | 316,883 | |
| | 1,566 | | | Intercept Pharmaceuticals, Inc.*(a) | | | 25,510 | |
| | 1,747 | | | Intra-Cellular Therapies, Inc.* | | | 91,438 | |
| | 21,115 | | | Jounce Therapeutics, Inc.* | | | 176,310 | |
| | 4,196 | | | Kronos Bio, Inc.* | | | 57,024 | |
| | 212 | | | Krystal Biotech, Inc.* | | | 14,829 | |
| | 1,294 | | | Kymera Therapeutics, Inc.* | | | 82,156 | |
| | 1,269 | | | MacroGenics, Inc.* | | | 20,367 | |
| | 308 | | | Madrigal Pharmaceuticals, Inc.* | | | 26,100 | |
| | 1,721 | | | MaxCyte, Inc.* | | | 17,537 | |
| | 4,805 | | | Medpace Holdings, Inc.* | | | 1,045,760 | |
| | 9,090 | | | Myriad Genetics, Inc.* | | | 250,884 | |
| | 16,115 | | | NanoString Technologies, Inc.* | | | 680,536 | |
| | 2,567 | | | Nkarta, Inc.* | | | 39,403 | |
| | 2,243 | | | Olema Pharmaceuticals, Inc.* | | | 20,994 | |
| | 7,693 | | | OPKO Health, Inc.* | | | 37,003 | |
| | 18,417 | | | Organogenesis Holdings, Inc.* | | | 170,173 | |
| | 1,580 | | | Personalis, Inc.* | | | 22,547 | |
| | 26,359 | | | Phibro Animal Health Corp., Class A | | | 538,251 | |
| | 38,355 | | | Precision BioSciences, Inc.* | | | 283,827 | |
| | 12,626 | | | Prestige Consumer Healthcare, Inc.* | | | 765,767 | |
| | 2,321 | | | Protagonist Therapeutics, Inc.* | | | 79,378 | |
| | 1,577 | | | Prothena Corp. PLC (Ireland)* | | | 77,904 | |
| | 7,051 | | | Puma Biotechnology, Inc.* | | | 21,435 | |
| | 13,654 | | | Rigel Pharmaceuticals, Inc.* | | | 36,183 | |
| | 5,043 | | | Rubius Therapeutics, Inc.* | | | 48,816 | |
| | 40,625 | | | Selecta Biosciences, Inc.* | | | 132,438 | |
| | 6,997 | | | Seres Therapeutics, Inc.* | | | 58,285 | |
| | 14,286 | | | SIGA Technologies, Inc.* | | | 107,431 | |
| | 12,542 | | | Solid Biosciences, Inc.* | | | 21,949 | |
| | 2,148 | | | Sorrento Therapeutics, Inc.* | | | 9,988 | |
| | 6,935 | | | Sutro Biopharma, Inc.* | | | 103,193 | |
| | |
| | |
| The accompanying notes are an integral part of these financial statements. | | 71 |
GOLDMAN SACHS VARIABLE INSURANCE TRUST SMALL CAP EQUITY INSIGHTS FUND
Schedule of Investments (continued)
December 31, 2021
| | | | | | | | |
Shares | | | Description | | Value | |
|
| Common Stocks – (continued) | |
| Pharmaceuticals, Biotechnology & Life Sciences – (continued) | |
| | 8,813 | | | Travere Therapeutics, Inc.* | | $ | 273,556 | |
| | 2,276 | | | Turning Point Therapeutics, Inc.* | | | 108,565 | |
| | 5,929 | | | Twist Bioscience Corp.* | | | 458,845 | |
| | 31,274 | | | Vanda Pharmaceuticals, Inc.* | | | 490,689 | |
| | 21,373 | | | VBI Vaccines, Inc.*(a) | | | 50,013 | |
| | 2,285 | | | Veracyte, Inc.* | | | 94,142 | |
| | 2,019 | | | Vericel Corp.* | | | 79,347 | |
| | 1,468 | | | Verve Therapeutics, Inc.* | | | 54,125 | |
| | 4,002 | | | Vir Biotechnology, Inc.* | | | 167,564 | |
| | 3,986 | | | XBiotech, Inc.(a) | | | 44,364 | |
| | 771 | | | Xencor, Inc.* | | | 30,933 | |
| | 559 | | | Y-mAbs Therapeutics, Inc.* | | | 9,061 | |
| | 1,138 | | | Zentalis Pharmaceuticals, Inc.* | | | 95,660 | |
| | | | | | | | |
| | | | | | | 14,758,796 | |
| | |
| Real Estate – 5.3% | |
| | 11,492 | | | American Assets Trust, Inc. REIT | | | 431,295 | |
| | 1,857 | | | City Office REIT, Inc. REIT | | | 36,620 | |
| | 5,897 | | | Corporate Office Properties Trust REIT | | | 164,939 | |
| | 1,463 | | | EastGroup Properties, Inc. REIT | | | 333,344 | |
| | 4,885 | | | Forestar Group, Inc.* | | | 106,249 | |
| | 3,448 | | | Independence Realty Trust, Inc. REIT | | | 89,062 | |
| | 23,611 | | | Industrial Logistics Properties Trust REIT | | | 591,456 | |
| | 5,724 | | | Macerich Co. (The) REIT | | | 98,911 | |
| | 15,101 | | | National Storage Affiliates Trust REIT | | | 1,044,989 | |
| | 11,478 | | | NexPoint Residential Trust, Inc. REIT | | | 962,201 | |
| | 23,158 | | | Outfront Media, Inc. REIT | | | 621,098 | |
| | 7,592 | | | Paramount Group, Inc. REIT | | | 63,317 | |
| | 997 | | | Phillips Edison & Co., Inc. REIT | | | 32,941 | |
| | 35,527 | | | Piedmont Office Realty Trust, Inc., Class A REIT | | | 652,986 | |
| | 1,513 | | | PotlatchDeltic Corp. REIT | | | 91,113 | |
| | 16,295 | | | Retail Opportunity Investments Corp. REIT | | | 319,382 | |
| | 14,027 | | | RPT Realty REIT | | | 187,681 | |
| | 28,781 | | | SITE Centers Corp. REIT | | | 455,603 | |
| | 328 | | | St. Joe Co. (The) | | | 17,072 | |
| | 5,367 | | | STAG Industrial, Inc. REIT | | | 257,401 | |
| | 1,357 | | | Tanger Factory Outlet Centers, Inc. REIT | | | 26,163 | |
| | 1,992 | | | Terreno Realty Corp. REIT | | | 169,898 | |
| | 4,228 | | | UMH Properties, Inc. REIT | | | 115,551 | |
| | 564 | | | Urban Edge Properties REIT | | | 10,716 | |
| | 695 | | | Urstadt Biddle Properties, Inc., Class A REIT | | | 14,803 | |
| | 10,612 | | | Whitestone REIT REIT | | | 107,500 | |
| | | | | | | | |
| | | | | | | 7,002,291 | |
| | |
| Retailing – 4.0% | |
| | 403 | | | 1-800-Flowers.com, Inc., Class A* | | | 9,418 | |
| | |
|
| Common Stocks – (continued) | |
| Retailing – (continued) | |
| | 10,159 | | | Academy Sports & Outdoors, Inc.* | | | 445,980 | |
| | 22,055 | | | American Eagle Outfitters, Inc. | | | 558,433 | |
| | 1,378 | | | Asbury Automotive Group, Inc.* | | | 238,022 | |
| | 631 | | | Bed Bath & Beyond, Inc.* | | | 9,200 | |
| | 2,744 | | | Boot Barn Holdings, Inc.* | | | 337,649 | |
| | 17,015 | | | Buckle, Inc. (The) | | | 719,905 | |
| | 20,764 | | | Cato Corp. (The), Class A | | | 356,310 | |
| | 18,347 | | | Chico’s FAS, Inc.* | | | 98,707 | |
| | 6,596 | | | Designer Brands, Inc., Class A* | | | 93,729 | |
| | 432 | | | Dillard’s, Inc., Class A(a) | | | 105,849 | |
| | 13,569 | | | Funko, Inc., Class A* | | | 255,097 | |
| | 4,166 | | | Lands’ End, Inc.* | | | 81,778 | |
| | 4,160 | | | Liquidity Services, Inc.* | | | 91,853 | |
| | 12,431 | | | Macy’s, Inc. | | | 325,444 | |
| | 4,401 | | | Murphy USA, Inc. | | | 876,855 | |
| | 1,199 | | | Overstock.com, Inc.* | | | 70,753 | |
| | 2,430 | | | Porch Group, Inc.* | | | 37,884 | |
| | 1,988 | | | Revolve Group, Inc.* | | | 111,407 | |
| | 1,260 | | | Shutterstock, Inc. | | | 139,709 | |
| | 1,916 | | | Stitch Fix, Inc., Class A* | | | 36,251 | |
| | 14,830 | | | Tilly’s, Inc., Class A | | | 238,911 | |
| | 615 | | | TravelCenters of America, Inc.* | | | 31,746 | |
| | | | | | | | |
| | | | | | | 5,270,890 | |
| | |
| Semiconductors & Semiconductor Equipment – 2.9% | |
| | 2,624 | | | Ambarella, Inc.* | | | 532,383 | |
| | 5,364 | | | Axcelis Technologies, Inc.* | | | 399,940 | |
| | 19,468 | | | Cohu, Inc.* | | | 741,536 | |
| | 2,013 | | | Diodes, Inc.* | | | 221,048 | |
| | 9,772 | | | FormFactor, Inc.* | | | 446,776 | |
| | 1,244 | | | Ichor Holdings Ltd.* | | | 57,261 | |
| | 7,475 | | | Kulicke & Soffa Industries, Inc. (Singapore) | | | 452,537 | |
| | 1,915 | | | Lattice Semiconductor Corp.* | | | 147,570 | |
| | 4,514 | | | MaxLinear, Inc.* | | | 340,310 | |
| | 382 | | | SiTime Corp.* | | | 111,750 | |
| �� | 2,164 | | | Ultra Clean Holdings, Inc.* | | | 124,127 | |
| | 9,728 | | | Veeco Instruments, Inc.* | | | 276,956 | |
| | | | | | | | |
| | | | | | | 3,852,194 | |
| | |
| Software & Services – 7.5% | |
| | 16,027 | | | A10 Networks, Inc. | | | 265,728 | |
| | 3,911 | | | ACI Worldwide, Inc.* | | | 135,712 | |
| | 809 | | | Appian Corp.* | | | 52,755 | |
| | 850 | | | Asana, Inc., Class A* | | | 63,367 | |
| | 590 | | | BigCommerce Holdings, Inc. Series 1* | | | 20,868 | |
| | 17,196 | | | Box, Inc., Class A* | | | 450,363 | |
| | 3,891 | | | Brightcove, Inc.* | | | 39,766 | |
| | 2,648 | | | Cerence, Inc.* | | | 202,943 | |
| | 19,765 | | | ChannelAdvisor Corp.* | | | 487,800 | |
| | 5,557 | | | CommVault Systems, Inc.* | | | 382,988 | |
| | 25,819 | | | Conduent, Inc.* | | | 137,873 | |
| | 3,472 | | | DigitalOcean Holdings, Inc.* | | | 278,906 | |
| | 7,200 | | | Domo, Inc., Class B* | | | 357,120 | |
| | |
| | |
| 72 | | The accompanying notes are an integral part of these financial statements. |
GOLDMAN SACHS VARIABLE INSURANCE TRUST SMALL CAP EQUITY INSIGHTS FUND
| | | | | | | | |
Shares | | | Description | | Value | |
|
| Common Stocks – (continued) | |
| Software & Services – (continued) | |
| | 53,256 | | | E2open Parent Holdings, Inc.* | | $ | 599,663 | |
| | 8,247 | | | eGain Corp.* | | | 82,305 | |
| | 2,737 | | | ExlService Holdings, Inc.* | | | 396,235 | |
| | 3,170 | | | Hackett Group, Inc. (The) | | | 65,080 | |
| | 526 | | | I3 Verticals, Inc., Class A* | | | 11,988 | |
| | 3,850 | | | JFrog Ltd. (Israel)* | | | 114,345 | |
| | 2,502 | | | Marathon Digital Holdings, Inc.*(a) | | | 82,216 | |
| | 250 | | | MicroStrategy, Inc., Class A*(a) | | | 136,122 | |
| | 10,788 | | | Mimecast Ltd.* | | | 858,401 | |
| | 4,426 | | | Momentive Global, Inc.* | | | 93,610 | |
| | 6,626 | | | Perficient, Inc.* | | | 856,676 | |
| | 5,985 | | | Ping Identity Holding Corp.* | | | 136,937 | |
| | 2,619 | | | Qualys, Inc.* | | | 359,379 | |
| | 14,131 | | | Rackspace Technology, Inc.* | | | 190,345 | |
| | 1,131 | | | Riot Blockchain, Inc.*(a) | | | 25,255 | |
| | 7,581 | | | Sapiens International Corp. NV (Israel) | | | 261,165 | |
| | 3,642 | | | SPS Commerce, Inc.* | | | 518,439 | |
| | 9,911 | | | Tenable Holdings, Inc.* | | | 545,799 | |
| | 12,197 | | | Upland Software, Inc.* | | | 218,814 | |
| | 7,515 | | | Varonis Systems, Inc.* | | | 366,582 | |
| | 5,563 | | | Workiva, Inc.* | | | 725,916 | |
| | 18,662 | | | Zuora, Inc., Class A* | | | 348,606 | |
| | | | | | | | |
| | | | | | | 9,870,067 | |
| | |
| Technology Hardware & Equipment – 4.0% | |
| | 6,242 | | | 3D Systems Corp.* | | | 134,453 | |
| | 2,729 | | | Avid Technology, Inc.* | | | 88,884 | |
| | 6,332 | | | Belden, Inc. | | | 416,202 | |
| | 2,237 | | | Cambium Networks Corp.* | | | 57,334 | |
| | 2,790 | | | Casa Systems, Inc.* | | | 15,819 | |
| | 3,306 | | | Clearfield, Inc.* | | | 279,093 | |
| | 22,042 | | | CTS Corp. | | | 809,382 | |
| | 17,632 | | | Daktronics, Inc.* | | | 89,042 | |
| | 926 | | | Fabrinet (Thailand)* | | | 109,703 | |
| | 30,714 | | | Harmonic, Inc.* | | | 361,197 | |
| | 41,682 | | | Infinera Corp.* | | | 399,730 | |
| | 22,756 | | | NetScout Systems, Inc.* | | | 752,769 | |
| | 3,810 | | | PC Connection, Inc. | | | 164,325 | |
| | 10,993 | | | Super Micro Computer, Inc.* | | | 483,142 | |
| | 39,583 | | | Vishay Intertechnology, Inc. | | | 865,680 | |
| | 4,237 | | | Vishay Precision Group, Inc.* | | | 157,278 | |
| | | | | | | | |
| | | | | | | 5,184,033 | |
| | |
| Telecommunication Services – 1.5% | |
| | 10,734 | | | Cogent Communications Holdings, Inc. | | | 785,514 | |
| | 16,165 | | | Globalstar, Inc.* | | | 18,751 | |
| | 4,449 | | | Gogo, Inc.* | | | 60,195 | |
| | 18,831 | | | Iridium Communications, Inc.* | | | 777,532 | |
| | 14,928 | | | Shenandoah Telecommunications Co. | | | 380,664 | |
| | | | | | | | |
| | | | | | | 2,022,656 | |
| | |
|
| Common Stocks – (continued) | |
| Transportation – 2.4% | |
| | 355 | | | ArcBest Corp. | | | 42,547 | |
| | 1,375 | | | Atlas Air Worldwide Holdings, Inc.* | | | 129,415 | |
| | 1,916 | | | Avis Budget Group, Inc.* | | | 397,321 | |
| | 3,756 | | | Eagle Bulk Shipping, Inc.(a) | | | 170,898 | |
| | 2,664 | | | Genco Shipping & Trading Ltd. | | | 42,624 | |
| | 7,813 | | | Heartland Express, Inc. | | | 131,415 | |
| | 42,927 | | | Marten Transport Ltd. | | | 736,627 | |
| | 84,454 | | | Safe Bulkers, Inc. (Greece)* | | | 318,392 | |
| | 1,503 | | | Saia, Inc.* | | | 506,556 | |
| | 14,040 | | | Werner Enterprises, Inc. | | | 669,146 | |
| | | | | | | | |
| | | | | | | 3,144,941 | |
| | |
| Utilities – 0.2% | |
| | 2,486 | | | Northwest Natural Holding Co. | | | 121,267 | |
| | 3,035 | | | Sunnova Energy International, Inc.* | | | 84,737 | |
| | | | | | | | |
| | | | | | | 206,004 | |
| | |
| TOTAL INVESTMENTS BEFORE SECURITIES LENDING
REINVESTMENT VEHICLE |
|
| | (Cost $115,956,688) | | $ | 128,936,106 | |
| | |
| | | | | | | | |
| | | | | | | | |
| Shares | | Dividend
Rate | | | Value | |
|
| Securities Lending Reinvestment Vehicle – 1.4%(c) | |
Goldman Sachs Financial Square Government Fund — Institutional Shares | |
| 1,845,983 | | | 0.026 | % | | $ | 1,845,983 | |
| (Cost $1,845,983) | |
| |
| TOTAL INVESTMENTS – 100.0% | |
| (Cost $117,802,671) | | | $ | 130,782,089 | |
| |
OTHER ASSETS IN EXCESS OF LIABILITIES – 0.0% | | | | 47,852 | |
| |
| NET ASSETS – 100.0% | | | $ | 130,829,941 | |
| |
| | |
| The percentage shown for each investment category reflects the value of investments in that category as a percentage of net assets. |
| |
| * | | Non-income producing security. |
| |
| (a) | | All or a portion of security is on loan. |
| |
| (b) | | All or a portion of security is segregated as collateral for initial margin requirements on futures transactions. |
| |
| (c) | | Represents an affiliated issuer. |
| | |
| |
| Investment Abbreviations: |
| PLC | | —Public Limited Company |
| REIT | | —Real Estate Investment Trust |
| | |
| The accompanying notes are an integral part of these financial statements. | | 73 |
GOLDMAN SACHS VARIABLE INSURANCE TRUST SMALL CAP EQUITY INSIGHTS FUND
Schedule of Investments (continued)
December 31, 2021
ADDITIONAL INVESTMENT INFORMATION
FUTURES CONTRACTS — At December 31, 2021, the Fund had the following futures contracts:
| | | | | | | | | | | | | | | | |
| Description | | Number of
Contracts | | | Expiration
Date | | | Notional
Amount | | | Unrealized
Appreciation/
(Depreciation) | |
| | | | |
Long position contracts: | | | | | | | | | | | | | | | | |
| Russell 2000 E-Mini Index | | | 6 | | | | 03/18/22 | | | $ | 662,665 | | | $ | 10,175 | |
| | |
| 74 | | The accompanying notes are an integral part of these financial statements. |
GOLDMAN SACHS VARIABLE INSURANCE TRUST STRATEGIC GROWTH FUND
Schedule of Investments
December 31, 2021
| | | | | | | | |
Shares | | | Description | | Value | |
|
| Common Stocks – 98.9% | |
| Automobiles & Components – 2.7% | |
| | 14,440 | | | Aptiv PLC* | | $ | 2,381,878 | |
| | 9,050 | | | Tesla, Inc.* | | | 9,563,859 | |
| | | | | | | | |
| | | | | | | 11,945,737 | |
| | |
| Capital Goods – 1.4% | |
| | 14,576 | | | Boeing Co. (The)* | | | 2,934,441 | |
| | 9,643 | | | Deere & Co. | | | 3,306,488 | |
| | | | | | | | |
| | | | | | | 6,240,929 | |
| | |
| Commercial & Professional Services – 1.3% | |
| | 24,855 | | | Verisk Analytics, Inc. | | | 5,685,084 | |
| | |
| Consumer Durables & Apparel – 3.0% | |
| | 10,722 | | | Lululemon Athletica, Inc.* | | | 4,197,127 | |
| | 49,471 | | | NIKE, Inc., Class B | | | 8,245,332 | |
| | 11,774 | | | PVH Corp. | | | 1,255,697 | |
| | | | | | | | |
| | | | | | | 13,698,156 | |
| | |
| Consumer Services – 1.7% | |
| | 22,324 | | | Chegg, Inc.* | | | 685,347 | |
| | 1,416 | | | Chipotle Mexican Grill, Inc.* | | | 2,475,522 | |
| | 16,433 | | | McDonald’s Corp. | | | 4,405,194 | |
| | | | | | | | |
| | | | | | | 7,566,063 | |
| | |
| Diversified Financials – 1.5% | |
| | 65,188 | | | Charles Schwab Corp. (The) | | | 5,482,311 | |
| | 10,186 | | | Intercontinental Exchange, Inc. | | | 1,393,139 | |
| | | | | | | | |
| | | | | | | 6,875,450 | |
| | |
| Food & Staples Retailing – 0.5% | |
| | 14,850 | | | Walmart, Inc. | | | 2,148,646 | |
| | |
| Food, Beverage & Tobacco – 3.0% | |
| | 77,220 | | | Coca-Cola Co. (The) | | | 4,572,196 | |
| | 43,261 | | | McCormick & Co., Inc. | | | 4,179,445 | |
| | 33,779 | | | Mondelez International, Inc., Class A | | | 2,239,886 | |
| | 28,391 | | | Monster Beverage Corp.* | | | 2,726,672 | |
| | | | | | | | |
| | | | | | | 13,718,199 | |
| | |
| Health Care Equipment & Services – 3.5% | |
| | 76,372 | | | American Well Corp., Class A* | | | 461,287 | |
| | 81,490 | | | Boston Scientific Corp.* | | | 3,461,695 | |
| | 14,555 | | | Guardant Health, Inc.* | | | 1,455,791 | |
| | 9,018 | | | Insulet Corp.* | | | 2,399,419 | |
| | 15,968 | | | Intuitive Surgical, Inc.* | | | 5,737,303 | |
| | 9,430 | | | Veeva Systems, Inc., Class A* | | | 2,409,176 | |
| | | | | | | | |
| | | | | | | 15,924,671 | |
| | |
| Household & Personal Products – 0.8% | |
| | 9,769 | | | Estee Lauder Cos., Inc. (The), Class A | | | 3,616,484 | |
| | |
| Materials – 2.4% | |
| | 29,887 | | | Danimer Scientific, Inc.*(a) | | | 254,637 | |
| | 9,928 | | | Ecolab, Inc. | | | 2,329,009 | |
| | 7,920 | | | Linde PLC (United Kingdom) | | | 2,743,726 | |
| | |
|
| Common Stocks – (continued) | |
| Materials – (continued) | |
| | 4,933 | | | Martin Marietta Materials, Inc. | | | 2,173,085 | |
| | 9,454 | | | Sherwin-Williams Co. (The) | | | 3,329,321 | |
| | | | | | | | |
| | | | | | | 10,829,778 | |
| | |
| Media & Entertainment – 15.2% | |
| | 7,703 | | | Alphabet, Inc., Class A* | | | 22,315,899 | |
| | 4,686 | | | Alphabet, Inc., Class C* | | | 13,559,363 | |
| | 22,526 | | | Live Nation Entertainment, Inc.* | | | 2,696,137 | |
| | 50,939 | | | Meta Platforms, Inc., Class A* | | | 17,133,333 | |
| | 16,640 | | | Netflix, Inc.* | | | 10,024,601 | |
| | 60,099 | | | Snap, Inc., Class A* | | | 2,826,456 | |
| | | | | | | | |
| | | | | | | 68,555,789 | |
| | |
| Pharmaceuticals, Biotechnology & Life Sciences – 7.2% | |
| | 7,408 | | | 10X Genomics, Inc., Class A* | | | 1,103,496 | |
| | 42,204 | | | Adaptive Biotechnologies Corp.* | | | 1,184,244 | |
| | 8,469 | | | Alnylam Pharmaceuticals, Inc.* | | | 1,436,173 | |
| | 18,963 | | | BioMarin Pharmaceutical, Inc.* | | | 1,675,381 | |
| | 15,772 | | | Danaher Corp. | | | 5,189,146 | |
| | 24,339 | | | Eli Lilly & Co. | | | 6,722,918 | |
| | 51,044 | | | Genmab A/S ADR (Denmark)* | | | 2,019,301 | |
| | 7,618 | | | Illumina, Inc.* | | | 2,898,192 | |
| | 6,723 | | | Moderna, Inc.* | | | 1,707,507 | |
| | 18,647 | | | Sarepta Therapeutics, Inc.* | | | 1,679,162 | |
| | 16,563 | | | Seagen, Inc.* | | | 2,560,640 | |
| | 8,798 | | | West Pharmaceutical Services, Inc. | | | 4,126,350 | |
| | | | | | | | |
| | | | | | | 32,302,510 | |
| | |
| Real Estate – 1.6% | |
| | 13,738 | | | American Tower Corp. REIT | | | 4,018,365 | |
| | 3,852 | | | Equinix, Inc. REIT | | | 3,258,176 | |
| | | | | | | | |
| | | | | | | 7,276,541 | |
| | |
| Retailing – 8.8% | |
| | 9,214 | | | Amazon.com, Inc.* | | | 30,722,609 | |
| | 11,764 | | | Etsy, Inc.* | | | 2,575,610 | |
| | 52,398 | | | Farfetch Ltd., Class A (United Kingdom)* | | | 1,751,665 | |
| | 40,925 | | | Ross Stores, Inc. | | | 4,676,909 | |
| | | | | | | | |
| | | | | | | 39,726,793 | |
| | |
| Semiconductors & Semiconductor Equipment – 5.8% | |
| | 93,492 | | | Marvell Technology, Inc. | | | 8,179,615 | |
| | 60,453 | | | NVIDIA Corp. | | | 17,779,832 | |
| | | | | | | | |
| | | | | | | 25,959,447 | |
| | |
| Software & Services – 25.1% | |
| | 16,338 | | | Adobe, Inc.* | | | 9,264,626 | |
| | 18,388 | | | Affirm Holdings, Inc.* | | | 1,849,097 | |
| | 7,942 | | | Atlassian Corp. PLC, Class A* | | | 3,028,205 | |
| | 11,800 | | | Bill.com Holdings, Inc.* | | | 2,939,970 | |
| | 31,466 | | | Dlocal Ltd. (Uruguay)* | | | 1,123,022 | |
| | 7,579 | | | HubSpot, Inc.* | | | 4,995,698 | |
| | 26,628 | | | Mastercard, Inc., Class A | | | 9,567,973 | |
| | 108,792 | | | Microsoft Corp. | | | 36,588,925 | |
| | 9,459 | | | Okta, Inc.* | | | 2,120,424 | |
| | |
| | |
| The accompanying notes are an integral part of these financial statements. | | 75 |
GOLDMAN SACHS VARIABLE INSURANCE TRUST STRATEGIC GROWTH FUND
Schedule of Investments (continued)
December 31, 2021
| | | | | | | | |
Shares | | | Description | | Value | |
|
| Common Stocks – (continued) | |
| Software & Services – (continued) | |
| | 49,942 | | | PayPal Holdings, Inc.* | | $ | 9,418,062 | |
| | 50,480 | | | Qualtrics International, Inc., Class A* | | | 1,786,992 | |
| | 7,600 | | | ServiceNow, Inc.* | | | 4,933,236 | |
| | 850 | | | Shopify, Inc., Class A (Canada)* | | | 1,170,782 | |
| | 14,213 | | | Snowflake, Inc., Class A* | | | 4,814,654 | |
| | 31,266 | | | Splunk, Inc.* | | | 3,618,102 | |
| | 25,142 | | | Toast, Inc., Class A*(a) | | | 872,679 | |
| | 21,719 | | | UiPath, Inc., Class A* | | | 936,740 | |
| | 14,917 | | | Visa, Inc., Class A | | | 3,232,663 | |
| | 32,568 | | | Workday, Inc., Class A* | | | 8,896,926 | |
| | 4,843 | | | Zscaler, Inc.* | | | 1,556,201 | |
| | | | | | | | |
| | | | | | | 112,714,977 | |
| | |
| Technology Hardware & Equipment – 10.3% | |
| | 41,866 | | | Amphenol Corp., Class A | | | 3,661,600 | |
| | 240,206 | | | Apple, Inc. | | | 42,653,380 | |
| | | | | | | | |
| | | | | | | 46,314,980 | |
| | |
| Transportation – 3.1% | |
| | 33,617 | | | Union Pacific Corp. | | | 8,469,131 | |
| | 24,506 | | | United Parcel Service, Inc., Class B | | | 5,252,616 | |
| | | | | | | | |
| | | | | | | 13,721,747 | |
| | |
| | TOTAL COMMON STOCKS | |
| | (Cost $178,070,332) | | $ | 444,821,981 | |
| | |
| | | | | | | | |
| Shares | | | Dividend
Rate | | Value | |
|
| Investment Company – 1.0%(b) | |
| Goldman Sachs Financial Square Government Fund —
Institutional Shares |
|
| | 4,509,290 | | | 0.026% | | $ | 4,509,290 | |
| | (Cost $4,509,290) | |
| | |
| | TOTAL INVESTMENTS – 99.9% | |
| | (Cost $182,579,622) | | $ | 449,331,271 | |
| | |
| TOTAL INVESTMENTS BEFORE SECURITIES LENDING
REINVESTMENT VEHICLE |
|
| | (Cost $182,579,622) | | $ | 449,331,271 | |
| | |
| | | | | | | | |
| Shares | | | Dividend
Rate | | Value | |
|
| Securities Lending Reinvestment Vehicle – 0.2% | |
| Goldman Sachs Financial Square Government Fund —
Institutional Shares |
|
| | 858,041 | | | 0.03% | | $ | 858,041 | |
| | (Cost $858,041) | |
| | |
| | TOTAL INVESTMENTS – 100.1% | |
| | (Cost $183,437,663) | | $ | 450,189,312 | |
| | |
| LIABILITIES IN EXCESS OF
OTHER ASSETS – (0.1)% | | | (262,590 | ) |
| | |
| | NET ASSETS – 100.0% | | $ | 449,926,722 | |
| | |
| | |
| The percentage shown for each investment category reflects the value of investments in that category as a percentage of net assets. |
| |
| * | | Non-income producing security. |
| |
| (a) | | All or a portion of security is on loan. |
| |
| (b) | | Represents an affiliated issuer. |
| | |
| |
| Investment Abbreviations: |
| ADR | | —American Depositary Receipt |
| PLC | | —Public Limited Company |
| REIT | | —Real Estate Investment Trust |
| | |
| 76 | | The accompanying notes are an integral part of these financial statements. |
GOLDMAN SACHS VARIABLE INSURANCE TRUST U.S. EQUITY INSIGHTS FUND
Schedule of Investments
December 31, 2021
| | | | | | | | |
| Shares | | | Description | | Value | |
|
| Common Stocks – 99.7% | |
| Automobiles & Components – 3.7% | |
| | 178,011 | | | Ford Motor Co. | | $ | 3,697,289 | |
| | 34,167 | | | General Motors Co.* | | | 2,003,211 | |
| | 7,785 | | | Tesla, Inc.* | | | 8,227,032 | |
| | | | | | | | |
| | | | | | | 13,927,532 | |
| | |
| Banks – 2.1% | |
| | 22,672 | | | Citigroup, Inc. | | | 1,369,162 | |
| | 44,387 | | | Citizens Financial Group, Inc. | | | 2,097,286 | |
| | 4,497 | | | JPMorgan Chase & Co. | | | 712,100 | |
| | 168,262 | | | KeyCorp | | | 3,891,900 | |
| | | | | | | | |
| | | | | | | 8,070,448 | |
| | |
| Capital Goods – 3.4% | |
| | 23,624 | | | Caterpillar, Inc. | | | 4,884,026 | |
| | 21,634 | | | Emerson Electric Co. | | | 2,011,313 | |
| | 2,696 | | | Lennox International, Inc. | | | 874,474 | |
| | 4,710 | | | MasTec, Inc.* | | | 434,639 | |
| | 7,049 | | | Otis Worldwide Corp. | | | 613,756 | |
| | 4,314 | | | Parker-Hannifin Corp. | | | 1,372,370 | |
| | 1,461 | | | SiteOne Landscape Supply, Inc.* | | | 353,971 | |
| | 12,316 | | | Stanley Black & Decker, Inc. | | | 2,323,044 | |
| | | | | | | | |
| | | | | | | 12,867,593 | |
| | |
| Commercial & Professional Services – 0.2% | |
| | 5,838 | | | Republic Services, Inc. | | | 814,109 | |
| | |
| Consumer Durables & Apparel – 0.7% | |
| | 16,710 | | | D.R. Horton, Inc. | | | 1,812,200 | |
| | 12,158 | | | PulteGroup, Inc. | | | 694,951 | |
| | | | | | | | |
| | | | | | | 2,507,151 | |
| | |
| Consumer Services – 2.0% | |
| | 2,139 | | | Airbnb, Inc., Class A* | | | 356,122 | |
| | 477 | | | Chipotle Mexican Grill, Inc.* | | | 833,915 | |
| | 7,186 | | | Hilton Worldwide Holdings, Inc.* | | | 1,120,944 | |
| | 710 | | | Hyatt Hotels Corp., Class A* | | | 68,089 | |
| | 13,269 | | | Marriott International, Inc., Class A* | | | 2,192,570 | |
| | 1,141 | | | Marriott Vacations Worldwide Corp. | | | 192,806 | |
| | 6,398 | | | McDonald’s Corp. | | | 1,715,112 | |
| | 7,456 | | | Wyndham Hotels & Resorts, Inc. | | | 668,430 | |
| | 10,776 | | | Yum China Holdings, Inc. (China) | | | 537,076 | |
| | | | | | | | |
| | | | | | | 7,685,064 | |
| | |
| Diversified Financials – 4.5% | |
| | 5,022 | | | Ally Financial, Inc. | | | 239,098 | |
| | 4,998 | | | Berkshire Hathaway, Inc., Class B* | | | 1,494,402 | |
| | 29,278 | | | Capital One Financial Corp. | | | 4,247,945 | |
| | 3,796 | | | CME Group, Inc. | | | 867,234 | |
| | 2,256 | | | Raymond James Financial, Inc. | | | 226,502 | |
| | 10,031 | | | S&P Global, Inc. | | | 4,733,930 | |
| | 76,985 | | | Synchrony Financial | | | 3,571,334 | |
| | 9,161 | | | T. Rowe Price Group, Inc. | | | 1,801,419 | |
| | | | | | | | |
| | | | | | | 17,181,864 | |
| | |
| Energy – 0.9% | |
| | 14,057 | | | APA Corp. | | | 377,993 | |
| | 800 | | | EOG Resources, Inc. | | | 71,064 | |
| | |
|
| Common Stocks – (continued) | |
| Energy – (continued) | |
| | 6,512 | | | Hess Corp. | | | 482,084 | |
| | 48,312 | | | Marathon Oil Corp. | | | 793,283 | |
| | 4,071 | | | Occidental Petroleum Corp. | | | 118,018 | |
| | 9,449 | | | Pioneer Natural Resources Co. | | | 1,718,584 | |
| | | | | | | | |
| | | | | | | 3,561,026 | |
| | |
| Food, Beverage & Tobacco – 2.6% | |
| | 2,653 | | | Altria Group, Inc. | | | 125,725 | |
| | 62,269 | | | Archer-Daniels-Midland Co. | | | 4,208,762 | |
| | 24,272 | | | Mondelez International, Inc., Class A | | | 1,609,476 | |
| | 5,795 | | | Monster Beverage Corp.* | | | 556,552 | |
| | 12,501 | | | PepsiCo, Inc. | | | 2,171,549 | |
| | 10,950 | | | Philip Morris International, Inc. | | | 1,040,250 | |
| | | | | | | | |
| | | | | | | 9,712,314 | |
| | |
| Health Care Equipment & Services – 6.1% | |
| | 4,309 | | | Align Technology, Inc.* | | | 2,831,789 | |
| | 7,517 | | | Anthem, Inc. | | | 3,484,430 | |
| | 83,569 | | | Boston Scientific Corp.* | | | 3,550,011 | |
| | 22,944 | | | Cerner Corp. | | | 2,130,809 | |
| | 13,062 | | | Cigna Corp. | | | 2,999,427 | |
| | 16,937 | | | HCA Healthcare, Inc. | | | 4,351,454 | |
| | 7,015 | | | Medtronic PLC | | | 725,702 | |
| | 5,171 | | | Molina Healthcare, Inc.* | | | 1,644,792 | |
| | 474 | | | Teleflex, Inc. | | | 155,699 | |
| | 2,657 | | | UnitedHealth Group, Inc. | | | 1,334,186 | |
| | | | | | | | |
| | | | | | | 23,208,299 | |
| | |
| Household & Personal Products – 0.4% | |
| | 15,772 | | | Colgate-Palmolive Co. | | | 1,345,982 | |
| | |
| Insurance – 2.6% | |
| | 16,424 | | | Arch Capital Group Ltd.* | | | 730,047 | |
| | 5,023 | | | Chubb Ltd. | | | 970,996 | |
| | 8,407 | | | Globe Life, Inc. | | | 787,904 | |
| | 16,703 | | | Marsh & McLennan Cos., Inc. | | | 2,903,315 | |
| | 11,957 | | | MetLife, Inc. | | | 747,193 | |
| | 9,600 | | | Reinsurance Group of America, Inc. | | | 1,051,104 | |
| | 16,962 | | | Travelers Cos., Inc. (The) | | | 2,653,366 | |
| | | | | | | | |
| | | | | | | 9,843,925 | |
| | |
| Materials – 4.0% | |
| | 14,551 | | | Air Products and Chemicals, Inc. | | | 4,427,287 | |
| | 11,535 | | | Alcoa Corp. | | | 687,255 | |
| | 15,441 | | | CF Industries Holdings, Inc. | | | 1,092,914 | |
| | 70,270 | | | Dow, Inc. | | | 3,985,714 | |
| | 104,737 | | | Freeport-McMoRan, Inc. | | | 4,370,675 | |
| | 1,037 | | | International Flavors & Fragrances, Inc. | | | 156,224 | |
| | 1,275 | | | Vulcan Materials Co. | | | 264,665 | |
| | | | | | | | |
| | | | | | | 14,984,734 | |
| | |
| Media & Entertainment – 9.9% | |
| | 2,052 | | | Alphabet, Inc., Class A* | | | 5,944,726 | |
| | 4,697 | | | Alphabet, Inc., Class C* | | | 13,591,192 | |
| | 7,236 | | | Charter Communications, Inc., Class A* | | | 4,717,655 | |
| | |
| | |
| The accompanying notes are an integral part of these financial statements. | | 77 |
GOLDMAN SACHS VARIABLE INSURANCE TRUST U.S. EQUITY INSIGHTS FUND
Schedule of Investments (continued)
December 31, 2021
| | | | | | | | |
| Shares | | | Description | | Value | |
|
| Common Stocks – (continued) | |
| Media & Entertainment – (continued) | |
| | 27,493 | | | Meta Platforms, Inc., Class A* | | $ | 9,247,271 | |
| | 14,952 | | | News Corp., Class A | | | 333,579 | |
| | 48,586 | | | Omnicom Group, Inc. | | | 3,559,896 | |
| | | | | | | | |
| | | | | | | 37,394,319 | |
| | |
| Pharmaceuticals, Biotechnology & Life Sciences – 8.5% | |
| | 44,752 | | | AbbVie, Inc. | | | 6,059,421 | |
| | 6,567 | | | Amgen, Inc. | | | 1,477,378 | |
| | 5,881 | | | Biogen, Inc.* | | | 1,410,970 | |
| | 2,205 | | | Danaher Corp. | | | 725,467 | |
| | 51,608 | | | Gilead Sciences, Inc. | | | 3,747,257 | |
| | 4,808 | | | Incyte Corp.* | | | 352,907 | |
| | 15,590 | | | IQVIA Holdings, Inc.* | | | 4,398,563 | |
| | 30,433 | | | Johnson & Johnson | | | 5,206,173 | |
| | 2,583 | | | Mettler-Toledo International, Inc.* | | | 4,383,893 | |
| | 2,019 | | | Moderna, Inc.* | | | 512,786 | |
| | 14,847 | | | Perrigo Co. PLC | | | 577,548 | |
| | 3,837 | | | Thermo Fisher Scientific, Inc. | | | 2,560,200 | |
| | 3,660 | | | Vertex Pharmaceuticals, Inc.* | | | 803,736 | |
| | 14,236 | | | Viatris, Inc. | | | 192,613 | |
| | | | | | | | |
| | | | | | | 32,408,912 | |
| | |
| Real Estate – 4.1% | |
| | 90,668 | | | American Homes 4 Rent, Class A REIT | | | 3,954,031 | |
| | 7,154 | | | Camden Property Trust REIT | | | 1,278,277 | |
| | 36,856 | | | Equity LifeStyle Properties, Inc. REIT | | | 3,230,797 | |
| | 58,270 | | | First Industrial Realty Trust, Inc. REIT | | | 3,857,474 | |
| | 65,763 | | | Invitation Homes, Inc. REIT | | | 2,981,694 | |
| | 3,742 | | | Rexford Industrial Realty, Inc. REIT | | | 303,514 | |
| | | | | | | | |
| | | | | | | 15,605,787 | |
| | |
| Retailing – 5.4% | |
| | 3,060 | | | Amazon.com, Inc.* | | | 10,203,081 | |
| | 9,573 | | | AutoNation, Inc.* | | | 1,118,605 | |
| | 4,697 | | | Dick’s Sporting Goods, Inc. | | | 540,108 | |
| | 15,002 | | | eBay, Inc. | | | 997,633 | |
| | 836 | | | Home Depot, Inc. (The) | | | 346,948 | |
| | 38,981 | | | LKQ Corp. | | | 2,340,030 | |
| | 5,923 | | | O’Reilly Automotive, Inc.* | | | 4,183,000 | |
| | 2,106 | | | Ulta Beauty, Inc.* | | | 868,388 | |
| | | | | | | | |
| | | | | | | 20,597,793 | |
| | |
| Semiconductors & Semiconductor Equipment – 4.7% | |
| | 10,956 | | | Applied Materials, Inc. | | | 1,724,036 | |
| | 6,286 | | | Broadcom, Inc. | | | 4,182,767 | |
| | 22,864 | | | Intel Corp. | | | 1,177,496 | |
| | 23,039 | | | NVIDIA Corp. | | | 6,776,001 | |
| | 20,953 | | | Texas Instruments, Inc. | | | 3,949,012 | |
| | | | | | | | |
| | | | | | | 17,809,312 | |
| | |
| Software & Services – 19.1% | |
| | 5,502 | | | Accenture PLC, Class A | | | 2,280,854 | |
| | 48,795 | | | Cognizant Technology Solutions Corp., Class A | | | 4,329,092 | |
| | 2,499 | | | DocuSign, Inc.* | | | 380,623 | |
| | |
|
| Common Stocks – (continued) | |
| Software & Services – (continued) | |
| | 3,358 | | | EPAM Systems, Inc.* | | | 2,244,655 | |
| | 18,787 | | | Fidelity National Information Services, Inc. | | | 2,050,601 | |
| | 12,746 | | | Fortinet, Inc.* | | | 4,580,912 | |
| | 12,197 | | | Gartner, Inc.* | | | 4,077,701 | |
| | 1,573 | | | HubSpot, Inc.* | | | 1,036,843 | |
| | 9,649 | | | International Business Machines Corp. | | | 1,289,685 | |
| | 8,514 | | | Intuit, Inc. | | | 5,476,375 | |
| | 58,999 | | | Microsoft Corp. | | | 19,842,544 | |
| | 13,344 | | | Oracle Corp. | | | 1,163,730 | |
| | 6,810 | | | Palo Alto Networks, Inc.* | | | 3,791,536 | |
| | 27,563 | | | PayPal Holdings, Inc.* | | | 5,197,831 | |
| | 8,658 | | | salesforce.com, Inc.* | | | 2,200,258 | |
| | 6,268 | | | ServiceNow, Inc.* | | | 4,068,621 | |
| | 759 | | | Snowflake, Inc., Class A* | | | 257,111 | |
| | 16,017 | | | VeriSign, Inc.* | | | 4,065,435 | |
| | 33,250 | | | VMware, Inc., Class A | | | 3,853,010 | |
| | 11,384 | | | Western Union Co. (The) | | | 203,091 | |
| | | | | | | | |
| | | | | | | 72,390,508 | |
| | |
| Technology Hardware & Equipment – 7.2% | |
| | 125,662 | | | Apple, Inc. | | | 22,313,801 | |
| | 4,576 | | | Corning, Inc. | | | 170,364 | |
| | 26,468 | | | Dell Technologies, Inc., Class C* | | | 1,486,708 | |
| | 36,088 | | | Hewlett Packard Enterprise Co. | | | 569,108 | |
| | 7,508 | | | NetApp, Inc. | | | 690,661 | |
| | 33,242 | | | Western Digital Corp.* | | | 2,167,711 | |
| | | | | | | | |
| | | | | | | 27,398,353 | |
| | |
| Telecommunication Services – 0.4% | |
| | 19,996 | | | AT&T, Inc. | | | 491,902 | |
| | 30,101 | | | Liberty Global PLC, Class C (United Kingdom)* | | | 845,537 | |
| | | | | | | | |
| | | | | | | 1,337,439 | |
| | |
| Transportation – 3.9% | |
| | 2,671 | | | AMERCO | | | 1,939,760 | |
| | 122,712 | | | CSX Corp. | | | 4,613,971 | |
| | 15,395 | | | Norfolk Southern Corp. | | | 4,583,246 | |
| | 14,325 | | | Union Pacific Corp. | | | 3,608,897 | |
| | 722 | | | United Parcel Service, Inc., Class B | | | 154,754 | |
| | | | | | | | |
| | | | | | | 14,900,628 | |
| | |
| Utilities – 3.3% | |
| | 46,903 | | | American Electric Power Co., Inc. | | | 4,172,960 | |
| | 44,713 | | | CMS Energy Corp. | | | 2,908,581 | |
| | 54,776 | | | NextEra Energy, Inc. | | | 5,113,887 | |
| | 10,868 | | | NRG Energy, Inc. | | | 468,193 | |
| | | | | | | | |
| | | | | | | 12,663,621 | |
| | |
| | TOTAL INVESTMENTS – 99.7% | |
| | (Cost $280,036,732) | | $ | 378,216,713 | |
| | |
| OTHER ASSETS IN EXCESS OF
LIABILITIES – 0.3% | | | 1,100,623 | |
| | |
| | NET ASSETS – 100.0% | | $ | 379,317,336 | |
| | |
| | |
| 78 | | The accompanying notes are an integral part of these financial statements. |
GOLDMAN SACHS VARIABLE INSURANCE TRUST U.S. EQUITY INSIGHTS FUND
| | |
| The percentage shown for each investment category reflects the value of investments in that category as a percentage of net assets. |
| |
| * | | Non-income producing security. |
| | |
| |
| Investment Abbreviations: |
| PLC | | —Public Limited Company |
| REIT | | —Real Estate Investment Trust |
| | |
| The accompanying notes are an integral part of these financial statements. | | 79 |
GOLDMAN SACHS VARIABLE INSURANCE TRUST EQUITY FUNDS
Statements of Assets and Liabilities
December 31, 2021
| | | | | | | | | | | | | | | | |
| | | Equity
Index Fund | | | Growth
Opportunities
Fund | | | International
Equity Insights
Fund | | | Large Cap
Value Fund | |
| | | | | | | | | | | | | | | | |
| Assets: | | | | | | | | | | | | |
| | | | |
Investments in unaffiliated issuers, at value (cost $51,632,794, $52,412,741, $96,651,067 and $362,219,381, respectively)(a) | | $ | 219,888,586 | | | $ | 76,546,850 | | | $ | 105,521,390 | | | $ | 485,337,266 | |
Investments in affiliated issuers, at value (cost $204,048, $933,690, $0 and $2,751,464, respectively) | | | 711,926 | | | | 933,690 | | | | — | | | | 2,751,464 | |
Investments in securities lending reinvestment vehicle, at value which equals cost | | | — | | | | 688,836 | | | | — | | | | — | |
Cash | | | 352,693 | | | | 58,964 | | | | 1,302,192 | | | | 655,925 | |
Foreign currency, at value (cost $—, $—, $601,238 and $—, respectively) | | | — | | | | — | | | | 608,455 | | | | — | |
Receivables: | | | | | | | | | | | | | | | | |
Collateral on certain derivative contracts | | | 57,500 | | | | — | | | | 18,038 | | | | — | |
Dividends | | | 132,536 | | | | 16,295 | | | | 129,587 | | | | 300,280 | |
Reimbursement from investment adviser | | | 20,402 | | | | 64,853 | | | | 15,334 | | | | 24,835 | |
Fund shares sold | | | 13,417 | | | | 48,981 | | | | 176,076 | | | | 154,863 | |
Investments sold | | | 6,501 | | | | — | | | | — | | | | — | |
Securities lending income | | | — | | | | 255 | | | | 104 | | | | — | |
Foreign tax reclaims | | | — | | | | — | | | | 297,066 | | | | — | |
Other assets | | | 17,884 | | | | 26,186 | | | | 10,443 | | | | 24,226 | |
| | | | |
| Total assets | | | 221,201,445 | | | | 78,384,910 | | | | 108,078,685 | | | | 489,248,859 | |
| | | | | | | | | | | | | | | | |
| | | | | | | | | | | | | | | | |
| Liabilities: | | | | | | | | | | | | |
| | | | |
Variation margin on futures contracts | | | 3,437 | | | | — | | | | 1,754 | | | | — | |
Payables: | | | | | | | | | | | | | | | | |
Management fees | | | 55,147 | | | | 56,660 | | | | 72,143 | | | | 292,794 | |
Distribution and Service fees and Transfer Agency fees | | | 53,780 | | | | 18,455 | | | | 9,511 | | | | 78,399 | |
Fund shares redeemed | | | 17 | | | | 487 | | | | 7,977 | | | | 1,416,410 | |
Upon return of securities loaned | | | — | | | | 688,836 | | | | — | | | | — | |
Legal fees | | | — | | | | — | | | | 126,403 | | | | — | |
Printing and postage fees | | | — | | | | — | | | | 123,727 | | | | — | |
Accrued expenses | | | 176,770 | | | | 151,966 | | | | 186,394 | | | | 199,180 | |
| | | | |
| Total liabilities | | | 289,151 | | | | 916,404 | | | | 527,909 | | | | 1,986,783 | |
| | | | | | | | | | | | | | | | |
| | | | | | | | | | | | | | | | |
| Net Assets: | | | | | | | | | | | | |
| | | | |
Paid-in capital | | | 54,685,748 | | | | 51,626,338 | | | | 99,106,900 | | | | 359,134,295 | |
Total distributable earnings | | | 166,226,546 | | | | 25,842,168 | | | | 8,443,876 | | | | 128,127,781 | |
| | | | |
| NET ASSETS | | $ | 220,912,294 | | | $ | 77,468,506 | | | $ | 107,550,776 | | | $ | 487,262,076 | |
Net Assets: | | | | | | | | | | | | | | | | |
Institutional | | $ | — | | | $ | 482,730 | | | $ | 63,178,996 | | | $ | 179,541,336 | |
Service | | | 220,912,294 | | | | 76,985,776 | | | | 44,371,780 | | | | 307,720,740 | |
| | | | |
Total Net Assets | | $ | 220,912,294 | | | $ | 77,468,506 | | | $ | 107,550,776 | | | $ | 487,262,076 | |
Shares Outstanding $0.001 par value (unlimited number of shares authorized): | | | | | | | | | | | | | | | | |
Institutional | | | — | | | | 36,982 | | | | 6,896,709 | | | | 18,003,308 | |
Service | | | 9,779,661 | | | | 6,311,158 | | | | 4,821,072 | | | | 30,841,732 | |
Net asset value and offering price per share: | | | | | | | | | | | | | | | | |
Institutional | | | $— | | | | $13.05 | | | | $9.16 | | | | $9.97 | |
Service | | | 22.59 | | | | 12.20 | | | | 9.20 | | | | 9.98 | |
| (a) | Includes loaned securities having a market value of $–, $656,769, $– and $–. |
| | |
| 80 | | The accompanying notes are an integral part of these financial statements. |
GOLDMAN SACHS VARIABLE INSURANCE TRUST EQUITY FUNDS
Statements of Assets and Liabilities (continued)
December 31, 2021
| | | | | | | | | | | | | | | | |
| | | Mid Cap Value Fund | | | Small Cap
Equity Insights
Fund | | | Strategic
Growth Fund | | | U.S. Equity
Insights Fund | |
| | | | | | | | | | | | | | | | |
| Assets: | | | | | | | | | | | | |
| | | | |
Investments in unaffiliated issuers, at value (cost $392,122,511, $115,956,688, $178,070,332 and $280,036,732, respectively)(a) | | $ | 547,975,739 | | | $ | 128,936,106 | | | $ | 444,821,981 | | | $ | 378,216,713 | |
Investments in affiliated issuers, at value (cost $4,761,405, $—, $4,509,290 and $—, respectively) | | | 4,761,405 | | | | — | | | | 4,509,290 | | | | — | |
Cash | | | 572,873 | | | | 2,000,736 | | | | 1,108,130 | | | | 3,209,179 | |
Investments in securities lending reinvestment vehicle, at value which equals cost | | | — | | | | 1,845,983 | | | | 858,041 | | | | — | |
Receivables: | | | | | | | | | | | | | | | | |
Dividends | | | 412,301 | | | | 86,319 | | | | 81,966 | | | | 169,014 | |
Reimbursement from investment adviser | | | 20,752 | | | | 11,405 | | | | 16,817 | | | | 20,623 | |
Fund shares sold | | | 15,511 | | | | 27,581 | | | | 9,741 | | | | 136,745 | |
Securities lending income | | | 180 | | | | 562 | | | | 1,693 | | | | 59 | |
Other assets | | | 66,653 | | | | 1,947 | | | | 3,225 | | | | 33,998 | |
| | | | |
| Total assets | | | 553,825,414 | | | | 132,910,639 | | | | 451,410,884 | | | | 381,786,331 | |
| | | | | | | | | | | | | | | | |
| | | | | | | | | | | | | | | | |
| Liabilities: | | | | | | | | | | | | |
| | | | |
Variation margin on futures contracts | | | — | | | | 1,230 | | | | — | | | | — | |
Payables: | | | | | | | | | | | | | | | | |
Fund shares redeemed | | | 452,370 | | | | 22,251 | | | | 100,283 | | | | 2,033,242 | |
Management fees | | | 352,716 | | | | 76,100 | | | | 269,955 | | | | 195,695 | |
Distribution and Service fees and Transfer Agency fees | | | 47,579 | | | | 7,079 | | | | 68,410 | | | | 22,285 | |
Upon return of securities loaned | | | — | | | | 1,845,983 | | | | 858,041 | | | | — | |
Accrued expenses | | | 375,126 | | | | 128,055 | | | | 187,473 | | | | 217,773 | |
| | | | |
| Total liabilities | | | 1,227,791 | | | | 2,080,698 | | | | 1,484,162 | | | | 2,468,995 | |
| | | | | | | | | | | | | | | | |
| | | | | | | | | | | | | | | | |
| Net Assets: | | | | | | | | | | | | |
| | | | |
Paid-in capital | | | 380,614,777 | | | | 117,105,802 | | | | 176,905,221 | | | | 280,371,390 | |
Total distributable earnings | | | 171,982,846 | | | | 13,724,139 | | | | 273,021,501 | | | | 98,945,946 | |
| | | | |
| NET ASSETS | | $ | 552,597,623 | | | $ | 130,829,941 | | | $ | 449,926,722 | | | $ | 379,317,336 | |
Net Assets: | | | | | | | | | | | | | | | | |
Institutional | | $ | 383,315,080 | | | $ | 108,716,290 | | | $ | 187,144,443 | | | $ | 317,468,228 | |
Service | | | 169,282,543 | | | | 22,113,651 | | | | 262,782,279 | | | | 61,849,108 | |
| | | | |
Total Net Assets | | $ | 552,597,623 | | | $ | 130,829,941 | | | $ | 449,926,722 | | | $ | 379,317,336 | |
Shares Outstanding $0.001 par value (unlimited number of shares authorized): | | | | | | | | | | | | | | | | |
Institutional | | | 19,629,013 | | | | 8,309,263 | | | | 11,256,169 | | | | 15,824,057 | |
Service | | | 8,581,180 | | | | 1,710,470 | | | | 15,873,835 | | | | 3,056,585 | |
Net asset value and offering price per share: | | | | | | | | | | | | | | | | |
Institutional | | | $19.53 | | | | $13.08 | | | | $16.63 | | | | $20.06 | |
Service | | | 19.73 | | | | 12.93 | | | | 16.55 | | | | 20.23 | |
| (a) | Includes loaned securities having a market value of $–, $1,741,223, $799,585 and $–. |
| | |
| The accompanying notes are an integral part of these financial statements. | | 81 |
GOLDMAN SACHS VARIABLE INSURANCE TRUST EQUITY FUNDS
Statements of Operations
For the Fiscal Year Ended December 31, 2021
| | | | | | | | | | | | | | | | |
| | | Equity Index Fund | | | Growth
Opportunities
Fund | | | International
Equity Insights
Fund | | | Large Cap
Value Fund | |
| | | | | | | | | | | | | | | | |
| Investment income: | | | | | | | | | | | | |
| | | | |
Dividends — unaffiliated issuers (net of foreign withholding taxes of $726, $—, $252,803 and $20,034, respectively) | | $ | 2,813,980 | | | $ | 277,766 | | | $ | 3,220,971 | | | $ | 8,466,618 | |
Securities lending income — affiliated issuer | | | 343 | | | | 18,822 | | | | 2,501 | | | | — | |
Dividends — affiliated issuers | | | 4,875 | | | | 205 | | | | — | | | | 500 | |
| | | | |
| Total investment income | | | 2,819,198 | | | | 296,793 | | | | 3,223,472 | | | | 8,467,118 | |
| | | | | | | | | | | | | | | | |
| | | | | | | | | | | | | | | | |
| Expenses: | | | | | | | | | | | | |
| | | | |
Management fees | | | 607,870 | | | | 698,556 | | | | 847,876 | | | | 3,450,732 | |
Distribution and/or Service (12b-1) fees | | | 506,557 | | | | 200,180 | | | | 112,989 | | | | 765,855 | |
Professional fees | | | 107,932 | | | | 105,485 | | | | 94,562 | | | | 105,590 | |
Custody, accounting and administrative services | | | 67,771 | | | | 71,367 | | | | 172,907 | | | | 82,591 | |
Printing and mailing costs | | | 67,176 | | | | 35,804 | | | | 58,060 | | | | 15,079 | |
Transfer Agency fees(a) | | | 40,522 | | | | 16,058 | | | | 20,934 | | | | 95,848 | |
Trustee fees | | | 19,528 | | | | 19,363 | | | | 19,307 | | | | 19,939 | |
Other | | | 28 | | | | — | | | | 7,758 | | | | 10,466 | |
| | | | |
| Total expenses | | | 1,417,384 | | | | 1,146,813 | | | | 1,334,393 | | | | 4,546,100 | |
| | | | |
Less — expense reductions | | | (447,223 | ) | | | (355,402 | ) | | | (310,436 | ) | | | (530,610 | ) |
| | | | |
| Net expenses | | | 970,161 | | | | 791,411 | | | | 1,023,957 | | | | 4,015,490 | |
| | | | |
| NET INVESTMENT INCOME (LOSS) | | | 1,849,037 | | | | (494,618 | ) | | | 2,199,515 | | | | 4,451,628 | |
| | | | | | | | | | | | | | | | |
| | | | | | | | | | | | | | | | |
| Realized and unrealized gain (loss): | | | | | | | | | | | | |
| | | | |
Net realized gain (loss) from: | | | | | | | | | | | | | | | | |
Investments — unaffiliated issuers | | | 11,827,497 | | | | 13,222,693 | | | | 14,648,412 | | | | 71,561,670 | |
Investments — affiliated issuers | | | 34,656 | | | | — | | | | — | | | | — | |
Futures | | | 410,607 | | | | — | | | | 189,281 | | | | — | |
Foreign currency transactions | | | — | | | | — | | | | (103,994 | ) | | | (2 | ) |
Net change in unrealized gain (loss) on: | | | | | | | | | | | | | | | | |
Investments — unaffiliated issuers | | | 36,423,626 | | | | (3,912,879 | ) | | | (5,269,670 | ) | | | 26,553,599 | |
Investments — affiliated issuers | | | 198,739 | | | | — | | | | — | | | | — | |
Futures | | | (28,046 | ) | | | — | | | | (22,567 | ) | | | — | |
Foreign currency translations | | | — | | | | — | | | | (44,008 | ) | | | 1 | |
| | | | |
| Net realized and unrealized gain | | | 48,867,079 | | | | 9,309,814 | | | | 9,397,454 | | | | 98,115,268 | |
| | | | |
| NET INCREASE IN NET ASSETS RESULTING FROM OPERATIONS | | $ | 50,716,116 | | | $ | 8,815,196 | | | $ | 11,596,969 | | | $ | 102,566,896 | |
(a) Class specific Transfer Agency fees were as follows:
| | | | | | | | |
| | | Transfer Agency Fees | |
Fund | | Institutional | | | Service | |
Equity Index Fund | | $ | — | | | $ | 40,522 | |
Growth Opportunities Fund | | | 45 | | | | 16,013 | |
International Equity Insights Fund | | | 11,277 | | | | 9,657 | |
Large Cap Value Fund | | | 34,583 | | | | 61,265 | |
| | |
| 82 | | The accompanying notes are an integral part of these financial statements. |
GOLDMAN SACHS VARIABLE INSURANCE TRUST EQUITY FUNDS
Statements of Operations (continued)
For the Fiscal Year Ended December 31, 2021
| | | | | | | | | | | | | | | | |
| | | Mid Cap Value Fund | | | Small Cap
Equity
Insights Fund | | | Strategic
Growth
Fund | | | U.S. Equity
Insights Fund | |
| | | | | | | | | | | | | | | | |
| Investment income: | | | | | | | | | | | | |
Dividends — unaffiliated issuers (net of foreign withholding taxes of $—, $3,161, $2,482 and $1,515, respectively) | | $ | 6,802,472 | | | $ | 1,436,021 | | | $ | 1,949,249 | | | $ | 4,805,998 | |
Securities lending income — affiliated issuer | | | 2,450 | | | | 10,077 | | | | 71,582 | | | | 24,429 | |
Dividends — affiliated issuers | | | 781 | | | | 350 | | | | 721 | | | | — | |
| | | | |
| Total investment income | | | 6,805,703 | | | | 1,446,448 | | | | 2,021,552 | | | | 4,830,427 | |
| | | | | | | | | | | | | | | | |
| | | | | | | | | | | | | | | | |
| Expenses: | | | | | | | | | | | | |
Management fees | | | 4,051,144 | | | | 881,928 | | | | 3,119,318 | | | | 2,199,946 | |
Distribution and/or Service (12b-1) fees | | | 413,782 | | | | 48,988 | | | | 652,229 | | | | 129,058 | |
Custody, accounting and administrative services | | | 76,850 | | | | 87,222 | | | | 76,190 | | | | 78,674 | |
Professional fees | | | 105,678 | | | | 106,968 | | | | 109,838 | | | | 107,038 | |
Transfer Agency fees(a) | | | 105,218 | | | | 25,196 | | | | 87,863 | | | | 70,962 | |
Printing and mailing costs | | | 98,620 | | | | 46,989 | | | | 43,491 | | | | 44,884 | |
Trustee fees | | | 20,002 | | | | 19,426 | | | | 19,857 | | | | 19,736 | |
Other | | | 13,399 | | | | 1,429 | | | | 7,431 | | | | 5,615 | |
| | | | |
| Total expenses | | | 4,884,693 | | | | 1,218,146 | | | | 4,116,217 | | | | 2,655,913 | |
| | | | |
Less — expense reductions | | | (95,715 | ) | | | (145,882 | ) | | | (237,970 | ) | | | (563,643 | ) |
| | | | |
| Net expenses | | | 4,788,978 | | | | 1,072,264 | | | | 3,878,247 | | | | 2,092,270 | |
| | | | |
| NET INVESTMENT INCOME (LOSS) | | | 2,016,725 | | | | 374,184 | | | | (1,856,695 | ) | | | 2,738,157 | |
| | | | | | | | | | | | | | | | |
| | | | | | | | | | | | | | | | |
| Realized and unrealized gain (loss): | | | | | | | | | | | | |
Net realized gain (loss) from: | | | | | | | | | | | | | | | | |
Investments — unaffiliated issuers | | | 99,516,679 | | | | 25,941,494 | | | | 54,667,136 | | | | 77,080,399 | |
Futures | | | — | | | | 192,178 | | | | — | | | | — | |
Net change in unrealized gain (loss) on: | | | | | | | | | | | | | | | | |
Investments — unaffiliated issuers | | | 38,869,211 | | | | (1,855,294 | ) | | | 33,677,090 | | | | 10,800,923 | |
Futures | | | — | | | | (43,630 | ) | | | — | | | | — | |
| | | | |
| Net realized and unrealized gain | | | 138,385,890 | | | | 24,234,748 | | | | 88,344,226 | | | | 87,881,322 | |
| | | | |
| NET INCREASE IN NET ASSETS RESULTING FROM OPERATIONS | | $ | 140,402,615 | | | $ | 24,608,932 | | | $ | 86,487,531 | | | $ | 90,619,479 | |
(a) Class specific Transfer Agency fees were as follows:
| | | | | | | | |
| | | Transfer Agency Fees | |
Fund | | Institutional | | | Service | |
Mid Cap Value Fund | | $ | 72,117 | | | $ | 33,101 | |
Small Cap Equity Insights Fund | | | 21,277 | | | | 3,919 | |
Strategic Growth Fund | | | 35,688 | | | | 52,175 | |
U.S. Equity Insights Fund | | | 59,256 | | | | 11,706 | |
| | |
| The accompanying notes are an integral part of these financial statements. | | 83 |
GOLDMAN SACHS VARIABLE INSURANCE TRUST EQUITY FUNDS
Statements of Changes in Net Assets
| | | | | | | | | | | | | | | | |
| | | Equity Index Fund | | | Growth Opportunities Fund | |
| | | For the
Fiscal Year Ended
December 31, 2021 | | | For the
Fiscal Year Ended
December 31, 2020 | | | For the
Fiscal Year Ended
December 31, 2021 | | | For the
Fiscal Year Ended
December 31, 2020 | |
| | | | | | | | | | | | | | | | |
| From operations: | | | | | | | | | | | | |
Net investment income (loss) | | $ | 1,849,037 | | | $ | 2,155,109 | | | $ | (494,618 | ) | | $ | (358,175 | ) |
Net realized gain | | | 12,272,760 | | | | 14,732,526 | | | | 13,222,693 | | | | 15,934,579 | |
Net change in unrealized gain (loss) | | | 36,594,319 | | | | 10,894,526 | | | | (3,912,879 | ) | | | 10,213,950 | |
| | | | |
| Net increase in net assets resulting from operations | | | 50,716,116 | | | | 27,782,161 | | | | 8,815,196 | | | | 25,790,354 | |
| | | | | | | | | | | | | | | | |
| | | | | | | | | | | | | | | | |
| Distributions to shareholders: | | | | | | | | | | | | |
From distributable earnings: | | | | | | | | | | | | | | | | |
Institutional Shares | | | — | | | | — | | | | (67,989 | ) | | | (23,510 | ) |
Service Shares | | | (16,050,234 | ) | | | (14,476,879 | ) | | | (13,375,264 | ) | | | (13,714,506 | ) |
| | | | |
| Total distributions to shareholders | | | (16,050,234 | ) | | | (14,476,879 | ) | | | (13,443,253 | ) | | | (13,738,016 | ) |
| | | | | | | | | | | | | | | | |
| | | | | | | | | | | | | | | | |
| From share transactions: | | | | | | | | | | | | |
Proceeds from sales of shares | | | 8,243,921 | | | | 2,826,875 | | | | 3,372,373 | | | | 8,075,423 | |
Reinvestment of distributions | | | 16,050,234 | | | | 14,476,879 | | | | 13,443,253 | | | | 13,738,016 | |
Cost of shares redeemed | | | (23,750,642 | ) | | | (24,448,149 | ) | | | (17,004,840 | ) | | | (25,079,859 | ) |
| | | | |
| Net increase (decrease) in net assets resulting from share transactions | | | 543,513 | | | | (7,144,395 | ) | | | (189,214 | ) | | | (3,266,420 | ) |
| | | | |
| TOTAL INCREASE (DECREASE) | | | 35,209,395 | | | | 6,160,887 | | | | (4,817,271 | ) | | | 8,785,918 | |
| | | | | | | | | | | | | | | | |
| | | | | | | | | | | | | | | | |
| Net assets: | | | | | | | | | | | | |
| | | | |
Beginning of year | | | 185,702,899 | | | | 179,542,012 | | | | 82,285,777 | | | | 73,499,859 | |
| | | | |
End of year | | $ | 220,912,294 | | | $ | 185,702,899 | | | $ | 77,468,506 | | | $ | 82,285,777 | |
| | |
| 84 | | The accompanying notes are an integral part of these financial statements. |
GOLDMAN SACHS VARIABLE INSURANCE TRUST EQUITY FUNDS
Statements of Changes in Net Assets (continued)
| | | | | | | | | | | | | | | | |
| | | International Equity Insights Fund | | | Large Cap Value Fund | |
| | | For the
Fiscal Year Ended
December 31, 2021 | | | For the
Fiscal Year Ended
December 31, 2020 | | | For the
Fiscal Year Ended
December 31, 2021 | | | For the
Fiscal Year Ended
December 31, 2020 | |
| | | | | | | | | | | | | | | | |
| From operations: | | | | | | | | | | | | |
Net investment income | | $ | 2,199,515 | | | $ | 1,197,265 | | | $ | 4,451,628 | | | $ | 5,387,194 | |
Net realized gain (loss) | | | 14,733,699 | | | | (4,206,523 | ) | | | 71,561,668 | | | | (6,988,415 | ) |
Net change in unrealized gain (loss) | | | (5,336,245 | ) | | | 8,183,210 | | | | 26,553,600 | | | | 20,107,747 | |
| | | | |
| Net increase in net assets resulting from operations | | | 11,596,969 | | | | 5,173,952 | | | | 102,566,896 | | | | 18,506,526 | |
| | | | | | | | | | | | | | | | |
| | | | | | | | | | | | | | | | |
| Distributions to shareholders: | | | | | | | | | | | | |
From distributable earnings: | | | | | | | | | | | | | | | | |
Institutional Shares | | | (3,288,959 | ) | | | (717,721 | ) | | | (23,694,892 | ) | | | (4,769,206 | ) |
Service Shares | | | (2,232,384 | ) | | | (579,185 | ) | | | (40,039,323 | ) | | | (8,295,083 | ) |
| | | | |
| Total distributions to shareholders | | | (5,521,343 | ) | | | (1,296,906 | ) | | | (63,734,215 | ) | | | (13,064,289 | ) |
| | | | | | | | | | | | | | | | |
| | | | | | | | | | | | | | | | |
| From share transactions: | | | | | | | | | | | | |
Proceeds from sales of shares | | | 14,541,209 | | | | 15,760,187 | | | | 16,916,259 | | | | 34,531,693 | |
Reinvestment of distributions | | | 5,521,343 | | | | 1,296,906 | | | | 63,734,215 | | | | 13,064,288 | |
Cost of shares redeemed | | | (16,387,138 | ) | | | (15,650,946 | ) | | | (91,861,106 | ) | | | (63,270,455 | ) |
| | | | |
| Net increase (decrease) in net assets resulting from share transactions | | | 3,675,414 | | | | 1,406,147 | | | | (11,210,632 | ) | | | (15,674,474 | ) |
| | | | |
| TOTAL INCREASE (DECREASE) | | | 9,751,040 | | | | 5,283,193 | | | | 27,622,049 | | | | (10,232,237 | ) |
| | | | | | | | | | | | | | | | |
| | | | | | | | | | | | | | | | |
| Net assets: | | | | | | | | | | | | |
| | | | |
Beginning of year | | | 97,799,736 | | | | 92,516,543 | | | | 459,640,027 | | | | 469,872,264 | |
| | | | |
End of year | | $ | 107,550,776 | | | $ | 97,799,736 | | | $ | 487,262,076 | | | $ | 459,640,027 | |
| | |
| The accompanying notes are an integral part of these financial statements. | | 85 |
GOLDMAN SACHS VARIABLE INSURANCE TRUST EQUITY FUNDS
Statements of Changes in Net Assets (continued)
| | | | | | | | | | | | | | | | |
| | | Mid Cap Value Fund | | | Small Cap Equity Insights Fund | |
| | | For the
Fiscal Year Ended
December 31, 2021 | | | For the
Fiscal Year Ended
December 31, 2020 | | | For the
Fiscal Year Ended
December 31, 2021 | | | For the
Fiscal Year Ended
December 31, 2020 | |
| | | | | | | | | | | | | | | | |
| From operations: | | | | | | | | | | | | |
Net investment income | | $ | 2,016,725 | | | $ | 2,391,622 | | | $ | 374,184 | | | $ | 350,873 | |
Net realized gain (loss) | | | 99,516,679 | | | | (9,440,981 | ) | | | 26,133,672 | | | | 2,742,391 | |
Net change in unrealized gain (loss) | | | 38,869,211 | | | | 27,741,103 | | | | (1,898,924 | ) | | | 5,323,157 | |
| | | | |
| Net increase in net assets resulting from operations | | | 140,402,615 | | | | 20,691,744 | | | | 24,608,932 | | | | 8,416,421 | |
| | | | | | | | | | | | | | | | |
| | | | | | | | | | | | | | | | |
| Distributions to shareholders: | | | | | | | | | | | | |
From distributable earnings: | | | | | | | | | | | | | | | | |
Institutional Shares | | | (51,237,122 | ) | | | (6,463,230 | ) | | | (23,948,283 | ) | | | (1,169,326 | ) |
Service Shares | | | (22,180,324 | ) | | | (2,864,537 | ) | | | (4,659,058 | ) | | | (210,446 | ) |
| | | | |
| Total distributions to shareholders | | | (73,417,446 | ) | | | (9,327,767 | ) | | | (28,607,341 | ) | | | (1,379,772 | ) |
| | | | | | | | | | | | | | | | |
| | | | | | | | | | | | | | | | |
| From share transactions: | | | | | | | | | | | | |
Proceeds from sales of shares | | | 13,454,928 | | | | 104,182,481 | | | | 30,972,672 | | | | 12,162,071 | |
Reinvestment of distributions | | | 73,417,446 | | | | 9,327,767 | | | | 28,607,341 | | | | 1,379,772 | |
Cost of shares redeemed | | | (87,544,935 | ) | | | (148,714,253 | ) | | | (26,877,758 | ) | | | (13,986,049 | ) |
| | | | |
| Net increase (decrease) in net assets resulting from share transactions | | | (672,561 | ) | | | (35,204,005 | ) | | | 32,702,255 | | | | (444,206 | ) |
| | | | |
| TOTAL INCREASE (DECREASE) | | | 66,312,608 | | | | (23,840,028 | ) | | | 28,703,846 | | | | 6,592,443 | |
| | | | | | | | | | | | | | | | |
| | | | | | | | | | | | | | | | |
| Net assets: | | | | | | | | | | | | |
| | | | |
Beginning of year | | | 486,285,015 | | | | 510,125,043 | | | | 102,126,095 | | | | 95,533,652 | |
| | | | |
End of year | | $ | 552,597,623 | | | $ | 486,285,015 | | | $ | 130,829,941 | | | $ | 102,126,095 | |
| | |
| 86 | | The accompanying notes are an integral part of these financial statements. |
GOLDMAN SACHS VARIABLE INSURANCE TRUST EQUITY FUNDS
Statements of Changes in Net Assets (continued)
| | | | | | | | | | | | | | | | |
| | | Strategic Growth Fund | | | U.S. Equity Insights Fund | |
| | | For the
Fiscal Year Ended
December 31, 2021 | | | For the
Fiscal Year Ended
December 31, 2020 | | | For the
Fiscal Year Ended
December 31, 2021 | | | For the
Fiscal Year Ended
December 31, 2020 | |
| | | | | | | | | | | | | | | | |
| From operations: | | | | | | | | | | | | |
Net investment income (loss) | | $ | (1,856,695 | ) | | $ | (559,611 | ) | | $ | 2,738,157 | | | $ | 2,391,184 | |
Net realized gain | | | 54,667,136 | | | | 39,110,537 | | | | 77,080,399 | | | | 17,525,008 | |
Net change in unrealized gain | | | 33,677,090 | | | | 78,842,415 | | | | 10,800,923 | | | | 28,349,314 | |
| | | | |
| Net increase in net assets resulting from operations | | | 86,487,531 | | | | 117,393,341 | | | | 90,619,479 | | | | 48,265,506 | |
| | | | | | | | | | | | | | | | |
| | | | | | | | | | | | | | | | |
| Distributions to shareholders: | | | | | | | | | | | | |
From distributable earnings: | | | | | | | | | | | | | | | | |
Institutional Shares | | | (22,122,701 | ) | | | (12,680,432 | ) | | | (71,715,395 | ) | | | (12,570,928 | ) |
Service Shares | | | (31,302,896 | ) | | | (19,462,681 | ) | | | (13,647,143 | ) | | | (2,480,325 | ) |
| | | | |
| Total distributions to shareholders | | | (53,425,597 | ) | | | (32,143,113 | ) | | | (85,362,538 | ) | | | (15,051,253 | ) |
| | | | | | | | | | | | | | | | |
| | | | | | | | | | | | | | | | |
| From share transactions: | | | | | | | | | | | | |
Proceeds from sales of shares | | | 14,745,884 | | | | 82,639,601 | | | | 24,061,285 | | | | 13,712,118 | |
Reinvestment of distributions | | | 53,425,597 | | | | 32,143,113 | | | | 85,362,538 | | | | 15,051,253 | |
Cost of shares redeemed | | | (76,950,698 | ) | | | (145,449,611 | ) | | | (57,104,159 | ) | | | (52,367,727 | ) |
| | | | |
| Net increase (decrease) in net assets resulting from share transactions | | | (8,779,217 | ) | | | (30,666,897 | ) | | | 52,319,664 | | | | (23,604,356 | ) |
| | | | |
| TOTAL INCREASE | | | 24,282,717 | | | | 54,583,331 | | | | 57,576,605 | | | | 9,609,897 | |
| | | | | | | | | | | | | | | | |
| | | | | | | | | | | | | | | | |
| Net assets: | | | | | | | | | | | | |
| | | | |
Beginning of year | | | 425,644,005 | | | | 371,060,674 | | | | 321,740,731 | | | | 312,130,834 | |
| | | | |
End of year | | $ | 449,926,722 | | | $ | 425,644,005 | | | $ | 379,317,336 | | | $ | 321,740,731 | |
| | |
| The accompanying notes are an integral part of these financial statements. | | 87 |
GOLDMAN SACHS VARIABLE INSURANCE TRUST EQUITY INDEX FUND
Financial Highlights
Selected Data for a Share Outstanding Throughout Each Year
| | | | | | | | | | | | | | | | | | | | |
| | | Goldman Sachs Equity Index Fund | |
| | | Service Shares | |
| | | Year Ended December 31, | |
| | | 2021 | | | 2020 | | | 2019 | | | 2018 | | | 2017 | |
| | | | | | | | | | | | | | | | | | | | |
| Per Share Data | | | | | | | | | | | | | | | |
| | | | | |
Net asset value, beginning of year | | $ | 19.01 | | | $ | 17.50 | | | $ | 14.43 | | | $ | 16.60 | | | $ | 14.49 | |
| | | | | |
Net investment income(a) | | | 0.20 | | | | 0.22 | | | | 0.25 | | | | 0.25 | | | | 0.24 | |
| | | | | |
Net realized and unrealized gain (loss) | | | 5.14 | | | | 2.89 | | | | 4.18 | | | | (1.04 | ) | | | 2.85 | |
| | | | | |
Total from investment operations | | | 5.34 | | | | 3.11 | | | | 4.43 | | | | (0.79 | ) | | | 3.09 | |
| | | | | |
Distributions to shareholders from net investment income | | | (0.22 | ) | | | (0.23 | ) | | | (0.26 | ) | | | (0.27 | ) | | | (0.26 | ) |
| | | | | |
Distributions to shareholders from net realized gains | | | (1.54 | ) | | | (1.37 | ) | | | (1.10 | ) | | | (1.11 | ) | | | (0.72 | ) |
| | | | | |
Total distributions | | | (1.76 | ) | | | (1.60 | ) | | | (1.36 | ) | | | (1.38 | ) | | | (0.98 | ) |
| | | | | |
Net asset value, end of year | | $ | 22.59 | | | $ | 19.01 | | | $ | 17.50 | | | $ | 14.43 | | | $ | 16.60 | |
| | | | | |
Total Return(b) | | | 28.20 | % | | | 17.84 | % | | | 30.85 | % | | | (4.87 | )% | | | 21.29 | % |
| | | | | |
Net assets, end of period (in 000’s) | | $ | 220,912 | | | $ | 185,703 | | | $ | 179,542 | | | $ | 155,098 | | | $ | 179,036 | |
| | | | | |
Ratio of net expenses to average net assets | | | 0.48 | % | | | 0.48 | % | | | 0.50 | % | | | 0.48 | % | | | 0.48 | % |
| | | | | |
Ratio of total expenses to average net assets | | | 0.70 | % | | | 0.76 | % | | | 0.78 | % | | | 0.72 | % | | | 0.71 | % |
| | | | | |
Ratio of net investment income to average net assets | | | 0.91 | % | | | 1.28 | % | | | 1.48 | % | | | 1.48 | % | | | 1.53 | % |
| | | | | |
Portfolio turnover rate(c) | | | 4 | % | | | 4 | % | | | 3 | % | | | 4 | % | | | 2 | % |
| (a) | Calculated based on the average shares outstanding methodology. |
| (b) | Assumes investment at the NAV at the beginning of the year, reinvestment of all dividends and distributions, a complete redemption of the investment at the NAV at the end of the year and no sales or redemption charges (if any). Total returns would be reduced if a sales or redemption charge was taken into account. Returns do not reflect the impact of taxes to shareholders relating to Fund distributions or the redemption of Fund shares. |
| (c) | The Fund’s portfolio turnover rate is calculated in accordance with regulatory requirements, without regard to transactions involving short term investments. If such transactions were included, the Fund’s portfolio turnover rate may be higher. |
| | |
| 88 | | The accompanying notes are an integral part of these financial statements. |
GOLDMAN SACHS VARIABLE INSURANCE TRUST GROWTH OPPORTUNITIES FUND
Financial Highlights (continued)
Selected Data for a Share Outstanding Throughout Each Year
| | | | | | | | | | | | | | | | | | | | |
| | | Goldman Sachs Growth Opportunities Fund | |
| | | Institutional Shares | |
| | | Year Ended December 31,(a) | |
| | | 2021 | | | 2020 | | | 2019 | | | 2018 | | | 2017 | |
| | | | | | | | | | | | | | | | | | | | |
| Per Share Data | | | | | | | | | | | | | | | |
| | | | | |
Net asset value, beginning of year | | $ | 13.93 | | | $ | 11.50 | | | $ | 10.51 | | | $ | 31.13 | | | $ | 27.13 | |
| | | | | |
Net investment income (loss)(b) | | | (0.07 | ) | | | (0.04 | ) | | | (0.01 | ) | | | (0.02 | ) | | | (0.04 | ) |
| | | | | |
Net realized and unrealized gain (loss) | | | 1.71 | | | | 5.06 | | | | 3.59 | | | | (1.30 | ) | | | 7.40 | |
| | | | | |
Total from investment operations | | | 1.64 | | | | 5.02 | | | | 3.58 | | | | (1.32 | ) | | | 7.36 | |
| | | | | |
Distributions to shareholders from net realized gains | | | (2.52 | ) | | | (2.59 | ) | | | (2.59 | ) | | | (19.30 | ) | | | (3.36 | ) |
| | | | | |
Net asset value, end of year | | $ | 13.05 | | | $ | 13.93 | | | $ | 11.50 | | | $ | 10.51 | | | $ | 31.13 | |
| | | | | |
Total Return(c) | | | 11.65 | % | | | 44.33 | % | | | 34.35 | % | | | (4.17 | )% | | | 27.14 | % |
| | | | | |
Net assets, end of period (in 000’s) | | $ | 483 | | | $ | 151 | | | $ | 94 | | | $ | 59 | | | $ | 52 | |
| | | | | |
Ratio of net expenses to average net assets | | | 0.83 | % | | | 0.85 | % | | | 0.88 | % | | | 0.85 | % | | | 0.87 | % |
| | | | | |
Ratio of total expenses to average net assets | | | 1.33 | % | | | 1.23 | % | | | 1.26 | % | | | 1.20 | % | | | 1.14 | % |
| | | | | |
Ratio of net investment income (loss) to average net assets | | | (0.47 | )% | | | (0.34 | )% | | | (0.12 | )% | | | (0.08 | )% | | | (0.13 | )% |
| | | | | |
Portfolio turnover rate(d) | | | 50 | % | | | 71 | % | | | 75 | % | | | 59 | % | | | 57 | % |
| (a) | All per share amounts representing data prior to May 17, 2019 have been restated to reflect a 4 to 1 reverse stock split which occurred on that date. |
| (b) | Calculated based on the average shares outstanding methodology. |
| (c) | Assumes investment at the NAV at the beginning of the year, reinvestment of all dividends and distributions, a complete redemption of the investment at the NAV at the end of the year and no sales or redemption charges (if any). Total returns would be reduced if a sales or redemption charge was taken into account. Returns do not reflect the impact of taxes to shareholders relating to Fund distributions or the redemption of Fund shares. |
| (d) | The Fund’s portfolio turnover rate is calculated in accordance with regulatory requirements, without regard to transactions involving short term investments. If such transactions were included, the Fund’s portfolio turnover rate may be higher. |
| | |
| The accompanying notes are an integral part of these financial statements. | | 89 |
GOLDMAN SACHS VARIABLE INSURANCE TRUST GROWTH OPPORTUNITIES FUND
Financial Highlights (continued)
Selected Data for a Share Outstanding Throughout Each Year
| | | | | | | | | | | | | | | | | | | | |
| | | Goldman Sachs Growth Opportunities Fund | |
| | | Service Shares | |
| | | Year Ended December 31,(a) | |
| | | 2021 | | | 2020 | | | 2019 | | | 2018 | | | 2017 | |
| | | | | | | | | | | | | | | | | | | | |
| Per Share Data | | | | | | | | | | | | | | | |
| | | | | |
Net asset value, beginning of year | | $ | 13.19 | | | $ | 11.00 | | | $ | 10.15 | | | $ | 30.80 | | | $ | 26.92 | |
| | | | | |
Net investment loss(b) | | | (0.09 | ) | | | (0.06 | ) | | | (0.02 | ) | | | (0.07 | ) | | | (0.08 | ) |
| | | | | |
Net realized and unrealized gain (loss) | | | 1.62 | | | | 4.84 | | | | 3.46 | | | | (1.28 | ) | | | 7.32 | |
| | | | | |
Total from investment operations | | | 1.53 | | | | 4.78 | | | | 3.44 | | | | (1.35 | ) | | | 7.24 | |
| | | | | |
Distributions to shareholders from net realized gains | | | (2.52 | ) | | | (2.59 | ) | | | (2.59 | ) | | | (19.30 | ) | | | (3.36 | ) |
| | | | | |
Net asset value, end of year | | $ | 12.20 | | | $ | 13.19 | | | $ | 11.00 | | | $ | 10.15 | | | $ | 30.80 | |
| | | | | |
Total Return(c) | | | 11.48 | % | | | 44.16 | % | | | 34.06 | % | | | (4.34 | )% | | | 26.92 | % |
| | | | | |
Net assets, end of period (in 000’s) | | $ | 76,986 | | | $ | 82,134 | | | $ | 73,406 | | | $ | 59,910 | | | $ | 170,785 | |
| | | | | |
Ratio of net expenses to average net assets | | | 0.99 | % | | | 1.01 | % | | | 1.04 | % | | | 1.01 | % | | | 1.02 | % |
| | | | | |
Ratio of total expenses to average net assets | | | 1.43 | % | | | 1.48 | % | | | 1.51 | % | | | 1.44 | % | | | 1.39 | % |
| | | | | |
Ratio of net investment loss to average net assets | | | (0.62 | )% | | | (0.50 | )% | | | (0.28 | )% | | | (0.24 | )% | | | (0.26 | )% |
| | | | | |
Portfolio turnover rate(d) | | | 50 | % | | | 71 | % | | | 75 | % | | | 59 | % | | | 57 | % |
| (a) | All per share amounts representing data prior to May 17, 2019 have been restated to reflect a 4 to 1 reverse stock split which occurred on that date. |
| (b) | Calculated based on the average shares outstanding methodology. |
| (c) | Assumes investment at the NAV at the beginning of the year, reinvestment of all dividends and distributions, a complete redemption of the investment at the NAV at the end of the year and no sales or redemption charges (if any). Total returns would be reduced if a sales or redemption charge was taken into account. Returns do not reflect the impact of taxes to shareholders relating to Fund distributions or the redemption of Fund shares. |
| (d) | The Fund’s portfolio turnover rate is calculated in accordance with regulatory requirements, without regard to transactions involving short term investments. If such transactions were included, the Fund’s portfolio turnover rate may be higher. |
| | |
| 90 | | The accompanying notes are an integral part of these financial statements. |
GOLDMAN SACHS VARIABLE INSURANCE TRUST INTERNATIONAL EQUITY INSIGHTS FUND
Financial Highlights (continued)
Selected Data for a Share Outstanding Throughout Each Year
| | | | | | | | | | | | | | | | | | | | |
| | | Goldman Sachs International Equity Insights Fund | |
| | | Institutional Shares | |
| | | Year Ended December 31, | |
| | | 2021 | | | 2020 | | | 2019 | | | 2018 | | | 2017 | |
| | | | | | | | | | | | | | | | | | | | |
| Per Share Data | | | | | | | | | | | | | | | |
| | | | | |
Net asset value, beginning of year | | $ | 8.62 | | | $ | 8.19 | | | $ | 7.08 | | | $ | 10.88 | | | $ | 8.75 | |
| | | | | |
Net investment income(a) | | | 0.21 | | | | 0.12 | | | | 0.17 | | | | 0.19 | | | | 0.17 | |
| | | | | |
Net realized and unrealized gain (loss) | | | 0.83 | | | | 0.43 | | | | 1.14 | | | | (1.94 | ) | | | 2.16 | |
| | | | | |
Total from investment operations | | | 1.04 | | | | 0.55 | | | | 1.31 | | | | (1.75 | ) | | | 2.33 | |
| | | | | |
Distributions to shareholders from net investment income | | | (0.27 | ) | | | (0.12 | ) | | | (0.20 | ) | | | (0.21 | ) | | | (0.20 | ) |
| | | | | |
Distributions to shareholders from net realized gains | | | (0.23 | ) | | | — | | | | — | (b) | | | (1.84 | ) | | | — | |
| | | | | |
Total distributions | | | (0.50 | ) | | | (0.12 | ) | | | (0.20 | ) | | | (2.05 | ) | | | (0.20 | ) |
| | | | | |
Net asset value, end of year | | $ | 9.16 | | | $ | 8.62 | | | $ | 8.19 | | | $ | 7.08 | | | $ | 10.88 | |
| | | | | |
Total Return(c) | | | 12.17 | % | | | 6.79 | % | | | 18.45 | % | | | (16.28 | )% | | | 26.60 | % |
| | | | | |
Net assets, end of period (in 000’s) | | $ | 63,179 | | | $ | 50,114 | | | $ | 43,632 | | | $ | 37,829 | | | $ | 41,512 | |
| | | | | |
Ratio of net expenses to average net assets | | | 0.85 | % | | | 0.87 | % | | | 0.90 | % | | | 0.87 | % | | | 0.87 | % |
| | | | | |
Ratio of total expenses to average net assets | | | 1.14 | % | | | 1.37 | % | | | 1.31 | % | | | 1.23 | % | | | 1.02 | % |
| | | | | |
Ratio of net investment income to average net assets | | | 2,22 | % | | | 1.59 | % | | | 3.21 | % | | | 1.79 | % | | | 1.69 | % |
| | | | | |
Portfolio turnover rate(d) | | | 167 | % | | | 175 | % | | | 146 | % | | | 156 | % | | | 23 | % |
| (a) | Calculated based on the average shares outstanding methodology. |
| (b) | Amount is less than $0.005 per share. |
| (c) | Assumes investment at the NAV at the beginning of the year, reinvestment of all dividends and distributions, a complete redemption of the investment at the NAV at the end of the year and no sales or redemption charges (if any). Total returns would be reduced if a sales or redemption charge was taken into account. Returns do not reflect the impact of taxes to shareholders relating to Fund distributions or the redemption of Fund shares. |
| (d) | The Fund’s portfolio turnover rate is calculated in accordance with regulatory requirements, without regard to transactions involving short term investments. If such transactions were included, the Fund’s portfolio turnover rate may be higher. |
| | |
| The accompanying notes are an integral part of these financial statements. | | 91 |
GOLDMAN SACHS VARIABLE INSURANCE TRUST INTERNATIONAL EQUITY INSIGHTS FUND
Financial Highlights (continued)
Selected Share Data for a Share Outstanding Throughout Each Year
| | | | | | | | | | | | | | | | | | | | |
| | | Goldman Sachs International Equity Insights Fund | |
| | | Service Shares | |
| | | Year Ended December 31, | |
| | | 2021 | | | 2020 | | | 2019 | | | 2018 | | | 2017 | |
| | | | | | | | | | | | | | | | | | | | |
| Per Share Data | | | | | | | | | | | | | | | |
| | | | | |
Net asset value, beginning of year | | $ | 8.66 | | | $ | 8.23 | | | $ | 7.11 | | | $ | 10.91 | | | $ | 8.78 | |
| | | | | |
Net investment income (loss)(a) | | | 0.19 | | | | 0.10 | | | | 0.15 | | | | 0.14 | | | | 0.14 | |
| | | | | |
Net realized and unrealized gain (loss) | | | 0.83 | | | | 0.44 | | | | 1.15 | | | | (1.93 | ) | | | 2.16 | |
| | | | | |
Total from investment operations | | | 1.02 | | | | 0.54 | | | | 1.30 | | | | (1.79 | ) | | | 2.30 | |
| | | | | |
Distributions to shareholders from net investment income | | | (0.25 | ) | | | (0.11 | ) | | | (0.18 | ) | | | (0.17 | ) | | | (0.17 | ) |
| | | | | |
Distributions to shareholders from net realized gains | | | (0.23 | ) | | | — | | | | — | (b) | | | (1.84 | ) | | | — | |
| | | | | |
Total distributions | | | (0.48 | ) | | | (0.11 | ) | | | (0.18 | ) | | | (2.01 | ) | | | (0.17 | ) |
| | | | | |
Net asset value, end of year | | $ | 9.20 | | | $ | 8.66 | | | $ | 8.23 | | | $ | 7.11 | | | $ | 10.91 | |
| | | | | |
Total Return(c) | | | 11.81 | % | | | 6.53 | % | | | 18.23 | % | | | (16.55 | )% | | | 26.21 | % |
| | | | | |
Net assets, end of period (in 000’s) | | $ | 44,372 | | | $ | 47,685 | | | $ | 48,884 | | | $ | 43,923 | | | $ | 123,778 | |
| | | | | |
Ratio of net expenses to average net assets | | | 1.10 | % | | | 1.12 | % | | | 1.15 | % | | | 1.12 | % | | | 1.12 | % |
| | | | | |
Ratio of total expenses to average net assets | | | 1.40 | % | | | 1.61 | % | | | 1.55 | % | | | 1.43 | % | | | 1.27 | % |
| | | | | |
Ratio of net investment income (loss) to average net assets | | | 1.97 | % | | | 1.30 | % | | | 1.89 | % | | | 1.30 | % | | | 1.44 | % |
| | | | | |
Portfolio turnover rate(d) | | | 167 | % | | | 175 | % | | | 146 | % | | | 156 | % | | | 23 | % |
| (a) | Calculated based on the average shares outstanding methodology. |
| (b) | Amount is less than $0.005 per share. |
| (c) | Assumes investment at the NAV at the beginning of the year, reinvestment of all dividends and distributions, a complete redemption of the investment at the NAV at the end of the year and no sales or redemption charges (if any). Total returns would be reduced if a sales or redemption charge was taken into account. Returns do not reflect the impact of taxes to shareholders relating to Fund distributions or the redemption of Fund shares. |
| (d) | The Fund’s portfolio turnover rate is calculated in accordance with regulatory requirements, without regard to transactions involving short term investments. If such transactions were included, the Fund’s portfolio turnover rate may be higher. |
| | |
| 92 | | The accompanying notes are an integral part of these financial statements. |
GOLDMAN SACHS VARIABLE INSURANCE TRUST LARGE CAP VALUE FUND
Financial Highlights (continued)
Selected Data for a Share Outstanding Throughout Each Year
| | | | | | | | | | | | | | | | | | | | |
| | | Goldman Sachs Large Cap Value Fund | |
| | | Institutional Shares | |
| | | Year Ended December 31, | |
| | | 2021 | | | 2020 | | | 2019 | | | 2018 | | | 2017 | |
| | | | | | | | | | | | | | | | | | | | |
| Per Share Data | | | | | | | | | | | | | | | |
| | | | | |
Net asset value, beginning of year | | $ | 9.27 | | | $ | 9.19 | | | $ | 7.67 | | | $ | 9.06 | | | $ | 10.16 | |
| | | | | |
Net investment income(a) | | | 0.11 | | | | 0.12 | | | | 0.13 | | | | 0.12 | | | | 0.16 | |
| | | | | |
Net realized and unrealized gain (loss) | | | 2.09 | | | | 0.24 | | | | 1.86 | | | | (0.88 | ) | | | 0.83 | |
| | | | | |
Total from investment operations | | | 2.20 | | | | 0.36 | | | | 1.99 | | | | (0.76 | ) | | | 0.99 | |
| | | | | |
Distributions to shareholders from net investment income | | | (0.13 | ) | | | (0.12 | ) | | | (0.14 | ) | | | (0.12 | ) | | | (0.18 | ) |
| | | | | |
Distributions to shareholders from net realized gains | | | (1.37 | ) | | | (0.16 | ) | | | (0.33 | ) | | | (0.51 | ) | | | (1.91 | ) |
| | | | | |
Total distributions | | | (1.50 | ) | | | (0.28 | ) | | | (0.47 | ) | | | (0.63 | ) | | | (2.09 | ) |
| | | | | |
Net asset value, end of year | | $ | 9.97 | | | $ | 9.27 | | | $ | 9.19 | | | $ | 7.67 | | | $ | 9.06 | |
| | | | | |
Total Return(b) | | | 24.13 | % | | | 3.97 | % | | | 25.93 | % | | | (8.46 | )% | | | 9.85 | % |
| | | | | |
Net assets, end of period (in 000’s) | | $ | 179,541 | | | $ | 160,076 | | | $ | 163,814 | | | $ | 150,963 | | | $ | 188,182 | |
| | | | | |
Ratio of net expenses to average net assets | | | 0.69 | % | | | 0.71 | % | | | 0.73 | % | | | 0.71 | % | | | 0.72 | % |
| | | | | |
Ratio of total expenses to average net assets | | | 0.79 | % | | | 0.81 | % | | | 0.83 | % | | | 0.81 | % | | | 0.81 | % |
| | | | | |
Ratio of net investment income to average net assets | | | 1.08 | % | | | 1.44 | % | | | 1.46 | % | | | 1.32 | % | | | 1.50 | % |
| | | | | |
Portfolio turnover rate(c) | | | 54 | % | | | 58 | % | | | 58 | % | | | 125 | % | | | 127 | % |
| (a) | Calculated based on the average shares outstanding methodology. |
| (b) | Assumes investment at the NAV at the beginning of the year, reinvestment of all dividends and distributions, a complete redemption of the investment at the NAV at the end of the year and no sales or redemption charges (if any). Total returns would be reduced if a sales or redemption charge was taken into account. Returns do not reflect the impact of taxes to shareholders relating to Fund distributions or the redemption of Fund shares. |
| (c) | The Fund’s portfolio turnover rate is calculated in accordance with regulatory requirements, without regard to transactions involving short term investments. If such transactions were included, the Fund’s portfolio turnover rate may be higher. |
| | |
| The accompanying notes are an integral part of these financial statements. | | 93 |
GOLDMAN SACHS VARIABLE INSURANCE TRUST LARGE CAP VALUE FUND
Financial Highlights (continued)
Selected Data for a Share Outstanding Throughout Each Year
| | | | | | | | | | | | | | | | | | | | |
| | | Goldman Sachs Large Cap Value Fund | |
| | | Service Shares | |
| | | Year Ended December 31, | |
| | | 2021 | | | 2020 | | | 2019 | | | 2018 | | | 2017 | |
| | | | | | | | | | | | | | | | | | | | |
| Per Share Data | | | | | | | | | | | | | | | |
| | | | | |
Net asset value, beginning of year | | $ | 9.27 | | | $ | 9.19 | | | $ | 7.67 | | | $ | 9.06 | | | $ | 10.16 | |
| | | | | |
Net investment income (loss)(a) | | | 0.09 | | | | 0.10 | | | | 0.11 | | | | 0.10 | | | | 0.13 | |
| | | | | |
Net realized and unrealized gain (loss) | | | 2.09 | | | | 0.24 | | | | 1.85 | | | | (0.88 | ) | | | 0.83 | |
| | | | | |
Total from investment operations | | | 2.18 | | | | 0.34 | | | | 1.96 | | | | (0.78 | ) | | | 0.96 | |
| | | | | |
Distributions to shareholders from net investment income | | | (0.10 | ) | | | (0.10 | ) | | | (0.11 | ) | | | (0.10 | ) | | | (0.15 | ) |
| | | | | |
Distributions to shareholders from net realized gains | | | (1.37 | ) | | | (0.16 | ) | | | (0.33 | ) | | | (0.51 | ) | | | (1.91 | ) |
| | | | | |
Total distributions | | | (1.47 | ) | | | (0.26 | ) | | | (0.44 | ) | | | (0.61 | ) | | | (2.06 | ) |
| | | | | |
Net asset value, end of year | | $ | 9.98 | | | $ | 9.27 | | | $ | 9.19 | | | $ | 7.67 | | | $ | 9.06 | |
| | | | | |
Total Return(b) | | | 23.93 | % | | | 3.73 | % | | | 25.61 | % | | | (8.72 | )% | | | 9.56 | % |
| | | | | |
Net assets, end of period (in 000’s) | | $ | 307,721 | | | $ | 299,564 | | | $ | 306,058 | | | $ | 282,891 | | | $ | 358,776 | |
| | | | | |
Ratio of net expenses to average net assets | | | 0.92 | % | | | 0.94 | % | | | 0.98 | % | | | 0.96 | % | | | 0.97 | % |
| | | | | |
Ratio of total expenses to average net assets | | | 1.04 | % | | | 1.06 | % | | | 1.08 | % | | | 1.06 | % | | | 1.06 | % |
| | | | | |
Ratio of net investment income (loss) to average net assets | | | 0.84 | % | | | 1.21 | % | | | 1.21 | % | | | 1.07 | % | | | 1.26 | % |
| | | | | |
Portfolio turnover rate(c) | | | 54 | % | | | 58 | % | | | 58 | % | | | 125 | % | | | 127 | % |
| (a) | Calculated based on the average shares outstanding methodology. |
| (b) | Assumes investment at the NAV at the beginning of the year, reinvestment of all dividends and distributions, a complete redemption of the investment at the NAV at the end of the year and no sales or redemption charges (if any). Total returns would be reduced if a sales or redemption charge was taken into account. Returns do not reflect the impact of taxes to shareholders relating to Fund distributions or the redemption of Fund shares. |
| (c) | The Fund’s portfolio turnover rate is calculated in accordance with regulatory requirements, without regard to transactions involving short term investments. If such transactions were included, the Fund’s portfolio turnover rate may be higher. |
| | |
| 94 | | The accompanying notes are an integral part of these financial statements. |
GOLDMAN SACHS VARIABLE INSURANCE TRUST MID CAP VALUE FUND
Financial Highlights (continued)
Selected Data for a Share Outstanding Throughout Each Year
| | | | | | | | | | | | | | | | | | | | |
| | | Goldman Sachs Mid Cap Value Fund | |
| | | Institutional Shares | |
| | | Year Ended December 31, | |
| | | 2021 | | | 2020 | | | 2019 | | | 2018 | | | 2017 | |
| | | | | | | | | | | | | | | | | | | | |
| Per Share Data | | | | | | | | | | | | | | | |
| | | | | |
Net asset value, beginning of year | | $ | 17.23 | | | $ | 16.22 | | | $ | 12.89 | | | $ | 16.93 | | | $ | 16.23 | |
| | | | | |
Net investment income(a) | | | 0.09 | | | | 0.10 | | | | 0.13 | | | | 0.13 | | | | 0.12 | |
| | | | | |
Net realized and unrealized gain (loss) | | | 5.20 | | | | 1.26 | | | | 3.93 | | | | (1.86 | ) | | | 1.68 | |
| | | | | |
Total from investment operations | | | 5.29 | | | | 1.36 | | | | 4.06 | | | | (1.73 | ) | | | 1.80 | |
| | | | | |
Distributions to shareholders from net investment income | | | (0.10 | ) | | | (0.10 | ) | | | (0.13 | ) | | | (0.23 | ) | | | (0.13 | ) |
| | | | | |
Distributions to shareholders from net realized gains | | | (2.89 | ) | | | (0.25 | ) | | | (0.60 | ) | | | (2.08 | ) | | | (0.97 | ) |
| | | | | |
Total distributions | | | (2.99 | ) | | | (0.35 | ) | | | (0.73 | ) | | | (2.31 | ) | | | (1.10 | ) |
| | | | | |
Net asset value, end of year | | $ | 19.53 | | | $ | 17.23 | | | $ | 16.22 | | | $ | 12.89 | | | $ | 16.93 | |
| | | | | |
Total Return(b) | | | 30.95 | % | | | 8.38 | % | | | 31.53 | % | | | (10.46 | )% | | | 11.07 | % |
| | | | | |
Net assets, end of period (in 000’s) | | $ | 383,315 | | | $ | 327,376 | | | $ | 335,229 | | | $ | 300,056 | | | $ | 388,709 | |
| | | | | |
Ratio of net expenses to average net assets | | | 0.83 | % | | | 0.84 | % | | | 0.87 | % | | | 0.84 | % | | | 0.84 | % |
| | | | | |
Ratio of total expenses to average net assets | | | 0.85 | % | | | 0.90 | % | | | 0.90 | % | | | 0.86 | % | | | 0.87 | % |
| | | | | |
Ratio of net investment income to average net assets | | | 0.46 | % | | | 0.68 | % | | | 0.85 | % | | | 0.75 | % | | | 0.71 | % |
| | | | | |
Portfolio turnover rate(c) | | | 63 | % | | | 111 | % | | | 89 | % | | | 109 | % | | | 134 | % |
| (a) | Calculated based on the average shares outstanding methodology. |
| (b) | Assumes investment at the NAV at the beginning of the year, reinvestment of all dividends and distributions, a complete redemption of the investment at the NAV at the end of the year and no sales or redemption charges (if any). Total returns would be reduced if a sales or redemption charge was taken into account. Returns do not reflect the impact of taxes to shareholders relating to Fund distributions or the redemption of Fund shares. |
| (c) | The Fund’s portfolio turnover rate is calculated in accordance with regulatory requirements, without regard to transactions involving short term investments. If such transactions were included, the Fund’s portfolio turnover rate may be higher. |
| | |
| The accompanying notes are an integral part of these financial statements. | | 95 |
GOLDMAN SACHS VARIABLE INSURANCE TRUST MID CAP VALUE FUND
Financial Highlights (continued)
Selected Data for a Share Outstanding Throughout Each Year
| | | | | | | | | | | | | | | | | | | | |
| | | Goldman Sachs Mid Cap Value Fund | |
| | | Service Shares | |
| | | Year Ended December 31, | |
| | | 2021 | | | 2020 | | | 2019 | | | 2018 | | | 2017 | |
| | | | | | | | | | | | | | | | | | | | |
| Per Share Data | | | | | | | | | | | | | | | |
| | | | | |
Net asset value, beginning of year | | $ | 17.39 | | | $ | 16.37 | | | $ | 13.01 | | | $ | 16.95 | | | $ | 16.25 | |
| | | | | |
Net investment income (loss)(a) | | | 0.04 | | | | 0.06 | | | | 0.10 | | | | 0.07 | | | | 0.08 | |
| | | | | |
Net realized and unrealized gain (loss) | | | 5.24 | | | | 1.28 | | | | 3.95 | | | | (1.84 | ) | | | 1.68 | |
| | | | | |
Total from investment operations | | | 5.28 | | | | 1.34 | | | | 4.05 | | | | (1.77 | ) | | | 1.76 | |
| | | | | |
Distributions to shareholders from net investment income | | | (0.05 | ) | | | (0.07 | ) | | | (0.09 | ) | | | (0.09 | ) | | | (0.09 | ) |
| | | | | |
Distributions to shareholders from net realized gains | | | (2.89 | ) | | | (0.25 | ) | | | (0.60 | ) | | | (2.08 | ) | | | (0.97 | ) |
| | | | | |
Total distributions | | | (2.94 | ) | | | (0.32 | ) | | | (0.69 | ) | | | (2.17 | ) | | | (1.06 | ) |
| | | | | |
Net asset value, end of year | | $ | 19.73 | | | $ | 17.39 | | | $ | 16.37 | | | $ | 13.01 | | | $ | 16.95 | |
| | | | | |
Total Return(b) | | | 30.57 | % | | | 8.17 | % | | | 31.17 | % | | | (10.70 | )% | | | 10.85 | % |
| | | | | |
Net assets, end of period (in 000’s) | | $ | 169,283 | | | $ | 158,909 | | | $ | 174,896 | | | $ | 76,835 | | | $ | 381,172 | |
| | | | | |
Ratio of net expenses to average net assets | | | 1.08 | % | | | 1.09 | % | | | 1.12 | % | | | 1.09 | % | | | 1.09 | % |
| | | | | |
Ratio of total expenses to average net assets | | | 1.10 | % | | | 1.14 | % | | | 1.16 | % | | | 1.11 | % | | | 1.12 | % |
| | | | | |
Ratio of net investment income (loss) to average net assets | | | 0.21 | % | | | 0.39 | % | | | 0.66 | % | | | 0.42 | % | | | 0.47 | % |
| | | | | |
Portfolio turnover rate(c) | | | 63 | % | | | 111 | % | | | 89 | % | | | 109 | % | | | 134 | % |
| (a) | Calculated based on the average shares outstanding methodology. |
| (b) | Assumes investment at the NAV at the beginning of the year, reinvestment of all dividends and distributions, a complete redemption of the investment at the NAV at the end of the year and no sales or redemption charges (if any). Total returns would be reduced if a sales or redemption charge was taken into account. Returns do not reflect the impact of taxes to shareholders relating to Fund distributions or the redemption of Fund shares. |
| (c) | The Fund’s portfolio turnover rate is calculated in accordance with regulatory requirements, without regard to transactions involving short term investments. If such transactions were included, the Fund’s portfolio turnover rate may be higher. |
| | |
| 96 | | The accompanying notes are an integral part of these financial statements. |
GOLDMAN SACHS VARIABLE INSURANCE TRUST SMALL CAP EQUITY INSIGHTS FUND
Financial Highlights (continued)
Selected Data for a Share Outstanding Throughout Each Year
| | | | | | | | | | | | | | | | | | | | |
| | | Goldman Sachs Small Cap Equity Insights Fund | |
| | | Institutional Shares | |
| | | Year Ended December 31, | |
| | | 2021 | | | 2020 | | | 2019 | | | 2018 | | | 2017 | |
| | | | | | | | | | | | | | | | | | | | |
| Per Share Data | | | | | | | | | | | | | | | |
| | | | | |
Net asset value, beginning of year | | $ | 13.51 | | | $ | 12.62 | | | $ | 10.37 | | | $ | 13.66 | | | $ | 13.79 | |
| | | | | |
Net investment income(a) | | | 0.05 | (b) | | | 0.05 | | | | 0.06 | | | | 0.07 | (c) | | | 0.08 | |
| | | | | |
Net realized and unrealized gain (loss) | | | 3.17 | | | | 1.03 | | | | 2.51 | | | | (1.21 | ) | | | 1.53 | |
| | | | | |
Total from investment operations | | | 3.22 | | | | 1.08 | | | | 2.57 | | | | (1.14 | ) | | | 1.61 | |
| | | | | |
Distributions to shareholders from net investment income | | | (0.08 | ) | | | (0.03 | ) | | | (0.06 | ) | | | (0.07 | ) | | | (0.08 | ) |
| | | | | |
Distributions to shareholders from net realized gains | | | (3.57 | ) | | | (0.16 | ) | | | (0.26 | ) | | | (2.08 | ) | | | (1.66 | ) |
| | | | | |
Total distributions | | | (3.65 | ) | | | (0.19 | ) | | | (0.32 | ) | | | (2.15 | ) | | | (1.74 | ) |
| | | | | |
Net asset value, end of year | | $ | 13.08 | | | $ | 13.51 | | | $ | 12.62 | | | $ | 10.37 | | | $ | 13.66 | |
| | | | | |
Total Return(d) | | | 23.79 | % | | | 8.56 | % | | | 24.84 | % | | | (8.62 | )% | | | 11.57 | % |
| | | | | |
Net assets, end of period (in 000’s) | | $ | 108,716 | | | $ | 84,887 | | | $ | 79,791 | | | $ | 68,951 | | | $ | 77,815 | |
| | | | | |
Ratio of net expenses to average net assets | | | 0.81 | % | | | 0.81 | % | | | 0.86 | % | | | 0.81 | % | | | 0.81 | % |
| | | | | |
Ratio of total expenses to average net assets | | | 0.93 | % | | | 1.08 | % | | | 1.05 | % | | | 0.98 | % | | | 1.00 | % |
| | | | | |
Ratio of net investment income to average net assets | | | 0.34 | %(b) | | | 0.46 | % | | | 0.51 | % | | | 0.46 | %(c) | | | 0.53 | % |
| | | | | |
Portfolio turnover rate(e) | | | 172 | % | | | 147 | % | | | 125 | % | | | 116 | % | | | 110 | % |
| (a) | Calculated based on the average shares outstanding methodology. |
| (b) | Reflects income recognized from special dividends which amounted to $0.03 per share and 0.22% of average net assets. |
| (c) | Reflects income recognized from special dividends which amounted to $0.02 per share and 0.17% of average net assets. |
| (d) | Assumes investment at the NAV at the beginning of the year, reinvestment of all dividends and distributions, a complete redemption of the investment at the NAV at the end of the year and no sales or redemption charges (if any). Total returns would be reduced if a sales or redemption charge was taken into account. Returns do not reflect the impact of taxes to shareholders relating to Fund distributions or the redemption of Fund shares. |
| (e) | The Fund’s portfolio turnover rate is calculated in accordance with regulatory requirements, without regard to transactions involving short term investments. If such transactions were included, the Fund’s portfolio turnover rate may be higher. |
| | |
| The accompanying notes are an integral part of these financial statements. | | 97 |
GOLDMAN SACHS VARIABLE INSURANCE TRUST SMALL CAP EQUITY INSIGHTS FUND
Financial Highlights (continued)
Selected Data for a Share Outstanding Throughout Each Year
| | | | | | | | | | | | | | | | | | | | |
| | | Goldman Sachs Small Cap Equity Insights Fund | |
| | | Service Shares | |
| | | Year Ended December 31, | |
| | | 2021 | | | 2020 | | | 2019 | | | 2018 | | | 2017 | |
| | | | | | | | | | | | | | | | | | | | |
| Per Share Data | | | | | | | | | | | | | | | |
| | | | | |
Net asset value, beginning of year | | $ | 13.39 | | | $ | 12.51 | | | $ | 10.28 | | | $ | 13.55 | | | $ | 13.70 | |
| | | | | |
Net investment income(a) | | | 0.01 | (b) | | | 0.02 | | | | 0.03 | | | | 0.03 | (c) | | | 0.04 | |
| | | | | |
Net realized and unrealized gain (loss) | | | 3.14 | | | | 1.02 | | | | 2.49 | | | | (1.19 | ) | | | 1.51 | |
| | | | | |
Total from investment operations | | | 3.15 | | | | 1.04 | | | | 2.52 | | | | (1.16 | ) | | | 1.55 | |
| | | | | |
Distributions to shareholders from net investment income | | | (0.04 | ) | | | — | | | | (0.03 | ) | | | (0.03 | ) | | | (0.04 | ) |
| | | | | |
Distributions to shareholders from net realized gains | | | (3.57 | ) | | | (0.16 | ) | | | (0.26 | ) | | | (2.08 | ) | | | (1.66 | ) |
| | | | | |
Total distributions | | | (3.61 | ) | | | (0.16 | ) | | | (0.29 | ) | | | (2.11 | ) | | | (1.70 | ) |
| | | | | |
Net asset value, end of year | | $ | 12.93 | | | $ | 13.39 | | | $ | 12.51 | | | $ | 10.28 | | | $ | 13.55 | |
| | | | | |
Total Return(d) | | | 23.50 | % | | | 8.34 | % | | | 24.53 | % | | | (8.82 | )% | | | 11.22 | % |
| | | | | |
Net assets, end of period (in 000’s) | | $ | 22,114 | | | $ | 17,239 | | | $ | 15,742 | | | $ | 16,537 | | | $ | 20,505 | |
| | | | | |
Ratio of net expenses to average net assets | | | 1.06 | % | | | 1.06 | % | | | 1.10 | % | | | 1.06 | % | | | 1.06 | % |
| | | | | |
Ratio of total expenses to average net assets | | | 1.18 | % | | | 1.33 | % | | | 1.30 | % | | | 1.23 | % | | | 1.25 | % |
| | | | | |
Ratio of net investment income to average net assets | | | 0.09 | %(b) | | | 0.22 | % | | | 0.27 | % | | | 0.19 | %(c) | | | 0.28 | % |
| | | | | |
Portfolio turnover rate(e) | | | 172 | % | | | 147 | % | | | 125 | % | | | 116 | % | | | 110 | % |
| (a) | Calculated based on the average shares outstanding methodology. |
| (b) | Reflects income recognized from special dividends which amounted to $0.03 per share and 0.22% of average net assets. |
| (c) | Reflects income recognized from special dividends which amounted to $0.02 per share and 0.17% of average net assets. |
| (d) | Assumes investment at the NAV at the beginning of the year, reinvestment of all dividends and distributions, a complete redemption of the investment at the NAV at the end of the year and no sales or redemption charges (if any). Total returns would be reduced if a sales or redemption charge was taken into account. Returns do not reflect the impact of taxes to shareholders relating to Fund distributions or the redemption of Fund shares. |
| (e) | The Fund’s portfolio turnover rate is calculated in accordance with regulatory requirements, without regard to transactions involving short term investments. If such transactions were included, the Fund’s portfolio turnover rate may be higher. |
| | |
| 98 | | The accompanying notes are an integral part of these financial statements. |
GOLDMAN SACHS VARIABLE INSURANCE TRUST STRATEGIC GROWTH FUND
Financial Highlights (continued)
Selected Data for a Share Outstanding Throughout Each Year
| | | | | | | | | | | | | | | | | | | | |
| | | Goldman Sachs Strategic Growth Fund | |
| | | Institutional Shares | |
| | | Year Ended December 31, | |
| | | 2021 | | | 2020 | | | 2019 | | | 2018 | | | 2017 | |
| | | | | | | | | | | | | | | | | | | | |
| Per Share Data | | | | | | | | | | | | | | | |
| | | | | |
Net asset value, beginning of year | | $ | 15.43 | | | $ | 11.90 | | | $ | 9.78 | | | $ | 19.73 | | | $ | 15.83 | |
| | | | | |
Net investment income (loss)(a) | | | (0.05 | ) | | | — | (b) | | | 0.03 | | | | 0.06 | | | | 0.09 | |
| | | | | |
Net realized and unrealized gain (loss) | | | 3.46 | | | | 4.79 | | | | 3.43 | | | | (0.18 | ) | | | 4.77 | |
| | | | | |
Total from investment operations | | | 3.41 | | | | 4.79 | | | | 3.46 | | | | (0.12 | ) | | | 4.86 | |
| | | | | |
Distributions to shareholders from net investment income | | | — | | | | (0.01 | ) | | | (0.04 | ) | | | (0.10 | ) | | | (0.10 | ) |
| | | | | |
Distributions to shareholders from net realized gains | | | (2.21 | ) | | | (1.25 | ) | | | (1.30 | ) | | | (9.73 | ) | | | (0.86 | ) |
| | | | | |
Total distributions | | | (2.21 | ) | | | (1.26 | ) | | | (1.34 | ) | | | (9.83 | ) | | | (0.96 | ) |
| | | | | |
Net asset value, end of year | | $ | 16.63 | | | $ | 15.43 | | | $ | 11.90 | | | $ | 9.78 | | | $ | 19.73 | |
| | | | | |
Total Return(c) | | | 21.93 | % | | | 40.37 | % | | | 35.53 | % | | | (1.04 | )% | | | 30.66 | % |
| | | | | |
Net assets, end of period (in 000’s) | | $ | 187,144 | | | $ | 167,930 | | | $ | 129,686 | | | $ | 102,199 | | | $ | 115,693 | |
| | | | | |
Ratio of net expenses to average net assets | | | 0.73 | % | | | 0.74 | % | | | 0.77 | % | | | 0.74 | % | | | 0.76 | % |
| | | | | |
Ratio of total expenses to average net assets | | | 0.79 | % | | | 0.81 | % | | | 0.85 | % | | | 0.82 | % | | | 0.82 | % |
| | | | | |
Ratio of net investment income (loss) to average net assets | | | (0.27 | )% | | | (0.01 | )% | | | 0.29 | % | | | 0.30 | % | | | 0.48 | % |
| | | | | |
Portfolio turnover rate(d) | | | 20 | % | | | 45 | % | | | 44 | % | | | 41 | % | | | 37 | % |
| (a) | Calculated based on the average shares outstanding methodology. |
| (b) | Amount is less than $0.005 per share. |
| (c) | Assumes investment at the NAV at the beginning of the year, reinvestment of all dividends and distributions, a complete redemption of the investment at the NAV at the end of the year and no sales or redemption charges (if any). Total returns would be reduced if a sales or redemption charge was taken into account. Returns do not reflect the impact of taxes to shareholders relating to Fund distributions or the redemption of Fund shares. |
| (d) | The Fund’s portfolio turnover rate is calculated in accordance with regulatory requirements, without regard to transactions involving short term investments. If such transactions were included, the Fund’s portfolio turnover rate may be higher. |
| | |
| The accompanying notes are an integral part of these financial statements. | | 99 |
GOLDMAN SACHS VARIABLE INSURANCE TRUST STRATEGIC GROWTH FUND
Financial Highlights (continued)
Selected Data for a Share Outstanding Throughout Each Year
| | | | | | | | | | | | | | | | | | | | |
| | | Goldman Sachs Strategic Growth Fund | |
| | | Service Shares | |
| | | Year Ended December 31, | |
| | | 2021 | | | 2020 | | | 2019 | | | 2018 | | | 2017 | |
| | | | | | | | | | | | | | | | | | | | |
| Per Share Data | | | | | | | | | | | | | | | |
| | | | | |
Net asset value, beginning of year | | $ | 15.41 | | | $ | 11.91 | | | $ | 9.78 | | | $ | 19.68 | | | $ | 15.79 | |
| | | | | |
Net investment income (loss)(a) | | | (0.09 | ) | | | (0.03 | ) | | | 0.01 | | | | 0.01 | | | | 0.04 | |
| | | | | |
Net realized and unrealized gain (loss) | | | 3.44 | | | | 4.78 | | | | 3.43 | | | | (0.18 | ) | | | 4.76 | |
| | | | | |
Total from investment operations | | | 3.35 | | | | 4.75 | | | | 3.44 | | | | (0.17 | ) | | | 4.80 | |
| | | | | |
Distributions to shareholders from net investment income | | | — | | | | — | | | | (0.01 | ) | | | — | | | | (0.05 | ) |
| | | | | |
Distributions to shareholders from net realized gains | | | (2.21 | ) | | | (1.25 | ) | | | (1.30 | ) | | | (9.73 | ) | | | (0.86 | ) |
| | | | | |
Total distributions | | | (2.21 | ) | | | (1.25 | ) | | | (1.31 | ) | | | (9.73 | ) | | | (0.91 | ) |
| | | | | |
Net asset value, end of year | | $ | 16.55 | | | $ | 15.41 | | | $ | 11.91 | | | $ | 9.78 | | | $ | 19.68 | |
| | | | | |
Total Return(b) | | | 21.56 | % | | | 39.98 | % | | | 35.32 | % | | | (1.32 | )% | | | 30.36 | % |
| | | | | |
Net assets, end of period (in 000’s) | | $ | 262,782 | | | $ | 257,714 | | | $ | 241,375 | | | $ | 139,414 | | | $ | 425,679 | |
| | | | | |
Ratio of net expenses to average net assets | | | 0.98 | % | | | 0.99 | % | | | 1.02 | % | | | 0.99 | % | | | 1.01 | % |
| | | | | |
Ratio of total expenses to average net assets | | | 1.04 | % | | | 1.06 | % | | | 1.10 | % | | | 1.07 | % | | | 1.07 | % |
| | | | | |
Ratio of net investment income (loss) to average net assets | | | (0.52 | )% | | | (0.24 | )% | | | 0.04 | % | | | 0.04 | % | | | 0.23 | % |
| | | | | |
Portfolio turnover rate(c) | | | 20 | % | | | 45 | % | | | 44 | % | | | 41 | % | | | 37 | % |
| (a) | Calculated based on the average shares outstanding methodology. |
| (b) | Assumes investment at the NAV at the beginning of the year, reinvestment of all dividends and distributions, a complete redemption of the investment at the NAV at the end of the year and no sales or redemption charges (if any). Total returns would be reduced if a sales or redemption charge was taken into account. Returns do not reflect the impact of taxes to shareholders relating to Fund distributions or the redemption of Fund shares. |
| (c) | The Fund’s portfolio turnover rate is calculated in accordance with regulatory requirements, without regard to transactions involving short term investments. If such transactions were included, the Fund’s portfolio turnover rate may be higher. |
| | |
| 100 | | The accompanying notes are an integral part of these financial statements. |
GOLDMAN SACHS VARIABLE INSURANCE TRUST U.S. EQUITY INSIGHTS FUND
Financial Highlights (continued)
Selected Data for a Share Outstanding Throughout Each Year
| | | | | | | | | | | | | | | | | | | | |
| | | Goldman Sachs U.S. Equity Insights Fund | |
| | | Institutional Shares | |
| | | Year Ended December 31, | |
| | | 2021 | | | 2020 | | | 2019 | | | 2018 | | | 2017 | |
| | | | | | | | | | | | | | | | | | | | |
| Per Share Data | | | | | | | | | | | | | | | |
| | | | | |
Net asset value, beginning of year | | $ | 20.08 | | | $ | 17.93 | | | $ | 15.03 | | | $ | 19.41 | | | $ | 17.65 | |
| | | | | |
Net investment income(a) | | | 0.18 | | | | 0.15 | | | | 0.21 | | | | 0.22 | | | | 0.28 | |
| | | | | |
Net realized and unrealized gain (loss) | | | 5.61 | | | | 2.98 | | | | 3.57 | | | | (1.38 | ) | | | 3.98 | |
| | | | | |
Total from investment operations | | | 5.79 | | | | 3.13 | | | | 3.78 | | | | (1.16 | ) | | | 4.26 | |
| | | | | |
Distributions to shareholders from net investment income | | | (0.19 | ) | | | (0.16 | ) | | | (0.23 | ) | | | (0.25 | ) | | | (0.28 | ) |
| | | | | |
Distributions to shareholders from net realized gains | | | (5.62 | ) | | | (0.82 | ) | | | (0.65 | ) | | | (2.97 | ) | | | (2.22 | ) |
| | | | | |
Total distributions | | | (5.81 | ) | | | (0.98 | ) | | | (0.88 | ) | | | (3.22 | ) | | | (2.50 | ) |
| | | | | |
Net asset value, end of year | | $ | 20.06 | | | $ | 20.08 | | | $ | 17.93 | | | $ | 15.03 | | | $ | 19.41 | |
| | | | | |
Total Return(b) | | | 29.41 | % | | | 17.49 | % | | | 25.21 | % | | | (6.19 | )% | | | 24.07 | % |
| | | | | |
Net assets, end of period (in 000’s) | | $ | 317,468 | | | $ | 267,592 | | | $ | 256,930 | | | $ | 235,553 | | | $ | 277,952 | |
| | | | | |
Ratio of net expenses to average net assets | | | 0.55 | % | | | 0.56 | % | | | 0.58 | % | | | 0.58 | % | | | 0.62 | % |
| | | | | |
Ratio of total expenses to average net assets | | | 0.71 | % | | | 0.75 | % | | | 0.76 | % | | | 0.73 | % | | | 0.70 | % |
| | | | | |
Ratio of net investment income to average net assets | | | 0.81 | % | | | 0.85 | % | | | 1.24 | % | | | 1.12 | % | | | 1.42 | % |
| | | | | |
Portfolio turnover rate(c) | | | 206 | % | | | 203 | % | | | 187 | % | | | 160 | % | | | 184 | % |
| (a) | Calculated based on the average shares outstanding methodology. |
| (b) | Assumes investment at the NAV at the beginning of the year, reinvestment of all dividends and distributions, a complete redemption of the investment at the NAV at the end of the year and no sales or redemption charges (if any). Total returns would be reduced if a sales or redemption charge was taken into account. Returns do not reflect the impact of taxes to shareholders relating to Fund distributions or the redemption of Fund shares. |
| (c) | The Fund’s portfolio turnover rate is calculated in accordance with regulatory requirements, without regard to transactions involving short term investments. If such transactions were included, the Fund’s portfolio turnover rate may be higher. |
| | |
| The accompanying notes are an integral part of these financial statements. | | 101 |
GOLDMAN SACHS VARIABLE INSURANCE TRUST U.S. EQUITY INSIGHTS FUND
Financial Highlights (continued)
Selected Data for a Share Outstanding Throughout Each Year
| | | | | | | | | | | | | | | | | | | | |
| | | Goldman Sachs U.S. Equity Insights Fund | |
| | | Service Shares | |
| | | Year Ended December 31, | |
| | | 2021 | | | 2020 | | | 2019 | | | 2018 | | | 2017 | |
| | | | | | | | | | | | | | | | | | | | |
| Per Share Data | | | | | | | | | | | | | | | |
| | | | | |
Net asset value, beginning of year | | $ | 20.21 | | | $ | 18.04 | | | $ | 15.12 | | | $ | 19.48 | | | $ | 17.71 | |
| | | | | |
Net investment income(a) | | | 0.14 | | | | 0.12 | | | | 0.18 | | | | 0.18 | | | | 0.24 | |
| | | | | |
Net realized and unrealized gain (loss) | | | 5.64 | | | | 2.99 | | | | 3.58 | | | | (1.37 | ) | | | 3.99 | |
| | | | | |
Total from investment operations | | | 5.78 | | | | 3.11 | | | | 3.76 | | | | (1.19 | ) | | | 4.23 | |
| | | | | |
Distributions to shareholders from net investment income | | | (0.14 | ) | | | (0.12 | ) | | | (0.19 | ) | | | (0.20 | ) | | | (0.24 | ) |
| | | | | |
Distributions to shareholders from net realized gains | | | (5.62 | ) | | | (0.82 | ) | | | (0.65 | ) | | | (2.97 | ) | | | (2.22 | ) |
| | | | | |
Total distributions | | | (5.76 | ) | | | (0.94 | ) | | | (0.84 | ) | | | (3.17 | ) | | | (2.46 | ) |
| | | | | |
Net asset value, end of year | | $ | 20.23 | | | $ | 20.21 | | | $ | 18.04 | | | $ | 15.12 | | | $ | 19.48 | |
| | | | | |
Total Return(b) | | | 29.11 | % | | | 17.27 | % | | | 24.93 | % | | | (6.36 | )% | | | 23.80 | % |
| | | | | |
Net assets, end of period (in 000’s) | | $ | 61,849 | | | $ | 54,149 | | | $ | 55,201 | | | $ | 53,208 | | | $ | 142,210 | |
| | | | | |
Ratio of net expenses to average net assets | | | 0.77 | % | | | 0.77 | % | | | 0.79 | % | | | 0.79 | % | | | 0.82 | % |
| | | | | |
Ratio of total expenses to average net assets | | | 0.93 | % | | | 1.00 | % | | | 1.01 | % | | | 0.97 | % | | | 0.95 | % |
| | | | | |
Ratio of net investment income to average net assets | | | 0.60 | % | | | 0.63 | % | | | 1.03 | % | | | 0.88 | % | | | 1.21 | % |
| | | | | |
Portfolio turnover rate(c) | | | 206 | % | | | 203 | % | | | 187 | % | | | 160 | % | | | 184 | % |
| (a) | Calculated based on the average shares outstanding methodology. |
| (b) | Assumes investment at the NAV at the beginning of the year, reinvestment of all dividends and distributions, a complete redemption of the investment at the NAV at the end of the year and no sales or redemption charges (if any). Total returns would be reduced if a sales or redemption charge was taken into account. Returns do not reflect the impact of taxes to shareholders relating to Fund distributions or the redemption of Fund shares. |
| (c) | The Fund’s portfolio turnover rate is calculated in accordance with regulatory requirements, without regard to transactions involving short term investments. If such transactions were included, the Fund’s portfolio turnover rate may be higher. |
| | |
| 102 | | The accompanying notes are an integral part of these financial statements. |
GOLDMAN SACHS VARIABLE INSURANCE TRUST EQUITY FUNDS
Notes to Financial Statements
December 31, 2021
1. ORGANIZATION
Goldman Sachs Variable Insurance Trust (the “Trust” or “VIT”) is a Delaware statutory trust registered under the Investment Company Act of 1940, as amended (the “Act”), as an open-end management investment company. The following table lists those series of the Trust that are included in this report (collectively, the “Funds” or individually a “Fund”), along with their corresponding share classes and respective diversification status under the Act:
| | | | |
| Fund | | Share Classes Offered | | Diversified/ Non-diversified |
Equity Index | | Service | | Diversified |
Growth Opportunities | | Institutional and Service | | Diversified |
International Equity Insights | | Institutional and Service | | Diversified |
Large Cap Value | | Institutional and Service | | Diversified |
Mid Cap Value | | Institutional and Service | | Diversified |
Small Cap Equity Insights | | Institutional and Service | | Diversified |
Strategic Growth | | Institutional and Service | | Non-Diversified |
U.S. Equity Insights | | Institutional and Service | | Diversified |
Shares of the Trust are offered to separate accounts of participating life insurance companies for the purpose of funding variable annuity contracts and variable life insurance policies.
Goldman Sachs Asset Management, L.P. (“GSAM” or the “Investment Adviser”), an affiliate of Goldman Sachs & Co. LLC (“Goldman Sachs”), serves as investment adviser to the Funds pursuant to management agreements (the “Agreements”) with the Trust.
2. SIGNIFICANT ACCOUNTING POLICIES
The financial statements have been prepared in accordance with accounting principles generally accepted in the United States of America (“GAAP”) and require management to make estimates and assumptions that may affect the reported amounts and disclosures. Actual results may differ from those estimates and assumptions. Each Fund is an investment company under GAAP and follows the accounting and reporting guidance applicable to investment companies.
A. Investment Valuation — The Fund’s valuation policy is to value investments at fair value.
B. Investment Income and Investments — Investment income includes interest income, dividend income, and securities lending income, if any. Interest income is accrued daily and adjusted for amortization of premiums and accretion of discounts. Dividend income is recognized on ex-dividend date or, for certain foreign securities, as soon as such information is obtained subsequent to the ex-dividend date. Non-cash dividends, if any, are recorded at the fair market value of the securities received. Investment transactions are reflected on trade date. Realized gains and losses are calculated using identified cost. Investment transactions are recorded on the following business day for daily net asset value (“NAV”) calculations. Investment income is recorded net of any foreign withholding taxes, less any amounts reclaimable. The Funds may file withholding tax reclaims in certain jurisdictions to recover a portion of amounts previously withheld. Any foreign capital gains tax is accrued daily based upon net unrealized gains, and is payable upon sale of such investments. Distributions received from the Funds’ investments in United States (“U.S.”) real estate investment trusts (“REITs”) may be characterized as ordinary income, net capital gain and/or a return of capital. A return of capital is recorded by the Funds as a reduction to the cost basis of the REIT.
For derivative contracts, realized gains and losses are recorded upon settlement of the contract.
C. Class Allocations and Expenses — Investment income, realized and unrealized gain (loss), if any, and non-class specific expenses of each Fund are allocated daily based upon the proportion of net assets of each class. Non-class specific expenses
GOLDMAN SACHS VARIABLE INSURANCE TRUST EQUITY FUNDS
Notes to Financial Statements (continued)
December 31, 2021
2. SIGNIFICANT ACCOUNTING POLICIES (continued)
directly incurred by a Fund are charged to that Fund, while such expenses incurred by the Trust are allocated across the applicable Funds on a straight-line and/or pro-rata basis depending upon the nature of the expenses. Class specific expenses, where applicable, are borne by the respective share classes and include Distribution and Service and Transfer Agency fees.
D. Federal Taxes and Distributions to Shareholders — It is each Fund’s policy to comply with the requirements of the Internal Revenue Code of 1986, as amended (the “Code”), applicable to regulated investment companies and to distribute each year substantially all of its investment company taxable income and capital gains to its shareholders. Accordingly, each Fund is not required to make any provisions for the payment of federal income tax. Distributions to shareholders are recorded on the ex-dividend date. Income and capital gains distributions, if any, are declared and paid at least annually.
Net capital losses, if any, are carried forward to future fiscal years and may be used to the extent allowed by the Code to offset any future capital gains. Losses that are carried forward will retain their character as either short-term or long-term capital losses. Utilization of capital loss carryforwards will reduce the requirement of future capital gains distributions.
The characterization of distributions to shareholders for financial reporting purposes is determined in accordance with federal income tax rules, which may differ from GAAP. The source of each Fund’s distributions may be shown in the accompanying financial statements as either from distributable earnings or capital. Certain components of the Funds’ net assets on the Statements of Assets and Liabilities reflect permanent GAAP/tax differences based on the appropriate tax character.
E. Foreign Currency Translation — The accounting records and reporting currency of a Fund are maintained in U.S. dollars. Assets and liabilities denominated in foreign currencies are translated into U.S. dollars using the current exchange rates at the close of each business day. The effect of changes in foreign currency exchange rates on investments is included within net realized and unrealized gain (loss) on investments. Changes in the value of other assets and liabilities as a result of fluctuations in foreign exchange rates are included in the Statements of Operations within net change in unrealized gain (loss) on foreign currency translation. Transactions denominated in foreign currencies are translated into U.S. dollars on the date the transaction occurred, the effects of which are included within net realized gain (loss) on foreign currency transactions.
3. INVESTMENTS AND FAIR VALUE MEASUREMENTS
U.S. GAAP defines the fair value of a financial instrument as the amount that would be received to sell an asset or paid to transfer a liability in an orderly transaction between market participants at the measurement date (i.e., the exit price); the Funds’ policy is to use the market approach. GAAP establishes a fair value hierarchy that prioritizes the inputs to valuation techniques used to measure fair value. The hierarchy gives the highest priority to unadjusted quoted prices in active markets for identical assets or liabilities (Level 1 measurements) and the lowest priority to unobservable inputs (Level 3 measurements). The level in the fair value hierarchy within which the fair value measurement in its entirety falls shall be determined based on the lowest level input that is significant to the fair value measurement in its entirety. The levels used for classifying investments are not necessarily an indication of the risk associated with investing in these investments. The three levels of the fair value hierarchy are described below:
Level 1 — Unadjusted quoted prices in active markets that are accessible at the measurement date for identical, unrestricted assets or liabilities;
Level 2 — Quoted prices in markets that are not active or financial instruments for which significant inputs are observable (including, but not limited to, quoted prices for similar investments, interest rates, foreign exchange rates, volatility and credit spreads), either directly or indirectly;
Level 3 — Prices or valuations that require significant unobservable inputs (including GSAM’s assumptions in determining fair value measurement).
The Board of Trustees (“Trustees”) has approved Valuation Procedures that govern the valuation of the portfolio investments held by the Funds, including investments for which market quotations are not readily available. The Trustees have delegated to GSAM day-to-day responsibility for implementing and maintaining internal controls and procedures related to the valuation of the Funds’ investments. To assess the continuing appropriateness of pricing sources and methodologies, GSAM regularly performs price
GOLDMAN SACHS VARIABLE INSURANCE TRUST EQUITY FUNDS
3. INVESTMENTS AND FAIR VALUE MEASUREMENTS (continued)
verification procedures and issues challenges as necessary to third party pricing vendors or brokers, and any differences are reviewed in accordance with the Valuation Procedures.
A. Level 1 and Level 2 Fair Value Investments — The valuation techniques and significant inputs used in determining the fair values for investments classified as Level 1 and Level 2 are as follows:
Equity Securities — Equity securities traded on a U.S. securities exchange or the NASDAQ system, or those located on certain foreign exchanges, including but not limited to the Americas, are valued daily at their last sale price or official closing price on the principal exchange or system on which they are traded. If there is no sale or official closing price or such price is believed by GSAM to not represent fair value, equity securities will be valued at the valid closing bid price for long positions and at the valid closing ask price for short positions (i.e. where there is sufficient volume, during normal exchange trading hours). If no valid bid/ask price is available, the equity security will be valued pursuant to the Valuation Procedures approved by the Trustees and consistent with applicable regulatory guidance. To the extent these investments are actively traded, they are classified as Level 1 of the fair value hierarchy, otherwise they are generally classified as Level 2. Certain equity securities containing unique attributes may be classified as Level 2.
Unlisted equity securities for which market quotations are available are valued at the last sale price on the valuation date, or if no sale occurs, at the last bid price for long positions or the last ask price for short positions, and are generally classified as Level 2. Securities traded on certain foreign securities exchanges are valued daily at fair value determined by an independent fair value service (if available) under Fair Valuation Procedures approved by the Trustees and consistent with applicable regulatory guidance. The independent fair value service takes into account multiple factors including, but not limited to, movements in the securities markets, certain depositary receipts, futures contracts and foreign currency exchange rates that have occurred subsequent to the close of the foreign securities exchange. These investments are generally classified as Level 2 of the fair value hierarchy.
Money Market Funds — Investments in the Goldman Sachs Financial Square Government Fund (“Underlying Fund”) are valued at the NAV per share of the Institutional Share class on the day of valuation. These investments are generally classified as Level 1 of the fair value hierarchy. For information regarding the Underlying Fund’s accounting policies and investment holdings, please see the Underlying Fund’s shareholder report.
Derivative Contracts — A derivative is an instrument whose value is derived from underlying assets, indices, reference rates or a combination of these factors. A Fund enters into derivative transactions to hedge against changes in interest rates, securities prices, and/or currency exchange rates, to increase total return, or to gain access to certain markets or attain exposure to other underliers. For financial reporting purposes, cash collateral that has been pledged to cover obligations of a Fund and cash collateral received, if any, is reported separately on the Statements of Assets and Liabilities as receivables/payables for collateral on certain derivatives contracts. Non-cash collateral pledged by a Fund, if any, is noted in the Schedules of Investments.
Exchange-traded derivatives, including futures and options contracts, are generally valued at the last sale or settlement price on the exchange where they are principally traded. Exchange-traded options without settlement prices are generally valued at the midpoint of the bid and ask prices on the exchange where they are principally traded (or, in the absence of two-way trading, at the last bid price for long positions and the last ask price for short positions). Exchange-traded derivatives typically fall within Level 1 of the fair value hierarchy. Over-the-counter (“OTC”) and centrally cleared derivatives are valued using market transactions and other market evidence, including market-based inputs to models, calibration to market-clearing transactions, broker or dealer quotations, or other alternative pricing sources. Where models are used, the selection of a particular model to value OTC and centrally cleared derivatives depends upon the contractual terms of, and specific risks inherent in, the instrument, as well as the availability of pricing information in the market. Valuation models require a variety of inputs, including contractual terms, market prices, yield curves, credit curves, measures of volatility, voluntary and involuntary prepayment rates, loss severity rates and correlations of such inputs. For OTC and centrally cleared derivatives that trade in liquid markets, model inputs can generally be verified and model selection does not involve significant management judgment. OTC and centrally cleared derivatives are classified within Level 2 of the fair value hierarchy when significant inputs are corroborated by market evidence.
GOLDMAN SACHS VARIABLE INSURANCE TRUST EQUITY FUNDS
Notes to Financial Statements (continued)
December 31, 2021
3. INVESTMENTS AND FAIR VALUE MEASUREMENTS (continued)
i. Futures Contracts — Futures contracts are contracts to buy or sell a standardized quantity of a specified commodity or security. Upon entering into a futures contract, a Fund deposits cash or securities in an account on behalf of the broker in an amount sufficient to meet the initial margin requirement. Subsequent payments are made or received by a Fund equal to the daily change in the contract value and are recorded as variation margin receivable or payable with a corresponding offset to unrealized gains or losses.
B. Level 3 Fair Value Investments — To the extent that significant inputs to valuation models and other alternative pricing sources are unobservable, or if quotations are not readily available, or if GSAM believes that such quotations do not accurately reflect fair value, the fair value of a Fund’s investments may be determined under Valuation Procedures approved by the Trustees. GSAM, consistent with its procedures and applicable regulatory guidance, may make an adjustment to the most recent valuation prices of either domestic or foreign securities in light of significant events to reflect what it believes to be the fair value of the securities at the time of determining a Fund’s NAV. To the extent investments are valued using single source broker quotations obtained directly from the broker or passed through from third party pricing vendors, such investments are classified as Level 3 investments.
C. Fair Value Hierarchy — The following is a summary of the Funds’ investments and derivatives classified in the fair value hierarchy as of December 31, 2021:
| | | | | | | | | | | | |
| | | |
| EQUITY INDEX FUND | | | | | | | | | |
| Investment Type | | Level 1 | | | Level 2 | | | Level 3 | |
| | | |
| Assets | | | | | | | | | | | | |
| Common Stock and/or Other Equity Investments(a) | | | | | | | | | | | | |
Asia | | $ | 326,864 | | | $ | — | | | $ | — | |
Europe | | | 975,201 | | | | — | | | | — | |
North America | | | 219,298,447 | | | | — | | | | — | |
| | | |
| Total | | $ | 220,600,512 | | | $ | — | | | $ | — | |
| | | |
| Derivative Type | | | | | | | | | |
| | | |
| Assets(b) | | | | | | | | | | | | |
| Futures Contracts | | $ | 13,903 | | | $ | — | | | $ | — | |
| | | |
| GROWTH OPPORTUNITIES FUND | | | | | | | | | |
| Investment Type | | Level 1 | | | Level 2 | | | Level 3 | |
| | | |
| Assets | | | | | | | | | | | | |
| Common Stock and/or Other Equity Investments(a) | | | | | | | | | | | | |
Europe | | $ | 1,481,810 | | | $ | — | | | $ | — | |
North America | | | 74,667,775 | | | | — | | | | — | |
South America | | | 397,265 | | | | — | | | | — | |
| Investment Company | | | 933,690 | | | | — | | | | — | |
| Securities Lending Reinvestment Vehicle | | | 688,836 | | | | — | | | | — | |
| | | |
| Total | | $ | 78,169,376 | | | $ | — | | | $ | — | |
GOLDMAN SACHS VARIABLE INSURANCE TRUST EQUITY FUNDS
3. INVESTMENTS AND FAIR VALUE MEASUREMENTS (continued)
| | | | | | | | | | | | |
| | | |
| INTERNATIONAL EQUITY INSIGHTS FUND | | | | | | | | | |
| Investment Type | | Level 1 | | | Level 2 | | | Level 3 | |
| | | |
| Assets | | | | | | | | | | | | |
| Common Stock and/or Other Equity Investments(a) | | | | | | | | | | | | |
Africa | | $ | — | | | $ | 1,011,073 | | | $ | — | |
Asia | | | 47,127 | | | | 31,045,170 | | | | — | |
Europe | | | 2,320,278 | | | | 57,792,496 | | | | — | |
North America | | | — | | | | 3,088,815 | | | | — | |
Oceania | | | 1,176,136 | | | | 9,040,295 | | | | — | |
| | | |
| Total | | $ | 3,543,541 | | | $ | 101,977,849 | | | $ | — | |
| | | |
| Derivative Type | | | | | | | | | |
| | | |
| Assets(b) | | | | | | | | | | | | |
| Futures Contracts | | $ | 2,788 | | | $ | — | | | $ | — | |
| | | |
| LARGE CAP VALUE FUND | | | | | | | | | |
| Investment Type | | Level 1 | | | Level 2 | | | Level 3 | |
| | | |
| Assets | | | | | | | | | | | | |
| Common Stock and/or Other Equity Investments(a) | | | | | | | | | | | | |
Europe | | $ | 10,354,344 | | | $ | — | | | $ | — | |
North America | | | 474,982,922 | | | | — | | | | — | |
| Investment Company | | | 2,751,464 | | | | — | | | | — | |
| | | |
| Total | | $ | 488,088,730 | | | $ | — | | | $ | — | |
| | | |
| MID CAP VALUE FUND | | | | | | | | | |
| Investment Type | | Level 1 | | | Level 2 | | | Level 3 | |
| | | |
| Assets | | | | | | | | | | | | |
| Common Stock and/or Other Equity Investments(a) | | | | | | | | | | | | |
Europe | | $ | 12,539,163 | | | $ | — | | | $ | — | |
North America | | | 535,436,576 | | | | — | | | | — | |
| Investment Company | | | 4,761,405 | | | | — | | | | — | |
| | | |
| Total | | $ | 552,737,144 | | | $ | — | | | $ | — | |
| | | |
| SMALL CAP EQUITY INSIGHTS FUND | | | | | | | | | |
| Investment Type | | Level 1 | | | Level 2 | | | Level 3 | |
| | | |
| Assets | | | | | | | | | | | | |
| Common Stock and/or Other Equity Investments(a) | | | | | | | | | | | | |
Africa | | $ | 100,994 | | | $ | — | | | $ | — | |
Asia | | | 937,750 | | | | — | | | | — | |
Europe | | | 591,542 | | | | — | | | | — | |
North America | | | 127,305,820 | | | | — | | | | — | |
| Securities Lending Reinvestment Vehicle | | | 1,845,983 | | | | — | | | | — | |
| | | |
| Total | | $ | 130,782,089 | | | $ | — | | | $ | — | |
GOLDMAN SACHS VARIABLE INSURANCE TRUST EQUITY FUNDS
Notes to Financial Statements (continued)
December 31, 2021
3. INVESTMENTS AND FAIR VALUE MEASUREMENTS (continued)
| | | | | | | | | | | | |
| | | |
| SMALL CAP EQUITY INSIGHTS FUND (continued) | | | | | | | | | |
| Derivative Type | | Level 1 | | | Level 2 | | | Level 3 | |
| | | |
| Assets(b) | | | | | | | | | | | | |
| Futures Contracts | | $ | 10,175 | | | $ | — | | | $ | — | |
| | | |
| STRATEGIC GROWTH FUND | | | | | | | | | |
| Investment Type | | Level 1 | | | Level 2 | | | Level 3 | |
| | | |
| Assets | | | | | | | | | | | | |
| Common Stock and/or Other Equity Investments(a) | | | | | | | | | | | | |
Europe | | $ | 6,514,692 | | | $ | — | | | $ | — | |
North America | | | 437,184,267 | | | | — | | | | — | |
South America | | | 1,123,022 | | | | — | | | | — | |
| Investment Company | | | 4,509,290 | | | | — | | | | — | |
| Securities Lending Reinvestment Vehicle | | | 858,041 | | | | — | | | | — | |
| | | |
| Total | | $ | 450,189,312 | | | $ | — | | | $ | — | |
| | | |
| U.S. EQUITY INSIGHTS FUND | | | | | | | | | |
| Investment Type | | Level 1 | | | Level 2 | | | Level 3 | |
| | | |
| Assets | | | | | | | | | | | | |
| Common Stock and/or Other Equity Investments(a) | | | | | | | | | | | | |
Asia | | $ | 537,076 | | | $ | — | | | $ | — | |
Europe | | | 845,537 | | | | — | | | | — | |
North America | | | 376,834,100 | | | | — | | | | — | |
| | | |
| Total | | $ | 378,216,713 | | | $ | — | | | $ | — | |
| (a) | Amounts are disclosed by continent to highlight the impact of time zone differences between local market close and the calculation of NAV. Security valuations are based on the principal exchange or system on which they are traded, which may differ from country of domicile noted in table. The Fund utilizes fair value model prices provided by an independent third-party (fair value) service for certain international equity securities resulting in a Level 2 classification. |
| (b) | Amount shown represents unrealized gain at fiscal year end. |
For further information regarding security characteristics, see the Schedules of Investments.
4. INVESTMENTS IN DERIVATIVES
The following table sets forth, by certain risk types, the gross value of derivative contracts (not considered to be hedging instruments for accounting disclosure purposes) as of December 31, 2021. These instruments were used as part of the Funds’ investment strategies and to obtain and/or manage exposure related to the risks below. The values in the tables below exclude the effects of cash collateral received or posted pursuant to these derivative contracts, and therefore are not representative of the Funds’ net exposure.
| | | | | | | | | | | | | | |
| Fund | | Risk | | Statements of Assets and Liabilities | | Assets(a) | | | Statements of Assets and Liabilities | | Liabilities(a) | |
| Equity Index | | Equity | | Variation margin on futures contracts | | $ | 13,903 | | | — | | $ | — | |
International Equity Insights | | Equity | | Variation margin on futures contracts | | | 2,788 | | | — | | | — | |
| Small Cap Equity Insights | | Equity | | Variation margin on futures contracts | | | 10,175 | | | — | | | — | |
| (a) | Includes unrealized gain (loss) on futures contracts described in the Additional Investment Information sections of the Schedules of Investments. Only the variation margin as of December 31, 2021 is reported within the Statements of Assets and Liabilities. |
GOLDMAN SACHS VARIABLE INSURANCE TRUST EQUITY FUNDS
4. INVESTMENTS IN DERIVATIVES (continued)
The following tables set forth, by certain risk types, the Funds’ gains (losses) related to these derivatives and their indicative volumes for the year ended December 31, 2021. These gains (losses) should be considered in the context that these derivative contracts may have been executed to create investment opportunities and/or economically hedge certain investments, and accordingly, certain gains (losses) on such derivative contracts may offset certain (losses) gains attributable to investments. These gains (losses) are included in “Net realized gain (loss)” or “Net change in unrealized gain (loss)” on the Statements of Operations:
Equity Index
| | | | | | | | |
| Risk | | Statement of Operations | | Net
Realized
Gain (Loss) | | Net Change in
Unrealized
Gain (Loss) | |
| | | |
| Equity | | Net realized gain (loss) from futures contracts/Net change in unrealized gain (loss) on futures contracts | | $410,607 | | $ | (28,046 | ) |
International Equity Insights
| | | | | | | | |
| Risk | | Statement of Operations | | Net
Realized
Gain (Loss) | | Net Change in
Unrealized
Gain (Loss) | |
| | | |
| Equity | | Net realized gain (loss) from futures contracts/Net change in unrealized gain (loss) on futures contracts | | $189,281 | | $ | (22,567 | ) |
Small Cap Equity Insights
| | | | | | | | |
| Risk | | Statement of Operations | | Net
Realized
Gain (Loss) | | Net Change in
Unrealized
Gain (Loss) | |
| | | |
| Equity | | Net realized gain (loss) from futures contracts/Net change in unrealized gain (loss) on futures contracts | | $192,178 | | $ | (43,630 | ) |
For the year ended December 31, 2021, the relevant values for each derivative type were as follows:
| | | | |
| | | Average Number
of Contracts(1) | |
| Fund | | Futures
Contracts | |
| Equity Index | | | 7 | |
| International Equity Insights | | | 20 | |
| Small Cap Equity Insights | | | 17 | |
| (1) | Amounts disclosed represent average number of contracts for futures contracts, based on absolute values, which is indicative of volume of this derivative type, for the months that the Fund held such derivatives during the fiscal year ended December 31, 2021. |
5. AGREEMENTS AND AFFILIATED TRANSACTIONS
A. Management Agreement — Under the Agreement, GSAM manages the Funds, subject to the general supervision of the Trustees.
As compensation for the services rendered pursuant to the Agreement, the assumption of the expenses related thereto and administration of the Funds’ business affairs, including providing facilities, GSAM is entitled to a management fee, accrued daily and paid monthly, equal to an annual percentage rate of each Fund’s average daily net assets.
GOLDMAN SACHS VARIABLE INSURANCE TRUST EQUITY FUNDS
Notes to Financial Statements (continued)
December 31, 2021
5. AGREEMENTS AND AFFILIATED TRANSACTIONS (continued)
For the year ended December 31, 2021, contractual and effective net management fees with GSAM were at the following rates:
| | | | | | | | | | | | | | | | | | | | | | | | | | | | |
| | | Contractual Management Rate | | | Effective
Rate | | | Effective Net
Management
Rate^ | |
| Fund | | First
$1 billion | | | Next
$1 billion | | | Next
$3 billion | | | Next
$3 billion | | | Over
$8 billion | |
| Growth Opportunities | | | 0.87 | % | | | 0.87 | % | | | 0.78 | % | | | 0.74 | % | | | 0.73 | % | | | 0.87 | % | | | 0.82 | %* |
| International Equity Insights | | | 0.81 | | | | 0.73 | | | | 0.69 | | | | 0.68 | | | | 0.67 | | | | 0.81 | | | | 0.81 | |
| Large Cap Value | | | 0.72 | | | | 0.65 | | | | 0.62 | | | | 0.60 | | | | 0.59 | | | | 0.72 | | | | 0.68 | * |
| Mid Cap Value | | | 0.77 | | | | 0.77 | | | | 0.69 | | | | 0.66 | | | | 0.65 | | | | 0.77 | | | | 0.77 | |
| Small Cap Equity Insights | | | 0.70 | | | | 0.70 | | | | 0.63 | | | | 0.60 | | | | 0.59 | | | | 0.70 | | | | 0.70 | |
| Strategic Growth | | | 0.71 | | | | 0.64 | | | | 0.61 | | | | 0.59 | | | | 0.58 | | | | 0.71 | | | | 0.71 | |
| U.S. Equity Insights | | | 0.62 | | | | 0.59 | | | | 0.56 | | | | 0.55 | | | | 0.54 | | | | 0.62 | | | | 0.54 | * |
| ^ | Effective Net Management Rate includes the impact of management fee waivers of affiliated Underlying Funds, if any. The Effective Net Management Rate may not correlate to the Contractual Management Rate as a result of management fee waivers that may be in effect from time to time. |
| * | GSAM agreed to waive a portion of its management fee in order to achieve an effective net management rate as defined in the Funds’ most recent prospectus. This waiver will remain in effect through at least April 30, 2022, and prior to such date GSAM may not terminate the arrangement without approval of the Trustees. |
The Growth Opportunities, International Equity Insights, Large Cap Value, Mid Cap Value, Small Cap Equity Insights, Strategic Growth and U.S. Equity Insights Funds invest in Institutional Shares of the Goldman Sachs Financial Square Government Fund, which is an affiliated Underlying Fund. GSAM has agreed to waive a portion of its management fee payable by the Funds in an amount equal to the management fee it earns as an investment adviser to the affiliated Underlying Fund in which the Funds invest, except those management fees it earns from the Funds’ investments of cash collateral received in connection with securities lending transactions in the Goldman Sachs Financial Square Government Fund. For the year ended December 31, 2021, with respect to the Funds’ investments in an affiliated Underlying Fund GSAM waived $479, $3, $1,469, $2,221, $849, $2,084 and $17 of the Growth Opportunities, International Equity Insights, Large Cap Value, Mid Cap Value, Small Cap Equity Insights, Strategic Growth and U.S. Equity Insights Funds’ management fees, respectively.
The Agreement for the Equity Index Fund provides for a contractual management fee at an annual rate equal to 0.30% of the Fund’s average daily net assets. The Investment Adviser has agreed to waive a portion of the management fee equal to 0.09% of the annual contractual rate applicable to the Equity Index Fund’s average daily net assets between $0 and $400 million and 0.10% of the annual contractual rate applicable to the Fund’s average daily net assets in excess of $400 million. This management fee waiver will remain in effect through at least April 30, 2022, and prior to such date the Investment Adviser may not terminate the arrangement without the approval of the Board of Trustees. For the year ended December 31, 2021, the Fund paid GSAM an Effective Net Management Rate of 0.21%.
As authorized by the Agreement for the Equity Index Fund, GSAM has entered into a Sub-advisory Agreement with SSgA Funds Management, Inc. (“SSgA”) which serves as the sub-adviser to the Fund and provides the day-to-day advice regarding the Fund’s portfolio transactions. As compensation for its services, SSgA is entitled to a fee, accrued daily and paid monthly by GSAM, at the following annual rates of the Fund’s average daily net assets: 0.03% on the first $50 million, 0.02% on the next $200 million, 0.01% on the next $750 million and 0.008% over $1 billion. The effective Sub-advisory fee was 0.02% for the year ended December 31, 2021.
B. Distribution and Service (12b-1) Plans — The Trust, on behalf of Service Shares of each Fund, has adopted a Distribution and Service Plan subject to Rule 12b-1 under the Act. Under the Distribution and Service Plan, Goldman Sachs, which serves as distributor (the “Distributor”), is entitled to a fee accrued daily and paid monthly for distribution services and personal and account maintenance services, which may then be paid by Goldman Sachs to authorized dealers, equal to, on an annual basis, 0.25% of the
GOLDMAN SACHS VARIABLE INSURANCE TRUST EQUITY FUNDS
5. AGREEMENTS AND AFFILIATED TRANSACTIONS (continued)
Funds’ average daily net assets attributable to Service Shares. For the fiscal year ended December 31, 2021 for the U.S. Equity Insights Fund, Goldman Sachs agreed to waive distribution and services fees so as not to exceed an annual rate of 0.21% of average daily net assets of the Fund. For the period from April 30, 2021 to December 31, 2021 for the Growth Opportunities Fund, Goldman Sachs agreed to waive distribution and services fees so as not to exceed an annual rate of 0.15% of average daily net assets of the Fund. These distribution and service fee waivers will remain in place through at least April 30, 2022, and prior to such date Goldman Sachs may not terminate the arrangement without the approval of the Trustees. Prior to April 30, 2021, Goldman Sachs had agreed to waive distribution and service fees so as not to exceed an annual rate of 0.16% of average daily net assets of the Growth Opportunities Fund.
C. Transfer Agency Agreement — Goldman Sachs also serves as the transfer agent of the Funds for a fee pursuant to the Transfer Agency Agreement. The fees charged for such transfer agency services are accrued daily and paid monthly at an annual rate of 0.02% of the average daily net assets of Institutional and Service Shares. Goldman Sachs has agreed to waive its transfer agency fee attributable to the Service Shares of the Large Cap Value Fund. This arrangement will remain in place through at least April 30, 2022, and prior to such date Goldman Sachs may not terminate the arrangement without approval of the Board of Trustees.
D. Other Expense Agreements and Affiliated Transactions — GSAM has agreed to reduce or limit certain “Other Expenses” of the Funds (excluding acquired fund fees and expenses, transfer agency fees and expenses, service fees and shareholder administration fees (as applicable), taxes, interest, brokerage fees, expenses of shareholder meetings, litigation and indemnification, and extraordinary expenses) to the extent such expenses exceed, on an annual basis, a percentage rate of the average daily net assets of each Fund. Such Other Expense reimbursements, if any, are accrued daily and paid monthly. In addition, the Funds are not obligated to reimburse GSAM for prior fiscal year expense reimbursements, if any. The Other Expense limitations as an annual percentage rate of average daily net assets for the Equity Index, Growth Opportunities, International Equity Insights, Large Cap Value, Mid Cap Value, Small Cap Equity Insights, Strategic Growth and U.S. Equity Insights Funds are 0.004%, 0.004%, 0.044%, 0.004%, 0.054%, 0.094%, 0.014% and 0.004%, respectively. These Other Expense limitations will remain in place through at least April 30, 2022, and prior to such date GSAM may not terminate the arrangements without the approval of the Trustees. In addition, the Funds have entered into certain offset arrangements with the custodian and the transfer agent, which may result in a reduction of the Funds’ expenses and are received irrespective of the application of the “Other Expense” limitations described above.
For the fiscal year ended December 31, 2021, these expense reductions, including any fee waivers and Other Expense reimbursements, were as follows:
| | | | | | | | | | | | | | | | | | | | |
| Fund | | Management
Fee Waiver | | | Distribution and
Service Fee Waiver | | | Transfer Agency
Waiver/Credits | | | Other Expense
Reimbursement | | | Total Expense
Reductions | |
| Equity Index | | $ | 182,363 | | | $ | — | | | $ | — | | | $ | 264,860 | | | $ | 447,223 | |
| Growth Opportunities | | | 43,361 | | | | 76,788 | | | | — | | | | 235,253 | | | | 355,402 | |
| International Equity Insights | | | 3 | | | | — | | | | — | | | | 310,433 | | | | 310,436 | |
| Large Cap Value | | | 193,178 | | | | — | | | | 46,366 | | | | 291,066 | | | | 530,610 | |
| Mid Cap Value | | | 2,221 | | | | 93,494 | | | | — | | | | — | | | | 95,715 | |
| Small Cap Equity Insights | | | 849 | | | | — | | | | — | | | | 145,033 | | | | 145,882 | |
| Strategic Growth | | | 2,084 | | | | — | | | | — | | | | 235,886 | | | | 237,970 | |
| U.S. Equity Insights | | | 283,883 | | | | 5,882 | | | | — | | | | 273,878 | | | | 563,643 | |
GOLDMAN SACHS VARIABLE INSURANCE TRUST EQUITY FUNDS
Notes to Financial Statements (continued)
December 31, 2021
5. AGREEMENTS AND AFFILIATED TRANSACTIONS (continued)
G. Line of Credit Facility — As of December 31, 2021, the Funds participated in a $1,000,000,000 committed, unsecured revolving line of credit facility (the “facility”) together with other funds of the Trust and certain registered investment companies having management agreements with GSAM or its affiliates. This facility is to be used for temporary emergency purposes, or to allow for an orderly liquidation of securities to meet redemption requests. The interest rate on borrowings is based on the federal funds rate. The facility also requires a fee to be paid by the Funds based on the amount of the commitment that has not been utilized. For the fiscal year ended December 31, 2021, the Fund did not have any borrowings under the facility. Prior to April 26, 2021, the facility was $700,000,000.
H. Other Transactions with Affiliates — For the fiscal year ended December 31, 2021, Goldman Sachs earned $64, $39, $436 and $919 in brokerage commissions from portfolio transactions, including futures transactions executed with Goldman Sachs as the Futures Commission Merchant, on behalf of the Growth Opportunities, Large Cap Value, Mid Cap Value and Strategic Growth Funds, respectively.
The following table provides information about the investment in shares of issuers of which a Fund is an affiliate as of and for the fiscal year ended December 31, 2021:
| | | | | | | | | | | | | | | | | | | | | | | | | | | | | | | | | | |
| Fund | | Name of Affiliated Issuer | | Beginning
Value as of
December 31, 2020 | | | Purchases
at Cost | | | Proceeds
from Sales | | | Net
Realized
Gain
(Loss) | | | Change in
Unrealized
Appreciation
(Depreciation) | | | Ending
Value as of
December 31,
2021 | | | Shares as of
December 31, 2021 | | | Dividend
Income | |
| Equity Index | | Goldman Sachs Group, Inc. (The) | | $ | 527,684 | | | $ | 14,700 | | | $ | (63,853 | ) | | $ | 34,656 | | | $ | 198,739 | | | $ | 711,926 | | | | 1,861 | | | $ | 4,875 | |
The following table provides information about the Funds’ investment in the Goldman Sachs Financial Square Government Fund as of and for the fiscal year ended December 31, 2021:
| | | | | | | | | | | | | | | | | | | | | | | | |
| Fund | | Beginning
Value as of
December 31, 2020 | | | Purchases
at Cost | | | Proceeds
from Sales | | | Ending
Value as of
December 31, 2021 | | | Shares as of
December 31, 2021 | | | Dividend
Income | |
| Growth Opportunities | | $ | 739,866 | | | $ | 20,063,016 | | | $ | (19,869,192 | ) | | $ | 933,690 | | | | 933,690 | | | $ | 205 | |
| International Equity Insights | | | — | | | | 1,442,826 | | | | (1,442,826 | ) | | | — | | | | — | | | | — | |
| Large Cap Value | | | 396,415 | | | | 73,360,661 | | | | (71,005,612 | ) | | | 2,751,464 | | | | 2,751,464 | | | | 500 | |
| Mid Cap Value | | | 1,803,152 | | | | 105,437,489 | | | | (102,479,236 | ) | | | 4,761,405 | | | | 4,761,405 | | | | 781 | |
| Small Cap Equity Insights | | | 1,017,248 | | | | 22,009,119 | | | | (23,026,367 | ) | | | — | | | | — | | | | 350 | |
| Strategic Growth | | | 3,315,576 | | | | 69,153,518 | | | | (67,959,804 | ) | | | 4,509,290 | | | | 4,509,290 | | | | 721 | |
As of December 31, 2021, The Goldman Sachs Group, Inc. was the beneficial owner of approximately 18% of the Institutional Shares of the Growth Opportunities Fund.
GOLDMAN SACHS VARIABLE INSURANCE TRUST EQUITY FUNDS
6. PORTFOLIO SECURITIES TRANSACTION
The cost of purchases and proceeds from sales and maturities of long-term securities for the fiscal year ended December 31, 2021, were as follows:
| | | | | | | | | | | | | | | | | | | | | | | | |
| Fund | | | | | | | | | | | | | | Purchases | | | Sales and
Maturities | |
| Equity Index | | | | | | | | | | | | | | | | | | $ | 8,044,741 | | | $ | 19,478,100 | |
| Growth Opportunities | | | | | | | | | | | | | | | | | | | 39,698,813 | | | | 54,080,568 | |
| International Equity Insights | | | | | | | | | | | | | | | | | | | 168,615,872 | | | | 167,995,322 | |
| Large Cap Value | | | | | | | | | | | | | | | | | | | 255,424,116 | | | | 327,340,597 | |
| Mid Cap Value | | | | | | | | | | | | | | | | | | | 325,962,341 | | | | 400,426,786 | |
| Small Cap Equity Insights | | | | | | | | | | | | | | | | | | | 213,405,302 | | | | 207,905,116 | |
| Strategic Growth | | | | | | | | | | | | | | | | | | | 87,126,395 | | | | 152,617,642 | |
| U.S. Equity Insights | | | | | | | | | | | | | | | | | | | 719,749,524 | | | | 749,657,479 | |
7. SECURITIES LENDING
The Growth Opportunities, Large Cap Value, Mid Cap Value and Strategic Growth Funds may lend their securities through a securities lending agent, the Bank of New York Mellon (“BNYM”), to certain qualified borrowers. Pursuant to exemptive relief granted by the Securities and Exchange Commission (“SEC”) and the terms and conditions contained therein, the Equity Index, International Equity Insights, Small Cap Equity Insights and U. S. Equity Insights Funds may lend their securities through a securities lending agent, Goldman Sachs Agency Lending (“GSAL”), a wholly-owned subsidiary of Goldman Sachs, to certain qualified borrowers including Goldman Sachs and affiliates. In accordance with the Funds’ securities lending procedures, the Funds receive cash collateral at least equal to the market value of the securities on loan. The market value of the loaned securities is determined at the close of business of the Funds, at their last sale price or official closing price on the principal exchange or system on which they are traded, and any additional required collateral is delivered to the Funds on the next business day. As with other extensions of credit, the Funds may experience delay in the recovery of their securities or incur a loss should the borrower of the securities breach its agreement with the Funds or become insolvent at a time when the collateral is insufficient to cover the cost of repurchasing securities on loan. Dividend income received from securities on loan may not be subject to withholding taxes and therefore withholding taxes paid may differ from the amounts listed in the Statements of Operations. Loans of securities are terminable at any time and as such 1) the remaining contractual maturities of the outstanding securities lending transactions are considered to be overnight and continuous and 2) the borrower, after notice, is required to return borrowed securities within the standard time period for settlement of securities transactions.
The Equity Index, Growth Opportunities, International Equity Insights, Large Cap Value, Mid Cap Value, Small Cap Equity Insights, Strategic Growth and U.S. Equity Insights Funds invest the cash collateral received in connection with securities lending transactions in the Goldman Sachs Financial Square Government Fund (“Government Money Market Fund”), an affiliated series of the Goldman Sachs Trust. The Government Money Market Fund is registered under the Act as an open end investment company, is subject to Rule 2a-7 under the Act, and is managed by GSAM, for which GSAM may receive a management fee of up to 0.16% on an annualized basis of the average daily net assets of the Government Money Market Fund.
In the event of a default by a borrower with respect to any loan, GSAL will, and BNYM may, exercise any and all remedies provided under the applicable borrower agreement to make the Funds whole. These remedies include purchasing replacement securities by applying the collateral held from the defaulting broker against the purchase cost of the replacement securities. If GSAL or BNYM are unable to purchase replacement securities, GSAL and/or BNYM will indemnify the Funds by paying the
GOLDMAN SACHS VARIABLE INSURANCE TRUST EQUITY FUNDS
Notes to Financial Statements (continued)
December 31, 2021
7. SECURITIES LENDING (continued)
Funds an amount equal to the market value of the securities loaned minus the value of cash collateral received from the borrower for the loan, subject to an exclusion for any shortfalls resulting from a loss of value in such cash collateral due to reinvestment risk. The Funds’ master netting agreements with certain borrowers provide the right, in the event of a default (including bankruptcy or insolvency), for the non-defaulting party to liquidate the collateral and calculate net exposure to the defaulting party or request additional collateral. However, in the event of a default by a borrower, a resolution authority could determine that such rights are not enforceable due to the restrictions or prohibitions against the right of set-off that may be imposed in accordance with a particular jurisdiction’s bankruptcy or insolvency laws. The Funds’ loaned securities were all subject to enforceable Securities Lending Agreements and the value of the collateral was at least equal to the value of the cash received. The amounts of the Funds’ overnight and continuous agreements, which represent the gross amounts of recognized liabilities for securities lending transactions outstanding as of December 31, 2021, are disclosed as “Payable upon return of securities loaned” on the Statements of Assets and Liabilities, where applicable. The Large Cap Value and Mid Cap Value Funds did not have securities on loan as of December 31, 2021.
Each of the Funds, GSAL and BNYM received compensation relating to the lending of the Funds’ securities. The amounts earned, if any, by the Funds’ for the fiscal year ended December 31, 2021, are reported under Investment Income on the Statements of Operations.
The table below details securities lending activity with affiliates of Goldman Sachs:
| | | | | | | | | | | | |
| | | For the fiscal year ended December 31, 2021 | | | Amounts payable to
Goldman Sachs Upon
Return of Securities Loaned
as of December 31, 2021 | |
| Fund | | Earnings of GSAL Relating
to Securities Loaned | | | Amounts Received by
the Funds from Lending
to Goldman Sachs | |
| Equity Index | | $ | 38 | | | $ | 276 | | | $ | — | |
| International Equity Insights | | | 278 | | | | 13 | | | | — | |
| Small Cap Equity Insights | | | 1,123 | | | | 2,690 | | | | 22,375 | |
| U.S. Equity Insights | | | 2,714 | | | | 2,986 | | | | — | |
The following table provides information about the Funds’ investment in the Government Money Market Fund for the fiscal year ended December 31, 2021:
| | | | | | | | | | | | | | | | |
| Fund | | Beginning
Value as of
December 31, 2020 | | | Purchases
at Cost | | | Proceeds
from Sales | | | Ending Value as of
December 31, 2021 | |
| Equity Index | | $ | 107,700 | | | $ | 213,250 | | | $ | (320,950 | ) | | $ | — | |
| Growth Opportunities | | | 1,380,662 | | | | 20,107,612 | | | | (20,799,438 | ) | | | 688,836 | |
| International Equity Insights | | | — | | | | 13,823,115 | | | | (13,823,115 | ) | | | — | |
| Mid Cap Value | | | 1,354,889 | | | | 8,846,086 | | | | (10,200,975 | ) | | | — | |
| Small Cap Equity Insights | | | 639,178 | | |
| 21,614,950
|
| | | (20,408,145 | ) | | | 1,845,983 | |
| Strategic Growth | | | 4,259,666 | | | | 53,864,832 | | | | (57,266,457 | ) | | | 858,041 | |
| U.S. Equity Insights | | | — | | | | 16,141,370 | | | | (16,141,370 | ) | | | — | |
GOLDMAN SACHS VARIABLE INSURANCE TRUST EQUITY FUNDS
8. TAX INFORMATION
The tax character of distributions paid during the fiscal year ended December 31, 2021 was as follows:
| | | | | | | | | | | | | | | | |
| | | Equity Index | | | Growth Opportunities | | | International Equity Insights | | | Large Cap Value | |
| Distributions paid from: | | | | | | | | | | | | | | | | |
Ordinary income | | $ | 2,333,133 | | | $ | 4,251,002 | | | $ | 3,833,918 | | | $ | 26,797,602 | |
Net long-term capital gains | | | 13,717,101 | | | | 9,192,251 | | | | 1,687,425 | | | | 36,936,613 | |
| Total taxable distributions | | $ | 16,050,234 | | | $ | 13,443,253 | | | $ | 5,521,343 | | | $ | 63,734,215 | |
| | | | | | | | | | | | | | | | |
| | | Mid Cap Value | | | Small Cap Equity Insights | | | Strategic Growth | | | U.S. Equity Insights | |
| Distributions paid from: | | | | | | | | | | | | | | | | |
Ordinary income | | $ | 44,797,367 | | | $ | 18,532,560 | | | $ | 13,427,087 | | | $ | 50,715,107 | |
Net long-term capital gains | | | 28,620,079 | | | | 10,074,781 | | | | 39,998,510 | | | | 34,647,431 | |
| Total taxable distributions | | $ | 73,417,446 | | | $ | 28,607,341 | | | $ | 53,425,597 | | | $ | 85,362,538 | |
The tax character of distributions paid during the fiscal year ended December 31, 2020 was as follows:
| | | | | | | | | | | | | | | | |
| | | Equity Index | | | Growth Opportunities | | | International Equity Insights | | | Large Cap Value | |
| Distributions paid from: | | | | | | | | | | | | | | | | |
Ordinary income | | $ | 2,165,597 | | | $ | 2,063,191 | | | $ | 1,296,906 | | | $ | 5,259,550 | |
Net long-term capital gains | | | 12,311,282 | | | | 11,674,825 | | | | — | | | | 7,804,739 | |
| Total taxable distributions | | $ | 14,476,879 | | | $ | 13,738,016 | | | $ | 1,296,906 | | | $ | 13,064,289 | |
| | | | | | | | | | | | | | | | |
| | | Mid Cap Value | | | Small Cap Equity Insights | | | Strategic Growth | | | U.S. Equity Insights | |
| Distributions paid from: | | | | | | | | | | | | | | | | |
Ordinary income | | $ | 5,574,669 | | | $ | 161,993 | | | $ | 6,087,164 | | | $ | 2,652,858 | |
Net long-term capital gains | | | 3,753,098 | | | | 1,217,779 | | | | 26,055,949 | | | | 12,398,395 | |
| Total taxable distributions | | $ | 9,327,767 | | | $ | 1,379,772 | | | $ | 32,143,113 | | | $ | 15,051,253 | |
As of December 31, 2021, the components of accumulated earnings (losses) on a tax-basis were as follows:
| | | | | | | | | | | | | | | | |
| | | Equity Index | | | Growth Opportunities | | | International Equity Insights | | | Large Cap Value | |
Undistributed ordinary income — net | | $ | 226,579 | | | $ | 55,910 | | | $ | 261,130 | | | $ | 1,695,119 | |
| Undistributed long-term capital gains | | | 1,176,981 | | | | 1,887,519 | | | | — | | | | 4,937,117 | |
| Total undistributed earnings | | $ | 1,403,560 | | | $ | 1,943,429 | | | $ | 261,130 | | | $ | 6,632,236 | |
| Timing differences (Real Estate Investment Trusts, late year ordinary loss deferral, post October loss deferral, and straddle loss deferrals) | | $ | 4,736 | | | $ | 2,663 | | | $ | (215,504 | ) | | $ | 53,518 | |
| Unrealized gains — net | | | 164,818,250 | | | | 23,896,076 | | | | 8,398,250 | | | | 121,442,027 | |
| Total accumulated earnings (losses) — net | | $ | 166,226,546 | | | $ | 25,842,168 | | | $ | 8,443,876 | | | $ | 128,127,781 | |
GOLDMAN SACHS VARIABLE INSURANCE TRUST EQUITY FUNDS
Notes to Financial Statements (continued)
December 31, 2021
8. TAX INFORMATION (continued)
| | | | | | | | | | | | | | | | |
| | | Mid Cap Value | | | Small Cap Equity Insights | | | Strategic Growth | | | U.S. Equity Insights | |
Undistributed ordinary income — net | | $ | 4,011,844 | | | $ | 60,618 | | | $ | 2,117,812 | | | $ | 229,536 | |
| Undistributed long-term capital gains | | | 17,932,677 | | | | 1,182,352 | | | | 5,739,907 | | | | 1,589,748 | |
| Total undistributed earnings | | $ | 21,944,521 | | | $ | 1,242,970 | | | $ | 7,857,719 | | | $ | 1,819,284 | |
| Timing differences (Real Estate Investment Trusts, late year ordinary loss deferral, post October loss deferral, and straddle loss deferrals) | | $ | 122,921 | | | $ | (229,579 | ) | | $ | — | | | $ | 4,020 | |
| Unrealized gains — net | | | 149,915,404 | | | | 12,710,748 | | | | 265,163,783 | | | | 97,122,642 | |
| Total accumulated earnings (losses) — net | | $ | 171,982,846 | | | $ | 13,724,139 | | | $ | 273,021,502 | | | $ | 98,945,946 | |
As of December 31, 2021, the Funds’ aggregate security unrealized gains and losses based on cost for U.S. federal income tax purposes were as follows:
| | | | | | | | | | | | | | | | |
| | | Equity Index | | | Growth Opportunities | | | International Equity Insights | | | Large Cap Value | |
| Tax cost | | $ | 55,735,384 | | | $ | 54,273,300 | | | $ | 97,139,188 | | | $ | 366,646,704 | |
Gross unrealized gain | | | 166,434,896 | | | | 26,387,114 | | | | 12,520,893 | | | | 128,821,719 | |
| Gross unrealized loss | | | (1,616,646 | ) | | | (2,491,038 | ) | | | (4,122,643 | ) | | | (7,379,692 | ) |
| Net unrealized gain (loss) | | $ | 164,818,250 | | | $ | 23,896,076 | | | $ | 8,398,250 | | | $ | 121,442,027 | |
| | | | | | | | | | | | | | | | |
| | | Mid Cap Value | | | Small Cap Equity Insights | | | Strategic Growth | | | U.S. Equity Insights | |
| Tax cost | | $ | 402,821,740 | | | $ | 118,081,516 | | | $ | 185,025,529 | | | $ | 281,094,071 | |
Gross unrealized gain | | | 156,969,714 | | | | 19,687,022 | | | | 274,698,581 | | | | 102,936,521 | |
| Gross unrealized loss | | | (7,054,310 | ) | | | (6,976,274 | ) | | | (9,534,798 | ) | | | (5,813,879 | ) |
| Net unrealized gain (loss) | | $ | 149,915,404 | | | $ | 12,710,748 | | | $ | 265,163,783 | | | $ | 97,122,642 | |
The difference between GAAP-basis and tax-basis unrealized gains (losses) is attributable primarily to wash sales, net mark to market gains (losses) on regulated futures and foreign currency contracts, and differences in the tax treatment of real estate investment trust investments and passive foreign investment company investments.
GSAM has reviewed the Funds’ tax positions for all open tax years (the current and prior three years, as applicable) and has concluded that no provision for income tax is required in the Funds’ financial statements. Such open tax years remain subject to examination and adjustment by tax authorities.
9. OTHER RISKS
The Funds’ risks include, but are not limited to, the following:
Derivatives Risk — A Fund’s use of derivatives may result in loss. Derivative instruments, which may pose risks in addition to and greater than those associated with investing directly in securities, currencies or other instruments, may be illiquid or less liquid, volatile, difficult to price and leveraged so that small changes in the value of the underlying instruments may produce disproportionate losses to the Funds. Derivatives are also subject to counterparty risk, which is the risk that the other party in the transaction will not fulfill its contractual obligation. The use of derivatives is a highly specialized activity that involves investment
GOLDMAN SACHS VARIABLE INSURANCE TRUST EQUITY FUNDS
9. OTHER RISKS (continued)
techniques and risks different from those associated with investments in more traditional securities and instruments. Losses from derivatives can also result from a lack of correlation between changes in the value of derivative instruments and the portfolio assets (if any) being hedged.
Foreign and Emerging Countries Risk — Investing in foreign markets may involve special risks and considerations not typically associated with investing in the U.S. Foreign securities may be subject to risk of loss because of more or less foreign government regulation, less public information and less economic, political and social stability in the countries in which a Fund invests. The imposition of exchange controls (including repatriation restrictions), confiscation of assets and property, trade restrictions (including tariffs) and other government restrictions by the U.S. or other governments, or problems with registration, settlement or custody, may also result in losses. Foreign risk also involves the risk of negative foreign currency rate fluctuations, which may cause the value of securities denominated in such foreign currency (or other instruments through which a Fund has exposure to foreign currencies) to decline in value. Currency exchange rates may fluctuate significantly over short periods of time. To the extent that a Fund also invests in securities of issuers located in emerging markets, these risks may be more pronounced.
Foreign Custody Risk — A Fund invests in foreign securities, and as such the Fund may hold such securities and cash with foreign banks, agents, and securities depositories appointed by the Fund’s custodian (each a “Foreign Custodian”). Some foreign custodians may be recently organized or new to the foreign custody business. In some countries, Foreign Custodians may be subject to little or no regulatory oversight over, or independent evaluation of, their operations. Further, the laws of certain countries may place limitations on a Fund’s ability to recover its assets if a Foreign Custodian enters bankruptcy. Investments in emerging markets may be subject to even greater custody risks than investments in more developed markets. Custody services in emerging market countries are very often undeveloped and may be considerably less well regulated than in more developed countries, and thus may not afford the same level of investor protection as would apply in developed countries.
Investments in Other Investment Companies Risk — As a shareholder of another investment company, a Fund will indirectly bear its proportionate share of any net management fees and other expenses paid by such other investment companies, in addition to the fees and expenses regularly borne by the Fund.
Large Shareholder Transactions Risk — A Fund may experience adverse effects when certain large shareholders, such as other funds, participating insurance companies, accounts and Goldman Sachs affiliates, purchase or redeem large amounts of shares of the Fund. Such large shareholder redemptions, which may occur rapidly or unexpectedly, may cause a Fund to sell portfolio securities at times when it would not otherwise do so, which may negatively impact a Fund’s NAV and liquidity. These transactions may also accelerate the realization of taxable income to shareholders if such sales of investments resulted in gains, and may also increase transaction costs. In addition, a large redemption could result in a Fund’s current expenses being allocated over a smaller asset base, leading to an increase in the Fund’s expense ratio. Similarly, large Fund share purchases may adversely affect a Fund’s performance to the extent that the Fund is delayed in investing new cash or otherwise maintains a larger cash position than it ordinarily would.
Liquidity Risk — A Fund may make investments that are illiquid or that may become less liquid in response to market developments or adverse investor perceptions. Illiquid investments may be more difficult to value. Liquidity risk may also refer to the risk that a Fund will not be able to pay redemption proceeds within the allowable time period or without significant dilution to remaining investors’ interests because of unusual market conditions, an unusually high volume of redemption requests, or other reasons. To meet redemption requests, a Fund may be forced to sell investments at an unfavorable time and/or under unfavorable conditions. If a Fund is forced to sell securities at an unfavorable time and/or under unfavorable conditions, such sales may adversely affect the Fund’s NAV and dilute remaining investors’ interests. These risks may be more pronounced in connection with a Fund`s investments in securities of issuers located in emerging market countries. Redemptions by large shareholders may have a negative impact on a Fund’s liquidity.
Market and Credit Risks — In the normal course of business, a Fund trades financial instruments and enters into financial transactions where risk of potential loss exists due to changes in the market (market risk). The value of the securities in which a
GOLDMAN SACHS VARIABLE INSURANCE TRUST EQUITY FUNDS
Notes to Financial Statements (continued)
December 31, 2021
9. OTHER RISKS (continued)
Fund invests may go up or down in response to the prospects of individual companies, particular sectors or governments and/or general economic conditions throughout the world due to increasingly interconnected global economies and financial markets. Events such as war, acts of terrorism, social unrest, natural disasters, the spread of infectious illness or other public health threats could also significantly impact a Fund and its investments. Additionally, a Fund may also be exposed to credit risk in the event that an issuer or guarantor fails to perform or that an institution or entity with which the Fund has unsettled or open transactions defaults.
Non-Diversification Risk — The Strategic Growth Fund is non-diversified, meaning that it is permitted to invest a larger percentage of its assets in one or more issuers or in fewer issuers than diversified mutual funds. Thus, the Fund may be more susceptible to adverse developments affecting any single issuer held in its portfolio, and may be more susceptible to greater losses because of these developments.
10. INDEMNIFICATIONS
Under the Trust’s organizational documents, its Trustees, officers, employees and agents are indemnified, to the extent permitted by the Act and state law, against certain liabilities that may arise out of performance of their duties to the Funds. Additionally, in the course of business, the Funds enter into contracts that contain a variety of indemnification clauses. The Funds’ maximum exposure under these arrangements is unknown, as this would involve future claims that may be made against the Funds that have not yet occurred. However, GSAM believes the risk of loss under these arrangements to be remote.
11. SUBSEQUENT EVENTS
Upon the recommendation of GSAM, the Board of Trustees of the Goldman Sachs Variable Insurance Trust recently approved changes to the Goldman Sachs Growth Opportunities Fund’s name and principal investment strategy. The Fund’s name will change to the “Goldman Sachs Mid Cap Growth Fund.” These changes are not expected to materially affect the Fund’s current portfolio holdings. These changes will become effective after the close of business on April 29, 2022.
Subsequent events after the Statements of Assets and Liabilities date, other than the above, have been evaluated, and GSAM has concluded that there is no impact requiring adjustment or disclosure in the financial statements.
12. SUMMARY OF SHARE TRANSACTIONS
Share activity is as follows:
| | | | | | | | | | | | | | | | |
| | | Equity Index Fund | |
| | | For the Fiscal Year Ended
December 31, 2021 | | | For the Fiscal Year Ended
December 31, 2020 | |
| | | Shares | | | Dollars | | | Shares | | | Dollars | |
| Service Shares | | | | | | | | | | | | | | | | |
| Shares sold | | | 361,708 | | | $ | 8,243,921 | | | | 172,523 | | | $ | 2,826,875 | |
| Reinvestment of distributions | | | 720,711 | | | | 16,050,234 | | | | 772,925 | | | | 14,476,879 | |
| Shares redeemed | | | (1,070,042 | ) | | | (23,750,642 | ) | | | (1,436,368 | ) | | | (24,448,149 | ) |
| | | | 12,377 | | | $ | 543,513 | | | | (490,920 | ) | | $ | (7,144,395 | ) |
GOLDMAN SACHS VARIABLE INSURANCE TRUST EQUITY FUNDS
12. SUMMARY OF SHARE TRANSACTIONS (continued)
| | | | | | | | | | | | | | | | |
| | | Growth Opportunities Fund | |
| | | For the Fiscal Year Ended
December 31, 2021 | | | For the Fiscal Year Ended
December 31, 2020 | |
| | | Shares | | | Dollars | | | Shares | | | Dollars | |
| Institutional Shares | | | | | | | | | | | | | | | | |
| Shares sold | | | 20,939 | | | $ | 308,042 | | | | 935 | | | $ | 11,972 | |
| Reinvestment of distributions | | | 5,182 | | | | 67,989 | | | | 1,747 | | | | 23,510 | |
| Shares redeemed | | | — | | | | — | | | | — | | | | — | |
| | | | 26,121 | | | | 376,031 | | | | 2,682 | | | | 35,482 | |
| Service Shares | | | | | | | | | | | | | | | | |
| Shares sold | | | 231,649 | | | | 3,064,331 | | | | 704,687 | | | | 8,063,451 | |
| Reinvestment of distributions | | | 1,090,968 | | | | 13,375,264 | | | | 1,075,647 | | | | 13,714,506 | |
| Shares redeemed | | | (1,240,070 | ) | | | (17,004,840 | ) | | | (2,222,571 | ) | | | (25,079,859 | ) |
| | | | 82,547 | | | | (565,245 | ) | | | (442,237 | ) | | | (3,301,902 | ) |
| | | | |
| NET DECREASE | | | 108,668 | | | $ | (189,214 | ) | | | (439,555 | ) | | $ | (3,266,420 | ) |
| | | | | | | | | | | | | | | | |
| | | International Equity Insights Fund | |
| | | For the Fiscal Year Ended
December 31, 2021 | | | For the Fiscal Year Ended
December 31, 2020 | |
| | | Shares | | | Dollars | | | Shares | | | Dollars | |
| Institutional Shares | | | | | | | | | | | | | | | | |
| Shares sold | | | 1,279,391 | | | $ | 12,019,024 | | | | 1,077,909 | | | $ | 8,130,619 | |
| Reinvestment of distributions | | | 363,020 | | | | 3,288,959 | | | | 85,749 | | | | 717,721 | |
| Shares redeemed | | | (559,940 | ) | | | (5,229,023 | ) | | | (674,822 | ) | | | (4,959,840 | ) |
| | | | 1,082,471 | | | | 10,078,960 | | | | 488,836 | | | | 3,888,500 | |
| Service Shares | | | | | | | | | | | | | | | | |
| Shares sold | | | 272,671 | | | | 2,522,185 | | | | 1,003,024 | | | | 7,629,568 | |
| Reinvestment of distributions | | | 245,317 | | | | 2,232,384 | | | | 68,869 | | | | 579,185 | |
| Shares redeemed | | | (1,206,056 | ) | | | (11,158,115 | ) | | | (1,502,901 | ) | | | (10,691,106 | ) |
| | | | (688,068 | ) | | | (6,403,546 | ) | | | (431,008 | ) | | | (2,482,353 | ) |
| | | | |
| NET DECREASE | | | 394,403 | | | $ | 3,675,414 | | | | 57,828 | | | $ | 1,406,147 | |
GOLDMAN SACHS VARIABLE INSURANCE TRUST EQUITY FUNDS
Notes to Financial Statements (continued)
December 31, 2021
12. SUMMARY OF SHARE TRANSACTIONS (continued)
| | | | | | | | | | | | | | | | |
| | | Large Cap Value Fund | |
| | | For the Fiscal Year Ended
December 31, 2021 | | | For the Fiscal Year Ended
December 31, 2020 | |
| | | Shares | | | Dollars | | | Shares | | | Dollars | |
| Institutional Shares | | | | | | | | | | | | | | | | |
| Shares sold | | | 1,017,136 | | | $ | 10,601,007 | | | | 1,674,921 | | | $ | 12,636,325 | |
| Reinvestment of distributions | | | 2,432,740 | | | | 23,694,892 | | | | 522,367 | | | | 4,769,205 | |
| Shares redeemed | | | (2,709,781 | ) | | | (28,139,387 | ) | | | (2,756,893 | ) | | | (22,865,975 | ) |
| | | | 740,095 | | | | 6,156,512 | | | | (559,605 | ) | | | (5,460,445 | ) |
| Service Shares | | | | | | | | | | | | | | | | |
| Shares sold | | | 603,933 | | | | 6,315,252 | | | | 2,896,787 | | | | 21,895,368 | |
| Reinvestment of distributions | | | 4,106,597 | | | | 40,039,323 | | | | 908,552 | | | | 8,295,083 | |
| Shares redeemed | | | (6,168,949 | ) | | | (63,721,719 | ) | | | (4,795,612 | ) | | | (40,404,480 | ) |
| | | | (1,458,419 | ) | | | (17,367,144 | ) | | | (990,273 | ) | | | (10,214,029 | ) |
| | | | |
| NET DECREASE | | | (718,324 | ) | | $ | (11,210,632 | ) | | | (1,549,878 | ) | | $ | (15,674,474 | ) |
| | | | | | | | | | | | | | | | |
| | | Mid Cap Value Fund | |
| | | For the Fiscal Year Ended
December 31, 2021 | | | For the Fiscal Year Ended
December 31, 2020 | |
| | | Shares | | | Dollars | | | Shares | | | Dollars | |
| Institutional Shares | | | | | | | | | | | | | | | | |
| Shares sold | | | 543,557 | | | $ | 10,751,501 | | | | 1,072,386 | | | $ | 14,111,808 | |
| Reinvestment of distributions | | | 2,669,991 | | | | 51,237,122 | | | | 384,030 | | | | 6,463,230 | |
| Shares redeemed | | | (2,580,959 | ) | | | (51,043,863 | ) | | | (3,123,869 | ) | | | (45,649,614 | ) |
| | | | 632,589 | | | | 10,944,760 | | | | (1,667,453 | ) | | | (25,074,576 | ) |
| Service Shares | | | | | | | | | | | | | | | | |
| Shares sold | | | 135,902 | | | | 2,703,427 | | | | 6,051,187 | | | | 90,070,673 | |
| Reinvestment of distributions | | | 1,143,905 | | | | 22,180,324 | | | | 168,701 | | | | 2,864,537 | |
| Shares redeemed | | | (1,838,658 | ) | | | (36,501,072 | ) | | | (7,760,547 | ) | | | (103,064,639 | ) |
| | | | (558,851 | ) | | | (11,617,321 | ) | | | (1,540,659 | ) | | | (10,129,429 | ) |
| | | | |
| NET DECREASE | | | 73,738 | | | $ | (672,561 | ) | | | (3,208,112 | ) | | $ | (35,204,005 | ) |
GOLDMAN SACHS VARIABLE INSURANCE TRUST EQUITY FUNDS
12. SUMMARY OF SHARE TRANSACTIONS (continued)
| | | | | | | | | | | | | | | | |
| | | Small Cap Equity Insights Fund | |
| | | For the Fiscal Year Ended
December 31, 2021 | | | For the Fiscal Year Ended
December 31, 2020 | |
| | | Shares | | | Dollars | | | Shares | | | Dollars | |
| Institutional Shares | | | | | | | | | | | | | | | | |
| Shares sold | | | 1,618,659 | | | $ | 25,450,651 | | | | 936,953 | | | $ | 10,144,169 | |
| Reinvestment of distributions | | | 1,829,510 | | | | 23,948,283 | | | | 88,719 | | | | 1,169,326 | |
| Shares redeemed | | | (1,420,214 | ) | | | (22,244,412 | ) | | | (1,067,788 | ) | | | (11,796,332 | ) |
| | | | 2,027,955 | | | | 27,154,522 | | | | (42,116 | ) | | | (482,837 | ) |
| Service Shares | | | | | | | | | | | | | | | | |
| Shares sold | | | 362,412 | | | | 5,522,021 | | | | 204,098 | | | | 2,017,902 | |
| Reinvestment of distributions | | | 360,051 | | | | 4,659,058 | | | | 16,114 | | | | 210,446 | |
| Shares redeemed | | | (299,332 | ) | | | (4,633,346 | ) | | | (191,110 | ) | | | (2,189,717 | ) |
| | | | 423,131 | | | | 5,547,733 | | | | 29,102 | | | | 38,631 | |
| | | | |
| NET DECREASE | | | 2,451,086 | | | $ | 32,702,255 | | | | (13,014 | ) | | $ | (444,206 | ) |
| | | | | | | | | | | | | | | | |
| | | Strategic Growth Fund | |
| | | For the Fiscal Year Ended
December 31, 2021 | | | For the Fiscal Year Ended
December 31, 2020 | |
| | | Shares | | | Dollars | | | Shares | | | Dollars | |
| Institutional Shares | | | | | | | | | | | | | | | | |
| Shares sold | | | 481,598 | | | $ | 7,976,739 | | | | 604,593 | | | $ | 7,949,713 | |
| Reinvestment of distributions | | | 1,313,700 | | | | 22,122,701 | | | | 843,114 | | | | 12,680,432 | |
| Shares redeemed | | | (1,421,500 | ) | | | (24,042,181 | ) | | | (1,460,048 | ) | | | (19,161,362 | ) |
| | | | 373,798 | | | | 6,057,259 | | | | (12,341 | ) | | | 1,468,783 | |
| Service Shares | | | | | | | | | | | | | | | | |
| Shares sold | | | 406,058 | | | | 6,769,145 | | | | 6,377,786 | | | | 74,689,888 | |
| Reinvestment of distributions | | | 1,866,601 | | | | 31,302,896 | | | | 1,295,784 | | | | 19,462,681 | |
| Shares redeemed | | | (3,121,407 | ) | | | (52,908,517 | ) | | | (11,218,495 | ) | | | (126,288,249 | ) |
| | | | (848,748 | ) | | | (14,836,476 | ) | | | (3,544,925 | ) | | | (32,135,680 | ) |
| | | | |
| NET DECREASE | | | (474,950 | ) | | $ | (8,779,217 | ) | | | (3,557,266 | ) | | $ | (30,666,897 | ) |
GOLDMAN SACHS VARIABLE INSURANCE TRUST EQUITY FUNDS
Notes to Financial Statements (continued)
December 31, 2021
12. SUMMARY OF SHARE TRANSACTIONS (continued)
| | | | | | | | | | | | | | | | |
| | | U.S. Equity Insights Fund | |
| | | For the Fiscal Year Ended
December 31, 2021 | | | For the Fiscal Year Ended
December 31, 2020 | |
| | | Shares | | | Dollars | | | Shares | | | Dollars | |
| Institutional Shares | | | | | | | | | | | | | | | | |
| Shares sold | | | 887,900 | | | $ | 20,340,436 | | | | 635,655 | | | $ | 11,594,488 | |
| Reinvestment of distributions | | | 3,644,075 | | | | 71,715,395 | | | | 632,341 | | | | 12,570,928 | |
| Shares redeemed | | | (2,036,401 | ) | | | (46,216,943 | ) | | | (2,268,793 | ) | | | (41,014,558 | ) |
| | | | 2,495,574 | | | | 45,838,888 | | | | (1,000,797 | ) | | | (16,849,142 | ) |
| Service Shares | | | | | | | | | | | | | | | | |
| Shares sold | | | 163,388 | | | | 3,720,849 | | | | 116,235 | | | | 2,117,630 | |
| Reinvestment of distributions | | | 687,514 | | | | 13,647,143 | | | | 123,954 | | | | 2,480,325 | |
| Shares redeemed | | | (474,227 | ) | | | (10,887,216 | ) | | | (619,902 | ) | | | (11,353,169 | ) |
| | | | 376,675 | | | | 6,480,776 | | | | (379,713 | ) | | | (6,755,214 | ) |
| | | | |
| NET DECREASE | | | 2,872,249 | | | $ | 52,319,664 | | | | (1,380,510 | ) | | $ | (23,604,356 | ) |
Report of Independent Registered Public Accounting Firm
To the Board of Trustees of Goldman Sachs Variable Insurance Trust and Shareholders of Goldman Sachs Equity Index Fund, Goldman Sachs Growth Opportunities Fund, Goldman Sachs International Equity Insights Fund, Goldman Sachs Large Cap Value Fund, Goldman Sachs Mid Cap Value Fund, Goldman Sachs Small Cap Equity Insights Fund, Goldman Sachs Strategic Growth Fund, and Goldman Sachs U.S. Equity Insights Fund
Opinions on the Financial Statements
We have audited the accompanying statements of assets and liabilities, including the schedules of investments, of Goldman Sachs Equity Index Fund, Goldman Sachs Growth Opportunities Fund, Goldman Sachs International Equity Insights Fund, Goldman Sachs Large Cap Value Fund, Goldman Sachs Mid Cap Value Fund, Goldman Sachs Small Cap Equity Insights Fund, Goldman Sachs Strategic Growth Fund, and Goldman Sachs U.S. Equity Insights Fund (eight of the Funds constituting Goldman Sachs Variable Insurance Trust, referred to hereafter as the “Funds”) as of December 31, 2021, the related statements of operations for the year ended December 31, 2021, the statements of changes in net assets for each of the two years in the period ended December 31, 2021, including the related notes, and the financial highlights for each of the five years in the period ended December 31, 2021 (collectively referred to as the “financial statements”). In our opinion, the financial statements present fairly, in all material respects, the financial position of each of the Funds as of December 31, 2021, the results of each of their operations for the year then ended, the changes in their net assets for each of the two years in the period ended December 31, 2021 and each of the financial highlights for each of the five years in the period ended December 31, 2021 in conformity with accounting principles generally accepted in the United States of America.
Basis for Opinions
These financial statements are the responsibility of the Funds’ management. Our responsibility is to express an opinion on the Funds’ financial statements based on our audits. We are a public accounting firm registered with the Public Company Accounting Oversight Board (United States) (PCAOB) and are required to be independent with respect to the Funds in accordance with the U.S. federal securities laws and the applicable rules and regulations of the Securities and Exchange Commission and the PCAOB.
We conducted our audits of these financial statements in accordance with the standards of the PCAOB. Those standards require that we plan and perform the audit to obtain reasonable assurance about whether the financial statements are free of material misstatement, whether due to error or fraud.
Our audits included performing procedures to assess the risks of material misstatement of the financial statements, whether due to error or fraud, and performing procedures that respond to those risks. Such procedures included examining, on a test basis, evidence regarding the amounts and disclosures in the financial statements. Our audits also included evaluating the accounting principles used and significant estimates made by management, as well as evaluating the overall presentation of the financial statements. Our procedures included confirmation of securities owned as of December 31, 2021 by correspondence with the custodian, transfer agent and brokers; when replies were not received from brokers, we performed other auditing procedures. We believe that our audits provide a reasonable basis for our opinions.
/s/ PricewaterhouseCoopers LLP
Boston, Massachusetts
February 23, 2022
We have served as the auditor of one or more investment companies in the Goldman Sachs fund complex since 2000.
GOLDMAN SACHS VARIABLE INSURANCE TRUST EQUITY FUNDS
Voting Results of Special Meeting of Shareholders (Unaudited)
A Special Meeting of the Goldman Sachs Variable Insurance Trust was held on January 8, 2021 to consider and act upon a proposal to approve a change to the Goldman Sachs Strategic Growth Fund’s sub-classification under the Investment Company Act of 1940 from “diversified” to “non-diversified” and eliminate the Fund’s related fundamental investment restriction.
The shareholders voted as follows:
| | | | | | | | | | | | |
| | | | |
| Proposal 1 | | For | | | Against/Withhold | | | Abstain | |
| | | | |
To approve a change to each respective Fund’s sub-classification under the Investment Company Act of 1940 from “diversified” to “non-diversified” and to eliminate any related fundamental investment restriction for the Fund. | | | 21,360,462.737 | | | | 1,890,396.988 | | | | 2,070,989.714 | |
GOLDMAN SACHS VARIABLE INSURANCE TRUST EQUITY FUNDS
| | |
| Fund Expenses — Six Month Period Ended December 31, 2021 (Unaudited) | | |
As a shareholder of Institutional or Service Shares of the Funds, you incur ongoing costs, including management fees, distribution and/or service (12b-1) fees (with respect to Service Shares) and other Fund expenses. This example is intended to help you understand your ongoing costs (in dollars) of investing in the Institutional Shares and Service Shares of the Funds and to compare these costs with the ongoing costs of investing in other mutual funds.
The example is based on an investment of $1,000 invested at the beginning of the period and held for the entire period from July 1, 2021 through December 31, 2021, which represents a period of 184 days of a 365 day year.
Actual Expenses — The first line under each share class in the table below provides information about actual account values and actual expenses. You may use the informationinthis line, together with the amount you invested, to estimate the expenses that you paid over the period. Simply divide your account value by $1,000 (for example, an $8,600 account value divided by $1,000=8.6), then multiply the result by the number in the first line under the heading entitled “Expenses Paid” to estimate the expenses you paid on your account during this period.
Hypothetical Example for Comparison Purposes — The second line under each share class in the table below provides information about hypothetical account values and hypothetical expenses based on the Funds’ actual net expense ratio and an assumed rate of return of 5% per year before expenses, which is not the Funds’ actual return. The hypothetical account values and expenses may not be used to estimate the actual ending account balance or expenses you paid for the period. You may use this information to compare the ongoing costs of investing in the Funds and other funds. To do so, compare this 5% hypothetical example with the 5% hypothetical examples that appear in the shareholder reports of the other funds.
Please note that the expenses shown in the table are meant to highlight your ongoing costs only. As a shareholder of the Funds you do not incur any transaction costs, such as sales charges, redemption fees, or exchange fees, but shareholders of other funds may incur such costs. The second line of the table is useful in comparing ongoing costs only and will not help you determine the relative total costs of owning different funds whose shareholders may incur transaction costs.
| | | | | | | | | | | | | | | | | | | | | | | | | | | | | | | | | | | | | | | | | | | | | | | | |
| | | Equity Index Fund | | | Growth Opportunities Fund | | | International Equity Insights Fund | | | Large Cap Value Fund | |
| Share Class | | Beginning
Account
Value
7/1/21 | | | Ending
Account
Value
12/31/21 | | | Expenses
Paid for the
6 months
ended
12/31/2021* | | | Beginning
Account
Value
7/1/21 | | | Ending
Account
Value
12/31/21 | | | Expenses
Paid for the
6 months
ended
12/31/2021* | | | Beginning
Account
Value
7/1/21 | | | Ending
Account
Value
12/31/21 | | | Expenses
Paid for the
6 months
ended
12/31/2021* | | | Beginning
Account
Value
7/1/21 | | | Ending
Account
Value
12/31/21 | | | Expenses
Paid for the
6 months
ended
12/31/2021* | |
| Institutional | | | | | | | | | | | | | | | | | | | | | | | | | | | | | | | | | | | | | | | | | | | | | | | | |
| | | | | | | | | | | | | |
Actual | | | N/A | | | | N/A | | | | N/A | | | $ | 1,000.00 | | | $ | 1,050.87 | | | $ | 4.60 | | | $ | 1,000.00 | | | $ | 1,011.41 | | | $ | 4.41 | | | $ | 1,000.00 | | | $ | 1,086.60 | | | $ | 3.68 | |
Hypothetical 5% return | | | N/A | | | | N/A | | | | N/A | | | | 1,000.00 | | | | 1,020.72 | + | | | 4.53 | | | | 1,000.00 | | | | 1,020.82 | + | | | 4.43 | | | | 1,000.00 | | | | 1,021.68 | + | | | 3.57 | |
| Service | | | | | | | | | | | | | | | | | | | | | | | | | | | | | | | | | | | | | | | | | | | | | | | | |
| | | | | | | | | | | | | |
Actual | | | 1,000.00 | | | $ | 1,114.32 | | | $ | 2.56 | | | | 1,000.00 | | | | 1,051.04 | | | | 5.38 | | | | 1,000.00 | | | | 1,010.72 | | | | 5.68 | | | | 1,000.00 | | | | 1,085.84 | | | | 4.94 | |
Hypothetical 5% return | | | 1,000.00 | | | | 1,022.79 | + | | | 2.45 | | | | 1,000.00 | | | | 1,019.96 | + | | | 5.30 | | | | 1,000.00 | | | | 1,019.56 | + | | | 5.70 | | | | 1,000.00 | | | | 1,020.47 | + | | | 4.79 | |
| | + | Hypothetical expenses are based on each Fund’s actual annualized net expense ratios and an assumed rate of return of 5% per year before expenses. | |
| | * | Expenses are calculated using each Fund’s annualized net expense ratio for each class, which represents the ongoing expenses as a percentage of net assets for the six months ended December 31, 2021. Expenses are calculated by multiplying the annualized net expense ratio by the average account value for the period; then multiplying the result by the number of days in the most recent fiscal half year; and then dividing that result by the number of days in the fiscal year. The annualized net expense ratios for the period were as follows: | |
| | | | | | |
| | |
| Fund | | Institutional
Shares | | Service
Shares | |
| Equity Index Fund | | N/A | | | 0.48 | % |
| Growth Opportunities Fund | | 0.89% | | | 1.04 | |
| International Equity Insights Fund | | 0.87 | | | 1.12 | |
| Large Cap Value Fund | | 0.70 | | | 0.94 | |
125
GOLDMAN SACHS VARIABLE INSURANCE TRUST EQUITY FUNDS
| | |
| Fund Expenses — Six Month Period Ended December 31, 2021 (Unaudited) (continued) | | |
As a shareholder of Institutional or Service Shares of the Funds, you incur ongoing costs, including management fees, distribution and/or service (12b-1) fees (with respect to Service and Advisor Shares) and other Fund expenses. This example is intended to help you understand your ongoing costs (in dollars) of investing in the Institutional Shares and Service Shares of the Funds and to compare these costs with the ongoing costs of investing in other mutual funds.
The example is based on an investment of $1,000 invested at the beginning of the period and held for the entire period from July 1, 2021 through December 31, 2021, which represents a period of 184 days of a 365 day year.
Actual Expenses — The first line under each share class in the table below provides information about actual account values and actual expenses. You may use the information in this line, together with the amount you invested, to estimate the expenses that you paid over the period. Simply divide your account value by $1,000 (for example, an $8,600 account value divided by $1,000=8.6), then multiply the result by the number in the first line under the heading entitled “Expenses Paid” to estimate the expenses you paid on your account during this period.
Hypothetical Example for Comparison Purposes — The second line under each share class in the table below provides information about hypothetical account values and hypothetical expenses based on the Funds’ actual net expense ratio and an assumed rate of return of 5% per year before expenses, which is not the Funds’ actual return. The hypothetical account values and expenses may not be used to estimate the actual ending account balance or expenses you paid for the period. You may use this information to compare the ongoing costs of investing in the Funds and other funds. To do so, compare this 5% hypothetical example with the 5% hypothetical examples that appear in the shareholder reports of the other funds.
Please note that the expenses shown in the table are meant to highlight your ongoing costs only. As a shareholder of the Funds you do not incur any transaction costs, such as sales charges, redemption fees, or exchange fees, but shareholders of other funds may incur such costs. The second line of the table is useful in comparing ongoing costs only and will not help you determine the relative total costs of owning different funds whose shareholders may incur transaction costs.
| | | | | | | | | | | | | | | | | | | | | | | | | | | | | | | | | | | | | | | | | | | | | | | | |
| | | Mid Cap Value Fund | | | Small Cap Equity Insights Fund | | | Strategic Growth Fund | | | U.S. Equity Insights Fund | |
| Share Class | | Beginning
Account
Value
7/1/21 | | | Ending
Account
Value
12/31/21 | | | Expenses
Paid for the
6 months
ended
12/31/2021* | | | Beginning
Account
Value
7/1/21 | | | Ending
Account
Value
12/31/21 | | | Expenses
Paid for the
6 months
ended
12/31/2021* | | | Beginning
Account
Value
7/1/21 | | | Ending
Account
Value
12/31/21 | | | Expenses
Paid for the
6 months
ended
12/31/2021* | | | Beginning
Account
Value
7/1/21 | | | Ending
Account
Value
12/31/21 | | | Expenses
Paid for the
6 months
ended
12/31/2021* | |
| Institutional | | | | | | | | | | | | | | | | | | | | | | | | | | | | | | | | | | | | | | | | | | | | | | | | |
| | | | | | | | | | | | | |
Actual | | $ | 1,000.00 | | | $ | 1,118.62 | | | $ | 4.49 | | | $ | 1,000.00 | | | $ | 1,013.57 | | | $ | 4.11 | | | $ | 1,000.00 | | | $ | 1,091.88 | | | $ | 3.90 | | | $ | 1,000.00 | | | $ | 1,109.98 | | | $ | 2.98 | |
Hypothetical 5% return | | | 1,000.00 | | | | 1,020.97 | + | | | 4.28 | | | | 1,000.00 | | | | 1,021.12 | + | | | 4.13 | | | | 1,000.00 | | | | 1,021.48 | + | | | 3.77 | | | | 1,000.00 | | | | 1,022.38 | + | | | 2.85 | |
| Service | | | | | | | | | | | | | | | | | | | | | | | | | | | | | | | | | | | | | | | | | | | | | | | | |
| | | | | | | | | | | | | |
Actual | | | 1,000.00 | | | | 1,116.89 | | | | 5.82 | | | | 1,000.00 | | | | 1,012.63 | | | | 5.38 | | | | 1,000.00 | | | | 1,090.32 | | | | 5.22 | | | | 1,000.00 | | | | 1,108.94 | | | | 4.09 | |
Hypothetical 5% return | | | 1,000.00 | | | | 1,019.71 | + | | | 5.55 | | | | 1,000.00 | | | | 1,019.86 | + | | | 5.40 | | | | 1,000.00 | | | | 1,020.21 | + | | | 5.04 | | | | 1,000.00 | | | | 1,021.32 | + | | | 3.92 | |
| | + | Hypothetical expenses are based on each Fund’s actual annualized net expense ratios and an assumed rate of return of 5% per year before expenses. | |
| | * | Expenses are calculated using each Fund’s annualized net expense ratio for each class, which represents the ongoing expenses as a percentage of net assets for the six months ended December 31, 2021. Expenses are calculated by multiplying the annualized net expense ratio by the average account value for the period; then multiplying the result by the number of days in the most recent fiscal half year; and then dividing that result by the number of days in the fiscal year. The annualized net expense ratios for the period were as follows: | |
| | | | | | |
| | |
| Fund | | Institutional
Shares | | Service
Shares | |
| Mid Cap Value Fund | | 0.84% | | | 1.09 | % |
| Small Cap Equity Insights Fund | | 0.81 | | | 1.06 | |
| Strategic Growth Fund | | 0.74 | | | 0.99 | |
| U.S. Equity Insights Fund | | 0.56 | | | 0.77 | |
126
GOLDMAN SACHS VARIABLE INSURANCE TRUST EQUITY FUNDS
Trustees and Officers (Unaudited)
Independent Trustees
| | | | | | | | | | | | |
| | | | | |
Name, Address and Age1 | | Position(s) Held
with the Trust | | Term of
Office and
Length of
Time Served2 | | Principal Occupation(s)
During Past 5 Years | | Number of
Portfolios in
Fund Complex
Overseen by
Trustee3 | | | Other
Directorships
Held by Trustee4 |
Jessica Palmer Age: 72 | | Chair of the Board of Trustees | | Since 2018 (Trustee since 2007) | | Ms. Palmer is retired. She was formerly Consultant, Citigroup Human Resources Department (2007-2008); Managing Director, Citigroup Corporate and Investment Banking (previously, Salomon Smith Barney/Salomon Brothers) (1984-2006). Ms. Palmer was a Member of the Board of Trustees of Indian Mountain School (private elementary and secondary school) (2004-2009). Chair of the Board of Trustees — Goldman Sachs Trust and Goldman Sachs Variable Insurance Trust. | | | 109 | | | None |
Dwight L. Bush Age: 64 | | Trustee | | Since 2020 | | Ambassador Bush is President and CEO of D.L. Bush & Associates (a financial advisory and private investment firm) (2002-2014 and 2017- present); Director of MoneyLion Inc. (an operator of a data drive, digital financial platform (2021-present); and was formerly U.S. Ambassador to the Kingdom of Morocco (2014-2017) and a Member of the Board of Directors of Santander Bank, N.A. (2018-2019). Previously, Ambassador Bush served as an Advisory Board Member of Goldman Sachs Trust and Goldman Sachs Variable Insurance Trust (October 2019-January 2020). Trustee — Goldman Sachs Trust and Goldman Sachs Variable Insurance Trust. | | | 109 | | | None |
Kathryn A. Cassidy Age: 67 | | Trustee | | Since 2015 | | Ms. Cassidy is retired. Formerly, she was Advisor to the Chairman (May 2014-December 2014); and Senior Vice President and Treasurer (2008-2014), General Electric Company & General Electric Capital Corporation (technology and financial services companies). Trustee — Goldman Sachs Trust and Goldman Sachs Variable Insurance Trust. | | | 109 | | | None |
Diana M. Daniels Age: 72 | | Trustee | | Since 2007 | | Ms. Daniels is retired. Formerly, she was Vice President, General Counsel and Secretary, The Washington Post Company (1991-2006). Ms. Daniels is a Trustee Emeritus and serves as a Presidential Councillor of Cornell University (2013-Present); former Member of the Legal Advisory Board, New York Stock Exchange (2003-2006) and of the Corporate Advisory Board, Standish Mellon Management Advisors (2006-2007). Trustee — Goldman Sachs Trust and Goldman Sachs Variable Insurance Trust. | | | 109 | | | None |
Joaquin Delgado Age: 61 | | Trustee | | Since 2020 | | Dr. Delgado is retired. He is Director, Hexion Inc. (a specialty chemical manufacturer) (2019- present); and Director, Stepan Company (a specialty chemical manufacturer) (2011-present); and was formerly Executive Vice President, Consumer Business Group of 3M Company (July 2016-July 2019); and Executive Vice President, Health Care Business Group of 3M Company (October 2012-July 2016). Previously, Dr. Delgado served as an Advisory Board Member of Goldman Sachs Trust and Goldman Sachs Variable Insurance Trust (October 2019-January 2020). Trustee — Goldman Sachs Trust and Goldman Sachs Variable Insurance Trust. | | | 109 | | | Hexion Inc. (a specialty chemical manufacturer); Stepan Company (a specialty chemical manufacturer) |
Eileen H. Dowling Age: 59 | | Trustee | | Since 2021 | | Ms. Dowling is retired. Formerly, she was Senior Advisor (April 2021- September 2021); and Managing Director (2013-2021), BlackRock, Inc. (a financial services firm). Trustee — Goldman Sachs Trust and Goldman Sachs Variable Insurance Trust. | | | 109 | | | None |
| | | | | | | | | | | | |
GOLDMAN SACHS VARIABLE INSURANCE TRUST EQUITY FUNDS
Trustees and Officers (Unaudited) (continued)
Independent Trustees (continued)
| | | | | | | | | | | | |
| | | | | |
Name, Address and Age1 | | Position(s) Held
with the Trust | | Term of
Office and
Length of
Time Served2 | | Principal Occupation(s)
During Past 5 Years | | Number of
Portfolios in
Fund Complex
Overseen by
Trustee3 | | | Other
Directorships
Held by Trustee4 |
Roy W. Templin Age: 61 | | Trustee | | Since 2013 | | Mr. Templin is retired. He is Director, Armstrong World Industries, Inc. (a designer and manufacturer of ceiling and wall systems) (2016-Present); and was formerly Chairman of the Board of Directors, Con- Way Incorporated (a transportation, logistics and supply chain management service company) (2014-2015); Executive Vice President and Chief Financial Officer, Whirlpool Corporation (an appliance manufacturer and marketer) (2004-2012). Trustee — Goldman Sachs Trust and Goldman Sachs Variable Insurance Trust. | | | 109 | | | Armstrong World Industries, Inc. (a ceiling and wall systems manufacturer) |
Gregory G. Weaver Age: 70 | | Trustee | | Since 2015 | | Mr. Weaver is retired. He is Director, Verizon Communications Inc. (2015-Present); and was formerly Chairman and Chief Executive Officer, Deloitte & Touche LLP (a professional services firm) (2001-2005 and 2012-2014); and Member of the Board of Directors, Deloitte & Touche LLP (2006-2012). Trustee — Goldman Sachs Trust and Goldman Sachs Variable Insurance Trust. | | | 109 | | | Verizon Communications Inc. |
| | | | | | | | | | | | |
Interested Trustee*
| | | | | | | | | | | | |
| | | | | |
Name, Address and Age1 | | Position(s) Held
with the Trust | | Term of
Office and
Length of
Time Served2 | | Principal Occupation(s)
During Past 5 Years | | Number of
Portfolios in
Fund Complex
Overseen by
Trustee3 | | | Other
Directorships
Held by Trustee4 |
James A. McNamara Age: 59 | | President and Trustee | | Since 2007 | | Advisory Director, Goldman Sachs (January 2018-Present); Managing Director, Goldman Sachs (January 2000-December 2017); Director of Institutional Fund Sales, GSAM (April 1998- December 2000); and Senior Vice President and Manager, Dreyfus Institutional Service Corporation (January 1993-April 1998). President and Trustee — Goldman Sachs Trust; Goldman Sachs Variable Insurance Trust; Goldman Sachs Trust II; Goldman Sachs ETF Trust; Goldman Sachs ETF Trust II; Goldman Sachs MLP and Energy Renaissance Fund; Goldman Sachs Credit Income Fund; and Goldman Sachs Real Estate Diversified Income Fund. | | | 170 | | | None |
| | | | | | | | | | | | |
| * | Mr. McNamara is considered to be an “Interested Trustee” because he holds positions with Goldman Sachs and owns securities issued by The Goldman Sachs Group, Inc. Mr. McNamara holds comparable positions with certain other companies of which Goldman Sachs, GSAM or an affiliate thereof is the investment adviser, administrator and/or distributor. |
| 1 | Each Trustee may be contacted by writing to the Trustee, c/o Goldman Sachs, 200 West Street, New York, New York, 10282, Attn: Caroline Kraus. Information is provided as of December 31, 2021. |
| 2 | Subject to such policies as may be adopted by the Board from time-to-time, each Trustee holds office for an indefinite term, until the earliest of: (a) the election of his or her successor; (b) the date the Trustee resigns or is removed by the Board or shareholders, in accordance with the Trust’s Declaration of Trust; or (c) the termination of the Trust. The Board has adopted policies which provide that each Independent Trustee shall retire as of December 31st of the calendar year in which he or she reaches (a) his or her 75th birthday or (b) the 15th anniversary of the date he or she became a Trustee, whichever is earlier, unless a waiver of such requirements shall have been adopted by a majority of the other Trustees. These policies may be changed by the Trustees without shareholder vote. |
| 3 | The Goldman Sachs Fund Complex includes certain other companies listed above for each respective Trustee. As of December 31, 2021, Goldman Sachs Trust consisted of 92 portfolios (90 of which offered shares to the public); Goldman Sachs Variable Insurance Trust consisted of 17 portfolios (13 of which offered shares to the public); Goldman Sachs Trust II consisted of 18 portfolios (16 of which offered shares to the public); Goldman Sachs ETF Trust consisted of 39 portfolios (26 of which offered shares to the public); and Goldman Sachs ETF Trust II, Goldman Sachs MLP and Energy Renaissance Fund, Goldman Sachs Credit Income Fund and Goldman Sachs Real Estate Diversified Income Fund each consisted of one portfolio. Goldman Sachs ETF Trust II and Goldman Sachs Credit Income Fund did not offer shares to the public. |
| 4 | This column includes only directorships of companies required to report to the Securities and Exchange Commission under the Securities Exchange Act of 1934 (i.e., “public companies”) or other investment companies registered under the Act. |
Additional information about the Trustees is available in the Funds’ Statement of Additional Information, which can be obtained from Goldman Sachs free of charge by calling this toll-free number (in the United States of America): 1-800-526-7384.
GOLDMAN SACHS VARIABLE INSURANCE TRUST EQUITY FUNDS
Trustees and Officers (Unaudited) (continued)
Officers of the Trust*
| | | | | | |
| | | |
| Name, Address and Age1 | | Positions Held
with the Trust | | Term of
Office and
Length of
Time Served2 | | Principal Occupation(s) During Past 5 Years |
James A. McNamara
200 West Street New York, NY 10282 Age: 59 | | Trustee and
President | | Since 2007 | | Advisory Director, Goldman Sachs (January 2018-Present); Managing Director, Goldman Sachs (January 2000-December 2017); Director of Institutional Fund Sales, GSAM (April 1998-December 2000); and Senior Vice President and Manager, Dreyfus Institutional Service Corporation (January 1993-April 1998). President and Trustee — Goldman Sachs Trust; Goldman Sachs Variable Insurance Trust; Goldman Sachs Trust II; Goldman Sachs ETF Trust; Goldman Sachs ETF Trust II; Goldman Sachs MLP and Energy Renaissance Fund; Goldman Sachs Credit Income Fund; and Goldman Sachs Real Estate Diversified Income Fund. |
Caroline L. Kraus
200 West Street New York, NY 10282 Age: 44 | | Secretary | | Since 2012 | | Managing Director, Goldman Sachs (January 2016-Present); Vice President, Goldman Sachs (August 2006-December 2015); Senior Counsel, Goldman Sachs (January 2020–Present); Associate General Counsel, Goldman Sachs (2012-December 2019); Assistant General Counsel, Goldman Sachs (August 2006-December 2011); and Associate, Weil, Gotshal & Manges, LLP (2002-2006). Secretary — Goldman Sachs Trust (previously Assistant Secretary (2012)); Goldman Sachs Variable Insurance Trust (previously Assistant Secretary (2012)); Goldman Sachs Trust II; Goldman Sachs BDC, Inc.; Goldman Sachs Private Middle Market Credit LLC; Goldman Sachs Private Middle Market Credit II LLC; Goldman Sachs Middle Market Lending Corp.; Goldman Sachs MLP and Energy Renaissance Fund; Goldman Sachs ETF Trust; Goldman Sachs ETF Trust II; Goldman Sachs Credit Income Fund; and Goldman Sachs Real Estate Diversified Income Fund. |
Joseph F. DiMaria
30 Hudson Street Jersey City, NJ 07302 Age: 53 | | Treasurer, Principal
Financial Officer
and Principal
Accounting Officer | | Since 2017
(Treasurer
and
Principal
Financial
Officer
since 2019) | | Managing Director, Goldman Sachs (November 2015-Present) and Vice President — Mutual Fund Administration, Columbia Management Investment Advisers, LLC (May 2010- October 2015). Treasurer, Principal Financial Officer and Principal Accounting Officer — Goldman Sachs Trust (previously Assistant Treasurer (2016)); Goldman Sachs Variable Insurance Trust (previously Assistant Treasurer (2016)); Goldman Sachs Trust II (previously Assistant Treasurer (2017)); Goldman Sachs MLP and Energy Renaissance Fund (previously Assistant Treasurer (2017)); Goldman Sachs ETF Trust (previously Assistant Treasurer (2017)); Goldman Sachs ETF Trust II; Goldman Sachs Credit Income Fund; and Goldman Sachs Real Estate Diversified Income Fund |
| | | | | | |
| * | Represents a partial list of officers of the Trust. Additional information about all the officers is available in the Funds’ Statement of Additional Information, which can be obtained from Goldman Sachs free of charge by calling this toll-free number (in the United States): 1-800-526-7384. |
| 1 | Information is provided as of December 31, 2021. |
| 2 | Officers hold office at the pleasure of the Board of Trustees or until their successors are duly elected and qualified. Each officer holds comparable positions with certain other companies of which Goldman Sachs, GSAM or an affiliate thereof is the investment adviser, administrator and/or distributor. |
Goldman Sachs Variable Insurance Trust – Tax Information (Unaudited)
For the year ended December 31, 2021, 100%, 12.37%, 8.32%, 28.95%, 10.09%, 16.73% and 11.34% of the dividends paid from net investment company taxable income by the Equity Index, Mid Cap Value, Growth Opportunities, Large Cap Value, Small Cap Equity Insights, Strategic Growth and U.S. Equity Insights Funds, respectively, qualify for the dividends received deduction available to corporations.
Pursuant to Section 852 of the Internal Revenue Code, the Equity Index, Mid Cap Value, Growth Opportunities, International Equity Insights, Large Cap Value, Small Cap Equity Insights, Strategic Growth and U.S. Equity Insights Funds designate $13,717,101, $28,620,079, $9,192,251, $1,687,425, $36,936,613, $10,074,781, $39,998,510 and $34,647,431 respectively, or if different, the maximum amount allowable, as capital gain dividends paid during the fiscal year ended December 31, 2021.
For the year end December 31, 2021, the International Equity Insights Fund has elected to pass through a credit for taxes paid to foreign jurisdictions. The total amount of income received by the International Equity Insights Fund from sources within foreign countries and possessions of the United States was $0.2408 per share, all of which is attributable to qualified passive income. The percentage of net investment income dividends paid by the Fund during the year ended December 31, 2021 from foreign sources was 70.68%. The total amount of foreign taxes paid by the Fund was $0.0215 per share.
| | |
| TRUSTEES | | OFFICERS |
| Jessica Palmer, Chair | | James A. McNamara, President |
| Dwight L. Bush | | Joseph F. DiMaria, Principal Financial Officer, |
| Kathryn A. Cassidy | | Principal Accounting Officer and Treasurer |
| Diana M. Daniels | | Caroline L. Kraus, Secretary |
| Joaquin Delgado | | |
| Eileen H. Dowling | | |
| James A. McNamara | | |
| Roy W. Templin |
| Gregory G. Weaver |
GOLDMAN SACHS & CO. LLC
Distributor and Transfer Agent
GOLDMAN SACHS ASSET MANAGEMENT, L.P.
Investment Adviser
200 West Street, New York
New York 10282
Visit our web site at www.GSAMFUNDS.com to obtain the most recent month-end returns.
The reports concerning the Fund included in this shareholder report may contain certain forward-looking statements about the factors that may affect the performance of the Fund in the future. These statements are based on Fund management’s predictions and expectations concerning certain future events and their expected impact on the Fund, such as performance of the economy as a whole and of specific industry sectors, changes in the levels of interest rates, the impact of developing world events, and other factors that may influence the future performance of the Fund. Management believes these forward-looking statements to be reasonable, although they are inherently uncertain and difficult to predict. Actual events may cause adjustments in portfolio management strategies from those currently expected to be employed.
A description of the policies and procedures that the Fund uses to determine how to vote proxies relating to portfolio securities and information regarding how the Fund voted proxies relating to portfolio securities during the most recent 12-month period ended June 30 is available (i) without charge, upon request by calling 1-800-621-2550; and (ii) on the Securities and Exchange Commission (“SEC”) web site at http://www.sec.gov.
The Fund will file its portfolio holdings information for each month in a fiscal quarter within 60 days after the end of the relevant fiscal quarter on Form N-PORT. Portfolio holdings information for the third month of each fiscal quarter will be made available on the SEC’s web site at http://www.sec.gov. Portfolio holdings information may be obtained upon request and without charge by calling 1-800-526-7384 (for Retail Shareholders) or 1-800-621-2550 (for Institutional Shareholders).
Views and opinions expressed are for informational purposes only and do not constitute a recommendation by GSAM to buy, sell, or hold any security. Views and opinions are current as of the date of this presentation and may be subject to change, they should not be construed as investment advice.
Goldman Sachs & Co. LLC (“Goldman Sachs”) does not provide legal, tax or accounting advice. Any statement contained in this communication (including any attachments) concerning U.S. tax matters was not intended or written to be used, and cannot be used, for the purpose of avoiding penalties under the Internal Revenue Code, and was written to support the promotion or marketing of transaction or matter addressed. Clients of Goldman Sachs should obtain their own independent tax advice based on their particular circumstances.
The website links provided are for your convenience only and are not an endorsement or recommendation by GSAM of any of these websites or the products or services offered. GSAM is not responsible for the accuracy and validity of the content of these websites.
Economic and market forecasts presented herein reflect our judgment as of the date of this presentation and are subject to change without notice. These forecasts do not take into account the specific investment objectives, restrictions, tax and financial situation or other needs of any specific client. Actual data will vary and may not be reflected here. These forecasts are subject to high levels of uncertainty that may affect actual performance. Accordingly, these forecasts should be viewed as merely representative of a broad range of possible outcomes. These forecasts are estimated, based on assumptions, and are subject to significant revision and may change materially as economic and market conditions change. Goldman Sachs has no obligation to provide updates or changes to these forecasts. Case studies and examples are for illustrative purposes only.
Fund holdings and allocations shown are as of December 31, 2021 and may not be representative of future investments. Fund holdings should not be relied on in making investment decisions and should not be construed as research or investment advice regarding particular securities. Current and future holdings are subject to risk.
References to indices, benchmarks or other measures of relative market performance over a specified period of time are provided for your information only and do not imply that the portfolio will achieve similar results. The index composition may not reflect the manner in which a portfolio is constructed. While an adviser seeks to design a portfolio which reflects appropriate risk and return features, portfolio characteristics may deviate from those of the benchmark.
The Global Industry Classification Standard (“GICS”) was developed by and is the exclusive property and a service mark of Morgan Stanley Capital International Inc. (“MSCI”) and Standard & Poor’s, a division of The McGraw-Hill Companies, Inc. (“S&P”) and is licensed for use by Goldman Sachs. Neither MSCI, S&P nor any other party involved in making or compiling the GICS or any GICS classifications makes any express or implied warranties or representations with respect to such standard or classification (or the results to be obtained by the use thereof), and all such parties hereby expressly disclaim all warranties of originality, accuracy, completeness, merchantability or fitness for a particular purpose with respect to any of such standard or classification. Without limiting any of the foregoing, in no event shall MSCI, S&P, any of their affiliates or any third party involved in making or compiling the GICS or any GICS classifications have any liability for any direct, indirect, special, punitive, consequential or any other damages (including lost profits) even if notified of the possibility of such damages.
The portfolio risk management process includes an effort to monitor and manage risk, but does not imply low risk.
Shares of the Goldman Sachs VIT Funds are offered to separate accounts of participating life insurance companies for the purpose of funding variable annuity contracts and variable life insurance policies. Shares of the Fund are not offered directly to the general public. The variable annuity contracts and variable life insurance policies are described in the separate prospectuses issued by participating insurance companies. You should refer to those prospectuses for information about surrender charges, mortality and expense risk fees and other charges that may be assessed by participating insurance companies under the variable annuity contracts or variable life insurance policies. Such fees or charges, if any, may affect the return you may realize with respect to your investments. Ask your representative for more complete information. Please consider a fund’s objectives, risks and charges and expenses, and read the prospectus carefully before investing. The prospectus contains this and other information about the Fund.
This material is not authorized for distribution to prospective investors unless preceded or accompanied by a current prospectus or summary prospectus, if applicable. Investors should consider the Fund’s objective, risks, and charges and expenses, and read the summary prospectus, if available, and/or the prospectus carefully before investing or sending money. The summary prospectus, if available, and the prospectus contain this and other information about the Fund and may be obtained from your authorized dealer or from Goldman Sachs & Co. LLC by calling 1-800-621-2550
This report is prepared for the general information of contract owners and is not an offer of shares of the Goldman Sachs Variable Insurance Trust Funds.
© 2022 Goldman Sachs. All rights reserved.
VITEQTYAR-22/268078-OTU-1554962
Goldman
Sachs Variable Insurance Trust
Goldman Sachs Government
Money Market Fund
Annual Report
December 31, 2021

Goldman Sachs Government Money Market Fund
You could lose money by investing in the Fund. Although the Fund seeks to preserve the value of your investment at $1.00 per share, it cannot guarantee it will do so. An investment in the Fund is not a deposit of the bank and is not insured or guaranteed by the Federal Deposit Insurance Corporation or any other government agency. The Fund’s sponsor has no legal obligation to provide financial support to the Fund, and you should not expect that the sponsor will provide financial support to the Fund at any time.
GOLDMAN SACHS VARIABLE INSURANCE TRUST GOVERNMENT MONEY MARKET FUND
INVESTMENT OBJECTIVE
The Fund seeks to maximize current income to the extent consistent with the preservation of capital and the maintenance of liquidity by investing exclusively in high quality money market instruments.
Portfolio Management Discussion and Analysis
Below, the Goldman Sachs Money Market Portfolio Management Team discusses the Goldman Sachs Variable Insurance Trust — Goldman Sachs Government Money Market Fund’s (the “Fund”) performance and positioning for the 12-month period ended December 31, 2021 (the “Reporting Period”).
How did the Fund perform during the Reporting Period?
The Fund’s Institutional Shares’ standardized 7-day current yield was 0.01% and their standardized 7-day effective yield was 0.01% as of December 31, 2021. The Institutional Shares’ one-month simple average yield was 0.01% as of December 31, 2021. The Institutional Shares’ 7-day distribution yield as of December 31, 2021 was 0.01%.
The Fund’s Service Shares’ standardized 7-day current yield was 0.01% and their standardized 7-day effective yield was 0.01% as of December 31, 2021. The Service Shares’ one-month simple average yield was 0.01% as of December 31, 2021. The Service Shares’ 7-day distribution yield as of December 31, 2021 was 0.01%.
The yields represent past performance. Past performance does not guarantee future results. Current performance may be lower or higher than the performance quoted above.
Yields will fluctuate as market conditions change. The yield quotations more closely reflect the current earnings of the Fund than total return quotations.
What economic and market factors most influenced the money markets as a whole during the Reporting Period?
During the Reporting Period, the money markets were most influenced by U.S. Federal Reserve (“Fed”) policy and the outlook for the U.S. economy. The Fed held the targeted federal funds rate in a range of between 0% and 0.25% throughout the Reporting Period.
In December 2020, just before the Reporting Period began, the Fed introduced dovish forward guidance, stating it would continue to increase its asset holdings “until substantial further progress has been made toward the Committee’s maximum employment and price stability goals.” (Dovish tends to suggest lower interest rates; opposite of hawkish. Committee refers to Federal Open Market Committee (“FOMC”).) In the first quarter of 2021, when the Reporting Period began, the Fed revised its economic growth and inflation projections higher but kept its median dot plot projection flat through 2023. (The dot plot shows interest rate projections of the members of the FOMC.) Fed policymakers also emphasized that they would focus on inflation outcomes rather than inflation outlooks. In May 2021, remarkably strong U.S. inflation data, coupled with the release of a disappointing April U.S. jobs reports, suggested that COVID-19 pandemic-related dynamics, such as economic reopening, fiscal policy support and temporary supply shortages, were likely to continue distorting economic data in the near term and could result in a sooner than anticipated withdrawal of Fed monetary policy support. Indeed, during June, the FOMC began to discuss when it might be appropriate to start tapering its asset purchases. The median dot plot projection also forecasts two interest rate hikes in 2023. In July 2021, the Fed kept its monetary policy unchanged but noted the U.S. economy was “making progress” towards policymakers’ price stability and employment goals.
At its September 2021 policy meeting, the FOMC provided notice that asset purchase tapering “may soon be warranted” if the U.S. economy continued to progress towards the Fed’s unemployment and inflation targets, though Fed Chair Jerome Powell noted that economic slack remained significant. In addition, the FOMC acknowledged recent elevated inflation but maintained the view that it was largely transitory and that Fed officials expected inflation to converge to their 2% target over the course of the new few years. Meanwhile, the median dot plot projection pointed to an interest rate hike in 2022, followed by three further rate hikes in 2023 and 2024. In October 2021, the Fed’s narrative on inflation shifted from “transitory” to “more persistent.” At its November policy meeting, the FOMC said it could be patient about raising interest rates but indicated it would not hesitate to act if inflation continued to rise. The Fed also began to scale back its $120 billion a month asset purchase program, announcing it would reduce it by $15 billion in November and December 2021. However, at the December FOMC meeting, the Fed announced it would double the pace of tapering its asset purchases, from $15 billion per month to $30 billion per month, beginning in January 2022. As a result, the Fed’s asset purchasing program is now set to end in March 2022 instead of June 2022, opening the door for interest rate increases sooner than investors originally expected.
GOLDMAN SACHS VARIABLE INSURANCE TRUST GOVERNMENT MONEY MARKET FUND
During the Reporting Period, countries with high COVID-19 vaccination rates largely reopened their economies. At the same time, supply-chain issues weighed on manufacturing activity, with worries about the COVID-19 Delta and Omicron variants dampening — albeit modestly — a rebound in consumer spending on services. That said, coronavirus-sensitive services started to recover in response to high and/or rising vaccination rates and elevated savings rates.
In this environment, the yields of taxable and tax-exempt money market funds generally remained stable and close to zero. Investments in taxable money market funds increased during the Reporting Period from approximately $4.2 trillion to $4.6 trillion, according to iMoneyNet.
The taxable money market yield curve, or spectrum of maturities, steepened during the Reporting Period overall, as the market priced in three or four 25 basis point interest hikes in the short-term end of the curve. (A basis point is 1/100th of a percentage point.) Spreads, or yield differentials, widened on this market sentiment, causing the yield curve to steepen. (Yield curve is a spectrum of interest rates based on maturities of varying lengths. A steepening yield curve is one wherein the differential in yields between longer-term and shorter-term maturities widens; opposite of a flattening yield curve.)
Money market funds overall remained a viable investment for investors seeking stability, liquidity and/or yield amid ongoing uncertainty and elevated volatility in the financial markets broadly.
What key factors were responsible for the Fund’s performance during the Reporting Period?
The Fund’s yields remained rather stable during the Reporting Period, largely because of the economic and market factors discussed above. The Fund remained highly liquid throughout the Reporting Period.
The Fund continued to be flexibly guided by shifting marketing conditions, and we positioned the Fund to seek to take advantage of the Fed’s accommodative monetary policy. Duration management and duration positioning play a key role in our management philosophy. (Duration is a measure of a fund’s sensitivity to changes in interest rates.) That said, it should be noted that regardless of interest rate conditions, we manage the Fund consistently. Our investment approach has always been tri-fold — to seek preservation of capital, daily liquidity and maximization of yield potential. We manage interest, liquidity and credit risk daily. Whether interest rates are historically low, high or in-between, we intend to continue to use our actively managed approach to provide the best possible return within the framework of the Fund’s guidelines and objectives.
How did you manage the Fund’s weighted average maturity during the Reporting Period?
On December 31, 2020, the Fund’s weighted average maturity was 58 days. At any given time, the Fund’s weighted average maturity is based on how market interest rates compare with our near-term expectations, including supply dynamics and monetary policy. At the end of the Reporting Period, the Fund’s weighted average maturity was 7 days.
Throughout the Reporting Period, we focused on U.S. government repurchase agreements, U.S. Treasuries, U.S. government agency securities, and, to a lesser extent, U.S. Treasury repurchase agreement and variable rate demand notes when and where we saw what we considered to be attractive opportunities.
The weighted average maturity of a money market fund is a measure of its price sensitivity to changes in interest rates. Also known as effective maturity, weighted average maturity measures the weighted average of the maturity date of bonds held by the Fund taking into consideration any available maturity shortening features.
How did you manage the Fund’s weighted average life during the Reporting Period?
During the Reporting Period, we managed the weighted average life of the Fund between 82 days and 114 days. The weighted average life of the Fund was 113 days as of December 31, 2021. The weighted average life of a money market fund is a measure of a money market fund’s price sensitivity to changes in liquidity and/or credit risk.
Pursuant to SEC Rule 2a-7, the maximum allowable dollar-weighted average life of a money market fund is 120 days. While one of the goals of the SEC’s money market fund rule is to reinforce conservative investment practices across the money market fund industry, our security selection process has long emphasized conservative investment choices.
How was the Fund invested during the Reporting Period?
The Fund had investments in U.S. government agency repurchase agreements, U.S. Treasury securities, U.S. government agency securities, and, to a lesser extent, U.S. Treasury repurchase agreements and variable rate demand notes during the Reporting Period.
Throughout, we stayed true to our investment discipline, favoring liquidity and high quality credits over added yield. The primary focal points for our team are consistently managing interest rate risk and credit risk. We were able to navigate interest rate risk by
GOLDMAN SACHS VARIABLE INSURANCE TRUST GOVERNMENT MONEY MARKET FUND
adjusting the Fund’s weighted average maturity longer or shorter as market conditions shifted and to mitigate potential credit risk by buying high quality, creditworthy names, strategies which added to the Fund’s performance during the Reporting Period. Throughout the Reporting Period, we managed the Fund’s allocations to different sub-sectors of the money market depending on their relative value. We also adapted a flexible approach to our duration management and positioning so that we could take advantage of opportunities wherever they may arise.
Did you make any changes in the Fund’s portfolio during the Reporting Period?
As indicated earlier, we made adjustments to the Fund’s weighted average maturity, weighted average life and specific security type composition allocations based on then-current market conditions, our near-term view, and anticipated and actual Fed monetary policy statements. During the Reporting Period, we generally increased the Fund’s exposure to U.S. government agency repurchase agreements and reduced its exposure to U.S. government agency securities and U.S. Treasury securities.
What is the Fund’s tactical view and strategy for the months ahead?
The Fed stated in December 2021 that it will double the pace of its asset purchase taper beginning in January 2022. The Fed also saw potential for three interest rate hikes in 2022 and no longer viewed high inflation as a “transitory” phenomenon. Interestingly, at the end of the Reporting Period, financial markets appeared unperturbed by the Fed’s somewhat hawkish reset. This may reflect fewer than widely expected cumulative interest rate hikes through to 2024.
At the end of the Reporting Period, we believed the global economy had the potential in 2022 to transition from a highly unusual pandemic recovery to a more normal expansion. In our view, growth will likely remain above trend in major economies as a recovery in services consumption and inventory rebuilding offset the impact of waning fiscal impulses. Inflation surprised sharply to the upside in 2021 due to excess demand for durable goods and a squeeze in labor supply. We believed inflation remained the biggest source of macro uncertainty into 2022. Higher prices appeared to cause households in advanced economies to delay rather than pull forward new purchases. In addition, we expect that a demand rotation from goods to services should allow supply bottlenecks to ease, and there were tentative signs of moderating cost-push inflation at the end of the Reporting Period. “(Cost-push inflation occurs when overall prices rise due to increases in production costs such as wages and raw materials.)” As of the end of December 2021, we expected the Fed to begin raising rates in June 2022, with risks skewed toward an earlier hike.
Looking ahead, our strategy continues to be flexibly guided by shifting market conditions, positioning the Fund and its duration to seek to take advantage of anticipated interest rate movements or lack thereof. As always, we intend to continue to use our actively managed approach to seek the best possible return within the framework of the Fund’s investment guidelines and objectives. In addition, we will continue to manage interest, liquidity and credit risk daily.
We will, of course, continue to closely monitor economic data, Fed policy, and any shifts in the money market yield curve, as we strive to strategically navigate the interest rate environment.
FUND BASICS
FUND COMPOSITION†
Security Type
(Percentage of Net Assets)
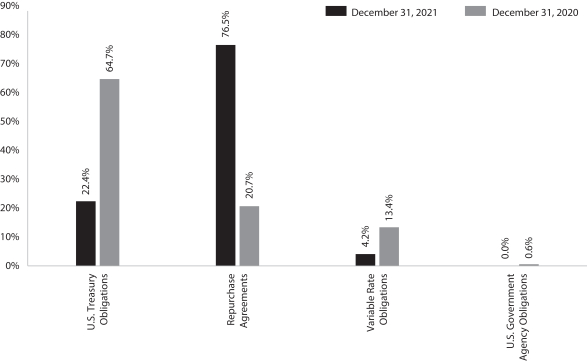
| † | The Fund is actively managed and, as such, its portfolio composition may differ over time. The percentage shown for each investment category reflects the value (based on amortized cost) of investments in that category as a percentage of net assets. Figures in the above chart may not sum to 100% due to the exclusion of other assets and liabilities. |
For more information about your Fund, please refer to www.GSAMFUNDS.com. There, you can learn more about your Fund’s investment strategies, holdings, and performance.
GOLDMAN SACHS VARIABLE INSURANCE TRUST GOVERNMENT MONEY MARKET FUND
Schedule of Investments
December 31, 2021
| | | | | | | | | | | | | | |
Principal
Amount | | | Interest
Rate | | | Maturity
Date | | | Amortized Cost | |
|
| Variable Rate Obligations – 4.2% | |
| | Federal Farm Credit Bank (3 Mo. U.S. T-Bill MMY + 0.02%) | |
| $ | 900,000 | | | | 0.105 | %(a) | | | 04/05/23 | | | $ | 899,971 | |
| | 500,000 | | | | 0.108 | (a) | | | 05/12/23 | | | | 500,000 | |
| | Federal Farm Credit Bank (3 Mo. U.S. T-Bill MMY + 0.04%) | |
| | 1,500,000 | | | | 0.120 | (a) | | | 10/23/23 | | | | 1,499,890 | |
| | 3,000,000 | | | | 0.130 | (a) | | | 10/30/23 | | | | 2,999,834 | |
| | Federal Farm Credit Bank (3 Mo. U.S. T-Bill MMY + 0.06%) | |
| | 200,000 | | | | 0.140 | (a) | | | 01/31/23 | | | | 200,077 | |
| | Federal Farm Credit Bank (FEDL01 + 0.00%) | |
| | 800,000 | | | | 0.080 | (a) | | | 02/17/23 | | | | 800,000 | |
| | Federal Farm Credit Bank (FEDL01 + 0.12%) | |
| | 1,200,000 | | | | 0.195 | (a) | | | 02/14/22 | | | | 1,200,000 | |
| | Federal Farm Credit Bank (FEDL01 + 0.17%) | |
| | 1,900,000 | | | | 0.250 | (a) | | | 01/13/22 | | | | 1,899,995 | |
| | Federal Farm Credit Bank (Prime Rate – 2.87%) | |
| | 500,000 | | | | 0.380 | (a) | | | 02/07/22 | | | | 499,995 | |
| | Federal Farm Credit Bank (Prime Rate – 3.02%) | |
| | 1,800,000 | | | | 0.234 | (a) | | | 01/13/22 | | | | 1,800,000 | |
| | Federal Farm Credit Bank (Prime Rate – 3.10%) | |
| | 1,600,000 | | | | 0.150 | (a) | | | 12/02/22 | | | | 1,600,000 | |
| | Federal Farm Credit Bank (Prime Rate – 3.11%) | |
| | 1,200,000 | | | | 0.140 | (a) | | | 11/21/22 | | | | 1,199,957 | |
| | Federal Farm Credit Bank (Prime Rate – 3.13%) | |
| | 500,000 | | | | 0.125 | (a) | | | 02/01/23 | | | | 500,000 | |
| | Federal Farm Credit Bank (Prime Rate – 3.15%) | |
| | 900,000 | | | | 0.105 | (a) | | | 04/13/23 | | | | 899,965 | |
| | Federal Farm Credit Bank (Prime Rate – 3.16%) | |
| | 1,100,000 | | | | 0.095 | (a) | | | 01/31/22 | | | | 1,099,996 | |
| | Federal Farm Credit Bank (Prime Rate – 3.17%) | |
| | 400,000 | | | | 0.085 | (a) | | | 11/25/22 | | | | 400,000 | |
| | Federal Farm Credit Bank (SOFR + 0.13%) | |
| | 500,000 | | | | 0.180 | (a) | | | 02/11/22 | | | | 500,000 | |
| | Federal Farm Credit Bank (SOFR + 0.18%) | |
| | 2,800,000 | | | | 0.230 | (a) | | | 01/14/22 | | | | 2,799,908 | |
| | Federal Home Loan Bank (SOFR + 0.17%) | |
| | 4,200,000 | | | | 0.220 | (a) | | | 07/21/22 | | | | 4,200,000 | |
| | Federal Home Loan Mortgage Corp. (SOFR + 0.31%) | |
| | 2,000,000 | | | | 0.360 | (a) | | | 01/03/22 | | | | 2,000,000 | |
| | Federal National Mortgage Association (SOFR + 0.34%) | |
| | 7,000,000 | | | | 0.390 | (a) | | | 01/21/22 | | | | 7,000,000 | |
| | Federal National Mortgage Association (SOFR + 0.36%) | |
| | 1,000,000 | | | | 0.410 | (a) | | | 01/20/22 | | | | 1,000,000 | |
| U.S. International Development Finance Corp. (3 Mo. U.S. T-Bill
+ 0.00%) |
|
| | 950,000 | | | | 0.074 | (a) | | | 01/07/22 | | | | 950,000 | |
| | 6,128,475 | | | | 0.090 | (a) | | | 01/07/22 | | | | 6,128,475 | |
| | |
| TOTAL U.S. GOVERNMENT AGENCY
OBLIGATIONS |
| | $ | 42,578,063 | |
| | |
| | | | | | | | | | | | | | |
|
| U.S. Treasury Obligations – 22.4% | |
| | United States Treasury Bills | |
| $ | 2,400,000 | | | | 0.056 | % | | | 04/14/22 | | | $ | 2,399,622 | |
| | 16,425,000 | | | | 0.061 | | | | 04/28/22 | | | | 16,421,787 | |
| | |
|
| U.S. Treasury Obligations – (continued) | |
| | United States Treasury Bills – (continued) | |
| 400,000 | | | | 0.069 | | | | 04/28/22 | | | | 399,922 | |
| | 4,900,000 | | | | 0.091 | | | | 10/06/22 | | | | 4,896,594 | |
| United States Treasury Floating Rate Note (3 Mo. U.S. T-Bill
MMY + 0.03%) |
|
| | 60,000,000 | | | | 0.119 | | | | 04/30/23 | | | | 60,003,209 | |
| | 25,800,000 | | | | 0.114 | | | | 07/31/23 | | | | 25,800,555 | |
| United States Treasury Floating Rate Note (3 Mo. U.S. T-Bill
MMY + 0.04%) |
|
| | 69,400,000 | | | | 0.120 | (a) | | | 10/31/23 | | | | 69,400,564 | |
| United States Treasury Floating Rate Note (3 Mo. U.S. T-Bill
MMY + 0.05%) |
|
| | 28,300,000 | | | | 0.134 | (a) | | | 01/31/23 | | | | 28,304,324 | |
| United States Treasury Floating Rate Note (3 Mo. U.S. T-Bill
MMY + 0.06%) |
|
| | 7,900,000 | | | | 0.140 | | | | 07/31/22 | | | | 7,901,369 | |
| | 5,200,000 | | | | 0.140 | | | | 10/31/22 | | | | 5,201,306 | |
| United States Treasury Floating Rate Note (3 Mo. U.S. T-Bill
MMY + 0.11%) |
|
| | 400,000 | | | | 0.199 | (a) | | | 04/30/22 | | | | 400,151 | |
| United States Treasury Floating Rate Note (3 Mo. U.S. T-Bill
MMY + 0.15%) |
|
| | 5,100,000 | | | | 0.239 | (a) | | | 01/31/22 | | | | 5,100,687 | |
| | United States Treasury Notes | |
| | 104,000 | | | | 2.500 | | | | 01/15/22 | | | | 104,096 | |
| | 96,000 | | | | 1.500 | | | | 01/31/22 | | | | 96,112 | |
| | 200,000 | | | | 1.875 | | | | 01/31/22 | | | | 200,294 | |
| | 19,000 | | | | 1.125 | | | | 02/28/22 | | | | 19,033 | |
| | 5,000 | | | | 1.750 | | | | 02/28/22 | | | | 5,014 | |
| | 727,800 | | | | 0.125 | | | | 06/30/22 | | | | 727,891 | |
| | 2,125,000 | | | | 1.750 | | | | 07/15/22 | | | | 2,143,725 | |
| | |
| TOTAL U.S. TREASURY
OBLIGATIONS |
| | $ | 229,526,255 | |
| | |
| TOTAL INVESTMENTS BEFORE
REPURCHASE AGREEMENTS |
| | $ | 272,104,318 | |
| | |
| | | | | | | | | | | | | | |
|
| Repurchase Agreements(b) – 76.5% | |
| | Bank of Montreal | |
| $ | 1,000,000 | | | | 0.055 | %(c) | | | 01/07/22 | | | $ | 1,000,000 | |
| | Maturity Value: $1,000,215 | |
| | Settlement Date: 08/26/21 | |
| Collateralized by a U.S. Treasury Bill, 0.000%, due 04/21/22, a
U.S. Treasury Bond, 6.250%, due 05/15/30, a U.S. Treasury
Inflation-Indexed Note, 0.250%, due 01/15/25, U.S. Treasury
Interest-Only Stripped Securities, 0.000%, due 02/15/22 to
08/15/41 and U.S. Treasury Notes, 0.125% to 2.000%, due
06/30/22 to 12/31/27. The aggregate market value of the
collateral, including accrued interest, was $1,020,002. |
|
| | 1,000,000 | | | | 0.055 | (c) | | | 01/07/22 | | | | 1,000,000 | |
| | |
| | |
| The accompanying notes are an integral part of these financial statements. | | 5 |
GOLDMAN SACHS VARIABLE INSURANCE TRUST GOVERNMENT MONEY MARKET FUND
Schedule of Investments (continued)
December 31, 2021
| | | | | | | | | | | | | | |
Principal
Amount | | | Interest
Rate | | | Maturity
Date | | | Amortized Cost | |
|
| Repurchase Agreements(b) – (continued) | |
| | Bank of Montreal – (continued) | |
| | Maturity Value: $1,000,277 | |
| | Settlement Date: 09/01/21 | |
| Collateralized by U.S. Treasury Bills, 0.000%, due 01/11/22 to
04/21/22, U.S. Treasury Bonds, 1.750% to 4.375%, due
05/15/41 to 11/15/49, U.S. Treasury Interest-Only Stripped
Securities, 0.000%, due 05/15/26 to 08/15/47 and U.S. Treasury
Notes, 0.625% to 2.625%, due 12/31/23 to 02/15/29. The
aggregate market value of the collateral, including accrued
interest, was $1,020,005. |
|
| $ | 1,000,000 | | | | 0.055 | %(c) | | | 01/07/22 | | | $ | 1,000,000 | |
| | Maturity Value: $1,000,139 | |
| | Settlement Date: 11/18/21 | |
| Collateralized by U.S. Treasury Bonds, 3.000% to 6.250%, due
05/15/30 to 02/15/49, U.S. Treasury Interest-Only Stripped
Securities, 0.000%, due 08/15/26 to 08/15/41 and a U.S.
Treasury Note, 0.625%, due 11/30/27. The aggregate market
value of the collateral, including accrued interest, was
$1,019,999. |
|
| | 1,000,000 | | | | 0.055 | (c) | | | 01/07/22 | | | | 1,000,000 | |
| | Maturity Value: $1,000,086 | |
| | Settlement Date: 12/06/21 | |
| Collateralized by a U.S. Treasury Bill, 0.000%, due 06/02/22, a
U.S. Treasury Inflation-Indexed Bond, 2.375%, due 01/15/25, a
U.S. Treasury Inflation-Indexed Note, 0.250%, due 01/15/25,
U.S. Treasury Interest-Only Stripped Securities, 0.000%, due
02/15/22 to 11/15/48 and a U.S. Treasury Principal-Only
Stripped Security, 0.000%, due 08/15/41. The aggregate market
value of the collateral, including accrued interest, was
$1,020,002. |
|
| | 1,000,000 | | | | 0.055 | (c) | | | 01/07/22 | | | | 1,000,000 | |
| | Maturity Value: $1,000,023 | |
| | Settlement Date: 12/23/21 | |
| Collateralized by a U.S. Treasury Bond, 6.250%, due 05/15/30
and U.S. Treasury Interest-Only Stripped Securities, 0.000%,
due 08/15/23 to 02/15/47. The aggregate market value of the
collateral, including accrued interest, was $1,020,087. |
|
| | 1,000,000 | | | | 0.055 | (c) | | | 01/07/22 | | | | 1,000,000 | |
| | Maturity Value: $1,000,050 | |
| | Settlement Date: 12/30/21 | |
| Collateralized by U.S. Treasury Interest-Only Stripped Securities,
0.000%, due 08/15/22 to 11/15/45. The aggregate market value
of the collateral, including accrued interest, was $1,019,999. |
|
| | 3,000,000 | | | | 0.070 | (c) | | | 01/07/22 | | | | 3,000,000 | |
| | Maturity Value: $3,001,079 | |
| | Settlement Date: 07/19/21 | |
| Collateralized by Federal National Mortgage Association, 2.500%
to 3.500%, due 01/01/48 to 01/01/52, Government National
Mortgage Association, 4.000%, due 12/20/51 and a U.S.
Treasury Note, 1.250%, due 11/30/26. The aggregate market
value of the collateral, including accrued interest, was
$3,090,012. |
|
| | 250,000 | | | | 0.100 | (c) | | | 01/07/22 | | | | 250,000 | |
| | |
|
| Repurchase Agreements(b) – (continued) | |
| | Bank of Montreal – (continued) | |
| | Maturity Value: $250,253 | |
| | Settlement Date: 07/30/21 | |
| Collateralized by Federal National Mortgage Association, 2.000%
to 3.000%, due 07/01/36 to 12/01/51 and Government National
Mortgage Association, 4.000%, due 12/20/51. The aggregate
market value of the collateral, including accrued interest, was
$257,902. |
|
| | |
| | BNP Paribas | |
| $ | 2,500,000 | | | | 0.050 | % | | | 01/03/22 | | | $ | 2,500,000 | |
| | Maturity Value: $2,500,010 | |
| Collateralized by U.S. Treasury Bills, 0.000%, due 01/20/22 to
05/19/22, U.S. Treasury Bonds, 2.875% to 4.250%, due
11/15/40 to 05/15/43, U.S. Treasury Interest-Only Stripped
Securities, 0.000%, due 02/15/22 to 05/15/48, U.S. Treasury
Notes, 1.500% to 2.625%, due 03/31/23 to 11/15/26 and U.S.
Treasury Principal-Only Stripped Securities, 0.000%, due
08/15/45 to 11/15/50. The aggregate market value of the
collateral, including accrued interest, was $2,550,002. |
|
| | 4,000,000 | | | | 0.060 | (c) | | | 01/07/22 | | | | 4,000,000 | |
| | Maturity Value: $4,001,213 | |
| | Settlement Date: 09/20/21 | |
| Collateralized by a U.S. Treasury Inflation-Indexed Note, 0.125%,
due 01/15/31, U.S. Treasury Interest-Only Stripped Securities,
0.000%, due 02/15/35 to 11/15/37, a U.S. Treasury Note,
2.250%, due 04/15/22 and U.S. Treasury Principal-Only
Stripped Securities, 0.000%, due 02/15/44 to 05/15/47. The
aggregate market value of the collateral, including accrued
interest, was $4,080,063. |
|
| | 5,000,000 | | | | 0.060 | (c) | | | 01/07/22 | | | | 5,000,000 | |
| | Maturity Value: $5,001,517 | |
| | Settlement Date: 08/19/21 | |
| Collateralized by Federal Farm Credit Bank, 1.950%, due
08/13/40, Federal Home Loan Mortgage Corp., 3.500% to
4.000%, due 02/01/34 to 06/01/42, Federal National Mortgage
Association, 2.500% to 4.500%, due 05/01/28 to 01/01/51, a
U.S. Treasury Bill, 0.000%, due 01/27/22, a U.S. Treasury
Inflation-Indexed Bond, 0.125%, due 02/15/51, U.S. Treasury
Interest-Only Stripped Securities, 0.000%, due 08/15/33 to
02/15/44, U.S. Treasury Notes, 2.000% to 3.000%, due
10/31/22 to 09/30/25 and a U.S. Treasury Principal-Only
Stripped Security, 0.000%, due 05/15/37. The aggregate market
value of the collateral, including accrued interest, was
$5,100,108. |
|
| | 6,000,000 | | | | 0.060 | (c) | | | 01/07/22 | | | | 6,000,000 | |
| | Maturity Value: $6,001,820 | |
| | Settlement Date: 09/07/21 | |
| Collateralized by a U.S. Treasury Bond, 3.000%, due 02/15/49, a
U.S. Treasury Floating Rate Note, 0.134%, due 01/31/23 and
U.S. Treasury Interest-Only Stripped Securities, 0.000%, due
02/15/30 to 02/15/47. The aggregate market value of the
collateral, including accrued interest, was $6,120,078. |
|
| | 10,000,000 | | | | 0.060 | (c) | | | 01/07/22 | | | | 10,000,000 | |
| | |
| | |
| 6 | | The accompanying notes are an integral part of these financial statements. |
GOLDMAN SACHS VARIABLE INSURANCE TRUST GOVERNMENT MONEY MARKET FUND
| | | | | | | | | | | | | | |
Principal
Amount | | | Interest
Rate | | | Maturity
Date | | | Amortized Cost | |
|
| Repurchase Agreements(b) – (continued) | |
| | BNP Paribas – (continued) | |
| | Maturity Value: $10,003,033 | |
| | Settlement Date: 08/19/21 | |
| Collateralized by U.S. Treasury Bonds, 3.000%, due 2/15/48 to
8/15/48, U.S. Treasury Notes, 0.250% to 2.000%, due 02/15/22
to 08/15/30 and U.S. Treasury Interest-Only Stripped Securities,
0.000%, due 05/15/31 to 11/15/37. The aggregate market value
of the collateral, including accrued interest, was $10,200,022. |
|
| $ | 12,000,000 | | | | 0.060 | %(c) | | | 01/07/22 | | | $ | 12,000,000 | |
| | Maturity Value: $12,003,640 | |
| | Settlement Date: 09/07/21 | |
| Collateralized by Federal National Mortgage Association, 2.000%
to 3.500%, due 01/01/33 to 08/01/51, a U.S. Treasury Bill,
0.000%, due 03/22/22, a U.S. Treasury Bond, 6.250%, due
08/15/23, a U.S. Treasury Inflation-Indexed Bond, 3.625%, due
04/15/28, U.S. Treasury Inflation-Indexed Notes, 0.375% to
0.750%, due 07/15/23 to 07/15/28, U.S. Treasury Interest-Only
Stripped Securities, 0.000%, due 05/15/37 to 11/15/39, U.S.
Treasury Notes, 0.125% to 2.875%, due 05/15/22 to 11/30/23
and a U.S. Treasury Principal-Only Stripped Security, 0.000%,
due 11/15/23. The aggregate market value of the collateral,
including accrued interest, was $12,240,166. |
|
| | |
| | Canadian Imperial Bank of Commerce | |
| | 3,000,000 | | | | 0.050 | | | | 01/03/22 | | | | 3,000,000 | |
| | Maturity Value: $3,000,013 | |
| Collateralized by a U.S. Treasury Bill, 0.000%, due 07/14/22, U.S.
Treasury Bonds, 1.375% to 3.625%, due 11/15/40 to 11/15/50,
U.S. Treasury Inflation-Indexed Bonds, 2.375% to 3.875%, due
01/15/25 to 04/15/29, U.S. Treasury Inflation-Indexed Notes,
0.125% to 0.875%, due 07/15/22 to 01/15/29 and U.S. Treasury
Notes, 0.125% to 2.875%, due 05/31/22 to 02/15/29. The
aggregate market value of the collateral, including accrued
interest, was $3,060,075. |
|
| | 1,000,000 | | | | 0.055 | (c) | | | 01/06/22 | | | | 1,000,000 | |
| | Maturity Value: $1,000,141 | |
| | Settlement Date: 10/06/21 | |
| Collateralized by U.S. Treasury Bonds, 1.625% to 3.000%, due
11/15/44 to 11/15/50, U.S. Treasury Inflation-Indexed Bonds,
0.875% to 3.375%, due 01/15/25 to 02/15/47, U.S. Treasury
Inflation-Indexed Notes, 0.500%, due 04/15/24 to 01/15/28 and
U.S. Treasury Notes, 0.125% to 2.875%, due 08/15/23 to
05/15/31. The aggregate market value of the collateral,
including accrued interest, was $1,020,038. |
|
| | 1,000,000 | | | | 0.055 | (c) | | | 01/07/22 | | | | 1,000,000 | |
| | Maturity Value: $1,000,277 | |
| | Settlement Date: 10/06/21 | |
| Collateralized by U.S. Treasury Bonds, 1.875% to 3.000%, due
02/15/41 to 11/15/44 and U.S. Treasury Inflation-Indexed
Bonds, 0.875% to 3.625%, due 01/15/25 to 02/15/47. The
aggregate market value of the collateral, including accrued
interest, was $1,020,072. |
|
| | 4,000,000 | | | | 0.055 | (c) | | | 01/07/22 | | | | 4,000,000 | |
| | |
|
| Repurchase Agreements(b) – (continued) | |
| | Canadian Imperial Bank of Commerce – (continued) | |
| | Maturity Value: $4,000,189 | |
| | Settlement Date: 12/20/21 | |
| Collateralized by U.S. Treasury Bonds, 1.375% to 3.000%, due
11/15/40 to 11/15/50, U.S. Treasury Inflation-Indexed Bonds,
0.250% to 1.375%, due 02/15/44 to 02/15/50, a U.S. Treasury
Inflation-Indexed Note, 0.500%, due 04/15/24 and U.S.
Treasury Notes, 0.125% to 3.125%, due 05/31/22 to 05/15/31.
The aggregate market value of the collateral, including accrued
interest, was $4,080,072. |
|
| $ | 5,000,000 | | | | 0.055 | %(c) | | | 01/07/22 | | | $ | 5,000,000 | |
| | Maturity Value: $5,000,466 | |
| | Settlement Date: 11/26/21 | |
| Collateralized by a U.S. Treasury Bill, 0.000%, due 07/14/22, U.S.
Treasury Bonds, 1.375% to 3.750%, due 11/15/40 to 11/15/50,
U.S. Treasury Inflation-Indexed Bonds, 0.750% to 3.375%, due
04/15/32 to 02/15/49 and U.S. Treasury Notes, 0.500% to
2.875%, due 01/15/23 to 05/15/31. The aggregate market value
of the collateral, including accrued interest, was $5,100,056. |
|
| | 5,000,000 | | | | 0.055 | (c) | | | 01/07/22 | | | | 5,000,000 | |
| | Maturity Value: $5,000,168 | |
| | Settlement Date: 12/21/21 | |
| Collateralized by U.S. Treasury Notes, 0.125% to 1.500%, due
01/15/23 to 05/31/27. The aggregate market value of the
collateral, including accrued interest, was $5,100,092. |
|
| | 7,500,000 | | | | 0.055 | (c) | | | 01/07/22 | | | | 7,500,000 | |
| | Maturity Value: $7,502,108 | |
| | Settlement Date: 08/18/21 | |
| Collateralized by Federal Home Loan Mortgage Corp., 3.000% to
3.500%, due 02/01/40 to 12/01/49, Federal National Mortgage
Association, 2.000% to 4.000%, due 10/01/43 to 10/01/51 and
Government National Mortgage Association, 3.000%, due
12/20/51. The aggregate market value of the collateral,
including accrued interest, was $7,725,000. |
|
| | 10,000,000 | | | | 0.055 | (c) | | | 01/07/22 | | | | 10,000,000 | |
| | Maturity Value: $10,002,750 | |
| | Settlement Date: 07/28/21 | |
| Collateralized by Federal Home Loan Mortgage Corp., 2.000% to
4.000%, due 04/01/29 to 08/01/51, Federal National Mortgage
Association, 2.000% to 4.500%, due 03/01/31 to 10/01/51 and
Government National Mortgage Association, 3.000% to
4.500%, due 03/20/44 to 12/20/51. The aggregate market value
of the collateral, including accrued interest, was $10,299,999. |
|
| | |
| | Joint Account III | |
| | 656,100,000 | | | | 0.050 | | | | 01/03/22 | | | | 656,100,000 | |
| | Maturity Value: $656,102,734 | |
| | |
| | Royal Bank of Canada | |
| | 1,000,000 | | | | 0.060 | (c) | | | 01/07/22 | | | | 1,000,000 | |
| | Maturity Value: $1,000,350 | |
| | Settlement Date: 08/30/21 | |
| Collateralized by Federal Home Loan Mortgage Corp., 2.000% to
5.000%, due 02/01/43 to 06/01/51 and Federal National
Mortgage Association, 2.000% to 5.500%, due 10/01/35 to
12/01/51. The aggregate market value of the collateral,
including accrued interest, was $1,020,003. |
|
| | |
| The accompanying notes are an integral part of these financial statements. | | 7 |
GOLDMAN SACHS VARIABLE INSURANCE TRUST GOVERNMENT MONEY MARKET FUND
Schedule of Investments (continued)
December 31, 2021
| | | | | | | | | | | | | | |
Principal
Amount | | | Interest
Rate | | | Maturity
Date | | | Amortized Cost | |
|
| Repurchase Agreements(b) – (continued) | |
| | Royal Bank of Canada – (continued) | |
| $ | 2,000,000 | | | | 0.060 | %(c) | | | 01/07/22 | | | $ | 2,000,000 | |
| | Maturity Value: $2,000,717 | |
| | Settlement Date: 06/30/21 | |
| Collateralized by Federal Home Loan Mortgage Corp., 2.000% to
5.000%, due 02/01/43 to 12/01/51 and Federal National
Mortgage Association, 2.000% to 5.500%, due 08/01/40 to
07/01/60. The aggregate market value of the collateral,
including accrued interest, was $2,040,001. |
|
| | 10,000,000 | | | | 0.060 | (c) | | | 01/07/22 | | | | 10,000,000 | |
| | Maturity Value: $10,003,567 | |
| | Settlement Date: 06/24/21 | |
| Collateralized by Federal Home Loan Mortgage Corp., 2.000% to
4.500%, due 02/01/43 to 10/01/51 and Federal National
Mortgage Association, 2.000% to 4.000%, due 06/01/40 to
07/01/60. The aggregate market value of the collateral,
including accrued interest, was $10,200,001. |
|
| | 15,000,000 | | | | 0.060 | (c) | | | 01/07/22 | | | | 15,000,000 | |
| | Maturity Value: $15,005,250 | |
| | Settlement Date: 08/12/21 | |
| Collateralized by Federal Home Loan Mortgage Corp., 2.000% to
5.000%, due 02/01/43 to 06/01/51 and Federal National
Mortgage Association, 2.000% to 6.000%, due 06/01/40 to
07/01/60. The aggregate market value of the collateral,
including accrued interest, was $15,299,998. |
|
| | 15,000,000 | | | | 0.060 | (c) | | | 01/07/22 | | | | 15,000,000 | |
| | Maturity Value: $15,005,250 | |
| | Settlement Date: 08/13/21 | |
| Collateralized by Federal Home Loan Mortgage Corp., 2.000% to
5.000%, due 02/01/43 to 09/01/51 and Federal National
Mortgage Association, 2.000% to 4.000%, due 06/01/41 to
07/01/60. The aggregate market value of the collateral,
including accrued interest, was $15,300,000. |
|
| | |
| | TOTAL REPURCHASE AGREEMENTS | | | $ | 784,350,000 | |
| | |
| | TOTAL INVESTMENTS – 103.1% | | | $ | 1,056,454,318 | |
| | |
| LIABILITIES IN EXCESS OF OTHER
ASSETS – (3.1)% |
| | | (31,695,725 | ) |
| | |
| | NET ASSETS – 100.0% | | | $ | 1,024,758,593 | |
| | |
| | |
| The percentage shown for each investment category reflects the value of investments in that category as a percentage of net assets. |
| |
| (a) | | Variable or floating rate security. Except for floating rate notes (for which final maturity is disclosed), maturity date disclosed is the next interest reset date. Interest rate disclosed is that which is in effect on December 31, 2021. |
| |
| (b) | | Unless noted, all repurchase agreements were entered into on December 31, 2021. Additional information on Joint Repurchase Agreement Account III appears in the Additional Investment Information section. |
| |
| (c) | | The instrument is subject to a demand feature. |
|
| Interest rates represent either the stated coupon rate, annualized yield on date of purchase for discounted securities, or, for floating rate securities, the current reset rate, which is based upon current interest rate indices. |
|
| Maturity dates represent either the final legal maturity date on the security, the demand date for puttable securities, the date of the next interest rate reset for variable rate securities, or the prerefunded date for those types of securities. |
| | |
| |
| Investment Abbreviations: |
| FEDL01 | | —US Federal Funds Effective Rate |
| MMY | | —Money Market Yield |
| Prime | | —Federal Reserve Bank Prime Loan Rate US |
| SOFR | | —Secured Overnight Financing Rate |
| T-Bill | | —Treasury Bill |
| | |
| 8 | | The accompanying notes are an integral part of these financial statements. |
GOLDMAN SACHS VARIABLE INSURANCE TRUST GOVERNMENT MONEY MARKET FUND
ADDITIONAL INVESTMENT INFORMATION
JOINT REPURCHASE AGREEMENT ACCOUNT III — At December 31, 2021, the Fund had undivided interests in the Joint Repurchase Agreement Account III, with a maturity date of January 3, 2022, as follows:
| | | | | | | | | | | | | |
| Principal Amount | | Maturity Value | | Collateral Value |
| | | $656,100,000 | | | | $ | 656,102,734 | | | | $ | 675,778,380 | |
REPURCHASE AGREEMENTS — At December 31, 2021, the Principal Amounts of the Fund’s interest in the Joint Repurchase Agreement Account III were as follows:
| | | | | | | | |
| Counterparty | | Interest
Rate | | | Principal
Amount | |
ABN Amro Bank N.V. | | | 0.050 | % | | $ | 246,037,500 | |
Bank of America, N.A. | | | 0.050 | | | | 205,031,250 | |
BofA Securities, Inc. | | | 0.050 | | | | 205,031,250 | |
| | |
| TOTAL | | | | | | $ | 656,100,000 | |
At December 31, 2021, the Joint Repurchase Agreement Account III was fully collateralized by:
| | | | | | |
| Issuer | | Interest Rates | | | Maturity Dates |
| Federal Home Loan Mortgage Corp. | | | 2.000 to 4.000 | % | | 08/01/46 to 07/01/51 |
| Federal National Mortgage Association | | | 2.000 to 5.500 | | | 03/01/33 to 11/01/51 |
| Government National Mortgage Association | | | 2.000 to 3.500 | | | 08/20/47 to 12/20/51 |
| U.S. Treasury Bond | | | 1.875 | | | 02/15/41 |
| U.S. Treasury Note | | | 1.625 | | | 05/15/31 |
| | |
| The accompanying notes are an integral part of these financial statements. | | 9 |
GOLDMAN SACHS VARIABLE INSURANCE TRUST GOVERNMENT MONEY MARKET FUND
Statement of Assets and Liabilities
December 31, 2021
| | | | |
| | | | |
| Assets: | | | |
Investments based on amortized cost | | $ | 272,104,318 | |
Repurchase agreements based on amortized cost | | | 784,350,000 | |
Cash | | | 5,647 | |
Receivables: | | | | |
Fund shares sold | | | 3,446,841 | |
Interest | | | 95,611 | |
Reimbursement from investment advisor | | | 21,319 | |
Other assets | | | 19,952 | |
| |
| Total assets | | | 1,060,043,688 | |
| | | | |
| | | | |
| Liabilities: | | | |
Payables: | | | | |
Fund shares redeemed | | | 35,058,877 | |
Management fees | | | 53,172 | |
Dividend distribution | | | 25 | |
Accrued expenses | | | 173,021 | |
| |
| Total liabilities | | | 35,285,095 | |
| | | | |
| | | | |
| Net Assets: | | | |
Paid-in capital | | | 1,024,758,198 | |
Total distributable earnings | | | 395 | |
| |
| NET ASSETS | | $ | 1,024,758,593 | |
| |
Net asset value, offering and redemption price per share | | $ | 1.00 | |
Net Assets: | | | | |
Institutional Shares | | $ | 523,750,923 | |
Service Shares | | | 501,007,670 | |
| |
Total Net Assets | | $ | 1,024,758,593 | |
Shares outstanding $0.001 par value (unlimited number of shares authorized): | | | | |
Institutional Shares | | | 523,750,704 | |
Service Shares | | | 501,007,475 | |
| | |
| 10 | | The accompanying notes are an integral part of these financial statements. |
GOLDMAN SACHS VARIABLE INSURANCE TRUST GOVERNMENT MONEY MARKET FUND
Statement of Operations
For the Year Ended December 31, 2021
| | | | |
| | | | |
| Investment Income: | | | |
| |
Interest income | | $ | 1,013,382 | |
| | | | |
| | | | |
| Expenses: | | | |
Management fees | | | 1,741,265 | |
Distribution and Service fees — Service Shares | | | 1,314,534 | |
Transfer Agency fees(a) | | | 217,639 | |
Professional fees | | | 135,205 | |
Custody, accounting and administrative services | | | 78,166 | |
Printing and mailing fees | | | 69,893 | |
Trustee fees | | | 18,252 | |
| |
Other | | | 10,034 | |
| |
| Total expenses | | | 3,584,988 | |
| |
Less — expense reductions | | | (2,621,340 | ) |
| |
| Net expenses | | | 963,648 | |
| |
| NET INVESTMENT INCOME | | $ | 49,734 | |
| |
| Net realized gain from investment transactions | | | 5,853 | |
| |
| NET INCREASE IN NET ASSETS RESULTING FROM OPERATIONS | | $ | 55,587 | |
(a) Institutional Shares and Service Shares incurred Transfer Agency fees of $112,484 and $105,155, respectively.
| | |
| The accompanying notes are an integral part of these financial statements. | | 11 |
GOLDMAN SACHS VARIABLE INSURANCE TRUST GOVERNMENT MONEY MARKET FUND
Statements of Changes in Net Assets
| | | | | | | | |
| | | For the
Fiscal Year Ended
December 31, 2021 | | | For the
Fiscal Year Ended
December 31, 2020 | |
| | | | | | | | |
| From operations: | | | | | | |
Net investment income | | $ | 49,734 | | | $ | 2,857,766 | |
Net realized gain from investment transactions | | | 5,853 | | | | 154,527 | |
| | |
| Net increase in net assets resulting from operations | | | 55,587 | | | | 3,012,293 | |
| | | | | | | | |
| | | | | | | | |
| Distributions to shareholders: | | | | | | |
From distributable earnings: | | | | | | | | |
Institutional Shares | | | (34,324 | ) | | | (1,973,720 | ) |
Service Shares | | | (32,088 | ) | | | (1,094,236 | ) |
| | |
| Total distributions to shareholders | | | (66,412 | ) | | | (3,067,956 | ) |
| | | | | | | | |
| | | | | | | | |
| From share transactions (at $1.00 per share): | | | | | | |
Proceeds from sales of shares | | | 690,873,762 | | | | 1,674,758,015 | |
Reinvestment of distributions | | | 66,343 | | | | 3,064,523 | |
Cost of shares redeemed | | | (827,803,075 | ) | | | (1,230,029,220 | ) |
| | |
| Net increase (decrease) in net assets resulting from share transactions | | | (136,862,970 | ) | | | 447,793,318 | |
| | |
| TOTAL INCREASE (DECREASE) | | | (136,873,795 | ) | | | 447,737,655 | |
| | | | | | | | |
| | | | | | | | |
| Net assets: | | | | | | |
| | |
Beginning of year | | | 1,161,632,388 | | | | 713,894,733 | |
| | |
End of year | | $ | 1,024,758,593 | | | $ | 1,161,632,388 | |
| | |
| 12 | | The accompanying notes are an integral part of these financial statements. |
GOLDMAN SACHS VARIABLE INSURANCE TRUST GOVERNMENT MONEY MARKET FUND
Financial Highlights
Selected Data for a Share Outstanding Throughout Each Year
| | | | | | | | | | | | | | | | | | | | |
| | | Goldman Sachs Government Money Market Fund | |
| | | Institutional Shares | |
| | | Year Ended December 31, | |
| | | 2021 | | | 2020 | | | 2019 | | | 2018 | | | 2017 | |
| | | | | | | | | | | | | | | | | | | | |
| Per Share Data: | | | | | | | | | | | | | | | |
| | | | | |
Net asset value, beginning of year | | $ | 1.00 | | | $ | 1.00 | | | $ | 1.00 | | | $ | 1.00 | | | $ | 1.00 | |
| | | | | |
Net investment income(a) | | | — | (b) | | | 0.004 | | | | 0.021 | | | | 0.017 | | | | 0.008 | |
| | | | | |
Distributions to shareholders from net investment income(c) | | | — | (b) | | | (0.004 | ) | | | (0.021 | ) | | | (0.017 | ) | | | (0.008 | ) |
| | | | | |
Net asset value, end of year | | $ | 1.00 | | | $ | 1.00 | | | $ | 1.00 | | | $ | 1.00 | | | $ | 1.00 | |
| | | | | |
Total return(d) | | | 0.01 | % | | | 0.43 | % | | | 2.11 | % | | | 1.74 | % | | | 0.76 | % |
| | | | | |
Net assets, end of year (in 000’s) | | $ | 523,751 | | | $ | 582,216 | | | $ | 363,783 | | | $ | 411,447 | | | $ | 302,507 | |
| | | | | |
Ratio of net expenses to average net assets | | | 0.09 | % | | | 0.18 | % | | | 0.18 | % | | | 0.18 | % | | | 0.18 | % |
| | | | | |
Ratio of total expenses to average net assets | | | 0.21 | % | | | 0.20 | % | | | 0.21 | % | | | 0.23 | % | | | 0.27 | % |
| | | | | |
Ratio of net investment income to average net assets | | | — | %(e) | | | 0.35 | % | | | 2.06 | % | | | 1.73 | % | | | 0.76 | % |
| (a) | Calculated based on the average shares outstanding methodology. |
| (b) | Amount is less than $0.0005 per share. |
| (c) | Distributions may not coincide with the current year net investment income or net realized gains as distributions may be paid from current or prior year earnings. |
| (d) | Assumes reinvestment of all distributions. |
| (e) | Amount is less than 0.005% of average net assets. |
| | |
| The accompanying notes are an integral part of these financial statements. | | 13 |
GOLDMAN SACHS VARIABLE INSURANCE TRUST GOVERNMENT MONEY MARKET FUND
Financial Highlights (continued)
Selected Data for a Share Outstanding Throughout Each Year
| | | | | | | | | | | | | | | | | | | | |
| | | Goldman Sachs Government Money Market Fund | |
| | | Service Shares | |
| | | Year Ended December 31, | |
| | | 2021 | | | 2020 | | | 2019 | | | 2018 | | | 2017 | |
| | | | | | | | | | | | | | | | | | | | |
| Per Share Data: | | | | | | | | | | | | | | | |
| | | | | |
Net asset value, beginning of year | | $ | 1.00 | | | $ | 1.00 | | | $ | 1.00 | | | $ | 1.00 | | | $ | 1.00 | |
| | | | | |
Net investment income(a) | | | — | (b) | | | 0.003 | | | | 0.018 | | | | 0.015 | | | | 0.005 | |
| | | | | |
Distributions to shareholders from net investment income(c) | | | — | (b) | | | (0.003 | ) | | | (0.018 | ) | | | (0.015 | ) | | | (0.005 | ) |
| | | | | |
Net asset value, end of year | | $ | 1.00 | | | $ | 1.00 | | | $ | 1.00 | | | $ | 1.00 | | | $ | 1.00 | |
| | | | | |
Total return(d) | | | 0.01 | % | | | 0.27 | % | | | 1.86 | % | | | 1.48 | % | | | 0.51 | % |
| | | | | |
Net assets, end of year (in 000’s) | | $ | 501,008 | | | $ | 579,416 | | | $ | 350,112 | | | $ | 368,652 | | | $ | 354,248 | |
| | | | | |
Ratio of net expenses to average net assets | | | 0.09 | % | | | 0.33 | % | | | 0.43 | % | | | 0.43 | % | | | 0.43 | % |
| | | | | |
Ratio of total expenses to average net assets | | | 0.46 | % | | | 0.45 | % | | | 0.46 | % | | | 0.48 | % | | | 0.52 | % |
| | | | | |
Ratio of net investment income to average net assets | | | — | %(e) | | | 0.19 | % | | | 1.81 | % | | | 1.48 | % | | | 0.51 | % |
| (a) | Calculated based on the average shares outstanding methodology. |
| (b) | Amount is less than $0.0005 per share. |
| (c) | Distributions may not coincide with the current year net investment income or net realized gains as distributions may be paid from current or prior year earnings. |
| (d) | Assumes reinvestment of all distributions. |
| (e) | Amount is less than 0.005% of average net assets. |
| | |
| 14 | | The accompanying notes are an integral part of these financial statements. |
GOLDMAN SACHS VARIABLE INSURANCE TRUST GOVERNMENT MONEY MARKET FUND
Notes to Financial Statements
December 31, 2021
1. ORGANIZATION
Goldman Sachs Variable Insurance Trust (the “Trust” or “VIT”) is a Delaware statutory trust registered under the Investment Company Act of 1940, as amended (the “Act”), as an open-end management investment company. The Trust includes the Goldman Sachs Government Money Market Fund (the “Fund”). The Fund is a diversified portfolio under the Act offering two classes of shares — Institutional Shares and Service Shares. Shares of the Trust are offered to separate accounts of participating life insurance companies for the purpose of funding variable annuity contracts and variable life insurance policies.
Goldman Sachs Asset Management, L.P. (“GSAM”), an affiliate of Goldman Sachs & Co. LLC (“Goldman Sachs”), serves as investment adviser to the Fund pursuant to a management agreement (the “Agreement”) with the Trust.
2. SIGNIFICANT ACCOUNTING POLICIES
The financial statements have been prepared in accordance with accounting principles generally accepted in the United States of America (“GAAP”) and require management to make estimates and assumptions that may affect the reported amounts and disclosures. Actual results may differ from those estimates and assumptions. The Fund is an investment company under GAAP and follows the accounting and reporting guidance applicable to investment companies.
A. Investment Valuation — The investment valuation policy of the Fund is to use the amortized-cost method permitted by Rule 2a-7 under the Act for valuing portfolio securities. The amortized-cost method of valuation involves valuing a security at its cost and thereafter applying a constant accretion or amortization to maturity of any discount or premium. Normally, a security’s amortized cost will approximate its market value. Under procedures and tolerances approved by the Board of Trustees (“Trustees”), GSAM evaluates daily the difference between the Fund’s net asset value (“NAV”) per share using the amortized costs of its portfolio securities and the Fund’s NAV per share using market-based values of its portfolio securities. The market-based value of a portfolio security is determined, where readily available, on the basis of market quotations provided by pricing services or securities dealers, or, where accurate market quotations are not readily available, on the basis of the security’s fair value as determined in accordance with Valuation Procedures approved by the Trustees. The pricing services may use valuation models or matrix pricing, which may consider (among other things): (i) yield or price with respect to debt securities that are considered comparable in characteristics such as rating, interest rate and maturity date or (ii) quotations from securities dealers to determine current value.
B. Investment Income and Investments — Interest income is accrued daily and adjusted for amortization of premiums and accretion of discounts. Investment transactions are reflected on trade date. Realized gains and losses are calculated using identified cost.
C. Class Allocations and Expenses — Investment income, realized and unrealized gain (loss), if any, and non-class specific expenses of the Fund are allocated daily based upon the proportion of net assets of each class. Class specific expenses, where applicable, are borne by the respective share classes and include Distribution and Service and Transfer Agency fees. Non-class specific expenses directly incurred by the Fund are charged to the Fund, while such expenses incurred by the Trust are allocated across the Fund on a straight-line and/or pro-rata basis depending upon the nature of the expenses.
D. Federal Taxes and Distributions to Shareholders — It is the Fund’s policy to comply with the requirements of the Internal Revenue Code of 1986, as amended (the “Code”), applicable to regulated investment companies (mutual funds) and to distribute each year substantially all of its investment company taxable and tax-exempt income and capital gains to its shareholders. Accordingly, the Fund is not required to make any provisions for the payment of federal income tax. Distributions to shareholders are declared and recorded daily and paid monthly by the Fund and may include short-term capital gains. Long-term capital gain distributions, if any, are declared and paid annually. The Fund may defer or accelerate the timing of the distribution of short-term capital gains (or any portion thereof).
The characterization of distributions to shareholders for financial reporting purposes is determined in accordance with federal income tax rules, which may differ from GAAP. The source of the Fund’s distributions may be shown in the accompanying financial statements as either from distributable earnings or capital. Certain components of the Fund’s net assets on the Statement of Assets and Liabilities reflect permanent GAAP/tax differences based on the appropriate tax character.
GOLDMAN SACHS VARIABLE INSURANCE TRUST GOVERNMENT MONEY MARKET FUND
Notes to Financial Statements (continued)
December 31, 2021
2. SIGNIFICANT ACCOUNTING POLICIES (continued)
The tax character of distributions paid during the fiscal years ended December 31, 2021 and December 31, 2020 were as follows:
| | | | | | | | |
| | | 2021 | | | 2020 | |
| Distribution paid from: | | | | | | | | |
| Ordinary income | | $ | 66,412 | | | $ | 3,067,901 | |
| Net long-term capital gains | | | — | | | | 55 | |
| | |
| Total taxable distributions | | $ | 66,412 | | | $ | 3,067,956 | |
As of December 31, 2021, the components of accumulated earnings (losses) on a tax basis were as follows:
| | | | |
| Undistributed (Distributions in excess of) ordinary income — net | | $ | 423 | |
| Timing differences (Distributions Payable) | | | (25 | ) |
| Unrealized gains (losses) — net | | | (3 | ) |
| Total accumulated earnings (losses) — net | | $ | 395 | |
The amortized cost for the Fund stated in the accompanying Statement of Assets and Liabilities also represents aggregate cost for U.S. federal income tax purposes.
The difference between GAAP-basis and tax basis unrealized gains (losses) is attributable primarily to wash sales.
GSAM has reviewed the Fund’s tax positions for all open tax years (the current and prior three years, as applicable) and had concluded that no provision for income tax is required in the Fund’s financial statements. Such open tax years remain subject to examination and adjustment by tax authorities.
E. Forward Commitments — A forward commitment involves entering into a contract to purchase or sell securities, typically on an extended settlement basis, for a fixed price at a future date. The purchase of securities on a forward commitment basis involves a risk of loss if the value of the security to be purchased declines before the settlement date. Conversely, the sale of securities on a forward commitment basis involves the risk that the value of the securities sold may increase before the settlement date. Although the Fund will generally purchase securities on a forward commitment basis with the intention of acquiring the securities for its portfolio, the Fund may dispose of forward commitments prior to settlement which may result in a realized gain or loss.
F. Repurchase Agreements — Repurchase agreements involve the purchase of securities subject to the seller’s agreement to repurchase the securities at a mutually agreed upon date and price, under the terms of a Master Repurchase Agreement (“MRA”). During the term of a repurchase agreement, the value of the underlying securities held as collateral on behalf of the Fund, including accrued interest, is required to exceed the value of the repurchase agreement, including accrued interest. The gross value of repurchase agreements is included in the Statement of Assets and Liabilities for financial reporting purposes. The underlying securities for all repurchase agreements are held at the Fund’s custodian or designated sub-custodians under tri-party repurchase agreements.
An MRA governs transactions between the Fund and select counterparties. An MRA contains provisions for, among other things, initiation of the transaction, income payments, events of default, and maintenance of securities for repurchase agreements. An MRA also permits offsetting with collateral to create one single net payment in the event of default or similar events, including the bankruptcy or insolvency of a counterparty.
If the seller defaults, the Fund could suffer a loss to the extent that the proceeds from the sale of the underlying securities and other collateral held by the Fund are less than the repurchase price and the Fund’s costs associated with delay and enforcement of the repurchase agreement. In addition, in the event of default or insolvency of the seller, a court could determine that the Fund’s interest in the collateral is not enforceable, resulting in additional losses to the Fund.
Pursuant to exemptive relief granted by the Securities and Exchange Commission (“SEC”) and terms and conditions contained therein, the Fund, together with other funds of the Trust and registered investment companies having management agreements with
GOLDMAN SACHS VARIABLE INSURANCE TRUST GOVERNMENT MONEY MARKET FUND
2. SIGNIFICANT ACCOUNTING POLICIES (continued)
GSAM or its affiliates, may transfer uninvested cash into joint accounts, the daily aggregate balance of which is invested in one or more repurchase agreements. Under these joint accounts, the Fund maintains pro-rata credit exposure to the underlying repurchase agreements’ counterparties. With the exception of certain transaction fees, the Fund is not subject to any expenses in relation to these investments.
3. INVESTMENTS AND FAIR VALUE MEASUREMENTS
U.S. GAAP defines the fair value of a financial instrument as the amount that would be received to sell an asset or paid to transfer a liability in an orderly transaction between market participants at the measurement date (i.e., the exit price); the Fund’s policy is to use the market approach. GAAP establishes a fair value hierarchy that prioritizes the inputs to valuation techniques used to measure fair value. The hierarchy gives the highest priority to unadjusted quoted prices in active markets for identical assets or liabilities (Level 1 measurements) and the lowest priority to unobservable inputs (Level 3 measurements). The level in the fair value hierarchy within which the fair value measurement in its entirety falls shall be determined based on the lowest level input that is significant to the fair value measurement in its entirety. The levels used for classifying investments are not necessarily an indication of the risk associated with investing in these investments. The three levels of the fair value hierarchy are described below:
Level 1 — Unadjusted quoted prices in active markets that are accessible at the measurement date for identical, unrestricted assets or liabilities;
Level 2 — Quoted prices in markets that are not active or financial instruments for which significant inputs are observable (including, but not limited to, quoted prices for similar investments, interest rates, foreign exchange rates, volatility and credit spreads), either directly or indirectly;
Level 3 — Prices or valuations that require significant unobservable inputs (including GSAM’s assumptions in determining fair value measurement).
The Trustees have approved Valuation Procedures that govern the valuation of the portfolio investments held by the Fund, including investments for which market quotations are not readily available. The Trustees have delegated to GSAM day-to-day responsibility for implementing and maintaining internal controls and procedures related to the valuation (including both the amortized cost and market-based methods of valuation) of the Fund’s investments. To assess the continuing appropriateness of pricing sources and methodologies related to the market-based method of valuation, GSAM regularly performs price verification procedures and issues challenges as necessary to third party pricing vendors or brokers, and any differences are reviewed in accordance with the Valuation Procedures.
As of December 31, 2021, all investments and repurchase agreements are classified as Level 2 of the fair value hierarchy. Please refer to the Schedule of Investments for further detail.
4. AGREEMENTS AND AFFILIATED TRANSACTIONS
A. Management Agreement — Under the Agreement, GSAM manages the Fund, subject to the general supervision of the Trustees.
As compensation for the services rendered pursuant to the Agreement, the assumption of the expenses related thereto and administration of the Fund’s business affairs, including providing facilities, GSAM is entitled to a management fee, accrued daily and paid monthly, equal to an annual percentage rate of the Fund’s average daily net assets.
B. Distribution and Service (12b-1) Plan — The Trust, on behalf of the Service Shares of the Fund, has adopted a Distribution and Service Plan subject to Rule 12b-1 under the Act. Under the Distribution and Service Plan, Goldman Sachs, which serves as distributor (the “Distributor”), is entitled to a fee accrued daily and paid monthly, for distribution services and personal and account maintenance services, which may then be paid by Goldman Sachs to authorized dealers, equal to, on an annual basis, 0.25% of the Fund’s average daily net assets attributable to Service Shares.
GOLDMAN SACHS VARIABLE INSURANCE TRUST GOVERNMENT MONEY MARKET FUND
Notes to Financial Statements (continued)
December 31, 2021
4. AGREEMENTS AND AFFILIATED TRANSACTIONS (continued)
C. Transfer Agency Agreement — Goldman Sachs also serves as the transfer agent of the Fund for a fee pursuant to a Transfer Agency Agreement. The fee charged for such transfer agency services is accrued daily and paid monthly at an annual rate of 0.02% of the Fund’s average daily net assets of Institutional Shares and Service Shares.
D. Other Expense Agreements — GSAM has agreed to limit certain “Other Expenses” of the Fund (excluding acquired fund fees and expenses, transfer agency fees and expenses, taxes, interest, brokerage fees, expenses of shareholder meetings, litigation and indemnification, and extraordinary expenses) to the extent that such expenses exceed, on an annual basis, 0.004% of the average daily net assets of the Fund. Such Other Expense reimbursements, if any, are accrued daily and paid monthly. In addition, the Fund is not obligated to reimburse GSAM for prior fiscal year expense reimbursements, if any. This Other Expense limitation will remain in place through at least April 30, 2022, and prior to such date GSAM may not terminate the arrangement without the approval of the Trustees. In addition, the Fund has entered into certain offset arrangements with the custodian and the transfer agent, which may result in a reduction of the Fund’s expenses and are received irrespective of the application of the “Other Expense” limitation described above. For the year ended December 31, 2021, these expense reductions, including any fee waiver and Other Expense reimbursements, were as follows:
| | | | | | | | | | | | | | | | | | |
Management
Fee Waivers | | | Distribution,
Administration,
Service and/or
Shareholder
Administration
Plans Fee Waivers | | | Transfer Agency
Waiver | | | Other
Expense
Reimbursements | | | Total
Expense
Reductions | |
| | | | |
| $ | 814,764 | | | $ | 1,314,534 | | | $ | 217,639 | | | $ | 274,403 | | | $ | 2,621,340 | |
E. Contractual and Net Fund Expenses — The investment adviser may contractually agree to waive or reimburse certain fees and expenses until a specified date. The investment adviser or transfer agent may also voluntarily waive certain fees and expenses, and such voluntary waivers may be discontinued or modified at any time without notice. The following table outlines such fees (net of waivers) and Other Expenses (net of reimbursements and custodian and transfer agency fee credit reductions) in order to determine the Fund’s net annualized expenses for the fiscal year. The Fund is not obligated to reimburse Goldman Sachs for prior fiscal year fee waivers, if any.
| | | | | | | | | | | | | | | | |
| | | Institutional Shares | | | Service Shares | |
| Fee/Expense Type | | Contractual rate,
if any | | | Ratio of net expenses to
average net assets
for the fiscal year ended
December 31, 2021 | | | Contractual rate,
if any | | | Ratio of net expenses to
average net assets
for the fiscal year ended
December 31, 2021 | |
| Management Fee | | | 0.16 | % | | | 0.09 | % | | | 0.16 | % | | | 0.09 | % |
| Distribution and Service Fees | | | N/A | | | | N/A | | | | 0.25 | | | | 0.00 | |
| Transfer Agency Fees | | | 0.02 | | | | 0.00 | | | | 0.02 | | | | 0.00 | |
| Other Expenses | | | — | | | | 0.00 | (a) | | | — | | | | 0.00 | (a) |
| Net Expenses | | | | | | | 0.09 | % | | | | | | | 0.09 | % |
| (a) | Amount is less than 0.005% of average net assets. |
| N/A | — Fees not applicable to respective share class. |
F. Other Transactions with Affiliates — The Fund may purchase securities from, or sell securities to, an affiliated fund provided the affiliation is solely due to having a common investment adviser, common officers, or common Trustees.
For the fiscal year ended December 31, 2021, the purchase and sale transactions and related net realized gain (loss) for the Fund with affiliated funds in compliance with Rule 17a-7 under the Act were as follows:
| | | | | | | | | | |
| Purchases | | | Sales | | | Net Realized Gain (loss) | |
| | |
| $ | — | | | $ | 199,999 | | | $ | 2 | |
GOLDMAN SACHS VARIABLE INSURANCE TRUST GOVERNMENT MONEY MARKET FUND
4. AGREEMENTS AND AFFILIATED TRANSACTIONS (continued)
G. Line of Credit Facility — As of December 31, 2021, the Fund participated in a $1,000,000,000 committed, unsecured revolving line of credit facility (the “facility”) together with other funds of the Trust and registered investment companies having management agreements with GSAM or its affiliates. This facility is to be used for temporary emergency purposes, or to allow for an orderly liquidation of securities to meet redemption requests. The interest rate on borrowings is based on the federal funds rate. The facility also requires a fee to be paid by the Fund based on the amount of the commitment that has not been utilized. For the year ended December 31, 2021, the Fund did not have any borrowings under the facility. Prior to April 26, 2021, the facility was $700,000,000.
5. OTHER RISKS
The Fund’s risks include, but are not limited to, the following:
Floating and Variable Rate Obligations Risk — Floating rate and variable rate obligations are debt instruments issued by companies or other entities with interest rates that reset periodically (typically, daily. monthly, quarterly, or semiannually) in response to changes in the market rate of interest on which the interest rate is based. For floating and variable rate obligations, there may be a lag between an actual change in the underlying interest rate benchmark and the reset time for an interest payment of such an obligation, which could harm or benefit the Fund, depending on the interest rate environment or other circumstances. In a rising interest rate environment, for example, a floating or variable rate obligation that does not reset immediately would prevent the Fund from taking full advantage of rising interest rates in a timely manner. However, in a declining interest rate environment, the Fund may benefit from a lag due to an obligation’s interest rate payment not being immediately impacted by a decline in interest rates.
On March 5, 2021, the United Kingdom’s Financial Conduct Authority (“FCA”) and ICE Benchmark Authority formally announced that certain LIBORs will cease publication after December 31, 2021 while others will cease publication after June 30, 2023. The unavailability or replacement of LIBOR may affect the value, liquidity or return on certain Fund investments and may result in costs incurred in connection with closing out positions and entering into new trades. Any pricing adjustments to the Fund’s investments resulting from a substitute reference rate may adversely affect the Fund’s performance and/or NAV.
Interest Rate Risk — When interest rates increase, the Fund’s yield will tend to be lower than prevailing market rates, and the market value of its securities or instruments may also be adversely affected. A low interest rate environment poses additional risks to the Fund, because low yields on the Fund’s portfolio holdings may have an adverse impact on the Fund’s ability to provide a positive yield to its shareholders, pay expenses out of Fund assets, or, at times, maintain a stable $1.00 share price. The risks associated with changing interest rates may have unpredictable effects on the markets and the Fund’s investments. Fluctuations in interest rates may also affect the liquidity of fixed income securities and instruments held by the Fund.
Large Shareholder Transactions Risk — The Fund may experience adverse effects when certain large shareholders, such as other funds, participating insurance companies, accounts and Goldman Sachs affiliates, purchase or redeem large amounts of shares of the Fund. Such large shareholder redemptions, which may occur rapidly or unexpectedly, may cause the Fund to sell portfolio securities at times when it would not otherwise do so, which may negatively impact the Fund’s NAV and liquidity. These transactions may also accelerate the realization of taxable income to shareholders if such sales of investments resulted in gains, and may also increase transaction costs. In addition, a large redemption could result in the Fund’s current expenses being allocated over a smaller asset base, leading to an increase in the Fund’s expense ratio. Similarly, large Fund share purchases may adversely affect the Fund’s performance to the extent that the Fund is delayed in investing new cash or otherwise maintains a larger cash position than it ordinarily would.
Market and Credit Risks — In the normal course of business, the Fund trades financial instruments and enter into financial transactions where risk of potential loss exists due to changes in the market (market risk). The value of the securities in which the Fund invests may go up or down in response to the prospects of individual companies, particular sectors or governments and/or general economic conditions throughout the world due to increasingly interconnected global economies and financial markets. Events such as war, acts of terrorism, social unrest, natural disasters, the spread of infectious illness or other public health threats could also significantly impact the Fund and its investments. Additionally, the Fund may also be exposed to credit risk in the event that an issuer or guarantor fails to perform or that an institution or entity with which the Fund has unsettled or open transactions defaults.
GOLDMAN SACHS VARIABLE INSURANCE TRUST GOVERNMENT MONEY MARKET FUND
Notes to Financial Statements (continued)
December 31, 2021
6. IDEMNIFICATIONS
Under the Trust’s organizational documents, its Trustees, officers, employees and agents are indemnified, to the extent permitted by the Act and state law, against certain liabilities that may arise out of performance of their duties to the Fund. Additionally, in the course of business, the Fund enters into contracts that contain a variety of indemnification clauses. The Fund’s maximum exposure under these arrangements is unknown, as this would involve future claims that may be made against the Fund that have not yet occurred. However, GSAM believes the risk of loss under these arrangements to be remote.
7. SUBSEQUENT EVENTS
Subsequent events after the Statement of Assets and Liabilities date have been evaluated and GSAM has concluded that there is no impact requiring adjustment or disclosure in the financial statements.
8. SUMMARY OF SHARE TRANSACTIONS
Share activity is as follows:
| | | | | | | | |
| | | For the Fiscal Year Ended
December 31, 2021 | | | For the Fiscal Year Ended
December 31, 2020 | |
| Institutional Shares* | | | | | | | | |
| Shares sold | | | 496,281,091 | | | | 1,110,386,804 | |
| Reinvestment of distributions | | | 34,294 | | | | 1,972,393 | |
| Shares redeemed | | | (554,775,442 | ) | | | (893,897,149 | ) |
| | | | (58,460,057 | ) | | | 218,462,048 | |
| Service Shares* | | | | | | | | |
| Shares sold | | | 194,592,671 | | | | 564,371,211 | |
| Reinvestment of distributions | | | 32,049 | | | | 1,092,130 | |
| Shares redeemed | | | (273,027,633 | ) | | | (336,132,071 | ) |
| | | | (78,402,913 | ) | | | 229,331,270 | |
| | |
| NET INCREASE (DECREASE) IN SHARES | | | (136,862,970 | ) | | | 447,793,318 | |
| * | Valued at $1.00 per share. |
Report of Independent Registered Public Accounting Firm
To the Board of Trustees of Goldman Sachs Variable Insurance Trust and Shareholders of
Goldman Sachs Government Money Market Fund
Opinion on the Financial Statements
We have audited the accompanying statement of assets and liabilities, including the schedule of investments, of Goldman Sachs Government Money Market Fund (one of the funds constituting Goldman Sachs Variable Insurance Trust, referred to hereafter as the “Fund”) as of December 31, 2021, the related statements of operations for the year ended December 31, 2021, the statement of changes in net assets for each of the two years in the period ended December 31, 2021, including the related notes, and the financial highlights for each of the five years in the period ended December 31, 2021 (collectively referred to as the “financial statements”). In our opinion, the financial statements present fairly, in all material respects, the financial position of the Fund as of December 31, 2021, the results of its operations for the year then ended, the changes in its net assets for each of the two years in the period ended December 31, 2021 and the financial highlights for each of the five years in the period ended December 31, 2021 in conformity with accounting principles generally accepted in the United States of America.
Basis for Opinion
These financial statements are the responsibility of the Fund’s management. Our responsibility is to express an opinion on the Fund’s financial statements based on our audits. We are a public accounting firm registered with the Public Company Accounting Oversight Board (United States) (PCAOB) and are required to be independent with respect to the Fund in accordance with the U.S. federal securities laws and the applicable rules and regulations of the Securities and Exchange Commission and the PCAOB.
We conducted our audits of these financial statements in accordance with the standards of the PCAOB. Those standards require that we plan and perform the audit to obtain reasonable assurance about whether the financial statements are free of material misstatement, whether due to error or fraud.
Our audits included performing procedures to assess the risks of material misstatement of the financial statements, whether due to error or fraud, and performing procedures that respond to those risks. Such procedures included examining, on a test basis, evidence regarding the amounts and disclosures in the financial statements. Our audits also included evaluating the accounting principles used and significant estimates made by management, as well as evaluating the overall presentation of the financial statements. Our procedures included confirmation of securities owned as of December 31, 2021 by correspondence with the custodian and brokers; when replies were not received from brokers, we performed other auditing procedures. We believe that our audits provide a reasonable basis for our opinion.
/s/PricewaterhouseCoopers LLP
Boston, Massachusetts
February 23, 2022
We have served as the auditor of one or more investment companies in the Goldman Sachs fund complex since 2000.
GOLDMAN SACHS VARIABLE INSURANCE TRUST GOVERNMENT MONEY MARKET FUND
| | |
| Fund Expenses — Six Month Period Ended December 31, 2021 (Unaudited) | | |
As a shareholder of Institutional Shares and Service Shares of the Fund, you incur ongoing costs, including management fees; distribution and service (12b-1) fees (with respect to Service Shares); and other Fund expenses. This example is intended to help you understand your ongoing costs (in dollars) of investing in the Fund and to compare these costs with the ongoing costs of investing in other mutual funds.
The example is based on an investment of $1,000 invested at the beginning of the period and held for the entire period from July 1, 2021 through December 31, 2021, which represents a period of 184 days of a 365 day year.
Actual Expenses — The first line in the table below provides information about actual account values and actual expenses. You may use the information in this line, together with the amount you invested, to estimate the expenses that you paid over the period. Simply divide your account value by $1,000 (for example, an $8,600 account value divided by $1,000=8.6), then multiply the result by the number in the first line under the heading entitled “Expenses Paid” to estimate the expenses you paid on your account during this period.
Hypothetical Example for Comparison Purposes — The second line in the table below provides information about hypothetical account values and hypothetical expenses based on the Fund’s actual net expense ratio and an assumed rate of return of 5% per year before expenses, which is not the Fund’s actual return. The hypothetical account values and expenses may not be used to estimate the actual ending account balance or expenses you paid for the period. You may use this information to compare the ongoing costs of investing in the Fund and other funds. To do so, compare this 5% hypothetical example with the 5% hypothetical examples that appear in the shareholder reports of the other funds.
Please note that the expenses shown in the table are meant to highlight your ongoing costs only and do not reflect any transactional costs, such as sales charges, redemption fees, or exchange fees. Therefore, the second line of the table is useful in comparing ongoing costs only and will not help you determine the relative total costs of owning different funds. In addition, if these transactional costs were included, your costs would have been higher.
| | | | | | | | | | | | |
| Share Class | | Beginning
Account Value
7/1/21 | | | Ending
Account Value
12/31/21 | | | Expenses Paid
for the
6 Months
Ended
12/31/21* | |
| Institutional Shares | | | | | | | | | | | | |
| | | | |
| Actual | | $ | 1,000.00 | | | $ | 1,000.03 | | | $ | 0.35 | |
| Hypothetical 5% return | | $ | 1,000.00 | | | $ | 1,024.85 | + | | $ | 0.36 | |
| Service Shares | | | | | | | | | | | | |
| | | | |
| Actual | | $ | 1,000.00 | | | $ | 1,000.03 | | | $ | 0.35 | |
| Hypothetical 5% return | | $ | 1,000.00 | | | $ | 1,024.85 | + | | $ | 0.36 | |
| | * | Expenses are calculated using the Fund’s annualized net expense ratio for each class, which represents the ongoing expenses as a percentage of net assets for the six months ended December 31, 2021. Expenses are calculated by multiplying the annualized net expense ratio by the average account value for the period; then multiplying the result by the number of days in the most recent fiscal half year (or, since inception, if shorter); and then dividing that result by the number of days in the period. The annualized net expense ratios for the period were 0.07% and 0.07% for Institutional Shares and Service Shares, respectively. | |
| | + | Hypothetical expenses are based on the Fund’s actual annualized net expense ratio and an assumed rate of return of 5% per year before expenses. | |
GOLDMAN SACHS VARIABLE INSURANCE TRUST GOVERNMENT MONEY MARKET FUND
Trustees and Officers (Unaudited)
Independent Trustees
| | | | | | | | | | | | |
| | | | | |
Name, Address and Age1 | | Position(s) Held
with the Trust | | Term of
Office and
Length of
Time Served2 | | Principal Occupation(s)
During Past 5 Years | | Number of
Portfolios in
Fund Complex
Overseen by
Trustee3 | | | Other
Directorships
Held by Trustee4 |
Jessica Palmer Age: 72 | | Chair of the Board of Trustees | | Since 2018 (Trustee since 2007) | | Ms. Palmer is retired. She was formerly Consultant, Citigroup Human Resources Department (2007-2008); Managing Director, Citigroup Corporate and Investment Banking (previously, Salomon Smith Barney/Salomon Brothers) (1984-2006). Ms. Palmer was a Member of the Board of Trustees of Indian Mountain School (private elementary and secondary school) (2004-2009). Chair of the Board of Trustees — Goldman Sachs Trust and Goldman Sachs Variable Insurance Trust. | | | 109 | | | None |
Dwight L. Bush Age: 64 | | Trustee | | Since 2020 | | Ambassador Bush is President and CEO of D.L. Bush & Associates (a financial advisory and private investment firm) (2002-2014 and 2017- present); Director of MoneyLion Inc. (an operator of a data drive, digital financial platform (2021-present); and was formerly U.S. Ambassador to the Kingdom of Morocco (2014-2017) and a Member of the Board of Directors of Santander Bank, N.A. (2018-2019). Previously, Ambassador Bush served as an Advisory Board Member of Goldman Sachs Trust and Goldman Sachs Variable Insurance Trust (October 2019-January 2020). Trustee — Goldman Sachs Trust and Goldman Sachs Variable Insurance Trust. | | | 109 | | | None |
Kathryn A. Cassidy Age: 67 | | Trustee | | Since 2015 | | Ms. Cassidy is retired. Formerly, she was Advisor to the Chairman (May 2014-December 2014); and Senior Vice President and Treasurer (2008-2014), General Electric Company & General Electric Capital Corporation (technology and financial services companies). Trustee — Goldman Sachs Trust and Goldman Sachs Variable Insurance Trust. | | | 109 | | | None |
Diana M. Daniels Age: 72 | | Trustee | | Since 2007 | | Ms. Daniels is retired. Formerly, she was Vice President, General Counsel and Secretary, The Washington Post Company (1991-2006). Ms. Daniels is a Trustee Emeritus and serves as a Presidential Councillor of Cornell University (2013-Present); former Member of the Legal Advisory Board, New York Stock Exchange (2003-2006) and of the Corporate Advisory Board, Standish Mellon Management Advisors (2006-2007). Trustee — Goldman Sachs Trust and Goldman Sachs Variable Insurance Trust. | | | 109 | | | None |
Joaquin Delgado Age: 61 | | Trustee | | Since 2020 | | Dr. Delgado is retired. He is Director, Hexion Inc. (a specialty chemical manufacturer) (2019- present); and Director, Stepan Company (a specialty chemical manufacturer) (2011-present); and was formerly Executive Vice President, Consumer Business Group of 3M Company (July 2016-July 2019); and Executive Vice President, Health Care Business Group of 3M Company (October 2012-July 2016). Previously, Dr. Delgado served as an Advisory Board Member of Goldman Sachs Trust and Goldman Sachs Variable Insurance Trust (October 2019-January 2020). Trustee — Goldman Sachs Trust and Goldman Sachs Variable Insurance Trust. | | | 109 | | | Hexion Inc. (a specialty chemical manufacturer); Stepan Company (a specialty chemical manufacturer) |
Eileen H. Dowling Age: 59 | | Trustee | | Since 2021 | | Ms. Dowling is retired. Formerly, she was Senior Advisor (April 2021- September 2021); and Managing Director (2013-2021), BlackRock, Inc. (a financial services firm). Trustee — Goldman Sachs Trust and Goldman Sachs Variable Insurance Trust. | | | 109 | | | None |
| | | | | | | | | | | | |
GOLDMAN SACHS VARIABLE INSURANCE TRUST GOVERNMENT MONEY MARKET FUND
Trustees and Officers (Unaudited) (continued)
Independent Trustees
| | | | | | | | | | | | |
| | | | | |
Name, Address and Age1 | | Position(s) Held
with the Trust | | Term of
Office and
Length of
Time Served2 | | Principal Occupation(s)
During Past 5 Years | | Number of
Portfolios in
Fund Complex
Overseen by
Trustee3 | | | Other
Directorships
Held by Trustee4 |
Roy W. Templin Age: 61 | | Trustee | | Since 2013 | | Mr. Templin is retired. He is Director, Armstrong World Industries, Inc. (a designer and manufacturer of ceiling and wall systems) (2016-Present); and was formerly Chairman of the Board of Directors, Con- Way Incorporated (a transportation, logistics and supply chain management service company) (2014-2015); Executive Vice President and Chief Financial Officer, Whirlpool Corporation (an appliance manufacturer and marketer) (2004-2012). Trustee — Goldman Sachs Trust and Goldman Sachs Variable Insurance Trust. | | | 109 | | | Armstrong World Industries, Inc. (a ceiling and wall systems manufacturer) |
Gregory G. Weaver Age: 70 | | Trustee | | Since 2015 | | Mr. Weaver is retired. He is Director, Verizon Communications Inc. (2015-Present); and was formerly Chairman and Chief Executive Officer, Deloitte & Touche LLP (a professional services firm) (2001-2005 and 2012-2014); and Member of the Board of Directors, Deloitte & Touche LLP (2006-2012). Trustee — Goldman Sachs Trust and Goldman Sachs Variable Insurance Trust. | | | 109 | | | Verizon Communications Inc. |
| | | | | | | | | | | | |
Interested Trustee*
| | | | | | | | | | | | |
| | | | | |
Name, Address and Age1 | | Position(s) Held
with the Trust | | Term of
Office and
Length of
Time Served2 | | Principal Occupation(s)
During Past 5 Years | | Number of
Portfolios in
Fund Complex
Overseen by
Trustee3 | | | Other
Directorships
Held by Trustee4 |
James A. McNamara Age: 59 | | President and Trustee | | Since 2007 | | Advisory Director, Goldman Sachs (January 2018 — Present); Managing Director, Goldman Sachs (January 2000-December 2017); Director of Institutional Fund Sales, GSAM (April 1998- December 2000); and Senior Vice President and Manager, Dreyfus Institutional Service Corporation (January 1993-April 1998). President and Trustee — Goldman Sachs Trust; Goldman Sachs Variable Insurance Trust; Goldman Sachs Trust II; Goldman Sachs ETF Trust; Goldman Sachs ETF Trust II; Goldman Sachs MLP and Energy Renaissance Fund; Goldman Sachs Credit Income Fund; and Goldman Sachs Real Estate Diversified Income Fund. | | | 170 | | | None |
| | | | | | | | | | | | |
| * | Mr. McNamara is considered to be an “Interested Trustee” because he holds positions with Goldman Sachs and owns securities issued by The Goldman Sachs Group, Inc. Mr. McNamara holds comparable positions with certain other companies of which Goldman Sachs, GSAM or an affiliate thereof is the investment adviser, administrator and/or distributor. |
| 1 | Each Trustee may be contacted by writing to the Trustee, c/o Goldman Sachs, 200 West Street, New York, New York, 10282, Attn: Caroline Kraus. Information is provided as of December 31, 2021. |
| 2 | Subject to such policies as may be adopted by the Board from time-to-time, each Trustee holds office for an indefinite term, until the earliest of: (a) the election of his or her successor; (b) the date the Trustee resigns or is removed by the Board or shareholders, in accordance with the Trust’s Declaration of Trust; or (c) the termination of the Trust. The Board has adopted policies which provide that each Independent Trustee shall retire as of December 31st of the calendar year in which he or she reaches (a) his or her 75th birthday or (b) the 15th anniversary of the date he or she became a Trustee, whichever is earlier, unless a waiver of such requirements shall have been adopted by a majority of the other Trustees. These policies may be changed by the Trustees without shareholder vote. |
| 3 | The Goldman Sachs Fund Complex includes certain other companies listed above for each respective Trustee. As of December 31, 2021, Goldman Sachs Trust consisted of 92 portfolios (90 of which offered shares to the public); Goldman Sachs Variable Insurance Trust consisted of 17 portfolios (13 of which offered shares to the public); Goldman Sachs Trust II consisted of 18 portfolios (16 of which offered shares to the public); Goldman Sachs ETF Trust consisted of 39 portfolios (26 of which offered shares to the public); and Goldman Sachs ETF Trust II, Goldman Sachs MLP and Energy Renaissance Fund, Goldman Sachs Credit Income Fund and Goldman Sachs Real Estate Diversified Income Fund each consisted of one portfolio. Goldman Sachs ETF Trust II and Goldman Sachs Credit Income Fund did not offer shares to the public. |
| 4 | This column includes only directorships of companies required to report to the Securities and Exchange Commission under the Securities Exchange Act of 1934 (i.e., “public companies”) or other investment companies registered under the Act. |
Additional information about the Trustees is available in the Funds’ Statement of Additional Information, which can be obtained from Goldman Sachs free of charge by calling this toll-free number (in the United States of America): 1-800-526-7384.
GOLDMAN SACHS VARIABLE INSURANCE TRUST GOVERNMENT MONEY MARKET FUND
Trustees and Officers (Unaudited) (continued)
Officers of the Trust*
| | | | | | |
| | | |
| Name, Address and Age1 | | Positions Held with the Trust | | Term of
Office and
Length of
Time Served2 | | Principal Occupation(s) During Past 5 Years |
James A. McNamara
200 West Street
New York, NY 10282 Age: 59 | | Trustee and President | | Since 2007 | | Advisory Director, Goldman Sachs (January 2018-Present); Managing Director, Goldman Sachs (January 2000-December 2017); Director of Institutional Fund Sales, GSAM (April 1998-December 2000); and Senior Vice President and Manager, Dreyfus Institutional Service Corporation (January 1993-April 1998). President and Trustee — Goldman Sachs Trust; Goldman Sachs Variable Insurance Trust; Goldman Sachs Trust II; Goldman Sachs ETF Trust; Goldman Sachs ETF Trust II; Goldman Sachs MLP and Energy Renaissance Fund; Goldman Sachs Credit Income Fund; and Goldman Sachs Real Estate Diversified Income Fund. |
Caroline L. Kraus
200 West Street
New York, NY 10282 Age: 44 | | Secretary | | Since 2012 | | Managing Director, Goldman Sachs (January 2016-Present); Vice President, Goldman Sachs (August 2006-December 2015); Senior Counsel, Goldman Sachs (January 2020–Present); Associate General Counsel, Goldman Sachs (2012-December 2019); Assistant General Counsel, Goldman Sachs (August 2006-December 2011); and Associate, Weil, Gotshal & Manges, LLP (2002-2006). Secretary — Goldman Sachs Trust (previously Assistant Secretary (2012)); Goldman Sachs Variable Insurance Trust (previously Assistant Secretary (2012)); Goldman Sachs Trust II; Goldman Sachs BDC, Inc.; Goldman Sachs Private Middle Market Credit LLC; Goldman Sachs Private Middle Market Credit II LLC; Goldman Sachs Middle Market Lending Corp.; Goldman Sachs MLP and Energy Renaissance Fund; Goldman Sachs ETF Trust; Goldman Sachs ETF Trust II; Goldman Sachs Credit Income Fund; and Goldman Sachs Real Estate Diversified Income Fund. |
Joseph F. DiMaria
30 Hudson Street
Jersey City, NJ 07302 Age: 53 | | Treasurer, Principal
Financial Officer and
Principal Accounting
Officer | | Since 2017
(Treasurer
and
Principal
Financial
Officer
since 2019) | | Managing Director, Goldman Sachs (November 2015-Present) and Vice President — Mutual Fund Administration, Columbia Management Investment Advisers, LLC (May 2010- October 2015). Treasurer, Principal Financial Officer and Principal Accounting Officer — Goldman Sachs Trust (previously Assistant Treasurer (2016)); Goldman Sachs Variable Insurance Trust (previously Assistant Treasurer (2016)); Goldman Sachs Trust II (previously Assistant Treasurer (2017)); Goldman Sachs MLP and Energy Renaissance Fund (previously Assistant Treasurer (2017)); Goldman Sachs ETF Trust (previously Assistant Treasurer (2017)); Goldman Sachs ETF Trust II; Goldman Sachs Credit Income Fund; and Goldman Sachs Real Estate Diversified Income Fund |
| | | | | | |
| * | Represents a partial list of officers of the Trust. Additional information about all the officers is available in the Funds’ Statement of Additional Information, which can be obtained from Goldman Sachs free of charge by calling this toll-free number (in the United States): 1-800-526-7384. |
| 1 | Information is provided as of December 31, 2021. |
| 2 | Officers hold office at the pleasure of the Board of Trustees or until their successors are duly elected and qualified. Each officer holds comparable positions with certain other companies of which Goldman Sachs, GSAM or an affiliate thereof is the investment adviser, administrator and/or distributor. |
Goldman Sachs Variable Insurance Trust — Tax Information (Unaudited)
For the year ended December 31, 2021, the Government Money Market Fund designates 83.12% of the dividends paid from net investment company taxable income as section 163(j) Interest Dividends.
| | |
TRUSTEES Jessica Palmer, Chair Dwight L. Bush Kathryn A. Cassidy Diana M. Daniels Joaquin Delgado Eileen H. Dowling James A. McNamara Roy W. Templin Gregory G. Weaver | | OFFICERS James A. McNamara, President Joseph F. DiMaria, Principal Financial Officer, Principal Accounting Officer and Treasurer Caroline L. Kraus, Secretary |
GOLDMAN SACHS & CO. LLC
Distributor and Transfer Agent
GOLDMAN SACHS ASSET MANAGEMENT, L.P.
Investment Adviser
200 West Street, New York
New York 10282
Visit our web site at www.GSAMFUNDS.com to obtain the most recent month-end returns.
The reports concerning the Fund included in this shareholder report may contain certain forward-looking statements about the factors that may affect the performance of the Fund in the future. These statements are based on Fund management’s predictions and expectations concerning certain future events and their expected impact on the Fund, such as performance of the economy as a whole and of specific industry sectors, changes in the levels of interest rates, the impact of developing world events, and other factors that may influence the future performance of the Fund. Management believes these forward-looking statements to be reasonable, although they are inherently uncertain and difficult to predict. Actual events may cause adjustments in portfolio management strategies from those currently expected to be employed.
A description of the policies and procedures that the Fund uses to determine how to vote proxies relating to portfolio securities and information regarding how the Fund voted proxies relating to portfolio securities during the most recent 12-month period ended December 31 is available (i) without charge, upon request by calling 1-800-621-2550; and (ii) on the Securities and Exchange Commission (“SEC”) Web site at http://www.sec.gov.
Views and opinions expressed are for informational purposes only and do not constitute a recommendation by GSAM to buy, sell, or hold any security. Views and opinions are current as of the date of this presentation and may be subject to change, they should not be construed as investment advice.
Goldman Sachs & Co. LLC (“Goldman Sachs”) does not provide legal, tax or accounting advice. Any statement contained in this communication (including any attachments) concerning U.S. tax matters was not intended or written to be used, and cannot be used, for the purpose of avoiding penalties under the Internal Revenue Code, and was written to support the promotion or marketing of transaction or matter addressed. Clients of Goldman Sachs should obtain their own independent tax advice based on their particular circumstances.
The web site links provided are for your convenience only and are not an endorsement or recommendation by GSAM of any of these web sites or the products or services offered. GSAM is not responsible for the accuracy and validity of the content of these web sites.
Fund holdings and allocations shown are as of December 31, 2021 and may not be representative of future investments. Fund holdings should not be relied on in making investment decisions and should not be construed as research or investment advice regarding particular securities. Current and future holdings are subject to risk.
The portfolio risk management process includes an effort to monitor and manage risk, but does not imply low risk.
Shares of the Goldman Sachs VIT Funds are offered to separate accounts of participating life insurance companies for the purpose of funding variable annuity contracts and variable life insurance policies. Shares of the Fund are not offered directly to the general public. The variable annuity contracts and variable life insurance policies are described in the separate prospectuses issued by participating insurance companies. You should refer to those prospectuses for information about surrender charges, mortality and expense risk fees and other charges that may be assessed by participating insurance companies under the variable annuity contracts or variable life insurance policies. Such fees or charges, if any, may affect the return you may realize with respect to your investments. Ask your representative for more complete information. Please consider a fund’s objectives, risks and charges and expenses, and read the prospectus carefully before investing. The prospectus contains this and other information about the Fund.
This material is not authorized for distribution to prospective investors unless preceded or accompanied by a current prospectus or summary prospectus, if applicable. Investors should consider the Fund’s objective, risks, and charges and expenses, and read the summary prospectus, if available, and/or the prospectus carefully before investing or sending money. The summary prospectus, if available, and the prospectus contain this and other information about the Fund and may be obtained from your authorized dealer or from Goldman Sachs & Co. LLC by calling 1-800-621-2550.
This report is prepared for the general information of contract owners and is not an offer of shares of the Goldman Sachs Variable Insurance Trust — Goldman Sachs Government Money Market Fund.
© 2022 Goldman Sachs. All rights reserved.
VITMMAR-22 /268093-OTU-1556111
| | (a) | As of the end of the period covered by this report, the registrant has adopted a code of ethics that applies to the registrant’s principal executive officer, principal financial officer, principal accounting officer or controller, or persons performing similar functions, regardless of whether these individuals are employed by the registrant or a third party (the “Code of Ethics”). |
| | (c) | During the period covered by this report, no amendments were made to the provisions of the Code of Ethics. |
| | (d) | During the period covered by this report, the registrant did not grant any waivers, including an implicit waiver, from any provision of the Code of Ethics. |
| | (f) | A copy of the Code of Ethics is available as provided in Item 13(a)(1) of this report. |
| ITEM 3. | AUDIT COMMITTEE FINANCIAL EXPERT. |
| | The registrant’s board of trustees has determined that the registrant has at least one “audit committee financial expert” (as defined in Item 3 of Form N-CSR) serving on its audit committee. Gregory G. Weaver is the “audit committee financial expert” and is “independent” (as each term is defined in Item 3 of Form N-CSR). |
| ITEM 4. | PRINCIPAL ACCOUNTANT FEES AND SERVICES. |
Item 4 — Principal Accountant Fees and Services for the Goldman Sachs Variable Insurance Trust (“GSVIT”):
Table 1 – Items 4(a) - 4(d)
| | | | | | | | | | |
| | | 2021 | | | 2020 | | | Description of Services Rendered |
Audit Fees: | | | | | | | | | | |
• PricewaterhouseCoopers (“PwC”) | | $ | 499,130 | | | $ | 436,130 | | | Financial Statement audits. |
Audit-Related Fees | | | | | | | | | | |
PwC | | $ | 95,166 | | | $ | 84,939 | | | Other attest services. |
Tax Fees | | | | | | | | | | |
PwC | | $ | 0 | | | $ | 0 | | | Tax compliance services provided in connection with the preparation and review of the registrant’s tax returns and certain other tax-related services. |
Items 4(b)(c) & (d) Table 2. Non-Audit Services to the GSVIT’s* that were pre-approved by the GSVIT’s Audit Committee pursuant to Rule 2-01(c)(7)(ii) of Regulation S-X
| | | | | | | | | | |
| | | 2021 | | | 2020 | | | Description of Services Rendered |
Audit-Related Fees | | | | | | | | | | |
PwC | | $ | 1,906,448 | | | $ | 2,060,932 | | | Internal control review performed in accordance with Statement on Standards for Attestation Engagements No. 16 and semi-annual updates related to withholding tax accrual for non-US jurisdictions. These fees are borne by the Funds’ adviser. |
| * | These include the advisor (excluding sub-advisors) and any entity controlling, controlled by or under common control with the advisor that provides ongoing services to the registrant (hereinafter referred to as “service affiliates”). |
Item 4(e)(1) — Audit Committee Pre-Approval Policies and Procedures
Pre-Approval of Audit and Non-Audit Services Provided to the Funds of the Goldman Sachs Variable Insurance Trust. The Audit and Non-Audit Services Pre-Approval Policy (the “Policy”) adopted by the Audit Committee of GSVIT sets forth the procedures and the conditions pursuant to which services performed by an independent auditor for GSVIT may be pre-approved. Services may be pre-approved specifically by the Audit Committee as a whole or, in certain circumstances, by the Audit Committee Chairman or the person designated as the Audit Committee Financial Expert. In addition, subject to specified cost limitations, certain services may be pre-approved under the provisions of the Policy. The Policy provides that the Audit Committee will consider whether the services provided by an independent auditor are consistent with the Securities and Exchange Commission’s rules on auditor independence. The Policy provides for periodic review and pre-approval by the Audit Committee of the services that may be provided by the independent auditor.
De Minimis Waiver. The pre-approval requirements of the Policy may be waived with respect to the provision of non-audit services that are permissible for an independent auditor to perform, provided (1) the aggregate amount of all such services provided constitutes no more than five percent of the total amount of revenues subject to pre-approval that was paid to the independent auditors during the fiscal year in which the services are provided; (2) such services were not recognized by GSVIT at the time of the engagement to be non-audit services; and (3) such services are promptly brought to the attention of the Audit Committee and approved prior to the completion of the audit by the Audit Committee or by one or more members of the Audit Committee to whom authority to grant such approvals has been delegated by the Audit Committee, pursuant to the pre-approval provisions of the Policy.
Pre-Approval of Non-Audit Services Provided to GSVIT’s Investment Advisers. The Policy provides that, in addition to requiring pre-approval of audit and non-audit services provided to GSVIT, the Audit Committee will pre-approve those non-audit services provided to GSVIT’s investment advisers (and entities controlling, controlled by or under common control with the investment advisers that provide ongoing services to GSVIT) where the engagement relates directly to the operations or financial reporting of GSVIT.
Item 4(e)(2) — 0% of the audit-related fees, tax fees and other fees listed in Table 1 were approved by GSVIT’s Audit Committee pursuant to the “de minimis” exception of Rule 2-01(c)(7)(i)(C) of Regulation S-X. In addition, 0% of the non-audit services to the GSVIT’s service affiliates listed in Table 2 were approved by GSVIT’s Audit Committee pursuant to the “de minimis” exception of Rule 2-01(c)(7)(i)(C) of Regulation S-X.
Item 4(f) — Not applicable.
Items 4(g) Aggregate Non-Audit Fees Disclosure
The aggregate non-audit fees billed to GSVIT for the twelve months ended December 31, 2021 and December 31, 2020 by PwC were approximately $95,166 and $84,939, respectively.
The aggregate non-audit fees billed to GSVIT’s adviser and service affiliates for non-audit services for the twelve months ended December 31, 2020 and December 31, 2019 by PwC were approximately $14.4 million and $14.7 million, respectively. The figures for these entities are not yet available for the twelve months ended December 31, 2021. With regard to the aggregate non-audit fees billed to GSVIT’s adviser and service affiliates, the 2020 and 2019 amounts include fees for non-audit services required to be pre-approved [see Table 2] and fees for non-audit services that did not require pre-approval since they did not directly relate to GSVIT’s operations or financial reporting.
Items 4(h) — GSVIT’s Audit Committee has considered whether the provision of non-audit services to GSVIT’s investment adviser and service affiliates that did not require pre-approval pursuant to paragraph (c)(7)(ii) of Rule 2-01 of Regulation S-X is compatible with maintaining the auditor’s independence.
| ITEM 5. | AUDIT COMMITTEE OF LISTED REGISTRANTS. |
Not applicable.
| ITEM 6. | SCHEDULE OF INVESTMENTS. |
Schedule of Investments is included as part of the Reports to Shareholders filed under Item 1.
| ITEM 7. | DISCLOSURE OF PROXY VOTING POLICIES AND PROCEDURES FOR CLOSED-END MANAGEMENT INVESTMENT COMPANIES. |
Not applicable.
| ITEM 8. | PORTFOLIO MANAGERS OF CLOSED-END MANAGEMENT INVESTMENT COMPANIES. |
Not applicable.
| ITEM 9. | PURCHASES OF EQUITY SECURITIES BY CLOSED-END MANAGEMENT INVESTMENT COMPANY AND AFFILIATED PURCHASERS. |
Not applicable.
| ITEM 10. | SUBMISSION OF MATTERS TO A VOTE OF SECURITY HOLDERS. |
There have been no material changes to the procedures by which shareholders may recommend nominees to the registrant’s board of trustees.
| ITEM 11. | CONTROLS AND PROCEDURES. |
| | (a) | The registrant’s principal executive and principal financial officers or persons performing similar functions have concluded that the registrant’s disclosure controls and procedures (as defined in Rule 30a-3(c) under the Investment Company Act of 1940, as amended (the “1940 Act”)) are effective as of a date within 90 days of the filing date of this report that includes the disclosure required by this paragraph, based on the evaluation of these controls and procedures required by Rule 30a-3(b) under the 1940 Act and 15d-15(b) under the Securities Exchange Act of 1934, as amended. |
| | (b) | There were no changes in the registrant’s internal control over financial reporting (as defined in Rule 30a-3(d) under the 1940 Act) that occurred during the period covered by this report that have materially affected, or are reasonably likely to materially affect, the registrant’s internal control over financial reporting. |
| ITEM 12. | DISCLOSURE OF SECURITIES LENDING ACTIVITIES FOR CLOSED-END MANAGEMENT INVESTMENT COMPANIES. |
Not applicable.
SIGNATURES
Pursuant to the requirements of the Securities Exchange Act of 1934 and the Investment Company Act of 1940, the registrant has duly caused this report to be signed on its behalf by the undersigned, thereunto duly authorized.
Goldman Sachs Variable Insurance Trust
| | |
/s/ James A. McNamara |
By: James A. McNamara |
Chief Executive Officer of |
Goldman Sachs Variable Insurance Trust |
|
Date: March 4, 2022 |
Pursuant to the requirements of the Securities Exchange Act of 1934 and the Investment Company Act of 1940, the report has been signed below by the following persons on behalf of the registrant and in the capacities and on the dates indicated.
| | |
/s/ James A. McNamara |
By: James A. McNamara |
Chief Executive Officer of |
Goldman Sachs Variable Insurance Trust |
|
Date: March 4, 2022 |
|
/s/ Joseph F. DiMaria |
By: Joseph F. DiMaria |
Principal Financial Officer of |
Goldman Sachs Variable Insurance Trust |
|
Date: March 4, 2022 |