UNITED STATES
SECURITIES AND EXCHANGE COMMISSION
Washington, D.C. 20549
FORMN-CSR
CERTIFIED SHAREHOLDER REPORT OF REGISTERED
MANAGEMENT INVESTMENT COMPANIES
Investment Company Act file number811-08361
Goldman Sachs Variable Insurance Trust
(Exact name of registrant as specified in charter)
71 South Wacker Drive, Chicago, Illinois 60606-6303
(Address of principal executive offices) (Zip code)
Caroline Kraus
Goldman Sachs & Co. LLC
200 West Street
New York, NY 10282
Copies to:
Geoffrey R.T. Kenyon, Esq.
Dechert LLP
One International Place, 40th Floor
100 Oliver Street
Boston, MA 02110-2605
(Name and address of agents for service)
Registrant’s telephone number, including area code:(312) 655-4400
Date of fiscal year end: December 31
Date of reporting period: December 31, 2018
| ITEM 1. | REPORTS TO STOCKHOLDERS. |
| | The Annual Reports to Shareholders are filed herewith. |
Goldman
SachsVariable Insurance Trust
Goldman Sachs
Global Trends
Allocation Fund
Annual Report
December 31, 2018

GOLDMAN SACHS VARIABLE INSURANCE TRUST GLOBAL TRENDS ALLOCATION FUND
INVESTMENT OBJECTIVE
The Fund seeks total return while seeking to provide volatility management.
Portfolio Management Discussion and Analysis
Below, the Goldman Sachs Quantitative Investment Strategies Team discusses the Goldman Sachs Variable Insurance Trust — Goldman Sachs Global Trends Allocation Fund’s (the “Fund”) performance and positioning for the12-month period ended December 31, 2018 (the “Reporting Period”).
How did the Fund perform during the Reporting Period?
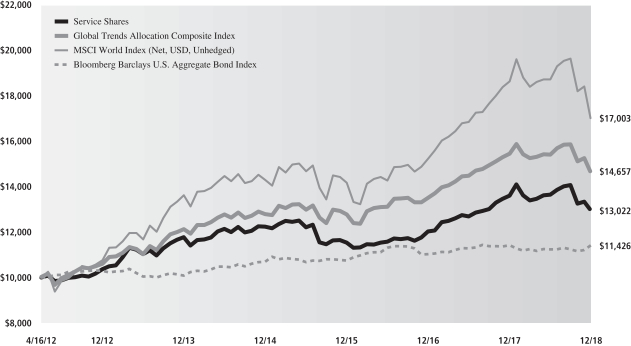
During the Reporting Period, the Fund’s Institutional and Service Shares generated average annual total returns of –4.08% and –4.34%, respectively. These returns compare to the –5.07% average annual total return of the Fund’s benchmark, the Global Trends Allocation Composite Index (the “Index”), during the same time period. The components of the Fund’s benchmark, the MSCI World Index (Net, USD, Unhedged) and the Bloomberg Barclays U.S. Aggregate Bond Index, generated average annual total returns of –8.71% and 0.01%, respectively, during the same time period.
Importantly, during the Reporting Period, the Fund’s overall annualized volatility (which is measured versus the S&P 500® Index) was 8.53%, less than the S&P 500® Index’s annualized volatility of 14.70% during the same time period.
What economic and market factors most influenced the Fund during the Reporting Period?
During the Reporting Period, the performance of the capital markets was influenced most by economic data, central bank monetary policy and geopolitical events.
Global equities saw a strong start to the Reporting Period in January 2018, peaking during the final week of the month. They then sold off during February 2018 on market speculation of a faster pace of Federal Reserve (“Fed”) short-term interest rate hikes, which stoked a sharp rise in bond yields and an increase in equity market volatility. Concerns about Fed monetary policy tightening were further exacerbated by solid U.S. labor and inflation data. In March 2018, escalating trade tensions and potential tariffs weighed on investor sentiment. Meanwhile, the Fed delivered on a widely expected interest rate increase, with its “dot plot” pointing to a total of three interest rate hikes in the 2018 calendar year and potentially two in 2019. (The “dot plot” shows rate projections of the members of the Fed’s Open Market Committee.) During the first calendar quarter overall, macroeconomic data moderated in the developed markets, particularly in Europe and Japan. Emerging markets equities generally outperformed their developed markets peers because of what many considered to be attractive valuations, because of the comparatively stronger economic data within emerging markets countries and because of higher commodity prices.
During the second quarter of 2018, developed markets equities generated positive returns, while emerging markets equities experienced broad-based weakness. In the developed markets, U.S., U.K., European and Japanese equities advanced, with U.K. export-driven stocks, in particular, benefiting from the depreciation of the British pound versus other major currencies. Emerging markets equities lagged developed markets stocks, as emerging markets’ economic growth slowed and disputes between the U.S. and China about trade tariffs dampened investor appetite for emerging markets assets in general.
Volatility was high for global equities during the third quarter of 2018, driven by trade-related headlines and strong U.S. macroeconomic data relative to other markets. Developed markets equities generally posted gains, though a number of factors weighed on investor sentiment, including trade and protectionism worries, uncertainty about Italy’s 2019 budget, the risk of ano-deal Brexit and concerns that Turkey’s financial crisis could spread to other markets. (Brexit refers to the U.K.’s efforts to leave the European Union.) As for emerging markets equities, they advanced in July 2018 after five consecutive months of declines but resumed their descent in August and September. They closed the third quarter of 2018 with rather flat returns overall, as heightened risk aversion, escalating trade tensions and tightening global liquidity dominated headlines.
In October 2018, global equities fell sharply, as investor sentiment rapidly deteriorated on heightened trade and political uncertainty and in a delayed reaction to rising interest rates. Market conditions eased in November, and developed markets stocks recorded modest gains, led by U.S. and Japanese stocks. Emerging markets equities also moved higher. The recovery, however, was short-lived, as global equities plunged in December 2018 on softer global economic data, which led to downward consensus expectations for corporate earnings growth, and on the Fed’s ongoing interest rate hikes. A partial U.S. federal government shutdown and the U.S. President’s criticism of Fed Chair Jerome Powell also weighed on U.S. stocks, while European equities fell on continued
1
GOLDMAN SACHS VARIABLE INSURANCE TRUST GLOBAL TRENDS ALLOCATION FUND
uncertainty surrounding ano-deal Brexit scenario. Although emerging markets equities also retreated during the fourth quarter overall, they generally outperformed developed markets equities, due largely to rallies in Brazilian and Indian stocks.
Regarding fixed income, spread, ornon-government bond, sectors were challenged during the first quarter of 2018 by a surge in market volatility and“risk-off” sentiment, or reduced risk appetite, amid equity market declines in February and March. Catalysts included firmer than consensus expected U.S. wage and price inflation data at the beginning of February 2018 and rising concerns about trade tensions during March. At their March policy meeting, Fed officials raised short-term interest rates, much as the market had expected, and continued to point to a total of three interest rate increases in 2018. However, Fed policymakers revised their economic growth forecast higher and their employment forecast lower.
During the second calendar quarter, spread sectors broadly weakened amid protectionist trade measures and political events in emerging markets countries and Italy as well as on higher U.S. interest rates and a stronger U.S. dollar. U.S. high yield corporate bonds, however, generated a small positive return. Rising oil prices were a tailwind for the broader high yield corporate bond sector, as many energy bonds are high yield rated. In June 2018, the Fed raised short-term interest rates, and its dot plot pointed to two more rate increases in 2018, implying a total of four rate hikes in the calendar year. U.S. economic growth strengthened, with the Gross Domestic Product expanding at an annualized rate of 4.2% in the second calendar quarter. In contrast, economic growth softened in the Eurozone, Japan and China.
Spread sectors performed well during the third quarter of 2018, as the global economy — led by particularly strong economic growth in the U.S. — expanded. However, some major economies, including those of the Eurozone, the U.K. and China, continued to exhibit a gradual weakening trend. Emerging markets debt broadly posted gains, with strength in July and September 2018 outweighing pronounced August weakness. High yield corporate bonds also advanced, recording their best quarterly performance since the first quarter of 2017. In September 2018, the Fed delivered the eighth interest rate hike of its current tightening cycle, with its dot plot pointing to another increase by calendaryear-end and three more during 2019. Fed Chair Powell delivered an upbeat assessment of the U.S. economy, which supported market expectations for these additional Fed rate hikes in 2019. U.S. Treasury rates rose in response, followed, in turn, by the interest rates of other developed markets countries.
During the fourth quarter of 2018, investor concerns about slowing global economic growth momentum as well as tighter financial conditions, mainly in the U.S., weighed on spread sector performance. In particular, U.S. corporate bonds experienced notable weakness, as credit spreads, or yield differentials versus U.S. Treasury securities, widened significantly. U.S. Treasury rates fell as investors grew fearful about the possible end of the global economic cycle and their expectations for Fed rate hikes diminished. In December 2018, Fed policymakers raised short-term interest rates, much as the market had expected, but lowered their projection for 2019 monetary policy tightening from three rate hikes to two. U.S. economic activity data remained in expansionary territory during the fourth calendar quarter but moderated from cycle highs. Headline inflation pressures eased as crude oil prices declined.
What key factors were responsible for the Fund’s performance during the Reporting Period?
The Fund primarily seeks to achieve its investment objective by investing in a global portfolio of equity and fixed income asset classes. Under normal market conditions, the Fund expects to invest at least 40% of its assets in equity investments and at least 20% of its assets in fixed income investments. The percentage of the Fund’s portfolio exposed to any asset class or geographic region will vary from time to time as the weightings of the Fund change, and the Fund may not be invested in each asset class at all times.
As part of the Fund’s investment strategy, the Investment Adviser seeks to manage volatility and limit losses by allocating the Fund’s assets away from risky investments in distressed or volatile market environments. Volatility is a statistical measurement of the magnitude of up and down fluctuations in the value of a financial instrument or index. In distressed or volatile market environments, the Fund may also hold significant amounts of U.S. Treasury, short-term or other fixed income investments, including money market funds and repurchase agreements or cash, and at times may invest up to 100% of its assets in such investments.
During the Reporting Period, the Fund continued dynamically allocating across global asset classes, using a momentum-based methodology, as it sought total return while also seeking to provide volatility management. Momentum investing seeks growth of capital by gaining exposure to asset classes that have exhibited trends in price performance over selected time periods. In managing the Fund, we use a methodology that evaluates historical three-,six- and nine-month returns, volatilities and correlations across a range of nine global asset classes. Represented by indices, these asset classes include, within the equities category, U.S.large-cap andsmall-cap, European, Asian, emerging markets and U.K. stocks. Within the fixed income category, the Fund may allocate assets to the U.S., Europe and Japan. The analysis of these asset classes drives the aggregate allocations of the Fund over time. We believe market price momentum — either positive or negative — has significant predictive power.
2
GOLDMAN SACHS VARIABLE INSURANCE TRUST GLOBAL TRENDS ALLOCATION FUND
During the Reporting Period, the Fund was hurt overall by our efforts to reduce risk in response to the market volatility in February 2018 and during the last three months of 2018. Allocations to U.S.large-cap stocks and Japanese equities detracted most from the Fund’s performance. The Fund’s allocations to European, U.K. and emerging markets equities also diminished returns. On the positive side, the Fund benefited from its allocations to U.S. Treasury securities and German and Japanese government bonds. An allocation to U.S.small-cap equities did not have a meaningful impact on the Fund’s performance during the Reporting Period.
What was the Fund’s volatility during the Reporting Period?
As part of our investment approach, we seek to mitigate the Fund’s volatility. As mentioned earlier, for the Reporting Period overall, the Fund’s actual volatility (annualized, using daily returns) was 8.53%, less than the S&P 500® Index’s annualized volatility of 14.70%.
How was the Fund positioned during the Reporting Period?
During the Reporting Period, we tactically managed the Fund’s allocations across equity and fixed income markets based on the momentum and volatility of these asset classes. At the beginning of the Reporting Period, the Fund’s total assets were allocated 80% to equities, 20% to fixed income and 0% to cash. (Many of these positions were implemented through the use of exchanged-traded index future contracts.) Within the equity category, the Fund had allocations to five of six global equity asset classes. It did not have an allocation to U.S.small-cap equities at the beginning of the Reporting Period. As for fixed income, the Fund had an allocation to Japanese government bonds. It had no exposure to U.S. Treasuries or German government bonds at the start of the Reporting Period.
In January 2018, we made no changes to the Fund’s allocations. During February, we reduced the Fund’s allocation to Japanese equities and added an allocation to U.S. small-cap equities. We also added a small position in cash as we sought to reduce risk in the portfolio. Overall, from early February through the end of April 2018, we actively sought to manage volatility within the Fund’s allocations to Japanese equities and U.S. large-cap equities.
During March 2018, we modestly increased the Fund’s position in cash as we continued in our efforts to reduce risk in the portfolio. We reduced the Fund’s allocations to Japanese and U.S. large-cap stocks. We increased its allocation to U.S. small-cap equities. Overall, from the end of March through the end of April, we actively sought to manage volatility within the Fund’s allocation to U.S. small-cap equities. Within fixed income during March, we added an allocation to German government bonds.
In April 2018, we reduced the Fund’s allocation to emerging markets equities and U.S. large-cap equities. We increased its allocations to Japanese, U.K., and European equities. Within fixed income, we increased the Fund’s allocations to German government bonds. By the end of the month, we had eliminated the Fund’s position in cash.
During May 2018, we eliminated the Fund’s allocation to emerging markets equities. We reduced its allocation to European equities and increased its allocations to U.K. and U.S. small-cap and large-cap equities. Within fixed income, we added an allocation to U.S. Treasury securities and decreased its allocation to German government bonds.
During June 2018, within the equity allocation, we increased the Fund’s exposure to Japanese equities and reduced its exposure to U.K. and U.S. large-cap equities. Within fixed income, we increased the Fund’s allocation to German government bonds and eliminated its allocation to U.S. Treasuries.
In July 2018, we increased the Fund’s allocations to U.S.large-cap equities and European equities. We moderated its allocations to Japanese equities and U.K. equities. Within fixed income, we lowered the Fund’s allocations to Japanese and German government bonds.
During August 2018, we increased the Fund’s allocations to U.S.large-cap equities and Japanese equities. We moderated its allocation to European equities. Within fixed income, we greatly reduced the Fund’s allocation to Japanese government bonds, while adding slightly to its allocation to German government bonds. We also established a small allocation to U.S. Treasuries.
During September 2018, we increased the Fund’s allocations to European and Japanese equities. We moderated its allocation to U.S.small-cap equities. Within fixed income, we greatly reduced the Fund’s allocation to German government bonds, while significantly increasing its allocation to Japanese government bonds. In addition, we eliminated the Fund’s small allocation to U.S. Treasuries.
In October 2018, we increased the Fund’s cash position and its allocation to fixed income. Were-established an allocation to U.S. Treasuries. We also decreased the Fund’s allocations to U.S.large-cap, European, U.K. and Japanese equities. During November, we gradually reduced the Fund’s cash position, reallocating the capital to equities and fixed income. In December, as we sought to
3
GOLDMAN SACHS VARIABLE INSURANCE TRUST GLOBAL TRENDS ALLOCATION FUND
reduce risk due to increased market stress, we significantly increased the Fund’s cash position and decreased its allocations to equities and fixed income overall.
How did the Fund use derivatives and similar instruments during the Reporting Period?
During the Reporting Period, the Fund employed exchange-traded index futures contracts to gain exposure to U.S.large-cap andsmall-cap stocks; the European, Japanese and U.K. equity markets; and U.S., Japanese and German government bonds. On an absolute basis, the use of these instruments had a negative impact on the Fund’s performance, as the majority of these allocations detracted from returns.
Were there any changes to the Fund’s portfolio management team during the Reporting Period?
Effective April 20, 2018, Amna Qaiser no longer served as a portfolio manager of the Fund. As of the same date, Federico Gilly and Oliver Bunn became portfolio managers of the Fund. By design, all investment decisions for the Fund are performed within aco-lead or team structure, with multiple subject matter experts. This strategic decision making has been the cornerstone of our approach and ensures continuity in the Fund. At the end of the Reporting Period, the portfolio managers for the Fund were Gary Chropuvka, Federico Gilly and Oliver Bunn.
What is the Fund’s tactical asset allocation view and strategy for the months ahead?
At the end of the Reporting Period, the Fund’s total assets were allocated 19.3% to equities, 38.3% to fixed income and 42.4% to cash. (Many of these positions were implemented through the use of exchanged-traded index future contracts.) We prepared for 2019 by maintaining a significant cash position in the Fund. Within the equity allocation, which we had decreased overall, the Fund continued to have exposure to U.S.large-cap stocks and Japanese equities and, to a lesser extent, to U.K. and European equities. Within the fixed income allocation, we had decreased the Fund’s exposure to Japanese and German government bonds as well as U.S. Treasury securities. At the end of the Reporting Period, the Fund had no exposure to emerging markets equities and U.S.small-cap stocks.
Going forward, we intend to position the Fund to provide exposure to price momentum from among nine underlying asset classes, while dynamically managing the volatility, or risk, of the overall portfolio. In general, the Fund seeks to maintain a strategic allocation of 60% of its assets in equity investments and 40% of its assets in fixed income investments. The Fund may deviate from these strategic allocations in order to allocate a greater percentage to asset classes with strong momentum and to reduce its allocation to assets with weak momentum. When volatility increases, our goal is to preserve capital by proportionally increasing the Fund’s cash exposure and reducing its exposure to riskier asset classes. There is no guarantee the Fund’s dynamic management strategy will cause it to achieve its investment objective.
4
GOLDMAN SACHS VARIABLE INSURANCE TRUST GLOBAL TRENDS ALLOCATION FUND
Index Definitions
Global Trends Allocation Composite Index is composed 60% of MSCI World Index (Net, USD, Unhedged) and 40% of Bloomberg Barclays U.S. Aggregate Bond Index. It is a composite representation prepared by the Investment Adviser of the performance of the Fund’s asset classes, weighted according to their respective weightings in the Fund’s target range.
MSCI World Index (Net, USD, Unhedged) is a free float-adjusted market capitalization weighted index that is designed to measure the equity market performance of 23 developed markets.
Bloomberg Barclays U.S. Aggregate Bond Indexrepresents an unmanaged diversified portfolio of fixed income securities, including U.S. Treasuries, investment grade corporate bonds, and mortgage-backed and asset-backed securities.
S&P 500® Index is an unmanaged index of 500 stocks that is generally representative of the performance of larger companies in the U.S.
It is not possible to invest directly in an unmanaged index.
5
FUND BASICS
Global Trends Allocation Fund
as of December 31, 2018
STANDARDIZED TOTAL RETURNS1
| | | | | | | | | | | | | | |
| | | | |
| For the year ended 12/31/18 | | One Year | | | Five Years | | | Since Inception | | | Inception Date |
| Institutional | | | -4.08 | % | | | 2.27 | % | | | 2.79 | % | | 10/16/13 |
| Service | | | -4.34 | | | | 2.02 | | | | 4.01 | | | 4/16/12 |
| 1 | Standardized Total Returns are average annual total returns as of the most recent calendar quarter-end. They assume reinvestment of all distributions at net asset value (“NAV”). Because Institutional Shares and Service Shares do not involve a sales charge, such a charge is not applied to their Standardized Total Returns. |
Total return figures in the above chart represent past performance and do not indicate future results, which will vary. The investment return and principal value of an investment will fluctuate and, therefore, an investor’s shares, when redeemed, may be worth more or less than their original cost. Current performance may be lower or higher than the total return figures in the above chart. Please visit www.GSAMFUNDS.com to obtain the most recent month-end returns.Performance reflects fee waivers and/or expense limitations in effect during the periods shown. In their absence, performance would be reduced.
EXPENSE RATIOS2
| | | | | | | | |
| | |
| | | Net Expense Ratio (Current) | | | Gross Expense Ratio (Before Waivers) | |
| Institutional | | | 0.75 | % | | | 1.00 | % |
| Service | | | 1.00 | | | | 1.25 | |
| 2 | The expense ratios of the Fund, both current (net of any fee waivers and/or expense limitations) and before waivers (gross of any fee waivers and/or expense limitations) are as set forth above according to the most recent publicly available Prospectuses for the Fund and may differ from the expense ratios disclosed in the Financial Highlights in this report. Pursuant to a contractual arrangement, the Fund’s fee waivers and/or expense limitations will remain in place through at least April 30, 2019, and prior to such date, the Investment Adviser may not terminate the arrangements without the approval of the Fund’s Board of Trustees. If these arrangements are discontinued in the future, the expense ratios may change without shareholder approval. |
6
FUND BASICS
FUND COMPOSITION3

| 3 | The percentage shown for each investment category reflects the value of investments in that category as a percentage of net assets. Figures in the above graph may not sum to 100% due to the exclusion of other assets and liabilities. The underlying composition of exchange traded funds and investment companies held by the Fund are not reflected in the graph above. Consequently, the Fund’s overall composition may differ from the percentages contained in the graph above. The graph depicts the Fund’s investments but may not represent the Fund’s market exposure due to the exclusion of certain derivatives, if any, as listed in the Additional Investment Information section of the Schedule of Investments. |
7
GOLDMAN SACHS VARIABLE INSURANCE TRUST GLOBAL TRENDS ALLOCATION FUND
Performance Summary
December 31, 2018
The following graph shows the value, as of December 31, 2018, of a $10,000 investment made on April 16, 2012 (commencement of the Fund’s operations) in Service Shares at NAV. For comparative purposes, the performance of the Fund’s benchmark, the Global Trends Allocation Composite Index, (comprised of the Morgan Stanley Capital International (MSCI) World Index (Net, USD, Unhedged) (60%) and the Bloomberg Barclays U.S. Aggregate Bond Index (40%)) is shown. This performance data represents past performance and should not be considered indicative of future performance, which will fluctuate with changes in market conditions. These performance fluctuations may cause an investor’s shares, when redeemed, to be worth more or less than their original cost. Performance reflects Fund level expenses but does not reflect fees and expenses associated with any variable annuity contract or variable life insurance policy that uses the Fund as an investment option for any contract or policy. Had performance reflected all of those fees and expenses, performance would have been reduced. Performance reflects applicable fee waivers and/or expense limitations in effect during the periods shown, and in their absence, performance would be reduced. Performance of Institutional Shares will vary from Service Shares due to differences in class specific fees. In addition to the Investment Adviser’s decisions regarding issuer/industry investment selection and allocation, other factors may affect Fund performance. These factors include, but are not limited to, Fund operating fees and expenses, portfolio turnover, and subscription and redemption cash flows affecting the Fund.
Global Trends Allocation Fund’s Lifetime Performance
Performance of a $10,000 investment, with distributions reinvested, from April 16, 2012 through December 31, 2018.
| | | | | | |
| Average Annual Total Return through December 31, 2018 | | One Year | | Five Years | | Since Inception |
Institutional (Commenced October 16, 2013) | | -4.08% | | 2.27% | | 2.79% |
Service (Commenced April 16, 2012) | | -4.34% | | 2.02% | | 4.01% |
8
GOLDMAN SACHS VARIABLE INSURANCE TRUST GLOBAL TRENDS ALLOCATION FUND
Schedule of Investments
December 31, 2018
| | | | | | |
| Shares | | Description | | Value | |
|
| Exchange Traded Fund –13.3% | |
| 208,444 | | iShares Core S&P 500 ETF | | | | |
| (Cost $42,482,984) | | $ | 52,446,595 | |
| |
| | | | | | | | |
| Shares | | Dividend Rate | | | Value | |
|
| Investment Companies(a) – 56.4% | |
Goldman Sachs Financial Square Government Fund — Institutional Shares | |
| 119,104,588 | | | 2.521 | % | | $ | 119,104,588 | |
Goldman Sachs Financial Square Treasury Obligations Fund —Institutional Shares | |
| 52,179,797 | | | 2.611 | | | | 52,179,797 | |
Goldman Sachs Financial Square Treasury Solutions Fund —Institutional Shares | |
| 52,179,797 | | | 2.235 | | | | 52,179,797 | |
| |
TOTAL INVESTMENT COMPANIES
| |
| (Cost $223,464,182) | | | $ | 223,464,182 | |
| |
TOTAL INVESTMENTS – 69.7%
| |
| (Cost $265,947,166) | | | $ | 275,910,777 | |
| |
OTHER ASSETS IN EXCESS OF LIABILITIES – 30.3% | | | | 120,177,668 | |
| |
| NET ASSETS – 100.0% | | | $ | 396,088,445 | |
| |
| | |
| The percentage shown for each investment category reflects the value of investments in that category as a percentage of net assets. |
| |
| (a) | | Represents an affiliated issuer. |
ADDITIONAL INVESTMENT INFORMATION
FUTURES CONTRACTS — At December 31, 2018, the Fund had the following futures contracts:
| | | | | | | | | | | | | | | | |
| Description | | Number of
Contracts | | | Expiration
Date | | | Notional
Amount | | | Unrealized
Appreciation/
(Depreciation) | |
| |
Long position contracts: | | | | | |
| EURO STOXX 50 Index | | | 358 | | | | 03/15/2019 | | | $ | 12,198,709 | | | $ | (218,062 | ) |
| Euro-Bund | | | 257 | | | | 03/07/2019 | | | | 48,155,620 | | | | 286,692 | |
| FTSE 100 Index | | | 146 | | | | 03/15/2019 | | | | 12,391,839 | | | | 25,554 | |
| Japan 10 Year Bond | | | 31 | | | | 03/13/2019 | | | | 43,140,641 | | | | 197,500 | |
| TOPIX Index | | | 60 | | | | 03/07/2019 | | | | 8,175,722 | | | | (413,465 | ) |
U.S. Treasury 10 Year Note | | | 416 | | | | 03/20/2019 | | | | 50,771,500 | | | | 963,034 | |
| | | | |
| Total | | | | | | | | | | | | | | $ | 841,253 | |
| |
Short position contracts: | | | | | |
S&P 500E-Mini Index | | | (57 | ) | | | 03/15/2019 | | | $ | (7,139,820 | ) | | $ | (53,298 | ) |
| |
| Total Futures Contracts | | | $ | 787,955 | |
| | |
| The accompanying notes are an integral part of these financial statements. | | 9 |
GOLDMAN SACHS VARIABLE INSURANCE TRUST GLOBAL TRENDS ALLOCATION FUND
Statement of Assets and Liabilities
December 31, 2018
| | | | |
| | | | |
| Assets: | | | |
Investments in unaffiliated issuers, at value (cost $42,482,984) | | $ | 52,446,595 | |
Investments in affiliated issuers, at value (cost $223,464,182) | | | 223,464,182 | |
Cash | | | 117,094,121 | |
Receivables: | | | | |
Collateral on certain derivative contracts | | | 3,520,288 | |
Dividends | | | 260,873 | |
Fund shares sold | | | 26,699 | |
Reimbursement from investment adviser | | | 16,887 | |
| Variation margin on futures | | | 37,817 | |
Other assets | | | 38 | |
| |
| Total assets | | | 396,867,500 | |
| | | | |
| | | | |
| Liabilities: | |
Payables: | | | | |
Fund shares redeemed | | | 395,210 | |
Management fees | | | 193,507 | |
Distribution and Service fees and Transfer Agency fees | | | 91,778 | |
Accrued expenses and other liabilities | | | 98,560 | |
| |
| Total liabilities | | | 779,055 | |
| | | | |
| | | | |
| Net Assets: | |
Paid-in capital | | | 389,978,969 | |
Total distributable earnings | | | 6,109,476 | |
| |
| NET ASSETS | | $ | 396,088,445 | |
Net Assets: | | | | |
Institutional | | $ | 246,688 | |
Service | | | 395,841,757 | |
| |
Total Net Assets | | $ | 396,088,445 | |
Shares outstanding $0.001 par value (unlimited shares authorized): | | | | |
Institutional | | | 21,171 | |
Service | | | 34,013,609 | |
Net asset value, offering and redemption price per share: | | | | |
Institutional | | | $11.65 | |
Service | | | 11.64 | |
| | |
| 10 | | The accompanying notes are an integral part of these financial statements. |
GOLDMAN SACHS VARIABLE INSURANCE TRUST GLOBAL TRENDS ALLOCATION FUND
Statement of Operations
For the Fiscal Year Ended December 31, 2018
| | | | |
| | | | |
| Investment income: | |
Dividends — affiliated issuers | | $ | 3,911,639 | |
Dividends — unaffiliated issuers | | | 2,035,809 | |
| |
| Total investment income | | | 5,947,448 | |
| | | | |
| | | | |
| Expenses: | |
Management fees | | | 3,262,432 | |
Distribution and Service fees — Service Shares | | | 1,032,044 | |
Professional fees | | | 98,208 | |
Transfer Agency fees(a) | | | 82,587 | |
Printing and mailing costs | | | 42,237 | |
Custody, accounting and administrative services | | | 34,784 | |
Trustee fees | | | 16,885 | |
Other | | | 19,583 | |
| |
| Total expenses | | | 4,588,760 | |
| |
Less — expense reductions | | | (1,227,100 | ) |
| |
| Net expenses | | | 3,361,660 | |
| |
| NET INVESTMENT INCOME | | | 2,585,788 | |
| | | | |
| | | | |
| Realized and unrealized gain (loss): | |
Net realized gain (loss) from: | | | | |
Investments — unaffiliated issuers | | | 12,177,593 | |
Futures contracts | | | (14,279,935 | ) |
Foreign currency transactions | | | 210,883 | |
Net change in unrealized loss on: | |
Investments — unaffiliated issuers | | | (18,150,267 | ) |
Futures contracts | | | (301,063 | ) |
Foreign currency translation | | | (91,634 | ) |
| |
| Net realized and unrealized loss | | | (20,434,423 | ) |
| |
| NET DECREASE IN NET ASSETS RESULTING FROM OPERATIONS | | $ | (17,848,635 | ) |
(a) Institutional and Service Shares incurred Transfer Agency fees of $30 and $82,557, respectively.
| | |
| The accompanying notes are an integral part of these financial statements. | | 11 |
GOLDMAN SACHS VARIABLE INSURANCE TRUST GLOBAL TRENDS ALLOCATION FUND
Statements of Changes in Net Assets
| | | | | | | | |
| | | For the
Fiscal Year Ended
December 31, 2018 | | | For the
Fiscal Year Ended
December 31, 2017 | |
| | | | | | | | |
| From operations: | |
Net investment income | | $ | 2,585,788 | | | $ | 812,849 | |
Net realized gain (loss) | | | (1,891,459 | ) | | | 30,615,788 | |
Net change in unrealized gain (loss) | | | (18,542,964 | ) | | | 15,102,236 | |
| | |
| Net increase (decrease) in net assets resulting from operations | | | (17,848,635 | ) | | | 46,530,873 | |
| | | | | | | | |
| | | | | | | | |
| Distributions to shareholders: | |
From distributable earnings: | | | | | | | | |
Institutional Shares | | | (6,273 | ) | | | (901 | )(a) |
Service Shares | | | (9,086,313 | ) | | | (11,254,056 | )(a) |
| | |
| Total distributions to shareholders | | | (9,092,586 | ) | | | (11,254,957 | ) |
| | | | | | | | |
| | | | | | | | |
| From share transactions: | |
Proceeds from sales of shares | | | 42,650,408 | | | | 38,959,444 | |
Reinvestment of distributions | | | 9,092,586 | | | | 11,254,957 | |
Cost of shares redeemed | | | (35,610,360 | ) | | | (32,234,857 | ) |
| | |
| Net increase in net assets resulting from share transactions | | | 16,132,634 | | | | 17,979,544 | |
| | |
| TOTAL INCREASE (DECREASE) | | | (10,808,587 | ) | | | 53,255,460 | |
| | | | | | | | |
| | | | | | | | |
| Net assets:(b) | |
| | |
Beginning of year | | | 406,897,032 | | | | 353,641,572 | |
| | |
End of year | | $ | 396,088,445 | | | $ | 406,897,032 | |
(a) Prior year information has been revised to conform to current year presentation, see prior year presentation below:
| | | | | | | | |
| | | Institutional | | | Service | |
Distribution from net investment income: | | $ | (157 | ) | | $ | (1,185,638 | ) |
| | |
Distributions from net realized gains: | | $ | (744 | ) | | $ | (10,068,418 | ) |
| (b) | Prior fiscal year information has been revised to conform with current year presentation. Undistributed net investment income was $888,720 for the Fund, as of December 31, 2017. |
| | |
| 12 | | The accompanying notes are an integral part of these financial statements. |
GOLDMAN SACHS VARIABLE INSURANCE TRUST GLOBAL TRENDS ALLOCATION FUND
Financial Highlights
Selected Data for a Share Outstanding Throughout Each Year
| | | | | | | | | | | | | | | | | | | | |
| | | Goldman Sachs Global Trends Allocation Fund | |
| | | Institutional Shares | |
| | | Year Ended December 31, | |
| | | 2018 | | | 2017 | | | 2016 | | | 2015 | | | 2014 | |
| | | | | | | | | | | | | | | | | | | | |
| Per Share Data | | | | | | | | | | | | | | | |
| | | | | |
Net asset value, beginning of year | | $ | 12.46 | | | $ | 11.33 | | | $ | 10.89 | | | $ | 11.82 | | | $ | 11.46 | |
| | | | | |
Net investment income (loss)(a) | | | 0.14 | | | | 0.06 | | | | (0.03 | ) | | | 0.01 | | | | 0.08 | |
| | | | | |
Net realized and unrealized gain (loss) | | | (0.64 | ) | | | 1.46 | | | | 0.52 | | | | (0.67 | ) | | | 0.41 | |
| | | | | |
Total from investment operations | | | (0.50 | ) | | | 1.52 | | | | 0.49 | | | | (0.66 | ) | | | 0.49 | |
| | | | | |
Distributions to shareholders from net investment income | | | (0.12 | ) | | | (0.07 | ) | | | (0.05 | ) | | | (0.03 | ) | | | (0.03 | ) |
| | | | | |
Distributions to shareholders from net realized gains | | | (0.19 | ) | | | (0.32 | ) | | | — | | | | (0.24 | ) | | | (0.10 | ) |
| | | | | |
Total distributions | | | (0.31 | ) | | | (0.39 | ) | | | (0.05 | ) | | | (0.27 | ) | | | (0.13 | ) |
| | | | | |
Net asset value, end of year | | $ | 11.65 | | | $ | 12.46 | | | $ | 11.33 | | | $ | 10.89 | | | $ | 11.82 | |
| | | | | |
Total return(b) | | | (4.08 | )% | | | 13.36 | % | | | 4.49 | % | | | (5.52 | )% | | | 4.23 | % |
| | | | | |
Net assets, end of year (in 000s) | | $ | 247 | | | $ | 30 | | | $ | 27 | | | $ | 1,008 | | | $ | 739 | |
| | | | | |
Ratio of net expenses to average net assets | | | 0.51 | % | | | 0.68 | % | | | 0.74 | % | | | 0.75 | % | | | 0.77 | % |
| | | | | |
Ratio of total expenses to average net assets | | | 0.86 | % | | | 0.86 | % | | | 0.89 | % | | | 0.92 | % | | | 1.01 | % |
| | | | | |
Ratio of net investment income (loss) to average net assets | | | 1.13 | % | | | 0.46 | % | | | (0.25 | )% | | | 0.12 | % | | | 0.68 | % |
| | | | | |
Portfolio turnover rate(c) | | | 60 | % | | | 64 | % | | | 260 | % | | | 504 | % | | | 304 | % |
| (a) | Calculated based on the average shares outstanding methodology. |
| (b) | Assumes investment at the net asset value at the beginning of the year, reinvestment of all distributions, and a complete redemption of the investment at the net asset value at the end of the year. |
| (c) | The Fund’s portfolio turnover rate is calculated in accordance with regulatory requirements, without regard to transactions involving short term investments and certain derivatives. If such transactions were included, the Fund’s portfolio turnover rate may be higher. |
| | |
| The accompanying notes are an integral part of these financial statements. | | 13 |
GOLDMAN SACHS VARIABLE INSURANCE TRUST GLOBAL TRENDS ALLOCATION FUND
Financial Highlights(continued)
Selected Data for a Share Outstanding Throughout Each Year
| | | | | | | | | | | | | | | | | | | | |
| | | Goldman Sachs Global Trends Allocation Fund | |
| | | Service Shares | |
| | | Year Ended December 31, | |
| | | 2018 | | | 2017 | | | 2016 | | | 2015 | | | 2014 | |
| | | | | | | | | | | | | | | | | | | | |
| Per Share Data | | | | | | | | | | | | | | | |
| | | | | |
Net asset value, beginning of year | | $ | 12.45 | | | $ | 11.32 | | | $ | 10.88 | | | $ | 11.82 | | | $ | 11.47 | |
| | | | | |
Net investment income (loss)(a) | | | 0.08 | | | | 0.03 | | | | 0.02 | | | | (0.02 | ) | | | — | (b) |
| | | | | | |
Net realized and unrealized gain (loss) | | | (0.62 | ) | | | 1.46 | | | | 0.45 | | | | (0.67 | ) | | | 0.45 | |
| | | | | |
Total from investment operations | | | (0.54 | ) | | | 1.49 | | | | 0.47 | | | | (0.69 | ) | | | 0.45 | |
| | | | | |
Distributions to shareholders from net investment income | | | (0.08 | ) | | | (0.04 | ) | | | (0.03 | ) | | | (0.01 | ) | | | — | (b) |
| | | | | | |
Distributions to shareholders from net realized gains | | | (0.19 | ) | | | (0.32 | ) | | | — | | | | (0.24 | ) | | | (0.10 | ) |
| | | | | |
Total distributions | | | (0.27 | ) | | | (0.36 | ) | | | (0.03 | ) | | | (0.25 | ) | | | (0.10 | ) |
| | | | | |
Net asset value, end of year | | $ | 11.64 | | | $ | 12.45 | | | $ | 11.32 | | | $ | 10.88 | | | $ | 11.82 | |
| | | | | |
Total return(c) | | | (4.34 | )% | | | 13.11 | % | | | 4.33 | % | | | (5.82 | )% | | | 3.95 | % |
| | | | | |
Net assets, end of year (in 000s) | | $ | 395,842 | | | $ | 406,867 | | | $ | 353,615 | | | $ | 354,706 | | | $ | 267,720 | |
| | | | | |
Ratio of net expenses to average net assets | | | 0.81 | % | | | 0.93 | % | | | 1.00 | % | | | 1.00 | % | | | 1.03 | % |
| | | | | |
Ratio of total expenses to average net assets | | | 1.11 | % | | | 1.11 | % | | | 1.13 | % | | | 1.17 | % | | | 1.24 | % |
| | | | | |
Ratio of net investment income (loss) to average net assets | | | 0.63 | % | | | 0.21 | % | | | 0.20 | % | | | (0.16 | )% | | | (0.04 | )% |
| | | | | |
Portfolio turnover rate(d) | | | 60 | % | | | 64 | % | | | 260 | % | | | 504 | % | | | 304 | % |
| (a) | Calculated based on the average shares outstanding methodology. |
| (b) | Amount is less than $0.005 per share. |
| (c) | Assumes investment at the net asset value at the beginning of the year, reinvestment of all distributions, and a complete redemption of the investment at the net asset value at the end of the year. |
| (d) | The Fund’s portfolio turnover rate is calculated in accordance with regulatory requirements, without regard to transactions involving short term investments and certain derivatives. If such transactions were included, the Fund’s portfolio turnover rate may be higher. |
| | |
| 14 | | The accompanying notes are an integral part of these financial statements. |
GOLDMAN SACHS VARIABLE INSURANCE TRUST GLOBAL TRENDS ALLOCATION FUND
Notes to Financial Statements
December 31, 2018
1. ORGANIZATION
Goldman Sachs Variable Insurance Trust (the “Trust” or “VIT”) is a Delaware statutory trust registered under the Investment Company Act of 1940, as amended (the “Act”), as anopen-end management investment company. The Trust includes the Goldman Sachs Global Trends Allocation Fund (the “Fund”). The Fund is a diversified portfolio under the Act offering two classes of shares — Institutional and Service Shares. Shares of the Trust are offered to separate accounts of participating life insurance companies for the purpose of funding variable annuity contracts and variable life insurance policies.
Goldman Sachs Asset Management, L.P. (“GSAM”), an affiliate of Goldman Sachs & Co. LLC (“Goldman Sachs”), serves as investment adviser to the Fund pursuant to a management agreement (the “Agreement”) with the Trust.
2. SIGNIFICANT ACCOUNTING POLICIES
The financial statements have been prepared in accordance with accounting principles generally accepted in the United States of America (“GAAP”) and require management to make estimates and assumptions that may affect the reported amounts and disclosures. Actual results may differ from those estimates and assumptions.
A. Investment Valuation —The Fund’s valuation policy is to value investments at fair value.
B. Investment Income and Investments —Investment income includes interest income, dividend income, and securities lending income, if any. Interest income is accrued daily and adjusted for amortization of premiums and accretion of discounts. Dividend income is recognized onex-dividend date or, for certain foreign securities, as soon as such information is obtained subsequent to theex-dividend date. Investment transactions are reflected on trade date. Realized gains and losses are calculated using identified cost. Investment transactions are recorded on the following business day for daily net asset value (“NAV”) calculations. Investment income is recorded net of any foreign withholding taxes, less any amounts reclaimable. The Fund may file withholding tax reclaims in certain jurisdictions to recover a portion of amounts previously withheld. Any foreign capital gains tax is accrued daily based upon net unrealized gains, and is payable upon sale of such investments.
For derivative contracts, realized gains and losses are recorded upon settlement of the contract.
C. Class Allocations and Expenses —Investment income, realized and unrealized gain (loss), if any, andnon-class specific expenses of the Fund are allocated daily based upon the proportion of net assets of each class.Non-class specific expenses directly incurred by the Fund are charged to the Fund, while such expenses incurred by the Trust are allocated across the Fund on a straight-line and/orpro-rata basis depending upon the nature of the expenses. Class-specific expenses, where applicable, are borne by the respective share classes and include Distribution and Service and Transfer Agency fees.
D. Federal Taxes and Distributions to Shareholders —It is the Fund’s policy to comply with the requirements of the Internal Revenue Code of 1986, as amended (the “Code”), applicable to regulated investment companies and to distribute each year substantially all of its investment company taxable income and capital gains to its shareholders. Accordingly, the Fund is not required to make any provisions for the payment of federal income tax. Distributions to shareholders are recorded on theex-dividend date. Income and capital gains distributions, if any, are declared and paid annually.
Net capital losses, if any, are carried forward to future fiscal years and may be used to the extent allowed by the Code to offset any future capital gains. Losses that are carried forward will retain their character as either short-term or long-term capital losses. Utilization of capital loss carryforwards will reduce the requirement of future capital gains distributions.
The characterization of distributions to shareholders for financial reporting purposes is determined in accordance with federal income tax rules, which may differ from GAAP. The source of the Fund’s distributions may be shown in the accompanying financial statements as either from distributable earnings or capital. Certain components of the Fund’s net assets on the Statement of Assets and Liabilities reflect permanent GAAP/tax differences based on the appropriate tax character.
E. Foreign Currency Translation —The accounting records and reporting currency of the Fund are maintained in United States (“U.S.”) dollars. Assets and liabilities denominated in foreign currencies are translated into U.S. dollars using the current exchange rates at the close of each business day. The effect of changes in foreign currency exchange rates on investments is included within
15
GOLDMAN SACHS VARIABLE INSURANCE TRUST GLOBAL TRENDS ALLOCATION FUND
Notes to Financial Statements(continued)
December 31, 2018
2. SIGNIFICANT ACCOUNTING POLICIES (continued)
net realized and unrealized gain (loss) on investments. Changes in the value of other assets and liabilities as a result of fluctuations in foreign exchange rates are included in the Statement of Operations within net change in unrealized gain (loss) on foreign currency translation. Transactions denominated in foreign currencies are translated into U.S. dollars on the date the transaction occurred, the effects of which are included within net realized gain (loss) on foreign currency transactions.
3. INVESTMENTS AND FAIR VALUE MEASUREMENTS
U.S. GAAP defines the fair value of a financial instrument as the amount that would be received to sell an asset or paid to transfer a liability in an orderly transaction between market participants at the measurement date (i.e., the exit price); the Fund’s policy is to use the market approach. GAAP establishes a fair value hierarchy that prioritizes the inputs to valuation techniques used to measure fair value. The hierarchy gives the highest priority to unadjusted quoted prices in active markets for identical assets or liabilities (Level 1 measurements) and the lowest priority to unobservable inputs (Level 3 measurements). The levels used for classifying investments are not necessarily an indication of the risk associated with investing in these investments. The three levels of the fair value hierarchy are described below:
Level 1 — Unadjusted quoted prices in active markets that are accessible at the measurement date for identical, unrestricted assets or liabilities;
Level 2 — Quoted prices in markets that are not active or financial instruments for which significant inputs are observable (including, but not limited to, quoted prices for similar investments, interest rates, foreign exchange rates, volatility and credit spreads), either directly or indirectly;
Level 3 — Prices or valuations that require significant unobservable inputs (including GSAM’s assumptions in determining fair value measurement).
Changes in valuation techniques may result in transfers into or out of an assigned level within the hierarchy. In accordance with the Fund’s policy, transfers between different levels of the fair value hierarchy resulting from such changes are deemed to have occurred as of the beginning of the reporting period.
The Board of Trustees (“Trustees”) has approved Valuation Procedures that govern the valuation of the portfolio investments held by the Fund, including investments for which market quotations are not readily available. The Trustees have delegated to GSAMday-to-day responsibility for implementing and maintaining internal controls and procedures related to the valuation of the Fund’s investments. To assess the continuing appropriateness of pricing sources and methodologies, GSAM regularly performs price verification procedures and issues challenges as necessary to third party pricing vendors or brokers, and any differences are reviewed in accordance with the Valuation Procedures.
A. Level 1 and Level 2 Fair Value Investments —The valuation techniques and significant inputs used in determining the fair values for investments classified as Level 1 and Level 2 are as follows:
Equity Securities —Equity securities traded on a U.S. securities exchange or the NASDAQ system, or those located on certain foreign exchanges, including but not limited to the Americas, are valued daily at their last sale price or official closing price on the principal exchange or system on which they are traded. If there is no sale or official closing price or such price is believed by GSAM to not represent fair value, equity securities are valued at the last bid price for long positions and at the last ask price for short positions. To the extent these investments are actively traded, they are classified as Level 1 of the fair value hierarchy, otherwise they are generally classified as Level 2.
Unlisted equity securities for which market quotations are available are valued at the last sale price on the valuation date, or if no sale occurs, at the last bid price, and are generally classified as Level 2. Securities traded on certain foreign securities exchanges are valued daily at fair value determined by an independent fair value service (if available) under Valuation Procedures approved by the Trustees and consistent with applicable regulatory guidance. The independent fair value service takes into account multiple factors including, but not limited to, movements in the securities markets, certain depositary receipts, futures contracts and foreign
16
GOLDMAN SACHS VARIABLE INSURANCE TRUST GLOBAL TRENDS ALLOCATION FUND
3. INVESTMENTS AND FAIR VALUE MEASUREMENTS (continued)
currency exchange rates that have occurred subsequent to the close of the foreign securities exchange. These investments are generally classified as Level 2 of the fair value hierarchy.
Underlying Funds (including Money Market Funds) —Underlying funds (“Underlying Funds”) include other investment companies and exchange-traded funds (“ETFs”). Investments in the Underlying Funds (except ETFs) are valued at the NAV per share of the Institutional share class on the day of valuation. ETFs are valued daily at the last sale price or official closing price on the principal exchange or system on which the investment is traded. Because the Fund invests in Underlying Funds that fluctuate in value, the Fund’s shares will correspondingly fluctuate in value. To the extent these investments are actively traded, they are classified as Level 1 of the fair value hierarchy, otherwise they are generally classified as Level 2. For information regarding an Underlying Fund’s accounting policies and investment holdings, please see the Underlying Fund’s shareholder report.
Derivative Contracts —A derivative is an instrument whose value is derived from underlying assets, indices, reference rates or a combination of these factors. The Fund enters into derivative transactions to hedge against changes in interest rates, securities prices, and/or currency exchange rates, to increase total return, or to gain access to certain markets or attain exposure to other underliers.
Exchange-traded derivatives, including futures and options contracts, are generally valued at the last sale or settlement price on the exchange where they are principally traded. Exchange-traded options without settlement prices are generally valued at the midpoint of the bid and ask prices on the exchange where they are principally traded (or, in the absence oftwo-way trading, at the last bid price for long positions and the last ask price for short positions). Exchange-traded derivatives typically fall within Level 1 of the fair value hierarchy.Over-the-counter (“OTC”) and centrally cleared derivatives are valued using market transactions and other market evidence, including market-based inputs to models, calibration to market-clearing transactions, broker or dealer quotations, or other alternative pricing sources. Where models are used, the selection of a particular model to value OTC and centrally cleared derivatives depends upon the contractual terms of, and specific risks inherent in, the instrument, as well as the availability of pricing information in the market. Valuation models require a variety of inputs, including contractual terms, market prices, yield curves, credit curves, measures of volatility, voluntary and involuntary prepayment rates, loss severity rates and correlations of such inputs. For OTC and centrally cleared derivatives that trade in liquid markets, model inputs can generally be verified and model selection does not involve significant management judgment. OTC and centrally cleared derivatives are classified within Level 2 of the fair value hierarchy when significant inputs are corroborated by market evidence.
i. Futures Contracts —Futures contracts are contracts to buy or sell a standardized quantity of a specified commodity or security. Upon entering into a futures contract, the Fund deposits cash or securities in an account on behalf of the broker in an amount sufficient to meet the initial margin requirement. Subsequent payments are made or received by the Fund equal to the daily change in the contract value and are recorded as variation margin receivable or payable with a corresponding offset to unrealized gains or losses. For financial reporting purposes, cash collateral that has been pledged to cover obligations of the Fund and cash collateral received, if any, is reported separately on the Statement of Assets and Liabilities as receivables/payables for collateral on certain derivative contracts.Non-cash collateral pledged by the Fund, if any, is noted in the Schedule of Investments.
B. Level 3 Fair Value Investments —To the extent that significant inputs to valuation models and other alternative pricing sources are unobservable, or if quotations are not readily available, or if GSAM believes that such quotations do not accurately reflect fair value, the fair value of the Fund’s investments may be determined under Valuation Procedures approved by the Trustees. GSAM, consistent with its procedures and applicable regulatory guidance, may make an adjustment to the most recent valuation prices of either domestic or foreign securities in light of significant events to reflect what it believes to be the fair value of the securities at the time of determining the Fund’s NAV. Significant events which could affect a large number of securities in a particular market may include, but are not limited to: significant fluctuations in U.S. or foreign markets; market dislocations; market disruptions; or unscheduled market closings. Significant events which could also affect a single issuer may include, but are not limited to: corporate actions such as reorganizations, mergers andbuy-outs; ratings downgrades; and bankruptcies.
17
GOLDMAN SACHS VARIABLE INSURANCE TRUST GLOBAL TRENDS ALLOCATION FUND
Notes to Financial Statements(continued)
December 31, 2018
3. INVESTMENTS AND FAIR VALUE MEASUREMENTS (continued)
C. Fair Value Hierarchy —The following is a summary of the Fund’s investments and derivatives classified in the fair value hierarchy as of December 31, 2018:
| | | | | | | | | | | | |
| Investment Type | | Level 1 | | | Level 2 | | | Level 3 | |
| | | |
| Assets | | | | | | | | | | | | |
| Exchange Traded Fund | | $ | 52,446,595 | | | $ | — | | | $ | — | |
Investment Companies | | | 223,464,182 | | | | — | | | | — | |
| | | |
| Total | | $ | 275,910,777 | | | $ | — | | | $ | — | |
| | | |
| Derivative Type | | | | | | | | | |
| | | |
| Assets(a) | | | | | | | | | | | | |
| Futures Contracts | | $ | 1,472,780 | | | $ | — | | | $ | — | |
| | | |
| Liabilities(a) | | | | | | | | | | | | |
| Futures Contracts | | $ | (684,825 | ) | | $ | — | | | $ | — | |
| (a) | Amount shown represents unrealized gain (loss) at fiscal year end. |
For further information regarding security characteristics, see the Schedule of Investments.
4. INVESTMENTS IN DERIVATIVES
The following table sets forth, by certain risk types, the gross value of derivative contracts (not considered to be hedging instruments for accounting disclosure purposes) as of December 31, 2018. These instruments were used as part of the Fund’s investment strategies and to obtain and/or manage exposure related to the risks below. The values in the table below exclude the effects of cash collateral received or posted pursuant to these derivative contracts, and therefore are not representative of the Fund’s net exposure.
| | | | | | | | | | | | | | |
| Risk | | | | Statement of Assets and Liabilities | | Assets(a) | | | Statement of Assets and Liabilities | | Liabilities(a) | |
| Equity | | | | Variation margin on futures contracts | | $ | 25,554 | | | Variation margin on futures contracts | | $ | (684,825 | ) |
| Interest Rate | | | | Variation margin on futures contracts | | | 1,447,226 | | | — | | | — | |
| | | | | |
| Total | | | | | | $ | 1,472,780 | | | | | $ | (684,825 | ) |
| (a) | Includes unrealized gain (loss) on futures contracts described in the Additional Investment Information section of the Schedule of Investments. Only the variation margin as of December 31, 2018 is reported within the Statement of Assets and Liabilities. |
The following table sets forth, by certain risk types, the Fund’s gains (losses) related to these derivatives and their indicative volumes for the fiscal year ended December 31, 2018. These gains (losses) should be considered in the context that these derivative contracts may have been executed to create investment opportunities and/or economically hedge certain investments, and
18
GOLDMAN SACHS VARIABLE INSURANCE TRUST GLOBAL TRENDS ALLOCATION FUND
4. INVESTMENTS IN DERIVATIVES (continued)
accordingly, certain gains (losses) on such derivative contracts may offset certain (losses) gains attributable to investments. These gains (losses) are included in “Net realized gain (loss)” or “Net change in unrealized gain (loss)” on the Statement of Operations:
| | | | | | | | | | | | | | |
| Risk | | Statement of Operations | | Net
Realized
Gain (Loss) | | | Net Change in
Unrealized
Gain (Loss) | | | Average
Number of
Contracts(a) | |
| Equity | | Net realized gain (loss) from futures contracts/Net change in unrealized gain (loss) on futures contracts | | $ | (17,520,874 | ) | | $ | (1,783,976 | ) | | | 1,467 | |
| Interest Rate | | Net realized gain (loss) from futures contracts/Net change in unrealized gain (loss) on futures contracts | | | 3,240,939 | | | | 1,482,913 | | | | 412 | |
| Total | | | | $ | (14,279,935 | ) | | $ | (301,063 | ) | | | 1,879 | |
| (a) | Average number of contracts is based on the average of month end balances for the fiscal year ended December 31, 2018. |
5. AGREEMENTS AND AFFILIATED TRANSACTIONS
A. Management Agreement —Under the Agreement, GSAM manages the Fund, subject to the general supervision of the Trustees.
As compensation for the services rendered pursuant to the Agreement, the assumption of the expenses related thereto and administration of the Fund’s business affairs, including providing facilities, GSAM is entitled to a management fee, accrued daily and paid monthly, equal to an annual percentage rate of the Fund’s average daily net assets.
As of December 31, 2018, the contractual management fees with GSAM were as stated below. The effective contractual management rates and effective net management rates represent the rates for the fiscal year ended December 31, 2018.
| | | | | | | | | | | | | | | | | | | | | | | | | | |
| Contractual Management Rate | | | | | | | |
First
$1 billion | | | Next
$1 billion | | | Next
$3 billion | | | Next
$3 billion | | | Over
$8 billion | | | Effective
Rate | | | Effective Net
Management Rate^ | |
| | 0.79% | | | | 0.71 | % | | | 0.68 | % | | | 0.66 | % | | | 0.65 | % | | | 0.79 | % | | | 0.55 | %* |
| ^ | Effective Net Management Rate includes the impact of management fee waivers of affiliated Underlying Funds, if any. |
| * | GSAM agreed to waive a portion of its management fee in order to achieve a net management rate, as defined in the Fund’s most recent prospectus. This waiver will be effective through at least April 30, 2019, and prior to such date GSAM may not terminate the arrangement without approval of the Trustees. For the fiscal year ended December 31, 2018, GSAM waived $495,564 of its management fee. |
The Fund invests in Institutional Shares of the Goldman Sachs Financial Square Government, Goldman Sachs Financial Square Treasury Obligations, and Goldman Sachs Financial Square Treasury Solutions Funds, which are affiliated Underlying Funds. GSAM has agreed to waive a portion of its management fee payable by the Fund in an amount equal to the management fee it earns as an investment adviser to the affiliated Underlying Funds in which the Fund invests, except those management fees it earns from the Fund’s investments of cash collateral received in connection with securities lending transactions in the Goldman Sachs Financial Square Government, Goldman Sachs Financial Square Treasury Obligations, and Goldman Sachs Financial Square Treasury Solutions Funds. For the fiscal year ended December 31, 2018, GSAM waived $513,308 of the Fund’s management fee.
B. Distribution and Service(12b-1) Plan —The Trust, on behalf of Service Shares of the Fund, has adopted a Distribution and Service Plan subject to Rule12b-1 under the Act. Under the Distribution and Service Plan, Goldman Sachs, which serves as distributor, is entitled to a fee accrued daily and paid monthly, for distribution services and personal and account maintenance services, which may then be paid by Goldman Sachs to authorized dealers, equal to, on an annual basis, 0.25% of the Fund’s average daily net assets attributable to Service Shares.
19
GOLDMAN SACHS VARIABLE INSURANCE TRUST GLOBAL TRENDS ALLOCATION FUND
Notes to Financial Statements(continued)
December 31, 2018
5. AGREEMENTS AND AFFILIATED TRANSACTIONS (continued)
C. Transfer Agency Agreement —Goldman Sachs also serves as the transfer agent of the Fund for a fee pursuant to the Transfer Agency Agreement. The fees charged for such transfer agency services are accrued daily and paid monthly at an annual rate of 0.02% of the average daily net assets of Institutional and Service Shares.
D. Other Expense Agreements and Affiliated Transactions —GSAM has agreed to limit certain “Other Expenses” of the Fund (excluding acquired fund fees and expenses, transfer agency fees and expenses, service fees and shareholder administration fees (as applicable), taxes, interest, brokerage fees, expenses of shareholder meetings, litigation and indemnification, and extraordinary expenses) to the extent such expenses exceed, on an annual basis, a percentage rate of the average daily net assets of the Fund. Such Other Expense reimbursements, if any, are accrued daily and paid monthly. In addition, the Fund is not obligated to reimburse GSAM for prior fiscal year expense reimbursements, if any. The Other Expense limitation as an annual percentage rate of average daily net assets for the Fund is 0.004%. The Other Expense limitation will remain in place through at least April 30, 2019, and prior to such date GSAM may not terminate the arrangement without the approval of the Trustees. In addition, the Fund has entered into certain offset arrangements with the custodian and the transfer agent, which may result in a reduction of the Fund’s expenses and are received irrespective of the application of the “Other Expense” limitation described above.
For the fiscal year ended December 31, 2018, these expense reductions, including any fee waivers and Other Expense reimbursements, were as follows:
| | | | | | | | | | | | | | |
Management Fee
Waiver | | | Custody Fee
Credits | | | Other Expense
Reimbursement | | | Total Expense
Reductions | |
| | | |
| | $1,008,872 | | | $ | 23,047 | | | $ | 195,181 | | | $ | 1,227,100 | |
E. Line of Credit Facility —As of December 31, 2018, the Fund participated in a $770,000,000 committed, unsecured revolving line of credit facility (the “facility”) together with other funds of the Trust and certain registered investment companies having management agreements with GSAM or its affiliates. This facility is to be used for temporary emergency purposes, or to allow for an orderly liquidation of securities to meet redemption requests. The interest rate on borrowings is based on the federal funds rate. The facility also requires a fee to be paid by the Fund based on the amount of the commitment that has not been utilized. For the fiscal year ended December 31, 2018, the Fund did not have any borrowings under the facility.
F. Other Transactions with Affiliates —The following table provides information about the Fund’s investments in the Goldman Sachs Financial Square Government, Goldman Sachs Financial Square Treasury Obligations, and Goldman Sachs Financial Square Treasury Solutions Funds as of and for the fiscal year ended December 31, 2018:
| | | | | | | | | | | | | | | | | | | | | | | | |
| Investment Companies | | Beginning
Value as of
December 31, 2017 | | | Purchases
at Cost | | | Proceeds
from Sales | | | Ending
Value as of
December 31, 2018 | | | Shares as of
December 31, 2018 | | | Dividend
Income | |
Goldman Sachs Financial Square Government Fund | | $ | 122,370,204 | | | $ | 59,786,246 | | | $ | (63,051,862 | ) | | $ | 119,104,588 | | | | 119,104,588 | | | $ | 2,144,905 | |
Goldman Sachs Financial Square Treasury Obligations Fund | | | 50,802,535 | | | | 1,377,262 | | | | — | | | | 52,179,797 | | | | 52,179,797 | | | | 888,397 | |
Goldman Sachs Financial Square Treasury Solutions Fund | | | 50,802,535 | | | | 1,377,262 | | | | — | | | | 52,179,797 | | | | 52,179,797 | | | | 878,337 | |
| | | | | | |
| Total | | $ | 223,975,274 | | | $ | 62,540,770 | | | $ | (63,051,862 | ) | | $ | 223,464,182 | | | | 223,464,182 | | | $ | 3,911,639 | |
As of December 31, 2018, The Goldman Sachs Group, Inc. was the beneficial owner of approximately 12% of the Institutional Shares of the Fund.
20
GOLDMAN SACHS VARIABLE INSURANCE TRUST GLOBAL TRENDS ALLOCATION FUND
6. PORTFOLIO SECURITIES TRANSACTIONS
The cost of purchases and proceeds from sales and maturities of long-term securities for the fiscal year ended December 31, 2018, were $68,252,836 and $152,561,616, respectively.
7. TAX INFORMATION
The tax character of distributions paid during the fiscal years ended December 31, 2017 and December 31, 2018 was as follows:
| | | | | | | | |
| | | 2017 | | | 2018 | |
| Distributions paid from: | | | | | | | | |
Ordinary income | | $ | 4,343,505 | | | $ | 7,135,108 | |
Net long-term capital gains | | | 6,911,452 | | | | 1,957,478 | |
| Total taxable distributions | | $ | 11,254,957 | | | $ | 9,092,586 | |
As of December 31, 2018, the components of accumulated earnings (losses) on atax-basis were as follows:
| | | | |
| Undistributed ordinary income — net | | $ | 3,104,633 | |
| Timing differences (Post October Loss Deferral) | | | (2,279,017 | ) |
| Unrealized gains — net | | | 5,283,860 | |
| Total accumulated earnings — net | | $ | 6,109,476 | |
As of December 31, 2018, the Fund’s aggregate security unrealized gains and losses based on cost for U.S. federal income tax purposes were as follows:
| | | | |
| Tax cost | | $ | 271,309,340 | |
| Gross unrealized gain | | | 11,436,391 | |
| Gross unrealized loss | | | (6,152,531 | ) |
| Net unrealized gain | | $ | 5,283,860 | |
The difference between GAAP-basis andtax-basis unrealized gains (losses) is attributable primarily to wash sales and net mark to market gains (losses) on regulated futures contracts.
GSAM has reviewed the Fund’s tax positions for all open tax years (the current and prior three years, as applicable) and has concluded that no provision for income tax is required in the Fund’s financial statements. Such open tax years remain subject to examination and adjustment by tax authorities.
8. OTHER RISKS
The Fund’s risks include, but are not limited to, the following:
Derivatives Risk —The Fund’s use of derivatives may result in loss. Derivative instruments, which may pose risks in addition to and greater than those associated with investing directly in securities, currencies or other instruments, may be illiquid or less liquid, volatile, difficult to price and leveraged so that small changes in the value of the underlying instruments may produce disproportionate losses to the Fund. Derivatives are also subject to counterparty risk, which is the risk that the other party in the transaction will not fulfill its contractual obligation. The use of derivatives is a highly specialized activity that involves investment techniques and risks different from those associated with investments in more traditional securities and instruments. Losses from
21
GOLDMAN SACHS VARIABLE INSURANCE TRUST GLOBAL TRENDS ALLOCATION FUND
Notes to Financial Statements(continued)
December 31, 2018
8. OTHER RISKS (continued)
derivatives can also result from a lack of correlation between changes in the value of derivative instruments and the portfolio assets (if any) being hedged.
Foreign and Emerging Countries Risk —Investing in foreign markets may involve special risks and considerations not typically associated with investing in the U.S. Foreign securities may be subject to risk of loss because of more or less foreign government regulation, less public information and less economic, political and social stability in the countries in which the Fund invests. The imposition of exchange controls (including repatriation restrictions), confiscations, trade restrictions (including tariffs) and other government restrictions by the U.S. or other governments, or from problems in share registration, settlement or custody, may also result in losses. Foreign risk also involves the risk of negative foreign currency rate fluctuations, which may cause the value of securities denominated in such foreign currency (or other instruments through which the Fund has exposure to foreign currencies) to decline in value. Currency exchange rates may fluctuate significantly over short periods of time. To the extent that the Fund also invests in securities of issuers located in emerging markets, these risks may be more pronounced.
Foreign Custody Risk —If the Fund invests in foreign securities, the Fund may hold such securities and cash with foreign banks, agents, and securities depositories appointed by the Fund’s custodian (each a “Foreign Custodian”). Some foreign custodians may be recently organized or new to the foreign custody business. In some countries, Foreign Custodians may be subject to little or no regulatory oversight over, or independent evaluation of, their operations. Further, the laws of certain countries may place limitations on the Fund’s ability to recover its assets if a Foreign Custodian enters bankruptcy. Investments in emerging markets may be subject to even greater custody risks than investments in more developed markets. Custody services in emerging market countries are very often undeveloped and may be considerably less well regulated than in more developed countries, and thus may not afford the same level of investor protection as would apply in developed countries.
Interest Rate Risk —When interest rates increase, fixed income securities or instruments held by the Fund will generally decline in value. Long-term fixed income securities or instruments will normally have more price volatility because of this risk than short-term fixed income securities or instruments. The risks associated with changing interest rates may have unpredictable effects on the markets and the Fund’s investments. Fluctuations in interest rates may also affect the liquidity of fixed income securities and instruments held by the Fund.
Investments in Other Investment Companies Risk —As a shareholder of another investment company, including an ETF, the Fund will indirectly bear its proportionate share of any net management fees and other expenses paid by such other investment companies, in addition to the fees and expenses regularly borne by the Fund. ETFs are subject to risks that do not apply to conventional mutual funds, including but not limited to the following: (i) the market price of the ETF’s shares may trade at a premium or a discount to their NAV; and (ii) an active trading market for an ETF’s shares may not develop or be maintained.
Large Shareholder Transactions Risk —The Fund may experience adverse effects when certain large shareholders, such as other funds, participating insurance companies, accounts and Goldman Sachs affiliates, purchase or redeem large amounts of shares of the Fund. Such large shareholder redemptions, which may occur rapidly or unexpectedly, may cause the Fund to sell portfolio securities at times when it would not otherwise do so, which may negatively impact the Fund’s NAV and liquidity. These transactions may also accelerate the realization of taxable income to shareholders if such sales of investments resulted in gains, and may also increase transaction costs. In addition, a large redemption could result in the Fund’s current expenses being allocated over a smaller asset base, leading to an increase in the Fund’s expense ratio. Similarly, large Fund share purchases may adversely affect the Fund’s performance to the extent that the Fund is delayed in investing new cash or otherwise maintains a larger cash position than it ordinarily would.
Liquidity Risk —The Fund may make investments that are illiquid or that may become less liquid in response to market developments or adverse investor perceptions. Illiquid investments may be more difficult to value. Liquidity risk may also refer to the risk that the Fund will not be able to pay redemption proceeds within the allowable time period or without significant dilution to remaining investors’ interests because of unusual market conditions, an unusually high volume of redemption requests, or other reasons. To meet redemption requests, the Fund may be forced to sell investments at an unfavorable time and/or under unfavorable
22
GOLDMAN SACHS VARIABLE INSURANCE TRUST GLOBAL TRENDS ALLOCATION FUND
8. OTHER RISKS (continued)
conditions. If a Fund is forced to sell securities at an unfavorable time and/or under unfavorable conditions, such sales may adversely affect the Fund’s NAV and dilute remaining investors’ interests. Liquidity risk may be the result of, among other things, the reduced number and capacity of traditional market participants to make a market in fixed income securities or the lack of an active market. The potential for liquidity risk may be magnified by a rising interest rate environment or other circumstances where investor redemptions from fixed income mutual funds may be higher than normal, potentially causing increased supply in the market due to selling activity. These risks may be more pronounced in connection with the Fund’s investments in securities of issuers located in emerging market countries.
Market and Credit Risks —In the normal course of business, the Fund trades financial instruments and enters into financial transactions where risk of potential loss exists due to changes in the market (market risk). Additionally, the Fund may also be exposed to credit risk in the event that an issuer or guarantor fails to perform or that an institution or entity with which the Fund has unsettled or open transactions defaults.
9. INDEMNIFICATIONS
Under the Trust’s organizational documents, its Trustees, officers, employees and agents are indemnified, to the extent permitted by the Act and state law, against certain liabilities that may arise out of performance of their duties to the Fund. Additionally, in the course of business, the Fund enters into contracts that contain a variety of indemnification clauses. The Fund’s maximum exposure under these arrangements is unknown, as this would involve future claims that may be made against the Fund that have not yet occurred. However, GSAM believes the risk of loss under these arrangements to be remote.
10. OTHER MATTERS
In September 2018, the Financial Accounting Standards Board issued Accounting Standards Update (ASU)2018-13 — Fair Value Measurement (Topic 820) Disclosure Framework — Changes to the Disclosure Requirements for Fair Value Measurement. The amendments in the ASU modify fair value measurement disclosures. The amendments are effective for the Fund’s fiscal year beginning after December 15, 2019. GSAM is currently evaluating the impact, if any, of the amendments.
11. SUBSEQUENT EVENTS
Subsequent events after the Statement of Assets and Liabilities date have been evaluated, and GSAM has concluded that there is no impact requiring adjustment or disclosure in the financial statements.
23
GOLDMAN SACHS VARIABLE INSURANCE TRUST GLOBAL TRENDS ALLOCATION FUND
Notes to Financial Statements(continued)
December 31, 2018
12. SUMMARY OF SHARE TRANSACTIONS
Share activity is as follows:
| | | | | | | | | | | | | | | | |
| | | For the Fiscal Year Ended
December 31, 2018 | | | For the Fiscal Year Ended
December 31, 2017 | |
| | | Shares | | | Dollars | | | Shares | | | Dollars | |
| Institutional Shares | | | | | | | | | | | | | | | | |
| Shares sold | | | 18,378 | | | $ | 229,900 | | | | — | | | $ | — | |
| Reinvestment of distributions | | | 535 | | | | 6,273 | | | | 72 | | | | 901 | |
| Shares redeemed | | | (157 | ) | | | (1,900 | ) | | | — | | | | — | |
| | | | 18,756 | | | | 234,273 | | | | 72 | | | | 901 | |
| Service Shares | | | | | | | | | | | | | | | | |
| Shares sold | | | 3,407,784 | | | | 42,420,508 | | | | 3,237,201 | | | | 38,959,444 | |
| Reinvestment of distributions | | | 775,283 | | | | 9,086,313 | | | | 901,767 | | | | 11,254,056 | |
| Shares redeemed | | | (2,858,297 | ) | | | (35,608,460 | ) | | | (2,685,457 | ) | | | (32,234,857 | ) |
| | | | 1,324,770 | | | | 15,898,361 | | | | 1,453,511 | | | | 17,978,643 | |
| | | | |
| NET INCREASE | | | 1,343,526 | | | $ | 16,132,634 | | | | 1,453,583 | | | $ | 17,979,544 | |
24
Report of Independent Registered Public Accounting Firm
To the Board of Trustees of
Goldman Sachs Variable Insurance Trust and Shareholders of Goldman Sachs Global Trends Allocation Fund
Opinion on the Financial Statements
We have audited the accompanying statement of assets and liabilities, including the schedule of investments, of Goldman Sachs Global Trends Allocation Fund (one of the funds constituting Goldman Sachs Variable Insurance Trust, referred to hereafter as the “Fund”) as of December 31, 2018, the related statement of operations for the year ended December 31, 2018, the statements of changes in net assets for each of the two years in the period ended December 31, 2018, including the related notes, and the financial highlights for each of the five years in the period ended December 31, 2018 (collectively referred to as the “financial statements”). In our opinion, the financial statements present fairly, in all material respects, the financial position of the Fund as of December 31, 2018, the results of its operations for the year then ended, the changes in its net assets for each of the two years in the period ended December 31, 2018 and the financial highlights for each of the five years in the period ended December 31, 2018 in conformity with accounting principles generally accepted in the United States of America.
Basis for Opinion
These financial statements are the responsibility of the Fund’s management. Our responsibility is to express an opinion on the Fund’s financial statements based on our audits. We are a public accounting firm registered with the Public Company Accounting Oversight Board (United States) (PCAOB) and are required to be independent with respect to the Fund in accordance with the U.S. federal securities laws and the applicable rules and regulations of the Securities and Exchange Commission and the PCAOB.
We conducted our audits of these financial statements in accordance with the standards of the PCAOB. Those standards require that we plan and perform the audit to obtain reasonable assurance about whether the financial statements are free of material misstatement, whether due to error or fraud.
Our audits included performing procedures to assess the risks of material misstatement of the financial statements, whether due to error or fraud, and performing procedures that respond to those risks. Such procedures included examining, on a test basis, evidence regarding the amounts and disclosures in the financial statements. Our audits also included evaluating the accounting principles used and significant estimates made by management, as well as evaluating the overall presentation of the financial statements. Our procedures included confirmation of securities owned as of December 31, 2018 by correspondence with the custodian, transfer agent and brokers; when replies were not received from brokers, we performed other auditing procedures. We believe that our audits provide a reasonable basis for our opinion.
PricewaterhouseCoopers LLP
Boston, Massachusetts
February 13, 2019
We have served as the auditor of one or more investment companies in the Goldman Sachs fund complex since 2000.
25
GOLDMAN SACHS VARIABLE INSURANCE TRUST GLOBAL TRENDS ALLOCATION FUND
| | |
| Fund Expenses — Six Month Period Ended December 31, 2018 (Unaudited) | | |
As a shareholder of Institutional or Service Shares of the Fund, you incur ongoing costs, including management fees, distribution and/or service(12b-1) fees (with respect to Service Shares) and other Fund expenses. This example is intended to help you understand your ongoing costs (in dollars) of investing in the Institutional Shares and Service Shares of the Fund and to compare these costs with the ongoing costs of investing in other mutual funds.
The example is based on an investment of $1,000 invested at the beginning of the period and held for the entire period from July 1, 2018 through December 31, 2018, which represents a period of 184 days of a 365 day year.
Actual Expenses— The first line under each share class in the table below provides information about actual account values and actual expenses. You may use the information in this line, together with the amount you invested, to estimate the expenses that you paid over the period. Simply divide your account value by $1,000 (for example, an $8,600 account value divided by $1,000=8.6), then multiply the result by the number in the first line under the heading entitled “Expenses Paid” to estimate the expenses you paid on your account during this period.
Hypothetical Example for Comparison Purposes— The second line under each share class in the table below provides information about hypothetical account values and hypothetical expenses based on the Fund’s actual net expense ratio and an assumed rate of return of 5% per year before expenses, which is not the Fund’s actual return. The hypothetical account values and expenses may not be used to estimate the actual ending account balance or expenses you paid for the period. You may use this information to compare the ongoing costs of investing in the Fund and other funds. To do so, compare this 5% hypothetical example with the 5% hypothetical examples that appear in the shareholder reports of the other funds.
Please note that the expenses shown in the table are meant to highlight your ongoing costs only. As a shareholder of the Fund, you do not incur any transaction costs, such as sales charges, redemption fees, or exchange fees, but shareholders of other funds may incur such costs. The second line of the table is useful in comparing ongoing costs only and will not help you determine the relative total costs of owning different funds whose shareholders may incur transaction costs.
| | | | | | | | | | | | |
| Share Class | | Beginning
Account Value
07/01/18 | | | Ending
Account Value
12/31/18 | | | Expenses Paid
for the
6 Months
Ended
12/31/18* | |
| Institutional | | | | | | | | | | | | |
| Actual | | $ | 1,000 | | | $ | 954.60 | | | $ | 2.46 | |
| Hypothetical 5% return | | | 1,000 | | | | 1,022.68 | + | | | 2.55 | |
| Service | | | | | | | | | | | | |
| Actual | | | 1,000 | | | | 953.60 | | | | 4.14 | |
| Hypothetical 5% return | | | 1,000 | | | | 1,020.97 | + | | | 4.28 | |
| | + | Hypothetical expenses are based on the Fund’s actual annualized net expense ratios and an assumed rate of return of 5% per year before expenses. | |
| | * | Expenses are calculated using the Fund’s annualized net expense ratio for each class, which represents the ongoing expenses as a percentage of net assets for the six months ended December 31, 2018. Expenses are calculated by multiplying the annualized net expense ratio by the average account value for the period; then multiplying the result by the number of days in the most recent fiscal half year; and then dividing that result by the number of days in the fiscal year. The annualized net expense ratios for the period were 0.50% and 0.84% for Institutional and Service Shares, respectively. | |
26
GOLDMAN SACHS VARIABLE INSURANCE TRUST GLOBAL TRENDS ALLOCATION FUND
Trustees and Officers (Unaudited)
Independent Trustees
| | | | | | | | | | | | |
| | | | | |
Name,
Address and Age1 | | Position(s) Held with the Trust | | Term of Office and
Length of
Time Served2 | | Principal Occupation(s) During Past 5 Years | | Number of
Portfolios in
Fund Complex
Overseen by
Trustee3 | | | Other Directorships Held by Trustee4 |
Jessica Palmer Age: 69 | | Chair of the Board of Trustees | | Since 2018 (Trustee since 2007) | | Ms. Palmer is retired. She was formerly Director, Emerson Center for the Arts and Culture (2011-2017); and Consultant, Citigroup Human Resources Department (2007-2008); Managing Director, Citigroup Corporate and Investment Banking (previously, Salomon Smith Barney/Salomon Brothers) (1984-2006). Ms. Palmer was a Member of the Board of Trustees of Indian Mountain School (private elementary and secondary school) (2004-2009). Chair of the Board of Trustees — Goldman Sachs Trust and Goldman Sachs Variable Insurance Trust. | | | 103 | | | None |
Kathryn A. Cassidy Age: 64 | | Trustee | | Since 2015 | | Ms. Cassidy is retired. Formerly, she was Advisor to the Chairman (May 2014-December 2014); and Senior Vice President and Treasurer (2008-2014), General Electric Company & General Electric Capital Corporation (technology and financial services companies). Trustee — Goldman Sachs Trust and Goldman Sachs Variable Insurance Trust. | | | 103 | | | None |
Diana M. Daniels Age: 69 | | Trustee | | Since 2007 | | Ms. Daniels is retired. Formerly, she was Vice President, General Counsel and Secretary, The Washington Post Company (1991-2006). Ms. Daniels is a Trustee Emeritus and serves as a Presidential Councillor of Cornell University (2013-Present); former Member of the Legal Advisory Board, New York Stock Exchange (2003-2006) and of the Corporate Advisory Board, Standish Mellon Management Advisors (2006-2007). Trustee — Goldman Sachs Trust and Goldman Sachs Variable Insurance Trust. | | | 103 | | | None |
Herbert J. Markley Age: 68 | | Trustee | | Since 2013 | | Mr. Markley is retired. Formerly, he was Executive Vice President, Deere & Company (an agricultural and construction equipment manufacturer) (2007-2009); and President, Agricultural Division, Deere & Company (2001-2007). Previously, Mr. Markley served as an Advisory Board Member of Goldman Sachs Trust and Goldman Sachs Variable Insurance Trust (June 2013-October 2013). Trustee — Goldman Sachs Trust and Goldman Sachs Variable Insurance Trust. | | | 103 | | | None |
Roy W. Templin Age: 58 | | Trustee | | Since 2013 | | Mr. Templin is retired. He is Director, Armstrong World Industries, Inc. (a designer and manufacturer of ceiling, wall and suspension system solutions) (2016-Present); and was formerly Chairman of the Board of Directors, Con-Way Incorporated (a transportation, logistics and supply chain management service company) (2014-2015); Executive Vice President and Chief Financial Officer, Whirlpool Corporation (an appliance manufacturer and marketer) (2004-2012). Previously, Mr. Templin served as an Advisory Board Member of Goldman Sachs Trust and Goldman Sachs Variable Insurance Trust (June 2013-October 2013). Trustee — Goldman Sachs Trust and Goldman Sachs Variable Insurance Trust. | | | 103 | | | Armstrong World Industries, Inc. (a ceiling, wall and suspension systems solutions manufacturer) |
Gregory G. Weaver Age: 67 | | Trustee | | Since 2015 | | Mr. Weaver is retired. He is Director, Verizon Communications Inc. (2015-Present); and was formerly Chairman and Chief Executive Officer, Deloitte & Touche LLP (a professional services firm) (2001-2005 and 2012-2014); and Member of the Board of Directors, Deloitte & Touche LLP (2006-2012). Trustee — Goldman Sachs Trust and Goldman Sachs Variable Insurance Trust. | | | 103 | | | Verizon Communications Inc. |
| | | | | | | | | | | | |
27
GOLDMAN SACHS VARIABLE INSURANCE TRUST GLOBAL TRENDS ALLOCATION FUND
Trustees and Officers (Unaudited) (continued)
Interested Trustee*
| | | | | | | | | | | | |
| | | | | |
Name,
Address and Age1 | | Position(s) Held with the Trust | | Term of Office and
Length of
Time Served2 | | Principal Occupation(s) During Past 5 Years | | Number of
Portfolios in
Fund Complex
Overseen by
Trustee3 | | | Other Directorships Held by Trustee4 |
James A. McNamara Age: 56 | | President and Trustee | | Since 2007 | | Advisory Director, Goldman Sachs (January 2018-Present); Managing Director, Goldman Sachs (January 2000-December 2017); Director of Institutional Fund Sales, GSAM (April 1998-December 2000); and Senior Vice President and Manager, Dreyfus Institutional Service Corporation (January 1993- April 1998). President and Trustee — Goldman Sachs Trust; Goldman Sachs Variable Insurance Trust; Goldman Sachs Trust II; Goldman Sachs MLP Income Opportunities Fund; Goldman Sachs MLP and Energy Renaissance Fund; Goldman Sachs ETF Trust; Goldman Sachs Private Markets Fund 2018 LLC; Goldman Sachs Private Markets Fund 2018 (A) LLC; and Goldman Sachs Private Markets Fund 2018 (B) LLC. | | | 156 | | | None |
| | | | | | | | | | | | |
| * | Mr. McNamara is considered to be an “Interested Trustee” because he holds positions with Goldman Sachs and owns securities issued by The Goldman Sachs Group, Inc. Mr. McNamara holds comparable positions with certain other companies of which Goldman Sachs, GSAM or an affiliate thereof is the investment adviser, administrator and/or distributor. |
| 1 | Each Trustee may be contacted by writing to the Trustee, c/o Goldman Sachs, 200 West Street, New York, New York, 10282, Attn: Caroline Kraus. Information is provided as of December 31, 2018. |
| 2 | Subject to such policies as may be adopted by the Board from time-to-time, each Trustee holds office for an indefinite term, until the earliest of: (a) the election of his or her successor; (b) the date the Trustee resigns or is removed by the Board or shareholders, in accordance with the Trust’s Declaration of Trust; or (c) the termination of the Trust. The Board has adopted policies which provide that (a) no Trustee shall hold office for more than 15 years and (b) a Trustee shall retire as of December 31st of the calendar year in which he or she reaches his or her 74th birthday, unless a waiver of such requirement shall have been adopted by a majority of the other Trustees. These policies may be changed by the Trustees without shareholder vote. |
| 3 | The Goldman Sachs Fund Complex includes certain other companies listed above for each respective Trustee. As of December 31, 2018, Goldman Sachs Trust consisted of 90 portfolios (88 of which offered shares to the public); Goldman Sachs Variable Insurance Trust consisted of 13 portfolios; Goldman Sachs Trust II consisted of 19 portfolios (17 of which offered shares to the public); Goldman Sachs MLP Income Opportunities Fund, Goldman Sachs MLP and Energy Renaissance Fund, Goldman Sachs Private Markets Fund 2018 LLC, Goldman Sachs Private Markets Fund 2018 (A) LLC and Goldman Sachs Private Markets Fund 2018 (B) LLC each consisted of one portfolio; and Goldman Sachs ETF Trust consisted of 29 portfolios (14 of which offered shares to the public). |
| 4 | This column includes only directorships of companies required to report to the Securities and Exchange Commission under the Securities Exchange Act of 1934 (i.e., “public companies”) or other investment companies registered under the Act. |
Additional information about the Trustees is available in the Fund’s Statement of Additional Information, which can be obtained from Goldman Sachs free of charge by calling this toll-free number (in the United States of America): 1-800-526-7384.
28
GOLDMAN SACHS VARIABLE INSURANCE TRUST GLOBAL TRENDS ALLOCATION FUND
Trustees and Officers (Unaudited) (continued)
Officers of the Trust*
| | | | | | |
| | | |
| Name, Address and Age1 | | Position(s) Held with the Trust | | Term of
Office and
Length of
Time Served2 | | Principal Occupation(s) During Past 5 Years |
James A. McNamara 200 West Street New York, NY 10282 Age: 56 | | Trustee and President | | Since 2007 | | Advisory Director, Goldman Sachs (January 2018-Present); Managing Director, Goldman Sachs (January 2000-December 2017); Director of Institutional Fund Sales, GSAM (April 1998-December 2000); and Senior Vice President and Manager, Dreyfus Institutional Service Corporation (January 1993-April 1998). President and Trustee — Goldman Sachs Trust; Goldman Sachs Variable Insurance Trust; Goldman Sachs Trust II; Goldman Sachs MLP Income Opportunities Fund; Goldman Sachs MLP and Energy Renaissance Fund; Goldman Sachs ETF Trust; Goldman Sachs Private Markets Fund 2018 LLC; Goldman Sachs Private Markets Fund 2018 (A) LLC; and Goldman Sachs Private Markets Fund 2018 (B) LLC. |
Caroline L. Kraus 200 West Street New York, NY 10282 Age: 41 | | Secretary | | Since 2012 | | Managing Director, Goldman Sachs (January 2016-Present); Vice President, Goldman Sachs (August 2006-December 2015); Associate General Counsel, Goldman Sachs (2012-Present); Assistant General Counsel, Goldman Sachs (August 2006-December 2011); and Associate, Weil, Gotshal & Manges, LLP (2002-2006). Secretary — Goldman Sachs Trust (previously Assistant Secretary (2012)); Goldman Sachs Variable Insurance Trust (previously Assistant Secretary (2012)); Goldman Sachs Trust II; Goldman Sachs BDC, Inc.; Goldman Sachs Private Middle Market Credit LLC; Goldman Sachs Middle Market Lending Corp.; Goldman Sachs MLP Income Opportunities Fund; Goldman Sachs MLP and Energy Renaissance Fund; Goldman Sachs ETF Trust; Goldman Sachs Private Markets Fund 2018 LLC; Goldman Sachs Private Markets Fund 2018 (A) LLC; and Goldman Sachs Private Markets Fund 2018 (B) LLC. |
Scott M. McHugh 200 West Street New York, NY 10282 Age: 47 | | Treasurer, Senior Vice President and Principal Financial Officer | | Since 2009 (Principal Financial Officer since 2013) | | Managing Director, Goldman Sachs (January 2016-Present); Vice President, Goldman Sachs (February 2007-December 2015); Assistant Treasurer of certain mutual funds administered by DWS Scudder (2005-2007); and Director (2005-2007), Vice President (2000-2005), and Assistant Vice President (1998-2000), Deutsche Asset Management or its predecessor (1998-2007). Treasurer, Senior Vice President and Principal Financial Officer — Goldman Sachs Trust; Goldman Sachs Variable Insurance Trust; Goldman Sachs Trust II; Goldman Sachs MLP Income Opportunities Fund; Goldman Sachs MLP and Energy Renaissance Fund; Goldman Sachs ETF Trust; Goldman Sachs Private Markets Fund 2018 LLC; Goldman Sachs Private Markets Fund 2018 (A) LLC; and Goldman Sachs Private Markets Fund 2018 (B) LLC. |
Joseph F. DiMaria 30 Hudson Street Jersey City, NJ 07302 Age: 50 | | Assistant Treasurer and Principal Accounting Officer | | Since 2016 (Principal Accounting Officer since 2017) | | Managing Director, Goldman Sachs (November 2015-Present) and Vice President — Mutual Fund Administration, Columbia Management Investment Advisers, LLC (May 2010-October 2015). Assistant Treasurer and Principal Accounting Officer — Goldman Sachs Trust; Goldman Sachs Variable Insurance Trust; Goldman Sachs Trust II; Goldman Sachs MLP Income Opportunities Fund; Goldman Sachs MLP and Energy Renaissance Fund; Goldman Sachs ETF Trust; Goldman Sachs Private Markets Fund 2018 LLC; Goldman Sachs Private Markets Fund 2018 (A) LLC; and Goldman Sachs Private Markets Fund 2018 (B) LLC. |
| | | | | | |
| * | Represents a partial list of officers of the Trust. Additional information about all the officers is available in the Fund’s Statement of Additional Information, which can be obtained from Goldman Sachs free of charge by calling this toll-free number (in the United States): 1-800-526-7384. |
| 1 | Information is provided as of December 31, 2018. |
| 2 | Officers hold office at the pleasure of the Board of Trustees or until their successors are duly elected and qualified. Each officer holds comparable positions with certain other companies of which Goldman Sachs, GSAM or an affiliate thereof is the investment adviser, administrator and/or distributor. |
Goldman Sachs Variable Insurance Trust — Tax Information (Unaudited)
For the year ended December 31, 2018, 24.99% of the dividends paid from net investment company taxable income by the Global Trends Allocation Fund qualify for the dividends received deduction available to corporations.
Pursuant to Section 852 of the Internal Revenue Code, the Global Trends Allocation Fund designates $1,957,478 or, if different, the maximum amount allowable, as capital gain dividends paid during the fiscal year ended December 31, 2018.
29
| | |
| TRUSTEES | | OFFICERS |
| Jessica Palmer,Chair | | James A. McNamara,President |
| Kathryn A. Cassidy | | Scott M. McHugh, Treasurer, Senior Vice |
| Diana M. Daniels | | President and Principal Financial Officer |
| Herbert J. Markley | | Joseph F. DiMaria,Assistant Treasurer and Principal Accounting Officer Caroline L. Kraus,Secretary |
| James A. McNamara |
| Roy W. Templin |
| Gregory G. Weaver | | |
GOLDMAN SACHS & CO. LLC
Distributor and Transfer Agent
GOLDMAN SACHS ASSET MANAGEMENT, L.P.
Investment Adviser
200 West Street, New York
New York 10282
Visit our web site at www.GSAMFUNDS.com to obtain the most recentmonth-end returns.
The reports concerning the Fund included in this shareholder report may contain certain forward-looking statements about the factors that may affect the performance of the Fund in the future. These statements are based on Fund management’s predictions and expectations concerning certain future events and their expected impact on the Fund, such as performance of the economy as a whole and of specific industry sectors, changes in the levels of interest rates, the impact of developing world events, and other factors that may influence the future performance of the Fund. Management believes these forward-looking statements to be reasonable, although they are inherently uncertain and difficult to predict. Actual events may cause adjustments in portfolio management strategies from those currently expected to be employed.
A description of the policies and procedures that the Fund uses to determine how to vote proxies relating to portfolio securities and information regarding how the Fund voted proxies relating to portfolio securities for the12-month period ended December 31 is available (i) without charge, upon request by calling1-800-621-2550; and (ii) on the Securities and Exchange Commission (“SEC”) web site athttp://www.sec.gov.
The Fund files its complete schedule of portfolio holdings with the SEC for the first and third quarters of each fiscal year onForm N-Q. The Fund’sForms N-Q are available on the SEC’s web site at http://www.sec.gov within 60 days after the Fund’s first and third fiscal quarters.Forms N-Q may be obtained upon request and without charge by calling1-800-621-2550.
Views and opinions expressed are for informational purposes only and do not constitute a recommendation by GSAM to buy, sell, or hold any security. Views and opinions are current as of the date of this presentation and may be subject to change, they should not be construed as investment advice.
Goldman Sachs & Co. LLC (“Goldman Sachs”) does not provide legal, tax or accounting advice. Any statement contained in this communication (including any attachments) concerning U.S. tax matters was not intended or written to be used, and cannot be used, for the purpose of avoiding penalties under the Internal Revenue Code, and was written to support the promotion or marketing of transaction or matter addressed. Clients of Goldman Sachs should obtain their own independent tax advice based on their particular circumstances.
The website links provided are for your convenience only and are not an endorsement or recommendation by GSAM of any of these websites or the products or services offered. GSAM is not responsible for the accuracy and validity of the content of these websites.
Fund holdings and allocations shown are as of December 31, 2018 and may not be representative of future investments. Fund holdings should not be relied on in making investment decisions and should not be construed as research or investment advice regarding particular securities. Current and future holdings are subject to risk.
References to indices, benchmarks or other measures of relative market performance over a specified period of time are provided for your information only and do not imply that the portfolio will achieve similar results. The index composition may not reflect the manner in which a portfolio is constructed. While an adviser seeks to design a portfolio which reflects appropriate risk and return features, portfolio characteristics may deviate from those of the benchmark.
The portfolio risk management process includes an effort to monitor and manage risk, but does not imply low risk.
Shares of the Goldman Sachs VIT Funds are offered to separate accounts of participating life insurance companies for the purpose of funding variable annuity contracts and variable life insurance policies. Shares of the Fund are not offered directly to the general public. The variable annuity contracts and variable life insurance policies are described in the separate prospectuses issued by participating insurance companies. You should refer to those prospectuses for information about surrender charges, mortality and expense risk fees and other charges that may be assessed by participating insurance companies under the variable annuity contracts or variable life insurance policies. Such fees or charges, if any, may affect the return you may realize with respect to your investments. Ask your representative for more complete information. Please consider a fund’s objectives, risks and charges and expenses, and read the prospectus carefully before investing. The prospectus contains this and other information about the Fund.
This material is not authorized for distribution to prospective investors unless preceded or accompanied by a current prospectus or summary prospectus, if applicable. Investors should consider the Fund’s objective, risks, and charges and expenses, and read the summary prospectus, if available, and/or the prospectus carefully before investing or sending money. The summary prospectus, if available, and the prospectus contain this and other information about the Fund and may be obtained from your authorized dealer or from Goldman Sachs & Co. LLC by calling1-800-621-2550.
This report is prepared for the general information of contract owners and is not an offer of shares of the Goldman Sachs Variable Insurance Trust — Goldman Sachs Global Trends Allocation Fund.
© 2019 Goldman Sachs. All rights reserved.
VITNAVAR-19/157034-OTU-02/2019/11.5k
Goldman
SachsVariable Insurance Trust
Goldman Sachs
Large Cap Value Fund
Annual Report
December 31, 2018

GOLDMAN SACHS VARIABLE INSURANCE TRUST LARGE CAP VALUE FUND
INVESTMENT OBJECTIVE
The Fund seeks long-term capital appreciation.
Portfolio Management Discussion and Analysis
Below, the Goldman Sachs Value Portfolio Management Team discusses the Goldman Sachs Variable Insurance Trust — Goldman Sachs Large Cap Value Fund’s (the “Fund”) performance and positioning for the12-month period ended December 31, 2018 (the “Reporting Period”).
How did the Fund perform during the Reporting Period?
During the Reporting Period, the Fund’s Institutional and Service Shares generated average annual total returns of –8.46% and –8.72%, respectively. These returns compare to the –8.27% average annual total return of the Fund’s benchmark, the Russell 1000® Value Index (with dividends reinvested) (the “Russell Index”) during the same time period.
What economic and market factors most influenced the equity markets as a whole during the Reporting Period?
Representing the U.S. equity market, the S&P 500® Index returned –9.03% in December 2018, posting its worst December since 1931 and bringing its total return to –4.38% for the Reporting Period, the worst calendar year since 2008.
Despite a strong start to the Reporting Period in January 2018 amid solid economic data, a $1.5 trillion tax reform law signed in December 2017, and a favorable corporate earnings season, U.S. equities endured a challenging and volatile year in 2018. In February 2018, U.S. and international equities sold off on market speculation of a faster pace of Federal Reserve (“Fed”) short-term interest rate hikes, which stoked a sharp rise in bond yields and an increase in equity market volatility. Concerns about Fed monetary policy tightening were further exacerbated by solid U.S. labor and inflation data. While the hawkish Fed minutes were largely expected, new Fed Chair Jerome Powell’s Congressional testimony, positing a more optimistic economic outlook since the December 2017 Fed meeting, surprised equity markets with its hawkish tilt, sparking anothersell-off in the U.S. equity markets. (Jerome Powell assumed the chairmanship of the Fed in February 2018. Hawkish language tends to suggest higher interest rates; opposite of dovish.) In March 2018, escalating trade tensions and potential tariffs weighed on investor sentiment. Meanwhile, the Fed delivered on a widely expected interest rate increase, with its “dot plot” pointing to a total of three interest rate hikes this calendar year and potentially two in 2019. (The “dot plot” shows rate projections of the members of the Fed’s Open Market Committee.) However, Fed policymakers acknowledged that the “economic outlook has strengthened in recent months,” revising their economic growth forecast higher and their unemployment forecast lower.
By the end of the Reporting Period, the Fed had hiked interest rates four times and communicated an upbeat view of its economic outlook, spurred by strong U.S. labor and inflation data. Against the strong fundamentals, escalating trade tensions, fears of a global economic slowdown and populist politics weighed on investor sentiment throughout the calendar year. After second and third calendar quarters of generally solid gains, supported by a combination of robust economic growth, strong corporate profits and rising earnings estimates, U.S. equities fell sharply again in the fourth quarter of 2018, as investor sentiment rapidly deteriorated on heightened trade and political uncertainty and in a delayed response to an earliersell-off in global rates. The correction resulted in tighter U.S. financial conditions, which had been resilient to Fed interest rate hikes earlier in the year. U.S. equities saw a reprieve in November 2018 on more accommodative comments from Fed Chair Powell and on encouraging progress towardChina-U.S. trade talks. However, the recovery was short-lived, as U.S. equities plunged in December 2018 on renewed investor fears sparked by the arrest of a Chinese technology executive, the partial Federal government shutdown and the U.S. President’s criticism of Fed Chair Powell.
For the Reporting Period overall, seven sectors posted negative absolute returns and four generated positive returns. Health care, utilities, consumer discretionary and information technology were the best performing sectors in the S&P 500® Index, as measured by total return, and the weakest performing sectors in the S&P 500® Index during the Reporting Period were energy, materials, industrials and financials.(After the close of business on September 28, 2018, the telecommunications services sector was renamed the communication services sector and was broadened to include certain companies from the information technology and consumer discretionary sectors that facilitate communication and offer related content and information through various media.)
Within the U.S. equity market, there was significant disparity in performance not only among sectors but also among the various capitalization and style segments. While all capitalization segments posted negative returns,large-cap stocks, as measured by the
1
GOLDMAN SACHS VARIABLE INSURANCE TRUST LARGE CAP VALUE FUND
Russell 1000® Index, performed best, followed at some distance bymid-cap stocks, as measured by the Russell Midcap® Index, and thensmall-cap stocks, as measured by the Russell 2000® Index. From a style perspective, growth-oriented stocks significantly outpaced value-oriented stocks across the capitalization spectrum. (All as measured by the FTSE Russell indices.)
What key factors were responsible for the Fund’s performance during the Reporting Period?
The Fund posted negative absolute returns that modestly underperformed the Russell Index during the Reporting Period due primarily to stock selection overall. Sector allocation as a whole contributed positively to the Fund’s performance relative to the Russell Index during the Reporting Period.
Which equity market sectors most significantly affected Fund performance?
Stock selection in the consumer discretionary, energy and financials sectors detracted most from the Fund’s relative results. Only partially offsetting these detractors was stock selection in the information technology, industrials and utilities sectors, which contributed positively. Having an overweighted allocation to the information technology sector, which outpaced the Russell Index during the Reporting Period, and having shifted from an underweighted allocation to a modestly overweighted allocation to utilities, which was also among the strongest sectors in the Russell Index during the Reporting Period, helped as well.
Which stocks detracted significantly from the Fund’s performance during the Reporting Period?
Among those companies detracting most from the Fund’s results relative to the Russell Index were positions in Delphi Technologies, Bank OZK and Devon Energy.
Delphi Technologies, a developer, designer and manufacturer of integrated powertrain technologies, was a new purchase for the Fund during the Reporting Period. Some of the stock’s weak performance was partially driven by investors’ response to the announcement of its Chief Executive Officer’s departure in early October 2018. Headwinds from a third quarter 2018 earnings report that showed decreasing organic growth, weaker than market expected earnings per share and lower guidance also hurt the stock’s performance during the Reporting Period. Overall, given its recent drawdown, at the end of the Reporting Period, we believed Delphi Technologies’ risk/reward outlook was appealing and felt its stock could be a beneficiary of stimulus in China.
Bank OZK, a regional bank, was a new purchase for the Fund during the Reporting Period. Its weak performance began in July 2018 when it announced disappointing second quarter 2018 earnings results. While its earnings per share were in line with market expectations, slower loan growth and net interest margins were below consensus expectations. The majority of Bank OZK’s share price decline, however, came on a single day in October 2018 upon the announcement that the bank had two large delinquent loans — one residential and one commercial. This challenged our confidence in its management team, and we sold the position, believing the incident would be a long-term headwind to its stock price.
Devon Energy is a natural gas, natural gas liquids and petroleum exploration company. The majority of its stock’s poor performance occurred in February 2018 after the company reported weak fourth quarter 2017 earnings, primarily driven by missed production expectations and disappointing 2018 guidance. While we continued to believe the value of the company’s large North American asset base was not fully recognized at the stock’s then-current price, we decided to exit the Fund’s position in favor of what we considered to be more compelling risk-adjusted opportunities elsewhere.
What were some of the Fund’s best-performing individual stocks?
Relative to the Russell Index, the Fund benefited most from positions in Eli Lilly, Microsoft and Red Hat.
Eli Lilly, a pharmaceutical company, was a new purchase for the Fund during the Reporting Period. Its stock rallied in July 2018 after the company reported exceptionally strong second quarter 2018 results and announced its spinoff of Elanco, the company’s animal health business. The company beat investor expectations on both earnings per share and revenues while also raising its full year guidance. Its results were driven by broad-based strength across all of its major products. Eli Lilly’s stock rose again through most of November 2018 when the company reported solid quarterly results in which it beat earnings per share and revenue market expectations and also raised its guidance again for the full year. Then, in December 2018, Eli Lilly shares benefited from the announcement of better than market expected 2019 guidance, featuring significant improvements in revenue growth and long-term sales growth. At the end of the Reporting Period, we maintained our belief that the company had strong risk/reward prospects versus its peers, and we saw an upside to its diabetes franchise. We were also optimistic about its management’s commitment to creating shareholder value through increased dividends and share repurchases. Additionally, we viewed the company’s upcoming split with Elanco as value accretive. Overall, we viewed Eli Lilly at the end of the Reporting Period as a high quality pharmaceutical business with leading franchises, a robust drug pipeline and an improving financial profile.
2
GOLDMAN SACHS VARIABLE INSURANCE TRUST LARGE CAP VALUE FUND
Software giant Microsoft engages in the design, manufacture and sale of computer products and technologies. Its stock rose in April 2018, after the company reported strong fiscal third quarter results and fiscal fourth quarter guidance, driven by solid growth in its commercial cloud business. Its stock rose again in May 2018, after Microsoft secured a multi-million dollar cloud deal with the Pentagon in which the 17 intelligence agencies and offices will utilize Microsoft’s Azure Government, a cloud service tailored for federal and local governments, in addition to other products the company already offers. Its shares continued to appreciate as the company reassured investors that cloud traction remains healthy. At the end of the Reporting Period, we remained confident the company was executing well in its ongoing emphasis on becoming a leader in cloud computing, effectively migrating its customer base and expanding its addressable market. The company’s recent reorganization, including the reallocation of Windows’ resources to the cloud franchise, has, in our opinion, reinforced Microsoft’s commitment to the cloud and initiatives to further drive growth. At the end of the Reporting Period, we believed its growth may accelerate over the next several years, driving multiple expansion and rewarding shareholders. Additionally, we believed Microsoft was trading at an attractive valuation with strong yield support at the end of the Reporting Period.
Red Hat, a software solutions company serving the enterprise community, was a new purchase for the Fund during the Reporting Period. Its shares soared in late October 2018 after IBM announced an offer to acquire Red Hat for a significant premium to its market price. This acquisition was in line with our thesis of consolidation within the software industry. We also believe the company has impressive growth prospects, led mostly by new business, and has solid sales capacity through its partnerships with cloud providers.
How did the Fund use derivatives and similar instruments during the Reporting Period?
During the reporting period, we did not use derivatives.
Did the Fund make any significant purchases or sales during the Reporting Period?
During the Reporting Period, in addition to those purchases already mentioned, we initiated a Fund position in Berkshire Hathaway, a multinational conglomerate holding company. We purchased the stock due to what we saw as the company’s collection of high quality businesses and its management team’s proven track record of successful capital allocation. Additionally, we are constructive on what we consider to be the company’s strong balance sheet, which provides the ability, in our view, to deploy excess cash toward value-enhancing acquisitions.
We established a Fund position in Verizon Communications. We are confident in the company’s strength in the wireless services segment. We also are positive on the company’s long-term prospects given what we consider to be its attractive valuation and our constructive view on the wireless spectrum space. Furthermore, we are encouraged by Verizon Communications’ recent 5G (fifth generation) trials, which have showcased its ability to successfully deploy wireless broadband in major test cities, providing an avenue for solid revenue growth potential going forward.
Conversely, in addition to those sales already mentioned, we eliminated the Fund’s position in Lowe’s Companies, a company that engages in the retail sale of home improvement products. We had originally purchased the stock due to what we saw as its attractive valuation and our belief it would be a direct beneficiary of the growing trends associated with the housing and home improvement industry. We elected to sell the stock in April 2018 due to our decreased confidence in the company’s execution as well as on near-term trends associated with more challenging weather conditions as presented in the company’s first quarter 2018 results.
We exited the Fund’s position in Citizens Financial Group, a regional bank that services both consumer and commercial clients through loans, deposit products and other financial services. Its stock performed well in January 2018 after the bank reported strong fourth quarter 2017 earnings, which included a $317 millionafter-tax benefit from an adjustment to its deferred tax liability, a direct result of the tax legislation passed in December 2017. While we remain confident in parts of the business, we exited the Fund’s position in favor of what we perceived as better risk/reward opportunities elsewhere, as tax tailwinds began to moderate and valuations became more inflated.
Were there any notable changes in the Fund’s weightings during the Reporting Period?
In constructing the Fund’s portfolio, we focus on picking stocks rather than on making industry or sector bets. We seek to outpace the benchmark index by overweighting stocks that we expect to outperform and underweighting those that we think may lag. Consequently, changes in its sector weights are generally the direct result of individual stock selection or of stock appreciation or depreciation. That said, during the Reporting Period, the Fund’s exposure compared to the Russell Index to consumer staples, financials, real estate and utilities increased. The Fund’s allocations compared to the Russell Index in consumer discretionary, health care, industrials, information technology and materials decreased.
3
GOLDMAN SACHS VARIABLE INSURANCE TRUST LARGE CAP VALUE FUND
How was the Fund positioned relative to its benchmark index at the end of the Reporting Period?
At the end of December 2018, the Fund had an overweighted position relative to the Russell Index in the communication services sector. On the same date, the Fund had underweighted positions compared to the Russell Index in financials, real estate and materials and was rather neutrally weighted to the Russell Index in the consumer discretionary, consumer staples, energy, health care, industrials, information technology and utilities sectors.
Were there any changes to the Fund’s portfolio management team during the Reporting Period?
Effective January 9, 2018, Goldman Sachs Asset Management, L.P. (the “Investment Adviser”) centralized its Fundamental Equity U.S. Value and Fundamental Equity U.S. Growth Teams into a single Fundamental Equity U.S. Equity Team. Effective the same date, decision-making for the Fund’s strategy was centralized with lead portfolio managers, who draw upon the combined team for idea generation and make final investment decisions. The Investment Adviser believes these changes will benefit the Funds by providing a more holistic investment perspective and the ability to leverage investment ideas across the U.S. Fundamental Equity platform.
Effective the same date,co-lead portfolio manager for the Fund, John Arege, left the firm. John shared portfolio management responsibility for the Fund’s strategy with Sean Gallagher, who had been in this role since 2001. Sean continued to serve as a lead portfolio manager for the Fund’s strategy until he announced his retirement, effective September 30, 2018. Charles “Brook” Dane serves as portfolio manager of the Fund effective July 17, 2018. There were no changes to the investment process or philosophy of the Fund’s strategy. We remain committed to high quality,bottom-up research and to the time-tested investment philosophy of the Fund’s strategy. We continue to believe that deep knowledge of company-specific and industry trends is key to our research edge.
What is the Fund’s tactical view and strategy for the months ahead?
At the end of the Reporting Period, we believed the risk/reward balance for equities in 2019 had improved relative to 2018 following thede-rating in valuation multiples, or price/earnings ratios, in the fourth quarter of 2018. We saw continued expansion of global economic growth and corporate profits. We believed U.S. economic growth would likely moderate in 2019, while the slowdown outside of the U.S. may be behind us. In our view, the ongoing global economic expansion should underpin corporate earnings growth, which we expect to remain positive across all global regions in 2019, supporting risk assets, such as equities. Meanwhile, lower valuations provide, in our view, an attractive entry point. Several challenges in 2018 — such as trade tensions and populist politics — resulted in a sharpde-rating. We think the shift in valuations was overdone relative to both macro and corporate fundamentals. Concerns around the length of the current economic cycle, trade tensions and populist politics may well continue, but we believed at the end of the Reporting Period that it was too soon to position for the end of the cycle and markets have already gone too far in pricing in the risks.
As the U.S. economic expansion approaches the longest on record, late-cycle signs, such as a tight labor market, firming inflation, higher volatility and a flatter yield curve, along with fading fiscal support and continued Fed interest rate hikes, have increased focus, we feel, on a possible moderation in U.S. economic growth. However, discussions around peak earnings are premature, in our view, as margins have historically continued to expand until very close to the beginning of recessions.
We believe rising interest rates and cost pressures make pricing power an increasingly critical differentiator of success. Selectivity, in our view, is also increasingly important amid higher volatility, elevated political and trade risks and slowing revenue growth and margin pressures. We believe this divergence between winners and losers reinforces the importance of active management.
Regardless of market direction, our fundamental,bottom-up stock selection continues to drive our process, rather than headlines or sentiment. We maintain high conviction in the companies the Fund owns and believe they have the potential to outperform relative to the broader market regardless of economic growth conditions. We continue to focus on undervalued companies that we believe have comparatively greater control of their own destiny, such as innovators with differentiated products, companies with low cost structures or companies that have been investing in their own businesses and may be poised to gain market share. We maintain our discipline in identifying companies with what we believe to be strong or improving balance sheets, led by quality management teams and trading at discounted valuations. We remain focused on the long-term performance of the Fund.
4
GOLDMAN SACHS VARIABLE INSURANCE TRUST LARGE CAP VALUE FUND
Index Definitions
The Russell 1000® Value Index is an unmanaged market capitalization weighted index of the 1000 largest U.S. companies with lower price-to-book ratios and lower forecasted growth values. The figures for the index do not include any deduction for fees, expenses or taxes.
The Russell 2000® Index is an unmanaged index of common stock prices that measures the performance of the 2000 smallest companies in the Russell 3000® Index. The figures for the index do not include any deduction for fees, expenses or taxes.
The S&P 500® Index is the Standard & Poor’s 500 Composite Index of 500 stocks, an unmanaged index of common stock prices. The figures for the index do not include any deduction for fees, expenses or taxes.
The Russell Midcap® Index measures the performance of the 800 smallest companies in the Russell 1000® Index, which represent approximately 25% of the total market capitalization of the Russell 1000 Index.
The Russell 1000® Index measures the performance of the 1,000 largest companies in the Russell 3000® Index, which represent approximately 92% of the total market capitalization of the Russell 3000 Index.
It is not possible to invest directly in an index.
5
FUND BASICS
Large Cap Value Fund
as of December 31, 2018
STANDARDIZED TOTAL RETURNS1
| | | | | | | | | | | | | | | | | | |
| For the period ended 12/31/18 | | One Year | | | Five Years | | | Ten Years | | | Since Inception | | | Inception Date |
| Institutional | | | -8.46 | % | | | 3.91 | % | | | 8.92 | % | | | 4.48 | % | | 1/12/98 |
| Service | | | -8.72 | | | | 3.64 | | | | 8.63 | | | | 3.24 | | | 7/24/07 |
| 1 | The Standardized Total Returns are average annual total returns as of the most recent calendar quarter-end. They assume reinvestment of all distributions at net asset value (“NAV”). Because Institutional Shares and Service Shares do not involve a sales charge, such a charge is not applied to their Standardized Total Returns. |
Total return figures in the above chart represent past performance and do not indicate future results, which will vary. The investment return and principal value of an investment will fluctuate and, therefore, an investor’s shares, when redeemed, may be worth more or less than their original cost. Current performance may be lower or higher than the total return figures in the above chart. Please visit www.GSAMFUNDS.com to obtain the most recent month-end returns.Performance reflects fee waivers and/or expense limitations in effect during the periods shown. In their absence, performance would be reduced.
EXPENSE RATIOS2
| | | | | | | | |
| | | Net Expense Ratio (Current) | | | Gross Expense Ratio (Before Waivers) | |
| Institutional | | | 0.71 | % | | | 0.78 | % |
| Service | | | 0.96 | | | | 1.03 | |
| 2 | The expense ratios of the Fund, both current (net of any fee waivers and/or expense limitations) and before waivers (gross of any fee waivers and/or expense limitations) are as set forth above according to the most recent publicly available Prospectuses for the Fund and may differ from the expense ratios disclosed in the Financial Highlights in this report. Pursuant to a contractual arrangement, the Fund’s fee waivers and/or expense limitations will remain in place through at least April 30, 2019, and prior to such date, the Investment Adviser may not terminate the arrangements without the approval of the Fund’s Board of Trustees. If these arrangements are discontinued in the future, the expense ratios may change without shareholder approval. |
TOP TEN HOLDINGS AS OF 12/31/183
| | | | | | |
| Holding | | % of Net Assets | | | Line of Business |
Berkshire Hathaway, Inc. Class B | | | 4.0% | | | Diversified Financials |
JPMorgan Chase & Co. | | | 3.4 | | | Banks |
Pfizer, Inc. | | | 3.2 | | | Pharmaceuticals, Biotechnology & Life Sciences |
Verizon Communications, Inc. | | | 3.2 | | | Telecommunication Services |
Bank of America Corp. | | | 2.9 | | | Banks |
Chevron Corp. | | | 2.8 | | | Energy |
Procter & Gamble Co. (The) | | | 2.7 | | | Household & Personal Products |
Cisco Systems, Inc. | | | 2.5 | | | Technology Hardware & Equipment |
Walmart, Inc. | | | 2.2 | | | Food & Staples Retailing |
Medtronic plc | | | 2.1 | | | Health Care Equipment & Services |
| 3 | The top 10 holdings may not be representative of the Fund’s future investments. |
6
FUND BASICS
FUND VS. BENCHMARK SECTOR ALLOCATIONS4
As of December 31, 2018
| 4 | The Fund is actively managed and, as such, its composition may differ over time. Consequently, the Fund’s overall sector allocations may differ from percentages contained in the graph above. The graph categorizes investments using Global Industry Classification Standard (“GICS”); however, the sector classifications used by the portfolio management team may differ from GICS. The percentage shown for each investment category reflects the value of investments in that category as a percentage of market value. Underlying sector allocations of exchange traded funds and investment companies held by the Fund are not reflected in the graph above. |
7
GOLDMAN SACHS VARIABLE INSURANCE TRUST LARGE CAP VALUE FUND
Performance Summary
December 31, 2018
The following graph shows the value, as of December 31, 2018, of a $10,000 investment made on January 1, 2009 in Service Shares at NAV. For comparative purposes, the performance of the Fund’s benchmark, the Russell 1000® Value Index (with distributions reinvested), is shown. This performance data represents past performance and should not be considered indicative of future performance, which will fluctuate with changes in market conditions. These performance fluctuations may cause an investor’s shares, when redeemed, to be worth more or less than their original cost. Performance reflects Fund level expenses but does not reflect fees and expenses associated with any variable annuity contract or variable life insurance policy that uses the Fund as an investment option for any contract or policy. Had performance reflected all of those fees and expenses, performance would have been reduced. Performance reflects applicable fee waivers and/or expense limitations in effect during the periods shown, and in their absence, performance would be reduced. Performance of Institutional Shares will vary from Service Shares due to differences in class specific fees. In addition to the Investment Adviser’s decisions regarding issuer/industry investment selection and allocation, other factors may affect Fund performance. These factors include, but are not limited to, Fund operating fees and expenses, portfolio turnover, and subscription and redemption cash flows affecting the Fund.
Large Cap Value Fund’s 10 Year Performance
Performance of a $10,000 investment, with distributions reinvested, from January 1, 2009 through December 31, 2018.
| | | | | | | | |
| Average Annual Total Return through December 31, 2018 | | One Year | | Five Years | | Ten Years | | Since Inception |
Institutional (Commenced January 12, 1998) | | -8.46% | | 3.91% | | 8.92% | | 4.48% |
Service (Commenced July 24, 2007) | | -8.72% | | 3.64% | | 8.63% | | 3.24% |
8
GOLDMAN SACHS VARIABLE INSURANCE TRUST LARGE CAP VALUE FUND
Schedule of Investments
December 31, 2018
| | | | | | | | |
Shares | | | Description | | Value | |
|
| | Common Stocks – 97.7% | |
| | Automobiles & Components – 0.3% | |
| | 106,630 | | | Delphi Technologies plc | | $ | 1,526,942 | |
| | |
| | Banks – 10.5% | |
| | 518,227 | | | Bank of America Corp. | | | 12,769,113 | |
| | 32,933 | | | First Republic Bank | | | 2,861,878 | |
| | 151,840 | | | JPMorgan Chase & Co. | | | 14,822,621 | |
| | 26,826 | | | M&T Bank Corp. | | | 3,839,605 | |
| | 17,941 | | | Signature Bank | | | 1,844,514 | |
| | 84,268 | | | SunTrust Banks, Inc. | | | 4,250,478 | |
| | 112,947 | | | Wells Fargo & Co. | | | 5,204,598 | |
| | | | | | | | |
| | | | | | | 45,592,807 | |
| | |
| | Capital Goods – 5.4% | |
| | 15,802 | | | Deere & Co. | | | 2,357,184 | |
| | 375,857 | | | General Electric Co. | | | 2,845,238 | |
| | 41,734 | | | Honeywell International, Inc. | | | 5,513,896 | |
| | 89,953 | | | ITT, Inc. | | | 4,342,031 | |
| | 24,426 | | | Raytheon Co. | | | 3,745,727 | |
| | 39,755 | | | Stanley Black & Decker, Inc. | | | 4,760,264 | |
| | | | | | | | |
| | | | | | | 23,564,340 | |
| | |
| | Commercial & Professional Services – 0.5% | |
| | 30,574 | | | Waste Connections, Inc. | | | 2,270,120 | |
| | |
| | Consumer Durables & Apparel – 0.6% | |
| | 29,269 | | | PVH Corp. | | | 2,720,554 | |
| | |
| | Consumer Services – 2.0% | |
| | 29,390 | | | Dunkin’ Brands Group, Inc. | | | 1,884,487 | |
| | 36,745 | | | Restaurant Brands International, Inc. | | | 1,921,764 | |
| | 49,736 | | | Royal Caribbean Cruises Ltd. | | | 4,863,683 | |
| | | | | | | | |
| | | | | | | 8,669,934 | |
| | |
| | Diversified Financials – 6.8% | |
| | 27,205 | | | American Express Co. | | | 2,593,180 | |
| | 84,563 | | | Berkshire Hathaway, Inc. Class B* | | | 17,266,073 | |
| | 34,805 | | | Intercontinental Exchange, Inc. | | | 2,621,861 | |
| | 76,393 | | | Lazard Ltd. Class A | | | 2,819,666 | |
| | 49,188 | | | Northern Trust Corp. | | | 4,111,625 | |
| | | | | | | | |
| | | | | | | 29,412,405 | |
| | |
| | Energy – 8.9% | |
| | 112,315 | | | Chevron Corp. | | | 12,218,749 | |
| | 28,427 | | | Concho Resources, Inc.* | | | 2,922,011 | |
| | 50,199 | | | EOG Resources, Inc. | | | 4,377,855 | |
| | 113,410 | | | Exxon Mobil Corp. | | | 7,733,428 | |
| | 79,636 | | | Halliburton Co. | | | 2,116,725 | |
| | 91,512 | | | Marathon Petroleum Corp. | | | 5,400,123 | |
| | 67,844 | | | Royal Dutch Shell plc Class B ADR | | | 4,066,569 | |
| | | | | | | | |
| | | | | | | 38,835,460 | |
| | |
| | Food & Staples Retailing – 2.2% | |
| | 104,524 | | | Walmart, Inc. | | | 9,736,411 | |
| | |
| | Food, Beverage & Tobacco – 2.6% | |
| | 83,721 | | | Altria Group, Inc. | | | 4,134,980 | |
| | 59,295 | | | Kraft Heinz Co. (The) | | | 2,552,057 | |
| | |
|
| | Common Stocks – (continued) | |
| | Food, Beverage & Tobacco – (continued) | |
| | 112,779 | | | Mondelez International, Inc. Class A | | | 4,514,543 | |
| | | | | | | | |
| | | | | | | 11,201,580 | |
| | |
| | Health Care Equipment & Services – 7.0% | |
| | 139,562 | | | Boston Scientific Corp.* | | | 4,932,121 | |
| | 15,203 | | | Cooper Cos., Inc. (The) | | | 3,869,164 | |
| | 60,393 | | | CVS Health Corp. | | | 3,956,949 | |
| | 5,778 | | | Humana, Inc. | | | 1,655,281 | |
| | 19,035 | | | Laboratory Corp. of America Holdings* | | | 2,405,263 | |
| | 99,218 | | | Medtronic plc | | | 9,024,869 | |
| | 44,135 | | | Zimmer Biomet Holdings, Inc. | | | 4,577,682 | |
| | | | | | | | |
| | | | | | | 30,421,329 | |
| | |
| | Household & Personal Products – 2.7% | |
| | 126,213 | | | Procter & Gamble Co. (The) | | | 11,601,499 | |
| | |
| | Insurance – 3.4% | |
| | 39,208 | | | American Financial Group, Inc. | | | 3,549,500 | |
| | 33,654 | | | Arthur J Gallagher & Co. | | | 2,480,300 | |
| | 34,954 | | | Chubb Ltd. | | | 4,515,358 | |
| | 97,955 | | | MetLife, Inc. | | | 4,022,032 | |
| | | | | | | | |
| | | | | | | 14,567,190 | |
| | |
| | Materials – 3.1% | |
| | 31,922 | | | Celanese Corp. | | | 2,872,022 | |
| | 159,145 | | | DowDuPont, Inc. | | | 8,511,075 | |
| | 10,992 | | | Martin Marietta Materials, Inc. | | | 1,889,195 | |
| | | | | | | | |
| | | | | | | 13,272,292 | |
| | |
| | Media & Entertainment – 4.9% | |
| | 3,959 | | | Alphabet, Inc. Class A* | | | 4,136,997 | |
| | 194,434 | | | Comcast Corp. Class A | | | 6,620,478 | |
| | 19,415 | | | Facebook, Inc. Class A* | | | 2,545,112 | |
| | 60,264 | | | Live Nation Entertainment, Inc.* | | | 2,968,002 | |
| | 107,009 | | | Twenty-First Century Fox, Inc. Class A | | | 5,149,273 | |
| | | | | | | | |
| | | | | | | 21,419,862 | |
| | |
| | Pharmaceuticals, Biotechnology & Life Sciences – 9.1% | |
| | 30,743 | | | Alexion Pharmaceuticals, Inc.* | | | 2,993,139 | |
| | 58,837 | | | AstraZeneca plc ADR | | | 2,234,629 | |
| | 35,375 | | | BioMarin Pharmaceutical, Inc.* | | | 3,012,181 | |
| | 40,499 | | | Eli Lilly & Co. | | | 4,686,544 | |
| | 65,524 | | | Johnson & Johnson | | | 8,455,872 | |
| | 58,285 | | | Merck & Co., Inc. | | | 4,453,557 | |
| | 316,941 | | | Pfizer, Inc. | | | 13,834,475 | |
| | | | | | | | |
| | | | | | | 39,670,397 | |
| | |
| | Real Estate Investment Trusts – 3.7% | |
| | 35,000 | | | Alexandria Real Estate Equities, Inc. | | | 4,033,400 | |
| | 33,607 | | | AvalonBay Communities, Inc. | | | 5,849,298 | |
| | 25,971 | | | Federal Realty Investment Trust | | | 3,065,617 | |
| | 52,421 | | | Prologis, Inc. | | | 3,078,161 | |
| | | | | | | | |
| | | | | | | 16,026,476 | |
| | |
| | |
| The accompanying notes are an integral part of these financial statements. | | 9 |
GOLDMAN SACHS VARIABLE INSURANCE TRUST LARGE CAP VALUE FUND
Schedule of Investments(continued)
December 31, 2018
| | | | | | | | |
Shares | | | Description | | Value | |
|
| | Common Stocks – (continued) | |
| | Retailing – 1.7% | |
| | 18,656 | | | Home Depot, Inc. (The) | | $ | 3,205,474 | |
| | 69,192 | | | LKQ Corp.* | | | 1,641,926 | |
| | 28,300 | | | Ross Stores, Inc. | | | 2,354,560 | |
| | | | | | | | |
| | | | | | | 7,201,960 | |
| | |
| | Semiconductors & Semiconductor Equipment – 3.0% | |
| | 62,833 | | | Advanced Micro Devices, Inc.* | | | 1,159,897 | |
| | 49,778 | | | Analog Devices, Inc. | | | 4,272,446 | |
| | 88,185 | | | Intel Corp. | | | 4,138,522 | |
| | 205,343 | | | Marvell Technology Group Ltd. | | | 3,324,503 | |
| | | | | | | | |
| | | | | | | 12,895,368 | |
| | |
| | Software & Services – 3.9% | |
| | 21,689 | | | Check Point Software Technologies Ltd.* | | | 2,226,376 | |
| | 32,596 | | | Global Payments, Inc. | | | 3,361,625 | |
| | 18,025 | | | Intuit, Inc. | | | 3,548,221 | |
| | 33,143 | | | Microsoft Corp. | | | 3,366,335 | |
| | 24,384 | | | Red Hat, Inc.* | | | 4,282,806 | |
| | | | | | | | |
| | | | | | | 16,785,363 | |
| | |
| | Technology Hardware & Equipment – 3.2% | |
| | 20,173 | | | Apple, Inc. | | | 3,182,089 | |
| | 246,824 | | | Cisco Systems, Inc. | | | 10,694,884 | |
| | | | | | | | |
| | | | | | | 13,876,973 | |
| | |
| | Telecommunication Services – 4.1% | |
| | 146,764 | | | AT&T, Inc. | | | 4,188,644 | |
| | 243,539 | | | Verizon Communications, Inc. | | | 13,691,763 | |
| | | | | | | | |
| | | | | | | 17,880,407 | |
| | |
| | Transportation – 1.3% | |
| | 25,247 | | | Union Pacific Corp. | | | 3,489,893 | |
| | 34,491 | | | XPO Logistics, Inc.* | | | 1,967,366 | |
| | | | | | | | |
| | | | | | | 5,457,259 | |
| | |
| | Utilities – 6.8% | |
| | 83,643 | | | Ameren Corp. | | | 5,456,033 | |
| | 25,528 | | | American Water Works Co., Inc. | | | 2,317,176 | |
| | 104,946 | | | CMS Energy Corp. | | | 5,210,569 | |
| | 45,440 | | | NextEra Energy, Inc. | | | 7,898,381 | |
| | 30,743 | | | Sempra Energy | | | 3,326,085 | |
| | 107,722 | | | Xcel Energy, Inc. | | | 5,307,463 | |
| | | | | | | | |
| | | | | | | 29,515,707 | |
| | |
| | TOTAL COMMON STOCKS | | | | |
| | (Cost $425,824,097) | | $ | 424,122,635 | |
| | |
| | | | | | |
| Shares | | Dividend
Rate | | Value | |
|
| Investment Company(a) – 0.6% | |
Goldman Sachs Financial Square Government Fund — Institutional Shares | |
| 2,443,839 | | 2.521% | | $ | 2,443,839 | |
| (Cost $2,443,839) | | | | |
| |
| TOTAL INVESTMENTS – 98.3% | |
| (Cost $428,267,936) | | $ | 426,566,474 | |
| |
OTHER ASSETS IN EXCESS OF LIABILITIES – 1.7% | | | 7,287,681 | |
| |
| NET ASSETS – 100.0% | | $ | 433,854,155 | |
| |
| | |
| The percentage shown for each investment category reflects the value of investments in that category as a percentage of net assets. |
| |
| * | | Non-income producing security. |
| |
| (a) | | Represents an Affiliated Issuer. |
| | |
| |
| Investment Abbreviation: |
| ADR | | —American Depositary Receipt |
| | |
| 10 | | The accompanying notes are an integral part of these financial statements. |
GOLDMAN SACHS VARIABLE INSURANCE TRUST LARGE CAP VALUE FUND
Statement of Assets and Liabilities
December 31, 2018
| | | | |
| | | | |
| Assets: | |
Investments in unaffiliated issuers, at value (cost $425,824,097) | | $ | 424,122,635 | |
Investments in affiliated issuers, at value (cost $2,443,839) | | | 2,443,839 | |
Cash | | | 6,492,578 | |
Receivables: | | | | |
Fund shares sold | | | 1,153,987 | |
Dividends | | | 618,089 | |
Other assets | | | 521 | |
| |
| Total assets | | | 434,831,649 | |
| | | | |
| | | | |
| Liabilities: | | | |
Payables: | | | | |
Fund shares redeemed | | | 537,783 | |
Management fees | | | 266,252 | |
Distribution and Service fees and Transfer Agency fees | | | 69,262 | |
Accrued expenses | | | 104,197 | |
| |
| Total liabilities | | | 977,494 | |
| | | | |
| | | | |
| Net Assets: | | | |
Paid-in capital | | | 433,092,072 | |
Total distributable earnings | | | 762,083 | |
| |
| NET ASSETS | | $ | 433,854,155 | |
Net Assets: | | | | |
Institutional | | $ | 150,963,249 | |
Service | | | 282,890,906 | |
| |
Total Net Assets | | $ | 433,854,155 | |
Shares outstanding $0.001 par value (unlimited shares authorized): | | | | |
Institutional | | | 19,682,215 | |
Service | | | 36,872,387 | |
Net asset value, offering and redemption price per share: | | | | |
Institutional | | | $7.67 | |
Service | | | 7.67 | |
| | |
| The accompanying notes are an integral part of these financial statements. | | 11 |
GOLDMAN SACHS VARIABLE INSURANCE TRUST LARGE CAP VALUE FUND
Statement of Operations
For the Fiscal Year Ended December 31, 2018
| | | | |
| | | | |
| Investment income: | |
Dividends — unaffiliated issuers (net of foreign taxes withheld of $6,652) | | $ | 10,329,021 | |
Dividends — affiliated issuers | | | 24,703 | |
Securities lending income — unaffiliated issuer | | | 7,447 | |
| |
| Total investment income | | | 10,361,171 | |
| | | | |
| | | | |
| Expenses: | | | |
Management fees | | | 3,715,842 | |
Distribution and Service fees — Service Shares | | | 831,928 | |
Transfer Agency fees(a) | | | 101,770 | |
Professional fees | | | 95,491 | |
Custody, accounting and administrative services | | | 91,799 | |
Printing and mailing costs | | | 72,688 | |
Trustee fees | | | 17,063 | |
Registration fees | | | 712 | |
Other | | | 15,073 | |
| |
| Total expenses | | | 4,942,366 | |
| |
Less — expense reductions | | | (483,469 | ) |
| |
| Net expenses | | | 4,458,897 | |
| |
| NET INVESTMENT INCOME | | | 5,902,274 | |
| | | | |
| | | | |
| Realized and unrealized gain (loss): | | | |
Net realized gain from investments — unaffiliated issuers (including commissions recaptured of $67,460) | | | 38,681,430 | |
| |
Net change in unrealized loss on investments — unaffiliated issuers | | | (85,485,686 | ) |
| |
| Net realized and unrealized loss | | | (46,804,256 | ) |
| |
| NET DECREASE IN NET ASSETS RESULTING FROM OPERATIONS | | $ | (40,901,982 | ) |
(a) Institutional and Service Shares incurred Transfer Agency fees of $35,221 and $66,549, respectively.
| | |
| 12 | | The accompanying notes are an integral part of these financial statements. |
GOLDMAN SACHS VARIABLE INSURANCE TRUST LARGE CAP VALUE FUND
Statements of Changes in Net Assets
| | | | | | | | |
| | | For the
Fiscal Year Ended
December 31, 2018 | | | For the
Fiscal Year Ended
December 31, 2017 | |
| | | | | | | | |
| From operations: | |
Net investment income | | $ | 5,902,274 | | | $ | 7,894,898 | |
Net realized gain | | | 38,681,430 | | | | 92,354,930 | |
Net change in unrealized loss | | | (85,485,686 | ) | | | (40,190,304 | ) |
| | |
| Net increase (decrease) in net assets resulting from operations | | | (40,901,982 | ) | | | 60,059,524 | |
| | | | | | | | |
| | | | | | | | |
| Distributions to shareholders: | | | | | | |
From distributable earnings: | | | | | | | | |
Institutional Shares | | | (11,515,289 | ) | | | (35,473,395 | )(a) |
Service Shares | | | (20,776,605 | ) | | | (66,746,375 | )(a) |
| | |
| Total distributions to shareholders | | | (32,291,894 | ) | | | (102,219,770 | ) |
| | | | | | | | |
| | | | | | | | |
| From share transactions: | | | | | | |
Proceeds from sales of shares | | | 25,313,246 | | | | 23,300,375 | |
Reinvestment of distributions | | | 32,291,894 | | | | 102,219,770 | |
Cost of shares redeemed | | | (97,515,109 | ) | | | (311,829,893 | ) |
| | |
| Net decrease in net assets resulting from share transactions | | | (39,909,969 | ) | | | (186,309,748 | ) |
| | |
| TOTAL DECREASE | | | (113,103,845 | ) | | | (228,469,994 | ) |
| | | | | | | | |
| | | | | | | | |
| Net assets:(b) | | | | | | |
| | |
Beginning of year | | | 546,958,000 | | | | 775,427,994 | |
| | |
End of year | | $ | 433,854,155 | | | $ | 546,958,000 | |
| (a) | Prior year information has been revised to conform to current year presentation, see prior year presentation below: |
| | | | | | | | |
| | | Institutional | | | Service | |
Distributions from net investment income: | | | (3,091,197 | ) | | | (4,927,889 | ) |
Distributions from net realized gains: | | | (32,382,198 | ) | | | (61,818,486 | ) |
| (b) | Prior fiscal year information has been revised to conform with current year presentation. Undistributed net investment income was $149,195 for the Fund as of December 31, 2017. |
| | |
| The accompanying notes are an integral part of these financial statements. | | 13 |
GOLDMAN SACHS VARIABLE INSURANCE TRUST LARGE CAP VALUE FUND
Financial Highlights
Selected Data for a Share Outstanding Throughout Each Year
| | | | | | | | | | | | | | | | | | | | |
| | | Goldman Sachs Large Cap Value Fund | |
| | | Institutional Shares | |
| | | Year Ended December 31, | |
| | | 2018 | | | 2017 | | | 2016 | | | 2015 | | | 2014 | |
| | | | | | | | | | | | | | | | | | | | |
| Per Share Data | | | | | | | | | | | | | | | |
| | | | | |
Net asset value, beginning of year | | $ | 9.06 | | | $ | 10.16 | | | $ | 9.39 | | | $ | 11.39 | | | $ | 12.59 | |
| | | | | |
Net investment income(a) | | | 0.12 | | | | 0.16 | | | | 0.18 | | | | 0.15 | | | | 0.16 | |
| | | | | |
Net realized and unrealized gain (loss) | | | (0.88 | ) | | | 0.83 | | | | 0.91 | | | | (0.67 | ) | | | 1.38 | |
| | | | | |
Total from investment operations | | | (0.76 | ) | | | 0.99 | | | | 1.09 | | | | (0.52 | ) | | | 1.54 | |
| | | | | |
Distributions to shareholders from net investment income | | | (0.12 | ) | | | (0.18 | ) | | | (0.22 | ) | | | (0.16 | ) | | | (0.19 | ) |
| | | | | |
Distributions to shareholders from net realized gains | | | (0.51 | ) | | | (1.91 | ) | | | (0.10 | ) | | | (1.32 | ) | | | (2.55 | ) |
| | | | | |
Total distributions | | | (0.63 | ) | | | (2.09 | ) | | | (0.32 | ) | | | (1.48 | ) | | | (2.74 | ) |
| | | | | |
Net asset value, end of year | | $ | 7.67 | | | $ | 9.06 | | | $ | 10.16 | | | $ | 9.39 | | | $ | 11.39 | |
| | | | | |
Total return(b) | | | (8.46 | )% | | | 9.85 | % | | | 11.55 | % | | | (4.41 | )% | | | 12.94 | % |
| | | | | |
Net assets, end of year (in 000s) | | $ | 150,963 | | | $ | 188,182 | | | $ | 243,875 | | | $ | 279,910 | | | $ | 326,543 | |
| | | | | |
Ratio of net expenses to average net assets | | | 0.71 | % | | | 0.72 | % | | | 0.74 | % | | | 0.74 | % | | | 0.75 | % |
| | | | | |
Ratio of total expenses to average net assets | | | 0.81 | % | | | 0.81 | % | | | 0.81 | % | | | 0.81 | % | | | 0.80 | % |
| | | | | |
Ratio of net investment income to average net assets | | | 1.32 | % | | | 1.50 | % | | | 1.91 | % | | | 1.38 | % | | | 1.21 | % |
| | | | | |
Portfolio turnover rate(c) | | | 125 | % | | | 127 | % | | | 130 | % | | | 83 | % | | | 72 | % |
| (a) | Calculated based on the average shares outstanding methodology. |
| (b) | Assumes investment at the net asset value at the beginning of the year, reinvestment of all distributions, and a complete redemption of the investment at the net asset value at the end of the year. |
| (c) | The Fund’s portfolio turnover rate is calculated in accordance with regulatory requirements, without regard to transactions involving short term investments. If such transactions were included, the Fund’s portfolio turnover rate may be higher. |
| | |
| 14 | | The accompanying notes are an integral part of these financial statements. |
GOLDMAN SACHS VARIABLE INSURANCE TRUST LARGE CAP VALUE FUND
Financial Highlights(continued)
Selected Data for a Share Outstanding Throughout Each Year
| | | | | | | | | | | | | | | | | | | | |
| | | Goldman Sachs Large Cap Value Fund | |
| | | Service Shares | |
| | | Year Ended December 31, | |
| | | 2018 | | | 2017 | | | 2016 | | | 2015 | | | 2014 | |
| | | | | | | | | | | | | | | | | | | | |
| Per Share Data | | | | | | | | | | | | | | | |
| | | | | |
Net asset value, beginning of year | | $ | 9.06 | | | $ | 10.16 | | | $ | 9.39 | | | $ | 11.38 | | | $ | 12.58 | |
| | | | | |
Net investment income(a) | | | 0.10 | | | | 0.13 | | | | 0.16 | | | | 0.13 | | | | 0.13 | |
| | | | | |
Net realized and unrealized gain (loss) | | | (0.88 | ) | | | 0.83 | | | | 0.90 | | | | (0.67 | ) | | | 1.37 | |
| | | | | |
Total from investment operations | | | (0.78 | ) | | | 0.96 | | | | 1.06 | | | | (0.54 | ) | | | 1.50 | |
| | | | | |
Distributions to shareholders from net investment income | | | (0.10 | ) | | | (0.15 | ) | | | (0.19 | ) | | | (0.13 | ) | | | (0.15 | ) |
| | | | | |
Distributions to shareholders from net realized gains | | | (0.51 | ) | | | (1.91 | ) | | | (0.10 | ) | | | (1.32 | ) | | | (2.55 | ) |
| | | | | |
Total distributions | | | (0.61 | ) | | | (2.06 | ) | | | (0.29 | ) | | | (1.45 | ) | | | (2.70 | ) |
| | | | | |
Net asset value, end of year | | $ | 7.67 | | | $ | 9.06 | | | $ | 10.16 | | | $ | 9.39 | | | $ | 11.38 | |
| | | | | |
Total return(b) | | | (8.72 | )% | | | 9.56 | % | | | 11.25 | % | | | (4.58 | )% | | | 12.61 | % |
| | | | | |
Net assets, end of year (in 000s) | | $ | 282,891 | | | $ | 358,776 | | | $ | 531,553 | | | $ | 610,689 | | | $ | 692,741 | |
| | | | | |
Ratio of net expenses to average net assets | | | 0.96 | % | | | 0.97 | % | | | 0.99 | % | | | 0.99 | % | | | 1.00 | % |
| | | | | |
Ratio of total expenses to average net assets | | | 1.06 | % | | | 1.06 | % | | | 1.06 | % | | | 1.06 | % | | | 1.05 | % |
| | | | | |
Ratio of net investment income to average net assets | | | 1.07 | % | | | 1.26 | % | | | 1.66 | % | | | 1.13 | % | | | 0.96 | % |
| | | | | |
Portfolio turnover rate(c) | | | 125 | % | | | 127 | % | | | 130 | % | | | 83 | % | | | 72 | % |
| (a) | Calculated based on the average shares outstanding methodology. |
| (b) | Assumes investment at the net asset value at the beginning of the year, reinvestment of all distributions, and a complete redemption of the investment at the net asset value at the end of the year. |
| (c) | The Fund’s portfolio turnover rate is calculated in accordance with regulatory requirements, without regard to transactions involving short term investments. If such transactions were included, the Fund’s portfolio turnover rate may be higher. |
| | |
| The accompanying notes are an integral part of these financial statements. | | 15 |
GOLDMAN SACHS VARIABLE INSURANCE TRUST LARGE CAP VALUE FUND
Notes to Financial Statements
December 31, 2018
1. ORGANIZATION
Goldman Sachs Variable Insurance Trust (the “Trust” or “VIT”) is a Delaware statutory trust registered under the Investment Company Act of 1940, as amended (the “Act”), as an open-end management investment company. The Trust includes the Goldman Sachs Large Cap Value Fund (the “Fund”). The Fund is a diversified portfolio under the Act offering two classes of shares — Institutional and Service Shares. Shares of the Trust are offered to separate accounts of participating life insurance companies for the purpose of funding variable annuity contracts and variable life insurance policies.
Goldman Sachs Asset Management, L.P. (“GSAM”), an affiliate of Goldman Sachs & Co. LLC (“Goldman Sachs”), serves as investment adviser to the Fund pursuant to a management agreement (the “Agreement”) with the Trust.
2. SIGNIFICANT ACCOUNTING POLICIES
The financial statements have been prepared in accordance with accounting principles generally accepted in the United States of America (“GAAP”) and require management to make estimates and assumptions that may affect the reported amounts and disclosures. Actual results may differ from those estimates and assumptions.
A. Investment Valuation — The Fund’s valuation policy is to value investments at fair value.
B. Investment Income and Investments — Investment income includes interest income, dividend income, and securities lending income, if any. Interest income is accrued daily and adjusted for amortization of premiums and accretion of discounts. Dividend income is recognized on ex-dividend date or, for certain foreign securities, as soon as such information is obtained subsequent to the ex-dividend date. Investment transactions are reflected on trade date. Realized gains and losses are calculated using identified cost. Investment transactions are recorded on the following business day for daily net asset value (“NAV”) calculations. Investment income is recorded net of any foreign withholding taxes, less any amounts reclaimable. The Fund may file withholding tax reclaims in certain jurisdictions to recover a portion of amounts previously withheld. Any foreign capital gains tax is accrued daily based upon net unrealized gains, and is payable upon sale of such investments. Distributions received from the Fund’s investments in United States (“U.S.”) real estate investment trusts (“REITs”) may be characterized as ordinary income, net capital gain or a return of capital. A return of capital is recorded by the Fund as a reduction to the cost basis of the REIT.
C. Class Allocations and Expenses — Investment income, realized and unrealized gain (loss), if any, and non-class specific expenses of the Fund are allocated daily based upon the proportion of net assets of each class. Non-class specific expenses directly incurred by the Fund are charged to the Fund, while such expenses incurred by the Trust are allocated across the Fund on a straight-line and/or pro-rata basis depending upon the nature of the expenses. Class specific expenses, where applicable, are borne by the respective share classes and include Distribution and Service and Transfer Agency fees.
D. Federal Taxes and Distributions to Shareholders — It is the Fund’s policy to comply with the requirements of the Internal Revenue Code of 1986, as amended (the “Code”), applicable to regulated investment companies and to distribute each year substantially all of its investment company taxable income and capital gains to its shareholders. Accordingly, the Fund is not required to make any provisions for the payment of federal income tax. Distributions to shareholders are recorded on the ex-dividend date. Income and capital gains distributions, if any, are declared and paid annually.
Net capital losses, if any, are carried forward to future fiscal years and may be used to the extent allowed by the Code to offset any future capital gains. Losses that are carried forward will retain their character as either short-term or long-term capital losses. Utilization of capital loss carryforwards will reduce the requirement of future capital gains distributions.
The characterization of distributions to shareholders for financial reporting purposes is determined in accordance with federal income tax rules, which may differ from GAAP. The source of the Fund’s distributions may be shown in the accompanying financial statements as either from distributable earnings or capital. Certain components of the Fund’s net assets on the Statement of Assets and Liabilities reflect permanent GAAP/tax differences based on the appropriate tax character.
16
GOLDMAN SACHS VARIABLE INSURANCE TRUST LARGE CAP VALUE FUND
2. SIGNIFICANT ACCOUNTING POLICIES (continued)
E. Commission Recapture — GSAM, on behalf of certain Funds, may direct portfolio trades, subject to seeking best execution, to various brokers who have agreed to rebate a portion of the commissions generated. Such rebates are made directly to the Fund as cash payments and are included in net realized gain (loss) from investments on the Statement of Operations.
3. INVESTMENTS AND FAIR VALUE MEASUREMENTS
U.S. GAAP defines the fair value of a financial instrument as the amount that would be received to sell an asset or paid to transfer a liability in an orderly transaction between market participants at the measurement date (i.e., the exit price); the Fund’s policy is to use the market approach. GAAP establishes a fair value hierarchy that prioritizes the inputs to valuation techniques used to measure fair value. The hierarchy gives the highest priority to unadjusted quoted prices in active markets for identical assets or liabilities (Level 1 measurements) and the lowest priority to unobservable inputs (Level 3 measurements). The levels used for classifying investments are not necessarily an indication of the risk associated with investing in these investments. The three levels of the fair value hierarchy are described below:
Level 1 — Unadjusted quoted prices in active markets that are accessible at the measurement date for identical, unrestricted assets or liabilities;
Level 2 — Quoted prices in markets that are not active or financial instruments for which significant inputs are observable (including, but not limited to, quoted prices for similar investments, interest rates, foreign exchange rates, volatility and credit spreads), either directly or indirectly;
Level 3 — Prices or valuations that require significant unobservable inputs (including GSAM’s assumptions in determining fair value measurement).
Changes in valuation techniques may result in transfers into or out of an assigned level within the hierarchy. In accordance with the Fund’s policy, transfers between different levels of the fair value hierarchy resulting from such changes are deemed to have occurred as of the beginning of the reporting period.
The Board of Trustees (“Trustees”) has approved Valuation Procedures that govern the valuation of the portfolio investments held by the Fund, including investments for which market quotations are not readily available. The Trustees have delegated to GSAM day-to-day responsibility for implementing and maintaining internal controls and procedures related to the valuation of the Fund’s investments. To assess the continuing appropriateness of pricing sources and methodologies, GSAM regularly performs price verification procedures and issues challenges as necessary to third party pricing vendors or brokers, and any differences are reviewed in accordance with the Valuation Procedures.
A. Level 1 and Level 2 Fair Value Investments — The valuation techniques and significant inputs used in determining the fair values for investments classified as Level 1 and Level 2 are as follows:
Equity Securities —Equity securities traded on a U.S. securities exchange or the NASDAQ system, or those located on certain foreign exchanges, including but not limited to the Americas, are valued daily at their last sale price or official closing price on the principal exchange or system on which they are traded. If there is no sale or official closing price or such price is believed by GSAM to not represent fair value, equity securities are valued at the last bid price for long positions and at the last ask price for short positions. To the extent these investments are actively traded, they are classified as Level 1 of the fair value hierarchy, otherwise they are generally classified as Level 2.
Unlisted equity securities for which market quotations are available are valued at the last sale price on the valuation date, or if no sale occurs, at the last bid price, and are generally classified as Level 2. Securities traded on certain foreign securities exchanges are valued daily at fair value determined by an independent fair value service (if available) under Valuation Procedures approved by the Trustees and consistent with applicable regulatory guidance. The independent fair value service takes into account multiple factors including, but not limited to, movements in the securities markets, certain depositary receipts, futures contracts and foreign currency exchange rates that have occurred subsequent to the close of the foreign securities exchange. These investments are generally classified as Level 2 of the fair value hierarchy.
17
GOLDMAN SACHS VARIABLE INSURANCE TRUST LARGE CAP VALUE FUND
Notes to Financial Statements(continued)
December 31, 2018
3. INVESTMENTS AND FAIR VALUE MEASUREMENTS (continued)
Money Market Funds — Investments in the Goldman Sachs Financial Square Government Fund (“Underlying Fund”) are valued at the NAV of the Institutional Share class on the day of valuation. These investments are generally classified as Level 1 of the fair value hierarchy. For information regarding the Underlying Fund’s accounting policies and investment holdings, please see the Underlying Fund’s shareholder report.
B. Level 3 Fair Value Investments — To the extent that significant inputs to valuation models and other alternative pricing sources are unobservable, or if quotations are not readily available, or if GSAM believes that such quotations do not accurately reflect fair value, the fair value of the Fund’s investments may be determined under Valuation Procedures approved by the Trustees. GSAM, consistent with its procedures and applicable regulatory guidance, may make an adjustment to the most recent valuation prices of either domestic or foreign securities in light of significant events to reflect what it believes to be the fair value of the securities at the time of determining the Fund’s NAV. Significant events which could affect a large number of securities in a particular market may include, but are not limited to: significant fluctuations in U.S. or foreign markets; market dislocations; market disruptions; or unscheduled market closings. Significant events which could also affect a single issuer may include, but are not limited to: corporate actions such as reorganizations, mergers and buy-outs; ratings downgrades; and bankruptcies.
C. Fair Value Hierarchy — The following is a summary of the Fund’s investments classified in the fair value hierarchy as of December 31, 2018:
| | | | | | | | | | | | |
| Investment Type | | Level 1 | | | Level 2 | | | Level 3 | |
| | | |
| Assets | | | | | | | | | | | | |
| Common Stock and/or Other Equity Investments(a) | | | | | | | | | | | | |
Asia | | $ | 2,226,376 | | | $ | — | | | $ | — | |
Europe | | | 6,301,198 | | | | — | | | | — | |
North America | | | 415,595,061 | | | | — | | | | — | |
| Investment Company | | | 2,443,839 | | | | — | | | | — | |
| | | |
| Total | | $ | 426,566,474 | | | $ | — | | | $ | — | |
| (a) | Amounts are disclosed by continent to highlight the impact of time zone differences between local market close and the calculation of NAV. Security valuations are based on the principal exchange or system on which they are traded, which may differ from country of domicile. |
For further information regarding security characteristics, see the Schedule of Investments.
4. AGREEMENTS AND AFFILIATED TRANSACTIONS
A. Management Agreement — Under the Agreement, GSAM manages the Fund, subject to the general supervision of the Trustees.
As compensation for the services rendered pursuant to the Agreement, the assumption of the expenses related thereto and administration of the Fund’s business affairs, including providing facilities, GSAM is entitled to a management fee, accrued daily and paid monthly, equal to an annual percentage rate of the Fund’s average daily net assets.
18
GOLDMAN SACHS VARIABLE INSURANCE TRUST LARGE CAP VALUE FUND
4. AGREEMENTS AND AFFILIATED TRANSACTIONS (continued)
As of December 31, 2018, the contractual management fees with GSAM were as stated below. The effective contractual management rates and effective net management rates represent the rates for the fiscal year ended December 31, 2018.
| | | | | | | | | | | | | | | | | | | | | | | | | | |
| Contractual Management Rate | | | | | | | |
First
$1 billion | | | Next
$1 billion | | | Next
$3 billion | | | Next
$3 billion | | | Over
$8 billion | | | Effective
Rate | | | Effective Net
Management
Rate^ | |
| | | | | | |
| | 0.72% | | | | 0.65 | % | | | 0.62 | % | | | 0.60 | % | | | 0.59 | % | | | 0.73 | % | | | 0.69 | %* |
| ^ | Effective Net Management Rate includes the impact of management fee waivers of affiliated Underlying Funds, if any. |
| * | GSAM agreed to waive a portion of its management fee in order to achieve a net management rate, as defined in the Fund’s most recent prospectuses. This waiver will be effective through at least April 30, 2019, and prior to such date GSAM may not terminate the arrangement without approval of the Trustees. For the fiscal year ended December 31, 2018, GSAM waived $204,495 of its management fee. |
Prior to April 30, 2018, the contractual management fee rates for the Fund were as stated below and GSAM agreed to waive a portion of its management fee in order to achieve an Effective Net Management Rate as set forth in the Fund’s prospectus dated April 28, 2017.
| | | | | | | | | | | | | | | | | | |
First
$1 billion | | | Next
$1 billion | | | Next
$3 billion | | | Next
$3 billion | | | Over
$8 billion | |
| | | | |
| | 0.75 | % | | | 0.68 | % | | | 0.65 | % | | | 0.64 | % | | | 0.63 | % |
The Fund invests in Institutional Shares of the Goldman Sachs Financial Square Government Fund, which is an affiliated Underlying Fund. GSAM has agreed to waive a portion of its management fee payable by the Fund in an amount equal to the management fee it earns as an investment adviser to the affiliated Underlying Fund in which the Fund invests, except those management fees it earns from the Fund’s investments of cash collateral received in connection with securities lending transactions in the Goldman Sachs Financial Square Government Fund. For the fiscal year ended December 31, 2018, GSAM waived $2,199 of the Fund’s management fee.
B. Distribution and Service (12b-1) Plan — The Trust, on behalf of Service Shares of the Fund, has adopted a Distribution and Service Plan subject to Rule 12b-1 under the Act. Under the Distribution and Service Plan, Goldman Sachs, which serves as distributor, is entitled to a fee accrued daily and paid monthly, for distribution services and personal and account maintenance services, which may then be paid by Goldman Sachs to authorized dealers, equal to, on an annual basis, 0.25% of the Fund’s average daily net assets attributable to Service Shares.
C. Transfer Agency Agreement — Goldman Sachs also serves as the transfer agent of the Fund for a fee pursuant to the Transfer Agency Agreement. The fees charged for such transfer agency services are accrued daily and paid monthly at an annual rate of 0.02% of the average daily net assets of Institutional and Service Shares.
D. Other Expense Agreements and Affiliated Transactions — GSAM has agreed to limit certain “Other Expenses” of the Fund (excluding acquired fund fees and expenses, transfer agency fees and expenses, service fees and shareholder administration fees (as applicable), taxes, interest, brokerage fees, expenses of shareholder meetings, litigation and indemnification, and extraordinary expenses) to the extent such expenses exceed, on an annual basis, a percentage rate of the average daily net assets of the Fund. Such Other Expense reimbursements, if any, are accrued daily and paid monthly. In addition, the Fund is not obligated to reimburse GSAM for prior fiscal year expense reimbursements, if any. The Other Expense limitation as an annual percentage rate of average daily net assets for the Fund is 0.004%. The Other Expense limitation will remain in place through at least April 30, 2019, and prior to such date GSAM may not terminate the arrangement without the approval of the Trustees. In addition, the Fund has entered into certain offset arrangements with the custodian and the transfer agent, which may result in a reduction of the Fund’s expenses and are received irrespective of the application of the “Other Expense” limitation described above.
19
GOLDMAN SACHS VARIABLE INSURANCE TRUST LARGE CAP VALUE FUND
Notes to Financial Statements(continued)
December 31, 2018
4. AGREEMENTS AND AFFILIATED TRANSACTIONS (continued)
For the fiscal year ended December 31, 2018, these expense reductions, including any fee waivers and Other Expense reimbursements, were as follows:
| | | | | | | | | | | | | | |
Management
Fee Waiver | | | Custody
Fee Credits | | | Other Expense
Reimbursement | | | Total Expense
Reductions | |
| | | |
| $ | 206,694 | | | $ | 4,296 | | | $ | 272,479 | | | $ | 483,469 | |
E. Line of Credit Facility — As of December 31, 2018, the Fund participated in a $770,000,000 committed, unsecured revolving line of credit facility (the “facility”) together with other funds of the Trust and certain registered investment companies having management agreements with GSAM or its affiliates. This facility is to be used for temporary emergency purposes, or to allow for an orderly liquidation of securities to meet redemption requests. The interest rate on borrowings is based on the federal funds rate. The facility also requires a fee to be paid by the Fund based on the amount of the commitment that has not been utilized. For the fiscal year ended December 31, 2018, the Fund did not have any borrowings under the facility.
F. Other Transactions with Affiliates — For the fiscal year ended December 31, 2018, Goldman Sachs earned $5,554 in brokerage commissions from portfolio transactions.
The following table provides information about the Fund’s investments in the Goldman Sachs Financial Square Government Fund as of and for the fiscal year ended December 31, 2018:
| | | | | | | | | | | | | | | | | | | | | | |
Beginning
Value as of
December 31, 2017 | | | Purchases
at Cost | | | Proceeds
from Sales | | | Ending
Value as of
December 31, 2018 | | | Shares as of
December 31, 2018 | | | Dividend Income from
Affiliated Investment
Company | |
| | | | | |
| $ | 2,415,456 | | | $ | 78,888,885 | | | $ | (78,860,502 | ) | | $ | 2,443,839 | | | | 2,443,839 | | | $ | 24,703 | |
5. PORTFOLIO SECURITIES TRANSACTIONS
The cost of purchases and proceeds from sales and maturities of long-term securities for the fiscal year ended December 31, 2018, were $622,489,724 and $687,413,424, respectively.
6. SECURITIES LENDING
The Fund may lend its securities through a securities lending agent, the Bank of New York Mellon (“BNYM”), to certain qualified borrowers. In accordance with the Fund’s securities lending procedures, the Fund receives cash collateral at least equal to the market value of the securities on loan. The market value of the loaned securities is determined at the close of business of the Fund, at their last sale price or official closing price on the principal exchange or system on which they are traded, and any additional required collateral is delivered to the Fund on the next business day. As with other extensions of credit, the Fund may experience delay in the recovery of its securities or incur a loss should the borrower of the securities breach its agreement with the Fund or become insolvent at a time when the collateral is insufficient to cover the cost of repurchasing securities on loan. Dividend income received from securities on loan may not be subject to withholding taxes and therefore withholding taxes paid may differ from the amounts listed in the Statement of Operations. Loans of securities are terminable at any time and as such 1) the remaining contractual maturities of the outstanding securities lending transactions are considered to be overnight and continuous and 2) the borrower, after notice, is required to return borrowed securities within the standard time period for settlement of securities transactions.
The Fund invests the cash collateral received in connection with securities lending transactions in the Goldman Sachs Financial Square Government Fund (“Government Money Market Fund”), an affiliated series of the Goldman Sachs Trust. The Government Money Market Fund is registered under the Act as an open end investment company, is subject to Rule 2a-7 under the
20
GOLDMAN SACHS VARIABLE INSURANCE TRUST LARGE CAP VALUE FUND
6. SECURITIES LENDING (continued)
Act, and is managed by GSAM, for which GSAM may receive a management fee of up to 0.16% (prior to February 21, 2018, GSAM may have received a management fee of up to 0.205%) on an annualized basis of the average daily net assets of the Government Money Market Fund.
In the event of a default by a borrower with respect to any loan, BNYM may exercise any and all remedies provided under the applicable borrower agreement to make the Fund whole. These remedies include purchasing replacement securities by applying the collateral held from the defaulting broker against the purchase cost of the replacement securities. If BNYM is unable to purchase replacement securities, BNYM will indemnify the Fund by paying the Fund an amount equal to the market value of the securities loaned minus the value of cash collateral received from the borrower for the loan, subject to an exclusion for any shortfalls resulting from a loss of value in such cash collateral due to reinvestment risk. The Fund may enter into master netting agreements with borrowers, which provide the right, in the event of a default (including bankruptcy or insolvency), for the non-defaulting party to liquidate the collateral and calculate net exposure to the defaulting party or request additional collateral. However, in the event of a default by a borrower, a resolution authority could determine that such rights are not enforceable due to the restrictions or prohibitions against the right of set-off that may be imposed in accordance with a particular jurisdiction’s bankruptcy or insolvency laws. The Fund’s loaned securities were all subject to enforceable Securities Lending Agreements and the value of the collateral was at least equal to the value of the cash received. The amounts of the Fund’s overnight and continuous agreements, which represent the gross amounts of recognized liabilities for securities lending transactions outstanding as of December 31, 2018, are disclosed as “Payable upon return of securities loaned” on the Statement of Assets and Liabilities, where applicable. The Fund did not have securities on loan as of December 31, 2018.
Both the Fund and BNYM received compensation relating to the lending of the Fund’s securities. The amounts earned, if any, by the Fund for the fiscal year ended December 31, 2018, are reported under Investment Income on the Statement of Operations.
The following table provides information about the Fund’s investment in the Government Money Market Fund for the fiscal year ended December 31, 2018:
| | | | | | | | | | | | | | |
Beginning
Value as of
December 31, 2017 | | | Purchases
at Cost | | | Proceeds
from Sales | | | Ending
Value as of
December 31, 2018 | |
| | | |
| $ | — | | | $ | 32,784,571 | | | $ | (32,784,571 | ) | | $ | — | |
7. TAX INFORMATION
The tax character of distributions paid during the fiscal years ended December 31, 2017 and December 31, 2018 was as follows:
| | | | | | | | |
| | | 2017 | | | 2018 | |
| Distributions paid from: | | | | | | | | |
Ordinary income | | $ | 31,508,940 | | | $ | 6,015,014 | |
Net long-term capital gains | | | 70,710,830 | | | | 26,276,880 | |
| | |
Total taxable distributions | | $ | 102,219,770 | | | $ | 32,291,894 | |
As of December 31, 2018, the components of accumulated earnings (losses) on a tax-basis were as follows:
| | | | |
| Undistributed ordinary income — net | | $ | 583,920 | |
| Undistributed long-term capital gains | | | 5,494,529 | |
| Total undistributed earnings | | $ | 6,078,449 | |
| Timing differences (Deferred Dividend/Post October Loss Deferral) | | | (3,115,385 | ) |
| Unrealized losses — net | | | (2,200,981 | ) |
| Total accumulated earnings — net | | $ | 762,083 | |
21
GOLDMAN SACHS VARIABLE INSURANCE TRUST LARGE CAP VALUE FUND
Notes to Financial Statements(continued)
December 31, 2018
7. TAX INFORMATION (continued)
As of December 31, 2018, the Fund’s aggregate security unrealized gains and losses based on cost for U.S. federal income tax purposes were as follows:
| | | | |
| Tax cost | | $ | 428,767,455 | |
| Gross unrealized gain | | | 40,908,992 | |
| Gross unrealized loss | | | (43,109,973 | ) |
| Net unrealized loss | | $ | (2,200,981 | ) |
The difference between GAAP-basis and tax-basis unrealized gains (losses) is attributable primarily to wash sales.
GSAM has reviewed the Fund’s tax positions for all open tax years (the current and prior three years, as applicable) and has concluded that no provision for income tax is required in the Fund’s financial statements. Such open tax years remain subject to examination and adjustment by tax authorities.
8. OTHER RISKS
The Fund’s risks include, but are not limited to, the following:
Foreign Countries Risk — Investing in foreign markets may involve special risks and considerations not typically associated with investing in the U.S. Foreign securities may be subject to risk of loss because of more or less foreign government regulation, less public information and less economic, political and social stability in the countries in which the Fund invests. The imposition of exchange controls (including repatriation restrictions), confiscations, trade restrictions (including tariffs) and other government restrictions by the U.S. or other governments, or from problems in share registration, settlement or custody, may also result in losses. Foreign risk also involves the risk of negative foreign currency rate fluctuations, which may cause the value of securities denominated in such foreign currency (or other instruments through which the Fund has exposure to foreign currencies) to decline in value. Currency exchange rates may fluctuate significantly over short periods of time.
Foreign Custody Risk — If the Fund invests in foreign securities, the Fund may hold such securities and cash with foreign banks, agents, and securities depositories appointed by the Fund’s custodian (each a “Foreign Custodian”). Some foreign custodians may be recently organized or new to the foreign custody business. In some countries, Foreign Custodians may be subject to little or no regulatory oversight over, or independent evaluation of, their operations. Further, the laws of certain countries may place limitations on the Fund’s ability to recover its assets if a Foreign Custodian enters bankruptcy.
Investments in Other Investment Companies Risk — As a shareholder of another investment company, including an exchange-traded fund (“ETF”), the Fund will indirectly bear its proportionate share of any net management fees and other expenses paid by such other investment companies, in addition to the fees and expenses regularly borne by the Fund.
Large Shareholder Transactions Risk — The Fund may experience adverse effects when certain large shareholders, such as other funds, participating insurance companies, accounts and Goldman Sachs affiliates, purchase or redeem large amounts of shares of the Fund. Such large shareholder redemptions, which may occur rapidly or unexpectedly, may cause the Fund to sell portfolio securities at times when it would not otherwise do so, which may negatively impact the Fund’s NAV and liquidity. These transactions may also accelerate the realization of taxable income to shareholders if such sales of investments resulted in gains, and may also increase transaction costs. In addition, a large redemption could result in the Fund’s current expenses being allocated over a smaller asset base, leading to an increase in the Fund’s expense ratio. Similarly, large Fund share purchases may adversely affect the Fund’s performance to the extent that the Fund is delayed in investing new cash or otherwise maintains a larger cash position than it ordinarily would.
22
GOLDMAN SACHS VARIABLE INSURANCE TRUST LARGE CAP VALUE FUND
8. OTHER RISKS (continued)
Liquidity Risk — The Fund may make investments that are illiquid or that may become less liquid in response to market developments or adverse investor perceptions. Illiquid investments may be more difficult to value. Liquidity risk may also refer to the risk that the Fund will not be able to pay redemption proceeds within the allowable time period or without significant dilution to remaining investors’ interests because of unusual market conditions, an unusually high volume of redemption requests, or other reasons. To meet redemption requests, the Fund may be forced to sell investments at an unfavorable time and/or under unfavorable conditions. If the Fund is forced to sell securities at an unfavorable time and/or under unfavorable conditions, such sales may adversely affect the Fund’s NAV and dilute remaining investors’ interests. Liquidity risk may be the result of, among other things, the reduced number and capacity of traditional market participants to make a market in fixed income securities or the lack of an active market. The potential for liquidity risk may be magnified by a rising interest rate environment or other circumstances where investor redemptions from fixed income mutual funds may be higher than normal, potentially causing increased supply in the market due to selling activity.
Market and Credit Risks — In the normal course of business, the Fund trades financial instruments and enters into financial transactions where risk of potential loss exists due to changes in the market (market risk). Additionally, the Fund may also be exposed to credit risk in the event that an issuer or guarantor fails to perform or that an institution or entity with which the Fund has unsettled or open transactions defaults.
9. INDEMNIFICATIONS
Under the Trust’s organizational documents, its Trustees, officers, employees and agents are indemnified, to the extent permitted by the Act and state law, against certain liabilities that may arise out of performance of their duties to the Fund. Additionally, in the course of business, the Fund enters into contracts that contain a variety of indemnification clauses. The Fund’s maximum exposure under these arrangements is unknown, as this would involve future claims that may be made against the Fund that have not yet occurred. However, GSAM believes the risk of loss under these arrangements to be remote.
10. OTHER MATTERS
In September 2018, the Financial Accounting Standards Board issued Accounting Standards Update (ASU) 2018-13 — Fair Value Measurement (Topic 820) Disclosure Framework — Changes to the Disclosure Requirements for Fair Value Measurement. The amendments in the ASU modify fair value measurement disclosures. The amendments are effective for the Fund’s fiscal year beginning after December 15, 2019. GSAM is currently evaluating the impact, if any, of the amendments.
11. SUBSEQUENT EVENTS
Subsequent events after the Statement of Assets and Liabilities date have been evaluated, and GSAM has concluded that there is no impact requiring adjustment or disclosure in the financial statements.
23
GOLDMAN SACHS VARIABLE INSURANCE TRUST LARGE CAP VALUE FUND
Notes to Financial Statements(continued)
December 31, 2018
12. SUMMARY OF SHARE TRANSACTIONS
Share activity is as follows:
| | | | | | | | | | | | | | | | |
| | | For the Fiscal Year Ended
December 31, 2018 | | | For the Fiscal Year Ended
December 31, 2017 | |
| | | Shares | | | Dollars | | | Shares | | | Dollars | |
| Institutional Shares | | | | | | | | | | | | | | | | |
| Shares sold | | | 854,945 | | | $ | 7,399,623 | | | | 993,800 | | | $ | 10,470,019 | |
| Reinvestment of distributions | | | 1,482,019 | | | | 11,515,289 | | | | 3,928,394 | | | | 35,473,395 | |
| Shares redeemed | | | (3,417,525 | ) | | | (30,831,738 | ) | | | (8,151,726 | ) | | | (86,109,541 | ) |
| | | | (1,080,561 | ) | | | (11,916,826 | ) | | | (3,229,532 | ) | | | (40,166,127 | ) |
| Service Shares | | | | | | | | | | | | | | | | |
| Shares sold | | | 2,024,327 | | | | 17,913,623 | | | | 1,222,029 | | | | 12,830,356 | |
| Reinvestment of distributions | | | 2,673,952 | | | | 20,776,605 | | | | 7,391,625 | | | | 66,746,375 | |
| Shares redeemed | | | (7,416,119 | ) | | | (66,683,371 | ) | | | (21,328,914 | ) | | | (225,720,352 | ) |
| | | | (2,717,840 | ) | | | (27,993,143 | ) | | | (12,715,260 | ) | | | (146,143,621 | ) |
| NET DECREASE | | | (3,798,401 | ) | | $ | (39,909,969 | ) | | | (15,944,792 | ) | | $ | (186,309,748 | ) |
24
Report of Independent Registered Public Accounting Firm
To the Board of Trustees of
Goldman Sachs Variable Insurance Trust and Shareholders of Goldman Sachs Large Cap Value Fund
Opinion on the Financial Statements
We have audited the accompanying statement of assets and liabilities, including the schedule of investments, of Goldman Sachs Large Cap Value Fund (one of the funds constituting Goldman Sachs Variable Insurance Trust, referred to hereafter as the “Fund”) as of December 31, 2018, the related statement of operations for the year ended December 31, 2018, the statements of changes in net assets for each of the two years in the period ended December 31, 2018, including the related notes, and the financial highlights for each of the five years in the period ended December 31, 2018 (collectively referred to as the “financial statements”). In our opinion, the financial statements present fairly, in all material respects, the financial position of the Fund as of December 31, 2018, the results of its operations for the year then ended, the changes in its net assets for each of the two years in the period ended December 31, 2018 and the financial highlights for each of the five years in the period ended December 31, 2018 in conformity with accounting principles generally accepted in the United States of America.
Basis for Opinion
These financial statements are the responsibility of the Fund’s management. Our responsibility is to express an opinion on the Fund’s financial statements based on our audits. We are a public accounting firm registered with the Public Company Accounting Oversight Board (United States) (PCAOB) and are required to be independent with respect to the Fund in accordance with the U.S. federal securities laws and the applicable rules and regulations of the Securities and Exchange Commission and the PCAOB.
We conducted our audits of these financial statements in accordance with the standards of the PCAOB. Those standards require that we plan and perform the audit to obtain reasonable assurance about whether the financial statements are free of material misstatement, whether due to error or fraud.
Our audits included performing procedures to assess the risks of material misstatement of the financial statements, whether due to error or fraud, and performing procedures that respond to those risks. Such procedures included examining, on a test basis, evidence regarding the amounts and disclosures in the financial statements. Our audits also included evaluating the accounting principles used and significant estimates made by management, as well as evaluating the overall presentation of the financial statements. Our procedures included confirmation of securities owned as of December 31, 2018 by correspondence with the custodian and transfer agent. We believe that our audits provide a reasonable basis for our opinion.
PricewaterhouseCoopers LLP
Boston, Massachusetts
February 13, 2019
We have served as the auditor of one or more investment companies in the Goldman Sachs fund complex since 2000.
25
GOLDMAN SACHS VARIABLE INSURANCE TRUST LARGE CAP VALUE FUND
| | |
| Fund Expenses — Six Month Period Ended December 31, 2018 (Unaudited) | | |
As a shareholder of Institutional or Service Shares of the Fund, you incur ongoing costs, including management fees, distribution and/or service (12b-1) fees (with respect to Service Shares) and other Fund expenses. This example is intended to help you understand your ongoing costs (in dollars) of investing in the Institutional Shares and Service Shares of the Fund and to compare these costs with the ongoing costs of investing in other mutual funds.
The example is based on an investment of $1,000 invested at the beginning of the period and held for the entire period from July 1, 2018 through December 31, 2018, which represents a period of 184 days of a 365 day year.
Actual Expenses — The first line under each share class in the table below provides information about actual account values and actual expenses. You may use the information in this line, together with the amount you invested, to estimate the expenses that you paid over the period. Simply divide your account value by $1,000 (for example, an $8,600 account value divided by $1,000=8.6), then multiply the result by the number in the first line under the heading entitled “Expenses Paid” to estimate the expenses you paid on your account during this period.
Hypothetical Example for Comparison Purposes — The second line under each share class in the table below provides information about hypothetical account values and hypothetical expenses based on the Fund’s actual net expense ratio and an assumed rate of return of 5% per year before expenses, which is not the Fund’s actual return. The hypothetical account values and expenses may not be used to estimate the actual ending account balance or expenses you paid for the period. You may use this information to compare the ongoing costs of investing in the Fund and other funds. To do so, compare this 5% hypothetical example with the 5% hypothetical examples that appear in the shareholder reports of the other funds.
Please note that the expenses shown in the table are meant to highlight your ongoing costs only. As a shareholder of the Fund, you do not incur any transaction costs, such as sales charges, redemption fees, or exchange fees, but shareholders of other funds may incur such costs. The second line of the table is useful in comparing ongoing costs only and will not help you determine the relative total costs of owning different funds whose shareholders may incur transaction costs.
| | | | | | | | | | | | |
| Share Class | | Beginning
Account Value
07/01/18 | | | Ending
Account Value
12/31/18 | | | Expenses Paid
for the
6 Months
Ended
12/31/18* | |
| Institutional | | | | | | | | | | | | |
| Actual | | $ | 1,000 | | | $ | 934.00 | | | $ | 3.46 | |
| Hypothetical 5% return | | | 1,000 | | | | 1,021.63 | + | | | 3.62 | |
| Service | | | | | | | | | | | | |
| Actual | | | 1,000 | | | | 933.40 | | | | 4.68 | |
| Hypothetical 5% return | | | 1,000 | | | | 1,020.37 | + | | | 4.89 | |
| | + | Hypothetical expenses are based on the Fund’s actual annualized net expense ratios and an assumed rate of return of 5% per year before expenses. | |
| | * | Expenses are calculated using the Fund’s annualized net expense ratio for each class, which represents the ongoing expenses as a percentage of net assets for the six months ended December 31, 2018. Expenses are calculated by multiplying the annualized net expense ratio by the average account value for the period; then multiplying the result by the number of days in the most recent fiscal half year; and then dividing that result by the number of days in the fiscal year. The annualized net expense ratios for the period were 0.71% and 0.96% for the Institutional and Service Shares, respectively. | |
26
GOLDMAN SACHS VARIABLE INSURANCE TRUST LARGE CAP VALUE FUND
Trustees and Officers (Unaudited)
Independent Trustees
| | | | | | | | | | | | |
| | | | | |
Name,
Address and Age1 | | Position(s) Held
with the Trust | | Term of Office and
Length of
Time Served2 | | Principal Occupation(s) During Past 5 Years | | Number of
Portfolios in
Fund Complex
Overseen by
Trustee3 | | | Other Directorships Held by Trustee4 |
Jessica Palmer Age: 69 | | Chair of the Board of Trustees | | Since 2018 (Trustee since 2007) | | Ms. Palmer is retired. She was formerly Director, Emerson Center for the Arts and Culture (2011-2017); and Consultant, Citigroup Human Resources Department (2007-2008); Managing Director, Citigroup Corporate and Investment Banking (previously, Salomon Smith Barney/Salomon Brothers) (1984-2006). Ms. Palmer was a Member of the Board of Trustees of Indian Mountain School (private elementary and secondary school) (2004-2009). Chair of the Board of Trustees — Goldman Sachs Trust and Goldman Sachs Variable Insurance Trust. | | | 103 | | | None |
Kathryn A. Cassidy Age: 64 | | Trustee | | Since 2015 | | Ms. Cassidy is retired. Formerly, she was Advisor to the Chairman (May 2014-December 2014); and Senior Vice President and Treasurer (2008-2014), General Electric Company & General Electric Capital Corporation (technology and financial services companies). Trustee — Goldman Sachs Trust and Goldman Sachs Variable Insurance Trust. | | | 103 | | | None |
Diana M. Daniels Age: 69 | | Trustee | | Since 2007 | | Ms. Daniels is retired. Formerly, she was Vice President, General Counsel and Secretary, The Washington Post Company (1991-2006). Ms. Daniels is a Trustee Emeritus and serves as a Presidential Councillor of Cornell University (2013-Present); former Member of the Legal Advisory Board, New York Stock Exchange (2003-2006) and of the Corporate Advisory Board, Standish Mellon Management Advisors (2006-2007). Trustee — Goldman Sachs Trust and Goldman Sachs Variable Insurance Trust. | | | 103 | | | None |
Herbert J. Markley Age: 68 | | Trustee | | Since 2013 | | Mr. Markley is retired. Formerly, he was Executive Vice President, Deere & Company (an agricultural and construction equipment manufacturer) (2007-2009); and President, Agricultural Division, Deere & Company (2001-2007). Previously, Mr. Markley served as an Advisory Board Member of Goldman Sachs Trust and Goldman Sachs Variable Insurance Trust (June 2013-October 2013). Trustee — Goldman Sachs Trust and Goldman Sachs Variable Insurance Trust. | | | 103 | | | None |
Roy W. Templin Age: 58 | | Trustee | | Since 2013 | | Mr. Templin is retired. He is Director, Armstrong World Industries, Inc. (a designer and manufacturer of ceiling, wall and suspension system solutions) (2016-Present); and was formerly Chairman of the Board of Directors, Con-Way Incorporated (a transportation, logistics and supply chain management service company) (2014-2015); Executive Vice President and Chief Financial Officer, Whirlpool Corporation (an appliance manufacturer and marketer) (2004-2012). Previously, Mr. Templin served as an Advisory Board Member of Goldman Sachs Trust and Goldman Sachs Variable Insurance Trust (June 2013-October 2013). Trustee — Goldman Sachs Trust and Goldman Sachs Variable Insurance Trust. | | | 103 | | | Armstrong World Industries, Inc. (a ceiling, wall and suspension systems solutions manufacturer) |
Gregory G. Weaver Age: 67 | | Trustee | | Since 2015 | | Mr. Weaver is retired. He is Director, Verizon Communications Inc. (2015-Present); and was formerly Chairman and Chief Executive Officer, Deloitte & Touche LLP (a professional services firm) (2001-2005 and 2012-2014); and Member of the Board of Directors, Deloitte & Touche LLP (2006-2012). Trustee — Goldman Sachs Trust and Goldman Sachs Variable Insurance Trust. | | | 103 | | | Verizon Communications Inc. |
| | | | | | | | | | | | |
27
GOLDMAN SACHS VARIABLE INSURANCE TRUST LARGE CAP VALUE FUND
Trustees and Officers (Unaudited) (continued)
Interested Trustee*
| | | | | | | | | | | | |
| | | | | |
Name,
Address and Age1 | | Position(s) Held with the Trust | | Term of Office and
Length of
Time Served2 | | Principal Occupation(s) During Past 5 Years | | Number of
Portfolios in
Fund Complex
Overseen by
Trustee3 | | | Other Directorships Held by Trustee4 |
James A. McNamara Age: 56 | | President and Trustee | | Since 2007 | | Advisory Director, Goldman Sachs (January 2018-Present); Managing Director, Goldman Sachs (January 2000-December 2017); Director of Institutional Fund Sales, GSAM (April 1998-December 2000); and Senior Vice President and Manager, Dreyfus Institutional Service Corporation (January 1993- April 1998). President and Trustee — Goldman Sachs Trust; Goldman Sachs Variable Insurance Trust; Goldman Sachs Trust II; Goldman Sachs MLP Income Opportunities Fund; Goldman Sachs MLP and Energy Renaissance Fund; Goldman Sachs ETF Trust; Goldman Sachs Private Markets Fund 2018 LLC; Goldman Sachs Private Markets Fund 2018 (A) LLC; and Goldman Sachs Private Markets Fund 2018 (B) LLC. | | | 156 | | | None |
| | | | | | | | | | | | |
| * | Mr. McNamara is considered to be an “Interested Trustee” because he holds positions with Goldman Sachs and owns securities issued by The Goldman Sachs Group, Inc. Mr. McNamara holds comparable positions with certain other companies of which Goldman Sachs, GSAM or an affiliate thereof is the investment adviser, administrator and/or distributor. |
| 1 | Each Trustee may be contacted by writing to the Trustee, c/o Goldman Sachs, 200 West Street, New York, New York, 10282, Attn: Caroline Kraus. Information is provided as of December 31, 2018. |
| 2 | Subject to such policies as may be adopted by the Board from time-to-time, each Trustee holds office for an indefinite term, until the earliest of: (a) the election of his or her successor; (b) the date the Trustee resigns or is removed by the Board or shareholders, in accordance with the Trust’s Declaration of Trust; or (c) the termination of the Trust. The Board has adopted policies which provide that (a) no Trustee shall hold office for more than 15 years and (b) a Trustee shall retire as of December 31st of the calendar year in which he or she reaches his or her 74th birthday, unless a waiver of such requirement shall have been adopted by a majority of the other Trustees. These policies may be changed by the Trustees without shareholder vote. |
| 3 | The Goldman Sachs Fund Complex includes certain other companies listed above for each respective Trustee. As of December 31, 2018, Goldman Sachs Trust consisted of 90 portfolios (88 of which offered shares to the public); Goldman Sachs Variable Insurance Trust consisted of 13 portfolios; Goldman Sachs Trust II consisted of 19 portfolios (17 of which offered shares to the public); Goldman Sachs MLP Income Opportunities Fund, Goldman Sachs MLP and Energy Renaissance Fund, Goldman Sachs Private Markets Fund 2018 LLC, Goldman Sachs Private Markets Fund 2018 (A) LLC and Goldman Sachs Private Markets Fund 2018 (B) LLC each consisted of one portfolio; and Goldman Sachs ETF Trust consisted of 29 portfolios (14 of which offered shares to the public). |
| 4 | This column includes only directorships of companies required to report to the Securities and Exchange Commission under the Securities Exchange Act of 1934 (i.e., “public companies”) or other investment companies registered under the Act. |
Additional information about the Trustees is available in the Fund’s Statement of Additional Information, which can be obtained from Goldman Sachs free of charge by calling this toll-free number (in the United States of America): 1-800-526-7384.
28
GOLDMAN SACHS VARIABLE INSURANCE TRUST LARGE CAP VALUE FUND
Trustees and Officers (Unaudited) (continued)
Officers of the Trust*
| | | | | | |
| | | |
| Name, Address and Age1 | | Position(s) Held with the Trust | | Term of
Office and
Length of
Time Served2 | | Principal Occupation(s) During Past 5 Years |
James A. McNamara
200 West Street New York, NY 10282 Age: 56 | | Trustee and
President | | Since 2007 | | Advisory Director, Goldman Sachs (January 2018-Present); Managing Director, Goldman Sachs (January 2000-December 2017); Director of Institutional Fund Sales, GSAM (April 1998-December 2000); and Senior Vice President and Manager, Dreyfus Institutional Service Corporation (January 1993-April 1998). President and Trustee — Goldman Sachs Trust; Goldman Sachs Variable Insurance Trust; Goldman Sachs Trust II; Goldman Sachs MLP Income Opportunities Fund; Goldman Sachs MLP and Energy Renaissance Fund; Goldman Sachs ETF Trust; Goldman Sachs Private Markets Fund 2018 LLC; Goldman Sachs Private Markets Fund 2018 (A) LLC; and Goldman Sachs Private Markets Fund 2018 (B) LLC. |
Caroline L. Kraus
200 West Street New York, NY 10282 Age: 41 | | Secretary | | Since 2012 | | Managing Director, Goldman Sachs (January 2016-Present); Vice President, Goldman Sachs (August 2006-December 2015); Associate General Counsel, Goldman Sachs (2012-Present); Assistant General Counsel, Goldman Sachs (August 2006-December 2011); and Associate, Weil, Gotshal & Manges, LLP (2002-2006). Secretary — Goldman Sachs Trust (previously Assistant Secretary (2012)); Goldman Sachs Variable Insurance Trust (previously Assistant Secretary (2012)); Goldman Sachs Trust II; Goldman Sachs BDC, Inc.; Goldman Sachs Private Middle Market Credit LLC; Goldman Sachs Middle Market Lending Corp.; Goldman Sachs MLP Income Opportunities Fund; Goldman Sachs MLP and Energy Renaissance Fund; Goldman Sachs ETF Trust; Goldman Sachs Private Markets Fund 2018 LLC; Goldman Sachs Private Markets Fund 2018 (A) LLC; and Goldman Sachs Private Markets Fund 2018 (B) LLC. |
Scott M. McHugh
200 West Street New York, NY 10282 Age: 47 | | Treasurer, Senior
Vice President and
Principal Financial
Officer | | Since 2009
(Principal
Financial
Officer since
2013) | | Managing Director, Goldman Sachs (January 2016-Present); Vice President, Goldman Sachs (February 2007-December 2015); Assistant Treasurer of certain mutual funds administered by DWS Scudder (2005-2007); and Director (2005-2007), Vice President (2000-2005), and Assistant Vice President (1998-2000), Deutsche Asset Management or its predecessor (1998-2007). Treasurer, Senior Vice President and Principal Financial Officer — Goldman Sachs Trust; Goldman Sachs Variable Insurance Trust; Goldman Sachs Trust II; Goldman Sachs MLP Income Opportunities Fund; Goldman Sachs MLP and Energy Renaissance Fund; Goldman Sachs ETF Trust; Goldman Sachs Private Markets Fund 2018 LLC; Goldman Sachs Private Markets Fund 2018 (A) LLC; and Goldman Sachs Private Markets Fund 2018 (B) LLC. |
Joseph F. DiMaria
30 Hudson Street Jersey City, NJ 07302 Age: 50 | | Assistant Treasurer
and Principal
Accounting Officer | | Since 2016
(Principal
Accounting
Officer since
2017) | | Managing Director, Goldman Sachs (November 2015-Present) and Vice President — Mutual Fund Administration, Columbia Management Investment Advisers, LLC (May 2010-October 2015). Assistant Treasurer and Principal Accounting Officer — Goldman Sachs Trust; Goldman Sachs Variable Insurance Trust; Goldman Sachs Trust II; Goldman Sachs MLP Income Opportunities Fund; Goldman Sachs MLP and Energy Renaissance Fund; Goldman Sachs ETF Trust; Goldman Sachs Private Markets Fund 2018 LLC; Goldman Sachs Private Markets Fund 2018 (A) LLC; and Goldman Sachs Private Markets Fund 2018 (B) LLC. |
| | | | | | |
| * | Represents a partial list of officers of the Trust. Additional information about all the officers is available in the Fund’s Statement of Additional Information, which can be obtained from Goldman Sachs free of charge by calling this toll-free number (in the United States): 1-800-526-7384. |
| 1 | Information is provided as of December 31, 2018. |
| 2 | Officers hold office at the pleasure of the Board of Trustees or until their successors are duly elected and qualified. Each officer holds comparable positions with certain other companies of which Goldman Sachs, GSAM or an affiliate thereof is the investment adviser, administrator and/or distributor. |
Goldman Sachs Variable Insurance Trust — Tax Information (Unaudited)
For the year ended December 31, 2018, 95.22% of the dividends paid from net investment company taxable income by the Large Cap Value Fund qualify for the dividends received deduction available to corporations.
Pursuant to Section 852 of the Internal Revenue Code, the Large Cap Value Fund designates $26,276,880 or, if different, the maximum amount allowable, as capital gain dividends paid during the fiscal year ended December 31, 2018.
29
| | |
| TRUSTEES | | OFFICERS |
| Jessica Palmer,Chair | | James A. McNamara,President |
| Kathryn A. Cassidy | | Scott M. McHugh,Treasurer, Senior Vice |
| Diana M. Daniels | | President and Principal Financial Officer |
| Herbert J. Markley | | Joseph F. DiMaria,Assistant Treasurer |
| James A. McNamara | | and Principal Accounting Officer |
| Roy W. Templin | | Caroline L. Kraus,Secretary |
| Gregory G. Weaver | | |
GOLDMAN SACHS & CO. LLC
Distributor and Transfer Agent
GOLDMAN SACHS ASSET MANAGEMENT, L.P.
Investment Adviser
200 West Street, New York
New York 10282
Visit our web site at www.GSAMFUNDS.com to obtain the most recentmonth-end returns.
The reports concerning the Fund included in this shareholder report may contain certain forward-looking statements about the factors that may affect the performance of the Fund in the future. These statements are based on Fund management’s predictions and expectations concerning certain future events and their expected impact on the Fund, such as performance of the economy as a whole and of specific industry sectors, changes in the levels of interest rates, the impact of developing world events, and other factors that may influence the future performance of the Fund. Management believes these forward-looking statements to be reasonable, although they are inherently uncertain and difficult to predict. Actual events may cause adjustments in portfolio management strategies from those currently expected to be employed.
A description of the policies and procedures that the Fund uses to determine how to vote proxies relating to portfolio securities and information regarding how the Fund voted proxies relating to portfolio securities for the12-month period ended December 31 is available (i) without charge, upon request by calling1-800-621-2550; and (ii) on the Securities and Exchange Commission (“SEC”) web site athttp://www.sec.gov.
The Fund files its complete schedule of portfolio holdings with the SEC for the first and third quarters of each fiscal year onForm N-Q. The Fund’sForm N-Qs are available on the SEC’s web site at http://www.sec.gov within 60 days after the Fund’s first and third fiscal quarters.Form N-Qs may be obtained upon request and without charge by calling1-800-621-2550.
Views and opinions expressed are for informational purposes only and do not constitute a recommendation by GSAM to buy, sell, or hold any security. Views and opinions are current as of the date of this presentation and may be subject to change, they should not be construed as investment advice.
Goldman Sachs & Co. LLC (“Goldman Sachs”) does not provide legal, tax or accounting advice. Any statement contained in this communication (including any attachments) concerning U.S. tax matters was not intended or written to be used, and cannot be used, for the purpose of avoiding penalties under the Internal Revenue Code, and was written to support the promotion or marketing of transaction or matter addressed. Clients of Goldman Sachs should obtain their own independent tax advice based on their particular circumstances.
The website links provided are for your convenience only and are not an endorsement or recommendation by GSAM of any of these websites or the products or services offered. GSAM is not responsible for the accuracy and validity of the content of these websites.
Fund holdings and allocations shown are as of December 31, 2018 and may not be representative of future investments. Fund holdings should not be relied on in making investment decisions and should not be construed as research or investment advice regarding particular securities. Current and future holdings are subject to risk.
References to indices, benchmarks or other measures of relative market performance over a specified period of time are provided for your information only and do not imply that the portfolio will achieve similar results. The index composition may not reflect the manner in which a portfolio is constructed. While an adviser seeks to design a portfolio which reflects appropriate risk and return features, portfolio characteristics may deviate from those of the benchmark.
The Global Industry Classification Standard (“GICS”) was developed by and is the exclusive property and a service mark of Morgan Stanley Capital International Inc. (“MSCI”) and Standard & Poor’s, a division of The McGraw-Hill Companies, Inc. (“S&P”) and is licensed for use by Goldman Sachs. Neither MSCI, S&P nor any other party involved in making or compiling the GICS or any GICS classifications makes any express or implied warranties or representations with respect to such standard or classification (or the results to be obtained by the use thereof), and all such parties hereby expressly disclaim all warranties of originality, accuracy, completeness, merchantability or fitness for a particular purpose with respect to any of such standard or classification. Without limiting any of the foregoing, in no event shall MSCI, S&P, any of their affiliates or any third party involved in making or compiling the GICS or any GICS classifications have any liability for any direct, indirect, special, punitive, consequential or any other damages (including lost profits) even if notified of the possibility of such damages.
The portfolio risk management process includes an effort to monitor and manage risk, but does not imply low risk.
Shares of the Goldman Sachs VIT Funds are offered to separate accounts of participating life insurance companies for the purpose of funding variable annuity contracts and variable life insurance policies. Shares of the Fund are not offered directly to the general public. The variable annuity contracts and variable life insurance policies are described in the separate prospectuses issued by participating insurance companies. You should refer to those prospectuses for information about surrender charges, mortality and expense risk fees and other charges that may be assessed by participating insurance companies under the variable annuity contracts or variable life insurance policies. Such fees or charges, if any, may affect the return you may realize with respect to your investments. Ask your representative for more complete information. Please consider a fund’s objectives, risks and charges and expenses, and read the prospectus carefully before investing. The prospectus contains this and other information about the Fund.
This material is not authorized for distribution to prospective investors unless preceded or accompanied by a current prospectus or summary prospectus, if applicable. Investors should consider the Fund’s objective, risks, and charges and expenses, and read the summary prospectus, if available, and/or the prospectus carefully before investing or sending money. The summary prospectus, if available, and the prospectus contain this and other information about the Fund and may be obtained from your authorized dealer or from Goldman Sachs & Co. LLC by calling1-800-621-2550.
This report is prepared for the general information of contract owners and is not an offer of shares of the Goldman Sachs Variable Insurance Trust — Goldman Sachs Large Cap Value Fund.
© 2019 Goldman Sachs. All rights reserved.
VITLCVAR-19/157036-OTU-914514/38.5K
Goldman
SachsVariable Insurance Trust
Goldman Sachs
Mid Cap Value Fund
Annual Report
December 31, 2018

GOLDMAN SACHS VARIABLE INSURANCE TRUST MID CAP VALUE FUND
INVESTMENT OBJECTIVE
The Fund seeks long-term capital appreciation.
Portfolio Management Discussion and Analysis
Below, the Goldman Sachs Value Portfolio Management Team discusses the Goldman Sachs Variable Insurance Trust — Goldman Sachs Mid Cap Value Fund’s (the “Fund”) performance and positioning for the12-month period ended December 31, 2018 (the “Reporting Period”).
How did the Fund perform during the Reporting Period?
During the Reporting Period, the Fund’s Institutional and Service Shares generated average annual total returns of –10.46% and –10.70%, respectively. These returns compare to the –12.29% average annual total return of the Fund’s benchmark, the Russell Midcap® Value Index (with dividends reinvested) (the “Russell Index”), during the same time period.
What economic and market factors most influenced the equity markets as a whole during the Reporting Period?
Representing the U.S. equity market, the S&P 500® Index returned –9.03% in December 2018, posting its worst December since 1931 and bringing its total return to –4.38% for the Reporting Period, the worst calendar year since 2008.
Despite a strong start to the Reporting Period in January 2018 amid solid economic data, a $1.5 trillion tax reform law signed in December 2017, and a favorable corporate earnings season, U.S. equities endured a challenging and volatile year in 2018. In February 2018, U.S. and international equities sold off on market speculation of a faster pace of Federal Reserve (“Fed”) short-term interest rate hikes, which stoked a sharp rise in bond yields and an increase in equity market volatility. Concerns about Fed monetary policy tightening were further exacerbated by solid U.S. labor and inflation data. While the hawkish Fed minutes were largely expected, new Fed Chair Jerome Powell’s Congressional testimony, positing a more optimistic economic outlook since the December 2017 Fed meeting, surprised equity markets with its hawkish tilt, sparking anothersell-off in the U.S. equity markets. (Jerome Powell assumed the chairmanship of the Fed in February 2018. Hawkish language tends to suggest higher interest rates; opposite of dovish.) In March 2018, escalating trade tensions and potential tariffs weighed on investor sentiment. Meanwhile, the Fed delivered on a widely expected interest rate increase, with its “dot plot” pointing to a total of three interest rate hikes this calendar year and potentially two in 2019. (The “dot plot” shows rate projections of the members of the Fed’s Open Market Committee.) However, Fed policymakers acknowledged that the “economic outlook has strengthened in recent months,” revising their economic growth forecast higher and their unemployment forecast lower.
By the end of the Reporting Period, the Fed had hiked interest rates four times and communicated an upbeat view of its economic outlook, spurred by strong U.S. labor and inflation data. Against the strong fundamentals, escalating trade tensions, fears of a global economic slowdown and populist politics weighed on investor sentiment throughout the calendar year. After second and third calendar quarters of generally solid gains, supported by a combination of robust economic growth, strong corporate profits and rising earnings estimates, U.S. equities fell sharply again in the fourth quarter of 2018, as investor sentiment rapidly deteriorated on heightened trade and political uncertainty and in a delayed response to an earliersell-off in global rates. The correction resulted in tighter U.S. financial conditions, which had been resilient to Fed interest rate hikes earlier in the year. U.S. equities saw a reprieve in November 2018 on more accommodative comments from Fed Chair Powell and on encouraging progress towardChina-U.S. trade talks. However, the recovery was short-lived, as U.S. equities plunged in December 2018 on renewed investor fears sparked by the arrest of a Chinese technology executive, the partial Federal government shutdown and the U.S. President’s criticism of Fed Chair Powell.
For the Reporting Period overall, seven sectors posted negative absolute returns and four generated positive returns. Health care, utilities, consumer discretionary and information technology were the best performing sectors in the S&P 500® Index, as measured by total return, and the weakest performing sectors in the S&P 500® Index during the Reporting Period were energy, materials, industrials and financials.(After the close of business on September 28, 2018, the telecommunications services sector was renamed the communication services sector and was broadened to include certain companies from the information technology and consumer discretionary sectors that facilitate communication and offer related content and information through various media.)
Within the U.S. equity market, there was significant disparity in performance not only among sectors but also among the various capitalization and style segments. While all capitalization segments posted negative returns,large-cap stocks, as measured by the
1
GOLDMAN SACHS VARIABLE INSURANCE TRUST MID CAP VALUE FUND
Russell 1000® Index, performed best, followed at some distance bymid-cap stocks, as measured by the Russell Midcap® Index, and thensmall-cap stocks, as measured by the Russell 2000® Index. From a style perspective, growth-oriented stocks significantly outpaced value-oriented stocks across the capitalization spectrum. (All as measured by the FTSE Russell indices.)
What key factors were responsible for the Fund’s performance during the Reporting Period?
The Fund posted negative absolute returns but outperformed the Russell Index during the Reporting Period due primarily to stock selection overall. Sector allocation as a whole also contributed positively, albeit more modestly, to the Fund’s performance relative to the Russell Index during the Reporting Period.
Which equity market sectors most significantly affected Fund performance?
Contributing most positively to the Fund’s relative results during the Reporting Period was effective stock selection in the information technology, materials and consumer staples sectors. Having an overweighted allocation to the strongly performing information technology sector also helped. Maintaining a position in cash, though modest, also added value during a Reporting Period when the Russell Index declined sharply. Such positive contributors were only partially offset by stock selection in the financials sector, which detracted. Allocation positioning in the industrials and real estate sectors also dampened the Fund’s relative results.
What were some of the Fund’s best-performing individual stocks?
The Fund benefited most relative to the Russell Index from positions in Ball, Red Hat and Fidelity National Information Services.
Ball is a metal packaging company that produces goods for beverages, household products and aerospace technologies. Its stock experienced weakness in the first half of 2018 but then turned around, as challenges surrounding its acquisition of London-based metal beverage can maker Rexam began to subside. Its stock also reacted positively to an earnings report that highlighted strong cash generation and better than market expected sales and core earnings before interest, taxes, depreciation and amortization across all sectors. At the end of the Reporting Period, we viewed Ball as a highly diversified company that has growing market share in the defense industry, a leader in the fragmented aerosol space and one of the more sustainable companies in beverage can production. Additionally, we saw positive upside potential moving forward given the company’s wide range of commercial opportunities to leverage its new global leadership position along with a multi-year stretch of margin improvement.
Red Hat, a software solutions company serving the enterprise community, was a new purchase for the Fund during the Reporting Period. Its shares soared in late October 2018 after IBM announced an offer to acquire Red Hat for a significant premium to its market price. This acquisition was in line with our thesis of consolidation within the software industry. We also believe the company has impressive growth prospects, led mostly by new business, and has solid sales capacity through its partnerships with cloud providers.
Fidelity National Information Services is a financial services technology company. Its performance throughout the Reporting Period was supported by three consecutive quarters of strong new sales and a healthy pipeline that has driven market optimism going into 2019. At the end of the Reporting Period, we were confident in what we saw as the improved quality of the company’s portfolio, solid revenue streams and rising free cash flows.
Which stocks detracted significantly from the Fund’s performance during the Reporting Period?
Detracting from the Fund’s results relative to the Russell Index were positions in LKQ, Stanley Black & Decker and Alkermes.
LKQ is an aftermarket automotive company. Its stock began to decline in April 2018 following an earnings reports that fell short of market expectations due to operational challenges. Its share price continued to decline after the company reported third quarter earnings that showed lower than market expected margin improvement, slightly lowered guidance and relativelyin-line earnings per share and organic sales. However, at the end of the Reporting Period, we remained optimistic about LKQ as operational improvement, in our opinion, has been evident across all aspects of its business. In our view, its valuation remained well below historical averages at the end of the Reporting Period, and its margins had improved.
Stanley Black & Decker is a global producer of tools, security systems and industrial products. In April 2018, the company reported strong earnings results, despite significant commodity headwinds. However, its gross margins came in below the market’s expectations, resulting in its stock’s sharp decline. At the end of the Reporting Period, we remained positive on the company moving forward, given its dominant industry position, which we believe should allow the company to offset inflation through price increases. In our view, the company’s multiple new product launches as well as future acquisition opportunities should continue to drive its growth above peer levels.
2
GOLDMAN SACHS VARIABLE INSURANCE TRUST MID CAP VALUE FUND
Alkermes, a biopharmaceutical company, was a new purchase for the Fund during the Reporting Period. Its share price declined in April 2018 following its announcement that the Food and Drug Administration (“FDA”) had refused to review Alkermes’ depression drug candidate. The FDA cited insufficient efficacy and requested additional clinical trials. The company’s stock saw another downturn in late June 2018 in conjunction with the release of the FDA’s new guidelines for developing drugs for major depressive disorder. While we still believe the company has some attractive growth opportunities, we exited the position in favor of what we viewed as better risk/reward opportunities elsewhere.
How did the Fund use derivatives and similar instruments during the Reporting Period?
During the Reporting Period, we did not use derivatives.
Did the Fund make any significant purchases or sales during the Reporting Period?
In addition to those purchases already mentioned, we initiated a Fund position in M&T Bank, a regional bank holding company, during the Reporting Period. We purchased the company because, although it had a slightly higher valuation than its peers, we viewed it as a higher quality company with a stronger balance sheet, making it more likely, in our opinion, to hold up well in more volatile market conditions.
We established a Fund position in Cooper Companies, a medical device company with exposure to the contact lens and women’s health space. While we have liked this company for some time due to what we see as its steady cash flows and consistent market share growth, when its valuation began to contract fromall-time highs, we purchased the company with the belief that it is a solid risk/reward opportunity in a growing industry.
Conversely, in addition to those sales already mentioned, we exited the Fund’s position in Westinghouse Air Brake Technologies, an equipment and system services company for the transit and freight rail industry. While we were originally positive on the company due to its technological advantages and favorable industry backdrop, our thesis began to change as freight orders began to decline. Demand for locomotives has dropped as railroad companies have transitioned to precision railroading, a process that maximizes the utilization of assets already held. In turn, this process minimizes the need to purchase new assets, causing a severe cyclical headwind, at least in the near term. Additionally, a lack of clarity from its management around margins dampened our confidence in the company. Given these conditions and the strong performance of the stock during the first half of the Reporting Period, we sold the position in favor of what we considered to be better risk/reward opportunities elsewhere.
We eliminated the Fund’s position in Steel Dynamics, a carbon-steel producer and metals recycler. We had originally purchased the company because fiscal stimulus and accommodative monetary policy improved market conditions, in our view. Steel Dynamics was also trading at a discount to its peers and utilized environmentally friendly and cost efficient production methods. However, we sold the Fund’s position in August 2018 as trade tensions and cost inputs began to increase margin pressures across the industry. After selling the stock, it sharply declined in the fourth quarter of 2018, helping to contribute to the Fund’s relative returns.
Were there any notable changes in the Fund’s weightings during the Reporting Period?
In constructing the Fund’s portfolio, we focus on picking stocks rather than on making industry or sector bets. We seek to outpace the benchmark index by overweighting stocks that we expect to outperform and underweighting those that we think may lag. Consequently, changes in its sector weights are generally the direct result of individual stock selection or of stock appreciation or depreciation. That said, during the Reporting Period, the Fund’s exposure to financials, health care, information technology, real estate and utilities increased and its exposure to communication services, consumer staples and industrials decreased compared to the Russell Index.
How was the Fund positioned relative to its benchmark index at the end of the Reporting Period?
At the end of December 2018, the Fund had an overweighted position relative to the Russell Index in the information technology sector. On the same date, the Fund had underweighted positions compared to the Russell Index in industrials, communication services and consumer staples and was rather neutrally weighted to the Russell Index in consumer discretionary, energy, financials, health care, materials, real estate and utilities.
Were there any changes to the Fund’s portfolio management team during the Reporting Period?
Effective January 9, 2018, Goldman Sachs Asset Management, L.P. (the “Investment Adviser”) centralized its Fundamental Equity U.S. Value and Fundamental Equity U.S. Growth Teams into a single Fundamental Equity U.S. Equity Team. Effective the same date, decision-making for the Fund’s strategy was centralized with lead portfolio managers, who draw upon the combined team for idea generation and make final investment decisions. The Investment Adviser believes these changes will benefit the Funds by
3
GOLDMAN SACHS VARIABLE INSURANCE TRUST MID CAP VALUE FUND
providing a more holistic investment perspective and the ability to leverage investment ideas across the U.S. Fundamental Equity platform.
Effective the same date, Adam Agress, vice president, joined Sean Gallagher and Sung Cho as aco-lead portfolio manager for the Fund’s strategy. Adam has 12 years of investment experience. Tim Ryan no longer serves as aco-lead portfolio manager with Sung on this Fund but maintains hisco-lead portfolio manager role on other Goldman Sachs Funds that focus on a U.S. real estate securities strategy. Sean Gallagher announced his retirement, effective September 30, 2018. There were no changes to the investment process or philosophy of the Fund’s strategy. We remain committed to high quality,bottom-up research and to the time-tested investment philosophy of the Fund’s strategy. We continue to believe that deep knowledge of company-specific and industry trends is key to our research edge.
What is the Fund’s tactical view and strategy for the months ahead?
At the end of the Reporting Period, we believed the risk/reward balance for equities in 2019 had improved relative to 2018 following thede-rating in valuation multiples, or price/earnings ratios, in the fourth quarter of 2018. We saw continued expansion of global economic growth and corporate profits. We believed U.S. economic growth would likely moderate in 2019, while the slowdown outside of the U.S. may be behind us. In our view, the ongoing global economic expansion should underpin corporate earnings growth, which we expect to remain positive across all global regions in 2019, supporting risk assets, such as equities. Meanwhile, lower valuations provide, in our view, an attractive entry point. Several challenges in 2018 — such as trade tensions and populist politics — resulted in a sharpde-rating. We think the shift in valuations was overdone relative to both macro and corporate fundamentals. Concerns around the length of the current economic cycle, trade tensions and populist politics may well continue, but we believed at the end of the Reporting Period that it was too soon to position for the end of the cycle and markets have already gone too far in pricing in the risks.
As the U.S. economic expansion approaches the longest on record, late-cycle signs, such as a tight labor market, firming inflation, higher volatility and a flatter yield curve, along with fading fiscal support and continued Fed interest rate hikes, have increased focus, we feel, on a possible moderation in U.S. economic growth. However, discussions around peak earnings are premature, in our view, as margins have historically continued to expand until very close to the beginning of recessions.
We believe rising interest rates and cost pressures make pricing power an increasingly critical differentiator of success. Selectivity, in our view, is also increasingly important amid higher volatility, elevated political and trade risks and slowing revenue growth and margin pressures. We believe this divergence between winners and losers reinforces the importance of active management.
Regardless of market direction, our fundamental,bottom-up stock selection continues to drive our process, rather than headlines or sentiment. We maintain high conviction in the companies the Fund owns and believe they have the potential to outperform relative to the broader market regardless of economic growth conditions. We continue to focus on undervalued companies that we believe have comparatively greater control of their own destiny, such as innovators with differentiated products, companies with low cost structures or companies that have been investing in their own businesses and may be poised to gain market share. We maintain our discipline in identifying companies with what we believe to be strong or improving balance sheets, led by quality management teams and trading at discounted valuations. We remain focused on the long-term performance of the Fund.
4
GOLDMAN SACHS VARIABLE INSURANCE TRUST MID CAP VALUE FUND
Index Definitions
The Russell Midcap Value® Index is an unmanaged index of common stock prices that measures the performance of those Russell Midcap companies with lower price-to-book ratios and lower forecasted growth values. The index figures do not reflect any deduction for fees, expenses or taxes.
The Russell 2000® Index is an unmanaged index of common stock prices that measures the performance of the 2000 smallest companies in the Russell 3000® Index. The figures for the index do not include any deduction for fees, expenses or taxes.
The S&P 500® Index is the Standard & Poor’s composite index of 500 stocks, an unmanaged index of common stock prices. The figures for the index do not include any deduction for fees, expenses or taxes.
The Russell Midcap® Index measures the performance of the 800 smallest companies in the Russell 1000® Index, which represent approximately 25% of the total market capitalization of the Russell 1000® Index.
The Russell 1000® Index measures the performance of the 1,000 largest companies in the Russell 3000® Index, which represent approximately 92% of the total market capitalization of the Russell 3000® Index.
It is not possible to invest directly in an index.
5
FUND BASICS
Mid Cap Value Fund
as of December 31, 2018
STANDARDIZED TOTAL RETURNS1
| | | | | | | | | | | | | | | | | | |
| | | | | |
| For the period ended 12/31/18 | | One Year | | | Five Years | | | Ten Years | | | Since Inception | | | Inception Date |
| Institutional | | | -10.46 | % | | | 3.08 | % | | | 11.05 | % | | | 7.78 | % | | 5/01/98 |
| Service | | | -10.70 | | | | 2.82 | | | | 10.78 | | | | 5.63 | | | 1/09/06 |
| 1 | The Standardized Total Returns are average annual total returns as of the most recent calendar quarter-end. They assume reinvestment of all distributions at net asset value (“NAV”). Because Institutional Shares and Service Shares do not involve a sales charge, such a charge is not applied to their Standardized Total Returns. |
Total return figures in the above chart represent past performance and do not indicate future results, which will vary. The investment return and principal value of an investment will fluctuate and, therefore, an investor’s shares, when redeemed, may be worth more or less than their original cost. Current performance may be lower or higher than the total return figures in the above chart. Please visit www.GSAMFUNDS.com to obtain the most recent month-end returns.Performance reflects fee waivers and/or expense limitations in effect during the periods shown. In their absence, performance would be reduced.
EXPENSE RATIOS2
| | | | | | | | |
| | |
| | | Net Expense Ratio (Current) | | | Gross Expense Ratio (Before Waivers) | |
| Institutional | | | 0.84 | % | | | 0.84 | % |
| Service | | | 1.09 | | | | 1.09 | |
| 2 | The expense ratios of the Fund, both current (net of any fee waivers and/or expense limitations) and before waivers (gross of any fee waivers and/or expense limitations) are as set forth above according to the most recent publicly available Prospectuses for the Fund and may differ from the expense ratios disclosed in the Financial Highlights in this report. Pursuant to a contractual arrangement, the Fund’s fee waivers and/or expense limitations will remain in place through at least April 30, 2019, and prior to such date, the Investment Adviser may not terminate the arrangements without the approval of the Fund’s Board of Trustees. If these arrangements are discontinued in the future, the expense ratios may change without shareholder approval. |
TOP TEN HOLDINGS AS OF 12/31/183
| | | | | | |
| | |
| Holding | | % of Net Assets | | | Line of Business |
| Fidelity National Information Services, Inc. | | | 2.6% | | | Software & Services |
| Xcel Energy, Inc. | | | 1.8 | | | Utilities |
| Stanley Black & Decker, Inc. | | | 1.8 | | | Capital Goods |
| L3 Technologies, Inc. | | | 1.7 | | | Capital Goods |
| Public Service Enterprise Group, Inc. | | | 1.7 | | | Utilities |
| Ball Corp. | | | 1.7 | | | Materials |
| M&T Bank Corp. | | | 1.7 | | | Banks |
| CMS Energy Corp. | | | 1.6 | | | Utilities |
| Cooper Cos., Inc. (The) | | | 1.6 | | | Health Care Equipment & Services |
| AvalonBay Communities, Inc. (REIT) | | | 1.6 | | | Real Estate |
| 3 | The top 10 holdings may not be representative of the Fund’s future investments. |
6
FUND BASICS
FUND vs. BENCHMARK SECTOR ALLOCATIONS4
As of December 31, 2018
| 4 | The Fund is actively managed and, as such, its composition may differ over time. Consequently, the Fund’s overall sector allocations may differ from percentages contained in the graph above. The graph categorizes investments using Global Industry Classification Standard (“GICS”); however, the sector classifications used by the portfolio management team may differ from GICS. The percentage shown for each investment category reflects the value of investments in that category as a percentage of market value. Underlying sector allocations of exchange traded funds and investment companies held by the Fund are not reflected in the graph above. |
7
GOLDMAN SACHS VARIABLE INSURANCE TRUST MID CAP VALUE FUND
Performance Summary
December 31, 2018
The following graph shows the value, as of December 31, 2018, of a $10,000 investment made on January 1, 2009 in Institutional Shares at NAV. For comparative purposes, the performance of the Fund’s benchmark, the Russell Midcap Value® Index (with distributions reinvested), is shown. This performance data represents past performance and should not be considered indicative of future performance, which will fluctuate with changes in market conditions. These performance fluctuations may cause an investor’s shares, when redeemed, to be worth more or less than their original cost. Performance reflects Fund level expenses but does not reflect fees and expenses associated with any variable annuity contract or variable life insurance policy that uses the Fund as an investment option for any contract or policy. Had performance reflected all of those fees and expenses, performance would have been reduced. Performance reflects applicable fee waivers and/or expense limitations in effect during the periods shown, and in their absence, performance would be reduced. Performance of Service Shares will vary from Institutional Shares due to differences in class specific fees. In addition to the Investment Adviser’s decisions regarding issuer/industry investment selection and allocation, other factors may affect Fund performance. These factors include, but are not limited to, Fund operating fees and expenses, portfolio turnover, and subscription and redemption cash flows affecting the Fund.
Mid Cap Value Fund’s 10 Year Performance
Performance of a $10,000 investment, with distributions reinvested, from January 1, 2009 through December 31, 2018.
| | | | | | | | |
| Average Annual Total Return through December 31, 2018 | | One Year | | Five Years | | Ten Years | | Since Inception |
Institutional (Commenced May 1, 1998) | | -10.46% | | 3.08% | | 11.05% | | 7.78% |
Service (Commenced January 9, 2006) | | -10.70% | | 2.82% | | 10.78% | | 5.63% |
8
GOLDMAN SACHS VARIABLE INSURANCE TRUST MID CAP VALUE FUND
Schedule of Investments
December 31, 2018
| | | | | | | | |
| Shares | | | Description | | Value | |
|
| | Common Stocks – 97.9% | |
| | Automobiles & Components – 0.5% | |
| | 31,837 | | | Aptiv plc | | $ | 1,960,204 | |
| | |
| | Banks – 7.6% | | | | |
| | 123,043 | | | Citizens Financial Group, Inc. | | | 3,658,068 | |
| | 51,252 | | | Comerica, Inc. | | | 3,520,500 | |
| | 65,026 | | | First Republic Bank | | | 5,650,760 | |
| | 43,513 | | | M&T Bank Corp. | | | 6,228,016 | |
| | 46,664 | | | Signature Bank | | | 4,797,526 | |
| | 97,703 | | | SunTrust Banks, Inc. | | | 4,928,139 | |
| | | | | | | | |
| | | | | | | 28,783,009 | |
| | |
| | Capital Goods – 6.6% | | | | |
| | 72,269 | | | Flowserve Corp. | | | 2,747,667 | |
| | 113,449 | | | ITT, Inc. | | | 5,476,183 | |
| | 58,071 | | | Jacobs Engineering Group, Inc. | | | 3,394,831 | |
| | 37,281 | | | L3 Technologies, Inc. | | | 6,474,219 | |
| | 57,297 | | | Stanley Black & Decker, Inc. | | | 6,860,743 | |
| | | | | | | | |
| | | | | | | 24,953,643 | |
| | |
| | Consumer Durables & Apparel – 1.8% | | | | |
| | 29,084 | | | Lennar Corp. Class A | | | 1,138,639 | |
| | 32,755 | | | PVH Corp. | | | 3,044,577 | |
| | 74,566 | | | Tapestry, Inc. | | | 2,516,602 | |
| | | | | | | | |
| | | | | | | 6,699,818 | |
| | |
| | Consumer Services – 2.7% | | | | |
| | 40,264 | | | Dunkin’ Brands Group, Inc. | | | 2,581,727 | |
| | 53,550 | | | Restaurant Brands International, Inc. | | | 2,800,665 | |
| | 48,511 | | | Royal Caribbean Cruises Ltd. | | | 4,743,891 | |
| | | | | | | | |
| | | | | | | 10,126,283 | |
| | |
| | Diversified Financials – 3.7% | | | | |
| | 23,684 | | | Cboe Global Markets, Inc. | | | 2,317,006 | |
| | 66,682 | | | E*TRADE Financial Corp. | | | 2,926,006 | |
| | 47,987 | | | Lazard Ltd. Class A | | | 1,771,200 | |
| | 56,681 | | | Northern Trust Corp. | | | 4,737,965 | |
| | 109,013 | | | Starwood Property Trust, Inc. (REIT) | | | 2,148,646 | |
| | | | | | | | |
| | | | | | | 13,900,823 | |
| | |
| | Energy – 5.7% | | | | |
| | 32,106 | | | Apergy Corp.* | | | 869,431 | |
| | 72,318 | | | Cheniere Energy, Inc.* | | | 4,280,502 | |
| | 37,667 | | | Concho Resources, Inc.* | | | 3,871,791 | |
| | 30,392 | | | Diamondback Energy, Inc. | | | 2,817,338 | |
| | 58,446 | | | Marathon Petroleum Corp. | | | 3,448,898 | |
| | 65,132 | | | Targa Resources Corp. | | | 2,346,055 | |
| | 102,952 | | | Williams Cos., Inc. (The) | | | 2,270,092 | |
| | 137,638 | | | WPX Energy, Inc.* | | | 1,562,191 | |
| | | | | | | | |
| | | | | | | 21,466,298 | |
| | |
| | Food, Beverage & Tobacco – 3.8% | | | | |
| | 56,656 | | | Bunge Ltd. | | | 3,027,697 | |
| | 86,010 | | | Coca-Cola European Partners plc | | | 3,943,559 | |
| | 72,576 | | | Conagra Brands, Inc. | | | 1,550,223 | |
| | |
|
| | Common Stocks – (continued) | |
| | Food, Beverage & Tobacco – (continued) | | | | |
| | 27,297 | | | McCormick & Co., Inc. (Non-Voting) | | $ | 3,800,834 | |
| | 128,227 | | | Nomad Foods Ltd.* | | | 2,143,955 | |
| | | | | | | | |
| | | | | | | 14,466,268 | |
| | |
| | Health Care Equipment & Services – 5.3% | | | | |
| | 60,167 | | | Acadia Healthcare Co., Inc.* | | | 1,546,894 | |
| | 23,839 | | | Cooper Cos., Inc. (The) | | | 6,067,025 | |
| | 41,380 | | | Laboratory Corp. of America Holdings* | | | 5,228,777 | |
| | 9,674 | | | Teleflex, Inc. | | | 2,500,536 | |
| | 45,559 | | | Zimmer Biomet Holdings, Inc. | | | 4,725,379 | |
| | | | | | | | |
| | | | | | | 20,068,611 | |
| | |
| | Insurance – 6.5% | | | | |
| | 117,880 | | | Arch Capital Group Ltd.* | | | 3,149,754 | |
| | 10,130 | | | Everest Re Group Ltd. | | | 2,205,909 | |
| | 13,562 | | | Hanover Insurance Group, Inc. (The) | | | 1,583,635 | |
| | 69,372 | | | Hartford Financial Services Group, Inc. (The) | | | 3,083,585 | |
| | 63,965 | | | Lincoln National Corp. | | | 3,282,044 | |
| | 1,997 | | | Markel Corp.* | | | 2,072,986 | |
| | 19,647 | | | Reinsurance Group of America, Inc. | | | 2,755,099 | |
| | 38,495 | | | Torchmark Corp. | | | 2,869,032 | |
| | 23,298 | | | Willis Towers Watson plc | | | 3,538,034 | |
| | | | | | | | |
| | | | | | | 24,540,078 | |
| | |
| | Materials – 6.5% | | | | |
| | 136,824 | | | Ball Corp. | | | 6,291,167 | |
| | 52,560 | | | Celanese Corp. | | | 4,728,823 | |
| | 156,826 | | | Freeport-McMoRan, Inc. | | | 1,616,876 | |
| | 30,663 | | | Martin Marietta Materials, Inc. | | | 5,270,050 | |
| | 66,012 | | | Newmont Mining Corp. | | | 2,287,316 | |
| | 63,793 | | | WR Grace & Co. | | | 4,140,804 | |
| | | | | | | | |
| | | | | | | 24,335,036 | |
| | |
| | Media & Entertainment – 1.8% | | | | |
| | 46,917 | | | Liberty Broadband Corp. Class C* | | | 3,379,431 | |
| | 69,163 | | | Live Nation Entertainment, Inc.* | | | 3,406,278 | |
| | | | | | | | |
| | | | | | | 6,785,709 | |
| | |
| | Pharmaceuticals, Biotechnology & Life Sciences – 2.1% | |
| | 70,127 | | | Agilent Technologies, Inc. | | | 4,730,767 | |
| | 17,039 | | | Alexion Pharmaceuticals, Inc.* | | | 1,658,917 | |
| | 19,043 | | | BioMarin Pharmaceutical, Inc.* | | | 1,621,512 | |
| | | | | | | | |
| | | | | | | 8,011,196 | |
| | |
| | Real Estate – 13.6% | | | | |
| | 49,519 | | | Alexandria Real Estate Equities, Inc. (REIT) | | | 5,706,570 | |
| | 33,763 | | | AvalonBay Communities, Inc. (REIT) | | | 5,876,450 | |
| | 46,629 | | | Boston Properties, Inc. (REIT) | | | 5,248,094 | |
| | 50,184 | | | Camden Property Trust (REIT) | | | 4,418,701 | |
| | 166,923 | | | Cushman & Wakefield plc* | | | 2,415,376 | |
| | |
| | |
| The accompanying notes are an integral part of these financial statements. | | 9 |
GOLDMAN SACHS VARIABLE INSURANCE TRUST MID CAP VALUE FUND
Schedule of Investments(continued)
December 31, 2018
| | | | | | | | |
| Shares | | | Description | | Value | |
|
| | Common Stocks – (continued) | |
| | Real Estate – (continued) | |
| | 45,553 | | | Equity LifeStyle Properties, Inc. (REIT) | | $ | 4,424,563 | |
| | 15,793 | | | Essex Property Trust, Inc. (REIT) | | | 3,872,602 | |
| | 90,774 | | | HCP, Inc. (REIT) | | | 2,535,318 | |
| | 69,956 | | | Hudson Pacific Properties, Inc. (REIT) | | | 2,032,921 | |
| | 41,163 | | | Prologis, Inc. (REIT) | | | 2,417,091 | |
| | 28,164 | | | Ryman Hospitality Properties, Inc. (REIT) | | | 1,878,257 | |
| | 18,008 | | | SBA Communications Corp. (REIT)* | | | 2,915,315 | |
| | 173,516 | | | SITE Centers Corp. (REIT) | | | 1,920,822 | |
| | 97,618 | | | Ventas, Inc. (REIT) | | | 5,719,439 | |
| | | | | | | | |
| | | | | | | 51,381,519 | |
| | |
| | Retailing – 4.0% | |
| | 22,429 | | | Advance Auto Parts, Inc. | | | 3,531,670 | |
| | 12,984 | | | Burlington Stores, Inc.* | | | 2,112,107 | |
| | 31,287 | | | Dollar General Corp. | | | 3,381,499 | |
| | 19,300 | | | Expedia Group, Inc. | | | 2,174,145 | |
| | 163,780 | | | LKQ Corp.* | | | 3,886,500 | |
| | | | | | | | |
| | | | | | | 15,085,921 | |
| | |
| | Semiconductors & Semiconductor Equipment – 3.5% | |
| | 75,390 | | | Advanced Micro Devices, Inc.* | | | 1,391,699 | |
| | 53,607 | | | Analog Devices, Inc. | | | 4,601,089 | |
| | 313,784 | | | Marvell Technology Group Ltd. | | | 5,080,163 | |
| | 26,175 | | | NXP Semiconductors NV | | | 1,918,104 | |
| | | | | | | | |
| | | | | | | 12,991,055 | |
| | |
| | Software & Services – 5.7% | |
| | 28,167 | | | Check Point Software Technologies Ltd.* | | | 2,891,342 | |
| | 94,409 | | | Fidelity National Information Services, Inc. | | | 9,681,643 | |
| | 35,943 | | | GoDaddy, Inc. Class A* | | | 2,358,580 | |
| | 20,537 | | | PTC, Inc.* | | | 1,702,517 | |
| | 5,379 | | | Red Hat, Inc.* | | | 944,768 | |
| | 57,562 | | | Symantec Corp. | | | 1,087,634 | |
| | 34,176 | | | Total System Services, Inc. | | | 2,778,167 | |
| | | | | | | | |
| | | | | | | 21,444,651 | |
| | |
| | Technology Hardware & Equipment – 2.1% | |
| | 69,176 | | | Juniper Networks, Inc. | | | 1,861,526 | |
| | 17,292 | | | Motorola Solutions, Inc. | | | 1,989,272 | |
| | 390,816 | | | Viavi Solutions, Inc.* | | | 3,927,701 | |
| | | | | | | | |
| | | | | | | 7,778,499 | |
| | |
| | Transportation – 3.1% | |
| | 38,250 | | | CH Robinson Worldwide, Inc. | | | 3,216,443 | |
| | 241,525 | | | JetBlue Airways Corp.* | | | 3,878,892 | |
| | 18,864 | | | Old Dominion Freight Line, Inc. | | | 2,329,515 | |
| | 36,410 | | | XPO Logistics, Inc.* | | | 2,076,826 | |
| | | | | | | | |
| | | | | | | 11,501,676 | |
| | |
|
| | Common Stocks – (continued) | |
| | Utilities – 11.3% | |
| | 53,063 | | | American Water Works Co., Inc. | | $ | 4,816,528 | |
| | 29,667 | | | Atmos Energy Corp. | | | 2,750,724 | |
| | 124,835 | | | CMS Energy Corp. | | | 6,198,058 | |
| | 87,699 | | | Evergy, Inc. | | | 4,978,672 | |
| | 23,569 | | | PG&E Corp.* | | | 559,764 | |
| | 52,765 | | | Pinnacle West Capital Corp. | | | 4,495,578 | |
| | 123,791 | | | Public Service Enterprise Group, Inc. | | | 6,443,322 | |
| | 51,402 | | | Sempra Energy | | | 5,561,182 | |
| | 141,178 | | | Xcel Energy, Inc. | | | 6,955,840 | |
| | | | | | | | |
| | | | | | | 42,759,668 | |
| | |
| | TOTAL COMMON STOCKS | |
| | (Cost $370,620,718) | | $ | 369,039,965 | |
| | |
| | | | | | | | |
| Shares | | Dividend
Rate | | | Value | |
|
| Investment Company(a) – 0.5% | |
Goldman Sachs Financial Square Government Fund —
Institutional Shares | |
| 1,868,218 | | | 2.521 | % | | $ | 1,868,218 | |
| (Cost $1,868,218) | | | | | |
| |
| TOTAL INVESTMENTS – 98.4% | |
| (Cost $372,488,936) | | | $ | 370,908,183 | |
| |
OTHER ASSETS IN EXCESS OF LIABILITIES – 1.6% | | | | 5,983,276 | |
| |
| NET ASSETS – 100.0% | | | $ | 376,891,459 | |
| |
| | |
| The percentage shown for each investment category reflects the value of investments in that category as a percentage of net assets. |
| |
| * | | Non-income producing security. |
| |
| (a) | | Represents an Affiliated Issuer. |
| | |
| |
| Investment Abbreviation: |
| REIT | | —Real Estate Investment Trust |
| | |
| 10 | | The accompanying notes are an integral part of these financial statements. |
GOLDMAN SACHS VARIABLE INSURANCE TRUST MID CAP VALUE FUND
Statement of Assets and Liabilities
December 31, 2018
| | | | |
| | | | |
| Assets: | | | |
Investments in unaffiliated issuers, at value (cost $370,620,718) | | $ | 369,039,965 | |
Investments in affiliated issuers, at value (cost $1,868,218) | | | 1,868,218 | |
Cash | | | 5,759,202 | |
Receivables: | | | | |
Dividends | | | 750,172 | |
Fund shares sold | | | 42,917 | |
Reimbursement from investment adviser | | | 32,782 | |
Other assets | | | 521 | |
| |
| Total assets | | | 377,493,777 | |
| | | | |
| | | | |
| Liabilities: | | | |
Payables: | | | | |
Management fees | | | 255,530 | |
Fund shares redeemed | | | 233,679 | |
Distribution and Service fees and Transfer Agency fees | | | 23,514 | |
Accrued expenses | | | 89,595 | |
| |
| Total liabilities | | | 602,318 | |
| | | | |
| | | | |
| Net Assets: | | | |
Paid-in capital | | | 385,665,365 | |
Total distributable loss | | | (8,773,906 | ) |
| |
| NET ASSETS | | $ | 376,891,459 | |
Net Assets: | | | | |
Institutional | | $ | 300,056,148 | |
Service | | | 76,835,311 | |
| |
Total Net Assets | | $ | 376,891,459 | |
Shares outstanding $0.001 par value (unlimited shares authorized): | | | | |
Institutional | | | 23,271,221 | |
Service | | | 5,904,615 | |
Net asset value, offering and redemption price per share: | | | | |
Institutional | | | $12.89 | |
Service | | | 13.01 | |
| | |
| The accompanying notes are an integral part of these financial statements. | | 11 |
GOLDMAN SACHS VARIABLE INSURANCE TRUST MID CAP VALUE FUND
Statement of Operations
For the Fiscal Year Ended December 31, 2018
| | | | |
| | | | |
| Investment income: | |
Dividends — unaffiliated issuers (net of foreign taxes withheld of $8,121) | | $ | 9,670,799 | |
Dividends — affiliated issuers | | | 73,618 | |
Securities lending income — unaffiliated issuer | | | 7,131 | |
| |
| Total investment income | | | 9,751,548 | |
| | | | |
| | | | |
| Expenses: | | | |
Management fees | | | 4,877,708 | |
Distribution and Service fees — Service Shares | | | 659,705 | |
Printing and mailing costs | | | 157,805 | |
Transfer Agency fees(a) | | | 124,881 | |
Professional fees | | | 95,674 | |
Custody, accounting and administrative services | | | 82,571 | |
Trustee fees | | | 17,351 | |
Registration fees | | | 713 | |
Other | | | 23,554 | |
| |
| Total expenses | | | 6,039,962 | |
| |
Less — expense reductions | | | (123,680 | ) |
| |
| Net expenses | | | 5,916,282 | |
| |
| NET INVESTMENT INCOME | | | 3,835,266 | |
| | | | |
| | | | |
| Realized and unrealized gain (loss): | | | |
Net realized gain from: | | | | |
Investments — unaffiliated issuers (including commissions recaptured of $18,124) | | | 45,366,902 | |
In-kind transactions | | | 1,337,073 | |
Net change in unrealized loss on investments — unaffiliated issuers | | | (100,296,769 | ) |
| |
| Net realized and unrealized loss | | | (53,592,794 | ) |
| |
| NET DECREASE IN NET ASSETS RESULTING FROM OPERATIONS | | $ | (49,757,528 | ) |
(a) Institutional and Service Shares incurred Transfer Agency fees of $72,109 and $52,772, respectively.
| | |
| 12 | | The accompanying notes are an integral part of these financial statements. |
GOLDMAN SACHS VARIABLE INSURANCE TRUST MID CAP VALUE FUND
Statements of Changes in Net Assets
| | | | | | | | |
| | | For the
Fiscal Year Ended
December 31, 2018 | | | For the
Fiscal Year Ended
December 31, 2017 | |
| | | | | | | | |
| From operations: | |
Net investment income | | $ | 3,835,266 | | | $ | 4,650,381 | |
Net realized gain | | | 46,703,975 | | | | 75,406,510 | |
Net change in unrealized gain (loss) | | | (100,296,769 | ) | | | 850,845 | |
| | |
| Net increase (decrease) in net assets resulting from operations | | | (49,757,528 | ) | | | 80,907,736 | |
| | | | | | | | |
| | | | | | | | |
| Distributions to shareholders: | | | | | | |
From distributable earnings: | | | | | | | | |
Institutional Shares | | | (45,878,403 | ) | | | (23,836,905 | )(a) |
Service Shares | | | (11,008,040 | ) | | | (22,396,605 | )(a) |
| | |
| Total distributions to shareholders | | | (56,886,443 | ) | | | (46,233,510 | ) |
| | | | | | | | |
| | | | | | | | |
| From share transactions: | | | | | | |
Proceeds from sales of shares | | | 33,413,557 | | | | 25,661,942 | |
Proceeds paid in connection with in kind transactions | | | (93,560,594 | ) | | | — | |
Reinvestment of distributions | | | 56,886,443 | | | | 46,233,510 | |
Cost of shares redeemed | | | (283,084,971 | ) | | | (145,139,270 | ) |
| | |
| Net decrease in net assets resulting from share transactions | | | (286,345,565 | ) | | | (73,243,818 | ) |
| | |
| TOTAL DECREASE | | | (392,989,536 | ) | | | (38,569,592 | ) |
| | | | | | | | |
| | | | | | | | |
| Net assets:(b) | | | | | | |
| | |
Beginning of year | | | 769,880,995 | | | | 808,450,587 | |
| | |
End of year | | $ | 376,891,459 | | | $ | 769,880,995 | |
| (a) | Prior year information has been revised to conform to current year presentation, see prior year presentation below: |
| | | | | | | | |
| | | Institutional | | | Service | |
Distributions from net investment income: | | $ | (2,801,151 | ) | | $ | (1,817,031 | ) |
Distributions from net realized gains: | | $ | (21,035,754 | ) | | $ | (20,579,574 | ) |
| (b) | Prior fiscal year information has been revised to conform with current year presentation. Undistributed net investment income was $1,310,520 for the Fund, as of December 31, 2017. |
| | |
| The accompanying notes are an integral part of these financial statements. | | 13 |
GOLDMAN SACHS VARIABLE INSURANCE TRUST MID CAP VALUE FUND
Financial Highlights
Selected Data for a Share Outstanding Throughout Each Year
| | | | | | | | | | | | | | | | | | | | |
| | | Goldman Sachs Mid Cap Value Fund | |
| | | Institutional Shares | |
| | | Year Ended December 31, | |
| | | 2018 | | | 2017 | | | 2016 | | | 2015 | | | 2014 | |
| | | | | | | | | | | | | | | | | | | | |
| Per Share Data | | | | | | | | | | | | | | | |
| | | | | |
Net asset value, beginning of year | | $ | 16.93 | | | $ | 16.23 | | | $ | 14.49 | | | $ | 17.43 | | | $ | 18.64 | |
| | | | | |
Net investment income(a) | | | 0.13 | | | | 0.12 | | | | 0.16 | | | | 0.13 | | | | 0.12 | |
| | | | | |
Net realized and unrealized gain (loss) | | | (1.86 | ) | | | 1.68 | | | | 1.80 | | | | (1.75 | ) | | | 2.31 | |
| | | | | |
Total from investment operations | | | (1.73 | ) | | | 1.80 | | | | 1.96 | | | | (1.62 | ) | | | 2.43 | |
| | | | | |
Distributions to shareholders from net investment income | | | (0.23 | ) | | | (0.13 | ) | | | (0.21 | ) | | | (0.07 | ) | | | (0.21 | ) |
| | | | | |
Distributions to shareholders from net realized gains | | | (2.08 | ) | | | (0.97 | ) | | | (0.01 | ) | | | (1.25 | ) | | | (3.43 | ) |
| | | | | |
Total distributions | | | (2.31 | ) | | | (1.10 | ) | | | (0.22 | ) | | | (1.32 | ) | | | (3.64 | ) |
| | | | | |
Net asset value, end of year | | $ | 12.89 | | | $ | 16.93 | | | $ | 16.23 | | | $ | 14.49 | | | $ | 17.43 | |
| | | | | |
Total return(b) | | | (10.46 | )% | | | 11.07 | % | | | 13.49 | % | | | (9.24 | )% | | | 13.57 | % |
| | | | | |
Net assets, end of year (in 000s) | | $ | 300,056 | | | $ | 388,709 | | | $ | 437,085 | | | $ | 535,459 | | | $ | 692,068 | |
| | | | | |
Ratio of net expenses to average net assets | | | 0.84 | % | | | 0.84 | % | | | 0.84 | % | | | 0.84 | % | | | 0.83 | % |
| | | | | |
Ratio of total expenses to average net assets | | | 0.86 | % | | | 0.87 | % | | | 0.87 | % | | | 0.87 | % | | | 0.87 | % |
| | | | | |
Ratio of net investment income to average net assets | | | 0.75 | % | | | 0.71 | % | | | 1.08 | % | | | 0.74 | % | | | 0.62 | % |
| | | | | |
Portfolio turnover rate(c) | | | 109 | % | | | 134 | % | | | 149 | % | | | 94 | % | | | 88 | % |
| (a) | Calculated based on the average shares outstanding methodology. |
| (b) | Assumes investment at the net asset value at the beginning of the year, reinvestment of all distributions, and a complete redemption of the investment at the net asset value at the end of the year. |
| (c) | The Fund’s portfolio turnover rate is calculated in accordance with regulatory requirements, without regard to transactions involving short term investments. If such transactions were included, the Fund’s portfolio turnover rate may be higher. |
| | |
| 14 | | The accompanying notes are an integral part of these financial statements. |
GOLDMAN SACHS VARIABLE INSURANCE TRUST MID CAP VALUE FUND
Financial Highlights(continued)
Selected Data for a Share Outstanding Throughout Each Year
| | | | | | | | | | | | | | | | | | | | |
| | | Goldman Sachs Mid Cap Value Fund | |
| | | Service Shares | |
| | | Year Ended December 31, | |
| | | 2018 | | | 2017 | | | 2016 | | | 2015 | | | 2014 | |
| | | | | | | | | | | | | | | | | | | | |
| Per Share Data | | | | | | | | | | | | | | | |
| | | | | |
Net asset value, beginning of year | | $ | 16.95 | | | $ | 16.25 | | | $ | 14.51 | | | $ | 17.45 | | | $ | 18.66 | |
| | | | | |
Net investment income(a) | | | 0.07 | | | | 0.08 | | | | 0.12 | | | | 0.08 | | | | 0.07 | |
| | | | | |
Net realized and unrealized gain (loss) | | | (1.84 | ) | | | 1.68 | | | | 1.81 | | | | (1.75 | ) | | | 2.31 | |
| | | | | |
Total from investment operations | | | (1.77 | ) | | | 1.76 | | | | 1.93 | | | | (1.67 | ) | | | 2.38 | |
| | | | | |
Distributions to shareholders from net investment income | | | (0.09 | ) | | | (0.09 | ) | | | (0.18 | ) | | | (0.02 | ) | | | (0.16 | ) |
| | | | | |
Distributions to shareholders from net realized gains | | | (2.08 | ) | | | (0.97 | ) | | | (0.01 | ) | | | (1.25 | ) | | | (3.43 | ) |
| | | | | |
Total distributions | | | (2.17 | ) | | | (1.06 | ) | | | (0.19 | ) | | | (1.27 | ) | | | (3.59 | ) |
| | | | | |
Net asset value, end of year | | $ | 13.01 | | | $ | 16.95 | | | $ | 16.25 | | | $ | 14.51 | | | $ | 17.45 | |
| | | | | |
Total return(b) | | | (10.70 | )% | | | 10.85 | % | | | 13.24 | % | | | (9.52 | )% | | | 13.29 | % |
| | | | | |
Net assets, end of year (in 000s) | | $ | 76,835 | | | $ | 381,172 | | | $ | 371,366 | | | $ | 265,545 | | | $ | 362,501 | |
| | | | | |
Ratio of net expenses to average net assets | | | 1.09 | % | | | 1.09 | % | | | 1.09 | % | | | 1.09 | % | | | 1.08 | % |
| | | | | |
Ratio of total expenses to average net assets | | | 1.11 | % | | | 1.12 | % | | | 1.12 | % | | | 1.12 | % | | | 1.12 | % |
| | | | | |
Ratio of net investment income to average net assets | | | 0.42 | % | | | 0.47 | % | | | 0.78 | % | | | 0.48 | % | | | 0.38 | % |
| | | | | |
Portfolio turnover rate(c) | | | 109 | % | | | 134 | % | | | 149 | % | | | 94 | % | | | 88 | % |
| (a) | Calculated based on the average shares outstanding methodology. |
| (b) | Assumes investment at the net asset value at the beginning of the year, reinvestment of all distributions, and a complete redemption of the investment at the net asset value at the end of the year. |
| (c) | The Fund’s portfolio turnover rate is calculated in accordance with regulatory requirements, without regard to transactions involving short term investments. If such transactions were included, the Fund’s portfolio turnover rate may be higher. |
| | |
| The accompanying notes are an integral part of these financial statements. | | 15 |
GOLDMAN SACHS VARIABLE INSURANCE TRUST MID CAP VALUE FUND
Notes to Financial Statements
December 31, 2018
1. ORGANIZATION
Goldman Sachs Variable Insurance Trust (the “Trust” or “VIT”) is a Delaware statutory trust registered under the Investment Company Act of 1940, as amended (the “Act”), as an open-end management investment company. The Trust includes the Goldman Sachs Mid Cap Value Fund (the “Fund”). The Fund is a diversified portfolio under the Act offering two classes of shares — Institutional and Service Shares. Shares of the Trust are offered to separate accounts of participating life insurance companies for the purpose of funding variable annuity contracts and variable life insurance policies.
Goldman Sachs Asset Management, L.P. (“GSAM”), an affiliate of Goldman Sachs & Co. LLC (“Goldman Sachs”), serves as investment adviser to the Fund pursuant to a management agreement (the “Agreement”) with the Trust.
2. SIGNIFICANT ACCOUNTING POLICIES
The financial statements have been prepared in accordance with accounting principles generally accepted in the United States of America (“GAAP”) and require management to make estimates and assumptions that may affect the reported amounts and disclosures. Actual results may differ from those estimates and assumptions.
A. Investment Valuation —The Fund’s valuation policy is to value investments at fair value.
B. Investment Income and Investments —Investment income includes interest income, dividend income, and securities lending income, if any. Interest income is accrued daily and adjusted for amortization of premiums and accretion of discounts. Dividend income is recognized on ex-dividend date or, for certain foreign securities, as soon as such information is obtained subsequent to the ex-dividend date. Investment transactions are reflected on trade date. Realized gains and losses are calculated using identified cost. Investment transactions are recorded on the following business day for daily net asset value (“NAV”) calculations. Investment income is recorded net of any foreign withholding taxes, less any amounts reclaimable. The Fund may file withholding tax reclaims in certain jurisdictions to recover a portion of amounts previously withheld. Any foreign capital gains tax is accrued daily based upon net unrealized gains, and is payable upon sale of such investments. Distributions received from the Fund’s investments in United States (“U.S.”) real estate investment trusts (“REITs”) may be characterized as ordinary income, net capital gain or a return of capital. A return of capital is recorded by the Fund as a reduction to the cost basis of the REIT.
C. Class Allocations and Expenses —Investment income, realized and unrealized gain (loss), if any, and non-class specific expenses of the Fund are allocated daily based upon the proportion of net assets of each class. Non-class specific expenses directly incurred by the Fund are charged to the Fund, while such expenses incurred by the Trust are allocated across the Fund on a straight-line and/or pro-rata basis depending upon the nature of the expenses. Class specific expenses, where applicable, are borne by the respective share classes and include Distribution and Service and Transfer Agency fees.
D. Federal Taxes and Distributions to Shareholders —It is the Fund’s policy to comply with the requirements of the Internal Revenue Code of 1986, as amended (the “Code”), applicable to regulated investment companies and to distribute each year substantially all of its investment company taxable income and capital gains to its shareholders. Accordingly, the Fund is not required to make any provisions for the payment of federal income tax. Distributions to shareholders are recorded on the ex-dividend date. Income and capital gains distributions, if any, are declared and paid annually.
Net capital losses, if any, are carried forward to future fiscal years and may be used to the extent allowed by the Code to offset any future capital gains. Losses that are carried forward will retain their character as either short-term or long-term capital losses. Utilization of capital loss carryforwards will reduce the requirement of future capital gains distributions.
The characterization of distributions to shareholders for financial reporting purposes is determined in accordance with federal income tax rules, which may differ from GAAP. The source of the Fund’s distributions may be shown in the accompanying financial statements as either from distributable earnings or capital. Certain components of the Fund’s net assets on the Statement of Assets and Liabilities reflect permanent GAAP/tax differences based on the appropriate tax character.
16
GOLDMAN SACHS VARIABLE INSURANCE TRUST MID CAP VALUE FUND
2. SIGNIFICANT ACCOUNTING POLICIES (continued)
E. In-Kind Transactions — The Fund may allow investors, under certain circumstances, to purchase shares with securities instead of cash. In addition, the Trust reserves the right to redeem an investor’s shares by distributing securities instead of cash. These are known as in-kind transactions. Securities included as part of in-kind purchases and redemptions of Fund shares are valued in the same manner as they are valued for purposes of computing the Fund’s NAV, in accordance with the Fund’s Valuation Procedures, and such valuations are as of the date the trade is submitted pursuant to the procedures specified in the Fund’s prospectus.
F. Commission Recapture — GSAM, on behalf of certain Funds, may direct portfolio trades, subject to seeking best execution, to various brokers who have agreed to rebate a portion of the commissions generated. Such rebates are made directly to the Fund as cash payments and are included in net realized gain (loss) from investments on the Statement of Operations.
3. INVESTMENTS AND FAIR VALUE MEASUREMENTS
U.S. GAAP defines the fair value of a financial instrument as the amount that would be received to sell an asset or paid to transfer a liability in an orderly transaction between market participants at the measurement date (i.e., the exit price); the Fund’s policy is to use the market approach. GAAP establishes a fair value hierarchy that prioritizes the inputs to valuation techniques used to measure fair value. The hierarchy gives the highest priority to unadjusted quoted prices in active markets for identical assets or liabilities (Level 1 measurements) and the lowest priority to unobservable inputs (Level 3 measurements). The levels used for classifying investments are not necessarily an indication of the risk associated with investing in these investments. The three levels of the fair value hierarchy are described below:
Level 1 — Unadjusted quoted prices in active markets that are accessible at the measurement date for identical, unrestricted assets or liabilities;
Level 2 — Quoted prices in markets that are not active or financial instruments for which significant inputs are observable (including, but not limited to, quoted prices for similar investments, interest rates, foreign exchange rates, volatility and credit spreads), either directly or indirectly;
Level 3 — Prices or valuations that require significant unobservable inputs (including GSAM’s assumptions in determining fair value measurement).
Changes in valuation techniques may result in transfers into or out of an assigned level within the hierarchy. In accordance with the Fund’s policy, transfers between different levels of the fair value hierarchy resulting from such changes are deemed to have occurred as of the beginning of the reporting period.
The Board of Trustees (“Trustees”) has approved Valuation Procedures that govern the valuation of the portfolio investments held by the Fund, including investments for which market quotations are not readily available. The Trustees have delegated to GSAM day-to-day responsibility for implementing and maintaining internal controls and procedures related to the valuation of the Fund’s investments. To assess the continuing appropriateness of pricing sources and methodologies, GSAM regularly performs price verification procedures and issues challenges as necessary to third party pricing vendors or brokers, and any differences are reviewed in accordance with the Valuation Procedures.
A. Level 1 and Level 2 Fair Value Investments — The valuation techniques and significant inputs used in determining the fair values for investments classified as Level 1 and Level 2 are as follows:
Equity Securities — Equity securities traded on a U.S. securities exchange or the NASDAQ system, or those located on certain foreign exchanges, including but not limited to the Americas, are valued daily at their last sale price or official closing price on the principal exchange or system on which they are traded. If there is no sale or official closing price or such price is believed by GSAM to not represent fair value, equity securities are valued at the last bid price for long positions and at the last ask price for short positions. To the extent these investments are actively traded, they are classified as Level 1 of the fair value hierarchy, otherwise they are generally classified as Level 2.
Unlisted equity securities for which market quotations are available are valued at the last sale price on the valuation date, or if no sale occurs, at the last bid price, and are generally classified as Level 2. Securities traded on certain foreign securities exchanges
17
GOLDMAN SACHS VARIABLE INSURANCE TRUST MID CAP VALUE FUND
Notes to Financial Statements(continued)
December 31, 2018
3. INVESTMENTS AND FAIR VALUE MEASUREMENTS (continued)
are valued daily at fair value determined by an independent fair value service (if available) under Valuation Procedures approved by the Trustees and consistent with applicable regulatory guidance. The independent fair value service takes into account multiple factors including, but not limited to, movements in the securities markets, certain depositary receipts, futures contracts and foreign currency exchange rates that have occurred subsequent to the close of the foreign securities exchange. These investments are generally classified as Level 2 of the fair value hierarchy.
Money Market Funds — Investments in the Goldman Sachs Financial Square Government Fund (“Underlying Fund”) are valued at the NAV of the Institutional Share class on the day of valuation. These investments are generally classified as Level 1 of the fair value hierarchy. For information regarding the Underlying Fund’s accounting policies and investment holdings, please see the Underlying Fund’s shareholder report.
B. Level 3 Fair Value Investments — To the extent that significant inputs to valuation models and other alternative pricing sources are unobservable, or if quotations are not readily available, or if GSAM believes that such quotations do not accurately reflect fair value, the fair value of the Fund’s investments may be determined under Valuation Procedures approved by the Trustees. GSAM, consistent with its procedures and applicable regulatory guidance, may make an adjustment to the most recent valuation prices of either domestic or foreign securities in light of significant events to reflect what it believes to be the fair value of the securities at the time of determining the Fund’s NAV. Significant events which could affect a large number of securities in a particular market may include, but are not limited to: significant fluctuations in U.S. or foreign markets; market dislocations; market disruptions; or unscheduled market closings. Significant events which could also affect a single issuer may include, but are not limited to: corporate actions such as reorganizations, mergers and buy-outs; ratings downgrades; and bankruptcies.
C. Fair Value Hierarchy — The following is a summary of the Fund’s investments classified in the fair value hierarchy as of December 31, 2018:
| | | | | | | | | | | | |
| Investment Type | | Level 1 | | | Level 2 | | | Level 3 | |
| | | |
| Assets | | | | | | | | | | | | |
| Common Stock and/or Other Equity Investments(a) | | | | | | | | | | | | |
Asia | | $ | 2,891,342 | | | $ | — | | | $ | — | |
Europe | | | 8,005,618 | | | | — | | | | — | |
North America | | | 358,143,005 | | | | — | | | | — | |
| Investment Company | | | 1,868,218 | | | | — | | | | — | |
| | | |
| Total | | $ | 370,908,183 | | | $ | — | | | $ | — | |
| (a) | Amounts are disclosed by continent to highlight the impact of time zone differences between local market close and the calculation of NAV. Security valuations are based on the principal exchange or system on which they are traded, which may differ from country of domicile. |
For further information regarding security characteristics, see the Schedule of Investments.
4. AGREEMENTS AND AFFILIATED TRANSACTIONS
A. Management Agreement —Under the Agreement, GSAM manages the Fund, subject to the general supervision of the Trustees.
As compensation for the services rendered pursuant to the Agreement, the assumption of the expenses related thereto and administration of the Fund’s business affairs, including providing facilities, GSAM is entitled to a management fee, accrued daily and paid monthly, equal to an annual percentage rate of the Fund’s average daily net assets.
As of December 31, 2018, the contractual management fees with GSAM were as stated below. The effective contractual management rates and effective net management rates represent the rates for the fiscal year ended December 31, 2018.
18
GOLDMAN SACHS VARIABLE INSURANCE TRUST MID CAP VALUE FUND
4. AGREEMENTS AND AFFILIATED TRANSACTIONS (continued)
| | | | | | | | | | | | | | | | | | | | | | |
| Contractual Management Rate | | | | | | | |
First
$2 billion | | | Next
$3 billion | | | Next
$3 billion | | | Over
$8 billion | | | Effective
Rate | | | Effective Net
Management
Rate^ | |
| | | | | |
| | 0.77% | | | | 0.69 | % | | | 0.66 | % | | | 0.65 | % | | | 0.78 | % | | | 0.77 | % |
| ^ | Effective Net Management Rate includes the impact of management fee waivers of affiliated Underlying Funds, if any. The Effective Net Management Fee Rate may not correlate to the Contractual Management Rate as a result of management fee waivers that may be in effect from time to time. For the fiscal year ended December 31, 2018, GSAM waived $69,396 of its management fee. |
Prior to April 30, 2018, the contractual management fee rates for the Fund was as stated below and GSAM agreed to waive a portion of its management fee in order to achieve an Effective Net Management Rate as set forth in the Fund’s prospectus dated April 28, 2017.
| | | | | | | | | | | | | | |
First
$2 billion | | | Next
$3 billion | | | Next
$3 billion | | | Over
$8 billion | |
| | | |
| | 0.80% | | | | 0.72 | % | | | 0.68 | % | | | 0.67 | % |
The Fund invests in Institutional Shares of the Goldman Sachs Financial Square Government Fund, which is an affiliated Underlying Fund. GSAM has agreed to waive a portion of its management fee payable by the Fund in an amount equal to the management fee it earns as an investment adviser to the affiliated Underlying Fund in which the Fund invests, except those management fees it earns from the Fund’s investments of cash collateral received in connection with securities lending transactions in the Goldman Sachs Financial Square Government Fund. For the fiscal year ended December 31, 2018, GSAM waived $6,887 of the Fund’s management fee.
B. Distribution and Service (12b-1) Plan — The Trust, on behalf of Service Shares of the Fund, has adopted a Distribution and Service Plan subject to Rule 12b-1 under the Act. Under the Distribution and Service Plan, Goldman Sachs, which serves as distributor, is entitled to a fee accrued daily and paid monthly, for distribution services and personal and account maintenance services, which may then be paid by Goldman Sachs to authorized dealers, equal to, on an annual basis, 0.25% of the Fund’s average daily net assets attributable to Service Shares.
C. Transfer Agency Agreement — Goldman Sachs also serves as the transfer agent of the Fund for a fee pursuant to the Transfer Agency Agreement. The fees charged for such transfer agency services are accrued daily and paid monthly at an annual rate of 0.02% of the average daily net assets of Institutional and Service Shares.
D. Other Expense Agreements and Affiliated Transactions — GSAM has agreed to limit certain “Other Expenses” of the Fund (excluding acquired fund fees and expenses, transfer agency fees and expenses, service fees and shareholder administration fees (as applicable), taxes, interest, brokerage fees, expenses of shareholder meetings, litigation and indemnification, and extraordinary expenses) to the extent such expenses exceed, on an annual basis, a percentage rate of the average daily net assets of the Fund. Such Other Expense reimbursements, if any, are accrued daily and paid monthly. In addition, the Fund is not obligated to reimburse GSAM for prior fiscal year expense reimbursements, if any. The Other Expense limitation as an annual percentage rate of average daily net assets for the Fund is 0.054%. The Other Expense limitation will remain in place through at least April 30, 2019, and prior to such date GSAM may not terminate the arrangement without the approval of the Trustees. In addition, the Fund has entered into certain offset arrangements with the custodian and the transfer agent, which may result in a reduction of the Fund’s expenses and are received irrespective of the application of the “Other Expense” limitation described above.
19
GOLDMAN SACHS VARIABLE INSURANCE TRUST MID CAP VALUE FUND
Notes to Financial Statements(continued)
December 31, 2018
4. AGREEMENTS AND AFFILIATED TRANSACTIONS (continued)
For the fiscal year ended December 31, 2018, these expense reductions, including any fee waivers and Other Expense reimbursements, were as follows:
| | | | | | | | | | | | |
Management Fee
Waiver | | Custody Fee
Credits | | | Other Expense
Reimbursement | | | Total Expense
Reductions | |
| $76,283 | | $ | 6,773 | | | $ | 40,624 | | | $ | 123,680 | |
E. Line of Credit Facility — As of December 31, 2018, the Fund participated in a $770,000,000 committed, unsecured revolving line of credit facility (the “facility”) together with other funds of the Trust and certain registered investment companies having management agreements with GSAM or its affiliates. This facility is to be used for temporary emergency purposes, or to allow for an orderly liquidation of securities to meet redemption requests. The interest rate on borrowings is based on the federal funds rate. The facility also requires a fee to be paid by the Fund based on the amount of the commitment that has not been utilized. For the fiscal year ended December 31, 2018, the Fund did not have any borrowings under the facility.
F. Other Transactions with Affiliates — For the fiscal year ended December 31, 2018, Goldman Sachs earned $9,238 in brokerage commissions from portfolio transactions.
The following table provides information about the Fund’s investment in the Goldman Sachs Financial Square Government Fund as of and for the fiscal year ended December 31, 2018:
| | | | | | | | | | | | | | | | | | | | | | |
Beginning
Value as of
December 31, 2017 | | | Purchases
at Cost | | | Proceeds from
Sales | | | Ending
Value as of
December 31, 2018 | | |
Shares as of
December 31, 2018 | | | Dividend Income
from Affiliated
Investment Company | |
| | | | | |
| $ | — | | | $ | 155,011,501 | | | $ | (153,143,283 | ) | | $ | 1,868,218 | | | | 1,868,218 | | | $ | 73,618 | |
5. PORTFOLIO SECURITIES TRANSACTIONS
The cost of purchases and proceeds from sales and maturities of long-term securities for the fiscal year ended December 31, 2018, were $664,265,810 and $899,319,551, respectively.
6. SECURITIES LENDING
The Fund may lend its securities through a securities lending agent, the Bank of New York Mellon (“BNYM”), to certain qualified borrowers. In accordance with the Fund’s securities lending procedures, the Fund receives cash collateral at least equal to the market value of the securities on loan. The market value of the loaned securities is determined at the close of business of the Fund, at their last sale price or official closing price on the principal exchange or system on which they are traded, and any additional required collateral is delivered to the Fund on the next business day. As with other extensions of credit, the Fund may experience delay in the recovery of its securities or incur a loss should the borrower of the securities breach its agreement with the Fund or become insolvent at a time when the collateral is insufficient to cover the cost of repurchasing securities on loan. Dividend income received from securities on loan may not be subject to withholding taxes and therefore withholding taxes paid may differ from the amounts listed in the Statement of Operations. Loans of securities are terminable at any time and as such 1) the remaining contractual maturities of the outstanding securities lending transactions are considered to be overnight and continuous and 2) the borrower, after notice, is required to return borrowed securities within the standard time period for settlement of securities transactions.
The Fund invests the cash collateral received in connection with securities lending transactions in the Goldman Sachs Financial Square Government Fund (“Government Money Market Fund���), an affiliated series of the Goldman Sachs Trust. The Government Money Market Fund is registered under the Act as an open end investment company, is subject to Rule 2a-7 under the Act, and is managed by GSAM, for which GSAM may receive a management fee of up to 0.16% (prior to February 21, 2018, GSAM may have received a management fee of up to 0.205%) on an annualized basis of the average daily net assets of the Government Money Market Fund.
20
GOLDMAN SACHS VARIABLE INSURANCE TRUST MID CAP VALUE FUND
6. SECURITIES LENDING (continued)
In the event of a default by a borrower with respect to any loan, BNYM may exercise any and all remedies provided under the applicable borrower agreement to make the Fund whole. These remedies include purchasing replacement securities by applying the collateral held from the defaulting broker against the purchase cost of the replacement securities. If BNYM is unable to purchase replacement securities, BNYM will indemnify the Fund by paying the Fund an amount equal to the market value of the securities loaned minus the value of cash collateral received from the borrower for the loan, subject to an exclusion for any shortfalls resulting from a loss of value in such cash collateral due to reinvestment risk. The Fund may enter into master netting agreements with borrowers, which provide the right, in the event of a default (including bankruptcy or insolvency), for the non-defaulting party to liquidate the collateral and calculate net exposure to the defaulting party or request additional collateral. However, in the event of a default by a borrower, a resolution authority could determine that such rights are not enforceable due to the restrictions or prohibitions against the right of set-off that may be imposed in accordance with a particular jurisdiction’s bankruptcy or insolvency laws. The Fund’s loaned securities were all subject to enforceable Securities Lending Agreements and the value of the collateral was at least equal to the value of the cash received. The amounts of the Fund’s overnight and continuous agreements, which represent the gross amounts of recognized liabilities for securities lending transactions outstanding as of December 31, 2018, are disclosed as “Payable upon return of securities loaned” on the Statement of Assets and Liabilities, where applicable. The Fund did not have securities on loan as of December 31, 2018.
Both the Fund and BNYM received compensation relating to the lending of the Fund’s securities. The amounts earned, if any, by the Fund for the fiscal year ended December 31, 2018, are reported under Investment Income on the Statement of Operations.
The following table provides information about the Fund’s investment in the Government Money Market Fund for the fiscal year ended December 31, 2018:
| | | | | | | | | | | | | | |
Market Value December 31, 2017 | | | Purchases
at Cost | | | Proceeds
from Sales | | | Market Value
December 31, 2018 | |
| | | |
| $ | — | | | $ | 51,683,311 | | | $ | (51,683,311 | ) | | $ | — | |
7. TAX INFORMATION
The tax character of distributions paid during the fiscal years ended December 31, 2017 and December 31, 2018 was as follows:
| | | | | | | | |
| | | 2017 | | | 2018 | |
| Distributions paid from: | | | | | | | | |
Ordinary income | | $ | 4,618,182 | | | $ | 18,508,506 | |
Net long-term capital gains | | | 41,615,328 | | | | 38,377,937 | |
| Total taxable distributions | | $ | 46,233,510 | | | $ | 56,886,443 | |
As of December 31, 2018, the components of accumulated earnings (losses) on a tax-basis were as follows:
| | | | |
| Undistributed ordinary income — net | | $ | 488,942 | |
| Timing differences (Post October Loss Deferral/Deferred Dividend) | | | (3,247,996 | ) |
| Unrealized losses — net | | | (6,014,852 | ) |
| Total accumulated losses — net | | $ | (8,773,906 | ) |
21
GOLDMAN SACHS VARIABLE INSURANCE TRUST MID CAP VALUE FUND
Notes to Financial Statements(continued)
December 31, 2018
7. TAX INFORMATION (continued)
As of December 31, 2018, the Fund’s aggregate security unrealized gains and losses based on cost for U.S. federal income tax purposes were as follows:
| | | | |
| Tax cost | | $ | 376,923,035 | |
| Gross unrealized gain | | | 25,089,200 | |
| Gross unrealized loss | | | (31,104,052 | ) |
| Net unrealized loss | | $ | (6,014,852 | ) |
The difference between GAAP-basis and tax-basis unrealized gains (losses) is attributable primarily to wash sales and differences in the tax treatment of underlying fund investments.
In order to present certain components of the Fund’s capital accounts on a tax-basis, the Fund has reclassified $146,296 of undistributed net investment income and $814,729 of paid-in capital from accumulated net realized gain. This reclassification has no impact on the NAV of the Fund and results primarily from redemptions in kind.
GSAM has reviewed the Fund’s tax positions for all open tax years (the current and prior three years, as applicable) and has concluded that no provision for income tax is required in the Fund’s financial statements. Such open tax years remain subject to examination and adjustment by tax authorities.
8. OTHER RISKS
The Fund’s risks include, but are not limited to, the following:
Foreign Countries Risk — Investing in foreign markets may involve special risks and considerations not typically associated with investing in the U. S. Foreign securities may be subject to risk of loss because of more or less foreign government regulation, less public information and less economic, political and social stability in the countries in which the Fund invests. The imposition of exchange controls (including repatriation restrictions), confiscations, trade restrictions (including tariffs) and other government restrictions by the U.S. or other governments, or from problems in share registration, settlement or custody, may also result in losses. Foreign risk also involves the risk of negative foreign currency rate fluctuations, which may cause the value of securities denominated in such foreign currency (or other instruments through which the Fund has exposure to foreign currencies) to decline in value. Currency exchange rates may fluctuate significantly over short periods of time.
Foreign Custody Risk — If the Fund invests in foreign securities, the Fund may hold such securities and cash with foreign banks, agents, and securities depositories appointed by the Fund’s custodian (each a “Foreign Custodian”). Some foreign custodians may be recently organized or new to the foreign custody business. In some countries, Foreign Custodians may be subject to little or no regulatory oversight over, or independent evaluation of, their operations. Further, the laws of certain countries may place limitations on the Fund’s ability to recover its assets if a Foreign Custodian enters bankruptcy.
Geographic Risk — If the Fund focuses its investments in securities of issuers located in a particular country or geographic region, the Fund may be subjected, to a greater extent than if its investments were less focused, to the risks of volatile economic cycles and/or conditions and developments that may be particular to that country or region, such as: adverse securities markets; adverse exchange rates; adverse social, political, regulatory, economic, business, environmental or other developments; or natural disasters.
Investments in Other Investment Companies Risk — As a shareholder of another investment company, including an exchange-traded fund (“ETF”), the Fund will indirectly bear its proportionate share of any net management fees and other expenses paid by such other investment companies, in addition to the fees and expenses regularly borne by the Fund.
Large Shareholder Transactions Risk — The Fund may experience adverse effects when certain large shareholders, such as other funds, participating insurance companies, accounts and Goldman Sachs affiliates, purchase or redeem large amounts of shares of the Fund. Such large shareholder redemptions, which may occur rapidly or unexpectedly, may cause the Fund to sell portfolio
22
GOLDMAN SACHS VARIABLE INSURANCE TRUST MID CAP VALUE FUND
8. OTHER RISKS (continued)
securities at times when it would not otherwise do so, which may negatively impact the Fund’s NAV and liquidity. These transactions may also accelerate the realization of taxable income to shareholders if such sales of investments resulted in gains, and may also increase transaction costs. In addition, a large redemption could result in the Fund’s current expenses being allocated over a smaller asset base, leading to an increase in the Fund’s expense ratio. Similarly, large Fund share purchases may adversely affect the Fund’s performance to the extent that the Fund is delayed in investing new cash or otherwise maintains a larger cash position than it ordinarily would.
Liquidity Risk — The Fund may make investments that are illiquid or that may become less liquid in response to market developments or adverse investor perceptions. Illiquid investments may be more difficult to value. Liquidity risk may also refer to the risk that the Fund will not be able to pay redemption proceeds within the allowable time period or without significant dilution to remaining investors’ interests because of unusual market conditions, an unusually high volume of redemption requests, or other reasons. To meet redemption requests, the Fund may be forced to sell investments at an unfavorable time and/or under unfavorable conditions. If the Fund is forced to sell securities at an unfavorable time and/or under unfavorable conditions, such sales may adversely affect the Fund’s NAV and dilute remaining investors’ interests.
Market and Credit Risks — In the normal course of business, the Fund trades financial instruments and enters into financial transactions where risk of potential loss exists due to changes in the market (market risk). Additionally, the Fund may also be exposed to credit risk in the event that an issuer or guarantor fails to perform or that an institution or entity with which the Fund has unsettled or open transactions defaults.
9. INDEMNIFICATIONS
Under the Trust’s organizational documents, its Trustees, officers, employees and agents are indemnified, to the extent permitted by the Act and state law, against certain liabilities that may arise out of performance of their duties to the Fund. Additionally, in the course of business, the Fund enters into contracts that contain a variety of indemnification clauses. The Fund’s maximum exposure under these arrangements is unknown, as this would involve future claims that may be made against the Fund that have not yet occurred. However, GSAM believes the risk of loss under these arrangements to be remote.
10. OTHER MATTERS
In September 2018, the Financial Accounting Standards Board issued Accounting Standards Update (ASU) 2018-13 — Fair Value Measurement (Topic 820) Disclosure Framework — Changes to the Disclosure Requirements for Fair Value Measurement. The amendments in the ASU modify fair value measurement disclosures. The amendments are effective for the Fund’s fiscal year beginning after December 15, 2019. GSAM is currently evaluating the impact, if any, of the amendments.
11. SUBSEQUENT EVENTS
Subsequent events after the Statement of Assets and Liabilities date have been evaluated, and GSAM has concluded that there is no impact requiring adjustment or disclosure in the financial statements.
23
GOLDMAN SACHS VARIABLE INSURANCE TRUST MID CAP VALUE FUND
Notes to Financial Statements(continued)
December 31, 2018
12. SUMMARY OF SHARE TRANSACTIONS
Share activity is as follows:
| | | | | | | | | | | | | | | | |
| | | For the Fiscal Year Ended
December 31, 2018 | | | For the Fiscal Year Ended
December 31, 2017 | |
| | | Shares | | | Dollars | | | Shares | | | Dollars | |
| Institutional Shares | | | | | | | | | | | | | | | | |
| Shares sold | | | 447,011 | | | $ | 7,502,741 | | | | 705,644 | | | $ | 11,893,865 | |
| Reinvestment of distributions | | | 3,486,201 | | | | 45,878,403 | | | | 1,418,863 | | | | 23,836,905 | |
| Shares redeemed | | | (3,628,101 | ) | | | (61,276,824 | ) | | | (6,089,122 | ) | | | (102,715,737 | ) |
| | | | 305,111 | | | | (7,895,680 | ) | | | (3,964,615 | ) | | | (66,984,967 | ) |
| Service Shares | | | | | | | | | | | | | | | | |
| Shares sold | | | 1,545,842 | | | | 25,910,816 | | | | 816,894 | | | | 13,768,077 | |
| Reinvestment of distributions | | | 828,918 | | | | 11,008,040 | | | | 1,330,755 | | | | 22,396,605 | |
| Shares redeemed | | | (13,353,565 | ) | | | (221,808,147 | ) | | | (2,508,559 | ) | | | (42,423,533 | ) |
| Shares redeemed in connection with in-kind transactions | | | (5,605,787 | ) | | | (93,560,594 | ) | | | — | | | | — | |
| | | | (16,584,592 | ) | | | (278,449,885 | ) | | | (360,910 | ) | | | (6,258,851 | ) |
| | | | |
| NET DECREASE | | | (16,279,481 | ) | | $ | (286,345,565 | ) | | | (4,325,525 | ) | | $ | (73,243,818 | ) |
24
Report of Independent Registered Public Accounting Firm
To the Board of Trustees of Goldman Sachs Variable Insurance Trust and Shareholders of Goldman Sachs Mid Cap Value Fund
Opinion on the Financial Statements
We have audited the accompanying statement of assets and liabilities, including the schedule of investments, of Goldman Sachs Mid Cap Value Fund (one of the funds constituting Goldman Sachs Variable Insurance Trust, referred to hereafter as the “Fund”) as of December 31, 2018, the related statement of operations for the year ended December 31, 2018, the statements of changes in net assets for each of the two years in the period ended December 31, 2018, including the related notes, and the financial highlights for each of the five years in the period ended December 31, 2018 (collectively referred to as the “financial statements”). In our opinion, the financial statements present fairly, in all material respects, the financial position of the Fund as of December 31, 2018, the results of its operations for the year then ended, the changes in its net assets for each of the two years in the period ended December 31, 2018 and the financial highlights for each of the five years in the period ended December 31, 2018 in conformity with accounting principles generally accepted in the United States of America.
Basis for Opinion
These financial statements are the responsibility of the Fund’s management. Our responsibility is to express an opinion on the Fund’s financial statements based on our audits. We are a public accounting firm registered with the Public Company Accounting Oversight Board (United States) (PCAOB) and are required to be independent with respect to the Fund in accordance with the U.S. federal securities laws and the applicable rules and regulations of the Securities and Exchange Commission and the PCAOB.
We conducted our audits of these financial statements in accordance with the standards of the PCAOB. Those standards require that we plan and perform the audit to obtain reasonable assurance about whether the financial statements are free of material misstatement, whether due to error or fraud.
Our audits included performing procedures to assess the risks of material misstatement of the financial statements, whether due to error or fraud, and performing procedures that respond to those risks. Such procedures included examining, on a test basis, evidence regarding the amounts and disclosures in the financial statements. Our audits also included evaluating the accounting principles used and significant estimates made by management, as well as evaluating the overall presentation of the financial statements. Our procedures included confirmation of securities owned as of December 31, 2018 by correspondence with the custodian and transfer agent. We believe that our audits provide a reasonable basis for our opinion.
PricewaterhouseCoopers LLP
Boston, Massachusetts
February 13, 2019
We have served as the auditor of one or more investment companies in the Goldman Sachs fund complex since 2000.
25
GOLDMAN SACHS VARIABLE INSURANCE TRUST MID CAP VALUE FUND
| | |
| Fund Expenses — Six Month Period Ended December 31, 2018 (Unaudited) | | |
As a shareholder of Institutional or Service Shares of the Fund, you incur ongoing costs, including management fees, distribution and/or service (12b-1) fees (with respect to Service Shares) and other Fund expenses. This example is intended to help you understand your ongoing costs (in dollars) of investing in the Institutional Shares and Service Shares of the Fund and to compare these costs with the ongoing costs of investing in other mutual funds.
The example is based on an investment of $1,000 invested at the beginning of the period and held for the entire period from July 1, 2018 through December 31, 2018, which represents a period of 184 days of a 365 day year.
Actual Expenses — The first line under each share class in the table below provides information about actual account values and actual expenses. You may use the information in this line, together with the amount you invested, to estimate the expenses that you paid over the period. Simply divide your account value by $1,000 (for example, an $8,600 account value divided by $1,000=8.6), then multiply the result by the number in the first line under the heading entitled “Expenses Paid” to estimate the expenses you paid on your account during this period.
Hypothetical Example for Comparison Purposes — The second line under each share class in the table below provides information about hypothetical account values and hypothetical expenses based on the Fund’s actual net expense ratio and an assumed rate of return of 5% per year before expenses, which is not the Fund’s actual return. The hypothetical account values and expenses may not be used to estimate the actual ending account balance or expenses you paid for the period. You may use this information to compare the ongoing costs of investing in the Fund and other funds. To do so, compare this 5% hypothetical example with the 5% hypothetical examples that appear in the shareholder reports of the other funds.
Please note that the expenses shown in the table are meant to highlight your ongoing costs only. As a shareholder of the Fund you do not incur any transaction costs, such as sales charges, redemption fees, or exchange fees, but shareholders of other funds may incur such costs. The second line of the table is useful in comparing ongoing costs only and will not help you determine the relative total costs of owning different funds whose shareholders may incur transaction costs.
| | | | | | | | | | | | |
| Share Class | | Beginning
Account Value
07/01/18 | | | Ending
Account Value
12/31/18 | | | Expenses
Paid for the
6 Months
Ended
12/31/18* | |
| Institutional | | | | | | | | | | | | |
| | | | |
| Actual | | $ | 1,000 | | | $ | 891.20 | | | $ | 4.05 | |
| Hypothetical 5% return | | | 1,000 | | | | 1,020.92 | + | | | 4.33 | |
| Service | | | | | | | | | | | | |
| | | | |
| Actual | | | 1,000 | | | $ | 890.40 | | | | 5.24 | |
| Hypothetical 5% return | | | 1,000 | | | | 1,019.66 | + | | | 5.60 | |
| | + | Hypothetical expenses are based on the Fund’s actual annualized net expense ratios and an assumed rate of return of 5% per year before expenses. | |
| | * | Expenses are calculated using the Fund’s annualized net expense ratio for each class, which represents the ongoing expenses as a percentage of net assets for the six months ended December 31, 2018. Expenses are calculated by multiplying the annualized net expense ratio by the average account value for the period; then multiplying the result by the number of days in the most recent fiscal half year; and then dividing that result by the number of days in the fiscal year. The annualized net expense ratios for the period were 0.85% and 1.10% for Institutional and Service Shares, respectively. | |
26
GOLDMAN SACHS VARIABLE INSURANCE TRUST MID CAP VALUE FUND
Trustees and Officers (Unaudited)
Independent Trustees
| | | | | | | | | | | | |
| | | | | |
Name,
Address and Age1 | | Position(s) Held with the Trust | | Term of Office and
Length of
Time Served2 | | Principal Occupation(s) During Past 5 Years | | Number of
Portfolios in
Fund Complex
Overseen by
Trustee3 | | | Other Directorships Held by Trustee4 |
Jessica Palmer Age: 69 | | Chair of the Board of Trustees | | Since 2018 (Trustee since 2007) | | Ms. Palmer is retired. She was formerly Director, Emerson Center for the Arts and Culture (2011-2017); and Consultant, Citigroup Human Resources Department (2007-2008); Managing Director, Citigroup Corporate and Investment Banking (previously, Salomon Smith Barney/Salomon Brothers) (1984-2006). Ms. Palmer was a Member of the Board of Trustees of Indian Mountain School (private elementary and secondary school) (2004-2009). Chair of the Board of Trustees — Goldman Sachs Trust and Goldman Sachs Variable Insurance Trust. | | | 103 | | | None |
Kathryn A. Cassidy Age: 64 | | Trustee | | Since 2015 | | Ms. Cassidy is retired. Formerly, she was Advisor to the Chairman (May 2014-December 2014); and Senior Vice President and Treasurer (2008-2014), General Electric Company & General Electric Capital Corporation (technology and financial services companies). Trustee — Goldman Sachs Trust and Goldman Sachs Variable Insurance Trust. | | | 103 | | | None |
Diana M. Daniels Age: 69 | | Trustee | | Since 2007 | | Ms. Daniels is retired. Formerly, she was Vice President, General Counsel and Secretary, The Washington Post Company (1991-2006). Ms. Daniels is a Trustee Emeritus and serves as a Presidential Councillor of Cornell University (2013-Present); former Member of the Legal Advisory Board, New York Stock Exchange (2003-2006) and of the Corporate Advisory Board, Standish Mellon Management Advisors (2006-2007). Trustee — Goldman Sachs Trust and Goldman Sachs Variable Insurance Trust. | | | 103 | | | None |
Herbert J. Markley Age: 68 | | Trustee | | Since 2013 | | Mr. Markley is retired. Formerly, he was Executive Vice President, Deere & Company (an agricultural and construction equipment manufacturer) (2007-2009); and President, Agricultural Division, Deere & Company (2001-2007). Previously, Mr. Markley served as an Advisory Board Member of Goldman Sachs Trust and Goldman Sachs Variable Insurance Trust (June 2013-October 2013). Trustee — Goldman Sachs Trust and Goldman Sachs Variable Insurance Trust. | | | 103 | | | None |
Roy W. Templin Age: 58 | | Trustee | | Since 2013 | | Mr. Templin is retired. He is Director, Armstrong World Industries, Inc. (a designer and manufacturer of ceiling, wall and suspension system solutions) (2016-Present); and was formerly Chairman of the Board of Directors, Con-Way Incorporated (a transportation, logistics and supply chain management service company) (2014-2015); Executive Vice President and Chief Financial Officer, Whirlpool Corporation (an appliance manufacturer and marketer) (2004-2012). Previously, Mr. Templin served as an Advisory Board Member of Goldman Sachs Trust and Goldman Sachs Variable Insurance Trust (June 2013-October 2013). Trustee — Goldman Sachs Trust and Goldman Sachs Variable Insurance Trust. | | | 103 | | | Armstrong World Industries, Inc. (a ceiling, wall and suspension systems solutions manufacturer) |
Gregory G. Weaver Age: 67 | | Trustee | | Since 2015 | | Mr. Weaver is retired. He is Director, Verizon Communications Inc. (2015-Present); and was formerly Chairman and Chief Executive Officer, Deloitte & Touche LLP (a professional services firm) (2001-2005 and 2012-2014); and Member of the Board of Directors, Deloitte & Touche LLP (2006-2012). Trustee — Goldman Sachs Trust and Goldman Sachs Variable Insurance Trust. | | | 103 | | | Verizon Communications Inc. |
| | | | | | | | | | | | |
27
GOLDMAN SACHS VARIABLE INSURANCE TRUST MID CAP VALUE FUND
Trustees and Officers (Unaudited) (continued)
Interested Trustee*
| | | | | | | | | | | | |
| | | | | |
Name,
Address and Age1 | | Position(s) Held with the Trust | | Term of Office and
Length of
Time Served2 | | Principal Occupation(s) During Past 5 Years | | Number of
Portfolios in
Fund Complex
Overseen by
Trustee3 | | | Other Directorships Held by Trustee4 |
James A. McNamara Age: 56 | | President and Trustee | | Since 2007 | | Advisory Director, Goldman Sachs (January 2018-Present); Managing Director, Goldman Sachs (January 2000-December 2017); Director of Institutional Fund Sales, GSAM (April 1998-December 2000); and Senior Vice President and Manager, Dreyfus Institutional Service Corporation (January 1993- April 1998). President and Trustee — Goldman Sachs Trust; Goldman Sachs Variable Insurance Trust; Goldman Sachs Trust II; Goldman Sachs MLP Income Opportunities Fund; Goldman Sachs MLP and Energy Renaissance Fund; Goldman Sachs ETF Trust; Goldman Sachs Private Markets Fund 2018 LLC; Goldman Sachs Private Markets Fund 2018 (A) LLC; and Goldman Sachs Private Markets Fund 2018 (B) LLC. | | | 156 | | | None |
| | | | | | | | | | | | |
| * | Mr. McNamara is considered to be an “Interested Trustee” because he holds positions with Goldman Sachs and owns securities issued by The Goldman Sachs Group, Inc. Mr. McNamara holds comparable positions with certain other companies of which Goldman Sachs, GSAM or an affiliate thereof is the investment adviser, administrator and/or distributor. |
| 1 | Each Trustee may be contacted by writing to the Trustee, c/o Goldman Sachs, 200 West Street, New York, New York, 10282, Attn: Caroline Kraus. Information is provided as of December 31, 2018. |
| 2 | Subject to such policies as may be adopted by the Board from time-to-time, each Trustee holds office for an indefinite term, until the earliest of: (a) the election of his or her successor; (b) the date the Trustee resigns or is removed by the Board or shareholders, in accordance with the Trust’s Declaration of Trust; or (c) the termination of the Trust. The Board has adopted policies which provide that (a) no Trustee shall hold office for more than 15 years and (b) a Trustee shall retire as of December 31st of the calendar year in which he or she reaches his or her 74th birthday, unless a waiver of such requirement shall have been adopted by a majority of the other Trustees. These policies may be changed by the Trustees without shareholder vote. |
| 3 | The Goldman Sachs Fund Complex includes certain other companies listed above for each respective Trustee. As of December 31, 2018, Goldman Sachs Trust consisted of 90 portfolios (88 of which offered shares to the public); Goldman Sachs Variable Insurance Trust consisted of 13 portfolios; Goldman Sachs Trust II consisted of 19 portfolios (17 of which offered shares to the public); Goldman Sachs MLP Income Opportunities Fund, Goldman Sachs MLP and Energy Renaissance Fund, Goldman Sachs Private Markets Fund 2018 LLC, Goldman Sachs Private Markets Fund 2018 (A) LLC and Goldman Sachs Private Markets Fund 2018 (B) LLC each consisted of one portfolio; and Goldman Sachs ETF Trust consisted of 29 portfolios (14 of which offered shares to the public). |
| 4 | This column includes only directorships of companies required to report to the Securities and Exchange Commission under the Securities Exchange Act of 1934 (i.e., “public companies”) or other investment companies registered under the Act. |
Additional information about the Trustees is available in the Fund’s Statement of Additional Information, which can be obtained from Goldman Sachs free of charge by calling this toll-free number (in the United States of America): 1-800-526-7384.
28
GOLDMAN SACHS VARIABLE INSURANCE TRUST MID CAP VALUE FUND
Trustees and Officers (Unaudited) (continued)
Officers of the Trust*
| | | | | | |
| | | |
| Name, Address and Age1 | | Position(s) Held with the Trust | | Term of
Office and
Length of
Time Served2 | | Principal Occupation(s) During Past 5 Years |
| | | |
James A. McNamara 200 West Street New York, NY 10282 Age: 56 | | Trustee and President | | Since 2007 | | Advisory Director, Goldman Sachs (January 2018-Present); Managing Director, Goldman Sachs (January 2000-December 2017); Director of Institutional Fund Sales, GSAM (April 1998-December 2000); and Senior Vice President and Manager, Dreyfus Institutional Service Corporation (January 1993-April 1998). President and Trustee — Goldman Sachs Trust; Goldman Sachs Variable Insurance Trust; Goldman Sachs Trust II; Goldman Sachs MLP Income Opportunities Fund; Goldman Sachs MLP and Energy Renaissance Fund; Goldman Sachs ETF Trust; Goldman Sachs Private Markets Fund 2018 LLC; Goldman Sachs Private Markets Fund 2018 (A) LLC; and Goldman Sachs Private Markets Fund 2018 (B) LLC. |
| | | |
Caroline L. Kraus 200 West Street New York, NY 10282 Age: 41 | | Secretary | | Since 2012 | | Managing Director, Goldman Sachs (January 2016-Present); Vice President, Goldman Sachs (August 2006-December 2015); Associate General Counsel, Goldman Sachs (2012-Present); Assistant General Counsel, Goldman Sachs (August 2006-December 2011); and Associate, Weil, Gotshal & Manges, LLP (2002-2006). Secretary — Goldman Sachs Trust (previously Assistant Secretary (2012)); Goldman Sachs Variable Insurance Trust (previously Assistant Secretary (2012)); Goldman Sachs Trust II; Goldman Sachs BDC, Inc.; Goldman Sachs Private Middle Market Credit LLC; Goldman Sachs Middle Market Lending Corp.; Goldman Sachs MLP Income Opportunities Fund; Goldman Sachs MLP and Energy Renaissance Fund; Goldman Sachs ETF Trust; Goldman Sachs Private Markets Fund 2018 LLC; Goldman Sachs Private Markets Fund 2018 (A) LLC; and Goldman Sachs Private Markets Fund 2018 (B) LLC. |
| | | |
Scott M. McHugh 200 West Street New York, NY 10282 Age: 47 | | Treasurer, Senior Vice President and Principal Financial Officer | | Since 2009 (Principal Financial Officer since 2013) | | Managing Director, Goldman Sachs (January 2016-Present); Vice President, Goldman Sachs (February 2007-December 2015); Assistant Treasurer of certain mutual funds administered by DWS Scudder (2005-2007); and Director (2005-2007), Vice President (2000-2005), and Assistant Vice President (1998-2000), Deutsche Asset Management or its predecessor (1998-2007). Treasurer, Senior Vice President and Principal Financial Officer — Goldman Sachs Trust; Goldman Sachs Variable Insurance Trust; Goldman Sachs Trust II; Goldman Sachs MLP Income Opportunities Fund; Goldman Sachs MLP and Energy Renaissance Fund; Goldman Sachs ETF Trust; Goldman Sachs Private Markets Fund 2018 LLC; Goldman Sachs Private Markets Fund 2018 (A) LLC; and Goldman Sachs Private Markets Fund 2018 (B) LLC. |
| | | |
Joseph F. DiMaria 30 Hudson Street Jersey City, NJ 07302 Age: 50 | | Assistant Treasurer and Principal Accounting Officer | | Since 2016 (Principal Accounting Officer since 2017) | | Managing Director, Goldman Sachs (November 2015-Present) and Vice President — Mutual Fund Administration, Columbia Management Investment Advisers, LLC (May 2010-October 2015). Assistant Treasurer and Principal Accounting Officer — Goldman Sachs Trust; Goldman Sachs Variable Insurance Trust; Goldman Sachs Trust II; Goldman Sachs MLP Income Opportunities Fund; Goldman Sachs MLP and Energy Renaissance Fund; Goldman Sachs ETF Trust; Goldman Sachs Private Markets Fund 2018 LLC; Goldman Sachs Private Markets Fund 2018 (A) LLC; and Goldman Sachs Private Markets Fund 2018 (B) LLC. |
| | | | | | |
| * | Represents a partial list of officers of the Trust. Additional information about all the officers is available in the Fund’s Statement of Additional Information, which can be obtained from Goldman Sachs free of charge by calling this toll-free number (in the United States): 1-800-526-7384. |
| 1 | Information is provided as of December 31, 2018. |
| 2 | Officers hold office at the pleasure of the Board of Trustees or until their successors are duly elected and qualified. Each officer holds comparable positions with certain other companies of which Goldman Sachs, GSAM or an affiliate thereof is the investment adviser, administrator and/or distributor. |
Goldman Sachs Variable Insurance Trust — Tax Information (Unaudited)
For the year ended December 31, 2018, 36.37% of the dividends paid from net investment company taxable income by the Mid Cap Value Fund qualify for the dividends received deduction available to corporations.
Pursuant to Section 852 of the Internal Revenue Code, the Mid Cap Value Fund designates $38,377,937 or, if different, the maximum amount allowable, as capital gain dividends paid during the fiscal year ended December 31, 2018.
29
| | |
| TRUSTEES | | OFFICERS |
Jessica Palmer,Chair Kathryn A. Cassidy Diana M. Daniels Herbert J. Markley James A. McNamara Roy W. Templin Gregory G. Weaver | | James A. McNamara,President Scott M. McHugh,Treasurer,Senior Vice President and Principal Financial Officer Joseph F. DiMaria,Assistant Treasurer andPrincipal Accounting Officer Caroline L. Kraus,Secretary |
GOLDMAN SACHS & CO. LLC
Distributor and Transfer Agent
GOLDMAN SACHS ASSET MANAGEMENT, L.P.
Investment Adviser
200 West Street, New York
New York 10282
Visit our web site at www.GSAMFUNDS.com to obtain the most recentmonth-end returns.
The reports concerning the Fund included in this shareholder report may contain certain forward-looking statements about the factors that may affect the performance of the Fund in the future. These statements are based on Fund management’s predictions and expectations concerning certain future events and their expected impact on the Fund, such as performance of the economy as a whole and of specific industry sectors, changes in the levels of interest rates, the impact of developing world events, and other factors that may influence the future performance of the Fund. Management believes these forward-looking statements to be reasonable, although they are inherently uncertain and difficult to predict. Actual events may cause adjustments in portfolio management strategies from those currently expected to be employed.
A description of the policies and procedures that the Fund uses to determine how to vote proxies relating to portfolio securities and information regarding how the Fund voted proxies relating to portfolio securities for the12-month period ended December 31 is available (i) without charge, upon request by calling1-800-621-2550; and (ii) on the Securities and Exchange Commission (“SEC”) web site athttp://www.sec.gov.
The Fund files its complete schedule of portfolio holdings with the SEC for the first and third quarters of each fiscal year onForm N-Q. The Fund’s Form N-Qs are available on the SEC’s web site at http://www.sec.gov within 60 days after the Fund’s first and third fiscal quarters.Form N-Qs may be obtained upon request and without charge by calling1-800-621-2550.
Views and opinions expressed are for informational purposes only and do not constitute a recommendation by GSAM to buy, sell, or hold any security. Views and opinions are current as of the date of this presentation and may be subject to change, they should not be construed as investment advice.
Goldman Sachs & Co. LLC (“Goldman Sachs”) does not provide legal, tax or accounting advice. Any statement contained in this communication (including any attachments) concerning U.S. tax matters was not intended or written to be used, and cannot be used, for the purpose of avoiding penalties under the Internal Revenue Code, and was written to support the promotion or marketing of transaction or matter addressed. Clients of Goldman Sachs should obtain their own independent tax advice based on their particular circumstances.
The website links provided are for your convenience only and are not an endorsement or recommendation by GSAM of any of these websites or the products or services offered. GSAM is not responsible for the accuracy and validity of the content of these websites.
Fund holdings and allocations shown are as of December 31, 2018 and may not be representative of future investments. Fund holdings should not be relied on in making investment decisions and should not be construed as research or investment advice regarding particular securities. Current and future holdings are subject to risk.
References to indices, benchmarks or other measures of relative market performance over a specified period of time are provided for your information only and do not imply that the portfolio will achieve similar results. The index composition may not reflect the manner in which a portfolio is constructed. While an adviser seeks to design a portfolio which reflects appropriate risk and return features, portfolio characteristics may deviate from those of the benchmark.
The Global Industry Classification Standard (“GICS”) was developed by and is the exclusive property and a service mark of Morgan Stanley Capital International Inc. (“MSCI”) and Standard & Poor’s, a division of The McGraw-Hill Companies, Inc. (“S&P”) and is licensed for use by Goldman Sachs. Neither MSCI, S&P nor any other party involved in making or compiling the GICS or any GICS classifications makes any express or implied warranties or representations with respect to such standard or classification (or the results to be obtained by the use thereof), and all such parties hereby expressly disclaim all warranties of originality, accuracy, completeness, merchantability or fitness for a particular purpose with respect to any of such standard or classification. Without limiting any of the foregoing, in no event shall MSCI, S&P, any of their affiliates or any third party involved in making or compiling the GICS or any GICS classifications have any liability for any direct, indirect, special, punitive, consequential or any other damages (including lost profits) even if notified of the possibility of such damages.
The portfolio risk management process includes an effort to monitor and manage risk, but does not imply low risk.
Shares of the Goldman Sachs VIT Funds are offered to separate accounts of participating life insurance companies for the purpose of funding variable annuity contracts and variable life insurance policies. Shares of the Fund are not offered directly to the general public. The variable annuity contracts and variable life insurance policies are described in the separate prospectuses issued by participating insurance companies. You should refer to those prospectuses for information about surrender charges, mortality and expense risk fees and other charges that may be assessed by participating insurance companies under the variable annuity contracts or variable life insurance policies. Such fees or charges, if any, may affect the return you may realize with respect to your investments. Ask your representative for more complete information. Please consider a fund’s objectives, risks and charges and expenses, and read the prospectus carefully before investing. The prospectus contains this and other information about the Fund.
This material is not authorized for distribution to prospective investors unless preceded or accompanied by a current prospectus or summary prospectus, if applicable. Investors should consider the Fund’s objective, risks, and charges and expenses, and read the summary prospectus, if available, and/or the prospectus carefully before investing or sending money. The summary prospectus, if available, and the prospectus contain this and other information about the Fund and may be obtained from your authorized dealer or from Goldman Sachs & Co. LLC by calling1-800-621-2550.
This report is prepared for the general information of contract owners and is not an offer of shares of the Goldman Sachs Variable Insurance Trust — Goldman Sachs Mid Cap Value Fund.
© 2019 Goldman Sachs. All rights reserved.
VITMCVAR-19/157037-OTU-914517/32k
Goldman
SachsVariable Insurance Trust
Goldman Sachs Government
Money Market Fund
Annual Report
December 31, 2018

You could lose money by investing in the Fund. Although the Fund seeks to preserve the value of your investment at $1.00 per share, it cannot guarantee it will do so. An investment in the Fund is not a deposit of the bank and is not insured or guaranteed by the Federal Deposit Insurance Corporation or any other government agency. The Fund’s sponsor has no legal obligation to provide financial support to the Fund, and you should not expect that the sponsor will provide financial support to the Fund at any time.
GOLDMAN SACHS VARIABLE INSURANCE TRUST GOVERNMENT MONEY MARKET FUND
INVESTMENT OBJECTIVE
The Fund seeks to maximize current income to the extent consistent with the preservation of capital and the maintenance of liquidity by investing exclusively in high quality money market instruments.
Portfolio Management Discussion and Analysis
Below, the Goldman Sachs Money Market Portfolio Management Team discusses the Goldman Sachs Variable Insurance Trust — Goldman Sachs Government Money Market Fund’s (the “Fund”) performance and positioning for the12-month period ended December 31, 2018 (the “Reporting Period”).
How did the Fund perform during the Reporting Period?
The Fund’s Institutional Shares’ standardized7-day current yield was 2.35% and their standardized7-day effective yield was 2.37% as of December 31, 2018. The Institutional Shares’one-month simple average yield was 2.20% as of December 31, 2018. The Institutional Shares’7-day distribution yield as of December 31, 2018 was 2.33%.
The Fund’s Service Shares’ standardized7-day current yield was 2.10% and their standardized7-day effective yield was 2.12% as of December 31, 2018. The Service Shares’one-month simple average yield was 1.95% as of December 31, 2018. The Service Shares’7-day distribution yield as of December 31, 2018 was 2.08%.
The yields represent past performance. Past performance does not guarantee future results. Current performance may be lower or higher than the performance quoted above.
Yields will fluctuate as market conditions change. The yield quotations more closely reflect the current earnings of the Fund than total return quotations.
What economic and market factors most influenced the money markets as a whole during the Reporting Period?
The Reporting Period was one wherein money market yields remained low throughout but did move noticeably higher as the Federal Reserve (the “Fed”) proceeded to raise the target range of the federal funds rate four more times, bringing it to a range of 2.25% to 2.50% by the end of December 2018. The money market yield curve, or spectrum of maturities, flattened, as yields on short-term maturities rose more than those on longer-term maturities. Other significant events that influenced the money markets during the Reporting Period included the continuation of the Fed’s balance sheet normalization, begun in October 2017, and action by other central banks around the world, including the European Central Bank’s (“ECB”) discussion of tapering its asset purchases. (Balance sheet normalization refers to the steps the Fed is taking to reverse quantitative easing and remove the substantial monetary accommodation it has provided to the economy since the financial crisis began in 2007.)
In March 2018, the Fed delivered its first interest rate hike of the calendar year, raising the targeted federal funds rate by 25 basis points. (A basis point is 1/100th of a percentage point.) Policymakers cited ongoing strength in the labor market and a pickup in household spending and business fixed investment. The Fed’s dot plot, which shows rate projections of the members of the Fed’s Open Market Committee, indicated at the March meeting that a total of three rate increases were on tap for 2018 and potentially two in 2019. In June 2018, the Fed delivered another 25 basis point interest rate hike. Additionally, at its June meeting, the Fed moved its projected interest rate hikes from three to four for the calendar year. Fed Chair Jerome Powell, who assumed the role in February 2018, cited increasing strength in the economy, low unemployment, and inflation close to the Fed’s objective. His comments were largely expected by the market. These interest rate hikes led the U.S. money market yield curve higher, with the curve overall becoming flatter.
In September 2018, the Fed delivered its third interest rate hike of the calendar year, raising the targeted federal funds rate another 25 basis points. The outcome was mixed, perhaps even slightly dovish on balance, mainly because of the removal of the word “accommodative” from its policy stance. There was no change in the medians for the targeted federal funds rate path and little change in the forecasts of key macroeconomic variables. In December 2018, the Fed delivered its fourth interest rate hike of the calendar year, raising the targeted federal funds rate by another 25 basis points, bringing it into the 2.25% to 2.50% range and citing an emphasis on data dependence with a tightening bias. The Fed mentioned it “expects further gradual increases” in the policy rate.
Outside the U.S., the ECB announced in June 2018 that it would end its monthly asset purchase program, seeking to wind it down by the end of 2018, an action confirmed later in the calendar year. The ECB also stated its policy rates would remain low for “an
1
GOLDMAN SACHS VARIABLE INSURANCE TRUST GOVERNMENT MONEY MARKET FUND
extended period of time, and well past the horizon of the net asset purchases.” Also, as of December 2018, the Bank of England maintained its benchmark interest rate of 0.5% and signaled that future monetary policy tightening would be appropriate to return inflation sustainably to its target. However, Bank of England members agreed that any future increases in its benchmark interest rate would be at a gradual pace and to a limited extent. At the end of the Reporting Period, we believed there was a mounting case for the Bank of England to raise interest rates in 2019. The U.K.’s unemployment rate remained close to a43-year low; real wage growth was rising across both the public and private sector; and inflation was moderating toward target amid lower oil prices and as the impact of earlier currency weakness fades.
What key factors were responsible for the Fund’s performance during the Reporting Period?
The Fund’s yields rose during the Reporting Period due primarily to the economic and market factors discussed above. The targeted federal funds rate was gradually increased during the Reporting Period to a range of 2.25% to 2.50%, and, as such, money market yields similarly rose modestly though with little difference between maturities during that time. As mentioned, the money market yield curve, or spectrum of maturities, flattened during the Reporting Period overall, as shorter-term rates rose more than longer-term rates did. The Fund remained highly liquid throughout.
We felt comfortable that the Fund was appropriately positioned given the interest rate environment during the Reporting Period, as we sought to take advantage of anticipated interest rate movements throughout. While conditions throughout the Reporting Period did not provide bountiful opportunities to pick up yield, as the interest rate yield curve flattened through most of the Reporting Period, it should be noted that regardless of interest rate conditions, we manage the Fund consistently. Our investment approach has always beentri-fold — to seek preservation of capital, daily liquidity and maximization of yield potential. We manage interest and credit risk daily. Whether interest rates are historically low, high orin-between, we intend to continue to use our actively managed approach to provide the best possible return within the framework of the Fund’s guidelines and objectives.
How did you manage the Fund’s weighted average maturity during the Reporting Period?
On December 31, 2017, the Fund’s weighted average maturity was 18 days. During the first quarter of 2018, we targeted a weighted average maturity for the Fund in an 18 to 24 day range in anticipation of the March 2018 interest rate increase by the Fed. By the end of March 2018, following the Fed’s rate hike, we extended the Fund’s weighted average maturity to 40 days. During the second quarter of 2018, with comments from the Fed about a potential June 2018 interest rate increase, we maintained a weighted average maturity for the Fund in a 29 to 33 day range. After the Fed raised interest rates at its June 2018 meeting, we allowed the weighted average maturity of the Fund to extend to a range of between 33 days and 37 days. The Fund’s weighted average maturity on June 30, 2018 was 37 days.
During the third quarter of 2018, we maintained a weighted average maturity for the Fund in a 27 to 33 day range, moving up to a weighted average maturity of 33 days by the end of September 2018. During the fourth quarter of 2018, we maintained a weighted average maturity for the Fund in a 21 to 45 day range, moving up to a weighted average maturity of 45 days by the end of December 2018.
Throughout the Reporting Period, we focused on U.S. government agency securities, U.S. government repurchase agreements and U.S. Treasuries when and where we saw what we considered to be attractive opportunities.
The weighted average maturity of a money market fund is a measure of its price sensitivity to changes in interest rates. Also known as effective maturity, weighted average maturity measures the weighted average of the maturity date of bonds held by the Fund taking into consideration any available maturity shortening features.
How did you manage the Fund’s weighted average life during the Reporting Period?
During the Reporting Period, we managed the weighted average life of the Fund below 120 days. The weighted average life of the Fund was 103 days as of December 31, 2018. The weighted average life of a money market fund is a measure of a money market fund’s price sensitivity to changes in liquidity and/or credit risk.
Under amendments to SEC Rule2a-7 that became effective in May 2010, the maximum allowable weighted average life of a money market fund is 120 days. While one of the goals of the SEC’s money market fund rule is to reinforce conservative investment practices across the money market fund industry, our security selection process has long emphasized conservative investment choices.
How was the Fund invested during the Reporting Period?
The Fund had investments in U.S. government agency securities, U.S. government repurchase agreements, U.S. Treasury securities and U.S. Treasury repurchase agreements during the Reporting Period.
2
GOLDMAN SACHS VARIABLE INSURANCE TRUST GOVERNMENT MONEY MARKET FUND
With yields bounds in astill-low range, there was not a lot of dispersion in performance among securities available for purchase. Throughout, though, we stayed true to our investment discipline, favoring liquidity and high quality credits over added yield. The primary focal points for our team are consistently managing interest rate risk and credit risk. We were able to navigate interest rate risk by adjusting the Fund’s weighted average maturity longer or shorter as market conditions shifted and to mitigate potential credit risk by buying high quality, creditworthy names, strategies which added to the Fund’s performance during the Reporting Period.
Did you make any changes in the Fund’s portfolio during the Reporting Period?
As indicated earlier, we made adjustments to the Fund’s weighted average maturity and to specific security type composition allocations based on then-current market conditions, our near-term view, and anticipated and actual Fed monetary policy statements. That said, there were no significant changes in the Fund’s investment exposures during the Reporting Period. Our duration positioning in the Fund ahead of the March, June, September and December 2018 Fed meetings was particularly positive for the Fund.
What is the Fund’s tactical view and strategy for the months ahead?
Following four Fed interest rate hikes in 2018, we anticipate two more in 2019. At the end of the Reporting Period, we believed the Fed would likely shift away from the “gradual” approach to a more data-dependent tightening bias, perhaps by deleting “gradual increases” from its next statement and inserting something like “additional increases” instead. An alternative would be to keep the current “gradual increases” but then add that the gradual approach is valid “in the near term.” While this is our outlook, we have less conviction on the Fed’s outlook for 2019.
For the last two years, we have had high conviction that the market was underpricing the path of Fed rate hikes. At the end of the Reporting Period, we believed that was still the case, which underpins our expectation for further increases in market interest rates, but we have less conviction in our Fed view compared to 2017 and 2018. With the recent tightening in financial conditions and the new year’s expected economic growth slowdown, we think the case for a pause in the Fed’s tightening campaign has grown stronger. We also see a risk that wage and price inflation pick up in 2019 given the tightness in the U.S. labor market, leading the Fed to possibly continue hiking every quarter through 2019. The Fed is both creating and responding to changes in financial conditions. If financial conditions continue to tighten primarily due to a cheapening in equities, we do not see that as a compelling reason for the Fed to respond or for investors tode-risk. If financial conditions tighten due to a rise in long-term interest rates, we think the Fed may pause to assess the medium- to long-term outlook, which could be supportive for risk assets. As a result, we think the main downside scenario for risk assets is that economic growth slows but rising inflation forces the Fed to continue raising the targeted federal funds rate.
Looking ahead, our strategy continues to be flexibly guided by shifting market conditions, positioning the Fund to seek to take advantage of anticipated interest rate movements. More specifically, at the end of the Reporting Period, we intended to adjust duration guided by the context of market pricing in relation to our own expectations. As always, we intend to continue to use our actively managed approach to seek the best possible return within the framework of the Fund’s investment guidelines and objectives. In addition, we will continue to manage interest, liquidity and credit risk daily.
We will, of course, continue to closely monitor economic data, Fed policy, and any shifts in the money market yield curve, as we strive to strategically navigate the interest rate environment.
3
FUND BASICS
FUND COMPOSITION†
Security Type
(Percentage of Net Assets)
| † | The Fund is actively managed and, as such, its portfolio composition may differ over time. The percentage shown for each investment category reflects the value (based on amortized cost) of investments in that category as a percentage of net assets. Figures in the above chart may not sum to 100% due to the exclusion of other assets and liabilities. |
4
GOLDMAN SACHS VARIABLE INSURANCE TRUST GOVERNMENT MONEY MARKET FUND
Schedule of Investments
December 31, 2018
| | | | | | | | | | | | | | |
Principal
Amount | | | Interest
Rate | | | Maturity
Date | | | Amortized
Cost | |
|
| | U.S. Government Agency Obligations – 18.5% | |
| | Federal Farm Credit Bank (1 Mo. LIBOR – 0.09%) | |
| $ | 1,000,000 | | | | 2.415 | %(a) | | | 03/28/19 | | | $ | 1,000,000 | |
| | Federal Farm Credit Bank (3 Mo. LIBOR – 0.14%) | |
| | 1,700,000 | | | | 2.663 | (a) | | | 09/30/19 | | | | 1,699,937 | |
| | Federal Farm Credit Bank (3 Mo. LIBOR – 0.26%) | |
| | 250,000 | | | | 2.154 | (a) | | | 07/10/19 | | | | 250,000 | |
| | Federal Farm Credit Bank (3 Mo. U.S.T-Bill MMY – 0.20%)(a) | |
| | 1,300,000 | | | | 2.495 | | | | 11/20/19 | | | | 1,299,966 | |
| | 650,000 | | | | 2.495 | | | | 11/29/19 | | | | 650,000 | |
| | 650,000 | | | | 2.500 | | | | 02/18/20 | | | | 650,000 | |
| | Federal Farm Credit Bank (3 Mo. U.S.T-Bill MMY – 0.15%)(a) | |
| | 800,000 | | | | 2.505 | | | | 10/18/19 | | | | 799,981 | |
| | 650,000 | | | | 2.505 | | | | 12/26/19 | | | | 649,975 | |
| | Federal Farm Credit Bank (3 Mo. U.S.T-Bill MMY – 0.18%)(a) | |
| | 800,000 | | | | 2.520 | | | | 02/19/19 | | | | 799,991 | |
| | 800,000 | | | | 2.515 | | | | 07/05/19 | | | | 799,992 | |
| | Federal Farm Credit Bank (FEDL01 – 0.11%) | |
| | 800,000 | | | | 2.510 | (a) | | | 08/13/20 | | | | 799,871 | |
| | Federal Farm Credit Bank (Prime Rate – 2.88%) | |
| | 1,000,000 | | | | 2.620 | (a) | | | 05/07/20 | | | | 999,893 | |
| | Federal Farm Credit Bank (Prime Rate – 2.90%) | |
| | 600,000 | | | | 2.600 | (a) | | | 01/30/20 | | | | 600,000 | |
| | Federal Farm Credit Bank (Prime Rate – 2.93%) | |
| | 1,200,000 | | | | 2.570 | (a) | | | 11/06/20 | | | | 1,200,000 | |
| | Federal Farm Credit Bank (Prime Rate – 2.94%) | |
| | 1,500,000 | | | | 2.565 | (a) | | | 10/30/20 | | | | 1,500,000 | |
| | Federal Farm Credit Bank (Prime Rate – 2.95%) | |
| | 100,000 | | | | 2.550 | (a) | | | 04/30/20 | | | | 100,000 | |
| | Federal Farm Credit Bank (Prime Rate – 2.96%) | |
| | 200,000 | | | | 2.540 | (a) | | | 03/13/20 | | | | 199,821 | |
| | Federal Farm Credit Bank (Prime Rate – 2.98%) | |
| | 300,000 | | | | 2.520 | (a) | | | 11/12/20 | | | | 299,723 | |
| | Federal Farm Credit Bank (Prime Rate – 6.16%)(a) | |
| | 250,000 | | | | 2.420 | | | | 06/27/19 | | | | 249,994 | |
| | 1,600,000 | | | | 2.420 | | | | 07/17/19 | | | | 1,599,913 | |
| | Federal Farm Credit Bank (Prime Rate – 3.12%) | |
| | 1,000,000 | | | | 2.380 | (a) | | | 01/24/19 | | | | 999,993 | |
| | Federal Home Loan Bank | |
| | 1,200,000 | | | | 2.500 | | | | 05/17/19 | | | | 1,199,802 | |
| | Federal Home Loan Bank (1 Mo. LIBOR – 0.05%) | |
| | 6,000,000 | | | | 2.333 | (a) | | | 10/07/19 | | | | 6,000,000 | |
| | Federal Home Loan Bank (1 Mo. LIBOR – 0.08%) | |
| | 13,000,000 | | | | 2.390 | (a) | | | 03/19/19 | | | | 13,000,000 | |
| | Federal Home Loan Bank (1 Mo. LIBOR – 0.09%) | |
| | 1,200,000 | | | | 2.350 | (a) | | | 01/14/19 | | | | 1,200,000 | |
| | Federal Home Loan Bank (1 Mo. LIBOR – 0.19%) | |
| | 5,700,000 | | | | 2.360 | (a) | | | 04/18/19 | | | | 5,700,000 | |
| | Federal Home Loan Bank (1 Mo. LIBOR – 0.33%)(a) | |
| | 9,500,000 | | | | 2.396 | | | | 01/25/19 | | | | 9,499,943 | |
| | 11,000,000 | | | | 2.394 | | | | 02/22/19 | | | | 10,999,954 | |
| | Federal Home Loan Bank (1 Mo. LIBOR – 0.12%) | |
| | 1,700,000 | | | | 2.389 | (a) | | | 01/22/19 | | | | 1,699,989 | |
| | Federal Home Loan Bank (3 Mo. LIBOR – 1.24%)(a) | |
| | 6,200,000 | | | | 2.466 | | | | 03/12/19 | | | | 6,200,000 | |
| | 3,500,000 | | | | 2.469 | | | | 03/13/19 | | | | 3,500,000 | |
| | 1,400,000 | | | | 2.514 | | | | 03/22/19 | | | | 1,400,000 | |
| | 750,000 | | | | 2.512 | | | | 03/25/19 | | | | 750,000 | |
| | |
|
| | U.S. Government Agency Obligations – (continued) | |
| | Federal Home Loan Bank (3 Mo. LIBOR – 0.96%)(a) | |
| $ | 2,900,000 | | | | 2.470 | % | | | 03/21/19 | | | $ | 2,900,000 | |
| | 5,900,000 | | | | 2.502 | | | | 03/25/19 | | | | 5,900,000 | |
| | 6,000,000 | | | | 2.502 | | | | 03/27/19 | | | | 6,000,000 | |
| | Federal Home Loan Bank (3 Mo. LIBOR – 0.66%)(a) | |
| | 4,500,000 | | | | 2.080 | | | | 01/07/19 | | | | 4,500,000 | |
| | 5,000,000 | | | | 2.090 | | | | 01/11/19 | | | | 5,000,000 | |
| | Federal Home Loan Bank (3 Mo. U.S.T-Bill – 0.07%) | |
| | 10,700,000 | | | | 2.534 | (a) | | | 01/30/20 | | | | 10,701,735 | |
| | Federal Home Loan Bank Discount Notes | |
| | 6,500,000 | | | | 2.394 | | | | 02/25/19 | | | | 6,476,365 | |
| | 6,500,000 | | | | 2.432 | | | | 03/01/19 | | | | 6,474,604 | |
| | Federal National Mortgage Association (SOFR – 0.08%) | |
| | 6,000,000 | | | | 2.540 | (a) | | | 01/30/19 | | | | 6,000,000 | |
| | Federal National Mortgage Association (SOFR – 0.12%) | |
| | 6,000,000 | | | | 2.580 | (a) | | | 07/30/19 | | | | 6,000,000 | |
| | Federal National Mortgage Association (SOFR – 0.16%) | |
| | 750,000 | | | | 2.620 | (a) | | | 01/30/20 | | | | 750,000 | |
| | Overseas Private Investment Corp. (3 Mo. U.S.T-Bill – 0.00%) | |
| | 5,385,317 | | | | 2.430 | (a) | | | 01/07/19 | | | | 5,385,317 | |
| | |
| TOTAL U.S. GOVERNMENT AGENCY
OBLIGATIONS |
| | $ | 144,386,759 | |
| | |
| | | | | | | | | | | | | | |
|
| | U.S. Treasury Obligations – 31.0% | |
| | United States Treasury Bills | |
| $ | 10,000 | | | | 2.412 | % | | | 02/05/19 | | | $ | 9,977 | |
| | 80,000 | | | | 2.417 | | | | 02/05/19 | | | | 79,815 | |
| | 320,000 | | | | 2.422 | | | | 02/05/19 | | | | 319,260 | |
| | 20,000 | | | | 2.416 | | | | 02/14/19 | | | | 19,942 | |
| | 20,000 | | | | 2.432 | | | | 02/19/19 | | | | 19,935 | |
| | 100,000 | | | | 2.420 | | | | 04/04/19 | | | | 99,390 | |
| | 300,000 | | | | 2.429 | | | | 04/04/19 | | | | 298,163 | |
| | 1,000,000 | | | | 2.438 | | | | 04/04/19 | | | | 993,839 | |
| | 1,100,000 | | | | 2.443 | | | | 04/04/19 | | | | 1,093,208 | |
| | 1,700,000 | | | | 2.444 | | | | 04/04/19 | | | | 1,689,504 | |
| | 1,000,000 | | | | 2.500 | (b) | | | 04/04/19 | | | | 993,806 | |
| | 3,000,000 | | | | 2.505 | (b) | | | 04/04/19 | | | | 2,981,383 | |
| | 1,500,000 | | | | 2.506 | (b) | | | 04/04/19 | | | | 1,490,688 | |
| | 100,000 | | | | 2.507 | | | | 05/02/19 | | | | 99,176 | |
| | 500,000 | | | | 2.524 | | | | 05/23/19 | | | | 495,148 | |
| | 11,000,000 | | | | 2.541 | | | | 05/30/19 | | | | 10,887,319 | |
| | 15,000,000 | | | | 2.562 | | | | 06/06/19 | | | | 14,837,825 | |
| | 20,000,000 | | | | 2.546 | | | | 06/13/19 | | | | 19,775,422 | |
| | 90,000 | | | | 2.477 | | | | 06/20/19 | | | | 88,974 | |
| | 18,500,000 | | | | 2.552 | | | | 06/20/19 | | | | 18,282,908 | |
| | 100,000 | | | | 2.494 | | | | 06/27/19 | | | | 98,805 | |
| | 34,910,000 | | | | 2.546 | | | | 06/27/19 | | | | 34,484,331 | |
| | 50,000,000 | | | | 2.573 | (b) | | | 07/05/19 | | | | 49,363,313 | |
| United States Treasury Floating Rate Note (3 Mo. U.S.T-Bill
MMY + 0.04%) |
|
| | 10,000,000 | | | | 2.473 | (a) | | | 07/31/20 | | | | 9,998,843 | |
| United States Treasury Floating Rate Notes (3 Mo. U.S.T-Bill
MMY + 0.05%)(a) |
|
| | 46,000,000 | | | | 2.478 | | | | 10/31/19 | | | | 46,003,742 | |
| | 15,000,000 | | | | 2.475 | | | | 10/31/20 | | | | 15,000,272 | |
| | |
| | |
| The accompanying notes are an integral part of these financial statements. | | 5 |
GOLDMAN SACHS VARIABLE INSURANCE TRUST GOVERNMENT MONEY MARKET FUND
Schedule of Investments(continued)
December 31, 2018
| | | | | | | | | | | | | | |
Principal
Amount | | | Interest
Rate | | | Maturity
Date | | | Amortized
Cost | |
|
| | U.S. Treasury Obligations – (continued) | |
| | United States Treasury Notes | |
| $ | 300,000 | | | | 1.125 | % | | | 01/31/19 | | | $ | 299,693 | |
| | 100,000 | | | | 1.500 | | | | 01/31/19 | | | | 99,926 | |
| | 500,000 | | | | 1.125 | | | | 05/31/19 | | | | 497,087 | |
| | 2,400,000 | | | | 1.250 | | | | 06/30/19 | | | | 2,384,194 | |
| | 3,100,000 | | | | 1.625 | | | | 06/30/19 | | | | 3,085,264 | |
| | 2,500,000 | | | | 0.750 | | | | 07/15/19 | | | | 2,475,531 | |
| | 1,200,000 | | | | 0.750 | | | | 08/15/19 | | | | 1,186,207 | |
| | 1,500,000 | | | | 3.625 | | | | 08/15/19 | | | | 1,509,106 | |
| | 600,000 | | | | 1.750 | | | | 09/30/19 | | | | 595,872 | |
| | |
| TOTAL U.S. TREASURY
OBLIGATIONS |
| | $ | 241,637,868 | |
| | |
| TOTAL INVESTMENTS BEFORE
REPURCHASE AGREEMENTS |
| | $ | 386,024,627 | |
| | |
| | | | | | | | | | | | | | |
|
| | Repurchase Agreements(c) – 55.8% | |
| | BNP Paribas | |
| $ | 5,000,000 | | | | 2.400 | %(d) | | | 01/07/19 | | | $ | 5,000,000 | |
| | Maturity Value: $5,030,667 | |
| | Settlement Date: 11/27/18 | |
| Collateralized by a U.S. Treasury Inflation-Indexed Bond,
2.000%, due 01/15/26, U.S. Treasury Interest-Only Stripped
Securities, 0.000%, due 02/15/20 to 11/15/44, a U.S. Treasury
Note, 1.750%, due 12/31/20 and U.S. Treasury Principal-Only
Stripped Securities, 0.000%, due 05/15/20 to 08/15/39. The
aggregate market value of the collateral, including accrued
interest, was $5,100,001. |
|
| | 5,000,000 | | | | 2.420 | (d) | | | 01/07/19 | | | | 5,000,000 | |
| | Maturity Value: $5,030,922 | |
| | Settlement Date: 11/27/18 | |
| Collateralized by Federal Home Loan Mortgage Corp., 3.000% to
6.500%, due 03/01/26 to 09/01/46, Federal National Mortgage
Association, 3.000% to 7.000%, due 11/01/21 to 11/01/48,
Government National Mortgage Association, 3.000% to
6.000%, due 09/15/38 to 05/20/46 and U.S. Treasury Notes,
1.000% to 2.625%, due 10/15/19 to 06/15/21. The aggregate
market value of the collateral, including accrued interest, was
$5,149,888. |
|
| | 10,000,000 | | | | 2.480 | (d) | | | 01/07/19 | | | | 10,000,000 | |
| | Maturity Value: $10,063,378 | |
| | Settlement Date: 12/20/18 | |
| Collateralized by Federal Home Loan Mortgage Corp., 4.000%,
due 12/01/45, Federal National Mortgage Association, 4.000%
to 4.500%, due 10/01/48 to 11/01/48 and Government National
Mortgage Association, 3.500%, due 12/20/45. The aggregate
market value of the collateral, including accrued interest, was
$10,300,001. |
|
| | |
| | Joint Repurchase Agreement Account III | |
| | 400,500,000 | | | | 2.993 | | | | 01/02/19 | | | | 400,500,000 | |
| | Maturity Value: $400,566,602 | |
| | |
|
| | Repurchase Agreements(c) – (continued) | |
| | Royal Bank ofCanada-New York Branch | |
| $ | 15,000,000 | | | | 2.390 | %(d) | | | 01/04/19 | | | $ | 15,000,000 | |
| | Maturity Value: $15,027,883 | |
| | Settlement Date: 12/07/18 | |
| Collateralized by Federal Home Loan Mortgage Corp., 3.000%,
due 03/01/46, Federal National Mortgage Association, 2.000%
to 5.000%, due 02/01/33 to 11/01/48 and Government National
Mortgage Association, 3.500% to 4.000%, due 09/20/42 to
02/20/48. The aggregate market value of the collateral,
including accrued interest, was $15,300,000. |
|
| | |
| | TOTAL REPURCHASE AGREEMENTS | | | $ | 435,500,000 | |
| | |
| | TOTAL INVESTMENTS – 105.3% | | | $ | 821,524,627 | |
| | |
| LIABILITIES IN EXCESS OF
OTHER ASSETS – (5.3)% |
| | | (41,425,165 | ) |
| | |
| | NET ASSETS – 100.0% | | | $ | 780,099,462 | |
| | |
| | |
| The percentage shown for each investment category reflects the value of investments in that category as a percentage of net assets. |
| |
| (a) | | Variable or floating rate security. Except for floating rate notes (for which final maturity is disclosed), maturity date disclosed is the next interest reset date. Interest rate disclosed is that which is in effect on December 31, 2018. |
| |
| (b) | | All or a portion represents a forward commitment. |
| |
| (c) | | Unless noted, all repurchase agreements were entered into on December 31, 2018. Additional information on Joint Repurchase Agreement Account III appears in the Additional Investment Information section. |
| |
| (d) | | The instrument is subject to a demand feature. |
|
| Interest rates represent either the stated coupon rate, annualized yield on date of purchase for discounted securities, or, for floating rate securities, the current reset rate, which is based upon current interest rate indices. |
|
| Maturity dates represent either the final legal maturity date on the security, the demand date for puttable securities, the date of the next interest rate reset for variable rate securities, or the prerefunded date for those types of securities. |
| | |
| |
| Investment Abbreviations: |
| FEDL01 | | —US Federal Funds Effective Rate |
| LIBOR | | —London Interbank Offered Rates |
| MMY | | —Money Market Yield |
| Prime | | —Federal Reserve Bank Prime Loan Rate US |
| SOFR | | —Secured Overnight Financing Rate |
| T-Bill | | —Treasury Bill |
| | |
| 6 | | The accompanying notes are an integral part of these financial statements. |
GOLDMAN SACHS VARIABLE INSURANCE TRUST GOVERNMENT MONEY MARKET FUND
ADDITIONAL INVESTMENT INFORMATION
JOINT REPURCHASE AGREEMENT ACCOUNT III — At December 31, 2018, the Fund had undivided interests in the Joint Repurchase Agreement Account III, with a maturity date of January 2, 2019, as follows:
| | | | | | | | | | | | | |
| Principal Amount | | Maturity Value | | Collateral Value |
| | | $400,500,000 | | | | $ | 400,566,602 | | | | $ | 412,482,134 | |
REPURCHASE AGREEMENTS — At December 31, 2018, the Principal Amounts of the Fund’s interest in the Joint Repurchase Agreement Account III were as follows:
| | | | | | | | |
| Counterparty | | Interest Rate | | | Principal Amount | |
| ABN Amro Bank N.V. | | | 2.970 | % | | $ | 22,247,528 | |
| Bank of America, N.A. | | | 3.000 | | | | 27,809,410 | |
| Bank of Nova Scotia (The) | | | 2.970 | | | | 122,361,405 | |
| BNP Paribas | | | 3.000 | | | | 27,809,410 | |
| Merrill Lynch, Pierce, Fenner & Smith, Inc. | | | 3.000 | | | | 116,799,522 | |
Wells Fargo Securities, LLC | | | 3.020 | | | | 83,472,725 | |
| | |
| TOTAL | | | | | | $ | 400,500,000 | |
At December 31, 2018, the Joint Repurchase Agreement Account III was fully collateralized by:
| | | | | | | | |
| Issuer | | Interest Rates | | | Maturity Dates | |
| Federal Farm Credit Bank | | | 1.550 to 4.150 | % | | | 04/13/20 to 06/27/33 | |
| Federal Home Loan Bank | | | 1.250 | | | | 01/16/19 | |
| Federal Home Loan Mortgage Corp. | | | 2.000 to 7.500 | | | | 05/01/21 to 01/01/49 | |
| Federal National Mortgage Association | | | 1.750 to 7.500 | | | | 02/01/19 to 10/01/56 | |
| Government National Mortgage Association | | | 2.500 to 7.500 | | | | 09/15/24 to 11/20/48 | |
| U.S. Treasury Bill | | | 0.000 | | | | 01/10/19 | |
| U.S. Treasury Bond | | | 2.750 | | | | 08/15/47 | |
| | |
| The accompanying notes are an integral part of these financial statements. | | 7 |
GOLDMAN SACHS VARIABLE INSURANCE TRUST GOVERNMENT MONEY MARKET FUND
Statement of Assets and Liabilities
December 31, 2018
| | | | |
| | | | |
| Assets: | | | |
Investments based on amortized cost | | $ | 386,024,627 | |
Repurchase agreements based on amortized cost | | | 435,500,000 | |
Cash | | | 63,814 | |
Receivables: | | | | |
Fund shares sold | | | 14,173,968 | |
Interest | | | 694,887 | |
Reimbursement from investment adviser | | | 43,117 | |
| |
| Total assets | | | 836,500,413 | |
| |
| | | | |
| Liabilities: | | | |
Payables: | | | | |
Investment securities purchased | | | 54,829,189 | |
Fund shares redeemed | | | 1,295,159 | |
Management fees | | | 94,789 | |
Distribution and Service fees and Transfer Agency fees | | | 87,929 | |
Accrued expenses | | | 93,885 | |
| |
| Total liabilities | | | 56,400,951 | |
| |
| | | | |
| Net Assets: | | | |
Paid-in capital | | | 780,114,877 | |
Total distributable loss | | | (15,415 | ) |
| |
| NET ASSETS | | $ | 780,099,462 | |
| |
Net asset value, offering and redemption price per share | | $ | 1.00 | |
Net Assets: | | | | |
Institutional Shares | | $ | 411,447,477 | |
Service Shares | | | 368,651,985 | |
| |
Total Net Assets | | $ | 780,099,462 | |
Shares of beneficial interest outstanding $0.001 par value (unlimited shares authorized): | | | | |
Institutional Shares | | | 411,455,450 | |
Service Shares | | | 368,659,408 | |
| | |
| 8 | | The accompanying notes are an integral part of these financial statements. |
GOLDMAN SACHS VARIABLE INSURANCE TRUST GOVERNMENT MONEY MARKET FUND
Statement of Operations
For the Fiscal Year Ended December 31, 2018
| | | | |
| | | | |
| Investment Income: | | | |
| |
Interest | | $ | 12,052,775 | |
| | | | |
| | | | |
| Expenses: | | | |
Management fees | | | 1,048,079 | |
Distribution and Service fees — Service Shares | | | 870,909 | |
Transfer Agency fees(a) | | | 126,047 | |
Professional fees | | | 121,495 | |
Printing and mailing costs | | | 57,490 | |
Custody, accounting and administrative services | | | 51,838 | |
Trustee fees | | | 17,182 | |
Other | | | 12,502 | |
| |
| Total expenses | | | 2,305,542 | |
| |
Less — expense reductions | | | (276,035 | ) |
| |
| Net expenses | | | 2,029,507 | |
| |
| NET INVESTMENT INCOME | | | 10,023,268 | |
| |
| NET REALIZED LOSS FROM INVESTMENT TRANSACTIONS | | | (46,644 | ) |
| |
| NET INCREASE IN NET ASSETS RESULTING FROM OPERATIONS | | $ | 9,976,624 | |
(a) Institutional and Service Shares incurred Transfer Agency fees of $56,380 and $69,667, respectively.
| | |
| The accompanying notes are an integral part of these financial statements. | | 9 |
GOLDMAN SACHS VARIABLE INSURANCE TRUST GOVERNMENT MONEY MARKET FUND
Statements of Changes in Net Assets
| | | | | | | | |
| | | For the
Fiscal Year Ended
December 31, 2018 | | | For the
Fiscal Year Ended
December 31, 2017 | |
| | | | | | | | |
| From operations: | | | | | | |
Net investment income | | $ | 10,023,268 | | | $ | 3,607,434 | |
Net realized loss from investment transactions | | | (46,644 | ) | | | (9,695 | ) |
| | |
| Net increase in net assets resulting from operations | | | 9,976,624 | | | | 3,597,739 | |
| | | | | | | | |
| | | | | | | | |
| Distributions to shareholders: | | | | | | |
From distributable earnings: | | | | | | | | |
Institutional Shares | | | (4,862,159 | ) | | | (1,764,524 | )(a) |
Service Shares | | | (5,123,116 | ) | | | (1,838,690 | )(a) |
| | |
| Total distributions to shareholders | | | (9,985,275 | ) | | | (3,603,214 | ) |
| | | | | | | | |
| | | | | | | | |
| From share transactions (at $1.00 per share): | | | | | | |
Proceeds from sales of shares | | | 791,066,132 | | | | 475,485,463 | |
Reinvestment of distributions | | | 9,982,588 | | | | 3,592,877 | |
Cost of shares redeemed | | | (677,694,987 | ) | | | (404,885,071 | ) |
| | |
| Net increase in net assets resulting from share transactions | | | 123,353,733 | | | | 74,193,269 | |
| | |
| TOTAL INCREASE | | | 123,345,082 | | | | 74,187,794 | |
| | | | | | | | |
| | | | | | | | |
| Net assets:(b) | | | | | | |
| | |
Beginning of year | | | 656,754,380 | | | | 582,566,586 | |
| | |
End of year | | $ | 780,099,462 | | | $ | 656,754,380 | |
(a) Prior year information has been revised to conform to current year presentation. Distributions to shareholders consisted solely of net investment income for the fiscal year ended December 31, 2017.
(b) Prior fiscal year information has been revised to conform with current year presentation. Undistributed net investment income was $6,724 for the fiscal year ended December 31, 2017.
| | |
| 10 | | The accompanying notes are an integral part of these financial statements. |
GOLDMAN SACHS VARIABLE INSURANCE TRUST GOVERNMENT MONEY MARKET FUND
Financial Highlights
Selected Data for a Share Outstanding Throughout Each Period
| | | | | | | | | | | | | | | | | | | | |
| | | Goldman Sachs Government Money Market Fund | |
| | | Institutional Shares | |
| | | Year Ended December 31, | |
| | | 2018 | | | 2017 | | | 2016 | | | 2015 | | | 2014 | |
| | | | | | | | | | | | | | | | | | | | |
| Per Share Data: | | | | | | | | | | | | | | | |
| | | | | |
Net asset value, beginning of period | | $ | 1.00 | | | $ | 1.00 | | | $ | 1.00 | | | $ | 1.00 | | | $ | 1.00 | |
| | | | | |
Net investment income(a) | | | 0.017 | | | | 0.008 | | | | 0.003 | | | | — | (b) | | | — | (b) |
| | | | | | |
Distributions to shareholders from net investment income(c) | | | (0.017 | ) | | | (0.008 | ) | | | (0.003 | ) | | | — | (b) | | | — | (b) |
| | | | | | |
Net asset value, end of period | | $ | 1.00 | | | $ | 1.00 | | | $ | 1.00 | | | $ | 1.00 | | | $ | 1.00 | |
| | | | | |
Total return(d) | | | 1.74 | % | | | 0.76 | % | | | 0.29 | % | | | 0.02 | % | | | 0.01 | % |
| | | | | |
Net assets, end of period (in 000’s) | | $ | 411,447 | | | $ | 302,507 | | | $ | 206,987 | | | $ | 1,143 | | | $ | 773 | |
| | | | | |
Ratio of net expenses to average net assets | | | 0.18 | % | | | 0.18 | % | | | 0.19 | % | | | 0.23 | % | | | 0.23 | % |
| | | | | |
Ratio of total expenses to average net assets | | | 0.23 | % | | | 0.27 | % | | | 0.30 | % | | | 0.31 | % | | | 0.31 | % |
| | | | | |
Ratio of net investment income to average net assets | | | 1.73 | % | | | 0.76 | % | | | 0.31 | % | | | 0.03 | % | | | 0.03 | % |
| (a) | Calculated based on the average shares outstanding methodology. |
| (b) | Amount is less than $0.0005 per share. |
| (c) | Distributions may not coincide with the current year net investment income or net realized gains as distributions may be paid from current or prior year earnings. |
| (d) | Assumes reinvestment of all distributions. |
| | |
| The accompanying notes are an integral part of these financial statements. | | 11 |
GOLDMAN SACHS VARIABLE INSURANCE TRUST GOVERNMENT MONEY MARKET FUND
Financial Highlights(continued)
Selected Data for a Share Outstanding Throughout Each Period
| | | | | | | | | | | | | | | | | | | | |
| | | Goldman Sachs Government Money Market Fund | |
| | | Service Shares | |
| | | Year Ended December 31, | |
| | | 2018 | | | 2017 | | | 2016 | | | 2015 | | | 2014 | |
| | | | | | | | | | | | | | | | | | | | |
| Per Share Data: | | | | | | | | | | | | | | | |
| | | | | |
Net asset value, beginning of period | | $ | 1.00 | | | $ | 1.00 | | | $ | 1.00 | | | $ | 1.00 | | | $ | 1.00 | |
| | | | | |
Net investment income(a) | | | 0.015 | | | | 0.005 | | | | — | (b) | | | — | (b) | | | — | (b) |
| | | | | | |
Distributions to shareholders from net investment income(c) | | | (0.015 | ) | | | (0.005 | ) | | | — | (b) | | | — | (b) | | | — | (b) |
| | | | | | |
Net asset value, end of period | | $ | 1.00 | | | $ | 1.00 | | | $ | 1.00 | | | $ | 1.00 | | | $ | 1.00 | |
| | | | | |
Total return(d) | | | 1.48 | % | | | 0.51 | % | | | 0.04 | % | | | 0.01 | % | | | 0.01 | % |
| | | | | |
Net assets, end of period (in 000’s) | | $ | 368,652 | | | $ | 354,248 | | | $ | 375,580 | | | $ | 328,202 | | | $ | 305,994 | |
| | | | | |
Ratio of net expenses to average net assets | | | 0.43 | % | | | 0.43 | % | | | 0.44 | % | | | 0.26 | % | | | 0.24 | % |
| | | | | |
Ratio of total expenses to average net assets | | | 0.48 | % | | | 0.52 | % | | | 0.55 | % | | | 0.56 | % | | | 0.56 | % |
| | | | | |
Ratio of net investment income to average net assets | | | 1.48 | % | | | 0.51 | % | | | 0.03 | % | | | 0.01 | % | | | — | %(e) |
| (a) | Calculated based on the average shares outstanding methodology. |
| (b) | Amount is less than $0.0005 per share. |
| (c) | Distributions may not coincide with the current year net investment income or net realized gains as distributions may be paid from current or prior year earnings. |
| (d) | Assumes reinvestment of all distributions. |
| (e) | Amount is less than 0.005% of average net assets. |
| | |
| 12 | | The accompanying notes are an integral part of these financial statements. |
GOLDMAN SACHS VARIABLE INSURANCE TRUST GOVERNMENT MONEY MARKET FUND
Notes to Financial Statements
December 31, 2018
1. ORGANIZATION
Goldman Sachs Variable Insurance Trust (the “Trust” or “VIT”) is a Delaware statutory trust registered under the Investment Company Act of 1940, as amended (the “Act”), as anopen-end management investment company. The Trust includes the Goldman Sachs Government Money Market Fund (the “Fund”). The Fund is a diversified portfolio under the Act offering two classes of shares — Institutional and Service Shares. Shares of the Trust are offered to separate accounts of participating life insurance companies for the purpose of funding variable annuity contracts and variable life insurance policies.
Goldman Sachs Asset Management, L.P. (“GSAM”), an affiliate of Goldman Sachs & Co. LLC (“Goldman Sachs”), serves as investment adviser to the Fund pursuant to a management agreement (the “Agreement”) with the Trust.
2. SIGNIFICANT ACCOUNTING POLICIES
The financial statements have been prepared in accordance with accounting principles generally accepted in the United States of America (“GAAP”) and require management to make estimates and assumptions that may affect the reported amounts and disclosures. Actual results may differ from those estimates and assumptions.
A. Investment Valuation — The investment valuation policy of the Fund is to use theamortized-cost method permitted byRule 2a-7 under the Act for valuing portfolio securities. Theamortized-cost method of valuation involves valuing a security at its cost and thereafter applying a constant accretion or amortization to maturity of any discount or premium. Normally, a security’s amortized cost will approximate its market value. Under procedures and tolerances approved by the Board of Trustees (“Trustees”), GSAM evaluates daily the difference between the Fund’s net asset value (“NAV”) per share using the amortized costs of its portfolio securities and the Fund’s NAV per share using market-based values of its portfolio securities. The market-based value of a portfolio security is determined, where readily available, on the basis of market quotations provided by pricing services or securities dealers, or, where accurate market quotations are not readily available, on the basis of the security’s fair value as determined in accordance with Valuation Procedures approved by the Trustees. The pricing services may use valuation models or matrix pricing, which may consider (among other things): (i) yield or price with respect to debt securities that are considered comparable in characteristics such as rating, interest rate and maturity date or (ii) quotations from securities dealers to determine current value.
B. Investment Income and Investments — Interest income is accrued daily and adjusted for amortization of premiums and accretion of discounts. Investment transactions are reflected on trade date. Realized gains and losses are calculated using identified cost.
C. Class Allocations and Expenses — Investment income, realized and unrealized gain (loss), if any, andnon-class specific expenses of the Fund are allocated daily based upon the proportion of net assets of each class. Class specific expenses, where applicable, are borne by the respective share classes and include Distribution and Service and Transfer Agency fees.Non-class specific expenses directly incurred by the Fund are charged to the Fund, while such expenses incurred by the Trust are allocated across the applicable Funds on a straight-line and/orpro-rata basis depending upon the nature of the expenses.
D. Federal Taxes and Distributions to Shareholders — It is the Fund’s policy to comply with the requirements of the Internal Revenue Code of 1986, as amended (the “Code”), applicable to regulated investment companies (mutual funds) and to distribute each year substantially all of its investment company taxable andtax-exempt income and capital gains to its shareholders. Accordingly, the Fund is not required to make any provisions for the payment of federal income tax. Distributions to shareholders are declared and recorded daily and paid monthly by the Fund and may include short-term capital gains. Long-term capital gain distributions, if any, are declared and paid annually. The Fund may defer or accelerate the timing of the distribution of short-term capital gains (or any portion thereof)
The characterization of distributions to shareholders for financial reporting purposes is determined in accordance with federal income tax rules, which may differ from GAAP. The source of the Fund’s distributions may be shown in the accompanying financial statements as either from distributable earnings or capital. Certain components of the Fund’s net assets on the Statement of Assets and Liabilities reflect permanent GAAP/tax differences based on the appropriate tax character.
13
GOLDMAN SACHS VARIABLE INSURANCE TRUST GOVERNMENT MONEY MARKET FUND
Notes to Financial Statements(continued)
December 31, 2018
2. SIGNIFICANT ACCOUNTING POLICIES (continued)
The tax character of distributions paid during the fiscal years ended December 31, 2018 and December 31, 2017 were as follows:
| | | | | | | | |
| | | 2018 | | | 2017 | |
| Distributions paid from: | | | | | | | | |
| Ordinary income | | $ | 9,985,275 | | | $ | 3,603,214 | |
| Net long-term capital gains | | | — | | | | — | |
| Total taxable distributions | | $ | 9,985,275 | | | $ | 3,603,214 | |
As of December 31, 2018, the components of accumulated earnings on a tax basis were as follows:
| | | | |
| Undistributed (Distributions in excess of) ordinary income — net | | $ | 44,717 | |
| Perpetual Short-term Capital loss carryforward | | | (43,959 | ) |
| Timing differences (Post October Loss Deferral/Distributions Payable) | | | (16,173 | ) |
| Unrealized gains (losses) — net | | | — | |
| Total accumulated earnings (losses) — net | | $ | (15,415 | ) |
The amortized cost for the Fund stated in the accompanying Statement of Assets and Liabilities also represents aggregate cost for U.S. federal income tax purposes.
GSAM has reviewed the Fund’s tax positions for all open tax years (the current and prior three years, as applicable) and has concluded that no provision for income tax is required in the Fund’s financial statements. Such open tax years remain subject to examination and adjustment by tax authorities.
E. Forward Commitments — A forward commitment involves entering into a contract to purchase or sell securities, typically on an extended settlement basis, for a fixed price at a future date. The purchase of securities on a forward commitment basis involves a risk of loss if the value of the security to be purchased declines before the settlement date. Conversely, the sale of securities on a forward commitment basis involves the risk that the value of the securities sold may increase before the settlement date. Although the Fund will generally purchase securities on a forward commitment basis with the intention of acquiring the securities for its portfolio, the Fund may dispose of forward commitments prior to settlement which may result in a realized gain or loss.
F. Repurchase Agreements — Repurchase agreements involve the purchase of securities subject to the seller’s agreement to repurchase the securities at a mutually agreed upon date and price, under the terms of a Master Repurchase Agreement (“MRA”). During the term of a repurchase agreement, the value of the underlying securities held as collateral on behalf of a Fund, including accrued interest, is required to exceed the value of the repurchase agreement, including accrued interest. The gross value of repurchase agreements is included in the Statement of Assets and Liabilities for financial reporting purposes. The underlying securities for all repurchase agreements are held at the Fund’s custodian or designatedsub-custodians undertri-party repurchase agreements.
An MRA governs transactions between the Fund and select counterparties. An MRA contains provisions for, among other things, initiation of the transaction, income payments, events of default, and maintenance of securities for repurchase agreements. An MRA also permits offsetting with collateral to create one single net payment in the event of default or similar events, including the bankruptcy or insolvency of a counterparty.
If the seller defaults, the Fund could suffer a loss to the extent that the proceeds from the sale of the underlying securities and other collateral held by the Fund are less than the repurchase price and the Fund’s costs associated with delay and enforcement of
14
GOLDMAN SACHS VARIABLE INSURANCE TRUST GOVERNMENT MONEY MARKET FUND
2. SIGNIFICANT ACCOUNTING POLICIES (continued)
the repurchase agreement. In addition, in the event of default or insolvency of the seller, a court could determine that a Fund’s interest in the collateral is not enforceable, resulting in additional losses to the Fund.
Pursuant to exemptive relief granted by the Securities and Exchange Commission (“SEC”) and terms and conditions contained therein, the Fund, together with other funds of the Trust and registered investment companies having management agreements with GSAM or its affiliates, may transfer uninvested cash into joint accounts, the daily aggregate balance of which is invested in one or more repurchase agreements. Under these joint accounts, the Fund maintainspro-rata credit exposure to the underlying repurchase agreements’ counterparties. With the exception of certain transaction fees, the Fund is not subject to any expenses in relation to these investments.
|
| 3. INVESTMENTS AND FAIR VALUE MEASUREMENTS |
U.S. GAAP defines the fair value of a financial instrument as the amount that would be received to sell an asset or paid to transfer a liability in an orderly transaction between market participants at the measurement date (i.e., the exit price); the Fund’s policy is to use the market approach. GAAP establishes a fair value hierarchy that prioritizes the inputs to valuation techniques used to measure fair value. The hierarchy gives the highest priority to unadjusted quoted prices in active markets for identical assets or liabilities (Level 1 measurements) and the lowest priority to unobservable inputs (Level 3 measurements). The levels used for classifying investments are not necessarily an indication of the risk associated with investing in these investments. The three levels of the fair value hierarchy are described below:
Level 1 — Unadjusted quoted prices in active markets that are accessible at the measurement date for identical, unrestricted assets or liabilities;
Level 2 — Quoted prices in markets that are not active or financial instruments for which significant inputs are observable (including, but not limited to, quoted prices for similar investments, interest rates, foreign exchange rates, volatility and credit spreads), either directly or indirectly;
Level 3 — Prices or valuations that require significant unobservable inputs (including GSAM’s assumptions in determining fair value measurement).
The Trustees have approved Valuation Procedures that govern the valuation of the portfolio investments held by the Fund, including investments for which market quotations are not readily available. The Trustees have delegated to GSAMday-to-day responsibility for implementing and maintaining internal controls and procedures related to the valuation (including both the amortized cost and market-based methods of valuation) of the Fund’s investments. To assess the continuing appropriateness of pricing sources and methodologies related to the market-based method of valuation, GSAM regularly performs price verification procedures and issues challenges as necessary to third party pricing vendors or brokers, and any differences are reviewed in accordance with the Valuation Procedures.
As of December 31, 2018, all investments and repurchase agreements are classified as Level 2 of the fair value hierarchy. Please refer to the Schedule of Investments for further detail.
|
| 4. AGREEMENTS AND AFFILIATED TRANSACTIONS |
A. Management Agreement — Under the Agreement, GSAM manages the Fund, subject to the general supervision of the Trustees.
As compensation for the services rendered pursuant to the Agreement, the assumption of the expenses related thereto and administration of the Fund’s business affairs, including providing facilities, GSAM is entitled to a management fee, accrued daily and paid monthly, equal to an annual percentage rate of the Fund’s average daily net assets. Prior to February 21, 2018, GSAM agreed to waive a portion of the management fee equal to 0.045% of the annual contractual rate applicable to the Fund’s average daily net assets.
15
GOLDMAN SACHS VARIABLE INSURANCE TRUST GOVERNMENT MONEY MARKET FUND
Notes to Financial Statements(continued)
December 31, 2018
4. AGREEMENTS AND AFFILIATED TRANSACTIONS (continued)
B. Distribution and Service(12b-1) Plan — The Trust, on behalf of Service Shares of the Fund, has adopted a Distribution and Service Plan subject to Rule12b-1 under the Act. Under the Distribution and Service Plan, Goldman Sachs, which serves as distributor (the “Distributor”), is entitled to a fee accrued daily and paid monthly, for distribution services and personal and account maintenance services, which may then be paid by Goldman Sachs to authorized dealers, equal to, on an annual basis, 0.25% of the Fund’s average daily net assets attributable to Service Shares.
C. Transfer Agency Agreement — Goldman Sachs also serves as the transfer agent of the Fund for a fee pursuant to a Transfer Agency Agreement. The fee charged for such transfer agency services is accrued daily and paid monthly at an annual rate of 0.02% of the Fund’s average daily net assets of Institutional and Service Shares.
D. Other Expense Agreements — GSAM has agreed to limit certain “Other Expenses” of the Fund (excluding transfer agency fees and expenses, taxes, interest, brokerage fees, expenses of shareholder meetings, litigation and indemnification, and extraordinary expenses) to the extent that such expenses exceed, on an annual basis, 0.004% of the average daily net assets of the Fund. Such Other Expense reimbursements, if any, are accrued daily and paid monthly. In addition, the Fund is not obligated to reimburse GSAM for prior fiscal year expense reimbursements, if any. This Other Expense limitation will remain in place through at least April 30, 2019, and prior to such date GSAM may not terminate the arrangement without the approval of the Trustees. For the fiscal year ended December 31, 2018, GSAM reimbursed $235,298 to the Fund. In addition, the Fund has entered into certain offset arrangements with the custodian and the transfer agent, which may result in a reduction of the Fund’s expenses and are received irrespective of the application of the “Other Expense” limitation described above. For the fiscal year ended December 31, 2018, custody fee credits were $1,036.
E. Contractual and Net Fund Expenses — During the fiscal year ended December 31, 2018, GSAM, as the investment adviser, and Goldman Sachs, as distributor and transfer agent, voluntarily agreed to waive a portion of management fees, distribution and service plan fees and transfer agency fees attributable to the Fund. These waivers may be modified or terminated at any time at the option of GSAM or Goldman Sachs (as applicable). The following table outlines such fees (net of waivers) and Other Expenses (net of reimbursements and custodian and transfer agency fee credit reductions) in order to determine the Fund’s net annualized expenses for the fiscal period. The Fund is not obligated to reimburse Goldman Sachs for prior fiscal year fee waivers, if any.
| | | | | | | | | | | | | | | | |
| | | Institutional Shares | | | Service Shares | |
| Fee/Expense Type | | Contractual rate, if any | | | Ratio of net expenses to
average net assets
for the fiscal year ended
December 31, 2018 | | | Contractual rate, if any | | | Ratio of net expenses to
average net assets
for the fiscal year ended
December 31, 2018 | |
| Management Fee(a) | | | 0.16 | % | | | 0.16 | % | | | 0.16 | % | | | 0.16 | % |
| Distribution and Service Fees | | | N/A | | | | N/A | | | | 0.25 | | | | 0.25 | |
| Transfer Agency Fees | | | 0.02 | | | | 0.02 | | | | 0.02 | | | | 0.02 | |
| Other Expenses | | | — | | | | 0.00 | (b) | | | — | | | | 0.00 | (b) |
| Net Expenses | | | | | | | 0.18 | % | | | | | | | 0.43 | % |
| (a) | Prior to February 21, 2018, the Fund’s contractual management fee rate was 0.205% of the Fund’s average daily net assets. |
| (b) | Amount is less than 0.005% of average net assets. |
| N/A | - Fees not applicable to respective share class. |
For the fiscal year ended December 31, 2018, Goldman Sachs waived $39,691 and $10 in management and transfer agency fees, respectively.
F. Other Transactions with Affiliates — The Fund may purchase securities from, or sell securities to, an affiliated fund provided the affiliation is solely due to having a common investment adviser, common officers, or common Trustees. For the fiscal
16
GOLDMAN SACHS VARIABLE INSURANCE TRUST GOVERNMENT MONEY MARKET FUND
4. AGREEMENTS AND AFFILIATED TRANSACTIONS (continued)
year ended December 31, 2018, there were no purchase and sale transactions for the Fund with affiliated funds in compliance with Rule17a-7 under the Act.
G. Line of Credit Facility — As of December 31, 2018, the Fund participated in a $770,000,000 committed, unsecured revolving line of credit facility (the “facility”) together with other funds of the Trust and registered investment companies having management agreements with GSAM or its affiliates. This facility is to be used for temporary emergency purposes, or to allow for an orderly liquidation of securities to meet redemption requests. The interest rate on borrowings is based on the federal funds rate. The facility also requires a fee to be paid by the Fund based on the amount of the commitment that has not been utilized. For the fiscal year ended December 31, 2018, the Fund did not have any borrowings under the facility.
The Fund’s risks include, but are not limited to, the following:
Large Shareholder Transactions Risk —The Fund may experience adverse effects when certain large shareholders, such as other funds, participating insurance companies, accounts and Goldman Sachs affiliates, purchase or redeem large amounts of shares of the Fund. Such large shareholder redemptions, which may occur rapidly or unexpectedly, may cause the Fund to sell portfolio securities at times when it would not otherwise do so, which may negatively impact the Fund’s NAV and liquidity. Similarly, large Fund share purchases may adversely affect the Fund’s performance to the extent that the Fund is delayed in investing new cash or otherwise maintains a larger cash position than it ordinarily would. These transactions may also increase transaction costs. In addition, a large redemption could result in the Fund’s current expenses being allocated over a smaller asset base, leading to an increase in the Fund’s expense ratio.
Interest Rate Risk — When interest rates increase, the Fund’s yield will tend to be lower than prevailing market rates, and the market value of its securities or instruments may also be adversely affected. A low interest rate environment poses additional risks to the Fund, because low yields on the Fund’s portfolio holdings may have an adverse impact on the Fund’s ability to provide a positive yield to its shareholders, pay expenses out of Fund assets, or, at times, maintain a stable $1.00 share price. The risks associated with changing interest rates may have unpredictable effects on the markets and the Fund’s investments. Fluctuations in interest rates may also affect the liquidity of fixed income securities and instruments held by the Fund.
Market and Credit Risks — In the normal course of business, the Fund trades financial instruments and enters into financial transactions where risk of potential loss exists due to changes in the market (market risk). Additionally, the Fund may also be exposed to credit risk in the event that an issuer or guarantor fails to perform or that an institution or entity with which the Fund has unsettled or open transactions defaults.
Credit/Default Risk — An issuer or guarantor of a security held by the Fund, or a bank or other financial institution that has entered into a repurchase agreement with the Fund, may default on its obligation to pay interest and repay principal or default on any other obligation. Additionally, the credit quality of securities may deteriorate rapidly, which may impair the Fund’s liquidity and cause significant deterioration in NAV.
Under the Trust’s organizational documents, its Trustees, officers, employees and agents are indemnified, to the extent permitted by the Act and state law, against certain liabilities that may arise out of performance of their duties to the Fund. Additionally, in the course of business, the Fund enters into contracts that contain a variety of indemnification clauses. The Fund’s maximum exposure under these arrangements is unknown, as this would involve future claims that may be made against the Fund that have not yet occurred. However, GSAM believes the risk of loss under these arrangements to be remote.
17
GOLDMAN SACHS VARIABLE INSURANCE TRUST GOVERNMENT MONEY MARKET FUND
Notes to Financial Statements(continued)
December 31, 2018
7. OTHER MATTERS
In September 2018, the Financial Accounting Standards Board issued Accounting Standards Update (ASU) 2018-13 — Fair Value Measurement (Topic 820) Disclosure Framework — Changes to the Disclosure Requirements for Fair Value Measurement. The amendments in the ASU modify fair value measurement disclosures. The amendments are effective for the Fund’s fiscal year beginning after December 15, 2019. GSAM is currently evaluating the impact, if any, of the amendments.
8. SUBSEQUENT EVENTS
Subsequent events after the Statement of Assets and Liabilities date have been evaluated, and GSAM has concluded that there is no impact requiring adjustment or disclosure in the financial statements.
9. SUMMARY OF SHARE TRANSACTIONS
Share activity is as follows:
| | | | | | | | |
| | | For the Fiscal Year Ended
December 31, 2018 | | | For the Fiscal Year Ended
December 31, 2017 | |
| Institutional Shares* | | | | | | | | |
| Shares sold | | | 576,263,982 | | | | 289,673,821 | |
| Reinvestment of distributions | | | 4,859,363 | | | | 1,754,187 | |
| Shares redeemed | | | (472,178,302 | ) | | | (195,904,682 | ) |
| | | | 108,945,043 | | | | 95,523,326 | |
| Service Shares* | | | | | | | | |
| Shares sold | | | 214,802,150 | | | | 185,811,642 | |
| Reinvestment of distributions | | | 5,123,225 | | | | 1,838,690 | |
| Shares redeemed | | | (205,516,685 | ) | | | (208,980,389 | ) |
| | | | 14,408,690 | | | | (21,330,057 | ) |
| | |
| NET INCREASE IN SHARES | | | 123,353,733 | | | | 74,193,269 | |
| * | Valued at $1.00 per share. |
18
Report of Independent Registered Public Accounting Firm
To the Board of Trustees of
Goldman Sachs Variable Insurance Trust and Shareholders of Goldman Sachs Government Money Market Fund
Opinion on the Financial Statements
We have audited the accompanying statement of assets and liabilities, including the schedule of investments, of Goldman Sachs Government Money Market Fund (one of the funds constituting Goldman Sachs Variable Insurance Trust, referred to hereafter as the “Fund”) as of December 31, 2018, the related statement of operationsfor the year ended December 31, 2018, the statements of changes in net assets for each of the two years in the period ended December 31, 2018, including the related notes,and the financial highlights for each of the five years in the period ended December 31, 2018 (collectively referred to as the “financial statements”). In our opinion, the financial statements present fairly, in all material respects, the financial position of the Fund as of December 31, 2018, the results of its operations for the year then ended, the changes in its net assets for each of the two years in the period ended December 31, 2018 and the financial highlights for each of the five years in the period ended December 31, 2018 in conformity with accounting principles generally accepted in the United States of America.
Basis for Opinion
These financial statements are the responsibility of the Fund’s management. Our responsibility is to express an opinion on the Fund’s financial statements based on our audits. We are a public accounting firm registered with the Public Company Accounting Oversight Board (United States) (PCAOB) and are required to be independent with respect to the Fund in accordance with the U.S. federal securities laws and the applicable rules and regulations of the Securities and Exchange Commission and the PCAOB.
We conducted our audits of these financial statements in accordance with the standards of the PCAOB. Those standards require that we plan and perform the audit to obtain reasonable assurance about whether the financial statements are free of material misstatement, whether due to error or fraud.
Our audits included performing procedures to assess the risks of material misstatement of the financial statements, whether due to error or fraud, and performing procedures that respond to those risks. Such procedures included examining, on a test basis, evidence regarding the amounts and disclosures in the financial statements. Our audits also included evaluating the accounting principles used and significant estimates made by management, as well as evaluating the overall presentation of the financial statements. Our procedures included confirmation of securities owned as of December 31, 2018 by correspondence with the custodian and brokers; when replies were not received from brokers, we performed other auditing procedures. We believe that our audits provide a reasonable basis for our opinion.
PricewaterhouseCoopers LLP
Boston, Massachusetts
February 13, 2019
We have served as the auditor of one or more investment companies in the Goldman Sachs fund complex since 2000.
19
GOLDMAN SACHS VARIABLE INSURANCE TRUST GOVERNMENT MONEY MARKET FUND
| | |
| Fund Expenses — Six Month Period Ended December 31, 2018 (Unaudited) | | |
As a shareholder of Institutional Shares and Service Shares of the Fund, you incur ongoing costs, including management fees; distribution and service(12b-1) fees (with respect to Service Shares); and other Fund expenses. This example is intended to help you understand your ongoing costs (in dollars) of investing in the Fund and to compare these costs with the ongoing costs of investing in other mutual funds.
The example is based on an investment of $1,000 invested at the beginning of the period and held for the entire period from July 1, 2018 through December 31, 2018, which represents a period of 184 days of a 365 day year.
Actual Expenses — The first line in the table below provides information about actual account values and actual expenses. You may use the information in this line, together with the amount you invested, to estimate the expenses that you paid over the period. Simply divide your account value by $1,000 (for example, an $8,600 account value divided by $1,000=8.6), then multiply the result by the number in the first line under the heading entitled “Expenses Paid” to estimate the expenses you paid on your account during this period.
Hypothetical Example for Comparison Purposes — The second line in the table below provides information about hypothetical account values and hypothetical expenses based on the Fund’s actual net expense ratio and an assumed rate of return of 5% per year before expenses, which is not the Fund’s actual return. The hypothetical account values and expenses may not be used to estimate the actual ending account balance or expenses you paid for the period. You may use this information to compare the ongoing costs of investing in the Fund and other funds. To do so, compare this 5% hypothetical example with the 5% hypothetical examples that appear in the shareholder reports of the other funds.
Please note that the expenses shown in the table are meant to highlight your ongoing costs only and do not reflect any transactional costs, such as sales charges, redemption fees, or exchange fees. Therefore, the second line of the table is useful in comparing ongoing costs only and will not help you determine the relative total costs of owning different funds. In addition, if these transactional costs were included, your costs would have been higher.
| | | | | | | | | | | | |
| Share Class | | Beginning
Account Value
7/1/18 | | | Ending
Account Value
12/31/18 | | | Expenses Paid
for the
6 Months
Ended
12/31/18* | |
| Institutional Shares | | | | | | | | | | | | |
| | | | |
| Actual | | $ | 1,000.00 | | | $ | 1,010.01 | | | $ | 0.91 | |
| Hypothetical 5% return | | $ | 1,000.00 | | | $ | 1,024.30 | + | | $ | 0.92 | |
| Service Shares | | | | | | | | | | | | |
| | | | |
| Actual | | $ | 1,000.00 | | | $ | 1,008.73 | | | $ | 2.18 | |
| Hypothetical 5% return | | $ | 1,000.00 | | | $ | 1,023.04 | + | | $ | 2.19 | |
| | * | Expenses are calculated using the Fund’s annualized net expense ratio for each class, which represents the ongoing expenses as a percentage of net assets for the six months ended December 31, 2018. Expenses are calculated by multiplying the annualized net expense ratio by the average account value for the period; then multiplying the result by the number of days in the most recent fiscal half year (or, since inception, if shorter); and then dividing that result by the number of days in the period. The annualized net expense ratios for the period were 0.18% and 0.43% for the Institutional Shares and Service Shares, respectively. | |
| | + | Hypothetical expenses are based on the Fund’s actual annualized net expense ratio and an assumed rate of return of 5% per year before expenses. | |
20
GOLDMAN SACHS VARIABLE INSURANCE TRUST GOVERNMENT MONEY MARKET FUND
Trustees and Officers (Unaudited)
Independent Trustees
| | | | | | | | | | | | |
| | | | | |
Name,
Address and Age1 | | Position(s) Held
with the Trust | | Term of
Office and
Length of
Time Served2 | | Principal Occupation(s)
During Past 5 Years | | Number of
Portfolios in
Fund Complex
Overseen by
Trustee3 | | | Other
Directorships
Held by Trustee4 |
Jessica Palmer Age: 69 | | Chair of the Board of Trustees | | Since 2018 (Trustee since 2007) | | Ms. Palmer is retired. She was formerly Director, Emerson Center for the Arts and Culture (2011-2017); and Consultant, Citigroup Human Resources Department (2007-2008); Managing Director, Citigroup Corporate and Investment Banking (previously, Salomon Smith Barney/ Salomon Brothers) (1984-2006). Ms. Palmer was a Member of the Board of Trustees of Indian Mountain School (private elementary and secondary school) (2004-2009). Chair of the Board of Trustees — Goldman Sachs Trust and Goldman Sachs Variable Insurance Trust. | | | 103 | | | None |
Kathryn A. Cassidy Age: 64 | | Trustee | | Since 2015 | | Ms. Cassidy is retired. Formerly, she was Advisor to the Chairman (May 2014-December 2014); and Senior Vice President and Treasurer (2008-2014), General Electric Company & General Electric Capital Corporation (technology and financial services companies). Trustee — Goldman Sachs Trust and Goldman Sachs Variable Insurance Trust. | | | 103 | | | None |
Diana M. Daniels Age: 69 | | Trustee | | Since 2007 | | Ms. Daniels is retired. Formerly, she was Vice President, General Counsel and Secretary, The Washington Post Company (1991-2006). Ms. Daniels is a Trustee Emeritus and serves as a Presidential Councillor of Cornell University (2013-Present); former Member of the Legal Advisory Board, New York Stock Exchange (2003-2006) and of the Corporate Advisory Board, Standish Mellon Management Advisors (2006-2007). Trustee — Goldman Sachs Trust and Goldman Sachs Variable Insurance Trust. | | | 103 | | | None |
Herbert J. Markley Age: 68 | | Trustee | | Since 2013 | | Mr. Markley is retired. Formerly, he was Executive Vice President, Deere & Company (an agricultural and construction equipment manufacturer) (2007-2009); and President, Agricultural Division, Deere & Company (2001-2007). Previously, Mr. Markley served as an Advisory Board Member of Goldman Sachs Trust and Goldman Sachs Variable Insurance Trust (June 2013-October 2013). Trustee — Goldman Sachs Trust and Goldman Sachs Variable Insurance Trust. | | | 103 | | | None |
Roy W. Templin Age: 58 | | Trustee | | Since 2013 | | Mr. Templin is retired. He is Director, Armstrong World Industries, Inc. (a designer and manufacturer of ceiling, wall and suspension system solutions) (2016-Present); and was formerly Chairman of the Board of Directors,Con-Way Incorporated (a transportation, logistics and supply chain management service company) (2014-2015); Executive Vice President and Chief Financial Officer, Whirlpool Corporation (an appliance manufacturer and marketer) (2004-2012). Previously, Mr. Templin served as an Advisory Board Member of Goldman Sachs Trust and Goldman Sachs Variable Insurance Trust (June 2013-October 2013). Trustee — Goldman Sachs Trust and Goldman Sachs Variable Insurance Trust. | | | 103 | | | Armstrong World Industries, Inc. (a ceiling, wall and suspension systems solutions manufacturer) |
Gregory G. Weaver Age: 67 | | Trustee | | Since 2015 | | Mr. Weaver is retired. He is Director, Verizon Communications Inc. (2015-Present); and was formerly Chairman and Chief Executive Officer, Deloitte & Touche LLP (a professional services firm) (2001-2005 and 2012-2014); and Member of the Board of Directors, Deloitte & Touche LLP (2006-2012). Trustee — Goldman Sachs Trust and Goldman Sachs Variable Insurance Trust. | | | 103 | | | Verizon Communications Inc. |
| | | | | | | | | | | | |
21
GOLDMAN SACHS VARIABLE INSURANCE TRUST GOVERNMENT MONEY MARKET FUND
Trustees and Officers (Unaudited) (continued)
Interested Trustee*
| | | | | | | | | | | | |
| | | | | |
Name,
Address and Age1 | | Position(s) Held
with the Trust | | Term of
Office and
Length of
Time Served2 | | Principal Occupation(s)
During Past 5 Years | | Number of
Portfolios in
Fund Complex
Overseen by
Trustee3 | | | Other
Directorships
Held by Trustee4 |
James A. McNamara Age: 56 | | President and Trustee | | Since 2007 | | Advisory Director, Goldman Sachs (January 2018-Present); Managing Director, Goldman Sachs (January 2000-December 2017); Director of Institutional Fund Sales, GSAM (April 1998-December 2000); and Senior Vice President and Manager, Dreyfus Institutional Service Corporation (January 1993-April 1998). President and Trustee — Goldman Sachs Trust; Goldman Sachs Variable Insurance Trust; Goldman Sachs Trust II; Goldman Sachs MLP Income Opportunities Fund; Goldman Sachs MLP and Energy Renaissance Fund; Goldman Sachs ETF Trust; Goldman Sachs Private Markets Fund 2018 LLC; Goldman Sachs Private Markets Fund 2018 (A) LLC; and Goldman Sachs Private Markets Fund 2018 (B) LLC. | | | 156 | | | None |
| | | | | | | | | | | | |
| * | Mr. McNamara is considered to be an “Interested Trustee” because he holds positions with Goldman Sachs and owns securities issued by The Goldman Sachs Group, Inc. Mr. McNamara holds comparable positions with certain other companies of which Goldman Sachs, GSAM or an affiliate thereof is the investment adviser, administrator and/or distributor. |
| 1 | Each Trustee may be contacted by writing to the Trustee, c/o Goldman Sachs, 200 West Street, New York, New York, 10282, Attn: Caroline Kraus. Information is provided as of December 31, 2018. |
| 2 | Subject to such policies as may be adopted by the Board from time-to-time, each Trustee holds office for an indefinite term, until the earliest of: (a) the election of his or her successor; (b) the date the Trustee resigns or is removed by the Board or shareholders, in accordance with the Trust’s Declaration of Trust; or (c) the termination of the Trust. The Board has adopted policies which provide that (a) no Trustee shall hold office for more than 15 years and (b) a Trustee shall retire as of December 31st of the calendar year in which he or she reaches his or her 74th birthday, unless a waiver of such requirement shall have been adopted by a majority of the other Trustees. These policies may be changed by the Trustees without shareholder vote. |
| 3 | The Goldman Sachs Fund Complex includes certain other companies listed above for each respective Trustee. As of December 31, 2018, Goldman Sachs Trust consisted of 90 portfolios (88 of which offered shares to the public); Goldman Sachs Variable Insurance Trust consisted of 13 portfolios; Goldman Sachs Trust II consisted of 19 portfolios (17 of which offered shares to the public); Goldman Sachs MLP Income Opportunities Fund, Goldman Sachs MLP and Energy Renaissance Fund, Goldman Sachs Private Markets Fund 2018 LLC, Goldman Sachs Private Markets Fund 2018 (A) LLC and Goldman Sachs Private Markets Fund 2018 (B) LLC each consisted of one portfolio; and Goldman Sachs ETF Trust consisted of 29 portfolios (14 of which offered shares to the public). |
| 4 | This column includes only directorships of companies required to report to the Securities and Exchange Commission under the Securities Exchange Act of 1934 (i.e., “public companies”) or other investment companies registered under the Act. |
Additional information about the Trustees is available in the Fund’s Statement of Additional Information, which can be obtained from Goldman Sachs free of charge by calling this toll-free number (in the United States of America): 1-800-526-7384.
22
GOLDMAN SACHS VARIABLE INSURANCE TRUST GOVERNMENT MONEY MARKET FUND
Trustees and Officers (Unaudited) (continued)
Officers of the Trust*
| | | | | | |
| | | |
| Name, Address and Age1 | | Position(s) Held
with the Trust | | Term of
Office and
Length of
Time Served2 | | Principal Occupation(s) During Past 5 Years |
James A. McNamara
200 West Street New York, NY 10282 Age: 56 | | Trustee and
President | | Since 2007 | | Advisory Director, Goldman Sachs (January 2018-Present); Managing Director, Goldman Sachs (January 2000-December 2017); Director of Institutional Fund Sales, GSAM (April 1998-December 2000); and Senior Vice President and Manager, Dreyfus Institutional Service Corporation (January 1993-April 1998). President and Trustee — Goldman Sachs Trust; Goldman Sachs Variable Insurance Trust; Goldman Sachs Trust II; Goldman Sachs MLP Income Opportunities Fund; Goldman Sachs MLP and Energy Renaissance Fund; Goldman Sachs ETF Trust; Goldman Sachs Private Markets Fund 2018 LLC; Goldman Sachs Private Markets Fund 2018 (A) LLC; and Goldman Sachs Private Markets Fund 2018 (B) LLC. |
Caroline L. Kraus
200 West Street New York, NY 10282 Age: 41 | | Secretary | | Since 2012 | | Managing Director, Goldman Sachs (January 2016-Present); Vice President, Goldman Sachs (August 2006-December 2015); Associate General Counsel, Goldman Sachs (2012-Present); Assistant General Counsel, Goldman Sachs (August 2006-December 2011); and Associate, Weil, Gotshal & Manges, LLP (2002-2006). Secretary — Goldman Sachs Trust (previously Assistant Secretary (2012)); Goldman Sachs Variable Insurance Trust (previously Assistant Secretary (2012)); Goldman Sachs Trust II; Goldman Sachs BDC, Inc.; Goldman Sachs Private Middle Market Credit LLC; Goldman Sachs Middle Market Lending Corp.; Goldman Sachs MLP Income Opportunities Fund; Goldman Sachs MLP and Energy Renaissance Fund; Goldman Sachs ETF Trust; Goldman Sachs Private Markets Fund 2018 LLC; Goldman Sachs Private Markets Fund 2018 (A) LLC; and Goldman Sachs Private Markets Fund 2018 (B) LLC. |
Scott M. McHugh
200 West Street New York, NY 10282 Age: 47 | | Treasurer, Senior
Vice President and
Principal Financial
Officer | | Since 2009
(Principal
Financial
Officer
since 2013) | | Managing Director, Goldman Sachs (January 2016-Present); Vice President, Goldman Sachs (February 2007-December 2015); Assistant Treasurer of certain mutual funds administered by DWS Scudder (2005-2007); and Director (2005-2007), Vice President (2000-2005), and Assistant Vice President (1998-2000), Deutsche Asset Management or its predecessor (1998-2007). Treasurer, Senior Vice President and Principal Financial Officer — Goldman Sachs Trust; Goldman Sachs Variable Insurance Trust; Goldman Sachs Trust II; Goldman Sachs MLP Income Opportunities Fund; Goldman Sachs MLP and Energy Renaissance Fund; Goldman Sachs ETF Trust; Goldman Sachs Private Markets Fund 2018 LLC; Goldman Sachs Private Markets Fund 2018 (A) LLC; and Goldman Sachs Private Markets Fund 2018 (B) LLC. |
Joseph F. DiMaria
30 Hudson Street Jersey City, NJ 07302 Age: 50 | | Assistant Treasurer
and Principal
Accounting Officer | | Since 2016
(Principal
Accounting
Officer
since 2017) | | Managing Director, Goldman Sachs (November 2015-Present) and Vice President — Mutual Fund Administration, Columbia Management Investment Advisers, LLC (May 2010-October 2015). Assistant Treasurer and Principal Accounting Officer — Goldman Sachs Trust; Goldman Sachs Variable Insurance Trust; Goldman Sachs Trust II; Goldman Sachs MLP Income Opportunities Fund; Goldman Sachs MLP and Energy Renaissance Fund; Goldman Sachs ETF Trust; Goldman Sachs Private Markets Fund 2018 LLC; Goldman Sachs Private Markets Fund 2018 (A) LLC; and Goldman Sachs Private Markets Fund 2018 (B) LLC. |
| | | | | | |
| * | Represents a partial list of officers of the Trust. Additional information about all the officers is available in the Fund’s Statement of Additional Information, which can be obtained from Goldman Sachs free of charge by calling this toll-free number (in the United States): 1-800-526-7384. |
| 1 | Information is provided as of December 31, 2018. |
| 2 | Officers hold office at the pleasure of the Board of Trustees or until their successors are duly elected and qualified. Each officer holds comparable positions with certain other companies of which Goldman Sachs, GSAM or an affiliate thereof is the investment adviser, administrator and/or distributor. |
23
| | |
TRUSTEES Jessica Palmer,Chair Kathryn A. Cassidy Diana M. Daniels Herbert J. Markley James A. McNamara Roy W. Templin Gregory G. Weaver | | OFFICERS James A. McNamara,President Scott M. McHugh,Treasurer, Senior Vice President and Principal Financial Officer Joseph F. DiMaria,Assistant Treasuer and Principal Accounting Officer Caroline L. Kraus,Secretary |
GOLDMAN SACHS & CO. LLC
Distributor and Transfer Agent
GOLDMAN SACHS ASSET MANAGEMENT, L.P.
Investment Adviser
200 West Street, New York
New York 10282
Visit our Web site at www.GSAMFUNDS.com to obtain the most recentmonth-end returns.
The reports concerning the Fund included in this shareholder report may contain certain forward-looking statements about the factors that may affect the performance of the Fund in the future. These statements are based on Fund management’s predictions and expectations concerning certain future events and their expected impact on the Fund, such as performance of the economy as a whole and of specific industry sectors, changes in the levels of interest rates, the impact of developing world events, and other factors that may influence the future performance of the Fund. Management believes these forward-looking statements to be reasonable, although they are inherently uncertain and difficult to predict. Actual events may cause adjustments in portfolio management strategies from those currently expected to be employed.
A description of the policies and procedures that the Fund uses to determine how to vote proxies relating to portfolio securities and information regarding how the Fund voted proxies relating to portfolio securities during the most recent12-month period ended December 31 is available (i) without charge, upon request by calling1-800-621-2550; and (ii) on the Securities and Exchange Commission (“SEC”) Web site athttp://www.sec.gov.
Views and opinions expressed are for informational purposes only and do not constitute a recommendation by GSAM to buy, sell, or hold any security. Views and opinions are current as of the date of this presentation and may be subject to change, they should not be construed as investment advice.
The Fund files its complete schedule of portfolio holdings with the SEC for the first and third quarters of each fiscal year on Form N-Q. The Fund’s Forms N-Q are available on the SEC’s web site at http://www.sec.gov within 60 days after the Fund’s first and third fiscal quarters. Forms N-Q may be obtained upon request and without charge by calling1-800-621-2550.
Goldman Sachs & Co. LLC (“Goldman Sachs”) does not provide legal, tax or accounting advice. Any statement contained in this communication (including any attachments) concerning U.S. tax matters was not intended or written to be used, and cannot be used, for the purpose of avoiding penalties under the Internal Revenue Code, and was written to support the promotion or marketing of transaction or matter addressed. Clients of Goldman Sachs should obtain their own independent tax advice based on their particular circumstances.
The web site links provided are for your convenience only and are not an endorsement or recommendation by GSAM of any of these web sites or the products or services offered. GSAM is not responsible for the accuracy and validity of the content of these web sites.
Fund holdings and allocations shown are as of December 31, 2018 and may not be representative of future investments. Fund holdings should not be relied on in making investment decisions and should not be construed as research or investment advice regarding particular securities. Current and future holdings are subject to risk.
The portfolio risk management process includes an effort to monitor and manage risk, but does not imply low risk.
Shares of the Goldman Sachs VIT Funds are offered to separate accounts of participating life insurance companies for the purpose of funding variable annuity contracts and variable life insurance policies. Shares of the Fund are not offered directly to the general public. The variable annuity contracts and variable life insurance policies are described in the separate prospectuses issued by participating insurance companies. You should refer to those prospectuses for information about surrender charges, mortality and expense risk fees and other charges that may be assessed by participating insurance companies under the variable annuity contracts or variable life insurance policies. Such fees or charges, if any, may affect the return you may realize with respect to your investments. Ask your representative for more complete information. Please consider a fund’s objectives, risks and charges and expenses, and read the prospectus carefully before investing. The prospectus contains this and other information about the Fund.
This material is not authorized for distribution to prospective investors unless preceded or accompanied by a current prospectus or summary prospectus, if applicable. Investors should consider the Fund’s objective, risks, and charges and expenses, and read the summary prospectus, if available, and/or the prospectus carefully before investing or sending money. The summary prospectus, if available, and the prospectus contain this and other information about the Fund and may be obtained from your authorized dealer or from Goldman Sachs & Co. LLC by calling1-800-621-2550.
This report is prepared for the general information of contract owners and is not an offer of shares of the Goldman Sachs Variable Insurance Trust — Goldman Sachs Government Money Market Fund.
© 2019 Goldman Sachs. All rights reserved.
VITMMAR-19/157330-OTU-916697/8.1k
Goldman
SachsVariable Insurance Trust
Goldman Sachs
Multi-Strategy
Alternatives Portfolio
Annual Report
December 31, 2018

GOLDMAN SACHS VARIABLE INSURANCE TRUST MULTI-STRATEGY ALTERNATIVES PORTFOLIO
INVESTMENT OBJECTIVE
The Portfolio seeks long-term growth of capital.
Portfolio Management Discussion and Analysis
Below, the Goldman Sachs Global Portfolio Solutions Team discusses the Goldman Sachs Variable Insurance Trust — Goldman Sachs Multi-Strategy Alternatives Portfolio’s (the “Portfolio”) performance and positioning for the 12-month period ended December 31, 2018 (the “Reporting Period”).
How did the Portfolio perform during the Reporting Period?
During the Reporting Period, the Portfolio’s Institutional, Service and Advisor Shares generated average annual total returns of –6.74%, –6.93% and –7.09%, respectively. These returns compare to the 2.08% average annual total return of the Portfolio’s benchmark, the ICE® BofAML® U.S. Dollar Three-Month LIBOR Constant Maturity Index (the “LIBOR Index”), during the same period.
Please note that the Portfolio’s benchmark being the LIBOR Index is a means of emphasizing that the Portfolio has an unconstrained strategy. That said, this Portfolio employs a benchmark agnostic strategy and thus comparisons to a benchmark index are not particularly relevant.
What economic and market factors most influenced the Portfolio during the Reporting Period?
The capital markets were influenced most during the Reporting Period by economic data, central bank monetary policy, higher commodity prices and geopolitical events.
In the first quarter of 2018, when the Reporting Period began, global equity markets experienced their first pullback after rallying for eight consecutive calendar quarters. Global equity prices peaked during the last week of January 2018 before retreating on news of stronger than consensus expected U.S. wage growth data in early February. In addition to the wage growth data, which led investors to anticipate a faster pace of U.S. Federal Reserve (“Fed”) interest rate hikes, rising concerns about potential trade protectionism and worsening market sentiment about U.S. information technology stocks weighed on global equity prices. In the second half of March 2018, U.S. information technology stocks sold off due to investor concerns about data privacy. During the first calendar quarter overall, macroeconomic data moderated in the developed markets, particularly in Europe and Japan. Emerging markets equities generally outperformed their developed markets peers because of what many considered to be attractive valuations, because of the comparatively stronger economic data within emerging markets countries and because of higher commodity prices. In the fixed income markets, the 10-year U.S. Treasury yield rose during the first quarter of 2018, driven by the Fed’s decision to raise interest rates at its March policy meeting as well as by a modest pickup in inflation and a higher than consensus expected U.S. fiscal deficit. The outcome of the Fed’s policy meeting was generally considered dovish by investors but was also in line with market expectations. (Dovish tends to imply lower interest rates; opposite of hawkish.) The U.S. dollar weakened relative to other major developed markets currencies during the first calendar quarter.
During the second quarter of 2018, developed markets equities generated positive returns, while emerging markets equities experienced broad-based weakness. Two large themes were at play: 1) divergence between U.S. economic growth compared to that of the rest of the world and 2) continued escalation of trade tensions. Within developed markets, U.S., U.K., European and Japanese equities rallied. U.K. export-driven stocks, in particular, benefited strongly from the depreciation of the British pound versus other major currencies. Meanwhile, emerging markets equities substantially underperformed developed markets stocks, as emerging markets’ economic growth slowed and disputes between the U.S. and China about trade tariffs soured investors’ appetite for emerging markets assets in general. Broad-based selling also contributed to the weakness of emerging markets stocks. Within fixed income, the 10-year U.S. Treasury yield rose, as U.S. macroeconomic data remained relatively strong, inflation increased and crude oil prices rose. The U.S. dollar strengthened against major currencies, driven by comparatively better U.S. economic growth and tighter Fed monetary policy. The Mexican peso and euro were among those currencies experiencing some of the largest drops versus the U.S. dollar. Weakening appetite for emerging markets assets and the looming Mexican presidential election weighed on the Mexican peso, while slower Eurozone economic growth and a dovish European Central Bank pressured the euro. Meanwhile, moderating global economic growth and escalating trade tensions weighed on the prices of metals, such as copper, and the stronger U.S. dollar pushed down gold prices.
1
GOLDMAN SACHS VARIABLE INSURANCE TRUST MULTI-STRATEGY ALTERNATIVES PORTFOLIO
In the third quarter of 2018, global economic growth continued to moderate, especially outside of the U.S. At the same time, U.S.-China trade tensions escalated, leading to tariffs of $250 billion on U.S. imports from China. In terms of monetary policy, the Fed raised short-term interest rates at its September policy meeting and signaled one more hike in 2018. Global equities overall posted gains during the third calendar quarter, driven by a rally in developed markets stocks. Within developed markets stocks, U.S. equities outperformed, recording one of their best performing quarters in five years due to strong corporate earnings and economic data. European equities retreated, as softer economic activity and concerns around Italy weighed on their performance. Japanese equities rallied on the back of a weakening Japanese yen. Meanwhile, emerging markets equities declined, primarily due to the negative performance of Chinese stocks. Regarding fixed income, the 10-year U.S. Treasury yield rose in response to strong U.S. economic activity, which caused the market to price in additional Fed rate hikes. In Europe, the spread, or yield differential, between 10-year Italian and German government bonds widened, reflecting higher risk premiums on Italian assets because of increased concerns about the Italian government’s budget. Also during the third quarter of 2018, the currencies of emerging markets countries with significant financing needs fell to their 2018 calendar year lows versus the U.S. dollar; the Turkish lira and Argentinian peso, as prime examples, were down 42% and 50%, respectively, between January 1 and August 31. Within commodities, higher U.S. interest rates and slowing Chinese economic growth dampened gold and copper prices.
In the fourth quarter of 2018, softer global economic data, which led to downward consensus expectations for corporate earnings growth, and the Fed’s less accommodative monetary policy weighed on global equity markets, driving a double-digit decline across most major equity indices. Within developed markets stocks, Japanese equities turned in the weakest performance, as cyclical stocks were pressured by decelerating global economic growth, and export-oriented stocks were hurt by a stronger Japanese yen. U.S. and European equities also experienced substantial losses. Despite weaker economic data from China, emerging markets equities outperformed developed markets equities during the fourth calendar quarter, thanks in large part to rallies in Brazilian and Indian stocks. Brazilian risk assets broadly benefited from renewed investor optimism about potentially market-friendly measures from its new government and relatively better economic data. Indian equities were helped by lower crude oil prices and improving macro data. Within fixed income, the 10-year U.S. Treasury yield fell in response to a decline in U.S. inflation, driven by the drop in crude oil prices and signs of slowing U.S. economic growth. Yields of government bonds in other developed markets countries also fell but by a lesser magnitude. Investors revised downward their expectations for 2019 Fed monetary policy action from two short-term interest rate increases to no rate hike at all. The Fed, however, still projected two rate hikes during the 2019 calendar year. Within commodities, crude oil prices declined on market concerns about global economic growth and as oversupply led investors to unwind long positions. Regarding metals, copper prices fell, while gold prices rallied. As for currencies, the Japanese yen was the best performing major currency during the fourth quarter of 2018. The U.S. dollar strengthened overall versus most major currencies.
What key factors were responsible for the Portfolio’s performance during the Reporting Period?
The Portfolio’s performance is driven by four sources of return: long-term strategic asset allocation to market exposures, medium-term cycle-aware allocation, short-term tactical allocation and excess returns from investments in Underlying Funds. Strategic asset allocation is the process by which the Portfolio’s assets are allocated across underlying asset classes and strategies in a way that considers the risks of each underlying asset class and strategy. Medium-term cycle-aware allocation is the process by which we adjust the portfolio for changes in the business or economic cycle. Short-term tactical allocation is the implementation of tactical market views with the goal of improving the Portfolio’s risk-adjusted return. The risk-adjusted return on an investment takes into account the risk associated with that investment relative to other potential investments.
During the Reporting Period, the Portfolio generated negative absolute returns, driven primarily by strategic asset allocation and by security selection within the Portfolio’s Underlying Funds. Short-term tactical asset allocation and medium-term cycle-aware allocation also hurt performance.
Strategic asset allocation detracted from the Portfolio’s results during the Reporting Period. Allocations to equities had the greatest negative impact, driven primarily by the Portfolio’s strategic allocation to emerging markets stocks, as emerging markets assets struggled due to trade-related tensions, slowing global economic growth and the spillover effects of country-specific idiosyncratic risks. In addition, the Portfolio’s allocation to U.S. real estate securities detracted from returns during the Reporting Period. Within fixed income, an allocation to emerging markets debt hampered performance amid broad weakness in emerging markets assets. The Portfolio was also hurt by our long U.S. interest rate options strategy, through which we seek to profit if interest rates fall, remain constant or rise less than anticipated. This strategy detracted from performance as U.S. Treasury yields rose over the course of the Reporting Period. (Our long U.S. interest rate options strategy is a macroeconomic hedge that buys put options on short-term interest rates. A put option is an option contract giving the owner the right, but not the obligation, to sell a specified amount of an underlying asset at a specified price within a specified time.) Additionally, a strategic allocation to U.S. high yield corporate bonds
2
GOLDMAN SACHS VARIABLE INSURANCE TRUST MULTI-STRATEGY ALTERNATIVES PORTFOLIO
detracted from the Portfolio’s returns as credit spreads widened. (Credit spreads are yield differentials between corporate bonds and U.S. Treasury securities of comparable maturity). Finally, the Portfolio’s allocations to liquid alternatives strategies had a negative impact on performance, though they outperformed relative to traditional investment strategies. In particular, the Portfolio’s volatility selling strategy was a source of weakness as volatility increased during the Reporting Period. (Our volatility selling strategy seeks to benefit from changes in the level of market implied volatility (i.e., expectations of future volatility) in equity markets.)
Medium-term cycle-aware allocation also detracted from the Portfolio’s performance. Over the course of the Reporting Period, the Portfolio held three medium-term cycle-aware views. The first was to have a short duration position, which we expressed through a short position in long-maturity German government bonds and short positions in specific segments of the U.S. Treasury yield curve. (Duration is a measure of the Portfolio’s sensitivity to changes in interest rates. Yield curve is a spectrum of interest rates based on maturities of varying lengths.) The Portfolio’s short position in long-maturity German government bonds detracted from results, as Germany’s long-term interest rates fell during the Reporting Period in response to slower European economic growth, dovish European Central Bank monetary policy and political risk in Italy. This was offset somewhat by the Portfolio’s short position in the two-year segment of the U.S. Treasury yield curve, which added to performance as yields rose during the Reporting Period overall. The second medium-term cycle-aware view was to hold a long position in emerging markets equities versus developed markets equities. This positioning detracted from the Portfolio’s returns, as emerging markets equities broadly underperformed developed markets equities during the Reporting Period. The third medium-term cycle-aware view — to hold a long position in local currency emerging markets bonds versus U.S. high yield corporate bonds — also hurt the Portfolio’s performance due to the broad underperformance of emerging markets assets.
Short-term tactical allocation had a negative impact on Portfolio returns during the Reporting Period overall. During the first three months of the Reporting Period, the Portfolio’s tactical long-short currency basket detracted from performance as did our tactical country view to hold a long position in Japanese equities. In addition, a tactical long position in U.S. dollar-denominated emerging markets bonds dampened results amid broad weakness in emerging markets assets. On April 4, 2018, we transitioned the Portfolio to a single implementation vehicle for expressing our tactical views — the Goldman Sachs Tactical Exposure Fund (the “Underlying Tactical Fund”). Between April 4, 2018 and the end of the Reporting Period, the Portfolio’s allocation to the Underlying Tactical Fund detracted from performance.
Overall, security selection within Underlying Funds detracted from the Portfolio’s performance during the Reporting Period. The Goldman Sachs Long Short Credit Fund, the Goldman Sachs Managed Futures Strategy Fund and the Goldman Sachs Strategic Income Fund underperformed their respective benchmark indices — and our expectations — during the Reporting Period. None of the Underlying Funds meaningfully outperformed their benchmark indices during the Reporting Period.
How was the Portfolio positioned at the beginning of the Reporting Period?
At the beginning of the Reporting Period, the Portfolio was positioned, in terms of its total net assets, with 61.1% in liquid alternative strategies, 31.4% in real assets/satellite asset classes and 7.6% in cash. (Liquid alternatives strategies generally include, but are not limited to, momentum or trend trading strategies (investment decisions based on trends in asset prices over time), hedge fund beta (long term total returns consistent with investment results that approximate the return and risk patterns of a diversified universe of hedge funds), managed risk investment strategies (which seek to manage extreme risk scenarios by implementing daily and monthly risk targets across a diversified mix of asset classes), emerging markets debt and unconstrained fixed income strategies (which have the ability to move across various fixed income sectors)). Real assets generally include, but are not limited to, commodities, global real estate securities, infrastructure and master limited partnerships. The strategic asset allocation of the Portfolio reflects a risk-based allocation approach to increase diversification across the Portfolio. The Portfolio had –7.9% of its total net assets invested in tactical exposures at the beginning of the Reporting Period.
How did you manage the Portfolio’s allocations during the Reporting Period?
Over the course of the Reporting Period, we made changes to the Portfolio’s strategic allocation, medium-term cycle-aware allocation and short-term tactical allocation. Within the strategic allocation, we added an allocation to alternative investment strategies through the Goldman Sachs Alternative Premia Fund. We consider the Portfolio’s strategic asset allocation and underlying active security selection strategies the largest drivers of risk and performance.
We also sought to adjust the Portfolio’s exposure for medium-term changes to the business or economic cycle. In early May 2018, we added a long position in local emerging markets debt versus U.S. high yield corporate debt. This view reflected our belief that we are approaching the point in the economic cycle at which credit spreads have historically started to widen, which could be a headwind for high yield fixed income. We considered it an opportune time to add this position, as credit spreads were likely, in our
3
GOLDMAN SACHS VARIABLE INSURANCE TRUST MULTI-STRATEGY ALTERNATIVES PORTFOLIO
view, to remain well anchored in the near term and because emerging markets assets had experienced a selloff earlier in the 2018 calendar year. However, in October, because of heightened volatility among emerging markets currencies, we modestly reduced the Fund’s exposure to local emerging markets debt and emerging markets equities. In November, we further reduced the Fund’s exposure to emerging markets equities. We had expected economic data out of China to improve on the back of stimulus measures implemented by the Chinese government, but this thesis did not play out as we expected. We took advantage of the heightened volatility to add to the Fund’s allocation to developed markets equities.
Within the short-term tactical allocation, we decreased the Portfolio’s exposure to equities overall at the beginning of the Reporting Period because we thought they might experience a temporary pullback. After the selloff in February 2018, we added tactical long positions in U.S. and emerging markets stocks. Within equities, we initiated tactical short positions in Japan and Singapore and a tactical long position in China. We eliminated the Portfolio’s tactical short position in South African equities. On the sector level, we added a tactical long position in European bank stocks. Finally, as mentioned previously, we transitioned the Portfolio to the Underlying Tactical Fund, which served as a single implementation vehicle for expressing our tactical views starting on April 4, 2018.
How was the Portfolio positioned at the end of the Reporting Period?
At the end of the Reporting Period, the Portfolio was positioned, in terms of its total net assets, with 65.5% in liquid alternative strategies, 30.6% in real assets/satellite asset classes and 3.9% in cash. The Portfolio had –7.6% of its total net assets invested in tactical exposures.
How did the Portfolio use derivatives and similar instruments during the Reporting Period?
During the Reporting Period, derivatives were used primarily to express our views across developed and emerging markets equities. More specifically, the Portfolio employed equity index futures to affect short exposures to U.S. large-cap equities (positive impact) and European equities (positive impact). In addition, the Portfolio used equity index futures to assume short positions in Australian equities (positive impact), U.K. large-cap equities (negative impact), European equities (positive impact), and South African equities (positive impact). The Portfolio also utilized equity index futures to take long positions in emerging markets equities (negative impact), Japanese equities (negative impact), Singapore equities (positive impact), European bank stocks (negative impact) and Chinese equities (negative impact). Furthermore, the Portfolio used European equity index dividend futures (negative impact) during the Reporting Period.
Within fixed income during the Reporting Period, the Portfolio used interest rate futures, specifically Eurodollar futures, to express views on the U.S. Treasury yield curve (positive impact). Eurodollar futures are contracts that have underlying assets linked to time deposits denominated in U.S. dollars at banks outside the U.S. The Portfolio also used bond futures to affect a short position in German government bonds (negative impact). The Portfolio employed interest rate options in a macroeconomic hedge that seeks to profit if interest rates fall, remain constant or rise less than anticipated (negative impact). In addition, the Portfolio employed foreign exchange forwards to go long and short select developed and emerging markets currencies within a tactical basket of currencies (negative impact).
Additionally, some of the Underlying Funds used derivatives during the Reporting Period to apply their active investment views with greater versatility and potentially to afford greater risk management precision. As market conditions warranted during the Reporting Period, some of these Underlying Funds engaged in forward foreign currency exchange contracts, financial futures contracts, options, swap contracts and structured securities to attempt to enhance portfolio return and for hedging purposes.
What is the Portfolio’s tactical view and strategy for the months ahead?
At the end of the Reporting Period, we emphasized three macro themes. First, we expected to see an elongated U.S. economic expansion in 2019, with U.S. economic growth slowing but remaining at above trend levels. Second, we expected to see renewed convergence in global economic growth, as the U.S. economy slows, the European economy stabilizes and emerging markets economic growth (outside of China) improves. Third, we saw attractive opportunities in the wake of the 2018 market downturn. In our view, valuations and investor expectations had adjusted significantly since the start of 2018, and we had become more positive about potential returns in the near term.
At the asset class level, we were positive on equities over the medium term. We believed a slowdown in U.S. economic growth, which could eventually reduce labor market pressures, had increased the likelihood at the margin of an elongation in the U.S. economic cycle. This, along with the 2018 equity market downturn, continued corporate earnings growth and global economic expansion, should support equity returns, in our view. As for fixed income, we remained bearish on government bonds. In our opinion, the elongated U.S. economic cycle is likely to lead to higher yields due to Fed interest rate hikes, and we expected a path
4
GOLDMAN SACHS VARIABLE INSURANCE TRUST MULTI-STRATEGY ALTERNATIVES PORTFOLIO
that is more hawkish than what the market was pricing in at the end of the Reporting Period. Additionally, we considered credit spreads rather wide and expected to see some compression in the near term. Over the course of 2019, credit spreads are likely to tighten further, we believe. Finally, while we still thought emerging markets assets would likely outperform developed markets assets over the long term, deterioration in China’s economic growth has been worse than we expected. As a result, we decided to reduce the Fund’s allocation to emerging markets assets in the medium term because we believe there is increased uncertainty around the timing and magnitude of economic growth improvements for China.
5
GOLDMAN SACHS VARIABLE INSURANCE TRUST MULTI-STRATEGY ALTERNATIVES PORTFOLIO
Index Definitions
ICE® BofAML® U.S. Dollar Three-Month LIBOR Constant Maturity Index is based on the assumed purchase of a synthetic instrument having three months to maturity and with a coupon equal to the closing quote for three-month LIBOR. That issue is sold the following day (priced at a yield equal to the current day closing three-month LIBOR rate) and is rolled into a new three-month instrument. The index, therefore, will always have a constant maturity equal to exactly three months.
MSCI Emerging Markets Index captures large- andmid-cap representation across 24 emerging markets countries. The index covers approximately 85% of the free float-adjusted market capitalization in each country.
S&P 500® Index is a U.S. stock market index based on the market capitalizations of 500 large companies having common stock listed on the New York Stock Exchange or NASDAQ. The S&P 500® Index components and their weightings are determined by S&P Dow Jones Indices.
It is not possible to invest directly in an unmanaged index.
6
FUND BASICS
Multi-Strategy Alternatives Portfolio
as of December 31, 2018
STANDARDIZED TOTAL RETURNS1
| | | | | | | | | | | | | | |
| | | | |
| For the period ended 12/31/18 | | One Year | | | Three Years | | | Since Inception | | | Inception Date |
| Institutional | | | -6.74 | % | | | -0.34 | % | | | -1.33 | % | | 4/25/14 |
| Service | | | -6.93 | | | | -0.56 | | | | -1.57 | | | 4/25/14 |
| Advisor | | | -7.09 | | | | -0.69 | | | | -1.70 | | | 4/25/14 |
| 1 | The Standardized Total Returns are average annual total returns as of the most recent calendar quarter-end. They assume reinvestment of all distributions at net asset value (“NAV”). Because Institutional, Service and Advisor Shares do not involve a sales charge, such a charge is not applied to their Standardized Total Returns. |
Total return figures in the above chart represent past performance and do not indicate future results, which will vary. The investment return and principal value of an investment will fluctuate and, therefore, an investor’s shares, when redeemed, may be worth more or less than their original cost. Current performance may be lower or higher than the total return figures in the above chart. Please visit www.GSAMFUNDS.com to obtain the most recentmonth-end returns.Performance reflects fee waivers and/or expense limitations in effect during the periods shown. In their absence, performance would be reduced.
EXPENSE RATIOS2
| | | | | | | | |
| | |
| | | Net Expense Ratio (Current) | | | Gross Expense Ratio (Before Waivers) | |
| Institutional | | | 1.09 | % | | | 2.36 | % |
| Service | | | 1.34 | | | | 2.61 | |
| Advisor | | | 1.49 | | | | 2.76 | |
| 2 | The expense ratios of the Portfolio, both current (net of any fee waivers and/or expense limitations) and before waivers (gross of any fee waivers and/or expense limitations) are as set forth above according to the most recent publicly available Prospectuses for the Portfolio and may differ from the expense ratios disclosed in the Financial Highlights of this report. Pursuant to a contractual arrangement, the Portfolio’s fee waivers and/or expense limitations will remain in place through at least April 30, 2019, and prior to such date, the Investment Adviser may not terminate the arrangements without the approval of the Portfolio’s Board of Trustees. If these arrangements are discontinued in the future, the expense ratios may change without shareholder approval. |
7
FUND BASICS
OVERALL UNDERLYING FUND AND ETF WEIGHTINGS3
Percentage of Net Assets
| 3 | The Portfolio is actively managed and, as such, its composition may differ over time. The percentage shown for each Underlying Fund and exchange traded fund (“ETF”) reflects the value of that Underlying Fund or ETF as a percentage of net assets of the Portfolio. Figures in the graph above may not sum to 100% due to rounding and/or exclusion of other assets and liabilities. Underlying sector allocations of exchange traded funds and investment companies held by the Portfolio are not reflected in the graph above. Investments in the securities lending reinvestment vehicle represented 1.3% of the Portfolio’s net assets at December 31, 2018. The graph depicts the Portfolio’s investments but may not represent the Portfolio’s market exposure due to the exclusion of certain derivatives, if any, as listed in the Additional Investment Information section of the Schedule of Investments. |
8
GOLDMAN SACHS VARIABLE INSURANCE TRUST MULTI-STRATEGY ALTERNATIVES PORTFOLIO
Performance Summary
December 31, 2018
The following graph shows the value, as of December 31, 2018, of a $10,000 investment made on April 25, 2014 (commencement of the Portfolio’s operations) in Advisor Shares at NAV. For comparative purposes, the performance of the Portfolio’s benchmark, the ICE BofAML U.S. Dollar Three-Month LIBOR Constant Maturity Index, is shown. This performance data represents past performance and should not be considered indicative of future performance, which will fluctuate with changes in market conditions. These performance fluctuations may cause an investor’s shares, when redeemed, to be worth more or less than their original cost. Performance reflects Portfolio level expenses but does not reflect fees and expenses associated with any variable annuity contract or variable life insurance policy that uses the Portfolio as an investment option for any contract or policy. Had performance reflected all of those fees and expenses, performance would have been reduced. Performance reflects applicable fee waivers and/or expense limitations in effect during the periods shown, and in their absence, performance would be reduced. Performance of Institutional and Service Shares will vary from Advisor Shares due to differences in class specific fees. In addition to the Investment Adviser’s decisions regarding issuer/industry investment selection and allocation, other factors may affect Portfolio performance. These factors include, but are not limited to, Portfolio operating fees and expenses, portfolio turnover, and subscription and redemption cash flows affecting the Portfolio.
Multi-Strategy Alternatives Portfolio’s Lifetime Performance
Performance of a $10,000 investment, with distributions reinvested, from April 25, 2014 through December 31, 2018.
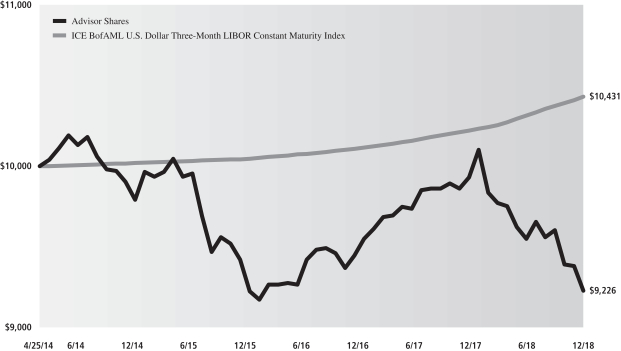
| | | | | | | | |
| Average Annual Total Return through December 31, 2018 | | One Year | | Three Years | | Since Inception | |
Institutional (Commenced April 25, 2014) | | -6.74% | | -0.34% | | | -1.33% | |
Service (Commenced April 25, 2014) | | -6.93% | | -0.56% | | | -1.57% | |
Advisor (Commenced April 25, 2014) | | -7.09% | | -0.69% | | | -1.70% | |
9
GOLDMAN SACHS VARIABLE INSURANCE TRUST MULTI-STRATEGY ALTERNATIVES PORTFOLIO
Schedule of Investments
December 31, 2018
| | | | | | | | |
| Shares | | |
Description | | Value | |
|
| | Underlying Funds (Class R6 Shares)(a) – 93.3% | |
| | Equity – 13.1% | |
| | 107,543 | | | Goldman Sachs Absolute Return Tracker Fund | | $ | 977,566 | |
| | 58,185 | | | Goldman Sachs Emerging Markets Equity Insights Fund | | | 511,446 | |
| | 36,746 | | | Goldman Sachs Real Estate Securities Fund | | | 479,541 | |
| | | | | | | | |
| | | | | | | 1,968,553 | |
| | |
| | Fixed Income – 80.2% | |
| | 246,434 | | | Goldman Sachs Tactical Exposure Fund | | | 2,247,480 | |
| | 196,091 | | | Goldman Sachs Managed Futures Strategy Fund | | | 2,017,781 | |
| | 195,089 | | | Goldman Sachs Long Short Credit Strategies Fund | | | 1,644,600 | |
| | 157,988 | | | Goldman Sachs Strategic Income Fund | | | 1,428,213 | |
| | 118,840 | | | Goldman Sachs Emerging Markets Debt Fund | | | 1,354,777 | |
| | 134,575 | | | Goldman Sachs Alternative Premia Fund | | | 1,088,711 | |
| | 114,860 | | | Goldman Sachs High Yield Floating Rate Fund | | | 1,048,669 | |
| | 127,927 | | | Goldman Sachs High Yield Fund | | | 763,723 | |
| | 79,939 | | | Goldman Sachs Local Emerging Markets Debt Fund | | | 448,457 | |
| | | | | | | | |
| | | | | | | 12,042,411 | |
| | |
| | TOTAL UNDERLYING FUNDS (CLASS R6 SHARES) | |
| | (Cost $15,055,611) | | $ | 14,010,964 | |
| | |
| | | | | | | | |
|
| | Exchange Traded Fund(b) – 1.7% | |
| | 6,264 | | | ProShares Short VIX Short-Term Futures ETF | | $ | 264,967 | |
| | (Cost $301,573) | | | | |
| | |
| | | | | | | | |
| Shares | | Dividend
Rate | | | Value | |
|
| Investment Company(a) – 1.3% | |
Goldman Sachs Financial Square Government Fund — Institutional Shares | |
| 191,106 | | | 2.521 | % | | $ | 191,106 | |
| (Cost $191,106) | | | | | |
| |
| TOTAL INVESTMENTS BEFORE SECURITIES LENDING REINVESTMENT VEHICLE | |
| (Cost $15,548,290) | | | $ | 14,467,037 | |
| |
| | | | | | | | |
|
| Securities Lending Reinvestment Vehicle(a) – 1.3% | |
Goldman Sachs Financial Square Government Fund — Institutional Shares | |
| 191,250 | | | 2.521 | % | | $ | 191,250 | |
| (Cost $191,250) | | | | | |
| |
| TOTAL INVESTMENTS – 97.6% | |
| (Cost $15,739,540) | | | $ | 14,658,287 | |
| |
OTHER ASSETS IN EXCESS OF LIABILITIES – 2.4% | | | | 357,838 | |
| |
| NET ASSETS – 100.0% | | | $ | 15,016,125 | |
| |
| | |
| The percentage shown for each investment category reflects the value of investments in that category as a percentage of net assets. |
| |
| (a) | | Represents an Affiliated Issuer. |
| |
| (b) | | All or a portion of security is on loan. |
| | |
| |
| Currency Abbreviation: |
| USD | | —United States Dollar |
| | |
| 10 | | The accompanying notes are an integral part of these financial statements. |
GOLDMAN SACHS VARIABLE INSURANCE TRUST MULTI-STRATEGY ALTERNATIVES PORTFOLIO
ADDITIONAL INVESTMENT INFORMATION
FUTURES CONTRACTS — At December 31, 2018, the Portfolio had the following futures contracts:
| | | | | | | | | | | | | | | | |
| Description | | Number of
Contracts | | | Expiration
Date | | | Notional
Amount | | | Unrealized
Appreciation/
(Depreciation) | |
|
Long position contracts: | |
MSCI Emerging Markets E-Mini Index | | | 22 | | | | 03/15/2019 | | | $ | 1,063,480 | | | $ | (2,524 | ) |
| | | | |
| Total | | | | | | | | | | | | | | $ | (2,524 | ) |
| | | | |
Short position contracts: | | | | | | | | | | | | | | | | |
| 3 Month Eurodollar | | | (41 | ) | | | 03/16/2020 | | | $ | (9,987,600 | ) | | $ | 32,430 | |
| Euro-Buxl | | | (4 | ) | | | 03/07/2019 | | | | (827,782 | ) | | | (16,148 | ) |
| MSCI EAFE E-Mini Index | | | (1 | ) | | | 03/15/2019 | | | | (85,800 | ) | | | 1,828 | |
S&P 500 E-Mini Index | | | (1 | ) | | | 03/15/2019 | | | | (125,260 | ) | | | 7,196 | |
| | | | |
| Total | | | | | | | | | | | | | | $ | 25,306 | |
| | | | |
| Total Futures Contracts | | | | | | | | | | | | | | $ | 22,782 | |
PURCHASED OPTIONS CONTRACTS — At December 31, 2018, the Portfolio had the following purchased options contracts:
| | | | | | | | | | | | | | | | | | | | | | | | | | | | | | |
| Description | | Counterparty | | Exercise Price | | | Expiration
Date | | | Number of
Contracts | | | Notional
Amount | | | Value | | | Premiums
Paid
(Received)
by the
Portfolio | | | Unrealized
Appreciation/
Depreciation | |
| | | | | | | |
Purchased options contracts: | | | | | | | | | | | | | | | | | | | | | | | | | | | | |
| | | | | | | | |
Calls | | | | | | | | | | | | | | | | | | | | | | | | | | | | | | |
| 3 Month Eurodollar | | Barclays Bank PLC | | | 96.00 USD | | | | 03/18/2019 | | | | 5 | | | $ | 1,250,000 | | | $ | 16,125 | | | $ | 14,774 | | | $ | 1,351 | |
| | | | | 96.50 USD | | | | 03/18/2019 | | | | 2 | | | | 500,000 | | | | 3,950 | | | | 3,655 | | | | 295 | |
| | | | | 97.13 USD | | | | 03/18/2019 | | | | 11 | | | | 2,750,000 | | | | 4,950 | | | | 20,313 | | | | (15,363 | ) |
| | | | | 99.00 USD | | | | 03/18/2019 | | | | 109 | | | | 27,250,000 | | | | 681 | | | | 9,789 | | | | (9,108 | ) |
| | | | | 96.00 USD | | | | 06/17/2019 | | | | 1 | | | | 250,000 | | | | 3,288 | | | | 2,877 | | | | 411 | |
| | | | | 96.88 USD | | | | 06/17/2019 | | | | 14 | | | | 3,500,000 | | | | 15,575 | | | | 24,395 | | | | (8,820 | ) |
| | | | | 99.00 USD | | | | 06/17/2019 | | | | 61 | | | | 15,250,000 | | | | 381 | | | | 6,241 | | | | (5,860 | ) |
| | | | | 96.75 USD | | | | 09/16/2019 | | | | 15 | | | | 3,750,000 | | | | 22,312 | | | | 30,822 | | | | (8,510 | ) |
| | | | | 97.75 USD | | | | 09/16/2019 | | | | 5 | | | | 1,250,000 | | | | 594 | | | | 3,137 | | | | (2,543 | ) |
| | | | | 96.50 USD | | | | 12/16/2019 | | | | 8 | | | | 2,000,000 | | | | 17,050 | | | | 15,969 | | | | 1,081 | |
| | | | | 96.00 USD | | | | 03/16/2020 | | | | 6 | | | | 1,500,000 | | | | 21,675 | | | | 15,289 | | | | 6,386 | |
| | | | | 96.75 USD | | | | 03/16/2020 | | | | 2 | | | | 500,000 | | | | 3,625 | | | | 2,255 | | | | 1,370 | |
| | | | | 97.00 USD | | | | 06/15/2020 | | | | 18 | | | | 4,500,000 | | | | 27,450 | | | | 13,318 | | | | 14,132 | |
| | | | | 97.13 USD | | | | 06/15/2020 | | | | 3 | | | | 750,000 | | | | 3,938 | | | | 2,332 | | | | 1,606 | |
| | | | | 97.00 USD | | | | 09/14/2020 | | | | 15 | | | | 3,750,000 | | | | 25,219 | | | | 12,247 | | | | 12,972 | |
| | | | | 97.13 USD | | | | 09/14/2020 | | | | 3 | | | | 750,000 | | | | 4,444 | | | | 2,744 | | | | 1,700 | |
| | | | | 96.75 USD | | | | 12/14/2020 | | | | 10 | | | | 2,500,000 | | | | 21,937 | | | | 12,748 | | | | 9,189 | |
| | | | | | 96.75 USD | | | | 03/15/2021 | | | | 3 | | | | 750,000 | | | | 6,975 | | | | 4,920 | | | | 2,055 | |
| | | | | | |
| Total purchased options contracts | | | | | | | | 291 | | | | | | | $ | 200,169 | | | $ | 197,825 | | | $ | 2,344 | |
| | |
| The accompanying notes are an integral part of these financial statements. | | 11 |
GOLDMAN SACHS VARIABLE INSURANCE TRUST MULTI-STRATEGY ALTERNATIVES PORTFOLIO
Statement of Assets and Liabilities
December 31, 2018
| | | | |
| | | | |
| Assets: | |
Investments in affiliated Underlying Funds, at value (cost $15,246,717) | | $ | 14,202,070 | |
Investments in unaffiliated Funds, at value (cost $301,573)(a) | | | 264,967 | |
Investments in affiliated securities lending reinvestment vehicle, at value (cost $191,250) | | | 191,250 | |
Purchased Options, at value (premiums paid $197,825) | | | 200,169 | |
Cash | | | 257,212 | |
Receivables: | | | | |
Portfolio shares sold | | | 89,314 | |
Collateral on certain derivative contracts(b) | | | 87,221 | |
Investments sold | | | 50,000 | |
Reimbursement from investment adviser | | | 29,821 | |
Dividends | | | 22,649 | |
Securities lending income | | | 337 | |
Other assets | | | 120 | |
| |
| Total assets | | | 15,395,130 | |
| | | | |
| | | | |
| Liabilities: | | | |
Variation margin on futures | | | 6,612 | |
Payables: | | | | |
Payable upon return of securities loaned | | | 191,250 | |
Due to custodian | | | 50,000 | |
Portfolio shares redeemed | | | 32,281 | |
Investments purchased | | | 24,008 | |
Distribution and Service fees and Transfer Agency fees | | | 5,308 | |
Accrued expenses | | | 69,546 | |
| |
| Total liabilities | | | 379,005 | |
| | | | |
| | | | |
| Net Assets: | | | |
Paid-in capital | | | 17,210,361 | |
Total distributable loss | | | (2,194,236 | ) |
| |
| NET ASSETS | | $ | 15,016,125 | |
Net Assets: | | | | |
Institutional | | $ | 745,117 | |
Service | | | 811,021 | |
Advisor | | | 13,459,987 | |
| |
Total Net Assets | | $ | 15,016,125 | |
Shares outstanding $0.001 par value (unlimited shares authorized): | | | | |
Institutional | | | 87,559 | |
Service | | | 95,227 | |
Advisor | | | 1,586,220 | |
Net asset value, offering and redemption price per share: | | | | |
Institutional | | | $8.51 | |
Service | | | 8.52 | |
Advisor | | | 8.49 | |
| (a) | Includes loaned securities having a market value of $186,930. |
| (b) | Includes amount segregated for initial margin on future transactions. |
| | |
| 12 | | The accompanying notes are an integral part of these financial statements. |
GOLDMAN SACHS VARIABLE INSURANCE TRUST MULTI-STRATEGY ALTERNATIVES PORTFOLIO
Statement of Operations
For the Fiscal Year Ended December 31, 2018
| | | | |
| | | | |
| Investment income: | |
Dividends from affiliated Underlying Funds | | $ | 425,946 | |
Dividends from unaffiliated Funds | | | 3,367 | |
Securities lending income — unaffiliated issuer | | | 1,484 | |
| |
| Total investment income | | | 430,797 | |
| | | | |
| | | | |
| Expenses: | | | |
Professional fees | | | 83,855 | |
Distribution and Service fees(a) | | | 64,046 | |
Printing and mailing costs | | | 62,591 | |
Custody, accounting and administrative services | | | 58,398 | |
Management fees | | | 25,114 | |
Trustee fees | | | 16,104 | |
Transfer Agency fees(a) | | | 3,348 | |
Registration fees | | | 1,114 | |
Other | | | 5,758 | |
| |
| Total expenses | | | 320,328 | |
| |
Less — expense reductions | | | (219,618 | ) |
| |
| Net expenses | | | 100,710 | |
| |
| NET INVESTMENT INCOME | | | 330,087 | |
| | | | |
| | | | |
| Realized and unrealized gain (loss): | | | |
Net realized loss from: | | | | |
Investments in affiliated Underlying Funds | | | (333,869 | ) |
Investments in unaffiliated Funds | | | (9,379 | ) |
Futures contracts | | | (223,612 | ) |
Purchased options | | | (139,672 | ) |
Forward foreign currency exchange contracts | | | (13,329 | ) |
Foreign currency transactions | | | (1,039 | ) |
Capital gain distributions from affiliated Underlying Funds | | | 164,008 | |
Net change in unrealized gain (loss) on: | | | | |
Investments in affiliated Underlying Funds | | | (938,512 | ) |
Investments in unaffiliated Funds | | | (142,621 | ) |
Futures contracts | | | (25,873 | ) |
Purchased options | | | 86,210 | |
Forward foreign currency exchange contracts | | | (740 | ) |
Foreign currency translation | | | 3,867 | |
| |
| Net realized and unrealized loss | | | (1,574,561 | ) |
| |
| NET DECREASE IN NET ASSETS RESULTING FROM OPERATIONS | | $ | (1,244,474 | ) |
(a) Class specific Distribution and/or Service, and Transfer Agency fees were as follows:
| | | | | | | | | | | | | | | | | | |
Distribution and/or
Service Fees | | | Transfer Agency Fees | |
Advisor | | | Service | | | Advisor | | | Institutional | | | Service | |
| $ | 63,171 | | | $ | 875 | | | $ | 3,158 | | | $ | 120 | | | $ | 70 | |
| | |
| The accompanying notes are an integral part of these financial statements. | | 13 |
GOLDMAN SACHS VARIABLE INSURANCE TRUST MULTI-STRATEGY ALTERNATIVES PORTFOLIO
Statements of Changes in Net Assets
| | | | | | | | |
| | | For the
Fiscal Year Ended
December 31, 2018 | | | For the
Fiscal Year Ended
December 31, 2017 | |
| | | | | | | | |
| From operations: | |
Net investment income | | $ | 330,087 | | | $ | 244,626 | |
Net realized gain (loss) | | | (556,892 | ) | | | 251,415 | |
Net change in unrealized gain (loss) | | | (1,017,669 | ) | | | 156,154 | |
| | |
| Net increase (decrease) in net assets resulting from operations | | | (1,244,474 | ) | | | 652,195 | |
| | | | | | | | |
| | | | | | | | |
| Distributions to shareholders: | | | | | | |
From distributable earnings: | | | | | | | | |
Institutional Shares | | | (20,403 | ) | | | (10,357 | )(a) |
Service Shares | | | (20,381 | ) | | | (2,291 | )(a) |
Advisor Shares | | | (318,314 | ) | | | (303,417 | )(a) |
| | |
| Total distributions to shareholders | | | (359,098 | ) | | | (316,065 | ) |
| | | | | | | | |
| | | | | | | | |
| From share transactions: | | | | | | |
Proceeds from sales of shares | | | 6,168,668 | | | | 5,892,266 | |
Reinvestment of distributions | | | 359,098 | | | | 316,065 | |
Cost of shares redeemed | | | (5,978,711 | ) | | | (1,594,340 | ) |
| | |
| Net increase in net assets resulting from share transactions | | | 549,055 | | | | 4,613,991 | |
| | |
| TOTAL INCREASE (DECREASE) | | | (1,054,517 | ) | | | 4,950,121 | |
| | | | | | | | |
| | | | | | | | |
| Net assets:(b) | | | | | | |
| | |
Beginning of year | | | 16,070,642 | | | | 11,120,521 | |
| | |
End of year | | $ | 15,016,125 | | | $ | 16,070,642 | |
| (a) | Prior year information has been revised to conform to current year presentation. Distributions to shareholders for the Fund consisted solely of net investment income for the fiscal year ended December 31, 2017. |
| (b) | Prior fiscal year information has been revised to conform with current year presentation. Undistributed net investment income was $43,805 for the Fund as of December 31, 2017. |
| | |
| 14 | | The accompanying notes are an integral part of these financial statements. |
GOLDMAN SACHS VARIABLE INSURANCE TRUST MULTI-STRATEGY ALTERNATIVES PORTFOLIO
Financial Highlights
Selected Data for a Share Outstanding Throughout Each Period
| | | | | | | | | | | | | | | | | | | | |
| | | Goldman Sachs Multi-Strategy Alternatives Portfolio | |
| | | Institutional Shares | |
| | | Year Ended December 31, | | | For the Period April 25, 2014* to December 31, 2014 | |
| | | 2018 | | | 2017 | | | 2016 | | | 2015 | |
| | | | | | | | | | | | | | | | | | | | |
| Per Share Data | | | | | | | | | | | | | | | |
| | | | | |
Net asset value, beginning of period | | $ | 9.39 | | | $ | 9.10 | | | $ | 9.15 | | | $ | 9.81 | | | $ | 10.00 | |
| | | | | |
Net investment income(a)(b) | | | 0.24 | | | | 0.21 | | | | 0.11 | | | | 0.20 | | | | 0.09 | |
| | | | | |
Net realized and unrealized gain (loss) | | | (0.87 | ) | | | 0.30 | | | | (0.06 | ) | | | (0.65 | ) | | | (0.16 | ) |
| | | | | |
Total from investment operations | | | (0.63 | ) | | | 0.51 | | | | 0.05 | | | | (0.45 | ) | | | (0.07 | ) |
| | | | | |
Distributions to shareholders from net investment income | | | (0.25 | ) | | | (0.22 | ) | | | (0.10 | ) | | | (0.20 | ) | | | (0.12 | ) |
| | | | | |
Distributions to shareholders from net realized gains | | | — | | | | — | | | | — | | | | (0.01 | ) | | | — | (c) |
| | | | | | |
Total distributions | | | (0.25 | ) | | | (0.22 | ) | | | (0.10 | ) | | | (0.21 | ) | | | (0.12 | ) |
| | | | | |
Net asset value, end of period | | $ | 8.51 | | | $ | 9.39 | | | $ | 9.10 | | | $ | 9.15 | | | $ | 9.81 | |
| | | | | |
Total return(d) | | | (6.74 | )% | | | 5.60 | % | | | 0.52 | % | | | (4.51 | )% | | | (0.67 | )% |
| | | | | |
Net assets, end of period (in 000s) | | $ | 745 | | | $ | 453 | | | $ | 309 | | | $ | 958 | | | $ | 1,003 | |
| | | | | |
Ratio of net expenses to average net assets(e) | | | 0.22 | % | | | 0.21 | % | | | 0.24 | % | | | 0.22 | % | | | 0.22 | %(f) |
| | | | | |
Ratio of total expenses to average net assets(e) | | | 1.57 | % | | | 1.47 | % | | | 2.37 | % | | | 4.40 | % | | | 24.63 | %(f) |
| | | | | |
Ratio of net investment income to average net assets(b) | | | 2.62 | % | | | 2.20 | % | | | 1.17 | % | | | 2.02 | % | | | 1.30 | %(f) |
| | | | | |
Portfolio turnover rate(g) | | | 61 | % | | | 53 | % | | | 44 | % | | | 53 | % | | | 25 | % |
| * | Commencement of Operations. |
| (a) | Calculated based on the average shares outstanding methodology. |
| (b) | Recognition of net investment income by the Portfolio is affected by the timing of declaration of dividends by the Underlying Funds in which the Portfolio invests. |
| (c) | Amount is less than $0.005 per share. |
| (d) | Assumes investment at the net asset value at the beginning of the period, reinvestment of all distributions, and a complete redemption of the investment at the net asset value at the end of the period. |
| (e) | Expense ratios exclude the expenses of the Underlying Funds in which the Portfolio invests. |
| (g) | The portfolio turnover rate is calculated in accordance with regulatory requirements, without regard to transactions involving short term investments and certain derivatives. If such transactions were included, the portfolio turnover rate may be higher. |
| | |
| The accompanying notes are an integral part of these financial statements. | | 15 |
GOLDMAN SACHS VARIABLE INSURANCE TRUST MULTI-STRATEGY ALTERNATIVES PORTFOLIO
Financial Highlights(continued)
Selected Data for a Share Outstanding Throughout Each Period
| | | | | | | | | | | | | | | | | | | | |
| | | Goldman Sachs Multi-Strategy Alternatives Portfolio | |
| | | Service Shares | |
| | | Year Ended December 31, | | | For the Period April 25, 2014* to December 31, 2014 | |
| | | 2018 | | | 2017 | | | 2016 | | | 2015 | |
| | | | | | | | | | | | | | | | | | | | |
| Per Share Data | | | | | | | | | | | | | | | |
| | | | | |
Net asset value, beginning of period | | $ | 9.41 | | | $ | 9.13 | | | $ | 9.14 | | | $ | 9.81 | | | $ | 10.00 | |
| | | | | |
Net investment income(a)(b) | | | 0.28 | | | | 0.27 | | | | 0.08 | | | | 0.24 | | | | 0.07 | |
| | | | | |
Net realized and unrealized gain (loss) | | | (0.93 | ) | | | 0.22 | | | | (0.05 | ) | | | (0.71 | ) | | | (0.16 | ) |
| | | | | |
Total from investment operations | | | (0.65 | ) | | | 0.49 | | | | 0.03 | | | | (0.47 | ) | | | (0.09 | ) |
| | | | | |
Distributions to shareholders from net investment income | | | (0.24 | ) | | | (0.21 | ) | | | (0.04 | ) | | | (0.19 | ) | | | (0.10 | ) |
| | | | | |
Distributions to shareholders from net realized gains | | | — | | | | — | | | | — | | | | (0.01 | ) | | | — | (c) |
| | | | | | |
Total distributions | | | (0.24 | ) | | | (0.21 | ) | | | (0.04 | ) | | | (0.20 | ) | | | (0.10 | ) |
| | | | | |
Net asset value, end of period | | $ | 8.52 | | | $ | 9.41 | | | $ | 9.13 | | | $ | 9.14 | | | $ | 9.81 | |
| | | | | |
Total return(d) | | | (6.93 | )% | | | 5.37 | % | | | 0.28 | % | | | (4.76 | )% | | | (0.85 | )% |
| | | | | |
Net assets, end of period (in 000s) | | $ | 811 | | | $ | 105 | | | $ | 34 | | | $ | 22 | | | $ | 10 | |
| | | | | |
Ratio of net expenses to average net assets(e) | | | 0.47 | % | | | 0.46 | % | | | 0.46 | % | | | 0.48 | % | | | 0.49 | %(f) |
| | | | | |
Ratio of total expenses to average net assets(e) | | | 1.95 | % | | | 1.73 | % | | | 1.97 | % | | | 3.33 | % | | | 25.05 | %(f) |
| | | | | |
Ratio of net investment income to average net assets(b) | | | 3.08 | % | | | 2.88 | % | | | 0.92 | % | | | 2.54 | % | | | 1.02 | %(f) |
| | | | | |
Portfolio turnover rate(g) | | | 61 | % | | | 53 | % | | | 44 | % | | | 53 | % | | | 25 | % |
| * | Commencement of Operations. |
| (a) | Calculated based on the average shares outstanding methodology. |
| (b) | Recognition of net investment income by the Portfolio is affected by the timing of declaration of dividends by the Underlying Funds in which the Portfolio invests. |
| (c) | Amount is less than $0.005 per share. |
| (d) | Assumes investment at the net asset value at the beginning of the period, reinvestment of all distributions, and a complete redemption of the investment at the net asset value at the end of the period. |
| (e) | Expense ratios exclude the expenses of the Underlying Funds in which the Portfolio invests. |
| (g) | The portfolio turnover rate is calculated in accordance with regulatory requirements, without regard to transactions involving short term investments and certain derivatives. If such transactions were included, the portfolio turnover rate may be higher. |
| | |
| 16 | | The accompanying notes are an integral part of these financial statements. |
GOLDMAN SACHS VARIABLE INSURANCE TRUST MULTI-STRATEGY ALTERNATIVES PORTFOLIO
Financial Highlights(continued)
Selected Data for a Share Outstanding Throughout Each Period
| | | | | | | | | | | | | | | | | | | | |
| | | Goldman Sachs Multi-Strategy Alternatives Portfolio | |
| | | Advisor Shares | |
| | | Year Ended December 31, | | | For the Period April 25, 2014* to December 31, 2014 | |
| | | 2018 | | | 2017 | | | 2016 | | | 2015 | |
| | | | | | | | | | | | | | | | | | | | |
| Per Share Data | | | | | | | | | | | | | | | |
| | | | | |
Net asset value, beginning of period | | $ | 9.36 | | | $ | 9.08 | | | $ | 9.12 | | | $ | 9.79 | | | $ | 10.00 | |
| | | | | |
Net investment income(a)(b) | | | 0.17 | | | | 0.17 | | | | 0.10 | | | | 0.21 | | | | 0.11 | |
| | | | | |
Net realized and unrealized gain (loss) | | | (0.83 | ) | | | 0.30 | | | | (0.07 | ) | | | (0.69 | ) | | | (0.21 | ) |
| | | | | |
Total from investment operations | | | (0.66 | ) | | | 0.47 | | | | 0.03 | | | | (0.48 | ) | | | (0.10 | ) |
| | | | | |
Distributions to shareholders from net investment income | | | (0.21 | ) | | | (0.19 | ) | | | (0.07 | ) | | | (0.18 | ) | | | (0.11 | ) |
| | | | | |
Distributions to shareholders from net realized gains | | | — | | | | — | | | | — | | | | (0.01 | ) | | | — | (c) |
| | | | | | |
Total distributions | | | (0.21 | ) | | | (0.19 | ) | | | (0.07 | ) | | | (0.19 | ) | | | (0.11 | ) |
| | | | | |
Net asset value, end of period | | $ | 8.49 | | | $ | 9.36 | | | $ | 9.08 | | | $ | 9.12 | | | $ | 9.79 | |
| | | | | |
Total return(d) | | | (7.09 | )% | | | 5.14 | % | | | 0.27 | % | | | (4.89 | )% | | | (0.97 | )% |
| | | | | |
Net assets, end of period (in 000s) | | $ | 13,460 | | | $ | 15,512 | | | $ | 10,778 | | | $ | 9,666 | | | $ | 3,246 | |
| | | | | |
Ratio of net expenses to average net assets(e) | | | 0.62 | % | | | 0.61 | % | | | 0.61 | % | | | 0.62 | % | | | 0.62 | %(f) |
| | | | | |
Ratio of total expenses to average net assets(e) | | | 1.93 | % | | | 1.88 | % | | | 2.58 | % | | | 3.51 | % | | | 16.16 | %(f) |
| | | | | |
Ratio of net investment income to average net assets(b) | | | 1.92 | % | | | 1.78 | % | | | 1.06 | % | | | 2.16 | % | | | 1.66 | %(f) |
| | | | | |
Portfolio turnover rate(g) | | | 61 | % | | | 53 | % | | | 44 | % | | | 53 | % | | | 25 | % |
| * | Commencement of Operations. |
| (a) | Calculated based on the average shares outstanding methodology. |
| (b) | Recognition of net investment income by the Portfolio is affected by the timing of declaration of dividends by the Underlying Funds in which the Portfolio invests. |
| (c) | Amount is less than $0.005 per share. |
| (d) | Assumes investment at the net asset value at the beginning of the period, reinvestment of all distributions, and a complete redemption of the investment at the net asset value at the end of the period. |
| (e) | Expense ratios exclude the expenses of the Underlying Funds in which the Portfolio invests. |
| (g) | The portfolio turnover rate is calculated in accordance with regulatory requirements, without regard to transactions involving short term investments and certain derivatives. If such transactions were included, the portfolio turnover rate may be higher. |
| | |
| The accompanying notes are an integral part of these financial statements. | | 17 |
GOLDMAN SACHS VARIABLE INSURANCE TRUST MULTI-STRATEGY ALTERNATIVES PORTFOLIO
Notes to Financial Statements
December 31, 2018
1. ORGANIZATION
Goldman Sachs Variable Insurance Trust (the “Trust” or “VIT”) is a Delaware statutory trust registered under the Investment Company Act of 1940, as amended (the “Act”), as an open-end management investment company. The Trust includes the Goldman Sachs Multi-Strategy Alternatives Portfolio (the “Portfolio”). The Portfolio is a diversified portfolio under the Act offering three classes of shares — Institutional, Service and Advisor Shares. Shares of the Trust are offered to separate accounts of participating life insurance companies for the purpose of funding variable annuity contracts and variable life insurance policies.
Goldman Sachs Asset Management, L.P. (“GSAM”), an affiliate of Goldman Sachs & Co. LLC (“Goldman Sachs”), serves as investment adviser to the Portfolio pursuant to a management agreement (the “Agreement”) with the Trust.
The Portfolio invests primarily in a combination of domestic and international equity and fixed income underlying funds (“Underlying Funds”) which are registered under the Act, for which GSAM acts as investment adviser. Additionally, this Portfolio may invest a portion of its assets directly in other securities and instruments, including unaffiliated exchange traded funds (“Unaffiliated Funds”).
2. SIGNIFICANT ACCOUNTING POLICIES
The financial statements have been prepared in accordance with accounting principles generally accepted in the United States of America (“GAAP”) and require management to make estimates and assumptions that may affect the reported amounts and disclosures. Actual results may differ from those estimates and assumptions.
A. Investment Valuation — The valuation policy of the Portfolio and Underlying Funds is to value investments at fair value.
B. Investment Income and Investments — Investment income includes interest income, dividend income, and securities lending income, if any. Interest income is accrued daily and adjusted for amortization of premiums and accretion of discounts. Dividend income is recognized on ex-dividend date or, for certain foreign securities, as soon as such information is obtained subsequent to the ex-dividend date. Capital gain distributions received from Underlying Funds are recognized on ex-dividend date. Investment transactions are reflected on trade date. Realized gains and losses are calculated using identified cost. Investment transactions are recorded on the following business day for daily net asset value (“NAV”) calculations. Income distributions are recognized as capital gains or income in the financial statements in accordance with the character that is distributed. Distributions received from the Portfolios investments in Goldman Sachs Real Estate Securities Fund (the “Underlying Fund invested in REITs”) may be characterized as ordinary income, net capital gain or a return of capital. A return of capital is recorded by the Portfolio as a reduction to the cost basis of the REIT.
For derivative contracts, realized gains and losses are recorded upon settlement of the contract.
C. Class Allocations and Expenses — Investment income, realized and unrealized gain (loss), if any, and non-class specific expenses of each Portfolio are allocated daily based upon the proportion of net assets of each class. Non-class specific expenses directly incurred by the Portfolio are charged to the Portfolio, while such expenses incurred by the Trust are allocated across the applicable Portfolios on a straight-line and/or pro-rata basis depending upon the nature of the expenses. Class specific expenses, where applicable, are borne by the respective share classes and include Distribution and Service and Transfer Agency. Expenses included in the accompanying financial statements reflect the expenses of each Portfolio and do not include any expenses associated with the Underlying Funds (“Underlying Funds”). Because the Underlying Funds have varied expense and fee levels and the Portfolio may own different proportions of the Underlying Funds at different times, the amount of fees and expenses incurred indirectly by the Portfolio will vary.
D. Federal Taxes and Distributions to Shareholders — It is the Portfolio’s policy to comply with the requirements of the Internal Revenue Code of 1986, as amended (the “Code”), applicable to regulated investment companies and to distribute each year substantially all of its investment company taxable income and capital gains to its shareholders. Accordingly, the Portfolio is not required to make any provisions for the payment of federal income tax. Distributions to shareholders are recorded on the ex-dividend date. Income and capital gains distributions, if any, are declared and paid annually.
18
GOLDMAN SACHS VARIABLE INSURANCE TRUST MULTI-STRATEGY ALTERNATIVES PORTFOLIO
2. SIGNIFICANT ACCOUNTING POLICIES (continued)
Net capital losses, if any, are carried forward to future fiscal years and may be used to the extent allowed by the Code to offset any future capital gains. Losses that are carried forward will retain their character as either short-term or long-term capital losses. Utilization of capital loss carryforwards will reduce the requirement of future capital gains distributions.
The characterization of distributions to shareholders for financial reporting purposes is determined in accordance with federal income tax rules, which may differ from GAAP. The source of the Portfolio’s distributions may be shown in the accompanying financial statements as either from distributable earnings or capital. Certain components of the Portfolio’s net assets on the Statement of Assets and Liabilities reflect permanent GAAP/tax differences based on the appropriate tax character.
3. INVESTMENTS AND FAIR VALUE MEASUREMENTS
U.S. GAAP defines the fair value of a financial instrument as the amount that would be received to sell an asset or paid to transfer a liability in an orderly transaction between market participants at the measurement date (i.e., the exit price); the Portfolio’s policy is to use the market approach. GAAP establishes a fair value hierarchy that prioritizes the inputs to valuation techniques used to measure fair value. The hierarchy gives the highest priority to unadjusted quoted prices in active markets for identical assets or liabilities (Level 1 measurements) and the lowest priority to unobservable inputs (Level 3 measurements). The levels used for classifying investments are not necessarily an indication of the risk associated with investing in these investments. The three levels of the fair value hierarchy are described below:
Level 1 — Unadjusted quoted prices in active markets that are accessible at the measurement date for identical, unrestricted assets or liabilities;
Level 2 — Quoted prices in markets that are not active or financial instruments for which significant inputs are observable (including, but not limited to, quoted prices for similar investments, interest rates, foreign exchange rates, volatility and credit spreads), either directly or indirectly;
Level 3 — Prices or valuations that require significant unobservable inputs (including GSAM’s assumptions in determining fair value measurement).
Changes in valuation techniques may result in transfers into or out of an assigned level within the hierarchy. In accordance with the Portfolio’s policy, transfers between different levels of the fair value hierarchy resulting from such changes are deemed to have occurred as of the beginning of the reporting period.
The Board of Trustees (“Trustees”) has approved Valuation Procedures that govern the valuation of the portfolio investments held by the Portfolio, including investments for which market quotations are not readily available. The Trustees have delegated to GSAM day-to-day responsibility for implementing and maintaining internal controls and procedures related to the valuation of the Portfolio’s investments. To assess the continuing appropriateness of pricing sources and methodologies, GSAM regularly performs price verification procedures and issues challenges as necessary to third party pricing vendors or brokers, and any differences are reviewed in accordance with the Valuation Procedures.
A. Level 1 and Level 2 Fair Value Investments — The valuation techniques and significant inputs used in determining the fair values for investments classified as Level 1 and Level 2 are as follows:
Underlying Funds (Including Money Market Funds) — Underlying funds (���Underlying Funds”) include other investment companies and exchange-traded funds (“ETFs”). Investments in the Underlying Funds (except ETFs) are valued at the NAV per share of the Class R6 or Institutional Share class on the day of valuation. ETFs are valued daily at the last sale price or official closing price on the principal exchange or system on which the investment is traded. Because the Portfolio invests in Underlying Funds that fluctuate in value, the Portfolio’s shares will correspondingly fluctuate in value. To the extent these investments are actively traded, they are classified as Level 1 of the fair value hierarchy, otherwise they are generally classified as Level 2. For information regarding an Underlying Fund’s accounting policies and investment holdings, please see the Underlying Fund’s shareholder report.
Derivative Contracts — A derivative is an instrument whose value is derived from underlying assets, indices, reference rates or a combination of these factors. The Portfolio enters into derivative transactions to hedge against changes in interest rates, securities
19
GOLDMAN SACHS VARIABLE INSURANCE TRUST MULTI-STRATEGY ALTERNATIVES PORTFOLIO
Notes to Financial Statements(continued)
December 31, 2018
3. INVESTMENTS AND FAIR VALUE MEASUREMENTS (continued)
prices, and/or currency exchange rates, to increase total return, or to gain access to certain markets or attain exposure to other underliers.
Exchange-traded derivatives, including futures and options contracts, are generally valued at the last sale or settlement price on the exchange where they are principally traded. Exchange-traded options without settlement prices are generally valued at the midpoint of the bid and ask prices on the exchange where they are principally traded (or, in the absence of two-way trading, at the last bid price for long positions and the last ask price for short positions). Exchange-traded derivatives typically fall within Level 1 of the fair value hierarchy. Over-the-counter (“OTC”) and centrally cleared derivatives are valued using market transactions and other market evidence, including market-based inputs to models, calibration to market-clearing transactions, broker or dealer quotations, or other alternative pricing sources. Where models are used, the selection of a particular model to value OTC and centrally cleared derivatives depends upon the contractual terms of, and specific risks inherent in, the instrument, as well as the availability of pricing information in the market. Valuation models require a variety of inputs, including contractual terms, market prices, yield curves, credit curves, measures of volatility, voluntary and involuntary prepayment rates, loss severity rates and correlations of such inputs. For OTC and centrally cleared derivatives that trade in liquid markets, model inputs can generally be verified and model selection does not involve significant management judgment. OTC and centrally cleared derivatives are classified within Level 2 of the fair value hierarchy when significant inputs are corroborated by market evidence.
i. Forward Contracts — A forward contract is a contract between two parties to buy or sell an asset at a specified price on a future date. A forward contract settlement can occur on a cash or delivery basis. Forward contracts are marked-to-market daily using independent vendor prices, and the change in value, if any, is recorded as an unrealized gain or loss. Cash and certain investments may be used to collateralize forward contracts.
Aforward foreign currency exchange contract is a forward contract in which the Portfolio agrees to receive or deliver a fixed quantity of one currency for another, at a pre-determined price at a future date. All forward foreign currency exchange contracts are marked-to-market daily at the applicable forward rate. Non-deliverable forward foreign currency exchange contracts are settled with the counterparty in cash without the delivery of foreign currency.
ii. Futures Contracts — Futures contracts are contracts to buy or sell a standardized quantity of a specified commodity or security. Upon entering into a futures contract, the Portfolio deposits cash or securities in an account on behalf of the broker in an amount sufficient to meet the initial margin requirement. Subsequent payments are made or received by the Portfolio equal to the daily change in the contract value and are recorded as variation margin receivable or payable with a corresponding offset to unrealized gains or losses. For financial reporting purposes, cash collateral that has been pledged to cover obligations of the Portfolio and cash collateral received, if any, is reported separately on the Statement of Assets and Liabilities as receivables/payables for collateral on certain derivative contracts. Non-cash collateral pledged by the Portfolio, if any, is noted in the Schedule of Investments.
iii. Options — When the Portfolio writes call or put options, an amount equal to the premium received is recorded as a liability and is subsequently marked-to-market to reflect the current value of the option written. Swaptions are options on interest rate swap contracts.
Upon the purchase of a call option or a put option by the Portfolio, the premium paid is recorded as an investment and subsequently marked-to-market to reflect the current value of the option. Certain options may be purchased with premiums to be determined on a future date. The premiums for these options are based upon implied volatility parameters at specified terms.
B. Level 3 Fair Value Investments — To the extent that significant inputs to valuation models and other alternative pricing sources are unobservable, or if quotations are not readily available, or if GSAM believes that such quotations do not accurately reflect fair value, the fair value of the Portfolio’s investments may be determined under Valuation Procedures approved by the Trustees. GSAM, consistent with its procedures and applicable regulatory guidance, may make an adjustment to the most recent valuation prices of either domestic or foreign securities in light of significant events to reflect what it believes to be the fair value of the securities at the time of determining the Portfolio’s NAV. Significant events which could affect a large number of securities in a particular market may include, but are not limited to: significant fluctuations in U.S. or foreign markets; market dislocations;
20
GOLDMAN SACHS VARIABLE INSURANCE TRUST MULTI-STRATEGY ALTERNATIVES PORTFOLIO
3. INVESTMENTS AND FAIR VALUE MEASUREMENTS (continued)
market disruptions; or unscheduled market closings. Significant events which could also affect a single issuer may include, but are not limited to: corporate actions such as reorganizations, mergers and buy-outs; ratings downgrades; and bankruptcies.
C. Fair Value Hierarchy — The following is a summary of the Portfolio’s investments and derivatives classified in the fair value hierarchy as of December 31, 2018:
| | | | | | | | | | | | |
| Investment Type | | Level 1 | | | Level 2 | | | Level 3 | |
| | | |
| Assets | | | | | | | | | | | | |
| Equity Underlying Funds | | $ | 1,968,553 | | | $ | — | | | $ | — | |
| Fixed Income Underlying Funds | | | 12,042,411 | | | | — | | | | — | |
| Exchange Traded Fund | | | 264,967 | | | | — | | | | — | |
| Investment Company | | | 191,106 | | | | — | | | | — | |
| Securities Lending Reinvestment Vehicle | | | 191,250 | | | | — | | | | — | |
| | | |
| Total | | $ | 14,658,287 | | | $ | — | | | $ | — | |
| | | |
| Derivative Type | | | | | | | | | |
| | | |
| Assets | | | | | | | | | | | | |
| Futures Contracts(a) | | $ | 41,454 | | | $ | — | | | $ | — | |
| Purchased Options Contracts | | | 200,169 | | | | — | | | | — | |
| | | |
| Total | | $ | 241,623 | | | $ | — | | | $ | — | |
| | | |
| Liabilities(a) | | | | | | | | | | | | |
| Futures Contracts | | $ | (18,672 | ) | | $ | — | | | $ | — | |
| (a) | Amount shown represents unrealized gain (loss) at fiscal year end. |
For further information regarding security characteristics, see the Schedule of Investments.
4. INVESTMENTS IN DERIVATIVES
The following table sets forth, by certain risk types, the gross value of derivative contracts (not considered to be hedging instruments for accounting disclosure purposes) as of December 31, 2018. These instruments were used as part of the Portfolio’s investment strategies and to obtain and/or manage exposure related to the risks below. The values in the table below exclude the effects of cash collateral received or posted pursuant to these derivative contracts, and therefore are not representative of the Portfolio’s net exposure.
| | | | | | | | | | | | | | |
| Risk | | | | Statement of Assets and Liabilities | | Assets(a) | | | Statement of Assets and Liabilities | | Liabilities(a) | |
| Equity | | | | Variation margin on futures contracts | | $ | 9,024 | | | Variation margin on futures contracts | | $ | (2,524 | ) |
| Interest Rate | | | | Variation margin on futures contracts and purchased options contracts at value | | | 232,599 | | | Variation margin on futures contracts | | | (16,148 | ) |
| | | | | |
| Total | | | | | | $ | 241,623 | | | | | $ | (18,672 | ) |
| (a) | Includes unrealized gain (loss) on futures contracts described in the Additional Investment Information section of the Schedule of Investments. Only the variation margin as of December 31, 2018 is reported within the Statement of Assets and Liabilities. |
The following table sets forth, by certain risk types, the Portfolio’s gains (losses) related to these derivatives and their indicative volumes for the fiscal year ended December 31, 2018. These gains (losses) should be considered in the context that these derivative contracts may have been executed to create investment opportunities and/or economically hedge certain investments, and
21
GOLDMAN SACHS VARIABLE INSURANCE TRUST MULTI-STRATEGY ALTERNATIVES PORTFOLIO
Notes to Financial Statements(continued)
December 31, 2018
4. INVESTMENTS IN DERIVATIVES (continued)
accordingly, certain gains (losses) on such derivative contracts may offset certain (losses) gains attributable to investments. These gains (losses) are included in “Net realized gain (loss)” or “Net change in unrealized gain (loss)” on the Statement of Operations.
| | | | | | | | | | | | | | |
| Risk | | Statement of Operations | | Net
Realized
Gain (Loss) | | | Net Change in
Unrealized
Gain (Loss) | | | Average
Number of
Contracts(a) | |
| Equity | | Net realized gain (loss) from futures contracts/Net change in unrealized gain (loss) on futures contracts | | $ | (158,072 | ) | | $ | (16,786 | ) | | | 33 | |
| Currency | | Net realized gain (loss) from forward foreign currency exchange contracts/Net change in unrealized gain (loss) on forward foreign currency exchange contracts | | | (13,329 | ) | | | (740 | ) | | | 13 | |
| Interest Rate | | Net realized gain (loss) from futures contracts and purchased options/Net change in unrealized gain (loss) on futures contracts and purchased options | | | (205,212 | ) | | | 77,123 | | | | 505 | |
| | | | |
| Total | | | | $ | (376,613 | ) | | $ | 59,597 | | | | 551 | |
| (a) | Average number of contracts is based on the average of month end balances for the fiscal year ended December 31, 2018. |
5. AGREEMENTS AND AFFILIATED TRANSACTIONS
A. Management Agreement — Under the Agreement, GSAM manages the Portfolio, subject to the general supervision of the Trustees.
As compensation for the services rendered pursuant to the Agreement, the assumption of the expenses related thereto and administration of the Portfolio’s business affairs, including providing facilities, GSAM is entitled to a management fee, accrued daily and paid monthly, equal to an annual percentage rate of 0.15% of the Portfolio’s average daily net assets. GSAM has agreed to waive all of its management fee. The management fee waiver will remain in effect through at least April 30, 2019, and prior to such date, GSAM may not terminate the arrangement without the approval of the Board of Trustees. For the fiscal year ended December 31, 2018, GSAM waived $25,114 of its management fee.
The Portfolio invests in Institutional Shares of the Goldman Sachs Financial Square Government Fund, which is an affiliated Underlying Fund. GSAM has agreed to waive a portion of its management fee payable by the Portfolio in an amount equal to the management fee it earns as an investment adviser to the affiliated Underlying Fund in which the Portfolio invests, except those management fees it earns from the Portfolio’s investments of cash collateral received in connection with securities lending transactions in the Goldman Sachs Financial Square Government Fund. For the fiscal year ended December 31, 2018, GSAM waived $637 of the Portfolio’s management fee.
B. Distribution and/or Service (12b-1) Plans — The Trust, on behalf of Service Shares of the Portfolio, has adopted a Distribution and Service Plan subject to Rule 12b-1 under the Act. Under the Distribution and Service Plan, Goldman Sachs, which serves as distributor (the “Distributor”), is entitled to a fee accrued daily and paid monthly, for distribution services and personal and account maintenance services, which may then be paid by Goldman Sachs to authorized dealers, equal to, on an annual basis, 0.25% of the Portfolio’s average daily net assets attributable to Service Shares.
The Trust, on behalf of Advisor Shares of the Portfolio, has adopted a Distribution Plan subject to Rule 12b-1 under the Act. Under the Distribution Plan, Goldman Sachs as Distributor is entitled to a fee accrued daily and paid monthly for distribution services, which may then be paid by Goldman Sachs to authorized dealers, equal to, on an annual basis, 0.15% of the Portfolio’s average daily net assets attributable to Advisor Shares.
C. Service Plans — The Trust, on behalf of Advisor Shares of the Portfolio, has adopted a Service Plan to allow Advisor Shares to compensate service organizations (including Goldman Sachs) for providing varying levels of personal and account maintenance and administration services to their customers who are beneficial owners of such shares. The Service Plans each provide for compensation to the service organizations equal to 0.25% of the average daily net assets attributable to Advisor Shares of the Portfolio.
22
GOLDMAN SACHS VARIABLE INSURANCE TRUST MULTI-STRATEGY ALTERNATIVES PORTFOLIO
5. AGREEMENTS AND AFFILIATED TRANSACTIONS (continued)
D. Transfer Agency Agreement — Goldman Sachs also serves as the transfer agent of the Portfolio for a fee pursuant to the Transfer Agency Agreement. The fees charged for such transfer agency services are accrued daily and paid monthly at an annual rate of 0.02% of the average daily net assets of Institutional, Service and Advisor Shares.
E. Other Expense Agreements and Affiliated Transactions — GSAM has agreed to limit certain “Other Expenses” of the Portfolio (excluding acquired fund fees and expenses, transfer agency fees and expenses, service fees and shareholder administration fees (as applicable), taxes, interest, brokerage fees, expenses of shareholder meetings, litigation and indemnification, and extraordinary expenses) to the extent such expenses exceed, on an annual basis, a percentage rate of the average daily net assets of the Portfolio. Such Other Expense reimbursements, if any, are accrued daily and paid monthly. In addition, the Portfolio is not obligated to reimburse GSAM for prior fiscal year expense reimbursements, if any. The Other Expense limitation as an annual percentage rate of average daily net assets for the Portfolio is 0.204%. The Other Expense limitation will remain in place through at least April 30, 2019, and prior to such date GSAM may not terminate the arrangement without the approval of the Trustees. In addition, the Portfolio has entered into certain offset arrangements with the custodian and the transfer agent, which may result in a reduction of the Portfolio’s expenses and are received irrespective of the application of the “Other Expense” limitation described above.
For the fiscal year ended December 31, 2018, these expense reductions, including any fee waivers and Other Expense reimbursements, were as follows:
| | | | | | | | | | | | | | |
Management Fee Waiver | | | Custody Fee Credits | | | Other Expense Reimbursement | | | Total Expense Reductions | |
| | | |
| $ | 25,752 | | | $ | 191 | | | $ | 193,675 | | | $ | 219,618 | |
F. Line of Credit Facility — As of December 31, 2018, the Portfolio participated in a $770,000,000 committed, unsecured revolving line of credit facility (the “facility”) together with other funds of the Trust and certain registered investment companies having management agreements with GSAM or its affiliates. This facility is to be used for temporary emergency purposes, or to allow for an orderly liquidation of securities to meet redemption requests. The interest rate on borrowings is based on the federal funds rate. The facility also requires a fee to be paid by the Portfolio based on the amount of the commitment that has not been utilized. For the fiscal year ended December 31, 2018, the Portfolio did not have any borrowings under the facility.
G. Other Transactions with Affiliates — The Portfolio invests primarily in the Class R6 Shares of the Underlying Funds. These Underlying Funds are considered to be affiliated with the Portfolio. During the fiscal year ended December 31, 2018, the Portfolio converted Institutional Shares of the Underlying Funds (except ETFs) to Class R6 Shares. The table below shows the transactions in and earnings from investments in these Underlying Funds for the fiscal year ended December 31, 2018:
| | | | | | | | | | | | | | | | | | | | | | | | | | | | | | | | | | | | |
| Underlying Funds | | Beginning
Value as of
December 31,
2017 | | | Purchases
at Cost | | | Proceeds
from Sales | | | Net
Realized
Gain (Loss)
from
Affiliated
Investment
Company | | | Change in
Unrealized
Appreciation
(Depreciation) | | | Ending Value
as of
December 31,
2018 | | | Shares
as of
December 31,
2018 | | | Dividend
Income
from
Affiliated
Investment
Company | | | Capital Gain
Distributions
from
Affiliated
Investment
Company | |
Goldman Sachs Alternative Premia Fund | | $ | — | | | $ | 1,375,913 | | | $ | (250,913 | ) | | $ | 51,799 | | | $ | (88,088 | ) | | $ | 1,088,711 | | | | 134,575 | | | $ | — | | | $ | 60,913 | |
Goldman Sachs Absolute Return Tracker Fund — Institutional Shares | | | 2,282,265 | | | | 90,000 | | | | (2,309,582 | )(a) | | | — | | | | (62,683 | ) | | | — | | | | — | | | | — | | | | — | |
Goldman Sachs Absolute Return Tracker Fund — Class R6 | | | — | | | | 2,412,007 | (a) | | | (1,451,650 | ) | | | 19,804 | | | | (2,595 | ) | | | 977,566 | | | | 107,543 | | | | 10,774 | | | | 16,651 | |
23
GOLDMAN SACHS VARIABLE INSURANCE TRUST MULTI-STRATEGY ALTERNATIVES PORTFOLIO
Notes to Financial Statements(continued)
December 31, 2018
5. AGREEMENTS AND AFFILIATED TRANSACTIONS (continued)
| | | | | | | | | | | | | | | | | | | | | | | | | | | | | | | | | | | | |
| Underlying Funds | | Beginning
Value as of
December 31,
2017 | | | Purchases
at Cost | | | Proceeds
from Sales | | | Net
Realized
Gain (Loss)
from
Affiliated
Investment
Company | | | Change in
Unrealized
Appreciation
(Depreciation) | | | Ending Value
as of
December 31,
2018 | | | Shares
as of
December 31,
2018 | | | Dividend
Income
from
Affiliated
Investment
Company | | | Capital Gain
Distributions
from
Affiliated
Investment
Company | |
Goldman Sachs Emerging Markets Debt Fund — Institutional Shares | | $ | 2,016,665 | | | $ | 109,983 | | | $ | (2,128,384 | )(b) | | $ | — | | | $ | 1,736 | | | $ | — | | | | — | | | $ | — | | | $ | — | |
Goldman Sachs Emerging Markets Debt Fund — Class R6 | | | — | | | | 2,496,833 | (b) | | | (945,000 | ) | | | (50,020 | ) | | | (147,036 | ) | | | 1,354,777 | | | | 118,840 | | | | 73,773 | | | | — | |
Goldman Sachs Emerging Markets Equity Insights Fund — Institutional Shares | | | 1,015,209 | | | | 30,000 | | | | (951,770 | )(c) | | | 4,305 | | | | (97,744 | ) | | | — | | | | — | | | | — | | | | — | |
Goldman Sachs Emerging Markets Equity Insights Fund — Class R6 | | | — | | | | 1,123,136 | (c) | | | (600,000 | ) | | | 33,561 | | | | (45,251 | ) | | | 511,446 | | | | 58,185 | | | | 11,367 | | | | — | |
Goldman Sachs Financial Square Government Fund | | | 868,891 | | | | 5,537,575 | | | | (6,215,360 | ) | | | — | | | | — | | | | 191,106 | | | | 191,106 | | | | 6,304 | | | | — | |
Goldman Sachs High Yield Floating Rate Fund — Institutional Shares | | | 470,785 | | | | 372,918 | | | | (844,784 | )(d) | | | — | | | | 1,081 | | | | — | | | | — | | | | — | | | | — | |
Goldman Sachs High Yield Floating Rate Fund — Class R6 | | | — | | | | 1,292,375 | (d) | | | (175,000 | ) | | | (5,537 | ) | | | (63,169 | ) | | | 1,048,669 | | | | 114,860 | | | | 49,926 | | | | — | |
Goldman Sachs High Yield Fund — Institutional Shares | | | 1,048,853 | | | | 59,630 | | | | (1,115,058 | )(e) | | | — | | | | 6,575 | | | | — | | | | — | | | | — | | | | — | |
Goldman Sachs High Yield Fund — Class R6 | | | — | | | | 1,504,002 | (e) | | | (650,000 | ) | | | (25,749 | ) | | | (64,530 | ) | | | 763,723 | | | | 127,927 | | | | 53,705 | | | | — | |
Goldman Sachs Local Emerging Markets Debt Fund | | | — | | | | 673,250 | | | | (170,000 | ) | | | (20,846 | ) | | | (33,947 | ) | | | 448,457 | | | | 79,939 | | | | 18,111 | | | | — | |
Goldman Sachs Long Short Credit Strategies Fund — Institutional Shares | | | 3,577,130 | | | | 195,006 | | | | (3,880,174 | )(f) | | | — | | | | 108,038 | | | | — | | | | — | | | | — | | | | — | |
24
GOLDMAN SACHS VARIABLE INSURANCE TRUST MULTI-STRATEGY ALTERNATIVES PORTFOLIO
5. AGREEMENTS AND AFFILIATED TRANSACTIONS (continued)
| | | | | | | | | | | | | | | | | | | | | | | | | | | | | | | | | | | | |
| Underlying Funds | | Beginning
Value as of
December 31,
2017 | | | Purchases
at Cost | | | Proceeds
from Sales | | | Net
Realized
Gain (Loss)
from
Affiliated
Investment
Company | | | Change in
Unrealized
Appreciation
(Depreciation) | | | Ending Value
as of
December 31,
2018 | | | Shares
as of
December 31,
2018 | | | Dividend
Income
from
Affiliated
Investment
Company | | | Capital Gain
Distributions
from
Affiliated
Investment
Company | |
Goldman Sachs Long Short Credit Strategies Fund — Class R6 | | $ | — | | | $ | 4,212,020 | (f) | | $ | (2,275,000 | ) | | $ | (112,380 | ) | | $ | (180,040 | ) | | $ | 1,644,600 | | | | 195,089 | | | $ | 117,144 | | | $ | — | |
Goldman Sachs Managed Futures Strategy Fund — Institutional Shares | | | 996,123 | | | | 1,350,000 | | | | (2,329,175 | )(g) | | | — | | | | (16,948 | ) | | | — | | | | — | | | | — | | | | — | |
Goldman Sachs Managed Futures Strategy Fund — Class R6 | | | — | | | | 2,457,618 | (g) | | | (408,443 | ) | | | (9,869 | ) | | | (21,525 | ) | | | 2,017,781 | | | | 196,091 | | | | — | | | | 3,443 | |
Goldman Sachs Real Estate Securities Fund — Institutional Shares | | | 511,928 | | | | 50,000 | | | | (633,666 | )(h) | | | — | | | | 71,738 | | | | — | | | | — | | | | — | | | | — | |
Goldman Sachs Real Estate Securities Fund — Class R6 | | | — | | | | 712,297 | (h) | | | (123,869 | ) | | | 45,706 | | | | (154,593 | ) | | | 479,541 | | | | 36,746 | | | | 14,760 | | | | 63,870 | |
Goldman Sachs Strategic Income Fund — Institutional Shares | | | 1,473,510 | | | | 670,000 | | | | (2,166,131 | )(i) | | | — | | | | 22,621 | | | | — | | | | — | | | | — | | | | — | |
Goldman Sachs Strategic Income Fund — Class R6 | | | — | | | | 2,448,253 | (i) | | | (920,000 | ) | | | (25,062 | ) | | | (74,978 | ) | | | 1,428,213 | | | | 157,988 | | | | 42,120 | | | | — | |
Goldman Sachs Strategic Macro Fund | | | 1,103,929 | | | | — | | | | (1,101,240 | ) | | | (77,849 | ) | | | 75,160 | | | | — | | | | — | | | | — | | | | — | |
Goldman Sachs Tactical Exposure Fund | | | — | | | | 2,817,093 | | | | (399,131 | ) | | | 2,276 | | | | (172,758 | ) | | | 2,247,480 | | | | 246,434 | | | | 27,962 | | | | 19,131 | |
| | | | | | | | | |
| Total | | $ | 15,365,288 | | | $ | 31,989,909 | | | $ | (32,044,330 | ) | | $ | (169,861 | ) | | $ | (938,936 | ) | | $ | 14,202,070 | | | | 1,765,323 | | | $ | 425,946 | | | $ | 164,008 | |
| (a) | Amounts include $2,309,582 for conversion of Institutional Shares to Class R6 Shares. |
| (b) | Amounts include $2,128,383 for conversion of Institutional Shares to Class R6 Shares. |
| (c) | Amounts include $901,770 for conversion of Institutional Shares to Class R6 Shares. |
| (d) | Amounts include $844,785 for conversion of Institutional Shares to Class R6 Shares. |
| (e) | Amounts include $1,115,058 for conversion of Institutional Shares to Class R6 Shares. |
| (f) | Amounts include $3,880,174 for conversion of Institutional Shares to Class R6 Shares. |
| (g) | Amounts include $2,329,175 for conversion of Institutional Shares to Class R6 Shares. |
| (h) | Amounts include $633,667 for conversion of Institutional Shares to Class R6 Shares |
| (i) | Amounts include $2,166,132 for conversion of Institutional Shares to Class R6 Shares |
25
GOLDMAN SACHS VARIABLE INSURANCE TRUST MULTI-STRATEGY ALTERNATIVES PORTFOLIO
Notes to Financial Statements(continued)
December 31, 2018
6. PORTFOLIO SECURITIES TRANSACTIONS
The cost of purchases and proceeds from sales and maturities of long-term securities for the fiscal year ended December 31, 2018, were $10,778,186 and $9,644,289, respectively.
7. SECURITIES LENDING
The Portfolio may lend its securities through a securities lending agent, the Bank of New York Mellon (“BNYM”), to certain qualified borrowers. In accordance with the Portfolio’s securities lending procedures, the Portfolio receives cash collateral at least equal to the market value of the securities on loan. The market value of the loaned securities is determined at the close of business of the Portfolio, at their last sale price or official closing price on the principal exchange or system on which they are traded, and any additional required collateral is delivered to the Portfolio on the next business day. As with other extensions of credit, the Portfolio may experience delay in the recovery of its securities or incur a loss should the borrower of the securities breach its agreement with the Portfolio or become insolvent at a time when the collateral is insufficient to cover the cost of repurchasing securities on loan. Dividend income received from securities on loan may not be subject to withholding taxes and therefore withholding taxes paid may differ from the amounts listed in the Statement of Operations. Loans of securities are terminable at any time and as such 1) the remaining contractual maturities of the outstanding securities lending transactions are considered to be overnight and continuous and 2) the borrower, after notice, is required to return borrowed securities within the standard time period for settlement of securities transactions.
The Portfolio invests the cash collateral received in connection with securities lending transactions in the Goldman Sachs Financial Square Government Fund (“Government Money Market Fund”), an affiliated series of the Goldman Sachs Trust. The Government Money Market Fund is registered under the Act as an open end investment company, is subject to Rule 2a-7 under the Act, and is managed by GSAM, for which GSAM may receive a management fee of up to 0.16% (prior to February 21, 2018, GSAM may have received a management fee of up to 0.205%) on an annualized basis of the average daily net assets of the Government Money Market Fund.
In the event of a default by a borrower with respect to any loan, BNYM may exercise any and all remedies provided under the applicable borrower agreement to make the Portfolio whole. These remedies include purchasing replacement securities by applying the collateral held from the defaulting broker against the purchase cost of the replacement securities. If BNYM is unable to purchase replacement securities, BNYM will indemnify the Portfolio by paying the Portfolio an amount equal to the market value of the securities loaned minus the value of cash collateral received from the borrower for the loan, subject to an exclusion for any shortfalls resulting from a loss of value in such cash collateral due to reinvestment risk. The Portfolio may enter into master netting agreements with borrowers, which provide the right, in the event of a default (including bankruptcy or insolvency), for the non-defaulting party to liquidate the collateral and calculate net exposure to the defaulting party or request additional collateral. However, in the event of a default by a borrower, a resolution authority could determine that such rights are not enforceable due to the restrictions or prohibitions against the right of set-off that may be imposed in accordance with a particular jurisdiction’s bankruptcy or insolvency laws. The Portfolio’s loaned securities were all subject to enforceable Securities Lending Agreements and the value of the collateral was at least equal to the value of the cash received. The amounts of the Portfolio’s overnight and continuous agreements, which represent the gross amounts of recognized liabilities for securities lending transactions outstanding as of December 31, 2018, are disclosed as “Payable upon return of securities loaned” on the Statement of Assets and Liabilities, where applicable. The Portfolio did not have securities on loan as of December 31, 2018.
Both the Portfolio and BNYM received compensation relating to the lending of the Portfolio’s securities. The amounts earned, if any, by the Portfolio for the fiscal year ended December 31, 2018, are reported under Investment Income on the Statement of Operations.
26
GOLDMAN SACHS VARIABLE INSURANCE TRUST MULTI-STRATEGY ALTERNATIVES PORTFOLIO
7. SECURITIES LENDING (continued)
The following table provides information about the Portfolio’s investment in the Government Money Market Fund for the fiscal year ended December 31, 2018:
| | | | | | | | | | | | | | |
Beginning
Value as of
December 31, 2017 | | | Purchases
at Cost | | | Proceeds
from Sales | | | Ending
Value as of
December 31, 2018 | |
| | | |
| $ | — | | | $ | 1,518,738 | | | $ | (1,327,488 | ) | | $ | 191,250 | |
8. TAX INFORMATION
The tax character of distributions paid during the fiscal years ended December 31, 2017 and December 31, 2018 was as follows:
| | | | | | | | |
| | | 2017 | | | 2018 | |
| Distributions paid from ordinary income | | $ | 316,065 | | | $ | 359,098 | |
As of December 31, 2018, the components of accumulated earnings (losses) on a tax-basis were as follows:
| | | | |
| Undistributed ordinary income — net | | $ | 62,768 | |
| Capital loss carryforwards: | | | | |
Perpetual Short-term | | | (514,168 | ) |
Perpetual Long-term | | | (369,817 | ) |
| Total capital loss carryforwards | | $ | (883,985 | ) |
| Timing differences (Qualified Late Year Loss Deferral/Post October Loss Deferral) | | | (23,546 | ) |
| Unrealized losses — net | | | (1,349,473 | ) |
| Total accumulated losses — net | | $ | (2,194,236 | ) |
As of December 31, 2018, the Portfolio’s aggregate security unrealized gains and losses based on cost for U.S. federal income tax purposes were as follows:
| | | | |
| Tax cost | | $ | 16,035,819 | |
| Gross unrealized gain | | | 94,002 | |
| Gross unrealized loss | | | (1,443,475 | ) |
| Net unrealized loss | | $ | (1,349,473 | ) |
The difference between GAAP-basis and tax-basis unrealized gains (losses) is attributable primarily to wash sales, net mark to market gains (losses) on regulated futures and options contracts and differences in the tax treatment of partnership investments.
GSAM has reviewed the Portfolio’s tax position for all open tax years (the current and prior three years, as applicable) and has concluded that no provision for income tax is required in the Portfolio’s financial statements. Such open tax years remain subject to examination and adjustment by tax authorities.
27
GOLDMAN SACHS VARIABLE INSURANCE TRUST MULTI-STRATEGY ALTERNATIVES PORTFOLIO
Notes to Financial Statements(continued)
December 31, 2018
9. OTHER RISKS
The Portfolio’s risks include, but are not limited to, the following:
Derivatives Risk — The Portfolio’s use of derivatives may result in loss. Derivative instruments, which may pose risks in addition to and greater than those associated with investing directly in securities, currencies or other instruments, may be illiquid or less liquid, volatile, difficult to price and leveraged so that small changes in the value of the underlying instruments may produce disproportionate losses to the Portfolio. Derivatives are also subject to counterparty risk, which is the risk that the other party in the transaction will not fulfill its contractual obligation. The use of derivatives is a highly specialized activity that involves investment techniques and risks different from those associated with investments in more traditional securities and instruments. Losses from derivatives can also result from a lack of correlation between changes in the value of derivative instruments and the portfolio assets (if any) being hedged.
Investments in the Underlying Funds — The investments of the Portfolio are concentrated in the Underlying Funds, and the Portfolio’s investment performance is directly related to the investment performance of the Underlying Funds it holds. The Portfolio is subject to the risk factors associated with the investments of the Underlying Funds in direct proportion to the amount of assets allocated to each. To the extent that the Portfolio has a relative concentration of its portfolio in a single Underlying Fund, the Portfolio may be more susceptible to adverse developments affecting that Underlying Fund, and may be more susceptible to losses because of these developments.
Investments in Other Investment Companies Risk — As a shareholder of another investment company, including an exchange-traded fund (“ETF”), the Portfolio will indirectly bear its proportionate share of any net management fees and other expenses paid by such other investment companies, in addition to the fees and expenses regularly borne by the Portfolio. ETFs are subject to risks that do not apply to conventional mutual funds, including but not limited to the following: (i) the market price of the ETF’s shares may trade at a premium or a discount to their NAV; and (ii) an active trading market for an ETF’s shares may not develop or be maintained.
Large Shareholder Transactions Risk — The Portfolio or an Underlying Fund may experience adverse effects when certain large shareholders, such as other funds, participating insurance companies, accounts and Goldman Sachs affiliates, purchase or redeem large amounts of shares of the Portfolio or an Underlying Fund. Such large shareholder redemptions, which may occur rapidly or unexpectedly, may cause the Portfolio or an Underlying Fund to sell portfolio securities at times when it would not otherwise do so, which may negatively impact the Portfolio���s or an Underlying Fund’s NAV and liquidity. These transactions may also accelerate the realization of taxable income to shareholders if such sales of investments resulted in gains, and may also increase transaction costs. In addition, a large redemption could result in the Portfolio’s or an Underlying Fund’s current expenses being allocated over a smaller asset base, leading to an increase in the Portfolio’s or an Underlying Fund’s expense ratio. Similarly, large Portfolio or Underlying Fund share purchases may adversely affect the Portfolio’s or an Underlying Fund’s performance to the extent that the Portfolio or an Underlying Fund is delayed in investing new cash or otherwise maintains a larger cash position than it ordinarily would.
Liquidity Risk — The Underlying Funds may make investments that are illiquid or that may become less liquid in response to market developments or adverse investor perceptions. Illiquid investments may be more difficult to value. Liquidity risk may also refer to the risk that the Portfolio will not be able to pay redemption proceeds within the allowable time period or without significant dilution to remaining investors’ interests because of unusual market conditions, an unusually high volume of redemption requests, or other reasons. To meet redemption requests, the Portfolio may be forced to sell investments at an unfavorable time and/or under unfavorable conditions. If the Fund is forced to sell securities at an unfavorable time and/or under unfavorable conditions, such sales may adversely affect the Fund’s NAV and dilute remaining investors’ interests. These risks may be more pronounced in connection with the Portfolio’s investments in securities of issuers located in emerging market countries.
Market and Credit Risks — In the normal course of business, the Portfolio and the Underlying Funds trade financial instruments and enters into financial transactions where risk of potential loss exists due to changes in the market (market risk). Additionally, the Portfolio and the Underlying Funds may also be exposed to credit risk in the event that an issuer or guarantor fails to perform or that an institution or entity with which the Portfolio or the Underlying Funds have unsettled or open transactions defaults.
28
GOLDMAN SACHS VARIABLE INSURANCE TRUST MULTI-STRATEGY ALTERNATIVES PORTFOLIO
10. INDEMNIFICATIONS
Under the Trust’s organizational documents, its Trustees, officers, employees and agents are indemnified, to the extent permitted by the Act and state law, against certain liabilities that may arise out of performance of their duties to the Portfolio. Additionally, in the course of business, the Portfolio enters into contracts that contain a variety of indemnification clauses. The Portfolio’s maximum exposure under these arrangements is unknown, as this would involve future claims that may be made against the Portfolio that have not yet occurred. However, GSAM believes the risk of loss under these arrangements to be remote.
11. OTHER MATTERS
In September 2018, the Financial Accounting Standards Board issued Accounting Standards Update (ASU) 2018-13 — Fair Value Measurement (Topic 820) Disclosure Framework — Changes to the Disclosure Requirements for Fair Value Measurement. The amendments in the ASU modify fair value measurement disclosures. The amendments are effective for the Fund’s fiscal year beginning after December 15, 2019. GSAM is currently evaluating the impact, if any, of the amendments.
12. SUBSEQUENT EVENTS
Subsequent events after the Statement of Assets and Liabilities date have been evaluated, and GSAM has concluded that there is no impact requiring adjustment or disclosure in the financial statements.
13. SUMMARY OF SHARE TRANSACTIONS
Share activity is as follows:
| | | | | | | | | | | | | | | | |
| | | For the Fiscal Year Ended
December 31, 2018 | | | For the Fiscal Year Ended
December 31, 2017 | |
| | | Shares | | | Dollars | | | Shares | | | Dollars | |
| Institutional Shares | | | | | | | | | | | | | | | | |
| Shares sold | | | 53,822 | | | $ | 488,301 | | | | 14,083 | | | $ | 133,278 | |
| Reinvestment of distributions | | | 2,400 | | | | 20,403 | | | | 1,104 | | | | 10,357 | |
| Shares redeemed | | | (16,933 | ) | | | (153,669 | ) | | | (837 | ) | | | (7,840 | ) |
| | | | 39,289 | | | | 355,035 | | | | 14,350 | | | | 135,795 | |
| Service Shares | | | | | | | | | | | | | | | | |
| Shares sold | | | 84,312 | | | | 762,281 | | | | 7,288 | | | | 69,479 | |
| Reinvestment of distributions | | | 2,398 | | | | 20,381 | | | | 244 | | | | 2,291 | |
| Shares redeemed | | | (2,657 | ) | | | (23,809 | ) | | | (27 | ) | | | (254 | ) |
| | | | 84,053 | | | | 758,853 | | | | 7,505 | | | | 71,516 | |
| Advisor Shares | | | | | | | | | | | | | | | | |
| Shares sold | | | 539,263 | | | | 4,918,086 | | | | 608,399 | | | | 5,689,509 | |
| Reinvestment of distributions | | | 37,581 | | | | 318,314 | | | | 32,451 | | | | 303,417 | |
| Shares redeemed | | | (648,355 | ) | | | (5,801,233 | ) | | | (170,306 | ) | | | (1,586,246 | ) |
| | | | (71,511 | ) | | | (564,833 | ) | | | 470,544 | | | | 4,406,680 | |
| | | | |
| NET INCREASE | | | 51,831 | | | $ | 549,055 | | | | 492,399 | | | $ | 4,613,991 | |
29
Report of Independent Registered Public Accounting Firm
To the Board of Trustees of Goldman Sachs Variable Insurance Trust and Shareholders of Goldman Sachs Multi-Strategy Alternatives Portfolio
Opinion on the Financial Statements
We have audited the accompanying statement of assets and liabilities, including the schedule of investments, of Goldman Sachs Multi-Strategy Alternatives Portfolio (one of the portfolios constituting Goldman Sachs Variable Insurance Trust, referred to hereafter as the “Portfolio”) as of December 31, 2018, the related statement of operations for the year ended December 31, 2018, the statements of changes in net assets for each of the two years in the period ended December 31, 2018, including the related notes, and the financial highlights for each of the periods indicated therein (collectively referred to as the “financial statements”). In our opinion, the financial statements present fairly, in all material respects, the financial position of the Portfolio as of December 31, 2018, the results of its operations for the year then ended, the changes in its net assets for each of the two years in the period ended December 31, 2018 and the financial highlights for each of the periods indicated therein in conformity with accounting principles generally accepted in the United States of America.
Basis for Opinion
These financial statements are the responsibility of the Portfolio’s management. Our responsibility is to express an opinion on the Portfolio’s financial statements based on our audits. We are a public accounting firm registered with the Public Company Accounting Oversight Board (United States) (PCAOB) and are required to be independent with respect to the Portfolio in accordance with the U.S. federal securities laws and the applicable rules and regulations of the Securities and Exchange Commission and the PCAOB.
We conducted our audits of these financial statements in accordance with the standards of the PCAOB. Those standards require that we plan and perform the audit to obtain reasonable assurance about whether the financial statements are free of material misstatement, whether due to error or fraud.
Our audits included performing procedures to assess the risks of material misstatement of the financial statements, whether due to error or fraud, and performing procedures that respond to those risks. Such procedures included examining, on a test basis, evidence regarding the amounts and disclosures in the financial statements. Our audits also included evaluating the accounting principles used and significant estimates made by management, as well as evaluating the overall presentation of the financial statements. Our procedures included confirmation of securities owned as of December 31, 2018 by correspondence with the custodian, transfer agent and brokers; when replies were not received from brokers, we performed other auditing procedures. We believe that our audits provide a reasonable basis for our opinion.
PricewaterhouseCoopers LLP
Boston, Massachusetts
February 13, 2019
We have served as the auditor of one or more investment companies in the Goldman Sachs fund complex since 2000.
30
GOLDMAN SACHS VARIABLE INSURANCE TRUST MULTI-STRATEGY ALTERNATIVES PORTFOLIO
| | |
| Portfolio Expenses — Six Month Period Ended December 31, 2018 (Unaudited) | | |
As a shareholder of Institutional, Service or Advisor Shares of the Portfolio, you incur ongoing costs, including management fees, distribution and/or service (12b-1) fees (with respect to Service and Advisor Shares) and other Portfolio expenses. This example is intended to help you understand your ongoing costs (in dollars) of investing in the Institutional Shares, Service Shares and Advisor Shares of the Portfolio and to compare these costs with the ongoing costs of investing in other mutual funds.
The example is based on an investment of $1,000 invested at the beginning of the period and held for the entire period from July 1, 2018 through December 31, 2018, which represents a period of 184 days of a 365 day year.
Actual Expenses — The first line under each share class in the table below provides information about actual account values and actual expenses. You may use the information in this line, together with the amount you invested, to estimate the expenses that you paid over the period. Simply divide your account value by $1,000 (for example, an $8,600 account value divided by $1,000=8.6), then multiply the result by the number in the first line under the heading entitled “Expenses Paid” to estimate the expenses you paid on your account during this period.
Hypothetical Example for Comparison Purposes — The second line under each share class in the table below provides information about hypothetical account values and hypothetical expenses based on the Portfolio’s actual net expense ratio and an assumed rate of return of 5% per year before expenses, which is not the Portfolio’s actual return. The hypothetical account values and expenses may not be used to estimate the actual ending account balance or expenses you paid for the period. You may use this information to compare the ongoing costs of investing in the Portfolio and other funds. To do so, compare this 5% hypothetical example with the 5% hypothetical examples that appear in the shareholder reports of the other funds.
Please note that the expenses shown in the table are meant to highlight your ongoing costs only. As a shareholder of the Portfolio you do not incur any transaction costs, such as sales charges, redemption fees, or exchange fees, but shareholders of other funds may incur such costs. The second line of the table is useful in comparing ongoing costs only and will not help you determine the relative total costs of owning different funds whose shareholders may incur transaction costs.
| | | | | | | | | | | | |
| Share Class | | Beginning
Account Value
07/01/18 | | | Ending
Account Value
12/31/18 | | | Expenses
Paid for the
6 Months
Ended
12/31/18* | |
| Institutional | | | | | | | | | | | | |
| | | | |
| Actual | | $ | 1,000 | | | $ | 967.60 | | | $ | 1.09 | |
| Hypothetical 5% return | | | 1,000 | | | | 1,024.10 | + | | | 1.12 | |
| Service | | | | | | | | | | | | |
| | | | |
| Actual | | | 1,000 | | | | 967.70 | | | | 2.33 | |
| Hypothetical 5% return | | | 1,000 | | | | 1,022.84 | + | | | 2.40 | |
| Advisor | | | | | | | | | | | | |
| | | | |
| Actual | | | 1,000 | | | | 966.20 | | | | 3.07 | |
| Hypothetical 5% return | | | 1,000 | | | | 1,022.08 | + | | | 3.16 | |
| | + | Hypothetical expenses are based on the Portfolio’s actual annualized net expense ratios and an assumed rate of return of 5% per year before expenses. | |
| | * | Expenses are calculated using the Portfolio’s annualized net expense ratio for each class, which represents the ongoing expenses as a percentage of net assets for the six months ended December 31, 2018. Expenses are calculated by multiplying the annualized net expense ratio by the average account value for the period; then multiplying the result by the number of days in the most recent fiscal half year; and then dividing that result by the number of days in the fiscal year. The annualized net expense ratios for the period were 0.22%, 0.47% and 0.62% for Institutional, Service and Advisor Shares, respectively. | |
31
GOLDMAN SACHS VARIABLE INSURANCE TRUST MULTI-STRATEGY ALTERNATIVES PORTFOLIO
Trustees and Officers (Unaudited)
Independent Trustees
| | | | | | | | | | |
| | | | | |
Name,
Address and Age1 | | Position(s) Held with the Trust | | Term of Office and
Length of
Time Served2 | | Principal Occupation(s) During Past 5 Years | | Number of
Portfolios in
Fund Complex
Overseen by
Trustee3 | | Other Directorships Held by Trustee4 |
| | | | | |
Jessica Palmer Age: 69 | | Chair of the Board of Trustees | | Since 2018 (Trustee since 2007) | | Ms. Palmer is retired. She was formerly Director, Emerson Center for the Arts and Culture (2011-2017); and Consultant, Citigroup Human Resources Department (2007-2008); Managing Director, Citigroup Corporate and Investment Banking (previously, Salomon Smith Barney/Salomon Brothers) (1984-2006). Ms. Palmer was a Member of the Board of Trustees of Indian Mountain School (private elementary and secondary school) (2004-2009). Chair of the Board of Trustees — Goldman Sachs Trust and Goldman Sachs Variable Insurance Trust. | | 103 | | None |
| | | | | |
Kathryn A. Cassidy Age: 64 | | Trustee | | Since 2015 | | Ms. Cassidy is retired. Formerly, she was Advisor to the Chairman (May 2014-December 2014); and Senior Vice President and Treasurer (2008-2014), General Electric Company & General Electric Capital Corporation (technology and financial services companies). Trustee — Goldman Sachs Trust and Goldman Sachs Variable Insurance Trust. | | 103 | | None |
| | | | | |
Diana M. Daniels Age: 69 | | Trustee | | Since 2007 | | Ms. Daniels is retired. Formerly, she was Vice President, General Counsel and Secretary, The Washington Post Company (1991-2006). Ms. Daniels is a Trustee Emeritus and serves as a Presidential Councillor of Cornell University (2013-Present); former Member of the Legal Advisory Board, New York Stock Exchange (2003-2006) and of the Corporate Advisory Board, Standish Mellon Management Advisors (2006-2007). Trustee — Goldman Sachs Trust and Goldman Sachs Variable Insurance Trust. | | 103 | | None |
| | | | | |
Herbert J. Markley Age: 68 | | Trustee | | Since 2013 | | Mr. Markley is retired. Formerly, he was Executive Vice President, Deere & Company (an agricultural and construction equipment manufacturer) (2007-2009); and President, Agricultural Division, Deere & Company (2001-2007). Previously, Mr. Markley served as an Advisory Board Member of Goldman Sachs Trust and Goldman Sachs Variable Insurance Trust (June 2013-October 2013). Trustee — Goldman Sachs Trust and Goldman Sachs Variable Insurance Trust. | | 103 | | None |
| | | | | |
Roy W. Templin Age: 58 | | Trustee | | Since 2013 | | Mr. Templin is retired. He is Director, Armstrong World Industries, Inc. (a designer and manufacturer of ceiling, wall and suspension system solutions) (2016-Present); and was formerly Chairman of the Board of Directors, Con-Way Incorporated (a transportation, logistics and supply chain management service company) (2014-2015); Executive Vice President and Chief Financial Officer, Whirlpool Corporation (an appliance manufacturer and marketer) (2004-2012). Previously, Mr. Templin served as an Advisory Board Member of Goldman Sachs Trust and Goldman Sachs Variable Insurance Trust (June 2013-October 2013). Trustee — Goldman Sachs Trust and Goldman Sachs Variable Insurance Trust. | | 103 | | Armstrong World Industries, Inc. (a ceiling, wall and suspension systems solutions manufacturer) |
| | | | | |
Gregory G. Weaver Age: 67 | | Trustee | | Since 2015 | | Mr. Weaver is retired. He is Director, Verizon Communications Inc. (2015-Present); and was formerly Chairman and Chief Executive Officer, Deloitte & Touche LLP (a professional services firm) (2001-2005 and 2012-2014); and Member of the Board of Directors, Deloitte & Touche LLP (2006-2012). Trustee — Goldman Sachs Trust and Goldman Sachs Variable Insurance Trust. | | 103 | | Verizon Communications Inc. |
| | | | | | | | | | |
32
GOLDMAN SACHS VARIABLE INSURANCE TRUST MULTI-STRATEGY ALTERNATIVES PORTFOLIO
Trustees and Officers (Unaudited) (continued)
Interested Trustee*
| | | | | | | | | | |
| | | | | |
Name,
Address and Age1 | | Position(s) Held with the Trust | | Term of Office and
Length of
Time Served2 | | Principal Occupation(s) During Past 5 Years | | Number of
Portfolios in
Fund Complex
Overseen by
Trustee3 | | Other Directorships Held by Trustee4 |
| | | | | |
James A. McNamara Age: 56 | | President and Trustee | | Since 2007 | | Advisory Director, Goldman Sachs (January 2018-Present); Managing Director, Goldman Sachs (January 2000-December 2017); Director of Institutional Fund Sales, GSAM (April 1998-December 2000); and Senior Vice President and Manager, Dreyfus Institutional Service Corporation (January 1993- April 1998). President and Trustee — Goldman Sachs Trust; Goldman Sachs Variable Insurance Trust; Goldman Sachs Trust II; Goldman Sachs MLP Income Opportunities Fund; Goldman Sachs MLP and Energy Renaissance Fund; Goldman Sachs ETF Trust; Goldman Sachs Private Markets Fund 2018 LLC; Goldman Sachs Private Markets Fund 2018 (A) LLC; and Goldman Sachs Private Markets Fund 2018 (B) LLC. | | 156 | | None |
| | | | | | | | | | |
| * | Mr. McNamara is considered to be an “Interested Trustee” because he holds positions with Goldman Sachs and owns securities issued by The Goldman Sachs Group, Inc. Mr. McNamara holds comparable positions with certain other companies of which Goldman Sachs, GSAM or an affiliate thereof is the investment adviser, administrator and/or distributor. |
| 1 | Each Trustee may be contacted by writing to the Trustee, c/o Goldman Sachs, 200 West Street, New York, New York, 10282, Attn: Caroline Kraus. Information is provided as of December 31, 2018. |
| 2 | Subject to such policies as may be adopted by the Board from time-to-time, each Trustee holds office for an indefinite term, until the earliest of: (a) the election of his or her successor; (b) the date the Trustee resigns or is removed by the Board or shareholders, in accordance with the Trust’s Declaration of Trust; or (c) the termination of the Trust. The Board has adopted policies which provide that (a) no Trustee shall hold office for more than 15 years and (b) a Trustee shall retire as of December 31st of the calendar year in which he or she reaches his or her 74th birthday, unless a waiver of such requirement shall have been adopted by a majority of the other Trustees. These policies may be changed by the Trustees without shareholder vote. |
| 3 | The Goldman Sachs Fund Complex includes certain other companies listed above for each respective Trustee. As of December 31, 2018, Goldman Sachs Trust consisted of 90 portfolios (88 of which offered shares to the public); Goldman Sachs Variable Insurance Trust consisted of 13 portfolios; Goldman Sachs Trust II consisted of 19 portfolios (17 of which offered shares to the public); Goldman Sachs MLP Income Opportunities Fund, Goldman Sachs MLP and Energy Renaissance Fund, Goldman Sachs Private Markets Fund 2018 LLC, Goldman Sachs Private Markets Fund 2018 (A) LLC and Goldman Sachs Private Markets Fund 2018 (B) LLC each consisted of one portfolio; and Goldman Sachs ETF Trust consisted of 29 portfolios (14 of which offered shares to the public). |
| 4 | This column includes only directorships of companies required to report to the Securities and Exchange Commission under the Securities Exchange Act of 1934 (i.e., “public companies”) or other investment companies registered under the Act. |
Additional information about the Trustees is available in the Portfolio’s Statement of Additional Information, which can be obtained from Goldman Sachs free of charge by calling this toll-free number (in the United States of America): 1-800-526-7384.
33
GOLDMAN SACHS VARIABLE INSURANCE TRUST MULTI-STRATEGY ALTERNATIVES PORTFOLIO
Trustees and Officers (Unaudited) (continued)
Officers of the Trust*
| | | | | | |
| | | |
| Name, Address and Age1 | | Position(s) Held with the Trust | | Term of
Office and
Length of
Time Served2 | | Principal Occupation(s) During Past 5 Years |
| | | |
James A. McNamara 200 West Street New York, NY 10282 Age: 56 | | Trustee and President | | Since 2007 | | Advisory Director, Goldman Sachs (January 2018-Present); Managing Director, Goldman Sachs (January 2000-December 2017); Director of Institutional Fund Sales, GSAM (April 1998-December 2000); and Senior Vice President and Manager, Dreyfus Institutional Service Corporation (January 1993-April 1998). President and Trustee — Goldman Sachs Trust; Goldman Sachs Variable Insurance Trust; Goldman Sachs Trust II; Goldman Sachs MLP Income Opportunities Fund; Goldman Sachs MLP and Energy Renaissance Fund; Goldman Sachs ETF Trust; Goldman Sachs Private Markets Fund 2018 LLC; Goldman Sachs Private Markets Fund 2018 (A) LLC; and Goldman Sachs Private Markets Fund 2018 (B) LLC. |
| | | |
Caroline L. Kraus 200 West Street New York, NY 10282 Age: 41 | | Secretary | | Since 2012 | | Managing Director, Goldman Sachs (January 2016-Present); Vice President, Goldman Sachs (August 2006-December 2015); Associate General Counsel, Goldman Sachs (2012-Present); Assistant General Counsel, Goldman Sachs (August 2006-December 2011); and Associate, Weil, Gotshal & Manges, LLP (2002-2006). Secretary — Goldman Sachs Trust (previously Assistant Secretary (2012)); Goldman Sachs Variable Insurance Trust (previously Assistant Secretary (2012)); Goldman Sachs Trust II; Goldman Sachs BDC, Inc.; Goldman Sachs Private Middle Market Credit LLC; Goldman Sachs Middle Market Lending Corp.; Goldman Sachs MLP Income Opportunities Fund; Goldman Sachs MLP and Energy Renaissance Fund; Goldman Sachs ETF Trust; Goldman Sachs Private Markets Fund 2018 LLC; Goldman Sachs Private Markets Fund 2018 (A) LLC; and Goldman Sachs Private Markets Fund 2018 (B) LLC. |
| | | |
Scott M. McHugh 200 West Street New York, NY 10282 Age: 47 | | Treasurer, Senior Vice President and Principal Financial Officer | | Since 2009 (Principal Financial Officer since 2013) | | Managing Director, Goldman Sachs (January 2016-Present); Vice President, Goldman Sachs (February 2007-December 2015); Assistant Treasurer of certain mutual funds administered by DWS Scudder (2005-2007); and Director (2005-2007), Vice President (2000-2005), and Assistant Vice President (1998-2000), Deutsche Asset Management or its predecessor (1998-2007). Treasurer, Senior Vice President and Principal Financial Officer — Goldman Sachs Trust; Goldman Sachs Variable Insurance Trust; Goldman Sachs Trust II; Goldman Sachs MLP Income Opportunities Fund; Goldman Sachs MLP and Energy Renaissance Fund; Goldman Sachs ETF Trust; Goldman Sachs Private Markets Fund 2018 LLC; Goldman Sachs Private Markets Fund 2018 (A) LLC; and Goldman Sachs Private Markets Fund 2018 (B) LLC. |
| | | |
Joseph F. DiMaria 30 Hudson Street Jersey City, NJ 07302 Age: 50 | | Assistant Treasurer and Principal Accounting Officer | | Since 2016 (Principal Accounting Officer since 2017) | | Managing Director, Goldman Sachs (November 2015-Present) and Vice President — Mutual Fund Administration, Columbia Management Investment Advisers, LLC (May 2010-October 2015). Assistant Treasurer and Principal Accounting Officer — Goldman Sachs Trust; Goldman Sachs Variable Insurance Trust; Goldman Sachs Trust II; Goldman Sachs MLP Income Opportunities Fund; Goldman Sachs MLP and Energy Renaissance Fund; Goldman Sachs ETF Trust; Goldman Sachs Private Markets Fund 2018 LLC; Goldman Sachs Private Markets Fund 2018 (A) LLC; and Goldman Sachs Private Markets Fund 2018 (B) LLC. |
| | | | | | |
| * | Represents a partial list of officers of the Trust. Additional information about all the officers is available in the Portfolio’s Statement of Additional Information, which can be obtained from Goldman Sachs free of charge by calling this toll-free number (in the United States): 1-800-526-7384. |
| 1 | Information is provided as of December 31, 2018. |
| 2 | Officers hold office at the pleasure of the Board of Trustees or until their successors are duly elected and qualified. Each officer holds comparable positions with certain other companies of which Goldman Sachs, GSAM or an affiliate thereof is the investment adviser, administrator and/or distributor. |
Goldman Sachs Variable Insurance Trust — Tax Information (Unaudited)
For the year ended December 31, 2018, 0.76% of the dividends paid from net investment company taxable income by the Multi-Strategy Alternatives Portfolio qualify for the dividends received deduction available to corporations.
For the 2018 tax year, the Multi-Strategy Alternatives Portfolio has elected to pass through a credit for taxes paid to foreign jurisdictions. The total amount of income received by the Multi-Strategy Alternatives Portfolio from sources within foreign countries and possessions of the United States was $0.0081 per share, all of which is attributable to qualified passive income. The percentage of net investment income dividends paid by the Portfolio during the year ended December 31, 2018 from foreign sources was 2.28%. The total amount of foreign taxes paid by the Portfolio was $0.0012 per share.
34
| | |
| TRUSTEES | | OFFICERS |
| Jessica Palmer,Chair | | James A. McNamara,President |
| Kathryn A. Cassidy | | Scott M. McHugh,Treasurer, Senior Vice |
| Diana M. Daniels | | President and Principal Financial Officer |
| Herbert J. Markley | | Joseph F. DiMaria,Assistant Treasurer and |
| James A. McNamara | | Principal Accounting Officer |
| Roy W. Templin | | Caroline L. Kraus,Secretary |
| Gregory G. Weaver | | |
GOLDMAN SACHS & CO. LLC
Distributor and Transfer Agent
GOLDMAN SACHS ASSET MANAGEMENT, L.P.
Investment Adviser
200 West Street, New York
New York 10282
Visit our web site at www.GSAMFUNDS.com to obtain the most recentmonth-end returns.
The reports concerning the Portfolio included in this shareholder report may contain certain forward-looking statements about the factors that may affect the performance of the Portfolio in the future. These statements are based on Portfolio management’s predictions and expectations concerning certain future events and their expected impact on the Portfolio, such as performance of the economy as a whole and of specific industry sectors, changes in the levels of interest rates, the impact of developing world events, and other factors that may influence the future performance of the Portfolio. Management believes these forward-looking statements to be reasonable, although they are inherently uncertain and difficult to predict. Actual events may cause adjustments in portfolio management strategies from those currently expected to be employed.
A description of the policies and procedures that the Portfolio uses to determine how to vote proxies relating to portfolio securities and information regarding how the Portfolio voted proxies relating to portfolio securities for the12-month period ended December 31 is available (i) without charge, upon request by calling1-800-621-2550; and (ii) on the Securities and Exchange Commission (“SEC”) web site athttp://www.sec.gov.
The Portfolio files its complete schedule of portfolio holdings with the SEC for the first and third quarters of each fiscal year onForm N-Q. The Portfolio’sForm N-Qs are available on the SEC’s web site at http://www.sec.gov within 60 days after the Portfolio’s first and third fiscal quarters.Form N-Qs may be obtained upon request and without charge by calling1-800-621-2550.
Views and opinions expressed are for informational purposes only and do not constitute a recommendation by GSAM to buy, sell, or hold any security. Views and opinions are current as of the date of this presentation and may be subject to change, they should not be construed as investment advice.
Goldman Sachs & Co. LLC (“Goldman Sachs”) does not provide legal, tax or accounting advice. Any statement contained in this communication (including any attachments) concerning U.S. tax matters was not intended or written to be used, and cannot be used, for the purpose of avoiding penalties under the Internal Revenue Code, and was written to support the promotion or marketing of transactions or matters addressed. Clients of Goldman Sachs should obtain their own independent tax advice based on their particular circumstances.
The website links provided are for your convenience only and are not an endorsement or recommendation by GSAM of any of these websites or the products or services offered. GSAM is not responsible for the accuracy and validity of the content of these websites.
Portfolio holdings and allocations shown are as of December 31, 2018 and may not be representative of future investments. Portfolio holdings should not be relied on in making investment decisions and should not be construed as research or investment advice regarding particular securities. Current and future holdings are subject to risk.
References to indices, benchmarks or other measures of relative market performance over a specified period of time are provided for your information only and do not imply that the portfolio will achieve similar results. The index composition may not reflect the manner in which a portfolio is constructed. While an adviser seeks to design a portfolio which reflects appropriate risk and return features, portfolio characteristics may deviate from those of the benchmark.
The Global Industry Classification Standard (“GICS”) was developed by and is the exclusive property and a service mark of Morgan Stanley Capital International Inc. (“MSCI”) and Standard & Poor’s, a division of The McGraw-Hill Companies, Inc. (“S&P”) and is licensed for use by Goldman Sachs. Neither MSCI, S&P nor any other party involved in making or compiling the GICS or any GICS classifications makes any express or implied warranties or representations with respect to such standard or classification (or the results to be obtained by the use thereof), and all such parties hereby expressly disclaim all warranties of originality, accuracy, completeness, merchantability or fitness for a particular purpose with respect to any of such standard or classification. Without limiting any of the foregoing, in no event shall MSCI, S&P, any of their affiliates or any third party involved in making or compiling the GICS or any GICS classifications have any liability for any direct, indirect, special, punitive, consequential or any other damages (including lost profits) even if notified of the possibility of such damages.
The portfolio risk management process includes an effort to monitor and manage risk, but does not imply low risk.
Diversification does not protect an investor from market risk and does not ensure a profit.
Shares of the Goldman Sachs VIT Funds are offered to separate accounts of participating life insurance companies for the purpose of funding variable annuity contracts and variable life insurance policies. Shares of the Portfolio are not offered directly to the general public. The variable annuity contracts and variable life insurance policies are described in the separate prospectuses issued by participating insurance companies. You should refer to those prospectuses for information about surrender charges, mortality and expense risk fees and other charges that may be assessed by participating insurance companies under the variable annuity contracts or variable life insurance policies. Such fees or charges, if any, may affect the return you may realize with respect to your investments. Ask your representative for more complete information. Please consider a fund’s objectives, risks and charges and expenses, and read the prospectus carefully before investing. The prospectus contains this and other information about the Portfolio.
This material is not authorized for distribution to prospective investors unless preceded or accompanied by a current prospectus or summary prospectus, if applicable. Investors should consider the Portfolio’s objective, risks, and charges and expenses, and read the summary prospectus, if available, and/or the prospectus carefully before investing or sending money. The summary prospectus, if available, and the prospectus contain this and other information about the Portfolio and may be obtained from your authorized dealer or from Goldman Sachs & Co. LLC by calling1-800-621-2550.
This report is prepared for the general information of contract owners and is not an offer of shares of the Goldman Sachs Variable Insurance Trust — Goldman Sachs Multi-Strategy Alternatives Portfolio.
© 2019 Goldman Sachs. All rights reserved.
VITMSAAR-19/157040-OTU-914557/535
Goldman
SachsVariable Insurance Trust
Goldman Sachs Core Fixed Income Fund
Goldman Sachs Equity Index Fund
Goldman Sachs Growth Opportunities Fund
Goldman Sachs High Quality Floating Rate Fund
Annual Report
December 31, 2018

MARKET REVIEW
Goldman Sachs Variable Insurance Trust Funds
Market Review
During the 12 months ended December 31, 2018 (the “Reporting Period”), the performance of the U.S. equity and fixed income markets were influenced most by Federal Reserve (“Fed”) monetary policy, U.S. and global economic data, and geopolitical issues, including the U.S.-China trade dispute.
Equity Markets
U.S. equities saw a strong start to the Reporting Period in January 2018, driven by positive economic data, a $1.5 trillion tax reform law signed in December 2017, and a favorable corporate earnings season. In February 2018, however, U.S. equities sold off on market speculation of a faster pace of Fed short-term interest rate hikes, which stoked a sharp rise in bond yields and an increase in equity market volatility. Concerns about Fed monetary policy tightening were further exacerbated by solid U.S. labor and inflation data. While the hawkish Fed minutes were largely expected, new Fed Chair Jerome Powell’s Congressional testimony, positing a more optimistic economic outlook since the December 2017 Fed meeting, surprised equity markets with its hawkish tilt, sparking another sell-off in the U.S. equity markets. (Jerome Powell assumed the chairmanship of the Fed in February 2018. Hawkish language tends to suggest higher interest rates; opposite of dovish.) In March 2018, escalating trade tensions and potential tariffs weighed on investor sentiment. Meanwhile, the Fed delivered on a widely expected interest rate increase, with its “dot plot” pointing to a total of three interest rate hikes the 2018 calendar year and potentially two in 2019. (The “dot plot” shows rate projections of the members of the Fed’s Open Market Committee.) However, Fed policymakers acknowledged that the “economic outlook has strengthened in recent months,” revising their economic growth forecast higher and their unemployment forecast lower.
By the end of the Reporting Period, the Fed had hiked interest rates four times and communicated an upbeat view of its economic outlook, spurred by strong U.S. labor and inflation data. Against these strong fundamentals, escalating trade tensions, fears of a global economic slowdown and populist politics weighed on investor sentiment throughout the calendar year. After second and third calendar quarters of generally solid gains, supported by a combination of robust economic growth, strong corporate profits and rising earnings estimates, U.S. equities fell sharply again in the fourth quarter of 2018, as investor sentiment rapidly deteriorated on heightened trade and political uncertainty and in a delayed reaction to rising interest rates. The retreat resulted in tighter U.S. financial conditions, which had been resilient to Fed interest rate hikes earlier in the year. U.S. equities saw a reprieve in November 2018 on more accommodative comments from Fed Chair Powell and on encouraging progress toward China-U.S. trade talks. However, the recovery was short-lived, as U.S. equities plunged in December 2018 on renewed investor fears sparked by the arrest of a Chinese technology executive, the partial federal government shutdown and the U.S. President’s criticism of Fed Chair Powell.
For the Reporting Period overall, seven sectors posted negative absolute returns and four generated positive returns. Health care, utilities, consumer discretionary and information technology were the best performing sectors in the S&P 500® Index, as measured by total return. The weakest performing sectors in the S&P 500® Index during the Reporting Period were energy, materials, industrials and financials. (After the close of business on September 28, 2018, the telecommunications services sector was renamed the communication services sector and was broadened to include certain companies from the information technology and consumer discretionary sectors that facilitate communication and offer related content and information through various media.)
Within the U.S. equity market, there was significant disparity in performance not only among sectors but also among the various capitalization and style segments. While all capitalization segments posted negative returns, large-cap stocks, as measured by the Russell 1000® Index, performed best, followed at some distance by mid-cap stocks, as measured by the Russell Midcap® Index, and then small-cap stocks, as measured by the Russell 2000® Index. From a style perspective, growth-oriented stocks significantly outpaced value-oriented stocks across the capitalization spectrum. (All as measured by the FTSE Russell indices.)
Fixed Income Markets
In the first quarter of 2018, spread, or non-government bond, sectors were challenged by a surge in market volatility and “risk-off” sentiment, or reduced risk appetite, amid equity market declines in February and March. Catalysts included firmer than consensus expected U.S. wage and price inflation data at the beginning of February 2018 and rising concerns about trade tensions during March. At their March policy meeting, Fed officials raised short-term interest rates, much as the market had expected, and
1
MARKET REVIEW
continued to point to a total of three interest rate increases in 2018. However, Fed policymakers revised their economic growth forecast higher and their employment forecast lower, given their view of the strengthening U.S. economic outlook.
During the second calendar quarter, spread sectors broadly weakened amid protectionist trade measures and political events in emerging markets countries and Italy as well as higher U.S. interest rates and a stronger U.S. dollar. U.S. high yield corporate bonds, however, generated a small positive return. Rising oil prices were a tailwind for the broader high yield corporate bond sector, as many energy bonds are high yield rated. In June 2018, the Fed raised short-term interest rates and its dot plot pointed to two more rate increases in 2018, implying a total of four rate hikes in the calendar year. U.S. economic growth strengthened, with the Gross Domestic Product expanding at an annualized rate of 4.2% in the second calendar quarter. In contrast, economic growth softened in the Eurozone, Japan and China.
Spread sectors performed well during the third quarter of 2018, as the global economy — led by particularly strong economic growth in the U.S. — expanded. However, some major economies, including those of the Eurozone, the U.K. and China, continued to exhibit a gradual weakening trend. Emerging markets debt broadly posted gains, with strength in July and September 2018 outweighing pronounced August weakness. High yield corporate bonds also advanced, recording their best quarterly performance since the first quarter of 2017. In September 2018, the Fed delivered the eighth interest rate hike of its current tightening cycle, with its dot plot pointing to another increase by calendar year-end and three more during 2019. Fed Chair Powell delivered an upbeat assessment of the U.S. economy, which supported market expectations for these additional Fed rate hikes in 2019. U.S. Treasury rates rose in response, followed, in turn, by the interest rates of other developed markets countries.
During the fourth quarter of 2018, investor concerns about slowing global economic growth momentum as well as tighter financial conditions, mainly in the U.S., weighed on spread sector performance. In particular, U.S. corporate bonds experienced notable weakness, as credit spreads, or yield differentials versus U.S. Treasury securities, widened significantly. U.S. Treasury yields fell as investors grew fearful about the possible end of the global economic cycle and as their expectations for Fed rate hikes diminished. In December 2018, Fed policymakers raised short-term interest rates, much as the market had expected, but lowered their projection for 2019 monetary policy tightening from three rate hikes to two. U.S. economic activity data remained in expansionary territory during the fourth quarter but moderated from cycle highs. Headline inflation pressures eased as crude oil prices declined.
For the Reporting Period overall, spread sectors generally lagged U.S. Treasury securities. Sovereign emerging markets debt, high yield corporate bonds and investment grade corporate bonds underperformed U.S. Treasuries the most, followed at some distance by agency securities, mortgage-backed securities and commercial mortgage-backed securities. Asset-backed securities, the only fixed income market segment to generate a positive return during the Reporting Period, outperformed U.S. Treasuries. The U.S. Treasury yield curve, or spectrum of maturities, flattened during the Reporting Period, as yields on maturities of two years and less rose more than yields on maturities of three years and longer. (A flattening yield curve is one wherein the differential in yields between longer-term and shorter-term maturities narrows.) The yield on the bellwether 10-year U.S. Treasury rose approximately 29 basis points to end the Reporting Period at 2.69%.
Looking Ahead
Equity Markets
At the end of the Reporting Period, we believed the risk/reward balance for equities in 2019 had improved relative to 2018 following the de-rating in valuation multiples, or price/earnings ratios, in the fourth quarter of 2018. We saw continued expansion of global economic growth and corporate profits. We believed U.S. economic growth would likely moderate in 2019, while the slowdown outside of the U.S. may be behind us. In our view, the ongoing global economic expansion should underpin corporate earnings growth, which we expect to remain positive across all global regions in 2019, supporting risk assets, such as equities. Meanwhile, lower valuations provide, in our view, an attractive entry point. Several challenges in 2018 — such as trade tensions and populist politics — resulted in a sharp de-rating. We think the shift in valuations was overdone relative to both macro and corporate fundamentals. Concerns around the length of the current economic cycle, trade tensions and populist politics may well continue, but we believed at the end of the Reporting Period that it was too soon to position for the end of the cycle and markets had already gone too far in pricing in the risks.
2
MARKET REVIEW
As the U.S. economic expansion approaches the longest on record, late-cycle signs, such as a tight labor market, firming inflation, higher volatility and a flatter yield curve, along with fading fiscal support and continued Fed interest rate hikes, have increased focus, we feel, on a possible moderation in U.S. economic growth. However, discussions around peak earnings are premature, in our view, as margins have historically continued to expand until very close to the beginning of recessions.
We believe rising interest rates and cost pressures make pricing power an increasingly critical differentiator of success. Selectivity, in our view, is also increasingly important amid higher volatility, elevated political and trade risks and slowing revenue growth and margin pressures. We believe this divergence between winners and losers reinforces the importance of active management.
Fixed Income Markets
At the end of the Reporting Period, we expected the global economic expansion to continue. However, we think the environment is shifting from one of divergence, with U.S. economic growth strongly outpacing that of many other countries, to one of convergence, wherein the pace of U.S. economic growth moderates as the impact of earlier fiscal stimulus fades. Outside of the U.S., we see stabilization in the economic growth of developed markets countries and expect economic growth in the emerging markets to surprise to the upside. As for China, we expect its economy to benefit from the government’s continued policy support measures.
Regarding U.S. monetary policy, we believe the Fed is likely to hike short-term interest rates twice during 2019, assuming the U.S. labor market remains healthy and inflationary pressures continue to build gradually. That said, at the end of the Reporting Period, the market was pricing in barely one rate increase during 2019. We think markets will continue to underprice the most likely path of interest rate hikes, and we expect to see a continuation of what we saw in 2018 — rapid rises in bond yields interrupted by periods of consolidation during which upward pressures rebuild.
While our overall outlook for 2019 is optimistic, we also saw a number of substantial risks at the end of the Reporting Period, including geopolitics, escalating trade tensions, potential for abrupt increases in bond yields driven by wage inflation, and investor concerns about the end of the current economic cycle. Until we see clearer signs of deterioration in the macro environment, however, we think episodic market declines should provide dynamic investment opportunities.
3
GOLDMAN SACHS VARIABLE INSURANCE TRUST CORE FIXED INCOME FUND
INVESTMENT OBJECTIVE
The Fund seeks a total return consisting of capital appreciation and income that exceeds the total return of the Bloomberg Barclays U.S. Aggregate Bond Index.
Portfolio Management Discussion and Analysis
Below, the Goldman Sachs Fixed Income Portfolio Management Team discusses the Goldman Sachs Variable Insurance Trust — Goldman Sachs Core Fixed Income Fund’s (the “Fund”) performance and positioning for the 12-month period ended December 31, 2018 (the “Reporting Period”).
How did the Fund perform during the Reporting Period?
During the Reporting Period, the Fund’s Institutional and Service Shares generated average annual total returns of –0.58% and –0.83%, respectively. This compares to the 0.01% average annual total return of the Fund’s benchmark, the Bloomberg Barclays U.S. Aggregate Bond Index (the “Bloomberg Barclays Index”), during the same time period.
What key factors were responsible for the Fund’s performance during the Reporting Period?
During the Reporting Period, the Fund’s top-down country strategy detracted from relative performance, driven by a long position in Italy. In addition, a long position in the U.S. versus short positions in the U.K. and Europe hurt results. Within our top-down currency strategy, the Fund was hampered by long positions in the Swedish krona and Australian dollar as well as by its tactical positions overall in the Japanese yen. These losses were partially offset by a short position in the euro and a long position in the Norwegian krone, which contributed positively.
Also detracting from relative returns was the Fund’s top-down cross-sector strategy. In our cross-sector strategy, we invest Fund assets across a variety of fixed income sectors, including some that may not be included in the Bloomberg Barclays Index. On the positive side, our bottom-up individual issue selection added to relative returns.
The Fund’s combined tactical duration and yield curve positioning contributed positively during the Reporting Period. (Duration is a measure of the Fund’s sensitivity to changes in interest rates. Yield curve is a spectrum of interest rates based on maturities of varying lengths.)
Which fixed income market sectors most affected Fund performance during the Reporting Period?
During the Reporting Period, the Fund was hurt by its allocations to corporate credit, collateralized loan obligations and residential mortgage-backed securities. An overweight position compared to the Bloomberg Barclays Index in emerging markets sovereign debt further detracted from relative performance. These losses were offset somewhat by the Fund’s exposure to the government/swaps sector as well as by its underweights in mortgage-backed securities and emerging markets debt broadly, which contributed positively.
As for individual issue selection, the Fund benefited from its holdings in the securitized sector, especially investments in mortgage-backed securities and asset backed securities (“ABS”). Within corporate credit, relative performance was helped by our selection of various maturities along the yield curve and by the Fund’s lower credit quality bias. Selection among Kuwaiti and United Arab Emirates external bonds further added to the Fund’s relative performance.
Did the Fund’s duration and yield curve positioning strategy help or hurt its results during the Reporting Period?
The Fund’s combined duration and yield curve positioning added to performance during the Reporting Period. Compared to the Bloomberg Barclays Index, the Fund held a short duration position because we believed the market was underestimating the pace of Federal Reserve (“Fed”) interest rate hikes.
How did the Fund use derivatives and similar instruments during the Reporting Period?
As market conditions warranted during the Reporting Period, currency transactions were carried out using primarily over-the-counter (“OTC”) forward foreign exchange contracts. Currency transactions were used as we sought both to enhance returns and to hedge the Fund’s portfolio against currency exchange rate fluctuations. OTC forward foreign exchange contracts detracted from Fund performance during the Reporting Period. In addition, futures contracts were employed as warranted to facilitate specific
4
GOLDMAN SACHS VARIABLE INSURANCE TRUST CORE FIXED INCOME FUND
duration, yield curve and country strategies. During the Reporting Period, futures contracts had a negative impact on the Fund’s results. Swaptions (options on interest rate swap contracts), which were used to express our interest rate views and to hedge volatility and yield curve risks in the Fund, did not have a meaningful impact on the Fund’s performance during the Reporting Period. Interest rate swaps, which were used to manage exposure to fluctuations in interest rates, added to the Fund’s performance during the Reporting Period.
Additionally, the Fund employed credit default swaps to implement specific credit-related investment strategies, including management of the Fund’s exposure to credit spreads. Credit default swaps had a negative impact on the Fund’s results during the Reporting Period. Overall, we employ derivatives and similar instruments for the efficient management of the Fund’s portfolio. Derivatives and similar instruments allow us to manage interest rate, credit and currency risks more effectively by allowing us both to hedge and to apply active investment views with greater versatility and to afford greater risk management precision than we would otherwise be able to implement.
Were there any notable changes in the Fund’s weightings during the Reporting Period?
On a contribution to duration basis, we moved the Fund from an underweight position relative to the Bloomberg Barclays Index in investment grade corporate credit to an overweight position during the Reporting Period.
Were there any changes to the Fund’s portfolio management team during the Reporting Period?
There were no changes to the Fund’s portfolio management team during the Reporting Period. However, effective January 1, 2019 after the end of the Reporting Period, Jonathan Beinner no longer served as a portfolio manager for the Fund and Ashish Shah became a portfolio manager for the Fund. As of January 1, 2019, Ashish Shah and Michael Swell are portfolio managers of the Fund.
How was the Fund positioned relative to the Bloomberg Barclays Index at the end of the Reporting Period?
At the end of the Reporting Period, the Fund was overweight ABS and non-agency mortgage-backed securities compared to the Bloomberg Barclays Index on a market-value weighted basis. As measured by contribution to duration, it was overweight in agency mortgage-backed securities and rather neutral in corporate credit. It was underweight emerging markets corporate bonds and overweight emerging markets sovereign bonds on a market-value weighted basis. In addition, the Fund was underweight U.S. government bonds and relatively neutral in quasi-government bonds. It was also rather neutral in commercial mortgage-backed securities on a market-value weighted basis. Finally, the Fund maintained an allocation to collateralized loan obligations, which are not represented in the Bloomberg Barclays Index, at the end of the Reporting Period.
5
FUND BASICS
Core Fixed Income Fund
as of December 31, 2018
STANDARDIZED TOTAL RETURNS1
| | | | | | | | | | | | | | | | | | |
| | | | | |
| For the period ended 12/31/18 | | One Year | | | Five Years | | | Ten Years | | | Since Inception | | | Inception Date |
| Institutional | | | -0.58 | % | | | 2.39 | % | | | N/A | | | | 1.72 | % | | 4/30/13 |
| Service | | | -0.83 | % | | | 2.15 | % | | | 4.41 | % | | | 3.50 | % | | 1/09/06 |
| 1 | The Standardized Total Returns are average annual total returns as of the most recent calendar quarter-end. They assume reinvestment of all distributions at net asset value (“NAV”). Because Institutional and Service Shares do not involve a sales charge, such a charge is not applied to their Standardized Total Returns. |
Total return figures in the above chart represent past performance and do not indicate future results, which will vary. The investment return and principal value of an investment will fluctuate and, therefore, an investor’s shares, when redeemed, may be worth more or less than their original cost. Current performance may be lower or higher than the total return figures in the above chart. Please visit www.GSAMFUNDS.com to obtain the most recent month-end returns.Performance reflects fee waivers and/or expense limitations in effect during the periods shown. In their absence, performance would be reduced.
EXPENSE RATIOS2
| | | | | | | | |
| | |
| | | Net Expense Ratio (Current) | | | Gross Expense Ratio (Before Waivers) | |
| Institutional | | | 0.42 | % | | | 0.65 | % |
| Service | | | 0.67 | | | | 0.90 | |
| 2 | The expense ratios of the Fund, both current (net of any fee waivers and/or expense limitations) and before waivers (gross of any fee waivers and/or expense limitations) are as set forth above according to the most recent publicly available Prospectus for the Fund and may differ from the expense ratios disclosed in the Financial Highlights in this report. Pursuant to a contractual arrangement, the Fund’s fee waivers and/or expense limitations will remain in place through at least April 30, 2019, and prior to such date, the Investment Adviser may not terminate the arrangements without the approval of the Fund’s Board of Trustees. If these arrangements are discontinued in the future, the expense ratios may change without shareholder approval. |
6
FUND BASICS
FUND COMPOSITION3
| 3 | The percentage shown for each investment category reflects the value of investments in that category as a percentage of net assets. Figures in the above graph may not sum to 100% due to the exclusion of other assets and liabilities. Short-Term Investments represent investments in commercial paper. Underlying sector allocations of investment companies held by the Fund are not reflected in the graph above. The graph depicts the Fund’s investments but may not represent the Fund’s market exposure due to the exclusion of certain derivatives, if any, as listed in the Additional Investment Information section of the Schedule of Investments. |
| 4 | “Mortgage-Backed Securities” are guaranteed by the Government National Mortgage Association (“GNMA”), the Federal National Mortgage Association (“FNMA”) or the Federal Home Loan Mortgage Corp. (“FHLMC”). GNMA instruments are backed by the full faith and credit of the United States Government. |
| 5 | “U.S. Government Agency Securities” include agency securities offered by companies such as FNMA and the Federal Home Loan Bank (“FHLB”), which operate under a government charter. While they are required to report to a government regulator, their assets are not explicitly guaranteed by the government and they otherwise operate like any other publicly traded company. |
7
GOLDMAN SACHS VARIABLE INSURANCE TRUST CORE FIXED INCOME FUND
Performance Summary
December 31, 2018
The following graph shows the value, as of December 31, 2018, of a $10,000 investment made on January 1, 2009 in Service Shares. For comparative purposes, the performance of the Fund’s benchmark, the Bloomberg Barclays U.S. Aggregate Bond Index, is shown. This performance data represents past performance and should not be considered indicative of future performance, which will fluctuate with changes in market conditions. These performance fluctuations may cause an investor’s shares, when redeemed, to be worth more or less than their original cost. Performance reflects Fund level expenses, but does not reflect fees and expenses associated with any variable annuity contract or variable life insurance policy that uses the Fund as an investment option for any contract or policy. Had performance reflected all of those fees and expenses, performance would have been reduced. Performance reflects applicable fee waivers and/or expense limitations in effect during the periods shown, and in their absence, performance would be reduced. Performance of Institutional Shares will vary from Service Shares due to differences in class specific fees. In addition to the Investment Adviser’s decisions regarding issuer/industry/country investment selection and allocation, other factors may affect Fund performance. These factors include, but are not limited to, Fund operating fees and expenses, portfolio turnover, and subscription and redemption cash flows affecting the Fund.
Core Fixed Income Fund’s 10 Year Performance
Performance of a $10,000 investment, with distributions reinvested, from January 1, 2009 through December 31, 2018.
| | | | | | | | |
| Average Annual Total Return through December 31, 2018 | | One Year | | Five Years | | Ten Years | | Since Inception |
Institutional (Commenced April 30, 2013) | | -0.58% | | 2.39% | | N/A | | 1.72% |
Service (Commenced January 9, 2006) | | -0.83% | | 2.15% | | 4.41% | | 3.50% |
8
GOLDMAN SACHS VARIABLE INSURANCE TRUST EQUITY INDEX FUND
INVESTMENT OBJECTIVE
The Fund seeks to achieve investment results that correspond to the aggregate price and yield performance of a benchmark index that measures the investment returns of large capitalization stocks.
Portfolio Management Discussion and Analysis
Below, SSgA Funds Management, Inc. (“SSgA”), the Fund’s Subadvisor, discusses the Goldman Sachs Variable Insurance Trust – Goldman Sachs Equity Index Fund’s (the “Fund”) performance and positioning for the 12-month period ended December 31, 2018 (the “Reporting Period”).
How did the Fund perform during the Reporting Period?
During the Reporting Period, the Fund’s Service Shares generated an average annual total return of –4.87%. This compares to the –4.38% average annual total return of the Fund’s benchmark, the Standard & Poor’s 500® Index (with dividends reinvested) (the “S&P 500® Index”), during the same time period.
During the Reporting Period, which sectors and which industries in the S&P 500® Index were the weakest contributors to the Fund’s performance?
Seven of the 11 sectors in the S&P 500® Index recorded declines during the Reporting Period. In terms of total return, the sectors that made the weakest contributions to the S&P 500® Index and to the Fund were energy, materials and industrials. The industries with the weakest performance in terms of total return were pharmaceuticals: other; home furnishings; oilfield services/equipment; automotive aftermarket; and savings banks.
On the basis of impact (which takes both total returns and weightings into account), the sectors that made the weakest contributions to the S&P 500® Index and to the Fund were financials, industrials and energy. The industries with the weakest performance on the basis of impact were major banks, industrial conglomerates, Internet software/services, tobacco and integrated oil.
Which sectors and industries in the S&P 500® Index were the strongest contributors to the Fund’s performance?
In terms of total return, during the Reporting Period, the strongest contributing sectors were health care, utilities and information technology. The largest sector by weighting in the S&P 500® Index at the end of the Reporting Period was information technology at a weighting of 20.10%. The industries with the strongest performance in terms of total return were hospital/nursing management, movies/entertainment, Internet retail, department stores and packaged software.
On the basis of impact, the strongest performing sectors were information technology, health care and consumer discretionary. The strongest performing industries on the basis of impact were packaged software; Internet retail; medical specialties; pharmaceuticals: major; and finance/rental/leasing.
Which individual stocks were the top detractors, and which were the greatest positive contributors?
On the basis of impact, the stocks that made the weakest contribution during the Reporting Period were Facebook, General Electric, AT&T, Exxon Mobil and Philip Morris International. The strongest performers were Microsoft, Amazon.com, Merck, Pfizer and Mastercard.
How did the Fund use derivatives and similar instruments during the Reporting Period?
During the Reporting Period, the Fund did not use derivatives as part of an active management strategy to add value to the Fund’s results. However, equity index futures were used to equitize the Fund’s cash holdings. In other words, we put the Fund’s cash holdings to work by using them as collateral for the purchase of equity index futures. We also used these equity index futures to provide liquidity for daily cash flow requirements. Equity index futures had a neutral impact on the Fund’s performance during the Reporting Period.
Were there any changes to the Fund’s portfolio management team during the Reporting Period?
There were no changes to the Fund’s portfolio management team during the Reporting Period.
What changes were made to the makeup of the S&P 500® Index during the Reporting Period?
Twenty-eight stocks were removed from the S&P 500® Index during the Reporting Period. They were Acuity Brands, Aetna, Andeavor, Apergy, CA, C.R. Bard, Chesapeake Energy, CSRA, Dr. Pepper Snapple Group, Envision Healthcare, EQT, Express
9
GOLDMAN SACHS VARIABLE INSURANCE TRUST EQUITY INDEX FUND
Scripts Holding, Garrett Motion, GGP, Monsanto Company, Navient, nVent Electric, Patterson Companies, Perspecta, Range Resources, Resideo Technologies, Rockwell Collins, Scripps Networks Interactive, Signet Jewelers, Stericycle, Time Warner, Wyndham Worldwide and XL Group.
There were 28 stocks added to the S&P 500® Index during the Reporting Period. They were Abiomed, Apergy, Arista Networks, Broadridge Financial Solutions, Celanese, Copart, Diamondback Energy, FleetCor Technologies, Fortinet, Garrett Motion, Henry Jack & Associates, HollyFrontier, Huntington Ingalls Industries, IPG Photonics, Keysight Technologies, Lamb Weston Holdings, Maxim Integrated Products, MSCI, Nektar Therapeutics, nVent Electric, Perspecta, Resideo Technologies, Rollins, Take-Two Interactive Software, Twitter, SVB Financial Group, Wellcare Health Plans and Westar Energy.
The source of the data included in the above Portfolio Management Discussion and Analysis with respect to the Goldman Sachs Equity Index Fund is FactSet as of 12/31/18.
Characteristics presented are calculated using the month end market value of holdings, except for beta and standard deviation, if shown, which use month end return values. Averages reflect the market weight of securities in the portfolio. Market data, prices, and dividend estimates for characteristics calculations provided by FactSet Research Systems, Inc. All other portfolio data provided by SSgA. Characteristics are as of the date indicated, are subject to change, and should not be relied upon as current thereafter.
Past performance is not a guarantee of future results.
Index returns are unmanaged and do not reflect the deduction of any fees or expenses. Index returns reflect all items of income, gain and loss and the reinvestment of dividends and other income.
SSgA may have or may seek investment management or other business relationships with companies discussed in this material or affiliates of those companies, such as their officers, directors and pension plans.
The views expressed in this material are the views of SSgA’s Global Equity Beta Solutions Team through the period ended December 31, 2018 and are subject to change based on market and other conditions. All information has been obtained from sources believed to be reliable, but its accuracy is not guaranteed. There is no representation or warranty as to the current accuracy, reliability or completeness of, nor liability for, decisions based on such information and it should not be relied on as such. This document contains certain statements that may be deemed forward-looking statements. Please note that any such statements are not guarantees of any future performance and actual results or developments may differ materially from those projected.
10
FUND BASICS
Equity Index Fund
as of December 31, 2018
STANDARDIZED TOTAL RETURNS1
| | | | | | | | | | | | | | | | | | |
| | | | | |
| For the period ended 12/31/18 | | One Year | | | Five Years | | | Ten Years | | | Since Inception | | | Inception Date |
| Service | | | -4.87 | % | | | 8.00 | % | | | 12.69 | % | | | 7.14 | % | | 1/09/06 |
| 1 | The Standardized Total Returns are average annual total returns as of the most recent calendar quarter-end. They assume reinvestment of all distributions at net asset value (“NAV”). Because Service Shares do not involve a sales charge, such a charge is not applied to their Standardized Total Returns. |
Total return figures in the above chart represent past performance and do not indicate future results, which will vary. The investment return and principal value of an investment will fluctuate and, therefore, an investor’s shares, when redeemed, may be worth more or less than their original cost. Current performance may be lower or higher than the total return figures in the above chart. Please visit www.GSAMFUNDS.com to obtain the most recent month-end returns.Performance reflects fee waivers and/or expense limitations in effect during the periods shown. In their absence, performance would be reduced.
EXPENSE RATIOS2
| | | | | | | | |
| | |
| | | Net Expense Ratio (Current) | | | Gross Expense Ratio (Before Waivers) | |
| Service | | | 0.48 | % | | | 0.71 | % |
| 2 | The expense ratios of the Fund, both current (net of any fee waivers and/or expense limitations) and before waivers (gross of any fee waivers and/or expense limitations) are as set forth above according to the most recent publicly available Prospectus for the Fund and may differ from the expense ratios disclosed in the Financial Highlights in this report. Pursuant to a contractual arrangement, the Fund’s fee waivers and/or expense limitations will remain in place through at least April 30, 2019, and prior to such date, the Investment Adviser may not terminate the arrangements without the approval of the Fund’s Board of Trustees. If these arrangements are discontinued in the future, the expense ratios may change without shareholder approval. |
TOP TEN HOLDINGS AS OF 12/31/183
| | | | | | |
| | |
| Holding | | % of Net Assets | | | Line of Business |
| Microsoft Corp. | | | 3.7% | | | Software & Services |
| Apple, Inc. | | | 3.4 | | | Technology Hardware & Equipment |
| Amazon.com, Inc. | | | 2.9 | | | Retailing |
| Berkshire Hathaway, Inc. Class B | | | 1.9 | | | Diversified Financials |
| Johnson & Johnson | | | 1.6 | | | Pharmaceuticals, Biotechnology & Life Sciences |
| JPMorgan Chase & Co. | | | 1.5 | | | Banks |
| Alphabet, Inc. Class C | | | 1.5 | | | Media & Entertainment |
| Facebook, Inc. Class A | | | 1.5 | | | Media & Entertainment |
| Alphabet, Inc. Class A | | | 1.5 | | | Media & Entertainment |
| Exxon Mobil Corp. | | | 1.4 | | | Energy |
3 The top 10 holdings may not be representative of the Fund’s future investments.
11
FUND BASICS
FUND VS. BENCHMARK SECTOR ALLOCATIONS4
As of December 31, 2018
| 4 | The graph categorizes investments using Global Industry Classification Standard (“GICS”); however, the sector classifications used by the portfolio management team may differ from GICS. The percentage shown for each investment category reflects the value of investments in that category as a percentage of market value (excluding short-term investments, if any). The graph depicts the Fund’s investments but may not represent the Fund’s market exposure due to the exclusion of certain derivatives, if any, as listed in the Additional Investment Information section of the Schedule of Investments. |
12
GOLDMAN SACHS VARIABLE INSURANCE TRUST EQUITY INDEX FUND
Performance Summary
December 31, 2018
The following graph shows the value, as of December 31, 2018, of a $10,000 investment made in the Fund on January 1, 2009. For comparative purposes, the performance of the Fund’s benchmark, the S&P 500 Index (with distributions reinvested), is shown. This performance data represents past performance and should not be considered indicative of future performance, which will fluctuate with changes in market conditions. These performance fluctuations may cause an investor’s shares, when redeemed, to be worth more or less than their original cost. Performance reflects Fund level expenses, but does not reflect fees and expenses associated with any variable annuity contract or variable life insurance policy that uses the Fund as an investment option for any contract or policy. Had performance reflected all of those fees and expenses, performance would have been reduced. Performance reflects applicable fee waivers and/or expense limitations in effect during the periods shown, and in their absence, performance would be reduced. In addition to the Investment Adviser’s decisions regarding issuer/industry investment selection and allocation, other factors may affect Fund performance. These factors include, but are not limited to, Fund operating fees and expenses, portfolio turnover, and subscription and redemption cash flows affecting the Fund.
Equity Index Fund’s 10 Year Performance
Performance of a $10,000 investment, with distributions reinvested, from January 1, 2009 through December 31, 2018.
| | | | | | | | |
| Average Annual Total Return through December 31, 2018 | | One Year | | Five Years | | Ten Years | | Since Inception |
Equity Index Fund (Commenced January 9, 2006) | | -4.87% | | 8.00% | | 12.69% | | 7.14% |
13
GOLDMAN SACHS VARIABLE INSURANCE TRUST GROWTH OPPORTUNITIES FUND
INVESTMENT OBJECTIVE
The Fund seeks long-term growth of capital.
Portfolio Management Discussion and Analysis
Below, the Goldman Sachs Growth Investment Team discusses the Goldman Sachs Variable Insurance Trust—Goldman Sachs Growth Opportunities Fund’s (the “Fund”) performance and positioning for the 12-month period ended December 31, 2018 (the “Reporting Period”).
How did the Fund perform during the Reporting Period?
During the Reporting Period, the Fund’s Institutional and Service Shares generated average annual total returns of –4.17% and –4.34%, respectively. These returns compare to the –4.75% average annual total return of the Fund’s benchmark, the Russell Midcap® Growth Index (with dividends reinvested) (the “Russell Index”), during the same time period.
What key factors were responsible for the Fund’s performance during the Reporting Period?
The Fund outperformed the Russell Index during the Reporting Period largely because of its sector positioning, which was the direct result of security selection.
Which equity market sectors helped and hurt Fund performance?
Our bottom-up approach focuses on security selection, and therefore, we do not make active sector-level investment decisions. That said, on a sector level, stock selection in the information technology sector contributed most positively to the Fund’s performance. The Fund also benefited from an underweight position compared to the Russell Index in the materials sector and from an overweight position in the consumer staples sector. Conversely, the Fund was hampered by stock selection in the industrials, consumer discretionary and energy sectors during the Reporting Period.
Which individual stocks added to the Fund’s relative performance during the Reporting Period?
During the Reporting Period, the Fund benefited most relative to the Russell Index from its positions in Illumina, McCormick & Company (“McCormick”) and Intuit.
Illumina was the top contributor to the Fund’s relative returns. During the first half of the Reporting Period, the biotechnology company’s shares rose steadily on the heels of multiple quarters in which earnings per share exceeded market expectations. The strong results were driven by the outperformance of NovaSeq, Illumina’s genetic sequencing platform. At the end of July 2018, its stock price spiked following another earnings release in which the company reported both earnings per share and revenues well ahead of consensus estimates. Sustained strength in the NovaSeq product line was a primary driver of performance. At the end of the Reporting Period, we continued to believe the company’s growth was at an inflection point, as NovaSeq, which we think is more cost- and time-effective for customers than competing products, is still in its early stages. In our view, the company was well positioned as a leader in its industry to capitalize on the NovaSeq product cycle, with the added benefit of strong and increasing secular demand for genetic sequencing.
McCormick, a spice manufacturer, marketer and distributor, also added to the Fund’s relative performance during the Reporting Period. We initiated the position in April 2018, and at the end of June, the company announced positive earnings that beat market expectations, which caused its stock to jump. Its shares continued to trend upward through the rest of the Reporting Period, in tandem with the consumer staples sector broadly, as investors fled to more defensive stocks amid increased market volatility. At the end of the Reporting Period, we continued to believe McCormick is a high quality company in an operating category that is relatively insulated from some of the pressures, such as cost and freight inflation, faced by other consumer-related companies. We were also positive on McCormick’s July 2018 acquisition of Reckitt Benckiser Group, as integration efforts have tracked better than the market expected. Overall, we felt McCormick had an attractive risk/reward profile within more challenged consumer-oriented sectors.
Intuit, a financial, accounting and tax preparation software maker, was another notable contributor during the Reporting Period. At the end of April 2018, following the 2017 tax filing season, the company pre-announced positive numbers that included continued market share gains. It also raised its full-year consumer tax guidance. Its stock price climbed higher in May 2018 on stronger than market expected earnings and revenues as well as on raised earning guidance. The company’s management attributed the positive
14
GOLDMAN SACHS VARIABLE INSURANCE TRUST GROWTH OPPORTUNITIES FUND
results to a market shift toward digital offerings, highlighted by Turbo Tax Live, additional services growth and strong pricing. In our view, Turbo Tax Live has the potential to unlock the underpenetrated tax professional market. In August 2018, the company again announced earnings per share that beat market expectations, and its stock continued to climb. Overall, at the end of the Reporting Period, we remained positive on Intuit’s ability to gain market share in the do-it-yourself tax space and considered its deep product line and growing customer base indicators of further potential growth. Intuit is a high quality franchise, in our opinion, with a healthy system of offerings that may benefit from the improving environment for small businesses.
Which individual stocks detracted from the Fund’s performance during the Reporting Period?
Middleby, Concho Resources and PVH detracted most from the Fund’s relative returns during the Reporting Period.
The Fund’s top detractor was Middleby, which designs, manufactures and distributes kitchen equipment around the world. Its stock price declined sharply in May 2018 following a disappointing earnings release. The company reported continued organic growth weakness and higher than market expected operating expenses related to recent acquisitions. In the wake of this announcement, our confidence in Middleby’s ability to execute eroded, and we decided to exit the Fund’s position in its stock.
Another key detractor was Concho Resources, which engages in the acquisition, development and exploration of oil and natural gas properties. Its shares were pressured by the drop in crude oil prices during the fourth quarter of 2018 as the equity market broadly declined. Despite the volatility in crude oil prices, we remained confident at the end of the Reporting Period in Concho Resources’ ability to operate efficiently and in its prime acreage in the Permian Basin of West Texas. We were also positive on the company’s acquisition of RSP Permian, completed in July 2018, which we believe strengthens Concho Resources’ position in the Permian Basin while also providing an attractive opportunity to unlock cost synergies.
The Fund was further hampered during the Reporting Period by an investment in PVH, a clothing company that owns brands such as Van Heusen, Tommy Hilfiger, Calvin Klein, IZOD, Arrow, Warner’s, Olga, True & Co. and Geoffrey Beene. In August 2018, the company announced solid quarterly results, with earnings per share coming in better than market expectations. At the same time, its management raised its full year guidance. Despite the strength in earnings, however, gross margins were weaker than consensus anticipated, and its management pointed to continued margin headwinds in the second half of the year, which caused its stock price to fall. Its shares continued to decline at the end of the 2018 calendar year along with the equity market as a whole. Even with potential margin pressures, we remained positive on PVH at the end of the Reporting Period given its geographic diversity and global growth potential. We also believed the company was well-positioned given its recognizable brand names, strong balance sheet and good free cash flow generation.
Did the Fund make any significant purchases or sales during the Reporting Period?
Among the positions initiated by the Fund during the Reporting Period was an investment in Dollar General. We view the off-price retailer favorably, as it has shown an ability to consistently grow sales, with its very low ticket averages (the average prices charged to customers) and frequent visits overall by customers, which we believe leaves Dollar General relatively insulated frome-commerce pressures. We also believe the company’s business model is positioned to benefit in a healthy market environment and to mitigate challenges in an economic downturn. Overall, we feel Dollar General is a high quality growth company that was trading at an attractive valuation at the time of purchase given its risk/reward profile.
The Fund also established a position in Teleflex, which provides medical technology products that enable health care providers to improve patient outcomes and enhance patient and provider safety. We are positive about the company given that medical purchasing trends overall have continued to shift toward improving patient outcomes and reducing hospital stays. In our view, Teleflex’s deep product pipeline positions it well for growth, as it continues to invest in key diseases and markets. We consider Teleflex a high quality growth company with strong cash flows and the opportunity to expand margins as it works to benefit from these secular growth themes.
In addition to the sale of Middle by, already mentioned, the Fund exited its position in Lam Research, a supplier of wafer fabrication equipment and services to the semiconductor industry. The stock had experienced several years of outperformance, driven by a strong equipment upgrade cycle. However, we believe that, with the slowing of Moore’s Law, companies may use their existing semiconductor equipment longer. (Moore’s Law is the observation that the number of transistors in a dense integrated circuit doubles about every two years.) In our view, this secular shift creates a less favorable outlook for Lam Research and its peers, leading us to sell the Fund’s position and seek opportunities elsewhere.
15
GOLDMAN SACHS VARIABLE INSURANCE TRUST GROWTH OPPORTUNITIES FUND
Were there any notable changes in the Fund’s weightings during the Reporting Period?
Changes to the Fund’s sector weightings relative to the Russell Index are due to our stock selection. As a result of these decisions during the Reporting Period, the Fund shifted from an overweight position in the financials sector to a rather neutral position versus the Russell Index. It also moved from a neutral position in the industrials sector to an underweight position.
How did the Fund use derivatives and similar instruments during the Reporting Period?
The Fund did not use derivatives or similar instruments within its investment process during the Reporting Period.
Were there any changes to the Fund’s portfolio management team during the Reporting Period?
Effective January 9, 2018, Goldman Sachs Asset Management, L.P. (the “Investment Adviser”) centralized its Fundamental Equity U.S. Growth and Fundamental Equity U.S. Value Teams into a single Fundamental Equity U.S. Equity Team. The Investment Adviser believes these changes will benefit the Fund by providing a more holistic investment perspective and the ability to leverage investment ideas across the U.S. Fundamental Equity platform. No changes were made to the Fund’s portfolio management team in connection with this new structure. Effective October 23, 2018, Ashley R. Woodruff no longer served as a portfolio manager of the Fund. At that time, Steven M. Barry, who has managed the Fund since its inception two decades ago, became the sole portfolio manager of the Fund.
How was the Fund positioned relative to the Russell Index at the end of the Reporting Period?
As mentioned, the Fund’s sector positioning relative to the Russell Index is the result of our stock selection, as we take a pure bottom-up, research-intensive approach to investing. From that perspective, then, at the end of the Reporting Period, the Fund’s portfolio was broadly diversified with overweight positions compared to the Russell Index in the health care and consumer staples sectors. The Fund had smaller weightings than the Russell Index in the industrials, information technology, consumer discretionary and communication services sectors. At the end of the Reporting Period, the Fund was relatively neutral compared to the Russell Index in the energy, real estate, financials and materials sectors.
16
FUND BASICS
Growth Opportunities Fund
as of December 31, 2018
STANDARDIZED TOTAL RETURNS1
| | | | | | | | | | | | | | | | | | |
| | | | | |
| For the period ended 12/31/18 | | One Year | | | Five Years | | | Ten Years | | | Since Inception | | | Inception Date |
| Institutional | | | -4.17 | % | | | 5.51 | % | | | N/A | | | | 8.22 | % | | 4/30/13 |
| Service | | | -4.34 | % | | | 5.33 | % | | | 14.04 | % | | | 7.93 | % | | 1/09/06 |
| 1 | The Standardized Total Returns are average annual total returns as of the most recent calendar quarter-end. They assume reinvestment of all distributions at net asset value (“NAV”). Because Institutional and Service Shares do not involve a sales charge, such a charge is not applied to their Standardized Total Returns. |
Total return figures in the above chart represent past performance and do not indicate future results, which will vary. The investment return and principal value of an investment will fluctuate and, therefore, an investor’s shares, when redeemed, may be worth more or less than their original cost. Current performance may be lower or higher than the total return figures in the above chart. Please visit www.GSAMFUNDS.com to obtain the most recent month-end returns.Performance reflects fee waivers and/or expense limitations in effect during the periods shown. In their absence, performance would be reduced.
EXPENSE RATIOS2
| | | | | | | | |
| | |
| | | Net Expense Ratio (Current) | | | Gross Expense Ratio (Before Waivers) | |
| Institutional | | | 0.85 | % | | | 1.01 | % |
| Service | | | 1.01 | | | | 1.26 | |
| 2 | The expense ratios of the Fund, both current (net of any fee waivers and/or expense limitations) and before waivers (gross of any fee waivers and/or expense limitations) are as set forth above according to the most recent publicly available Prospectus for the Fund and may differ from the expense ratios disclosed in the Financial Highlights in this report. Pursuant to a contractual arrangement, the Fund’s fee waivers and/or expense limitations will remain in place through at least April 30, 2019, and prior to such date, the Investment Adviser may not terminate the arrangements without the approval of the Fund’s Board of Trustees. If these arrangements are discontinued in the future, the expense ratios may change without shareholder approval. |
TOP TEN HOLDINGS AS OF 12/31/183
| | | | | | |
| | |
Holding | | % of Net Assets | | | Line of Business |
Dollar General Corp. | | | 2.7% | | | Retailing |
Amphenol Corp. Class A | | | 2.5 | | | Technology Hardware & Equipment |
Global Payments, Inc. | | | 2.2 | | | Software & Services |
Fiserv, Inc. | | | 2.2 | | | Software & Services |
IDEXX Laboratories, Inc. | | | 2.0 | | | Health Care Equipment & Services |
GoDaddy, Inc. Class A | | | 2.0 | | | Software & Services |
Total System Services, Inc. | | | 1.9 | | | Software & Services |
Agilent Technologies, Inc. | | | 1.9 | | | Pharmaceuticals, Biotechnology & Life Sciences |
Teleflex, Inc. | | | 1.8 | | | Health Care Equipment & Services |
Ross Stores, Inc. | | | 1.8 | | | Retailing |
| 3 | The top 10 holdings may not be representative of the Fund’s future investments. |
17
FUND BASICS
FUND VS. BENCHMARK SECTOR ALLOCATIONS4
As of December 31, 2018
| 4 | The Fund is actively managed and, as such, its composition may differ over time. Consequently, the Fund’s overall sector allocations may differ from percentages contained in the graph above. The graph categorizes investments using Global Industry Classification Standard (“GICS”); however, the sector classifications used by the portfolio management team may differ from GICS. The percentage shown for each investment category reflects the value of investments in that category as a percentage of market value (excluding investments in the securities lending reinvestment vehicle, if any). Underlying sector allocations of exchange traded funds and investment companies held by the Fund are not reflected in the graph above. Investments in the securities lending reinvestment vehicle represented 0.3% of the Fund’s net assets at December 31, 2018. |
18
GOLDMAN SACHS VARIABLE INSURANCE TRUST GROWTH OPPORTUNITIES FUND
Performance Summary
December 31, 2018
The following graph shows the value, as of December 31, 2018, of a $10,000 investment made on January 1, 2009 in Service Shares. For comparative purposes, the performance of the Fund’s benchmark, the Russell Midcap Growth Index (with distributions reinvested), is shown. This performance data represents past performance and should not be considered indicative of future performance which will fluctuate with changes in market conditions. These performance fluctuations may cause an investor’s shares, when redeemed, to be worth more or less than their original cost. Performance reflects Fund level expenses, but does not reflect fees and expenses associated with any variable annuity contract or variable life insurance policy that uses the Fund as an investment option for any contract or policy. Had performance reflected all of those fees and expenses, performance would have been reduced. Performance reflects applicable fee waivers and/or expense limitations in effect during the periods shown, and in their absence, performance would be reduced. Performance of Institutional Shares will vary from Service Shares due to differences in class specific fees. In addition to the Investment Adviser’s decisions regarding issuer/industry investment selection and allocation, other factors may affect Fund performance. These factors include, but are not limited to, Fund operating fees and expenses, portfolio turnover, and subscription and redemption cash flows affecting the Fund.
Growth Opportunities Fund’s 10 Year Performance
Performance of a $10,000 investment, with distributions reinvested, from January 1, 2009 through December 31, 2018.
| | | | | | | | |
| Average Annual Total Return through December 31, 2018 | | One Year | | Five Years | | Ten Years | | Since Inception |
Institutional (Commenced April 30, 2013) | | -4.17% | | 5.51% | | N/A | | 8.22% |
Service (Commenced January 9, 2006) | | -4.34% | | 5.33% | | 14.04% | | 7.93% |
19
GOLDMAN SACHS VARIABLE INSURANCE TRUST HIGH QUALITY FLOATING RATE FUND
INVESTMENT OBJECTIVE
The Fund seeks to provide a high level of current income, consistent with low volatility of principal.
Portfolio Management Discussion and Analysis
Below, the Goldman Sachs Fixed Income Portfolio Management Team discusses the Goldman Sachs High Quality Floating Rate Fund’s (the “Fund”) performance and positioning for the12-month period ended December 31, 2018 (the “Reporting Period”).
How did the Fund perform during the Reporting Period?
During the Reporting Period, the Fund’s Institutional, Service and Advisor Shares generated average annual total returns of 1.75%, 1.50% and 1.37%, respectively. These returns compare to the 1.87% average annual total return of the Fund’s benchmark, the ICE® BofAML® Three-Month U.S. Treasury Bill Index (the “ICE® BofAML® Index”), during the Reporting Period.
We note that the Fund’s benchmark being the ICE® BofAML® Index is a means of emphasizing that the Fund has an unconstrained strategy. That said, this Fund employs a benchmark agnostic strategy and thus comparisons to a benchmark index are not particularly relevant.
What key factors had the greatest impact on the Fund’s performance during the Reporting Period?
During the Reporting Period, our individual issue selection added most to the Fund’s relative returns. Ourtop-down cross-sector strategy also contributed positively. In our cross-sector strategy, we invest Fund assets based on a discipline of valuing each fixed income sector in the context of all investment opportunities within the Fund’s universe.
Conversely, the Fund’s combined tactical duration and yield curve positioning detracted from results. Duration is a measure of the Fund’s sensitivity to changes in interest rates. Yield curve is a spectrum of interest rates based on maturities of varying lengths.
Which fixed income market sectors helped or hurt Fund performance during the Reporting Period?
Individual issue selection bolstered the Fund’s relative performance during the Reporting Period. In particular, the Fund benefited from selection within the securitized sector, led by investments in shorter-duration collateralized mortgage obligations and Federal Family Education Loan Program (“FFELP”) asset backed securities (“ABS”). FFELP ABS are backed by loans that are at least 97% guaranteed by the U.S. Department of Education, and they are also an attractive source of short spread duration, in our view. (Spread duration is the sensitivity of the price of a bond to a 100 basis point change to its option-adjusted spread. A basis point is 1/100th of a percentage point. The option adjusted spread is a measurement tool for evaluating price differences between similar products with different embedded options.) Within the government/swaps sector, individual issue selection of U.S. government securities detracted from relative returns.
Our cross-sector strategy also contributed positively to relative performance. Compared to the ICE® BofAML® Index, the Fund’s overweight in ABS added to returns, as the ABS sector’s increased yield from carry performed strongly in spite of widening spreads, or yield differentials versus bonds of comparable maturity. (Carry is essentially the return an investor might expect on an investment if nothing happens to the price of the assets.) In addition, Federal Reserve (“Fed”) interest rate hikes led floating rate ABS to outperform fixed rate ABS during the Reporting Period. On the negative side, the Fund was hurt by its overweight in agency mortgage-backed securities, as their spreads widened due to the Fed’s balance sheet normalization process. (Balance sheet normalization refers to the steps the Fed is taking, which includes fewer purchases of agency mortgage-backed securities, to reverse quantitative easing and remove the substantial monetary accommodation it has provided to the economy since the financial crisis began in 2007.)
Did the Fund’s duration and yield curve positioning strategy help or hurt its results during the Reporting Period?
The Fund’s combined tactical duration and yield curve positioning detracted from performance. More specifically, the Fund was hurt by its exposure to specific segments of the U.S. Treasury yield curve during the Reporting Period. In our view, the market was underpricing the pace of Fed monetary policy tightening. At the end of the Reporting Period, the market did not expect the Fed to raise short-term interest rates in 2019, while we anticipate one or two rate increases.
20
GOLDMAN SACHS VARIABLE INSURANCE TRUST HIGH QUALITY FLOATING RATE FUND
Were there any notable changes in the Fund’s weightings during the Reporting Period?
During the Reporting Period, we reduced the Fund’s exposure to ABS. That said, within ABS, we continued to favor high quality floating rate securitized credit, especially FFELP student loan ABS, which tend to benefit from strong U.S. government support and limited supply pressures, in our view. Additionally, we decreased the Fund’s exposure to agency mortgage-backed securities during the Reporting Period. As mentioned previously, the Fed has been buying fewer agency mortgage-backed securities as part of its balance sheet normalization process, which has been a headwind for the sector.
How did the Fund use derivatives and similar instruments during the Reporting Period?
As market conditions warranted, the Fund used Treasury futures and Eurodollar futures to hedge interest rate exposure and to facilitate duration management. (Eurodollar futures are contracts that have underlying assets linked to time deposits denominated in U.S. dollars at banks outside the U.S.) During the Reporting Period, the use of futures overall did not have a material impact on performance. The Fund also employed interest rate swaps to manage interest risk, which did not have a meaningful impact on performance during the Reporting Period.
Were there any changes to the Fund’s portfolio management team during the Reporting Period?
There were no changes to the Fund’s portfolio management team during the Reporting Period.
How was the Fund positioned relative to the ICE® BofAML® Index at the end of the Reporting Period?
At the end of the Reporting Period, the Fund had little exposure to U.S. government securities, which represent 100% of the ICE® BofAML® Index. The Fund had positions in ABS, agency collateralized mortgage obligations, residential mortgage-backed securities and agency mortgage-backed securities, none of which are represented in the ICE® BofAML® Index.
21
FUND BASICS
High Quality Floating Rate Fund
as of December 31, 2018
STANDARDIZED TOTAL RETURNS1
| | | | | | | | | | | | | | | | | | |
| | | | | |
| For the period ended 12/31/18 | | One Year | | | Five Years | | | Ten Years | | | Since Inception | | | Inception Date |
| Institutional | | | 1.75 | % | | | 0.94 | % | | | N/A | | | | 0.92 | % | | 4/30/13 |
| Service | | | 1.50 | | | | 0.69 | | | | 2.43 | % | | | 2.97 | | | 1/09/06 |
| Advisor | | | 1.37 | | | | N/A | | | | N/A | | | | 0.69 | | | 10/15/14 |
| 1 | The Standardized Total Returns are average annual total returns as of the most recent calendar quarter-end. They assume reinvestment of all distributions at net asset value (“NAV”). Because Institutional, Service and Advisor Shares do not involve a sales charge, such a charge is not applied to their Standardized Total Returns. |
Total return figures in the above chart represent past performance and do not indicate future results, which will vary. The investment return and principal value of an investment will fluctuate and, therefore, an investor’s shares, when redeemed, may be worth more or less than their original cost. Current performance may be lower or higher than the total return figures in the above chart. Please visit www.GSAMFUNDS.com to obtain the most recent month-end returns.Performance reflects fee waivers and/or expense limitations in effect during the periods shown. In their absence, performance would be reduced.
EXPENSE RATIOS2
| | | | | | | | |
| | |
| | | Net Expense Ratio (Current) | | | Gross Expense Ratio (Before Waivers) | |
| Institutional | | | 0.36 | % | | | 0.63 | % |
| Service | | | 0.61 | | | | 0.88 | |
| Advisor | | | 0.76 | | | | 1.03 | |
| 2 | The expense ratios of the Fund, both current (net of any fee waivers and/or expense limitations) and before waivers (gross of any fee waivers and/or expense limitations) are as set forth above according to the most recent publicly available Prospectus for the Fund and may differ from the expense ratios disclosed in the Financial Highlights in this report. Pursuant to a contractual arrangement, the Fund’s fee waivers and/or expense limitations will remain in place through at least April 30, 2019, and prior to such date, the Investment Adviser may not terminate the arrangements without the approval of the Fund’s Board of Trustees. If these arrangements are discontinued in the future, the expense ratios may change without shareholder approval. |
22
FUND BASICS
FUND COMPOSITION3
| 3 | The percentage shown for each investment category reflects the value of investments in that category as a percentage of net assets. Figures in the above graph may not sum to 100% due to the exclusion of other assets and liabilities. Short-Term Investments represent investments in commercial paper. Underlying sector allocations of investment companies held by the Fund are not reflected in the graph above. The graph depicts the Fund’s investments but may not represent the Fund’s market exposure due to the exclusion of certain derivatives, if any, as listed in the Additional Investment Information section of the Schedule of Investments. |
| 4 | Mortgage-backed securities guaranteed by the Government National Mortgage Association (“GNMA”), the Federal National Mortgage Association (“FNMA”) or the Federal Home Loan Mortgage Corp. (“FHLMC”). GNMA instruments are backed by the full faith and credit of the United States Government. |
| 5 | “U.S. Government Agency Security” include agency securities offered by companies such as FNMA and the Federal Home Loan Bank (“FHLB”), which operate under a government charter. While they are required to report to a government regulator, their assets are not explicitly guaranteed by the government and they otherwise operate like any other publicly traded company. |
23
GOLDMAN SACHS VARIABLE INSURANCE TRUST HIGH QUALITY FLOATING RATE FUND
Performance Summary
December 31, 2018
The following graph shows the value, as of December 31, 2018, of a $10,000 investment made on January 1, 2009 in Service Shares. For comparative purposes, the performance of the Fund’s benchmark, the ICE BofAML® Three-Month U.S. Treasury Bill Index, is shown. This performance data represents past performance and should not be considered indicative of future performance, which will fluctuate with changes in market conditions. These performance fluctuations may cause an investor’s shares, when redeemed, to be worth more or less than their original cost. Performance reflects Fund level expenses, but does not reflect fees and expenses associated with any variable annuity contract or variable life insurance policy that uses the Fund as an investment option for any contract or policy. Had performance reflected all of those fees and expenses, performance would have been reduced. Performance reflects applicable fee waivers and/or expense limitations in effect during the periods shown, and in their absence, performance would be reduced. Performance of Institutional and Advisor Shares will vary from Service Shares due to differences in class specific fees. In addition to the Investment Adviser’s decisions regarding issuer/industry investment selection and allocation, other factors may affect Fund performance. These factors include, but are not limited to, Fund operating fees and expenses, portfolio turnover, and subscription and redemption cash flows affecting the Fund.
High Quality Floating Rate Fund’s 10 Year Performance
Performance of a $10,000 investment, with distributions reinvested, from January 1, 2009 through December 31, 2018.
| | | | | | | | |
| Average Annual Total Return through December 31, 2018 | | One Year | | Five Years | | Ten Years | | Since Inception |
Institutional (Commenced April 30, 2013) | | 1.75% | | 0.94% | | N/A | | 0.92% |
Service (Commenced January 9, 2006) | | 1.50% | | 0.69% | | 2.43% | | 2.97% |
Advisor (Commenced October 15, 2014) | | 1.37% | | N/A | | N/A | | 0.69% |
24
GOLDMAN SACHS VARIABLE INSURANCE TRUST FUNDS
Index Definitions
Bloomberg Barclays U.S. Aggregate Bond Index represents an unmanaged diversified portfolio of fixed income securities, including U.S. Treasuries, investment-grade corporate bonds and mortgage-backed and asset-backed securities.
ICE® BofAML® Three-Month U.S. Treasury Bill Index measures total return on cash, including price and interest income, based on short-term government Treasury Bills of about 90-day maturity, as reported by Bank of America Merrill Lynch.
Russell Midcap® Growth Index is an unmanaged index that measures the performance of those companies in the Russell Midcap® Index with higher price-to-book ratios and higher forecasted growth values.
Russell Midcap® Index measures the performance of themid-cap segment of the U.S. equity universe. The Russell Midcap® Index is a subset of the Russell 1000®Index. The Russell Midcap® Index includes approximately 800 of the smallest securities based on a combination of their market cap and current index membership. The Russell Midcap® Index represents approximately 31% of the total market capitalization of the Russell 1000® Index companies. The Russell Midcap® Index is constructed to provide a comprehensive and unbiased barometer for themid-cap segment. The Russell Midcap® Index is completely reconstituted annually to ensure larger stocks do not distort the performance and characteristics of the truemid-cap opportunity set.
Russell 1000® Index measures the performance of thelarge-cap segment of the U.S. equity universe. The Russell 1000® Index is a subset of the Russell 3000® Index and includes approximately 1000 of the largest securities based on a combination of their market cap and current index membership. The Russell 1000® Index represents approximately 92% of the U.S. market. The Russell 1000® Index is constructed to provide a comprehensive and unbiased barometer for thelarge-cap segment and is completely reconstituted annually to ensure new and growing equities are reflected.
Russell 2000® Index measures the performance of thesmall-cap segment of the U.S. equity universe. The Russell 2000®Index is a subset of the Russell 3000® Index representing approximately 10% of the total market capitalization of that index. The Russell 2000® Index includes approximately 2000 of the smallest securities based on a combination of their market cap and current index membership. The Russell 2000® Index is constructed to provide a comprehensive and unbiasedsmall-cap barometer and is completely reconstituted annually to ensure larger stocks do not distort the performance and characteristics of the truesmall-cap opportunity set.
It is not possible to invest directly in an unmanaged index.
25
GOLDMAN SACHS VARIABLE INSURANCE TRUST CORE FIXED INCOME FUND
Schedule of Investments
December 31, 2018
| | | | | | | | | | | | |
Principal
Amount | | | Interest
Rate | | Maturity
Date | | | Value | |
|
| | Corporate Bonds – 32.9% | |
| | Banks – 7.4% | |
| | American Express Co.(a) | |
| $ | 25,000 | | | 3.625% | | | 12/05/2024 | | | $ | 24,446 | |
| | Bank of America Corp. | |
| | 75,000 | | | 4.125 | | | 01/22/2024 | | | | 75,962 | |
| | 49,000 | | | 4.000 | | | 04/01/2024 | | | | 49,282 | |
| | 75,000 | | | (3 Mo. LIBOR + 0.94%),
3.864(a)(b) | | | 07/23/2024 | | | | 74,878 | |
| | 45,000 | | | 3.248(a) | | | 10/21/2027 | | | | 41,622 | |
| | 75,000 | | | (3 Mo. LIBOR + 1.58%),
3.824(a)(b) | | | 01/20/2028 | | | | 72,571 | |
| | 85,000 | | | (3 Mo. LIBOR + 1.04%),
3.419(a)(b) | | | 12/20/2028 | | | | 79,167 | |
| | 50,000 | | | (3 Mo. LIBOR + 1.31%),
4.271(a)(b) | | | 07/23/2029 | | | | 49,738 | |
| | Bank of America Corp. Series L(a) | |
| | 25,000 | | | 4.183 | | | 11/25/2027 | | | | 24,020 | |
| | Bank of New York Mellon Corp. (The)(a) | |
| | 25,000 | | | 3.300 | | | 08/23/2029 | | | | 23,478 | |
| | Citigroup, Inc. | |
| | 220,000 | | | 3.400 | | | 05/01/2026 | | | | 207,047 | |
| | 25,000 | | | 4.125 | | | 07/25/2028 | | | | 23,453 | |
| | Deutsche Bank AG | |
| | 15,000 | | | 2.500 | | | 02/13/2019 | | | | 14,979 | |
| | 190,000 | | | 2.700 | | | 07/13/2020 | | | | 184,289 | |
| | Discover Financial Services(a) | |
| | 75,000 | | | 3.750 | | | 03/04/2025 | | | | 71,568 | |
| | Huntington Bancshares, Inc.(a) | |
| | 50,000 | | | 4.000 | | | 05/15/2025 | | | | 50,202 | |
| | JPMorgan Chase & Co. | |
| | 155,000 | | | 4.400 | | | 07/22/2020 | | | | 157,783 | |
| | 95,000 | | | 2.700(a) | | | 05/18/2023 | | | | 91,222 | |
| | 200,000 | | | (3 Mo. LIBOR + 1.00%),
4.023(a)(b) | | | 12/05/2024 | | | | 201,427 | |
| | 15,000 | | | 3.625(a) | | | 12/01/2027 | | | | 13,997 | |
| | 75,000 | | | (3 Mo. LIBOR + 1.34%),
3.782(a)(b) | | | 02/01/2028 | | | | 72,728 | |
| | 45,000 | | | (3 Mo. LIBOR + 0.95%),
3.509(a)(b) | | | 01/23/2029 | | | | 42,597 | |
| | JPMorgan Chase & Co. Series Z(a)(b) | |
| | 85,000 | | | (3 Mo. LIBOR + 3.80%),
5.300 | | | 12/31/2049 | | | | 84,078 | |
| | Mizuho Financial Group, Inc. | |
| | 250,000 | | | 2.601 | | | 09/11/2022 | | | | 241,745 | |
| | Morgan Stanley | |
| | 50,000 | | | (3 Mo. LIBOR + 1.40%),
3.887(a)(b) | | | 10/24/2023 | | | | 49,777 | |
| | 50,000 | | | (3 Mo. LIBOR + 0.85%),
3.737(a)(b) | | | 04/24/2024 | | | | 49,609 | |
| | 225,000 | | | 3.700 | | | 10/23/2024 | | | | 221,484 | |
| | 25,000 | | | 3.625 | | | 01/20/2027 | | | | 23,786 | |
| | Morgan Stanley Series F | |
| | 35,000 | | | 3.875 | | | 04/29/2024 | | | | 34,847 | |
| | Nuveen LLC(a)(c) | |
| | 50,000 | | | 4.000 | | | 11/01/2028 | | | | 51,463 | |
| | |
|
| | Corporate Bonds – (continued) | |
| | Banks – (continued) | |
| | Royal Bank of Canada | |
| $ | 50,000 | | | (3 Mo. LIBOR + 0.39%),
2.910%(b) | | | 04/30/2021 | | | $ | 49,660 | |
| | 50,000 | | | 3.200 | | | 04/30/2021 | | | | 50,041 | |
| | Standard Chartered plc(a)(b)(c) | |
| | 200,000 | | | (3 Mo. LIBOR + 1.15%),
4.247 | | | 01/20/2023 | | | | 197,862 | |
| | Synchrony Financial(a) | |
| | 12,000 | | | 4.500 | | | 07/23/2025 | | | | 10,897 | |
| | Wells Fargo & Co. | |
| | 175,000 | | | 3.000 | | | 10/23/2026 | | | | 162,085 | |
| | Westpac Banking Corp.(a)(b) | |
| | 25,000 | | | (5 Yr. Swap Rate + 2.24%),
4.322 | | | 11/23/2031 | | | | 23,648 | |
| | | | | | | | | | | | |
| | | | | | | | | | | 2,897,438 | |
| | |
| | Capital Goods – 1.2% | |
| | Boeing Co. (The)(a) | |
| | 50,000 | | | 3.450 | | | 11/01/2028 | | | | 49,473 | |
| | Hubbell, Inc.(a) | |
| | 45,000 | | | 3.500 | | | 02/15/2028 | | | | 41,993 | |
| | Northrop Grumman Corp. | |
| | 75,000 | | | 2.930(a) | | | 01/15/2025 | | | | 71,165 | |
| | 75,000 | | | 3.250(a) | | | 01/15/2028 | | | | 70,101 | |
| | 25,000 | | | 4.750 | | | 06/01/2043 | | | | 25,211 | |
| | Roper Technologies, Inc.(a) | |
| | 50,000 | | | 4.200 | | | 09/15/2028 | | | | 49,776 | |
| | Stanley Black & Decker, Inc.(a) | |
| | 50,000 | | | 4.250 | | | 11/15/2028 | | | | 51,404 | |
| | United Technologies Corp. | |
| | 25,000 | | | (3 Mo. LIBOR + 0.65%),
3.279(a)(b) | | | 08/16/2021 | | | | 24,875 | |
| | 25,000 | | | 3.350 | | | 08/16/2021 | | | | 24,929 | |
| | 50,000 | | | 3.950(a) | | | 08/16/2025 | | | | 49,662 | |
| | | | | | | | | | | | |
| | | | | | | | | | | 458,589 | |
| | |
| | Consumer Services(a) – 0.4% | |
| | Marriott International, Inc. | |
| | 85,000 | | | 2.300 | | | 01/15/2022 | | | | 81,471 | |
| | Starbucks Corp. | |
| | 75,000 | | | 3.800 | | | 08/15/2025 | | | | 74,101 | |
| | | | | | | | | | | | |
| | | | | | | | | | | 155,572 | |
| | |
| | Electric – 2.1% | |
| | Alliant Energy Finance LLC(a)(c) | |
| | 25,000 | | | 3.750 | | | 06/15/2023 | | | | 25,046 | |
| | Arizona Public Service Co.(a) | |
| | 45,000 | | | 2.950 | | | 09/15/2027 | | | | 42,301 | |
| | Berkshire Hathaway Energy Co.(a) | |
| | 25,000 | | | 3.250 | | | 04/15/2028 | | | | 23,805 | |
| | Duke Energy Carolinas LLC(a) | |
| | 25,000 | | | 3.950 | | | 03/15/2048 | | | | 23,932 | |
| | Emera US Finance LP(a) | |
| | 45,000 | | | 2.700 | | | 06/15/2021 | | | | 43,844 | |
| | |
| | |
| 26 | | The accompanying notes are an integral part of these financial statements. |
GOLDMAN SACHS VARIABLE INSURANCE TRUST CORE FIXED INCOME FUND
| | | | | | | | | | | | |
Principal
Amount | | | Interest
Rate | | Maturity
Date | | | Value | |
|
| | Corporate Bonds – (continued) | |
| | Electric – (continued) | |
| | Entergy Corp.(a) | |
| $ | 45,000 | | | 2.950% | | | 09/01/2026 | | | $ | 41,507 | |
| | Exelon Corp.(a) | |
| | 45,000 | | | 3.497 | | | 06/01/2022 | | | | 43,960 | |
| | Florida Power & Light Co.(a) | |
| | 68,000 | | | 4.125 | | | 02/01/2042 | | | | 68,456 | |
| | 25,000 | | | 3.950 | | | 03/01/2048 | | | | 24,489 | |
| | NiSource, Inc.(a) | |
| | 50,000 | | | 3.650(c) | | | 06/15/2023 | | | | 50,122 | |
| | 95,000 | | | 3.490 | | | 05/15/2027 | | | | 90,943 | |
| | Pacific Gas & Electric Co.(a) | |
| | 10,000 | | | 3.500 | | | 06/15/2025 | | | | 8,604 | |
| | Progress Energy, Inc. | |
| | 120,000 | | | 7.000 | | | 10/30/2031 | | | | 151,707 | |
| | Sempra Energy(a)(b) | |
| | 70,000 | | | (3 Mo. LIBOR + 0.50%),
2.936 | | | 01/15/2021 | | | | 68,776 | |
| | Southern California Edison Co.(a) | |
| | 60,000 | | | 4.050 | | | 03/15/2042 | | | | 55,906 | |
| | Southern Co. (The)(a) | |
| | 60,000 | | | 3.250 | | | 07/01/2026 | | | | 56,138 | |
| | | | | | | | | | | | |
| | | | | | | | | | | 819,536 | |
| | |
| | Energy – 4.0% | |
| | Anadarko Petroleum Corp. | |
| | 15,000 | | | 5.550 (a) | | | 03/15/2026 | | | | 15,716 | |
| | 15,000 | | | 6.450 | | | 09/15/2036 | | | | 15,953 | |
| | BP Capital Markets America, Inc.(a) | |
| | 75,000 | | | 3.224 | | | 04/14/2024 | | | | 73,240 | |
| | 25,000 | | | 4.234 | | | 11/06/2028 | | | | 25,605 | |
| | Canadian Natural Resources Ltd.(a) | |
| | 35,000 | | | 3.850 | | | 06/01/2027 | | | | 33,127 | |
| | Cenovus Energy, Inc.(a) | |
| | 25,000 | | | 4.250 | | | 04/15/2027 | | | | 22,775 | |
| | Concho Resources, Inc.(a) | |
| | 50,000 | | | 4.300 | | | 08/15/2028 | | | | 48,942 | |
| | Continental Resources, Inc.(a) | |
| | 150,000 | | | 4.500 | | | 04/15/2023 | | | | 147,332 | |
| | Devon Energy Corp.(a) | |
| | 29,000 | | | 5.850 | | | 12/15/2025 | | | | 30,590 | |
| | 25,000 | | | 5.600 | | | 07/15/2041 | | | | 23,714 | |
| | 5,000 | | | 4.750 | | | 05/15/2042 | | | | 4,310 | |
| | Dolphin Energy Ltd. LLC(c) | |
| | 10,464 | | | 5.888 | | | 06/15/2019 | | | | 10,516 | |
| | Energy Transfer Operating LP(a) | |
| | 25,000 | | | 4.650 | | | 06/01/2021 | | | | 25,353 | |
| | 75,000 | | | 4.200 | | | 09/15/2023 | | | | 74,060 | |
| | 25,000 | | | 4.950 | | | 06/15/2028 | | | | 24,512 | |
| | 25,000 | | | 5.300 | | | 04/15/2047 | | | | 22,131 | |
| | 25,000 | | | 6.000 | | | 06/15/2048 | | | | 24,303 | |
| | EQM Midstream Partners LP(a) | |
| | 100,000 | | | 4.750 | | | 07/15/2023 | | | | 99,526 | |
| | Kinder Morgan Energy Partners LP(a) | |
| | 25,000 | | | 5.400 | | | 09/01/2044 | | | | 24,096 | |
| | |
|
| | Corporate Bonds – (continued) | |
| | Energy – (continued) | |
| | Kinder Morgan, Inc.(a) | |
| $ | 145,000 | | | 3.050% | | | 12/01/2019 | | | $ | 144,152 | |
| | Marathon Oil Corp.(a) | |
| | 50,000 | | | 4.400 | | | 07/15/2027 | | | | 47,415 | |
| | Marathon Petroleum Corp.(a) | |
| | 25,000 | | | 3.625 | | | 09/15/2024 | | | | 24,384 | |
| | 25,000 | | | 3.800(c) | | | 04/01/2028 | | | | 23,534 | |
| | MPLX LP(a) | |
| | 25,000 | | | 4.800 | | | 02/15/2029 | | | | 24,935 | |
| | 35,000 | | | 4.500 | | | 04/15/2038 | | | | 30,739 | |
| | 25,000 | | | 4.700 | | | 04/15/2048 | | | | 21,671 | |
| | 25,000 | | | 5.500 | | | 02/15/2049 | | | | 24,230 | |
| | Newfield Exploration Co. | |
| | 50,000 | | | 5.625 | | | 07/01/2024 | | | | 50,750 | |
| | ONEOK, Inc.(a) | |
| | 75,000 | | | 4.550 | | | 07/15/2028 | | | | 74,166 | |
| | Petroleos Mexicanos | |
| | 60,000 | | | 6.375 | | | 02/04/2021 | | | | 60,615 | |
| | 12,000 | | | 6.350 | | | 02/12/2048 | | | | 9,558 | |
| | Phillips 66(a) | |
| | 60,000 | | | 3.900 | | | 03/15/2028 | | | | 57,742 | |
| | Pioneer Natural Resources Co.(a) | |
| | 25,000 | | | 3.950 | | | 07/15/2022 | | | | 25,057 | |
| | Plains All American Pipeline LP(a) | |
| | 15,000 | | | 3.650 | | | 06/01/2022 | | | | 14,695 | |
| | 35,000 | | | 3.850 | | | 10/15/2023 | | | | 33,843 | |
| | 45,000 | | | 4.500 | | | 12/15/2026 | | | | 43,280 | |
| | Sabine Pass Liquefaction LLC(a) | |
| | 75,000 | | | 5.625 | | | 03/01/2025 | | | | 78,170 | |
| | Valero Energy Corp. | |
| | 35,000 | | | 3.650 | | | 03/15/2025 | | | | 33,523 | |
| | | | | | | | | | | | |
| | | | | | | | | | | 1,568,260 | |
| | |
| | Food & Beverage – 1.5% | |
| | Anheuser-Busch Cos. LLC(a)(c) | |
| | 35,000 | | | 4.700 | | | 02/01/2036 | | | | 32,564 | |
| | 35,000 | | | 4.900 | | | 02/01/2046 | | | | 32,397 | |
| | Anheuser-Busch InBev Finance, Inc.(a) | |
| | 37,000 | | | 2.650 | | | 02/01/2021 | | | | 36,371 | |
| | Anheuser-Busch InBev Worldwide, Inc.(a) | |
| | 125,000 | | | 4.000 | | | 04/13/2028 | | | | 119,638 | |
| | Conagra Brands, Inc.(a) | |
| | 25,000 | | | 5.400 | | | 11/01/2048 | | | | 23,066 | |
| | Constellation Brands, Inc.(a) | |
| | 75,000 | | | (3 Mo. LIBOR + 0.70%),
3.209(b) | | | 11/15/2021 | | | | 74,864 | |
| | 25,000 | | | 4.400 | | | 11/15/2025 | | | | 25,198 | |
| | Keurig Dr Pepper, Inc.(a)(c) | |
| | 50,000 | | | 4.057 | | | 05/25/2023 | | | | 49,805 | |
| | Kraft Heinz Foods Co.(a) | |
| | 15,000 | | | 4.375 | | | 06/01/2046 | | | | 12,418 | |
| | Smithfield Foods, Inc.(c) | |
| | 125,000 | | | 2.700 | | | 01/31/2020 | | | | 123,450 | |
| | |
| | |
| The accompanying notes are an integral part of these financial statements. | | 27 |
GOLDMAN SACHS VARIABLE INSURANCE TRUST CORE FIXED INCOME FUND
Schedule of Investments(continued)
December 31, 2018
| | | | | | | | | | | | |
Principal
Amount | | | Interest
Rate | | Maturity
Date | | | Value | |
|
| | Corporate Bonds – (continued) | |
| | Food & Beverage – (continued) | |
| | Tyson Foods, Inc.(a) | |
| $ | 50,000 | | | 3.900% | | | 09/28/2023 | | | $ | 49,903 | |
| | | | | | | | | | | | |
| | | | | | | | | | | 579,674 | |
| | |
| | Health Care Equipment & Services – 1.9% | |
| | Allergan Sales LLC(a)(c) | |
| | 35,000 | | | 5.000 | | | 12/15/2021 | | | | 36,031 | |
| | Becton Dickinson and Co.(a) | |
| | 125,000 | | | (3 Mo. LIBOR + 0.88%),
3.678(b) | | | 12/29/2020 | | | | 124,158 | |
| | 95,000 | | | 2.894 | | | 06/06/2022 | | | | 91,989 | |
| | 25,000 | | | 3.363 | | | 06/06/2024 | | | | 23,935 | |
| | 35,000 | | | 4.685 | | | 12/15/2044 | | | | 32,941 | |
| | Cigna Corp.(a)(c) | |
| | 150,000 | | | 3.750 | | | 07/15/2023 | | | | 149,611 | |
| | CVS Health Corp.(a) | |
| | 45,000 | | | 2.800 | | | 07/20/2020 | | | | 44,605 | |
| | 45,000 | | | 4.125 | | | 05/15/2021 | | | | 45,512 | |
| | 75,000 | | | 3.500 | | | 07/20/2022 | | | | 74,538 | |
| | 75,000 | | | 3.875 | | | 07/20/2025 | | | | 73,170 | |
| | 25,000 | | | 4.780 | | | 03/25/2038 | | | | 24,001 | |
| | UnitedHealth Group, Inc. | |
| | 35,000 | | | 4.625 | | | 07/15/2035 | | | | 37,109 | |
| | | | | | | | | | | | |
| | | | | | | | | | | 757,600 | |
| | |
| | Life Insurance – 0.8% | |
| | American International Group, Inc.(a) | |
| | 125,000 | | | 3.900 | | | 04/01/2026 | | | | 120,367 | |
| | 25,000 | | | 4.200 | | | 04/01/2028 | | | | 24,079 | |
| | Northwestern Mutual Life Insurance Co. (The)(c) | |
| | 70,000 | | | 6.063 | | | 03/30/2040 | | | | 85,059 | |
| | Principal Financial Group, Inc.(a) | |
| | 50,000 | | | 3.100 | | | 11/15/2026 | | | | 46,752 | |
| | Prudential Financial, Inc.(a) | |
| | 50,000 | | | 3.878 | | | 03/27/2028 | | | | 50,333 | |
| | | | | | | | | | | | |
| | | | | | | | | | | 326,590 | |
| | |
| | Materials – 0.4% | |
| | DowDuPont, Inc.(a) | |
| | 50,000 | | | 4.205 | | | 11/15/2023 | | | | 51,102 | |
| | 50,000 | | | 4.493 | | | 11/15/2025 | | | | 51,448 | |
| | 25,000 | | | 4.725 | | | 11/15/2028 | | | | 25,993 | |
| | Ecolab, Inc. | |
| | 4,000 | | | 5.500 | | | 12/08/2041 | | | | 4,578 | |
| | Sherwin-Williams Co. (The)(a) | |
| | 25,000 | | | 3.450 | | | 06/01/2027 | | | | 23,280 | |
| | | | | | | | | | | | |
| | | | | | | | | | | 156,401 | |
| | |
| | Media & Entertainment – 1.8% | |
| | 21st Century Fox America, Inc. | |
| | 25,000 | | | 3.700(a) | | | 09/15/2024 | | | | 25,306 | |
| | 25,000 | | | 6.150 | | | 03/01/2037 | | | | 30,478 | |
| | |
|
| | Corporate Bonds – (continued) | |
| | Media & Entertainment – (continued) | |
| | CCO Safari II LLC(a) | |
| $ | 75,000 | | | 3.579% | | | 07/23/2020 | | | $ | 75,071 | |
| | 65,000 | | | 4.464 | | | 07/23/2022 | | | | 65,624 | |
| | 50,000 | | | 4.500 | | | 02/01/2024 | | | | 49,872 | |
| | 45,000 | | | 4.908 | | | 07/23/2025 | | | | 44,721 | |
| | Comcast Corp.(a) | |
| | 125,000 | | | 3.700 | | | 04/15/2024 | | | | 125,667 | |
| | 45,000 | | | 3.375 | | | 08/15/2025 | | | | 43,887 | |
| | 25,000 | | | 3.300 | | | 02/01/2027 | | | | 23,936 | |
| | 25,000 | | | 3.150 | | | 02/15/2028 | | | | 23,474 | |
| | 125,000 | | | 4.150 | | | 10/15/2028 | | | | 126,945 | |
| | 50,000 | | | 4.250 | | | 10/15/2030 | | | | 50,577 | |
| | Time Warner Cable LLC | |
| | 15,000 | | | 5.000 | | | 02/01/2020 | | | | 15,220 | |
| | | | | | | | | | | | |
| | | | | | | | | | | 700,778 | |
| | |
| | Metals and Mining(c) – 0.1% | |
| | Glencore Funding LLC | |
| | 25,000 | | | 4.625 | | | 04/29/2024 | | | | 24,912 | |
| | |
| | Pharmaceuticals, Biotechnology & Life Sciences – 2.7% | |
| | AbbVie, Inc. | |
| | 45,000 | | | 2.500(a) | | | 05/14/2020 | | | | 44,524 | |
| | 75,000 | | | 3.375 | | | 11/14/2021 | | | | 74,964 | |
| | 50,000 | | | 3.750(a) | | | 11/14/2023 | | | | 49,762 | |
| | Amgen, Inc.(a) | |
| | 70,000 | | | 3.125 | | | 05/01/2025 | | | | 67,256 | |
| | Bayer US Finance II LLC(a)(c) | |
| | 200,000 | | | 3.875 | | | 12/15/2023 | | | | 196,266 | |
| | 200,000 | | | 4.375 | | | 12/15/2028 | | | | 190,780 | |
| | Bayer US Finance LLC(c) | |
| | 200,000 | | | 3.000 | | | 10/08/2021 | | | | 195,575 | |
| | Elanco Animal Health, Inc.(c) | |
| | 50,000 | | | 3.912 | | | 08/27/2021 | | | | 50,265 | |
| | 25,000 | | | 4.272(a) | | | 08/28/2023 | | | | 25,045 | |
| | Teva Pharmaceutical Finance Netherlands III BV | |
| | 30,000 | | | 2.200 | | | 07/21/2021 | | | | 27,641 | |
| | 30,000 | | | 2.800 | | | 07/21/2023 | | | | 26,109 | |
| | Thermo Fisher Scientific, Inc.(a) | |
| | 35,000 | | | 3.000 | | | 04/15/2023 | | | | 34,026 | |
| | 15,000 | | | 3.650 | | | 12/15/2025 | | | | 14,810 | |
| | Zoetis, Inc.(a) | |
| | 45,000 | | | 3.000 | | | 09/12/2027 | | | | 41,576 | |
| | | | | | | | | | | | |
| | | | | | | | | | | 1,038,599 | |
| | |
| | Pipelines(a) – 0.6% | |
| | Columbia Pipeline Group, Inc. | |
| | 35,000 | | | 3.300 | | | 06/01/2020 | | | | 34,891 | |
| | Sunoco Logistics Partners Operations LP | |
| | 15,000 | | | 4.250 | | | 04/01/2024 | | | | 14,692 | |
| | 75,000 | | | 5.400 | | | 10/01/2047 | | | | 67,426 | |
| | |
| | |
| 28 | | The accompanying notes are an integral part of these financial statements. |
GOLDMAN SACHS VARIABLE INSURANCE TRUST CORE FIXED INCOME FUND
| | | | | | | | | | | | |
Principal
Amount | | | Interest
Rate | | Maturity
Date | | | Value | |
|
| | Corporate Bonds – (continued) | |
| | Pipelines(a) – (continued) | |
| | Williams Cos., Inc. (The) | |
| $ | 25,000 | | | 3.600% | | | 03/15/2022 | | | $ | 24,543 | |
| | 50,000 | | | 3.900 | | | 01/15/2025 | | | | 48,546 | |
| | 35,000 | | | 4.000 | | | 09/15/2025 | | | | 33,866 | |
| | | | | | | | | | | | |
| | | | | | | | | | | 223,964 | |
| | |
| | Property/Casualty Insurance – 0.2% | |
| | Arch Capital Group US, Inc. | |
| | 36,000 | | | 5.144 | | | 11/01/2043 | | | | 37,590 | |
| | XLIT Ltd. | |
| | 45,000 | | | 4.450 | | | 03/31/2025 | | | | 44,757 | |
| | | | | | | | | | | | |
| | | | | | | | | | | 82,347 | |
| | |
| | Real Estate Investment Trusts(a) – 1.5% | |
| | American Campus Communities Operating Partnership LP | |
| | 95,000 | | | 4.125 | | | 07/01/2024 | | | | 95,266 | |
| | Crown Castle International Corp. | |
| | 25,000 | | | 2.250 | | | 09/01/2021 | | | | 24,125 | |
| | 85,000 | | | 3.150 | | | 07/15/2023 | | | | 81,653 | |
| | 60,000 | | | 3.650 | | | 09/01/2027 | | | | 55,860 | |
| | CubeSmart LP | |
| | 45,000 | | | 4.000 | | | 11/15/2025 | | | | 44,493 | |
| | Duke Realty LP | |
| | 50,000 | | | 4.000 | | | 09/15/2028 | | | | 49,785 | |
| | HCP, Inc. | |
| | 10,000 | | | 2.625 | | | 02/01/2020 | | | | 9,928 | |
| | Healthcare Trust of America Holdings LP | |
| | 35,000 | | | 3.375 | | | 07/15/2021 | | | | 34,768 | |
| | Kilroy Realty LP | |
| | 25,000 | | | 4.750 | | | 12/15/2028 | | | | 25,439 | |
| | National Retail Properties, Inc. | |
| | 45,000 | | | 4.000 | | | 11/15/2025 | | | | 44,597 | |
| | Select Income REIT | |
| | 25,000 | | | 3.600 | | | 02/01/2020 | | | | 24,860 | |
| | Ventas Realty LP | |
| | 45,000 | | | 3.500 | | | 02/01/2025 | | | | 43,230 | |
| | VEREIT Operating Partnership LP | |
| | 50,000 | | | 4.625 | | | 11/01/2025 | | | | 50,064 | |
| | | | | | | | | | | | |
| | | | | | | | | | | 584,068 | |
| | |
| | Retailing(a) – 0.9% | |
| | Alimentation Couche-Tard, Inc.(c) | |
| | 45,000 | | | 2.700 | | | 07/26/2022 | | | | 43,499 | |
| | Amazon.com, Inc. | |
| | 35,000 | | | 5.200 | | | 12/03/2025 | | | | 38,424 | |
| | 45,000 | | | 4.800 | | | 12/05/2034 | | | | 48,615 | |
| | 15,000 | | | 3.875 | | | 08/22/2037 | | | | 14,593 | |
| | Dollar Tree, Inc. | |
| | 50,000 | | | 4.000 | | | 05/15/2025 | | | | 48,071 | |
| | 50,000 | | | 4.200 | | | 05/15/2028 | | | | 47,383 | |
| | Expedia Group, Inc. | |
| | 35,000 | | | 3.800 | | | 02/15/2028 | | | | 31,794 | |
| | |
|
| | Corporate Bonds – (continued) | |
| | Retailing(a) – (continued) | |
| | Home Depot, Inc. (The) | |
| $ | 50,000 | | | 3.900% | | | 12/06/2028 | | | $ | 51,181 | |
| | 25,000 | | | 4.250 | | | 04/01/2046 | | | | 24,967 | |
| | | | | | | | | | | | |
| | | | | | | | | | | 348,527 | |
| | |
| | Software & Services(a) – 0.2% | |
| | Fidelity National Information Services, Inc. | |
| | 45,000 | | | 3.000 | | | 08/15/2026 | | | | 41,381 | |
| | Fiserv, Inc. | |
| | 25,000 | | | 3.800 | | | 10/01/2023 | | | | 25,166 | |
| | 25,000 | | | 4.200 | | | 10/01/2028 | | | | 25,043 | |
| | | | | | | | | | | | |
| | | | | | | | | | | 91,590 | |
| | |
| | Technology – 1.9% | |
| | Apple, Inc.(a) | |
| | 225,000 | | | 2.450 | | | 08/04/2026 | | | | 208,004 | |
| | 25,000 | | | 4.650 | | | 02/23/2046 | | | | 26,468 | |
| | Broadcom Corp.(a) | |
| | 50,000 | | | 2.650 | | | 01/15/2023 | | | | 46,336 | |
| | 100,000 | | | 3.625 | | | 01/15/2024 | | | | 94,542 | |
| | 25,000 | | | 3.125 | | | 01/15/2025 | | | | 22,552 | |
| | Dell International LLC(a)(c) | |
| | 95,000 | | | 5.450 | | | 06/15/2023 | | | | 96,795 | |
| | Hewlett Packard Enterprise Co.(a) | |
| | 45,000 | | | 4.900 | | | 10/15/2025 | | | | 45,503 | |
| | Microchip Technology, Inc.(c) | |
| | 25,000 | | | 3.922 | | | 06/01/2021 | | | | 24,628 | |
| | Oracle Corp.(a) | |
| | 70,000 | | | 2.500 | | | 05/15/2022 | | | | 68,484 | |
| | 60,000 | | | 3.250 | | | 11/15/2027 | | | | 57,898 | |
| | 35,000 | | | 4.000 | | | 07/15/2046 | | | | 32,698 | |
| | QUALCOMM, Inc.(a) | |
| | 25,000 | | | 2.600 | | | 01/30/2023 | | | | 24,036 | |
| | | | | | | | | | | | |
| | | | | | | | | | | 747,944 | |
| | |
| | Tobacco(a) – 0.3% | |
| | BAT Capital Corp. | | | | | | | | |
| | 70,000 | | | 3.222 | | | 08/15/2024 | | | | 64,428 | |
| | Reynolds American, Inc. | |
| | 55,000 | | | 4.450 | | | 06/12/2025 | | | | 52,958 | |
| | | | | | | | | | | | |
| | | | | | | | | | | 117,386 | |
| | |
| | Transportation – 0.7% | |
| | Burlington Northern Santa Fe LLC(a) | |
| | 25,000 | | | 4.050 | | | 06/15/2048 | | | | 23,953 | |
| | Delta Air Lines, Inc. | |
| | 150,000 | | | 3.400 | | | 04/19/2021 | | | | 149,081 | |
| | FedEx Corp.(a) | |
| | 45,000 | | | 3.400 | | | 02/15/2028 | | | | 42,460 | |
| | Penske Truck Leasing Co. LP(a)(c) | |
| | 70,000 | | | 3.375 | | | 02/01/2022 | | | | 69,063 | |
| | | | | | | | | | | | |
| | | | | | | | | | | 284,557 | |
| | |
| | |
| The accompanying notes are an integral part of these financial statements. | | 29 |
GOLDMAN SACHS VARIABLE INSURANCE TRUST CORE FIXED INCOME FUND
Schedule of Investments(continued)
December 31, 2018
| | | | | | | | | | | | |
Principal
Amount | | | Interest
Rate | | Maturity
Date | | | Value | |
|
| | Corporate Bonds – (continued) | |
| | Wireless Telecommunications – 2.3% | |
| | American Tower Corp. | |
| $ | 45,000 | | | 4.700% | | | 03/15/2022 | | | $ | 46,213 | |
| | AT&T, Inc. | |
| | 60,000 | | | 3.200(a) | | | 03/01/2022 | | | | 59,200 | |
| | 105,000 | | | 3.800 | | | 03/15/2022 | | | | 105,435 | |
| | 50,000 | | | 3.000(a) | | | 06/30/2022 | | | | 48,796 | |
| | 120,000 | | | 3.600(a) | | | 02/17/2023 | | | | 119,162 | |
| | 70,000 | | | 3.400(a) | | | 05/15/2025 | | | | 65,751 | |
| | 110,000 | | | 4.250(a) | | | 03/01/2027 | | | | 107,595 | |
| | Verizon Communications, Inc. | |
| | 25,000 | | | 2.625 | | | 08/15/2026 | | | | 22,669 | |
| | 145,000 | | | 4.329 | | | 09/21/2028 | | | | 145,728 | |
| | 62,000 | | | 5.012 | | | 04/15/2049 | | | | 61,800 | |
| | Vodafone Group plc | |
| | 100,000 | | | 3.750 | | | 01/16/2024 | | | | 98,437 | |
| | | | | | | | | | | | |
| | | | | | | | | | | 880,786 | |
| | |
| | TOTAL CORPORATE BONDS | |
| | (Cost $13,119,628) | | | $ | 12,845,118 | |
| | |
| | | | | | | | | | | | |
|
| | Mortgage-Backed Securities – 29.0% | |
| | FHLMC – 0.1% | |
| $ | 2,866 | | | 6.500% | | | 10/01/2020 | | | $ | 2,866 | |
| | 3,654 | | | 4.500 | | | 07/01/2024 | | | | 3,770 | |
| | 21,832 | | | 4.500 | | | 11/01/2024 | | | | 22,538 | |
| | 4,944 | | | 4.500 | | | 12/01/2024 | | | | 5,102 | |
| | 8,018 | | | 7.500 | | | 12/01/2029 | | | | 9,153 | |
| | 2,509 | | | 5.000 | | | 10/01/2033 | | | | 2,674 | |
| | 3,653 | | | 5.000 | | | 07/01/2035 | | | | 3,894 | |
| | 4,988 | | | 5.000 | | | 12/01/2035 | | | | 5,302 | |
| | 1,072 | | | 5.000 | | | 03/01/2038 | | | | 1,140 | |
| | 3,037 | | | 5.000 | | | 06/01/2041 | | | | 3,218 | |
| | | | | | | | | | | | |
| | | | | | | | | | | 59,657 | |
| | |
| | FNMA – 12.0% | |
| | 404 | | | 5.000 | | | 06/01/2023 | | | | 417 | |
| | 34,559 | | | 5.500 | | | 09/01/2023 | | | | 35,636 | |
| | 10,021 | | | 5.500 | | | 10/01/2023 | | | | 10,343 | |
| | 2,186 | | | 4.500 | | | 07/01/2024 | | | | 2,253 | |
| | 55,849 | | | 4.500 | | | 11/01/2024 | | | | 57,656 | |
| | 24,370 | | | 4.500 | | | 12/01/2024 | | | | 25,168 | |
| | 7,825 | | | 9.000 | | | 11/01/2025 | | | | 8,620 | |
| | 31,234 | | | 7.000 | | | 08/01/2026 | | | | 34,145 | |
| | 15,062 | | | 8.000 | | | 10/01/2029 | | | | 17,258 | |
| | 1,185 | | | 8.500 | | | 04/01/2030 | | | | 1,394 | |
| | 2,204 | | | 8.000 | | | 05/01/2030 | | | | 2,290 | |
| | 81 | | | 8.500 | | | 06/01/2030 | | | | 83 | |
| | 6,661 | | | 8.000 | | | 08/01/2032 | | | | 7,520 | |
| | 9,568 | | | 4.500 | | | 08/01/2039 | | | | 10,054 | |
| | 44,393 | | | 3.000 | | | 01/01/2043 | | | | 43,614 | |
| | 178,562 | | | 3.000 | | | 03/01/2043 | | | | 175,487 | |
| | 250,647 | | | 3.000 | | | 04/01/2043 | | | | 246,331 | |
| | 185,617 | | | 3.000 | | | 05/01/2043 | | | | 182,421 | |
| | |
|
| | Mortgage-Backed Securities – (continued) | |
| | FNMA – (continued) | |
| $ | 612,565 | | | 4.500% | | | 04/01/2045 | | | $ | 642,553 | |
| | 68,105 | | | 4.500 | | | 05/01/2045 | | | | 71,461 | |
| | 411,258 | | | 4.000 | | | 02/01/2048 | | | | 421,283 | |
| | 550,834 | | | 4.000 | | | 03/01/2048 | | | | 564,262 | |
| | 45,017 | | | 4.000 | | | 07/01/2048 | | | | 46,160 | |
| | 2,000,000 | | | 4.500 | | | TBA-30yr | (d) | | | 2,070,411 | |
| | | | | | | | | | | | |
| | | | | | | | | | | 4,676,820 | |
| | |
| | GNMA – 16.9% | |
| | 1,591 | | | 7.000 | | | 10/15/2025 | | | | 1,615 | |
| | 6,177 | | | 7.000 | | | 11/15/2025 | | | | 6,502 | |
| | 928 | | | 7.000 | | | 02/15/2026 | | | | 948 | |
| | 2,969 | | | 7.000 | | | 04/15/2026 | | | | 3,132 | |
| | 2,821 | | | 7.000 | | | 03/15/2027 | | | | 2,963 | |
| | 19,512 | | | 7.000 | | | 11/15/2027 | | | | 20,022 | |
| | 223 | | | 7.000 | | | 01/15/2028 | | | | 223 | |
| | 14,460 | | | 7.000 | | | 02/15/2028 | | | | 15,849 | |
| | 1,639 | | | 7.000 | | | 03/15/2028 | | | | 1,653 | |
| | 912 | | | 7.000 | | | 04/15/2028 | | | | 920 | |
| | 168 | | | 7.000 | | | 05/15/2028 | | | | 184 | |
| | 2,777 | | | 7.000 | | | 06/15/2028 | | | | 2,996 | |
| | 6,241 | | | 7.000 | | | 07/15/2028 | | | | 6,788 | |
| | 10,448 | | | 7.000 | | | 09/15/2028 | | | | 11,084 | |
| | 2,037 | | | 7.000 | | | 11/15/2028 | | | | 2,144 | |
| | 1,599 | | | 7.500 | | | 11/15/2030 | | | | 1,602 | |
| | 116,267 | | | 6.000 | | | 08/20/2034 | | | | 129,407 | |
| | 113,751 | | | 5.000 | | | 06/15/2040 | | | | 121,033 | |
| | 539,529 | | | 4.000 | | | 08/20/2043 | | | | 556,751 | |
| | 268,764 | | | 4.000 | | | 08/20/2045 | | | | 276,335 | |
| | 262,644 | | | 4.000 | | | 10/20/2045 | | | | 270,043 | |
| | 2,989,184 | | | 4.500 | | | 08/20/2048 | | | | 3,094,866 | |
| | 996,135 | | | 4.500 | | | 10/20/2048 | | | | 1,031,430 | |
| | 1,000,000 | | | 5.000 | | | TBA-30yr | (d) | | | 1,040,173 | |
| | | | | | | | | | | | |
| | | | | | | | | | | 6,598,663 | |
| | |
| | TOTAL MORTGAGE-BACKED SECURITIES | |
| | (Cost $11,340,940) | | | $ | 11,335,140 | |
| | |
| | | | | | | | | | | | |
|
| | Collateralized Mortgage Obligations – 3.3% | |
| | Adjustable Rate Non-Agency(a)(b) – 2.4% | |
| | Alternative Loan Trust Series 2005-38, Class A1 | |
| $ | 89,572 | | | 3.657% | | | 09/25/2035 | | | $ | 87,722 | |
| | Harben Finance plc Series 2017-1X, Class A | |
| GBP | 83,323 | | | 1.689 | | | 08/20/2056 | | | | 105,286 | |
| | Lehman XS Trust Series 2005-7N, Class 1A1A | |
| $ | 158,054 | | | 3.046 | | | 12/25/2035 | | | | 148,451 | |
| | London Wall Mortgage Capital plc Series 2017-FL1, Class A | |
| GBP | 103,535 | | | 1.735 | | | 11/15/2049 | | | | 130,684 | |
| MASTR Adjustable Rate Mortgages Trust Series 2006-OA2,
Class 4A1A |
|
| $ | 194,383 | | | 3.007 | | | 12/25/2046 | | | | 256,242 | |
| | |
| | |
| 30 | | The accompanying notes are an integral part of these financial statements. |
GOLDMAN SACHS VARIABLE INSURANCE TRUST CORE FIXED INCOME FUND
| | | | | | | | | | | | | | |
Principal
Amount | | | Interest
Rate | | | Maturity
Date | | | Value | |
|
| | Collateralized Mortgage Obligations – (continued) | |
| | Adjustable Rate Non-Agency(a)(b) – (continued) | |
| | Ripon Mortgages plc Series 1X, Class A2 | |
| GBP | 149,875 | | | | 1.689% | | | | 08/20/2056 | | | $ | 189,708 | |
| | | | | | | | | | | | | | |
| | | | | | | | | | | | | 918,093 | |
| | |
| | Sequential Fixed Rate – 0.9% | |
| | FNMA REMIC Series 2012-111, Class B | |
| $ | 13,200 | | | | 7.000 | | | | 10/25/2042 | | | | 14,962 | |
| | FNMA REMIC Series 2012-153, Class B | |
| | 35,774 | | | | 7.000 | | | | 07/25/2042 | | | | 40,731 | |
| | NCUA Guaranteed Notes Series A4 | |
| | 300,000 | | | | 3.000 | | | | 06/12/2019 | | | | 300,307 | |
| | | | | | | | | | | | | | |
| | | | | | | | | | | | | 356,000 | |
| | |
| | TOTAL COLLATERALIZED MORTGAGE OBLIGATIONS | |
| | (Cost $1,200,520) | | | $ | 1,274,093 | |
| | |
| | | | | | | | | | | | | | |
|
| | Commercial Mortgage-Backed Security(a)(b)(c) – 0.4% | |
| | Adjustable Rate Non-Agency – 0.4% | |
| | Exantas Capital Corp. Ltd. Series 2018-RSO6, Class A | |
| $ | 150,000 | | | | 3.285% | | | | 06/15/2035 | | | $ | 147,394 | |
| | (Cost $150,000) | |
| | |
| | |
|
| | U.S. Government Agency Securities – 2.5% | |
| | FHLB | | | | | | | | | | | | | |
| $ | 100,000 | | | | 3.375% | | | | 12/08/2023 | | | $ | 103,113 | |
| | FNMA | | | | | | | | | | | | | |
| | 400,000 | | | | 1.875 | | | | 09/24/2026 | | | | 372,259 | |
| | 400,000 | | | | 6.250 | | | | 05/15/2029 | | | | 511,129 | |
| | |
| | TOTAL U.S. GOVERNMENT AGENCY SECURITIES | |
| | (Cost $1,017,502) | | | $ | 986,501 | |
| | |
| | | | | | | | | | | | | | |
|
| | Asset-Backed Securities(a) – 11.8% | |
| | Automobile – 0.2% | |
| | Ally Master Owner Trust Series 2018-1, Class A2 | |
| $ | 100,000 | | | | 2.700% | | | | 01/17/2023 | | | $ | 99,302 | |
| | |
| | Collateralized Debt Obligations(b)(c) – 1.6% | |
| Arbor Realty Commercial Real Estate Notes Ltd.
Series 2018-FL1, Class A |
|
| | 200,000 | | | | 3.605 | | | | 06/15/2028 | | | | 196,772 | |
| | KREF Ltd. Series 2018-FL1, Class A | |
| | 150,000 | | | | 3.402 | | | | 06/15/2036 | | | | 149,997 | |
| | Orix Series 2018-CRE1, Class A | |
| | 125,000 | | | | 3.487 | | | | 06/15/2036 | | | | 125,000 | |
| | TPG Real Estate Finance Issuer Ltd. Series 2018-FL2, Class A | |
| | 175,000 | | | | 3.585 | | | | 11/15/2037 | | | | 175,000 | |
| | | | | | | | | | | | | | |
| | | | | | | | | | | | | 646,769 | |
| | |
|
| | Asset-Backed Securities(a) – (continued) | |
| | Collateralized Loan Obligations(b)(c) – 4.4% | |
| | CBAM Ltd. Series 2018-5A, Class A | |
| $ | 525,000 | | | 3.469% | | | 04/17/2031 | | | $ | 518,736 | |
| | Cutwater Ltd. Series 2014-1A, Class A1AR | |
| | 458,985 | | | 3.686 | | | 07/15/2026 | | | | 458,560 | |
| | Madison Park Funding XXX Ltd. Series 2018-30A, Class A | |
| | 750,000 | | | 3.186 | | | 04/15/2029 | | | | 731,438 | |
| | | | | | | | | | | | |
| | | | | | | | | | | 1,708,734 | |
| | |
| | Home Equity(b) – 0.2% | |
| | GMACM Home Equity Loan Trust Series 2007-HE3, Class 1A1 | |
| | 11,004 | | | 7.000 | | | 09/25/2037 | | | | 11,065 | |
| | GMACM Home Equity Loan Trust Series 2007-HE3, Class 2A1 | |
| | 59,654 | | | 7.000 | | | 09/25/2037 | | | | 61,611 | |
| | | | | | | | | | | | |
| | | | | | | | | | | 72,676 | |
| | |
| | Student Loans(b) – 5.4% | |
| | Academic Loan Funding Trust Series 2012-1A, Class A2(c) | |
| | 487,761 | | | 3.606 | | | 12/27/2044 | | | | 491,734 | |
| | AccessLex Institute Series 2005-2, Class A3 | |
| | 16,632 | | | 2.857 | | | 11/22/2024 | | | | 16,607 | |
| | Chase Education Loan Trust Series 2007-A, Class A3 | |
| | 14,961 | | | 2.883 | | | 12/28/2023 | | | | 14,934 | |
| | ECMC Group Student Loan Trust Series 2016-1A, Class A(c) | |
| | 394,713 | | | 3.856 | | | 07/26/2066 | | | | 399,881 | |
| | EFS Volunteer No. 2 LLC Series 2012-1, Class A2(c) | |
| | 550,000 | | | 3.856 | | | 03/25/2036 | | | | 552,276 | |
| | Nelnet Student Loan Trust Series 2006-2, Class A5 | |
| | 104,400 | | | 2.590 | | | 01/25/2030 | | | | 104,229 | |
| | Northstar Education Finance, Inc. Series 2007-1, Class A1 | |
| | 56,477 | | | 2.590 | | | 04/28/2030 | | | | 56,179 | |
| | Scholar Funding Trust Series 2010-A, Class A(c) | |
| | 113,720 | | | 3.259 | | | 10/28/2041 | | | | 112,726 | |
| | SLM Student Loan Trust Series 2003-7A, Class A5A(c) | |
| | 344,549 | | | 3.988 | | | 12/15/2033 | | | | 348,146 | |
| | | | | | | | | | | | |
| | | | | | | | | | | 2,096,712 | |
| | |
| | TOTAL ASSET-BACKED SECURITIES | |
| | (Cost $4,634,707) | | | | | | $ | 4,624,193 | |
| | |
| | | | | | | | | | | | |
|
| | Foreign Government Securities – 4.4% | |
| | Indonesia Government International Note(c) | |
| $ | 230,000 | | | 4.750% | | | 01/08/2026 | | | $ | 232,757 | |
| | Israel Government AID Bond(e) | |
| | 400,000 | | | 5.500 | | | 09/18/2023 | | | | 448,860 | |
| | 200,000 | | | 5.500 | | | 12/04/2023 | | | | 225,013 | |
| | 100,000 | | | 5.500 | | | 04/26/2024 | | | | 113,456 | |
| | Kuwait International Government Bond | |
| | 500,000 | | | 3.500 | | | 03/20/2027 | | | | 496,750 | |
| | United Arab Emirates Government International Bond(c) | |
| | 220,000 | | | 3.125 | | | 10/11/2027 | | | | 210,100 | |
| | |
| | TOTAL FOREIGN GOVERNMENT SECURITIES | |
| | (Cost $1,754,889) | | | $ | 1,726,936 | |
| | |
| | |
| The accompanying notes are an integral part of these financial statements. | | 31 |
GOLDMAN SACHS VARIABLE INSURANCE TRUST CORE FIXED INCOME FUND
Schedule of Investments(continued)
December 31, 2018
| | | | | | | | | | | | | | |
Principal
Amount | | | Interest
Rate | | | Maturity
Date | | | Value | |
|
| | Municipal Bonds – 1.1% | |
| | California – 0.4% | |
| | California State Various Purpose GO Bonds Series 2010 | |
| $ | 105,000 | | | | 7.625% | | | | 03/01/2040 | | | $ | 149,498 | |
| | |
| | Illinois – 0.4% | |
| | Illinois State GO Bonds for Build America Bonds Series 2010-5 | |
| | 100,000 | | | | 7.350 | | | | 07/01/2035 | | | | 110,843 | |
| | Illinois State GO Bonds Pension Funding Series 2003 | |
| | 25,000 | | | | 5.100 | | | | 06/01/2033 | | | | 23,836 | |
| | | | | | | | | | | | | | |
| | | | | | | | | | | | | 134,679 | |
| | |
| | Ohio – 0.3% | |
| American Municipal Power, Inc. RB Build America Bond
Series 2010 E RMKT |
|
| | 100,000 | | | | 6.270 | | | | 02/15/2050 | | | | 124,100 | |
| | |
| | TOTAL MUNICIPAL BONDS | |
| | (Cost $333,210) | | | $ | 408,277 | |
| | |
| | | | | | | | | | | | | | |
|
| | U.S. Treasury Obligations – 18.5% | |
| | U.S. Treasury Bonds | |
| $ | 410,000 | | | | 3.125% | | | | 02/15/2043 | | | $ | 418,587 | |
| | 490,000 | | | | 3.750 | | | | 11/15/2043 | | | | 553,801 | |
| | 490,000 | | | | 3.125 | | | | 08/15/2044 | | | | 500,465 | |
| | 100,000 | | | | 3.000 | | | | 11/15/2044 | | | | 99,900 | |
| | 200,000 | | | | 2.875 | | | | 08/15/2045 | | | | 194,896 | |
| | 2,120,000 | | | | 2.875 | | | | 11/15/2046 | | | | 2,062,787 | |
| | 120,000 | | | | 3.000 | | | | 05/15/2047 | | | | 119,592 | |
| | 1,180,000 | | | | 2.750 | | | | 11/15/2047 | | | | 1,117,659 | |
| | U.S. Treasury Inflation Linked Notes | |
| | 261,934 | | | | 0.750 | | | | 07/15/2028 | | | | 256,652 | |
| | U.S. Treasury Notes | |
| | 400,000 | | | | 2.625 | | | | 08/31/2020 | | | | 400,538 | |
| | 300,000 | | | | 2.625 | | | | 07/15/2021 | | | | 301,102 | |
| | 100,000 | | | | 2.875 | | | | 08/15/2028 | | | | 101,592 | |
| | U.S. Treasury STRIPS Bonds(f) | |
| | 1,800,000 | | | | 0.000 | | | | 02/15/2036 | | | | 1,092,445 | |
| | |
| | TOTAL U.S. TREASURY OBLIGATIONS | |
| | (Cost $7,283,286) | | | $ | 7,220,016 | |
| | |
| | | | | | | | | | | | | | |
| Shares | | | Dividend Rate | | | Value | |
|
| | Investment Company(g) – 0.7% | |
| Goldman Sachs Financial Square Government Fund —
Institutional Shares |
|
| | 275,823 | | | | 2.521% | | | $ | 275,823 | |
| | (Cost $275,823) | | | | | |
| | |
Principal
Amount | | | Interest Rate | | Maturity
Date | | | Value | |
|
| | Short-Term Investment – 0.6% | |
| | Commercial Paper – 0.6% | |
| | Bell Canada, Inc. | |
| $ | 250,000 | | | 2.683% | | | 01/22/2019 | | | $ | 249,580 | |
| | (Cost $249,612) | | | | | |
| | |
| | TOTAL INVESTMENTS – 105.2% | |
| | (Cost $41,360,117) | | | $ | 41,093,071 | |
| | |
| LIABILITIES IN EXCESS OF
OTHER ASSETS – (5.2)% |
| | | (2,019,618 | ) |
| | |
| | NET ASSETS – 100.0% | | | $ | 39,073,453 | |
| | |
| | |
| The percentage shown for each investment category reflects the value of investments in that category as a percentage of net assets. |
| |
| (a) | | Securities with “Call” features. Maturity dates disclosed are the final maturity dates. |
| |
| (b) | | Variable rate security. Except for floating rate notes (for which final maturity is disclosed), maturity date disclosed is the next interest reset date. Interest rate disclosed is that which is in effect on December 31, 2018. |
| |
| (c) | | Exempt from registration under Rule 144A of the Securities Act of 1933. Under procedures approved by the Board of Trustees, such securities may be deemed liquid by the Investment Adviser and may be resold, normally to qualified institutional buyers in transactions exempt from registration. Total market value of Rule 144A securities amounts to $6,634,805, which represents approximately 17.0% of net assets as of December 31, 2018. The liquidity determination is unaudited. |
| |
| (d) | | TBA (To Be Announced) Securities are purchased on a forward commitment basis with an approximate principal amount and no defined maturity date. The actual principal and maturity date will be determined upon settlement when the specific mortgage pools are assigned. Total market value of TBA securities (excluding forward sales contracts, if any) amounts to $3,110,584 which represents approximately 8.0% of net assets as of December 31, 2018. |
| |
| (e) | | Guaranteed by the United States Government. Total market value of these securities amounts to $787,329, which represents 2.0% of net assets as of December 31, 2018. |
| |
| (f) | | Issued with a zero coupon. Income is recognized through the accretion of discount. |
| |
| (g) | | Represents an Affiliated Issuer. |
| | |
| 32 | | The accompanying notes are an integral part of these financial statements. |
GOLDMAN SACHS VARIABLE INSURANCE TRUST CORE FIXED INCOME FUND
| | |
| |
| Investment Abbreviations: |
| BA | | —Banker Acceptance Rate |
| BBR | | —Bank Bill Reference Rate |
| EURIBOR | | —Euro Interbank Offered Rate |
| FHLB | | —Federal Home Loan Bank |
| FHLMC | | —Federal Home Loan Mortgage Corp. |
| FNMA | | —Federal National Mortgage Association |
| GNMA | | —Government National Mortgage Association |
| GO | | —General Obligation |
| LIBOR | | —London Interbank Offered Rate |
| Mo. | | —Month |
| NIBOR | | —Norwegian Interbank Offered Rate |
| RB | | —Revenue Bond |
| REIT | | —Real Estate Investment Trust |
| REMIC | | —Real Estate Mortgage Investment Conduit |
| RMKT | | —Remarketed |
| SONIA | | —Sterling Overnight Index Average |
| STIBOR | | —Stockholm Interbank Offered Rate |
| STRIPS | | —Separate Trading of Registered Interest and Principal of Securities |
| Yr. | | —Year |
| Currency Abbreviations: |
| AUD | | —Australian Dollar |
| CAD | | —Canadian Dollar |
| CHF | | —Swiss Franc |
| EUR | | —Euro |
| GBP | | —British Pound |
| JPY | | —Japanese Yen |
| NOK | | —Norwegian Krone |
| NZD | | —New Zealand Dollar |
| SEK | | —Swedish Krona |
| USD | | —United States Dollar |
ADDITIONAL INVESTMENT INFORMATION
FORWARD FOREIGN CURRENCY EXCHANGE CONTRACTS — At December 31, 2018, the Fund had the following forward foreign currency exchange contracts:
FORWARD FOREIGN CURRENCY EXCHANGE CONTRACTS WITH UNREALIZED GAIN
| | | | | | | | | | | | | | | | |
| Counterparty | | Currency
Purchased | | | Currency
Sold | | | Settlement
Date | | | Unrealized
Gain | |
Morgan Stanley Co., Inc. | | CAD | 16,283 | | | AUD | 16,759 | | | | 03/20/2019 | | | $ | 129 | |
| | CHF | 229,971 | | | EUR | 204,269 | | | | 03/20/2019 | | | | 112 | |
| | EUR | 53,011 | | | CAD | 81,851 | | | | 03/20/2019 | | | | 1,066 | |
| | EUR | 23,513 | | | NOK | 229,495 | | | | 03/20/2019 | | | | 482 | |
| | EUR | 89,761 | | | USD | 102,758 | | | | 02/08/2019 | | | | 408 | |
| | | EUR485,944 | | | USD | 557,879 | | | | 03/20/2019 | | | | 2,484 | |
| | GBP | 35,139 | | | EUR | 38,634 | | | | 03/20/2019 | | | | 405 | |
| | GBP | 35,652 | | | USD | 45,568 | | | | 03/20/2019 | | | | 43 | |
| | JPY | 10,029,050 | | | EUR | 79,000 | | | | 03/20/2019 | | | | 970 | |
| | JPY | 11,613,101 | | | USD | 103,756 | | | | 01/15/2019 | | | | 2,308 | |
| | JPY | 27,016,626 | | | USD | 241,030 | | | | 03/20/2019 | | | | 6,989 | |
| | NOK | 1,419,901 | | | EUR | 142,475 | | | | 03/20/2019 | | | | 480 | |
| | NOK | 262,793 | | | USD | 29,995 | | | | 03/20/2019 | | | | 501 | |
| | SEK | 1,228,449 | | | EUR | 119,537 | | | | 03/20/2019 | | | | 1,616 | |
| | SEK | 1,223,000 | | | USD | 136,683 | | | | 02/07/2019 | | | | 1,716 | |
| | USD | 115,633 | | | AUD | 163,475 | | | | 01/16/2019 | | | | 458 | |
| | USD | 212,180 | | | AUD | 289,997 | | | | 03/20/2019 | | | | 7,654 | |
| | USD | 184,296 | | | CAD | 241,731 | | | | 01/24/2019 | | | | 7,126 | |
| | USD | 363,300 | | | CAD | 481,896 | | | | 03/20/2019 | | | | 9,685 | |
| | USD | 993,229 | | | EUR | 862,492 | | | | 02/08/2019 | | | | 1,929 | |
| | USD | 59,994 | | | EUR | 52,009 | | | | 03/20/2019 | | | | 20 | |
| | USD | 823,298 | | | GBP | 643,219 | | | | 01/17/2019 | | | | 2,862 | |
| | | USD | 397,269 | | | NZD | 583,148 | | | | 03/20/2019 | | | | 5,335 | |
| |
| TOTAL | | | $ | 54,778 | |
| | |
| The accompanying notes are an integral part of these financial statements. | | 33 |
GOLDMAN SACHS VARIABLE INSURANCE TRUST CORE FIXED INCOME FUND
Schedule of Investments(continued)
December 31, 2018
��
ADDITIONAL INVESTMENT INFORMATION (continued)
FORWARD FOREIGN CURRENCY EXCHANGE CONTRACTS WITH UNREALIZED LOSS
| | | | | | | | | | | | | | | | |
| Counterparty | | Currency
Purchased | | | Currency
Sold | | | Settlement
Date | | | Unrealized
Loss | |
Morgan Stanley Co., Inc. | | AUD | 83,935 | | | EUR | 53,004 | | | | 03/20/2019 | | | $ | (1,924 | ) |
| | AUD | 16,996 | | | JPY | 1,325,540 | | | | 03/20/2019 | | | | (182 | ) |
| | AUD | 42,017 | | | NZD | 44,196 | | | | 03/20/2019 | | | | (70 | ) |
| | AUD | 206,843 | | | USD | 146,310 | | | | 01/16/2019 | | | | (579 | ) |
| | AUD | 494,650 | | | USD | 361,743 | | | | 03/20/2019 | | | | (12,881 | ) |
| | CAD | 243,177 | | | EUR | 160,472 | | | | 03/20/2019 | | | | (6,604 | ) |
| | CAD | 16,352 | | | JPY | 1,363,609 | | | | 03/20/2019 | | | | (519 | ) |
| | CAD | 258,925 | | | USD | 197,405 | | | | 01/24/2019 | | | | (7,633 | ) |
| | CAD | 380,272 | | | USD | 285,140 | | | | 03/20/2019 | | | | (6,098 | ) |
| | EUR | 80,962 | | | CHF | 91,626 | | | | 03/20/2019 | | | | (533 | ) |
| | EUR | 27,015 | | | GBP | 24,440 | | | | 03/20/2019 | | | | (116 | ) |
| | EUR | 11,749 | | | NOK | 117,023 | | | | 03/20/2019 | | | | (32 | ) |
| | EUR | 26,011 | | | SEK | 264,540 | | | | 03/20/2019 | | | | (37 | ) |
| | EUR | 797,131 | | | USD | 917,960 | | | | 02/08/2019 | | | | (1,783 | ) |
| | GBP | 24,152 | | | EUR | 27,024 | | | | 03/20/2019 | | | | (263 | ) |
| | GBP | 300,832 | | | USD | 385,389 | | | | 01/17/2019 | | | | (1,673 | ) |
| | GBP | 124,884 | | | USD | 160,052 | | | | 03/20/2019 | | | | (282 | ) |
| | NOK | 2,846,084 | | | EUR | 291,267 | | | | 03/20/2019 | | | | (5,595 | ) |
| | NOK | 103,221 | | | USD | 12,191 | | | | 03/20/2019 | | | | (213 | ) |
| | NZD | 44,186 | | | EUR | 25,996 | | | | 03/20/2019 | | | | (279 | ) |
| | NZD | 223,914 | | | USD | 153,903 | | | | 03/20/2019 | | | | (3,410 | ) |
| | USD | 299,135 | | | EUR | 261,202 | | | | 03/20/2019 | | | | (2,069 | ) |
| | USD | 60,972 | | | GBP | 48,021 | | | | 03/20/2019 | | | | (463 | ) |
| | USD | 80,061 | | | JPY | 8,960,919 | | | | 01/15/2019 | | | | (1,781 | ) |
| | USD | 302,390 | | | JPY | 33,745,675 | | | | 03/20/2019 | | | | (7,401 | ) |
| | USD | 117,405 | | | SEK | 1,050,504 | | | | 02/07/2019 | | | | (1,474 | ) |
| | | USD | 43,305 | | | SEK | 383,295 | | | | 03/20/2019 | | | | (209 | ) |
| | | | |
| TOTAL | | | | | | | | | | | | | | $ | (64,103 | ) |
FORWARD SALES CONTRACT —At December 31, 2018, the Fund had the following forward sales contract:
| | | | | | | | | | | | | | | | | | | | |
| Description | | Interest
Rate | | | Maturity
Date(a) | | | Principal
Amount | | | Settlement
Date | | | Value | |
GNMA (Proceeds Received: $1,018,750) | | | 4.000 | % | | | TBA-30yr | | | $ | 1,000,000 | | | | 01/23/2019 | | | $ | (1,024,029 | ) |
| (a) | TBA (To Be Announced) Securities are sold on a forward commitment basis with an approximate principal amounted and no defined maturity date. The actual principal and maturity date will be determined upon settlement when the specific mortgage pools are assigned. |
| | |
| 34 | | The accompanying notes are an integral part of these financial statements. |
GOLDMAN SACHS VARIABLE INSURANCE TRUST CORE FIXED INCOME FUND
ADDITIONAL INVESTMENT INFORMATION (continued)
FUTURES CONTRACTS —At December 31, 2018, the Fund had the following futures contracts:
| | | | | | | | | | | | | | | | |
| Description | | Number of
Contracts | | | Expiration
Date | | | Notional
Amount | | | Unrealized
Appreciation/
(Depreciation) | |
| | | | |
Long position contracts: | | | | | | | | | | | | | | | | |
| Euro-Bobl | | | 4 | | | | 03/07/2019 | | | $ | 607,339 | | | $ | 1,748 | |
| Euro-Bund | | | 2 | | | | 03/07/2019 | | | | 374,752 | | | | 1,805 | |
| U.S. Treasury 10 Year Note | | | 6 | | | | 03/20/2019 | | | | 732,281 | | | | 4,544 | |
| U.S. Treasury 2 Year Note | | | 24 | | | | 03/29/2019 | | | | 5,094,375 | | | | 34,286 | |
| U.S. Treasury 5 Year Note | | | 47 | | | | 03/29/2019 | | | | 5,389,211 | | | | 89,038 | |
U.S. Treasury Long Bond | | | 13 | | | | 03/20/2019 | | | | 1,899,625 | | | | 81,194 | |
| | | | |
| Total | | | | | | | | | | | | | | $ | 212,615 | |
| | | | |
Short position contracts: | | | | | | | | | | | | | | | | |
| 3 Month Euro Euribor | | | (5 | ) | | | 12/16/2019 | | | $ | (1,435,768 | ) | | $ | (859 | ) |
| 3 Month Eurodollar | | | (4 | ) | | | 06/17/2019 | | | | (973,200 | ) | | | 6,793 | |
| 3 Month Eurodollar | | | (1 | ) | | | 09/16/2019 | | | | (243,350 | ) | | | (352 | ) |
| 3 Month Eurodollar | | | (48 | ) | | | 12/16/2019 | | | | (11,680,800 | ) | | | (25,745 | ) |
| 3 Month Eurodollar | | | (4 | ) | | | 12/14/2020 | | | | (975,200 | ) | | | (5,203 | ) |
| Euro-BTP | | | (1 | ) | | | 03/07/2019 | | | | (146,450 | ) | | | (4,611 | ) |
| Euro-OAT | | | (2 | ) | | | 03/07/2019 | | | | (345,558 | ) | | | 155 | |
| U.S. Treasury 10 Year Ultra Note | | | (9 | ) | | | 03/20/2019 | | | | (1,171,406 | ) | | | (29,224 | ) |
U.S. Treasury Ultra Bond | | | (20 | ) | | | 03/20/2019 | | | | (3,221,875 | ) | | | (164,256 | ) |
| | | | |
| Total | | | | | | | | | | | | | | $ | (223,302 | ) |
| | | | |
| Total futures contracts | | | | | | | | | | | | | | $ | (10,687 | ) |
SWAP CONTRACTS —At December 31, 2018, the Fund had the following swap contracts:
CENTRALLY CLEARED CREDIT DEFAULT SWAP CONTRACTS
| | | | | | | | | | | | | | | | | | | | | | | | | | |
| Reference Obligation/Index | | Financing
Rate
Received
(Paid) by
the Fund | | | Credit
Spread at
December 31,
2018(a) | | | Termination
Date | | Notional
Amount (000’s) | | | Value | | | Upfront Premium (Received) Paid | | | Unrealized
Appreciation/
(Depreciation) | |
| |
Protection Purchased(b): | | | | | |
| iTraxx Europe Index | | | (1.000 | )% | | | 0.888 | % | | 12/20/2023 | | | EUR 190 | | | $ | (1,262 | ) | | $ | (1,534 | ) | | $ | 272 | |
| | | | | | | |
Protection Sold(c): | | | | | | | | | | | | | | | | | | | | | | | | | | |
| Markit CDX North America Investment Grade Index | | | 1.000 | | | | 0.806 | | | 06/20/2023 | | | USD 2,175 | | | | 18,150 | | | | 33,366 | | | | (15,216 | ) |
| Markit CDX North America Investment Grade Index | | | 1.000 | | | | 0.878 | | | 12/20/2023 | | | 1,495 | | | | 8,828 | | | | 17,713 | | | | (8,885 | ) |
| | | | | | | |
| TOTAL | | | | | | | | | | | | | | | | $ | 25,716 | | | $ | 49,545 | | | $ | (23,829 | ) |
| (a) | Credit spread on the referenced obligation, together with the period of expiration, are indicators of payment/performance risk. The likelihood of a credit event occurring which would require a fund or its counterparty to make a payment or otherwise be required to perform under the swap contract is generally greater as the credit spread and term of the swap contract increase. |
| (b) | Payments made quarterly. |
| (c) | Payments received quarterly. |
| | |
| The accompanying notes are an integral part of these financial statements. | | 35 |
GOLDMAN SACHS VARIABLE INSURANCE TRUST CORE FIXED INCOME FUND
Schedule of Investments(continued)
December 31, 2018
ADDITIONAL INVESTMENT INFORMATION (continued)
CENTRALLY CLEARED INTEREST RATE SWAP CONTRACTS
| | | | | | | | | | | | | | | | | | | | | | | | |
Payments Made by the Fund | | Payments Received by the Fund | | | Termination
Date | | | Notional
Amount
(000’s) | | | Value | | | Upfront
Premium
(Received)
Paid | | | Unrealized
Appreciation/
(Depreciation) | |
| 3 Month EURIBOR(b) | | | (0.085)% | | | | 11/22/2020 | | | EUR | 1,830 | (a) | | $ | 2,443 | | | $ | 100 | | | $ | 2,343 | |
| 3 Month EURIBOR(b) | | | (0.100) | | | | 01/16/2021 | | | EUR | 790 | (a) | | | 2,411 | | | | (125 | ) | | | 2,536 | |
| 0.050%(c) | | | 3 Month STIBOR | | | | 01/16/2021 | | | SEK | 5,830 | (a) | | | 275 | | | | (238 | ) | | | 513 | |
| 3 Month BA(d) | | | 2.500 | | | | 03/20/2021 | | | CAD | 320 | (a) | | | 1,245 | | | | 119 | | | | 1,126 | |
| 3 Month BBR(b) | | | 2.250 | | | | 03/20/2021 | | | NZD | 1,170 | (a) | | | 4,167 | | | | 1,971 | | | | 2,196 | |
| 2.750(d) | | | 3 Month LIBOR | | | | 03/20/2021 | | | USD | 1,510 | (a) | | | (3,503 | ) | | | 4,260 | | | | (7,763 | ) |
| 6 Month EURIBOR(d) | | | 0.350 | | | | 12/16/2021 | | | EUR | 1,410 | (a) | | | 11,550 | | | | (2,753 | ) | | | 14,303 | |
| 0.500(c) | | | 3 Month STIBOR | | | | 12/16/2021 | | | SEK | 11,710 | (a) | | | (4,567 | ) | | | 4,304 | | | | (8,871 | ) |
| 6 Month EURIBOR(d) | | | 0.600 | | | | 09/28/2022 | | | EUR | 660 | (a) | | | 5,954 | | | | (22 | ) | | | 5,976 | |
| 6 Month EURIBOR(d) | | | 0.500 | | | | 03/20/2023 | | | EUR | 450 | (a) | | | 8,200 | | | | 6,082 | | | | 2,118 | |
| 0.500(c) | | | 3 Month STIBOR | | | | 03/20/2023 | | | SEK | 3,570 | (a) | | | (1,548 | ) | | | (1,090 | ) | | | (458 | ) |
| 1.100(c) | | | 1 Day SONIA | | | | 08/01/2023 | | | GBP | 240 | | | | (1,814 | ) | | | (561 | ) | | | (1,253 | ) |
| 6 Month EURIBOR(d) | | | 0.670 | | | | 08/03/2023 | | | EUR | 410 | (a) | | | 4,963 | | | | 280 | | | | 4,683 | |
| 2.750(d) | | | 6 Month BBR | | | | 03/20/2024 | | | AUD | 840 | (a) | | | (14,840 | ) | | | (11,169 | ) | | | (3,671 | ) |
| 3 Month BA(d) | | | 2.500 | | | | 03/20/2024 | | | CAD | 630 | (a) | | | 4,453 | | | | 92 | | | | 4,361 | |
| 6 Month EURIBOR(d) | | | 0.500 | | | | 03/20/2024 | | | EUR | 1,810 | (a) | | | 26,580 | | | | 17,958 | | | | 8,622 | |
| 6 Month NIBOR(d) | | | 2.000 | | | | 03/20/2024 | | | NOK | 980 | (a) | | | 918 | | | | 384 | | | | 534 | |
| 0.750(c) | | | 3 Month STIBOR | | | | 03/20/2024 | | | SEK | 9,450 | (a) | | | (9,907 | ) | | | (8,014 | ) | | | (1,893 | ) |
| 2.750(d) | | | 3 Month LIBOR | | | | 03/20/2024 | | | USD | 870 | (a) | | | (7,338 | ) | | | 3,571 | | | | (10,909 | ) |
| 1.900(d) | | | 6 Month LIBOR | | | | 08/03/2028 | | | GBP | 180 | (a) | | | (3,696 | ) | | | (308 | ) | | | (3,388 | ) |
| 6 Month LIBOR(d) | | | 1.050 | | | | 08/07/2028 | | | CHF | 280 | (a) | | | 3,819 | | | | (235 | ) | | | 4,054 | |
| 1.150(c) | | | 1 Day SONIA | | | | 12/18/2028 | | | GBP | 40 | | | | 18 | | | | 47 | | | | (29 | ) |
| 6 Month EURIBOR(d) | | | 1.000 | | | | 03/20/2029 | | | EUR | 240 | (a) | | | 4,021 | | | | 2,172 | | | | 1,849 | |
| 1.250(c) | | | 3 Month STIBOR | | | | 03/20/2029 | | | SEK | 760 | (a) | | | (691 | ) | | | (423 | ) | | | (268 | ) |
| 3 Month LIBOR(b) | | | 3.000 | | | | 03/20/2029 | | | USD | 60 | (a) | | | 1,510 | | | | 410 | | | | 1,100 | |
| 3 Month LIBOR(b) | | | 3.500 | | | | 11/08/2048 | | | USD | 100 | (a) | | | 6,905 | | | | 1,860 | | | | 5,045 | |
| 1.000(d) | | | 6 Month LIBOR | | | | 03/20/2049 | | | JPY | 14,740 | (a) | | | (10,147 | ) | | | (5,396 | ) | | | (4,751 | ) |
| | | | | | |
| TOTAL | | | | | | | | | | | | | | $ | 31,381 | | | $ | 13,276 | | | $ | 18,105 | |
| (a) | Represents forward starting interest rate swaps whose effective dates of commencement of accruals and cash flows occur subsequent to December 31, 2018. |
| (b) | Payments made quarterly. |
| (c) | Payments made annually. |
| (d) | Payments made semi-annually. |
| | |
| 36 | | The accompanying notes are an integral part of these financial statements. |
GOLDMAN SACHS VARIABLE INSURANCE TRUST EQUITY INDEX FUND
Schedule of Investments
December 31, 2018
| | | | | | | | |
Shares | | | Description | | Value | |
|
| | Common Stocks – 99.5% | |
| | Automobiles & Components – 0.5% | |
| | 1,933 | | | Aptiv plc | | $ | 119,015 | |
| | 1,437 | | | BorgWarner, Inc. | | | 49,921 | |
| | 28,318 | | | Ford Motor Co. | | | 216,633 | |
| | 9,707 | | | General Motors Co. | | | 324,699 | |
| | 1,729 | | | Goodyear Tire & Rubber Co. (The) | | | 35,289 | |
| | 1,249 | | | Harley-Davidson, Inc. | | | 42,616 | |
| | | | | | | | |
| | | | | | | 788,173 | |
| | |
| | Banks – 5.6% | |
| | 67,132 | | | Bank of America Corp. | | | 1,654,133 | |
| | 5,740 | | | BB&T Corp. | | | 248,657 | |
| | 17,962 | | | Citigroup, Inc. | | | 935,102 | |
| | 3,384 | | | Citizens Financial Group, Inc. | | | 100,606 | |
| | 1,154 | | | Comerica, Inc. | | | 79,268 | |
| | 4,978 | | | Fifth Third Bancorp | | | 117,132 | |
| | 1,199 | | | First Republic Bank | | | 104,193 | |
| | 8,155 | | | Huntington Bancshares, Inc. | | | 97,208 | |
| | 24,357 | | | JPMorgan Chase & Co. | | | 2,377,730 | |
| | 7,473 | | | KeyCorp | | | 110,451 | |
| | 1,065 | | | M&T Bank Corp. | | | 152,433 | |
| | 2,617 | | | People’s United Financial, Inc. | | | 37,763 | |
| | 3,429 | | | PNC Financial Services Group, Inc. (The) | | | 400,884 | |
| | 7,428 | | | Regions Financial Corp. | | | 99,387 | |
| | 3,248 | | | SunTrust Banks, Inc. | | | 163,829 | |
| | 390 | | | SVB Financial Group* | | | 74,069 | |
| | 11,157 | | | US Bancorp | | | 509,875 | |
| | 31,160 | | | Wells Fargo & Co. | | | 1,435,853 | |
| | 1,442 | | | Zions Bancorp NA | | | 58,747 | |
| | | | | | | | |
| | | | | | | 8,757,320 | |
| | |
| | Capital Goods – 6.4% | |
| | 4,280 | | | 3M Co. | | | 815,511 | |
| | 666 | | | Allegion plc | | | 53,087 | |
| | 1,657 | | | AMETEK, Inc. | | | 112,179 | |
| | 1,081 | | | AO Smith Corp. | | | 46,159 | |
| | 2,985 | | | Arconic, Inc. | | | 50,327 | |
| | 3,865 | | | Boeing Co. (The) | | | 1,246,463 | |
| | 4,329 | | | Caterpillar, Inc. | | | 550,086 | |
| | 1,121 | | | Cummins, Inc. | | | 149,810 | |
| | 2,380 | | | Deere & Co. | | | 355,025 | |
| | 1,098 | | | Dover Corp. | | | 77,903 | |
| | 3,121 | | | Eaton Corp. plc | | | 214,288 | |
| | 4,563 | | | Emerson Electric Co. | | | 272,639 | |
| | 2,093 | | | Fastenal Co. | | | 109,443 | |
| | 906 | | | Flowserve Corp. | | | 34,446 | |
| | 988 | | | Fluor Corp. | | | 31,814 | |
| | 2,217 | | | Fortive Corp. | | | 150,002 | |
| | 1,039 | | | Fortune Brands Home & Security, Inc. | | | 39,472 | |
| | 2,059 | | | General Dynamics Corp. | | | 323,695 | |
| | 64,113 | | | General Electric Co. | | | 485,335 | |
| | 877 | | | Harris Corp. | | | 118,088 | |
| | 5,417 | | | Honeywell International, Inc. | | | 715,694 | |
| | 319 | | | Huntington Ingalls Industries, Inc. | | | 60,709 | |
| | 2,285 | | | Illinois Tool Works, Inc. | | | 289,487 | |
| | |
|
| | Common Stocks – (continued) | |
| | Capital Goods – (continued) | |
| | 1,816 | | | Ingersoll-Rand plc | | $ | 165,674 | |
| | 903 | | | Jacobs Engineering Group, Inc. | | | 52,789 | |
| | 6,790 | | | Johnson Controls International plc | | | 201,324 | |
| | 581 | | | L3 Technologies, Inc. | | | 100,896 | |
| | 1,805 | | | Lockheed Martin Corp. | | | 472,621 | |
| | 2,210 | | | Masco Corp. | | | 64,620 | |
| | 1,288 | | | Northrop Grumman Corp. | | | 315,431 | |
| | 2,566 | | | PACCAR, Inc. | | | 146,621 | |
| | 987 | | | Parker-Hannifin Corp. | | | 147,201 | |
| | 1,227 | | | Pentair plc | | | 46,356 | |
| | 1,029 | | | Quanta Services, Inc. | | | 30,973 | |
| | 2,109 | | | Raytheon Co. | | | 323,415 | |
| | 876 | | | Rockwell Automation, Inc. | | | 131,821 | |
| | 763 | | | Roper Technologies, Inc. | | | 203,355 | |
| | 398 | | | Snap-on, Inc. | | | 57,825 | |
| | 1,131 | | | Stanley Black & Decker, Inc. | | | 135,426 | |
| | 1,832 | | | Textron, Inc. | | | 84,254 | |
| | 354 | | | TransDigm Group, Inc.* | | | 120,381 | |
| | 605 | | | United Rentals, Inc.* | | | 62,031 | |
| | 5,907 | | | United Technologies Corp. | | | 628,977 | |
| | 324 | | | WW Grainger, Inc. | | | 91,485 | |
| | 1,339 | | | Xylem, Inc. | | | 89,338 | |
| | | | | | | | |
| | | | | | | 9,974,476 | |
| | |
| | Commercial & Professional Services – 0.7% | |
| | 622 | | | Cintas Corp. | | | 104,490 | |
| | 1,509 | | | Copart, Inc.* | | | 72,100 | |
| | 901 | | | Equifax, Inc. | | | 83,910 | |
| | 2,597 | | | IHS Markit Ltd.* | | | 124,578 | |
| | 2,557 | | | Nielsen Holdings plc | | | 59,655 | |
| | 1,549 | | | Republic Services, Inc. | | | 111,667 | |
| | 917 | | | Robert Half International, Inc. | | | 52,452 | |
| | 1,077 | | | Rollins, Inc. | | | 38,880 | |
| | 1,231 | | | Verisk Analytics, Inc.* | | | 134,228 | |
| | 2,926 | | | Waste Management, Inc. | | | 260,385 | |
| | | | | | | | |
| | | | | | | 1,042,345 | |
| | |
| | Consumer Durables & Apparel – 1.1% | |
| | 2,535 | | | DR Horton, Inc. | | | 87,863 | |
| | 927 | | | Garmin Ltd. | | | 58,698 | |
| | 2,697 | | | Hanesbrands, Inc. | | | 33,793 | |
| | 815 | | | Hasbro, Inc. | | | 66,219 | |
| | 931 | | | Leggett & Platt, Inc. | | | 33,367 | |
| | 2,205 | | | Lennar Corp. Class A | | | 86,326 | |
| | 2,376 | | | Mattel, Inc.* | | | 23,736 | |
| | 1,057 | | | Michael Kors Holdings Ltd.* | | | 40,081 | |
| | 473 | | | Mohawk Industries, Inc.* | | | 55,322 | |
| | 3,034 | | | Newell Brands, Inc. | | | 56,402 | |
| | 9,337 | | | NIKE, Inc. Class B | | | 692,245 | |
| | 1,915 | | | PulteGroup, Inc. | | | 49,771 | |
| | 579 | | | PVH Corp. | | | 53,818 | |
| | 413 | | | Ralph Lauren Corp. | | | 42,729 | |
| | 2,140 | | | Tapestry, Inc. | | | 72,225 | |
| | 1,254 | | | Under Armour, Inc. Class A* | | | 22,158 | |
| | 1,232 | | | Under Armour, Inc. Class C* | | | 19,922 | |
| | |
| | |
| The accompanying notes are an integral part of these financial statements. | | 37 |
GOLDMAN SACHS VARIABLE INSURANCE TRUST EQUITY INDEX FUND
Schedule of Investments(continued)
December 31, 2018
| | | | | | | | |
Shares | | | Description | | Value | |
|
| | Common Stocks – (continued) | |
| | Consumer Durables & Apparel – (continued) | |
| | 2,418 | | | VF Corp. | | $ | 172,500 | |
| | 464 | | | Whirlpool Corp. | | | 49,588 | |
| | | | | | | | |
| | | | | | | 1,716,763 | |
| | |
| | Consumer Services – 1.9% | |
| | 2,878 | | | Carnival Corp. | | | 141,885 | |
| | 176 | | | Chipotle Mexican Grill, Inc.* | | | 75,995 | |
| | 929 | | | Darden Restaurants, Inc. | | | 92,770 | |
| | 1,623 | | | H&R Block, Inc. | | | 41,175 | |
| | 2,226 | | | Hilton Worldwide Holdings, Inc. | | | 159,827 | |
| | 2,073 | | | Marriott International, Inc. Class A | | | 225,045 | |
| | 5,674 | | | McDonald’s Corp. | | | 1,007,532 | |
| | 3,644 | | | MGM Resorts International | | | 88,403 | |
| | 1,409 | | | Norwegian Cruise Line Holdings Ltd.* | | | 59,728 | |
| | 1,262 | | | Royal Caribbean Cruises Ltd. | | | 123,411 | |
| | 9,082 | | | Starbucks Corp. | | | 584,881 | |
| | 744 | | | Wynn Resorts Ltd. | | | 73,589 | |
| | 2,279 | | | Yum! Brands, Inc. | | | 209,486 | |
| | | | | | | | |
| | | | | | | 2,883,727 | |
| | |
| | Diversified Financials – 5.3% | |
| | 380 | | | Affiliated Managers Group, Inc. | | | 37,027 | |
| | 5,144 | | | American Express Co. | | | 490,326 | |
| | 1,037 | | | Ameriprise Financial, Inc. | | | 108,232 | |
| | 6,746 | | | Bank of New York Mellon Corp. (The) | | | 317,534 | |
| | 14,281 | | | Berkshire Hathaway, Inc. Class B* | | | 2,915,895 | |
| | 884 | | | BlackRock, Inc. | | | 347,253 | |
| | 3,542 | | | Capital One Financial Corp. | | | 267,740 | |
| | 841 | | | Cboe Global Markets, Inc. | | | 82,275 | |
| | 8,884 | | | Charles Schwab Corp. (The) | | | 368,953 | |
| | 2,577 | | | CME Group, Inc. | | | 484,785 | |
| | 2,454 | | | Discover Financial Services | | | 144,737 | |
| | 1,829 | | | E*TRADE Financial Corp. | | | 80,256 | |
| | 2,129 | | | Franklin Resources, Inc. | | | 63,146 | |
| | 2,522 | | | Goldman Sachs Group, Inc. (The)(a) | | | 421,300 | |
| | 4,244 | | | Intercontinental Exchange, Inc. | | | 319,700 | |
| | 3,083 | | | Invesco Ltd. | | | 51,609 | |
| | 2,127 | | | Jefferies Financial Group, Inc. | | | 36,925 | |
| | 1,213 | | | Moody’s Corp. | | | 169,868 | |
| | 9,526 | | | Morgan Stanley | | | 377,706 | |
| | 644 | | | MSCI, Inc. | | | 94,945 | |
| | 835 | | | Nasdaq, Inc. | | | 68,111 | |
| | 1,666 | | | Northern Trust Corp. | | | 139,261 | |
| | 924 | | | Raymond James Financial, Inc. | | | 68,755 | |
| | 1,831 | | | S&P Global, Inc. | | | 311,160 | |
| | 2,822 | | | State Street Corp. | | | 177,984 | |
| | 4,871 | | | Synchrony Financial | | | 114,274 | |
| | 1,764 | | | T. Rowe Price Group, Inc. | | | 162,852 | |
| | | | | | | | |
| | | | | | | 8,222,609 | |
| | |
| | Energy – 5.3% | |
| | 3,769 | | | Anadarko Petroleum Corp. | | | 165,233 | |
| | 2,762 | | | Apache Corp. | | | 72,503 | |
| | 3,018 | | | Baker Hughes a GE Co. | | | 64,887 | |
| | 3,095 | | | Cabot Oil & Gas Corp. | | | 69,173 | |
| | |
|
| | Common Stocks – (continued) | |
| | Energy – (continued) | |
| | 14,027 | | | Chevron Corp. | | $ | 1,525,997 | |
| | 696 | | | Cimarex Energy Co. | | | 42,908 | |
| | 1,490 | | | Concho Resources, Inc.* | | | 153,157 | |
| | 8,467 | | | ConocoPhillips | | | 527,918 | |
| | 3,341 | | | Devon Energy Corp. | | | 75,306 | |
| | 1,111 | | | Diamondback Energy, Inc. | | | 102,990 | |
| | 4,225 | | | EOG Resources, Inc. | | | 368,462 | |
| | 31,009 | | | Exxon Mobil Corp. | | | 2,114,504 | |
| | 6,411 | | | Halliburton Co. | | | 170,404 | |
| | 800 | | | Helmerich & Payne, Inc. | | | 38,352 | |
| | 1,795 | | | Hess Corp. | | | 72,698 | |
| | 1,140 | | | HollyFrontier Corp. | | | 58,277 | |
| | 13,711 | | | Kinder Morgan, Inc. | | | 210,875 | |
| | 6,132 | | | Marathon Oil Corp. | | | 87,933 | |
| | 4,963 | | | Marathon Petroleum Corp. | | | 292,867 | |
| | 2,775 | | | National Oilwell Varco, Inc. | | | 71,318 | |
| | 1,411 | | | Newfield Exploration Co.* | | | 20,685 | |
| | 3,593 | | | Noble Energy, Inc. | | | 67,405 | |
| | 5,586 | | | Occidental Petroleum Corp. | | | 342,869 | |
| | 2,965 | | | ONEOK, Inc. | | | 159,962 | |
| | 3,163 | | | Phillips 66 | | | 272,492 | |
| | 1,239 | | | Pioneer Natural Resources Co. | | | 162,953 | |
| | 10,215 | | | Schlumberger Ltd. | | | 368,557 | |
| | 3,216 | | | TechnipFMC plc | | | 62,969 | |
| | 3,127 | | | Valero Energy Corp. | | | 234,431 | |
| | 8,745 | | | Williams Cos., Inc. (The) | | | 192,827 | |
| | | | | | | | |
| | | | | | | 8,170,912 | |
| | |
| | Food & Staples Retailing – 1.6% | |
| | 3,198 | | | Costco Wholesale Corp. | | | 651,465 | |
| | 5,905 | | | Kroger Co. (The) | | | 162,388 | |
| | 3,467 | | | Sysco Corp. | | | 217,242 | |
| | 5,913 | | | Walgreens Boots Alliance, Inc. | | | 404,035 | |
| | 10,476 | | | Walmart, Inc. | | | 975,839 | |
| | | | | | | | |
| | | | | | | 2,410,969 | |
| | |
| | Food, Beverage & Tobacco – 4.0% | |
| | 13,750 | | | Altria Group, Inc. | | | 679,112 | |
| | 4,079 | | | Archer-Daniels-Midland Co. | | | 167,117 | |
| | 1,236 | | | Brown-Forman Corp. Class B | | | 58,809 | |
| | 1,352 | | | Campbell Soup Co. | | | 44,602 | |
| | 28,012 | | | Coca-Cola Co. (The) | | | 1,326,368 | |
| | 3,405 | | | Conagra Brands, Inc. | | | 72,731 | |
| | 1,213 | | | Constellation Brands, Inc. Class A | | | 195,075 | |
| | 4,436 | | | General Mills, Inc. | | | 172,738 | |
| | 1,040 | | | Hershey Co. (The) | | | 111,467 | |
| | 1,987 | | | Hormel Foods Corp. | | | 84,805 | |
| | 818 | | | JM Smucker Co. (The) | | | 76,475 | |
| | 1,817 | | | Kellogg Co. | | | 103,587 | |
| | 4,616 | | | Kraft Heinz Co. (The) | | | 198,673 | |
| | 1,072 | | | Lamb Weston Holdings, Inc. | | | 78,856 | |
| | 873 | | | McCormick & Co., Inc.(Non-Voting) | | | 121,557 | |
| | 1,400 | | | Molson Coors Brewing Co. Class B | | | 78,624 | |
| | 10,604 | | | Mondelez International, Inc. Class A | | | 424,478 | |
| | 2,847 | | | Monster Beverage Corp.* | | | 140,129 | |
| | |
| | |
| 38 | | The accompanying notes are an integral part of these financial statements. |
GOLDMAN SACHS VARIABLE INSURANCE TRUST EQUITY INDEX FUND
| | | | | | | | |
Shares | | | Description | | Value | |
|
| | Common Stocks – (continued) | |
| | Food, Beverage & Tobacco – (continued) | |
| | 10,348 | | | PepsiCo, Inc. | | $ | 1,143,247 | |
| | 11,347 | | | Philip Morris International, Inc. | | | 757,526 | |
| | 2,107 | | | Tyson Foods, Inc. Class A | | | 112,514 | |
| | | | | | | | |
| | | | | | | 6,148,490 | |
| | |
| | Health Care Equipment & Services – 6.7% | |
| | 12,804 | | | Abbott Laboratories | | | 926,113 | |
| | 336 | | | ABIOMED, Inc.* | | | 109,214 | |
| | 535 | | | Align Technology, Inc.* | | | 112,045 | |
| | 1,168 | | | AmerisourceBergen Corp. | | | 86,899 | |
| | 1,918 | | | Anthem, Inc. | | | 503,724 | |
| | 3,605 | | | Baxter International, Inc. | | | 237,281 | |
| | 1,976 | | | Becton Dickinson and Co. | | | 445,232 | |
| | 10,224 | | | Boston Scientific Corp.* | | | 361,316 | |
| | 2,259 | | | Cardinal Health, Inc. | | | 100,751 | |
| | 1,500 | | | Centene Corp.* | | | 172,950 | |
| | 2,461 | | | Cerner Corp.* | | | 129,055 | |
| | 2,810 | | | Cigna Corp. | | | 533,675 | |
| | 366 | | | Cooper Cos., Inc. (The) | | | 93,147 | |
| | 9,422 | | | CVS Health Corp. | | | 617,330 | |
| | 4,547 | | | Danaher Corp. | | | 468,887 | |
| | 887 | | | DaVita, Inc.* | | | 45,645 | |
| | 1,701 | | | DENTSPLY SIRONA, Inc. | | | 63,294 | |
| | 1,528 | | | Edwards Lifesciences Corp.* | | | 234,044 | |
| | 1,951 | | | HCA Healthcare, Inc. | | | 242,802 | |
| | 1,129 | | | Henry Schein, Inc.* | | | 88,649 | |
| | 1,906 | | | Hologic, Inc.* | | | 78,337 | |
| | 1,019 | | | Humana, Inc. | | | 291,923 | |
| | 639 | | | IDEXX Laboratories, Inc.* | | | 118,867 | |
| | 840 | | | Intuitive Surgical, Inc.* | | | 402,293 | |
| | 722 | | | Laboratory Corp. of America Holdings* | | | 91,232 | |
| | 1,432 | | | McKesson Corp. | | | 158,193 | |
| | 9,857 | | | Medtronic plc | | | 896,593 | |
| | 1,024 | | | Quest Diagnostics, Inc. | | | 85,269 | |
| | 1,068 | | | ResMed, Inc. | | | 121,613 | |
| | 2,295 | | | Stryker Corp. | | | 359,741 | |
| | 7,047 | | | UnitedHealth Group, Inc. | | | 1,755,549 | |
| | 616 | | | Universal Health Services, Inc. Class B | | | 71,801 | |
| | 653 | | | Varian Medical Systems, Inc.* | | | 73,991 | |
| | 360 | | | WellCare Health Plans, Inc.* | | | 84,992 | |
| | 1,463 | | | Zimmer Biomet Holdings, Inc. | | | 151,742 | |
| | | | | | | | |
| | | | | | | 10,314,189 | |
| | |
| | Household & Personal Products – 1.8% | |
| | 1,773 | | | Church & Dwight Co., Inc. | | | 116,592 | |
| | 940 | | | Clorox Co. (The) | | | 144,892 | |
| | 6,415 | | | Colgate-Palmolive Co. | | | 381,821 | |
| | 3,489 | | | Coty, Inc. Class A | | | 22,888 | |
| | 1,617 | | | Estee Lauder Cos., Inc. (The) Class A | | | 210,372 | |
| | 2,529 | | | Kimberly-Clark Corp. | | | 288,154 | |
| | 18,223 | | | Procter & Gamble Co. (The) | | | 1,675,058 | |
| | | | | | | | |
| | | | | | | 2,839,777 | |
| | |
|
| | Common Stocks – (continued) | |
| | Insurance – 2.4% | |
| | 5,641 | | | Aflac, Inc. | | $ | 257,004 | |
| | 2,571 | | | Allstate Corp. (The) | | | 212,442 | |
| | 6,420 | | | American International Group, Inc. | | | 253,012 | |
| | 1,798 | | | Aon plc | | | 261,357 | |
| | 1,356 | | | Arthur J Gallagher & Co. | | | 99,937 | |
| | 397 | | | Assurant, Inc. | | | 35,508 | |
| | 940 | | | Brighthouse Financial, Inc.* | | | 28,651 | |
| | 3,422 | | | Chubb Ltd. | | | 442,054 | |
| | 1,136 | | | Cincinnati Financial Corp. | | | 87,949 | |
| | 305 | | | Everest Re Group Ltd. | | | 66,417 | |
| | 2,620 | | | Hartford Financial Services Group, Inc. (The) | | | 116,459 | |
| | 1,630 | | | Lincoln National Corp. | | | 83,635 | |
| | 2,095 | | | Loews Corp. | | | 95,364 | |
| | 3,672 | | | Marsh & McLennan Cos., Inc. | | | 292,842 | |
| | 7,363 | | | MetLife, Inc. | | | 302,325 | |
| | 2,000 | | | Principal Financial Group, Inc. | | | 88,340 | |
| | 4,262 | | | Progressive Corp. (The) | | | 257,127 | |
| | 3,089 | | | Prudential Financial, Inc. | | | 251,908 | |
| | 747 | | | Torchmark Corp. | | | 55,674 | |
| | 1,969 | | | Travelers Cos., Inc. (The) | | | 235,788 | |
| | 1,673 | | | Unum Group | | | 49,153 | |
| | 977 | | | Willis Towers Watson plc | | | 148,367 | |
| | | | | | | | |
| | | | | | | 3,721,313 | |
| | |
| | Materials – 2.7% | |
| | 1,585 | | | Air Products & Chemicals, Inc. | | | 253,679 | |
| | 822 | | | Albemarle Corp. | | | 63,351 | |
| | 631 | | | Avery Dennison Corp. | | | 56,683 | |
| | 2,434 | | | Ball Corp. | | | 111,915 | |
| | 981 | | | Celanese Corp. | | | 88,261 | |
| | 1,681 | | | CF Industries Holdings, Inc. | | | 73,140 | |
| | 16,874 | | | DowDuPont, Inc. | | | 902,421 | |
| | 991 | | | Eastman Chemical Co. | | | 72,452 | |
| | 1,883 | | | Ecolab, Inc. | | | 277,460 | |
| | 985 | | | FMC Corp. | | | 72,851 | |
| | 10,860 | | | Freeport-McMoRan, Inc. | | | 111,967 | |
| | 735 | | | International Flavors & Fragrances, Inc. | | | 98,688 | |
| | 2,902 | | | International Paper Co. | | | 117,125 | |
| | 4,015 | | | Linde plc | | | 626,501 | |
| | 2,372 | | | LyondellBasell Industries NV Class A | | | 197,255 | |
| | 449 | | | Martin Marietta Materials, Inc. | | | 77,170 | |
| | 2,585 | | | Mosaic Co. (The) | | | 75,508 | |
| | 3,881 | | | Newmont Mining Corp. | | | 134,477 | |
| | 2,351 | | | Nucor Corp. | | | 121,805 | |
| | 705 | | | Packaging Corp. of America | | | 58,839 | |
| | 1,733 | | | PPG Industries, Inc. | | | 177,165 | |
| | 1,214 | | | Sealed Air Corp. | | | 42,296 | |
| | 604 | | | Sherwin-Williams Co. (The) | | | 237,650 | |
| | 974 | | | Vulcan Materials Co. | | | 96,231 | |
| | 1,834 | | | Westrock Co. | | | 69,252 | |
| | | | | | | | |
| | | | | | | 4,214,142 | |
| | |
| | |
| The accompanying notes are an integral part of these financial statements. | | 39 |
GOLDMAN SACHS VARIABLE INSURANCE TRUST EQUITY INDEX FUND
Schedule of Investments(continued)
December 31, 2018
| | | | | | | | |
Shares | | | Description | | Value | |
|
| | Common Stocks – (continued) | |
| | Media & Entertainment – 7.9% | |
| | 5,641 | | | Activision Blizzard, Inc. | | $ | 262,701 | |
| | 2,189 | | | Alphabet, Inc. Class A* | | | 2,287,418 | |
| | 2,255 | | | Alphabet, Inc. Class C* | | | 2,335,301 | |
| | 2,404 | | | CBS Corp.(Non-Voting) Class B | | | 105,103 | |
| | 1,284 | | | Charter Communications, Inc. Class A* | | | 365,902 | |
| | 33,220 | | | Comcast Corp. Class A | | | 1,131,141 | |
| | 1,181 | | | Discovery, Inc. Class A* | | | 29,218 | |
| | 2,727 | | | Discovery, Inc. Class C* | | | 62,939 | |
| | 1,615 | | | DISH Network Corp. Class A* | | | 40,327 | |
| | 2,237 | | | Electronic Arts, Inc.* | | | 176,522 | |
| | 17,596 | | | Facebook, Inc. Class A* | | | 2,306,660 | |
| | 2,948 | | | Interpublic Group of Cos., Inc. (The) | | | 60,817 | |
| | 3,177 | | | Netflix, Inc.* | | | 850,356 | |
| | 2,809 | | | News Corp. Class A | | | 31,882 | |
| | 1,017 | | | News Corp. Class B | | | 11,746 | |
| | 1,593 | | | Omnicom Group, Inc. | | | 116,671 | |
| | 832 | | | Take-Two Interactive Software, Inc.* | | | 85,646 | |
| | 693 | | | TripAdvisor, Inc.* | | | 37,380 | |
| | 7,795 | | | Twenty-First Century Fox, Inc. Class A | | | 375,095 | |
| | 3,632 | | | Twenty-First Century Fox, Inc. Class B | | | 173,537 | |
| | 5,364 | | | Twitter, Inc.* | | | 154,161 | |
| | 2,641 | | | Viacom, Inc. Class B | | | 67,874 | |
| | 10,882 | | | Walt Disney Co. (The) | | | 1,193,211 | |
| | | | | | | | |
| | | | | | | 12,261,608 | |
| | |
| | Pharmaceuticals, Biotechnology & Life Sciences – 8.8% | |
| | 11,073 | | | AbbVie, Inc. | | | 1,020,820 | |
| | 2,314 | | | Agilent Technologies, Inc. | | | 156,102 | |
| | 1,635 | | | Alexion Pharmaceuticals, Inc.* | | | 159,183 | |
| | 2,359 | | | Allergan plc | | | 315,304 | |
| | 4,660 | | | Amgen, Inc. | | | 907,162 | |
| | 1,487 | | | Biogen, Inc.* | | | 447,468 | |
| | 11,895 | | | Bristol-Myers Squibb Co. | | | 618,302 | |
| | 5,136 | | | Celgene Corp.* | | | 329,166 | |
| | 6,892 | | | Eli Lilly & Co. | | | 797,542 | |
| | 9,450 | | | Gilead Sciences, Inc. | | | 591,097 | |
| | 1,087 | | | Illumina, Inc.* | | | 326,024 | |
| | 1,335 | | | Incyte Corp.* | | | 84,893 | |
| | 1,211 | | | IQVIA Holdings, Inc.* | | | 140,682 | |
| | 19,652 | | | Johnson & Johnson | | | 2,536,091 | |
| | 19,126 | | | Merck & Co., Inc. | | | 1,461,418 | |
| | 186 | | | Mettler-Toledo International, Inc.* | | | 105,198 | |
| | 3,849 | | | Mylan NV* | | | 105,463 | |
| | 1,164 | | | Nektar Therapeutics* | | | 38,261 | |
| | 783 | | | PerkinElmer, Inc. | | | 61,505 | |
| | 944 | | | Perrigo Co. plc | | | 36,580 | |
| | 42,516 | | | Pfizer, Inc. | | | 1,855,823 | |
| | 568 | | | Regeneron Pharmaceuticals, Inc.* | | | 212,148 | |
| | 2,937 | | | Thermo Fisher Scientific, Inc. | | | 657,271 | |
| | 1,865 | | | Vertex Pharmaceuticals, Inc.* | | | 309,049 | |
| | 579 | | | Waters Corp.* | | | 109,228 | |
| | 3,566 | | | Zoetis, Inc. | | | 305,036 | |
| | | | | | | | |
| | | | | | | 13,686,816 | |
| | |
|
| | Common Stocks – (continued) | |
| | Real Estate – 2.9% | |
| | 743 | | | Alexandria Real Estate Equities, Inc. (REIT) | | $ | 85,623 | |
| | 3,211 | | | American Tower Corp. (REIT) | | | 507,948 | |
| | 1,113 | | | Apartment Investment & Management Co. Class A (REIT) | | | 48,838 | |
| | 1,017 | | | AvalonBay Communities, Inc. (REIT) | | | 177,009 | |
| | 1,134 | | | Boston Properties, Inc. (REIT) | | | 127,632 | |
| | 2,381 | | | CBRE Group, Inc. Class A* | | | 95,335 | |
| | 3,008 | | | Crown Castle International Corp. (REIT) | | | 326,759 | |
| | 1,507 | | | Digital Realty Trust, Inc. (REIT) | | | 160,571 | |
| | 2,616 | | | Duke Realty Corp. (REIT) | | | 67,754 | |
| | 583 | | | Equinix, Inc. (REIT) | | | 205,543 | |
| | 2,704 | | | Equity Residential (REIT) | | | 178,491 | |
| | 489 | | | Essex Property Trust, Inc. (REIT) | | | 119,908 | |
| | 931 | | | Extra Space Storage, Inc. (REIT) | | | 84,237 | |
| | 562 | | | Federal Realty Investment Trust (REIT) | | | 66,338 | |
| | 3,435 | | | HCP, Inc. (REIT) | | | 95,940 | |
| | 5,516 | | | Host Hotels & Resorts, Inc. (REIT) | | | 91,952 | |
| | 1,967 | | | Iron Mountain, Inc. (REIT) | | | 63,750 | |
| | 3,014 | | | Kimco Realty Corp. (REIT) | | | 44,155 | |
| | 813 | | | Macerich Co. (The) (REIT) | | | 35,187 | |
| | 862 | | | Mid-America Apartment Communities, Inc. (REIT) | | | 82,493 | |
| | 4,662 | | | Prologis, Inc. (REIT) | | | 273,753 | |
| | 1,101 | | | Public Storage (REIT) | | | 222,853 | |
| | 2,172 | | | Realty Income Corp. (REIT) | | | 136,923 | |
| | 1,285 | | | Regency Centers Corp. (REIT) | | | 75,404 | |
| | 815 | | | SBA Communications Corp. (REIT)* | | | 131,940 | |
| | 2,248 | | | Simon Property Group, Inc. (REIT) | | | 377,642 | |
| | 620 | | | SL Green Realty Corp. (REIT) | | | 49,030 | |
| | 1,934 | | | UDR, Inc. (REIT) | | | 76,625 | |
| | 2,558 | | | Ventas, Inc. (REIT) | | | 149,873 | |
| | 1,238 | | | Vornado Realty Trust (REIT) | | | 76,793 | |
| | 2,678 | | | Welltower, Inc. (REIT) | | | 185,880 | |
| | 5,479 | | | Weyerhaeuser Co. (REIT) | | | 119,771 | |
| | | | | | | | |
| | | | | | | 4,541,950 | |
| | |
| | Retailing – 6.4% | |
| | 548 | | | Advance Auto Parts, Inc. | | | 86,288 | |
| | 3,010 | | | Amazon.com, Inc.* | | | 4,520,930 | |
| | 182 | | | AutoZone, Inc.* | | | 152,578 | |
| | 1,798 | | | Best Buy Co., Inc. | | | 95,222 | |
| | 338 | | | Booking Holdings, Inc.* | | | 582,178 | |
| | 1,278 | | | CarMax, Inc.* | | | 80,169 | |
| | 1,972 | | | Dollar General Corp. | | | 213,134 | |
| | 1,704 | | | Dollar Tree, Inc.* | | | 153,905 | |
| | 6,837 | | | eBay, Inc.* | | | 191,915 | |
| | 861 | | | Expedia Group, Inc. | | | 96,992 | |
| | 910 | | | Foot Locker, Inc. | | | 48,412 | |
| | 1,637 | | | Gap, Inc. (The) | | | 42,169 | |
| | 1,069 | | | Genuine Parts Co. | | | 102,645 | |
| | 8,267 | | | Home Depot, Inc. (The) | | | 1,420,436 | |
| | 1,173 | | | Kohl’s Corp. | | | 77,817 | |
| | 1,575 | | | L Brands, Inc. | | | 40,430 | |
| | 2,207 | | | LKQ Corp.* | | | 52,372 | |
| | |
| | |
| 40 | | The accompanying notes are an integral part of these financial statements. |
GOLDMAN SACHS VARIABLE INSURANCE TRUST EQUITY INDEX FUND
| | | | | | | | |
Shares | | | Description | | Value | |
|
| | Common Stocks – (continued) | |
| | Retailing – (continued) | |
| | 5,862 | | | Lowe’s Cos., Inc. | | $ | 541,414 | |
| | 2,233 | | | Macy’s, Inc. | | | 66,499 | |
| | 849 | | | Nordstrom, Inc. | | | 39,572 | |
| | 599 | | | O’Reilly Automotive, Inc.* | | | 206,254 | |
| | 2,791 | | | Ross Stores, Inc. | | | 232,211 | |
| | 3,895 | | | Target Corp. | | | 257,420 | |
| | 764 | | | Tiffany & Co. | | | 61,510 | |
| | 9,021 | | | TJX Cos., Inc. (The) | | | 403,599 | |
| | 901 | | | Tractor Supply Co. | | | 75,179 | |
| | 402 | | | Ulta Beauty, Inc.* | | | 98,426 | |
| | | | | | | | |
| | | | | | | 9,939,676 | |
| | |
| | Semiconductors & Semiconductor Equipment – 3.7% | |
| | 6,423 | | | Advanced Micro Devices, Inc.* | | | 118,569 | |
| | 2,710 | | | Analog Devices, Inc. | | | 232,599 | |
| | 7,294 | | | Applied Materials, Inc. | | | 238,806 | |
| | 3,041 | | | Broadcom, Inc. | | | 773,265 | |
| | 33,411 | | | Intel Corp. | | | 1,567,978 | |
| | 1,155 | | | KLA-Tencor Corp. | | | 103,361 | |
| | 1,130 | | | Lam Research Corp. | | | 153,872 | |
| | 2,035 | | | Maxim Integrated Products, Inc. | | | 103,480 | |
| | 1,737 | | | Microchip Technology, Inc. | | | 124,925 | |
| | 8,137 | | | Micron Technology, Inc.* | | | 258,187 | |
| | 4,478 | | | NVIDIA Corp. | | | 597,813 | |
| | 945 | | | Qorvo, Inc.* | | | 57,390 | |
| | 8,908 | | | QUALCOMM, Inc. | | | 506,954 | |
| | 1,346 | | | Skyworks Solutions, Inc. | | | 90,209 | |
| | 7,089 | | | Texas Instruments, Inc. | | | 669,911 | |
| | 1,818 | | | Xilinx, Inc. | | | 154,839 | |
| | | | | | | | |
| | | | | | | 5,752,158 | |
| | |
| | Software & Services – 10.9% | |
| | 4,674 | | | Accenture plc Class A | | | 659,081 | |
| | 3,573 | | | Adobe, Inc.* | | | 808,356 | |
| | 1,255 | | | Akamai Technologies, Inc.* | | | 76,655 | |
| | 344 | | | Alliance Data Systems Corp. | | | 51,628 | |
| | 612 | | | ANSYS, Inc.* | | | 87,479 | |
| | 1,584 | | | Autodesk, Inc.* | | | 203,718 | |
| | 3,235 | | | Automatic Data Processing, Inc. | | | 424,173 | |
| | 850 | | | Broadridge Financial Solutions, Inc. | | | 81,813 | |
| | 2,071 | | | Cadence Design Systems, Inc.* | | | 90,047 | |
| | 958 | | | Citrix Systems, Inc. | | | 98,157 | |
| | 4,240 | | | Cognizant Technology Solutions Corp. Class A | | | 269,155 | |
| | 2,060 | | | DXC Technology Co. | | | 109,530 | |
| | 2,439 | | | Fidelity National Information Services, Inc. | | | 250,120 | |
| | 2,913 | | | Fiserv, Inc.* | | | 214,076 | |
| | 642 | | | FleetCor Technologies, Inc.* | | | 119,232 | |
| | 1,047 | | | Fortinet, Inc.* | | | 73,740 | |
| | 649 | | | Gartner, Inc.* | | | 82,968 | |
| | 1,149 | | | Global Payments, Inc. | | | 118,496 | |
| | 6,659 | | | International Business Machines Corp. | | | 756,929 | |
| | 1,911 | | | Intuit, Inc. | | | 376,180 | |
| | 567 | | | Jack Henry & Associates, Inc. | | | 71,737 | |
| | |
|
| | Common Stocks – (continued) | |
| | Software & Services – (continued) | |
| | 6,676 | | | Mastercard, Inc. Class A | | $ | 1,259,427 | |
| | 56,642 | | | Microsoft Corp. | | | 5,753,128 | |
| | 18,688 | | | Oracle Corp. | | | 843,763 | |
| | 2,364 | | | Paychex, Inc. | | | 154,015 | |
| | 8,633 | | | PayPal Holdings, Inc.* | | | 725,949 | |
| | 1,318 | | | Red Hat, Inc.* | | | 231,494 | |
| | 5,520 | | | salesforce.com, Inc.* | | | 756,074 | |
| | 4,408 | | | Symantec Corp. | | | 83,289 | |
| | 1,097 | | | Synopsys, Inc.* | | | 92,411 | |
| | 1,200 | | | Total System Services, Inc. | | | 97,548 | |
| | 802 | | | VeriSign, Inc.* | | | 118,929 | |
| | 12,866 | | | Visa, Inc. Class A | | | 1,697,540 | |
| | 3,108 | | | Western Union Co. (The) | | | 53,023 | |
| | | | | | | | |
| | | | | | | 16,889,860 | |
| | |
| | Technology Hardware & Equipment – 5.4% | |
| | 2,209 | | | Amphenol Corp. Class A | | | 178,973 | |
| | 33,037 | | | Apple, Inc. | | | 5,211,256 | |
| | 390 | | | Arista Networks, Inc.* | | | 82,173 | |
| | 33,068 | | | Cisco Systems, Inc. | | | 1,432,836 | |
| | 5,824 | | | Corning, Inc. | | | 175,943 | |
| | 440 | | | F5 Networks, Inc.* | | | 71,293 | |
| | 1,002 | | | FLIR Systems, Inc. | | | 43,627 | |
| | 10,556 | | | Hewlett Packard Enterprise Co. | | | 139,445 | |
| | 11,445 | | | HP, Inc. | | | 234,165 | |
| | 286 | | | IPG Photonics Corp.* | | | 32,401 | |
| | 2,510 | | | Juniper Networks, Inc. | | | 67,544 | |
| | 1,357 | | | Keysight Technologies, Inc.* | | | 84,243 | |
| | 1,169 | | | Motorola Solutions, Inc. | | | 134,482 | |
| | 1,853 | | | NetApp, Inc. | | | 110,569 | |
| | 1,846 | | | Seagate Technology plc | | | 71,237 | |
| | 2,529 | | | TE Connectivity Ltd. | | | 191,268 | |
| | 2,142 | | | Western Digital Corp. | | | 79,190 | |
| | 1,569 | | | Xerox Corp. | | | 31,003 | |
| | | | | | | | |
| | | | | | | 8,371,648 | |
| | |
| | Telecommunication Services – 2.1% | |
| | 53,160 | | | AT&T, Inc. | | | 1,517,186 | |
| | 6,771 | | | CenturyLink, Inc. | | | 102,581 | |
| | 30,252 | | | Verizon Communications, Inc. | | | 1,700,767 | |
| | | | | | | | |
| | | | | | | 3,320,534 | |
| | |
| | Transportation – 2.1% | |
| | 861 | | | Alaska Air Group, Inc. | | | 52,392 | |
| | 2,979 | | | American Airlines Group, Inc. | | | 95,656 | |
| | 1,002 | | | CH Robinson Worldwide, Inc. | | | 84,258 | |
| | 5,844 | | | CSX Corp. | | | 363,088 | |
| | 4,666 | | | Delta Air Lines, Inc. | | | 232,833 | |
| | 1,317 | | | Expeditors International of Washington, Inc. | | | 89,674 | |
| | 1,798 | | | FedEx Corp. | | | 290,071 | |
| | 620 | | | JB Hunt Transport Services, Inc. | | | 57,685 | |
| | 768 | | | Kansas City Southern | | | 73,306 | |
| | 1,981 | | | Norfolk Southern Corp. | | | 296,239 | |
| | 3,712 | | | Southwest Airlines Co. | | | 172,534 | |
| | |
| | |
| The accompanying notes are an integral part of these financial statements. | | 41 |
GOLDMAN SACHS VARIABLE INSURANCE TRUST EQUITY INDEX FUND
Schedule of Investments(continued)
December 31, 2018
| | | | | | | | |
Shares | | | Description | | Value | |
|
| | Common Stocks – (continued) | |
| | Transportation – (continued) | |
| | 5,395 | | | Union Pacific Corp. | | $ | 745,751 | |
| | 1,630 | | | United Continental Holdings, Inc.* | | | 136,480 | |
| | 5,116 | | | United Parcel Service, Inc. Class B | | | 498,963 | |
| | | | | | | | |
| | | | | | | 3,188,930 | |
| | |
| | Utilities – 3.3% | |
| | 4,791 | | | AES Corp. | | | 69,278 | |
| | 1,695 | | | Alliant Energy Corp. | | | 71,614 | |
| | 1,790 | | | Ameren Corp. | | | 116,762 | |
| | 3,562 | | | American Electric Power Co., Inc. | | | 266,224 | |
| | 1,327 | | | American Water Works Co., Inc. | | | 120,452 | |
| | 3,707 | | | CenterPoint Energy, Inc. | | | 104,649 | |
| | 2,018 | | | CMS Energy Corp. | | | 100,194 | |
| | 2,246 | | | Consolidated Edison, Inc. | | | 171,729 | |
| | 4,786 | | | Dominion Energy, Inc. | | | 342,008 | |
| | 1,308 | | | DTE Energy Co. | | | 144,272 | |
| | 5,186 | | | Duke Energy Corp. | | | 447,552 | |
| | 2,419 | | | Edison International | | | 137,327 | |
| | 1,304 | | | Entergy Corp. | | | 112,235 | |
| | 2,027 | | | Evergy, Inc. | | | 115,073 | |
| | 2,354 | | | Eversource Energy | | | 153,104 | |
| | 6,984 | | | Exelon Corp. | | | 314,978 | |
| | 3,637 | | | FirstEnergy Corp. | | | 136,569 | |
| | 3,438 | | | NextEra Energy, Inc. | | | 597,593 | |
| | 2,594 | | | NiSource, Inc. | | | 65,758 | |
| | 2,197 | | | NRG Energy, Inc. | | | 87,001 | |
| | 3,741 | | | PG&E Corp.* | | | 88,849 | |
| | 791 | | | Pinnacle West Capital Corp. | | | 67,393 | |
| | 5,074 | | | PPL Corp. | | | 143,746 | |
| | 3,729 | | | Public Service Enterprise Group, Inc. | | | 194,094 | |
| | 993 | | | SCANA Corp. | | | 47,445 | |
| | 2,030 | | | Sempra Energy | | | 219,626 | |
| | 7,504 | | | Southern Co. (The) | | | 329,576 | |
| | 2,341 | | | WEC Energy Group, Inc. | | | 162,138 | |
| | 3,704 | | | Xcel Energy, Inc. | | | 182,496 | |
| | | | | | | | |
| | | | | | | 5,109,735 | |
| | |
| | TOTAL COMMON STOCKS | | | | |
| | (Cost $64,148,397) | | $ | 154,268,120 | |
| | |
| | | | | | | | | | | | |
Principal
Amount | | Interest
Rate | | | Maturity
Date | | | Value | |
|
| Short-term Investment(b) – 0.0% | |
U.S. Treasury Obligation – 0.0% | |
U.S. Treasury Bills | |
| $75,000 | | | 2.501 | % | | | 06/20/2019 | | | $ | 74,146 | |
| (Cost $74,125) | | | | | |
| |
| TOTAL INVESTMENTS – 99.5% | | | | | |
| (Cost $64,222,522) | | | | | | | $ | 154,342,266 | |
| |
OTHER ASSETS IN EXCESS OF LIABILITIES – 0.5% | | | | 756,003 | |
| |
| NET ASSETS – 100.0% | | | $ | 155,098,269 | |
| |
| | |
| The percentage shown for each investment category reflects the value of investments in that category as a percentage of net assets. |
| |
| * | | Non-income producing security. |
| |
| (a) | | Represents an Affiliated Issuer. |
| |
| (b) | | All or a portion of security is segregated as collateral for initial margin requirements on futures transactions. Total market value of these securities amounts to $74,146, which represents 0.0% of net assets as of December 31, 2018. |
| | |
| |
| Investment Abbreviation: |
| REIT | | —Real Estate Investment Trust |
ADDITIONAL INVESTMENT INFORMATION
FUTURES CONTRACTS — At December 31, 2018, the Fund had the following futures contracts:
| | | | | | | | | | | | | | |
| Description | | Number of
Contracts | | | Expiration
Date | | Notional
Amount | | | Unrealized
Appreciation/
(Depreciation) | |
| Long position contracts: | | | | | | | | | | | |
| S&P 500E-Mini Index | | | 8 | | | 03/15/2019 | | $ | 1,002,080 | | | $ | (49,193 | ) |
| | |
| 42 | | The accompanying notes are an integral part of these financial statements. |
GOLDMAN SACHS VARIABLE INSURANCE TRUST GROWTH OPPORTUNITIES FUND
Schedule of Investments
December 31, 2018
| | | | | | | | |
Shares | | | Description | | Value | |
|
| | Common Stocks – 96.0% | |
| | Automobiles & Components – 0.8% | |
| | 8,128 | | | Aptiv plc | | $ | 500,441 | |
| | |
| | Banks – 1.3% | | | | |
| | 9,031 | | | First Republic Bank | | | 784,794 | |
| | |
| | Capital Goods – 10.4% | | | | |
| | 10,750 | | | Fortive Corp. | | | 727,345 | |
| | 4,342 | | | Harris Corp. | | | 584,650 | |
| | 5,856 | | | HEICO Corp. | | | 453,723 | |
| | 3,001 | | | HEICO Corp. Class A | | | 189,063 | |
| | 5,448 | | | IDEX Corp. | | | 687,865 | |
| | 3,892 | | | Ingersoll-Rand plc | | | 355,067 | |
| | 7,881 | | | John Bean Technologies Corp. | | | 565,935 | |
| | 2,752 | | | L3 Technologies, Inc. | | | 477,912 | |
| | 3,875 | | | Roper Technologies, Inc. | | | 1,032,765 | |
| | 15,440 | | | Sensata Technologies Holding plc* | | | 692,330 | |
| | 6,992 | | | Xylem, Inc. | | | 466,506 | |
| | | | | | | | |
| | | | | | | 6,233,161 | |
| | |
| | Commercial & Professional Services – 2.3% | | | | |
| | 3,496 | | | Cintas Corp. | | | 587,293 | |
| | 7,406 | | | Verisk Analytics, Inc.* | | | 807,550 | |
| | | | | | | | |
| | | | | | | 1,394,843 | |
| | |
| | Consumer Durables & Apparel – 2.0% | | | | |
| | 5,483 | | | Lululemon Athletica, Inc.* | | | 666,787 | |
| | 5,707 | | | PVH Corp. | | | 530,466 | |
| | | | | | | | |
| | | | | | | 1,197,253 | |
| | |
| | Consumer Services – 5.6% | | | | |
| | 9,082 | | | Bright Horizons Family Solutions, Inc.* | | | 1,012,189 | |
| | 544 | | | Chipotle Mexican Grill, Inc.* | | | 234,894 | |
| | 12,669 | | | Choice Hotels International, Inc. | | | 906,847 | |
| | 1,282 | | | Domino’s Pizza, Inc. | | | 317,923 | |
| | 13,379 | | | Dunkin’ Brands Group, Inc. | | | 857,861 | |
| | | | | | | | |
| | | | | | | 3,329,714 | |
| | |
| | Diversified Financials – 4.7% | | | | |
| | 8,433 | | | Cboe Global Markets, Inc. | | | 825,001 | |
| | 11,391 | | | Lazard Ltd. Class A | | | 420,442 | |
| | 2,156 | | | Moody’s Corp. | | | 301,926 | |
| | 3,642 | | | MSCI, Inc. | | | 536,940 | |
| | 8,682 | | | Northern Trust Corp. | | | 725,728 | |
| | | | | | | | |
| | | | | | | 2,810,037 | |
| | |
| | Energy – 2.4% | | | | |
| | 10,428 | | | Cheniere Energy, Inc.* | | | 617,233 | |
| | 4,149 | | | Concho Resources, Inc.* | | | 426,476 | |
| | 4,439 | | | Diamondback Energy, Inc. | | | 411,495 | |
| | | | | | | | |
| | | | | | | 1,455,204 | |
| | |
| | Food, Beverage & Tobacco – 4.0% | | | | |
| | 17,654 | | | Brown-Forman Corp. Class B | | | 839,977 | |
| | 7,629 | | | McCormick & Co., Inc. (Non-Voting) | | | 1,062,262 | |
| | 9,403 | | | Monster Beverage Corp.* | | | 462,816 | |
| | | | | | | | |
| | | | | | | 2,365,055 | |
| | |
|
| | Common Stocks – (continued) | |
| | Health Care Equipment & Services – 8.3% | | | | |
| | 787 | | | ABIOMED, Inc.* | | $ | 255,806 | |
| | 4,036 | | | Align Technology, Inc.* | | | 845,259 | |
| | 1,370 | | | Cooper Cos., Inc. (The) | | | 348,665 | |
| | 4,860 | | | Edwards Lifesciences Corp.* | | | 744,406 | |
| | 6,581 | | | IDEXX Laboratories, Inc.* | | | 1,224,198 | |
| | 4,235 | | | Teleflex, Inc. | | | 1,094,663 | |
| | 4,487 | | | West Pharmaceutical Services, Inc. | | | 439,861 | |
| | | | | | | | |
| | | | | | | 4,952,858 | |
| | |
| | Household & Personal Products – 0.8% | | | | |
| | 3,234 | | | Clorox Co. (The) | | | 498,489 | |
| | |
| | Materials – 2.9% | | | | |
| | 9,264 | | | Ashland Global Holdings, Inc. | | | 657,373 | |
| | 8,944 | | | Avery Dennison Corp. | | | 803,440 | |
| | 1,741 | | | Martin Marietta Materials, Inc. | | | 299,226 | |
| | | | | | | | |
| | | | | | | 1,760,039 | |
| | |
| | Media & Entertainment – 1.8% | | | | |
| | 2,535 | | | IAC/InterActiveCorp* | | | 464,007 | |
| | 2,302 | | | Spotify Technology SA* | | | 261,277 | |
| | 12,265 | | | Twitter, Inc.* | | | 352,496 | |
| | | | | | | | |
| | | | | | | 1,077,780 | |
| | |
| | Pharmaceuticals, Biotechnology & Life Sciences – 10.0% | |
| | 16,764 | | | Agilent Technologies, Inc. | | | 1,130,899 | |
| | 3,611 | | | Agios Pharmaceuticals, Inc.* | | | 166,503 | |
| | 9,614 | | | Alkermes plc* | | | 283,709 | |
| | 4,341 | | | BioMarin Pharmaceutical, Inc.* | | | 369,636 | |
| | 758 | | | Bluebird Bio, Inc.* | | | 75,194 | |
| | 8,652 | | | Elanco Animal Health, Inc.* | | | 272,798 | |
| | 6,795 | | | Exact Sciences Corp.* | | | 428,765 | |
| | 13,634 | | | Exelixis, Inc.* | | | 268,181 | |
| | 3,087 | | | Illumina, Inc.* | | | 925,884 | |
| | 2,214 | | | Incyte Corp.* | | | 140,788 | |
| | 729 | | | Mettler-Toledo International, Inc.* | | | 412,308 | |
| | 13,494 | | | Moderna, Inc.*(a) | | | 206,053 | |
| | 5,594 | | | PRA Health Sciences, Inc.* | | | 514,424 | |
| | 1,166 | | | Sarepta Therapeutics, Inc.* | | | 127,246 | |
| | 3,903 | | | Spark Therapeutics, Inc.* | | | 152,763 | |
| | 6,047 | | | Zoetis, Inc. | | | 517,260 | |
| | | | | | | | |
| | | | | | | 5,992,411 | |
| | |
| | Real Estate Investment Trusts – 2.6% | | | | |
| | 5,098 | | | Equity LifeStyle Properties, Inc. | | | 495,169 | |
| | 6,493 | | | SBA Communications Corp.* | | | 1,051,152 | |
| | | | | | | | |
| | | | | | | 1,546,321 | |
| | |
| | Retailing – 6.6% | | | | |
| | 14,883 | | | Dollar General Corp. | | | 1,608,555 | |
| | 8,099 | | | Farfetch Ltd. Class A* | | | 143,433 | |
| | 4,903 | | | Five Below, Inc.* | | | 501,675 | |
| | 2,622 | | | GrubHub, Inc.* | | | 201,396 | |
| | 13,074 | | | Ross Stores, Inc. | | | 1,087,757 | |
| | 5,069 | | | Tiffany & Co. | | | 408,105 | |
| | | | | | | | |
| | | | | | | 3,950,921 | |
| | |
| | |
| The accompanying notes are an integral part of these financial statements. | | 43 |
GOLDMAN SACHS VARIABLE INSURANCE TRUST GROWTH OPPORTUNITIES FUND
Schedule of Investments(continued)
December 31, 2018
| | | | | | | | |
| Shares | | |
Description | | Value | |
|
| | Common Stocks – (continued) | |
| | Semiconductors & Semiconductor Equipment – 4.5% | |
| | 20,567 | | | Advanced Micro Devices, Inc.* | | $ | 379,667 | |
| | 9,876 | | | Analog Devices, Inc. | | | 847,657 | |
| | 50,864 | | | Marvell Technology Group Ltd. | | | 823,488 | |
| | 12,265 | | | Maxim Integrated Products, Inc. | | | 623,675 | |
| | | | | | | | |
| | | | | | | 2,674,487 | |
| | |
| | Software & Services – 21.2% | |
| | 3,776 | | | Atlassian Corp. plc Class A* | | | 335,988 | |
| | 6,096 | | | Autodesk, Inc.* | | | 784,007 | |
| | 23,424 | | | Black Knight, Inc.* | | | 1,055,485 | |
| | 6,992 | | | Citrix Systems, Inc. | | | 716,400 | |
| | 10,049 | | | Fidelity National Information Services, Inc. | | | 1,030,525 | |
| | 17,621 | | | Fiserv, Inc.* | | | 1,294,967 | |
| | 12,654 | | | Global Payments, Inc. | | | 1,305,007 | |
| | 18,441 | | | GoDaddy, Inc. Class A* | | | 1,210,098 | |
| | 5,332 | | | Intuit, Inc. | | | 1,049,604 | |
| | 7,545 | | | PTC, Inc.* | | | 625,481 | |
| | 6,012 | | | ServiceNow, Inc.* | | | 1,070,437 | |
| | 4,370 | | | Splunk, Inc.* | | | 458,195 | |
| | 5,535 | | | Square, Inc. Class A* | | | 310,458 | |
| | 14,140 | | | Total System Services, Inc. | | | 1,149,441 | |
| | 1,954 | | | Workday, Inc. Class A* | | | 312,015 | |
| | | | | | | | |
| | | | | | | 12,708,108 | |
| | |
| | Technology Hardware & Equipment – 2.5% | |
| | 18,663 | | | Amphenol Corp. Class A | | | 1,512,076 | |
| | |
| | Transportation – 1.3% | |
| | 3,409 | | | Old Dominion Freight Line, Inc. | | | 420,977 | |
| | 6,319 | | | XPO Logistics, Inc.* | | | 360,436 | |
| | | | | | | | |
| | | | | | | 781,413 | |
| | |
| | TOTAL COMMON STOCKS | | | | |
| | (Cost $47,541,835) | | $ | 57,525,405 | |
| | |
| | | | | | | | |
| Shares | | | Dividend
Rate | | Value | |
|
| | Investment Company(b) – 2.7% | |
| Goldman Sachs Financial Square Government Fund —
Institutional Shares |
|
| | 1,640,990 | | | 2.521% | | $ | 1,640,990 | |
| | (Cost $1,640,990) | | | | |
| | |
| TOTAL INVESTMENTS BEFORE SECURITIES
LENDING REINVESTMENT VEHICLE | | | | |
| | (Cost $49,182,825) | | $ | 59,166,395 | |
| | |
|
| | Securities Lending Reinvestment Vehicle(b) – 0.3% | |
| Goldman Sachs Financial Square Government Fund —
Institutional Shares |
|
| | 193,706 | | | 2.521% | | $ | 193,706 | |
| | (Cost $193,706) | | | | |
| | |
| | TOTAL INVESTMENTS – 99.0% | |
| | (Cost $49,376,531) | | $ | 59,360,101 | |
| | |
| OTHER ASSETS IN EXCESS OF
LIABILITIES – 1.0% | | | 609,527 | |
| | |
| | NET ASSETS – 100.0% | | $ | 59,969,628 | |
| | |
| | |
| The percentage shown for each investment category reflects the value of investments in that category as a percentage of net assets. |
| |
| * | | Non-income producing security. |
| |
| (a) | | All or a portion of security is on loan. |
| |
| (b) | | Represents an Affiliated Issuer. |
| | |
| 44 | | The accompanying notes are an integral part of these financial statements. |
GOLDMAN SACHS VARIABLE INSURANCE TRUST HIGH QUALITY FLOATING RATE FUND
Schedule of Investments
December 31, 2018
| | | | | | | | | | | | | | |
Principal
Amount | | | Interest
Rate | | | Maturity
Date | | | Value | |
|
| | Mortgage-Backed Securities – 3.6% | |
| | Adjustable Rate FHLMC(a) – 1.3% | |
| $ | 127,330 | | | | 4.171 | % | | | 05/01/2035 | | | $ | 133,172 | |
| | 55,827 | | | | 4.511 | | | | 09/01/2035 | | | | 58,839 | |
| | 106,471 | | | | 4.633 | | | | 12/01/2036 | | | | 111,289 | |
| | 203,244 | | | | 4.305 | | | | 04/01/2037 | | | | 214,887 | |
| | 206,942 | | | | 4.222 | | | | 01/01/2038 | | | | 214,244 | |
| | 276,378 | | | | 4.459 | | | | 01/01/2038 | | | | 287,569 | |
| | | | | | | | | | | | | | |
| | | | | | | | | | | | | 1,020,000 | |
| | |
| | Adjustable Rate FNMA(a) – 1.5% | |
| | 39,761 | | | | 4.013 | | | | 05/01/2033 | | | | 40,963 | |
| | 74,205 | | | | 4.208 | | | | 05/01/2035 | | | | 78,201 | |
| | 315,403 | | | | 4.164 | | | | 06/01/2035 | | | | 328,994 | |
| | 491,244 | | | | 4.372 | | | | 11/01/2035 | | | | 511,122 | |
| | 59,735 | | | | 4.669 | | | | 12/01/2035 | | | | 62,512 | |
| | 213,735 | | | | 4.631 | | | | 03/01/2037 | | | | 224,900 | |
| | | | | | | | | | | | | | |
| | | | | | | | | | | | | 1,246,692 | |
| | |
| | Adjustable Rate GNMA(a) – 0.2% | |
| | 190,603 | | | | 3.625 | | | | 04/20/2033 | | | | 195,010 | |
| | |
| | Agency Multi-Family – 0.6% | |
| | FNMA | |
| | 40,807 | | | | 3.416 | | | | 10/01/2020 | | | | 41,087 | |
| | 49,807 | | | | 3.619 | | | | 12/01/2020 | | | | 50,438 | |
| | 255,085 | | | | 3.771 | | | | 12/01/2020 | | | | 258,442 | |
| | 112,665 | | | | 4.381 | | | | 06/01/2021 | | | | 116,447 | |
| | | | | | | | | | | | | | |
| | | | | | | | | | | | | 466,414 | |
| | |
| | TOTAL MORTGAGE-BACKED SECURITIES | |
| | (Cost $2,963,625) | | | $ | 2,928,116 | |
| | |
| | | | | | | | | | | | | | |
|
| | Collateralized Mortgage Obligations(a) – 27.9% | |
| | Adjustable RateNon-Agency(b) – 0.3% | |
| | Holmes Master Issuer plc Series2018-1A, Class A2 | |
| $ | 200,000 | | | | 2.796 | % | | | 10/15/2054 | | | $ | 199,206 | |
| | |
| | Agency Multi-Family – 4.4% | |
| FHLMC Multifamily Structured Pass-Through Certificates
REMIC Series KP04, Class AG1(c) |
|
| | 1,350,000 | | | | 2.567 | | | | 07/25/2020 | | | | 1,347,677 | |
| FHLMC Multifamily Structured Pass-Through Certificates
REMIC Series KF03, Class A |
|
| | 67,182 | | | | 2.687 | | | | 01/25/2021 | | | | 67,139 | |
| FHLMC Multifamily Structured Pass-Through Certificates
REMIC Series KS02, Class A |
|
| | 235,318 | | | | 2.727 | | | | 08/25/2023 | | | | 235,153 | |
| FHLMC Multifamily Structured Pass-Through Certificates
REMIC Series KF32, Class A(c) |
|
| | 1,013,181 | | | | 2.717 | | | | 05/25/2024 | | | | 1,007,383 | |
| FHLMC Multifamily Structured Pass-Through Certificates
REMIC Series KF42, Class A(c) |
|
| | 393,068 | | | | 2.597 | | | | 12/25/2024 | | | | 390,983 | |
| FHLMC Multifamily Structured Pass-Through Certificates
REMIC Series J15L, Class AFL(c) |
|
| | |
|
| | Collateralized Mortgage Obligations(a) – (continued) | |
| | Agency Multi-Family – (continued) | |
| $ | 607,524 | | | | 2.697 | % | | | 08/25/2025 | | | $ | 604,446 | |
| | | | | | | | | | | | | | |
| | | | | | | | | | | | | 3,652,781 | |
| | |
| | Regular Floater – 23.2% | |
| | FHLMC REMIC Series 3049, Class FP | |
| | 177,051 | | | | 2.805 | | | | 10/15/2035 | | | | 177,130 | |
| | FHLMC REMIC Series 3208, Class FB(c) | |
| | 108,659 | | | | 2.855 | | | | 08/15/2036 | | | | 109,008 | |
| | FHLMC REMIC Series 3208, Class FD(c) | |
| | 161,902 | | | | 2.855 | | | | 08/15/2036 | | | | 162,422 | |
| | FHLMC REMIC Series 3208, Class FG(c) | |
| | 651,952 | | | | 2.855 | | | | 08/15/2036 | | | | 654,048 | |
| | FHLMC REMIC Series 3307, Class FT | |
| | 1,009,721 | | | | 2.695 | | | | 07/15/2034 | | | | 1,007,050 | |
| | FHLMC REMIC Series 3311, Class KF(c) | |
| | 1,789,041 | | | | 2.795 | | | | 05/15/2037 | | | | 1,787,414 | |
| | FHLMC REMIC Series 3371, Class FA(c) | |
| | 409,610 | | | | 3.055 | | | | 09/15/2037 | | | | 413,897 | |
| | FHLMC REMIC Series 4174, Class FB(c) | |
| | 751,697 | | | | 2.755 | | | | 05/15/2039 | | | | 750,373 | |
| | FHLMC REMIC Series 4320, Class FD | |
| | 365,901 | | | | 2.855 | | | | 07/15/2039 | | | | 366,689 | |
| | FHLMC REMIC Series 4477, Class FG | |
| | 486,084 | | | | 2.599 | | | | 10/15/2040 | | | | 484,095 | |
| | FHLMC REMIC Series 4508, Class CF(c) | |
| | 345,112 | | | | 2.855 | | | | 09/15/2045 | | | | 346,670 | |
| | FHLMC REMIC Series 4631, Class GF | |
| | 2,217,427 | | | | 2.955 | | | | 11/15/2046 | | | | 2,231,898 | |
| | FHLMC REMIC Series 4637, Class QF(c) | |
| | 1,896,891 | | | | 3.349 | | | | 04/15/2044 | | | | 1,898,271 | |
| | FNMA REMIC Series2006-82, Class F | |
| | 167,513 | | | | 3.076 | | | | 09/25/2036 | | | | 168,691 | |
| | FNMA REMIC Series2006-96, Class FA | |
| | 544,207 | | | | 2.806 | | | | 10/25/2036 | | | | 543,482 | |
| | FNMA REMIC Series2007-33, Class HF | |
| | 93,348 | | | | 2.856 | | | | 04/25/2037 | | | | 93,387 | |
| | FNMA REMIC Series2007-36, Class F | |
| | 155,757 | | | | 2.736 | | | | 04/25/2037 | | | | 155,019 | |
| | FNMA REMIC Series2007-85, Class FC | |
| | 424,208 | | | | 3.046 | | | | 09/25/2037 | | | | 427,507 | |
| | FNMA REMIC Series2008-8, Class FB | |
| | 361,093 | | | | 3.326 | | | | 02/25/2038 | | | | 364,771 | |
| | FNMA REMIC Series2011-63, Class FG | |
| | 370,989 | | | | 2.956 | | | | 07/25/2041 | | | | 372,267 | |
| | FNMA REMIC Series2012-35, Class QF | |
| | 1,152,848 | | | | 2.906 | | | | 04/25/2042 | | | | 1,155,229 | |
| | FNMA REMIC Series2016-1, Class FT | |
| | 1,118,578 | | | | 2.856 | | | | 02/25/2046 | | | | 1,120,402 | |
| | FNMA REMIC Series2017-45, Class FA | |
| | 679,302 | | | | 2.619 | | | | 06/25/2047 | | | | 678,226 | |
| | FNMA REMIC Series2017-96, Class FC | |
| | 1,234,640 | | | | 2.906 | | | | 12/25/2057 | | | | 1,235,890 | |
| | GNMA REMIC Series2005-48, Class AF | |
| | 551,291 | | | | 2.670 | | | | 06/20/2035 | | | | 548,165 | |
| | |
| | |
| The accompanying notes are an integral part of these financial statements. | | 45 |
GOLDMAN SACHS VARIABLE INSURANCE TRUST HIGH QUALITY FLOATING RATE FUND
Schedule of Investments(continued)
December 31, 2018
| | | | | | | | | | | | | | |
Principal
Amount | | | Interest
Rate | | | Maturity
Date | | | Value | |
|
| | Collateralized Mortgage Obligations(a) – (continued) | |
| | Regular Floater – (continued) | |
| | GNMA REMIC Series2012-98, Class FA | |
| $ | 515,235 | | | | 2.870% | | | | 08/20/2042 | | | $ | 517,439 | |
| | NCUA Guaranteed Notes Trust Series2010-R1, Class 1A(c) | |
| | 118,018 | | | | 2.829 | | | | 10/07/2020 | | | | 118,017 | |
| | NCUA Guaranteed Notes Trust Series2010-R2, Class 2A(c) | |
| | 297,366 | | | | 2.850 | | | | 11/05/2020 | | | | 297,456 | |
| | NCUA Guaranteed Notes Trust Series2011-R1, Class 1A(c) | |
| | 924,770 | | | | 2.829 | | | | 01/08/2020 | | | | 924,549 | |
| | | | | | | | | | | | | | |
| | | | | | | | | | | | | 19,109,462 | |
| | |
| | TOTAL COLLATERALIZED MORTGAGE OBLIGATIONS | |
| | (Cost $22,962,325) | | | $ | 22,961,449 | |
| | |
| | | | | | | | | | | | | | |
|
| | Commercial Mortgage-Backed Security(a) – 0.5% | |
| | Agency Multi-Family – 0.5% | |
| | FNMA ACES REMIC Series2017-M13, Class FA | |
| $ | 425,071 | | | | 2.701% | | | | 10/25/2024 | | | $ | 421,228 | |
| | (Cost $424,607) | | | | | |
| | |
| | |
|
| | U.S. Government Agency Security(a) – 2.4% | |
| | FNMA | |
| $ | 2,000,000 | | |
| (SOFR + 0.16%),
2.620% |
| | | 01/30/2020 | | | $ | 2,001,622 | |
| | (Cost $2,000,000) | | | | | |
| | |
| | |
|
| | Asset-Backed Securities – 38.8% | |
| | Automobile – 8.1% | |
| | Ally Master Owner Trust Series2017-3, Class A1(a)(c) | |
| $ | 1,350,000 | | | | 2.885% | | | | 06/15/2022 | | | $ | 1,349,187 | |
| | Ally Master Owner Trust Series2018-1, Class A2(c) | |
| | 800,000 | | | | 2.700 | | | | 01/17/2023 | | | | 794,411 | |
| | Chesapeake Funding II LLC Series2016-2A, Class A2(a)(b)(c) | |
| | 190,539 | | | | 3.455 | | | | 06/15/2028 | | | | 190,889 | |
| | Chesapeake Funding II LLC Series2017-3A, Class A2(a)(b)(c) | |
| | 389,855 | | | | 2.795 | | | | 08/15/2029 | | | | 388,614 | |
| Ford Credit Floorplan Master Owner Trust A Series2015-2,
Class A2(a) |
|
| | 1,210,000 | | | | 3.025 | | | | 01/15/2022 | | | | 1,213,218 | |
| GMF Floorplan Owner Revolving Trust Series2017-2,
Class A2(a)(b)(c) |
|
| | 900,000 | | | | 2.885 | | | | 07/15/2022 | | | | 898,737 | |
| Mercedes-Benz Master Owner Trust Series2018-AA,
Class A(a)(b)(c) |
|
| | 1,500,000 | | | | 2.715 | | | | 05/16/2022 | | | | 1,497,408 | |
| Nissan Master Owner Trust Receivables Series2017-C,
Class A(a)(c) |
|
| | 300,000 | | | | 2.775 | | | | 10/17/2022 | | | | 299,275 | |
| | | | | | | | | | | | | | |
| | | | | | | | | | | | | 6,631,739 | |
| | |
|
| | Asset-Backed Securities – (continued) | |
| | Collateralized Loan Obligations(a)(b)(c) – 6.3% | |
| | Bowman Park CLO Ltd. Series2014-1A, Class AR | |
| $ | 250,000 | | | | 3.857 | % | | | 11/23/2025 | | | $ | 249,315 | |
| | CBAM Ltd. Series2018-5A, Class A | |
| | 1,100,000 | | | | 3.469 | | | | 04/17/2031 | | | | 1,086,875 | |
| | Cutwater Ltd. Series2014-1A, Class A1AR | |
| | 292,081 | | | | 3.686 | | | | 07/15/2026 | | | | 291,811 | |
| | Dryden 64 CLO Ltd. Series2018-64A, Class A | |
| | 600,000 | | | | 3.415 | | | | 04/18/2031 | | | | 585,190 | |
| | Halcyon Loan Advisors Funding Ltd. Series2014-1A, Class A1R | |
| | 213,369 | | | | 3.575 | | | | 04/18/2026 | | | | 212,716 | |
| | Madison Park Funding XXX Ltd. Series2018-30A, Class A | |
| | 1,100,000 | | | | 3.186 | | | | 04/15/2029 | | | | 1,072,776 | |
| | Parallel Ltd. Series2015-1A, Class AR | |
| | 300,000 | | | | 3.319 | | | | 07/20/2027 | | | | 296,658 | |
| | Pikes Peak CLO 2 Series2018-2A, Class A | |
| | 800,000 | | | | 4.109 | | | | 01/18/2032 | | | | 797,842 | |
| | Trinitas CLO II Ltd. Series2014-2A, Class A1R | |
| | 265,980 | | | | 3.616 | | | | 07/15/2026 | | | | 264,873 | |
| | WhiteHorse IX Ltd. Series2014-9A, Class AR | |
| | 356,711 | | | | 3.609 | | | | 07/17/2026 | | | | 355,195 | |
| | | | | | | | | | | | | | |
| | | | | 5,213,251 | |
| | |
| | Credit Card(a) – 8.0% | |
| | BA Credit Card Trust Series2014-A1, Class A | |
| | 1,000,000 | | | | 2.835 | | | | 06/15/2021 | | | | 1,000,066 | |
| Capital One Multi-Asset Execution Trust Series2016-A1,
Class A1(c) |
|
| | 300,000 | | | | 2.905 | | | | 02/15/2022 | | | | 300,213 | |
| | CARDS II Trust Series2017-1A, Class A(b) | |
| | 300,000 | | | | 2.825 | | | | 04/18/2022 | | | | 299,977 | |
| | CARDS II Trust Series2018-1A, Class A(b)(c) | |
| | 2,200,000 | | | | 2.805 | | | | 04/17/2023 | | | | 2,202,243 | |
| | Citibank Credit Card Issuance Trust Series2017-A5, Class A5(c) | |
| | 1,400,000 | | | | 3.124 | | | | 04/22/2026 | | | | 1,406,154 | |
| | Citibank Credit Card Issuance Trust Series2017-A7, Class A7(c) | |
| | 500,000 | | | | 2.757 | | | | 08/08/2024 | | | | 498,390 | |
| | Trillium Credit Card Trust II Series2018-1A, Class A(b)(c) | |
| | 900,000 | | | | 2.756 | | | | 02/27/2023 | | | | 898,315 | |
| | | | | | | | | | | | | | |
| | | | | 6,605,358 | |
| | |
| | Student Loans(a) – 16.4% | |
| | Academic Loan Funding Trust Series2013-1A, Class A(b)(c) | |
| | 424,160 | | | | 3.306 | | | | 12/26/2044 | | | | 422,223 | |
| | Access Group, Inc. Series2015-1, Class A(b)(c) | |
| | 173,695 | | | | 3.206 | | | | 07/25/2056 | | | | 172,561 | |
| Access to Loans for Learning Student Loan Corp. Series2013-I,
Class A(c) |
|
| | 416,407 | | | | 3.115 | | | | 02/25/2041 | | | | 413,709 | |
| Brazos Higher Education Authority, Inc. Series2011-1,
Class A2(c) |
|
| | 945,861 | | | | 3.477 | | | | 02/25/2030 | | | | 945,800 | |
| | ECMC Group Student Loan Trust Series2016-1A, Class A(b)(c) | |
| | 230,249 | | | | 3.856 | | | | 07/26/2066 | | | | 233,263 | |
| | ECMC Group Student Loan Trust Series2018-1A, Class A(b)(c) | |
| | |
| | |
| 46 | | The accompanying notes are an integral part of these financial statements. |
GOLDMAN SACHS VARIABLE INSURANCE TRUST HIGH QUALITY FLOATING RATE FUND
| | | | | | | | | | | | | | |
Principal
Amount | | | Interest
Rate | | | Maturity
Date | | | Value | |
|
| | Asset-Backed Securities – (continued) | |
| | Student Loans(a) – (continued) | |
| $ | 670,877 | | | | 3.256 | % | | | 02/27/2068 | | | $ | 667,865 | |
| | Edsouth Indenture No. 1 LLC Series2010-1, Class A1(b)(c) | |
| | 311,484 | | | | 3.340 | | | | 07/25/2023 | | | | 311,442 | |
| | Edsouth Indenture No. 4 LLC Series2013-1, Class A(b)(c) | |
| | 127,218 | | | | 3.076 | | | | 02/26/2029 | | | | 125,852 | |
| | Edsouth Indenture No. 5 LLC Series2014-1, Class A(b)(c) | |
| | 227,849 | | | | 3.206 | | | | 02/25/2039 | | | | 226,239 | |
| | Education Loan Asset-Backed Trust I Series2013-1, Class A1(b) | |
| | 160,358 | | | | 3.306 | | | | 06/25/2026 | | | | 160,412 | |
| | Education Loan Asset-Backed Trust I Series2013-1, Class A2(b) | |
| | 500,000 | | | | 3.306 | | | | 04/26/2032 | | | | 491,504 | |
| | Educational Funding of the South, Inc. Series2011-1, Class A2(c) | |
| | 420,110 | | | | 3.140 | | | | 04/25/2035 | | | | 417,112 | |
| | Educational Funding of the South, Inc. Series2012-1, Class A | |
| | 291,598 | | | | 3.365 | | | | 03/25/2036 | | | | 292,043 | |
| | EFS Volunteer No. 3 LLC Series2012-1, Class A2(b)(c) | |
| | 59,342 | | | | 3.506 | | | | 02/25/2025 | | | | 59,349 | |
| | Goal Capital Funding Trust Series2006-1, Class A4(c) | |
| | 53,881 | | | | 2.827 | | | | 11/27/2028 | | | | 53,837 | |
| | Higher Education Funding I Series2014-1, Class A(b)(c) | |
| | 272,737 | | | | 3.739 | | | | 05/25/2034 | | | | 275,018 | |
| | Illinois Student Assistance Commission Series2010-1, Class A3 | |
| | 198,664 | | | | 3.390 | | | | 07/25/2045 | | | | 198,811 | |
| Kentucky Higher Education Student Loan Corp. Series2013-2,
Class A1(c) |
|
| | 602,066 | | | | 2.949 | | | | 09/01/2028 | | | | 595,113 | |
| Kentucky Higher Education Student Loan Corp. Series2015-1,
Class A1 |
|
| | 560,407 | | | | 3.099 | | | | 12/01/2031 | | | | 555,578 | |
| Montana Higher Education Student Assistance Corp.
Series 2012-1, Class A2(c) |
|
| | 590,384 | | | | 3.470 | | | | 05/20/2030 | | | | 592,694 | |
| | Navient Student Loan Trust Series2016-5A, Class A(b)(c) | |
| | 1,030,440 | | | | 3.756 | | | | 06/25/2065 | | | | 1,038,486 | |
| | Navient Student Loan Trust Series2016-7A, Class A(b)(c) | |
| | 225,836 | | | | 3.656 | | | | 03/25/2066 | | | | 226,704 | |
| | Nelnet Student Loan Trust Series2006-1, Class A5(c) | |
| | 651,080 | | | | 2.763 | | | | 08/23/2027 | | | | 648,813 | |
| | Nelnet Student Loan Trust Series2006-2, Class A5(c) | |
| | 135,720 | | | | 2.590 | | | | 01/25/2030 | | | | 135,498 | |
| | Nelnet Student Loan Trust Series2013-5A, Class A(b)(c) | |
| | 78,456 | | | | 3.136 | | | | 01/25/2037 | | | | 77,964 | |
| New Hampshire Higher Education Loan Corp. Series2011-1,
Class A3(c) |
|
| | 200,000 | | | | 3.340 | | | | 10/25/2037 | | | | 200,534 | |
| North Carolina State Education Assistance Authority
Series 2010-1, Class A1(c) |
|
| | 100,779 | | | | 3.390 | | | | 07/25/2041 | | | | 100,567 | |
| Panhandle-Plains Higher Education Authority, Inc. Series2011-1,
Class A2(c) |
|
| | 75,528 | | | | 3.346 | | | | 07/01/2024 | | | | 75,559 | |
| Pennsylvania Higher Education Assistance Agency Series2006-1,
Class A3(c) |
|
| | 483,520 | | | | 2.630 | | | | 10/25/2035 | | | | 473,066 | |
| | |
|
| | Asset-Backed Securities – (continued) | |
| | Student Loans(a) – (continued) | |
| | Scholar Funding Trust Series2010-A, Class A(b)(c) | |
| $ | 233,757 | | | 3.259% | | | 10/28/2041 | | | $ | 231,714 | |
| | Scholar Funding Trust Series2011-A, Class A(b)(c) | |
| | 200,901 | | | 3.409 | | | 10/28/2043 | | | | 200,579 | |
| | SLM Student Loan Trust Series2005-5, Class A4(c) | |
| | 1,000,711 | | | 2.627 | | | 10/25/2028 | | | | 994,084 | |
| | SLM Student Loan Trust Series2005-9, Class A6(c) | |
| | 56,994 | | | 3.037 | | | 10/26/2026 | | | | 56,994 | |
| | SLM Student Loan Trust Series2007-1, Class A5(c) | |
| | 920,906 | | | 2.580 | | | 01/26/2026 | | | | 918,004 | |
| | SLM Student Loan Trust Series2008-5, Class A4(c) | |
| | 124,995 | | | 4.187 | | | 07/25/2023 | | | | 126,948 | |
| South Texas Higher Education Authority, Inc. Series2012-1,
Class A2 |
|
| | 81,922 | | | 3.250 | | | 10/01/2024 | | | | 82,170 | |
| | Utah State Board of Regents Series2015-1, Class A(c) | |
| | 329,290 | | | 3.106 | | | 02/25/2043 | | | | 326,951 | |
| | Utah State Board of Regents Series2016-1, Class A | |
| | 380,884 | | | 3.256 | | | 09/25/2056 | | | | 379,478 | |
| | Wachovia Student Loan Trust Series2005-1, Class A5(c) | |
| | 13,523 | | | 2.620 | | | 01/26/2026 | | | | 13,509 | |
| | | | | | | | | | | | |
| | | | | 13,518,047 | |
| | |
| | TOTAL ASSET-BACKED SECURITIES
| |
| | (Cost $32,006,874) | | | $ | 31,968,395 | |
| | |
| | | | | | | | | | | | |
|
| | Supranational(a) – 1.2% | |
| | International Bank for Reconstruction & Development | |
| $ | 1,000,000 | | | (SOFR + 0.22%),
2.680% | | | 08/21/2020 | | | $ | 1,000,318 | |
| | (Cost $1,000,000) | | | | | | | | |
| | |
| | | | | | | | | | | | |
|
| | Municipal Bond(a)(b)(c) – 0.1% | |
| | New York – 0.1% | |
| Freddie Mac Multifamily ML Certificates RB Pass Through
Series 2017 |
|
| $ | 97,093 | | | (1 Mo. LIBOR +
0.50%), 3.022% | | | 01/25/2033 | | | $ | 96,408 | |
| | (Cost $97,093) | |
| | |
| | | | | | | | | | | | |
|
| | U.S. Treasury Obligations – 10.9% | |
| | U.S. Treasury Bonds | |
| $ | 220,000 | | | 3.750% | | | 11/15/2043 | | | $ | 248,645 | |
| | U.S. Treasury Notes(a) | |
| | 1,500,000 | | | (3 Mo. U.S. T-Bill
MMY + 0.03%), 2.463 | | | 04/30/2020 | | | | 1,499,248 | |
| | 2,300,000 | | | (3 Mo. U.S.T-Bill
MMY + 0.04%), 2.473 | | | 07/31/2020 | | | | 2,298,054 | |
| | |
| | |
| The accompanying notes are an integral part of these financial statements. | | 47 |
GOLDMAN SACHS VARIABLE INSURANCE TRUST HIGH QUALITY FLOATING RATE FUND
Schedule of Investments(continued)
December 31, 2018
| | | | | | | | | | | | |
Principal
Amount | | | Interest
Rate | | Maturity
Date | | | Value | |
|
| | U.S. Treasury Obligations – (continued) | |
| $ | 4,900,000 | | | (3 Mo. U.S. T-Bill
MMY + 0.05%), 2.475% | | | 10/31/2020 | | | $ | 4,893,043 | |
| | |
| | TOTAL U.S. TREASURY OBLIGATIONS
| | | | | |
| | (Cost $8,936,366) | | | $ | 8,938,990 | |
| | |
| | | | | | | | | | | | |
| | | | | | | | | | |
| Shares | | | Dividend Rate | | | Value | |
|
| | Investment Company(d) – 11.8% | |
| Goldman Sachs Financial Square Government Fund —
Institutional Shares |
|
| | 9,734,004 | | | | 2.521 | % | | $ | 9,734,004 | |
| | (Cost $9,734,004) | |
| | |
| | |
| | | | | | | | | | | | | | |
Principal
Amount | | | Interest Rate | | | Maturity
Date | | | Value | |
|
| | Short-Term Investments – 1.6% | |
| | Commercial Paper – 1.6% | |
| | Bell Canada, Inc. | |
| $ | 250,000 | | | | 2.683 | % | | | 01/22/2019 | | | $ | 249,580 | |
| | General Electric Co. | |
| | 250,000 | | | | 3.186 | | | | 03/01/2019 | | | | 248,679 | |
| | VW Credit, Inc. | |
| | 250,000 | | | | 2.577 | | | | 01/07/2019 | | | | 249,869 | |
| | 250,000 | | | | 2.577 | | | | 01/08/2019 | | | | 249,850 | |
| | 300,000 | | | | 2.820 | | | | 03/20/2019 | | | | 297,955 | |
| | |
| | TOTAL SHORT-TERM INVESTMENTS
| |
| | (Cost $1,296,276) | | | $ | 1,295,933 | |
| | |
| | TOTAL INVESTMENTS – 98.8%
| |
| | (Cost $81,421,170) | | | $ | 81,346,463 | |
| | |
| OTHER ASSETS IN EXCESS OF
LIABILITIES – 1.2% |
| | | 947,922 | |
| | |
| | NET ASSETS – 100.0% | | | $ | 82,294,385 | |
| | |
| | |
| The percentage shown for each investment category reflects the value of investments in that category as a percentage of net assets. |
| |
| (a) | | Variable rate security. Except for floating rate notes (for which final maturity is disclosed), maturity date disclosed is the next interest reset date. Interest rate disclosed is that which is in effect on December 31, 2018. |
| |
| (b) | | Exempt from registration under Rule 144A of the Securities Act of 1933. Under procedures approved by the Board of Trustees, such securities may be deemed liquid by the Investment Adviser and may be resold, normally to qualified institutional buyers in transactions exempt from registration. Total market value of Rule 144A securities amounts to $16,806,223, which represents approximately 20.4% of net assets as of December 31, 2018. The liquidity determination is unaudited. |
| (c) | | Securities with “Call” features. Maturity dates disclosed are the final maturity dates. |
| |
| (d) | | Represents an Affiliated Issuer. |
| | |
| |
| Investment Abbreviations: |
| ACES | | —Alternative Credit Enhancement Securities |
| FHLMC | | —Federal Home Loan Mortgage Corp. |
| FNMA | | —Federal National Mortgage Association |
| GNMA | | —Government National Mortgage Association |
| LIBOR | | —London Interbank Offered Rate |
| MMY | | —Money Market Yield |
| Mo. | | —Month |
| RB | | —Revenue Bond |
| REMIC | | —Real Estate Mortgage Investment Conduit |
| SOFR | | —Secured Overnight Financing Rate |
| T-Bill | | —Treasury Bill |
| U.S. | | —United States |
| | |
| 48 | | The accompanying notes are an integral part of these financial statements. |
GOLDMAN SACHS VARIABLE INSURANCE TRUST HIGH QUALITY FLOATING RATE FUND
ADDITIONAL INVESTMENT INFORMATION
FUTURES CONTRACTS— At December 31, 2018, the Fund had the following futures contracts:
| | | | | | | | | | | | | | | | |
| Description | | Number of
Contracts | | | Expiration
Date | | | Notional
Amount | | | Unrealized
Appreciation/
(Depreciation) | |
| | | | |
Long position contracts: | | | | | | | | | | | | | | | | |
| U.S. Treasury 10 Year Note | | | 3 | | | | 03/20/2019 | | | $ | 366,140 | | | $ | 8,996 | |
U.S. Treasury 10 Year Ultra Note | | | 3 | | | | 03/20/2019 | | | | 390,469 | | | | 12,684 | |
| | | | |
| Total | | | | | | | | | | | | | | $ | 21,680 | |
| |
Short position contracts: | | | | | |
| U.S. Treasury 2 Year Note | | | (6) | | | | 03/29/2019 | | | $ | (1,273,594 | ) | | $ | (8,552 | ) |
| U.S. Treasury 5 Year Note | | | (3) | | | | 03/29/2019 | | | | (343,992 | ) | | | (5,685 | ) |
U.S. Treasury Long Bond | | | (11) | | | | 03/20/2019 | | | | (1,607,375 | ) | | | (76,040 | ) |
| | | | |
| Total | | | | | | | | | | | | | | $ | (90,277 | ) |
| |
| Total Futures Contracts | | | $ | (68,597 | ) |
| | |
| The accompanying notes are an integral part of these financial statements. | | 49 |
GOLDMAN SACHS VARIABLE INSURANCE TRUST FUNDS
Statements of Assets and Liabilities
December 31, 2018
| | | | | | | | | | | | | | | | |
| | | Core Fixed Income
Fund | | | Equity Index
Fund | | | Growth
Opportunities
Fund | | | High Quality
Floating Rate
Fund | |
| | | | | | | | | | | | | | | | |
| Assets: | | | | | | | | | | | | |
Investments in unaffiliated issuers, at value (cost $41,084,294, $63,950,712, $47,541,835 and $71,687,166)(a) | | $ | 40,817,248 | | | $ | 153,920,966 | | | $ | 57,525,405 | | | $ | 71,612,459 | |
Investments in affiliated issuers, at value (cost $275,823, $271,810, $1,640,990 and $9,734,004) | | | 275,823 | | | | 421,300 | | | | 1,640,990 | | | | 9,734,004 | |
Investments in affiliated securities lending reinvestment vehicle, at value
(cost $0, $0, $193,706 and $0) | | | — | | | | — | | | | 193,706 | | | | — | |
Cash | | | 541,863 | | | | 795,410 | | | | 896,150 | | | | 1,232,185 | |
Foreign currencies, at value (cost $32,323, $0, $0 and $0) | | | 32,621 | | | | — | | | | — | | | | — | |
Receivables: | | | | | | | | | | | | | | | | |
Investments sold on an extended-settlement basis | | | 4,105,664 | | | | — | | | | — | | | | 114,078 | |
Collateral on certain derivative contracts(b) | | | 387,849 | | | | — | | | | — | | | | 30,895 | |
Interest and dividends | | | 254,945 | | | | 179,051 | | | | 35,890 | | | | 195,546 | |
Reimbursement from investment adviser | | | 22,183 | | | | 54,394 | | | | 19,114 | | | | 18,368 | |
Investments sold | | | 3,954 | | | | 49,189 | | | | — | | | | — | |
Fund shares sold | | | 99 | | | | — | | | | 319 | | | | 7,998 | |
Securities lending income | | | — | | | | 9 | | | | 918 | | | | — | |
Unrealized gain on forward foreign currency exchange contracts | | | 54,778 | | | | — | | | | — | | | | — | |
Variation margin on futures | | | — | | | | 7,680 | | | | — | | | | — | |
Other assets | | | 22 | | | | 22 | | | | 22 | | | | 22 | |
| | | | |
| Total assets | | | 46,497,049 | | | | 155,428,021 | | | | 60,312,514 | | | | 82,945,555 | |
| | | | | | | | | | | | | | | | |
| | | | | | | | | | | | | | | | |
| Liabilities: | | | | | | | | | | | | |
Forward sale contracts, at value (proceeds received $1,018,750, $0, $0 and $0) | | | 1,024,029 | | | | — | | | | — | | | | — | |
Unrealized loss on forward foreign currency exchange contracts | | | 64,103 | | | | — | | | | — | | | | — | |
Variation margin on futures | | | 2,830 | | | | — | | | | — | | | | 4,867 | |
Variation margin on swaps | | | 337 | | | | — | | | | — | | | | — | |
Payables: | | | | | | | | | | | | | | | | |
Investments purchased on an extended-settlement basis | | | 6,188,906 | | | | — | | | | — | | | | — | |
Management fees | | | 13,239 | | | | 28,555 | | | | 42,895 | | | | 20,274 | |
Fund shares redeemed | | | 13,180 | | | | 85,900 | | | | 16,917 | | | | 15,596 | |
Distribution and Service fees and Transfer Agency fees | | | 8,447 | | | | 36,714 | | | | 9,355 | | | | 19,312 | |
Investments purchased | | | — | | | | 104,153 | | | | — | | | | 498,438 | |
Payable upon return of securities loaned | | | — | | | | — | | | | 193,706 | | | | — | |
Accrued expenses | | | 108,525 | | | | 74,430 | | | | 80,013 | | | | 92,683 | |
| | | | |
| Total liabilities | | | 7,423,596 | | | | 329,752 | | | | 342,886 | | | | 651,170 | |
| | | | | | | | | | | | | | | | |
| | | | | | | | | | | | | | | | |
| Net Assets: | | | | | | | | | | | | |
Paid-in capital | | | 41,600,463 | | | | 69,204,454 | | | | 47,790,382 | | | | 83,452,648 | |
Total distributable earnings (loss) | | | (2,527,010 | ) | | | 85,893,815 | | | | 12,179,246 | | | | (1,158,263 | ) |
| | | | |
| NET ASSETS | | $ | 39,073,453 | | | $ | 155,098,269 | | | $ | 59,969,628 | | | $ | 82,294,385 | |
Net Assets: | | | | | | | | | | | | | | | | |
Institutional | | $ | 2,656,969 | | | $ | — | | | $ | 59,177 | | | $ | 2,326,116 | |
Service | | | 36,416,484 | | | | 155,098,269 | | | | 59,910,451 | | | | 72,784,441 | |
Advisor | | | — | | | | — | | | | — | | | | 7,183,828 | |
| | | | |
Total Net Assets | | $ | 39,073,453 | | | $ | 155,098,269 | | | $ | 59,969,628 | | | $ | 82,294,385 | |
Shares outstanding $0.001 par value (unlimited shares authorized): | | | | | | | | | | | | | | | | |
Institutional | | | 260,360 | | | | — | | | | 22,518 | | | | 224,093 | |
Service | | | 3,567,846 | | | | 10,747,382 | | | | 23,599,075 | | | | 7,024,509 | |
Advisor | | | — | | | | — | | | | — | | | | 692,634 | |
Net asset value, offering and redemption price per share: | | | | | | | | | | | | | | | | |
Institutional | | $ | 10.20 | | | | — | | | $ | 2.63 | | | $ | 10.38 | |
Service | | | 10.21 | | | | 14.43 | | | | 2.54 | | | | 10.36 | |
Advisor | | | — | | | | — | | | | — | | | | 10.37 | |
(a) Includes loaned securities having a market value of $189,030 for the Growth Opportunities Fund.
(b) Segregated for initial margin and/or collateral on transactions as follows:
| | | | | | | | | | | | |
Fund | | Forwards | | | Futures | | | Swaps | |
| Core Fixed Income | | $ | 210,000 | | | $ | 62,029 | | | $ | 115,820 | |
| High Quality Floating Rate | | | — | | | | 30,895 | | | | — | |
| | |
| 50 | | The accompanying notes are an integral part of these financial statements. |
GOLDMAN SACHS VARIABLE INSURANCE TRUST FUNDS
Statements of Operations
For the Fiscal Year Ended December 31, 2018
| | | | | | | | | | | | | | | | |
| | | Core Fixed Income
Fund | | | Equity Index
Fund | | | Growth
Opportunities
Fund | | | High Quality
Floating
Rate Fund | |
| | | | | | | | | | | | | | | | |
| Investment income: | | | | | | | | | | | | |
Interest | | $ | 1,527,179 | | | $ | 1,351 | | | $ | — | | | $ | 1,751,293 | |
Dividends — affiliated issuers | | | 27,180 | | | | 8,262 | | | | 18,778 | | | | 91,594 | |
Dividends — unaffiliated issuers | | | — | | | | 3,434,398 | | | | 700,823 | | | | — | |
Securities lending income — affiliated issuer | | | — | | | | 717 | | | | — | | | | — | |
Securities lending income — unaffiliated issuer | | | — | | | | — | | | | 7,665 | | | | — | |
| | | | |
| Total investment income | | | 1,554,359 | | | | 3,444,728 | | | | 727,266 | | | | 1,842,887 | |
| | | | | | | | | | | | | | | | |
| | | | | | | | | | | | | | | | |
| Expenses: | | | | | | | | | | | | |
Management fees | | | 198,497 | | | | 525,957 | | | | 873,240 | | | | 257,316 | |
Distribution and Service fees(a) | | | 122,530 | | | | 438,296 | | | | 234,699 | | | | 198,422 | |
Professional fees | | | 111,201 | | | | 95,669 | | | | 95,674 | | | | 98,499 | |
Custody, accounting and administrative services | | | 66,896 | | | | 56,814 | | | | 59,958 | | | | 60,889 | |
Printing and mailing costs | | | 49,993 | | | | 67,972 | | | | 47,797 | | | | 45,694 | |
Trustee fees | | | 16,150 | | | | 16,418 | | | | 16,238 | | | | 16,218 | |
Transfer Agency fees(a) | | | 9,924 | | | | 35,061 | | | | 18,786 | | | | 15,233 | |
Other | | | 7,342 | | | | 22,625 | | | | 8,653 | | | | 7,450 | |
| | | | |
| Total expenses | | | 582,533 | | | | 1,258,812 | | | | 1,355,045 | | | | 699,721 | |
| | | | |
Less — expense reductions | | | (253,318 | ) | | | (411,057 | ) | | | (405,463 | ) | | | (235,871 | ) |
| | | | |
| Net expenses | | | 329,215 | | | | 847,755 | | | | 949,582 | | | | 463,850 | |
| | | | |
| NET INVESTMENT INCOME (LOSS) | | | 1,225,144 | | | | 2,596,973 | | | | (222,316 | ) | | | 1,379,037 | |
| | | | | | | | | | | | | | | | |
| | | | | | | | | | | | | | | | |
| Realized and unrealized gain (loss): | | | | | | | | | | | | |
Net realized gain (loss) from: | | | | | | | | | | | | | | | | |
Investments — unaffiliated issuers (including commissions recaptured of $0, $0, $2,163 and $0) | | | (1,022,449 | ) | | | 11,617,060 | | | | 38,998,411 | | | | 26,862 | |
Investments — affiliated issuers | | | — | | | | 21,235 | | | | — | | | | — | |
Futures contracts | | | (365,196 | ) | | | (14,936 | ) | | | — | | | | 55,912 | |
Purchased options | | | (1,102 | ) | | | — | | | | — | | | | — | |
Swap contracts | | | (41,573 | ) | | | — | | | | — | | | | (3,939 | ) |
Forward foreign currency exchange contracts | | | (115,183 | ) | | | — | | | | — | | | | — | |
Foreign currency transactions | | | 7,126 | | | | — | | | | — | | | | — | |
Net change in unrealized gain (loss) on: | | | | | | | | | | | | | | | | |
Investments — unaffiliated issuers | | | (1,504,228 | ) | | | (21,281,591 | ) | | | (38,082,096 | ) | | | (272,680 | ) |
Investments — affiliated issuers | | | — | | | | (250,441 | ) | | | — | | | | — | |
Futures contracts | | | 6,981 | | | | (66,039 | ) | | | — | | | | (60,549 | ) |
Purchased options | | | (1,966 | ) | | | — | | | | — | | | | — | |
Swap contracts | | | 26,797 | | | | — | | | | — | | | | 1,873 | |
Forward foreign currency exchange contracts | | | (111,142 | ) | | | — | | | | — | | | | — | |
Foreign currency translation | | | (1,500 | ) | | | — | | | | — | | | | — | |
| | | | |
| Net realized and unrealized gain (loss) | | | (3,123,435 | ) | | | (9,974,712 | ) | | | 916,315 | | | | (252,521 | ) |
| | | | |
| NET INCREASE (DECREASE) IN NET ASSETS RESULTING FROM OPERATIONS | | $ | (1,898,291 | ) | | $ | (7,377,739 | ) | | $ | 693,999 | | | $ | 1,126,516 | |
(a) Class specific Distribution and Service, and Transfer Agency fees were as follows:
| | | | | | | | | | | | | | | | | | | | |
| | | Distribution and
Service Fees | | | Transfer Agency Fees | |
Fund | | Service | | | Advisor | | | Institutional | | | Service | | | Advisor | |
Core Fixed Income | | $ | 122,530 | | | | N/A | | | $ | 122 | | | $ | 9,802 | | | | N/A | |
Equity Index | | | 438,296 | | | | N/A | | | | N/A | | | | 35,061 | | | | N/A | |
Growth Opportunities | | | 234,699 | | | | N/A | | | | 11 | | | | 18,775 | | | | N/A | |
High Quality Floating Rate | | | 174,682 | | | $ | 23,740 | | | | 73 | | | | 13,973 | | | $ | 1,187 | |
| | |
| The accompanying notes are an integral part of these financial statements. | | 51 |
GOLDMAN SACHS VARIABLE INSURANCE TRUST FUNDS
Statements of Changes in Net Assets
| | | | | | | | | | | | | | | | |
| | | Core Fixed Income Fund | | | Equity Index Fund | |
| | | For the
Fiscal Year Ended
December 31, 2018 | | | For the
Fiscal Year Ended
December 31, 2017 | | | For the
Fiscal Year Ended
December 31, 2018 | | | For the
Fiscal Year Ended
December 31, 2017 | |
| | | | | | | | | | | | | | | | |
| From operations: | |
Net investment income | | $ | 1,225,144 | | | $ | 2,151,679 | | | $ | 2,596,973 | | | $ | 2,634,930 | |
Net realized gain (loss) | | | (1,538,377 | ) | | | 1,020,532 | | | | 11,623,359 | | | | 9,666,167 | |
Net change in unrealized gain (loss) | | | (1,585,058 | ) | | | 261,262 | | | | (21,598,071 | ) | | | 20,858,368 | |
| | | | |
| Net increase (decrease) in net assets resulting from operations | | | (1,898,291 | ) | | | 3,433,473 | | | | (7,377,739 | ) | | | 33,159,465 | |
| | | | | | | | | | | | | | | | |
| | | | | | | | | | | | | | | | |
| Distributions to shareholders: | |
From distributable earnings: | | | | | | | | | | | | | | | | |
Institutional Shares | | | (14,101 | ) | | | (5,356 | )(a) | | | — | | | | — | |
Service Shares | | | (1,241,765 | ) | | | (2,870,144 | )(a) | | | (13,646,931 | ) | | | (10,027,577 | )(a) |
| | | | |
| Total distributions to shareholders | | | (1,255,866 | ) | | | (2,875,500 | ) | | | (13,646,931 | ) | | | (10,027,577 | ) |
| | | | | | | | | | | | | | | | |
| | | | | | | | | | | | | | | | |
| From share transactions: | |
Proceeds from sales of shares | | | 5,175,072 | | | | 7,052,506 | | | | 4,433,966 | | | | 2,056,692 | |
Reinvestment of distributions | | | 1,255,866 | | | | 2,875,500 | | | | 13,646,931 | | | | 10,027,577 | |
Cost of shares redeemed | | | (73,392,129 | ) | | | (11,863,453 | ) | | | (20,993,560 | ) | | | (21,731,411 | ) |
| | | | |
| Net decrease in net assets resulting from share transactions | | | (66,961,191 | ) | | | (1,935,447 | ) | | | (2,912,663 | ) | | | (9,647,142 | ) |
| | | | |
| TOTAL INCREASE (DECREASE) | | | (70,115,348 | ) | | | (1,377,474 | ) | | | (23,937,333 | ) | | | 13,484,746 | |
| | | | | | | | | | | | | | | | |
| | | | | | | | | | | | | | | | |
| Net assets:(b) | |
| | | | |
Beginning of year | | | 109,188,801 | | | | 110,566,275 | | | | 179,035,602 | | | | 165,550,856 | |
| | | | |
End of year | | $ | 39,073,453 | | | $ | 109,188,801 | | | $ | 155,098,269 | | | $ | 179,035,602 | |
(a) Prior year information has been revised to conform to current year presentation, see prior year presentation below:
| | | | | | | | |
| | | Institutional | | | Service | |
Distributions from net investment income: | | | | | | | | |
Core Fixed Income Fund: | | $ | (5,356 | ) | | $ | (2,870,144 | ) |
Equity Index Fund: | | | — | | | | (2,616,868 | ) |
| | |
Distributions from net realized gains: | | | | | | | | |
Equity Index Fund: | | $ | — | | | $ | (7,410,709 | ) |
| (b) | Prior fiscal year information has been revised to conform with current year presentation. Undistributed net investment income was $134,428 and $262,554 for the Core Fixed Income and Equity Index Funds, respectively, as of December 31, 2017. |
| | |
| 52 | | The accompanying notes are an integral part of these financial statements. |
GOLDMAN SACHS VARIABLE INSURANCE TRUST FUNDS
Statements of Changes in Net Assets(continued)
| | | | | | | | | | | | | | | | |
| | | Growth Opportunities Fund | | | High Quality Floating Rate Fund | |
| | | For the
Fiscal Year Ended
December 31, 2018 | | | For the
Fiscal Year Ended
December 31, 2017 | | | For the
Fiscal Year Ended
December 31, 2018 | | | For the
Fiscal Year Ended
December 31, 2017 | |
| | | | | | | | | | | | | | | | |
| From operations: | |
Net investment income (loss) | | $ | (222,316 | ) | | $ | (428,934 | ) | | $ | 1,379,037 | | | $ | 755,781 | |
Net realized gain | | | 38,998,411 | | | | 21,900,883 | | | | 78,835 | | | | 28,050 | |
Net change in unrealized gain (loss) | | | (38,082,096 | ) | | | 18,521,181 | | | | (331,356 | ) | | | 202,672 | |
| | | | |
| Net increase in net assets resulting from operations | | | 693,999 | | | | 39,993,130 | | | | 1,126,516 | | | | 986,503 | |
| | | | | | | | | | | | | | | | |
| | | | | | | | | | | | | | | | |
| Distributions to shareholders: | |
From distributable earnings: | | | | | | | | | | | | | | | | |
Institutional Shares | | | (37,921 | ) | | | (4,985 | )(a) | | | (12,809 | ) | | | (956 | )(a) |
Service Shares | | | (39,325,197 | ) | | | (16,867,555 | )(a) | | | (1,323,812 | ) | | | (842,342 | )(a) |
Advisor Shares | | | — | | | | — | | | | (107,740 | ) | | | (43,482 | )(a) |
| | | | |
| Total distributions to shareholders | | | (39,363,118 | ) | | | (16,872,540 | ) | | | (1,444,361 | ) | | | (886,780 | ) |
| | | | | | | | | | | | | | | | |
| | | | | | | | | | | | | | | | |
| From share transactions: | |
Proceeds from sales of shares | | | 2,826,810 | | | | 4,405,396 | | | | 21,196,717 | | | | 12,689,584 | |
Reinvestment of distributions | | | 39,363,118 | | | | 16,872,540 | | | | 1,444,361 | | | | 886,780 | |
Cost of shares redeemed | | | (114,387,857 | ) | | | (33,003,465 | ) | | | (11,359,427 | ) | | | (10,739,000 | ) |
| | | | |
| Net increase (decrease) in net assets resulting from share transactions | | | (72,197,929 | ) | | | (11,725,529 | ) | | | 11,281,651 | | | | 2,837,364 | |
| | | | |
| TOTAL INCREASE (DECREASE) | | | (110,867,048 | ) | | | 11,395,061 | | | | 10,963,806 | | | | 2,937,087 | |
| | | | | | | | | | | | | | | | |
| | | | | | | | | | | | | | | | |
| Net assets:(b) | |
| | | | |
Beginning of year | | | 170,836,676 | | | | 159,441,615 | | | | 71,330,579 | | | | 68,393,492 | |
| | | | |
End of year | | $ | 59,969,628 | | | $ | 170,836,676 | | | $ | 82,294,385 | | | $ | 71,330,579 | |
(a) Prior year information has been revised to conform to current year presentation, see prior year presentation below:
| | | | | | | | | | | | |
| | | Institutional | | | Service | | | Advisor | |
Distributions from net investment income: | | | | | | | | | | | | |
High Quality Floating Rate Fund: | | $ | (956 | ) | | $ | (842,342 | ) | | $ | (43,482 | ) |
| | | |
Distributions from net realized gains: | | | | | | | | | | | | |
Growth Opportunities Fund: | | $ | (4,985 | ) | | $ | (16,867,555 | ) | | $ | — | |
| (b) | Prior fiscal year information has been revised to conform with current year presentation. Undistributed net investment income was $3,637 and $94,959 for the Growth Opportunities and High Quality Floating Rate Funds, respectively, as of December 31, 2017. |
| | |
| The accompanying notes are an integral part of these financial statements. | | 53 |
GOLDMAN SACHS VARIABLE INSURANCE TRUST CORE FIXED INCOME FUND
Financial Highlights
Selected Data for a Share Outstanding Throughout Each Year
| | | | | | | | | | | | | | | | | | | | |
| | | Goldman Sachs Core Fixed Income Fund | |
| | | Institutional Shares | |
| | | Year Ended December 31, | |
| | | 2018 | | | 2017 | | | 2016 | | | 2015 | | | 2014 | |
| | | | | | | | | | | | | | | | | | | | |
| Per Share Data | | | | | | | | | | | | | | | |
| | | | | |
Net asset value, beginning of year | | $ | 10.66 | | | $ | 10.61 | | | $ | 10.53 | | | $ | 10.75 | | | $ | 10.48 | |
| | | | | |
Net investment income(a) | | | 0.29 | | | | 0.23 | | | | 0.24 | | | | 0.27 | | | | 0.25 | |
| | | | | |
Net realized and unrealized gain (loss) | | | (0.37 | ) | | | 0.13 | | | | 0.08 | | | | (0.20 | ) | | | 0.34 | |
| | | | | |
Total from investment operations | | | (0.08 | ) | | | 0.36 | | | | 0.32 | | | | 0.07 | | | | 0.59 | |
| | | | | |
Distributions to shareholders from net investment income | | | (0.38 | ) | | | (0.31 | ) | | | (0.24 | ) | | | (0.29 | ) | | | (0.32 | ) |
| | | | | |
Net asset value, end of year | | $ | 10.20 | | | $ | 10.66 | | | $ | 10.61 | | | $ | 10.53 | | | $ | 10.75 | |
| | | | | |
Total return(b) | | | (0.58 | )% | | | 3.40 | % | | | 2.98 | % | | | 0.60 | % | | | 5.68 | % |
| | | | | |
Net assets, end of year (in 000s) | | $ | 2,657 | | | $ | 241 | | | $ | 90 | | | $ | 26 | | | $ | 26 | |
| | | | | |
Ratio of net expenses to average net assets | | | 0.42 | % | | | 0.42 | % | | | 0.43 | % | | | 0.42 | % | | | 0.44 | % |
| | | | | |
Ratio of total expenses to average net assets | | | 1.06 | % | | | 0.65 | % | | | 0.65 | % | | | 0.74 | % | | | 0.65 | % |
| | | | | |
Ratio of net investment income to average net assets | | | 2.88 | % | | | 2.18 | % | | | 2.28 | % | | | 2.53 | % | | | 2.31 | % |
| | | | | |
Portfolio turnover rate(c) | | | 406 | % | | | 229 | % | | | 329 | % | | | 376 | % | | | 353 | % |
| (a) | Calculated based on the average shares outstanding methodology. |
| (b) | Assumes investment at the net asset value at the beginning of the year, reinvestment of all distributions, and a complete redemption of the investment at the net asset value at the end of the year. |
| (c) | The Fund’s portfolio turnover rate is calculated in accordance with regulatory requirements, without regard to transactions involving short term investments and certain derivatives. If such transactions were included, the Fund’s portfolio turnover rate may be higher. |
| | |
| 54 | | The accompanying notes are an integral part of these financial statements. |
GOLDMAN SACHS VARIABLE INSURANCE TRUST CORE FIXED INCOME FUND
Financial Highlights(continued)
Selected Data for a Share Outstanding Throughout Each Year
| | | | | | | | | | | | | | | | | | | | |
| | | Goldman Sachs Core Fixed Income Fund | |
| | | Service Shares | |
| | | Year Ended December 31, | |
| | | 2018 | | | 2017 | | | 2016 | | | 2015 | | | 2014 | |
| | | | | | | | | | | | | | | | | | | | |
| Per Share Data | | | | | | | | | | | | | | | |
| | | | | |
Net asset value, beginning of year | | $ | 10.65 | | | $ | 10.60 | | | $ | 10.53 | | | $ | 10.76 | | | $ | 10.47 | |
| | | | | |
Net investment income(a) | | | 0.25 | | | | 0.21 | | | | 0.22 | | | | 0.24 | | | | 0.22 | |
| | | | | |
Net realized and unrealized gain (loss) | | | (0.34 | ) | | | 0.12 | | | | 0.07 | | | | (0.21 | ) | | | 0.36 | |
| | | | | |
Total from investment operations | | | (0.09 | ) | | | 0.33 | | | | 0.29 | | | | 0.03 | | | | 0.58 | |
| | | | | |
Distributions to shareholders from net investment income | | | (0.35 | ) | | | (0.28 | ) | | | (0.22 | ) | | | (0.26 | ) | | | (0.29 | ) |
| | | | | |
Net asset value, end of year | | $ | 10.21 | | | $ | 10.65 | | | $ | 10.60 | | | $ | 10.53 | | | $ | 10.76 | |
| | | | | |
Total return(b) | | | (0.83 | )% | | | 3.14 | % | | | 2.70 | % | | | 0.27 | % | | | 5.61 | % |
| | | | | |
Net assets, end of year (in 000s) | | $ | 36,416 | | | $ | 108,948 | | | $ | 110,476 | | | $ | 104,924 | | | $ | 107,063 | |
| | | | | |
Ratio of net expenses to average net assets | | | 0.67 | % | | | 0.67 | % | | | 0.67 | % | | | 0.67 | % | | | 0.68 | % |
| | | | | |
Ratio of total expenses to average net assets | | | 1.18 | % | | | 0.90 | % | | | 0.91 | % | | | 0.99 | % | | | 0.91 | % |
| | | | | |
Ratio of net investment income to average net assets | | | 2.46 | % | | | 1.95 | % | | | 2.05 | % | | | 2.27 | % | | | 2.06 | % |
| | | | | |
Portfolio turnover rate(c) | | | 406 | % | | | 229 | % | | | 329 | % | | | 376 | % | | | 353 | % |
| (a) | Calculated based on the average shares outstanding methodology. |
| (b) | Assumes investment at the net asset value at the beginning of the year, reinvestment of all distributions, and a complete redemption of the investment at the net asset value at the end of the year. |
| (c) | The Fund’s portfolio turnover rate is calculated in accordance with regulatory requirements, without regard to transactions involving short term investments and certain derivatives. If such transactions were included, the Fund’s portfolio turnover rate may be higher. |
| | |
| The accompanying notes are an integral part of these financial statements. | | 55 |
GOLDMAN SACHS VARIABLE INSURANCE TRUST EQUITY INDEX FUND
Financial Highlights(continued)
Selected Data for a Share Outstanding Throughout Each Year
| | | | | | | | | | | | | | | | | | | | |
| | | Goldman Sachs Equity Index Fund | |
| | | Service Shares | |
| | | Year Ended December 31, | |
| | | 2018 | | | 2017 | | | 2016 | | | 2015 | | | 2014 | |
| | | | | | | | | | | | | | | | | | | | |
| Per Share Data | | | | | | | | | | | | | | | |
| | | | | |
Net asset value, beginning of year | | $ | 16.60 | | | $ | 14.49 | | | $ | 13.91 | | | $ | 14.91 | | | $ | 13.68 | |
| | | | | |
Net investment income(a) | | | 0.25 | | | | 0.24 | | | | 0.25 | | | | 0.32 | | | | 0.22 | |
| | | | | |
Net realized and unrealized gain (loss) | | | (1.04 | ) | | | 2.85 | | | | 1.35 | | | | (0.18 | ) | | | 1.58 | |
| | | | | |
Total from investment operations | | | (0.79 | ) | | | 3.09 | | | | 1.60 | | | | 0.14 | | | | 1.80 | |
| | | | | |
Distributions to shareholders from net investment income | | | (0.27 | ) | | | (0.26 | ) | | | (0.33 | ) | | | (0.28 | ) | | | (0.25 | ) |
| | | | | |
Distributions to shareholders from net realized gains | | | (1.11 | ) | | | (0.72 | ) | | | (0.69 | ) | | | (0.86 | ) | | | (0.32 | ) |
| | | | | |
Total distributions | | | (1.38 | ) | | | (0.98 | ) | | | (1.02 | ) | | | (1.14 | ) | | | (0.57 | ) |
| | | | | |
Net asset value, end of year | | $ | 14.43 | | | $ | 16.60 | | | $ | 14.49 | | | $ | 13.91 | | | $ | 14.91 | |
| | | | | |
Total return(b) | | | (4.87 | )% | | | 21.29 | % | | | 11.41 | % | | | 0.94 | % | | | 13.22 | % |
| | | | | |
Net assets, end of year (in 000s) | | $ | 155,098 | | | $ | 179,036 | | | $ | 165,551 | | | $ | 169,295 | | | $ | 190,009 | |
| | | | | |
Ratio of net expenses to average net assets | | | 0.48 | % | | | 0.48 | % | | | 0.48 | % | | | 0.48 | % | | | 0.49 | % |
| | | | | |
Ratio of total expenses to average net assets | | | 0.72 | % | | | 0.71 | % | | | 0.73 | % | | | 0.70 | % | | | 0.71 | % |
| | | | | |
Ratio of net investment income to average net assets | | | 1.48 | % | | | 1.53 | % | | | 1.73 | % | | | 2.15 | % | | | 1.55 | % |
| | | | | |
Portfolio turnover rate(c) | | | 4 | % | | | 2 | % | | | 3 | % | | | 4 | % | | | 2 | % |
| (a) | Calculated based on the average shares outstanding methodology. |
| (b) | Assumes investment at the net asset value at the beginning of the year, reinvestment of all distributions, and a complete redemption of the investment at the net asset value at the end of the year. |
| (c) | The Fund’s portfolio turnover rate is calculated in accordance with regulatory requirements, without regard to transactions involving short term investments and certain derivatives. If such transactions were included, the Fund’s portfolio turnover rate may be higher. |
| | |
| 56 | | The accompanying notes are an integral part of these financial statements. |
GOLDMAN SACHS VARIABLE INSURANCE TRUST GROWTH OPPORTUNITIES FUND
Financial Highlights(continued)
Selected Data for a Share Outstanding Throughout Each Year
| | | | | | | | | | | | | | | | | | | | |
| | | Goldman Sachs Growth Opportunities Fund | |
| | | Institutional Shares | |
| | | Year Ended December 31, | |
| | | 2018 | | | 2017 | | | 2016 | | | 2015 | | | 2014 | |
| | | | | | | | | | | | | | | | | | | | |
| Per Share Data | | | | | | | | | | | | | | | |
| | | | | |
Net asset value, beginning of year | | $ | 7.78 | | | $ | 6.78 | | | $ | 6.71 | | | $ | 7.72 | | | $ | 8.59 | |
| | | | | |
Net investment loss(a) | | | (0.01 | ) | | | (0.01 | ) | | | (0.02 | ) | | | (0.01 | ) | | | (0.02 | ) |
| | | | | |
Net realized and unrealized gain (loss) | | | (0.31 | ) | | | 1.85 | | | | 0.14 | | | | (0.39 | ) | | | 0.94 | |
| | | | | |
Total from investment operations | | | (0.32 | ) | | | 1.84 | | | | 0.12 | | | | (0.40 | ) | | | 0.92 | |
| | | | | |
Distributions to shareholders from net realized gains | | | (4.83 | ) | | | (0.84 | ) | | | (0.05 | ) | | | (0.61 | ) | | | (1.79 | ) |
| | | | | |
Net asset value, end of year | | $ | 2.63 | | | $ | 7.78 | | | $ | 6.78 | | | $ | 6.71 | | | $ | 7.72 | |
| | | | | |
Total return(b) | | | (4.17 | )% | | | 27.14 | % | | | 1.71 | % | | | (5.20 | )% | | | 11.32 | % |
| | | | | |
Net assets, end of year (in 000s) | | $ | 59 | | | $ | 52 | | | $ | 3,518 | | | $ | 32 | | | $ | 33 | |
| | | | | |
Ratio of net expenses to average net assets | | | 0.85 | % | | | 0.87 | % | | | 0.89 | % | | | 0.93 | % | | | 1.01 | % |
| | | | | |
Ratio of total expenses to average net assets | | | 1.20 | % | | | 1.14 | % | | | 1.16 | % | | | 1.14 | % | | | 1.15 | % |
| | | | | |
Ratio of net investment loss to average net assets | | | (0.08 | )% | | | (0.13 | )% | | | (0.26 | )% | | | (0.19 | )% | | | (0.24 | )% |
| | | | | |
Portfolio turnover rate(c) | | | 59 | % | | | 57 | % | | | 63 | % | | | 57 | % | | | 62 | % |
| (a) | Calculated based on the average shares outstanding methodology. |
| (b) | Assumes investment at the net asset value at the beginning of the year, reinvestment of all distributions, and a complete redemption of the investment at the net asset value at the end of the year. |
| (c) | The Fund’s portfolio turnover rate is calculated in accordance with regulatory requirements, without regard to transactions involving short term investments. If such transactions were included, the Fund’s portfolio turnover rate may be higher. |
| | |
| The accompanying notes are an integral part of these financial statements. | | 57 |
GOLDMAN SACHS VARIABLE INSURANCE TRUST GROWTH OPPORTUNITIES FUND
Financial Highlights(continued)
Selected Data for a Share Outstanding Throughout Each Year
| | | | | | | | | | | | | | | | | | | | |
| | | Goldman Sachs Growth Opportunities Fund | |
| | | Service Shares | |
| | | Year Ended December 31, | |
| | | 2018 | | | 2017 | | | 2016 | | | 2015 | | | 2014 | |
| | | | | | | | | | | | | | | | | | | | |
| Per Share Data | | | | | | | | | | | | | | | |
| | | | | |
Net asset value, beginning of year | | $ | 7.70 | | | $ | 6.73 | | | $ | 6.68 | | | $ | 7.69 | | | $ | 8.58 | |
| | | | | |
Net investment loss(a) | | | (0.02 | ) | | | (0.02 | ) | | | (0.02 | ) | | | (0.03 | ) | | | (0.03 | ) |
| | | | | |
Net realized and unrealized gain (loss) | | | (0.31 | ) | | | 1.83 | | | | 0.12 | | | | (0.37 | ) | | | 0.93 | |
| | | | | |
Total from investment operations | | | (0.33 | ) | | | 1.81 | | | | 0.10 | | | | (0.40 | ) | | | 0.90 | |
| | | | | |
Distributions to shareholders from net realized gains | | | (4.83 | ) | | | (0.84 | ) | | | (0.05 | ) | | | (0.61 | ) | | | (1.79 | ) |
| | | | | |
Net asset value, end of year | | $ | 2.54 | | | $ | 7.70 | | | $ | 6.73 | | | $ | 6.68 | | | $ | 7.69 | |
| | | | | |
Total return(b) | | | (4.34 | )% | | | 26.92 | % | | | 1.42 | % | | | (5.20 | )% | | | 11.10 | % |
| | | | | |
Net assets, end of year (in 000s) | | $ | 59,910 | | | $ | 170,785 | | | $ | 155,924 | | | $ | 168,653 | | | $ | 201,519 | |
| | | | | |
Ratio of net expenses to average net assets | | | 1.01 | % | | | 1.02 | % | | | 1.05 | % | | | 1.09 | % | | | 1.17 | % |
| | | | | |
Ratio of total expenses to average net assets | | | 1.44 | % | | | 1.39 | % | | | 1.40 | % | | | 1.40 | % | | | 1.39 | % |
| | | | | |
Ratio of net investment loss to average net assets | | | (0.24 | )% | | | (0.26 | )% | | | (0.37 | )% | | | (0.36 | )% | | | (0.39 | )% |
| | | | | |
Portfolio turnover rate(c) | | | 59 | % | | | 57 | % | | | 63 | % | | | 57 | % | | | 62 | % |
| (a) | Calculated based on the average shares outstanding methodology. |
| (b) | Assumes investment at the net asset value at the beginning of the year, reinvestment of all distributions, and a complete redemption of the investment at the net asset value at the end of the year. |
| (c) | The Fund’s portfolio turnover rate is calculated in accordance with regulatory requirements, without regard to transactions involving short term investments. If such transactions were included, the Fund’s portfolio turnover rate may be higher. |
| | |
| 58 | | The accompanying notes are an integral part of these financial statements. |
GOLDMAN SACHS VARIABLE INSURANCE TRUST HIGH QUALITY FLOATING RATE FUND
Financial Highlights(continued)
Selected Data for a Share Outstanding Throughout Each Year
| | | | | | | | | | | | | | | | | | | | |
| | | Goldman Sachs High Quality Floating Rate Fund | |
| | | Institutional Shares | |
| | | Year Ended December 31, | |
| | | 2018 | | | 2017 | | | 2016 | | | 2015 | | | 2014 | |
| | | | | | | | | | | | | | | | | | | | |
| Per Share Data | | | | | | | | | | | | | | | |
| | | | | |
Net asset value, beginning of year | | $ | 10.42 | | | $ | 10.41 | | | $ | 10.40 | | | $ | 10.49 | | | $ | 10.51 | |
| | | | | |
Net investment income(a) | | | 0.24 | | | | 0.14 | | | | 0.11 | | | | 0.06 | | | | 0.05 | |
| | | | | |
Net realized and unrealized gain (loss) | | | (0.06 | ) | | | 0.03 | | | | 0.03 | | | | (0.08 | ) | | | (0.03 | ) |
| | | | | |
Total from investment operations | | | 0.18 | | | | 0.17 | | | | 0.14 | | | | (0.02 | ) | | | 0.02 | |
| | | | | |
Distributions to shareholders from net investment income | | | (0.22 | ) | | | (0.16 | ) | | | (0.13 | ) | | | (0.07 | ) | | | (0.04 | ) |
| | | | | |
Net asset value, end of year | | $ | 10.38 | | | $ | 10.42 | | | $ | 10.41 | | | $ | 10.40 | | | $ | 10.49 | |
| | | | | |
Total return(b) | | | 1.75 | % | | | 1.62 | % | | | 1.35 | % | | | (0.16 | )% | | | 0.17 | % |
| | | | | |
Net assets, end of year (in 000s) | | $ | 2,326 | | | $ | 57 | | | $ | 25 | | | $ | 25 | | | $ | 25 | |
| | | | | |
Ratio of net expenses to average net assets | | | 0.34 | % | | | 0.36 | % | | | 0.39 | % | | | 0.38 | % | | | 0.40 | % |
| | | | | |
Ratio of total expenses to average net assets | | | 0.63 | % | | | 0.72 | % | | | 0.78 | % | | | 0.81 | % | | | 0.70 | % |
| | | | | |
Ratio of net investment income to average net assets | | | 2.28 | % | | | 1.33 | % | | | 1.03 | % | | | 0.54 | % | | | 0.51 | % |
| | | | | |
Portfolio turnover rate(c) | | | 36 | % | | | 38 | % | | | 47 | % | | | 14 | % | | | 17 | % |
| (a) | Calculated based on the average shares outstanding methodology. |
| (b) | Assumes investment at the net asset value at the beginning of the year, reinvestment of all distributions, and a complete redemption of the investment at the net asset value at the end of the year. |
| (c) | The Fund’s portfolio turnover rate is calculated in accordance with regulatory requirements, without regard to transactions involving short term investments and certain derivatives. If such transactions were included, the Fund’s portfolio turnover rate may be higher. |
| | |
| The accompanying notes are an integral part of these financial statements. | | 59 |
GOLDMAN SACHS VARIABLE INSURANCE TRUST HIGH QUALITY FLOATING RATE FUND
Financial Highlights(continued)
Selected Data for a Share Outstanding Throughout Each Year
| | | | | | | | | | | | | | | | | | | | |
| | | Goldman Sachs High Quality Floating Rate Fund | |
| | | Service Shares | |
| | | Year Ended December 31, | |
| | | 2018 | | | 2017 | | | 2016 | | | 2015 | | | 2014 | |
| | | | | | | | | | | | | | | | | | | | |
| Per Share Data | | | | | | | | | | | | | | | |
| | | | | |
Net asset value, beginning of year | | $ | 10.40 | | | $ | 10.38 | | | $ | 10.38 | | | $ | 10.47 | | | $ | 10.51 | |
| | | | | |
Net investment income(a) | | | 0.19 | | | | 0.11 | | | | 0.08 | | | | 0.03 | | | | 0.03 | |
| | | | | |
Net realized and unrealized gain (loss) | | | (0.03 | ) | | | 0.04 | | | | 0.02 | | | | (0.07 | ) | | | (0.04 | ) |
| | | | | |
Total from investment operations | | | 0.16 | | | | 0.15 | | | | 0.10 | | | | (0.04 | ) | | | (0.01 | ) |
| | | | | |
Distributions to shareholders from net investment income | | | (0.20 | ) | | | (0.13 | ) | | | (0.10 | ) | | | (0.05 | ) | | | (0.03 | ) |
| | | | | |
Net asset value, end of year | | $ | 10.36 | | | $ | 10.40 | | | $ | 10.38 | | | $ | 10.38 | | | $ | 10.47 | |
| | | | | |
Total return(b) | | | 1.50 | % | | | 1.47 | % | | | 1.00 | % | | | (0.42 | )% | | | (0.09 | )% |
| | | | | |
Net assets, end of year (in 000s) | | $ | 72,784 | | | $ | 66,548 | | | $ | 66,710 | | | $ | 69,625 | | | $ | 74,892 | |
| | | | | |
Ratio of net expenses to average net assets | | | 0.60 | % | | | 0.61 | % | | | 0.65 | % | | | 0.64 | % | | | 0.66 | % |
| | | | | |
Ratio of total expenses to average net assets | | | 0.91 | % | | | 0.97 | % | | | 1.04 | % | | | 1.05 | % | | | 0.96 | % |
| | | | | |
Ratio of net investment income to average net assets | | | 1.82 | % | | | 1.08 | % | | | 0.77 | % | | | 0.28 | % | | | 0.25 | % |
| | | | | |
Portfolio turnover rate(c) | | | 36 | % | | | 38 | % | | | 47 | % | | | 14 | % | | | 17 | % |
| (a) | Calculated based on the average shares outstanding methodology. |
| (b) | Assumes investment at the net asset value at the beginning of the year, reinvestment of all distributions, and a complete redemption of the investment at the net asset value at the end of the year. |
| (c) | The Fund’s portfolio turnover rate is calculated in accordance with regulatory requirements, without regard to transactions involving short term investments and certain derivatives. If such transactions were included, the Fund’s portfolio turnover rate may be higher. |
| | |
| 60 | | The accompanying notes are an integral part of these financial statements. |
GOLDMAN SACHS VARIABLE INSURANCE TRUST HIGH QUALITY FLOATING RATE FUND
Financial Highlights(continued)
Selected Data for a Share Outstanding Throughout Each Period
| | | | | | | | | | | | | | | | | | | | |
| | | Goldman Sachs High Quality Floating Rate Fund | |
| | | Advisor Shares | |
| | | Year Ended December 31, | | | For the Period October 15, 2014* to December 31, 2014 | |
| | | 2018 | | | 2017 | | | 2016 | | | 2015 | |
| | | | | | | | | | | | | | | | | | | | |
| Per Share Data | | | | | | | | | | | | | | | |
| | | | | |
Net asset value, beginning of period | | $ | 10.41 | | | $ | 10.40 | | | $ | 10.40 | | | $ | 10.49 | | | $ | 10.51 | |
| | | | | |
Net investment income(a) | | | 0.18 | | | | 0.10 | | | | 0.06 | | | | 0.01 | | | | — | (b) |
| | | | | | |
Net realized and unrealized gain (loss) | | | (0.04 | ) | | | 0.03 | | | | 0.03 | | | | (0.06 | ) | | | (0.02 | ) |
| | | | | |
Total from investment operations | | | 0.14 | | | | 0.13 | | | | 0.09 | | | | (0.05 | ) | | | (0.02 | ) |
| | | | | |
Distributions to shareholders from net investment income | | | (0.18 | ) | | | (0.12 | ) | | | (0.09 | ) | | | (0.04 | ) | | | — | |
| | | | | |
Net asset value, end of period | | $ | 10.37 | | | $ | 10.41 | | | $ | 10.40 | | | $ | 10.40 | | | $ | 10.49 | |
| | | | | |
Total return(c) | | | 1.37 | % | | | 1.26 | % | | | 0.96 | % | | | (0.57 | )% | | | (0.10 | )%(d) |
| | | | | |
Net assets, end of period (in 000s) | | $ | 7,184 | | | $ | 4,726 | | | $ | 1,658 | | | $ | 1,315 | | | $ | 10 | |
| | | | | |
Ratio of net expenses to average net assets | | | 0.75 | % | | | 0.76 | % | | | 0.80 | % | | | 0.78 | % | | | 0.77 | %(e) |
| | | | | |
Ratio of total expenses to average net assets | | | 1.05 | % | | | 1.12 | % | | | 1.18 | % | | | 1.25 | % | | | 1.13 | %(e) |
| | | | | |
Ratio of net investment income to average net assets | | | 1.69 | % | | | 0.96 | % | | | 0.62 | % | | | 0.12 | % | | | 0.15 | %(e) |
| | | | | |
Portfolio turnover rate(f) | | | 36 | % | | | 38 | % | | | 47 | % | | | 14 | % | | | 17 | % |
| * | Commencement of Operations. |
| (a) | Calculated based on the average shares outstanding methodology. |
| (b) | Amount is less than $0.005 per share. |
| (c) | Assumes investment at the net asset value at the beginning of the period, reinvestment of all distributions, and a complete redemption of the investment at the net asset value at the end of the period. Total returns for periods less than one full year are not annualized. |
| (d) | Represents cumulative total returns |
| (f) | The Fund’s portfolio turnover rate is calculated in accordance with regulatory requirements, without regard to transactions involving short term investments and certain derivatives. If such transactions were included, the Fund’s portfolio turnover rate may be higher. |
| | |
| The accompanying notes are an integral part of these financial statements. | | 61 |
GOLDMAN SACHS VARIABLE INSURANCE TRUST FUNDS
Notes to Financial Statements
December 31, 2018
1. ORGANIZATION
Goldman Sachs Variable Insurance Trust (the “Trust” or “VIT”) is a Delaware statutory trust registered under the Investment Company Act of 1940, as amended (the “Act”), as an open-end management investment company. The following table lists those series of the Trust that are included in this report (collectively, the “Funds” or individually a “Fund”), along with their corresponding share classes and respective diversification status under the Act:
| | | | |
| Fund | | Share Classes Offered | | Diversified/ Non-diversified |
High Quality Floating Rate | | Institutional, Service and Advisor | | Diversified |
Core Fixed Income and Growth Opportunities | | Institutional and Service | | Diversified |
Equity Index | | Service | | Diversified |
Shares of the Trust are offered to a separate account of participating life insurance companies for the purpose of funding variable annuity contracts and variable life insurance policies.
Goldman Sachs Asset Management, L.P. (“GSAM”), an affiliate of Goldman Sachs & Co. LLC (“Goldman Sachs”), serves as investment adviser to the Funds pursuant to management agreements (the “Agreements”) with the Trust.
2. SIGNIFICANT ACCOUNTING POLICIES
The financial statements have been prepared in accordance with accounting principles generally accepted in the United States of America (“GAAP”) and require management to make estimates and assumptions that may affect the reported amounts and disclosures. Actual results may differ from those estimates and assumptions.
A. Investment Valuation — The Funds’ valuation policy is to value investments at fair value.
B. Investment Income and Investments — Investment income includes interest income, dividend income, and securities lending income, if any. Interest income is accrued daily and adjusted for amortization of premiums and accretion of discounts. Dividend income is recognized on ex-dividend date or, for certain foreign securities, as soon as such information is obtained subsequent to the ex-dividend date. Investment transactions are reflected on trade date. Realized gains and losses are calculated using identified cost. Investment transactions are recorded on the following business day for daily net asset value (“NAV”) calculations. Distributions received from the Funds’ investments in United States (“U.S.”) real estate investment trusts (“REITs”) may be characterized as ordinary income, net capital gain or a return of capital. A return of capital is recorded by the Funds as a reduction to the cost basis of the REIT.
For derivative contracts, realized gains and losses are recorded upon settlement of the contract. Upfront payments, if any, are made or received upon entering into a swap agreement and are reflected in the Statements of Assets and Liabilities. Upfront payments are recognized over the contract’s term/event as realized gains or losses, with the exception of forward starting swap contracts whose realized gains or losses are recognized from the effective start date. For securities with paydown provisions, principal payments received are treated as a proportionate reduction to the cost basis of the securities, and excess or shortfall amounts are recorded as income. For treasury inflation protected securities (“TIPS”), adjustments to principal due to inflation/deflation are reflected as increases/decreases to interest income with a corresponding adjustment to cost.
C. Class Allocations and Expenses — Investment income, realized and unrealized gain (loss), if any, and non-class specific expenses of each Fund are allocated daily based upon the proportion of net assets of each class. Non-class specific expenses directly incurred by a Fund are charged to that Fund, while such expenses incurred by the Trust are allocated across the applicable Funds on a straight-line and/or pro-rata basis depending upon the nature of the expenses. Class-specific expenses, where applicable, are borne by the respective share classes and include Distribution and Service and Transfer Agency fees.
D. Federal Taxes and Distributions to Shareholders — It is each Fund’s policy to comply with the requirements of the Internal Revenue Code of 1986, as amended (the “Code”), applicable to regulated investment companies and to distribute each year
62
GOLDMAN SACHS VARIABLE INSURANCE TRUST FUNDS
2. SIGNIFICANT ACCOUNTING POLICIES (continued)
substantially all of its investment company taxable income and capital gains to its shareholders. Accordingly, each Fund is not required to make any provisions for the payment of federal income tax. Distributions to shareholders are recorded on theex-dividend date. Income and capital gains distributions, if any, are declared and paid according to the following schedule:
| | | | |
| Fund | | Income Distributions Declared/Paid | | Capital Gains Distributions
Declared/Paid |
Core Fixed Income and High Quality Floating Rate | | Quarterly | | Annually |
Equity Index and Growth Opportunities | | Annually | | Annually |
Net capital losses, if any, are carried forward to future fiscal years and may be used to the extent allowed by the Code to offset any future capital gains. Losses that are carried forward will retain their character as either short-term or long-term capital losses. Utilization of capital loss carryforwards will reduce the requirement of future capital gains distributions.
The characterization of distributions to shareholders for financial reporting purposes is determined in accordance with federal income tax rules, which may differ from GAAP. The source of each Fund’s distributions may be shown in the accompanying financial statements as either from distributable earnings or capital. Certain components of the Funds’ net assets on the Statements of Assets and Liabilities reflect permanent GAAP/tax differences based on the appropriate tax character.
E. Foreign Currency Translation — The accounting records and reporting currency of a Fund are maintained in U.S. dollars. Assets and liabilities denominated in foreign currencies are translated into U.S. dollars using the current exchange rates at the close of each business day. The effect of changes in foreign currency exchange rates on investments is included within net realized and unrealized gain (loss) on investments. Changes in the value of other assets and liabilities as a result of fluctuations in foreign exchange rates are included in the Statements of Operations within net change in unrealized gain (loss) on foreign currency translation. Transactions denominated in foreign currencies are translated into U.S. dollars on the date the transaction occurred, the effects of which are included within net realized gain (loss) on foreign currency transactions.
F. Commission Recapture — GSAM, on behalf of certain Funds, may direct portfolio trades, subject to seeking best execution, to various brokers who have agreed to rebate a portion of the commissions generated. Such rebates are made directly to a Fund as cash payments and are included in net realized gain (loss) from investments on the Statements of Operations.
3. INVESTMENTS AND FAIR VALUE MEASUREMENTS
U.S. GAAP defines the fair value of a financial instrument as the amount that would be received to sell an asset or paid to transfer a liability in an orderly transaction between market participants at the measurement date (i.e., the exit price); the Funds’ policy is to use the market approach. GAAP establishes a fair value hierarchy that prioritizes the inputs to valuation techniques used to measure fair value. The hierarchy gives the highest priority to unadjusted quoted prices in active markets for identical assets or liabilities (Level 1 measurements) and the lowest priority to unobservable inputs (Level 3 measurements). The levels used for classifying investments are not necessarily an indication of the risk associated with investing in these investments. The three levels of the fair value hierarchy are described below:
Level 1 — Unadjusted quoted prices in active markets that are accessible at the measurement date for identical, unrestricted assets or liabilities;
Level 2 — Quoted prices in markets that are not active or financial instruments for which significant inputs are observable (including, but not limited to, quoted prices for similar investments, interest rates, foreign exchange rates, volatility and credit spreads), either directly or indirectly;
Level 3 — Prices or valuations that require significant unobservable inputs (including GSAM’s assumptions in determining fair value measurement).
63
GOLDMAN SACHS VARIABLE INSURANCE TRUST FUNDS
Notes to Financial Statements(continued)
December 31, 2018
3. INVESTMENTS AND FAIR VALUE MEASUREMENTS (continued)
Changes in valuation techniques may result in transfers into or out of an assigned level within the hierarchy. In accordance with the Funds’ policy, transfers between different levels of the fair value hierarchy resulting from such changes are deemed to have occurred as of the beginning of the reporting period.
The Board of Trustees (“Trustees”) has approved Valuation Procedures that govern the valuation of the portfolio investments held by the Funds, including investments for which market quotations are not readily available. The Trustees have delegated to GSAM day-to-day responsibility for implementing and maintaining internal controls and procedures related to the valuation of the Funds’ investments. To assess the continuing appropriateness of pricing sources and methodologies, GSAM regularly performs price verification procedures and issues challenges as necessary to third party pricing vendors or brokers, and any differences are reviewed in accordance with the Valuation Procedures.
A. Level 1 and Level 2 Fair Value Investments — The valuation techniques and significant inputs used in determining the fair values for investments classified as Level 1 and Level 2 are as follows:
Equity Securities — Equity securities traded on a U.S. securities exchange or the NASDAQ system, or those located on certain foreign exchanges, including but not limited to the Americas, are valued daily at their last sale price or official closing price on the principal exchange or system on which they are traded. If there is no sale or official closing price or such price is believed by GSAM to not represent fair value, equity securities are valued at the last bid price for long positions and at the last ask price for short positions. To the extent these investments are actively traded, they are classified as Level 1 of the fair value hierarchy, otherwise they are generally classified as Level 2.
Unlisted equity securities for which market quotations are available are valued at the last sale price on the valuation date, or if no sale occurs, at the last bid price, and are generally classified as Level 2.
Money Market Funds — Investments in the Goldman Sachs Financial Square Government Fund (“Underlying Fund”) are valued at the NAV of the Institutional Share class on the day of valuation. These investments are generally classified as Level 1 of the fair value hierarchy. For information regarding the Underlying Fund’s accounting policies and investment holdings, please see the Underlying Fund’s shareholder report.
Debt Securities — Debt securities for which market quotations are readily available are valued daily on the basis of quotations supplied by dealers or an independent pricing service approved by the Trustees. The pricing services may use valuation models or matrix pricing, which consider: (i) yield or price with respect to bonds that are considered comparable in characteristics such as rating, interest rate and maturity date or (ii) quotations from securities dealers to determine current value. With the exception of treasury securities of G8 countries, which are generally classified as Level 1, these investments are generally classified as Level 2 of the fair value hierarchy.
i. Commercial Paper — Commercial paper normally represents short-term unsecured promissory notes issued in bearer form by banks or bank holding companies, corporations, finance companies and other issuers. Commercial paper consists of direct U.S. dollar-denominated obligations of domestic or foreign issuers. Asset-backed commercial paper is issued by a special purpose entity that is organized to issue the commercial paper and to purchase trade receivables or other financial assets.
ii. Mortgage-Backed and Asset-Backed Securities — Mortgage-backed securities represent direct or indirect participations in, or are collateralized by and payable from, mortgage loans secured by residential and/or commercial real estate property. Asset-backed securities include securities whose principal and interest payments are collateralized by pools of other assets or receivables. The value of certain mortgage-backed and asset-backed securities (including adjustable rate mortgage loans) may be particularly sensitive to changes in prevailing interest rates. The value of these securities may also fluctuate in response to the market’s perception of the creditworthiness of the issuers.
Asset-backed securities may present credit risks that are not presented by mortgage-backed securities because they generally do not have the benefit of a security interest in collateral that is comparable to mortgage assets. Some asset-backed securities may only have a subordinated claim on collateral.
64
GOLDMAN SACHS VARIABLE INSURANCE TRUST FUNDS
3. INVESTMENTS AND FAIR VALUE MEASUREMENTS (continued)
Stripped mortgage-backed securities are usually structured with two different classes: one that receives substantially all interest payments (interest-only, or “IO” and/or high coupon rate with relatively low principal amount, or “IOette”), and the other that receives substantially all principal payments (principal-only, or “PO”) from a pool of mortgage loans. Little to no principal will be received at the maturity of an IO; as a result, periodic adjustments are recorded to reduce the cost of the security until maturity. These adjustments are included in interest income.
iii. Mortgage Dollar Rolls — Mortgage dollar rolls are transactions whereby a Fund sells mortgage-backed-securities and simultaneously contracts with the same counterparty to repurchase similar securities on a specified future date. During the settlement period, a Fund will not be entitled to accrue interest and receive principal payments on the securities sold. The Funds account for mortgage dollar roll transactions as purchases and sales and realize gains and losses on these transactions.
iv. Treasury Inflation Protected Securities — TIPS are treasury securities in which the principal amount is adjusted daily to keep pace with inflation, as measured by the U.S. Consumer Pricing Index for Urban Consumers. The repayment of the original bond principal upon maturity is guaranteed by the full faith and credit of the U.S. Government.
v. When-Issued Securities and Forward Commitments — When-issued securities, including TBA (“To Be Announced”) securities, are securities that are authorized but not yet issued in the market and purchased in order to secure what is considered to be an advantageous price or yield to a Fund. A forward commitment involves entering into a contract to purchase or sell securities, typically on an extended settlement basis, for a fixed price at a future date. The purchase of securities on a when-issued or forward commitment basis involves a risk of loss if the value of the security to be purchased declines before the settlement date. Conversely, the sale of securities on a forward commitment basis involves the risk that the value of the securities sold may increase before the settlement date. Although a Fund will generally purchase securities on a when-issued or forward commitment basis with the intention of acquiring the securities for its portfolio, the Fund may dispose of when-issued securities or forward commitments prior to settlement, which may result in a realized gain or loss.
Derivative Contracts — A derivative is an instrument whose value is derived from underlying assets, indices, reference rates or a combination of these factors. A Fund enters into derivative transactions to hedge against changes in interest rates, securities prices, and/or currency exchange rates, to increase total return, or to gain access to certain markets or attain exposure to other underliers.
Exchange-traded derivatives, including futures and options contracts, are generally valued at the last sale or settlement price on the exchange where they are principally traded. Exchange-traded options without settlement prices are generally valued at the midpoint of the bid and ask prices on the exchange where they are principally traded (or, in the absence of two-way trading, at the last bid price for long positions and the last ask price for short positions). Exchange-traded derivatives typically fall within Level 1 of the fair value hierarchy. Over-the-counter (“OTC”) and centrally cleared derivatives are valued using market transactions and other market evidence, including market-based inputs to models, calibration to market-clearing transactions, broker or dealer quotations, or other alternative pricing sources. Where models are used, the selection of a particular model to value OTC and centrally cleared derivatives depends upon the contractual terms of, and specific risks inherent in, the instrument, as well as the availability of pricing information in the market. Valuation models require a variety of inputs, including contractual terms, market prices, yield curves, credit curves, measures of volatility, voluntary and involuntary prepayment rates, loss severity rates and correlations of such inputs. For OTC and centrally cleared derivatives that trade in liquid markets, model inputs can generally be verified and model selection does not involve significant management judgment. OTC and centrally cleared derivatives are classified within Level 2 of the fair value hierarchy when significant inputs are corroborated by market evidence.
i. Forward Contracts — A forward contract is a contract between two parties to buy or sell an asset at a specified price on a future date. A forward contract settlement can occur on a cash or delivery basis. Forward contracts are marked-to-market daily using independent vendor prices, and the change in value, if any, is recorded as an unrealized gain or loss. Cash and certain investments may be used to collateralize forward contracts.
Aforward foreign currency exchange contractis a forward contract in which a Fund agrees to receive or deliver a fixed quantity of one currency for another, at a pre-determined price at a future date. All forward foreign currency exchange
65
GOLDMAN SACHS VARIABLE INSURANCE TRUST FUNDS
Notes to Financial Statements(continued)
December 31, 2018
3. INVESTMENTS AND FAIR VALUE MEASUREMENTS (continued)
contracts are marked-to-market daily at the applicable forward rate. Non-deliverable forward foreign currency exchange contracts are settled with the counterparty in cash without the delivery of foreign currency.
ii. Futures Contracts — Futures contracts are contracts to buy or sell a standardized quantity of a specified commodity or security. Upon entering into a futures contract, a Fund deposits cash or securities in an account on behalf of the broker in an amount sufficient to meet the initial margin requirement. Subsequent payments are made or received by a Fund equal to the daily change in the contract value and are recorded as variation margin receivable or payable with a corresponding offset to unrealized gains or losses. For financial reporting purposes, cash collateral that has been pledged to cover obligations of the Funds and cash collateral received, if any, is reported separately on the Statements of Assets and Liabilities as receivables/payables for collateral on certain derivative contracts. Non-cash collateral pledged by a Fund, if any, is noted in the Schedules of Investments.
iii. Options — When a Fund writes call or put options, an amount equal to the premium received is recorded as a liability and is subsequently marked-to-market to reflect the current value of the option written. Swaptions are options on interest rate swap contracts.
Upon the purchase of a call option or a put option by a Fund, the premium paid is recorded as an investment and subsequently marked-to-market to reflect the current value of the option. Certain options may be purchased with premiums to be determined on a future date. The premiums for these options are based upon implied volatility parameters at specified terms.
iv. Swap Contracts — Bilateral swap contracts are agreements in which a Fund and a counterparty agree to exchange periodic payments on a specified notional amount or make a net payment upon termination. Bilateral swap transactions are privately negotiated in the OTC market and payments are settled through direct payments between a Fund and the counterparty. By contrast, certain swap transactions are subject to mandatory central clearing. These swaps are executed through a derivatives clearing member (“DCM”), acting in an agency capacity, and submitted to a central counterparty (“CCP”) (“centrally cleared swaps”), in which case all payments are settled with the CCP through the DCM. Swaps are marked-to-market daily using pricing vendor quotations, counterparty or clearinghouse prices or model prices, and the change in value, if any, is recorded as an unrealized gain or loss. Upon entering into a swap contract, a Fund is required to satisfy an initial margin requirement by delivering cash or securities to the counterparty (or in some cases, segregated in a triparty account on behalf of the counterparty), which can be adjusted by any mark-to-market gains or losses pursuant to bilateral or centrally cleared arrangements. For centrally cleared swaps the daily change in valuation, if any, is recorded as a receivable or payable for variation margin.
An interest rate swap is an agreement that obligates two parties to exchange a series of cash flows at specified intervals, based upon or calculated by reference to changes in interest rates on a specified notional principal amount. The payment flows are usually netted against each other, with the difference being paid by one party to the other.
A credit default swap is an agreement that involves one party (the buyer of protection) making a stream of payments to another party (the seller of protection) in exchange for the right to receive protection on a reference security or obligation, including a group of assets or exposure to the performance of an index. A Fund’s investment in credit default swaps may involve greater risks than if the Fund had invested in the referenced obligation directly. Credit events are contract specific but may include bankruptcy, failure to pay, restructuring and obligation acceleration. If a Fund buys protection through a credit default swap and no credit event occurs, its payments are limited to the periodic payments previously made to the counterparty. Upon the occurrence of a specified credit event, a Fund, as a buyer of credit protection, is entitled to receive an amount equal to the notional amount of the swap and deliver to the seller the defaulted reference obligation in a physically settled trade. A Fund may also receive a net settlement amount in the form of cash or securities equal to the notional amount of the swap reduced by the recovery value of the reference obligation in a cash settled trade.
As a seller of protection, a Fund generally receives a payment stream throughout the term of the swap, provided that there is no credit event. In addition, if a Fund sells protection through a credit default swap, a Fund could suffer a loss because the value of the referenced obligation and the premium payments received may be less than the notional amount of the swap paid
66
GOLDMAN SACHS VARIABLE INSURANCE TRUST FUNDS
3. INVESTMENTS AND FAIR VALUE MEASUREMENTS (continued)
to the buyer of protection. Upon the occurrence of a specified credit event, a Fund, as a seller of credit protection, may be required to take possession of the defaulted reference obligation and pay the buyer an amount equal to the notional amount of the swap in a physically settled trade. A Fund may also pay a net settlement amount in the form of cash or securities equal to the notional amount of the swap reduced by the recovery value of the reference obligation in a cash settled trade. Recovery values are at times established through the credit event auction process in which market participants are ensured that a transparent price has been set for the defaulted security or obligation. In addition, a Fund is entitled to a return of any assets, which have been pledged as collateral to the counterparty upon settlement.
The maximum potential amount of future payments (undiscounted) that a Fund as seller of protection could be required to make under a credit default swap would be an amount equal to the notional amount of the agreement. These potential amounts would be partially offset by any recovery values of the respective referenced obligations or net amounts received from a settlement of a credit default swap for the same reference security or obligation where a Fund bought credit protection.
B. Level 3 Fair Value Investments — To the extent that significant inputs to valuation models and other alternative pricing sources are unobservable, or if quotations are not readily available, or if GSAM believes that such quotations do not accurately reflect fair value, the fair value of a Fund’s investments may be determined under Valuation Procedures approved by the Trustees. GSAM, consistent with its procedures and applicable regulatory guidance, may make an adjustment to the most recent valuation prices of either domestic or foreign securities in light of significant events to reflect what it believes to be the fair value of the securities at the time of determining a Fund’s NAV. Significant events which could affect a large number of securities in a particular market may include, but are not limited to: significant fluctuations in U.S. or foreign markets; market dislocations; market disruptions; or unscheduled market closings. Significant events which could also affect a single issuer may include, but are not limited to: corporate actions such as reorganizations, mergers and buy-outs; ratings downgrades; and bankruptcies.
C. Fair Value Hierarchy — The following is a summary of the Funds’ investments and derivatives classified in the fair value hierarchy as of December 31, 2018:
| | | | | | | | | | | | |
| | | |
| CORE FIXED INCOME | | | | | | | | | |
| Investment Type | | Level 1 | | | Level 2 | | | Level 3 | |
| | | |
| Assets | | | | | | | | | | | | |
| Fixed Income | | | | | | | | | | | | |
Corporate Bonds | | $ | — | | | $ | 12,845,118 | | | $ | — | |
Mortgage-Backed Securities | | | — | | | | 11,335,140 | | | | — | |
Collateralized Mortgage Obligations | | | — | | | | 1,274,093 | | | | — | |
Commercial Mortgage-Backed Security | | | — | | | | 147,394 | | | | — | |
U.S. Treasury Obligations and/or Other U.S. Government Agencies | | | 7,220,016 | | | | 986,501 | | | | — | |
Asset-Backed Securities | | | — | | | | 4,624,193 | | | | — | |
Foreign Government Securities | | | — | | | | 1,726,936 | | | | — | |
Municipal Bonds | | | — | | | | 408,277 | | | | — | |
| Investment Company | | | 275,823 | | | | — | | | | — | |
| Short-Term Investment | | | — | | | | 249,580 | | | | — | |
| | | |
| Total | | $ | 7,495,839 | | | $ | 33,597,232 | | | $ | — | |
| | | |
| Liabilities | | | | | | | | | | | | |
| Fixed Income | | | | | | | | | | | | |
Mortgage-Backed Security — Forward Sales Contract | | $ | — | | | $ | (1,024,029 | ) | | $ | — | |
67
GOLDMAN SACHS VARIABLE INSURANCE TRUST FUNDS
Notes to Financial Statements(continued)
December 31, 2018
3. INVESTMENTS AND FAIR VALUE MEASUREMENTS (continued)
| | | | | | | | | | | | |
| | | |
| CORE FIXED INCOME (continued) | | | | | | | | | |
| Derivative Type | | Level 1 | | | Level 2 | | | Level 3 | |
| | | |
| Assets(a) | | | | | | | | | | | | |
| Forward Foreign Currency Exchange Contracts | | $ | — | | | $ | 54,778 | | | $ | — | |
| Futures Contracts | | | 219,563 | | | | — | | | | — | |
| Credit Default Swap Contracts | | | — | | | | 272 | | | | — | |
| Interest Rate Swap Contracts | | | — | | | | 61,359 | | | | — | |
| | | |
| Total | | $ | 219,563 | | | $ | 116,409 | | | $ | — | |
| | | |
| Liabilities(a) | | | | | | | | | | | | |
| Forward Foreign Currency Exchange Contracts | | $ | — | | | $ | (64,103 | ) | | $ | — | |
| Futures Contracts | | | (230,250 | ) | | | — | | | | — | |
| Credit Default Swap Contracts | | | — | | | | (24,101 | ) | | | — | |
| Interest Rate Swap Contracts | | | — | | | | (43,254 | ) | | | — | |
| | | |
| Total | | $ | (230,250 | ) | | $ | (131,458 | ) | | $ | — | |
| | | |
| EQUITY INDEX | | | | | | | | | |
| Investment Type | | Level 1 | | | Level 2 | | | Level 3 | |
| | | |
| Assets | | | | | | | | | | | | |
| Common Stock and/or Other Equity Investments(b) | | | | | | | | | | | | |
Europe | | $ | 735,826 | | | $ | — | | | $ | — | |
North America | | | 153,532,294 | | | | — | | | | — | |
| Short-Term Investment | | | 74,146 | | | | — | | | | — | |
| | | |
| Total | | $ | 154,342,266 | | | $ | — | | | $ | — | |
| | | |
| Derivative Type | | | | | | | | | |
| | | |
| Liabilities(a) | | | | | | | | | | | | |
| Futures Contracts | | $ | (49,193 | ) | | $ | — | | | $ | — | |
| | | |
| GROWTH OPPORTUNITIES | | | | | | | | | |
| Investment Type | | Level 1 | | | Level 2 | | | Level 3 | |
| | | |
| Assets | | | | | | | | | | | | |
| Common Stock and/or Other Equity Investments(b) | | | | | | | | | | | | |
Europe | | $ | 143,433 | | | $ | — | | | $ | — | |
North America | | | 57,381,972 | | | | — | | | | — | |
| Investment Company | | | 1,640,990 | | | | — | | | | — | |
| Securities Lending Reinvestment Vehicle | | | 193,706 | | | | — | | | | — | |
| | | |
| Total | | $ | 59,360,101 | | | $ | — | | | $ | — | |
| (a) | Amount shown represents unrealized gain (loss) at fiscal year end. |
| (b) | Amounts are disclosed by continent to highlight the impact of time zone differences between local market close and the calculation of NAV. Security valuations are based on the principal exchange or system on which they are traded, which may differ from country of domicile. |
68
GOLDMAN SACHS VARIABLE INSURANCE TRUST FUNDS
3. INVESTMENTS AND FAIR VALUE MEASUREMENTS (continued)
| | | | | | | | | | | | |
| | | |
| HIGH QUALITY FLOATING RATE | | | | | | | | | |
| Investment Type | | Level 1 | | | Level 2 | | | Level 3 | |
| | | |
| Assets | | | | | | | | | | | | |
| Fixed Income | | | | | | | | | | | | |
U.S. Treasury Obligations and/or Other U.S. Government Agencies | | $ | 8,938,990 | | | $ | 2,001,622 | | | $ | — | |
Mortgage-Backed Securities | | | — | | | | 2,928,116 | | | | — | |
Collateralized Mortgage Obligations | | | — | | | | 22,961,449 | | | | — | |
Commercial Mortgage-Backed Security | | | — | | | | 421,228 | | | | — | |
Asset-Backed Securities | | | — | | | | 31,968,395 | | | | — | |
Municipal Bond | | | — | | | | 96,408 | | | | — | |
Supranational | | | — | | | | 1,000,318 | | | | — | |
Investment Company | | | 9,734,004 | | | | — | | | | — | |
| Short Term Investments | | | — | | | | 1,295,933 | | | | — | |
| | | |
| Total | | $ | 18,672,994 | | | $ | 62,673,469 | | | $ | — | |
| | | |
| Derivative Type | | | | | | | | | |
| | | |
| Assets(a) | | | | | | | | | | | | |
| Futures Contracts | | $ | 21,680 | | | $ | — | | | $ | — | |
| | | |
| Liabilities(a) | | | | | | | | | | | | |
| Futures Contracts | | $ | (90,277 | ) | | $ | — | | | $ | — | |
| (a) | Amount shown represents unrealized gain (loss) at fiscal year end. |
For further information regarding security characteristics, see the Schedules of Investments.
4. INVESTMENTS IN DERIVATIVES
The following tables set forth, by certain risk types, the gross value of derivative contracts (not considered to be hedging instruments for accounting disclosure purposes) as of December 31, 2018. These instruments were used as part of the Funds’ investment strategies and to obtain and/or manage exposure related to the risks below. The values in the tables below exclude the effects of cash collateral received or posted pursuant to these derivative contracts, and therefore are not representative of the Funds’ net exposure.
Core Fixed Income
| | | | | | | | | | | | | | |
| Risk | | | | Statements of Assets and Liabilities | | Assets | | | Statements of Assets and Liabilities | | Liabilities | |
| Interest Rate | | | | Variation margin on futures and swaps contracts | | $ | 280,922 | (a) | | Variation margin on futures and swaps contracts | | $ | (273,504 | )(a) |
| Credit | | | | Variation margin on Swap contracts | | | 272 | (a) | | Variation margin on Swap contracts | | | (24,101 | )(a) |
| Currency | | | | Receivables for unrealized gain on forward foreign currency exchange contracts | | | 54,778 | | | Payable for unrealized loss on forward foreign currency exchange contracts | | | (64,103 | ) |
| | | | | |
| Total | | | | | | $ | 335,972 | | | | | $ | (361,708 | ) |
69
GOLDMAN SACHS VARIABLE INSURANCE TRUST FUNDS
Notes to Financial Statements(continued)
December 31, 2018
4. INVESTMENTS IN DERIVATIVES (continued)
| | | | | | | | | | | | | | |
| | | | | | | | | | | | | | |
| Fund | | Risk | | Statements of Assets and Liabilities | | Assets(a) | | | Statements of Assets and Liabilities | | Liabilities(a) | |
| Equity Index | | Equity | | — | | $ | — | | | Variation margin on futures | | $ | (49,193 | ) |
| | | | | |
| High Quality Floating Rate | | Interest Rate | | Variation margin on futures
contracts | | | 21,680 | | | Variation margin on futures
contracts | | | (90,277 | ) |
| (a) | Includes unrealized gain (loss) on futures contracts and centrally cleared swap contracts described in the Additional Investment Information sections of the Schedules of Investments. Only the variation margin as of December 31, 2018 is reported within the Statements of Assets and Liabilities. |
The following tables set forth, by certain risk types, the Funds’ gains (losses) related to these derivatives and their indicative volumes for the fiscal year ended December 31, 2018. These gains (losses) should be considered in the context that these derivative contracts may have been executed to create investment opportunities and/or economically hedge certain investments, and accordingly, certain gains (losses) on such derivative contracts may offset certain (losses) gains attributable to investments. These gains (losses) are included in “Net realized gain (loss)” or “Net change in unrealized gain (loss)” on the Statements of Operations:
Core Fixed Income
| | | | | | | | | | | | | | |
| Risk | | Statements of Operations | | Net
Realized
Gain (Loss) | | | Net Change in
Unrealized
Gain (Loss) | | | Average
Number of
Contracts(a) | |
| Interest Rate | | Net realized gain (loss) from futures contracts, purchased options and swap contracts/Net change in unrealized gain (loss) on futures contracts, purchased options and swap contracts | | $ | (414,361 | ) | | $ | 55,641 | | | | 190 | |
| Credit | | Net realized gain (loss) from swap contracts/Net change in unrealized gain (loss) on swap contracts | | | 6,490 | | | | (23,829 | ) | | | 2 | |
| Currency | | Net realized gain (loss) from forward foreign currency exchange contracts/Net change in unrealized gain (loss) on forward foreign currency exchange contracts | | | (115,183 | ) | | | (111,142 | ) | | | 386 | |
| | | | |
| Total | | | | $ | (523,054 | ) | | $ | (79,330 | ) | | | 578 | |
Equity Index
| | | | | | | | | | | | | | |
| Risk | | Statements of Operations | | Net
Realized
Gain (Loss) | | | Net Change in
Unrealized
Gain (Loss) | | | Average
Number of
Contracts(a) | |
| | | | |
| Equity | | Net realized gain (loss) from futures contracts/Net change in unrealized gain (loss) on futures contracts | | $ | (14,936 | ) | | $ | (66,039 | ) | | | 10 | |
High Quality Floating Rate
| | | | | | | | | | | | | | |
| Risk | | Statements of Operations | | Net
Realized
Gain (Loss) | | | Net Change in
Unrealized
Gain (Loss) | | | Average
Number of
Contracts(a) | |
| | | | |
| Interest Rate | | Net realized gain (loss) from futures contracts and swap contracts/Net change in unrealized gain (loss) on futures contracts and swap contracts | | $ | 51,973 | | | $ | (58,676 | ) | | | 65 | |
| (a) | Average number of contracts is based on the average of month end balances for the fiscal year ended December 31, 2018. |
70
GOLDMAN SACHS VARIABLE INSURANCE TRUST FUNDS
5. AGREEMENTS AND AFFILIATED TRANSACTIONS
A. Management Agreements — Under the Agreements, GSAM manages the Funds, subject to the general supervision of the Trustees.
As compensation for the services rendered pursuant to the Agreements, the assumption of the expenses related thereto and administration of the Funds’ business affairs, including providing facilities, GSAM is entitled to a management fee, accrued daily and paid monthly, equal to an annual percentage rate of each Fund’s average daily net assets.
As of December 31, 2018, the contractual management fees with GSAM were as stated below. The effective contractual management rates and effective net management rates represent the rates for the fiscal year ended December 31, 2018.
| | | | | | | | | | | | | | | | | | | | | | | | | | | | |
| | | Contractual Management Rate | | | | | | Effective Net
Management
Rate^ | |
| Fund | | First
$1 billion | | | Next
$1 billion | | | Next
$3 billion | | | Next
$3 billion | | | Over
$8 billion | | | Effective
Rate | |
| Core Fixed Income | | | 0.40 | % | | | 0.36 | % | | | 0.34 | % | | | 0.33 | % | | | 0.32 | % | | | 0.40 | % | | | 0.39 | % |
| Growth Opportunities | | | 0.87 | | | | 0.87 | | | | 0.78 | | | | 0.74 | | | | 0.73 | | | | 0.93 | | | | 0.83 | * |
| High Quality Floating Rate | | | 0.31 | | | | 0.28 | | | | 0.27 | | | | 0.26 | | | | 0.25 | | | | 0.34 | | | | 0.30 | |
| ^ | Effective Net Management Rate includes the impact of management fee waivers of affiliated Underlying Funds, if any. The Effective Net Management Rate may not correlate to the Contractual Management Rate as a result of management fee waivers that may be in effect from time to time. |
| * | GSAM agreed to waive a portion of its management fee in order to achieve net management rate, as defined in the Fund’s most recent prospectuses. This waiver will be effective through at least April 30, 2019, and prior to such date GSAM may not terminate the arrangement without approval of the Trustees. |
Prior to April 30, 2018, the contractual management fee rates for the Growth Opportunities Fund and High Quality Floating Rate Fund were as stated below and GSAM agreed to waive a portion of its management fee in order to achieve an Effective Net Management Rate as set forth in the Funds’ prospectuses dated April 28, 2017.
| | | | | | | | | | | | | | | | | | | | |
| Fund | | First $1 billion | | | Next $1 billion | | | Next $3 billion | | | Next $3 billion | | | Over $8 billion | |
| Growth Opportunities | | | 1.00 | % | | | 1.00 | % | | | 0.90 | % | | | 0.86 | % | | | 0.84 | % |
| High Quality Floating Rate | | | 0.40 | | | | 0.36 | | | | 0.34 | | | | 0.33 | | | | 0.32 | |
The Core Fixed Income, Growth Opportunities and High Quality Floating Rate Funds invest in Institutional Shares of the Goldman Sachs Financial Square Government Fund, which is an affiliated Underlying Fund. GSAM has agreed to waive a portion of its management fee payable by the Funds in an amount equal to the management fee it earns as an investment adviser to the affiliated Underlying Fund in which the Funds invest, except those management fees it earns from the Funds’ investments of cash collateral received in connection with securities lending transactions in the Goldman Sachs Financial Square Government Fund. For the fiscal year ended December 31, 2018, GSAM waived $2,816, $1,759 and $8,472 of the Core Fixed Income, Growth Opportunities and High Quality Floating Rate Funds’ management fees, respectively.
The Agreement for the Equity Index Fund provides for a contractual management fee at an annual rate equal to 0.30% of the Fund’s average daily net assets. For the fiscal year ended December 31, 2018, GSAM agreed to waive a portion of its management fee in order to achieve the following effective annual rates which will remain in effect through at least April 30, 2019 and prior to such date GSAM may not terminate the arrangement without the approval of the Trustees:
| | | | | | |
| Net Management Rate |
| Fund | | $0-$400 million | | Over $400 million | | Effective Rate |
| Equity Index | | 0.21% | | 0.20% | | 0.21% |
71
GOLDMAN SACHS VARIABLE INSURANCE TRUST FUNDS
Notes to Financial Statements(continued)
December 31, 2018
5. AGREEMENTS AND AFFILIATED TRANSACTIONS (continued)
As authorized by the Agreement for the Equity Index Fund, GSAM has entered into a Sub-advisory Agreement with SSgA Funds Management, Inc. (“SSgA”) which serves as the sub-adviser to the Fund and provides the day-to-day advice regarding the Fund’s portfolio transactions. As compensation for its services, SSgA is entitled to a fee, accrued daily and paid monthly by GSAM, at the following annual rates of the Fund’s average daily net assets: 0.03% on the first $50 million, 0.02% on the next $200 million, 0.01% on the next $750 million and 0.008% over $1 billion. The effective Sub-advisory fee was 0.02% for the fiscal year ended December 31, 2018.
B. Distribution and/or Service (12b-1) Plans — The Trust, on behalf of Service Shares of each applicable Fund, has adopted a Distribution and Service Plan subject to Rule 12b-1 under the Act. Under the Distribution and Service Plan, Goldman Sachs, which serves as distributor (the “Distributor”), is entitled to a fee accrued daily and paid monthly, for distribution services and personal and account maintenance services, which may then be paid by Goldman Sachs to authorized dealers, equal to, on an annual basis, 0.25% of the Fund’s average daily net assets attributable to Service Shares. For the fiscal year ended December 31, 2018 for the Growth Opportunities Fund, Goldman Sachs agreed to waive distribution and services fees so as not to exceed an annual rate of 0.16% of average daily net assets of the Fund. This distribution and service fee waiver will remain in place through at least April 30, 2019, and prior to such date Goldman Sachs may not terminate the arrangement without the approval of the Trustees.
The Trust, on behalf of Advisor Shares of each applicable Fund, has adopted a Distribution Plan subject to Rule 12b-1 under the Act. Under the Distribution Plan, Goldman Sachs as Distributor is entitled to a fee accrued daily and paid monthly for distribution services, which may then be paid by Goldman Sachs to authorized dealers, equal to, on an annual basis, 0.15% of the Fund’s average daily net assets attributable to Advisor Shares.
C. Service Plans — The Trust, on behalf of Advisor Shares of each applicable Fund, has adopted a Service Plan to allow Advisor Shares to compensate service organizations (including Goldman Sachs) for providing varying levels of personal and account maintenance and administration services to their customers who are beneficial owners of such shares. The Service Plans each provide for compensation to the service organizations equal to 0.25% of the average daily net assets attributable to Advisor Shares of the Fund.
D. Transfer Agency Agreement — Goldman Sachs also serves as the transfer agent of the Funds for a fee pursuant to the Transfer Agency Agreement. The fees charged for such transfer agency services are accrued daily and paid monthly at an annual rate of 0.02% of the average daily net assets of Institutional, Service and Advisor Shares.
E. Other Expense Agreements and Affiliated Transactions — GSAM has agreed to limit certain “Other Expenses” of the Funds (excluding acquired fund fees and expenses, transfer agency fees and expenses, service fees and shareholder administration fees (as applicable), taxes, interest, brokerage fees, expenses of shareholder meetings, litigation and indemnification, and extraordinary expenses) to the extent such expenses exceed, on an annual basis, a percentage rate of the average daily net assets of each Fund. Such Other Expense reimbursements, if any, are accrued daily and paid monthly. In addition, the Funds are not obligated to reimburse GSAM for prior fiscal year expense reimbursements, if any. The Other Expense limitations as an annual percentage rate of average daily net assets for the Core Fixed Income, Equity Index, Growth Opportunities and High Quality Floating Rate Funds are 0.004%, 0.004%, 0.004% and 0.034%, respectively. These Other Expense limitations will remain in place through at least April 30, 2019, and prior to such date GSAM may not terminate the arrangements without the approval of the Trustees. In addition, the Funds have entered into certain offset arrangements with the custodian and the transfer agent, which may result in a reduction of the Funds’ expenses and are received irrespective of the application of the “Other Expense” limitations described above.
72
GOLDMAN SACHS VARIABLE INSURANCE TRUST FUNDS
5. AGREEMENTS AND AFFILIATED TRANSACTIONS (continued)
For the fiscal year ended December 31, 2018, these expense reductions, including any fee waivers and Other Expense reimbursements, were as follows:
| | | | | | | | | | | | | | | | | | | | |
| Fund | | Management
Fee Waiver | | | Distribution and
Service Fee
Waiver | | | Custody Fee
Credits | | | Other Expense
Reimbursement | | | Total Expense
Reductions | |
| Core Fixed Income | | $ | 2,816 | | | $ | — | | | $ | 904 | | | $ | 249,598 | | | $ | 253,318 | |
| Equity Index | | | 157,790 | | | | — | | | | 780 | | | | 252,487 | | | | 411,057 | |
| Growth Opportunities | | | 95,298 | | | | 84,493 | | | | 1,105 | | | | 224,567 | | | | 405,463 | |
| High Quality Floating Rate | | | 31,988 | | | | — | | | | 1,033 | | | | 202,850 | | | | 235,871 | |
F. Line of Credit Facility — As of December 31, 2018, the Funds participated in a $770,000,000 committed, unsecured revolving line of credit facility (the “facility”) together with other funds of the Trust and certain registered investment companies having management agreements with GSAM or its affiliates. This facility is to be used for temporary emergency purposes, or to allow for an orderly liquidation of securities to meet redemption requests. The interest rate on borrowings is based on the federal funds rate. The facility also requires a fee to be paid by the Funds based on the amount of the commitment that has not been utilized. For the fiscal year ended December 31, 2018, the Funds did not have any borrowings under the facility.
G. Other Transactions with Affiliates — For the fiscal year ended December 31, 2018, Goldman Sachs earned $7, $444 and $28 in brokerage commissions from portfolio transactions, including futures transactions executed with Goldman Sachs as the Futures Commission Merchant, on behalf of the Core Fixed Income, Growth Opportunities and High Quality Floating Rate Funds, respectively.
The following table provides information about the investment in shares of issuers of which a Fund is an affiliate as of and for the fiscal year ended December 31, 2018:
| | | | | | | | | | | | | | | | | | | | | | | | | | | | | | | | | | |
| Fund | | Name of Affiliated Issuer | | Beginning
Value as of
December 31,
2017 | | | Purchases
at Cost | | | Proceeds
from Sales | | | Net
Realized
Gain
(Loss) | | | Change in
Unrealized
Appreciation
(Depreciation) | | | Ending
Value as of
December 31,
2018 | | | Shares
as of
December 31,
2018 | | | Dividend
Income from
Affiliated
Issuer | |
| Equity Index | | Goldman Sachs Group, Inc. (The) | | $ | 697,023 | | | $ | 8,590 | | | $ | (55,107 | ) | | $ | 21,235 | | | $ | (250,441 | ) | | $ | 421,300 | | | | 2,522 | | | $ | 8,262 | |
The following table provides information about the Funds’ investment in the Goldman Sachs Financial Square Government Fund as of and for the fiscal year ended December 31, 2018:
| | | | | | | | | | | | | | | | | | | | | | | | |
| Fund | | Beginning
Value as of
December 31,
2017 | | | Purchases
at Cost | | | Proceeds
from Sales | | | Ending
Value as of
December 31,
2018 | | | Shares as of
December 31,
2018 | | | Dividend
Income from
Affiliated
Investment
Company | |
| Core Fixed Income | | $ | 1,280,522 | | | $ | 37,924,082 | | | $ | (38,928,781 | ) | | $ | 275,823 | | | | 275,823 | | | $ | 27,180 | |
| Growth Opportunities | | | 572 | | | | 26,207,214 | | | | (24,566,796 | ) | | | 1,640,990 | | | | 1,640,990 | | | | 18,778 | |
| High Quality Floating Rate | | | 5,655,467 | | | | 44,682,966 | | | | (40,604,429 | ) | | | 9,734,004 | | | | 9,734,004 | | | | 91,594 | |
As of December 31, 2018, The Goldman Sachs Group, Inc. was the beneficial owner of approximately 66% of the Institutional Shares of the Growth Opportunities Fund.
73
GOLDMAN SACHS VARIABLE INSURANCE TRUST FUNDS
Notes to Financial Statements(continued)
December 31, 2018
6. PORTFOLIO SECURITIES TRANSACTIONS
The cost of purchases and proceeds from sales and maturities of long-term securities for the fiscal year ended December 31, 2018, were as follows:
| | | | | | | | | | | | | | | | |
| Fund | | Purchases of U.S.
Government and
Agency Obligations | | | Purchases
(Excluding U.S.
Government and
Agency Obligations) | | | Sales and
Maturities of U.S.
Government and
Agency Obligations | | | Sales and
Maturities
(Excluding U.S.
Government and
Agency Obligations) | |
| Core Fixed Income | | $ | 208,832,409 | | | $ | 15,981,943 | | | $ | 227,733,374 | | | $ | 54,198,281 | |
| Equity Index | | | — | | | | 7,580,560 | | | | — | | | | 20,919,487 | |
| Growth Opportunities | | | — | | | | 56,628,116 | | | | — | | | | 168,869,671 | |
| High Quality Floating Rate | | | 13,296,224 | | | | 17,054,325 | | | | 8,701,263 | | | | 15,491,895 | |
7. SECURITIES LENDING
The Growth Opportunities Fund may lend its securities through a securities lending agent, the Bank of New York Mellon (“BNYM”), to certain qualified borrowers. Pursuant to exemptive relief granted by the Securities and Exchange Commission (“SEC”) and the terms and conditions contained therein, the Equity Index Fund may lend its securities through a securities lending agent, Goldman Sachs Agency Lending (“GSAL”), a wholly-owned subsidiary of Goldman Sachs, to certain qualified borrowers including Goldman Sachs and affiliates. In accordance with the Funds’ securities lending procedures, the Funds receive cash collateral at least equal to the market value of the securities on loan. The market value of the loaned securities is determined at the close of business of the Funds, at their last sale price or official closing price on the principal exchange or system on which they are traded, and any additional required collateral is delivered to the Funds on the next business day. As with other extensions of credit, the Funds may experience delay in the recovery of their securities or incur a loss should the borrower of the securities breach its agreement with the Funds or become insolvent at a time when the collateral is insufficient to cover the cost of repurchasing securities on loan. Dividend income received from securities on loan may not be subject to withholding taxes and therefore withholding taxes paid may differ from the amounts listed in the Statements of Operations. Loans of securities are terminable at any time and as such 1) the remaining contractual maturities of the outstanding securities lending transactions are considered to be overnight and continuous and 2) the borrower, after notice, is required to return borrowed securities within the standard time period for settlement of securities transactions.
The Equity Index and Growth Opportunities Funds invest the cash collateral received in connection with securities lending transactions in the Goldman Sachs Financial Square Government Fund (“Government Money Market Fund”), an affiliated series of the Goldman Sachs Trust. The Government Money Market Fund is registered under the Act as an open end investment company, is subject to Rule 2a-7 under the Act, and is managed by GSAM, for which GSAM may receive a management fee of up to 0.16% (prior to February 21, 2018, GSAM may have received a management fee of up to 0.205%) on an annualized basis of the average daily net assets of the Government Money Market Fund.
In the event of a default by a borrower with respect to any loan, GSAL will and BNYM may exercise any and all remedies provided under the applicable borrower agreement to make the Funds whole. These remedies include purchasing replacement securities by applying the collateral held from the defaulting broker against the purchase cost of the replacement securities. If GSAL or BNYM are unable to purchase replacement securities, GSAL and/or BNYM will indemnify the Funds by paying the Funds an amount equal to the market value of the securities loaned minus the value of cash collateral received from the borrower for the loan, subject to an exclusion for any shortfalls resulting from a loss of value in such cash collateral due to reinvestment risk. The Funds may enter into master netting agreements with borrowers, which provide the right, in the event of a default (including bankruptcy or insolvency), for the non-defaulting party to liquidate the collateral and calculate net exposure to the defaulting party or request additional collateral. However, in the event of a default by a borrower, a resolution authority could determine that such
74
GOLDMAN SACHS VARIABLE INSURANCE TRUST FUNDS
7. SECURITIES LENDING (continued)
rights are not enforceable due to the restrictions or prohibitions against the right of set-off that may be imposed in accordance with a particular jurisdiction’s bankruptcy or insolvency laws. The Funds’ loaned securities were all subject to enforceable Securities Lending Agreements and the value of the collateral was at least equal to the value of the cash received. The amounts of the Funds’ overnight and continuous agreements, which represent the gross amounts of recognized liabilities for securities lending transactions outstanding as of December 31, 2018, are disclosed as “Payable upon return of securities loaned” on the Statements of Assets and Liabilities, where applicable. The Equity Index Fund did not have securities on loan as of December 31, 2018.
Each of the Equity Index and Growth Opportunities Funds and GSAL and BNYM received compensation relating to the lending of the Funds’ securities. The amounts earned, if any, by the Funds’ for the fiscal year ended December 31, 2018, are reported under Investment Income on the Statements of Operations.
The table below details securities lending activity with affiliates of Goldman Sachs:
| | | | | | | | | | | | | | |
| | | | | For the Fiscal Year ended December 31, 2018 | | | | |
| Fund | | | | Earnings of GSAL Relating
to Securities Loaned | | | Amount Received by
the Funds from Lending
to Goldman Sachs | | | Amounts Payable to
Goldman Sachs Upon
Return of Securities Loaned
as of December 31, 2018 | |
| Equity Index | | | | $ | 77 | | | $ | 168 | | | $ | — | |
The following table provides information about the Funds’ investment in the Government Money Market Fund for the fiscal year ended December 31, 2018:
| | | | | | | | | | | | | | | | | | |
| Fund | | | | Beginning
Value as of
December 31, 2017 | | | Purchases
at Cost | | | Proceeds
from Sales | | | Ending
Value as of
December 31, 2018 | |
| Equity Index | | | | $ | 165,850 | | | $ | 1,835,625 | | | $ | (2,001,475 | ) | | $ | — | |
| Growth Opportunities | | | | | 1,040,835 | | | | 14,240,539 | | | | (15,087,668 | ) | | | 193,706 | |
8. TAX INFORMATION
The tax character of distributions paid during the fiscal year ended December 31, 2018 was as follows:
| | | | | | | | | | | | | | | | |
| | | Core Fixed Income | | | Equity Index | | | Growth Opportunities | | | High Quality Floating Rate | |
| Distributions paid from: | | | | | | | | | | | | | | | | |
Ordinary income | | $ | 1,255,866 | | | $ | 2,726,622 | | | $ | 5,004,305 | | | $ | 1,444,361 | |
Net long-term capital gains | | | — | | | | 10,920,309 | | | | 34,358,813 | | | | — | |
| Total taxable distributions | | $ | 1,255,866 | | | $ | 13,646,931 | | | $ | 39,363,118 | | | $ | 1,444,361 | |
The tax character of distributions paid during the fiscal year ended December 31, 2017 was as follows:
| | | | | | | | | | | | | | | | |
| | | Core Fixed Income | | | Equity Index | | | Growth Opportunities | | | High Quality Floating Rate | |
| Distributions paid from: | | | | | | | | | | | | | | | | |
Ordinary income | | $ | 2,875,500 | | | $ | 2,728,376 | | | $ | — | | | $ | 886,780 | |
Net long-term capital gains | | | — | | | | 7,299,201 | | | | 16,872,540 | | | | — | |
| Total taxable distributions | | $ | 2,875,500 | | | $ | 10,027,577 | | | $ | 16,872,540 | | | $ | 886,780 | |
75
GOLDMAN SACHS VARIABLE INSURANCE TRUST FUNDS
Notes to Financial Statements(continued)
December 31, 2018
8. TAX INFORMATION (continued)
As of December 31, 2018, the components of accumulated earnings (losses) on a tax-basis were as follows:
| | | | | | | | | | | | | | | | |
| | | Core Fixed Income | | | Equity Index | | | Growth Opportunities | | | High Quality Floating Rate | |
| Undistributed ordinary income — net | | $ | 99,899 | | | $ | 136,525 | | | $ | 773,892 | | | $ | 158,141 | |
| Undistributed long-term capital gains | | | — | | | | 1,545,206 | | | | 2,419,597 | | | | — | |
| Total undistributed earnings | | $ | 99,899 | | | $ | 1,681,731 | | | $ | 3,193,489 | | | $ | 158,141 | |
| Capital loss carryforwards(1): | | | | | | | | | | | | | | | | |
Perpetual short-term | | $ | (1,042,210 | ) | | $ | — | | | $ | — | | | $ | (166,128 | ) |
Perpetual long-term | | | (1,165,002 | ) | | | — | | | | — | | | | (969,533 | ) |
| Total capital loss carryforwards | | $ | (2,207,212 | ) | | $ | — | | | $ | — | | | $ | (1,135,661 | ) |
| Timing differences (§ 857 (b)(9) deferred dividend, post October loss deferral, and straddle loss deferrals) | | $ | (143,546 | ) | | $ | (129,576 | ) | | $ | (239,899 | ) | | $ | (106,038 | ) |
| Unrealized gains (losses) — net | | | (276,151 | ) | | | 84,341,660 | | | | 9,225,656 | | | | (74,705 | ) |
| Total accumulated earnings (losses) — net | | $ | (2,527,010 | ) | | $ | 85,893,815 | | | $ | 12,179,246 | | | $ | (1,158,263 | ) |
| (1) | The Core Fixed Income Fund had $4,214,815 capital loss carryforwards expire in the current fiscal year end. |
As of December 31, 2018, the Funds’ aggregate security unrealized gains and losses based on cost for U.S. federal income tax purposes were as follows:
| | | | | | | | | | | | | | | | |
| | | Core Fixed Income | | | Equity Index | | | Growth Opportunities | | | High Quality Floating Rate | |
| Tax cost | | $ | 41,337,322 | | | $ | 69,996,259 | | | $ | 50,134,445 | | | $ | 81,352,571 | |
| Gross unrealized gain | | | 813,985 | | | | 94,948,964 | | | | 13,126,789 | | | | 273,496 | |
| Gross unrealized loss | | | (1,090,136 | ) | | | (10,607,304 | ) | | | (3,901,133 | ) | | | (348,201 | ) |
| Net unrealized security gain (loss) | | $ | (276,151 | ) | | $ | 84,341,660 | | | $ | 9,225,656 | | | $ | (74,705 | ) |
The difference between GAAP-basis and tax-basis unrealized gains (losses) is attributable primarily to wash sales, net mark to market gains (losses) on regulated futures and foreign currency contracts, and differences in the tax treatment of underlying fund investments, real estate investment trust investments, partnership investments and swap transactions.
The Core Fixed Income Fund reclassified $4,214,815 from distributable earnings to paid in capital for the year ending December 31, 2018. In order to present certain components of the Fund’s capital accounts on a tax-basis, certain reclassifications have been recorded to the Fund’s accounts. These reclassifications have no impact on the net asset value of the Fund and result primarily from expired capital loss carryforwards.
The Equity Index Fund reclassified $44,846 from distributable earnings to paid in capital for the year ending December 31, 2018. In order to present certain components of the Fund’s capital accounts on a tax-basis, certain reclassifications have been recorded to the Fund’s accounts. These reclassifications have no impact on the net asset value of the Fund and result primarily from differences in the tax treatment of underlying fund investments.
GSAM has reviewed the Funds’ tax positions for all open tax years (the current and prior three years, as applicable) and has concluded that no provision for income tax is required in the Funds’ financial statements. Such open tax years remain subject to examination and adjustment by tax authorities.
76
GOLDMAN SACHS VARIABLE INSURANCE TRUST FUNDS
9. OTHER RISKS
The Funds’ risks include, but are not limited to, the following:
Derivatives Risk— The Funds’ use of derivatives may result in loss. Derivative instruments, which may pose risks in addition to and greater than those associated with investing directly in securities, currencies or other instruments, may be illiquid or less liquid, volatile, difficult to price and leveraged so that small changes in the value of the underlying instruments may produce disproportionate losses to the Funds. Derivatives are also subject to counterparty risk, which is the risk that the other party in the transaction will not fulfill its contractual obligation. The use of derivatives is a highly specialized activity that involves investment techniques and risks different from those associated with investments in more traditional securities and instruments. Losses from derivatives can also result from a lack of correlation between changes in the value of derivative instruments and the portfolio assets (if any) being hedged.
Interest Rate Risk — When interest rates increase, fixed income securities or instruments held by a Fund will generally decline in value. Long-term fixed income securities or instruments will normally have more price volatility because of this risk than short-term fixed income securities or instruments. The risks associated with changing interest rates may have unpredictable effects on the markets and a Fund’s investments. Fluctuations in interest rates may also affect the liquidity of fixed income securities and instruments held by the Funds.
Investments in Other Investment Companies Risk — As a shareholder of another investment company, including an exchange traded fund (“ETF”), a Fund will indirectly bear its proportionate share of any net management fees and other expenses paid by such other investment companies, in addition to the fees and expenses regularly borne by the Fund.
Large Shareholder Transactions Risk— A Fund may experience adverse effects when certain large shareholders, such as other funds, participating insurance companies, accounts and Goldman Sachs affiliates, purchase or redeem large amounts of shares of a Fund. Such large shareholder redemptions, which may occur rapidly or unexpectedly, may cause a Fund to sell portfolio securities at times when it would not otherwise do so, which may negatively impact a Fund’s NAV and liquidity. These transactions may also accelerate the realization of taxable income to shareholders if such sales of investments resulted in gains, and may also increase transaction costs. In addition, a large redemption could result in a Fund’s current expenses being allocated over a smaller asset base, leading to an increase in the Fund’s expense ratio. Similarly, large Fund share purchases may adversely affect a Fund’s performance to the extent that the Fund is delayed in investing new cash or otherwise maintains a larger cash position than it ordinarily would.
Liquidity Risk— A Fund may make investments that are illiquid or that may become less liquid in response to market developments or adverse investor perceptions. Illiquid investments may be more difficult to value. Liquidity risk may also refer to the risk that a Fund will not be able to pay redemption proceeds within the allowable time period or without significant dilution to remaining investors’ interests because of unusual market conditions, an unusually high volume of redemption requests, or other reasons. To meet redemption requests, a Fund may be forced to sell investments at an unfavorable time and/or under unfavorable conditions. If a Fund is forced to sell securities at an unfavorable time and/or under unfavorable conditions, such sales may adversely affect the Fund’s NAV and dilute remaining investors’ interests. Liquidity risk may be the result of, among other things, the reduced number and capacity of traditional market participants to make a market in fixed income securities or the lack of an active market. The potential for liquidity risk may be magnified by a rising interest rate environment or other circumstances where investor redemptions from fixed income mutual funds may be higher than normal, potentially causing increased supply in the market due to selling activity.
Market and Credit Risks — In the normal course of business, a Fund trades financial instruments and enters into financial transactions where risk of potential loss exists due to changes in the market (market risk). Additionally, a Fund may also be exposed to credit risk in the event that an issuer or guarantor fails to perform or that an institution or entity with which the Fund has unsettled or open transactions defaults.
10. INDEMNIFICATIONS
Under the Trust’s organizational documents, its Trustees, officers, employees and agents are indemnified, to the extent permitted by the Act and state law, against certain liabilities that may arise out of performance of their duties to the Funds. Additionally, in the
77
GOLDMAN SACHS VARIABLE INSURANCE TRUST FUNDS
Notes to Financial Statements(continued)
December 31, 2018
10. INDEMNIFICATIONS (continued)
course of business, the Funds enter into contracts that contain a variety of indemnification clauses. The Funds’ maximum exposure under these arrangements is unknown, as this would involve future claims that may be made against the Funds that have not yet occurred. However, GSAM believes the risk of loss under these arrangements to be remote.
11. OTHER MATTERS
In March 2017, the Financial Accounting Standards Board issued Accounting Standards Update (ASU) 2017-08 – Receivables – Nonrefundable Fees and Other Costs (Subtopic 310-20): Premium Amortization on Purchased Callable Debt Securities. The amendments in the ASU shorten the amortization period for certain callable debt securities held at a premium, by requiring amortization to the earliest call date. The ASU is effective for fiscal years, and interim periods within those fiscal years, beginning after December 15, 2018. GSAM is currently evaluating the impact, if any, of the amendments.
In September 2018, the Financial Accounting Standards Board issued Accounting Standards Update (ASU) 2018-13— Fair Value Measurement (Topic 820) Disclosure Framework — Changes to the Disclosure Requirements for Fair Value Measurement. The amendments in the ASU modify fair value measurement disclosures. The amendments are effective for the Funds’ fiscal year beginning after December 15, 2019. GSAM is currently evaluating the impact, if any, of the amendments.
12. SUBSEQUENT EVENTS
Subsequent events after the Statements of Assets and Liabilities date have been evaluated, and GSAM has concluded that there is no impact requiring adjustment or disclosure in the financial statements.
13. SUMMARY OF SHARE TRANSACTIONS
Share activity is as follows:
| | | | | | | | | | | | | | | | |
| | | Core Fixed Income Fund | |
| | | For the Fiscal Year Ended
December 31, 2018 | | | For the Fiscal Year Ended
December 31, 2017 | |
| | | Shares | | | Dollars | | | Shares | | | Dollars | |
| Institutional Shares | | | | | | | | | | | | | | | | |
| Shares sold | | | 239,264 | | | $ | 2,398,042 | | | | 15,479 | | | $ | 164,881 | |
| Reinvestment of distributions | | | 1,385 | | | | 14,101 | | | | 504 | | | | 5,356 | |
| Shares redeemed | | | (2,860 | ) | | | (29,294 | ) | | | (1,931 | ) | | | (20,628 | ) |
| | | | 237,789 | | | | 2,382,849 | | | | 14,052 | | | | 149,609 | |
| Service Shares | | | | | | | | | | | | | | | | |
| Shares sold | | | 269,492 | | | | 2,777,030 | | | | 646,406 | | | | 6,887,625 | |
| Reinvestment of distributions | | | 121,784 | | | | 1,241,765 | | | | 270,542 | | | | 2,870,144 | |
| Shares redeemed | | | (7,052,075 | ) | | | (73,362,835 | ) | | | (1,110,095 | ) | | | (11,842,825 | ) |
| | | | (6,660,799 | ) | | | (69,344,040 | ) | | | (193,147 | ) | | | (2,085,056 | ) |
| | | | |
| NET DECREASE | | | (6,423,010 | ) | | $ | (66,961,191 | ) | | | (179,095 | ) | | $ | (1,935,447 | ) |
78
GOLDMAN SACHS VARIABLE INSURANCE TRUST FUNDS
13. SUMMARY OF SHARE TRANSACTIONS (continued)
| | | | | | | | | | | | | | | | |
| | | Equity Index Fund | |
| | | For the Fiscal Year Ended
December 31, 2018 | | | For the Fiscal Year Ended
December 31, 2017 | |
| | | Shares | | | Dollars | | | Shares | | | Dollars | |
| Service Shares | | | | | | | | | | | | | | | | |
| Shares sold | | | 255,683 | | | $ | 4,433,966 | | | | 128,581 | | | $ | 2,056,692 | |
| Reinvestment of distributions | | | 931,531 | | | | 13,646,931 | | | | 600,454 | | | | 10,027,577 | |
| Shares redeemed | | | (1,225,406 | ) | | | (20,993,560 | ) | | | (1,367,871 | ) | | | (21,731,411 | ) |
| | | | |
| NET DECREASE | | | (38,192 | ) | | $ | (2,912,663 | ) | | | (638,836 | ) | | $ | (9,647,142 | ) |
| | | | | | | | | | | | | | | | |
| | | Growth Opportunities Fund | |
| | | For the Fiscal Year Ended
December 31, 2018 | | | For the Fiscal Year Ended
December 31, 2017 | |
| | | Shares | | | Dollars | | | Shares | | | Dollars | |
| Institutional Shares | | | | | | | | | | | | | | | | |
| Shares sold | | | 1,452 | | | $ | 10,553 | | | | 48,128 | | | $ | 365,935 | |
| Reinvestment of distributions | | | 14,418 | | | | 37,921 | | | | 642 | | | | 4,985 | |
| Shares redeemed | | | — | | | | (6 | ) | | | (560,729 | ) | | | (4,411,997 | ) |
| | | | 15,870 | | | | 48,468 | | | | (511,959 | ) | | | (4,041,077 | ) |
| Service Shares | | | | | | | | | | | | | | | | |
| Shares sold | | | 400,481 | | | | 2,816,257 | | | | 531,350 | | | | 4,039,461 | |
| Reinvestment of distributions | | | 15,482,361 | | | | 39,325,197 | | | | 2,196,296 | | | | 16,867,555 | |
| Shares redeemed | | | (14,466,620 | ) | | | (114,387,851 | ) | | | (3,713,893 | ) | | | (28,591,468 | ) |
| | | | 1,416,222 | | | | (72,246,397 | ) | | | (986,247 | ) | | | (7,684,452 | ) |
| | | | |
| NET INCREASE (DECREASE) | | | 1,432,092 | | | $ | (72,197,929 | ) | | | (1,498,206 | ) | | $ | (11,725,529 | ) |
79
GOLDMAN SACHS VARIABLE INSURANCE TRUST FUNDS
Notes to Financial Statements(continued)
December 31, 2018
13. SUMMARY OF SHARE TRANSACTIONS (continued)
| | | | | | | | | | | | | | | | |
| | | High Quality Floating Rate Fund | |
| | | For the Fiscal Year Ended
December 31, 2018 | | | For the Fiscal Year Ended
December 31, 2017 | |
| | | Shares | | | Dollars | | | Shares | | | Dollars | |
| Institutional Shares | | | | | | | | | | | | | | | | |
| Shares sold | | | 220,421 | | | $ | 2,298,983 | | | | 6,236 | | | $ | 65,055 | |
| Reinvestment of distributions | | | 1,234 | | | | 12,809 | | | | 92 | | | | 956 | |
| Shares redeemed | | | (2,992 | ) | | | (31,202 | ) | | | (3,345 | ) | | | (34,922 | ) |
| | | | 218,663 | | | | 2,280,590 | | | | 2,983 | | | | 31,089 | |
| Service Shares | | | | | | | | | | | | | | | | |
| Shares sold | | | 1,428,964 | | | | 14,877,058 | | | | 537,817 | | | | 5,602,003 | |
| Reinvestment of distributions | | | 127,506 | | | | 1,323,812 | | | | 80,994 | | | | 842,342 | |
| Shares redeemed | | | (930,951 | ) | | | (9,686,886 | ) | | | (643,776 | ) | | | (6,705,632 | ) |
| | | | 625,519 | | | | 6,513,984 | | | | (24,965 | ) | | | (261,287 | ) |
| Advisor Shares | | | | | | | | | | | | | | | | |
| Shares sold | | | 385,926 | | | | 4,020,676 | | | | 673,871 | | | | 7,022,526 | |
| Reinvestment of distributions | | | 10,367 | | | | 107,740 | | | | 4,176 | | | | 43,482 | |
| Shares redeemed | | | (157,560 | ) | | | (1,641,339 | ) | | | (383,555 | ) | | | (3,998,446 | ) |
| | | | 238,733 | | | | 2,487,077 | | | | 294,492 | | | | 3,067,562 | |
| | | | |
| NET INCREASE | | | 1,082,915 | | | $ | 11,281,651 | | | | 272,510 | | | $ | 2,837,364 | |
80
Report of Independent Registered Public Accounting Firm
To the Board of Trustees of Goldman Sachs Variable Insurance Trust and Shareholders of the
Goldman Sachs Core Fixed Income Fund, Goldman Sachs Equity Index Fund, Goldman Sachs Growth Opportunities Fund and Goldman Sachs High Quality Floating Rate Fund
Opinions on the Financial Statements
We have audited the accompanying statements of assets and liabilities, including the schedules of investments, of Goldman Sachs Core Fixed Income Fund, Goldman Sachs Equity Index Fund, Goldman Sachs Growth Opportunities Fund and Goldman Sachs High Quality Floating Rate Fund (four of the funds constituting Goldman Sachs Variable Insurance Trust, hereafter collectively referred to as the “Funds”) as of December 31, 2018, the related statements of operations for the year ended December 31, 2018, the statements of changes in net assets for each of the two years in the period ended December 31, 2018, including the related notes, and the financial highlights for each of the periods indicated therein (collectively referred to as the “financial statements”). In our opinion, the financial statements present fairly, in all material respects, the financial position of each of the Funds as of December 31, 2018, the results of each of their operations for the year then ended, the changes in each of their net assets for each of the two years in the period ended December 31, 2018 and the financial highlights for each of the periods indicated therein in conformity with accounting principles generally accepted in the United States of America.
Basis for Opinions
These financial statements are the responsibility of the Funds’ management. Our responsibility is to express an opinion on the Funds’ financial statements based on our audits. We are a public accounting firm registered with the Public Company Accounting Oversight Board (United States) (PCAOB) and are required to be independent with respect to the Funds in accordance with the U.S. federal securities laws and the applicable rules and regulations of the Securities and Exchange Commission and the PCAOB.
We conducted our audits of these financial statements in accordance with the standards of the PCAOB. Those standards require that we plan and perform the audit to obtain reasonable assurance about whether the financial statements are free of material misstatement, whether due to error or fraud.
Our audits included performing procedures to assess the risks of material misstatement of the financial statements, whether due to error or fraud, and performing procedures that respond to those risks. Such procedures included examining, on a test basis, evidence regarding the amounts and disclosures in the financial statements. Our audits also included evaluating the accounting principles used and significant estimates made by management, as well as evaluating the overall presentation of the financial statements. Our procedures included confirmation of securities owned as of December 31, 2018 by correspondence with the custodian, transfer agent and brokers; when replies were not received from brokers, we performed other auditing procedures. We believe that our audits provide a reasonable basis for our opinions.
PricewaterhouseCoopers LLP
Boston, Massachusetts
February 13, 2019
We have served as the auditor of one or more investment companies in the Goldman Sachs fund complex since 2000.
81
GOLDMAN SACHS VARIABLE INSURANCE TRUST FUNDS
| | |
| Fund Expenses — Six Month Period Ended December 31, 2018 (Unaudited) | | |
As a shareholder of Institutional, Service or Advisor Shares of the Funds, you incur ongoing costs, including management fees, distribution and/or service (12b-1) fees (with respect to Service and Advisor Shares) and other Fund expenses. This example is intended to help you understand your ongoing costs (in dollars) of investing in the Institutional Shares, Service Shares and Advisor Shares of the Funds and to compare these costs with the ongoing costs of investing in other mutual funds.
The example is based on an investment of $1,000 invested at the beginning of the period and held for the entire period from July 1, 2018 through December 31, 2018, which represents a period of 184 days of a 365 day year.
Actual Expenses — The first line under each share class in the table below provides information about actual account values and actual expenses. You may use the information in this line, together with the amount you invested, to estimate the expenses that you paid over the period. Simply divide your account value by $1,000 (for example, an $8,600 account value divided by $1,000=8.6), then multiply the result by the number in the first line under the heading entitled “Expenses Paid” to estimate the expenses you paid on your account during this period.
Hypothetical Example for Comparison Purposes — The second line under each share class in the table below provides information about hypothetical account values and hypothetical expenses based on the Funds’ actual net expense ratio and an assumed rate of return of 5% per year before expenses, which is not the Funds’ actual return. The hypothetical account values and expenses may not be used to estimate the actual ending account balance or expenses you paid for the period. You may use this information to compare the ongoing costs of investing in the Funds and other funds. To do so, compare this 5% hypothetical example with the 5% hypothetical examples that appear in the shareholder reports of the other funds.
Please note that the expenses shown in the table are meant to highlight your ongoing costs only. As a shareholder of the Funds you do not incur any transaction costs, such as sales charges, redemption fees, or exchange fees, but shareholders of other funds may incur such costs. The second line of the table is useful in comparing ongoing costs only and will not help you determine the relative total costs of owning different funds whose shareholders may incur transaction costs.
| | | | | | | | | | | | | | | | | | | | | | | | | | | | | | | | | | | | | | | | | | | | | | | | |
| | | Core Fixed Income Fund | | | Equity Index Fund | | | Growth Opportunities Fund | | | High Quality Floating Rate Fund | |
| Share Class | | Beginning
Account
Value 07/01/18 | | | Ending
Account
Value 12/31/18 | | | Expenses Paid for the
6 Months
Ended 12/31/18* | | | Beginning
Account
Value 07/01/18 | | | Ending Account Value
12/31/18 | | | Expenses Paid for the
6 Months
Ended 12/31/18* | | | Beginning
Account
Value 07/01/18 | | | Ending Account
Value 12/31/18 | | | Expenses Paid for the
6 Months
Ended 12/31/18* | | | Beginning
Account
Value 07/01/18 | | | Ending
Account
Value 12/31/18 | | | Expenses Paid for the
6 Months
Ended 12/31/18* | |
| Institutional | | | | | | | | | | | | | | | | | | | | | | | | | | | | | | | | | | | | | | | | | | | | | | | | |
| | | | | | | | | | | | | |
Actual | | $ | 1,000 | | | $ | 1,013.20 | | | $ | 2.13 | | | | N/A | | | | N/A | | | | N/A | | | $ | 1,000 | | | $ | 921.60 | | | $ | 4.12 | | | $ | 1,000 | | | $ | 1,008.00 | | | $ | 1.72 | |
Hypothetical 5% return | | | 1,000 | | | | 1,023.09 | + | | | 2.14 | | | | N/A | | | | N/A | | | | N/A | | | | 1,000 | | | | 1,020.92 | + | | | 4.33 | | | | 1,000 | | | | 1,023.49 | + | | | 1.73 | |
| Service | | | | | | | | | | | | | | | | | | | | | | | | | | | | | | | | | | | | | | | | | | | | | | | | |
| | | | | | | | | | | | | |
Actual | | | 1,000 | | | | 1,011.90 | | | | 3.40 | | | $ | 1,000 | | | $ | 928.90 | | | $ | 2.33 | | | | 1,000 | | | | 920.70 | | | | 4.89 | | | | 1,000 | | | | 1,006.70 | | | | 3.03 | |
Hypothetical 5% return | | | 1,000 | | | | 1,021.83 | + | | | 3.41 | | | | 1,000 | | | | 1,022.79 | + | | | 2.45 | | | | 1,000 | | | | 1,020.11 | + | | | 5.14 | | | | 1,000 | | | | 1,022.18 | + | | | 3.06 | |
| Advisor | | | | | | | | | | | | | | | | | | | | | | | | | | | | | | | | | | | | | | | | | | | | | | | | |
| | | | | | | | | | | | | |
Actual | | | N/A | | | | N/A | | | | N/A | | | | N/A | | | | N/A | | | | N/A | | | | N/A | | | | N/A | | | | N/A | | | | 1,000 | | | | 1,005.80 | | | | 3.79 | |
Hypothetical 5% return | | | N/A | | | | N/A | | | | N/A | | | | N/A | | | | N/A | | | | N/A | | | | N/A | | | | N/A | | | | N/A | | | | 1,000 | | | | 1,021.42 | + | | | 3.82 | |
| | + | Hypothetical expenses are based on each Fund’s actual annualized net expense ratios and an assumed rate of return of 5% per year before expenses. | |
| | * | Expenses are calculated using each Fund’s annualized net expense ratio for each class, which represents the ongoing expenses as a percentage of net assets for the six months ended December 31, 2018. Expenses are calculated by multiplying the annualized net expense ratio by the average account value for the period; then multiplying the result by the number of days in the most recent fiscal half year; and then dividing that result by the number of days in the fiscal year. The annualized net expense ratios for the period were as follows: | |
| | | | | | | | | | | | |
| | | |
| Fund | | Institutional | | | Service | | | Advisor | |
| Core Fixed Income | | | 0.42 | % | | | 0.67 | % | | | N/A | |
| Equity Index | | | N/A | | | | 0.48 | | | | N/A | |
| Growth Opportunities | | | 0.85 | | | | 1.01 | | | | N/A | |
| High Quality Floating Rate | | | 0.34 | | | | 0.60 | | | | 0.75 | % |
82
GOLDMAN SACHS VARIABLE INSURANCE TRUST FUNDS
Trustees and Officers (Unaudited)
Independent Trustees
| | | | | | | | | | | | |
| | | | | |
Name,
Address and Age1 | | Position(s) Held
with the Trust | | Term of Office and
Length of
Time Served2 | | Principal Occupation(s) During Past 5 Years | | Number of
Portfolios in
Fund Complex
Overseen by
Trustee3 | | | Other Directorships Held by Trustee4 |
Jessica Palmer Age: 69 | | Chair of the Board of Trustees | | Since 2018 (Trustee since 2007) | | Ms. Palmer is retired. She was formerly Director, Emerson Center for the Arts and Culture (2011-2017); and Consultant, Citigroup Human Resources Department (2007-2008); Managing Director, Citigroup Corporate and Investment Banking (previously, Salomon Smith Barney/Salomon Brothers) (1984-2006). Ms. Palmer was a Member of the Board of Trustees of Indian Mountain School (private elementary and secondary school) (2004-2009). Chair of the Board of Trustees — Goldman Sachs Trust and Goldman Sachs Variable Insurance Trust. | | | 103 | | | None |
Kathryn A. Cassidy Age: 64 | | Trustee | | Since 2015 | | Ms. Cassidy is retired. Formerly, she was Advisor to the Chairman (May 2014-December 2014); and Senior Vice President and Treasurer (2008-2014), General Electric Company & General Electric Capital Corporation (technology and financial services companies). Trustee — Goldman Sachs Trust and Goldman Sachs Variable Insurance Trust. | | | 103 | | | None |
Diana M. Daniels Age: 69 | | Trustee | | Since 2007 | | Ms. Daniels is retired. Formerly, she was Vice President, General Counsel and Secretary, The Washington Post Company (1991-2006). Ms. Daniels is a Trustee Emeritus and serves as a Presidential Councillor of Cornell University (2013-Present); former Member of the Legal Advisory Board, New York Stock Exchange (2003-2006) and of the Corporate Advisory Board, Standish Mellon Management Advisors (2006-2007). Trustee — Goldman Sachs Trust and Goldman Sachs Variable Insurance Trust. | | | 103 | | | None |
Herbert J. Markley Age: 68 | | Trustee | | Since 2013 | | Mr. Markley is retired. Formerly, he was Executive Vice President, Deere & Company (an agricultural and construction equipment manufacturer) (2007-2009); and President, Agricultural Division, Deere & Company (2001-2007). Previously, Mr. Markley served as an Advisory Board Member of Goldman Sachs Trust and Goldman Sachs Variable Insurance Trust (June 2013-October 2013). Trustee — Goldman Sachs Trust and Goldman Sachs Variable Insurance Trust. | | | 103 | | | None |
Roy W. Templin Age: 58 | | Trustee | | Since 2013 | | Mr. Templin is retired. He is Director, Armstrong World Industries, Inc. (a designer and manufacturer of ceiling, wall and suspension system solutions) (2016-Present); and was formerly Chairman of the Board of Directors, Con-Way Incorporated (a transportation, logistics and supply chain management service company) (2014-2015); Executive Vice President and Chief Financial Officer, Whirlpool Corporation (an appliance manufacturer and marketer) (2004-2012). Previously, Mr. Templin served as an Advisory Board Member of Goldman Sachs Trust and Goldman Sachs Variable Insurance Trust (June 2013-October 2013). Trustee — Goldman Sachs Trust and Goldman Sachs Variable Insurance Trust. | | | 103 | | | Armstrong World Industries, Inc. (a ceiling, wall and suspension systems solutions manufacturer) |
Gregory G. Weaver Age: 67 | | Trustee | | Since 2015 | | Mr. Weaver is retired. He is Director, Verizon Communications Inc. (2015-Present); and was formerly Chairman and Chief Executive Officer, Deloitte & Touche LLP (a professional services firm) (2001-2005 and 2012-2014); and Member of the Board of Directors, Deloitte & Touche LLP (2006-2012). Trustee — Goldman Sachs Trust and Goldman Sachs Variable Insurance Trust. | | | 103 | | | Verizon Communications Inc. |
| | | | | | | | | | | | |
83
GOLDMAN SACHS VARIABLE INSURANCE TRUST FUNDS
Trustees and Officers (Unaudited) (continued)
Interested Trustee*
| | | | | | | | | | | | |
| | | | | |
Name,
Address and Age1 | | Position(s) Held with the Trust | | Term of Office and
Length of
Time Served2 | | Principal Occupation(s) During Past 5 Years | | Number of
Portfolios in
Fund Complex
Overseen by
Trustee3 | | | Other Directorships Held by Trustee4 |
James A. McNamara Age: 56 | | President and Trustee | | Since 2007 | | Advisory Director, Goldman Sachs (January 2018-Present); Managing Director, Goldman Sachs (January 2000-December 2017); Director of Institutional Fund Sales, GSAM (April 1998-December 2000); and Senior Vice President and Manager, Dreyfus Institutional Service Corporation (January 1993- April 1998). President and Trustee — Goldman Sachs Trust; Goldman Sachs Variable Insurance Trust; Goldman Sachs Trust II; Goldman Sachs MLP Income Opportunities Fund; Goldman Sachs MLP and Energy Renaissance Fund; Goldman Sachs ETF Trust; Goldman Sachs Private Markets Fund 2018 LLC; Goldman Sachs Private Markets Fund 2018 (A) LLC; and Goldman Sachs Private Markets Fund 2018 (B) LLC. | | | 156 | | | None |
| | | | | | | | | | | | |
| * | Mr. McNamara is considered to be an “Interested Trustee” because he holds positions with Goldman Sachs and owns securities issued by The Goldman Sachs Group, Inc. Mr. McNamara holds comparable positions with certain other companies of which Goldman Sachs, GSAM or an affiliate thereof is the investment adviser, administrator and/or distributor. |
| 1 | Each Trustee may be contacted by writing to the Trustee, c/o Goldman Sachs, 200 West Street, New York, New York, 10282, Attn: Caroline Kraus. Information is provided as of December 31, 2018. |
| 2 | Subject to such policies as may be adopted by the Board from time-to-time, each Trustee holds office for an indefinite term, until the earliest of: (a) the election of his or her successor; (b) the date the Trustee resigns or is removed by the Board or shareholders, in accordance with the Trust’s Declaration of Trust; or (c) the termination of the Trust. The Board has adopted policies which provide that (a) no Trustee shall hold office for more than 15 years and (b) a Trustee shall retire as of December 31st of the calendar year in which he or she reaches his or her 74th birthday, unless a waiver of such requirement shall have been adopted by a majority of the other Trustees. These policies may be changed by the Trustees without shareholder vote. |
| 3 | The Goldman Sachs Fund Complex includes certain other companies listed above for each respective Trustee. As of December 31, 2018, Goldman Sachs Trust consisted of 90 portfolios (88 of which offered shares to the public); Goldman Sachs Variable Insurance Trust consisted of 13 portfolios; Goldman Sachs Trust II consisted of 19 portfolios (17 of which offered shares to the public); Goldman Sachs MLP Income Opportunities Fund, Goldman Sachs MLP and Energy Renaissance Fund, Goldman Sachs Private Markets Fund 2018 LLC, Goldman Sachs Private Markets Fund 2018 (A) LLC and Goldman Sachs Private Markets Fund 2018 (B) LLC each consisted of one portfolio; and Goldman Sachs ETF Trust consisted of 29 portfolios (14 of which offered shares to the public). |
| 4 | This column includes only directorships of companies required to report to the Securities and Exchange Commission under the Securities Exchange Act of 1934 (i.e., “public companies”) or other investment companies registered under the Act. |
Additional information about the Trustees is available in the Funds’ Statement of Additional Information, which can be obtained from Goldman Sachs free of charge by calling this toll-free number (in the United States of America): 1-800-526-7384.
84
GOLDMAN SACHS VARIABLE INSURANCE TRUST FUNDS
Trustees and Officers (Unaudited) (continued)
Officers of the Trust*
| | | | | | |
| | | |
| Name, Address and Age1 | | Position(s) Held with the Trust | | Term of
Office and
Length of
Time Served2 | | Principal Occupation(s) During Past 5 Years |
James A. McNamara
200 West Street New York, NY 10282 Age: 56 | | Trustee and
President | | Since 2007 | | Advisory Director, Goldman Sachs (January 2018-Present); Managing Director, Goldman Sachs (January 2000-December 2017); Director of Institutional Fund Sales, GSAM (April 1998-December 2000); and Senior Vice President and Manager, Dreyfus Institutional Service Corporation (January 1993-April 1998). President and Trustee — Goldman Sachs Trust; Goldman Sachs Variable Insurance Trust; Goldman Sachs Trust II; Goldman Sachs MLP Income Opportunities Fund; Goldman Sachs MLP and Energy Renaissance Fund; Goldman Sachs ETF Trust; Goldman Sachs Private Markets Fund 2018 LLC; Goldman Sachs Private Markets Fund 2018 (A) LLC; and Goldman Sachs Private Markets Fund 2018 (B) LLC. |
Caroline L. Kraus
200 West Street New York, NY 10282 Age: 41 | | Secretary | | Since 2012 | | Managing Director, Goldman Sachs (January 2016-Present); Vice President, Goldman Sachs (August 2006-December 2015); Associate General Counsel, Goldman Sachs (2012-Present); Assistant General Counsel, Goldman Sachs (August 2006-December 2011); and Associate, Weil, Gotshal & Manges, LLP (2002-2006). Secretary — Goldman Sachs Trust (previously Assistant Secretary (2012)); Goldman Sachs Variable Insurance Trust (previously Assistant Secretary (2012)); Goldman Sachs Trust II; Goldman Sachs BDC, Inc.; Goldman Sachs Private Middle Market Credit LLC; Goldman Sachs Middle Market Lending Corp.; Goldman Sachs MLP Income Opportunities Fund; Goldman Sachs MLP and Energy Renaissance Fund; Goldman Sachs ETF Trust; Goldman Sachs Private Markets Fund 2018 LLC; Goldman Sachs Private Markets Fund 2018 (A) LLC; and Goldman Sachs Private Markets Fund 2018 (B) LLC. |
Scott M. McHugh
200 West Street New York, NY 10282 Age: 47 | | Treasurer, Senior
Vice President and
Principal Financial
Officer | | Since 2009
(Principal
Financial
Officer since
2013) | | Managing Director, Goldman Sachs (January 2016-Present); Vice President, Goldman Sachs (February 2007-December 2015); Assistant Treasurer of certain mutual funds administered by DWS Scudder (2005-2007); and Director (2005-2007), Vice President (2000-2005), and Assistant Vice President (1998-2000), Deutsche Asset Management or its predecessor (1998-2007). Treasurer, Senior Vice President and Principal Financial Officer — Goldman Sachs Trust; Goldman Sachs Variable Insurance Trust; Goldman Sachs Trust II; Goldman Sachs MLP Income Opportunities Fund; Goldman Sachs MLP and Energy Renaissance Fund; Goldman Sachs ETF Trust; Goldman Sachs Private Markets Fund 2018 LLC; Goldman Sachs Private Markets Fund 2018 (A) LLC; and Goldman Sachs Private Markets Fund 2018 (B) LLC. |
Joseph F. DiMaria
30 Hudson Street Jersey City, NJ 07302 Age: 50 | | Assistant Treasurer
and Principal
Accounting Officer | | Since 2016
(Principal
Accounting
Officer since
2017) | | Managing Director, Goldman Sachs (November 2015-Present) and Vice President — Mutual Fund Administration, Columbia Management Investment Advisers, LLC (May 2010-October 2015). Assistant Treasurer and Principal Accounting Officer — Goldman Sachs Trust; Goldman Sachs Variable Insurance Trust; Goldman Sachs Trust II; Goldman Sachs MLP Income Opportunities Fund; Goldman Sachs MLP and Energy Renaissance Fund; Goldman Sachs ETF Trust; Goldman Sachs Private Markets Fund 2018 LLC; Goldman Sachs Private Markets Fund 2018 (A) LLC; and Goldman Sachs Private Markets Fund 2018 (B) LLC. |
| | | | | | |
| * | Represents a partial list of officers of the Trust. Additional information about all the officers is available in the Funds’ Statement of Additional Information, which can be obtained from Goldman Sachs free of charge by calling this toll-free number (in the United States): 1-800-526-7384. |
| 1 | Information is provided as of December 31, 2018. |
| 2 | Officers hold office at the pleasure of the Board of Trustees or until their successors are duly elected and qualified. Each officer holds comparable positions with certain other companies of which Goldman Sachs, GSAM or an affiliate thereof is the investment adviser, administrator and/or distributor. |
Goldman Sachs Variable Insurance Trust — Tax Information (Unaudited)
For the year ended December 31, 2018, 100% and 9.27% of the dividends paid from net investment company taxable income by the Equity Index and Growth Opportunities Funds qualify for the dividends received deduction available to corporations.
Pursuant to Section 852 of the Internal Revenue Code, the Equity Index and Growth Opportunities Funds designate $10,920,309 and $34,358,813 respectively, or, if different, the maximum amount allowable, as capital gain dividends paid during the year ended December 31, 2018.
85
| | |
| TRUSTEES | | OFFICERS |
| Jessica Palmer,Chair | | James A. McNamara,President |
| Kathryn A. Cassidy | | Scott M. McHugh,Treasurer, Senior Vice |
| Diana M. Daniels | | President and Principal Financial Officer |
| Herbert J. Markley | | Joseph F. DiMaria,Assistant Treasurer and |
| James A. McNamara | | Principal Accounting Officer |
| Roy W. Templin | | Caroline L. Kraus,Secretary |
| Gregory G. Weaver | | |
GOLDMAN SACHS & CO. LLC
Distributor and Transfer Agent
GOLDMAN SACHS ASSET MANAGEMENT, L.P.
Investment Adviser
200 West Street, New York,
New York 10282
Visit our web site at www.GSAMFUNDS.com to obtain the most recentmonth-end returns.
The reports concerning the Funds included in this shareholder report may contain certain forward-looking statements about the factors that may affect the performance of the Funds in the future. These statements are based on Fund management’s predictions and expectations concerning certain future events and their expected impact on the Funds, such as performance of the economy as a whole and of specific industry sectors, changes in the levels of interest rates, the impact of developing world events, and other factors that may influence the future performance of the Funds. Management believes these forward-looking statements to be reasonable, although they are inherently uncertain and difficult to predict. Actual events may cause adjustments in portfolio management strategies from those currently expected to be employed.
A description of the policies and procedures that the Funds use to determine how to vote proxies relating to portfolio securities and information regarding how the Funds voted proxies relating to portfolio securities for the12-month period ended December 31 is available (i) without charge, upon request by calling1-800-621-2550; and (ii) on the Securities and Exchange Commission (“SEC”) web site athttp://www.sec.gov.
The Funds file their complete schedule of portfolio holdings with the SEC for the first and third quarters of each fiscal year onForm N-Q. The Funds’ Form N-Qs are available on the SEC’s web site at http://www.sec.gov within 60 days after the Funds’ first and third fiscal quarters. Form N-Qs may be obtained upon request and without charge by calling1-800-621-2550.
Views and opinions expressed are for informational purposes only and do not constitute a recommendation by GSAM to buy, sell, or hold any security. Views and opinions are current as of the date of this presentation and may be subject to change, they should not be construed as investment advice.
Goldman Sachs & Co. LLC (“Goldman Sachs”) does not provide legal, tax or accounting advice. Any statement contained in this communication (including any attachments) concerning U.S. tax matters was not intended or written to be used, and cannot be used, for the purpose of avoiding penalties under the Internal Revenue Code, and was written to support the promotion or marketing of transactions or matters addressed. Clients of Goldman Sachs should obtain their own independent tax advice based on their particular circumstances.
The website links provided are for your convenience only and are not an endorsement or recommendation by GSAM of any of these websites or the products or services offered. GSAM is not responsible for the accuracy and validity of the content of these websites.
Fund holdings and allocations shown are as of December 31, 2018 and may not be representative of future investments. Fund holdings should not be relied on in making investment decisions and should not be construed as research or investment advice regarding particular securities. Current and future holdings are subject to risk.
References to indices, benchmarks or other measures of relative market performance over a specified period of time are provided for your information only and do not imply that the portfolio will achieve similar results. The index composition may not reflect the manner in which a portfolio is constructed. While an adviser seeks to design a portfolio which reflects appropriate risk and return features, portfolio characteristics may deviate from those of the benchmark.
The Global Industry Classification Standard (“GICS”) was developed by and is the exclusive property and a service mark of Morgan Stanley Capital International Inc. (“MSCI”) and Standard & Poor’s, a division of The McGraw-Hill Companies, Inc. (“S&P”) and is licensed for use by Goldman Sachs. Neither MSCI, S&P nor any other party involved in making or compiling the GICS or any GICS classifications makes any express or implied warranties or representations with respect to such standard or classification (or the results to be obtained by the use thereof), and all such parties hereby expressly disclaim all warranties of originality, accuracy, completeness, merchantability or fitness for a particular purpose with respect to any of such standard or classification. Without limiting any of the foregoing, in no event shall MSCI, S&P, any of their affiliates or any third party involved in making or compiling the GICS or any GICS classifications have any liability for any direct, indirect, special, punitive, consequential or any other damages (including lost profits) even if notified of the possibility of such damages.
The portfolio risk management process includes an effort to monitor and manage risk, but does not imply low risk.
Shares of the Goldman Sachs VIT Funds are offered to separate accounts of participating life insurance companies for the purpose of funding variable annuity contracts and variable life insurance policies. Shares of the Funds are not offered directly to the general public. The variable annuity contracts and variable life insurance policies are described in the separate prospectuses issued by participating insurance companies. You should refer to those prospectuses for information about surrender charges, mortality and expense risk fees and other charges that may be assessed by participating insurance companies under the variable annuity contracts or variable life insurance policies. Such fees or charges, if any, may affect the return you may realize with respect to your investments. Ask your representative for more complete information. Please consider a fund’s objectives, risks and charges and expenses, and read the prospectus carefully before investing. The prospectus contains this and other information about the Funds.
This material is not authorized for distribution to prospective investors unless preceded or accompanied by a current prospectus or summary prospectus, if applicable. Investors should consider the Funds’ objective, risks, and charges and expenses, and read the summary prospectus, if available, and/or the prospectus carefully before investing or sending money. The summary prospectus, if available, and the prospectus contain this and other information about the Funds and may be obtained from your authorized dealer or from Goldman Sachs & Co. LLC by calling1-800-621-2550.
This report is prepared for the general information of contract owners and is not an offer of shares of the Goldman Sachs Variable Insurance Trust Funds.
© 2019 Goldman Sachs. All rights reserved.
VITMLTIAR-19/157038-OTU-914415/15.2k
Goldman
SachsVariable Insurance Trust
Goldman Sachs
Small Cap Equity Insights Fund
Annual Report
December 31, 2018

GOLDMAN SACHS VARIABLE INSURANCE TRUST SMALL CAP EQUITY INSIGHTS FUND
Investment Process. The Investment Adviser begins with a broad universe of U.S. equity investments for the Fund. As described more fully below, the Investment Adviser uses proprietary multifactor models (the “Multifactor Models”) that attempt to forecast the returns of different markets, currencies and individual securities.
The Multifactor Models rely on some or all of the following investment pillars and themes to forecast the returns of individual securities (although additional pillars or themes may be added in the future without prior notice):
Fundamental Mispricings
• Valuation: The Valuation theme attempts to capture potential mispricings of securities, typically by comparing a measure of the company’s intrinsic value to its market value.
High Quality Business Models
• Profitability: The Profitability theme seeks to assess whether a company is earning more than its cost of capital.
• Quality: The Quality theme assesses both firm and management quality.
• Management: The Management theme assesses the characteristics, policies and strategic decisions of company management.
Market Themes and Trends
• Momentum: The Momentum theme seeks to predict drifts in stock prices caused by delayed investor reaction to company-specific information and information about related companies.
Sentiment Analysis
• Sentiment: The Sentiment theme reflects selected investment views and decisions of individuals and financial intermediaries.
1
GOLDMAN SACHS VARIABLE INSURANCE TRUST SMALL CAP EQUITY INSIGHTS FUND
INVESTMENT OBJECTIVE
The Fund seeks long-term growth of capital.
Portfolio Management Discussion and Analysis
Below, the Goldman Sachs Quantitative Investment Strategies Team discusses the Goldman Sachs Variable Insurance Trust — Goldman Sachs Small Cap Equity Insights Fund’s (the “Fund”) performance and positioning for the12-month period ended December 31, 2018 (the “Reporting Period”).
How did the Fund perform during the Reporting Period?
During the Reporting Period, the Fund’s Institutional and Service Shares generated average annual total returns of –8.62% and –8.82%, respectively. These returns compare to the –11.01% average annual total return of the Fund’s benchmark, the Russell 2000® Index (with dividends reinvested) (the “Russell Index”) during the same time period.
What economic and market factors most influenced the equity markets as a whole during the Reporting Period?
Representing the U.S. equity market, the S&P 500® Index returned –9.03% in December 2018, posting its worst December since 1931 and bringing its total return to –4.38% for the Reporting Period, the worst calendar year since 2008.
Despite a strong start to the Reporting Period in January 2018 amid solid economic data, a $1.5 trillion tax reform law signed in December 2017, and a favorable corporate earnings season, U.S. equities endured a challenging and volatile year in 2018. In February 2018, U.S. and international equities sold off on market speculation of a faster pace of Federal Reserve (“Fed”) short-term interest rate hikes, which stoked a sharp rise in bond yields and an increase in equity market volatility. Concerns about Fed monetary policy tightening were further exacerbated by solid U.S. labor and inflation data. While the hawkish Fed minutes were largely expected, new Fed Chair Jerome Powell’s Congressional testimony, positing a more optimistic economic outlook since the December 2017 Fed meeting, surprised equity markets with its hawkish tilt, sparking anothersell-off in the U.S. equity markets. (Jerome Powell assumed the chairmanship of the Fed in February 2018. Hawkish language tends to suggest higher interest rates; opposite of dovish.) In March 2018, escalating trade tensions and potential tariffs weighed on investor sentiment. Meanwhile, the Fed delivered on a widely expected interest rate increase, with its “dot plot” pointing to a total of three interest rate hikes in calendar year 2018 and potentially two in 2019. (The “dot plot” shows rate projections of the members of the Fed’s Open Market Committee.) However, Fed policymakers acknowledged that the “economic outlook has strengthened in recent months,” revising their economic growth forecast higher and their unemployment forecast lower.
By the end of the Reporting Period, the Fed had hiked interest rates four times and communicated an upbeat view of its economic outlook, spurred by strong U.S. labor and inflation data. Against the strong fundamentals, escalating trade tensions, fears of a global economic slowdown and populist politics weighed on investor sentiment throughout the calendar year. After second and third calendar quarters of generally solid gains, supported by a combination of robust economic growth, strong corporate profits and rising earnings estimates, U.S. equities fell sharply again in the fourth quarter of 2018, as investor sentiment rapidly deteriorated on heightened trade and political uncertainty and in a delayed response to an earliersell-off in global rates. The correction resulted in tighter U.S. financial conditions, which had been resilient to Fed interest rate hikes earlier in the year. U.S. equities saw a reprieve in November 2018 on more accommodative comments from Fed Chair Powell and on encouraging progress towardChina-U.S. trade talks. However, the recovery was short-lived, as U.S. equities plunged in December 2018 on renewed investor fears sparked by the arrest of a Chinese technology executive, the partial Federal government shutdown and the U.S. President’s criticism of Fed Chair Powell.
For the Reporting Period overall, seven sectors posted negative absolute returns and four generated positive returns. Health care, utilities, consumer discretionary and information technology were the best performing sectors in the S&P 500® Index, as measured by total return, and the weakest performing sectors in the S&P 500® Index during the Reporting Period were energy, materials, industrials and financials.(After the close of business on September 28, 2018, the telecommunications services sector was renamed the communication services sector and was broadened to include certain companies from the information technology and consumer discretionary sectors that facilitate communication and offer related content and information through various media.)
Within the U.S. equity market, there was significant disparity in performance not only among sectors but also among the various capitalization and style segments. While all capitalization segments posted negative returns,large-cap stocks, as measured by the
2
GOLDMAN SACHS VARIABLE INSURANCE TRUST SMALL CAP EQUITY INSIGHTS FUND
Russell 1000® Index, performed best, followed at some distance bymid-cap stocks, as measured by the Russell Midcap® Index, and thensmall-cap stocks, as measured by the Russell 2000® Index. From a style perspective, growth-oriented stocks significantly outpaced value-oriented stocks across the capitalization spectrum. (All as measured by the FTSE Russell indices.)
What key factors were responsible for the Fund’s performance during the Reporting Period?
During the Reporting Period, the Fund posted negative absolute returns but outperformed the Russell Index on a relative basis. Four of our quantitative model’s six investment themes added to relative performance.
What impact did the Fund’s investment themes have on performance during the Reporting Period?
As expected, and in keeping with our investment approach, our quantitative model and its six investment themes — Valuation, Profitability, Quality, Management, Momentum and Sentiment — had the greatest impact on relative performance. We use these themes to take a long-term view of market patterns and look for inefficiencies, selecting stocks for the Fund and overweighting or underweighting the ones chosen by the model. Over time and by design, the performance of any one of the model’s investment themes tends to have a low correlation with the model’s other themes, demonstrating the diversification benefit of the Fund’s theme-driven quantitative model. The variance in performance supports our research indicating that the diversification provided by the Fund’s different investment themes is a significant investment advantage over the long term, even though the Fund may experience underperformance in the short term. Of course, diversification does not protect an investor from market risk nor does it ensure a profit.
During the Reporting Period, four of our six investment themes contributed positively to the Fund’s relative performance. Momentum contributed most positively to relative performance, followed by Quality and Management. The Sentiment theme also contributed positively, albeit to a lesser extent. The Momentum theme seeks to predict drifts in stock prices caused by delayed investor reaction to company-specific information and information about related companies. The Quality theme assesses both firm and financial quality. The Management theme assesses the characteristics, policies and strategic decisions of company management. The Sentiment theme reflects selected investment views and decisions of individuals and financial intermediaries.
The Fund’s Valuation theme detracted most from the Fund’s relative performance. Valuation attempts to capture potential mispricings of securities, typically by comparing a measure of the company’s intrinsic value to its market value. The Profitability theme also detracted, albeit to a much lesser extent. The Profitability theme assesses whether a company is earning more than its cost of capital.
How did the Fund’s sector and industry allocations affect relative performance?
In constructing the Fund’s portfolio, we focus on picking stocks rather than making industry or sector bets. Consequently, the Fund is similar to its benchmark, the Russell Index, in terms of its sector allocation and style. We manage the Fund’s industry and sector exposure by including industry factors in our risk model and by explicitly penalizing industry and sector deviations from the benchmark index in optimization. Sector weights or changes in weights generally do not have a meaningful impact on relative performance.
Did stock selection help or hurt Fund performance during the Reporting Period?
We seek to outpace the Russell Index by overweighting stocks that we expect to outperform and underweighting those that we think may lag. We also build positions based on our thematic views. For example, the Fund aims to hold a basket of stocks with more favorable Momentum characteristics than the benchmark index. During the Reporting Period, stock selection overall contributed positively to the Fund’s relative performance.
Effective stock selection in the industrials, financials and consumer discretionary sectors contributed most positively to the Fund’s results relative to the Russell Index. Partially offsetting these positive contributors was having an overweight to energy, the weakest sector in the Russell Index during the Reporting Period, which detracted from the Fund’s relative results. Having an overweight to materials, which lagged the Russell Index during the Reporting Period, and underweights to information technology which outperformed the Russell Index during the annual period, also hurt. There were no significant detractors from a stock selection perspective during the Reporting Period.
Which individual stock positions contributed the most to the Fund’s relative returns during the Reporting Period?
The Fund benefited most from overweight positions in genomic-based cancer clinical diagnostic tests developer Genomic Health, human resources and business optimization services provider Insperity and alternate-site health care services provider Amedisys. We chose to overweight Genomic Health because of our positive views on Value and Sentiment. Our positive views on Momentum and Profitability led us to overweight Insperity. The Fund had an overweight in Amedisys based on our positive views on Quality and Profitability.
3
GOLDMAN SACHS VARIABLE INSURANCE TRUST SMALL CAP EQUITY INSIGHTS FUND
Which individual positions detracted from the Fund’s results during the Reporting Period?
Detracting most from the Fund’s results relative to its benchmark index were overweight positions in integrated heavy construction and industrial equipment services company H&E Equipment Services, automotive systems manufacturer and distributor Cooper-Standard Holdings and behavioral health care treatment services coordinator Magellan Health. The Fund had an overweight position in H&E Equipment Services based on our positive views on Management and Value. We chose to overweight Cooper-Standard Holdings due to our positive views on Value and Sentiment. Our positive view on Momentum led us to overweight Magellan Health.
How did the Fund use derivatives during the Reporting Period?
During the Reporting Period, we did not use derivatives as part of an active management strategy to add value to the Fund’s results. However, we used equity index futures contracts, on an opportunistic basis, to equitize the Fund’s excess cash holdings. In other words, we put the Fund’s excess cash holdings to work by using them as collateral for the purchase of stock futures. The use of these futures contracts did not have a material impact on the Fund’s performance during the Reporting Period.
Did you make any enhancements to your quantitative models during the Reporting Period?
We continuously look for ways to improve our investment process. During the Reporting Period, we made numerous enhancements to our models. As example, during the second quarter of 2018, we introduced two new signals to our Sentiment theme in the U.S. region that use options data to gauge sentiment around companies. The first signal looks at high conviction option purchases to assess how strongly market participants feel about the prospects of a particular stock. The second signal aims to infer the positive or negative sentiment around a stock by looking at put and call options purchased for the particular company.
We also introduced a new signal within our Momentum theme that helps us create economic links between different companies, potentially giving us insights into price movements of related companies. The signal, introduced in the U.S., European, Japanese and emerging markets regions, uses natural language processing to read through various sections in the patent document to form linkages.
In the fourth quarter of 2018, we added a signal within our Quality theme that uses novel data to help us understand consumer retail trends. We believe this signal will complement our existing suite of alternative data metrics to help us better understand retailers’ earnings growth. We also added a number of signals that utilize natural language processing and regulatory filings to help us better understand the regulatory and business risks faced by companies.
Within our Sentiment theme, we enhanced our existing signals, which use machine learning to help understand sell-side analyst sentiment. With a larger body of sell-side research reports to analyze, we introduced a new machine learning algorithm to help classify sentiment.
What was the Fund’s sector positioning relative to its benchmark index at the end of the Reporting Period?
As of December 31, 2018, the Fund was overweight the consumer discretionary, communication services, energy and materials sectors relative to the Russell Index. The Fund was underweight information technology, industrials and utilities and was rather neutrally weighted in financials, health care, real estate and consumer staples compared to the benchmark index on the same date.
Were there any changes to the Fund’s portfolio management team during the Reporting Period?
There were no changes to the Fund’s portfolio management team during the Reporting Period.
What is your strategy going forward for the Fund?
Looking ahead, we continue to believe that less expensive stocks should outpace more expensive stocks, and stocks with good momentum are likely to outperform those with poor momentum. We intend to maintain our focus on seeking companies about which fundamental research analysts are becoming more positive as well as profitable companies with sustainable earnings and a track record of using their capital to enhance shareholder value. As such, we anticipate remaining fully invested with long-term performance likely to be the result of stock selection rather than sector or capitalization allocations.
We stand behind our investment philosophy that sound economic investment principles, coupled with a disciplined quantitative approach, can provide strong, uncorrelated returns over the long term. Our research agenda is robust, and we continue to enhance our existing models, add new proprietary forecasting signals and improve our trading execution as we seek to provide the most value to our shareholders.
4
GOLDMAN SACHS VARIABLE INSURANCE TRUST SMALL CAP EQUITY INSIGHTS FUND
Index Definitions
TheRussell 2000® Index is an unmanaged index of common stock prices that measures the performance of the 2000 smallest companies in the Russell 3000® Index. The figures for the index do not include any deduction for fees, expenses or taxes.
TheS&P 500® Index is the Standard & Poor’s 500 Composite Index of 500 stocks, an unmanaged index of common stock prices. The figures for the index do not include any deduction for fees, expenses or taxes.
TheRussell Midcap® Index measures the performance of the 800 smallest companies in the Russell 1000® Index, which represents approximately 25% of the total market capitalization of the Russell 1000 Index.
TheRussell 1000® Index measures the performance of the 1,000 largest companies in the Russell 3000® Index, which represents approximately 92% of the total market capitalization of the Russell 3000 Index.
It is not possible to invest directly in an index.
5
FUND BASICS
Small Cap Equity Insights Fund
as of December 31, 2018
STANDARDIZED TOTAL RETURNS1
| | | | | | | | | | | | | | | | | | |
| | | | | |
| For the period ended 12/31/18 | | One Year | | | Five Years | | | Ten Years | | | Since Inception | | | Inception Date |
| Institutional | | | -8.62 | % | | | 5.62 | % | | | 12.89 | % | | | 6.34 | % | | 2/13/98 |
| Service | | | -8.82 | | | | 5.34 | | | | 12.60 | | | | 6.44 | | | 8/31/07 |
| 1 | The Standardized Total Returns are average annual total returns as of the most recent calendar quarter-end. They assume reinvestment of all distributions at net asset value (“NAV”). Because Institutional Shares and Service Shares do not involve a sales charge, such a charge is not applied to their Standardized Total Returns. |
Total return figures in the above chart represent past performance and do not indicate future results, which will vary. The investment return and principal value of an investment will fluctuate and, therefore, an investor’s shares, when redeemed, may be worth more or less than their original cost. Current performance may be lower or higher than the total return figures in the above chart. Please visit www.GSAMFUNDS.com to obtain the most recent month-end returns.Performance reflects fee waivers and/or expense limitations in effect during the periods shown. In their absence, performance would be reduced.
EXPENSE RATIOS2
| | | | | | | | |
| | |
| | | Net Expense Ratio (Current) | | | Gross Expense Ratio (Before Waivers) | |
| Institutional | | | 0.81 | % | | | 0.95 | % |
| Service | | | 1.06 | | | | 1.20 | |
| 2 | The expense ratios of the Fund, both current (net of any fee waivers and/or expense limitations) and before waivers (gross of any fee waivers and/or expense limitations) are as set forth above according to the most recent publicly available Prospectuses for the Fund and may differ from the expense ratios disclosed in the Financial Highlights in this report. Pursuant to a contractual arrangement, the Fund’s fee waivers and/or expense limitations will remain in place through at least April 30, 2019, and prior to such date, the Investment Adviser may not terminate the arrangements without the approval of the Fund’s Board of Trustees. If these arrangements are discontinued in the future, the expense ratios may change without shareholder approval. |
TOP TEN HOLDINGS AS OF 12/31/183,4
| | | | | | |
| | |
| Holding | | % of Net Assets | | | Line of Business |
| Texas Roadhouse, Inc. | | | 0.9% | | | Consumer Services |
| Portland General Electric Co. | | | 0.9 | | | Utilities |
| Nexstar Media Group, Inc. Class A | | | 0.8 | | | Media & Entertainment |
| NorthWestern Corp. | | | 0.8 | | | Utilities |
| Fabrinet | | | 0.8 | | | Technology Hardware & Equipment |
| Insperity, Inc. | | | 0.8 | | | Commercial & Professional Services |
| Argo Group International Holdings Ltd. | | | 0.8 | | | Insurance |
| Amedisys, Inc. | | | 0.8 | | | Health Care Equipment & Services |
| American Equity Investment Life Holding Co. | | | 0.7 | | | Insurance |
| J&J Snack Foods Corp. | | | 0.7 | | | Food, Beverage & Tobacco |
| 3 | The top 10 holdings may not be representative of the Fund’s future investments. |
| 4 | The Fund’s overall top ten holdings differ from the table above due to the exclusion of the Goldman Sachs Financial Square Government Fund (a securities lending reinvestment vehicle) which represents 1.2% of the Fund’s net assets as of 12/31/2018. |
6
FUND BASICS
FUND VS. BENCHMARK SECTOR ALLOCATIONS4
As of December 31, 2018
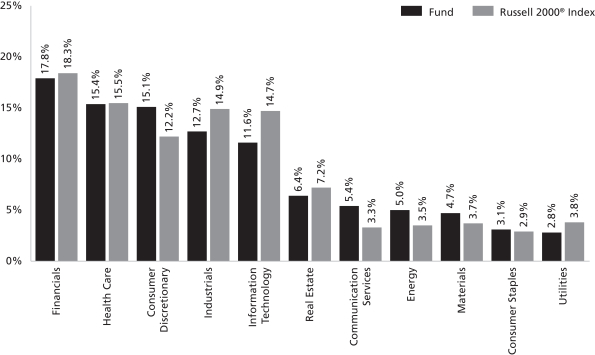
| 5 | The Fund is actively managed and, as such, its composition may differ over time. Consequently, the Fund’s overall sector allocations may differ from percentages contained in the graph above. The graph categorizes investments using Global Industry Classification Standard (“GICS”); however, the sector classifications used by the portfolio management team may differ from GICS. The percentage shown for each investment category reflects the value of investments in that category as a percentage of market value (excluding investments in the securities lending reinvestment vehicle, if any). Investments in the securities lending reinvestment vehicle represented 1.2% of the Fund’s net assets at December 31, 2018. |
7
GOLDMAN SACHS VARIABLE INSURANCE TRUST SMALL CAP EQUITY INSIGHTS FUND
Performance Summary
December 31, 2018
The following graph shows the value, as of December 31, 2018, of a $10,000 investment made on January 1, 2009 in Institutional Shares at NAV. For comparative purposes, the performance of the Fund’s benchmark, the Russell 2000® Index (with distributions reinvested), is shown. This performance data represents past performance and should not be considered indicative of future performance, which will fluctuate with changes in market conditions. These performance fluctuations may cause an investor’s shares, when redeemed, to be worth more or less than their original cost. Performance reflects Fund level expenses but does not reflect fees and expenses associated with any variable annuity contract or variable life insurance policy that uses the Fund as an investment option for any contract or policy. Had performance reflected all of those fees and expenses, performance would have been reduced. Performance reflects applicable fee waivers and/or expense limitations in effect during the periods shown, and in their absence, performance would be reduced. Performance of Service Shares will vary from Institutional Shares due to differences in class specific fees. In addition to the Investment Adviser’s decisions regarding issuer/industry investment selection and allocation, other factors may affect Fund performance. These factors include, but are not limited to, Fund operating fees and expenses, portfolio turnover, and subscription and redemption cash flows affecting the Fund.
Small Cap Equity Insights Fund’s 10 Year Performance
Performance of a $10,000 investment, with distributions reinvested, from January 1, 2009 through December 31, 2018.
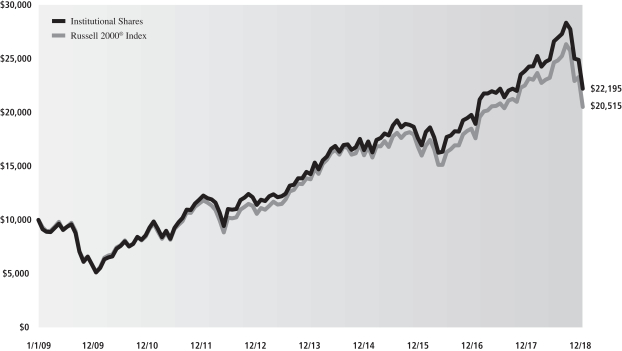
| | | | | | | | | | |
| Average Annual Total Return through December 31, 2018 | | One Year | | Five Years | | | Ten Years | | Since Inception |
Institutional (Commenced February 13, 1998) | | -8.62% | | | 5.62% | | | 12.89% | | 6.34% |
Service (Commenced August 31, 2007) | | -8.82% | | | 5.34% | | | 12.60% | | 6.44% |
8
GOLDMAN SACHS VARIABLE INSURANCE TRUST SMALL CAP EQUITY INSIGHTS FUND
Schedule of Investments
December 31, 2018
| | | | | | | | |
| Shares | | | Description | | Value | |
|
| | Common Stocks – 98.7% | |
| | Automobiles & Components – 0.4% | |
| | 5,612 | | | Cooper Tire & Rubber Co. | | $ | 181,436 | |
| | 1,523 | | | Dana, Inc. | | | 20,758 | |
| | 1,164 | | | Modine Manufacturing Co.* | | | 12,583 | |
| | 1,950 | | | Standard Motor Products, Inc. | | | 94,439 | |
| | 1,388 | | | Tower International, Inc. | | | 33,034 | |
| | | | | | | | |
| | | | | | | 342,250 | |
| | |
| | Banks – 11.7% | |
| | 5,025 | | | 1st Source Corp. | | | 202,708 | |
| | 410 | | | ACNB Corp. | | | 16,092 | |
| | 6,734 | | | Amalgamated Bank Class A | | | 131,313 | |
| | 629 | | | Arrow Financial Corp. | | | 20,141 | |
| | 5,023 | | | Bancorp, Inc. (The)* | | | 39,983 | |
| | 1,379 | | | BankFinancial Corp. | | | 20,616 | |
| | 637 | | | Banner Corp. | | | 34,067 | |
| | 3,461 | | | Berkshire Hills Bancorp, Inc. | | | 93,343 | |
| | 22,908 | | | Cadence BanCorp | | | 384,396 | |
| | 1,424 | | | Cathay General Bancorp | | | 47,747 | |
| | 25,183 | | | CenterState Bank Corp. | | | 529,850 | |
| | 20,596 | | | Central Pacific Financial Corp. | | | 501,513 | |
| | 378 | | | Century Bancorp, Inc. Class A | | | 25,602 | |
| | 1,667 | | | ConnectOne Bancorp, Inc. | | | 30,789 | |
| | 13,755 | | | Customers Bancorp, Inc.* | | | 250,341 | |
| | 27,944 | | | CVB Financial Corp. | | | 565,307 | |
| | 650 | | | Enterprise Bancorp, Inc. | | | 20,904 | |
| | 5,191 | | | Equity Bancshares, Inc. Class A* | | | 182,983 | |
| | 5,742 | | | Essent Group Ltd.* | | | 196,262 | |
| | 4,753 | | | Federal Agricultural Mortgage Corp. Class C | | | 287,271 | |
| | 3,352 | | | Financial Institutions, Inc. | | | 86,146 | |
| | 9,832 | | | First Bancorp | | | 321,113 | |
| | 38,879 | | | First Commonwealth Financial Corp. | | | 469,658 | |
| | 4,373 | | | First Financial Corp. | | | 175,576 | |
| | 6,418 | | | First Internet Bancorp | | | 131,184 | |
| | 894 | | | First of Long Island Corp. (The) | | | 17,835 | |
| | 1,792 | | | Flushing Financial Corp. | | | 38,582 | |
| | 24,846 | | | Fulton Financial Corp. | | | 384,616 | |
| | 11,668 | | | Hanmi Financial Corp. | | | 229,860 | |
| | 7,836 | | | Hilltop Holdings, Inc. | | | 139,716 | |
| | 13,545 | | | Home BancShares, Inc. | | | 221,325 | |
| | 1,069 | | | HomeTrust Bancshares, Inc. | | | 27,986 | |
| | 8,589 | | | Independent Bank Group, Inc. | | | 393,118 | |
| | 16,087 | | | International Bancshares Corp. | | | 553,393 | |
| | 50,987 | | | Investors Bancorp, Inc. | | | 530,265 | |
| | 2,488 | | | LegacyTexas Financial Group, Inc. | | | 79,840 | |
| | 2,006 | | | Macatawa Bank Corp. | | | 19,298 | |
| | 4,969 | | | Mercantile Bank Corp. | | | 140,424 | |
| | 583 | | | Metropolitan Bank Holding Corp.* | | | 17,986 | |
| | 1,752 | | | NMI Holdings, Inc. Class A* | | | 31,273 | |
| | 11,582 | | | OFG Bancorp | | | 190,640 | |
| | 1,281 | | | Opus Bank | | | 25,095 | |
| | 807 | | | Pacific Premier Bancorp, Inc.* | | | 20,595 | |
| | 1,516 | | | Parke Bancorp, Inc. | | | 28,372 | |
| | 4,137 | | | PennyMac Financial Services, Inc. | | | 87,953 | |
| | 37,555 | | | Radian Group, Inc. | | | 614,400 | |
| | 1,756 | | | Riverview Bancorp, Inc. | | | 12,784 | |
| | |
|
| | Common Stocks – (continued) | |
| | Banks – (continued) | |
| | 3,977 | | | Sierra Bancorp | | $ | 95,567 | |
| | 690 | | | South State Corp. | | | 41,365 | |
| | 1,776 | | | Southern National Bancorp of Virginia, Inc. | | | 23,479 | |
| | 800 | | | Territorial Bancorp, Inc. | | | 20,784 | |
| | 10,094 | | | TriCo Bancshares | | | 341,076 | |
| | 20,737 | | | TrustCo Bank Corp. | | | 142,256 | |
| | 2,994 | | | United Bankshares, Inc. | | | 93,143 | |
| | 11,556 | | | United Community Banks, Inc. | | | 247,992 | |
| | 3,909 | | | United Community Financial Corp. | | | 34,595 | |
| | 29,714 | | | Valley National Bancorp | | | 263,860 | |
| | 2,994 | | | WSFS Financial Corp. | | | 113,503 | |
| | | | | | | | |
| | | | | | | 9,987,881 | |
| | |
| | Capital Goods – 6.8% | |
| | 1,454 | | | Advanced Drainage Systems, Inc. | | | 35,259 | |
| | 7,751 | | | Aegion Corp.* | | | 126,496 | |
| | 11,668 | | | Aerojet Rocketdyne Holdings, Inc.* | | | 411,064 | |
| | 4,375 | | | Albany International Corp. Class A | | | 273,131 | |
| | 1,402 | | | Atkore International Group, Inc.* | | | 27,816 | |
| | 2,376 | | | Barnes Group, Inc. | | | 127,401 | |
| | 3,873 | | | BMC Stock Holdings, Inc.* | | | 59,954 | |
| | 11,288 | | | Comfort Systems USA, Inc. | | | 493,060 | |
| | 18,970 | | | Continental Building Products, Inc.* | | | 482,787 | |
| | 1,476 | | | Ducommun, Inc.* | | | 53,608 | |
| | 737 | | | DXP Enterprises, Inc.* | | | 20,518 | |
| | 1,870 | | | Dycom Industries, Inc.* | | | 101,055 | |
| | 7,702 | | | EMCOR Group, Inc. | | | 459,732 | |
| | 286 | | | EnerSys | | | 22,196 | |
| | 692 | | | EnPro Industries, Inc. | | | 41,589 | |
| | 805 | | | ESCO Technologies, Inc. | | | 53,090 | |
| | 8,291 | | | H&E Equipment Services, Inc. | | | 169,302 | |
| | 2,116 | | | Herc Holdings, Inc.* | | | 54,995 | |
| | 12,631 | | | Hillenbrand, Inc. | | | 479,094 | |
| | 614 | | | Hurco Cos., Inc. | | | 21,920 | |
| | 769 | | | Kaman Corp. | | | 43,133 | |
| | 3,589 | | | MasTec, Inc.* | | | 145,570 | |
| | 3,303 | | | Meritor, Inc.* | | | 55,854 | |
| | 22,542 | | | Milacron Holdings Corp.* | | | 268,024 | |
| | 4,149 | | | Miller Industries, Inc. | | | 112,023 | |
| | 1,037 | | | Moog, Inc. Class A | | | 80,347 | |
| | 1,682 | | | MRC Global, Inc.* | | | 20,571 | |
| | 1,023 | | | NV5 Global, Inc.* | | | 61,943 | |
| | 6,203 | | | Rexnord Corp.* | | | 142,359 | |
| | 2,756 | | | Rush Enterprises, Inc. Class A | | | 95,027 | |
| | 9,859 | | | Simpson Manufacturing Co., Inc. | | | 533,668 | |
| | 554 | | | SiteOne Landscape Supply, Inc.* | | | 30,620 | |
| | 1,033 | | | Systemax, Inc. | | | 24,678 | |
| | 8,033 | | | Titan Machinery, Inc.* | | | 105,634 | |
| | 13,521 | | | TriMas Corp.* | | | 368,988 | |
| | 7,824 | | | Tutor Perini Corp.* | | | 124,949 | |
| | 2,090 | | | Vectrus, Inc.* | | | 45,102 | |
| | | | | | | | |
| | | | | | | 5,772,557 | |
| | |
| | Commercial & Professional Services – 5.1% | |
| | 1,665 | | | Advanced Disposal Services, Inc.* | | | 39,860 | |
| | |
| | |
| The accompanying notes are an integral part of these financial statements. | | 9 |
GOLDMAN SACHS VARIABLE INSURANCE TRUST SMALL CAP EQUITY INSIGHTS FUND
Schedule of Investments(continued)
December 31, 2018
| | | | | | | | |
| Shares | | | Description | | Value | |
|
| | Common Stocks – (continued) | |
| | Commercial & Professional Services – (continued) | |
| | 2,195 | | | Barrett Business Services, Inc. | | $ | 125,664 | |
| | 13,080 | | | CBIZ, Inc.* | | | 257,676 | |
| | 5,248 | | | CRA International, Inc. | | | 223,302 | |
| | 2,705 | | | Deluxe Corp. | | | 103,980 | |
| | 5,147 | | | Exponent, Inc. | | | 261,004 | |
| | 2,795 | | | Huron Consulting Group, Inc.* | | | 143,412 | |
| | 1,971 | | | ICF International, Inc. | | | 127,681 | |
| | 7,223 | | | Insperity, Inc. | | | 674,339 | |
| | 16,480 | | | Kforce, Inc. | | | 509,562 | |
| | 13,120 | | | Korn/Ferry International | | | 518,765 | |
| | 11,463 | | | McGrath RentCorp | | | 590,115 | |
| | 18,717 | | | Navigant Consulting, Inc. | | | 450,144 | |
| | 7,239 | | | TrueBlue, Inc.* | | | 161,068 | |
| | 143 | | | UniFirst Corp. | | | 20,459 | |
| | 439 | | | US Ecology, Inc. | | | 27,648 | |
| | 3,469 | | | WageWorks, Inc.* | | | 94,218 | |
| | | | | | | | |
| | | | | | | 4,328,897 | |
| | |
| | Consumer Durables & Apparel – 4.1% | |
| | 14,176 | | | American Outdoor Brands Corp.* | | | 182,303 | |
| | 1,017 | | | Bassett Furniture Industries, Inc. | | | 20,381 | |
| | 32,700 | | | Callaway Golf Co. | | | 500,310 | |
| | 16,487 | | | Crocs, Inc.* | | | 428,332 | |
| | 13,400 | | | Ethan Allen Interiors, Inc. | | | 235,706 | |
| | 990 | | | Fossil Group, Inc.* | | | 15,573 | |
| | 1,442 | | | Helen of Troy Ltd.* | | | 189,162 | |
| | 2,876 | | | Installed Building Products, Inc.* | | | 96,892 | |
| | 832 | | | Johnson Outdoors, Inc. Class A | | | 48,872 | |
| | 13,870 | | | KB Home | | | 264,917 | |
| | 4,723 | | | Malibu Boats, Inc. Class A* | | | 164,360 | |
| | 11,768 | | | MasterCraft Boat Holdings, Inc.* | | | 220,062 | |
| | 7,166 | | | Meritage Homes Corp.* | | | 263,136 | |
| | 911 | | | Nautilus, Inc.* | | | 9,930 | |
| | 2,765 | | | Sturm Ruger & Co., Inc. | | | 147,153 | |
| | 10,584 | | | Tupperware Brands Corp. | | | 334,137 | |
| | 19,770 | | | Vista Outdoor, Inc.* | | | 224,389 | |
| | 14,465 | | | William Lyon Homes Class A* | | | 154,631 | |
| | 2,380 | | | ZAGG, Inc.* | | | 23,276 | |
| | | | | | | | |
| | | | | | | 3,523,522 | |
| | |
| | Consumer Services – 5.9% | |
| | 1,504 | | | American Public Education, Inc.* | | | 42,804 | |
| | 8,362 | | | BJ’s Restaurants, Inc. | | | 422,866 | |
| | 3,218 | | | Bloomin’ Brands, Inc. | | | 57,570 | |
| | 1,014 | | | Boyd Gaming Corp. | | | 21,071 | |
| | 5,492 | | | Brinker International, Inc.(a) | | | 241,538 | |
| | 14,521 | | | Carrols Restaurant Group, Inc.* | | | 142,887 | |
| | 8,934 | | | Cheesecake Factory, Inc. (The) | | | 388,718 | |
| | 5,091 | | | Chegg, Inc.* | | | 144,686 | |
| | 3,631 | | | Denny’s Corp.* | | | 58,859 | |
| | 7,779 | | | Fiesta Restaurant Group, Inc.* | | | 120,652 | |
| | 52,737 | | | Houghton Mifflin Harcourt Co.* | | | 467,250 | |
| | 6,923 | | | Jack in the Box, Inc. | | | 537,432 | |
| | 21,290 | | | K12, Inc.* | | | 527,779 | |
| | 2,782 | | | Planet Fitness, Inc. Class A* | | | 149,171 | |
| | 11,530 | | | Red Robin Gourmet Burgers, Inc.* | | | 308,082 | |
| | |
|
| | Common Stocks – (continued) | |
| | Consumer Services – (continued) | |
| | 14,969 | | | SeaWorld Entertainment, Inc.* | | $ | 330,665 | |
| | 12,582 | | | Texas Roadhouse, Inc. | | | 751,145 | |
| | 2,358 | | | Weight Watchers International, Inc.* | | | 90,901 | |
| | 4,208 | | | Wingstop, Inc. | | | 270,112 | |
| | | | | | | | |
| | | | | | | 5,074,188 | |
| | |
| | Diversified Financials – 2.6% | |
| | 32,165 | | | Anworth Mortgage Asset Corp. (REIT) | | | 129,947 | |
| | 1,618 | | | Artisan Partners Asset Management, Inc. Class A | | | 35,774 | |
| | 7,241 | | | BrightSphere Investment Group plc | | | 77,334 | |
| | 10,861 | | | Cannae Holdings, Inc.* | | | 185,940 | |
| | 1,169 | | | Cherry Hill Mortgage Investment Corp. (REIT) | | | 20,504 | |
| | 11,103 | | | Enova International, Inc.* | | | 216,064 | |
| | 4,321 | | | Focus Financial Partners, Inc. Class A* | | | 113,772 | |
| | 2,212 | | | Green Dot Corp. Class A* | | | 175,898 | |
| | 657 | | | Houlihan Lokey, Inc. | | | 24,178 | |
| | 34,976 | | | Ladder Capital Corp. (REIT) | | | 541,079 | |
| | 3,478 | | | On Deck Capital, Inc.* | | | 20,520 | |
| | 8,180 | | | Oppenheimer Holdings, Inc. Class A | | | 208,999 | |
| | 4,371 | | | Piper Jaffray Cos. | | | 287,787 | |
| | 441 | | | PJT Partners, Inc. Class A | | | 17,093 | |
| | 2,264 | | | Regional Management Corp.* | | | 54,449 | |
| | 4,472 | | | Westwood Holdings Group, Inc. | | | 152,048 | |
| | | | | | | | |
| | | | | | | 2,261,386 | |
| | |
| | Energy – 4.9% | |
| | 1,578 | | | Arch Coal, Inc. Class A | | | 130,958 | |
| | 1,840 | | | California Resources Corp.* | | | 31,354 | |
| | 10,033 | | | CONSOL Energy, Inc.* | | | 318,146 | |
| | 715 | | | CVR Energy, Inc. | | | 24,653 | |
| | 16,704 | | | Delek US Holdings, Inc. | | | 543,047 | |
| | 30,272 | | | Denbury Resources, Inc.* | | | 51,765 | |
| | 17,349 | | | DHT Holdings, Inc. | | | 68,008 | |
| | 20,738 | | | FTS International, Inc.* | | | 147,447 | |
| | 30,544 | | | Helix Energy Solutions Group, Inc.* | | | 165,243 | |
| | 3,186 | | | Keane Group, Inc.* | | | 26,062 | |
| | 15,525 | | | Matrix Service Co.* | | | 278,519 | |
| | 9,962 | | | McDermott International, Inc.* | | | 65,151 | |
| | 27,118 | | | Newpark Resources, Inc.* | | | 186,301 | |
| | 14,887 | | | Oasis Petroleum, Inc.* | | | 82,325 | |
| | 3,846 | | | PDC Energy, Inc.* | | | 114,457 | |
| | 15,751 | | | Peabody Energy Corp. | | | 480,090 | |
| | 30,808 | | | Pioneer Energy Services Corp.* | | | 37,894 | |
| | 18,674 | | | Renewable Energy Group, Inc.* | | | 479,922 | |
| | 11,481 | | | SEACOR Holdings, Inc.* | | | 424,797 | |
| | 3,205 | | | Select Energy Services, Inc. Class A* | | | 20,256 | |
| | 30,604 | | | Superior Energy Services, Inc.* | | | 102,523 | |
| | 8,388 | | | Unit Corp.* | | | 119,781 | |
| | 22,276 | | | W&T Offshore, Inc.* | | | 91,777 | |
| | 9,761 | | | World Fuel Services Corp. | | | 208,983 | |
| | | | | | | | |
| | | | | | | 4,199,459 | |
| | |
| | Food & Staples Retailing – 0.4% | |
| | 5,747 | | | Ingles Markets, Inc. Class A | | | 156,433 | |
| | |
| | |
| 10 | | The accompanying notes are an integral part of these financial statements. |
GOLDMAN SACHS VARIABLE INSURANCE TRUST SMALL CAP EQUITY INSIGHTS FUND
| | | | | | | | |
| Shares | | | Description | | Value | |
|
| | Common Stocks – (continued) | |
| | Food & Staples Retailing – (continued) | |
| | 6,160 | | | Smart & Final Stores, Inc.* | | $ | 29,199 | |
| | 1,111 | | | SpartanNash Co. | | | 19,087 | |
| | 3,685 | | | Village Super Market, Inc. Class A | | | 98,537 | |
| | 1,655 | | | Weis Markets, Inc. | | | 79,076 | |
| | | | | | | | |
| | | | | | | 382,332 | |
| | |
| | Food, Beverage & Tobacco – 2.2% | |
| | 2,591 | | | Calavo Growers, Inc. | | | 189,039 | |
| | 3,188 | | | Cal-Maine Foods, Inc. | | | 134,852 | |
| | 10,816 | | | Dean Foods Co. | | | 41,209 | |
| | 3,652 | | | Fresh Del Monte Produce, Inc. | | | 103,242 | |
| | 11,498 | | | Freshpet, Inc.* | | | 369,776 | |
| | 4,278 | | | J&J Snack Foods Corp. | | | 618,556 | |
| | 1,005 | | | John B Sanfilippo & Son, Inc. | | | 55,938 | |
| | 3,224 | | | National Beverage Corp. | | | 231,387 | |
| | 17,939 | | | Vector Group Ltd. | | | 174,547 | |
| | | | | | | | |
| | | | | | | 1,918,546 | |
| | |
| | Health Care Equipment & Services – 4.0% | |
| | 5,723 | | | Amedisys, Inc.* | | | 670,221 | |
| | 1,753 | | | BioTelemetry, Inc.* | | | 104,689 | |
| | 1,281 | | | Computer Programs & Systems, Inc. | | | 32,153 | |
| | 15,719 | | | Ensign Group, Inc. (The) | | | 609,740 | |
| | 3,321 | | | Globus Medical, Inc. Class A* | | | 143,733 | |
| | 117 | | | Heska Corp.* | | | 10,074 | |
| | 892 | | | HMS Holdings Corp.* | | | 25,092 | |
| | 1,282 | | | Inogen, Inc.* | | | 159,186 | |
| | 1,761 | | | National HealthCare Corp. | | | 138,150 | |
| | 5,123 | | | NxStage Medical, Inc.* | | | 146,620 | |
| | 9,405 | | | Orthofix Medical, Inc.* | | | 493,668 | |
| | 1,463 | | | Patterson Cos., Inc. | | | 28,763 | |
| | 799 | | | Quidel Corp.* | | | 39,007 | |
| | 3,175 | | | STAAR Surgical Co.* | | | 101,314 | |
| | 5,673 | | | Tandem Diabetes Care, Inc.* | | | 215,404 | |
| | 1,008 | | | Teladoc Health, Inc.* | | | 49,967 | |
| | 10,222 | | | Tenet Healthcare Corp.* | | | 175,205 | |
| | 1,227 | | | Tivity Health, Inc.* | | | 30,442 | |
| | 12,700 | | | Triple-S Management Corp. Class B* | | | 220,853 | |
| | | | | | | | |
| | | | | | | 3,394,281 | |
| | |
| | Household & Personal Products – 0.4% | |
| | 2,824 | | | Medifast, Inc. | | | 353,057 | |
| | |
| | Insurance – 3.2% | |
| | 22,887 | | | American Equity Investment Life Holding Co. | | | 639,463 | |
| | 2,406 | | | AMERISAFE, Inc. | | | 136,396 | |
| | 10,019 | | | Argo Group International Holdings Ltd. | | | 673,778 | |
| | 6,679 | | | Employers Holdings, Inc. | | | 280,318 | |
| | 5,564 | | | FBL Financial Group, Inc. Class A | | | 365,277 | |
| | 10,804 | | | Genworth Financial, Inc. Class A* | | | 50,347 | |
| | 435 | | | Health Insurance Innovations, Inc. Class A* | | | 11,627 | |
| | 1,221 | | | National General Holdings Corp. | | | 29,560 | |
| | 103 | | | National Western Life Group, Inc. Class A | | | 30,972 | |
| | 4,257 | | | ProAssurance Corp. | | | 172,664 | |
| | 277 | | | Safety Insurance Group, Inc. | | | 22,661 | |
| | 13,154 | | | Trupanion, Inc.*(a) | | | 334,901 | |
| | | | | | | | |
| | | | | | | 2,747,964 | |
| | |
|
| | Common Stocks – (continued) | |
| | Materials – 4.6% | |
| | 1,078 | | | AdvanSix, Inc.* | | $ | 26,239 | |
| | 50,255 | | | AK Steel Holding Corp.* | | | 113,074 | |
| | 6,727 | | | Balchem Corp. | | | 527,060 | |
| | 15,591 | | | Boise Cascade Co. | | | 371,845 | |
| | 11,284 | | | Carpenter Technology Corp. | | | 401,823 | |
| | 3,376 | | | Chase Corp. | | | 337,769 | |
| | 2,011 | | | Ferro Corp.* | | | 31,532 | |
| | 1,366 | | | FutureFuel Corp. | | | 21,665 | |
| | 4,570 | | | Innophos Holdings, Inc. | | | 112,102 | |
| | 2,227 | | | Innospec, Inc. | | | 137,540 | |
| | 7,774 | | | Kraton Corp.* | | | 169,784 | |
| | 18,719 | | | Louisiana-Pacific Corp. | | | 415,936 | |
| | 4,237 | | | Materion Corp. | | | 190,623 | |
| | 5,669 | | | Minerals Technologies, Inc. | | | 291,046 | |
| | 6,158 | | | OMNOVA Solutions, Inc.* | | | 45,138 | |
| | 2,269 | | | PolyOne Corp. | | | 64,893 | |
| | 6,787 | | | Schnitzer Steel Industries, Inc. Class A | | | 146,260 | |
| | 5,317 | | | Schweitzer-Mauduit International, Inc. | | | 133,191 | |
| | 7,941 | | | SunCoke Energy, Inc.* | | | 67,896 | |
| | 3,109 | | | Trinseo SA | | | 142,330 | |
| | 8,577 | | | Verso Corp. Class A* | | | 192,125 | |
| | | | | | | | |
| | | | | | | 3,939,871 | |
| | |
| | Media & Entertainment – 3.7% | |
| | 31,641 | | | AMC Entertainment Holdings, Inc. Class A(a) | | | 388,551 | |
| | 4,023 | | | Entravision Communications Corp. Class A | | | 11,707 | |
| | 3,354 | | | Glu Mobile, Inc.* | | | 27,067 | |
| | 5,197 | | | Gray Television, Inc.* | | | 76,604 | |
| | 1,736 | | | IMAX Corp.* | | | 32,654 | |
| | 11,729 | | | Liberty TripAdvisor Holdings, Inc. Class A* | | | 186,374 | |
| | 1,622 | | | Loral Space & Communications, Inc.* | | | 60,419 | |
| | 23,321 | | | MSG Networks, Inc. Class A* | | | 549,443 | |
| | 17,209 | | | New Media Investment Group, Inc. | | | 199,108 | |
| | 8,870 | | | New York Times Co. (The) Class A | | | 197,712 | |
| | 8,924 | | | Nexstar Media Group, Inc. Class A | | | 701,783 | |
| | 5,217 | | | QuinStreet, Inc.* | | | 84,672 | |
| | 865 | | | Scholastic Corp. | | | 34,825 | |
| | 11,937 | | | Sinclair Broadcast Group, Inc. Class A | | | 314,421 | |
| | 2,189 | | | WideOpenWest, Inc.* | | | 15,608 | |
| | 2,656 | | | World Wrestling Entertainment, Inc. Class A | | | 198,456 | |
| | 3,485 | | | Yelp, Inc.* | | | 121,940 | |
| | | | | | | | |
| | | | | | | 3,201,344 | |
| | |
| | Pharmaceuticals, Biotechnology & Life Sciences – 11.3% | |
| | 7,826 | | | ACADIA Pharmaceuticals, Inc.* | | | 126,546 | |
| | 4,421 | | | Acceleron Pharma, Inc.* | | | 192,535 | |
| | 3,218 | | | Acorda Therapeutics, Inc.* | | | 50,136 | |
| | 10,513 | | | Akorn, Inc.* | | | 35,639 | |
| | 1,497 | | | AMAG Pharmaceuticals, Inc.* | | | 22,739 | |
| | 14,908 | | | Array BioPharma, Inc.* | | | 212,439 | |
| | 2,244 | | | Arrowhead Pharmaceuticals, Inc.*(a) | | | 27,870 | |
| | 3,901 | | | Assertio Therapeutics, Inc.* | | | 14,083 | |
| | |
| | |
| The accompanying notes are an integral part of these financial statements. | | 11 |
GOLDMAN SACHS VARIABLE INSURANCE TRUST SMALL CAP EQUITY INSIGHTS FUND
Schedule of Investments(continued)
December 31, 2018
| | | | | | | | |
| Shares | | | Description | | Value | |
|
| | Common Stocks – (continued) | |
| | Pharmaceuticals, Biotechnology & Life Sciences – (continued) | |
| | 1,733 | | | Blueprint Medicines Corp.* | | $ | 93,426 | |
| | 4,846 | | | CareDx, Inc.* | | | 121,828 | |
| | 9,097 | | | ChemoCentryx, Inc.* | | | 99,248 | |
| | 2,356 | | | Coherus Biosciences, Inc.* | | | 21,322 | |
| | 5,763 | | | Collegium Pharmaceutical, Inc.* | | | 98,951 | |
| | 13,995 | | | CytomX Therapeutics, Inc.* | | | 211,325 | |
| | 3,070 | | | Eagle Pharmaceuticals, Inc.* | | | 123,690 | |
| | 2,602 | | | Editas Medicine, Inc.* | | | 59,196 | |
| | 4,885 | | | Emergent BioSolutions, Inc.* | | | 289,583 | |
| | 3,080 | | | Enanta Pharmaceuticals, Inc.* | | | 218,156 | |
| | 16,268 | | | Endo International plc* | | | 118,756 | |
| | 2,165 | | | Fate Therapeutics, Inc.* | | | 27,777 | |
| | 4,665 | | | FibroGen, Inc.* | | | 215,896 | |
| | 8,661 | | | Genomic Health, Inc.* | | | 557,855 | |
| | 1,869 | | | Global Blood Therapeutics, Inc.* | | | 76,722 | |
| | 37,891 | | | Halozyme Therapeutics, Inc.* | | | 554,345 | |
| | 9,792 | | | Horizon Pharma plc* | | | 191,336 | |
| | 23,160 | | | Innoviva, Inc.* | | | 404,142 | |
| | 1,043 | | | Intercept Pharmaceuticals, Inc.* | | | 105,124 | |
| | 7,015 | | | Intersect ENT, Inc.* | | | 197,683 | |
| | 4,276 | | | Invitae Corp.* | | | 47,293 | |
| | 15,696 | | | Ironwood Pharmaceuticals, Inc.* | | | 162,611 | |
| | 3,251 | | | Ligand Pharmaceuticals, Inc.* | | | 441,161 | |
| | 2,911 | | | Loxo Oncology, Inc.* | | | 407,744 | |
| | 2,768 | | | MacroGenics, Inc.* | | | 35,154 | |
| | 3,279 | | | Mallinckrodt plc* | | | 51,808 | |
| | 4,802 | | | Minerva Neurosciences, Inc.* | | | 32,365 | |
| | 503 | | | Mirati Therapeutics, Inc.* | | | 21,337 | |
| | 8,781 | | | Myriad Genetics, Inc.* | | | 255,264 | |
| | 9,474 | | | Natera, Inc.* | | | 132,257 | |
| | 13,811 | | | Pacira Pharmaceuticals, Inc.* | | | 594,149 | |
| | 14,915 | | | Phibro Animal Health Corp. Class A | | | 479,666 | |
| | 38,611 | | | Pieris Pharmaceuticals, Inc.* | | | 102,705 | |
| | 12,956 | | | Prestige Consumer Healthcare, Inc.* | | | 400,081 | |
| | 4,086 | | | Prothena Corp. plc* | | | 42,086 | |
| | 3,546 | | | PTC Therapeutics, Inc.* | | | 121,699 | |
| | 6,829 | | | REGENXBIO, Inc.* | | | 286,477 | |
| | 4,519 | | | Repligen Corp.* | | | 238,332 | |
| | 12,433 | | | Retrophin, Inc.* | | | 281,359 | |
| | 3,342 | | | Spark Therapeutics, Inc.* | | | 130,806 | |
| | 1,802 | | | Spectrum Pharmaceuticals, Inc.* | | | 15,768 | |
| | 9,592 | | | Vanda Pharmaceuticals, Inc.* | | | 250,639 | |
| | 27,540 | | | Veracyte, Inc.* | | | 346,453 | |
| | 4,921 | | | Vericel Corp.* | | | 85,625 | |
| | 5,047 | | | Voyager Therapeutics, Inc.* | | | 47,442 | |
| | 3,927 | | | Xencor, Inc.* | | | 142,000 | |
| | 4,780 | | | Zafgen, Inc.* | | | 23,661 | |
| | | | | | | | |
| | | | | | | 9,644,290 | |
| | |
| | Real Estate Investment Trusts – 6.3% | |
| | 4,876 | | | American Assets Trust, Inc. | | | 195,869 | |
| | 2,473 | | | CareTrust REIT, Inc. | | | 45,652 | |
| | 13,221 | | | Cedar Realty Trust, Inc. | | | 41,514 | |
| | 78,015 | | | Cousins Properties, Inc. | | | 616,319 | |
| | 459 | | | EastGroup Properties, Inc. | | | 42,104 | |
| | 20,668 | | | First Industrial Realty Trust, Inc. | | | 596,478 | |
| | |
|
| | Common Stocks – (continued) | |
| | Real Estate Investment Trusts – (continued) | |
| | 4,317 | | | Gladstone Commercial Corp. | | $ | 77,361 | |
| | 1,849 | | | Healthcare Realty Trust, Inc. | | | 52,586 | |
| | 11,228 | | | Lexington Realty Trust | | | 92,182 | |
| | 7,407 | | | NexPoint Residential Trust, Inc. | | | 259,615 | |
| | 2,220 | | | NorthStar Realty Europe Corp. | | | 32,279 | |
| | 16,879 | | | Pennsylvania REIT | | | 100,261 | |
| | 5,640 | | | Physicians Realty Trust | | | 90,409 | |
| | 17,130 | | | Piedmont Office Realty Trust, Inc. Class A | | | 291,895 | |
| | 20,668 | | | Rexford Industrial Realty, Inc. | | | 609,086 | |
| | 3,025 | | | RLJ Lodging Trust | | | 49,610 | |
| | 627 | | | Ryman Hospitality Properties, Inc. | | | 41,815 | |
| | 33,172 | | | Sabra Health Care REIT, Inc. | | | 546,675 | |
| | 14,216 | | | STAG Industrial, Inc. | | | 353,694 | |
| | 36,602 | | | Sunstone Hotel Investors, Inc. | | | 476,192 | |
| | 17,224 | | | Terreno Realty Corp. | | | 605,768 | |
| | 4,245 | | | Tier REIT, Inc. | | | 87,574 | |
| | 1,129 | | | Urstadt Biddle Properties, Inc. Class A | | | 21,699 | |
| | 7,291 | | | Washington Prime Group, Inc. | | | 35,434 | |
| | 3,069 | | | Xenia Hotels & Resorts, Inc | | | 52,787 | |
| | | | | | | | |
| | | | | | | 5,414,858 | |
| | |
| | Retailing – 4.5% | |
| | 25,898 | | | Abercrombie & Fitch Co. Class A | | | 519,255 | |
| | 22,027 | | | American Eagle Outfitters, Inc. | | | 425,782 | |
| | 403 | | | America’s Car-Mart, Inc.* | | | 29,197 | |
| | 3,095 | | | Boot Barn Holdings, Inc.* | | | 52,708 | |
| | 1,591 | | | Cato Corp. (The) Class A | | | 22,704 | |
| | 10,103 | | | Citi Trends, Inc. | | | 206,000 | |
| | 1,634 | | | Conn’s, Inc.* | | | 30,817 | |
| | 18,197 | | | Core-Mark Holding Co., Inc. | | | 423,080 | |
| | 15,619 | | | DSW, Inc. Class A | | | 385,789 | |
| | 37,168 | | | Express, Inc.* | | | 189,928 | |
| | 3,387 | | | Five Below, Inc.* | | | 346,558 | |
| | 1,602 | | | Genesco, Inc.* | | | 70,969 | |
| | 11,649 | | | Groupon, Inc.* | | | 37,277 | |
| | 4,984 | | | Hudson Ltd. Class A* | | | 85,476 | |
| | 14,364 | | | Liberty Expedia Holdings, Inc. Class A* | | | 561,776 | |
| | 1,490 | | | PetMed Express, Inc.(a) | | | 34,657 | |
| | 8,745 | | | Shoe Carnival, Inc. | | | 293,045 | |
| | 1,604 | | | Sleep Number Corp.* | | | 50,895 | |
| | 2,018 | | | Zumiez, Inc.* | | | 38,685 | |
| | | | | | | | |
| | | | | | | 3,804,598 | |
| | |
| | Semiconductors & Semiconductor Equipment – 1.5% | |
| | 1,785 | | | Cirrus Logic, Inc.* | | | 59,227 | |
| | 12,312 | | | Diodes, Inc.* | | | 397,185 | |
| | 17,056 | | | Entegris, Inc. | | | 475,777 | |
| | 5,494 | | | Inphi Corp.* | | | 176,632 | |
| | 2,884 | | | Semtech Corp.* | | | 132,289 | |
| | | | | | | | |
| | | | | | | 1,241,110 | |
| | |
| | Software & Services – 5.5% | |
| | 8,118 | | | 8x8, Inc.* | | | 146,449 | |
| | 2,306 | | | Appfolio, Inc. Class A* | | | 136,561 | |
| | 10,593 | | | Bottomline Technologies DE, Inc.* | | | 508,464 | |
| | |
| | |
| 12 | | The accompanying notes are an integral part of these financial statements. |
GOLDMAN SACHS VARIABLE INSURANCE TRUST SMALL CAP EQUITY INSIGHTS FUND
| | | | | | | | |
| Shares | | | Description | | Value | |
|
| | Common Stocks – (continued) | |
| | Software & Services – (continued) | |
| | 15,156 | | | Box, Inc. Class A* | | $ | 255,833 | |
| | 15,277 | | | Cloudera, Inc.* | | | 168,964 | |
| | 3,943 | | | Cornerstone OnDemand, Inc.* | | | 198,845 | |
| | 3,178 | | | Coupa Software, Inc.* | | | 199,769 | |
| | 2,406 | | | Five9, Inc.* | | | 105,190 | |
| | 6,588 | | | Hortonworks, Inc.* | | | 94,999 | |
| | 2,342 | | | HubSpot, Inc.* | | | 294,460 | |
| | 3,167 | | | MicroStrategy, Inc. Class A* | | | 404,584 | |
| | 821 | | | New Relic, Inc.* | | | 66,476 | |
| | 8,360 | | | Paylocity Holding Corp.* | | | 503,356 | |
| | 8,014 | | | Perficient, Inc.* | | | 178,392 | |
| | 22,759 | | | Perspecta, Inc. | | | 391,910 | |
| | 16,046 | | | Progress Software Corp. | | | 569,473 | |
| | 272 | | | Qualys, Inc.* | | | 20,329 | |
| | 2,448 | | | Science Applications International Corp. | | | 155,938 | |
| | 15,414 | | | ServiceSource International, Inc.* | | | 16,647 | |
| | 786 | | | SPS Commerce, Inc.* | | | 64,751 | |
| | 603 | | | Trade Desk, Inc. (The) Class A* | | | 69,984 | |
| | 1,907 | | | Varonis Systems, Inc.* | | | 100,880 | |
| | 1,632 | | | Workiva, Inc.* | | | 58,572 | |
| | | | | | | | |
| | | | | | | 4,710,826 | |
| | |
| | Technology Hardware & Equipment – 4.5% | |
| | 1,304 | | | Acacia Communications, Inc.* | | | 49,552 | |
| | 4,400 | | | ADTRAN, Inc. | | | 47,256 | |
| | 163 | | | Anixter International, Inc.* | | | 8,852 | |
| | 3,396 | | | CalAmp Corp.* | | | 44,182 | |
| | 19,158 | | | Casa Systems, Inc.* | | | 251,544 | |
| | 15,176 | | | Ciena Corp.* | | | 514,618 | |
| | 14,373 | | | Comtech Telecommunications Corp. | | | 349,839 | |
| | 2,461 | | | Control4 Corp.* | | | 43,314 | |
| | 1,639 | | | ePlus, Inc.* | | | 116,648 | |
| | 11,075 | | | Extreme Networks, Inc.* | | | 67,557 | |
| | 13,347 | | | Fabrinet* | | | 684,835 | |
| | 3,595 | | | FARO Technologies, Inc.* | | | 146,101 | |
| | 19,885 | | | Fitbit, Inc. Class A* | | | 98,828 | |
| | 12,926 | | | Insight Enterprises, Inc.* | | | 526,734 | |
| | 2,196 | | | Knowles Corp.* | | | 29,229 | |
| | 9,345 | | | Lumentum Holdings, Inc.* | | | 392,583 | |
| | 789 | | | Novanta, Inc.* | | | 49,707 | |
| | 5,231 | | | PC Connection, Inc. | | | 155,518 | |
| | 836 | | | ScanSource, Inc.* | | | 28,742 | |
| | 369 | | | Tech Data Corp.* | | | 30,188 | |
| | 7,269 | | | Vishay Precision Group, Inc.* | | | 219,742 | |
| | | | | | | | |
| | | | | | | 3,855,569 | |
| | |
| | Telecommunication Services – 1.6% | |
| | 13,443 | | | Cogent Communications Holdings, Inc. | | | 607,758 | |
| | 3,838 | | | Ooma, Inc.* | | | 53,271 | |
| | 2,164 | | | Shenandoah Telecommunications Co. | | | 95,757 | |
| | 8,105 | | | Spok Holdings, Inc. | | | 107,472 | |
| | 55,935 | | | Vonage Holdings Corp.* | | | 488,313 | |
| | | | | | | | |
| | | | | | | 1,352,571 | |
| | |
|
| | Common Stocks – (continued) | |
| | Transportation – 0.7% | |
| | 967 | | | Covenant Transportation Group, Inc. Class A* | | $ | 18,566 | |
| | 10,769 | | | Echo Global Logistics, Inc.* | | | 218,934 | |
| | 7,942 | | | Marten Transport Ltd. | | | 128,581 | |
| | 1,144 | | | Saia, Inc.* | | | 63,858 | |
| | 3,549 | | | SkyWest, Inc. | | | 157,824 | |
| | 7,092 | | | YRC Worldwide, Inc.* | | | 22,340 | |
| | | | | | | | |
| | | | | | | 610,103 | |
| | |
| | Utilities – 2.8% | |
| | 8,376 | | | Black Hills Corp. | | | 525,845 | |
| | 11,565 | | | NorthWestern Corp. | | | 687,424 | |
| | 1,103 | | | ONE Gas, Inc. | | | 87,799 | |
| | 16,131 | | | Portland General Electric Co. | | | 739,606 | |
| | 5,960 | | | Unitil Corp. | | | 301,814 | |
| | 962 | | | York Water Co. (The) | | | 30,842 | |
| | | | | | | | |
| | | | | | | 2,373,330 | |
| | |
| TOTAL INVESTMENTS BEFORE SECURITIES LENDING
REINVESTMENT VEHICLE |
|
| | (Cost $91,750,161) | | $ | 84,434,790 | |
| | |
| | | | | | |
| Shares | | Dividend
Rate | | Value | |
|
| Securities Lending Reinvestment Vehicle(b) – 1.2% | |
Goldman Sachs Financial Square Government Fund — Institutional Shares | |
| 993,085 | | 2.521% | | $ | 993,085 | |
| (Cost $993,085) | | | | |
| |
| TOTAL INVESTMENTS – 99.9% | |
| (Cost $92,743,246) | | $ | 85,427,875 | |
| |
OTHER ASSETS IN EXCESS OF
LIABILITIES – 0.1% | | | 59,837 | |
| |
| NET ASSETS – 100.0% | | $ | 85,487,712 | |
| |
| | |
| The percentage shown for each investment category reflects the value of investments in that category as a percentage of net assets. |
| |
| * | | Non-income producing security. |
| |
| (a) | | All or a portion of security is on loan. |
| |
| (b) | | Represents an Affiliated Issuer. |
| | |
| |
| Investment Abbreviation: |
| REIT | | —Real Estate Investment Trust |
| | |
| The accompanying notes are an integral part of these financial statements. | | 13 |
GOLDMAN SACHS VARIABLE INSURANCE TRUST SMALL CAP EQUITY INSIGHTS FUND
Statement of Assets and Liabilities
December 31, 2018
| | | | |
| | | | |
| Assets: | |
Investments in unaffiliated issuers, at value (cost $91,750,161)(a) | | $ | 84,434,790 | |
Investments in affiliated securities lending reinvestment vehicle, at value (cost $993,085) | | | 993,085 | |
Cash | | | 795,025 | |
Receivables: | | | | |
Fund shares sold | | | 233,082 | |
Dividends | | | 137,750 | |
Reimbursement from investment adviser | | | 17,849 | |
Securities lending income | | | 822 | |
Other assets | | | 534 | |
| |
| Total assets | | | 86,612,937 | |
| | | | |
| | | | |
| Liabilities: | |
Payables: | | | | |
Payable upon return of securities loaned | | | 993,085 | |
Management fees | | | 52,451 | |
Distribution and Service fees and Transfer Agency fees | | | 5,110 | |
Fund shares redeemed | | | 4,695 | |
Accrued expenses | | | 69,884 | |
| |
| Total liabilities | | | 1,125,225 | |
| | | | |
| | | | |
| Net Assets: | |
Paid-in capital | | | 92,699,479 | |
Total distributable loss | | | (7,211,767 | ) |
| |
| NET ASSETS | | $ | 85,487,712 | |
Net Assets: | | | | |
Institutional | | $ | 68,950,896 | |
Service | | | 16,536,816 | |
| |
Total Net Assets | | $ | 85,487,712 | |
Shares outstanding $0.001 par value (unlimited shares authorized): | | | | |
Institutional | | | 6,647,861 | |
Service | | | 1,607,950 | |
Net asset value, offering and redemption price per share: | | | | |
Institutional | | $ | 10.37 | |
Service | | | 10.28 | |
(a) Includes loaned securities having a market value of $971,446.
| | |
| 14 | | The accompanying notes are an integral part of these financial statements. |
GOLDMAN SACHS VARIABLE INSURANCE TRUST SMALL CAP EQUITY INSIGHTS FUND
Statement of Operations
For the Fiscal Year Ended December 31, 2018
| | | | |
| | | | |
| Investment income: | |
Dividends — unaffiliated issuers (net of foreign taxes withheld of $267) | | $ | 1,255,251 | |
Securities lending income — affiliated issuer | | | 20,220 | |
Dividends — affiliated issuers | | | 6,694 | |
| |
| Total investment income | | | 1,282,165 | |
| |
| | | | |
| Expenses: | |
Management fees | | | 725,915 | |
Professional fees | | | 100,451 | |
Custody, accounting and administrative services | | | 72,157 | |
Distribution and Service fees — Service Shares | | | 50,661 | |
Printing and mailing costs | | | 44,490 | |
Transfer Agency fees(a) | | | 20,273 | |
Trustee fees | | | 16,276 | |
Registration fees | | | 730 | |
Other | | | 9,807 | |
| |
| Total expenses | | | 1,040,760 | |
| |
Less — expense reductions | | | (166,935 | ) |
| |
| Net expenses | | | 873,825 | |
| |
| NET INVESTMENT INCOME | | | 408,340 | |
| | | | |
| | | | |
| Realized and unrealized gain (loss): | |
Net realized gain from: | | | | |
Investments — unaffiliated issuers | | | 12,760,111 | |
Futures contracts | | | 9,535 | |
Net change in unrealized loss on: | | | | |
Investments — unaffiliated issuers | | | (20,842,090 | ) |
Futures contracts | | | (4,406 | ) |
| |
| Net realized and unrealized loss | | | (8,076,850 | ) |
| |
| NET DECREASE IN NET ASSETS RESULTING FROM OPERATIONS | | $ | (7,668,510 | ) |
(a) Institutional and Service Shares incurred Transfer Agency fees of $16,221 and $4,052, respectively.
| | |
| The accompanying notes are an integral part of these financial statements. | | 15 |
GOLDMAN SACHS VARIABLE INSURANCE TRUST SMALL CAP EQUITY INSIGHTS FUND
Statements of Changes in Net Assets
| | | | | | | | |
| | | For the
Fiscal Year Ended
December 31, 2018 | | | For the
Fiscal Year Ended
December 31, 2017 | |
| | | | | | | | |
| From operations: | |
Net investment income | | $ | 408,340 | | | $ | 460,184 | |
Net realized gain | | | 12,769,646 | | | | 10,781,537 | |
Net change in unrealized loss | | | (20,846,496 | ) | | | (835,483 | ) |
| | |
| Net increase (decrease) in net assets resulting from operations | | | (7,668,510 | ) | | | 10,406,238 | |
| |
| | | | | | | | |
| Distributions to shareholders: | |
From distributable earnings: | | | | | | | | |
Institutional Shares | | | (11,874,335 | ) | | | (8,809,035 | )(a) |
Service Shares | | | (2,807,539 | ) | | | (2,298,766 | )(a) |
| | |
| Total distributions to shareholders | | | (14,681,874 | ) | | | (11,107,801 | ) |
| | | | | | | | |
| | | | | | | | |
| From share transactions: | |
Proceeds from sales of shares | | | 12,578,607 | | | | 7,393,057 | |
Reinvestment of distributions | | | 14,681,874 | | | | 11,107,801 | |
Cost of shares redeemed | | | (17,743,096 | ) | | | (17,336,021 | ) |
| | |
| Net increase in net assets resulting from share transactions | | | 9,517,385 | | | | 1,164,837 | |
| | |
| TOTAL INCREASE (DECREASE) | | | (12,832,999 | ) | | | 463,274 | |
| |
| | | | | | | | |
| Net assets:(b) | |
| | |
Beginning of year | | | 98,320,711 | | | | 97,857,437 | |
| | |
End of year | | $ | 85,487,712 | | | $ | 98,320,711 | |
(a) Prior year information has been revised to conform to current year presentation, see prior year presentation below:
| | | | | | | | |
| | | Institutional | | | Service | |
Distribution from net investment income: | | $ | (410,159 | ) | | $ | (60,003 | ) |
Distributions from net realized gains: | | $ | (8,398,876 | ) | | $ | (2,238,763 | ) |
| (b) | Prior fiscal year information has been revised to conform with current year presentation. Undistributed net investment income was $64,150 for the Fund as of December 31, 2017. |
| | |
| 16 | | The accompanying notes are an integral part of these financial statements. |
GOLDMAN SACHS VARIABLE INSURANCE TRUST SMALL CAP EQUITY INSIGHTS FUND
Financial Highlights
Selected Data for a Share Outstanding Throughout Each Year
| | | | | | | | | | | | | | | | | | | | |
| | | Goldman Sachs Small Cap Equity Insights Fund | |
| | | Institutional Shares | |
| | | Year Ended December 31, | |
| | | 2018 | | | 2017 | | | 2016 | | | 2015 | | | 2014 | |
| | | | | | | | | | | | | | | | | | | | |
| Per Share Data | | | | | | | | | | | | | | | |
| | | | | |
Net asset value, beginning of year | | $ | 13.66 | | | $ | 13.79 | | | $ | 11.60 | | | $ | 13.67 | | | $ | 15.07 | |
| | | | | |
Net investment income(a) | | | 0.07 | (b) | | | 0.08 | | | | 0.11 | | | | 0.08 | (c) | | | 0.08 | |
| | | | | |
Net realized and unrealized gain (loss) | | | (1.21 | ) | | | 1.53 | | | | 2.59 | | | | (0.37 | ) | | | 0.90 | |
| | | | | |
Total from investment operations | | | (1.14 | ) | | | 1.61 | | | | 2.70 | | | | (0.29 | ) | | | 0.98 | |
| | | | | |
Distributions to shareholders from net investment income | | | (0.07 | ) | | | (0.08 | ) | | | (0.15 | ) | | | (0.04 | ) | | | (0.12 | ) |
| | | | | |
Distributions to shareholders from net realized gains | | | (2.08 | ) | | | (1.66 | ) | | | (0.36 | ) | | | (1.74 | ) | | | (2.26 | ) |
| | | | | |
Total distributions | | | (2.15 | ) | | | (1.74 | ) | | | (0.51 | ) | | | (1.78 | ) | | | (2.38 | ) |
| | | | | |
Net asset value, end of year | | $ | 10.37 | | | $ | 13.66 | | | $ | 13.79 | | | $ | 11.60 | | | $ | 13.67 | |
| | | | | |
Total return(d) | | | (8.62 | )% | | | 11.57 | % | | | 23.13 | % | | | (2.13 | )% | | | 6.93 | % |
| | | | | |
Net assets, end of year (in 000s) | | $ | 68,951 | | | $ | 77,815 | | | $ | 77,421 | | | $ | 73,270 | | | $ | 89,043 | |
| | | | | |
Ratio of net expenses to average net assets | | | 0.81 | % | | | 0.81 | % | | | 0.81 | % | | | 0.81 | % | | | 0.83 | % |
| | | | | |
Ratio of total expenses to average net assets | | | 0.98 | % | | | 1.00 | % | | | 1.04 | % | | | 0.99 | % | | | 1.04 | % |
| | | | | |
Ratio of net investment income to average net assets | | | 0.46 | %(b) | | | 0.53 | % | | | 0.95 | % | | | 0.59 | %(c) | | | 0.53 | % |
| | | | | |
Portfolio turnover rate(e) | | | 116 | % | | | 110 | % | | | 119 | % | | | 124 | % | | | 119 | % |
| (a) | Calculated based on the average shares outstanding methodology. |
| (b) | Reflects income recognized from special dividends which amounted to $0.02 per share and 0.17% of average net assets. |
| (c) | Reflects income recognized from special dividends which amounted to $0.02 per share and 0.15% of average net assets. |
| (d) | Assumes investment at the net asset value at the beginning of the year, reinvestment of all distributions, and a complete redemption of the investment at the net asset value at the end of the year. |
| (e) | The Fund’s portfolio turnover rate is calculated in accordance with regulatory requirements, without regard to transactions involving short term investments and certain derivatives. If such transactions were included, the Fund’s portfolio turnover rate may be higher. |
| | |
| The accompanying notes are an integral part of these financial statements. | | 17 |
GOLDMAN SACHS VARIABLE INSURANCE TRUST SMALL CAP EQUITY INSIGHTS FUND
Financial Highlights(continued)
Selected Data for a Share Outstanding Throughout Each Year
| | | | | | | | | | | | | | | | | | | | |
| | | Goldman Sachs Small Cap Equity Insights Fund | |
| | | Service Shares | |
| | | Year Ended December 31, | |
| | | 2018 | | | 2017 | | | 2016 | | | 2015 | | | 2014 | |
| | | | | | | | | | | | | | | | | | | | |
| Per Share Data | | | | | | | | | | | | | | | |
| | | | | |
Net asset value, beginning of year | | $ | 13.55 | | | $ | 13.70 | | | $ | 11.52 | | | $ | 13.60 | | | $ | 15.00 | |
| | | | | |
Net investment income(a) | | | 0.03 | (b) | | | 0.04 | | | | 0.08 | | | | 0.05 | (c) | | | 0.04 | |
| | | | | |
Net realized and unrealized gain (loss) | | | (1.19 | ) | | | 1.51 | | | | 2.58 | | | | (0.39 | ) | | | 0.90 | |
| | | | | |
Total from investment operations | | | (1.16 | ) | | | 1.55 | | | | 2.66 | | | | (0.34 | ) | | | 0.94 | |
| | | | | |
Distributions to shareholders from net investment income | | | (0.03 | ) | | | (0.04 | ) | | | (0.12 | ) | | | — | (d) | | | (0.08 | ) |
| | | | | |
Distributions to shareholders from net realized gains | | | (2.08 | ) | | | (1.66 | ) | | | (0.36 | ) | | | (1.74 | ) | | | (2.26 | ) |
| | | | | |
Total distributions | | | (2.11 | ) | | | (1.70 | ) | | | (0.48 | ) | | | (1.74 | ) | | | (2.34 | ) |
| | | | | |
Net asset value, end of year | | $ | 10.28 | | | $ | 13.55 | | | $ | 13.70 | | | $ | 11.52 | | | $ | 13.60 | |
| | | | | |
Total return(e) | | | (8.82 | )% | | | 11.22 | % | | | 22.92 | % | | | (2.49 | )% | | | 6.69 | % |
| | | | | |
Net assets, end of year (in 000s) | | $ | 16,537 | | | $ | 20,505 | | | $ | 20,437 | | | $ | 19,488 | | | $ | 23,744 | |
| | | | | |
Ratio of net expenses to average net assets | | | 1.06 | % | | | 1.06 | % | | | 1.06 | % | | | 1.06 | % | | | 1.08 | % |
| | | | | |
Ratio of total expenses to average net assets | | | 1.23 | % | | | 1.25 | % | | | 1.29 | % | | | 1.24 | % | | | 1.29 | % |
| | | | | |
Ratio of net investment income to average net assets | | | 0.19 | %(b) | | | 0.28 | % | | | 0.70 | % | | | 0.34 | %(c) | | | 0.28 | % |
| | | | | |
Portfolio turnover rate(f) | | | 116 | % | | | 110 | % | | | 119 | % | | | 124 | % | | | 119 | % |
| (a) | Calculated based on the average shares outstanding methodology. |
| (b) | Reflects income recognized from special dividends which amounted to $0.02 per share and 0.17% of average net assets. |
| (c) | Reflects income recognized from special dividends which amounted to $0.02 per share and 0.15% of average net assets. |
| (d) | Amount is less than $0.005 per share. |
| (e) | Assumes investment at the net asset value at the beginning of the year, reinvestment of all distributions, and a complete redemption of the investment at the net asset value at the end of the year. |
| (f) | The Fund’s portfolio turnover rate is calculated in accordance with regulatory requirements, without regard to transactions involving short term investments and certain derivatives. If such transactions were included, the Fund’s portfolio turnover rate may be higher. |
| | |
| 18 | | The accompanying notes are an integral part of these financial statements. |
GOLDMAN SACHS VARIABLE INSURANCE TRUST SMALL CAP EQUITY INSIGHTS FUND
Notes to Financial Statements
December 31, 2018
1. ORGANIZATION
Goldman Sachs Variable Insurance Trust (the “Trust” or “VIT”) is a Delaware statutory trust registered under the Investment Company Act of 1940, as amended (the “Act”), as anopen-end management investment company. The Trust includes the Goldman Sachs Small Cap Equity Insights Fund (the “Fund”). The Fund is a diversified portfolio under the Act offering two classes of shares — Institutional and Service Shares. Shares of the Trust are offered to separate accounts of participating life insurance companies for the purpose of funding variable annuity contracts and variable life insurance policies.
Goldman Sachs Asset Management, L.P. (“GSAM”), an affiliate of Goldman Sachs & Co. LLC (“Goldman Sachs”), serves as investment adviser to the Fund pursuant to a management agreement (the “Agreement”) with the Trust.
2. SIGNIFICANT ACCOUNTING POLICIES
The financial statements have been prepared in accordance with accounting principles generally accepted in the United States of America (“GAAP”) and require management to make estimates and assumptions that may affect the reported amounts and disclosures. Actual results may differ from those estimates and assumptions.
A. Investment Valuation — The Fund’s valuation policy is to value investments at fair value.
B. Investment Income and Investments — Investment income includes interest income, dividend income, and securities lending income, if any. Interest income is accrued daily and adjusted for amortization of premiums and accretion of discounts. Dividend income is recognized onex-dividend date or, for certain foreign securities, as soon as such information is obtained subsequent to theex-dividend date. Investment transactions are reflected on trade date. Realized gains and losses are calculated using identified cost. Investment transactions are recorded on the following business day for daily net asset value (“NAV”) calculations. Investment income is recorded net of any foreign withholding taxes, less any amounts reclaimable. The Fund may file withholding tax reclaims in certain jurisdictions to recover a portion of amounts previously withheld. Any foreign capital gains tax is accrued daily based upon net unrealized gains, and is payable upon sale of such investments. Distributions received from the Fund’s investments in United States (“U.S.”) real estate investment trusts (“REITs”) may be characterized as ordinary income, net capital gain or a return of capital. A return of capital is recorded by the Fund as a reduction to the cost basis of the REIT.
For derivative contracts, realized gains and losses are recorded upon settlement of the contract.
C. Class Allocations and Expenses — Investment income, realized and unrealized gain (loss), if any, andnon-class specific expenses of the Fund are allocated daily based upon the proportion of net assets of each class.Non-class specific expenses directly incurred by the Fund are charged to the Fund, while such expenses incurred by the Trust are allocated across the Fund on a straight-line and/orpro-rata basis depending upon the nature of the expenses. Class specific expenses, where applicable, are borne by the respective share classes and include Distribution and Service and Transfer Agency fees.
D. Federal Taxes and Distributions to Shareholders — It is the Fund’s policy to comply with the requirements of the Internal Revenue Code of 1986, as amended (the “Code”), applicable to regulated investment companies and to distribute each year substantially all of its investment company taxable income and capital gains to its shareholders. Accordingly, the Fund is not required to make any provisions for the payment of federal income tax. Distributions to shareholders are recorded on theex-dividend date. Income and capital gains distributions, if any, are declared and paid annually.
Net capital losses, if any, are carried forward to future fiscal years and may be used to the extent allowed by the Code to offset any future capital gains. Losses that are carried forward will retain their character as either short-term or long-term capital losses. Utilization of capital loss carryforwards will reduce the requirement of future capital gains distributions.
The characterization of distributions to shareholders for financial reporting purposes is determined in accordance with federal income tax rules, which may differ from GAAP. The source of the Fund’s distributions may be shown in the accompanying financial statements as either from distributable earnings or capital. Certain components of the Fund’s net assets on the Statement of Assets and Liabilities reflect permanent GAAP/tax differences based on the appropriate tax character.
19
GOLDMAN SACHS VARIABLE INSURANCE TRUST SMALL CAP EQUITY INSIGHTS FUND
Notes to Financial Statements(continued)
December 31, 2018
3. INVESTMENTS AND FAIR VALUE MEASUREMENTS
U.S. GAAP defines the fair value of a financial instrument as the amount that would be received to sell an asset or paid to transfer a liability in an orderly transaction between market participants at the measurement date (i.e., the exit price); the Fund’s policy is to use the market approach. GAAP establishes a fair value hierarchy that prioritizes the inputs to valuation techniques used to measure fair value. The hierarchy gives the highest priority to unadjusted quoted prices in active markets for identical assets or liabilities (Level 1 measurements) and the lowest priority to unobservable inputs (Level 3 measurements). The levels used for classifying investments are not necessarily an indication of the risk associated with investing in these investments. The three levels of the fair value hierarchy are described below:
Level 1 — Unadjusted quoted prices in active markets that are accessible at the measurement date for identical, unrestricted assets or liabilities;
Level 2 — Quoted prices in markets that are not active or financial instruments for which significant inputs are observable (including, but not limited to, quoted prices for similar investments, interest rates, foreign exchange rates, volatility and credit spreads), either directly or indirectly;
Level 3 — Prices or valuations that require significant unobservable inputs (including GSAM’s assumptions in determining fair value measurement).
Changes in valuation techniques may result in transfers into or out of an assigned level within the hierarchy. In accordance with the Fund’s policy, transfers between different levels of the fair value hierarchy resulting from such changes are deemed to have occurred as of the beginning of the reporting period.
The Board of Trustees (“Trustees”) has approved Valuation Procedures that govern the valuation of the portfolio investments held by the Fund, including investments for which market quotations are not readily available. The Trustees have delegated to GSAMday-to-day responsibility for implementing and maintaining internal controls and procedures related to the valuation of the Fund’s investments. To assess the continuing appropriateness of pricing sources and methodologies, GSAM regularly performs price verification procedures and issues challenges as necessary to third party pricing vendors or brokers, and any differences are reviewed in accordance with the Valuation Procedures.
A. Level 1 and Level 2 Fair Value Investments — The valuation techniques and significant inputs used in determining the fair values for investments classified as Level 1 and Level 2 are as follows:
Equity Securities — Equity securities traded on a U.S. securities exchange or the NASDAQ system, or those located on certain foreign exchanges, including but not limited to the Americas, are valued daily at their last sale price or official closing price on the principal exchange or system on which they are traded. If there is no sale or official closing price or such price is believed by GSAM to not represent fair value, equity securities are valued at the last bid price for long positions and at the last ask price for short positions. To the extent these investments are actively traded, they are classified as Level 1 of the fair value hierarchy, otherwise they are generally classified as Level 2.
Unlisted equity securities for which market quotations are available are valued at the last sale price on the valuation date, or if no sale occurs, at the last bid price, and are generally classified as Level 2.
Money Market Funds — Investments in the Goldman Sachs Financial Square Government Fund (“Underlying Fund”) are valued at the NAV of the Institutional Share class on the day of valuation. These investments are generally classified as Level 1 of the fair value hierarchy. For information regarding the Underlying Fund’s accounting policies and investment holdings, please see the Underlying Fund’s shareholder report.
Derivative Contracts — A derivative is an instrument whose value is derived from underlying assets, indices, reference rates or a combination of these factors. The Fund enters into derivative transactions to hedge against changes in interest rates, securities prices, and/or currency exchange rates, to increase total return, or to gain access to certain markets or attain exposure to other underliers.
Exchange-traded derivatives, including futures and options contracts, are generally valued at the last sale or settlement price on the exchange where they are principally traded. Exchange-traded options without settlement prices are generally valued at the
20
GOLDMAN SACHS VARIABLE INSURANCE TRUST SMALL CAP EQUITY INSIGHTS FUND
3. INVESTMENTS AND FAIR VALUE MEASUREMENTS (continued)
midpoint of the bid and ask prices on the exchange where they are principally traded (or, in the absence oftwo-way trading, at the last bid price for long positions and the last ask price for short positions). Exchange-traded derivatives typically fall within Level 1 of the fair value hierarchy.Over-the-counter (“OTC”) and centrally cleared derivatives are valued using market transactions and other market evidence, including market-based inputs to models, calibration to market-clearing transactions, broker or dealer quotations, or other alternative pricing sources. Where models are used, the selection of a particular model to value OTC and centrally cleared derivatives depends upon the contractual terms of, and specific risks inherent in, the instrument, as well as the availability of pricing information in the market. Valuation models require a variety of inputs, including contractual terms, market prices, yield curves, credit curves, measures of volatility, voluntary and involuntary prepayment rates, loss severity rates and correlations of such inputs. For OTC and centrally cleared derivatives that trade in liquid markets, model inputs can generally be verified and model selection does not involve significant management judgment. OTC and centrally cleared derivatives are classified within Level 2 of the fair value hierarchy when significant inputs are corroborated by market evidence.
i. Futures Contracts — Futures contracts are contracts to buy or sell a standardized quantity of a specified commodity or security. Upon entering into a futures contract, the Fund deposits cash or securities in an account on behalf of the broker in an amount sufficient to meet the initial margin requirement. Subsequent payments are made or received by the Fund equal to the daily change in the contract value and are recorded as variation margin receivable or payable with a corresponding offset to unrealized gains or losses. For financial reporting purposes, cash collateral that has been pledged to cover obligations of the Fund and cash collateral received, if any, is reported separately on the Statement of Assets and Liabilities as receivables/payables for collateral on certain derivative contracts.Non-cash collateral pledged by the Fund, if any, is noted in the Schedule of Investments.
B. Level 3 Fair Value Investments— To the extent that significant inputs to valuation models and other alternative pricing sources are unobservable, or if quotations are not readily available, or if GSAM believes that such quotations do not accurately reflect fair value, the fair value of the Fund’s investments may be determined under Valuation Procedures approved by the Trustees. GSAM, consistent with its procedures and applicable regulatory guidance, may make an adjustment to the most recent valuation prices of either domestic or foreign securities in light of significant events to reflect what it believes to be the fair value of the securities at the time of determining the Fund’s NAV. Significant events which could affect a large number of securities in a particular market may include, but are not limited to: significant fluctuations in U.S. or foreign markets; market dislocations; market disruptions; or unscheduled market closings. Significant events which could also affect a single issuer may include, but are not limited to: corporate actions such as reorganizations, mergers andbuy-outs; ratings downgrades; and bankruptcies.
C. Fair Value Hierarchy — The following is a summary of the Fund’s investments and derivatives classified in the fair value hierarchy as of December 31, 2018:
| | | | | | | | | | | | |
| Investment Type | | Level 1 | | | Level 2 | | | Level 3 | |
| | | |
| Assets | | | | | | | | | | | | |
| Common Stock and/or Other Equity Investments(a) | | | | | | | | | | | | |
Asia | | $ | 684,835 | | | $ | — | | | $ | — | |
Europe | | | 42,086 | | | | — | | | | — | |
North America | | | 83,707,869 | | | | — | | | | — | |
| Securities Lending Reinvestment Vehicle | | | 993,085 | | | | — | | | | — | |
| | | |
| Total | | $ | 85,427,875 | | | $ | — | | | $ | — | |
| (a) | Amounts are disclosed by continent to highlight the impact of time zone differences between local market close and the calculation of net asset value. Security valuations are based on the principal exchange or system on which they are traded, which may differ from country of domicile. |
For further information regarding security characteristics, see the Schedule of Investments.
21
GOLDMAN SACHS VARIABLE INSURANCE TRUST SMALL CAP EQUITY INSIGHTS FUND
Notes to Financial Statements(continued)
December 31, 2018
4. INVESTMENTS IN DERIVATIVES
The following table sets forth, by certain risk types, the Fund’s gains (losses) related to these derivatives and their indicative volumes for the fiscal year ended December 31, 2018. These gains (losses) should be considered in the context that these derivative contracts may have been executed to create investment opportunities and/or economically hedge certain investments, and accordingly, certain gains (losses) on such derivative contracts may offset certain (losses) gains attributable to investments. These gains (losses) are included in “Net realized gain (loss)” or “Net change in unrealized gain (loss)” on the Statement of Operations:
| | | | | | | | | | | | | | |
| Risk | | Statement of Operations | | Net
Realized
Gain (Loss) | | | Net Change in Unrealized Gain (Loss) | | | Average
Number of
Contracts(a) | |
| | | | |
| Equity | | Net realized gain (loss) from futures contracts/Net change in unrealized gain (loss) on futures contracts | | $ | 9,535 | | | $ | (4,406 | ) | | | 7 | |
| (a) | Average number of contracts is based on the average of month end balances for the fiscal year ended December 31, 2018. |
5. AGREEMENTS AND AFFILIATED TRANSACTIONS
A. Management Agreement — Under the Agreement, GSAM manages the Fund, subject to the general supervision of the Trustees.
As compensation for the services rendered pursuant to the Agreement, the assumption of the expenses related thereto and administration of the Fund’s business affairs, including providing facilities, GSAM is entitled to a management fee, accrued daily and paid monthly, equal to an annual percentage rate of the Fund’s average daily net assets.
As of December 31, 2018, the contractual management fees with GSAM were as stated below. The effective contractual management rate and effective net management rate represent the rates for the fiscal year ended December 31, 2018.
| | | | | | | | | | | | | | | | | | | | |
| Contractual Management Rate | | | | | | Effective
Net Management
Rate^ | |
First
$2 billion | | Next
$3 billion | | | Next
$3 billion | | | Over
$8 billion | | | Effective
Rate | |
| 0.70% | | | 0.63 | % | | | 0.60 | % | | | 0.59 | % | | | 0.72 | % | | | 0.70 | % |
| ^ | Effective Net Management Rate includes the impact of management fee waivers of affiliated Underlying Funds, if any. The Effective Net Management Rate may not correlate to the Contractual Management Rate as a result of management fee waivers that may be in effect from time to time. For the fiscal year ended December 31, 2018, GSAM waived $16,294 of its management fee. |
Prior to April 30, 2018, the contractual management fee rate for the Fund was as stated below and GSAM agreed to waive a portion of its management fee in order to achieve an Effective Net Management Rate as set forth in the Fund’s prospectus dated April 28, 2017.
| | | | | | | | | | | | | | |
First
$2 billion | | | Next
$3 billion | | | Next
$3 billion | | | Over
$8 billion | |
| | | |
| | 0.75% | | | | 0.68 | % | | | 0.65 | % | | | 0.64 | % |
The Fund invests in Institutional Shares of the Goldman Sachs Financial Square Government Fund, which is an affiliated Underlying Fund. GSAM has agreed to waive a portion of its management fee payable by the Fund in an amount equal to the management fee it earns as an investment adviser to the affiliated Underlying Fund in which the Fund invests, except those management fees it earns from the Fund’s investments of cash collateral received in connection with securities lending transactions in the Goldman Sachs Financial Square Government Fund. For the fiscal year ended December 31, 2018, GSAM waived $669 of the Fund’s management fee.
22
GOLDMAN SACHS VARIABLE INSURANCE TRUST SMALL CAP EQUITY INSIGHTS FUND
5. AGREEMENTS AND AFFILIATED TRANSACTIONS (continued)
B. Distribution and Service(12b-1) Plan — The Trust, on behalf of Service Shares of the Fund, has adopted a Distribution and Service Plan subject to Rule12b-1 under the Act. Under the Distribution and Service Plan, Goldman Sachs, which serves as distributor, is entitled to a fee accrued daily and paid monthly, for distribution services and personal and account maintenance services, which may then be paid by Goldman Sachs to authorized dealers, equal to, on an annual basis, 0.25% of the Fund’s average daily net assets attributable to Service Shares.
C. Transfer Agency Agreement — Goldman Sachs also serves as the transfer agent of the Fund for a fee pursuant to the Transfer Agency Agreement. The fees charged for such transfer agency services are accrued daily and paid monthly at an annual rate of 0.02% of the average daily net assets of Institutional and Service Shares.
D. Other Expense Agreements and Affiliated Transactions — GSAM has agreed to limit certain “Other Expenses” of the Fund (excluding acquired fund fees and expenses, transfer agency fees and expenses, service fees and shareholder administration fees (as applicable), taxes, interest, brokerage fees, expenses of shareholder meetings, litigation and indemnification, and extraordinary expenses) to the extent such expenses exceed, on an annual basis, a percentage rate of the average daily net assets of the Fund. Such Other Expense reimbursements, if any, are accrued daily and paid monthly. In addition, the Fund is not obligated to reimburse GSAM for prior fiscal year expense reimbursements, if any. The Other Expense limitation as an annual percentage rate of average daily net assets for the Fund is 0.094%. The Other Expense limitation will remain in place through at least April 30, 2019, and prior to such date GSAM may not terminate the arrangement without the approval of the Trustees. In addition, the Fund has entered into certain offset arrangements with the custodian and the transfer agent, which may result in a reduction of the Fund’s expenses and are received irrespective of the application of the “Other Expense” limitation described above.
For the fiscal year ended December 31, 2018, these expense reductions, including any fee waivers and Other Expense reimbursements, were as follows:
| | | | | | | | | | | | | | |
Management
Fee Waiver | | | Custody Fee
Credits | | | Other Expense
Reimbursement | | | Total Expense
Reductions | |
| | | |
| $ | 16,963 | | | $ | 1,119 | | | $ | 148,853 | | | $ | 166,935 | |
E. Line of Credit Facility — As of December 31, 2018, the Fund participated in a $770,000,000 committed, unsecured revolving line of credit facility (the “facility”) together with other funds of the Trust and certain registered investment companies having management agreements with GSAM or its affiliates. This facility is to be used for temporary emergency purposes, or to allow for an orderly liquidation of securities to meet redemption requests. The interest rate on borrowings is based on the federal funds rate. The facility also requires a fee to be paid by the Fund based on the amount of the commitment that has not been utilized. For the fiscal year ended December 31, 2018, the Fund did not have any borrowings under the facility.
F. Other Transactions with Affiliates — The following table provides information about the Fund’s investments in the Goldman Sachs Financial Square Government Fund as of and for the fiscal year ended December 31, 2018:
| | | | | | | | | | | | | | | | | | | | | | |
Beginning Value as of
December 31, 2017 | | | Purchases
at Cost | | | Proceeds
from Sales | | | Ending
Value as of
December 31, 2018 | | | Shares as of
December 31, 2018 | | | Dividend Income
from Affiliated
Investment Company | |
| | | | | |
| $ | 264,823 | | | $ | 9,647,720 | | | $ | (9,912,543 | ) | | $ | — | | | | — | | | $ | 6,694 | |
6. PORTFOLIO SECURITIES TRANSACTIONS
The cost of purchases and proceeds from sales and maturities of long-term securities for the fiscal year ended December 31, 2018, were $114,489,776 and $118,320,649, respectively.
23
GOLDMAN SACHS VARIABLE INSURANCE TRUST SMALL CAP EQUITY INSIGHTS FUND
Notes to Financial Statements(continued)
December 31, 2018
7. SECURITIES LENDING
Pursuant to exemptive relief granted by the Securities and Exchange Commission (“SEC”) and the terms and conditions contained therein, the Fund may lend its securities through a securities lending agent, Goldman Sachs Agency Lending (“GSAL”), a wholly-owned subsidiary of Goldman Sachs, to certain qualified borrowers including Goldman Sachs and affiliates. In accordance with the Fund’s securities lending procedures, the Fund receives cash collateral at least equal to the market value of the securities on loan. The market value of the loaned securities is determined at the close of business of the Fund, at their last sale price or official closing price on the principal exchange or system on which they are traded, and any additional required collateral is delivered to the Fund on the next business day. As with other extensions of credit, the Fund may experience delay in the recovery of its securities or incur a loss should the borrower of the securities breach its agreement with the Fund or become insolvent at a time when the collateral is insufficient to cover the cost of repurchasing securities on loan. Dividend income received from securities on loan may not be subject to withholding taxes and therefore withholding taxes paid may differ from the amounts listed in the Statement of Operations. Loans of securities are terminable at any time and as such 1) the remaining contractual maturities of the outstanding securities lending transactions are considered to be overnight and continuous and 2) the borrower, after notice, is required to return borrowed securities within the standard time period for settlement of securities transactions.
The Fund invests the cash collateral received in connection with securities lending transactions in the Goldman Sachs Financial Square Government Fund (“Government Money Market Fund”), an affiliated series of the Goldman Sachs Trust. The Government Money Market Fund is registered under the Act as an open end investment company, is subject to Rule2a-7 under the Act, and is managed by GSAM, for which GSAM may receive a management fee of up to 0.16% (prior to February 21, 2018, GSAM may have received a management fee of up to 0.205%) on an annualized basis of the average daily net assets of the Government Money Market Fund.
In the event of a default by a borrower with respect to any loan, GSAL will exercise any and all remedies provided under the applicable borrower agreement to make the Fund whole. These remedies include purchasing replacement securities by applying the collateral held from the defaulting broker against the purchase cost of the replacement securities. If GSAL is unable to purchase replacement securities, GSAL will indemnify the Fund by paying the Fund an amount equal to the market value of the securities loaned minus the value of cash collateral received from the borrower for the loan, subject to an exclusion for any shortfalls resulting from a loss of value in such cash collateral due to reinvestment risk. The Fund may enter into master netting agreements with borrowers, which provide the right, in the event of a default (including bankruptcy or insolvency), for thenon-defaulting party to liquidate the collateral and calculate net exposure to the defaulting party or request additional collateral. However, in the event of a default by a borrower, a resolution authority could determine that such rights are not enforceable due to the restrictions or prohibitions against the right ofset-off that may be imposed in accordance with a particular jurisdiction’s bankruptcy or insolvency laws. The Fund’s loaned securities were all subject to enforceable Securities Lending Agreements and the value of the collateral was at least equal to the value of the cash received. The amounts of the Fund’s overnight and continuous agreements, which represent the gross amounts of recognized liabilities for securities lending transactions outstanding as of December 31, 2018, are disclosed as “Payable upon return of securities loaned” on the Statement of Assets and Liabilities, where applicable.
Both the Fund and GSAL received compensation relating to the lending of the Fund’s securities. The amounts earned, if any, by the Fund for the fiscal year ended December 31, 2018, are reported under Investment Income on the Statement of Operations.
The table below details securities lending activity with affiliates of Goldman Sachs:
| | | | | | | | | | |
| For the Fiscal Year Ended December 31, 2018 | | | | |
Earnings of GSAL
Relating to
Securities
Loaned | | | Amount Received
by the Fund
from Lending to
Goldman Sachs | | | Amount Payable to
Goldman Sachs
Upon Return of
Securities Loaned as of
December 31, 2018 | |
| | |
| $ | 2,225 | | | $ | 1,934 | | | $ | 34,300 | |
24
GOLDMAN SACHS VARIABLE INSURANCE TRUST SMALL CAP EQUITY INSIGHTS FUND
7. SECURITIES LENDING (continued)
The following table provides information about the Fund’s investment in the Government Money Market Fund for the fiscal year ended December 31, 2018:
| | | | | | | | | | | | | | |
Beginning
Value as of
December 31, 2017 | | | Purchases
at Cost | | | Proceeds
from Sales | | | Ending
Value as of
December 31, 2018 | |
| | | |
| | $1,053,265 | | | $ | 12,770,633 | | | $ | (12,830,813 | ) | | $ | 993,085 | |
8. TAX INFORMATION
The tax character of distributions paid during the fiscal years ended December 31, 2017 and December 31, 2018 was as follows:
| | | | | | | | |
| | | 2017 | | | 2018 | |
| Distributions paid from: | | | | | | | | |
Ordinary income | | $ | 4,147,037 | | | $ | 6,368,697 | |
Net long-term capital gains | | | 6,960,764 | | | | 8,313,177 | |
| | |
| Total taxable distributions | | $ | 11,107,801 | | | $ | 14,681,874 | |
As of December 31, 2018, the components of accumulated earnings (losses) on atax-basis were as follows:
| | | | |
| Undistributed ordinary income — net | | $ | 44,432 | |
| Undistributed long-term capital gains | | | 869,401 | |
| Total undistributed earnings | | $ | 913,833 | |
| Timing differences (§ 857(b)(9) Deferred Dividend/ Post October Loss Deferral) | | $ | (667,178 | ) |
| Unrealized losses — net | | | (7,458,422 | ) |
| Total accumulated losses — net | | $ | (7,211,767 | ) |
As of December 31, 2018, the Fund’s aggregate security unrealized gains and losses based on cost for U.S. federal income tax purposes were as follows:
| | | | |
| Tax cost | | $ | 92,886,297 | |
| Gross unrealized gain | | | 5,976,533 | |
| Gross unrealized loss | | | (13,434,955 | ) |
| Net unrealized loss | | $ | (7,458,422 | ) |
The difference between GAAP-basis andtax-basis unrealized gains (losses) is attributable primarily to wash sales.
GSAM has reviewed the Fund’s tax positions for all open tax years (the current and prior three years, as applicable) and has concluded that no provision for income tax is required in the Fund’s financial statements. Such open tax years remain subject to examination and adjustment by tax authorities.
25
GOLDMAN SACHS VARIABLE INSURANCE TRUST SMALL CAP EQUITY INSIGHTS FUND
Notes to Financial Statements(continued)
December 31, 2018
9. OTHER RISKS
The Fund’s risks include, but are not limited to, the following:
Derivatives Risk — The Fund’s use of derivatives may result in loss. Derivative instruments, which may pose risks in addition to and greater than those associated with investing directly in securities, currencies or other instruments, may be illiquid or less liquid, volatile, difficult to price and leveraged so that small changes in the value of the underlying instruments may produce disproportionate losses to the Fund. Derivatives are also subject to counterparty risk, which is the risk that the other party in the transaction will not fulfill its contractual obligation. The use of derivatives is a highly specialized activity that involves investment techniques and risks different from those associated with investments in more traditional securities and instruments. Losses from derivatives can also result from a lack of correlation between changes in the value of derivative instruments and the portfolio assets (if any) being hedged.
Investments in Other Investment Companies Risk — As a shareholder of another investment company, including an exchange-traded fund (“ETF”), the Fund will indirectly bear its proportionate share of any net management fees and other expenses paid by such other investment companies, in addition to the fees and expenses regularly borne by the Fund.
Large Shareholder Transactions Risk — The Fund may experience adverse effects when certain large shareholders, such as other funds, participating insurance companies, accounts and Goldman Sachs affiliates, purchase or redeem large amounts of shares of the Fund. Such large shareholder redemptions, which may occur rapidly or unexpectedly, may cause the Fund to sell portfolio securities at times when it would not otherwise do so, which may negatively impact the Fund’s NAV and liquidity. These transactions may also accelerate the realization of taxable income to shareholders if such sales of investments resulted in gains, and may also increase transaction costs. In addition, a large redemption could result in the Fund’s current expenses being allocated over a smaller asset base, leading to an increase in the Fund’s expense ratio. Similarly, large Fund share purchases may adversely affect the Fund’s performance to the extent that the Fund is delayed in investing new cash or otherwise maintains a larger cash position than it ordinarily would.
Liquidity Risk — The Fund may make investments that are illiquid or that may become less liquid in response to market developments or adverse investor perceptions. Illiquid investments may be more difficult to value. Liquidity risk may also refer to the risk that the Fund will not be able to pay redemption proceeds within the allowable time period or without significant dilution to remaining investors’ interests because of unusual market conditions, an unusually high volume of redemption requests, or other reasons. To meet redemption requests, the Fund may be forced to sell investments at an unfavorable time and/or under unfavorable conditions. If the Fund is forced to sell securities at an unfavorable time and/or under unfavorable conditions, such sales may adversely affect the Fund’s NAV and dilute remaining investors’ interests.
Market and Credit Risks — In the normal course of business, the Fund trades financial instruments and enters into financial transactions where risk of potential loss exists due to changes in the market (market risk). Additionally, the Fund may also be exposed to credit risk in the event that an issuer or guarantor fails to perform or that an institution or entity with which the Fund has unsettled or open transactions defaults.
10. INDEMNIFICATIONS
Under the Trust’s organizational documents, its Trustees, officers, employees and agents are indemnified, to the extent permitted by the Act and state law, against certain liabilities that may arise out of performance of their duties to the Fund. Additionally, in the course of business, the Fund enters into contracts that contain a variety of indemnification clauses. The Fund’s maximum exposure under these arrangements is unknown, as this would involve future claims that may be made against the Fund that have not yet occurred. However, GSAM believes the risk of loss under these arrangements to be remote.
26
GOLDMAN SACHS VARIABLE INSURANCE TRUST SMALL CAP EQUITY INSIGHTS FUND
11. OTHER MATTERS
In September 2018, the Financial Accounting Standards Board issued Accounting Standards Update (ASU)2018-13 — Fair Value Measurement (Topic 820) Disclosure Framework — Changes to the Disclosure Requirements for Fair Value Measurement. The amendments in the ASU modify fair value measurement disclosures. The amendments are effective for the Fund’s fiscal year beginning after December 15, 2019. GSAM is currently evaluating the impact, if any, of the amendments.
12. SUBSEQUENT EVENTS
Subsequent events after the Statement of Assets and Liabilities date have been evaluated, and GSAM has concluded that there is no impact requiring adjustment or disclosure in the financial statements.
13. SUMMARY OF SHARE TRANSACTIONS
Share activity is as follows:
| | | | | | | | | | | | | | | | |
| | | For the Fiscal Year Ended
December 31, 2018 | | | For the Fiscal Year Ended
December 31, 2017 | |
| | | Shares | | | Dollars | | | Shares | | | Dollars | |
| Institutional Shares | | | | | | | | | | | | | | | | |
| Shares sold | | | 746,343 | | | $ | 10,751,346 | | | | 449,078 | | | $ | 6,364,463 | |
| Reinvestment of distributions | | | 1,125,530 | | | | 11,874,335 | | | | 640,192 | | | | 8,809,035 | |
| Shares redeemed | | | (921,549 | ) | | | (13,354,939 | ) | | | (1,006,312 | ) | | | (14,236,742 | ) |
| | | | 950,324 | | | | 9,270,742 | | | | 82,958 | | | | 936,756 | |
| Service Shares | | | | | | | | | | | | | | | | |
| Shares sold | | | 128,444 | | | | 1,827,261 | | | | 73,489 | | | | 1,028,594 | |
| Reinvestment of distributions | | | 268,407 | | | | 2,807,539 | | | | 168,284 | | | | 2,298,766 | |
| Shares redeemed | | | (301,678 | ) | | | (4,388,157 | ) | | | (220,914 | ) | | | (3,099,279 | ) |
| | | | 95,173 | | | | 246,643 | | | | 20,859 | | | | 228,081 | |
| | | | |
| NET INCREASE | | | 1,045,497 | | | $ | 9,517,385 | | | | 103,817 | | | $ | 1,164,837 | |
27
Report of Independent Registered Public Accounting Firm
To the Board of Trustees of
Goldman Sachs Variable Insurance Trust and Shareholders of Goldman Sachs Small Cap Equity Insights Fund
Opinion on the Financial Statements
We have audited the accompanying statement of assets and liabilities, including the schedule of investments, of Goldman Sachs Small Cap Equity Insights Fund (one of the funds constituting Goldman Sachs Variable Insurance Trust, referred to hereafter as the “Fund”) as of December 31, 2018, the related statement of operations for the year ended December 31, 2018, the statements of changes in net assets for each of the two years in the period ended December 31, 2018, including the related notes, and the financial highlights for each of the five years in the period ended December 31, 2018 (collectively referred to as the “financial statements”). In our opinion, the financial statements present fairly, in all material respects, the financial position of the Fund as of December 31, 2018, the results of its operations for the year then ended, the changes in its net assets for each of the two years in the period ended December 31, 2018 and the financial highlights for each of the five years in the period ended December 31, 2018 in conformity with accounting principles generally accepted in the United States of America.
Basis for Opinion
These financial statements are the responsibility of the Fund’s management. Our responsibility is to express an opinion on the Fund’s financial statements based on our audits. We are a public accounting firm registered with the Public Company Accounting Oversight Board (United States) (PCAOB) and are required to be independent with respect to the Fund in accordance with the U.S. federal securities laws and the applicable rules and regulations of the Securities and Exchange Commission and the PCAOB.
We conducted our audits of these financial statements in accordance with the standards of the PCAOB. Those standards require that we plan and perform the audit to obtain reasonable assurance about whether the financial statements are free of material misstatement, whether due to error or fraud.
Our audits included performing procedures to assess the risks of material misstatement of the financial statements, whether due to error or fraud, and performing procedures that respond to those risks. Such procedures included examining, on a test basis, evidence regarding the amounts and disclosures in the financial statements. Our audits also included evaluating the accounting principles used and significant estimates made by management, as well as evaluating the overall presentation of the financial statements. Our procedures included confirmation of securities owned as of December 31, 2018 by correspondence with the custodian, transfer agent and brokers; when replies were not received from brokers, we performed other auditing procedures. We believe that our audits provide a reasonable basis for our opinion.
PricewaterhouseCoopers LLP
Boston, Massachusetts
February 13, 2019
We have served as the auditor of one or more investment companies in the Goldman Sachs fund complex since 2000.
28
GOLDMAN SACHS VARIABLE INSURANCE TRUST SMALL CAP EQUITY INSIGHTS FUND
| | |
| Fund Expenses — Six Month Period Ended December 31, 2018 (Unaudited) | | |
As a shareholder of Institutional or Service Shares of the Fund, you incur ongoing costs, including management fees, distribution and/or service(12b-1) fees (with respect to Service Shares) and other Fund expenses. This example is intended to help you understand your ongoing costs (in dollars) of investing in the Institutional Shares and Service Shares of the Fund and to compare these costs with the ongoing costs of investing in other mutual funds.
The example is based on an investment of $1,000 invested at the beginning of the period and held for the entire period from July 1, 2018 through December 31, 2018, which represents a period of 184 days of a 365 day year.
Actual Expenses— The first line under each share class in the table below provides information about actual account values and actual expenses. You may use the information in this line, together with the amount you invested, to estimate the expenses that you paid over the period. Simply divide your account value by $1,000 (for example, an $8,600 account value divided by $1,000=8.6), then multiply the result by the number in the first line under the heading entitled “Expenses Paid” to estimate the expenses you paid on your account during this period.
Hypothetical Example for Comparison Purposes— The second line under each share class in the table below provides information about hypothetical account values and hypothetical expenses based on the Fund’s actual net expense ratio and an assumed rate of return of 5% per year before expenses, which is not the Fund’s actual return. The hypothetical account values and expenses may not be used to estimate the actual ending account balance or expenses you paid for the period. You may use this information to compare the ongoing costs of investing in the Fund and other funds. To do so, compare this 5% hypothetical example with the 5% hypothetical examples that appear in the shareholder reports of the other funds.
Please note that the expenses shown in the table are meant to highlight your ongoing costs only. As a shareholder of the Fund you do not incur any transaction costs, such as sales charges, redemption fees, or exchange fees, but shareholders of other funds may incur such costs. The second line of the table is useful in comparing ongoing costs only and will not help you determine the relative total costs of owning different funds whose shareholders may incur transaction costs.
| | | | | | | | | | | | |
| Share Class | | Beginning
Account Value
07/01/18 | | | Ending
Account Value
12/31/18 | | | Expenses Paid
for the
6 Months
Ended
12/31/18* | |
| Institutional | | | | | | | | | | | | |
| | | | |
| Actual | | $ | 1,000 | | | $ | 823.90 | | | $ | 3.72 | |
| Hypothetical 5% return | | | 1,000 | | | | 1,021.12 | + | | | 4.13 | |
| Service | | | | | | | | | | | | |
| | | | |
| Actual | | | 1,000 | | | | 822.50 | | | | 4.87 | |
| Hypothetical 5% return | | | 1,000 | | | | 1,019.86 | + | | | 5.40 | |
| | + | Hypothetical expenses are based on the Fund’s actual annualized net expense ratios and an assumed rate of return of 5% per year before expenses. | |
| | * | Expenses are calculated using the Fund’s annualized net expense ratio for each class, which represents the ongoing expenses as a percentage of net assets for the six months ended December 31, 2018. Expenses are calculated by multiplying the annualized net expense ratio by the average account value for the period; then multiplying the result by the number of days in the most recent fiscal half year; and then dividing that result by the number of days in the fiscal year. The annualized net expense ratios for the period were 0.81% and 1.06% for the Institutional and Service Shares, respectively. | |
29
GOLDMAN SACHS VARIABLE INSURANCE TRUST SMALL CAP EQUITY INSIGHTS FUND
Trustees and Officers (Unaudited)
Independent Trustees
| | | | | | | | | | |
| | | | | |
Name,
Address and Age1 | | Position(s) Held
with the Trust | | Term of Office and
Length of
Time Served2 | | Principal Occupation(s) During Past 5 Years | | Number of
Portfolios in
Fund Complex
Overseen by
Trustee3 | | Other Directorships Held by Trustee4 |
| | | | | |
Jessica Palmer Age: 69 | | Chair of the Board of Trustees | | Since 2018 (Trustee since 2007) | | Ms. Palmer is retired. She was formerly Director, Emerson Center for the Arts and Culture (2011-2017); and Consultant, Citigroup Human Resources Department (2007-2008); Managing Director, Citigroup Corporate and Investment Banking (previously, Salomon Smith Barney/Salomon Brothers) (1984-2006). Ms. Palmer was a Member of the Board of Trustees of Indian Mountain School (private elementary and secondary school) (2004-2009). Chair of the Board of Trustees — Goldman Sachs Trust and Goldman Sachs Variable Insurance Trust. | | 103 | | None |
| | | | | |
Kathryn A. Cassidy Age: 64 | | Trustee | | Since 2015 | | Ms. Cassidy is retired. Formerly, she was Advisor to the Chairman (May 2014-December 2014); and Senior Vice President and Treasurer (2008-2014), General Electric Company & General Electric Capital Corporation (technology and financial services companies). Trustee — Goldman Sachs Trust and Goldman Sachs Variable Insurance Trust. | | 103 | | None |
| | | | | |
Diana M. Daniels Age: 69 | | Trustee | | Since 2007 | | Ms. Daniels is retired. Formerly, she was Vice President, General Counsel and Secretary, The Washington Post Company (1991-2006). Ms. Daniels is a Trustee Emeritus and serves as a Presidential Councillor of Cornell University (2013-Present); former Member of the Legal Advisory Board, New York Stock Exchange (2003-2006) and of the Corporate Advisory Board, Standish Mellon Management Advisors (2006-2007). Trustee — Goldman Sachs Trust and Goldman Sachs Variable Insurance Trust. | | 103 | | None |
| | | | | |
Herbert J. Markley Age: 68 | | Trustee | | Since 2013 | | Mr. Markley is retired. Formerly, he was Executive Vice President, Deere & Company (an agricultural and construction equipment manufacturer) (2007-2009); and President, Agricultural Division, Deere & Company (2001-2007). Previously, Mr. Markley served as an Advisory Board Member of Goldman Sachs Trust and Goldman Sachs Variable Insurance Trust (June 2013-October 2013). Trustee — Goldman Sachs Trust and Goldman Sachs Variable Insurance Trust. | | 103 | | None |
| | | | | |
Roy W. Templin Age: 58 | | Trustee | | Since 2013 | | Mr. Templin is retired. He is Director, Armstrong World Industries, Inc. (a designer and manufacturer of ceiling, wall and suspension system solutions) (2016-Present); and was formerly Chairman of the Board of Directors, Con-Way Incorporated (a transportation, logistics and supply chain management service company) (2014-2015); Executive Vice President and Chief Financial Officer, Whirlpool Corporation (an appliance manufacturer and marketer) (2004-2012). Previously, Mr. Templin served as an Advisory Board Member of Goldman Sachs Trust and Goldman Sachs Variable Insurance Trust (June 2013-October 2013). Trustee — Goldman Sachs Trust and Goldman Sachs Variable Insurance Trust. | | 103 | | Armstrong World Industries, Inc. (a ceiling, wall and suspension systems solutions manufacturer) |
| | | | | |
Gregory G. Weaver Age: 67 | | Trustee | | Since 2015 | | Mr. Weaver is retired. He is Director, Verizon Communications Inc. (2015-Present); and was formerly Chairman and Chief Executive Officer, Deloitte & Touche LLP (a professional services firm) (2001-2005 and 2012-2014); and Member of the Board of Directors, Deloitte & Touche LLP (2006-2012). Trustee — Goldman Sachs Trust and Goldman Sachs Variable Insurance Trust. | | 103 | | Verizon Communications Inc. |
| | | | | | | | | | |
30
GOLDMAN SACHS VARIABLE INSURANCE TRUST SMALL CAP EQUITY INSIGHTS FUND
Trustees and Officers (Unaudited) (continued)
Interested Trustee*
| | | | | | | | | | |
| | | | | |
Name,
Address and Age1 | | Position(s) Held
with the Trust | | Term of Office and
Length of
Time Served2 | | Principal Occupation(s) During Past 5 Years | | Number of
Portfolios in
Fund Complex
Overseen by
Trustee3 | | Other Directorships Held by Trustee4 |
| | | | | |
James A. McNamara Age: 56 | | President and Trustee | | Since 2007 | | Advisory Director, Goldman Sachs (January 2018-Present); Managing Director, Goldman Sachs (January 2000-December 2017); Director of Institutional Fund Sales, GSAM (April 1998-December 2000); and Senior Vice President and Manager, Dreyfus Institutional Service Corporation (January 1993- April 1998). President and Trustee — Goldman Sachs Trust; Goldman Sachs Variable Insurance Trust; Goldman Sachs Trust II; Goldman Sachs MLP Income Opportunities Fund; Goldman Sachs MLP and Energy Renaissance Fund; Goldman Sachs ETF Trust; Goldman Sachs Private Markets Fund 2018 LLC; Goldman Sachs Private Markets Fund 2018 (A) LLC; and Goldman Sachs Private Markets Fund 2018 (B) LLC. | | 156 | | None |
| | | | | | | | | | |
| * | Mr. McNamara is considered to be an “Interested Trustee” because he holds positions with Goldman Sachs and owns securities issued by The Goldman Sachs Group, Inc. Mr. McNamara holds comparable positions with certain other companies of which Goldman Sachs, GSAM or an affiliate thereof is the investment adviser, administrator and/or distributor. |
| 1 | Each Trustee may be contacted by writing to the Trustee, c/o Goldman Sachs, 200 West Street, New York, New York, 10282, Attn: Caroline Kraus. Information is provided as of December 31, 2018. |
| 2 | Subject to such policies as may be adopted by the Board from time-to-time, each Trustee holds office for an indefinite term, until the earliest of: (a) the election of his or her successor; (b) the date the Trustee resigns or is removed by the Board or shareholders, in accordance with the Trust’s Declaration of Trust; or (c) the termination of the Trust. The Board has adopted policies which provide that (a) no Trustee shall hold office for more than 15 years and (b) a Trustee shall retire as of December 31st of the calendar year in which he or she reaches his or her 74th birthday, unless a waiver of such requirement shall have been adopted by a majority of the other Trustees. These policies may be changed by the Trustees without shareholder vote. |
| 3 | The Goldman Sachs Fund Complex includes certain other companies listed above for each respective Trustee. As of December 31, 2018, Goldman Sachs Trust consisted of 90 portfolios (88 of which offered shares to the public); Goldman Sachs Variable Insurance Trust consisted of 13 portfolios; Goldman Sachs Trust II consisted of 19 portfolios (17 of which offered shares to the public); Goldman Sachs MLP Income Opportunities Fund, Goldman Sachs MLP and Energy Renaissance Fund, Goldman Sachs Private Markets Fund 2018 LLC, Goldman Sachs Private Markets Fund 2018 (A) LLC and Goldman Sachs Private Markets Fund 2018 (B) LLC each consisted of one portfolio; and Goldman Sachs ETF Trust consisted of 29 portfolios (14 of which offered shares to the public). |
| 4 | This column includes only directorships of companies required to report to the Securities and Exchange Commission under the Securities Exchange Act of 1934 (i.e., “public companies”) or other investment companies registered under the Act. |
Additional information about the Trustees is available in the Fund’s Statement of Additional Information, which can be obtained from Goldman Sachs free of charge by calling this toll-free number (in the United States of America): 1-800-526-7384.
31
GOLDMAN SACHS VARIABLE INSURANCE TRUST SMALL CAP EQUITY INSIGHTS FUND
Trustees and Officers (Unaudited) (continued)
Officers of the Trust*
| | | | | | |
| | | |
| Name, Address and Age1 | | Position(s) Held with the Trust | | Term of
Office and
Length of
Time Served2 | | Principal Occupation(s) During Past 5 Years |
| | | |
James A. McNamara 200 West Street New York, NY 10282 Age: 56 | | Trustee and President | | Since 2007 | | Advisory Director, Goldman Sachs (January 2018-Present); Managing Director, Goldman Sachs (January 2000-December 2017); Director of Institutional Fund Sales, GSAM (April 1998-December 2000); and Senior Vice President and Manager, Dreyfus Institutional Service Corporation (January 1993-April 1998). President and Trustee — Goldman Sachs Trust; Goldman Sachs Variable Insurance Trust; Goldman Sachs Trust II; Goldman Sachs MLP Income Opportunities Fund; Goldman Sachs MLP and Energy Renaissance Fund; Goldman Sachs ETF Trust; Goldman Sachs Private Markets Fund 2018 LLC; Goldman Sachs Private Markets Fund 2018 (A) LLC; and Goldman Sachs Private Markets Fund 2018 (B) LLC. |
| | | |
Caroline L. Kraus 200 West Street New York, NY 10282 Age: 41 | | Secretary | | Since 2012 | | Managing Director, Goldman Sachs (January 2016-Present); Vice President, Goldman Sachs (August 2006-December 2015); Associate General Counsel, Goldman Sachs (2012-Present); Assistant General Counsel, Goldman Sachs (August 2006-December 2011); and Associate, Weil, Gotshal & Manges, LLP (2002-2006). Secretary — Goldman Sachs Trust (previously Assistant Secretary (2012)); Goldman Sachs Variable Insurance Trust (previously Assistant Secretary (2012)); Goldman Sachs Trust II; Goldman Sachs BDC, Inc.; Goldman Sachs Private Middle Market Credit LLC; Goldman Sachs Middle Market Lending Corp.; Goldman Sachs MLP Income Opportunities Fund; Goldman Sachs MLP and Energy Renaissance Fund; Goldman Sachs ETF Trust; Goldman Sachs Private Markets Fund 2018 LLC; Goldman Sachs Private Markets Fund 2018 (A) LLC; and Goldman Sachs Private Markets Fund 2018 (B) LLC. |
| | | |
Scott M. McHugh 200 West Street New York, NY 10282 Age: 47 | | Treasurer, Senior Vice President and Principal Financial Officer | | Since 2009 (Principal Financial Officer since 2013) | | Managing Director, Goldman Sachs (January 2016-Present); Vice President, Goldman Sachs (February 2007-December 2015); Assistant Treasurer of certain mutual funds administered by DWS Scudder (2005-2007); and Director (2005-2007), Vice President (2000-2005), and Assistant Vice President (1998-2000), Deutsche Asset Management or its predecessor (1998-2007). Treasurer, Senior Vice President and Principal Financial Officer — Goldman Sachs Trust; Goldman Sachs Variable Insurance Trust; Goldman Sachs Trust II; Goldman Sachs MLP Income Opportunities Fund; Goldman Sachs MLP and Energy Renaissance Fund; Goldman Sachs ETF Trust; Goldman Sachs Private Markets Fund 2018 LLC; Goldman Sachs Private Markets Fund 2018 (A) LLC; and Goldman Sachs Private Markets Fund 2018 (B) LLC. |
| | | |
Joseph F. DiMaria 30 Hudson Street Jersey City, NJ 07302 Age: 50 | | Assistant Treasurer and Principal Accounting Officer | | Since 2016 (Principal Accounting Officer since 2017) | | Managing Director, Goldman Sachs (November 2015-Present) and Vice President — Mutual Fund Administration, Columbia Management Investment Advisers, LLC (May 2010-October 2015). Assistant Treasurer and Principal Accounting Officer — Goldman Sachs Trust; Goldman Sachs Variable Insurance Trust; Goldman Sachs Trust II; Goldman Sachs MLP Income Opportunities Fund; Goldman Sachs MLP and Energy Renaissance Fund; Goldman Sachs ETF Trust; Goldman Sachs Private Markets Fund 2018 LLC; Goldman Sachs Private Markets Fund 2018 (A) LLC; and Goldman Sachs Private Markets Fund 2018 (B) LLC. |
| | | | | | |
| * | Represents a partial list of officers of the Trust. Additional information about all the officers is available in the Fund’s Statement of Additional Information, which can be obtained from Goldman Sachs free of charge by calling this toll-free number (in the United States): 1-800-526-7384. |
| 1 | Information is provided as of December 31, 2018. |
| 2 | Officers hold office at the pleasure of the Board of Trustees or until their successors are duly elected and qualified. Each officer holds comparable positions with certain other companies of which Goldman Sachs, GSAM or an affiliate thereof is the investment adviser, administrator and/or distributor. |
Goldman Sachs Variable Insurance Trust — Tax Information (Unaudited)
For the year ended December 31, 2018, 16.43% of the dividends paid from net investment company taxable income by the Small Cap Equity Insights Fund qualify for the dividends received deduction available to corporations.
Pursuant to Section 852 of the Internal Revenue Code, the Small Cap Equity Insights Fund designates $8,313,177 or, if different, the maximum amount allowable, as capital gain dividends paid during the fiscal year ended December 31, 2018.
32
| | |
| TRUSTEES | | OFFICERS |
Jessica Palmer,Chair Kathryn A. Cassidy Diana M. Daniels Herbert J. Markley James A. McNamara Roy W. Templin Gregory G. Weaver | | James A. McNamara,President Scott M. McHugh,Treasurer, Senior Vice President and Principal Financial Officer Joseph F. DiMaria,Assistant Treasurer and Principal Accounting Officer Caroline L. Kraus,Secretary |
GOLDMAN SACHS & CO. LLC
Distributor and Transfer Agent
GOLDMAN SACHS ASSET MANAGEMENT, L.P.
Investment Adviser
200 West Street, New York
New York 10282
Visit our web site at www.GSAMFUNDS.com to obtain the most recentmonth-end returns.
The reports concerning the Fund included in this shareholder report may contain certain forward-looking statements about the factors that may affect the performance of the Fund in the future. These statements are based on Fund management’s predictions and expectations concerning certain future events and their expected impact on the Fund, such as performance of the economy as a whole and of specific industry sectors, changes in the levels of interest rates, the impact of developing world events, and other factors that may influence the future performance of the Fund. Management believes these forward-looking statements to be reasonable, although they are inherently uncertain and difficult to predict. Actual events may cause adjustments in portfolio management strategies from those currently expected to be employed.
A description of the policies and procedures that the Fund uses to determine how to vote proxies relating to portfolio securities and information regarding how the Fund voted proxies relating to portfolio securities for the12-month period ended December 31 is available (i) without charge, upon request by calling1-800-621-2550; and (ii) on the Securities and Exchange Commission (“SEC”) web site athttp://www.sec.gov.
The Fund files its complete schedule of portfolio holdings with the SEC for the first and third quarters of each fiscal year onForm N-Q. The Fund’s Form N-Qs are available on the SEC’s web site at http://www.sec.gov within 60 days after the Fund’s first and third fiscal quarters. FormN-Qs may be obtained upon request and without charge by calling1-800-621-2550.
Views and opinions expressed are for informational purposes only and do not constitute a recommendation by GSAM to buy, sell, or hold any security. Views and opinions are current as of the date of this presentation and may be subject to change, they should not be construed as investment advice.
Goldman Sachs & Co. LLC (“Goldman Sachs”) does not provide legal, tax or accounting advice. Any statement contained in this communication (including any attachments) concerning U.S. tax matters was not intended or written to be used, and cannot be used, for the purpose of avoiding penalties under the Internal Revenue Code, and was written to support the promotion or marketing of transaction or matter addressed. Clients of Goldman Sachs should obtain their own independent tax advice based on their particular circumstances.
The website links provided are for your convenience only and are not an endorsement or recommendation by GSAM of any of these websites or the products or services offered. GSAM is not responsible for the accuracy and validity of the content of these websites.
Fund holdings and allocations shown are as of December 31, 2018 and may not be representative of future investments. Fund holdings should not be relied on in making investment decisions and should not be construed as research or investment advice regarding particular securities. Current and future holdings are subject to risk.
References to indices, benchmarks or other measures of relative market performance over a specified period of time are provided for your information only and do not imply that the portfolio will achieve similar results. The index composition may not reflect the manner in which a portfolio is constructed. While an adviser seeks to design a portfolio which reflects appropriate risk and return features, portfolio characteristics may deviate from those of the benchmark.
The Global Industry Classification Standard (“GICS”) was developed by and is the exclusive property and a service mark of Morgan Stanley Capital International Inc. (“MSCI”) and Standard & Poor’s, a division of The McGraw-Hill Companies, Inc. (“S&P”) and is licensed for use by Goldman Sachs. Neither MSCI, S&P nor any other party involved in making or compiling the GICS or any GICS classifications makes any express or implied warranties or representations with respect to such standard or classification (or the results to be obtained by the use thereof), and all such parties hereby expressly disclaim all warranties of originality, accuracy, completeness, merchantability or fitness for a particular purpose with respect to any of such standard or classification. Without limiting any of the foregoing, in no event shall MSCI, S&P, any of their affiliates or any third party involved in making or compiling the GICS or any GICS classifications have any liability for any direct, indirect, special, punitive, consequential or any other damages (including lost profits) even if notified of the possibility of such damages.
The portfolio risk management process includes an effort to monitor and manage risk, but does not imply low risk.
Shares of the Goldman Sachs VIT Funds are offered to separate accounts of participating life insurance companies for the purpose of funding variable annuity contracts and variable life insurance policies. Shares of the Fund are not offered directly to the general public. The variable annuity contracts and variable life insurance policies are described in the separate prospectuses issued by participating insurance companies. You should refer to those prospectuses for information about surrender charges, mortality and expense risk fees and other charges that may be assessed by participating insurance companies under the variable annuity contracts or variable life insurance policies. Such fees or charges, if any, may affect the return you may realize with respect to your investments. Ask your representative for more complete information. Please consider a fund’s objectives, risks and charges and expenses, and read the prospectus carefully before investing. The prospectus contains this and other information about the Fund.
This material is not authorized for distribution to prospective investors unless preceded or accompanied by a current prospectus or summary prospectus, if applicable. Investors should consider the Funds’ objective, risks, and charges and expenses, and read the summary prospectus, if available, and/or the prospectus carefully before investing or sending money. The summary prospectus, if available, and the prospectus contain this and other information about the Funds and may be obtained from your authorized dealer or from Goldman Sachs & Co. LLC by calling 1-800-621-2550.
This report is prepared for the general information of contract owners and is not an offer of shares of the Goldman Sachs Variable Insurance Trust — Goldman Sachs Small Cap Equity Insights Fund.
© 2019 Goldman Sachs. All rights reserved.
VITSCAR-19/157041-OTU-914559/7.4k
Goldman
SachsVariable Insurance Trust
Goldman Sachs
Strategic Growth Fund
Annual Report
December 31, 2018

GOLDMAN SACHS VARIABLE INSURANCE TRUST STRATEGIC GROWTH FUND
INVESTMENT OBJECTIVE
The Fund seeks long-term growth of capital.
Portfolio Management Discussion and Analysis
Below, the Goldman Sachs Fundamental Equity U.S. Equity Portfolio Management Team discusses the Goldman Sachs Variable Insurance Trust — Goldman Sachs Strategic Growth Fund’s (the “Fund”) performance and positioning for the 12-month period ended December 31, 2018 (the “Reporting Period”).
How did the Fund perform during the Reporting Period?
During the Reporting Period, the Fund’s Institutional and Service Shares generated average annual total returns of –1.04% and –1.32%, respectively. These returns compare to the –1.51% average annual total return of the Fund’s benchmark, the Russell 1000® Growth Index (with dividends reinvested) (the “Russell Index”), during the same time period.
What economic and market factors most influenced the equity markets as a whole during the Reporting Period?
Representing the U.S. equity market, the S&P 500® Index returned –9.03% in December 2018, posting its worst December since 1931 and bringing its total return to –4.38% for the Reporting Period, the worst calendar year since 2008.
Despite a strong start to the Reporting Period in January 2018 amid solid economic data, a $1.5 trillion tax reform law signed in December 2017, and a favorable corporate earnings season, U.S. equities endured a challenging and volatile year in 2018. In February 2018, U.S. and international equities sold off on market speculation of a faster pace of Federal Reserve (“Fed”) short-term interest rate hikes, which stoked a sharp rise in bond yields and an increase in equity market volatility. Concerns about Fed monetary policy tightening were further exacerbated by solid U.S. labor and inflation data. While the hawkish Fed minutes were largely expected, new Fed Chair Jerome Powell’s Congressional testimony, positing a more optimistic economic outlook since the December 2017 Fed meeting, surprised equity markets with its hawkish tilt, sparking another sell-off in the U.S. equity markets. (Jerome Powell assumed the chairmanship of the Fed in February 2018. Hawkish language tends to suggest higher interest rates; opposite of dovish.) In March 2018, escalating trade tensions and potential tariffs weighed on investor sentiment. Meanwhile, the Fed delivered on a widely expected interest rate increase, with its “dot plot” pointing to a total of three interest rate hikes in calendar year 2018 and potentially two in 2019. (The “dot plot” shows rate projections of the members of the Fed’s Open Market Committee.) However, Fed policymakers acknowledged that the “economic outlook has strengthened in recent months,” revising their economic growth forecast higher and their unemployment forecast lower.
By the end of the Reporting Period, the Fed had hiked interest rates four times and communicated an upbeat view of its economic outlook, spurred by strong U.S. labor and inflation data. Against the strong fundamentals, escalating trade tensions, fears of a global economic slowdown and populist politics weighed on investor sentiment throughout the calendar year. After second and third calendar quarters of generally solid gains, supported by a combination of robust economic growth, strong corporate profits and rising earnings estimates, U.S. equities fell sharply again in the fourth quarter of 2018, as investor sentiment rapidly deteriorated on heightened trade and political uncertainty and in a delayed response to an earlier sell-off in global rates. The correction resulted in tighter U.S. financial conditions, which had been resilient to Fed interest rate hikes earlier in the year. U.S. equities saw a reprieve in November 2018 on more accommodative comments from Fed Chair Powell and on encouraging progress toward China-U.S. trade talks. However, the recovery was short-lived, as U.S. equities plunged in December 2018 on renewed investor fears sparked by the arrest of a Chinese technology executive, the partial Federal government shutdown and the U.S. President’s criticism of Fed Chair Powell.
For the Reporting Period overall, seven sectors posted negative absolute returns and four generated positive returns. Health care, utilities, consumer discretionary and information technology were the best performing sectors in the S&P 500® Index, as measured by total return, and the weakest performing sectors in the S&P 500® Index during the Reporting Period were energy, materials, industrials and financials.(After the close of business on September 28, 2018, the telecommunications services sector was renamed the communication services sector and was broadened to include certain companies from the information technology and consumer discretionary sectors that facilitate communication and offer related content and information through various media.)
Within the U.S. equity market, there was significant disparity in performance not only among sectors but also among the various capitalization and style segments. While all capitalization segments posted negative returns, large-cap stocks, as measured by the
1
GOLDMAN SACHS VARIABLE INSURANCE TRUST STRATEGIC GROWTH FUND
Russell 1000® Index, performed best, followed at some distance by mid-cap stocks, as measured by the Russell Midcap® Index, and then small-cap stocks, as measured by the Russell 2000® Index. From a style perspective, growth-oriented stocks significantly outpaced value-oriented stocks across the capitalization spectrum. (All as measured by the FTSE Russell indices.)
What key factors were responsible for the Fund’s performance during the Reporting Period?
While the Fund posted negative absolute returns, it outperformed the Russell Index during the Reporting Period attributable primarily to stock selection overall. Sector allocation as a whole also contributed positively, albeit more modestly.
Which equity market sectors most significantly affected Fund performance?
Contributing most positively to the Fund’s relative results during the Reporting Period was effective stock selection in the health care, information technology and materials sectors. The sectors that detracted most from the Fund’s relative results during the Reporting Period were consumer staples, consumer discretionary and real estate, wherein stock selection hurt most.
What were some of the Fund’s best-performing individual stocks?
Among those stocks the Fund benefited most from relative to the Russell Index were positions in customer relationship management services software on demand provider salesforce.com, genetics company Illumina and pharmaceutical company Eli Lilly.
Shares of salesforce.com rose in the middle of February 2018 following an upgrade in which the analysts cited strong enterprise growth as being a key driver to its strong performance. Also, the company reported earnings and revenue that beat consensus expectations, led by strong billings growth. The company’s stock rose further following its earnings announcement in May 2018, in which both revenue and earnings per share exceeded market estimates with strong guidance. In November 2018, its stock spiked again following another strong earnings report in which earnings per share beat market estimates with better than market expected guidance. Overall, at the end of the Reporting Period, we believed the company presented an attractive growth story, as it continued to grow and gain market share through strategic partnerships, international markets and government opportunities. We also believed salesforce.com remained a high quality growth company with a strong management team.
Throughout the first half of the Reporting Period, shares of Illumina rose rather steadily, and the company had multiple quarters in which its earnings per share exceeded market expectations. The strong results were driven by the performance of NovaSeq, Illumina’s genetic sequencing platform. At the end of July 2018, its stock surged following another earnings release in which the company reported both earnings per share and revenues well ahead of consensus estimates. Sustained strength in the NovaSeq product line was a primary driver of performance. At the end of the Reporting Period, we maintained our belief that the company’s growth was at an inflection point, as NovaSeq, which is more cost and time effective for customers than competitors’ platforms, was still in its early stages. In our view, the company remained well positioned as a leader in its industry to capitalize on the NovaSeq product cycle with the tailwind of strong and increasing secular demand for genetic sequencing.
Much of Eli Lilly’s strong performance is attributable to the second half of the Reporting Period. Its stock rallied in July 2018 after the company reported exceptionally strong second quarter results and announced its spinoff of Elanco, the company’s animal health business. The company beat investor expectations on both earnings per share and revenues while also raising its full year guidance. Its results were driven by broad-based strength across all of its major products. Eli Lilly’s stock rose again through most of November 2018 when the company reported solid quarterly results in which it beat earnings per share and revenue market expectations and also raised its guidance again for the full year. Then, in December 2018, Eli Lilly shares benefited from the announcement of better than market expected 2019 guidance, featuring significant improvements in revenue growth and long-term sales growth. At the end of the Reporting Period, we maintained our belief that the company had strong risk/reward prospects versus its peers, and we saw an upside to its diabetes franchise. We were also optimistic about its management’s commitment to creating shareholder value through increased dividends and share repurchases. Additionally, we viewed the company’s upcoming split with Elanco as value accretive. Overall, we viewed Eli Lilly at the end of the Reporting Period as a high quality pharmaceutical business with leading franchises, a robust drug pipeline and an improving financial profile.
Which stocks detracted significantly from the Fund’s performance during the Reporting Period?
Detracting from the Fund’s results relative to the Russell Index were positions in processed food and beverages producer Kraft Heinz, tobacco company Philip Morris International and biopharmaceutical company Incyte.
Shares of Kraft Heinz traded lower during the first part of the Reporting Period following the company’s fourth quarter 2017 earnings release in which it missed earnings estimates due to weaker than market expected margins. The margin pressure was primarily driven by both increased commodity costs and strategic investments. Its stock also fell in November 2018 following a
2
GOLDMAN SACHS VARIABLE INSURANCE TRUST STRATEGIC GROWTH FUND
disappointing earnings report in which earnings per share came in lower than market estimates. Despite these results, we continued to view Kraft Heinz at the end of the Reporting Period as a high quality company with a strong balance sheet that allows for flexibility around capital deployment and potential strategic acquisitions.
In April 2018, shares of Philip Morris International declined sharply following a disappointing quarterly earnings announcement. Its earnings per share beat market estimates, but its top-line revenue was lower than market expectations, driven primarily by disappointing results in the company’s iQOS segment and organic sales. (iQOS is the company’s electronic smokeless cigarette products line.) Later in the second calendar quarter, the company raised its quarterly dividend by more than 6% and finished a study concluding that its iQOS segment met its primary objective. Still, its stock fell sharply again in December 2018 amidst the overall equity market pullback as well as on negative Japan cigarette category volume data. Despite the decline in its stock, at the end of the Reporting Period, we felt the company provided best-in-class pricing, was attractively valued and paid an above-market dividend. We continued to view Philip Morris International as a high quality franchise, well positioned to benefit from an improving macroeconomic backdrop.
Most of the decline in Incyte’s share price occurred during the first half of the Reporting Period. Incyte’s shares sold off early in April 2018 following the highly anticipated Phase III trial results for its melanoma drug. Following the poor trial results, Incyte announced it would halt the study given that its product failed to show any benefit in conjunction with another cancer immunotherapy drug. At the end of June 2018, the company reported an end to another one of its drugs, REACH1, after the drug reported a low response rate. Despite these setbacks, we remained confident at the end of the Reporting Period in what we see as the company’s strong internal research and development capability and deep product pipeline.
How did the Fund use derivatives and similar instruments during the Reporting Period?
During the Reporting Period, we did not use derivatives as part of an active management strategy.
Did the Fund make any significant purchases or sales during the Reporting Period?
Among the purchases initiated during the Reporting Period, we established a Fund position in Visa. Visa is a global leader in the provisioning of payment services. At the time of purchase, we felt confident the company would benefit from several secular growth themes as transaction volume continues to shift toward electronic payments. We also viewed the company favorably, as it invests in multiple services and geographies, which we think provides several potential sources of growth. Finally, we felt the stock was trading at attractive levels given what we see as its growth prospects.
We initiated a Fund position in Union Pacific. Union Pacific is one of the most recognized railroad transportation companies in the world with approximately 32,000 miles of track covering 23 states in the western two-thirds of the U.S. We believe Union Pacific is a high quality company because of what we view as its strong balance sheet, free cash flow and diversified business mix relative to its peers. We were also positive at the time of purchase on the company’s shareholder-friendly management team, which we believe has been prudent in reducing costs as well as increasing share buybacks. We were also positive on the benefits the company could reap from tax reform and good economic growth in the U.S.
Conversely, we eliminated the Fund’s position in online travel fare aggregator Booking Holdings. During the Reporting Period, its shares came under pressure following its second quarter results in which its earnings per share and revenues exceeded market expectations, but its guidance came in softer than the market expected. Given the less favorable outlook and what we viewed as a less compelling valuation, we decided to exit the position and reallocate capital to companies we felt had better risk/reward profiles.
We sold the Fund’s position in Amgen. During the Reporting Period, we grew less positive on one of the company’s key drugs, Repatha, which we believe might experience slower growth than Amgen had previously expected. While we still believe Amgen is one of the leaders in the biotechnology industry and has a strong balance sheet and good free cash flow, we decided to exit the position and allocate the capital elsewhere.
Were there any notable changes in the Fund’s weightings during the Reporting Period?
In constructing the Fund’s portfolio, we focus on picking stocks rather than on making industry or sector bets. We seek to outpace the benchmark index by overweighting stocks that we expect to outperform and underweighting those that we think may lag. Consequently, changes in its sector weights are generally the direct result of individual stock selection or of stock appreciation or depreciation. That said, during the Reporting Period, the Fund’s exposure to materials increased compared to the Russell Index. The Fund’s allocation compared to the Russell Index in financials decreased.
How was the Fund positioned relative to its benchmark index at the end of the Reporting Period?
At the end of December 2018, the Fund had overweighted positions relative to the Russell Index in the health care and energy sectors. On the same date, the Fund had an underweighted position compared to the Russell Index in consumer discretionary and
3
GOLDMAN SACHS VARIABLE INSURANCE TRUST STRATEGIC GROWTH FUND
was rather neutrally weighted to the Russell Index in materials, communication services, consumer staples, real estate, industrials, information technology and financials. The Fund had no exposure to the utilities sector at the end of the Reporting Period.
Were there any changes to the Fund’s portfolio management team during the Reporting Period?
Effective January 9, 2018, Goldman Sachs Asset Management, L.P. (the “Investment Adviser”) centralized its Fundamental Equity U.S. Value and Fundamental Equity U.S. Growth Teams into a single Fundamental Equity U.S. Equity Team. The Investment Adviser believes these changes will benefit the Funds by providing a more holistic investment perspective and the ability to leverage investment ideas across the U.S. Fundamental Equity platform.
Effective the same date, co-lead portfolio manager for the Fund, Tim Leahy, left the firm. Tim shared portfolio management responsibility with Steve Barry and Stephen Becker, who have been co-lead portfolio managers of the Fund’s strategy since 2000 and 2013, respectively, and who continue in those roles. There were no changes to the investment process or philosophy of the Fund’s strategy. We remain committed to high quality, bottom-up research and to the time-tested investment philosophy of the Fund’s strategy. We continue to believe that deep knowledge of company-specific and industry trends is key to our research edge.
What is the Fund’s tactical view and strategy for the months ahead?
At the end of the Reporting Period, we believed the risk/reward balance for equities in 2019 had improved relative to 2018 following the de-rating in valuation multiples, or price/earnings ratios, in the fourth quarter of 2018. We saw continued expansion of global economic growth and corporate profits. We believed U.S. economic growth would likely moderate in 2019, while the slowdown outside of the U.S. may be behind us. In our view, the ongoing global economic expansion should underpin corporate earnings growth, which we expect to remain positive across all global regions in 2019, supporting risk assets, such as equities. Meanwhile, lower valuations provide, in our view, an attractive entry point. Several challenges in 2018 — such as trade tensions and populist politics — resulted in a sharp de-rating. We think the shift in valuations was overdone relative to both macro and corporate fundamentals. Concerns around the length of the current economic cycle, trade tensions and populist politics may well continue, but we believed at the end of the Reporting Period that it was too soon to position for the end of the cycle and markets have already gone too far in pricing in the risks.
As the U.S. economic expansion approaches the longest on record, late-cycle signs, such as a tight labor market, firming inflation, higher volatility and a flatter yield curve, along with fading fiscal support and continued Fed interest rate hikes, have increased focus, we feel, on a possible moderation in U.S. economic growth. However, discussions around peak earnings are premature, in our view, as margins have historically continued to expand until very close to the beginning of recessions.
We believe rising interest rates and cost pressures make pricing power an increasingly critical differentiator of success. Selectivity, in our view, is also increasingly important amid higher volatility, elevated political and trade risks and slowing revenue growth and margin pressures. We believe this divergence between winners and losers reinforces the importance of active management.
Regardless of market direction, we remain committed to our core philosophy and process. We intend to maintain a long-term time horizon, rather than forecast the next quarter. We intend to continue to favor high quality growth businesses over breathtaking concepts. We intend to invest when we consider valuations to be attractive, rather than following the trend. These core beliefs have guided our team during the past 30 years; we believe they hold the answer for the next 30.
As always, we maintain our focus on seeking companies that we believe will generate long-term growth in today’s ever-changing market conditions.
4
GOLDMAN SACHS VARIABLE INSURANCE TRUST STRATEGIC GROWTH FUND
Index Definitions
The Russell 1000® Growth Index (with dividends reinvested) is an unmanaged market capitalization weighted index of the 1000 largest U.S. companies with higher price-to-book ratios and higher forecasted growth values. The figures for the index do not include any deduction for fees, expenses or taxes.
The Russell 2000® Index (with dividends reinvested) is an unmanaged index of common stock prices that measures the performance of the 2000 smallest companies in the Russell 3000® Index. The figures for the index do not include any deduction for fees, expenses or taxes.
The S&P 500® Index (with dividends reinvested) is the Standard & Poor’s 500 Composite Index of 500 stocks, an unmanaged index of common stock prices. The figures for the index do not include any deduction for fees, expenses or taxes.
The Russell Midcap® Index measures the performance of the 800 smallest companies in the Russell 1000® Index, which represent approximately 25% of the total market capitalization of the Russell 1000® Index.
The Russell 1000® Index measures the performance of the 1,000 largest companies in the Russell 3000® Index, which represent approximately 92% of the total market capitalization of the Russell 3000® Index.
It is not possible to invest directly in an index.
5
FUND BASICS
Strategic Growth Fund
as of December 31, 2018
STANDARDIZED TOTAL RETURNS1
| | | | | | | | | | | | | | | | | | |
| | | | | |
| For the period ended 12/31/18 | | One Year | | | Five Years | | | Ten Years | | | Since Inception | | | Inception Date |
| Institutional | | | -1.04 | % | | | 9.15 | % | | | 14.63 | % | | | 5.87 | % | | 4/30/98 |
| Service | | | -1.32 | | | | 8.87 | | | | 14.35 | | | | 7.52 | | | 1/09/06 |
| 1 | The Standardized Total Returns are average annual total returns as of the most recent calendar quarter-end. They assume reinvestment of all distributions at net asset value (“NAV”). Because Institutional Shares and Service Shares do not involve a sales charge, such a charge is not applied to their Standardized Total Returns. |
Total return figures in the above chart represent past performance and do not indicate future results, which will vary. The investment return and principal value of an investment will fluctuate and, therefore, an investor’s shares, when redeemed, may be worth more or less than their original cost. Current performance may be lower or higher than the total return figures in the above chart. Please visit www.GSAMFUNDS.com to obtain the most recent month-end returns.Performance reflects fee waivers and/or expense limitations in effect during the periods shown. In their absence, performance would be reduced.
EXPENSE RATIOS2
| | | | | | | | |
| | |
| | | Net Expense Ratio (Current) | | | Gross Expense Ratio (Before Waivers) | |
| Institutional | | | 0.74 | % | | | 0.78 | % |
| Service | | | 0.99 | | | | 1.03 | |
| 2 | The expense ratios of the Fund, both current (net of any fee waivers and/or expense limitations) and before waivers (gross of any fee waivers and/or expense limitations) are as set forth above according to the most recent publicly available Prospectuses for the Fund and may differ from the expense ratios disclosed in the Financial Highlights in this report. Pursuant to a contractual arrangement, the Fund’s fee waivers and/or expense limitations will remain in place through at least April 30, 2019, and prior to such date, the Investment Adviser may not terminate the arrangements without the approval of the Fund’s Board of Trustees. If these arrangements are discontinued in the future, the expense ratios may change without shareholder approval. |
TOP TEN HOLDINGS AS OF 12/31/183
| | | | | | |
| | |
| Holding | | % of Net Assets | | | Line of Business |
| Microsoft Corp. | | | 6.7% | | | Software & Services |
| Apple, Inc. | | | 5.9 | | | Technology Hardware & Equipment |
| Amazon.com, Inc. | | | 5.6 | | | Retailing |
| Alphabet, Inc. Class A | | | 3.3 | | | Media & Entertainment |
| Facebook, Inc. Class A | | | 3.1 | | | Media & Entertainment |
| Visa, Inc. Class A | | | 3.0 | | | Software & Services |
| Alphabet, Inc. Class C | | | 2.5 | | | Media & Entertainment |
| Boeing Co. (The) | | | 2.1 | | | Capital Goods |
| Mastercard, Inc. Class A | | | 2.0 | | | Software & Services |
| salesforce.com, Inc. | | | 1.9 | | | Software & Services |
| 3 | The top 10 holdings may not be representative of the Fund’s future investments. |
6
FUND BASICS
FUND vs. BENCHMARK SECTOR ALLOCATIONS4
As of December 31, 2018
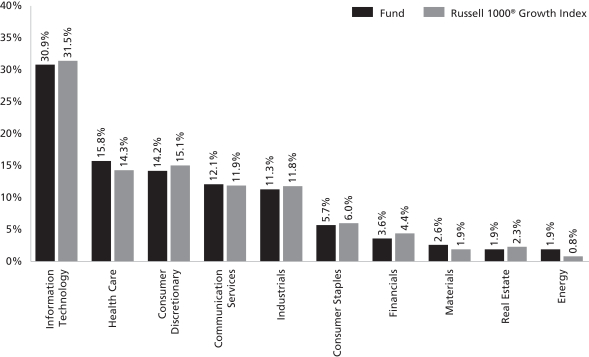
| 4 | The Fund is actively managed and, as such, its composition may differ over time. Consequently, the Fund’s overall sector allocations may differ from percentages contained in the graph above. The graph categorizes investments using Global Industry Classification Standard (“GICS”); however, the sector classifications used by the portfolio management team may differ from GICS. The percentage shown for each investment category reflects the value of investments in that category as a percentage of market value. |
7
GOLDMAN SACHS VARIABLE INSURANCE TRUST STRATEGIC GROWTH FUND
Performance Summary
December 31, 2018
The following graph shows the value, as of December 31, 2018, of a $10,000 investment made on January 1, 2009 in Service Shares at NAV. For comparative purposes, the performance of the Fund’s benchmark, the Russell 1000® Growth Index (with distributions reinvested), is shown. This performance data represents past performance and should not be considered indicative of future performance, which will fluctuate with changes in market conditions. These performance fluctuations may cause an investor’s shares, when redeemed, to be worth more or less than their original cost. Performance reflects Fund level expenses but does not reflect fees and expenses associated with any variable annuity contract or variable life insurance policy that uses the Fund as an investment option for any contract or policy. Had performance reflected all of those fees and expenses, performance would have been reduced. Performance reflects applicable fee waivers and/or expense limitations in effect during the periods shown, and in their absence, performance would be reduced. Performance of Institutional Shares will vary from Service Shares due to differences in class specific fees. In addition to the Investment Adviser’s decisions regarding issuer/industry investment selection and allocation, other factors may affect Fund performance. These factors include, but are not limited to, Fund operating fees and expenses, portfolio turnover, and subscription and redemption cash flows affecting the Fund.
Strategic Growth Fund’s 10 Year Performance
Performance of a $10,000 investment, with distributions reinvested, from January 1, 2009 through December 31, 2018.
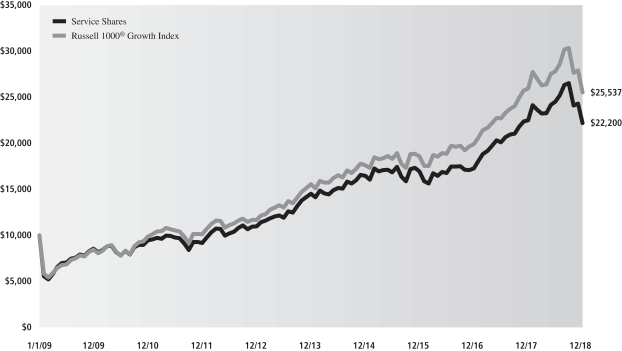
| | | | | | | | |
| Average Annual Total Return through December 31, 2018 | | One Year | | Five Years | | Ten Years | | Since Inception |
Institutional (Commenced April 30, 1998) | | -1.04% | | 9.15% | | 14.63% | | 5.87% |
Service (Commenced January 9, 2006) | | -1.32% | | 8.87% | | 14.35% | | 7.52% |
8
GOLDMAN SACHS VARIABLE INSURANCE TRUST STRATEGIC GROWTH FUND
Schedule of Investments
December 31, 2018
| | | | | | | | |
| Shares | | | Description | | Value | |
|
| | Common Stocks – 99.3% | |
| | Automobiles & Components – 0.8% | |
| | 32,053 | | | Aptiv plc | | $ | 1,973,503 | |
| | |
| | Banks – 1.1% | | | | |
| | 29,627 | | | First Republic Bank | | | 2,574,586 | |
| | |
| | Capital Goods – 8.2% | | | | |
| | 15,394 | | | Boeing Co. (The) | | | 4,964,565 | |
| | 15,662 | | | Deere & Co. | | | 2,336,301 | |
| | 39,846 | | | Fortive Corp. | | | 2,695,980 | |
| | 27,954 | | | Honeywell International, Inc. | | | 3,693,283 | |
| | 13,358 | | | Northrop Grumman Corp. | | | 3,271,374 | |
| | 33,397 | | | Sensata Technologies Holding plc* | | | 1,497,521 | |
| | 10,152 | | | Stanley Black & Decker, Inc. | | | 1,215,601 | |
| | | | | | | | |
| | | | | | | 19,674,625 | |
| | |
| | Consumer Durables & Apparel – 2.5% | | | | |
| | 57,967 | | | NIKE, Inc. Class B | | | 4,297,673 | |
| | 17,352 | | | PVH Corp. | | | 1,612,869 | |
| | | | | | | | |
| | | | | | | 5,910,542 | |
| | |
| | Consumer Services – 2.6% | | | | |
| | 2,303 | | | Chipotle Mexican Grill, Inc.* | | | 994,412 | |
| | 37,395 | | | Dunkin’ Brands Group, Inc. | | | 2,397,768 | |
| | 16,835 | | | McDonald’s Corp. | | | 2,989,391 | |
| | | | | | | | |
| | | | | | | 6,381,571 | |
| | |
| | Diversified Financials – 2.2% | | | | |
| | 14,975 | | | Cboe Global Markets, Inc. | | | 1,465,004 | |
| | 22,932 | | | Intercontinental Exchange, Inc. | | | 1,727,467 | |
| | 25,813 | | | Northern Trust Corp. | | | 2,157,709 | |
| | | | | | | | |
| | | | | | | 5,350,180 | |
| | |
| | Energy – 1.9% | | | | |
| | 14,835 | | | Cheniere Energy, Inc.* | | | 878,083 | |
| | 12,947 | | | Diamondback Energy, Inc. | | | 1,200,187 | |
| | 12,434 | | | EOG Resources, Inc. | | | 1,084,369 | |
| | 22,475 | | | Marathon Petroleum Corp. | | | 1,326,250 | |
| | | | | | | | |
| | | | | | | 4,488,889 | |
| | |
| | Food & Staples Retailing – 1.0% | | | | |
| | 25,203 | | | Walmart, Inc. | | | 2,347,659 | |
| | |
| | Food, Beverage & Tobacco – 4.0% | | | | |
| | 28,832 | | | Brown-Forman Corp. Class B | | | 1,371,827 | |
| | 39,034 | | | Coca-Cola Co. (The) | | | 1,848,260 | |
| | 22,022 | | | Kraft Heinz Co. (The) | | | 947,827 | |
| | 42,351 | | | Mondelez International, Inc. Class A | | | 1,695,311 | |
| | 55,579 | | | Monster Beverage Corp.* | | | 2,735,598 | |
| | 17,107 | | | Philip Morris International, Inc. | | | 1,142,063 | |
| | | | | | | | |
| | | | | | | 9,740,886 | |
| | |
| | Health Care Equipment & Services – 7.2% | | | | |
| | 8,740 | | | Align Technology, Inc.* | | | 1,830,418 | |
| | 90,964 | | | Boston Scientific Corp.* | | | 3,214,668 | |
| | 26,833 | | | Danaher Corp. | | | 2,767,019 | |
| | 11,175 | | | Humana, Inc. | | | 3,201,414 | |
| | 5,220 | | | Intuitive Surgical, Inc.* | | | 2,499,962 | |
| | |
|
| | Common Stocks – (continued) | |
| | Health Care Equipment & Services – (continued) | |
| | 10,757 | | | UnitedHealth Group, Inc. | | $ | 2,679,784 | |
| | 12,010 | | | West Pharmaceutical Services, Inc. | | | 1,177,340 | |
| | | | | | | | |
| | | | | | | 17,370,605 | |
| | |
| | Household & Personal Products – 0.7% | | | | |
| | 26,317 | | | Colgate-Palmolive Co. | | | 1,566,388 | |
| | |
| | Insurance – 0.3% | | | | |
| | 723 | | | Markel Corp.* | | | 750,510 | |
| | |
| | Materials – 2.5% | | | | |
| | 21,084 | | | DowDuPont, Inc. | | | 1,127,572 | |
| | 18,334 | | | Ecolab, Inc. | | | 2,701,515 | |
| | 5,376 | | | Martin Marietta Materials, Inc. | | | 923,973 | |
| | 3,465 | | | Sherwin-Williams Co. (The) | | | 1,363,339 | |
| | | | | | | | |
| | | | | | | 6,116,399 | |
| | |
| | Media & Entertainment – 12.0% | | | | |
| | 7,627 | | | Alphabet, Inc. Class A* | | | 7,969,910 | |
| | 5,771 | | | Alphabet, Inc. Class C* | | | 5,976,505 | |
| | 73,954 | | | Comcast Corp. Class A | | | 2,518,134 | |
| | 23,428 | | | Electronic Arts, Inc.* | | | 1,848,704 | |
| | 57,538 | | | Facebook, Inc. Class A* | | | 7,542,656 | |
| | 11,971 | | | Netflix, Inc.* | | | 3,204,158 | |
| | | | | | | | |
| | | | | | | 29,060,067 | |
| | |
| | Pharmaceuticals, Biotechnology & Life Sciences – 8.5% | |
| | 8,461 | | | AbbVie, Inc. | | | 780,020 | |
| | 36,173 | | | Agilent Technologies, Inc. | | | 2,440,231 | |
| | 14,559 | | | Alexion Pharmaceuticals, Inc.* | | | 1,417,464 | |
| | 14,542 | | | BioMarin Pharmaceutical, Inc.* | | | 1,238,251 | |
| | 15,546 | | | Elanco Animal Health, Inc.* | | | 490,165 | |
| | 34,907 | | | Eli Lilly & Co. | | | 4,039,438 | |
| | 10,889 | | | Illumina, Inc.* | | | 3,265,938 | |
| | 21,840 | | | Incyte Corp.* | | | 1,388,806 | |
| | 16,272 | | | Vertex Pharmaceuticals, Inc.* | | | 2,696,433 | |
| | 32,761 | | | Zoetis, Inc. | | | 2,802,376 | |
| | | | | | | | |
| | | | | | | 20,559,122 | |
| | |
| | Real Estate Investment Trusts – 1.9% | | | | |
| | 18,677 | | | American Tower Corp. | | | 2,954,515 | |
| | 4,874 | | | Equinix, Inc. | | | 1,718,377 | |
| | | | | | | | |
| | | | | | | 4,672,892 | |
| | |
| | Retailing – 8.2% | |
| | 8,461 | | | Alibaba Group Holding Ltd. ADR* | | | 1,159,749 | |
| | 9,074 | | | Amazon.com, Inc.* | | | 13,628,876 | |
| | 10,848 | | | Home Depot, Inc. (The) | | | 1,863,904 | |
| | 38,111 | | | Ross Stores, Inc. | | | 3,170,835 | |
| | | | | | | | |
| | | | | | | 19,823,364 | |
| | |
| | Semiconductors & Semiconductor Equipment – 4.0% | |
| | 17,421 | | | Analog Devices, Inc. | | | 1,495,244 | |
| | 98,169 | | | Marvell Technology Group Ltd. | | | 1,589,356 | |
| | 15,211 | | | NVIDIA Corp. | | | 2,030,669 | |
| | 25,783 | | | NXP Semiconductors NV | | | 1,889,378 | |
| | 28,669 | | | Texas Instruments, Inc. | | | 2,709,221 | |
| | | | | | | | |
| | | | | | | 9,713,868 | |
| | |
| | |
| The accompanying notes are an integral part of these financial statements. | | 9 |
GOLDMAN SACHS VARIABLE INSURANCE TRUST STRATEGIC GROWTH FUND
Schedule of Investments(continued)
December 31, 2018
| | | | | | | | |
| Shares | | | Description | | Value | |
|
| | Common Stocks – (continued) | |
| | Software & Services – 18.9% | |
| | 16,556 | | | Adobe, Inc.* | | $ | 3,745,629 | |
| | 11,684 | | | Autodesk, Inc.* | | | 1,502,679 | |
| | 24,266 | | | Fiserv, Inc.* | | | 1,783,308 | |
| | 22,143 | | | Global Payments, Inc. | | | 2,283,608 | |
| | 16,637 | | | Intuit, Inc. | | | 3,274,994 | |
| | 26,017 | | | Mastercard, Inc. Class A | | | 4,908,107 | |
| | 160,114 | | | Microsoft Corp. | | | 16,262,779 | |
| | 33,399 | | | salesforce.com, Inc.* | | | 4,574,661 | |
| | 54,951 | | | Visa, Inc. Class A | | | 7,250,235 | |
| | | | | | | | |
| | | | | | | 45,586,000 | |
| | |
| | Technology Hardware & Equipment – 7.8% | |
| | 31,073 | | | Amphenol Corp. Class A | | | 2,517,535 | |
| | 90,080 | | | Apple, Inc. | | | 14,209,219 | |
| | 50,146 | | | Cisco Systems, Inc. | | | 2,172,826 | |
| | | | | | | | |
| | | | | | | 18,899,580 | |
| | |
| | Transportation – 3.0% | |
| | 48,549 | | | CSX Corp. | | | 3,016,350 | |
| | 23,245 | | | Union Pacific Corp. | | | 3,213,156 | |
| | 19,234 | | | XPO Logistics, Inc.* | | | 1,097,107 | |
| | | | | | | | |
| | | | | | | 7,326,613 | |
| | |
| | TOTAL INVESTMENTS – 99.3% | |
| | (Cost $160,449,998) | | $ | 239,887,849 | |
| | |
| OTHER ASSETS IN EXCESS OF
LIABILITIES – 0.7% | | | 1,724,983 | |
| | |
| | NET ASSETS – 100.0% | | $ | 241,612,832 | |
| | |
| | |
| The percentage shown for each investment category reflects the value of investments in that category as a percentage of net assets. |
| |
| * | | Non-income producing security. |
| | |
| |
| Investment Abbreviation: |
| ADR | | —American Depositary Receipt |
| | |
| 10 | | The accompanying notes are an integral part of these financial statements. |
GOLDMAN SACHS VARIABLE INSURANCE TRUST STRATEGIC GROWTH FUND
Statement of Assets and Liabilities
December 31, 2018
| | | | |
| | | | |
| Assets: | | | |
Investments in unaffiliated issuers, at value (cost $160,449,998) | | $ | 239,887,849 | |
Cash | | | 1,718,246 | |
Receivables: | | | | |
Fund shares sold | | | 166,813 | |
Dividends | | | 161,689 | |
Reimbursement from investment adviser | | | 20,675 | |
Other assets | | | 521 | |
| |
| Total assets | | | 241,955,793 | |
| |
| | | | |
| Liabilities: | | | |
Payables: | | | | |
Management fees | | | 151,370 | |
Fund shares redeemed | | | 67,340 | |
Distribution and Service fees and Transfer Agency fees | | | 35,345 | |
Accrued expenses | | | 88,906 | |
| |
| Total liabilities | | | 342,961 | |
| |
| | | | |
| Net Assets: | | | |
Paid-in capital | | | 143,805,443 | |
Total distributable earnings | | | 97,807,389 | |
| |
| NET ASSETS | | $ | 241,612,832 | |
Net Assets: | | | | |
Institutional | | $ | 102,198,640 | |
Service | | | 139,414,192 | |
| |
Total Net Assets | | $ | 241,612,832 | |
Shares outstanding $0.001 par value (unlimited shares authorized): | | | | |
Institutional | | | 10,453,748 | |
Service | | | 14,252,140 | |
Net asset value, offering and redemption price per share: | | | | |
Institutional | | | $9.78 | |
Service | | | 9.78 | |
| | |
| The accompanying notes are an integral part of these financial statements. | | 11 |
GOLDMAN SACHS VARIABLE INSURANCE TRUST STRATEGIC GROWTH FUND
Statement of Operations
For the Fiscal Year Ended December 31, 2018
| | | | |
| | | | |
| Investment income: | |
Dividends — unaffiliated issuers (net of foreign taxes withheld of $2,006) | | $ | 4,002,351 | |
Securities lending income — unaffiliated issuer | | | 35,855 | |
Dividends — affiliated issuers | | | 6,451 | |
| |
| Total investment income | | | 4,044,657 | |
| |
| | | | |
| Expenses: | | | |
Management fees | | | 2,825,965 | |
Distribution and Service fees — Service Shares | | | 679,563 | |
Professional fees | | | 95,484 | |
Transfer Agency fees(a) | | | 77,878 | |
Printing and mailing costs | | | 77,182 | |
Custody, accounting and administrative services | | | 67,725 | |
Trustee fees | | | 16,834 | |
Registration fees | | | 713 | |
Other | | | 18,064 | |
| |
| Total expenses | | | 3,859,408 | |
| |
Less — expense reductions | | | (286,005 | ) |
| |
| Net expenses | | | 3,573,403 | |
| |
| NET INVESTMENT INCOME | | | 471,254 | |
| |
| | | | |
| Realized and unrealized gain (loss): | | | |
Net realized gain from investments — unaffiliated issuers (including commissions recaptured of $3,523) | | | 130,943,811 | |
Net change in unrealized loss on investments — unaffiliated issuers | | | (119,739,252 | ) |
| |
| Net realized and unrealized gain | | | 11,204,559 | |
| |
| NET INCREASE IN NET ASSETS RESULTING FROM OPERATIONS | | $ | 11,675,813 | |
(a) Institutional and Service Shares incurred Transfer Agency fees of $23,517 and $54,361, respectively.
| | |
| 12 | | The accompanying notes are an integral part of these financial statements. |
GOLDMAN SACHS VARIABLE INSURANCE TRUST STRATEGIC GROWTH FUND
Statements of Changes in Net Assets
| | | | | | | | |
| | | For the
Fiscal Year Ended
December 31, 2018 | | | For the
Fiscal Year Ended
December 31, 2017 | |
| | | | | | | | |
| From operations: | |
Net investment income | | $ | 471,254 | | | $ | 1,482,058 | |
Net realized gain | | | 130,943,811 | | | | 42,429,492 | |
Net change in unrealized gain (loss) | | | (119,739,252 | ) | | | 92,211,760 | |
| | |
| Net increase in net assets resulting from operations | | | 11,675,813 | | | | 136,123,310 | |
| |
| | | | | | | | |
| Distributions to shareholders: | | | | | | |
From distributable earnings: | | | | | | | | |
Institutional Shares | | | (51,500,129 | ) | | | (5,401,988 | )(a) |
Service Shares | | | (70,247,289 | ) | | | (18,972,420 | )(a) |
| | |
| Total distributions to shareholders | | | (121,747,418 | ) | | | (24,374,408 | ) |
| |
| | | | | | | | |
| From share transactions: | | | | | | |
Proceeds from sales of shares | | | 30,210,299 | | | | 16,566,518 | |
Reinvestment of distributions | | | 121,747,418 | | | | 24,374,408 | |
Cost of shares redeemed | | | (341,645,863 | ) | | | (77,648,929 | ) |
| | |
| Net decrease in net assets resulting from share transactions | | | (189,688,146 | ) | | | (36,708,003 | ) |
| | |
| TOTAL INCREASE (DECREASE) | | | (299,759,751 | ) | | | 75,040,899 | |
| |
| | | | | | | | |
| Net assets:(b) | | | | | | |
| | |
Beginning of year | | | 541,372,583 | | | | 466,331,684 | |
| | |
End of year | | $ | 241,612,832 | | | $ | 541,372,583 | |
| (a) | Prior year information has been revised to conform to current year presentation, see prior year presentation below: |
| | | | | | | | |
| | | Institutional | | | Service | |
Distributions from net investment income: | | | (558,904 | ) | | | (1,043,857 | ) |
| | |
Distributions from net realized gains: | | | (4,843,084 | ) | | | (17,928,563 | ) |
| (b) | Prior fiscal year information has been revised to conform with current year presentation. Undistributed net investment income was $210,851 for the Fund as of December 31, 2017. |
| | |
| The accompanying notes are an integral part of these financial statements. | | 13 |
GOLDMAN SACHS VARIABLE INSURANCE TRUST STRATEGIC GROWTH FUND
Financial Highlights
Selected Data for a Share Outstanding Throughout Each Year
| | | | | | | | | | | | | | | | | | | | |
| | | Goldman Sachs Strategic Growth Fund | |
| | | Institutional Shares | |
| | | Year Ended December 31, | |
| | | 2018 | | | 2017 | | | 2016 | | | 2015 | | | 2014 | |
| | | | | | | | | | | | | | | | | | | | |
| Per Share Data | | | | | | | | | | | | | | | |
| | | | | |
Net asset value, beginning of year | | $ | 19.73 | | | $ | 15.83 | | | $ | 15.62 | | | $ | 16.16 | | | $ | 17.64 | |
| | | | | |
Net investment income(a) | | | 0.06 | | | | 0.09 | | | | 0.07 | | | | 0.09 | (b) | | | 0.07 | |
| | | | | |
Net realized and unrealized gain (loss) | | | (0.18 | ) | | | 4.77 | | | | 0.24 | | | | 0.46 | | | | 2.24 | |
| | | | | |
Total from investment operations | | | (0.12 | ) | | | 4.86 | | | | 0.31 | | | | 0.55 | | | | 2.31 | |
| | | | | |
Distributions to shareholders from net investment income | | | (0.10 | ) | | | (0.10 | ) | | | (0.10 | ) | | | (0.06 | ) | | | (0.07 | ) |
| | | | | |
Distributions to shareholders from net realized gains | | | (9.73 | ) | | | (0.86 | ) | | | — | (c) | | | (1.03 | ) | | | (3.72 | ) |
| | | | | |
Total distributions | | | (9.83 | ) | | | (0.96 | ) | | | (0.10 | ) | | | (1.09 | ) | | | (3.79 | ) |
| | | | | |
Net asset value, end of year | | $ | 9.78 | | | $ | 19.73 | | | $ | 15.83 | | | $ | 15.62 | | | $ | 16.16 | |
| | | | | |
Total return(d) | | | (1.04 | )% | | | 30.66 | % | | | 1.98 | % | | | 3.40 | % | | | 13.64 | % |
| | | | | |
Net assets, end of year (in 000s) | | $ | 102,199 | | | $ | 115,693 | | | $ | 98,090 | | | $ | 109,801 | | | $ | 119,934 | |
| | | | | |
Ratio of net expenses to average net assets | | | 0.74 | % | | | 0.76 | % | | | 0.79 | % | | | 0.79 | % | | | 0.79 | % |
| | | | | |
Ratio of total expenses to average net assets | | | 0.82 | % | | | 0.82 | % | | | 0.84 | % | | | 0.83 | % | | | 0.81 | % |
| | | | | |
Ratio of net investment income to average net assets | | | 0.30 | % | | | 0.48 | % | | | 0.48 | % | | | 0.55 | %(b) | | | 0.37 | % |
| | | | | |
Portfolio turnover rate(e) | | | 41 | % | | | 37 | % | | | 72 | % | | | 56 | % | | | 48 | % |
| (a) | Calculated based on the average shares outstanding methodology. |
| (b) | Reflects income recognized from special dividends which amounted to $0.03 per share and 0.20% of average net assets. |
| (c) | Amount is less than $0.005 per share. |
| (d) | Assumes investment at the net asset value at the beginning of the year, reinvestment of all distributions, and a complete redemption of the investment at the net asset value at the end of the year. |
| (e) | The Fund’s portfolio turnover rate is calculated in accordance with regulatory requirements, without regard to transactions involving short term investments. If such transactions were included, the Fund’s portfolio turnover rate may be higher. |
| | |
| 14 | | The accompanying notes are an integral part of these financial statements. |
GOLDMAN SACHS VARIABLE INSURANCE TRUST STRATEGIC GROWTH FUND
Financial Highlights(continued)
Selected Data for a Share Outstanding Throughout Each Year
| | | | | | | | | | | | | | | | | | | | |
| | | Goldman Sachs Strategic Growth Fund | |
| | | Service Shares | |
| | | Year Ended December 31, | |
| | | 2018 | | | 2017 | | | 2016 | | | 2015 | | | 2014 | |
| | | | | | | | | | | | | | | | | | | | |
| Per Share Data | | | | | | | | | | | | | | | |
| | | | | |
Net asset value, beginning of year | | $ | 19.68 | | | $ | 15.79 | | | $ | 15.59 | | | $ | 16.13 | | | $ | 17.61 | |
| | | | | |
Net investment income(a) | | | 0.01 | | | | 0.04 | | | | 0.03 | | | | 0.05 | (b) | | | 0.02 | |
| | | | | |
Net realized and unrealized gain (loss) | | | (0.18 | ) | | | 4.76 | | | | 0.23 | | | | 0.46 | | | | 2.24 | |
| | | | | |
Total from investment operations | | | (0.17 | ) | | | 4.80 | | | | 0.26 | | | | 0.51 | | | | 2.26 | |
| | | | | |
Distributions to shareholders from net investment income | | | — | | | | (0.05 | ) | | | (0.06 | ) | | | (0.02 | ) | | | (0.02 | ) |
| | | | | |
Distributions to shareholders from net realized gains | | | (9.73 | ) | | | (0.86 | ) | | | — | (c) | | | (1.03 | ) | | | (3.72 | ) |
| | | | | |
Total distributions | | | (9.73 | ) | | | (0.91 | ) | | | (0.06 | ) | | | (1.05 | ) | | | (3.74 | ) |
| | | | | |
Net asset value, end of year | | $ | 9.78 | | | $ | 19.68 | | | $ | 15.79 | | | $ | 15.59 | | | $ | 16.13 | |
| | | | | |
Total return(d) | | | (1.32 | )% | | | 30.36 | % | | | 1.69 | % | | | 3.14 | % | | | 13.38 | % |
| | | | | |
Net assets, end of year (in 000s) | | $ | 139,414 | | | $ | 425,679 | | | $ | 368,242 | | | $ | 360,966 | | | $ | 394,747 | |
| | | | | |
Ratio of net expenses to average net assets | | | 0.99 | % | | | 1.01 | % | | | 1.04 | % | | | 1.04 | % | | | 1.04 | % |
| | | | | |
Ratio of total expenses to average net assets | | | 1.07 | % | | | 1.07 | % | | | 1.08 | % | | | 1.08 | % | | | 1.08 | % |
| | | | | |
Ratio of net investment income to average net assets | | | 0.04 | % | | | 0.23 | % | | | 0.22 | % | | | 0.29 | %(b) | | | 0.12 | % |
| | | | | |
Portfolio turnover rate(e) | | | 41 | % | | | 37 | % | | | 72 | % | | | 56 | % | | | 48 | % |
| (a) | Calculated based on the average shares outstanding methodology. |
| (b) | Reflects income recognized from special dividends which amounted to $0.03 per share and 0.20% of average net assets. |
| (c) | Amount is less than $0.005 per share. |
| (d) | Assumes investment at the net asset value at the beginning of the year, reinvestment of all distributions, and a complete redemption of the investment at the net asset value at the end of the year. |
| (e) | The Fund’s portfolio turnover rate is calculated in accordance with regulatory requirements, without regard to transactions involving short term investments. If such transactions were included, the Fund’s portfolio turnover rate may be higher. |
| | |
| The accompanying notes are an integral part of these financial statements. | | 15 |
GOLDMAN SACHS VARIABLE INSURANCE TRUST STRATEGIC GROWTH FUND
Notes to Financial Statements
December 31, 2018
1. ORGANIZATION
Goldman Sachs Variable Insurance Trust (the “Trust” or “VIT”) is a Delaware statutory trust registered under the Investment Company Act of 1940, as amended (the “Act”), as anopen-end management investment company. The Trust includes the Goldman Sachs Strategic Growth Fund (the “Fund”). The Fund is a diversified portfolio under the Act offering two classes of shares — Institutional and Service Shares. Shares of the Trust are offered to separate accounts of participating life insurance companies for the purpose of funding variable annuity contracts and variable life insurance policies.
Goldman Sachs Asset Management, L.P. (“GSAM”), an affiliate of Goldman Sachs & Co. LLC (“Goldman Sachs”), serves as investment adviser to the Fund pursuant to a management agreement (the “Agreement”) with the Trust.
2. SIGNIFICANT ACCOUNTING POLICIES
The financial statements have been prepared in accordance with accounting principles generally accepted in the United States of America (“GAAP”) and require management to make estimates and assumptions that may affect the reported amounts and disclosures. Actual results may differ from those estimates and assumptions.
A. Investment Valuation — The Fund’s valuation policy is to value investments at fair value.
B. Investment Income and Investments — Investment income includes interest income, dividend income, and securities lending income, if any. Interest income is accrued daily and adjusted for amortization of premiums and accretion of discounts. Dividend income is recognized onex-dividend date or, for certain foreign securities, as soon as such information is obtained subsequent to theex-dividend date. Investment transactions are reflected on trade date. Realized gains and losses are calculated using identified cost. Investment transactions are recorded on the following business day for daily net asset value (“NAV”) calculations. Distributions received from the Fund’s investments in United States (“U.S.”) real estate investment trusts (“REITs”) may be characterized as ordinary income, net capital gain or a return of capital. A return of capital is recorded by the Fund as a reduction to the cost basis of the REIT.
C. Class Allocations and Expenses — Investment income, realized and unrealized gain (loss), if any, andnon-class specific expenses of the Fund are allocated daily based upon the proportion of net assets of each class.Non-class specific expenses directly incurred by the Fund are charged to the Fund, while such expenses incurred by the Trust are allocated across the Fund on a straight-line and/orpro-rata basis depending upon the nature of the expenses. Class specific expenses, where applicable, are borne by the respective share classes and include Distribution and Service and Transfer Agency fees.
D. Federal Taxes and Distributions to Shareholders — It is the Fund’s policy to comply with the requirements of the Internal Revenue Code of 1986, as amended (the “Code”), applicable to regulated investment companies and to distribute each year substantially all of its investment company taxable income and capital gains to its shareholders. Accordingly, the Fund is not required to make any provisions for the payment of federal income tax. Distributions to shareholders are recorded on theex-dividend date. Income and capital gains distributions, if any, are declared and paid annually.
Net capital losses, if any, are carried forward to future fiscal years and may be used to the extent allowed by the Code to offset any future capital gains. Losses that are carried forward will retain their character as either short-term or long-term capital losses. Utilization of capital loss carryforwards will reduce the requirement of future capital gains distributions.
The characterization of distributions to shareholders for financial reporting purposes is determined in accordance with federal income tax rules, which may differ from GAAP. The source of the Fund’s distributions may be shown in the accompanying financial statements as either from distributable earnings or capital. Certain components of the Fund’s net assets on the Statement of Assets and Liabilities reflect permanent GAAP/tax differences based on the appropriate tax character.
E. Commission Recapture — GSAM, on behalf of certain Funds, may direct portfolio trades, subject to seeking best execution, to various brokers who have agreed to rebate a portion of the commissions generated. Such rebates are made directly to the Fund as cash payments and are included in net realized gain (loss) from investments on the Statement of Operations.
16
GOLDMAN SACHS VARIABLE INSURANCE TRUST STRATEGIC GROWTH FUND
3. INVESTMENTS AND FAIR VALUE MEASUREMENTS
U.S. GAAP defines the fair value of a financial instrument as the amount that would be received to sell an asset or paid to transfer a liability in an orderly transaction between market participants at the measurement date (i.e., the exit price); the Fund’s policy is to use the market approach. GAAP establishes a fair value hierarchy that prioritizes the inputs to valuation techniques used to measure fair value. The hierarchy gives the highest priority to unadjusted quoted prices in active markets for identical assets or liabilities (Level 1 measurements) and the lowest priority to unobservable inputs (Level 3 measurements). The levels used for classifying investments are not necessarily an indication of the risk associated with investing in these investments. The three levels of the fair value hierarchy are described below:
Level 1 — Unadjusted quoted prices in active markets that are accessible at the measurement date for identical, unrestricted assets or liabilities;
Level 2 — Quoted prices in markets that are not active or financial instruments for which significant inputs are observable (including, but not limited to, quoted prices for similar investments, interest rates, foreign exchange rates, volatility and credit spreads), either directly or indirectly;
Level 3 — Prices or valuations that require significant unobservable inputs (including GSAM’s assumptions in determining fair value measurement).
Changes in valuation techniques may result in transfers into or out of an assigned level within the hierarchy. In accordance with the Fund’s policy, transfers between different levels of the fair value hierarchy resulting from such changes are deemed to have occurred as of the beginning of the reporting period.
The Board of Trustees (“Trustees”) has approved Valuation Procedures that govern the valuation of the portfolio investments held by the Fund, including investments for which market quotations are not readily available. The Trustees have delegated to GSAMday-to-day responsibility for implementing and maintaining internal controls and procedures related to the valuation of the Fund’s investments. To assess the continuing appropriateness of pricing sources and methodologies, GSAM regularly performs price verification procedures and issues challenges as necessary to third party pricing vendors or brokers, and any differences are reviewed in accordance with the Valuation Procedures.
A. Level 1 and Level 2 Fair Value Investments — The valuation techniques and significant inputs used in determining the fair values for investments classified as Level 1 and Level 2 are as follows:
Equity Securities — Equity securities traded on a U.S. securities exchange or the NASDAQ system, or those located on certain foreign exchanges, including but not limited to the Americas, are valued daily at their last sale price or official closing price on the principal exchange or system on which they are traded. If there is no sale or official closing price or such price is believed by GSAM to not represent fair value, equity securities are valued at the last bid price for long positions and at the last ask price for short positions. To the extent these investments are actively traded, they are classified as Level 1 of the fair value hierarchy, otherwise they are generally classified as Level 2.
Unlisted equity securities for which market quotations are available are valued at the last sale price on the valuation date, or if no sale occurs, at the last bid price, and are generally classified as Level 2.
Money Market Funds — Investments in the Goldman Sachs Financial Square Government Fund (“Underlying Fund”) are valued at the NAV of the Institutional Share class on the day of valuation. These investments are generally classified as Level 1 of the fair value hierarchy. For information regarding the Underlying Fund’s accounting policies and investment holdings, please see the Underlying Fund’s shareholder report.
B. Level 3 Fair Value Investments — To the extent that significant inputs to valuation models and other alternative pricing sources are unobservable, or if quotations are not readily available, or if GSAM believes that such quotations do not accurately reflect fair value, the fair value of the Fund’s investments may be determined under Valuation Procedures approved by the Trustees. GSAM, consistent with its procedures and applicable regulatory guidance, may make an adjustment to the most recent valuation prices of either domestic or foreign securities in light of significant events to reflect what it believes to be the fair value of the securities at the time of determining the Fund’s NAV. Significant events which could affect a large number of securities in a
17
GOLDMAN SACHS VARIABLE INSURANCE TRUST STRATEGIC GROWTH FUND
Notes to Financial Statements(continued)
December 31, 2018
3. INVESTMENTS AND FAIR VALUE MEASUREMENTS (continued)
particular market may include, but are not limited to: significant fluctuations in U.S. or foreign markets; market dislocations; market disruptions; or unscheduled market closings. Significant events which could also affect a single issuer may include, but are not limited to: corporate actions such as reorganizations, mergers andbuy-outs; ratings downgrades; and bankruptcies.
C. Fair Value Hierarchy — The following is a summary of the Fund’s investments classified in the fair value hierarchy as of December 31, 2018:
| | | | | | | | | | | | |
| Investment Type | | Level 1 | | | Level 2 | | | Level 3 | |
| | | |
| Assets | | | | | | | | | | | | |
| Common Stock and/or Other Equity Investments(a) | | | | | | | | | | | | |
Asia | | $ | 1,159,749 | | | $ | — | | | $ | — | |
Europe | | | 1,889,378 | | | | — | | | | — | |
North America | | | 236,838,722 | | | | — | | | | — | |
| | | |
| Total | | $ | 239,887,849 | | | $ | — | | | $ | — | |
| (a) | Amounts are disclosed by continent to highlight the impact of time zone differences between local market close and the calculation of NAV. Security valuations are based on the principal exchange or system on which they are traded, which may differ from country of domicile. |
For further information regarding security characteristics, see the Schedule of Investments.
4. AGREEMENTS AND AFFILIATED TRANSACTIONS
A. Management Agreement — Under the Agreement, GSAM manages the Fund, subject to the general supervision of the Trustees.
As compensation for the services rendered pursuant to the Agreement, the assumption of the expenses related thereto and administration of the Fund’s business affairs, including providing facilities, GSAM is entitled to a management fee, accrued daily and paid monthly, equal to an annual percentage rate of the Fund’s average daily net assets.
As of December 31, 2018, the contractual management fees with GSAM were as stated below. The effective contractual management rates and effective net management rates represent the rates for the fiscal year ended December 31, 2018.
| | | | | | | | | | | | | | | | | | | | | | | | |
| Contractual Management Rate | | | | | | | |
First
$1 billion | | Next
$1 billion | | | Next
$3 billion | | | Next
$3 billion | | | Over
$8 billion | | | Effective
Rate | | | Effective Net
Management
Rate^ | |
| | | | | | |
| 0.71% | | | 0.64 | % | | | 0.61 | % | | | 0.59 | % | | | 0.58 | % | | | 0.73 | % | | | 0.71 | % |
| ^ | Effective Net Management Rate includes the impact of management fee waivers of affiliated Underlying Funds, if any. The Effective Net Management Rate may not correlate to the Contractual Management Rate as a result of management fee waivers that may be in effect from time to time. For the fiscal year ended December 31, 2018, GSAM waived $61,074 of its management fee. |
Prior to April 30, 2018, the contractual management fee rates for the Fund was as stated below and GSAM agreed to waive a portion of its management fee in order to achieve an Effective Net Management Rate as set forth in the Fund’s prospectus dated April 28, 2017.
| | | | | | | | | | | | | | | | |
First $1 billion | | Next $1 billion | | | Next $3 billion | | | Next $3 billion | | | Over $8 billion | |
| 0.75% | | | 0.68 | % | | | 0.65 | % | | | 0.64 | % | | | 0.63 | % |
18
GOLDMAN SACHS VARIABLE INSURANCE TRUST STRATEGIC GROWTH FUND
4. AGREEMENTS AND AFFILIATED TRANSACTIONS (continued)
The Fund invests in Institutional Shares of the Goldman Sachs Financial Square Government Fund, which is an affiliated Underlying Fund. GSAM has agreed to waive a portion of its management fee payable by the Fund in an amount equal to the management fee it earns as an investment adviser to the affiliated Underlying Fund in which the Fund invests, except those management fees it earns from the Fund’s investments of cash collateral received in connection with securities lending transactions in the Goldman Sachs Financial Square Government Fund. For the fiscal year ended December 31, 2018, GSAM waived $497 of the Fund’s management fee.
B. Distribution and Service(12b-1) Plan — The Trust, on behalf of Service Shares of the Fund, has adopted a Distribution and Service Plan subject to Rule12b-1 under the Act. Under the Distribution and Service Plan, Goldman Sachs, which serves as distributor, is entitled to a fee accrued daily and paid monthly, for distribution services and personal and account maintenance services, which may then be paid by Goldman Sachs to authorized dealers, equal to, on an annual basis, 0.25% of the Fund’s average daily net assets attributable to Service Shares.
C. Transfer Agency Agreement — Goldman Sachs also serves as the transfer agent of the Fund for a fee pursuant to the Transfer Agency Agreement. The fees charged for such transfer agency services are accrued daily and paid monthly at an annual rate of 0.02% of the average daily net assets of Institutional and Service Shares.
D. Other Expense Agreements and Affiliated Transactions — GSAM has agreed to limit certain “Other Expenses” of the Fund (excluding acquired fund fees and expenses, transfer agency fees and expenses, service fees and shareholder administration fees (as applicable), taxes, interest, brokerage fees, expenses of shareholder meetings, litigation and indemnification, and extraordinary expenses) to the extent such expenses exceed, on an annual basis, a percentage rate of the average daily net assets of the Fund. Such Other Expense reimbursements, if any, are accrued daily and paid monthly. In addition, the Fund is not obligated to reimburse GSAM for prior fiscal year expense reimbursements, if any. The Other Expense limitation as an annual percentage rate of average daily net assets for the Fund is 0.014%. The Other Expense limitation will remain in place through at least April 30, 2019, and prior to such date GSAM may not terminate the arrangement without the approval of the Trustees. In addition, the Fund has entered into certain offset arrangements with the custodian and the transfer agent, which may result in a reduction of the Fund’s expenses and are received irrespective of the application of the “Other Expense” limitation described above.
For the fiscal year ended December 31, 2018, these expense reductions, including any fee waivers and Other Expense reimbursements, were as follows:
| | | | | | | | | | | | |
Management
Fee Waiver | | Custody
Fee Credits | | | Other Expense
Reimbursement | | | Total Expense Reductions | |
| $61,571 | | $ | 2,908 | | | $ | 221,526 | | | $ | 286,005 | |
E. Line of Credit Facility — As of December 31, 2018, the Fund participated in a $770,000,000 committed, unsecured revolving line of credit facility (the “facility”) together with other funds of the Trust and certain registered investment companies having management agreements with GSAM or its affiliates. This facility is to be used for temporary emergency purposes, or to allow for an orderly liquidation of securities to meet redemption requests. The interest rate on borrowings is based on the federal funds rate. The facility also requires a fee to be paid by the Fund based on the amount of the commitment that has not been utilized. For the fiscal year ended December 31, 2018, the Fund did not have any borrowings under the facility.
F. Other Transactions with Affiliates — The following table provides information about the Fund’s investment in the Goldman Sachs Financial Square Government Fund as of and for the fiscal year ended December 31, 2018:
| | | | | | | | | | | | | | | | | | | | |
Beginning
Value as of
December 31, 2017 | | Purchases
at Cost | | | Proceeds
from Sales | | | Ending
Value as of
December 31, 2018 | | | Shares as of
December 31, 2018 | | | Dividend Income
from Affiliated
Investment
Company | |
| $722 | | $ | 17,156,410 | | | $ | (17,157,132) | | | $ | — | | | | — | | | $ | 6,451 | |
19
GOLDMAN SACHS VARIABLE INSURANCE TRUST STRATEGIC GROWTH FUND
Notes to Financial Statements(continued)
December 31, 2018
5. PORTFOLIO SECURITIES TRANSACTIONS
The cost of purchases and proceeds from sales and maturities of long-term securities for the fiscal year ended December 31, 2018, were $158,992,710 and $468,072,815, respectively.
6. SECURITIES LENDING
The Fund may lend its securities through a securities lending agent, the Bank of New York Mellon (“BNYM”), to certain qualified borrowers. In accordance with the Fund’s securities lending procedures, the Fund receives cash collateral at least equal to the market value of the securities on loan. The market value of the loaned securities is determined at the close of business of the Fund, at their last sale price or official closing price on the principal exchange or system on which they are traded, and any additional required collateral is delivered to the Fund on the next business day. As with other extensions of credit, the Fund may experience delay in the recovery of its securities or incur a loss should the borrower of the securities breach its agreement with the Fund or become insolvent at a time when the collateral is insufficient to cover the cost of repurchasing securities on loan. Dividend income received from securities on loan may not be subject to withholding taxes and therefore withholding taxes paid may differ from the amounts listed in the Statement of Operations. Loans of securities are terminable at any time and as such 1) the remaining contractual maturities of the outstanding securities lending transactions are considered to be overnight and continuous and 2) the borrower, after notice, is required to return borrowed securities within the standard time period for settlement of securities transactions.
The Fund invests the cash collateral received in connection with securities lending transactions in the Goldman Sachs Financial Square Government Fund (“Government Money Market Fund”), an affiliated series of the Goldman Sachs Trust. The Government Money Market Fund is registered under the Act as an open end investment company, is subject to Rule2a-7 under the Act, and is managed by GSAM, for which GSAM may receive a management fee of up to 0.16% (prior to February 21, 2018, GSAM may have received a management fee of up to 0.205%) on an annualized basis of the average daily net assets of the Government Money Market Fund.
In the event of a default by a borrower with respect to any loan, BNYM may exercise any and all remedies provided under the applicable borrower agreement to make the Fund whole. These remedies include purchasing replacement securities by applying the collateral held from the defaulting broker against the purchase cost of the replacement securities. If BNYM is unable to purchase replacement securities, BNYM will indemnify the Fund by paying the Fund an amount equal to the market value of the securities loaned minus the value of cash collateral received from the borrower for the loan, subject to an exclusion for any shortfalls resulting from a loss of value in such cash collateral due to reinvestment risk. The Fund may enter into master netting agreements with borrowers, which provide the right, in the event of a default (including bankruptcy or insolvency), for thenon-defaulting party to liquidate the collateral and calculate net exposure to the defaulting party or request additional collateral. However, in the event of a default by a borrower, a resolution authority could determine that such rights are not enforceable due to the restrictions or prohibitions against the right ofset-off that may be imposed in accordance with a particular jurisdiction’s bankruptcy or insolvency laws. The Fund’s loaned securities were all subject to enforceable Securities Lending Agreements and the value of the collateral was at least equal to the value of the cash received. The amounts of the Fund’s overnight and continuous agreements, which represent the gross amounts of recognized liabilities for securities lending transactions outstanding as of December 31, 2018, are disclosed as “Payable upon return of securities loaned” on the Statement of Assets and Liabilities, where applicable. The Fund did not have securities on loan as of December 31, 2018.
Both the Fund and BNYM received compensation relating to the lending of the Fund’s securities. The amounts earned, if any, by the Fund for the fiscal year ended December 31, 2018, are reported under Investment Income on the Statement of Operations.
20
GOLDMAN SACHS VARIABLE INSURANCE TRUST STRATEGIC GROWTH FUND
6. SECURITIES LENDING (continued)
The following table provides information about the Fund’s investment in the Government Money Market Fund for the fiscal year ended December 31, 2018:
| | | | | | | | | | | | | | |
Beginning
Value as of
December 31, 2017 | | | Purchases
at Cost | | | Proceeds
from Sales | | | Ending
Value as of
December 31, 2018 | |
| | | |
| $ | — | | | $ | 19,260,615 | | | $ | (19,260,615 | ) | | $ | — | |
7. TAX INFORMATION
The tax character of distributions paid during the fiscal years ended December 31, 2017 and December 31, 2018 was as follows:
| | | | | | | | |
| | | 2017 | | | 2018 | |
| Distributions paid from: | | | | | | | | |
Ordinary income | | $ | 1,602,761 | | | $ | 7,594,847 | |
Net long-term capital gains | | | 22,771,647 | | | | 114,152,571 | |
| Total taxable distributions | | $ | 24,374,408 | | | $ | 121,747,418 | |
As of December 31, 2018, the components of accumulated earnings (losses) on atax-basis were as follows:
| | | | |
| Undistributed ordinary income — net | | $ | 154, 272 | |
| Undistributed long-term capital gains | | | 21,200,927 | |
| Total undistributed earnings | | $ | 21,355,199 | |
| Timing Differences (Post October Loss Deferral) | | | (1,577,639 | ) |
| Unrealized gains — net | | | 78,029,829 | |
| Total accumulated gains — net | | $ | 97,807,389 | |
As of December 31, 2018, the Fund’s aggregate security unrealized gains and losses based on cost for U.S. federal income tax purposes were as follows:
| | | | |
| Tax cost | | $ | 161,858,020 | |
| Gross unrealized gain | | | 89,286,957 | |
| Gross unrealized loss | | | (11,257,128 | ) |
| Net unrealized gain | | $ | 78,029,829 | |
The difference between GAAP-basis andtax-basis unrealized gains (losses) is attributable primarily to wash sales and differences in the tax treatment of underlying fund investments.
GSAM has reviewed the Fund’s tax positions for all open tax years (the current and prior three years, as applicable) and has concluded that no provision for income tax is required in the Fund’s financial statements. Such open tax years remain subject to examination and adjustment by tax authorities.
21
GOLDMAN SACHS VARIABLE INSURANCE TRUST STRATEGIC GROWTH FUND
Notes to Financial Statements(continued)
December 31, 2018
8. OTHER RISKS
The Fund’s risks include, but are not limited to, the following:
Investments in Other Investment Companies Risk — As a shareholder of another investment company, including an exchange-traded fund (“ETF”), the Fund will indirectly bear its proportionate share of any net management fees and other expenses paid by such other investment companies, in addition to the fees and expenses regularly borne by the Fund.
Large Shareholder Transactions Risk — The Fund may experience adverse effects when certain large shareholders, such as other funds, participating insurance companies, accounts and Goldman Sachs affiliates, purchase or redeem large amounts of shares of the Fund. Such large shareholder redemptions, which may occur rapidly or unexpectedly, may cause the Fund to sell portfolio securities at times when it would not otherwise do so, which may negatively impact the Fund’s NAV and liquidity. These transactions may also accelerate the realization of taxable income to shareholders if such sales of investments resulted in gains, and may also increase transaction costs. In addition, a large redemption could result in the Fund’s current expenses being allocated over a smaller asset base, leading to an increase in the Fund’s expense ratio. Similarly, large Fund share purchases may adversely affect the Fund’s performance to the extent that the Fund is delayed in investing new cash or otherwise maintains a larger cash position than it ordinarily would.
Liquidity Risk — The Fund may make investments that are illiquid or that may become less liquid in response to market developments or adverse investor perceptions. Illiquid investments may be more difficult to value. Liquidity risk may also refer to the risk that the Fund will not be able to pay redemption proceeds within the allowable time period or without significant dilution to remaining investors’ interests because of unusual market conditions, an unusually high volume of redemption requests, or other reasons. To meet redemption requests, the Fund may be forced to sell investments at an unfavorable time and/or under unfavorable conditions. If the Fund is forced to sell securities at an unfavorable time and/or under unfavorable conditions, such sales may adversely affect the Fund’s NAV and dilute remaining investors’ interests.
Market and Credit Risks — In the normal course of business, the Fund trades financial instruments and enters into financial transactions where risk of potential loss exists due to changes in the market (market risk). Additionally, the Fund may also be exposed to credit risk in the event that an issuer or guarantor fails to perform or that an institution or entity with which the Fund has unsettled or open transactions defaults.
9. INDEMNIFICATIONS
Under the Trust’s organizational documents, its Trustees, officers, employees and agents are indemnified, to the extent permitted by the Act and state law, against certain liabilities that may arise out of performance of their duties to the Fund. Additionally, in the course of business, the Fund enters into contracts that contain a variety of indemnification clauses. The Fund’s maximum exposure under these arrangements is unknown, as this would involve future claims that may be made against the Fund that have not yet occurred. However, GSAM believes the risk of loss under these arrangements to be remote.
10. OTHER MATTERS
In September 2018, the Financial Accounting Standards Board issued Accounting Standards Update (ASU)2018-13 — Fair Value Measurement (Topic 820) Disclosure Framework — Changes to the Disclosure Requirements for Fair Value Measurement. The amendments in the ASU modify fair value measurement disclosures. The amendments are effective for the Fund’s fiscal year beginning after December 15, 2019. GSAM is currently evaluating the impact, if any, of the amendments.
11. SUBSEQUENT EVENTS
Subsequent events after the Statement of Assets and Liabilities date have been evaluated, and GSAM has concluded that there is no impact requiring adjustment or disclosure in the financial statements.
22
GOLDMAN SACHS VARIABLE INSURANCE TRUST STRATEGIC GROWTH FUND
12. SUMMARY OF SHARE TRANSACTIONS
Share activity is as follows:
| | | | | | | | | | | | | | | | |
| | | For the Fiscal Year Ended
December 31, 2018 | | | For the Fiscal Year Ended
December 31, 2017 | |
| | | Shares | | | Dollars | | | Shares | | | Dollars | |
| Institutional Shares | | | | | | | | | | | | | | | | |
| Shares sold | | | 707,283 | | | $ | 15,560,038 | | | | 173,227 | | | $ | 3,153,417 | |
| Reinvestment of distributions | | | 5,223,137 | | | | 51,500,129 | | | | 271,457 | | | | 5,401,988 | |
| Shares redeemed | | | (1,339,125 | ) | | | (28,892,999 | ) | | | (779,284 | ) | | | (14,386,601 | ) |
| | | | 4,591,295 | | | | 38,167,168 | | | | (334,600 | ) | | | (5,831,196 | ) |
| Service Shares | | | | | | | | | | | | | | | | |
| Shares sold | | | 700,489 | | | | 14,650,261 | | | | 761,609 | | | | 13,413,101 | |
| Reinvestment of distributions | | | 7,117,253 | | | | 70,247,289 | | | | 955,308 | | | | 18,972,420 | |
| Shares redeemed | | | (15,191,101 | ) | | | (312,752,864 | ) | | | (3,410,382 | ) | | | (63,262,328 | ) |
| | | | (7,373,359 | ) | | | (227,855,314 | ) | | | (1,693,465 | ) | | | (30,876,807 | ) |
| | | | |
| NET DECREASE | | | (2,782,064 | ) | | $ | (189,688,146 | ) | | | (2,028,065 | ) | | $ | (36,708,003 | ) |
23
Report of Independent Registered Public Accounting Firm
To the Board of Trustees of Goldman Sachs Variable Insurance Trust and Shareholders of Goldman Sachs Strategic Growth Fund
Opinion on the Financial Statements
We have audited the accompanying statement of assets and liabilities, including the schedule of investments, of Goldman Sachs Strategic Growth Fund (one of the funds constituting Goldman Sachs Variable Insurance Trust, referred to hereafter as the “Fund”) as of December 31, 2018, the related statement of operations for the year ended December 31, 2018, the statements of changes in net assets for each of the two years in the period ended December 31, 2018, including the related notes, and the financial highlights for each of the five years in the period ended December 31, 2018 (collectively referred to as the “financial statements”). In our opinion, the financial statements present fairly, in all material respects, the financial position of the Fund as of December 31, 2018, the results of its operations for the year then ended, the changes in its net assets for each of the two years in the period ended December 31, 2018 and the financial highlights for each of the five years in the period ended December 31, 2018 in conformity with accounting principles generally accepted in the United States of America.
Basis for Opinion
These financial statements are the responsibility of the Fund’s management. Our responsibility is to express an opinion on the Fund’s financial statements based on our audits. We are a public accounting firm registered with the Public Company Accounting Oversight Board (United States) (PCAOB) and are required to be independent with respect to the Fund in accordance with the U.S. federal securities laws and the applicable rules and regulations of the Securities and Exchange Commission and the PCAOB.
We conducted our audits of these financial statements in accordance with the standards of the PCAOB. Those standards require that we plan and perform the audit to obtain reasonable assurance about whether the financial statements are free of material misstatement, whether due to error or fraud.
Our audits included performing procedures to assess the risks of material misstatement of the financial statements, whether due to error or fraud, and performing procedures that respond to those risks. Such procedures included examining, on a test basis, evidence regarding the amounts and disclosures in the financial statements. Our audits also included evaluating the accounting principles used and significant estimates made by management, as well as evaluating the overall presentation of the financial statements. Our procedures included confirmation of securities owned as of December 31, 2018 by correspondence with the custodian. We believe that our audits provide a reasonable basis for our opinion.
PricewaterhouseCoopers LLP
Boston, Massachusetts
February 13, 2019
We have served as the auditor of one or more investment companies in the Goldman Sachs fund complex since 2000.
24
GOLDMAN SACHS VARIABLE INSURANCE TRUST STRATEGIC GROWTH FUND
| | |
| Fund Expenses — Six Month Period Ended December 31, 2018 (Unaudited) | | |
As a shareholder of Institutional or Service Shares of the Fund, you incur ongoing costs, including management fees, distribution and/or service (12b-1) fees (with respect to Service Shares) and other Fund expenses. This example is intended to help you understand your ongoing costs (in dollars) of investing in the Institutional Shares and Service Shares of the Fund and to compare these costs with the ongoing costs of investing in other mutual funds.
The example is based on an investment of $1,000 invested at the beginning of the period and held for the entire period from July 1, 2018 through December 31, 2018, which represents a period of 184 days of a 365 day year.
Actual Expenses — The first line under each share class in the table below provides information about actual account values and actual expenses. You may use the information in this line, together with the amount you invested, to estimate the expenses that you paid over the period. Simply divide your account value by $1,000 (for example, an $8,600 account value divided by $1,000=8.6), then multiply the result by the number in the first line under the heading entitled “Expenses Paid” to estimate the expenses you paid on your account during this period.
Hypothetical Example for Comparison Purposes — The second line under each share class in the table below provides information about hypothetical account values and hypothetical expenses based on the Fund’s actual net expense ratio and an assumed rate of return of 5% per year before expenses, which is not the Fund’s actual return. The hypothetical account values and expenses may not be used to estimate the actual ending account balance or expenses you paid for the period. You may use this information to compare the ongoing costs of investing in the Fund and other funds. To do so, compare this 5% hypothetical example with the 5% hypothetical examples that appear in the shareholder reports of the other funds.
Please note that the expenses shown in the table are meant to highlight your ongoing costs only. As a shareholder of the Fund you do not incur any transaction costs, such as sales charges, redemption fees, or exchange fees, but shareholders of other funds may incur such costs. The second line of the table is useful in comparing ongoing costs only and will not help you determine the relative total costs of owning different funds whose shareholders may incur transaction costs.
| | | | | | | | | | | | |
| Share Class | | Beginning
Account Value
07/01/18 | | | Ending
Account Value
12/31/18 | | | Expenses Paid
for the
6 Months
Ended
12/31/18* | |
| Institutional | | | | | | | | | | | | |
| Actual | | $ | 1,000 | | | $ | 907.30 | | | $ | 3.61 | |
| Hypothetical 5% return | | | 1,000 | | | | 1,021.42 | + | | | 3.82 | |
| Service | | | | | | | | | | | | |
| Actual | | | 1,000 | | | | 905.70 | | | | 4.80 | |
| Hypothetical 5% return | | | 1,000 | | | | 1,020.16 | + | | | 5.09 | |
| | + | Hypothetical expenses are based on the Fund’s actual annualized net expense ratios and an assumed rate of return of 5% per year before expenses. | |
| | * | Expenses are calculated using the Fund’s annualized net expense ratio for each class, which represents the ongoing expenses as a percentage of net assets for the six months ended December 31, 2018. Expenses are calculated by multiplying the annualized net expense ratio by the average account value for the period; then multiplying the result by the number of days in the most recent fiscal half year; and then dividing that result by the number of days in the fiscal year. The annualized net expense ratios for the period were 0.75%, and 1.00% for the Institutional and Service Shares, respectively. | |
25
GOLDMAN SACHS VARIABLE INSURANCE TRUST STRATEGIC GROWTH FUND
Trustees and Officers (Unaudited)
Independent Trustees
| | | | | | | | | | | | |
| | | | | |
Name,
Address and Age1 | | Position(s) Held
with the Trust | | Term of Office and
Length of
Time Served2 | | Principal Occupation(s) During Past 5 Years | | Number of
Portfolios in
Fund Complex
Overseen by
Trustee3 | | | Other Directorships Held by Trustee4 |
Jessica Palmer Age: 69 | | Chair of the Board of Trustees | | Since 2018 (Trustee since 2007) | | Ms. Palmer is retired. She was formerly Director, Emerson Center for the Arts and Culture (2011-2017); and Consultant, Citigroup Human Resources Department (2007-2008); Managing Director, Citigroup Corporate and Investment Banking (previously, Salomon Smith Barney/Salomon Brothers) (1984-2006). Ms. Palmer was a Member of the Board of Trustees of Indian Mountain School (private elementary and secondary school) (2004-2009). Chair of the Board of Trustees — Goldman Sachs Trust and Goldman Sachs Variable Insurance Trust. | | | 103 | | | None |
Kathryn A. Cassidy Age: 64 | | Trustee | | Since 2015 | | Ms. Cassidy is retired. Formerly, she was Advisor to the Chairman (May 2014-December 2014); and Senior Vice President and Treasurer (2008-2014), General Electric Company & General Electric Capital Corporation (technology and financial services companies). Trustee — Goldman Sachs Trust and Goldman Sachs Variable Insurance Trust. | | | 103 | | | None |
Diana M. Daniels Age: 69 | | Trustee | | Since 2007 | | Ms. Daniels is retired. Formerly, she was Vice President, General Counsel and Secretary, The Washington Post Company (1991-2006). Ms. Daniels is a Trustee Emeritus and serves as a Presidential Councillor of Cornell University (2013-Present); former Member of the Legal Advisory Board, New York Stock Exchange (2003-2006) and of the Corporate Advisory Board, Standish Mellon Management Advisors (2006-2007). Trustee — Goldman Sachs Trust and Goldman Sachs Variable Insurance Trust. | | | 103 | | | None |
Herbert J. Markley Age: 68 | | Trustee | | Since 2013 | | Mr. Markley is retired. Formerly, he was Executive Vice President, Deere & Company (an agricultural and construction equipment manufacturer) (2007-2009); and President, Agricultural Division, Deere & Company (2001-2007). Previously, Mr. Markley served as an Advisory Board Member of Goldman Sachs Trust and Goldman Sachs Variable Insurance Trust (June 2013-October 2013). Trustee — Goldman Sachs Trust and Goldman Sachs Variable Insurance Trust. | | | 103 | | | None |
Roy W. Templin Age: 58 | | Trustee | | Since 2013 | | Mr. Templin is retired. He is Director, Armstrong World Industries, Inc. (a designer and manufacturer of ceiling, wall and suspension system solutions) (2016-Present); and was formerly Chairman of the Board of Directors, Con-Way Incorporated (a transportation, logistics and supply chain management service company) (2014-2015); Executive Vice President and Chief Financial Officer, Whirlpool Corporation (an appliance manufacturer and marketer) (2004-2012). Previously, Mr. Templin served as an Advisory Board Member of Goldman Sachs Trust and Goldman Sachs Variable Insurance Trust (June 2013-October 2013). Trustee — Goldman Sachs Trust and Goldman Sachs Variable Insurance Trust. | | | 103 | | | Armstrong World Industries, Inc. (a ceiling, wall and suspension systems solutions manufacturer) |
Gregory G. Weaver Age: 67 | | Trustee | | Since 2015 | | Mr. Weaver is retired. He is Director, Verizon Communications Inc. (2015-Present); and was formerly Chairman and Chief Executive Officer, Deloitte & Touche LLP (a professional services firm) (2001-2005 and 2012-2014); and Member of the Board of Directors, Deloitte & Touche LLP (2006-2012). Trustee — Goldman Sachs Trust and Goldman Sachs Variable Insurance Trust. | | | 103 | | | Verizon Communications Inc. |
| | | | | | | | | | | | |
26
GOLDMAN SACHS VARIABLE INSURANCE TRUST STRATEGIC GROWTH FUND
Trustees and Officers (Unaudited) (continued)
Interested Trustee*
| | | | | | | | | | | | |
| | | | | |
Name,
Address and Age1 | | Position(s) Held with the Trust | | Term of Office and
Length of
Time Served2 | | Principal Occupation(s) During Past 5 Years | | Number of
Portfolios in
Fund Complex
Overseen by
Trustee3 | | | Other Directorships Held by Trustee4 |
James A. McNamara Age: 56 | | President and Trustee | | Since 2007 | | Advisory Director, Goldman Sachs (January 2018-Present); Managing Director, Goldman Sachs (January 2000-December 2017); Director of Institutional Fund Sales, GSAM (April 1998-December 2000); and Senior Vice President and Manager, Dreyfus Institutional Service Corporation (January 1993- April 1998). President and Trustee — Goldman Sachs Trust; Goldman Sachs Variable Insurance Trust; Goldman Sachs Trust II; Goldman Sachs MLP Income Opportunities Fund; Goldman Sachs MLP and Energy Renaissance Fund; Goldman Sachs ETF Trust; Goldman Sachs Private Markets Fund 2018 LLC; Goldman Sachs Private Markets Fund 2018 (A) LLC; and Goldman Sachs Private Markets Fund 2018 (B) LLC. | | | 156 | | | None |
| | | | | | | | | | | | |
| * | Mr. McNamara is considered to be an “Interested Trustee” because he holds positions with Goldman Sachs and owns securities issued by The Goldman Sachs Group, Inc. Mr. McNamara holds comparable positions with certain other companies of which Goldman Sachs, GSAM or an affiliate thereof is the investment adviser, administrator and/or distributor. |
| 1 | Each Trustee may be contacted by writing to the Trustee, c/o Goldman Sachs, 200 West Street, New York, New York, 10282, Attn: Caroline Kraus. Information is provided as of December 31, 2018. |
| 2 | Subject to such policies as may be adopted by the Board from time-to-time, each Trustee holds office for an indefinite term, until the earliest of: (a) the election of his or her successor; (b) the date the Trustee resigns or is removed by the Board or shareholders, in accordance with the Trust’s Declaration of Trust; or (c) the termination of the Trust. The Board has adopted policies which provide that (a) no Trustee shall hold office for more than 15 years and (b) a Trustee shall retire as of December 31st of the calendar year in which he or she reaches his or her 74th birthday, unless a waiver of such requirement shall have been adopted by a majority of the other Trustees. These policies may be changed by the Trustees without shareholder vote. |
| 3 | The Goldman Sachs Fund Complex includes certain other companies listed above for each respective Trustee. As of December 31, 2018, Goldman Sachs Trust consisted of 90 portfolios (88 of which offered shares to the public); Goldman Sachs Variable Insurance Trust consisted of 13 portfolios; Goldman Sachs Trust II consisted of 19 portfolios (17 of which offered shares to the public); Goldman Sachs MLP Income Opportunities Fund, Goldman Sachs MLP and Energy Renaissance Fund, Goldman Sachs Private Markets Fund 2018 LLC, Goldman Sachs Private Markets Fund 2018 (A) LLC and Goldman Sachs Private Markets Fund 2018 (B) LLC each consisted of one portfolio; and Goldman Sachs ETF Trust consisted of 29 portfolios (14 of which offered shares to the public). |
| 4 | This column includes only directorships of companies required to report to the Securities and Exchange Commission under the Securities Exchange Act of 1934 (i.e., “public companies”) or other investment companies registered under the Act. |
Additional information about the Trustees is available in the Fund’s Statement of Additional Information, which can be obtained from Goldman Sachs free of charge by calling this toll-free number (in the United States of America): 1-800-526-7384.
27
GOLDMAN SACHS VARIABLE INSURANCE TRUST STRATEGIC GROWTH FUND
Trustees and Officers (Unaudited) (continued)
Officers of the Trust*
| | | | | | |
| | | |
| Name, Address and Age1 | | Position(s) Held with the Trust | | Term of
Office and
Length of
Time Served2 | | Principal Occupation(s) During Past 5 Years |
James A. McNamara
200 West Street New York, NY 10282 Age: 56 | | Trustee and
President | | Since 2007 | | Advisory Director, Goldman Sachs (January 2018-Present); Managing Director, Goldman Sachs (January 2000-December 2017); Director of Institutional Fund Sales, GSAM (April 1998-December 2000); and Senior Vice President and Manager, Dreyfus Institutional Service Corporation (January 1993-April 1998). President and Trustee — Goldman Sachs Trust; Goldman Sachs Variable Insurance Trust; Goldman Sachs Trust II; Goldman Sachs MLP Income Opportunities Fund; Goldman Sachs MLP and Energy Renaissance Fund; Goldman Sachs ETF Trust; Goldman Sachs Private Markets Fund 2018 LLC; Goldman Sachs Private Markets Fund 2018 (A) LLC; and Goldman Sachs Private Markets Fund 2018 (B) LLC. |
Caroline L. Kraus
200 West Street New York, NY 10282 Age: 41 | | Secretary | | Since 2012 | | Managing Director, Goldman Sachs (January 2016-Present); Vice President, Goldman Sachs (August 2006-December 2015); Associate General Counsel, Goldman Sachs (2012-Present); Assistant General Counsel, Goldman Sachs (August 2006-December 2011); and Associate, Weil, Gotshal & Manges, LLP (2002-2006). Secretary — Goldman Sachs Trust (previously Assistant Secretary (2012)); Goldman Sachs Variable Insurance Trust (previously Assistant Secretary (2012)); Goldman Sachs Trust II; Goldman Sachs BDC, Inc.; Goldman Sachs Private Middle Market Credit LLC; Goldman Sachs Middle Market Lending Corp.; Goldman Sachs MLP Income Opportunities Fund; Goldman Sachs MLP and Energy Renaissance Fund; Goldman Sachs ETF Trust; Goldman Sachs Private Markets Fund 2018 LLC; Goldman Sachs Private Markets Fund 2018 (A) LLC; and Goldman Sachs Private Markets Fund 2018 (B) LLC. |
Scott M. McHugh
200 West Street New York, NY 10282 Age: 47 | | Treasurer, Senior
Vice President and
Principal Financial
Officer | | Since 2009
(Principal
Financial
Officer since
2013) | | Managing Director, Goldman Sachs (January 2016-Present); Vice President, Goldman Sachs (February 2007-December 2015); Assistant Treasurer of certain mutual funds administered by DWS Scudder (2005-2007); and Director (2005-2007), Vice President (2000-2005), and Assistant Vice President (1998-2000), Deutsche Asset Management or its predecessor (1998-2007). Treasurer, Senior Vice President and Principal Financial Officer — Goldman Sachs Trust; Goldman Sachs Variable Insurance Trust; Goldman Sachs Trust II; Goldman Sachs MLP Income Opportunities Fund; Goldman Sachs MLP and Energy Renaissance Fund; Goldman Sachs ETF Trust; Goldman Sachs Private Markets Fund 2018 LLC; Goldman Sachs Private Markets Fund 2018 (A) LLC; and Goldman Sachs Private Markets Fund 2018 (B) LLC. |
Joseph F. DiMaria
30 Hudson Street Jersey City, NJ 07302 Age: 50 | | Assistant Treasurer
and Principal
Accounting Officer | | Since 2016
(Principal
Accounting
Officer since
2017) | | Managing Director, Goldman Sachs (November 2015-Present) and Vice President — Mutual Fund Administration, Columbia Management Investment Advisers, LLC(May 2010-October 2015). Assistant Treasurer and Principal Accounting Officer — Goldman Sachs Trust; Goldman Sachs Variable Insurance Trust; Goldman Sachs Trust II; Goldman Sachs MLP Income Opportunities Fund; Goldman Sachs MLP and Energy Renaissance Fund; Goldman Sachs ETF Trust; Goldman Sachs Private Markets Fund 2018 LLC; Goldman Sachs Private Markets Fund 2018 (A) LLC; and Goldman Sachs Private Markets Fund 2018 (B) LLC. |
| | | | | | |
| * | Represents a partial list of officers of the Trust. Additional information about all the officers is available in the Fund’s Statement of Additional Information, which can be obtained from Goldman Sachs free of charge by calling this toll-free number (in the United States): 1-800-526-7384. |
| 1 | Information is provided as of December 31, 2018. |
| 2 | Officers hold office at the pleasure of the Board of Trustees or until their successors are duly elected and qualified. Each officer holds comparable positions with certain other companies of which Goldman Sachs, GSAM or an affiliate thereof is the investment adviser, administrator and/or distributor. |
Goldman Sachs Variable Insurance Trust — Tax Information (Unaudited)
For the year ended December 31, 2018, 49.67% of the dividends paid from net investment company taxable income by the Strategic Growth Fund qualify for the dividends received deduction available to corporations.
Pursuant to Section 852 of the Internal Revenue Code, the Strategic Growth Fund designates $114,152,571 or, if different, the maximum amount allowable, as capital gain dividends paid during the fiscal year ended December 31, 2018.
28
| | |
| TRUSTEES | | OFFICERS |
| Jessica Palmer,Chair | | James A. McNamara,President |
| Kathryn A. Cassidy | | Scott M. McHugh,Treasurer, Senior Vice |
| Diana M. Daniels | | President and Principal Financial Officer |
| Herbert J. Markley | | Joseph F. DiMaria,Assistant Treasurer |
| James A. McNamara | | and Principal Accounting Officer |
| Roy W. Templin | | Caroline L. Kraus,Secretary |
| Gregory G. Weaver | | |
GOLDMAN SACHS & CO. LLC
Distributor and Transfer Agent
GOLDMAN SACHS ASSET MANAGEMENT, L.P.
Investment Adviser
200 West Street, New York
New York 10282
Visit our web site at www.GSAMFUNDS.com to obtain the most recentmonth-end returns.
The reports concerning the Fund included in this shareholder report may contain certain forward-looking statements about the factors that may affect the performance of the Fund in the future. These statements are based on Fund management’s predictions and expectations concerning certain future events and their expected impact on the Fund, such as performance of the economy as a whole and of specific industry sectors, changes in the levels of interest rates, the impact of developing world events, and other factors that may influence the future performance of the Fund. Management believes these forward-looking statements to be reasonable, although they are inherently uncertain and difficult to predict. Actual events may cause adjustments in portfolio management strategies from those currently expected to be employed.
A description of the policies and procedures that the Fund uses to determine how to vote proxies relating to portfolio securities and information regarding how the Fund voted proxies relating to portfolio securities for the12-month period ended December 31 is available (i) without charge, upon request by calling1-800-621-2550; and (ii) on the Securities and Exchange Commission (“SEC”) web site athttp://www.sec.gov.
The Fund files its complete schedule of portfolio holdings with the SEC for the first and third quarters of each fiscal year onForm N-Q. The Fund’s Form N-Qs are available on the SEC’s web site at http://www.sec.gov within 60 days after the Fund’s first and third fiscal quarters. Form N-Qs may be obtained upon request and without charge by calling1-800-621-2550.
Views and opinions expressed are for informational purposes only and do not constitute a recommendation by GSAM to buy, sell, or hold any security. Views and opinions are current as of the date of this presentation and may be subject to change, they should not be construed as investment advice.
Goldman Sachs & Co. LLC (“Goldman Sachs”) does not provide legal, tax or accounting advice. Any statement contained in this communication (including any attachments) concerning U.S. tax matters was not intended or written to be used, and cannot be used, for the purpose of avoiding penalties under the Internal Revenue Code, and was written to support the promotion or marketing of transaction or matter addressed. Clients of Goldman Sachs should obtain their own independent tax advice based on their particular circumstances.
The website links provided are for your convenience only and are not an endorsement or recommendation by GSAM of any of these websites or the products or services offered. GSAM is not responsible for the accuracy and validity of the content of these websites.
Fund holdings and allocations shown are as of December 31, 2018 and may not be representative of future investments. Fund holdings should not be relied on in making investment decisions and should not be construed as research or investment advice regarding particular securities. Current and future holdings are subject to risk.
References to indices, benchmarks or other measures of relative market performance over a specified period of time are provided for your information only and do not imply that the portfolio will achieve similar results. The index composition may not reflect the manner in which a portfolio is constructed. While an adviser seeks to design a portfolio which reflects appropriate risk and return features, portfolio characteristics may deviate from those of the benchmark.
The Global Industry Classification Standard (“GICS”) was developed by and is the exclusive property and a service mark of Morgan Stanley Capital International Inc. (“MSCI”) and Standard & Poor’s, a division of The McGraw-Hill Companies, Inc. (“S&P”) and is licensed for use by Goldman Sachs. Neither MSCI, S&P nor any other party involved in making or compiling the GICS or any GICS classifications makes any express or implied warranties or representations with respect to such standard or classification (or the results to be obtained by the use thereof), and all such parties hereby expressly disclaim all warranties of originality, accuracy, completeness, merchantability or fitness for a particular purpose with respect to any of such standard or classification. Without limiting any of the foregoing, in no event shall MSCI, S&P, any of their affiliates or any third party involved in making or compiling the GICS or any GICS classifications have any liability for any direct, indirect, special, punitive, consequential or any other damages (including lost profits) even if notified of the possibility of such damages.
The portfolio risk management process includes an effort to monitor and manage risk, but does not imply low risk.
Shares of the Goldman Sachs VIT Funds are offered to separate accounts of participating life insurance companies for the purpose of funding variable annuity contracts and variable life insurance policies. Shares of the Fund are not offered directly to the general public. The variable annuity contracts and variable life insurance policies are described in the separate prospectuses issued by participating insurance companies. You should refer to those prospectuses for information about surrender charges, mortality and expense risk fees and other charges that may be assessed by participating insurance companies under the variable annuity contracts or variable life insurance policies. Such fees or charges, if any, may affect the return you may realize with respect to your investments. Ask your representative for more complete information. Please consider a fund’s objectives, risks and charges and expenses, and read the prospectus carefully before investing. The prospectus contains this and other information about the Fund.
This material is not authorized for distribution to prospective investors unless preceded or accompanied by a current prospectus or summary prospectus, if applicable. Investors should consider the Fund’s objective, risks, and charges and expenses, and read the summary prospectus, if available, and/or the prospectus carefully before investing or sending money. The summary prospectus, if available, and the prospectus contain this and other information about the Fund and may be obtained from your authorized dealer or from Goldman Sachs & Co. LLC by calling1-800-621-2550.
This report is prepared for the general information of contract owners and is not an offer of shares of the Goldman Sachs Variable Insurance Trust — Goldman Sachs Strategic Growth Fund.
© 2019 Goldman Sachs. All rights reserved.
VITGRWAR-19/157043-OTU-914421/31.3k
Goldman
SachsVariable Insurance Trust
Goldman Sachs
International Equity Insights Fund*
| * | Effective on April 23, 2018, the Goldman Sachs Strategic International Equity Fund was renamed the Goldman Sachs International Equity Insights Fund |
Annual Report
December 31, 2018

GOLDMAN SACHS VARIABLE INSURANCE TRUST INTERNATIONAL EQUITY INSIGHTS FUND
Investment Process. The Investment Adviser begins with a broad universe of foreign equity investments for the Fund. As described more fully below, the Investment Adviser uses proprietary multifactor models (the “Multifactor Models”) that attempt to forecast the returns of different markets, currencies and individual securities.
The Multifactor Models rely on some or all of the following investment pillars and themes to forecast the returns of individual securities (although additional pillars or themes may be added in the future without prior notice):
Fundamental Mispricings
• Valuation: The Valuation theme attempts to capture potential mispricings of securities, typically by comparing a measure of the company’s intrinsic value to its market value.
High Quality Business Models
• Profitability: The Profitability theme seeks to assess whether a company is earning more than its cost of capital.
• Quality: The Quality theme assesses both firm and management quality.
• Management: The Management theme assesses the characteristics, policies and strategic decisions of company management.
Market Themes and Trends
• Momentum: The Momentum theme seeks to predict drifts in stock prices caused by delayed investor reaction to company-specific information and information about related companies.
Sentiment Analysis
• Sentiment: The Sentiment theme reflects selected investment views and decisions of individuals and financial intermediaries.
1
GOLDMAN SACHS VARIABLE INSURANCE TRUST INTERNATIONAL EQUITY INSIGHTS FUND
(formerly Goldman Sachs Strategic International Equity Fund)
INVESTMENT OBJECTIVE
The Fund seeks long-term growth of capital.
Portfolio Management Discussion and Analysis
Effective on April 23, 2018, Goldman Sachs Variable Insurance Trust — Goldman Sachs Strategic International Equity Fund was re-named Goldman Sachs Variable Insurance Trust — Goldman Sachs International Equity Insights Fund (the “Fund”) and certain changes were made to its principal investment strategy. In light of these changes, the portfolio management team for the Fund changed as well. Below, the Goldman Sachs International Equity Portfolio Management Team and the Goldman Sachs Quantitative Investment Strategies Team discuss the Fund’s performance and positioning for the 12-month period ended December 31, 2018 (the “Reporting Period”).
How did the Fund perform during the Reporting Period?
During the Reporting Period, the Fund’s Institutional and Service Shares generated average annual total returns of –16.28% and –16.55%, respectively. These returns compare to the –13.79% average annual total return of the Fund’s benchmark, the MSCI Europe, Australasia, Far East (EAFE) Standard Index (net, USD, unhedged) (the “MSCI EAFE Index”), during the same time period.
What economic and market factors most influenced the international equity markets as a whole during the Reporting Period?
International equities, as measured by the MSCI EAFE Index, posted a return of –13.79% in U.S. dollar terms for the Reporting Period as a whole.
Despite a strong start to the Reporting Period in January 2018 amid solid economic data, a $1.5 trillion U.S. tax reform law signed in December 2017, and a favorable corporate earnings season, global equities endured a challenging and volatile year in 2018. In February 2018, equities sold off globally on market speculation of a faster pace of Federal Reserve (“Fed”) short-term interest rate hikes, which stoked a sharp rise in bond yields and an increase in equity market volatility. Concerns about Fed monetary policy tightening were further exacerbated by solid U.S. labor and inflation data. While the hawkish Fed minutes were largely expected, new Fed Chair Jerome Powell’s Congressional testimony, positing a more optimistic economic outlook since the December 2017 Fed meeting, surprised equity markets with its hawkish tilt, sparking another sell-off in the global equity markets. (Jerome Powell assumed the chairmanship of the Fed in February 2018. Hawkish language tends to suggest higher interest rates; opposite of dovish.) In March 2018, escalating trade tensions and potential tariffs weighed on investor sentiment. Meanwhile, the Fed delivered on a widely expected interest rate increase, with its “dot plot” pointing to a total of three interest rate hikes in calendar year 2018 and potentially two in 2019. (The “dot plot” shows rate projections of the members of the Fed’s Open Market Committee.) In Europe, an agreement on a 21-month transition after Brexit between the U.K. and the European Union reduced political uncertainty. (Brexit is the popular term for the U.K.’s approved vote on a referendum to exit the European Union.)
By the end of the Reporting Period, the Fed had hiked interest rates four times and communicated an upbeat view of its economic outlook, spurred by strong U.S. labor and inflation data. Against the strong fundamentals, escalating trade tensions, fears of global economic slowdown and populist politics weighed on investor sentiment throughout the year. Political uncertainty remained elevated in Europe, particularly surrounding the Italian fiscal budget and ongoing Brexit negotiations. After a second calendar quarter with only modestly negative returns for the MSCI EAFE Index and a third calendar quarter with only modest gains for the MSCI EAFE Index, U.S. and international equities alike fell sharply in the fourth quarter of 2018 on continued trade war escalations between the U.S. and China, on heightened political uncertainty and in a delayed response to an earlier sell-off in global rates. Global equities saw a reprieve in November on more accommodative comments from Fed Chair Powell and on encouraging progress toward China-U.S. trade talks. However, the recovery was short-lived, as U.S. and international equities plunged in December 2018 on renewed investor fears sparked by the arrest of a Chinese technology executive, the partial U.S. government shutdown and the U.S. President’s criticism of Fed Chair Powell.
For the Reporting Period overall, all but one sector of the MSCI EAFE Index declined, with financials, materials, information technology, consumer discretionary and industrials the weakest performers on the basis of total return during the Reporting Period. Utilities was the only sector in the MSCI EAFE Index to post a positive return during the Reporting Period. Health care, energy and
2
GOLDMAN SACHS VARIABLE INSURANCE TRUST INTERNATIONAL EQUITY INSIGHTS FUND
real estate generated negative absolute returns but significantly outperformed the broad MSCI EAFE Index during the Reporting Period.
From a country perspective, all equity markets in the MSCI EAFE Index posted a negative absolute return during the Reporting Period. Austria, Belgium, Ireland and Germany were the weakest individual country constituents in the MSCI EAFE Index during the Reporting Period. Finland, New Zealand, Israel, Norway, Hong Kong and Switzerland posted negative returns but significantly outpaced the MSCI EAFE Index on a relative basis during the Reporting Period.
What changes were made to the Fund’s principal investment strategy during the Reporting Period?
Effective on April 23, 2018, the Fund invests, under normal circumstance, at least 80% of its net assets plus any borrowings for investment purposes (measured at the time of purchase) (“Net Assets”) in a broadly diversified portfolio of equity investments in non-U.S. issuers. The Fund intends to have investments economically tied to at least three countries, not including the United States, and may invest in the securities of issuers in emerging market countries. The Fund seeks broad representation of large-cap and mid-cap issuers across major countries and sectors of the international economy with some exposure to small-cap issuers. Additionally, the Fund’s contractual management fee rate was lowered from 0.85% to 0.81% of the Fund’s average daily net assets.
What key factors were responsible for the Fund’s performance from January 1, 2018 through April 22, 2018 (the “initial part of the Reporting Period”)?
The Fund outperformed the MSCI EAFE Index during the initial part of the Reporting Period, attributable primarily to individual stock selection overall. Sector allocation as a whole detracted, albeit modestly.
What were some of the Fund’s best-performing individual stocks during the initial part of the Reporting Period?
Among the greatest contributors to Fund performance relative to the MSCI EAFE Index during the initial part of the Reporting Period were U.K.-based global business-to-business events organizer UBM and Singapore-based multinational banking and financial services provider DBS Group Holdings.
In January 2018, Informa made a cash/equity offer to acquire UBM at a 30% premium, which contributed to UBM’s strong stock performance. UBM shareholders would own a 34.5% stake in the combined entity, and the transaction was expected to close by the end of the second quarter of 2018. The acquisition was indeed completed on June 15, 2018. UBM’s stock also rose on reports made during the Reporting Period of top-line earnings and earnings before interest, taxes, depreciation and amortization that beat market estimates for the company’s fiscal year 2017. The company’s organic growth was also positive and exceeded market expectations during the Reporting Period.
Shares of DBS Group Holdings rose on improved margin expansion and loan growth and first quarter 2018 earnings that beat market expectations, in part due to higher fee income. Further, DBS Group Holdings had excess capital from record profits, which it distributed in May 2018 in the form of a one-time special dividend and also announced dividend growth going forward in line with its earnings growth.
Which stocks detracted significantly from the Fund’s performance during the initial part of the Reporting Period?
Among the biggest detractors from Fund performance relative to the MSCI EAFE Index during the initial part of the Reporting Period were Denmark-based multinational pharmaceuticals company Novo Nordisk and Germany-based manufacturer of industrial machinery and process technology GEA Group.
Novo Nordisk focuses on diabetes care and offers insulin delivery systems and other diabetes products. Novo Nordisk also works in areas such as haemostasis management, growth disorders and hormone replacement therapy. Novo Nordisk underperformed the broader European Union pharmaceuticals sector after headlines about its oral semaglutide Phase 3 trials were out in mid-February 2018. Oral semaglutide is the first oral treatment for diabetes. We believe Novo Nordisk’s weak performance was driven by several factors. First — investor confusion around the statistical analysis used in the headline data. Second — a perception that the “catalyst has passed.” We believe such concerns were unwarranted with further key oral semaglutide data due in the second calendar quarter. Third — currency concerns given the significant impact of such during the first quarter of 2018. After the severe price reaction and the opportunity we had to discuss the issues with the company’s management, we felt the news on this oral treatment was over-discounted in its share price.
GEA Group’s weak performance was driven by mis-execution of a number of orders that resulted in management changes within the company as well as investor doubts about when its business might stabilize.
3
GOLDMAN SACHS VARIABLE INSURANCE TRUST INTERNATIONAL EQUITY INSIGHTS FUND
Which equity market sectors most significantly affected Fund performance during the initial part of the Reporting Period?
Effective stock selection in the consumer discretionary, information technology and financials sectors contributed most positively to the Fund’s performance relative to the MSCI EAFE Index during the initial part of the Reporting Period. Partially offsetting these positive contributors was weaker stock selection in the health care, consumer staples and energy sectors, which detracted from the Fund’s performance relative to the MSCI EAFE Index during the initial part of the Reporting Period. Having an overweighted allocation to consumer staples, which lagged the MSCI EAFE Index during the initial part of the Reporting Period, also dampened the Fund’s relative results.
Which countries or regions most affected the Fund’s performance during the initial part of the Reporting Period?
Typically, the Fund’s individual stock holdings would significantly influence the Fund’s performance within a particular country or region relative to the MSCI EAFE Index. This effect may be even more pronounced in countries that represent only a modest proportion of the MSCI EAFE Index.
That said, having an overweighted allocation to Italy, which outperformed the MSCI EAFE Index during the initial part of the Reporting Period, and strong stock selection in Japan and Singapore contributed most positively to the Fund’s returns relative to the MSCI EAFE Index. The countries that detracted most from the Fund’s relative performance during the initial part of the Reporting Period were France, Denmark and Germany, where stock selection overall hurt.
What key factors were responsible for the Fund’s performance from April 23, 2018 through December 31, 2018 (the “second part of the Reporting Period”)?
During the second part of the Reporting Period, the Fund underperformed the MSCI EAFE Index largely due to stock selection driven by our quantitative model. However, five of our quantitative model’s six investment themes contributed positively.
What impact did the Fund’s investment themes have on performance during the second part of the Reporting Period?
As expected, and in keeping with our investment approach, our quantitative model and its six investment themes — Valuation, Profitability, Quality, Management, Momentum and Sentiment — had the greatest impact on relative performance. We use these themes to take a long-term view of market patterns and look for inefficiencies, selecting stocks for the Fund and overweighting or underweighting the ones chosen by the model. Over time and by design, the performance of any one of the model’s investment themes tends to have a low correlation with the model’s other themes, demonstrating the diversification benefit of the Fund’s theme-driven quantitative model. The variance in performance supports our research indicating that the diversification provided by the Fund’s different investment themes is a significant investment advantage over the long term, even though the Fund may experience underperformance in the short term. Of course, diversification does not protect an investor from market risk nor does it ensure a profit.
During the second part of the Reporting Period, five of our six investment themes contributed positively to relative returns. Quality contributed most positively to relative performance, followed by Momentum and Valuation. The Sentiment and Management themes also contributed positively, albeit to a lesser extent. The Quality theme assesses both firm and financial quality. The Momentum theme seeks to predict drifts in stock prices caused by delayed investor reaction to company-specific information and information about related companies. The Valuation theme attempts to capture potential mispricings of securities, typically by comparing a measure of the company’s intrinsic value to its market value. The Sentiment theme reflects selected investment views and decisions of individuals and financial intermediaries. The Management theme assesses the characteristics, policies and strategic decisions of company managements.
The Profitability theme detracted from the Fund’s relative returns during the second part of the Reporting Period. The Profitability theme assesses whether a company is earning more than its cost of capital.
How did the Fund’s country, sector and industry allocations affect relative performance during the second part of the Reporting Period?
In constructing the Fund’s portfolio, we focus on picking stocks rather than making country, industry or sector bets. Consequently, the Fund is similar to its benchmark, the MSCI EAFE Index, in terms of its country, industry and sector allocation and style. Changes in country, sector or industry weights generally do not have a meaningful impact on relative performance.
4
GOLDMAN SACHS VARIABLE INSURANCE TRUST INTERNATIONAL EQUITY INSIGHTS FUND
Did stock selection help or hurt Fund performance during the second part of the Reporting Period?
We seek to outpace the MSCI EAFE Index by overweighting stocks that we expect to outperform and underweighting those that we think may lag. We also build positions based on our thematic views. For example, the Fund aims to hold a basket of stocks with more favorable Momentum characteristics than the benchmark index. During the second part of the Reporting Period, stock selection overall detracted from the Fund’s relative performance.
Stock selection in the materials, consumer discretionary and communication services sectors detracted most from the Fund’s results relative to the MSCI EAFE Index. Partially offsetting these detractors was stock selection in the information technology sector, which was the only sector to contribute positively to the Fund’s results relative to the MSCI EAFE Index during the second part of the Reporting Period.
Which individual positions detracted from the Fund’s results during the second part of the Reporting Period?
Detracting most from the Fund’s results relative to the MSCI EAFE Index were overweight positions in German chemicals manufacturer Covestro and Denmark’s jewelry manufacturer and retailer Pandora and an underweight position in Switzerland’s pharmaceutical and consumer healthcare products manufacturer Novartis. The Fund had an overweight position in Covestro based on our positive views on Momentum and Value. We chose to overweight Pandora due to our positive views on Value and Quality. Negative views on Management and Profitability drove the Fund’s underweight in Novartis.
Which individual stock positions contributed the most to the Fund’s relative returns during the second part of the Reporting Period?
The Fund benefited most from overweighted positions in Japanese skin care cosmetics producer Fancl, Swiss pharmaceutical and diagnostic products manufacturer Roche Holding and Japanese pharmaceutical company Shionogi & Co. We chose to overweight Fancl due to our positive views on Management and Sentiment. The Fund’s overweight to Roche Holding was based on our positive views on Value and Quality. Our positive views on Value and Momentum drove the Fund’s overweight in Shionogi & Co.
What impact did the Goldman Sachs Quantitative Investment Strategies Team’s country/currency selection strategy have on the Fund’s relative performance during the second part of the Reporting Period?
To construct the Fund’s portfolio, we focus on security selection rather than on making country bets. As a result, the Fund is similar to the MSCI EAFE Index in terms of its country allocation. Changes in the Fund’s country weights are generally the result of our stock picking.
Did you make any enhancements to your quantitative models during the second part of the Reporting Period?
We continuously look for ways to improve our investment process. During the second part of the Reporting Period, we made numerous enhancements to our models. As example, we introduced two new signals within our Momentum theme that help us create economic links between different companies, potentially giving us insights into price movements of related companies. The first signal uses natural language processing to read through various sections in the patent document to form linkages in the markets of Europe and Japan. The second signal, introduced in the Japan region, uses natural language processing techniques to analyze various sections within the annual financial statements of companies.
Also in the Japan region, we added a signal that uses consumer and retailer activity data to predict the sales of retailers and consumer goods companies.
Within our Sentiment theme, we enhanced existing signals that use machine learning to help understand sell-side analyst sentiment. With a larger body of sell-side research reports to analyze, we introduced a new machine learning algorithm to help classify sentiment. We extended an existing market sentiment signal from the U.S. to the U.K. region. The signal examines institutional investor activity to extract conviction positions.
We also extended a suite of signals within our Quality and Sentiment themes that use natural language processing on U.S. regulatory filings to the Japan region with Japanese regulatory filings.
How did the Fund use derivatives during the Reporting Period?
During the initial part of the Reporting Period, we did not use derivatives to hedge positions or as part of an active management strategy. During the second part of the Reporting Period, we did not use derivatives as part of an active management strategy to add value to the Fund’s results. However, we used equity index futures contracts, on an opportunistic basis, to equitize the Fund’s excess cash holdings. In other words, we put the Fund’s excess cash holdings to work by using them as collateral for the purchase of stock futures. The use of these futures contracts did not have a material impact on the Fund’s performance during the second part of the Reporting Period.
5
GOLDMAN SACHS VARIABLE INSURANCE TRUST INTERNATIONAL EQUITY INSIGHTS FUND
What were the Fund’s sector and country weightings at the end of the Reporting Period?
As of December 31, 2018, the Fund was overweight the industrials, health care, energy and information technology sectors relative to the MSCI EAFE Index. The Fund was underweight consumer staples, real estate and communication services and rather neutral to the MSCI EAFE Index in financials, consumer discretionary, materials and utilities on the same date.
In terms of countries, the Fund was overweight relative to the MSCI EAFE Index in Japan, the Netherlands and Hong Kong. Compared to the MSCI EAFE Index, the Fund was underweight in the U.K., France, Australia and Singapore and was relatively neutral compared to the MSCI EAFE Index in the remaining constituents of the MSCI EAFE Index at the end of the Reporting Period.
Were there any changes to the Fund’s portfolio management team during the Reporting Period?
As mentioned earlier, the Fund’s portfolio management team was changed from the Goldman Sachs International Equity Portfolio Management Team to the Goldman Sachs Quantitative Investment Strategies (“QIS”) Team. QIS employs a globally integrated team of more than 95 professionals, with an additional 70-plus professionals dedicated to trading, information technology and development of analytical tools.
What is your strategy going forward for the Fund?
Looking ahead, we continue to believe that less expensive stocks should outpace more expensive stocks, and stocks with good momentum are likely to outperform those with poor momentum. We intend to maintain our focus on seeking companies about which fundamental research analysts are becoming more positive as well as profitable companies with sustainable earnings and a track record of using their capital to enhance shareholder value. As such, we anticipate remaining fully invested with long-term performance likely to be the result of stock selection rather than sector or capitalization allocations.
We stand behind our investment philosophy that sound economic investment principles, coupled with a disciplined quantitative approach, can provide strong, uncorrelated returns over the long term. Our research agenda is robust, and we continue to enhance our existing models, add new proprietary forecasting signals and improve our trading execution as we seek to provide the most value to our shareholders.
6
GOLDMAN SACHS VARIABLE INSURANCE TRUST INTERNATIONAL EQUITY INSIGHTS FUND
Index Definitions
The MSCI EAFE Standard Index is a market capitalization-weighted composite of securities in 21 developed markets. The MSCI EAFE Standard Index approximates the minimum possible dividend reinvestment. The dividend is reinvested after deduction for withholding tax, applying the rate to non-resident individuals who do not benefit from double taxation treaties. MSCI Barra uses withholding tax rates applicable to Luxembourg holding companies, as Luxembourg applies the highest rates. The MSCI EAFE Standard Index is unmanaged and the figures for the Index do not include any deduction for fees or expenses.
It is not possible to invest directly in an index.
7
FUND BASICS
International Equity Insights Fund
as of December 31, 2018
STANDARDIZED TOTAL RETURNS1
| | | | | | | | | | | | | | | | | | |
| | | | | |
| For the period ended 12/31/18 | | One Year | | | Five Years | | | Ten Years | | | Since Inception | | | Inception Date |
| Institutional | | | -16.28 | % | | | -0.75 | % | | | 5.75 | % | | | 3.11 | % | | 1/12/98 |
| Service | | | -16.55 | | | | -0.99 | | | | 5.48 | | | | 1.07 | | | 1/09/06 |
| 1 | The Standardized Total Returns are average annual total returns as of the most recent calendar quarter-end. They assume reinvestment of all distributions at net asset value (“NAV”). Because Institutional Shares and Service Shares do not involve a sales charge, such a charge is not applied to their Standardized Total Returns. |
Total return figures in the above chart represent past performance and do not indicate future results, which will vary. The investment return and principal value of an investment will fluctuate and, therefore, an investor’s shares, when redeemed, may be worth more or less than their original cost. Current performance may be lower or higher than the total return figures in the above chart. Please visit www.GSAMFUNDS.com to obtain the most recent month-end returns.
Performance reflects fee waivers and/or expense limitations in effect during the periods shown. In their absence, performance would be reduced.
EXPENSE RATIOS2
| | | | | | | | | | | | |
| | | |
| | | Net Expense Ratio (Current) | | | Gross Expense Ratio (Before Waivers) | | | | |
| Institutional | | | 0.88 | % | | | 0.99 | % | | | | |
| Service | | | 1.13 | | | | 1.24 | | | | | |
| 2 | The expense ratios of the Fund, both current (net of any fee waivers and/or expense limitations) and before waivers (gross of any fee waivers and/or expense limitations) are as set forth above according to the most recent publicly available Prospectuses for the Fund and may differ from the expense ratios disclosed in the Financial Highlights in this report. Pursuant to a contractual arrangement, the Fund’s fee waivers and/or expense limitations will remain in place through at least April 30, 2019, and prior to such date, the Investment Adviser may not terminate the arrangements without the approval of the Fund’s Board of Trustees. If these arrangements are discontinued in the future, the expense ratios may change without shareholder approval. |
TOP TEN HOLDINGS AS OF 12/31/183
| | | | | | | | |
| | | |
Holding | | % of
Net Assets | | | Line of Business | | Country |
Roche Holding AG | | | 2.3% | | | Pharmaceuticals, Biotechnology & Life Sciences | | Switzerland |
BP plc ADR | | | 1.8 | | | Energy | | United Kingdom |
AIA Group Ltd. | | | 1.5 | | | Insurance | | Hong Kong |
Novo Nordisk A/S Class B | | | 1.3 | | | Pharmaceuticals, Biotechnology & Life Sciences | | Denmark |
Safran SA | | | 1.2 | | | Capital Goods | | France |
International Consolidated Airlines Group SA | | | 1.2 | | | Transportation | | United Kingdom |
Toyota Motor Corp. | | | 1.2 | | | Automobiles & Components | | Japan |
Air Liquide SA | | | 1.1 | | | Materials | | France |
Rio Tinto plc ADR | | | 1.0 | | | Materials | | Australia |
Eni SpA | | | 1.0 | | | Energy | | Italy |
| 3 | The top 10 holdings may not be representative of the Fund’s future investments. |
8
FUND BASICS
FUND VS. BENCHMARK SECTOR ALLOCATIONS4
As of December 31, 2018
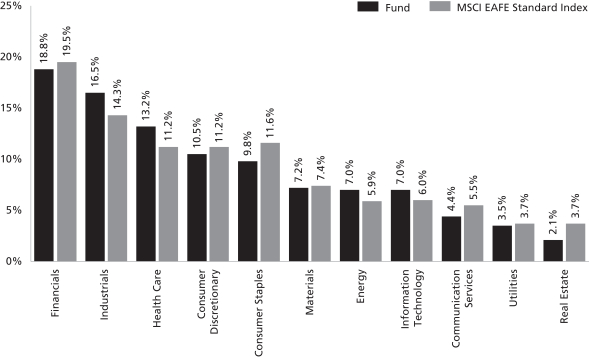
| 4 | The Fund is actively managed and, as such, its composition may differ over time. Consequently, the Fund’s overall sector allocations may differ from percentages contained in the graph above. The graph categorizes investments using Global Industry Classification Standard (“GICS”); however, the sector classifications used by the portfolio management team may differ from GICS. The percentage shown for each investment category reflects the value of investments in that category as a percentage of market value (excluding investments in the securities lending reinvestment vehicle, if any). Underlying sector allocations of exchange traded funds and investment companies held by the Fund are not reflected in the graph above. Investments in the securities lending reinvestment vehicle represented 0.5% of the Fund’s net assets at December 31, 2018. The graph depicts the Fund’s investments but may not represent the Fund’s market exposure due to the exclusion of certain derivatives, if any, as listed in the Additional Investment Information section of the Schedule of Investments. |
9
GOLDMAN SACHS VARIABLE INSURANCE TRUST INTERNATIONAL EQUITY INSIGHTS FUND
Performance Summary
December 31, 2018
The following graph shows the value, as of December 31, 2018, of a $10,000 investment made on January 1, 2009 in Service Shares at NAV. For comparative purposes, the performance of the Fund’s benchmark, the MSCI EAFE Standard Index (Net, USD, Unhedged), is shown. This performance data represents past performance and should not be considered indicative of future performance, which will fluctuate with changes in market conditions. These performance fluctuations may cause an investor’s shares, when redeemed, to be worth more or less than their original cost. Performance reflects Fund level expenses but does not reflect fees and expenses associated with any variable annuity contract or variable life insurance policy that uses the Fund as an investment option for any contract or policy. Had performance reflected all of those fees and expenses, performance would have been reduced. Performance reflects applicable fee waivers and/or expense limitations in effect during the periods shown, and in their absence performance would be reduced. Performance of Institutional Shares will vary from Service Shares due to differences in class specific fees. In addition to theInvestment Adviser’s decisions regarding issuer/industry/country investment selection and allocation, other factors may affect Fund performance. These factors include, but are not limited to, Fund operating fees and expenses, portfolio turnover, and subscription and redemption cash flows affecting the Fund.
International Equity Insights Fund’s 10 Year Performance
Performance of a $10,000 investment, with distributions reinvested, from January 1, 2009 through December 31, 2018.
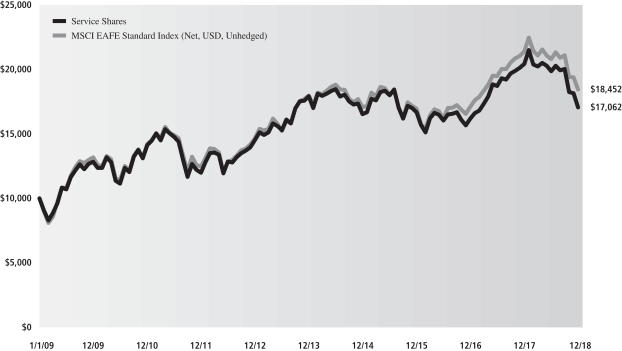
| | | | | | | | |
| Average Annual Total Return through December 31, 2018 | | One Year | | Five Years | | Ten Years | | Since Inception |
Institutional (Commenced January 12, 1998) | | -16.28% | | -0.75% | | 5.75% | | 3.11% |
Service (Commenced January 9, 2006) | | -16.55% | | -0.99% | | 5.48% | | 1.07% |
10
GOLDMAN SACHS VARIABLE INSURANCE TRUST INTERNATIONAL EQUITY INSIGHTS FUND
Schedule of Investments
December 31, 2018
| | | | | | | | |
| Shares | | | Description | | Value | |
|
| | Common Stocks – 96.4% | |
| | Australia – 7.0% | |
| | 2,233 | | | ASX Ltd. (Diversified Financials) | | $ | 94,355 | |
| | 168,364 | | | Aurizon Holdings Ltd. (Transportation) | | | 507,954 | |
| | 12,300 | | | BHP Group plc (Materials) | | | 259,911 | |
| | 82,725 | | | Coca-Cola Amatil Ltd. (Food, Beverage & Tobacco) | | | 477,123 | |
| | 25,416 | | | Coles Group Ltd. (Food & Staples Retailing)* | | | 210,167 | |
| | 53,266 | | | Crown Resorts Ltd. (Consumer Services) | | | 445,160 | |
| | 6,423 | | | Goodman Group (REIT) | | | 48,114 | |
| | 106,514 | | | Insurance Australia Group Ltd. (Insurance) | | | 525,350 | |
| | 3,742 | | | Macquarie Group Ltd. (Diversified Financials) | | | 286,622 | |
| | 19,936 | | | Metcash Ltd. (Food & Staples Retailing) | | | 34,432 | |
| | 123,683 | | | Qantas Airways Ltd. (Transportation) | | | 504,568 | |
| | 17,652 | | | Rio Tinto plc ADR (Materials) | | | 855,769 | |
| | 21,311 | | | Telstra Corp. Ltd. (Telecommunication Services) | | | 42,768 | |
| | 23,727 | | | TPG Telecom Ltd. (Telecommunication Services) | | | 107,627 | |
| | 12,894 | | | Vicinity Centres (REIT) | | | 23,627 | |
| | 22,433 | | | Wesfarmers Ltd. (Retailing) | | | 509,648 | |
| | 36,842 | | | Woolworths Group Ltd. (Food & Staples Retailing) | | | 764,251 | |
| | | | | | | | |
| | | | | | | 5,697,446 | |
| | |
| | Austria – 0.4% | |
| | 8,139 | | | OMV AG (Energy) | | | 355,456 | |
| | |
| | Belgium – 0.5% | |
| | 1,463 | | | KBC Group NV (Banks) | | | 94,128 | |
| | 2,872 | | | UCB SA (Pharmaceuticals, Biotechnology & Life Sciences) | | | 234,575 | |
| | 335 | | | Warehouses De Pauw CVA (REIT) | | | 44,217 | |
| | | | | | | | |
| | | | | | | 372,920 | |
| | |
| | China – 0.8% | |
| | 43,000 | | | ENN Energy Holdings Ltd. (Utilities) | | | 382,174 | |
| | 384,000 | | | Towngas China Co. Ltd. (Utilities) | | | 284,524 | |
| | | | | | | | |
| | | | | | | 666,698 | |
| | |
| | Denmark – 1.8% | |
| | 2,625 | | | Carlsberg A/S Class B (Food, Beverage & Tobacco) | | | 279,245 | |
| | 1,963 | | | GN Store Nord A/S (Health Care Equipment & Services) | | | 73,552 | |
| | 23,878 | | | Novo Nordisk A/S Class B (Pharmaceuticals, Biotechnology & Life Sciences) | | | 1,096,647 | |
| | 1,898 | | | Scandinavian Tobacco Group A/S Class A (Food, Beverage & Tobacco)(a) | | | 22,874 | |
| | | | | | | | |
| | | | | | | 1,472,318 | |
| | |
|
| | Common Stocks – (continued) | |
| | Finland – 0.3% | |
| | 1,863 | | | Kesko OYJ Class B (Food & Staples Retailing) | | $ | 100,543 | |
| | 1,707 | | | Neste OYJ (Energy) | | | 132,160 | |
| | 4,321 | | | Ramirent OYJ (Capital Goods) | | | 26,983 | |
| | | | | | | | |
| | | | | | | 259,686 | |
| | |
| | France – 9.1% | |
| | 7,206 | | | Air Liquide SA (Materials) | | | 894,810 | |
| | 3,598 | | | Arkema SA (Materials) | | | 308,882 | |
| | 14,575 | | | Beneteau SA (Consumer Durables & Apparel) | | | 191,677 | |
| | 6,430 | | | BNP Paribas SA (Banks) | | | 290,384 | |
| | 1,277 | | | Christian Dior SE (Consumer Durables & Apparel) | | | 488,635 | |
| | 3,281 | | | Cie Generale des Etablissements Michelin SCA (Automobiles & Components) | | | 322,939 | |
| | 5,937 | | | Eiffage SA (Capital Goods) | | | 496,376 | |
| | 7,077 | | | Eutelsat Communications SA (Media & Entertainment) | | | 139,425 | |
| | 2,211 | | | Faurecia SA (Automobiles & Components) | | | 83,424 | |
| | 534 | | | Ipsen SA (Pharmaceuticals, Biotechnology & Life Sciences) | | | 69,092 | |
| | 1,743 | | | Kering SA (Consumer Durables & Apparel) | | | 816,541 | |
| | 8,057 | | | Lagardere SCA (Media & Entertainment) | | | 203,321 | |
| | 578 | | | Legrand SA (Capital Goods) | | | 32,676 | |
| | 2,579 | | | Rubis SCA (Utilities) | | | 138,683 | |
| | 8,216 | | | Safran SA (Capital Goods) | | | 985,386 | |
| | 10,941 | | | Schneider Electric SE (Capital Goods) | | | 742,142 | |
| | 2,965 | | | Teleperformance (Commercial & Professional Services) | | | 474,311 | |
| | 15,282 | | | TOTAL SA (Energy) | | | 806,051 | |
| | | | | | | | |
| | | | | | | 7,484,755 | |
| | |
| | Germany – 7.6% | |
| | 3,542 | | | adidas AG (Consumer Durables & Apparel) | | | 740,239 | |
| | 2,052 | | | Allianz SE (Registered) (Insurance) | | | 412,360 | |
| | 1,396 | | | Axel Springer SE (Media & Entertainment) | | | 79,092 | |
| | 7,700 | | | BASF SE (Materials) | | | 536,333 | |
| | 314 | | | Bayer AG (Registered) (Pharmaceuticals, Biotechnology & Life Sciences) | | | 21,838 | |
| | 7,310 | | | CANCOM SE (Software & Services) | | | 239,909 | |
| | 3,800 | | | Continental AG (Automobiles & Components) | | | 529,097 | |
| | 8,750 | | | Covestro AG (Materials)(a) | | | 433,339 | |
| | 24,393 | | | Deutsche Lufthansa AG (Registered) (Transportation) | | | 550,881 | |
| | 2,727 | | | E.ON SE (Utilities) | | | 26,919 | |
| | 1,680 | | | Evotec AG (Pharmaceuticals, Biotechnology & Life Sciences)* | | | 33,320 | |
| | |
| | |
| The accompanying notes are an integral part of these financial statements. | | 11 |
GOLDMAN SACHS VARIABLE INSURANCE TRUST INTERNATIONAL EQUITY INSIGHTS FUND
Schedule of Investments(continued)
December 31, 2018
| | | | | | | | |
| Shares | | | Description | | Value | |
|
| | Common Stocks – (continued) | |
| | Germany – (continued) | |
| | 7,941 | | | Fresenius Medical Care AG & Co. KGaA (Health Care Equipment & Services) | | $ | 514,745 | |
| | 10,112 | | | Fresenius SE & Co. KGaA (Health Care Equipment & Services) | | | 488,755 | |
| | 26,747 | | | Infineon Technologies AG (Semiconductors & Semiconductor Equipment) | | | 535,520 | |
| | 1,216 | | | Nemetschek SE (Software & Services) | | | 133,775 | |
| | 18,696 | | | ProSiebenSat.1 Media SE (Media & Entertainment) | | | 332,669 | |
| | 3,858 | | | Wirecard AG (Software & Services) | | | 581,602 | |
| | | | | | | | |
| | | | | | | 6,190,393 | |
| | |
| | Hong Kong – 4.3% | |
| | 151,600 | | | AIA Group Ltd. (Insurance) | | | 1,259,313 | |
| | 55,500 | | | CLP Holdings Ltd. (Utilities) | | | 627,200 | |
| | 27,800 | | | Hong Kong Exchanges & Clearing Ltd. (Diversified Financials) | | | 803,658 | |
| | 38,000 | | | Hysan Development Co. Ltd. (Real Estate) | | | 180,705 | |
| | 89,000 | | | NWS Holdings Ltd. (Capital Goods) | | | 182,750 | |
| | 70,000 | | | Swire Pacific Ltd. Class B (Real Estate) | | | 117,002 | |
| | 62,000 | | | Techtronic Industries Co. Ltd. (Consumer Durables & Apparel) | | | 329,013 | |
| | | | | | | | |
| | | | | | | 3,499,641 | |
| | |
| | Italy – 1.5% | |
| | 1,850 | | | Avio SpA (Capital Goods) | | | 23,655 | |
| | 53,760 | | | Eni SpA (Energy) | | | 849,258 | |
| | 27,625 | | | Iren SpA (Utilities) | | | 66,344 | |
| | 11,172 | | | Mediobanca Banca di Credito Finanziario SpA (Banks) | | | 94,531 | |
| | 34,507 | | | Terna Rete Elettrica Nazionale SpA (Utilities) | | | 195,970 | |
| | | | | | | | |
| | | | | | | 1,229,758 | |
| | |
| | Japan – 26.4% | |
| | 29,200 | | | AEON Financial Service Co. Ltd. (Diversified Financials) | | | 518,033 | |
| | 2,600 | | | Amada Holdings Co. Ltd. (Capital Goods) | | | 23,340 | |
| | 2,700 | | | ANA Holdings, Inc. (Transportation) | | | 96,927 | |
| | 2,000 | | | Aozora Bank Ltd. (Banks) | | | 59,610 | |
| | 39,200 | | | Asahi Kasei Corp. (Materials) | | | 402,324 | |
| | 44,200 | | | Astellas Pharma, Inc. (Pharmaceuticals, Biotechnology & Life Sciences) | | | 564,727 | |
| | 3,500 | | | Central Japan Railway Co. (Transportation) | | | 738,456 | |
| | 1,300 | | | Central Sports Co. Ltd. (Consumer Services) | | | 41,442 | |
| | 3,500 | | | Chodai Co. Ltd. (Capital Goods) | | | 22,189 | |
| | 1,600 | | | Chubu Electric Power Co., Inc. (Utilities) | | | 22,735 | |
| | 1,700 | | | cocokara fine, Inc. (Food & Staples Retailing) | | | 82,807 | |
| | |
|
| | Common Stocks – (continued) | |
| | Japan – (continued) | |
| | 7,800 | | | East Japan Railway Co. (Transportation) | | | 688,819 | |
| | 2,800 | | | Eisai Co. Ltd. (Pharmaceuticals, Biotechnology & Life Sciences) | | | 216,776 | |
| | 5,000 | | | Fancl Corp. (Household & Personal Products) | | | 127,566 | |
| | 700 | | | Fujimori Kogyo Co. Ltd. (Materials) | | | 18,759 | |
| | 1,900 | | | Geo Holdings Corp. (Retailing) | | | 28,847 | |
| | 900 | | | Heiwa Corp. (Consumer Durables & Apparel) | | | 18,323 | |
| | 1,100 | | | Himaraya Co. Ltd. (Retailing) | | | 9,147 | |
| | 24,200 | | | Hitachi Ltd. (Technology Hardware & Equipment) | | | 641,548 | |
| | 5,600 | | | Honda Motor Co. Ltd. (Automobiles & Components) | | | 147,532 | |
| | 2,600 | | | Hulic Co. Ltd. (Real Estate) | | | 23,235 | |
| | 3,600 | | | IMAGICA GROUP, Inc. (Media & Entertainment) | | | 16,449 | |
| | 2,600 | | | ISB Corp. (Software & Services) | | | 36,589 | |
| | 15,300 | | | Japan Airlines Co. Ltd. (Transportation) | | | 542,249 | |
| | 4,700 | | | Japan Exchange Group, Inc. (Diversified Financials) | | | 75,810 | |
| | 277 | | | Japan Retail Fund Investment Corp. (REIT) | | | 552,773 | |
| | 30,900 | | | JFE Holdings, Inc. (Materials) | | | 492,186 | |
| | 76,800 | | | JXTG Holdings, Inc. (Energy) | | | 398,863 | |
| | 2,700 | | | Kamigumi Co. Ltd. (Transportation) | | | 55,239 | |
| | 14,500 | | | Kansai Electric Power Co., Inc. (The) (Utilities) | | | 217,452 | |
| | 1,600 | | | KDDI Corp. (Telecommunication Services) | | | 38,232 | |
| | 1,500 | | | Kewpie Corp. (Food, Beverage & Tobacco) | | | 33,401 | |
| | 15,900 | | | Kirin Holdings Co. Ltd. (Food, Beverage & Tobacco) | | | 331,540 | |
| | 4,800 | | | Kyocera Corp. (Technology Hardware & Equipment) | | | 239,928 | |
| | 4,300 | | | Macnica Fuji Electronics Holdings, Inc. (Technology Hardware & Equipment) | | | 52,690 | |
| | 800 | | | Mandom Corp. (Household & Personal Products) | | | 21,797 | |
| | 8,000 | | | Marui Group Co. Ltd. (Retailing) | | | 155,039 | |
| | 4,800 | | | Matsumotokiyoshi Holdings Co. Ltd. (Food & Staples Retailing) | | | 147,584 | |
| | 2,800 | | | Medipal Holdings Corp. (Health Care Equipment & Services) | | | 59,904 | |
| | 73,000 | | | Mitsubishi Chemical Holdings Corp. (Materials) | | | 551,512 | |
| | 84,400 | | | Mitsubishi UFJ Financial Group, Inc. (Banks) | | | 414,206 | |
| | 369,200 | | | Mizuho Financial Group, Inc. (Banks) | | | 571,240 | |
| | 12,300 | | | MS&AD Insurance Group Holdings, Inc. (Insurance) | | | 349,631 | |
| | 4,300 | | | NEC Networks & System Integration Corp. (Software & Services) | | | 95,675 | |
| | |
| | |
| 12 | | The accompanying notes are an integral part of these financial statements. |
GOLDMAN SACHS VARIABLE INSURANCE TRUST INTERNATIONAL EQUITY INSIGHTS FUND
| | | | | | | | |
| Shares | | | Description | | Value | |
|
| | Common Stocks – (continued) | |
| | Japan – (continued) | |
| | 10,400 | | | Nippon Telegraph & Telephone Corp. (Telecommunication Services) | | $ | 424,313 | |
| | 5,500 | | | Nomura Research Institute Ltd. (Software & Services) | | | 203,955 | |
| | 9,600 | | | Ono Pharmaceutical Co. Ltd. (Pharmaceuticals, Biotechnology & Life Sciences) | | | 196,039 | |
| | 31,500 | | | ORIX Corp. (Diversified Financials) | | | 460,276 | |
| | 27,400 | | | Osaka Gas Co. Ltd. (Utilities) | | | 499,830 | |
| | 4,100 | | | Pola Orbis Holdings, Inc. (Household & Personal Products) | | | 110,487 | |
| | 14,400 | | | Rohto Pharmaceutical Co. Ltd. (Pharmaceuticals, Biotechnology & Life Sciences) | | | 393,051 | |
| | 2,200 | | | Round One Corp. (Consumer Services) | | | 22,575 | |
| | 300 | | | Ryohin Keikaku Co. Ltd. (Retailing) | | | 72,835 | |
| | 42,300 | | | Santen Pharmaceutical Co. Ltd. (Pharmaceuticals, Biotechnology & Life Sciences) | | | 610,315 | |
| | 1,100 | | | SCSK Corp. (Software & Services) | | | 38,977 | |
| | 36,300 | | | Sega Sammy Holdings, Inc. (Consumer Durables & Apparel) | | | 506,049 | |
| | 14,500 | | | Seven & i Holdings Co. Ltd. (Food & Staples Retailing) | | | 630,099 | |
| | 13,500 | | | Shionogi & Co. Ltd. (Pharmaceuticals, Biotechnology & Life Sciences) | | | 770,519 | |
| | 2,400 | | | SoftBank Group Corp. (Telecommunication Services) | | | 157,198 | |
| | 4,800 | | | Sompo Holdings, Inc. (Insurance) | | | 163,056 | |
| | 56,000 | | | Sumitomo Chemical Co. Ltd. (Materials) | | | 271,192 | |
| | 40,800 | | | Sumitomo Corp. (Capital Goods) | | | 578,902 | |
| | 18,100 | | | Sumitomo Heavy Industries Ltd. (Capital Goods) | | | 536,687 | |
| | 25,200 | | | Sumitomo Mitsui Financial Group, Inc. (Banks) | | | 830,720 | |
| | 15,200 | | | Sumitomo Mitsui Trust Holdings, Inc. (Banks) | | | 553,538 | |
| | 800 | | | Suzuken Co. Ltd. (Health Care Equipment & Services) | | | 40,738 | |
| | 10,600 | | | Takashimaya Co. Ltd. (Retailing) | | | 135,344 | |
| | 12,900 | | | Takeda Pharmaceutical Co. Ltd. (Pharmaceuticals, Biotechnology & Life Sciences)(b) | | | 437,239 | |
| | 11,700 | | | TIS, Inc. (Software & Services) | | | 460,663 | |
| | 5,600 | | | Tohoku Electric Power Co., Inc. (Utilities) | | | 73,729 | |
| | 12,900 | | | Tokio Marine Holdings, Inc. (Insurance) | | | 612,863 | |
| | 16,500 | | | Toyota Motor Corp. (Automobiles & Components) | | | 955,129 | |
| | 2,500 | | | XNET Corp. (Software & Services) | | | 18,819 | |
| | 200,900 | | | Yahoo Japan Corp. (Media & Entertainment) | | | 499,783 | |
| | 13,600 | | | Yamaha Motor Co. Ltd. (Automobiles & Components) | | | 265,522 | |
| | |
|
| | Common Stocks – (continued) | |
| | Japan – (continued) | |
| | 1,500 | | | Yamaya Corp. (Food & Staples Retailing) | | | 30,019 | |
| | 3,200 | | | Zuken, Inc. (Software & Services) | | | 43,413 | |
| | | | | | | | |
| | | | | | | 21,547,005 | |
| | |
| | Netherlands – 6.7% | |
| | 23,086 | | | ABN AMRO Group NV CVA (Banks)(a) | | | 543,256 | |
| | 31,618 | | | Altice Europe NV (Media & Entertainment)* | | | 61,349 | |
| | 2,978 | | | ASML Holding NV (Semiconductors & Semiconductor Equipment) | | | 466,532 | |
| | 4,761 | | | ASR Nederland NV (Insurance) | | | 188,388 | |
| | 32,601 | | | Koninklijke Ahold Delhaize NV (Food & Staples Retailing) | | | 823,573 | |
| | 7,786 | | | Koninklijke DSM NV (Materials) | | | 631,645 | |
| | 14,392 | | | NN Group NV (Insurance) | | | 572,206 | |
| | 2,398 | | | NXP Semiconductors NV (Semiconductors & Semiconductor Equipment) | | | 175,726 | |
| | 8,282 | | | Randstad NV (Commercial & Professional Services) | | | 379,730 | |
| | 15,711 | | | Royal Dutch Shell plc Class A (Energy) | | | 463,080 | |
| | 10,300 | | | Royal Dutch Shell plc Class B (Energy) | | | 307,944 | |
| | 14,076 | | | Wolters Kluwer NV (Commercial & Professional Services) | | | 827,770 | |
| | | | | | | | |
| | | | | | | 5,441,199 | |
| | |
| | New Zealand – 0.0% | |
| | 3,151 | | | Trustpower Ltd. (Utilities) | | | 13,015 | |
| | |
| | Norway – 1.6% | |
| | 3,782 | | | Austevoll Seafood ASA (Food, Beverage & Tobacco) | | | 46,688 | |
| | 5,188 | | | DNB ASA (Banks) | | | 83,276 | |
| | 40,723 | | | DNO ASA (Energy) | | | 59,169 | |
| | 16,736 | | | Kongsberg Gruppen ASA (Capital Goods) | | | 227,523 | |
| | 37,445 | | | Leroy Seafood Group ASA (Food, Beverage & Tobacco) | | | 284,975 | |
| | 8,165 | | | Salmar ASA (Food, Beverage & Tobacco) | | | 404,974 | |
| | 19,139 | | | SpareBank 1SR-Bank ASA (Banks) | | | 197,469 | |
| | | | | | | | |
| | | | | | | 1,304,074 | |
| | |
| | Portugal – 0.7% | |
| | 35,901 | | | Galp Energia SGPS SA (Energy) | | | 565,291 | |
| | |
| | Singapore – 0.2% | |
| | 22,000 | | | Singapore Exchange Ltd. (Diversified Financials) | | | 115,298 | |
| | 4,300 | | | Venture Corp. Ltd. (Technology Hardware & Equipment) | | | 44,147 | |
| | | | | | | | |
| | | | | | | 159,445 | |
| | |
| | Spain – 2.5% | |
| | 616 | | | ACS Actividades de Construccion y Servicios SA (Capital Goods) | | | 23,844 | |
| | |
| | |
| The accompanying notes are an integral part of these financial statements. | | 13 |
GOLDMAN SACHS VARIABLE INSURANCE TRUST INTERNATIONAL EQUITY INSIGHTS FUND
Schedule of Investments(continued)
December 31, 2018
| | | | | | | | |
| Shares | | | Description | | Value | |
|
| | Common Stocks – (continued) | |
| | Spain – (continued) | |
| | 139,011 | | | Banco Bilbao Vizcaya Argentaria SA (Banks) | | $ | 738,401 | |
| | 18,788 | | | Banco de Sabadell SA (Banks) | | | 21,497 | |
| | 82,953 | | | CaixaBank SA (Banks) | | | 300,409 | |
| | 3,020 | | | Enagas SA (Energy) | | | 81,637 | |
| | 9,681 | | | Grifols SA (Pharmaceuticals, Biotechnology & Life Sciences) | | | 254,144 | |
| | 34,291 | | | Merlin Properties Socimi SA (REIT) | | | 423,609 | |
| | 23,801 | | | Telefonica SA (Telecommunication Services) | | | 200,342 | |
| | | | | | | | |
| | | | | | | 2,043,883 | |
| | |
| | Sweden – 3.1% | |
| | 24,203 | | | Alfa Laval AB (Capital Goods) | | | 520,298 | |
| | 12,662 | | | Biotage AB (Pharmaceuticals, Biotechnology & Life Sciences) | | | 156,687 | |
| | 1,020 | | | Nolato AB Class B (Capital Goods) | | | 42,218 | |
| | 2,318 | | | Skandinaviska Enskilda Banken AB Class A (Banks) | | | 22,533 | |
| | 5,616 | | | SSAB AB Class B (Materials) | | | 15,849 | |
| | 2,554 | | | Swedbank AB Class A (Banks) | | | 57,085 | |
| | 12,347 | | | Swedish Match AB (Food, Beverage & Tobacco) | | | 486,070 | |
| | 77,280 | | | Telefonaktiebolaget LM Ericsson Class B (Technology Hardware & Equipment) | | | 684,080 | |
| | 43,773 | | | Volvo AB Class B (Capital Goods) | | | 573,166 | |
| | | | | | | | |
| | | | | | | 2,557,986 | |
| | |
| | Switzerland – 8.1% | |
| | 10,713 | | | Adecco Group AG (Registered) (Commercial & Professional Services) | | | 503,537 | |
| | 1,904 | | | BKW AG (Utilities) | | | 133,149 | |
| | 1,818 | | | Galenica AG (Pharmaceuticals, Biotechnology & Life Sciences)(a) | | | 80,082 | |
| | 8,522 | | | Logitech International SA (Registered) (Technology Hardware & Equipment) | | | 269,198 | |
| | 2,000 | | | Lonza Group AG (Registered) (Pharmaceuticals, Biotechnology & Life Sciences)* | | | 519,910 | |
| | 8,847 | | | Nestle SA (Registered) (Food, Beverage & Tobacco) | | | 718,047 | |
| | 2,981 | | | Novartis AG (Registered) (Pharmaceuticals, Biotechnology & Life Sciences) | | | 255,306 | |
| | 3,354 | | | Oriflame Holding AG (Household & Personal Products) | | | 75,442 | |
| | 7,574 | | | Roche Holding AG (Pharmaceuticals, Biotechnology & Life Sciences) | | | 1,880,314 | |
| | 1,308 | | | Siegfried Holding AG (Registered) (Pharmaceuticals, Biotechnology & Life Sciences)* | | | 447,353 | |
| | 32 | | | Swiss Life Holding AG (Registered) (Insurance) | | | 12,351 | |
| | |
|
| | Common Stocks – (continued) | |
| | Switzerland – (continued) | |
| | 2,697 | | | Tecan Group AG (Registered) (Pharmaceuticals, Biotechnology & Life Sciences) | | | 524,933 | |
| | 4,350 | | | Temenos AG (Registered) (Software & Services) | | | 522,708 | |
| | 2,322 | | | Zurich Insurance Group AG (Insurance)* | | | 692,162 | |
| | | | | | | | |
| | | | | | | 6,634,492 | |
| | |
| | United Kingdom – 13.6% | |
| | 56,601 | | | 3i Group plc (Diversified Financials) | | | 558,494 | |
| | 12,792 | | | Abcam plc (Pharmaceuticals, Biotechnology & Life Sciences) | | | 178,058 | |
| | 4,249 | | | Ashtead Group plc (Capital Goods) | | | 88,631 | |
| | 115,855 | | | Aviva plc (Insurance) | | | 554,482 | |
| | 38,192 | | | BP plc ADR (Energy) | | | 1,448,241 | |
| | 34,650 | | | BT Group plc (Telecommunication Services) | | | 105,357 | |
| | 13,766 | | | Burberry Group plc (Consumer Durables & Apparel) | | | 302,288 | |
| | 12,066 | | | Diageo plc (Food, Beverage & Tobacco) | | | 431,171 | |
| | 131,915 | | | Direct Line Insurance Group plc (Insurance) | | | 536,227 | |
| | 28,396 | | | Experian plc (Commercial & Professional Services) | | | 688,374 | |
| | 40,146 | | | Fiat Chrysler Automobiles NV (Automobiles & Components)* | | | 578,840 | |
| | 28,501 | | | Genel Energy plc (Energy)* | | | 64,445 | |
| | 26,740 | | | Great Portland Estates plc (REIT) | | | 224,777 | |
| | 22,193 | | | HSBC Holdings plc (Banks) | | | 183,086 | |
| | 22,800 | | | Imperial Brands plc (Food, Beverage & Tobacco) | | | 692,020 | |
| | 122,136 | | | International Consolidated Airlines Group SA (Transportation) | | | 965,659 | |
| | 5,457 | | | Intertek Group plc (Commercial & Professional Services) | | | 333,984 | |
| | 208,202 | | | Legal & General Group plc (Insurance) | | | 613,440 | |
| | 554,203 | | | Lloyds Banking Group plc (Banks) | | | 365,320 | |
| | 11,882 | | | National Grid plc (Utilities) | | | 116,245 | |
| | 9,877 | | | Next plc (Retailing) | | | 502,906 | |
| | 45,682 | | | Pearson plc (Media & Entertainment) | | | 547,266 | |
| | 8,063 | | | Smith & Nephew plc (Health Care Equipment & Services) | | | 150,929 | |
| | 7,063 | | | Unilever plc ADR (Household & Personal Products) | | | 369,042 | |
| | 25,707 | | | Vodafone Group plc ADR (Telecommunication Services) | | | 495,631 | |
| | | | | | | | |
| | | | | | | 11,094,913 | |
| | |
| | |
| 14 | | The accompanying notes are an integral part of these financial statements. |
GOLDMAN SACHS VARIABLE INSURANCE TRUST INTERNATIONAL EQUITY INSIGHTS FUND
| | | | | | | | |
| Shares | | | Description | | Value | |
|
| | Common Stocks – (continued) | |
| | United States – 0.2% | |
| | 1,607 | | | Carnival plc ADR (Consumer Services) | | $ | 78,309 | |
| | 3,244 | | | QIAGEN NV (Pharmaceuticals, Biotechnology & Life Sciences)* | | | 110,850 | |
| | | | | | | | |
| | | | | | | 189,159 | |
| | |
| | TOTAL COMMON STOCKS | |
| | (Cost $90,407,498) | | $ | 78,779,533 | |
| | |
| TOTAL INVESTMENTS BEFORE SECURITIES LENDING
REINVESTMENT VEHICLE |
|
| | (Cost $90,407,498) | | $ | 78,779,533 | |
| | |
| | | | | | | | |
| Shares | | Dividend Rate | | | Value | |
|
| Securities Lending Reinvestment Vehicle(c) – 0.5% | |
Goldman Sachs Financial Square Government Fund — Institutional Shares | |
| 431,989 | | | 2.521 | % | | $ | 431,989 | |
| (Cost $431,989) | |
| |
| TOTAL INVESTMENTS – 96.9% | |
| (Cost $90,839,487) | | | $ | 79,211,522 | |
| |
OTHER ASSETS IN EXCESS OF LIABILITIES – 3.1% | | | | 2,540,538 | |
| |
| NET ASSETS – 100.0% | | | $ | 81,752,060 | |
| |
| | |
| The percentage shown for each investment category reflects the value of investments in that category as a percentage of net assets. |
| |
| * | | Non-income producing security. |
| |
| (a) | | Exempt from registration under Rule 144A of the Securities Act of 1933. Under procedures approved by the Board of Trustees, such securities may be deemed liquid by the Investment Adviser and may be resold, normally to qualified institutional buyers in transactions exempt from registration. Total market value of Rule 144A securities amounts to $1,079,551, which represents approximately 1.3% of net assets as of December 31, 2018. The liquidity determination is unaudited. |
| |
| (b) | | All or a portion of security is on loan. |
| |
| (c) | | Represents an Affiliated Issuer. |
| | |
| |
| Investment Abbreviations: |
| ADR | | —American Depositary Receipt |
| CVA | | —Dutch Certification |
| REIT | | —Real Estate Investment Trust |
ADDITIONAL INVESTMENT INFORMATION
FUTURES CONTRACTS — At December 31, 2018, the Fund had the following futures contracts:
| | | | | | | | | | | | | | | | |
| Description | | Number of
Contracts | | | Expiration
Date | | | Notional
Amount | | | Unrealized
Appreciation/
(Depreciation) | |
| | | | |
Long position contracts: | | | | | | | | | | | | | | | | |
| EURO STOXX 50 Index | | | 20 | | | | 03/15/2019 | | | $ | 681,492 | | | $ | (16,730 | ) |
| FTSE 100 Index | | | 4 | | | | 03/15/2019 | | | | 339,502 | | | | (3,440 | ) |
| MSCI Singapore Index | | | 1 | | | | 01/30/2019 | | | | 25,071 | | | | 70 | |
| SPI 200 Index | | | 1 | | | | 03/21/2019 | | | | 97,922 | | | | 72 | |
TOPIX Index | | | 2 | | | | 03/07/2019 | | | | 272,524 | | | | (16,506 | ) |
| |
| Total Futures Contracts | | | $ | (36,534 | ) |
| | |
| The accompanying notes are an integral part of these financial statements. | | 15 |
GOLDMAN SACHS VARIABLE INSURANCE TRUST INTERNATIONAL EQUITY INSIGHTS FUND
Statement of Assets and Liabilities
December 31, 2018
| | | | |
| | | | |
| Assets: | |
Investments in unaffiliated issuers, at value (cost $90,407,498)(a) | | $ | 78,779,533 | |
Investments in affiliated securities lending reinvestment vehicle, at value (cost $431,989) | | | 431,989 | |
Cash | | | 938,716 | |
Foreign currencies, at value (cost $1,708,659) | | | 1,690,067 | |
Receivables: | | | | |
Foreign tax reclaims | | | 404,068 | |
Collateral on certain derivative contracts | | | 82,601 | |
Reimbursement from investment adviser | | | 75,466 | |
Dividends | | | 67,519 | |
Fund shares sold | | | 2,296 | |
Securities lending income | | | 1,119 | |
Other assets | | | 534 | |
| |
| Total assets | | | 82,473,908 | |
| | | | |
| | | | |
| Liabilities: | |
Variation margin on futures | | | 1,580 | |
Payables: | | | | |
Payable upon return of securities loaned | | | 431,989 | |
Due to custodian | | | 94,876 | |
Management fees | | | 57,101 | |
Fund shares redeemed | | | 26,352 | |
Distribution and Service fees and Transfer Agency fees | | | 10,866 | |
Accrued expenses | | | 99,084 | |
| |
| Total liabilities | | | 721,848 | |
| | | | |
| | | | |
| Net Assets: | |
Paid-in capital | | | 95,533,397 | |
Total distributable loss | | | (13,781,337 | ) |
| |
| NET ASSETS | | $ | 81,752,060 | |
Net Assets: | | | | |
Institutional | | $ | 37,828,851 | |
Service | | | 43,923,209 | |
| |
Total Net Assets | | $ | 81,752,060 | |
Shares outstanding $0.001 par value (unlimited shares authorized): | | | | |
Institutional | | | 5,344,929 | |
Service | | | 6,178,787 | |
Net asset value, offering and redemption price per share: | | | | |
Institutional | | | $7.08 | |
Service | | | 7.11 | |
(a) Includes loaned securities having a market value of $411,201.
| | |
| 16 | | The accompanying notes are an integral part of these financial statements. |
GOLDMAN SACHS VARIABLE INSURANCE TRUST INTERNATIONAL EQUITY INSIGHTS FUND
Statement of Operations
For the Fiscal Year Ended December 31, 2018
| | | | |
| Investment income: | |
Dividends — unaffiliated issuers (net of foreign taxes withheld of $277,128) | | $ | 2,698,137 | |
Securities lending income — affiliated issuer | | | 30,263 | |
Dividends — affiliated issuers | | | 8,484 | |
| |
| Total investment income | | | 2,736,884 | |
| | | | |
| | | | |
| Expenses: | |
Management fees | | | 899,515 | |
Distribution and Service fees — Service Shares | | | 164,480 | |
Professional fees | | | 156,997 | |
Custody, accounting and administrative services | | | 117,177 | |
Printing and mailing costs | | | 79,884 | |
Transfer Agency fees(a) | | | 21,781 | |
Trustee fees | | | 16,271 | |
Registration fees | | | 730 | |
Other | | | 16,707 | |
| |
| Total expenses | | | 1,473,542 | |
| |
Less — expense reductions | | | (359,321 | ) |
| |
| Net expenses | | | 1,114,221 | |
| |
| NET INVESTMENT INCOME | | | 1,622,663 | |
| | | | |
| | | | |
| Realized and unrealized gain (loss): | |
Net realized gain (loss) from: | | | | |
Investments — unaffiliated issuers | | | 19,723,629 | |
Futures contracts | | | (67,439 | ) |
Foreign currency transactions | | | (59,504 | ) |
Net change in unrealized loss on: | |
Investments — unaffiliated issuers | | | (37,735,827 | ) |
Futures contracts | | | (36,534 | ) |
Foreign currency translation | | | (23,410 | ) |
| |
| Net realized and unrealized loss | | | (18,199,085 | ) |
| |
| NET DECREASE IN NET ASSETS RESULTING FROM OPERATIONS | | $ | (16,576,422 | ) |
(a) Institutional and Service Shares incurred Transfer Agency fees of $8,624 and $13,157, respectively.
| | |
| The accompanying notes are an integral part of these financial statements. | | 17 |
GOLDMAN SACHS VARIABLE INSURANCE TRUST INTERNATIONAL EQUITY INSIGHTS FUND
Statements of Changes in Net Assets
| | | | | | | | |
| | | For the
Fiscal Year Ended
December 31, 2018 | | | For the
Fiscal Year Ended
December 31, 2017 | |
| | | | | | | | |
| From operations: | |
Net investment income | | $ | 1,622,663 | | | $ | 2,387,471 | |
Net realized gain (loss) | | | 19,596,686 | | | | (257,284 | ) |
Net change in unrealized gain (loss) | | | (37,795,771 | ) | | | 34,780,956 | |
| | |
| Net increase (decrease) in net assets resulting from operations | | | (16,576,422 | ) | | | 36,911,143 | |
| | | | | | | | |
| | | | | | | | |
| Distributions to shareholders: | |
From distributable earnings: | | | | | | | | |
Institutional Shares | | | (8,500,382 | ) | | | (739,059 | )(a) |
Service Shares | | | (9,678,544 | ) | | | (1,909,638 | )(a) |
| | |
| Total distributions to shareholders | | | (18,178,926 | ) | | | (2,648,697 | ) |
| | | | | | | | |
| | | | | | | | |
| From share transactions: | |
Proceeds from sales of shares | | | 12,142,507 | | | | 7,888,528 | |
Reinvestment of distributions | | �� | 18,178,926 | | | | 2,648,697 | |
Cost of shares redeemed | | | (79,104,015 | ) | | | (21,932,620 | ) |
| | |
| Net decrease in net assets resulting from share transactions | | | (48,782,582 | ) | | | (11,395,395 | ) |
| | |
| TOTAL INCREASE (DECREASE) | | | (83,537,930 | ) | | | 22,867,051 | |
| | | | | | | | |
| | | | | | | | |
| Net assets:(b) | |
| | |
Beginning of year | | | 165,289,990 | | | | 142,422,939 | |
| | |
End of year | | $ | 81,752,060 | | | $ | 165,289,990 | |
| (a) | Prior year information has been revised to conform to current year presentation. Distributions to shareholders for the Fund consisted solely of net investment income for the fiscal year ended December 31, 2017. |
| (b) | Prior fiscal year information has been revised to conform with current year presentation. Distributions in excess of net investment income were $(216,255) for the Fund as of December 31, 2017. |
| | |
| 18 | | The accompanying notes are an integral part of these financial statements. |
GOLDMAN SACHS VARIABLE INSURANCE TRUST INTERNATIONAL EQUITY INSIGHTS FUND
Financial Highlights
Selected Data for a Share Outstanding Throughout Each Year
| | | | | | | | | | | | | | | | | | | | |
| | | Goldman Sachs
International Equity Insights Fund | |
| | | Institutional Shares | |
| | | Year Ended December 31, | |
| | | 2018 | | | 2017 | | | 2016 | | | 2015 | | | 2014 | |
| | | | | | | | | | | | | | | | | | | | |
| Per Share Data | | | | | | | | | | | | | | | |
| | | | | |
Net asset value, beginning of year | | $ | 10.88 | | | $ | 8.75 | | | $ | 9.19 | | | $ | 9.26 | | | $ | 10.43 | |
| | | | | |
Net investment income(a) | | | 0.19 | | | | 0.17 | | | | 0.17 | (b) | | | 0.14 | (c) | | | 0.39 | (d) |
| | | | | | |
Net realized and unrealized gain (loss) | | | (1.94 | ) | | | 2.16 | | | | (0.42 | ) | | | (0.04 | ) | | | (1.18 | ) |
| | | | | |
Total from investment operations | | | (1.75 | ) | | | 2.33 | | | | (0.25 | ) | | | 0.10 | | | | (0.79 | ) |
| | | | | |
Distributions to shareholders from net investment income | | | (0.21 | ) | | | (0.20 | ) | | | (0.19 | ) | | | (0.17 | ) | | | (0.38 | ) |
| | | | | |
Distributions to shareholders from net realized gains | | | (1.84 | ) | | | — | | | | — | | | | — | | | | — | |
| | | | | |
Total distributions | | | (2.05 | ) | | | (0.20 | ) | | | (0.19 | ) | | | (0.17 | ) | | | (0.38 | ) |
| | | | | |
Net asset value, end of year | | $ | 7.08 | | | $ | 10.88 | | | $ | 8.75 | | | $ | 9.19 | | | $ | 9.26 | |
| | | | | |
Total return(e) | | | (16.28 | )% | | | 26.60 | % | | | (2.72 | )% | | | 1.05 | % | | | (7.54 | )% |
| | | | | |
Net assets, end of year (in 000s) | | $ | 37,829 | | | $ | 41,512 | | | $ | 37,061 | | | $ | 41,737 | | | $ | 46,871 | |
| | | | | |
Ratio of net expenses to average net assets | | | 0.87 | % | | | 0.87 | % | | | 0.89 | % | | | 0.89 | % | | | 0.99 | % |
| | | | | |
Ratio of total expenses to average net assets | | | 1.23 | % | | | 1.02 | % | | | 1.06 | % | | | 1.06 | % | | | 1.04 | % |
| | | | | |
Ratio of net investment income to average net assets | | | 1.79 | % | | | 1.69 | % | | | 1.94 | %(b) | | | 1.42 | %(c) | | | 3.75 | %(d) |
| | | | | |
Portfolio turnover rate(f) | | | 156 | % | | | 23 | % | | | 39 | % | | | 58 | % | | | 74 | % |
| (a) | Calculated based on the average shares outstanding methodology. |
| (b) | Reflects income recognized from corporate actions which amounted to $0.03 per share and 0.36% of average net assets. |
| (c) | Reflects income recognized from a corporate action which amounted to $0.02 per share and 0.17% of average net assets. |
| (d) | Reflects income recognized from a corporate action which amounted to $0.22 per share and 2.10% of average net assets. |
| (e) | Assumes investment at the net asset value at the beginning of the year, reinvestment of all distributions, and a complete redemption of the investment at the net asset value at the end of the year. |
| (f) | The Fund’s portfolio turnover rate is calculated in accordance with regulatory requirements, without regard to transactions involving short term investments. If such transactions were included, the Fund’s portfolio turnover rate may be higher. |
| | |
| The accompanying notes are an integral part of these financial statements. | | 19 |
GOLDMAN SACHS VARIABLE INSURANCE TRUST INTERNATIONAL EQUITY INSIGHTS FUND
Financial Highlights(continued)
Selected Data for a Share Outstanding Throughout Each Year
| | | | | | | | | | | | | | | | | | | | |
| | | Goldman Sachs
International Equity Insights Fund | |
| | | Service Shares | |
| | | Year Ended December 31, | |
| | | 2018 | | | 2017 | | | 2016 | | | 2015 | | | 2014 | |
| | | | | | | | | | | | | | | | | | | | |
| Per Share Data | | | | | | | | | | | | | | | |
| | | | | |
Net asset value, beginning of year | | $ | 10.91 | | | $ | 8.78 | | | $ | 9.21 | | | $ | 9.28 | | | $ | 10.44 | |
| | | | | |
Net investment income(a) | | | 0.14 | | | | 0.14 | | | | 0.15 | (b) | | | 0.12 | (c) | | | 0.36 | (d) |
| | | | | | |
Net realized and unrealized gain (loss) | | | (1.93 | ) | | | 2.16 | | | | (0.42 | ) | | | (0.05 | ) | | | (1.17 | ) |
| | | | | |
Total from investment operations | | | (1.79 | ) | | | 2.30 | | | | (0.27 | ) | | | 0.07 | | | | (0.81 | ) |
| | | | | |
Distributions to shareholders from net investment income | | | (0.17 | ) | | | (0.17 | ) | | | (0.16 | ) | | | (0.14 | ) | | | (0.35 | ) |
| | | | | |
Distributions to shareholders from net realized gains | | | (1.84 | ) | | | — | | | | — | | | | — | | | | — | |
| | | | | |
Total distributions | | | (2.01 | ) | | | (0.17 | ) | | | (0.16 | ) | | | (0.14 | ) | | | (0.35 | ) |
| | | | | |
Net asset value, end of year | | $ | 7.11 | | | $ | 10.91 | | | $ | 8.78 | | | $ | 9.21 | | | $ | 9.28 | |
| | | | | |
Total return(e) | | | (16.55 | )% | | | 26.21 | % | | | (2.86 | )% | | | 0.77 | % | | | (7.70 | )% |
| | | | | |
Net assets, end of year (in 000s) | | $ | 43,923 | | | $ | 123,778 | | | $ | 105,362 | | | $ | 116,811 | | | $ | 126,230 | |
| | | | | |
Ratio of net expenses to average net assets | | | 1.12 | % | | | 1.12 | % | | | 1.14 | % | | | 1.14 | % | | | 1.24 | % |
| | | | | |
Ratio of total expenses to average net assets | | | 1.43 | % | | | 1.27 | % | | | 1.31 | % | | | 1.31 | % | | �� | 1.29 | % |
| | | | | |
Ratio of net investment income to average net assets | | | 1.30 | % | | | 1.44 | % | | | 1.68 | %(b) | | | 1.18 | %(c) | | | 3.47 | %(d) |
| | | | | |
Portfolio turnover rate(f) | | | 156 | % | | | 23 | % | | | 39 | % | | | 58 | % | | | 74 | % |
| (a) | Calculated based on the average shares outstanding methodology. |
| (b) | Reflects income recognized from corporate actions which amounted to $0.03 per share and 0.36% of average net assets. |
| (c) | Reflects income recognized from a corporate action which amounted to $0.02 per share and 0.17% of average net assets. |
| (d) | Reflects income recognized from a corporate action which amounted to $0.22 per share and 2.10% of average net assets. |
| (e) | Assumes investment at the net asset value at the beginning of the year, reinvestment of all distributions, and a complete redemption of the investment at the net asset value at the end of the year. |
| (f) | The Fund’s portfolio turnover rate is calculated in accordance with regulatory requirements, without regard to transactions involving short term investments. If such transactions were included, the Fund’s portfolio turnover rate may be higher. |
| | |
| 20 | | The accompanying notes are an integral part of these financial statements. |
GOLDMAN SACHS VARIABLE INSURANCE TRUST INTERNATIONAL EQUITY INSIGHTS FUND
Notes to Financial Statements
December 31, 2018
1. ORGANIZATION
Goldman Sachs Variable Insurance Trust (the “Trust” or “VIT”) is a Delaware statutory trust registered under the Investment Company Act of 1940, as amended (the “Act”), as anopen-end management investment company. The Trust includes the Goldman Sachs International Equity Insights Fund (the “Fund”) (formerly the Goldman Sachs Strategic International Equity Fund). The Fund is a diversified portfolio under the Act offering two classes of shares — Institutional and Service Shares. Shares of the Trust are offered to separate accounts of participating life insurance companies for the purpose of funding variable annuity contracts and variable life insurance policies.
Goldman Sachs Asset Management, L.P. (“GSAM”), an affiliate of Goldman Sachs & Co. LLC (“Goldman Sachs”), serves as investment adviser to the Fund pursuant to a management agreement (the “Agreement”) with the Trust.
2. SIGNIFICANT ACCOUNTING POLICIES
The financial statements have been prepared in accordance with accounting principles generally accepted in the United States of America (“GAAP”) and require management to make estimates and assumptions that may affect the reported amounts and disclosures. Actual results may differ from those estimates and assumptions.
A. Investment Valuation —The Fund’s valuation policy is to value investments at fair value.
B. Investment Income and Investments —Investment income includes interest income, dividend income, and securities lending income, if any. Interest income is accrued daily and adjusted for amortization of premiums and accretion of discounts. Dividend income is recognized onex-dividend date or, for certain foreign securities, as soon as such information is obtained subsequent to theex-dividend date. Investment transactions are reflected on trade date. Realized gains and losses are calculated using identified cost. Investment transactions are recorded on the following business day for daily net asset value (“NAV”) calculations. Investment income is recorded net of any foreign withholding taxes, less any amounts reclaimable. The Fund may file withholding tax reclaims in certain jurisdictions to recover a portion of amounts previously withheld. Any foreign capital gains tax is accrued daily based upon net unrealized gains, and is payable upon sale of such investments.
For derivative contracts, realized gains and losses are recorded upon settlement of the contract.
C. Class Allocations and Expenses —Investment income, realized and unrealized gain (loss), if any, andnon-class specific expenses of the Fund are allocated daily based upon the proportion of net assets of each class.Non-class specific expenses directly incurred by the Fund are charged to the Fund, while such expenses incurred by the Trust are allocated across the Fund on a straight-line and/orpro-rata basis depending upon the nature of the expenses. Class specific expenses, where applicable, are borne by the respective share classes and include Distribution and Service and Transfer Agency fees.
D. Federal Taxes and Distributions to Shareholders —It is the Fund’s policy to comply with the requirements of the Internal Revenue Code of 1986, as amended (the “Code”), applicable to regulated investment companies and to distribute each year substantially all of its investment company taxable income and capital gains to its shareholders. Accordingly, the Fund is not required to make any provisions for the payment of federal income tax. Distributions to shareholders are recorded on theex-dividend date. Income and capital gains distributions, if any, are declared and paid annually.
Net capital losses, if any, are carried forward to future fiscal years and may be used to the extent allowed by the Code to offset any future capital gains. Losses that are carried forward will retain their character as either short-term or long-term capital losses. Utilization of capital loss carryforwards will reduce the requirement of future capital gains distributions.
The characterization of distributions to shareholders for financial reporting purposes is determined in accordance with federal income tax rules, which may differ from GAAP. The source of the Fund’s distributions may be shown in the accompanying financial statements as either from distributable earnings or capital. Certain components of the Fund’s net assets on the Statement of Assets and Liabilities reflect permanent GAAP/tax differences based on the appropriate tax character.
E. Foreign Currency Translation —The accounting records and reporting currency of the Fund are maintained in United States (“U.S.”) dollars. Assets and liabilities denominated in foreign currencies are translated into U.S. dollars using the current exchange
21
GOLDMAN SACHS VARIABLE INSURANCE TRUST INTERNATIONAL EQUITY INSIGHTS FUND
Notes to Financial Statements(continued)
December 31, 2018
2. SIGNIFICANT ACCOUNTING POLICIES (continued)
rates at the close of each business day. The effect of changes in foreign currency exchange rates on investments is included within net realized and unrealized gain (loss) on investments. Changes in the value of other assets and liabilities as a result of fluctuations in foreign exchange rates are included in the Statement of Operations within net change in unrealized gain (loss) on foreign currency translation. Transactions denominated in foreign currencies are translated into U.S. dollars on the date the transaction occurred, the effects of which are included within net realized gain (loss) on foreign currency transactions.
3. INVESTMENTS AND FAIR VALUE MEASUREMENTS
U.S. GAAP defines the fair value of a financial instrument as the amount that would be received to sell an asset or paid to transfer a liability in an orderly transaction between market participants at the measurement date (i.e., the exit price); the Fund’s policy is to use the market approach. GAAP establishes a fair value hierarchy that prioritizes the inputs to valuation techniques used to measure fair value. The hierarchy gives the highest priority to unadjusted quoted prices in active markets for identical assets or liabilities (Level 1 measurements) and the lowest priority to unobservable inputs (Level 3 measurements). The levels used for classifying investments are not necessarily an indication of the risk associated with investing in these investments. The three levels of the fair value hierarchy are described below:
Level 1 — Unadjusted quoted prices in active markets that are accessible at the measurement date for identical, unrestricted assets or liabilities;
Level 2 — Quoted prices in markets that are not active or financial instruments for which significant inputs are observable (including, but not limited to, quoted prices for similar investments, interest rates, foreign exchange rates, volatility and credit spreads), either directly or indirectly;
Level 3 — Prices or valuations that require significant unobservable inputs (including GSAM’s assumptions in determining fair value measurement).
Changes in valuation techniques may result in transfers into or out of an assigned level within the hierarchy. In accordance with the Fund’s policy, transfers between different levels of the fair value hierarchy resulting from such changes are deemed to have occurred as of the beginning of the reporting period.
The Board of Trustees (“Trustees”) has approved Valuation Procedures that govern the valuation of the portfolio investments held by the Fund, including investments for which market quotations are not readily available. The Trustees have delegated to GSAMday-to-day responsibility for implementing and maintaining internal controls and procedures related to the valuation of the Fund’s investments. To assess the continuing appropriateness of pricing sources and methodologies, GSAM regularly performs price verification procedures and issues challenges as necessary to third party pricing vendors or brokers, and any differences are reviewed in accordance with the Valuation Procedures.
A. Level 1 and Level 2 Fair Value Investments —The valuation techniques and significant inputs used in determining the fair values for investments classified as Level 1 and Level 2 are as follows:
Equity Securities —Equity securities traded on a U.S. securities exchange or the NASDAQ system, or those located on certain foreign exchanges, including but not limited to the Americas, are valued daily at their last sale price or official closing price on the principal exchange or system on which they are traded. If there is no sale or official closing price or such price is believed by GSAM to not represent fair value, equity securities are valued at the last bid price for long positions and at the last ask price for short positions. To the extent these investments are actively traded, they are classified as Level 1 of the fair value hierarchy, otherwise they are generally classified as Level 2.
Unlisted equity securities for which market quotations are available are valued at the last sale price on the valuation date, or if no sale occurs, at the last bid price, and are generally classified as Level 2. Securities traded on certain foreign securities exchanges are valued daily at fair value determined by an independent fair value service (if available) under Valuation Procedures approved by the Trustees and consistent with applicable regulatory guidance. The independent fair value service takes into account multiple factors including, but not limited to, movements in the securities markets, certain depositary receipts, futures contracts and foreign
22
GOLDMAN SACHS VARIABLE INSURANCE TRUST INTERNATIONAL EQUITY INSIGHTS FUND
3. INVESTMENTS AND FAIR VALUE MEASUREMENTS (continued)
currency exchange rates that have occurred subsequent to the close of the foreign securities exchange. These investments are generally classified as Level 2 of the fair value hierarchy.
Money Market Funds —Investments in the Goldman Sachs Financial Square Government Fund (“Underlying Fund”) are valued at the NAV of the Institutional Share class on the day of valuation. These investments are generally classified as Level 1 of the fair value hierarchy. For information regarding the Underlying Fund’s accounting policies and investment holdings, please see the Underlying Fund’s shareholder report.
Derivative Contracts —A derivative is an instrument whose value is derived from underlying assets, indices, reference rates or a combination of these factors. The Fund enters into derivative transactions to hedge against changes in interest rates, securities prices, and/or currency exchange rates, to increase total return, or to gain access to certain markets or attain exposure to other underliers.
Exchange-traded derivatives, including futures and options contracts, are generally valued at the last sale or settlement price on the exchange where they are principally traded. Exchange-traded options without settlement prices are generally valued at the midpoint of the bid and ask prices on the exchange where they are principally traded (or, in the absence oftwo-way trading, at the last bid price for long positions and the last ask price for short positions). Exchange-traded derivatives typically fall within Level 1 of the fair value hierarchy.Over-the-counter (“OTC”) and centrally cleared derivatives are valued using market transactions and other market evidence, including market-based inputs to models, calibration to market-clearing transactions, broker or dealer quotations, or other alternative pricing sources. Where models are used, the selection of a particular model to value OTC and centrally cleared derivatives depends upon the contractual terms of, and specific risks inherent in, the instrument, as well as the availability of pricing information in the market. Valuation models require a variety of inputs, including contractual terms, market prices, yield curves, credit curves, measures of volatility, voluntary and involuntary prepayment rates, loss severity rates and correlations of such inputs. For OTC and centrally cleared derivatives that trade in liquid markets, model inputs can generally be verified and model selection does not involve significant management judgment. OTC and centrally cleared derivatives are classified within Level 2 of the fair value hierarchy when significant inputs are corroborated by market evidence.
i. Futures Contracts —Futures contracts are contracts to buy or sell a standardized quantity of a specified commodity or security. Upon entering into a futures contract, the Fund deposits cash or securities in an account on behalf of the broker in an amount sufficient to meet the initial margin requirement. Subsequent payments are made or received by the Fund equal to the daily change in the contract value and are recorded as variation margin receivable or payable with a corresponding offset to unrealized gains or losses. For financial reporting purposes, cash collateral that has been pledged to cover obligations of the Fund and cash collateral received, if any, is reported separately on the Statement of Assets and Liabilities as receivables/payables for collateral on certain derivative contracts.Non-cash collateral pledged by the Fund, if any, is noted in the Schedule of Investments.
B. Level 3 Fair Value Investments —To the extent that significant inputs to valuation models and other alternative pricing sources are unobservable, or if quotations are not readily available, or if GSAM believes that such quotations do not accurately reflect fair value, the fair value of the Fund’s investments may be determined under Valuation Procedures approved by the Trustees. GSAM, consistent with its procedures and applicable regulatory guidance, may make an adjustment to the most recent valuation prices of either domestic or foreign securities in light of significant events to reflect what it believes to be the fair value of the securities at the time of determining the Fund’s NAV. Significant events which could affect a large number of securities in a particular market may include, but are not limited to: significant fluctuations in U.S. or foreign markets; market dislocations; market disruptions; or unscheduled market closings. Significant events which could also affect a single issuer may include, but are not limited to: corporate actions such as reorganizations, mergers andbuy-outs; ratings downgrades; and bankruptcies.
23
GOLDMAN SACHS VARIABLE INSURANCE TRUST INTERNATIONAL EQUITY INSIGHTS FUND
Notes to Financial Statements(continued)
December 31, 2018
3. INVESTMENTS AND FAIR VALUE MEASUREMENTS (continued)
C. Fair Value Hierarchy —The following is a summary of the Fund’s investments classified in the fair value hierarchy as of December 31, 2018:
| | | | | | | | | | | | |
| Investment Type | | Level 1 | | | Level 2 | | | Level 3 | |
| | | |
| Assets | | | | | | | | | | | | |
| Common Stock and/or Other Equity Investments(a) | | | | | | | | | | | | |
Asia | | $ | — | | | $ | 25,872,789 | | | $ | — | |
Australia and Oceania | | | 855,769 | | | | 4,854,692 | | | | — | |
Europe | | | 2,488,640 | | | | 44,518,484 | | | | — | |
North America | | | 78,309 | | | | 110,850 | | | | — | |
| Securities Lending Reinvestment Vehicle | | | 431,989 | | | | — | | | | — | |
| | | |
| Total | | $ | 3,854,707 | | | $ | 75,356,815 | | | $ | — | |
| | | |
| Derivative Type | | | | | | | | | |
| | | |
| Assets(b) | | | | | | | | | | | | |
| Futures Contracts | | $ | 142 | | | $ | — | | | $ | — | |
| | | |
| Liabilities(b) | | | | | | | | | | | | |
| Futures Contracts | | $ | (36,676 | ) | | $ | — | | | $ | — | |
| (a) | Amounts are disclosed by continent to highlight the impact of time zone differences between local market close and the calculation of NAV. Security valuations are based on the principal exchange or system on which they are traded, which may differ from country of domicile. The Fund utilizes fair value model prices provided by an independent fair value service for certain international equity securities, resulting in a Level 2 classification. |
| (b) | Amount shown represents unrealized gain (loss) at fiscal year end. |
For further information regarding security characteristics, see the Schedule of Investments.
4. INVESTMENTS IN DERIVATIVES
The following table sets forth, by certain risk types, the gross value of derivative contracts (not considered to be hedging instruments for accounting disclosure purposes) as of December 31, 2018. These instruments were used as part of the Fund’s investment strategies and to obtain and/or manage exposure related to the risks below. The values in the table below exclude the effects of cash collateral received or posted pursuant to these derivative contracts, and therefore are not representative of the Fund’s net exposure.
| | | | | | | | | | | | | | |
| Risk | | | | Statement of Assets and Liabilities | | Assets(a) | | | Statement of Assets and Liabilities | | Liabilities(a) | |
| | | | | |
| Equity | | | | Variation margin on futures | | $ | 142 | | | Variation margin on futures | | $ | (36,676 | ) |
| (a) | Includes unrealized gain (loss) on futures contracts described in the Additional Investment Information section of the Schedule of Investments. Only the variation margin as of December 31, 2018 is reported within the Statement of Assets and Liabilities. |
The following table sets forth, by certain risk types, the Fund’s gains (losses) related to these derivatives and their indicative volumes for the fiscal year ended December 31, 2018. These gains (losses) should be considered in the context that these derivative contracts may have been executed to create investment opportunities and/or economically hedge certain investments, and
24
GOLDMAN SACHS VARIABLE INSURANCE TRUST INTERNATIONAL EQUITY INSIGHTS FUND
4. INVESTMENTS IN DERIVATIVES (continued)
accordingly, certain gains (losses) on such derivative contracts may offset certain (losses) gains attributable to investments. These gains (losses) are included in “Net realized gain (loss)” or “Net change in unrealized gain (loss)” on the Statement of Operations:
| | | | | | | | | | | | | | |
| Risk | | Statement of Operations | | Net
Realized
Gain (Loss) | | | Net Change in
Unrealized
Gain (Loss) | | | Average
Number of
Contracts(a) | |
| | | | |
| Equity | | Net realized gain (loss) from futures contracts/Net change in unrealized gain (loss) on futures contracts | | $ | (67,439 | ) | | $ | (36,534 | ) | | | 8 | |
| (a) | Average number of contracts is based on the average of month end balances for the fiscal year ended December 31, 2018. |
5. AGREEMENTS AND AFFILIATED TRANSACTIONS
A. Management Agreement —Under the Agreement, GSAM manages the Fund, subject to the general supervision of the Trustees.
As compensation for the services rendered pursuant to the Agreement, the assumption of the expenses related thereto and administration of the Fund’s business affairs, including providing facilities, GSAM is entitled to a management fee, accrued daily and paid monthly, equal to an annual percentage rate of the Fund’s average daily net assets.
As of December 31, 2018, the contractual management fees with GSAM were as stated below. The effective contractual management rate and effective net management rate represent the rates for the fiscal year ended December 31, 2018.
| | | | | | | | | | | | | | | | | | | | | | | | | | |
| Contractual Management Rate | | | | | | | |
First
$1 billion | | | Next
$1 billion | | | Next
$3 billion | | | Next
$3 billion | | | Over
$8 billion | | | Effective
Rate | | | Effective Net
Management Rate^ | |
| | | | | | |
| | 0.81% | | | | 0.73 | % | | | 0.69 | % | | | 0.68 | % | | | 0.67 | % | | | 0.83 | % | | | 0.81 | % |
| ^ | Effective Net Management Rate includes the impact of management fee waivers of affiliated Underlying Funds, if any. The Effective Net Management Rate may not correlate to the Contractual Management Rate as a result of management fee waivers that may be in effect from time to time. For the fiscal year ended December 31, 2018, GSAM waived $17,323 of its management fee. |
Prior to April 23, 2018, the contractual management fee rates for the Fund were as stated below and GSAM agreed to waive a portion of its management fee in order to achieve an Effective Net Management Rate as set forth in the Fund’s prospectus dated April 28, 2017.
| | | | | | | | | | | | | | | | | | |
First
$1 billion | | | Next
$1 billion | | | Next
$3 billion | | | Next
$3 billion | | | Over
$8 billion | |
| | | | |
| | 0.85 | % | | | 0.77 | % | | | 0.73 | % | | | 0.72 | % | | | 0.71 | % |
The Fund invests in Institutional Shares of the Goldman Sachs Financial Square Government Fund, which is an affiliated Underlying Fund. GSAM has agreed to waive a portion of its management fee payable by the Fund in an amount equal to the management fee it earns as an investment adviser to the affiliated Underlying Fund in which the Fund invests, except those management fees it earns from the Fund’s investments of cash collateral received in connection with securities lending transactions in the Goldman Sachs Financial Square Government Fund. For the fiscal year ended December 31, 2018, GSAM waived $981 of the Fund’s management fee.
B. Distribution and Service(12b-1) Plan — The Trust, on behalf of Service Shares of the Fund, has adopted a Distribution and Service Plan subject to Rule12b-1 under the Act. Under the Distribution and Service Plan, Goldman Sachs, which serves as distributor, is entitled to a fee accrued daily and paid monthly, for distribution services and personal and account maintenance services, which may then be paid by Goldman Sachs to authorized dealers, equal to, on an annual basis, 0.25% of the Fund’s average daily net assets attributable to Service Shares.
25
GOLDMAN SACHS VARIABLE INSURANCE TRUST INTERNATIONAL EQUITY INSIGHTS FUND
Notes to Financial Statements(continued)
December 31, 2018
5. AGREEMENTS AND AFFILIATED TRANSACTIONS (continued)
C. Transfer Agency Agreement —Goldman Sachs also serves as the transfer agent of the Fund for a fee pursuant to the Transfer Agency Agreement. The fees charged for such transfer agency services are accrued daily and paid monthly at an annual rate of 0.02% of the average daily net assets of Institutional and Service Shares.
D. Other Expense Agreements and Affiliated Transactions —GSAM has agreed to limit certain “Other Expenses” of the Fund (excluding acquired fund fees and expenses, transfer agency fees and expenses, service fees and shareholder administration fees (as applicable), taxes, interest, brokerage fees, expenses of shareholder meetings, litigation and indemnification, and extraordinary expenses) to the extent such expenses exceed, on an annual basis, a percentage rate of the average daily net assets of the Fund. Such Other Expense reimbursements, if any, are accrued daily and paid monthly. In addition, the Fund is not obligated to reimburse GSAM for prior fiscal year expense reimbursements, if any. The Other Expense limitation as an annual percentage rate of average daily net assets for the Fund is 0.044%. The Other Expense limitation will remain in place through at least April 30, 2019, and prior to such date GSAM may not terminate the arrangement without the approval of the Trustees. In addition, the Fund has entered into certain offset arrangements with the custodian and the transfer agent, which may result in a reduction of the Fund’s expenses and are received irrespective of the application of the “Other Expense” limitation described above.
For the fiscal year ended December 31, 2018, these expense reductions, including any fee waivers and Other Expense reimbursements, were as follows:
| | | | | | | | | | | | | | |
Management
Fee Waiver | | | Custody Fee
Credits | | | Other Expense
Reimbursement | | | Total Expense
Reductions | |
| | | |
| $ | 18,304 | | | $ | 1,131 | | | $ | 339,886 | | | $ | 359,321 | |
E. Line of Credit Facility —As of December 31, 2018, the Fund participated in a $770,000,000 committed, unsecured revolving line of credit facility (the “facility”) together with other funds of the Trust and certain registered investment companies having management agreements with GSAM or its affiliates. This facility is to be used for temporary emergency purposes, or to allow for an orderly liquidation of securities to meet redemption requests. The interest rate on borrowings is based on the federal funds rate. The facility also requires a fee to be paid by the Fund based on the amount of the commitment that has not been utilized. For the fiscal year ended December 31, 2018, the Fund did not have any borrowings under the facility.
F. Other Transactions with Affiliates —The following table provides information about the Fund’s investments in the Goldman Sachs Financial Square Government Fund as of and for the fiscal year ended December 31, 2018:
| | | | | | | | | | | | | | | | | | | | | | |
Beginning Value as of
December 31, 2017 | | | Purchases
at Cost | | | Proceeds
from Sales | | | Ending Value as of
December 31, 2018 | | | Shares as of
December 31, 2018 | | | Dividend Income
from Affiliated
Investment Company | |
| | | | | |
| $ | 952,535 | | | $ | 15,358,348 | | | $ | (16,310,883 | ) | | $ | — | | | | — | | | $ | 8,484 | |
6. PORTFOLIO SECURITIES TRANSACTIONS
The cost of purchases and proceeds from sales and maturities of long-term securities for the fiscal year ended December 31, 2018, were $170,910,360 and $235,533,771, respectively.
7. SECURITIES LENDING
Pursuant to exemptive relief granted by the Securities and Exchange Commission (“SEC”) and the terms and conditions contained therein, the Fund may lend its securities through a securities lending agent, Goldman Sachs Agency Lending (“GSAL”), a wholly-owned subsidiary of Goldman Sachs, to certain qualified borrowers including Goldman Sachs and affiliates. In accordance with the Fund’s securities lending procedures, the Fund receives cash collateral at least equal to the market value of the securities on loan.
26
GOLDMAN SACHS VARIABLE INSURANCE TRUST INTERNATIONAL EQUITY INSIGHTS FUND
7. SECURITIES LENDING (continued)
The market value of the loaned securities is determined at the close of business of the Fund, at their last sale price or official closing price on the principal exchange or system on which they are traded, and any additional required collateral is delivered to the Fund on the next business day. As with other extensions of credit, the Fund may experience delay in the recovery of its securities or incur a loss should the borrower of the securities breach its agreement with the Fund or become insolvent at a time when the collateral is insufficient to cover the cost of repurchasing securities on loan. Dividend income received from securities on loan may not be subject to withholding taxes and therefore withholding taxes paid may differ from the amounts listed in the Statement of Operations. Loans of securities are terminable at any time and as such 1) the remaining contractual maturities of the outstanding securities lending transactions are considered to be overnight and continuous and 2) the borrower, after notice, is required to return borrowed securities within the standard time period for settlement of securities transactions.
The Fund invests the cash collateral received in connection with securities lending transactions in the Goldman Sachs Financial Square Government Fund (“Government Money Market Fund”), an affiliated series of the Goldman Sachs Trust. The Government Money Market Fund is registered under the Act as an open end investment company, is subject to Rule2a-7 under the Act, and is managed by GSAM, for which GSAM may receive a management fee of up to 0.16% (prior to February 21, 2018, GSAM may have received a management fee of up to 0.205%) on an annualized basis of the average daily net assets of the Government Money Market Fund.
In the event of a default by a borrower with respect to any loan, GSAL will exercise any and all remedies provided under the applicable borrower agreement to make the Fund whole. These remedies include purchasing replacement securities by applying the collateral held from the defaulting broker against the purchase cost of the replacement securities. If GSAL is unable to purchase replacement securities, GSAL will indemnify the Fund by paying the Fund an amount equal to the market value of the securities loaned minus the value of cash collateral received from the borrower for the loan, subject to an exclusion for any shortfalls resulting from a loss of value in such cash collateral due to reinvestment risk. The Fund may enter into master netting agreements with borrowers, which provide the right, in the event of a default (including bankruptcy or insolvency), for thenon-defaulting party to liquidate the collateral and calculate net exposure to the defaulting party or request additional collateral. However, in the event of a default by a borrower, a resolution authority could determine that such rights are not enforceable due to the restrictions or prohibitions against the right ofset-off that may be imposed in accordance with a particular jurisdiction’s bankruptcy or insolvency laws. The Fund’s loaned securities were all subject to enforceable Securities Lending Agreements and the value of the collateral was at least equal to the value of the cash received. The amounts of the Fund’s overnight and continuous agreements, which represent the gross amounts of recognized liabilities for securities lending transactions outstanding as of December 31, 2018, are disclosed as “Payable upon return of securities loaned” on the Statement of Assets and Liabilities, where applicable.
Both the Fund and GSAL received compensation relating to the lending of the Fund’s securities. The amounts earned, if any, by the Fund for the fiscal year ended December 31, 2018, are reported under Investment Income on the Statement of Operations.
The table below details securities lending activity with affiliates of Goldman Sachs:
| | | | | | | | | | |
| For the Fiscal Year ended December 31, 2018 | | | | |
Earnings of GSAL
Relating to
Securities
Loaned | | | Amount Received
by the Fund
from Lending to
Goldman Sachs | | | Amount Payable to
Goldman Sachs
Upon Return of
Securities Loaned as of
December 31, 2018 | |
| | |
| $ | 1,758 | | | $ | 4,226 | | | $ | 431,989 | |
The following table provides information about the Fund’s investment in the Government Money Market Fund for the fiscal year ended December 31, 2018:
| | | | | | | | | | | | | | |
Beginning Value as of
December 31, 2017 | | | Purchases
at Cost | | | Proceeds
from Sales | | | Ending Value as of
December 31, 2018 | |
| | | |
| $ | — | | | $ | 15,326,568 | | | $ | (14,894,579 | ) | | $ | 431,989 | |
27
GOLDMAN SACHS VARIABLE INSURANCE TRUST INTERNATIONAL EQUITY INSIGHTS FUND
Notes to Financial Statements(continued)
December 31, 2018
8. TAX INFORMATION
The tax character of distributions paid during the fiscal years ended December 31, 2017 and December 31, 2018 was as follows:
| | | | | | | | |
| | | 2017 | | | 2018 | |
| Distributions paid from: | | | | | | | | |
Ordinary income | | $ | 2,648,697 | | | $ | 1,681,091 | |
Net long-term capital gains | | | — | | | | 16,497,835 | |
| Total taxable distributions | | $ | 2,648,697 | | | $ | 18,178,926 | |
As of December 31, 2018, the components of accumulated earnings (losses) on atax-basis were as follows:
| | | | |
| Undistributed ordinary income — net | | $ | 48,044 | |
| Timing differences (Qualified Late Year Loss Deferral/Post October Loss Deferral) | | $ | (2,120,967 | ) |
| Unrealized losses — net | | $ | (11,708,414 | ) |
| Total accumulated losses — net | | $ | (13,781,337 | ) |
| (1) | Expiration occurs on December 31 of the year indicated. |
As of December 31, 2018, the Fund’s aggregate security unrealized gains and losses based on cost for U.S. federal income tax purposes were as follows:
| | | | |
| Tax cost | | $ | 90,861,248 | |
| Gross unrealized gain | | | 1,309,346 | |
| Gross unrealized loss | | | (13,017,760 | ) |
| Net unrealized loss | | $ | (11,708,414 | ) |
The difference between GAAP-basis andtax-basis unrealized gains (losses) is attributable primarily to wash sales, net mark to market gains/(losses) on regulated futures and passive foreign investment company investments.
GSAM has reviewed the Fund’s tax positions for all open tax years (the current and prior three years, as applicable) and has concluded that no provision for income tax is required in the Fund’s financial statements. Such open tax years remain subject to examination and adjustment by tax authorities.
9. OTHER RISKS
The Fund’s risks include, but are not limited to, the following:
Foreign and Emerging Countries Risk —Investing in foreign markets may involve special risks and considerations not typically associated with investing in the U.S. Foreign securities may be subject to risk of loss because of more or less foreign government regulation, less public information and less economic, political and social stability in the countries in which the Fund invests. The imposition of exchange controls (including repatriation restrictions), confiscations, trade restrictions (including tariffs) and other government restrictions by the U.S. or other governments, or from problems in share registration, settlement or custody, may also result in losses. Foreign risk also involves the risk of negative foreign currency rate fluctuations, which may cause the value of securities denominated in such foreign currency (or other instruments through which the Fund has exposure to foreign currencies) to decline in value. Currency exchange rates may fluctuate significantly over short periods of time. To the extent that the Fund also invests in securities of issuers located in emerging markets, these risks may be more pronounced.
28
GOLDMAN SACHS VARIABLE INSURANCE TRUST INTERNATIONAL EQUITY INSIGHTS FUND
9. OTHER RISKS (continued)
Derivatives Risk — The Fund’s use of derivatives may result in loss. Derivative instruments, which may pose risks in addition to and greater than those associated with investing directly in securities, currencies or other instruments, may be illiquid or less liquid, volatile, difficult to price and leveraged so that small changes in the value of the underlying instruments may produce disproportionate losses to the Fund. Derivatives are also subject to counterparty risk, which is the risk that the other party in the transaction will not fulfill its contractual obligation. The use of derivatives is a highly specialized activity that involves investment techniques and risks different from those associated with investments in more traditional securities and instruments. Losses from derivatives can also result from a lack of correlation between changes in the value of derivative instruments and the portfolio assets (if any) being hedged.
Foreign Custody Risk —If the Fund invests in foreign securities, the Fund may hold such securities and cash with foreign banks, agents, and securities depositories appointed by the Fund’s custodian (each a “Foreign Custodian”). Some foreign custodians may be recently organized or new to the foreign custody business. In some countries, Foreign Custodians may be subject to little or no regulatory oversight over, or independent evaluation of, their operations. Further, the laws of certain countries may place limitations on the Fund’s ability to recover its assets if a Foreign Custodian enters bankruptcy. Investments in emerging markets may be subject to even greater custody risks than investments in more developed markets. Custody services in emerging market countries are very often undeveloped and may be considerably less well regulated than in more developed countries, and thus may not afford the same level of investor protection as would apply in developed countries.
Investments in Other Investment Companies Risk —As a shareholder of another investment company, including an exchange-traded fund (“ETF”), the Fund will indirectly bear its proportionate share of any net management fees and other expenses paid by such other investment companies, in addition to the fees and expenses regularly borne by the Fund.
Large Shareholder Transactions Risk —The Fund may experience adverse effects when certain large shareholders, such as other funds, participating insurance companies, accounts and Goldman Sachs affiliates, purchase or redeem large amounts of shares of the Fund. Such large shareholder redemptions, which may occur rapidly or unexpectedly, may cause the Fund to sell portfolio securities at times when it would not otherwise do so, which may negatively impact the Fund’s NAV and liquidity. These transactions may also accelerate the realization of taxable income to shareholders if such sales of investments resulted in gains, and may also increase transaction costs. In addition, a large redemption could result in the Fund’s current expenses being allocated over a smaller asset base, leading to an increase in the Fund’s expense ratio. Similarly, large Fund share purchases may adversely affect the Fund’s performance to the extent that the Fund is delayed in investing new cash or otherwise maintains a larger cash position than it ordinarily would.
Liquidity Risk —The Fund may make investments that are illiquid or that may become less liquid in response to market developments or adverse investor perceptions. Illiquid investments may be more difficult to value. Liquidity risk may also refer to the risk that the Fund will not be able to pay redemption proceeds within the allowable time period or without significant dilution to remaining investors’ interests because of unusual market conditions, an unusually high volume of redemption requests, or other reasons. To meet redemption requests, the Fund may be forced to sell investments at an unfavorable time and/or under unfavorable conditions. If the Fund is forced to sell securities at an unfavorable time and/or under unfavorable conditions, such sales may adversely affect the Fund’s NAV and dilute remaining investors’ interests. These risks may be more pronounced in connection with the Fund’s investments in securities of issuers located in emerging market countries.
Market and Credit Risks —In the normal course of business, the Fund trades financial instruments and enters into financial transactions where risk of potential loss exists due to changes in the market (market risk). Additionally, the Fund may also be exposed to credit risk in the event that an issuer or guarantor fails to perform or that an institution or entity with which the Fund has unsettled or open transactions defaults.
29
GOLDMAN SACHS VARIABLE INSURANCE TRUST INTERNATIONAL EQUITY INSIGHTS FUND
Notes to Financial Statements(continued)
December 31, 2018
10. INDEMNIFICATIONS
Under the Trust’s organizational documents, its Trustees, officers, employees and agents are indemnified, to the extent permitted by the Act and state law, against certain liabilities that may arise out of performance of their duties to the Fund. Additionally, in the course of business, the Fund enters into contracts that contain a variety of indemnification clauses. The Fund’s maximum exposure under these arrangements is unknown, as this would involve future claims that may be made against the Fund that have not yet occurred. However, GSAM believes the risk of loss under these arrangements to be remote.
11. OTHER MATTERS
In September 2018, the Financial Accounting Standards Board issued Accounting Standards Update (ASU)2018-13 — Fair Value Measurement (Topic 820) Disclosure Framework — Changes to the Disclosure Requirements for Fair Value Measurement. The amendments in the ASU modify fair value measurement disclosures. The amendments are effective for the Fund’s fiscal year beginning after December 15, 2019. GSAM is currently evaluating the impact, if any, of the amendments.
12. SUBSEQUENT EVENTS
Subsequent events after the Statement of Assets and Liabilities date have been evaluated, and GSAM has concluded that there is no impact requiring adjustment or disclosure in the financial statements.
13. SUMMARY OF SHARE TRANSACTIONS
Share activity is as follows:
| | | | | | | | | | | | | | | | |
| | | For the Fiscal Year Ended
December 31, 2018 | | | For the Fiscal Year Ended
December 31, 2017 | |
| | | Shares | | | Dollars | | | Shares | | | Dollars | |
| Institutional Shares | | | | | | | | | | | | | | | | |
| Shares sold | | | 745,548 | | | $ | 7,784,495 | | | | 116,273 | | | $ | 1,205,739 | |
| Reinvestment of distributions | | | 1,192,199 | | | | 8,500,382 | | | | 68,179 | | | | 739,059 | |
| Shares redeemed | | | (407,538 | ) | | | (4,306,214 | ) | | | (603,057 | ) | | | (6,124,918 | ) |
| | | | 1,530,209 | | | | 11,978,663 | | | | (418,605 | ) | | | (4,180,120 | ) |
| Service Shares | | | | | | | | | | | | | | | | |
| Shares sold | | | 420,689 | | | | 4,358,012 | | | | 729,786 | | | | 6,682,789 | |
| Reinvestment of distributions | | | 1,351,752 | | | | 9,678,544 | | | | 175,842 | | | | 1,909,638 | |
| Shares redeemed | | | (6,939,757 | ) | | | (74,797,801 | ) | | | (1,563,959 | ) | | | (15,807,702 | ) |
| | | | (5,167,316 | ) | | | (60,761,245 | ) | | | (658,331 | ) | | | (7,215,275 | ) |
| | | | |
| NET DECREASE | | | (3,637,107 | ) | | $ | (48,782,582 | ) | | | (1,076,936 | ) | | $ | (11,395,395 | ) |
30
Report of Independent Registered Public Accounting Firm
To the Board of Trustees of
Goldman Sachs Variable Insurance Trust and Shareholders of Goldman Sachs International Equity Insights Fund (formerly known as Goldman Sachs Strategic International Equity Fund)
Opinion on the Financial Statements
We have audited the accompanying statement of assets and liabilities, including the schedule of investments, of Goldman Sachs International Equity Insights Fund (formerly known as Goldman Sachs Strategic International Equity Fund) (one of the funds constituting Goldman Sachs Variable Insurance Trust, referred to hereafter as the “Fund”) as of December 31, 2018, the related statement of operations for the year ended December 31, 2018, the statements of changes in net assets for each of the two years in the period ended December 31, 2018, including the related notes, and the financial highlights for each of the five years in the period ended December 31, 2018 (collectively referred to as the “financial statements”). In our opinion, the financial statements present fairly, in all material respects, the financial position of the Fund as of December 31, 2018, the results of its operations for the year then ended, the changes in its net assets for each of the two years in the period ended December 31, 2018 and the financial highlights for each of the five years in the period ended December 31, 2018 in conformity with accounting principles generally accepted in the United States of America.
Basis for Opinion
These financial statements are the responsibility of the Fund’s management. Our responsibility is to express an opinion on the Fund’s financial statements based on our audits. We are a public accounting firm registered with the Public Company Accounting Oversight Board (United States) (PCAOB) and are required to be independent with respect to the Fund in accordance with the U.S. federal securities laws and the applicable rules and regulations of the Securities and Exchange Commission and the PCAOB.
We conducted our audits of these financial statements in accordance with the standards of the PCAOB. Those standards require that we plan and perform the audit to obtain reasonable assurance about whether the financial statements are free of material misstatement, whether due to error or fraud.
Our audits included performing procedures to assess the risks of material misstatement of the financial statements, whether due to error or fraud, and performing procedures that respond to those risks. Such procedures included examining, on a test basis, evidence regarding the amounts and disclosures in the financial statements. Our procedures included confirmation of securities owned as of December 31, 2018 by correspondence with the custodian, transfer agent, and brokers; when replies were not received from brokers, we performed other auditing procedures. We believe that our audits provide a reasonable basis for our opinion.
PricewaterhouseCoopers LLP
Boston, Massachusetts
February 13, 2019
We have served as the auditor of one or more investment companies in the Goldman Sachs fund complex since 2000.
31
GOLDMAN SACHS VARIABLE INSURANCE TRUST INTERNATIONAL EQUITY INSIGHTS FUND
| | |
| Fund Expenses — Six Month Period Ended December 31, 2018 (Unaudited) | | |
As a shareholder of Institutional or Service Shares of the Fund, you incur ongoing costs, including management fees, distribution and/or service(12b-1) fees (with respect to Service Shares) and other Fund expenses. This example is intended to help you understand your ongoing costs (in dollars) of investing in the Institutional Shares and Service Shares of the Fund and to compare these costs with the ongoing costs of investing in other mutual funds.
The example is based on an investment of $1,000 invested at the beginning of the period and held for the entire period from July 1, 2018 through December 31, 2018, which represents a period of 184 days of a 365 day year.
Actual Expenses— The first line under each share class in the table below provides information about actual account values and actual expenses. You may use the information in this line, together with the amount you invested, to estimate the expenses that you paid over the period. Simply divide your account value by $1,000 (for example, an $8,600 account value divided by $1,000=8.6), then multiply the result by the number in the first line under the heading entitled “Expenses Paid” to estimate the expenses you paid on your account during this period.
Hypothetical Example for Comparison Purposes — The second line under each share class in the table below provides information about hypothetical account values and hypothetical expenses based on the Fund’s actual net expense ratio and an assumed rate of return of 5% per year before expenses, which is not the Fund’s actual return. The hypothetical account values and expenses may not be used to estimate the actual ending account balance or expenses you paid for the period. You may use this information to compare the ongoing costs of investing in the Fund and other funds. To do so, compare this 5% hypothetical example with the 5% hypothetical examples that appear in the shareholder reports of the other funds.
Please note that the expenses shown in the table are meant to highlight your ongoing costs only. As a shareholder of the Fund you do not incur any transaction costs, such as sales charges, redemption fees, or exchange fees, but shareholders of other funds may incur such costs. The second line of the table is useful in comparing ongoing costs only and will not help you determine the relative total costs of owning different funds whose shareholders may incur transaction costs.
| | | | | | | | | | | | |
| Share Class | | Beginning
Account Value
07/01/18 | | | Ending
Account Value
12/31/18 | | | Expenses Paid
for the
6 Months
Ended
12/31/18* | |
| Institutional | | | | | | | | | | | | |
| | | | |
| Actual | | $ | 1,000 | | | $ | 860.10 | | | $ | 4.08 | |
| Hypothetical 5% return | | | 1,000 | | | | 1,020.82 | + | | | 4.43 | |
| Service | | | | | | | | | | | | |
| | | | |
| Actual | | | 1,000 | | | | 858.90 | | | | 5.29 | |
| Hypothetical 5% return | | | 1,000 | | | | 1,019.51 | + | | | 5.75 | |
| | + | Hypothetical expenses are based on the Fund’s actual annualized net expense ratios and an assumed rate of return of 5% per year before expenses. | |
| | * | Expenses are calculated using the Fund’s annualized net expense ratio for each class, which represents the ongoing expenses as a percentage of net assets for the six months ended December 31, 2018. Expenses are calculated by multiplying the annualized net expense ratio by the average account value for the period; then multiplying the result by the number of days in the most recent fiscal half year; and then dividing that result by the number of days in the fiscal year. The annualized net expense ratios for the period were 0.87% and 1.13% for the Institutional and Service Shares, respectively. | |
32
GOLDMAN SACHS VARIABLE INSURANCE TRUST INTERNATIONAL EQUITY INSIGHTS FUND
Trustees and Officers (Unaudited)
Independent Trustees
| | | | | | | | | | | | |
| | | | | |
Name,
Address and Age1 | | Position(s) Held with the Trust | | Term of Office and
Length of
Time Served2 | | Principal Occupation(s) During Past 5 Years | | Number of
Portfolios in
Fund Complex
Overseen by
Trustee3 | | | Other Directorships Held by Trustee4 |
Jessica Palmer Age: 69 | | Chair of the Board of Trustees | | Since 2018 (Trustee since 2007) | | Ms. Palmer is retired. She was formerly Director, Emerson Center for the Arts and Culture (2011-2017); and Consultant, Citigroup Human Resources Department (2007-2008); Managing Director, Citigroup Corporate and Investment Banking (previously, Salomon Smith Barney/Salomon Brothers) (1984-2006). Ms. Palmer was a Member of the Board of Trustees of Indian Mountain School (private elementary and secondary school) (2004-2009). Chair of the Board of Trustees — Goldman Sachs Trust and Goldman Sachs Variable Insurance Trust. | | | 103 | | | None |
Kathryn A. Cassidy Age: 64 | | Trustee | | Since 2015 | | Ms. Cassidy is retired. Formerly, she was Advisor to the Chairman (May 2014-December 2014); and Senior Vice President and Treasurer (2008-2014), General Electric Company & General Electric Capital Corporation (technology and financial services companies). Trustee — Goldman Sachs Trust and Goldman Sachs Variable Insurance Trust. | | | 103 | | | None |
Diana M. Daniels Age: 69 | | Trustee | | Since 2007 | | Ms. Daniels is retired. Formerly, she was Vice President, General Counsel and Secretary, The Washington Post Company (1991-2006). Ms. Daniels is a Trustee Emeritus and serves as a Presidential Councillor of Cornell University (2013-Present); former Member of the Legal Advisory Board, New York Stock Exchange (2003-2006) and of the Corporate Advisory Board, Standish Mellon Management Advisors (2006-2007). Trustee — Goldman Sachs Trust and Goldman Sachs Variable Insurance Trust. | | | 103 | | | None |
Herbert J. Markley Age: 68 | | Trustee | | Since 2013 | | Mr. Markley is retired. Formerly, he was Executive Vice President, Deere & Company (an agricultural and construction equipment manufacturer) (2007-2009); and President, Agricultural Division, Deere & Company (2001-2007). Previously, Mr. Markley served as an Advisory Board Member of Goldman Sachs Trust and Goldman Sachs Variable Insurance Trust (June 2013-October 2013). Trustee — Goldman Sachs Trust and Goldman Sachs Variable Insurance Trust. | | | 103 | | | None |
Roy W. Templin Age: 58 | | Trustee | | Since 2013 | | Mr. Templin is retired. He is Director, Armstrong World Industries, Inc. (a designer and manufacturer of ceiling, wall and suspension system solutions) (2016-Present); and was formerly Chairman of the Board of Directors, Con-Way Incorporated (a transportation, logistics and supply chain management service company) (2014-2015); Executive Vice President and Chief Financial Officer, Whirlpool Corporation (an appliance manufacturer and marketer) (2004-2012). Previously, Mr. Templin served as an Advisory Board Member of Goldman Sachs Trust and Goldman Sachs Variable Insurance Trust (June 2013-October 2013). Trustee — Goldman Sachs Trust and Goldman Sachs Variable Insurance Trust. | | | 103 | | | Armstrong World Industries, Inc. (a ceiling, wall and suspension systems solutions manufacturer) |
Gregory G. Weaver Age: 67 | | Trustee | | Since 2015 | | Mr. Weaver is retired. He is Director, Verizon Communications Inc. (2015-Present); and was formerly Chairman and Chief Executive Officer, Deloitte & Touche LLP (a professional services firm) (2001-2005 and 2012-2014); and Member of the Board of Directors, Deloitte & Touche LLP (2006-2012). Trustee — Goldman Sachs Trust and Goldman Sachs Variable Insurance Trust. | | | 103 | | | Verizon Communications Inc. |
| | | | | | | | | | | | |
33
GOLDMAN SACHS VARIABLE INSURANCE TRUST INTERNATIONAL EQUITY INSIGHTS FUND
Trustees and Officers (Unaudited) (continued)
Interested Trustee*
| | | | | | | | | | | | |
| | | | | |
Name,
Address and Age1 | | Position(s) Held with the Trust | | Term of Office and
Length of
Time Served2 | | Principal Occupation(s) During Past 5 Years | | Number of
Portfolios in
Fund Complex
Overseen by
Trustee3 | | | Other Directorships Held by Trustee4 |
James A. McNamara Age: 56 | | President and Trustee | | Since 2007 | | Advisory Director, Goldman Sachs (January 2018-Present); Managing Director, Goldman Sachs (January 2000-December 2017); Director of Institutional Fund Sales, GSAM (April 1998-December 2000); and Senior Vice President and Manager, Dreyfus Institutional Service Corporation (January 1993- April 1998). President and Trustee — Goldman Sachs Trust; Goldman Sachs Variable Insurance Trust; Goldman Sachs Trust II; Goldman Sachs MLP Income Opportunities Fund; Goldman Sachs MLP and Energy Renaissance Fund; Goldman Sachs ETF Trust; Goldman Sachs Private Markets Fund 2018 LLC; Goldman Sachs Private Markets Fund 2018 (A) LLC; and Goldman Sachs Private Markets Fund 2018 (B) LLC. | | | 156 | | | None |
| | | | | | | | | | | | |
| * | Mr. McNamara is considered to be an “Interested Trustee” because he holds positions with Goldman Sachs and owns securities issued by The Goldman Sachs Group, Inc. Mr. McNamara holds comparable positions with certain other companies of which Goldman Sachs, GSAM or an affiliate thereof is the investment adviser, administrator and/or distributor. |
| 1 | Each Trustee may be contacted by writing to the Trustee, c/o Goldman Sachs, 200 West Street, New York, New York, 10282, Attn: Caroline Kraus. Information is provided as of December 31, 2018. |
| 2 | Subject to such policies as may be adopted by the Board from time-to-time, each Trustee holds office for an indefinite term, until the earliest of: (a) the election of his or her successor; (b) the date the Trustee resigns or is removed by the Board or shareholders, in accordance with the Trust’s Declaration of Trust; or (c) the termination of the Trust. The Board has adopted policies which provide that (a) no Trustee shall hold office for more than 15 years and (b) a Trustee shall retire as of December 31st of the calendar year in which he or she reaches his or her 74th birthday, unless a waiver of such requirement shall have been adopted by a majority of the other Trustees. These policies may be changed by the Trustees without shareholder vote. |
| 3 | The Goldman Sachs Fund Complex includes certain other companies listed above for each respective Trustee. As of December 31, 2018, Goldman Sachs Trust consisted of 90 portfolios (88 of which offered shares to the public); Goldman Sachs Variable Insurance Trust consisted of 13 portfolios; Goldman Sachs Trust II consisted of 19 portfolios (17 of which offered shares to the public); Goldman Sachs MLP Income Opportunities Fund, Goldman Sachs MLP and Energy Renaissance Fund, Goldman Sachs Private Markets Fund 2018 LLC, Goldman Sachs Private Markets Fund 2018 (A) LLC and Goldman Sachs Private Markets Fund 2018 (B) LLC each consisted of one portfolio; and Goldman Sachs ETF Trust consisted of 29 portfolios (14 of which offered shares to the public). |
| 4 | This column includes only directorships of companies required to report to the Securities and Exchange Commission under the Securities Exchange Act of 1934 (i.e., “public companies”) or other investment companies registered under the Act. |
Additional information about the Trustees is available in the Fund’s Statement of Additional Information, which can be obtained from Goldman Sachs free of charge by calling this toll-free number (in the United States of America): 1-800-526-7384.
34
GOLDMAN SACHS VARIABLE INSURANCE TRUST INTERNATIONAL EQUITY INSIGHTS FUND
Trustees and Officers (Unaudited) (continued)
Officers of the Trust*
| | | | | | |
| | | |
| Name, Address and Age1 | | Position(s) Held with the Trust | | Term of
Office and
Length of
Time Served2 | | Principal Occupation(s) During Past 5 Years |
James A. McNamara
200 West Street New York, NY 10282 Age: 56 | | Trustee and President | | Since 2007 | | Advisory Director, Goldman Sachs (January 2018-Present); Managing Director, Goldman Sachs (January 2000-December 2017); Director of Institutional Fund Sales, GSAM (April 1998-December 2000); and Senior Vice President and Manager, Dreyfus Institutional Service Corporation (January 1993-April 1998). President and Trustee — Goldman Sachs Trust; Goldman Sachs Variable Insurance Trust; Goldman Sachs Trust II; Goldman Sachs MLP Income Opportunities Fund; Goldman Sachs MLP and Energy Renaissance Fund; Goldman Sachs ETF Trust; Goldman Sachs Private Markets Fund 2018 LLC; Goldman Sachs Private Markets Fund 2018 (A) LLC; and Goldman Sachs Private Markets Fund 2018 (B) LLC. |
Caroline L. Kraus
200 West Street New York, NY 10282 Age: 41 | | Secretary | | Since 2012 | | Managing Director, Goldman Sachs (January 2016-Present); Vice President, Goldman Sachs (August 2006-December 2015); Associate General Counsel, Goldman Sachs (2012-Present); Assistant General Counsel, Goldman Sachs (August 2006-December 2011); and Associate, Weil, Gotshal & Manges, LLP (2002-2006). Secretary — Goldman Sachs Trust (previously Assistant Secretary (2012)); Goldman Sachs Variable Insurance Trust (previously Assistant Secretary (2012)); Goldman Sachs Trust II; Goldman Sachs BDC, Inc.; Goldman Sachs Private Middle Market Credit LLC; Goldman Sachs Middle Market Lending Corp.; Goldman Sachs MLP Income Opportunities Fund; Goldman Sachs MLP and Energy Renaissance Fund; Goldman Sachs ETF Trust; Goldman Sachs Private Markets Fund 2018 LLC; Goldman Sachs Private Markets Fund 2018 (A) LLC; and Goldman Sachs Private Markets Fund 2018 (B) LLC. |
Scott M. McHugh
200 West Street New York, NY 10282 Age: 47 | | Treasurer, Senior Vice
President and
Principal Financial
Officer | | Since 2009
(Principal
Financial
Officer since
2013) | | Managing Director, Goldman Sachs (January 2016-Present); Vice President, Goldman Sachs (February 2007-December 2015); Assistant Treasurer of certain mutual funds administered by DWS Scudder (2005-2007); and Director (2005-2007), Vice President (2000-2005), and Assistant Vice President (1998-2000), Deutsche Asset Management or its predecessor (1998-2007). Treasurer, Senior Vice President and Principal Financial Officer — Goldman Sachs Trust; Goldman Sachs Variable Insurance Trust; Goldman Sachs Trust II; Goldman Sachs MLP Income Opportunities Fund; Goldman Sachs MLP and Energy Renaissance Fund; Goldman Sachs ETF Trust; Goldman Sachs Private Markets Fund 2018 LLC; Goldman Sachs Private Markets Fund 2018 (A) LLC; and Goldman Sachs Private Markets Fund 2018 (B) LLC. |
Joseph F. DiMaria
30 Hudson Street Jersey City, NJ 07302 Age: 50 | | Assistant Treasurer
and Principal
Accounting Officer | | Since 2016
(Principal
Accounting
Officer since
2017) | | Managing Director, Goldman Sachs (November 2015-Present) and Vice President — Mutual Fund Administration, Columbia Management Investment Advisers, LLC (May 2010-October 2015). Assistant Treasurer and Principal Accounting Officer — Goldman Sachs Trust; Goldman Sachs Variable Insurance Trust; Goldman Sachs Trust II; Goldman Sachs MLP Income Opportunities Fund; Goldman Sachs MLP and Energy Renaissance Fund; Goldman Sachs ETF Trust; Goldman Sachs Private Markets Fund 2018 LLC; Goldman Sachs Private Markets Fund 2018 (A) LLC; and Goldman Sachs Private Markets Fund 2018 (B) LLC. |
| | | | | | |
| * | Represents a partial list of officers of the Trust. Additional information about all the officers is available in the Fund’s Statement of Additional Information, which can be obtained from Goldman Sachs free of charge by calling this toll-free number (in the United States): 1-800-526-7384. |
| 1 | Information is provided as of December 31, 2018. |
| 2 | Officers hold office at the pleasure of the Board of Trustees or until their successors are duly elected and qualified. Each officer holds comparable positions with certain other companies of which Goldman Sachs, GSAM or an affiliate thereof is the investment adviser, administrator and/or distributor. |
35
GOLDMAN SACHS VARIABLE INSURANCE TRUST INTERNATIONAL EQUITY INSIGHTS FUND
Goldman Sachs Variable Insurance Trust — Tax Information (Unaudited)
For the 2018 tax year, the International Equity Insights Fund has elected to pass through a credit for taxes paid to foreign jurisdictions. The total amount of income received by the International Equity Insights Fund from sources within foreign countries and possessions of the United States was $0.1947 per share, all of which is attributable to qualified passive income. The percentage of net investment income dividends paid by the Fund during the year ended December 31, 2018 from foreign sources was 94.98%. The total amount of foreign taxes paid by the Fund was $0.0244 per share.
Pursuant to Section 852 of the Internal Revenue Code, the International Equity Insights Fund designates $16,497,835 or, if different, the maximum amount allowable, as capital gain dividends paid during the fiscal year ended December 31, 2018.
36
| | |
| TRUSTEES | | OFFICERS |
| Jessica Palmer,Chair | | James A. McNamara,President |
| Kathryn A. Cassidy | | Scott M. McHugh,Treasurer, Senior Vice |
| Diana M. Daniels | | President and Principal Financial Officer |
| Herbert J. Markley | | Joseph F. DiMaria,Assistant Treasurer and Principal Accounting Officer Caroline L. Kraus,Secretary |
| James A. McNamara |
| Roy W. Templin |
| Gregory G. Weaver | | |
GOLDMAN SACHS & CO. LLC
Distributor and Transfer Agent
GOLDMAN SACHS ASSET MANAGEMENT, L.P.
Investment Adviser
200 West Street, New York
New York 10282
Visit our web site at www.GSAMFUNDS.com to obtain the most recentmonth-end returns.
The reports concerning the Fund included in this shareholder report may contain certain forward-looking statements about the factors that may affect the performance of the Fund in the future. These statements are based on Fund management’s predictions and expectations concerning certain future events and their expected impact on the Fund, such as performance of the economy as a whole and of specific industry sectors, changes in the levels of interest rates, the impact of developing world events, and other factors that may influence the future performance of the Fund. Management believes these forward-looking statements to be reasonable, although they are inherently uncertain and difficult to predict. Actual events may cause adjustments in portfolio management strategies from those currently expected to be employed.
A description of the policies and procedures that the Fund uses to determine how to vote proxies relating to portfolio securities and information regarding how the Fund voted proxies relating to portfolio securities during the most recent12-month period ended December 31 is available (i) without charge, upon request by calling1-800-621-2550; and (ii) on the Securities and Exchange Commission (“SEC”) web site athttp://www.sec.gov.
The Fund files its complete schedule of portfolio holdings with the SEC for the first and third quarters of each fiscal year onForm N-Q. The Fund’s Form N-Qs are available on the SEC’s web site at http://www.sec.gov within 60 days after the Fund’s first and third fiscal quarters. Form N-Qs may be obtained upon request and without charge by calling1-800-621-2550.
Views and opinions expressed are for informational purposes only and do not constitute a recommendation by GSAM to buy, sell, or hold any security. Views and opinions are current as of the date of this presentation and may be subject to change, they should not be construed as investment advice.
Goldman Sachs & Co. LLC (“Goldman Sachs”) does not provide legal, tax or accounting advice. Any statement contained in this communication (including any attachments) concerning U.S. tax matters was not intended or written to be used, and cannot be used, for the purpose of avoiding penalties under the Internal Revenue Code, and was written to support the promotion or marketing of transaction or matter addressed. Clients of Goldman Sachs should obtain their own independent tax advice based on their particular circumstances.
The website links provided are for your convenience only and are not an endorsement or recommendation by GSAM of any of these websites or the products or services offered. GSAM is not responsible for the accuracy and validity of the content of these websites.
Economic and market forecasts presented herein reflect our judgment as of the date of this presentation and are subject to change without notice. These forecasts do not take into account the specific investment objectives, restrictions, tax and financial situation or other needs of any specific client. Actual data will vary and may not be reflected here. These forecasts are subject to high levels of uncertainty that may affect actual performance. Accordingly, these forecasts should be viewed as merely representative of a broad range of possible outcomes. These forecasts are estimated, based on assumptions, and are subject to significant revision and may change materially as economic and market conditions change. Goldman Sachs has no obligation to provide updates or changes to these forecasts. Case studies and examples are for illustrative purposes only.
Fund holdings and allocations shown are as of December 31, 2018 and may not be representative of future investments. Fund holdings should not be relied on in making investment decisions and should not be construed as research or investment advice regarding particular securities. Current and future holdings are subject to risk.
References to indices, benchmarks or other measures of relative market performance over a specified period of time are provided for your information only and do not imply that the portfolio will achieve similar results. The index composition may not reflect the manner in which a portfolio is constructed. While an adviser seeks to design a portfolio which reflects appropriate risk and return features, portfolio characteristics may deviate from those of the benchmark.
The Global Industry Classification Standard (“GICS”) was developed by and is the exclusive property and a service mark of Morgan Stanley Capital International Inc. (“MSCI”) and Standard & Poor’s, a division of The McGraw-Hill Companies, Inc. (“S&P”) and is licensed for use by Goldman Sachs. Neither MSCI, S&P nor any other party involved in making or compiling the GICS or any GICS classifications makes any express or implied warranties or representations with respect to such standard or classification (or the results to be obtained by the use thereof), and all such parties hereby expressly disclaim all warranties of originality, accuracy, completeness, merchantability or fitness for a particular purpose with respect to any of such standard or classification. Without limiting any of the foregoing, in no event shall MSCI, S&P, any of their affiliates or any third party involved in making or compiling the GICS or any GICS classifications have any liability for any direct, indirect, special, punitive, consequential or any other damages (including lost profits) even if notified of the possibility of such damages.
The portfolio risk management process includes an effort to monitor and manage risk, but does not imply low risk.
Shares of the Goldman Sachs VIT Funds are offered to separate accounts of participating life insurance companies for the purpose of funding variable annuity contracts and variable life insurance policies. Shares of the Fund are not offered directly to the general public. The variable annuity contracts and variable life insurance policies are described in the separate prospectuses issued by participating insurance companies. You should refer to those prospectuses for information about surrender charges, mortality and expense risk fees and other charges that may be assessed by participating insurance companies under the variable annuity contracts or variable life insurance policies. Such fees or charges, if any, may affect the return you may realize with respect to your investments. Ask your representative for more complete information. Please consider a fund’s objectives, risks and charges and expenses, and read the prospectus carefully before investing. The prospectus contains this and other information about the Fund.
This material is not authorized for distribution to prospective investors unless preceded or accompanied by a current prospectus or summary prospectus, if applicable. Investors should consider the Fund’s objective, risks, and charges and expenses, and read the summary prospectus, if available, and/or the prospectus carefully before investing or sending money. The summary prospectus, if available, and the prospectus contain this and other information about the Fund and may be obtained from your authorized dealer or from Goldman Sachs & Co. LLC by calling 1-800-621-2550
This report is prepared for the general information of contract owners and is not an offer of shares of the Goldman Sachs Variable Insurance Trust — Goldman Sachs International Equity Insights Fund.
© 2019 Goldman Sachs. All rights reserved.
VITINTLAR-19/157035-OTU-914536/10.3K
Goldman
SachsVariable Insurance Trust
Goldman Sachs
U.S. Equity Insights Fund
Annual Report
December 31, 2018

GOLDMAN SACHS VARIABLE INSURANCE TRUST U.S. EQUITY INSIGHTS FUND
Investment Process.The Investment Adviser begins with a broad universe of U.S. equity investments for the Fund. As described more fully below, the Investment Adviser uses proprietary multifactor models (the “Multifactor Models”) that attempt to forecast the returns of different markets, currencies and individual securities.
The Multifactor Models rely on some or all of the following investment pillars and themes to forecast the returns of individual securities (although additional pillars or themes may be added in the future without prior notice):
Fundamental Mispricings
• Valuation: The Valuation theme attempts to capture potential mispricings of securities, typically by comparing a measure of the company’s intrinsic value to its market value.
High Quality Business Models
• Profitability: The Profitability theme seeks to assess whether a company is earning more than its cost of capital.
• Quality: The Quality theme assesses both firm and management quality.
• Management: The Management theme assesses the characteristics, policies and strategic decisions of company management.
Market Themes and Trends
• Momentum: The Momentum theme seeks to predict drifts in stock prices caused by delayed investor reaction to company-specific information and information about related companies.
Sentiment Analysis
• Sentiment: The Sentiment theme reflects selected investment views and decisions of individuals and financial intermediaries.
1
GOLDMAN SACHS VARIABLE INSURANCE TRUST U.S. EQUITY INSIGHTS FUND
INVESTMENT OBJECTIVE
The Fund seeks long-term growth of capital and dividend income.
Portfolio Management Discussion and Analysis
Below, the Goldman Sachs Quantitative Investment Strategies Team discusses the Goldman Sachs Variable Insurance Trust — Goldman Sachs U.S. Equity Insights Fund’s (the “Fund”) performance and positioning for the 12-month period ended December 31, 2018 (the “Reporting Period”).
How did the Fund perform during the Reporting Period?
During the Reporting Period, the Fund’s Institutional and Service Shares generated average annual total returns of –6.19% and –6.36%, respectively. These returns compare to the –4.38% average annual total return of the Fund’s benchmark, the Standard & Poor’s 500® Index (with dividends reinvested) (the “S&P 500® Index”) during the same time period.
What economic and market factors most influenced the equity markets as a whole during the Reporting Period?
Representing the U.S. equity market, the S&P 500® Index returned –9.03% in December 2018, posting its worst December since 1931 and bringing its total return to –4.38% for the Reporting Period, the worst calendar year since 2008.
Despite a strong start to the Reporting Period in January 2018 amid solid economic data, a $1.5 trillion tax reform law signed in December 2017, and a favorable corporate earnings season, U.S. equities endured a challenging and volatile year in 2018. In February 2018, U.S. and international equities sold off on market speculation of a faster pace of Federal Reserve (“Fed”) short-term interest rate hikes, which stoked a sharp rise in bond yields and an increase in equity market volatility. Concerns about Fed monetary policy tightening were further exacerbated by solid U.S. labor and inflation data. While the hawkish Fed minutes were largely expected, new Fed Chair Jerome Powell’s Congressional testimony, positing a more optimistic economic outlook since the December 2017 Fed meeting, surprised equity markets with its hawkish tilt, sparking another sell-off in the U.S. equity markets. (Jerome Powell assumed the chairmanship of the Fed in February 2018. Hawkish language tends to suggest higher interest rates; opposite of dovish.) In March 2018, escalating trade tensions and potential tariffs weighed on investor sentiment. Meanwhile, the Fed delivered on a widely expected interest rate increase, with its “dot plot” pointing to a total of three interest rate hikes in calendar year 2018 and potentially two in 2019. (The “dot plot” shows rate projections of the members of the Fed’s Open Market Committee.) However, Fed policymakers acknowledged that the “economic outlook has strengthened in recent months,” revising their economic growth forecast higher and their unemployment forecast lower.
By the end of the Reporting Period, the Fed had hiked interest rates four times and communicated an upbeat view of its economic outlook, spurred by strong U.S. labor and inflation data. Against the strong fundamentals, escalating trade tensions, fears of a global economic slowdown and populist politics weighed on investor sentiment throughout the calendar year. After second and third calendar quarters of generally solid gains, supported by a combination of robust economic growth, strong corporate profits and rising earnings estimates, U.S. equities fell sharply again in the fourth quarter of 2018, as investor sentiment rapidly deteriorated on heightened trade and political uncertainty and in a delayed response to an earlier sell-off in global rates. The correction resulted in tighter U.S. financial conditions, which had been resilient to Fed interest rate hikes earlier in the year. U.S. equities saw a reprieve in November 2018 on more accommodative comments from Fed Chair Powell and on encouraging progress toward China-U.S. trade talks. However, the recovery was short-lived, as U.S. equities plunged in December 2018 on renewed investor fears sparked by the arrest of a Chinese technology executive, the partial Federal government shutdown and the U.S. President’s criticism of Fed Chair Powell.
For the Reporting Period overall, seven sectors posted negative absolute returns and four generated positive returns. Health care, utilities, consumer discretionary and information technology were the best performing sectors in the S&P 500® Index, as measured by total return, and the weakest performing sectors in the S&P 500® Index during the Reporting Period were energy, materials, industrials and financials.(After the close of business on September 28, 2018, the telecommunications services sector was renamed the communication services sector and was broadened to include certain companies from the information technology and consumer discretionary sectors that facilitate communication and offer related content and information through various media.)
Within the U.S. equity market, there was significant disparity in performance not only among sectors but also among the various capitalization and style segments. While all capitalization segments posted negative returns, large-cap stocks, as measured by the
2
GOLDMAN SACHS VARIABLE INSURANCE TRUST U.S. EQUITY INSIGHTS FUND
Russell 1000® Index, performed best, followed at some distance by mid-cap stocks, as measured by the Russell Midcap® Index, and then small-cap stocks, as measured by the Russell 2000® Index. From a style perspective, growth-oriented stocks significantly outpaced value-oriented stocks across the capitalization spectrum. (All as measured by the FTSE Russell indices.)
What key factors were responsible for the Fund’s performance during the Reporting Period?
During the Reporting Period, five of our quantitative model’s six investment themes contributed positively. However, the Fund underperformed the S&P 500® Index due to select individual stock positions that detracted.
What impact did the Fund’s investment themes have on performance during the Reporting Period?
As expected, and in keeping with our investment approach, our quantitative model and its six investment themes — Valuation, Profitability, Quality, Management, Momentum and Sentiment — had the greatest impact on relative performance. We use these themes to take a long-term view of market patterns and look for inefficiencies, selecting stocks for the Fund and overweighting or underweighting the ones chosen by the model. Over time and by design, the performance of any one of the model’s investment themes tends to have a low correlation with the model’s other themes, demonstrating the diversification benefit of the Fund’s theme-driven quantitative model. The variance in performance supports our research indicating that the diversification provided by the Fund’s different investment themes is a significant investment advantage over the long term, even though the Fund may experience underperformance in the short term. Of course, diversification does not protect an investor from market risk nor does it ensure a profit.
During the Reporting Period, five of our six investment themes contributed positively to relative returns. Quality contributed most positively to relative performance, followed by Management and Momentum. The Profitability and Sentiment themes also contributed positively, albeit to a lesser extent. The Quality theme assesses both firm and financial quality. The Management theme assesses the characteristics, policies and strategic decisions of company managements. The Momentum theme seeks to predict drifts in stock prices caused by delayed investor reaction to company-specific information and information about related companies. The Profitability theme assesses whether a company is earning more than its cost of capital. The Sentiment theme reflects selected investment views and decisions of individuals and financial intermediaries.
The Valuation theme was the only one that detracted from the Fund’s relative returns during the Reporting Period. The Valuation theme attempts to capture potential mispricings of securities, typically by comparing a measure of the company’s intrinsic value to its market value.
How did the Fund’s sector and industry allocations affect relative performance?
In constructing the Fund’s portfolio, we focus on picking stocks rather than making industry or sector bets. Consequently, the Fund is similar to its benchmark, the S&P 500® Index, in terms of its industry and sector allocation and style. We manage the Fund’s industry and sector exposure by including industry factors in our risk model and by explicitly penalizing industry and sector deviations from the benchmark index in optimization. Sector weights or changes in sector weights generally do not have a meaningful impact on relative performance.
Did stock selection help or hurt Fund performance during the Reporting Period?
We seek to outpace the S&P 500® Index by overweighting stocks that we expect to outperform and underweighting those that we think may lag. We also build positions based on our thematic views. For example, the Fund aims to hold a basket of stocks with more favorable Momentum characteristics than the benchmark index.
During the Reporting Period, the Fund was hurt by certain individual stock positions, with investments in the consumer discretionary, consumer staples and materials sectors detracting most from the Fund’s results relative to the S&P 500® Index. Contributing positively were holdings in the industrials, utilities and energy sectors.
Which individual positions detracted from the Fund’s results during the Reporting Period?
Detracting most from the Fund’s results relative to the S&P 500® Index were overweight positions in packaged foods manufacturer Conagra Brands, energy and engineering and construction services provider Halliburton and semiconductor company Lam Research. The Fund had an overweight position in Conagra Brands based on our positive views on Sentiment and Momentum. We chose to overweight Halliburton due to our positive views on Sentiment and Value. Our positive views on Sentiment and Value also drove the Fund’s overweight in Lam Research.
3
GOLDMAN SACHS VARIABLE INSURANCE TRUST U.S. EQUITY INSIGHTS FUND
Which individual stock positions contributed the most to the Fund’s relative returns during the Reporting Period?
The Fund benefited most from overweighted positions in tobacco company Philip Morris International and software developer Adobe Systems and from an underweight position in industrials conglomerate General Electric. We chose to overweight Philip Morris International due to our positive views on Sentiment and Quality. The Fund was overweight Adobe Systems given our positive views on Sentiment and Profitability. The underweight in General Electric was established because of our negative views on Management.
How did the Fund use derivatives during the Reporting Period?
During the Reporting Period, we did not use derivatives as part of an active management strategy to add value to the Fund’s results. However, we used equity index futures contracts, on an opportunistic basis, to equitize the Fund’s excess cash holdings. In other words, we put the Fund’s excess cash holdings to work by using them as collateral for the purchase of stock futures. The use of these futures contracts did not have a material impact on the Fund’s performance during the Reporting Period.
Did you make any enhancements to your quantitative models during the Reporting Period?
We continuously look for ways to improve our investment process. During the Reporting Period, we made numerous enhancements to our models. As example, during the second quarter of 2018, we introduced two new signals to our Sentiment theme in the U.S. region that use options data to gauge sentiment around companies. The first signal looks at high conviction option purchases to assess how strongly market participants feel about the prospects of a particular stock. The second signal aims to infer the positive or negative sentiment around a stock by looking at put and call options purchased for the particular company.
We also introduced a new signal within our Momentum theme that helps us create economic links between different companies, potentially giving us insights into price movements of related companies. The signal, introduced in the U.S., European, Japanese and emerging markets regions, uses natural language processing to read through various sections in the patent document to form linkages.
In the fourth quarter of 2018, we added a signal within our Quality theme that uses novel data to help us understand consumer retail trends. We believe this signal will complement our existing suite of alternative data metrics to help us better understand retailers’ earnings growth. We also added a number of signals that utilize natural language processing and regulatory filings to help us better understand the regulatory and business risks faced by companies.
Within our Sentiment theme, we enhanced our existing signals, which use machine learning to help understand sell-side analyst sentiment. With a larger body of sell-side research reports to analyze, we introduced a new machine learning algorithm to help classify sentiment.
What was the Fund’s sector positioning relative to its benchmark index at the end of the Reporting Period?
As of December 31, 2018, the Fund was overweight the health care, utilities, financials and energy sectors relative to the S&P 500® Index. The Fund was underweight consumer staples, communication services, information technology and consumer discretionary and was rather neutrally weighted in industrials, real estate and materials compared to the benchmark index on the same date.
Were there any changes to the Fund’s portfolio management team during the Reporting Period?
During the Reporting Period, one Vice President left the Equity Alpha team within the Goldman Sachs Quantitative Investment Strategies (“QIS”) Team. QIS employs a globally integrated team of more than 95 professionals, with an additional 70-plus professionals dedicated to trading, information technology and development of analytical tools.
What is your strategy going forward for the Fund?
Looking ahead, we continue to believe that less expensive stocks should outpace more expensive stocks, and stocks with good momentum are likely to outperform those with poor momentum. We intend to maintain our focus on seeking companies about which fundamental research analysts are becoming more positive as well as profitable companies with sustainable earnings and a track record of using their capital to enhance shareholder value. As such, we anticipate remaining fully invested with long-term performance likely to be the result of stock selection rather than sector or capitalization allocations.
We stand behind our investment philosophy that sound economic investment principles, coupled with a disciplined quantitative approach, can provide strong, uncorrelated returns over the long term. Our research agenda is robust, and we continue to enhance our existing models, add new proprietary forecasting signals and improve our trading execution as we seek to provide the most value to our shareholders.
4
GOLDMAN SACHS VARIABLE INSURANCE TRUST U.S. EQUITY INSIGHTS FUND
Index Definitions
S&P 500®Indexis the Standard & Poor’s 500 Composite Index of 500 stocks, an unmanaged index of common stock prices. The figures for the index do not include any deduction for fees, expenses or taxes.
Russell 2000®Indexis an unmanaged index of common stock prices that measures the performance of the 2000 smallest companies in the Russell 3000®Index. The figures for the index do not include any deduction for fees, expenses or taxes.
Russell Midcap®Indexmeasures the performance of the 800 smallest companies in the Russell 1000®Index, which represents approximately 25% of the total market capitalization of the Russell 1000 Index.
Russell 1000®Indexmeasures the performance of the 1,000 largest companies in the Russell 3000®Index, which represents approximately 92% of the total market capitalization of the Russell 3000 Index.
It is not possible to invest directly in an index.
5
FUND BASICS
U.S. Equity Insights Fund
as of December 31, 2018
STANDARDIZED TOTAL RETURNS1
| | | | | | | | | | | | | | | | | | |
| | | | | |
| For the period ended 12/31/18 | | One Year | | | Five Years | | | Ten Years | | | Since Inception | | | Inception Date |
| Institutional | | | -6.19 | % | | | 8.39 | % | | | 12.85 | % | | | 5.87 | % | | 02/13/98 |
| Service | | | -6.36 | | | | 8.18 | | | | 12.61 | | | | 6.33 | | | 01/09/06 |
| 1 | The Standardized Total Returns are average annual total returns as of the most recent calendar quarter-end. They assume reinvestment of all distributions at net asset value (“NAV”). Because Institutional and Service Shares do not involve a sales charge, such a charge is not applied to their Standardized Total Returns. |
Total return figures in the above chart represent past performance and do not indicate future results, which will vary. The investment return and principal value of an investment will fluctuate and, therefore, an investor’s shares, when redeemed, may be worth more or less than their original cost. Current performance may be lower or higher than the total return figures in the above chart. Please visit www.GSAMFUNDS.com to obtain the most recentmonth-end returns.Performance reflects fee waivers and/or expense limitations in effect during the periods shown. In their absence, performance would be reduced.
EXPENSE RATIOS2
| | | | | | | | |
| | |
| | | Net Expense Ratio (Current) | | | Gross Expense Ratio (Before Waivers) | |
| Institutional | | | 0.56 | % | | | 0.70 | % |
| Service | | | 0.77 | | | | 0.95 | |
| 2 | The expense ratios of the Fund, both current (net of any fee waivers and/or expense limitations) and before waivers (gross of any fee waivers and/or expense limitations) are as set forth above according to the most recent publicly available Prospectuses for the Fund and may differ from the expense ratios disclosed in the Financial Highlights in this report. Pursuant to a contractual arrangement, the Fund’s fee waivers and/or expense limitations will remain in place through at least April 30, 2019, and prior to such date, the Investment Adviser may not terminate the arrangements without the approval of the Fund’s Board of Trustees. If these arrangements are discontinued in the future, the expense ratios may change without shareholder approval. |
TOP TEN HOLDINGS AS OF 12/31/183
| | | | | | |
| | |
Holding | | % of Net Assets | | | Line of Business |
Apple, Inc. | | | 4.2 | % | | Technology Hardware & Equipment |
Amazon.com, Inc. | | | 3.0 | | | Retailing |
Microsoft Corp. | | | 2.7 | | | Software & Services |
Johnson & Johnson | | | 2.6 | | | Pharmaceuticals, Biotechnology & Life Sciences |
Boeing Co. (The) | | | 1.9 | | | Capital Goods |
Medtronic plc | | | 1.6 | | | Health Care Equipment & Services |
Citigroup, Inc. | | | 1.5 | | | Banks |
PayPal Holdings, Inc. | | | 1.5 | | | Software & Services |
Alphabet, Inc. Class C | | | 1.5 | | | Media & Entertainment |
Bank of America Corp. | | | 1.5 | | | Banks |
| 3 | The top 10 holdings may not be representative of the Fund’s future investments. |
6
FUND BASICS
FUND vs. BENCHMARK SECTOR ALLOCATIONS4
As of December 31, 2018
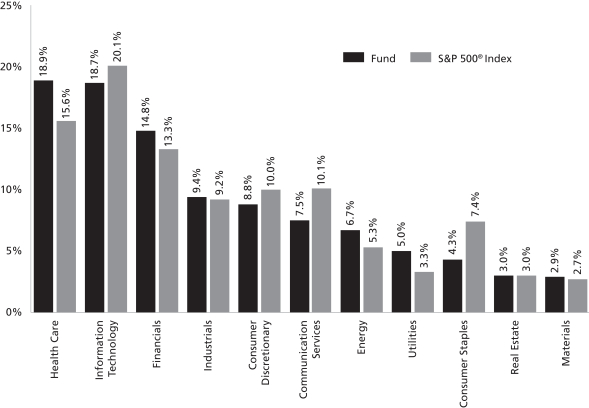
| 4 | The Fund is actively managed and, as such, its composition may differ over time. Consequently, the Fund’s overall sector allocations may differ from percentages contained in the graph above. The graph categorizes investments using Global Industry Classification Standard (“GICS”); however, the sector classifications used by the portfolio management team may differ from GICS. The percentage shown for each investment category reflects the value of investments in that category as a percentage of market value. |
7
GOLDMAN SACHS VARIABLE INSURANCE TRUST U.S. EQUITY INSIGHTS FUND
Performance Summary
December 31, 2018
The following graph shows the value, as of December 31, 2018, of a $10,000 investment made on January 1, 2009 in the Institutional Shares at NAV. For comparative purposes, the performance of the Fund’s benchmark, the S&P 500® Index, is shown. This performance data represents past performance and should not be considered indicative of future performance, which will fluctuate with changes in market conditions. These performance fluctuations may cause an investor’s shares, when redeemed, to be worth more or less than their original cost. Performance reflects Fund level expenses but does not reflect fees and expenses associated with any variable annuity contract or variable life insurance policy that uses the Fund as an investment option for any contract or policy. Had performance reflected all of those fees and expenses, performance would have been reduced. Performance reflects applicable fee waivers and/or expense limitations in effect during the periods shown, and in their absence, performance would be reduced. Performance of Service Shares will vary from Institutional Shares due to differences in class specific fees. In addition to the Investment Adviser’s decisions regarding issuer/industry investment selection and allocation, other factors may affect Fund performance. These factors include, but are not limited to, Fund operating fees and expenses, portfolio turnover, and subscription and redemption cash flows affecting the Fund.
U.S. Equity Insights Fund’s 10 Year Performance
Performance of a $10,000 investment, with distributions reinvested, from January 1, 2009 through December 31, 2018.
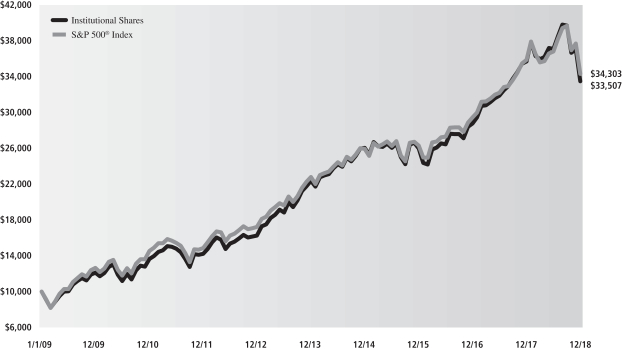
| | | | | | | | |
| Average Annual Total Return through December 31, 2018 | | One Year | | Five Years | | Ten Years | | Since Inception |
Institutional (Commenced February 13, 1998) | | -6.19% | | 8.39% | | 12.85% | | 5.87% |
Service (Commenced January 9, 2006) | | -6.36% | | 8.18% | | 12.61% | | 6.33% |
8
GOLDMAN SACHS VARIABLE INSURANCE TRUST U.S. EQUITY INSIGHTS FUND
Schedule of Investments
December 31, 2018
| | | | | | | | |
| Shares | | | Description | | Value | |
|
| | Common Stocks – 99.4% | |
| | Automobiles & Components – 1.2% | |
| | 71,391 | | | General Motors Co. | | $ | 2,388,029 | |
| | 21,100 | | | Thor Industries, Inc. | | | 1,097,200 | |
| | | | | | | | |
| | | | | | | 3,485,229 | |
| | |
| | Banks – 6.4% | | | | |
| | 175,151 | | | Bank of America Corp. | | | 4,315,721 | |
| | 84,862 | | | Citigroup, Inc. | | | 4,417,916 | |
| | 93,868 | | | Citizens Financial Group, Inc. | | | 2,790,696 | |
| | 45,179 | | | Comerica, Inc. | | | 3,103,345 | |
| | 356 | | �� | First Citizens BancShares, Inc. Class A | | | 134,230 | |
| | 15,749 | | | JPMorgan Chase & Co. | | | 1,537,417 | |
| | 8,951 | | | PacWest Bancorp | | | 297,889 | |
| | 2,700 | | | SVB Financial Group* | | | 512,784 | |
| | 8,218 | | | Western Alliance Bancorp* | | | 324,529 | |
| | 24,915 | | | Zions Bancorp NA | | | 1,015,037 | |
| | | | | | | | |
| | | | | | | 18,449,564 | |
| | |
| | Capital Goods – 4.9% | | | | |
| | 8,643 | | | AECOM* | | | 229,040 | |
| | 4,279 | | | Allison Transmission Holdings, Inc. | | | 187,891 | |
| | 16,843 | | | Boeing Co. (The) | | | 5,431,868 | |
| | 4,146 | | | Caterpillar, Inc. | | | 526,832 | |
| | 5,565 | | | Harris Corp. | | | 749,327 | |
| | 20,172 | | | Honeywell International, Inc. | | | 2,665,125 | |
| | 1,691 | | | Illinois Tool Works, Inc. | | | 214,233 | |
| | 11,239 | | | Ingersoll-Rand plc | | | 1,025,334 | |
| | 20,795 | | | Parker-Hannifin Corp. | | | 3,101,366 | |
| | 2,951 | | | Textron, Inc. | | | 135,716 | |
| | | | | | | | |
| | | | | | | 14,266,732 | |
| | |
| | Commercial & Professional Services – 0.4% | | | | |
| | 13,953 | | | ManpowerGroup, Inc. | | | 904,154 | |
| | 1,676 | | | Republic Services, Inc. | | | 120,823 | |
| | | | | | | | |
| | | | | | | 1,024,977 | |
| | |
| | Consumer Durables & Apparel – 0.5% | | | | |
| | 20,618 | | | DR Horton, Inc. | | | 714,620 | |
| | 30,735 | | | PulteGroup, Inc. | | | 798,803 | |
| | | | | | | | |
| | | | | | | 1,513,423 | |
| | |
| | Consumer Services – 1.1% | | | | |
| | 1,467 | | | Chipotle Mexican Grill, Inc.* | | | 633,436 | |
| | 4,893 | | | Darden Restaurants, Inc. | | | 488,615 | |
| | 1,227 | | | H&R Block, Inc. | | | 31,129 | |
| | 21,251 | | | Yum! Brands, Inc. | | | 1,953,392 | |
| | | | | | | | |
| | | | | | | 3,106,572 | |
| | |
| | Diversified Financials – 4.5% | | | | |
| | 111,310 | | | Ally Financial, Inc. | | | 2,522,285 | |
| | 11,695 | | | Berkshire Hathaway, Inc. Class B* | | | 2,387,885 | |
| | 12,689 | | | Charles Schwab Corp. (The) | | | 526,974 | |
| | 4,010 | | | E*TRADE Financial Corp. | | | 175,959 | |
| | 12,980 | | | MSCI, Inc. | | | 1,913,641 | |
| | 8,910 | | | S&P Global, Inc. | | | 1,514,165 | |
| | 49,975 | | | Synchrony Financial | | | 1,172,414 | |
| | |
|
| | Common Stocks – (continued) | |
| | Diversified Financials – (continued) | | | | |
| | 65,900 | | | Voya Financial, Inc. | | $ | 2,645,226 | |
| | | | | | | | |
| | | | | | | 12,858,549 | |
| | |
| | Energy – 6.7% | | | | |
| | 8,377 | | | Chevron Corp. | | | 911,334 | |
| | 53,591 | | | CNX Resources Corp.* | | | 612,009 | |
| | 62,523 | | | ConocoPhillips | | | 3,898,309 | |
| | 18,041 | | | Exxon Mobil Corp. | | | 1,230,216 | |
| | 30,393 | | | HollyFrontier Corp. | | | 1,553,690 | |
| | 45,662 | | | Marathon Petroleum Corp. | | | 2,694,515 | |
| | 9,985 | | | PBF Energy, Inc. Class A | | | 326,210 | |
| | 40,542 | | | Phillips 66 | | | 3,492,693 | |
| | 70,082 | | | TechnipFMC plc | | | 1,372,205 | |
| | 42,512 | | | Valero Energy Corp. | | | 3,187,125 | |
| | | | | | | | |
| | | | | | | 19,278,306 | |
| | |
| | Food & Staples Retailing – 0.2% | | | | |
| | 16,835 | | | Kroger Co. (The) | | | 462,962 | |
| | 2,551 | | | Walmart, Inc. | | | 237,626 | |
| | | | | | | | |
| | | | | | | 700,588 | |
| | |
| | Food, Beverage & Tobacco – 3.4% | | | | |
| | 9,029 | | | Coca-Cola European Partners plc | | | 413,980 | |
| | 102,656 | | | Conagra Brands, Inc. | | | 2,192,732 | |
| | 2,986 | | | Constellation Brands, Inc. Class A | | | 480,208 | |
| | 2,450 | | | General Mills, Inc. | | | 95,403 | |
| | 16,513 | | | Ingredion, Inc. | | | 1,509,288 | |
| | 3,186 | | | Lamb Weston Holdings, Inc. | | | 234,362 | |
| | 24,530 | | | Monster Beverage Corp.* | | | 1,207,367 | |
| | 8,108 | | | Philip Morris International, Inc. | | | 541,290 | |
| | 58,100 | | | Tyson Foods, Inc. Class A | | | 3,102,540 | |
| | | | | | | | |
| | | | | | | 9,777,170 | |
| | |
| | Health Care Equipment & Services – 5.9% | | | | |
| | 4,872 | | | ABIOMED, Inc.* | | | 1,583,595 | |
| | 30,102 | | | Boston Scientific Corp.* | | | 1,063,805 | |
| | 27,592 | | | HCA Healthcare, Inc. | | | 3,433,824 | |
| | 5,420 | | | Hill-Rom Holdings, Inc. | | | 479,941 | |
| | 3,328 | | | Humana, Inc. | | | 953,405 | |
| | 16,546 | | | IDEXX Laboratories, Inc.* | | | 3,077,887 | |
| | 50,698 | | | Medtronic plc | | | 4,611,490 | |
| | 1,454 | | | Molina Healthcare, Inc.* | | | 168,984 | |
| | 1,999 | | | UnitedHealth Group, Inc. | | | 497,991 | |
| | 6,286 | | | Universal Health Services, Inc. Class B | | | 732,696 | |
| | 1,239 | | | Varian Medical Systems, Inc.* | | | 140,391 | |
| | 3,247 | | | Zimmer Biomet Holdings, Inc. | | | 336,779 | |
| | | | | | | | |
| | | | | | | 17,080,788 | |
| | |
| | Household & Personal Products – 0.6% | | | | |
| | 5,967 | | | Colgate-Palmolive Co. | | | 355,156 | |
| | 15,792 | | | Procter & Gamble Co. (The) | | | 1,451,600 | |
| | | | | | | | |
| | | | | | | 1,806,756 | |
| | |
| | |
| The accompanying notes are an integral part of these financial statements. | | 9 |
GOLDMAN SACHS VARIABLE INSURANCE TRUST U.S. EQUITY INSIGHTS FUND
Schedule of Investments(continued)
December 31, 2018
| | | | | | | | |
| Shares | | | Description | | Value | |
|
| | Common Stocks – (continued) | |
| | Insurance – 3.8% | | | | |
| | 41,131 | | | Allstate Corp. (The) | | $ | 3,398,655 | |
| | 59,316 | | | Arch Capital Group Ltd.* | | | 1,584,924 | |
| | 28,079 | | | Assured Guaranty Ltd. | | | 1,074,864 | |
| | 1,777 | | | Athene Holding Ltd. Class A* | | | 70,778 | |
| | 56,315 | | | Progressive Corp. (The) | | | 3,397,484 | |
| | 5,982 | | | Torchmark Corp. | | | 445,838 | |
| | 12,379 | | | Unum Group | | | 363,695 | |
| | 844 | | | White Mountains Insurance Group Ltd. | | | 723,890 | |
| | | | | | | | |
| | | | | | | 11,060,128 | |
| | |
| | Materials – 2.9% | |
| | 4,851 | | | Berry Global Group, Inc.* | | | 230,568 | |
| | 28,138 | | | CF Industries Holdings, Inc. | | | 1,224,284 | |
| | 54,510 | | | Freeport-McMoRan, Inc. | | | 561,998 | |
| | 12,929 | | | International Paper Co. | | | 521,814 | |
| | 10,410 | | | Nucor Corp. | | | 539,342 | |
| | 6,028 | | | Sherwin-Williams Co. (The) | | | 2,371,777 | |
| | 76,698 | | | Westrock Co. | | | 2,896,117 | |
| | | | | | | | |
| | | | | | | 8,345,900 | |
| | |
| | Media & Entertainment – 6.9% | | | | |
| | 4,059 | | | Alphabet, Inc. Class A* | | | 4,241,493 | |
| | 4,182 | | | Alphabet, Inc. Class C* | | | 4,330,921 | |
| | 19,862 | | | Cinemark Holdings, Inc. | | | 711,060 | |
| | 60,785 | | | Comcast Corp. Class A | | | 2,069,729 | |
| | 32,780 | | | Facebook, Inc. Class A* | | | 4,297,130 | |
| | 413 | | | Madison Square Garden Co. (The) Class A* | | | 110,560 | |
| | 5,766 | | | Netflix, Inc.* | | | 1,543,327 | |
| | 14,943 | | | News Corp. Class A | | | 169,603 | |
| | 1,909 | | | Omnicom Group, Inc. | | | 139,815 | |
| | 2,057 | | | Twitter, Inc.* | | | 59,118 | |
| | 57,918 | | | Viacom, Inc. Class B | | | 1,488,493 | |
| | 7,018 | | | Walt Disney Co. (The) | | | 769,524 | |
| | | | | | | | |
| | | | | | | 19,930,773 | |
| | |
| | Pharmaceuticals, Biotechnology & Life Sciences – 12.9% | |
| | 37,046 | | | AbbVie, Inc. | | | 3,415,271 | |
| | 29,895 | | | Agilent Technologies, Inc. | | | 2,016,717 | |
| | 24,204 | | | Allergan plc | | | 3,235,106 | |
| | 19,998 | | | Amgen, Inc. | | | 3,893,011 | |
| | 4,287 | | | Biogen, Inc.* | | | 1,290,044 | |
| | 76,560 | | | Bristol-Myers Squibb Co. | | | 3,979,589 | |
| | 32,414 | | | Gilead Sciences, Inc. | | | 2,027,496 | |
| | 57,863 | | | Johnson & Johnson | | | 7,467,220 | |
| | 101,149 | | | Mylan NV* | | | 2,771,482 | |
| | 13,091 | | | Pfizer, Inc. | | | 571,422 | |
| | 18,507 | | | Vertex Pharmaceuticals, Inc.* | | | 3,066,795 | |
| | 41,618 | | | Zoetis, Inc. | | | 3,560,004 | |
| | | | | | | | |
| | | | | | | 37,294,157 | |
| | |
| | Real Estate Investment Trusts – 2.9% | | | | |
| | 3,420 | | | Alexandria Real Estate Equities, Inc. | | | 394,121 | |
| | 24,355 | | | American Homes 4 Rent Class A | | | 483,447 | |
| | |
|
| | Common Stocks – (continued) | |
| | Real Estate Investment Trusts – (continued) | | | | |
| | 5,877 | | | Apartment Investment & Management Co. Class A | | $ | 257,883 | |
| | 4,854 | | | Brixmor Property Group, Inc. | | | 71,305 | |
| | 2,713 | | | Camden Property Trust | | | 238,880 | |
| | 68,437 | | | Duke Realty Corp. | | | 1,772,518 | |
| | 14,411 | | | Empire State Realty Trust, Inc. Class A | | | 205,069 | |
| | 7,477 | | | Equity Residential | | | 493,557 | |
| | 176,192 | | | Host Hotels & Resorts, Inc. | | | 2,937,121 | |
| | 54,199 | | | Kimco Realty Corp. | | | 794,015 | |
| | 2,888 | | | Lamar Advertising Co. Class A | | | 199,792 | |
| | 1,909 | | | Mid-America Apartment Communities, Inc. | | | 182,691 | |
| | 2,302 | | | Spirit Realty Capital, Inc. | | | 81,145 | |
| | 3,540 | | | Sun Communities, Inc. | | | 360,053 | |
| | | | | | | | |
| | | | | | | 8,471,597 | |
| | |
| | Retailing – 5.9% | | | | |
| | 5,802 | | | Amazon.com, Inc.* | | | 8,714,430 | |
| | 3,806 | | | AutoZone, Inc.* | | | 3,190,722 | |
| | 24,532 | | | Best Buy Co., Inc. | | | 1,299,215 | |
| | 688 | | | Booking Holdings, Inc.* | | | 1,185,025 | |
| | 3,120 | | | Dollar Tree, Inc.* | | | 281,798 | |
| | 1,185 | | | Expedia Group, Inc. | | | 133,490 | |
| | 259 | | | O’Reilly Automotive, Inc.* | | | 89,182 | |
| | 30,826 | | | Target Corp. | | | 2,037,290 | |
| | 453 | | | Ulta Beauty, Inc.* | | | 110,913 | |
| | | | | | | | |
| | | | | | | 17,042,065 | |
| | |
| | Semiconductors & Semiconductor Equipment – 1.6% | |
| | 92,954 | | | Applied Materials, Inc. | | | 3,043,314 | |
| | 24,494 | | | Micron Technology, Inc.* | | | 777,195 | |
| | 12,411 | | | NXP Semiconductors NV | | | 909,478 | |
| | | | | | | | |
| | | | | | | 4,729,987 | |
| | |
| | Software & Services – 11.1% | | | | |
| | 8,212 | | | Adobe, Inc.* | | | 1,857,883 | |
| | 34,781 | | | Black Knight, Inc.* | | | 1,567,232 | |
| | 29,824 | | | Citrix Systems, Inc. | | | 3,055,767 | |
| | 2,099 | | | Fidelity National Information Services, Inc. | | | 215,252 | |
| | 26,169 | | | Fortinet, Inc.* | | | 1,843,083 | |
| | 37,839 | | | International Business Machines Corp. | | | 4,301,159 | |
| | 17,601 | | | Intuit, Inc. | | | 3,464,757 | |
| | 76,400 | | | Microsoft Corp. | | | 7,759,948 | |
| | 34,651 | | | Oracle Corp. | | | 1,564,493 | |
| | 52,140 | | | PayPal Holdings, Inc.* | | | 4,384,453 | |
| | 6,181 | | | VeriSign, Inc.* | | | 916,580 | |
| | 8,728 | | | Visa, Inc. Class A | | | 1,151,572 | |
| | | | | | | | |
| | | | | | | 32,082,179 | |
| | |
| | Technology Hardware & Equipment – 5.9% | | | | |
| | 77,741 | | | Apple, Inc. | | | 12,262,865 | |
| | 14,975 | | | CDW Corp. | | | 1,213,724 | |
| | 2,682 | | | Juniper Networks, Inc. | | | 72,173 | |
| | |
| | |
| 10 | | The accompanying notes are an integral part of these financial statements. |
GOLDMAN SACHS VARIABLE INSURANCE TRUST U.S. EQUITY INSIGHTS FUND
| | | | | | | | |
| Shares | | | Description | | Value | |
|
| | Common Stocks – (continued) | |
| | Technology Hardware & Equipment – (continued) | | | | |
| | 15,397 | | | Palo Alto Networks, Inc.* | | $ | 2,900,025 | |
| | 2,734 | | | Zebra Technologies Corp. Class A* | | | 435,335 | |
| | | | | | | | |
| | | | | | | 16,884,122 | |
| | |
| | Telecommunication Services – 0.6% | | | | |
| | 50,079 | | | AT&T, Inc. | | | 1,429,255 | |
| | 4,825 | | | Verizon Communications, Inc. | | | 271,261 | |
| | | | | | | | |
| | | | | | | 1,700,516 | |
| | |
| | Transportation – 4.1% | | | | |
| | 18,349 | | | American Airlines Group, Inc. | | | 589,186 | |
| | 13,982 | | | CSX Corp. | | | 868,702 | |
| | 50,198 | | | Delta Air Lines, Inc. | | | 2,504,880 | |
| | 13,794 | | | Norfolk Southern Corp. | | | 2,062,755 | |
| | 34,939 | | | Southwest Airlines Co. | | | 1,623,965 | |
| | 7,302 | | | Union Pacific Corp. | | | 1,009,355 | |
| | 37,073 | | | United Continental Holdings, Inc.* | | | 3,104,122 | |
| | 1,589 | | | XPO Logistics, Inc.* | | | 90,637 | |
| | | | | | | | |
| | | | | | | 11,853,602 | |
| | |
| | Utilities – 5.0% | | | | |
| | 25,412 | | | Ameren Corp. | | | 1,657,625 | |
| | 25,822 | | | American Electric Power Co., Inc. | | | 1,929,936 | |
| | 50,665 | | | CenterPoint Energy, Inc. | | | 1,430,273 | |
| | 61,550 | | | CMS Energy Corp. | | | 3,055,957 | |
| | 28,069 | | | DTE Energy Co. | | | 3,096,011 | |
| | 51,176 | | | Exelon Corp. | | | 2,308,037 | |
| | 16,253 | | | NRG Energy, Inc. | | | 643,619 | |
| | 1,963 | | | OGE Energy Corp. | | | 76,930 | |
| | 6,308 | | | PPL Corp. | | | 178,706 | |
| | | | | | | | |
| | | | | | | 14,377,094 | |
| | |
| | TOTAL INVESTMENTS – 99.4% | |
| | (Cost $279,082,624) | | $ | 287,120,774 | |
| | |
| OTHER ASSETS IN EXCESS OF
LIABILITIES – 0.6% | | | 1,640,158 | |
| | |
| | NET ASSETS – 100.0% | | $ | 288,760,932 | |
| | |
| | |
| The percentage shown for each investment category reflects the value of investments in that category as a percentage of net assets. |
| |
| * | | Non-income producing security. |
| | |
| The accompanying notes are an integral part of these financial statements. | | 11 |
GOLDMAN SACHS VARIABLE INSURANCE TRUST U.S. EQUITY INSIGHTS FUND
Statement of Assets and Liabilities
December 31, 2018
| | | | |
| | | | |
| Assets: | |
Investments in unaffiliated issuers, at value (cost $279,082,624) | | $ | 287,120,774 | |
Cash | | | 1,082,282 | |
Receivables: | | | | |
Fund shares sold | | | 841,870 | |
Dividends | | | 261,585 | |
Reimbursement from investment adviser | | | 35,303 | |
Other assets | | | 432 | |
| |
| Total assets | | | 289,342,246 | |
| |
| | | | |
| Liabilities: | | | |
Payables: | | | | |
Fund shares redeemed | | | 343,264 | |
Management fees | | | 137,255 | |
Distribution and Service fees and Transfer Agency fees | | | 15,135 | |
Accrued expenses | | | 85,660 | |
| |
| Total liabilities | | | 581,314 | |
| |
| | | | |
| Net Assets: | | | |
Paid-in capital | | | 282,058,513 | |
Total distributable earnings | | | 6,702,419 | |
| |
| NET ASSETS | | $ | 288,760,932 | |
Net Assets: | | | | |
Institutional | | $ | 235,553,210 | |
Service | | | 53,207,722 | |
| |
Total Net Assets | | $ | 288,760,932 | |
Shares outstanding $0.001 par value (unlimited shares authorized): | | | | |
Institutional | | | 15,674,344 | |
Service | | | 3,519,815 | |
Net asset value, offering and redemption price per share: | | | | |
Institutional | | | $15.03 | |
Service | | | 15.12 | |
| | |
| 12 | | The accompanying notes are an integral part of these financial statements. |
GOLDMAN SACHS VARIABLE INSURANCE TRUST U.S. EQUITY INSIGHTS FUND
Statement of Operations
For the Fiscal Year Ended December 31, 2018
| | | | |
| | | | |
| Investment income: | |
Dividends — unaffiliated issuers (net of foreign taxes withheld of $342) | | $ | 5,949,433 | |
Dividends — affiliated issuers | | | 9,428 | |
Securities lending income — affiliated issuer | | | 617 | |
| |
| Total investment income | | | 5,959,478 | |
| |
| | | | |
| Expenses: | | | |
Management fees | | | 2,189,472 | |
Distribution and Service fees — Service Shares | | | 197,112 | |
Professional fees | | | 101,214 | |
Printing and mailing costs | | | 91,806 | |
Custody, accounting and administrative services | | | 73,558 | |
Transfer Agency fees(a) | | | 70,622 | |
Trustee fees | | | 16,758 | |
Registration fees | | | 832 | |
Other | | | 15,528 | |
| |
| Total expenses | | | 2,756,902 | |
| |
Less — expense reductions | | | (553,262 | ) |
| |
| Net expenses | | | 2,203,640 | |
| |
| NET INVESTMENT INCOME | | | 3,755,838 | |
| |
| | | | |
| Realized and unrealized gain (loss): | | | |
Net realized gain from: | | | | |
Investments — unaffiliated issuers | | | 37,595,901 | |
Futures contracts | | | 351,953 | |
Net change in unrealized loss on: | | | | |
Investments — unaffiliated issuers | | | (58,960,049 | ) |
Futures contracts | | | (4,030 | ) |
| |
| Net realized and unrealized loss | | | (21,016,225 | ) |
| |
| NET DECREASE IN NET ASSETS RESULTING FROM OPERATIONS | | $ | (17,260,387 | ) |
(a) Institutional and Service Shares incurred Transfer Agency fees of $54,854 and $15,768, respectively.
| | |
| The accompanying notes are an integral part of these financial statements. | | 13 |
GOLDMAN SACHS VARIABLE INSURANCE TRUST U.S. EQUITY INSIGHTS FUND
Statements of Changes in Net Assets
| | | | | | | | |
| | | For the
Fiscal Year Ended
December 31, 2018 | | | For the
Fiscal Year Ended
December 31, 2017 | |
| | | | | | | | |
| From operations: | |
Net investment income | | $ | 3,755,838 | | | $ | 5,402,288 | |
Net realized gain | | | 37,947,854 | | | | 44,732,266 | |
Net change in unrealized gain (loss) | | | (58,964,079 | ) | | | 35,451,851 | |
| | |
| Net increase (decrease) in net assets resulting from operations | | | (17,260,387 | ) | | | 85,586,405 | |
| |
| | | | | | | | |
| Distributions to shareholders: | | | | | | |
From distributable earnings: | | | | | | | | |
Institutional Shares | | | (41,717,467 | ) | | | (31,912,323 | )(a) |
Service Shares | | | (9,387,391 | ) | | | (15,966,368 | )(a) |
| | |
| Total distributions to shareholders | | | (51,104,858 | ) | | | (47,878,691 | ) |
| |
| | | | | | | | |
| From share transactions: | | | | | | |
Proceeds from sales of shares | | | 23,858,438 | | | | 22,663,929 | |
Reinvestment of distributions | | | 51,104,858 | | | | 47,878,691 | |
Cost of shares redeemed | | | (137,999,297 | ) | | | (64,040,172 | ) |
| | |
| Net increase (decrease) in net assets resulting from share transactions | | | (63,036,001 | ) | | | 6,502,448 | |
| | |
| TOTAL INCREASE (DECREASE) | | | (131,401,246 | ) | | | 44,210,162 | |
| |
| | | | | | | | |
| Net assets:(b) | | | | | | |
| | |
Beginning of year | | | 420,162,178 | | | | 375,952,016 | |
| | |
End of year | | $ | 288,760,932 | | | $ | 420,162,178 | |
(a) Prior year information has been revised to conform to current year presentation, see prior year presentation below:
| | | | | | | | |
| | | Institutional | | | Service | |
Distributions from net investment income: | | $ | (3,615,437 | ) | | $ | (1,564,680 | ) |
Distributions from net realized gains: | | $ | (28,296,886 | ) | | $ | (14,401,688 | ) |
| (b) | Prior fiscal year information has been revised to conform with current year presentation. Undistributed net investment income was $475,295 for the Fund, as of December 31, 2017. |
| | |
| 14 | | The accompanying notes are an integral part of these financial statements. |
GOLDMAN SACHS VARIABLE INSURANCE TRUST U.S. EQUITY INSIGHTS FUND
Financial Highlights
Selected Data for a Share Outstanding Throughout Each Year
| | | | | | | | | | | | | | | | | | | | |
| | | Goldman Sachs U.S. Equity Insights Fund | |
| | | Institutional Shares | |
| | | Year Ended December 31, | |
| | | 2018 | | | 2017 | | | 2016 | | | 2015 | | | 2014 | |
| | | | | | | | | | | | | | | | | | | | |
| Per Share Data | | | | | | | | | | | | | | | |
| | | | | |
Net asset value, beginning of year | | $ | 19.41 | | | $ | 17.65 | | | $ | 16.71 | | | $ | 18.12 | | | $ | 16.52 | |
| | | | | |
Net investment income(a) | | | 0.22 | | | | 0.28 | | | | 0.22 | | | | 0.23 | | | | 0.21 | |
| | | | | |
Net realized and unrealized gain (loss) | | | (1.38 | ) | | | 3.98 | | | | 1.58 | | | | (0.27 | ) | | | 2.47 | |
| | | | | |
Total from investment operations | | | (1.16 | ) | | | 4.26 | | | | 1.80 | | | | (0.04 | ) | | | 2.68 | |
| | | | | |
Distributions to shareholders from net investment income | | | (0.25 | ) | | | (0.28 | ) | | | (0.23 | ) | | | (0.25 | ) | | | (0.26 | ) |
| | | | | |
Distributions to shareholders from net realized gains | | | (2.97 | ) | | | (2.22 | ) | | | (0.63 | ) | | | (1.12 | ) | | | (0.82 | ) |
| | | | | |
Total distributions | | | (3.22 | ) | | | (2.50 | ) | | | (0.86 | ) | | | (1.37 | ) | | | (1.08 | ) |
| | | | | |
Net asset value, end of year | | $ | 15.03 | | | $ | 19.41 | | | $ | 17.65 | | | $ | 16.71 | | | $ | 18.12 | |
| | | | | |
Total return(b) | | | (6.19 | )% | | | 24.07 | % | | | 10.70 | % | | | (0.20 | )% | | | 16.37 | % |
| | | | | |
Net assets, end of year (in 000s) | | $ | 235,553 | | | $ | 277,952 | | | $ | 255,565 | | | $ | 269,238 | | | $ | 312,370 | |
| | | | | |
Ratio of net expenses to average net assets | | | 0.58 | % | | | 0.62 | % | | | 0.64 | % | | | 0.64 | % | | | 0.65 | % |
| | | | | |
Ratio of total expenses to average net assets | | | 0.73 | % | | | 0.70 | % | | | 0.70 | % | | | 0.71 | % | | | 0.71 | % |
| | | | | |
Ratio of net investment income to average net assets | | | 1.12 | % | | | 1.42 | % | | | 1.25 | % | | | 1.29 | % | | | 1.21 | % |
| | | | | |
Portfolio turnover rate(c) | | | 160 | % | | | 184 | % | | | 204 | % | | | 200 | % | | | 214 | % |
| (a) | Calculated based on the average shares outstanding methodology. |
| (b) | Assumes investment at the net asset value at the beginning of the year, reinvestment of all distributions, and a complete redemption of the investment at the net asset value at the end of the year. |
| (c) | The Fund’s portfolio turnover rate is calculated in accordance with regulatory requirements, without regard to transactions involving short term investments and certain derivatives. If such transactions were included, the Fund’s portfolio turnover rate may be higher. |
| | |
| The accompanying notes are an integral part of these financial statements. | | 15 |
GOLDMAN SACHS VARIABLE INSURANCE TRUST U.S. EQUITY INSIGHTS FUND
Financial Highlights(continued)
Selected Data for a Share Outstanding Throughout Each Year
| | | | | | | | | | | | | | | | | | | | |
| | | Goldman Sachs U.S. Equity Insights Fund | |
| | | Service Shares | |
| | | Year Ended December 31, | |
| | | 2018 | | | 2017 | | | 2016 | | | 2015 | | | 2014 | |
| | | | | | | | | | | | | | | | | | | | |
| Per Share Data | | | | | | | | | | | | | | | |
| | | | | |
Net asset value, beginning of year | | $ | 19.48 | | | $ | 17.71 | | | $ | 16.77 | | | $ | 18.17 | | | $ | 16.55 | |
| | | | | |
Net investment income(a) | | | 0.18 | | | | 0.24 | | | | 0.18 | | | | 0.20 | | | | 0.18 | |
| | | | | |
Net realized and unrealized gain (loss) | | | (1.37 | ) | | | 3.99 | | | | 1.59 | | | | (0.28 | ) | | | 2.47 | |
| | | | | |
Total from investment operations | | | (1.19 | ) | | | 4.23 | | | | 1.77 | | | | (0.08 | ) | | | 2.65 | |
| | | | | |
Distributions to shareholders from net investment income | | | (0.20 | ) | | | (0.24 | ) | | | (0.20 | ) | | | (0.20 | ) | | | (0.21 | ) |
| | | | | |
Distributions to shareholders from net realized gains | | | (2.97 | ) | | | (2.22 | ) | | | (0.63 | ) | | | (1.12 | ) | | | (0.82 | ) |
| | | | | |
Total distributions | | | (3.17 | ) | | | (2.46 | ) | | | (0.83 | ) | | | (1.32 | ) | | | (1.03 | ) |
| | | | | |
Net asset value, end of year | | $ | 15.12 | | | $ | 19.48 | | | $ | 17.71 | | | $ | 16.77 | | | $ | 18.17 | |
| | | | | |
Total return(b) | | | (6.36 | )% | | | 23.80 | % | | | 10.44 | % | | | (0.41 | )% | | | 16.18 | % |
| | | | | |
Net assets, end of year (in 000s) | | $ | 53,208 | | | $ | 142,210 | | | $ | 120,387 | | | $ | 122,531 | | | $ | 138,725 | |
| | | | | |
Ratio of net expenses to average net assets | | | 0.79 | % | | | 0.82 | % | | | 0.85 | % | | | 0.85 | % | | | 0.86 | % |
| | | | | |
Ratio of total expenses to average net assets | | | 0.97 | % | | | 0.95 | % | | | 0.95 | % | | | 0.96 | % | | | 0.96 | % |
| | | | | |
Ratio of net investment income to average net assets | | | 0.88 | % | | | 1.21 | % | | | 1.04 | % | | | 1.08 | % | | | 1.01 | % |
| | | | | |
Portfolio turnover rate(c) | | | 160 | % | | | 184 | % | | | 204 | % | | | 200 | % | | | 214 | % |
| (a) | Calculated based on the average shares outstanding methodology. |
| (b) | Assumes investment at the net asset value at the beginning of the year, reinvestment of all distributions, and a complete redemption of the investment at the net asset value at the end of the year. |
| (c) | The Fund’s portfolio turnover rate is calculated in accordance with regulatory requirements, without regard to transactions involving short term investments and certain derivatives. If such transactions were included, the Fund’s portfolio turnover rate may be higher. |
| | |
| 16 | | The accompanying notes are an integral part of these financial statements. |
GOLDMAN SACHS VARIABLE INSURANCE TRUST U.S. EQUITY INSIGHTS FUND
Notes to Financial Statements
December 31, 2018
1. ORGANIZATION
Goldman Sachs Variable Insurance Trust (the “Trust” or “VIT”) is a Delaware statutory trust registered under the Investment Company Act of 1940, as amended (the “Act”), as anopen-end management investment company. The Trust includes the Goldman Sachs U.S. Equity Insights Fund (the “Fund”). The Fund is a diversified portfolio under the Act offering two classes of shares — Institutional and Service Shares. Shares of the Trust are offered to separate accounts of participating life insurance companies for the purpose of funding variable annuity contracts and variable life insurance policies.
Goldman Sachs Asset Management, L.P. (“GSAM”), an affiliate of Goldman Sachs & Co. LLC (“Goldman Sachs”), serves as investment adviser to the Fund pursuant to a management agreement (the “Agreement”) with the Trust.
2. SIGNIFICANT ACCOUNTING POLICIES
The financial statements have been prepared in accordance with accounting principles generally accepted in the United States of America (“GAAP”) and require management to make estimates and assumptions that may affect the reported amounts and disclosures. Actual results may differ from those estimates and assumptions.
A. Investment Valuation — The Fund’s valuation policy is to value investments at fair value.
B. Investment Income and Investments— Investment income includes interest income, dividend income, and securities lending income, if any. Interest income is accrued daily and adjusted for amortization of premiums and accretion of discounts. Dividend income is recognized onex-dividend date or, for certain foreign securities, as soon as such information is obtained subsequent to theex-dividend date. Investment transactions are reflected on trade date. Realized gains and losses are calculated using identified cost. Investment transactions are recorded on the following business day for daily net asset value (“NAV”) calculations. Investment income is recorded net of any foreign withholding taxes, less any amounts reclaimable. The Fund may file withholding tax reclaims in certain jurisdictions to recover a portion of amounts previously withheld. Any foreign capital gains tax is accrued daily based upon net unrealized gains, and is payable upon sale of such investments. Distributions received from the Fund’s investments in United States (“U.S.”) real estate investment trusts (“REITs”) may be characterized as ordinary income, net capital gain or a return of capital. A return of capital is recorded by the Fund as a reduction to the cost basis of the REIT.
For derivative contracts, realized gains and losses are recorded upon settlement of the contract.
C. Class Allocations and Expenses — Investment income, realized and unrealized gain (loss), if any, andnon-class specific expenses of the Fund are allocated daily based upon the proportion of net assets of each class. Non-class specific expenses directly incurred by the Fund are charged to the Fund, while such expenses incurred by the Trust are allocated across the Fund on a straight-line and/orpro-rata basis depending upon the nature of the expenses. Class specific expenses, where applicable, are borne by the respective share classes and include Distribution and Service and Transfer Agency fees.
D. Federal Taxes and Distributions to Shareholders — It is the Fund’s policy to comply with the requirements of the Internal Revenue Code of 1986, as amended (the “Code”), applicable to regulated investment companies and to distribute each year substantially all of its investment company taxable income and capital gains to its shareholders. Accordingly, the Fund is not required to make any provisions for the payment of federal income tax. Distributions to shareholders are recorded on theex-dividend date. Income and capital gains distributions, if any, are declared and paid annually.
Net capital losses, if any, are carried forward to future fiscal years and may be used to the extent allowed by the Code to offset any future capital gains. Losses that are carried forward will retain their character as either short-term or long-term capital losses. Utilization of capital loss carryforwards will reduce the requirement of future capital gains distributions.
The characterization of distributions to shareholders for financial reporting purposes is determined in accordance with federal income tax rules, which may differ from GAAP. The source of the Fund’s distributions may be shown in the accompanying financial statements as either from distributable earnings or capital. Certain components of the Fund’s net assets on the Statement of Assets and Liabilities reflect permanent GAAP/tax differences based on the appropriate tax character.
17
GOLDMAN SACHS VARIABLE INSURANCE TRUST U.S. EQUITY INSIGHTS FUND
Notes to Financial Statements(continued)
December 31, 2018
3. INVESTMENTS AND FAIR VALUE MEASUREMENTS
U.S. GAAP defines the fair value of a financial instrument as the amount that would be received to sell an asset or paid to transfer a liability in an orderly transaction between market participants at the measurement date (i.e., the exit price); the Fund’s policy is to use the market approach. GAAP establishes a fair value hierarchy that prioritizes the inputs to valuation techniques used to measure fair value. The hierarchy gives the highest priority to unadjusted quoted prices in active markets for identical assets or liabilities (Level 1 measurements) and the lowest priority to unobservable inputs (Level 3 measurements). The levels used for classifying investments are not necessarily an indication of the risk associated with investing in these investments. The three levels of the fair value hierarchy are described below:
Level 1 — Unadjusted quoted prices in active markets that are accessible at the measurement date for identical, unrestricted assets or liabilities;
Level 2 — Quoted prices in markets that are not active or financial instruments for which significant inputs are observable (including, but not limited to, quoted prices for similar investments, interest rates, foreign exchange rates, volatility and credit spreads), either directly or indirectly;
Level 3 — Prices or valuations that require significant unobservable inputs (including GSAM’s assumptions in determining fair value measurement).
Changes in valuation techniques may result in transfers into or out of an assigned level within the hierarchy. In accordance with the Fund’s policy, transfers between different levels of the fair value hierarchy resulting from such changes are deemed to have occurred as of the beginning of the reporting period.
The Board of Trustees (“Trustees”) has approved Valuation Procedures that govern the valuation of the portfolio investments held by the Fund, including investments for which market quotations are not readily available. The Trustees have delegated to GSAMday-to-day responsibility for implementing and maintaining internal controls and procedures related to the valuation of the Fund’s investments. To assess the continuing appropriateness of pricing sources and methodologies, GSAM regularly performs price verification procedures and issues challenges as necessary to third party pricing vendors or brokers, and any differences are reviewed in accordance with the Valuation Procedures.
A. Level 1 and Level 2 Fair Value Investments — The valuation techniques and significant inputs used in determining the fair values for investments classified as Level 1 and Level 2 are as follows:
Equity Securities — Equity securities traded on a U.S. securities exchange or the NASDAQ system, or those located on certain foreign exchanges, including but not limited to the Americas, are valued daily at their last sale price or official closing price on the principal exchange or system on which they are traded. If there is no sale or official closing price or such price is believed by GSAM to not represent fair value, equity securities are valued at the last bid price for long positions and at the last ask price for short positions. To the extent these investments are actively traded, they are classified as Level 1 of the fair value hierarchy, otherwise they are generally classified as Level 2.
Unlisted equity securities for which market quotations are available are valued at the last sale price on the valuation date, or if no sale occurs, at the last bid price, and are generally classified as Level 2.
Money Market Funds — Investments in the Goldman Sachs Financial Square Government Fund (“Underlying Fund”) are valued at the NAV of the Institutional Share class on the day of valuation. These investments are generally classified as Level 1 of the fair value hierarchy. For information regarding the Underlying Fund’s accounting policies and investment holdings, please see the Underlying Fund’s shareholder report.
Derivative Contracts — A derivative is an instrument whose value is derived from underlying assets, indices, reference rates or a combination of these factors. The Fund enters into derivative transactions to hedge against changes in interest rates, securities prices, and/or currency exchange rates, to increase total return, or to gain access to certain markets or attain exposure to other underliers.
Exchange-traded derivatives, including futures and options contracts, are generally valued at the last sale or settlement price on the exchange where they are principally traded. Exchange-traded options without settlement prices are generally valued at the
18
GOLDMAN SACHS VARIABLE INSURANCE TRUST U.S. EQUITY INSIGHTS FUND
3. INVESTMENTS AND FAIR VALUE MEASUREMENTS (continued)
midpoint of the bid and ask prices on the exchange where they are principally traded (or, in the absence oftwo-way trading, at the last bid price for long positions and the last ask price for short positions). Exchange-traded derivatives typically fall within Level 1 of the fair value hierarchy.Over-the-counter (“OTC”) and centrally cleared derivatives are valued using market transactions and other market evidence, including market-based inputs to models, calibration to market-clearing transactions, broker or dealer quotations, or other alternative pricing sources. Where models are used, the selection of a particular model to value OTC and centrally cleared derivatives depends upon the contractual terms of, and specific risks inherent in, the instrument, as well as the availability of pricing information in the market. Valuation models require a variety of inputs, including contractual terms, market prices, yield curves, credit curves, measures of volatility, voluntary and involuntary prepayment rates, loss severity rates and correlations of such inputs. For OTC and centrally cleared derivatives that trade in liquid markets, model inputs can generally be verified and model selection does not involve significant management judgment. OTC and centrally cleared derivatives are classified within Level 2 of the fair value hierarchy when significant inputs are corroborated by market evidence.
i. Futures Contracts — Futures contracts are contracts to buy or sell a standardized quantity of a specified commodity or security. Upon entering into a futures contract, the Fund deposits cash or securities in an account on behalf of the broker in an amount sufficient to meet the initial margin requirement. Subsequent payments are made or received by the Fund equal to the daily change in the contract value and are recorded as variation margin receivable or payable with a corresponding offset to unrealized gains or losses. For financial reporting purposes, cash collateral that has been pledged to cover obligations of the Fund and cash collateral received, if any, is reported separately on the Statement of Assets and Liabilities as receivables/payables for collateral on certain derivative contracts. Non-cash collateral pledged by the Fund, if any, is noted in the Schedule of Investments.
B. Level 3 Fair Value Investments — To the extent that significant inputs to valuation models and other alternative pricing sources are unobservable, or if quotations are not readily available, or if GSAM believes that such quotations do not accurately reflect fair value, the fair value of the Fund’s investments may be determined under Valuation Procedures approved by the Trustees. GSAM, consistent with its procedures and applicable regulatory guidance, may make an adjustment to the most recent valuation prices of either domestic or foreign securities in light of significant events to reflect what it believes to be the fair value of the securities at the time of determining the Fund’s NAV. Significant events which could affect a large number of securities in a particular market may include, but are not limited to: significant fluctuations in U.S. or foreign markets; market dislocations; market disruptions; or unscheduled market closings. Significant events which could also affect a single issuer may include, but are not limited to: corporate actions such as reorganizations, mergers andbuy-outs; ratings downgrades; and bankruptcies.
C. Fair Value Hierarchy — The following is a summary of the Fund’s investments and derivatives classified in the fair value hierarchy as of December 31, 2018:
| | | | | | | | | | | | |
| Investment Type | | Level 1 | | | Level 2 | | | Level 3 | |
| | | |
| Assets | | | | | | | | | | | | |
| Common Stock(a) | | | | | | | | | | | | |
Europe | | $ | 2,695,663 | | | $ | — | | | $ | — | |
North America | | | 284,425,111 | | | | — | | | | — | |
| | | |
| Total | | $ | 287,120,774 | | | $ | — | | | $ | — | |
| (a) | Amounts are disclosed by continent to highlight the impact of time zone differences between local market close and the calculation of NAV. Security valuations are based on the principal exchange or system on which they are traded, which may differ from country of domicile. |
For further information regarding security characteristics, see the Schedule of Investments.
19
GOLDMAN SACHS VARIABLE INSURANCE TRUST U.S. EQUITY INSIGHTS FUND
Notes to Financial Statements(continued)
December 31, 2018
4. INVESTMENTS IN DERIVATIVES
The following table sets forth, by certain risk types, the Fund’s gains (losses) related to these derivatives and their indicative volumes for the fiscal year ended December 31, 2018. These gains (losses) should be considered in the context that these derivative contracts may have been executed to create investment opportunities and/or economically hedge certain investments, and accordingly, certain gains (losses) on such derivative contracts may offset certain (losses) gains attributable to investments. These gains (losses) are included in “Net realized gain (loss)” or “Net change in unrealized gain (loss)” on the Statement of Operations:
| | | | | | | | | | | | | | |
| Risk | | Statement of Operations | | Net
Realized
Gain (Loss) | | | Net Change in
Unrealized
Gain (Loss) | | | Average
Number of
Contracts(a) | |
| | | | |
| Equity | | Net realized gain (loss) from futures contracts/Net change in unrealized gain (loss) on futures contracts | | $ | 351,953 | | | $ | (4,030 | ) | | | 10 | |
| (a) | Average number of contracts is based on the average of month end balances for the fiscal year ended December 31, 2018. |
5. AGREEMENTS AND AFFILIATED TRANSACTIONS
A. Management Agreement — Under the Agreement, GSAM manages the Fund, subject to the general supervision of the Trustees.
As compensation for the services rendered pursuant to the Agreement, the assumption of the expenses related thereto and administration of the Fund’s business affairs, including providing facilities, GSAM is entitled to a management fee, accrued daily and paid monthly, equal to an annual percentage rate of the Fund’s average daily net assets.
As of December 31, 2018, the contractual management fees with GSAM were as stated below. The effective contractual management rates and effective net management rates represent the rates for the fiscal year ended December 31, 2018.
| | | | | | | | | | | | |
| Contractual Management Rate | | Effective
Rate | | Effective Net
Management
Rate^ |
First
$1 billion | | Next
$1 billion | | Next
$3 billion | | Next
$3 billion | | Over
$8 billion |
| 0.62% | | 0.59% | | 0.56% | | 0.55% | | 0.54% | | 0.62% | | 0.55%* |
| ^ | Effective Net Management Rate includes the impact of management fee waivers of affiliated Underlying Funds, if any. |
| * | GSAM agreed to waive a portion of its management fee in order to achieve a net management rate, as defined in the Fund’s most recent prospectus. This waiver will be effective through at least April 30, 2019, and prior to such date GSAM may not terminate the arrangement without approval of the Trustees. For the fiscal year ended December 31, 2018, GSAM waived $232,205 of its management fee. |
The Fund invests in Institutional Shares of the Goldman Sachs Financial Square Government Fund, which is an affiliated Underlying Fund. GSAM has agreed to waive a portion of its management fee payable by the Fund in an amount equal to the management fee it earns as an investment adviser to the affiliated Underlying Fund in which the Fund invests, except those management fees it earns from the Fund’s investments of cash collateral received in connection with securities lending transactions in the Goldman Sachs Financial Square Government Fund. For the fiscal year ended December 31, 2018, GSAM waived $846 of the Fund’s management fee.
B. Distribution and/or Service(12b-1) Plan — The Trust, on behalf of Service Shares of the Fund, has adopted a Distribution and Service Plan subject to Rule12b-1 under the Act. Under the Distribution and Service Plan, Goldman Sachs, which serves as distributor, is entitled to a fee accrued daily and paid monthly, for distribution services and personal and account maintenance services, which may then be paid by Goldman Sachs to authorized dealers, equal to, on an annual basis, 0.25% of the Fund’s average daily net assets attributable to Service Shares. Goldman Sachs has agreed to waive distribution and service fees so as not to exceed an annual rate of 0.21% of average daily net assets attributable to Service Shares. This distribution and service fee waiver will remain in place through at least April 30, 2019, and prior to such date Goldman Sachs may not terminate the arrangement without the approval of the Trustees. For the fiscal year ended December 31, 2018, Goldman Sachs waived $31,538 in distribution and service fees for the Fund’s Service Shares.
20
GOLDMAN SACHS VARIABLE INSURANCE TRUST U.S. EQUITY INSIGHTS FUND
5. AGREEMENTS AND AFFILIATED TRANSACTIONS (continued)
C. Transfer Agency Agreement — Goldman Sachs also serves as the transfer agent of the Fund for a fee pursuant to the Transfer Agency Agreement. The fees charged for such transfer agency services are accrued daily and paid monthly at an annual rate of 0.02% of the average daily net assets of Institutional and Service Shares.
D. Other Expense Agreements and Affiliated Transactions — GSAM has agreed to limit certain “Other Expenses” of the Fund (excluding acquired fund fees and expenses, transfer agency fees and expenses, service fees and shareholder administration fees (as applicable), taxes, interest, brokerage fees, expenses of shareholder meetings, litigation and indemnification, and extraordinary expenses) to the extent such expenses exceed, on an annual basis, a percentage rate of the average daily net assets of the Fund. Such Other Expense reimbursements, if any, are accrued daily and paid monthly. In addition, the Fund is not obligated to reimburse GSAM for prior fiscal year expense reimbursements, if any. The Other Expense limitation as an annual percentage rate of average daily net assets for the Fund is 0.004%. The Other Expense limitation will remain in place through at least April 30, 2019, and prior to such date GSAM may not terminate the arrangement without the approval of the Trustees. In addition, the Fund has entered into certain offset arrangements with the custodian and the transfer agent, which may result in a reduction of the Fund’s expenses and are received irrespective of the application of the “Other Expense” limitation described above.
For the fiscal year ended December 31, 2018, these expense reductions, including any fee waivers and Other Expense reimbursements, were as follows:
| | | | | | | | | | | | | | | | | | |
Management Fee
Waiver | | | Distribution and
Service Fee Waiver | | | Custody Fee
Credits | | | Other Expense
Reimbursement | | | Total Expense
Reductions | |
| | | | |
| | $233,052 | | | $ | 31,538 | | | $ | 3,095 | | | $ | 285,577 | | | $ | 553,262 | |
E. Line of Credit Facility — As of December 31, 2018, the Fund participated in a $770,000,000 committed, unsecured revolving line of credit facility (the “facility”) together with other funds of the Trust and certain registered investment companies having management agreements with GSAM or its affiliates. This facility is to be used for temporary emergency purposes, or to allow for an orderly liquidation of securities to meet redemption requests. The interest rate on borrowings is based on the federal funds rate. The facility also requires a fee to be paid by the Fund based on the amount of the commitment that has not been utilized. For the fiscal year ended December 31, 2018, the Fund did not have any borrowings under the facility.
F. Other Transactions with Affiliates — The following table provides information about the Fund’s investment in the Goldman Sachs Financial Square Government Fund as of and for the fiscal year ended December 31, 2018:
| | | | | | | | | | | | | | | | | | | | | | |
Beginning
Value as of
December 31, 2017 | | | Purchases
at Cost | | | Proceeds
from Sales | | | Ending
Value as of
December 31, 2018 | | | Shares as of
December 31, 2018 | | | Dividend Income
from Affiliated
Investment Company | |
| | | | | |
| | $— | | | $ | 13,444,128 | | | $ | (13,444,128 | ) | | $ | — | | | | — | | | $ | 9,428 | |
6. PORTFOLIO SECURITIES TRANSACTIONS
The cost of purchases and proceeds from sales and maturities of long-term securities for the fiscal year ended December 31, 2018, were $563,809,702 and $672,072,414, respectively.
7. SECURITIES LENDING
Pursuant to exemptive relief granted by the Securities and Exchange Commission (“SEC”) and the terms and conditions contained therein, the Fund may lend its securities through a securities lending agent, Goldman Sachs Agency Lending (“GSAL”), a wholly-owned subsidiary of Goldman Sachs, to certain qualified borrowers including Goldman Sachs and affiliates. In accordance with the
21
GOLDMAN SACHS VARIABLE INSURANCE TRUST U.S. EQUITY INSIGHTS FUND
Notes to Financial Statements(continued)
December 31, 2018
7. SECURITIES LENDING (continued)
Fund’s securities lending procedures, the Fund receives cash collateral at least equal to the market value of the securities on loan. The market value of the loaned securities is determined at the close of business of the Fund, at their last sale price or official closing price on the principal exchange or system on which they are traded, and any additional required collateral is delivered to the Fund on the next business day. As with other extensions of credit, the Fund may experience delay in the recovery of its securities or incur a loss should the borrower of the securities breach its agreement with the Fund or become insolvent at a time when the collateral is insufficient to cover the cost of repurchasing securities on loan. Dividend income received from securities on loan may not be subject to withholding taxes and therefore withholding taxes paid may differ from the amounts listed in the Statement of Operations. Loans of securities are terminable at any time and as such 1) the remaining contractual maturities of the outstanding securities lending transactions are considered to be overnight and continuous and 2) the borrower, after notice, is required to return borrowed securities within the standard time period for settlement of securities transactions.
The Fund invests the cash collateral received in connection with securities lending transactions in the Goldman Sachs Financial Square Government Fund (“Government Money Market Fund”), an affiliated series of the Goldman Sachs Trust. The Government Money Market Fund is registered under the Act as an open end investment company, is subject to Rule2a-7 under the Act, and is managed by GSAM, for which GSAM may receive a management fee of up to 0.16% (prior to February 21, 2018, GSAM may have received a management fee of up to 0.205%) on an annualized basis of the average daily net assets of the Government Money Market Fund.
In the event of a default by a borrower with respect to any loan, GSAL will exercise any and all remedies provided under the applicable borrower agreement to make the Fund whole. These remedies include purchasing replacement securities by applying the collateral held from the defaulting broker against the purchase cost of the replacement securities. If GSAL is unable to purchase replacement securities, GSAL will indemnify the Fund by paying the Fund an amount equal to the market value of the securities loaned minus the value of cash collateral received from the borrower for the loan, subject to an exclusion for any shortfalls resulting from a loss of value in such cash collateral due to reinvestment risk. The Fund may enter into master netting agreements with borrowers, which provide the right, in the event of a default (including bankruptcy or insolvency), for thenon-defaulting party to liquidate the collateral and calculate net exposure to the defaulting party or request additional collateral. However, in the event of a default by a borrower, a resolution authority could determine that such rights are not enforceable due to the restrictions or prohibitions against the right ofset-off that may be imposed in accordance with a particular jurisdiction’s bankruptcy or insolvency laws. The Fund’s loaned securities were all subject to enforceable Securities Lending Agreements and the value of the collateral was at least equal to the value of the cash received. The amounts of the Fund’s overnight and continuous agreements, which represent the gross amounts of recognized liabilities for securities lending transactions outstanding as of December 31, 2018, are disclosed as “Payable upon return of securities loaned” on the Statement of Assets and Liabilities, where applicable. The Fund did not have securities on loan as of December 31, 2018.
Both the Fund and GSAL received compensation relating to the lending of the Fund’s securities. The amounts earned, if any, by the Fund for the fiscal year ended December 31, 2018, are reported under Investment Income on the Statement of Operations.
The table below details securities lending activity with affiliates of Goldman Sachs:
| | | | | | | | | | |
| For the fiscal year Ended December 31, 2018 | | | | |
Earnings of GSAL
Relating to
Securities
Loaned | | | Amount Received
by the Fund
from Lending to
Goldman Sachs | | | Amount Payable to
Goldman Sachs
Upon Return of
Securities Loaned as of
December 31, 2018 | |
| | |
| $ | 69 | | | $ | 53 | | | $ | — | |
The following table provides information about the Fund’s investment in the Government Money Market Fund for the fiscal year ended December 31, 2018:
| | | | | | | | | | | | | | |
Beginning
Value as of
December 31, 2017 | | | Purchases
at Cost | | | Proceeds
from Sales | | | Ending
Value as of
December 31, 2018 | |
| | | |
| | $— | | | $ | 3,743,740 | | | $ | (3,743,740 | ) | | $ | — | |
22
GOLDMAN SACHS VARIABLE INSURANCE TRUST U.S. EQUITY INSIGHTS FUND
8. TAX INFORMATION
The tax character of distributions paid during the fiscal years ended December 31, 2017 and December 31, 2018 was as follows:
| | | | | | | | |
| | | 2017 | | | 2018 | |
| Distributions paid from: | | | | | | | | |
Ordinary income | | $ | 38,065,317 | | | $ | 27,075,755 | |
Net long-term capital gains | | | 9,813,374 | | | | 24,029,103 | |
| Total taxable distributions | | $ | 47,878,691 | | | $ | 51,104,858 | |
As of December 31, 2018, the components of accumulated earnings (losses) on atax-basis were as follows:
| | | | |
| Undistributed ordinary income — net | | $ | 298,030 | |
| Timing differences (§857 (b)(9) Deferred Dividend/Post October Loss Deferral) | | | (658,536 | ) |
| Unrealized gains — net | | | 7,062,925 | |
| Total accumulated gains — net | | $ | 6,702,419 | |
As of December 31, 2018, the Fund’s aggregate security unrealized gains and losses based on cost for U.S. federal income tax purposes were as follows:
| | | | |
| Tax cost | | $ | 280,057,849 | |
| Gross unrealized gain | | | 31,334,141 | |
| Gross unrealized loss | | | (24,271,216 | ) |
| Net unrealized gain | | $ | 7,062,925 | |
The difference between GAAP-basis andtax-basis unrealized gains (losses) is attributable primarily to wash sales.
GSAM has reviewed the Fund’s tax positions for all open tax years (the current and prior three years, as applicable) and has concluded that no provision for income tax is required in the Fund’s financial statements. Such open tax years remain subject to examination and adjustment by tax authorities.
9. OTHER RISKS
The Fund’s risks include, but are not limited to, the following:
Derivatives Risk —The Fund’s use of derivatives may result in loss. Derivative instruments, which may pose risks in addition to and greater than those associated with investing directly in securities, currencies or other instruments, may be illiquid or less liquid, volatile, difficult to price and leveraged so that small changes in the value of the underlying instruments may produce disproportionate losses to the Fund. Derivatives are also subject to counterparty risk, which is the risk that the other party in the transaction will not fulfill its contractual obligation. The use of derivatives is a highly specialized activity that involves investment techniques and risks different from those associated with investments in more traditional securities and instruments. Losses from derivatives can also result from a lack of correlation between changes in the value of derivative instruments and the portfolio assets (if any) being hedged.
Investments in Other Investment Companies Risk — As a shareholder of another investment company, including an exchange-traded fund (“ETF”), the Fund will indirectly bear its proportionate share of any net management fees and other expenses paid by such other investment companies, in addition to the fees and expenses regularly borne by the Fund.
23
GOLDMAN SACHS VARIABLE INSURANCE TRUST U.S. EQUITY INSIGHTS FUND
Notes to Financial Statements(continued)
December 31, 2018
9. OTHER RISKS (continued)
Large Shareholder Transactions Risk — The Fund may experience adverse effects when certain large shareholders, such as other funds, participating insurance companies, accounts and Goldman Sachs affiliates, purchase or redeem large amounts of shares of the Fund. Such large shareholder redemptions, which may occur rapidly or unexpectedly, may cause the Fund to sell portfolio securities at times when it would not otherwise do so, which may negatively impact the Fund’s NAV and liquidity. These transactions may also accelerate the realization of taxable income to shareholders if such sales of investments resulted in gains, and may also increase transaction costs. In addition, a large redemption could result in the Fund’s current expenses being allocated over a smaller asset base, leading to an increase in the Fund’s expense ratio. Similarly, large Fund share purchases may adversely affect the Fund’s performance to the extent that the Fund is delayed in investing new cash or otherwise maintains a larger cash position than it ordinarily would.
Liquidity Risk — The Fund may make investments that are illiquid or that may become less liquid in response to market developments or adverse investor perceptions. Illiquid investments may be more difficult to value. Liquidity risk may also refer to the risk that the Fund will not be able to pay redemption proceeds within the allowable time period or without significant dilution to remaining investors’ interests because of unusual market conditions, an unusually high volume of redemption requests, or other reasons. To meet redemption requests, the Fund may be forced to sell investments at an unfavorable time and/or under unfavorable conditions. If a Fund is forced to sell securities at an unfavorable time and/or under unfavorable conditions, such sales may adversely affect the Fund’s NAV and dilute remaining investors’ interests.
Market and Credit Risks — In the normal course of business, the Fund trades financial instruments and enters into financial transactions where risk of potential loss exists due to changes in the market (market risk). Additionally, the Fund may also be exposed to credit risk in the event that an issuer or guarantor fails to perform or that an institution or entity with which the Fund has unsettled or open transactions defaults.
10. INDEMNIFICATIONS
Under the Trust’s organizational documents, its Trustees, officers, employees and agents are indemnified, to the extent permitted by the Act and state law, against certain liabilities that may arise out of performance of their duties to the Fund. Additionally, in the course of business, the Fund enters into contracts that contain a variety of indemnification clauses. The Fund’s maximum exposure under these arrangements is unknown, as this would involve future claims that may be made against the Fund that have not yet occurred. However, GSAM believes the risk of loss under these arrangements to be remote.
10. OTHER MATTERS
In September 2018, the Financial Accounting Standards Board issued Accounting Standards Update (ASU)2018-13 — Fair Value Measurement (Topic 820) Disclosure Framework — Changes to the Disclosure Requirements for Fair Value Measurement. The amendments in the ASU modify fair value measurement disclosures. The amendments are effective for the Fund’s fiscal year beginning after December 15, 2019. GSAM is currently evaluating the impact, if any, of the amendments.
11. SUBSEQUENT EVENTS
Subsequent events after the Statement of Assets and Liabilities date have been evaluated, and GSAM has concluded that there is no impact requiring adjustment or disclosure in the financial statements.
24
GOLDMAN SACHS VARIABLE INSURANCE TRUST U.S. EQUITY INSIGHTS FUND
12. SUMMARY OF SHARE TRANSACTIONS
Share activity is as follows:
| | | | | | | | | | | | | | | | |
| | | For the Fiscal Year Ended
December 31, 2018 | | | For the Fiscal Year Ended
December 31, 2017 | |
| | | Shares | | | Dollars | | | Shares | | | Dollars | |
| Institutional Shares | | | | | | | | | | | | | | | | |
| Shares sold | | | 416,442 | | | $ | 8,122,674 | | | | 358,460 | | | $ | 6,845,622 | |
| Reinvestment of distributions | | | 2,739,164 | | | | 41,717,467 | | | | 1,635,690 | | | | 31,912,323 | |
| Shares redeemed | | | (1,798,863 | ) | | | (36,105,931 | ) | | | (2,153,338 | ) | | | (42,049,816 | ) |
| | | | 1,356,743 | | | | 13,734,210 | | | | (159,188 | ) | | | (3,291,871 | ) |
| Service Shares | | | | | | | | | | | | | | | | |
| Shares sold | | | 774,115 | | | | 15,735,764 | | | | 801,197 | | | | 15,818,307 | |
| Reinvestment of distributions | | | 612,754 | | | | 9,387,391 | | | | 815,443 | | | | 15,966,368 | |
| Shares redeemed | | | (5,165,531 | ) | | | (101,893,366 | ) | | | (1,114,105 | ) | | | (21,990,356 | ) |
| | | | (3,778,662 | ) | | | (76,770,211 | ) | | | 502,535 | | | | 9,794,319 | |
| | | | |
| NET INCREASE (DECREASE) | | | (2,421,919 | ) | | $ | (63,036,001 | ) | | | 343,347 | | | $ | 6,502,448 | |
25
Report of Independent Registered Public Accounting Firm
To the Board of Trustees of Goldman Sachs Variable Insurance Trust and Shareholders of
Goldman Sachs U.S. Equity Insights Fund
Opinion on the Financial Statements
We have audited the accompanying statement of assets and liabilities, including the schedule of investments, of Goldman Sachs U.S. Equity Insights Fund (one of the funds constituting Goldman Sachs Variable Insurance Trust, referred to hereafter as the “Fund”) as of December 31, 2018, the related statement of operationsfor the year ended December 31, 2018, the statements of changes in net assets for each of the two years in the period ended December 31, 2018, including the related notes,and the financial highlights for each of the five years in the period ended December 31, 2018 (collectively referred to as the “financial statements”). In our opinion, the financial statements present fairly, in all material respects, the financial position of the Fund as of December 31, 2018, the results of its operations for the year then ended, the changes in its net assets for each of the two years in the period ended December 31, 2018 and the financial highlights for each of the five years in the period ended December 31, 2018 in conformity with accounting principles generally accepted in the United States of America.
Basis for Opinion
These financial statements are the responsibility of the Fund’s management. Our responsibility is to express an opinion on the Fund’s financial statements based on our audits. We are a public accounting firm registered with the Public Company Accounting Oversight Board (United States) (PCAOB) and are required to be independent with respect to the Fund in accordance with the U.S. federal securities laws and the applicable rules and regulations of the Securities and Exchange Commission and the PCAOB.
We conducted our audits of these financial statements in accordance with the standards of the PCAOB. Those standards require that we plan and perform the audit to obtain reasonable assurance about whether the financial statements are free of material misstatement, whether due to error or fraud.
Our audits included performing procedures to assess the risks of material misstatement of the financial statements, whether due to error or fraud, and performing procedures that respond to those risks. Such procedures included examining, on a test basis, evidence regarding the amounts and disclosures in the financial statements. Our audits also included evaluating the accounting principles used and significant estimates made by management, as well as evaluating the overall presentation of the financial statements. Our procedures included confirmation of securities owned as of December 31, 2018 by correspondence with the custodian, transfer agent and brokers; when replies were not received from brokers, we performed other auditing procedures. We believe that our audits provide a reasonable basis for our opinion.
PricewaterhouseCoopers LLP
Boston, Massachusetts
February 13, 2019
We have served as the auditor of one or more investment companies in the Goldman Sachs fund complex since 2000.
26
GOLDMAN SACHS VARIABLE INSURANCE TRUST U.S. EQUITY INSIGHTS FUND
| | |
| Fund Expenses — Six Month Period Ended December 31, 2018 (Unaudited) | | |
As a shareholder of Institutional or Service Shares of the Fund, you incur ongoing costs, including management fees, distribution and/or service(12b-1) fees (with respect to Service Shares) and other Fund expenses. This example is intended to help you understand your ongoing costs (in dollars) of investing in the Institutional Shares and Service Shares of the Fund and to compare these costs with the ongoing costs of investing in other mutual funds.
The example is based on an investment of $1,000 invested at the beginning of the period and held for the entire period from July 1, 2018 through December 31, 2018, which represents a period of 184 days of a 365 day year.
Actual Expenses— The first line under each share class in the table below provides information about actual account values and actual expenses. You may use the information in this line, together with the amount you invested, to estimate the expenses that you paid over the period. Simply divide your account value by $1,000 (for example, an $8,600 account value divided by $1,000=8.6), then multiply the result by the number in the first line under the heading entitled “Expenses Paid” to estimate the expenses you paid on your account during this period.
Hypothetical Example for Comparison Purposes— The second line under each share class in the table below provides information about hypothetical account values and hypothetical expenses based on the Fund’s actual net expense ratio and an assumed rate of return of 5% per year before expenses, which is not the Fund’s actual return. The hypothetical account values and expenses may not be used to estimate the actual ending account balance or expenses you paid for the period. You may use this information to compare the ongoing costs of investing in the Fund and other funds. To do so, compare this 5% hypothetical example with the 5% hypothetical examples that appear in the shareholder reports of the other funds.
Please note that the expenses shown in the table are meant to highlight your ongoing costs only. As a shareholder of the Fund you do not incur any transaction costs, such as sales charges, redemption fees, or exchange fees, but shareholders of other funds may incur such costs. The second line of the table is useful in comparing ongoing costs only and will not help you determine the relative total costs of owning different funds whose shareholders may incur transaction costs.
| | | | | | | | | | | | |
| Share Class | | Beginning
Account Value
07/01/18 | | | Ending
Account Value
12/31/18 | | | Expenses Paid
for the
6 Months
Ended
12/31/18* | |
| Institutional | | | | | | | | | | | | |
| | | | |
| Actual | | $ | 1,000 | | | $ | 902.70 | | | $ | 2.69 | |
| Hypothetical 5% return | | | 1,000 | | | | 1,022.38 | + | | | 2.85 | |
| Service | | | | | | | | | | | | |
| | | | |
| Actual | | | 1,000 | | | | 901.70 | | | | 3.74 | |
| Hypothetical 5% return | | | 1,000 | | | | 1,021.27 | + | | | 3.97 | |
| | + | Hypothetical expenses are based on the Fund’s actual annualized net expense ratios and an assumed rate of return of 5% per year before expenses. | |
| | * | Expenses are calculated using the Fund’s annualized net expense ratio for each class, which represents the ongoing expenses as a percentage of net assets for the six months ended December 31, 2018. Expenses are calculated by multiplying the annualized net expense ratio by the average account value for the period; then multiplying the result by the number of days in the most recent fiscal half year; and then dividing that result by the number of days in the fiscal year. The annualized net expense ratios for the period were 0.56% and 0.78% for Institutional and Service Shares, respectively. | |
27
GOLDMAN SACHS VARIABLE INSURANCE TRUST U.S. EQUITY INSIGHTS FUND
Trustees and Officers (Unaudited)
Independent Trustees
| | | | | | | | | | | | |
| | | | | |
Name,
Address and Age1 | | Position(s) Held with the Trust | | Term of Office and
Length of
Time Served2 | | Principal Occupation(s) During Past 5 Years | | Number of
Portfolios in
Fund Complex
Overseen by
Trustee3 | | | Other Directorships Held by Trustee4 |
Jessica Palmer Age: 69 | | Chair of the Board of Trustees | | Since 2018 (Trustee since 2007) | | Ms. Palmer is retired. She was formerly Director, Emerson Center for the Arts and Culture (2011-2017); and Consultant, Citigroup Human Resources Department (2007-2008); Managing Director, Citigroup Corporate and Investment Banking (previously, Salomon Smith Barney/Salomon Brothers) (1984-2006). Ms. Palmer was a Member of the Board of Trustees of Indian Mountain School (private elementary and secondary school) (2004-2009). Chair of the Board of Trustees — Goldman Sachs Trust and Goldman Sachs Variable Insurance Trust. | | | 103 | | | None |
Kathryn A. Cassidy Age: 64 | | Trustee | | Since 2015 | | Ms. Cassidy is retired. Formerly, she was Advisor to the Chairman (May 2014-December 2014); and Senior Vice President and Treasurer (2008-2014), General Electric Company & General Electric Capital Corporation (technology and financial services companies). Trustee — Goldman Sachs Trust and Goldman Sachs Variable Insurance Trust. | | | 103 | | | None |
Diana M. Daniels Age: 69 | | Trustee | | Since 2007 | | Ms. Daniels is retired. Formerly, she was Vice President, General Counsel and Secretary, The Washington Post Company (1991-2006). Ms. Daniels is a Trustee Emeritus and serves as a Presidential Councillor of Cornell University (2013-Present); former Member of the Legal Advisory Board, New York Stock Exchange (2003-2006) and of the Corporate Advisory Board, Standish Mellon Management Advisors (2006-2007). Trustee — Goldman Sachs Trust and Goldman Sachs Variable Insurance Trust. | | | 103 | | | None |
Herbert J. Markley Age: 68 | | Trustee | | Since 2013 | | Mr. Markley is retired. Formerly, he was Executive Vice President, Deere & Company (an agricultural and construction equipment manufacturer) (2007-2009); and President, Agricultural Division, Deere & Company (2001-2007). Previously, Mr. Markley served as an Advisory Board Member of Goldman Sachs Trust and Goldman Sachs Variable Insurance Trust (June 2013-October 2013). Trustee — Goldman Sachs Trust and Goldman Sachs Variable Insurance Trust. | | | 103 | | | None |
Roy W. Templin Age: 58 | | Trustee | | Since 2013 | | Mr. Templin is retired. He is Director, Armstrong World Industries, Inc. (a designer and manufacturer of ceiling, wall and suspension system solutions) (2016-Present); and was formerly Chairman of the Board of Directors, Con-Way Incorporated (a transportation, logistics and supply chain management service company) (2014-2015); Executive Vice President and Chief Financial Officer, Whirlpool Corporation (an appliance manufacturer and marketer) (2004-2012). Previously, Mr. Templin served as an Advisory Board Member of Goldman Sachs Trust and Goldman Sachs Variable Insurance Trust (June 2013-October 2013). Trustee — Goldman Sachs Trust and Goldman Sachs Variable Insurance Trust. | | | 103 | | | Armstrong World Industries, Inc. (a ceiling, wall and suspension systems solutions manufacturer) |
Gregory G. Weaver Age: 67 | | Trustee | | Since 2015 | | Mr. Weaver is retired. He is Director, Verizon Communications Inc. (2015-Present); and was formerly Chairman and Chief Executive Officer, Deloitte & Touche LLP (a professional services firm) (2001-2005 and 2012-2014); and Member of the Board of Directors, Deloitte & Touche LLP (2006-2012). Trustee — Goldman Sachs Trust and Goldman Sachs Variable Insurance Trust. | | | 103 | | | Verizon Communications Inc. |
| | | | | | | | | | | | |
28
GOLDMAN SACHS VARIABLE INSURANCE TRUST U.S. EQUITY INSIGHTS FUND
Trustees and Officers (Unaudited) (continued)
Interested Trustee*
| | | | | | | | | | | | |
| | | | | |
Name,
Address and Age1 | | Position(s) Held with the Trust | | Term of Office and
Length of
Time Served2 | | Principal Occupation(s) During Past 5 Years | | Number of
Portfolios in
Fund Complex
Overseen by
Trustee3 | | | Other Directorships Held by Trustee4 |
James A. McNamara Age: 56 | | President and Trustee | | Since 2007 | | Advisory Director, Goldman Sachs (January 2018-Present); Managing Director, Goldman Sachs (January 2000-December 2017); Director of Institutional Fund Sales, GSAM (April 1998-December 2000); and Senior Vice President and Manager, Dreyfus Institutional Service Corporation (January 1993- April 1998). President and Trustee — Goldman Sachs Trust; Goldman Sachs Variable Insurance Trust; Goldman Sachs Trust II; Goldman Sachs MLP Income Opportunities Fund; Goldman Sachs MLP and Energy Renaissance Fund; Goldman Sachs ETF Trust; Goldman Sachs Private Markets Fund 2018 LLC; Goldman Sachs Private Markets Fund 2018 (A) LLC; and Goldman Sachs Private Markets Fund 2018 (B) LLC. | | | 156 | | | None |
| | | | | | | | | | | | |
| *Mr. | McNamara is considered to be an “Interested Trustee” because he holds positions with Goldman Sachs and owns securities issued by The Goldman Sachs Group, Inc. Mr. McNamara holds comparable positions with certain other companies of which Goldman Sachs, GSAM or an affiliate thereof is the investment adviser, administrator and/or distributor. |
| 1 | Each Trustee may be contacted by writing to the Trustee, c/o Goldman Sachs, 200 West Street, New York, New York, 10282, Attn: Caroline Kraus. Information is provided as of December 31, 2018. |
| 2 | Subject to such policies as may be adopted by the Board from time-to-time, each Trustee holds office for an indefinite term, until the earliest of: (a) the election of his or her successor; (b) the date the Trustee resigns or is removed by the Board or shareholders, in accordance with the Trust’s Declaration of Trust; or (c) the termination of the Trust. The Board has adopted policies which provide that (a) no Trustee shall hold office for more than 15 years and (b) a Trustee shall retire as of December 31st of the calendar year in which he or she reaches his or her 74th birthday, unless a waiver of such requirement shall have been adopted by a majority of the other Trustees. These policies may be changed by the Trustees without shareholder vote. |
| 3 | The Goldman Sachs Fund Complex includes certain other companies listed above for each respective Trustee. As of December 31, 2018, Goldman Sachs Trust consisted of 90 portfolios (88 of which offered shares to the public); Goldman Sachs Variable Insurance Trust consisted of 13 portfolios; Goldman Sachs Trust II consisted of 19 portfolios (17 of which offered shares to the public); Goldman Sachs MLP Income Opportunities Fund, Goldman Sachs MLP and Energy Renaissance Fund, Goldman Sachs Private Markets Fund 2018 LLC, Goldman Sachs Private Markets Fund 2018 (A) LLC and Goldman Sachs Private Markets Fund 2018 (B) LLC each consisted of one portfolio; and Goldman Sachs ETF Trust consisted of 29 portfolios (14 of which offered shares to the public). |
| 4 | This column includes only directorships of companies required to report to the Securities and Exchange Commission under the Securities Exchange Act of 1934 (i.e., “public companies”) or other investment companies registered under the Act. |
Additional information about the Trustees is available in the Fund’s Statement of Additional Information, which can be obtained from Goldman Sachs free of charge by calling this toll-free number (in the United States of America): 1-800-526-7384.
29
GOLDMAN SACHS VARIABLE INSURANCE TRUST U.S. EQUITY INSIGHTS FUND
Trustees and Officers (Unaudited) (continued)
Officers of the Trust*
| | | | | | |
| | | |
| Name, Address and Age1 | | Position(s) Held with the Trust | | Term of
Office and
Length of
Time Served2 | | Principal Occupation(s) During Past 5 Years |
James A. McNamara
200 West Street New York, NY 10282 Age: 56 | | Trustee and
President | | Since 2007 | | Advisory Director, Goldman Sachs (January 2018-Present); Managing Director, Goldman Sachs (January 2000-December 2017); Director of Institutional Fund Sales, GSAM (April 1998-December 2000); and Senior Vice President and Manager, Dreyfus Institutional Service Corporation (January 1993-April 1998). President and Trustee — Goldman Sachs Trust; Goldman Sachs Variable Insurance Trust; Goldman Sachs Trust II; Goldman Sachs MLP Income Opportunities Fund; Goldman Sachs MLP and Energy Renaissance Fund; Goldman Sachs ETF Trust; Goldman Sachs Private Markets Fund 2018 LLC; Goldman Sachs Private Markets Fund 2018 (A) LLC; and Goldman Sachs Private Markets Fund 2018 (B) LLC. |
Caroline L. Kraus
200 West Street New York, NY 10282 Age: 41 | | Secretary | | Since 2012 | | Managing Director, Goldman Sachs (January 2016-Present); Vice President, Goldman Sachs (August 2006-December 2015); Associate General Counsel, Goldman Sachs (2012-Present); Assistant General Counsel, Goldman Sachs (August 2006-December 2011); and Associate, Weil, Gotshal & Manges, LLP (2002-2006). Secretary — Goldman Sachs Trust (previously Assistant Secretary (2012)); Goldman Sachs Variable Insurance Trust (previously Assistant Secretary (2012)); Goldman Sachs Trust II; Goldman Sachs BDC, Inc.; Goldman Sachs Private Middle Market Credit LLC; Goldman Sachs Middle Market Lending Corp.; Goldman Sachs MLP Income Opportunities Fund; Goldman Sachs MLP and Energy Renaissance Fund; Goldman Sachs ETF Trust; Goldman Sachs Private Markets Fund 2018 LLC; Goldman Sachs Private Markets Fund 2018 (A) LLC; and Goldman Sachs Private Markets Fund 2018 (B) LLC. |
Scott M. McHugh
200 West Street New York, NY 10282 Age: 47 | | Treasurer, Senior
Vice President and
Principal Financial
Officer | | Since 2009
(Principal
Financial
Officer since
2013) | | Managing Director, Goldman Sachs (January 2016-Present); Vice President, Goldman Sachs (February 2007-December 2015); Assistant Treasurer of certain mutual funds administered by DWS Scudder (2005-2007); and Director (2005-2007), Vice President (2000-2005), and Assistant Vice President (1998-2000), Deutsche Asset Management or its predecessor (1998-2007). Treasurer, Senior Vice President and Principal Financial Officer — Goldman Sachs Trust; Goldman Sachs Variable Insurance Trust; Goldman Sachs Trust II; Goldman Sachs MLP Income Opportunities Fund; Goldman Sachs MLP and Energy Renaissance Fund; Goldman Sachs ETF Trust; Goldman Sachs Private Markets Fund 2018 LLC; Goldman Sachs Private Markets Fund 2018 (A) LLC; and Goldman Sachs Private Markets Fund 2018 (B) LLC. |
Joseph F. DiMaria
30 Hudson Street Jersey City, NJ 07302 Age: 50 | | Assistant Treasurer
and Principal
Accounting Officer | | Since 2016
(Principal
Accounting
Officer since
2017) | | Managing Director, Goldman Sachs (November 2015-Present) and Vice President — Mutual Fund Administration, Columbia Management Investment Advisers, LLC (May 2010-October 2015). Assistant Treasurer and Principal Accounting Officer — Goldman Sachs Trust; Goldman Sachs Variable Insurance Trust; Goldman Sachs Trust II; Goldman Sachs MLP Income Opportunities Fund; Goldman Sachs MLP and Energy Renaissance Fund; Goldman Sachs ETF Trust; Goldman Sachs Private Markets Fund 2018 LLC; Goldman Sachs Private Markets Fund 2018 (A) LLC; and Goldman Sachs Private Markets Fund 2018 (B) LLC. |
| | | | | | |
| * | Represents a partial list of officers of the Trust. Additional information about all the officers is available in the Fund’s Statement of Additional Information, which can be obtained from Goldman Sachs free of charge by calling this toll-free number (in the United States): 1-800-526-7384. |
| 1 | Information is provided as of December 31, 2018. |
| 2 | Officers hold office at the pleasure of the Board of Trustees or until their successors are duly elected and qualified. Each officer holds comparable positions with certain other companies of which Goldman Sachs, GSAM or an affiliate thereof is the investment adviser, administrator and/or distributor. |
Goldman Sachs Variable Insurance Trust — Tax Information (Unaudited)
For the year ended December 31, 2018, 22.78% of the dividends paid from net investment company taxable income by the U.S. Equity Insights Fund qualify for the dividends received deduction available to corporations.
Pursuant to Section 852 of the Internal Revenue Code, the U.S. Equity Insights Fund designates $24,029,103, or, if different, the maximum amount allowable, as capital gain dividends paid during the year ended December 31, 2018.
30
| | |
| TRUSTEES | | OFFICERS |
| Jessica Palmer,Chair | | James A. McNamara,President |
| Kathryn A. Cassidy | | Scott M. McHugh,Treasurer, Senior Vice |
| Diana M. Daniels | | President and Principal Financial Officer |
| Herbert J. Markley | | Joseph F. DiMaria,Assistant Treasurer and Principal Accounting Officer Caroline L. Kraus,Secretary |
| James A. McNamara |
| Roy W. Templin |
| Gregory G. Weaver | | |
GOLDMAN SACHS & CO. LLC
Distributor and Transfer Agent
GOLDMAN SACHS ASSET MANAGEMENT, L.P.
Investment Adviser
200 West Street, New York
New York 10282
Visit our web site at www.GSAMFUNDS.com to obtain the most recentmonth-end returns.
The reports concerning the Fund included in this shareholder report may contain certain forward-looking statements about the factors that may affect the performance of the Fund in the future. These statements are based on Fund management’s predictions and expectations concerning certain future events and their expected impact on the Fund, such as performance of the economy as a whole and of specific industry sectors, changes in the levels of interest rates, the impact of developing world events, and other factors that may influence the future performance of the Fund. Management believes these forward-looking statements to be reasonable, although they are inherently uncertain and difficult to predict. Actual events may cause adjustments in portfolio management strategies from those currently expected to be employed.
A description of the policies and procedures that the Fund uses to determine how to vote proxies relating to portfolio securities and information regarding how the Fund voted proxies relating to portfolio securities for the12-month period ended December 31 is available (i) without charge, upon request by calling1-800-621-2550; and (ii) on the Securities and Exchange Commission (“SEC”) web site athttp://www.sec.gov.
The Fund files its complete schedule of portfolio holdings with the SEC for the first and third quarters of each fiscal year onForm N-Q. The Fund’sForm N-Qs are available on the SEC’s web site at http://www.sec.gov within 60 days after the Fund’s first and third fiscal quarters.Form N-Qs may be obtained upon request and without charge by calling1-800-621-2550.
Views and opinions expressed are for informational purposes only and do not constitute a recommendation by GSAM to buy, sell, or hold any security. Views and opinions are current as of the date of this presentation and may be subject to change, they should not be construed as investment advice.
Goldman Sachs & Co. LLC (“Goldman Sachs”) does not provide legal, tax or accounting advice. Any statement contained in this communication (including any attachments) concerning U.S. tax matters was not intended or written to be used, and cannot be used, for the purpose of avoiding penalties under the Internal Revenue Code, and was written to support the promotion or marketing of transaction or matter addressed. Clients of Goldman Sachs should obtain their own independent tax advice based on their particular circumstances.
The website links provided are for your convenience only and are not an endorsement or recommendation by GSAM of any of these websites or the products or services offered. GSAM is not responsible for the accuracy and validity of the content of these websites.
Fund holdings and allocations shown are as of December 31, 2018 and may not be representative of future investments. Fund holdings should not be relied on in making investment decisions and should not be construed as research or investment advice regarding particular securities. Current and future holdings are subject to risk.
References to indices, benchmarks or other measures of relative market performance over a specified period of time are provided for your information only and do not imply that the portfolio will achieve similar results. The index composition may not reflect the manner in which a portfolio is constructed. While an adviser seeks to design a portfolio which reflects appropriate risk and return features, portfolio characteristics may deviate from those of the benchmark.
The Global Industry Classification Standard (“GICS”) was developed by and is the exclusive property and a service mark of Morgan Stanley Capital International Inc. (“MSCI”) and Standard & Poor’s, a division of The McGraw-Hill Companies, Inc. (“S&P”) and is licensed for use by Goldman Sachs. Neither MSCI, S&P nor any other party involved in making or compiling the GICS or any GICS classifications makes any express or implied warranties or representations with respect to such standard or classification (or the results to be obtained by the use thereof), and all such parties hereby expressly disclaim all warranties of originality, accuracy, completeness, merchantability or fitness for a particular purpose with respect to any of such standard or classification. Without limiting any of the foregoing, in no event shall MSCI, S&P, any of their affiliates or any third party involved in making or compiling the GICS or any GICS classifications have any liability for any direct, indirect, special, punitive, consequential or any other damages (including lost profits) even if notified of the possibility of such damages.
The portfolio risk management process includes an effort to monitor and manage risk, but does not imply low risk.
Shares of the Goldman Sachs VIT Funds are offered to separate accounts of participating life insurance companies for the purpose of funding variable annuity contracts and variable life insurance policies. Shares of the Fund are not offered directly to the general public. The variable annuity contracts and variable life insurance policies are described in the separate prospectuses issued by participating insurance companies. You should refer to those prospectuses for information about surrender charges, mortality and expense risk fees and other charges that may be assessed by participating insurance companies under the variable annuity contracts or variable life insurance policies. Such fees or charges, if any, may affect the return you may realize with respect to your investments. Ask your representative for more complete information. Please consider a fund’s objectives, risks and charges and expenses, and read the prospectus carefully before investing. The prospectus contains this and other information about the Fund.
This material is not authorized for distribution to prospective investors unless preceded or accompanied by a current prospectus or summary prospectus, if applicable. Investors should consider the Fund’s objective, risks, and charges and expenses, and read the summary prospectus, if available, and/or the prospectus carefully before investing or sending money. The summary prospectus, if available, and the prospectus contain this and other information about the Fund and may be obtained from your authorized dealer or from Goldman Sachs & Co. LLC by calling1-800-621-2550.
This report is prepared for the general information of contract owners and is not an offer of shares of the Goldman Sachs Variable Insurance Trust — Goldman Sachs U.S. Equity Insights Fund.
© 2019 Goldman Sachs. All rights reserved.
VITUSAR-19/157044-OTU-916570/7.5K
| | (a) | As of the end of the period covered by this report, the registrant has adopted a code of ethics that applies to the registrant’s principal executive officer, principal financial officer, principal accounting officer or controller, or persons performing similar functions, regardless of whether these individuals are employed by the registrant or a third party (the “Code of Ethics”). |
| | (b) | During the period covered by this report, no amendments were made to the provisions of the Code of Ethics. |
| | (c) | During the period covered by this report, the registrant did not grant any waivers, including an implicit waiver, from any provision of the Code of Ethics. |
| | (d) | A copy of the Code of Ethics is available as provided in Item 13(a)(1) of this report. |
| ITEM 3. | AUDIT COMMITTEE FINANCIAL EXPERT. |
| | The registrant’s board of trustees has determined that the registrant has at least one “audit committee financial expert” (as defined in Item 3 of FormN-CSR) serving on its audit committee. Gregory G. Weaver is the “audit committee financial expert” and is “independent” (as each term is defined in Item 3 of FormN-CSR). |
| ITEM 4. | PRINCIPAL ACCOUNTANT FEES AND SERVICES. |
Item 4 — Principal Accountant Fees and Services for the Goldman Sachs Variable Insurance Trust (“GSVIT”):
Table 1 – Items 4(a)- 4(d)
| | | | | | | | | | |
| | | 2018 | | | 2017 | | | Description of Services Rendered |
Audit Fees: | | | | | | | | | | |
• PricewaterhouseCoopers (“PwC”) | | $
| 476,700
|
| | $ | 508,700 | | | Financial statement audits. |
Audit-Related Fees | | | | | | | | | | |
PwC | | $
| 18,142
|
| | $ | — | | | Other attest services. |
Tax Fees | | | | | | | | | | |
PwC | | $ | 116,270 | | | $ | 116,271 | | | Tax compliance services provided in connection with the preparation and review of the Registrant’s tax returns. |
Items 4(b)(c) & (d) Table 2.Non-Audit Services to the GSVIT’s * that werepre-approved by the GSVIT’s Audit Committee pursuant to Rule2-01(c)(7)(ii) of RegulationS-X
| | | | | | | | | | |
| | | 2018 | | | 2017 | | | Description of Services Rendered |
Audit-Related Fees | | | | | | | | | | |
PwC | | $ | 1,845,098 | | | $ | 1,860,429 | | | Internal control review performed in accordance with Statement on Standards for Attestation Engagements No. 16 and Semi-Annual Updates related to withholding tax accrual for non-US Jurisdictions. These fees are borne by the Funds’ adviser. |
| * | These include the advisor (excludingsub-advisors) and any entity controlling, controlled by or under common control with the advisor that provides ongoing services to the registrant (hereinafter referred to as “service affiliates”). |
Item 4(e)(1) — Audit Committee Pre Approval Policies and Procedures
Pre-Approval of Audit andNon-Audit Services Provided to the Funds of the Goldman Sachs Variable Insurance Trust. The Audit andNon-Audit ServicesPre-Approval Policy (the “Policy”) adopted by the Audit Committee of GSVIT sets forth the procedures and the conditions pursuant to which services performed by an independent auditor for GSVIT may bepre-approved. Services may bepre-approved specifically by the Audit Committee as a whole or, in certain circumstances, by the Audit Committee Chairman or the person designated as the Audit Committee Financial Expert. In addition, subject to specified cost limitations, certain services may bepre-approved under the provisions of the Policy. The Policy provides that the Audit Committee will consider whether the services provided by an independent auditor are consistent with the Securities and Exchange Commission’s rules on auditor independence. The Policy provides for periodic review andpre-approval by the Audit Committee of the services that may be provided by the independent auditor.
De Minimis Waiver. Thepre-approval requirements of the Policy may be waived with respect to the provision ofnon-audit services that are permissible for an independent auditor to perform, provided (1) the aggregate amount of all such services provided constitutes no more than five percent of the total amount of revenues subject topre-approval that was paid to the independent auditors during the fiscal year in which the services are provided; (2) such services were not recognized by GSVIT at the time of the engagement to benon-audit services; and (3) such services are promptly brought to the attention of the Audit Committee and approved prior to the completion of the audit by the Audit Committee or by one or more members of the Audit Committee to whom authority to grant such approvals has been delegated by the Audit Committee, pursuant to thepre-approval provisions of the Policy.
Pre-Approval ofNon-Audit Services Provided to GSVIT’s Investment Advisers. The Policy provides that, in addition to requiringpre-approval of audit andnon-audit services provided to GSVIT, the Audit Committee willpre-approve thosenon-audit services provided to GSVIT’s investment advisers (and entities controlling, controlled by or under common control with the investment advisers that provide ongoing services to GSVIT) where the engagement relates directly to the operations or financial reporting of GSVIT.
Item 4(e)(2) —0% of the audit-related fees, tax fees and other fees listed in Table 1 were approved by GSVIT’s Audit Committee pursuant to the “de minimis” exception of Rule2-01(c)(7)(i)(C) of RegulationS-X. In addition, 0% of thenon-audit services to the GSVIT’s service affiliates listed in Table 2 were approved by GSVIT’s Audit Committee pursuant to the “de minimis” exception of Rule2-01(c)(7)(i)(C) of RegulationS-X.
Item 4(f) —Not applicable.
Items 4(g) AggregateNon-Audit Fees Disclosure
The aggregatenon-audit fees billed to GSVIT for the twelve months ended December 31, 2018 and December 31, 2017 by PwC were approximately $134,412 and $116,271, respectively.
The aggregatenon-audit fees billed to GSVIT’s adviser and service affiliates fornon-audit services for the twelve months ended December 31, 2017 and December 31, 2016 by PwC were approximately $9.4 million and $11.4 million, respectively. The figures for these entities are not yet available for the twelve months ended December 31, 2018. With regard to the aggregate non-audit fees billed to GSVIT’s adviser and service affiliates, the 2017 and 2016 amounts include fees for non-audit services required to be pre-approved [see Table 2] and fees for non-audit services that did not require pre-approval since they did not directly relate to GSVIT’s operations or financial reporting.
Items 4(h) —GSVIT’s Audit Committee has considered whether the provision ofnon-audit services to GSVIT’s investment adviser and service affiliates that did not requirepre-approval pursuant to paragraph (c)(7)(ii) of Rule2-01 of RegulationS-X is compatible with maintaining the auditor’s independence.
| ITEM 5. | AUDIT COMMITTEE OF LISTED REGISTRANTS. |
Not applicable.
| ITEM 6. | SCHEDULE OF INVESTMENTS |
Schedule of Investments is included as part of the Reports to Shareholders filed under Item 1.
| ITEM 7. | DISCLOSURE OF PROXY VOTING POLICIES AND PROCEDURES FORCLOSED-END MANAGEMENT INVESTMENT COMPANIES. |
Not applicable.
| ITEM 8. | PORTFOLIO MANAGERS OFCLOSED-END MANAGEMENT INVESTMENT COMPANIES |
Not applicable.
| ITEM 9. | PURCHASES OF EQUITY SECURITIES BYCLOSED-END MANAGEMENT INVESTMENT COMPANY AND AFFILIATED PURCHASERS |
Not applicable.
| ITEM 10. | SUBMISSION OF MATTERS TO A VOTE OF SECURITY HOLDERS. |
There have been no material changes to the procedures by which shareholders may recommend nominees to the registrant’s board of trustees.
| ITEM 11. | CONTROLS AND PROCEDURES. |
| | (a) | The registrant’s principal executive and principal financial officers or persons performing similar functions have concluded that the registrant’s disclosure controls and procedures (as defined in Rule30a-3(c) under the Investment Company Act of 1940, as amended (the “1940 Act”)) are effective as of a date within 90 days of the filing date of this report that includes the disclosure required by this paragraph, based on the evaluation of these controls and procedures required by Rule30a-3(b) under the 1940 Act and15d-15(b) under the Securities Exchange Act of 1934, as amended. |
| | (b) | There were no changes in the registrant’s internal control over financial reporting (as defined in Rule30a-3(d) under the 1940 Act) that occurred during the registrant’s last fiscal quarter that have materially affected, or are reasonably likely to materially affect the registrant’s internal control over financial reporting. |
| ITEM 12. | DISCLOSURE OF SECURITIES LENDING ACTIVITIES FOR CLOSED-END MANAGEMENT INVESTMENT COMPANIES. |
Not applicable.
| | | | |
| (a)(1) | | | | Goldman Sachs Variable Insurance Trust’s Code of Ethics for Principal Executive and Senior Financial Officers is incorporated by reference to Exhibit 12(a)(1) of the registrant’sForm N-CSR filed on February 27, 2015. |
| | |
| (a)(2) | | Exhibit 99.CERT | | Certifications pursuant to Section 302 of the Sarbanes-Oxley Act of 2002 filed herewith |
| | |
| (a)(3) | | | | Not applicable to open-end investment companies. |
| | |
| (a)(4) | | | | There was no change in the registrant’s independent public accountant for the period covered by this report. |
| | |
| (b) | | Exhibit 99.906CERT | | Certifications pursuant to Section 906 of the Sarbanes-Oxley Act of 2002 filed herewith |
SIGNATURES
Pursuant to the requirements of the Securities Exchange Act of 1934 and the Investment Company Act of 1940, the registrant has duly caused this report to be signed on its behalf by the undersigned, thereunto duly authorized.
Goldman Sachs Variable Insurance Trust
| | |
/s/ James A. McNamara |
By: James A. McNamara |
Chief Executive Officer of |
Goldman Sachs Variable Insurance Trust |
|
Date: February 22, 2019 |
Pursuant to the requirements of the Securities Exchange Act of 1934 and the Investment Company Act of 1940, the report has been signed below by the following persons on behalf of the registrant and in the capacities and on the dates indicated.
| | |
/s/ James A. McNamara |
By: James A. McNamara |
Chief Executive Officer of |
Goldman Sachs Variable Insurance Trust |
|
Date: February 22, 2019 |
|
/s/ Scott McHugh |
By: Scott McHugh |
Principal Financial Officer of |
Goldman Sachs Variable Insurance Trust |
|
Date: February 22, 2019 |