UNITED STATES
SECURITIES AND EXCHANGE COMMISSION
Washington, D.C. 20549
FORM N-CSR
CERTIFIED SHAREHOLDER REPORT OF REGISTERED
MANAGEMENT INVESTMENT COMPANIES
Investment Company Act file number 811-08361
Goldman Sachs Variable Insurance Trust
(Exact name of registrant as specified in charter)
71 South Wacker Drive, Chicago, Illinois 60606-6303
(Address of principal executive offices) (Zip code)
Caroline Kraus
Goldman Sachs & Co. LLC
200 West Street
New York, NY 10282
Copies to:
Geoffrey R.T. Kenyon, Esq.
Dechert LLP
One International Place, 40th Floor
100 Oliver Street
Boston, MA 02110-2605
(Name and address of agents for service)
Registrant’s telephone number, including area code: (312) 655-4400
Date of fiscal year end: December 31
Date of reporting period: June 30, 2018
| ITEM 1. | REPORTS TO STOCKHOLDERS. |
The Semi-Annual Reports to Shareholders are filed herewith. |
Goldman
Sachs Variable Insurance Trust
Goldman Sachs
Global Trends
Allocation Fund
Semi-Annual Report
June 30, 2018

GOLDMAN SACHS VARIABLE INSURANCE TRUST GLOBAL TRENDS ALLOCATION FUND
INVESTMENT OBJECTIVE
The Fund seeks total return while seeking to provide volatility management.
Portfolio Management Discussion and Analysis
Below, the Goldman Sachs Quantitative Investment Strategies Team discusses the Goldman Sachs Variable Insurance Trust — Goldman Sachs Global Trends Allocation Fund’s (the “Fund”) performance and positioning for the six-month period ended June 30, 2018 (the “Reporting Period”).
How did the Fund perform during the Reporting Period?
During the Reporting Period, the Fund’s Institutional and Service Shares generated cumulative total returns of returns of 0.48% and 0.32%, respectively. These returns compare to the -0.13% cumulative total return of the Fund’s benchmark, the Global Trends Allocation Composite Index (the “Index”), during the same time period. The components of the Fund’s benchmark, the Morgan Stanley Capital International (MSCI) World Index and the Bloomberg Barclays U.S. Aggregate Bond Index, generated cumulative total returns of 0.76% and -1.62%, respectively, during the same time period.
Importantly, during the Reporting Period, the Fund’s overall annualized volatility (which is measured versus the S&P 500® Index) was 10.19%, less than the S&P 500® Index’s annualized volatility of 16.32% during the same time period.
What economic and market factors most influenced the Fund during the Reporting Period?
During the Reporting Period, the performance of the capital markets was influenced most by economic data, central bank monetary policy and geopolitical events.
Global equities saw a strong start to the Reporting Period in January 2018, peaking during the final week of the month. In February 2018, however, global equities sold off on market speculation of a faster pace of Federal Reserve (“Fed”) short-term interest rate hikes, which stoked a sharp rise in bond yields and an increase in equity market volatility. Concerns about Fed monetary policy tightening were further exacerbated by solid U.S. labor and inflation data. In March 2018, escalating trade tensions and potential tariffs weighed on investor sentiment. Meanwhile, the Fed delivered on a widely expected interest rate increase, with its “dot plot” pointing to a total of three interest rate hikes this calendar year and potentially two in 2019. (The “dot plot” shows rate projections of the members of the Fed’s Open Market Committee.) During the first calendar quarter overall, macroeconomic data moderated in the developed markets, particularly in Europe and Japan. Emerging markets equities generally outperformed their developed markets peers because of what many considered to be attractive valuations and because of the comparatively stronger economic data within emerging markets countries as well as higher commodity prices.
During the second quarter of 2018, developed markets equities generated positive returns, while emerging markets equities experienced broad-based weakness. In the developed markets, U.S., U.K., European and Japanese equities advanced, with U.K. export-driven stocks, in particular, benefiting from the depreciation of the British pound versus other major currencies. Emerging markets equities lagged developed markets stocks, as emerging markets’ economic growth slowed and disputes between the U.S. and China about trade tariffs dampened investor appetite for emerging markets assets in general. The Fed raised interest rates in June 2018, as widely expected, but the outcome of the Fed meeting was more hawkish than the market consensus had anticipated. (Hawkish tends to imply higher interest rates; opposite of dovish.) The Fed retained language indicating an “accommodative” monetary policy stance, but its economic growth and inflation forecasts were upgraded, and its median projection was lifted to four interest rate hikes in 2018 from the three it had indicated in March 2018.
Regarding fixed income, spread (or non-government bond) sectors were challenged by a surge in market volatility during the first quarter of 2018. Firmer than consensus expected U.S. wage and price inflation data prompted higher market volatility and equity market declines, though the magnitude of the moves was exacerbated by certain investors’ algorithmic trading. (Algorithmic trading uses complex mathematical models and formulas to make high-speed decisions and transactions in the financial markets.) The Fed raised short-term interest rates at its March policy meeting and reiterated its plan for a total of three rate hikes during 2018. Beyond the U.S., monetary policy action was muted in the developed markets during the first calendar quarter, though policymakers in Europe and Japan sounded mildly dovish and those in Norway appeared more hawkish. Economic activity data moderated in emerging markets and developed markets countries but remained in expansionary territory and therefore was supportive of cyclical asset classes geared toward growth. The U.S. was a notable exception, experiencing continued strength in economic data.
1
GOLDMAN SACHS VARIABLE INSURANCE TRUST GLOBAL TRENDS ALLOCATION FUND
During the second calendar quarter, spread sectors broadly weakened amid increased U.S.-China trade tensions, political events in emerging countries and Italy, higher U.S. interest rates and a stronger U.S. dollar. U.S. high yield corporate bonds, however, generated a small positive return. Rising oil prices were a tailwind for the broader high yield corporate bond sector, as many energy bonds are high yield rated. In June 2018, the Fed delivered the seventh interest rate hike of its current tightening cycle. Elsewhere, the European Central Bank announced plans to taper its quantitative easing program beginning September 2018.
What key factors were responsible for the Fund’s performance during the Reporting Period?
The Fund primarily seeks to achieve its investment objective by investing in a global portfolio of equity and fixed income asset classes. Under normal market conditions, the Fund expects to invest at least 40% of its assets in equity investments and at least 20% of its assets in fixed income investments. The percentage of the Fund’s portfolio exposed to any asset class or geographic region will vary from time to time as the weightings of the Fund change, and the Fund may not be invested in each asset class at all times.
As part of the Fund’s investment strategy, the Investment Adviser seeks to manage volatility and limit losses by allocating the Fund’s assets away from risky investments in distressed or volatile market environments. Volatility is a statistical measurement of the magnitude of up and down fluctuations in the value of a financial instrument or index. In distressed or volatile market environments, the Fund may also hold significant amounts of U.S. Treasury, short-term or other fixed income investments, including money market funds and repurchase agreements or cash, and at times may invest up to 100% of its assets in such investments.
During the Reporting Period, the Fund continued dynamically allocating across global asset classes, using a momentum-based methodology, as it sought total return while also seeking to provide volatility management. Momentum investing seeks growth of capital by gaining exposure to asset classes that have exhibited trends in price performance over selected time periods. In managing the Fund, we use a methodology that evaluates historical three-, six- and nine-month returns, volatilities and correlations across a range of nine global asset classes. Represented by indices, these asset classes include, within the equities category, U.S. large-cap and small-cap, European, Asian, emerging markets and U.K. stocks. Within the fixed income category, the Fund may allocate assets to the U.S., Europe and Japan. The analysis of these asset classes drives the aggregate allocations of the Fund over time. We believe market price momentum — either positive or negative — has significant predictive power.
During the Reporting Period, the Fund benefited from its allocations to German and Japanese government bonds. Its allocations to U.S. small-cap and large-cap equities as well as to U.K. equities also added to performance. On the other hand, the Fund’s allocations to Japanese and emerging markets equities detracted from returns. The Fund was also hurt overall by our efforts to reduce risk following February 2018 market volatility. Allocations to U.S. Treasury securities and European equities did not have a meaningful impact on the Fund’s performance during the Reporting Period.
What was the Fund’s volatility during the Reporting Period?
As part of our investment approach, we seek to mitigate the Fund’s volatility. As mentioned earlier, for the Reporting Period overall, the Fund’s actual volatility (annualized, using daily returns) was 10.19%, less than the S&P 500® Index’s annualized volatility of 16.32%.
How was the Fund positioned during the Reporting Period?
During the Reporting Period, we tactically managed the Fund’s allocations across equity and fixed income markets based on the momentum and volatility of these asset classes. At the beginning of the Reporting Period, the Fund’s total assets were allocated 80% to equities, 20% to fixed income and 0% to cash. (Many of these positions were implemented through the use of exchange-traded index future contracts.) Within the equity category, the Fund had allocations to five of six global equity asset classes in which it may invest. It did not have an allocation to U.S. small-cap equities at the beginning of the Reporting Period. As for fixed income, the Fund had an allocation to Japanese government bonds. It had no exposure to U.S. Treasuries or German government bonds at the start of the Reporting Period.
In January 2018, we made no changes to the Fund’s allocations. During February, we reduced the Fund’s allocation to Japanese equities and added an allocation to U.S. small-cap equities. We also added a small position in cash as we sought to reduce risk in the portfolio. Overall, from early February through the end of April 2018, we actively sought to manage volatility within the Fund’s allocations to Japanese equities and U.S. large-cap equities.
During March 2018, we modestly increased the Fund’s position in cash as we continued in our efforts to reduce risk in the portfolio. We reduced the Fund’s allocations to Japanese and U.S. large-cap stocks. We increased its allocation to U.S. small-cap equities. Overall, from the end of March through the end of April, we actively sought to manage volatility within the Fund’s allocation to U.S. small-cap equities. Within fixed income during March, we added an allocation to German government bonds.
2
GOLDMAN SACHS VARIABLE INSURANCE TRUST GLOBAL TRENDS ALLOCATION FUND
In April 2018, we reduced the Fund’s allocation to emerging markets equities and U.S. large-cap equities. We increased its allocations to Japanese, U.K., and European equities. Within fixed income, we increased the Fund’s allocations to German government bonds. By the end of the month, we had eliminated the Fund’s position in cash.
During May 2018, we eliminated the Fund’s allocation to emerging markets equities. We reduced its allocation to European equities and increased its allocations to U.K. and U.S. small-cap and large-cap equities. Within fixed income, we added an allocation to U.S. Treasury securities and decreased its allocation to German government bonds.
Near the end of the Reporting Period, within the equity allocation, we increased the Fund’s exposure to Japanese equities and reduced its exposure to U.K. and U.S. large-cap equities. Within fixed income, we increased the Fund’s allocation to German government bonds and eliminated its allocation to U.S. Treasuries.
How did the Fund use derivatives and similar instruments during the Reporting Period?
During the Reporting Period, the Fund employed exchange-traded index futures contracts to gain exposure to U.S. large-cap and small-cap stocks; the European, Japanese and U.K. equity markets; emerging markets equities; and U.S., Japanese and German government bonds. On an absolute basis, the use of these instruments had a negative impact on the Fund’s performance.
Were there any changes to the Fund’s portfolio management team during the Reporting Period?
Effective April 20, 2018, Amna Qaiser no longer served as a portfolio manager of the Fund. As of the same date, Federico Gilly and Oliver Bunn became portfolio managers of the Fund. By design, all investment decisions for the Fund are performed within a co-lead or team structure, with multiple subject matter experts. This strategic decision making has been the cornerstone of our approach and ensures continuity in the Fund. At the end of the Reporting Period, the portfolio managers for the Fund were Gary Chropuvka, Federico Gilly and Oliver Bunn.
What is the Fund’s tactical asset allocation view and strategy for the months ahead?
At the end of the Reporting Period, the Fund’s total assets were allocated 60% to equities, 40% to fixed income and 0% to cash. (Many of these positions were implemented through the use of exchange-traded index future contracts.) Within the equity allocation, we sought to prepare for the last six months of 2018 by increasing the Fund’s exposure to Japanese equities and decreasing its exposure to U.S. large-cap stocks and U.K. equities. The Fund maintained its allocations to European and U.S. small-cap equities and had no exposure to emerging markets equities. Within the fixed income allocation, we increased the Fund’s exposure to German government bonds and maintained its allocation to Japanese government bonds. The Fund had no exposure to U.S. Treasury securities at the end of the Reporting Period.
Going forward, we intend to position the Fund to provide exposure to price momentum from among nine underlying asset classes, while dynamically managing the volatility, or risk, of the overall portfolio. In general, the Fund seeks to maintain a strategic allocation of 60% of its assets in equity investments and 40% of its assets in fixed income investments. The Fund may deviate from these strategic allocations in order to allocate a greater percentage to asset classes with strong momentum and to reduce its allocation to assets with weak momentum. When volatility increases, our goal is to preserve capital by proportionally increasing the Fund’s cash exposure and reducing its exposure to riskier asset classes. There is no guarantee the Fund’s dynamic management strategy will cause it to achieve its investment objective.
3
GOLDMAN SACHS VARIABLE INSURANCE TRUST GLOBAL TRENDS ALLOCATION FUND
Index Definitions
Global Trends Allocation Composite Index is composed 60% of MSCI World Index and 40% of Bloomberg Barclays U.S. Aggregate Bond Index. It is a composite representation prepared by the Investment Adviser of the performance of the Fund’s asset classes, weighted according to their respective weightings in the Fund’s target range.
MSCI World Index (Net, USD, Unhedged) is a free float-adjusted market capitalization weighted index that is designed to measure the equity market performance of 23 developed markets.
Bloomberg Barclays U.S. Aggregate Bond Index represents an unmanaged diversified portfolio of fixed income securities, including U.S. Treasuries, investment grade corporate bonds, and mortgage-backed and asset-backed securities.
S&P 500® Index is an unmanaged index of 500 stocks that is generally representative of the performance of larger companies in the U.S.
It is not possible to invest directly in an unmanaged index.
4
FUND BASICS
Global Trends Allocation Fund
as of June 30, 2018
STANDARDIZED TOTAL RETURNS1
| For the period ended 6/30/18 | One Year | Five Years | Since Inception | Inception Date | ||||||||||
| Institutional | 7.81 | % | N/A | 4.12 | % | 10/16/13 | ||||||||
| Service | 7.58 | 4.35 | % | 5.14 | 4/16/12 | |||||||||
| 1 | Standardized Total Returns are average annual total returns as of the most recent calendar quarter-end. They assume reinvestment of all distributions at net asset value (“NAV”). Because Institutional Shares and Service Shares do not involve a sales charge, such a charge is not applied to their Standardized Total Returns. |
Total return figures in the above chart represent past performance and do not indicate future results, which will vary. The investment return and principal value of an investment will fluctuate and, therefore, an investor’s shares, when redeemed, may be worth more or less than their original cost. Current performance may be lower or higher than the total return figures in the above chart. Please visit www.GSAMFUNDS.com to obtain the most recent month-end returns. Performance reflects fee waivers and/or expense limitations in effect during the periods shown. In their absence, performance would be reduced.
EXPENSE RATIOS2
| Net Expense Ratio (Current) | Gross Expense Ratio (Before Waivers) | |||||||
| Institutional | 0.75 | % | 1.00 | % | ||||
| Service | 1.00 | 1.25 | ||||||
| 2 | The expense ratios of the Fund, both current (net of any fee waivers and/or expense limitations) and before waivers (gross of any fee waivers and/or expense limitations) are as set forth above according to the most recent publicly available Prospectuses for the Fund and may differ from the expense ratios disclosed in the Financial Highlights in this report. Pursuant to a contractual arrangement, the Fund’s fee waivers and/or expense limitations will remain in place through at least April 30, 2019, and prior to such date, the Investment Adviser may not terminate the arrangements without the approval of the Fund’s Board of Trustees. If these arrangements are discontinued in the future, the expense ratios may change without shareholder approval. |
5
FUND BASICS
FUND COMPOSITION3
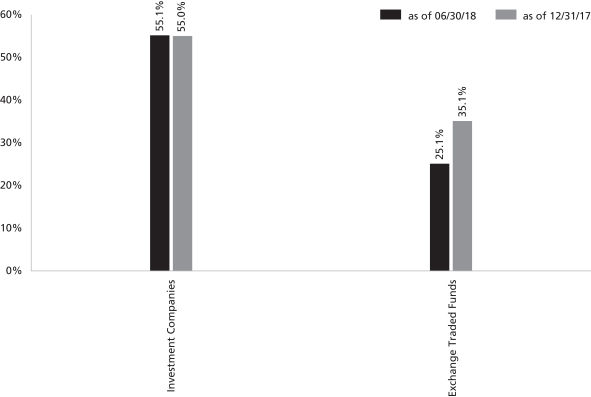
| 3 | The percentage shown for each investment category reflects the value of investments in that category as a percentage of net assets. Figures in the above graph may not sum to 100% due to the exclusion of other assets and liabilities. The underlying composition of exchange traded funds and investment companies held by the Fund are not reflected in the graph above. Consequently, the Fund’s overall composition may differ from the percentages contained in the graph above. The graph depicts the Fund’s investments but may not represent the Fund’s market exposure due to the exclusion of certain derivatives, if any, as listed in the Additional Investment Information section of the Schedule of Investments. |
6
GOLDMAN SACHS VARIABLE INSURANCE TRUST GLOBAL TRENDS ALLOCATION FUND
Schedule of Investments
June 30, 2018 (Unaudited)
| Shares | Description | Value | ||||||
| Exchange Traded Funds – 25.1% | ||||||||
| 198,244 | iShares Core S&P 500 ETF | $ | 54,130,525 | |||||
| 200,462 | Vanguard S&P 500 ETF | 50,017,273 | ||||||
|
| |||||||
| TOTAL EXCHANGE TRADED FUNDS | ||||||||
| (Cost $79,204,799) | $ | 104,147,798 | ||||||
|
| |||||||
| Shares | Distribution Rate | Value | ||||||
| Investment Companies(a) – 55.1% |
| |||||||
Goldman Sachs Financial Square Government Fund — Institutional Shares |
| |||||||
| 124,497,322 | 1.869 | % | $ | 124,497,322 | ||||
Goldman Sachs Financial Square Treasury Obligations Fund — Institutional Shares |
| |||||||
| 52,179,797 | 1.898 | 52,179,797 | ||||||
Goldman Sachs Financial Square Treasury Solutions Fund — Institutional Shares |
| |||||||
| 52,179,797 | 1.724 | 52,179,797 | ||||||
| ||||||||
| TOTAL INVESTMENT COMPANIES | ||||||||
| (Cost $228,856,916) | $ | 228,856,916 | ||||||
| ||||||||
| TOTAL INVESTMENTS – 80.2% |
| |||||||
| (Cost $308,061,715) |
| $ | 333,004,714 | |||||
| ||||||||
OTHER ASSETS IN EXCESS OF LIABILITIES – 19.8% |
| 81,994,208 | ||||||
| ||||||||
| NET ASSETS – 100.0% |
| $ | 414,998,922 | |||||
| ||||||||
| The percentage shown for each investment category reflects the value of investments in that category as a percentage of net assets. | ||
| (a) | Represents an Affiliated Issuer. | |
ADDITIONAL INVESTMENT INFORMATION
FUTURES CONTRACTS — At June 30, 2018, the Fund had the following futures contracts:
| Description | Number of Contracts | Expiration Date | Notional Amount | Unrealized (Depreciation) | ||||||||||
Long position contracts: |
| |||||||||||||
| EURO STOXX 50 Index | 534 | 09/21/2018 | $ | 21,146,452 | $ | (489,553 | ) | |||||||
| Euro-Bund | 440 | 09/06/2018 | 83,523,392 | 516,810 | ||||||||||
| FTSE 100 Index | 349 | 09/21/2018 | 35,011,957 | (225,000 | ) | |||||||||
| Japan 10 Year Bond | 61 | 09/12/2018 | 83,107,438 | 112,364 | ||||||||||
| Russell 2000 E-Mini Index | 252 | 09/21/2018 | 20,758,500 | (364,207 | ) | |||||||||
| S&P 500 E-Mini Index | 254 | 09/21/2018 | 34,564,320 | (833,265 | ) | |||||||||
TOPIX Index | 175 | 09/13/2018 | 27,352,888 | (674,499 | ) | |||||||||
| Total Futures Contracts |
| $ | (1,957,350 | ) | ||||||||||
| The accompanying notes are an integral part of these financial statements. | 7 |
GOLDMAN SACHS VARIABLE INSURANCE TRUST GLOBAL TRENDS ALLOCATION FUND
Statement of Assets and Liabilities
June 30, 2018 (Unaudited)
| Assets: | ||||
Investments in unaffiliated issuers, at value (cost $79,204,799) | $ | 104,147,798 | ||
Investments in affiliated issuers, at value (cost $228,856,916) | 228,856,916 | |||
Cash | 73,823,600 | |||
Receivables: | ||||
Collateral on certain derivative contracts | 7,495,766 | |||
Dividends | 803,410 | |||
Fund shares sold | 48,889 | |||
Reimbursement from investment adviser | 22,329 | |||
Variation margin on futures | 1,034,848 | |||
Other assets | 1,510 | |||
| Total assets | 416,235,066 | |||
| Liabilities: | ||||
Payables: | ||||
Investments purchased | 991,240 | |||
Distribution and Service fees and Transfer Agency fees | 92,419 | |||
Fund shares redeemed | 61,507 | |||
Accrued expenses | 90,978 | |||
| Total liabilities | 1,236,144 | |||
| Net Assets: | ||||
Paid-in capital | 380,194,783 | |||
Undistributed net investment income | 1,906,931 | |||
Accumulated net realized gain | 9,895,541 | |||
Net unrealized gain | 23,001,667 | |||
| NET ASSETS | $ | 414,998,922 | ||
Net Assets: | ||||
Institutional | $ | 260,411 | ||
Service | 414,738,511 | |||
Total Net Assets | $ | 414,998,922 | ||
Shares outstanding $0.001 par value (unlimited shares authorized): | ||||
Institutional | 20,792 | |||
Service | 33,187,074 | |||
Net asset value, offering and redemption price per share: | ||||
Institutional | $12.52 | |||
Service | 12.50 | |||
| 8 | The accompanying notes are an integral part of these financial statements. |
GOLDMAN SACHS VARIABLE INSURANCE TRUST GLOBAL TRENDS ALLOCATION FUND
Statement of Operations
For the Six Months Ended June 30, 2018 (Unaudited)
| Investment income: | ||||
Dividends — affiliated issuers | $ | 1,640,593 | ||
Dividends — unaffiliated issuers | 982,447 | |||
| Total investment income | 2,623,040 | |||
| Expenses: | ||||
Management fees | 1,616,179 | |||
Distribution and Service fees — Service Shares | 511,405 | |||
Professional fees | 46,988 | |||
Transfer Agency fees(a) | 40,913 | |||
Printing and mailing costs | 22,828 | |||
Custody, accounting and administrative services | 14,104 | |||
Trustee fees | 9,074 | |||
Other | 7,223 | |||
| Total expenses | 2,268,714 | |||
Less — expense reductions | (663,885 | ) | ||
| Net expenses | 1,604,829 | |||
| NET INVESTMENT INCOME | 1,018,211 | |||
| Realized and unrealized gain (loss): | ||||
Net realized gain from: | ||||
Investments — unaffiliated issuers | 4,447,419 | |||
Futures contracts | 2,389,849 | |||
Foreign currency transactions | 85,294 | |||
Net change in unrealized gain (loss) on: | ||||
Investments — unaffiliated issuers | (3,170,879 | ) | ||
Futures contracts | (3,046,368 | ) | ||
Foreign currency translation | 29,916 | |||
| Net realized and unrealized gain | 735,231 | |||
| NET INCREASE IN NET ASSETS RESULTING FROM OPERATIONS | $ | 1,753,442 | ||
(a) Institutional and Service Shares incurred Transfer Agency fees of $4 and $40,909, respectively.
| The accompanying notes are an integral part of these financial statements. | 9 |
GOLDMAN SACHS VARIABLE INSURANCE TRUST GLOBAL TRENDS ALLOCATION FUND
Statements of Changes in Net Assets
| For the Six Months Ended June 30, 2018 (Unaudited) | For the Fiscal Year Ended December 31, 2017 | |||||||
| From operations: | ||||||||
Net investment income | $ | 1,018,211 | $ | 812,849 | ||||
Net realized gain | 6,922,562 | 30,615,788 | ||||||
Net change in unrealized gain (loss) | (6,187,331 | ) | 15,102,236 | |||||
| Net increase in net assets resulting from operations | 1,753,442 | 46,530,873 | ||||||
| Distributions to shareholders: | ||||||||
From net investment income | ||||||||
Institutional Shares | — | (157 | ) | |||||
Service Shares | — | (1,185,638 | ) | |||||
From net realized gains | ||||||||
Institutional Shares | — | (744 | ) | |||||
Service Shares | — | (10,068,418 | ) | |||||
| Total distributions to shareholders | — | (11,254,957 | ) | |||||
| From share transactions: | ||||||||
Proceeds from sales of shares | 23,645,456 | �� | 38,959,444 | |||||
Reinvestment of distributions | — | 11,254,957 | ||||||
Cost of shares redeemed | (17,297,008 | ) | (32,234,857 | ) | ||||
| Net increase in net assets resulting from share transactions | 6,348,448 | 17,979,544 | ||||||
| TOTAL INCREASE | 8,101,890 | 53,255,460 | ||||||
| Net assets: | ||||||||
Beginning of period | 406,897,032 | 353,641,572 | ||||||
End of period | $ | 414,998,922 | $ | 406,897,032 | ||||
| Undistributed net investment income | $ | 1,906,931 | $ | 888,720 | ||||
| 10 | The accompanying notes are an integral part of these financial statements. |
GOLDMAN SACHS VARIABLE INSURANCE TRUST GLOBAL TRENDS ALLOCATION FUND
Financial Highlights
Selected Data for a Share Outstanding Throughout Each Period
| Income (loss) from investment operations | Distributions to shareholders | |||||||||||||||||||||||||||||||||||||||||||||||||||||||
| Year - Share Class | Net asset value, beginning of period | Net investment income (loss)(a) | Net realized and unrealized gain (loss) | Total from investment operations | From net investment income | From net realized gains | Total distributions | Net asset value, end of period | Total return(b) | Net assets, end of period (in 000s) | Ratio of net expenses to average net assets | Ratio of total expenses to average net assets | Ratio of net investment income (loss) to average net assets | Portfolio turnover rate(c) | ||||||||||||||||||||||||||||||||||||||||||
FOR THE SIX MONTHS ENDED JUNE 30, (UNAUDITED) | ||||||||||||||||||||||||||||||||||||||||||||||||||||||||
2018 - Institutional | $ | 12.46 | $ | 0.09 | $ | (0.03 | ) | $ | 0.06 | $ | — | $ | — | $ | — | $ | 12.52 | 0.48 | % | $ | 260 | 0.54 | %(d) | 0.86 | %(d) | 1.43 | %(d) | 7 | % | |||||||||||||||||||||||||||
2018 - Service | 12.45 | 0.03 | 0.02 | 0.05 | — | — | — | 12.50 | 0.32 | 414,739 | 0.78 | (d) | 1.11 | (d) | 0.50 | (d) | 7 | |||||||||||||||||||||||||||||||||||||||
FOR THE FISCAL YEARS ENDED DECEMBER 31, | ||||||||||||||||||||||||||||||||||||||||||||||||||||||||
2017 - Institutional | 11.33 | 0.06 | 1.46 | 1.52 | (0.07 | ) | (0.32 | ) | (0.39 | ) | 12.46 | 13.36 | 30 | 0.68 | 0.86 | 0.46 | 64 | |||||||||||||||||||||||||||||||||||||||
2017 - Service | 11.32 | 0.03 | 1.46 | 1.49 | (0.04 | ) | (0.32 | ) | (0.36 | ) | 12.45 | 13.11 | 406,867 | 0.93 | 1.11 | 0.21 | 64 | |||||||||||||||||||||||||||||||||||||||
2016 - Institutional | 10.89 | (0.03 | ) | 0.52 | 0.49 | (0.05 | ) | — | (0.05 | ) | 11.33 | 4.49 | 27 | 0.74 | 0.89 | (0.25 | ) | 260 | ||||||||||||||||||||||||||||||||||||||
2016 - Service | 10.88 | 0.02 | 0.45 | 0.47 | (0.03 | ) | — | (0.03 | ) | 11.32 | 4.33 | 353,615 | 1.00 | 1.13 | 0.20 | 260 | ||||||||||||||||||||||||||||||||||||||||
2015 - Institutional | 11.82 | 0.01 | (0.67 | ) | (0.66 | ) | (0.03 | ) | (0.24 | ) | (0.27 | ) | 10.89 | (5.52 | ) | 1,008 | 0.75 | 0.92 | 0.12 | 504 | ||||||||||||||||||||||||||||||||||||
2015 - Service | 11.82 | (0.02 | ) | (0.67 | ) | (0.69 | ) | (0.01 | ) | (0.24 | ) | (0.25 | ) | 10.88 | (5.82 | ) | 354,706 | 1.00 | 1.17 | (0.16 | ) | 504 | ||||||||||||||||||||||||||||||||||
2014 - Institutional | 11.46 | 0.08 | 0.41 | 0.49 | (0.03 | ) | (0.10 | ) | (0.13 | ) | 11.82 | 4.23 | 739 | 0.77 | 1.01 | 0.68 | 304 | |||||||||||||||||||||||||||||||||||||||
2014 - Service | 11.47 | — | (e) | 0.45 | 0.45 | — | (e) | (0.10 | ) | (0.10 | ) | 11.82 | 3.95 | 267,720 | 1.03 | 1.24 | 0.04 | 304 | ||||||||||||||||||||||||||||||||||||||
2013 - Institutional (Commenced October 16, 2013) | 11.41 | 0.01 | 0.34 | 0.35 | (0.02 | ) | (0.28 | ) | (0.30 | ) | 11.46 | 3.17 | 26 | 0.81 | (d) | 1.09 | (d) | 0.33 | (d) | 195 | ||||||||||||||||||||||||||||||||||||
2013 - Service | 10.36 | (0.02 | ) | 1.42 | 1.40 | (0.01 | ) | (0.28 | ) | (0.29 | ) | 11.47 | 13.57 | 136,116 | 1.04 | 1.51 | (0.21 | ) | 195 | |||||||||||||||||||||||||||||||||||||
| (a) | Calculated based on the average shares outstanding methodology. |
| (b) | Assumes investment at the net asset value at the beginning of the period, reinvestment of all distributions, and a complete redemption of the investment at the net asset value at the end of the period. Total returns for periods less than one full year are not annualized. |
| (c) | The Fund’s portfolio turnover rate is calculated in accordance with regulatory requirements, without regard to transactions involving short term investments and certain derivatives. If such transactions were included, the Fund’s portfolio turnover rate may be higher. |
| (d) | Annualized. |
| (e) | Amount is less than $0.005 per share. |
| The accompanying notes are an integral part of these financial statements. | 11 |
GOLDMAN SACHS VARIABLE INSURANCE TRUST GLOBAL TRENDS ALLOCATION FUND
Notes to Financial Statements
June 30, 2018 (Unaudited)
1. ORGANIZATION
Goldman Sachs Variable Insurance Trust (the “Trust” or “VIT”) is a Delaware statutory trust registered under the Investment Company Act of 1940, as amended (the “Act”), as an open-end management investment company. The Trust includes the Goldman Sachs Global Trends Allocation Fund (the “Fund”). The Fund is a diversified portfolio under the Act offering two classes of shares — Institutional and Service Shares. Shares of the Trust are offered to separate accounts of participating life insurance companies for the purpose of funding variable annuity contracts and variable life insurance policies.
Goldman Sachs Asset Management, L.P. (“GSAM”), an affiliate of Goldman Sachs & Co. LLC (“Goldman Sachs”), serves as investment adviser to the Fund pursuant to a management agreement (the “Agreement”) with the Trust.
2. SIGNIFICANT ACCOUNTING POLICIES
The financial statements have been prepared in accordance with accounting principles generally accepted in the United States of America (“GAAP”) and require management to make estimates and assumptions that may affect the reported amounts and disclosures. Actual results may differ from those estimates and assumptions.
A. Investment Valuation — The Fund’s valuation policy is to value investments at fair value.
B. Investment Income and Investments — Investment income includes interest income, dividend income, and securities lending income, if any. Interest income is accrued daily and adjusted for amortization of premiums and accretion of discounts. Dividend income is recognized on ex-dividend date or, for certain foreign securities, as soon as such information is obtained subsequent to the ex-dividend date. Investment transactions are reflected on trade date. Realized gains and losses are calculated using identified cost. Investment transactions are recorded on the following business day for daily net asset value (“NAV”) calculations. Investment income is recorded net of any foreign withholding taxes, less any amounts reclaimable. The Fund may file withholding tax reclaims in certain jurisdictions to recover a portion of amounts previously withheld. Any foreign capital gains tax is accrued daily based upon net unrealized gains, and is payable upon sale of such investments.
For derivative contracts, realized gains and losses are recorded upon settlement of the contract.
C. Class Allocations and Expenses — Investment income, realized and unrealized gain (loss), if any, and non-class specific expenses of the Fund are allocated daily based upon the proportion of net assets of each class. Non-class specific expenses directly incurred by the Fund are charged to the Fund, while such expenses incurred by the Trust are allocated across the Fund on a straight-line and/or pro-rata basis depending upon the nature of the expenses. Class-specific expenses, where applicable, are borne by the respective share classes and include Distribution and Service and Transfer Agency fees.
D. Federal Taxes and Distributions to Shareholders — It is the Fund’s policy to comply with the requirements of the Internal Revenue Code of 1986, as amended (the “Code”), applicable to regulated investment companies (mutual funds) and to distribute each year substantially all of its investment company taxable income and capital gains to its shareholders. Accordingly, the Fund is not required to make any provisions for the payment of federal income tax. Distributions to shareholders are recorded on the ex-dividend date. Income and capital gains distributions, if any, are declared and paid annually.
Net capital losses, if any, are carried forward to future fiscal years and may be used to the extent allowed by the Code to offset any future capital gains. Losses that are carried forward will retain their character as either short-term or long-term capital losses. Utilization of capital loss carryforwards will reduce the requirement of future capital gains distributions.
The characterization of distributions to shareholders for financial reporting purposes is determined in accordance with federal income tax rules, which may differ from GAAP. The source of the Fund’s distributions may be shown in the accompanying financial statements as either from net investment income, net realized gain or capital. Certain components of the Fund’s net assets on the Statement of Assets and Liabilities reflect permanent GAAP/tax differences based on the appropriate tax character.
E. Foreign Currency Translation — The accounting records and reporting currency of the Fund are maintained in United States (“U.S.”) dollars. Assets and liabilities denominated in foreign currencies are translated into U.S. dollars using the current exchange rates at the close of each business day. The effect of changes in foreign currency exchange rates on investments is included within net realized and unrealized gain (loss) on investments. Changes in the value of other assets and liabilities as a result of fluctuations
12
GOLDMAN SACHS VARIABLE INSURANCE TRUST GLOBAL TRENDS ALLOCATION FUND
2. SIGNIFICANT ACCOUNTING POLICIES (continued)
in foreign exchange rates are included in the Statement of Operations within net change in unrealized gain (loss) on foreign currency translation. Transactions denominated in foreign currencies are translated into U.S. dollars on the date the transaction occurred, the effects of which are included within net realized gain (loss) on foreign currency transactions.
3. INVESTMENTS AND FAIR VALUE MEASUREMENTS
U.S. GAAP defines the fair value of a financial instrument as the amount that would be received to sell an asset or paid to transfer a liability in an orderly transaction between market participants at the measurement date (i.e., the exit price); the Fund’s policy is to use the market approach. GAAP establishes a fair value hierarchy that prioritizes the inputs to valuation techniques used to measure fair value. The hierarchy gives the highest priority to unadjusted quoted prices in active markets for identical assets or liabilities (Level 1 measurements) and the lowest priority to unobservable inputs (Level 3 measurements). The levels used for classifying investments are not necessarily an indication of the risk associated with investing in these investments. The three levels of the fair value hierarchy are described below:
Level 1 — Unadjusted quoted prices in active markets that are accessible at the measurement date for identical, unrestricted assets or liabilities;
Level 2 — Quoted prices in markets that are not active or financial instruments for which significant inputs are observable (including, but not limited to, quoted prices for similar investments, interest rates, foreign exchange rates, volatility and credit spreads), either directly or indirectly;
Level 3 — Prices or valuations that require significant unobservable inputs (including GSAM’s assumptions in determining fair value measurement).
Changes in valuation techniques may result in transfers into or out of an assigned level within the hierarchy. In accordance with the Fund’s policy, transfers between different levels of the fair value hierarchy resulting from such changes are deemed to have occurred as of the beginning of the reporting period.
The Board of Trustees (“Trustees”) has approved Valuation Procedures that govern the valuation of the portfolio investments held by the Fund, including investments for which market quotations are not readily available. The Trustees have delegated to GSAM day-to-day responsibility for implementing and maintaining internal controls and procedures related to the valuation of the Fund’s investments. To assess the continuing appropriateness of pricing sources and methodologies, GSAM regularly performs price verification procedures and issues challenges as necessary to third party pricing vendors or brokers, and any differences are reviewed in accordance with the Valuation Procedures.
A. Level 1 and Level 2 Fair Value Investments — The valuation techniques and significant inputs used in determining the fair values for investments classified as Level 1 and Level 2 are as follows:
Equity Securities — Equity securities traded on a U.S. securities exchange or the NASDAQ system, or those located on certain foreign exchanges, including but not limited to the Americas, are valued daily at their last sale price or official closing price on the principal exchange or system on which they are traded. If there is no sale or official closing price or such price is believed by GSAM to not represent fair value, equity securities are valued at the last bid price for long positions and at the last ask price for short positions. To the extent these investments are actively traded, they are classified as Level 1 of the fair value hierarchy, otherwise they are generally classified as Level 2.
Unlisted equity securities for which market quotations are available are valued at the last sale price on the valuation date, or if no sale occurs, at the last bid price, and are generally classified as Level 2. Securities traded on certain foreign securities exchanges are valued daily at fair value determined by an independent fair value service (if available) under Valuation Procedures approved by the Trustees and consistent with applicable regulatory guidance. The independent fair value service takes into account multiple factors including, but not limited to, movements in the securities markets, certain depositary receipts, futures contracts and foreign currency exchange rates that have occurred subsequent to the close of the foreign securities exchange. These investments are generally classified as Level 2 of the fair value hierarchy.
13
GOLDMAN SACHS VARIABLE INSURANCE TRUST GLOBAL TRENDS ALLOCATION FUND
Notes to Financial Statements (continued)
June 30, 2018 (Unaudited)
3. INVESTMENTS AND FAIR VALUE MEASUREMENTS (continued)
Underlying Funds (including Money Market Funds) — Underlying Funds (“Underlying Funds”) include other investment companies and exchange-traded funds (“ETFs”). Investments in the Underlying Funds (except ETFs) are valued at the NAV per share of the Institutional Share class on the day of valuation. ETFs are valued daily at the last sale price or official closing price on the principal exchange or system on which the investment is traded. Because the Fund invests in Underlying Funds that fluctuate in value, the Fund’s shares will correspondingly fluctuate in value. To the extent these investments are actively traded, they are classified as Level 1 of the fair value hierarchy, otherwise they are generally classified as Level 2. For information regarding an Underlying Fund’s accounting policies and investment holdings, please see the Underlying Fund’s shareholder report.
Derivative Contracts — A derivative is an instrument whose value is derived from underlying assets, indices, reference rates or a combination of these factors. The Fund enters into derivative transactions to hedge against changes in interest rates, securities prices, and/or currency exchange rates, to increase total return, or to gain access to certain markets or attain exposure to other underliers.
Exchange-traded derivatives, including futures and options contracts, are valued at the last sale or settlement price and typically fall within Level 1 of the fair value hierarchy. Over-the-counter (“OTC”) and centrally cleared derivatives are valued using market transactions and other market evidence, including market-based inputs to models, calibration to market-clearing transactions, broker or dealer quotations, or other alternative pricing sources. Where models are used, the selection of a particular model to value OTC and centrally cleared derivatives depends upon the contractual terms of, and specific risks inherent in, the instrument, as well as the availability of pricing information in the market. Valuation models require a variety of inputs, including contractual terms, market prices, yield curves, credit curves, measures of volatility, voluntary and involuntary prepayment rates, loss severity rates and correlations of such inputs. For OTC and centrally cleared derivatives that trade in liquid markets, model inputs can generally be verified and model selection does not involve significant management judgment. OTC and centrally cleared derivatives are classified within Level 2 of the fair value hierarchy when significant inputs are corroborated by market evidence.
i. Futures Contracts — Futures contracts are contracts to buy or sell a standardized quantity of a specified commodity or security and are valued based on exchanged settlement prices or independent market quotes. Futures contracts are valued at the last settlement price, or in the absence of a sale, the last bid price for long positions and at the last ask price for short positions, at the end of each day on the board of trade or exchange upon which they are traded. Upon entering into a futures contract, the Fund deposits cash or securities in an account on behalf of the broker in an amount sufficient to meet the initial margin requirement. Subsequent payments are made or received by the Fund equal to the daily change in the contract value and are recorded as variation margin receivable or payable with a corresponding offset to unrealized gains or losses. For financial reporting purposes, cash collateral that has been pledged to cover obligations of the Fund and cash collateral received, if any, is reported separately on the Statement of Assets and Liabilities as receivables/payables for collateral on certain derivative contracts. Non-cash collateral pledged by the Fund, if any, is noted in the Schedule of Investments.
B. Level 3 Fair Value Investments — To the extent that significant inputs to valuation models and other alternative pricing sources are unobservable, or if quotations are not readily available, or if GSAM believes that such quotations do not accurately reflect fair value, the fair value of the Fund’s investments may be determined under Valuation Procedures approved by the Trustees. GSAM, consistent with its procedures and applicable regulatory guidance, may make an adjustment to the most recent valuation prices of either domestic or foreign securities in light of significant events to reflect what it believes to be the fair value of the securities at the time of determining the Fund’s NAV. Significant events which could affect a large number of securities in a particular market may include, but are not limited to: significant fluctuations in U.S. or foreign markets; market dislocations;
14
GOLDMAN SACHS VARIABLE INSURANCE TRUST GLOBAL TRENDS ALLOCATION FUND
3. INVESTMENTS AND FAIR VALUE MEASUREMENTS (continued)
market disruptions; or unscheduled market closings. Significant events which could also affect a single issuer may include, but are not limited to: corporate actions such as reorganizations, mergers and buy-outs; ratings downgrades; and bankruptcies.
C. Fair Value Hierarchy — The following is a summary of the Fund’s investments and derivatives classified in the fair value hierarchy as of June 30, 2018:
| Investment Type | Level 1 | Level 2 | Level 3 | |||||||||
| Assets | ||||||||||||
| Exchange Traded Funds | $ | 104,147,798 | $ | — | $ | — | ||||||
| Investment Companies | 228,856,916 | — | — | |||||||||
| Total | $ | 333,004,714 | $ | — | $ | — | ||||||
| Derivative Type | ||||||||||||
| Assets(a) | ||||||||||||
| Futures Contracts | $ | 629,174 | $ | — | $ | — | ||||||
| Liabilities(a) | ||||||||||||
| Futures Contracts | $ | (2,586,524 | ) | $ | — | $ | — | |||||
| (a) | Amount shown represents unrealized gain (loss) at fiscal year end. |
For further information regarding security characteristics, see the Schedule of Investments.
4. INVESTMENTS IN DERIVATIVES
The following table sets forth, by certain risk types, the gross value of derivative contracts (not considered to be hedging instruments for accounting disclosure purposes) as of June 30, 2018. These instruments were used as part of the Fund’s investment strategies and to obtain and/or manage exposure related to the risks below. The values in the table below exclude the effects of cash collateral received or posted pursuant to these derivative contracts, and therefore are not representative of the Fund’s net exposure.
| Risk | Statement of Assets and Liabilities | Assets(a) | Statement of Assets and Liabilities | Liabilities(a) | ||||||||||
| Equity | — | $ | — | Variation margin on futures | $ | (2,586,524 | ) | |||||||
| Interest Rate | Variation margin on futures | 629,174 | — | — | ||||||||||
| Total | $ | 629,174 | $ | (2,586,524 | ) | |||||||||
| (a) | Includes unrealized gain (loss) on futures contracts described in the Additional Investment Information section of the Schedule of Investments. Only the variation margin as of June 30, 2018 is reported within the Statement of Assets and Liabilities. |
The following table sets forth, by certain risk types, the Fund’s gains (losses) related to these derivatives and their indicative volumes for the six months ended June 30, 2018. These gains (losses) should be considered in the context that these derivative contracts may have been executed to create investment opportunities and/or economically hedge certain investments, and
15
GOLDMAN SACHS VARIABLE INSURANCE TRUST GLOBAL TRENDS ALLOCATION FUND
Notes to Financial Statements (continued)
June 30, 2018 (Unaudited)
4. INVESTMENTS IN DERIVATIVES (continued)
accordingly, certain gains (losses) on such derivative contracts may offset certain (losses) gains attributable to investments. These gains (losses) are included in “Net realized gain (loss)” or “Net change in unrealized gain (loss)” on the Statement of Operations:
| Risk | Statement of Operations | Net Realized Gain (Loss) | Net Change in Unrealized Gain (Loss) | Average Number of Contracts(a) | ||||||||||
| Equity | Net realized gain (loss) from futures contracts/Net change in unrealized gain (loss) on futures contracts | $ | 1,447,687 | $ | (3,711,229 | ) | 1,590 | |||||||
| Interest Rate | Net realized gain (loss) from futures contracts/Net change in unrealized gain (loss) on futures contracts | 942,162 | 664,861 | 233 | ||||||||||
| Total | $ | 2,389,849 | $ | (3,046,368 | ) | 1,823 | ||||||||
| (a) | Average number of contracts is based on the average of month end balances for the six months ended June 30, 2018. |
5. AGREEMENTS AND AFFILIATED TRANSACTIONS
A. Management Agreement — Under the Agreement, GSAM manages the Fund, subject to the general supervision of the Trustees.
As compensation for the services rendered pursuant to the Agreement, the assumption of the expenses related thereto and administration of the Fund’s business affairs, including providing facilities, GSAM is entitled to a management fee, accrued daily and paid monthly, equal to an annual percentage rate of the Fund’s average daily net assets.
For the six months ended June 30, 2018, contractual and effective net management fees with GSAM were at the following rates:
| Contractual Management Rate | ||||||||||||||||||||||||||
| First $1 billion | Next $1 billion | Next $3 billion | Next $3 billion | Over $8 billion | Effective Rate | Effective Net Management Rate^ | ||||||||||||||||||||
| 0.79% | 0.71 | % | 0.68 | % | 0.66 | % | 0.65 | % | 0.79 | % | 0.52 | %* | ||||||||||||||
| ^ | Effective Net Management Rate includes the impact of management fee waivers of affiliated Underlying Funds, if any. |
| * | GSAM agreed to waive a portion of its management fee in order to achieve a net management rate, as defined in the Fund’s most recent prospectus. This waiver will be effective through at least April 30, 2019, and prior to such date GSAM may not terminate the arrangement without approval of the Trustees. For the six months ended June 30, 2018, GSAM waived $245,498 of its management fee. |
The Fund invests in Institutional Shares of the Goldman Sachs Financial Square Government, Goldman Sachs Financial Square Treasury Obligations, and Goldman Sachs Financial Square Treasury Solutions Funds, which are affiliated Underlying Funds. GSAM has agreed to waive a portion of its management fee payable by the Fund in an amount equal to the management fee it earns as an investment adviser to the affiliated Underlying Funds in which the Fund invests, except those management fees it earns from the Fund’s investments of cash collateral received in connection with securities lending transactions in the Goldman Sachs Financial Square Government, Goldman Sachs Financial Square Treasury Obligations, and Goldman Sachs Financial Square Treasury Solutions Funds. For the six months ended June 30, 2018, GSAM waived $315,853 of the Fund’s management fee.
B. Distribution and/or Service (12b-1) Plan — The Trust, on behalf of Service Shares of the Fund, has adopted a Distribution and Service Plan subject to Rule 12b-1 under the Act. Under the Distribution and Service Plan, Goldman Sachs, which serves as distributor, is entitled to a fee accrued daily and paid monthly, for distribution services and personal and account maintenance services, which may then be paid by Goldman Sachs to authorized dealers, equal to, on an annual basis, 0.25% of the Fund’s average daily net assets attributable to Service Shares.
16
GOLDMAN SACHS VARIABLE INSURANCE TRUST GLOBAL TRENDS ALLOCATION FUND
5. AGREEMENTS AND AFFILIATED TRANSACTIONS (continued)
C. Transfer Agency Agreement — Goldman Sachs also serves as the transfer agent of the Fund for a fee pursuant to the Transfer Agency Agreement. The fees charged for such transfer agency services are accrued daily and paid monthly at an annual rate of 0.02% of the average daily net assets of Institutional and Service Shares.
D. Other Expense Agreements and Affiliated Transactions — GSAM has agreed to limit certain “Other Expenses” of the Fund (excluding acquired fund fees and expenses, transfer agency fees and expenses, service fees and shareholder administration fees (as applicable), taxes, interest, brokerage fees, expenses of shareholder meetings, litigation and indemnification, and extraordinary expenses) to the extent such expenses exceed, on an annual basis, a percentage rate of the average daily net assets of the Fund. Such Other Expense reimbursements, if any, are accrued daily and paid monthly. In addition, the Fund is not obligated to reimburse GSAM for prior fiscal year expense reimbursements, if any. The Other Expense limitation as an annual percentage rate of average daily net assets for the Fund is 0.004%. The Other Expense limitation will remain in place through at least April 30, 2019, and prior to such date GSAM may not terminate the arrangement without the approval of the Trustees. For the six months ended June 30, 2018, GSAM reimbursed $92,034 to the Fund. In addition, the Fund has entered into certain offset arrangements with the custodian and the transfer agent, which may result in a reduction of the Fund’s expenses and are received irrespective of the application of the “Other Expense” limitation described above. For the six months ended June 30, 2018, custody fee credits were $10,500.
E. Line of Credit Facility — As of June 30, 2018, the Fund participated in a $770,000,000 committed, unsecured revolving line of credit facility (the “facility”) together with other funds of the Trust and certain registered investment companies having management agreements with GSAM or its affiliates. This facility is to be used for temporary emergency purposes, or to allow for an orderly liquidation of securities to meet redemption requests. The interest rate on borrowings is based on the federal funds rate. The facility also requires a fee to be paid by the Fund based on the amount of the commitment that has not been utilized. For the six months ended June 30, 2018, the Fund did not have any borrowings under the facility. Prior to May 1, 2018, the facility was $1,100,000,000. The facility was decreased to $770,000,000 effective May 1, 2018.
F. Other Transactions with Affiliates — The following table provides information about the Fund’s investments in the Goldman Sachs Financial Square Government, Goldman Sachs Financial Square Treasury Obligations, and Goldman Sachs Financial Square Treasury Solutions Funds as of and for the six months ended June 30, 2018:
| Investment Companies | Beginning Value as of December 31, 2017 | Purchases at Cost | Proceeds from Sales | Ending Value as of June 30, 2018 | Shares as of June 30, 2018 | Dividend Income | ||||||||||||||||||
Goldman Sachs Financial Square Government Fund | $ | 122,370,204 | $ | 36,698,669 | $ | (34,571,551 | ) | $ | 124,497,322 | 124,497,322 | $ | 904,278 | ||||||||||||
Goldman Sachs Financial Square Treasury Obligations Fund | 50,802,535 | 1,377,262 | — | 52,179,797 | 52,179,797 | 369,707 | ||||||||||||||||||
Goldman Sachs Financial Square Treasury Solutions Fund | 50,802,535 | 1,377,262 | — | 52,179,797 | 52,179,797 | 366,608 | ||||||||||||||||||
| Total | $ | 223,975,274 | $ | 39,453,193 | $ | (34,571,551 | ) | $ | 228,856,916 | 228,856,916 | $ | 1,640,593 | ||||||||||||
As of June 30, 2018, The Goldman Sachs Group, Inc. was the beneficial owner of approximately 12% of the Institutional Shares of the Fund.
6. PORTFOLIO SECURITIES TRANSACTIONS
The cost of purchases and proceeds from sales and maturities of long-term securities for the six months ended June 30, 2018, were $9,718,733 and $49,575,523, respectively.
17
GOLDMAN SACHS VARIABLE INSURANCE TRUST GLOBAL TRENDS ALLOCATION FUND
Notes to Financial Statements (continued)
June 30, 2018 (Unaudited)
7. TAX INFORMATION
As of the Fund’s most recent fiscal year end, December 31, 2017, the Fund’s certain timing differences, on a tax-basis were as follows:
| Timing differences (Qualified Late Year Loss Deferral) | $ | (24,600 | ) |
As of June 30, 2018, the Fund’s aggregate security unrealized gains and losses based on cost for U.S. federal income tax purposes were as follows:
| Tax cost | $ | 311,401,151 | ||
| Gross unrealized gain | 27,529,523 | |||
| Gross unrealized loss | (5,925,960 | ) | ||
| Net unrealized gain | $ | 21,603,563 |
The difference between GAAP-basis and tax-basis unrealized gains (losses) is attributable primarily to wash sales and net mark to market gains (losses) on regulated futures contracts.
GSAM has reviewed the Fund’s tax positions for all open tax years (the current and prior three years, as applicable) and has concluded that no provision for income tax is required in the Fund’s financial statements. Such open tax years remain subject to examination and adjustment by tax authorities.
8. OTHER RISKS
The Fund’s risks include, but are not limited to, the following:
Derivatives Risk — The Fund’s use of derivatives may result in loss. Derivative instruments, which may pose risks in addition to and greater than those associated with investing directly in securities, currencies or other instruments, may be illiquid or less liquid, volatile, difficult to price and leveraged so that small changes in the value of the underlying instruments may produce disproportionate losses to the Fund. Derivatives are also subject to counterparty risk, which is the risk that the other party in the transaction will not fulfill its contractual obligation. The use of derivatives is a highly specialized activity that involves investment techniques and risks different from those associated with investments in more traditional securities and instruments. Losses from derivatives can also result from a lack of correlation between changes in the value of derivative instruments and the portfolio assets (if any) being hedged.
Foreign and Emerging Countries Risk — Investing in foreign markets may involve special risks and considerations not typically associated with investing in the U.S. Foreign securities may be subject to risk of loss because of more or less foreign government regulation, less public information and less economic, political and social stability in the countries in which the Fund invests. The imposition of exchange controls (including repatriation restrictions), confiscations, trade restrictions (including tariffs) and other government restrictions by the U.S. or other governments, or from problems in share registration, settlement or custody, may also result in losses. Foreign risk also involves the risk of negative foreign currency rate fluctuations, which may cause the value of securities denominated in such foreign currency (or other instruments through which the Fund has exposure to foreign currencies) to decline in value. Currency exchange rates may fluctuate significantly over short periods of time. To the extent that the Fund also invests in securities of issuers located in emerging markets, these risks may be more pronounced.
Foreign Custody Risk — If the Fund invests in foreign securities, the Fund may hold such securities and cash with foreign banks, agents, and securities depositories appointed by the Fund’s custodian (each a “Foreign Custodian”). Some foreign custodians may be recently organized or new to the foreign custody business. In some countries, Foreign Custodians may be subject to little or no regulatory oversight over, or independent evaluation of, their operations. Further, the laws of certain countries may place limitations on the Fund’s ability to recover its assets if a Foreign Custodian enters bankruptcy. Investments in emerging markets
18
GOLDMAN SACHS VARIABLE INSURANCE TRUST GLOBAL TRENDS ALLOCATION FUND
8. OTHER RISKS (continued)
may be subject to even greater custody risks than investments in more developed markets. Custody services in emerging market countries are very often undeveloped and may be considerably less well regulated than in more developed countries, and thus may not afford the same level of investor protection as would apply in developed countries.
Interest Rate Risk — When interest rates increase, fixed income securities or instruments held by the Fund will generally decline in value. Long-term fixed income securities or instruments will normally have more price volatility because of this risk than short-term fixed income securities or instruments. The risks associated with changing interest rates may have unpredictable effects on the markets and the Fund’s investments. Fluctuations in interest rates may also affect the liquidity of fixed income securities and instruments held by the Fund.
Investments in Other Investment Companies Risk — As a shareholder of another investment company, including an exchange-traded fund (“ETF”), the Fund will indirectly bear its proportionate share of any net management fees and other expenses paid by such other investment companies, in addition to the fees and expenses regularly borne by the Fund. ETFs are subject to risks that do not apply to conventional mutual funds, including but not limited to the following: (i) the market price of the ETF’s shares may trade at a premium or a discount to their NAV; and (ii) an active trading market for an ETF’s shares may not develop or be maintained.
Large Shareholder Transactions Risk — The Fund may experience adverse effects when certain large shareholders, such as other funds, participating insurance companies, accounts and Goldman Sachs affiliates, purchase or redeem large amounts of shares of the Fund. Such large shareholder redemptions may cause the Fund to sell portfolio securities at times when it would not otherwise do so, which may negatively impact the Fund’s NAV and liquidity. These transactions may also accelerate the realization of taxable income to shareholders if such sales of investments resulted in gains, and may also increase transaction costs. In addition, a large redemption could result in the Fund’s current expenses being allocated over a smaller asset base, leading to an increase in the Fund’s expense ratio. Similarly, large Fund share purchases may adversely affect the Fund’s performance to the extent that the Fund is delayed in investing new cash and is required to maintain a larger cash position than it ordinarily would.
Liquidity Risk — The Fund may make investments that are illiquid or that may become less liquid in response to market developments or adverse investor perceptions. Illiquid investments may be more difficult to value. Liquidity risk may also refer to the risk that the Fund will not be able to pay redemption proceeds within the allowable time period because of unusual market conditions, an unusually high volume of redemption requests, or other reasons. To meet redemption requests, the Fund may be forced to sell investments at an unfavorable time and/or under unfavorable conditions. Liquidity risk may be the result of, among other things, the reduced number and capacity of traditional market participants to make a market in fixed income securities or the lack of an active market. The potential for liquidity risk may be magnified by a rising interest rate environment or other circumstances where investor redemptions from fixed income mutual funds may be higher than normal, potentially causing increased supply in the market due to selling activity.
Market and Credit Risks — In the normal course of business, the Fund trades financial instruments and enters into financial transactions where risk of potential loss exists due to changes in the market (market risk). Additionally, the Fund may also be exposed to credit risk in the event that an issuer or guarantor fails to perform or that an institution or entity with which the Fund has unsettled or open transactions defaults.
9. INDEMNIFICATIONS
Under the Trust’s organizational documents, its Trustees, officers, employees and agents are indemnified, to the extent permitted by the Act and state law, against certain liabilities that may arise out of performance of their duties to the Fund. Additionally, in the course of business, the Fund enters into contracts that contain a variety of indemnification clauses. The Fund’s maximum exposure under these arrangements is unknown, as this would involve future claims that may be made against the Fund that have not yet occurred. However, GSAM believes the risk of loss under these arrangements to be remote.
19
GOLDMAN SACHS VARIABLE INSURANCE TRUST GLOBAL TRENDS ALLOCATION FUND
Notes to Financial Statements (continued)
June 30, 2018 (Unaudited)
10. SUBSEQUENT EVENTS
Subsequent events after the Statement of Assets and Liabilities date have been evaluated, and GSAM has concluded that there is no impact requiring adjustment or disclosure in the financial statements.
11. SUMMARY OF SHARE TRANSACTIONS
Share activity is as follows:
| For the Six Months Ended June 30, 2018 (Unaudited) | For the Fiscal Year Ended December 31, 2017 | |||||||||||||||
| Shares | Dollars | Shares | Dollars | |||||||||||||
| Institutional Shares | ||||||||||||||||
| Shares sold | 18,377 | $ | 229,900 | — | $ | — | ||||||||||
| Reinvestment of distributions | — | — | 72 | 901 | ||||||||||||
| 18,377 | 229,900 | 72 | 901 | |||||||||||||
| Service Shares | ||||||||||||||||
| Shares sold | 1,877,975 | 23,415,556 | 3,237,201 | 38,959,444 | ||||||||||||
| Reinvestment of distributions | — | — | 901,767 | 11,254,056 | ||||||||||||
| Shares redeemed | (1,379,740 | ) | (17,297,008 | ) | (2,685,457 | ) | (32,234,857 | ) | ||||||||
| 498,235 | 6,118,548 | 1,453,511 | 17,978,643 | |||||||||||||
| NET INCREASE | 516,612 | $ | 6,348,448 | 1,453,583 | $ | 17,979,544 | ||||||||||
20
GOLDMAN SACHS VARIABLE INSURANCE TRUST GLOBAL TRENDS ALLOCATION FUND
| Fund Expenses — Six Month Period Ended June 30, 2018 (Unaudited) |
As a shareholder of Institutional or Service Shares of the Fund, you incur ongoing costs, including management fees, distribution and/or service (12b-1) fees (with respect to Service Shares) and other Fund expenses. This example is intended to help you understand your ongoing costs (in dollars) of investing in the Institutional Shares and Service Shares of the Fund and to compare these costs with the ongoing costs of investing in other mutual funds.
The example is based on an investment of $1,000 invested at the beginning of the period and held for the entire period from January 1, 2018 through June 30, 2018, which represents a period of 181 days of a 365 day year.
Actual Expenses — The first line under each share class in the table below provides information about actual account values and actual expenses. You may use the information in this line, together with the amount you invested, to estimate the expenses that you paid over the period. Simply divide your account value by $1,000 (for example, an $8,600 account value divided by $1,000=8.6), then multiply the result by the number in the first line under the heading entitled “Expenses Paid” to estimate the expenses you paid on your account during this period.
Hypothetical Example for Comparison Purposes — The second line under each share class in the table below provides information about hypothetical account values and hypothetical expenses based on the Fund’s actual net expense ratio and an assumed rate of return of 5% per year before expenses, which is not the Fund’s actual return. The hypothetical account values and expenses may not be used to estimate the actual ending account balance or expenses you paid for the period. You may use this information to compare the ongoing costs of investing in the Fund and other funds. To do so, compare this 5% hypothetical example with the 5% hypothetical examples that appear in the shareholder reports of the other funds.
Please note that the expenses shown in the table are meant to highlight your ongoing costs only. As a shareholder of the Fund, you do not incur any transaction costs, such as sales charges, redemption fees, or exchange fees, but shareholders of other funds may incur such costs. The second line of the table is useful in comparing ongoing costs only and will not help you determine the relative total costs of owning different funds whose shareholders may incur transaction costs.
| Share Class | Beginning Account Value 01/01/18 | Ending Account Value 06/30/18 | Expenses Paid for the 6 Months Ended 06/30/18* | |||||||||
| Institutional | ||||||||||||
| Actual | $ | 1,000 | $ | 1,004.80 | $ | 2.68 | ||||||
| Hypothetical 5% return | 1,000 | 1,022.12 | + | 2.71 | ||||||||
| Service | ||||||||||||
| Actual | 1,000 | 1,003.20 | 3.87 | |||||||||
| Hypothetical 5% return | 1,000 | 1,020.93 | + | 3.91 | ||||||||
| * | Expenses are calculated using the Fund’s annualized net expense ratio for each class, which represents the ongoing expenses as a percentage of net assets for the six months ended June 30, 2018. Expenses are calculated by multiplying the annualized net expense ratio by the average account value for the period; then multiplying the result by the number of days in the most recent fiscal half year; and then dividing that result by the number of days in the fiscal year. The annualized net expense ratios for the period were 0.54% and 0.78% for Institutional and Service Shares, respectively. |
| + | Hypothetical expenses are based on the Fund’s actual annualized net expense ratios and an assumed rate of return of 5% per year before expenses. |
21
GOLDMAN SACHS VARIABLE INSURANCE TRUST GLOBAL TRENDS ALLOCATION FUND
Statement Regarding Basis for Approval of Management Agreement (Unaudited)
Background
The Goldman Sachs Global Trends Allocation Fund (the “Fund”) is an investment portfolio of Goldman Sachs Variable Insurance Trust (the “Trust”). The Board of Trustees oversees the management of the Trust and reviews the investment performance and expenses of the Fund at regularly scheduled meetings held throughout the year. In addition, the Board of Trustees determines annually whether to approve the continuance of the Trust’s investment management agreement (the “Management Agreement”) with Goldman Sachs Asset Management, L.P. (the “Investment Adviser”) on behalf of the Fund.
The Management Agreement was most recently approved for continuation until June 30, 2019 by the Board of Trustees, including those Trustees who are not parties to the Management Agreement or “interested persons” (as defined in the Investment Company Act of 1940, as amended) of any party thereto (the “Independent Trustees”), at a meeting held on June 13-14, 2018 (the “Annual Meeting”).
The review process undertaken by the Trustees spans the course of the year and culminates with the Annual Meeting. To assist the Trustees in their deliberations, the Trustees have established a Contract Review Committee (the “Committee”), comprised of the Independent Trustees. The Committee held four meetings over the course of the year since the Management Agreement was last approved. At those Committee meetings, regularly scheduled Board or other committee meetings, and/or the Annual Meeting, matters relevant to the renewal of the Management Agreement were considered by the Board, or the Independent Trustees, as applicable. With respect to the Fund, such matters included:
| (a) | the nature and quality of the advisory, administrative, and other services provided to the Fund by the Investment Adviser and its affiliates, including information about: |
| (i) | the structure, staff, and capabilities of the Investment Adviser and its portfolio management teams; |
| (ii) | the groups within the Investment Adviser and its affiliates that support the portfolio management teams or provide other types of necessary services, including fund services groups (e.g., accounting and financial reporting, tax, shareholder services, and operations); controls and risk management groups (e.g., legal, compliance, valuation oversight, credit risk management, internal audit, compliance testing, market risk analysis, finance, and central funding); sales and distribution support groups, and others (e.g., information technology and training); |
| (iii) | trends in employee headcount; |
| (iv) | the Investment Adviser’s financial resources and ability to hire and retain talented personnel and strengthen its operations; and |
| (v) | the parent company’s support of the Investment Adviser and its mutual fund business, as expressed by the firm’s senior management; |
| (b) | information on the investment performance of the Fund, including comparisons to the performance of similar mutual funds, as provided by a third-party mutual fund data provider engaged as part of the contract review process (the “Outside Data Provider”), and a benchmark performance index; and information on general investment outlooks in the markets in which the Fund invests; |
| (c) | information provided by the Investment Adviser indicating the Investment Adviser’s views on whether the Fund’s peer group and/or benchmark index had high, medium, or low relevance given the Fund’s particular investment strategy; |
| (d) | the terms of the Management Agreement and other agreements with affiliated service providers entered into by the Trust on behalf of the Fund; |
| (e) | fee and expense information for the Fund, including: |
| (i) | the relative management fee and expense levels of the Fund as compared to those of comparable funds managed by other advisers, as provided by the Outside Data Provider; |
| (ii) | the Fund’s expense trends over time; and |
| (iii) | to the extent the Investment Adviser manages other types of accounts (such as bank collective trusts, private wealth management accounts, institutional separate accounts, sub-advised mutual funds, and non-U.S. funds) having investment objectives and policies similar to those of the Fund, comparative information on the advisory fees charged and services provided to those accounts by the Investment Adviser; |
| (f) | with respect to the extensive investment performance and expense comparison data provided by the Outside Data Provider, its processes in producing that data for the Fund; |
| (g) | the undertakings of the Investment Adviser and its affiliates to implement fee waivers and/or expense limitations; |
| (h) | information relating to the profitability of the Management Agreement and the transfer agency and distribution and service arrangements of the Fund to the Investment Adviser and its affiliates; |
| (i) | whether the Fund’s existing management fee schedule adequately addressed any economies of scale; |
22
GOLDMAN SACHS VARIABLE INSURANCE TRUST GLOBAL TRENDS ALLOCATION FUND
Statement Regarding Basis for Approval of Management Agreement (Unaudited) (continued)
| (j) | a summary of the “fall-out” benefits derived by the Investment Adviser and its affiliates from their relationships with the Fund, including the fees received by the Investment Adviser’s affiliates from the Fund for transfer agency, securities lending, portfolio trading, distribution and other services; |
| (k) | a summary of potential benefits derived by the Fund as a result of its relationship with the Investment Adviser; |
| (l) | information regarding commissions paid by the Fund and broker oversight, other information regarding portfolio trading, and how the Investment Adviser carries out its duty to seek best execution; |
| (m) | the manner in which portfolio manager compensation is determined; and the number and types of accounts managed by the portfolio managers; |
| (n) | the nature and quality of the services provided to the Fund by its unaffiliated service providers, and the Investment Adviser’s general oversight and evaluation (including reports on due diligence) of those service providers as part of the administrative services provided under the Management Agreement; and |
| (o) | the Investment Adviser’s processes and policies addressing various types of potential conflicts of interest; its approach to risk management; the annual review of the effectiveness of the Fund’s compliance program; and periodic compliance reports. |
The Trustees also received an overview of the Fund’s distribution arrangements. They received information regarding the Fund’s assets, share purchase and redemption activity, and payment of distribution and service fees. Information was also provided to the Trustees relating to revenue sharing payments made by and services provided by the Investment Adviser and its affiliates to intermediaries that promote the sale, distribution, and/or servicing of Fund shares. The Independent Trustees also discussed the broad range of other investment choices that are available to Fund investors, including the availability of comparable funds managed by other advisers.
The presentations made at the Board and Committee meetings and at the Annual Meeting encompassed the Fund and other mutual funds for which the Board of Trustees has responsibility. In evaluating the Management Agreement at the Annual Meeting, the Trustees relied upon their knowledge, resulting from their meetings and other interactions throughout the year, of the Investment Adviser and its affiliates, their services, and the Fund. In conjunction with these meetings, the Trustees received written materials and oral presentations on the topics covered, and the Investment Adviser addressed the questions and concerns of the Trustees, including concerns regarding the investment performance of certain of the funds they oversee. The Independent Trustees were advised by their independent legal counsel regarding their responsibilities and other regulatory requirements related to the approval and continuation of mutual fund investment management agreements under applicable law. In addition, the Investment Adviser and its affiliates provided the Independent Trustees with a written response to a formal request for information sent on behalf of the Independent Trustees by their independent legal counsel. During the course of their deliberations, the Independent Trustees met in executive sessions with their independent legal counsel, without representatives of the Investment Adviser or its affiliates present.
Nature, Extent, and Quality of the Services Provided Under the Management Agreement
As part of their review, the Trustees considered the nature, extent, and quality of the services provided to the Fund by the Investment Adviser. In this regard, the Trustees considered both the investment advisory services and non-advisory services that are provided by the Investment Adviser and its affiliates. The Trustees noted the transition in the leadership and changes in personnel of various of the Investment Adviser’s portfolio management teams that had occurred in recent periods, and the ongoing recruitment efforts aimed at bringing high quality investment talent to the Investment Adviser. They also noted the Investment Adviser’s commitment to maintaining high quality systems and expending substantial resources to respond to ongoing changes to the regulatory and control environment in which the Fund and its service providers operate, as well as the efforts of the Investment Adviser and its affiliates to combat cyber security risks. The Trustees concluded that the Investment Adviser continued to commit substantial financial and operational resources to the Fund and expressed confidence that the Investment Adviser would continue to do so in the future. The Trustees also recognized that the Investment Adviser had made significant commitments to address regulatory compliance requirements applicable to the Fund and the Investment Adviser and its affiliates.
Investment Performance
The Trustees also considered the investment performance of the Fund. In this regard, they compared the investment performance of the Fund to its peers using rankings and ratings compiled by the Outside Data Provider as of December 31, 2017, and updated performance information prepared by the Investment Adviser using the peer group identified by the Outside Data Provider as of March 31, 2018. The information on the Fund’s investment performance was provided for the one-, three- and five-year periods ending on the applicable dates. The Trustees also reviewed the Fund’s investment performance relative to its
23
GOLDMAN SACHS VARIABLE INSURANCE TRUST GLOBAL TRENDS ALLOCATION FUND
Statement Regarding Basis for Approval of Management Agreement (Unaudited) (continued)
performance benchmark. As part of this review, they considered the investment performance trends of the Fund over time, and reviewed the investment performance of the Fund in light of its investment objective and policies and market conditions.
In addition, the Trustees considered materials prepared and presentations made by the Investment Adviser’s senior management and portfolio management personnel in which Fund performance was assessed. The Trustees also considered the Investment Adviser’s periodic reports with respect to the Fund’s risk profile, and how the Investment Adviser’s approach to risk monitoring and management influences portfolio management. They noted the efforts of the Fund’s portfolio management team to continue to enhance the investment model used in managing the Fund.
The Trustees observed that the Fund’s Institutional Shares had placed in the third quartile of the Fund’s peer group for the one- and three-year periods; had underperformed the Fund’s benchmark index for the one-year period; and had underperformed the average performance of a group of competitor funds, as determined by the Investment Adviser, for the one- and three-year periods ended March 31, 2018. The Trustees also noted that in April 2015 the Fund had been repositioned from the Goldman Sachs Global Markets Navigator Fund, which involved changes to the Fund’s investment objective, investment strategy, and benchmark. The Trustees observed that the Fund had experienced certain portfolio management changes in the first half of 2018.
Costs of Services Provided and Competitive Information
The Trustees considered the contractual terms of the Management Agreement and the fee rates payable by the Fund thereunder. In this regard, the Trustees considered information on the services rendered by the Investment Adviser to the Fund, which included both advisory and administrative services that were directed to the needs and operations of the Fund as a registered mutual fund.
In particular, the Trustees reviewed analyses prepared by the Outside Data Provider regarding the expense rankings of the Fund. The analyses provided a comparison of the Fund’s management fee and breakpoints to those of a relevant peer group and category universe; an expense analysis which compared the Fund’s overall net and gross expenses to a peer group and a category universe; and data comparing the Fund’s net expenses to the peer and category medians. The analyses also compared the Fund’s transfer agency, custody, and distribution fees, other expenses and fee waivers/reimbursements to those of the peer group and category medians. The Trustees concluded that the comparisons provided by the Outside Data Provider were useful in evaluating the reasonableness of the management fees and total expenses paid by the Fund.
In addition, the Trustees considered the Investment Adviser’s undertakings to implement fee waivers and/or expense limitations. They also considered, to the extent that the Investment Adviser manages other types of accounts having investment objectives and policies similar to those of the Fund, comparative fee information for services provided by the Investment Adviser to those accounts, and information that indicated that services provided to the Fund differed in various significant respects from the services provided to other types of accounts which, in many cases, operated under less stringent legal and regulatory structures, required fewer services from the Investment Adviser to a smaller number of client contact points, and were less time-intensive.
In addition, the Trustees noted that shareholders are able to redeem their Fund shares at any time if shareholders believe that the Fund fees and expenses are too high or if they are dissatisfied with the performance of the Fund.
Profitability
The Trustees reviewed the Fund’s contribution to the Investment Adviser’s revenues and pre-tax profit margins. In this regard the Trustees noted that they had received, among other things, profitability analyses and summaries, revenue and expense schedules by Fund and by function (i.e., investment management, transfer agency and distribution and service), and information on the Investment Adviser’s expense allocation methodology. They observed that the profitability and expense figures are substantially similar to those used by the Investment Adviser for many internal purposes, including compensation decisions among various business groups, and are thus subject to a vigorous internal debate about how certain revenue and expenses should be allocated. The Trustees also noted that the internal audit group within the Goldman Sachs organization had audited the expense allocation methodology and that the internal audit group was satisfied with the reasonableness, consistency, and accuracy of the Investment Adviser’s expense allocation methodology and profitability analysis calculations. Profitability data for the Fund was provided for 2017 and 2016, and the Trustees considered this information in relation to the Investment Adviser’s overall profitability.
24
GOLDMAN SACHS VARIABLE INSURANCE TRUST GLOBAL TRENDS ALLOCATION FUND
Statement Regarding Basis for Approval of Management Agreement (Unaudited) (continued)
Economies of Scale
The Trustees considered the information that had been provided regarding whether there have been economies of scale with respect to the management of the Fund. The Trustees also considered the breakpoints in the fee rate payable under the Management Agreement for the Fund at the following annual percentage rates of the average daily net assets of the Fund:
| First $1 billion | 0.79 | % | ||
| Next $1 billion | 0.71 | |||
| Next $3 billion | 0.68 | |||
| Next $3 billion | 0.66 | |||
| Over $8 billion | 0.65 |
The Trustees noted that the breakpoints were designed to share potential economies of scale, if any, with the Fund and its shareholders as assets under management reach those asset levels. The Trustees considered the amounts of assets in the Fund; the Fund’s recent share purchase and redemption activity; the information provided by the Investment Adviser relating to the costs of the services provided by the Investment Adviser and its affiliates and their realized profits; information comparing fee rates charged by the Investment Adviser with fee rates charged to other funds in the peer group; and the Investment Adviser’s undertakings to waive a portion of its management fee and to limit certain expenses of the Fund that exceed specified levels. Upon reviewing these matters at the Annual Meeting, the Trustees concluded that the fee breakpoints represented a means of assuring that benefits of scalability, if any, would be passed along to shareholders at the specified asset levels.
Other Benefits to the Investment Adviser and Its Affiliates
The Trustees also considered the other benefits derived by the Investment Adviser and its affiliates from their relationships with the Fund as stated above, including: (a) transfer agency fees received by Goldman Sachs & Co. LLC (“Goldman Sachs”); (b) brokerage and futures commissions earned by Goldman Sachs for executing securities and futures transactions on behalf of the Fund; (c) trading efficiencies resulting from aggregation of orders of the Fund with those for other funds or accounts managed by the Investment Adviser; (d) fees earned by Goldman Sachs Agency Lending (“GSAL”), an affiliate of the Investment Adviser, as securities lending agent (and fees earned by the Investment Adviser for managing the fund in which the Fund’s cash collateral is invested); (e) the Investment Adviser’s ability to leverage the infrastructure designed to service the Fund on behalf of its other clients; (f) the Investment Adviser’s ability to cross-market other products and services to Fund shareholders; (g) Goldman Sachs’ retention of certain fees as Fund Distributor; (h) the Investment Adviser’s ability to negotiate better pricing with custodians on behalf of its other clients, as a result of the relationship with the Fund; and (i) the possibility that the working relationship between the Investment Adviser and the Fund’s third-party service providers may cause those service providers to be more likely to do business with other areas of Goldman Sachs. In the course of considering the foregoing, the Independent Trustees requested and received further information quantifying certain of these fall-out benefits.
Other Benefits to the Fund and Its Shareholders
The Trustees also noted that the Fund receives certain potential benefits as a result of its relationship with the Investment Adviser, including: (a) trading efficiencies resulting from aggregation of orders of the Fund with those of other funds or accounts managed by the Investment Adviser; (b) enhanced servicing from vendors because of the volume of business generated by the Investment Adviser and its affiliates; (c) enhanced servicing from broker-dealers because of the volume of business generated by the Investment Adviser and its affiliates; (d) the Investment Adviser’s ability to negotiate favorable terms with derivatives counterparties on behalf of the Fund as a result of the size and reputation of the Goldman Sachs organization; (e) the Investment Adviser’s knowledge and experience gained from managing other accounts and products; (f) the Investment Adviser’s ability to hire and retain qualified personnel to provide services to the Fund because of the reputation of the Goldman Sachs organization; (g) the Fund’s access, through the Investment Adviser, to certain firmwide resources (e.g., proprietary risk management systems and databases), subject to certain restrictions; (h) the Fund’s ability to participate in the securities lending program administered by GSAL, as measured by the revenue received by the Fund in connection with the program; and (i) the Fund’s access to certain affiliated distribution channels. In addition, the Trustees noted the competitive nature of the mutual fund marketplace, and considered that many of the Fund’s shareholders invested in the Fund in part because of the Fund’s relationship with the Investment Adviser and that those shareholders have a general expectation that the relationship will continue.
25
GOLDMAN SACHS VARIABLE INSURANCE TRUST GLOBAL TRENDS ALLOCATION FUND
Statement Regarding Basis for Approval of Management Agreement (Unaudited) (continued)
Conclusion
In connection with their consideration of the Management Agreement, the Trustees gave weight to each of the factors described above, but did not identify any particular factor as controlling their decision. After deliberation and consideration of all of the information provided, including the factors described above, the Trustees concluded, in the exercise of their business judgment, that the management fees paid by the Fund were reasonable in light of the services provided to it by the Investment Adviser, the Investment Adviser’s costs and the Fund’s current and reasonably foreseeable asset levels. The Trustees unanimously concluded that the Investment Adviser’s continued management likely would benefit the Fund and its shareholders and that the Management Agreement should be approved and continued with respect to the Fund until June 30, 2019.
26
| TRUSTEES | OFFICERS | |
| Jessica Palmer, Chair | James A. McNamara, President | |
| Kathryn A. Cassidy | Scott M. McHugh, Treasurer, Senior Vice | |
| Diana M. Daniels | President and Principal Financial Officer | |
| Herbert J. Markley | Joseph F. DiMaria, Assistant Treasurer and Principal Accounting Officer Caroline L. Kraus, Secretary | |
| James A. McNamara | ||
| Roy W. Templin | ||
| Gregory G. Weaver |
GOLDMAN SACHS & CO. LLC
Distributor and Transfer Agent
GOLDMAN SACHS ASSET MANAGEMENT, L.P.
Investment Adviser
200 West Street, New York
New York 10282
Visit our web site at www.GSAMFUNDS.com to obtain the most recent month-end returns.
The reports concerning the Fund included in this shareholder report may contain certain forward-looking statements about the factors that may affect the performance of the Fund in the future. These statements are based on Fund management’s predictions and expectations concerning certain future events and their expected impact on the Fund, such as performance of the economy as a whole and of specific industry sectors, changes in the levels of interest rates, the impact of developing world events, and other factors that may influence the future performance of the Fund. Management believes these forward-looking statements to be reasonable, although they are inherently uncertain and difficult to predict. Actual events may cause adjustments in portfolio management strategies from those currently expected to be employed.
A description of the policies and procedures that the Fund uses to determine how to vote proxies relating to portfolio securities and information regarding how the Fund voted proxies relating to portfolio securities for the 12-month period ended June 30 is available (i) without charge, upon request by calling 1-800-621-2550; and (ii) on the Securities and Exchange Commission (“SEC”) web site at http://www.sec.gov.
The Fund files its complete schedule of portfolio holdings with the SEC for the first and third quarters of each fiscal year on Form N-Q. The Fund’s Forms N-Q are available on the SEC’s web site at http://www.sec.gov within 60 days after the Fund’s first and third fiscal quarters. The Fund’s Forms N-Q may be reviewed and copied at the SEC’s Public Reference Room in Washington, D.C. and information on the operation of the Public Reference Room may also be obtained by calling 1-800-SEC-0330. Forms N-Q may be obtained upon request and without charge by calling 1-800-621-2550.
Views and opinions expressed are for informational purposes only and do not constitute a recommendation by GSAM to buy, sell, or hold any security. Views and opinions are current as of the date of this presentation and may be subject to change, they should not be construed as investment advice.
Goldman Sachs & Co. LLC (“Goldman Sachs”) does not provide legal, tax or accounting advice. Any statement contained in this communication (including any attachments) concerning U.S. tax matters was not intended or written to be used, and cannot be used, for the purpose of avoiding penalties under the Internal Revenue Code, and was written to support the promotion or marketing of transaction or matter addressed. Clients of Goldman Sachs should obtain their own independent tax advice based on their particular circumstances.
The website links provided are for your convenience only and are not an endorsement or recommendation by GSAM of any of these websites or the products or services offered. GSAM is not responsible for the accuracy and validity of the content of these websites.
Fund holdings and allocations shown are as of June 30, 2018 and may not be representative of future investments. Fund holdings should not be relied on in making investment decisions and should not be construed as research or investment advice regarding particular securities. Current and future holdings are subject to risk.
References to indices, benchmarks or other measures of relative market performance over a specified period of time are provided for your information only and do not imply that the portfolio will achieve similar results. The index composition may not reflect the manner in which a portfolio is constructed. While an adviser seeks to design a portfolio which reflects appropriate risk and return features, portfolio characteristics may deviate from those of the benchmark.
The portfolio risk management process includes an effort to monitor and manage risk, but does not imply low risk.
Shares of the Goldman Sachs VIT Funds are offered to separate accounts of participating life insurance companies for the purpose of funding variable annuity contracts and variable life insurance policies. Shares of the Fund are not offered directly to the general public. The variable annuity contracts and variable life insurance policies are described in the separate prospectuses issued by participating insurance companies. You should refer to those prospectuses for information about surrender charges, mortality and expense risk fees and other charges that may be assessed by participating insurance companies under the variable annuity contracts or variable life insurance policies. Such fees or charges, if any, may affect the return you may realize with respect to your investments. Ask your representative for more complete information. Please consider a fund’s objectives, risks and charges and expenses, and read the prospectus carefully before investing. The prospectus contains this and other information about the Fund.
This material is not authorized for distribution to prospective investors unless preceded or accompanied by a current prospectus or summary prospectus, if applicable. Investors should consider the Fund’s objective, risks, and charges and expenses, and read the summary prospectus, if available, and/or the prospectus carefully before investing or sending money. The summary prospectus, if available, and the prospectus contain this and other information about the Fund and may be obtained from your authorized dealer or from Goldman Sachs & Co. LLC by calling 1-800-621-2550.
This report is prepared for the general information of contract owners and is not an offer of shares of the Goldman Sachs Variable Insurance Trust — Goldman Sachs Global Trends Allocation Fund.
© 2018 Goldman Sachs. All rights reserved.
VITNAVSAR-18/139308-OTU-809583/12K
Goldman
Sachs Variable Insurance Trust
Goldman Sachs
Large Cap Value Fund
Semi-Annual Report
June 30, 2018

GOLDMAN SACHS VARIABLE INSURANCE TRUST LARGE CAP VALUE FUND
INVESTMENT OBJECTIVE
The Fund seeks long-term capital appreciation.
Portfolio Management Discussion and Analysis
Below, the Goldman Sachs Value Portfolio Management Team discusses the Goldman Sachs Variable Insurance Trust — Goldman Sachs Large Cap Value Fund’s (the “Fund”) performance and positioning for the six-month period ended June 30, 2018 (the “Reporting Period”).
How did the Fund perform during the Reporting Period?
During the Reporting Period, the Fund’s Institutional and Service Shares generated cumulative total returns of –1.99% and –2.21%, respectively. These returns compare to the –1.69% cumulative total return of the Fund’s benchmark, the Russell 1000® Value Index (with dividends reinvested) (the “Russell Index”) during the same time period.
What economic and market factors most influenced the equity markets as a whole during the Reporting Period?
Representing the U.S. equity market, the S&P 500® Index gained 2.65% during the Reporting Period.
U.S. equities saw a strong start to the Reporting Period in January 2018, driven by positive economic data, a $1.5 trillion tax reform law signed in December 2017, and a favorable corporate earnings season. In February 2018, however, U.S. and international equities sold off on market speculation of a faster pace of Federal Reserve (“Fed”) short-term interest rate hikes, which stoked a sharp rise in bond yields and an increase in equity market volatility. Concerns about Fed monetary policy tightening were further exacerbated by solid U.S. labor and inflation data. While the hawkish Fed minutes were largely expected, new Fed Chair Jerome Powell’s Congressional testimony, positing a more optimistic economic outlook since the December 2017 Fed meeting, surprised equity markets with its hawkish tilt, sparking another sell-off in the U.S. equity markets. (Jerome Powell assumed the chairmanship of the Fed in February 2018. Hawkish language tends to suggest higher interest rates; opposite of dovish.) In March 2018, escalating trade tensions and potential tariffs weighed on investor sentiment. Meanwhile, the Fed delivered on a widely expected interest rate increase, with its “dot plot” pointing to a total of three interest rate hikes this calendar year and potentially two in 2019. (The “dot plot” shows rate projections of the members of the Fed’s Open Market Committee.) However, Fed policymakers acknowledged that the “economic outlook has strengthened in recent months,” revising their economic growth forecast higher and their unemployment forecast lower.
The U.S. and China continued to generate trade headlines and geopolitical uncertainty about sanctions on Russia surfaced, but the impact of such on the U.S. equity markets remained relatively muted during April 2018, as investors stayed rather resistant to the risk of a trade war. A number of macroeconomic drivers, including U.S. labor market strength, higher inflation and fiscal stimulus, pushed up U.S. Treasury yields, with the 10-year U.S. Treasury yield breaching 3% toward month end. With more than half of S&P 500® Index companies having reported their first quarter 2018 results, the earnings season began strongly during April 2018. U.S. equities rallied in May 2018, driven not only by strong corporate earnings but also by upside surprises in economic activity and sentiment data as well as on a new U.S. unemployment low of 3.8%. However, the U.S. equity rally was hampered by escalating geopolitical uncertainty stemming from the unexpected political outcome in Italy, the ongoing unpredictability around the U.S.-North Korea summit, and escalating trade tensions with many U.S. allies. The Fed raised interest rates again in June 2018, as widely expected, but the outcome of the Fed meeting was more hawkish than the consensus had anticipated. The Fed retained language indicating an “accommodative” monetary policy stance, but its economic growth and inflation forecasts were upgraded, and its median projection was lifted to four interest rate hikes in 2018 from the three it had indicated in March 2018. Fed Chair Powell was also slightly hawkish in his June press conference. Still-escalating trade tensions between the U.S. and China hurt market sentiment, with the U.S. threatening tariffs on $200 billion worth of Chinese goods and China vowing to retaliate. All told, then, the S&P 500® Index produced modestly positive but rather flat returns for the month of June 2018.
For the Reporting Period overall, six sectors posted positive absolute returns and five generated negative returns. Consumer discretionary, information technology and energy were the best performing sectors in the S&P 500® Index, as measured by total return, and the weakest performing sectors in the S&P 500® Index during the Reporting Period were telecommunication services, consumer staples and industrials.
Within the U.S. equity market, there was significant disparity in performance not only among sectors but also among the various capitalization and style segments. While all capitalization segments posted positive returns, small-cap stocks, as measured by the Russell 2000® Index, performed best, followed at some distance by large-cap stocks, as measured by the Russell 1000® Index, and
1
GOLDMAN SACHS VARIABLE INSURANCE TRUST LARGE CAP VALUE FUND
mid-cap stocks, as measured by the Russell Midcap® Index, which performed similarly to each other. From a style perspective, growth-oriented stocks significantly outpaced value-oriented stocks across the capitalization spectrum, with value-oriented stocks overall in the large-cap and mid-cap segments posting modestly negative absolute returns. (All as measured by the FTSE Russell indices.)
What key factors were responsible for the Fund’s performance during the Reporting Period?
The Fund posted negative absolute returns that underperformed the Russell Index during the Reporting Period due primarily to stock selection overall. Sector allocation as a whole contributed positively, albeit modestly, to the Fund’s performance relative to the Russell Index during the Reporting Period.
Which equity market sectors most significantly affected Fund performance?
Stock selection in the energy, consumer discretionary and financials sectors detracted most from the Fund’s relative results. Only partially offsetting these detractors was stock selection in the industrials, information technology and consumer staples sectors, which contributed positively. Having an overweighted allocation to the information technology sector, which outpaced the Russell Index during the Reporting Period, and having an underweighted allocation to consumer staples, which was among the weakest sectors in the Russell Index during the Reporting Period, also helped.
Which stocks detracted significantly from the Fund’s performance during the Reporting Period?
Among those companies detracting most from the Fund’s results relative to the Russell Index were positions in Devon Energy, Intel and Lowe’s Companies.
Devon Energy is a natural gas, natural gas liquids and petroleum exploration company. The majority of its stock’s poor performance occurred in February 2018 after the company reported weak fourth quarter 2017 earnings, primarily driven by missed production expectations and disappointing 2018 guidance. Despite these headwinds, we remained positive at the end of the Reporting Period on the company’s North American asset base and believed it was largely undervalued at the stock’s then-current market price.
Intel is a company that engages in the design, manufacture and sale of computer products and technologies. In January 2018, false reports surfaced about a fundamental design flaw in Intel’s processing chips, which caused its stock price to decline. While we remained positive on the company’s data center business and its efforts to improve cost controls, we exited the Fund’s position in favor of what we felt were better reward/risk opportunities elsewhere. Its stock subsequently traded up following its fourth quarter 2017 earnings report in February 2018, which included better than consensus expected top and bottom line results, further exacerbating the detracting effect of the position on the Fund’s relative results during the Reporting Period.
Lowe’s Companies is the second-largest home improvement retailer in the U.S. Its shares fell sharply in February 2018 after the company reported fourth quarter 2017 earnings that came in below market expectations. We had originally purchased the stock based on what we considered to be its attractive valuation and on our belief it would be a direct beneficiary of the growing trends associated with the housing and home improvement industry. However, we exited the stock in April 2018 due to our decreased confidence in the company’s execution as well as on near-term trends associated with more challenging weather conditions presented in the company’s fourth quarter 2017 results.
What were some of the Fund’s best-performing individual stocks?
Relative to the Russell Index, the Fund benefited most from positions in Westinghouse Air Brake Technologies, Microsoft and Union Pacific.
Westinghouse Air Brake Technologies (“Wabtec”) is an equipment and system services company for the transit and freight rail industry. In late January and early February 2018, Wabtec’s stock was challenged by short-term margin concerns from backlog contracts. Despite these early headwinds, its stock turned around after the company signed a $62 million contract to provide equipment and services for SunRail service in central Florida. In May 2018, its stock rose again, as the company re-affirmed its 2018 financial guidance and long-term financial targets, which continued to be ahead of market consensus. Toward the end of May 2018, it was announced General Electric’s transport business would be merging with Wabtec, which was also viewed positively by the market, as it could provide synergies for the company and is expected to be cash accretive. At the end of the Reporting Period, we remained positive on the company’s recent acquisitions and believed it had potential to explore additional opportunities that may unlock further synergies.
Software giant Microsoft engages in the design, manufacture and sale of computer products and technologies. Its stock rose in April 2018 after the company reported strong fiscal third quarter results and fiscal fourth quarter guidance, driven by solid growth
2
GOLDMAN SACHS VARIABLE INSURANCE TRUST LARGE CAP VALUE FUND
in its commercial cloud business. Its stock rose again in May 2018, after Microsoft secured a multi-million dollar cloud deal with the Pentagon in which the 17 intelligence agencies and offices will utilize Microsoft’s Azure Government, a cloud service tailored for federal and local governments, in addition to other products the company already offers. At the end of the Reporting Period, we remained positive on Microsoft’s ongoing focus on improving margins and generating free cash flow. We continued to hold the position in the Fund, as we believe there is more room to run with its commercial cloud business, given the company’s management team’s commitment to innovation and market foothold.
Union Pacific engages in the provision of railroad and freight transportation services. After a slight miss to its fourth quarter 2017 earnings, the company’s stock saw a span of declining performance followed by volatile increases for the remainder of the first quarter of 2018, performing in line with the heightened volatility the broad equity market experienced in February and March 2018. However, its stock appreciated in late April 2018 after announcing positive first quarter 2018 earnings that beat consensus estimates. In late May 2018, Union Pacific highlighted capital structure and key infrastructure developments with large projects to be completed by 2020 that could potentially free up capacity and costs to achieve a projected operating ratio. In addition to its new infrastructure developments, we believed at the end of the Reporting Period that Union Pacific was poised to be a beneficiary of logistics demand with opportunities for positive volume growth and core pricing gains.
How did the Fund use derivatives and similar instruments during the Reporting Period?
During the Reporting Period, we did not use derivatives.
Did the Fund make any significant purchases or sales during the Reporting Period?
During the Reporting Period, we initiated a Fund position in Berkshire Hathaway, a multinational conglomerate holding company. We initially purchased the stock in February 2018 due to what we saw as the company’s collection of high quality businesses and its management team’s proven track record of successful capital allocation. We increased the Fund’s position in the stock in late May 2018. We are constructive on what we consider to be the company’s strong balance sheet, which provides the ability, in our view, to deploy excess cash toward value-enhancing acquisitions.
We established a Fund position in Chevon, a multinational energy company. We purchased the stock based on our view that Chevron is well positioned to generate best-in-class growth over the longer term, driven by its dominant position in the Permian Basin as well as by its vast array of liquid natural gas projects in its pipeline. Additionally, we are constructive on its management team’s commitment to reducing production costs and redeploying excess cash into its capital expenditure program.
Conversely, in addition to those sales already mentioned, we eliminated the Fund’s position in Wells Fargo & Company, a bank holding and financial services company. Its shares had struggled as the company navigates through punitive sanctions of the consent order imposed by the Fed, which led to Standard & Poor’s cutting the company’s credit rating. In light of the negative sentiment surrounding the company, we ultimately decided to exit the position and use the proceeds to fund higher conviction ideas.
We exited the Fund’s position in Proctor & Gamble, a multinational consumer goods corporation. We had originally purchased the stock as we believed the company could start to see an inflection from its recent consolidation, which had resulted, in our view, in stronger growth potential and accelerating margins. However, reduced pricing power, coupled with heightened retail pressures placed downward pressure on its stock, leading us to sell the Fund’s position.
Were there any notable changes in the Fund’s weightings during the Reporting Period?
In constructing the Fund’s portfolio, we focus on picking stocks rather than on making industry or sector bets. We seek to outpace the benchmark index by overweighting stocks that we expect to outperform and underweighting those that we think may lag. Consequently, changes in its sector weights are generally the direct result of individual stock selection or of stock appreciation or depreciation. That said, during the Reporting Period, the Fund’s exposure compared to the Russell Index to financials, real estate and utilities increased. The Fund’s allocations compared to the Russell Index in health care, consumer discretionary, industrials, consumer staples, materials and telecommunication services decreased.
How was the Fund positioned relative to its benchmark index at the end of the Reporting Period?
At the end of June 2018, the Fund had overweighted positions relative to the Russell Index in the information technology, consumer discretionary and investment company sectors. On the same date, the Fund had underweighted positions compared to the Russell Index in the consumer staples, financials and real estate sectors and was rather neutrally weighted to the Russell Index in the health care, energy, industrials, materials, telecommunication services and utilities sectors.
3
GOLDMAN SACHS VARIABLE INSURANCE TRUST LARGE CAP VALUE FUND
Were there any changes to the Fund’s portfolio management team during the Reporting Period?
Effective January 9, 2018, Goldman Sachs Asset Management, L.P. (the “Investment Adviser”) centralized its Fundamental Equity U.S. Value and Fundamental Equity U.S. Growth Teams into a single Fundamental Equity U.S. Equity Team. Effective the same date, decision-making for the Fund’s strategy was centralized with lead portfolio managers, who draw upon the combined team for idea generation and make final investment decisions. The Investment Adviser believes these changes will benefit the Funds by providing a more holistic investment perspective and the ability to leverage investment ideas across the U.S. Fundamental Equity platform.
Effective the same date, co-lead portfolio manager for the Fund, John Arege, left the firm. John shared portfolio management responsibility for the Fund’s strategy with Sean Gallagher, who has been in this role since 2001. Sean continues to serve as a lead portfolio manager for the Fund’s strategy. There were no changes to the investment process or philosophy of the Fund’s strategy. We remain committed to high quality, bottom-up research and to the time-tested investment philosophy of the Fund’s strategy. We continue to believe that deep knowledge of company-specific and industry trends is key to our research edge.
What is the Fund’s tactical view and strategy for the months ahead?
At the end of the Reporting Period, we believed U.S. equities continued to offer a reasonable risk premium over other asset classes, despite fuller valuations. While fiscal stimulus in a strong economy raises overheating risk, in our view, U.S. equities should be resilient to rising interest rates to the extent these interest rates reflect strong economic growth prospects, as is the case, thus far, in the current cycle of monetary policy tightening. In our view, cost pressures and rising interest rates make pricing power an increasingly important differentiator of a company’s success. This divergence between winners and losers also reinforces, we feel, the importance of active management. Although we believe it is too early in the monetary policy tightening cycle for a shift to a persistent high volatility regime, we expect U.S. equity markets will likely see more frequent drawdowns, or corrections, from here, and investors are likely, in our opinion, to continue to prefer an active, dynamic investment approach. We believe focusing on company fundamentals, while being aware of the potential effect of various macroeconomic factors, is a process that should continue to reward the Fund’s shareholders over the long term.
Regardless of market direction, our fundamental, bottom-up stock selection continues to drive our process, rather than headlines or sentiment. We maintain high conviction in the companies the Fund owns and believe they have the potential to outperform relative to the broader market regardless of economic growth conditions. We continue to focus on undervalued companies that we believe have comparatively greater control of their own destiny, such as innovators with differentiated products, companies with low cost structures or companies that have been investing in their own businesses and may be poised to gain market share. We maintain our discipline in identifying companies with what we believe to be strong or improving balance sheets, led by quality management teams and trading at discounted valuations. We remain focused on the long-term performance of the Fund.
Effective September 30, 2018, Sean Gallagher will be retiring from Goldman Sachs and will no longer serve as a portfolio manager for the Fund. In addition, effective July 17, 2018, Charles “Brook” Dane, CFA, Vice President, serves as a portfolio manager for the Fund. Mr. Dane joined Goldman Sachs in 2010 as a portfolio manager for the Value Team. Prior to joining the firm, Mr. Dane spent 13 years at Putnam Investments as a research analyst and more recently as a portfolio manager.
4
GOLDMAN SACHS VARIABLE INSURANCE TRUST LARGE CAP VALUE FUND
Index Definitions
The Russell 1000® Value Index is an unmanaged market capitalization weighted index of the 1000 largest U.S. companies with lower price-to-book ratios and lower forecasted growth values. The figures for the index do not include any deduction for fees, expenses or taxes.
The Russell 2000® Index is an unmanaged index of common stock prices that measures the performance of the 2000 smallest companies in the Russell 3000® Index. The figures for the index do not include any deduction for fees, expenses or taxes.
The S&P 500® Index is the Standard & Poor’s 500 Composite Index of 500 stocks, an unmanaged index of common stock prices. The figures for the index do not include any deduction for fees, expenses or taxes.
The Russell Midcap® Index measures the performance of the 800 smallest companies in the Russell 1000® Index, which represent approximately 25% of the total market capitalization of the Russell 1000 Index.
The Russell 1000® Index measures the performance of the 1,000 largest companies in the Russell 3000® Index, which represent approximately 92% of the total market capitalization of the Russell 3000 Index.
It is not possible to invest directly in an index.
5
FUND BASICS
Large Cap Value Fund
as of June 30, 2018
STANDARDIZED TOTAL RETURNS1
| For the period ended 6/30/18 | One Year | Five Years | Ten Years | Since Inception | Inception Date | |||||||||||||
| Institutional | 2.14 | % | 8.42 | % | 5.93 | % | 4.94 | % | 1/12/98 | |||||||||
| Service | 1.83 | 8.13 | 5.65 | 4.05 | 7/24/07 | |||||||||||||
| 1 | The Standardized Total Returns are average annual total returns as of the most recent calendar quarter-end. They assume reinvestment of all distributions at net asset value (“NAV”). Because Institutional Shares and Service Shares do not involve a sales charge, such a charge is not applied to their Standardized Total Returns. |
Total return figures in the above chart represent past performance and do not indicate future results, which will vary. The investment return and principal value of an investment will fluctuate and, therefore, an investor’s shares, when redeemed, may be worth more or less than their original cost. Current performance may be lower or higher than the total return figures in the above chart. Please visit www.GSAMFUNDS.com to obtain the most recent month-end returns. Performance reflects fee waivers and/or expense limitations in effect during the periods shown. In their absence, performance would be reduced.
EXPENSE RATIOS2
| Net Expense Ratio (Current) | Gross Expense Ratio (Before Waivers) | |||||||
| Institutional | 0.71 | % | 0.78 | % | ||||
| Service | 0.96 | 1.03 | ||||||
| 2 | The expense ratios of the Fund, both current (net of any fee waivers and/or expense limitations) and before waivers (gross of any fee waivers and/or expense limitations) are as set forth above according to the most recent publicly available Prospectuses for the Fund and may differ from the expense ratios disclosed in the Financial Highlights in this report. Pursuant to a contractual arrangement, the Fund’s fee waivers and/or expense limitations will remain in place through at least April 30, 2019, and prior to such date, the Investment Adviser may not terminate the arrangements without the approval of the Fund’s Board of Trustees. If these arrangements are discontinued in the future, the expense ratios may change without shareholder approval. |
TOP TEN HOLDINGS AS OF 6/30/183
| Holding | % of Net Assets | Line of Business | ||||
Berkshire Hathaway, Inc. Class B | 3.4% | Diversified Financials | ||||
JPMorgan Chase & Co. | 3.2 | Banks | ||||
Bank of America Corp. | 3.0 | Banks | ||||
Chevron Corp. | 2.8 | Energy | ||||
Verizon Communications, Inc. | 2.6 | Telecommunication Services | ||||
Cisco Systems, Inc. | 2.3 | Technology Hardware & Equipment | ||||
DowDuPont, Inc. | 2.2 | Materials | ||||
Walmart, Inc. | 2.0 | Food & Staples Retailing | ||||
Medtronic plc | 1.8 | Health Care Equipment & Services | ||||
United Technologies Corp. | 1.7 | Capital Goods | ||||
| 3 | The top 10 holdings may not be representative of the Fund’s future investments. |
6
FUND BASICS
FUND vs. BENCHMARK SECTOR ALLOCATIONS4
As of June 30, 2018
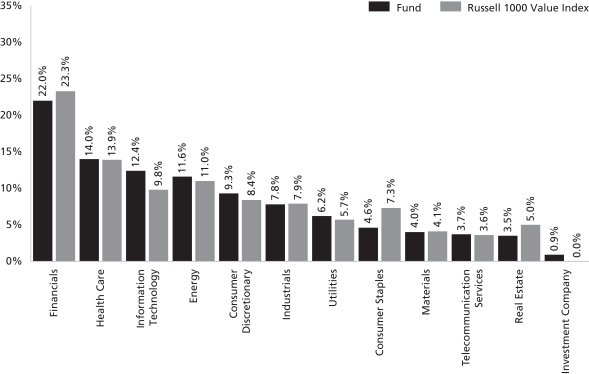
| 4 | The Fund is actively managed and, as such, its composition may differ over time. Consequently, the Fund’s overall sector allocations may differ from percentages contained in the graph above. The graph categorizes investments using Global Industry Classification Standard (“GICS”); however, the sector classifications used by the portfolio management team may differ from GICS. The percentage shown for each investment category reflects the value of investments in that category as a percentage of market value (excluding investments in the securities lending reinvestment vehicle, if any). Underlying sector allocations of exchange traded funds and investment companies held by the Fund are not reflected in the graph above. Investments in the securities lending reinvestment vehicle represented 0.8% of the Fund’s net assets at June 30, 2018. |
7
GOLDMAN SACHS VARIABLE INSURANCE TRUST LARGE CAP VALUE FUND
Schedule of Investments
June 30, 2018 (Unaudited)
| Shares | Description | Value | ||||||
| Common Stocks – 98.0% | ||||||||
Automobiles & Components – 0.9% | ||||||||
| 100,638 | Delphi Technologies plc | $ | 4,575,003 | |||||
|
| |||||||
Banks – 11.8% | ||||||||
| 541,987 | Bank of America Corp. | 15,278,614 | ||||||
| 105,993 | Bank of the Ozarks, Inc. | 4,773,925 | ||||||
| 82,853 | Citizens Financial Group, Inc. | 3,222,982 | ||||||
| 267,175 | First Horizon National Corp. | 4,766,402 | ||||||
| 56,437 | First Republic Bank | 5,462,537 | ||||||
| 154,032 | JPMorgan Chase & Co. | 16,050,134 | ||||||
| 14,940 | M&T Bank Corp. | 2,542,041 | ||||||
| 19,298 | Signature Bank* | 2,467,828 | ||||||
| 73,061 | SunTrust Banks, Inc. | 4,823,487 | ||||||
|
| |||||||
| 59,387,950 | ||||||||
|
| |||||||
Capital Goods – 5.7% | ||||||||
| 97,774 | ITT, Inc. | 5,110,647 | ||||||
| 26,276 | Raytheon Co. | 5,075,997 | ||||||
| 36,279 | Stanley Black & Decker, Inc. | 4,818,214 | ||||||
| 68,525 | United Technologies Corp. | 8,567,681 | ||||||
| 51,505 | Wabtec Corp. | 5,077,363 | ||||||
|
| |||||||
| 28,649,902 | ||||||||
|
| |||||||
Consumer Durables & Apparel – 0.9% | ||||||||
| 70,849 | Brunswick Corp. | 4,568,344 | ||||||
|
| |||||||
Consumer Services – 1.8% | ||||||||
| 55,025 | Dunkin’ Brands Group, Inc. | 3,800,577 | ||||||
| 53,511 | Royal Caribbean Cruises Ltd. | 5,543,739 | ||||||
|
| |||||||
| 9,344,316 | ||||||||
|
| |||||||
Diversified Financials – 6.8% | ||||||||
| 25,133 | Affiliated Managers Group, Inc. | 3,736,523 | ||||||
| 91,450 | Berkshire Hathaway, Inc. Class B* | 17,069,142 | ||||||
| 69,861 | Lazard Ltd. Class A | 3,416,902 | ||||||
| 100,172 | Morgan Stanley | 4,748,153 | ||||||
| 52,923 | Northern Trust Corp. | 5,445,247 | ||||||
|
| |||||||
| 34,415,967 | ||||||||
|
| |||||||
Energy – 11.5% | ||||||||
| 112,498 | Chevron Corp. | 14,223,122 | ||||||
| 92,660 | Devon Energy Corp. | 4,073,334 | ||||||
| 391,346 | Encana Corp. | 5,107,065 | ||||||
| 43,378 | EOG Resources, Inc. | 5,397,525 | ||||||
| 103,019 | Exxon Mobil Corp. | 8,522,762 | ||||||
| 85,679 | Halliburton Co. | 3,860,696 | ||||||
| 83,371 | Marathon Petroleum Corp. | 5,849,309 | ||||||
| 29,696 | Pioneer Natural Resources Co. | 5,619,671 | ||||||
| 72,979 | Royal Dutch Shell plc Class B ADR(a) | 5,301,924 | ||||||
|
| |||||||
| 57,955,408 | ||||||||
|
| |||||||
Food & Staples Retailing – 2.8% | ||||||||
| 133,646 | Kroger Co. (The) | 3,802,229 | ||||||
| 118,631 | Walmart, Inc. | 10,160,745 | ||||||
|
| |||||||
| 13,962,974 | ||||||||
|
| |||||||
| Common Stocks – (continued) | ||||||||
Food, Beverage & Tobacco – 1.8% | ||||||||
| 90,048 | Altria Group, Inc. | $ | 5,113,826 | |||||
| 63,787 | Kraft Heinz Co. (The) | 4,007,099 | ||||||
|
| |||||||
| 9,120,925 | ||||||||
|
| |||||||
Health Care Equipment & Services – 6.2% | ||||||||
| 35,323 | Aetna, Inc. | 6,481,771 | ||||||
| 171,559 | Boston Scientific Corp.* | 5,609,979 | ||||||
| 16,359 | Cooper Cos., Inc. (The) | 3,851,727 | ||||||
| 106,730 | Medtronic plc | 9,137,155 | ||||||
| 53,561 | Zimmer Biomet Holdings, Inc. | 5,968,838 | ||||||
|
| |||||||
| 31,049,470 | ||||||||
|
| |||||||
Insurance – 3.1% | ||||||||
| 31,089 | American Financial Group, Inc. | 3,336,783 | ||||||
| 45,715 | Arthur J Gallagher & Co. | 2,984,275 | ||||||
| 37,415 | Chubb Ltd. | 4,752,453 | ||||||
| 106,105 | MetLife, Inc. | 4,626,178 | ||||||
|
| |||||||
| 15,699,689 | ||||||||
|
| |||||||
Materials – 4.0% | ||||||||
| 34,346 | Celanese Corp. Series A | 3,814,467 | ||||||
| 171,199 | DowDuPont, Inc. | 11,285,438 | ||||||
| 77,380 | Nucor Corp. | 4,836,250 | ||||||
|
| |||||||
| 19,936,155 | ||||||||
|
| |||||||
Media – 2.4% | ||||||||
| 10,843 | Charter Communications, Inc. Class A* | 3,179,276 | ||||||
| 64,810 | Live Nation Entertainment, Inc.* | 3,147,822 | ||||||
| 115,094 | Twenty-First Century Fox, Inc. Class A | 5,719,021 | ||||||
|
| |||||||
| 12,046,119 | ||||||||
|
| |||||||
Pharmaceuticals, Biotechnology & Life Sciences – 7.7% | ||||||||
| 43,008 | Alexion Pharmaceuticals, Inc.* | 5,339,443 | ||||||
| 47,514 | BioMarin Pharmaceutical, Inc.* | 4,475,819 | ||||||
| 73,487 | Eli Lilly & Co. | 6,270,646 | ||||||
| 46,461 | Johnson & Johnson | 5,637,578 | ||||||
| 62,694 | Merck & Co., Inc. | 3,805,526 | ||||||
| 90,051 | Pfizer, Inc. | 3,267,050 | ||||||
| 31,889 | Shire plc ADR | 5,382,863 | ||||||
| 27,634 | Vertex Pharmaceuticals, Inc.* | 4,696,674 | ||||||
|
| |||||||
| 38,875,599 | ||||||||
|
| |||||||
Real Estate Investment Trusts – 3.4% | ||||||||
| 23,672 | Alexandria Real Estate Equities, Inc. | 2,986,696 | ||||||
| 36,160 | AvalonBay Communities, Inc. | 6,215,542 | ||||||
| 85,676 | Equity Residential | 5,456,705 | ||||||
| 20,128 | Federal Realty Investment Trust | 2,547,198 | ||||||
|
| |||||||
| 17,206,141 | ||||||||
|
| |||||||
Retailing – 3.2% | ||||||||
| 37,333 | Dollar Tree, Inc.* | 3,173,305 | ||||||
| 41,189 | Expedia Group, Inc. | 4,950,506 | ||||||
| 20,131 | Home Depot, Inc. (The) | 3,927,558 | ||||||
| 46,549 | Ross Stores, Inc. | 3,945,028 | ||||||
|
| |||||||
| 15,996,397 | ||||||||
|
| |||||||
| 8 | The accompanying notes are an integral part of these financial statements. |
GOLDMAN SACHS VARIABLE INSURANCE TRUST LARGE CAP VALUE FUND
| Shares | Description | Value | ||||||
| Common Stocks – (continued) | ||||||||
Semiconductors & Semiconductor Equipment – 2.6% | ||||||||
| 164,097 | Advanced Micro Devices, Inc.* | $ | 2,459,814 | |||||
| 21,011 | Broadcom, Inc. | 5,098,109 | ||||||
| 256,284 | Marvell Technology Group Ltd. | 5,494,729 | ||||||
|
| |||||||
| 13,052,652 | ||||||||
|
| |||||||
Software & Services – 6.5% | ||||||||
| 3,662 | Alphabet, Inc. Class A* | 4,135,094 | ||||||
| 48,373 | Citrix Systems, Inc.* | 5,071,425 | ||||||
| 21,030 | Facebook, Inc. Class A* | 4,086,550 | ||||||
| 35,061 | Global Payments, Inc. | 3,908,951 | ||||||
| 19,416 | Intuit, Inc. | 3,966,786 | ||||||
| 66,076 | Microsoft Corp. | 6,515,754 | ||||||
| 39,724 | Visa, Inc. Class A | 5,261,444 | ||||||
|
| |||||||
| 32,946,004 | ||||||||
|
| |||||||
Technology Hardware & Equipment – 3.1% | ||||||||
| 21,926 | Apple, Inc. | 4,058,722 | ||||||
| 268,283 | Cisco Systems, Inc. | 11,544,217 | ||||||
|
| |||||||
| 15,602,939 | ||||||||
|
| |||||||
Telecommunication Services – 3.6% | ||||||||
| 157,183 | AT&T, Inc. | 5,047,146 | ||||||
| 261,981 | Verizon Communications, Inc. | 13,180,264 | ||||||
|
| |||||||
| 18,227,410 | ||||||||
|
| |||||||
Transportation – 2.0% | ||||||||
| 20,665 | FedEx Corp. | 4,692,195 | ||||||
| 39,076 | Union Pacific Corp. | 5,536,288 | ||||||
|
| |||||||
| 10,228,483 | ||||||||
|
| |||||||
Utilities – 6.2% | ||||||||
| 98,962 | Ameren Corp. | 6,021,838 | ||||||
| 112,913 | CMS Energy Corp. | 5,338,527 | ||||||
| 48,349 | Evergy, Inc. | 2,714,796 | ||||||
| 39,685 | NextEra Energy, Inc. | 6,628,586 | ||||||
| 35,128 | Sempra Energy | 4,078,712 | ||||||
| 136,546 | Xcel Energy, Inc. | 6,237,421 | ||||||
|
| |||||||
| 31,019,880 | ||||||||
|
| |||||||
| TOTAL COMMON STOCKS | ||||||||
| (Cost $452,238,718) | $ | 493,867,727 | ||||||
|
| |||||||
| Shares | Distribution Rate | Value | ||||||
| Investment Company(b) – 0.9% | ||||||||
Goldman Sachs Financial Square Government Fund — Institutional Shares |
| |||||||
| 4,409,527 | 1.869 | % | $ | 4,409,527 | ||||
| (Cost $4,409,527) | ||||||||
| ||||||||
| TOTAL INVESTMENTS BEFORE SECURITIES LENDING REINVESTMENT VEHICLE | ||||||||
| (Cost $456,648,245) | $ | 498,277,254 | ||||||
| ||||||||
| Securities Lending Reinvestment Vehicle(b) – 0.8% | ||||||||
Goldman Sachs Financial Square Government Fund — Institutional Shares |
| |||||||
| 4,009,500 | 1.869 | % | $ | 4,009,500 | ||||
| (Cost $4,009,500) | ||||||||
| ||||||||
| TOTAL INVESTMENTS – 99.7% | ||||||||
| (Cost $460,657,745) | $ | 502,286,754 | ||||||
| ||||||||
OTHER ASSETS IN EXCESS OF LIABILITIES – 0.3% |
| 1,749,643 | ||||||
| ||||||||
| NET ASSETS – 100.0% | $ | 504,036,397 | ||||||
| ||||||||
| The percentage shown for each investment category reflects the value of investments in that category as a percentage of net assets. | ||
| * | Non-income producing security. | |
| (a) | All or a portion of security is on loan. | |
| (b) | Represents an Affiliated Issuer. | |
| Investment Abbreviation: | ||
| ADR | —American Depositary Receipt | |
| The accompanying notes are an integral part of these financial statements. | 9 |
GOLDMAN SACHS VARIABLE INSURANCE TRUST LARGE CAP VALUE FUND
Statement of Assets and Liabilities
June 30, 2018 (Unaudited)
| Assets: | ||||
Investments in unaffiliated issuers, at value (cost $452,238,718)(a) | $ | 493,867,727 | ||
Investments in affiliated issuers, at value (cost $4,409,527) | 4,409,527 | |||
Investments in affiliated securities lending reinvestment vehicle, at value (cost $4,009,500) | 4,009,500 | |||
Cash | 7,448,061 | |||
Receivables: | ||||
Investments sold | 14,835,351 | |||
Dividends | 497,203 | |||
Fund shares sold | 88,450 | |||
Reimbursement from investment adviser | 24,114 | |||
Securities lending income | 1,622 | |||
Other assets | 3,054 | |||
| Total assets | 525,184,609 | |||
| Liabilities: | ||||
Payables: | ||||
Investments purchased | 16,433,600 | |||
Payable upon return of securities loaned | 4,009,500 | |||
Management fees | 290,031 | |||
Fund shares redeemed | 231,343 | |||
Distribution and Service fees and Transfer Agency fees | 77,222 | |||
Accrued expenses | 106,516 | |||
| Total liabilities | 21,148,212 | |||
| Net Assets: | ||||
Paid-in capital | 441,323,431 | |||
Undistributed net investment income | 3,016,708 | |||
Accumulated net realized gain | 18,067,249 | |||
Net unrealized gain | 41,629,009 | |||
| NET ASSETS | $ | 504,036,397 | ||
Net Assets: | ||||
Institutional | $ | 174,442,402 | ||
Service | 329,593,995 | |||
Total Net Assets | $ | 504,036,397 | ||
Shares outstanding $0.001 par value (unlimited shares authorized): | ||||
Institutional | 19,654,602 | |||
Service | 37,186,705 | |||
Net asset value, offering and redemption price per share: | ||||
Institutional | $8.88 | |||
Service | 8.86 | |||
(a) Includes loaned securities having a market value of $3,920,940.
| 10 | The accompanying notes are an integral part of these financial statements. |
GOLDMAN SACHS VARIABLE INSURANCE TRUST LARGE CAP VALUE FUND
Statement of Operations
For the Six Months Ended June 30, 2018 (Unaudited)
| Investment income: | ||||
Dividends — unaffiliated issuers (net of foreign taxes withheld of $2,077) | $ | 5,129,260 | ||
Dividends — affiliated issuers | 9,672 | |||
Securities lending income — unaffiliated issuer | 4,370 | |||
| Total investment income | 5,143,302 | |||
| Expenses: | ||||
Management fees | 1,921,942 | |||
Distribution and Service fees — Service Shares | 424,351 | |||
Custody, accounting and administrative services | 51,997 | |||
Transfer Agency fees(a) | 51,943 | |||
Printing and mailing costs | 47,820 | |||
Professional fees | 42,165 | |||
Trustee fees | 9,226 | |||
Other | 10,623 | |||
| Total expenses | 2,560,067 | |||
Less — expense reductions | (284,278 | ) | ||
| Net expenses | 2,275,789 | |||
| NET INVESTMENT INCOME | 2,867,513 | |||
| Realized and unrealized gain (loss): | ||||
Net realized gain from investments — unaffiliated issuers (including commissions recaptured of $58,063) | 28,044,709 | |||
Net change in unrealized loss on investments — unaffiliated issuers | (42,155,215 | ) | ||
| Net realized and unrealized loss | (14,110,506 | ) | ||
| NET DECREASE IN NET ASSETS RESULTING FROM OPERATIONS | $ | (11,242,993 | ) | |
(a) Institutional and Service Shares incurred Transfer Agency fees of $17,998 and $33,945 respectively.
| The accompanying notes are an integral part of these financial statements. | 11 |
GOLDMAN SACHS VARIABLE INSURANCE TRUST LARGE CAP VALUE FUND
Statements of Changes in Net Assets
| For the Six Months Ended June 30, 2018 (Unaudited) | For the Fiscal Year Ended December 31, 2017 | |||||||
| From operations: | ||||||||
Net investment income | $ | 2,867,513 | $ | 7,894,898 | ||||
Net realized gain | 28,044,709 | 92,354,930 | ||||||
Net change in unrealized loss | (42,155,215 | ) | (40,190,304 | ) | ||||
| Net increase (decrease) in net assets resulting from operations | (11,242,993 | ) | 60,059,524 | |||||
| Distributions to shareholders: | ||||||||
From net investment income | ||||||||
Institutional Shares | — | (3,091,197 | ) | |||||
Service Shares | — | (4,927,889 | ) | |||||
From net realized gains | ||||||||
Institutional Shares | — | (32,382,198 | ) | |||||
Service Shares | — | (61,818,486 | ) | |||||
| Total distributions to shareholders | — | (102,219,770 | ) | |||||
| From share transactions: | ||||||||
Proceeds from sales of shares | 15,305,319 | 23,300,375 | ||||||
Reinvestment of distributions | — | 102,219,770 | ||||||
Cost of shares redeemed | (46,983,929 | ) | (311,829,893 | ) | ||||
| Net decrease in net assets resulting from share transactions | (31,678,610 | ) | (186,309,748 | ) | ||||
| TOTAL DECREASE | (42,921,603 | ) | (228,469,994 | ) | ||||
| Net assets: | ||||||||
Beginning of period | 546,958,000 | 775,427,994 | ||||||
End of period | $ | 504,036,397 | $ | 546,958,000 | ||||
| Undistributed net investment income | $ | 3,016,708 | $ | 149,195 | ||||
| 12 | The accompanying notes are an integral part of these financial statements. |
GOLDMAN SACHS VARIABLE INSURANCE TRUST LARGE CAP VALUE FUND
Financial Highlights
Selected Data for a Share Outstanding Throughout Each Period
| Income (loss) from investment operations | Distributions to shareholders | |||||||||||||||||||||||||||||||||||||||||||||||||||||||
| Year - Share Class | Net asset value, beginning of period | Net investment income(a) | Net realized and unrealized gain (loss) | Total from investment operations | From net investment income | From net realized gains | Total distributions | Net asset value, end of period | Total return(b) | Net assets, end of period (in 000s) | Ratio of net expenses to average net assets | Ratio of total expenses to average net assets | Ratio of net investment income to average net assets | Portfolio turnover rate(c) | ||||||||||||||||||||||||||||||||||||||||||
FOR THE SIX MONTHS ENDED JUNE 30, (UNAUDITED) | ||||||||||||||||||||||||||||||||||||||||||||||||||||||||
2018 - Institutional | $ | 9.06 | $ | 0.06 | $ | (0.24 | ) | $ | (0.18 | ) | $ | — | $ | — | $ | — | $ | 8.88 | (1.99 | )% | $ | 174,442 | 0.71 | %(d) | 0.82 | %(d) | 1.27 | %(d) | 95 | % | ||||||||||||||||||||||||||
2018 - Service | 9.06 | 0.05 | (0.25 | ) | (0.20 | ) | — | — | — | 8.86 | (2.21 | ) | 329,594 | 0.96 | (d) | 1.07 | (d) | 1.02 | (d) | 95 | ||||||||||||||||||||||||||||||||||||
FOR THE FISCAL YEARS ENDED DECEMBER 31, | ||||||||||||||||||||||||||||||||||||||||||||||||||||||||
2017 - Institutional | 10.16 | 0.16 | 0.83 | 0.99 | (0.18 | ) | (1.91 | ) | (2.09 | ) | 9.06 | 9.85 | 188,182 | 0.72 | 0.81 | 1.50 | 127 | |||||||||||||||||||||||||||||||||||||||
2017 - Service | 10.16 | 0.13 | 0.83 | 0.96 | (0.15 | ) | (1.91 | ) | (2.06 | ) | 9.06 | 9.56 | 358,776 | 0.97 | 1.06 | 1.26 | 127 | |||||||||||||||||||||||||||||||||||||||
2016 - Institutional | 9.39 | 0.18 | 0.91 | 1.09 | (0.22 | ) | (0.10 | ) | (0.32 | ) | 10.16 | 11.55 | 243,875 | 0.74 | 0.81 | 1.91 | 130 | |||||||||||||||||||||||||||||||||||||||
2016 - Service | 9.39 | 0.16 | 0.90 | 1.06 | (0.19 | ) | (0.10 | ) | (0.29 | ) | 10.16 | 11.25 | 531,553 | 0.99 | 1.06 | 1.66 | 130 | |||||||||||||||||||||||||||||||||||||||
2015 - Institutional | 11.39 | 0.15 | (0.67 | ) | (0.52 | ) | (0.16 | ) | (1.32 | ) | (1.48 | ) | 9.39 | (4.41 | ) | 279,910 | 0.74 | 0.81 | 1.38 | 83 | ||||||||||||||||||||||||||||||||||||
2015 - Service | 11.38 | 0.13 | (0.67 | ) | (0.54 | ) | (0.13 | ) | (1.32 | ) | (1.45 | ) | 9.39 | (4.58 | ) | 610,689 | 0.99 | 1.06 | 1.13 | 83 | ||||||||||||||||||||||||||||||||||||
2014 - Institutional | 12.59 | 0.16 | 1.38 | 1.54 | (0.19 | ) | (2.55 | ) | (2.74 | ) | 11.39 | 12.94 | 326,543 | 0.75 | 0.80 | 1.21 | 72 | |||||||||||||||||||||||||||||||||||||||
2014 - Service | 12.58 | 0.13 | 1.37 | 1.50 | (0.15 | ) | (2.55 | ) | (2.70 | ) | 11.38 | 12.61 | 692,741 | 1.00 | 1.05 | 0.96 | 72 | |||||||||||||||||||||||||||||||||||||||
2013 - Institutional | 10.76 | 0.14 | 3.39 | 3.53 | (0.16 | ) | (1.54 | ) | (1.70 | ) | 12.59 | 33.23 | 370,241 | 0.75 | 0.79 | 1.15 | 86 | |||||||||||||||||||||||||||||||||||||||
2013 - Service | 10.75 | 0.11 | 3.39 | 3.50 | (0.13 | ) | (1.54 | ) | (1.67 | ) | 12.58 | 32.93 | 792,553 | 1.00 | 1.04 | 0.91 | 86 | |||||||||||||||||||||||||||||||||||||||
| (a) | Calculated based on the average shares outstanding methodology. |
| (b) | Assumes investment at the net asset value at the beginning of the period, reinvestment of all distributions, and a complete redemption of the investment at the net asset value at the end of the period. Total returns for periods less than one full year are not annualized. |
| (c) | The Fund’s portfolio turnover rate is calculated in accordance with regulatory requirements, without regard to transactions involving short term investments. If such transactions were included, the Fund’s portfolio turnover rate may be higher. |
| (d) | Annualized. |
| The accompanying notes are an integral part of these financial statements. | 13 |
GOLDMAN SACHS VARIABLE INSURANCE TRUST LARGE CAP VALUE FUND
Notes to Financial Statements
June 30, 2018 (Unaudited)
1. ORGANIZATION
Goldman Sachs Variable Insurance Trust (the “Trust” or “VIT”) is a Delaware statutory trust registered under the Investment Company Act of 1940, as amended (the “Act”), as an open-end management investment company. The Trust includes the Goldman Sachs Large Cap Value Fund (the “Fund”). The Fund is a diversified portfolio under the Act offering two classes of shares — Institutional and Service Shares. Shares of the Trust are offered to separate accounts of participating life insurance companies for the purpose of funding variable annuity contracts and variable life insurance policies.
Goldman Sachs Asset Management, L.P. (“GSAM”), an affiliate of Goldman Sachs & Co. LLC (“Goldman Sachs”), serves as investment adviser to the Fund pursuant to a management agreement (the “Agreement”) with the Trust.
2. SIGNIFICANT ACCOUNTING POLICIES
The financial statements have been prepared in accordance with accounting principles generally accepted in the United States of America (“GAAP”) and require management to make estimates and assumptions that may affect the reported amounts and disclosures. Actual results may differ from those estimates and assumptions.
A. Investment Valuation — The Fund’s valuation policy is to value investments at fair value.
B. Investment Income and Investments — Investment income includes interest income, dividend income, and securities lending income, if any. Interest income is accrued daily and adjusted for amortization of premiums and accretion of discounts. Dividend income is recognized on ex-dividend date or, for certain foreign securities, as soon as such information is obtained subsequent to the ex-dividend date. Investment transactions are reflected on trade date. Realized gains and losses are calculated using identified cost. Investment transactions are recorded on the following business day for daily net asset value (“NAV”) calculations. Investment income is recorded net of any foreign withholding taxes, less any amounts reclaimable. The Fund may file withholding tax reclaims in certain jurisdictions to recover a portion of amounts previously withheld. Any foreign capital gains tax is accrued daily based upon net unrealized gains, and is payable upon sale of such investments. Distributions received from the Fund’s investments in United States (“U.S.”) real estate investment trusts (“REITs”) may be characterized as ordinary income, net capital gain or a return of capital. A return of capital is recorded by the Fund as a reduction to the cost basis of the REIT.
C. Class Allocations and Expenses — Investment income, realized and unrealized gain (loss), if any, and non-class specific expenses of the Fund are allocated daily based upon the proportion of net assets of each class. Non-class specific expenses directly incurred by the Fund are charged to the Fund, while such expenses incurred by the Trust are allocated across the Fund on a straight-line and/or pro-rata basis depending upon the nature of the expenses. Class specific expenses, where applicable, are borne by the respective share classes and include Distribution and Service and Transfer Agency fees.
D. Federal Taxes and Distributions to Shareholders — It is the Fund’s policy to comply with the requirements of the Internal Revenue Code of 1986, as amended (the “Code”), applicable to regulated investment companies (mutual funds) and to distribute each year substantially all of its investment company taxable income and capital gains to its shareholders. Accordingly, the Fund is not required to make any provisions for the payment of federal income tax. Distributions to shareholders are recorded on the ex-dividend date. Income and capital gains distributions, if any, are declared and paid annually.
Net capital losses, if any, are carried forward to future fiscal years and may be used to the extent allowed by the Code to offset any future capital gains. Losses that are carried forward will retain their character as either short-term or long-term capital losses. Utilization of capital loss carryforwards will reduce the requirement of future capital gains distributions.
The characterization of distributions to shareholders for financial reporting purposes is determined in accordance with federal income tax rules, which may differ from GAAP. The source of the Fund’s distributions may be shown in the accompanying financial statements as either from net investment income, net realized gain or capital. Certain components of the Fund’s net assets on the Statement of Assets and Liabilities reflect permanent GAAP/tax differences based on the appropriate tax character.
14
GOLDMAN SACHS VARIABLE INSURANCE TRUST LARGE CAP VALUE FUND
2. SIGNIFICANT ACCOUNTING POLICIES (continued)
E. Commission Recapture — GSAM, on behalf of certain Funds, may direct portfolio trades, subject to seeking best execution, to various brokers who have agreed to rebate a portion of the commissions generated. Such rebates are made directly to the Fund as cash payments and are included in net realized gain (loss) from investments on the Statement of Operations.
3. INVESTMENTS AND FAIR VALUE MEASUREMENTS
U.S. GAAP defines the fair value of a financial instrument as the amount that would be received to sell an asset or paid to transfer a liability in an orderly transaction between market participants at the measurement date (i.e., the exit price); the Fund’s policy is to use the market approach. GAAP establishes a fair value hierarchy that prioritizes the inputs to valuation techniques used to measure fair value. The hierarchy gives the highest priority to unadjusted quoted prices in active markets for identical assets or liabilities (Level 1 measurements) and the lowest priority to unobservable inputs (Level 3 measurements). The levels used for classifying investments are not necessarily an indication of the risk associated with investing in these investments. The three levels of the fair value hierarchy are described below:
Level 1 — Unadjusted quoted prices in active markets that are accessible at the measurement date for identical, unrestricted assets or liabilities;
Level 2 — Quoted prices in markets that are not active or financial instruments for which significant inputs are observable (including, but not limited to, quoted prices for similar investments, interest rates, foreign exchange rates, volatility and credit spreads), either directly or indirectly;
Level 3 — Prices or valuations that require significant unobservable inputs (including GSAM’s assumptions in determining fair value measurement).
Changes in valuation techniques may result in transfers into or out of an assigned level within the hierarchy. In accordance with the Fund’s policy, transfers between different levels of the fair value hierarchy resulting from such changes are deemed to have occurred as of the beginning of the reporting period.
The Board of Trustees (“Trustees”) has approved Valuation Procedures that govern the valuation of the portfolio investments held by the Fund, including investments for which market quotations are not readily available. The Trustees have delegated to GSAM day-to-day responsibility for implementing and maintaining internal controls and procedures related to the valuation of the Fund’s investments. To assess the continuing appropriateness of pricing sources and methodologies, GSAM regularly performs price verification procedures and issues challenges as necessary to third party pricing vendors or brokers, and any differences are reviewed in accordance with the Valuation Procedures.
A. Level 1 and Level 2 Fair Value Investments — The valuation techniques and significant inputs used in determining the fair values for investments classified as Level 1 and Level 2 are as follows:
Equity Securities — Equity securities traded on a U.S. securities exchange or the NASDAQ system, or those located on certain foreign exchanges, including but not limited to the Americas, are valued daily at their last sale price or official closing price on the principal exchange or system on which they are traded. If there is no sale or official closing price or such price is believed by GSAM to not represent fair value, equity securities are valued at the last bid price for long positions and at the last ask price for short positions. To the extent these investments are actively traded, they are classified as Level 1 of the fair value hierarchy, otherwise they are generally classified as Level 2.
Unlisted equity securities for which market quotations are available are valued at the last sale price on the valuation date, or if no sale occurs, at the last bid price, and are generally classified as Level 2. Securities traded on certain foreign securities exchanges are valued daily at fair value determined by an independent fair value service (if available) under Valuation Procedures approved by the Trustees and consistent with applicable regulatory guidance. The independent fair value service takes into account multiple factors including, but not limited to, movements in the securities markets, certain depositary receipts, futures contracts and foreign currency exchange rates that have occurred subsequent to the close of the foreign securities exchange. These investments are generally classified as Level 2 of the fair value hierarchy.
15
GOLDMAN SACHS VARIABLE INSURANCE TRUST LARGE CAP VALUE FUND
Notes to Financial Statements (continued)
June 30, 2018 (Unaudited)
3. INVESTMENTS AND FAIR VALUE MEASUREMENTS (continued)
Money Market Funds — Investments in the Goldman Sachs Financial Square Government Fund (“Underlying Fund”) are valued at the NAV of the Institutional Share class on the day of valuation. These investments are generally classified as Level 1 of the fair value hierarchy. For information regarding an Underlying Fund’s accounting policies and investment holdings, please see the Underlying Fund’s shareholder report.
B. Level 3 Fair Value Investments — To the extent that significant inputs to valuation models and other alternative pricing sources are unobservable, or if quotations are not readily available, or if GSAM believes that such quotations do not accurately reflect fair value, the fair value of the Fund’s investments may be determined under Valuation Procedures approved by the Trustees. GSAM, consistent with its procedures and applicable regulatory guidance, may make an adjustment to the most recent valuation prices of either domestic or foreign securities in light of significant events to reflect what it believes to be the fair value of the securities at the time of determining the Fund’s NAV. Significant events which could affect a large number of securities in a particular market may include, but are not limited to: significant fluctuations in U.S. or foreign markets; market dislocations; market disruptions; or unscheduled market closings. Significant events which could also affect a single issuer may include, but are not limited to: corporate actions such as reorganizations, mergers and buy-outs; ratings downgrades; and bankruptcies.
C. Fair Value Hierarchy — The following is a summary of the Fund’s investments classified in the fair value hierarchy as of June 30, 2018:
| Investment Type | Level 1 | Level 2 | Level 3 | |||||||||
| Assets | ||||||||||||
| Common Stock and/or Other Equity Investments(a) | ||||||||||||
Europe | $ | 5,301,924 | $ | — | $ | — | ||||||
North America | 488,565,803 | — | — | |||||||||
| Investment Company | 4,409,527 | — | — | |||||||||
| Securities Lending Reinvestment Vehicle | 4,009,500 | — | — | |||||||||
| Total | $ | 502,286,754 | $ | — | $ | — | ||||||
| (a) | Amounts are disclosed by continent to highlight the impact of time zone differences between local market close and the calculation of NAV. Security valuations are based on the principal exchange or system on which they are traded, which may differ from country of domicile. |
For further information regarding security characteristics, see the Schedule of Investments.
4. AGREEMENTS AND AFFILIATED TRANSACTIONS
A. Management Agreement — Under the Agreement, GSAM manages the Fund, subject to the general supervision of the Trustees.
As compensation for the services rendered pursuant to the Agreement, the assumption of the expenses related thereto and administration of the Fund’s business affairs, including providing facilities, GSAM is entitled to a management fee, accrued daily and paid monthly, equal to an annual percentage rate of the Fund’s average daily net assets.
As of June 30, 2018, contractual management fees with GSAM were at the following rates. The effective contractual management rate and effective net management rate represent the rates for the six month period ended June 30, 2018.
| Contractual Management Rate | Effective Net | |||||||||||||||||||||||||
| First $1 billion | Next $1 billion | Next $3 billion | Next $3 billion | Over $8 billion | Effective Rate | |||||||||||||||||||||
| 0.72% | 0.65 | % | 0.62 | % | 0.60 | % | 0.59 | % | 0.74 | % | 0.69 | %* | ||||||||||||||
| ^ | Effective Net Management Rate includes the impact of management fee waivers of affiliated Underlying Funds, if any. |
| * | GSAM agreed to waive a portion of its management fee in order to achieve a net management rate, as defined in the Fund’s most recent prospectus. This waiver will be effective through at least April 30, 2019, and prior to such date GSAM may not terminate the arrangement without approval of the Trustees. For the six months ended June 30, 2018, GSAM waived $155,840 of its management fee. |
16
GOLDMAN SACHS VARIABLE INSURANCE TRUST LARGE CAP VALUE FUND
4. AGREEMENTS AND AFFILIATED TRANSACTIONS (continued)
Prior to April 30, 2018, the contractual management fee rates for the Fund were as stated below and GSAM agreed to waive a portion of its management fee in order to achieve an Effective Net Management Rate as set forth in the Fund’s prospectus dated April 28, 2017.
| First $1 billion | Next $1 billion | Next $3 billion | Next $3 billion | Over $8 billion | ||||||||||||||
| 0.75 | % | 0.68 | % | 0.65 | % | 0.64 | % | 0.63 | % | |||||||||
The Fund invests in Institutional Shares of the Goldman Sachs Financial Square Government Fund, which is an affiliated Underlying Fund. GSAM has agreed to waive a portion of its management fee payable by the Fund in an amount equal to the management fee it earns as an investment adviser to the affiliated Underlying Fund in which the Fund invests, except those management fees it earns from the Fund’s investments of cash collateral received in connection with securities lending transactions in the Goldman Sachs Financial Square Government Fund. For the six months ended June 30, 2018, GSAM waived $1,007 of the Fund’s management fee.
B. Distribution and Service (12b-1) Plan — The Trust, on behalf of Service Shares of the Fund, has adopted a Distribution and Service Plan subject to Rule 12b-1 under the Act. Under the Distribution and Service Plan, Goldman Sachs, which serves as distributor, is entitled to a fee accrued daily and paid monthly, for distribution services and personal and account maintenance services, which may then be paid by Goldman Sachs to authorized dealers, equal to, on an annual basis, 0.25% of the Fund’s average daily net assets attributable to Service Shares.
C. Transfer Agency Agreement — Goldman Sachs also serves as the transfer agent of the Fund for a fee pursuant to the Transfer Agency Agreement. The fees charged for such transfer agency services are accrued daily and paid monthly at an annual rate of 0.02% of the average daily net assets of Institutional and Service Shares.
D. Other Expense Agreements and Affiliated Transactions — GSAM has agreed to limit certain “Other Expenses” of the Fund (excluding acquired fund fees and expenses, transfer agency fees and expenses, service fees and shareholder administration fees (as applicable), taxes, interest, brokerage fees, expenses of shareholder meetings, litigation and indemnification, and extraordinary expenses) to the extent such expenses exceed, on an annual basis, a percentage rate of the average daily net assets of the Fund. Such Other Expense reimbursements, if any, are accrued daily and paid monthly. In addition, the Fund is not obligated to reimburse GSAM for prior fiscal year expense reimbursements, if any. The Other Expense limitation as an annual percentage rate of average daily net assets for the Fund is 0.004%. The Other Expense limitation will remain in place through at least April 30, 2019, and prior to such date GSAM may not terminate the arrangement without the approval of the Trustees. For the six months ended June 30, 2018, GSAM reimbursed $151,443 to the Fund. In addition, the Fund has entered into certain offset arrangements with the custodian and the transfer agent, which may result in a reduction of the Fund’s expenses and are received irrespective of the application of the “Other Expense” limitation described above. For the six months ended June 30, 2018, custody fee credits were $2,076.
E. Line of Credit Facility — As of June 30, 2018, the Fund participated in a $770,000,000 committed, unsecured revolving line of credit facility (the “facility”) together with other funds of the Trust and certain registered investment companies having management agreements with GSAM or its affiliates. This facility is to be used for temporary emergency purposes, or to allow for an orderly liquidation of securities to meet redemption requests. The interest rate on borrowings is based on the federal funds rate. The facility also requires a fee to be paid by the Fund based on the amount of the commitment that has not been utilized. For the six months ended June 30, 2018, the Fund did not have any borrowings under the facility. Prior to May 1, 2018 the facility was $1,100,000,000. The facility was decreased to $770,000,000 effective May 1, 2018.
F. Other Transactions with Affiliates — For the six months ended June 30, 2018, Goldman Sachs earned $2,281 in brokerage commissions from portfolio transactions.
17
GOLDMAN SACHS VARIABLE INSURANCE TRUST LARGE CAP VALUE FUND
Notes to Financial Statements (continued)
June 30, 2018 (Unaudited)
4. AGREEMENTS AND AFFILIATED TRANSACTIONS (continued)
The following table provides information about the Fund’s investment in the Goldman Sachs Financial Square Government Fund as of and for the six months ended June 30, 2018:
| Beginning Value as of December 31, 2017 | Purchases at Cost | Proceeds from Sales | Ending Value as of June 30, 2018 | Shares as of June 30, 2018 | Dividend Income from Affiliated Investment Company | |||||||||||||||||
| $ | 2,415,456 | $ | 50,191,768 | $ | (48,197,697 | ) | $ | 4,409,527 | 4,409,527 | $ | 9,672 | |||||||||||
5. PORTFOLIO SECURITIES TRANSACTIONS
The cost of purchases and proceeds from sales and maturities of long-term securities for the six months ended June 30, 2018, were $486,263,332 and $514,238,754, respectively.
6. SECURITIES LENDING
The Fund may lend its securities through a securities lending agent, the Bank of New York Mellon (“BNYM”), to certain qualified borrowers. In accordance with the Fund’s securities lending procedures, the Fund receives cash collateral at least equal to the market value of the securities on loan. The market value of the loaned securities is determined at the close of business of the Fund, at their last sale price or official closing price on the principal exchange or system on which they are traded, and any additional required collateral is delivered to the Fund on the next business day. As with other extensions of credit, the Fund may experience delay in the recovery of its securities or incur a loss should the borrower of the securities breach its agreement with the Fund or become insolvent at a time when the collateral is insufficient to cover the cost of repurchasing securities on loan. Dividend income received from securities on loan may not be subject to withholding taxes and therefore withholding taxes paid may differ from the amounts listed in the Statement of Operations. Loans of securities are terminable at any time and as such 1) the remaining contractual maturities of the outstanding securities lending transactions are considered to be overnight and continuous and 2) the borrower, after notice, is required to return borrowed securities within the standard time period for settlement of securities transactions.
The Fund invests the cash collateral received in connection with securities lending transactions in the Goldman Sachs Financial Square Government Fund (“Government Money Market Fund”), an affiliated series of the Goldman Sachs Trust. The Government Money Market Fund is registered under the Act as an open end investment company, is subject to Rule 2a-7 under the Act, and is managed by GSAM, for which GSAM may receive a management fee of up to 0.16% (prior to February 21, 2018, GSAM may have received a management fee of up to 0.205%) on an annualized basis of the average daily net assets of the Government Money Market Fund.
In the event of a default by a borrower with respect to any loan, BNYM may exercise any and all remedies provided under the applicable borrower agreement to make the Fund whole. These remedies include purchasing replacement securities by applying the collateral held from the defaulting broker against the purchase cost of the replacement securities. If BNYM is unable to purchase replacement securities, BNYM will indemnify the Fund by paying the Fund an amount equal to the market value of the securities loaned minus the value of cash collateral received from the borrower for the loan, subject to an exclusion for any shortfalls resulting from a loss of value in such cash collateral due to reinvestment risk. The Fund’s loaned securities were all subject to enforceable Securities Lending Agreements and the value of the collateral was at least equal to the value of the cash received. The amounts of the Fund’s overnight and continuous agreements represent the gross amounts of recognized liabilities for securities lending transactions outstanding as of June 30, 2018 are disclosed as “Payable upon return of securities loaned” on the Statement of Assets and Liabilities, where applicable.
Both the Fund and BNYM received compensation relating to the lending of the Fund’s securities. The amounts earned, if any, by the Fund for the six months ended June 30, 2018, are reported under Investment Income on the Statement of Operations.
18
GOLDMAN SACHS VARIABLE INSURANCE TRUST LARGE CAP VALUE FUND
6. SECURITIES LENDING (continued)
The following table provides information about the Fund’s investment in the Government Money Market Fund for the six months ended June 30, 2018:
| Beginning Value as of December 31, 2017 | Purchases at Cost | Proceeds from Sales | Ending Value as of June 30, 2018 | |||||||||||
| $ | — | $ | 27,728,134 | $ | (23,718,634 | ) | $ | 4,009,500 | ||||||
7. TAX INFORMATION
As of the Fund’s most recent fiscal year end, December 31, 2017, the Fund’s timing differences, on a tax-basis were as follows:
| Timing differences (Post October Loss Deferral) | $ | (2,041,191) |
As of June 30, 2018, the Fund’s aggregate security unrealized gains and losses based on cost for U.S. federal income tax purposes were as follows:
| Tax cost | $ | 468,772,290 | ||
| Gross unrealized gain | 53,495,094 | |||
| Gross unrealized loss | (19,980,630 | ) | ||
| Net unrealized gain | $ | 33,514,464 |
The difference between GAAP-basis and tax-basis unrealized gains (losses) is attributable primarily to wash sales.
GSAM has reviewed the Fund’s tax positions for all open tax years (the current and prior three years, as applicable) and has concluded that no provision for income tax is required in the Fund’s financial statements. Such open tax years remain subject to examination and adjustment by tax authorities.
8. OTHER RISKS
The Fund’s risks include, but are not limited to, the following:
Foreign Countries Risk — Investing in foreign markets may involve special risks and considerations not typically associated with investing in the U.S. Foreign securities may be subject to risk of loss because of more or less foreign government regulation, less public information and less economic, political and social stability in the countries in which the Fund invests. The imposition of exchange controls (including repatriation restrictions), confiscations, trade restrictions (including tariffs) and other government restrictions by the U.S. or other governments, or from problems in share registration, settlement or custody, may also result in losses. Foreign risk also involves the risk of negative foreign currency rate fluctuations, which may cause the value of securities denominated in such foreign currency (or other instruments through which the Fund has exposure to foreign currencies) to decline in value. Currency exchange rates may fluctuate significantly over short periods of time.
Foreign Custody Risk — If the Fund invests in foreign securities, the Fund may hold such securities and cash with foreign banks, agents, and securities depositories appointed by the Fund’s custodian (each a “Foreign Custodian”). Some foreign custodians may be recently organized or new to the foreign custody business. In some countries, Foreign Custodians may be subject to little or no regulatory oversight over, or independent evaluation of, their operations. Further, the laws of certain countries may place limitations on the Fund’s ability to recover its assets if a Foreign Custodian enters bankruptcy.
19
GOLDMAN SACHS VARIABLE INSURANCE TRUST LARGE CAP VALUE FUND
Notes to Financial Statements (continued)
June 30, 2018 (Unaudited)
8. OTHER RISKS (continued)
Investments in Other Investment Companies Risk — As a shareholder of another investment company, including an exchange-traded fund (“ETF”), the Fund will indirectly bear its proportionate share of any net management fees and other expenses paid by such other investment companies, in addition to the fees and expenses regularly borne by the Fund. ETFs are subject to risks that do not apply to conventional mutual funds, including but not limited to the following: (i) the market price of the ETF’s shares may trade at a premium or a discount to their NAV; and (ii) an active trading market for an ETF’s shares may not develop or be maintained.
Large Shareholder Transactions Risk — The Fund may experience adverse effects when certain large shareholders, such as other funds, participating insurance companies, accounts and Goldman Sachs affiliates, purchase or redeem large amounts of shares of the Fund. Such large shareholder redemptions may cause the Fund to sell portfolio securities at times when it would not otherwise do so, which may negatively impact the Fund’s NAV and liquidity. These transactions may also accelerate the realization of taxable income to shareholders if such sales of investments resulted in gains, and may also increase transaction costs. In addition, a large redemption could result in the Fund’s current expenses being allocated over a smaller asset base, leading to an increase in the Fund’s expense ratio. Similarly, large Fund share purchases may adversely affect the Fund’s performance to the extent that the Fund is delayed in investing new cash and is required to maintain a larger cash position than it ordinarily would.
Market and Credit Risks — In the normal course of business, the Fund trades financial instruments and enters into financial transactions where risk of potential loss exists due to changes in the market (market risk). Additionally, the Fund may also be exposed to credit risk in the event that an issuer or guarantor fails to perform or that an institution or entity with which the Fund has unsettled or open transactions defaults.
9. INDEMNIFICATIONS
Under the Trust’s organizational documents, its Trustees, officers, employees and agents are indemnified, to the extent permitted by the Act and state law, against certain liabilities that may arise out of performance of their duties to the Fund. Additionally, in the course of business, the Fund enters into contracts that contain a variety of indemnification clauses. The Fund’s maximum exposure under these arrangements is unknown, as this would involve future claims that may be made against the Fund that have not yet occurred. However, GSAM believes the risk of loss under these arrangements to be remote.
10. SUBSEQUENT EVENTS
Subsequent events after the Statement of Assets and Liabilities date have been evaluated, and GSAM has concluded that there is no impact requiring adjustment or disclosure in the financial statements.
20
GOLDMAN SACHS VARIABLE INSURANCE TRUST LARGE CAP VALUE FUND
11. SUMMARY OF SHARE TRANSACTIONS
Share activity is as follows:
| For the Six Months Ended June 30, 2018 (Unaudited) | For the Fiscal Year Ended December 31, 2017 | |||||||||||||||
| Shares | Dollars | Shares | Dollars | |||||||||||||
| Institutional Shares | ||||||||||||||||
| Shares sold | 513,569 | $ | 4,493,952 | 993,800 | $ | 10,470,019 | ||||||||||
| Reinvestment of distributions | — | — | 3,928,394 | 35,473,395 | ||||||||||||
| Shares redeemed | (1,621,743 | ) | (14,585,475 | ) | (8,151,726 | ) | (86,109,541 | ) | ||||||||
| (1,108,174 | ) | (10,091,523 | ) | (3,229,532 | ) | (40,166,127 | ) | |||||||||
| Service Shares | ||||||||||||||||
| Shares sold | 1,211,630 | 10,811,367 | 1,222,029 | 12,830,356 | ||||||||||||
| Reinvestment of distributions | — | — | 7,391,625 | 66,746,375 | ||||||||||||
| Shares redeemed | (3,615,152 | ) | (32,398,454 | ) | (21,328,914 | ) | (225,720,352 | ) | ||||||||
| (2,403,522 | ) | (21,587,087 | ) | (12,715,260 | ) | (146,143,621 | ) | |||||||||
| NET DECREASE | (3,511,696 | ) | $ | (31,678,610 | ) | (15,944,792 | ) | $ | (186,309,748 | ) | ||||||
21
GOLDMAN SACHS VARIABLE INSURANCE TRUST LARGE CAP VALUE FUND
| Fund Expenses — Six Month Period Ended June 30, 2018 (Unaudited) |
As a shareholder of Institutional or Service Shares of the Fund, you incur ongoing costs, including management fees, distribution and/or service (12b-1) fees (with respect to Service Shares) and other Fund expenses. This example is intended to help you understand your ongoing costs (in dollars) of investing in the Institutional Shares and Service Shares of the Fund and to compare these costs with the ongoing costs of investing in other mutual funds.
The example is based on an investment of $1,000 invested at the beginning of the period and held for the entire period from January 1, 2018 through June 30, 2018, which represents a period of 181 days of a 365 day year.
Actual Expenses — The first line under each share class in the table below provides information about actual account values and actual expenses. You may use the information in this line, together with the amount you invested, to estimate the expenses that you paid over the period. Simply divide your account value by $1,000 (for example, an $8,600 account value divided by $1,000=8.6), then multiply the result by the number in the first line under the heading entitled “Expenses Paid” to estimate the expenses you paid on your account during this period.
Hypothetical Example for Comparison Purposes — The second line under each share class in the table below provides information about hypothetical account values and hypothetical expenses based on the Fund’s actual net expense ratio and an assumed rate of return of 5% per year before expenses, which is not the Fund’s actual return. The hypothetical account values and expenses may not be used to estimate the actual ending account balance or expenses you paid for the period. You may use this information to compare the ongoing costs of investing in the Fund and other funds. To do so, compare this 5% hypothetical example with the 5% hypothetical examples that appear in the shareholder reports of the other funds.
Please note that the expenses shown in the table are meant to highlight your ongoing costs only. As a shareholder of the Fund, you do not incur any transaction costs, such as sales charges, redemption fees, or exchange fees, but shareholders of other funds may incur such costs. The second line of the table is useful in comparing ongoing costs only and will not help you determine the relative total costs of owning different funds whose shareholders may incur transaction costs.
| Share Class | Beginning Account Value 01/01/18 | Ending Account Value 06/30/18 | Expenses Paid 6 Months Ended 06/30/18* | |||||||||
| Institutional | ||||||||||||
| Actual | $ | 1,000 | $ | 980.10 | $ | 3.49 | ||||||
| Hypothetical 5% return | 1,000 | 1,021.27 | + | 3.56 | ||||||||
| Service | ||||||||||||
| Actual | 1,000 | 977.90 | 4.71 | |||||||||
| Hypothetical 5% return | 1,000 | 1,020.03 | + | 4.81 | ||||||||
| + | Hypothetical expenses are based on the Fund’s actual annualized net expense ratios and an assumed rate of return of 5% per year before expenses. |
| * | Expenses are calculated using the Fund’s annualized net expense ratio for each class, which represents the ongoing expenses as a percentage of net assets for the six months ended June 30, 2018. Expenses are calculated by multiplying the annualized net expense ratio by the average account value for the period; then multiplying the result by the number of days in the most recent fiscal half year; and then dividing that result by the number of days in the fiscal year. The annualized net expense ratios for the period were 0.71% and 0.96% for the Institutional and Service Shares, respectively. |
22
GOLDMAN SACHS VARIABLE INSURANCE TRUST LARGE CAP VALUE FUND
Statement Regarding Basis for Approval of Management Agreement (Unaudited)
Background
The Goldman Sachs Large Cap Value Fund (the “Fund”) is an investment portfolio of Goldman Sachs Variable Insurance Trust (the “Trust”). The Board of Trustees oversees the management of the Trust and reviews the investment performance and expenses of the Fund at regularly scheduled meetings held throughout the year. In addition, the Board of Trustees determines annually whether to approve the continuance of the Trust’s investment management agreement (the “Management Agreement”) with Goldman Sachs Asset Management, L.P. (the “Investment Adviser”) on behalf of the Fund.
The Management Agreement was most recently approved for continuation until June 30, 2019 by the Board of Trustees, including those Trustees who are not parties to the Management Agreement or “interested persons” (as defined in the Investment Company Act of 1940, as amended) of any party thereto (the “Independent Trustees”), at a meeting held on June 13-14, 2018 (the “Annual Meeting”).
The review process undertaken by the Trustees spans the course of the year and culminates with the Annual Meeting. To assist the Trustees in their deliberations, the Trustees have established a Contract Review Committee (the “Committee”), comprised of the Independent Trustees. The Committee held four meetings over the course of the year since the Management Agreement was last approved. At those Committee meetings, regularly scheduled Board or other committee meetings, and/or the Annual Meeting, matters relevant to the renewal of the Management Agreement were considered by the Board, or the Independent Trustees, as applicable. With respect to the Fund, such matters included:
| (a) | the nature and quality of the advisory, administrative, and other services provided to the Fund by the Investment Adviser and its affiliates, including information about: |
| (i) | the structure, staff, and capabilities of the Investment Adviser and its portfolio management teams; |
| (ii) | the groups within the Investment Adviser and its affiliates that support the portfolio management teams or provide other types of necessary services, including fund services groups (e.g., accounting and financial reporting, tax, shareholder services, and operations); controls and risk management groups (e.g., legal, compliance, valuation oversight, credit risk management, internal audit, compliance testing, market risk analysis, finance, and central funding); sales and distribution support groups, and others (e.g., information technology and training); |
| (iii) | trends in employee headcount; |
| (iv) | the Investment Adviser’s financial resources and ability to hire and retain talented personnel and strengthen its operations; and |
| (v) | the parent company’s support of the Investment Adviser and its mutual fund business, as expressed by the firm’s senior management; |
| (b) | information on the investment performance of the Fund, including comparisons to the performance of similar mutual funds, as provided by a third-party mutual fund data provider engaged as part of the contract review process (the “Outside Data Provider”), a benchmark performance index and a composite of accounts with comparable investment strategies managed by the Investment Adviser; and information on general investment outlooks in the markets in which the Fund invests; |
| (c) | information provided by the Investment Adviser indicating the Investment Adviser’s views on whether the Fund’s peer group and/or benchmark index had high, medium, or low relevance given the Fund’s particular investment strategy; |
| (d) | the terms of the Management Agreement and other agreements with affiliated service providers entered into by the Trust on behalf of the Fund; |
| (e) | fee and expense information for the Fund, including: |
| (i) | the relative management fee and expense levels of the Fund as compared to those of comparable funds managed by other advisers, as provided by the Outside Data Provider; |
| (ii) | the Fund’s expense trends over time ; and |
| (iii) | to the extent the Investment Adviser manages other types of accounts (such as bank collective trusts, private wealth management accounts, institutional separate accounts, sub-advised mutual funds, and non-U.S. funds) having investment objectives and policies similar to those of the Fund, comparative information on the advisory fees charged and services provided to those accounts by the Investment Adviser; |
| (f) | with respect to the extensive investment performance and expense comparison data provided by the Outside Data Provider, its processes in producing that data for the Fund; |
| (g) | the undertakings of the Investment Adviser and its affiliates to implement fee waivers and/or expense limitations; |
| (h) | information relating to the profitability of the Management Agreement and the transfer agency and distribution and service arrangements of the Fund to the Investment Adviser and its affiliates; |
| (i) | whether the Fund’s existing management fee schedule adequately addressed any economies of scale; |
23
GOLDMAN SACHS VARIABLE INSURANCE TRUST LARGE CAP VALUE FUND
Statement Regarding Basis for Approval of Management Agreement (Unaudited) (continued)
| (j) | a summary of the “fall-out” benefits derived by the Investment Adviser and its affiliates from their relationships with the Fund, including the fees received by the Investment Adviser’s affiliates from the Fund for transfer agency, portfolio trading, distribution and other services; |
| (k) | a summary of potential benefits derived by the Fund as a result of its relationship with the Investment Adviser; |
| (l) | information regarding commissions paid by the Fund and broker oversight, an update on the Investment Adviser’s soft dollars practices, other information regarding portfolio trading, and how the Investment Adviser carries out its duty to seek best execution; |
| (m) | the manner in which portfolio manager compensation is determined; and the number and types of accounts managed by the portfolio managers; |
| (n) | the nature and quality of the services provided to the Fund by its unaffiliated service providers, and the Investment Adviser’s general oversight and evaluation (including reports on due diligence) of those service providers as part of the administrative services provided under the Management Agreement; and |
| (o) | the Investment Adviser’s processes and policies addressing various types of potential conflicts of interest; its approach to risk management; the annual review of the effectiveness of the Fund’s compliance program; and periodic compliance reports. |
The Trustees also received an overview of the Fund’s distribution arrangements. They received information regarding the Fund’s assets, share purchase and redemption activity, and payment of distribution and service fees. Information was also provided to the Trustees relating to revenue sharing payments made by and services provided by the Investment Adviser and its affiliates to intermediaries that promote the sale, distribution, and/or servicing of Fund shares. The Independent Trustees also discussed the broad range of other investment choices that are available to Fund investors, including the availability of comparable funds managed by other advisers.
The presentations made at the Board and Committee meetings and at the Annual Meeting encompassed the Fund and other mutual funds for which the Board of Trustees has responsibility. In evaluating the Management Agreement at the Annual Meeting, the Trustees relied upon their knowledge, resulting from their meetings and other interactions throughout the year, of the Investment Adviser and its affiliates, their services, and the Fund. In conjunction with these meetings, the Trustees received written materials and oral presentations on the topics covered, and the Investment Adviser addressed the questions and concerns of the Trustees, including concerns regarding the investment performance of certain of the funds they oversee. The Independent Trustees were advised by their independent legal counsel regarding their responsibilities and other regulatory requirements related to the approval and continuation of mutual fund investment management agreements under applicable law. In addition, the Investment Adviser and its affiliates provided the Independent Trustees with a written response to a formal request for information sent on behalf of the Independent Trustees by their independent legal counsel. During the course of their deliberations, the Independent Trustees met in executive sessions with their independent legal counsel, without representatives of the Investment Adviser or its affiliates present.
Nature, Extent, and Quality of the Services Provided Under the Management Agreement
As part of their review, the Trustees considered the nature, extent, and quality of the services provided to the Fund by the Investment Adviser. In this regard, the Trustees considered both the investment advisory services and non-advisory services that are provided by the Investment Adviser and its affiliates. The Trustees noted the transition in the leadership and changes in personnel of various of the Investment Adviser’s portfolio management teams that had occurred in recent periods, and the ongoing recruitment efforts aimed at bringing high quality investment talent to the Investment Adviser. They also noted the Investment Adviser’s commitment to maintaining high quality systems and expending substantial resources to respond to ongoing changes to the regulatory and control environment in which the Fund and its service providers operate, as well as the efforts of the Investment Adviser and its affiliates to combat cyber security risks. The Trustees concluded that the Investment Adviser continued to commit substantial financial and operational resources to the Fund and expressed confidence that the Investment Adviser would continue to do so in the future. The Trustees also recognized that the Investment Adviser had made significant commitments to address regulatory compliance requirements applicable to the Fund and the Investment Adviser and its affiliates.
Investment Performance
The Trustees also considered the investment performance of the Fund. In this regard, they compared the investment performance of the Fund to its peers using rankings and ratings compiled by the Outside Data Provider as of December 31, 2017, and updated performance information prepared by the Investment Adviser using the peer group identified by the Outside Data Provider as of March 31, 2018. The information on the Fund’s investment performance was provided for the one-, three-, five-, and
24
GOLDMAN SACHS VARIABLE INSURANCE TRUST LARGE CAP VALUE FUND
Statement Regarding Basis for Approval of Management Agreement (Unaudited) (continued)
ten-year periods ending on the applicable dates. The Trustees also reviewed the Fund’s investment performance relative to its performance benchmark. As part of this review, they considered the investment performance trends of the Fund over time, and reviewed the investment performance of the Fund in light of its investment objective and policies and market conditions. The Trustees also received information comparing the Fund’s performance to that of a composite of accounts with comparable investment strategies managed by the Investment Adviser.
In addition, the Trustees considered materials prepared and presentations made by the Investment Adviser’s senior management and portfolio management personnel in which Fund performance was assessed. The Trustees also considered the Investment Adviser’s periodic reports with respect to the Fund’s risk profile, and how the Investment Adviser’s approach to risk monitoring and management influences portfolio management.
The Trustees noted that the Fund’s Institutional Shares had placed in the fourth quartile of the Fund’s peer group and had underperformed the Fund’s benchmark index for the one-, three-, five-, and ten-year periods ended March 31, 2018. The Trustees also noted that in January 2018, the Investment Adviser had combined the U.S. Value and U.S. Growth portfolio management teams into a single U.S. Equity portfolio management team and had made certain personnel changes with respect to the Fund’s portfolio management team in connection with that restructuring.
Costs of Services Provided and Competitive Information
The Trustees considered the contractual terms of the Management Agreement and the fee rates payable by the Fund thereunder. In this regard, the Trustees considered information on the services rendered by the Investment Adviser to the Fund, which included both advisory and administrative services that were directed to the needs and operations of the Fund as a registered mutual fund.
In particular, the Trustees reviewed analyses prepared by the Outside Data Provider regarding the expense rankings of the Fund. The analyses provided a comparison of the Fund’s management fee and breakpoints to those of a relevant peer group and category universe; an expense analysis which compared the Fund’s overall net and gross expenses to a peer group and a category universe; and data comparing the Fund’s net expenses to the peer and category medians. The analyses also compared the Fund’s transfer agency, custody, and distribution fees, other expenses and fee waivers/reimbursements to those of the peer group and category medians. The Trustees concluded that the comparisons provided by the Outside Data Provider were useful in evaluating the reasonableness of the management fees and total expenses paid by the Fund.
The Trustees noted that the management fee breakpoint schedule had been reduced at all asset levels since the Management Agreement was last approved. In addition, the Trustees considered the Investment Adviser’s undertakings to implement fee waivers and/or expense limitations. They also considered, to the extent that the Investment Adviser manages other types of accounts having investment objectives and policies similar to those of the Fund, comparative fee information for services provided by the Investment Adviser to those accounts, and information that indicated that services provided to the Fund differed in various significant respects from the services provided to other types of accounts which, in many cases, operated under less stringent legal and regulatory structures, required fewer services from the Investment Adviser to a smaller number of client contact points, and were less time-intensive.
In addition, the Trustees noted that shareholders are able to redeem their Fund shares at any time if shareholders believe that the Fund fees and expenses are too high or if they are dissatisfied with the performance of the Fund.
Profitability
The Trustees reviewed the Fund’s contribution to the Investment Adviser’s revenues and pre-tax profit margins. In this regard the Trustees noted that they had received, among other things, profitability analyses and summaries, revenue and expense schedules by Fund and by function (i.e., investment management, transfer agency and distribution and service), and information on the Investment Adviser’s expense allocation methodology. They observed that the profitability and expense figures are substantially similar to those used by the Investment Adviser for many internal purposes, including compensation decisions among various business groups, and are thus subject to a vigorous internal debate about how certain revenue and expenses should be allocated. The Trustees also noted that the internal audit group within the Goldman Sachs organization had audited the expense allocation methodology and that the internal audit group was satisfied with the reasonableness, consistency, and accuracy of the Investment Adviser’s expense allocation methodology and profitability analysis calculations. Profitability data for the Fund was provided for 2017 and 2016, and the Trustees considered this information in relation to the Investment Adviser’s overall profitability.
25
GOLDMAN SACHS VARIABLE INSURANCE TRUST LARGE CAP VALUE FUND
Statement Regarding Basis for Approval of Management Agreement (Unaudited) (continued)
Economies of Scale
The Trustees considered the information that had been provided regarding whether there have been economies of scale with respect to the management of the Fund. The Trustees also considered the breakpoints in the fee rate payable under the Management Agreement for the Fund at the following annual percentage rates of the average daily net assets of the Fund:
| First $1 billion | 0.72 | % | ||
| Next $1 billion | 0.65 | |||
| Next $3 billion | 0.62 | |||
| Next $3 billion | 0.60 | |||
| Over $8 billion | 0.59 |
The Trustees noted that the breakpoints were designed to share potential economies of scale, if any, with the Fund and its shareholders as assets under management reach those asset levels. The Trustees considered the amounts of assets in the Fund; the Fund’s recent share purchase and redemption activity; the information provided by the Investment Adviser relating to the costs of the services provided by the Investment Adviser and its affiliates and their realized profits; information comparing fee rates charged by the Investment Adviser with fee rates charged to other funds in the peer group; and the Investment Adviser’s undertakings to waive a portion of its management fee and to limit certain expenses of the Fund that exceed a specified level. Upon reviewing these matters at the Annual Meeting, the Trustees concluded that the fee breakpoints represented a means of assuring that benefits of scalability, if any, would be passed along to shareholders at the specified asset levels.
Other Benefits to the Investment Adviser and Its Affiliates
The Trustees also considered the other benefits derived by the Investment Adviser and its affiliates from their relationships with the Fund as stated above, including: (a) transfer agency fees received by Goldman Sachs & Co. LLC (“Goldman Sachs”); (b) brokerage and futures commissions earned by Goldman Sachs for executing securities and futures transactions on behalf of the Fund; (c) research received by the Investment Adviser from broker-dealers in exchange for executing certain transactions on behalf of the Fund; (d) trading efficiencies resulting from aggregation of orders of the Fund with those for other funds or accounts managed by the Investment Adviser; (e) fees earned by the Investment Adviser for managing the fund in which the Fund’s securities lending cash collateral is invested; (f) the Investment Adviser’s ability to leverage the infrastructure designed to service the Fund on behalf of its other clients; (g) the Investment Adviser’s ability to cross-market other products and services to Fund shareholders; (h) Goldman Sachs’ retention of certain fees as Fund Distributor; (i) the Investment Adviser’s ability to negotiate better pricing with custodians on behalf of its other clients, as a result of the relationship with the Fund; and (j) the possibility that the working relationship between the Investment Adviser and the Fund’s third-party service providers may cause those service providers to be more likely to do business with other areas of Goldman Sachs. In the course of considering the foregoing, the Independent Trustees requested and received further information quantifying certain of these fall-out benefits.
Other Benefits to the Fund and Its Shareholders
The Trustees also noted that the Fund receives certain potential benefits as a result of its relationship with the Investment Adviser, including: (a) trading efficiencies resulting from aggregation of orders of the Fund with those of other funds or accounts managed by the Investment Adviser; (b) enhanced servicing from vendors because of the volume of business generated by the Investment Adviser and its affiliates; (c) enhanced servicing from broker-dealers because of the volume of business generated by the Investment Adviser and its affiliates; (d) the Investment Adviser’s ability to negotiate favorable terms with derivatives counterparties on behalf of the Fund as a result of the size and reputation of the Goldman Sachs organization; (e) the Investment Adviser’s knowledge and experience gained from managing other accounts and products; (f) the Investment Adviser’s ability to hire and retain qualified personnel to provide services to the Fund because of the reputation of the Goldman Sachs organization; (g) the Fund’s access, through the Investment Adviser, to certain firmwide resources (e.g., proprietary risk management systems and databases), subject to certain restrictions; and (h) the Fund’s access to certain affiliated distribution channels. In addition, the Trustees noted the competitive nature of the mutual fund marketplace, and considered that many of the Fund’s shareholders invested in the Fund in part because of the Fund’s relationship with the Investment Adviser and that those shareholders have a general expectation that the relationship will continue.
26
GOLDMAN SACHS VARIABLE INSURANCE TRUST LARGE CAP VALUE FUND
Statement Regarding Basis for Approval of Management Agreement (Unaudited) (continued)
Conclusion
In connection with their consideration of the Management Agreement, the Trustees gave weight to each of the factors described above, but did not identify any particular factor as controlling their decision. After deliberation and consideration of all of the information provided, including the factors described above, the Trustees concluded, in the exercise of their business judgment, that the management fees paid by the Fund were reasonable in light of the services provided to it by the Investment Adviser, the Investment Adviser’s costs and the Fund’s current and reasonably foreseeable asset levels. The Trustees unanimously concluded that the Investment Adviser’s continued management likely would benefit the Fund and its shareholders and that the Management Agreement should be approved and continued with respect to the Fund until June 30, 2019.
27
| TRUSTEES | OFFICERS | |
| Jessica Palmer, Chair | James A. McNamara, President | |
| Kathryn A. Cassidy | Scott M. McHugh, Treasurer, Senior Vice | |
| Diana M. Daniels | President and Principal Financial Officer | |
| Herbert J. Markley | Joseph F. DiMaria, Assistant Treasurer | |
| James A. McNamara | and Principal Accounting Officer | |
| Roy W. Templin | Caroline L. Kraus, Secretary | |
| Gregory G. Weaver |
GOLDMAN SACHS & CO. LLC
Distributor and Transfer Agent
GOLDMAN SACHS ASSET MANAGEMENT, L.P.
Investment Adviser
200 West Street, New York
New York 10282
Visit our web site at www.GSAMFUNDS.com to obtain the most recent month-end returns.
The reports concerning the Fund included in this shareholder report may contain certain forward-looking statements about the factors that may affect the performance of the Fund in the future. These statements are based on Fund management’s predictions and expectations concerning certain future events and their expected impact on the Fund, such as performance of the economy as a whole and of specific industry sectors, changes in the levels of interest rates, the impact of developing world events, and other factors that may influence the future performance of the Fund. Management believes these forward-looking statements to be reasonable, although they are inherently uncertain and difficult to predict. Actual events may cause adjustments in portfolio management strategies from those currently expected to be employed.
A description of the policies and procedures that the Fund uses to determine how to vote proxies relating to portfolio securities and information regarding how the Fund voted proxies relating to portfolio securities for the 12-month period ended June 30 is available (i) without charge, upon request by calling 1-800-621-2550; and (ii) on the Securities and Exchange Commission (“SEC”) web site at
http://www.sec.gov.
The Fund files its complete schedule of portfolio holdings with the SEC for the first and third quarters of each fiscal year on Form N-Q. The Fund’s Form N-Qs are available on the SEC’s web site at http://www.sec.gov within 60 days after the Fund’s first and third fiscal quarters. The Fund’s Form N-Qs may be reviewed and copied at the SEC’s Public Reference Room in Washington, D.C. and information on the operation of the Public Reference Room may also be obtained by calling 1-800-SEC-0330. Form N-Qs may be obtained upon request and without charge by calling 1-800-621-2550.
Views and opinions expressed are for informational purposes only and do not constitute a recommendation by GSAM to buy, sell, or hold any security. Views and opinions are current as of the date of this presentation and may be subject to change, they should not be construed as investment advice.
Goldman Sachs & Co. LLC (“Goldman Sachs”) does not provide legal, tax or accounting advice. Any statement contained in this communication (including any attachments) concerning U.S. tax matters was not intended or written to be used, and cannot be used, for the purpose of avoiding penalties under the Internal Revenue Code, and was written to support the promotion or marketing of transaction or matter addressed. Clients of Goldman Sachs should obtain their own independent tax advice based on their particular circumstances.
The website links provided are for your convenience only and are not an endorsement or recommendation by GSAM of any of these websites or the products or services offered. GSAM is not responsible for the accuracy and validity of the content of these websites.
Fund holdings and allocations shown are as of June 30, 2018 and may not be representative of future investments. Fund holdings should not be relied on in making investment decisions and should not be construed as research or investment advice regarding particular securities. Current and future holdings are subject to risk.
References to indices, benchmarks or other measures of relative market performance over a specified period of time are provided for your information only and do not imply that the portfolio will achieve similar results. The index composition may not reflect the manner in which a portfolio is constructed. While an adviser seeks to design a portfolio which reflects appropriate risk and return features, portfolio characteristics may deviate from those of the benchmark.
The Global Industry Classification Standard (“GICS”) was developed by and is the exclusive property and a service mark of Morgan Stanley Capital International Inc. (“MSCI”) and Standard & Poor’s, a division of The McGraw-Hill Companies, Inc. (“S&P”) and is licensed for use by Goldman Sachs. Neither MSCI, S&P nor any other party involved in making or compiling the GICS or any GICS classifications makes any express or implied warranties or representations with respect to such standard or classification (or the results to be obtained by the use thereof), and all such parties hereby expressly disclaim all warranties of originality, accuracy, completeness, merchantability or fitness for a particular purpose with respect to any of such standard or classification. Without limiting any of the foregoing, in no event shall MSCI, S&P, any of their affiliates or any third party involved in making or compiling the GICS or any GICS classifications have any liability for any direct, indirect, special, punitive, consequential or any other damages (including lost profits) even if notified of the possibility of such damages.
The portfolio risk management process includes an effort to monitor and manage risk, but does not imply low risk.
Shares of the Goldman Sachs VIT Funds are offered to separate accounts of participating life insurance companies for the purpose of funding variable annuity contracts and variable life insurance policies. Shares of the Fund are not offered directly to the general public. The variable annuity contracts and variable life insurance policies are described in the separate prospectuses issued by participating insurance companies. You should refer to those prospectuses for information about surrender charges, mortality and expense risk fees and other charges that may be assessed by participating insurance companies under the variable annuity contracts or variable life insurance policies. Such fees or charges, if any, may affect the return you may realize with respect to your investments. Ask your representative for more complete information. Please consider a fund’s objectives, risks and charges and expenses, and read the prospectus carefully before investing. The prospectus contains this and other information about the Fund.
This material is not authorized for distribution to prospective investors unless preceded or accompanied by a current prospectus or summary prospectus, if applicable. Investors should consider the Fund’s objective, risks, and charges and expenses, and read the summary prospectus, if available, and/or the prospectus carefully before investing or sending money. The summary prospectus, if available, and the prospectus contain this and other information about the Fund and may be obtained from your authorized dealer or from Goldman Sachs & Co. LLC by calling 1-800-621-2550.
This report is prepared for the general information of contract owners and is not an offer of shares of the Goldman Sachs Variable Insurance Trust — Goldman Sachs Large Cap Value Fund.
© 2018 Goldman Sachs. All rights reserved.
VITLCVSAR-18/139315-OTU-810108/39K
Goldman
Sachs Variable Insurance Trust
Goldman Sachs
Mid Cap Value Fund
Semi-Annual Report
June 30, 2018

GOLDMAN SACHS VARIABLE INSURANCE TRUST MID CAP VALUE FUND
INVESTMENT OBJECTIVE
The Fund seeks long-term capital appreciation.
Portfolio Management Discussion and Analysis
Below, the Goldman Sachs Value Portfolio Management Team discusses the Goldman Sachs Variable Insurance Trust — Goldman Sachs Mid Cap Value Fund’s (the “Fund”) performance and positioning for the six-month period ended June 30, 2018 (the “Reporting Period”).
How did the Fund perform during the Reporting Period?
During the Reporting Period, the Fund’s Institutional and Service Shares generated cumulative total returns of 0.47% and 0.30%, respectively. These returns compare to the –0.16% cumulative total return of the Fund’s benchmark, the Russell Midcap® Value Index (with dividends reinvested) (the “Russell Index”), during the same time period.
What economic and market factors most influenced the equity markets as a whole during the Reporting Period?
Representing the U.S. equity market, the S&P 500® Index gained 2.65% during the Reporting Period.
U.S. equities saw a strong start to the Reporting Period in January 2018, driven by positive economic data, a $1.5 trillion tax reform law signed in December 2017, and a favorable corporate earnings season. In February 2018, however, U.S. and international equities sold off on market speculation of a faster pace of Federal Reserve (“Fed”) short-term interest rate hikes, which stoked a sharp rise in bond yields and an increase in equity market volatility. Concerns about Fed monetary policy tightening were further exacerbated by solid U.S. labor and inflation data. While the hawkish Fed minutes were largely expected, new Fed Chair Jerome Powell’s Congressional testimony, positing a more optimistic economic outlook since the December 2017 Fed meeting, surprised equity markets with its hawkish tilt, sparking another sell-off in the U.S. equity markets. (Jerome Powell assumed the chairmanship of the Fed in February 2018. Hawkish language tends to suggest higher interest rates; opposite of dovish.) In March 2018, escalating trade tensions and potential tariffs weighed on investor sentiment. Meanwhile, the Fed delivered on a widely expected interest rate increase, with its “dot plot” pointing to a total of three interest rate hikes this calendar year and potentially two in 2019. (The “dot plot” shows rate projections of the members of the Fed’s Open Market Committee.) However, Fed policymakers acknowledged that the “economic outlook has strengthened in recent months,” revising their economic growth forecast higher and their unemployment forecast lower.
The U.S. and China continued to generate trade headlines and geopolitical uncertainty about sanctions on Russia surfaced, but the impact of such on the U.S. equity markets remained relatively muted during April 2018, as investors stayed rather resistant to the risk of a trade war. A number of macroeconomic drivers, including U.S. labor market strength, higher inflation and fiscal stimulus, pushed up U.S. Treasury yields, with the 10-year U.S. Treasury yield breaching 3% toward month end. With more than half of S&P 500® Index companies having reported their first quarter 2018 results, the earnings season began strongly during April 2018. U.S. equities rallied in May 2018, driven not only by strong corporate earnings but also by upside surprises in economic activity and sentiment data as well as on a new U.S. unemployment low of 3.8%. However, the U.S. equity rally was hampered by escalating geopolitical uncertainty stemming from the unexpected political outcome in Italy, the ongoing unpredictability around the U.S.-North Korea summit, and escalating trade tensions with many U.S. allies. The Fed raised interest rates again in June 2018, as widely expected, but the outcome of the Fed meeting was more hawkish than the consensus had anticipated. The Fed retained language indicating an “accommodative” monetary policy stance, but its economic growth and inflation forecasts were upgraded, and its median projection was lifted to four interest rate hikes in 2018 from the three it had indicated in March 2018. Fed Chair Powell was also slightly hawkish in his June press conference. Still-escalating trade tensions between the U.S. and China hurt market sentiment, with the U.S. threatening tariffs on $200 billion worth of Chinese goods and China vowing to retaliate. All told, then, the S&P 500® Index produced modestly positive but rather flat returns for the month of June 2018.
For the Reporting Period overall, six sectors posted positive absolute returns and five generated negative returns. Consumer discretionary, information technology and energy were the best performing sectors in the S&P 500® Index, as measured by total return, and the weakest performing sectors in the S&P 500® Index during the Reporting Period were telecommunication services, consumer staples and industrials.
Within the U.S. equity market, there was significant disparity in performance not only among sectors but also among the various capitalization and style segments. While all capitalization segments posted positive returns, small-cap stocks, as measured by the Russell 2000® Index, performed best, followed at some distance by large-cap stocks, as measured by the Russell 1000® Index, and
1
GOLDMAN SACHS VARIABLE INSURANCE TRUST MID CAP VALUE FUND
mid-cap stocks, as measured by the Russell Midcap® Index, which performed similarly to each other. From a style perspective, growth-oriented stocks significantly outpaced value-oriented stocks across the capitalization spectrum, with value-oriented stocks overall in the large-cap and mid-cap segments posting modestly negative absolute returns. (All as measured by the FTSE Russell indices.)
What key factors were responsible for the Fund’s performance during the Reporting Period?
The Fund posted modestly positive returns that outperformed the Russell Index during the Reporting Period due primarily to stock selection overall. Sector allocation as a whole had a rather neutral effect on the Fund’s performance relative to the Russell Index during the Reporting Period.
Which equity market sectors most significantly affected Fund performance?
Contributing most positively to the Fund’s relative results during the Reporting Period was effective stock selection in the industrials, health care and information technology sectors. Having an overweighted allocation to the strongly performing information technology sector also helped. Such positive contributors were only partially offset by stock selection in the consumer discretionary, energy and financials sectors, which detracted. Having an underweighted allocation to the strongly performing energy sector also hurt.
What were some of the Fund’s best-performing individual stocks?
The Fund benefited most relative to the Russell Index from positions in Westinghouse Air Brake Technologies, WPX Energy and GoDaddy.
Westinghouse Air Brake Technologies (“Wabtec”) is an equipment and system services company for the transit and freight rail industry. In late January and early February 2018, Wabtec’s stock was challenged by short-term margin concerns from backlog contracts. Despite these early headwinds, its stock turned around after the company signed a $62 million contract to provide equipment and services for SunRail service in central Florida. In May 2018, its stock rose again, as the company re-affirmed its 2018 financial guidance and long-term financial targets, which continued to be ahead of market consensus. Toward the end of May 2018, it was announced General Electric’s transport business would be merging with Wabtec, which was also viewed positively by the market, as it could provide synergies for the company and is expected to be cash accretive. At the end of the Reporting Period, we remained positive on the company’s recent acquisitions and believed it has potential to explore additional opportunities that may unlock further synergies.
WPX Energy is an oil and natural gas exploration and production company. Its stock rose in early February 2018 following the company’s announcement it had signed an agreement to divest its San Juan Gallup holdings for $700 million, a significant portion of which would be slated for debt reduction. Its stock rose again after the company reported strong fourth quarter 2017 earnings results. At the end of the Reporting Period, we remained positive on WPX Energy’s transformation from being a high-cost natural gas production company to an oil-focused production company. We also liked what we saw as an impressive portfolio of low-cost acreage in the core of the Permian Basin. Furthermore, we believed the stock was significantly undervalued at the end of the Reporting Period, as investors had not fully recognized, in our view, the quality of the company’s assets and its ability to de-lever its balance sheet.
GoDaddy is a company that provides website building, hosting and security tools. Its stock rose following positive earnings reports for the fourth quarter of 2017 and first quarter of 2018, reported in February and May 2018, respectively. Also, during the Reporting period, GoDaddy announced its acquisition of Main Street Hub, a small business social network manager, for $125 million in cash. GoDaddy’s stock also gained momentum when Amazon.com announced that GoDaddy would leverage Amazon’s Web Services to innovate faster and meet its worldwide customer growth goals. In our view, GoDaddy was well positioned at the end of the Reporting Period for solid growth should its senior management continue to implement and benefit from expansion and new service innovation.
Which stocks detracted significantly from the Fund’s performance during the Reporting Period?
Detracting from the Fund’s results relative to the Russell Index were positions in Twitter, Stanley Black & Decker and Devon Energy.
Twitter, a new position for the Fund during the Reporting Period, is an online news and social networking service. We purchased the stock for the Fund near the end of the first quarter of 2018, and the stock declined shortly thereafter along with the broad sell-off in most technology and Internet companies. The sell-off was driven primarily by negative sentiment over the use of consumer data. In May 2018, we exited the Fund’s position in Twitter for what we viewed as more favorable risk/return
2
GOLDMAN SACHS VARIABLE INSURANCE TRUST MID CAP VALUE FUND
opportunities elsewhere. The remainder of the second calendar quarter saw positive stock performance for Twitter, further contributing to the detracting effect of the position on the Fund’s relative results.
Stanley Black & Decker engages in the provision of power and hand tools, products and services for various infrastructure applications, mechanical access, and health care solutions. Despite slightly beating consensus expectations for fourth quarter 2017 earnings with moderate growth, the company’s stock detracted on weaker margins. Significant headwinds from commodity inflation, particularly in tools and storage, also pressured the stock. Due to the lag between cost inflation and offset pricing, its first quarter 2018 guidance fell short of consensus expectations, despite a lower tax rate. Following a June investor event to launch its Craftsman brand with a full roll-out at Lowe’s, Amazon.com and Ace in the second half of 2018, we increased the Fund’s position in the stock in late June 2018 in preparation of the launch. At the end of the Reporting Period, we remained positive on Stanley Black & Decker’s long-term growth potential moving forward, as the company broadens its product line and targets new markets.
Devon Energy is a natural gas, natural gas liquids and petroleum exploration company. The majority of its stock’s poor performance occurred in February 2018 after the company reported weak fourth quarter 2017 earnings, primarily driven by missed production expectations and disappointing 2018 guidance. Despite these headwinds, we remained positive at the end of the Reporting Period on the company’s North American asset base and believed it was largely undervalued at the stock’s then-current market price.
How did the Fund use derivatives and similar instruments during the Reporting Period?
During the Reporting Period, we did not use derivatives.
Did the Fund make any significant purchases or sales during the Reporting Period?
We initiated a position in Northern Trust, an asset management and financial services company, when its stock traded down on a report expressing a more challenged environment given lower loan standards. In our view, Northern Trust is a high quality franchise with an experienced management team who have a proven track record of returning value to shareholders through dividends and share buybacks. Furthermore, we believe what we consider to be the company’s strong balance sheet, consistent free cash flow generation and deregulation within the industry should continue to serve as catalysts for Northern Trust going forward.
During the Reporting Period, we established a Fund position in Royal Caribbean Cruises, a global cruise vacation company. We purchased the stock based on our belief the cruising industry is on a steady incline, primarily due to baby boomers and millennials who continue to pump money into this lucrative industry. Additionally, we are positive on the upcoming regulatory change in 2019 that will require the use of low sulfur fuel in marine vessels, a regulation that, in our view, may serve as a positive tailwind for Royal Caribbean and likely set the company apart from its peers.
Conversely, in addition to those sales already mentioned, we exited the Fund’s position in Ameriprise Financial, a financial services company, in the first quarter of 2018. While we continue to believe in the company’s management team and its strong capital allocation track record, we sold the position after the stock appreciated and our concern around the company’s legacy long-term care insurance exposure reduced its overall risk/reward profile, in our view.
We sold the Fund’s position in US Foods Holding, a food distributor. We became increasingly concerned on its earnings risk, as we felt the competitive environment for the company became pressured from a revenue perspective. Also, higher freight and shipping costs compressed its margins. We eliminated the position in an effort to manage risk and reallocated the proceeds into what we saw as better risk/reward opportunities.
Were there any notable changes in the Fund’s weightings during the Reporting Period?
In constructing the Fund’s portfolio, we focus on picking stocks rather than on making industry or sector bets. We seek to outpace the benchmark index by overweighting stocks that we expect to outperform and underweighting those that we think may lag. Consequently, changes in its sector weights are generally the direct result of individual stock selection or of stock appreciation or depreciation. That said, during the Reporting Period, the Fund’s exposure to financials and utilities increased and its exposure to energy and consumer staples decreased compared to the Russell Index.
How was the Fund positioned relative to its benchmark index at the end of the Reporting Period?
At the end of June 2018, the Fund had overweighted positions relative to the Russell Index in the financials, industrials, materials and information technology sectors. On the same date, the Fund had underweighted positions compared to the Russell Index in real estate and consumer staples and was rather neutrally weighted to the Russell Index in consumer discretionary, energy, utilities, health care and telecommunication services sectors.
3
GOLDMAN SACHS VARIABLE INSURANCE TRUST MID CAP VALUE FUND
Were there any changes to the Fund’s portfolio management team during the Reporting Period?
Effective January 9, 2018, Goldman Sachs Asset Management, L.P. (the “Investment Adviser”) centralized its Fundamental Equity U.S. Value and Fundamental Equity U.S. Growth Teams into a single Fundamental Equity U.S. Equity Team. Effective the same date, decision-making for the Fund’s strategy was centralized with lead portfolio managers, who draw upon the combined team for idea generation and make final investment decisions. The Investment Adviser believes these changes will benefit the Funds by providing a more holistic investment perspective and the ability to leverage investment ideas across the U.S. Fundamental Equity platform.
Effective the same date, Adam Agress, vice president, joined Sean Gallagher and Sung Cho as a co-lead portfolio manager for the Fund’s strategy. Adam has 12 years of investment experience. Tim Ryan no longer serves as a co-lead portfolio manager with Sung but will maintain his co-lead portfolio manager role on the U.S. real estate securities strategy.
There were no changes to the investment process or philosophy of the Fund’s strategy. We remain committed to high quality, bottom-up research and to the time-tested investment philosophy of the Fund’s strategy. We continue to believe that deep knowledge of company-specific and industry trends is key to our research edge.
What is the Fund’s tactical view and strategy for the months ahead?
At the end of the Reporting Period, we believed U.S. equities continued to offer a reasonable risk premium over other asset classes, despite fuller valuations. While fiscal stimulus in a strong economy raises overheating risk, in our view, U.S. equities should be resilient to rising interest rates to the extent these interest rates reflect strong economic growth prospects, as is the case, thus far, in the current cycle of monetary policy tightening. In our view, cost pressures and rising interest rates make pricing power an increasingly important differentiator of a company’s success. This divergence between winners and losers also reinforces, we feel, the importance of active management. Although we believe it is too early in the monetary policy tightening cycle for a shift to a persistent high volatility regime, we expect U.S. equity markets will likely see more frequent drawdowns, or corrections, from here, and investors are likely, in our opinion, to continue to prefer an active, dynamic investment approach. We believe focusing on company fundamentals, while being aware of the potential effect of various macroeconomic factors, is a process that should continue to reward the Fund’s shareholders over the long term.
Regardless of market direction, our fundamental, bottom-up stock selection continues to drive our process, rather than headlines or sentiment. We maintain high conviction in the companies the Fund owns and believe they have the potential to outperform relative to the broader market regardless of economic growth conditions. We continue to focus on undervalued companies that we believe have comparatively greater control of their own destiny, such as innovators with differentiated products, companies with low cost structures or companies that have been investing in their own businesses and may be poised to gain market share. We maintain our discipline in identifying companies with what we believe to be strong or improving balance sheets, led by quality management teams and trading at discounted valuations. We remain focused on the long-term performance of the Fund.
4
GOLDMAN SACHS VARIABLE INSURANCE TRUST MID CAP VALUE FUND
Index Definitions
The Russell Midcap Value® Index is an unmanaged index of common stock prices that measures the performance of those Russell Midcap companies with lower price-to-book ratios and lower forecasted growth values. The index figures do not reflect any deduction for fees, expenses or taxes.
The Russell 2000® Index is an unmanaged index of common stock prices that measures the performance of the 2000 smallest companies in the Russell 3000® Index. The figures for the index do not include any deduction for fees, expenses or taxes.
The S&P 500® Index is the Standard & Poor’s composite index of 500 stocks, an unmanaged index of common stock prices. The figures for the index do not include any deduction for fees, expenses or taxes.
The Russell Midcap® Index measures the performance of the 800 smallest companies in the Russell 1000® Index, which represent approximately 25% of the total market capitalization of the Russell 1000® Index.
The Russell 1000® Index measures the performance of the 1,000 largest companies in the Russell 3000® Index, which represent approximately 92% of the total market capitalization of the Russell 3000® Index.
It is not possible to invest directly in an index.
5
FUND BASICS
Mid Cap Value Fund
as of June 30, 2018
STANDARDIZED TOTAL RETURNS1
| For the period ended 6/30/18 | One Year | Five Years | Ten Years | Since Inception | Inception Date | |||||||||||||
| Institutional | 7.23 | % | 8.50 | % | 7.70 | % | 8.60 | % | 5/01/98 | |||||||||
| Service | 6.96 | 8.22 | 7.43 | 6.85 | 1/09/06 | |||||||||||||
| 1 | The Standardized Total Returns are average annual total returns as of the most recent calendar quarter-end. They assume reinvestment of all distributions at net asset value (“NAV”). Because Institutional Shares and Service Shares do not involve a sales charge, such a charge is not applied to their Standardized Total Returns. |
Total return figures in the above chart represent past performance and do not indicate future results, which will vary. The investment return and principal value of an investment will fluctuate and, therefore, an investor’s shares, when redeemed, may be worth more or less than their original cost. Current performance may be lower or higher than the total return figures in the above chart. Please visit www.GSAMFUNDS.com to obtain the most recent month-end returns. Performance reflects fee waivers and/or expense limitations in effect during the periods shown. In their absence, performance would be reduced.
EXPENSE RATIOS2
| Net Expense Ratio (Current) | Gross Expense Ratio (Before Waivers) | |||||||
| Institutional | 0.84 | % | 0.87 | % | ||||
| Service | 1.09 | 1.12 | ||||||
| 2 | The expense ratios of the Fund, both current (net of any fee waivers and/or expense limitations) and before waivers (gross of any fee waivers and/or expense limitations) are as set forth above according to the most recent publicly available Prospectuses for the Fund and may differ from the expense ratios disclosed in the Financial Highlights in this report. Pursuant to a contractual arrangement, the Fund’s fee waivers and/or expense limitations will remain in place through at least April 30, 2019, and prior to such date, the Investment Adviser may not terminate the arrangements without the approval of the Fund’s Board of Trustees. If these arrangements are discontinued in the future, the expense ratios may change without shareholder approval. |
TOP TEN HOLDINGS AS OF 6/30/183
| Holding | % of Net Assets | Line of Business | ||||||||
| Stanley Black & Decker, Inc. | 1.9% | Capital Goods | ||||||||
| Fidelity National Information Services, Inc. | 1.9 | Software & Services | ||||||||
| Marvell Technology Group Ltd. | 1.8 | Semiconductors & Semiconductor Equipment | ||||||||
| Zimmer Biomet Holdings, Inc. | 1.8 | Health Care Equipment & Services | ||||||||
| Celanese Corp. Series A | 1.7 | Materials | ||||||||
| Wabtec Corp. | 1.7 | Capital Goods | ||||||||
| Camden Property Trust | 1.7 | Real Estate Investment Trusts | ||||||||
| Ball Corp. | 1.6 | Materials | ||||||||
| Steel Dynamics, Inc. | 1.6 | Materials | ||||||||
| AvalonBay Communities, Inc. | 1.5 | Real Estate Investment Trusts | ||||||||
| 3 | The top 10 holdings may not be representative of the Fund’s future investments. |
6
FUND BASICS
FUND VS. BENCHMARK SECTOR ALLOCATIONS4
As of June 30, 2018
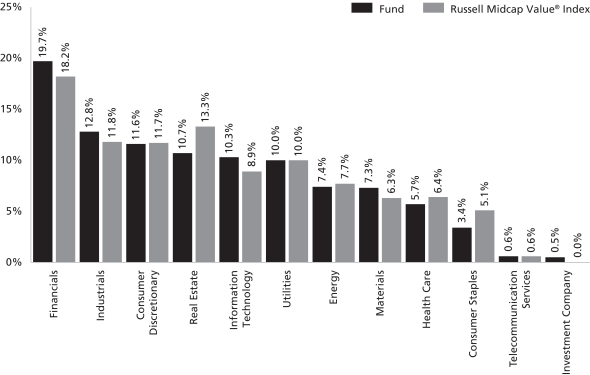
| 4 | The Fund is actively managed and, as such, its composition may differ over time. Consequently, the Fund’s overall sector allocations may differ from percentages contained in the graph above. The graph categorizes investments using Global Industry Classification Standard (“GICS”); however, the sector classifications used by the portfolio management team may differ from GICS. The percentage shown for each investment category reflects the value of investments in that category as a percentage of market value. Underlying sector allocations of exchange traded funds and investment companies held by the Fund are not reflected in the graph above. |
7
GOLDMAN SACHS VARIABLE INSURANCE TRUST MID CAP VALUE FUND
Schedule of Investments
June 30, 2018 (Unaudited)
| Shares | Description | Value | ||||||
| Common Stocks – 98.3% | ||||||||
Automobiles & Components – 0.7% | ||||||||
| 96,148 | Delphi Technologies plc | $ | 4,370,888 | |||||
|
| |||||||
Banks – 8.5% | ||||||||
| 71,972 | Bank of the Ozarks, Inc. | 3,241,619 | ||||||
| 179,851 | Citizens Financial Group, Inc. | 6,996,204 | ||||||
| 46,352 | Comerica, Inc. | 4,214,324 | ||||||
| 360,498 | First Horizon National Corp. | 6,431,284 | ||||||
| 93,846 | First Republic Bank | 9,083,354 | ||||||
| 48,238 | M&T Bank Corp. | 8,207,696 | ||||||
| 75,482 | Signature Bank* | 9,652,638 | ||||||
| 118,680 | SunTrust Banks, Inc. | 7,835,254 | ||||||
|
| |||||||
| 55,662,373 | ||||||||
|
| |||||||
Capital Goods – 9.2% | ||||||||
| 170,940 | ITT, Inc. | 8,935,034 | ||||||
| 85,101 | Jacobs Engineering Group, Inc. | 5,403,062 | ||||||
| 36,238 | John Bean Technologies Corp. | 3,221,558 | ||||||
| 47,611 | L3 Technologies, Inc. | 9,156,548 | ||||||
| 93,427 | Stanley Black & Decker, Inc. | 12,408,040 | ||||||
| 85,918 | Terex Corp. | 3,624,880 | ||||||
| 179,110 | Trinity Industries, Inc. | 6,136,309 | ||||||
| 113,843 | Wabtec Corp. | 11,222,643 | ||||||
|
| |||||||
| 60,108,074 | ||||||||
|
| |||||||
Consumer Durables & Apparel – 3.7% | ||||||||
| 69,780 | Brunswick Corp. | 4,499,414 | ||||||
| 82,620 | Lennar Corp. Class A | 4,337,550 | ||||||
| 44,019 | PVH Corp. | 6,590,525 | ||||||
| 76,532 | Skechers U.S.A., Inc. Class A* | 2,296,725 | ||||||
| 140,414 | Tapestry, Inc. | 6,558,738 | ||||||
|
| |||||||
| 24,282,952 | ||||||||
|
| |||||||
Consumer Services – 2.0% | ||||||||
| 75,072 | Dunkin’ Brands Group, Inc. | 5,185,223 | ||||||
| 74,511 | Royal Caribbean Cruises Ltd. | 7,719,340 | ||||||
|
| |||||||
| 12,904,563 | ||||||||
|
| |||||||
Diversified Financials – 4.7% | ||||||||
| 21,326 | Affiliated Managers Group, Inc. | 3,170,537 | ||||||
| 80,864 | E*TRADE Financial Corp.* | 4,945,642 | ||||||
| 69,528 | Lazard Ltd. Class A | 3,400,615 | ||||||
| 92,437 | Northern Trust Corp. | 9,510,843 | ||||||
| 417,254 | SLM Corp.* | 4,777,558 | ||||||
| 237,072 | Starwood Property Trust, Inc. (REIT) | 5,146,833 | ||||||
|
| |||||||
| 30,952,028 | ||||||||
|
| |||||||
Energy – 7.3% | ||||||||
| 157,769 | Devon Energy Corp. | 6,935,525 | ||||||
| 44,378 | Diamondback Energy, Inc. | 5,838,814 | ||||||
| 319,708 | Encana Corp. | 4,172,189 | ||||||
| 59,815 | EQT Corp. | 3,300,592 | ||||||
| 353,350 | Marathon Oil Corp. | 7,370,881 | ||||||
| 107,934 | Marathon Petroleum Corp. | 7,572,649 | ||||||
| 17,157 | Pioneer Natural Resources Co. | 3,246,791 | ||||||
| 40,852 | RSP Permian, Inc.* | 1,798,305 | ||||||
| 414,869 | WPX Energy, Inc.* | 7,480,088 | ||||||
|
| |||||||
| 47,715,834 | ||||||||
|
| |||||||
| Common Stocks – (continued) | ||||||||
Food, Beverage & Tobacco – 3.3% | ||||||||
| 70,752 | Bunge Ltd. | $ | 4,932,122 | |||||
| 139,439 | Coca-Cola European Partners plc | 5,666,801 | ||||||
| 212,153 | Conagra Brands, Inc. | 7,580,227 | ||||||
| 31,367 | McCormick & Co., Inc. (Non-Voting) | 3,641,395 | ||||||
|
| |||||||
| 21,820,545 | ||||||||
|
| |||||||
Health Care Equipment & Services – 4.1% | ||||||||
| 61,083 | Acadia Healthcare Co., Inc.* | 2,498,904 | ||||||
| 97,194 | Boston Scientific Corp.* | 3,178,244 | ||||||
| 52,745 | Laboratory Corp. of America Holdings* | 9,469,310 | ||||||
| 105,534 | Zimmer Biomet Holdings, Inc. | 11,760,709 | ||||||
|
| |||||||
| 26,907,167 | ||||||||
|
| |||||||
Insurance – 6.2% | ||||||||
| 46,856 | American Financial Group, Inc. | 5,029,055 | ||||||
| 171,189 | Arch Capital Group Ltd.* | 4,529,661 | ||||||
| 14,422 | Everest Re Group Ltd. | 3,323,983 | ||||||
| 19,933 | Hanover Insurance Group, Inc. (The) | 2,383,189 | ||||||
| 93,208 | Lincoln National Corp. | 5,802,198 | ||||||
| 3,926 | Markel Corp.* | 4,257,158 | ||||||
| 28,309 | Reinsurance Group of America, Inc. | 3,778,685 | ||||||
| 61,215 | Torchmark Corp. | 4,983,513 | ||||||
| 43,269 | Willis Towers Watson plc | 6,559,580 | ||||||
|
| |||||||
| 40,647,022 | ||||||||
|
| |||||||
Materials – 7.2% | ||||||||
| 295,730 | Ball Corp. | 10,513,202 | ||||||
| 101,773 | Celanese Corp. Series A | 11,302,909 | ||||||
| 316,269 | Freeport-McMoRan, Inc. | 5,458,803 | ||||||
| 42,189 | Martin Marietta Materials, Inc. | 9,422,069 | ||||||
| 220,235 | Steel Dynamics, Inc. | 10,119,798 | ||||||
|
| |||||||
| 46,816,781 | ||||||||
|
| |||||||
Media – 0.8% | ||||||||
| 47,672 | DISH Network Corp. Class A* | 1,602,256 | ||||||
| 43,516 | Liberty Broadband Corp. Class C* | 3,295,031 | ||||||
|
| |||||||
| 4,897,287 | ||||||||
|
| |||||||
Pharmaceuticals, Biotechnology & Life Sciences – 1.5% | ||||||||
| 37,535 | Alexion Pharmaceuticals, Inc.* | 4,659,970 | ||||||
| 70,278 | Alkermes plc* | 2,892,643 | ||||||
| 24,084 | BioMarin Pharmaceutical, Inc.* | 2,268,713 | ||||||
|
| |||||||
| 9,821,326 | ||||||||
|
| |||||||
Real Estate Investment Trusts – 10.6% | ||||||||
| 74,818 | Alexandria Real Estate Equities, Inc. | 9,439,787 | ||||||
| 58,132 | AvalonBay Communities, Inc. | 9,992,310 | ||||||
| 65,497 | Boston Properties, Inc. | 8,214,634 | ||||||
| 118,902 | Camden Property Trust | 10,835,539 | ||||||
| 251,197 | DDR Corp. | 4,496,426 | ||||||
| 66,001 | Equity LifeStyle Properties, Inc. | 6,065,492 | ||||||
| 202,287 | Hudson Pacific Properties, Inc. | 7,167,028 | ||||||
| 76,757 | Prologis, Inc. | 5,042,167 | ||||||
| 160,217 | RLJ Lodging Trust | 3,532,785 | ||||||
| 24,840 | SBA Communications Corp.* | 4,101,581 | ||||||
|
| |||||||
| 68,887,749 | ||||||||
|
| |||||||
| 8 | The accompanying notes are an integral part of these financial statements. |
GOLDMAN SACHS VARIABLE INSURANCE TRUST MID CAP VALUE FUND
| Shares | Description | Value | ||||||
| Common Stocks – (continued) | ||||||||
Retailing – 4.3% | ||||||||
| 43,466 | Advance Auto Parts, Inc. | $ | 5,898,336 | |||||
| 32,601 | Burlington Stores, Inc.* | 4,907,428 | ||||||
| 59,433 | Dollar Tree, Inc.* | 5,051,805 | ||||||
| 37,736 | Expedia Group, Inc. | 4,535,490 | ||||||
| 238,703 | LKQ Corp.* | 7,614,626 | ||||||
|
| |||||||
| 28,007,685 | ||||||||
|
| |||||||
Semiconductors & Semiconductor Equipment – 3.7% | ||||||||
| 169,390 | Advanced Micro Devices, Inc.* | 2,539,156 | ||||||
| 65,705 | Analog Devices, Inc. | 6,302,424 | ||||||
| 551,451 | �� | Marvell Technology Group Ltd. | 11,823,109 | |||||
| 48,360 | Xilinx, Inc. | 3,155,974 | ||||||
|
| |||||||
| 23,820,663 | ||||||||
|
| |||||||
Software & Services – 4.4% | ||||||||
| 39,935 | Check Point Software Technologies Ltd.* | 3,900,851 | ||||||
| 36,780 | Citrix Systems, Inc.* | 3,856,015 | ||||||
| 29,744 | Dell Technologies, Inc. Class V* | 2,515,748 | ||||||
| 116,798 | Fidelity National Information Services, Inc. | 12,384,092 | ||||||
| 51,103 | Global Payments, Inc. | 5,697,473 | ||||||
|
| |||||||
| 28,354,179 | ||||||||
|
| |||||||
Technology Hardware & Equipment – 2.2% | ||||||||
| 157,355 | Juniper Networks, Inc. | 4,314,674 | ||||||
| 595,216 | Viavi Solutions, Inc.* | 6,095,012 | ||||||
| 47,611 | Western Digital Corp. | 3,685,568 | ||||||
|
| |||||||
| 14,095,254 | ||||||||
|
| |||||||
Telecommunication Services – 0.6% | ||||||||
| 203,961 | CenturyLink, Inc. | 3,801,833 | ||||||
|
| |||||||
Transportation – 3.4% | ||||||||
| 58,089 | Delta Air Lines, Inc. | 2,877,729 | ||||||
| 255,419 | JetBlue Airways Corp.* | 4,847,853 | ||||||
| 49,891 | Old Dominion Freight Line, Inc. | 7,431,763 | ||||||
| 72,793 | XPO Logistics, Inc.* | 7,292,403 | ||||||
|
| |||||||
| 22,449,748 | ||||||||
|
| |||||||
Utilities – 9.9% | ||||||||
| 56,885 | Ameren Corp. | 3,461,452 | ||||||
| 84,032 | American Water Works Co., Inc. | 7,174,652 | ||||||
| 66,940 | Atmos Energy Corp. | 6,033,972 | ||||||
| 179,843 | CMS Energy Corp. | 8,502,977 | ||||||
| 83,222 | Evergy, Inc. | 4,672,915 | ||||||
| 82,973 | PG&E Corp. | 3,531,331 | ||||||
| 106,268 | Pinnacle West Capital Corp. | 8,560,950 | ||||||
| 150,121 | Public Service Enterprise Group, Inc. | 8,127,551 | ||||||
| 52,277 | Sempra Energy | 6,069,882 | ||||||
| 189,098 | Xcel Energy, Inc. | 8,637,997 | ||||||
|
| |||||||
| 64,773,679 | ||||||||
|
| |||||||
| TOTAL COMMON STOCKS | ||||||||
| (Cost $575,140,425) | $ | 641,097,630 | ||||||
|
| |||||||
| Shares | Distribution Rate | Value | ||||||
| Investment Company(a) – 0.5% | ||||||||
Goldman Sachs Financial Square Government Fund — Institutional Shares |
| |||||||
| 2,977,536 | 1.869 | % | $ | 2,977,536 | ||||
| (Cost $2,977,536) | ||||||||
| ||||||||
| TOTAL INVESTMENTS – 98.8% | ||||||||
| (Cost $578,117,961) | $ | 644,075,166 | ||||||
| ||||||||
OTHER ASSETS IN EXCESS OF LIABILITIES – 1.2% |
| 7,685,900 | ||||||
| ||||||||
| NET ASSETS – 100.0% | $ | 651,761,066 | ||||||
| ||||||||
| The percentage shown for each investment category reflects the value of investments in that category as a percentage of net assets. | ||
| * | Non-income producing security. | |
| (a) | Represents an affiliated issuer. | |
| Investment Abbreviation: | ||
| REIT | —Real Estate Investment Trust | |
| The accompanying notes are an integral part of these financial statements. | 9 |
GOLDMAN SACHS VARIABLE INSURANCE TRUST MID CAP VALUE FUND
Statement of Assets and Liabilities
June 30, 2018 (Unaudited)
| Assets: | ||||
Investments in unaffiliated issuers, at value (cost $575,140,425) | $ | 641,097,630 | ||
Investments in affiliated issuers, at value (cost $2,977,536) | 2,977,536 | |||
Cash | 9,884,264 | |||
Receivables: | ||||
Investments sold | 13,857,699 | |||
Dividends | 1,096,405 | |||
Fund shares sold | 25,393 | |||
Other assets | 3,656 | |||
| Total assets | 668,942,583 | |||
| Liabilities: | ||||
Payables: | ||||
Investments purchased | 16,257,843 | |||
Management fees | 417,132 | |||
Fund shares redeemed | 330,871 | |||
Distribution and Service fees and Transfer Agency fees | 71,050 | |||
Accrued expenses | 104,621 | |||
| Total liabilities | 17,181,517 | |||
| Net Assets: | ||||
Paid-in capital | 553,111,172 | |||
Undistributed net investment income | 3,257,962 | |||
Accumulated net realized gain | 29,434,727 | |||
Net unrealized gain | 65,957,205 | |||
| NET ASSETS | $ | 651,761,066 | ||
Net Assets: | ||||
Institutional | $ | 362,942,336 | ||
Service | 288,818,730 | |||
Total Net Assets | $ | 651,761,066 | ||
Shares outstanding $0.001 par value (unlimited shares authorized): | ||||
Institutional | 21,352,249 | |||
Service | 16,987,563 | |||
Net asset value, offering and redemption price per share: | ||||
Institutional | $17.00 | |||
Service | 17.00 | |||
| 10 | The accompanying notes are an integral part of these financial statements. |
GOLDMAN SACHS VARIABLE INSURANCE TRUST MID CAP VALUE FUND
Statement of Operations
For the Six Months Ended June 30, 2018 (Unaudited)
| Investment income: | ||||
Dividends — unaffiliated issuers (net of foreign taxes withheld of $2,362) | $ | 5,181,781 | ||
Dividends — affiliated issuers | 38,216 | |||
Securities lending income — unaffiliated issuer | 1,432 | |||
| Total investment income | 5,221,429 | |||
| Expenses: | ||||
Management fees | 2,712,695 | |||
Distribution and Service fees — Service Shares | 394,782 | |||
Printing and mailing costs | 69,787 | |||
Transfer Agency fees(a) | 68,651 | |||
Professional fees | 42,199 | |||
Custody, accounting and administrative services | 40,280 | |||
Trustee fees | 9,458 | |||
Other | 12,151 | |||
| Total expenses | 3,350,003 | |||
Less — expense reductions | (76,016 | ) | ||
| Net expenses | 3,273,987 | |||
| NET INVESTMENT INCOME | 1,947,442 | |||
| Realized and unrealized gain (loss): | ||||
Net realized gain from investments — unaffiliated issuers (including commissions recaptured of $16,810) | 30,776,469 | |||
Net change in unrealized loss on investments — unaffiliated issuers | (32,758,811 | ) | ||
| Net realized and unrealized loss | (1,982,342 | ) | ||
| NET DECREASE IN NET ASSETS RESULTING FROM OPERATIONS | $ | (34,900 | ) | |
(a) Institutional and Service Shares incurred Transfer Agency fees of $37,071 and $31,580, respectively.
| The accompanying notes are an integral part of these financial statements. | 11 |
GOLDMAN SACHS VARIABLE INSURANCE TRUST MID CAP VALUE FUND
Statements of Changes in Net Assets
| For the Six Months Ended June 30, 2018 (Unaudited) | For the Fiscal Year Ended December 31, 2017 | |||||||
| From operations: | ||||||||
Net investment income | $ | 1,947,442 | $ | 4,650,381 | ||||
Net realized gain | 30,776,469 | 75,406,510 | ||||||
Net change in unrealized gain (loss) | (32,758,811 | ) | 850,845 | |||||
| Net increase (decrease) in net assets resulting from operations | (34,900 | ) | 80,907,736 | |||||
| Distributions to shareholders: | ||||||||
From net investment income | ||||||||
Institutional Shares | — | (2,801,151 | ) | |||||
Service Shares | — | (1,817,031 | ) | |||||
From net realized gains | ||||||||
Institutional Shares | — | (21,035,754 | ) | |||||
Service Shares | — | (20,579,574 | ) | |||||
| Total distributions to shareholders | — | (46,233,510 | ) | |||||
| From share transactions: | ||||||||
Proceeds from sales of shares | 27,742,682 | 25,661,942 | ||||||
Reinvestment of distributions | — | 46,233,510 | ||||||
Cost of shares redeemed | (145,827,711 | ) | (145,139,270 | ) | ||||
| Net decrease in net assets resulting from share transactions | (118,085,029 | ) | (73,243,818 | ) | ||||
| TOTAL DECREASE | (118,119,929 | ) | (38,569,592 | ) | ||||
| Net assets: | ||||||||
Beginning of period | 769,880,995 | 808,450,587 | ||||||
End of period | $ | 651,761,066 | $ | 769,880,995 | ||||
| Undistributed net investment income | $ | 3,257,962 | $ | 1,310,520 | ||||
| 12 | The accompanying notes are an integral part of these financial statements. |
GOLDMAN SACHS VARIABLE INSURANCE TRUST MID CAP VALUE FUND
Financial Highlights
Selected Data for a Share Outstanding Throughout Each Period
| Income (loss) from investment operations | Distributions to shareholders | |||||||||||||||||||||||||||||||||||||||||||||||||||||||
| Year - Share Class | Net asset value, beginning of period | Net investment income(a) | Net and gain (loss) | Total from investment operations | From net investment income | From realized gains | Total distributions | Net asset value, end of period | Total return(b) | Net assets, end of period (in 000s) | Ratio of net expenses to average net assets | Ratio of total expenses to average net assets | Ratio of net investment income | Portfolio turnover rate(c) | ||||||||||||||||||||||||||||||||||||||||||
FOR THE SIX MONTHS ENDED JUNE 30, (UNAUDITED) | ||||||||||||||||||||||||||||||||||||||||||||||||||||||||
2018 - Institutional | $ | 16.93 | $ | 0.06 | $ | 0.01 | $ | 0.07 | $ | — | $ | — | $ | — | $ | 17.00 | 0.47 | % | $ | 362,942 | 0.84 | %(d) | 0.86 | %(d) | 0.70 | %(d) | 60 | % | ||||||||||||||||||||||||||||
2018 - Service | 16.95 | 0.03 | 0.02 | 0.05 | — | — | — | 17.00 | 0.30 | 288,819 | 1.09 | (d) | 1.11 | (d) | 0.41 | (d) | 60 | |||||||||||||||||||||||||||||||||||||||
FOR THE FISCAL YEARS ENDED DECEMBER 31, | ||||||||||||||||||||||||||||||||||||||||||||||||||||||||
2017 - Institutional | 16.23 | 0.12 | 1.68 | 1.80 | (0.13 | ) | (0.97 | ) | (1.10 | ) | 16.93 | 11.07 | 388,709 | 0.84 | 0.87 | 0.71 | 134 | |||||||||||||||||||||||||||||||||||||||
2017 - Service | 16.25 | 0.08 | 1.68 | 1.76 | (0.09 | ) | (0.97 | ) | (1.06 | ) | 16.95 | 10.85 | 381,172 | 1.09 | 1.12 | 0.47 | 134 | |||||||||||||||||||||||||||||||||||||||
2016 - Institutional | 14.49 | 0.16 | 1.80 | 1.96 | (0.21 | ) | (0.01 | ) | (0.22 | ) | 16.23 | 13.49 | 437,085 | 0.84 | 0.87 | 1.08 | 149 | |||||||||||||||||||||||||||||||||||||||
2016 - Service | 14.51 | 0.12 | 1.81 | 1.93 | (0.18 | ) | (0.01 | ) | (0.19 | ) | 16.25 | 13.24 | 371,366 | 1.09 | 1.12 | 0.78 | 149 | |||||||||||||||||||||||||||||||||||||||
2015 - Institutional | 17.43 | 0.13 | (1.75 | ) | (1.62 | ) | (0.07 | ) | (1.25 | ) | (1.32 | ) | 14.49 | (9.24 | ) | 535,459 | 0.84 | 0.87 | 0.74 | 94 | ||||||||||||||||||||||||||||||||||||
2015 - Service | 17.45 | 0.08 | (1.75 | ) | (1.67 | ) | (0.02 | ) | (1.25 | ) | (1.27 | ) | 14.51 | (9.52 | ) | 265,545 | 1.09 | 1.12 | 0.48 | 94 | ||||||||||||||||||||||||||||||||||||
2014 - Institutional | 18.64 | 0.12 | 2.31 | 2.43 | (0.21 | ) | (3.43 | ) | (3.64 | ) | 17.43 | 13.57 | 692,068 | 0.83 | 0.87 | 0.62 | 88 | |||||||||||||||||||||||||||||||||||||||
2014 - Service | 18.66 | 0.07 | 2.31 | 2.38 | (0.16 | ) | (3.43 | ) | (3.59 | ) | 17.45 | 13.29 | 362,501 | 1.08 | 1.12 | 0.38 | 88 | |||||||||||||||||||||||||||||||||||||||
2013 - Institutional | 15.33 | 0.13 | 4.88 | 5.01 | (0.16 | ) | (1.54 | ) | (1.70 | ) | 18.64 | 32.89 | 695,832 | 0.83 | 0.86 | 0.74 | 108 | |||||||||||||||||||||||||||||||||||||||
2013 - Service | 15.35 | 0.09 | 4.88 | 4.97 | (0.12 | ) | (1.54 | ) | (1.66 | ) | 18.66 | 32.56 | 319,524 | 1.08 | 1.11 | 0.51 | 108 | |||||||||||||||||||||||||||||||||||||||
| (a) | Calculated based on the average shares outstanding methodology. |
| (b) | Assumes investment at the net asset value at the beginning of the period, reinvestment of all distributions, and a complete redemption of the investment at the net asset value at the end of the period. Total returns for periods less than one full year are not annualized. |
| (c) | The Fund’s portfolio turnover rate is calculated in accordance with regulatory requirements, without regard to transactions involving short term investments. If such transactions were included, the Fund’s portfolio turnover rate may be higher. |
| (d) | Annualized. |
| The accompanying notes are an integral part of these financial statements. | 13 |
GOLDMAN SACHS VARIABLE INSURANCE TRUST MID CAP VALUE FUND
Notes to Financial Statements
June 30, 2018 (Unaudited)
1. ORGANIZATION
Goldman Sachs Variable Insurance Trust (the “Trust” or “VIT”) is a Delaware statutory trust registered under the Investment Company Act of 1940, as amended (the “Act”), as an open-end management investment company. The Trust includes the Goldman Sachs Mid Cap Value Fund (the “Fund”). The Fund is a diversified portfolio under the Act offering two classes of shares — Institutional and Service Shares. Shares of the Trust are offered to separate accounts of participating life insurance companies for the purpose of funding variable annuity contracts and variable life insurance policies.
Goldman Sachs Asset Management, L.P. (“GSAM”), an affiliate of Goldman Sachs & Co. LLC (“Goldman Sachs”), serves as investment adviser to the Fund pursuant to a management agreement (the “Agreement”) with the Trust.
2. SIGNIFICANT ACCOUNTING POLICIES
The financial statements have been prepared in accordance with accounting principles generally accepted in the United States of America (“GAAP”) and require management to make estimates and assumptions that may affect the reported amounts and disclosures. Actual results may differ from those estimates and assumptions.
A. Investment Valuation — The Fund’s valuation policy is to value investments at fair value.
B. Investment Income and Investments — Investment income includes interest income, dividend income, and securities lending income, if any. Interest income is accrued daily and adjusted for amortization of premiums and accretion of discounts. Dividend income is recognized on ex-dividend date or, for certain foreign securities, as soon as such information is obtained subsequent to the ex-dividend date. Investment transactions are reflected on trade date. Realized gains and losses are calculated using identified cost. Investment transactions are recorded on the following business day for daily net asset value (“NAV”) calculations. Investment income is recorded net of any foreign withholding taxes, less any amounts reclaimable. The Fund may file withholding tax reclaims in certain jurisdictions to recover a portion of amounts previously withheld. Any foreign capital gains tax is accrued daily based upon net unrealized gains, and is payable upon sale of such investments. Distributions received from the Fund’s investments in United States (“U.S.”) real estate investment trusts (“REITs”) may be characterized as ordinary income, net capital gain or a return of capital. A return of capital is recorded by the Fund as a reduction to the cost basis of the REIT.
C. Class Allocations and Expenses — Investment income, realized and unrealized gain (loss), if any, and non-class specific expenses of the Fund are allocated daily based upon the proportion of net assets of each class. Non-class specific expenses directly incurred by the Fund are charged to the Fund, while such expenses incurred by the Trust are allocated across the Fund on a straight-line and/or pro-rata basis depending upon the nature of the expenses. Class specific expenses, where applicable, are borne by the respective share classes and include Distribution and Service and Transfer Agency fees.
D. Federal Taxes and Distributions to Shareholders — It is the Fund’s policy to comply with the requirements of the Internal Revenue Code of 1986, as amended (the “Code”), applicable to regulated investment companies (mutual funds) and to distribute each year substantially all of its investment company taxable income and capital gains to its shareholders. Accordingly, the Fund is not required to make any provisions for the payment of federal income tax. Distributions to shareholders are recorded on the ex-dividend date. Income and capital gains distributions, if any, are declared and paid annually.
Net capital losses, if any, are carried forward to future fiscal years and may be used to the extent allowed by the Code to offset any future capital gains. Losses that are carried forward will retain their character as either short-term or long-term capital losses. Utilization of capital loss carryforwards will reduce the requirement of future capital gains distributions.
The characterization of distributions to shareholders for financial reporting purposes is determined in accordance with federal income tax rules, which may differ from GAAP. The source of the Fund’s distributions may be shown in the accompanying financial statements as either from net investment income, net realized gain or capital. Certain components of the Fund’s net assets on the Statement of Assets and Liabilities reflect permanent GAAP/tax differences based on the appropriate tax character.
E. Commission Recapture — GSAM, on behalf of certain Funds, may direct portfolio trades, subject to seeking best execution, to various brokers who have agreed to rebate a portion of the commissions generated. Such rebates are made directly to the Fund as cash payments and are included in net realized gain (loss) from investments on the Statement of Operations.
14
GOLDMAN SACHS VARIABLE INSURANCE TRUST MID CAP VALUE FUND
3. INVESTMENTS AND FAIR VALUE MEASUREMENTS
U.S. GAAP defines the fair value of a financial instrument as the amount that would be received to sell an asset or paid to transfer a liability in an orderly transaction between market participants at the measurement date (i.e., the exit price); the Fund’s policy is to use the market approach. GAAP establishes a fair value hierarchy that prioritizes the inputs to valuation techniques used to measure fair value. The hierarchy gives the highest priority to unadjusted quoted prices in active markets for identical assets or liabilities (Level 1 measurements) and the lowest priority to unobservable inputs (Level 3 measurements). The levels used for classifying investments are not necessarily an indication of the risk associated with investing in these investments. The three levels of the fair value hierarchy are described below:
Level 1 — Unadjusted quoted prices in active markets that are accessible at the measurement date for identical, unrestricted assets or liabilities;
Level 2 — Quoted prices in markets that are not active or financial instruments for which significant inputs are observable (including, but not limited to, quoted prices for similar investments, interest rates, foreign exchange rates, volatility and credit spreads), either directly or indirectly;
Level 3 — Prices or valuations that require significant unobservable inputs (including GSAM’s assumptions in determining fair value measurement).
Changes in valuation techniques may result in transfers into or out of an assigned level within the hierarchy. In accordance with the Fund’s policy, transfers between different levels of the fair value hierarchy resulting from such changes are deemed to have occurred as of the beginning of the reporting period.
The Board of Trustees (“Trustees”) has approved Valuation Procedures that govern the valuation of the portfolio investments held by the Fund, including investments for which market quotations are not readily available. The Trustees have delegated to GSAM day-to-day responsibility for implementing and maintaining internal controls and procedures related to the valuation of the Fund’s investments. To assess the continuing appropriateness of pricing sources and methodologies, GSAM regularly performs price verification procedures and issues challenges as necessary to third party pricing vendors or brokers, and any differences are reviewed in accordance with the Valuation Procedures.
A. Level 1 and Level 2 Fair Value Investments — The valuation techniques and significant inputs used in determining the fair values for investments classified as Level 1 and Level 2 are as follows:
Equity Securities — Equity securities traded on a U.S. securities exchange or the NASDAQ system, or those located on certain foreign exchanges, including but not limited to the Americas, are valued daily at their last sale price or official closing price on the principal exchange or system on which they are traded. If there is no sale or official closing price or such price is believed by GSAM to not represent fair value, equity securities are valued at the last bid price for long positions and at the last ask price for short positions. To the extent these investments are actively traded, they are classified as Level 1 of the fair value hierarchy, otherwise they are generally classified as Level 2.
Unlisted equity securities for which market quotations are available are valued at the last sale price on the valuation date, or if no sale occurs, at the last bid price, and are generally classified as Level 2. Securities traded on certain foreign securities exchanges are valued daily at fair value determined by an independent fair value service (if available) under Valuation Procedures approved by the Trustees and consistent with applicable regulatory guidance. The independent fair value service takes into account multiple factors including, but not limited to, movements in the securities markets, certain depositary receipts, futures contracts and foreign currency exchange rates that have occurred subsequent to the close of the foreign securities exchange. These investments are generally classified as Level 2 of the fair value hierarchy.
Money Market Funds — Investments in the Goldman Sachs Financial Square Government Fund (“Underlying Fund”) are valued at the NAV of the Institutional Share class on the day of valuation. These investments are generally classified as Level 1 of the fair value hierarchy. For information regarding an Underlying Fund’s accounting policies and investment holdings, please see the Underlying Fund’s shareholder report.
15
GOLDMAN SACHS VARIABLE INSURANCE TRUST MID CAP VALUE FUND
Notes to Financial Statements (continued)
June 30, 2018 (Unaudited)
3. INVESTMENTS AND FAIR VALUE MEASUREMENTS (continued)
B. Level 3 Fair Value Investments — To the extent that significant inputs to valuation models and other alternative pricing sources are unobservable, or if quotations are not readily available, or if GSAM believes that such quotations do not accurately reflect fair value, the fair value of the Fund’s investments may be determined under Valuation Procedures approved by the Trustees. GSAM, consistent with its procedures and applicable regulatory guidance, may make an adjustment to the most recent valuation prices of either domestic or foreign securities in light of significant events to reflect what it believes to be the fair value of the securities at the time of determining the Fund’s NAV. Significant events which could affect a large number of securities in a particular market may include, but are not limited to: significant fluctuations in U.S. or foreign markets; market dislocations; market disruptions; or unscheduled market closings. Significant events which could also affect a single issuer may include, but are not limited to: corporate actions such as reorganizations, mergers and buy-outs; ratings downgrades; and bankruptcies.
C. Fair Value Hierarchy — The following is a summary of the Fund’s investments classified in the fair value hierarchy as of June 30, 2018:
| Investment Type | Level 1 | Level 2 | Level 3 | |||||||||
| Assets | ||||||||||||
| Common Stock and/or Other Equity Investments(a) | ||||||||||||
Asia | $ | 3,900,851 | $ | — | $ | — | ||||||
North America | 631,529,978 | — | — | |||||||||
Europe | 5,666,801 | — | — | |||||||||
| Investment Company | 2,977,536 | — | — | |||||||||
| Total | $ | 644,075,166 | $ | — | $ | — | ||||||
| (a) | Amounts are disclosed by continent to highlight the impact of time zone differences between local market close and the calculation of NAV. Security valuations are based on the principal exchange or system on which they are traded, which may differ from country of domicile. |
For further information regarding security characteristics, see the Schedule of Investments.
4. AGREEMENTS AND AFFILIATED TRANSACTIONS
A. Management Agreement — Under the Agreement, GSAM manages the Fund, subject to the general supervision of the Trustees.
As compensation for the services rendered pursuant to the Agreement, the assumption of the expenses related thereto and administration of the Fund’s business affairs, including providing facilities, GSAM is entitled to a management fee, accrued daily and paid monthly, equal to an annual percentage rate of the Fund’s average daily net assets.
As of June 30, 2018, contractual management fees with GSAM were at the following rates. The effective contractual management rate and effective net management rate represent the rates for the six month period ended June 30, 2018.
| Contractual Management Rate | ||||||||||||||||||||||
First $2 billion | Next $3 billion | Next $3 billion | Over $8 billion | Effective Rate | Effective Net Management Rate^ | |||||||||||||||||
| 0.77% | 0.69 | % | 0.66 | % | 0.65 | % | 0.79 | % | 0.77 | % | ||||||||||||
| ^ | Effective Net Management Rate includes the impact of management fee waivers of affiliated Underlying Funds, if any. The Effective Net Management Fee Rate may not correlate to the Contractual Management Rate as a result of management fee waivers that may be in effect from time to time. For the six months ended June 30, 2018, GSAM waived $69,396 of its management fee. |
Prior to April 30, 2018, the contractual management fee rate for the Fund was as stated below and GSAM agreed to waive a
portion of its management fee in order to achieve an Effective Net Management Rate as set forth in the Fund’s prospectus dated
April 28, 2017.
16
GOLDMAN SACHS VARIABLE INSURANCE TRUST MID CAP VALUE FUND
4. AGREEMENTS AND AFFILIATED TRANSACTIONS (continued)
First $2 billion | Next $3 billion | Next $3 billion | Over $8 billion | |||||||||||
| 0.80% | 0.72 | % | 0.68 | % | 0.67 | % | ||||||||
The Fund invests in Institutional Shares of the Goldman Sachs Financial Square Government Fund, which is an affiliated Underlying Fund. GSAM has agreed to waive a portion of its management fee payable by the Fund in an amount equal to the management fee it earns as an investment adviser to the affiliated Underlying Fund in which the Fund invests, except those management fees it earns from the Fund’s investments of cash collateral received in connection with securities lending transactions in the Goldman Sachs Financial Square Government Fund. For the six months ended June 30, 2018, GSAM waived $3,861 of the Fund’s management fee.
B. Distribution and Service (12b-1) Plan — The Trust, on behalf of Service Shares of the Fund, has adopted a Distribution and Service Plan subject to Rule 12b-1 under the Act. Under the Distribution and Service Plan, Goldman Sachs, which serves as distributor, is entitled to a fee accrued daily and paid monthly, for distribution services and personal and account maintenance services, which may then be paid by Goldman Sachs to authorized dealers, equal to, on an annual basis, 0.25% of the Fund’s average daily net assets attributable to Service Shares.
C. Transfer Agency Agreement — Goldman Sachs also serves as the transfer agent of the Fund for a fee pursuant to the Transfer Agency Agreement. The fees charged for such transfer agency services are accrued daily and paid monthly at an annual rate of 0.02% of the average daily net assets of Institutional and Service Shares.
D. Other Expense Agreements and Affiliated Transactions — GSAM has agreed to limit certain “Other Expenses” of the Fund (excluding acquired fund fees and expenses, transfer agency fees and expenses, service fees and shareholder administration fees (as applicable), taxes, interest, brokerage fees, expenses of shareholder meetings, litigation and indemnification, and extraordinary expenses) to the extent such expenses exceed, on an annual basis, a percentage rate of the average daily net assets of the Fund. Such Other Expense reimbursements, if any, are accrued daily and paid monthly. In addition, the Fund is not obligated to reimburse GSAM for prior fiscal year expense reimbursements, if any. The Other Expense limitation as an annual percentage rate of average daily net assets for the Fund is 0.054%. The Other Expense limitation will remain in place through at least April 30, 2019, and prior to such date GSAM may not terminate the arrangement without the approval of the Trustees. For the six months ended June 30, 2018, GSAM did not reimburse the Fund. In addition, the Fund has entered into certain offset arrangements with the custodian and the transfer agent, which may result in a reduction of the Fund’s expenses and are received irrespective of the application of the “Other Expense” limitation described above. For the six months ended June 30, 2018, custody fee credits were $2,759.
E. Line of Credit Facility — As of June 30, 2018, the Fund participated in a $770,000,000 committed, unsecured revolving line of credit facility (the “facility”) together with other funds of the Trust and certain registered investment companies having management agreements with GSAM or its affiliates. This facility is to be used for temporary emergency purposes, or to allow for an orderly liquidation of securities to meet redemption requests. The interest rate on borrowings is based on the federal funds rate. The facility also requires a fee to be paid by the Fund based on the amount of the commitment that has not been utilized. For the six months ended June 30, 2018, the Fund did not have any borrowings under the facility. Prior to May 1, 2018 the facility was $1,100,000,000. The facility was decreased to $770,000,000 effective May 1, 2018.
F. Other Transactions with Affiliates — For the six months ended June 30, 2018, Goldman Sachs earned $7,043 in brokerage commissions from portfolio transactions.
17
GOLDMAN SACHS VARIABLE INSURANCE TRUST MID CAP VALUE FUND
Notes to Financial Statements (continued)
June 30, 2018 (Unaudited)
4. AGREEMENTS AND AFFILIATED TRANSACTIONS (continued)
The following table provides information about the Fund’s investment in the Goldman Sachs Financial Square Government Fund as of and for the six months ended June 30, 2018:
| Beginning Value as of December 31, 2017 | Purchases at Cost | Proceeds from Sales | Ending Value as of June 30, 2018 | Shares as of June 30, 2018 | Dividend Income from Affiliated Investment Company | |||||||||||||||||
| $— | $ | 89,149,261 | $ | (86,171,725 | ) | $ | 2,977,536 | 2,977,536 | $ | 38,216 | ||||||||||||
5. PORTFOLIO SECURITIES TRANSACTIONS
The cost of purchases and proceeds from sales and maturities of long-term securities for the six months ended June 30, 2018, were $408,687,005 and $516,565,077, respectively.
6. SECURITIES LENDING
The Fund may lend its securities through a securities lending agent, the Bank of New York Mellon (“BNYM”), to certain qualified borrowers. In accordance with the Fund’s securities lending procedures, the Fund receives cash collateral at least equal to the market value of the securities on loan. The market value of the loaned securities is determined at the close of business of the Fund, at their last sale price or official closing price on the principal exchange or system on which they are traded, and any additional required collateral is delivered to the Fund on the next business day. As with other extensions of credit, the Fund may experience delay in the recovery of its securities or incur a loss should the borrower of the securities breach its agreement with the Fund or become insolvent at a time when the collateral is insufficient to cover the cost of repurchasing securities on loan. Dividend income received from securities on loan may not be subject to withholding taxes and therefore withholding taxes paid may differ from the amounts listed in the Statement of Operations. Loans of securities are terminable at any time and as such 1) the remaining contractual maturities of the outstanding securities lending transactions are considered to be overnight and continuous and 2) the borrower, after notice, is required to return borrowed securities within the standard time period for settlement of securities transactions.
The Fund invests the cash collateral received in connection with securities lending transactions in the Goldman Sachs Financial Square Government Fund (“Government Money Market Fund”), an affiliated series of the Goldman Sachs Trust. The Government Money Market Fund is registered under the Act as an open end investment company, is subject to Rule 2a-7 under the Act, and is managed by GSAM, for which GSAM may receive a management fee of up to 0.16% (prior to February 21, 2018, GSAM may have received a management fee of up to 0.205%) on an annualized basis of the average daily net assets of the Government Money Market Fund.
In the event of a default by a borrower with respect to any loan, BNYM may exercise any and all remedies provided under the applicable borrower agreement to make the Fund whole. These remedies include purchasing replacement securities by applying the collateral held from the defaulting broker against the purchase cost of the replacement securities. If BNYM is unable to purchase replacement securities, BNYM will indemnify the Fund by paying the Fund an amount equal to the market value of the securities loaned minus the value of cash collateral received from the borrower for the loan, subject to an exclusion for any shortfalls resulting from a loss of value in such cash collateral due to reinvestment risk. The Fund’s loaned securities were all subject to enforceable Securities Lending Agreements and the value of the collateral was at least equal to the value of the cash received. The amounts of the Fund’s overnight and continuous agreements represent the gross amounts of recognized liabilities for securities lending transactions outstanding as of June 30, 2018 are disclosed as “Payable upon return of securities loaned” on the Statement of Assets and Liabilities, where applicable. The Fund did not have securities on loan as of June 30, 2018.
18
GOLDMAN SACHS VARIABLE INSURANCE TRUST MID CAP VALUE FUND
6. SECURITIES LENDING (continued)
Both the Fund and BNYM received compensation relating to the lending of the Fund’s securities. The amounts earned, if any, by the Fund for the six months ended June 30, 2018, are reported under Investment Income on the Statement of Operations.
The following table provides information about the Fund’s investment in the Government Money Market Fund for the six months ended June 30, 2018:
Market Value December 31, 2017 | Purchases at Cost | Proceeds from Sales | Market Value June 30, 2018 | |||||||||||
| $— | $ | 30,226,379 | $ | (30,226,379 | ) | $ | — | |||||||
7. TAX INFORMATION
As of the Fund’s most recent fiscal year end, December 31, 2017, the Fund’s certain timing differences, on a tax-basis were as follows:
| Timing differences (Deferred Dividend) | $ | 381,636 |
As of June 30, 2018, the Fund’s aggregate security unrealized gains and losses based on cost for U.S. federal income tax purposes were as follows:
| Tax cost | $ | 583,787,541 | ||
| Gross unrealized gain | 77,305,311 | |||
| Gross unrealized loss | (17,017,686 | ) | ||
| Net unrealized gain | $ | 60,287,625 |
The difference between GAAP-basis and tax-basis unrealized gains (losses) is attributable primarily to wash sales and differences in the tax treatment of underlying fund investments.
GSAM has reviewed the Fund’s tax positions for all open tax years (the current and prior three years, as applicable) and has concluded that no provision for income tax is required in the Fund’s financial statements. Such open tax years remain subject to examination and adjustment by tax authorities.
8. OTHER RISKS
The Fund’s risks include, but are not limited to, the following:
Foreign Countries Risk — Investing in foreign markets may involve special risks and considerations not typically associated with investing in the U. S. Foreign securities may be subject to risk of loss because of more or less foreign government regulation, less public information and less economic, political and social stability in the countries in which the Fund invests. The imposition of exchange controls (including repatriation restrictions), confiscations, trade restrictions (including tariffs) and other government restrictions by the U.S. or other governments, or from problems in share registration, settlement or custody, may also result in losses. Foreign risk also involves the risk of negative foreign currency rate fluctuations, which may cause the value of securities denominated in such foreign currency (or other instruments through which the Fund has exposure to foreign currencies) to decline in value. Currency exchange rates may fluctuate significantly over short periods of time.
Foreign Custody Risk — If the Fund invests in foreign securities, the Fund may hold such securities and cash with foreign banks, agents, and securities depositories appointed by the Fund’s custodian (each a “Foreign Custodian”). Some foreign custodians may be recently organized or new to the foreign custody business. In some countries, Foreign Custodians may be subject to little or no
19
GOLDMAN SACHS VARIABLE INSURANCE TRUST MID CAP VALUE FUND
Notes to Financial Statements (continued)
June 30, 2018 (Unaudited)
8. OTHER RISKS (continued)
regulatory oversight over, or independent evaluation of, their operations. Further, the laws of certain countries may place limitations on the Fund’s ability to recover its assets if a Foreign Custodian enters bankruptcy.
Geographic Risk — If the Fund focuses its investments in securities of issuers located in a particular country or geographic region, the Fund may be subjected, to a greater extent than if its investments were less focused, to the risks of volatile economic cycles and/or conditions and developments that may be particular to that country or region, such as: adverse securities markets; adverse exchange rates; adverse social, political, regulatory, economic, business, environmental or other developments; or natural disasters.
Investments in Other Investment Companies Risk — As a shareholder of another investment company, including an exchange-traded fund (“ETF”), the Fund will indirectly bear its proportionate share of any net management fees and other expenses paid by such other investment companies, in addition to the fees and expenses regularly borne by the Fund. ETFs are subject to risks that do not apply to conventional mutual funds, including but not limited to the following: (i) the market price of the ETF’s shares may trade at a premium or a discount to their NAV; and (ii) an active trading market for an ETF’s shares may not develop or be maintained.
Large Shareholder Transactions Risk — The Fund may experience adverse effects when certain large shareholders, such as other funds, participating insurance companies, accounts and Goldman Sachs affiliates, purchase or redeem large amounts of shares of the Fund. Such large shareholder redemptions may cause the Fund to sell portfolio securities at times when it would not otherwise do so, which may negatively impact the Fund’s NAV and liquidity. These transactions may also accelerate the realization of taxable income to shareholders if such sales of investments resulted in gains, and may also increase transaction costs. In addition, a large redemption could result in the Fund’s current expenses being allocated over a smaller asset base, leading to an increase in the Fund’s expense ratio. Similarly, large Fund share purchases may adversely affect the Fund’s performance to the extent that the Fund is delayed in investing new cash and is required to maintain a larger cash position than it ordinarily would.
Liquidity Risk — The Fund may make investments that are illiquid or that may become less liquid in response to market developments or adverse investor perceptions. Illiquid investments may be more difficult to value. Liquidity risk may also refer to the risk that the Fund will not be able to pay redemption proceeds within the allowable time period because of unusual market conditions, an unusually high volume of redemption requests, or other reasons. To meet redemption requests, the Fund may be forced to sell investments at an unfavorable time and/or under unfavorable conditions.
Market and Credit Risks — In the normal course of business, the Fund trades financial instruments and enters into financial transactions where risk of potential loss exists due to changes in the market (market risk). Additionally, the Fund may also be exposed to credit risk in the event that an issuer or guarantor fails to perform or that an institution or entity with which the Fund has unsettled or open transactions defaults.
9. INDEMNIFICATIONS
Under the Trust’s organizational documents, its Trustees, officers, employees and agents are indemnified, to the extent permitted by the Act and state law, against certain liabilities that may arise out of performance of their duties to the Fund. Additionally, in the course of business, the Fund enters into contracts that contain a variety of indemnification clauses. The Fund’s maximum exposure under these arrangements is unknown, as this would involve future claims that may be made against the Fund that have not yet occurred. However, GSAM believes the risk of loss under these arrangements to be remote.
20
GOLDMAN SACHS VARIABLE INSURANCE TRUST MID CAP VALUE FUND
10. SUBSEQUENT EVENTS
Subsequent events after the Statement of Assets and Liabilities date have been evaluated, and GSAM has concluded that there is no impact requiring adjustment or disclosure in the financial statements.
11. SUMMARY OF SHARE TRANSACTIONS
Share activity is as follows:
| For the Six Months Ended June 30, 2018 (Unaudited) | For the Fiscal Year Ended December 31, 2017 | |||||||||||||||
| Shares | Dollars | Shares | Dollars | |||||||||||||
| Institutional Shares | ||||||||||||||||
| Shares sold | 259,413 | $ | 4,356,375 | 705,644 | $ | 11,893,865 | ||||||||||
| Reinvestment of distributions | — | — | 1,418,863 | 23,836,905 | ||||||||||||
| Shares redeemed | (1,873,274 | ) | (31,670,133 | ) | (6,089,122 | ) | (102,715,737 | ) | ||||||||
| (1,613,861 | ) | (27,313,758 | ) | (3,964,615 | ) | (66,984,967 | ) | |||||||||
| Service Shares | ||||||||||||||||
| Shares sold | 1,391,245 | 23,386,307 | 816,894 | 13,768,077 | ||||||||||||
| Reinvestment of distributions | — | — | 1,330,755 | 22,396,605 | ||||||||||||
| Shares redeemed | (6,892,889 | ) | (114,157,578 | ) | (2,508,559 | ) | (42,423,533 | ) | ||||||||
| (5,501,644 | ) | (90,771,271 | ) | (360,910 | ) | (6,258,851 | ) | |||||||||
| NET DECREASE | (7,115,505 | ) | $ | (118,085,029 | ) | (4,325,525 | ) | $ | (73,243,818 | ) | ||||||
21
GOLDMAN SACHS VARIABLE INSURANCE TRUST MID CAP VALUE FUND
| Fund Expenses — Six Month Period Ended June 30, 2018 (Unaudited) |
As a shareholder of Institutional or Service Shares of the Fund, you incur ongoing costs, including management fees, distribution and/or service (12b-1) fees (with respect to Service Shares) and other Fund expenses. This example is intended to help you understand your ongoing costs (in dollars) of investing in the Institutional Shares and Service Shares of the Fund and to compare these costs with the ongoing costs of investing in other mutual funds.
The example is based on an investment of $1,000 invested at the beginning of the period and held for the entire period from January 1, 2018 through June 30, 2018, which represents a period of 181 days of a 365 day year.
Actual Expenses — The first line under each share class in the table below provides information about actual account values and actual expenses. You may use the information in this line, together with the amount you invested, to estimate the expenses that you paid over the period. Simply divide your account value by $1,000 (for example, an $8,600 account value divided by $1,000=8.6), then multiply the result by the number in the first line under the heading entitled “Expenses Paid” to estimate the expenses you paid on your account during this period.
Hypothetical Example for Comparison Purposes — The second line under each share class in the table below provides information about hypothetical account values and hypothetical expenses based on the Fund’s actual net expense ratio and an assumed rate of return of 5% per year before expenses, which is not the Fund’s actual return. The hypothetical account values and expenses may not be used to estimate the actual ending account balance or expenses you paid for the period. You may use this information to compare the ongoing costs of investing in the Fund and other funds. To do so, compare this 5% hypothetical example with the 5% hypothetical examples that appear in the shareholder reports of the other funds.
Please note that the expenses shown in the table are meant to highlight your ongoing costs only. As a shareholder of the Fund you do not incur any transaction costs, such as sales charges, redemption fees, or exchange fees, but shareholders of other funds may incur such costs. The second line of the table is useful in comparing ongoing costs only and will not help you determine the relative total costs of owning different funds whose shareholders may incur transaction costs.
| Share Class | Beginning Account Value 01/01/18 | Ending Account Value 06/30/18 | Expenses Paid for the 6 Months Ended 06/30/18* | |||||||||
| Institutional | ||||||||||||
| Actual | $ | 1,000 | $ | 1,004.70 | $ | 4.18 | ||||||
| Hypothetical 5% return | 1,000 | 1,020.63 | + | 4.21 | ||||||||
| Service | ||||||||||||
| Actual | 1,000 | $ | 1,003.00 | 5.41 | ||||||||
| Hypothetical 5% return | 1,000 | 1,019.39 | + | 5.46 | ||||||||
| + | Hypothetical expenses are based on the Fund’s actual annualized net expense ratios and an assumed rate of return of 5% per year before expenses. |
| * | Expenses are calculated using the Fund’s annualized net expense ratio for each class, which represents the ongoing expenses as a percentage of net assets for the six months ended June 30, 2018. Expenses are calculated by multiplying the annualized net expense ratio by the average account value for the period; then multiplying the result by the number of days in the most recent fiscal half year; and then dividing that result by the number of days in the fiscal year. The annualized net expense ratios for the period were 0.84% and 1.09% for Institutional and Service Shares, respectively. |
22
GOLDMAN SACHS VARIABLE INSURANCE TRUST MID CAP VALUE FUND
Statement Regarding Basis for Approval of Management Agreement (Unaudited)
Background
The Goldman Sachs Mid Cap Value Fund (the “Fund”) is an investment portfolio of Goldman Sachs Variable Insurance Trust (the “Trust”). The Board of Trustees oversees the management of the Trust and reviews the investment performance and expenses of the Fund at regularly scheduled meetings held throughout the year. In addition, the Board of Trustees determines annually whether to approve the continuance of the Trust’s investment management agreement (the “Management Agreement”) with Goldman Sachs Asset Management, L.P. (the “Investment Adviser”) on behalf of the Fund.
The Management Agreement was most recently approved for continuation until June 30, 2019 by the Board of Trustees, including those Trustees who are not parties to the Management Agreement or “interested persons” (as defined in the Investment Company Act of 1940, as amended) of any party thereto (the “Independent Trustees”), at a meeting held on June 13-14, 2018 (the “Annual Meeting”).
The review process undertaken by the Trustees spans the course of the year and culminates with the Annual Meeting. To assist the Trustees in their deliberations, the Trustees have established a Contract Review Committee (the “Committee”), comprised of the Independent Trustees. The Committee held four meetings over the course of the year since the Management Agreement was last approved. At those Committee meetings, regularly scheduled Board or other committee meetings, and/or the Annual Meeting, matters relevant to the renewal of the Management Agreement were considered by the Board, or the Independent Trustees, as applicable. With respect to the Fund, such matters included:
| (a) | the nature and quality of the advisory, administrative, and other services provided to the Fund by the Investment Adviser and its affiliates, including information about: |
| (i) | the structure, staff, and capabilities of the Investment Adviser and its portfolio management teams; |
| (ii) | the groups within the Investment Adviser and its affiliates that support the portfolio management teams or provide other types of necessary services, including fund services groups (e.g., accounting and financial reporting, tax, shareholder services, and operations); controls and risk management groups (e.g., legal, compliance, valuation oversight, credit risk management, internal audit, compliance testing, market risk analysis, finance, and central funding); sales and distribution support groups, and others (e.g., information technology and training); |
| (iii) | trends in employee headcount; |
| (iv) | the Investment Adviser’s financial resources and ability to hire and retain talented personnel and strengthen its operations; and |
| (v) | the parent company’s support of the Investment Adviser and its mutual fund business, as expressed by the firm’s senior management; |
| (b) | information on the investment performance of the Fund, including comparisons to the performance of similar mutual funds, as provided by a third-party mutual fund data provider engaged as part of the contract review process (the “Outside Data Provider”), a benchmark performance index and a composite of accounts with comparable investment strategies managed by the Investment Adviser; and information on general investment outlooks in the markets in which the Fund invests; |
| (c) | information provided by the Investment Adviser indicating the Investment Adviser’s views on whether the Fund’s peer group and/or benchmark index had high, medium, or low relevance given the Fund’s particular investment strategy; |
| (d) | the terms of the Management Agreement and other agreements with affiliated service providers entered into by the Trust on behalf of the Fund; |
| (e) | fee and expense information for the Fund, including: |
| (i) | the relative management fee and expense levels of the Fund as compared to those of comparable funds managed by other advisers, as provided by the Outside Data Provider; |
| (ii) | the Fund’s expense trends over time; and |
| (iii) | to the extent the Investment Adviser manages other types of accounts (such as bank collective trusts, private wealth management accounts, institutional separate accounts, sub-advised mutual funds, and non-U.S. funds) having investment objectives and policies similar to those of the Fund, comparative information on the advisory fees charged and services provided to those accounts by the Investment Adviser; |
| (f) | with respect to the extensive investment performance and expense comparison data provided by the Outside Data Provider, its processes in producing that data for the Fund; |
| (g) | the undertakings of the Investment Adviser and its affiliates to implement fee waivers and/or expense limitations; |
| (h) | information relating to the profitability of the Management Agreement and the transfer agency and distribution and service arrangements of the Fund to the Investment Adviser and its affiliates; |
| (i) | whether the Fund’s existing management fee schedule adequately addressed any economies of scale; |
23
GOLDMAN SACHS VARIABLE INSURANCE TRUST MID CAP VALUE FUND
Statement Regarding Basis for Approval of Management Agreement (Unaudited) (continued)
| (j) | a summary of the “fall-out” benefits derived by the Investment Adviser and its affiliates from their relationships with the Fund, including the fees received by the Investment Adviser’s affiliates from the Fund for transfer agency, portfolio trading, distribution and other services; |
| (k) | a summary of potential benefits derived by the Fund as a result of its relationship with the Investment Adviser; |
| (l) | information regarding commissions paid by the Fund and broker oversight, an update on the Investment Adviser’s soft dollars practices, other information regarding portfolio trading, and how the Investment Adviser carries out its duty to seek best execution; |
| (m) | the manner in which portfolio manager compensation is determined; and the number and types of accounts managed by the portfolio managers; |
| (n) | the nature and quality of the services provided to the Fund by its unaffiliated service providers, and the Investment Adviser’s general oversight and evaluation (including reports on due diligence) of those service providers as part of the administrative services provided under the Management Agreement; and |
| (o) | the Investment Adviser’s processes and policies addressing various types of potential conflicts of interest; its approach to risk management; the annual review of the effectiveness of the Fund’s compliance program; and periodic compliance reports. |
The Trustees also received an overview of the Fund’s distribution arrangements. They received information regarding the Fund’s assets, share purchase and redemption activity, and payment of distribution and service fees. Information was also provided to the Trustees relating to revenue sharing payments made by and services provided by the Investment Adviser and its affiliates to intermediaries that promote the sale, distribution, and/or servicing of Fund shares. The Independent Trustees also discussed the broad range of other investment choices that are available to Fund investors, including the availability of comparable funds managed by other advisers.
The presentations made at the Board and Committee meetings and at the Annual Meeting encompassed the Fund and other mutual funds for which the Board of Trustees has responsibility. In evaluating the Management Agreement at the Annual Meeting, the Trustees relied upon their knowledge, resulting from their meetings and other interactions throughout the year, of the Investment Adviser and its affiliates, their services, and the Fund. In conjunction with these meetings, the Trustees received written materials and oral presentations on the topics covered, and the Investment Adviser addressed the questions and concerns of the Trustees, including concerns regarding the investment performance of certain of the funds they oversee. The Independent Trustees were advised by their independent legal counsel regarding their responsibilities and other regulatory requirements related to the approval and continuation of mutual fund investment management agreements under applicable law. In addition, the Investment Adviser and its affiliates provided the Independent Trustees with a written response to a formal request for information sent on behalf of the Independent Trustees by their independent legal counsel. During the course of their deliberations, the Independent Trustees met in executive sessions with their independent legal counsel, without representatives of the Investment Adviser or its affiliates present.
Nature, Extent, and Quality of the Services Provided Under the Management Agreement
As part of their review, the Trustees considered the nature, extent, and quality of the services provided to the Fund by the Investment Adviser. In this regard, the Trustees considered both the investment advisory services and non-advisory services that are provided by the Investment Adviser and its affiliates. The Trustees noted the transition in the leadership and changes in personnel of various of the Investment Adviser’s portfolio management teams that had occurred in recent periods, and the ongoing recruitment efforts aimed at bringing high quality investment talent to the Investment Adviser. They also noted the Investment Adviser’s commitment to maintaining high quality systems and expending substantial resources to respond to ongoing changes to the regulatory and control environment in which the Fund and its service providers operate, as well as the efforts of the Investment Adviser and its affiliates to combat cyber security risks. The Trustees concluded that the Investment Adviser continued to commit substantial financial and operational resources to the Fund and expressed confidence that the Investment Adviser would continue to do so in the future. The Trustees also recognized that the Investment Adviser had made significant commitments to address regulatory compliance requirements applicable to the Fund and the Investment Adviser and its affiliates.
Investment Performance
The Trustees also considered the investment performance of the Fund. In this regard, they compared the investment performance of the Fund to its peers using rankings and ratings compiled by the Outside Data Provider as of December 31, 2017, and updated performance information prepared by the Investment Adviser using the peer group identified by the Outside Data Provider as of March 31, 2018. The information on the Fund’s investment performance was provided for the one-, three-, five-, and
24
GOLDMAN SACHS VARIABLE INSURANCE TRUST MID CAP VALUE FUND
Statement Regarding Basis for Approval of Management Agreement (Unaudited) (continued)
ten-year periods ending on the applicable dates. The Trustees also reviewed the Fund’s investment performance relative to its performance benchmark. As part of this review, they considered the investment performance trends of the Fund over time, and reviewed the investment performance of the Fund in light of its investment objective and policies and market conditions. The Trustees also received information comparing the Fund’s performance to that of a composite of accounts with comparable investment strategies managed by the Investment Adviser.
In addition, the Trustees considered materials prepared and presentations made by the Investment Adviser’s senior management and portfolio management personnel in which Fund performance was assessed. The Trustees also considered the Investment Adviser’s periodic reports with respect to the Fund’s risk profile, and how the Investment Adviser’s approach to risk monitoring and management influences portfolio management.
The Trustees observed that the Fund’s Institutional Shares had placed in the third quartile of the Fund’s peer group for the one-year period and in the fourth quartile for the three-, five-, and ten-year periods, and had underperformed the Fund’s benchmark index for the one-, three-, five-, and ten-year periods ended March 31, 2018. The Trustees also observed that in January 2018, the Investment Adviser had combined the U.S. Value and U.S. Growth portfolio management teams into a single U.S. Equity portfolio management team and had made certain personnel changes with respect to the Fund’s portfolio management team in connection with that restructuring.
Costs of Services Provided and Competitive Information
The Trustees considered the contractual terms of the Management Agreement and the fee rates payable by the Fund thereunder. In this regard, the Trustees considered information on the services rendered by the Investment Adviser to the Fund, which included both advisory and administrative services that were directed to the needs and operations of the Fund as a registered mutual fund.
In particular, the Trustees reviewed analyses prepared by the Outside Data Provider regarding the expense rankings of the Fund. The analyses provided a comparison of the Fund’s management fee and breakpoints to those of a relevant peer group and category universe; an expense analysis which compared the Fund’s overall net and gross expenses to a peer group and a category universe; and data comparing the Fund’s net expenses to the peer and category medians. The analyses also compared the Fund’s transfer agency, custody, and distribution fees, other expenses and fee waivers/reimbursements to those of the peer group and category medians. The Trustees concluded that the comparisons provided by the Outside Data Provider were useful in evaluating the reasonableness of the management fees and total expenses paid by the Fund.
The Trustees noted that the management fee breakpoint schedule had been reduced at all asset levels since the Management Agreement was last approved. In addition, the Trustees considered the Investment Adviser’s undertakings to implement fee waivers and/or expense limitations. They also considered, to the extent that the Investment Adviser manages other types of accounts having investment objectives and policies similar to those of the Fund, comparative fee information for services provided by the Investment Adviser to those accounts, and information that indicated that services provided to the Fund differed in various significant respects from the services provided to other types of accounts which, in many cases, operated under less stringent legal and regulatory structures, required fewer services from the Investment Adviser to a smaller number of client contact points, and were less time-intensive.
In addition, the Trustees noted that shareholders are able to redeem their Fund shares at any time if shareholders believe that the Fund fees and expenses are too high or if they are dissatisfied with the performance of the Fund.
Profitability
The Trustees reviewed the Fund’s contribution to the Investment Adviser’s revenues and pre-tax profit margins. In this regard the Trustees noted that they had received, among other things, profitability analyses and summaries, revenue and expense schedules by Fund and by function (i.e., investment management, transfer agency and distribution and service), and information on the Investment Adviser’s expense allocation methodology. They observed that the profitability and expense figures are substantially similar to those used by the Investment Adviser for many internal purposes, including compensation decisions among various business groups, and are thus subject to a vigorous internal debate about how certain revenue and expenses should be allocated. The Trustees also noted that the internal audit group within the Goldman Sachs organization had audited the expense allocation methodology and that the internal audit group was satisfied with the reasonableness, consistency, and accuracy of the Investment Adviser’s expense allocation methodology and profitability analysis calculations. Profitability data for the Fund was provided for 2017 and 2016, and the Trustees considered this information in relation to the Investment Adviser’s overall profitability.
25
GOLDMAN SACHS VARIABLE INSURANCE TRUST MID CAP VALUE FUND
Statement Regarding Basis for Approval of Management Agreement (Unaudited) (continued)
Economies of Scale
The Trustees considered the information that had been provided regarding whether there have been economies of scale with respect to the management of the Fund. The Trustees also considered the breakpoints in the fee rate payable under the Management Agreement for the Fund at the following annual percentage rates of the average daily net assets of the Fund:
| First $2 billion | 0.77 | % | ||
| Next $3 billion | 0.69 | |||
| Next $3 billion | 0.66 | |||
| Over $8 billion | 0.65 |
The Trustees noted that the breakpoints were designed to share potential economies of scale, if any, with the Fund and its shareholders as assets under management reach those asset levels. The Trustees considered the amounts of assets in the Fund; the Fund’s recent share purchase and redemption activity; the information provided by the Investment Adviser relating to the costs of the services provided by the Investment Adviser and its affiliates and their realized profits; information comparing fee rates charged by the Investment Adviser with fee rates charged to other funds in the peer group; and the Investment Adviser’s undertaking to limit certain expenses of the Fund that exceed a specified level. Upon reviewing these matters at the Annual Meeting, the Trustees concluded that the fee breakpoints represented a means of assuring that benefits of scalability, if any, would be passed along to shareholders at the specified asset levels.
Other Benefits to the Investment Adviser and Its Affiliates
The Trustees also considered the other benefits derived by the Investment Adviser and its affiliates from their relationships with the Fund as stated above, including: (a) transfer agency fees received by Goldman Sachs & Co. LLC (“Goldman Sachs”); (b) brokerage and futures commissions earned by Goldman Sachs for executing securities and futures transactions on behalf of the Fund; (c) research received by the Investment Adviser from broker-dealers in exchange for executing certain transactions on behalf of the Fund; (d) trading efficiencies resulting from aggregation of orders of the Fund with those for other funds or accounts managed by the Investment Adviser; (e) fees earned by the Investment Adviser for managing the fund in which the Fund’s securities lending cash collateral is invested; (f) the Investment Adviser’s ability to leverage the infrastructure designed to service the Fund on behalf of its other clients; (g) the Investment Adviser’s ability to cross-market other products and services to Fund shareholders; (h) Goldman Sachs’ retention of certain fees as Fund Distributor; (i) the Investment Adviser’s ability to negotiate better pricing with custodians on behalf of its other clients, as a result of the relationship with the Fund; and (j) the possibility that the working relationship between the Investment Adviser and the Fund’s third-party service providers may cause those service providers to be more likely to do business with other areas of Goldman Sachs. In the course of considering the foregoing, the Independent Trustees requested and received further information quantifying certain of these fall-out benefits.
Other Benefits to the Fund and Its Shareholders
The Trustees also noted that the Fund receives certain potential benefits as a result of its relationship with the Investment Adviser, including: (a) trading efficiencies resulting from aggregation of orders of the Fund with those of other funds or accounts managed by the Investment Adviser; (b) enhanced servicing from vendors because of the volume of business generated by the Investment Adviser and its affiliates; (c) enhanced servicing from broker-dealers because of the volume of business generated by the Investment Adviser and its affiliates; (d) the Investment Adviser’s ability to negotiate favorable terms with derivatives counterparties on behalf of the Fund as a result of the size and reputation of the Goldman Sachs organization; (e) the Investment Adviser’s knowledge and experience gained from managing other accounts and products; (f) the Investment Adviser’s ability to hire and retain qualified personnel to provide services to the Fund because of the reputation of the Goldman Sachs organization; (g) the Fund’s access, through the Investment Adviser, to certain firmwide resources (e.g., proprietary risk management systems and databases), subject to certain restrictions; and (h) the Fund’s access to certain affiliated distribution channels. In addition, the Trustees noted the competitive nature of the mutual fund marketplace, and considered that many of the Fund’s shareholders invested in the Fund in part because of the Fund’s relationship with the Investment Adviser and that those shareholders have a general expectation that the relationship will continue.
26
GOLDMAN SACHS VARIABLE INSURANCE TRUST MID CAP VALUE FUND
Statement Regarding Basis for Approval of Management Agreement (Unaudited) (continued)
Conclusion
In connection with their consideration of the Management Agreement, the Trustees gave weight to each of the factors described above, but did not identify any particular factor as controlling their decision. After deliberation and consideration of all of the information provided, including the factors described above, the Trustees concluded, in the exercise of their business judgment, that the management fees paid by the Fund were reasonable in light of the services provided to it by the Investment Adviser, the Investment Adviser’s costs and the Fund’s current and reasonably foreseeable asset levels. The Trustees unanimously concluded that the Investment Adviser’s continued management likely would benefit the Fund and its shareholders and that the Management Agreement should be approved and continued with respect to the Fund until June 30, 2019.
27
| TRUSTEES | OFFICERS | |
Jessica Palmer, Chair Kathryn A. Cassidy Diana M. Daniels Herbert J. Markley James A. McNamara Roy W. Templin Gregory G. Weaver | James A. McNamara, President Scott M. McHugh, Treasurer, Senior Vice President and Principal Financial Officer Joseph F. DiMaria, Assistant Treasurer and Principal Accounting Officer Caroline L. Kraus, Secretary |
GOLDMAN SACHS & CO. LLC
Distributor and Transfer Agent
GOLDMAN SACHS ASSET MANAGEMENT, L.P.
Investment Adviser
200 West Street, New York
New York 10282
Visit our web site at www.GSAMFUNDS.com to obtain the most recent month-end returns.
The reports concerning the Fund included in this shareholder report may contain certain forward-looking statements about the factors that may affect the performance of the Fund in the future. These statements are based on Fund management’s predictions and expectations concerning certain future events and their expected impact on the Fund, such as performance of the economy as a whole and of specific industry sectors, changes in the levels of interest rates, the impact of developing world events, and other factors that may influence the future performance of the Fund. Management believes these forward-looking statements to be reasonable, although they are inherently uncertain and difficult to predict. Actual events may cause adjustments in portfolio management strategies from those currently expected to be employed.
A description of the policies and procedures that the Fund uses to determine how to vote proxies relating to portfolio securities and information regarding how the Fund voted proxies relating to portfolio securities for the 12-month period ended June 30 is available (i) without charge, upon request by calling 1-800-621-2550; and (ii) on the Securities and Exchange Commission (“SEC”) web site at http://www.sec.gov.
The Fund files its complete schedule of portfolio holdings with the SEC for the first and third quarters of each fiscal year on Form N-Q. The Fund’s Form N-Qs are available on the SEC’s web site at http://www.sec.gov within 60 days after the Fund’s first and third fiscal quarters. The Fund’s Form N-Qs may be reviewed and copied at the SEC’s Public Reference Room in Washington, D.C. and information on the operation of the Public Reference Room may also be obtained by calling 1-800-SEC-0330. Form N-Qs may be obtained upon request and without charge by calling 1-800-621-2550.
Views and opinions expressed are for informational purposes only and do not constitute a recommendation by GSAM to buy, sell, or hold any security. Views and opinions are current as of the date of this presentation and may be subject to change, they should not be construed as investment advice.
Goldman Sachs & Co. LLC (“Goldman Sachs”) does not provide legal, tax or accounting advice. Any statement contained in this communication (including any attachments) concerning U.S. tax matters was not intended or written to be used, and cannot be used, for the purpose of avoiding penalties under the Internal Revenue Code, and was written to support the promotion or marketing of transaction or matter addressed. Clients of Goldman Sachs should obtain their own independent tax advice based on their particular circumstances.
The website links provided are for your convenience only and are not an endorsement or recommendation by GSAM of any of these websites or the products or services offered. GSAM is not responsible for the accuracy and validity of the content of these websites.
Fund holdings and allocations shown are as of June 30, 2018 and may not be representative of future investments. Fund holdings should not be relied on in making investment decisions and should not be construed as research or investment advice regarding particular securities. Current and future holdings are subject to risk.
References to indices, benchmarks or other measures of relative market performance over a specified period of time are provided for your information only and do not imply that the portfolio will achieve similar results. The index composition may not reflect the manner in which a portfolio is constructed. While an adviser seeks to design a portfolio which reflects appropriate risk and return features, portfolio characteristics may deviate from those of the benchmark.
The Global Industry Classification Standard (“GICS”) was developed by and is the exclusive property and a service mark of Morgan Stanley Capital International Inc. (“MSCI”) and Standard & Poor’s, a division of The McGraw-Hill Companies, Inc. (“S&P”) and is licensed for use by Goldman Sachs. Neither MSCI, S&P nor any other party involved in making or compiling the GICS or any GICS classifications makes any express or implied warranties or representations with respect to such standard or classification (or the results to be obtained by the use thereof), and all such parties hereby expressly disclaim all warranties of originality, accuracy, completeness, merchantability or fitness for a particular purpose with respect to any of such standard or classification. Without limiting any of the foregoing, in no event shall MSCI, S&P, any of their affiliates or any third party involved in making or compiling the GICS or any GICS classifications have any liability for any direct, indirect, special, punitive, consequential or any other damages (including lost profits) even if notified of the possibility of such damages.
The portfolio risk management process includes an effort to monitor and manage risk, but does not imply low risk.
Shares of the Goldman Sachs VIT Funds are offered to separate accounts of participating life insurance companies for the purpose of funding variable annuity contracts and variable life insurance policies. Shares of the Fund are not offered directly to the general public. The variable annuity contracts and variable life insurance policies are described in the separate prospectuses issued by participating insurance companies. You should refer to those prospectuses for information about surrender charges, mortality and expense risk fees and other charges that may be assessed by participating insurance companies under the variable annuity contracts or variable life insurance policies. Such fees or charges, if any, may affect the return you may realize with respect to your investments. Ask your representative for more complete information. Please consider a fund’s objectives, risks and charges and expenses, and read the prospectus carefully before investing. The prospectus contains this and other information about the Fund.
This material is not authorized for distribution to prospective investors unless preceded or accompanied by a current prospectus or summary prospectus, if applicable. Investors should consider the Fund’s objective, risks, and charges and expenses, and read the summary prospectus, if available, and/or the prospectus carefully before investing or sending money. The summary prospectus, if available, and the prospectus contain this and other information about the Fund and may be obtained from your authorized dealer or from Goldman Sachs & Co. LLC by calling 1-800-621-2550.
This report is prepared for the general information of contract owners and is not an offer of shares of the Goldman Sachs Variable Insurance Trust — Goldman Sachs Mid Cap Value Fund.
© 2018 Goldman Sachs. All rights reserved.
VITMCVSAR-18/139316-OTU-807531/30K
Goldman
Sachs Variable Insurance Trust
Goldman Sachs Government
Money Market Fund
Semi-Annual Report
June 30, 2018

You could lose money by investing in the Fund. Although the Fund seeks to preserve the value of your investment at $1.00 per share, it cannot guarantee it will do so. An investment in the Fund is not a deposit of the bank and is not insured or guaranteed by the Federal Deposit Insurance Corporation or any other government agency. The Fund’s sponsor has no legal obligation to provide financial support to the Fund, and you should not expect that the sponsor will provide financial support to the Fund at any time.
GOLDMAN SACHS VARIABLE INSURANCE TRUST GOVERNMENT MONEY MARKET FUND
INVESTMENT OBJECTIVE
The Fund seeks to maximize current income to the extent consistent with the preservation of capital and the maintenance of liquidity by investing exclusively in high quality money market instruments.
Portfolio Management Discussion and Analysis
Below, the Goldman Sachs Money Market Portfolio Management Team discusses the Goldman Sachs Variable Insurance Trust — Goldman Sachs Government Money Market Fund’s (the “Fund”) performance and positioning for the six-month period ended June 30, 2018 (the “Reporting Period”).
How did the Fund perform during the Reporting Period?
The Fund’s Institutional Shares’ standardized 7-day current yield was 1.82% and their standardized 7-day effective yield was 1.84% as of June 30, 2018. The Institutional Shares’ one-month simple average yield was 1.73% as of June 30, 2018. The Institutional Shares’ 7-day distribution yield as of June 30, 2018 was 1.82%.
The Fund’s Service Shares’ standardized 7-day current yield was 1.57% and their standardized 7-day effective yield was 1.58% as of June 30, 2018. The Service Shares’ one-month simple average yield was 1.48% as of June 30, 2018. The Service Shares’ 7-day distribution yield as of June 30, 2018 was 1.57%.
The yields represent past performance. Past performance does not guarantee future results. Current performance may be lower or higher than the performance quoted above.
Yields will fluctuate as market conditions change. The yield quotations more closely reflect the current earnings of the Fund than total return quotations.
What economic and market factors most influenced the money markets as a whole during the Reporting Period?
The Reporting Period was one wherein money market yields remained low throughout but did move higher as the Federal Reserve (the “Fed”) proceeded to raise the target range of the federal funds rate two more times, bringing it to a range of 1.75% to 2.00% by the end of June 2018. The money market yield curve, or spectrum of maturities, flattened, meaning differentials between yields on short-term maturities rose more than those on longer-term maturities. Other significant events that influenced the money markets during the Reporting Period included the continuation of the Fed’s balance sheet normalization, begun in October 2017, and action by other central banks around the world, including the European Central Bank’s (“ECB”) discussion of tapering its asset purchases. (Balance sheet normalization refers to the steps the Fed is taking to reverse quantitative easing and remove the substantial monetary accommodation it has provided to the economy since the financial crisis began in 2007.)
In March 2018, the Fed delivered its first interest rate hike of the calendar year, raising the targeted federal funds rate by 25 basis points. (A basis point is 1/100th of a percentage point.) Policymakers cited ongoing strength in the labor market and a pickup in household spending and business fixed investment. The Fed’s dot plot, which shows rate projections of the members of the Fed’s Open Market Committee, indicated at the March meeting that three more rate increases were on tap for 2018 and potentially two in 2019. In June 2018, the Fed delivered another 25 basis point interest rate hike. Additionally, at its June meeting, the Fed moved its projected interest rate hikes from three to four for the calendar year. New Fed Chair Jerome Powell, who assumed the role in February 2018, cited increasing strength in the economy, low unemployment, and inflation close to the Fed’s objective. His comments were largely expected by the market.
Outside the U.S., the ECB announced in June 2018 that it would end its monthly asset purchase program, seeking to wind it down by the end of 2018. The ECB also stated its policy rates would remain low for “an extended period of time, and well past the horizon of the net asset purchases.” Also, as of June 2018, the Bank of England maintained its benchmark interest rate of 0.5% and signaled that future monetary policy tightening would be appropriate to return inflation sustainably to its target. However, Bank of England members agreed that any future increases in its benchmark interest rate would be at a gradual pace and to a limited extent.
What key factors were responsible for the Fund’s performance during the Reporting Period?
The Fund’s yields remained low but did rise during the Reporting Period due primarily to the economic and market factors discussed above. The targeted federal funds rate was gradually increased during the Reporting Period to a range of 1.75% to 2.00%,
1
GOLDMAN SACHS VARIABLE INSURANCE TRUST GOVERNMENT MONEY MARKET FUND
and, as such, money market yields similarly rose modestly though with little difference between maturities during that time. As mentioned, the money market yield curve, or spectrum of maturities, flattened during the Reporting Period overall, as shorter-term rates rose more than longer-term rates did. The Fund remained highly liquid throughout.
We felt comfortable that the Fund was appropriately positioned given the interest rate environment during the Reporting Period, as we sought to take advantage of anticipated interest rate movements throughout. While conditions throughout the Reporting Period did not provide bountiful opportunities to pick up yield, as the interest rate yield curve flattened through most of the Reporting Period, it should be noted that regardless of interest rate conditions, we manage the Fund consistently. Our investment approach has always been tri-fold — to seek preservation of capital, daily liquidity and maximization of yield potential. We manage interest and credit risk daily. Whether interest rates are historically low, high or in-between, we intend to continue to use our actively managed approach to provide the best possible return within the framework of the Fund’s guidelines and objectives.
How did you manage the Fund’s weighted average maturity during the Reporting Period?
On December 31, 2017, the Fund’s weighted average maturity was 18 days. During the first quarter of 2018, we targeted a weighted average maturity for the Fund in an 18 to 24 day range in anticipation of the March 2018 interest rate increase by the Fed. By the end of March 2018, following the Fed’s rate hike, we extended the Fund’s weighted average maturity to 40 days. During the second quarter of 2018, with comments from the Fed about a potential June 2018 interest rate increase, we maintained a weighted average maturity for the Fund in a 29 to 33 day range.
Throughout the Reporting Period, we focused on U.S. government agency securities, U.S. government repurchase agreements and U.S. Treasuries where we saw what we considered to be attractive opportunities. After the Fed raised interest rates at its June 2018 meeting, we allowed the weighted average maturity of the Fund to extend to a range of between 33 days and 37 days. The Fund’s weighted average maturity on June 30, 2018 was 37 days.
The weighted average maturity of a money market fund is a measure of its price sensitivity to changes in interest rates. Also known as effective maturity, weighted average maturity measures the weighted average of the maturity date of bonds held by the Fund taking into consideration any available maturity shortening features.
How did you manage the Fund’s weighted average life during the Reporting Period?
During the Reporting Period, we managed the weighted average life of the Fund below 120 days. The weighted average life of the Fund was 112 days as of June 30, 2018. The weighted average life of a money market fund is a measure of a money market fund’s price sensitivity to changes in liquidity and/or credit risk.
Under amendments to SEC Rule 2a-7 that became effective in May 2010, the maximum allowable weighted average life of a money market fund is 120 days. While one of the goals of the SEC’s money market fund rule is to reinforce conservative investment practices across the money market fund industry, our security selection process has long emphasized conservative investment choices.
How was the Fund invested during the Reporting Period?
The Fund had investments in U.S. government agency securities, U.S. government repurchase agreements and U.S. Treasury securities during the Reporting Period.
With yields bound in a still-low range, there was not a lot of dispersion in performance among securities available for purchase. Throughout, though, we stayed true to our investment discipline, favoring liquidity and high quality credits over added yield. The primary focal points for our team are consistently managing interest rate risk and credit risk. We were able to navigate interest rate risk by adjusting the Fund’s weighted average maturity longer or shorter as market conditions shifted and to mitigate potential credit risk by buying high quality, creditworthy names, strategies which added to the Fund’s performance during the Reporting Period.
Did you make any changes in the Fund’s portfolio during the Reporting Period?
As indicated earlier, we made adjustments to the Fund’s weighted average maturity and to specific security type composition allocations based on then-current market conditions, our near-term view, and anticipated and actual Fed monetary policy statements. That said, there were no significant changes in the Fund’s investment exposures during the Reporting Period. Our duration positioning in the Fund ahead of the March 2018 and June 2018 Fed meetings was particularly positive for the Fund.
What is the Fund’s tactical view and strategy for the months ahead?
At the end of the Reporting Period, we saw scope for two further interest rate hikes by the Fed over the course of 2018 — in addition to balance sheet normalization. At the end of the Fed’s normalization process, anticipated by the Fed to be in either
2
GOLDMAN SACHS VARIABLE INSURANCE TRUST GOVERNMENT MONEY MARKET FUND
September or October 2018, we expect the Fed’s balance sheet to still be larger than pre-2007/2008 financial crisis norms and for quantitative easing to remain in its monetary policy toolbox for possible future use. We expect the Fed to take the lead among developed markets’ central banks in terms of interest rate hikes and balance sheet normalization.
Looking ahead, our strategy continues to be flexibly guided by shifting market conditions, positioning the Fund to seek to take advantage of anticipated interest rate movements. More specifically, at the end of the Reporting Period, we intended to adjust duration guided by the context of market pricing in relation to our expectations. As always, we intend to continue to use our actively managed approach to seek the best possible return within the framework of the Fund’s investment guidelines and objectives. In addition, we will continue to manage interest, liquidity and credit risk daily.
We will, of course, continue to closely monitor economic data, Fed policy, and any shifts in the money market yield curve, as we strive to strategically navigate the interest rate environment.
3
FUND BASICS
FUND COMPOSITION†
Security Type
(Percentage of Net Assets)
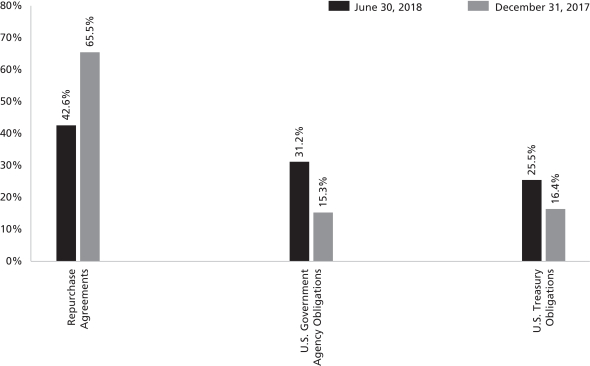
| † | The Fund is actively managed and, as such, its portfolio composition may differ over time. The percentage shown for each investment category reflects the value (based on amortized cost) of investments in that category as a percentage of net assets. Figures in the above chart may not sum to 100% due to the exclusion of other assets and liabilities. |
4
GOLDMAN SACHS VARIABLE INSURANCE TRUST GOVERNMENT MONEY MARKET FUND
Schedule of Investments
June 30, 2018 (Unaudited)
| Principal Amount | Interest Rate | Maturity Date | Amortized Cost | |||||||||||
| U.S. Government Agency Obligations – 31.2% | ||||||||||||||
Federal Farm Credit Bank (1 Mo. LIBOR – 0.09%) | ||||||||||||||
| $ | 1,000,000 | 2.011 | %(a) | 03/28/19 | $ | 1,000,000 | ||||||||
Federal Farm Credit Bank (3 Mo. LIBOR – 0.14%) | ||||||||||||||
| 1,700,000 | 2.197 | (a) | 09/30/19 | 1,699,894 | ||||||||||
Federal Farm Credit Bank (3 Mo. LIBOR – 0.26%) | ||||||||||||||
| 250,000 | 2.077 | (a) | 07/10/19 | 250,000 | ||||||||||
Federal Farm Credit Bank (3 Mo. U.S. T-Bill MMY + 0.07%)(a) | ||||||||||||||
| 1,300,000 | 1.974 | 11/20/19 | 1,299,946 | |||||||||||
| 650,000 | 1.974 | 11/29/19 | 650,000 | |||||||||||
| 650,000 | 1.979 | 02/18/20 | 650,000 | |||||||||||
Federal Farm Credit Bank (3 Mo. U.S. T-Bill MMY + 0.08%)(a) | ||||||||||||||
| 800,000 | 1.984 | 10/18/19 | 799,969 | |||||||||||
| 650,000 | 1.984 | 12/26/19 | 649,962 | |||||||||||
Federal Farm Credit Bank (3 Mo. U.S. T-Bill MMY + 0.09%)(a) | ||||||||||||||
| 800,000 | 1.999 | 02/19/19 | 799,959 | |||||||||||
| 800,000 | 1.994 | 07/05/19 | 799,984 | |||||||||||
Federal Farm Credit Bank (Prime Rate – 2.88%) | ||||||||||||||
| 1,000,000 | 2.120 | (a) | 05/07/20 | 999,853 | ||||||||||
Federal Farm Credit Bank (Prime Rate – 2.90%) | ||||||||||||||
| 600,000 | 2.100 | (a) | 01/30/20 | 600,000 | ||||||||||
Federal Farm Credit Bank (Prime Rate – 2.96%) | ||||||||||||||
| 200,000 | 2.040 | (a) | 03/13/20 | 199,745 | ||||||||||
Federal Farm Credit Bank (Prime Rate – 3.08%)(a) | ||||||||||||||
| 250,000 | 1.920 | 06/27/19 | 249,987 | |||||||||||
| 1,600,000 | 1.920 | 07/17/19 | 1,599,833 | |||||||||||
Federal Farm Credit Bank (Prime Rate – 3.12%) | ||||||||||||||
| 1,000,000 | 1.880 | (a) | 01/24/19 | 999,937 | ||||||||||
Federal Home Loan Bank (1 Mo. LIBOR – 0.05%)(a) | ||||||||||||||
| 2,800,000 | 1.997 | 07/13/18 | 2,800,000 | |||||||||||
| 6,000,000 | 1.975 | 10/07/19 | 6,000,000 | |||||||||||
Federal Home Loan Bank (1 Mo. LIBOR – 0.08%) | ||||||||||||||
| 13,000,000 | 2.005 | (a) | 03/19/19 | 13,000,000 | ||||||||||
Federal Home Loan Bank (1 Mo. LIBOR – 0.09%) | ||||||||||||||
| 1,200,000 | 1.967 | (a) | 01/14/19 | 1,200,000 | ||||||||||
Federal Home Loan Bank (1 Mo. LIBOR – 0.10%) | ||||||||||||||
| 5,700,000 | 1.990 | (a) | 04/18/19 | 5,700,000 | ||||||||||
Federal Home Loan Bank (1 Mo. LIBOR – 0.14%) | ||||||||||||||
| 8,000,000 | 1.945 | (a) | 10/19/18 | 8,000,000 | ||||||||||
Federal Home Loan Bank (1 Mo. LIBOR – 0.15%)(a) | ||||||||||||||
| 1,500,000 | 1.934 | 08/20/18 | 1,500,000 | |||||||||||
| 10,000,000 | 1.947 | 08/30/18 | 10,000,000 | |||||||||||
| 21,400,000 | 1.856 | 09/04/18 | 21,400,000 | |||||||||||
Federal Home Loan Bank (1 Mo. LIBOR – 0.17%)(a) | ||||||||||||||
| 3,000,000 | 1.920 | 08/17/18 | 3,000,000 | |||||||||||
| 1,600,000 | 1.919 | 08/20/18 | 1,600,000 | |||||||||||
| 4,800,000 | 1.926 | 08/23/18 | 4,800,000 | |||||||||||
Federal Home Loan Bank (3 Mo. LIBOR – 0.22%)(a) | ||||||||||||||
| 600,000 | 2.111 | 07/09/18 | 599,999 | |||||||||||
| 800,000 | 2.119 | 07/12/18 | 799,999 | |||||||||||
Federal Home Loan Bank (3 Mo. LIBOR – 0.26%)(a) | ||||||||||||||
| 1,500,000 | 2.071 | 10/07/19 | 1,500,000 | |||||||||||
| 3,500,000 | 2.077 | 10/11/19 | 3,500,000 | |||||||||||
Federal Home Loan Bank (3 Mo. LIBOR – 0.31%)(a) | ||||||||||||||
| 6,200,000 | 2.016 | 03/12/19 | 6,200,000 | |||||||||||
| 3,500,000 | 2.023 | 03/13/19 | 3,500,000 | |||||||||||
| 1,400,000 | 2.026 | 03/22/19 | 1,400,000 | |||||||||||
| 750,000 | 2.020 | 03/25/19 | 750,000 | |||||||||||
|
| |||||||||||||
| U.S. Government Agency Obligations – (continued) | ||||||||||||||
Federal Home Loan Bank (3 Mo. LIBOR – 0.32%)(a) | ||||||||||||||
| $ | 2,900,000 | 2.015 | % | 03/21/19 | $ | 2,900,000 | ||||||||
| 5,900,000 | 2.015 | 03/25/19 | 5,900,000 | |||||||||||
| 6,000,000 | 2.017 | 03/27/19 | 6,000,000 | |||||||||||
Federal Home Loan Bank Discount Notes | ||||||||||||||
| 7,600,000 | 1.925 | 08/10/18 | 7,584,040 | |||||||||||
| 1,400,000 | 1.927 | 08/15/18 | 1,396,643 | |||||||||||
| 2,500,000 | 1.932 | 08/20/18 | 2,493,403 | |||||||||||
| 2,800,000 | 1.927 | 08/22/18 | 2,792,336 | |||||||||||
| 800,000 | 1.949 | 08/23/18 | 797,745 | |||||||||||
| 8,100,000 | 1.927 | 08/24/18 | 8,076,976 | |||||||||||
| 2,700,000 | 1.927 | 08/27/18 | 2,691,899 | |||||||||||
| 3,800,000 | 1.935 | 08/27/18 | 3,788,568 | |||||||||||
| 1,500,000 | 1.950 | 08/27/18 | 1,495,452 | |||||||||||
| 1,500,000 | 1.950 | 08/28/18 | 1,495,372 | |||||||||||
| 1,700,000 | 1.950 | 08/30/18 | 1,694,574 | |||||||||||
| 1,400,000 | 1.955 | 08/30/18 | 1,395,520 | |||||||||||
| 700,000 | 1.923 | 08/31/18 | 697,729 | |||||||||||
| 2,100,000 | 1.930 | 08/31/18 | 2,093,164 | |||||||||||
| 1,400,000 | 1.956 | 09/06/18 | 1,394,997 | |||||||||||
| 1,700,000 | 1.961 | 09/06/18 | 1,693,909 | |||||||||||
| 4,900,000 | 1.962 | 09/06/18 | 4,882,445 | |||||||||||
| 7,800,000 | 1.956 | 09/07/18 | 7,771,712 | |||||||||||
| 2,500,000 | 1.962 | 09/07/18 | 2,490,910 | |||||||||||
| 4,000,000 | 1.955 | 09/14/18 | 3,984,042 | |||||||||||
| 1,100,000 | 1.972 | 09/17/18 | 1,095,400 | |||||||||||
Overseas Private Investment Corp. (3 Mo. U.S. T-Bill + 0.00%) | ||||||||||||||
| 4,439,062 | 1.960 | (a)(b) | 07/07/18 | 4,439,062 | ||||||||||
|
| |||||||||||||
| | TOTAL U.S. GOVERNMENT AGENCY OBLIGATIONS | | $ | 191,544,965 | ||||||||||
|
| |||||||||||||
| U.S. Treasury Obligations – 25.5% | ||||||||||||||
| United States Treasury Bills | ||||||||||||||
| $ 200,000 | 1.883% | 08/16/18 | $ | 199,527 | ||||||||||
| 900,000 | 1.862 | 08/23/18 | 897,588 | |||||||||||
| 500,000 | 1.880 | 08/23/18 | 498,646 | |||||||||||
| 200,000 | 1.885 | 08/23/18 | 199,457 | |||||||||||
| 250,000 | 1.920 | 08/30/18 | 249,215 | |||||||||||
| 7,200,000 | 1.873 | 09/06/18 | 7,175,478 | |||||||||||
| 1,150,000 | 1.924 | 09/06/18 | 1,145,955 | |||||||||||
| 200,000 | 1.943 | 09/06/18 | 199,291 | |||||||||||
| 1,200,000 | 1.948 | 09/06/18 | 1,195,734 | |||||||||||
| 400,000 | 1.925 | 09/13/18 | 398,446 | |||||||||||
| 2,200,000 | 1.961 | 09/13/18 | 2,191,295 | |||||||||||
| 5,900,000 | 1.997 | 09/20/18 | 5,874,114 | |||||||||||
| 900,000 | 1.928 | 09/27/18 | 895,837 | |||||||||||
| 600,000 | 1.931 | 09/27/18 | 597,221 | |||||||||||
| 300,000 | 1.995 | 10/04/18 | 298,452 | |||||||||||
| 200,000 | 2.027 | 10/18/18 | 198,798 | |||||||||||
| 15,700,000 | 2.048 | 11/08/18 | 15,586,611 | |||||||||||
| 300,000 | 2.049 | 11/15/18 | 297,711 | |||||||||||
| 1,400,000 | 2.080 | 11/15/18 | 1,389,185 | |||||||||||
| 400,000 | 2.082 | 11/15/18 | 396,902 | |||||||||||
| 15,900,000 | 2.085 | 11/15/18 | 15,776,865 | |||||||||||
| 1,900,000 | 2.069 | 11/29/18 | 1,883,902 | |||||||||||
|
| |||||||||||||
| The accompanying notes are an integral part of these financial statements. | 5 |
GOLDMAN SACHS VARIABLE INSURANCE TRUST GOVERNMENT MONEY MARKET FUND
Schedule of Investments (continued)
June 30, 2018 (Unaudited)
| Principal Amount | Interest Rate | Maturity Date | Amortized Cost | |||||||||||
U.S. Treasury Obligations – (continued) | ||||||||||||||
| United States Treasury Bills – (continued) | ||||||||||||||
| $ 1,300,000 | 2.078 % | 11/29/18 | $ | 1,288,931 | ||||||||||
| 13,500,000 | 2.080 | 11/29/18 | 13,385,051 | |||||||||||
| 14,600,000 | 2.121 | 12/06/18 | 14,467,359 | |||||||||||
| 7,500,000 | 2.126 | 12/13/18 | 7,428,672 | |||||||||||
| 100,000 | 2.121 | 12/20/18 | 99,011 | |||||||||||
| 1,000,000 | 2.122 | 12/20/18 | 990,105 | |||||||||||
| 8,600,000 | 2.126 | 12/20/18 | 8,514,741 | |||||||||||
| 1,000,000 | 2.127 | 12/20/18 | 990,081 | |||||||||||
| 2,100,000 | 2.126 | 12/27/18 | 2,078,334 | |||||||||||
| 700,000 | 2.131 | 12/27/18 | 692,760 | |||||||||||
| | United States Treasury Floating Rate Note (3 Mo. U.S. T-Bill | | ||||||||||||
| 46,000,000 | 1.957(a) | 10/31/19 | 46,006,014 | |||||||||||
| United States Treasury Notes | ||||||||||||||
| 1,000,000 | 0.750 | 07/31/18 | 999,119 | |||||||||||
| 700,000 | 1.375 | 07/31/18 | 699,732 | |||||||||||
| 200,000 | 0.750 | 08/31/18 | 199,595 | |||||||||||
| 1,200,000 | 1.500 | 08/31/18 | 1,199,080 | |||||||||||
|
| |||||||||||||
| TOTAL U.S. TREASURY OBLIGATIONS | $ | 156,584,815 | ||||||||||||
|
| |||||||||||||
| | TOTAL INVESTMENTS BEFORE REPURCHASE AGREEMENTS | | $ | 348,129,780 | ||||||||||
|
| |||||||||||||
| Repurchase Agreements(c) – 42.6% | ||||||||||||||
BNP Paribas | ||||||||||||||
| $ | 5,000,000 | 1.960 | %(b) | 07/07/18 | $ | 5,000,000 | ||||||||
Maturity Value: $5,017,150 | ||||||||||||||
Settlement Date: 06/14/18 | ||||||||||||||
| | Collateralized by a U.S. Treasury Bill, 0.000%, due 08/09/18, a | | ||||||||||||
| 12,500,000 | 1.970 | (b) | 07/07/18 | 12,500,000 | ||||||||||
Maturity Value: $12,543,094 | ||||||||||||||
Settlement Date: 06/14/18 | ||||||||||||||
| | Collateralized by Federal Home Loan Mortgage Corp., 4.000%, | | ||||||||||||
|
| |||||||||||||
Joint Repurchase Agreement Account III | ||||||||||||||
| 244,400,000 | 2.120 | 07/02/18 | 244,400,000 | |||||||||||
Maturity Value: $244,443,177 | ||||||||||||||
|
| |||||||||||||
TOTAL REPURCHASE AGREEMENTS | $ | 261,900,000 | ||||||||||||
|
| |||||||||||||
TOTAL INVESTMENTS – 99.3% | $ | 610,029,780 | ||||||||||||
|
| |||||||||||||
| | OTHER ASSETS IN EXCESS OF | | 4,044,654 | |||||||||||
|
| |||||||||||||
| NET ASSETS – 100.0% | $ | 614,074,434 | ||||||||||||
|
| |||||||||||||
| The percentage shown for each investment category reflects the value of investments in that category as a percentage of net assets. | ||
| (a) | Variable or floating rate security. Except for floating rate notes (for which final maturity is disclosed), maturity date disclosed is the next interest reset date. Interest rate disclosed is that which is in effect on June 30, 2018. | |
| (b) | The instrument is subject to a demand feature. | |
| (c) | Unless noted, all repurchase agreements were entered into on June 29, 2018. Additional information on Joint Repurchase Agreement Account III appears on page 7. | |
| Interest rates represent either the stated coupon rate, annualized yield on date of purchase for discounted securities, or, for floating rate securities, the current reset rate, which is based upon current interest rate indices. | ||
| Maturity dates represent either the final legal maturity date on the security, the demand date for puttable securities, the date of the next interest rate reset for variable rate securities, or the prerefunded date for those types of securities. | ||
| Investment Abbreviations: | ||
| LIBOR | —London Interbank Offered Rates | |
| MMY | —Money Market Yield | |
| Prime | —Federal Reserve Bank Prime Loan Rate US | |
| T-Bill | —Treasury Bill | |
| 6 | The accompanying notes are an integral part of these financial statements. |
GOLDMAN SACHS VARIABLE INSURANCE TRUST GOVERNMENT MONEY MARKET FUND
ADDITIONAL INVESTMENT INFORMATION
JOINT REPURCHASE AGREEMENT ACCOUNT III — At June 30, 2018, the Fund had undivided interests in the Joint Repurchase Agreement Account III, with a maturity date of July 2, 2018, as follows:
| Principal Amount | Maturity Value | Collateral Value | |||||||||||
| $244,400,000 | $ | 244,443,177 | $ | 251,310,146 | |||||||||
REPURCHASE AGREEMENTS — At June 30, 2018, the Principal Amounts of the Fund’s interest in the Joint Repurchase Agreement Account III were as follows:
| Counterparty | Interest Rate | Principal Amount | ||||||
| ABN Amro Bank N.V. | 2.120 | % | $ | 15,129,380 | ||||
| Bank of America, N.A. | 2.120 | 12,607,817 | ||||||
| Bank of Nova Scotia (The) | 2.120 | 55,474,392 | ||||||
| BNP Paribas | 2.120 | 20,888,630 | ||||||
| Citigroup Global Markets, Inc. | 2.120 | 15,482,399 | ||||||
| Merrill Lynch, Pierce, Fenner & Smith, Inc. | 2.120 | 55,474,392 | ||||||
Wells Fargo Securities, LLC | 2.120 | 69,342,990 | ||||||
| TOTAL | $ | 244,400,000 | ||||||
At June 30, 2018, the Joint Repurchase Agreement Account III was fully collateralized by:
| Issuer | Interest Rates | Maturity Dates | ||||||
| Federal Farm Credit Bank | 2.900 to 3.490 | % | 05/30/23 to 10/28/33 | |||||
| Federal Home Loan Bank | 0.000 to 5.500 | 07/27/18 to 07/15/36 | ||||||
| Federal Home Loan Mortgage Corp. | 2.500 to 9.500 | 01/17/19 to 07/01/48 | ||||||
| Federal National Mortgage Association | 0.000 to 7.000 | 01/01/19 to 02/01/57 | ||||||
| Federal National Mortgage Association Stripped Security | 0.000 | 02/07/28 | ||||||
| Government National Mortgage Association | 1.500 to 8.500 | 04/15/26 to 06/20/48 | ||||||
| U.S. Treasury Bonds | 2.750 to 3.750 | 11/15/43 to 11/15/47 | ||||||
| U.S. Treasury Inflation-Indexed Notes | 0.125 to 0.375 | 07/15/24 to 07/15/27 | ||||||
| U.S. Treasury Interest-Only Stripped Securities | 0.000 | 11/15/20 to 08/15/27 | ||||||
| U.S. Treasury Notes | 1.125 to 3.625 | 01/31/19 to 10/31/24 | ||||||
| U.S. Treasury Principal-Only Stripped Securities | 0.000 | 05/15/19 to 11/15/42 | ||||||
| The accompanying notes are an integral part of these financial statements. | 7 |
GOLDMAN SACHS VARIABLE INSURANCE TRUST GOVERNMENT MONEY MARKET FUND
Statement of Assets and Liabilities
June 30, 2018 (Unaudited)
| Assets: | ||||
Investments based on amortized cost | $ | 348,129,780 | ||
Repurchase agreements based on amortized cost | 261,900,000 | |||
Cash | 77,438 | |||
Receivables: | ||||
Fund shares sold | 4,367,010 | |||
Interest | 384,532 | |||
Reimbursement from investment adviser | 17,775 | |||
Other assets | 2,003 | |||
| Total assets | 614,878,538 | |||
| Liabilities: | ||||
Payables: | ||||
Fund shares redeemed | 583,526 | |||
Distribution and Service fees and Transfer Agency fees | 80,166 | |||
Management fees | 79,472 | |||
Accrued expenses | 60,940 | |||
| Total liabilities | 804,104 | |||
| Net Assets: | ||||
Paid-in capital | 614,074,839 | |||
Undistributed net investment income | 36,633 | |||
Accumulated net realized loss | (37,038 | ) | ||
| NET ASSETS | $ | 614,074,434 | ||
Net asset value, offering and redemption price per share | $ | 1.00 | ||
Net Assets: | ||||
Institutional Shares | $ | 268,257,284 | ||
Service Shares | 345,817,150 | |||
Total Net Assets | $ | 614,074,434 | ||
Shares of beneficial interest outstanding $0.001 par value (unlimited shares authorized): | ||||
Institutional Shares | 268,257,452 | |||
Service Shares | 345,817,368 | |||
| 8 | The accompanying notes are an integral part of these financial statements. |
GOLDMAN SACHS VARIABLE INSURANCE TRUST GOVERNMENT MONEY MARKET FUND
Statement of Operations
For the Six Months Ended June 30, 2018 (Unaudited)
| Investment Income: | ||||
Interest | $ | 5,171,345 | ||
| Expenses: | ||||
Management fees | 542,041 | |||
Distribution and Service fees — Service Shares | 434,964 | |||
Transfer Agency fees(a) | 62,664 | |||
Professional fees | 55,876 | |||
Custody, accounting and administrative services | 26,127 | |||
Printing and mailing costs | 15,256 | |||
Trustee fees | 8,975 | |||
Other | 5,189 | |||
| Total expenses | 1,151,092 | |||
Less — expense reductions | (140,414 | ) | ||
| Net expenses | 1,010,678 | |||
| NET INVESTMENT INCOME | 4,160,667 | |||
| NET REALIZED LOSS FROM INVESTMENT TRANSACTIONS | (23,550 | ) | ||
| NET INCREASE IN NET ASSETS RESULTING FROM OPERATIONS | $ | 4,137,117 | ||
(a) Institutional and Service Shares incurred Transfer Agency fees of $27,867 and $34,797, respectively.
| The accompanying notes are an integral part of these financial statements. | 9 |
GOLDMAN SACHS VARIABLE INSURANCE TRUST GOVERNMENT MONEY MARKET FUND
Statements of Changes in Net Assets
| For the Six Months Ended June 30, 2018 (Unaudited) | For the Fiscal Year Ended December 31, 2017 | |||||||
| From operations: | ||||||||
Net investment income | $ | 4,160,667 | $ | 3,607,434 | ||||
Net realized loss from investment transactions | (23,550 | ) | (9,695 | ) | ||||
| Net increase in net assets resulting from operations | 4,137,117 | 3,597,739 | ||||||
| Distributions to shareholders: | ||||||||
From net investment income: | ||||||||
Institutional Shares | (2,022,951 | ) | (1,764,524 | ) | ||||
Service Shares | (2,107,807 | ) | (1,838,690 | ) | ||||
| Total distributions to shareholders | (4,130,758 | ) | (3,603,214 | ) | ||||
| From share transactions (at $1.00 per share): | ||||||||
Proceeds from sales of shares | 236,028,326 | 475,485,463 | ||||||
Reinvestment of distributions | 4,127,882 | 3,592,877 | ||||||
Cost of shares redeemed | (282,842,513 | ) | (404,885,071 | ) | ||||
| Net increase (decrease) in net assets resulting from share transactions | (42,686,305 | ) | 74,193,269 | |||||
| TOTAL INCREASE (DECREASE) | (42,679,946 | ) | 74,187,794 | |||||
| Net assets: | ||||||||
Beginning of period | 656,754,380 | 582,566,586 | ||||||
End of period | $ | 614,074,434 | $ | 656,754,380 | ||||
| Undistributed net investment income | $ | 36,633 | $ | 6,724 | ||||
| 10 | The accompanying notes are an integral part of these financial statements. |
GOLDMAN SACHS VARIABLE INSURANCE TRUST GOVERNMENT MONEY MARKET FUND
Financial Highlights
Selected Data for a Share Outstanding Throughout Each Period
| Government Money Market Fund | ||||||||||||||||||||||||||
| Institutional Shares | ||||||||||||||||||||||||||
| Six Months Ended June 30, 2018 (Unaudited) | Year Ended December 31, | |||||||||||||||||||||||||
| 2017 | 2016 | 2015 | 2014 | 2013(a) | ||||||||||||||||||||||
| Per Share Data: | ||||||||||||||||||||||||||
| Net asset value, beginning of period | $ | 1.00 | $ | 1.00 | $ | 1.00 | $ | 1.00 | $ | 1.00 | $ | 1.00 | ||||||||||||||
| Net investment income(b) | 0.007 | 0.008 | 0.003 | — | (c) | — | (c) | — | (c) | |||||||||||||||||
| Distributions to shareholders from net investment income(d) | (0.007 | ) | (0.008 | ) | (0.003 | ) | — | (c) | — | (c) | — | (c) | ||||||||||||||
| Net asset value, end of period | $ | 1.00 | $ | 1.00 | $ | 1.00 | $ | 1.00 | $ | 1.00 | $ | 1.00 | ||||||||||||||
| Total return(e) | 0.73 | % | 0.76 | % | 0.29 | % | 0.02 | % | 0.01 | % | 0.01 | % | ||||||||||||||
| Net assets, end of period (in 000’s) | $ | 268,257 | $ | 302,507 | $ | 206,987 | $ | 1,143 | $ | 773 | $ | 25 | ||||||||||||||
| Ratio of net expenses to average net assets | 0.18 | %(f) | 0.18 | % | 0.19 | % | 0.23 | % | 0.23 | % | 0.24 | %(f) | ||||||||||||||
| Ratio of total expenses to average net assets | 0.22 | %(f) | 0.27 | % | 0.30 | % | 0.31 | % | 0.31 | % | 0.36 | %(f) | ||||||||||||||
| Ratio of net investment income to average net assets | 1.46 | %(f) | 0.76 | % | 0.31 | % | 0.03 | % | 0.03 | % | 0.04 | %(f) | ||||||||||||||
| (a) | Commenced operations on October 16, 2013. |
| (b) | Calculated based on the average shares outstanding methodology. |
| (c) | Amount is less than $0.0005 per share. |
| (d) | Distributions may not coincide with the current year net investment income or net realized gains as distributions may be paid from current or prior year earnings. |
| (e) | Assumes reinvestment of all distributions. Total returns for periods less than one full year are not annualized. |
| (f) | Annualized. |
| The accompanying notes are an integral part of these financial statements. | 11 |
GOLDMAN SACHS VARIABLE INSURANCE TRUST GOVERNMENT MONEY MARKET FUND
Financial Highlights (continued)
Selected Data for a Share Outstanding Throughout Each Period
| Government Money Market Fund | ||||||||||||||||||||||||||
| Service Shares | ||||||||||||||||||||||||||
| Six Months Ended June 30, 2018 (Unaudited) | Year Ended December 31, | |||||||||||||||||||||||||
| 2017 | 2016 | 2015 | 2014 | 2013 | ||||||||||||||||||||||
| Per Share Data: | ||||||||||||||||||||||||||
| Net asset value, beginning of period | $ | 1.00 | $ | 1.00 | $ | 1.00 | $ | 1.00 | $ | 1.00 | $ | 1.00 | ||||||||||||||
| Net investment income(a) | 0.006 | 0.005 | — | (b) | — | (b) | — | (b) | — | (b) | ||||||||||||||||
| Distributions to shareholders from net investment income(c) | (0.006 | ) | (0.005 | ) | — | (b) | — | (b) | — | (b) | — | (b) | ||||||||||||||
| Net asset value, end of period | $ | 1.00 | $ | 1.00 | $ | 1.00 | $ | 1.00 | $ | 1.00 | $ | 1.00 | ||||||||||||||
| Total return(d) | 0.60 | % | 0.51 | % | 0.04 | % | 0.01 | % | 0.01 | % | 0.01 | % | ||||||||||||||
| Net assets, end of period (in 000’s) | $ | 345,817 | $ | 354,248 | $ | 375,580 | $ | 328,202 | $ | 305,994 | $ | 316,404 | ||||||||||||||
| Ratio of net expenses to average net assets | 0.43 | %(e) | 0.43 | % | 0.44 | % | 0.26 | % | 0.24 | % | 0.28 | % | ||||||||||||||
| Ratio of total expenses to average net assets | 0.47 | %(e) | 0.52 | % | 0.55 | % | 0.56 | % | 0.56 | % | 0.55 | % | ||||||||||||||
| Ratio of net investment income to average net assets | 1.22 | %(e) | 0.51 | % | 0.03 | % | 0.01 | % | — | %(f) | — | %(f) | ||||||||||||||
| (a) | Calculated based on the average shares outstanding methodology. |
| (b) | Amount is less than $0.0005 per share. |
| (c) | Distributions may not coincide with the current year net investment income or net realized gains as distributions may be paid from current or prior year earnings. |
| (d) | Assumes reinvestment of all distributions. Total returns for periods less than one full year are not annualized. |
| (e) | Annualized. |
| (f) | Amount is less than 0.005% of average net assets. |
| 12 | The accompanying notes are an integral part of these financial statements. |
GOLDMAN SACHS VARIABLE INSURANCE TRUST GOVERNMENT MONEY MARKET FUND
Notes to Financial Statements
June 30, 2018 (Unaudited)
1. ORGANIZATION
Goldman Sachs Variable Insurance Trust (the “Trust” or “VIT”) is a Delaware statutory trust registered under the Investment Company Act of 1940, as amended (the “Act”), as an open-end management investment company. The Trust includes the Goldman Sachs Government Money Market Fund (the “Fund”). The Fund is a diversified portfolio under the Act offering two classes of shares — Institutional and Service Shares. Shares of the Trust are offered to separate accounts of participating life insurance companies for the purpose of funding variable annuity contracts and variable life insurance policies.
Goldman Sachs Asset Management, L.P. (“GSAM”), an affiliate of Goldman Sachs & Co. LLC (“Goldman Sachs”), serves as investment adviser to the Fund pursuant to a management agreement (the “Agreement”) with the Trust.
2. SIGNIFICANT ACCOUNTING POLICIES
The financial statements have been prepared in accordance with accounting principles generally accepted in the United States of America (“GAAP”) and require management to make estimates and assumptions that may affect the reported amounts and disclosures. Actual results may differ from those estimates and assumptions.
A. Investment Valuation — The investment valuation policy of the Fund is to use the amortized-cost method permitted by Rule 2a-7 under the Act for valuing portfolio securities. The amortized-cost method of valuation involves valuing a security at its cost and thereafter applying a constant accretion or amortization to maturity of any discount or premium. Normally, a security’s amortized cost will approximate its market value. Under procedures and tolerances approved by the Board of Trustees (“Trustees”), GSAM evaluates daily the difference between the Fund’s net asset value (“NAV”) per share using the amortized costs of its portfolio securities and the Fund’s NAV per share using market-based values of its portfolio securities. The market-based value of a portfolio security is determined, where readily available, on the basis of market quotations provided by pricing services or securities dealers, or, where accurate market quotations are not readily available, on the basis of the security’s fair value as determined in accordance with Valuation Procedures approved by the Trustees. The pricing services may use valuation models or matrix pricing, which may consider (among other things): (i) yield or price with respect to debt securities that are considered comparable in characteristics such as rating, interest rate and maturity date or (ii) quotations from securities dealers to determine current value.
B. Investment Income and Investments — Interest income is accrued daily and adjusted for amortization of premiums and accretion of discounts. Investment transactions are reflected on trade date. Realized gains and losses are calculated using identified cost.
C. Class Allocations and Expenses — Investment income, realized and unrealized gain (loss), if any, and non-class specific expenses of the Fund are allocated daily based upon the proportion of net assets of each class. Class specific expenses, where applicable, are borne by the respective share classes and include Distribution and Service and Transfer Agency fees. Non-class specific expenses directly incurred by the Fund are charged to the Fund, while such expenses incurred by the Trust are allocated across the applicable Funds on a straight-line and/or pro-rata basis depending upon the nature of the expenses.
D. Federal Taxes and Distributions to Shareholders — It is the Fund’s policy to comply with the requirements of the
Internal Revenue Code of 1986, as amended (the “Code”), applicable to regulated investment companies (mutual funds) and to distribute each year substantially all of its investment company taxable and tax-exempt income and capital gains to its shareholders. Accordingly, the Fund is not required to make any provisions for the payment of federal income tax. Distributions to shareholders are declared and recorded daily and paid monthly by the Fund and may include short-term capital gains. Long-term capital gain distributions, if any, are declared and paid annually. The Fund may defer or accelerate the timing of the distributions of short-term capital gains (or any portion thereof)
The characterization of distributions to shareholders for financial reporting purposes is determined in accordance with federal income tax rules, which may differ from GAAP. The source of the Fund’s distributions may be shown in the accompanying financial statements as either from net investment income, net realized gain or capital. Certain components of the Fund’s net assets on the Statement of Assets and Liabilities reflect permanent GAAP/tax differences based on the appropriate tax character.
13
GOLDMAN SACHS VARIABLE INSURANCE TRUST GOVERNMENT MONEY MARKET FUND
Notes to Financial Statements (continued)
June 30, 2018 (Unaudited)
2. SIGNIFICANT ACCOUNTING POLICIES (continued)
The amortized cost for the Fund stated in the accompanying Statement of Assets and Liabilities also represents aggregate cost for U.S. federal income tax purposes.
GSAM has reviewed the Fund’s tax positions for all open tax years (the current and prior three years, as applicable) and has concluded that no provision for income tax is required in the Fund’s financial statements. Such open tax years remain subject to examination and adjustment by tax authorities.
E. Forward Commitments — A forward commitment involves entering into a contract to purchase or sell securities, typically on an extended settlement basis, for a fixed price at a future date. The purchase of securities on a forward commitment basis involves a risk of loss if the value of the security to be purchased declines before the settlement date. Conversely, the sale of securities on a forward commitment basis involves the risk that the value of the securities sold may increase before the settlement date. Although the Fund will generally purchase securities on a forward commitment basis with the intention of acquiring the securities for its portfolio, the Fund may dispose of forward commitments prior to settlement which may result in a realized gain or loss.
F. Repurchase Agreements — Repurchase agreements involve the purchase of securities subject to the seller’s agreement to repurchase the securities at a mutually agreed upon date and price, under the terms of a Master Repurchase Agreement (“MRA”). During the term of a repurchase agreement, the value of the underlying securities held as collateral on behalf of a Fund, including accrued interest, is required to exceed the value of the repurchase agreement, including accrued interest. The gross value of repurchase agreements is included in the Statement of Assets and Liabilities for financial reporting purposes. The underlying securities for all repurchase agreements are held at the Fund’s custodian or designated sub-custodians under tri-party repurchase agreements.
An MRA governs transactions between the Fund and select counterparties. An MRA contains provisions for, among other things, initiation of the transaction, income payments, events of default, and maintenance of securities for repurchase agreements. An MRA also permits offsetting with collateral to create one single net payment in the event of default or similar events, including the bankruptcy or insolvency of a counterparty.
If the seller defaults, the Fund could suffer a loss to the extent that the proceeds from the sale of the underlying securities and other collateral held by the Fund are less than the repurchase price and the Fund’s costs associated with delay and enforcement of the repurchase agreement. In addition, in the event of default or insolvency of the seller, a court could determine that a Fund’s interest in the collateral is not enforceable, resulting in additional losses to the Fund.
Pursuant to exemptive relief granted by the Securities and Exchange Commission (“SEC”) and terms and conditions contained therein, the Fund, together with other funds of the Trust and registered investment companies having management agreements with GSAM or its affiliates, may transfer uninvested cash into joint accounts, the daily aggregate balance of which is invested in one or more repurchase agreements. Under these joint accounts, the Fund maintains pro-rata credit exposure to the underlying repurchase agreements’ counterparties. With the exception of certain transaction fees, the Fund is not subject to any expenses in relation to these investments.
3. INVESTMENTS AND FAIR VALUE MEASUREMENTS
U.S. GAAP defines the fair value of a financial instrument as the amount that would be received to sell an asset or paid to transfer a liability in an orderly transaction between market participants at the measurement date (i.e., the exit price); the Fund’s policy is to use the market approach. GAAP establishes a fair value hierarchy that prioritizes the inputs to valuation techniques used to measure fair value. The hierarchy gives the highest priority to unadjusted quoted prices in active markets for identical assets or liabilities (Level 1 measurements) and the lowest priority to unobservable inputs (Level 3 measurements). The levels used for classifying investments are not necessarily an indication of the risk associated with investing in these investments. The three levels of the fair value hierarchy are described below:
Level 1 — Unadjusted quoted prices in active markets that are accessible at the measurement date for identical, unrestricted assets or liabilities;
14
GOLDMAN SACHS VARIABLE INSURANCE TRUST GOVERNMENT MONEY MARKET FUND
Notes to Financial Statements (continued)
June 30, 2018 (Unaudited)
3. INVESTMENTS AND FAIR VALUE MEASUREMENTS (continued)
Level 2 — Quoted prices in markets that are not active or financial instruments for which significant inputs are observable (including, but not limited to, quoted prices for similar investments, interest rates, foreign exchange rates, volatility and credit spreads), either directly or indirectly;
Level 3 — Prices or valuations that require significant unobservable inputs (including GSAM’s assumptions in determining fair value measurement).
The Trustees have approved Valuation Procedures that govern the valuation of the portfolio investments held by the Fund, including investments for which market quotations are not readily available. The Trustees have delegated to GSAM day-to-day responsibility for implementing and maintaining internal controls and procedures related to the valuation (including both the amortized cost and market-based methods of valuation) of the Fund’s investments. To assess the continuing appropriateness of pricing sources and methodologies related to the market-based method of valuation, GSAM regularly performs price verification procedures and issues challenges as necessary to third party pricing vendors or brokers, and any differences are reviewed in accordance with the Valuation Procedures.
As of June 30, 2018, all investments are classified as Level 2 of the fair value hierarchy. Please refer to the Schedule of Investments for further detail.
4. AGREEMENTS AND AFFILIATED TRANSACTIONS
A. Management Agreement — Under the Agreement, GSAM manages the Fund, subject to the general supervision of the Trustees.
As compensation for the services rendered pursuant to the Agreement, the assumption of the expenses related thereto and administration of the Fund’s business affairs, including providing facilities, GSAM is entitled to a management fee, accrued daily and paid monthly, equal to an annual percentage rate of the Fund’s average daily net assets. Prior to February 21, 2018, GSAM agreed to waive a portion of the management fee equal to 0.045% of the annual contractual rate applicable to the Fund’s average daily net assets.
B. Distribution and Service (12b-1) Plan — The Trust, on behalf of the Service Shares of the Fund, has adopted a Distribution and Service Plan subject to Rule 12b-1 under the Act. Under the Distribution and Service Plan, Goldman Sachs, which serves as distributor (the “Distributor”), is entitled to a fee accrued daily and paid monthly, for distribution services and personal and account maintenance services, which may then be paid by Goldman Sachs to authorized dealers, equal to, on an annual basis, 0.25% of the Fund’s average daily net assets attributable to Service Shares.
C. Transfer Agency Agreement — Goldman Sachs also serves as the transfer agent of the Fund for a fee pursuant to a Transfer Agency Agreement. The fee charged for such transfer agency services is accrued daily and paid monthly at an annual rate of 0.02% of the Fund’s average daily net assets of Institutional and Service Shares.
D. Other Expense Agreements — GSAM has agreed to limit certain “Other Expenses” of the Fund (excluding transfer agency fees and expenses, taxes, interest, brokerage fees, expenses of shareholder meetings, litigation and indemnification, and extraordinary expenses) to the extent that such expenses exceed, on an annual basis, 0.004% of the average daily net assets of the Fund. Such Other Expense reimbursements, if any, are accrued daily and paid monthly. In addition, the Fund is not obligated to reimburse GSAM for prior fiscal year expense reimbursements, if any. This Other Expense limitation will remain in place through April 30, 2019, and prior to such date GSAM may not terminate the arrangement without the approval of the Trustees. For the six months ended June 30, 2018, GSAM reimbursed $98,889 to the Fund. In addition, the Fund has entered into certain offset arrangements with the custodian and the transfer agent, which may result in a reduction of the Fund’s expenses and are received irrespective of the application of the “Other Expense” limitation described above. For the six months ended June 30, 2018, custody fee credits were $796.
E. Contractual and Net Fund Expenses — During the six months ended June 30, 2018, GSAM, as the investment adviser, and Goldman Sachs, as distributor and transfer agent, voluntarily agreed to waive a portion of management fees, distribution and service plan fees and transfer agency fees attributable to the Fund. These waivers may be modified or terminated at any time at the
15
GOLDMAN SACHS VARIABLE INSURANCE TRUST GOVERNMENT MONEY MARKET FUND
Notes to Financial Statements (continued)
June 30, 2018 (Unaudited)
4. AGREEMENTS AND AFFILIATED TRANSACTIONS (continued)
option of GSAM or Goldman Sachs (as applicable). Prior to February 21, 2018, GSAM contractually agreed to waive a portion of the management fee equal annually to 0.045% of the Fund’s average daily net assets. The following table outlines such fees (net of waivers) and Other Expenses (net of reimbursements and custodian and transfer agency fee credit reductions) in order to determine the Fund’s net annualized expenses for the fiscal period. The Fund is not obligated to reimburse Goldman Sachs for prior fiscal year fee waivers, if any.
| Institutional Shares | Service Shares | |||||||||||||||
| Fee/Expense Type | Contractual rate, if any | Ratio of net expenses to average net assets for the six months ended June 30, 2018 | Contractual rate, if any | Ratio of net expenses to average net assets for the six months ended June 30, 2018 | ||||||||||||
| Management Fee(a) | 0.16 | % | 0.16 | % | 0.16 | % | 0.16 | % | ||||||||
| Distribution and Service Fees | N/A | N/A | 0.25 | 0.25 | ||||||||||||
| Transfer Agency Fees | 0.02 | 0.02 | 0.02 | 0.02 | ||||||||||||
| Other Expenses | — | 0.00 | (b) | — | 0.00 | (b) | ||||||||||
| Net Expenses | 0.18 | % | 0.43 | % | ||||||||||||
| (a) | Prior to February 21, 2018, the Fund’s contractual management fee rate was 0.205% of the Fund’s average daily net assets. |
| (b) | Amount is less than 0.005% of average net assets. |
N/A - Fees not applicable to respective share class.
For the six months ended June 30, 2018, Goldman Sachs waived $40,724 and $5 in management and transfer agency fees, respectively.
F. Other Transactions with Affiliates — The Fund may purchase securities from, or sell securities to, an affiliated fund provided the affiliation is solely due to having a common investment adviser, common officers, or common Trustees. For the six months ended June 30, 2018, there were no purchase and sale transactions for the Fund with affiliated funds in compliance with Rule 17a-7 under the Act.
G. Line of Credit Facility — As of June 30, 2018, the Fund participated in a $770,000,000 committed, unsecured revolving line of credit facility (the “facility”) together with other funds of the Trust and registered investment companies having management agreements with GSAM or its affiliates. This facility is to be used for temporary emergency purposes, or to allow for an orderly liquidation of securities to meet redemption requests. The interest rate on borrowings is based on the federal funds rate. The facility also requires a fee to be paid by the Fund based on the amount of the commitment that has not been utilized. For the six months ended June 30, 2018, the Fund did not have any borrowings under the facility. Prior to May 1, 2018, the facility was $1,100,000,000. The facility was decreased to $770,000,000 effective May 1, 2018.
5. OTHER RISKS
The Fund’s risks include, but are not limited to, the following:
Large Shareholder Transactions Risk — The Fund may experience adverse effects when certain large shareholders, such as other funds, participating insurance companies, accounts and Goldman Sachs affiliates, purchase or redeem large amounts of shares of the Fund. Such large shareholder redemptions may cause the Fund to sell portfolio securities at times when it would not otherwise do so, which may negatively impact the Fund’s NAV and liquidity. Similarly, large Fund share purchases may adversely affect the Fund’s performance to the extent that the Fund is delayed in investing new cash and is required to maintain a larger cash position than it ordinarily would. These transactions may also increase transaction costs. In addition, a large redemption could result in the Fund’s current expenses being allocated over a smaller asset base, leading to an increase in the Fund’s expense ratio.
Interest Rate Risk — When interest rates increase, the Fund’s yield will tend to be lower than prevailing market rates, and the market value of its securities or instruments may also be adversely affected. A low interest rate environment poses additional risks
16
GOLDMAN SACHS VARIABLE INSURANCE TRUST GOVERNMENT MONEY MARKET FUND
Notes to Financial Statements (continued)
June 30, 2018 (Unaudited)
5. OTHER RISKS (continued)
to the Fund, because low yields on the Fund’s portfolio holdings may have an adverse impact on the Fund’s ability to provide a positive yield to its shareholders, pay expenses out of Fund assets, or, at times, maintain a stable $1.00 share price. The risks associated with changing interest rates may have unpredictable effects on the markets and the Fund’s investments. Fluctuations in interest rates may also affect the liquidity of fixed income securities and instruments held by the Fund.
Market and Credit Risks — In the normal course of business, the Fund trades financial instruments and enters into financial transactions where risk of potential loss exists due to changes in the market (market risk). Additionally, the Fund may also be exposed to credit risk in the event that an issuer or guarantor fails to perform or that an institution or entity with which the Fund has unsettled or open transactions defaults.
6. INDEMNIFICATIONS
Under the Trust’s organizational documents, its Trustees, officers, employees and agents are indemnified, to the extent permitted by the Act and state law, against certain liabilities that may arise out of performance of their duties to the Fund. Additionally, in the course of business, the Fund enters into contracts that contain a variety of indemnification clauses. The Fund’s maximum exposure under these arrangements is unknown, as this would involve future claims that may be made against the Fund that have not yet occurred. However, GSAM believes the risk of loss under these arrangements to be remote.
7. SUBSEQUENT EVENTS
Subsequent events after the Statement of Assets and Liabilities date have been evaluated and GSAM has concluded that there is no impact requiring adjustment or disclosure in the financial statements.
8. SUMMARY OF SHARE TRANSACTIONS
Share activity is as follows:
For the Six Months Ended (Unaudited) | For the Fiscal Year Ended December 31, 2017 | |||||||
| Institutional Shares* | ||||||||
| Shares sold | 135,967,703 | 289,673,821 | ||||||
| Reinvestment of distributions | 2,020,075 | 1,754,187 | ||||||
| Shares redeemed | (172,240,733 | ) | (195,904,682 | ) | ||||
| (34,252,955 | ) | 95,523,326 | ||||||
| Service Shares* | ||||||||
| Shares sold | 100,060,623 | 185,811,642 | ||||||
| Reinvestment of distributions | 2,107,807 | 1,838,690 | ||||||
| Shares redeemed | (110,601,780 | ) | (208,980,389 | ) | ||||
| (8,433,350 | ) | (21,330,057 | ) | |||||
| NET INCREASE (DECREASE) IN SHARES | (42,686,305 | ) | 74,193,269 | |||||
| * | Valued at $1.00 per share. |
17
GOLDMAN SACHS VARIABLE INSURANCE TRUST GOVERNMENT MONEY MARKET FUND
| Fund Expenses — Six Month Period Ended June 30, 2018 (Unaudited) |
As a shareholder of the Institutional Shares and Service Shares of the Fund, you incur ongoing costs, including management fees; distribution and service (12b-1) fees (with respect to Service Shares); and other Fund expenses. This example is intended to help you understand your ongoing costs (in dollars) of investing in the Fund and to compare these costs with the ongoing costs of investing in other mutual funds.
The example is based on an investment of $1,000 invested at the beginning of the period and held for the entire period from January 1, 2018 through June 30, 2018, which represents a period of 181 days of a 365 day year.
Actual Expenses — The first line in the table below provides information about actual account values and actual expenses. You may use the information in this line, together with the amount you invested, to estimate the expenses that you paid over the period. Simply divide your account value by $1,000 (for example, an $8,600 account value divided by $1,000=8.6), then multiply the result by the number in the first line under the heading entitled “Expenses Paid” to estimate the expenses you paid on your account during this period.
Hypothetical Example for Comparison Purposes — The second line in the table below provides information about hypothetical account values and hypothetical expenses based on the Fund’s actual net expense ratio and an assumed rate of return of 5% per year before expenses, which is not the Fund’s actual return. The hypothetical account values and expenses may not be used to estimate the actual ending account balance or expenses you paid for the period. You may use this information to compare the ongoing costs of investing in the Fund and other funds. To do so, compare this 5% hypothetical example with the 5% hypothetical examples that appear in the shareholder reports of the other funds.
Please note that the expenses shown in the table are meant to highlight your ongoing costs only and do not reflect any transactional costs, such as sales charges, redemption fees, or exchange fees. Therefore, the second line of the table is useful in comparing ongoing costs only and will not help you determine the relative total costs of owning different funds. In addition, if these transactional costs were included, your costs would have been higher.
| Share Class | Beginning Account Value 1/1/18 | Ending Account Value 6/30/18 | Expenses Paid for the 6 Months Ended 6/30/18* | |||||||||
| Institutional Shares | ||||||||||||
| Actual | $ | 1,000.00 | $ | 1,007.28 | $ | 0.90 | ||||||
| Hypothetical 5% return | $ | 1,000.00 | $ | 1,023.90 | + | $ | 0.90 | |||||
| Service Shares | ||||||||||||
| Actual | $ | 1,000.00 | $ | 1,006.03 | $ | 2.14 | ||||||
| Hypothetical 5% return | $ | 1,000.00 | $ | 1,022.66 | + | $ | 2.16 | |||||
| * | Expenses are calculated using the Fund’s annualized net expense ratio for each class, which represents the ongoing expenses as a percentage of net assets for the six months ended June 30, 2018. Expenses are calculated by multiplying the annualized net expense ratio by the average account value for the period; then multiplying the result by the number of days in the most recent fiscal half year (or, since inception, if shorter); and then dividing that result by the number of days in the period. The annualized net expense ratios for the period were 0.18% and 0.43% for the Institutional Shares and Service Shares, respectively. |
| + | Hypothetical expenses are based on the Fund’s actual annualized net expense ratio and an assumed rate of return of 5% per year before expenses. |
18
GOLDMAN SACHS VARIABLE INSURANCE TRUST GOVERNMENT MONEY MARKET FUND
Statement Regarding Basis for Approval of Management Agreement (Unaudited)
Background
The Goldman Sachs Government Money Market Fund (the “Fund”) is an investment portfolio of Goldman Sachs Variable Insurance Trust (the “Trust”). The Board of Trustees oversees the management of the Trust and reviews the investment performance and expenses of the Fund at regularly scheduled meetings held throughout the year. In addition, the Board of Trustees determines annually whether to approve the continuance of the Trust’s investment management agreement (the “Management Agreement”) with Goldman Sachs Asset Management, L.P. (the “Investment Adviser”) on behalf of the Fund.
The Management Agreement was most recently approved for continuation until June 30, 2019 by the Board of Trustees, including those Trustees who are not parties to the Management Agreement or “interested persons” (as defined in the Investment Company Act of 1940, as amended) of any party thereto (the “Independent Trustees”), at a meeting held on June 13-14, 2018 (the “Annual Meeting”).
The review process undertaken by the Trustees spans the course of the year and culminates with the Annual Meeting. To assist the Trustees in their deliberations, the Trustees have established a Contract Review Committee (the “Committee”), comprised of the Independent Trustees. The Committee held four meetings over the course of the year since the Management Agreement was last approved. At those Committee meetings, regularly scheduled Board or other committee meetings, and/or the Annual Meeting, matters relevant to the renewal of the Management Agreement were considered by the Board, or the Independent Trustees, as applicable. With respect to the Fund, such matters included:
| (a) | the nature and quality of the advisory, administrative, and other services provided to the Fund by the Investment Adviser and its affiliates, including information about: |
| (i) | the structure, staff, and capabilities of the Investment Adviser and its portfolio management teams; |
| (ii) | the groups within the Investment Adviser and its affiliates that support the portfolio management teams or provide other types of necessary services, including fund services groups (e.g., accounting and financial reporting, tax, shareholder services, and operations); controls and risk management groups (e.g., legal, compliance, valuation oversight, credit risk management, internal audit, compliance testing, market risk analysis, finance, and central funding); sales and distribution support groups, and others (e.g., information technology and training); |
| (iii) | trends in employee headcount; |
| (iv) | the Investment Adviser’s financial resources and ability to hire and retain talented personnel and strengthen its operations; and |
| (v) | the parent company’s support of the Investment Adviser and its mutual fund business, as expressed by the firm’s senior management; |
| (b) | information on the investment performance of the Fund, including comparisons to the performance of similar mutual funds, as provided by a third-party mutual fund data provider engaged as part of the contract review process (the “Outside Data Provider”); and information on general investment outlooks in the markets in which the Fund invests; |
| (c) | information provided by the Investment Adviser indicating the Investment Adviser’s views on whether the Fund’s peer group and/or benchmark index had high, medium, or low relevance given the Fund’s particular investment strategy; |
| (d) | the terms of the Management Agreement and other agreements with affiliated service providers entered into by the Trust on behalf of the Fund; |
| (e) | fee and expense information for the Fund, including: |
| (i) | the relative management fee and expense levels of the Fund as compared to those of comparable funds managed by other advisers, as provided by the Outside Data Provider; |
| (ii) | the Fund’s expense trends over time; and |
| (iii) | to the extent the Investment Adviser manages other types of accounts (such as bank collective trusts, private wealth management accounts, institutional separate accounts, sub-advised mutual funds, and non-U.S. funds) having investment objectives and policies similar to those of the Fund, comparative information on the advisory fees charged and services provided to those accounts by the Investment Adviser; |
| (f) | with respect to the extensive investment performance and expense comparison data provided by the Outside Data Provider, its processes in producing that data for the Fund; |
| (g) | the undertakings of the Investment Adviser and its affiliates to implement fee waivers and/or expense limitations; |
| (h) | information relating to the profitability of the Management Agreement and the transfer agency and distribution and service arrangements of the Fund to the Investment Adviser and its affiliates; |
| (i) | whether the Fund’s existing management fee schedule adequately addressed any economies of scale; |
19
GOLDMAN SACHS VARIABLE INSURANCE TRUST GOVERNMENT MONEY MARKET FUND
Statement Regarding Basis for Approval of Management Agreement (Unaudited) (continued)
| (j) | a summary of the “fall-out” benefits derived by the Investment Adviser and its affiliates from their relationships with the Fund, including the fees received by the Investment Adviser’s affiliates from the Fund for transfer agency, distribution and other services; |
| (k) | a summary of potential benefits derived by the Fund as a result of its relationship with the Investment Adviser; |
| (l) | information regarding portfolio trading and how the Investment Adviser carries out its duty to seek best execution; |
| (m) | the nature and quality of the services provided to the Fund by its unaffiliated service providers, and the Investment Adviser’s general oversight and evaluation (including reports on due diligence) of those service providers as part of the administrative services provided under the Management Agreement; and |
| (n) | the Investment Adviser’s processes and policies addressing various types of potential conflicts of interest; its approach to risk management; the annual review of the effectiveness of the Fund’s compliance program; and periodic compliance reports. |
The Trustees also received an overview of the Fund’s distribution arrangements. They received information regarding the Fund’s assets, share purchase and redemption activity, and payment of distribution and service fees. Information was also provided to the Trustees relating to revenue sharing payments made by and services provided by the Investment Adviser and its affiliates to intermediaries that promote the sale, distribution, and/or servicing of Fund shares. The Independent Trustees also discussed the broad range of other investment choices that are available to Fund investors, including the availability of comparable funds managed by other advisers.
The presentations made at the Board and Committee meetings and at the Annual Meeting encompassed the Fund and other mutual funds for which the Board of Trustees has responsibility. In evaluating the Management Agreement at the Annual Meeting, the Trustees relied upon their knowledge, resulting from their meetings and other interactions throughout the year, of the Investment Adviser and its affiliates, their services, and the Fund. In conjunction with these meetings, the Trustees received written materials and oral presentations on the topics covered, and the Investment Adviser addressed the questions and concerns of the Trustees, including concerns regarding the investment performance of certain of the funds they oversee. The Independent Trustees were advised by their independent legal counsel regarding their responsibilities and other regulatory requirements related to the approval and continuation of mutual fund investment management agreements under applicable law. In addition, the Investment Adviser and its affiliates provided the Independent Trustees with a written response to a formal request for information sent on behalf of the Independent Trustees by their independent legal counsel. During the course of their deliberations, the Independent Trustees met in executive sessions with their independent legal counsel, without representatives of the Investment Adviser or its affiliates present.
Nature, Extent, and Quality of the Services Provided Under the Management Agreement
As part of their review, the Trustees considered the nature, extent, and quality of the services provided to the Fund by the Investment Adviser. In this regard, the Trustees considered both the investment advisory services and non-advisory services that are provided by the Investment Adviser and its affiliates. The Trustees noted the transition in the leadership and changes in personnel of various of the Investment Adviser’s portfolio management teams that had occurred in recent periods, and the ongoing recruitment efforts aimed at bringing high quality investment talent to the Investment Adviser. They also noted the Investment Adviser’s commitment to maintaining high quality systems and expending substantial resources to respond to ongoing changes to the regulatory and control environment in which the Fund and its service providers operate, as well as the efforts of the Investment Adviser and its affiliates to combat cyber security risks. The Trustees concluded that the Investment Adviser continued to commit substantial financial and operational resources to the Fund and expressed confidence that the Investment Adviser would continue to do so in the future. The Trustees also recognized that the Investment Adviser had made significant commitments to address regulatory compliance requirements applicable to the Fund and the Investment Adviser and its affiliates.
Investment Performance
The Trustees also considered the investment performance of the Fund. In this regard, they compared the investment performance of the Fund to its peers using rankings compiled by the Outside Data Provider as of December 31, 2017. The information on the Fund’s investment performance was provided for the one-, three-, five-, and ten-year periods ending on the applicable dates.
In addition, the Trustees considered materials prepared and presentations made by the Investment Adviser’s senior management and portfolio management personnel in which Fund performance was assessed. The Trustees also considered the Investment Adviser’s periodic reports with respect to the Fund’s risk profile, and how the Investment Adviser’s approach to risk monitoring and management influences portfolio management.
20
GOLDMAN SACHS VARIABLE INSURANCE TRUST GOVERNMENT MONEY MARKET FUND
Statement Regarding Basis for Approval of Management Agreement (Unaudited) (continued)
The Trustees considered the performance of the Fund in light of its investment policies and strategy. They noted that the Fund had operated for over a full calendar year following the implementation of the final set of money market fund reforms in 2016, including the requirements relating to liquidity fees and redemption gates. They also noted that, although the Fund had operated in a challenging yield environment since 2009, yields had continued to improve through 2017 and early 2018 as a result of actions by the Federal Reserve, including a series of interest rate increases. The Trustees considered that the Fund had maintained a competitive yield throughout the period, in part due to the Investment Adviser’s agreement to contractually and voluntarily waive a portion of its management fee and reimburse certain other expenses. They observed that the Investment Adviser had made its previous contractual management fee waiver permanent, lowering the Fund’s contractual management fee schedule, and had also reduced its voluntary management fee waiver throughout the year with the rise in interest rates. The Trustees also considered that the Fund had maintained a stable net asset value per share. In light of these considerations, the Trustees believed that the Fund was providing investment performance within a competitive range for investors.
Costs of Services Provided and Competitive Information
The Trustees considered the contractual terms of the Management Agreement and the fee rates payable by the Fund thereunder. In this regard, the Trustees considered information on the services rendered by the Investment Adviser to the Fund, which included both advisory and administrative services that were directed to the needs and operations of the Fund as a registered mutual fund.
In particular, the Trustees reviewed analyses prepared by the Outside Data Provider regarding the expense rankings of the Fund. The analyses provided a comparison of the Fund’s management fee to those of a relevant peer group and category universe; an expense analysis which compared the Fund’s overall net and gross expenses to a peer group and a category universe; and data comparing the Fund’s net expenses to the peer and category medians. The analyses also compared the Fund’s transfer agency and custody fees, other expenses and fee waivers/reimbursements to those of the peer group and category medians. The Trustees concluded that the comparisons provided by the Outside Data Provider were useful in evaluating the reasonableness of the management fees and total expenses paid by the Fund.
In addition, the Trustees considered the Investment Adviser’s undertakings to implement fee waivers and/or expense limitations. They noted that the Investment Adviser and Goldman Sachs had waived fees and reimbursed expenses for the Fund in order to maintain a competitive yield. They observed that the Investment Adviser had made its previous contractual management fee waiver permanent, lowering the Fund’s contractual management fee schedules, and had also reduced its voluntary management fee waiver for the Fund throughout the year with the rise in interest rates. They noted that the Fund had operated for over a full calendar year following the implementation of the final set of money market fund reforms in 2016, including the requirements relating to liquidity fees and redemption gates. They also considered, to the extent that the Investment Adviser manages other types of accounts having investment objectives and policies similar to those of the Fund, comparative fee information for services provided by the Investment Adviser to those accounts, and information that indicated that services provided to the Fund differed in various significant respects from the services provided to other types of accounts which, in many cases, operated under less stringent legal and regulatory structures, required fewer services from the Investment Adviser to a smaller number of client contact points, and were less time-intensive.
In addition, the Trustees noted that shareholders are able to redeem their Fund shares at any time if shareholders believe that the Fund fees and expenses are too high or if they are dissatisfied with the performance of the Fund.
Profitability
The Trustees reviewed the Fund’s contribution to the Investment Adviser’s revenues and pre-tax profit margins. In this regard the Trustees noted that they had received, among other things, profitability analyses and summaries, revenue and expense schedules by Fund and by function (i.e., investment management, transfer agency and distribution and service), and information on the Investment Adviser’s expense allocation methodology. They observed that the profitability and expense figures are substantially similar to those used by the Investment Adviser for many internal purposes, including compensation decisions among various business groups, and are thus subject to a vigorous internal debate about how certain revenue and expenses should be allocated. The Trustees also noted that the internal audit group within the Goldman Sachs organization had audited the expense allocation methodology and that the internal audit group was satisfied with the reasonableness, consistency, and accuracy of the Investment Adviser’s expense allocation methodology and profitability analysis calculations. Profitability data for the Fund was provided for 2017 and 2016, and the Trustees considered this information in relation to the Investment Adviser’s overall profitability.
21
GOLDMAN SACHS VARIABLE INSURANCE TRUST GOVERNMENT MONEY MARKET FUND
Statement Regarding Basis for Approval of Management Agreement (Unaudited) (continued)
Economies of Scale
The Trustees considered the information that had been provided regarding whether there have been economies of scale with respect to the management of the Fund. The Trustees noted that the Fund does not have management fee breakpoints. They considered the asset levels in the Fund; the Fund’s recent purchase and redemption activity; the information provided by the Investment Adviser relating to the costs of the services provided by the Investment Adviser and its affiliates and their realized profits; information comparing the contractual fee rates charged by the Investment Adviser with fee rates charged to other money market funds in the peer group; and the Investment Adviser’s undertaking to limit certain expenses of the Fund that exceed a specified level. They considered a report prepared by the Outside Data Provider, which surveyed money market funds’ management fee arrangements and use of breakpoints. The Trustees also considered the competitive nature of the money market fund business and the competitiveness of the fees charged to the Fund by the Investment Adviser.
Other Benefits to the Investment Adviser and Its Affiliates
The Trustees also considered the other benefits derived by the Investment Adviser and its affiliates from their relationships with the Fund as stated above, including: (a) transfer agency fees received by Goldman Sachs & Co. LLC (“Goldman Sachs”); (b) trading efficiencies resulting from aggregation of orders of the Fund with those for other funds or accounts managed by the Investment Adviser; (c) the Investment Adviser’s ability to leverage the infrastructure designed to service the Fund on behalf of its other clients; (d) the Investment Adviser’s ability to cross-market other products and services to Fund shareholders; (e) Goldman Sachs’ retention of certain fees as Fund Distributor; (f) Goldman Sachs’ ability to engage in principal transactions with the Fund under exemptive orders from the U.S. Securities and Exchange Commission permitting such trades; (g) the Investment Adviser’s ability to negotiate better pricing with custodians on behalf of its other clients, as a result of the relationship with the Fund; and (h) the possibility that the working relationship between the Investment Adviser and the Fund’s third-party service providers may cause those service providers to be more likely to do business with other areas of Goldman Sachs. In the course of considering the foregoing, the Independent Trustees requested and received further information quantifying certain of these fall-out benefits.
Other Benefits to the Fund and Its Shareholders
The Trustees also noted that the Fund receives certain potential benefits as a result of its relationship with the Investment Adviser, including: (a) trading efficiencies resulting from aggregation of orders of the Fund with those of other funds or accounts managed by the Investment Adviser; (b) enhanced servicing from vendors because of the volume of business generated by the Investment Adviser and its affiliates; (c) enhanced servicing from broker-dealers because of the volume of business generated by the Investment Adviser and its affiliates; (d) the Investment Adviser’s knowledge and experience gained from managing other accounts and products; (e) the Investment Adviser’s ability to hire and retain qualified personnel to provide services to the Fund because of the reputation of the Goldman Sachs organization; (f) the Fund’s access, through the Investment Adviser, to certain firmwide resources (e.g., proprietary risk management systems and databases), subject to certain restrictions; and (g) the Fund’s access to certain affiliated distribution channels. In addition, the Trustees noted the competitive nature of the mutual fund marketplace, and considered that many of the Fund’s shareholders invested in the Fund in part because of the Fund’s relationship with the Investment Adviser and that those shareholders have a general expectation that the relationship will continue.
Conclusion
In connection with their consideration of the Management Agreement, the Trustees gave weight to each of the factors described above, but did not identify any particular factor as controlling their decision. After deliberation and consideration of all of the information provided, including the factors described above, the Trustees concluded, in the exercise of their business judgment, that the management fees paid by the Fund were reasonable in light of the services provided to it by the Investment Adviser, the Investment Adviser’s costs and the Fund’s current and reasonably foreseeable asset levels. The Trustees unanimously concluded that the Investment Adviser’s continued management likely would benefit the Fund and its shareholders and that the Management Agreement should be approved and continued with respect to the Fund until June 30, 2019.
22
TRUSTEES Jessica Palmer, Chair Kathryn A. Cassidy Diana M. Daniels Herbert J. Markley James A. McNamara Roy W. Templin Gregory G. Weaver | OFFICERS James A. McNamara, President Scott M. McHugh, Treasurer, Senior Vice President and Principal Financial Officer Joseph F. DiMaria, Assistant Treasuer and Principal Accounting Officer Caroline L. Kraus, Secretary |
GOLDMAN SACHS & CO. LLC
Distributor and Transfer Agent
GOLDMAN SACHS ASSET MANAGEMENT, L.P.
Investment Adviser
200 West Street, New York
New York 10282
Visit our Web site at www.GSAMFUNDS.com to obtain the most recent month-end returns.
The reports concerning the Fund included in this shareholder report may contain certain forward-looking statements about the factors that may affect the performance of the Fund in the future. These statements are based on Fund management’s predictions and expectations concerning certain future events and their expected impact on the Fund, such as performance of the economy as a whole and of specific industry sectors, changes in the levels of interest rates, the impact of developing world events, and other factors that may influence the future performance of the Fund. Management believes these forward-looking statements to be reasonable, although they are inherently uncertain and difficult to predict. Actual events may cause adjustments in portfolio management strategies from those currently expected to be employed.
A description of the policies and procedures that the Fund uses to determine how to vote proxies relating to portfolio securities and information regarding how the Fund voted proxies relating to portfolio securities during the most recent 12-month period ended June 30 is available (i) without charge, upon request by calling 1-800-621-2550; and (ii) on the Securities and Exchange Commission (“SEC”) Web site at http://www.sec.gov.
Views and opinions expressed are for informational purposes only and do not constitute a recommendation by GSAM to buy, sell, or hold any security. Views and opinions are current as of the date of this presentation and may be subject to change, they should not be construed as investment advice.
The Fund files its complete schedule of portfolio holdings with the SEC for the first and third quarters of each fiscal year on Form N-Q. The Fund’s Forms N-Q are available on the SEC’s web site at http://www.sec.gov within 60 days after the Fund’s first and third fiscal quarters. The Fund’s Forms N-Q may be reviewed and copied at the SEC’s Public Reference Room in Washington, D.C. and information on the operation of the Public Reference Room may also be obtained by calling 1-800-SEC-0330. Forms N-Q may be obtained upon request and without charge by calling 1-800-621-2550.
Goldman Sachs & Co. LLC (“Goldman Sachs”) does not provide legal, tax or accounting advice. Any statement contained in this communication (including any attachments) concerning U.S. tax matters was not intended or written to be used, and cannot be used, for the purpose of avoiding penalties under the Internal Revenue Code, and was written to support the promotion or marketing of transaction or matter addressed. Clients of Goldman Sachs should obtain their own independent tax advice based on their particular circumstances.
The web site links provided are for your convenience only and are not an endorsement or recommendation by GSAM of any of these web sites or the products or services offered. GSAM is not responsible for the accuracy and validity of the content of these web sites.
Fund holdings and allocations shown are as of June 30, 2018 and may not be representative of future investments. Fund holdings should not be relied on in making investment decisions and should not be construed as research or investment advice regarding particular securities. Current and future holdings are subject to risk.
The portfolio risk management process includes an effort to monitor and manage risk, but does not imply low risk.
Shares of the Goldman Sachs VIT Funds are offered to separate accounts of participating life insurance companies for the purpose of funding variable annuity contracts and variable life insurance policies. Shares of the Fund are not offered directly to the general public. The variable annuity contracts and variable life insurance policies are described in the separate prospectuses issued by participating insurance companies. You should refer to those prospectuses for information about surrender charges, mortality and expense risk fees and other charges that may be assessed by participating insurance companies under the variable annuity contracts or variable life insurance policies. Such fees or charges, if any, may affect the return you may realize with respect to your investments. Ask your representative for more complete information. Please consider a fund’s objectives, risks and charges and expenses, and read the prospectus carefully before investing. The prospectus contains this and other information about the Fund.
This material is not authorized for distribution to prospective investors unless preceded or accompanied by a current prospectus or summary prospectus, if applicable. Investors should consider the Fund’s objective, risks, and charges and expenses, and read the summary prospectus, if available, and/or the prospectus carefully before investing or sending money. The summary prospectus, if available, and the prospectus contain this and other information about the Fund and may be obtained from your authorized dealer or from Goldman Sachs & Co. LLC by calling 1-800-621-2550.
THIS MATERIAL IS FOR INFORMATIONAL PURPOSES ONLY AND IS PROVIDED SOLELY ON THE BASIS THAT IT WILL NOT CONSTITUTE INVESTMENT OR OTHER ADVICE OR A RECOMMENDATION RELATING TO ANY PERSON’S OR PLAN’S INVESTMENT OR OTHER DECISIONS, AND GOLDMAN SACHS IS NOT A FIDUCIARY OR ADVISOR WITH RESPECT TO ANY PERSON OR PLAN BY REASON OF PROVIDING THE MATERIAL OR CONTENT HEREIN INCLUDING UNDER THE EMPLOYEE RETIREMENT INCOME SECURITY ACT OF 1974 OR DEPARTMENT OF LABOR REGULATIONS. PLAN SPONSORS AND OTHER FIDUCIARIES SHOULD CONSIDER THEIR OWN CIRCUMSTANCES IN ASSESSING ANY POTENTIAL COURSE OF ACTION.
This report is prepared for the general information of contract owners and is not an offer of shares of the Goldman Sachs Variable Insurance Trust — Goldman Sachs Government Money Market Fund.
© 2018 Goldman Sachs. All rights reserved.
VITMMSAR-18/139310-OTU-807530
Goldman
Sachs Variable Insurance Trust
Goldman Sachs
Multi-Strategy
Alternatives Portfolio
Semi-Annual Report
June 30, 2018

GOLDMAN SACHS VARIABLE INSURANCE TRUST MULTI-STRATEGY ALTERNATIVES PORTFOLIO
INVESTMENT OBJECTIVE
The Portfolio seeks long-term growth of capital.
Portfolio Management Discussion and Analysis
Below, the Goldman Sachs Global Portfolio Solutions Team discusses the Goldman Sachs Variable Insurance Trust — Goldman Sachs Multi-Strategy Alternatives Portfolio’s (the “Portfolio”) performance and positioning for the six-month period ended June 30, 2018 (the “Reporting Period”).
How did the Portfolio perform during the Reporting Period?
During the Reporting Period, the Portfolio’s Institutional, Service and Advisor Shares generated cumulative total returns of –3.62%, –3.83% and –3.85%, respectively. These returns compare to the 0.92% cumulative total return of the Portfolio’s benchmark, the ICE® BofAML® U.S. Dollar Three-Month LIBOR Constant Maturity Index (the “LIBOR Index”), during the same period.
Please note that the Portfolio’s benchmark being the LIBOR Index is a means of emphasizing that the Portfolio has an unconstrained strategy. That said, this Portfolio employs a benchmark agnostic strategy and thus comparisons to a benchmark index are not particularly relevant.
What economic and market factors most influenced the Portfolio during the Reporting Period?
The capital markets were influenced most during the Reporting Period by economic data, central bank monetary policy, higher commodity prices and geopolitical events.
In the first quarter of 2018, when the Reporting Period began, global equity markets experienced their first pullback after rallying for eight consecutive calendar quarters. Global equity prices peaked during the last week of January 2018 before retreating on news of stronger than consensus expected U.S. wage growth data in early February. In addition to the wage growth data, which led investors to anticipate a faster pace of U.S. Federal Reserve (“Fed”) interest rate hikes, rising concerns about potential trade protectionism and worsening market sentiment about U.S. information technology stocks weighed on global equity prices. In the second half of March 2018, U.S. information technology stocks sold off due to investor concerns about data privacy. During the first calendar quarter overall, macroeconomic data moderated in the developed markets, particularly in Europe and Japan. Emerging markets equities generally outperformed their developed markets peers because of what many considered to be attractive valuations and because of the comparatively stronger economic data within emerging markets countries as well as higher commodity prices. In the fixed income markets, the 10-year U.S. Treasury yield rose during the first quarter of 2018, driven by the Fed’s decision to raise interest rates at its March policy meeting as well as by a modest pickup in inflation and a higher than consensus expected U.S. fiscal deficit. The outcome of the Fed’s policy meeting was generally considered dovish by investors but was also in line with market expectations. (Dovish tends to imply lower interest rates; opposite of hawkish.) The U.S. dollar weakened relative to other major developed markets currencies during the first calendar quarter.
During the second quarter of 2018, developed markets equities generated positive returns, while emerging markets equities experienced broad-based weakness. Two large themes were at play: 1) divergence between U.S. economic growth compared to that of the rest of the world and 2) continued escalation of trade tensions. Within developed markets, U.S., U.K., European and Japanese equities rallied. U.K. export-driven stocks, in particular, benefited strongly from the depreciation of the British pound versus other major currencies. Meanwhile, emerging markets equities substantially underperformed developed markets stocks, as emerging markets’ economic growth slowed and disputes between the U.S. and China about trade tariffs soured investors’ appetite for emerging markets assets in general. Broad-based selling also contributed to the weakness of emerging markets stocks. Within fixed income, the 10-year U.S. Treasury yield rose, as U.S. macroeconomic data remained relatively strong, inflation increased and oil prices rose. The U.S. dollar strengthened against major currencies, driven by comparatively better U.S. economic growth and tighter Fed monetary policy. The Mexican peso and euro were among those currencies experiencing some of the largest drops versus the U.S. dollar. Weakening appetite for emerging markets assets and the looming Mexican presidential election weighed on the Mexican peso, while slower Eurozone economic growth and a dovish European Central Bank pressured the euro. Meanwhile, moderating global economic growth and escalating trade tensions weighed on the prices of metals, such as copper, and the stronger U.S. dollar pushed down gold prices.
1
GOLDMAN SACHS VARIABLE INSURANCE TRUST MULTI-STRATEGY ALTERNATIVES PORTFOLIO
What key factors were responsible for the Portfolio’s performance during the Reporting Period?
The Portfolio’s performance is driven by four sources of return: long-term strategic asset allocation to market exposures, medium-term cycle-aware allocation, short-term tactical allocation and excess returns from investments in Underlying Funds. Strategic asset allocation is the process by which the Portfolio’s assets are allocated across underlying asset classes and strategies in a way that considers the risks of each underlying asset class and strategy. Medium-term cycle-aware allocation is the process by which we adjust the portfolio for changes in the business or economic cycle. Short-term tactical allocation is the implementation of tactical market views with the goal of improving the Portfolio’s risk-adjusted return. The risk-adjusted return on an investment takes into account the risk associated with that investment relative to other potential investments.
During the Reporting Period, the Portfolio generated negative absolute returns, driven primarily by strategic asset allocation and by security selection within the Portfolio’s Underlying Funds. Short-term tactical asset allocation and medium-term cycle-aware allocation also hurt performance.
Strategic asset allocation detracted from the Portfolio’s results during the Reporting Period. Allocations to specific liquid alternatives strategies had the greatest negative impact, with the Portfolio’s volatility selling strategy a source of weakness as volatility spiked in early February 2018. (Our volatility selling strategy seeks to benefit from changes in the level of market implied volatility (i.e., expectations of future volatility) in equity markets.) Within fixed income, the Portfolio was hurt by our long U.S. interest rates options strategy through which we seek to profit if interest rates fall, remain constant or rise less than anticipated. This strategy detracted from the Portfolio’s performance as U.S. Treasury yields rose over the course of the Reporting Period. (Our long U.S. interest rate options strategy is a macroeconomic hedge that buys put options on short-term interest rates. A put option is an option contract giving the owner the right, but not the obligation, to sell a specified amount of an underlying asset at a specified price within a specified time.) In addition, the Portfolio’s strategic allocation to U.S. dollar- and local currency-denominated emerging markets bonds detracted from returns, as emerging markets assets struggled amid increasing trade tensions and a strengthening U.S. dollar. For similar reasons, within equities, the Portfolio was hampered by its long position in emerging markets stocks.
Medium-term cycle-aware allocation also detracted from the Portfolio’s performance. Over the course of the Reporting Period, the Portfolio held three medium-term cycle-aware views. The first was to have a short duration position, which we expressed through a short position in long-maturity German government bonds and short positions in specific segments of the U.S. Treasury yield curve. (Duration is a measure of the Portfolio’s sensitivity to changes in interest rates. Yield curve is a spectrum of maturities.) The Portfolio’s short position in long-maturity German government bonds detracted from results, as Germany’s long-term interest rates fell during the second half of the Reporting Period in response to slower European economic growth, dovish European Central Bank monetary policy and political risk in Italy. This was offset somewhat by the Portfolio’s short position in the two-year segment of the U.S. Treasury yield curve, which added to performance. The second medium-term cycle-aware view was to hold a long position in emerging markets equities versus developed markets equities. This positioning detracted from the Portfolio’s returns, as emerging markets equities broadly underperformed developed markets equities during the Reporting Period. The third medium-term cycle-aware view — to hold a long position in local currency emerging markets bonds versus U.S. high yield corporate bonds
— also hurt the Portfolio’s performance due to the broad underperformance of emerging markets assets.
Short-term tactical allocation had a negative impact on Portfolio returns during the Reporting Period. The Portfolio’s tactical long-short currency basket detracted from performance as did our tactical country view to hold a long position in Japanese equities. In addition, a tactical long position in U.S. dollar-denominated emerging markets bonds dampened results amid broad weakness in emerging markets assets. On April 4, 2018, we transitioned the Portfolio to a single implementation vehicle for expressing our tactical views — the Goldman Sachs Tactical Exposure Fund (the “Underlying Tactical Fund”). Between April 4, 2018 and the end of the Reporting Period, the Portfolio’s allocation to the Underlying Tactical Fund detracted from performance.
Overall, security selection within Underlying Funds detracted from the Portfolio’s performance during the Reporting Period. The Goldman Sachs Managed Futures Strategy Fund underperformed its benchmark index the most. The Goldman Sachs Long Short Credit Fund and the Goldman Sachs Strategic Income Fund also underperformed their respective benchmark indices. None of the Underlying Funds meaningfully outperformed their benchmark indices during the Reporting Period.
How was the Portfolio positioned at the beginning of the Reporting Period?
At the beginning of the Reporting Period, the Portfolio was positioned, in terms of its total net assets, with 61.1% in liquid alternative strategies, 31.4% in real assets/satellite asset classes and 7.6% in cash. (Liquid alternatives strategies generally include, but are not limited to, momentum or trend trading strategies (investment decisions based on trends in asset prices over time), hedge fund beta (long term total returns consistent with investment results that approximate the return and risk patterns of a diversified
2
GOLDMAN SACHS VARIABLE INSURANCE TRUST MULTI-STRATEGY ALTERNATIVES PORTFOLIO
universe of hedge funds), managed risk investment strategies (which seek to manage extreme risk scenarios by implementing daily and monthly risk targets across a diversified mix of asset classes), emerging markets debt and unconstrained fixed income strategies (which have the ability to move across various fixed income sectors). Real assets generally include, but are not limited to, commodities, global real estate securities, infrastructure and master limited partnerships. The strategic asset allocation of the Portfolio reflects a risk-based allocation approach to increase diversification across the Portfolio. The Portfolio had –7.9% of its total net assets invested in tactical exposures at the beginning of the Reporting Period.
How did you manage the Portfolio’s allocations during the Reporting Period?
Over the course of the Reporting Period, we made changes to the Portfolio’s strategic allocation, medium-term cycle-aware allocation and short-term tactical allocation. Within the strategic allocation, we added an allocation to alternative investment strategies through the Goldman Sachs Alternative Premia Fund. We consider the Portfolio’s strategic asset allocation and underlying active security selection strategies the largest drivers of risk and performance.
We also sought to adjust the Portfolio’s exposure for medium-term changes to the business or economic cycle. In early May 2018, we added a long position in local emerging markets debt versus U.S. high yield corporate debt. This view reflected our belief that we are approaching the point in the economic cycle at which credit spreads (i.e., yield differentials between corporate bonds and U.S. Treasury securities of comparable maturity) have historically started to widen, which could be a headwind for high yield fixed income. We considered it an opportune time to add this position, as credit spreads were likely, in our view, to remain well anchored in the near term and because emerging markets assets had experienced a selloff earlier in the calendar year.
Within the short-term tactical allocation, we decreased the Portfolio’s exposure to equities overall at the beginning of the Reporting Period because we thought they might experience a temporary pullback. After the selloff in February 2018, we added tactical long positions in U.S. and emerging markets stocks. Within equities, we initiated tactical short positions in Japan and Singapore and a tactical long position in China. We eliminated the Portfolio’s tactical short position in South African equities. On the sector level, we added a tactical long position in European bank stocks. Finally, as mentioned previously, we transitioned the Portfolio to the Underlying Tactical Fund, which served as a single implementation vehicle for expressing our tactical views starting on April 4, 2018.
How was the Portfolio positioned at the end of the Reporting Period?
At the end of the Reporting Period, the Portfolio was positioned, in terms of its total net assets, with 65.4% in liquid alternative strategies, 30.5% in real assets/satellite asset classes and 4.1% in cash. The Portfolio had –6.7% of its total net assets invested in tactical exposures.
How did the Portfolio use derivatives and similar instruments during the Reporting Period?
During the Reporting Period, the Portfolio used derivatives primarily to express views across developed and emerging markets equities. The Portfolio employed equity index futures to replicate exposures to U.S. large-cap equities (positive impact) and European equities (positive impact). Additionally, the Portfolio used equity index futures to gain tactical exposure to emerging market equities (negative impact); Australian equities (positive impact); Japanese equities (negative impact); U.K. large-cap equities (negative impact); Singapore equities (positive impact); European equities (positive impact); European bank stocks (negative impact); South African equities (positive impact); and Chinese equities (negative impact). The Portfolio also used European equity index dividend futures (negative impact) during the Reporting Period.
Within fixed income, the Portfolio used interest rate futures, specifically Eurodollar futures, to take views on the U.S. Treasury yield curve (positive impact). Eurodollar futures are contracts that have underlying assets linked to time deposits denominated in U.S. dollars at banks outside the U.S. The Portfolio also used bond futures to affect a short position in German government bonds (negative impact). The Portfolio employed interest rate options in a macroeconomic hedge that seeks to profit if interest rates fall, remain constant or rise less than anticipated (negative impact). In addition, during the Reporting Period, the Portfolio employed foreign exchange forwards to go long and short select developed and emerging markets currencies within a tactical basket of currencies (negative impact).
Additionally, some of the underlying funds used derivatives during the Reporting Period to apply their active investment views with greater versatility and potentially to afford greater risk management precision. As market conditions warranted during the Reporting Period, some of these underlying funds engaged in forward foreign currency exchange contracts, financial futures contracts, options, swap contracts and structured securities to attempt to enhance portfolio return and for hedging purposes.
3
GOLDMAN SACHS VARIABLE INSURANCE TRUST MULTI-STRATEGY ALTERNATIVES PORTFOLIO
What is the Portfolio’s tactical view and strategy for the months ahead?
At the end of the Reporting Period, we emphasized three macro themes. First, we expected to see divergence in the global economic expansion, with the U.S. and Japanese economies likely to surprise to the upside and European and Chinese economies more at risk, in our view. Second, we believed that shorter-term yields, which experienced a sharp rise in early 2018, would be comparatively stable in the near term. Third, we thought that, in the near term, the capital markets may experience temporary bouts of volatility. Accordingly, at the end of the Reporting Period, we believed the environment may favor a dynamic approach to asset allocation.
On the asset class level, we expected global equities to generate positive but moderate returns over the medium term. In our opinion, global equity performance may well be supported by continued economic expansion overall, corporate earnings growth and inexpensive valuations relative to macroeconomic conditions, though valuations are likely to remain high in absolute terms. Regarding fixed income, we were bearish on government bonds at the end of the Reporting Period, as the Fed is likely, in our view, to raise interest rates faster than the market seems to expect. At the end of the Reporting Period, we thought credit spreads were at reasonable levels relative to macroeconomic conditions.
However, we plan to monitor them because we believe the corporate bond market may be approaching the point in the economic cycle when credit spreads historically start to widen. We were bullish on emerging markets assets overall in the medium term. Emerging economies outside of China are generally earlier in their economic cycle than developed market economies, which allows us to remain confident about a widening gap between the economic growth trajectories of emerging and developed markets. However, given the rise in volatility during the Reporting Period and the increased frequency of political shocks, we had become more cautious by the end of the Reporting Period about the performance of emerging markets assets in the near term.
4
GOLDMAN SACHS VARIABLE INSURANCE TRUST MULTI-STRATEGY ALTERNATIVES PORTFOLIO
Index Definitions
ICE® BofAML® U.S. Dollar Three-Month LIBOR Constant Maturity Index is based on the assumed purchase of a synthetic instrument having three months to maturity and with a coupon equal to the closing quote for three-month LIBOR. That issue is sold the following day (priced at a yield equal to the current day closing three-month LIBOR rate) and is rolled into a new three-month instrument. The index, therefore, will always have a constant maturity equal to exactly three months.
MSCI Emerging Markets Index captures large- and mid-cap representation across 24 emerging markets countries. The index covers approximately 85% of the free float-adjusted market capitalization in each country.
CBOE Volatility Index® (VIX®) is a key measure of market expectations of near-term volatility conveyed by S&P 500® Index option prices. Since its introduction in 1993, VIX® has been considered by many to be the world’s premier barometer of investor sentiment and market volatility.
S&P 500® Index is a U.S. stock market index based on the market capitalizations of 500 large companies having common stock listed on the New York Stock Exchange or NASDAQ. The S&P 500® Index components and their weightings are determined by S&P Dow Jones Indices.
It is not possible to invest directly in an unmanaged index.
5
FUND BASICS
Multi-Strategy Alternatives Portfolio
as of June 30, 2018
STANDARDIZED TOTAL RETURNS1
| For the period ended 6/30/18 | One Year | Three Years | Since Inception | Inception Date | ||||||||||
| Institutional | -1.47 | % | -0.94 | % | -0.71 | % | 4/25/14 | |||||||
| Service | -1.79 | -1.22 | -0.98 | 4/25/14 | ||||||||||
| Advisor | -1.92 | -1.31 | -1.10 | 4/25/14 | ||||||||||
| 1 | The Standardized Total Returns are average annual total returns as of the most recent calendar quarter-end. They assume reinvestment of all distributions at net asset value (“NAV”). Because Institutional, Service and Advisor Shares do not involve a sales charge, such a charge is not applied to their Standardized Total Returns. |
Total return figures in the above chart represent past performance and do not indicate future results, which will vary. The investment return and principal value of an investment will fluctuate and, therefore, an investor’s shares, when redeemed, may be worth more or less than their original cost. Current performance may be lower or higher than the total return figures in the above chart. Please visit www.GSAMFUNDS.com to obtain the most recent month-end returns. Performance reflects fee waivers and/or expense limitations in effect during the periods shown. In their absence, performance would be reduced.
EXPENSE RATIOS2
| Net Expense Ratio (Current) | Gross Expense Ratio (Before Waivers) | |||||||
| Institutional | 1.09 | % | 2.36 | % | ||||
| Service | 1.34 | 2.61 | ||||||
| Advisor | 1.49 | 2.76 | ||||||
| 2 | The expense ratios of the Portfolio, both current (net of any fee waivers and/or expense limitations) and before waivers (gross of any fee waivers and/or expense limitations) are as set forth above according to the most recent publicly available Prospectuses for the Portfolio and may differ from the expense ratios disclosed in the Financial Highlights in this report. Pursuant to a contractual arrangement, the Portfolio’s fee waivers and/or expense limitations will remain in place through at least April 30, 2019, and prior to such date, the Investment Adviser may not terminate the arrangements without the approval of the Portfolio’s Board of Trustees. If these arrangements are discontinued in the future, the expense ratios may change without shareholder approval. |
6
FUND BASICS
OVERALL UNDERLYING FUND AND ETF WEIGHTINGS3
Percentage of Net Assets
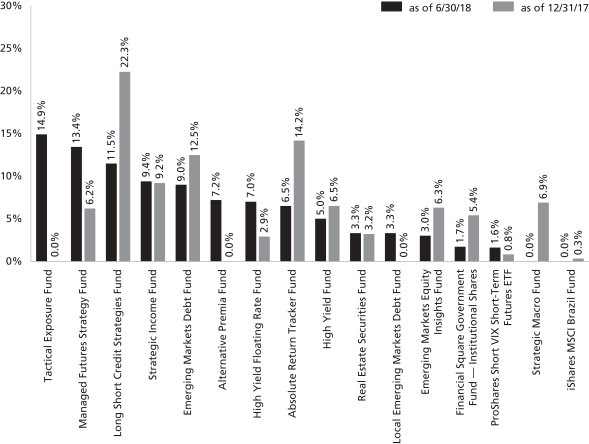
| 3 | The Portfolio is actively managed and, as such, its composition may differ over time. The percentage shown for each Underlying Fund and exchange traded fund (“ETF”) reflects the value of that Underlying Fund or ETF as a percentage of net assets of the Portfolio. Figures in the graph above may not sum to 100% due to rounding and/or exclusion of other assets and liabilities. Underlying sector allocations of exchange traded funds and investment companies held by the Portfolio are not reflected in the graph above. The graph depicts the Portfolio’s investments but may not represent the Portfolio’s market exposure due to the exclusion of certain derivatives, if any, as listed in the Additional Investment Information section of the Schedule of Investments. |
7
GOLDMAN SACHS VARIABLE INSURANCE TRUST MULTI-STRATEGY ALTERNATIVES PORTFOLIO
Schedule of Investments
June 30, 2018 (Unaudited)
| Shares | Description | Value | ||||||
| Underlying Funds(a) – 93.5% | ||||||||
Equity – 12.8% | ||||||||
| 116,627 | Goldman Sachs Absolute Return Tracker Fund | $ | 1,124,282 | |||||
| 35,734 | Goldman Sachs Real Estate Securities Fund | 573,178 | ||||||
| 52,412 | Goldman Sachs Emerging Markets Equity Insights Fund | 523,594 | ||||||
|
| |||||||
| 2,221,054 | ||||||||
|
| |||||||
Fixed Income – 80.7% | ||||||||
| 268,561 | Goldman Sachs Tactical Exposure Fund | 2,575,497 | ||||||
| 228,712 | Goldman Sachs Managed Futures Strategy Fund | 2,330,571 | ||||||
| 216,159 | Goldman Sachs Long Short Credit Strategies Fund | 1,986,498 | ||||||
| 175,181 | Goldman Sachs Strategic Income Fund | 1,630,936 | ||||||
| 131,583 | Goldman Sachs Emerging Markets Debt Fund | 1,553,994 | ||||||
| 139,956 | Goldman Sachs Alternative Premia Fund | 1,249,811 | ||||||
| 126,195 | Goldman Sachs High Yield Floating Rate Fund | 1,210,206 | ||||||
| 136,457 | Goldman Sachs High Yield Fund | 863,770 | ||||||
| 98,218 | Goldman Sachs Local Emerging Markets Debt Fund | 569,664 | ||||||
|
| |||||||
| 13,970,947 | ||||||||
|
| |||||||
| | TOTAL UNDERLYING FUNDS (INSTITUTIONAL SHARES) | |||||||
| (Cost $16,583,510) | $ | 16,192,001 | ||||||
|
| |||||||
| Exchange Traded Fund – 1.6% | ||||||||
| 21,608 | ProShares Short VIX Short-Term Futures ETF | $ | 274,854 | |||||
| (Cost $261,205) | ||||||||
|
| |||||||
| Shares | Distribution Rate | Value | ||||||
| Investment Company(a) – 1.7% | ||||||||
Goldman Sachs Financial Square Government Fund — Institutional Shares |
| |||||||
| 293,468 | 1.869 | % | $ | 293,468 | ||||
| (Cost $293,468) | ||||||||
| ||||||||
| TOTAL INVESTMENTS – 96.8% | ||||||||
| (Cost $17,138,183) | $ | 16,760,323 | ||||||
| ||||||||
OTHER ASSETS IN EXCESS OF LIABILITIES – 3.2% |
| 553,825 | ||||||
| ||||||||
| NET ASSETS – 100.0% | $ | 17,314,148 | ||||||
| ||||||||
| The percentage shown for each investment category reflects the value of investments in that category as a percentage of net assets. | ||||
| (a) | Represents an Affiliated Issuer. | |||
| Currency Abbreviation: | ||
| USD | —United States Dollar | |
| 8 | The accompanying notes are an integral part of these financial statements. |
GOLDMAN SACHS VARIABLE INSURANCE TRUST MULTI-STRATEGY ALTERNATIVES PORTFOLIO
ADDITIONAL INVESTMENT INFORMATION
| FUTURES CONTRACTS — At June 30, 2018, the Portfolio had the following futures contracts: | ||
| Description | Number of Contracts | Expiration Date | Notional Amount | Unrealized Appreciation/ (Depreciation) | ||||||||||
Long position contracts: | ||||||||||||||
| MSCI Emerging Markets S&P 500 E-Mini Index | 27 | 09/21/2018 | $ | 1,435,455 | $ | (100,913 | ) | |||||||
| Total | $ | (100,913 | ) | |||||||||||
Short position contracts: | ||||||||||||||
| 3 Month Eurodollar | (45 | ) | 03/16/2020 | $ | (10,914,750 | ) | $ | 78,696 | ||||||
| Euro-Buxl | (4 | ) | 09/06/2018 | (830,072 | ) | (12,403 | ) | |||||||
| MSCI EAFE E-Mini Index | (2 | ) | 09/21/2018 | (195,540 | ) | 5,796 | ||||||||
S&P 500 E-Mini Index | (2 | ) | 09/21/2018 | (272,160 | ) | 5,416 | ||||||||
| Total | $ | 77,505 | ||||||||||||
| Total Futures Contracts | $ | (23,408 | ) | |||||||||||
PURCHASED OPTIONS CONTRACTS — At June 30, 2018, the Portfolio had the following purchased options contracts:
| Description | Counterparty | Exercise Price | Expiration Date | Number of Contracts | Notional Amount | Value | Premiums Paid by the Portfolio | Unrealized Appreciation/ (Depreciation) | ||||||||||||||||||||
Purchased options contracts: |
| |||||||||||||||||||||||||||
Calls |
| |||||||||||||||||||||||||||
| 3 Month Eurodollar | Barclays Bank PLC | 96.50 USD | 09/17/2018 | 4 | $ | 1,000,000 | $ | 10,450 | $ | 10,259 | $ | 191 | ||||||||||||||||
| 97.00 USD | 09/17/2018 | 4 | 1,000,000 | 5,450 | 6,509 | (1,059 | ) | |||||||||||||||||||||
| 97.38 USD | 09/17/2018 | 8 | 2,000,000 | 3,450 | 14,193 | (10,743 | ) | |||||||||||||||||||||
| 96.50 USD | 12/17/2018 | 2 | 500,000 | 4,300 | 4,255 | 45 | ||||||||||||||||||||||
| 97.25 USD | 12/17/2018 | 4 | 1,000,000 | 1,475 | 6,459 | (4,984 | ) | |||||||||||||||||||||
| 99.00 USD | 12/17/2018 | 145 | 36,250,000 | 906 | 9,397 | (8,491 | ) | |||||||||||||||||||||
| 96.50 USD | 03/18/2019 | 2 | 500,000 | 3,700 | 3,655 | 45 | ||||||||||||||||||||||
| 97.13 USD | 03/18/2019 | 11 | 2,750,000 | 5,294 | 20,313 | (15,019 | ) | |||||||||||||||||||||
| 99.00 USD | 03/18/2019 | 109 | 27,250,000 | 681 | 9,789 | (9,108 | ) | |||||||||||||||||||||
| 96.88 USD | 06/17/2019 | 13 | 3,250,000 | 10,644 | 23,818 | (13,174 | ) | |||||||||||||||||||||
| 99.00 USD | 06/17/2019 | 61 | 15,250,000 | 381 | 6,241 | (5,860 | ) | |||||||||||||||||||||
| 96.75 USD | 09/16/2019 | 14 | 3,500,000 | 14,175 | 30,083 | (15,908 | ) | |||||||||||||||||||||
| 97.75 USD | 09/16/2019 | 5 | 1,250,000 | 813 | 3,137 | (2,324 | ) | |||||||||||||||||||||
| 96.50 USD | 12/16/2019 | 7 | 1,750,000 | 10,238 | 14,791 | (4,553 | ) | |||||||||||||||||||||
| 96.00 USD | 03/16/2020 | 4 | 1,000,000 | 10,225 | 10,734 | (509 | ) | |||||||||||||||||||||
| 97.00 USD | 06/15/2020 | 6 | 1,500,000 | 5,212 | 4,889 | 323 | ||||||||||||||||||||||
| 97.00 USD | 09/14/2020 | 4 | 1,000,000 | 3,875 | 3,559 | 316 | ||||||||||||||||||||||
| Total purchased options contracts | 403 | $ | 91,269 | $ | 182,081 | $ | (90,812 | ) | ||||||||||||||||||||
| The accompanying notes are an integral part of these financial statements. | 9 |
GOLDMAN SACHS VARIABLE INSURANCE TRUST MULTI-STRATEGY ALTERNATIVES PORTFOLIO
Statement of Assets and Liabilities
June 30, 2018 (Unaudited)
| Assets: | ||||
Investments in affiliated Underlying Funds, at value (cost $16,876,978) | $ | 16,485,469 | ||
Investments in unaffiliated Funds, at value (cost $261,205) | 274,854 | |||
Purchased Options, at value (premiums paid $182,081) | 91,269 | |||
Cash | 265,257 | |||
Receivables: | ||||
Portfolio shares sold | 128,489 | |||
Collateral on certain derivative contracts(a) | 99,192 | |||
Reimbursement from investment adviser | 14,353 | |||
Variation margin on futures | 19,605 | |||
Other assets | 1,180 | |||
| Total assets | 17,379,668 | |||
| Liabilities: | ||||
Payables: | ||||
Distribution and Service fees and Transfer Agency fees | 5,602 | |||
Portfolio shares redeemed | 1,867 | |||
Accrued expenses | 58,051 | |||
| Total liabilities | 65,520 | |||
| Net Assets: | ||||
Paid-in capital | 18,568,438 | |||
Undistributed net investment income | 144,530 | |||
Accumulated net realized loss | (907,100 | ) | ||
Net unrealized loss | (491,720 | ) | ||
| NET ASSETS | $ | 17,314,148 | ||
Net Assets: | ||||
Institutional | $ | 703,965 | ||
Service | 234,013 | |||
Advisor | 16,376,170 | |||
Total Net Assets | $ | 17,314,148 | ||
Shares outstanding $0.001 par value (unlimited shares authorized): | ||||
Institutional | 77,822 | |||
Service | 25,849 | |||
Advisor | 1,820,334 | |||
Net asset value, offering and redemption price per share: | ||||
Institutional | $9.05 | |||
Service | 9.05 | |||
Advisor | 9.00 | |||
(a) Includes amounts segregated for initial margin on futures transactions.
| 10 | The accompanying notes are an integral part of these financial statements. |
GOLDMAN SACHS VARIABLE INSURANCE TRUST MULTI-STRATEGY ALTERNATIVES PORTFOLIO
Statement of Operations
For the Six Months Ended June 30, 2018 (Unaudited)
| Investment income: | ||||
Dividends from affiliated Underlying Funds | $ | 147,394 | ||
Dividends from unaffiliated Funds | 1,948 | |||
Securities lending income — unaffiliated issuer | 562 | |||
| Total investment income | 149,904 | |||
| Expenses: | ||||
Professional fees | 33,731 | |||
Distribution and Service fees(a) | 31,454 | |||
Custody, accounting and administrative services | 27,579 | |||
Printing and mailing costs | 25,466 | |||
Management fees | 12,197 | |||
Trustee fees | 8,681 | |||
Transfer Agency fees(a) | 1,626 | |||
Registration fees | 425 | |||
Other | 2,561 | |||
| Total expenses | 143,720 | |||
Less — expense reductions | (234,084 | ) | ||
| Net expenses | 1,183,141 | |||
| NET INVESTMENT INCOME | 1,782,805 | |||
| Realized and unrealized gain (loss): | ||||
Net realized gain (loss) from: | ||||
Investments — in affiliated Underlying Funds | (154,862 | ) | ||
Investments — in unaffiliated Funds | (9,381 | ) | ||
Futures contracts | (16,175 | ) | ||
Purchased options | (114,393 | ) | ||
Forward foreign currency exchange contracts | (13,329 | ) | ||
Foreign currency transactions | (16 | ) | ||
Net change in unrealized gain (loss) on: | ||||
Investments — in affiliated Underlying Funds | (285,374 | ) | ||
Investments — in unaffiliated Funds | (92,366 | ) | ||
Futures contracts | (72,063 | ) | ||
Purchased options | (6,946 | ) | ||
Forward foreign currency exchange contracts | (740 | ) | ||
Foreign currency translation | 1,294 | |||
| Net realized and unrealized loss | (764,351 | ) | ||
| NET DECREASE IN NET ASSETS RESULTING FROM OPERATIONS | $ | (663,626 | ) | |
(a) Class specific Distribution and/or Service, and Transfer Agency fees were as follows:
| Distribution and/or Service Fees | Transfer Agency Fees | |||||||||||
Advisor | Service | Advisor | Institutional | Service | ||||||||
| $31,254 | $200 | $1,563 | $ | 47 | $ | 16 | ||||||
| The accompanying notes are an integral part of these financial statements. | 11 |
GOLDMAN SACHS VARIABLE INSURANCE TRUST MULTI-STRATEGY ALTERNATIVES PORTFOLIO
Statements of Changes in Net Assets
| For the Six Months Ended June 30, 2018 (Unaudited) | For the Fiscal Year Ended December 31, 2017 | |||||||
| From operations: | ||||||||
Net investment income | $ | 100,725 | $ | 244,626 | ||||
Net realized gain (loss) | (308,156 | ) | 251,415 | |||||
Net change in unrealized gain (loss) | (456,195 | ) | 156,154 | |||||
| Net increase (decrease) in net assets resulting from operations | (663,626 | ) | 652,195 | |||||
| Distributions to shareholders: | ||||||||
From net investment income | ||||||||
Institutional Shares | — | (10,357 | ) | |||||
Service Shares | — | (2,291 | ) | |||||
Advisor Shares | — | (303,417 | ) | |||||
| Total distributions to shareholders | — | (316,065 | ) | |||||
| From share transactions: | ||||||||
Proceeds from sales of shares | 3,550,041 | 5,892,266 | ||||||
Reinvestment of distributions | — | 316,065 | ||||||
Cost of shares redeemed | (1,642,909 | ) | (1,594,340 | ) | ||||
| Net increase in net assets resulting from share transactions | 1,907,132 | 4,613,991 | ||||||
| TOTAL INCREASE | 1,243,506 | 4,950,121 | ||||||
| Net assets: | ||||||||
Beginning of period | 16,070,642 | 11,120,521 | ||||||
End of period | $ | 17,314,148 | $ | 16,070,642 | ||||
| Undistributed net investment income | $ | 144,530 | $ | 43,805 | ||||
| 12 | The accompanying notes are an integral part of these financial statements. |
GOLDMAN SACHS VARIABLE INSURANCE TRUST MULTI-STRATEGY ALTERNATIVES PORTFOLIO
Financial Highlights
Selected Data for a Share Outstanding Throughout Each Period
| Income (loss) from investment operations | Distributions to shareholders | |||||||||||||||||||||||||||||||||||||||||||||||||||||||
| Year - Share Class | Net asset value, beginning of period | Net investment income(a)(b) | Net realized | Total from investment operations | From net investment income | From net | Total distributions | Net asset value, end of period | Total return(c) | Net assets, end of period (in 000s) | Ratio of net expenses to average net assets(d) | Ratio of total expenses to average net assets(d) | Ratio of to average net assets(b) | Portfolio turnover rate(e) | ||||||||||||||||||||||||||||||||||||||||||
FOR THE SIX MONTHS ENDED JUNE 30, (UNAUDITED) | ||||||||||||||||||||||||||||||||||||||||||||||||||||||||
2018 - Institutional | $ | 9.39 | $ | 0.08 | $ | (0.42 | ) | $ | (0.34 | ) | $ | — | $ | — | $ | — | $ | 9.05 | (3.62 | )% | $ | 704 | 0.22 | %(f) | 1.38 | %(f) | 1.68 | %(f) | 45 | % | ||||||||||||||||||||||||||
2018 - Service | 9.41 | 0.07 | (0.43 | ) | (0.36 | ) | — | — | — | 9.05 | (3.83 | ) | 234 | 0.47 | (f) | 1.64 | (f) | 1.45 | (f) | 45 | ||||||||||||||||||||||||||||||||||||
2018 - Advisor | 9.36 | 0.06 | (0.42 | ) | (0.36 | ) | — | — | — | 9.00 | (3.85 | ) | 16,376 | 0.62 | (f) | 1.78 | (f) | 1.22 | (f) | 45 | ||||||||||||||||||||||||||||||||||||
FOR THE FISCAL YEARS ENDED DECEMBER 31, | ||||||||||||||||||||||||||||||||||||||||||||||||||||||||
2017 - Institutional | 9.10 | 0.21 | 0.30 | 0.51 | (0.22 | ) | — | (0.22 | ) | 9.39 | 5.60 | 453 | 0.21 | 1.47 | 2.20 | 53 | ||||||||||||||||||||||||||||||||||||||||
2017 - Service | 9.13 | 0.27 | 0.22 | 0.49 | (0.21 | ) | — | (0.21 | ) | 9.41 | 5.37 | 105 | 0.46 | 1.73 | 2.88 | 53 | ||||||||||||||||||||||||||||||||||||||||
2017 - Advisor | 9.08 | 0.17 | 0.30 | 0.47 | (0.19 | ) | — | (0.19 | ) | 9.36 | 5.14 | 15,512 | 0.61 | 1.88 | 1.78 | 53 | ||||||||||||||||||||||||||||||||||||||||
2016 - Institutional | 9.15 | 0.11 | (0.06 | ) | 0.05 | (0.10 | ) | — | (0.10 | ) | 9.10 | 0.52 | 309 | 0.24 | 2.37 | 1.17 | 44 | |||||||||||||||||||||||||||||||||||||||
2016 - Service | 9.14 | 0.08 | (0.05 | ) | 0.03 | (0.04 | ) | — | (0.04 | ) | 9.13 | 0.28 | 34 | 0.46 | 1.97 | 0.92 | 44 | |||||||||||||||||||||||||||||||||||||||
2016 - Advisor | 9.12 | 0.10 | (0.07 | ) | 0.03 | (0.07 | ) | — | (0.07 | ) | 9.08 | 0.27 | 10,778 | 0.61 | 2.58 | 1.06 | 44 | |||||||||||||||||||||||||||||||||||||||
2015 - Institutional | 9.81 | 0.20 | (0.65 | ) | (0.45 | ) | (0.20 | ) | (0.01 | ) | (0.21 | ) | 9.15 | (4.51 | ) | 958 | 0.22 | 4.40 | 2.02 | 53 | ||||||||||||||||||||||||||||||||||||
2015 - Service | 9.81 | 0.24 | (0.71 | ) | (0.47 | ) | (0.19 | ) | (0.01 | ) | (0.20 | ) | 9.14 | (4.76 | ) | 22 | 0.48 | 3.33 | 2.54 | 53 | ||||||||||||||||||||||||||||||||||||
2015 - Advisor | 9.79 | 0.21 | (0.69 | ) | (0.48 | ) | (0.18 | ) | (0.01 | ) | (0.19 | ) | 9.12 | (4.89 | ) | 9,666 | 0.62 | 3.51 | 2.16 | 53 | ||||||||||||||||||||||||||||||||||||
FOR THE PERIOD ENDED DECEMBER 31, | ||||||||||||||||||||||||||||||||||||||||||||||||||||||||
2014 - Institutional (Commenced April 25, 2014) | 10.00 | 0.09 | (0.16 | ) | (0.07 | ) | (0.12 | ) | — | (g) | (0.12 | ) | 9.81 | (0.67 | ) | 1,003 | 0.22 | (f) | 24.63 | (f) | 1.30 | (f) | 25 | |||||||||||||||||||||||||||||||||
2014 - Service (Commenced April 25, 2014) | 10.00 | 0.07 | (0.16 | ) | (0.09 | ) | (0.10 | ) | — | (g) | (0.10 | ) | 9.81 | (0.85 | ) | 10 | 0.49 | (f) | 25.05 | (f) | 1.02 | (f) | 25 | |||||||||||||||||||||||||||||||||
2014 - Advisor (Commenced April 25, 2014) | 10.00 | 0.11 | (0.21 | ) | (0.10 | ) | (0.11 | ) | — | (g) | (0.11 | ) | 9.79 | (0.97 | ) | 3,246 | 0.62 | (f) | 16.16 | (f) | 1.66 | (f) | 25 | |||||||||||||||||||||||||||||||||
| (a) | Calculated based on the average shares outstanding methodology. |
| (b) | Recognition of net investment income by the Portfolio is affected by the timing of declaration of dividends by the Underlying Funds in which the Portfolio invests. |
| (c) | Assumes investment at the net asset value at the beginning of the period, reinvestment of all distributions, and a complete redemption of the investment at the net asset value at the end of the period. Total returns for periods less than one full year are not annualized. |
| (d) | Expense ratios exclude the expenses of the Underlying Funds in which the Portfolio invests. |
| (e) | The portfolio turnover rate is calculated in accordance with regulatory requirements, without regard to transactions involving short term investments and certain derivatives. If such transactions were included, the portfolio turnover rate may be higher. |
| (f) | Annualized. |
| (g) | Amount is less than $0.005 per share. |
| The accompanying notes are an integral part of these financial statements. | 13 |
GOLDMAN SACHS VARIABLE INSURANCE TRUST MULTI-STRATEGY ALTERNATIVES PORTFOLIO
Notes to Financial Statements
June 30, 2018 (Unaudited)
1. ORGANIZATION
Goldman Sachs Variable Insurance Trust (the “Trust” or “VIT”) is a Delaware statutory trust registered under the Investment Company Act of 1940, as amended (the “Act”), as an open-end management investment company. The Trust includes the Goldman Sachs Multi-Strategy Alternatives Portfolio (the “Portfolio”). The Portfolio is a diversified portfolio under the Act offering three classes of shares — Institutional, Service and Advisor Shares. Shares of the Trust are offered to separate accounts of participating life insurance companies for the purpose of funding variable annuity contracts and variable life insurance policies.
Goldman Sachs Asset Management, L.P. (“GSAM”), an affiliate of Goldman Sachs & Co. LLC (“Goldman Sachs”), serves as investment adviser to the Portfolio pursuant to a management agreement (the “Agreement”) with the Trust.
The Portfolio invests primarily in a combination of domestic and international equity and fixed income underlying funds (“Underlying Funds”) which are registered under the Act, for which GSAM acts as investment adviser. Additionally, this Portfolio may invest a portion of its assets directly in other securities and instruments, including unaffiliated exchange traded funds (“Unaffiliated Funds”).
2. SIGNIFICANT ACCOUNTING POLICIES
The financial statements have been prepared in accordance with accounting principles generally accepted in the United States of America (“GAAP”) and require management to make estimates and assumptions that may affect the reported amounts and disclosures. Actual results may differ from those estimates and assumptions.
A. Investment Valuation — The valuation policy of the Portfolio and Underlying Funds is to value investments at fair value.
B. Investment Income and Investments — Investment income includes interest income, dividend income, and securities lending income, if any. Interest income is accrued daily and adjusted for amortization of premiums and accretion of discounts. Dividend income is recognized on ex-dividend date or, for certain foreign securities, as soon as such information is obtained subsequent to the ex-dividend date. Capital gain distributions received from Underlying Funds are recognized on ex-dividend date. Investment transactions are reflected on trade date. Realized gains and losses are calculated using identified cost. Investment transactions are recorded on the following business day for daily net asset value (“NAV”) calculations. Income distributions are recognized as capital gains or income in the financial statements in accordance with the character that is distributed. Distributions received from the Portfolio’s investments in the Goldman Sachs Real Estate Securities Fund (the “Underlying Fund invested in REITs”) may be characterized as ordinary income, net capital gain or a return of capital. A return of capital is recorded by the Portfolio as a reduction to the cost basis of the Underlying Fund invested in REITs.
For derivative contracts, realized gains and losses are recorded upon settlement of the contract.
C. Class Allocations and Expenses — Investment income, realized and unrealized gain (loss), if any, and non-class specific expenses of the Portfolio are allocated daily based upon the proportion of net assets of each class. Non-class specific expenses directly incurred by the Portfolio are charged to the Portfolio, while such expenses incurred by the Trust are allocated across the applicable funds on a straight-line and/or pro-rata basis depending upon the nature of the expenses. Class specific expenses, where applicable, are borne by the respective share classes and include Distribution and Service and Transfer Agency fees. Expenses included in the accompanying financial statements reflect the expenses of the Portfolio and do not include any expenses associated with the Underlying Funds. Because the Underlying Funds have varied expense and fee levels and the Portfolio may own different proportions of the Underlying Funds at different times, the amount of fees and expenses incurred indirectly by the Portfolio will vary.
D. Federal Taxes and Distributions to Shareholders — It is the Portfolio’s policy to comply with the requirements of the Internal Revenue Code of 1986, as amended (the “Code”), applicable to regulated investment companies (mutual funds) and to distribute each year substantially all of its investment company taxable income and capital gains to its shareholders. Accordingly, the Portfolio is not required to make any provisions for the payment of federal income tax. Distributions to shareholders are recorded on the ex-dividend date. Income and capital gains distributions, if any, are declared and paid annually.
14
GOLDMAN SACHS VARIABLE INSURANCE TRUST MULTI-STRATEGY ALTERNATIVES PORTFOLIO
2. SIGNIFICANT ACCOUNTING POLICIES (continued)
Net capital losses, if any, are carried forward to future fiscal years and may be used to the extent allowed by the Code to offset any future capital gains. Losses that are carried forward will retain their character as either short-term or long-term capital losses. Utilization of capital loss carryforwards will reduce the requirement of future capital gains distributions.
The characterization of distributions to shareholders for financial reporting purposes is determined in accordance with federal income tax rules, which may differ from GAAP. The source of the Portfolio’s distributions may be shown in the accompanying financial statements as either from net investment income, net realized gain or capital. Certain components of the Portfolio’s net assets on the Statement of Assets and Liabilities reflect permanent GAAP/tax differences based on the appropriate tax character.
3. INVESTMENTS AND FAIR VALUE MEASUREMENTS
U.S. GAAP defines the fair value of a financial instrument as the amount that would be received to sell an asset or paid to transfer a liability in an orderly transaction between market participants at the measurement date (i.e., the exit price); the Portfolio’s policy is to use the market approach. GAAP establishes a fair value hierarchy that prioritizes the inputs to valuation techniques used to measure fair value. The hierarchy gives the highest priority to unadjusted quoted prices in active markets for identical assets or liabilities (Level 1 measurements) and the lowest priority to unobservable inputs (Level 3 measurements). The levels used for classifying investments are not necessarily an indication of the risk associated with investing in these investments. The three levels of the fair value hierarchy are described below:
Level 1 — Unadjusted quoted prices in active markets that are accessible at the measurement date for identical, unrestricted assets or liabilities;
Level 2 — Quoted prices in markets that are not active or financial instruments for which significant inputs are observable (including, but not limited to, quoted prices for similar investments, interest rates, foreign exchange rates, volatility and credit spreads), either directly or indirectly;
Level 3 — Prices or valuations that require significant unobservable inputs (including GSAM’s assumptions in determining fair value measurement).
Changes in valuation techniques may result in transfers into or out of an assigned level within the hierarchy. In accordance with the Portfolio’s policy, transfers between different levels of the fair value hierarchy resulting from such changes are deemed to have occurred as of the beginning of the reporting period.
The Board of Trustees (“Trustees”) has approved Valuation Procedures that govern the valuation of the portfolio investments held by the Portfolio, including investments for which market quotations are not readily available. The Trustees have delegated to GSAM day-to-day responsibility for implementing and maintaining internal controls and procedures related to the valuation of the Portfolio’s investments. To assess the continuing appropriateness of pricing sources and methodologies, GSAM regularly performs price verification procedures and issues challenges as necessary to third party pricing vendors or brokers, and any differences are reviewed in accordance with the Valuation Procedures.
A. Level 1 and Level 2 Fair Value Investments — The valuation techniques and significant inputs used in determining the fair values for investments classified as Level 1 and Level 2 are as follows:
Underlying Funds (Including Money Market Funds) — Investments in the Underlying Funds are valued at the NAV per share of the Institutional Share class of each Underlying Fund on the day of valuation. Because the Portfolio invests primarily in other mutual funds that fluctuate in value, the Portfolio’s shares will correspondingly fluctuate in value. These investments are generally classified as Level 1 of the fair value hierarchy. For information regarding an Underlying Fund’s accounting policies and investment holdings, please see the Underlying Fund’s shareholder report.
Derivative Contracts — A derivative is an instrument whose value is derived from underlying assets, indices, reference rates or a combination of these factors. The Portfolio enters into derivative transactions to hedge against changes in interest rates, securities prices, and/or currency exchange rates, to increase total return, or to gain access to certain markets or attain exposure to other underliers.
15
GOLDMAN SACHS VARIABLE INSURANCE TRUST MULTI-STRATEGY ALTERNATIVES PORTFOLIO
Notes to Financial Statements (continued)
June 30, 2018 (Unaudited)
3. INVESTMENTS AND FAIR VALUE MEASUREMENTS (continued)
Exchange-traded derivatives, including futures and options contracts, are valued at the last sale or settlement price and typically fall within Level 1 of the fair value hierarchy. Over-the-counter (“OTC”) and centrally cleared derivatives are valued using market transactions and other market evidence, including market-based inputs to models, calibration to market-clearing transactions, broker or dealer quotations, or other alternative pricing sources. Where models are used, the selection of a particular model to value OTC and centrally cleared derivatives depends upon the contractual terms of, and specific risks inherent in, the instrument, as well as the availability of pricing information in the market. Valuation models require a variety of inputs, including contractual terms, market prices, yield curves, credit curves, measures of volatility, voluntary and involuntary prepayment rates, loss severity rates and correlations of such inputs. For OTC and centrally cleared derivatives that trade in liquid markets, model inputs can generally be verified and model selection does not involve significant management judgment. OTC and centrally cleared derivatives are classified within Level 2 of the fair value hierarchy when significant inputs are corroborated by market evidence.
i. Forward Contracts — A forward contract is a contract between two parties to buy or sell an asset at a specified price on a future date. A forward contract settlement can occur on a cash or delivery basis. Forward contracts are marked-to-market daily using independent vendor prices, and the change in value, if any, is recorded as an unrealized gain or loss. Cash and certain investments may be used to collateralize forward contracts.
A forward foreign currency exchange contract is a forward contract in which the Portfolio agrees to receive or deliver a fixed quantity of one currency for another, at a pre-determined price at a future date. All forward foreign currency exchange contracts are marked-to-market daily at the applicable forward rate. Non-deliverable forward foreign currency exchange contracts are settled with the counterparty in cash without the delivery of foreign currency.
ii. Futures Contracts — Futures contracts are contracts to buy or sell a standardized quantity of a specified commodity or security and are valued based on exchanged settlement prices or independent market quotes. Futures contracts are valued at the last settlement price, or in the absence of a sale, the last bid price for long positions and at the last ask price for short positions, at the end of each day on the board of trade or exchange upon which they are traded. Upon entering into a futures contract, the Portfolio deposits cash or securities in an account on behalf of the broker in an amount sufficient to meet the initial margin requirement. Subsequent payments are made or received by the Portfolio equal to the daily change in the contract value and are recorded as variation margin receivable or payable with a corresponding offset to unrealized gains or losses. For financial reporting purposes, cash collateral that has been pledged to cover obligations of the Portfolio and cash collateral received, if any, is reported separately on the Statement of Assets and Liabilities as receivables/payables for collateral on certain derivative contracts. Non-cash collateral pledged by the Portfolio, if any, is noted in the Schedule of Investments.
iii. Options — When the Portfolio writes call or put options, an amount equal to the premium received is recorded as a liability and is subsequently marked-to-market to reflect the current value of the option written. Swaptions are options on interest rate swap contracts.
Upon the purchase of a call option or a put option by the Portfolio, the premium paid is recorded as an investment and subsequently marked-to-market to reflect the current value of the option. Certain options may be purchased with premiums to be determined on a future date. The premiums for these options are based upon implied volatility parameters at specified terms.
B. Level 3 Fair Value Investments — To the extent that significant inputs to valuation models and other alternative pricing sources are unobservable, or if quotations are not readily available, or if GSAM believes that such quotations do not accurately reflect fair value, the fair value of the Portfolio’s investments may be determined under Valuation Procedures approved by the Trustees. GSAM, consistent with its procedures and applicable regulatory guidance, may make an adjustment to the most recent valuation prices of either domestic or foreign securities in light of significant events to reflect what it believes to be the fair value of the securities at the time of determining the Portfolio’s NAV. Significant events which could affect a large number of securities in a particular market may include, but are not limited to: significant fluctuations in U.S. or foreign markets; market dislocations; market disruptions; or unscheduled market closings. Significant events which could also affect a single issuer may include, but are not limited to: corporate actions such as reorganizations, mergers and buy-outs; ratings downgrades; and bankruptcies.
16
GOLDMAN SACHS VARIABLE INSURANCE TRUST MULTI-STRATEGY ALTERNATIVES PORTFOLIO
3. INVESTMENTS AND FAIR VALUE MEASUREMENTS (continued)
C. Fair Value Hierarchy — The following is a summary of the Portfolio’s investments and derivatives classified in the fair value hierarchy as of June 30, 2018:
| Investment Type | Level 1 | Level 2 | Level 3 | |||||||||
| Assets | ||||||||||||
| Equity Underlying Funds | $ | 2,221,054 | $ | — | $ | — | ||||||
| Fixed Income Underlying Funds | 13,970,947 | — | — | |||||||||
| Exchange Traded Funds | 274,854 | — | — | |||||||||
| Investment Company | 293,468 | — | — | |||||||||
| Total | $ | 16,760,323 | $ | — | $ | — | ||||||
| Derivative Type | ||||||||||||
| Assets(a) | ||||||||||||
| Futures Contracts | $ | 89,908 | $ | — | $ | — | ||||||
| Purchased Options Contracts | 91,269 | — | — | |||||||||
| Total | $ | 181,177 | $ | — | $ | — | ||||||
| Liabilities(a) | ||||||||||||
| Futures Contracts | $ | (113,316 | ) | $ | — | $ | — | |||||
| (a) | Amount shown represents unrealized gain (loss) at period end. |
For further information regarding security characteristics, see the Schedule of Investments.
4. INVESTMENTS IN DERIVATIVES
The following table sets forth, by certain risk types, the gross value of derivative contracts (not considered to be hedging instruments for accounting disclosure purposes) as of June 30, 2018. These instruments were used as part of the Portfolio’s investment strategies and to obtain and/or manage exposure related to the risks below. The values in the table below exclude the effects of cash collateral received or posted pursuant to these derivative contracts, and therefore are not representative of the Portfolio’s net exposure.
| Risk | Statement of Assets and Liabilities | Assets(a) | Statement of Assets and Liabilities | Liabilities(a) | ||||||||||
| Equity | Variation margin on futures | $ | 11,212 | Variation margin on futures | $ | (100,913 | ) | |||||||
| Interest Rate | Variation margin on futures and purchased options contracts at value | 169,965 | Variation margin on futures | (12,403 | ) | |||||||||
| Total | $ | 181,177 | $ | (113,316 | ) | |||||||||
| (a) | Includes unrealized gain (loss) on futures contracts described in the Additional Investment Information section of the Schedule of Investments. Only the variation margin as of June 30, 2018 is reported within the Statement of Assets and Liabilities. |
17
GOLDMAN SACHS VARIABLE INSURANCE TRUST MULTI-STRATEGY ALTERNATIVES PORTFOLIO
Notes to Financial Statements (continued)
June 30, 2018 (Unaudited)
4. INVESTMENTS IN DERIVATIVES (continued)
The following table sets forth, by certain risk types, the Portfolio’s gains (losses) related to these derivatives and their indicative volumes for the six months ended June 30, 2018. These gains (losses) should be considered in the context that these derivative contracts may have been executed to create investment opportunities and/or economically hedge certain investments, and accordingly, certain gains (losses) on such derivative contracts may offset certain (losses) gains attributable to investments. These gains (losses) are included in “Net realized gain (loss)” or “Net change in unrealized gain (loss)” on the Statement of Operations.
| Risk | Statement of Operations | Net Realized Gain (Loss) | Net Change in Unrealized Gain (Loss) | Average Number of Contracts(a) | ||||||||||
| Equity | Net realized gain (loss) from futures contracts/Net change in unrealized gain (loss) on futures contracts | $ | 26,840 | $ | (112,987 | ) | 37 | |||||||
| Currency | Net realized gain (loss) from forward foreign currency exchange contracts/Net change in unrealized gain (loss) on forward foreign currency exchange contracts | (13,329 | ) | (740 | ) | 25 | ||||||||
| Interest Rate | Net realized gain (loss) from futures contracts and purchased options/Net change in unrealized gain (loss) on futures contracts and purchased options | (157,408 | ) | 33,978 | 562 | |||||||||
| Total | $ | (143,897 | ) | $ | (79,749 | ) | 624 | |||||||
| (a) | Average number of contracts is based on the average of month end balances for the six months ended June 30, 2018. |
5. AGREEMENTS AND AFFILIATED TRANSACTIONS
A. Management Agreement — Under the Agreement, GSAM manages the Portfolio, subject to the general supervision of the Trustees.
As compensation for the services rendered pursuant to the Agreement, the assumption of the expenses related thereto and administration of the Portfolio’s business affairs, including providing facilities, GSAM is entitled to a management fee, accrued daily and paid monthly, equal to an annual percentage rate of 0.15% of the Portfolio’s average daily net assets. GSAM has agreed to waive all of its management fee. The management fee waiver will remain in effect through at least April 30, 2019, and prior to such date, GSAM may not terminate the arrangement without the approval of the Board of Trustees. For the six months ended June 30, 2018, GSAM waived $12,197 of its management fee.
The Portfolio invests in Institutional Shares of the Goldman Sachs Financial Square Government Fund, which is an affiliated Underlying Fund. GSAM has agreed to waive a portion of its management fee payable by the Portfolio in an amount equal to the management fee it earns as an investment adviser to the affiliated Underlying Fund in which the Portfolio invests, except those management fees it earns from the Portfolio’s investments of cash collateral received in connection with securities lending transactions in the Goldman Sachs Financial Square Government Fund. For the six months ended June 30, 2018, GSAM waived $402 of the Portfolio’s management fee.
B. Distribution and/or Service (12b-1) Plans — The Trust, on behalf of Service Shares of the Portfolio, has adopted a Distribution and Service Plan subject to Rule 12b-1 under the Act. Under the Distribution and Service Plan, Goldman Sachs, which serves as distributor (the “Distributor”), is entitled to a fee accrued daily and paid monthly, for distribution services and personal and account maintenance services, which may then be paid by Goldman Sachs to authorized dealers, equal to, on an annual basis, 0.25% of the Portfolio’s average daily net assets attributable to Service Shares.
The Trust, on behalf of Advisor Shares of the Portfolio, has adopted a Distribution Plan subject to Rule 12b-1 under the Act. Under the Distribution Plan, Goldman Sachs as Distributor is entitled to a fee accrued daily and paid monthly for distribution services, which may then be paid by Goldman Sachs to authorized dealers, equal to, on an annual basis, 0.15% of the Portfolio’s average daily net assets attributable to Advisor Shares.
18
GOLDMAN SACHS VARIABLE INSURANCE TRUST MULTI-STRATEGY ALTERNATIVES PORTFOLIO
5. AGREEMENTS AND AFFILIATED TRANSACTIONS (continued)
C. Service Plans — The Trust, on behalf of Advisor Shares of the Portfolio, has adopted a Service Plan to allow Advisor Shares to compensate service organizations (including Goldman Sachs) for providing varying levels of personal and account maintenance and administration services to their customers who are beneficial owners of such shares. The Service Plans each provide for compensation to the service organizations equal to 0.25% of the average daily net assets attributable to Advisor Shares of the Portfolio.
D. Transfer Agency Agreement — Goldman Sachs also serves as the transfer agent of the Portfolio for a fee pursuant to the Transfer Agency Agreement. The fees charged for such transfer agency services are accrued daily and paid monthly at an annual rate of 0.02% of the average daily net assets of Institutional, Service and Advisor Shares.
E. Other Expense Agreements and Affiliated Transactions — GSAM has agreed to limit certain “Other Expenses” of the Portfolio (excluding acquired fund fees and expenses, transfer agency fees and expenses, service fees and shareholder administration fees (as applicable), taxes, interest, brokerage fees, expenses of shareholder meetings, litigation and indemnification, and extraordinary expenses) to the extent such expenses exceed, on an annual basis, a percentage rate of the average daily net assets of the Portfolio. Such Other Expense reimbursements, if any, are accrued daily and paid monthly. In addition, the Portfolio is not obligated to reimburse GSAM for prior fiscal year expense reimbursements, if any. The Other Expense limitation as an annual percentage rate of average daily net assets for the Portfolio is 0.204%. The Other Expense limitation will remain in place through at least April 30, 2019, and prior to such date GSAM may not terminate the arrangement without the approval of the Trustees. For the six months ended June 30, 2018, GSAM reimbursed $81,858 to the Portfolio. In addition, the Portfolio has entered into certain offset arrangements with the custodian and the transfer agent, which may result in a reduction of the Portfolio’s expenses and are received irrespective of the application of the “Other Expense” limitation described above. For the six months ended June 30, 2018, custody fee credits were $84.
F. Line of Credit Facility — As of June 30, 2018, the Portfolio participated in a $770,000,000 committed, unsecured revolving line of credit facility (the “facility”) together with other funds of the Trust and certain registered investment companies having management agreements with GSAM or its affiliates. This facility is to be used for temporary emergency purposes, or to allow for an orderly liquidation of securities to meet redemption requests. The interest rate on borrowings is based on the federal funds rate. The facility also requires a fee to be paid by the Portfolio based on the amount of the commitment that has not been utilized. For the six months ended June 30, 2018, the Portfolio did not have any borrowings under the facility. Prior to May 1, 2018 the facility was $1,100,000,000. The facility was decreased to $770,000,000 effective May 1, 2018.
G. Other Transactions with Affiliates — The Portfolio invests primarily in the Institutional Shares of the Underlying Funds. These Underlying Funds are considered to be affiliated with the Portfolio. The table below shows the transactions in and earnings from investments in these Underlying Funds for the six months ended June 30, 2018:
| Underlying Funds | Beginning Value as of December 31, 2017 | Purchases at Cost | Proceeds from Sales | Net Realized Gain (Loss) from Affiliated Investment Company | Change in Unrealized Appreciation (Depreciation) | Ending Value 2018 | Shares as of June 30, 2018 | Dividend Income from Affiliated Investment Company | ||||||||||||||||||||||||
Goldman Sachs Alternative Premia Fund | $ | — | $ | 1,230,000 | $ | — | $ | — | $ | 19,811 | $ | 1,249,811 | 139,956 | $ | — | |||||||||||||||||
Goldman Sachs Absolute Return Tracker Fund | 2,282,265 | 140,000 | (1,300,000 | ) | 6,884 | (4,867 | ) | 1,124,282 | 116,627 | — | ||||||||||||||||||||||
Goldman Sachs Emerging Markets Debt Fund | 2,016,665 | 319,658 | (640,000 | ) | (15,138 | ) | (127,191 | ) | 1,553,994 | 131,583 | 35,282 | |||||||||||||||||||||
Goldman Sachs Emerging Markets Equity Insights Fund | 1,015,209 | 90,000 | (550,000 | ) | 53,527 | (85,142 | ) | 523,594 | 52,412 | — | ||||||||||||||||||||||
19
GOLDMAN SACHS VARIABLE INSURANCE TRUST MULTI-STRATEGY ALTERNATIVES PORTFOLIO
Notes to Financial Statements (continued)
June 30, 2018 (Unaudited)
5. AGREEMENTS AND AFFILIATED TRANSACTIONS (continued)
| Underlying Funds | Beginning Value as of December 31, 2017 | Purchases at Cost | Proceeds from Sales | Net Realized Gain (Loss) from Affiliated Investment Company | Change in Unrealized Appreciation (Depreciation) | Ending Value 2018 | Shares as of June 30, 2018 | Dividend Income from Affiliated Investment Company | ||||||||||||||||||||||||
Goldman Sachs Financial Square Government Fund | $ | 868,891 | $ | 2,647,465 | $ | (3,222,888 | ) | $ | — | $ | — | $ | 293,468 | 293,468 | $ | 3,485 | ||||||||||||||||
Goldman Sachs High Yield Floating Rate Fund | 470,785 | 751,125 | — | — | (11,704 | ) | 1,210,206 | 126,195 | 21,271 | |||||||||||||||||||||||
Goldman Sachs High Yield Fund | 1,048,853 | 398,858 | (550,000 | ) | (17,657 | ) | (16,284 | ) | 863,770 | 136,457 | 29,245 | |||||||||||||||||||||
Goldman Sachs Local Emerging Markets Debt Fund | — | 603,970 | — | — | (34,306 | ) | 569,664 | 98,218 | 3,971 | |||||||||||||||||||||||
Goldman Sachs Long Short Credit Strategies Fund | 3,577,130 | 344,173 | (1,900,000 | ) | (91,735 | ) | 56,930 | 1,986,498 | 216,159 | 34,845 | ||||||||||||||||||||||
Goldman Sachs Managed Futures Strategy Fund | 996,123 | 1,410,000 | — | — | (75,552 | ) | 2,330,571 | 228,712 | — | |||||||||||||||||||||||
Goldman Sachs Real Estate Securities Fund | 511,928 | 56,127 | — | — | 5,123 | 573,178 | 35,734 | 6,127 | ||||||||||||||||||||||||
Goldman Sachs Strategic Income Fund | 1,473,510 | 843,169 | (655,000 | ) | (12,717 | ) | (18,026 | ) | 1,630,936 | 175,181 | 13,168 | |||||||||||||||||||||
Goldman Sachs Strategic Macro Fund | 1,103,929 | — | (1,101,240 | ) | (77,849 | ) | 75,160 | — | — | — | ||||||||||||||||||||||
Goldman Sachs Tactical Exposure Fund | — | 2,670,000 | (25,000 | ) | (177 | ) | (69,326 | ) | 2,575,497 | 268,561 | — | |||||||||||||||||||||
| Total | $ | 15,365,288 | $ | 11,504,545 | $ | (9,944,128 | ) | $ | (154,862 | ) | $ | (285,374 | ) | $ | 16,485,469 | $ | 2,019,263 | $ | 147,394 | |||||||||||||
6. PORTFOLIO SECURITIES TRANSACTIONS
The cost of purchases and proceeds from sales and maturities of long-term securities for the six months ended June 30, 2018, were $9,402,701 and $7,009,289, respectively.
7. SECURITIES LENDING
The Portfolio may lend its securities through a securities lending agent, the Bank of New York Mellon (“BNYM”), to certain qualified borrowers. In accordance with the Portfolio’s securities lending procedures, the Portfolio receives cash collateral at least equal to the market value of the securities on loan. The market value of the loaned securities is determined at the close of business of the Portfolio, at their last sale price or official closing price on the principal exchange or system on which they are traded, and any additional required collateral is delivered to the Portfolio on the next business day. As with other extensions of credit, the Portfolio may experience delay in the recovery of its securities or incur a loss should the borrower of the securities breach its agreement with the Portfolio or become insolvent at a time when the collateral is insufficient to cover the cost of repurchasing securities on loan. Dividend income received from securities on loan may not be subject to withholding taxes and therefore
20
GOLDMAN SACHS VARIABLE INSURANCE TRUST MULTI-STRATEGY ALTERNATIVES PORTFOLIO
7. SECURITIES LENDING (continued)
withholding taxes paid may differ from the amounts listed in the Statement of Operations. Loans of securities are terminable at any time and as such 1) the remaining contractual maturities of the outstanding securities lending transactions are considered to be overnight and continuous and 2) the borrower, after notice, is required to return borrowed securities within the standard time period for settlement of securities transactions.
The Portfolio invests the cash collateral received in connection with securities lending transactions in the Goldman Sachs Financial Square Government Fund (“Government Money Market Fund”), an affiliated series of the Goldman Sachs Trust. The Government Money Market Fund is registered under the Act as an open end investment company, is subject to Rule 2a-7 under the Act, and is managed by GSAM, for which GSAM may receive a management fee of up to 0.16% (prior to February 21, 2018, GSAM may have received a management fee of up to 0.205%) on an annualized basis of the average daily net assets of the Government Money Market Fund.
In the event of a default by a borrower with respect to any loan, BNYM may exercise any and all remedies provided under the applicable borrower agreement to make the Portfolio whole. These remedies include purchasing replacement securities by applying the collateral held from the defaulting broker against the purchase cost of the replacement securities. If BNYM is unable to purchase replacement securities, BNYM will indemnify the Portfolio by paying the Portfolio an amount equal to the market value of the securities loaned minus the value of cash collateral received from the borrower for the loan, subject to an exclusion for any shortfalls resulting from a loss of value in such cash collateral due to reinvestment risk. The Portfolio’s loaned securities were all subject to enforceable Securities Lending Agreements and the value of the collateral was at least equal to the value of the cash received. The amounts of the Portfolio’s overnight and continuous agreements represent the gross amounts of recognized liabilities for securities lending transactions outstanding as of June 30, 2018 are disclosed as “Payable upon return of securities loaned” on the Statement of Assets and Liabilities, where applicable. The Portfolio did not have securities on loan as of June 30, 2018.
Both the Portfolio and BNYM received compensation relating to the lending of the Portfolio’s securities. The amounts earned, if any, by the Portfolio for the six months ended June 30, 2018, are reported under Investment Income on the Statement of Operations.
The following table provides information about the Portfolio’s investment in the Government Money Market Fund for the six months ended June 30, 2018:
| Beginning Value as of December 31, 2017 | Purchases at Cost | Proceeds from Sales | Ending Value as of June 30, 2018 | |||||||||||
| $ | — | $ | 611,626 | $ | (611,626 | ) | $ | — | ||||||
8. TAX INFORMATION
As of the Portfolio’s most recent fiscal year end, December 31, 2017, the Portfolio’s capital loss carryforwards and certain timing differences, on a tax-basis were as follows:
| Capital loss carryforwards: | ||||
Perpetual Short-term | $ | (276,579 | ) | |
Perpetual Long-term | (88,679 | ) | ||
| Total capital loss carryforwards | $ | (365,258 | ) | |
| Timing differences (Qualified Late Year Loss Deferral) | (5,108 | ) |
21
GOLDMAN SACHS VARIABLE INSURANCE TRUST MULTI-STRATEGY ALTERNATIVES PORTFOLIO
Notes to Financial Statements (continued)
June 30, 2018 (Unaudited)
8. TAX INFORMATION (continued)
As of June 30, 2018, the Portfolio’s aggregate security unrealized gains and losses based on cost for U.S. federal income tax purposes were as follows:
| Tax cost | $ | 17,372,089 | ||
| Gross unrealized gain | 189,471 | |||
| Gross unrealized loss | (801,237 | ) | ||
| Net unrealized loss | $ | (611,766 | ) |
The difference between GAAP-basis and tax-basis unrealized gains (losses) is attributable primarily to wash sales, net mark to market gains (losses) on regulated futures, options and foreign exchange contracts and differences in the tax treatment of underlying fund investments and partnership investments.
GSAM has reviewed the Portfolio’s tax position for all open tax years (the current and prior three years, as applicable) and has concluded that no provision for income tax is required in the Portfolio’s financial statements. Such open tax years remain subject to examination and adjustment by tax authorities.
9. OTHER RISKS
The Portfolio’s risks include, but are not limited to, the following:
Derivatives Risk — The Portfolio’s use of derivatives may result in loss. Derivative instruments, which may pose risks in addition to and greater than those associated with investing directly in securities, currencies or other instruments, may be illiquid or less liquid, volatile, difficult to price and leveraged so that small changes in the value of the underlying instruments may produce disproportionate losses to the Portfolio. Derivatives are also subject to counterparty risk, which is the risk that the other party in the transaction will not fulfill its contractual obligation. The use of derivatives is a highly specialized activity that involves investment techniques and risks different from those associated with investments in more traditional securities and instruments. Losses from derivatives can also result from a lack of correlation between changes in the value of derivative instruments and the portfolio assets (if any) being hedged.
Investments in the Underlying Funds — The investments of the Portfolio are concentrated in the Underlying Funds, and the Portfolio’s investment performance is directly related to the investment performance of the Underlying Funds it holds. The Portfolio is subject to the risk factors associated with the investments of the Underlying Funds in direct proportion to the amount of assets allocated to each. To the extent that the Portfolio has a relative concentration of its portfolio in a single Underlying Fund, the Portfolio may be more susceptible to adverse developments affecting that Underlying Fund, and may be more susceptible to losses because of these developments.
Investments in Other Investment Companies Risk — As a shareholder of another investment company, including an exchange-traded fund (“ETF”), the Portfolio will indirectly bear its proportionate share of any net management fees and other expenses paid by such other investment companies, in addition to the fees and expenses regularly borne by the Portfolio. ETFs are subject to risks that do not apply to conventional mutual funds, including but not limited to the following: (i) the market price of the ETF’s shares may trade at a premium or a discount to their NAV; and (ii) an active trading market for an ETF’s shares may not develop or be maintained.
Large Shareholder Transactions Risk — The Portfolio or an Underlying Fund may experience adverse effects when certain large shareholders, such as other funds, participating insurance companies, accounts and Goldman Sachs affiliates, purchase or redeem large amounts of shares of the Portfolio or an Underlying Fund. Such large shareholder redemptions may cause the Portfolio or an Underlying Fund to sell portfolio securities at times when it would not otherwise do so, which may negatively impact the Portfolio’s or an Underlying Fund’s NAV and liquidity. These transactions may also accelerate the realization of taxable
22
GOLDMAN SACHS VARIABLE INSURANCE TRUST MULTI-STRATEGY ALTERNATIVES PORTFOLIO
9. OTHER RISKS (continued)
income to shareholders if such sales of investments resulted in gains, and may also increase transaction costs. In addition, a large redemption could result in the Portfolio’s or an Underlying Fund’s current expenses being allocated over a smaller asset base, leading to an increase in the Portfolio’s or an Underlying Fund’s expense ratio. Similarly, large Portfolio or Underlying Fund share purchases may adversely affect the Portfolio’s or an Underlying Fund’s performance to the extent that the Portfolio or an Underlying Fund is delayed in investing new cash and is required to maintain a larger cash position than it ordinarily would.
Liquidity Risk — The Underlying Funds may make investments that are illiquid or that may become less liquid in response to market developments or adverse investor perceptions. Illiquid investments may be more difficult to value. Liquidity risk may also refer to the risk that the Portfolio will not be able to pay redemption proceeds within the allowable time period because of unusual market conditions, an unusually high volume of redemption requests, or other reasons. To meet redemption requests, the Portfolio may be forced to sell investments at an unfavorable time and/or under unfavorable conditions. Liquidity risk may be the result of, among other things, the reduced number and capacity of traditional market participants to make a market in fixed income securities or the lack of an active market. The potential for liquidity risk may be magnified by a rising interest rate environment or other circumstances where investor redemptions from fixed income mutual funds may be higher than normal, potentially causing increased supply in the market due to selling activity.
Market and Credit Risks — In the normal course of business, the Portfolio and the Underlying Funds trade financial instruments and enter into financial transactions where risk of potential loss exists due to changes in the market (market risk). Additionally, the Portfolio and the Underlying Funds may also be exposed to credit risk in the event that an issuer or guarantor fails to perform or that an institution or entity with which the Portfolio or the Underlying Funds have unsettled or open transactions defaults.
10. INDEMNIFICATIONS
Under the Trust’s organizational documents, its Trustees, officers, employees and agents are indemnified, to the extent permitted by the Act and state law, against certain liabilities that may arise out of performance of their duties to the Portfolio. Additionally, in the course of business, the Portfolio enters into contracts that contain a variety of indemnification clauses. The Portfolio’s maximum exposure under these arrangements is unknown, as this would involve future claims that may be made against the Portfolio that have not yet occurred. However, GSAM believes the risk of loss under these arrangements to be remote.
11. SUBSEQUENT EVENTS
Subsequent events after the Statement of Assets and Liabilities date have been evaluated, and GSAM has concluded that there is no impact requiring adjustment or disclosure in the financial statements.
23
GOLDMAN SACHS VARIABLE INSURANCE TRUST MULTI-STRATEGY ALTERNATIVES PORTFOLIO
Notes to Financial Statements (continued)
June 30, 2018 (Unaudited)
12. SUMMARY OF SHARE TRANSACTIONS
Share activity is as follows:
| For the Six Months Ended June 30, 2018 (Unaudited) | For the Fiscal Year Ended December 31, 2017 | |||||||||||||||
| Shares | Dollars | Shares | Dollars | |||||||||||||
| Institutional Shares | ||||||||||||||||
| Shares sold | 33,230 | $ | 304,808 | 14,083 | $ | 133,278 | ||||||||||
| Reinvestment of distributions | — | — | 1,104 | 10,357 | ||||||||||||
| Shares redeemed | (3,678 | ) | (34,123 | ) | (837 | ) | (7,840 | ) | ||||||||
| 29,552 | 270,685 | 14,350 | 135,795 | |||||||||||||
| Service Shares | ||||||||||||||||
| Shares sold | 14,743 | 136,925 | 7,288 | 69,479 | ||||||||||||
| Reinvestment of distributions | — | — | 244 | 2,291 | ||||||||||||
| Shares redeemed | (68 | ) | (625 | ) | (27 | ) | (254 | ) | ||||||||
| 14,675 | 136,300 | 7,505 | 71,516 | |||||||||||||
| Advisor Shares | ||||||||||||||||
| Shares sold | 336,439 | 3,108,308 | 608,399 | 5,689,509 | ||||||||||||
| Reinvestment of distributions | — | — | 32,451 | 303,417 | ||||||||||||
| Shares redeemed | (173,836 | ) | (1,608,161 | ) | (170,306 | ) | (1,586,246 | ) | ||||||||
| 162,603 | 1,500,147 | 470,544 | 4,406,680 | |||||||||||||
| NET INCREASE | 206,830 | $ | 1,907,132 | 492,399 | $ | 4,613,991 | ||||||||||
24
GOLDMAN SACHS VARIABLE INSURANCE TRUST MULTI-STRATEGY ALTERNATIVES PORTFOLIO
| Portfolio Expenses — Six Month Period Ended June 30, 2018 (Unaudited) |
As a shareholder of Institutional, Service or Advisor Shares of the Portfolio, you incur ongoing costs, including management fees, distribution and/or service (12b-1) fees (with respect to Service and Advisor Shares) and other Portfolio expenses. This example is intended to help you understand your ongoing costs (in dollars) of investing in the Institutional Shares, Service Shares and Advisor Shares of the Portfolio and to compare these costs with the ongoing costs of investing in other mutual funds.
The example is based on an investment of $1,000 invested at the beginning of the period and held for the entire period from January 1, 2018 through June 30, 2018, which represents a period of 181 days of a 365 day year.
Actual Expenses — The first line under each share class in the table below provides information about actual account values and actual expenses. You may use the information in this line, together with the amount you invested, to estimate the expenses that you paid over the period. Simply divide your account value by $1,000 (for example, an $8,600 account value divided by $1,000=8.6), then multiply the result by the number in the first line under the heading entitled “Expenses Paid” to estimate the expenses you paid on your account during this period.
Hypothetical Example for Comparison Purposes — The second line under each share class in the table below provides information about hypothetical account values and hypothetical expenses based on the Portfolio’s actual net expense ratio and an assumed rate of return of 5% per year before expenses, which is not the Portfolio’s actual return. The hypothetical account values and expenses may not be used to estimate the actual ending account balance or expenses you paid for the period. You may use this information to compare the ongoing costs of investing in the Portfolio and other funds. To do so, compare this 5% hypothetical example with the 5% hypothetical examples that appear in the shareholder reports of the other funds.
Please note that the expenses shown in the table are meant to highlight your ongoing costs only. As a shareholder of the Portfolio you do not incur any transaction costs, such as sales charges, redemption fees, or exchange fees, but shareholders of other funds may incur such costs. The second line of the table is useful in comparing ongoing costs only and will not help you determine the relative total costs of owning different funds whose shareholders may incur transaction costs.
| Share Class | Beginning Account Value 01/01/18 | Ending Account Value 06/30/18 | Expenses Paid for the 6 Months Ended 6/30/18* | |||||||||
| Institutional | ||||||||||||
| Actual | $ | 1,000 | $ | 963.80 | $ | 1.07 | ||||||
| Hypothetical 5% return | 1,000 | 1,023.70 | + | 1.10 | ||||||||
| Service | ||||||||||||
| Actual | 1,000 | 961.70 | 2.29 | |||||||||
| Hypothetical 5% return | 1,000 | 1,022.46 | + | 2.36 | ||||||||
| Advisor | ||||||||||||
| Actual | 1,000 | 961.50 | 3.02 | |||||||||
| Hypothetical 5% return | 1,000 | 1,021.72 | + | 3.11 | ||||||||
| + | Hypothetical expenses are based on the Portfolio’s actual annualized net expense ratios and an assumed rate of return of 5% per year before expenses. |
| * | Expenses are calculated using the Portfolio’s annualized net expense ratio for each class, which represents the ongoing expenses as a percentage of net assets for the six months ended June 30, 2018. Expenses are calculated by multiplying the annualized net expense ratio by the average account value for the period; then multiplying the result by the number of days in the most recent fiscal half year; and then dividing that result by the number of days in the fiscal year. The annualized net expense ratios for the period were 0.22%, 0.47% and 0.62% for Institutional, Service and Advisor Shares, respectively. |
25
GOLDMAN SACHS VARIABLE INSURANCE TRUST MULTI-STRATEGY ALTERNATIVES PORTFOLIO
Statement Regarding Basis for Approval of Management Agreement (Unaudited)
Background
The Goldman Sachs Multi-Strategy Alternatives Portfolio (the “Portfolio”) is an investment portfolio of Goldman Sachs Variable Insurance Trust (the “Trust”). The Board of Trustees oversees the management of the Trust and reviews the investment performance and expenses of the Portfolio at regularly scheduled meetings held throughout the year. In addition, the Board of Trustees determines annually whether to approve the continuance of the Trust’s investment management agreement (the “Management Agreement”) with Goldman Sachs Asset Management, L.P. (the “Investment Adviser”) on behalf of the Portfolio.
The Management Agreement was most recently approved for continuation until June 30, 2019 by the Board of Trustees, including those Trustees who are not parties to the Management Agreement or “interested persons” (as defined in the Investment Company Act of 1940, as amended) of any party thereto (the “Independent Trustees”), at a meeting held on June 13-14, 2018 (the “Annual Meeting”).
The review process undertaken by the Trustees spans the course of the year and culminates with the Annual Meeting. To assist the Trustees in their deliberations, the Trustees have established a Contract Review Committee (the “Committee”), comprised of the Independent Trustees. The Committee held four meetings over the course of the year since the Management Agreement was last approved. At those Committee meetings, regularly scheduled Board or other committee meetings, and/or the Annual Meeting, matters relevant to the renewal of the Management Agreement were considered by the Board, or the Independent Trustees, as applicable. With respect to the Portfolio, such matters included:
| (a) | the nature and quality of the advisory, administrative, and other services provided to the Portfolio and the underlying funds in which it invests (the “Underlying Funds”) by the Investment Adviser and its affiliates, including information about: |
| (i) | the structure, staff, and capabilities of the Investment Adviser and its portfolio management teams; |
| (ii) | the groups within the Investment Adviser and its affiliates that support the portfolio management teams or provide other types of necessary services, including fund services groups (e.g., accounting and financial reporting, tax, shareholder services, and operations); controls and risk management groups (e.g., legal, compliance, valuation oversight, credit risk management, internal audit, compliance testing, market risk analysis, finance, and central funding); sales and distribution support groups, and others (e.g., information technology and training); |
| (iii) | trends in employee headcount; |
| (iv) | the Investment Adviser’s financial resources and ability to hire and retain talented personnel and strengthen its operations; and |
| (v) | the parent company’s support of the Investment Adviser and its mutual fund business, as expressed by the firm’s senior management; |
| (b) | information on the investment performance of the Portfolio and Underlying Funds, including comparisons to the performance of similar mutual funds, as provided by a third-party mutual fund data provider engaged as part of the contract review process (the “Outside Data Provider”), and a benchmark performance index; and information on general investment outlooks in the markets in which the Underlying Funds invest; |
| (c) | information provided by the Investment Adviser indicating the Investment Adviser’s views on whether the Portfolio’s peer group and/or benchmark index had high, medium, or low relevance given the Portfolio’s particular investment strategy; |
| (d) | the terms of the Management Agreement and other agreements with affiliated service providers entered into by the Trust on behalf of the Portfolio; |
| (e) | fee and expense information for the Portfolio, including: |
| (i) | the relative management fee and expense levels of the Portfolio as compared to those of comparable funds managed by other advisers, as provided by the Outside Data Provider; |
| (ii) | the Portfolio’s expense trends over time; and |
| (iii) | to the extent the Investment Adviser manages other types of accounts (such as bank collective trusts, private wealth management accounts, institutional separate accounts, sub-advised mutual funds, and non-U.S. funds) having investment objectives and policies similar to those of the Portfolio, comparative information on the advisory fees charged and services provided to those accounts by the Investment Adviser; |
| (f) | with respect to the extensive investment performance and expense comparison data provided by the Outside Data Provider, its processes in producing that data for the Portfolio; |
| (g) | the undertakings of the Investment Adviser and its affiliates to implement fee waivers and/or expense limitations of the Portfolio and the Underlying Funds; |
26
GOLDMAN SACHS VARIABLE INSURANCE TRUST MULTI-STRATEGY ALTERNATIVES PORTFOLIO
Statement Regarding Basis for Approval of Management Agreement (Unaudited) (continued)
| (h) | information relating to the profitability of the Management Agreement and the transfer agency and distribution and service arrangements of the Portfolio to the Investment Adviser and its affiliates; |
| (i) | whether the Portfolio’s existing management fee schedule, together with the management fee schedules of the Underlying Funds, adequately addressed any economies of scale; |
| (j) | a summary of the “fall-out” benefits derived by the Investment Adviser and its affiliates from their relationships with the Portfolio and/or the Underlying Funds, including the fees received by the Investment Adviser’s affiliates from the Portfolio and/or the Underlying Funds for transfer agency, securities lending, portfolio trading, distribution and other services; |
| (k) | a summary of potential benefits derived by the Portfolio and/or the Underlying Funds as a result of their relationship with the Investment Adviser; |
| (l) | with respect to the applicable Underlying Funds, information regarding commissions paid by the Underlying Equity Funds and broker oversight, an update on the Investment Adviser’s soft dollars practices, other information regarding portfolio trading, and how the Investment Adviser carries out its duty to seek best execution; |
| (m) | the manner in which portfolio manager compensation is determined; and the number and types of accounts managed by the portfolio managers; |
| (n) | the nature and quality of the services provided to the Portfolio and the Underlying Funds by their unaffiliated service providers, and the Investment Adviser’s general oversight and evaluation (including reports on due diligence) of those service providers as part of the administrative services provided under the Management Agreement; and |
| (o) | the Investment Adviser’s processes and policies addressing various types of potential conflicts of interest; its approach to risk management; the annual review of the effectiveness of the Portfolio’s compliance program; and periodic compliance reports. |
The Trustees also received an overview of the Portfolio’s distribution arrangements. They received information regarding the Portfolio’s assets, share purchase and redemption activity, and payment of distribution and service fees. Information was also provided to the Trustees relating to revenue sharing payments made by and services provided by the Investment Adviser and its affiliates to intermediaries that promote the sale, distribution, and/or servicing of Portfolio shares. The Independent Trustees also discussed the broad range of other investment choices that are available to Portfolio investors, including the availability of comparable funds managed by other advisers.
The presentations made at the Board and Committee meetings and at the Annual Meeting encompassed the Portfolio and other mutual funds for which the Board of Trustees has responsibility. In evaluating the Management Agreement at the Annual Meeting, the Trustees relied upon their knowledge, resulting from their meetings and other interactions throughout the year, of the Investment Adviser and its affiliates, their services, and the Portfolio. In conjunction with these meetings, the Trustees received written materials and oral presentations on the topics covered, and the Investment Adviser addressed the questions and concerns of the Trustees, including concerns regarding the investment performance of certain of the funds they oversee. The Independent Trustees were advised by their independent legal counsel regarding their responsibilities and other regulatory requirements related to the approval and continuation of mutual fund investment management agreements under applicable law. In addition, the Investment Adviser and its affiliates provided the Independent Trustees with a written response to a formal request for information sent on behalf of the Independent Trustees by their independent legal counsel. During the course of their deliberations, the Independent Trustees met in executive sessions with their independent legal counsel, without representatives of the Investment Adviser or its affiliates present.
Nature, Extent, and Quality of the Services Provided Under the Management Agreement
As part of their review, the Trustees considered the nature, extent, and quality of the services provided to the Portfolio and the Underlying Funds by the Investment Adviser. In this regard, the Trustees considered both the investment advisory services and non-advisory services that are provided by the Investment Adviser and its affiliates. The Trustees noted the transition in the leadership and changes in personnel of various of the Investment Adviser’s portfolio management teams that had occurred in recent periods, and the ongoing recruitment efforts aimed at bringing high quality investment talent to the Investment Adviser. They also noted the Investment Adviser’s commitment to maintaining high quality systems and expending substantial resources to respond to ongoing changes to the regulatory and control environment in which the Portfolio and the Underlying Funds and their service providers operate, as well as the efforts of the Investment Adviser and its affiliates to combat cyber security risks. The Trustees concluded that the Investment Adviser continued to commit substantial financial and operational resources to the Portfolio and expressed confidence that the Investment Adviser would continue to do so in the future. The Trustees also recognized that the
27
GOLDMAN SACHS VARIABLE INSURANCE TRUST MULTI-STRATEGY ALTERNATIVES PORTFOLIO
Statement Regarding Basis for Approval of Management Agreement (Unaudited) (continued)
Investment Adviser had made significant commitments to address regulatory compliance requirements applicable to the Portfolio, the Underlying Funds, and the Investment Adviser and its affiliates.
Investment Performance
The Trustees also considered the investment performance of the Portfolio and the Underlying Funds. In this regard, they compared the investment performance of the Portfolio to its peers using rankings and ratings compiled by the Outside Data Provider as of December 31, 2017, and updated performance information prepared by the Investment Adviser using the peer group identified by the Outside Data Provider as of March 31, 2018. The information on the Portfolio’s investment performance was provided for the one- and three-year periods ending on the applicable dates. The Trustees also reviewed the Portfolio’s investment performance relative to its performance benchmark. As part of this review, they considered the investment performance trends of the Portfolio over time, and reviewed the investment performance of the Portfolio in light of its investment objective and policies and market conditions.
In addition, the Trustees considered materials prepared and presentations made by the Investment Adviser’s senior management and portfolio management personnel in which Portfolio performance was assessed. The Trustees also considered the Investment Adviser’s periodic reports with respect to the Underlying Funds’ risk profiles, and how the Investment Adviser’s approach to risk monitoring and management influences portfolio management.
The Trustees noted that the Portfolio’s Institutional Shares had placed in the third quartile of the Portfolio’s peer group for the one- and three-year periods, had outperformed the Portfolio’s LIBOR-based benchmark index by 0.04% for the one-year period and underperformed by 0.94% for the three-year period, and had underperformed the average performance of a group of competitor funds, as determined by the Investment Adviser, for the one- and three-year periods ending March 31, 2018.
Costs of Services Provided and Competitive Information
The Trustees considered the contractual terms of the Management Agreement and the fee rates payable by the Portfolio thereunder. In this regard, the Trustees considered information on the services rendered by the Investment Adviser to the Portfolio, which included both advisory and administrative services that were directed to the needs and operations of the Portfolio as a registered mutual fund.
In particular, the Trustees reviewed analyses prepared by the Outside Data Provider regarding the expense rankings of the Portfolio. The analyses provided a comparison of the Portfolio’s management fee to those of a relevant peer group and category universe; an expense analysis which compared the Portfolio’s overall net and gross expenses to a peer group and a category universe; and data comparing the Portfolio’s net expenses to the peer and category medians. The analyses also compared the Portfolio’s transfer agency, custody, and distribution fees, other expenses and fee waivers/reimbursements to those of the peer group and category medians. The Trustees concluded that the comparisons provided by the Outside Data Provider were useful in evaluating the reasonableness of the management fees and total expenses paid by the Portfolio.
In addition, the Trustees considered the Investment Adviser’s undertakings to implement fee waivers and/or expense limitations of the Portfolio and the Underlying Funds. They also considered, to the extent that the Investment Adviser manages other types of accounts having investment objectives and policies similar to those of the Portfolio, comparative fee information for services provided by the Investment Adviser to those accounts, and information that indicated that services provided to the Portfolio differed in various significant respects from the services provided to other types of accounts which, in many cases, operated under less stringent legal and regulatory structures, required fewer services from the Investment Adviser to a smaller number of client contact points, and were less time-intensive.
In addition, the Trustees noted that shareholders are able to redeem their Portfolio shares at any time if shareholders believe that the Portfolio fees and expenses are too high or if they are dissatisfied with the performance of the Portfolio.
Profitability
The Trustees reviewed the Portfolio’s contribution to the Investment Adviser’s revenues and pre-tax profit margins. In this regard the Trustees noted that they had received, among other things, profitability analyses and summaries, revenue and expense schedules by Portfolio and by function (i.e., investment management, transfer agency and distribution and service), and information on the Investment Adviser’s expense allocation methodology. They observed that the profitability and expense figures are substantially similar to those used by the Investment Adviser for many internal purposes, including compensation decisions among various business groups, and are thus subject to a vigorous internal debate about how certain revenue and expenses should be allocated. The Trustees also noted that the internal audit group within the Goldman Sachs organization had audited the expense allocation methodology and that the internal audit group was satisfied with the reasonableness, consistency, and accuracy of the
28
GOLDMAN SACHS VARIABLE INSURANCE TRUST MULTI-STRATEGY ALTERNATIVES PORTFOLIO
Statement Regarding Basis for Approval of Management Agreement (Unaudited) (continued)
Investment Adviser’s expense allocation methodology and profitability analysis calculations. Profitability data for the Portfolio was provided for 2017 and 2016, and the Trustees considered this information in relation to the Investment Adviser’s overall profitability.
Economies of Scale
The Trustees considered the information that had been provided regarding whether there have been economies of scale with respect to the management of the Portfolio. The Trustees noted that, although the Portfolio itself does not have breakpoints in its management fee schedule, any benefits of the breakpoints in the management fee schedules of certain Underlying Funds, when reached, would pass through to the shareholders in the Portfolio at the specified asset levels. The Trustees considered the amounts of assets in the Portfolio; the Portfolio’s recent purchase and redemption activity; the information provided by the Investment Adviser relating to the costs of the services provided by the Investment Adviser and its affiliates and the profits realized by them; information comparing the fee rates charged by the Investment Adviser with fee rates charged to other funds in the peer group; and the Investment Adviser’s undertakings to waive the management fee paid by the Portfolio and a portion of the management fees paid by certain Underlying Funds and to limit certain expenses of the Portfolio and Underlying Funds that exceed specified levels. They also considered the services provided to the Portfolio under the Management Agreement and the fees and expenses borne by the Underlying Funds.
Other Benefits to the Investment Adviser and Its Affiliates
The Trustees also considered the other benefits derived by the Investment Adviser and its affiliates from their relationships with the Portfolio and/or the Underlying Funds as stated above, including: (a) transfer agency fees received by Goldman Sachs & Co. LLC (“Goldman Sachs”); (b) brokerage and futures commissions earned by Goldman Sachs for executing securities and futures transactions on behalf of certain Underlying Funds; (c) research received by the Investment Adviser from broker-dealers in exchange for executing certain transactions on behalf of certain Underlying Funds; (d) trading efficiencies resulting from aggregation of orders of the Underlying Funds with those for other funds or accounts managed by the Investment Adviser; (e) fees earned by Goldman Sachs Agency Lending (“GSAL”), an affiliate of the Investment Adviser, as securities lending agent for certain Underlying Funds (and fees earned by the Investment Adviser for managing the fund in which the Portfolio’s and those Underlying Funds’ securities lending cash collateral is invested); (f) the Investment Adviser’s ability to leverage the infrastructure designed to service the Portfolio on behalf of its other clients; (g) the Investment Adviser’s ability to cross-market other products and services to Portfolio shareholders; (h) Goldman Sachs’ retention of certain fees as Portfolio Distributor; (i) the Investment Adviser’s ability to negotiate better pricing with custodians on behalf of its other clients, as a result of the relationship with the Portfolio and Underlying Funds; and (j) the possibility that the working relationship between the Investment Adviser and the Portfolio’s and Underlying Funds’ third-party service providers may cause those service providers to be more likely to do business with other areas of Goldman Sachs. In the course of considering the foregoing, the Independent Trustees requested and received further information quantifying certain of these fall-out benefits.
Other Benefits to the Portfolio and Its Shareholders
The Trustees also noted that the Portfolio and/or the Underlying Funds receive certain potential benefits as a result of their relationship with the Investment Adviser, including: (a) trading efficiencies resulting from aggregation of orders of the Underlying Funds with those of other funds or accounts managed by the Investment Adviser; (b) enhanced servicing from vendors because of the volume of business generated by the Investment Adviser and its affiliates; (c) with respect to the Underlying Funds, enhanced servicing from broker-dealers because of the volume of business generated by the Investment Adviser and its affiliates; (d) with respect to certain Underlying Funds, the Investment Adviser’s ability to negotiate favorable terms with derivatives counterparties as a result of the size and reputation of the Goldman Sachs organization; (e) the Investment Adviser’s knowledge and experience gained from managing other accounts and products; (f) the Investment Adviser’s ability to hire and retain qualified personnel to provide services to the Portfolio and the Underlying Funds because of the reputation of the Goldman Sachs organization; (g) the Portfolio’s and Underlying Funds’ access, through the Investment Adviser, to certain firmwide resources (e.g., proprietary risk management systems and databases), subject to certain restrictions; (h) with respect to certain Underlying Funds, the ability to participate in the securities lending program administered by GSAL, as measured by the revenue received by the Underlying Funds in connection with the program; and (i) the Portfolio’s access to certain affiliated distribution channels. In addition, the Trustees noted the competitive nature of the mutual fund marketplace, and considered that many of the Portfolio’s shareholders invested in the Portfolio in part because of the Portfolio’s relationship with the Investment Adviser and that those shareholders have a general expectation that the relationship will continue.
29
GOLDMAN SACHS VARIABLE INSURANCE TRUST MULTI-STRATEGY ALTERNATIVES PORTFOLIO
Statement Regarding Basis for Approval of Management Agreement (Unaudited) (continued)
Conclusion
In connection with their consideration of the Management Agreement, the Trustees gave weight to each of the factors described above, but did not identify any particular factor as controlling their decision. After deliberation and consideration of all of the information provided, including the factors described above, the Trustees concluded, in the exercise of their business judgment, that the management fees paid by the Portfolio were reasonable in light of the services provided to it by the Investment Adviser, the Investment Adviser’s costs and the Portfolio’s current and reasonably foreseeable asset levels. The Trustees unanimously concluded that the Investment Adviser’s continued management likely would benefit the Portfolio and its shareholders and that the Management Agreement should be approved and continued with respect to the Portfolio until June 30, 2019.
30
| TRUSTEES | OFFICERS | |
| Jessica Palmer, Chair | James A. McNamara, President | |
| Kathryn A. Cassidy | Scott M. McHugh, Treasurer, Senior Vice | |
| Diana M. Daniels | President and Principal Financial Officer | |
| Herbert J. Markley | Joseph F. DiMaria, Assistant Treasurer and | |
| James A. McNamara | Principal Accounting Officer | |
| Roy W. Templin | Caroline L. Kraus, Secretary | |
| Gregory G. Weaver |
GOLDMAN SACHS & CO. LLC
Distributor and Transfer Agent
GOLDMAN SACHS ASSET MANAGEMENT, L.P.
Investment Adviser
200 West Street, New York
New York 10282
Visit our web site at www.GSAMFUNDS.com to obtain the most recent month-end returns.
The reports concerning the Portfolio included in this shareholder report may contain certain forward-looking statements about the factors that may affect the performance of the Portfolio in the future. These statements are based on Portfolio management’s predictions and expectations concerning certain future events and their expected impact on the Portfolio, such as performance of the economy as a whole and of specific industry sectors, changes in the levels of interest rates, the impact of developing world events, and other factors that may influence the future performance of the Portfolio. Management believes these forward-looking statements to be reasonable, although they are inherently uncertain and difficult to predict. Actual events may cause adjustments in portfolio management strategies from those currently expected to be employed.
A description of the policies and procedures that the Portfolio uses to determine how to vote proxies relating to portfolio securities and information regarding how the Portfolio voted proxies relating to portfolio securities for the 12-month period ended June 30 is available (i) without charge, upon request by calling 1-800-621-2550; and (ii) on the Securities and Exchange Commission (“SEC”) web site at http://www.sec.gov.
The Portfolio files its complete schedule of portfolio holdings with the SEC for the first and third quarters of each fiscal year on Form N-Q. The Portfolio’s Form N-Qs are available on the SEC’s web site at http://www.sec.gov within 60 days after the Portfolio’s first and third fiscal quarters. The Portfolio’s Form N-Qs may be reviewed and copied at the SEC’s Public Reference Room in Washington, D.C. and information on the operation of the Public Reference Room may also be obtained by calling 1-800-SEC-0330. Form N-Qs may be obtained upon request and without charge by calling 1-800-621-2550.
Views and opinions expressed are for informational purposes only and do not constitute a recommendation by GSAM to buy, sell, or hold any security. Views and opinions are current as of the date of this presentation and may be subject to change, they should not be construed as investment advice.
Goldman Sachs & Co. LLC (“Goldman Sachs”) does not provide legal, tax or accounting advice. Any statement contained in this communication (including any attachments) concerning U.S. tax matters was not intended or written to be used, and cannot be used, for the purpose of avoiding penalties under the Internal Revenue Code, and was written to support the promotion or marketing of transactions or matters addressed. Clients of Goldman Sachs should obtain their own independent tax advice based on their particular circumstances.
The website links provided are for your convenience only and are not an endorsement or recommendation by GSAM of any of these websites or the products or services offered. GSAM is not responsible for the accuracy and validity of the content of these websites.
Portfolio holdings and allocations shown are as of June 30, 2018 and may not be representative of future investments. Portfolio holdings should not be relied on in making investment decisions and should not be construed as research or investment advice regarding particular securities. Current and future holdings are subject to risk.
References to indices, benchmarks or other measures of relative market performance over a specified period of time are provided for your information only and do not imply that the portfolio will achieve similar results. The index composition may not reflect the manner in which a portfolio is constructed. While an adviser seeks to design a portfolio which reflects appropriate risk and return features, portfolio characteristics may deviate from those of the benchmark.
The Global Industry Classification Standard (“GICS”) was developed by and is the exclusive property and a service mark of Morgan Stanley Capital International Inc. (“MSCI”) and Standard & Poor’s, a division of The McGraw-Hill Companies, Inc. (“S&P”) and is licensed for use by Goldman Sachs. Neither MSCI, S&P nor any other party involved in making or compiling the GICS or any GICS classifications makes any express or implied warranties or representations with respect to such standard or classification (or the results to be obtained by the use thereof), and all such parties hereby expressly disclaim all warranties of originality, accuracy, completeness, merchantability or fitness for a particular purpose with respect to any of such standard or classification. Without limiting any of the foregoing, in no event shall MSCI, S&P, any of their affiliates or any third party involved in making or compiling the GICS or any GICS classifications have any liability for any direct, indirect, special, punitive, consequential or any other damages (including lost profits) even if notified of the possibility of such damages.
The portfolio risk management process includes an effort to monitor and manage risk, but does not imply low risk.
Diversification does not protect an investor from market risk and does not ensure a profit.
Shares of the Goldman Sachs VIT Funds are offered to separate accounts of participating life insurance companies for the purpose of funding variable annuity contracts and variable life insurance policies. Shares of the Portfolio are not offered directly to the general public. The variable annuity contracts and variable life insurance policies are described in the separate prospectuses issued by participating insurance companies. You should refer to those prospectuses for information about surrender charges, mortality and expense risk fees and other charges that may be assessed by participating insurance companies under the variable annuity contracts or variable life insurance policies. Such fees or charges, if any, may affect the return you may realize with respect to your investments. Ask your representative for more complete information. Please consider a fund’s objectives, risks and charges and expenses, and read the prospectus carefully before investing. The prospectus contains this and other information about the Portfolio.
This material is not authorized for distribution to prospective investors unless preceded or accompanied by a current prospectus or summary prospectus, if applicable. Investors should consider the Portfolio’s objective, risks, and charges and expenses, and read the summary prospectus, if available, and/or the prospectus carefully before investing or sending money. The summary prospectus, if available, and the prospectus contain this and other information about the Portfolio and may be obtained from your authorized dealer or from Goldman Sachs & Co. LLC by calling 1-800-621-2550.
This report is prepared for the general information of contract owners and is not an offer of shares of the Goldman Sachs Variable Insurance Trust — Goldman Sachs Multi-Strategy Alternatives Portfolio.
© 2018 Goldman Sachs. All rights reserved.
VITMSASAR-18/139320-OTU-808797/538
Goldman
Sachs Variable Insurance Trust
Goldman Sachs Core Fixed Income Fund
Goldman Sachs Equity Index Fund
Goldman Sachs Growth Opportunities Fund
Goldman Sachs High Quality Floating Rate Fund
Semi-Annual Report
June 30, 2018

MARKET REVIEW
Goldman Sachs Variable Insurance Trust Funds
Market Review
During the six months ended June 30, 2018 (the “Reporting Period”), the performance of the U.S. equity and fixed income markets was influenced most by economic data, central bank monetary policy and geopolitical events.
Equity Markets
U.S. equities saw a strong start to the Reporting Period in January 2018, driven by positive economic data, a $1.5 trillion tax reform law signed in December 2017, and a favorable corporate earnings season. In February 2018, however, U.S. equities sold off on market speculation of a faster pace of Federal Reserve (“Fed”) short-term interest rate hikes, which stoked a sharp rise in bond yields and an increase in equity market volatility. Concerns about Fed monetary policy tightening were further exacerbated by solid U.S. labor and inflation data. While the hawkish Fed minutes were largely expected, new Fed Chair Jerome Powell’s Congressional testimony, positing a more optimistic economic outlook since the December 2017 Fed meeting, surprised equity markets with its hawkish tilt, sparking another sell-off in the U.S. equity markets. (Jerome Powell assumed the chairmanship of the Fed in February 2018. Hawkish language tends to suggest higher interest rates; opposite of dovish.) In March 2018, escalating trade tensions and potential tariffs weighed on investor sentiment. Meanwhile, the Fed delivered on a widely expected interest rate increase, with its “dot plot” pointing to a total of three interest rate hikes this calendar year and potentially two in 2019. (The “dot plot” shows rate projections of the members of the Fed’s Open Market Committee.) However, Fed policymakers acknowledged that the “economic outlook has strengthened in recent months,” revising their economic growth forecast higher and their unemployment forecast lower.
The U.S. and China continued to generate trade headlines and geopolitical uncertainty about sanctions on Russia surfaced, but the impact of such on the U.S. equity markets remained relatively muted during April 2018, as investors stayed rather resistant to the risk of a trade war. A number of macroeconomic drivers, including U.S. labor market strength, higher inflation and fiscal stimulus, pushed up U.S. Treasury yields, with the 10-year U.S. Treasury yield breaching 3% toward month end. With more than half of S&P 500® Index companies having reported their first quarter 2018 results, the earnings season began strongly during April 2018. U.S. equities rallied in May 2018, driven not only by strong corporate earnings but also by upside surprises in economic activity and sentiment data as well as on a new U.S. unemployment low of 3.8%. However, the U.S. equity rally was hampered by escalating geopolitical uncertainty stemming from the unexpected political outcome in Italy, the ongoing unpredictability around the U.S.-North Korea summit, and escalating trade tensions with many U.S. allies. The Fed raised interest rates again in June 2018, as widely expected, but the outcome of the Fed meeting was more hawkish than the consensus had anticipated. The Fed retained language indicating an “accommodative” monetary policy stance, but its economic growth and inflation forecasts were upgraded, and its median projection was lifted to four interest rate hikes in 2018 from the three it had indicated in March 2018. Fed Chair Powell was also slightly hawkish in his June press conference. Still-escalating trade tensions between the U.S. and China hurt market sentiment, with the U.S. threatening tariffs on $200 billion worth of Chinese goods and China vowing to retaliate. All told, then, the S&P 500® Index produced modestly positive but rather flat returns for the month of June 2018.
For the Reporting Period overall, six sectors posted positive absolute returns and five generated negative returns. Consumer discretionary, information technology and energy were the best performing sectors in the S&P 500® Index, as measured by total return, and the weakest performing sectors in the S&P 500® Index during the Reporting Period were telecommunication services, consumer staples and industrials.
Within the U.S. equity market, there was significant disparity in performance not only among sectors but also among the various capitalization and style segments. While all capitalization segments posted positive returns, small-cap stocks, as measured by the Russell 2000® Index, performed best, followed at some distance by large-cap stocks, as measured by the Russell 1000® Index, and mid-cap stocks, as measured by the Russell Midcap® Index, which performed similarly to each other. From a style perspective, growth-oriented stocks significantly outpaced value-oriented stocks across the capitalization spectrum, with value-oriented stocks overall in the large-cap and mid-cap capitalization segments posting modestly negative absolute returns. (All as measured by the FTSE Russell indices.)
Fixed Income Markets
In the first quarter of 2018, spread, or non-government bond, sectors were challenged by a surge in market volatility. Firmer than consensus expected U.S. wage and price inflation data prompted higher market volatility and equity market declines, though the magnitude of the moves was exacerbated by certain investors’ algorithmic trading. (Algorithmic trading uses complex
1
MARKET REVIEW
mathematical models and formulas to make high-speed decisions and transactions in the financial markets.) The Fed raised short-term interest rates at its March policy meeting and reiterated its plan for a total of three rate hikes during 2018. Beyond the U.S., monetary policy action was muted in the developed markets during the first calendar quarter, though policymakers in Europe and Japan sounded mildly dovish and those in Norway appeared more hawkish. Economic activity data moderated in emerging markets and developed markets countries but remained in expansionary territory and therefore was supportive of cyclical asset classes geared toward growth. The U.S. was a notable exception, experiencing continued strength in economic data.
During the second calendar quarter, spread sectors broadly weakened amid increased U.S.-China trade tensions, political events in emerging countries and Italy as well as higher U.S. interest rates and a stronger U.S. dollar. U.S. high yield corporate bonds, however, generated a small positive return. Rising oil prices were a tailwind for the broader high yield corporate bond sector, as many energy bonds are high yield rated. In June 2018, the Fed delivered the seventh interest rate hike of its current tightening cycle. The Fed’s dot plot pointed to two more rate increases in 2018, implying a total of four rate hikes in the calendar year. Elsewhere, the European Central Bank announced plans to taper its quantitative easing program beginning September 2018.
For the Reporting Period as a whole, spread sectors generally underperformed U.S. Treasury securities. The exception was high yield corporate bonds, which produced a modestly positive return overall and outpaced U.S. Treasuries. Sovereign emerging markets debt and investment grade corporate bonds were notable underperformers. The U.S. Treasury yield curve, or spectrum of maturities, remained relatively flat, as yields on shorter-term maturities rose more than those on intermediate- and longer-term maturities. (A flattening yield curve is one wherein the differential in yields between longer-term and shorter-term maturities narrows.) The yield on the bellwether 10-year U.S. Treasury rose approximately 45 basis points to end the Reporting Period at 2.85%. (A basis point is 1/100th of a percentage point.)
Looking Ahead
Equity Markets
At the end of the Reporting Period, there were increasing market concerns that the equities cycle had reached its peak, particularly in the U.S., as central banks pursue their interest rate hiking policies. However, history has shown that rising interest rates alone are a poor indicator of subsequent equity returns; the context is just as important. If interest rates increase because of stronger economic growth, as is the case in the current hiking cycle, equities can benefit despite valuation headwinds. We estimate that U.S. equities can absorb a 10-year U.S. Treasury yield of approximately 3.5% before rates become a material negative. In fact, U.S. equities saw double-digit positive returns over the subsequent 12 months for all but one hiking cycle exceeding 100 basis points since 1988.
Furthermore, in our view, the normalization of interest rates and resulting rising cost of capital reinforce a Darwinistic framework wherein strong companies thrive and the weak perish, increasing the dispersion among companies and sectors. For large-cap U.S. equities, much of the corporate earnings recovery since the 2007/2008 financial crisis has been driven by cost-cutting measures and margins growth rather than by revenue growth. With rising cost pressures, we believe pricing power may well become an increasingly important differentiator of future success. We further believe the increased dispersion between winners and losers reinforces the importance of active management.
Fixed Income Markets
At the end of the Reporting Period, the global economic growth picture reflected less synchronization than observed in 2017, with the U.S. exhibiting ongoing strength while other key developed markets, as well as emerging markets, experiencing moderating growth momentum. We see scope for global economic growth to pick up during the second half of the 2018, if business investment strengthens. However, we are watchful of the headwinds generated by protectionist trade rhetoric. Meanwhile, higher crude oil prices have lifted headline inflation in most economies, although core inflation remains subdued in both the Eurozone and Japan. U.S. inflation was close to the Fed’s 2% target at the end of the Reporting Period. Given the strength in U.S. economic activity and firming price and wage data, Fed policymakers are likely, we believe, to raise interest rates two more times in 2018 and three times during 2019. In terms of our investment views at the end of the Reporting Period, we believed the market was continuing to underprice the pace of Fed rate hikes. We had a positive view overall of short duration, high quality securitized credit. In particular, we favored AAA-rated collateralized loan obligations and government guaranteed student loan asset-backed securities. Among other spread sectors, we had a preference for U.S. investment grade corporate bonds over high yield corporate bonds at the end of the Reporting Period.
2
GOLDMAN SACHS VARIABLE INSURANCE TRUST CORE FIXED INCOME FUND
INVESTMENT OBJECTIVE
The Fund seeks a total return consisting of capital appreciation and income that exceeds the total return of the Bloomberg Barclays U.S. Aggregate Bond Index.
Portfolio Management Discussion and Analysis
Below, the Goldman Sachs Fixed Income Portfolio Management Team discusses the Goldman Sachs Variable Insurance Trust — Goldman Sachs Core Fixed Income Fund’s (the “Fund”) performance and positioning for the six-month period ended June 30, 2018 (the “Reporting Period”).
How did the Fund perform during the Reporting Period?
During the Reporting Period, the Fund’s Institutional and Service Shares generated cumulative total returns of -1.88% and -1.99%, respectively. This compares to the -1.62% cumulative total return of the Fund’s benchmark, the Bloomberg Barclays U.S. Aggregate Bond Index (the “Bloomberg Barclays Index”), during the same time period.
What key factors were responsible for the Fund’s performance during the Reporting Period?
During the Reporting Period, the Fund’s top-down country strategy detracted from relative performance, driven by a long position in Italy versus a short position in Germany. Long positions in Europe overall versus short positions in Sweden also hurt results. Within our top-down currency strategy, the Fund was hampered by long positions in the Swedish krona and Australian dollar as well as by a short position in the Japanese yen. These losses were partially offset by a short position in the euro and a long position in the Norwegian krone, which contributed positively.
Conversely, the Fund’s top-down cross-sector strategy contributed positively to relative performance. In our cross-sector strategy, we invest Fund assets across a variety of fixed income sectors, including some that may not be included in the Bloomberg Barclays Index. Our bottom-up individual issue selection also added to relative returns.
The Fund’s combined tactical duration and yield curve positioning contributed positively during the Reporting Period. (Duration is a measure of the Fund’s sensitivity to changes in interest rates. Yield curve is a spectrum of maturities.)
Which fixed income market sectors most affected Fund performance during the Reporting Period?
During the Reporting Period, the Fund benefited from its positioning within the government/swaps sector. An underweight compared to the Bloomberg Barclays Index in mortgage-backed securities as well as allocations to government agency debt bolstered performance. Elsewhere, the Fund’s allocation to asset-backed securities (“ABS”) contributed positively as did its allocation to corporate credit. These gains were partially offset by an overweight in emerging markets debt and allocations to commercial mortgage-backed securities, which detracted from performance.
As for individual issue selection, the Fund’s lower credit quality bias added to returns. Within corporate credit, relative performance was helped by our selection of various maturities along the yield curve and the Fund’s holdings of investment grade corporate bonds in the financial sector. Within the securitized sector, selection of ABS added to performance. Selection of U.S. government and agency debt within the government/swaps sector also contributed positively. Investments in Kuwaiti and United Arab Emirates external bonds further added to the Fund’s relative performance.
Did the Fund’s duration and yield curve positioning strategy help or hurt its results during the Reporting Period?
The Fund’s combined duration and yield curve positioning added to performance during the Reporting Period. Compared to the Bloomberg Barclays Index, the Fund held a short duration position because we believe the market was underestimating the pace of Fed interest rate hikes.
How did the Fund use derivatives and similar instruments during the Reporting Period?
As market conditions warranted during the Reporting Period, currency transactions were carried out using primarily over-the-counter (“OTC”) forward foreign exchange contracts. Currency transactions were used as we sought both to enhance returns and to hedge the Fund’s portfolio against currency exchange rate fluctuations. OTC forward foreign exchange contracts detracted from Fund performance during the Reporting Period. In addition, Treasury futures were employed as warranted to facilitate specific duration, yield curve and country strategies. During the Reporting Period, Treasury futures had a negative impact on the Fund’s results. Swaptions (options on interest rate swap contracts), which were used to express our interest rate views and to hedge
3
GOLDMAN SACHS VARIABLE INSURANCE TRUST CORE FIXED INCOME FUND
volatility and yield curve risks in the Fund, did not have a meaningful impact on the Fund’s performance during the Reporting Period. Interest rate swaps, which were used to manage exposure to fluctuations in interest rates, detracted from Fund performance during the Reporting Period. Additionally, the Fund employed credit default swaps to implement specific credit-related investment strategies, including management of the Fund’s exposure to credit spreads. Credit default swaps did not have a material impact on the Fund’s results during the Reporting Period. Overall, we employ derivatives and similar instruments for the efficient management of the Fund’s portfolio. Derivatives and similar instruments allow us to manage interest rate, credit and currency risks more effectively by allowing us both to hedge and to apply active investment views with greater versatility and to afford greater risk management precision than we would otherwise be able to implement.
Were there any notable changes in the Fund’s weightings during the Reporting Period?
During the Reporting Period, we shifted the Fund from a rather neutral position relative to the Bloomberg Barclays Index in sovereign emerging markets debt to an overweight position.
Were there any changes to the Fund’s portfolio management team during the Reporting Period?
There were no changes to the Fund’s portfolio management team during the Reporting Period.
How was the Fund positioned relative to the Bloomberg Barclays Index at the end of the Reporting Period?
At the end of the Reporting Period, the Fund was overweight ABS and non-agency mortgage-backed securities compared to the Bloomberg Barclays Index on a market-value weighted basis. As measured by contribution to duration, it was underweight in agency mortgage-backed securities and rather neutral in corporate credit. It was underweight emerging markets corporate bonds and overweight emerging markets sovereign bonds on a market-value weighted basis. The Fund also maintained an allocation to collateralized loan obligations, which are not represented in the Bloomberg Barclays Index, at the end of the Reporting Period.
4
FUND BASICS
Core Fixed Income Fund
as of June 30, 2018
STANDARDIZED TOTAL RETURNS1
| For the period ended 6/30/18 | One Year | Five Years | Ten Years | Since Inception | Inception Date | |||||||||||||
| Institutional | -0.93 | % | 2.38 | % | N/A | 1.63 | % | 4/30/13 | ||||||||||
| Service | -1.17 | 2.12 | 3.65 | % | 3.55 | 1/09/06 | ||||||||||||
| 1 | The Standardized Total Returns are average annual total returns as of the most recent calendar quarter-end. They assume reinvestment of all distributions at net asset value (“NAV”). Because Institutional and Service Shares do not involve a sales charge, such a charge is not applied to their Standardized Total Returns. |
Total return figures in the above chart represent past performance and do not indicate future results, which will vary. The investment return and principal value of an investment will fluctuate and, therefore, an investor’s shares, when redeemed, may be worth more or less than their original cost. Current performance may be lower or higher than the total return figures in the above chart. Please visit www.GSAMFUNDS.com to obtain the most recent month-end returns. Performance reflects fee waivers and/or expense limitations in effect during the periods shown. In their absence, performance would be reduced.
EXPENSE RATIOS2
| Net Expense Ratio (Current) | Gross Expense Ratio (Before Waivers) | |||||||
| Institutional | 0.42 | % | 0.65 | % | ||||
| Service | 0.67 | 0.90 | ||||||
| 2 | The expense ratios of the Fund, both current (net of any fee waivers and/or expense limitations) and before waivers (gross of any fee waivers and/or expense limitations) are as set forth above according to the most recent publicly available Prospectus for the Fund and may differ from the expense ratios disclosed in the Financial Highlights in this report. Pursuant to a contractual arrangement, the Fund’s fee waivers and/or expense limitations will remain in place through at least April 30, 2019, and prior to such date, the Investment Adviser may not terminate the arrangements without the approval of the Fund’s Board of Trustees. If these arrangements are discontinued in the future, the expense ratios may change without shareholder approval. |
5
FUND BASICS
FUND COMPOSITION3
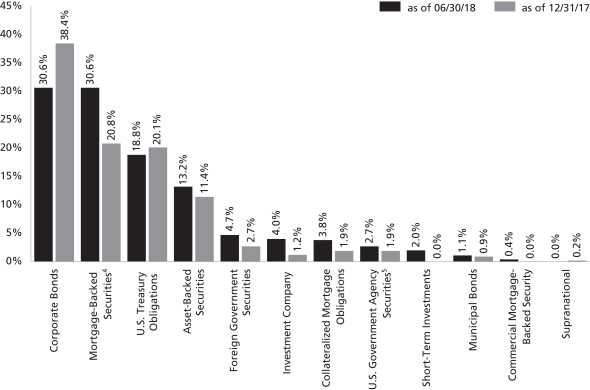
| 3 | The percentage shown for each investment category reflects the value of investments in that category as a percentage of net assets. Figures in the above graph may not sum to 100% due to the exclusion of other assets and liabilities. Short-Term Investments represent investments in commercial paper. The graph depicts the Fund’s investments but may not represent the Fund’s market exposure due to the exclusion of certain derivatives, if any, as listed in the Additional Investment Information section of the Schedule of Investments. |
| 4 | “Mortgage-Backed Securities” are guaranteed by the Government National Mortgage Association (“GNMA”), the Federal National Mortgage Association (“FNMA”) or the Federal Home Loan Mortgage Corp. (“FHLMC”). GNMA instruments are backed by the full faith and credit of the United States Government. |
| 5 | “U.S. Government Agency Securities” include agency securities offered by companies such as FNMA and the Federal Home Loan Bank (“FHLB”), which operate under a government charter. While they are required to report to a government regulator, their assets are not explicitly guaranteed by the government and they otherwise operate like any other publicly traded company. |
6
GOLDMAN SACHS VARIABLE INSURANCE TRUST EQUITY INDEX FUND
INVESTMENT OBJECTIVE
The Fund seeks to achieve investment results that correspond to the aggregate price and yield performance of a benchmark index that measures the investment returns of large capitalization stocks.
Portfolio Management Discussion and Analysis
Below, SSgA Funds Management, Inc. (“SSgA”), the Fund’s Subadvisor, discusses the Goldman Sachs Variable Insurance Trust – Goldman Sachs Equity Index Fund’s (the “Fund”) performance and positioning for the six-month period ended June 30, 2018 (the “Reporting Period”).
How did the Fund perform during the Reporting Period?
During the Reporting Period, the Fund’s Service Shares generated a cumulative total return of 2.41%. This compares to the 2.65% cumulative total return of the Fund’s benchmark, the Standard & Poor’s 500® Index (with dividends reinvested) (the “S&P 500® Index”), during the same time period.
During the Reporting Period, which sectors and which industries in the S&P 500® Index were the strongest contributors to the Fund’s performance?
Six of the 11 sectors in the S&P 500® Index recorded gains during the Reporting Period. In terms of total return, the sectors that made the strongest positive contributions to the S&P 500® Index and to the Fund were consumer discretionary, information technology and energy. The largest sector by weighting in the S&P 500® Index at the end of the Reporting Period was information technology at a weighting of 25.96%. The industries with the strongest performance in terms of total return were Internet retail, department stores, movies/entertainment, apparel/footwear and recreational products.
On the basis of impact (which takes both total returns and weightings into account), the sectors that made the strongest positive contributions to the S&P 500® Index and to the Fund were information technology, consumer discretionary and energy. The industries with the strongest performance on the basis of impact were Internet retail, packaged software, telecommunications equipment, Internet software/services and medical specialties.
Which sectors and industries in the S&P 500® Index were the weakest contributors to the Fund’s performance?
In terms of total return, during the Reporting Period, the weakest performing sectors were consumer staples, telecommunication services and industrials. The weakest performing industries in terms of total return were aluminum, automotive aftermarket, tobacco, home furnishings and homebuilding.
On the basis of impact, the weakest performing sectors were consumer staples, financials and industrials. The weakest performing industries on the basis of impact were tobacco, industrial conglomerates, major banks, household/personal care and major telecommunications.
Which individual stocks were the top performers, and which were the greatest detractors?
On the basis of impact, the stocks that made the strongest positive contribution during the Reporting Period were Amazon.com, Microsoft, Apple, Netflix and Facebook. The weakest performers were Johnson & Johnson, AT&T, Philip Morris International, Comcast and Procter & Gamble.
How did the Fund use derivatives and similar instruments during the Reporting Period?
During the Reporting Period, the Fund did not use derivatives as part of an active management strategy to add value to the Fund’s results. However, equity index futures were used to equitize the Fund’s cash holdings. In other words, we put the Fund’s cash holdings to work by using them as collateral for the purchase of equity index futures. We also used these equity index futures to provide liquidity for daily cash flow requirements. Equity index futures had a neutral impact on the Fund’s performance during the Reporting Period.
Were there any changes to the Fund’s portfolio management team during the Reporting Period?
There were no changes to the Fund’s portfolio management team during the Reporting Period.
7
GOLDMAN SACHS VARIABLE INSURANCE TRUST EQUITY INDEX FUND
What changes were made to the makeup of the S&P 500® Index during the Reporting Period?
Fifteen stocks were removed from the S&P 500® Index during the Reporting Period. They were Acuity Brands, Apergy, C.R. Bard, Chesapeake Energy, CSRA, Monsanto Company, Navient, nVent Electric, Patterson Companies, Perspecta, Range Resources, Scripps Networks Interactive, Signet Jewelers, Time Warner and Wyndham Worldwide.
There were 15 stocks added to the S&P 500® Index during the Reporting Period. They were Abiomed, Apergy, Broadridge Financial Solutions, FleetCor Technologies, HollyFrontier, Huntington Ingalls Industries, IPG Photonics, MSCI, Nektar Therapeutics, nVent Electric, Perspecta, Take-Two Interactive Software, Twitter, SVB Financial Group and Westar Energy.
The source of the data included in the above Portfolio Management Discussion and Analysis with respect to the Goldman Sachs Equity Index Fund is FactSet as of 6/30/18.
Characteristics presented are calculated using the month end market value of holdings, except for beta and standard deviation, if shown, which use month end return values. Averages reflect the market weight of securities in the portfolio. Market data, prices, and dividend estimates for characteristics calculations provided by FactSet Research Systems, Inc. All other portfolio data provided by SSgA. Characteristics are as of the date indicated, are subject to change, and should not be relied upon as current thereafter.
Past performance is not a guarantee of future results.
Index returns are unmanaged and do not reflect the deduction of any fees or expenses. Index returns reflect all items of income, gain and loss and the reinvestment of dividends and other income.
SSgA may have or may seek investment management or other business relationships with companies discussed in this material or affiliates of those companies, such as their officers, directors and pension plans.
The views expressed in this material are the views of SSgA’s Global Equity Beta Solutions Team through the period ended June 30, 2018 and are subject to change based on market and other conditions. All information has been obtained from sources believed to be reliable, but its accuracy is not guaranteed. There is no representation or warranty as to the current accuracy, reliability or completeness of, nor liability for, decisions based on such information and it should not be relied on as such. This document contains certain statements that may be deemed forward-looking statements. Please note that any such statements are not guarantees of any future performance and actual results or developments may differ materially from those projected.
8
FUND BASICS
Equity Index Fund
as of June 30, 2018
STANDARDIZED TOTAL RETURNS1
| For the period ended 6/30/18 | One Year | Five Years | Ten Years | Since Inception | Inception Date | |||||||||||||
| Service | 13.84 | % | 12.92 | % | 9.76 | % | 8.08 | % | 1/09/06 | |||||||||
| 1 | The Standardized Total Returns are average annual total returns as of the most recent calendar quarter-end. They assume reinvestment of all distributions at net asset value (“NAV”). Because Service Shares do not involve a sales charge, such a charge is not applied to their Standardized Total Returns. |
Total return figures in the above chart represent past performance and do not indicate future results, which will vary. The investment return and principal value of an investment will fluctuate and, therefore, an investor’s shares, when redeemed, may be worth more or less than their original cost. Current performance may be lower or higher than the total return figures in the above chart. Please visit www.GSAMFUNDS.com to obtain the most recent month-end returns. Performance reflects fee waivers and/or expense limitations in effect during the periods shown. In their absence, performance would be reduced.
EXPENSE RATIOS2
| Net Expense Ratio (Current) | Gross Expense Ratio (Before Waivers) | |||||||
| Service | 0.48 | % | 0.71 | % | ||||
| 2 | The expense ratios of the Fund, both current (net of any fee waivers and/or expense limitations) and before waivers (gross of any fee waivers and/or expense limitations) are as set forth above according to the most recent publicly available Prospectus for the Fund and may differ from the expense ratios disclosed in the Financial Highlights in this report. Pursuant to a contractual arrangement, the Fund’s fee waivers and/or expense limitations will remain in place through at least April 30, 2019, and prior to such date, the Investment Adviser may not terminate the arrangements without the approval of the Fund’s Board of Trustees. If these arrangements are discontinued in the future, the expense ratios may change without shareholder approval. |
TOP TEN HOLDINGS AS OF 6/30/183
| Holding | % of Net Assets | Line of Business | ||||
Apple, Inc. | 3.9% | Technology Hardware & Equipment | ||||
Microsoft Corp. | 3.3 | Software & Services | ||||
Amazon.com, Inc. | 3.0 | Retailing | ||||
Facebook, Inc. Class A | 2.0 | Software & Services | ||||
Berkshire Hathaway, Inc. Class B | 1.5 | Diversified Financials | ||||
JPMorgan Chase & Co. | 1.5 | Banks | ||||
Exxon Mobil Corp. | 1.5 | Energy | ||||
Alphabet, Inc. Class C | 1.5 | Software & Services | ||||
Alphabet, Inc. Class A | 1.4 | Software & Services | ||||
Johnson & Johnson | 1.4 | Pharmaceuticals, Biotechnology & Life Sciences | ||||
3 The top 10 holdings may not be representative of the Fund’s future investments.
9
FUND BASICS
FUND VS. BENCHMARK SECTOR ALLOCATIONS4
As of June 30, 2018
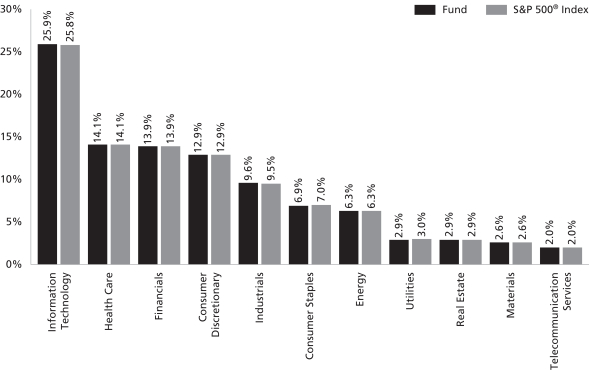
| 4 | The graph categorizes investments using Global Industry Classification Standard (“GICS”); however, the sector classifications used by the portfolio management team may differ from GICS. The percentage shown for each investment category reflects the value of investments in that category as a percentage of market value (excluding short-term investments and investments in the securities lending reinvestment vehicle, if any). Investments in the securities lending reinvestment vehicle represented 0.1% of the Fund’s net assets at June 30, 2018. The graph depicts the Fund’s investments but may not represent the Fund’s market exposure due to the exclusion of certain derivatives, if any, as listed in the Additional Investment Information section of the Schedule of Investments. |
10
GOLDMAN SACHS VARIABLE INSURANCE TRUST GROWTH OPPORTUNITIES FUND
INVESTMENT OBJECTIVE
The Fund seeks long-term growth of capital.
Portfolio Management Discussion and Analysis
Below, the Goldman Sachs Growth Investment Team discusses the Goldman Sachs Variable Insurance Trust — Goldman Sachs Growth Opportunities Fund’s (the “Fund”) performance and positioning for the six-month period ended June 30, 2018 (the “Reporting Period”).
How did the Fund perform during the Reporting Period?
During the Reporting Period, the Fund’s Institutional and Service Shares generated cumulative total returns of 3.98% and 3.90%, respectively. These returns compare to the 5.40% cumulative total return of the Fund’s benchmark, the Russell Midcap® Growth Index (with dividends reinvested) (the “Russell Index”), during the same time period.
What key factors were responsible for the Fund’s performance during the Reporting Period?
The Fund underperformed the Russell Index during the Reporting Period largely because of stock selection.
Which equity market sectors helped and hurt Fund performance?
Our bottom-up approach focuses on security selection, and as a result, we do not make active sector-level investment decisions. That said, on a sector level, stock selection in the consumer discretionary, industrials and energy sectors detracted from the Fund’s relative returns. Stock selection in the information technology and financials sectors added to relative performance. An underweight position relative to the Russell Index in the materials sector also contributed positively.
Which individual stocks detracted from the Fund’s performance during the Reporting Period?
Middleby, Valvoline and John Bean Technologies detracted most from the Fund’s relative returns during the Reporting Period.
The Fund’s top detractor was Middleby, which designs, manufactures and distributes kitchen equipment around the world. Its stock price declined sharply in May 2018 following a disappointing earnings release. The company reported continued organic growth weakness and higher than market expected operating expenses related to recent acquisitions. In the wake of this announcement, our confidence in Middleby’s ability to execute eroded, and we decided to exit the Fund’s position in the stock.
Valvoline, a supplier of premium branded lubricants and automotive services, was another leading detractor from Fund performance during the Reporting Period. In early February 2018, the company announced mixed quarterly results. Comparable store sales were strong, with positive store traffic and good sales growth, but higher commodity prices and performance in the company’s core North American and international segments weighed on its earnings. In June 2018, Valvoline again reported mixed results, which included ongoing margin pressures. Although we think the company continues to have a number of attractive characteristics, we believe there are other consumer-oriented companies that have a better risk/reward profile and so we eliminated the Fund’s position in Valvoline.
The Fund was also hurt during the Reporting Period by an investment in John Bean Technologies, a technology solutions provider in the food, beverage and air transportation industries. In early May 2018, its stock sold off after the company missed earnings estimates due to margin pressures and operational challenges related to a new product release. In our view, these are transitory issues. At the end of the Reporting Period, we remained positive on John Bean Technologies because it is well positioned, in our view, to benefit from secular growth trends over the near term. We also believed the company has long-term margin expansion opportunities.
Which individual stocks added to the Fund’s relative performance during the Reporting Period?
During the Reporting Period, the Fund benefited most relative to the Russell Index from its positions in Intuit, GoDaddy and Five Below.
Intuit, a financial, accounting and tax preparation software maker, was the Fund’s largest positive contributor during the Reporting Period. At the end of April 2018, following the 2017 tax filing season, the company pre-announced positive numbers that included continued market share gains. It also raised its full-year consumer tax guidance. Its stock price climbed higher in May 2018 on stronger than market expected earnings and revenues, as well as on raised earning guidance. The company’s management attributed the positive results to a market shift toward digital offerings, highlighted by Turbo Tax Live, additional services growth and strong pricing. In our view, Turbo Tax Live has the potential to unlock the underpenetrated tax professional market. We also believe Intuit
11
GOLDMAN SACHS VARIABLE INSURANCE TRUST GROWTH OPPORTUNITIES FUND
can continue to gain market share in the do-it-yourself tax space and consider its deep product line and growing customer base indicators of further potential growth. Intuit is a high quality franchise, in our opinion, with a healthy system of offerings that may benefit from the improving environment for small businesses.
GoDaddy also added to the Fund’s performance during the Reporting Period. In February 2018, the Internet domain registrar and web hosting company reported strong quarterly earnings and provided impressive guidance for the first quarter and full calendar year 2018. Its revenue grew organically ahead of market estimates, with margin expansion and free cash flow guidance increasing slightly. At the end of the Reporting Period, we had a positive outlook on GoDaddy and believed the domain registration business has matured well. In our view, the company’s revenue growth is sustainable in the near term, and we anticipated continued margin expansion and good growth in earnings before interest, taxes, depreciation and amortization. We also believed merger and acquisition activity could potentially augment the company’s future growth. Overall, at the end of the Reporting Period, we considered GoDaddy’s growth profile attractive given the stock’s valuation and the company’s consistency in execution.
Discount retailer Five Below was another notable contributor during the Reporting Period. The majority of its stock’s outperformance came in early June 2018 when the company reported better than market expected earnings, causing its share price to spike. In spite of weather-related headwinds, Five Below generated strong comparable same store sales, leading to better than market anticipated revenue and earnings per share. At the end of the Reporting Period, we believed the company was well positioned in its industry and offered a compelling growth story, which we think supports our positive outlook on its stock’s trajectory in the near term.
Did the Fund make any significant purchases or sales during the Reporting Period?
Among the positions initiated by the Fund during the Reporting Period was an investment in Fidelity National Information Services. The financial services technology company focuses on retail and institutional banking, payments, asset and wealth management, risk and compliance, consulting and outsourcing solutions. We have a positive view on the company’s strong earnings and cash flow growth potential. Furthermore, Fidelity National Information Services seems likely, in our opinion, to benefit from U.S. tax reform as it is focused on returning capital to shareholders through stock buybacks. During the Reporting Period, a pull-back in the stock presented us with what we viewed as a favorable risk/reward opportunity to add the position to the Fund.
The Fund also established a position in Teleflex, which provides medical technology products that enable health care providers to improve patient outcomes and enhance patient and provider safety. We are positive about the company given that medical purchasing trends overall have continued to shift toward improving patient outcomes and reducing hospital stays. In our view, Teleflex’s deep product pipeline positions it well for growth, as it continues to invest in key diseases and markets. We consider Teleflex a high quality growth company with strong cash flows and the opportunity to expand margins as it works to benefit from these secular growth themes.
Conversely, in addition to the sale of Middleby, already mentioned, the Fund exited its position in Lam Research, a supplier of wafer fabrication equipment and services to the semiconductor industry. Its stock has experienced several years of outperformance, driven by a strong equipment upgrade cycle. However, we believe that, with the slowing of Moore’s Law, companies may use their existing semiconductor equipment longer. (Moore’s Law is the observation that the number of transistors in a dense integrated circuit doubles about every two years.) In our view, this secular shift creates a less favorable outlook for Lam Research and its peers, leading us to sell the Fund’s position and seek opportunities elsewhere.
Were there any notable changes in the Fund’s weightings during the Reporting Period?
Changes to the Fund’s sector weightings relative to the Russell Index are due to our stock selection. As a result of these decisions during the Reporting Period, the Fund shifted from an underweight position in the consumer discretionary sector to a rather neutral position versus the Russell Index. It moved from a neutral position in the materials sector to an underweight position.
How did the Fund use derivatives and similar instruments during the Reporting Period?
The Fund did not use derivatives or similar instruments within its investment process during the Reporting Period.
Were there any changes to the Fund’s portfolio management team during the Reporting Period?
Effective January 9, 2018, Goldman Sachs Asset Management, L.P. (the “Investment Adviser”) centralized its Fundamental Equity U.S. Growth and Fundamental Equity U.S. Value Teams into a single Fundamental Equity U.S. Equity Team. The Investment Adviser believes these changes will benefit the Fund by providing a more holistic investment perspective and the ability to leverage investment ideas across the U.S. Fundamental Equity platform. No changes were made to the Fund’s portfolio management team in connection with this new structure. The portfolio managers of the Fund are Steven M. Barry and Ashley R. Woodruff.
12
GOLDMAN SACHS VARIABLE INSURANCE TRUST GROWTH OPPORTUNITIES FUND
How was the Fund positioned relative to the Russell Index at the end of the Reporting Period?
As mentioned, the Fund’s sector positioning relative to the Russell Index is the result of our stock selection, as we take a pure bottom-up, research-intensive approach to investing. From that perspective, then, at the end of the Reporting Period, the Fund’s portfolio was broadly diversified with overweight positions compared to the Russell Index in the health care and financials sectors. The Fund had smaller weightings than the Russell Index in the industrials, materials, information technology and real estate sectors at the end of the Reporting Period. It was relatively neutral compared to the Russell Index at the end of the Reporting Period in the energy, consumer staples, telecommunication services and consumer discretionary sectors.
13
FUND BASICS
Growth Opportunities Fund
as of June 30, 2018
STANDARDIZED TOTAL RETURNS1
| For the period ended 6/30/18 | One Year | Five Years | Ten Years | Since Inception | Inception Date | |||||||||||||
| Institutional | 15.07 | % | 11.12 | % | N/A | 10.79 | % | 4/30/13 | ||||||||||
| Service | 14.95 | 10.93 | 9.60 | % | 8.98 | 1/09/06 | ||||||||||||
| 1 | The Standardized Total Returns are average annual total returns as of the most recent calendar quarter-end. They assume reinvestment of all distributions at net asset value (“NAV”). Because Institutional and Service Shares do not involve a sales charge, such a charge is not applied to their Standardized Total Returns. |
Total return figures in the above chart represent past performance and do not indicate future results, which will vary. The investment return and principal value of an investment will fluctuate and, therefore, an investor’s shares, when redeemed, may be worth more or less than their original cost. Current performance may be lower or higher than the total return figures in the above chart. Please visit www.GSAMFUNDS.com to obtain the most recent month-end returns. Performance reflects fee waivers and/or expense limitations in effect during the periods shown. In their absence, performance would be reduced.
EXPENSE RATIOS2
| Net Expense Ratio (Current) | Gross Expense Ratio (Before Waivers) | |||||||
| Institutional | 0.85 | % | 1.01 | % | ||||
| Service | 1.01 | 1.26 | ||||||
| 2 | The expense ratios of the Fund, both current (net of any fee waivers and/or expense limitations) and before waivers (gross of any fee waivers and/or expense limitations) are as set forth above according to the most recent publicly available Prospectus for the Fund and may differ from the expense ratios disclosed in the Financial Highlights in this report. Pursuant to a contractual arrangement, the Fund’s fee waivers and/or expense limitations will remain in place through at least April 30, 2019, and prior to such date, the Investment Adviser may not terminate the arrangements without the approval of the Fund’s Board of Trustees. If these arrangements are discontinued in the future, the expense ratios may change without shareholder approval. |
TOP TEN HOLDINGS AS OF 6/30/183
| Holding | % of Net Assets | Line of Business | ||||
Dunkin’ Brands Group, Inc. | 2.8% | Consumer Services | ||||
Amphenol Corp. Class A | 2.7 | Technology Hardware & Equipment | ||||
Black Knight, Inc. | 2.7 | Software & Services | ||||
Global Payments, Inc. | 2.6 | Software & Services | ||||
Illumina, Inc. | 2.5 | Pharmaceuticals, Biotechnology & Life Sciences | ||||
First Republic Bank | 2.4 | Banks | ||||
Fiserv, Inc. | 2.4 | Software & Services | ||||
Intuit, Inc. | 2.2 | Software & Services | ||||
Bright Horizons Family Solutions, Inc. | 2.1 | Consumer Services | ||||
Fidelity National Information Services, Inc. | 2.1 | Software & Services | ||||
| 3 | The top 10 holdings may not be representative of the Fund’s future investments. |
14
FUND BASICS
FUND vs. BENCHMARK SECTOR ALLOCATIONS4
As of June 30, 2018
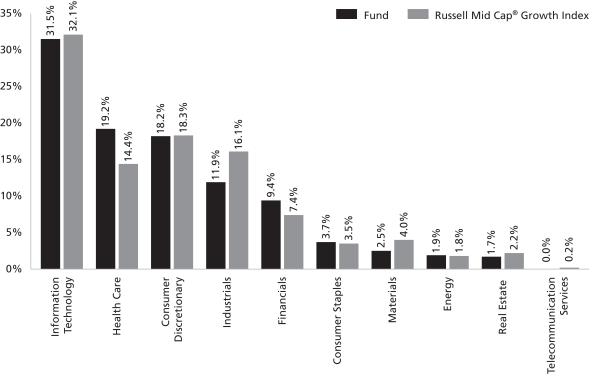
| 4 | The Fund is actively managed and, as such, its composition may differ over time. Consequently, the Fund’s overall sector allocations may differ from percentages contained in the graph above. The graph categorizes investments using Global Industry Classification Standard (“GICS”); however, the sector classifications used by the portfolio management team may differ from GICS. The percentage shown for each investment category reflects the value of investments in that category as a percentage of market value. Underlying sector allocations of exchange traded funds and investment companies held by the Fund are not reflected in the graph above. |
15
GOLDMAN SACHS VARIABLE INSURANCE TRUST HIGH QUALITY FLOATING RATE FUND
INVESTMENT OBJECTIVE
The Fund seeks to provide a high level of current income, consistent with low volatility of principal.
Portfolio Management Discussion and Analysis
Below, the Goldman Sachs Fixed Income Portfolio Management Team discusses the Goldman Sachs High Quality Floating Rate Fund’s (the “Fund”) performance and positioning for the six-month period ended June 30, 2018 (the “Reporting Period”).
How did the Fund perform during the Reporting Period?
During the Reporting Period, the Fund’s Institutional, Service and Advisor Shares generated cumulative total returns of 0.95%, 0.83% and 0.78%, respectively. These returns compare to the 0.81% cumulative total return of the Fund’s benchmark, the ICE® Bank of America Merrill Lynch Three-Month U.S. Treasury Bill Index (the “ICE® BofAML® Index”), during the Reporting Period.
We note that the Fund’s benchmark being the ICE® BofAML® Index is a means of emphasizing that the Fund has an unconstrained strategy. That said, this Fund employs a benchmark agnostic strategy and thus comparisons to a benchmark index are not particularly relevant.
What key factors had the greatest impact on the Fund’s performance during the Reporting Period?
During the Reporting Period, our individual issue selection added most to the Fund’s relative returns. Our top-down cross-sector strategy also contributed positively. In our cross-sector strategy, we invest Fund assets based on a discipline of valuing each fixed income sector in the context of all investment opportunities within the Fund’s universe.
Conversely, the Fund’s combined tactical duration and yield curve positioning detracted from results. Duration is a measure of the Fund’s sensitivity to changes in interest rates. Yield curve indicates a spectrum of maturities.
Which fixed income market sectors helped or hurt Fund performance during the Reporting Period?
Individual issue selection bolstered the Fund’s relative performance during the Reporting Period. In particular, the Fund benefited from selection within the securitized sector, led by investments in asset backed securities (“ABS”) and collateralized mortgage obligations. Within the government/swaps sector, individual issue selection of U.S. government securities further added to relative returns.
Our cross-sector strategy also contributed positively to relative performance. The Fund was helped by its overweight compared to the ICE® BofAML® Index in ABS and agency mortgage-backed securities. Federal Reserve (“Fed”) interest rate hikes led floating rate ABS, which represent the bulk of the Fund’s ABS holdings, to outperform fixed rate ABS during the Reporting Period. Furthermore, ABS generally benefited from a drop in supply. ABS new issuance was $64.5 billion during the second calendar quarter, a 5.5% decline relative to the second quarter of 2017 and a 4% decline compared to the first quarter of 2018. Regarding agency mortgage-backed securities, they outperformed duration-equivalent U.S. Treasury securities during the second calendar quarter. In April 2018, agency mortgage-backed securities spreads (yield differentials versus U.S. Treasuries of comparable duration) tightened, as concerns around U.S. trade policy subsided. They subsequently widened as investor risk aversion increased, driven by political uncertainty in Italy and renewed concerns about protectionist U.S. trade policies.
Did the Fund’s duration and yield curve positioning strategy help or hurt its results during the Reporting Period?
The Fund’s combined tactical duration and yield curve positioning detracted from performance during the Reporting Period. The Fund was hurt, primarily in the second quarter of 2018, by its positioning in the three-month through seven-year segments of the U.S. Treasury yield curve. In our view, the market was underpricing the pace of Fed monetary policy tightening. The Fed delivered the seventh interest rate hike of its current tightening cycle in June 2018, and its median projection points to two additional rate increases by the end of the calendar year, which is in line with our expectations.
Were there any notable changes in the Fund’s weightings during the Reporting Period?
During the Reporting Period, we increased the Fund’s exposure to ABS. Within ABS, we generally favored high quality floating rate securitized credit, especially senior collateralized loan obligations and Federal Family Education Loan Program student loan ABS. In addition, we reduced the Fund’s exposure to agency mortgage-backed securities during the Reporting Period. The Fed’s reduced purchases of agency mortgage-backed securities, which are the result of its balance sheet normalization process, has been a
16
GOLDMAN SACHS VARIABLE INSURANCE TRUST HIGH QUALITY FLOATING RATE FUND
headwind for the sector. (Balance sheet normalization refers to the steps the Fed is taking to reverse quantitative easing and remove the substantial monetary accommodation it has provided to the economy since the financial crisis began in 2007.) In June 2018, the monthly supply of agency mortgage-backed securities in the fixed income market increased by $12 billion, and many observers expect the monthly supply to climb to $20 billion by the end of 2018.
How did the Fund use derivatives and similar instruments during the Reporting Period?
As market conditions warranted, the Fund used Treasury futures to manage the duration and term structure of the Fund. (Term structure, most often depicted as a yield curve, refers to the term structure of interest rates, which is the relationship between the yield to maturity and the time to maturity for pure discount bonds.) The use of Treasury futures had a positive impact on Fund performance during the Reporting Period. In addition, the Fund employed interest rate swaps to manage interest rate risk and to express our views on the direction of interest rates. During the Reporting Period, the use of interest rate swaps did not have a material impact on the Fund’s performance.
Were there any changes to the Fund’s portfolio management team during the Reporting Period?
There were no changes to the Fund’s portfolio management team during the Reporting Period.
How was the Fund positioned relative to the ICE® BofAML® Index at the end of the Reporting Period?
At the end of the Reporting Period, the Fund had little exposure to U.S. government securities, which represent 100% of the ICE® BofAML® Index. The Fund had positions in ABS, agency collateralized mortgage obligations, residential mortgage-backed securities and agency mortgage-backed securities, none of which are represented in the ICE® BofAML® Index.
17
FUND BASICS
High Quality Floating Rate Fund
as of June 30, 2018
STANDARDIZED TOTAL RETURNS1
| For the period ended 6/30/18 | One Year | Five Years | Ten Years | Since Inception | Inception Date | |||||||||||||
| Institutional | 1.77 | % | 0.90 | % | N/A | 0.85 | % | 4/30/13 | ||||||||||
| Service | 1.52 | 0.65 | 2.65 | % | 3.04 | 1/09/06 | ||||||||||||
| Advisor | 1.39 | N/A | N/A | 0.63 | 10/15/14 | |||||||||||||
| 1 | The Standardized Total Returns are average annual total returns as of the most recent calendar quarter-end. They assume reinvestment of all distributions at net asset value (“NAV”). Because Institutional, Service and Advisor Shares do not involve a sales charge, such a charge is not applied to their Standardized Total Returns. |
Total return figures in the above chart represent past performance and do not indicate future results, which will vary. The investment return and principal value of an investment will fluctuate and, therefore, an investor’s shares, when redeemed, may be worth more or less than their original cost. Current performance may be lower or higher than the total return figures in the above chart. Please visit www.GSAMFUNDS.com to obtain the most recent month-end returns. Performance reflects fee waivers and/or expense limitations in effect during the periods shown. In their absence, performance would be reduced.
EXPENSE RATIOS2
| Net Expense Ratio (Current) | Gross Expense Ratio (Before Waivers) | |||||||
| Institutional | 0.36 | % | 0.63 | % | ||||
| Service | 0.61 | 0.88 | ||||||
| Advisor | 0.76 | 1.03 | ||||||
| 2 | The expense ratios of the Fund, both current (net of any fee waivers and/or expense limitations) and before waivers (gross of any fee waivers and/or expense limitations) are as set forth above according to the most recent publicly available Prospectus for the Fund and may differ from the expense ratios disclosed in the Financial Highlights in this report. Pursuant to a contractual arrangement, the Fund’s fee waivers and/or expense limitations will remain in place through at least April 30, 2019, and prior to such date, the Investment Adviser may not terminate the arrangements without the approval of the Fund’s Board of Trustees. If these arrangements are discontinued in the future, the expense ratios may change without shareholder approval. |
18
FUND BASICS
FUND COMPOSITION3
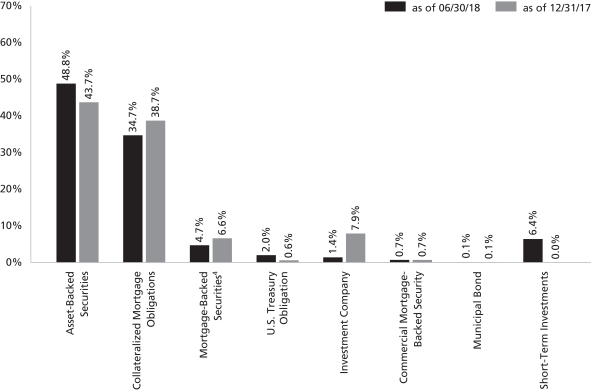
| 3 | The percentage shown for each investment category reflects the value of investments in that category as a percentage of net assets. Figures in the above graph may not sum to 100% due to the exclusion of other assets and liabilities. Short-Term Investments represent investments in commercial paper. Underlying sector allocations of investment companies held by the Fund are not reflected in the graph above. The graph depicts the Fund’s investments but may not represent the Fund’s market exposure due to the exclusion of certain derivatives, if any, as listed in the Additional Investment Information section of the Schedule of Investments. |
| 4 | Mortgage-backed securities guaranteed by the Government National Mortgage Association (“GNMA”), the Federal National Mortgage Association (“FNMA”) or the Federal Home Loan Mortgage Corp. (“FHLMC”). GNMA instruments are backed by the full faith and credit of the United States Government. |
19
GOLDMAN SACHS VARIABLE INSURANCE TRUST FUNDS
Index Definitions
Russell Midcap® Index measures the performance of the mid-cap segment of the U.S. equity universe. The Russell Midcap® Index is a subset of the Russell 1000® Index. The Russell Midcap® Index includes approximately 800 of the smallest securities based on a combination of their market cap and current index membership. The Russell Midcap® Index represents approximately 31% of the total market capitalization of the Russell 1000® Index companies. The Russell Midcap® Index is constructed to provide a comprehensive and unbiased barometer for the mid-cap segment. The Russell Midcap® Index is completely reconstituted annually to ensure larger stocks do not distort the performance and characteristics of the true mid-cap opportunity set.
Russell 1000® Index measures the performance of the large-cap segment of the U.S. equity universe. The Russell 1000® Index is a subset of the Russell 3000® Index and includes approximately 1000 of the largest securities based on a combination of their market cap and current index membership. The Russell 1000® Index represents approximately 92% of the U.S. market. The Russell 1000® Index is constructed to provide a comprehensive and unbiased barometer for the large-cap segment and is completely reconstituted annually to ensure new and growing equities are reflected.
Russell 2000® Index measures the performance of the small-cap segment of the U.S. equity universe. The Russell 2000® Index is a subset of the Russell 3000® Index representing approximately 10% of the total market capitalization of that index. The Russell 2000® Index includes approximately 2000 of the smallest securities based on a combination of their market cap and current index membership. The Russell 2000® Index is constructed to provide a comprehensive and unbiased small-cap barometer and is completely reconstituted annually to ensure larger stocks do not distort the performance and characteristics of the true small-cap opportunity set.
S&P 500® Index is Standard & Poor’s index of 500 U.S. stocks, an unmanaged index of common stock prices, captures approximately 80% coverage of available U.S. market capitalization.
It is not possible to invest directly in an unmanaged index.
20
GOLDMAN SACHS VARIABLE INSURANCE TRUST CORE FIXED INCOME FUND
Schedule of Investments
June 30, 2018 (Unaudited)
| Principal Amount | Interest Rate | Maturity Date | Value | |||||||||
| Corporate Bonds – 30.6% | ||||||||||||
Automobiles & Components – 0.8% | ||||||||||||
Ford Motor Credit Co. LLC | ||||||||||||
| $ | 275,000 | 5.875% | 08/02/2021 | $ | 291,533 | |||||||
|
| |||||||||||
Banks – 7.6% | ||||||||||||
American Express Co.(a) | ||||||||||||
| 25,000 | 3.625 | 12/05/2024 | 24,623 | |||||||||
AXA Equitable Holdings, Inc.(a)(b) | ||||||||||||
| 25,000 | 3.900 | 04/20/2023 | 24,803 | |||||||||
Bank of America Corp. | ||||||||||||
| 75,000 | 4.125 | 01/22/2024 | 76,235 | |||||||||
| 49,000 | 4.000 | 04/01/2024 | 49,429 | |||||||||
| 45,000 | 3.248(a) | 10/21/2027 | 41,939 | |||||||||
| 75,000 | (3 Mo. LIBOR + 1.58%), 3.824(a)(c) | 01/20/2028 | 73,159 | |||||||||
| 85,000 | (3 Mo. LIBOR + 1.04%), 3.419(a)(c) | 12/20/2028 | 80,042 | |||||||||
Bank of America Corp. Series L(a) | ||||||||||||
| 25,000 | 4.183 | 11/25/2027 | 24,347 | |||||||||
Bank of New York Mellon Corp. (The)(a) | ||||||||||||
| 25,000 | 3.300 | 08/23/2029 | 23,241 | |||||||||
Citigroup, Inc. | ||||||||||||
| 70,000 | 3.400 | 05/01/2026 | 66,332 | |||||||||
| 25,000 | 4.125 | 07/25/2028 | 23,935 | |||||||||
Deutsche Bank AG | ||||||||||||
| 15,000 | 2.500 | 02/13/2019 | 14,896 | |||||||||
| 190,000 | 2.700 | 07/13/2020 | 184,784 | |||||||||
Discover Financial Services(a) | ||||||||||||
| 75,000 | 3.750 | 03/04/2025 | 71,614 | |||||||||
Huntington Bancshares, Inc.(a) | ||||||||||||
| 50,000 | 4.000 | 05/15/2025 | 50,147 | |||||||||
ING Bank NV(a)(c) | ||||||||||||
| 325,000 | (5 Yr. Swap Rate + 2.70%), 4.125 | 11/21/2023 | 325,780 | |||||||||
JPMorgan Chase & Co. | ||||||||||||
| 155,000 | 4.400 | 07/22/2020 | 158,773 | |||||||||
| 95,000 | 2.700(a) | 05/18/2023 | 91,200 | |||||||||
| 15,000 | 3.625(a) | 12/01/2027 | 14,103 | |||||||||
| 75,000 | (3 Mo. LIBOR + 1.34%), 3.782(a)(c) | 02/01/2028 | 73,174 | |||||||||
| 45,000 | (3 Mo. LIBOR + 0.95%), 3.509(a)(c) | 01/23/2029 | 42,635 | |||||||||
JPMorgan Chase & Co. Series Z(a)(c) | ||||||||||||
| 85,000 | (3 Mo. LIBOR + 3.80%), 5.300 | 12/31/2049 | 86,573 | |||||||||
Lloyds Bank plc | ||||||||||||
| 175,000 | 2.300 | 11/27/2018 | 174,786 | |||||||||
Mizuho Financial Group, Inc. | ||||||||||||
| 250,000 | 2.601 | 09/11/2022 | 239,603 | |||||||||
Morgan Stanley | ||||||||||||
| 50,000 | (3 Mo. LIBOR + 1.40%), 3.759(a)(c) | 10/24/2023 | 51,144 | |||||||||
| 50,000 | (3 Mo. LIBOR + 0.85%), 3.737(a)(c) | 04/24/2024 | 49,700 | |||||||||
| 225,000 | 3.700 | 10/23/2024 | 222,130 | |||||||||
| 25,000 | 3.625 | 01/20/2027 | 24,006 | |||||||||
|
| |||||||||||
| Corporate Bonds – (continued) | ||||||||||||
Banks – (continued) | ||||||||||||
Morgan Stanley Series F | ||||||||||||
| $ | 35,000 | 3.875% | 04/29/2024 | $ | 35,062 | |||||||
Royal Bank of Canada | ||||||||||||
| 50,000 | (3 Mo. LIBOR + 0.39%), 2.749(c) | 04/30/2021 | 49,983 | |||||||||
| 50,000 | 3.200 | 04/30/2021 | 49,978 | |||||||||
Synchrony Financial(a) | ||||||||||||
| 112,000 | 4.500 | 07/23/2025 | 109,996 | |||||||||
Wells Fargo & Co. | ||||||||||||
| 175,000 | 3.000 | 10/23/2026 | 161,584 | |||||||||
Westpac Banking Corp.(a)(c) | ||||||||||||
| 25,000 | (5 Yr. Swap Rate + 2.24%), 4.322 | 11/23/2031 | 24,088 | |||||||||
|
| |||||||||||
| 2,813,824 | ||||||||||||
|
| |||||||||||
Capital Goods – 0.9% | ||||||||||||
General Dynamics Corp. | ||||||||||||
| 50,000 | (3 Mo. LIBOR + 0.38%), 2.736(c) | 05/11/2021 | 50,174 | |||||||||
| 50,000 | 3.000 | 05/11/2021 | 49,839 | |||||||||
| 25,000 | 3.375(a) | 05/15/2023 | 25,051 | |||||||||
Hubbell, Inc.(a) | ||||||||||||
| 45,000 | 3.500 | 02/15/2028 | 43,072 | |||||||||
Northrop Grumman Corp.(a) | ||||||||||||
| 75,000 | 2.930 | 01/15/2025 | 71,202 | |||||||||
| 75,000 | 3.250 | 01/15/2028 | 70,460 | |||||||||
Oshkosh Corp.(a) | ||||||||||||
| 25,000 | 4.600 | 05/15/2028 | 24,938 | |||||||||
|
| |||||||||||
| 334,736 | ||||||||||||
|
| |||||||||||
Consumer Services(a) – 0.2% | ||||||||||||
Marriott International, Inc. | ||||||||||||
| 85,000 | 2.300 | 01/15/2022 | 81,523 | |||||||||
|
| |||||||||||
Diversified Financials – 0.0% | ||||||||||||
Jefferies Group LLC | ||||||||||||
| 10,000 | 4.150 | 01/23/2030 | 8,824 | |||||||||
|
| |||||||||||
Electric – 2.3% | ||||||||||||
Alliant Energy Finance LLC(a)(b) | ||||||||||||
| 25,000 | 3.750 | 06/15/2023 | 24,995 | |||||||||
Arizona Public Service Co.(a) | ||||||||||||
| 45,000 | 2.950 | 09/15/2027 | 42,316 | |||||||||
Berkshire Hathaway Energy Co.(a) | ||||||||||||
| 25,000 | 3.250 | 04/15/2028 | 23,776 | |||||||||
Duke Energy Carolinas LLC(a) | ||||||||||||
| 25,000 | 3.950 | 03/15/2048 | 24,263 | |||||||||
Emera US Finance LP(a) | ||||||||||||
| 45,000 | 2.700 | 06/15/2021 | 43,799 | |||||||||
Entergy Corp.(a) | ||||||||||||
| 45,000 | 2.950 | 09/01/2026 | 41,058 | |||||||||
Exelon Corp.(a) | ||||||||||||
| 45,000 | 3.497 | 06/01/2022 | 44,479 | |||||||||
Florida Power & Light Co.(a) | ||||||||||||
| 68,000 | 4.125 | 02/01/2042 | 68,689 | |||||||||
| 25,000 | 3.950 | 03/01/2048 | 24,528 | |||||||||
|
| |||||||||||
| The accompanying notes are an integral part of these financial statements. | 21 |
GOLDMAN SACHS VARIABLE INSURANCE TRUST CORE FIXED INCOME FUND
Schedule of Investments (continued)
June 30, 2018 (Unaudited)
| Principal Amount | Interest Rate | Maturity Date | Value | |||||||||
| Corporate Bonds – (continued) | ||||||||||||
Electric – (continued) | ||||||||||||
NiSource, Inc.(a) | ||||||||||||
| $ | 50,000 | 3.650%(b) | 06/15/2023 | $ | 49,949 | |||||||
| 95,000 | 3.490 | 05/15/2027 | 90,840 | |||||||||
Pacific Gas & Electric Co.(a) | ||||||||||||
| 35,000 | 3.500 | 06/15/2025 | 32,652 | |||||||||
Progress Energy, Inc. | ||||||||||||
| 120,000 | 7.000 | 10/30/2031 | 153,098 | |||||||||
Sempra Energy(a)(c) | ||||||||||||
| 70,000 | (3 Mo. LIBOR + 0.50%), 2.848 | 01/15/2021 | 70,035 | |||||||||
Southern California Edison Co.(a) | ||||||||||||
| 60,000 | 4.050 | 03/15/2042 | 56,314 | |||||||||
Southern Co. (The)(a) | ||||||||||||
| 60,000 | 3.250 | 07/01/2026 | 56,320 | |||||||||
|
| |||||||||||
| 847,111 | ||||||||||||
|
| |||||||||||
Energy – 3.3% | ||||||||||||
Anadarko Petroleum Corp. | ||||||||||||
| 10,000 | 3.450(a) | 07/15/2024 | 9,609 | |||||||||
| 15,000 | 5.550(a) | 03/15/2026 | 16,075 | |||||||||
| 15,000 | 6.450 | 09/15/2036 | 17,335 | |||||||||
BP Capital Markets plc(a) | ||||||||||||
| 75,000 | 3.224 | 04/14/2024 | 73,589 | |||||||||
Canadian Natural Resources Ltd.(a) | ||||||||||||
| 35,000 | 3.850 | 06/01/2027 | 34,148 | |||||||||
Concho Resources, Inc.(a) | ||||||||||||
| 50,000 | 4.300 | 08/15/2028 | 50,116 | |||||||||
Continental Resources, Inc.(a) | ||||||||||||
| 75,000 | 4.500 | 04/15/2023 | 76,109 | |||||||||
Devon Energy Corp.(a) | ||||||||||||
| 25,000 | 5.600 | 07/15/2041 | 26,967 | |||||||||
| 5,000 | 4.750 | 05/15/2042 | 4,881 | |||||||||
Dolphin Energy Ltd. LLC(b) | ||||||||||||
| 19,680 | 5.888 | 06/15/2019 | 19,951 | |||||||||
Energy Transfer Partners LP(a) | ||||||||||||
| 25,000 | 4.650 | 06/01/2021 | 25,600 | |||||||||
| 75,000 | 4.200 | 09/15/2023 | 74,963 | |||||||||
| 25,000 | 5.300 | 04/15/2047 | 22,919 | |||||||||
EQT Midstream Partners LP(a) | ||||||||||||
| 75,000 | 4.750 | 07/15/2023 | 74,879 | |||||||||
Kinder Morgan Energy Partners LP(a) | ||||||||||||
| 25,000 | 5.400 | 09/01/2044 | 24,188 | |||||||||
Kinder Morgan, Inc.(a) | ||||||||||||
| 145,000 | 3.050 | 12/01/2019 | 144,552 | |||||||||
Marathon Oil Corp.(a) | ||||||||||||
| 50,000 | 4.400 | 07/15/2027 | 50,177 | |||||||||
MPLX LP(a) | ||||||||||||
| 35,000 | 4.500 | 04/15/2038 | 32,328 | |||||||||
| 25,000 | 4.700 | 04/15/2048 | 23,180 | |||||||||
ONEOK, Inc.(a) | ||||||||||||
| 50,000 | 4.550 | 07/15/2028 | 50,439 | |||||||||
Petroleos Mexicanos | ||||||||||||
| 60,000 | 6.375 | 02/04/2021 | 63,150 | |||||||||
| 12,000 | 6.350(b) | 02/12/2048 | 10,830 | |||||||||
|
| |||||||||||
| Corporate Bonds – (continued) | ||||||||||||
Energy – (continued) | ||||||||||||
Phillips 66(a) | ||||||||||||
| $ | 60,000 | 3.900% | 03/15/2028 | $ | 58,559 | |||||||
Pioneer Natural Resources Co.(a) | ||||||||||||
| 25,000 | 3.950 | 07/15/2022 | 25,286 | |||||||||
Plains All American Pipeline LP(a) | ||||||||||||
| 15,000 | 3.650 | 06/01/2022 | 14,704 | |||||||||
| 35,000 | 3.850 | 10/15/2023 | 34,112 | |||||||||
| 45,000 | 4.500 | 12/15/2026 | 44,049 | |||||||||
Sabine Pass Liquefaction LLC(a) | ||||||||||||
| 75,000 | 5.625 | 03/01/2025 | 79,775 | |||||||||
Valero Energy Corp. | ||||||||||||
| 35,000 | 3.650 | 03/15/2025 | 34,185 | |||||||||
|
| |||||||||||
| 1,216,655 | ||||||||||||
|
| |||||||||||
Food & Beverage – 1.2% | ||||||||||||
Anheuser-Busch InBev Finance, Inc.(a) | ||||||||||||
| 75,000 | 2.650 | 02/01/2021 | 73,967 | |||||||||
| 35,000 | 4.700 | 02/01/2036 | 35,474 | |||||||||
| 35,000 | 4.900 | 02/01/2046 | 35,993 | |||||||||
Anheuser-Busch InBev Worldwide, Inc.(a) | ||||||||||||
| 125,000 | 4.000 | 04/13/2028 | 124,710 | |||||||||
Kraft Heinz Foods Co.(a) | ||||||||||||
| 15,000 | 4.375 | 06/01/2046 | 12,976 | |||||||||
Maple Escrow Subsidiary, Inc.(a)(b) | ||||||||||||
| 50,000 | 4.057 | 05/25/2023 | 50,122 | |||||||||
Smithfield Foods, Inc.(b) | ||||||||||||
| 125,000 | 2.700 | 01/31/2020 | 123,206 | |||||||||
|
| |||||||||||
| 456,448 | ||||||||||||
|
| |||||||||||
Health Care Equipment & Services – 1.7% | ||||||||||||
Allergan Sales LLC(a)(b) | ||||||||||||
| 35,000 | 5.000 | 12/15/2021 | 36,213 | |||||||||
Becton Dickinson and Co.(a) | ||||||||||||
| 125,000 | (3 Mo. LIBOR + 0.88%), 3.209(c) | 12/29/2020 | 125,204 | |||||||||
| 95,000 | 2.894 | 06/06/2022 | 91,887 | |||||||||
| 25,000 | 3.363 | 06/06/2024 | 24,015 | |||||||||
| 35,000 | 4.685 | 12/15/2044 | 33,925 | |||||||||
CVS Health Corp.(a) | ||||||||||||
| 45,000 | 2.800 | 07/20/2020 | 44,575 | |||||||||
| 45,000 | 4.125 | 05/15/2021 | 45,795 | |||||||||
| 75,000 | 3.500 | 07/20/2022 | 74,339 | |||||||||
| 75,000 | 3.875 | 07/20/2025 | 72,670 | |||||||||
| 50,000 | 5.050 | 03/25/2048 | 50,885 | |||||||||
UnitedHealth Group, Inc. | ||||||||||||
| 35,000 | 4.625 | 07/15/2035 | 36,810 | |||||||||
|
| |||||||||||
| 636,318 | ||||||||||||
|
| |||||||||||
Life Insurance – 0.6% | ||||||||||||
American International Group, Inc.(a) | ||||||||||||
| 25,000 | 4.200 | 04/01/2028 | 24,459 | |||||||||
Northwestern Mutual Life Insurance Co. (The)(b) | ||||||||||||
| 70,000 | 6.063 | 03/30/2040 | 87,041 | |||||||||
Principal Financial Group, Inc.(a) | ||||||||||||
| 50,000 | 3.100 | 11/15/2026 | 46,820 | |||||||||
|
| |||||||||||
| 22 | The accompanying notes are an integral part of these financial statements. |
GOLDMAN SACHS VARIABLE INSURANCE TRUST CORE FIXED INCOME FUND
| Principal Amount | Interest Rate | Maturity Date | Value | |||||||||
| Corporate Bonds – (continued) | ||||||||||||
Life Insurance – (continued) | ||||||||||||
Prudential Financial, Inc.(a) | ||||||||||||
| $ | 50,000 | 3.878% | 03/27/2028 | $ | 49,420 | |||||||
|
| |||||||||||
| 207,740 | ||||||||||||
|
| |||||||||||
Materials – 0.4% | ||||||||||||
Ecolab, Inc. | ||||||||||||
| 4,000 | 5.500 | 12/08/2041 | 4,704 | |||||||||
| 40,000 | 3.950(a) | 12/01/2047 | 38,244 | |||||||||
LYB International Finance II BV(a) | ||||||||||||
| 70,000 | 3.500 | 03/02/2027 | 65,643 | |||||||||
Sherwin-Williams Co. (The)(a) | ||||||||||||
| 25,000 | 3.450 | 06/01/2027 | 23,619 | |||||||||
|
| |||||||||||
| 132,210 | ||||||||||||
|
| |||||||||||
Media – 1.0% | ||||||||||||
21st Century Fox America, Inc. | ||||||||||||
| 25,000 | 3.700(a) | 09/15/2024 | 24,903 | |||||||||
| 25,000 | 6.150 | 03/01/2037 | 29,323 | |||||||||
CCO Safari II LLC(a) | ||||||||||||
| 75,000 | 3.579 | 07/23/2020 | 74,905 | |||||||||
| 65,000 | 4.464 | 07/23/2022 | 65,798 | |||||||||
| 50,000 | 4.500 | 02/01/2024 | 49,951 | |||||||||
| 45,000 | 4.908 | 07/23/2025 | 45,445 | |||||||||
Comcast Corp.(a) | ||||||||||||
| 45,000 | 3.375 | 08/15/2025 | 43,165 | |||||||||
Time Warner Cable LLC | ||||||||||||
| 15,000 | 5.000 | 02/01/2020 | 15,313 | |||||||||
|
| |||||||||||
| 348,803 | ||||||||||||
|
| |||||||||||
Metals and Mining(b) – 0.0% | ||||||||||||
Glencore Funding LLC | ||||||||||||
| 15,000 | 4.125 | 05/30/2023 | 14,967 | |||||||||
|
| |||||||||||
Noncaptive-Financial(b) – 0.1% | ||||||||||||
International Lease Finance Corp. | ||||||||||||
| 50,000 | 7.125 | 09/01/2018 | 50,326 | |||||||||
|
| |||||||||||
Pharmaceuticals, Biotechnology & Life Sciences – 2.3% | ||||||||||||
AbbVie, Inc.(a) | ||||||||||||
| 45,000 | 2.500 | 05/14/2020 | 44,458 | |||||||||
Amgen, Inc.(a) | ||||||||||||
| 70,000 | 3.125 | 05/01/2025 | 66,989 | |||||||||
Bayer US Finance II LLC(a)(b) | ||||||||||||
| 200,000 | 3.875 | 12/15/2023 | 200,009 | |||||||||
| 200,000 | 4.375 | 12/15/2028 | 200,380 | |||||||||
Bayer US Finance LLC(b) | ||||||||||||
| 200,000 | 3.000 | 10/08/2021 | 196,747 | |||||||||
Teva Pharmaceutical Finance Netherlands III BV | ||||||||||||
| 30,000 | 2.200 | 07/21/2021 | 27,826 | |||||||||
| 30,000 | 2.800 | 07/21/2023 | 25,913 | |||||||||
Thermo Fisher Scientific, Inc.(a) | ||||||||||||
| 35,000 | 3.000 | 04/15/2023 | 34,030 | |||||||||
| 15,000 | 3.650 | 12/15/2025 | 14,645 | |||||||||
Zoetis, Inc.(a) | ||||||||||||
| 45,000 | 3.000 | 09/12/2027 | 41,623 | |||||||||
|
| |||||||||||
| 852,620 | ||||||||||||
|
| |||||||||||
| Corporate Bonds – (continued) | ||||||||||||
Pipelines(a) – 0.8% | ||||||||||||
Columbia Pipeline Group, Inc. | ||||||||||||
| $ | 35,000 | 3.300% | 06/01/2020 | $ | 34,855 | |||||||
Enbridge, Inc. | ||||||||||||
| 35,000 | 2.900 | 07/15/2022 | 33,995 | |||||||||
Enterprise Products Operating LLC Series A(c) | ||||||||||||
| 85,000 | (3 Mo. LIBOR + 3.71%), 6.066 | 08/01/2066 | 85,213 | |||||||||
Sunoco Logistics Partners Operations LP | ||||||||||||
| 15,000 | 4.250 | 04/01/2024 | 14,858 | |||||||||
Williams Partners LP | ||||||||||||
| 25,000 | 3.600 | 03/15/2022 | 24,878 | |||||||||
| 50,000 | 3.900 | 01/15/2025 | 48,776 | |||||||||
| 35,000 | 4.000 | 09/15/2025 | 34,208 | |||||||||
|
| |||||||||||
| 276,783 | ||||||||||||
|
| |||||||||||
Property/Casualty Insurance – 0.3% | ||||||||||||
Arch Capital Group US, Inc. | ||||||||||||
| 36,000 | 5.144 | 11/01/2043 | 38,059 | |||||||||
Hartford Financial Services Group, Inc. (The) | ||||||||||||
| 10,000 | 5.125 | 04/15/2022 | 10,553 | |||||||||
XLIT Ltd. | ||||||||||||
| 45,000 | 4.450 | 03/31/2025 | 44,275 | |||||||||
|
| |||||||||||
| 92,887 | ||||||||||||
|
| |||||||||||
Real Estate Investment Trusts(a) – 1.3% | ||||||||||||
American Campus Communities Operating Partnership LP | ||||||||||||
| 95,000 | 4.125 | 07/01/2024 | 94,522 | |||||||||
American Homes 4 Rent LP | ||||||||||||
| 25,000 | 4.250 | 02/15/2028 | 23,942 | |||||||||
Crown Castle International Corp. | ||||||||||||
| 25,000 | 2.250 | 09/01/2021 | 23,965 | |||||||||
| 85,000 | 3.150 | 07/15/2023 | 81,369 | |||||||||
| 60,000 | 3.650 | 09/01/2027 | 55,809 | |||||||||
CubeSmart LP | ||||||||||||
| 45,000 | 4.000 | 11/15/2025 | 44,233 | |||||||||
HCP, Inc. | ||||||||||||
| 10,000 | 2.625 | 02/01/2020 | 9,881 | |||||||||
Healthcare Trust of America Holdings LP | ||||||||||||
| 35,000 | 3.375 | 07/15/2021 | 34,884 | |||||||||
National Retail Properties, Inc. | ||||||||||||
| 45,000 | 4.000 | 11/15/2025 | 44,149 | |||||||||
Select Income REIT | ||||||||||||
| 25,000 | 3.600 | 02/01/2020 | 24,867 | |||||||||
Ventas Realty LP | ||||||||||||
| 45,000 | 3.500 | 02/01/2025 | 43,089 | |||||||||
|
| |||||||||||
| 480,710 | ||||||||||||
|
| |||||||||||
Retailing(a) – 0.8% | ||||||||||||
Alimentation Couche-Tard, Inc.(b) | ||||||||||||
| 45,000 | 2.700 | 07/26/2022 | 43,251 | |||||||||
Amazon.com, Inc. | ||||||||||||
| 35,000 | 5.200 | 12/03/2025 | 38,476 | |||||||||
| 45,000 | 4.800 | 12/05/2034 | 49,304 | |||||||||
| 15,000 | 3.875 | 08/22/2037 | 14,641 | |||||||||
|
| |||||||||||
| The accompanying notes are an integral part of these financial statements. | 23 |
GOLDMAN SACHS VARIABLE INSURANCE TRUST CORE FIXED INCOME FUND
Schedule of Investments (continued)
June 30, 2018 (Unaudited)
| Principal Amount | Interest Rate | Maturity Date | Value | |||||||||
| Corporate Bonds – (continued) | ||||||||||||
Retailing(a) – (continued) | ||||||||||||
Dollar Tree, Inc. | ||||||||||||
| $ | 50,000 | 4.000% | 05/15/2025 | $ | 48,865 | |||||||
| 50,000 | 4.200 | 05/15/2028 | 48,264 | |||||||||
Expedia Group, Inc. | ||||||||||||
| 35,000 | 3.800 | 02/15/2028 | 32,051 | |||||||||
Home Depot, Inc. (The) | ||||||||||||
| 25,000 | 4.250 | 04/01/2046 | 25,150 | |||||||||
|
| |||||||||||
| 300,002 | ||||||||||||
|
| |||||||||||
Software & Services(a) – 0.1% | ||||||||||||
Fidelity National Information Services, Inc. | ||||||||||||
| 45,000 | 3.000 | 08/15/2026 | 41,224 | |||||||||
|
| |||||||||||
Technology – 1.0% | ||||||||||||
Broadcom Corp.(a) | ||||||||||||
| 50,000 | 2.650 | 01/15/2023 | 47,087 | |||||||||
| 25,000 | 3.625 | 01/15/2024 | 24,200 | |||||||||
Dell International LLC(a)(b) | ||||||||||||
| 45,000 | 5.450 | 06/15/2023 | 47,099 | |||||||||
Hewlett Packard Enterprise Co.(a) | ||||||||||||
| 45,000 | 4.900 | 10/15/2025 | 45,931 | |||||||||
Microchip Technology, Inc.(b) | ||||||||||||
| 25,000 | 3.922 | 06/01/2021 | 25,049 | |||||||||
Oracle Corp.(a) | ||||||||||||
| 70,000 | 2.500 | 05/15/2022 | 68,160 | |||||||||
| 60,000 | 3.250 | 11/15/2027 | 57,371 | |||||||||
| 35,000 | 4.000 | 07/15/2046 | 33,025 | |||||||||
QUALCOMM, Inc.(a) | ||||||||||||
| 25,000 | 2.600 | 01/30/2023 | 23,906 | |||||||||
|
| |||||||||||
| 371,828 | ||||||||||||
|
| |||||||||||
Tobacco(a) – 0.7% | ||||||||||||
BAT Capital Corp.(b) | ||||||||||||
| 95,000 | 3.222 | 08/15/2024 | 89,987 | |||||||||
| 10,000 | 3.557 | 08/15/2027 | 9,304 | |||||||||
| 35,000 | 4.390 | 08/15/2037 | 32,835 | |||||||||
Reynolds American, Inc. | ||||||||||||
| 130,000 | 4.450 | 06/12/2025 | 130,833 | |||||||||
|
| |||||||||||
| 262,959 | ||||||||||||
|
| |||||||||||
Transportation – 0.9% | ||||||||||||
Burlington Northern Santa Fe LLC(a) | ||||||||||||
| 25,000 | 4.050 | 06/15/2048 | 24,173 | |||||||||
Delta Air Lines, Inc. | ||||||||||||
| 150,000 | 3.400 | 04/19/2021 | 149,286 | |||||||||
FedEx Corp.(a) | ||||||||||||
| 45,000 | 3.400 | 02/15/2028 | 42,825 | |||||||||
Penske Truck Leasing Co. LP(a)(b) | ||||||||||||
| 70,000 | 3.375 | 02/01/2022 | 68,995 | |||||||||
Union Pacific Corp.(a) | ||||||||||||
| 50,000 | 3.950 | 09/10/2028 | 50,239 | |||||||||
|
| |||||||||||
| 335,518 | ||||||||||||
|
| |||||||||||
Wireless Telecommunications – 2.3% | ||||||||||||
American Tower Corp. | ||||||||||||
| 45,000 | 4.700 | 03/15/2022 | 46,388 | |||||||||
|
| |||||||||||
| Corporate Bonds – (continued) | ||||||||||||
Wireless Telecommunications – (continued) | ||||||||||||
AT&T, Inc. | ||||||||||||
| $ | 60,000 | 3.200%(a) | 03/01/2022 | $ | 58,879 | |||||||
| 105,000 | 3.800 | 03/15/2022 | 105,179 | |||||||||
| 50,000 | 3.000(a) | 06/30/2022 | 48,540 | |||||||||
| 45,000 | 3.600(a) | 02/17/2023 | 44,334 | |||||||||
| 70,000 | 3.400(a) | 05/15/2025 | 65,642 | |||||||||
| 35,000 | 4.125(a) | 02/17/2026 | 34,209 | |||||||||
| 110,000 | 4.250(a) | 03/01/2027 | 107,659 | |||||||||
Verizon Communications, Inc. | ||||||||||||
| 25,000 | 2.625 | 08/15/2026 | 22,188 | |||||||||
| 145,000 | 4.329(b) | 09/21/2028 | 143,710 | |||||||||
| 62,000 | 5.012 | 04/15/2049 | 60,379 | |||||||||
Vodafone Group plc | ||||||||||||
| 100,000 | 3.750 | 01/16/2024 | 99,145 | |||||||||
|
| |||||||||||
| 836,252 | ||||||||||||
|
| |||||||||||
| TOTAL CORPORATE BONDS | ||||||||||||
| (Cost $11,504,311) | $ | 11,291,801 | ||||||||||
|
| |||||||||||
| Mortgage-Backed Securities – 30.6% | ||||||||||||
FHLMC – 1.1% | ||||||||||||
| $ | 53 | 4.500% | 09/01/2018 | $ | 53 | |||||||
| 224 | 5.500 | 09/01/2018 | 225 | |||||||||
| 2 | 9.500 | 08/01/2020 | 2 | |||||||||
| 8,885 | 6.500 | 10/01/2020 | 8,991 | |||||||||
| 4,284 | 4.500 | 07/01/2024 | 4,424 | |||||||||
| 26,148 | 4.500 | 11/01/2024 | 27,035 | |||||||||
| 6,375 | 4.500 | 12/01/2024 | 6,584 | |||||||||
| 7,157 | 6.000 | 03/01/2029 | 7,818 | |||||||||
| 142 | 6.000 | 04/01/2029 | 155 | |||||||||
| 8,421 | 7.500 | 12/01/2029 | 9,509 | |||||||||
| 92,439 | 7.000 | 05/01/2032 | 105,249 | |||||||||
| 158 | 6.000 | 08/01/2032 | 176 | |||||||||
| 50,107 | 7.000 | 12/01/2032 | 57,131 | |||||||||
| 2,801 | 5.000 | 10/01/2033 | 2,987 | |||||||||
| 4,036 | 5.000 | 07/01/2035 | 4,304 | |||||||||
| 5,525 | 5.000 | 12/01/2035 | 5,913 | |||||||||
| 45,537 | 5.500 | 01/01/2037 | 49,014 | |||||||||
| 1,195 | 5.000 | 03/01/2038 | 1,275 | |||||||||
| 75,486 | 7.000 | 02/01/2039 | 86,278 | |||||||||
| 3,080 | 5.000 | 06/01/2041 | 3,290 | |||||||||
|
| |||||||||||
| 380,413 | ||||||||||||
|
| |||||||||||
FNMA – 16.2% | ||||||||||||
| 19 | 6.500 | 08/01/2018 | 19 | |||||||||
| 171 | 7.000 | 08/01/2018 | 170 | |||||||||
| 492 | 5.000 | 06/01/2023 | 506 | |||||||||
| 44,659 | 5.500 | 09/01/2023 | 46,347 | |||||||||
| 12,537 | 5.500 | 10/01/2023 | 13,025 | |||||||||
| 2,539 | 4.500 | 07/01/2024 | 2,620 | |||||||||
| 68,200 | 4.500 | 11/01/2024 | 70,502 | |||||||||
| 28,383 | 4.500 | 12/01/2024 | 29,360 | |||||||||
|
| |||||||||||
| 24 | The accompanying notes are an integral part of these financial statements. |
GOLDMAN SACHS VARIABLE INSURANCE TRUST CORE FIXED INCOME FUND
Principal Amount | Interest Rate | Maturity Date | Value | |||||||||
| Mortgage-Backed Securities – (continued) | ||||||||||||
FNMA – (continued) | ||||||||||||
| $ | 54 | 7.000% | 07/01/2025 | $ | 60 | |||||||
| 8,611 | 9.000 | 11/01/2025 | 9,609 | |||||||||
| 33,041 | 7.000 | 08/01/2026 | 36,130 | |||||||||
| 587 | 7.000 | 08/01/2027 | 656 | |||||||||
| 3,229 | 7.000 | 09/01/2027 | 3,422 | |||||||||
| 90 | 7.000 | 01/01/2028 | 100 | |||||||||
| 49,818 | 6.000 | 02/01/2029 | 54,868 | |||||||||
| 45,229 | 6.000 | 06/01/2029 | 49,817 | |||||||||
| 16,277 | 8.000 | 10/01/2029 | 18,396 | |||||||||
| 4,368 | 7.000 | 12/01/2029 | 4,866 | |||||||||
| 1,216 | 8.500 | 04/01/2030 | 1,432 | |||||||||
| 2,262 | 8.000 | 05/01/2030 | 2,618 | |||||||||
| 107 | 8.500 | 06/01/2030 | 110 | |||||||||
| 5,075 | 7.000 | 05/01/2032 | 5,752 | |||||||||
| 39,533 | 7.000 | 06/01/2032 | 45,046 | |||||||||
| 43,890 | 7.000 | 08/01/2032 | 50,119 | |||||||||
| 6,885 | 8.000 | 08/01/2032 | 7,599 | |||||||||
| 2,136 | 5.000 | 08/01/2033 | 2,279 | |||||||||
| 593 | 5.500 | 09/01/2033 | 645 | |||||||||
| 696 | 5.500 | 02/01/2034 | 758 | |||||||||
| 142 | 5.500 | 04/01/2034 | 154 | |||||||||
| 4,566 | 5.500 | 12/01/2034 | 4,979 | |||||||||
| 22,675 | 5.000 | 04/01/2035 | 24,263 | |||||||||
| 39,063 | 6.000 | 04/01/2035 | 43,175 | |||||||||
| 874 | 5.500 | 09/01/2035 | 951 | |||||||||
| 97,365 | 6.000 | 10/01/2035 | 108,221 | |||||||||
| 194,337 | 6.000 | 09/01/2036 | 215,225 | |||||||||
| 62 | 5.500 | 02/01/2037 | 67 | |||||||||
| 99 | 5.500 | 04/01/2037 | 108 | |||||||||
| 120,540 | 5.500 | 08/01/2037 | 130,013 | |||||||||
| 185 | 5.500 | 03/01/2038 | 202 | |||||||||
| 53 | 5.500 | 06/01/2038 | 58 | |||||||||
| 117 | 5.500 | 07/01/2038 | 127 | |||||||||
| 136 | 5.500 | 08/01/2038 | 148 | |||||||||
| 108 | 5.500 | 09/01/2038 | 118 | |||||||||
| 1,663 | 5.500 | 10/01/2038 | 1,813 | |||||||||
| 39 | 5.500 | 12/01/2038 | 42 | |||||||||
| 107,993 | 5.000 | 01/01/2039 | 115,553 | |||||||||
| 46,504 | 7.000 | 03/01/2039 | 52,674 | |||||||||
| 184,860 | 6.000 | 05/01/2039 | 202,682 | |||||||||
| 11,269 | 4.500 | 08/01/2039 | 11,856 | |||||||||
| 48,227 | 3.000 | 01/01/2043 | 47,217 | |||||||||
| 190,741 | 3.000 | 03/01/2043 | 186,926 | |||||||||
| 268,894 | 3.000 | 04/01/2043 | 263,516 | |||||||||
| 197,755 | 3.000 | 05/01/2043 | 193,800 | |||||||||
| 671,826 | 4.500 | 04/01/2045 | 707,149 | |||||||||
| 76,919 | 4.500 | 05/01/2045 | 80,787 | |||||||||
| 1,000,001 | 4.500 | 06/01/2048 | 1,041,876 | |||||||||
| 1,000,000 | 5.000 | TBA-30yr | (d) | 1,059,375 | ||||||||
| 1,000,000 | 4.500 | TBA-30yr | (d) | 1,041,250 | ||||||||
|
| |||||||||||
| 5,991,156 | ||||||||||||
|
| |||||||||||
| Mortgage-Backed Securities – (continued) | ||||||||||||
GNMA – 13.3% | ||||||||||||
| $ | 1,739 | 7.000% | 10/15/2025 | $ | 1,753 | |||||||
| 6,545 | 7.000 | 11/15/2025 | 6,902 | |||||||||
| 1,016 | 7.000 | 02/15/2026 | 1,030 | |||||||||
| 4,716 | 7.000 | 04/15/2026 | 5,078 | |||||||||
| 2,944 | 7.000 | 03/15/2027 | 3,292 | |||||||||
| 21,143 | 7.000 | 11/15/2027 | 23,025 | |||||||||
| 283 | 7.000 | 01/15/2028 | 299 | |||||||||
| 15,648 | 7.000 | 02/15/2028 | 16,620 | |||||||||
| 1,701 | 7.000 | 03/15/2028 | 1,916 | |||||||||
| 947 | 7.000 | 04/15/2028 | 1,066 | |||||||||
| 183 | 7.000 | 05/15/2028 | 203 | |||||||||
| 3,481 | 7.000 | 06/15/2028 | 3,903 | |||||||||
| 7,350 | 7.000 | 07/15/2028 | 8,276 | |||||||||
| 10,822 | 7.000 | 09/15/2028 | 12,217 | |||||||||
| 2,112 | 7.000 | 11/15/2028 | 2,380 | |||||||||
| 1,921 | 7.500 | 11/15/2030 | 1,925 | |||||||||
| 125,034 | 6.000 | 08/20/2034 | 138,087 | |||||||||
| 123,236 | 5.000 | 06/15/2040 | 131,603 | |||||||||
| 593,031 | 4.000 | 08/20/2043 | 612,513 | |||||||||
| 299,513 | 4.000 | 08/20/2045 | 308,323 | |||||||||
| 290,903 | 4.000 | 10/20/2045 | 299,460 | |||||||||
| 226,370 | 4.000 | 02/20/2046 | 233,028 | |||||||||
| 2,000,000 | 4.500 | TBA-30yr | (d) | 2,078,594 | ||||||||
| 1,000,000 | 4.000 | TBA-30yr | (d) | 1,023,203 | ||||||||
|
| |||||||||||
| 4,914,696 | ||||||||||||
|
| |||||||||||
| TOTAL MORTGAGE-BACKED SECURITIES | ||||||||||||
| (Cost $11,296,931) | $ | 11,286,265 | ||||||||||
|
| |||||||||||
| Collateralized Mortgage Obligations – 3.8% | ||||||||||||
Adjustable Rate Non-Agency(a)(c) – 2.9% | ||||||||||||
Alternative Loan Trust Series 2005-38, Class A1 | ||||||||||||
| $ | 97,708 | 3.058% | 09/25/2035 | $ | 97,935 | |||||||
Harben Finance plc Series 2017-1X, Class A | ||||||||||||
| GBP | 88,690 | 1.423 | 08/20/2056 | 117,627 | ||||||||
Lehman XS Trust Series 2005-7N, Class 1A1A | ||||||||||||
| 171,077 | 2.361 | 12/25/2035 | 170,077 | |||||||||
London Wall Mortgage Capital plc Series 2017-FL1, Class A | ||||||||||||
| GBP | 186,669 | 1.490 | 11/15/2049 | 246,710 | ||||||||
| | MASTR Adjustable Rate Mortgages Trust Series 2006-OA2, | | ||||||||||
| 211,430 | 2.408 | 12/25/2046 | 199,305 | |||||||||
Ripon Mortgages plc Series 1X, Class A2 | ||||||||||||
| GBP | 160,557 | 1.427 | 08/20/2056 | 212,890 | ||||||||
|
| |||||||||||
| 1,044,544 | ||||||||||||
|
| |||||||||||
Sequential Fixed Rate – 0.9% | ||||||||||||
FNMA REMIC Series 2012-111, Class B | ||||||||||||
| 15,144 | 7.000 | 10/25/2042 | 17,077 | |||||||||
FNMA REMIC Series 2012-153, Class B | ||||||||||||
| 40,446 | 7.000 | 07/25/2042 | 45,787 | |||||||||
|
| |||||||||||
| The accompanying notes are an integral part of these financial statements. | 25 |
GOLDMAN SACHS VARIABLE INSURANCE TRUST CORE FIXED INCOME FUND
Schedule of Investments (continued)
June 30, 2018 (Unaudited)
| Principal Amount | Interest Rate | Maturity Date | Value | |||||||||||
| Collateralized Mortgage Obligations – (continued) | ||||||||||||||
Sequential Fixed Rate – (continued) | ||||||||||||||
NCUA Guaranteed Notes Series A4 | ||||||||||||||
| $ | 300,000 | 3.000% | 06/12/2019 | $ | 301,484 | |||||||||
|
| |||||||||||||
| 364,348 | ||||||||||||||
|
| |||||||||||||
| TOTAL COLLATERALIZED MORTGAGE OBLIGATIONS | ||||||||||||||
| (Cost $1,374,113) | $ | 1,408,892 | ||||||||||||
|
| |||||||||||||
| Commercial Mortgage-Backed Security(a)(b)(c) – 0.4% | ||||||||||||||
Adjustable Rate Non-Agency – 0.4% | ||||||||||||||
Exantas Capital Corp. Ltd. Series 2018-RSO6, Class A | ||||||||||||||
| $ | 150,000 | 2.791% | 06/15/2035 | $ | 149,775 | |||||||||
| (Cost $150,000) | ||||||||||||||
|
| |||||||||||||
| U.S. Government Agency Securities – 2.7% | ||||||||||||||
FHLB | ||||||||||||||
| $ | 100,000 | 3.375% | 12/08/2023 | $ | 102,560 | |||||||||
FNMA | ||||||||||||||
| 400,000 | 1.875 | 09/24/2026 | 365,246 | |||||||||||
| 400,000 | 6.250 | 05/15/2029 | 513,184 | |||||||||||
|
| |||||||||||||
| TOTAL U.S. GOVERNMENT AGENCY SECURITIES | ||||||||||||||
| (Cost $1,022,303) | $ | 980,990 | ||||||||||||
|
| |||||||||||||
| Asset-Backed Securities(a) – 13.2% | ||||||||||||||
Automobile – 0.3% | ||||||||||||||
Ally Master Owner Trust Series 2018-1, Class A2 | ||||||||||||||
| $ | 100,000 | 2.700% | 01/17/2023 | $ | 99,023 | |||||||||
|
| |||||||||||||
Collateralized Debt Obligations(b)(c) – 0.5% | ||||||||||||||
| | Arbor Realty Commercial Real Estate Notes Ltd. | | ||||||||||||
| 200,000 | 3.059 | 06/15/2028 | 200,013 | |||||||||||
|
| |||||||||||||
Collateralized Loan Obligations(b)(c) – 5.8% | ||||||||||||||
Acis CLO Ltd. Series 2013-1A, Class ACOM | ||||||||||||||
| 317,443 | 3.582 | 04/18/2024 | 316,872 | |||||||||||
CBAM Ltd. Series 2018-5A, Class A | ||||||||||||||
| 525,000 | 3.322 | 04/17/2031 | 521,001 | |||||||||||
Cutwater Ltd. Series 2014-1A, Class A1AR | ||||||||||||||
| 550,000 | 3.598 | 07/15/2026 | 549,678 | |||||||||||
Madison Park Funding XXX Ltd. Series 2018-30A, Class A | ||||||||||||||
| 750,000 | 3.089 | 04/15/2029 | 741,950 | |||||||||||
|
| |||||||||||||
| 2,129,501 | ||||||||||||||
|
| |||||||||||||
Home Equity(c) – 0.2% | ||||||||||||||
GMACM Home Equity Loan Trust Series 2007-HE3, Class 1A1 | ||||||||||||||
| 15,528 | 6.951 | 09/25/2037 | 15,668 | |||||||||||
GMACM Home Equity Loan Trust Series 2007-HE3, Class 2A1 | ||||||||||||||
| 65,783 | 6.804 | 09/25/2037 | 67,203 | |||||||||||
|
| |||||||||||||
| 82,871 | ||||||||||||||
|
| |||||||||||||
| Asset-Backed Securities(a) – (continued) | ||||||||||||||
Student Loans(c) – 6.4% | ||||||||||||||
Academic Loan Funding Trust Series 2012-1A, Class A2(b) | ||||||||||||||
| $ | 520,965 | 3.191% | 12/27/2044 | $ | 522,192 | |||||||||
AccessLex Institute Series 2005-2, Class A3 | ||||||||||||||
| 54,574 | 2.509 | 11/22/2024 | 54,574 | |||||||||||
Chase Education Loan Trust Series 2007-A, Class A3 | ||||||||||||||
| 23,475 | 2.406 | 12/28/2023 | 23,424 | |||||||||||
ECMC Group Student Loan Trust Series 2016-1A, Class A(b) | ||||||||||||||
| 418,348 | 3.441 | 07/26/2066 | 425,182 | |||||||||||
EFS Volunteer No. 2 LLC Series 2012-1, Class A2(b) | ||||||||||||||
| 550,000 | 3.441 | 03/25/2036 | 559,485 | |||||||||||
Nelnet Student Loan Trust Series 2006-2, Class A5 | ||||||||||||||
| 163,982 | 2.460 | 01/25/2030 | 163,834 | |||||||||||
Northstar Education Finance, Inc. Series 2007-1, Class A1 | ||||||||||||||
| 70,466 | 2.459 | 04/28/2030 | 70,154 | |||||||||||
Scholar Funding Trust Series 2010-A, Class A(b) | ||||||||||||||
| 123,402 | 3.109 | 10/28/2041 | 122,947 | |||||||||||
SLM Student Loan Trust Series 2003-7A, Class A5A(b) | ||||||||||||||
| 366,448 | 3.541 | 12/15/2033 | 370,840 | |||||||||||
SLM Student Loan Trust Series 2006-2, Class A5 | ||||||||||||||
| 30,904 | 2.470 | 07/25/2025 | 30,904 | |||||||||||
|
| |||||||||||||
| 2,343,536 | ||||||||||||||
|
| |||||||||||||
| TOTAL ASSET-BACKED SECURITIES | ||||||||||||||
| (Cost $4,829,035) | $ | 4,854,944 | ||||||||||||
|
| |||||||||||||
| Foreign Government Securities – 4.7% | ||||||||||||||
Indonesia Government International Note(b) | ||||||||||||||
| $ | 230,000 | 4.750% | 01/08/2026 | $ | 233,162 | |||||||||
Israel Government AID Bond(e) | ||||||||||||||
| 400,000 | 5.500 | 09/18/2023 | 450,340 | |||||||||||
| 200,000 | 5.500 | 12/04/2023 | 225,544 | |||||||||||
| 100,000 | 5.500 | 04/26/2024 | 113,409 | |||||||||||
Kuwait International Government Bond | ||||||||||||||
| 500,000 | 3.500 | 03/20/2027 | 486,250 | |||||||||||
United Arab Emirates Government International Bond(b) | ||||||||||||||
| 220,000 | 3.125 | 10/11/2027 | 204,875 | |||||||||||
|
| |||||||||||||
| TOTAL FOREIGN GOVERNMENT SECURITIES | ||||||||||||||
| (Cost $1,765,021) | $ | 1,713,580 | ||||||||||||
|
| |||||||||||||
| Municipal Bonds – 1.1% | ||||||||||||||
California – 0.4% | ||||||||||||||
California State Various Purpose GO Bonds Series 2010 | ||||||||||||||
| $ | 105,000 | 7.625% | 03/01/2040 | $ | 154,858 | |||||||||
|
| |||||||||||||
Illinois – 0.4% | ||||||||||||||
Illinois State GO Bonds for Build America Bonds Series 2010-5 | ||||||||||||||
| 100,000 | 7.350 | 07/01/2035 | 111,661 | |||||||||||
Illinois State GO Bonds Pension Funding Series 2003 | ||||||||||||||
| 25,000 | 5.100 | 06/01/2033 | 23,659 | |||||||||||
|
| |||||||||||||
| 135,320 | ||||||||||||||
|
| |||||||||||||
| 26 | The accompanying notes are an integral part of these financial statements. |
GOLDMAN SACHS VARIABLE INSURANCE TRUST CORE FIXED INCOME FUND
Principal Amount | Interest Rate | Maturity Date | Value | |||||||||||
| Municipal Bonds – (continued) | ||||||||||||||
Ohio – 0.3% | ||||||||||||||
| | American Municipal Power, Inc. RB Build America Bond | | ||||||||||||
| $ | 100,000 | 6.270 | % | 02/15/2050 | $ | 127,545 | ||||||||
|
| |||||||||||||
| TOTAL MUNICIPAL BONDS | ||||||||||||||
| (Cost $333,232) | $ | 417,723 | ||||||||||||
|
| |||||||||||||
| U.S. Treasury Obligations – 18.8% | ||||||||||||||
U.S. Treasury Bonds | ||||||||||||||
| $ | 470,000 | 2.750% | 11/15/2042 | $ | 451,722 | |||||||||
| 410,000 | 3.125 | 02/15/2043 | 420,553 | |||||||||||
| 490,000 | 3.625 | 02/15/2044 | 546,355 | |||||||||||
| 490,000 | 3.125 | 08/15/2044 | 502,882 | |||||||||||
| 100,000 | 3.000 | 11/15/2044 | 100,358 | |||||||||||
| 200,000 | 2.875 | 08/15/2045 | 195,964 | |||||||||||
| 1,420,000 | 2.875 | 11/15/2046 | 1,390,436 | |||||||||||
| 120,000 | 3.000 | 05/15/2047 | 120,362 | |||||||||||
| 1,880,000 | 2.750 | 11/15/2047 | 1,793,858 | |||||||||||
U.S. Treasury Notes | ||||||||||||||
| 360,000 | 2.875 | 04/30/2025 | 361,462 | |||||||||||
U.S. Treasury STRIPS Bonds(f) | ||||||||||||||
| 1,800,000 | 0.000 | 02/15/2036 | 1,063,548 | |||||||||||
|
| |||||||||||||
| TOTAL U.S. TREASURY OBLIGATIONS | ||||||||||||||
| (Cost $7,013,910) | $ | 6,947,500 | ||||||||||||
|
| |||||||||||||
| Shares | Distribution Rate | Value | ||||||||||||
| Investment Company(g) – 4.0% | ||||||||||||||
| | Goldman Sachs Financial Square Government Fund — | | ||||||||||||
| 1,492,767 | 1.869% | $ | 1,492,767 | |||||||||||
| (Cost $1,492,767) | ||||||||||||||
|
| |||||||||||||
| Principal Amount | Interest Rate | Maturity Date | Value | |||||||||||
| Short-Term Investments – 2.0% | ||||||||||||||
Commercial Paper – 2.0% | ||||||||||||||
AT&T, Inc. | ||||||||||||||
| $ | 250,000 | 2.695 | % | 10/09/2018 | $ | 248,137 | ||||||||
Mondelez International, Inc. | ||||||||||||||
| 250,000 | 2.620 | 10/02/2018 | 248,308 | |||||||||||
VW Credit, Inc. | ||||||||||||||
| 250,000 | 2.637 | 09/20/2018 | 248,543 | |||||||||||
|
| |||||||||||||
| TOTAL SHORT-TERM INVESTMENTS | ||||||||||||||
| (Cost $744,993) | $ | 744,988 | ||||||||||||
|
| |||||||||||||
| TOTAL INVESTMENTS – 111.9% | ||||||||||||||
| (Cost $41,526,616) | $ | 41,289,225 | ||||||||||||
|
| |||||||||||||
| | LIABILITIES IN EXCESS OF | (4,375,928 | ) | |||||||||||
|
| |||||||||||||
| NET ASSETS – 100.0% | $ | 36,913,297 | ||||||||||||
|
| |||||||||||||
| The percentage shown for each investment category reflects the value of investments in that category as a percentage of net assets. | ||
| (a) | Securities with “Call” features. Maturity dates disclosed are the final maturity dates. | |
| (b) | Exempt from registration under Rule 144A of the Securities Act of 1933. Under procedures approved by the Board of Trustees, such securities may be deemed liquid by the Investment Adviser and may be resold, normally to qualified institutional buyers in transactions exempt from registration. Total market value of Rule 144A securities amounts to $6,467,741, which represents approximately 17.5% of net assets as of June 30, 2018. The liquidity determination is unaudited. | |
| (c) | Variable rate security. Except for floating rate notes (for which final maturity is disclosed), maturity date disclosed is the next interest reset date. Interest rate disclosed is that which is in effect on June 30, 2018. | |
| (d) | TBA (To Be Announced) Securities are purchased on a forward commitment basis with an approximate principal amount and no defined maturity date. The actual principal and maturity date will be determined upon settlement when the specific mortgage pools are assigned. Total market value of TBA securities (excluding forward sales contracts, if any) amounts to $5,202,422 which represents approximately 14.1% of net assets as of June 30, 2018. | |
| (e) | Guaranteed by the United States Government. Total market value of these securities amounts to $789,293, which represents 2.1% of net assets as of June 30, 2018. | |
| (f) | Issued with a zero coupon. Income is recognized through the accretion of discount. | |
| (g) | Represents an Affiliated Issuer. | |
| Investment Abbreviations: | ||
| BA | —Banker Acceptance Rate | |
| BBR | —Bank Bill Reference Rate | |
| EURIBOR | —Euro Interbank Offered Rate | |
| FHLB | —Federal Home Loan Bank | |
| FHLMC | —Federal Home Loan Mortgage Corp. | |
| FNMA | —Federal National Mortgage Association | |
| GNMA | —Government National Mortgage Association | |
| GO | —General Obligation | |
| LIBOR | —London Interbank Offered Rate | |
| Mo. | —Month | |
| NIBOR | —Norwegian Interbank Offered Rate | |
| RB | —Revenue Bond | |
| REIT | —Real Estate Investment Trust | |
| REMIC | —Real Estate Mortgage Investment Conduit | |
| RMKT | —Remarketed | |
| STIBOR | —Stockholm Interbank Offered Rate | |
| STRIPS | —Separate Trading of Registered Interest and Principal of Securities | |
| Yr. | —Year | |
| Currency Abbreviations: | ||
| AUD | —Australian Dollar | |
| CAD | —Canadian Dollar | |
| CHF | —Swiss Franc | |
| EUR | —Euro | |
| GBP | —British Pound | |
| JPY | —Japanese Yen | |
| NOK | —Norwegian Krone | |
| NZD | —New Zealand Dollar | |
| SEK | —Swedish Krona | |
| USD | —United States Dollar | |
| The accompanying notes are an integral part of these financial statements. | 27 |
GOLDMAN SACHS VARIABLE INSURANCE TRUST CORE FIXED INCOME FUND
Schedule of Investments (continued)
June 30, 2018 (Unaudited)
ADDITIONAL INVESTMENT INFORMATION
FORWARD FOREIGN CURRENCY EXCHANGE CONTRACTS — At June 30, 2018, the Fund had the following forward foreign currency exchange contracts:
FORWARD FOREIGN CURRENCY EXCHANGE CONTRACTS WITH UNREALIZED GAIN
| Counterparty | Currency Purchased | Currency Sold | Current Value | Settlement Date | Unrealized Gain | |||||||||||||||
Morgan Stanley Co., Inc. | AUD | 112,213 | NZD | 120,525 | $ | 83,064 | 09/19/2018 | $ | 1,427 | |||||||||||
| AUD | 38,010 | USD | 28,090 | 28,136 | 09/19/2018 | 46 | ||||||||||||||
| CAD | 11,372 | EUR | 7,307 | 8,662 | 09/19/2018 | 78 | ||||||||||||||
| CAD | 55,069 | USD | 41,712 | 41,946 | 09/19/2018 | 234 | ||||||||||||||
| CHF | 156,995 | EUR | 135,336 | 159,628 | 09/19/2018 | 631 | ||||||||||||||
| CHF | 56,148 | USD | 57,007 | 57,089 | 09/19/2018 | 82 | ||||||||||||||
| EUR | 49,015 | AUD | 77,128 | 57,584 | 09/19/2018 | 492 | ||||||||||||||
| EUR | 73,016 | CAD | 112,319 | 85,782 | 09/19/2018 | 231 | ||||||||||||||
| EUR | 219,045 | GBP | 192,129 | 257,343 | 09/19/2018 | 2,879 | ||||||||||||||
| EUR | 24,008 | JPY | 3,078,735 | 28,205 | 09/19/2018 | 242 | ||||||||||||||
| EUR | 102,785 | NOK | 974,665 | 120,755 | 09/19/2018 | 701 | ||||||||||||||
| EUR | 195,075 | NZD | 327,916 | 229,181 | 09/19/2018 | 7,066 | ||||||||||||||
| EUR | 189,324 | SEK | 1,948,007 | 222,425 | 09/19/2018 | 3,604 | ||||||||||||||
| EUR | 255,994 | USD | 298,254 | 300,750 | 09/19/2018 | 2,496 | ||||||||||||||
| GBP | 8,347 | AUD | 14,777 | 11,055 | 09/19/2018 | 117 | ||||||||||||||
| NOK | 789,544 | USD | 96,827 | 97,251 | 09/19/2018 | 424 | ||||||||||||||
| USD | 123,063 | AUD | 163,475 | 120,995 | 08/10/2018 | 2,068 | ||||||||||||||
| USD | 112,924 | AUD | 150,004 | 111,037 | 09/19/2018 | 1,887 | ||||||||||||||
| USD | 192,185 | CAD | 247,355 | 188,303 | 08/17/2018 | 3,882 | ||||||||||||||
| USD | 269,891 | CAD | 349,932 | 266,540 | 09/19/2018 | 3,351 | ||||||||||||||
| USD | 838,592 | EUR | 707,773 | 830,304 | 08/31/2018 | 8,288 | ||||||||||||||
| USD | 46,205 | EUR | 39,014 | 45,835 | 09/19/2018 | 370 | ||||||||||||||
| USD | 937,126 | GBP | 701,237 | 927,262 | 08/14/2018 | 9,864 | ||||||||||||||
| USD | 115,203 | GBP | 85,927 | 113,804 | 09/19/2018 | 1,399 | ||||||||||||||
| USD | 89,025 | JPY | 9,749,402 | 88,279 | 08/08/2018 | 746 | ||||||||||||||
| USD | 141,015 | JPY | 15,415,824 | 140,016 | 09/19/2018 | 999 | ||||||||||||||
| USD | 64,956 | NOK | 524,945 | 64,660 | 09/19/2018 | 296 | ||||||||||||||
| USD | 282,367 | NZD | 409,645 | 277,476 | 09/19/2018 | 4,891 | ||||||||||||||
| USD | 137,901 | SEK | 1,224,004 | 137,343 | 09/05/2018 | 558 | ||||||||||||||
| USD | 28,659 | SEK | 245,794 | 27,610 | 09/19/2018 | 1,049 | ||||||||||||||
| TOTAL | $ | 60,398 | ||||||||||||||||||
| 28 | The accompanying notes are an integral part of these financial statements. |
GOLDMAN SACHS VARIABLE INSURANCE TRUST CORE FIXED INCOME FUND
ADDITIONAL INVESTMENT INFORMATION (continued)
FORWARD FOREIGN CURRENCY EXCHANGE CONTRACTS WITH UNREALIZED LOSS
| Counterparty | Currency Purchased | Currency Sold | Current Value | Settlement Date | Unrealized Loss | |||||||||||||||
Morgan Stanley Co., Inc. | AUD | 49,302 | EUR | 31,187 | $ | 36,494 | 09/19/2018 | $ | (145 | ) | ||||||||||
| AUD | 17,390 | GBP | 9,725 | 12,873 | 09/19/2018 | (8 | ) | |||||||||||||
| AUD | 203,718 | USD | 153,358 | 150,781 | 08/10/2018 | (2,577 | ) | |||||||||||||
| AUD | 869,287 | USD | 647,775 | 643,471 | 09/19/2018 | (4,304 | ) | |||||||||||||
| CAD | 258,925 | USD | 201,175 | 197,112 | 08/17/2018 | (4,063 | ) | |||||||||||||
| CAD | 331,965 | USD | 254,475 | 252,855 | 09/19/2018 | (1,620 | ) | |||||||||||||
| EUR | 779,493 | USD | 923,569 | 914,441 | 08/31/2018 | (9,128 | ) | |||||||||||||
| EUR | 268,314 | USD | 316,540 | 315,225 | 09/19/2018 | (1,315 | ) | |||||||||||||
| GBP | 93,070 | EUR | 105,607 | 123,266 | 09/19/2018 | (806 | ) | |||||||||||||
| GBP | 299,534 | USD | 400,531 | 396,081 | 08/14/2018 | (4,450 | ) | |||||||||||||
| GBP | 525,379 | USD | 700,401 | 695,831 | 09/19/2018 | (4,570 | ) | |||||||||||||
| JPY | 3,101,567 | EUR | 24,004 | 28,170 | 09/19/2018 | (30 | ) | |||||||||||||
| JPY | 11,613,101 | USD | 106,044 | 105,153 | 08/08/2018 | (891 | ) | |||||||||||||
| JPY | 59,712,211 | USD | 544,655 | 542,342 | 09/19/2018 | (2,313 | ) | |||||||||||||
| NOK | 639,647 | EUR | 67,456 | 78,789 | 09/19/2018 | (461 | ) | |||||||||||||
| NOK | 226,918 | USD | 27,992 | 27,951 | 09/19/2018 | (41 | ) | |||||||||||||
| NZD | 207,235 | AUD | 191,004 | 140,371 | 09/19/2018 | (1,016 | ) | |||||||||||||
| NZD | 851,024 | USD | 596,544 | 576,442 | 09/19/2018 | (20,102 | ) | |||||||||||||
| SEK | 9,848,022 | EUR | 968,596 | 1,106,232 | 09/19/2018 | (31,711 | ) | |||||||||||||
| SEK | 1,223,000 | USD | 137,731 | 137,231 | 09/05/2018 | (500 | ) | |||||||||||||
| SEK | 252,683 | USD | 28,614 | 28,384 | 09/19/2018 | (230 | ) | |||||||||||||
| USD | 335,035 | AUD | 455,316 | 337,038 | 09/19/2018 | (2,003 | ) | |||||||||||||
| USD | 191,278 | CAD | 253,308 | 192,943 | 09/19/2018 | (1,665 | ) | |||||||||||||
| USD | 998,594 | EUR | 854,212 | 1,003,556 | 09/19/2018 | (4,962 | ) | |||||||||||||
| USD | 87,211 | GBP | 66,043 | 87,469 | 09/19/2018 | (258 | ) | |||||||||||||
| TOTAL | $ | (99,169 | ) | |||||||||||||||||
FORWARD SALES CONTRACT — At June 30, 2018, the Fund had the following forward sales contract:
| Description | Interest Rate | Maturity Date(a) | Principal Amount | Settlement Date | Value | |||||||||||||||
GNMA (Proceeds Received: $2,045,391) | 4.000 | % | TBA-30yr | $ | 2,000,000 | 07/19/2018 | $ | (2,049,375 | ) | |||||||||||
| (a) | TBA (To Be Announced) Securities are sold on a forward commitment basis with an approximate principal amounted and no defined maturity date. The actual principal and maturity date will be determined upon settlement when the specific mortgage pools are assigned. |
| The accompanying notes are an integral part of these financial statements. | 29 |
GOLDMAN SACHS VARIABLE INSURANCE TRUST CORE FIXED INCOME FUND
Schedule of Investments (continued)
June 30, 2018 (Unaudited)
ADDITIONAL INVESTMENT INFORMATION (continued)
FUTURES CONTRACTS — At June 30, 2018, the Fund had the following futures contracts:
| Description | Number of Contracts | Expiration Date | Notional Amount | Unrealized Appreciation/ (Depreciation) | ||||||||||||
Long position contracts: | ||||||||||||||||
| Australia 3 Year Bond | 6 | 09/17/2018 | $ | 494,399 | $ | 1,088 | ||||||||||
| Canada 10 Year Bond | 1 | 09/19/2018 | 103,990 | 2,197 | ||||||||||||
| Euro-Bund | 1 | 09/06/2018 | 189,826 | 823 | ||||||||||||
| Short-Term Euro-BTP | 1 | 09/06/2018 | 129,240 | 204 | ||||||||||||
| U.S. Treasury 10 Year Note | 13 | 09/19/2018 | 1,562,437 | 13,941 | ||||||||||||
| U.S. Treasury 2 Year Note | 20 | 09/28/2018 | 4,236,562 | (2,401 | ) | |||||||||||
| U.S. Treasury 5 Year Note | 35 | 09/28/2018 | 3,976,602 | 19,624 | ||||||||||||
U.S. Treasury Long Bond | 13 | 09/19/2018 | 1,885,000 | 30,508 | ||||||||||||
| TOTAL | $ | 65,984 | ||||||||||||||
Short position contracts: | ||||||||||||||||
| 3 Month Euro Euribor | (4 | ) | 12/16/2019 | $ | (1,169,318 | ) | $ | (296 | ) | |||||||
| 3 Month Eurodollar | (4 | ) | 06/17/2019 | (971,450 | ) | 8,543 | ||||||||||
| 3 Month Eurodollar | (17 | ) | 12/16/2019 | (4,123,987 | ) | 7,581 | ||||||||||
| 3 Month Eurodollar | (9 | ) | 12/14/2020 | (2,182,950 | ) | 344 | ||||||||||
| Euro-OAT | (1 | ) | 09/06/2018 | (180,472 | ) | (801 | ) | |||||||||
| U.S. Treasury 10 Year Ultra Note | (3 | ) | 09/19/2018 | (384,703 | ) | (3,415 | ) | |||||||||
U.S. Treasury Ultra Bond | (28 | ) | 09/19/2018 | (4,467,750 | ) | (82,355 | ) | |||||||||
| TOTAL | $ | (70,399 | ) | |||||||||||||
| TOTAL FUTURES CONTRACTS | $ | (4,415 | ) | |||||||||||||
SWAP CONTRACTS — At June 30, 2018, the Fund had the following swap contracts:
CENTRALLY CLEARED CREDIT DEFAULT SWAP CONTRACTS
| Reference Obligation/Index(a) | Financing Rate Received (paid) by the Fund | Credit Spread at June 30, 2018(b) | Termination Date | Notional Amount (000’s) | Value | Upfront Premium (Received) Paid | Unrealized Appreciation/ (Depreciation) | |||||||||||||||||||||
Protection Sold: | ||||||||||||||||||||||||||||
| CDX North America Investment Grade Index | 1.000 | % | 0.672 | % | 06/20/2023 | USD 425 | $ | 6,488 | $ | 6,383 | $ | 105 | ||||||||||||||||
iTraxx Europe Index | 1.000 | 0.735 | 06/20/2023 | EUR 200 | 3,092 | 3,226 | (134 | ) | ||||||||||||||||||||
| TOTAL | $ | 9,580 | $ | 9,609 | $ | (29 | ) | |||||||||||||||||||||
| (a) | Payments received quarterly. |
| (b) | Credit spread on the referenced obligation, together with the period of expiration, are indicators of payment/performance risk. The likelihood of a credit event occurring which would require a fund or its counterparty to make a payment or otherwise be required to perform under the swap contract is generally greater as the credit spread and term of the swap contract increase. |
| 30 | The accompanying notes are an integral part of these financial statements. |
GOLDMAN SACHS VARIABLE INSURANCE TRUST CORE FIXED INCOME FUND
ADDITIONAL INVESTMENT INFORMATION (continued)
CENTRALLY CLEARED INTEREST RATE SWAP CONTRACTS
| Payments Made by the Fund | Payments Received by the Fund | Termination Date | Notional Amount (000’s)(a) | Value | Upfront Premium (Received) Paid | Unrealized Appreciation/ (Depreciation) | ||||||||||||||||||||||
| 3 Month BA(b) | 2.000% | 09/19/2020 | CAD | 470 | $ | (2,449 | ) | $ | (2,815 | ) | $ | 366 | ||||||||||||||||
| 3 Month EURIBOR(c) | 0.100 | 09/19/2020 | EUR | 380 | 2,595 | 1,810 | 785 | |||||||||||||||||||||
| 6 Month LIBOR(b) | 1.000 | 09/19/2020 | GBP | 540 | (1,242 | ) | (1,175 | ) | (67 | ) | ||||||||||||||||||
| 3 Month NIBOR(c) | 1.450 | 09/19/2020 | NOK | 2,670 | 60 | 176 | (116 | ) | ||||||||||||||||||||
| 6 Month NIBOR(b) | 1.600 | 09/19/2020 | NOK | 2,480 | 453 | 446 | 7 | |||||||||||||||||||||
| 0.100%(d) | 3 Month STIBOR | 09/19/2020 | SEK | 6,250 | (2,623 | ) | (1,656 | ) | (967 | ) | ||||||||||||||||||
| 0.100(d) | 6 Month EURIBOR | 10/15/2020 | EUR | 100 | (568 | ) | (551 | ) | (17 | ) | ||||||||||||||||||
| 3 Month LIBOR(c) | 2.139 | 11/20/2020 | USD | 5,920 | (87,145 | ) | (15,270 | ) | (71,875 | ) | ||||||||||||||||||
| 6 Month EURIBOR(b) | 0.350 | 12/16/2021 | EUR | 1,410 | 4,427 | (2,753 | ) | 7,180 | ||||||||||||||||||||
| 0.500(d) | 3 Month STIBOR | 12/16/2021 | SEK | 11,710 | (2,234 | ) | 4,304 | (6,538 | ) | |||||||||||||||||||
| 3 Month BA(b) | 2.250 | 09/19/2023 | CAD | 60 | (517 | ) | (810 | ) | 293 | |||||||||||||||||||
| 6 Month EURIBOR(b) | 0.500 | 09/19/2023 | EUR | 790 | 8,516 | 2,390 | 6,126 | |||||||||||||||||||||
| 1.250(b) | 6 Month LIBOR | 09/19/2023 | GBP | 750 | 4,640 | 5,104 | (464 | ) | ||||||||||||||||||||
| 2.750(b) | 3 Month BBR | 09/19/2023 | NZD | 210 | (1,126 | ) | 221 | (1,347 | ) | |||||||||||||||||||
| 0.750(d) | 3 Month STIBOR | 09/19/2023 | SEK | 9,780 | (14,029 | ) | (7,452 | ) | (6,577 | ) | ||||||||||||||||||
| 3 Month LIBOR(c) | 2.250 | 09/19/2023 | USD | 980 | (30,086 | ) | (32,740 | ) | 2,654 | |||||||||||||||||||
| 2.275(b) | 3 Month LIBOR | 11/20/2023 | USD | 2,600 | 78,375 | 10,296 | 68,079 | |||||||||||||||||||||
| 2.000(d) | 3 Month STIBOR | 11/02/2027 | SEK | 1,290 | (1,743 | ) | (176 | ) | (1,567 | ) | ||||||||||||||||||
| 6 Month BBR(b) | 2.750 | 09/19/2028 | AUD | 160 | (978 | ) | (2,797 | ) | 1,819 | |||||||||||||||||||
| 3 Month BA(b) | 2.250 | 09/19/2028 | CAD | 70 | (1,615 | ) | (2,214 | ) | 599 | |||||||||||||||||||
| 3.250(b) | 3 Month BBR | 09/19/2028 | NZD | 170 | (1,949 | ) | 60 | (2,009 | ) | |||||||||||||||||||
| 1.250(d) | 3 Month STIBOR | 09/19/2028 | SEK | 800 | (627 | ) | 918 | (1,545 | ) | |||||||||||||||||||
| 2.500(b) | 3 Month LIBOR | 09/19/2028 | USD | 20 | 780 | 987 | (207 | ) | ||||||||||||||||||||
| 1.750(b) | 6 Month LIBOR | 12/14/2037 | GBP | 280 | 1,357 | 3,383 | (2,026 | ) | ||||||||||||||||||||
| 3 Month LIBOR(c) | 3.000 | 06/15/2048 | USD | 600 | 4,479 | 224 | 4,255 | |||||||||||||||||||||
| 1.500(d) | 6 Month EURIBOR | 09/19/2048 | EUR | 60 | (622 | ) | 990 | (1,612 | ) | |||||||||||||||||||
| 1.000(b) | 6 Month LIBOR | 09/19/2048 | JPY | 13,070 | (5,059 | ) | (4,034 | ) | (1,025 | ) | ||||||||||||||||||
| TOTAL | $ | (48,930 | ) | $ | (43,134 | ) | $ | (5,796 | ) | |||||||||||||||||||
| (a) | Represents forward starting interest rate swaps whose effective dates of commencement of accruals and cash flows occur subsequent to June 30, 2018. |
| (b) | Payments made semi-annually. |
| (c) | Payments made quarterly. |
| (d) | Payments made annually. |
| The accompanying notes are an integral part of these financial statements. | 31 |
GOLDMAN SACHS VARIABLE INSURANCE TRUST EQUITY INDEX FUND
Schedule of Investments
June 30, 2018 (Unaudited)
| Shares | Description | Value | ||||||
| Common Stocks – 99.2% | ||||||||
Automobiles & Components – 0.6% | ||||||||
| 2,006 | Aptiv plc | $ | 183,810 | |||||
| 1,437 | BorgWarner, Inc. | 62,021 | ||||||
| 29,084 | Ford Motor Co. | 321,960 | ||||||
| 9,381 | General Motors Co. | 369,611 | ||||||
| 1,729 | Goodyear Tire & Rubber Co. (The) | 40,268 | ||||||
| 1,249 | Harley-Davidson, Inc. | 52,558 | ||||||
|
| |||||||
| 1,030,228 | ||||||||
|
| |||||||
Banks – 6.1% | ||||||||
| 70,276 | Bank of America Corp. | 1,981,080 | ||||||
| 5,849 | BB&T Corp. | 295,024 | ||||||
| 18,990 | Citigroup, Inc. | 1,270,811 | ||||||
| 3,599 | Citizens Financial Group, Inc. | 140,001 | ||||||
| 1,272 | Comerica, Inc. | 115,650 | ||||||
| 5,195 | Fifth Third Bancorp | 149,097 | ||||||
| 8,155 | Huntington Bancshares, Inc. | 120,368 | ||||||
| 25,410 | JPMorgan Chase & Co. | 2,647,722 | ||||||
| 7,852 | KeyCorp | 153,428 | ||||||
| 1,108 | M&T Bank Corp. | 188,526 | ||||||
| 2,617 | People’s United Financial, Inc. | 47,342 | ||||||
| 3,508 | PNC Financial Services Group, Inc. (The) | 473,931 | ||||||
| 8,396 | Regions Financial Corp. | 149,281 | ||||||
| 3,522 | SunTrust Banks, Inc. | 232,522 | ||||||
| 390 | SVB Financial Group* | 112,616 | ||||||
| 11,736 | US Bancorp | 587,035 | ||||||
| 32,680 | Wells Fargo & Co. | 1,811,779 | ||||||
| 1,442 | Zions Bancorp | 75,979 | ||||||
|
| |||||||
| 10,552,192 | ||||||||
|
| |||||||
Capital Goods – 6.8% | ||||||||
| 4,448 | 3M Co. | 875,011 | ||||||
| 740 | Allegion plc | 57,246 | ||||||
| 1,738 | AMETEK, Inc. | 125,414 | ||||||
| 1,081 | AO Smith Corp. | 63,941 | ||||||
| 2,985 | Arconic, Inc. | 50,775 | ||||||
| 4,083 | Boeing Co. (The) | 1,369,887 | ||||||
| 4,461 | Caterpillar, Inc. | 605,224 | ||||||
| 1,164 | Cummins, Inc. | 154,812 | ||||||
| 2,409 | Deere & Co. | 336,778 | ||||||
| 1,172 | Dover Corp. | 85,790 | ||||||
| 3,318 | Eaton Corp. plc | 247,987 | ||||||
| 4,752 | Emerson Electric Co. | 328,553 | ||||||
| 2,214 | Fastenal Co. | 106,560 | ||||||
| 1,025 | Flowserve Corp. | 41,410 | ||||||
| 1,113 | Fluor Corp. | 54,292 | ||||||
| 2,270 | Fortive Corp. | 175,040 | ||||||
| 1,158 | Fortune Brands Home & Security, Inc. | 62,173 | ||||||
| 2,046 | General Dynamics Corp. | 381,395 | ||||||
| 64,873 | General Electric Co. | 882,922 | ||||||
| 877 | Harris Corp. | 126,762 | ||||||
| 5,589 | Honeywell International, Inc. | 805,095 | ||||||
| 353 | Huntington Ingalls Industries, Inc. | 76,527 | ||||||
| 2,257 | Illinois Tool Works, Inc. | 312,685 | ||||||
| 1,895 | Ingersoll-Rand plc | 170,038 | ||||||
|
| |||||||
| Common Stocks – (continued) | ||||||||
Capital Goods – (continued) | ||||||||
| 903 | Jacobs Engineering Group, Inc. | $ | 57,331 | |||||
| 6,984 | Johnson Controls International plc | 233,615 | ||||||
| 581 | L3 Technologies, Inc. | 111,738 | ||||||
| 1,858 | Lockheed Martin Corp. | 548,909 | ||||||
| 2,373 | Masco Corp. | 88,798 | ||||||
| 1,302 | Northrop Grumman Corp. | 400,625 | ||||||
| 2,667 | PACCAR, Inc. | 165,247 | ||||||
| 986 | Parker-Hannifin Corp. | 153,668 | ||||||
| 1,227 | Pentair plc | 51,632 | ||||||
| 1,227 | Quanta Services, Inc.* | 40,982 | ||||||
| 2,145 | Raytheon Co. | 414,371 | ||||||
| 963 | Rockwell Automation, Inc. | 160,080 | ||||||
| 1,237 | Rockwell Collins, Inc. | 166,599 | ||||||
| 763 | Roper Technologies, Inc. | 210,519 | ||||||
| 436 | Snap-on, Inc. | 70,074 | ||||||
| 1,131 | Stanley Black & Decker, Inc. | 150,208 | ||||||
| 1,927 | Textron, Inc. | 127,009 | ||||||
| 354 | TransDigm Group, Inc. | 122,180 | ||||||
| 647 | United Rentals, Inc.* | 95,510 | ||||||
| 5,541 | United Technologies Corp. | 692,791 | ||||||
| 389 | WW Grainger, Inc. | 119,968 | ||||||
| 1,339 | Xylem, Inc. | 90,222 | ||||||
|
| |||||||
| 11,768,393 | ||||||||
|
| |||||||
Commercial & Professional Services – 0.6% | ||||||||
| 653 | Cintas Corp. | 120,851 | ||||||
| 1,509 | Copart, Inc.* | 85,349 | ||||||
| 901 | Equifax, Inc. | 112,724 | ||||||
| 2,597 | IHS Markit Ltd.* | 133,979 | ||||||
| 2,557 | Nielsen Holdings plc | 79,088 | ||||||
| 1,667 | Republic Services, Inc. | 113,956 | ||||||
| 917 | Robert Half International, Inc. | 59,697 | ||||||
| 647 | Stericycle, Inc.* | 42,243 | ||||||
| 1,172 | Verisk Analytics, Inc.* | 126,154 | ||||||
| 2,991 | Waste Management, Inc. | 243,288 | ||||||
|
| |||||||
| 1,117,329 | ||||||||
|
| |||||||
Consumer Durables & Apparel – 1.2% | ||||||||
| 2,535 | DR Horton, Inc. | 103,935 | ||||||
| 813 | Garmin Ltd. | 49,593 | ||||||
| 2,697 | Hanesbrands, Inc. | 59,388 | ||||||
| 815 | Hasbro, Inc. | 75,233 | ||||||
| 931 | Leggett & Platt, Inc. | 41,560 | ||||||
| 2,085 | Lennar Corp. Class A | 109,462 | ||||||
| 2,776 | Mattel, Inc.(a) | 45,582 | ||||||
| 1,146 | Michael Kors Holdings Ltd.* | 76,324 | ||||||
| 473 | Mohawk Industries, Inc.* | 101,350 | ||||||
| 3,655 | Newell Brands, Inc. | 94,262 | ||||||
| 9,536 | NIKE, Inc. Class B | 759,828 | ||||||
| 1,915 | PulteGroup, Inc. | 55,056 | ||||||
| 579 | PVH Corp. | 86,688 | ||||||
| 413 | Ralph Lauren Corp. | 51,922 | ||||||
| 2,140 | Tapestry, Inc. | 99,959 | ||||||
|
| |||||||
| 32 | The accompanying notes are an integral part of these financial statements. |
GOLDMAN SACHS VARIABLE INSURANCE TRUST EQUITY INDEX FUND
| Shares | Description | Value | ||||||
| Common Stocks – (continued) | ||||||||
Consumer Durables & Apparel – (continued) | ||||||||
| 1,254 | Under Armour, Inc. Class A* | $ | 28,190 | |||||
| 1,232 | Under Armour, Inc. Class C* | 25,971 | ||||||
| 2,488 | VF Corp. | 202,822 | ||||||
| 464 | Whirlpool Corp. | 67,851 | ||||||
|
| |||||||
| 2,134,976 | ||||||||
|
| |||||||
Consumer Services – 1.6% | ||||||||
| 3,009 | Carnival Corp. | 172,446 | ||||||
| 191 | Chipotle Mexican Grill, Inc.* | 82,392 | ||||||
| 929 | Darden Restaurants, Inc. | 99,459 | ||||||
| 1,623 | H&R Block, Inc. | 36,972 | ||||||
| 2,122 | Hilton Worldwide Holdings, Inc. | 167,978 | ||||||
| 2,194 | Marriott International, Inc. Class A | 277,760 | ||||||
| 5,850 | McDonald’s Corp. | 916,636 | ||||||
| 3,888 | MGM Resorts International | 112,869 | ||||||
| 1,409 | Norwegian Cruise Line Holdings Ltd.* | 66,575 | ||||||
| 1,262 | Royal Caribbean Cruises Ltd. | 130,743 | ||||||
| 10,258 | Starbucks Corp. | 501,103 | ||||||
| 612 | Wynn Resorts Ltd. | 102,412 | ||||||
| 2,382 | Yum! Brands, Inc. | 186,320 | ||||||
|
| |||||||
| 2,853,665 | ||||||||
|
| |||||||
Diversified Financials – 5.3% | ||||||||
| 424 | Affiliated Managers Group, Inc. | 63,036 | ||||||
| 5,302 | American Express Co. | 519,596 | ||||||
| 1,082 | Ameriprise Financial, Inc. | 151,350 | ||||||
| 7,519 | Bank of New York Mellon Corp. (The) | 405,500 | ||||||
| 14,334 | Berkshire Hathaway, Inc. Class B* | 2,675,441 | ||||||
| 918 | BlackRock, Inc. | 458,119 | ||||||
| 3,657 | Capital One Financial Corp. | 336,078 | ||||||
| 841 | Cboe Global Markets, Inc. | 87,523 | ||||||
| 8,995 | Charles Schwab Corp. (The) | 459,645 | ||||||
| 2,534 | CME Group, Inc. | 415,373 | ||||||
| 2,661 | Discover Financial Services | 187,361 | ||||||
| 1,975 | E*TRADE Financial Corp.* | 120,791 | ||||||
| 2,368 | Franklin Resources, Inc. | 75,894 | ||||||
| 2,610 | Goldman Sachs Group, Inc. (The)(b) | 575,688 | ||||||
| 4,345 | Intercontinental Exchange, Inc. | 319,575 | ||||||
| 3,083 | Invesco Ltd. | 81,884 | ||||||
| 2,395 | Jefferies Financial Services, Inc. | 54,462 | ||||||
| 1,252 | Moody’s Corp. | 213,541 | ||||||
| 10,118 | Morgan Stanley | 479,593 | ||||||
| 683 | MSCI, Inc. | 112,989 | ||||||
| 905 | Nasdaq, Inc. | 82,599 | ||||||
| 1,590 | Northern Trust Corp. | 163,595 | ||||||
| 993 | Raymond James Financial, Inc. | 88,725 | ||||||
| 1,863 | S&P Global, Inc. | 379,847 | ||||||
| 2,722 | State Street Corp. | 253,391 | ||||||
| 5,356 | Synchrony Financial | 178,783 | ||||||
| 1,818 | T. Rowe Price Group, Inc. | 211,052 | ||||||
|
| |||||||
| 9,151,431 | ||||||||
|
| |||||||
Energy – 6.3% | ||||||||
| 3,863 | Anadarko Petroleum Corp. | 282,965 | ||||||
| 1,050 | Andeavor | 137,739 | ||||||
|
| |||||||
| Common Stocks – (continued) | ||||||||
Energy – (continued) | ||||||||
| 2,900 | Apache Corp. | $ | 135,575 | |||||
| 3,244 | Baker Hughes a GE Co. | 107,149 | ||||||
| 3,422 | Cabot Oil & Gas Corp. | 81,444 | ||||||
| 14,263 | Chevron Corp. | 1,803,271 | ||||||
| 696 | Cimarex Energy Co. | 70,811 | ||||||
| 1,139 | Concho Resources, Inc.* | 157,581 | ||||||
| 8,785 | ConocoPhillips | 611,612 | ||||||
| 3,872 | Devon Energy Corp. | 170,213 | ||||||
| 4,344 | EOG Resources, Inc. | 540,524 | ||||||
| 1,888 | EQT Corp. | 104,180 | ||||||
| 31,557 | Exxon Mobil Corp. | 2,610,711 | ||||||
| 6,566 | Halliburton Co. | 295,864 | ||||||
| 800 | Helmerich & Payne, Inc. | 51,008 | ||||||
| 1,915 | Hess Corp. | 128,094 | ||||||
| 1,347 | HollyFrontier Corp. | 92,175 | ||||||
| 14,117 | Kinder Morgan, Inc. | 249,447 | ||||||
| 6,441 | Marathon Oil Corp. | 134,359 | ||||||
| 3,414 | Marathon Petroleum Corp. | 239,526 | ||||||
| 2,909 | National Oilwell Varco, Inc. | 126,251 | ||||||
| 1,411 | Newfield Exploration Co.* | 42,683 | ||||||
| 3,593 | Noble Energy, Inc. | 126,761 | ||||||
| 5,674 | Occidental Petroleum Corp. | 474,800 | ||||||
| 2,965 | ONEOK, Inc. | 207,046 | ||||||
| 3,124 | Phillips 66 | 350,856 | ||||||
| 1,276 | Pioneer Natural Resources Co. | 241,470 | ||||||
| 10,360 | Schlumberger Ltd. | 694,431 | ||||||
| 3,216 | TechnipFMC plc | 102,076 | ||||||
| 3,253 | Valero Energy Corp. | 360,530 | ||||||
| 6,069 | Williams Cos., Inc. (The) | 164,531 | ||||||
|
| |||||||
| 10,895,683 | ||||||||
|
| |||||||
Food & Staples Retailing – 1.4% | ||||||||
| 3,276 | Costco Wholesale Corp. | 684,619 | ||||||
| 5,905 | Kroger Co. (The) | 167,997 | ||||||
| 3,566 | Sysco Corp. | 243,522 | ||||||
| 6,342 | Walgreens Boots Alliance, Inc. | 380,615 | ||||||
| 10,843 | Walmart, Inc. | 928,703 | ||||||
|
| |||||||
| 2,405,456 | ||||||||
|
| |||||||
Food, Beverage & Tobacco – 3.9% | ||||||||
| 14,078 | Altria Group, Inc. | 799,490 | ||||||
| 4,219 | Archer-Daniels-Midland Co. | 193,357 | ||||||
| 1,795 | Brown-Forman Corp. Class B | 87,973 | ||||||
| 1,507 | Campbell Soup Co.(a) | 61,094 | ||||||
| 28,648 | Coca-Cola Co. (The) | 1,256,501 | ||||||
| 3,054 | Conagra Brands, Inc. | 109,120 | ||||||
| 1,244 | Constellation Brands, Inc. Class A | 272,274 | ||||||
| 4,220 | General Mills, Inc. | 186,777 | ||||||
| 1,040 | Hershey Co. (The) | 96,782 | ||||||
| 1,987 | Hormel Foods Corp. | 73,936 | ||||||
| 878 | JM Smucker Co. (The) | 94,368 | ||||||
| 1,911 | Kellogg Co. | 133,522 | ||||||
| 4,502 | Kraft Heinz Co. (The) | 282,816 | ||||||
| 926 | McCormick & Co., Inc. (Non-Voting) | 107,499 | ||||||
| 1,400 | Molson Coors Brewing Co. Class B | 95,256 | ||||||
|
| |||||||
| The accompanying notes are an integral part of these financial statements. | 33 |
GOLDMAN SACHS VARIABLE INSURANCE TRUST EQUITY INDEX FUND
Schedule of Investments (continued)
June 30, 2018 (Unaudited)
| Shares | Description | Value | ||||||
| Common Stocks – (continued) | ||||||||
Food, Beverage & Tobacco – (continued) | ||||||||
| 11,076 | Mondelez International, Inc. Class A | $ | 454,116 | |||||
| 3,118 | Monster Beverage Corp.* | 178,661 | ||||||
| 10,576 | PepsiCo, Inc. | 1,151,409 | ||||||
| 11,545 | Philip Morris International, Inc. | 932,143 | ||||||
| 2,228 | Tyson Foods, Inc. Class A | 153,398 | ||||||
|
| |||||||
| 6,720,492 | ||||||||
|
| |||||||
Health Care Equipment & Services – 6.3% | ||||||||
| 12,935 | Abbott Laboratories | 788,906 | ||||||
| 315 | ABIOMED, Inc.* | 128,851 | ||||||
| 2,452 | Aetna, Inc. | 449,942 | ||||||
| 535 | Align Technology, Inc.* | 183,045 | ||||||
| 1,249 | AmerisourceBergen Corp. | 106,502 | ||||||
| 1,904 | Anthem, Inc. | 453,209 | ||||||
| 3,702 | Baxter International, Inc. | 273,356 | ||||||
| 1,973 | Becton Dickinson and Co. | 472,652 | ||||||
| 10,196 | Boston Scientific Corp.* | 333,409 | ||||||
| 2,396 | Cardinal Health, Inc. | 116,997 | ||||||
| 1,552 | Centene Corp.* | 191,222 | ||||||
| 2,394 | Cerner Corp.* | 143,137 | ||||||
| 1,831 | Cigna Corp. | 311,178 | ||||||
| 366 | Cooper Cos., Inc. (The) | 86,175 | ||||||
| 7,523 | CVS Health Corp. | 484,105 | ||||||
| 4,585 | Danaher Corp. | 452,448 | ||||||
| 1,007 | DaVita, Inc.* | 69,926 | ||||||
| 1,701 | DENTSPLY SIRONA, Inc. | 74,453 | ||||||
| 1,575 | Edwards Lifesciences Corp.* | 229,273 | ||||||
| 912 | Envision Healthcare Corp.* | 40,137 | ||||||
| 4,211 | Express Scripts Holding Co.* | 325,131 | ||||||
| 2,102 | HCA Healthcare, Inc. | 215,665 | ||||||
| 1,129 | Henry Schein, Inc.* | 82,011 | ||||||
| 2,080 | Hologic, Inc.* | 82,680 | ||||||
| 1,037 | Humana, Inc. | 308,642 | ||||||
| 639 | IDEXX Laboratories, Inc.* | 139,264 | ||||||
| 832 | Intuitive Surgical, Inc.* | 398,095 | ||||||
| 766 | Laboratory Corp. of America Holdings* | 137,520 | ||||||
| 1,489 | McKesson Corp. | 198,633 | ||||||
| 10,104 | Medtronic plc | 865,003 | ||||||
| 1,024 | Quest Diagnostics, Inc. | 112,579 | ||||||
| 1,068 | ResMed, Inc. | 110,623 | ||||||
| 2,405 | Stryker Corp. | 406,108 | ||||||
| 7,169 | UnitedHealth Group, Inc. | 1,758,842 | ||||||
| 668 | Universal Health Services, Inc. Class B | 74,442 | ||||||
| 711 | Varian Medical Systems, Inc.* | 80,855 | ||||||
| 1,517 | Zimmer Biomet Holdings, Inc. | 169,054 | ||||||
|
| |||||||
| 10,854,070 | ||||||||
|
| |||||||
Household & Personal Products – 1.6% | ||||||||
| 1,894 | Church & Dwight Co., Inc. | 100,685 | ||||||
| 990 | Clorox Co. (The) | 133,897 | ||||||
| 6,504 | Colgate-Palmolive Co. | 421,524 | ||||||
| 3,489 | Coty, Inc. Class A | 49,195 | ||||||
| 1,669 | Estee Lauder Cos., Inc. (The) Class A | 238,150 | ||||||
| 2,589 | Kimberly-Clark Corp. | 272,725 | ||||||
|
| |||||||
| Common Stocks – (continued) | ||||||||
Household & Personal Products – (continued) | ||||||||
| 18,759 | Procter & Gamble Co. (The) | $ | 1,464,328 | |||||
|
| |||||||
| 2,680,504 | ||||||||
|
| |||||||
Insurance – 2.4% | ||||||||
| 5,781 | Aflac, Inc. | 248,699 | ||||||
| 2,640 | Allstate Corp. (The) | 240,953 | ||||||
| 6,736 | American International Group, Inc. | 357,143 | ||||||
| 1,844 | Aon plc | 252,941 | ||||||
| 1,356 | Arthur J Gallagher & Co. | 88,520 | ||||||
| 397 | Assurant, Inc. | 41,086 | ||||||
| 693 | Brighthouse Financial, Inc.* | 27,768 | ||||||
| 3,450 | Chubb Ltd. | 438,219 | ||||||
| 1,136 | Cincinnati Financial Corp. | 75,953 | ||||||
| 305 | Everest Re Group Ltd. | 70,296 | ||||||
| 2,620 | Hartford Financial Services Group, Inc. (The) | 133,961 | ||||||
| 1,630 | Lincoln National Corp. | 101,467 | ||||||
| 1,992 | Loews Corp. | 96,174 | ||||||
| 3,828 | Marsh & McLennan Cos., Inc. | 313,781 | ||||||
| 7,672 | MetLife, Inc. | 334,499 | ||||||
| 2,000 | Principal Financial Group, Inc. | 105,900 | ||||||
| 4,369 | Progressive Corp. (The) | 258,426 | ||||||
| 3,160 | Prudential Financial, Inc. | 295,492 | ||||||
| 821 | Torchmark Corp. | 66,838 | ||||||
| 2,019 | Travelers Cos., Inc. (The) | 247,004 | ||||||
| 1,673 | Unum Group | 61,884 | ||||||
| 977 | Willis Towers Watson plc | 148,113 | ||||||
| 1,903 | XL Group Ltd. | 106,473 | ||||||
|
| |||||||
| 4,111,590 | ||||||||
|
| |||||||
Materials – 2.6% | ||||||||
| 1,629 | Air Products & Chemicals, Inc. | 253,684 | ||||||
| 822 | Albemarle Corp. | 77,539 | ||||||
| 688 | Avery Dennison Corp. | 70,245 | ||||||
| 2,588 | Ball Corp. | 92,003 | ||||||
| 1,681 | CF Industries Holdings, Inc. | 74,636 | ||||||
| 17,298 | DowDuPont, Inc. | 1,140,284 | ||||||
| 1,076 | Eastman Chemical Co. | 107,557 | ||||||
| 1,951 | Ecolab, Inc. | 273,784 | ||||||
| 985 | FMC Corp. | 87,872 | ||||||
| 10,104 | Freeport-McMoRan, Inc. | 174,395 | ||||||
| 604 | International Flavors & Fragrances, Inc. | 74,872 | ||||||
| 3,058 | International Paper Co. | 159,261 | ||||||
| 2,424 | LyondellBasell Industries NV Class A | 266,276 | ||||||
| 481 | Martin Marietta Materials, Inc. | 107,422 | ||||||
| 2,585 | Mosaic Co. (The) | 72,509 | ||||||
| 4,065 | Newmont Mining Corp. | 153,291 | ||||||
| 2,351 | Nucor Corp. | 146,938 | ||||||
| 705 | Packaging Corp. of America | 78,812 | ||||||
| 1,877 | PPG Industries, Inc. | 194,701 | ||||||
| 2,135 | Praxair, Inc. | 337,650 | ||||||
| 1,214 | Sealed Air Corp. | 51,534 | ||||||
| 619 | Sherwin-Williams Co. (The) | 252,286 | ||||||
| 974 | Vulcan Materials Co. | 125,705 | ||||||
|
| |||||||
| 34 | The accompanying notes are an integral part of these financial statements. |
GOLDMAN SACHS VARIABLE INSURANCE TRUST EQUITY INDEX FUND
| Shares | Description | Value | ||||||
| Common Stocks – (continued) | ||||||||
Materials – (continued) | ||||||||
| 1,950 | WestRock Co. | $ | 111,189 | |||||
|
| |||||||
| 4,484,445 | ||||||||
|
| |||||||
Media – 2.2% | ||||||||
| 2,538 | CBS Corp. (Non-Voting) Class B | 142,686 | ||||||
| 1,381 | Charter Communications, Inc. Class A* | 404,923 | ||||||
| 34,228 | Comcast Corp. Class A | 1,123,021 | ||||||
| 1,181 | Discovery, Inc. Class A*(a) | 32,478 | ||||||
| 2,194 | Discovery, Inc. Class C* | 55,947 | ||||||
| 1,800 | DISH Network Corp. Class A* | 60,498 | ||||||
| 2,948 | Interpublic Group of Cos., Inc. (The) | 69,101 | ||||||
| 2,809 | News Corp. Class A | 43,540 | ||||||
| 1,017 | News Corp. Class B | 16,119 | ||||||
| 1,690 | Omnicom Group, Inc. | 128,896 | ||||||
| 7,862 | Twenty-First Century Fox, Inc. Class A | 390,663 | ||||||
| 3,229 | Twenty-First Century Fox, Inc. Class B | 159,093 | ||||||
| 2,641 | Viacom, Inc. Class B | 79,653 | ||||||
| 11,082 | Walt Disney Co. (The) | 1,161,504 | ||||||
|
| |||||||
| 3,868,122 | ||||||||
|
| |||||||
Pharmaceuticals, Biotechnology & Life Sciences – 7.7% | ||||||||
| 11,346 | AbbVie, Inc. | 1,051,207 | ||||||
| 2,415 | Agilent Technologies, Inc. | 149,344 | ||||||
| 1,635 | Alexion Pharmaceuticals, Inc.* | 202,985 | ||||||
| 2,445 | Allergan plc | 407,630 | ||||||
| 4,969 | Amgen, Inc. | 917,228 | ||||||
| 1,583 | Biogen, Inc.* | 459,450 | ||||||
| 12,120 | Bristol-Myers Squibb Co. | 670,721 | ||||||
| 5,292 | Celgene Corp.* | 420,291 | ||||||
| 7,098 | Eli Lilly & Co. | 605,672 | ||||||
| 9,666 | Gilead Sciences, Inc. | 684,739 | ||||||
| 1,104 | Illumina, Inc.* | 308,336 | ||||||
| 1,335 | Incyte Corp.* | 89,445 | ||||||
| 1,097 | IQVIA Holdings, Inc.* | 109,503 | ||||||
| 19,980 | Johnson & Johnson | 2,424,373 | ||||||
| 20,153 | Merck & Co., Inc. | 1,223,287 | ||||||
| 186 | Mettler-Toledo International, Inc.* | 107,625 | ||||||
| 3,849 | Mylan NV* | 139,103 | ||||||
| 1,164 | Nektar Therapeutics* | 56,838 | ||||||
| 857 | PerkinElmer, Inc. | 62,758 | ||||||
| 944 | Perrigo Co. plc | 68,827 | ||||||
| 43,580 | Pfizer, Inc. | 1,581,082 | ||||||
| 586 | Regeneron Pharmaceuticals, Inc.* | 202,164 | ||||||
| 3,011 | Thermo Fisher Scientific, Inc. | 623,699 | ||||||
| 1,904 | Vertex Pharmaceuticals, Inc.* | 323,604 | ||||||
| 579 | Waters Corp.* | 112,089 | ||||||
| 3,620 | Zoetis, Inc. | 308,388 | ||||||
|
| |||||||
| 13,310,388 | ||||||||
|
| |||||||
Real Estate – 2.8% | ||||||||
| 743 | Alexandria Real Estate Equities, Inc. (REIT) | 93,744 | ||||||
| 3,244 | American Tower Corp. (REIT) | 467,688 | ||||||
| 1,113 | Apartment Investment & Management Co. Class A (REIT) | 47,080 | ||||||
|
| |||||||
| Common Stocks – (continued) | ||||||||
Real Estate – (continued) | ||||||||
| 1,017 | AvalonBay Communities, Inc. (REIT) | $ | 174,812 | |||||
| 1,134 | Boston Properties, Inc. (REIT) | 142,226 | ||||||
| 2,311 | CBRE Group, Inc. Class A* | 110,327 | ||||||
| 3,073 | Crown Castle International Corp. (REIT) | 331,331 | ||||||
| 1,564 | Digital Realty Trust, Inc. (REIT) | 174,511 | ||||||
| 2,616 | Duke Realty Corp. (REIT) | 75,942 | ||||||
| 598 | Equinix, Inc. (REIT) | 257,074 | ||||||
| 2,704 | Equity Residential (REIT) | 172,218 | ||||||
| 489 | Essex Property Trust, Inc. (REIT) | 116,905 | ||||||
| 931 | Extra Space Storage, Inc. (REIT) | 92,923 | ||||||
| 562 | Federal Realty Investment Trust (REIT) | 71,121 | ||||||
| 4,808 | GGP, Inc. (REIT) | 98,227 | ||||||
| 3,435 | HCP, Inc. (REIT) | 88,692 | ||||||
| 5,516 | Host Hotels & Resorts, Inc. (REIT) | 116,222 | ||||||
| 1,967 | Iron Mountain, Inc. (REIT) | 68,865 | ||||||
| 3,014 | Kimco Realty Corp. (REIT) | 51,208 | ||||||
| 813 | Macerich Co. (The) (REIT) | 46,203 | ||||||
| 862 | Mid-America Apartment Communities, Inc. (REIT) | 86,778 | ||||||
| 3,946 | Prologis, Inc. (REIT) | 259,213 | ||||||
| 1,132 | Public Storage (REIT) | 256,806 | ||||||
| 2,160 | Realty Income Corp. (REIT) | 116,186 | ||||||
| 1,137 | Regency Centers Corp. (REIT) | 70,585 | ||||||
| 860 | SBA Communications Corp. (REIT)* | 142,003 | ||||||
| 2,325 | Simon Property Group, Inc. (REIT) | 395,692 | ||||||
| 684 | SL Green Realty Corp. (REIT) | 68,763 | ||||||
| 1,934 | UDR, Inc. (REIT) | 72,602 | ||||||
| 2,674 | Ventas, Inc. (REIT) | 152,284 | ||||||
| 1,322 | Vornado Realty Trust (REIT) | 97,722 | ||||||
| 2,781 | Welltower, Inc. (REIT) | 174,341 | ||||||
| 5,665 | Weyerhaeuser Co. (REIT) | 206,546 | ||||||
|
| |||||||
| 4,896,840 | ||||||||
|
| |||||||
Retailing – 7.1% | ||||||||
| 548 | Advance Auto Parts, Inc. | 74,364 | ||||||
| 3,007 | Amazon.com, Inc.* | 5,111,299 | ||||||
| 201 | AutoZone, Inc.* | 134,857 | ||||||
| 1,798 | Best Buy Co., Inc. | 134,095 | ||||||
| 359 | Booking Holdings, Inc.* | 727,725 | ||||||
| 1,366 | CarMax, Inc.* | 99,540 | ||||||
| 1,913 | Dollar General Corp. | 188,622 | ||||||
| 1,783 | Dollar Tree, Inc.* | 151,555 | ||||||
| 912 | Expedia Group, Inc. | 109,613 | ||||||
| 910 | Foot Locker, Inc. | 47,912 | ||||||
| 1,637 | Gap, Inc. (The) | 53,022 | ||||||
| 1,069 | Genuine Parts Co. | 98,124 | ||||||
| 8,604 | Home Depot, Inc. (The) | 1,678,640 | ||||||
| 1,267 | Kohl’s Corp. | 92,364 | ||||||
| 1,832 | L Brands, Inc. | 67,564 | ||||||
| 2,396 | LKQ Corp.* | 76,432 | ||||||
| 6,107 | Lowe’s Cos., Inc. | 583,646 | ||||||
| 2,233 | Macy’s, Inc. | 83,581 | ||||||
| 3,237 | Netflix, Inc.* | 1,267,059 | ||||||
|
| |||||||
| The accompanying notes are an integral part of these financial statements. | 35 |
GOLDMAN SACHS VARIABLE INSURANCE TRUST EQUITY INDEX FUND
Schedule of Investments (continued)
June 30, 2018 (Unaudited)
| Shares | Description | Value | ||||||
| Common Stocks – (continued) | ||||||||
Retailing – (continued) | ||||||||
| 849 | Nordstrom, Inc. | $ | 43,961 | |||||
| 624 | O’Reilly Automotive, Inc.* | 170,708 | ||||||
| 2,858 | Ross Stores, Inc. | 242,216 | ||||||
| 3,948 | Target Corp. | 300,522 | ||||||
| 764 | Tiffany & Co. | 100,542 | ||||||
| 4,699 | TJX Cos., Inc. (The) | 447,251 | ||||||
| 901 | Tractor Supply Co. | 68,917 | ||||||
| 829 | TripAdvisor, Inc.* | 46,184 | ||||||
| 427 | Ulta Beauty, Inc.* | 99,687 | ||||||
|
| |||||||
| 12,300,002 | ||||||||
|
| |||||||
Semiconductors & Semiconductor Equipment – 4.0% | ||||||||
| 5,969 | Advanced Micro Devices, Inc.* | 89,475 | ||||||
| 2,776 | Analog Devices, Inc. | 266,274 | ||||||
| 7,476 | Applied Materials, Inc. | 345,317 | ||||||
| 2,985 | Broadcom, Inc. | 724,280 | ||||||
| 34,762 | Intel Corp. | 1,728,019 | ||||||
| 1,155 | KLA-Tencor Corp. | 118,422 | ||||||
| 1,213 | Lam Research Corp. | 209,667 | ||||||
| 1,737 | Microchip Technology, Inc. | 157,980 | ||||||
| 8,601 | Micron Technology, Inc.* | 451,036 | ||||||
| 4,514 | NVIDIA Corp. | 1,069,367 | ||||||
| 945 | Qorvo, Inc.* | 75,761 | ||||||
| 10,992 | QUALCOMM, Inc. | 616,871 | ||||||
| 1,346 | Skyworks Solutions, Inc. | 130,091 | ||||||
| 7,333 | Texas Instruments, Inc. | 808,463 | ||||||
| 1,904 | Xilinx, Inc. | 124,255 | ||||||
|
| |||||||
| 6,915,278 | ||||||||
|
| |||||||
Software & Services – 15.8% | ||||||||
| 4,783 | Accenture plc Class A | 782,451 | ||||||
| 5,685 | Activision Blizzard, Inc. | 433,879 | ||||||
| 3,654 | Adobe Systems, Inc.* | 890,882 | ||||||
| 1,255 | Akamai Technologies, Inc.* | 91,904 | ||||||
| 372 | Alliance Data Systems Corp. | 86,750 | ||||||
| 2,223 | Alphabet, Inc. Class A* | 2,510,189 | ||||||
| 2,267 | Alphabet, Inc. Class C* | 2,529,179 | ||||||
| 612 | ANSYS, Inc.* | 106,598 | ||||||
| 1,631 | Autodesk, Inc.* | 213,808 | ||||||
| 3,268 | Automatic Data Processing, Inc. | 438,369 | ||||||
| 899 | Broadridge Financial Solutions, Inc. | 103,475 | ||||||
| 2,291 | CA, Inc. | 81,674 | ||||||
| 2,071 | Cadence Design Systems, Inc.* | 89,695 | ||||||
| 958 | Citrix Systems, Inc.* | 100,437 | ||||||
| 4,417 | Cognizant Technology Solutions Corp. Class A | 348,899 | ||||||
| 2,136 | DXC Technology Co. | 172,183 | ||||||
| 6,837 | eBay, Inc.* | 247,910 | ||||||
| 2,293 | Electronic Arts, Inc.* | 323,359 | ||||||
| 17,906 | Facebook, Inc. Class A* | 3,479,494 | ||||||
| 2,491 | Fidelity National Information Services, Inc. | 264,121 | ||||||
| 3,099 | Fiserv, Inc.* | 229,605 | ||||||
| 671 | FleetCor Technologies, Inc.* | 141,346 | ||||||
| 691 | Gartner, Inc.* | 91,834 | ||||||
|
| |||||||
| Common Stocks – (continued) | ||||||||
Software & Services – (continued) | ||||||||
| 1,203 | Global Payments, Inc. | $ | 134,122 | |||||
| 6,368 | International Business Machines Corp. | 889,610 | ||||||
| 1,822 | Intuit, Inc. | 372,244 | ||||||
| 6,829 | Mastercard, Inc. Class A | 1,342,035 | ||||||
| 57,376 | Microsoft Corp. | 5,657,847 | ||||||
| 22,203 | Oracle Corp. | 978,264 | ||||||
| 2,364 | Paychex, Inc. | 161,579 | ||||||
| 8,307 | PayPal Holdings, Inc.* | 691,724 | ||||||
| 1,310 | Red Hat, Inc.* | 176,025 | ||||||
| 5,280 | salesforce.com, Inc.* | 720,192 | ||||||
| 4,731 | Symantec Corp. | 97,695 | ||||||
| 1,097 | Synopsys, Inc.* | 93,870 | ||||||
| 832 | Take-Two Interactive Software, Inc.* | 98,475 | ||||||
| 1,275 | Total System Services, Inc. | 107,763 | ||||||
| 4,816 | Twitter, Inc.* | 210,315 | ||||||
| 648 | VeriSign, Inc.* | 89,048 | ||||||
| 13,324 | Visa, Inc. Class A | 1,764,764 | ||||||
| 3,541 | Western Union Co. (The) | 71,989 | ||||||
|
| |||||||
| 27,415,602 | ||||||||
|
| |||||||
Technology Hardware & Equipment – 5.9% | ||||||||
| 2,284 | Amphenol Corp. Class A | 199,051 | ||||||
| 36,664 | Apple, Inc. | 6,786,873 | ||||||
| 35,034 | Cisco Systems, Inc. | 1,507,513 | ||||||
| 6,111 | Corning, Inc. | 168,114 | ||||||
| 478 | F5 Networks, Inc.* | 82,431 | ||||||
| 1,002 | FLIR Systems, Inc. | 52,074 | ||||||
| 11,220 | Hewlett Packard Enterprise Co. | 163,924 | ||||||
| 12,333 | HP, Inc. | 279,836 | ||||||
| 286 | IPG Photonics Corp.* | 63,100 | ||||||
| 2,510 | Juniper Networks, Inc. | 68,824 | ||||||
| 1,220 | Motorola Solutions, Inc. | 141,971 | ||||||
| 2,047 | NetApp, Inc. | 160,751 | ||||||
| 2,095 | Seagate Technology plc | 118,305 | ||||||
| 2,604 | TE Connectivity Ltd. | 234,516 | ||||||
| 2,252 | Western Digital Corp. | 174,327 | ||||||
| 1,569 | Xerox Corp. | 37,656 | ||||||
|
| |||||||
| 10,239,266 | ||||||||
|
| |||||||
Telecommunication Services – 2.0% | ||||||||
| 54,187 | AT&T, Inc. | 1,739,944 | ||||||
| 7,406 | CenturyLink, Inc. | 138,048 | ||||||
| 30,812 | Verizon Communications, Inc. | 1,550,152 | ||||||
|
| |||||||
| 3,428,144 | ||||||||
|
| |||||||
Transportation – 2.1% | ||||||||
| 959 | Alaska Air Group, Inc. | 57,914 | ||||||
| 3,146 | American Airlines Group, Inc. | 119,422 | ||||||
| 1,075 | CH Robinson Worldwide, Inc. | 89,934 | ||||||
| 6,574 | CSX Corp. | 419,290 | ||||||
| 4,897 | Delta Air Lines, Inc. | 242,597 | ||||||
| 1,317 | Expeditors International of Washington, Inc. | 96,273 | ||||||
| 1,844 | FedEx Corp. | 418,699 | ||||||
| 620 | JB Hunt Transport Services, Inc. | 75,361 | ||||||
| 768 | Kansas City Southern | 81,377 | ||||||
|
| |||||||
| 36 | The accompanying notes are an integral part of these financial statements. |
GOLDMAN SACHS VARIABLE INSURANCE TRUST EQUITY INDEX FUND
| Shares | Description | Value | ||||||
| Common Stocks – (continued) | ||||||||
Transportation – (continued) | ||||||||
| 2,126 | Norfolk Southern Corp. | $ | 320,750 | |||||
| 4,032 | Southwest Airlines Co. | 205,148 | ||||||
| 5,776 | Union Pacific Corp. | 818,344 | ||||||
| 1,802 | United Continental Holdings, Inc.* | 125,653 | ||||||
| 5,134 | United Parcel Service, Inc. Class B | 545,385 | ||||||
|
| |||||||
| 3,616,147 | ||||||||
|
| |||||||
Utilities – 2.9% | ||||||||
| 4,791 | AES Corp. | 64,247 | ||||||
| 1,695 | Alliant Energy Corp. | 71,732 | ||||||
| 1,790 | Ameren Corp. | 108,922 | ||||||
| 3,655 | American Electric Power Co., Inc. | 253,109 | ||||||
| 1,327 | American Water Works Co., Inc. | 113,299 | ||||||
| 3,307 | CenterPoint Energy, Inc. | 91,637 | ||||||
| 2,150 | CMS Energy Corp. | 101,652 | ||||||
| 2,329 | Consolidated Edison, Inc. | 181,615 | ||||||
| 4,882 | Dominion Energy, Inc. | 332,855 | ||||||
| 1,365 | DTE Energy Co. | 141,455 | ||||||
| 5,263 | Duke Energy Corp. | 416,198 | ||||||
| 2,419 | Edison International | 153,050 | ||||||
| 1,383 | Entergy Corp. | 111,733 | ||||||
| 2,027 | Evergy, Inc. | 113,816 | ||||||
| 2,354 | Eversource Energy | 137,968 | ||||||
| 7,130 | Exelon Corp. | 303,738 | ||||||
| 3,421 | FirstEnergy Corp. | 122,848 | ||||||
| 3,491 | NextEra Energy, Inc. | 583,102 | ||||||
| 2,594 | NiSource, Inc. | 68,170 | ||||||
| 2,197 | NRG Energy, Inc. | 67,448 | ||||||
| 3,886 | PG&E Corp. | 165,388 | ||||||
| 870 | Pinnacle West Capital Corp. | 70,087 | ||||||
| 5,299 | PPL Corp. | 151,287 | ||||||
| 3,729 | Public Service Enterprise Group, Inc. | 201,888 | ||||||
| 1,159 | SCANA Corp. | 44,645 | ||||||
| 1,890 | Sempra Energy | 219,448 | ||||||
| 7,456 | Southern Co. (The) | 345,287 | ||||||
| 2,341 | WEC Energy Group, Inc. | 151,346 | ||||||
| 3,843 | Xcel Energy, Inc. | 175,548 | ||||||
|
| |||||||
| 5,063,518 | ||||||||
|
| |||||||
| TOTAL COMMON STOCKS | ||||||||
| (Cost $63,196,998) | $ | 171,813,761 | ||||||
|
| |||||||
Principal Amount | Interest Rate | Maturity Date | Value | |||||||
| Short-Term Investment(c)(d) – 0.0% | ||||||||||
U.S. Treasury Obligation – 0.0% |
| |||||||||
U.S. Treasury Bills |
| |||||||||
| $75,000 | 0.000% | 12/06/2018 | $ | 74,334 | ||||||
| (Cost $74,320) | ||||||||||
| ||||||||||
| TOTAL INVESTMENTS BEFORE SECURITIES LENDING REINVESTMENT VEHICLE | ||||||||||
| (Cost $63,271,318) | $ | 171,888,095 | ||||||||
| ||||||||||
| Shares | Distribution Rate | Value | ||||
| Securities Lending Reinvestment Vehicle(b) – 0.1% | ||||||
Goldman Sachs Financial Square Government Fund — Institutional Shares |
| |||||
| 134,175 | 1.869% | $ | 134,175 | |||
| (Cost $134,175) | ||||||
| ||||||
| TOTAL INVESTMENTS – 99.3% | ||||||
| (Cost $63,405,493) | $ | 172,022,270 | ||||
| ||||||
OTHER ASSETS IN EXCESS OF | 1,194,335 | |||||
| ||||||
| NET ASSETS – 100.0% | $ | 173,216,605 | ||||
| ||||||
| The percentage shown for each investment category reflects the value of investments in that category as a percentage of net assets. | ||
| * | Non-income producing security. | |
| (a) | All or a portion of security is on loan. | |
| (b) | Represents an Affiliated Issuer. | |
| (c) | Issued with a zero coupon. Income is recognized through the accretion of discount. | |
| (d) | All or a portion of security is segregated as collateral for initial margin requirements on futures transactions. | |
| Investment Abbreviation: | ||
| REIT | —Real Estate Investment Trust | |
ADDITIONAL INVESTMENT INFORMATION
FUTURES CONTRACTS — At June 30, 2018, the Fund had the following futures contracts:
| Description | Number of Contracts | Expiration Date | Notional Amount | Unrealized Appreciation/ (Depreciation) | ||||||||||
Long position contracts: |
| |||||||||||||
| S&P 500 E-Mini Index | 10 | 09/21/2018 | $ | 1,360,800 | $ | (31,623 | ) | |||||||
| The accompanying notes are an integral part of these financial statements. | 37 |
GOLDMAN SACHS VARIABLE INSURANCE TRUST GROWTH OPPORTUNITIES FUND
Schedule of Investments
June 30, 2018 (Unaudited)
Shares | Description | Value | ||||||
| Common Stocks – 98.2% | ||||||||
Automobiles & Components – 0.8% | ||||||||
| 7,058 | Aptiv plc | $ | 646,724 | |||||
|
| |||||||
Banks – 3.3% | ||||||||
| 10,905 | Eagle Bancorp, Inc.* | 668,476 | ||||||
| 19,807 | First Republic Bank | 1,917,120 | ||||||
|
| |||||||
| 2,585,596 | ||||||||
|
| |||||||
Capital Goods – 10.9% | ||||||||
| 10,949 | Fortive Corp. | 844,277 | ||||||
| 5,192 | Harris Corp. | 750,452 | ||||||
| 6,948 | HEICO Corp. | 506,681 | ||||||
| 3,591 | HEICO Corp. Class A | 218,887 | ||||||
| 4,177 | IDEX Corp. | 570,077 | ||||||
| 8,947 | John Bean Technologies Corp. | 795,388 | ||||||
| 5,318 | L3 Technologies, Inc. | 1,022,758 | ||||||
| 4,427 | Roper Technologies, Inc. | 1,221,454 | ||||||
| 29,651 | Sensata Technologies Holding plc* | 1,410,795 | ||||||
| 4,452 | SiteOne Landscape Supply, Inc.* | 373,834 | ||||||
| 14,080 | Welbilt, Inc.* | 314,125 | ||||||
| 8,488 | Xylem, Inc. | 571,921 | ||||||
|
| |||||||
| 8,600,649 | ||||||||
|
| |||||||
Consumer Durables & Apparel – 2.1% | ||||||||
| 3,677 | Carter’s, Inc. | 398,550 | ||||||
| 6,673 | PVH Corp. | 999,082 | ||||||
| 10,005 | Skechers U.S.A., Inc. Class A* | 300,250 | ||||||
|
| |||||||
| 1,697,882 | ||||||||
|
| |||||||
Consumer Services – 9.3% | ||||||||
| 16,110 | Bright Horizons Family Solutions, Inc.* | 1,651,597 | ||||||
| 1,314 | Chipotle Mexican Grill, Inc.* | 566,820 | ||||||
| 14,528 | Choice Hotels International, Inc. | 1,098,317 | ||||||
| 1,094 | Domino’s Pizza, Inc. | 308,694 | ||||||
| 32,279 | Dunkin’ Brands Group, Inc. | 2,229,512 | ||||||
| 17,338 | Hilton Worldwide Holdings, Inc. | 1,372,476 | ||||||
| 1,275 | Yum! Brands, Inc. | 99,730 | ||||||
|
| |||||||
| 7,327,146 | ||||||||
|
| |||||||
Diversified Financials – 5.9% | ||||||||
| 3,012 | Affiliated Managers Group, Inc. | 447,794 | ||||||
| 30,709 | Lazard Ltd. Class A | 1,501,977 | ||||||
| 7,603 | MSCI, Inc. | 1,257,765 | ||||||
| 14,471 | Northern Trust Corp. | 1,488,921 | ||||||
|
| |||||||
| 4,696,457 | ||||||||
|
| |||||||
Energy – 1.8% | ||||||||
| 3,129 | Concho Resources, Inc.* | 432,897 | ||||||
| 3,382 | Diamondback Energy, Inc. | 444,970 | ||||||
| 32,034 | WPX Energy, Inc.* | 577,573 | ||||||
|
| |||||||
| 1,455,440 | ||||||||
|
| |||||||
Food, Beverage & Tobacco – 3.6% | ||||||||
| 15,075 | Brown-Forman Corp. Class B | 738,826 | ||||||
| 8,530 | McCormick & Co., Inc. (Non-Voting) | 990,248 | ||||||
| 19,672 | Monster Beverage Corp.* | 1,127,205 | ||||||
|
| |||||||
| 2,856,279 | ||||||||
|
| |||||||
| Common Stocks – (continued) | ||||||||
Health Care Equipment & Services – 7.5% | ||||||||
| 1,396 | ABIOMED, Inc.* | $ | 571,034 | |||||
| 1,804 | Align Technology, Inc.* | 617,220 | ||||||
| 1,693 | Cooper Cos., Inc. (The) | 398,617 | ||||||
| 10,687 | Edwards Lifesciences Corp.* | 1,555,706 | ||||||
| 3,732 | IDEXX Laboratories, Inc.* | 813,352 | ||||||
| 4,448 | Nevro Corp.* | 355,173 | ||||||
| 6,013 | Teleflex, Inc. | 1,612,747 | ||||||
|
| |||||||
| 5,923,849 | ||||||||
|
| |||||||
Materials – 2.5% | ||||||||
| 11,010 | Ashland Global Holdings, Inc. | 860,762 | ||||||
| 10,628 | Avery Dennison Corp. | 1,085,119 | ||||||
|
| |||||||
| 1,945,881 | ||||||||
|
| |||||||
Pharmaceuticals, Biotechnology & Life Sciences – 11.4% | ||||||||
| 24,115 | Agilent Technologies, Inc. | 1,491,272 | ||||||
| 3,558 | Agios Pharmaceuticals, Inc.* | 299,690 | ||||||
| 18,621 | Alkermes plc* | 766,440 | ||||||
| 922 | Bluebird Bio, Inc.* | 144,708 | ||||||
| 24,514 | Exelixis, Inc.* | 527,541 | ||||||
| 7,125 | Illumina, Inc.* | 1,989,941 | ||||||
| 2,980 | Incyte Corp.* | 199,660 | ||||||
| 1,274 | Mettler-Toledo International, Inc.* | 737,175 | ||||||
| 4,375 | Neurocrine Biosciences, Inc.* | 429,800 | ||||||
| 6,667 | PRA Health Sciences, Inc.* | 622,431 | ||||||
| 9,168 | Seattle Genetics, Inc.* | 608,664 | ||||||
| 13,948 | Zoetis, Inc. | 1,188,230 | ||||||
|
| |||||||
| 9,005,552 | ||||||||
|
| |||||||
Real Estate Investment Trusts – 1.6% | ||||||||
| 7,917 | SBA Communications Corp.* | 1,307,255 | ||||||
|
| |||||||
Retailing – 5.6% | ||||||||
| 12,809 | Dollar General Corp. | 1,262,967 | ||||||
| 9,353 | Dollar Tree, Inc.* | 795,005 | ||||||
| 8,169 | Five Below, Inc.* | 798,193 | ||||||
| 18,514 | Ross Stores, Inc. | 1,569,062 | ||||||
|
| |||||||
| 4,425,227 | ||||||||
|
| |||||||
Semiconductors & Semiconductor Equipment – 3.8% | ||||||||
| 20,403 | Advanced Micro Devices, Inc.* | 305,841 | ||||||
| 8,142 | Analog Devices, Inc. | 780,981 | ||||||
| 58,787 | Marvell Technology Group Ltd. | 1,260,393 | ||||||
| 10,707 | Maxim Integrated Products, Inc. | 628,072 | ||||||
|
| |||||||
| 2,975,287 | ||||||||
|
| |||||||
Software & Services – 24.6% | ||||||||
| 8,859 | Autodesk, Inc.* | 1,161,326 | ||||||
| 39,376 | Black Knight, Inc.* | 2,108,585 | ||||||
| 7,690 | Citrix Systems, Inc.* | 806,220 | ||||||
| 15,515 | Fidelity National Information Services, Inc. | 1,645,055 | ||||||
| 25,125 | Fiserv, Inc.* | 1,861,511 | ||||||
| 18,518 | Global Payments, Inc. | 2,064,572 | ||||||
| 18,808 | GoDaddy, Inc. Class A* | 1,327,845 | ||||||
|
| |||||||
| 38 | The accompanying notes are an integral part of these financial statements. |
GOLDMAN SACHS VARIABLE INSURANCE TRUST GROWTH OPPORTUNITIES FUND
Shares | Description | Value | ||||||
| Common Stocks – (continued) | ||||||||
Software & Services – (continued) | ||||||||
| 3,004 | IAC/InterActiveCorp* | $ | 458,080 | |||||
| 8,628 | Intuit, Inc. | 1,762,743 | ||||||
| 5,134 | Proofpoint, Inc.* | 592,002 | ||||||
| 4,112 | PTC, Inc.* | 385,747 | ||||||
| 8,617 | Red Hat, Inc.* | 1,157,866 | ||||||
| 5,048 | ServiceNow, Inc.* | 870,629 | ||||||
| 7,121 | Splunk, Inc.* | 705,762 | ||||||
| 2,638 | Spotify Technology SA* | 443,817 | ||||||
| 7,400 | Square, Inc. Class A* | 456,136 | ||||||
| 14,590 | Total System Services, Inc. | 1,233,147 | ||||||
| 8,914 | Twitter, Inc.* | 389,274 | ||||||
|
| |||||||
| 19,430,317 | ||||||||
|
| |||||||
Technology Hardware & Equipment – 2.7% | ||||||||
| 24,373 | Amphenol Corp. Class A | 2,124,107 | ||||||
|
| |||||||
Transportation – 0.8% | ||||||||
| 4,052 | Old Dominion Freight Line, Inc. | 603,586 | ||||||
|
| |||||||
| TOTAL COMMON STOCKS | ||||||||
| (Cost $55,380,437) | $ | 77,607,234 | ||||||
|
| |||||||
| Shares | Distribution Rate | Value | ||||||||
| Investment Company(a) – 0.0% | ||||||||||
| | Goldman Sachs Financial Square Government Fund — | | ||||||||
| 1,534 | 1.869 | % | $ | 1,534 | ||||||
| (Cost $1,534) | ||||||||||
|
| |||||||||
| TOTAL INVESTMENTS – 98.2% | ||||||||||
| (Cost $55,381,971) | $ | 77,608,768 | ||||||||
|
| |||||||||
| | OTHER ASSETS IN EXCESS OF | | 1,390,891 | |||||||
|
| |||||||||
| NET ASSETS – 100.0% | $ | 78,999,659 | ||||||||
|
| |||||||||
| The percentage shown for each investment category reflects the value of investments in that category as a percentage of net assets. | ||
| * | Non-income producing security. | |
| (a) | Represents an Affiliated Issuer. | |
| The accompanying notes are an integral part of these financial statements. | 39 |
GOLDMAN SACHS VARIABLE INSURANCE TRUST HIGH QUALITY FLOATING RATE FUND
Schedule of Investments
June 30, 2018 (Unaudited)
| Principal Amount | Interest Rate | Maturity Date | Value | |||||||||||
| Mortgage-Backed Securities – 4.7% | ||||||||||||||
Adjustable Rate FHLMC(a) – 1.7% | ||||||||||||||
| $ | 158,987 | 4.185 | % | 05/01/2035 | $ | 166,820 | ||||||||
| 71,680 | 3.383 | 09/01/2035 | 75,666 | |||||||||||
| 108,274 | 4.141 | 12/01/2036 | 111,576 | |||||||||||
| 289,746 | 4.334 | 04/01/2037 | 306,165 | |||||||||||
| 373,906 | 3.516 | 01/01/2038 | 392,384 | |||||||||||
| 267,581 | 3.723 | 01/01/2038 | 275,684 | |||||||||||
|
| |||||||||||||
| 1,328,295 | ||||||||||||||
|
| |||||||||||||
Adjustable Rate FNMA(a) – 2.0% | ||||||||||||||
| 41,406 | 4.011 | 05/01/2033 | 42,687 | |||||||||||
| 110,331 | 4.208 | 05/01/2035 | 114,340 | |||||||||||
| 395,932 | 3.594 | 06/01/2035 | 415,540 | |||||||||||
| 571,038 | 3.309 | 11/01/2035 | 599,055 | |||||||||||
| 64,683 | 3.545 | 12/01/2035 | 66,561 | |||||||||||
| 235,941 | 3.811 | 03/01/2037 | 249,983 | |||||||||||
|
| |||||||||||||
| 1,488,166 | ||||||||||||||
|
| |||||||||||||
Adjustable Rate GNMA(a) – 0.3% | ||||||||||||||
| 241,506 | 2.625 | 04/20/2033 | 247,081 | |||||||||||
|
| |||||||||||||
Agency Multi-Family – 0.7% | ||||||||||||||
| FNMA | ||||||||||||||
| 59,686 | 3.416 | 10/01/2020 | 60,270 | |||||||||||
| 64,555 | 3.619 | 12/01/2020 | 65,485 | |||||||||||
| 282,955 | 3.762 | 12/01/2020 | 287,792 | |||||||||||
| 124,343 | 4.381 | 06/01/2021 | 128,563 | |||||||||||
|
| |||||||||||||
| 542,110 | ||||||||||||||
|
| |||||||||||||
| TOTAL MORTGAGE-BACKED SECURITIES | ||||||||||||||
| (Cost $3,641,091) | $ | 3,605,652 | ||||||||||||
|
| |||||||||||||
| Collateralized Mortgage Obligations(a) – 34.7% | ||||||||||||||
Adjustable Rate Non-Agency(b) – 0.3% | ||||||||||||||
Holmes Master Issuer plc Series 2018-1A, Class A2 | ||||||||||||||
| $ | 200,000 | 2.708 | % | 10/15/2054 | $ | 199,884 | ||||||||
|
| |||||||||||||
Agency Multi-Family – 6.4% | ||||||||||||||
| | FHLMC Multifamily Structured Pass-Through Certificates | | ||||||||||||
| 1,350,000 | 2.221 | 07/25/2020 | 1,351,477 | |||||||||||
| | FHLMC Multifamily Structured Pass-Through Certificates | | ||||||||||||
| 94,099 | 2.341 | 01/25/2021 | 94,128 | |||||||||||
| | FHLMC Multifamily Structured Pass-Through Certificates | | ||||||||||||
| 923,501 | 2.381 | 08/25/2023 | 923,801 | |||||||||||
| | FHLMC Multifamily Structured Pass-Through Certificates | | ||||||||||||
| 1,243,369 | 2.371 | 05/25/2024 | 1,245,988 | |||||||||||
| | FHLMC Multifamily Structured Pass-Through Certificates | | ||||||||||||
| 399,948 | 2.251 | 12/25/2024 | 400,811 | |||||||||||
| | FHLMC Multifamily Structured Pass-Through Certificates | | ||||||||||||
| 932,094 | 2.351 | 08/25/2025 | 934,502 | |||||||||||
|
| |||||||||||||
| 4,950,707 | ||||||||||||||
|
| |||||||||||||
| Collateralized Mortgage Obligations(a) – (continued) | ||||||||||||||
Regular Floater – 28.0% | ||||||||||||||
FHLMC REMIC Series 3049, Class FP | ||||||||||||||
| $ | 201,095 | 2.423 | % | 10/15/2035 | $ | 201,609 | ||||||||
FHLMC REMIC Series 3208, Class FB(c) | ||||||||||||||
| 118,085 | 2.473 | 08/15/2036 | 118,379 | |||||||||||
FHLMC REMIC Series 3208, Class FD(c) | ||||||||||||||
| 175,946 | 2.473 | 08/15/2036 | 176,972 | |||||||||||
FHLMC REMIC Series 3208, Class FG(c) | ||||||||||||||
| 708,508 | 2.473 | 08/15/2036 | 712,640 | |||||||||||
FHLMC REMIC Series 3307, Class FT | ||||||||||||||
| 1,100,355 | 2.313 | 07/15/2034 | 1,100,610 | |||||||||||
FHLMC REMIC Series 3311, Class KF(c) | ||||||||||||||
| 1,978,552 | 2.413 | 05/15/2037 | 1,982,977 | |||||||||||
FHLMC REMIC Series 3371, Class FA(c) | ||||||||||||||
| 435,611 | 2.673 | 09/15/2037 | 440,484 | |||||||||||
FHLMC REMIC Series 4174, Class FB(c) | ||||||||||||||
| 872,794 | 2.373 | 05/15/2039 | 873,047 | |||||||||||
FHLMC REMIC Series 4320, Class FD | ||||||||||||||
| 401,787 | 2.473 | 07/15/2039 | 403,755 | |||||||||||
FHLMC REMIC Series 4477, Class FG | ||||||||||||||
| 612,936 | 2.187 | 10/15/2040 | 611,875 | |||||||||||
FHLMC REMIC Series 4508, Class CF | ||||||||||||||
| 387,756 | 2.473 | 09/15/2045 | 389,342 | |||||||||||
FHLMC REMIC Series 4631, Class GF | ||||||||||||||
| 2,402,497 | 2.573 | 11/15/2046 | 2,425,494 | |||||||||||
FHLMC REMIC Series 4637, Class QF(c) | ||||||||||||||
| 1,972,301 | 2.982 | 04/15/2044 | 1,981,668 | |||||||||||
FNMA REMIC Series 2006-82, Class F | ||||||||||||||
| 211,684 | 2.661 | 09/25/2036 | 213,861 | |||||||||||
FNMA REMIC Series 2006-96, Class FA | ||||||||||||||
| 605,234 | 2.391 | 10/25/2036 | 605,611 | |||||||||||
FNMA REMIC Series 2007-33, Class HF | ||||||||||||||
| 104,559 | 2.441 | 04/25/2037 | 104,857 | |||||||||||
FNMA REMIC Series 2007-36, Class F | ||||||||||||||
| 170,128 | 2.321 | 04/25/2037 | 169,850 | |||||||||||
FNMA REMIC Series 2007-85, Class FC | ||||||||||||||
| 473,541 | 2.631 | 09/25/2037 | 478,530 | |||||||||||
FNMA REMIC Series 2008-8, Class FB | ||||||||||||||
| 428,641 | 2.911 | 02/25/2038 | 433,744 | |||||||||||
FNMA REMIC Series 2011-63, Class FG | ||||||||||||||
| 416,978 | 2.541 | 07/25/2041 | 419,533 | |||||||||||
FNMA REMIC Series 2012-35, Class QF | ||||||||||||||
| 1,246,278 | 2.491 | 04/25/2042 | 1,252,426 | |||||||||||
FNMA REMIC Series 2016-1, Class FT | ||||||||||||||
| 1,219,753 | 2.441 | 02/25/2046 | 1,223,057 | |||||||||||
FNMA REMIC Series 2017-45, Class FA | ||||||||||||||
| 805,406 | 2.227 | 06/25/2047 | 806,289 | |||||||||||
FNMA REMIC Series 2017-96, Class FC | ||||||||||||||
| 1,375,538 | 2.491 | 12/25/2057 | 1,382,221 | |||||||||||
GNMA REMIC Series 2005-48, Class AF | ||||||||||||||
| 602,497 | 2.284 | 06/20/2035 | 601,023 | |||||||||||
GNMA REMIC Series 2012-98, Class FA | ||||||||||||||
| 564,686 | 2.484 | 08/20/2042 | 567,826 | |||||||||||
NCUA Guaranteed Notes Trust Series 2010-R1, Class 1A(c) | ||||||||||||||
| 142,124 | 2.475 | 10/07/2020 | 142,474 | |||||||||||
|
| |||||||||||||
| 40 | The accompanying notes are an integral part of these financial statements. |
GOLDMAN SACHS VARIABLE INSURANCE TRUST HIGH QUALITY FLOATING RATE FUND
| Principal Amount | Interest Rate | Maturity Date | Value | |||||||||||
| Collateralized Mortgage Obligations(a) – (continued) | ||||||||||||||
Regular Floater – (continued) | ||||||||||||||
NCUA Guaranteed Notes Trust Series 2010-R2, Class 2A(c) | ||||||||||||||
| $ | 327,496 | 2.495 | % | 11/05/2020 | $ | 328,571 | ||||||||
NCUA Guaranteed Notes Trust Series 2011-R1, Class 1A | ||||||||||||||
| 1,169,871 | 2.373 | 01/08/2020 | 1,171,288 | |||||||||||
|
| |||||||||||||
| 21,320,013 | ||||||||||||||
|
| |||||||||||||
| TOTAL COLLATERALIZED MORTGAGE OBLIGATIONS | ||||||||||||||
| (Cost $26,393,925) | $ | 26,470,604 | ||||||||||||
|
| |||||||||||||
| Commercial Mortgage-Backed Security(a) – 0.7% | ||||||||||||||
Agency Multi-Family – 0.7% | ||||||||||||||
FNMA ACES REMIC Series 2017-M13, Class FA | ||||||||||||||
| $ | 498,448 | 2.348 | % | 10/25/2024 | $ | 499,859 | ||||||||
| (Cost $497,904) | ||||||||||||||
|
| |||||||||||||
| Asset-Backed Securities – 48.8% | ||||||||||||||
Automobile – 9.0% | ||||||||||||||
Ally Master Owner Trust Series 2017-3, Class A1(a)(c) | ||||||||||||||
| $ | 1,350,000 | 2.503 | % | 06/15/2022 | $ | 1,353,546 | ||||||||
Ally Master Owner Trust Series 2018-1, Class A2(c) | ||||||||||||||
| 800,000 | 2.700 | 01/17/2023 | 792,184 | |||||||||||
Chesapeake Funding II LLC Series 2016-2A, Class A2(a)(b)(c) | ||||||||||||||
| 292,528 | 3.073 | 06/15/2028 | 293,386 | |||||||||||
Chesapeake Funding II LLC Series 2017-3A, Class A2(a)(b)(c) | ||||||||||||||
| 492,386 | 2.413 | 08/15/2029 | 492,069 | |||||||||||
| | Ford Credit Floorplan Master Owner Trust A Series 2015-2, | | ||||||||||||
| 1,210,000 | 2.643 | 01/15/2022 | 1,215,936 | |||||||||||
| | GMF Floorplan Owner Revolving Trust Series 2017-2, | | ||||||||||||
| 900,000 | 2.503 | 07/15/2022 | 902,353 | |||||||||||
| | Mercedes-Benz Master Owner Trust Series 2018-AA, | | ||||||||||||
| 1,500,000 | 2.333 | 05/16/2022 | 1,499,998 | |||||||||||
| | Nissan Master Owner Trust Receivables Series 2017-C, | | ||||||||||||
| 300,000 | 2.393 | 10/17/2022 | 300,189 | |||||||||||
|
| |||||||||||||
| 6,849,661 | ||||||||||||||
|
| |||||||||||||
Collateralized Loan Obligations(a)(b)(c) – 8.5% | ||||||||||||||
BlueMountain CLO Ltd. Series 2014-2A, Class AR | ||||||||||||||
| 350,000 | 3.289 | 07/20/2026 | 350,030 | |||||||||||
Bowman Park CLO Ltd. Series 2014-1A, Class AR | ||||||||||||||
| 250,000 | 3.510 | 11/23/2025 | 250,106 | |||||||||||
CBAM Ltd. Series 2018-5A, Class A | ||||||||||||||
| 1,100,000 | 3.322 | 04/17/2031 | 1,091,622 | |||||||||||
Cutwater Ltd. Series 2014-1A, Class A1AR | ||||||||||||||
| 350,000 | 3.598 | 07/15/2026 | 349,795 | |||||||||||
Halcyon Loan Advisors Funding Ltd. Series 2014-1A, Class A1R | ||||||||||||||
| 350,000 | 3.485 | 04/18/2026 | 349,817 | |||||||||||
Madison Park Funding XXX Ltd. Series 2018-30A, Class A | ||||||||||||||
| 1,100,000 | 3.089 | 04/15/2029 | 1,088,192 | |||||||||||
|
| |||||||||||||
| Asset-Backed Securities – (continued) | ||||||||||||||
Collateralized Loan Obligations(a)(b)(c) – (continued) | ||||||||||||||
OFSI Fund V Ltd. Series 2013-5A, Class A1LA | ||||||||||||||
| $ | 68,243 | 3.283 | % | 04/17/2025 | $ | 68,240 | ||||||||
Parallel Ltd. Series 2015-1A, Class AR | ||||||||||||||
| 300,000 | 3.209 | 07/20/2027 | 299,646 | |||||||||||
Sound Point CLO XI Ltd. Series 2016-1A, Class A | ||||||||||||||
| 700,000 | 4.009 | 07/20/2028 | 701,033 | |||||||||||
Trinitas CLO II Ltd. Series 2014-2A, Class A1R | ||||||||||||||
| 300,000 | 3.528 | 07/15/2026 | 300,035 | |||||||||||
Voya CLO Ltd. Series 2014-4A, Class A1R | ||||||||||||||
| 1,200,000 | 3.298 | 10/14/2026 | 1,198,770 | |||||||||||
WhiteHorse IX Ltd. Series 2014-9A, Class AR | ||||||||||||||
| 400,000 | 3.513 | 07/17/2026 | 400,041 | |||||||||||
|
| |||||||||||||
| 6,447,327 | ||||||||||||||
|
| |||||||||||||
Credit Card(a) – 11.0% | ||||||||||||||
BA Credit Card Trust Series 2014-A1, Class A | ||||||||||||||
| 1,000,000 | 2.453 | 06/15/2021 | 1,001,568 | |||||||||||
| | Capital One Multi-Asset Execution Trust Series 2016-A1, | | ||||||||||||
| 300,000 | 2.523 | 02/15/2022 | 300,781 | |||||||||||
CARDS II Trust Series 2016-1A, Class A(b)(c) | ||||||||||||||
| 300,000 | 2.773 | 07/15/2021 | 300,068 | |||||||||||
CARDS II Trust Series 2017-1A, Class A(b) | ||||||||||||||
| 300,000 | 2.443 | 04/18/2022 | 300,169 | |||||||||||
CARDS II Trust Series 2018-1A, Class A(b)(c) | ||||||||||||||
| 2,200,000 | 2.423 | 04/17/2023 | 2,200,000 | |||||||||||
Chase Issuance Trust Series 2013-A9, Class A(c) | ||||||||||||||
| 2,000,000 | 2.493 | 11/16/2020 | 2,002,610 | |||||||||||
Citibank Credit Card Issuance Trust Series 2013-A7, Class A7(c) | ||||||||||||||
| 900,000 | 2.476 | 09/10/2020 | 900,613 | |||||||||||
Citibank Credit Card Issuance Trust Series 2017-A5, Class A5(c) | ||||||||||||||
| 1,400,000 | 2.704 | 04/22/2026 | 1,418,392 | |||||||||||
|
| |||||||||||||
| 8,424,201 | ||||||||||||||
|
| |||||||||||||
Student Loans(a) – 20.3% | ||||||||||||||
Academic Loan Funding Trust Series 2013-1A, Class A(b)(c) | ||||||||||||||
| 454,450 | 2.891 | 12/26/2044 | 455,090 | |||||||||||
Access Group, Inc. Series 2015-1, Class A(b)(c) | ||||||||||||||
| 192,289 | 2.791 | 07/25/2056 | 192,023 | |||||||||||
| | Access to Loans for Learning Student Loan Corp. Series 2013-I, | | ||||||||||||
| 439,388 | 2.891 | 02/25/2041 | 438,909 | |||||||||||
| | Brazos Higher Education Authority, Inc. Series 2011-1, | | ||||||||||||
| 1,083,640 | 3.130 | 02/25/2030 | 1,089,121 | |||||||||||
ECMC Group Student Loan Trust Series 2016-1A, Class A(b)(c) | ||||||||||||||
| 244,036 | 3.441 | 07/26/2066 | 248,023 | |||||||||||
ECMC Group Student Loan Trust Series 2018-1A, Class A(b)(c) | ||||||||||||||
| 722,746 | 2.841 | 02/27/2068 | 723,650 | |||||||||||
Edsouth Indenture No. 1 LLC Series 2010-1, Class A1(b)(c) | ||||||||||||||
| 406,922 | 3.210 | 07/25/2023 | 407,609 | |||||||||||
Edsouth Indenture No. 4 LLC Series 2013-1, Class A(b)(c) | ||||||||||||||
| 71,647 | 2.661 | 02/26/2029 | 71,376 | |||||||||||
Edsouth Indenture No. 5 LLC Series 2014-1, Class A(b)(c) | ||||||||||||||
| 243,500 | 2.791 | 02/25/2039 | 243,500 | |||||||||||
|
| |||||||||||||
| The accompanying notes are an integral part of these financial statements. | 41 |
GOLDMAN SACHS VARIABLE INSURANCE TRUST HIGH QUALITY FLOATING RATE FUND
Schedule of Investments (continued)
June 30, 2018 (Unaudited)
| Principal Amount | Interest Rate | Maturity Date | Value | |||||||||||
| Asset-Backed Securities – (continued) | ||||||||||||||
Student Loans(a) – (continued) | ||||||||||||||
Education Loan Asset-Backed Trust I Series 2013-1, Class A1(b) | ||||||||||||||
| $ | 205,070 | 2.891 | % | 06/25/2026 | $ | 205,155 | ||||||||
Education Loan Asset-Backed Trust I Series 2013-1, Class A2(b) | ||||||||||||||
| 500,000 | 2.891 | 04/26/2032 | 502,408 | |||||||||||
Educational Funding of the South, Inc. Series 2011-1, Class A2(c) | ||||||||||||||
| 468,387 | 3.010 | 04/25/2035 | 468,741 | |||||||||||
Educational Funding of the South, Inc. Series 2012-1, Class A(c) | ||||||||||||||
| 318,828 | 3.141 | 03/25/2036 | 320,203 | |||||||||||
EFS Volunteer No. 3 LLC Series 2012-1, Class A2(b)(c) | ||||||||||||||
| 261,221 | 3.091 | 02/25/2025 | 261,618 | |||||||||||
GCO Education Loan Funding Trust Series 2006-1, Class A8L | ||||||||||||||
| 130,261 | 2.460 | 05/25/2025 | 130,054 | |||||||||||
Goal Capital Funding Trust Series 2006-1, Class A4(c) | ||||||||||||||
| 215,792 | 2.480 | 11/27/2028 | 215,640 | |||||||||||
Higher Education Funding I Series 2014-1, Class A(b)(c) | ||||||||||||||
| 272,737 | 3.380 | 05/25/2034 | 274,170 | |||||||||||
Illinois Student Assistance Commission Series 2010-1, Class A3 | ||||||||||||||
| 200,000 | 3.260 | 07/25/2045 | 202,110 | |||||||||||
| | Kentucky Higher Education Student Loan Corp. Series 2013-2, | | ||||||||||||
| 664,723 | 2.583 | 09/01/2028 | 663,061 | |||||||||||
| | Kentucky Higher Education Student Loan Corp. Series 2015-1, | | ||||||||||||
| 606,293 | 2.732 | 12/01/2031 | 604,050 | |||||||||||
| | Montana Higher Education Student Assistance Corp. | | ||||||||||||
| 669,133 | 2.948 | 05/20/2030 | 676,649 | |||||||||||
Navient Student Loan Trust Series 2016-2A, Class A1(b)(c) | ||||||||||||||
| 56,287 | 2.841 | 06/25/2065 | 56,331 | |||||||||||
Navient Student Loan Trust Series 2016-5A, Class A(b)(c) | ||||||||||||||
| 1,096,963 | 3.341 | 06/25/2065 | 1,125,666 | |||||||||||
Navient Student Loan Trust Series 2016-7A, Class A(b)(c) | ||||||||||||||
| 242,496 | 3.241 | 03/25/2066 | 247,041 | |||||||||||
Nelnet Student Loan Trust Series 2006-1, Class A5(c) | ||||||||||||||
| 854,434 | 2.440 | 08/23/2027 | 853,356 | |||||||||||
Nelnet Student Loan Trust Series 2006-2, Class A5(c) | ||||||||||||||
| 213,176 | 2.460 | 01/25/2030 | 212,984 | |||||||||||
Nelnet Student Loan Trust Series 2013-5A, Class A(b)(c) | ||||||||||||||
| 84,698 | 2.590 | 01/25/2037 | 84,765 | |||||||||||
| | New Hampshire Higher Education Loan Corp. Series 2011-1, | | ||||||||||||
| 200,000 | 3.210 | 10/25/2037 | 201,306 | |||||||||||
| | North Carolina State Education Assistance Authority | | ||||||||||||
| 108,682 | 3.260 | 07/25/2041 | 108,444 | |||||||||||
| | Panhandle-Plains Higher Education Authority, Inc. Series 2011-1, | | ||||||||||||
| 178,685 | 3.258 | 07/01/2024 | 178,982 | |||||||||||
| | Pennsylvania Higher Education Assistance Agency Series 2006-1, | | ||||||||||||
| 528,335 | 2.500 | 10/25/2035 | 520,897 | |||||||||||
Scholar Funding Trust Series 2010-A, Class A(b)(c) | ||||||||||||||
| 253,659 | 3.109 | 10/28/2041 | 252,725 | |||||||||||
Scholar Funding Trust Series 2011-A, Class A(b)(c) | ||||||||||||||
| 215,649 | 3.259 | 10/28/2043 | 216,110 | |||||||||||
|
| |||||||||||||
| Asset-Backed Securities – (continued) | ||||||||||||||
Student Loans(a) – (continued) | ||||||||||||||
SLM Student Loan Trust Series 2003-14, Class A5(c) | ||||||||||||||
| $ | 8,399 | 2.590% | 01/25/2023 | $ | 8,399 | |||||||||
SLM Student Loan Trust Series 2005-5, Class A4(c) | ||||||||||||||
| 1,100,000 | 2.500 | 10/25/2028 | 1,096,057 | |||||||||||
SLM Student Loan Trust Series 2005-9, Class A6(c) | ||||||||||||||
| 192,344 | 2.910 | 10/26/2026 | 192,596 | |||||||||||
SLM Student Loan Trust Series 2006-2, Class A5(c) | ||||||||||||||
| 43,265 | 2.470 | 07/25/2025 | 43,266 | |||||||||||
SLM Student Loan Trust Series 2007-1, Class A5(c) | ||||||||||||||
| 661,151 | 2.450 | 01/26/2026 | 659,628 | |||||||||||
SLM Student Loan Trust Series 2008-5, Class A4(c) | ||||||||||||||
| 135,667 | 4.060 | 07/25/2023 | 139,132 | |||||||||||
| | South Texas Higher Education Authority, Inc. Series 2012-1, | | ||||||||||||
| 98,106 | 3.162 | 10/01/2024 | 98,556 | |||||||||||
Utah State Board of Regents Series 2015-1, Class A(c) | ||||||||||||||
| 367,566 | 2.560 | 02/25/2043 | 366,451 | |||||||||||
Utah State Board of Regents Series 2016-1, Class A | ||||||||||||||
| 419,208 | 2.841 | 09/25/2056 | 419,207 | |||||||||||
Wachovia Student Loan Trust Series 2005-1, Class A5(c) | ||||||||||||||
| 21,768 | 2.490 | 01/26/2026 | 21,754 | |||||||||||
|
| |||||||||||||
| 15,496,813 | ||||||||||||||
|
| |||||||||||||
| TOTAL ASSET-BACKED SECURITIES | ||||||||||||||
| (Cost $37,109,069) | $ | 37,218,002 | ||||||||||||
|
| |||||||||||||
| Municipal Bond(a)(b) – 0.1% | ||||||||||||||
New York– 0.1% | ||||||||||||||
| | Freddie Mac Multifamily ML Certificates RB Pass Through | | ||||||||||||
| $ | 97,706 | | (1 Mo. LIBOR + 0.50%), 2.591% |
| 01/25/2033 | $ | 99,584 | |||||||
| (Cost $97,706) | ||||||||||||||
|
| |||||||||||||
| U.S. Treasury Obligation(a) – 2.0% | ||||||||||||||
U.S. Treasury Notes | ||||||||||||||
| $ | 1,500,000 | | (3 Mo. U.S. T-Bill MMY + 0.03%), 1.942% |
| 04/30/2020 | $ | 1,500,075 | |||||||
| (Cost $1,500,130) | ||||||||||||||
|
| |||||||||||||
| Shares | Distribution Rate | Value | ||||||||||||
| Investment Company(d) – 1.4% | ||||||||||||||
| | Goldman Sachs Financial Square Government Fund — | | ||||||||||||
| 1,035,463 | 1.869 | % | $ | 1,035,463 | ||||||||||
| (Cost $1,035,463) | ||||||||||||||
|
| |||||||||||||
| 42 | The accompanying notes are an integral part of these financial statements. |
GOLDMAN SACHS VARIABLE INSURANCE TRUST HIGH QUALITY FLOATING RATE FUND
| Principal Amount | Interest Rate | Maturity Date | Value | |||||||||||
| Short-Term Investments – 6.4% | ||||||||||||||
Commercial Paper – 6.4% | ||||||||||||||
AT&T, Inc. | ||||||||||||||
| $ | 652,000 | 2.694 | % | 10/05/2018 | $ | 647,332 | ||||||||
| 250,000 | 2.695 | 10/09/2018 | 248,137 | |||||||||||
Duke Energy Corp.(e) | ||||||||||||||
| 383,000 | 0.000 | 08/27/2018 | 381,464 | |||||||||||
Hewlett Packard Enterprise Co. | ||||||||||||||
| 250,000 | 2.352 | 07/10/2018 | 249,852 | |||||||||||
| 250,000 | 2.342 | 07/11/2018 | 249,838 | |||||||||||
HP, Inc. | ||||||||||||||
| 500,000 | 2.404 | 07/23/2018 | 499,342 | |||||||||||
Marriott International, Inc. | ||||||||||||||
| 500,000 | 2.410 | 07/05/2018 | 499,813 | |||||||||||
Mondelez International, Inc. | ||||||||||||||
| 350,000 | 2.620 | 10/01/2018 | 347,659 | |||||||||||
Nutrien Ltd. | ||||||||||||||
| 250,000 | 2.486 | 07/26/2018 | 249,525 | |||||||||||
Schlumberger Holdings Corp. | ||||||||||||||
| 250,000 | 2.412 | 07/27/2018 | 249,562 | |||||||||||
Southern Co. (The) | ||||||||||||||
| 250,000 | 2.560 | 08/30/2018 | 248,942 | |||||||||||
Suncor Energy, Inc. | ||||||||||||||
| 500,000 | 2.668 | 07/27/2018 | 499,089 | |||||||||||
VW Credit, Inc. | ||||||||||||||
| 250,000 | 2.556 | 08/13/2018 | 249,249 | |||||||||||
| 300,000 | 2.637 | 09/20/2018 | 298,252 | |||||||||||
|
| |||||||||||||
| TOTAL SHORT-TERM INVESTMENTS | ||||||||||||||
| (Cost $4,918,180) | $ | 4,918,056 | ||||||||||||
|
| |||||||||||||
| TOTAL INVESTMENTS – 98.8% | ||||||||||||||
| (Cost $75,193,468) | $ | 75,347,295 | ||||||||||||
|
| |||||||||||||
| | OTHER ASSETS IN EXCESS OF | | 911,115 | |||||||||||
|
| |||||||||||||
| NET ASSETS – 100.0% | $ | 76,258,410 | ||||||||||||
|
| |||||||||||||
| The percentage shown for each investment category reflects the value of investments in that category as a percentage of net assets. | ||
| (a) | Variable rate security. Except for floating rate notes (for which final maturity is disclosed), maturity date disclosed is the next interest reset date. Interest rate disclosed is that which is in effect on June 30, 2018. | |
| (b) | Exempt from registration under Rule 144A of the Securities Act of 1933. Under procedures approved by the Board of Trustees, such securities may be deemed liquid by the Investment Adviser and may be resold, normally to qualified institutional buyers in transactions exempt from registration. Total market value of Rule 144A securities amounts to $18,302,098, which represents approximately 24.0% of net assets as of June 30, 2018. The liquidity determination is unaudited. | |
| (c) | Securities with “Call” features. Maturity dates disclosed are the final maturity dates. | |
| (d) | Represents an Affiliated Issuer. | |
| (e) | Issued with a zero coupon. Income is recognized through the accretion of discount. | |
| Investment Abbreviations: | ||
| ACES | —Alternative Credit Enhancement Securities | |
| FHLMC | —Federal Home Loan Mortgage Corp. | |
| FNMA | —Federal National Mortgage Association | |
| GNMA | —Government National Mortgage Association | |
| LIBOR | —London Interbank Offered Rate | |
| MMY | —Money Market Yield | |
| Mo. | —Month | |
| RB | —Revenue Bond | |
| REMIC | —Real Estate Mortgage Investment Conduit | |
| T-Bill | —Treasury Bill | |
| U.S. | —United States | |
Currency Abbreviation: | ||
| USD | —United States Dollar | |
ADDITIONAL INVESTMENT INFORMATION
FUTURES CONTRACTS — At June 30, 2018, the Fund had the following futures contracts:
| Description | Number of Contracts | Expiration Date | Notional Amount | Unrealized Appreciation/ (Depreciation) | ||||||||||||
Long position contracts: | ||||||||||||||||
| U.S. Treasury 10 Year Note | 24 | 09/19/2018 | $ | 2,884,500 | $ | 27,138 | ||||||||||
U.S. Treasury Ultra Bond | 3 | 09/19/2018 | 478,688 | 12,194 | ||||||||||||
| TOTAL | $ | 39,332 | ||||||||||||||
| The accompanying notes are an integral part of these financial statements. | 43 |
GOLDMAN SACHS VARIABLE INSURANCE TRUST HIGH QUALITY FLOATING RATE FUND
Schedule of Investments (continued)
June 30, 2018 (Unaudited)
ADDITIONAL INVESTMENT INFORMATION (continued)
| Description | Number of Contracts | Expiration Date | Notional Amount | Unrealized Appreciation/ (Depreciation) | ||||||||||||
Short position contracts: |
| |||||||||||||||
| U.S. Treasury 10 Year Ultra Note | (3 | ) | 09/19/2018 | $ | (384,703 | ) | $ | (3,786 | ) | |||||||
| U.S. Treasury 2 Year Note | (6 | ) | 09/28/2018 | (1,270,969 | ) | 7 | ||||||||||
| U.S. Treasury 5 Year Note | (24 | ) | 09/28/2018 | (2,726,813 | ) | (10,489 | ) | |||||||||
U.S. Treasury Long Bond | (11 | ) | 09/19/2018 | (1,595,000 | ) | (23,112 | ) | |||||||||
| TOTAL | $ | (37,380 | ) | |||||||||||||
| TOTAL FUTURES CONTRACTS | $ | 1,952 | ||||||||||||||
SWAP CONTRACTS — At June 30, 2018, the Fund had the following swap contracts:
CENTRALLY CLEARED INTEREST RATE SWAP CONTRACTS
Payments Made by the Fund | Payments Received by the Fund | Termination Date | Notional | Value | Upfront Premium (Received) Paid | Unrealized Appreciation/ (Depreciation) | ||||||||||||||||||||||
| 3 Month LIBOR(b) | 2.139% | 11/20/2020 | USD | 3,050 | $ | (44,897 | ) | $ | (14,361 | ) | $ | (30,536 | ) | |||||||||||||||
2.275%(c) | 3 Month LIBOR | 11/20/2023 | USD | 1,280 | 38,585 | 9,488 | 29,097 | |||||||||||||||||||||
| TOTAL | $ | (6,312 | ) | $ | (4,873 | ) | $ | (1,439 | ) | |||||||||||||||||||
| (a) | Represents forward starting interest rate swaps whose effective dates of commencement of accruals and cash flows occur subsequent to June 30, 2018. |
| (b) | Payments made quarterly. |
| (c) | Payments made semi-annually. |
| 44 | The accompanying notes are an integral part of these financial statements. |
GOLDMAN SACHS VARIABLE INSURANCE TRUST FUNDS
Statements of Assets and Liabilities
June 30, 2018 (Unaudited)
| Core Fixed Income Fund | Equity Index Fund | Growth Opportunities Fund | High Quality Floating Rate Fund | |||||||||||||
| Assets: | ||||||||||||||||
Investments in unaffiliated issuers, at value (cost $40,033,849, $62,989,112, $55,380,437 and $74,158,005)(a) | $ | 39,796,458 | $ | 171,312,407 | $ | 77,607,234 | $ | 74,311,832 | ||||||||
Investments in affiliated issuers, at value (cost $1,492,767, $282,206, $1,534 and $1,035,463) | 1,492,767 | 575,688 | 1,534 | 1,035,463 | ||||||||||||
Investments in affiliated securities lending reinvestment vehicle, at value (cost $0, $134,175, $0 and $0) | — | 134,175 | — | — | ||||||||||||
Cash | 557,887 | 1,041,291 | 837,548 | 1,158,966 | ||||||||||||
Foreign currencies, at value (cost $49,716, $0, $0 and $0) | 49,686 | — | — | — | ||||||||||||
Receivables: | ||||||||||||||||
Investments sold on an extended-settlement basis | 11,263,359 | — | — | 60,302 | ||||||||||||
Investments sold | 527,800 | 360,587 | 1,061,589 | — | ||||||||||||
Collateral on certain derivative contracts(b) | 338,752 | — | — | 40,202 | ||||||||||||
Interest and dividends | 226,528 | 142,279 | 20,610 | 153,203 | ||||||||||||
Reimbursement from investment adviser | 17,604 | 13,966 | 18,122 | 15,867 | ||||||||||||
Fund shares sold | — | — | 13,123 | 568 | ||||||||||||
Securities lending income | — | 33 | — | — | ||||||||||||
Unrealized gain on forward foreign currency exchange contracts | 60,398 | — | — | — | ||||||||||||
Variation margin on futures | 2,806 | 8,350 | — | 648 | ||||||||||||
Variation margin on swaps | — | — | — | 698 | ||||||||||||
Other assets | 873 | 1,068 | 1,042 | 770 | ||||||||||||
| Total assets | 54,334,918 | 173,589,844 | 79,560,802 | 76,778,519 | ||||||||||||
| Liabilities: | ||||||||||||||||
Forward sale contracts, at value (proceeds received $2,045,391, $0, $0 and $0) | 2,049,375 | — | — | — | ||||||||||||
Unrealized loss on forward foreign currency exchange contracts | 99,169 | — | — | — | ||||||||||||
Variation margin on swaps | 378 | — | — | — | ||||||||||||
Payables: | ||||||||||||||||
Investments purchased on an extended-settlement basis | 14,503,697 | — | — | — | ||||||||||||
Investments purchased | 577,787 | 85,353 | 388,856 | 381,588 | ||||||||||||
Fund shares redeemed | 89,015 | 29,807 | 47,681 | 23,381 | ||||||||||||
Management fees | 11,844 | 30,421 | 55,312 | 19,975 | ||||||||||||
Distribution and Service fees and Transfer Agency fees | 8,145 | 39,112 | 12,018 | 17,776 | ||||||||||||
Payable upon return of securities loaned | — | 134,175 | — | — | ||||||||||||
Accrued expenses | 82,211 | 54,371 | 57,276 | 77,389 | ||||||||||||
| Total liabilities | 17,421,621 | 373,239 | 561,143 | 520,109 | ||||||||||||
| Net Assets: | ||||||||||||||||
Paid-in capital | 43,818,884 | 62,061,264 | 22,334,426 | 77,178,631 | ||||||||||||
Undistributed (distributions in excess of) net investment income (loss) | (118,410 | ) | 1,545,909 | (117,800 | ) | 3,287 | ||||||||||
Accumulated net realized gain (loss) | (6,497,099 | ) | 1,024,278 | 34,556,236 | (1,077,848 | ) | ||||||||||
Net unrealized gain (loss) | (290,078 | ) | 108,585,154 | 22,226,797 | 154,340 | |||||||||||
| NET ASSETS | $ | 36,913,297 | $ | 173,216,605 | $ | 78,999,659 | $ | 76,258,410 | ||||||||
Net Assets: | ||||||||||||||||
Institutional | $ | 273,971 | $ | — | $ | 60,331 | $ | 26,122 | ||||||||
Service | 36,639,326 | 173,216,605 | 78,939,328 | 69,628,259 | ||||||||||||
Advisor | — | — | — | 6,604,029 | ||||||||||||
Total Net Assets | $ | 36,913,297 | $ | 173,216,605 | $ | 78,999,659 | $ | 76,258,410 | ||||||||
Shares outstanding $0.001 par value (unlimited shares authorized): | ||||||||||||||||
Institutional | 26,935 | — | 7,458 | 2,510 | ||||||||||||
Service | 3,601,740 | 10,191,278 | 9,867,326 | 6,701,595 | ||||||||||||
Advisor | — | — | — | 635,056 | ||||||||||||
Net asset value, offering and redemption price per share: | ||||||||||||||||
Institutional | $10.17 | $— | $8.09 | $10.41 | ||||||||||||
Service | 10.17 | 17.00 | 8.00 | 10.39 | ||||||||||||
Advisor | — | — | — | 10.40 | ||||||||||||
(a) Includes loaned securities having a market value of $129,698 for the Equity Index Fund.
(b) Segregated for initial margin and/or collateral on transactions as follows:
Fund | Forwards | Futures | Swaps | |||||||||
| Core Fixed Income | $ | 210,000 | $ | 71,583 | $ | 57,169 | ||||||
| High Quality Floating Rate | — | 27,018 | 13,184 | |||||||||
| The accompanying notes are an integral part of these financial statements. | 45 |
GOLDMAN SACHS VARIABLE INSURANCE TRUST FUNDS
Statements of Operations
For the Six Months Ended June 30, 2018 (Unaudited)
| Core Fixed Income Fund | Equity Index Fund | Growth Opportunities Fund | High Quality Floating Rate Fund | |||||||||||||
| Investment income: | ||||||||||||||||
Interest | $ | 890,140 | $ | 537 | $ | — | $ | 783,799 | ||||||||
Dividends — affiliated issuers | 19,014 | 4,125 | 10,996 | 28,785 | ||||||||||||
Dividends — unaffiliated issuers | — | 1,703,669 | 439,228 | — | ||||||||||||
Securities lending income — affiliated issuer | — | 535 | 2,391 | — | ||||||||||||
| Total investment income | 909,154 | 1,708,866 | 452,615 | 812,584 | ||||||||||||
| Expenses: | ||||||||||||||||
Management fees | 122,088 | 263,952 | 550,031 | 134,075 | ||||||||||||
Distribution and Service fees(a) | 75,978 | 219,959 | 141,902 | 94,973 | ||||||||||||
Professional fees | 53,889 | 42,185 | 42,195 | 47,500 | ||||||||||||
Custody, accounting and administrative services | 32,612 | 27,140 | 29,647 | 28,395 | ||||||||||||
Printing and mailing costs | 16,235 | 12,489 | 18,866 | 20,228 | ||||||||||||
Trustee fees | 8,778 | 8,849 | 8,842 | 8,740 | ||||||||||||
Transfer Agency fees(a) | 6,104 | 17,595 | 11,357 | 7,284 | ||||||||||||
Other | 3,561 | 8,056 | 4,230 | 2,984 | ||||||||||||
| Total expenses | 319,245 | 600,225 | 807,070 | 344,179 | ||||||||||||
Less — expense reductions | (116,571 | ) | (174,714 | ) | (233,018 | ) | (123,012 | ) | ||||||||
| Net expenses | 202,674 | 425,511 | 574,052 | 221,167 | ||||||||||||
| NET INVESTMENT INCOME (LOSS) | 706,480 | 1,283,355 | (121,437 | ) | 591,417 | |||||||||||
| Realized and unrealized gain (loss): | ||||||||||||||||
Net realized gain (loss) from: | ||||||||||||||||
Investments — unaffiliated issuers (including commissions recaptured of $0, $0, $2,163 and $0) | (960,898 | ) | 5,998,682 | 31,777,174 | 33,313 | |||||||||||
Investments — affiliated issuers | — | 16,006 | — | — | ||||||||||||
Futures contracts | (418,591 | ) | 67,127 | — | 13,976 | |||||||||||
Purchased options | (1,102 | ) | — | — | — | |||||||||||
Swap contracts | (45,019 | ) | — | — | (1,708 | ) | ||||||||||
Forward foreign currency exchange contracts | (62,005 | ) | — | — | — | |||||||||||
Foreign currency transactions | (641 | ) | — | — | — | |||||||||||
Net change in unrealized gain (loss) on: | ||||||||||||||||
Investments — unaffiliated issuers | (1,473,278 | ) | (2,928,550 | ) | (25,838,869 | ) | (44,146 | ) | ||||||||
Investments — affiliated issuers | — | (106,449 | ) | — | — | |||||||||||
Futures contracts | 13,253 | (48,469 | ) | — | 10,000 | |||||||||||
Purchased options | (1,966 | ) | — | — | — | |||||||||||
Swap contracts | 26,696 | — | — | 434 | ||||||||||||
Forward foreign currency exchange contracts | (140,588 | ) | — | — | — | |||||||||||
Foreign currency translation | (942 | ) | — | — | — | |||||||||||
| Net realized and unrealized gain (loss) | (3,065,081 | ) | 2,998,347 | 5,938,305 | 11,869 | |||||||||||
| NET INCREASE (DECREASE) IN NET ASSETS RESULTING FROM OPERATIONS | $ | (2,358,601 | ) | $ | 4,281,702 | $ | 5,816,868 | $ | 603,286 | |||||||
(a) Class specific Distribution and/or Service, and Transfer Agency fees were as follows:
| Distribution and/or Service Fees | Transfer Agency Fees | |||||||||||||||||||
Fund | Service | Advisor | Institutional | Service | Advisor | |||||||||||||||
Core Fixed Income | $ | 75,978 | N/A | $ | 26 | $ | 6,078 | N/A | ||||||||||||
Equity Index | 219,959 | N/A | N/A | 17,595 | N/A | |||||||||||||||
Growth Opportunities | 141,902 | N/A | 6 | 11,351 | N/A | |||||||||||||||
High Quality Floating Rate | 84,380 | $ | 10,593 | 4 | 6,750 | $ | 530 | |||||||||||||
| 46 | The accompanying notes are an integral part of these financial statements. |
[THIS PAGE INTENTIONALLY LEFT BLANK]
GOLDMAN SACHS VARIABLE INSURANCE TRUST FUNDS
Statements of Changes in Net Assets
| Core Fixed Income Fund | Equity Index Fund | |||||||||||||||
| For the Six Months Ended June 30, 2018 (Unaudited) | For the Fiscal Year Ended December 31, 2017 | For the Six Months Ended June 30, 2018 (Unaudited) | For the Fiscal Year Ended December 31, 2017 | |||||||||||||
| From operations: | ||||||||||||||||
Net investment income (loss) | $ | 706,480 | $ | 2,151,679 | $ | 1,283,355 | $ | 2,634,930 | ||||||||
Net realized gain (loss) | (1,488,256 | ) | 1,020,532 | 6,081,815 | 9,666,167 | |||||||||||
Net change in unrealized gain (loss) | (1,576,825 | ) | 261,262 | (3,083,468 | ) | 20,858,368 | ||||||||||
| Net increase (decrease) in net assets resulting from operations | (2,358,601 | ) | 3,433,473 | 4,281,702 | 33,159,465 | |||||||||||
| Distributions to shareholders: | ||||||||||||||||
From net investment income | ||||||||||||||||
Institutional Shares | (7,568 | ) | (5,356 | ) | — | — | ||||||||||
Service Shares | (951,750 | ) | (2,870,144 | ) | — | (2,616,868 | ) | |||||||||
Advisor Shares | — | — | — | — | ||||||||||||
From net realized gains | ||||||||||||||||
Institutional Shares | — | — | — | — | ||||||||||||
Service Shares | — | — | — | (7,410,709 | ) | |||||||||||
Advisor Shares | — | — | — | — | ||||||||||||
| Total distributions to shareholders | (959,318 | ) | (2,875,500 | ) | — | (10,027,577 | ) | |||||||||
| From share transactions: | ||||||||||||||||
Proceeds from sales of shares | 1,581,453 | 7,052,506 | 752,280 | 2,056,692 | ||||||||||||
Reinvestment of distributions | 959,318 | 2,875,500 | — | 10,027,577 | ||||||||||||
Cost of shares redeemed | (71,498,356 | ) | (11,863,453 | ) | (10,852,979 | ) | (21,731,411 | ) | ||||||||
| Net decrease in net assets resulting from share transactions | (68,957,585 | ) | (1,935,447 | ) | (10,100,699 | ) | (9,647,142 | ) | ||||||||
| TOTAL INCREASE (DECREASE) | (72,275,504 | ) | (1,377,474 | ) | (5,818,997 | ) | 13,484,746 | |||||||||
| Net assets: | ||||||||||||||||
Beginning of period | 109,188,801 | 110,566,275 | 179,035,602 | 165,550,856 | ||||||||||||
End of period | $ | 36,913,297 | $ | 109,188,801 | $ | 173,216,605 | $ | 179,035,602 | ||||||||
| Undistributed (distributions in excess of) net investment income (loss) | $ | (118,410 | ) | $ | 134,428 | $ | 1,545,909 | $ | 262,554 | |||||||
| 48 | The accompanying notes are an integral part of these financial statements. |
GOLDMAN SACHS VARIABLE INSURANCE TRUST FUNDS
| Growth Opportunities Fund | High Quality Floating Rate Fund | |||||||||||||
| For the Six Months Ended June 30, 2018 (Unaudited) | For the Fiscal Year Ended December 31, 2017 | For the Six Months Ended June 30, 2018 (Unaudited) | For the Fiscal Year Ended December 31, 2017 | |||||||||||
| $ | (121,437 | ) | $ | (428,934 | ) | $ | 591,417 | $ | 755,781 | |||||
| 31,777,174 | 21,900,883 | 45,581 | 28,050 | |||||||||||
| (25,838,869 | ) | 18,521,181 | (33,712 | ) | 202,672 | |||||||||
| 5,816,868 | 39,993,130 | 603,286 | 986,503 | |||||||||||
| — | — | (424 | ) | (956 | ) | |||||||||
| — | — | (631,808 | ) | (842,342 | ) | |||||||||
| — | — | (50,857 | ) | (43,482 | ) | |||||||||
| — | (4,985 | ) | — | — | ||||||||||
| — | (16,867,555 | ) | — | — | ||||||||||
| — | — | — | — | |||||||||||
| — | (16,872,540 | ) | (683,089 | ) | (886,780 | ) | ||||||||
| 2,132,845 | 4,405,396 | 8,711,187 | 12,689,584 | |||||||||||
| — | 16,872,540 | 683,089 | 886,780 | |||||||||||
| (99,786,730 | ) | (33,003,465 | ) | (4,386,642 | ) | (10,739,000 | ) | |||||||
| (97,653,885 | ) | (11,725,529 | ) | 5,007,634 | 2,837,364 | |||||||||
| (91,837,017 | ) | 11,395,061 | 4,927,831 | 2,937,087 | ||||||||||
| 170,836,676 | 159,441,615 | 71,330,579 | 68,393,492 | |||||||||||
| $ | 78,999,659 | $ | 170,836,676 | $ | 76,258,410 | $ | 71,330,579 | |||||||
| $ | (117,800 | ) | $ | 3,637 | $ | 3,287 | $ | 94,959 | ||||||
| The accompanying notes are an integral part of these financial statements. | 49 |
GOLDMAN SACHS VARIABLE INSURANCE CORE FIXED INCOME FUND
Financial Highlights
Selected Data for a Share Outstanding Throughout Each Period
| Income (loss) from investment operations | ||||||||||||||||||||||||||||||||||||||||||||||||
| Net asset value, beginning of period | Net investment income(a) | Net realized and unrealized gain (loss) | Total from investment operations | Distributions to shareholders from net investment income | Net asset value, end of period | Total return(b) | Net assets, end of period (in 000s) | Ratio of net expenses to average net assets | Ratio of total expenses to average net assets | Ratio of net investment income to average net assets | Portfolio turnover rate(c) | |||||||||||||||||||||||||||||||||||||
FOR THE SIX MONTHS ENDED JUNE 30, (UNAUDITED) | ||||||||||||||||||||||||||||||||||||||||||||||||
2018 - Institutional | $ | 10.66 | $ | 0.14 | $ | (0.34 | ) | $ | (0.20 | ) | $ | (0.29 | ) | $ | 10.17 | (1.88 | )% | $ | 274 | 0.41 | %(d) | 0.90 | %(d) | 2.66 | %(d) | 192 | % | |||||||||||||||||||||
2018 - Service | 10.65 | 0.12 | (0.33 | ) | (0.21 | ) | (0.27 | ) | 10.17 | (1.99 | ) | 36,639 | 0.67 | (d) | 1.05 | (d) | 2.31 | (d) | 192 | |||||||||||||||||||||||||||||
FOR THE FISCAL YEARS ENDED DECEMBER 31, | ||||||||||||||||||||||||||||||||||||||||||||||||
2017 - Institutional | 10.61 | 0.23 | 0.13 | 0.36 | (0.31 | ) | 10.66 | 3.40 | 241 | 0.42 | 0.65 | 2.18 | 229 | |||||||||||||||||||||||||||||||||||
2017 - Service | 10.60 | 0.21 | 0.12 | 0.33 | (0.28 | ) | 10.65 | 3.14 | 108,948 | 0.67 | 0.90 | 1.95 | 229 | |||||||||||||||||||||||||||||||||||
2016 - Institutional | 10.53 | 0.24 | 0.08 | 0.32 | (0.24 | ) | 10.61 | 2.98 | 90 | 0.43 | 0.65 | 2.28 | 329 | |||||||||||||||||||||||||||||||||||
2016 - Service | 10.53 | 0.22 | 0.07 | 0.29 | (0.22 | ) | 10.60 | 2.70 | 110,476 | 0.67 | 0.91 | 2.05 | 329 | |||||||||||||||||||||||||||||||||||
2015 - Institutional | 10.75 | 0.27 | (0.20 | ) | 0.07 | (0.29 | ) | 10.53 | 0.60 | 26 | 0.42 | 0.74 | 2.53 | 376 | ||||||||||||||||||||||||||||||||||
2015 - Service | 10.76 | 0.24 | (0.21 | ) | 0.03 | (0.26 | ) | 10.53 | 0.27 | 104,924 | 0.67 | 0.99 | 2.27 | 376 | ||||||||||||||||||||||||||||||||||
2014 - Institutional | 10.48 | 0.25 | 0.34 | 0.59 | (0.32 | ) | 10.75 | 5.68 | 26 | 0.44 | 0.65 | 2.31 | 353 | |||||||||||||||||||||||||||||||||||
2014 - Service | 10.47 | 0.22 | 0.36 | 0.58 | (0.29 | ) | 10.76 | 5.61 | 107,063 | 0.68 | 0.91 | 2.06 | 353 | |||||||||||||||||||||||||||||||||||
2013 - Institutional (Commenced April 30, 2013) | 10.91 | 0.15 | (0.38 | ) | (0.23 | ) | (0.20 | ) | 10.48 | (2.13 | ) | 24 | 0.43 | (d) | 0.69 | (d) | 2.10 | (d) | 557 | |||||||||||||||||||||||||||||
2013 - Service | 10.88 | 0.20 | (0.35 | ) | (0.15 | ) | (0.26 | ) | 10.47 | (1.35 | ) | 116,530 | 0.67 | 0.89 | 1.88 | 557 | ||||||||||||||||||||||||||||||||
| (a) | Calculated based on the average shares outstanding methodology. |
| (b) | Assumes investment at the net asset value at the beginning of the period, reinvestment of all distributions, and a complete redemption of the investment at the net asset value at the end of the period. Total returns for periods less than one full year are not annualized. |
| (c) | The Fund’s portfolio turnover rate is calculated in accordance with regulatory requirements, without regard to transactions involving short term investments and certain derivatives. If such transactions were included, the Fund’s portfolio turnover rate may be higher. |
| (d) | Annualized. |
| The accompanying notes are an integral part of these financial statements. | 50 |
GOLDMAN SACHS VARIABLE INSURANCE TRUST EQUITY INDEX FUND
Financial Highlights
Selected Data for a Share Outstanding Throughout Each Period
| Income (loss) from investment operations | Distributions to shareholders | |||||||||||||||||||||||||||||||||||||||||||||||||||||||
| Net asset value, beginning of period | Net investment income(a) | Net realized and unrealized gain (loss) | Total from investment operations | From net investment income | From net realized gains | Total distributions | Net asset value, end of period | Total return(b) | Net assets, end of period (in 000s) | Ratio of net expenses to average net assets | Ratio of total expenses to average net assets | Ratio of net investment income to average net assets | Portfolio turnover rate(c) | |||||||||||||||||||||||||||||||||||||||||||
FOR THE SIX MONTHS ENDED JUNE 30, (UNAUDITED) | ||||||||||||||||||||||||||||||||||||||||||||||||||||||||
2018 - Service | $ | 16.60 | $ | 0.12 | $ | 0.28 | $ | 0.40 | $ | — | $ | — | $ | — | $ | 17.00 | 2.41 | % | $ | 173,217 | 0.48 | %(d) | 0.68 | %(d) | 1.46 | %(d) | 1 | % | ||||||||||||||||||||||||||||
FOR THE FISCAL YEARS ENDED DECEMBER 31, | ||||||||||||||||||||||||||||||||||||||||||||||||||||||||
2017 - Service | 14.49 | 0.24 | 2.85 | 3.09 | (0.26 | ) | (0.72 | ) | (0.98 | ) | 16.60 | 21.29 | 179,036 | 0.48 | 0.71 | 1.53 | 2 | |||||||||||||||||||||||||||||||||||||||
2016 - Service | 13.91 | 0.25 | 1.35 | 1.60 | (0.33 | ) | (0.69 | ) | (1.02 | ) | 14.49 | 11.41 | 165,551 | 0.48 | 0.73 | 1.73 | 3 | |||||||||||||||||||||||||||||||||||||||
2015 - Service | 14.91 | 0.32 | (0.18 | ) | 0.14 | (0.28 | ) | (0.86 | ) | (1.14 | ) | 13.91 | 0.94 | 169,295 | 0.48 | 0.70 | 2.15 | 4 | ||||||||||||||||||||||||||||||||||||||
2014 - Service | 13.68 | 0.22 | 1.58 | 1.80 | (0.25 | ) | (0.32 | ) | (0.57 | ) | 14.91 | 13.22 | 190,009 | 0.49 | 0.71 | 1.55 | 2 | |||||||||||||||||||||||||||||||||||||||
2013 - Service | 10.54 | 0.20 | 3.15 | 3.35 | (0.21 | ) | — | (0.21 | ) | 13.68 | 31.83 | 193,899 | 0.49 | 0.73 | 1.61 | 3 | ||||||||||||||||||||||||||||||||||||||||
| (a) | Calculated based on the average shares outstanding methodology. |
| (b) | Assumes investment at the net asset value at the beginning of the period, reinvestment of all distributions, and a complete redemption of the investment at the net asset value at the end of the period. Total returns for periods less than one full year are not annualized. |
| (c) | The Fund’s portfolio turnover rate is calculated in accordance with regulatory requirements, without regard to transactions involving short term investments and certain derivatives. If such transactions were included, the Fund’s portfolio turnover rate may be higher. |
| (d) | Annualized. |
| The accompanying notes are an integral part of these financial statements. | 51 |
GOLDMAN SACHS GROWTH OPPORTUNITIES FUND
Financial Highlights
Selected Data for a Share Outstanding Throughout Each Period
| Income (loss) from investment operations | ||||||||||||||||||||||||||||||||||||||||||||||||
| Net asset value, beginning of period | Net investment loss(a) | Net realized and unrealized gain (loss) | Total from investment operations | Distributions to shareholders from net realized gains | Net asset value, end of period | Total return(b) | Net assets, end of period (in 000s) | Ratio of net expenses to average net assets | Ratio of total expenses to average net assets | Ratio of net investment loss to average net assets | Portfolio turnover rate(c) | |||||||||||||||||||||||||||||||||||||
FOR THE SIX MONTHS ENDED JUNE 30, (UNAUDITED) | ||||||||||||||||||||||||||||||||||||||||||||||||
2018 - Institutional | $ | 7.78 | $ | — | (d)(e) | $ | 0.31 | $ | 0.31 | $ | — | $ | 8.09 | 3.98 | % | $ | 60 | 0.85 | %(f) | 1.23 | %(f) | (0.05 | )%(e)(f) | 31 | % | |||||||||||||||||||||||
2018 - Service | 7.70 | (0.01 | )(e) | 0.31 | 0.30 | — | 8.00 | 3.90 | 78,939 | 1.01 | (f) | 1.45 | (f) | (0.21 | )(e)(f) | 31 | ||||||||||||||||||||||||||||||||
FOR THE FISCAL YEARS ENDED DECEMBER 31, | ||||||||||||||||||||||||||||||||||||||||||||||||
2017 - Institutional | 6.78 | (0.01 | ) | 1.85 | 1.84 | (0.84 | ) | 7.78 | 27.14 | 52 | 0.87 | 1.14 | (0.13 | ) | 57 | |||||||||||||||||||||||||||||||||
2017 - Service | 6.73 | (0.02 | ) | 1.83 | 1.81 | (0.84 | ) | 7.70 | 26.92 | 170,785 | 1.02 | 1.39 | (0.26 | ) | 57 | |||||||||||||||||||||||||||||||||
2016 - Institutional | 6.71 | (0.02 | ) | 0.14 | 0.12 | (0.05 | ) | 6.78 | 1.71 | 3,518 | 0.89 | 1.16 | (0.26 | ) | 63 | |||||||||||||||||||||||||||||||||
2016 - Service | 6.68 | (0.02 | ) | 0.12 | 0.10 | (0.05 | ) | 6.73 | 1.42 | 155,924 | 1.05 | 1.40 | (0.37 | ) | 63 | |||||||||||||||||||||||||||||||||
2015 - Institutional | 7.72 | (0.01 | ) | (0.39 | ) | (0.40 | ) | (0.61 | ) | 6.71 | (5.20 | ) | 32 | 0.93 | 1.14 | (0.19 | ) | 57 | ||||||||||||||||||||||||||||||
2015 - Service | 7.69 | (0.03 | ) | (0.37 | ) | (0.40 | ) | (0.61 | ) | 6.68 | (5.20 | ) | 168,653 | 1.09 | 1.40 | (0.36 | ) | 57 | ||||||||||||||||||||||||||||||
2014 - Institutional | 8.59 | (0.02 | ) | 0.94 | 0.92 | (1.79 | ) | 7.72 | 11.32 | 33 | 1.01 | 1.15 | (0.24 | ) | 62 | |||||||||||||||||||||||||||||||||
2014 - Service | 8.58 | (0.03 | ) | 0.93 | 0.90 | (1.79 | ) | 7.69 | 11.10 | 201,519 | 1.17 | 1.39 | (0.39 | ) | 62 | |||||||||||||||||||||||||||||||||
2013 - Institutional (Commenced April 30, 2013) | 7.66 | (0.02 | ) | 1.52 | 1.50 | (0.57 | ) | 8.59 | 19.73 | 30 | 1.00 | (f) | 1.16 | (f) | (0.27 | )(f) | 42 | |||||||||||||||||||||||||||||||
2013 - Service | 6.93 | (0.04 | ) | 2.26 | 2.22 | (0.57 | ) | 8.58 | 32.20 | 201,872 | 1.16 | 1.39 | (0.47 | ) | 42 | |||||||||||||||||||||||||||||||||
| (a) | Calculated based on the average shares outstanding methodology. |
| (b) | Assumes investment at the net asset value at the beginning of the period, reinvestment of all distributions, and a complete redemption of the investment at the net asset value at the end of the period. Total returns for periods less than one full year are not annualized. |
| (c) | The Fund’s portfolio turnover rate is calculated in accordance with regulatory requirements, without regard to transactions involving short term investments. If such transactions were included, the Fund’s portfolio turnover rate may be higher. |
| (d) | Amount is less than $0.005 per share. |
| (e) | Reflects income recognized from special dividends which amounted to $0.01 per share and 0.08% of average net assets. |
| (f) | Annualized. |
| The accompanying notes are an integral part of these financial statements. | 52 |
GOLDMAN SACHS VARIABLE INSURANCE TRUST HIGH QUALITY FLOATING RATE FUND
Financial Highlights
Selected Data for a Share Outstanding Throughout Each Period
| Income (loss) from investment operations | Distributions to shareholders | |||||||||||||||||||||||||||||||||||||||||||||||||||||||
| Net asset value, beginning of period | Net investment income(a) | Net realized and unrealized gain (loss) | Total from investment operations | From net investment income | From net realized gains | Total distributions | Net asset value, end of period | Total return(b) | Net assets, end of period (in 000s) | Ratio of net expenses to average net assets | Ratio of total expenses to average net assets | Ratio of net investment income to average net assets | Portfolio turnover rate(c) | |||||||||||||||||||||||||||||||||||||||||||
FOR THE SIX MONTHS ENDED JUNE 30, (UNAUDITED) | ||||||||||||||||||||||||||||||||||||||||||||||||||||||||
2018 - Institutional | $ | 10.42 | $ | 0.09 | $ | 0.01 | $ | 0.10 | $ | (0.11 | ) | $ | — | $ | (0.11 | ) | $ | 10.41 | 0.95 | % | $ | 26 | 0.34 | %(d) | 0.69 | %(d) | 1.83 | %(d) | 17 | % | ||||||||||||||||||||||||||
2018 - Service | 10.40 | 0.08 | 0.01 | 0.09 | (0.10 | ) | — | (0.10 | ) | 10.39 | 0.83 | 69,629 | 0.60 | (d) | 0.93 | (d) | 1.63 | (d) | 17 | |||||||||||||||||||||||||||||||||||||
2018 - Advisor | 10.41 | 0.08 | — | (e) | 0.08 | (0.09 | ) | — | (0.09 | ) | 10.40 | 0.78 | 6,604 | 0.75 | (d) | 1.08 | (d) | 1.50 | (d) | 17 | ||||||||||||||||||||||||||||||||||||
FOR THE FISCAL YEARS ENDED DECEMBER 31, | ||||||||||||||||||||||||||||||||||||||||||||||||||||||||
2017 - Institutional | 10.41 | 0.14 | 0.03 | 0.17 | (0.16 | ) | — | (0.16 | ) | 10.42 | 1.62 | 57 | 0.36 | 0.72 | 1.33 | 38 | ||||||||||||||||||||||||||||||||||||||||
2017 - Service | 10.38 | 0.11 | 0.04 | 0.15 | (0.13 | ) | — | (0.13 | ) | 10.40 | 1.47 | 66,548 | 0.61 | 0.97 | 1.08 | 38 | ||||||||||||||||||||||||||||||||||||||||
2017 - Advisor | 10.40 | 0.10 | 0.03 | 0.13 | (0.12 | ) | — | (0.12 | ) | 10.41 | 1.26 | 4,726 | 0.76 | 1.12 | 0.96 | 38 | ||||||||||||||||||||||||||||||||||||||||
2016 - Institutional | 10.40 | 0.11 | 0.03 | 0.14 | (0.13 | ) | — | (0.13 | ) | 10.41 | 1.35 | 25 | 0.39 | 0.78 | 1.03 | 47 | ||||||||||||||||||||||||||||||||||||||||
2016 - Service | 10.38 | 0.08 | 0.02 | 0.10 | (0.10 | ) | — | (0.10 | ) | 10.38 | 1.00 | 66,710 | 0.65 | 1.04 | 0.77 | 47 | ||||||||||||||||||||||||||||||||||||||||
2016 - Advisor | 10.40 | 0.06 | 0.03 | 0.09 | (0.09 | ) | — | (0.09 | ) | 10.40 | 0.96 | 1,658 | 0.80 | 1.18 | 0.62 | 47 | ||||||||||||||||||||||||||||||||||||||||
2015 - Institutional | 10.49 | 0.06 | (0.08 | ) | (0.02 | ) | (0.07 | ) | — | (0.07 | ) | 10.40 | (0.16 | ) | 25 | 0.38 | 0.81 | 0.54 | 14 | |||||||||||||||||||||||||||||||||||||
2015 - Service | 10.47 | 0.03 | (0.07 | ) | (0.04 | ) | (0.05 | ) | — | (0.05 | ) | 10.38 | (0.42 | ) | 69,625 | 0.64 | 1.05 | 0.28 | 14 | |||||||||||||||||||||||||||||||||||||
2015 - Advisor | 10.49 | 0.01 | (0.06 | ) | (0.05 | ) | (0.04 | ) | — | (0.04 | ) | 10.40 | (0.57 | ) | 1,315 | 0.78 | 1.25 | 0.12 | 14 | |||||||||||||||||||||||||||||||||||||
2014 - Institutional | 10.51 | 0.05 | (0.03 | ) | 0.02 | (0.04 | ) | — | (0.04 | ) | 10.49 | 0.17 | 25 | 0.40 | 0.70 | 0.51 | 17 | |||||||||||||||||||||||||||||||||||||||
2014 - Service | 10.51 | 0.03 | (0.04 | ) | (0.01 | ) | (0.03 | ) | — | (0.03 | ) | 10.47 | (0.09 | ) | 74,892 | 0.66 | 0.96 | 0.25 | 17 | |||||||||||||||||||||||||||||||||||||
2014 - Advisor (Commenced October 15, 2014) | 10.51 | — | (e) | (0.02 | ) | (0.02 | ) | — | — | — | 10.49 | (0.10 | )* | 10 | 0.77 | (d) | 1.13 | (d) | 0.15 | (d) | 17 | |||||||||||||||||||||||||||||||||||
2013 - Institutional (Commenced April 30, 2013) | 10.56 | 0.02 | 0.03 | 0.05 | (0.04 | ) | (0.06 | ) | (0.10 | )(f) | 10.51 | 0.50 | 25 | 0.40 | (d) | 0.86 | (d) | 0.25 | (d) | 467 | ||||||||||||||||||||||||||||||||||||
2013 - Service | 10.58 | 0.01 | 0.03 | 0.04 | (0.05 | ) | (0.06 | ) | (0.11 | )(f) | 10.51 | 0.40 | 78,142 | 0.70 | 1.10 | 0.08 | 467 | |||||||||||||||||||||||||||||||||||||||
| (a) | Calculated based on the average shares outstanding methodology. |
| (b) | Assumes investment at the net asset value at the beginning of the period, reinvestment of all distributions, and a complete redemption of the investment at the net asset value at the end of the period. Total returns for periods less than one full year are not annualized. |
| (c) | The Fund’s portfolio turnover rate is calculated in accordance with regulatory requirements, without regard to transactions involving short term investments and certain derivatives. If such transactions were included, the Fund’s portfolio turnover rate may be higher. |
| (d) | Annualized. |
| (e) | Amount is less than $0.005 per share. |
| (f) | Included a distribution from capital of less than $0.01 per share. |
| * | Represents cumulative total returns |
| The accompanying notes are an integral part of these financial statements. | 53 |
GOLDMAN SACHS VARIABLE INSURANCE TRUST FUNDS
Notes to Financial Statements
June 30, 2018 (Unaudited)
1. ORGANIZATION
Goldman Sachs Variable Insurance Trust (the “Trust” or “VIT”) is a Delaware statutory trust registered under the Investment Company Act of 1940, as amended (the “Act”), as an open-end management investment company. The following table lists those series of the Trust that are included in this report (collectively, the “Funds” or individually a “Fund”), along with their corresponding share classes and respective diversification status under the Act:
| Fund | Share Classes Offered | Diversified/ Non-diversified | ||
High Quality Floating Rate | Institutional, Service and Advisor | Diversified | ||
Core Fixed Income and Growth Opportunities | Institutional and Service | Diversified | ||
Equity Index | Service | Diversified |
Shares of the Trust are offered to a separate account of participating life insurance companies for the purpose of funding variable annuity contracts and variable life insurance policies.
Goldman Sachs Asset Management, L.P. (“GSAM”), an affiliate of Goldman Sachs & Co. LLC (“Goldman Sachs”), serves as investment adviser to the Funds pursuant to management agreements (the “Agreements”) with the Trust.
2. SIGNIFICANT ACCOUNTING POLICIES
The financial statements have been prepared in accordance with accounting principles generally accepted in the United States of America (“GAAP”) and require management to make estimates and assumptions that may affect the reported amounts and disclosures. Actual results may differ from those estimates and assumptions.
A. Investment Valuation — The Funds’ valuation policy is to value investments at fair value.
B. Investment Income and Investments — Investment income includes interest income, dividend income, and securities lending income, if any. Interest income is accrued daily and adjusted for amortization of premiums and accretion of discounts. Dividend income is recognized on ex-dividend date or, for certain foreign securities, as soon as such information is obtained subsequent to the ex-dividend date. Investment transactions are reflected on trade date. Realized gains and losses are calculated using identified cost. Investment transactions are recorded on the following business day for daily net asset value (“NAV”) calculations. Distributions received from the Funds’ investments in United States (“U.S.”) real estate investment trusts (“REITs”) may be characterized as ordinary income, net capital gain or a return of capital. A return of capital is recorded by the Funds as a reduction to the cost basis of the REIT.
For derivative contracts, realized gains and losses are recorded upon settlement of the contract. Upfront payments, if any, are made or received upon entering into a swap agreement and are reflected in the Statements of Assets and Liabilities. Upfront payments are recognized over the contract’s term/event as realized gains or losses, with the exception of forward starting interest rate swaps whose realized gains or losses are recognized from the effective start date. For securities with paydown provisions, principal payments received are treated as a proportionate reduction to the cost basis of the securities, and excess or shortfall amounts are recorded as income. For treasury inflation protected securities (“TIPS”), adjustments to principal due to inflation/deflation are reflected as increases/decreases to interest income with a corresponding adjustment to cost.
C. Class Allocations and Expenses — Investment income, realized and unrealized gain (loss), if any, and non-class specific expenses of each Fund are allocated daily based upon the proportion of net assets of each class. Non-class specific expenses directly incurred by a Fund are charged to that Fund, while such expenses incurred by the Trust are allocated across the applicable Funds on a straight-line and/or pro-rata basis depending upon the nature of the expenses. Class-specific expenses, where applicable, are borne by the respective share classes and include Distribution and Service and Transfer Agency fees.
D. Federal Taxes and Distributions to Shareholders — It is each Fund’s policy to comply with the requirements of the Internal Revenue Code of 1986, as amended (the “Code”), applicable to regulated investment companies (mutual funds) and to
54
GOLDMAN SACHS VARIABLE INSURANCE TRUST FUNDS
2. SIGNIFICANT ACCOUNTING POLICIES (continued)
distribute each year substantially all of its investment company taxable income and capital gains to its shareholders. Accordingly, each Fund is not required to make any provisions for the payment of federal income tax. Distributions to shareholders are recorded on the ex-dividend date. Income and capital gains distributions, if any, are declared and paid according to the following schedule:
| Fund | Income Distributions Declared/Paid | Capital Gains Distributions Declared/Paid | ||
Core Fixed Income and High Quality Floating Rate | Quarterly | Annually | ||
Equity Index and Growth Opportunities | Annually | Annually |
Net capital losses, if any, are carried forward to future fiscal years and may be used to the extent allowed by the Code to offset any future capital gains. Losses that are carried forward will retain their character as either short-term or long-term capital losses. Utilization of capital loss carryforwards will reduce the requirement of future capital gains distributions.
The characterization of distributions to shareholders for financial reporting purposes is determined in accordance with federal income tax rules, which may differ from GAAP. The source of each Fund’s distributions may be shown in the accompanying financial statements as either from net investment income, net realized gain or capital. Certain components of the Funds’ net assets on the Statements of Assets and Liabilities reflect permanent GAAP/tax differences based on the appropriate tax character.
E. Foreign Currency Translation — The accounting records and reporting currency of a Fund are maintained in U.S. dollars. Assets and liabilities denominated in foreign currencies are translated into U.S. dollars using the current exchange rates at the close of each business day. The effect of changes in foreign currency exchange rates on investments is included within net realized and unrealized gain (loss) on investments. Changes in the value of other assets and liabilities as a result of fluctuations in foreign exchange rates are included in the Statements of Operations within net change in unrealized gain (loss) on foreign currency translation. Transactions denominated in foreign currencies are translated into U.S. dollars on the date the transaction occurred, the effects of which are included within net realized gain (loss) on foreign currency transactions.
F. Commission Recapture — GSAM, on behalf of certain Funds, may direct portfolio trades, subject to seeking best execution, to various brokers who have agreed to rebate a portion of the commissions generated. Such rebates are made directly to a Fund as cash payments and are included in net realized gain (loss) from investments on the Statements of Operations.
3. INVESTMENTS AND FAIR VALUE MEASUREMENTS
U.S. GAAP defines the fair value of a financial instrument as the amount that would be received to sell an asset or paid to transfer a liability in an orderly transaction between market participants at the measurement date (i.e., the exit price); the Funds’ policy is to use the market approach. GAAP establishes a fair value hierarchy that prioritizes the inputs to valuation techniques used to measure fair value. The hierarchy gives the highest priority to unadjusted quoted prices in active markets for identical assets or liabilities (Level 1 measurements) and the lowest priority to unobservable inputs (Level 3 measurements). The levels used for classifying investments are not necessarily an indication of the risk associated with investing in these investments. The three levels of the fair value hierarchy are described below:
Level 1 — Unadjusted quoted prices in active markets that are accessible at the measurement date for identical, unrestricted assets or liabilities;
Level 2 — Quoted prices in markets that are not active or financial instruments for which significant inputs are observable (including, but not limited to, quoted prices for similar investments, interest rates, foreign exchange rates, volatility and credit spreads), either directly or indirectly;
Level 3 — Prices or valuations that require significant unobservable inputs (including GSAM’s assumptions in determining fair value measurement).
55
GOLDMAN SACHS VARIABLE INSURANCE TRUST FUNDS
Notes to Financial Statements (continued)
June 30, 2018 (Unaudited)
3. INVESTMENTS AND FAIR VALUE MEASUREMENTS (continued)
Changes in valuation techniques may result in transfers into or out of an assigned level within the hierarchy. In accordance with the Funds’ policy, transfers between different levels of the fair value hierarchy resulting from such changes are deemed to have occurred as of the beginning of the reporting period.
The Board of Trustees (“Trustees”) has approved Valuation Procedures that govern the valuation of the portfolio investments held by the Funds, including investments for which market quotations are not readily available. The Trustees have delegated to GSAM day-to-day responsibility for implementing and maintaining internal controls and procedures related to the valuation of the Funds’ investments. To assess the continuing appropriateness of pricing sources and methodologies, GSAM regularly performs price verification procedures and issues challenges as necessary to third party pricing vendors or brokers, and any differences are reviewed in accordance with the Valuation Procedures.
A. Level 1 and Level 2 Fair Value Investments — The valuation techniques and significant inputs used in determining the fair values for investments classified as Level 1 and Level 2 are as follows:
Equity Securities — Equity securities traded on a U.S. securities exchange or the NASDAQ system, or those located on certain foreign exchanges, including but not limited to the Americas, are valued daily at their last sale price or official closing price on the principal exchange or system on which they are traded. If there is no sale or official closing price or such price is believed by GSAM to not represent fair value, equity securities are valued at the last bid price for long positions and at the last ask price for short positions. To the extent these investments are actively traded, they are classified as Level 1 of the fair value hierarchy, otherwise they are generally classified as Level 2.
Unlisted equity securities for which market quotations are available are valued at the last sale price on the valuation date, or if no sale occurs, at the last bid price, and are generally classified as Level 2.
Money Market Funds — Investments in the Goldman Sachs Financial Square Government Fund (“Underlying Fund”) are valued at the NAV of the Institutional Share class on the day of valuation. These investments are generally classified as Level 1 of the fair value hierarchy. For information regarding an Underlying Fund’s accounting policies and investment holdings, please see the Underlying Fund’s shareholder report.
Debt Securities — Debt securities for which market quotations are readily available are valued daily on the basis of quotations supplied by dealers or an independent pricing service approved by the Trustees. The pricing services may use valuation models or matrix pricing, which consider: (i) yield or price with respect to bonds that are considered comparable in characteristics such as rating, interest rate and maturity date or (ii) quotations from securities dealers to determine current value. With the exception of treasury securities of G8 countries, which are generally classified as Level 1, these investments are generally classified as Level 2 of the fair value hierarchy.
i. Commercial Paper — Commercial paper normally represents short-term unsecured promissory notes issued in bearer form by banks or bank holding companies, corporations, finance companies and other issuers. Commercial paper consists of direct U.S. dollar-denominated obligations of domestic or foreign issuers. Asset-backed commercial paper is issued by a special purpose entity that is organized to issue the commercial paper and to purchase trade receivables or other financial assets.
ii. Mortgage-Backed and Asset-Backed Securities — Mortgage-backed securities represent direct or indirect participations in, or are collateralized by and payable from, mortgage loans secured by residential and/or commercial real estate property. Asset-backed securities include securities whose principal and interest payments are collateralized by pools of other assets or receivables. The value of certain mortgage-backed and asset-backed securities (including adjustable rate mortgage loans) may be particularly sensitive to changes in prevailing interest rates. The value of these securities may also fluctuate in response to the market’s perception of the creditworthiness of the issuers.
Asset-backed securities may present credit risks that are not presented by mortgage-backed securities because they generally do not have the benefit of a security interest in collateral that is comparable to mortgage assets. Some asset-backed securities may only have a subordinated claim on collateral.
56
GOLDMAN SACHS VARIABLE INSURANCE TRUST FUNDS
3. INVESTMENTS AND FAIR VALUE MEASUREMENTS (continued)
Stripped mortgage-backed securities are usually structured with two different classes: one that receives substantially all interest payments (interest-only, or “IO” and/or high coupon rate with relatively low principal amount, or “IOette”), and the other that receives substantially all principal payments (principal-only, or “PO”) from a pool of mortgage loans. Little to no principal will be received at the maturity of an IO; as a result, periodic adjustments are recorded to reduce the cost of the security until maturity. These adjustments are included in interest income.
iii. Mortgage Dollar Rolls — Mortgage dollar rolls are transactions whereby a Fund sells mortgage-backed-securities and simultaneously contracts with the same counterparty to repurchase similar securities on a specified future date. During the settlement period, a Fund will not be entitled to accrue interest and receive principal payments on the securities sold. The Funds account for mortgage dollar roll transactions as purchases and sales and realize gains and losses on these transactions.
iv. Treasury Inflation Protected Securities — TIPS are treasury securities in which the principal amount is adjusted daily to keep pace with inflation, as measured by the U.S. Consumer Pricing Index for Urban Consumers. The repayment of the original bond principal upon maturity is guaranteed by the full faith and credit of the U.S. Government.
v. When-Issued Securities and Forward Commitments — When-issued securities, including TBA (“To Be Announced”) securities, are securities that are authorized but not yet issued in the market and purchased in order to secure what is considered to be an advantageous price or yield to a Fund. A forward commitment involves entering into a contract to purchase or sell securities, typically on an extended settlement basis, for a fixed price at a future date. The purchase of securities on a when-issued or forward commitment basis involves a risk of loss if the value of the security to be purchased declines before the settlement date. Conversely, the sale of securities on a forward commitment basis involves the risk that the value of the securities sold may increase before the settlement date. Although a Fund will generally purchase securities on a when-issued or forward commitment basis with the intention of acquiring the securities for its portfolio, the Fund may dispose of when-issued securities or forward commitments prior to settlement, which may result in a realized gain or loss.
Derivative Contracts — A derivative is an instrument whose value is derived from underlying assets, indices, reference rates or a combination of these factors. A Fund enters into derivative transactions to hedge against changes in interest rates, securities prices, and/or currency exchange rates, to increase total return, or to gain access to certain markets or attain exposure to other underliers.
Exchange-traded derivatives, including futures and options contracts, are valued at the last sale or settlement price and typically fall within Level 1 of the fair value hierarchy. Over-the-counter (“OTC”) and centrally cleared derivatives are valued using market transactions and other market evidence, including market-based inputs to models, calibration to market-clearing transactions, broker or dealer quotations, or other alternative pricing sources. Where models are used, the selection of a particular model to value OTC and centrally cleared derivatives depends upon the contractual terms of, and specific risks inherent in, the instrument, as well as the availability of pricing information in the market. Valuation models require a variety of inputs, including contractual terms, market prices, yield curves, credit curves, measures of volatility, voluntary and involuntary prepayment rates, loss severity rates and correlations of such inputs. For OTC and centrally cleared derivatives that trade in liquid markets, model inputs can generally be verified and model selection does not involve significant management judgment. OTC and centrally cleared derivatives are classified within Level 2 of the fair value hierarchy when significant inputs are corroborated by market evidence.
i. Forward Contracts — A forward contract is a contract between two parties to buy or sell an asset at a specified price on a future date. A forward contract settlement can occur on a cash or delivery basis. Forward contracts are marked-to-market daily using independent vendor prices, and the change in value, if any, is recorded as an unrealized gain or loss. Cash and certain investments may be used to collateralize forward contracts.
A forward foreign currency exchange contract is a forward contract in which a Fund agrees to receive or deliver a fixed quantity of one currency for another, at a pre-determined price at a future date. All forward foreign currency exchange contracts are marked-to-market daily at the applicable forward rate. Non-deliverable forward foreign currency exchange contracts are settled with the counterparty in cash without the delivery of foreign currency.
57
GOLDMAN SACHS VARIABLE INSURANCE TRUST FUNDS
Notes to Financial Statements (continued)
June 30, 2018 (Unaudited)
3. INVESTMENTS AND FAIR VALUE MEASUREMENTS (continued)
ii. Futures Contracts — Futures contracts are contracts to buy or sell a standardized quantity of a specified commodity or security and are valued based on exchanged settlement prices or independent market quotes. Futures contracts are valued at the last settlement price, or in the absence of a sale, the last bid price for long positions and at the last ask price for short positions, at the end of each day on the board of trade or exchange upon which they are traded. Upon entering into a futures contract, a Fund deposits cash or securities in an account on behalf of the broker in an amount sufficient to meet the initial margin requirement. Subsequent payments are made or received by a Fund equal to the daily change in the contract value and are recorded as variation margin receivable or payable with a corresponding offset to unrealized gains or losses. For financial reporting purposes, cash collateral that has been pledged to cover obligations of the Funds and cash collateral received, if any, is reported separately on the Statements of Assets and Liabilities as receivables/payables for collateral on certain derivative contracts. Non-cash collateral pledged by a Fund, if any, is noted in the Schedules of Investments.
iii. Options — When a Fund writes call or put options, an amount equal to the premium received is recorded as a liability and is subsequently marked-to-market to reflect the current value of the option written. Swaptions are options on interest rate swap contracts.
Upon the purchase of a call option or a put option by a Fund, the premium paid is recorded as an investment and subsequently marked-to-market to reflect the current value of the option. Certain options may be purchased with premiums to be determined on a future date. The premiums for these options are based upon implied volatility parameters at specified terms.
iv. Swap Contracts — Bilateral swap contracts are agreements in which a Fund and a counterparty agree to exchange periodic payments on a specified notional amount or make a net payment upon termination. Bilateral swap transactions are privately negotiated in the OTC market and payments are settled through direct payments between a Fund and the counterparty. By contrast, certain swap transactions are subject to mandatory central clearing. These swaps are executed through a derivatives clearing member (“DCM”), acting in an agency capacity, and submitted to a central counterparty (“CCP”) (“centrally cleared swaps”), in which case all payments are settled with the CCP through the DCM. Swaps are marked-to-market daily using pricing vendor quotations, counterparty or clearinghouse prices or model prices, and the change in value, if any, is recorded as an unrealized gain or loss. Upon entering into a swap contract, a Fund is required to satisfy an initial margin requirement by delivering cash or securities to the counterparty (or in some cases, segregated in a triparty account on behalf of the counterparty), which can be adjusted by any mark-to-market gains or losses pursuant to bilateral or centrally cleared arrangements. For centrally cleared swaps the daily change in valuation, if any, is recorded as a receivable or payable for variation margin.
An interest rate swap is an agreement that obligates two parties to exchange a series of cash flows at specified intervals, based upon or calculated by reference to changes in interest rates on a specified notional principal amount. The payment flows are usually netted against each other, with the difference being paid by one party to the other.
A credit default swap is an agreement that involves one party (the buyer of protection) making a stream of payments to another party (the seller of protection) in exchange for the right to receive protection on a reference security or obligation, including a group of assets or exposure to the performance of an index. A Fund’s investment in credit default swaps may involve greater risks than if the Fund had invested in the referenced obligation directly. Credit events are contract specific but may include bankruptcy, failure to pay, restructuring and obligation acceleration. If a Fund buys protection through a credit default swap and no credit event occurs, its payments are limited to the periodic payments previously made to the counterparty. Upon the occurrence of a specified credit event, a Fund, as a buyer of credit protection, is entitled to receive an amount equal to the notional amount of the swap and deliver to the seller the defaulted reference obligation in a physically settled trade. A Fund may also receive a net settlement amount in the form of cash or securities equal to the notional amount of the swap reduced by the recovery value of the reference obligation in a cash settled trade.
As a seller of protection, a Fund generally receives a payment stream throughout the term of the swap, provided that there is no credit event. In addition, if a Fund sells protection through a credit default swap, a Fund could suffer a loss because the value of the referenced obligation and the premium payments received may be less than the notional amount of the swap paid
58
GOLDMAN SACHS VARIABLE INSURANCE TRUST FUNDS
3. INVESTMENTS AND FAIR VALUE MEASUREMENTS (continued)
to the buyer of protection. Upon the occurrence of a specified credit event, a Fund, as a seller of credit protection, may be required to take possession of the defaulted reference obligation and pay the buyer an amount equal to the notional amount of the swap in a physically settled trade. A Fund may also pay a net settlement amount in the form of cash or securities equal to the notional amount of the swap reduced by the recovery value of the reference obligation in a cash settled trade. Recovery values are at times established through the credit event auction process in which market participants are ensured that a transparent price has been set for the defaulted security or obligation. In addition, a Fund is entitled to a return of any assets, which have been pledged as collateral to the counterparty upon settlement.
The maximum potential amount of future payments (undiscounted) that a Fund as seller of protection could be required to make under a credit default swap would be an amount equal to the notional amount of the agreement. These potential amounts would be partially offset by any recovery values of the respective referenced obligations or net amounts received from a settlement of a credit default swap for the same reference security or obligation where a Fund bought credit protection.
B. Level 3 Fair Value Investments — To the extent that significant inputs to valuation models and other alternative pricing sources are unobservable, or if quotations are not readily available, or if GSAM believes that such quotations do not accurately reflect fair value, the fair value of a Fund’s investments may be determined under Valuation Procedures approved by the Trustees. GSAM, consistent with its procedures and applicable regulatory guidance, may make an adjustment to the most recent valuation prices of either domestic or foreign securities in light of significant events to reflect what it believes to be the fair value of the securities at the time of determining a Fund’s NAV. Significant events which could affect a large number of securities in a particular market may include, but are not limited to: significant fluctuations in U.S. or foreign markets; market dislocations; market disruptions; or unscheduled market closings. Significant events which could also affect a single issuer may include, but are not limited to: corporate actions such as reorganizations, mergers and buy-outs; ratings downgrades; and bankruptcies.
C. Fair Value Hierarchy — The following is a summary of the Funds’ investments and derivatives classified in the fair value hierarchy as of June 30, 2018:
| CORE FIXED INCOME | ||||||||||||
| Investment Type | Level 1 | Level 2 | Level 3 | |||||||||
| Assets | ||||||||||||
| Fixed Income | ||||||||||||
Corporate Bonds | $ | — | $ | 11,291,801 | $ | — | ||||||
Mortgage-Backed Securities | — | 11,286,265 | — | |||||||||
U.S. Treasury Obligations and/or Other U.S. Government Agencies | 6,947,500 | 980,990 | — | |||||||||
Collateralized Mortgage Obligations | — | 1,408,892 | — | |||||||||
Commercial Mortgage-Backed Security | — | 149,775 | — | |||||||||
Asset-Backed Securities | — | 4,854,944 | — | |||||||||
Foreign Government Securities | — | 1,713,580 | — | |||||||||
Municipal Bonds | — | 417,723 | — | |||||||||
| Investment Company | 1,492,767 | — | — | |||||||||
| Short-Term Investments | �� | — | 744,988 | — | ||||||||
| Total | $ | 8,440,267 | $ | 32,848,958 | $ | — | ||||||
| Liabilities | ||||||||||||
| Fixed Income | ||||||||||||
Mortgage-Backed Obligations — Forward Sales Contracts | $ | — | $ | (2,049,375 | ) | $ | — | |||||
59
GOLDMAN SACHS VARIABLE INSURANCE TRUST FUNDS
Notes to Financial Statements (continued)
June 30, 2018 (Unaudited)
3. INVESTMENTS AND FAIR VALUE MEASUREMENTS (continued)
| CORE FIXED INCOME (continued) | ||||||||||||
| Derivative Type | Level 1 | Level 2 | Level 3 | |||||||||
| Assets(a) | ||||||||||||
| Forward Foreign Currency Exchange Contracts | $ | — | $ | 60,398 | $ | — | ||||||
| Futures Contracts | 84,853 | — | — | |||||||||
| Credit Default Swap Contract | — | 105 | — | |||||||||
| Interest Rate Swap Contracts | — | 92,163 | — | |||||||||
| Total | $ | 84,853 | $ | 152,666 | $ | — | ||||||
| Liabilities(a) | ||||||||||||
| Forward Foreign Currency Exchange Contracts | $ | — | $ | (99,169 | ) | $ | — | |||||
| Futures Contracts | (89,268 | ) | — | — | ||||||||
| Credit Default Swap Contract | — | (134 | ) | — | ||||||||
| Interest Rate Swap Contracts | — | (97,959 | ) | — | ||||||||
| Total | $ | (89,268 | ) | $ | (197,262 | ) | $ | — | ||||
| EQUITY INDEX | ||||||||||||
| Investment Type | Level 1 | Level 2 | Level 3 | |||||||||
| Assets | ||||||||||||
| Common Stock and/or Other Equity Investments(b) | ||||||||||||
Europe | $ | 153,708 | $ | — | $ | — | ||||||
North America | 171,660,053 | — | — | |||||||||
| U.S. Treasury Obligations and/or Other U.S. Government Agencies | 74,334 | — | — | |||||||||
| Securities Lending Reinvestment Vehicle | 134,175 | — | — | |||||||||
| Total | $ | 172,022,270 | $ | — | $ | — | ||||||
| Derivative Type | ||||||||||||
| Liabilities(a) | ||||||||||||
| Futures Contracts | $ | (31,623 | ) | $ | — | $ | — | |||||
| GROWTH OPPORTUNITIES | ||||||||||||
| Investment Type | Level 1 | Level 2 | Level 3 | |||||||||
| Assets | ||||||||||||
| Common Stock and/or Other Equity Investments(b) | ||||||||||||
North America | $ | 77,607,234 | $ | — | $ | — | ||||||
| Investment Company | 1,534 | — | — | |||||||||
| Total | $ | 77,608,768 | $ | — | $ | — | ||||||
| (a) | Amount shown represents unrealized gain (loss) at period end. |
| (b) | Amounts are disclosed by continent to highlight the impact of time zone differences between local market close and the calculation of NAV. Security valuations are based on the principal exchange or system on which they are traded, which may differ from country of domicile. |
60
GOLDMAN SACHS VARIABLE INSURANCE TRUST FUNDS
3. INVESTMENTS AND FAIR VALUE MEASUREMENTS (continued)
| HIGH QUALITY FLOATING RATE | ||||||||||||
| Investment Type | Level 1 | Level 2 | Level 3 | |||||||||
| Assets | ||||||||||||
| Fixed Income | ||||||||||||
U.S. Treasury Obligations and/or Other U.S. Government Agencies | $ | 1,500,075 | $ | — | $ | — | ||||||
Mortgage-Backed Securities | — | 3,605,652 | — | |||||||||
Collateralized Mortgage Obligations | — | 26,470,604 | — | |||||||||
Commercial Mortgage-Backed Security | — | 499,859 | — | |||||||||
Asset-Backed Securities | — | 37,218,002 | — | |||||||||
Municipal Bond | — | 99,584 | — | |||||||||
| Investment Company | 1,035,463 | — | — | |||||||||
| Short-Term Investments | — | 4,918,056 | — | |||||||||
| Total | $ | 2,535,538 | $ | 72,811,757 | $ | — | ||||||
| Derivative Type | ||||||||||||
| Assets(a) | ||||||||||||
| Futures Contracts | $ | 39,339 | $ | — | $ | — | ||||||
| Interest Rate Swap Contracts | — | 29,097 | — | |||||||||
| Total | $ | 39,339 | $ | 29,097 | $ | — | ||||||
| Liabilities(a) | ||||||||||||
| Futures Contracts | $ | (37,387 | ) | $ | — | $ | — | |||||
| Interest Rate Swap Contracts | — | (30,536 | ) | — | ||||||||
| Total | $ | (37,387 | ) | $ | (30,536 | ) | $ | — | ||||
| (a) | Amount shown represents unrealized gain (loss) at period end. |
For further information regarding security characteristics, see the Schedules of Investments.
4. INVESTMENTS IN DERIVATIVES
The following tables set forth, by certain risk types, the gross value of derivative contracts (not considered to be hedging instruments for accounting disclosure purposes) as of June 30, 2018. These instruments were used as part of the Funds’ investment strategies and to obtain and/or manage exposure related to the risks below. The values in the tables below exclude the effects of cash collateral received or posted pursuant to these derivative contracts, and therefore are not representative of the Funds’ net exposure.
61
GOLDMAN SACHS VARIABLE INSURANCE TRUST FUNDS
Notes to Financial Statements (continued)
June 30, 2018 (Unaudited)
4. INVESTMENTS IN DERIVATIVES (continued)
Core Fixed Income
| Risk | Statements of Assets and Liabilities | Assets | Statements of Assets and Liabilities | Liabilities | ||||||||||
| Interest Rate | Variation margin on futures and swaps contracts | $ | 177,016 | (a) | Variation margin on futures and swaps contracts | $ | (187,227 | )(a) | ||||||
| Credit | Variation margin on swap contracts | 105 | (a) | Variation margin on swap contracts | (134 | )(a) | ||||||||
| Currency | Receivables for unrealized gain on forward foreign currency exchange contracts | 60,398 | Payable for unrealized loss on forward foreign currency exchange contracts | (99,169 | ) | |||||||||
| Total | $ | 237,519 | $ | (286,530 | ) | |||||||||
| Fund | Risk | Statements of Assets and Liabilities | Assets(a) | Statements of Assets and Liabilities | Liabilities(a) | |||||||||
| Equity Index | Equity | — | $ | — | Variation margin on futures | $ | (31,623 | ) | ||||||
| High Quality Floating Rate | Interest Rate | Variation margin on futures and swaps contracts | 68,436 | Variation margin on futures and swaps contracts | (67,923 | ) | ||||||||
| (a) | Includes unrealized gain (loss) on futures contracts and centrally cleared swap contracts described in the Additional Investment Information sections of the Schedules of Investments. Only the variation margin as of June 30, 2018 is reported within the Statements of Assets and Liabilities. |
The following tables set forth, by certain risk types, the Funds’ gains (losses) related to these derivatives and their indicative volumes for the six months ended June 30, 2018. These gains (losses) should be considered in the context that these derivative contracts may have been executed to create investment opportunities and/or economically hedge certain investments, and accordingly, certain gains (losses) on such derivative contracts may offset certain (losses) gains attributable to investments. These gains (losses) are included in “Net realized gain (loss)” or “Net change in unrealized gain (loss)” on the Statements of Operations:
Core Fixed Income
| Risk | Statements of Operations | Net Realized Gain (Loss) | Net Change in Unrealized Gain (Loss) | Average Number of Contracts(a) | ||||||||||
| Interest Rate | Net realized gain (loss) from futures contracts, purchased options and swap contracts/Net change in unrealized gain (loss) on futures contracts, purchased options and swap contracts | $ | (468,730 | ) | $ | 38,012 | 189 | |||||||
| Credit | Net realized gain (loss) from swap contracts/Net change in unrealized gain (loss) on swap contracts | 4,018 | (29 | ) | 1 | |||||||||
| Currency | Net realized gain (loss) from forward foreign currency exchange contracts/Net change in unrealized gain (loss) on forward foreign currency exchange contracts | (62,005 | ) | (140,588 | ) | 454 | ||||||||
| Total | $ | (526,717 | ) | $ | (102,605 | ) | 644 | |||||||
Equity Index
| Risk | Statements of Operations | Net Realized Gain (Loss) | Net Change in Unrealized Gain (Loss) | Average Number of Contracts(a) | ||||||||||
| Equity | Net realized gain (loss) from futures contracts/Net change in unrealized gain (loss) on futures contracts | $ | 67,127 | $ | (48,469 | ) | 10 | |||||||
| (a) | Average number of contracts is based on the average of month end balances for the six months ended June 30, 2018. |
62
GOLDMAN SACHS VARIABLE INSURANCE TRUST FUNDS
4. INVESTMENTS IN DERIVATIVES (continued)
High Quality Floating Rate
| Risk | Statements of Operations | Net Realized Gain (Loss) | Net Change in Unrealized Gain (Loss) | Average Number of Contracts(a) | ||||||
| Interest Rate | Net realized gain (loss) from futures contracts and swap contracts/Net change in unrealized gain (loss) on futures contracts and swap contracts | $12,268 | $ | 10,434 | 93 | |||||
| (a) | Average number of contracts is based on the average of month end balances for the six months ended June 30, 2018. |
5. AGREEMENTS AND AFFILIATED TRANSACTIONS
A. Management Agreements — Under the Agreements, GSAM manages the Funds, subject to the general supervision of the Trustees.
As compensation for the services rendered pursuant to the Agreements, the assumption of the expenses related thereto and administration of the Funds’ business affairs, including providing facilities, GSAM is entitled to a management fee, accrued daily and paid monthly, equal to an annual percentage rate of each Fund’s average daily net assets.
As of June 30, 2018, contractual management fees with GSAM were at the following rates. The effective contractual management rate and effective net management rate represent the rates for the six month period ended June 30, 2018.
| Contractual Management Rate | Effective Net Management | |||||||||||||||||||||||||||
| Fund | First $1 billion | Next $1 billion | Next $3 billion | Next $3 billion | Over $8 billion | Effective Rate | ||||||||||||||||||||||
| Core Fixed Income | 0.40 | % | 0.36 | % | 0.34 | % | 0.33 | % | 0.32 | % | 0.40 | % | 0.39 | % | ||||||||||||||
| Growth Opportunities | 0.87 | 0.87 | 0.78 | 0.74 | 0.73 | 0.97 | 0.83 | * | ||||||||||||||||||||
| High Quality Floating Rate | 0.31 | 0.28 | 0.27 | 0.26 | 0.25 | 0.37 | 0.29 | |||||||||||||||||||||
| ^ | Effective Net Management Rate includes the impact of management fee waivers of affiliated Underlying Funds, if any. The Effective Net Management Rate may not correlate to the Contractual Management Rate as a result of management fee waivers that may be in effect from time to time. |
| * | GSAM agreed to waive a portion of its management fee in order to achieve a net management rate, as defined in the Fund’s most recent prospectus. This waiver will be effective through at least April 30, 2019, and prior to such date GSAM may not terminate the arrangement without approval of the Trustees. |
Prior to April 30, 2018, the contractual management fee rates for the Growth Opportunities Fund, and High Quality Floating Rate Fund were as stated below and GSAM agreed to waive a portion of its management fee in order to achieve an Effective Net Management Rate as set forth in the Funds’ prospectus dated April 28, 2017.
| Fund | First $1 billion | Next $1 billion | Next $3 billion | Next $3 billion | Over $8 billion | |||||||||||||||
| Growth Opportunities | 1.00 | 1.00 | 0.90 | 0.86 | 0.84 | |||||||||||||||
| High Quality Floating Rate | 0.40 | 0.36 | 0.34 | 0.33 | 0.32 | |||||||||||||||
The Core Fixed Income, Growth Opportunities and High Quality Floating Rate Funds invest in Institutional Shares of the Goldman Sachs Financial Square Government Fund, which is an affiliated Underlying Fund. GSAM has agreed to waive a portion of its management fee payable by the Funds in an amount equal to the management fee it earns as an investment adviser to the affiliated Underlying Fund in which the Funds invest, except those management fees it earns from the Funds’ investments of cash collateral received in connection with securities lending transactions in the Goldman Sachs Financial Square Government Fund. For the six months ended June 30, 2018, GSAM waived $2,158, $1,137, and $3,463 of the Core Fixed Income, Growth Opportunities, and High Quality Floating Rate Funds’ management fees, respectively.
63
GOLDMAN SACHS VARIABLE INSURANCE TRUST FUNDS
Notes to Financial Statements (continued)
June 30, 2018 (Unaudited)
5. AGREEMENTS AND AFFILIATED TRANSACTIONS (continued)
The Agreement for the Equity Index Fund provides for a contractual management fee at an annual rate equal to 0.30 % of the Fund’s average daily net assets. For the six months ended June 30, 2018, GSAM agreed to waive a portion of its management fee in order to achieve the following effective annual rates which will remain in effect through at least April 30, 2019 and prior to such date GSAM may not terminate the arrangement without the approval of the Trustees:
| Net Management Rate | ||||||||||||||
| Fund | $0-$400 million | Over $400 million | Effective Rate | |||||||||||
| Equity Index | 0.21 | % | 0.20 | % | 0.21 | % | ||||||||
As authorized by the Agreement for the Equity Index Fund, GSAM has entered into a Sub-advisory Agreement with SSgA Funds Management, Inc. (“SSgA”) which serves as the sub-adviser to the Fund and provides the day-to-day advice regarding the Fund’s portfolio transactions. As compensation for its services, SSgA is entitled to a fee, accrued daily and paid monthly by GSAM, at the following annual rates of the Fund’s average daily net assets: 0.03% on the first $50 million, 0.02% on the next $200 million, 0.01% on the next $750 million and 0.008% over $1 billion. The effective Sub-advisory fee was 0.02% for the six months ended June 30, 2018.
B. Distribution and/or Service (12b-1) Plans — The Trust, on behalf of Service Shares of each applicable Fund, has adopted a Distribution and Service Plan subject to Rule 12b-1 under the Act. Under the Distribution and Service Plan, Goldman Sachs, which serves as distributor (the “Distributor”), is entitled to a fee accrued daily and paid monthly, for distribution services and personal and account maintenance services, which may then be paid by Goldman Sachs to authorized dealers, equal to, on an annual basis, 0.25% of the Fund’s average daily net assets attributable to Service Shares. For the six months ended June 30, 2018 for the Growth Opportunities Fund, Goldman Sachs agreed to waive distribution and services fees so as not to exceed an annual rate of 0.16% of average daily net assets of the Fund. This distribution and service fee waiver will remain in place through at least April 30, 2019, and prior to such date Goldman Sachs may not terminate the arrangement without the approval of the Trustees.
The Trust, on behalf of Advisor Shares of each applicable Fund, has adopted a Distribution Plan subject to Rule 12b-1 under the Act. Under the Distribution Plan, Goldman Sachs as Distributor is entitled to a fee accrued daily and paid monthly for distribution services, which may then be paid by Goldman Sachs to authorized dealers, equal to, on an annual basis, 0.15% of the Fund’s average daily net assets attributable to Advisor Shares.
C. Service Plans — The Trust, on behalf of Advisor Shares of each applicable Fund, has adopted a Service Plan to allow Advisor Shares to compensate service organizations (including Goldman Sachs) for providing varying levels of personal and account maintenance and administration services to their customers who are beneficial owners of such shares. The Service Plans each provide for compensation to the service organizations equal to 0.25% of the average daily net assets attributable to Advisor Shares of the Fund.
D. Transfer Agency Agreement — Goldman Sachs also serves as the transfer agent of the Funds for a fee pursuant to the Transfer Agency Agreement. The fees charged for such transfer agency services are accrued daily and paid monthly at an annual rate of 0.02% of the average daily net assets of Institutional, Service and Advisor Shares.
E. Other Expense Agreements and Affiliated Transactions — GSAM has agreed to limit certain “Other Expenses” of the Funds (excluding acquired fund fees and expenses, transfer agency fees and expenses, service fees and shareholder administration fees (as applicable), taxes, interest, brokerage fees, expenses of shareholder meetings, litigation and indemnification, and extraordinary expenses) to the extent such expenses exceed, on an annual basis, a percentage rate of the average daily net assets of each Fund. Such Other Expense reimbursements, if any, are accrued daily and paid monthly. In addition, the Funds are not obligated to reimburse GSAM for prior fiscal year expense reimbursements, if any. The Other Expense limitations as an annual percentage rate of average daily net assets for Core Fixed Income, Equity Index, Growth Opportunities and High Quality Floating Rate Funds are 0.004%, 0.004%, 0.004% and 0.034%, respectively. These Other Expense limitations will remain in place through at least April 30, 2019, and prior to such date GSAM may not terminate the arrangements without the approval of the Trustees. In
64
GOLDMAN SACHS VARIABLE INSURANCE TRUST FUNDS
5. AGREEMENTS AND AFFILIATED TRANSACTIONS (continued)
addition, the Funds have entered into certain offset arrangements with the custodian and the transfer agent, which may result in a reduction of the Funds’ expenses and are received irrespective of the application of the “Other Expense” limitations described above.
For the six months ended June 30, 2018, these expense reductions, including any fee waivers and Other Expense reimbursements, were as follows:
| Fund | Management Fee Waiver | Distribution and Service Fee Waiver | Custody Fee Credits | Other Expense Reimbursement | Total Expense Reductions | |||||||||||||||
| Core Fixed Income | $ | 2,158 | $ | — | $ | 559 | $ | 113,854 | $ | 116,571 | ||||||||||
| Equity Index | 79,187 | — | 328 | 95,199 | 174,714 | |||||||||||||||
| Growth Opportunities | 79,815 | 51,086 | 609 | 101,508 | 233,018 | |||||||||||||||
| High Quality Floating Rate | 26,981 | — | 567 | 95,464 | 123,012 | |||||||||||||||
F. Line of Credit Facility — As of June 30, 2018, the Funds participated in a $770,000,000 committed, unsecured revolving line of credit facility (the “facility”) together with other funds of the Trust and certain registered investment companies having management agreements with GSAM or its affiliates. This facility is to be used for temporary emergency purposes, or to allow for an orderly liquidation of securities to meet redemption requests. The interest rate on borrowings is based on the federal funds rate. The facility also requires a fee to be paid by the Funds based on the amount of the commitment that has not been utilized. For the six months ended June 30, 2018, the Funds did not have any borrowings under the facility. Prior to May 1, 2018 the facility was $1,100,000,000. The facility was decreased to $770,000,000 effective May 1, 2018.
G. Other Transactions with Affiliates — The following table provides information about the investment in shares of issuers of which a Fund is an affiliate as of and for the six months ended June 30, 2018:
| Fund | Name of Affiliated Issuer | Beginning Value as of December 31, 2017 | Purchases at Cost | Proceeds from Sales | Net Realized Gain (Loss) | Change in Unrealized Appreciation (Depreciation) | Ending Value as of June 30, 2018 | Shares as of June 30, 2018 | Dividend Income from Affiliated Issuer | |||||||||||||||||||||||||
| Equity Index | Goldman Sachs Group, Inc. (The) | $ | 697,023 | $ | — | $ | (30,892 | ) | $ | 16,006 | $ | (106,449 | ) | $ | 575,688 | 2,610 | $ | 4,125 | ||||||||||||||||
The following table provides information about the Funds’ investment in the Goldman Sachs Financial Square Government Fund as of and for the six months ended June 30, 2018:
| Fund | Beginning Value as of December 31, 2017 | Purchases at Cost | Proceeds from Sales | Ending Value as of June 30, 2018 | Shares as of June 30, 2018 | Dividend Income from Affiliated Investment Company | ||||||||||||||||||
| Core Fixed Income | $ | 1,280,522 | $ | 27,233,258 | $ | (27,021,013 | ) | $ | 1,492,767 | 1,492,767 | $ | 19,014 | ||||||||||||
| Growth Opportunities | 572 | 12,383,025 | (12,382,063 | ) | 1,534 | 1,534 | 10,996 | |||||||||||||||||
| High Quality Floating Rate | 5,655,467 | 16,637,564 | (21,257,568 | ) | 1,035,463 | 1,035,463 | 28,785 | |||||||||||||||||
65
GOLDMAN SACHS VARIABLE INSURANCE TRUST FUNDS
Notes to Financial Statements (continued)
June 30, 2018 (Unaudited)
5. AGREEMENTS AND AFFILIATED TRANSACTIONS (continued)
As of June 30, 2018, The Goldman Sachs Group, Inc. was the beneficial owner of approximately 10%, 70% and 100% of the Institutional Shares of the Core Fixed Income, Growth Opportunities and High Quality Floating Rate Funds, respectively.
6. PORTFOLIO SECURITIES TRANSACTIONS
The cost of purchases and proceeds from sales and maturities of long-term securities for the six months ended June 30, 2018, were as follows:
| Fund | Purchases of U.S. Government and Agency Obligations | Purchases (Excluding U.S. Government and Agency Obligations) | Sales and Maturities of U.S. Government and Agency Obligations | Sales and Maturities (Excluding U.S. Government and Agency Obligations) | ||||||||||||
| Core Fixed Income | $ | 117,401,232 | $ | 11,806,852 | $ | 143,953,039 | $ | 51,217,109 | ||||||||
| Equity Index | — | 1,834,950 | — | 10,568,558 | ||||||||||||
| Growth Opportunities | — | 36,739,949 | — | 133,937,579 | ||||||||||||
| High Quality Floating Rate | 3,351,023 | 12,812,272 | 4,346,392 | 6,852,457 | ||||||||||||
7. SECURITIES LENDING
The Growth Opportunities Fund may lend its securities through a securities lending agent, the Bank of New York Mellon (“BNYM”), to certain qualified borrowers. Pursuant to exemptive relief granted by the Securities and Exchange Commission (“SEC”) and the terms and conditions contained therein, the Equity Index Fund may lend its securities through a securities lending agent, Goldman Sachs Agency Lending (“GSAL”), a wholly-owned subsidiary of Goldman Sachs, to certain qualified borrowers including Goldman Sachs and affiliates. In accordance with the Funds’ securities lending procedures, the Funds receive cash collateral at least equal to the market value of the securities on loan. The market value of the loaned securities is determined at the close of business of the Funds, at their last sale price or official closing price on the principal exchange or system on which they are traded, and any additional required collateral is delivered to the Funds on the next business day. As with other extensions of credit, the Funds may experience delay in the recovery of their securities or incur a loss should the borrower of the securities breach its agreement with the Funds or become insolvent at a time when the collateral is insufficient to cover the cost of repurchasing securities on loan. Dividend income received from securities on loan may not be subject to withholding taxes and therefore withholding taxes paid may differ from the amounts listed in the Statements of Operations. Loans of securities are terminable at any time and as such 1) the remaining contractual maturities of the outstanding securities lending transactions are considered to be overnight and continuous and 2) the borrower, after notice, is required to return borrowed securities within the standard time period for settlement of securities transactions.
The Equity Index and Growth Opportunities Funds invest the cash collateral received in connection with securities lending transactions in the Goldman Sachs Financial Square Government Fund (“Government Money Market Fund”), an affiliated series of the Goldman Sachs Trust. The Government Money Market Fund is registered under the Act as an open end investment company, is subject to Rule 2a-7 under the Act, and is managed by GSAM, for which GSAM may receive a management fee of up to 0.16% (prior to February 21, 2018, GSAM may have received a management fee of up to 0.205%) on an annualized basis of the average daily net assets of the Government Money Market Fund.
In the event of a default by a borrower with respect to any loan, GSAL will and BNYM may exercise any and all remedies provided under the applicable borrower agreement to make the Funds whole. These remedies include purchasing replacement securities by applying the collateral held from the defaulting broker against the purchase cost of the replacement securities. If
66
GOLDMAN SACHS VARIABLE INSURANCE TRUST FUNDS
7. SECURITIES LENDING (continued)
GSAL or BNYM are unable to purchase replacement securities, GSAL and/or BNYM will indemnify the Funds by paying the Funds an amount equal to the market value of the securities loaned minus the value of cash collateral received from the borrower for the loan, subject to an exclusion for any shortfalls resulting from a loss of value in such cash collateral due to reinvestment risk. The Funds’ loaned securities were all subject to enforceable Securities Lending Agreements and the value of the collateral was at least equal to the value of the cash received. The amounts of the Funds’ overnight and continuous agreements represent the gross amounts of recognized liabilities for securities lending transactions outstanding as of June 30, 2018 are disclosed as “Payable upon return of securities loaned” on the Statements of Assets and Liabilities, where applicable. The Growth Opportunities Fund did not have securities on loan as of June 30, 2018.
Each of the Equity Index and Growth Opportunities Funds and GSAL and BNYM received compensation relating to the lending of the Funds’ securities. The amounts earned, if any, by the Funds’ for the six months ended June 30, 2018, are reported under Investment Income on the Statements of Operations.
The table below details securities lending activity with affiliates of Goldman Sachs:
| For the Six months ended June 30, 2018 | ||||||||||||||
| Fund | Earnings of GSAL Relating to Securities Loaned | Amount Received by the Fund from Lending to Goldman Sachs | Amount Payable to Goldman Sachs Upon Return of Securities Loaned as of June 30, 2018 | |||||||||||
| Equity Index | $ | 58 | $ | 51 | $ | 32,175 | ||||||||
The following table provides information about the Funds’ investment in the Government Money Market Fund for the six months ended June 30, 2018:
| Fund | Beginning Value as of December 31, 2017 | Purchases at Cost | Proceeds from Sales | Ending Value as of June 30, 2018 | ||||||||||||||
| Equity Index | $ | 165,850 | $ | 977,125 | $ | (1,008,800 | ) | $ | 134,175 | |||||||||
| Growth Opportunities | 1,040,835 | 12,111,075 | (13,151,910 | ) | — | |||||||||||||
8. TAX INFORMATION
As of the Funds’ most recent fiscal year end, December 31, 2017, the Funds’ capital loss carryforwards and certain timing differences, on a tax-basis were as follows:
| Core Fixed Income | Equity Index | Growth Opportunities | High Quality Floating Rate | |||||||||||||
| Capital loss carryforwards: | ||||||||||||||||
Expiring 2018(1) | $ | (4,214,815 | ) | $ | — | $ | — | $ | — | |||||||
Perpetual short-term | — | — | — | (197,425 | ) | |||||||||||
Perpetual long-term | (345,051 | ) | — | — | (908,667 | ) | ||||||||||
| Total capital loss carryforwards | $ | (4,559,866 | ) | $ | — | $ | — | $ | (1,106,092 | ) | ||||||
| Timing differences (§ 857 (b)(9) deferred dividend, post October loss deferral and straddle loss deferrals) | (463,889 | ) | 5,635 | — | (25,387 | ) | ||||||||||
| (1) | Expiration occurs on December 31 of the year indicated. |
67
GOLDMAN SACHS VARIABLE INSURANCE TRUST FUNDS
Notes to Financial Statements (continued)
June 30, 2018 (Unaudited)
8. TAX INFORMATION (continued)
As of June 30, 2018, the Funds’ aggregate security unrealized gains and losses based on cost for U.S. federal income tax purposes were as follows:
| Core Fixed Income | Equity Index | Growth Opportunities | High Quality Floating Rate | |||||||||||||
| Tax cost | $ | 41,613,522 | $ | 69,282,552 | $ | 55,643,140 | $ | 75,185,418 | ||||||||
| Gross unrealized gain | 596,486 | 111,591,184 | 22,897,454 | 390,341 | ||||||||||||
| Gross unrealized loss | (920,783 | ) | (8,851,466 | ) | (931,826 | ) | (228,464 | ) | ||||||||
| Net unrealized gain (loss) | $ | (324,297 | ) | $ | 102,739,718 | $ | 21,965,628 | $ | 161,877 | |||||||
The difference between GAAP-basis and tax-basis unrealized gains (losses) is attributable primarily to wash sales, net mark to market gains (losses) on regulated futures, options and foreign currency contracts, and differences in the tax treatment of underlying fund investments, real estate investment trust investments, partnership investments and swap transactions.
GSAM has reviewed the Funds’ tax positions for all open tax years (the current and prior three years, as applicable) and has concluded that no provision for income tax is required in the Funds’ financial statements. Such open tax years remain subject to examination and adjustment by tax authorities.
9. OTHER RISKS
The Funds’ risks include, but are not limited to, the following:
Derivatives Risk — The Funds’ use of derivatives may result in loss. Derivative instruments, which may pose risks in addition to and greater than those associated with investing directly in securities, currencies or other instruments, may be illiquid or less liquid, volatile, difficult to price and leveraged so that small changes in the value of the underlying instruments may produce disproportionate losses to the Funds. Derivatives are also subject to counterparty risk, which is the risk that the other party in the transaction will not fulfill its contractual obligation. The use of derivatives is a highly specialized activity that involves investment techniques and risks different from those associated with investments in more traditional securities and instruments. Losses from derivatives can also result from a lack of correlation between changes in the value of derivative instruments and the portfolio assets (if any) being hedged.
Interest Rate Risk — When interest rates increase, fixed income securities or instruments held by a Fund will generally decline in value. Long-term fixed income securities or instruments will normally have more price volatility because of this risk than short-term fixed income securities or instruments. The risks associated with changing interest rates may have unpredictable effects on the markets and a Fund’s investments. Fluctuations in interest rates may also affect the liquidity of fixed income securities and instruments held by the Funds.
Investments in Other Investment Companies Risk — As a shareholder of another investment company, including an exchange traded fund (“ETF”), a Fund will indirectly bear its proportionate share of any net management fees and other expenses paid by such other investment companies, in addition to the fees and expenses regularly borne by the Fund. ETFs are subject to risks that do not apply to conventional mutual funds, including but not limited to the following: (i) the market price of the ETF’s shares may trade at a premium or a discount to their NAV; and (ii) an active trading market for an ETF’s shares may not develop or be maintained.
Large Shareholder Transactions Risk — A Fund may experience adverse effects when certain large shareholders, such as other funds, participating insurance companies, accounts and Goldman Sachs affiliates, purchase or redeem large amounts of shares of the Fund. Such large shareholder redemptions may cause a Fund to sell portfolio securities at times when it would not otherwise do so, which may negatively impact a Fund’s NAV and liquidity. These transactions may also accelerate the realization of taxable
68
GOLDMAN SACHS VARIABLE INSURANCE TRUST FUNDS
9. OTHER RISKS (continued)
income to shareholders if such sales of investments resulted in gains, and may also increase transaction costs. In addition, a large redemption could result in a Fund’s current expenses being allocated over a smaller asset base, leading to an increase in the Fund’s expense ratio. Similarly, large Fund share purchases may adversely affect a Fund’s performance to the extent that the Fund is delayed in investing new cash and is required to maintain a larger cash position than it ordinarily would.
Liquidity Risk — A Fund may make investments that are illiquid or that may become less liquid in response to market developments or adverse investor perceptions. Illiquid investments may be more difficult to value. Liquidity risk may also refer to the risk that a Fund will not be able to pay redemption proceeds within the allowable time period because of unusual market conditions, an unusually high volume of redemption requests, or other reasons. To meet redemption requests, a Fund may be forced to sell investments at an unfavorable time and/or under unfavorable conditions. Liquidity risk may be the result of, among other things, the reduced number and capacity of traditional market participants to make a market in fixed income securities or the lack of an active market. The potential for liquidity risk may be magnified by a rising interest rate environment or other circumstances where investor redemptions from fixed income mutual funds may be higher than normal, potentially causing increased supply in the market due to selling activity.
Market and Credit Risks — In the normal course of business, a Fund trades financial instruments and enters into financial transactions where risk of potential loss exists due to changes in the market (market risk). Additionally, a Fund may also be exposed to credit risk in the event that an issuer or guarantor fails to perform or that an institution or entity with which the Fund has unsettled or open transactions defaults.
10. INDEMNIFICATIONS
Under the Trust’s organizational documents, its Trustees, officers, employees and agents are indemnified, to the extent permitted by the Act and state law, against certain liabilities that may arise out of performance of their duties to the Funds. Additionally, in the course of business, the Funds enter into contracts that contain a variety of indemnification clauses. The Funds’ maximum exposure under these arrangements is unknown, as this would involve future claims that may be made against the Funds that have not yet occurred. However, GSAM believes the risk of loss under these arrangements to be remote.
11. OTHER MATTERS
In March 2017, the Financial Accounting Standards Board issued Accounting Standards Update (“ASU”) 2017-08 — Receivables — Nonrefundable Fees and Other Costs (Subtopic 310-20): Premium Amortization on Purchased Callable Debt Securities. The amendments in the ASU shorten the amortization period for certain callable debt securities held at a premium, by requiring amortization to the earliest call date. The amendments are effective for the Funds’ fiscal year ended December 31, 2019. GSAM is currently evaluating the impact, if any, of the amendments.
12. SUBSEQUENT EVENTS
Subsequent events after the Statements of Assets and Liabilities date have been evaluated, and GSAM has concluded that there is no impact requiring adjustment or disclosure in the financial statements.
69
GOLDMAN SACHS VARIABLE INSURANCE TRUST FUNDS
Notes to Financial Statements (continued)
June 30, 2018 (Unaudited)
13. SUMMARY OF SHARE TRANSACTIONS
Share activity is as follows:
| Core Fixed Income Fund | ||||||||||||||||
| For the Six Months Ended June 30, 2018 (Unaudited) | For the Fiscal Year Ended December 31, 2017 | |||||||||||||||
| Shares | Dollars | Shares | Dollars | |||||||||||||
| Institutional Shares | ||||||||||||||||
| Shares sold | 4,967 | $ | 51,867 | 15,479 | $ | 164,881 | ||||||||||
| Reinvestment of distributions | 740 | 7,568 | 504 | 5,356 | ||||||||||||
| Shares redeemed | (1,343 | ) | (13,927 | ) | (1,931 | ) | (20,628 | ) | ||||||||
| 4,364 | 45,508 | 14,052 | 149,609 | |||||||||||||
| Service Shares | ||||||||||||||||
| Shares sold | 146,854 | 1,529,586 | 646,406 | 6,887,625 | ||||||||||||
| Reinvestment of distributions | 93,112 | 951,750 | 270,542 | 2,870,144 | ||||||||||||
| Shares redeemed | (6,866,871 | ) | (71,484,429 | ) | (1,110,095 | ) | (11,842,825 | ) | ||||||||
| (6,626,905 | ) | (69,003,093 | ) | (193,147 | ) | (2,085,056 | ) | |||||||||
| NET DECREASE | (6,622,541 | ) | $ | (68,957,585 | ) | (179,095 | ) | $ | (1,935,447 | ) | ||||||
| Equity Index Fund | ||||||||||||||||
| For the Six Months Ended June 30, 2018 (Unaudited) | For the Fiscal Year Ended December 31, 2017 | |||||||||||||||
| Shares | Dollars | Shares | Dollars | |||||||||||||
| Service Shares | ||||||||||||||||
| Shares sold | 45,843 | $ | 752,280 | 128,581 | $ | 2,056,692 | ||||||||||
| Reinvestment of distributions | — | — | 600,454 | 10,027,577 | ||||||||||||
| Shares redeemed | (640,139 | ) | (10,852,979 | ) | (1,367,871 | ) | (21,731,411 | ) | ||||||||
| NET DECREASE | (594,296 | ) | $ | (10,100,699 | ) | (638,836 | ) | $ | (9,647,142 | ) | ||||||
70
GOLDMAN SACHS VARIABLE INSURANCE TRUST FUNDS
13. SUMMARY OF SHARE TRANSACTIONS (continued)
| Growth Opportunities Fund | ||||||||||||||||
| For the Six Months Ended June 30, 2018 (Unaudited) | For the Fiscal Year Ended December 31, 2017 | |||||||||||||||
| Shares | Dollars | Shares | Dollars | |||||||||||||
| Institutional Shares | ||||||||||||||||
| Shares sold | 810 | $ | 6,624 | 48,128 | $ | 365,935 | ||||||||||
| Reinvestment of distributions | — | — | 642 | 4,985 | ||||||||||||
| Shares redeemed | — | — | (560,729 | ) | (4,411,997 | ) | ||||||||||
| 810 | 6,624 | (511,959 | ) | (4,041,077 | ) | |||||||||||
| Service Shares | ||||||||||||||||
| Shares sold | 267,570 | 2,126,221 | 531,350 | 4,039,461 | ||||||||||||
| Reinvestment of distributions | — | — | 2,196,296 | 16,867,555 | ||||||||||||
| Shares redeemed | (12,583,097 | ) | (99,786,730 | ) | (3,713,893 | ) | (28,591,468 | ) | ||||||||
| (12,315,527 | ) | (97,660,509 | ) | (986,247 | ) | (7,684,452 | ) | |||||||||
| NET DECREASE | (12,314,717 | ) | $ | (97,653,885 | ) | (1,498,206 | ) | $ | (11,725,529 | ) | ||||||
| High Quality Floating Rate Fund | ||||||||||||||||
| For the Six Months Ended June 30, 2018 (Unaudited) | For the Fiscal Year Ended December 31, 2017 | |||||||||||||||
| Shares | Dollars | Shares | Dollars | |||||||||||||
| Institutional Shares | ||||||||||||||||
| Shares sold | 31 | $ | 316 | 6,236 | $ | 65,055 | ||||||||||
| Reinvestment of distributions | 41 | 424 | 92 | 956 | ||||||||||||
| Shares redeemed | (2,992 | ) | (31,202 | ) | (3,345 | ) | (34,922 | ) | ||||||||
| (2,920 | ) | (30,462 | ) | 2,983 | 31,089 | |||||||||||
| Service Shares | ||||||||||||||||
| Shares sold | 615,543 | 6,409,856 | 537,817 | 5,602,003 | ||||||||||||
| Reinvestment of distributions | 60,809 | 631,808 | 80,994 | 842,342 | ||||||||||||
| Shares redeemed | (373,747 | ) | (3,892,891 | ) | (643,776 | ) | (6,705,632 | ) | ||||||||
| 302,605 | 3,148,773 | (24,965 | ) | (261,287 | ) | |||||||||||
| Advisor Shares | ||||||||||||||||
| Shares sold | 220,594 | 2,301,015 | 673,871 | 7,022,526 | ||||||||||||
| Reinvestment of distributions | 4,890 | 50,857 | 4,176 | 43,482 | ||||||||||||
| Shares redeemed | (44,329 | ) | (462,549 | ) | (383,555 | ) | (3,998,446 | ) | ||||||||
| 181,155 | 1,889,323 | 294,492 | 3,067,562 | |||||||||||||
| NET INCREASE | 480,840 | $ | 5,007,634 | 272,510 | $ | 2,837,364 | ||||||||||
71
GOLDMAN SACHS VARIABLE INSURANCE TRUST FUNDS
| Fund Expenses — Six Month Period Ended June 30, 2018 (Unaudited) |
As a shareholder of Institutional, Service or Advisor Shares of the Funds, you incur ongoing costs, including management fees, distribution and/or service (12b-1) fees (with respect to Service and Advisor Shares) and other Fund expenses. This example is intended to help you understand your ongoing costs (in dollars) of investing in the Institutional Shares, Service Shares and Advisor Shares of the Funds and to compare these costs with the ongoing costs of investing in other mutual funds.
The example is based on an investment of $1,000 invested at the beginning of the period and held for the entire period from January 1, 2018 through June 30, 2018, which represents a period of 181 days of a 365 day year.
Actual Expenses — The first line under each share class in the table below provides information about actual account values and actual expenses. You may use the information in this line, together with the amount you invested, to estimate the expenses that you paid over the period. Simply divide your account value by $1,000 (for example, an $8,600 account value divided by $1,000=8.6), then multiply the result by the number in the first line under the heading entitled “Expenses Paid” to estimate the expenses you paid on your account during this period.
Hypothetical Example for Comparison Purposes — The second line under each share class in the table below provides information about hypothetical account values and hypothetical expenses based on the Funds’ actual net expense ratio and an assumed rate of return of 5% per year before expenses, which is not the Funds’ actual return. The hypothetical account values and expenses may not be used to estimate the actual ending account balance or expenses you paid for the period. You may use this information to compare the ongoing costs of investing in the Funds and other funds. To do so, compare this 5% hypothetical example with the 5% hypothetical examples that appear in the shareholder reports of the other funds.
Please note that the expenses shown in the table are meant to highlight your ongoing costs only. As a shareholder of the Funds you do not incur any transaction costs, such as sales charges, redemption fees, or exchange fees, but shareholders of other funds may incur such costs. The second line of the table is useful in comparing ongoing costs only and will not help you determine the relative total costs of owning different funds whose shareholders may incur transaction costs.
| Core Fixed Income Fund | Equity Index Fund | Growth Opportunities Fund | High Quality Floating Rate Fund | |||||||||||||||||||||||||||||||||||||||||||||
| Share Class | Beginning Account 01/01/18 | Ending Account 06/30/18 | Expenses Paid for the 6 Months Ended 06/30/18* | Beginning Account 01/01/18 | Ending Account 06/30/18 | Expenses Paid for the 6 Months Ended 06/30/18* | Beginning Account 01/01/18 | Ending Account 06/30/18 | Expenses Paid for the 6 Months Ended 06/30/18* | Beginning Account 01/01/18 | Ending Account 06/30/18 | Expenses Paid for the 6 Months Ended 06/30/18* | ||||||||||||||||||||||||||||||||||||
| Institutional | ||||||||||||||||||||||||||||||||||||||||||||||||
Actual | $ | 1,000 | $ | 981.20 | $ | 2.01 | N/A | N/A | N/A | $ | 1,000 | $ | 1,039.80 | $ | 4.30 | $ | 1,000 | $ | 1,009.50 | $ | 1.69 | |||||||||||||||||||||||||||
Hypothetical 5% return | 1,000 | 1,022.76 | + | 2.06 | N/A | N/A | N/A | 1,000 | 1,020.58 | + | 4.26 | 1,000 | 1,023.11 | + | 1.71 | |||||||||||||||||||||||||||||||||
| Service | ||||||||||||||||||||||||||||||||||||||||||||||||
Actual | 1,000 | 980.10 | 3.29 | $ | 1,000 | $ | 1,024.10 | $ | 2.41 | 1,000 | 1,039.00 | 5.11 | 1,000 | 1,008.30 | 2.94 | |||||||||||||||||||||||||||||||||
Hypothetical 5% return | 1,000 | 1,021.47 | + | 3.36 | 1,000 | 1,022.41 | + | 2.41 | 1,000 | 1,019.79 | + | 5.06 | 1,000 | 1,021.87 | + | 2.96 | ||||||||||||||||||||||||||||||||
| Advisor | ||||||||||||||||||||||||||||||||||||||||||||||||
Actual | N/A | N/A | N/A | N/A | N/A | N/A | N/A | N/A | N/A | 1,000 | 1,007.80 | 3.68 | ||||||||||||||||||||||||||||||||||||
Hypothetical 5% return | N/A | N/A | N/A | N/A | N/A | N/A | N/A | N/A | N/A | 1,000 | 1,021.12 | + | 3.71 | |||||||||||||||||||||||||||||||||||
| + | Hypothetical expenses are based on each Fund’s actual annualized net expense ratios and an assumed rate of return of 5% per year before expenses. |
| * | Expenses are calculated using each Fund’s annualized net expense ratio for each class, which represents the ongoing expenses as a percentage of net assets for the six months ended June 30, 2018. Expenses are calculated by multiplying the annualized net expense ratio by the average account value for the period; then multiplying the result by the number of days in the most recent fiscal half year; and then dividing that result by the number of days in the fiscal year. The annualized net expense ratios for the period were as follows: |
| Fund | Institutional | Service | Advisor | |||||||||
| Core Fixed Income | 0.41 | % | 0.67 | % | N/A | |||||||
| Equity Index | N/A | 0.48 | N/A | |||||||||
| Growth Opportunities | 0.85 | 1.01 | N/A | |||||||||
| High Quality Floating Rate | 0.34 | 0.59 | 0.74 | % | ||||||||
72
GOLDMAN SACHS VARIABLE INSURANCE TRUST FUNDS
Statement Regarding Basis for Approval of Management Agreements (Unaudited)
Background
The Goldman Sachs Core Fixed Income, Goldman Sachs Equity Index, Goldman Sachs Growth Opportunities and Goldman Sachs High Quality Floating Rate Funds (the “Funds”) are investment portfolios of Goldman Sachs Variable Insurance Trust (the “Trust”). The Board of Trustees oversees the management of the Trust and reviews the investment performance and expenses of the Funds at regularly scheduled meetings held throughout the year. In addition, the Board of Trustees determines annually whether to approve the continuance of the Trust’s investment management agreements (the “Management Agreements”) with Goldman Sachs Asset Management, L.P. (the “Investment Adviser”) on behalf of the Funds and the sub-advisory agreement (the “Sub-Advisory Agreement,” and together with the Management Agreements, the “Agreements”) between the Investment Adviser and SSgA Funds Management, Inc. (the “Sub-Adviser”) on behalf of the Equity Index Fund.
The Agreements were most recently approved for continuation until June 30, 2019 by the Board of Trustees, including those Trustees who are not parties to the Agreements or “interested persons” (as defined in the Investment Company Act of 1940, as amended) of any party thereto (the “Independent Trustees”), at a meeting held on June 13-14, 2018 (the “Annual Meeting”).
The review process undertaken by the Trustees spans the course of the year and culminates with the Annual Meeting. To assist the Trustees in their deliberations, the Trustees have established a Contract Review Committee (the “Committee”), comprised of the Independent Trustees. The Committee held four meetings over the course of the year since the Agreements were last approved. At those Committee meetings, regularly scheduled Board or other committee meetings, and/or the Annual Meeting, matters relevant to the renewal of the Agreements were considered by the Board, or the Independent Trustees, as applicable. With respect to each Fund, such matters included:
| (a) | the nature and quality of the advisory, administrative, and other services provided to the Fund by the Investment Adviser and its affiliates, including information about: |
| (i) | the structure, staff, and capabilities of the Investment Adviser and its portfolio management teams; |
| (ii) | the groups within the Investment Adviser and its affiliates that support the portfolio management teams or provide other types of necessary services, including fund services groups (e.g., accounting and financial reporting, tax, shareholder services, and operations); controls and risk management groups (e.g., legal, compliance, valuation oversight, credit risk management, internal audit, compliance testing, market risk analysis, finance, and central funding); sales and distribution support groups, and others (e.g., information technology and training); |
| (iii) | trends in employee headcount; |
| (iv) | the Investment Adviser’s financial resources and ability to hire and retain talented personnel and strengthen its operations; and |
| (v) | the parent company’s support of the Investment Adviser and its mutual fund business, as expressed by the firm’s senior management; |
| (b) | information on the investment performance of the Fund, including comparisons to the performance of similar mutual funds, as provided by a third-party mutual fund data provider engaged as part of the contract review process (the “Outside Data Provider”), a benchmark performance index, and (in the case of the Core Fixed Income and Growth Opportunities Funds) a composite of accounts with comparable investment strategies managed by the Investment Adviser; and information on general investment outlooks in the markets in which the Fund invests; |
| (c) | information provided by the Investment Adviser indicating the Investment Adviser’s views on whether the Fund’s peer group and/or benchmark index had high, medium, or low relevance given the Fund’s particular investment strategy; |
| (d) | the terms of the Agreements and other agreements with affiliated service providers entered into by the Trust on behalf of the Fund; |
| (e) | fee and expense information for the Fund, including: |
| (i) | the relative management fee and expense levels of the Fund as compared to those of comparable funds managed by other advisers, as provided by the Outside Data Provider; |
| (ii) | the Fund’s expense trends over time; and |
| (iii) | to the extent the Investment Adviser manages other types of accounts (such as bank collective trusts, private wealth management accounts, institutional separate accounts, sub-advised mutual funds, and non-U.S. funds) having investment objectives and policies similar to those of the Fund, comparative information on the advisory fees charged and services provided to those accounts by the Investment Adviser; |
| (f) | with respect to the extensive investment performance and expense comparison data provided by the Outside Data Provider, its processes in producing that data for the Fund; |
| (g) | the undertakings of the Investment Adviser and its affiliates to implement fee waivers and/or expense limitations; |
73
GOLDMAN SACHS VARIABLE INSURANCE TRUST FUNDS
Statement Regarding Basis for Approval of Management Agreements (Unaudited) (continued)
| (h) | information relating to the profitability of the Management Agreements and the transfer agency and distribution and service arrangements of the Fund to the Investment Adviser and its affiliates; |
| (i) | whether the Fund’s existing management fee schedule adequately addressed any economies of scale; |
| (j) | a summary of the “fall-out” benefits derived by the Investment Adviser and its affiliates from their relationships with the Fund, including the fees received by the Investment Adviser’s affiliates from the Fund for transfer agency, securities lending (in the case of the Equity Index Fund), portfolio trading, distribution and other services; |
| (k) | a summary of potential benefits derived by the Fund as a result of its relationship with the Investment Adviser; |
| (l) | information regarding commissions paid by the Equity Index and Growth Opportunities Funds (the “Equity Funds”) and broker oversight, an update on the Investment Adviser’s soft dollars practices (with respect to the Growth Opportunities Fund), other information regarding portfolio trading, and how the Investment Adviser carries out its duty to seek best execution; |
| (m) | the manner in which portfolio manager compensation is determined; and the number and types of accounts managed by the portfolio managers; |
| (n) | the nature and quality of the services provided to the Fund by its unaffiliated service providers (including the Sub-Adviser for the Equity Index Fund), and the Investment Adviser’s general oversight and evaluation (including reports on due diligence) of those service providers as part of the administrative services provided under the Management Agreements; and |
| (o) | the Investment Adviser’s processes and policies addressing various types of potential conflicts of interest; its approach to risk management; the annual review of the effectiveness of the Fund’s compliance program; and periodic compliance reports. |
The Trustees also received an overview of the Funds’ distribution arrangements. They received information regarding the Funds’ assets, share purchase and redemption activity, and payment of distribution and service fees. Information was also provided to the Trustees relating to revenue sharing payments made by and services provided by the Investment Adviser and its affiliates to intermediaries that promote the sale, distribution, and/or servicing of Fund shares. The Independent Trustees also discussed the broad range of other investment choices that are available to Fund investors, including the availability of comparable funds managed by other advisers.
The presentations made at the Board and Committee meetings and at the Annual Meeting encompassed the Funds and other mutual funds for which the Board of Trustees has responsibility. In evaluating the Management Agreements at the Annual Meeting, the Trustees relied upon their knowledge, resulting from their meetings and other interactions throughout the year, of the Investment Adviser and its affiliates, their services, and the Funds. In conjunction with these meetings, the Trustees received written materials and oral presentations on the topics covered, and the Investment Adviser addressed the questions and concerns of the Trustees, including concerns regarding the investment performance of certain of the funds they oversee. The Independent Trustees were advised by their independent legal counsel regarding their responsibilities and other regulatory requirements related to the approval and continuation of mutual fund investment management agreements under applicable law. In addition, the Investment Adviser and its affiliates provided the Independent Trustees with a written response to a formal request for information sent on behalf of the Independent Trustees by their independent legal counsel. During the course of their deliberations, the Independent Trustees met in executive sessions with their independent legal counsel, without representatives of the Investment Adviser or its affiliates present.
Nature, Extent, and Quality of the Services Provided Under the Management Agreements
As part of their review, the Trustees considered the nature, extent, and quality of the services provided to the Funds by the Investment Adviser. In this regard, the Trustees considered both the investment advisory services and non-advisory services (including, with respect to the Equity Index Fund, the Investment Adviser’s oversight of the Sub-Adviser) that are provided by the Investment Adviser and its affiliates. The Trustees noted the transition in the leadership and changes in personnel of various of the Investment Adviser’s portfolio management teams that had occurred in recent periods, and the ongoing recruitment efforts aimed at bringing high quality investment talent to the Investment Adviser. They also noted the Investment Adviser’s commitment to maintaining high quality systems and expending substantial resources to respond to ongoing changes to the regulatory and control environment in which the Funds and their service providers operate, as well as the efforts of the Investment Adviser and its affiliates to combat cyber security risks. The Trustees concluded that the Investment Adviser continued to commit substantial financial and operational resources to the Funds and expressed confidence that the Investment Adviser would continue to do so in the future. The Trustees also recognized that the Investment Adviser had made significant commitments to address regulatory compliance requirements applicable to the Funds and the Investment Adviser and its affiliates.
74
GOLDMAN SACHS VARIABLE INSURANCE TRUST FUNDS
Statement Regarding Basis for Approval of Management Agreements (Unaudited) (continued)
Investment Performance
The Trustees also considered the investment performance of the Funds. In this regard, they compared the investment performance of each Fund to its peers using rankings and ratings compiled by the Outside Data Provider as of December 31, 2017, and updated performance information prepared by the Investment Adviser using the peer group identified by the Outside Data Provider as of March 31, 2018. The information on each Fund’s investment performance was provided for the one-, three-, five-, and ten-year periods ending on the applicable dates. The Trustees also reviewed each Fund’s investment performance relative to its performance benchmark. As part of this review, they considered the investment performance trends of the Funds over time, and reviewed the investment performance of each Fund in light of its investment objective and policies and market conditions. The Trustees also received information comparing the Core Fixed Income and Growth Opportunities Funds’ performance to that of composites of accounts with comparable investment strategies managed by the Investment Adviser.
In addition, the Trustees considered materials prepared and presentations made by the Investment Adviser’s senior management and portfolio management personnel in which Fund performance was assessed. The Trustees also considered the Investment Adviser’s periodic reports with respect to the Funds’ risk profiles, and how the Investment Adviser’s approach to risk monitoring and management influences portfolio management.
The Trustees observed that the Core Fixed Income Fund’s Institutional Shares had placed in the second quartile of the Fund’s peer group for the three-year period and in the fourth quartile for the one-year period, and had outperformed the Fund’s benchmark index for the three-year period and underperformed for the one-year period ended March 31, 2018. They noted that the Equity Index Fund’s Service Shares had placed in the second quartile of the Fund’s peer group and had underperformed the Fund’s benchmark index by an amount approximately equal to Fund fees and expenses for the one-, three-, five-, and ten-year periods ended March 31, 2018. The Trustees also noted that the Growth Opportunities Fund’s Institutional Shares had placed in the second quartile of the Fund’s peer group for the one-year period and in the third quartile for the three-year period, and had outperformed the Fund’s benchmark index for the one-year period and underperformed for the three-year period ended March 31, 2018. The Trustees observed (with respect to the Growth Opportunities Fund) that in January 2018, the Investment Adviser had combined the U.S. Growth and U.S. Value portfolio management teams into a single U.S. Equity portfolio management team. They also observed that the High Quality Floating Rate Fund’s Institutional Shares had placed in the fourth quartile of the Fund’s peer group and had outperformed the Fund’s benchmark index for the one- and three-year periods ended March 31, 2018.
Costs of Services Provided and Competitive Information
The Trustees considered the contractual terms of the Agreements and the fee rates payable by each Fund thereunder and, with respect to the Equity Index Fund, payable by the Investment Adviser under the Sub-Advisory Agreement. In this regard, the Trustees considered information on the services rendered by the Investment Adviser to the Funds, which included both advisory and administrative services that were directed to the needs and operations of the Funds as registered mutual funds.
In particular, the Trustees reviewed analyses prepared by the Outside Data Provider regarding the expense rankings of the Funds. The analyses provided a comparison of each Fund’s management fee and breakpoints (as applicable) to those of a relevant peer group and category universe; an expense analysis which compared each Fund’s overall net and gross expenses to a peer group and a category universe; and data comparing each Fund’s net expenses to the peer and category medians. The analyses also compared each Fund’s transfer agency, custody, and distribution fees, other expenses and fee waivers/reimbursements to those of the peer group and category medians. The Trustees concluded that the comparisons provided by the Outside Data Provider were useful in evaluating the reasonableness of the management fees and total expenses paid by the Funds.
With respect to the Growth Opportunities and High Quality Floating Rate Funds, the Trustees noted that the management fee breakpoint schedules had been reduced at all asset levels since the Management Agreement was last approved. In addition, the Trustees considered the Investment Adviser’s undertakings to implement fee waivers and/or expense limitations. They also considered, to the extent that the Investment Adviser manages other types of accounts having investment objectives and policies similar to those of the Funds, comparative fee information for services provided by the Investment Adviser to those accounts, and information that indicated that services provided to the Funds differed in various significant respects from the services provided to other types of accounts which, in many cases, operated under less stringent legal and regulatory structures, required fewer services from the Investment Adviser to a smaller number of client contact points, and were less time-intensive.
In addition, the Trustees noted that shareholders are able to redeem their Fund shares at any time if shareholders believe that the Fund fees and expenses are too high or if they are dissatisfied with the performance of the Fund.
75
GOLDMAN SACHS VARIABLE INSURANCE TRUST FUNDS
Statement Regarding Basis for Approval of Management Agreements (Unaudited) (continued)
Profitability
The Trustees reviewed each Fund’s contribution to the Investment Adviser’s revenues and pre-tax profit margins. In this regard the Trustees noted that they had received, among other things, profitability analyses and summaries, revenue and expense schedules by Fund and by function (i.e., investment management, transfer agency and distribution and service), and information on the Investment Adviser’s expense allocation methodology. They observed that the profitability and expense figures are substantially similar to those used by the Investment Adviser for many internal purposes, including compensation decisions among various business groups, and are thus subject to a vigorous internal debate about how certain revenue and expenses should be allocated. The Trustees also noted that the internal audit group within the Goldman Sachs organization had audited the expense allocation methodology and that the internal audit group was satisfied with the reasonableness, consistency, and accuracy of the Investment Adviser’s expense allocation methodology and profitability analysis calculations. Profitability data for each Fund was provided for 2017 and 2016, and the Trustees considered this information in relation to the Investment Adviser’s overall profitability.
Economies of Scale
The Trustees considered the information that had been provided regarding whether there have been economies of scale with respect to the management of the Funds. The Trustees also considered the breakpoints in the fee rate payable under the Management Agreement for each of the Core Fixed Income, High Quality Floating Rate and Growth Opportunities Funds at the following annual percentage rates of the average daily net assets of the Funds:
Core Fixed Income Fund | High Quality Floating Rate Fund | |||||||
| First $1 billion | 0.40 | % | 0.31 | % | ||||
| Next $1 billion | 0.36 | 0.28 | ||||||
| Next $3 billion | 0.34 | 0.27 | ||||||
| Next $3 billion | 0.33 | 0.26 | ||||||
| Over $8 billion | 0.32 | 0.25 | ||||||
Growth Opportunities Fund | ||||
| First $2 billion | 0.87 | % | ||
| Next $3 billion | 0.78 | |||
| Next $3 billion | 0.74 | |||
| Over $8 billion | 0.73 | |||
The Trustees noted that the breakpoints were designed to share potential economies of scale, if any, with the Funds and their shareholders as assets under management reach those asset levels. The Trustees considered the amounts of assets in the Funds; the Funds’ recent share purchase and redemption activity; the information provided by the Investment Adviser relating to the costs of the services provided by the Investment Adviser and its affiliates and their realized profits; information comparing fee rates charged by the Investment Adviser with fee rates charged to other funds in the peer groups; and the Investment Adviser’s undertakings to waive a portion of its management fee (with respect to the Equity Index and Growth Opportunities Funds) and to limit certain expenses of the Funds that exceed specified levels as well as Goldman Sachs & Co. LLC’s (“Goldman Sachs”) undertaking to waive a portion of the distribution and service fees paid by the Growth Opportunities Fund’s Service Shares. Upon reviewing these matters at the Annual Meeting, the Trustees concluded that the fee breakpoints represented a means of assuring that benefits of scalability, if any, would be passed along to shareholders at the specified asset levels.
With respect to the Equity Index Fund, the Trustees noted that, while its Management Agreement did not have breakpoints, the Investment Adviser had agreed to waive a portion of its management fee in order to achieve the following effective annual rates: 0.21% on the first $400 million of average daily net assets and 0.20% of average daily net assets in excess of $400 million. The Trustees noted that, in addition to the Investment Adviser’s management fee waiver mentioned above, the Fund’s total expenses were further reduced by the Investment Adviser’s undertaking to limit certain expenses of the Fund that exceed a specified level.
76
GOLDMAN SACHS VARIABLE INSURANCE TRUST FUNDS
Statement Regarding Basis for Approval of Management Agreements (Unaudited) (continued)
Other Benefits to the Investment Adviser and Its Affiliates
The Trustees also considered the other benefits derived by the Investment Adviser and its affiliates from their relationships with the Funds as stated above, including: (a) transfer agency fees received by Goldman Sachs; (b) brokerage and futures commissions earned by Goldman Sachs for executing securities transactions on behalf of the Equity Funds and futures transactions on behalf of the Funds; (c) research received by the Investment Adviser from broker-dealers in exchange for executing certain transactions on behalf of the Growth Opportunities Fund; (d) trading efficiencies resulting from aggregation of orders of the Funds with those for other funds or accounts managed by the Investment Adviser; (e) fees earned by Goldman Sachs Agency Lending (“GSAL”), an affiliate of the Investment Adviser, as securities lending agent for the Equity Index Fund (and fees earned by the Investment Adviser for managing the fund in which the Equity Index and Growth Opportunities Funds’ securities lending cash collateral is invested); (f) the Investment Adviser’s ability to leverage the infrastructure designed to service the Funds on behalf of its other clients; (g) the Investment Adviser’s ability to cross-market other products and services to Fund shareholders; (h) Goldman Sachs’ retention of certain fees as Fund Distributor; (i) the Investment Adviser’s ability to negotiate better pricing with custodians on behalf of its other clients, as a result of the relationship with the Funds; and (j) the possibility that the working relationship between the Investment Adviser and the Funds’ third-party service providers may cause those service providers to be more likely to do business with other areas of Goldman Sachs. In the course of considering the foregoing, the Independent Trustees requested and received further information quantifying certain of these fall-out benefits.
Other Benefits to the Funds and Their Shareholders
The Trustees also noted that the Funds receive certain potential benefits as a result of their relationship with the Investment Adviser, including: (a) trading efficiencies resulting from aggregation of orders of the Funds with those of other funds or accounts managed by the Investment Adviser; (b) enhanced servicing from vendors because of the volume of business generated by the Investment Adviser and its affiliates; (c) enhanced servicing from broker-dealers because of the volume of business generated by the Investment Adviser and its affiliates; (d) the Investment Adviser’s ability to negotiate favorable terms with derivatives counterparties on behalf of the Funds as a result of the size and reputation of the Goldman Sachs organization; (e) the Investment Adviser’s knowledge and experience gained from managing other accounts and products; (f) the Investment Adviser’s ability to hire and retain qualified personnel to provide services to the Funds because of the reputation of the Goldman Sachs organization; (g) the Funds’ access, through the Investment Adviser, to certain firmwide resources (e.g., proprietary risk management systems and databases), subject to certain restrictions; (h) the Equity Index Fund’s ability to participate in the securities lending program administered by GSAL, as measured by the revenue received by the Fund in connection with the program; and (i) the Funds’ access to certain affiliated distribution channels. In addition, the Trustees noted the competitive nature of the mutual fund marketplace, and considered that many of the Funds’ shareholders invested in the Funds in part because of the Funds’ relationship with the Investment Adviser and that those shareholders have a general expectation that the relationship will continue.
Conclusion
In connection with their consideration of the Agreements, the Trustees gave weight to each of the factors described above, but did not identify any particular factor as controlling their decision. After deliberation and consideration of all of the information provided, including the factors described above, the Trustees concluded, in the exercise of their business judgment, that the management fees paid by each of the Funds were reasonable in light of the services provided to it by the Investment Adviser, the Investment Adviser’s costs and each Fund’s current and reasonably foreseeable asset levels. The Trustees unanimously concluded that the Investment Adviser’s continued management likely would benefit each Fund and its shareholders and that the Management Agreements should be approved and continued with respect to each Fund until June 30, 2019.
Sub-Advisory Agreement for the Equity Index Fund
Nature, Extent, and Quality of the Services Provided Under the Sub-Advisory Agreement and Investment Performance. In evaluating the Sub-Advisory Agreement, the Trustees relied upon materials furnished and presentations made by the Investment Adviser and the Sub-Adviser. In evaluating the nature, extent, and quality of services provided by the Sub-Adviser, the Trustees considered information on the services provided to the Equity Index Fund by the Sub-Adviser, including information about the Sub-Adviser’s (a) personnel and organizational structure; (b) experience in index investing and track record in tracking the performance of the Fund’s benchmark in line with the investment objective of the Fund; (c) policies and procedures in place to address potential conflicts of interest; and (d) compliance program and code of ethics. The Trustees noted that the Fund had commenced operations in January 2006, and reviewed the Fund’s operations and investment performance since its inception. The Trustees reviewed the services provided to the Fund under the Sub-Advisory Agreement. They noted that the Fund’s Service Shares
77
GOLDMAN SACHS VARIABLE INSURANCE TRUST FUNDS
Statement Regarding Basis for Approval of Management Agreements (Unaudited) (continued)
had placed in the second quartile of the Fund’s peer group and had underperformed the Fund’s benchmark index by an amount approximately equal to Fund fees and expenses for the one-, three-, five-, and ten-year periods ended March 31, 2018.
Costs of Services Provided. The Trustees reviewed the terms of the Sub-Advisory Agreement, including the schedule of fees payable to the Sub-Adviser. They considered the breakpoints in the sub-advisory fee rate payable under the Sub-Advisory Agreement at the following annual percentage rates of the average daily net assets of the Fund:
| Average Daily Net Assets | Sub-Advisory Fee Annual Rate | |||
| First $50 Million | 0.030 | % | ||
| Next $200 Million | 0.020 | % | ||
| Next $750 Million | 0.010 | % | ||
| Over $1 Billion | 0.008 | % | ||
The Trustees noted that the Sub-Adviser’s compensation is paid by the Investment Adviser, not by the Fund, and that the retention of the Sub-Adviser does not increase the fees incurred by the Fund for advisory services. They considered the Investment Adviser’s belief that the relationship between the management fees paid by the Fund and the sub-advisory fees paid by the Investment Adviser is appropriate given the level of services the Investment Adviser provides to the Fund and the significant differences in cost drivers and risks associated with the respective services offered by the Investment Adviser and the Sub-Adviser, as well as the management fee waivers and expense limitations that substantially reduce the fees retained by the Investment Adviser.
Conclusion. After deliberation and consideration of the information provided, the Trustees concluded that the sub-advisory fee to be paid by the Investment Adviser to the Sub-Adviser with respect to the Equity Index Fund is reasonable in light of the services to be provided by the Sub-Adviser and the Fund’s reasonably foreseeable asset levels, and that the Sub-Advisory Agreement should be approved and continued until June 30, 2019.
78
| TRUSTEES | OFFICERS | |
| Jessica Palmer, Chair | James A. McNamara, President | |
| Kathryn A. Cassidy | Scott M. McHugh, Treasurer, Senior Vice | |
| Diana M. Daniels | President and Principal Financial Officer | |
| Herbert J. Markley | Joseph F. DiMaria, Assistant Treasurer and | |
| James A. McNamara | Principal Accounting Officer | |
| Roy W. Templin | Caroline L. Kraus, Secretary | |
| Gregory G. Weaver |
GOLDMAN SACHS & CO. LLC
Distributor and Transfer Agent
GOLDMAN SACHS ASSET MANAGEMENT, L.P.
Investment Adviser
200 West Street, New York,
New York 10282
Visit our web site at www.GSAMFUNDS.com to obtain the most recent month-end returns.
The reports concerning the Funds included in this shareholder report may contain certain forward-looking statements about the factors that may affect the performance of the Funds in the future. These statements are based on Fund management’s predictions and expectations concerning certain future events and their expected impact on the Funds, such as performance of the economy as a whole and of specific industry sectors, changes in the levels of interest rates, the impact of developing world events, and other factors that may influence the future performance of the Funds. Management believes these forward-looking statements to be reasonable, although they are inherently uncertain and difficult to predict. Actual events may cause adjustments in portfolio management strategies from those currently expected to be employed.
A description of the policies and procedures that the Funds use to determine how to vote proxies relating to portfolio securities and information regarding how the Funds voted proxies relating to portfolio securities for the 12-month period ended June 30 is available (i) without charge, upon request by calling 1-800-621-2550; and (ii) on the Securities and Exchange Commission (“SEC”) web site at http://www.sec.gov.
The Funds file their complete schedule of portfolio holdings with the SEC for the first and third quarters of each fiscal year on Form N-Q. The Funds’ Form N-Qs are available on the SEC’s web site at http://www.sec.gov within 60 days after the Funds’ first and third fiscal quarters. The Funds’ Form N-Qs may be reviewed and copied at the SEC’s Public Reference Room in Washington, D.C. and information on the operation of the Public Reference Room may also be obtained by calling 1-800-SEC-0330. Form N-Qs may be obtained upon request and without charge by calling 1-800-621-2550.
Views and opinions expressed are for informational purposes only and do not constitute a recommendation by GSAM to buy, sell, or hold any security. Views and opinions are current as of the date of this presentation and may be subject to change, they should not be construed as investment advice.
Goldman Sachs & Co. LLC (“Goldman Sachs”) does not provide legal, tax or accounting advice. Any statement contained in this communication (including any attachments) concerning U.S. tax matters was not intended or written to be used, and cannot be used, for the purpose of avoiding penalties under the Internal Revenue Code, and was written to support the promotion or marketing of transactions or matters addressed. Clients of Goldman Sachs should obtain their own independent tax advice based on their particular circumstances.
The website links provided are for your convenience only and are not an endorsement or recommendation by GSAM of any of these websites or the products or services offered. GSAM is not responsible for the accuracy and validity of the content of these websites.
Fund holdings and allocations shown are as of June 30, 2018 and may not be representative of future investments. Fund holdings should not be relied on in making investment decisions and should not be construed as research or investment advice regarding particular securities. Current and future holdings are subject to risk.
References to indices, benchmarks or other measures of relative market performance over a specified period of time are provided for your information only and do not imply that the portfolio will achieve similar results. The index composition may not reflect the manner in which a portfolio is constructed. While an adviser seeks to design a portfolio which reflects appropriate risk and return features, portfolio characteristics may deviate from those of the benchmark.
The Global Industry Classification Standard (“GICS”) was developed by and is the exclusive property and a service mark of Morgan Stanley Capital International Inc. (“MSCI”) and Standard & Poor’s, a division of The McGraw-Hill Companies, Inc. (“S&P”) and is licensed for use by Goldman Sachs. Neither MSCI, S&P nor any other party involved in making or compiling the GICS or any GICS classifications makes any express or implied warranties or representations with respect to such standard or classification (or the results to be obtained by the use thereof), and all such parties hereby expressly disclaim all warranties of originality, accuracy, completeness, merchantability or fitness for a particular purpose with respect to any of such standard or classification. Without limiting any of the foregoing, in no event shall MSCI, S&P, any of their affiliates or any third party involved in making or compiling the GICS or any GICS classifications have any liability for any direct, indirect, special, punitive, consequential or any other damages (including lost profits) even if notified of the possibility of such damages.
The portfolio risk management process includes an effort to monitor and manage risk, but does not imply low risk.
Shares of the Goldman Sachs VIT Funds are offered to separate accounts of participating life insurance companies for the purpose of funding variable annuity contracts and variable life insurance policies. Shares of the Funds are not offered directly to the general public. The variable annuity contracts and variable life insurance policies are described in the separate prospectuses issued by participating insurance companies. You should refer to those prospectuses for information about surrender charges, mortality and expense risk fees and other charges that may be assessed by participating insurance companies under the variable annuity contracts or variable life insurance policies. Such fees or charges, if any, may affect the return you may realize with respect to your investments. Ask your representative for more complete information. Please consider a fund’s objectives, risks and charges and expenses, and read the prospectus carefully before investing. The prospectus contains this and other information about the Funds.
This material is not authorized for distribution to prospective investors unless preceded or accompanied by a current prospectus or summary prospectus, if applicable. Investors should consider the Funds’ objective, risks, and charges and expenses, and read the summary prospectus, if available, and/or the prospectus carefully before investing or sending money. The summary prospectus, if available, and the prospectus contain this and other information about the Funds and may be obtained from your authorized dealer or from Goldman Sachs & Co. LLC by calling 1-800-621-2550.
This report is prepared for the general information of contract owners and is not an offer of shares of the Goldman Sachs Variable Insurance Trust Funds.
© 2018 Goldman Sachs. All rights reserved.
VITMLTISAR-18/139317-OTU-807534/15.9k
Goldman
Sachs Variable Insurance Trust
Goldman Sachs
Small Cap Equity Insights Fund
Semi-Annual Report
June 30, 2018

GOLDMAN SACHS VARIABLE INSURANCE TRUST SMALL CAP EQUITY INSIGHTS FUND
Investment Process. The Investment Adviser begins with a broad universe of U.S. equity investments for the Fund. As described more fully below, the Investment Adviser uses proprietary multifactor models (the “Multifactor Models”) that attempt to forecast the returns of different markets, currencies and individual securities.
The Multifactor Models rely on some or all of the following investment pillars and themes to forecast the returns of individual securities (although additional pillars or themes may be added in the future without prior notice):
Fundamental Mispricings
• Valuation: The Valuation theme attempts to capture potential mispricings of securities, typically by comparing a measure of the company’s intrinsic value to its market value.
High Quality Business Models
• Profitability: The Profitability theme seeks to assess whether a company is earning more than its cost of capital.
• Quality: The Quality theme assesses both firm and management quality.
• Management: The Management theme assesses the characteristics, policies and strategic decisions of company management.
Market Themes and Trends
• Momentum: The Momentum theme seeks to predict drifts in stock prices caused by delayed investor reaction to company-specific information and information about related companies.
Sentiment Analysis
• Sentiment: The Sentiment theme reflects selected investment views and decisions of individuals and financial intermediaries.
1
GOLDMAN SACHS VARIABLE INSURANCE TRUST SMALL CAP EQUITY INSIGHTS FUND
INVESTMENT OBJECTIVE
The Fund seeks long-term growth of capital.
Portfolio Management Discussion and Analysis
Below, the Goldman Sachs Quantitative Investment Strategies Team discusses the Goldman Sachs Variable Insurance Trust — Goldman Sachs Small Cap Equity Insights Fund’s (the “Fund”) performance and positioning for the six-month period ended June 30, 2018 (the “Reporting Period”).
How did the Fund perform during the Reporting Period?
During the Reporting Period, the Fund’s Institutional and Service Shares generated cumulative total returns of 10.91% and 10.85%, respectively. These returns compare to the 7.66% cumulative total return of the Fund’s benchmark, the Russell 2000® Index (with dividends reinvested) (the “Russell Index”) during the same time period.
What economic and market factors most influenced the equity markets as a whole during the Reporting Period?
Representing the U.S. equity market, the S&P 500® Index gained 2.65% during the Reporting Period.
U.S. equities saw a strong start to the Reporting Period in January 2018, driven by positive economic data, a $1.5 trillion tax reform law signed in December 2017, and a favorable corporate earnings season. In February 2018, however, U.S. and international equities sold off on market speculation of a faster pace of U.S. Federal Reserve (“Fed”) short-term interest rate hikes, which stoked a sharp rise in bond yields and an increase in equity market volatility. Concerns about Fed monetary policy tightening were further exacerbated by solid U.S. labor and inflation data. While the hawkish Fed minutes were largely expected, new Fed Chair Jerome Powell’s Congressional testimony, positing a more optimistic economic outlook since the December 2017 Fed meeting, surprised equity markets with its hawkish tilt, sparking another sell-off in the U.S. equity markets. (Jerome Powell assumed the chairmanship of the Fed in February 2018. Hawkish language tends to suggest higher interest rates; opposite of dovish.) In March 2018, escalating trade tensions and potential tariffs weighed on investor sentiment. Meanwhile, the Fed delivered on a widely expected interest rate increase, with its “dot plot” pointing to a total of three interest rate hikes this calendar year and potentially two in 2019. (The “dot plot” shows rate projections of the members of the Fed’s Open Market Committee.) However, Fed policymakers acknowledged that the “economic outlook has strengthened in recent months,” revising their economic growth forecast higher and their unemployment forecast lower.
The U.S. and China continued to generate trade headlines and geopolitical uncertainty about sanctions on Russia surfaced, but the impact of such on the U.S. equity markets remained relatively muted during April 2018, as investors stayed rather resistant to the risk of a trade war. A number of macroeconomic drivers, including U.S. labor market strength, higher inflation and fiscal stimulus, pushed up U.S. Treasury yields, with the 10-year U.S. Treasury yield breaching 3% toward month end. With more than half of S&P 500® Index companies having reported their first quarter 2018 results, the earnings season began strongly during April 2018. U.S. equities rallied in May 2018, driven not only by strong corporate earnings but also by upside surprises in economic activity and sentiment data as well as on a new U.S. unemployment low of 3.8%. However, the U.S. equity rally was hampered by escalating geopolitical uncertainty stemming from the unexpected political outcome in Italy, the ongoing unpredictability around the U.S.-North Korea summit, and escalating trade tensions with many U.S. allies. The Fed raised interest rates again in June 2018, as widely expected, but the outcome of the Fed meeting was more hawkish than the consensus had anticipated. The Fed retained language indicating an “accommodative” monetary policy stance, but its economic growth and inflation forecasts were upgraded, and its median projection was lifted to four interest rate hikes in 2018 from the three it had indicated in March 2018. Fed Chair Powell was also slightly hawkish in his June press conference. Still-escalating trade tensions between the U.S. and China hurt market sentiment, with the U.S. threatening tariffs on $200 billion worth of Chinese goods and China vowing to retaliate. All told, then, the S&P 500® Index produced modestly positive but rather flat returns for the month of June 2018.
For the Reporting Period overall, six sectors posted positive absolute returns and five generated negative returns. Consumer discretionary, information technology and energy were the best performing sectors in the S&P 500® Index, as measured by total return, and the weakest performing sectors in the S&P 500® Index during the Reporting Period were telecommunication services, consumer staples and industrials.
2
GOLDMAN SACHS VARIABLE INSURANCE TRUST SMALL CAP EQUITY INSIGHTS FUND
Within the U.S. equity market, there was significant disparity in performance not only among sectors but also among the various capitalization and style segments. While all capitalization segments posted positive returns, small-cap stocks, as measured by the Russell Index, performed best, followed at some distance by large-cap stocks, as measured by the Russell 1000® Index, and mid-cap stocks, as measured by the Russell Midcap® Index, which performed similarly to each other. From a style perspective, growth-oriented stocks significantly outpaced value-oriented stocks across the capitalization spectrum, with value-oriented stocks overall in the large-cap and mid-cap segments posting modestly negative absolute returns. (All as measured by the FTSE Russell indices.)
What key factors were responsible for the Fund’s performance during the Reporting Period?
During the Reporting Period, the Fund outperformed the Russell Index on a relative basis. Five of our quantitative model’s six investment themes added to relative performance.
What impact did the Fund’s investment themes have on performance during the Reporting Period?
As expected, and in keeping with our investment approach, our quantitative model and its six investment themes — Valuation, Profitability, Quality, Management, Momentum and Sentiment — had the greatest impact on relative performance. We use these themes to take a long-term view of market patterns and look for inefficiencies, selecting stocks for the Fund and overweighting or underweighting the ones chosen by the model. Over time and by design, the performance of any one of the model’s investment themes tends to have a low correlation with the model’s other themes, demonstrating the diversification benefit of the Fund’s theme-driven quantitative model. The variance in performance supports our research indicating that the diversification provided by the Fund’s different investment themes is a significant investment advantage over the long term, even though the Fund may experience underperformance in the short term. Of course, diversification does not protect an investor from market risk nor does it ensure a profit.
During the Reporting Period, five of our six investment themes contributed positively to the Fund’s relative performance. Quality contributed most positively to relative performance, followed by Momentum, Management and Profitability. The Sentiment theme also contributed positively, albeit to a lesser extent. The Quality theme assesses both firm and financial quality. The Momentum theme seeks to predict drifts in stock prices caused by delayed investor reaction to company-specific information and information about related companies. The Management theme assesses the characteristics, policies and strategic decisions of company management. The Profitability theme assesses whether a company is earning more than its cost of capital. The Sentiment theme reflects selected investment views and decisions of individuals and financial intermediaries.
The Fund’s Valuation theme detracted from the Fund’s relative performance. Valuation attempts to capture potential mispricings of securities, typically by comparing a measure of the company’s intrinsic value to its market value.
How did the Fund’s sector and industry allocations affect relative performance?
In constructing the Fund’s portfolio, we focus on picking stocks rather than making industry or sector bets. Consequently, the Fund is similar to its benchmark, the Russell Index, in terms of its sector allocation and style. We manage the Fund’s industry and sector exposure by including industry factors in our risk model and by explicitly penalizing industry and sector deviations from the benchmark index in optimization. Sector weights or changes in weights generally do not have a meaningful impact on relative performance.
Did stock selection help or hurt Fund performance during the Reporting Period?
We seek to outpace the Russell Index by overweighting stocks that we expect to outperform and underweighting those that we think may lag. We also build positions based on our thematic views. For example, the Fund aims to hold a basket of stocks with more favorable Momentum characteristics than the benchmark index. During the Reporting Period, stock selection overall contributed positively to the Fund’s relative performance.
Effective stock selection in the industrials, financials and information technology sectors contributed most positively to the Fund’s results relative to the Russell Index. Partially offsetting these positive contributors was stock selection and relative allocation positioning in the health care sector, which detracted from the Fund’s results relative to the Russell Index during the Reporting Period. The only other sector to dampen relative results during the Reporting Period was energy, wherein relative allocation positioning modestly detracted.
3
GOLDMAN SACHS VARIABLE INSURANCE TRUST SMALL CAP EQUITY INSIGHTS FUND
Which individual stock positions contributed the most to the Fund’s relative returns during the Reporting Period?
The Fund benefited most from overweight positions in specialty finance company Enova International, cloud-based application performance management solutions provider New Relic and human resources and business optimization services provider Insperity. We chose to overweight Enova International and New Relic because of our positive views on Quality and Momentum. Our positive views on Momentum and Sentiment led us to overweight Insperity.
Which individual positions detracted from the Fund’s results during the Reporting Period?
Detracting most from the Fund’s results relative to its benchmark index were overweight positions in energy services company ProPetro Holding Corp and pharmaceutical company Akebia Therapeutics as well as an underweight position in biotechnology company Avexis Inc. The Fund had overweight positions in ProPetro Holding Corp due to Sentiment and Profitability and an overweight in Akebia Therapeutics due to Sentiment and Momentum. We chose to underweight Avexis due to our negative views on Quality and Management.
How did the Fund use derivatives during the Reporting Period?
During the Reporting Period, we did not use derivatives as part of an active management strategy to add value to the Fund’s results. However, we used equity index futures contracts, on an opportunistic basis, to equitize the Fund’s excess cash holdings. In other words, we put the Fund’s excess cash holdings to work by using them as collateral for the purchase of stock futures. The use of these futures contracts did not have a material impact on the Fund’s performance during the Reporting Period.
Did you make any enhancements to your quantitative models during the Reporting Period?
We continuously look for ways to improve our investment process. During the Reporting Period, we made numerous enhancements to our models. As example, during the second quarter of 2018, we introduced two new signals to our Sentiment theme in the U.S. region that use options data to gauge sentiment around companies. The first signal looks at high conviction option purchases to assess how strongly market participants feel about the prospects of a particular stock. The second signal aims to infer the positive or negative sentiment around a stock by looking at put and call options purchased for the particular company.
We also introduced a new signal within our Momentum theme that helps us create economic links between different companies, potentially giving us insights into price movements of related companies. The signal, introduced in the U.S., European, Japanese and emerging markets regions, uses natural language processing to read through various sections in the patent document to form linkages.
What was the Fund’s sector positioning relative to its benchmark index at the end of the Reporting Period?
As of June 30, 2018, the Fund was overweight the consumer discretionary and materials sectors relative to the Russell Index. The Fund was underweight information technology, health care and utilities and was rather neutrally weighted in telecommunication services, energy, real estate, consumer staples, industrials and financials compared to the benchmark index on the same date.
What is your strategy going forward for the Fund?
Looking ahead, we continue to believe that less expensive stocks should outpace more expensive stocks, and stocks with good momentum are likely to outperform those with poor momentum. We intend to maintain our focus on seeking companies about which fundamental research analysts are becoming more positive as well as profitable companies with sustainable earnings and a track record of using their capital to enhance shareholder value. As such, we anticipate remaining fully invested with long-term performance likely to be the result of stock selection rather than sector or capitalization allocations.
We stand behind our investment philosophy that sound economic investment principles, coupled with a disciplined quantitative approach, can provide strong, uncorrelated returns over the long term. Our research agenda is robust, and we continue to enhance our existing models, add new proprietary forecasting signals and improve our trading execution as we seek to provide the most value to our shareholders.
4
GOLDMAN SACHS VARIABLE INSURANCE TRUST SMALL CAP EQUITY INSIGHTS FUND
Index Definitions
The Russell 2000® Index is an unmanaged index of common stock prices that measures the performance of the 2000 smallest companies in the Russell 3000® Index. The figures for the index do not include any deduction for fees, expenses or taxes.
The S&P 500® Index is the Standard & Poor’s 500 Composite Index of 500 stocks, an unmanaged index of common stock prices. The figures for the index do not include any deduction for fees, expenses or taxes.
The Russell Midcap® Index measures the performance of the 800 smallest companies in the Russell 1000® Index, which represents approximately 25% of the total market capitalization of the Russell 1000 Index.
The Russell 1000® Index measures the performance of the 1,000 largest companies in the Russell 3000® Index, which represents approximately 92% of the total market capitalization of the Russell 3000 Index.
It is not possible to invest directly in an index.
5
FUND BASICS
Small Cap Equity Insights Fund
as of June 30, 2018
STANDARDIZED TOTAL RETURNS1
| For the period ended 6/30/18 | One Year | Five Years | Ten Years | Since Inception | Inception Date | |||||||||||||
| Institutional | 22.23 | % | 13.54 | % | 11.46 | % | 7.52 | % | 2/13/98 | |||||||||
| Service | 21.95 | 13.26 | 11.17 | 8.69 | 8/31/07 | |||||||||||||
| 1 | The Standardized Total Returns are average annual total returns as of the most recent calendar quarter-end. They assume reinvestment of all distributions at net asset value (“NAV”). Because Institutional Shares and Service Shares do not involve a sales charge, such a charge is not applied to their Standardized Total Returns. |
Total return figures in the above chart represent past performance and do not indicate future results, which will vary. The investment return and principal value of an investment will fluctuate and, therefore, an investor’s shares, when redeemed, may be worth more or less than their original cost. Current performance may be lower or higher than the total return figures in the above chart. Please visit www.GSAMFUNDS.com to obtain the most recent month-end returns. Performance reflects fee waivers and/or expense limitations in effect during the periods shown. In their absence, performance would be reduced.
EXPENSE RATIOS2
| Net Expense Ratio (Current) | Gross Expense Ratio (Before Waivers) | |||||||
| Institutional | 0.81 | % | 0.95 | % | ||||
| Service | 1.06 | 1.20 | ||||||
| 2 | The expense ratios of the Fund, both current (net of any fee waivers and/or expense limitations) and before waivers (gross of any fee waivers and/or expense limitations) are as set forth above according to the most recent publicly available Prospectuses for the Fund and may differ from the expense ratios disclosed in the Financial Highlights in this report. Pursuant to a contractual arrangement, the Fund’s fee waivers and/or expense limitations will remain in place through at least April 30, 2019, and prior to such date, the Investment Adviser may not terminate the arrangements without the approval of the Fund’s Board of Trustees. If these arrangements are discontinued in the future, the expense ratios may change without shareholder approval. |
TOP TEN HOLDINGS AS OF 6/30/183
| Holding | % of Net Assets | Line of Business | ||||
| Insperity, Inc. | 0.8% | Commercial & Professional Services | ||||
| American Equity Investment Life Holding Co. | 0.8 | Insurance | ||||
| Peabody Energy Corp. | 0.8 | Energy | ||||
| New Relic, Inc. | 0.8 | Software & Services | ||||
| Texas Roadhouse, Inc. | 0.8 | Consumer Services | ||||
| Callaway Golf Co. | 0.7 | Consumer Durables & Apparel | ||||
| Genomic Health, Inc. | 0.7 | Pharmaceuticals, Biotechnology & Life Sciences | ||||
| Cousins Properties, Inc. (REIT) | 0.7 | Real Estate | ||||
| EMCOR Group, Inc. | 0.7 | Capital Goods | ||||
| Portland General Electric Co. | 0.7 | Utilities | ||||
| 3 | The top 10 holdings may not be representative of the Fund’s future investments. |
6
FUND BASICS
FUND VS. BENCHMARK SECTOR ALLOCATIONS4
As of June 30, 2018
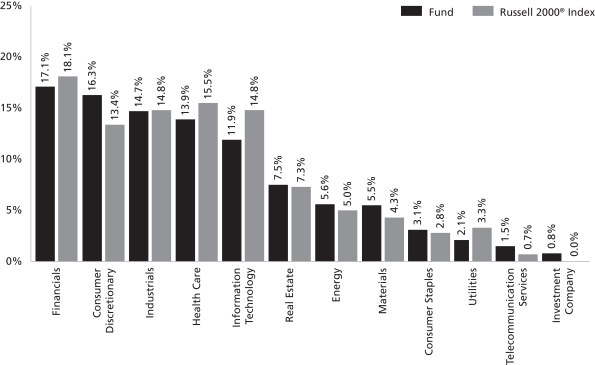
| 4 | The Fund is actively managed and, as such, its composition may differ over time. Consequently, the Fund’s overall sector allocations may differ from percentages contained in the graph above. The graph categorizes investments using Global Industry Classification Standard (“GICS”); however, the sector classifications used by the portfolio management team may differ from GICS. The percentage shown for each investment category reflects the value of investments in that category as a percentage of market value (excluding investments in the securities lending reinvestment vehicle, if any). Underlying sector allocations of exchange traded funds and investment companies held by the Fund are not reflected in the graph above. Investments in the securities lending reinvestment vehicle represented 0.7% of the Fund’s net assets at June 30, 2018. The graph depicts the Fund’s investments but may not represent the Fund’s market exposure due to the exclusion of certain derivatives, if any, as listed in the Additional Investment Information section of the Schedule of Investments. |
7
GOLDMAN SACHS VARIABLE INSURANCE TRUST SMALL CAP EQUITY INSIGHTS FUND
Schedule of Investments
June 30, 2018 (Unaudited)
| Shares | Description | Value | ||||||
| Common Stocks – 98.3% | ||||||||
Automobiles & Components – 0.9% | ||||||||
| 4,504 | Cooper-Standard Holdings, Inc.* | $ | 588,538 | |||||
| 1,164 | Modine Manufacturing Co.* | 21,243 | ||||||
| 8,740 | Tenneco, Inc. | 384,210 | ||||||
|
| |||||||
| 993,991 | ||||||||
|
| |||||||
Banks – 9.0% | ||||||||
| 410 | ACNB Corp. | 13,961 | ||||||
| 611 | Arrow Financial Corp. | 22,240 | ||||||
| 1,885 | Bancorp, Inc. (The)* | 19,717 | ||||||
| 1,379 | BankFinancial Corp. | 24,339 | ||||||
| 637 | Banner Corp. | 38,303 | ||||||
| 12,466 | Beneficial Bancorp, Inc. | 201,949 | ||||||
| 2,972 | Blue Hills Bancorp, Inc. | 65,978 | ||||||
| 43,552 | Capitol Federal Financial, Inc. | 573,144 | ||||||
| 3,956 | Cathay General Bancorp | 160,178 | ||||||
| 21,576 | CenterState Bank Corp. | 643,396 | ||||||
| 20,596 | Central Pacific Financial Corp. | 590,075 | ||||||
| 27,944 | CVB Financial Corp. | 626,505 | ||||||
| 456 | FCB Financial Holdings, Inc. Class A* | 26,813 | ||||||
| 4,753 | Federal Agricultural Mortgage Corp. Class C | 425,298 | ||||||
| 2,185 | First Bancorp | 89,388 | ||||||
| 16,373 | First Busey Corp. | 519,352 | ||||||
| 712 | First Defiance Financial Corp. | 47,747 | ||||||
| 2,575 | First Financial Corp. | 116,776 | ||||||
| 529 | First Internet Bancorp | 18,039 | ||||||
| 894 | First of Long Island Corp. (The) | 22,216 | ||||||
| 885 | Flushing Financial Corp. | 23,099 | ||||||
| 4,175 | Hancock Whitney Corp. | 194,764 | ||||||
| 13,334 | Hanmi Financial Corp. | 378,019 | ||||||
| 2,921 | Home Bancorp, Inc. | 135,973 | ||||||
| 11,679 | Home BancShares, Inc. | 263,478 | ||||||
| 1,069 | HomeTrust Bancshares, Inc.* | 30,092 | ||||||
| 5,150 | Hope Bancorp, Inc. | 91,825 | ||||||
| 779 | Independent Bank Group, Inc. | 52,037 | ||||||
| 16,087 | International Bancshares Corp. | 688,524 | ||||||
| 29,114 | Investors Bancorp, Inc. | 372,368 | ||||||
| 996 | LegacyTexas Financial Group, Inc. | 38,864 | ||||||
| 638 | Mercantile Bank Corp. | 23,580 | ||||||
| 441 | Meta Financial Group, Inc. | 42,953 | ||||||
| 583 | Metropolitan Bank Holding Corp.* | 30,596 | ||||||
| 762 | National Bank Holdings Corp. Class A | 29,406 | ||||||
| 1,127 | NBT Bancorp, Inc. | 42,995 | ||||||
| 16,421 | OFG Bancorp | 230,715 | ||||||
| 1,929 | Old National Bancorp | 35,879 | ||||||
| 1,281 | Opus Bank | 36,765 | ||||||
| 4,599 | Pacific Premier Bancorp, Inc.* | 175,452 | ||||||
| 1,756 | Riverview Bancorp, Inc. | 14,821 | ||||||
| 1,540 | Simmons First National Corp. Class A | 46,046 | ||||||
| 1,833 | South State Corp. | 158,096 | ||||||
| 10,094 | TriCo Bancshares | 378,020 | ||||||
| 20,737 | TrustCo Bank Corp. | 184,559 | ||||||
| 5,716 | UMB Financial Corp. | 435,731 | ||||||
| 2,994 | United Bankshares, Inc. | 108,982 | ||||||
| 11,556 | United Community Banks, Inc. | 354,423 | ||||||
|
| |||||||
| Common Stocks – (continued) | ||||||||
Banks – (continued) | ||||||||
| 3,909 | United Community Financial Corp. | $ | 42,960 | |||||
| 9,391 | Walker & Dunlop, Inc. | 522,609 | ||||||
| 5,839 | Washington Federal, Inc. | 190,935 | ||||||
| 290 | WSFS Financial Corp. | 15,457 | ||||||
|
| |||||||
| 9,615,437 | ||||||||
|
| |||||||
Capital Goods – 6.6% | ||||||||
| 3,367 | Aegion Corp.* | 86,700 | ||||||
| 6,547 | Aircastle Ltd. | 134,214 | ||||||
| 709 | Barnes Group, Inc. | 41,760 | ||||||
| 3,825 | BMC Stock Holdings, Inc.* | 79,751 | ||||||
| 647 | Builders FirstSource, Inc.* | 11,834 | ||||||
| 7,587 | Comfort Systems USA, Inc. | 347,485 | ||||||
| 21,669 | Continental Building Products, Inc.* | 683,657 | ||||||
| 1,476 | Ducommun, Inc.* | 48,841 | ||||||
| 1,281 | Dycom Industries, Inc.* | 121,067 | ||||||
| 9,761 | EMCOR Group, Inc. | 743,593 | ||||||
| 806 | Encore Wire Corp. | 38,245 | ||||||
| 5,683 | EnerSys | 424,179 | ||||||
| 815 | Engility Holdings, Inc.* | 24,972 | ||||||
| 8,806 | Esterline Technologies Corp.* | 649,883 | ||||||
| 1,824 | Greenbrier Cos., Inc. (The) | 96,216 | ||||||
| 14,910 | H&E Equipment Services, Inc. | 560,765 | ||||||
| 4,045 | Herc Holdings, Inc.* | 227,895 | ||||||
| 13,740 | Hillenbrand, Inc. | 647,841 | ||||||
| 769 | Kaman Corp. | 53,592 | ||||||
| 15,236 | Milacron Holdings Corp.* | 288,417 | ||||||
| 4,149 | Miller Industries, Inc. | 106,007 | ||||||
| 14,525 | PGT Innovations, Inc.* | 302,846 | ||||||
| 12,306 | Primoris Services Corp. | 335,092 | ||||||
| 923 | Quanex Building Products Corp. | 16,568 | ||||||
| 127 | RBC Bearings, Inc.* | 16,359 | ||||||
| 459 | Rush Enterprises, Inc. Class A* | 19,911 | ||||||
| 1,510 | Simpson Manufacturing Co., Inc. | 93,907 | ||||||
| 8,428 | SPX FLOW, Inc.* | 368,894 | ||||||
| 8,033 | Titan Machinery, Inc.* | 124,913 | ||||||
| 9,268 | TriMas Corp.* | 272,479 | ||||||
| 718 | Vectrus, Inc.* | 22,129 | ||||||
|
| |||||||
| 6,990,012 | ||||||||
|
| |||||||
Commercial & Professional Services – 6.2% | ||||||||
| 4,167 | ACCO Brands Corp. | 57,713 | ||||||
| 7,900 | ASGN, Inc.* | 617,701 | ||||||
| 2,195 | Barrett Business Services, Inc. | 211,971 | ||||||
| 17,072 | Brady Corp. Class A | 658,125 | ||||||
| 13,080 | CBIZ, Inc.* | 300,840 | ||||||
| 5,248 | CRA International, Inc. | 267,071 | ||||||
| 973 | Deluxe Corp. | 64,422 | ||||||
| 13,400 | Exponent, Inc. | 647,220 | ||||||
| 256 | FTI Consulting, Inc.* | 15,483 | ||||||
| 778 | Huron Consulting Group, Inc.* | 31,820 | ||||||
| 2,808 | ICF International, Inc. | 199,508 | ||||||
| 9,345 | Insperity, Inc. | 890,111 | ||||||
| 691 | Kelly Services, Inc. Class A | 15,513 | ||||||
| 3,002 | Kforce, Inc. | 102,969 | ||||||
| 24,236 | Kimball International, Inc. Class B | 391,654 | ||||||
|
| |||||||
| 8 | The accompanying notes are an integral part of these financial statements. |
GOLDMAN SACHS VARIABLE INSURANCE TRUST SMALL CAP EQUITY INSIGHTS FUND
| Shares | Description | Value | ||||||
| Common Stocks – (continued) | ||||||||
Commercial & Professional Services – (continued) | ||||||||
| 9,705 | Korn/Ferry International | $ | 601,031 | |||||
| 11,463 | McGrath RentCorp | 725,264 | ||||||
| 13,941 | Navigant Consulting, Inc.* | 308,654 | ||||||
| 1,036 | TriNet Group, Inc.* | 57,954 | ||||||
| 7,239 | TrueBlue, Inc.* | 195,091 | ||||||
| 143 | UniFirst Corp. | 25,297 | ||||||
| 3,469 | WageWorks, Inc.* | 173,450 | ||||||
|
| |||||||
| 6,558,862 | ||||||||
|
| |||||||
Consumer Durables & Apparel – 3.9% | ||||||||
| 1,021 | Acushnet Holdings Corp. | 24,974 | ||||||
| 1,432 | Beazer Homes USA, Inc.* | 21,122 | ||||||
| 40,896 | Callaway Golf Co. | 775,797 | ||||||
| 16,487 | Crocs, Inc.* | 290,336 | ||||||
| 6,107 | Ethan Allen Interiors, Inc. | 149,621 | ||||||
| 5,571 | G-III Apparel Group Ltd.* | 247,352 | ||||||
| 230 | Helen of Troy Ltd.* | 22,644 | ||||||
| 3,477 | Installed Building Products, Inc.* | 196,624 | ||||||
| 832 | Johnson Outdoors, Inc. Class A | 70,329 | ||||||
| 12,232 | KB Home | 333,200 | ||||||
| 6,746 | Malibu Boats, Inc. Class A* | 282,927 | ||||||
| 12,670 | MCBC Holdings, Inc.* | 366,796 | ||||||
| 911 | Nautilus, Inc.* | 14,303 | ||||||
| 1,137 | Superior Group of Cos., Inc. | 23,547 | ||||||
| 38,080 | TRI Pointe Group, Inc.* | 622,989 | ||||||
| 594 | Tupperware Brands Corp. | 24,497 | ||||||
| 30,318 | Vista Outdoor, Inc.* | 469,626 | ||||||
| 7,355 | William Lyon Homes Class A* | 170,636 | ||||||
| 2,380 | ZAGG, Inc.* | 41,174 | ||||||
|
| |||||||
| 4,148,494 | ||||||||
|
| |||||||
Consumer Services – 4.9% | ||||||||
| 1,504 | American Public Education, Inc.* | 63,318 | ||||||
| 7,172 | BJ’s Restaurants, Inc. | 430,320 | ||||||
| 9,465 | Boyd Gaming Corp. | 328,057 | ||||||
| 15,146 | Brinker International, Inc. | 720,950 | ||||||
| 3,846 | Career Education Corp.* | 62,190 | ||||||
| 11,569 | Cheesecake Factory, Inc. (The) | 636,989 | ||||||
| 5,345 | Chegg, Inc.* | 148,538 | ||||||
| 639 | Dave & Buster’s Entertainment, Inc.* | 30,416 | ||||||
| 57,607 | Houghton Mifflin Harcourt Co.* | 440,694 | ||||||
| 21,290 | K12, Inc.* | 348,517 | ||||||
| 2,782 | Planet Fitness, Inc. Class A* | 122,241 | ||||||
| 3,817 | Red Robin Gourmet Burgers, Inc.* | 177,872 | ||||||
| 4,889 | Sotheby’s* | 265,668 | ||||||
| 12,582 | Texas Roadhouse, Inc. | 824,247 | ||||||
| 5,493 | Weight Watchers International, Inc.* | 555,342 | ||||||
| 1,381 | Wingstop, Inc. | 71,978 | ||||||
|
| |||||||
| 5,227,337 | ||||||||
|
| |||||||
Diversified Financials – 4.4% | ||||||||
| 10,349 | AG Mortgage Investment Trust, Inc. (REIT) | 194,458 | ||||||
| 23,744 | Anworth Mortgage Asset Corp. (REIT) | 118,007 | ||||||
| 7,981 | Arbor Realty Trust, Inc. (REIT) | 83,242 | ||||||
|
| |||||||
| Common Stocks – (continued) | ||||||||
Diversified Financials – (continued) | ||||||||
| 1,618 | Artisan Partners Asset Management, Inc. Class A | $ | 48,783 | |||||
| 9,400 | Cannae Holdings, Inc.* | 174,370 | ||||||
| 970 | Donnelley Financial Solutions, Inc.* | 16,849 | ||||||
| 3,715 | Dynex Capital, Inc. (REIT) | 24,259 | ||||||
| 18,106 | Enova International, Inc.* | 661,774 | ||||||
| 1,399 | Federated Investors, Inc. Class B | 32,625 | ||||||
| 7,432 | Green Dot Corp. Class A* | 545,434 | ||||||
| 12,390 | Houlihan Lokey, Inc. | 634,616 | ||||||
| 20,676 | Investment Technology Group, Inc. | 432,542 | ||||||
| 10,222 | Ladder Capital Corp. (REIT) | 159,667 | ||||||
| 11,135 | Moelis & Co. Class A | 653,068 | ||||||
| 551 | Oppenheimer Holdings, Inc. Class A | 15,428 | ||||||
| 7,319 | Piper Jaffray Cos. | 562,465 | ||||||
| 441 | PJT Partners, Inc. Class A | 23,545 | ||||||
| 4,472 | Westwood Holdings Group, Inc. | 266,263 | ||||||
|
| |||||||
| 4,647,395 | ||||||||
|
| |||||||
Energy – 5.5% | ||||||||
| 4,000 | Arch Coal, Inc. Class A | 313,720 | ||||||
| 2,014 | Cactus, Inc. Class A* | 68,053 | ||||||
| 2,565 | California Resources Corp.* | 116,553 | ||||||
| 1,417 | CONSOL Energy, Inc.* | 54,342 | ||||||
| 15,263 | Exterran Corp.* | 382,185 | ||||||
| 9,028 | FTS International, Inc.* | 128,559 | ||||||
| 7,224 | Gulfport Energy Corp.* | 90,806 | ||||||
| 6,023 | Matador Resources Co.* | 180,991 | ||||||
| 12,011 | Matrix Service Co.* | 220,402 | ||||||
| 27,118 | Newpark Resources, Inc.* | 294,230 | ||||||
| 525 | Nine Energy Service, Inc.* | 17,388 | ||||||
| 5,643 | Oasis Petroleum, Inc.* | 73,190 | ||||||
| 2,448 | Ocean Rig UDW, Inc. Class A* | 72,167 | ||||||
| 4,174 | Par Pacific Holdings, Inc.* | 72,544 | ||||||
| 8,498 | PDC Energy, Inc.* | 513,704 | ||||||
| 18,426 | Peabody Energy Corp. | 838,014 | ||||||
| 30,808 | Pioneer Energy Services Corp.* | 180,227 | ||||||
| 25,740 | ProPetro Holding Corp.* | 403,603 | ||||||
| 3,644 | REX American Resources Corp.* | 295,055 | ||||||
| 5,384 | SEACOR Holdings, Inc.* | 308,342 | ||||||
| 28,495 | Southwestern Energy Co.* | 151,023 | ||||||
| 16,985 | SRC Energy, Inc.* | 187,175 | ||||||
| 30,604 | Superior Energy Services, Inc.* | 298,083 | ||||||
| 7,337 | Unit Corp.* | 187,534 | ||||||
| 15,665 | US Silica Holdings, Inc. | 402,434 | ||||||
| 6,198 | W&T Offshore, Inc.* | 44,316 | ||||||
|
| |||||||
| 5,894,640 | ||||||||
|
| |||||||
Food & Staples Retailing – 0.4% | ||||||||
| 5,747 | Ingles Markets, Inc. Class A | 182,754 | ||||||
| 6,160 | Smart & Final Stores, Inc.* | 34,188 | ||||||
| 1,111 | SpartanNash Co. | 28,353 | ||||||
| 3,685 | Village Super Market, Inc. Class A | 108,560 | ||||||
| 1,655 | Weis Markets, Inc. | 88,278 | ||||||
|
| |||||||
| 442,133 | ||||||||
|
| |||||||
| The accompanying notes are an integral part of these financial statements. | 9 |
GOLDMAN SACHS VARIABLE INSURANCE TRUST SMALL CAP EQUITY INSIGHTS FUND
Schedule of Investments (continued)
June 30, 2018 (Unaudited)
| Shares | Description | Value | ||||||
| Common Stocks – (continued) | ||||||||
Food, Beverage & Tobacco – 1.7% | ||||||||
| 3,501 | Calavo Growers, Inc. | $ | 336,621 | |||||
| 456 | Cal-Maine Foods, Inc.* | 20,908 | ||||||
| 1,562 | Darling Ingredients, Inc.* | 31,053 | ||||||
| 10,816 | Dean Foods Co. | 113,676 | ||||||
| 693 | J&J Snack Foods Corp. | 105,662 | ||||||
| 1,005 | John B Sanfilippo & Son, Inc. | 74,822 | ||||||
| 361 | Lancaster Colony Corp. | 49,970 | ||||||
| 3,224 | National Beverage Corp.* | 344,646 | ||||||
| 2,154 | Primo Water Corp.* | 37,673 | ||||||
| 1,523 | Sanderson Farms, Inc. | 160,143 | ||||||
| 4,933 | Simply Good Foods Co. (The)* | 71,232 | ||||||
| 26,796 | Vector Group Ltd. | 511,268 | ||||||
|
| |||||||
| 1,857,674 | ||||||||
|
| |||||||
Health Care Equipment & Services – 4.3% | ||||||||
| 661 | Addus HomeCare Corp.* | 37,842 | ||||||
| 4,427 | Allscripts Healthcare Solutions, Inc.* | 53,124 | ||||||
| 4,979 | Amedisys, Inc.* | 425,505 | ||||||
| 353 | AMN Healthcare Services, Inc.* | 20,686 | ||||||
| 3,697 | Anika Therapeutics, Inc.* | 118,304 | ||||||
| 174 | Atrion Corp. | 104,296 | ||||||
| 2,272 | CorVel Corp.* | 122,688 | ||||||
| 3,640 | Cross Country Healthcare, Inc.* | 40,950 | ||||||
| 1,094 | Cutera, Inc.* | 44,088 | ||||||
| 8,905 | Ensign Group, Inc. (The) | 318,977 | ||||||
| 5,213 | HealthStream, Inc. | 142,367 | ||||||
| 117 | Heska Corp.* | 12,143 | ||||||
| 2,059 | Inogen, Inc.* | 383,653 | ||||||
| 4,724 | Integer Holdings Corp.* | 305,407 | ||||||
| 2,316 | LifePoint Health, Inc.* | 113,021 | ||||||
| 6,747 | Magellan Health, Inc.* | 647,375 | ||||||
| 1,761 | National HealthCare Corp. | 123,939 | ||||||
| 5,123 | NxStage Medical, Inc.* | 142,932 | ||||||
| 9,405 | Orthofix International NV* | 534,392 | ||||||
| 6,069 | RadNet, Inc.* | 91,035 | ||||||
| 3,175 | STAAR Surgical Co.* | 98,425 | ||||||
| 4,413 | Tivity Health, Inc.* | 155,338 | ||||||
| 12,700 | Triple-S Management Corp. Class B* | 496,062 | ||||||
| 953 | Vocera Communications, Inc.* | 28,485 | ||||||
|
| |||||||
| 4,561,034 | ||||||||
|
| |||||||
Household & Personal Products – 0.9% | ||||||||
| 504 | Central Garden & Pet Co. Class A* | 20,397 | ||||||
| 2,121 | Inter Parfums, Inc. | 113,473 | ||||||
| 3,616 | Medifast, Inc. | 579,139 | ||||||
| 1,867 | USANA Health Sciences, Inc.* | 215,265 | ||||||
|
| |||||||
| 928,274 | ||||||||
|
| |||||||
Insurance – 3.5% | ||||||||
| 23,790 | American Equity Investment Life Holding Co. | 856,440 | ||||||
| 467 | AMERISAFE, Inc. | 26,969 | ||||||
| 12,370 | Argo Group International Holdings Ltd. | 719,316 | ||||||
| 1,410 | Employers Holdings, Inc. | 56,682 | ||||||
| 5,564 | FBL Financial Group, Inc. Class A | 438,165 | ||||||
| 52,008 | Genworth Financial, Inc. Class A* | 234,036 | ||||||
|
| |||||||
| Common Stocks – (continued) | ||||||||
Insurance – (continued) | ||||||||
| 6,180 | Health Insurance Innovations, Inc. Class A*(a) | $ | 199,923 | |||||
| 2,085 | Horace Mann Educators Corp. | 92,991 | ||||||
| 366 | Navigators Group, Inc. (The) | 20,862 | ||||||
| 1,785 | ProAssurance Corp. | 63,278 | ||||||
| 11,053 | Stewart Information Services Corp. | 476,053 | ||||||
| 14,587 | Trupanion, Inc.*(a) | 563,058 | ||||||
| 454 | Universal Insurance Holdings, Inc. | 15,935 | ||||||
|
| |||||||
| 3,763,708 | ||||||||
|
| |||||||
Materials – 5.4% | ||||||||
| 4,939 | Balchem Corp. | 484,713 | ||||||
| 5,984 | Boise Cascade Co. | 267,485 | ||||||
| 13,802 | Carpenter Technology Corp. | 725,571 | ||||||
| 4,046 | Chase Corp. | 474,393 | ||||||
| 7,381 | Ingevity Corp.* | 596,828 | ||||||
| 4,570 | Innophos Holdings, Inc. | 217,532 | ||||||
| 635 | Innospec, Inc. | 48,609 | ||||||
| 7,774 | Kraton Corp.* | 358,692 | ||||||
| 18,719 | Louisiana-Pacific Corp. | 509,531 | ||||||
| 8,659 | Materion Corp. | 468,885 | ||||||
| 8,259 | Minerals Technologies, Inc. | 622,316 | ||||||
| 926 | PolyOne Corp. | 40,022 | ||||||
| 17,176 | Schnitzer Steel Industries, Inc. Class A | 578,831 | ||||||
| 5,297 | SunCoke Energy, Inc.* | 70,980 | ||||||
| 3,123 | Trinseo SA | 221,577 | ||||||
| 1,606 | Verso Corp. Class A* | 34,947 | ||||||
| 1,924 | Warrior Met Coal, Inc. | 53,045 | ||||||
|
| |||||||
| 5,773,957 | ||||||||
|
| |||||||
Media – 2.1% | ||||||||
| 5,197 | Gray Television, Inc.* | 82,113 | ||||||
| 16,309 | MSG Networks, Inc. Class A* | 390,600 | ||||||
| 33,488 | New Media Investment Group, Inc. | 618,858 | ||||||
| 9,382 | Nexstar Media Group, Inc. Class A | 688,639 | ||||||
| 865 | Scholastic Corp. | 38,328 | ||||||
| 11,937 | Sinclair Broadcast Group, Inc. Class A | 383,775 | ||||||
|
| |||||||
| 2,202,313 | ||||||||
|
| |||||||
Pharmaceuticals, Biotechnology & Life Sciences – 9.5% | ||||||||
| 4,421 | Acceleron Pharma, Inc.* | 214,507 | ||||||
| 1,779 | Acorda Therapeutics, Inc.* | 51,057 | ||||||
| 1,497 | AMAG Pharmaceuticals, Inc.* | 29,191 | ||||||
| 1,700 | Amphastar Pharmaceuticals, Inc.* | 25,942 | ||||||
| 10,993 | Array BioPharma, Inc.* | 184,463 | ||||||
| 7,671 | Catalyst Pharmaceuticals, Inc.* | 23,934 | ||||||
| 5,984 | ChemoCentryx, Inc.* | 78,809 | ||||||
| 3,730 | Concert Pharmaceuticals, Inc.* | 62,776 | ||||||
| 17,273 | CytomX Therapeutics, Inc.* | 394,861 | ||||||
| 3,901 | Depomed, Inc.* | 26,020 | ||||||
| 595 | Eagle Pharmaceuticals, Inc.* | 45,018 | ||||||
| 2,207 | Editas Medicine, Inc.* | 79,077 | ||||||
| 2,311 | Emergent BioSolutions, Inc.* | 116,682 | ||||||
| 3,080 | Enanta Pharmaceuticals, Inc.* | 356,972 | ||||||
| 10,673 | Endo International plc* | 100,646 | ||||||
| 5,230 | FibroGen, Inc.* | 327,398 | ||||||
|
| |||||||
| 10 | The accompanying notes are an integral part of these financial statements. |
GOLDMAN SACHS VARIABLE INSURANCE TRUST SMALL CAP EQUITY INSIGHTS FUND
| Shares | Description | Value | ||||||
| Common Stocks – (continued) | ||||||||
Pharmaceuticals, Biotechnology & Life Sciences – (continued) | ||||||||
| 1,157 | Foundation Medicine, Inc.* | $ | 158,162 | |||||
| 15,025 | Genomic Health, Inc.* | 757,260 | ||||||
| 3,400 | Global Blood Therapeutics, Inc.* | 153,680 | ||||||
| 32,893 | Halozyme Therapeutics, Inc.* | 554,905 | ||||||
| 1,610 | Heron Therapeutics, Inc.* | 62,549 | ||||||
| 11,681 | Horizon Pharma plc* | 193,437 | ||||||
| 23,160 | Innoviva, Inc.* | 319,608 | ||||||
| 1,043 | Intercept Pharmaceuticals, Inc.* | 87,518 | ||||||
| 7,015 | Intersect ENT, Inc.* | 262,712 | ||||||
| 1,462 | Ironwood Pharmaceuticals, Inc.* | 27,953 | ||||||
| 7,713 | Karyopharm Therapeutics, Inc.* | 131,044 | ||||||
| 1,512 | Ligand Pharmaceuticals, Inc.* | 313,241 | ||||||
| 2,911 | Loxo Oncology, Inc.* | 505,000 | ||||||
| 2,768 | MacroGenics, Inc.* | 57,159 | ||||||
| 641 | Mirati Therapeutics, Inc.* | 31,601 | ||||||
| 13,432 | Myriad Genetics, Inc.* | 501,954 | ||||||
| 2,979 | Pacira Pharmaceuticals, Inc.* | 95,477 | ||||||
| 87,665 | PDL BioPharma, Inc.* | 205,136 | ||||||
| 14,915 | Phibro Animal Health Corp. Class A | 686,836 | ||||||
| 38,611 | Pieris Pharmaceuticals, Inc.* | 195,758 | ||||||
| 11,560 | PTC Therapeutics, Inc.* | 389,919 | ||||||
| 894 | Puma Biotechnology, Inc.* | 52,880 | ||||||
| 9,191 | REGENXBIO, Inc.* | 659,454 | ||||||
| 14,815 | Retrophin, Inc.* | 403,857 | ||||||
| 646 | Revance Therapeutics, Inc.* | 17,733 | ||||||
| 3,342 | Spark Therapeutics, Inc.* | 276,584 | ||||||
| 826 | Spectrum Pharmaceuticals, Inc.* | 17,313 | ||||||
| 7,720 | Supernus Pharmaceuticals, Inc.* | 462,042 | ||||||
| 9,370 | Vericel Corp.* | 90,889 | ||||||
| 3,043 | Voyager Therapeutics, Inc.* | 59,460 | ||||||
| 6,212 | Xencor, Inc.* | 229,906 | ||||||
|
| |||||||
| 10,078,380 | ||||||||
|
| |||||||
Real Estate – 7.5% | ||||||||
| 792 | American Assets Trust, Inc. (REIT) | 30,326 | ||||||
| 4,104 | Ashford Hospitality Trust, Inc. (REIT) | 33,242 | ||||||
| 3,232 | Braemar Hotels & Resorts, Inc. (REIT) | 36,909 | ||||||
| 1,250 | CareTrust REIT, Inc. (REIT) | 20,863 | ||||||
| 4,209 | Cedar Realty Trust, Inc. (REIT) | 19,867 | ||||||
| 4,035 | Chatham Lodging Trust (REIT) | 85,623 | ||||||
| 78,015 | Cousins Properties, Inc. (REIT) | 755,965 | ||||||
| 58,047 | DiamondRock Hospitality Co. (REIT) | 712,817 | ||||||
| 459 | EastGroup Properties, Inc. (REIT) | 43,862 | ||||||
| 3,042 | Healthcare Realty Trust, Inc. (REIT) | 88,461 | ||||||
| 6,138 | HFF, Inc. Class A | 210,840 | ||||||
| 1,106 | Industrial Logistics Properties Trust (REIT) | 24,719 | ||||||
| 11,691 | InfraREIT, Inc. (REIT) | 259,190 | ||||||
| 7,730 | Kite Realty Group Trust (REIT) | 132,028 | ||||||
| 33,597 | Mack-Cali Realty Corp. (REIT) | 681,347 | ||||||
| 1,102 | Marcus & Millichap, Inc.* | 42,989 | ||||||
| 795 | National Health Investors, Inc. (REIT) | 58,576 | ||||||
| 1,236 | National Storage Affiliates Trust (REIT) | 38,094 | ||||||
| 836 | NexPoint Residential Trust, Inc. (REIT) | 23,784 | ||||||
| 17,449 | Pebblebrook Hotel Trust (REIT) | 677,021 | ||||||
|
| |||||||
| Common Stocks – (continued) | ||||||||
Real Estate – (continued) | ||||||||
| 14,187 | Piedmont Office Realty Trust, Inc. Class A (REIT) | $ | 282,747 | |||||
| 5,374 | PS Business Parks, Inc. (REIT) | 690,559 | ||||||
| 1,369 | RE/MAX Holdings, Inc. Class A | 71,804 | ||||||
| 8,706 | Ryman Hospitality Properties, Inc. (REIT) | 723,904 | ||||||
| 2,886 | St Joe Co. (The)* | 51,804 | ||||||
| 3,535 | Summit Hotel Properties, Inc. (REIT) | 50,586 | ||||||
| 44,066 | Sunstone Hotel Investors, Inc. (REIT) | 732,377 | ||||||
| 11,270 | Terreno Realty Corp. (REIT) | 424,541 | ||||||
| 8,544 | Tier REIT, Inc. (REIT) | 203,176 | ||||||
| 1,129 | Urstadt Biddle Properties, Inc. Class A (REIT) | 25,549 | ||||||
| 18,764 | Washington Prime Group, Inc. (REIT) | 152,176 | ||||||
| 23,359 | Xenia Hotels & Resorts, Inc. (REIT) | 569,025 | ||||||
|
| |||||||
| 7,954,771 | ||||||||
|
| |||||||
Retailing – 4.3% | ||||||||
| 23,693 | Abercrombie & Fitch Co. Class A | 580,005 | ||||||
| 31,519 | American Eagle Outfitters, Inc. | 732,817 | ||||||
| 1,297 | America’s Car-Mart, Inc.* | 80,284 | ||||||
| 2,805 | Asbury Automotive Group, Inc.* | 192,283 | ||||||
| 5,920 | Boot Barn Holdings, Inc.* | 122,840 | ||||||
| 8,290 | Caleres, Inc. | 285,093 | ||||||
| 1,920 | Chico’s FAS, Inc. | 15,629 | ||||||
| 1,454 | Children’s Place, Inc. (The) | 175,643 | ||||||
| 5,677 | Citi Trends, Inc. | 155,777 | ||||||
| 496 | Dillard’s, Inc. Class A | 46,872 | ||||||
| 9,312 | DSW, Inc. Class A | 240,436 | ||||||
| 37,168 | Express, Inc.* | 340,087 | ||||||
| 1,928 | Five Below, Inc.* | 188,385 | ||||||
| 11,649 | Groupon, Inc.* | 50,091 | ||||||
| 8,451 | Hibbett Sports, Inc.* | 193,528 | ||||||
| 432 | Liberty Expedia Holdings, Inc. Class A* | 18,982 | ||||||
| 12,700 | Liberty TripAdvisor Holdings, Inc. Class A* | 204,470 | ||||||
| 3,993 | Nutrisystem, Inc. | 153,730 | ||||||
| 751 | Shoe Carnival, Inc. | 24,370 | ||||||
| 8,638 | Signet Jewelers Ltd. | 481,568 | ||||||
| 2,058 | Tailored Brands, Inc. | 52,520 | ||||||
| 9,702 | Zumiez, Inc.* | 243,035 | ||||||
|
| |||||||
| 4,578,445 | ||||||||
|
| |||||||
Semiconductors & Semiconductor Equipment – 2.2% | ||||||||
| 9,995 | Amkor Technology, Inc.* | 85,857 | ||||||
| 3,468 | Axcelis Technologies, Inc.* | 68,666 | ||||||
| 6,630 | Cabot Microelectronics Corp.(b) | 713,123 | ||||||
| 12,505 | Diodes, Inc.* | 431,047 | ||||||
| 21,364 | Entegris, Inc. | 724,240 | ||||||
| 7,091 | FormFactor, Inc.* | 94,310 | ||||||
| 4,532 | Photronics, Inc.* | 36,143 | ||||||
| 15,507 | Rambus, Inc.* | 194,458 | ||||||
|
| |||||||
| 2,347,844 | ||||||||
|
| |||||||
| The accompanying notes are an integral part of these financial statements. | 11 |
GOLDMAN SACHS VARIABLE INSURANCE TRUST SMALL CAP EQUITY INSIGHTS FUND
Schedule of Investments (continued)
June 30, 2018 (Unaudited)
| Shares | Description | Value | ||||||
| Common Stocks – (continued) | ||||||||
Software & Services – 5.3% | ||||||||
| 2,247 | Acxiom Corp.* | $ | 67,298 | |||||
| 1,610 | Altair Engineering, Inc. Class A* | 55,030 | ||||||
| 7,478 | Appfolio, Inc. Class A* | 457,280 | ||||||
| 15,008 | Apptio, Inc. Class A* | 543,290 | ||||||
| 3,005 | Avaya Holdings Corp.* | 60,340 | ||||||
| 6,089 | Bottomline Technologies de, Inc.* | 303,415 | ||||||
| 15,156 | Box, Inc. Class A* | 378,748 | ||||||
| 5,481 | Etsy, Inc.* | 231,243 | ||||||
| 3,351 | Five9, Inc.* | 115,844 | ||||||
| 5,305 | Hortonworks, Inc.* | 96,657 | ||||||
| 799 | HubSpot, Inc.* | 100,195 | ||||||
| 1,481 | MAXIMUS, Inc. | 91,985 | ||||||
| 3,167 | MicroStrategy, Inc. Class A* | 404,584 | ||||||
| 8,253 | New Relic, Inc.* | 830,169 | ||||||
| 2,457 | Paylocity Holding Corp.* | 144,619 | ||||||
| 5,568 | Perficient, Inc.* | 146,828 | ||||||
| 855 | Progress Software Corp. | 33,191 | ||||||
| 7,615 | Q2 Holdings, Inc.* | 434,436 | ||||||
| 1,731 | QuinStreet, Inc.* | 21,984 | ||||||
| 749 | Rapid7, Inc.* | 21,137 | ||||||
| 15,414 | ServiceSource International, Inc.* | 60,731 | ||||||
| 985 | Stamps.com, Inc.* | 249,254 | ||||||
| 13,961 | Syntel, Inc.* | 448,008 | ||||||
| 214 | Trade Desk, Inc. (The) Class A* | 20,073 | ||||||
| 1,907 | Varonis Systems, Inc.* | 142,072 | ||||||
| 4,317 | Yelp, Inc.* | 169,140 | ||||||
|
| |||||||
| 5,627,551 | ||||||||
|
| |||||||
Technology Hardware & Equipment – 4.3% | ||||||||
| 1,780 | ADTRAN, Inc. | 26,433 | ||||||
| 13,144 | AVX Corp. | 205,966 | ||||||
| 8,299 | Benchmark Electronics, Inc. | 241,916 | ||||||
| 3,125 | CalAmp Corp.* | 73,219 | ||||||
| 12,717 | Casa Systems, Inc.* | 207,669 | ||||||
| 21,328 | Ciena Corp.* | 565,405 | ||||||
| 10,234 | Comtech Telecommunications Corp. | 326,260 | ||||||
| 609 | Control4 Corp.* | 14,805 | ||||||
| 487 | CTS Corp. | 17,532 | ||||||
| 30,278 | Electro Scientific Industries, Inc.* | 477,484 | ||||||
| 1,639 | ePlus, Inc.* | 154,230 | ||||||
| 9,070 | Fitbit, Inc. Class A* | 59,227 | ||||||
| 7,390 | Immersion Corp.* | 114,101 | ||||||
| 12,926 | Insight Enterprises, Inc.* | 632,469 | ||||||
| 17,149 | Kimball Electronics, Inc.* | 313,827 | ||||||
| 492 | NETGEAR, Inc.* | 30,750 | ||||||
| 1,348 | OSI Systems, Inc.* | 104,241 | ||||||
| 1,491 | Rogers Corp.* | 166,187 | ||||||
| 836 | ScanSource, Inc.* | 33,691 | ||||||
| 2,196 | SYNNEX Corp. | 211,936 | ||||||
| 1,019 | Tech Data Corp.* | 83,680 | ||||||
| 24,059 | Vishay Intertechnology, Inc. | 558,169 | ||||||
|
| |||||||
| 4,619,197 | ||||||||
|
| |||||||
| Common Stocks – (continued) | ||||||||
Telecommunication Services – 1.5% | ||||||||
| 6,636 | Boingo Wireless, Inc.* | $ | 149,907 | |||||
| 13,443 | Cogent Communications Holdings, Inc. | 717,856 | ||||||
| 2,590 | Spok Holdings, Inc. | 38,980 | ||||||
| 55,935 | Vonage Holdings Corp.* | 721,002 | ||||||
|
| |||||||
| 1,627,745 | ||||||||
|
| |||||||
Transportation – 1.9% | ||||||||
| 2,684 | ArcBest Corp. | 122,659 | ||||||
| 3,273 | Avis Budget Group, Inc.* | 106,372 | ||||||
| 967 | Covenant Transportation Group, Inc. Class A* | 30,460 | ||||||
| 12,028 | Echo Global Logistics, Inc.* | 351,819 | ||||||
| 17,770 | Marten Transport Ltd. | 416,707 | ||||||
| 1,144 | Saia, Inc.* | 92,492 | ||||||
| 3,549 | SkyWest, Inc. | 184,193 | ||||||
| 18,070 | Werner Enterprises, Inc. | 678,529 | ||||||
| 1,342 | YRC Worldwide, Inc.* | 13,487 | ||||||
|
| |||||||
| 1,996,718 | ||||||||
|
| |||||||
Utilities – 2.1% | ||||||||
| 5,321 | Black Hills Corp. | 325,699 | ||||||
| 12,133 | NorthWestern Corp. | 694,614 | ||||||
| 2,002 | ONE Gas, Inc. | 149,630 | ||||||
| 17,333 | Portland General Electric Co. | 741,159 | ||||||
| 5,960 | Unitil Corp. | 304,198 | ||||||
|
| |||||||
| 2,215,300 | ||||||||
|
| |||||||
| TOTAL COMMON STOCKS | ||||||||
| (Cost $88,780,907) | $ | 104,651,212 | ||||||
|
| |||||||
| Units | Description | Value | ||||||
| Right*(c) – 0.0% | ||||||||
Pharmaceuticals, Biotechnology & Life Sciences – 0.0% | ||||||||
| 1,561 | Dyax Corp., CVR | $ | 4,683 | |||||
| (Cost $0) | ||||||||
|
| |||||||
| Shares | Distribution Rate | Value | ||||
| Investment Company(d) – 0.8% |
| |||||
Goldman Sachs Financial Square Government Fund — Institutional Shares |
| |||||
| 873,192 | 1.869% | $ | 873,192 | |||
| (Cost $873,192) |
| |||||
| ||||||
| TOTAL INVESTMENTS BEFORE SECURITIES LENDING REINVESTMENT VEHICLE |
| |||||
| (Cost $89,654,099) | $ | 105,529,087 | ||||
| ||||||
| 12 | The accompanying notes are an integral part of these financial statements. |
GOLDMAN SACHS VARIABLE INSURANCE TRUST SMALL CAP EQUITY INSIGHTS FUND
| Shares | Distribution Rate | Value | ||||
| Securities Lending Reinvestment Vehicle(d) – 0.7% |
| |||||
Goldman Sachs Financial Square Government Fund — Institutional Shares |
| |||||
| 734,930 | 1.869% | $ | 734,930 | |||
(Cost $734,930) |
| |||||
| ||||||
| TOTAL INVESTMENTS – 99.8% |
| |||||
| (Cost $90,389,029) | $ | 106,264,017 | ||||
| ||||||
OTHER ASSETS IN EXCESS OF LIABILITIES – 0.2% | 247,413 | |||||
| ||||||
| NET ASSETS – 100.0% | $ | 106,511,430 | ||||
| ||||||
| The percentage shown for each investment category reflects the value of investments in that category as a percentage of net assets. | ||
| * | Non-income producing security. | |
| (a) | All or a portion of security is on loan. | |
| (b) | All or a portion of security is segregated as collateral for initial margin requirements on futures transactions. | |
| (c) | Significant unobservable inputs were used in the valuation of this portfolio security; i.e. Level 3. | |
| (d) | Represents an Affiliated Issuer. | |
| Investment Abbreviations: | ||
| CVR | — Contingent Value Rights | |
| REIT | — Real Estate Investment Trust | |
ADDITIONAL INVESTMENT INFORMATION
FUTURES CONTRACTS — At June 30, 2018, the Fund had the following futures contracts:
| Description | Number of Contracts | Expiration Date | Notional Amount | Unrealized Appreciation/ (Depreciation) | ||||||||||
Long position contracts: |
| |||||||||||||
| Russell 2000 E-Mini Index | 8 | 09/21/2018 | $ | 659,000 | $ | (11,514 | ) | |||||||
| The accompanying notes are an integral part of these financial statements. | 13 |
GOLDMAN SACHS VARIABLE INSURANCE TRUST SMALL CAP EQUITY INSIGHTS FUND
Statement of Assets and Liabilities
June 30, 2018 (Unaudited)
| Assets: | ||||
Investments in unaffiliated issuers, at value (cost $88,780,907)(a) | $ | 104,655,895 | ||
Investments in affiliated issuers, at value (cost $873,192) | 873,192 | |||
Investments in affiliated securities lending reinvestment vehicle, at value (cost $734,930) | 734,930 | |||
Cash | 1,629,373 | |||
Receivables: | ||||
Investments sold | 1,557,635 | |||
Fund shares sold | 258,401 | |||
Dividends | 79,033 | |||
Reimbursement from investment adviser | 11,038 | |||
Securities lending income | 3,797 | |||
Other assets | 1,861 | |||
| Total assets | 109,805,155 | |||
| Liabilities: | ||||
Variation margin on futures | 1,280 | |||
Payables: | ||||
Investments purchased | 2,363,904 | |||
Payable upon return of securities loaned | 734,930 | |||
Fund shares redeemed | 75,608 | |||
Management fees | 61,850 | |||
Distribution and Service fees and Transfer Agency fees | 6,180 | |||
Accrued expenses | 49,973 | |||
| Total liabilities | 3,293,725 | |||
| Net Assets: | ||||
Paid-in capital | 80,814,713 | |||
Undistributed net investment income | 253,400 | |||
Accumulated net realized gain | 9,579,843 | |||
Net unrealized gain | 15,863,474 | |||
| NET ASSETS | $ | 106,511,430 | ||
Net Assets: | ||||
Institutional | $ | 85,213,394 | ||
Service | 21,298,036 | |||
Total Net Assets | $ | 106,511,430 | ||
Shares outstanding $0.001 par value (unlimited shares authorized): | ||||
Institutional | 5,623,086 | |||
Service | 1,417,840 | |||
Net asset value, offering and redemption price per share: | ||||
Institutional | $15.15 | |||
Service | 15.02 | |||
(a) Includes loaned securities having a market value of $720,310.
| 14 | The accompanying notes are an integral part of these financial statements. |
GOLDMAN SACHS VARIABLE INSURANCE TRUST SMALL CAP EQUITY INSIGHTS FUND
Statement of Operations
For the Six Months Ended June 30, 2018 (Unaudited)
| Investment income: | ||||
Dividends — unaffiliated issuers (net of foreign taxes withheld of $99) | $ | 609,422 | ||
Securities lending income — affiliated issuer | 9,354 | |||
Dividends — affiliated issuers | 5,246 | |||
| Total investment income | 624,022 | |||
| Expenses: | ||||
Management fees | 369,077 | |||
Professional fees | 43,808 | |||
Custody, accounting and administrative services | 33,851 | |||
Distribution and Service fees — Service Shares | 25,693 | |||
Printing and mailing costs | 22,894 | |||
Transfer Agency fees(a) | 10,079 | |||
Trustee fees | 8,767 | |||
Other | 4,230 | |||
| Total expenses | 518,399 | |||
Less — expense reductions | (83,627 | ) | ||
| Net expenses | 434,772 | |||
| NET INVESTMENT INCOME | 189,250 | |||
| Realized and unrealized gain (loss): | ||||
Net realized gain from: | ||||
Investments — unaffiliated issuers | 7,979,879 | |||
Futures contracts | 56,622 | |||
Net change in unrealized gain (loss) on: | ||||
Investments — unaffiliated issuers | 2,348,269 | |||
Futures contracts | (15,920 | ) | ||
| Net realized and unrealized gain | 10,368,850 | |||
| NET INCREASE IN NET ASSETS RESULTING FROM OPERATIONS | $ | 10,558,100 | ||
(a) Institutional and Service Shares incurred Transfer Agency fees of $8,024 and $2,055, respectively.
| The accompanying notes are an integral part of these financial statements. | 15 |
GOLDMAN SACHS VARIABLE INSURANCE TRUST SMALL CAP EQUITY INSIGHTS FUND
Statements of Changes in Net Assets
| For the Six Months Ended June 30, 2018 (Unaudited) | For the Fiscal Year Ended December 31, 2017 | |||||||
| From operations: | ||||||||
Net investment income | $ | 189,250 | $ | 460,184 | ||||
Net realized gain | 8,036,501 | 10,781,537 | ||||||
Net change in unrealized gain (loss) | 2,332,349 | (835,483 | ) | |||||
| Net increase in net assets resulting from operations | 10,558,100 | 10,406,238 | ||||||
| Distributions to shareholders: | ||||||||
From net investment income | ||||||||
Institutional Shares | — | (410,159 | ) | |||||
Service Shares | — | (60,003 | ) | |||||
From net realized gains | ||||||||
Institutional Shares | — | (8,398,876 | ) | |||||
Service Shares | — | (2,238,763 | ) | |||||
| Total distributions to shareholders | — | (11,107,801 | ) | |||||
| From share transactions: | ||||||||
Proceeds from sales of shares | 6,216,366 | 7,393,057 | ||||||
Reinvestment of distributions | — | 11,107,801 | ||||||
Cost of shares redeemed | (8,583,747 | ) | (17,336,021 | ) | ||||
| Net increase (decrease) in net assets resulting from share transactions | (2,367,381 | ) | 1,164,837 | |||||
| TOTAL INCREASE | 8,190,719 | 463,274 | ||||||
| Net assets: | ||||||||
Beginning of period | 98,320,711 | 97,857,437 | ||||||
End of period | $ | 106,511,430 | $ | 98,320,711 | ||||
| Undistributed net investment income | $ | 253,400 | $ | 64,150 | ||||
| 16 | The accompanying notes are an integral part of these financial statements. |
GOLDMAN SACHS VARIABLE INSURANCE TRUST SMALL CAP EQUITY INSIGHTS FUND
Financial Highlights
Selected Data for a Share Outstanding Throughout Each Period
| Income (loss) from investment operations | Distributions to shareholders | |||||||||||||||||||||||||||||||||||||||||||||||||||||||
| Year - Share Class | Net asset value, beginning of period | Net investment income(a) | Net gain (loss) | Total from investment operations | From net investment income | From net realized gains | Total distributions | Net asset value, end of period | Total return(b) | Net assets, end of (in 000s) | Ratio of net expenses to average net assets | Ratio of to average net assets | Ratio of net investment income | Portfolio turnover rate(c) | ||||||||||||||||||||||||||||||||||||||||||
FOR THE SIX MONTHS ENDED JUNE 30, (UNAUDITED) | ||||||||||||||||||||||||||||||||||||||||||||||||||||||||
2018 - Institutional | $ | 13.66 | $ | 0.03 | $ | 1.46 | $ | 1.49 | $ | — | $ | — | $ | — | $ | 15.15 | 10.91 | % | $ | 85,213 | 0.81 | %(d) | 0.98 | %(d) | 0.43 | %(d) | 65 | % | ||||||||||||||||||||||||||||
2018 - Service | 13.55 | 0.01 | 1.46 | 1.47 | — | — | — | 15.02 | 10.85 | 21,298 | 1.06 | (d) | 1.23 | (d) | 0.17 | (d) | 65 | |||||||||||||||||||||||||||||||||||||||
FOR THE FISCAL YEARS ENDED DECEMBER 31, | ||||||||||||||||||||||||||||||||||||||||||||||||||||||||
2017 - Institutional | 13.79 | 0.08 | 1.53 | 1.61 | (0.08 | ) | (1.66 | ) | (1.74 | ) | 13.66 | 11.57 | 77,815 | 0.81 | 1.00 | 0.53 | 110 | |||||||||||||||||||||||||||||||||||||||
2017 - Service | 13.70 | 0.04 | 1.51 | 1.55 | (0.04 | ) | (1.66 | ) | (1.70 | ) | 13.55 | 11.22 | 20,505 | 1.06 | 1.25 | 0.28 | 110 | |||||||||||||||||||||||||||||||||||||||
2016 - Institutional | 11.60 | 0.11 | 2.59 | 2.70 | (0.15 | ) | (0.36 | ) | (0.51 | ) | 13.79 | 23.13 | 77,421 | 0.81 | 1.04 | 0.95 | 119 | |||||||||||||||||||||||||||||||||||||||
2016 - Service | 11.52 | 0.08 | 2.58 | 2.66 | (0.12 | ) | (0.36 | ) | (0.48 | ) | 13.70 | 22.92 | 20,437 | 1.06 | 1.29 | 0.70 | 119 | |||||||||||||||||||||||||||||||||||||||
2015 - Institutional | 13.67 | 0.08 | (e) | (0.37 | ) | (0.29 | ) | (0.04 | ) | (1.74 | ) | (1.78 | ) | 11.60 | (2.13 | ) | 73,270 | 0.81 | 0.99 | 0.59 | (e) | 124 | ||||||||||||||||||||||||||||||||||
2015 - Service | 13.60 | 0.05 | (e) | (0.39 | ) | (0.34 | ) | — | (f) | (1.74 | ) | (1.74 | ) | 11.52 | (2.49 | ) | 19,488 | 1.06 | 1.24 | 0.34 | (e) | 124 | ||||||||||||||||||||||||||||||||||
2014 - Institutional | 15.07 | 0.08 | 0.90 | 0.98 | (0.12 | ) | (2.26 | ) | (2.38 | ) | 13.67 | 6.93 | 89,043 | 0.83 | 1.04 | 0.53 | 119 | |||||||||||||||||||||||||||||||||||||||
2014 - Service | 15.00 | 0.04 | 0.90 | 0.94 | (0.08 | ) | (2.26 | ) | (2.34 | ) | 13.60 | 6.69 | 23,744 | 1.08 | 1.29 | 0.28 | 119 | |||||||||||||||||||||||||||||||||||||||
2013 - Institutional | 12.71 | 0.11 | 4.37 | 4.48 | (0.16 | ) | (1.96 | ) | (2.12 | ) | 15.07 | 35.62 | 98,114 | 0.82 | 0.98 | 0.77 | 152 | |||||||||||||||||||||||||||||||||||||||
2013 - Service | 12.65 | 0.08 | 4.34 | 4.42 | (0.11 | ) | (1.96 | ) | (2.07 | ) | 15.00 | 35.38 | 25,932 | 1.07 | 1.23 | 0.52 | 152 | |||||||||||||||||||||||||||||||||||||||
| (a) | Calculated based on the average shares outstanding methodology. |
| (b) | Assumes investment at the net asset value at the beginning of the period, reinvestment of all distributions, and a complete redemption of the investment at the net asset value at the end of the period. Total returns for periods less than one full year are not annualized. |
| (c) | The Fund’s portfolio turnover rate is calculated in accordance with regulatory requirements, without regard to transactions involving short term investments and certain derivatives. If such transactions were included, the Fund’s portfolio turnover rate may be higher. |
| (d) | Annualized. |
| (e) | Reflects income recognized from special dividends which amounted to $0.02 per share and 0.15% of average net assets. |
| (f) | Amount is less than $0.005 per share. |
| The accompanying notes are an integral part of these financial statements. | 17 |
GOLDMAN SACHS VARIABLE INSURANCE TRUST SMALL CAP EQUITY INSIGHTS FUND
Notes to Financial Statements
June 30, 2018 (Unaudited)
1. ORGANIZATION
Goldman Sachs Variable Insurance Trust (the “Trust” or “VIT”) is a Delaware statutory trust registered under the Investment Company Act of 1940, as amended (the “Act”), as an open-end management investment company. The Trust includes the Goldman Sachs Small Cap Equity Insights Fund (the “Fund”). The Fund is a diversified portfolio under the Act offering two classes of shares — Institutional and Service Shares. Shares of the Trust are offered to separate accounts of participating life insurance companies for the purpose of funding variable annuity contracts and variable life insurance policies.
Goldman Sachs Asset Management, L.P. (“GSAM”), an affiliate of Goldman Sachs & Co. LLC (“Goldman Sachs”), serves as investment adviser to the Fund pursuant to a management agreement (the “Agreement”) with the Trust.
2. SIGNIFICANT ACCOUNTING POLICIES
The financial statements have been prepared in accordance with accounting principles generally accepted in the United States of America (“GAAP”) and require management to make estimates and assumptions that may affect the reported amounts and disclosures. Actual results may differ from those estimates and assumptions.
A. Investment Valuation — The Fund’s valuation policy is to value investments at fair value.
B. Investment Income and Investments — Investment income includes interest income, dividend income, and securities lending income, if any. Interest income is accrued daily and adjusted for amortization of premiums and accretion of discounts. Dividend income is recognized on ex-dividend date or, for certain foreign securities, as soon as such information is obtained subsequent to the ex-dividend date. Investment transactions are reflected on trade date. Realized gains and losses are calculated using identified cost. Investment transactions are recorded on the following business day for daily net asset value (“NAV”) calculations. Investment income is recorded net of any foreign withholding taxes, less any amounts reclaimable. The Fund may file withholding tax reclaims in certain jurisdictions to recover a portion of amounts previously withheld. Any foreign capital gains tax is accrued daily based upon net unrealized gains, and is payable upon sale of such investments. Distributions received from the Fund’s investments in United States (“U.S.”) real estate investment trusts (“REITs”) may be characterized as ordinary income, net capital gain or a return of capital. A return of capital is recorded by the Fund as a reduction to the cost basis of the REIT.
For derivative contracts, realized gains and losses are recorded upon settlement of the contract.
C. Class Allocations and Expenses — Investment income, realized and unrealized gain (loss), if any, and non-class specific expenses of the Fund are allocated daily based upon the proportion of net assets of each class. Non-class specific expenses directly incurred by the Fund are charged to the Fund, while such expenses incurred by the Trust are allocated across the Fund on a straight-line and/or pro-rata basis depending upon the nature of the expenses. Class specific expenses, where applicable, are borne by the respective share classes and include Distribution and Service and Transfer Agency fees.
D. Federal Taxes and Distributions to Shareholders — It is the Fund’s policy to comply with the requirements of the Internal Revenue Code of 1986, as amended (the “Code”), applicable to regulated investment companies (mutual funds) and to distribute each year substantially all of its investment company taxable income and capital gains to its shareholders. Accordingly, the Fund is not required to make any provisions for the payment of federal income tax. Distributions to shareholders are recorded on the ex-dividend date. Income and capital gains distributions, if any, are declared and paid annually.
Net capital losses, if any, are carried forward to future fiscal years and may be used to the extent allowed by the Code to offset any future capital gains. Losses that are carried forward will retain their character as either short-term or long-term capital losses. Utilization of capital loss carryforwards will reduce the requirement of future capital gains distributions.
The characterization of distributions to shareholders for financial reporting purposes is determined in accordance with federal income tax rules, which may differ from GAAP. The source of the Fund’s distributions may be shown in the accompanying financial statements as either from net investment income, net realized gain or capital. Certain components of the Fund’s net assets on the Statement of Assets and Liabilities reflect permanent GAAP/tax differences based on the appropriate tax character.
18
GOLDMAN SACHS VARIABLE INSURANCE TRUST SMALL CAP EQUITY INSIGHTS FUND
3. INVESTMENTS AND FAIR VALUE MEASUREMENTS
U.S. GAAP defines the fair value of a financial instrument as the amount that would be received to sell an asset or paid to transfer a liability in an orderly transaction between market participants at the measurement date (i.e., the exit price); the Fund’s policy is to use the market approach. GAAP establishes a fair value hierarchy that prioritizes the inputs to valuation techniques used to measure fair value. The hierarchy gives the highest priority to unadjusted quoted prices in active markets for identical assets or liabilities (Level 1 measurements) and the lowest priority to unobservable inputs (Level 3 measurements). The levels used for classifying investments are not necessarily an indication of the risk associated with investing in these investments. The three levels of the fair value hierarchy are described below:
Level 1 — Unadjusted quoted prices in active markets that are accessible at the measurement date for identical, unrestricted assets or liabilities;
Level 2 — Quoted prices in markets that are not active or financial instruments for which significant inputs are observable (including, but not limited to, quoted prices for similar investments, interest rates, foreign exchange rates, volatility and credit spreads), either directly or indirectly;
Level 3 — Prices or valuations that require significant unobservable inputs (including GSAM’s assumptions in determining fair value measurement).
Changes in valuation techniques may result in transfers into or out of an assigned level within the hierarchy. In accordance with the Fund’s policy, transfers between different levels of the fair value hierarchy resulting from such changes are deemed to have occurred as of the beginning of the reporting period.
The Board of Trustees (“Trustees”) has approved Valuation Procedures that govern the valuation of the portfolio investments held by the Fund, including investments for which market quotations are not readily available. The Trustees have delegated to GSAM day-to-day responsibility for implementing and maintaining internal controls and procedures related to the valuation of the Fund’s investments. To assess the continuing appropriateness of pricing sources and methodologies, GSAM regularly performs price verification procedures and issues challenges as necessary to third party pricing vendors or brokers, and any differences are reviewed in accordance with the Valuation Procedures.
A. Level 1 and Level 2 Fair Value Investments — The valuation techniques and significant inputs used in determining the fair values for investments classified as Level 1 and Level 2 are as follows:
Equity Securities — Equity securities traded on a U.S. securities exchange or the NASDAQ system, or those located on certain foreign exchanges, including but not limited to the Americas, are valued daily at their last sale price or official closing price on the principal exchange or system on which they are traded. If there is no sale or official closing price or such price is believed by GSAM to not represent fair value, equity securities are valued at the last bid price for long positions and at the last ask price for short positions. To the extent these investments are actively traded, they are classified as Level 1 of the fair value hierarchy, otherwise they are generally classified as Level 2.
Unlisted equity securities for which market quotations are available are valued at the last sale price on the valuation date, or if no sale occurs, at the last bid price, and are generally classified as Level 2.
Money Market Funds — Investments in the Goldman Sachs Financial Square Government Fund (“Underlying Fund”) are valued at the NAV of the Institutional Share class on the day of valuation. These investments are generally classified as Level 1 of the fair value hierarchy. For information regarding an Underlying Fund’s accounting policies and investment holdings, please see the Underlying Fund’s shareholder report.
Derivative Contracts — A derivative is an instrument whose value is derived from underlying assets, indices, reference rates or a combination of these factors. The Fund enters into derivative transactions to hedge against changes in interest rates, securities prices, and/or currency exchange rates, to increase total return, or to gain access to certain markets or attain exposure to other underliers.
Exchange-traded derivatives, including futures and options contracts, are valued at the last sale or settlement price and typically fall within Level 1 of the fair value hierarchy. Over-the-counter (“OTC”) and centrally cleared derivatives are valued using market transactions and other market evidence, including market-based inputs to models, calibration to market-clearing transactions, broker or dealer quotations, or other alternative pricing sources. Where models are used, the selection of a particular
19
GOLDMAN SACHS VARIABLE INSURANCE TRUST SMALL CAP EQUITY INSIGHTS FUND
Notes to Financial Statements (continued)
June 30, 2018 (Unaudited)
3. INVESTMENTS AND FAIR VALUE MEASUREMENTS (continued)
model to value OTC and centrally cleared derivatives depends upon the contractual terms of, and specific risks inherent in, the instrument, as well as the availability of pricing information in the market. Valuation models require a variety of inputs, including contractual terms, market prices, yield curves, credit curves, measures of volatility, voluntary and involuntary prepayment rates, loss severity rates and correlations of such inputs. For OTC and centrally cleared derivatives that trade in liquid markets, model inputs can generally be verified and model selection does not involve significant management judgment. OTC and centrally cleared derivatives are classified within Level 2 of the fair value hierarchy when significant inputs are corroborated by market evidence.
i. Futures Contracts — Futures contracts are contracts to buy or sell a standardized quantity of a specified commodity or security and are valued based on exchanged settlement prices or independent market quotes. Futures contracts are valued at the last settlement price, or in the absence of a sale, the last bid price for long positions and at the last ask price for short positions, at the end of each day on the board of trade or exchange upon which they are traded. Upon entering into a futures contract, the Fund deposits cash or securities in an account on behalf of the broker in an amount sufficient to meet the initial margin requirement. Subsequent payments are made or received by the Fund equal to the daily change in the contract value and are recorded as variation margin receivable or payable with a corresponding offset to unrealized gains or losses. For financial reporting purposes, cash collateral that has been pledged to cover obligations of the Fund and cash collateral received, if any, is reported separately on the Statement of Assets and Liabilities as receivables/payables for collateral on certain derivative contracts. Non-cash collateral pledged by the Fund, if any, is noted in the Schedule of Investments.
B. Level 3 Fair Value Investments — To the extent that significant inputs to valuation models and other alternative pricing sources are unobservable, or if quotations are not readily available, or if GSAM believes that such quotations do not accurately reflect fair value, the fair value of the Fund’s investments may be determined under Valuation Procedures approved by the Trustees. GSAM, consistent with its procedures and applicable regulatory guidance, may make an adjustment to the most recent valuation prices of either domestic or foreign securities in light of significant events to reflect what it believes to be the fair value of the securities at the time of determining the Fund’s NAV. Significant events which could affect a large number of securities in a particular market may include, but are not limited to: significant fluctuations in U.S. or foreign markets; market dislocations; market disruptions; or unscheduled market closings. Significant events which could also affect a single issuer may include, but are not limited to: corporate actions such as reorganizations, mergers and buy-outs; ratings downgrades; and bankruptcies.
C. Fair Value Hierarchy — The following is a summary of the Fund’s investments and derivatives classified in the fair value hierarchy as of June 30, 2018:
| Investment Type | Level 1 | Level 2 | Level 3 | |||||||||
| Assets | ||||||||||||
| Common Stock and/or Other Equity Investments(a) | ||||||||||||
Europe | $ | 72,167 | $ | — | $ | — | ||||||
North America | 104,579,045 | — | 4,683 | |||||||||
| Investment Company | 873,192 | — | — | |||||||||
| Securities Lending Reinvestment Vehicle | 734,930 | — | — | |||||||||
| Total | $ | 106,259,334 | $ | — | $ | 4,683 | ||||||
| Derivative Type | ||||||||||||
| Liabilities(b) | ||||||||||||
| Futures Contracts | $ | (11,514 | ) | $ | — | $ | — | |||||
| (a) | Amounts are disclosed by continent to highlight the impact of time zone differences between local market close and the calculation of net asset value. Security valuations are based on the principal exchange or system on which they are traded, which may differ from country of domicile. |
| (b) | Amount shown represents unrealized gain (loss) at period end. |
For further information regarding security characteristics, see the Schedule of Investments.
20
GOLDMAN SACHS VARIABLE INSURANCE TRUST SMALL CAP EQUITY INSIGHTS FUND
4. INVESTMENTS IN DERIVATIVES
The following table sets forth, by certain risk types, the gross value of derivative contracts (not considered to be hedging instruments for accounting disclosure purposes) as of June 30, 2018. These instruments were used as part of the Fund’s investment strategies and to obtain and/or manage exposure related to the risks below. The values in the table below exclude the effects of cash collateral received or posted pursuant to these derivative contracts, and therefore are not representative of the Fund’s net exposure.
| Risk | Statement of Assets and Liabilities | Assets | Statement of Assets and Liabilities | Liabilities(a) | ||||||||||
| Equity | — | $ | — | Variation margin on futures | $ | (11,514 | ) | |||||||
| (a) | Includes unrealized gain (loss) on futures contracts described in the Additional Investment Information section of the Schedule of Investments. Only the variation margin as of June 30, 2018 is reported within the Statement of Assets and Liabilities. |
The following table sets forth, by certain risk types, the Fund’s gains (losses) related to these derivatives and their indicative volumes for the six months ended June 30, 2018. These gains (losses) should be considered in the context that these derivative contracts may have been executed to create investment opportunities and/or economically hedge certain investments, and accordingly, certain gains (losses) on such derivative contracts may offset certain (losses) gains attributable to investments. These gains (losses) are included in “Net realized gain (loss)” or “Net change in unrealized gain (loss)” on the Statement of Operations:
| Risk | Statement of Operations | Net Realized Gain (Loss) | Net Change in Unrealized Gain (Loss) | Average Number of Contracts(a) | ||||||||||
| Equity | Net realized gain (loss) from futures contracts/Net change in unrealized gain (loss) on futures contracts | $ | 56,622 | $ | (15,920 | ) | 8 | |||||||
(a) Average number of contracts is based on the average of month end balances for the fiscal year ended June 30, 2018.
5. AGREEMENTS AND AFFILIATED TRANSACTIONS
A. Management Agreement — Under the Agreement, GSAM manages the Fund, subject to the general supervision of the Trustees.
As compensation for the services rendered pursuant to the Agreement, the assumption of the expenses related thereto and administration of the Fund’s business affairs, including providing facilities, GSAM is entitled to a management fee, accrued daily and paid monthly, equal to an annual percentage rate of the Fund’s average daily net assets.
As of June 30, 2018, contractual management fees with GSAM were at the following rates. The effective contractual management rate and effective net management rate represent the rates for the six month period ended June 30, 2018.
| Contractual Management Rate | ||||||||||||||||||||
| First $2 billion | Next $3 billion | Next $3 billion | Over $8 billion | Effective Rate | Effective Net Management Rate^ | |||||||||||||||
| 0.70% | 0.63 | % | 0.60 | % | 0.59 | % | 0.73 | % | 0.70 | % | ||||||||||
| ^ | Effective Net Management Rate includes the impact of management fee waivers of affiliated Underlying Funds, if any. The Effective Net Management Rate may not correlate to the Contractual Management Rate as a result of management fee waivers that may be in effect from time to time. For the six months ended June 30, 2018, GSAM waived $16,294 of its management fee. |
21
GOLDMAN SACHS VARIABLE INSURANCE TRUST SMALL CAP EQUITY INSIGHTS FUND
Notes to Financial Statements (continued)
June 30, 2018 (Unaudited)
5. AGREEMENTS AND AFFILIATED TRANSACTIONS (continued)
Prior to April 30, 2018, the contractual management fee rate for the Fund was as stated below and GSAM agreed to waive a portion of its management fee in order to achieve an Effective Net Management Rate as set forth in the Fund’s prospectus dated April 28, 2017.
| First $2 billion | Next $3 billion | Next $3 billion | Over $8 billion | |||||||||
| 0.75% | 0.68 | % | 0.65 | % | 0.64 | % | ||||||
The Fund invests in Institutional Shares of the Goldman Sachs Financial Square Government Fund, which is an affiliated Underlying Fund. GSAM has agreed to waive a portion of its management fee payable by the Fund in an amount equal to the management fee it earns as an investment adviser to the affiliated Underlying Fund in which the Fund invests, except those management fees it earns from the Fund’s investments of cash collateral received in connection with securities lending transactions in the Goldman Sachs Financial Square Government Fund. For the six months ended June 30, 2018, GSAM waived $543 of the Fund’s management fee.
B. Distribution and Service (12b-1) Plan — The Trust, on behalf of Service Shares of the Fund, has adopted a Distribution and Service Plan subject to Rule 12b-1 under the Act. Under the Distribution and Service Plan, Goldman Sachs, which serves as distributor, is entitled to a fee accrued daily and paid monthly, for distribution services and personal and account maintenance services, which may then be paid by Goldman Sachs to authorized dealers, equal to, on an annual basis, 0.25% of the Fund’s average daily net assets attributable to Service Shares.
C. Transfer Agency Agreement — Goldman Sachs also serves as the transfer agent of the Fund for a fee pursuant to the Transfer Agency Agreement. The fees charged for such transfer agency services are accrued daily and paid monthly at an annual rate of 0.02% of the average daily net assets of Institutional and Service Shares.
D. Other Expense Agreements and Affiliated Transactions — GSAM has agreed to limit certain “Other Expenses” of the Fund (excluding acquired fund fees and expenses, transfer agency fees and expenses, service fees and shareholder administration fees (as applicable), taxes, interest, brokerage fees, expenses of shareholder meetings, litigation and indemnification, and extraordinary expenses) to the extent such expenses exceed, on an annual basis, a percentage rate of the average daily net assets of the Fund. Such Other Expense reimbursements, if any, are accrued daily and paid monthly. In addition, the Fund is not obligated to reimburse GSAM for prior fiscal year expense reimbursements, if any. The Other Expense limitation as an annual percentage rate of average daily net assets for the Fund is 0.094%. The Other Expense limitation will remain in place through at least April 30, 2019, and prior to such date GSAM may not terminate the arrangement without the approval of the Trustees. For the six months ended June 30, 2018, GSAM reimbursed $66,323 to the Fund. In addition, the Fund has entered into certain offset arrangements with the custodian and the transfer agent, which may result in a reduction of the Fund’s expenses and are received irrespective of the application of the “Other Expense” limitation described above. For the six months ended June 30, 2018, custody fee credits were $467.
E. Line of Credit Facility — As of June 30, 2018, the Fund participated in a $770,000,000 committed, unsecured revolving line of credit facility (the “facility”) together with other funds of the Trust and certain registered investment companies having management agreements with GSAM or its affiliates. This facility is to be used for temporary emergency purposes, or to allow for an orderly liquidation of securities to meet redemption requests. The interest rate on borrowings is based on the federal funds rate. The facility also requires a fee to be paid by the Fund based on the amount of the commitment that has not been utilized. For the six months ended June 30, 2018, the Fund did not have any borrowings under the facility. Prior to May 1, 2018, the facility was $1,100,000,000. The facility was decreased to $770,000,000 effective May 1, 2018.
22
GOLDMAN SACHS VARIABLE INSURANCE TRUST SMALL CAP EQUITY INSIGHTS FUND
5. AGREEMENTS AND AFFILIATED TRANSACTIONS (continued)
F. Other Transactions with Affiliates — The following table provides information about the Fund’s investment in the Goldman Sachs Financial Square Government Fund as of and for the six months ended June 30, 2018:
| Beginning Value as of December 31, 2017 | Purchases at Cost | Proceeds from Sales | Ending Value as of June 30, 2018 | Shares as of June 30, 2018 | Dividend Income from Affiliated Investment Company | |||||||||||||||||
| $264,823 | $ | 6,494,898 | $ | (5,886,529 | ) | $ | 873,192 | 873,192 | $ | 5,246 | ||||||||||||
6. PORTFOLIO SECURITIES TRANSACTIONS
The cost of purchases and proceeds from sales and maturities of long-term securities for the six months ended June 30, 2018, were $63,852,237 and $66,071,423, respectively.
7. SECURITIES LENDING
Pursuant to exemptive relief granted by the Securities and Exchange Commission (“SEC”) and the terms and conditions contained therein, the Fund may lend its securities through a securities lending agent, Goldman Sachs Agency Lending (“GSAL”), a wholly-owned subsidiary of Goldman Sachs, to certain qualified borrowers including Goldman Sachs and affiliates. In accordance with the Fund’s securities lending procedures, the Fund receives cash collateral at least equal to the market value of the securities on loan. The market value of the loaned securities is determined at the close of business of the Fund, at their last sale price or official closing price on the principal exchange or system on which they are traded, and any additional required collateral is delivered to the Fund on the next business day. As with other extensions of credit, the Fund may experience delay in the recovery of its securities or incur a loss should the borrower of the securities breach its agreement with the Fund or become insolvent at a time when the collateral is insufficient to cover the cost of repurchasing securities on loan. Dividend income received from securities on loan may not be subject to withholding taxes and therefore withholding taxes paid may differ from the amounts listed in the Statement of Operations. Loans of securities are terminable at any time and as such 1) the remaining contractual maturities of the outstanding securities lending transactions are considered to be overnight and continuous and 2) the borrower, after notice, is required to return borrowed securities within the standard time period for settlement of securities transactions.
The Fund invests the cash collateral received in connection with securities lending transactions in the Goldman Sachs Financial Square Government Fund (“Government Money Market Fund”), an affiliated series of the Goldman Sachs Trust. The Government Money Market Fund is registered under the Act as an open end investment company, is subject to Rule 2a-7 under the Act, and is managed by GSAM, for which GSAM may receive a management fee of up to 0.16% (prior to February 21, 2018, GSAM may have received a management fee of up to 0.205%) on an annualized basis of the average daily net assets of the Government Money Market Fund.
In the event of a default by a borrower with respect to any loan, GSAL will exercise any and all remedies provided under the applicable borrower agreement to make the Fund whole. These remedies include purchasing replacement securities by applying the collateral held from the defaulting broker against the purchase cost of the replacement securities. If GSAL is unable to purchase replacement securities, GSAL will indemnify the Fund by paying the Fund an amount equal to the market value of the securities loaned minus the value of cash collateral received from the borrower for the loan, subject to an exclusion for any shortfalls resulting from a loss of value in such cash collateral due to reinvestment risk. The Fund’s loaned securities were all subject to enforceable Securities Lending Agreements and the value of the collateral was at least equal to the value of the cash received. The amounts of the Fund’s overnight and continuous agreements represent the gross amounts of recognized liabilities for securities lending transactions outstanding as of June 30, 2018 are disclosed as “Payable upon return of securities loaned” on the Statement of Assets and Liabilities, where applicable.
23
GOLDMAN SACHS VARIABLE INSURANCE TRUST SMALL CAP EQUITY INSIGHTS FUND
Notes to Financial Statements (continued)
June 30, 2018 (Unaudited)
7. SECURITIES LENDING (continued)
Both the Fund and GSAL received compensation relating to the lending of the Fund’s securities. The amounts earned, if any, by the Fund for the six months ended June 30, 2018, are reported under Investment Income on the Statement of Operations.
The table below details securities lending activity with affiliates of Goldman Sachs:
| For the Six Months ended June 30, 2018 | ||||||||
| Earnings of GSAL Relating to Securities Loaned | Amount Received by the Fund from Lending to Goldman Sachs | Amount Payable to Goldman Sachs Upon Return of Securities Loaned as of June 30, 2018 | ||||||
| $1,048 | $ | 1,345 | $ | 134,300 | ||||
The following table provides information about the Fund’s investment in the Government Money Market Fund for the six months ended June 30, 2018:
| Beginning Value as of December 31, 2017 | Purchases at Cost | Proceeds from Sales | Ending Value as of June 30, 2018 | |||||||||||
| $1,053,265 | $ | 4,741,573 | $ | (5,059,908 | ) | $ | 734,930 | |||||||
8. TAX INFORMATION
As of the Fund’s most recent fiscal year end, December 31, 2017, the Fund’s timing differences, on a tax-basis were as follows:
Timing differences (§ 857(b)(9) Deferred Dividend) | $16,568 |
As of June 30, 2018, the Fund’s aggregate security unrealized gains and losses based on cost for U.S. federal income tax purposes were as follows:
| Tax cost | $ | 90,456,333 | ||
| Gross unrealized gain | 18,393,566 | |||
| Gross unrealized loss | (2,585,882 | ) | ||
| Net unrealized gain | $ | 15,807,684 |
The difference between GAAP-basis and tax-basis unrealized gains (losses) is attributable primarily to wash sales, net mark to market gains (losses) on regulated futures contracts and differences in the tax treatment of underlying fund investments.
GSAM has reviewed the Fund’s tax positions for all open tax years (the current and prior three years, as applicable) and has concluded that no provision for income tax is required in the Fund’s financial statements. Such open tax years remain subject to examination and adjustment by tax authorities.
9. OTHER RISKS
The Fund’s risks include, but are not limited to, the following:
Derivatives Risk — The Fund’s use of derivatives may result in loss. Derivative instruments, which may pose risks in addition to and greater than those associated with investing directly in securities, currencies or other instruments, may be illiquid or less liquid, volatile, difficult to price and leveraged so that small changes in the value of the underlying instruments may produce disproportionate losses to the Fund. Derivatives are also subject to counterparty risk, which is the risk that the other party in the
24
GOLDMAN SACHS VARIABLE INSURANCE TRUST SMALL CAP EQUITY INSIGHTS FUND
9. OTHER RISKS (continued)
transaction will not fulfill its contractual obligation. The use of derivatives is a highly specialized activity that involves investment techniques and risks different from those associated with investments in more traditional securities and instruments. Losses from derivatives can also result from a lack of correlation between changes in the value of derivative instruments and the portfolio assets (if any) being hedged.
Investments in Other Investment Companies Risk — As a shareholder of another investment company, including an exchange-traded fund (“ETF”), the Fund will indirectly bear its proportionate share of any net management fees and other expenses paid by such other investment companies, in addition to the fees and expenses regularly borne by the Fund. ETFs are subject to risks that do not apply to conventional mutual funds, including but not limited to the following: (i) the market price of the ETF’s shares may trade at a premium or a discount to their NAV; and (ii) an active trading market for an ETF’s shares may not develop or be maintained.
Large Shareholder Transactions Risk — The Fund may experience adverse effects when certain large shareholders, such as other funds, participating insurance companies, accounts and Goldman Sachs affiliates, purchase or redeem large amounts of shares of the Fund. Such large shareholder redemptions may cause the Fund to sell portfolio securities at times when it would not otherwise do so, which may negatively impact the Fund’s NAV and liquidity. These transactions may also accelerate the realization of taxable income to shareholders if such sales of investments resulted in gains, and may also increase transaction costs. In addition, a large redemption could result in the Fund’s current expenses being allocated over a smaller asset base, leading to an increase in the Fund’s expense ratio. Similarly, large Fund share purchases may adversely affect the Fund’s performance to the extent that the Fund is delayed in investing new cash and is required to maintain a larger cash position than it ordinarily would.
Liquidity Risk — The Fund may make investments that are illiquid or that may become less liquid in response to market developments or adverse investor perceptions. Illiquid investments may be more difficult to value. Liquidity risk may also refer to the risk that the Fund will not be able to pay redemption proceeds within the allowable time period because of unusual market conditions, an unusually high volume of redemption requests, or other reasons. To meet redemption requests, the Fund may be forced to sell investments at an unfavorable time and/or under unfavorable conditions.
Market and Credit Risks — In the normal course of business, the Fund trades financial instruments and enters into financial transactions where risk of potential loss exists due to changes in the market (market risk). Additionally, the Fund may also be exposed to credit risk in the event that an issuer or guarantor fails to perform or that an institution or entity with which the Fund has unsettled or open transactions defaults.
10. INDEMNIFICATIONS
Under the Trust’s organizational documents, its Trustees, officers, employees and agents are indemnified, to the extent permitted by the Act and state law, against certain liabilities that may arise out of performance of their duties to the Fund. Additionally, in the course of business, the Fund enters into contracts that contain a variety of indemnification clauses. The Fund’s maximum exposure under these arrangements is unknown, as this would involve future claims that may be made against the Fund that have not yet occurred. However, GSAM believes the risk of loss under these arrangements to be remote.
11. SUBSEQUENT EVENTS
Subsequent events after the Statement of Assets and Liabilities date have been evaluated, and GSAM has concluded that there is no impact requiring adjustment or disclosure in the financial statements.
25
GOLDMAN SACHS VARIABLE INSURANCE TRUST SMALL CAP EQUITY INSIGHTS FUND
Notes to Financial Statements (continued)
June 30, 2018 (Unaudited)
12. SUMMARY OF SHARE TRANSACTIONS
Share activity is as follows:
| For the Six Months Ended June 30, 2018 (Unaudited) | For the Fiscal Year Ended December 31, 2017 | |||||||||||||||
| Shares | Dollars | Shares | Dollars | |||||||||||||
| Institutional Shares | ||||||||||||||||
| Shares sold | 364,676 | $ | 5,272,094 | 449,078 | $ | 6,364,463 | ||||||||||
| Reinvestment of distributions | — | — | 640,192 | 8,809,035 | ||||||||||||
| Shares redeemed | (439,127 | ) | (6,300,140 | ) | (1,006,312 | ) | (14,236,742 | ) | ||||||||
| (74,451 | ) | (1,028,046 | ) | 82,958 | 936,756 | |||||||||||
| Service Shares | ||||||||||||||||
| Shares sold | 65,115 | 944,272 | 73,489 | 1,028,594 | ||||||||||||
| Reinvestment of distributions | — | — | 168,284 | 2,298,766 | ||||||||||||
| Shares redeemed | (160,052 | ) | (2,283,607 | ) | (220,914 | ) | (3,099,279 | ) | ||||||||
| (94,937 | ) | (1,339,335 | ) | 20,859 | 228,081 | |||||||||||
| NET INCREASE (DECREASE) | (169,388 | ) | $ | (2,367,381 | ) | 103,817 | $ | 1,164,837 | ||||||||
26
GOLDMAN SACHS VARIABLE INSURANCE TRUST SMALL CAP EQUITY INSIGHTS FUND
| Fund Expenses — Six Month Period Ended June 30, 2018 (Unaudited) |
As a shareholder of Institutional or Service Shares of the Fund, you incur ongoing costs, including management fees, distribution and/or service (12b-1) fees (with respect to Service Shares) and other Fund expenses. This example is intended to help you understand your ongoing costs (in dollars) of investing in the Institutional Shares and Service Shares of the Fund and to compare these costs with the ongoing costs of investing in other mutual funds.
The example is based on an investment of $1,000 invested at the beginning of the period and held for the entire period from January 1, 2018 through June 30, 2018, which represents a period of 181 days of a 365 day year.
Actual Expenses — The first line under each share class in the table below provides information about actual account values and actual expenses. You may use the information in this line, together with the amount you invested, to estimate the expenses that you paid over the period. Simply divide your account value by $1,000 (for example, an $8,600 account value divided by $1,000=8.6), then multiply the result by the number in the first line under the heading entitled “Expenses Paid” to estimate the expenses you paid on your account during this period.
Hypothetical Example for Comparison Purposes — The second line under each share class in the table below provides information about hypothetical account values and hypothetical expenses based on the Fund’s actual net expense ratio and an assumed rate of return of 5% per year before expenses, which is not the Fund’s actual return. The hypothetical account values and expenses may not be used to estimate the actual ending account balance or expenses you paid for the period. You may use this information to compare the ongoing costs of investing in the Fund and other funds. To do so, compare this 5% hypothetical example with the 5% hypothetical examples that appear in the shareholder reports of the other funds.
Please note that the expenses shown in the table are meant to highlight your ongoing costs only. As a shareholder of the Fund you do not incur any transaction costs, such as sales charges, redemption fees, or exchange fees, but shareholders of other funds may incur such costs. The second line of the table is useful in comparing ongoing costs only and will not help you determine the relative total costs of owning different funds whose shareholders may incur transaction costs.
| Share Class | Beginning Account Value 01/01/18 | Ending Account Value 06/30/18 | Expenses Paid for the 6 Months Ended 06/30/18* | |||||||||
| Institutional | ||||||||||||
| Actual | $ | 1,000 | $ | 1,109.10 | $ | 4.24 | ||||||
| Hypothetical 5% return | 1,000 | 1,020.78 | + | 4.06 | ||||||||
| Service | ||||||||||||
| Actual | 1,000 | 1,108.50 | 5.54 | |||||||||
| Hypothetical 5% return | 1,000 | 1,019.54 | + | 5.31 | ||||||||
| * | Expenses are calculated using the Fund’s annualized net expense ratio for each class, which represents the ongoing expenses as a percentage of net assets for the six months ended June 30, 2018. Expenses are calculated by multiplying the annualized net expense ratio by the average account value for the period; then multiplying the result by the number of days in the most recent fiscal half year; and then dividing that result by the number of days in the fiscal year. The annualized net expense ratios for the period were 0.81% and 1.06% for the Institutional and Service Shares, respectively. |
| + | Hypothetical expenses are based on the Fund’s actual annualized net expense ratios and an assumed rate of return of 5% per year before expenses. |
27
GOLDMAN SACHS VARIABLE INSURANCE TRUST SMALL CAP EQUITY INSIGHTS FUND
Statement Regarding Basis for Approval of Management Agreement (Unaudited)
Background
The Goldman Sachs Small Cap Equity Insights Fund (the “Fund”) is an investment portfolio of Goldman Sachs Variable Insurance Trust (the “Trust”). The Board of Trustees oversees the management of the Trust and reviews the investment performance and expenses of the Fund at regularly scheduled meetings held throughout the year. In addition, the Board of Trustees determines annually whether to approve the continuance of the Trust’s investment management agreement (the “Management Agreement”) with Goldman Sachs Asset Management, L.P. (the “Investment Adviser”) on behalf of the Fund.
The Management Agreement was most recently approved for continuation until June 30, 2019 by the Board of Trustees, including those Trustees who are not parties to the Management Agreement or “interested persons” (as defined in the Investment Company Act of 1940, as amended) of any party thereto (the “Independent Trustees”), at a meeting held on June 13-14, 2018 (the “Annual Meeting”).
The review process undertaken by the Trustees spans the course of the year and culminates with the Annual Meeting. To assist the Trustees in their deliberations, the Trustees have established a Contract Review Committee (the “Committee”), comprised of the Independent Trustees. The Committee held four meetings over the course of the year since the Management Agreement was last approved. At those Committee meetings, regularly scheduled Board or other committee meetings, and/or the Annual Meeting, matters relevant to the renewal of the Management Agreement were considered by the Board, or the Independent Trustees, as applicable. With respect to the Fund, such matters included:
| (a) | the nature and quality of the advisory, administrative, and other services provided to the Fund by the Investment Adviser and its affiliates, including information about: |
| (i) | the structure, staff, and capabilities of the Investment Adviser and its portfolio management teams; |
| (ii) | the groups within the Investment Adviser and its affiliates that support the portfolio management teams or provide other types of necessary services, including fund services groups (e.g., accounting and financial reporting, tax, shareholder services, and operations); controls and risk management groups (e.g., legal, compliance, valuation oversight, credit risk management, internal audit, compliance testing, market risk analysis, finance, and central funding); sales and distribution support groups, and others (e.g., information technology and training); |
| (iii) | trends in employee headcount; |
| (iv) | the Investment Adviser’s financial resources and ability to hire and retain talented personnel and strengthen its operations; and |
| (v) | the parent company’s support of the Investment Adviser and its mutual fund business, as expressed by the firm’s senior management; |
| (b) | information on the investment performance of the Fund, including comparisons to the performance of similar mutual funds, as provided by a third-party mutual fund data provider engaged as part of the contract review process (the “Outside Data Provider”) and a benchmark performance index; and information on general investment outlooks in the markets in which the Fund invests; |
| (c) | information provided by the Investment Adviser indicating the Investment Adviser’s views on whether the Fund’s peer group and/or benchmark index had high, medium, or low relevance given the Fund’s particular investment strategy; |
| (d) | the terms of the Management Agreement and other agreements with affiliated service providers entered into by the Trust on behalf of the Fund; |
| (e) | fee and expense information for the Fund, including: |
| (i) | the relative management fee and expense levels of the Fund as compared to those of comparable funds managed by other advisers, as provided by the Outside Data Provider; |
| (ii) | the Fund’s expense trends over time; and |
| (iii) | to the extent the Investment Adviser manages other types of accounts (such as bank collective trusts, private wealth management accounts, institutional separate accounts, sub-advised mutual funds, and non-U.S. funds) having investment objectives and policies similar to those of the Fund, comparative information on the advisory fees charged and services provided to those accounts by the Investment Adviser; |
| (f) | with respect to the extensive investment performance and expense comparison data provided by the Outside Data Provider, its processes in producing that data for the Fund; |
| (g) | the undertakings of the Investment Adviser and its affiliates to implement fee waivers and/or expense limitations; |
| (h) | information relating to the profitability of the Management Agreement and the transfer agency and distribution and service arrangements of the Fund to the Investment Adviser and its affiliates; |
| (i) | whether the Fund’s existing management fee schedule adequately addressed any economies of scale; |
28
GOLDMAN SACHS VARIABLE INSURANCE TRUST SMALL CAP EQUITY INSIGHTS FUND
Statement Regarding Basis for Approval of Management Agreement (Unaudited) (continued)
| (j) | a summary of the “fall-out” benefits derived by the Investment Adviser and its affiliates from their relationships with the Fund, including the fees received by the Investment Adviser’s affiliates from the Fund for transfer agency, securities lending, portfolio trading, distribution and other services; |
| (k) | a summary of potential benefits derived by the Fund as a result of its relationship with the Investment Adviser; |
| (l) | information regarding commissions paid by the Fund and broker oversight, other information regarding portfolio trading, and how the Investment Adviser carries out its duty to seek best execution; |
| (m) | the manner in which portfolio manager compensation is determined; and the number and types of accounts managed by the portfolio managers; |
| (n) | the nature and quality of the services provided to the Fund by its unaffiliated service providers, and the Investment Adviser’s general oversight and evaluation (including reports on due diligence) of those service providers as part of the administrative services provided under the Management Agreement; and |
| (o) | the Investment Adviser’s processes and policies addressing various types of potential conflicts of interest; its approach to risk management; the annual review of the effectiveness of the Fund’s compliance program; and periodic compliance reports. |
The Trustees also received an overview of the Fund’s distribution arrangements. They received information regarding the Fund’s assets, share purchase and redemption activity, and payment of distribution and service fees. Information was also provided to the Trustees relating to revenue sharing payments made by and services provided by the Investment Adviser and its affiliates to intermediaries that promote the sale, distribution, and/or servicing of Fund shares. The Independent Trustees also discussed the broad range of other investment choices that are available to Fund investors, including the availability of comparable funds managed by other advisers.
The presentations made at the Board and Committee meetings and at the Annual Meeting encompassed the Fund and other mutual funds for which the Board of Trustees has responsibility. In evaluating the Management Agreement at the Annual Meeting, the Trustees relied upon their knowledge, resulting from their meetings and other interactions throughout the year, of the Investment Adviser and its affiliates, their services, and the Fund. In conjunction with these meetings, the Trustees received written materials and oral presentations on the topics covered, and the Investment Adviser addressed the questions and concerns of the Trustees, including concerns regarding the investment performance of certain of the funds they oversee. The Independent Trustees were advised by their independent legal counsel regarding their responsibilities and other regulatory requirements related to the approval and continuation of mutual fund investment management agreements under applicable law. In addition, the Investment Adviser and its affiliates provided the Independent Trustees with a written response to a formal request for information sent on behalf of the Independent Trustees by their independent legal counsel. During the course of their deliberations, the Independent Trustees met in executive sessions with their independent legal counsel, without representatives of the Investment Adviser or its affiliates present.
Nature, Extent, and Quality of the Services Provided Under the Management Agreement
As part of their review, the Trustees considered the nature, extent, and quality of the services provided to the Fund by the Investment Adviser. In this regard, the Trustees considered both the investment advisory services and non-advisory services that are provided by the Investment Adviser and its affiliates. The Trustees noted the transition in the leadership and changes in personnel of various of the Investment Adviser’s portfolio management teams that had occurred in recent periods, and the ongoing recruitment efforts aimed at bringing high quality investment talent to the Investment Adviser. They also noted the Investment Adviser’s commitment to maintaining high quality systems and expending substantial resources to respond to ongoing changes to the regulatory and control environment in which the Fund and its service providers operate, as well as the efforts of the Investment Adviser and its affiliates to combat cyber security risks. The Trustees concluded that the Investment Adviser continued to commit substantial financial and operational resources to the Fund and expressed confidence that the Investment Adviser would continue to do so in the future. The Trustees also recognized that the Investment Adviser had made significant commitments to address regulatory compliance requirements applicable to the Fund and the Investment Adviser and its affiliates.
Investment Performance
The Trustees also considered the investment performance of the Fund. In this regard, they compared the investment performance of the Fund to its peers using rankings and ratings compiled by the Outside Data Provider as of December 31, 2017, and updated performance information prepared by the Investment Adviser using the peer group identified by the Outside Data Provider as of March 31, 2018. The information on the Fund’s investment performance was provided for the one-, three-, five-, and ten-year periods ending on the applicable dates. The Trustees also reviewed the Fund’s investment performance relative to its
29
GOLDMAN SACHS VARIABLE INSURANCE TRUST SMALL CAP EQUITY INSIGHTS FUND
Statement Regarding Basis for Approval of Management Agreement (Unaudited) (continued)
performance benchmark. As part of this review, they considered the investment performance trends of the Fund over time, and reviewed the investment performance of the Fund in light of its investment objective and policies and market conditions.
In addition, the Trustees considered materials prepared and presentations made by the Investment Adviser’s senior management and portfolio management personnel in which Fund performance was assessed. The Trustees also considered the Investment Adviser’s periodic reports with respect to the Fund’s risk profile, and how the Investment Adviser’s approach to risk monitoring and management influences portfolio management. They noted the efforts of the Fund’s portfolio management team to continue to enhance the investment model used in managing the Fund.
The Trustees observed that the Fund’s Institutional Shares had placed in the top half of the Fund’s peer group and had outperformed the Fund’s benchmark index for the one-, three-, five-, and ten-year periods ended March 31, 2018.
Costs of Services Provided and Competitive Information
The Trustees considered the contractual terms of the Management Agreement and the fee rates payable by the Fund thereunder. In this regard, the Trustees considered information on the services rendered by the Investment Adviser to the Fund, which included both advisory and administrative services that were directed to the needs and operations of the Fund as a registered mutual fund.
In particular, the Trustees reviewed analyses prepared by the Outside Data Provider regarding the expense rankings of the Fund. The analyses provided a comparison of the Fund’s management fee and breakpoints to those of a relevant peer group and category universe; an expense analysis which compared the Fund’s overall net and gross expenses to a peer group and a category universe; and data comparing the Fund’s net expenses to the peer and category medians. The analyses also compared the Fund’s transfer agency, custody and distribution fees, other expenses and fee waivers/reimbursements to those of the peer group and category medians. The Trustees concluded that the comparisons provided by the Outside Data Provider were useful in evaluating the reasonableness of the management fees and total expenses paid by the Fund.
The Trustees noted that the management fee breakpoint schedule had been reduced at all asset levels since the Management Agreement was last approved. In addition, the Trustees considered the Investment Adviser’s undertakings to implement fee waivers and/or expense limitations. They also considered, to the extent that the Investment Adviser manages other types of accounts having investment objectives and policies similar to those of the Fund, comparative fee information for services provided by the Investment Adviser to those accounts, and information that indicated that services provided to the Fund differed in various significant respects from the services provided to other types of accounts which, in many cases, operated under less stringent legal and regulatory structures, required fewer services from the Investment Adviser to a smaller number of client contact points, and were less time-intensive.
In addition, the Trustees noted that shareholders are able to redeem their Fund shares at any time if shareholders believe that the Fund fees and expenses are too high or if they are dissatisfied with the performance of the Fund.
Profitability
The Trustees reviewed the Fund’s contribution to the Investment Adviser’s revenues and pre-tax profit margins. In this regard the Trustees noted that they had received, among other things, profitability analyses and summaries, revenue and expense schedules by Fund and by function (i.e., investment management, transfer agency and distribution and service), and information on the Investment Adviser’s expense allocation methodology. They observed that the profitability and expense figures are substantially similar to those used by the Investment Adviser for many internal purposes, including compensation decisions among various business groups, and are thus subject to a vigorous internal debate about how certain revenue and expenses should be allocated. The Trustees also noted that the internal audit group within the Goldman Sachs organization had audited the expense allocation methodology and that the internal audit group was satisfied with the reasonableness, consistency, and accuracy of the Investment Adviser’s expense allocation methodology and profitability analysis calculations. Profitability data for the Fund was provided for 2017 and 2016, and the Trustees considered this information in relation to the Investment Adviser’s overall profitability.
30
GOLDMAN SACHS VARIABLE INSURANCE TRUST SMALL CAP EQUITY INSIGHTS FUND
Statement Regarding Basis for Approval of Management Agreement (Unaudited) (continued)
Economies of Scale
The Trustees considered the information that had been provided regarding whether there have been economies of scale with respect to the management of the Fund. The Trustees also considered the breakpoints in the fee rate payable under the Management Agreement for the Fund at the following annual percentage rates of the average daily net assets of the Fund:
| First $2 billion | 0.70 | % | ||
| Next $3 billion | 0.63 | |||
| Next $3 billion | 0.60 | |||
| Over $8 billion | 0.59 |
The Trustees noted that the breakpoints were designed to share potential economies of scale, if any, with the Fund and its shareholders as assets under management reach those asset levels. The Trustees considered the amounts of assets in the Fund; the Fund’s recent share purchase and redemption activity; the information provided by the Investment Adviser relating to the costs of the services provided by the Investment Adviser and its affiliates and their realized profits; information comparing fee rates charged by the Investment Adviser with fee rates charged to other funds in the peer group; and the Investment Adviser’s undertaking to limit certain expenses of the Fund that exceed a specified level. Upon reviewing these matters at the Annual Meeting, the Trustees concluded that the fee breakpoints represented a means of assuring that benefits of scalability, if any, would be passed along to shareholders at the specified asset levels.
Other Benefits to the Investment Adviser and Its Affiliates
The Trustees also considered the other benefits derived by the Investment Adviser and its affiliates from their relationships with the Fund as stated above, including: (a) transfer agency fees received by Goldman Sachs & Co. LLC (“Goldman Sachs”); (b) brokerage and futures commissions earned by Goldman Sachs for executing securities and futures transactions on behalf of the Fund; (c) trading efficiencies resulting from aggregation of orders of the Fund with those for other funds or accounts managed by the Investment Adviser; (d) fees earned by Goldman Sachs Agency Lending (“GSAL”), an affiliate of the Investment Adviser, as securities lending agent (and fees earned by the Investment Adviser for managing the fund in which the Fund’s cash collateral is invested); (e) the Investment Adviser’s ability to leverage the infrastructure designed to service the Fund on behalf of its other clients; (f) the Investment Adviser’s ability to cross-market other products and services to Fund shareholders; (g) Goldman Sachs’ retention of certain fees as Fund Distributor; (h) the Investment Adviser’s ability to negotiate better pricing with custodians on behalf of its other clients, as a result of the relationship with the Fund; and (i) the possibility that the working relationship between the Investment Adviser and the Fund’s third-party service providers may cause those service providers to be more likely to do business with other areas of Goldman Sachs. In the course of considering the foregoing, the Independent Trustees requested and received further information quantifying certain of these fall-out benefits.
Other Benefits to the Fund and Its Shareholders
The Trustees also noted that the Fund receives certain potential benefits as a result of its relationship with the Investment Adviser, including: (a) trading efficiencies resulting from aggregation of orders of the Fund with those of other funds or accounts managed by the Investment Adviser; (b) enhanced servicing from vendors because of the volume of business generated by the Investment Adviser and its affiliates; (c) enhanced servicing from broker-dealers because of the volume of business generated by the Investment Adviser and its affiliates; (d) the Investment Adviser’s ability to negotiate favorable terms with derivatives counterparties on behalf of the Fund as a result of the size and reputation of the Goldman Sachs organization; (e) the Investment Adviser’s knowledge and experience gained from managing other accounts and products; (f) the Investment Adviser’s ability to hire and retain qualified personnel to provide services to the Fund because of the reputation of the Goldman Sachs organization; (g) the Fund’s access, through the Investment Adviser, to certain firmwide resources (e.g., proprietary risk management systems and databases), subject to certain restrictions; (h) the Fund’s ability to participate in the securities lending program administered by GSAL, as measured by the revenue received by the Fund in connection with the program; and (i) the Fund’s access to certain affiliated distribution channels. In addition, the Trustees noted the competitive nature of the mutual fund marketplace, and considered that many of the Fund’s shareholders invested in the Fund in part because of the Fund’s relationship with the Investment Adviser and that those shareholders have a general expectation that the relationship will continue.
31
GOLDMAN SACHS VARIABLE INSURANCE TRUST SMALL CAP EQUITY INSIGHTS FUND
Statement Regarding Basis for Approval of Management Agreement (Unaudited) (continued)
Conclusion
In connection with their consideration of the Management Agreement, the Trustees gave weight to each of the factors described above, but did not identify any particular factor as controlling their decision. After deliberation and consideration of all of the information provided, including the factors described above, the Trustees concluded, in the exercise of their business judgment, that the management fees paid by the Fund were reasonable in light of the services provided to it by the Investment Adviser, the Investment Adviser’s costs and the Fund’s current and reasonably foreseeable asset levels. The Trustees unanimously concluded that the Investment Adviser’s continued management likely would benefit the Fund and its shareholders and that the Management Agreement should be approved and continued with respect to the Fund until June 30, 2019.
32
| TRUSTEES | OFFICERS | |
Jessica Palmer, Chair Kathryn A. Cassidy Diana M. Daniels Herbert J. Markley James A. McNamara Roy W. Templin Gregory G. Weaver | James A. McNamara, President Scott M. McHugh, Treasurer, Senior Vice President and Principal Financial Officer Joseph F. DiMaria, Assistant Treasurer and Principal Accounting Officer Caroline L. Kraus, Secretary |
GOLDMAN SACHS & CO. LLC
Distributor and Transfer Agent
GOLDMAN SACHS ASSET MANAGEMENT, L.P.
Investment Adviser
200 West Street, New York
New York 10282
Visit our web site at www.GSAMFUNDS.com to obtain the most recent month-end returns.
The reports concerning the Fund included in this shareholder report may contain certain forward-looking statements about the factors that may affect the performance of the Fund in the future. These statements are based on Fund management’s predictions and expectations concerning certain future events and their expected impact on the Fund, such as performance of the economy as a whole and of specific industry sectors, changes in the levels of interest rates, the impact of developing world events, and other factors that may influence the future performance of the Fund. Management believes these forward-looking statements to be reasonable, although they are inherently uncertain and difficult to predict. Actual events may cause adjustments in portfolio management strategies from those currently expected to be employed.
A description of the policies and procedures that the Fund uses to determine how to vote proxies relating to portfolio securities and information regarding how the Fund voted proxies relating to portfolio securities for the 12-month period ended June 30 is available (i) without charge, upon request by calling 1-800-621-2550; and (ii) on the Securities and Exchange Commission (“SEC”) web site at http://www.sec.gov.
The Fund files its complete schedule of portfolio holdings with the SEC for the first and third quarters of each fiscal year on Form N-Q. The Fund’s Form N-Qs are available on the SEC’s web site at http://www.sec.gov within 60 days after the Fund’s first and third fiscal quarters. The Fund’s Form N-Qs may be reviewed and copied at the SEC’s Public Reference Room in Washington, D.C. and information on the operation of the Public Reference Room may also be obtained by calling 1-800-SEC-0330. Form N-Qs may be obtained upon request and without charge by calling 1-800-621-2550.
Views and opinions expressed are for informational purposes only and do not constitute a recommendation by GSAM to buy, sell, or hold any security. Views and opinions are current as of the date of this presentation and may be subject to change, they should not be construed as investment advice.
Goldman Sachs & Co. LLC (“Goldman Sachs”) does not provide legal, tax or accounting advice. Any statement contained in this communication (including any attachments) concerning U.S. tax matters was not intended or written to be used, and cannot be used, for the purpose of avoiding penalties under the Internal Revenue Code, and was written to support the promotion or marketing of transaction or matter addressed. Clients of Goldman Sachs should obtain their own independent tax advice based on their particular circumstances.
The website links provided are for your convenience only and are not an endorsement or recommendation by GSAM of any of these websites or the products or services offered. GSAM is not responsible for the accuracy and validity of the content of these websites.
Fund holdings and allocations shown are as of June 30, 2018 and may not be representative of future investments. Fund holdings should not be relied on in making investment decisions and should not be construed as research or investment advice regarding particular securities. Current and future holdings are subject to risk.
References to indices, benchmarks or other measures of relative market performance over a specified period of time are provided for your information only and do not imply that the portfolio will achieve similar results. The index composition may not reflect the manner in which a portfolio is constructed. While an adviser seeks to design a portfolio which reflects appropriate risk and return features, portfolio characteristics may deviate from those of the benchmark.
The Global Industry Classification Standard (“GICS”) was developed by and is the exclusive property and a service mark of Morgan Stanley Capital International Inc. (“MSCI”) and Standard & Poor’s, a division of The McGraw-Hill Companies, Inc. (“S&P”) and is licensed for use by Goldman Sachs. Neither MSCI, S&P nor any other party involved in making or compiling the GICS or any GICS classifications makes any express or implied warranties or representations with respect to such standard or classification (or the results to be obtained by the use thereof), and all such parties hereby expressly disclaim all warranties of originality, accuracy, completeness, merchantability or fitness for a particular purpose with respect to any of such standard or classification. Without limiting any of the foregoing, in no event shall MSCI, S&P, any of their affiliates or any third party involved in making or compiling the GICS or any GICS classifications have any liability for any direct, indirect, special, punitive, consequential or any other damages (including lost profits) even if notified of the possibility of such damages.
The portfolio risk management process includes an effort to monitor and manage risk, but does not imply low risk.
Shares of the Goldman Sachs VIT Funds are offered to separate accounts of participating life insurance companies for the purpose of funding variable annuity contracts and variable life insurance policies. Shares of the Fund are not offered directly to the general public. The variable annuity contracts and variable life insurance policies are described in the separate prospectuses issued by participating insurance companies. You should refer to those prospectuses for information about surrender charges, mortality and expense risk fees and other charges that may be assessed by participating insurance companies under the variable annuity contracts or variable life insurance policies. Such fees or charges, if any, may affect the return you may realize with respect to your investments. Ask your representative for more complete information. Please consider a fund’s objectives, risks and charges and expenses, and read the prospectus carefully before investing. The prospectus contains this and other information about the Fund.
This material is not authorized for distribution to prospective investors unless preceded or accompanied by a current prospectus or summary prospectus, if applicable. Investors should consider the Fund’s objective, risks, and charges and expenses, and read the summary prospectus, if available, and/or the prospectus carefully before investing or sending money. The summary prospectus, if available, and the prospectus contain this and other information about the Fund and may be obtained from your authorized dealer or from Goldman Sachs & Co. LLC by calling 1-800-621-2550.
This report is prepared for the general information of contract owners and is not an offer of shares of the Goldman Sachs Variable Insurance Trust — Goldman Sachs Small Cap Equity Insights Fund.
© 2018 Goldman Sachs. All rights reserved.
VITSCSAR-18/139322-OTU-809588/6.8K
Goldman
Sachs Variable Insurance Trust
Goldman Sachs
Strategic Growth Fund
Semi-Annual Report
June 30, 2018

GOLDMAN SACHS VARIABLE INSURANCE TRUST STRATEGIC GROWTH FUND
INVESTMENT OBJECTIVE
The Fund seeks long-term growth of capital.
Portfolio Management Discussion and Analysis
Below, the Goldman Sachs Fundamental Equity U.S. Equity Portfolio Management Team discusses the Goldman Sachs Variable Insurance Trust — Goldman Sachs Strategic Growth Fund’s (the “Fund”) performance and positioning for the six-month period ended June 30, 2018 (the “Reporting Period”).
How did the Fund perform during the Reporting Period?
During the Reporting Period, the Fund’s Institutional and Service Shares generated cumulative total returns of 9.07% and 8.94%, respectively. These returns compare to the 7.25% cumulative total return of the Fund’s benchmark, the Russell 1000® Growth Index (with dividends reinvested) (the “Russell Index”), during the same time period.
What economic and market factors most influenced the equity markets as a whole during the Reporting Period?
Representing the U.S. equity market, the S&P 500® Index gained 2.65% during the Reporting Period.
U.S. equities saw a strong start to the Reporting Period in January 2018, driven by positive economic data, a $1.5 trillion tax reform law signed in December 2017, and a favorable corporate earnings season. In February 2018, however, U.S. and international equities sold off on market speculation of a faster pace of U.S. Federal Reserve (“Fed”) short-term interest rate hikes, which stoked a sharp rise in bond yields and an increase in equity market volatility. Concerns about Fed monetary policy tightening were further exacerbated by solid U.S. labor and inflation data. While the hawkish Fed minutes were largely expected, new Fed Chair Jerome Powell’s Congressional testimony, positing a more optimistic economic outlook since the December 2017 Fed meeting, surprised equity markets with its hawkish tilt, sparking another sell-off in the U.S. equity markets. (Jerome Powell assumed the chairmanship of the Fed in February 2018. Hawkish language tends to suggest higher interest rates; opposite of dovish.) In March 2018, escalating trade tensions and potential tariffs weighed on investor sentiment. Meanwhile, the Fed delivered on a widely expected interest rate increase, with its “dot plot” pointing to a total of three interest rate hikes this calendar year and potentially two in 2019. (The “dot plot” shows rate projections of the members of the Fed’s Open Market Committee.) However, Fed policymakers acknowledged that the “economic outlook has strengthened in recent months,” revising their economic growth forecast higher and their unemployment forecast lower.
The U.S. and China continued to generate trade headlines and geopolitical uncertainty about sanctions on Russia surfaced, but the impact of such on the U.S. equity markets remained relatively muted during April 2018, as investors stayed rather resistant to the risk of a trade war. A number of macroeconomic drivers, including U.S. labor market strength, higher inflation and fiscal stimulus, pushed up U.S. Treasury yields, with the 10-year U.S. Treasury yield breaching 3% toward month end. With more than half of S&P 500® Index companies having reported their first quarter 2018 results, the earnings season began strongly during April 2018. U.S. equities rallied in May 2018, driven not only by strong corporate earnings but also by upside surprises in economic activity and sentiment data as well as on a new U.S. unemployment low of 3.8%. However, the U.S. equity rally was hampered by escalating geopolitical uncertainty stemming from the unexpected political outcome in Italy, the ongoing unpredictability around the U.S.-North Korea summit, and escalating trade tensions with many U.S. allies. The Fed raised interest rates again in June 2018, as widely expected, but the outcome of the Fed meeting was more hawkish than the consensus had anticipated. The Fed retained language indicating an “accommodative” monetary policy stance, but its economic growth and inflation forecasts were upgraded, and its median projection was lifted to four interest rate hikes in 2018 from the three it had indicated in March 2018. Fed Chair Powell was also slightly hawkish in his June press conference. Still-escalating trade tensions between the U.S. and China hurt market sentiment, with the U.S. threatening tariffs on $200 billion worth of Chinese goods and China vowing to retaliate. All told, then, the S&P 500® Index produced modestly positive but rather flat returns for the month of June 2018.
For the Reporting Period overall, six sectors posted positive absolute returns and five generated negative returns. Consumer discretionary, information technology and energy were the best performing sectors in the S&P 500® Index, as measured by total return, and the weakest performing sectors in the S&P 500® Index during the Reporting Period were telecommunication services, consumer staples and industrials.
1
GOLDMAN SACHS VARIABLE INSURANCE TRUST STRATEGIC GROWTH FUND
Within the U.S. equity market, there was significant disparity in performance not only among sectors but also among the various capitalization and style segments. While all capitalization segments posted positive returns, small-cap stocks, as measured by the Russell 2000® Index, performed best, followed at some distance by large-cap stocks, as measured by the Russell 1000® Index, and mid-cap stocks, as measured by the Russell Midcap® Index, which performed similarly to each other. From a style perspective, growth-oriented stocks significantly outpaced value-oriented stocks across the capitalization spectrum, with value-oriented stocks overall in the large-cap and mid-cap segments posting modestly negative absolute returns. (All as measured by the FTSE Russell indices.)
What key factors were responsible for the Fund’s performance during the Reporting Period?
The Fund outperformed the Russell Index during the Reporting Period attributable primarily to stock selection overall. Sector allocation as a whole contributed positively, albeit modestly.
Which equity market sectors most significantly affected Fund performance?
Contributing most positively to the Fund’s relative results during the Reporting Period was effective stock selection in the consumer discretionary, information technology and health care sectors. The only two sectors that detracted from the Fund’s relative results during the Reporting Period were consumer staples and real estate, wherein stock selection hurt.
What were some of the Fund’s best-performing individual stocks?
Among those stocks the Fund benefited most from relative to the Russell Index were positions in Internet subscription service for streamed television shows and movies Netflix, customer relationship management services software on demand provider salesforce.com and financial transaction processing services provider Mastercard.
Shares of Netflix rallied in January 2018 following its earnings announcement in which it reported in-line earnings and revenues, with subscriber growth well ahead of consensus estimates. The healthy subscriber growth was driven, according to Netflix, by strength in both its domestic and international markets. The company also reported free cash flow that exceeded consensus estimates, which was well-received by the market as the company continued to demonstrate strong execution. Later in the Reporting Period, with the help of an earnings report that beat market expectations, based on ongoing subscriber growth both domestically and internationally, and the announcement of game streaming on its platform, Netflix’s shares continued to rally. Overall, at the end of the Reporting Period, we remained positive on Netflix as the market leader within the movie streaming space, offering, in our view, a convenient way to consume content without the burden of ownership. We also believed the introduction of gaming illustrated the company’s ability to disrupt the global media industry and deepen its competitive position. Finally, we believed at the end of the Reporting Period that the company was well positioned to capture continued subscriber growth globally.
Shares of salesforce.com rose in the middle of February 2018 following an upgrade in which the analyst cited strong enterprise growth as being a key driver to its strong performance. Also, the company reported earnings and revenue that beat consensus expectations, led by strong billings growth. The company’s stock rose further following its earnings announcement in May 2018, in which both revenue and earnings per share exceeded market estimates with strong guidance. Overall, at the end of the Reporting Period, we believed the company presented an attractive growth story, as it continued to grow and gain market share through strategic partnerships, international markets and government opportunities. We also believed salesforce.com remained a high quality growth company with a strong management team.
Mastercard reported strong quarterly results at the beginning of February 2018, with higher than market expected earnings and revenue, driven by improvements across processed transactions, cross-border volume and gross dollar volume. The company’s stock continued to rise throughout the Reporting Period, as the information technology sector overall outperformed the broad U.S. equity market. At the end of the Reporting Period, we remained optimistic on the company’s ability to grow its core payments business through new client wins and to further differentiate itself by expanding to new growth areas, such as consumer credit and peer-to-peer lending. We also remained positive on the company’s plans to accelerate investments, driven by the tax savings from recent U.S. tax reform legislation and by its own strong operating trends, which we believe position Mastercard well relative to its competitors.
Which stocks detracted significantly from the Fund’s performance during the Reporting Period?
Detracting from the Fund’s results relative to the Russell Index were positions in biopharmaceutical company Incyte, tobacco company Philip Morris International and kitchen equipment manufacturer Middleby.
Incyte’s shares sold off early in April 2018 following the highly anticipated Phase III trial results for its melanoma drug. Following the poor trial results, Incyte announced it would halt the study given that its product failed to show any benefit in conjunction with another cancer immunotherapy drug. At the end of June 2018, the company reported an end to another one of its drugs, REACH1,
2
GOLDMAN SACHS VARIABLE INSURANCE TRUST STRATEGIC GROWTH FUND
after the drug reported a low response rate. Despite these setbacks, we remained confident at the end of the Reporting Period in what we see as the company’s strong internal research and development capability and deep product pipeline.
In April 2018, shares of Philip Morris International declined sharply following a disappointing quarterly earnings announcement. Its earnings per share beat market estimates, but its top-line revenue was lower than market expectations, driven primarily by disappointing results in the company’s iQOS segment and organic sales. (iQOS is the company’s electronic smokeless cigarette products line.) Later in the second calendar quarter, the company raised its quarterly dividend by more than 6% and finished a study concluding that its iQOS segment met its primary objective. At the end of the Reporting Period, we felt the company provided best-in-class pricing, was attractively valued and paid an above-market dividend. We continued to view Philip Morris International as a high quality franchise, well positioned to benefit from an improving macroeconomic backdrop.
Middleby’s stock price declined sharply in early May 2018 following its disappointing earnings release. Middleby reported persistent organic growth weakness and higher than company-expected operating expenses related to recent acquisitions. This announcement led us to review our initial investment thesis and to ultimately exit the Fund’s position as our confidence in the company’s ability to execute eroded.
How did the Fund use derivatives and similar instruments during the Reporting Period?
During the Reporting Period, we did not use derivatives as part of an active management strategy.
Did the Fund make any significant purchases or sales during the Reporting Period?
Among the purchases initiated during the Reporting Period, we established a Fund position in Visa. Visa is a global leader in the provisioning of payment services. At the time of purchase, we felt confident the company would benefit from several secular growth themes as transaction volume continues to shift toward electronic payments. We also viewed the company favorably, as it invests in multiple services and geographies, which we think provides several potential sources of growth. Finally, we felt the stock was trading at attractive levels given what we see as its growth prospects.
We initiated a Fund position in integrated circuit manufacturer Analog Devices. The company engages in the design and manufacturing of analog, mixed-signal and digital signal processing integrated circuits used in virtually all types of electronic equipment. We feel the company has an attractive revenue growth and margin profile and has lagged the industry in recent years, which we believe presented a compelling buying opportunity for the Fund.
Conversely, in addition to those sales already mentioned, we sold the Fund’s position in Amgen. During the Reporting Period, we grew less positive on one of the company’s key drugs, Repatha, which we believe might experience slower growth than Amgen had previously expected. While we still believe Amgen is one of the leaders in the biotechnology industry and has a strong balance sheet and good free cash flow, we decided to exit the position and allocate the capital elsewhere.
We eliminated the Fund’s position in SunTrust Banks. Its stock had rallied toward the end of 2017, as U.S. tax reform legislation was passed and the consensus outlook for further monetary tightening became clearer. Its share price also increased following an earnings announcement in January 2018 in which SunTrust Banks reported strong expense control and improved net interest income. While we continue to believe SunTrust Banks is a high quality company with favorable growth prospects, we felt its share price increase during the Reporting Period presented an attractive opportunity to realize gains and reallocate the capital to ideas we considered to have better risk/reward profiles.
Were there any notable changes in the Fund’s weightings during the Reporting Period?
In constructing the Fund’s portfolio, we focus on picking stocks rather than on making industry or sector bets. We seek to outpace the benchmark index by overweighting stocks that we expect to outperform and underweighting those that we think may lag. Consequently, changes in its sector weights are generally the direct result of individual stock selection or of stock appreciation or depreciation. That said, during the Reporting Period, the Fund’s exposure to consumer discretionary and materials increased compared to the Russell Index. The Fund’s allocation compared to the Russell Index in financials decreased.
How was the Fund positioned relative to its benchmark index at the end of the Reporting Period?
At the end of June 2018, the Fund had overweighted positions relative to the Russell Index in the health care and consumer discretionary sectors. On the same date, the Fund had an underweighted position compared to the Russell Index in financials and was rather neutrally weighted to the Russell Index in energy, industrials, materials, consumer staples, real estate and information technology. The Fund had no exposure to the utilities and telecommunication services sectors at the end of the Reporting Period.
3
GOLDMAN SACHS VARIABLE INSURANCE TRUST STRATEGIC GROWTH FUND
Were there any changes to the Fund’s portfolio management team during the Reporting Period?
Effective January 9, 2018, Goldman Sachs Asset Management, L.P. (the “Investment Adviser”) centralized its Fundamental Equity U.S. Value and Fundamental Equity U.S. Growth Teams into a single Fundamental Equity U.S. Equity Team. The Investment Adviser believes these changes will benefit the Funds by providing a more holistic investment perspective and the ability to leverage investment ideas across the U.S. Fundamental Equity platform.
Effective the same date, co-lead portfolio manager for the Fund, Tim Leahy, left the firm. Tim shared portfolio management responsibility with Steve Barry and Stephen Becker, who have been co-lead portfolio managers of the Fund’s strategy since 2000 and 2013, respectively, and who continue in those roles. There were no changes to the investment process or philosophy of the Fund’s strategy. We remain committed to high quality, bottom-up research and to the time-tested investment philosophy of the Fund’s strategy. We continue to believe that deep knowledge of company-specific and industry trends is key to our research edge.
What is the Fund’s tactical view and strategy for the months ahead?
At the end of the Reporting Period, there were increasing market concerns that the equities cycle had reached its peak, particularly in the U.S., as central banks pursue their interest rate hiking policies. However, history has shown that rising interest rates alone are a poor indicator of subsequent equity returns; the context is just as important. If interest rates increase because of stronger economic growth, as is the case in the current hiking cycle, equities can benefit despite valuation headwinds. We estimate that U.S. equities can absorb a 10-year U.S. Treasury yield of approximately 3.5% before rates become a material negative. In fact, U.S. equities saw double-digit positive returns over the subsequent 12 months for all but one hiking cycle exceeding 100 basis points since 1988. (A basis point is 1/100th of a percentage point.)
Furthermore, in our view, the normalization of interest rates and resulting rising cost of capital reinforce a Darwinistic framework wherein strong companies thrive and the weak perish, increasing the dispersion among companies and sectors. For large-cap U.S. equities, much of the corporate earnings recovery since the 2007/2008 financial crisis has been driven by cost-cutting measures and margins growth rather than by revenue growth. With rising cost pressures, we believe pricing power may well become an increasingly important differentiator of future success. We further believe the increased dispersion between winners and losers reinforces the importance of active management.
Not all areas of the U.S. equity market have fully participated in the bull market rally. Small-cap U.S. equities remain an underappreciated bright spot, in our view. The more domestically-oriented nature of these companies often enables them to benefit more from fiscal stimulus and tax cuts, while being relatively insulated from the negative effect of potential tariffs and trade tensions. Moreover, small-cap companies have historically outperformed large-cap companies in a late cycle, rising interest rate environment. At the end of the Reporting Period, operating margins for small-cap companies remained well below pre-financial crisis peaks in contrast to the new highs reached by large-cap companies overall, offering the potential, in our view, to tap higher operational leverage.
Regardless of market direction, we remain committed to our core philosophy and process. We intend to maintain a long-term time horizon, rather than forecast the next quarter. We intend to continue to favor high quality growth businesses over breathtaking concepts. We intend to invest when we consider valuations to be attractive, rather than following the trend. These core beliefs have guided our team during the past 30 years; we believe they hold the answer for the next 30.
As always, we maintain our focus on seeking companies that we believe will generate long-term growth in today’s ever-changing market conditions.
4
GOLDMAN SACHS VARIABLE INSURANCE TRUST STRATEGIC GROWTH FUND
Index Definitions
The Russell 1000® Growth Index (with dividends reinvested) is an unmanaged market capitalization weighted index of the 1000 largest U.S. companies with higher price-to-book ratios and higher forecasted growth values. The figures for the index do not include any deduction for fees, expenses or taxes.
The Russell 2000® Index (with dividends reinvested) is an unmanaged index of common stock prices that measures the performance of the 2000 smallest companies in the Russell 3000® Index. The figures for the index do not include any deduction for fees, expenses or taxes.
The S&P 500® Index (with dividends reinvested) is the Standard & Poor’s 500 Composite Index of 500 stocks, an unmanaged index of common stock prices. The figures for the index do not include any deduction for fees, expenses or taxes.
The Russell Midcap® Index measures the performance of the 800 smallest companies in the Russell 1000® Index, which represent approximately 25% of the total market capitalization of the Russell 1000® Index.
The Russell 1000® Index measures the performance of the 1,000 largest companies in the Russell 3000® Index, which represent approximately 92% of the total market capitalization of the Russell 3000® Index.
It is not possible to invest directly in an index.
5
FUND BASICS
Strategic Growth Fund
as of June 30, 2018
STANDARDIZED TOTAL RETURNS1
| For the period ended 6/30/18 | One Year | Five Years | Ten Years | Since Inception | Inception Date | |||||||||||||
| Institutional | 22.28 | % | 15.76 | % | 10.42 | % | 6.54 | % | 4/30/98 | |||||||||
| Service | 21.94 | 15.48 | 10.15 | 8.70 | 1/09/06 | |||||||||||||
| 1 | The Standardized Total Returns are average annual total returns as of the most recent calendar quarter-end. They assume reinvestment of all distributions at net asset value (“NAV”). Because Institutional Shares and Service Shares do not involve a sales charge, such a charge is not applied to their Standardized Total Returns. |
Total return figures in the above chart represent past performance and do not indicate future results, which will vary. The investment return and principal value of an investment will fluctuate and, therefore, an investor’s shares, when redeemed, may be worth more or less than their original cost. Current performance may be lower or higher than the total return figures in the above chart. Please visit www.GSAMFUNDS.com to obtain the most recent month-end returns. Performance reflects fee waivers and/or expense limitations in effect during the periods shown. In their absence, performance would be reduced.
EXPENSE RATIOS2
| Net Expense Ratio (Current) | Gross Expense Ratio (Before Waivers) | |||||||
| Institutional | 0.74 | % | 0.78 | % | ||||
| Service | 0.99 | 1.03 | ||||||
| 2 | The expense ratios of the Fund, both current (net of any fee waivers and/or expense limitations) and before waivers (gross of any fee waivers and/or expense limitations) are as set forth above according to the most recent publicly available Prospectuses for the Fund and may differ from the expense ratios disclosed in the Financial Highlights in this report. Pursuant to a contractual arrangement, the Fund’s fee waivers and/or expense limitations will remain in place through at least April 30, 2019, and prior to such date, the Investment Adviser may not terminate the arrangements without the approval of the Fund’s Board of Trustees. If these arrangements are discontinued in the future, the expense ratios may change without shareholder approval. |
TOP TEN HOLDINGS AS OF 6/30/183
Holding | % of Net Assets | Line of Business | ||||
Microsoft Corp. | 6.2% | Software & Services | ||||
Apple, Inc. | 6.2 | Technology Hardware & Equipment | ||||
Amazon.com, Inc. | 5.9 | Retailing | ||||
Facebook, Inc. Class A | 4.1 | Software & Services | ||||
Alphabet, Inc. Class A | 3.2 | Software & Services | ||||
Visa, Inc. Class A | 2.7 | Software & Services | ||||
Alphabet, Inc. Class C | 2.4 | Software & Services | ||||
Mastercard, Inc. Class A | 1.9 | Software & Services | ||||
NIKE, Inc. Class B | 1.9 | Consumer Durables & Apparel | ||||
Boeing Co. (The) | 1.8 | Capital Goods | ||||
| 3 | The top 10 holdings may not be representative of the Fund’s future investments. |
6
FUND BASICS
FUND vs. BENCHMARK SECTOR ALLOCATIONS4
As of June 30, 2018
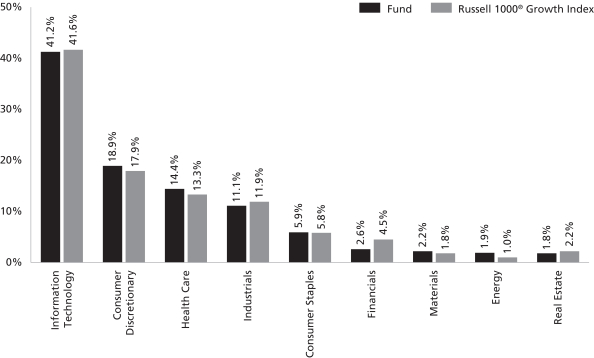
| 4 | The Fund is actively managed and, as such, its composition may differ over time. Consequently, the Fund’s overall sector allocations may differ from percentages contained in the graph above. The graph categorizes investments using Global Industry Classification Standard (“GICS”); however, the sector classifications used by the portfolio management team may differ from GICS. The percentage shown for each investment category reflects the value of investments in that category as a percentage of market value (excluding investments in the securities lending reinvestment vehicle, if any). Investments in the securities lending reinvestment vehicle represented 0.6% of the Fund’s net assets at June 30, 2018. |
7
GOLDMAN SACHS VARIABLE INSURANCE TRUST STRATEGIC GROWTH FUND
Schedule of Investments
June 30, 2018 (Unaudited)
| Shares | Description | Value | ||||||
| Common Stocks – 99.8% | ||||||||
Automobiles & Components – 1.7% | ||||||||
| 32,322 | Aptiv plc | $ | 2,961,665 | |||||
| 22,629 | Delphi Technologies plc | 1,028,714 | ||||||
| 6,766 | Tesla, Inc.*(a) | 2,320,400 | ||||||
|
| |||||||
| 6,310,779 | ||||||||
|
| |||||||
Banks – 1.1% | ||||||||
| 41,305 | First Republic Bank | 3,997,911 | ||||||
|
| |||||||
Capital Goods – 8.4% | ||||||||
| 20,269 | Boeing Co. (The) | 6,800,452 | ||||||
| 34,170 | Fortive Corp. | 2,634,849 | ||||||
| 12,309 | General Dynamics Corp. | 2,294,521 | ||||||
| 38,785 | Honeywell International, Inc. | 5,586,979 | ||||||
| 16,176 | Northrop Grumman Corp. | 4,977,355 | ||||||
| 6,624 | Roper Technologies, Inc. | 1,827,628 | ||||||
| 46,564 | Sensata Technologies Holding plc* | 2,215,515 | ||||||
| 14,025 | Stanley Black & Decker, Inc. | 1,862,660 | ||||||
| 46,394 | Xylem, Inc. | 3,126,028 | ||||||
|
| |||||||
| 31,325,987 | ||||||||
|
| |||||||
Consumer Durables & Apparel – 2.7% | ||||||||
| 88,551 | NIKE, Inc. Class B | 7,055,744 | ||||||
| 20,241 | PVH Corp. | 3,030,482 | ||||||
|
| |||||||
| 10,086,226 | ||||||||
|
| |||||||
Consumer Services – 2.8% | ||||||||
| 52,136 | Dunkin’ Brands Group, Inc. | 3,601,034 | ||||||
| 30,787 | Las Vegas Sands Corp. | 2,350,895 | ||||||
| 27,287 | McDonald’s Corp. | 4,275,600 | ||||||
|
| |||||||
| 10,227,529 | ||||||||
|
| |||||||
Diversified Financials – 1.0% | ||||||||
| 35,802 | Northern Trust Corp. | 3,683,668 | ||||||
|
| |||||||
Energy – 1.9% | ||||||||
| 15,266 | Diamondback Energy, Inc. | 2,008,548 | ||||||
| 30,332 | EOG Resources, Inc. | 3,774,211 | ||||||
| 19,047 | Marathon Petroleum Corp. | 1,336,337 | ||||||
|
| |||||||
| 7,119,096 | ||||||||
|
| |||||||
Food & Staples Retailing – 0.7% | ||||||||
| 29,352 | Walmart, Inc. | 2,513,999 | ||||||
|
| |||||||
Food, Beverage & Tobacco – 3.8% | ||||||||
| 106,944 | Coca-Cola Co. (The) | 4,690,564 | ||||||
| 30,426 | Kraft Heinz Co. (The) | 1,911,361 | ||||||
| 77,493 | Monster Beverage Corp.* | 4,440,349 | ||||||
| 39,145 | Philip Morris International, Inc. | 3,160,567 | ||||||
|
| |||||||
| 14,202,841 | ||||||||
|
| |||||||
Health Care Equipment & Services – 5.5% | ||||||||
| 137,190 | Boston Scientific Corp.* | 4,486,113 | ||||||
| 37,216 | Danaher Corp. | 3,672,475 | ||||||
| 26,097 | Edwards Lifesciences Corp.* | 3,798,940 | ||||||
| 10,841 | Humana, Inc. | 3,226,607 | ||||||
| 7,201 | Intuitive Surgical, Inc.* | 3,445,534 | ||||||
| 7,875 | UnitedHealth Group, Inc. | 1,932,053 | ||||||
|
| |||||||
| 20,561,722 | ||||||||
|
| |||||||
| Common Stocks – (continued) | ||||||||
Household & Personal Products – 1.4% | ||||||||
| 53,245 | Colgate-Palmolive Co. | $ | 3,450,808 | |||||
| 13,191 | Estee Lauder Cos., Inc. (The) Class A | 1,882,224 | ||||||
|
| |||||||
| 5,333,032 | ||||||||
|
| |||||||
Insurance – 0.5% | ||||||||
| 1,592 | Markel Corp.* | 1,726,285 | ||||||
|
| |||||||
Materials – 2.2% | ||||||||
| 29,108 | DowDuPont, Inc. | 1,918,799 | ||||||
| 30,138 | Ecolab, Inc. | 4,229,266 | ||||||
| 4,833 | Sherwin-Williams Co. (The) | 1,969,786 | ||||||
|
| |||||||
| 8,117,851 | ||||||||
|
| |||||||
Media – 0.9% | ||||||||
| 102,146 | Comcast Corp. Class A | 3,351,410 | ||||||
|
| |||||||
Pharmaceuticals, Biotechnology & Life Sciences – 8.9% | ||||||||
| 11,708 | AbbVie, Inc. | 1,084,746 | ||||||
| 49,206 | Agilent Technologies, Inc. | 3,042,899 | ||||||
| 20,128 | Alexion Pharmaceuticals, Inc.* | 2,498,891 | ||||||
| 31,299 | Alkermes plc* | 1,288,267 | ||||||
| 61,388 | Eli Lilly & Co. | 5,238,238 | ||||||
| 16,602 | Illumina, Inc.* | 4,636,773 | ||||||
| 30,197 | Incyte Corp.* | 2,023,199 | ||||||
| 23,652 | Shire plc ADR | 3,992,458 | ||||||
| 27,546 | Vertex Pharmaceuticals, Inc.* | 4,681,718 | ||||||
| 53,302 | Zoetis, Inc. | 4,540,797 | ||||||
|
| |||||||
| 33,027,986 | ||||||||
|
| |||||||
Real Estate Investment Trusts – 1.8% | ||||||||
| 25,797 | American Tower Corp. | 3,719,153 | ||||||
| 6,730 | Equinix, Inc. | 2,893,160 | ||||||
|
| |||||||
| 6,612,313 | ||||||||
|
| |||||||
Retailing – 10.8% | ||||||||
| 12,813 | Amazon.com, Inc.* | 21,779,537 | ||||||
| 2,388 | Booking Holdings, Inc.* | 4,840,691 | ||||||
| 18,983 | Home Depot, Inc. (The) | 3,703,583 | ||||||
| 16,687 | Netflix, Inc.* | 6,531,793 | ||||||
| 40,367 | Ross Stores, Inc. | 3,421,103 | ||||||
|
| |||||||
| 40,276,707 | ||||||||
|
| |||||||
Semiconductors & Semiconductor Equipment – 4.1% | ||||||||
| 45,996 | Analog Devices, Inc. | 4,411,937 | ||||||
| 69,533 | Marvell Technology Group Ltd. | 1,490,788 | ||||||
| 21,207 | NVIDIA Corp. | 5,023,938 | ||||||
| 39,969 | Texas Instruments, Inc. | 4,406,582 | ||||||
|
| |||||||
| 15,333,245 | ||||||||
|
| |||||||
Software & Services – 28.9% | ||||||||
| 22,868 | Adobe Systems, Inc.* | 5,575,447 | ||||||
| 9,394 | Alibaba Group Holding Ltd. ADR* | 1,742,869 | ||||||
| 10,539 | Alphabet, Inc. Class A* | 11,900,534 | ||||||
| 8,045 | Alphabet, Inc. Class C* | 8,975,404 | ||||||
| 16,289 | Autodesk, Inc.* | 2,135,325 | ||||||
| 32,663 | Electronic Arts, Inc.* | 4,606,136 | ||||||
|
| |||||||
| 8 | The accompanying notes are an integral part of these financial statements. |
GOLDMAN SACHS VARIABLE INSURANCE TRUST STRATEGIC GROWTH FUND
Schedule of Investments (continued)
June 30, 2018 (Unaudited)
| Shares | Description | Value | ||||||
| Common Stocks – (continued) | ||||||||
Software & Services – (continued) | ||||||||
| 77,578 | Facebook, Inc. Class A* | $ | 15,074,957 | |||||
| 33,829 | Fiserv, Inc.* | 2,506,391 | ||||||
| 30,872 | Global Payments, Inc. | 3,441,919 | ||||||
| 23,197 | Intuit, Inc. | 4,739,263 | ||||||
| 35,936 | Mastercard, Inc. Class A | 7,062,143 | ||||||
| 234,592 | Microsoft Corp. | 23,133,117 | ||||||
| 46,564 | salesforce.com, Inc.* | 6,351,330 | ||||||
| 76,612 | Visa, Inc. Class A | 10,147,259 | ||||||
|
| |||||||
| 107,392,094 | ||||||||
|
| |||||||
Technology Hardware & Equipment – 8.1% | ||||||||
| 42,914 | Amphenol Corp. Class A | 3,739,955 | ||||||
| 124,534 | Apple, Inc. | 23,052,489 | ||||||
| 78,881 | Cisco Systems, Inc. | 3,394,249 | ||||||
|
| |||||||
| 30,186,693 | ||||||||
|
| |||||||
Transportation – 2.6% | ||||||||
| 78,914 | CSX Corp. | 5,033,135 | ||||||
| 14,422 | FedEx Corp. | 3,274,659 | ||||||
| 13,873 | XPO Logistics, Inc.* | 1,389,797 | ||||||
|
| |||||||
| 9,697,591 | ||||||||
|
| |||||||
| | TOTAL INVESTMENTS BEFORE SECURITIES LENDING REINVESTMENT VEHICLE | | ||||||
| (Cost $227,251,562) | $ | 371,084,965 | ||||||
|
| |||||||
| Shares | Distribution Rate | Value | ||||||
| Securities Lending Reinvestment Vehicle(b) – 0.6% |
| |||||||
Goldman Sachs Financial Square Government Fund — Institutional Shares |
| |||||||
| 2,378,334 | 1.869 | % | $ | 2,378,334 | ||||
| (Cost $2,378,334) | ||||||||
| ||||||||
| TOTAL INVESTMENTS – 100.4% |
| |||||||
| (Cost $229,629,896) |
| $ | 373,463,299 | |||||
| ||||||||
LIABILITIES IN EXCESS OF OTHER ASSETS – (0.4)% |
| (1,661,794 | ) | |||||
| ||||||||
| NET ASSETS – 100.0% |
| $ | 371,801,505 | |||||
| ||||||||
| The percentage shown for each investment category reflects the value of investments in that category as a percentage of net assets. | ||
| * | Non-income producing security. | |
| (a) | All or a portion of security is on loan. | |
| (b) | Represents an Affiliated Issuer. | |
| Investment Abbreviation: | ||
| ADR | —American Depositary Receipt | |
| The accompanying notes are an integral part of these financial statements. | 9 |
GOLDMAN SACHS VARIABLE INSURANCE TRUST STRATEGIC GROWTH FUND
Statement of Assets and Liabilities
June 30, 2018 (Unaudited)
| Assets: | ||||
Investments in unaffiliated issuers, at value (cost $227,251,562)(a) | $ | 371,084,965 | ||
Investments in affiliated securities lending reinvestment vehicle, at value (cost $2,378,334) | 2,378,334 | |||
Cash | 969,296 | |||
Receivables: | ||||
Dividends | 189,791 | |||
Reimbursement from investment adviser | 15,974 | |||
Fund shares sold | 14,143 | |||
Securities lending income | 3,374 | |||
Other assets | 3,059 | |||
| Total assets | 374,658,936 | |||
| Liabilities: | ||||
Payables: | ||||
Payable upon return of securities loaned | 2,378,334 | |||
Management fees | 221,035 | |||
Fund shares redeemed | 131,266 | |||
Distribution and Service fees and Transfer Agency fees | 59,300 | |||
Accrued expenses | 67,496 | |||
| Total liabilities | 2,857,431 | |||
| Net Assets: | ||||
Paid-in capital | 124,563,373 | |||
Undistributed net investment income | 512,224 | |||
Accumulated net realized gain | 102,892,505 | |||
Net unrealized gain | 143,833,403 | |||
| NET ASSETS | $ | 371,801,505 | ||
Net Assets: | ||||
Institutional | $ | 118,615,085 | ||
Service | 253,186,420 | |||
Total Net Assets | $ | 371,801,505 | ||
Shares outstanding $0.001 par value (unlimited shares authorized): | ||||
Institutional | 5,512,487 | |||
Service | 11,809,364 | |||
Net asset value, offering and redemption price per share: | ||||
Institutional | $21.52 | |||
Service | 21.44 | |||
(a) Includes loaned securities having a market value of $2,331,234.
| 10 | The accompanying notes are an integral part of these financial statements. |
GOLDMAN SACHS VARIABLE INSURANCE TRUST STRATEGIC GROWTH FUND
Statement of Operations
For the Six Months Ended June 30, 2018 (Unaudited)
| Investment income: | ||||
Dividends — unaffiliated issuers | $ | 2,284,886 | ||
Securities lending income — unaffiliated issuer | 16,319 | |||
Dividends — affiliated issuers | 1,860 | |||
| Total investment income | 2,303,065 | |||
| Expenses: | ||||
Management fees | 1,596,890 | |||
Distribution and Service fees — Service Shares | 394,009 | |||
Transfer Agency fees(a) | 43,259 | |||
Professional fees | 42,164 | |||
Custody, accounting and administrative services | 30,731 | |||
Printing and mailing costs | 30,299 | |||
Trustee fees | 9,213 | |||
Other | 8,532 | |||
| Total expenses | 2,155,097 | |||
Less — expense reductions | (153,405 | ) | ||
| Net expenses | 2,001,692 | |||
| NET INVESTMENT INCOME | 301,373 | |||
| Realized and unrealized gain (loss): | ||||
Net realized gain from investments — unaffiliated issuers (including commissions recaptured of $3,523) | 94,401,465 | |||
Net change in unrealized loss on investments — unaffiliated issuers | (55,343,700 | ) | ||
| Net realized and unrealized gain | 39,057,765 | |||
| NET INCREASE IN NET ASSETS RESULTING FROM OPERATIONS | $ | 39,359,138 | ||
(a) Institutional and Service Shares incurred Transfer Agency fees of $11,741 and $31,518, respectively.
| The accompanying notes are an integral part of these financial statements. | 11 |
GOLDMAN SACHS VARIABLE INSURANCE TRUST STRATEGIC GROWTH FUND
Statements of Changes in Net Assets
| For the Six Months Ended June 30, 2018 (Unaudited) | For the Fiscal Year Ended December 31, 2017 | |||||||
| From operations: | ||||||||
Net investment income | $ | 301,373 | $ | 1,482,058 | ||||
Net realized gain | 94,401,465 | 42,429,492 | ||||||
Net change in unrealized gain (loss) | (55,343,700 | ) | 92,211,760 | |||||
| Net increase in net assets resulting from operations | 39,359,138 | 136,123,310 | ||||||
| Distributions to shareholders: | ||||||||
From net investment income | ||||||||
Institutional Shares | — | (558,904 | ) | |||||
Service Shares | — | (1,043,857 | ) | |||||
From net realized gains | ||||||||
Institutional Shares | — | (4,843,084 | ) | |||||
Service Shares | — | (17,928,563 | ) | |||||
| Total distributions to shareholders | — | (24,374,408 | ) | |||||
| From share transactions: | ||||||||
Proceeds from sales of shares | 8,670,577 | 16,566,518 | ||||||
Reinvestment of distributions | — | 24,374,408 | ||||||
Cost of shares redeemed | (217,600,793 | ) | (77,648,929 | ) | ||||
| Net decrease in net assets resulting from share transactions | (208,930,216 | ) | (36,708,003 | ) | ||||
| TOTAL INCREASE (DECREASE) | (169,571,078 | ) | 75,040,899 | |||||
| Net assets: | ||||||||
Beginning of period | 541,372,583 | 466,331,684 | ||||||
End of period | $ | 371,801,505 | $ | 541,372,583 | ||||
| Undistributed net investment income | $ | 512,224 | $ | 210,851 | ||||
| 12 | The accompanying notes are an integral part of these financial statements. |
GOLDMAN SACHS VARIABLE INSURANCE TRUST STRATEGIC GROWTH FUND
Financial Highlights
Selected Data for a Share Outstanding Throughout Each Period
| Income (loss) from investment operations | Distributions to shareholders | |||||||||||||||||||||||||||||||||||||||||||||||||||||||
| Year - Share Class | Net asset value, beginning of period | Net investment income(a) | Net and gain | Total from investment operations | From net investment income | From realized gains | Total distributions | Net asset value, end of period | Total return(b) | Net assets, end of period (in 000s) | Ratio of net expenses to average net assets | Ratio of total expenses to average net assets | Ratio of net investment income | Portfolio turnover rate(c) | ||||||||||||||||||||||||||||||||||||||||||
FOR THE SIX MONTHS ENDED JUNE 30, (UNAUDITED) | ||||||||||||||||||||||||||||||||||||||||||||||||||||||||
2018 - Institutional | $ | 19.73 | $ | 0.03 | $ | 1.76 | $ | 1.79 | $ | — | $ | — | $ | — | $ | 21.52 | 9.07 | % | $ | 118,615 | 0.74 | %(d) | 0.82 | %(d) | 0.33 | %(d) | 25 | % | ||||||||||||||||||||||||||||
2018 - Service | 19.68 | 0.01 | 1.75 | 1.76 | — | — | — | 21.44 | 8.94 | 253,186 | 0.99 | (d) | 1.06 | (d) | 0.07 | (d) | 25 | |||||||||||||||||||||||||||||||||||||||
FOR THE FISCAL YEARS ENDED DECEMBER 31, | ||||||||||||||||||||||||||||||||||||||||||||||||||||||||
2017 - Institutional | 15.83 | 0.09 | 4.77 | 4.86 | (0.10 | ) | (0.86 | ) | (0.96 | ) | 19.73 | 30.66 | 115,693 | 0.76 | 0.82 | 0.48 | 37 | |||||||||||||||||||||||||||||||||||||||
2017 - Service | 15.79 | 0.04 | 4.76 | 4.80 | (0.05 | ) | (0.86 | ) | (0.91 | ) | 19.68 | 30.36 | 425,679 | 1.01 | 1.07 | 0.23 | 37 | |||||||||||||||||||||||||||||||||||||||
2016 - Institutional | 15.62 | 0.07 | 0.24 | 0.31 | (0.10 | ) | — | (e) | (0.10 | ) | 15.83 | 1.98 | 98,090 | 0.79 | 0.84 | 0.48 | 72 | |||||||||||||||||||||||||||||||||||||||
2016 - Service | 15.59 | 0.03 | 0.23 | 0.26 | (0.06 | ) | — | (e) | (0.06 | ) | 15.79 | 1.69 | 368,242 | 1.04 | 1.08 | 0.22 | 72 | |||||||||||||||||||||||||||||||||||||||
2015 - Institutional | 16.16 | 0.09 | (f) | 0.46 | 0.55 | (0.06 | ) | (1.03 | ) | (1.09 | ) | 15.62 | 3.40 | 109,801 | 0.79 | 0.83 | 0.55 | (f) | 56 | |||||||||||||||||||||||||||||||||||||
2015 - Service | 16.13 | 0.05 | (f) | 0.46 | 0.51 | (0.02 | ) | (1.03 | ) | (1.05 | ) | 15.59 | 3.14 | 360,966 | 1.04 | 1.08 | 0.29 | (f) | 56 | |||||||||||||||||||||||||||||||||||||
2014 - Institutional | 17.64 | 0.07 | 2.24 | 2.31 | (0.07 | ) | (3.72 | ) | (3.79 | ) | 16.16 | 13.64 | 119,934 | 0.79 | 0.81 | 0.37 | 48 | |||||||||||||||||||||||||||||||||||||||
2014 - Service | 17.61 | 0.02 | 2.24 | 2.26 | (0.02 | ) | (3.72 | ) | (3.74 | ) | 16.13 | 13.38 | 394,747 | 1.04 | 1.08 | 0.12 | 48 | |||||||||||||||||||||||||||||||||||||||
2013 - Institutional | 13.86 | 0.06 | 4.42 | 4.48 | (0.07 | ) | (0.63 | ) | (0.70 | ) | 17.64 | 32.42 | 122,220 | 0.80 | 0.84 | 0.35 | 66 | |||||||||||||||||||||||||||||||||||||||
2013 - Service | 13.85 | 0.02 | 4.40 | 4.42 | (0.03 | ) | (0.63 | ) | (0.66 | ) | 17.61 | 32.00 | 391,219 | 1.05 | 1.09 | 0.10 | 66 | |||||||||||||||||||||||||||||||||||||||
| (a) | Calculated based on the average shares outstanding methodology. |
| (b) | Assumes investment at the net asset value at the beginning of the period, reinvestment of all distributions, and a complete redemption of the investment at the net asset value at the end of the period. Total returns for periods less than one full year are not annualized. |
| (c) | The Fund’s portfolio turnover rate is calculated in accordance with regulatory requirements, without regard to transactions involving short term investments. If such transactions were included, the Fund’s portfolio turnover rate may be higher. |
| (d) | Annualized. |
| (e) | Amount is less than $0.005 per share. |
| (f) | Reflects income recognized from special dividends which amounted to $0.03 per share and 0.20% of average net assets. |
| The accompanying notes are an integral part of these financial statements. | 13 |
GOLDMAN SACHS VARIABLE INSURANCE TRUST STRATEGIC GROWTH FUND
Notes to Financial Statements
June 30, 2018 (Unaudited)
1. ORGANIZATION
Goldman Sachs Variable Insurance Trust (the “Trust” or “VIT”) is a Delaware statutory trust registered under the Investment Company Act of 1940, as amended (the “Act”), as an open-end management investment company. The Trust includes the Goldman Sachs Strategic Growth Fund (the “Fund”). The Fund is a diversified portfolio under the Act offering two classes of shares — Institutional and Service Shares. Shares of the Trust are offered to separate accounts of participating life insurance companies for the purpose of funding variable annuity contracts and variable life insurance policies.
Goldman Sachs Asset Management, L.P. (“GSAM”), an affiliate of Goldman Sachs & Co. LLC (“Goldman Sachs”), serves as investment adviser to the Fund pursuant to a management agreement (the “Agreement”) with the Trust.
2. SIGNIFICANT ACCOUNTING POLICIES
The financial statements have been prepared in accordance with accounting principles generally accepted in the United States of America (“GAAP”) and require management to make estimates and assumptions that may affect the reported amounts and disclosures. Actual results may differ from those estimates and assumptions.
A. Investment Valuation — The Fund’s valuation policy is to value investments at fair value.
B. Investment Income and Investments — Investment income includes interest income, dividend income, and securities lending income, if any. Interest income is accrued daily and adjusted for amortization of premiums and accretion of discounts. Dividend income is recognized on ex-dividend date or, for certain foreign securities, as soon as such information is obtained subsequent to the ex-dividend date. Investment transactions are reflected on trade date. Realized gains and losses are calculated using identified cost. Investment transactions are recorded on the following business day for daily net asset value (“NAV”) calculations. Distributions received from the Fund’s investments in United States (“U.S.”) real estate investment trusts (“REITs”) may be characterized as ordinary income, net capital gain or a return of capital. A return of capital is recorded by the Fund as a reduction to the cost basis of the REIT.
C. Class Allocations and Expenses — Investment income, realized and unrealized gain (loss), if any, and non-class specific expenses of the Fund are allocated daily based upon the proportion of net assets of each class. Non-class specific expenses directly incurred by the Fund are charged to the Fund, while such expenses incurred by the Trust are allocated across the Fund on a straight-line and/or pro-rata basis depending upon the nature of the expenses. Class specific expenses, where applicable, are borne by the respective share classes and include Distribution and Service and Transfer Agency fees.
D. Federal Taxes and Distributions to Shareholders — It is the Fund’s policy to comply with the requirements of the Internal Revenue Code of 1986, as amended (the “Code”), applicable to regulated investment companies (mutual funds) and to distribute each year substantially all of its investment company taxable income and capital gains to its shareholders. Accordingly, the Fund is not required to make any provisions for the payment of federal income tax. Distributions to shareholders are recorded on the ex-dividend date. Income and capital gains distributions, if any, are declared and paid annually.
Net capital losses, if any, are carried forward to future fiscal years and may be used to the extent allowed by the Code to offset any future capital gains. Losses that are carried forward will retain their character as either short-term or long-term capital losses. Utilization of capital loss carryforwards will reduce the requirement of future capital gains distributions.
The characterization of distributions to shareholders for financial reporting purposes is determined in accordance with federal income tax rules, which may differ from GAAP. The source of the Fund’s distributions may be shown in the accompanying financial statements as either from net investment income, net realized gain or capital. Certain components of the Fund’s net assets on the Statement of Assets and Liabilities reflect permanent GAAP/tax differences based on the appropriate tax character.
E. Commission Recapture — GSAM, on behalf of certain Funds, may direct portfolio trades, subject to seeking best execution, to various brokers who have agreed to rebate a portion of the commissions generated. Such rebates are made directly to the Fund as cash payments and are included in net realized gain (loss) from investments on the Statement of Operations.
14
GOLDMAN SACHS VARIABLE INSURANCE TRUST STRATEGIC GROWTH FUND
3. INVESTMENTS AND FAIR VALUE MEASUREMENTS
U.S. GAAP defines the fair value of a financial instrument as the amount that would be received to sell an asset or paid to transfer a liability in an orderly transaction between market participants at the measurement date (i.e., the exit price); the Fund’s policy is to use the market approach. GAAP establishes a fair value hierarchy that prioritizes the inputs to valuation techniques used to measure fair value. The hierarchy gives the highest priority to unadjusted quoted prices in active markets for identical assets or liabilities (Level 1 measurements) and the lowest priority to unobservable inputs (Level 3 measurements). The levels used for classifying investments are not necessarily an indication of the risk associated with investing in these investments. The three levels of the fair value hierarchy are described below:
Level 1 — Unadjusted quoted prices in active markets that are accessible at the measurement date for identical, unrestricted assets or liabilities;
Level 2 — Quoted prices in markets that are not active or financial instruments for which significant inputs are observable (including, but not limited to, quoted prices for similar investments, interest rates, foreign exchange rates, volatility and credit spreads), either directly or indirectly;
Level 3 — Prices or valuations that require significant unobservable inputs (including GSAM’s assumptions in determining fair value measurement).
Changes in valuation techniques may result in transfers into or out of an assigned level within the hierarchy. In accordance with the Fund’s policy, transfers between different levels of the fair value hierarchy resulting from such changes are deemed to have occurred as of the beginning of the reporting period.
The Board of Trustees (“Trustees”) has approved Valuation Procedures that govern the valuation of the portfolio investments held by the Fund, including investments for which market quotations are not readily available. The Trustees have delegated to GSAM day-to-day responsibility for implementing and maintaining internal controls and procedures related to the valuation of the Fund’s investments. To assess the continuing appropriateness of pricing sources and methodologies, GSAM regularly performs price verification procedures and issues challenges as necessary to third party pricing vendors or brokers, and any differences are reviewed in accordance with the Valuation Procedures.
A. Level 1 and Level 2 Fair Value Investments — The valuation techniques and significant inputs used in determining the fair values for investments classified as Level 1 and Level 2 are as follows:
Equity Securities — Equity securities traded on a U.S. securities exchange or the NASDAQ system, or those located on certain foreign exchanges, including but not limited to the Americas, are valued daily at their last sale price or official closing price on the principal exchange or system on which they are traded. If there is no sale or official closing price or such price is believed by GSAM to not represent fair value, equity securities are valued at the last bid price for long positions and at the last ask price for short positions. To the extent these investments are actively traded, they are classified as Level 1 of the fair value hierarchy, otherwise they are generally classified as Level 2.
Unlisted equity securities for which market quotations are available are valued at the last sale price on the valuation date, or if no sale occurs, at the last bid price, and are generally classified as Level 2.
Money Market Funds — Investments in the Goldman Sachs Financial Square Government Fund (“Underlying Fund”) are valued at the NAV of the Institutional Share class on the day of valuation. These investments are generally classified as Level 1 of the fair value hierarchy. For information regarding an Underlying Fund’s accounting policies and investment holdings, please see the Underlying Fund’s shareholder report.
B. Level 3 Fair Value Investments — To the extent that significant inputs to valuation models and other alternative pricing sources are unobservable, or if quotations are not readily available, or if GSAM believes that such quotations do not accurately reflect fair value, the fair value of the Fund’s investments may be determined under Valuation Procedures approved by the Trustees. GSAM, consistent with its procedures and applicable regulatory guidance, may make an adjustment to the most recent valuation prices of either domestic or foreign securities in light of significant events to reflect what it believes to be the fair value of the securities at the time of determining the Fund’s NAV. Significant events which could affect a large number of securities in a
15
GOLDMAN SACHS VARIABLE INSURANCE TRUST STRATEGIC GROWTH FUND
Notes to Financial Statements (continued)
June 30, 2018 (Unaudited)
3. INVESTMENTS AND FAIR VALUE MEASUREMENTS (continued)
particular market may include, but are not limited to: significant fluctuations in U.S. or foreign markets; market dislocations; market disruptions; or unscheduled market closings. Significant events which could also affect a single issuer may include, but are not limited to: corporate actions such as reorganizations, mergers and buy-outs; ratings downgrades; and bankruptcies.
C. Fair Value Hierarchy — The following is a summary of the Fund’s investments classified in the fair value hierarchy as of June 30, 2018:
| Investment Type | Level 1 | Level 2 | Level 3 | |||||||||
| Assets | ||||||||||||
| Common Stock and/or Other Equity Investments(a) | ||||||||||||
North America | $ | 371,084,965 | $ | — | $ | — | ||||||
| Securities Lending Reinvestment Vehicle | 2,378,334 | — | — | |||||||||
| Total | $ | 373,463,299 | $ | — | $ | — | ||||||
| (a) | Amounts are disclosed by continent to highlight the impact of time zone differences between local market close and the calculation of NAV. Security valuations are based on the principal exchange or system on which they are traded, which may differ from country of domicile. |
For further information regarding security characteristics, see the Schedule of Investments.
4. AGREEMENTS AND AFFILIATED TRANSACTIONS
A. Management Agreement — Under the Agreement, GSAM manages the Fund, subject to the general supervision of the Trustees.
As compensation for the services rendered pursuant to the Agreement, the assumption of the expenses related thereto and administration of the Fund’s business affairs, including providing facilities, GSAM is entitled to a management fee, accrued daily and paid monthly, equal to an annual percentage rate of the Fund’s average daily net assets.
As of June 30, 2018, contractual management fees with GSAM were at the following rates. The effective contractual management rate and effective net management rate represent the rates for the six month period ended June 30, 2018.
| Contractual Management Rate | Effective Net | |||||||||||||||||||||||||
| First $1 billion | Next $1 billion | Next $3 billion | Next $3 billion | Over $8 billion | Effective Rate | |||||||||||||||||||||
| 0.71% | 0.64 | % | 0.61 | % | 0.59 | % | 0.58 | % | 0.74 | % | 0.71 | % | ||||||||||||||
| ^ | Effective Net Management Rate includes the impact of management fee waivers of affiliated Underlying Funds, if any. The Effective Net Management Rate may not correlate to the Contractual Management Rate as a result of management fee waivers that may be in effect from time to time. For the six months ended June 30, 2018, GSAM waived $61,074 of its management fee. |
Prior to April 30, 2018, the contractual management fee rates for the Fund was as stated below and GSAM agreed to waive a portion of its management fee in order to achieve an Effective Net Management Rate as set forth in the Fund’s prospectus dated April 28, 2017.
First $1 billion | Next $1 billion | Next $3 billion | Next $3 billion | Over $8 billion | ||||||||||||||
| 0.75% | 0.68 | % | 0.65 | % | 0.64 | % | 0.63 | % | ||||||||||
The Fund invests in Institutional Shares of the Goldman Sachs Financial Square Government Fund, which is an affiliated Underlying Fund. GSAM has agreed to waive a portion of its management fee payable by the Fund in an amount equal to the management fee it earns as an investment adviser to the affiliated Underlying Fund in which the Fund invests, except those
16
GOLDMAN SACHS VARIABLE INSURANCE TRUST STRATEGIC GROWTH FUND
4. AGREEMENTS AND AFFILIATED TRANSACTIONS (continued)
management fees it earns from the Fund’s investments of cash collateral received in connection with securities lending transactions in the Goldman Sachs Financial Square Government Fund. For the six months ended June 30, 2018, GSAM waived $211 of the Fund’s management fee.
B. Distribution and Service (12b-1) Plan — The Trust, on behalf of Service Shares of the Fund, has adopted a Distribution and Service Plan subject to Rule 12b-1 under the Act. Under the Distribution and Service Plan, Goldman Sachs, which serves as distributor, is entitled to a fee accrued daily and paid monthly, for distribution services and personal and account maintenance services, which may then be paid by Goldman Sachs to authorized dealers, equal to, on an annual basis, 0.25% of the Fund’s average daily net assets attributable to Service Shares.
C. Transfer Agency Agreement — Goldman Sachs also serves as the transfer agent of the Fund for a fee pursuant to the Transfer Agency Agreement. The fees charged for such transfer agency services are accrued daily and paid monthly at an annual rate of 0.02% of the average daily net assets of Institutional and Service Shares.
D. Other Expense Agreements and Affiliated Transactions — GSAM has agreed to limit certain “Other Expenses” of the Fund (excluding acquired fund fees and expenses, transfer agency fees and expenses, service fees and shareholder administration fees (as applicable), taxes, interest, brokerage fees, expenses of shareholder meetings, litigation and indemnification, and extraordinary expenses) to the extent such expenses exceed, on an annual basis, a percentage rate of the average daily net assets of the Fund. Such Other Expense reimbursements, if any, are accrued daily and paid monthly. In addition, the Fund is not obligated to reimburse GSAM for prior fiscal year expense reimbursements, if any. The Other Expense limitation as an annual percentage rate of average daily net assets for the Fund is 0.014%. The Other Expense limitation will remain in place through at least April 30, 2019, and prior to such date GSAM may not terminate the arrangement without the approval of the Trustees. For the six months ended June 30, 2018, GSAM reimbursed $90,640 to the Fund. In addition, the Fund has entered into certain offset arrangements with the custodian and the transfer agent, which may result in a reduction of the Fund’s expenses and are received irrespective of the application of the “Other Expense” limitation described above. For the six months ended June 30, 2018, custody fee credits were $1,480.
E. Line of Credit Facility — As of June 30, 2018, the Fund participated in a $770,000,000 committed, unsecured revolving line of credit facility (the “facility”) together with other funds of the Trust and certain registered investment companies having management agreements with GSAM or its affiliates. This facility is to be used for temporary emergency purposes, or to allow for an orderly liquidation of securities to meet redemption requests. The interest rate on borrowings is based on the federal funds rate. The facility also requires a fee to be paid by the Fund based on the amount of the commitment that has not been utilized. For the six months ended June 30, 2018, the Fund did not have any borrowings under the facility. Prior to May 1, 2018 the facility was $1,100,000,000. The facility was decreased to $770,000,000 effective May 1, 2018.
F. Other Transactions with Affiliates —The following table provides information about the Fund’s investment in the Goldman Sachs Financial Square Government Fund as of and for the six months ended June 30, 2018:
Beginning Value as of | Purchases at Cost | Proceeds from Sales | Ending Value as of | Shares as of June 30, 2018 | Dividend Income from Affiliated Investment Company | |||||||||||||||||
| $ | 722 | $ | 7,344,401 | $ | (7,345,123 | ) | $ | — | — | $ | 1,860 | |||||||||||
5. PORTFOLIO SECURITIES TRANSACTIONS
The cost of purchases and proceeds from sales and maturities of long-term securities for the six months ended June 30, 2018, were $112,059,021 and $317,824,077, respectively.
17
GOLDMAN SACHS VARIABLE INSURANCE TRUST STRATEGIC GROWTH FUND
Notes to Financial Statements (continued)
June 30, 2018 (Unaudited)
6. SECURITIES LENDING
The Fund may lend its securities through a securities lending agent, the Bank of New York Mellon (“BNYM”), to certain qualified borrowers. In accordance with the Fund’s securities lending procedures, the Fund receives cash collateral at least equal to the market value of the securities on loan. The market value of the loaned securities is determined at the close of business of the Fund, at their last sale price or official closing price on the principal exchange or system on which they are traded, and any additional required collateral is delivered to the Fund on the next business day. As with other extensions of credit, the Fund may experience delay in the recovery of its securities or incur a loss should the borrower of the securities breach its agreement with the Fund or become insolvent at a time when the collateral is insufficient to cover the cost of repurchasing securities on loan. Dividend income received from securities on loan may not be subject to withholding taxes and therefore withholding taxes paid may differ from the amounts listed in the Statement of Operations. Loans of securities are terminable at any time and as such 1) the remaining contractual maturities of the outstanding securities lending transactions are considered to be overnight and continuous and 2) the borrower, after notice, is required to return borrowed securities within the standard time period for settlement of securities transactions.
The Fund invests the cash collateral received in connection with securities lending transactions in the Goldman Sachs Financial Square Government Fund (“Government Money Market Fund”), an affiliated series of the Goldman Sachs Trust. The Government Money Market Fund is registered under the Act as an open end investment company, is subject to Rule 2a-7 under the Act, and is managed by GSAM, for which GSAM may receive a management fee of up to 0.16% (prior to February 21, 2018, GSAM may have received a management fee of up to 0.205%) on an annualized basis of the average daily net assets of the Government Money Market Fund.
In the event of a default by a borrower with respect to any loan, BNYM may exercise any and all remedies provided under the applicable borrower agreement to make the Fund whole. These remedies include purchasing replacement securities by applying the collateral held from the defaulting broker against the purchase cost of the replacement securities. If BNYM is unable to purchase replacement securities, BNYM will indemnify the Fund by paying the Fund an amount equal to the market value of the securities loaned minus the value of cash collateral received from the borrower for the loan, subject to an exclusion for any shortfalls resulting from a loss of value in such cash collateral due to reinvestment risk. The Fund’s loaned securities were all subject to enforceable Securities Lending Agreements and the value of the collateral was at least equal to the value of the cash received. The amounts of the Fund’s overnight and continuous agreements represent the gross amounts of recognized liabilities for securities lending transactions outstanding as of June 30, 2018 are disclosed as “Payable upon return of securities loaned” on the Statement of Assets and Liabilities, where applicable. The Fund did not have securities on loan as of June 30, 2018.
Both the Fund and BNYM received compensation relating to the lending of the Fund’s securities. The amounts earned, if any, by the Fund for the six months ended June 30, 2018, are reported under Investment Income on the Statement of Operations.
The following table provides information about the Fund’s investment in the Government Money Market Fund for the six months ended June 30, 2018:
Beginning Value as of | Purchases at Cost | Proceeds from Sales | Ending Value as of | |||||||||||
| $ | — | $ | 14,610,220 | $ | (12,231,886 | ) | $ | 2,378,334 | ||||||
18
GOLDMAN SACHS VARIABLE INSURANCE TRUST STRATEGIC GROWTH FUND
7. TAX INFORMATION
As of June 30, 2018, the Fund’s aggregate security unrealized gains and losses based on cost for U.S. federal income tax purposes were as follows:
| Tax cost | $ | 230,584,050 | ||
| Gross unrealized gain | 148,398,131 | |||
| Gross unrealized loss | (5,518,882 | ) | ||
| Net unrealized gain | $ | 142,879,249 |
The difference between GAAP-basis and tax-basis unrealized gains (losses) is attributable primarily to wash sales and differences in the tax treatment of underlying fund investments.
GSAM has reviewed the Fund’s tax positions for all open tax years (the current and prior three years, as applicable) and has concluded that no provision for income tax is required in the Fund’s financial statements. Such open tax years remain subject to examination and adjustment by tax authorities.
8. OTHER RISKS
The Fund’s risks include, but are not limited to, the following:
Investments in Other Investment Companies Risk — As a shareholder of another investment company, including an exchange-traded fund (“ETF”), the Fund will indirectly bear its proportionate share of any net management fees and other expenses paid by such other investment companies, in addition to the fees and expenses regularly borne by the Fund. ETFs are subject to risks that do not apply to conventional mutual funds, including but not limited to the following: (i) the market price of the ETF’s shares may trade at a premium or a discount to their NAV; and (ii) an active trading market for an ETF’s shares may not develop or be maintained.
Large Shareholder Transactions Risk — The Fund may experience adverse effects when certain large shareholders, such as other funds, participating insurance companies, accounts and Goldman Sachs affiliates, purchase or redeem large amounts of shares of the Fund. Such large shareholder redemptions may cause the Fund to sell portfolio securities at times when it would not otherwise do so, which may negatively impact the Fund’s NAV and liquidity. These transactions may also accelerate the realization of taxable income to shareholders if such sales of investments resulted in gains, and may also increase transaction costs. In addition, a large redemption could result in the Fund’s current expenses being allocated over a smaller asset base, leading to an increase in the Fund’s expense ratio. Similarly, large Fund share purchases may adversely affect the Fund’s performance to the extent that the Fund is delayed in investing new cash and is required to maintain a larger cash position than it ordinarily would.
Liquidity Risk — The Fund may make investments that are illiquid or that may become less liquid in response to market developments or adverse investor perceptions. Illiquid investments may be more difficult to value. Liquidity risk may also refer to the risk that the Fund will not be able to pay redemption proceeds within the allowable time period because of unusual market conditions, an unusually high volume of redemption requests, or other reasons. To meet redemption requests, the Fund may be forced to sell investments at an unfavorable time and/or under unfavorable conditions.
Market and Credit Risks — In the normal course of business, the Fund trades financial instruments and enters into financial transactions where risk of potential loss exists due to changes in the market (market risk). Additionally, the Fund may also be exposed to credit risk in the event that an issuer or guarantor fails to perform or that an institution or entity with which the Fund has unsettled or open transactions defaults.
19
GOLDMAN SACHS VARIABLE INSURANCE TRUST STRATEGIC GROWTH FUND
Notes to Financial Statements (continued)
June 30, 2018 (Unaudited)
9. INDEMNIFICATIONS
Under the Trust’s organizational documents, its Trustees, officers, employees and agents are indemnified, to the extent permitted by the Act and state law, against certain liabilities that may arise out of performance of their duties to the Fund. Additionally, in the course of business, the Fund enters into contracts that contain a variety of indemnification clauses. The Fund’s maximum exposure under these arrangements is unknown, as this would involve future claims that may be made against the Fund that have not yet occurred. However, GSAM believes the risk of loss under these arrangements to be remote.
10. SUBSEQUENT EVENTS
Subsequent events after the Statement of Assets and Liabilities date have been evaluated, and GSAM has concluded that there is no impact requiring adjustment or disclosure in the financial statements.
11. SUMMARY OF SHARE TRANSACTIONS
Share activity is as follows:
| For the Six Months Ended June 30, 2018 (Unaudited) | For the Fiscal Year Ended December 31, 2017 | |||||||||||||||
| Shares | Dollars | Shares | Dollars | |||||||||||||
| Institutional Shares | ||||||||||||||||
| Shares sold | 107,400 | $ | 2,246,105 | 173,227 | $ | 3,153,417 | ||||||||||
| Reinvestment of distributions | — | — | 271,457 | 5,401,988 | ||||||||||||
| Shares redeemed | (457,366 | ) | (9,498,108 | ) | (779,284 | ) | (14,386,601 | ) | ||||||||
| (349,966 | ) | (7,252,003 | ) | (334,600 | ) | (5,831,196 | ) | |||||||||
| Service Shares | ||||||||||||||||
| Shares sold | 309,367 | 6,424,472 | 761,609 | 13,413,101 | ||||||||||||
| Reinvestment of distributions | — | — | 955,308 | 18,972,420 | ||||||||||||
| Shares redeemed | (10,125,502 | ) | (208,102,685 | ) | (3,410,382 | ) | (63,262,328 | ) | ||||||||
| (9,816,135 | ) | (201,678,213 | ) | (1,693,465 | ) | (30,876,807 | ) | |||||||||
| NET DECREASE | (10,166,101 | ) | $ | (208,930,216 | ) | (2,028,065 | ) | $ | (36,708,003 | ) | ||||||
20
GOLDMAN SACHS VARIABLE INSURANCE TRUST STRATEGIC GROWTH FUND
| Fund Expenses — Six Month Period Ended June 30, 2018 (Unaudited) |
As a shareholder of Institutional or Service Shares of the Fund, you incur ongoing costs, including management fees, distribution and/or service (12b-1) fees (with respect to Service Shares) and other Fund expenses. This example is intended to help you understand your ongoing costs (in dollars) of investing in the Institutional Shares and Service Shares of the Fund and to compare these costs with the ongoing costs of investing in other mutual funds.
The example is based on an investment of $1,000 invested at the beginning of the period and held for the entire period from January 1, 2018 through June 30, 2018, which represents a period of 181 days of a 365 day year.
Actual Expenses — The first line under each share class in the table below provides information about actual account values and actual expenses. You may use the information in this line, together with the amount you invested, to estimate the expenses that you paid over the period. Simply divide your account value by $1,000 (for example, an $8,600 account value divided by $1,000=8.6), then multiply the result by the number in the first line under the heading entitled “Expenses Paid” to estimate the expenses you paid on your account during this period.
Hypothetical Example for Comparison Purposes — The second line under each share class in the table below provides information about hypothetical account values and hypothetical expenses based on the Fund’s actual net expense ratio and an assumed rate of return of 5% per year before expenses, which is not the Fund’s actual return. The hypothetical account values and expenses may not be used to estimate the actual ending account balance or expenses you paid for the period. You may use this information to compare the ongoing costs of investing in the Fund and other funds. To do so, compare this 5% hypothetical example with the 5% hypothetical examples that appear in the shareholder reports of the other funds.
Please note that the expenses shown in the table are meant to highlight your ongoing costs only. As a shareholder of the Fund you do not incur any transaction costs, such as sales charges, redemption fees, or exchange fees, but shareholders of other funds may incur such costs. The second line of the table is useful in comparing ongoing costs only and will not help you determine the relative total costs of owning different funds whose shareholders may incur transaction costs.
| Share Class | Beginning Account Value 01/01/18 | Ending Account Value 06/30/18 | Expenses Paid 6 Months Ended 06/30/18* | |||||||||
| Institutional | ||||||||||||
| Actual | $ | 1,000 | $ | 1,090.70 | $ | 3.84 | ||||||
| Hypothetical 5% return | 1,000 | 1,021.12 | + | 3.71 | ||||||||
| Service | ||||||||||||
| Actual | 1,000 | 1,089.40 | 5.13 | |||||||||
| Hypothetical 5% return | 1,000 | 1,019.89 | + | 4.96 | ||||||||
| + | Hypothetical expenses are based on the Fund’s actual annualized net expense ratios and an assumed rate of return of 5% per year before expenses. |
| * | Expenses are calculated using the Fund’s annualized net expense ratio for each class, which represents the ongoing expenses as a percentage of net assets for the six months ended June 30, 2018. Expenses are calculated by multiplying the annualized net expense ratio by the average account value for the period; then multiplying the result by the number of days in the most recent fiscal half year; and then dividing that result by the number of days in the fiscal year. The annualized net expense ratios for the period were 0.74%, and 0.99% for the Institutional and Service Shares, respectively. |
21
GOLDMAN SACHS VARIABLE INSURANCE TRUST STRATEGIC GROWTH FUND
Statement Regarding Basis for Approval of Management Agreement (Unaudited)
Background
The Goldman Sachs Strategic Growth Fund (the “Fund”) is an investment portfolio of Goldman Sachs Variable Insurance Trust (the “Trust”). The Board of Trustees oversees the management of the Trust and reviews the investment performance and expenses of the Fund at regularly scheduled meetings held throughout the year. In addition, the Board of Trustees determines annually whether to approve the continuance of the Trust’s investment management agreement (the “Management Agreement”) with Goldman Sachs Asset Management, L.P. (the “Investment Adviser”) on behalf of the Fund.
The Management Agreement was most recently approved for continuation until June 30, 2019 by the Board of Trustees, including those Trustees who are not parties to the Management Agreement or “interested persons” (as defined in the Investment Company Act of 1940, as amended) of any party thereto (the “Independent Trustees”), at a meeting held on June 13-14, 2018 (the “Annual Meeting”).
The review process undertaken by the Trustees spans the course of the year and culminates with the Annual Meeting. To assist the Trustees in their deliberations, the Trustees have established a Contract Review Committee (the “Committee”), comprised of the Independent Trustees. The Committee held four meetings over the course of the year since the Management Agreement was last approved. At those Committee meetings, regularly scheduled Board or other committee meetings, and/or the Annual Meeting, matters relevant to the renewal of the Management Agreement were considered by the Board, or the Independent Trustees, as applicable. With respect to the Fund, such matters included:
| (a) | the nature and quality of the advisory, administrative, and other services provided to the Fund by the Investment Adviser and its affiliates, including information about: |
| (i) | the structure, staff, and capabilities of the Investment Adviser and its portfolio management teams; |
| (ii) | the groups within the Investment Adviser and its affiliates that support the portfolio management teams or provide other types of necessary services, including fund services groups (e.g., accounting and financial reporting, tax, shareholder services, and operations); controls and risk management groups (e.g., legal, compliance, valuation oversight, credit risk management, internal audit, compliance testing, market risk analysis, finance, and central funding); sales and distribution support groups, and others (e.g., information technology and training); |
| (iii) | trends in employee headcount; |
| (iv) | the Investment Adviser’s financial resources and ability to hire and retain talented personnel and strengthen its operations; and |
| (v) | the parent company’s support of the Investment Adviser and its mutual fund business, as expressed by the firm’s senior management; |
| (b) | information on the investment performance of the Fund, including comparisons to the performance of similar mutual funds, as provided by a third-party mutual fund data provider engaged as part of the contract review process (the “Outside Data Provider”), a benchmark performance index, and a composite of accounts with comparable investment strategies managed by the Investment Adviser; and information on general investment outlooks in the markets in which the Fund invests; |
| (c) | information provided by the Investment Adviser indicating the Investment Adviser’s views on whether the Fund’s peer group and/or benchmark index had high, medium, or low relevance given the Fund’s particular investment strategy; |
| (d) | the terms of the Management Agreement and other agreements with affiliated service providers entered into by the Trust on behalf of the Fund; |
| (e) | fee and expense information for the Fund, including: |
| (i) | the relative management fee and expense levels of the Fund as compared to those of comparable funds managed by other advisers, as provided by the Outside Data Provider; |
| (ii) | the Fund’s expense trends over time; and |
| (iii) | to the extent the Investment Adviser manages other types of accounts (such as bank collective trusts, private wealth management accounts, institutional separate accounts, sub-advised mutual funds, and non-U.S. funds) having investment objectives and policies similar to those of the Fund, comparative information on the advisory fees charged and services provided to those accounts by the Investment Adviser; |
| (f) | with respect to the extensive investment performance and expense comparison data provided by the Outside Data Provider, its processes in producing that data for the Fund; |
| (g) | the undertakings of the Investment Adviser and its affiliates to implement fee waivers and/or expense limitations; |
| (h) | information relating to the profitability of the Management Agreement and the transfer agency and distribution and service arrangements of the Fund to the Investment Adviser and its affiliates; |
| (i) | whether the Fund’s existing management fee schedule adequately addressed any economies of scale; |
22
GOLDMAN SACHS VARIABLE INSURANCE TRUST STRATEGIC GROWTH FUND
Statement Regarding Basis for Approval of Management Agreement (Unaudited) (continued)
| (j) | a summary of the “fall-out” benefits derived by the Investment Adviser and its affiliates from their relationships with the Fund, including the fees received by the Investment Adviser’s affiliates from the Fund for transfer agency, portfolio trading, distribution and other services; |
| (k) | a summary of potential benefits derived by the Fund as a result of its relationship with the Investment Adviser; |
| (l) | information regarding commissions paid by the Fund and broker oversight, an update on the Investment Adviser’s soft dollars practices, other information regarding portfolio trading, and how the Investment Adviser carries out its duty to seek best execution; |
| (m) | the manner in which portfolio manager compensation is determined; and the number and types of accounts managed by the portfolio managers; |
| (n) | the nature and quality of the services provided to the Fund by its unaffiliated service providers, and the Investment Adviser’s general oversight and evaluation (including reports on due diligence) of those service providers as part of the administrative services provided under the Management Agreement; and |
| (o) | the Investment Adviser’s processes and policies addressing various types of potential conflicts of interest; its approach to risk management; the annual review of the effectiveness of the Fund’s compliance program; and periodic compliance reports. |
The Trustees also received an overview of the Fund’s distribution arrangements. They received information regarding the Fund’s assets, share purchase and redemption activity, and payment of distribution and service fees. Information was also provided to the Trustees relating to revenue sharing payments made by and services provided by the Investment Adviser and its affiliates to intermediaries that promote the sale, distribution, and/or servicing of Fund shares. The Independent Trustees also discussed the broad range of other investment choices that are available to Fund investors, including the availability of comparable funds managed by other advisers.
The presentations made at the Board and Committee meetings and at the Annual Meeting encompassed the Fund and other mutual funds for which the Board of Trustees has responsibility. In evaluating the Management Agreement at the Annual Meeting, the Trustees relied upon their knowledge, resulting from their meetings and other interactions throughout the year, of the Investment Adviser and its affiliates, their services, and the Fund. In conjunction with these meetings, the Trustees received written materials and oral presentations on the topics covered, and the Investment Adviser addressed the questions and concerns of the Trustees, including concerns regarding the investment performance of certain of the funds they oversee. The Independent Trustees were advised by their independent legal counsel regarding their responsibilities and other regulatory requirements related to the approval and continuation of mutual fund investment management agreements under applicable law. In addition, the Investment Adviser and its affiliates provided the Independent Trustees with a written response to a formal request for information sent on behalf of the Independent Trustees by their independent legal counsel. During the course of their deliberations, the Independent Trustees met in executive sessions with their independent legal counsel, without representatives of the Investment Adviser or its affiliates present.
Nature, Extent, and Quality of the Services Provided Under the Management Agreement
As part of their review, the Trustees considered the nature, extent, and quality of the services provided to the Fund by the Investment Adviser. In this regard, the Trustees considered both the investment advisory services and non-advisory services that are provided by the Investment Adviser and its affiliates. The Trustees noted the transition in the leadership and changes in personnel of various of the Investment Adviser’s portfolio management teams that had occurred in recent periods, and the ongoing recruitment efforts aimed at bringing high quality investment talent to the Investment Adviser. They also noted the Investment Adviser’s commitment to maintaining high quality systems and expending substantial resources to respond to ongoing changes to the regulatory and control environment in which the Fund and its service providers operate, as well as the efforts of the Investment Adviser and its affiliates to combat cyber security risks. The Trustees concluded that the Investment Adviser continued to commit substantial financial and operational resources to the Fund and expressed confidence that the Investment Adviser would continue to do so in the future. The Trustees also recognized that the Investment Adviser had made significant commitments to address regulatory compliance requirements applicable to the Fund and the Investment Adviser and its affiliates.
Investment Performance
The Trustees also considered the investment performance of the Fund. In this regard, they compared the investment performance of the Fund to its peers using rankings and ratings compiled by the Outside Data Provider as of December 31, 2017, and updated performance information prepared by the Investment Adviser using the peer group identified by the Outside Data Provider as of March 31, 2018. The information on the Fund’s investment performance was provided for the one-, three-, five-, and
23
GOLDMAN SACHS VARIABLE INSURANCE TRUST STRATEGIC GROWTH FUND
Statement Regarding Basis for Approval of Management Agreement (Unaudited) (continued)
ten-year periods ending on the applicable dates. The Trustees also reviewed the Fund’s investment performance relative to its performance benchmark. As part of this review, they considered the investment performance trends of the Fund over time, and reviewed the investment performance of the Fund in light of its investment objective and policies and market conditions. The Trustees also received information comparing the Fund’s performance to that of a composite of accounts with comparable investment strategies managed by the Investment Adviser.
In addition, the Trustees considered materials prepared and presentations made by the Investment Adviser’s senior management and portfolio management personnel in which Fund performance was assessed. The Trustees also considered the Investment Adviser’s periodic reports with respect to the Fund’s risk profile, and how the Investment Adviser’s approach to risk monitoring and management influences portfolio management.
The Trustees observed that the Fund’s Institutional Shares had placed in the second quartile of the Fund’s peer group for the one-, three-, five-, and ten-year periods, and had outperformed the Fund’s benchmark index for the one-year period and underperformed for the three-, five-, and ten-year periods ended March 31, 2018. The Trustees also observed that in January 2018, the Investment Adviser had combined the U.S. Growth and U.S. Value portfolio management teams into a single U.S. Equity portfolio management team and had made certain personnel changes with respect to the Fund’s portfolio management team in connection with that restructuring.
Costs of Services Provided and Competitive Information
The Trustees considered the contractual terms of the Management Agreement and the fee rates payable by the Fund thereunder. In this regard, the Trustees considered information on the services rendered by the Investment Adviser to the Fund, which included both advisory and administrative services that were directed to the needs and operations of the Fund as a registered mutual fund.
In particular, the Trustees reviewed analyses prepared by the Outside Data Provider regarding the expense rankings of the Fund. The analyses provided a comparison of the Fund’s management fee and breakpoints to those of a relevant peer group and category universe; an expense analysis which compared the Fund’s overall net and gross expenses to a peer group and a category universe; and data comparing the Fund’s net expenses to the peer and category medians. The analyses also compared the Fund’s transfer agency, custody, and distribution fees, other expenses and fee waivers/reimbursements to those of the peer group and category medians. The Trustees concluded that the comparisons provided by the Outside Data Provider were useful in evaluating the reasonableness of the management fees and total expenses paid by the Fund.
The Trustees noted that the management fee breakpoint schedule had been reduced at all asset levels since the Management Agreement was last approved. In addition, the Trustees considered the Investment Adviser’s undertakings to implement fee waivers and/or expense limitations. They also considered, to the extent that the Investment Adviser manages other types of accounts having investment objectives and policies similar to those of the Fund, comparative fee information for services provided by the Investment Adviser to those accounts, and information that indicated that services provided to the Fund differed in various significant respects from the services provided to other types of accounts which, in many cases, operated under less stringent legal and regulatory structures, required fewer services from the Investment Adviser to a smaller number of client contact points, and were less time-intensive.
In addition, the Trustees noted that shareholders are able to redeem their Fund shares at any time if shareholders believe that the Fund fees and expenses are too high or if they are dissatisfied with the performance of the Fund.
Profitability
The Trustees reviewed the Fund’s contribution to the Investment Adviser’s revenues and pre-tax profit margins. In this regard the Trustees noted that they had received, among other things, profitability analyses and summaries, revenue and expense schedules by Fund and by function (i.e., investment management, transfer agency and distribution and service), and information on the Investment Adviser’s expense allocation methodology. They observed that the profitability and expense figures are substantially similar to those used by the Investment Adviser for many internal purposes, including compensation decisions among various business groups, and are thus subject to a vigorous internal debate about how certain revenue and expenses should be allocated. The Trustees also noted that the internal audit group within the Goldman Sachs organization had audited the expense allocation methodology and that the internal audit group was satisfied with the reasonableness, consistency, and accuracy of the Investment Adviser’s expense allocation methodology and profitability analysis calculations. Profitability data for the Fund was provided for 2017 and 2016, and the Trustees considered this information in relation to the Investment Adviser’s overall profitability.
24
GOLDMAN SACHS VARIABLE INSURANCE TRUST STRATEGIC GROWTH FUND
Statement Regarding Basis for Approval of Management Agreement (Unaudited) (continued)
Economies of Scale
The Trustees considered the information that had been provided regarding whether there have been economies of scale with respect to the management of the Fund. The Trustees also considered the breakpoints in the fee rate payable under the Management Agreement for the Fund at the following annual percentage rates of the average daily net assets of the Fund:
| First $1 billion | 0.71 | % | ||
| Next $1 billion | 0.64 | |||
| Next $3 billion | 0.61 | |||
| Next $3 billion | 0.59 | |||
| Over $8 billion | 0.58 |
The Trustees noted that the breakpoints were designed to share potential economies of scale, if any, with the Fund and its shareholders as assets under management reach those asset levels. The Trustees considered the amounts of assets in the Fund; the Fund’s recent share purchase and redemption activity; the information provided by the Investment Adviser relating to the costs of the services provided by the Investment Adviser and its affiliates and their realized profits; information comparing fee rates charged by the Investment Adviser with fee rates charged to other funds in the peer group; and the Investment Adviser’s undertaking to limit certain expenses of the Fund that exceed a specified level. Upon reviewing these matters at the Annual Meeting, the Trustees concluded that the fee breakpoints represented a means of assuring that benefits of scalability, if any, would be passed along to shareholders at the specified asset levels.
Other Benefits to the Investment Adviser and Its Affiliates
The Trustees also considered the other benefits derived by the Investment Adviser and its affiliates from their relationships with the Fund as stated above, including: (a) transfer agency fees received by Goldman Sachs & Co. LLC (“Goldman Sachs”); (b) brokerage and futures commissions earned by Goldman Sachs for executing securities and futures transactions on behalf of the Fund; (c) research received by the Investment Adviser from broker-dealers in exchange for executing certain transactions on behalf of the Fund; (d) trading efficiencies resulting from aggregation of orders of the Fund with those for other funds or accounts managed by the Investment Adviser; (e) fees earned by the Investment Adviser for managing the fund in which the Fund’s securities lending cash collateral is invested; (f) the Investment Adviser’s ability to leverage the infrastructure designed to service the Fund on behalf of its other clients; (g) the Investment Adviser’s ability to cross-market other products and services to Fund shareholders; (h) Goldman Sachs’ retention of certain fees as Fund Distributor; (i) the Investment Adviser’s ability to negotiate better pricing with custodians on behalf of its other clients, as a result of the relationship with the Fund; and (j) the possibility that the working relationship between the Investment Adviser and the Fund’s third-party service providers may cause those service providers to be more likely to do business with other areas of Goldman Sachs. In the course of considering the foregoing, the Independent Trustees requested and received further information quantifying certain of these fall-out benefits.
Other Benefits to the Fund and Its Shareholders
The Trustees also noted that the Fund receives certain potential benefits as a result of its relationship with the Investment Adviser, including: (a) trading efficiencies resulting from aggregation of orders of the Fund with those of other funds or accounts managed by the Investment Adviser; (b) enhanced servicing from vendors because of the volume of business generated by the Investment Adviser and its affiliates; (c) enhanced servicing from broker-dealers because of the volume of business generated by the Investment Adviser and its affiliates; (d) the Investment Adviser’s ability to negotiate favorable terms with derivatives counterparties on behalf of the Fund as a result of the size and reputation of the Goldman Sachs organization; (e) the Investment Adviser’s knowledge and experience gained from managing other accounts and products; (f) the Investment Adviser’s ability to hire and retain qualified personnel to provide services to the Fund because of the reputation of the Goldman Sachs organization; (g) the Fund’s access, through the Investment Adviser, to certain firmwide resources (e.g., proprietary risk management systems and databases), subject to certain restrictions; and (h) the Fund’s access to certain affiliated distribution channels. In addition, the Trustees noted the competitive nature of the mutual fund marketplace, and considered that many of the Fund’s shareholders invested in the Fund in part because of the Fund’s relationship with the Investment Adviser and that those shareholders have a general expectation that the relationship will continue.
25
GOLDMAN SACHS VARIABLE INSURANCE TRUST STRATEGIC GROWTH FUND
Statement Regarding Basis for Approval of Management Agreement (Unaudited) (continued)
Conclusion
In connection with their consideration of the Management Agreement, the Trustees gave weight to each of the factors described above, but did not identify any particular factor as controlling their decision. After deliberation and consideration of all of the information provided, including the factors described above, the Trustees concluded, in the exercise of their business judgment, that the management fees paid by the Fund were reasonable in light of the services provided to it by the Investment Adviser, the Investment Adviser’s costs and the Fund’s current and reasonably foreseeable asset levels. The Trustees unanimously concluded that the Investment Adviser’s continued management likely would benefit the Fund and its shareholders and that the Management Agreement should be approved and continued with respect to the Fund until June 30, 2019.
26
| TRUSTEES | OFFICERS | |
| Jessica Palmer, Chair | James A. McNamara, President | |
| Kathryn A. Cassidy | Scott M. McHugh, Treasurer, Senior Vice | |
| Diana M. Daniels | President and Principal Financial Officer | |
| Herbert J. Markley | Joseph F. DiMaria, Assistant Treasurer | |
| James A. McNamara | and Principal Accounting Officer | |
| Roy W. Templin | Caroline L. Kraus, Secretary | |
| Gregory G. Weaver |
GOLDMAN SACHS & CO. LLC
Distributor and Transfer Agent
GOLDMAN SACHS ASSET MANAGEMENT, L.P.
Investment Adviser
200 West Street, New York
New York 10282
Visit our web site at www.GSAMFUNDS.com to obtain the most recent month-end returns.
The reports concerning the Fund included in this shareholder report may contain certain forward-looking statements about the factors that may affect the performance of the Fund in the future. These statements are based on Fund management’s predictions and expectations concerning certain future events and their expected impact on the Fund, such as performance of the economy as a whole and of specific industry sectors, changes in the levels of interest rates, the impact of developing world events, and other factors that may influence the future performance of the Fund. Management believes these forward-looking statements to be reasonable, although they are inherently uncertain and difficult to predict. Actual events may cause adjustments in portfolio management strategies from those currently expected to be employed.
A description of the policies and procedures that the Fund uses to determine how to vote proxies relating to portfolio securities and information regarding how the Fund voted proxies relating to portfolio securities for the 12-month period ended June 30 is available (i) without charge, upon request by calling 1-800-621-2550; and (ii) on the Securities and Exchange Commission (“SEC”) web site at http://www.sec.gov.
The Fund files its complete schedule of portfolio holdings with the SEC for the first and third quarters of each fiscal year on Form N-Q. The Fund’s Form N-Qs are available on the SEC’s web site at http://www.sec.gov within 60 days after the Fund’s first and third fiscal quarters. The Fund’s Form N-Qs may be reviewed and copied at the SEC’s Public Reference Room in Washington, D.C. and information on the operation of the Public Reference Room may also be obtained by calling 1-800-SEC-0330. Form N-Qs may be obtained upon request and without charge by calling 1-800-621-2550.
Views and opinions expressed are for informational purposes only and do not constitute a recommendation by GSAM to buy, sell, or hold any security. Views and opinions are current as of the date of this presentation and may be subject to change, they should not be construed as investment advice.
Goldman Sachs & Co. LLC (“Goldman Sachs”) does not provide legal, tax or accounting advice. Any statement contained in this communication (including any attachments) concerning U.S. tax matters was not intended or written to be used, and cannot be used, for the purpose of avoiding penalties under the Internal Revenue Code, and was written to support the promotion or marketing of transaction or matter addressed. Clients of Goldman Sachs should obtain their own independent tax advice based on their particular circumstances.
The website links provided are for your convenience only and are not an endorsement or recommendation by GSAM of any of these websites or the products or services offered. GSAM is not responsible for the accuracy and validity of the content of these websites.
Fund holdings and allocations shown are as of June 30, 2018 and may not be representative of future investments. Fund holdings should not be relied on in making investment decisions and should not be construed as research or investment advice regarding particular securities. Current and future holdings are subject to risk.
References to indices, benchmarks or other measures of relative market performance over a specified period of time are provided for your information only and do not imply that the portfolio will achieve similar results. The index composition may not reflect the manner in which a portfolio is constructed. While an adviser seeks to design a portfolio which reflects appropriate risk and return features, portfolio characteristics may deviate from those of the benchmark.
The Global Industry Classification Standard (“GICS”) was developed by and is the exclusive property and a service mark of Morgan Stanley Capital International Inc. (“MSCI”) and Standard & Poor’s, a division of The McGraw-Hill Companies, Inc. (“S&P”) and is licensed for use by Goldman Sachs. Neither MSCI, S&P nor any other party involved in making or compiling the GICS or any GICS classifications makes any express or implied warranties or representations with respect to such standard or classification (or the results to be obtained by the use thereof), and all such parties hereby expressly disclaim all warranties of originality, accuracy, completeness, merchantability or fitness for a particular purpose with respect to any of such standard or classification. Without limiting any of the foregoing, in no event shall MSCI, S&P, any of their affiliates or any third party involved in making or compiling the GICS or any GICS classifications have any liability for any direct, indirect, special, punitive, consequential or any other damages (including lost profits) even if notified of the possibility of such damages.
The portfolio risk management process includes an effort to monitor and manage risk, but does not imply low risk.
Shares of the Goldman Sachs VIT Funds are offered to separate accounts of participating life insurance companies for the purpose of funding variable annuity contracts and variable life insurance policies. Shares of the Fund are not offered directly to the general public. The variable annuity contracts and variable life insurance policies are described in the separate prospectuses issued by participating insurance companies. You should refer to those prospectuses for information about surrender charges, mortality and expense risk fees and other charges that may be assessed by participating insurance companies under the variable annuity contracts or variable life insurance policies. Such fees or charges, if any, may affect the return you may realize with respect to your investments. Ask your representative for more complete information. Please consider a fund’s objectives, risks and charges and expenses, and read the prospectus carefully before investing. The prospectus contains this and other information about the Fund.
This material is not authorized for distribution to prospective investors unless preceded or accompanied by a current prospectus or summary prospectus, if applicable. Investors should consider the Fund’s objective, risks, and charges and expenses, and read the summary prospectus, if available, and/or the prospectus carefully before investing or sending money. The summary prospectus, if available, and the prospectus contain this and other information about the Fund and may be obtained from your authorized dealer or from Goldman Sachs & Co. LLC by calling 1-800-621-2550.
This report is prepared for the general information of contract owners and is not an offer of shares of the Goldman Sachs Variable Insurance Trust — Goldman Sachs Strategic Growth Fund.
©2018 Goldman Sachs. All rights reserved.
VITGRWSAR-18/139323-OTU-807835/30.1k
Goldman
Sachs Variable Insurance Trust
Goldman Sachs
International Equity Insights Fund*
| * | Effective at the close of business on April 23, 2018, the Goldman Sachs Strategic International Equity Fund was renamed the Goldman Sachs International Equity Insights Fund |
Semi-Annual Report
June 30, 2018

GOLDMAN SACHS VARIABLE INSURANCE TRUST INTERNATIONAL EQUITY INSIGHTS FUND
Investment Process. The Investment Adviser begins with a broad universe of foreign equity investments for the Fund. As described more fully below, the Investment Adviser uses proprietary multifactor models (the “Multifactor Models”) that attempt to forecast the returns of different markets, currencies and individual securities.
The Multifactor Models rely on some or all of the following investment pillars and themes to forecast the returns of individual securities (although additional pillars or themes may be added in the future without prior notice):
Fundamental Mispricings
• Valuation: The Valuation theme attempts to capture potential mispricings of securities, typically by comparing a measure of the company’s intrinsic value to its market value.
High Quality Business Models
• Profitability: The Profitability theme seeks to assess whether a company is earning more than its cost of capital.
• Quality: The Quality theme assesses both firm and management quality.
• Management: The Management theme assesses the characteristics, policies and strategic decisions of company management.
Market Themes and Trends
• Momentum: The Momentum theme seeks to predict drifts in stock prices caused by delayed investor reaction to company-specific information and information about related companies.
Sentiment Analysis
• Sentiment: The Sentiment theme reflects selected investment views and decisions of individuals and financial intermediaries.
1
GOLDMAN SACHS VARIABLE INSURANCE TRUST INTERNATIONAL EQUITY INSIGHTS FUND
INVESTMENT OBJECTIVE
The Fund seeks long-term growth of capital.
Portfolio Management Discussion and Analysis
Effective on April 23, 2018, Goldman Sachs Variable Insurance Trust — Strategic International Equity Fund was re-named Goldman Sachs Variable Insurance Trust — Goldman Sachs International Equity Insights Fund (the “Fund”) and certain changes were made to its principal investment strategy. In light of these changes, the portfolio management team for the Fund changed as well. Below, the Goldman Sachs International Equity Portfolio Management Team and the Goldman Sachs Quantitative Investment Strategies Team discuss the Fund’s performance and positioning for the six-month period ended June 30, 2018 (the “Reporting Period”).
How did the Fund perform during the Reporting Period?
During the Reporting Period, the Fund’s Institutional and Service Shares generated cumulative total returns of –2.67% and –2.84%, respectively. These returns compare to the –2.75% cumulative total return of the Fund’s benchmark, the MSCI Europe, Australasia, Far East (EAFE) Standard Index (net, USD, unhedged) (the “MSCI EAFE Index”), during the same time period.
What economic and market factors most influenced the international equity markets as a whole during the Reporting Period?
International equities, as measured by the MSCI EAFE Index, posted a return of –2.75% in U.S. dollar terms for the Reporting Period as a whole.
International equities saw a strong start to the Reporting Period in January 2018, driven by market exuberance over positive economic data, a $1.5 trillion U.S. tax reform law signed in December 2017, and a favorable start to the corporate earnings season. In February 2018, however, equities sold off globally on market speculation of a faster pace of U.S. Federal Reserve (“Fed”) short-term interest rate hikes, which stoked a sharp rise in bond yields and an increase in equity market volatility. Concerns about Fed monetary policy tightening were further exacerbated by solid U.S. labor and inflation data. While the hawkish Fed minutes were largely expected, new Fed Chair Jerome Powell’s Congressional testimony, positing a more optimistic economic outlook since the December 2017 Fed meeting, surprised equity markets with its hawkish tilt, sparking another sell-off in the global equity markets. (Jerome Powell assumed the chairmanship of the Fed in February 2018. Hawkish language tends to suggest higher interest rates; opposite of dovish.) In March 2018, escalating trade tensions and potential tariffs weighed on investor sentiment. Meanwhile, the Fed delivered on a widely expected interest rate increase, with its “dot plot” pointing to a total of three interest rate hikes this calendar year and potentially two in 2019. (The “dot plot” shows rate projections of the members of the Fed’s Open Market Committee.) In Europe, an agreement on a 21-month transition after Brexit between the U.K. and the European Union reduced political uncertainty. (Brexit is the popular term for the U.K.’s approved vote on a referendum to exit the European Union.)
The U.S. and China continued to generate trade headlines and geopolitical uncertainty about sanctions on Russia surfaced, but the impact of such on the international equity markets remained relatively muted during April 2018, as investors stayed rather resistant to the risk of a trade war. European equities were boosted, driven by rising U.S. Treasury yields, which, in turn, led to the euro weakening against the U.S. dollar. Japanese equities faced multiple headwinds from mounting trade tensions between the U.S. and China and from a sell-off in U.S. equities. The European Central Bank and Bank of Japan kept their respective monetary policies unchanged, indicating ongoing monetary accommodation. May 2018 was a volatile month for international equities amid further political and protectionism concerns, including Italian political turmoil, the ongoing unpredictability around the U.S.-North Korea summit, and escalating trade tensions. European equity markets were rather flat in May both on concerns around political developments in Italy and on weakening economic growth. Japanese equities recovered in May driven by healthy earnings and by sustained weakening of the yen, driven by rising long-term U.S. interest rates. The Fed raised interest rates again in June 2018, as widely expected, but the outcome of the Fed meeting was more hawkish than the consensus had anticipated. The Fed retained language indicating an “accommodative” monetary policy stance, but its economic growth and inflation forecasts were upgraded, and its median projection was lifted to four interest rate hikes in 2018 from the three it had indicated in March 2018. Still-escalating trade tensions between the U.S. and China hurt market sentiment, with the U.S. threatening tariffs on $200 billion worth of Chinese goods and China vowing to retaliate. European equities fell in June even as the European Central Bank and Bank of England left their respective key interest rates unchanged after the Fed’s interest rate hike. Tensions related to the G7 summit pulled down equities in Japan in June. All told, then, the MSCI EAFE Index produced modestly negative returns both for the month of June 2018 and for the second calendar quarter.
2
GOLDMAN SACHS VARIABLE INSURANCE TRUST INTERNATIONAL EQUITY INSIGHTS FUND
For the Reporting Period overall, energy was the best performing sector in the MSCI EAFE Index on the basis of total return by some distance, followed by utilities and health care. The weakest performing sectors in the MSCI EAFE Index during the Reporting Period were telecommunication services, financials and industrials.
From a country perspective, Finland, Portugal and Norway were the best performing equity markets in the MSCI EAFE Index during the Reporting Period. Austria, Denmark and Switzerland were the weakest individual country constituents in the MSCI EAFE Index during the Reporting Period.
What changes were made to the Fund’s principal investment strategy during the Reporting Period?
Effective on April 23, 2018, the Fund invests, under normal circumstance, at least 80% of its net assets plus any borrowings for investment purposes (measured at the time of purchase) (“Net Assets”) in a broadly diversified portfolio of equity investments in non-U.S. issuers. The Fund intends to have investments economically tied to at least three countries, not including the United States, and may invest in the securities of issuers in emerging market countries. The Fund seeks broad representation of large-cap and mid-cap issuers across major countries and sectors of the international economy with some exposure to small-cap issuers. Additionally, the Fund’s contractual management fee rate was lowered from 0.85% to 0.81% of the Fund’s average daily net assets.
What key factors were responsible for the Fund’s performance from January 1, 2018 through April 22, 2018 (the “initial part of the Reporting Period”)?
The Fund outperformed the MSCI EAFE Index during the initial part of the Reporting Period, attributable primarily to individual stock selection overall. Sector allocation as a whole detracted, albeit modestly.
What were some of the Fund’s best-performing individual stocks during the initial part of the Reporting Period?
Among the greatest contributors to Fund performance relative to the MSCI EAFE Index during the initial part of the Reporting Period were U.K.-based global business-to-business events organizer UBM and Singapore-based multinational banking and financial services provider DBS Group Holdings.
In January 2018, Informa made a cash/equity offer to acquire UBM at a 30% premium, which contributed to UBM’s strong stock performance. UBM shareholders would own a 34.5% stake in the combined entity, and the transaction was expected to close by the end of the second quarter of 2018. The acquisition was indeed completed on June 15, 2018. UBM’s stock also rose on reports made during the Reporting Period of top-line earnings and earnings before interest, taxes, depreciation and amortization that beat market estimates for the company’s fiscal year 2017. The company’s organic growth was also positive and exceeded market expectations during the Reporting Period.
Shares of DBS Group Holdings rose on improved margin expansion and loan growth and first quarter 2018 earnings that beat market expectations, in part due to higher fee income. Further, DBS Group Holdings had excess capital from record profits, which it distributed in May 2018 in the form of a one-time special dividend and also announced dividend growth going forward in line with its earnings growth.
Which stocks detracted significantly from the Fund’s performance during the initial part of the Reporting Period?
Among the biggest detractors from Fund performance relative to the MSCI EAFE Index during the initial part of the Reporting Period were Denmark-based multinational pharmaceuticals company Novo Nordisk and Germany-based manufacturer of industrial machinery and process technology GEA Group.
Novo Nordisk focuses on diabetes care and offers insulin delivery systems and other diabetes products. Novo Nordisk also works in areas such as haemostatis management, growth disorders and hormone replacement therapy. Novo Nordisk underperformed the broader European Union pharmaceuticals sector after headlines about its oral semaglutide Phase 3 trials were out in mid-February 2018. Oral semaglutide is the first oral treatment for diabetes. We believe Novo Nordisk’s weak performance was driven by several factors. First — investor confusion around the statistical analysis used in the headline data. Second — a perception that the “catalyst has passed.” We believe such concerns were unwarranted with further key oral semaglutide data due in the second calendar quarter. Third — currency concerns given the significant impact of such during the first quarter of 2018. After the severe price reaction and the opportunity we had to discuss the issues with the company’s management, we felt the news on this oral treatment was over-discounted in its share price.
GEA Group’s weak performance was driven by mis-execution of a number of orders that resulted in management changes within the company as well as investor doubts about when its business might stabilize.
3
GOLDMAN SACHS VARIABLE INSURANCE TRUST INTERNATIONAL EQUITY INSIGHTS FUND
Which equity market sectors most significantly affected Fund performance during the initial part of the Reporting Period?
Effective stock selection in the consumer discretionary, information technology and financials sectors contributed most positively to the Fund’s performance relative to the MSCI EAFE Index during the initial part of the Reporting Period. Partially offsetting these positive contributors was weaker stock selection in the health care, consumer staples and energy sectors, which detracted from the Fund’s performance relative to the MSCI EAFE Index during the initial part of the Reporting Period. Having an overweighted allocation to consumer staples, which lagged the MSCI EAFE Index during the initial part of the Reporting Period, also dampened the Fund’s relative results.
Which countries or regions most affected the Fund’s performance during the initial part of the Reporting Period?
Typically, the Fund’s individual stock holdings would significantly influence the Fund’s performance within a particular country or region relative to the MSCI EAFE Index. This effect may be even more pronounced in countries that represent only a modest proportion of the MSCI EAFE Index.
That said, having an overweighted allocation to Italy, which outperformed the MSCI EAFE Index during the initial part of the Reporting Period, and strong stock selection in Japan and Singapore contributed most positively to the Fund’s returns relative to the MSCI EAFE Index. The countries that detracted most from the Fund’s relative performance during the initial part of the Reporting Period were France, Denmark and Germany, where stock selection overall hurt.
What key factors were responsible for the Fund’s performance from April 23, 2018 through June 30 (the “second part of the Reporting Period”)?
During the second part of the Reporting Period, the Fund outperformed the MSCI EAFE Index largely due to stock selection driven by our quantitative model and four of our quantitative model’s six investment themes.
What impact did the Fund’s investment themes have on performance during the second part of the Reporting Period?
As expected, and in keeping with our investment approach, our quantitative model and its six investment themes — Valuation, Profitability, Quality, Management, Momentum and Sentiment — had the greatest impact on relative performance. We use these themes to take a long-term view of market patterns and look for inefficiencies, selecting stocks for the Fund and overweighting or underweighting the ones chosen by the model. Over time and by design, the performance of any one of the model’s investment themes tends to have a low correlation with the model’s other themes, demonstrating the diversification benefit of the Fund’s theme-driven quantitative model. The variance in performance supports our research indicating that the diversification provided by the Fund’s different investment themes is a significant investment advantage over the long term, even though the Fund may experience underperformance in the short term. Of course, diversification does not protect an investor from market risk nor does it ensure a profit.
During the second part of the Reporting Period, four of our six investment themes contributed positively to relative returns. Momentum contributed most positively to relative performance, followed by Quality and Sentiment. The Management theme also contributed positively, albeit to a lesser extent. The Momentum theme seeks to predict drifts in stock prices caused by delayed investor reaction to company-specific information and information about related companies. The Quality theme assesses both firm and financial quality. The Sentiment theme reflects selected investment views and decisions of individuals and financial intermediaries. The Management theme assesses the characteristics, policies and strategic decisions of company managements.
The Valuation and Profitability themes modestly detracted from the Fund’s relative returns during the second part of the Reporting Period. The Valuation theme attempts to capture potential mispricings of securities, typically by comparing a measure of the company’s intrinsic value to its market value. The Profitability theme assesses whether a company is earning more than its cost of capital.
How did the Fund’s country, sector and industry allocations affect relative performance during the second part of the Reporting Period?
During the second part of the Reporting Period, when the quantitative model was being used, in constructing the Fund’s portfolio, we focused on picking stocks rather than making country, industry or sector bets. Consequently, the Fund is similar to its benchmark, the MSCI EAFE Index, in terms of its country, industry and sector allocation and style. Changes in country, sector or industry weights generally do not have a meaningful impact on relative performance.
4
GOLDMAN SACHS VARIABLE INSURANCE TRUST INTERNATIONAL EQUITY INSIGHTS FUND
Did stock selection help or hurt Fund performance during the second part of the Reporting Period?
We seek to outpace the MSCI EAFE Index by overweighting stocks that we expect to outperform and underweighting those that we think may lag. We also build positions based on our thematic views. For example, the Fund aims to hold a basket of stocks with more favorable Momentum characteristics than the benchmark index. During the second part of the Reporting Period, stock selection overall contributed positively to the Fund’s relative performance.
Effective stock selection in the information technology, health care and utilities sectors contributed most positively to the Fund’s results relative to the MSCI EAFE Index. Partially offsetting these positive contributors was stock selection in the industrials, materials and financials sectors, which detracted from the Fund’s results relative to the MSCI EAFE Index during the second part of the Reporting Period.
Which individual stock positions contributed the most to the Fund’s relative returns during the second part of the Reporting Period?
The Fund benefited most from overweighted positions in Japanese skin care cosmetics producer Fancl, Swiss integrated software solutions provider Temenos and Australian gaming machines manufacturer Aristocrat Leisure. We chose to overweight each of these positions due to our positive views on Momentum and Sentiment.
Which individual positions detracted from the Fund’s results during the second part of the Reporting Period?
Detracting most from the Fund’s results relative to the MSCI EAFE Index were overweight positions in Denmark’s jewelry manufacturer and retailer Pandora, Hong Kong meat products provider WH Group and Chinese ship builder Yangzijiang Shipbuilding. The Fund had overweight positions in Pandora and WH Group based on our positive views on Value and Profitability. We chose to overweight Yangzijiang Shipbuilding due to our positive views on Value and Sentiment.
What impact did the Goldman Sachs Quantitative Investment Strategies Team’s country/currency selection strategy have on the Fund’s relative performance during the second part of the Reporting Period?
Our country/currency selection strategy added to the Fund’s relative returns during the second part of the Reporting Period. The Fund benefited most from positioning in Switzerland, Spain and Japan. Detracting from Fund performance most was positioning in the U.K., Hong Kong and France.
We made our picks using our proprietary models, which, during the second part of the Reporting Period, were based on five investment themes specific to our country/currency strategy — Valuation, Momentum, Risk Premium, Fund Flows and Macro. Valuation favors equity and currency markets that appear cheap relative to accounting measures of value and purchasing power. Momentum favors countries and currencies that have had strong recent outperformance. Risk Premium evaluates whether a country is overcompensating investors for various types of risk, while Fund Flows evaluates the strength of capital market inflows. Finally, Macro assesses a market’s macroeconomic environment and growth prospects.
Did you make any enhancements to your quantitative models during the second part of the Reporting Period?
We continuously look for ways to improve our investment process. During the second part of the Reporting Period, we made numerous enhancements to our models. As example, we introduced two new signals within our Momentum theme that help us create economic links between different companies, potentially giving us insights into price movements of related companies. The first signal uses natural language processing to read through various sections in the patent document to form linkages in the markets of Europe and Japan. The second signal, introduced in the Japan region, uses natural language processing techniques to analyze various sections within the annual financial statements of companies.
How did the Fund use derivatives during the Reporting Period?
During the Reporting Period, we did not use derivatives within the Fund, and as such derivatives did not have an impact upon Fund returns. However, the strategy may utilize derivatives to equitize the Fund’s excess cash holdings in the future at the discretion of the portfolio management team.
What were the Fund’s sector and country weightings at the end of the Reporting Period?
As of June 30, 2018, the Fund was overweight the health care, energy, consumer discretionary, information technology and materials sectors relative to the MSCI EAFE Index. The Fund was underweight telecommunication services, financials, real estate, industrials, consumer staples and utilities compared to the benchmark index on the same date.
5
GOLDMAN SACHS VARIABLE INSURANCE TRUST INTERNATIONAL EQUITY INSIGHTS FUND
In terms of countries, the Fund was overweight relative to the MSCI EAFE Index in Switzerland and the Netherlands. Compared to the MSCI EAFE Index, the Fund was underweight in the U.K., Sweden and Germany and was relatively neutral compared to the MSCI EAFE Index in the remaining constituents of the MSCI EAFE Index at the end of the Reporting Period.
Were there any changes to the Fund’s portfolio management team during the Reporting Period?
As mentioned earlier, the Fund’s portfolio management team was changed from the Goldman Sachs International Equity Portfolio Management Team to the Goldman Sachs Quantitative Investment Strategies (“QIS”) Team. QIS employs a globally integrated team of more than 90 professionals, with an additional 60-plus professionals dedicated to trading, information technology and development of analytical tools.
What is your strategy going forward for the Fund?
Looking ahead, we continue to believe that less expensive stocks should outpace more expensive stocks, and stocks with good momentum are likely to outperform those with poor momentum. We intend to maintain our focus on seeking companies about which fundamental research analysts are becoming more positive as well as profitable companies with sustainable earnings and a track record of using their capital to enhance shareholder value. As such, we anticipate remaining fully invested with long-term performance likely to be the result of stock selection rather than sector or capitalization allocations.
We stand behind our investment philosophy that sound economic investment principles, coupled with a disciplined quantitative approach, can provide strong, uncorrelated returns over the long term. Our research agenda is robust, and we continue to enhance our existing models, add new proprietary forecasting signals and improve our trading execution as we seek to provide the most value to our shareholders.
6
GOLDMAN SACHS VARIABLE INSURANCE TRUST INTERNATIONAL EQUITY INSIGHTS FUND
Index Definitions
The MSCI EAFE Standard Index is a market capitalization-weighted composite of securities in 21 developed markets. The MSCI EAFE Index approximates the minimum possible dividend reinvestment. The dividend is reinvested after deduction for withholding tax, applying the rate to non-resident individuals who do not benefit from double taxation treaties. MSCI Barra uses withholding tax rates applicable to Luxembourg holding companies, as Luxembourg applies the highest rates. The MSCI EAFE Index is unmanaged and the figures for the Index do not include any deduction for fees or expenses. It is not possible to invest directly in an index.
7
FUND BASICS
International Equity Insights Fund
as of June 30, 2018
STANDARDIZED TOTAL RETURNS1
| For the period ended 6/30/18 | One Year | Five Years | Ten Years | Since Inception | Inception Date | |||||||||||||
| Institutional | 6.44 | % | 5.61 | % | 2.41 | % | 3.95 | % | 1/12/98 | |||||||||
| Service | 6.07 | 5.35 | 2.15 | 2.35 | 1/09/06 | |||||||||||||
| 1 | The Standardized Total Returns are average annual total returns as of the most recent calendar quarter-end. They assume reinvestment of all distributions at net asset value (“NAV”). Because Institutional Shares and Service Shares do not involve a sales charge, such a charge is not applied to their Standardized Total Returns. |
Total return figures in the above chart represent past performance and do not indicate future results, which will vary. The investment return and principal value of an investment will fluctuate and, therefore, an investor’s shares, when redeemed, may be worth more or less than their original cost. Current performance may be lower or higher than the total return figures in the above chart. Please visit www.GSAMFUNDS.com to obtain the most recent month-end returns.
Performance reflects fee waivers and/or expense limitations in effect during the periods shown. In their absence, performance would be reduced.
EXPENSE RATIOS2
| Net Expense Ratio (Current) | Gross Expense Ratio (Before Waivers) | |||||||||||
| Institutional | 0.88 | % | 0.99 | % | ||||||||
| Service | 1.13 | 1.24 | ||||||||||
| 2 | The expense ratios of the Fund, both current (net of any fee waivers and/or expense limitations) and before waivers (gross of any fee waivers and/or expense limitations) are as set forth above according to the most recent publicly available Prospectuses for the Fund and may differ from the expense ratios disclosed in the Financial Highlights in this report. Pursuant to a contractual arrangement, the Fund’s fee waivers and/or expense limitations will remain in place through at least April 30, 2019, and prior to such date, the Investment Adviser may not terminate the arrangements without the approval of the Fund’s Board of Trustees. If these arrangements are discontinued in the future, the expense ratios may change without shareholder approval. |
TOP TEN HOLDINGS AS OF 6/30/183
| Holding | % of Net Assets | Line of Business | Country | |||||
| Roche Holding AG | 1.8% | Pharmaceuticals, Biotechnology & Life Sciences | Switzerland | |||||
| BP plc ADR | 1.8 | Energy | United Kingdom | |||||
| Nestle SA (Registered) | 1.6 | Food, Beverage & Tobacco | Switzerland | |||||
| AIA Group Ltd. | 1.4 | Insurance | Hong Kong | |||||
| Novo Nordisk A/S Class B | 1.3 | Pharmaceuticals, Biotechnology & Life Sciences | Denmark | |||||
| BASF SE | 1.2 | Materials | Germany | |||||
| BNP Paribas SA | 1.0 | Banks | France | |||||
| Eni SpA | 1.0 | Energy | Italy | |||||
| Safran SA | 1.0 | Capital Goods | France | |||||
| Royal Dutch Shell plc Class A | 1.0 | Energy | Netherlands | |||||
| 3 | The top 10 holdings may not be representative of the Fund’s future investments. |
8
FUND BASICS
FUND VS. BENCHMARK SECTOR ALLOCATIONS4
As of June 30, 2018
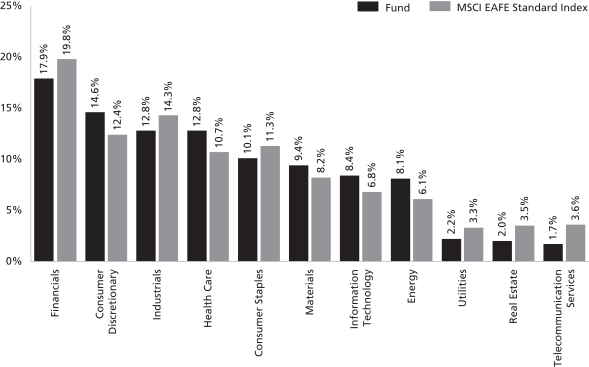
| 4 | The Fund is actively managed and, as such, its composition may differ over time. Consequently, the Fund’s overall sector allocations may differ from percentages contained in the graph above. The graph categorizes investments using Global Industry Classification Standard (“GICS”); however, the sector classifications used by the portfolio management team may differ from GICS. The percentage shown for each investment category reflects the value of investments in that category as a percentage of market value (excluding investments in the securities lending reinvestment vehicle, if any). Underlying sector allocations of exchange traded funds and investment companies held by the Fund are not reflected in the graph above. Investments in the securities lending reinvestment vehicle represented 0.2% of the Fund’s net assets at June 30, 2018. |
9
GOLDMAN SACHS VARIABLE INSURANCE TRUST INTERNATIONAL EQUITY INSIGHTS FUND
Schedule of Investments
June 30, 2018 (Unaudited)
| Shares | Description | Value | ||||||
| Common Stocks – 99.0% | ||||||||
Australia – 6.9% | ||||||||
| 9,605 | ASX Ltd. (Diversified Financials) | $ | 457,849 | |||||
| 14,976 | BHP Billiton plc (Materials) | 336,098 | ||||||
| 1,893 | Cochlear Ltd. (Health Care Equipment & Services) | 280,262 | ||||||
| 14,301 | Flight Centre Travel Group Ltd. (Consumer Services) | 673,205 | ||||||
| 58,392 | Goodman Group (REIT) | 416,267 | ||||||
| 4,780 | Iluka Resources Ltd. (Materials) | 39,482 | ||||||
| 36,955 | Origin Energy Ltd. (Energy)* | 274,101 | ||||||
| 2,127 | OZ Minerals Ltd. (Materials) | 14,832 | ||||||
| 94,977 | Qantas Airways Ltd. (Transportation) | 432,487 | ||||||
| 2,478 | REA Group Ltd. (Media) | 166,301 | ||||||
| 13,262 | Rio Tinto Ltd. (Materials) | 819,397 | ||||||
| 9,832 | Rio Tinto plc ADR (Materials) | 545,479 | ||||||
| 156,862 | South32 Ltd. (Materials) | 418,872 | ||||||
| 25,416 | Wesfarmers Ltd. (Food & Staples Retailing) | 927,336 | ||||||
| 41,955 | Whitehaven Coal Ltd. (Energy) | 179,094 | ||||||
| 36,842 | Woolworths Group Ltd. (Food & Staples Retailing) | 832,029 | ||||||
|
| |||||||
| 6,813,091 | ||||||||
|
| |||||||
Austria – 0.0% | ||||||||
| 769 | OMV AG (Energy) | 43,493 | ||||||
|
| |||||||
Belgium – 1.2% | ||||||||
| 5,051 | Ageas (Insurance) | 254,283 | ||||||
| 9,294 | KBC Group NV (Banks) | 713,780 | ||||||
| 705 | UCB SA (Pharmaceuticals, Biotechnology & Life Sciences) | 55,265 | ||||||
| 955 | Warehouses De Pauw CVA (REIT) | 120,687 | ||||||
|
| |||||||
| 1,144,015 | ||||||||
|
| |||||||
China – 1.0% | ||||||||
| 127,000 | CITIC Telecom International Holdings Ltd. (Telecommunication Services) | 33,280 | ||||||
| 14,000 | ENN Energy Holdings Ltd. (Utilities) | 137,108 | ||||||
| 213,000 | Fosun International Ltd. (Capital Goods) | 398,947 | ||||||
| 384,000 | Towngas China Co. Ltd. (Utilities)* | 371,571 | ||||||
| 22,700 | Yangzijiang Shipbuilding Holdings Ltd. (Capital Goods) | 15,025 | ||||||
|
| |||||||
| 955,931 | ||||||||
|
| |||||||
Denmark – 2.1% | ||||||||
| 7,805 | GN Store Nord A/S (Health Care Equipment & Services) | 354,629 | ||||||
| 26,997 | Novo Nordisk A/S Class B (Pharmaceuticals, Biotechnology & Life Sciences) | 1,247,007 | ||||||
| 6,392 | Pandora A/S (Consumer Durables & Apparel) | 445,506 | ||||||
|
| |||||||
| 2,047,142 | ||||||||
|
| |||||||
| Common Stocks – (continued) | ||||||||
Finland – 0.5% | ||||||||
| 4,321 | Ramirent OYJ (Capital Goods) | $ | 45,750 | |||||
| 11,964 | UPM-Kymmene OYJ (Materials) | 425,979 | ||||||
|
| |||||||
| 471,729 | ||||||||
|
| |||||||
France – 10.3% | ||||||||
| 14,575 | Beneteau SA (Consumer Durables & Apparel) | 273,037 | ||||||
| 16,223 | BNP Paribas SA (Banks) | 1,003,505 | ||||||
| 1,633 | Capgemini SE (Software & Services) | 218,838 | ||||||
| 1,543 | Christian Dior SE (Consumer Durables & Apparel) | 644,445 | ||||||
| 11,612 | Cie de Saint-Gobain (Capital Goods) | 517,256 | ||||||
| 3,281 | Cie Generale des Etablissements Michelin SCA (Automobiles & Components) | 396,929 | ||||||
| 263 | Dassault Aviation SA (Capital Goods) | 500,085 | ||||||
| 5,937 | Eiffage SA (Capital Goods) | 645,016 | ||||||
| 2,510 | Faurecia SA (Automobiles & Components) | 178,427 | ||||||
| 1,240 | Hermes International (Consumer Durables & Apparel) | 757,460 | ||||||
| 824 | Ingenico Group SA (Technology Hardware & Equipment) | 73,883 | ||||||
| 1,743 | Kering SA (Consumer Durables & Apparel) | 981,832 | ||||||
| 8,216 | Safran SA (Capital Goods) | 994,998 | ||||||
| 10,941 | Schneider Electric SE (Capital Goods) | 909,928 | ||||||
| 1,796 | Teleperformance (Commercial & Professional Services) | 316,986 | ||||||
| 16,226 | TOTAL SA (Energy) | 985,336 | ||||||
| 32,386 | Vivendi SA (Media) | 792,256 | ||||||
|
| |||||||
| 10,190,217 | ||||||||
|
| |||||||
Germany – 8.4% | ||||||||
| 3,264 | adidas AG (Consumer Durables & Apparel) | 710,631 | ||||||
| 2,262 | Aurubis AG (Materials) | 172,668 | ||||||
| 11,954 | BASF SE (Materials) | 1,141,231 | ||||||
| 4,574 | CANCOM SE (Software & Services) | 464,769 | ||||||
| 1,869 | Continental AG (Automobiles & Components) | 425,343 | ||||||
| 8,304 | Covestro AG (Materials)(a) | 738,090 | ||||||
| 19,588 | Deutsche Lufthansa AG (Registered) (Transportation) | 469,282 | ||||||
| 7,994 | Fresenius Medical Care AG & Co. KGaA (Health Care Equipment & Services) | 804,928 | ||||||
| 4,747 | HUGO BOSS AG (Consumer Durables & Apparel) | 430,501 | ||||||
| 28,427 | Infineon Technologies AG (Semiconductors & Semiconductor Equipment) | 722,083 | ||||||
| 1,916 | Linde AG (Materials) | 455,201 | ||||||
| 4,681 | Nemetschek SE (Software & Services) | 561,049 | ||||||
| 3,036 | ProSiebenSat.1 Media SE (Media) | 76,826 | ||||||
|
| |||||||
| 10 | The accompanying notes are an integral part of these financial statements. |
GOLDMAN SACHS VARIABLE INSURANCE TRUST INTERNATIONAL EQUITY INSIGHTS FUND
| Shares | Description | Value | ||||||
| Common Stocks – (continued) | ||||||||
Germany – (continued) | ||||||||
| 1,387 | Siemens AG (Registered) (Capital Goods) | $ | 182,745 | |||||
| 299 | Siltronic AG (Semiconductors & Semiconductor Equipment) | 42,488 | ||||||
| 5,327 | Wirecard AG (Software & Services) | 852,429 | ||||||
|
| |||||||
| 8,250,264 | ||||||||
|
| |||||||
Hong Kong – 3.4% | ||||||||
| 159,800 | AIA Group Ltd. (Insurance) | 1,392,083 | ||||||
| 90,000 | Galaxy Entertainment Group Ltd. (Consumer Services) | 693,761 | ||||||
| 24,900 | Hong Kong Exchanges & Clearing Ltd. (Diversified Financials) | 745,196 | ||||||
| 664,500 | WH Group Ltd. (Food, Beverage & Tobacco)(a) | 537,705 | ||||||
|
| |||||||
| 3,368,745 | ||||||||
|
| |||||||
Italy – 2.1% | ||||||||
| 53,760 | Eni SpA (Energy) | 996,784 | ||||||
| 6,545 | Geox SpA (Consumer Durables & Apparel) | 18,451 | ||||||
| 261,815 | Intesa Sanpaolo SpA (Banks) | 757,502 | ||||||
| 17,274 | Mediobanca Banca di Credito Finanziario SpA (Banks) | 159,785 | ||||||
| 31,106 | OVS SpA (Consumer Durables & Apparel)*(a) | 101,292 | ||||||
|
| |||||||
| 2,033,814 | ||||||||
|
| |||||||
Japan – 24.2% | ||||||||
| 11,400 | AEON Financial Service Co. Ltd. (Diversified Financials) | 242,980 | ||||||
| 900 | Aisin Seiki Co. Ltd. (Automobiles & Components) | 40,979 | ||||||
| 1,600 | Albis Co. Ltd. (Food & Staples Retailing) | 46,239 | ||||||
| 13,500 | AOKI Holdings, Inc. (Retailing) | 197,004 | ||||||
| 2,700 | Asahi Group Holdings Ltd. (Food, Beverage & Tobacco) | 138,477 | ||||||
| 14,300 | Asahi Kasei Corp. (Materials) | 181,345 | ||||||
| 35,000 | Astellas Pharma, Inc. (Pharmaceuticals, Biotechnology & Life Sciences) | 532,650 | ||||||
| 2,400 | Benesse Holdings, Inc. (Consumer Services) | 85,109 | ||||||
| 6,600 | cocokara fine, Inc. (Food & Staples Retailing) | 405,797 | ||||||
| 3,100 | Computer Institute of Japan Ltd. (Software & Services) | 19,136 | ||||||
| 8,200 | Credit Saison Co. Ltd. (Diversified Financials) | 128,830 | ||||||
| 21,500 | Daiwa House Industry Co. Ltd. (Real Estate) | 731,469 | ||||||
| 4,800 | EPS Holdings, Inc. (Pharmaceuticals, Biotechnology & Life Sciences) | 102,701 | ||||||
| 17,300 | Fancl Corp. (Household & Personal Products) | 865,495 | ||||||
| 700 | Fujimori Kogyo Co. Ltd. (Materials) | 23,038 | ||||||
|
| |||||||
| Common Stocks – (continued) | ||||||||
Japan – (continued) | ||||||||
| 120,000 | Fujitsu Ltd. (Software & Services) | $ | 726,182 | |||||
| 2,300 | Goldcrest Co. Ltd. (Real Estate) | 37,361 | ||||||
| 43,200 | Gree, Inc. (Software & Services) | 231,048 | ||||||
| 900 | Heiwa Corp. (Consumer Durables & Apparel) | 21,710 | ||||||
| 2,200 | Himaraya Co. Ltd. (Retailing) | 21,036 | ||||||
| 600 | Hitachi Construction Machinery Co. Ltd. (Capital Goods) | 19,452 | ||||||
| 121,000 | Hitachi Ltd. (Technology Hardware & Equipment) | 852,443 | ||||||
| 3,900 | Honda Motor Co. Ltd. (Automobiles & Components) | 114,352 | ||||||
| 11,800 | Ichiyoshi Securities Co. Ltd. (Diversified Financials) | 127,597 | ||||||
| 1,000 | Jafco Co. Ltd. (Diversified Financials) | 40,537 | ||||||
| 16,700 | Japan Exchange Group, Inc. (Diversified Financials) | 309,754 | ||||||
| 30,900 | JFE Holdings, Inc. (Materials) | 583,630 | ||||||
| 71,600 | JXTG Holdings, Inc. (Energy) | 496,745 | ||||||
| 4,000 | Kajima Corp. (Capital Goods) | 30,907 | ||||||
| 16,900 | Kansai Electric Power Co., Inc. (The) (Utilities) | 246,471 | ||||||
| 9,800 | Kao Corp. (Household & Personal Products) | 746,971 | ||||||
| 2,800 | KDDI Corp. (Telecommunication Services) | 76,566 | ||||||
| 8,300 | Kirin Holdings Co. Ltd. (Food, Beverage & Tobacco) | 222,481 | ||||||
| 1,200 | Kobayashi Pharmaceutical Co. Ltd. (Household & Personal Products) | 103,579 | ||||||
| 4,700 | Kohnan Shoji Co. Ltd. (Retailing) | 109,407 | ||||||
| 2,800 | Konoike Transport Co. Ltd. (Transportation) | 42,212 | ||||||
| 9,700 | Kyocera Corp. (Technology Hardware & Equipment) | 545,508 | ||||||
| 16,400 | Kyowa Hakko Kirin Co. Ltd. (Pharmaceuticals, Biotechnology & Life Sciences) | 330,103 | ||||||
| 1,600 | Look Holdings, Inc. (Consumer Durables & Apparel) | 19,656 | ||||||
| 4,300 | Macnica Fuji Electronics Holdings, Inc. (Technology Hardware & Equipment) | 72,099 | ||||||
| 11,400 | Mandom Corp. (Household & Personal Products) | 354,553 | ||||||
| 1,200 | Marusan Securities Co. Ltd. (Diversified Financials) | 11,012 | ||||||
| 1,000 | Ministop Co. Ltd. (Food & Staples Retailing) | 20,169 | ||||||
| 21,700 | Mitsubishi Corp. (Capital Goods) | 601,721 | ||||||
| 17,500 | Mitsubishi UFJ Financial Group, Inc. (Banks) | 99,135 | ||||||
| 37,000 | Mitsui & Co. Ltd. (Capital Goods) | 616,135 | ||||||
| 4,300 | Mitsui Sugar Co. Ltd. (Food, Beverage & Tobacco) | 133,274 | ||||||
|
| |||||||
| The accompanying notes are an integral part of these financial statements. | 11 |
GOLDMAN SACHS VARIABLE INSURANCE TRUST INTERNATIONAL EQUITY INSIGHTS FUND
Schedule of Investments (continued)
June 30, 2018 (Unaudited)
| Shares | Description | Value | ||||||
| Common Stocks – (continued) | ||||||||
Japan – (continued) | ||||||||
| 8,200 | NEC Networks & System Integration Corp. (Software & Services) | $ | 184,302 | |||||
| 6,900 | NET One Systems Co. Ltd. (Software & Services) | 118,457 | ||||||
| 111,600 | Nippon Light Metal Holdings Co. Ltd. (Materials) | 250,376 | ||||||
| 300 | Nippon Shokubai Co. Ltd. (Materials) | 21,666 | ||||||
| 3,000 | NSD Co. Ltd. (Software & Services) | 68,293 | ||||||
| 8,000 | Obayashi Corp. (Capital Goods) | 83,067 | ||||||
| 46,200 | ORIX Corp. (Diversified Financials) | 728,209 | ||||||
| 33,500 | Osaka Gas Co. Ltd. (Utilities) | 693,650 | ||||||
| 15,800 | Persol Holdings Co. Ltd. (Commercial & Professional Services) | 351,872 | ||||||
| 6,000 | Prima Meat Packers Ltd. (Food, Beverage & Tobacco) | 34,682 | ||||||
| 20,200 | Rakuten, Inc. (Retailing) | 136,343 | ||||||
| 92,100 | Resona Holdings, Inc. (Banks) | 490,873 | ||||||
| 17,700 | Rohto Pharmaceutical Co. Ltd. (Pharmaceuticals, Biotechnology & Life Sciences) | 567,126 | ||||||
| 1,200 | Ryohin Keikaku Co. Ltd. (Retailing) | 421,588 | ||||||
| 42,300 | Santen Pharmaceutical Co. Ltd. (Pharmaceuticals, Biotechnology & Life Sciences) | 735,868 | ||||||
| 1,100 | SCSK Corp. (Software & Services) | 51,076 | ||||||
| 42,200 | Sega Sammy Holdings, Inc. (Consumer Durables & Apparel) | 722,273 | ||||||
| 20,100 | Seven & i Holdings Co. Ltd. (Food & Staples Retailing) | 876,675 | ||||||
| 3,700 | Shimizu Corp. (Capital Goods) | 38,295 | ||||||
| 14,700 | Shionogi & Co. Ltd. (Pharmaceuticals, Biotechnology & Life Sciences) | 754,314 | ||||||
| 9,300 | SoftBank Group Corp. (Telecommunication Services) | 664,096 | ||||||
| 25,700 | Sony Financial Holdings, Inc. (Insurance) | 489,665 | ||||||
| 2,200 | Square Enix Holdings Co. Ltd. (Software & Services) | 107,871 | ||||||
| 6,700 | Sumitomo Heavy Industries Ltd. (Capital Goods) | 225,743 | ||||||
| 25,200 | Sumitomo Mitsui Financial Group, Inc. (Banks) | 982,951 | ||||||
| 9,900 | Suruga Bank Ltd. (Banks) | 88,183 | ||||||
| 11,700 | TIS, Inc. (Software & Services) | 537,680 | ||||||
| 27,400 | Tokyo Gas Co. Ltd. (Utilities) | 727,532 | ||||||
| 500 | Toyota Motor Corp. (Automobiles & Components) | 32,335 | ||||||
| 1,200 | Tsuruha Holdings, Inc. (Food & Staples Retailing) | 150,305 | ||||||
| 2,800 | Usen-Next Holdings Co. Ltd. (Telecommunication Services)* | 31,110 | ||||||
| 1,600 | West Japan Railway Co. (Transportation) | 117,799 | ||||||
| 24,500 | Yamaha Motor Co. Ltd. (Automobiles & Components) | 615,041 | ||||||
|
| |||||||
| Shares | Description | Value | ||||||
| Common Stocks – (continued) | ||||||||
Japan – (continued) | ||||||||
| 400 | Zenkoku Hosho Co. Ltd. (Diversified Financials) | $ | 18,111 | |||||
| 3,200 | Zuken, Inc. (Software & Services) | 51,948 | ||||||
|
| |||||||
| 23,874,430 | ||||||||
|
| |||||||
Luxembourg – 0.6% | ||||||||
| 19,844 | ArcelorMittal (Materials) | 578,964 | ||||||
|
| |||||||
Netherlands – 5.9% | ||||||||
| 63,009 | ING Groep NV (Banks) | 904,464 | ||||||
| 7,722 | Koninklijke DSM NV (Materials) | 772,501 | ||||||
| 20,815 | Koninklijke Philips NV (Health Care Equipment & Services) | 881,889 | ||||||
| 3,557 | NN Group NV (Insurance) | 144,259 | ||||||
| 2,398 | NXP Semiconductors NV (Semiconductors & Semiconductor Equipment)* | 262,030 | ||||||
| 4,252 | Randstad NV (Commercial & Professional Services) | 249,572 | ||||||
| 28,540 | Royal Dutch Shell plc Class A (Energy) | 990,465 | ||||||
| 22,920 | Royal Dutch Shell plc Class B (Energy) | 820,834 | ||||||
| 14,076 | Wolters Kluwer NV (Commercial & Professional Services) | 790,744 | ||||||
|
| |||||||
| 5,816,758 | ||||||||
|
| |||||||
Norway – 1.6% | ||||||||
| 278,187 | DNO ASA (Energy)* | 512,103 | ||||||
| 8,606 | Kongsberg Gruppen ASA (Capital Goods) | 182,968 | ||||||
| 37,445 | Leroy Seafood Group ASA (Food, Beverage & Tobacco) | 252,240 | ||||||
| 16,708 | Marine Harvest ASA (Food, Beverage & Tobacco) | 332,203 | ||||||
| 8,165 | Salmar ASA (Food, Beverage & Tobacco) | 342,471 | ||||||
|
| |||||||
| 1,621,985 | ||||||||
|
| |||||||
Portugal – 0.7% | ||||||||
| 2,813 | Altri SGPS SA (Materials) | 28,348 | ||||||
| 35,901 | Galp Energia SGPS SA (Energy) | 682,968 | ||||||
|
| |||||||
| 711,316 | ||||||||
|
| |||||||
Singapore – 1.9% | ||||||||
| 168,600 | ComfortDelGro Corp. Ltd. (Transportation) | 290,158 | ||||||
| 35,400 | Keppel Corp. Ltd. (Capital Goods) | 185,184 | ||||||
| 84,500 | Oversea-Chinese Banking Corp. Ltd. (Banks) | 719,750 | ||||||
| 5,300 | Singapore Airlines Ltd. (Transportation) | 41,507 | ||||||
| 106,400 | Singapore Exchange Ltd. (Diversified Financials) | 559,122 | ||||||
| 5,900 | Venture Corp. Ltd. (Technology Hardware & Equipment) | 77,083 | ||||||
|
| |||||||
| 1,872,804 | ||||||||
|
| |||||||
| 12 | The accompanying notes are an integral part of these financial statements. |
GOLDMAN SACHS VARIABLE INSURANCE TRUST INTERNATIONAL EQUITY INSIGHTS FUND
| Shares | Description | Value | ||||||
| Common Stocks – (continued) | ||||||||
Spain – 3.3% | ||||||||
| 3,589 | Aena SME SA (Transportation)(a) | $ | 649,778 | |||||
| 139,011 | Banco Bilbao Vizcaya Argentaria SA (Banks) | 980,384 | ||||||
| 41,255 | Ence Energia y Celulosa SA (Materials) | 364,659 | ||||||
| 24,627 | Grifols SA (Pharmaceuticals, Biotechnology & Life Sciences) | 738,141 | ||||||
| 34,291 | Merlin Properties Socimi SA (REIT) | 497,840 | ||||||
|
| |||||||
| 3,230,802 | ||||||||
|
| |||||||
Sweden – 1.5% | ||||||||
| 12,662 | Biotage AB (Pharmaceuticals, Biotechnology & Life Sciences) | 161,618 | ||||||
| 9,124 | Hemfosa Fastigheter AB (Real Estate) | 106,572 | ||||||
| 14,220 | Holmen AB Class B (Materials) | 322,081 | ||||||
| 1,139 | Lundin Petroleum AB (Energy) | 36,152 | ||||||
| 1,020 | Nolato AB Class B (Capital Goods) | 82,076 | ||||||
| 32,487 | Sandvik AB (Capital Goods) | 573,752 | ||||||
| 10,712 | Volvo AB Class B (Capital Goods) | 170,247 | ||||||
|
| |||||||
| 1,452,498 | ||||||||
|
| |||||||
Switzerland – 10.8% | ||||||||
| 10,713 | Adecco Group AG (Registered) (Commercial & Professional Services) | 632,218 | ||||||
| 10,461 | Cie Financiere Richemont SA (Registered) (Consumer Durables & Apparel) | 884,315 | ||||||
| 85,739 | Ferrexpo plc (Materials) | 206,161 | ||||||
| 313 | Inficon Holding AG (Registered) (Technology Hardware & Equipment)* | 159,101 | ||||||
| 6,080 | Logitech International SA (Registered) (Technology Hardware & Equipment) | 266,370 | ||||||
| 19,995 | Nestle SA (Registered) (Food, Beverage & Tobacco) | 1,549,630 | ||||||
| 11,405 | Novartis AG (Registered) (Pharmaceuticals, Biotechnology & Life Sciences) | 863,940 | ||||||
| 7,887 | Roche Holding AG (Pharmaceuticals, Biotechnology & Life Sciences) | 1,749,795 | ||||||
| 1,308 | Siegfried Holding AG (Registered) (Pharmaceuticals, Biotechnology & Life Sciences)* | 522,878 | ||||||
| 3,786 | Sonova Holding AG (Registered) (Health Care Equipment & Services) | 677,253 | ||||||
| 9,614 | STMicroelectronics NV (Semiconductors & Semiconductor Equipment) | 213,270 | ||||||
| 1,312 | Swatch Group AG (The) (Consumer Durables & Apparel) | 621,077 | ||||||
| 2,697 | Tecan Group AG (Registered) (Pharmaceuticals, Biotechnology & Life Sciences) | 654,520 | ||||||
| 4,776 | Temenos AG (Registered) (Software & Services)* | 718,246 | ||||||
| 3,074 | Zurich Insurance Group AG (Insurance)* | 909,074 | ||||||
|
| |||||||
| 10,627,848 | ||||||||
|
| |||||||
| Common Stocks – (continued) | ||||||||
United Kingdom – 12.0% | ||||||||
| 56,601 | 3i Group plc (Diversified Financials) | $ | 670,107 | |||||
| 19,081 | Abcam plc (Pharmaceuticals, Biotechnology & Life Sciences) | 335,199 | ||||||
| 4,249 | Ashtead Group plc (Capital Goods) | 126,533 | ||||||
| 115,855 | Aviva plc (Insurance) | 768,708 | ||||||
| 4,719 | Bellway plc (Consumer Durables & Apparel) | 186,428 | ||||||
| 38,192 | BP plc ADR (Energy) | 1,743,847 | ||||||
| 34,650 | BT Group plc (Telecommunication Services) | 99,402 | ||||||
| 7,198 | Burberry Group plc (Consumer Durables & Apparel) | 204,571 | ||||||
| 26,655 | Diageo plc (Food, Beverage & Tobacco) | 957,605 | ||||||
| 131,915 | Direct Line Insurance Group plc (Insurance) | 595,289 | ||||||
| 12,099 | Experian plc (Commercial & Professional Services) | 298,466 | ||||||
| 8,286 | Fiat Chrysler Automobiles NV (Automobiles & Components)* | 156,309 | ||||||
| 50,978 | Genel Energy plc (Energy)*(b) | 182,660 | ||||||
| 33,986 | HSBC Holdings plc (Banks) | 317,577 | ||||||
| 208,202 | Legal & General Group plc (Insurance) | 728,257 | ||||||
| 1,144,891 | Lloyds Banking Group plc (Banks) | 949,936 | ||||||
| 25,134 | Mondi plc (Materials) | 678,067 | ||||||
| 9,877 | Next plc (Retailing) | 786,197 | ||||||
| 38,065 | Pearson plc (Media) | 443,293 | ||||||
| 31,600 | RELX NV (Commercial & Professional Services) | 671,780 | ||||||
| 5,013 | Smith & Nephew plc (Health Care Equipment & Services) | 92,341 | ||||||
| 1,011 | Unilever plc ADR (Household & Personal Products) | 55,888 | ||||||
| 29,846 | Vodafone Group plc ADR (Telecommunication Services) | 725,556 | ||||||
|
| |||||||
| 11,774,016 | ||||||||
|
| |||||||
United States – 0.6% | ||||||||
| 11,023 | Carnival plc ADR (Consumer Services) | 635,476 | ||||||
|
| |||||||
| TOTAL COMMON STOCKS | ||||||||
| (Cost $101,206,659) | $ | 97,515,338 | ||||||
|
| |||||||
| Units | Description | Expiration Month | Value | |||||||||
| Right* – 0.0% |
| |||||||||||
Italy – 0.0% |
| |||||||||||
| 261,815 | | Intesa Sanpaolo SpA (Banks) | | 07/2018 | $ | — | ||||||
| (Cost $0) | ||||||||||||
| ||||||||||||
| TOTAL INVESTMENTS BEFORE SECURITIES LENDING REINVESTMENT VEHICLE |
| |||||||||||
| (Cost $101,206,659) |
| $ | 97,515,338 | |||||||||
| ||||||||||||
| The accompanying notes are an integral part of these financial statements. | 13 |
GOLDMAN SACHS VARIABLE INSURANCE TRUST INTERNATIONAL EQUITY INSIGHTS FUND
Schedule of Investments (continued)
June 30, 2018 (Unaudited)
| Shares | Distribution Rate | Value | ||||||
| Securities Lending Reinvestment Vehicle(c) – 0.2% |
| |||||||
Goldman Sachs Financial Square Government Fund — Institutional Shares |
| |||||||
| 180,000 | 1.869 | % | $ | 180,000 | ||||
| (Cost $180,000) |
| |||||||
| ||||||||
| TOTAL INVESTMENTS – 99.2% |
| |||||||
| (Cost $101,386,659) |
| $ | 97,695,338 | |||||
| ||||||||
OTHER ASSETS IN EXCESS OF LIABILITIES – 0.8% |
| 829,688 | ||||||
| ||||||||
| NET ASSETS – 100.0% |
| $ | 98,525,026 | |||||
| ||||||||
| The percentage shown for each investment category reflects the value of investments in that category as a percentage of net assets. | ||
| * | Non-income producing security. | |
| (a) | Exempt from registration under Rule 144A of the Securities Act of 1933. Under procedures approved by the Board of Trustees, such securities may be deemed liquid by the Investment Adviser and may be resold, normally to qualified institutional buyers in transactions exempt from registration. Total market value of Rule 144A securities amounts to $2,026,865, which represents approximately 2.1% of net assets as of June 30, 2018. The liquidity determination is unaudited. | |
| (b) | All or a portion of security is on loan. | |
| (c) | Represents an Affiliated Issuer. | |
| Investment Abbreviations: | ||
| ADR | —American Depositary Receipt | |
| CVA | —Dutch Certification | |
| REIT | —Real Estate Investment Trust | |
| 14 | The accompanying notes are an integral part of these financial statements. |
GOLDMAN SACHS VARIABLE INSURANCE TRUST INTERNATIONAL EQUITY INSIGHTS FUND
Statement of Assets and Liabilities
June 30, 2018 (Unaudited)
| Assets: | ||||
Investments in unaffiliated issuers, at value (cost $101,206,659)(a) | $ | 97,515,338 | ||
Investments in affiliated securities lending reinvestment vehicle, at value (cost $180,000) | 180,000 | |||
Foreign currencies, at value (cost $38,544) | 38,660 | |||
Receivables: | ||||
Investments sold | 2,139,621 | |||
Foreign tax reclaims | 464,645 | |||
Dividends | 118,887 | |||
Reimbursement from investment adviser | 17,843 | |||
Securities lending income | 5,542 | |||
Fund shares sold | 1,292 | |||
Other assets | 2,042 | |||
| Total assets | 100,483,870 | |||
| Liabilities: | ||||
Payables: | ||||
Investments purchased | 1,590,908 | |||
Payable upon return of securities loaned | 180,000 | |||
Management fees | 68,543 | |||
Fund shares redeemed | 48,905 | |||
Due to custodian | 30,128 | |||
Distribution and Service fees and Transfer Agency fees | 13,694 | |||
Accrued expenses | 26,666 | |||
| Total liabilities | 1,958,844 | |||
| Net Assets: | ||||
Paid-in capital | 80,876,282 | |||
Undistributed net investment income | 979,070 | |||
Accumulated net realized gain | 20,363,161 | |||
Net unrealized loss | (3,693,487 | ) | ||
| NET ASSETS | $ | 98,525,026 | ||
Net Assets: | ||||
Institutional | $ | 43,483,196 | ||
Service | 55,041,830 | |||
Total Net Assets | $ | 98,525,026 | ||
Shares outstanding $0.001 par value (unlimited shares authorized): | ||||
Institutional | 4,106,930 | |||
Service | 5,193,651 | |||
Net asset value, offering and redemption price per share: | ||||
Institutional | $10.59 | |||
Service | 10.60 | |||
(a) Includes loaned securities having a market value of $172,055.
| The accompanying notes are an integral part of these financial statements. | 15 |
GOLDMAN SACHS VARIABLE INSURANCE TRUST INTERNATIONAL EQUITY INSIGHTS FUND
Statement of Operations
For the Six Months Ended June 30, 2018 (Unaudited)
| Investment income: | ||||
Dividends — unaffiliated issuers (net of foreign taxes withheld of $209,059) | $ | 1,814,956 | ||
Securities lending income — affiliated issuer | 24,874 | |||
Dividends — affiliated issuers | 8,295 | |||
| Total investment income | 1,848,125 | |||
| Expenses: | ||||
Management fees | 528,882 | |||
Distribution and Service fees — Service Shares | 102,558 | |||
Professional fees | 49,861 | |||
Custody, accounting and administrative services | 39,043 | |||
Printing and mailing costs | 22,529 | |||
Transfer Agency fees(a) | 12,630 | |||
Trustee fees | 8,833 | |||
Other | 5,233 | |||
| Total expenses | 769,569 | |||
Less — expense reductions | (116,769 | ) | ||
| Net expenses | 652,800 | |||
| NET INVESTMENT INCOME | 1,195,325 | |||
| Realized and unrealized gain (loss): | ||||
Net realized gain (loss) from: | ||||
Investments — unaffiliated issuers | 25,344,020 | |||
Foreign currency transactions | (62,007 | ) | ||
Net change in unrealized loss on: | ||||
Investments — unaffiliated issuers | (29,799,183 | ) | ||
Foreign currency translation | (3,422 | ) | ||
| Net realized and unrealized loss | (4,520,592 | ) | ||
| NET DECREASE IN NET ASSETS RESULTING FROM OPERATIONS | $ | (3,325,267 | ) | |
(a) Institutional and Service Shares incurred Transfer Agency fees of $4,426 and $8,204, respectively.
| 16 | The accompanying notes are an integral part of these financial statements. |
GOLDMAN SACHS VARIABLE INSURANCE TRUST INTERNATIONAL EQUITY INSIGHTS FUND
Statements of Changes in Net Assets
| For the Six Months Ended June 30, 2018 (Unaudited) | For the Fiscal Year Ended December 31, 2017 | |||||||
| From operations: | ||||||||
Net investment income | $ | 1,195,325 | $ | 2,387,471 | ||||
Net realized gain (loss) | 25,282,013 | (257,284 | ) | |||||
Net change in unrealized gain (loss) | (29,802,605 | ) | 34,780,956 | |||||
| Net increase (decrease) in net assets resulting from operations | (3,325,267 | ) | 36,911,143 | |||||
| Distributions to shareholders: | ||||||||
From net investment income | ||||||||
Institutional Shares | — | (739,059 | ) | |||||
Service Shares | — | (1,909,638 | ) | |||||
| Total distributions to shareholders | — | (2,648,697 | ) | |||||
| From share transactions: | ||||||||
Proceeds from sales of shares | 6,432,589 | 7,888,528 | ||||||
Reinvestment of distributions | — | 2,648,697 | ||||||
Cost of shares redeemed | (69,872,286 | ) | (21,932,620 | ) | ||||
| Net decrease in net assets resulting from share transactions | (63,439,697 | ) | (11,395,395 | ) | ||||
| TOTAL INCREASE (DECREASE) | (66,764,964 | ) | 22,867,051 | |||||
| Net assets: | ||||||||
Beginning of period | 165,289,990 | 142,422,939 | ||||||
End of period | $ | 98,525,026 | $ | 165,289,990 | ||||
| Undistributed (distributions in excess of) net investment income | $ | 979,070 | $ | (216,255 | ) | |||
| The accompanying notes are an integral part of these financial statements. | 17 |
GOLDMAN SACHS VARIABLE INSURANCE TRUST INTERNATIONAL EQUITY INSIGHTS FUND
Financial Highlights
Selected Data for a Share Outstanding Throughout Each Period
| Income (loss) from investment operations | ||||||||||||||||||||||||||||||||||||||||||||||||
| Year - Share Class | Net asset value, beginning of period | Net investment income(a) | Net realized and unrealized gain (loss) | Total from investment operations | Distributions to shareholders from net investment income | Net asset value, | Total return(b) | Net assets, end of period (in 000s) | Ratio of net expenses to average net assets | Ratio of total expenses to average net assets | Ratio of net investment income to average net assets | Portfolio turnover rate(c) | ||||||||||||||||||||||||||||||||||||
FOR THE SIX MONTHS ENDED JUNE 30, (UNAUDITED) | ||||||||||||||||||||||||||||||||||||||||||||||||
2018 - Institutional | $ | 10.88 | $ | 0.13 | $ | (0.42 | ) | $ | (0.29 | ) | $ | — | $ | 10.59 | (2.67 | )% | $ | 43,483 | 0.87 | %(d) | 1.06 | %(d) | 2.47 | %(d) | 90 | % | ||||||||||||||||||||||
2018 - Service | 10.91 | 0.09 | (0.40 | ) | (0.31 | ) | — | 10.60 | (2.84 | ) | 55,042 | 1.12 | (d) | 1.30 | (d) | 1.58 | (d) | 90 | ||||||||||||||||||||||||||||||
FOR THE FISCAL YEARS ENDED DECEMBER 31, | ||||||||||||||||||||||||||||||||||||||||||||||||
2017 - Institutional | 8.75 | 0.17 | 2.16 | 2.33 | (0.20 | ) | 10.88 | 26.60 | 41,512 | 0.87 | 1.02 | 1.69 | 23 | |||||||||||||||||||||||||||||||||||
2017 - Service | 8.78 | 0.14 | 2.16 | 2.30 | (0.17 | ) | 10.91 | 26.21 | 123,778 | 1.12 | 1.27 | 1.44 | 23 | |||||||||||||||||||||||||||||||||||
2016 - Institutional | 9.19 | 0.17 | (e) | (0.42 | ) | (0.25 | ) | (0.19 | ) | 8.75 | (2.72 | ) | 37,061 | 0.89 | 1.06 | 1.94 | (e) | 39 | ||||||||||||||||||||||||||||||
2016 - Service | 9.21 | 0.15 | (e) | (0.42 | ) | (0.27 | ) | (0.16 | ) | 8.78 | (2.86 | ) | 105,362 | 1.14 | 1.31 | 1.68 | (e) | 39 | ||||||||||||||||||||||||||||||
2015 - Institutional | 9.26 | 0.14 | (f) | (0.04 | ) | 0.10 | (0.17 | ) | 9.19 | 1.05 | 41,737 | 0.89 | 1.06 | 1.42 | (f) | 58 | ||||||||||||||||||||||||||||||||
2015 - Service | 9.28 | 0.12 | (f) | (0.05 | ) | 0.07 | (0.14 | ) | 9.21 | 0.77 | 116,811 | 1.14 | 1.31 | 1.18 | (f) | 58 | ||||||||||||||||||||||||||||||||
2014 - Institutional | 10.43 | 0.39 | (g) | (1.18 | ) | (0.79 | ) | (0.38 | ) | 9.26 | (7.54 | ) | 46,871 | 0.99 | 1.04 | 3.75 | (g) | 74 | ||||||||||||||||||||||||||||||
2014 - Service | 10.44 | 0.36 | (g) | (1.17 | ) | (0.81 | ) | (0.35 | ) | 9.28 | (7.70 | ) | 126,230 | 1.24 | 1.29 | 3.47 | (g) | 74 | ||||||||||||||||||||||||||||||
2013 - Institutional | 8.56 | 0.16 | 1.89 | 2.05 | (0.18 | ) | 10.43 | 24.20 | 59,187 | 0.98 | 1.05 | 1.67 | 95 | |||||||||||||||||||||||||||||||||||
2013 - Service | 8.57 | 0.13 | 1.90 | 2.03 | (0.16 | ) | 10.44 | 23.73 | 152,513 | 1.23 | 1.30 | 1.42 | 95 | |||||||||||||||||||||||||||||||||||
| (a) | Calculated based on the average shares outstanding methodology. |
| (b) | Assumes investment at the net asset value at the beginning of the period, reinvestment of all distributions, and a complete redemption of the investment at the net asset value at the end of the period. Total returns for periods less than one full year are not annualized. |
| (c) | The Fund’s portfolio turnover rate is calculated in accordance with regulatory requirements, without regard to transactions involving short term investments. If such transactions were included, the Fund’s portfolio turnover rate may be higher. |
| (d) | Annualized. |
| (e) | Reflects income recognized from corporate actions which amounted to $0.03 per share and 0.36% of average net assets. |
| (f) | Reflects income recognized from a corporate action which amounted to $0.02 per share and 0.17% of average net assets. |
| (g) | Reflects income recognized from a corporate action which amounted to $0.22 per share and 2.10% of average net assets. |
| The accompanying notes are an integral part of these financial statements. | 18 |
GOLDMAN SACHS VARIABLE INSURANCE TRUST INTERNATIONAL EQUITY INSIGHTS FUND
Notes to Financial Statements
June 30, 2018 (Unaudited)
1. ORGANIZATION
Goldman Sachs Variable Insurance Trust (the “Trust” or “VIT”) is a Delaware statutory trust registered under the Investment Company Act of 1940, as amended (the “Act”), as an open-end management investment company. The Trust includes the Goldman Sachs International Equity Insights Fund (the “Fund”) (formerly the Goldman Sachs Strategic International Equity Fund). The Fund is a diversified portfolio under the Act offering two classes of shares — Institutional and Service Shares. Shares of the Trust are offered to separate accounts of participating life insurance companies for the purpose of funding variable annuity contracts and variable life insurance policies.
Goldman Sachs Asset Management, L.P. (“GSAM”), an affiliate of Goldman Sachs & Co. LLC (“Goldman Sachs”), serves as investment adviser to the Fund pursuant to a management agreement (the “Agreement”) with the Trust.
2. SIGNIFICANT ACCOUNTING POLICIES
The financial statements have been prepared in accordance with accounting principles generally accepted in the United States of America (“GAAP”) and require management to make estimates and assumptions that may affect the reported amounts and disclosures. Actual results may differ from those estimates and assumptions.
A. Investment Valuation — The Fund’s valuation policy is to value investments at fair value.
B. Investment Income and Investments — Investment income includes interest income, dividend income, and securities lending income, if any. Interest income is accrued daily and adjusted for amortization of premiums and accretion of discounts. Dividend income is recognized on ex-dividend date or, for certain foreign securities, as soon as such information is obtained subsequent to the ex-dividend date. Investment transactions are reflected on trade date. Realized gains and losses are calculated using identified cost. Investment transactions are recorded on the following business day for daily net asset value (“NAV”) calculations. Investment income is recorded net of any foreign withholding taxes, less any amounts reclaimable. The Fund may file withholding tax reclaims in certain jurisdictions to recover a portion of amounts previously withheld. Any foreign capital gains tax is accrued daily based upon net unrealized gains, and is payable upon sale of such investments.
C. Class Allocations and Expenses — Investment income, realized and unrealized gain (loss), if any, and non-class specific expenses of the Fund are allocated daily based upon the proportion of net assets of each class. Non-class specific expenses directly incurred by the Fund are charged to the Fund, while such expenses incurred by the Trust are allocated across the Fund on a straight-line and/or pro-rata basis depending upon the nature of the expenses. Class specific expenses, where applicable, are borne by the respective share classes and include Distribution and Service and Transfer Agency fees.
D. Federal Taxes and Distributions to Shareholders — It is the Fund’s policy to comply with the requirements of the Internal Revenue Code of 1986, as amended (the “Code”), applicable to regulated investment companies (mutual funds) and to distribute each year substantially all of its investment company taxable income and capital gains to its shareholders. Accordingly, the Fund is not required to make any provisions for the payment of federal income tax. Distributions to shareholders are recorded on the ex-dividend date. Income and capital gains distributions, if any, are declared and paid annually.
Net capital losses, if any, are carried forward to future fiscal years and may be used to the extent allowed by the Code to offset any future capital gains. Losses that are carried forward will retain their character as either short-term or long-term capital losses. Utilization of capital loss carryforwards will reduce the requirement of future capital gains distributions.
The characterization of distributions to shareholders for financial reporting purposes is determined in accordance with federal income tax rules, which may differ from GAAP. The source of the Fund’s distributions may be shown in the accompanying financial statements as either from net investment income, net realized gain or capital. Certain components of the Fund’s net assets on the Statement of Assets and Liabilities reflect permanent GAAP/tax differences based on the appropriate tax character.
E. Foreign Currency Translation — The accounting records and reporting currency of the Fund are maintained in United States (“U.S.”) dollars. Assets and liabilities denominated in foreign currencies are translated into U.S. dollars using the current exchange rates at the close of each business day. The effect of changes in foreign currency exchange rates on investments is included within
19
GOLDMAN SACHS VARIABLE INSURANCE TRUST INTERNATIONAL EQUITY INSIGHTS FUND
Notes to Financial Statements (continued)
June 30, 2018 (Unaudited)
2. SIGNIFICANT ACCOUNTING POLICIES (continued)
net realized and unrealized gain (loss) on investments. Changes in the value of other assets and liabilities as a result of fluctuations in foreign exchange rates are included in the Statement of Operations within net change in unrealized gain (loss) on foreign currency translation. Transactions denominated in foreign currencies are translated into U.S. dollars on the date the transaction occurred, the effects of which are included within net realized gain (loss) on foreign currency transactions.
3. INVESTMENTS AND FAIR VALUE MEASUREMENTS
U.S. GAAP defines the fair value of a financial instrument as the amount that would be received to sell an asset or paid to transfer a liability in an orderly transaction between market participants at the measurement date (i.e., the exit price); the Fund’s policy is to use the market approach. GAAP establishes a fair value hierarchy that prioritizes the inputs to valuation techniques used to measure fair value. The hierarchy gives the highest priority to unadjusted quoted prices in active markets for identical assets or liabilities (Level 1 measurements) and the lowest priority to unobservable inputs (Level 3 measurements). The levels used for classifying investments are not necessarily an indication of the risk associated with investing in these investments. The three levels of the fair value hierarchy are described below:
Level 1 — Unadjusted quoted prices in active markets that are accessible at the measurement date for identical, unrestricted assets or liabilities;
Level 2 — Quoted prices in markets that are not active or financial instruments for which significant inputs are observable (including, but not limited to, quoted prices for similar investments, interest rates, foreign exchange rates, volatility and credit spreads), either directly or indirectly;
Level 3 — Prices or valuations that require significant unobservable inputs (including GSAM’s assumptions in determining fair value measurement).
Changes in valuation techniques may result in transfers into or out of an assigned level within the hierarchy. In accordance with the Fund’s policy, transfers between different levels of the fair value hierarchy resulting from such changes are deemed to have occurred as of the beginning of the reporting period.
The Board of Trustees (“Trustees”) has approved Valuation Procedures that govern the valuation of the portfolio investments held by the Fund, including investments for which market quotations are not readily available. The Trustees have delegated to GSAM day-to-day responsibility for implementing and maintaining internal controls and procedures related to the valuation of the Fund’s investments. To assess the continuing appropriateness of pricing sources and methodologies, GSAM regularly performs price verification procedures and issues challenges as necessary to third party pricing vendors or brokers, and any differences are reviewed in accordance with the Valuation Procedures.
A. Level 1 and Level 2 Fair Value Investments — The valuation techniques and significant inputs used in determining the fair values for investments classified as Level 1 and Level 2 are as follows:
Equity Securities — Equity securities traded on a U.S. securities exchange or the NASDAQ system, or those located on certain foreign exchanges, including but not limited to the Americas, are valued daily at their last sale price or official closing price on the principal exchange or system on which they are traded. If there is no sale or official closing price or such price is believed by GSAM to not represent fair value, equity securities are valued at the last bid price for long positions and at the last ask price for short positions. To the extent these investments are actively traded, they are classified as Level 1 of the fair value hierarchy, otherwise they are generally classified as Level 2.
Unlisted equity securities for which market quotations are available are valued at the last sale price on the valuation date, or if no sale occurs, at the last bid price, and are generally classified as Level 2. Securities traded on certain foreign securities exchanges are valued daily at fair value determined by an independent fair value service (if available) under Valuation Procedures approved by the Trustees and consistent with applicable regulatory guidance. The independent fair value service takes into account multiple factors including, but not limited to, movements in the securities markets, certain depositary receipts, futures contracts and foreign currency exchange rates that have occurred subsequent to the close of the foreign securities exchange. These investments are generally classified as Level 2 of the fair value hierarchy.
20
GOLDMAN SACHS VARIABLE INSURANCE TRUST INTERNATIONAL EQUITY INSIGHTS FUND
3. INVESTMENTS AND FAIR VALUE MEASUREMENTS (continued)
Money Market Funds — Investments in the Goldman Sachs Financial Square Government Fund (“Underlying Fund”) are valued at the NAV of the Institutional Share class on the day of valuation. These investments are generally classified as Level 1 of the fair value hierarchy. For information regarding an Underlying Fund’s accounting policies and investment holdings, please see the Underlying Fund’s shareholder report.
B. Level 3 Fair Value Investments — To the extent that significant inputs to valuation models and other alternative pricing sources are unobservable, or if quotations are not readily available, or if GSAM believes that such quotations do not accurately reflect fair value, the fair value of the Fund’s investments may be determined under Valuation Procedures approved by the Trustees. GSAM, consistent with its procedures and applicable regulatory guidance, may make an adjustment to the most recent valuation prices of either domestic or foreign securities in light of significant events to reflect what it believes to be the fair value of the securities at the time of determining the Fund’s NAV. Significant events which could affect a large number of securities in a particular market may include, but are not limited to: significant fluctuations in U.S. or foreign markets; market dislocations; market disruptions; or unscheduled market closings. Significant events which could also affect a single issuer may include, but are not limited to: corporate actions such as reorganizations, mergers and buy-outs; ratings downgrades; and bankruptcies.
C. Fair Value Hierarchy — The following is a summary of the Fund’s investments classified in the fair value hierarchy as of June 30, 2018:
| Investment Type | Level 1 | Level 2 | Level 3 | |||||||||
| Assets | ||||||||||||
| Common Stock and/or Other Equity Investments(a) | ||||||||||||
Asia | $ | — | $ | 30,071,910 | $ | — | ||||||
Australia and Oceania | 545,479 | 6,267,612 | — | |||||||||
Europe | 2,787,321 | 57,207,540 | — | |||||||||
North America | 635,476 | — | — | |||||||||
| Securities Lending Reinvestment Vehicle | 180,000 | — | — | |||||||||
| Total | $ | 4,148,276 | $ | 93,547,062 | $ | — | ||||||
| (a) | Amounts are disclosed by continent to highlight the impact of time zone differences between local market close and the calculation of NAV. Security valuations are based on the principal exchange or system on which they are traded, which may differ from country of domicile. The Fund utilizes fair value model prices provided by an independent fair value service for certain international equity securities, resulting in a Level 2 classification. |
For further information regarding security characteristics, see the Schedule of Investments.
4. AGREEMENTS AND AFFILIATED TRANSACTIONS
A. Management Agreement — Under the Agreement, GSAM manages the Fund, subject to the general supervision of the Trustees.
As compensation for the services rendered pursuant to the Agreement, the assumption of the expenses related thereto and administration of the Fund’s business affairs, including providing facilities, GSAM is entitled to a management fee, accrued daily and paid monthly, equal to an annual percentage rate of the Fund’s average daily net assets.
21
GOLDMAN SACHS VARIABLE INSURANCE TRUST INTERNATIONAL EQUITY INSIGHTS FUND
Notes to Financial Statements (continued)
June 30, 2018 (Unaudited)
4. AGREEMENTS AND AFFILIATED TRANSACTIONS (continued)
As of June 30, 2018, contractual management fees with GSAM were at the following rates. The effective contractual management rate and effective net management rate represent the rates for the six month period ended June 30, 2018.
| Contractual Management Rate | ||||||||||||||||||||||||||
| First $1 billion | Next $1 billion | Next $3 billion | Next $3 billion | Over $8 billion | Effective Rate | Effective Net Management Rate^ | ||||||||||||||||||||
| 0.81% | 0.73 | % | 0.69 | % | 0.68 | % | 0.67 | % | 0.84 | % | 0.81 | % | ||||||||||||||
| ^ | Effective Net Management Rate includes the impact of management fee waivers of affiliated Underlying Funds, if any. The Effective Net Management Rate may not correlate to the Contractual Management Rate as a result of management fee waivers that may be in effect from time to time. For the six months ended June 30, 2018, GSAM waived $17,323 of its management fee. |
Prior to April 30, 2018, the contractual management fee rates for the Fund were as stated below and GSAM agreed to waive a portion of its management fee in order to achieve an Effective Net Management Rate as set forth in the Fund’s prospectus dated April 28, 2017.
| First $1 billion | Next $1 billion | Next $3 billion | Next $3 billion | Over $8 billion | ||||||||||||||
| 0.85% | 0.77 | % | 0.73 | % | 0.72 | % | 0.71 | % | ||||||||||
The Fund invests in Institutional Shares of the Goldman Sachs Financial Square Government Fund, which is an affiliated Underlying Fund. GSAM has agreed to waive a portion of its management fee payable by the Fund in an amount equal to the management fee it earns as an investment adviser to the affiliated Underlying Fund in which the Fund invests, except those management fees it earns from the Fund’s investments of cash collateral received in connection with securities lending transactions in the Goldman Sachs Financial Square Government Fund. For the six months ended June 30, 2018, GSAM waived $964 of the Fund’s management fee.
B. Distribution and Service (12b-1) Plan — The Trust, on behalf of Service Shares of the Fund, has adopted a Distribution and Service Plan subject to Rule 12b-1 under the Act. Under the Distribution and Service Plan, Goldman Sachs, which serves as distributor, is entitled to a fee accrued daily and paid monthly, for distribution services and personal and account maintenance services, which may then be paid by Goldman Sachs to authorized dealers, equal to, on an annual basis, 0.25% of the Fund’s average daily net assets attributable to Service Shares.
C. Transfer Agency Agreement — Goldman Sachs also serves as the transfer agent of the Fund for a fee pursuant to the Transfer Agency Agreement. The fees charged for such transfer agency services are accrued daily and paid monthly at an annual rate of 0.02% of the average daily net assets of Institutional and Service Shares.
D. Other Expense Agreements and Affiliated Transactions — GSAM has agreed to limit certain “Other Expenses” of the Fund (excluding acquired fund fees and expenses, transfer agency fees and expenses, service fees and shareholder administration fees (as applicable), taxes, interest, brokerage fees, expenses of shareholder meetings, litigation and indemnification, and extraordinary expenses) to the extent such expenses exceed, on an annual basis, a percentage rate of the average daily net assets of the Fund. Such Other Expense reimbursements, if any, are accrued daily and paid monthly. In addition, the Fund is not obligated to reimburse GSAM for prior fiscal year expense reimbursements, if any. The Other Expense limitation as an annual percentage rate of average daily net assets for the Fund is 0.044%. The Other Expense limitation will remain in place through at least April 30, 2019, and prior to such date GSAM may not terminate the arrangement without the approval of the Trustees. For the six months ended June 30, 2018, GSAM reimbursed $97,715 to the Fund. In addition, the Fund has entered into certain offset arrangements with the custodian and the transfer agent, which may result in a reduction of the Fund’s expenses and are received irrespective of the application of the “Other Expense” limitation described above. For the six months ended June 30, 2018, custody fee credits were $767.
22
GOLDMAN SACHS VARIABLE INSURANCE TRUST INTERNATIONAL EQUITY INSIGHTS FUND
4. AGREEMENTS AND AFFILIATED TRANSACTIONS (continued)
E. Line of Credit Facility — As of June 30, 2018, the Fund participated in a $770,000,000 committed, unsecured revolving line of credit facility (the “facility”) together with other funds of the Trust and certain registered investment companies having management agreements with GSAM or its affiliates. This facility is to be used for temporary emergency purposes, or to allow for an orderly liquidation of securities to meet redemption requests. The interest rate on borrowings is based on the federal funds rate. The facility also requires a fee to be paid by the Fund based on the amount of the commitment that has not been utilized. For the six months ended June 30, 2018, the Fund did not have any borrowings under the facility. Prior to May 1, 2018, the facility was $1,100,000,000. The facility was decreased to $770,000,000 effective May 1, 2018.
F. Other Transactions with Affiliates — The following table provides information about the Fund’s investment in the Goldman Sachs Financial Square Government Fund as of and for the six months ended June 30, 2018:
| Beginning Value as of December 31, 2017 | Purchases at Cost | Proceeds from Sales | Ending Value as of June 30, 2018 | Shares as of June 30, 2018 | Dividend Income from Affiliated Investment Company | |||||||||||||||||
| $952,535 | $ | 14,373,251 | $ | (15,325,786 | ) | $ | — | — | $ | 8,295 | ||||||||||||
5. PORTFOLIO SECURITIES TRANSACTIONS
The cost of purchases and proceeds from sales and maturities of long-term securities for the six months ended June 30, 2018, were $114,833,479 and $174,322,877, respectively.
6. SECURITIES LENDING
Pursuant to exemptive relief granted by the Securities and Exchange Commission (“SEC”) and the terms and conditions contained therein, the Fund may lend its securities through a securities lending agent, Goldman Sachs Agency Lending (“GSAL”), a wholly-owned subsidiary of Goldman Sachs, to certain qualified borrowers including Goldman Sachs and affiliates. In accordance with the Fund’s securities lending procedures, the Fund receives cash collateral at least equal to the market value of the securities on loan. The market value of the loaned securities is determined at the close of business of the Fund, at their last sale price or official closing price on the principal exchange or system on which they are traded, and any additional required collateral is delivered to the Fund on the next business day. As with other extensions of credit, the Fund may experience delay in the recovery of its securities or incur a loss should the borrower of the securities breach its agreement with the Fund or become insolvent at a time when the collateral is insufficient to cover the cost of repurchasing securities on loan. Dividend income received from securities on loan may not be subject to withholding taxes and therefore withholding taxes paid may differ from the amounts listed in the Statement of Operations. Loans of securities are terminable at any time and as such 1) the remaining contractual maturities of the outstanding securities lending transactions are considered to be overnight and continuous and 2) the borrower, after notice, is required to return borrowed securities within the standard time period for settlement of securities transactions.
The Fund invests the cash collateral received in connection with securities lending transactions in the Goldman Sachs Financial Square Government Fund (“Government Money Market Fund”), an affiliated series of the Goldman Sachs Trust. The Government Money Market Fund is registered under the Act as an open end investment company, is subject to Rule 2a-7 under the Act, and is managed by GSAM, for which GSAM may receive a management fee of up to 0.16% (prior to February 21, 2018, GSAM may have received a management fee of up to 0.205%) on an annualized basis of the average daily net assets of the Government Money Market Fund.
In the event of a default by a borrower with respect to any loan, GSAL will exercise any and all remedies provided under the applicable borrower agreement to make the Fund whole. These remedies include purchasing replacement securities by applying the collateral held from the defaulting broker against the purchase cost of the replacement securities. If GSAL is unable to purchase replacement securities, GSAL will indemnify the Fund by paying the Fund an amount equal to the market value of the securities
23
GOLDMAN SACHS VARIABLE INSURANCE TRUST INTERNATIONAL EQUITY INSIGHTS FUND
Notes to Financial Statements (continued)
June 30, 2018 (Unaudited)
6. SECURITIES LENDING (continued)
loaned minus the value of cash collateral received from the borrower for the loan, subject to an exclusion for any shortfalls resulting from a loss of value in such cash collateral due to reinvestment risk. The Fund’s loaned securities were all subject to enforceable Securities Lending Agreements and the value of the collateral was at least equal to the value of the cash received. The amounts of the Fund’s overnight and continuous agreements represent the gross amounts of recognized liabilities for securities lending transactions outstanding as of June 30, 2018 are disclosed as “Payable upon return of securities loaned” on the Statement of Assets and Liabilities, where applicable.
Both the Fund and GSAL received compensation relating to the lending of the Fund’s securities. The amounts earned, if any, by the Fund for the six months ended June 30, 2018, are reported under Investment Income on the Statement of Operations.
The table below details securities lending activity with affiliates of Goldman Sachs:
| For the Six Months ended June 30, 2018 | ||||||||||
| Earnings of GSAL Relating to Securities Loaned | Amount Received by the Fund from Lending to Goldman Sachs | Amount Payable to Goldman Sachs Upon Return of Securities Loaned as of June 30, 2018 | ||||||||
| $ | 1,162 | $ | 3,051 | $ | — | |||||
The following table provides information about the Fund’s investment in the Government Money Market Fund for the six months ended June 30, 2018:
| Beginning Value as of December 31, 2017 | Purchases at Cost | Proceeds from Sales | Ending Value as of June 30, 2018 | |||||||||||
| $ | — | $ | 11,016,058 | $ | (10,836,058 | ) | $ | 180,000 | ||||||
7. TAX INFORMATION
As of the Fund’s most recent fiscal year end, December 31, 2017, the Fund’s capital loss carryforwards and certain timing differences, on a tax-basis were as follows:
| Capital loss carryforwards: | ||||
Perpetual long-term | $ | (4,910,992 | ) | |
| Timing differences (Qualified Late Year Loss Deferral) | (47,616 | ) |
As of June 30, 2018, the Fund’s aggregate security unrealized gains and losses based on cost for U.S. federal income tax purposes were as follows:
| Tax cost | $ | 101,670,717 | | |
| Gross unrealized gain | 2,753,382 | |||
| Gross unrealized loss | (6,728,761 | ) | ||
| Net unrealized loss | $ | (3,975,379 | ) |
The difference between GAAP-basis and tax-basis unrealized gains (losses) is attributable primarily to wash sales and differences in the tax treatment of passive foreign investment company investments.
GSAM has reviewed the Fund’s tax positions for all open tax years (the current and prior three years, as applicable) and has concluded that no provision for income tax is required in the Fund’s financial statements. Such open tax years remain subject to examination and adjustment by tax authorities.
24
GOLDMAN SACHS VARIABLE INSURANCE TRUST INTERNATIONAL EQUITY INSIGHTS FUND
8. OTHER RISKS
The Fund’s risks include, but are not limited to, the following:
Foreign and Emerging Countries Risk — Investing in foreign markets may involve special risks and considerations not typically associated with investing in the U.S. Foreign securities may be subject to risk of loss because of more or less foreign government regulation, less public information and less economic, political and social stability in the countries in which the Fund invests. The imposition of exchange controls (including repatriation restrictions), confiscations, trade restrictions (including tariffs) and other government restrictions by the U.S. or other governments, or from problems in share registration, settlement or custody, may also result in losses. Foreign risk also involves the risk of negative foreign currency rate fluctuations, which may cause the value of securities denominated in such foreign currency (or other instruments through which the Fund has exposure to foreign currencies) to decline in value. Currency exchange rates may fluctuate significantly over short periods of time. To the extent that the Fund also invests in securities of issuers located in emerging markets, these risks may be more pronounced.
Foreign Custody Risk — If the Fund invests in foreign securities, the Fund may hold such securities and cash with foreign banks, agents, and securities depositories appointed by the Fund’s custodian (each a “Foreign Custodian”). Some foreign custodians may be recently organized or new to the foreign custody business. In some countries, Foreign Custodians may be subject to little or no regulatory oversight over, or independent evaluation of, their operations. Further, the laws of certain countries may place limitations on the Fund’s ability to recover its assets if a Foreign Custodian enters bankruptcy. Investments in emerging markets may be subject to even greater custody risks than investments in more developed markets. Custody services in emerging market countries are very often undeveloped and may be considerably less well regulated than in more developed countries, and thus may not afford the same level of investor protection as would apply in developed countries.
Investments in Other Investment Companies Risk — As a shareholder of another investment company, including an exchange-traded fund (“ETF”), the Fund will indirectly bear its proportionate share of any net management fees and other expenses paid by such other investment companies, in addition to the fees and expenses regularly borne by the Fund. ETFs are subject to risks that do not apply to conventional mutual funds, including but not limited to the following: (i) the market price of the ETF’s shares may trade at a premium or a discount to their NAV; and (ii) an active trading market for an ETF’s shares may not develop or be maintained.
Large Shareholder Transactions Risk — The Fund may experience adverse effects when certain large shareholders, such as other funds, participating insurance companies, accounts and Goldman Sachs affiliates, purchase or redeem large amounts of shares of the Fund. Such large shareholder redemptions may cause the Fund to sell portfolio securities at times when it would not otherwise do so, which may negatively impact the Fund’s NAV and liquidity. These transactions may also accelerate the realization of taxable income to shareholders if such sales of investments resulted in gains, and may also increase transaction costs. In addition, a large redemption could result in the Fund’s current expenses being allocated over a smaller asset base, leading to an increase in the Fund’s expense ratio. Similarly, large Fund share purchases may adversely affect the Fund’s performance to the extent that the Fund is delayed in investing new cash and is required to maintain a larger cash position than it ordinarily would.
Liquidity Risk — The Fund may make investments that are illiquid or that may become less liquid in response to market developments or adverse investor perceptions. Illiquid investments may be more difficult to value. Liquidity risk may also refer to the risk that the Fund will not be able to pay redemption proceeds within the allowable time period because of unusual market conditions, an unusually high volume of redemption requests, or other reasons. To meet redemption requests, the Fund may be forced to sell investments at an unfavorable time and/or under unfavorable conditions.
Market and Credit Risks — In the normal course of business, the Fund trades financial instruments and enters into financial transactions where risk of potential loss exists due to changes in the market (market risk). Additionally, the Fund may also be exposed to credit risk in the event that an issuer or guarantor fails to perform or that an institution or entity with which the Fund has unsettled or open transactions defaults.
25
GOLDMAN SACHS VARIABLE INSURANCE TRUST INTERNATIONAL EQUITY INSIGHTS FUND
Notes to Financial Statements (continued)
June 30, 2018 (Unaudited)
9. INDEMNIFICATIONS
Under the Trust’s organizational documents, its Trustees, officers, employees and agents are indemnified, to the extent permitted by the Act and state law, against certain liabilities that may arise out of performance of their duties to the Fund. Additionally, in the course of business, the Fund enters into contracts that contain a variety of indemnification clauses. The Fund’s maximum exposure under these arrangements is unknown, as this would involve future claims that may be made against the Fund that have not yet occurred. However, GSAM believes the risk of loss under these arrangements to be remote.
10. SUBSEQUENT EVENTS
Subsequent events after the Statement of Assets and Liabilities date have been evaluated, and GSAM has concluded that there is no impact requiring adjustment or disclosure in the financial statements.
11. SUMMARY OF SHARE TRANSACTIONS
Share activity is as follows:
| For the Six Months Ended June 30, 2018 (Unaudited) | For the Fiscal Year Ended December 31, 2017 | |||||||||||||||
| Shares | Dollars | Shares | Dollars | |||||||||||||
| Institutional Shares | ||||||||||||||||
| Shares sold | 533,752 | $ | 5,693,779 | 116,273 | $ | 1,205,739 | ||||||||||
| Reinvestment of distributions | — | — | 68,179 | 739,059 | ||||||||||||
| Shares redeemed | (241,542 | ) | (2,661,606 | ) | (603,057 | ) | (6,124,918 | ) | ||||||||
| 292,210 | 3,032,173 | (418,605 | ) | (4,180,120 | ) | |||||||||||
| Service Shares | ||||||||||||||||
| Shares sold | 67,093 | 738,810 | 729,786 | 6,682,789 | ||||||||||||
| Reinvestment of distributions | — | — | 175,842 | 1,909,638 | ||||||||||||
| Shares redeemed | (6,219,545 | ) | (67,210,680 | ) | (1,563,959 | ) | (15,807,702 | ) | ||||||||
| (6,152,452 | ) | (66,471,870 | ) | (658,331 | ) | (7,215,275 | ) | |||||||||
| NET DECREASE | (5,860,242 | ) | $ | (63,439,697 | ) | (1,076,936 | ) | $ | (11,395,395 | ) | ||||||
26
GOLDMAN SACHS VARIABLE INSURANCE TRUST INTERNATIONAL EQUITY INSIGHTS FUND
| Fund Expenses — Six Month Period Ended June 30, 2018 (Unaudited) |
As a shareholder of Institutional or Service Shares of the Fund, you incur ongoing costs, including management fees, distribution and/or service (12b-1) fees (with respect to Service Shares) and other Fund expenses. This example is intended to help you understand your ongoing costs (in dollars) of investing in the Institutional Shares and Service Shares of the Fund and to compare these costs with the ongoing costs of investing in other mutual funds.
The example is based on an investment of $1,000 invested at the beginning of the period and held for the entire period from January 1, 2018 through June 30, 2018, which represents a period of 181 days of a 365 day year.
Actual Expenses — The first line under each share class in the table below provides information about actual account values and actual expenses. You may use the information in this line, together with the amount you invested, to estimate the expenses that you paid over the period. Simply divide your account value by $1,000 (for example, an $8,600 account value divided by $1,000=8.6), then multiply the result by the number in the first line under the heading entitled “Expenses Paid” to estimate the expenses you paid on your account during this period.
Hypothetical Example for Comparison Purposes — The second line under each share class in the table below provides information about hypothetical account values and hypothetical expenses based on the Fund’s actual net expense ratio and an assumed rate of return of 5% per year before expenses, which is not the Fund’s actual return. The hypothetical account values and expenses may not be used to estimate the actual ending account balance or expenses you paid for the period. You may use this information to compare the ongoing costs of investing in the Fund and other funds. To do so, compare this 5% hypothetical example with the 5% hypothetical examples that appear in the shareholder reports of the other funds.
Please note that the expenses shown in the table are meant to highlight your ongoing costs only. As a shareholder of the Fund you do not incur any transaction costs, such as sales charges, redemption fees, or exchange fees, but shareholders of other funds may incur such costs. The second line of the table is useful in comparing ongoing costs only and will not help you determine the relative total costs of owning different funds whose shareholders may incur transaction costs.
| Share Class | Beginning Account Value 01/01/18 | Ending Account Value 06/30/18 | Expenses Paid for the 6 Months Ended 06/30/18* | |||||||||
| Institutional | ||||||||||||
| Actual | $ | 1,000 | $ | 973.30 | $ | 4.26 | ||||||
| Hypothetical 5% return | 1,000 | 1,020.48 | + | 4.36 | ||||||||
| Service | ||||||||||||
| Actual | 1,000 | 971.60 | 5.48 | |||||||||
| Hypothetical 5% return | 1,000 | 1,019.24 | + | 5.61 | ||||||||
| * | Expenses are calculated using the Fund’s annualized net expense ratio for each class, which represents the ongoing expenses as a percentage of net assets for the six months ended June 30, 2018. Expenses are calculated by multiplying the annualized net expense ratio by the average account value for the period; then multiplying the result by the number of days in the most recent fiscal half year; and then dividing that result by the number of days in the fiscal year. The annualized net expense ratios for the period were 0.87% and 1.12% for the Institutional and Service Shares, respectively. |
| + | Hypothetical expenses are based on the Fund’s actual annualized net expense ratios and an assumed rate of return of 5% per year before expenses. |
27
GOLDMAN SACHS VARIABLE INSURANCE TRUST INTERNATIONAL EQUITY INSIGHTS FUND
Statement Regarding Basis for Approval of Management Agreement (Unaudited)
Background
The Goldman Sachs International Equity Insights Fund (the “Fund”) is an investment portfolio of Goldman Sachs Variable Insurance Trust (the “Trust”). The Board of Trustees oversees the management of the Trust and reviews the investment performance and expenses of the Fund at regularly scheduled meetings held throughout the year. In addition, the Board of Trustees determines annually whether to approve the continuance of the Trust’s investment management agreement (the “Management Agreement”) with Goldman Sachs Asset Management, L.P. (the “Investment Adviser”) on behalf of the Fund.
The Management Agreement was most recently approved for continuation until June 30, 2019 by the Board of Trustees, including those Trustees who are not parties to the Management Agreement or “interested persons” (as defined in the Investment Company Act of 1940, as amended) of any party thereto (the “Independent Trustees”), at a meeting held on June 13-14, 2018 (the “Annual Meeting”).
The review process undertaken by the Trustees spans the course of the year and culminates with the Annual Meeting. To assist the Trustees in their deliberations, the Trustees have established a Contract Review Committee (the “Committee”), comprised of the Independent Trustees. The Committee held four meetings over the course of the year since the Management Agreement was last approved. At those Committee meetings, regularly scheduled Board or other committee meetings, and/or the Annual Meeting, matters relevant to the renewal of the Management Agreement were considered by the Board, or the Independent Trustees, as applicable. With respect to the Fund, such matters included:
| (a) | the nature and quality of the advisory, administrative, and other services provided to the Fund by the Investment Adviser and its affiliates, including information about: |
| (i) | the structure, staff, and capabilities of the Investment Adviser and its portfolio management teams; |
| (ii) | the groups within the Investment Adviser and its affiliates that support the portfolio management teams or provide other types of necessary services, including fund services groups (e.g., accounting and financial reporting, tax, shareholder services, and operations); controls and risk management groups (e.g., legal, compliance, valuation oversight, credit risk management, internal audit, compliance testing, market risk analysis, finance, and central funding); sales and distribution support groups, and others (e.g., information technology and training); |
| (iii) | trends in employee headcount; |
| (iv) | the Investment Adviser’s financial resources and ability to hire and retain talented personnel and strengthen its operations; and |
| (v) | the parent company’s support of the Investment Adviser and its mutual fund business, as expressed by the firm’s senior management; |
| (b) | information on the investment performance of the Fund, including comparisons to the performance of similar mutual funds, as provided by a third-party mutual fund data provider engaged as part of the contract review process (the “Outside Data Provider”), and a benchmark performance index; and information on general investment outlooks in the markets in which the Fund invests; |
| (c) | information provided by the Investment Adviser indicating the Investment Adviser’s views on whether the Fund’s peer group and/or benchmark index had high, medium, or low relevance given the Fund’s particular investment strategy; |
| (d) | the terms of the Management Agreement and other agreements with affiliated service providers entered into by the Trust on behalf of the Fund; |
| (e) | fee and expense information for the Fund, including: |
| (i) | the relative management fee and expense levels of the Fund as compared to those of comparable funds managed by other advisers, as provided by the Outside Data Provider; |
| (ii) | the Fund’s expense trends over time; and |
| (iii) | to the extent the Investment Adviser manages other types of accounts (such as bank collective trusts, private wealth management accounts, institutional separate accounts, sub-advised mutual funds, and non-U.S. funds) having investment objectives and policies similar to those of the Fund, comparative information on the advisory fees charged and services provided to those accounts by the Investment Adviser; |
| (f) | with respect to the extensive investment performance and expense comparison data provided by the Outside Data Provider, its processes in producing that data for the Fund; |
| (g) | the undertakings of the Investment Adviser and its affiliates to implement fee waivers and/or expense limitations; |
| (h) | information relating to the profitability of the Management Agreement and the transfer agency and distribution and service arrangements of the Fund to the Investment Adviser and its affiliates; |
| (i) | whether the Fund’s existing management fee schedule adequately addressed any economies of scale; |
28
GOLDMAN SACHS VARIABLE INSURANCE TRUST INTERNATIONAL EQUITY INSIGHTS FUND
Statement Regarding Basis for Approval of Management Agreement (Unaudited) (continued)
| (j) | a summary of the “fall-out” benefits derived by the Investment Adviser and its affiliates from their relationships with the Fund, including the fees received by the Investment Adviser’s affiliates from the Fund for transfer agency, securities lending, portfolio trading, distribution and other services; |
| (k) | a summary of potential benefits derived by the Fund as a result of its relationship with the Investment Adviser; |
| (l) | information regarding commissions paid by the Fund and broker oversight, other information regarding portfolio trading, and how the Investment Adviser carries out its duty to seek best execution; |
| (m) | the manner in which portfolio manager compensation is determined; and the number and types of accounts managed by the portfolio managers; |
| (n) | the nature and quality of the services provided to the Fund by its unaffiliated service providers, and the Investment Adviser’s general oversight and evaluation (including reports on due diligence) of those service providers as part of the administrative services provided under the Management Agreement; and |
| (o) | the Investment Adviser’s processes and policies addressing various types of potential conflicts of interest; its approach to risk management; the annual review of the effectiveness of the Fund’s compliance program; and periodic compliance reports. |
The Trustees also received an overview of the Fund’s distribution arrangements. They received information regarding the Fund’s assets, share purchase and redemption activity, and payment of distribution and service fees. Information was also provided to the Trustees relating to revenue sharing payments made by and services provided by the Investment Adviser and its affiliates to intermediaries that promote the sale, distribution, and/or servicing of Fund shares. The Independent Trustees also discussed the broad range of other investment choices that are available to Fund investors, including the availability of comparable funds managed by other advisers.
The presentations made at the Board and Committee meetings and at the Annual Meeting encompassed the Fund and other mutual funds for which the Board of Trustees has responsibility. In evaluating the Management Agreement at the Annual Meeting, the Trustees relied upon their knowledge, resulting from their meetings and other interactions throughout the year, of the Investment Adviser and its affiliates, their services, and the Fund. In conjunction with these meetings, the Trustees received written materials and oral presentations on the topics covered, and the Investment Adviser addressed the questions and concerns of the Trustees, including concerns regarding the investment performance of certain of the funds they oversee. The Independent Trustees were advised by their independent legal counsel regarding their responsibilities and other regulatory requirements related to the approval and continuation of mutual fund investment management agreements under applicable law. In addition, the Investment Adviser and its affiliates provided the Independent Trustees with a written response to a formal request for information sent on behalf of the Independent Trustees by their independent legal counsel. During the course of their deliberations, the Independent Trustees met in executive sessions with their independent legal counsel, without representatives of the Investment Adviser or its affiliates present.
Nature, Extent, and Quality of the Services Provided Under the Management Agreement
As part of their review, the Trustees considered the nature, extent, and quality of the services provided to the Fund by the Investment Adviser. In this regard, the Trustees considered both the investment advisory services and non-advisory services that are provided by the Investment Adviser and its affiliates. The Trustees noted the transition in the leadership and changes in personnel of various of the Investment Adviser’s portfolio management teams that had occurred in recent periods, and the ongoing recruitment efforts aimed at bringing high quality investment talent to the Investment Adviser. They also noted the Investment Adviser’s commitment to maintaining high quality systems and expending substantial resources to respond to ongoing changes to the regulatory and control environment in which the Fund and its service providers operate, as well as the efforts of the Investment Adviser and its affiliates to combat cyber security risks. The Trustees concluded that the Investment Adviser continued to commit substantial financial and operational resources to the Fund and expressed confidence that the Investment Adviser would continue to do so in the future. The Trustees also recognized that the Investment Adviser had made significant commitments to address regulatory compliance requirements applicable to the Fund and the Investment Adviser and its affiliates.
Investment Performance
The Trustees also considered the investment performance of the Fund. In this regard, they compared the investment performance of the Fund to its peers using rankings and ratings compiled by the Outside Data Provider as of December 31, 2017, and updated performance information prepared by the Investment Adviser using the peer group identified by the Outside Data Provider as of March 31, 2018. The information on the Fund’s investment performance was provided for the one-, three-, five-, and ten-year periods ending on the applicable dates. The Trustees also reviewed the Fund’s investment performance relative to its
29
GOLDMAN SACHS VARIABLE INSURANCE TRUST INTERNATIONAL EQUITY INSIGHTS FUND
Statement Regarding Basis for Approval of Management Agreement (Unaudited) (continued)
performance benchmark. As part of this review, they considered the investment performance trends of the Fund over time, and reviewed the investment performance of the Fund in light of its investment objective and policies and market conditions.
In addition, the Trustees considered materials prepared and presentations made by the Investment Adviser’s senior management and portfolio management personnel in which Fund performance was assessed. The Trustees also considered the Investment Adviser’s periodic reports with respect to the Fund’s risk profile, and how the Investment Adviser’s approach to risk monitoring and management influences portfolio management. They noted the efforts of the Fund’s portfolio management team to continue to enhance the investment models used in managing the Fund.
The Trustees observed that the Fund’s Institutional Shares had placed in the first quartile of the Fund’s peer group for the one-year period and in the third quartile for the three-, five-, and ten-year periods, and had outperformed the Fund’s benchmark index for the one-year period and underperformed for the three-, five-, and ten-year periods ended March 31, 2018.
Costs of Services Provided and Competitive Information
The Trustees considered the contractual terms of the Management Agreement and the fee rates payable by the Fund thereunder. In this regard, the Trustees considered information on the services rendered by the Investment Adviser to the Fund, which included both advisory and administrative services that were directed to the needs and operations of the Fund as a registered mutual fund.
In particular, the Trustees reviewed analyses prepared by the Outside Data Provider regarding the expense rankings of the Fund. The analyses provided a comparison of the Fund’s management fee and breakpoints to those of a relevant peer group and category universe; an expense analysis which compared the Fund’s overall net and gross expenses to a peer group and a category universe; and data comparing the Fund’s net expenses to the peer and category medians. The analyses also compared the Fund’s transfer agency, custody and distribution fees, other expenses and fee waivers/reimbursements to those of the peer group and category medians. The Trustees concluded that the comparisons provided by the Outside Data Provider were useful in evaluating the reasonableness of the management fees and total expenses paid by the Fund.
The Trustees noted that the management fee breakpoint schedule had been reduced at all asset levels since the Management Agreement was last approved. In addition, the Trustees considered the Investment Adviser’s undertakings to implement fee waivers and/or expense limitations. They also considered, to the extent that the Investment Adviser manages other types of accounts having investment objectives and policies similar to those of the Fund, comparative fee information for services provided by the Investment Adviser to those accounts, and information that indicated that services provided to the Fund differed in various significant respects from the services provided to other types of accounts which, in many cases, operated under less stringent legal and regulatory structures, required fewer services from the Investment Adviser to a smaller number of client contact points, and were less time-intensive.
In addition, the Trustees noted that shareholders are able to redeem their Fund shares at any time if shareholders believe that the Fund fees and expenses are too high or if they are dissatisfied with the performance of the Fund.
Profitability
The Trustees reviewed the Fund’s contribution to the Investment Adviser’s revenues and pre-tax profit margins. In this regard the Trustees noted that they had received, among other things, profitability analyses and summaries, revenue and expense schedules by Fund and by function (i.e., investment management, transfer agency and distribution and service), and information on the Investment Adviser’s expense allocation methodology. They observed that the profitability and expense figures are substantially similar to those used by the Investment Adviser for many internal purposes, including compensation decisions among various business groups, and are thus subject to a vigorous internal debate about how certain revenue and expenses should be allocated. The Trustees also noted that the internal audit group within the Goldman Sachs organization had audited the expense allocation methodology and that the internal audit group was satisfied with the reasonableness, consistency, and accuracy of the Investment Adviser’s expense allocation methodology and profitability analysis calculations. Profitability data for the Fund was provided for 2017 and 2016, and the Trustees considered this information in relation to the Investment Adviser’s overall profitability.
30
GOLDMAN SACHS VARIABLE INSURANCE TRUST INTERNATIONAL EQUITY INSIGHTS FUND
Statement Regarding Basis for Approval of Management Agreement (Unaudited) (continued)
Economies of Scale
The Trustees considered the information that had been provided regarding whether there have been economies of scale with respect to the management of the Fund. The Trustees also considered the breakpoints in the fee rate payable under the Management Agreement for the Fund at the following annual percentage rates of the average daily net assets of the Fund:
| First $1 billion | 0.81 | % | ||
| Next $1 billion | 0.73 | |||
| Next $3 billion | 0.69 | |||
| Next $3 billion | 0.68 | |||
| Over $8 billion | 0.67 |
The Trustees noted that the breakpoints were designed to share potential economies of scale, if any, with the Fund and its shareholders as assets under management reach those asset levels. The Trustees considered the amounts of assets in the Fund; the Fund’s recent share purchase and redemption activity; the information provided by the Investment Adviser relating to the costs of the services provided by the Investment Adviser and its affiliates and their realized profits; information comparing fee rates charged by the Investment Adviser with fee rates charged to other funds in the peer group; and the Investment Adviser’s undertaking to limit certain expenses of the Fund that exceed a specified level. Upon reviewing these matters at the Annual Meeting, the Trustees concluded that the fee breakpoints represented a means of assuring that benefits of scalability, if any, would be passed along to shareholders at the specified asset levels.
Other Benefits to the Investment Adviser and Its Affiliates
The Trustees also considered the other benefits derived by the Investment Adviser and its affiliates from their relationships with the Fund as stated above, including: (a) transfer agency fees received by Goldman Sachs & Co. LLC (“Goldman Sachs”); (b) brokerage and futures commissions earned by Goldman Sachs for executing securities and futures transactions on behalf of the Fund; (c) trading efficiencies resulting from aggregation of orders of the Fund with those for other funds or accounts managed by the Investment Adviser; (d) fees earned by Goldman Sachs Agency Lending (“GSAL”), an affiliate of the Investment Adviser, as securities lending agent (and fees earned by the Investment Adviser for managing the fund in which the Fund’s cash collateral is invested); (e) the Investment Adviser’s ability to leverage the infrastructure designed to service the Fund on behalf of its other clients; (f) the Investment Adviser’s ability to cross-market other products and services to Fund shareholders; (g) Goldman Sachs’ retention of certain fees as Fund Distributor; (h) the Investment Adviser’s ability to negotiate better pricing with custodians on behalf of its other clients, as a result of the relationship with the Fund; and (i) the possibility that the working relationship between the Investment Adviser and the Fund’s third-party service providers may cause those service providers to be more likely to do business with other areas of Goldman Sachs. In the course of considering the foregoing, the Independent Trustees requested and received further information quantifying certain of these fall-out benefits.
Other Benefits to the Fund and Its Shareholders
The Trustees also noted that the Fund receives certain potential benefits as a result of its relationship with the Investment Adviser, including: (a) trading efficiencies resulting from aggregation of orders of the Fund with those of other funds or accounts managed by the Investment Adviser; (b) enhanced servicing from vendors because of the volume of business generated by the Investment Adviser and its affiliates; (c) enhanced servicing from broker-dealers because of the volume of business generated by the Investment Adviser and its affiliates; (d) the Investment Adviser’s ability to negotiate favorable terms with derivatives counterparties on behalf of the Fund as a result of the size and reputation of the Goldman Sachs organization; (e) the Investment Adviser’s knowledge and experience gained from managing other accounts and products; (f) the Investment Adviser’s ability to hire and retain qualified personnel to provide services to the Fund because of the reputation of the Goldman Sachs organization; (g) the Fund’s access, through the Investment Adviser, to certain firmwide resources (e.g., proprietary risk management systems and databases), subject to certain restrictions; (h) the Fund’s ability to participate in the securities lending program administered by GSAL, as measured by the revenue received by the Fund in connection with the program; and (i) the Fund’s access to certain affiliated distribution channels. In addition, the Trustees noted the competitive nature of the mutual fund marketplace, and considered that many of the Fund’s shareholders invested in the Fund in part because of the Fund’s relationship with the Investment Adviser and that those shareholders have a general expectation that the relationship will continue.
31
GOLDMAN SACHS VARIABLE INSURANCE TRUST INTERNATIONAL EQUITY INSIGHTS FUND
Statement Regarding Basis for Approval of Management Agreement (Unaudited) (continued)
Conclusion
In connection with their consideration of the Management Agreement, the Trustees gave weight to each of the factors described above, but did not identify any particular factor as controlling their decision. After deliberation and consideration of all of the information provided, including the factors described above, the Trustees concluded, in the exercise of their business judgment, that the management fees paid by the Fund were reasonable in light of the services provided to it by the Investment Adviser, the Investment Adviser’s costs and the Fund’s current and reasonably foreseeable asset levels. The Trustees unanimously concluded that the Investment Adviser’s continued management likely would benefit the Fund and its shareholders and that the Management Agreement should be approved and continued with respect to the Fund until June 30, 2019.
32
-
| TRUSTEES | OFFICERS | |
| Jessica Palmer, Chair | James A. McNamara, President | |
| Kathryn A. Cassidy | Scott M. McHugh, Treasurer, Senior Vice | |
| Diana M. Daniels | President and Principal Financial Officer | |
| Herbert J. Markley | Joseph F. DiMaria, Assistant Treasurer and Principal Accounting Officer Caroline L. Kraus, Secretary | |
| James A. McNamara | ||
| Roy W. Templin | ||
| Gregory G. Weaver |
GOLDMAN SACHS & CO. LLC
Distributor and Transfer Agent
GOLDMAN SACHS ASSET MANAGEMENT, L.P.
Investment Adviser
200 West Street, New York
New York 10282
Visit our web site at www.GSAMFUNDS.com to obtain the most recent month-end returns.
The reports concerning the Fund included in this shareholder report may contain certain forward-looking statements about the factors that may affect the performance of the Fund in the future. These statements are based on Fund management’s predictions and expectations concerning certain future events and their expected impact on the Fund, such as performance of the economy as a whole and of specific industry sectors, changes in the levels of interest rates, the impact of developing world events, and other factors that may influence the future performance of the Fund. Management believes these forward-looking statements to be reasonable, although they are inherently uncertain and difficult to predict. Actual events may cause adjustments in portfolio management strategies from those currently expected to be employed.
A description of the policies and procedures that the Fund uses to determine how to vote proxies relating to portfolio securities and information regarding how the Fund voted proxies relating to portfolio securities during the most recent 12-month period ended June 30 is available (i) without charge, upon request by calling 1-800-621-2550; and (ii) on the Securities and Exchange Commission (“SEC”) web site at http://www.sec.gov.
The Fund files its complete schedule of portfolio holdings with the SEC for the first and third quarters of each fiscal year on Form N-Q. The Fund’s Form N-Qs are available on the SEC’s web site at http://www.sec.gov within 60 days after the Fund’s first and third fiscal quarters. The Fund’s Form N-Qs may be reviewed and copied at the SEC’s Public Reference Room in Washington, D.C. and information on the operation of the Public Reference Room may also be obtained by calling 1-800-SEC-0330. Form N-Qs may be obtained upon request and without charge by calling 1-800-621-2550.
Views and opinions expressed are for informational purposes only and do not constitute a recommendation by GSAM to buy, sell, or hold any security. Views and opinions are current as of the date of this presentation and may be subject to change, they should not be construed as investment advice.
Goldman Sachs & Co. LLC (“Goldman Sachs”) does not provide legal, tax or accounting advice. Any statement contained in this communication (including any attachments) concerning U.S. tax matters was not intended or written to be used, and cannot be used, for the purpose of avoiding penalties under the Internal Revenue Code, and was written to support the promotion or marketing of transaction or matter addressed. Clients of Goldman Sachs should obtain their own independent tax advice based on their particular circumstances.
The website links provided are for your convenience only and are not an endorsement or recommendation by GSAM of any of these websites or the products or services offered. GSAM is not responsible for the accuracy and validity of the content of these websites.
Economic and market forecasts presented herein reflect our judgment as of the date of this presentation and are subject to change without notice. These forecasts do not take into account the specific investment objectives, restrictions, tax and financial situation or other needs of any specific client. Actual data will vary and may not be reflected here. These forecasts are subject to high levels of uncertainty that may affect actual performance. Accordingly, these forecasts should be viewed as merely representative of a broad range of possible outcomes. These forecasts are estimated, based on assumptions, and are subject to significant revision and may change materially as economic and market conditions change. Goldman Sachs has no obligation to provide updates or changes to these forecasts. Case studies and examples are for illustrative purposes only.
Fund holdings and allocations shown are as of June 30, 2018 and may not be representative of future investments. Fund holdings should not be relied on in making investment decisions and should not be construed as research or investment advice regarding particular securities. Current and future holdings are subject to risk.
References to indices, benchmarks or other measures of relative market performance over a specified period of time are provided for your information only and do not imply that the portfolio will achieve similar results. The index composition may not reflect the manner in which a portfolio is constructed. While an adviser seeks to design a portfolio which reflects appropriate risk and return features, portfolio characteristics may deviate from those of the benchmark.
The Global Industry Classification Standard (“GICS”) was developed by and is the exclusive property and a service mark of Morgan Stanley Capital International Inc. (“MSCI”) and Standard & Poor’s, a division of The McGraw-Hill Companies, Inc. (“S&P”) and is licensed for use by Goldman Sachs. Neither MSCI, S&P nor any other party involved in making or compiling the GICS or any GICS classifications makes any express or implied warranties or representations with respect to such standard or classification (or the results to be obtained by the use thereof), and all such parties hereby expressly disclaim all warranties of originality, accuracy, completeness, merchantability or fitness for a particular purpose with respect to any of such standard or classification. Without limiting any of the foregoing, in no event shall MSCI, S&P, any of their affiliates or any third party involved in making or compiling the GICS or any GICS classifications have any liability for any direct, indirect, special, punitive, consequential or any other damages (including lost profits) even if notified of the possibility of such damages.
The portfolio risk management process includes an effort to monitor and manage risk, but does not imply low risk.
Shares of the Goldman Sachs VIT Funds are offered to separate accounts of participating life insurance companies for the purpose of funding variable annuity contracts and variable life insurance policies. Shares of the Fund are not offered directly to the general public. The variable annuity contracts and variable life insurance policies are described in the separate prospectuses issued by participating insurance companies. You should refer to those prospectuses for information about surrender charges, mortality and expense risk fees and other charges that may be assessed by participating insurance companies under the variable annuity contracts or variable life insurance policies. Such fees or charges, if any, may affect the return you may realize with respect to your investments. Ask your representative for more complete information. Please consider a fund’s objectives, risks and charges and expenses, and read the prospectus carefully before investing. The prospectus contains this and other information about the Fund.
This material is not authorized for distribution to prospective investors unless preceded or accompanied by a current prospectus or summary prospectus, if applicable. Investors should consider the Fund’s objective, risks, and charges and expenses, and read the summary prospectus, if available, and/or the prospectus carefully before investing or sending money. The summary prospectus, if available, and the prospectus contain this and other information about the Fund and may be obtained from your authorized dealer or from Goldman Sachs & Co. LLC by calling 1-800-621-2550.
This report is prepared for the general information of contract owners and is not an offer of shares of the Goldman Sachs Variable Insurance Trust — Goldman Sachs International Equity Insights Fund.
© 2018 Goldman Sachs. All rights reserved.
VITINTLSAR-18/139314-OTU-809586/10.7K
Goldman
Sachs Variable Insurance Trust
Goldman Sachs
U.S. Equity Insights Fund
Semi-Annual Report
June 30, 2018

GOLDMAN SACHS VARIABLE INSURANCE TRUST U.S. EQUITY INSIGHTS FUND
Investment Process. The Investment Adviser begins with a broad universe of U.S. equity investments for the Fund. As described more fully below, the Investment Adviser uses proprietary multifactor models (the “Multifactor Models”) that attempt to forecast the returns of different markets, currencies and individual securities.
The Multifactor Models rely on some or all of the following investment pillars and themes to forecast the returns of individual securities (although additional pillars or themes may be added in the future without prior notice):
Fundamental Mispricings
• Valuation: The Valuation theme attempts to capture potential mispricings of securities, typically by comparing a measure of the company’s intrinsic value to its market value.
High Quality Business Models
• Profitability: The Profitability theme seeks to assess whether a company is earning more than its cost of capital.
• Quality: The Quality theme assesses both firm and management quality.
• Management: The Management theme assesses the characteristics, policies and strategic decisions of company management.
Market Themes and Trends
• Momentum: The Momentum theme seeks to predict drifts in stock prices caused by delayed investor reaction to company-specific information and information about related companies.
Sentiment Analysis
• Sentiment: The Sentiment theme reflects selected investment views and decisions of individuals and financial intermediaries.
1
GOLDMAN SACHS VARIABLE INSURANCE TRUST U.S. EQUITY INSIGHTS FUND
INVESTMENT OBJECTIVE
The Fund seeks long-term growth of capital and dividend income.
Portfolio Management Discussion and Analysis
Below, the Goldman Sachs Quantitative Investment Strategies Team discusses the Goldman Sachs Variable Insurance Trust — Goldman Sachs U.S. Equity Insights Fund’s (the “Fund”) performance and positioning for the six-month period ended June 30, 2018 (the “Reporting Period”).
How did the Fund perform during the Reporting Period?
During the Reporting Period, the Fund’s Institutional and Service Shares generated cumulative total returns of 3.92% and 3.85%, respectively. These returns compare to the 2.65% cumulative total return of the Fund’s benchmark, the Standard & Poor’s 500® Index (with dividends reinvested) (the “S&P 500® Index”) during the same time period.
What economic and market factors most influenced the equity markets as a whole during the Reporting Period?
Representing the U.S. equity market, the S&P 500® Index gained 2.65% during the Reporting Period.
U.S. equities saw a strong start to the Reporting Period in January 2018, driven by positive economic data, a $1.5 trillion tax reform law signed in December 2017, and a favorable corporate earnings season. In February 2018, however, U.S. and international equities sold off on market speculation of a faster pace of U.S. Federal Reserve (“Fed”) short-term interest rate hikes, which stoked a sharp rise in bond yields and an increase in equity market volatility. Concerns about Fed monetary policy tightening were further exacerbated by solid U.S. labor and inflation data. While the hawkish Fed minutes were largely expected, new Fed Chair Jerome Powell’s Congressional testimony, positing a more optimistic economic outlook since the December 2017 Fed meeting, surprised equity markets with its hawkish tilt, sparking another sell-off in the U.S. equity markets. (Jerome Powell assumed the chairmanship of the Fed in February 2018. Hawkish language tends to suggest higher interest rates; opposite of dovish.) In March 2018, escalating trade tensions and potential tariffs weighed on investor sentiment. Meanwhile, the Fed delivered on a widely expected interest rate increase, with its “dot plot” pointing to a total of three interest rate hikes this calendar year and potentially two in 2019. (The “dot plot” shows rate projections of the members of the Fed’s Open Market Committee.) However, Fed policymakers acknowledged that the “economic outlook has strengthened in recent months,” revising their economic growth forecast higher and their unemployment forecast lower.
The U.S. and China continued to generate trade headlines and geopolitical uncertainty about sanctions on Russia surfaced, but the impact of such on the U.S. equity markets remained relatively muted during April 2018, as investors stayed rather resistant to the risk of a trade war. A number of macroeconomic drivers, including U.S. labor market strength, higher inflation and fiscal stimulus, pushed up U.S. Treasury yields, with the 10-year U.S. Treasury yield breaching 3% toward month end. With more than half of S&P 500® Index companies having reported their first quarter 2018 results, the earnings season began strongly during April 2018. U.S. equities rallied in May 2018, driven not only by strong corporate earnings but also by upside surprises in economic activity and sentiment data as well as on a new U.S. unemployment low of 3.8%. However, the U.S. equity rally was hampered by escalating geopolitical uncertainty stemming from the unexpected political outcome in Italy, the ongoing unpredictability around the U.S.-North Korea summit, and escalating trade tensions with many U.S. allies. The Fed raised interest rates again in June 2018, as widely expected, but the outcome of the Fed meeting was more hawkish than the consensus had anticipated. The Fed retained language indicating an “accommodative” monetary policy stance, but its economic growth and inflation forecasts were upgraded, and its median projection was lifted to four interest rate hikes in 2018 from the three it had indicated in March 2018. Fed Chair Powell was also slightly hawkish in his June press conference. Still-escalating trade tensions between the U.S. and China hurt market sentiment, with the U.S. threatening tariffs on $200 billion worth of Chinese goods and China vowing to retaliate. All told, then, the S&P 500® Index produced modestly positive but rather flat returns for the month of June 2018.
For the Reporting Period overall, six sectors posted positive absolute returns and five generated negative returns. Consumer discretionary, information technology and energy were the best performing sectors in the S&P 500® Index, as measured by total return, and the weakest performing sectors in the S&P 500® Index during the Reporting Period were telecommunication services, consumer staples and industrials.
2
GOLDMAN SACHS VARIABLE INSURANCE TRUST U.S. EQUITY INSIGHTS FUND
Within the U.S. equity market, there was significant disparity in performance not only among sectors but also among the various capitalization and style segments. While all capitalization segments posted positive returns, small-cap stocks, as measured by the Russell 2000® Index, performed best, followed at some distance by large-cap stocks, as measured by the Russell 1000® Index, and mid-cap stocks, as measured by the Russell Midcap® Index, which performed similarly to each other. From a style perspective, growth-oriented stocks significantly outpaced value-oriented stocks across the capitalization spectrum, with value-oriented stocks overall in the large-cap and mid-cap segments posting modestly negative absolute returns. (All as measured by the FTSE Russell indices.)
What key factors were responsible for the Fund’s performance during the Reporting Period?
During the Reporting Period, the Fund outperformed the S&P 500® Index largely due to stock selection driven by our quantitative model and five of our quantitative model’s six investment themes.
What impact did the Fund’s investment themes have on performance during the Reporting Period?
As expected, and in keeping with our investment approach, our quantitative model and its six investment themes — Valuation, Profitability, Quality, Management, Momentum and Sentiment — had the greatest impact on relative performance. We use these themes to take a long-term view of market patterns and look for inefficiencies, selecting stocks for the Fund and overweighting or underweighting the ones chosen by the model. Over time and by design, the performance of any one of the model’s investment themes tends to have a low correlation with the model’s other themes, demonstrating the diversification benefit of the Fund’s theme-driven quantitative model. The variance in performance supports our research indicating that the diversification provided by the Fund’s different investment themes is a significant investment advantage over the long term, even though the Fund may experience underperformance in the short term. Of course, diversification does not protect an investor from market risk nor does it ensure a profit.
During the Reporting Period, five of our six investment themes contributed positively to relative returns. Quality contributed most positively to relative performance, followed by Momentum, Profitability and Sentiment. The Management theme also contributed positively, albeit to a lesser extent. The Quality theme assesses both firm and financial quality. The Momentum theme seeks to predict drifts in stock prices caused by delayed investor reaction to company-specific information and information about related companies. The Profitability theme assesses whether a company is earning more than its cost of capital. The Sentiment theme reflects selected investment views and decisions of individuals and financial intermediaries. The Management theme assesses the characteristics, policies and strategic decisions of company managements.
The Valuation theme was the only one that detracted from the Fund’s relative returns during the Reporting Period. The Valuation theme attempts to capture potential mispricings of securities, typically by comparing a measure of the company’s intrinsic value to its market value.
How did the Fund’s sector and industry allocations affect relative performance?
In constructing the Fund’s portfolio, we focus on picking stocks rather than making industry or sector bets. Consequently, the Fund is similar to its benchmark, the S&P 500® Index, in terms of its industry and sector allocation and style. We manage the Fund’s industry and sector exposure by including industry factors in our risk model and by explicitly penalizing industry and sector deviations from the benchmark index in optimization. Sector weights or changes in sector weights generally do not have a meaningful impact on relative performance.
Did stock selection help or hurt Fund performance during the Reporting Period?
We seek to outpace the S&P 500® Index by overweighting stocks that we expect to outperform and underweighting those that we think may lag. We also build positions based on our thematic views. For example, the Fund aims to hold a basket of stocks with more favorable Momentum characteristics than the benchmark index. During the Reporting Period, stock selection overall contributed positively to the Fund’s relative performance.
Effective stock selection in the industrials, energy and financials sectors contributed most positively to the Fund’s results relative to the S&P 500® Index. Partially offsetting these positive contributors was stock selection in the consumer discretionary, consumer staples and materials sectors, which detracted from the Fund’s results relative to the S&P 500® Index during the Reporting Period.
Which individual stock positions contributed the most to the Fund’s relative returns during the Reporting Period?
The Fund benefited most from overweighted positions in petroleum refiner Valero Energy, software developer Adobe Systems and semiconductor manufacturer Micron Technology. We chose to overweight Valero Energy due to our positive views on Value and
3
GOLDMAN SACHS VARIABLE INSURANCE TRUST U.S. EQUITY INSIGHTS FUND
Quality. The Fund was overweight Adobe Systems given our positive views on Sentiment and Profitability. The overweight in Micron Technology was established because of our positive views on Sentiment and Value.
Which individual positions detracted from the Fund’s results during the Reporting Period?
Detracting most from the Fund’s results relative to the S&P 500® Index were overweight positions in integrated energy company Chevron and aerospace and defense company Lockheed Martin and an underweight position in financial transactions processor Mastercard. The Fund had overweight positions in Chevron and Lockheed Martin based on our positive views on Sentiment and Quality. We chose to underweight Mastercard due to our negative views on Value and Profitability.
How did the Fund use derivatives during the Reporting Period?
During the Reporting Period, we did not use derivatives as part of an active management strategy to add value to the Fund’s results. However, we used equity index futures contracts, on an opportunistic basis, to equitize the Fund’s excess cash holdings. In other words, we put the Fund’s excess cash holdings to work by using them as collateral for the purchase of stock futures. The use of these futures contracts had a modestly positive impact on the Fund’s performance during the Reporting Period.
Did you make any enhancements to your quantitative models during the Reporting Period?
We continuously look for ways to improve our investment process. During the Reporting Period, we made numerous enhancements to our models. As example, during the second quarter of 2018, we introduced two new signals to our Sentiment theme in the U.S. region that use options data to gauge sentiment around companies. The first signal looks at high conviction option purchases to assess how strongly market participants feel about the prospects of a particular stock. The second signal aims to infer the positive or negative sentiment around a stock by looking at put and call options purchased for the particular company.
We also introduced a new signal within our Momentum theme that helps us create economic links between different companies, potentially giving us insights into price movements of related companies. The signal, introduced in the U.S., European, Japanese and emerging markets regions, uses natural language processing to read through various sections in the patent document to form linkages.
What was the Fund’s sector positioning relative to its benchmark index at the end of the Reporting Period?
As of June 30, 2018, the Fund was overweight the health care, consumer discretionary and real estate sectors relative to the S&P 500® Index. The Fund was underweight information technology, telecommunication services, consumer staples, utilities and financials and was rather neutrally weighted in energy, industrials and materials compared to the benchmark index on the same date.
What is your strategy going forward for the Fund?
Looking ahead, we continue to believe that less expensive stocks should outpace more expensive stocks, and stocks with good momentum are likely to outperform those with poor momentum. We intend to maintain our focus on seeking companies about which fundamental research analysts are becoming more positive as well as profitable companies with sustainable earnings and a track record of using their capital to enhance shareholder value. As such, we anticipate remaining fully invested with long-term performance likely to be the result of stock selection rather than sector or capitalization allocations.
We stand behind our investment philosophy that sound economic investment principles, coupled with a disciplined quantitative approach, can provide strong, uncorrelated returns over the long term. Our research agenda is robust, and we continue to enhance our existing models, add new proprietary forecasting signals and improve our trading execution as we seek to provide the most value to our shareholders.
4
GOLDMAN SACHS VARIABLE INSURANCE TRUST U.S. EQUITY INSIGHTS FUND
Index Definitions
S&P 500® Index is the Standard & Poor’s 500 Composite Index of 500 stocks, an unmanaged index of common stock prices. The figures for the index do not include any deduction for fees, expenses or taxes.
Russell 2000® Index is an unmanaged index of common stock prices that measures the performance of the 2000 smallest companies in the Russell 3000® Index. The figures for the index do not include any deduction for fees, expenses or taxes.
Russell Midcap® Index measures the performance of the 800 smallest companies in the Russell 1000® Index, which represents approximately 25% of the total market capitalization of the Russell 1000 Index.
Russell 1000® Index measures the performance of the 1,000 largest companies in the Russell 3000® Index, which represents approximately 92% of the total market capitalization of the Russell 3000 Index.
It is not possible to invest directly in an index.
5
FUND BASICS
U.S. Equity Insights Fund
as of June 30, 2018
STANDARDIZED TOTAL RETURNS1
| For the period ended 6/30/18 | One Year | Five Years | Ten Years | Since Inception | Inception Date | |||||||||||||
| Institutional | 16.45 | % | 14.53 | % | 10.18 | % | 6.55 | % | 02/13/98 | |||||||||
| Service | 16.23 | 14.30 | 9.95 | 7.48 | 01/09/06 | |||||||||||||
| 1 | The Standardized Total Returns are average annual total returns as of the most recent calendar quarter-end. They assume reinvestment of all distributions at net asset value (“NAV”). Because Institutional and Service Shares do not involve a sales charge, such a charge is not applied to their Standardized Total Returns. |
Total return figures in the above chart represent past performance and do not indicate future results, which will vary. The investment return and principal value of an investment will fluctuate and, therefore, an investor’s shares, when redeemed, may be worth more or less than their original cost. Current performance may be lower or higher than the total return figures in the above chart. Please visit www.GSAMFUNDS.com to obtain the most recent month-end returns. Performance reflects fee waivers and/or expense limitations in effect during the periods shown. In their absence, performance would be reduced.
EXPENSE RATIOS2
| Net Expense Ratio (Current) | Gross Expense Ratio (Before Waivers) | |||||||
| Institutional | 0.56 | % | 0.70 | % | ||||
| Service | 0.77 | 0.95 | ||||||
| 2 | The expense ratios of the Fund, both current (net of any fee waivers and/or expense limitations) and before waivers (gross of any fee waivers and/or expense limitations) are as set forth above according to the most recent publicly available Prospectuses for the Fund and may differ from the expense ratios disclosed in the Financial Highlights in this report. Pursuant to a contractual arrangement, the Fund’s fee waivers and/or expense limitations will remain in place through at least April 30, 2019, and prior to such date, the Investment Adviser may not terminate the arrangements without the approval of the Fund’s Board of Trustees. If these arrangements are discontinued in the future, the expense ratios may change without shareholder approval. |
TOP TEN HOLDINGS AS OF 6/30/183
| Holding | % of Net Assets | Line of Business | ||||
| Apple, Inc. | 4.7% | Technology Hardware & Equipment | ||||
| Amazon.com, Inc. | 2.9 | Retailing | ||||
| Johnson & Johnson | 2.4 | Pharmaceuticals, Biotechnology & Life Sciences | ||||
| Microsoft Corp. | 2.3 | Software & Services | ||||
| Bank of America Corp. | 2.2 | Banks | ||||
| Facebook, Inc. Class A | 2.1 | Software & Services | ||||
| Walt Disney Co. (The) | 1.7 | Media | ||||
| Comcast Corp. Class A | 1.6 | Media | ||||
| International Business Machines Corp. | 1.5 | Software & Services | ||||
| Alphabet, Inc. Class C | 1.5 | Software & Services | ||||
| 3 | The top 10 holdings may not be representative of the Fund’s future investments. |
6
FUND BASICS
FUND vs. BENCHMARK SECTOR ALLOCATIONS4
As of June 30, 2018
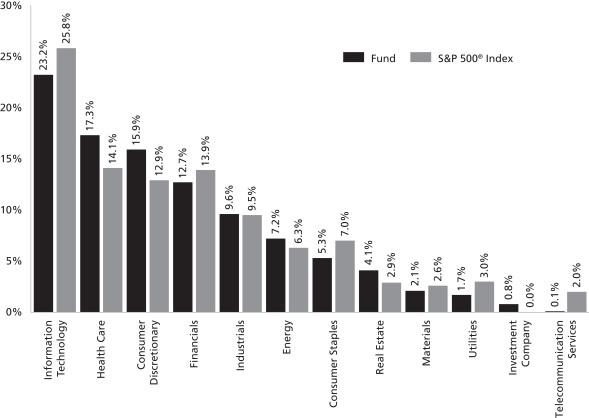
| 4 | The Fund is actively managed and, as such, its composition may differ over time. Consequently, the Fund’s overall sector allocations may differ from percentages contained in the graph above. The graph categorizes investments using Global Industry Classification Standard (“GICS”); however, the sector classifications used by the portfolio management team may differ from GICS. The percentage shown for each investment category reflects the value of investments in that category as a percentage of market value. Underlying sector allocations of exchange traded funds and investment companies held by the Fund are not reflected in the graph above. The graph depicts the Fund’s investments but may not represent the Fund’s market exposure due to the exclusion of certain derivatives, if any, as listed in the Additional Investment Information section of the Schedule of Investments. |
7
GOLDMAN SACHS VARIABLE INSURANCE TRUST U.S. EQUITY INSIGHTS FUND
Schedule of Investments
June 30, 2018 (Unaudited)
| Shares | Description | Value | ||||||
| Common Stocks – 98.4% | ||||||||
Automobiles & Components – 1.7% | ||||||||
| 20,373 | Delphi Technologies plc | $ | 926,156 | |||||
| 100,562 | General Motors Co. | 3,962,143 | ||||||
| 8,828 | Thor Industries, Inc. | 859,759 | ||||||
|
| |||||||
| 5,748,058 | ||||||||
|
| |||||||
Banks – 4.8% | ||||||||
| 259,709 | Bank of America Corp. | 7,321,197 | ||||||
| 86,912 | Citizens Financial Group, Inc. | 3,380,877 | ||||||
| 6,496 | Comerica, Inc. | 590,616 | ||||||
| 356 | First Citizens BancShares, Inc. Class A | 143,575 | ||||||
| 17,785 | JPMorgan Chase & Co. | 1,853,197 | ||||||
| 12,122 | PacWest Bancorp | 599,069 | ||||||
| 4,645 | SVB Financial Group* | 1,341,290 | ||||||
| 15,308 | Synovus Financial Corp. | 808,722 | ||||||
| 897 | Wells Fargo & Co. | 49,730 | ||||||
| 1,755 | Western Alliance Bancorp* | 99,350 | ||||||
|
| |||||||
| 16,187,623 | ||||||||
|
| |||||||
Capital Goods – 6.2% | ||||||||
| 9,663 | Acuity Brands, Inc. | 1,119,652 | ||||||
| 8,643 | AECOM* | 285,478 | ||||||
| 12,991 | Allison Transmission Holdings, Inc. | 526,006 | ||||||
| 47,240 | AMETEK, Inc. | 3,408,838 | ||||||
| 13,791 | Boeing Co. (The) | 4,627,019 | ||||||
| 18,123 | Caterpillar, Inc. | 2,458,747 | ||||||
| 17,999 | Fortune Brands Home & Security, Inc. | 966,366 | ||||||
| 4,638 | Honeywell International, Inc. | 668,104 | ||||||
| 1,260 | Huntington Ingalls Industries, Inc. | 273,155 | ||||||
| 19,736 | Ingersoll-Rand plc | 1,770,911 | ||||||
| 13,404 | Lockheed Martin Corp. | 3,959,944 | ||||||
| 7,706 | Masco Corp. | 288,359 | ||||||
| 12,049 | Toro Co. (The) | 725,952 | ||||||
|
| |||||||
| 21,078,531 | ||||||||
|
| |||||||
Commercial & Professional Services – 0.3% | ||||||||
| 17,482 | KAR Auction Services, Inc. | 958,014 | ||||||
| 1,676 | Republic Services, Inc. | 114,571 | ||||||
|
| |||||||
| 1,072,585 | ||||||||
|
| |||||||
Consumer Durables & Apparel – 1.4% | ||||||||
| 794 | Carter’s, Inc. | 86,062 | ||||||
| 38,285 | DR Horton, Inc. | 1,569,685 | ||||||
| 60,901 | PulteGroup, Inc. | 1,750,904 | ||||||
| 7,095 | PVH Corp. | 1,062,263 | ||||||
| 2,583 | Ralph Lauren Corp. | 324,735 | ||||||
|
| |||||||
| 4,793,649 | ||||||||
|
| |||||||
Consumer Services – 1.8% | ||||||||
| 12,157 | Darden Restaurants, Inc. | 1,301,528 | ||||||
| 2,682 | Las Vegas Sands Corp. | 204,798 | ||||||
| 29,422 | Marriott International, Inc. Class A | 3,724,825 | ||||||
| 14,528 | MGM Resorts International | 421,748 | ||||||
| 5,187 | Yum! Brands, Inc. | 405,727 | ||||||
|
| |||||||
| 6,058,626 | ||||||||
|
| |||||||
| Common Stocks – (continued) | ||||||||
Diversified Financials – 3.7% | ||||||||
| 21,353 | AGNC Investment Corp. (REIT) | $ | 396,952 | |||||
| 118,068 | Ally Financial, Inc. | 3,101,646 | ||||||
| 10,654 | Berkshire Hathaway, Inc. Class B* | 1,988,569 | ||||||
| 68,069 | Jefferies Financial Services, Inc. | 1,547,889 | ||||||
| 20,069 | S&P Global, Inc. | 4,091,869 | ||||||
| 45,290 | Synchrony Financial | 1,511,780 | ||||||
|
| |||||||
| 12,638,705 | ||||||||
|
| |||||||
Energy – 7.1% | ||||||||
| 24,831 | Anadarko Petroleum Corp. | 1,818,871 | ||||||
| 488 | Chevron Corp. | 61,698 | ||||||
| 89,998 | CNX Resources Corp.* | 1,600,164 | ||||||
| 46,260 | ConocoPhillips | 3,220,621 | ||||||
| 14,140 | Continental Resources, Inc.* | 915,706 | ||||||
| 9,885 | Energen Corp.* | 719,826 | ||||||
| 20,282 | Exxon Mobil Corp. | 1,677,930 | ||||||
| 87,935 | Halliburton Co. | 3,962,351 | ||||||
| 37,314 | HollyFrontier Corp. | 2,553,397 | ||||||
| 45,447 | Marathon Petroleum Corp. | 3,188,562 | ||||||
| 5,536 | PBF Energy, Inc. Class A | 232,125 | ||||||
| 36,417 | Phillips 66 | 4,089,993 | ||||||
|
| |||||||
| 24,041,244 | ||||||||
|
| |||||||
Food & Staples Retailing – 1.5% | ||||||||
| 9,787 | US Foods Holding Corp.* | 370,144 | ||||||
| 56,790 | Walmart, Inc. | 4,864,064 | ||||||
|
| |||||||
| 5,234,208 | ||||||||
|
| |||||||
Food, Beverage & Tobacco – 2.6% | ||||||||
| 92,867 | Conagra Brands, Inc. | 3,318,138 | ||||||
| 922 | Constellation Brands, Inc. Class A | 201,798 | ||||||
| 23,180 | General Mills, Inc. | 1,025,947 | ||||||
| 1,888 | Lamb Weston Holdings, Inc. | 129,347 | ||||||
| 47,792 | Molson Coors Brewing Co. Class B | 3,251,767 | ||||||
| 4,924 | Mondelez International, Inc. Class A | 201,884 | ||||||
| 8,323 | Philip Morris International, Inc. | 671,999 | ||||||
|
| |||||||
| 8,800,880 | ||||||||
|
| |||||||
Health Care Equipment & Services – 5.6% | ||||||||
| 126,294 | Boston Scientific Corp.* | 4,129,814 | ||||||
| 32,461 | HCA Healthcare, Inc. | 3,330,499 | ||||||
| 9,060 | Humana, Inc. | 2,696,528 | ||||||
| 10,325 | IDEXX Laboratories, Inc.* | 2,250,230 | ||||||
| 35,546 | Medtronic plc | 3,043,093 | ||||||
| 585 | UnitedHealth Group, Inc. | 143,524 | ||||||
| 13,321 | WellCare Health Plans, Inc.* | 3,280,163 | ||||||
|
| |||||||
| 18,873,851 | ||||||||
|
| |||||||
Household & Personal Products – 1.1% | ||||||||
| 22,946 | Estee Lauder Cos., Inc. (The) Class A | 3,274,165 | ||||||
| 9,332 | Herbalife Nutrition Ltd.* | 501,315 | ||||||
| 972 | Kimberly-Clark Corp. | 102,390 | ||||||
|
| |||||||
| 3,877,870 | ||||||||
|
| |||||||
| 8 | The accompanying notes are an integral part of these financial statements. |
GOLDMAN SACHS VARIABLE INSURANCE TRUST U.S. EQUITY INSIGHTS FUND
| Shares | Description | Value | ||||||
| Common Stocks – (continued) | ||||||||
Insurance – 4.1% | ||||||||
| 35,210 | Allstate Corp. (The) | $ | 3,213,617 | |||||
| 84,766 | Arch Capital Group Ltd.* | 2,242,908 | ||||||
| 23,686 | Assured Guaranty Ltd. | 846,301 | ||||||
| 28,222 | Athene Holding Ltd. Class A* | 1,237,253 | ||||||
| 13,918 | Brighthouse Financial, Inc.* | 557,694 | ||||||
| 65,021 | Progressive Corp. (The) | 3,845,992 | ||||||
| 5,203 | Reinsurance Group of America, Inc. | 694,496 | ||||||
| 5,982 | Torchmark Corp. | 486,995 | ||||||
| 844 | White Mountains Insurance Group Ltd. | 765,179 | ||||||
|
| |||||||
| 13,890,435 | ||||||||
|
| |||||||
Materials – 2.1% | ||||||||
| 5,360 | Air Products & Chemicals, Inc. | 834,713 | ||||||
| 14,609 | Berry Global Group, Inc.* | 671,137 | ||||||
| 4,869 | CF Industries Holdings, Inc. | 216,184 | ||||||
| 68,865 | Freeport-McMoRan, Inc. | 1,188,610 | ||||||
| 20,107 | Huntsman Corp. | 587,124 | ||||||
| 14,612 | LyondellBasell Industries NV Class A | 1,605,128 | ||||||
| 33,233 | WestRock Co. | 1,894,946 | ||||||
|
| |||||||
| 6,997,842 | ||||||||
|
| |||||||
Media – 4.3% | ||||||||
| 4,261 | Charter Communications, Inc. Class A* | 1,249,368 | ||||||
| 169,773 | Comcast Corp. Class A | 5,570,252 | ||||||
| 75,024 | News Corp. Class A | 1,162,872 | ||||||
| 31,977 | Viacom, Inc. Class B | 964,426 | ||||||
| 53,596 | Walt Disney Co. (The) | 5,617,397 | ||||||
|
| |||||||
| 14,564,315 | ||||||||
|
| |||||||
Pharmaceuticals, Biotechnology & Life Sciences – 11.6% | ||||||||
| 50,489 | AbbVie, Inc. | 4,677,806 | ||||||
| 11,131 | Agilent Technologies, Inc. | 688,341 | ||||||
| 10,175 | Alexion Pharmaceuticals, Inc.* | 1,263,226 | ||||||
| 14,148 | Allergan plc | 2,358,755 | ||||||
| 16,283 | Amgen, Inc. | 3,005,679 | ||||||
| 12,794 | Biogen, Inc.* | 3,713,331 | ||||||
| 622 | Bio-Rad Laboratories, Inc. Class A* | 179,472 | ||||||
| 75,831 | Bristol-Myers Squibb Co. | 4,196,487 | ||||||
| 67,839 | Johnson & Johnson | 8,231,584 | ||||||
| 66,593 | Merck & Co., Inc. | 4,042,195 | ||||||
| 599 | Regeneron Pharmaceuticals, Inc.* | 206,649 | ||||||
| 15,846 | Vertex Pharmaceuticals, Inc.* | 2,693,186 | ||||||
| 47,336 | Zoetis, Inc. | 4,032,554 | ||||||
|
| |||||||
| 39,289,265 | ||||||||
|
| |||||||
Real Estate – 4.1% | ||||||||
| 13,972 | American Homes 4 Rent Class A (REIT) | 309,899 | ||||||
| 7,726 | Apartment Investment & Management Co. Class A (REIT) | 326,810 | ||||||
| 14,484 | CBRE Group, Inc. Class A* | 691,466 | ||||||
| 57,793 | Duke Realty Corp. (REIT) | 1,677,731 | ||||||
| 14,411 | Empire State Realty Trust, Inc. Class A (REIT) | 246,428 | ||||||
|
| |||||||
| Common Stocks – (continued) | ||||||||
Real Estate – (continued) | ||||||||
| 2,626 | Equity Residential (REIT) | $ | 167,250 | |||||
| 58,828 | Forest City Realty Trust, Inc. Class A (REIT) | 1,341,867 | ||||||
| 3,968 | Gaming and Leisure Properties, Inc. (REIT) | 142,054 | ||||||
| 6,076 | Highwoods Properties, Inc. (REIT) | 308,235 | ||||||
| 6,017 | Hospitality Properties Trust (REIT) | 172,146 | ||||||
| 169,151 | Host Hotels & Resorts, Inc. (REIT) | 3,564,012 | ||||||
| 36,219 | Kimco Realty Corp. (REIT) | 615,361 | ||||||
| 2,888 | Lamar Advertising Co. Class A (REIT) | 197,279 | ||||||
| 15,944 | Mid-America Apartment Communities, Inc. (REIT) | 1,605,082 | ||||||
| 9,892 | Piedmont Office Realty Trust, Inc. Class A (REIT) | 197,147 | ||||||
| 3,101 | Prologis, Inc. (REIT) | 203,705 | ||||||
| 1,856 | Simon Property Group, Inc. (REIT) | 315,873 | ||||||
| 6,055 | STORE Capital Corp. (REIT) | 165,907 | ||||||
| 4,503 | Sun Communities, Inc. (REIT) | 440,754 | ||||||
| 30,984 | Weyerhaeuser Co. (REIT) | 1,129,677 | ||||||
|
| |||||||
| 13,818,683 | ||||||||
|
| |||||||
Retailing – 6.6% | ||||||||
| 5,802 | Amazon.com, Inc.* | 9,862,240 | ||||||
| 36,904 | Best Buy Co., Inc. | 2,752,300 | ||||||
| 757 | Booking Holdings, Inc.* | 1,534,507 | ||||||
| 5,740 | Burlington Stores, Inc.* | 864,042 | ||||||
| 2,312 | Dick’s Sporting Goods, Inc. | 81,498 | ||||||
| 20,109 | Dollar Tree, Inc.* | 1,709,265 | ||||||
| 1,185 | Expedia Group, Inc. | 142,425 | ||||||
| 16,251 | Foot Locker, Inc. | 855,615 | ||||||
| 18,889 | Macy’s, Inc. | 707,015 | ||||||
| 6,117 | Netflix, Inc.* | 2,394,377 | ||||||
| 4,831 | TJX Cos., Inc. (The) | 459,815 | ||||||
| 15,423 | Williams-Sonoma, Inc. | 946,664 | ||||||
|
| |||||||
| 22,309,763 | ||||||||
|
| |||||||
Semiconductors & Semiconductor Equipment – 2.6% | ||||||||
| 46,733 | Applied Materials, Inc. | 2,158,597 | ||||||
| 5,324 | Intel Corp. | 264,656 | ||||||
| 12,092 | KLA-Tencor Corp. | 1,239,793 | ||||||
| 22,372 | Lam Research Corp. | 3,867,000 | ||||||
| 26,270 | Micron Technology, Inc.* | 1,377,599 | ||||||
|
| |||||||
| 8,907,645 | ||||||||
|
| |||||||
Software & Services – 12.8% | ||||||||
| 14,728 | Adobe Systems, Inc.* | 3,590,834 | ||||||
| 4,324 | Alphabet, Inc. Class A* | 4,882,618 | ||||||
| 4,476 | Alphabet, Inc. Class C* | 4,993,649 | ||||||
| 34,607 | Citrix Systems, Inc.* | 3,628,198 | ||||||
| 3,718 | DXC Technology Co. | 299,708 | ||||||
| 47,934 | eBay, Inc.* | 1,738,087 | ||||||
| 36,887 | Facebook, Inc. Class A* | 7,167,882 | ||||||
| 11,754 | Fortinet, Inc.* | 733,802 | ||||||
| 35,831 | International Business Machines Corp. | 5,005,591 | ||||||
|
| |||||||
| The accompanying notes are an integral part of these financial statements. | 9 |
GOLDMAN SACHS VARIABLE INSURANCE TRUST U.S. EQUITY INSIGHTS FUND
Schedule of Investments (continued)
June 30, 2018 (Unaudited)
| Shares | Description | Value | ||||||
| Common Stocks – (continued) | ||||||||
Software & Services – (continued) | ||||||||
| 744 | Intuit, Inc. | $ | 152,003 | |||||
| 79,632 | Microsoft Corp. | 7,852,511 | ||||||
| 8,973 | ServiceNow, Inc.* | 1,547,573 | ||||||
| 14,707 | Splunk, Inc.* | 1,457,611 | ||||||
| 2,057 | Twitter, Inc.* | 89,829 | ||||||
| 390 | Visa, Inc. Class A | 51,655 | ||||||
|
| |||||||
| 43,191,551 | ||||||||
|
| |||||||
Technology Hardware & Equipment – 7.6% | ||||||||
| 85,857 | Apple, Inc. | 15,892,989 | ||||||
| 2,879 | Arista Networks, Inc.* | 741,314 | ||||||
| 9,741 | F5 Networks, Inc.* | 1,679,836 | ||||||
| 2,488 | Juniper Networks, Inc. | 68,221 | ||||||
| 4,395 | National Instruments Corp. | 184,502 | ||||||
| 16,204 | Palo Alto Networks, Inc.* | 3,329,436 | ||||||
| 47,374 | Western Digital Corp. | 3,667,221 | ||||||
|
| |||||||
| 25,563,519 | ||||||||
|
| |||||||
Telecommunication Services – 0.1% | ||||||||
| 1,620 | AT&T, Inc. | 52,018 | ||||||
| 7,734 | Zayo Group Holdings, Inc.* | 282,136 | ||||||
|
| |||||||
| 334,154 | ||||||||
|
| |||||||
Transportation – 3.0% | ||||||||
| 3,647 | Copa Holdings SA Class A | 345,079 | ||||||
| 18,081 | CSX Corp. | 1,153,206 | ||||||
| 34,037 | Delta Air Lines, Inc. | 1,686,193 | ||||||
| 6,125 | Kansas City Southern | 649,005 | ||||||
| 10,375 | Norfolk Southern Corp. | 1,565,277 | ||||||
| 32,800 | Union Pacific Corp. | 4,647,104 | ||||||
|
| |||||||
| 10,045,864 | ||||||||
|
| |||||||
Utilities – 1.7% | ||||||||
| 1,672 | Ameren Corp. | 101,741 | ||||||
| 25,771 | CenterPoint Energy, Inc. | 714,114 | ||||||
| 18,197 | CMS Energy Corp. | 860,354 | ||||||
| 35,160 | Exelon Corp. | 1,497,816 | ||||||
| 22,254 | MDU Resources Group, Inc. | 638,245 | ||||||
|
| |||||||
| Common Stocks – (continued) | ||||||||
Utilities – (continued) | ||||||||
| 16,253 | NRG Energy, Inc. | $ | 498,967 | |||||
| 11,003 | OGE Energy Corp. | 387,416 | ||||||
| 5,269 | PG&E Corp. | 224,249 | ||||||
| 24,655 | PPL Corp. | 703,900 | ||||||
| 2,637 | UGI Corp. | 137,309 | ||||||
|
| |||||||
| 5,764,111 | ||||||||
|
| |||||||
| TOTAL COMMON STOCKS | ||||||||
| (Cost $288,350,374) | $ | 333,082,977 | ||||||
|
| |||||||
| Shares | Distribution Rate | Value | ||||||
| Investment Company(a) – 0.7% |
| |||||||
Goldman Sachs Financial Square Government Fund — Institutional Shares |
| |||||||
| 2,516,472 | 1.869 | % | $ | 2,516,472 | ||||
| (Cost $2,516,472) |
| |||||||
| ||||||||
| TOTAL INVESTMENTS – 99.1% |
| |||||||
| (Cost $290,866,846) |
| $ | 335,599,449 | |||||
| ||||||||
OTHER ASSETS IN EXCESS OF LIABILITIES – 0.9% |
| 3,167,540 | ||||||
| ||||||||
| NET ASSETS – 100.0% |
| $ | 338,766,989 | |||||
| ||||||||
| The percentage shown for each investment category reflects the value of investments in that category as a percentage of net assets. | ||
| * | Non-income producing security. | |
| (a) | Represents an Affiliated Issuer. | |
| Investment Abbreviation: | ||
| REIT | —Real Estate Investment Trust | |
ADDITIONAL INVESTMENT INFORMATION
FUTURES CONTRACTS — At June 30, 2018, the Fund had the following futures contracts:
| Description | Number of Contracts | Expiration Date | Notional Amount | Unrealized Appreciation/ (Depreciation) | ||||||||||
Long position contracts: |
| |||||||||||||
| S&P 500 E-Mini Index | 18 | 09/21/2018 | $ | 2,449,440 | $ | (47,873 | ) | |||||||
| 10 | The accompanying notes are an integral part of these financial statements. |
GOLDMAN SACHS VARIABLE INSURANCE TRUST U.S. EQUITY INSIGHTS FUND
Statement of Assets and Liabilities
June 30, 2018 (Unaudited)
| Assets: | ||||
Investments in unaffiliated issuers, at value (cost $288,350,374) | $ | 333,082,977 | ||
Investments in affiliated issuers, at value (cost $2,516,472) | 2,516,472 | |||
Cash | 5,099,370 | |||
Receivables: | ||||
Investments sold | 7,807,365 | |||
Fund shares sold | 359,310 | |||
Dividends | 226,473 | |||
Collateral on certain derivative contracts | 110,880 | |||
Reimbursement from investment adviser | 20,817 | |||
Securities lending income | 30 | |||
Variation margin on futures | 214,374 | |||
Other assets | 2,748 | |||
| Total assets | 349,440,816 | |||
| Liabilities: | ||||
Payables: | ||||
Investments purchased | 10,290,599 | |||
Management fees | 141,190 | |||
Fund shares redeemed | 160,105 | |||
Distribution and Service fees and Transfer Agency fees | 17,120 | |||
Accrued expenses | 64,813 | |||
| Total liabilities | 10,673,827 | |||
| Net Assets: | ||||
Paid-in capital | 249,737,802 | |||
Undistributed net investment income | 2,258,100 | |||
Accumulated net realized gain | 42,086,357 | |||
Net unrealized gain | 44,684,730 | |||
| NET ASSETS | $ | 338,766,989 | ||
Net Assets: | ||||
Institutional | $ | 273,268,004 | ||
Service | 65,498,985 | |||
Total Net Assets | $ | 338,766,989 | ||
Shares outstanding $0.001 par value (unlimited shares authorized): | ||||
Institutional | 13,548,492 | |||
Service | 3,238,134 | |||
Net asset value, offering and redemption price per share: | ||||
Institutional | $20.17 | |||
Service | 20.23 | |||
| The accompanying notes are an integral part of these financial statements. | 11 |
GOLDMAN SACHS VARIABLE INSURANCE TRUST U.S. EQUITY INSIGHTS FUND
Statement of Operations
For the Six Months Ended June 30, 2018 (Unaudited)
| Investment income: | ||||
Dividends — unaffiliated issuers | $ | 2,960,781 | ||
Dividends — affiliated issuers | 4,931 | |||
Securities lending income — affiliated issuer | 234 | |||
| Total investment income | 2,965,946 | |||
| Expenses: | ||||
Management fees | 1,141,107 | |||
Distribution and Service fees — Service Shares | 115,020 | |||
Professional fees | 43,878 | |||
Transfer Agency fees(a) | 36,807 | |||
Custody, accounting and administrative services | 33,402 | |||
Printing and mailing costs | 30,592 | |||
Trustee fees | 9,089 | |||
Other | 7,330 | |||
| Total expenses | 1,417,225 | |||
Less — expense reductions | (234,084 | ) | ||
| Net expenses | 1,183,141 | |||
| NET INVESTMENT INCOME | 1,782,805 | |||
| Realized and unrealized gain (loss): | ||||
Net realized gain from: | ||||
Investments — unaffiliated issuers | 34,034,307 | |||
Futures contracts | 461,910 | |||
Net change in unrealized loss on: | ||||
Investments — unaffiliated issuers | (22,265,596 | ) | ||
Futures contracts | (51,903 | ) | ||
| Net realized and unrealized gain | 12,178,718 | |||
| NET INCREASE IN NET ASSETS RESULTING FROM OPERATIONS | $ | 13,961,523 | ||
(a) Institutional and Service Shares incurred Transfer Agency fees of $27,606 and $9,201, respectively.
| 12 | The accompanying notes are an integral part of these financial statements. |
GOLDMAN SACHS VARIABLE INSURANCE TRUST U.S. EQUITY INSIGHTS FUND
Statements of Changes in Net Assets
| For the Six Months Ended June 30, 2018 (Unaudited) | For the Fiscal Year Ended December 31, 2017 | |||||||
| From operations: | ||||||||
Net investment income | $ | 1,782,805 | $ | 5,402,288 | ||||
Net realized gain | 34,496,217 | 44,732,266 | ||||||
Net change in unrealized gain (loss) | (22,317,499 | ) | 35,451,851 | |||||
| Net increase in net assets resulting from operations | 13,961,523 | 85,586,405 | ||||||
| Distributions to shareholders: | ||||||||
From net investment income | ||||||||
Institutional Shares | — | (3,615,437 | ) | |||||
Service Shares | — | (1,564,680 | ) | |||||
From net realized gains | ||||||||
Institutional Shares | — | (28,296,886 | ) | |||||
Service Shares | — | (14,401,688 | ) | |||||
| Total distributions to shareholders | — | (47,878,691 | ) | |||||
| From share transactions: | ||||||||
Proceeds from sales of shares | 15,443,469 | 22,663,929 | ||||||
Reinvestment of distributions | — | 47,878,691 | ||||||
Cost of shares redeemed | (110,800,181 | ) | (64,040,172 | ) | ||||
| Net increase (decrease) in net assets resulting from share transactions | (95,356,712 | ) | 6,502,448 | |||||
| TOTAL INCREASE (DECREASE) | (81,395,189 | ) | 44,210,162 | |||||
| Net assets: | ||||||||
Beginning of period | 420,162,178 | 375,952,016 | ||||||
End of period | $ | 338,766,989 | $ | 420,162,178 | ||||
| Undistributed net investment income | $ | 2,258,100 | $ | 475,295 | ||||
| The accompanying notes are an integral part of these financial statements. | 13 |
GOLDMAN SACHS VARIABLE INSURANCE TRUST U.S. EQUITY INSIGHTS FUND
Financial Highlights
Selected Data for a Share Outstanding Throughout Each Period
| Income (loss) from investment operations | Distributions to shareholders | |||||||||||||||||||||||||||||||||||||||||||||||||||||||
| Year - Share Class | Net asset of period | Net income(a) | Net gain (loss) | Total from investment operations | From net investment income | From realized gains | Total distributions | Net asset value, end of period | Total return(b) | Net assets, end of period (in 000s) | Ratio of net expenses to average net assets | Ratio of to average net assets | Ratio of net assets | Portfolio turnover rate(c) | ||||||||||||||||||||||||||||||||||||||||||
FOR THE SIX MONTHS ENDED JUNE 30, (UNAUDITED) | ||||||||||||||||||||||||||||||||||||||||||||||||||||||||
2018 - Institutional | $ | 19.41 | $ | 0.10 | $ | 0.66 | $ | 0.76 | $ | — | $ | — | $ | — | $ | 20.17 | 3.92 | % | $ | 273,268 | 0.59 | %(d) | 0.71 | %(d) | 1.03 | %(d) | 82 | % | ||||||||||||||||||||||||||||
2018 - Service | 19.48 | 0.08 | 0.67 | 0.75 | — | — | — | 20.23 | 3.85 | 65,499 | 0.80 | (d) | 0.95 | (d) | 0.79 | (d) | 82 | |||||||||||||||||||||||||||||||||||||||
FOR THE FISCAL YEARS ENDED DECEMBER 31, | ||||||||||||||||||||||||||||||||||||||||||||||||||||||||
2017 - Institutional | 17.65 | 0.28 | 3.98 | 4.26 | (0.28 | ) | (2.22 | ) | (2.50 | ) | 19.41 | 24.07 | 277,952 | 0.62 | 0.70 | 1.42 | 184 | |||||||||||||||||||||||||||||||||||||||
2017 - Service | 17.71 | 0.24 | 3.99 | 4.23 | (0.24 | ) | (2.22 | ) | (2.46 | ) | 19.48 | 23.80 | 142,210 | 0.82 | 0.95 | 1.21 | 184 | |||||||||||||||||||||||||||||||||||||||
2016 - Institutional | 16.71 | 0.22 | 1.58 | 1.80 | (0.23 | ) | (0.63 | ) | (0.86 | ) | 17.65 | 10.70 | 255,565 | 0.64 | 0.70 | 1.25 | 204 | |||||||||||||||||||||||||||||||||||||||
2016 - Service | 16.77 | 0.18 | 1.59 | 1.77 | (0.20 | ) | (0.63 | ) | (0.83 | ) | 17.71 | 10.44 | 120,387 | 0.85 | 0.95 | 1.04 | 204 | |||||||||||||||||||||||||||||||||||||||
2015 - Institutional | 18.12 | 0.23 | (0.27 | ) | (0.04 | ) | (0.25 | ) | (1.12 | ) | (1.37 | ) | 16.71 | (0.20 | ) | 269,238 | 0.64 | 0.71 | 1.29 | 200 | ||||||||||||||||||||||||||||||||||||
2015 - Service | 18.17 | 0.20 | (0.28 | ) | (0.08 | ) | (0.20 | ) | (1.12 | ) | (1.32 | ) | 16.77 | (0.41 | ) | 122,531 | 0.85 | 0.96 | 1.08 | 200 | ||||||||||||||||||||||||||||||||||||
2014 - Institutional | 16.52 | 0.21 | 2.47 | 2.68 | (0.26 | ) | (0.82 | ) | (1.08 | ) | 18.12 | 16.37 | 312,370 | 0.65 | 0.71 | 1.21 | 214 | |||||||||||||||||||||||||||||||||||||||
2014 - Service | 16.55 | 0.18 | 2.47 | 2.65 | (0.21 | ) | (0.82 | ) | (1.03 | ) | 18.17 | 16.18 | 138,725 | 0.86 | 0.96 | 1.01 | 214 | |||||||||||||||||||||||||||||||||||||||
2013 - Institutional | 12.14 | 0.20 | 4.35 | 4.55 | (0.17 | ) | — | (0.17 | ) | 16.52 | 37.52 | 307,589 | 0.65 | 0.71 | 1.36 | 207 | ||||||||||||||||||||||||||||||||||||||||
2013 - Service | 12.16 | 0.17 | 4.35 | 4.52 | (0.13 | ) | — | (0.13 | ) | 16.55 | 37.23 | 125,748 | 0.86 | 0.96 | 1.15 | 207 | ||||||||||||||||||||||||||||||||||||||||
| (a) | Calculated based on the average shares outstanding methodology. |
| (b) | Assumes investment at the net asset value at the beginning of the period, reinvestment of all distributions, and a complete redemption of the investment at the net asset value at the end of the period. Total returns for periods less than one full year are not annualized. |
| (c) | The Fund’s portfolio turnover rate is calculated in accordance with regulatory requirements, without regard to transactions involving short term investments and certain derivatives. If such transactions were included, the Fund’s portfolio turnover rate may be higher. |
| (d) | Annualized. |
| The accompanying notes are an integral part of these financial statements. | 14 |
GOLDMAN SACHS VARIABLE INSURANCE TRUST U.S. EQUITY INSIGHTS FUND
Notes to Financial Statements
June 30, 2018 (Unaudited)
1. ORGANIZATION
Goldman Sachs Variable Insurance Trust (the “Trust” or “VIT”) is a Delaware statutory trust registered under the Investment Company Act of 1940, as amended (the “Act”), as an open-end management investment company. The Trust includes the Goldman Sachs U.S. Equity Insights Fund (the “Fund”). The Fund is a diversified portfolio under the Act offering two classes of shares — Institutional and Service Shares. Shares of the Trust are offered to separate accounts of participating life insurance companies for the purpose of funding variable annuity contracts and variable life insurance policies.
Goldman Sachs Asset Management, L.P. (“GSAM”), an affiliate of Goldman Sachs & Co. LLC (“Goldman Sachs”), serves as investment adviser to the Fund pursuant to a management agreement (the “Agreement”) with the Trust.
2. SIGNIFICANT ACCOUNTING POLICIES
The financial statements have been prepared in accordance with accounting principles generally accepted in the United States of America (“GAAP”) and require management to make estimates and assumptions that may affect the reported amounts and disclosures. Actual results may differ from those estimates and assumptions.
A. Investment Valuation — The Fund’s valuation policy is to value investments at fair value.
B. Investment Income and Investments — Investment income includes interest income, dividend income, and securities lending income, if any. Interest income is accrued daily and adjusted for amortization of premiums and accretion of discounts. Dividend income is recognized on ex-dividend date or, for certain foreign securities, as soon as such information is obtained subsequent to the ex-dividend date. Investment transactions are reflected on trade date. Realized gains and losses are calculated using identified cost. Investment transactions are recorded on the following business day for daily net asset value (“NAV”) calculations. Investment income is recorded net of any foreign withholding taxes, less any amounts reclaimable. The Fund may file withholding tax reclaims in certain jurisdictions to recover a portion of amounts previously withheld. Any foreign capital gains tax is accrued daily based upon net unrealized gains, and is payable upon sale of such investments. Distributions received from the Fund’s investments in United States (“U.S.”) real estate investment trusts (“REITs”) may be characterized as ordinary income, net capital gain or a return of capital. A return of capital is recorded by the Fund as a reduction to the cost basis of the REIT.
For derivative contracts, realized gains and losses are recorded upon settlement of the contract.
C. Class Allocations and Expenses — Investment income, realized and unrealized gain (loss), if any, and non-class specific expenses of the Fund are allocated daily based upon the proportion of net assets of each class. Non-class specific expenses directly incurred by the Fund are charged to the Fund, while such expenses incurred by the Trust are allocated across the Fund on a straight-line and/or pro-rata basis depending upon the nature of the expenses. Class specific expenses, where applicable, are borne by the respective share classes and include Distribution and Service and Transfer Agency fees.
D. Federal Taxes and Distributions to Shareholders — It is the Fund’s policy to comply with the requirements of the Internal Revenue Code of 1986, as amended (the “Code”), applicable to regulated investment companies (mutual funds) and to distribute each year substantially all of its investment company taxable income and capital gains to its shareholders. Accordingly, the Fund is not required to make any provisions for the payment of federal income tax. Distributions to shareholders are recorded on the ex-dividend date. Income and capital gains distributions, if any, are declared and paid annually.
Net capital losses, if any, are carried forward to future fiscal years and may be used to the extent allowed by the Code to offset any future capital gains. Losses that are carried forward will retain their character as either short-term or long-term capital losses. Utilization of capital loss carryforwards will reduce the requirement of future capital gains distributions.
The characterization of distributions to shareholders for financial reporting purposes is determined in accordance with federal income tax rules, which may differ from GAAP. The source of the Fund’s distributions may be shown in the accompanying financial statements as either from net investment income, net realized gain or capital. Certain components of the Fund’s net assets on the Statement of Assets and Liabilities reflect permanent GAAP/tax differences based on the appropriate tax character.
15
GOLDMAN SACHS VARIABLE INSURANCE TRUST U.S. EQUITY INSIGHTS FUND
Notes to Financial Statements (continued)
June 30, 2018 (Unaudited)
3. INVESTMENTS AND FAIR VALUE MEASUREMENTS
U.S. GAAP defines the fair value of a financial instrument as the amount that would be received to sell an asset or paid to transfer a liability in an orderly transaction between market participants at the measurement date (i.e., the exit price); the Fund’s policy is to use the market approach. GAAP establishes a fair value hierarchy that prioritizes the inputs to valuation techniques used to measure fair value. The hierarchy gives the highest priority to unadjusted quoted prices in active markets for identical assets or liabilities (Level 1 measurements) and the lowest priority to unobservable inputs (Level 3 measurements). The levels used for classifying investments are not necessarily an indication of the risk associated with investing in these investments. The three levels of the fair value hierarchy are described below:
Level 1— Unadjusted quoted prices in active markets that are accessible at the measurement date for identical, unrestricted assets or liabilities;
Level 2— Quoted prices in markets that are not active or financial instruments for which significant inputs are observable (including, but not limited to, quoted prices for similar investments, interest rates, foreign exchange rates, volatility and credit spreads), either directly or indirectly;
Level 3— Prices or valuations that require significant unobservable inputs (including GSAM’s assumptions in determining fair value measurement).
Changes in valuation techniques may result in transfers into or out of an assigned level within the hierarchy. In accordance with the Fund’s policy, transfers between different levels of the fair value hierarchy resulting from such changes are deemed to have occurred as of the beginning of the reporting period.
The Board of Trustees (“Trustees”) has approved Valuation Procedures that govern the valuation of the portfolio investments held by the Fund, including investments for which market quotations are not readily available. The Trustees have delegated to GSAM day-to-day responsibility for implementing and maintaining internal controls and procedures related to the valuation of the Fund’s investments. To assess the continuing appropriateness of pricing sources and methodologies, GSAM regularly performs price verification procedures and issues challenges as necessary to third party pricing vendors or brokers, and any differences are reviewed in accordance with the Valuation Procedures.
A. Level 1 and Level 2 Fair Value Investments — The valuation techniques and significant inputs used in determining the fair values for investments classified as Level 1 and Level 2 are as follows:
Equity Securities — Equity securities traded on a U.S. securities exchange or the NASDAQ system, or those located on certain foreign exchanges, including but not limited to the Americas, are valued daily at their last sale price or official closing price on the principal exchange or system on which they are traded. If there is no sale or official closing price or such price is believed by GSAM to not represent fair value, equity securities are valued at the last bid price for long positions and at the last ask price for short positions. To the extent these investments are actively traded, they are classified as Level 1 of the fair value hierarchy, otherwise they are generally classified as Level 2.
Unlisted equity securities for which market quotations are available are valued at the last sale price on the valuation date, or if no sale occurs, at the last bid price, and are generally classified as Level 2.
Money Market Funds — Investments in the Goldman Sachs Financial Square Government Fund (“Underlying Fund”) are valued at the NAV of the Institutional Share class on the day of valuation. These investments are generally classified as Level 1 of the fair value hierarchy. For information regarding an Underlying Fund’s accounting policies and investment holdings, please see the Underlying Fund’s shareholder report.
Derivative Contracts — A derivative is an instrument whose value is derived from underlying assets, indices, reference rates or a combination of these factors. The Fund enters into derivative transactions to hedge against changes in interest rates, securities prices, and/or currency exchange rates, to increase total return, or to gain access to certain markets or attain exposure to other underliers.
16
GOLDMAN SACHS VARIABLE INSURANCE TRUST U.S. EQUITY INSIGHTS FUND
3. INVESTMENTS AND FAIR VALUE MEASUREMENTS (continued)
Exchange-traded derivatives, including futures and options contracts, are valued at the last sale or settlement price and typically fall within Level 1 of the fair value hierarchy. Over-the-counter (“OTC”) and centrally cleared derivatives are valued using market transactions and other market evidence, including market-based inputs to models, calibration to market-clearing transactions, broker or dealer quotations, or other alternative pricing sources. Where models are used, the selection of a particular model to value OTC and centrally cleared derivatives depends upon the contractual terms of, and specific risks inherent in, the instrument, as well as the availability of pricing information in the market. Valuation models require a variety of inputs, including contractual terms, market prices, yield curves, credit curves, measures of volatility, voluntary and involuntary prepayment rates, loss severity rates and correlations of such inputs. For OTC and centrally cleared derivatives that trade in liquid markets, model inputs can generally be verified and model selection does not involve significant management judgment. OTC and centrally cleared derivatives are classified within Level 2 of the fair value hierarchy when significant inputs are corroborated by market evidence.
i. Futures Contracts — Futures contracts are contracts to buy or sell a standardized quantity of a specified commodity or security and are valued based on exchanged settlement prices or independent market quotes. Futures contracts are valued at the last settlement price, or in the absence of a sale, the last bid price for long positions and at the last ask price for short positions, at the end of each day on the board of trade or exchange upon which they are traded. Upon entering into a futures contract, the Fund deposits cash or securities in an account on behalf of the broker in an amount sufficient to meet the initial margin requirement. Subsequent payments are made or received by the Fund equal to the daily change in the contract value and are recorded as variation margin receivable or payable with a corresponding offset to unrealized gains or losses. For financial reporting purposes, cash collateral that has been pledged to cover obligations of the Fund and cash collateral received, if any, is reported separately on the Statement of Assets and Liabilities as receivables/payables for collateral on certain derivative contracts. Non-cash collateral pledged by the Fund, if any, is noted in the Schedule of Investments.
B. Level 3 Fair Value Investments — To the extent that significant inputs to valuation models and other alternative pricing sources are unobservable, or if quotations are not readily available, or if GSAM believes that such quotations do not accurately reflect fair value, the fair value of the Fund’s investments may be determined under Valuation Procedures approved by the Trustees. GSAM, consistent with its procedures and applicable regulatory guidance, may make an adjustment to the most recent valuation prices of either domestic or foreign securities in light of significant events to reflect what it believes to be the fair value of the securities at the time of determining the Fund’s NAV. Significant events which could affect a large number of securities in a particular market may include, but are not limited to: significant fluctuations in U.S. or foreign markets; market dislocations; market disruptions; or unscheduled market closings. Significant events which could also affect a single issuer may include, but are not limited to: corporate actions such as reorganizations, mergers and buy-outs; ratings downgrades; and bankruptcies.
C. Fair Value Hierarchy — The following is a summary of the Fund’s investments and derivatives classified in the fair value hierarchy as of June 30, 2018:
| Investment Type | Level 1 | Level 2 | Level 3 | |||||||||
| Assets | ||||||||||||
| Common Stock(a) | ||||||||||||
North America | $ | 333,082,977 | $ | — | $ | — | ||||||
| Investment Company | 2,516,472 | — | — | |||||||||
| Total | $ | 335,599,449 | $ | — | $ | — | ||||||
| Derivative Type | ||||||||||||
| Liability(b) | ||||||||||||
| Futures Contracts | $ | (47,873 | ) | $ | — | $ | — | |||||
| (a) | Amounts are disclosed by continent to highlight the impact of time zone differences between local market close and the calculation of NAV. Security valuations are based on the principal exchange or system on which they are traded, which may differ from country of domicile. |
| (b) | Amount shown represents unrealized gain (loss) at fiscal period end. |
For further information regarding security characteristics, see the Schedule of Investments.
17
GOLDMAN SACHS VARIABLE INSURANCE TRUST U.S. EQUITY INSIGHTS FUND
Notes to Financial Statements (continued)
June 30, 2018 (Unaudited)
4. INVESTMENTS IN DERIVATIVES
The following table sets forth, by certain risk types, the gross value of derivative contracts (not considered to be hedging instruments for accounting disclosure purposes) as of June 30, 2018. These instruments were used as part of the Fund’s investment strategies and to obtain and/or manage exposure related to the risks below. The values in the table below exclude the effects of cash collateral received or posted pursuant to these derivative contracts, and therefore are not representative of the Fund’s net exposure.
| Risk | Statement of Assets and Liabilities | Assets | Statement of Assets and Liabilities | Liabilities(a) | ||||||||||
| Equity | — | $— | Variation margin on futures | $ | (47,873 | ) | ||||||||
| (a) | Includes unrealized gain (loss) on futures contracts described in the Additional Investment Information section of the Schedule of Investments. Only the variation margin as of June 30, 2018 is reported within the Statement of Assets and Liabilities. |
The following table sets forth, by certain risk types, the Fund’s gains (losses) related to these derivatives and their indicative volumes for the six months ended June 30, 2018. These gains (losses) should be considered in the context that these derivative contracts may have been executed to create investment opportunities and/or economically hedge certain investments, and accordingly, certain gains (losses) on such derivative contracts may offset certain (losses) gains attributable to investments. These gains (losses) are included in “Net realized gain (loss)” or “Net change in unrealized gain (loss)” on the Statement of Operations:
| Risk | Statement of Operations | Net Realized | Net Change in Unrealized Gain (Loss) | Average Number of Contracts(a) | ||||||||
Equity | Net realized gain (loss) from futures contracts/Net change in unrealized gain (loss) on futures contracts | $461,910 | $ | (51,903 | ) | 8 | ||||||
| (a) | Average number of contracts is based on the average of month end balances for the six months ended June 30, 2018. |
5. AGREEMENTS AND AFFILIATED TRANSACTIONS
A. Management Agreement — Under the Agreement, GSAM manages the Fund, subject to the general supervision of the Trustees.
As compensation for the services rendered pursuant to the Agreement, the assumption of the expenses related thereto and administration of the Fund’s business affairs, including providing facilities, GSAM is entitled to a management fee, accrued daily and paid monthly, equal to an annual percentage rate of the Fund’s average daily net assets.
For the six months ended June 30, 2018, contractual and effective net management fees with GSAM were at the following rates:
Contractual Management Rate | Effective Net | |||||||||||||||||||||||
First $1 billion | Next $1 billion | Next $3 billion | Next $3 billion | Over $8 billion | Effective Rate | |||||||||||||||||||
| 0.62% | 0.59 | % | 0.56 | % | 0.55 | % | 0.54 | % | 0.62 | % | 0.57 | %* | ||||||||||||
| ^ | Effective Net Management Rate includes the impact of management fee waivers of affiliated Underlying Funds, if any. |
| * | GSAM agreed to waive a portion of its management fee in order to achieve a net management rate prior to April 30, 2018, as defined in the Fund’s most recent prospectus. This waiver will be effective through at least April 30, 2019, and prior to such date GSAM may not terminate the arrangement without approval of the Trustees. For the six months ended June 30, 2018, GSAM waived $96,932 of its management fee. |
The Fund invests in Institutional Shares of the Goldman Sachs Financial Square Government Fund, which is an affiliated Underlying Fund. GSAM has agreed to waive a portion of its management fee payable by the Fund in an amount equal to the management fee it earns as an investment adviser to the affiliated Underlying Fund in which the Fund invests, except those management fees it earns from the Fund’s investments of cash collateral received in connection with securities lending transactions in the Goldman Sachs Financial Square Government Fund. For the six months ended June 30, 2018, GSAM waived $450 of the Fund’s management fee.
18
GOLDMAN SACHS VARIABLE INSURANCE TRUST U.S. EQUITY INSIGHTS FUND
5. AGREEMENTS AND AFFILIATED TRANSACTIONS (continued)
B. Distribution and Service (12b-1) Plan — The Trust, on behalf of Service Shares of the Fund, has adopted a Distribution and Service Plan subject to Rule 12b-1 under the Act. Under the Distribution and Service Plan, Goldman Sachs, which serves as distributor, is entitled to a fee accrued daily and paid monthly, for distribution services and personal and account maintenance services, which may then be paid by Goldman Sachs to authorized dealers, equal to, on an annual basis, 0.25% of the Fund’s average daily net assets attributable to Service Shares. Goldman Sachs has agreed to waive distribution and service fees so as not to exceed an annual rate of 0.21% of average daily net assets attributable to Service Shares. This distribution and service fee waiver will remain in place through at least April 30, 2019, and prior to such date Goldman Sachs may not terminate the arrangement without the approval of the Trustees. For the six months ended June 30, 2018, Goldman Sachs waived $18,403 in distribution and service fees for the Fund’s Service Shares.
C. Transfer Agency Agreement — Goldman Sachs also serves as the transfer agent of the Fund for a fee pursuant to the Transfer Agency Agreement. The fees charged for such transfer agency services are accrued daily and paid monthly at an annual rate of 0.02% of the average daily net assets of Institutional and Service Shares.
D. Other Expense Agreements and Affiliated Transactions — GSAM has agreed to limit certain “Other Expenses” of the Fund (excluding acquired fund fees and expenses, transfer agency fees and expenses, service fees and shareholder administration fees (as applicable), taxes, interest, brokerage fees, expenses of shareholder meetings, litigation and indemnification, and extraordinary expenses) to the extent such expenses exceed, on an annual basis, a percentage rate of the average daily net assets of the Fund. Such Other Expense reimbursements, if any, are accrued daily and paid monthly. In addition, the Fund is not obligated to reimburse GSAM for prior fiscal year expense reimbursements, if any. The Other Expense limitation as an annual percentage rate of average daily net assets for the Fund is 0.004%. The Other Expense limitation will remain in place through at least April 30, 2019, and prior to such date GSAM may not terminate the arrangement without the approval of the Trustees. For the six months ended June 30, 2018, GSAM reimbursed $116,927 to the Fund. In addition, the Fund has entered into certain offset arrangements with the custodian and the transfer agent, which may result in a reduction of the Fund’s expenses and are received irrespective of the application of the “Other Expense” limitation described above. For the six months ended June 30, 2018, custody fee credits were $1,372.
E. Line of Credit Facility — As of June 30, 2018, the Fund participated in a $770,000,000 committed, unsecured revolving line of credit facility (the “facility”) together with other funds of the Trust and certain registered investment companies having management agreements with GSAM or its affiliates. This facility is to be used for temporary emergency purposes, or to allow for an orderly liquidation of securities to meet redemption requests. The interest rate on borrowings is based on the federal funds rate. The facility also requires a fee to be paid by the Fund based on the amount of the commitment that has not been utilized. For the six months ended June 30, 2018, the Fund did not have any borrowings under the facility. Prior to May 1, 2018, the facility was $1,100,000,000. The facility was decreased to $770,000,000 effective May 1, 2018.
F. Other Transactions with Affiliates — The following table provides information about the Fund’s investment in the Goldman Sachs Financial Square Government Fund as of and for the six months ended June 30, 2018:
| Beginning Value as of December 31, 2017 | Purchases at Cost | Proceeds from Sales | Ending Value as of June 30, 2018 | Shares as of June 30, 2018 | Dividend Income Company | |||||||||||||||
| $— | $ | 7,249,911 | $ | (4,733,439 | ) | $ | 2,516,472 | 2,516,472 | $ | 4,931 | ||||||||||
6. PORTFOLIO SECURITIES TRANSACTIONS
The cost of purchases and proceeds from sales and maturities of long-term securities for the six months ended June 30, 2018, were $303,167,323 and $398,620,021, respectively.
19
GOLDMAN SACHS VARIABLE INSURANCE TRUST U.S. EQUITY INSIGHTS FUND
Notes to Financial Statements (continued)
June 30, 2018 (Unaudited)
7. SECURITIES LENDING
Pursuant to exemptive relief granted by the Securities and Exchange Commission (“SEC”) and the terms and conditions contained therein, the Fund may lend its securities through a securities lending agent, Goldman Sachs Agency Lending (“GSAL”), a wholly-owned subsidiary of Goldman Sachs, to certain qualified borrowers including Goldman Sachs and affiliates. In accordance with the Fund’s securities lending procedures, the Fund receives cash collateral at least equal to the market value of the securities on loan. The market value of the loaned securities is determined at the close of business of the Fund, at their last sale price or official closing price on the principal exchange or system on which they are traded, and any additional required collateral is delivered to the Fund on the next business day. As with other extensions of credit, the Fund may experience delay in the recovery of its securities or incur a loss should the borrower of the securities breach its agreement with the Fund or become insolvent at a time when the collateral is insufficient to cover the cost of repurchasing securities on loan. Dividend income received from securities on loan may not be subject to withholding taxes and therefore withholding taxes paid may differ from the amounts listed in the Statement of Operations. Loans of securities are terminable at any time and as such 1) the remaining contractual maturities of the outstanding securities lending transactions are considered to be overnight and continuous and 2) the borrower, after notice, is required to return borrowed securities within the standard time period for settlement of securities transactions.
The Fund invests the cash collateral received in connection with securities lending transactions in the Goldman Sachs Financial Square Government Fund (“Government Money Market Fund”), an affiliated series of the Goldman Sachs Trust. The Government Money Market Fund is registered under the Act as an open end investment company, is subject to Rule 2a-7 under the Act, and is managed by GSAM, for which GSAM may receive a management fee of up to 0.16% (prior to February 21, 2018, GSAM may have received a management fee of up to 0.205%) on an annualized basis of the average daily net assets of the Government Money Market Fund.
In the event of a default by a borrower with respect to any loan, GSAL will exercise any and all remedies provided under the applicable borrower agreement to make the Fund whole. These remedies include purchasing replacement securities by applying the collateral held from the defaulting broker against the purchase cost of the replacement securities. If GSAL is unable to purchase replacement securities, GSAL will indemnify the Fund by paying the Fund an amount equal to the market value of the securities loaned minus the value of cash collateral received from the borrower for the loan, subject to an exclusion for any shortfalls resulting from a loss of value in such cash collateral due to reinvestment risk. The Fund’s loaned securities were all subject to enforceable Securities Lending Agreements and the value of the collateral was at least equal to the value of the cash received. The amounts of the Fund’s overnight and continuous agreements represent the gross amounts of recognized liabilities for securities lending transactions outstanding as of June 30, 2018 are disclosed as “Payable upon return of securities loaned” on the Statement of Assets and Liabilities, where applicable. The Fund did not have securities on loan as of June 30, 2018.
Both the Fund and GSAL received compensation relating to the lending of the Fund’s securities. The amounts earned, if any, by the Fund for the six months ended June 30, 2018, are reported under Investment Income on the Statement of Operations.
The table below details securities lending activity with affiliates of Goldman Sachs:
| For the six months ended June 30, 2018 | ||||||||||
| Earnings of GSAL Relating to Securities Loaned | Amount Received by the Fund from Lending to Goldman Sachs | Amount Payable to Goldman Sachs Upon Return of Securities Loaned as of June 30, 2018 | ||||||||
| $ | 26 | $ | 8,082 | $ | — | |||||
20
GOLDMAN SACHS VARIABLE INSURANCE TRUST U.S. EQUITY INSIGHTS FUND
7. SECURITIES LENDING (continued)
The following table provides information about the Fund’s investment in the Government Money Market Fund for the six months ended June 30, 2018:
| Beginning Value as of December 31, 2017 | Purchases at Cost | Proceeds from Sales | Ending Value as of June 30, 2018 | |||||||||||
| $ | — | $ | 686,500 | $ | (686,500 | ) | $ | — | ||||||
8. TAX INFORMATION
As of June 30, 2018, the Fund’s aggregate security unrealized gains and losses based on cost for U.S. federal income tax purposes were as follows:
| Tax cost | $ | 291,740,138 | ||
| Gross unrealized gain | 53,511,304 | |||
| Gross unrealized loss | (9,651,993 | ) | ||
| Net unrealized gain | $ | 43,859,311 |
The difference between GAAP-basis and tax-basis unrealized gains (losses) is attributable primarily to wash sales, net mark to market gains (losses) on regulated futures contracts and differences in the tax treatment of underlying fund investments.
GSAM has reviewed the Fund’s tax positions for all open tax years (the current and prior three years, as applicable) and has concluded that no provision for income tax is required in the Fund’s financial statements. Such open tax years remain subject to examination and adjustment by tax authorities.
9. OTHER RISKS
The Fund’s risks include, but are not limited to, the following:
Derivatives Risk — The Fund’s use of derivatives may result in loss. Derivative instruments, which may pose risks in addition to and greater than those associated with investing directly in securities, currencies or other instruments, may be illiquid or less liquid, volatile, difficult to price and leveraged so that small changes in the value of the underlying instruments may produce disproportionate losses to the Fund. Derivatives are also subject to counterparty risk, which is the risk that the other party in the transaction will not fulfill its contractual obligation. The use of derivatives is a highly specialized activity that involves investment techniques and risks different from those associated with investments in more traditional securities and instruments. Losses from derivatives can also result from a lack of correlation between changes in the value of derivative instruments and the portfolio assets (if any) being hedged.
Investments in Other Investment Companies Risk — As a shareholder of another investment company, including an exchange-traded fund (“ETF”), the Fund will indirectly bear its proportionate share of any net management fees and other expenses paid by such other investment companies, in addition to the fees and expenses regularly borne by the Fund. ETFs are subject to risks that do not apply to conventional mutual funds, including but not limited to the following: (i) the market price of the ETF’s shares may trade at a premium or a discount to their NAV; and (ii) an active trading market for an ETF’s shares may not develop or be maintained.
Large Shareholder Transactions Risk — The Fund may experience adverse effects when certain large shareholders, such as other funds, participating insurance companies, accounts and Goldman Sachs affiliates, purchase or redeem large amounts of shares
21
GOLDMAN SACHS VARIABLE INSURANCE TRUST U.S. EQUITY INSIGHTS FUND
Notes to Financial Statements (continued)
June 30, 2018 (Unaudited)
9. OTHER RISKS (continued)
of the Fund. Such large shareholder redemptions may cause the Fund to sell portfolio securities at times when it would not otherwise do so, which may negatively impact the Fund’s NAV and liquidity. These transactions may also accelerate the realization of taxable income to shareholders if such sales of investments resulted in gains, and may also increase transaction costs. In addition, a large redemption could result in the Fund’s current expenses being allocated over a smaller asset base, leading to an increase in the Fund’s expense ratio. Similarly, large Fund share purchases may adversely affect the Fund’s performance to the extent that the Fund is delayed in investing new cash and is required to maintain a larger cash position than it ordinarily would.
Liquidity Risk — The Fund may make investments that are illiquid or that may become less liquid in response to market developments or adverse investor perceptions. Illiquid investments may be more difficult to value. Liquidity risk may also refer to the risk that the Fund will not be able to pay redemption proceeds within the allowable time period because of unusual market conditions, an unusually high volume of redemption requests, or other reasons. To meet redemption requests, the Fund may be forced to sell investments at an unfavorable time and/or under unfavorable conditions.
Market and Credit Risks — In the normal course of business, the Fund trades financial instruments and enters into financial transactions where risk of potential loss exists due to changes in the market (market risk). Additionally, the Fund may also be exposed to credit risk in the event that an issuer or guarantor fails to perform or that an institution or entity with which the Fund has unsettled or open transactions defaults.
10. INDEMNIFICATIONS
Under the Trust’s organizational documents, its Trustees, officers, employees and agents are indemnified, to the extent permitted by the Act and state law, against certain liabilities that may arise out of performance of their duties to the Fund. Additionally, in the course of business, the Fund enters into contracts that contain a variety of indemnification clauses. The Fund’s maximum exposure under these arrangements is unknown, as this would involve future claims that may be made against the Fund that have not yet occurred. However, GSAM believes the risk of loss under these arrangements to be remote.
11. SUBSEQUENT EVENTS
Subsequent events after the Statement of Assets and Liabilities date have been evaluated, and GSAM has concluded that there is no impact requiring adjustment or disclosure in the financial statements.
22
GOLDMAN SACHS VARIABLE INSURANCE TRUST U.S. EQUITY INSIGHTS FUND
12. SUMMARY OF SHARE TRANSACTIONS
Share activity is as follows:
| For the Six Months Ended June 30, 2018 (Unaudited) | For the Fiscal Year Ended December 31, 2017 | |||||||||||||||
| Shares | Dollars | Shares | Dollars | |||||||||||||
| Institutional Shares | ||||||||||||||||
| Shares sold | 217,012 | $ | 4,334,881 | 358,460 | $ | 6,845,622 | ||||||||||
| Reinvestment of distributions | — | — | 1,635,690 | 31,912,323 | ||||||||||||
| Shares redeemed | (986,121 | ) | (19,787,795 | ) | (2,153,338 | ) | (42,049,816 | ) | ||||||||
| (769,109 | ) | (15,452,914 | ) | (159,188 | ) | (3,291,871 | ) | |||||||||
| Service Shares | ||||||||||||||||
| Shares sold | 548,339 | 11,108,588 | 801,197 | 15,818,307 | ||||||||||||
| Reinvestment of distributions | — | — | 815,443 | 15,966,368 | ||||||||||||
| Shares redeemed | (4,608,682 | ) | (91,012,386 | ) | (1,114,105 | ) | (21,990,356 | ) | ||||||||
| (4,060,343 | ) | (79,903,798 | ) | 502,535 | 9,794,319 | |||||||||||
| NET INCREASE (DECREASE) | (4,829,452 | ) | $ | (95,356,712 | ) | 343,347 | $ | 6,502,448 | ||||||||
23
GOLDMAN SACHS VARIABLE INSURANCE TRUST U.S. EQUITY INSIGHTS FUND
Fund Expenses — Six Month Period Ended June 30, 2018 (Unaudited) |
As a shareholder of Institutional or Service Shares of the Fund, you incur ongoing costs, including management fees, distribution and/or service (12b-1) fees (with respect to Service Shares) and other Fund expenses. This example is intended to help you understand your ongoing costs (in dollars) of investing in the Institutional Shares and Service Shares of the Fund and to compare these costs with the ongoing costs of investing in other mutual funds.
The example is based on an investment of $1,000 invested at the beginning of the period and held for the entire period from January 1, 2018 through June 30, 2018, which represents a period of 181 days of a 365 day year.
Actual Expenses — The first line under each share class in the table below provides information about actual account values and actual expenses. You may use the information in this line, together with the amount you invested, to estimate the expenses that you paid over the period. Simply divide your account value by $1,000 (for example, an $8,600 account value divided by $1,000=8.6), then multiply the result by the number in the first line under the heading entitled “Expenses Paid” to estimate the expenses you paid on your account during this period.
Hypothetical Example for Comparison Purposes — The second line under each share class in the table below provides information about hypothetical account values and hypothetical expenses based on the Fund’s actual net expense ratio and an assumed rate of return of 5% per year before expenses, which is not the Fund’s actual return. The hypothetical account values and expenses may not be used to estimate the actual ending account balance or expenses you paid for the period. You may use this information to compare the ongoing costs of investing in the Fund and other funds. To do so, compare this 5% hypothetical example with the 5% hypothetical examples that appear in the shareholder reports of the other funds.
Please note that the expenses shown in the table are meant to highlight your ongoing costs only. As a shareholder of the Fund you do not incur any transaction costs, such as sales charges, redemption fees, or exchange fees, but shareholders of other funds may incur such costs. The second line of the table is useful in comparing ongoing costs only and will not help you determine the relative total costs of owning different funds whose shareholders may incur transaction costs.
| Share Class | Beginning Account Value 01/01/18 | Ending Account Value 06/30/18 | Expenses Paid for the 6 Months Ended 06/30/18* | |||||||||
| Institutional | ||||||||||||
| Actual | $ | 1,000 | $ | 1,039.20 | $ | 2.98 | ||||||
| Hypothetical 5% return | 1,000 | 1,021.87 | + | 2.96 | ||||||||
| Service | ||||||||||||
| Actual | 1,000 | 1,038.50 | 4.04 | |||||||||
| Hypothetical 5% return | 1,000 | 1,020.83 | + | 4.01 | ||||||||
| * | Expenses are calculated using the Fund’s annualized net expense ratio for each class, which represents the ongoing expenses as a percentage of net assets for the six months ended June 30, 2018. Expenses are calculated by multiplying the annualized net expense ratio by the average account value for the period; then multiplying the result by the number of days in the most recent fiscal half year; and then dividing that result by the number of days in the fiscal year. The annualized net expense ratios for the period were 0.59% and 0.80% for Institutional and Service Shares, respectively. |
| + | Hypothetical expenses are based on the Fund’s actual annualized net expense ratios and an assumed rate of return of 5% per year before expenses. |
24
GOLDMAN SACHS VARIABLE INSURANCE TRUST U.S. EQUITY INSIGHTS FUND
Statement Regarding Basis for Approval of Management Agreement (Unaudited)
Background
The Goldman Sachs U.S. Equity Insights Fund (the “Fund”) is an investment portfolio of Goldman Sachs Variable Insurance Trust (the “Trust”). The Board of Trustees oversees the management of the Trust and reviews the investment performance and expenses of the Fund at regularly scheduled meetings held throughout the year. In addition, the Board of Trustees determines annually whether to approve the continuance of the Trust’s investment management agreement (the “Management Agreement”) with Goldman Sachs Asset Management, L.P. (the “Investment Adviser”) on behalf of the Fund.
The Management Agreement was most recently approved for continuation until June 30, 2019 by the Board of Trustees, including those Trustees who are not parties to the Management Agreement or “interested persons” (as defined in the Investment Company Act of 1940, as amended) of any party thereto (the “Independent Trustees”), at a meeting held on June 13-14, 2018 (the “Annual Meeting”).
The review process undertaken by the Trustees spans the course of the year and culminates with the Annual Meeting. To assist the Trustees in their deliberations, the Trustees have established a Contract Review Committee (the “Committee”), comprised of the Independent Trustees. The Committee held four meetings over the course of the year since the Management Agreement was last approved. At those Committee meetings, regularly scheduled Board or other committee meetings, and/or the Annual Meeting, matters relevant to the renewal of the Management Agreement were considered by the Board, or the Independent Trustees, as applicable. With respect to the Fund, such matters included:
| (a) | the nature and quality of the advisory, administrative, and other services provided to the Fund by the Investment Adviser and its affiliates, including information about: |
| (i) | the structure, staff, and capabilities of the Investment Adviser and its portfolio management teams; |
| (ii) | the groups within the Investment Adviser and its affiliates that support the portfolio management teams or provide other types of necessary services, including fund services groups (e.g., accounting and financial reporting, tax, shareholder services, and operations); controls and risk management groups (e.g., legal, compliance, valuation oversight, credit risk management, internal audit, compliance testing, market risk analysis, finance, and central funding); sales and distribution support groups, and others (e.g., information technology and training); |
| (iii) | trends in employee headcount; |
| (iv) | the Investment Adviser’s financial resources and ability to hire and retain talented personnel and strengthen its operations; and |
| (v) | the parent company’s support of the Investment Adviser and its mutual fund business, as expressed by the firm’s senior management; |
| (b) | information on the investment performance of the Fund, including comparisons to the performance of similar mutual funds, as provided by a third-party mutual fund data provider engaged as part of the contract review process (the “Outside Data Provider”), and a benchmark performance index; and information on general investment outlooks in the markets in which the Fund invests; |
| (c) | information provided by the Investment Adviser indicating the Investment Adviser’s views on whether the Fund’s peer group and/or benchmark index had high, medium, or low relevance given the Fund’s particular investment strategy; |
| (d) | the terms of the Management Agreement and other agreements with affiliated service providers entered into by the Trust on behalf of the Fund; |
| (e) | fee and expense information for the Fund, including: |
| (i) | the relative management fee and expense levels of the Fund as compared to those of comparable funds managed by other advisers, as provided by the Outside Data Provider; |
| (ii) | the Fund’s expense trends over time; and |
| (iii) | to the extent the Investment Adviser manages other types of accounts (such as bank collective trusts, private wealth management accounts, institutional separate accounts, sub-advised mutual funds, and non-U.S. funds) having investment objectives and policies similar to those of the Fund, comparative information on the advisory fees charged and services provided to those accounts by the Investment Adviser; |
| (f) | with respect to the extensive investment performance and expense comparison data provided by the Outside Data Provider, its processes in producing that data for the Fund; |
| (g) | the undertakings of the Investment Adviser and its affiliates to implement fee waivers and/or expense limitations; |
| (h) | information relating to the profitability of the Management Agreement and the transfer agency and distribution and service arrangements of the Fund to the Investment Adviser and its affiliates; |
| (i) | whether the Fund’s existing management fee schedule adequately addressed any economies of scale; |
25
GOLDMAN SACHS VARIABLE INSURANCE TRUST U.S. EQUITY INSIGHTS FUND
Statement Regarding Basis for Approval of Management Agreement (Unaudited) (continued)
| (j) | a summary of the “fall-out” benefits derived by the Investment Adviser and its affiliates from their relationships with the Fund, including the fees received by the Investment Adviser’s affiliates from the Fund for transfer agency, securities lending, portfolio trading, distribution and other services; |
| (k) | a summary of potential benefits derived by the Fund as a result of its relationship with the Investment Adviser; |
| (l) | information regarding commissions paid by the Fund and broker oversight, other information regarding portfolio trading, and how the Investment Adviser carries out its duty to seek best execution; |
| (m) | the manner in which portfolio manager compensation is determined; and the number and types of accounts managed by the portfolio managers; |
| (n) | the nature and quality of the services provided to the Fund by its unaffiliated service providers, and the Investment Adviser’s general oversight and evaluation (including reports on due diligence) of those service providers as part of the administrative services provided under the Management Agreement; and |
| (o) | the Investment Adviser’s processes and policies addressing various types of potential conflicts of interest; its approach to risk management; the annual review of the effectiveness of the Fund’s compliance program; and periodic compliance reports. |
The Trustees also received an overview of the Fund’s distribution arrangements. They received information regarding the Fund’s assets, share purchase and redemption activity, and payment of distribution and service fees. Information was also provided to the Trustees relating to revenue sharing payments made by and services provided by the Investment Adviser and its affiliates to intermediaries that promote the sale, distribution, and/or servicing of Fund shares. The Independent Trustees also discussed the broad range of other investment choices that are available to Fund investors, including the availability of comparable funds managed by other advisers.
The presentations made at the Board and Committee meetings and at the Annual Meeting encompassed the Fund and other mutual funds for which the Board of Trustees has responsibility. In evaluating the Management Agreement at the Annual Meeting, the Trustees relied upon their knowledge, resulting from their meetings and other interactions throughout the year, of the Investment Adviser and its affiliates, their services, and the Fund. In conjunction with these meetings, the Trustees received written materials and oral presentations on the topics covered, and the Investment Adviser addressed the questions and concerns of the Trustees, including concerns regarding the investment performance of certain of the funds they oversee. The Independent Trustees were advised by their independent legal counsel regarding their responsibilities and other regulatory requirements related to the approval and continuation of mutual fund investment management agreements under applicable law. In addition, the Investment Adviser and its affiliates provided the Independent Trustees with a written response to a formal request for information sent on behalf of the Independent Trustees by their independent legal counsel. During the course of their deliberations, the Independent Trustees met in executive sessions with their independent legal counsel, without representatives of the Investment Adviser or its affiliates present.
Nature, Extent, and Quality of the Services Provided Under the Management Agreement
As part of their review, the Trustees considered the nature, extent, and quality of the services provided to the Fund by the Investment Adviser. In this regard, the Trustees considered both the investment advisory services and non-advisory services that are provided by the Investment Adviser and its affiliates. The Trustees noted the transition in the leadership and changes in personnel of various of the Investment Adviser’s portfolio management teams that had occurred in recent periods, and the ongoing recruitment efforts aimed at bringing high quality investment talent to the Investment Adviser. They also noted the Investment Adviser’s commitment to maintaining high quality systems and expending substantial resources to respond to ongoing changes to the regulatory and control environment in which the Fund and its service providers operate, as well as the efforts of the Investment Adviser and its affiliates to combat cyber security risks. The Trustees concluded that the Investment Adviser continued to commit substantial financial and operational resources to the Fund and expressed confidence that the Investment Adviser would continue to do so in the future. The Trustees also recognized that the Investment Adviser had made significant commitments to address regulatory compliance requirements applicable to the Fund and the Investment Adviser and its affiliates.
Investment Performance
The Trustees also considered the investment performance of the Fund. In this regard, they compared the investment performance of the Fund to its peers using rankings and ratings compiled by the Outside Data Provider as of December 31, 2017, and updated performance information prepared by the Investment Adviser using the peer group identified by the Outside Data Provider as of March 31, 2018. The information on the Fund’s investment performance was provided for the one-, three-, five-, and ten-year periods ending on the applicable dates. The Trustees also reviewed the Fund’s investment performance relative to its
26
GOLDMAN SACHS VARIABLE INSURANCE TRUST U.S. EQUITY INSIGHTS FUND
Statement Regarding Basis for Approval of Management Agreement (Unaudited) (continued)
performance benchmark. As part of this review, they considered the investment performance trends of the Fund over time, and reviewed the investment performance of the Fund in light of its investment objective and policies and market conditions.
In addition, the Trustees considered materials prepared and presentations made by the Investment Adviser’s senior management and portfolio management personnel in which Fund performance was assessed. The Trustees also considered the Investment Adviser’s periodic reports with respect to the Fund’s risk profile, and how the Investment Adviser’s approach to risk monitoring and management influences portfolio management. They noted the efforts of the Fund’s portfolio management team to continue to enhance the investment model used in managing the Fund.
The Trustees observed that the Fund’s Institutional Shares had placed in the first quartile of the Fund’s peer group and had outperformed the Fund’s benchmark index for the one-, three-, five-, and ten-year periods ended March 31, 2018.
Costs of Services Provided and Competitive Information
The Trustees considered the contractual terms of the Management Agreement and the fee rates payable by the Fund thereunder. In this regard, the Trustees considered information on the services rendered by the Investment Adviser to the Fund, which included both advisory and administrative services that were directed to the needs and operations of the Fund as a registered mutual fund.
In particular, the Trustees reviewed analyses prepared by the Outside Data Provider regarding the expense rankings of the Fund. The analyses provided a comparison of the Fund’s management fee and breakpoints to those of a relevant peer group and category universe; an expense analysis which compared the Fund’s overall net and gross expenses to a peer group and a category universe; and data comparing the Fund’s net expenses to the peer and category medians. The analyses also compared the Fund’s transfer agency, custody and distribution fees, other expenses and fee waivers/reimbursements to those of the peer group and category medians. The Trustees concluded that the comparisons provided by the Outside Data Provider were useful in evaluating the reasonableness of the management fees and total expenses paid by the Fund.
In addition, the Trustees considered the Investment Adviser’s undertakings to implement fee waivers and/or expense limitations. They also considered, to the extent that the Investment Adviser manages other types of accounts having investment objectives and policies similar to those of the Fund, comparative fee information for services provided by the Investment Adviser to those accounts, and information that indicated that services provided to the Fund differed in various significant respects from the services provided to other types of accounts which, in many cases, operated under less stringent legal and regulatory structures, required fewer services from the Investment Adviser to a smaller number of client contact points, and were less time-intensive.
In addition, the Trustees noted that shareholders are able to redeem their Fund shares at any time if shareholders believe that the Fund fees and expenses are too high or if they are dissatisfied with the performance of the Fund.
Profitability
The Trustees reviewed the Fund’s contribution to the Investment Adviser’s revenues and pre-tax profit margins. In this regard the Trustees noted that they had received, among other things, profitability analyses and summaries, revenue and expense schedules by Fund and by function (i.e., investment management, transfer agency and distribution and service), and information on the Investment Adviser’s expense allocation methodology. They observed that the profitability and expense figures are substantially similar to those used by the Investment Adviser for many internal purposes, including compensation decisions among various business groups, and are thus subject to a vigorous internal debate about how certain revenue and expenses should be allocated. The Trustees also noted that the internal audit group within the Goldman Sachs organization had audited the expense allocation methodology and that the internal audit group was satisfied with the reasonableness, consistency, and accuracy of the Investment Adviser’s expense allocation methodology and profitability analysis calculations. Profitability data for the Fund was provided for 2017 and 2016, and the Trustees considered this information in relation to the Investment Adviser’s overall profitability.
Economies of Scale
The Trustees considered the information that had been provided regarding whether there have been economies of scale with respect to the management of the Fund. The Trustees also considered the breakpoints in the fee rate payable under the Management Agreement for the Fund at the following annual percentage rates of the average daily net assets of the Fund:
| First $1 billion | 0.62 | % | ||
| Next $1 billion | 0.59 | |||
| Next $3 billion | 0.56 | |||
| Next $3 billion | 0.55 | |||
| Over $8 billion | 0.54 |
27
GOLDMAN SACHS VARIABLE INSURANCE TRUST U.S. EQUITY INSIGHTS FUND
Statement Regarding Basis for Approval of Management Agreement (Unaudited) (continued)
The Trustees noted that the breakpoints were designed to share potential economies of scale, if any, with the Fund and its shareholders as assets under management reach those asset levels. The Trustees considered the amounts of assets in the Fund; the Fund’s recent share purchase and redemption activity; the information provided by the Investment Adviser relating to the costs of the services provided by the Investment Adviser and its affiliates and their realized profits; information comparing fee rates charged by the Investment Adviser with fee rates charged to other funds in the peer group; and the Investment Adviser’s undertaking to limit certain expenses of the Fund that exceed a specified level as well as Goldman Sachs & Co. LLC’s (“Goldman Sachs”) undertaking to waive a portion of the distribution and service fees paid by the Fund’s Service Shares. Upon reviewing these matters at the Annual Meeting, the Trustees concluded that the fee breakpoints represented a means of assuring that benefits of scalability, if any, would be passed along to shareholders at the specified asset levels.
Other Benefits to the Investment Adviser and Its Affiliates
The Trustees also considered the other benefits derived by the Investment Adviser and its affiliates from their relationships with the Fund as stated above, including: (a) transfer agency fees received by Goldman Sachs; (b) brokerage and futures commissions earned by Goldman Sachs for executing securities and futures transactions on behalf of the Fund; (c) trading efficiencies resulting from aggregation of orders of the Fund with those for other funds or accounts managed by the Investment Adviser; (d) fees earned by Goldman Sachs Agency Lending (“GSAL”), an affiliate of the Investment Adviser, as securities lending agent (and fees earned by the Investment Adviser for managing the fund in which the Fund’s cash collateral is invested); (e) the Investment Adviser’s ability to leverage the infrastructure designed to service the Fund on behalf of its other clients; (f) the Investment Adviser’s ability to cross-market other products and services to Fund shareholders; (g) Goldman Sachs’ retention of certain fees as Fund Distributor; (h) the Investment Adviser’s ability to negotiate better pricing with custodians on behalf of its other clients, as a result of the relationship with the Fund; and (i) the possibility that the working relationship between the Investment Adviser and the Fund’s third-party service providers may cause those service providers to be more likely to do business with other areas of Goldman Sachs. In the course of considering the foregoing, the Independent Trustees requested and received further information quantifying certain of these fall-out benefits.
Other Benefits to the Fund and Its Shareholders
The Trustees also noted that the Fund receives certain potential benefits as a result of its relationship with the Investment Adviser, including: (a) trading efficiencies resulting from aggregation of orders of the Fund with those of other funds or accounts managed by the Investment Adviser; (b) enhanced servicing from vendors because of the volume of business generated by the Investment Adviser and its affiliates; (c) enhanced servicing from broker-dealers because of the volume of business generated by the Investment Adviser and its affiliates; (d) the Investment Adviser’s ability to negotiate favorable terms with derivatives counterparties on behalf of the Fund as a result of the size and reputation of the Goldman Sachs organization; (e) the Investment Adviser’s knowledge and experience gained from managing other accounts and products; (f) the Investment Adviser’s ability to hire and retain qualified personnel to provide services to the Fund because of the reputation of the Goldman Sachs organization; (g) the Fund’s access, through the Investment Adviser, to certain firmwide resources (e.g., proprietary risk management systems and databases), subject to certain restrictions; (h) the Fund’s ability to participate in the securities lending program administered by GSAL, as measured by the revenue received by the Fund in connection with the program; and (i) the Fund’s access to certain affiliated distribution channels. In addition, the Trustees noted the competitive nature of the mutual fund marketplace, and considered that many of the Fund’s shareholders invested in the Fund in part because of the Fund’s relationship with the Investment Adviser and that those shareholders have a general expectation that the relationship will continue.
Conclusion
In connection with their consideration of the Management Agreement, the Trustees gave weight to each of the factors described above, but did not identify any particular factor as controlling their decision. After deliberation and consideration of all of the information provided, including the factors described above, the Trustees concluded, in the exercise of their business judgment, that the management fees paid by the Fund were reasonable in light of the services provided to it by the Investment Adviser, the Investment Adviser’s costs and the Fund’s current and reasonably foreseeable asset levels. The Trustees unanimously concluded that the Investment Adviser’s continued management likely would benefit the Fund and its shareholders and that the Management Agreement should be approved and continued with respect to the Fund until June 30, 2019.
28
| TRUSTEES | OFFICERS | |
| Jessica Palmer, Chair | James A. McNamara, President | |
| Kathryn A. Cassidy | Scott M. McHugh, Treasurer, Senior Vice | |
| Diana M. Daniels | President and Principal Financial Officer | |
| Herbert J. Markley | Joseph F. DiMaria, Assistant Treasurer and Principal Accounting Officer Caroline L. Kraus, Secretary | |
| James A. McNamara | ||
| Roy W. Templin | ||
| Gregory G. Weaver |
GOLDMAN SACHS & CO. LLC
Distributor and Transfer Agent
GOLDMAN SACHS ASSET MANAGEMENT, L.P.
Investment Adviser
200 West Street, New York
New York 10282
Visit our web site at www.GSAMFUNDS.com to obtain the most recent month-end returns.
The reports concerning the Fund included in this shareholder report may contain certain forward-looking statements about the factors that may affect the performance of the Fund in the future. These statements are based on Fund management’s predictions and expectations concerning certain future events and their expected impact on the Fund, such as performance of the economy as a whole and of specific industry sectors, changes in the levels of interest rates, the impact of developing world events, and other factors that may influence the future performance of the Fund. Management believes these forward-looking statements to be reasonable, although they are inherently uncertain and difficult to predict. Actual events may cause adjustments in portfolio management strategies from those currently expected to be employed.
A description of the policies and procedures that the Fund uses to determine how to vote proxies relating to portfolio securities and information regarding how the Fund voted proxies relating to portfolio securities for the 12-month period ended June 30 is available (i) without charge, upon request by calling 1-800-621-2550; and (ii) on the Securities and Exchange Commission (“SEC”) web site at http://www.sec.gov.
The Fund files its complete schedule of portfolio holdings with the SEC for the first and third quarters of each fiscal year on Form N-Q. The Fund’s Form N-Qs are available on the SEC’s web site at http://www.sec.gov within 60 days after the Fund’s first and third fiscal quarters. The Fund’s Form N-Qs may be reviewed and copied at the SEC’s Public Reference Room in Washington, D.C. and information on the operation of the Public Reference Room may also be obtained by calling 1-800-SEC-0330. Form N-Qs may be obtained upon request and without charge by calling 1-800-621-2550.
Views and opinions expressed are for informational purposes only and do not constitute a recommendation by GSAM to buy, sell, or hold any security. Views and opinions are current as of the date of this presentation and may be subject to change, they should not be construed as investment advice.
Goldman Sachs & Co. LLC (“Goldman Sachs”) does not provide legal, tax or accounting advice. Any statement contained in this communication (including any attachments) concerning U.S. tax matters was not intended or written to be used, and cannot be used, for the purpose of avoiding penalties under the Internal Revenue Code, and was written to support the promotion or marketing of transaction or matter addressed. Clients of Goldman Sachs should obtain their own independent tax advice based on their particular circumstances.
The website links provided are for your convenience only and are not an endorsement or recommendation by GSAM of any of these websites or the products or services offered. GSAM is not responsible for the accuracy and validity of the content of these websites.
Fund holdings and allocations shown are as of June 30, 2018 and may not be representative of future investments. Fund holdings should not be relied on in making investment decisions and should not be construed as research or investment advice regarding particular securities. Current and future holdings are subject to risk.
References to indices, benchmarks or other measures of relative market performance over a specified period of time are provided for your information only and do not imply that the portfolio will achieve similar results. The index composition may not reflect the manner in which a portfolio is constructed. While an adviser seeks to design a portfolio which reflects appropriate risk and return features, portfolio characteristics may deviate from those of the benchmark.
The Global Industry Classification Standard (“GICS”) was developed by and is the exclusive property and a service mark of Morgan Stanley Capital International Inc. (“MSCI”) and Standard & Poor’s, a division of The McGraw-Hill Companies, Inc. (“S&P”) and is licensed for use by Goldman Sachs. Neither MSCI, S&P nor any other party involved in making or compiling the GICS or any GICS classifications makes any express or implied warranties or representations with respect to such standard or classification (or the results to be obtained by the use thereof), and all such parties hereby expressly disclaim all warranties of originality, accuracy, completeness, merchantability or fitness for a particular purpose with respect to any of such standard or classification. Without limiting any of the foregoing, in no event shall MSCI, S&P, any of their affiliates or any third party involved in making or compiling the GICS or any GICS classifications have any liability for any direct, indirect, special, punitive, consequential or any other damages (including lost profits) even if notified of the possibility of such damages.
The portfolio risk management process includes an effort to monitor and manage risk, but does not imply low risk.
Shares of the Goldman Sachs VIT Funds are offered to separate accounts of participating life insurance companies for the purpose of funding variable annuity contracts and variable life insurance policies. Shares of the Fund are not offered directly to the general public. The variable annuity contracts and variable life insurance policies are described in the separate prospectuses issued by participating insurance companies. You should refer to those prospectuses for information about surrender charges, mortality and expense risk fees and other charges that may be assessed by participating insurance companies under the variable annuity contracts or variable life insurance policies. Such fees or charges, if any, may affect the return you may realize with respect to your investments. Ask your representative for more complete information. Please consider a fund’s objectives, risks and charges and expenses, and read the prospectus carefully before investing. The prospectus contains this and other information about the Fund.
This material is not authorized for distribution to prospective investors unless preceded or accompanied by a current prospectus or summary prospectus, if applicable. Investors should consider the Fund’s objective, risks, and charges and expenses, and read the summary prospectus, if available, and/or the prospectus carefully before investing or sending money. The summary prospectus, if available, and the prospectus contain this and other information about the Fund and may be obtained from your authorized dealer or from Goldman Sachs & Co. LLC by calling 1-800-621-2550.
This report is prepared for the general information of contract owners and is not an offer of shares of the Goldman Sachs Variable Insurance Trust — Goldman Sachs U.S. Equity Insights Fund.
© 2018 Goldman Sachs. All rights reserved.
VITUSSAR-18/139324-OTU-809589/7.5k
| ITEM 2. | CODE OF ETHICS. |
| (a) | As of the end of the period covered by this report, the registrant has adopted a code of ethics that applies to the registrant’s principal executive officer, principal financial officer, principal accounting officer or controller, or persons performing similar functions, regardless of whether these individuals are employed by the registrant or a third party (the “Code of Ethics”). |
| (b) | During the period covered by this report, no amendments were made to the provisions of the Code of Ethics. |
| (c) | During the period covered by this report, the registrant did not grant any waivers, including an implicit waiver, from any provision of the Code of Ethics. |
| (d) | A copy of the Code of Ethics is available as provided in Item 12(a)(1) of this report. |
| ITEM 3. | AUDIT COMMITTEE FINANCIAL EXPERT. |
The registrant’s board of trustees has determined that the registrant has at least one “audit committee financial expert” (as defined in Item 3 of Form N-CSR) serving on its audit committee. Gregory G. Weaver is the “audit committee financial expert” and is “independent” (as each term is defined in Item 3 of Form N-CSR). |
| ITEM 4. | PRINCIPAL ACCOUNTANT FEES AND SERVICES. |
The information required by this Item is only required in an annual report on this Form N-CSR. |
| ITEM 5. | AUDIT COMMITTEE OF LISTED REGISTRANTS. |
Not applicable.
| ITEM 6. | SCHEDULE OF INVESTMENTS |
Schedule of Investments is included as part of the Reports to Shareholders filed under Item 1.
| ITEM 7. | DISCLOSURE OF PROXY VOTING POLICIES AND PROCEDURES FOR CLOSED-END MANAGEMENT INVESTMENT COMPANIES. |
Not applicable.
| ITEM 8. | PORTFOLIO MANAGERS OF CLOSED-END MANAGEMENT INVESTMENT COMPANIES |
Not applicable.
| ITEM 9. | PURCHASES OF EQUITY SECURITIES BY CLOSED-END MANAGEMENT INVESTMENT COMPANY AND AFFILIATED PURCHASERS |
Not applicable.
| ITEM 10. | SUBMISSION OF MATTERS TO A VOTE OF SECURITY HOLDERS. |
There have been no material changes to the procedures by which shareholders may recommend nominees to the registrant’s board of trustees.
| ITEM 11. | CONTROLS AND PROCEDURES. |
| (a) | The registrant’s principal executive and principal financial officers or persons performing similar functions have concluded that the registrant’s disclosure controls and procedures (as defined in Rule 30a-3(c) under the Investment Company Act of 1940, as amended (the “1940 Act”)) are effective as of a date within 90 days of the filing date of this report that includes the disclosure required by this paragraph, based on the evaluation of these controls and procedures required by Rule 30a-3(b) under the 1940 Act and 15d-15(b) under the Securities Exchange Act of 1934, as amended. |
| (b) | There were no changes in the registrant’s internal control over financial reporting (as defined in Rule 30a-3(d) under the 1940 Act) that occurred during the registrant’s second fiscal quarter of the period covered by this report that has materially affected, or is reasonably likely to materially affect the registrant’s internal control over financial reporting. |
| ITEM 12. | EXHIBITS. |
| (a)(1) | Goldman Sachs Variable Insurance Trust’s Code of Ethics for Principal Executive and Senior Financial Officers is incorporated by reference to Exhibit 12(a)(1) of the registrant’s Form N-CSR filed on February 27, 2015. | |||
| (a)(2) | Exhibit 99.CERT | Certifications pursuant to Section 302 of the Sarbanes-Oxley Act of 2002 filed herewith | ||
| Exhibit 99.906CERT | Certifications pursuant to Section 906 of the Sarbanes-Oxley Act of 2002 filed herewith | |||
SIGNATURES
Pursuant to the requirements of the Securities Exchange Act of 1934 and the Investment Company Act of 1940, the registrant has duly caused this report to be signed on its behalf by the undersigned, thereunto duly authorized.
Goldman Sachs Variable Insurance Trust
/s/ James A. McNamara | ||
By: James A. McNamara | ||
Chief Executive Officer of | ||
Goldman Sachs Variable Insurance Trust | ||
Date: August 22, 2018 | ||
Pursuant to the requirements of the Securities Exchange Act of 1934 and the Investment Company Act of 1940, the report has been signed below by the following persons on behalf of the registrant and in the capacities and on the dates indicated.
/s/ James A. McNamara | ||
By: James A. McNamara | ||
Chief Executive Officer of | ||
Goldman Sachs Variable Insurance Trust | ||
Date: August 22, 2018 | ||
/s/ Scott McHugh | ||
By: Scott McHugh | ||
Principal Financial Officer of | ||
Goldman Sachs Variable Insurance Trust | ||
Date: August 22, 2018 | ||