UNITED STATES
SECURITIES AND EXCHANGE COMMISSION
Washington, D.C. 20549
FORMN-CSR
CERTIFIED SHAREHOLDER REPORT OF REGISTERED
MANAGEMENT INVESTMENT COMPANIES
Investment Company Act file number811-08361
Goldman Sachs Variable Insurance Trust
(Exact name of registrant as specified in charter)
71 South Wacker Drive, Chicago, Illinois 60606-6303
(Address of principal executive offices) (Zip code)
Caroline Kraus
Goldman Sachs & Co. LLC
200 West Street
New York, NY 10282
Copies to:
Geoffrey R.T. Kenyon, Esq.
Dechert LLP
One International Place, 40th Floor
100 Oliver Street
Boston, MA 02110-2605
(Name and address of agents for service)
Registrant’s telephone number, including area code:(312) 655-4400
Date of fiscal year end: December 31
Date of reporting period: June 30, 2019
| ITEM 1. | REPORTS TO STOCKHOLDERS. |
| | The Semi-Annual Reports to Shareholders are filed herewith. |
Goldman
SachsVariable Insurance Trust
Goldman Sachs
Global Trends
Allocation Fund
Beginning on or after January 1, 2021, you may not receive paper copies of the Fund’s annual and semi-annual shareholder reports from the insurance company that offers your variable insurance contract or your financial intermediary, unless you specifically request paper copies of the reports from the insurance company or from your financial intermediary. Instead, the reports will be made available on a website, and you will be notified by mail each time a report is posted and provided with a website link to access the report.
If you already elected to receive shareholder reports electronically, you will not be affected by this change and you need not take any action. At any time, you may elect to receive reports and certain communications from the insurance company electronically by contacting your insurance company or your financial intermediary.
You may elect to receive all future shareholder reports in paper free of charge. You can inform the insurance company or your financial intermediary that you wish to receive paper copies of reports. Your election to receive reports in paper will apply to all Goldman Sachs Funds available under your contract and may apply to all funds held with your financial intermediary.

Semi-Annual Report
June 30, 2019
GOLDMAN SACHS VARIABLE INSURANCE TRUST – GOLDMAN SACHS GLOBAL TRENDS ALLOCATION FUND
INVESTMENT OBJECTIVE
The Fund seeks total return while seeking to provide volatility management.
Portfolio Management Discussion and Analysis
Effective April 30, 2019, the components of the Goldman Sachs Variable Insurance Trust — Goldman Sachs Global Trends Allocation Fund’s (the “Fund”) performance benchmark changed from 60% MSCI World Index (Net, USD, Unhedged) and 40% Bloomberg Barclays U.S. Aggregate Bond Index to 60% MSCI World Index (Net, USD, Hedged) and 40% Bloomberg Barclays U.S. Treasury Composite Index (Total Return, USD, Unhedged). No modifications in the Fund’s investment objective or its principal investment strategy were made in connection with this change.
Below, the Goldman Sachs Quantitative Investment Strategies (“QIS”) Team discusses the Fund’s performance and positioning for thesix-month period ended June 30, 2019 (the “Reporting Period”).
How did the Fund perform during the Reporting Period?
During the Reporting Period, the Fund’s Institutional and Service Shares generated cumulative total returns of 7.04% and 6.79%, respectively. These returns compare to the 12.48% cumulative total return of the Fund’s blended benchmark index (the “Index”), which is comprised of 60% the MSCI World Index and 40% the Bloomberg Barclays U.S. Treasury Index, during the Reporting Period. The MSCI World Index (Net, USD, Hedged) and the Bloomberg Barclays U.S. Treasury Index (Total Return, USD, Unhedged) generated cumulative total returns of 17.24% and 5.18%, respectively, during the same time period.
To compare, the Fund’s previous blended benchmark returned 12.71% during the Reporting Period. Its components, the MSCI World Index (Net, USD, Hedged) and the Bloomberg Barclays U.S. Aggregate Bond Index, generated cumulative total returns of 17.38% and 6.11%, respectively, during the same time period.
Importantly, during the Reporting Period, the Fund’s overall annualized volatility (which is measured versus the S&P 500® Index) was 3.91%, less than the S&P 500® Index’s annualized volatility of 12.45% during the same time period.
What economic and market factors most influenced the Fund during the Reporting Period?
During the Reporting Period, the performance of the capital markets and the Fund was influenced most by central bank monetary policy, economic data and geopolitics.
Global equities posted double-digit gains during the first quarter of 2019 when the Reporting Period began. Federal Reserve (“Fed”) commentary provided a supportive background, as Fed Chair Jerome Powell reiterated a “patient” approach to monetary policy that included a pause in interest rate hikes and a plan to end quantitative tightening, or the shrinking of the Fed’s balance sheet as securities mature, by the end of the 2019 calendar year. The U.S. unemployment rate remained below trend at 3.8% in February 2019, with a steady increase in wages of 3.4% year over year. Housing data showed strength in the first calendar quarters, with new home sales reaching 667,000 in February, bringing the three-month average up to 630,000. Strength in housing data could be partially attributed to a steep decline in mortgage rates resulting from a more cautious Fed. The University of Michigan Consumer Sentiment Index was also a point of significant strength in the U.S. economy, steadily climbing in each month of the first quarter of 2019 and eventually reaching 98.4 in March, its highest level in six months. However, the economic growth concerns that had dominated the fourth quarter of 2018 failed to completely disappear, as fourth quarter 2018 U.S. Gross Domestic Product (“GDP”) growth was revised down 0.4% in March 2019 to 2.2%. In Europe, uncertainty surrounding the U.K.’s plan to exit the European Union, also known as Brexit, and trade tensions with the U.S. were headwinds, as Brexit talks extended beyond the U.K.’s original departure date of March 29th and the U.S. Administration threatened import taxes on goods from the European Union. Signs of weakness in European data indicated the pace of economic expansion was slowing, and the 2019 European GDP growth forecast was reduced from 1.7% to 1.1%. The European Central Bank (“ECB”) announced it would hold its deposit rate steady at-0.4% and said it would delay interest rate hikes until 2020. Regarding Japan, slowing global demand and weakening domestic economic growth, coupled with falling inflation, pressured the Bank of Japan to maintain its accommodative monetary policy. As for China, progress in trade discussions with the U.S. was positive for investor risk sentiment overall. In addition, the annual National People’s Congress and Chinese People’s Political Consultative Conference took centerstage, as China’s leaders announced key 2019 economic targets, such as GDP growth of between 6% and 6.5%, and introduced a series of tax cuts to support
1
GOLDMAN SACHS VARIABLE INSURANCE TRUST – GOLDMAN SACHS GLOBAL TRENDS ALLOCATION FUND
economic growth. In Australia, the central bank kept interest rates on hold in the face of slowing economic growth and increased downside risks to the global and domestic outlooks in spite of a tight labor market and gradually rising inflation.
In the second quarter of 2019, global equities posted a more modest gain. Trade tensions between the U.S. and China dominated headlines and broadly added noise to the markets. (Noise refers to market activity that can confuse or misrepresent genuine underlying trends.) In April 2019, investors grew optimistic about a possible U.S.-China trade deal, but this optimism faded in May when the U.S. President threatened to raise current tariffs and impose new duties on $300 billion of additional Chinese imports. Also, sanctions were temporarily placed on a Chinese telecommunications giant, until they were lifted in June 2019, when additional tariffs or compromise were postponed. During the second calendar quarter, investors kept a close eye on the Fed, which said it might take a more accommodative approach to monetary policy. Following the Fed’s statement, the market consensus actually priced in at least one interest rate cut by the end of 2019. U.S. economic indicators were mixed during the second calendar quarter, with consumer sentiment remaining elevated but nonfarm payroll data and manufacturing indices falling short of consensus expectations.
Regarding fixed income, spread, ornon-government bond, sectors broadly posted gains in the first quarter of 2019, as dovish pivots by global central banks boosted investor sentiment and helped fuel rallies in both sovereign government bonds and riskier segments of the fixed income market. (Dovish tends to suggest lower interest rates; opposite of hawkish.) Notably, high yield corporate bonds recorded their strongest start to a calendar year on record. The Fed kept its monetary policy unchanged during the first calendar quarter, with its dot plot projecting no interest rate hikes at all during 2019. (The “dot plot” shows interest rate projections of the members of the Federal Open Market Committee.) Meanwhile, the ECB extended its forward guidance, noting its interest rates would remain unchanged through 2019. Other developed markets’ central banks — namely, those of Australia, New Zealand, Switzerland and, to some degree, the U.K. — also turned dovish. The U.S. economy continued to benefit from strength in household consumption, which was underpinned by a healthy labor market. The U.S. dollar strengthened relative to many major currencies during the first quarter of 2019.
In the second calendar quarter, most spread sectors recorded gains. The quarter started off on a positive note in April 2019, as developed markets’ central banks kept monetary policy unchanged. In the U.S., the Fed provided dovish commentary around household spending and inflation, though this was counterbalanced somewhat by the observation that inflation softness might be due to “transitory factors.” The Bank of Japan clarified its forward guidance to signal unchanged monetary policy through the spring of 2020, while the Bank of England maintained its guidance around interest rate hikes occurring at a gradual pace and to a limited extent. Meanwhile, statements by Sweden’s Riksbank and the Bank of Canada were rather dovish, as they generally focused on external risks. However, in May 2019, spread sectors were challenged by the escalation of U.S.-China trade tensions. That same month, market speculation about possible 2019 Fed rate cuts increased due to an accumulation of factors, including soft inflation and weakness in U.S. economic data, continued U.S. economic growth headwinds from unresolved U.S.-China trade negotiations, and subdued global economic activity, particularly in the manufacturing sector. During June 2019, spread sector performance improved on raised prospects of ongoing monetary policy accommodation by global central banks, particularly the Fed. At its June meeting, the U.S. central bank left interest rates unchanged, with eight of the 12 members on the Federal Open Market Committee projecting rate cuts during the 2019 calendar year. In Europe, a dovish speech by outgoing ECB President Mario Draghi signaled forthcoming easing. The U.S. dollar weakened versus many major currencies during the second quarter of 2019.
What key factors were responsible for the Fund’s performance during the Reporting Period?
The Fund primarily seeks to achieve its investment objective by investing in a global portfolio of equity and fixed income asset classes. Under normal market conditions, the Fund expects to invest at least 40% of its assets in equity investments and at least 20% of its assets in fixed income investments. The percentage of the Fund’s portfolio exposed to any asset class or geographic region will vary from time to time as the weightings of the Fund change, and the Fund may not be invested in each asset class at all times.
As part of the Fund’s investment strategy, the Investment Adviser seeks to manage volatility and limit losses by allocating the Fund’s assets away from risky investments in distressed or volatile market environments. Volatility is a statistical measurement of the magnitude of up and down fluctuations in the value of a financial instrument or index. In distressed or volatile market environments, the Fund may also hold significant amounts of U.S. Treasury, short-term or other fixed income investments, including money market funds and repurchase agreements or cash, and at times may invest up to 100% of its assets in such investments.
During the Reporting Period, the Fund continued dynamically allocating across global asset classes, using a momentum-based methodology, as it sought total return while also seeking to provide volatility management. Momentum investing seeks growth of capital by gaining exposure to asset classes that have exhibited trends in price performance over selected time periods. In managing
2
GOLDMAN SACHS VARIABLE INSURANCE TRUST – GOLDMAN SACHS GLOBAL TRENDS ALLOCATION FUND
the Fund, we use a methodology that evaluates historical three-,six- and nine-month returns, volatilities and correlations across a range of nine global asset classes. Represented by indices, these asset classes include, within the equities category, U.S.large-cap andsmall-cap, European, Asian, emerging markets and U.K. stocks. Within the fixed income category, the Fund may allocate assets to the U.S., Europe and Japan. The analysis of these asset classes drives the aggregate allocations of the Fund over time. We believe market price momentum — either positive or negative — has significant predictive power.
During the Reporting Period, the Fund’s defensive cash positioning detracted significantly from relative performance, as global equities rebounded from declines suffered in the fourth quarter of 2018. On the positive side, the Fund’s allocations to U.S.large-cap stocks and to European, U.K. and Japanese equities added to absolute returns. Allocations to German government bonds, U.S. Treasury securities and Japanese government bonds also bolstered absolute performance. The Fund did not have allocations to emerging markets equities or U.S.small-cap equities during the Reporting Period.
What was the Fund’s volatility during the Reporting Period?
As part of our investment approach, we seek to mitigate the Fund’s volatility. As mentioned earlier, for the Reporting Period overall, the Fund’s actual volatility (annualized, using daily returns) was 3.91%, less than the S&P 500® Index’s annualized volatility of 12.45%.
How was the Fund positioned during the Reporting Period?
During the Reporting Period, we tactically managed the Fund’s allocations across equity and fixed income markets based on the momentum and volatility of these asset classes. At the beginning of the Reporting Period, the Fund’s total assets were allocated 19.3% to equities, 38.3% to fixed income and 42.4% to cash. (Many of these positions were implemented through the use of exchanged-traded index future contracts.) Within the equity category, the Fund had allocations to four of six global equity asset classes. It did not have an allocation to emerging markets equities orU.S. small-cap equities at the beginning of the Reporting Period. As for fixed income, the Fund had allocations to U.S. Treasury securities, German government bonds and Japanese government bonds at the start of the Reporting Period.
During January 2019, we greatly decreased the Fund’s cash position in response to the rally in global equities. At the same time, we significantly increased the Fund’s allocation to U.S.large-cap equities and, to a lesser extent, its allocations to Japanese, European and U.K. stocks. We also substantially increased the Fund’s allocations to fixed income overall.
In February 2019, we eliminated the Fund’s position in cash and further increased its allocations to U.S.large-cap stocks and Japanese equities. We increased its allocation to German government bonds and reduced its allocation to U.S. Treasury securities.
During March 2019, the Fund’s allocations remained relatively unchanged.
In April 2019, we increased the Fund’s allocations to U.S.large-cap stocks, U.K. equities and European equities. In fixed income, we decreased the Fund’s allocations to U.S. Treasury securities and Japanese government bonds.
During May 2019, we actively sought to manage volatility within the Fund’s equity allocations. Specifically, we reduced the Fund’s allocations toU.S. large-cap stocks, U.K. stocks and European stocks. Within fixed income, we increased the Fund’s allocation to U.S. Treasury securities.
In June 2019, the Fund’s equity allocations stayed relatively unchanged. Within fixed income, we increased the Fund’s allocation to Japanese government bonds and decreased its allocation to German government bonds.
How did the Fund use derivatives and similar instruments during the Reporting Period?
During the Reporting Period, the Fund employed exchange-traded index futures contracts to gain exposure to U.S.large-cap stocks; the European, Japanese and U.K. equity markets; and U.S., Japanese and German government bonds. On an absolute basis, the use of these instruments had a positive impact on the Fund’s performance, as the majority of these allocations added to returns.
Were there any changes to the Fund’s portfolio management team during the Reporting Period?
Effective April 30, 2019, Gary Chropuvka no longer served as a portfolio manager of the Fund but remainedco-Head of the QIS Team. As of the same date, Matthew Schwab became a portfolio manager of the Fund. By design, all investment decisions for the Fund are performed within aco-lead or team structure, with multiple subject matter experts. This strategic decision making has been the cornerstone of our approach and ensures continuity in the Fund. At the end of the Reporting Period, the portfolio managers for the Fund were Federico Gilly, Oliver Bunn and Matthew Schwab.
3
GOLDMAN SACHS VARIABLE INSURANCE TRUST – GOLDMAN SACHS GLOBAL TRENDS ALLOCATION FUND
What is the Fund’s tactical asset allocation view and strategy for the months ahead?
At the end of the Reporting Period, the Fund’s total assets were allocated 40.0% to equities, 60.0% to fixed income and 0% to cash. (Many of these positions were implemented through the use of exchanged-traded index future contracts.) Within the equity allocation, the Fund continued to have significant exposure to U.S.large-cap stocks and, to a lesser extent, to Japanese, U.K. and European equities. Within the fixed income allocation, the Fund had substantial exposure to U.S. Treasury securities as well as exposure to Japanese and German government bonds. At the end of the Reporting Period, the Fund had no exposure to emerging markets equities and U.S.small-cap stocks.
Going forward, we intend to position the Fund to provide exposure to price momentum from among nine underlying asset classes, while dynamically managing the volatility, or risk, of the overall portfolio. In general, we expect the Fund to maintain a strategic allocation of 60% of its assets in equity investments and 40% of its assets in fixed income investments. The Fund may deviate from these strategic allocations in order to allocate a greater percentage to asset classes with strong momentum and to reduce its allocation to assets with weak momentum. When volatility increases, our goal is to preserve capital by proportionally increasing the Fund’s cash exposure and reducing its exposure to riskier asset classes. There is no guarantee the Fund’s dynamic management strategy will cause it to achieve its investment objective.
4
GOLDMAN SACHS VARIABLE INSURANCE TRUST GLOBAL TRENDS ALLOCATION FUND
Index Definitions
Bloomberg Barclays U.S. Aggregate Bond Index represents an unmanaged diversified portfolio of fixed income securities, including U.S. Treasuries, investment-grade corporate bonds and mortgage-backed and asset-backed securities.
Bloomberg Barclays U.S. Treasury Composite Indexmeasures U.S. dollar-denominated, fixed-rate, nominal debt issued by the U.S. Treasury. Treasury bills are excluded by the maturity constraint.
MSCI World Index is a broad global equity index that represents large and mid-cap equity performance across 23 developed markets countries. It covers approximately 85% of the free float-adjusted market capitalization in each country.
S&P 500® Index is a U.S. stock market index based on the market capitalizations of 500 large companies having common stock listed on the New York Stock Exchange or NASDAQ. The S&P 500® Index components and their weightings are determined by S&P Dow Jones Indices.
It is not possible to invest directly in an unmanaged index.
5
FUND BASICS
Global Trends Allocation Fund
as of June 30, 2019
STANDARDIZED TOTAL RETURNS1
| | | | | | | | | | | | | | |
| | | | |
| For the period ended 6/30/19 | | One Year | | | Five Years | | | Since Inception | | | Inception Date |
| Institutional | | | 2.18 | % | | | 3.02 | % | | | 3.78 | % | | 10/16/13 |
| Service | | | 1.83 | | | | 2.75 | | | | 4.68 | | | 4/16/12 |
| 1 | Standardized Total Returns are average annual total returns as of the most recent calendar quarter-end. They assume reinvestment of all distributions at net asset value (“NAV”). Because Institutional Shares and Service Shares do not involve a sales charge, such a charge is not applied to their Standardized Total Returns. |
Total return figures in the above chart represent past performance and do not indicate future results, which will vary. The investment return and principal value of an investment will fluctuate and, therefore, an investor’s shares, when redeemed, may be worth more or less than their original cost. Current performance may be lower or higher than the total return figures in the above chart. Please visit www.GSAMFUNDS.com to obtain the most recent month-end returns.Performance reflects fee waivers and/or expense limitations in effect during the periods shown. In their absence, performance would be reduced.
EXPENSE RATIOS2
| | | | | | | | |
| | |
| | | Net Expense Ratio (Current) | | | Gross Expense Ratio (Before Waivers) | |
| Institutional | | | 0.74 | % | | | 1.00 | % |
| Service | | | 0.99 | | | | 1.25 | |
| 2 | The expense ratios of the Fund, both current (net of any fee waivers and/or expense limitations) and before waivers (gross of any fee waivers and/or expense limitations) are as set forth above according to the most recent publicly available Prospectuses for the Fund and may differ from the expense ratios disclosed in the Financial Highlights in this report. Pursuant to a contractual arrangement, the Fund’s fee waivers and/or expense limitations will remain in place through at least April 30, 2020, and prior to such date, the Investment Adviser may not terminate the arrangements without the approval of the Fund’s Board of Trustees. If these arrangements are discontinued in the future, the expense ratios may change without shareholder approval. |
6
FUND BASICS
FUND COMPOSITION3
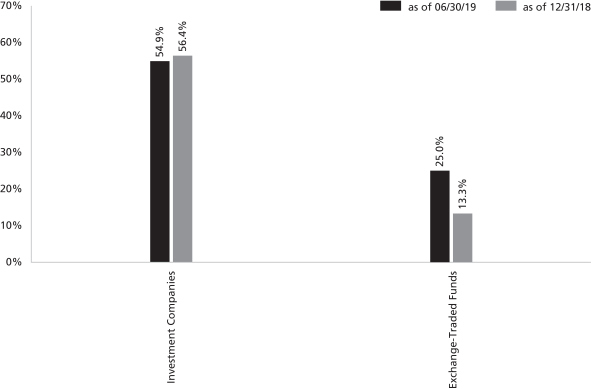
| 3 | The percentage shown for each investment category reflects the value of investments in that category as a percentage of net assets. Figures in the above graph may not sum to 100% due to the exclusion of other assets and liabilities. The underlying composition of exchange traded funds and investment companies held by the Fund are not reflected in the graph above. Consequently, the Fund’s overall composition may differ from the percentages contained in the graph above. The graph depicts the Fund’s investments but may not represent the Fund’s market exposure due to the exclusion of certain derivatives, if any, as listed in the Additional Investment Information section of the Schedule of Investments. |
7
GOLDMAN SACHS VARIABLE INSURANCE TRUST GLOBAL TRENDS ALLOCATION FUND
Schedule of Investments
June 30, 2019 (Unaudited)
| | | | | | | | |
| Shares | | | Description | | Value | |
|
| Exchange Traded Funds – 25.0% | |
| | 149,844 | | | iShares Core S&P 500 ETF | | $ | 44,166,519 | |
| | 151,900 | | | Vanguard S&P 500 ETF | | | 40,883,885 | |
| | |
| | TOTAL EXCHANGE TRADED FUNDS | | | | |
| | (Cost $65,943,923) | | $ | 85,050,404 | |
| | |
| | | | | | | | |
| Shares | | Dividend
Rate | | | Value | |
|
| Investment Companies(a) – 54.9% | |
Goldman Sachs Financial Square Government Fund — Institutional Shares | |
| 101,890,103 | | | 2.308 | % | | $ | 101,890,103 | |
Goldman Sachs Financial Square Treasury Obligations Fund — Institutional Shares | |
| 42,329,175 | | | 2.248 | | | | 42,329,175 | |
Goldman Sachs Financial Square Treasury Solutions Fund — Institutional Shares | |
| 42,329,175 | | | 2.209 | | | | 42,329,175 | |
| |
| TOTAL INVESTMENT COMPANIES | |
| (Cost $186,548,453) | | | $ | 186,548,453 | |
| |
| TOTAL INVESTMENTS – 79.9% | |
| (Cost $252,492,376) | | | $ | 271,598,857 | |
| |
OTHER ASSETS IN EXCESS OF LIABILITIES – 20.1% | | | | 68,122,857 | |
| |
| NET ASSETS – 100.0% | | | $ | 339,721,714 | |
| |
| | |
| The percentage shown for each investment category reflects the value of investments in that category as a percentage of net assets. |
| |
| (a) | | Represents an Affiliated Issuer. |
ADDITIONAL INVESTMENT INFORMATION
FUTURES CONTRACTS— At June 30, 2019, the Fund had the following futures contracts:
| | | | | | | | | | | | | | | | |
| Description | | Number of
Contracts | | | Expiration
Date | | | Notional
Amount | | | Unrealized
Appreciation/
(Depreciation) | |
|
Long position contracts: | |
| EURO STOXX 50 Index | | | 434 | | | | 09/20/2019 | | | $ | 17,104,757 | | | $ | 118,122 | |
| Euro-Bund | | | 230 | | | | 09/06/2019 | | | | 45,171,977 | | | | 476,008 | |
| FTSE 100 Index | | | 185 | | | | 09/20/2019 | | | | 17,312,783 | | | | (23,231 | ) |
| Japan 10 Year Bond | | | 31 | | | | 09/12/2019 | | | | 44,247,925 | | | | 140,386 | |
| TOPIX Index | | | 118 | | | | 09/12/2019 | | | | 16,975,189 | | | | (59,825 | ) |
U.S. Treasury 10 Year Note | | | 706 | | | | 09/19/2019 | | | | 90,301,813 | | | | 1,178,289 | |
| |
| Total Futures Contracts | | | $ | 1,829,749 | |
| | |
| 8 | | The accompanying notes are an integral part of these financial statements. |
GOLDMAN SACHS VARIABLE INSURANCE TRUST GLOBAL TRENDS ALLOCATION FUND
Statement of Assets and Liabilities
June 30, 2019 (Unaudited)
| | | | |
| | | | |
| Assets: | | | |
Investments in affiliated issuers, at value (cost $186,548,453) | | $ | 186,548,453 | |
Investments in unaffiliated issuers, at value (cost $65,943,923) | | | 85,050,404 | |
Cash | | | 64,132,935 | |
Receivables: | | | | |
Collateral on certain derivative contracts | | | 3,953,626 | |
Dividends | | | 359,001 | |
Fund shares sold | | | 53,337 | |
Reimbursement from investment adviser | | | 18,310 | |
Variation margin on futures | | | 674,402 | |
Other assets | | | 1,156 | |
| |
| Total assets | | | 340,791,624 | |
| | | | |
| | | | |
| Liabilities: | |
Payables: | | | | |
Investments purchased | | | 642,414 | |
Management fees | | | 160,978 | |
Fund shares redeemed | | | 91,985 | |
Distribution and Service fees and Transfer Agency fees | | | 74,398 | |
Accrued expenses | | | 100,135 | |
| |
| Total liabilities | | | 1,069,910 | |
| | | | |
| | | | |
| Net Assets: | |
Paid-in capital | | | 309,226,176 | |
Total distributable earnings (loss) | | | 30,495,538 | |
| |
| NET ASSETS | | $ | 339,721,714 | |
Net Assets: | | | | |
Institutional | | $ | 263,915 | |
Service | | | 339,457,799 | |
| |
Total Net Assets | | $ | 339,721,714 | |
Shares outstanding $0.001 par value (unlimited shares authorized): | | | | |
Institutional | | | 21,171 | |
Service | | | 27,299,294 | |
Net asset value, offering and redemption price per share: | | | | |
Institutional | | | $12.47 | |
Service | | | 12.43 | |
| | |
| The accompanying notes are an integral part of these financial statements. | | 9 |
GOLDMAN SACHS VARIABLE INSURANCE TRUST GLOBAL TRENDS ALLOCATION FUND
Statement of Operations
For the Six Months Ended June 30, 2019 (Unaudited)
| | | | |
| | | | |
| Investment income: | |
Dividends — affiliated issuers | | $ | 2,241,407 | |
Dividends — unaffiliated issuers | | | 906,717 | |
| |
| Total investment income | | | 3,148,124 | |
| | | | |
| | | | |
| Expenses: | |
Management fees | | | 1,392,732 | |
Distribution and Service fees — Service Shares | | | 440,419 | |
Professional fees | | | 50,089 | |
Transfer Agency fees(a) | | | 35,256 | |
Custody, accounting and administrative services | | | 25,489 | |
Printing and mailing costs | | | 22,578 | |
Trustee fees | | | 8,292 | |
Other | | | 8,271 | |
| |
| Total expenses | | | 1,983,126 | |
| |
Less — expense reductions | | | (497,886 | ) |
| |
| Net expenses | | | 1,485,240 | |
| |
| NET INVESTMENT INCOME | | | 1,662,884 | |
| | | | |
| | | | |
| Realized and unrealized gain (loss): | |
Net realized gain (loss) from: | | | | |
Investments — unaffiliated issuers | | | 3,726,719 | |
Futures contracts | | | 8,861,627 | |
Foreign currency transactions | | | (214,380 | ) |
Net change in unrealized gain on: | |
Investments — unaffiliated issuers | | | 9,142,870 | |
Futures contracts | | | 1,041,794 | |
Foreign currency translation | | | 164,548 | |
| |
| Net realized and unrealized gain | | | 22,723,178 | |
| |
| NET INCREASE IN NET ASSETS RESULTING FROM OPERATIONS | | $ | 24,386,062 | |
(a) Institutional and Service Shares incurred Transfer Agency fees of $25 and $35,231, respectively.
| | |
| 10 | | The accompanying notes are an integral part of these financial statements. |
GOLDMAN SACHS VARIABLE INSURANCE TRUST GLOBAL TRENDS ALLOCATION FUND
Statements of Changes in Net Assets
| | | | | | | | |
| | | For the
Six Months Ended
June 30, 2019
(Unaudited) | | | For the
Fiscal Year Ended
December 31, 2018 | |
| | | | | | | | |
| From operations: | |
Net investment income | | $ | 1,662,884 | | | $ | 2,585,788 | |
Net realized gain (loss) | | | 12,373,966 | | | | (1,891,459 | ) |
Net change in unrealized gain (loss) | | | 10,349,212 | | | | (18,542,964 | ) |
| | |
| Net increase (decrease) in net assets resulting from operations | | | 24,386,062 | | | | (17,848,635 | ) |
| | | | | | | | |
| | | | | | | | |
| Distributions to shareholders: | |
From distributable earnings: | | | | | | | | |
Institutional Shares | | | — | | | | (6,273 | ) |
Service Shares | | | — | | | | (9,086,313 | ) |
| | |
| Total distributions to shareholders | | | — | | | | (9,092,586 | ) |
| | | | | | | | |
| | | | | | | | |
| From share transactions: | |
Proceeds from sales of shares | | | 15,431,542 | | | | 42,650,408 | |
Reinvestment of distributions | | | — | | | | 9,092,586 | |
Cost of shares redeemed | | | (96,184,335 | ) | | | (35,610,360 | ) |
| | |
| Net increase (decrease) in net assets resulting from share transactions | | | (80,752,793 | ) | | | 16,132,634 | |
| | |
| TOTAL DECREASE | | | (56,366,731 | ) | | | (10,808,587 | ) |
| | | | | | | | |
| | | | | | | | |
| Net Assets: | |
| | |
Beginning of period | | | 396,088,445 | | | | 406,897,032 | |
| | |
End of period | | $ | 339,721,714 | | | $ | 396,088,445 | |
| | |
| The accompanying notes are an integral part of these financial statements. | | 11 |
GOLDMAN SACHS VARIABLE INSURANCE TRUST GLOBAL TRENDS ALLOCATION FUND
Financial Highlights
Selected Data for a Share Outstanding Throughout Each Period
| | | | | | | | | | | | | | | | | | | | | | | | |
| | | Goldman Sachs Global Trends Allocation Fund | |
| | | Institutional Shares | |
| | | Six Months Ended
June 30, 2019
(Unaudited) | | | Year Ended December 31, | |
| | | 2018 | | | 2017 | | | 2016 | | | 2015 | | | 2014 | |
| | | | | | | | | | | | | | | | | | | | | | | | |
| Per Share Data | | | | | | | | | | | | | | | | | | |
| | | | | | |
Net asset value, beginning of period | | $ | 11.65 | | | $ | 12.46 | | | $ | 11.33 | | | $ | 10.89 | | | $ | 11.82 | | | $ | 11.46 | |
| | | | | | |
Net investment income (loss)(a) | | | 0.07 | | | | 0.14 | | | | 0.06 | | | | (0.03 | ) | | | 0.01 | | | | 0.08 | |
| | | | | | |
Net realized and unrealized gain (loss) | | | 0.75 | | | | (0.64 | ) | | | 1.46 | | | | 0.52 | | | | (0.67 | ) | | | 0.41 | |
| | | | | | |
Total from investment operations | | | 0.82 | | | | (0.50 | ) | | | 1.52 | | | | 0.49 | | | | (0.66 | ) | | | 0.49 | |
| | | | | | |
Distributions to shareholders from net investment income | | | — | | | | (0.12 | ) | | | (0.07 | ) | | | (0.05 | ) | | | (0.03 | ) | | | (0.03 | ) |
| | | | | | |
Distributions to shareholders from net realized gains | | | — | | | | (0.19 | ) | | | (0.32 | ) | | | — | | | | (0.24 | ) | | | (0.10 | ) |
| | | | | | |
Total distributions | | | — | | | | (0.31 | ) | | | (0.39 | ) | | | (0.05 | ) | | | (0.27 | ) | | | (0.13 | ) |
| | | | | | |
Net asset value, end of period | | $ | 12.47 | | | $ | 11.65 | | | $ | 12.46 | | | $ | 11.33 | | | $ | 10.89 | | | $ | 11.82 | |
| | | | | | |
Total return(b) | | | 7.04 | % | | | (4.08 | )% | | | 13.36 | % | | | 4.49 | % | | | (5.52 | )% | | | 4.23 | % |
| | | | | | |
Net assets, end of period (in 000s) | | $ | 264 | | | $ | 247 | | | $ | 30 | | | $ | 27 | | | $ | 1,008 | | | $ | 739 | |
| | | | | | |
Ratio of net expenses to average net assets | | | 0.59 | %(c) | | | 0.51 | % | | | 0.68 | % | | | 0.74 | % | | | 0.75 | % | | | 0.77 | % |
| | | | | | |
Ratio of total expenses to average net assets | | | 0.88 | %(c) | | | 0.86 | % | | | 0.86 | % | | | 0.89 | % | | | 0.92 | % | | | 1.01 | % |
| | | | | | |
Ratio of net investment income (loss) to average net assets | | | 1.23 | %(c) | | | 1.13 | % | | | 0.46 | % | | | (0.25 | )% | | | 0.12 | % | | | 0.68 | % |
| | | | | | |
Portfolio turnover rate(d) | | | 38 | % | | | 60 | % | | | 64 | % | | | 260 | % | | | 504 | % | | | 304 | % |
| (a) | Calculated based on the average shares outstanding methodology. |
| (b) | Assumes investment at the net asset value at the beginning of the period, reinvestment of all distributions, a complete redemption of the investment at the net asset value at the end of the period and no sales or redemption charges (if any). Total returns would be reduced if a sales or redemption charge was taken into account. Returns do not reflect the impact of taxes to shareholders relating to Fund distributions or the redemption of Fund shares. Total returns for periods less than one full year are not annualized. |
| (d) | The Fund’s portfolio turnover rate is calculated in accordance with regulatory requirements, without regard to transactions involving short term investments and certain derivatives. If such transactions were included, the Fund’s portfolio turnover rate may be higher. |
| | |
| 12 | | The accompanying notes are an integral part of these financial statements. |
GOLDMAN SACHS VARIABLE INSURANCE TRUST GLOBAL TRENDS ALLOCATION FUND
Financial Highlights(continued)
Selected Data for a Share Outstanding Throughout Each Period
| | | | | | | | | | | | | | | | | | | | | | | | |
| | | Goldman Sachs Global Trends Allocation Fund | |
| | | Service Shares | |
| | | Six Months Ended
June 30, 2019
(Unaudited) | | | Year Ended December 31, | |
| | | 2018 | | | 2017 | | | 2016 | | | 2015 | | | 2014 | |
| | | | | | | | | | | | | | | | | | | | | | | | |
| Per Share Data | | | | | | | | | | | | | | | | | | |
| | | | | | |
Net asset value, beginning of period | | $ | 11.64 | | | $ | 12.45 | | | $ | 11.32 | | | $ | 10.88 | | | $ | 11.82 | | | $ | 11.47 | |
| | | | | | |
Net investment income (loss)(a) | | | 0.06 | | | | 0.08 | | | | 0.03 | | | | 0.02 | | | | (0.02 | ) | | | — | (b) |
| | | | | | |
Net realized and unrealized gain (loss) | | | 0.73 | | | | (0.62 | ) | | | 1.46 | | | | 0.45 | | | | (0.67 | ) | | | 0.45 | |
| | | | | | |
Total from investment operations | | | 0.79 | | | | (0.54 | ) | | | 1.49 | | | | 0.47 | | | | (0.69 | ) | | | 0.45 | |
| | | | | | |
Distributions to shareholders from net investment income | | | — | | | | (0.08 | ) | | | (0.04 | ) | | | (0.03 | ) | | | (0.01 | ) | | | — | (b) |
| | | | | | |
Distributions to shareholders from net realized gains | | | — | | | | (0.19 | ) | | | (0.32 | ) | | | — | | | | (0.24 | ) | | | (0.10 | ) |
| | | | | | |
Total distributions | | | — | | | | (0.27 | ) | | | (0.36 | ) | | | (0.03 | ) | | | (0.25 | ) | | | (0.10 | ) |
| | | | | | |
Net asset value, end of period | | $ | 12.43 | | | $ | 11.64 | | | $ | 12.45 | | | $ | 11.32 | | | $ | 10.88 | | | $ | 11.82 | |
| | | | | | |
Total return(c) | | | 6.79 | % | | | (4.34 | )% | | | 13.11 | % | | | 4.33 | % | | | (5.82 | )% | | | 3.95 | % |
| | | | | | |
Net assets, end of period (in 000s) | | $ | 339,458 | | | $ | 395,842 | | | $ | 406,867 | | | $ | 353,615 | | | $ | 354,706 | | | $ | 267,720 | |
| | | | | | |
Ratio of net expenses to average net assets | | | 0.84 | %(d) | | | 0.81 | % | | | 0.93 | % | | | 1.00 | % | | | 1.00 | % | | | 1.03 | % |
| | | | | | |
Ratio of total expenses to average net assets | | | 1.12 | %(d) | | | 1.11 | % | | | 1.11 | % | | | 1.13 | % | | | 1.17 | % | | | 1.24 | % |
| | | | | | |
Ratio of net investment income (loss) to average net assets | | | 0.94 | %(d) | | | 0.63 | % | | | 0.21 | % | | | 0.20 | % | | | (0.16 | )% | | | (0.04 | )% |
| | | | | | |
Portfolio turnover rate(e) | | | 38 | % | | | 60 | % | | | 64 | % | | | 260 | % | | | 504 | % | | | 304 | % |
| (a) | Calculated based on the average shares outstanding methodology. |
| (b) | Amount is less than $0.005 per share. |
| (c) | Assumes investment at the net asset value at the beginning of the period, reinvestment of all distributions, a complete redemption of the investment at the net asset value at the end of the period and no sales or redemption charges (if any). Total returns would be reduced if a sales or redemption charge was taken into account. Returns do not reflect the impact of taxes to shareholders relating to Fund distributions or the redemption of Fund shares. Total returns for periods less than one full year are not annualized. |
| (e) | The Fund’s portfolio turnover rate is calculated in accordance with regulatory requirements, without regard to transactions involving short term investments and certain derivatives. If such transactions were included, the Fund’s portfolio turnover rate may be higher. |
| | |
| The accompanying notes are an integral part of these financial statements. | | 13 |
GOLDMAN SACHS VARIABLE INSURANCE TRUST GLOBAL TRENDS ALLOCATION FUND
Notes to Financial Statements
June 30, 2019 (Unaudited)
1. ORGANIZATION
Goldman Sachs Variable Insurance Trust (the “Trust” or “VIT”) is a Delaware statutory trust registered under the Investment Company Act of 1940, as amended (the “Act”), as anopen-end management investment company. The Trust includes the Goldman Sachs Global Trends Allocation Fund (the “Fund”). The Fund is a diversified portfolio under the Act offering two classes of shares — Institutional and Service Shares. Shares of the Trust are offered to separate accounts of participating life insurance companies for the purpose of funding variable annuity contracts and variable life insurance policies.
Goldman Sachs Asset Management, L.P. (“GSAM”), an affiliate of Goldman Sachs & Co. LLC (“Goldman Sachs”), serves as investment adviser to the Fund pursuant to a management agreement (the “Agreement”) with the Trust.
2. SIGNIFICANT ACCOUNTING POLICIES
The financial statements have been prepared in accordance with accounting principles generally accepted in the United States of America (“GAAP”) and require management to make estimates and assumptions that may affect the reported amounts and disclosures. Actual results may differ from those estimates and assumptions.
A. Investment Valuation — The Fund’s valuation policy is to value investments at fair value.
B. Investment Income and Investments —Investment income includes interest income, dividend income, and securities lending income, if any. Interest income is accrued daily and adjusted for amortization of premiums and accretion of discounts. Dividend income is recognized onex-dividend date or, for certain foreign securities, as soon as such information is obtained subsequent to theex-dividend date. Investment transactions are reflected on trade date. Realized gains and losses are calculated using identified cost. Investment transactions are recorded on the following business day for daily net asset value (“NAV”) calculations. Investment income is recorded net of any foreign withholding taxes, less any amounts reclaimable. The Fund may file withholding tax reclaims in certain jurisdictions to recover a portion of amounts previously withheld. Any foreign capital gains tax is accrued daily based upon net unrealized gains, and is payable upon sale of such investments.
For derivative contracts, realized gains and losses are recorded upon settlement of the contract.
C. Class Allocations and Expenses — Investment income, realized and unrealized gain (loss), if any, andnon-class specific expenses of the Fund are allocated daily based upon the proportion of net assets of each class.Non-class specific expenses directly incurred by the Fund are charged to the Fund, while such expenses incurred by the Trust are allocated across the Fund on a straight-line and/orpro-rata basis depending upon the nature of the expenses. Class-specific expenses, where applicable, are borne by the respective share classes and include Distribution and Service and Transfer Agency fees.
D. Federal Taxes and Distributions to Shareholders — It is the Fund’s policy to comply with the requirements of the Internal Revenue Code of 1986, as amended (the “Code”), applicable to regulated investment companies and to distribute each year substantially all of its investment company taxable income and capital gains to its shareholders. Accordingly, the Fund is not required to make any provisions for the payment of federal income tax. Distributions to shareholders are recorded on theex-dividend date. Income and capital gains distributions, if any, are declared and paid at least annually.
Net capital losses, if any, are carried forward to future fiscal years and may be used to the extent allowed by the Code to offset any future capital gains. Losses that are carried forward will retain their character as either short-term or long-term capital losses. Utilization of capital loss carryforwards will reduce the requirement of future capital gains distributions.
The characterization of distributions to shareholders for financial reporting purposes is determined in accordance with federal income tax rules, which may differ from GAAP. The source of the Fund’s distributions may be shown in the accompanying financial statements as either from distributable earnings or capital. Certain components of the Fund’s net assets on the Statement of Assets and Liabilities reflect permanent GAAP/tax differences based on the appropriate tax character.
E. Foreign Currency Translation — The accounting records and reporting currency of the Fund are maintained in United States (“U.S.”) dollars. Assets and liabilities denominated in foreign currencies are translated into U.S. dollars using the current exchange rates at the close of each business day. The effect of changes in foreign currency exchange rates on investments is included within
14
GOLDMAN SACHS VARIABLE INSURANCE TRUST GLOBAL TRENDS ALLOCATION FUND
2. SIGNIFICANT ACCOUNTING POLICIES (continued)
net realized and unrealized gain (loss) on investments. Changes in the value of other assets and liabilities as a result of fluctuations in foreign exchange rates are included in the Statement of Operations within net change in unrealized gain (loss) on foreign currency translation. Transactions denominated in foreign currencies are translated into U.S. dollars on the date the transaction occurred, the effects of which are included within net realized gain (loss) on foreign currency transactions.
3. INVESTMENTS AND FAIR VALUE MEASUREMENTS
U.S. GAAP defines the fair value of a financial instrument as the amount that would be received to sell an asset or paid to transfer a liability in an orderly transaction between market participants at the measurement date (i.e., the exit price); the Fund’s policy is to use the market approach. GAAP establishes a fair value hierarchy that prioritizes the inputs to valuation techniques used to measure fair value. The hierarchy gives the highest priority to unadjusted quoted prices in active markets for identical assets or liabilities (Level 1 measurements) and the lowest priority to unobservable inputs (Level 3 measurements). The levels used for classifying investments are not necessarily an indication of the risk associated with investing in these investments. The three levels of the fair value hierarchy are described below:
Level 1 — Unadjusted quoted prices in active markets that are accessible at the measurement date for identical, unrestricted assets or liabilities;
Level 2 — Quoted prices in markets that are not active or financial instruments for which significant inputs are observable (including, but not limited to, quoted prices for similar investments, interest rates, foreign exchange rates, volatility and credit spreads), either directly or indirectly;
Level 3 — Prices or valuations that require significant unobservable inputs (including GSAM’s assumptions in determining fair value measurement).
The Board of Trustees (“Trustees”) has approved Valuation Procedures that govern the valuation of the portfolio investments held by the Fund, including investments for which market quotations are not readily available. The Trustees have delegated to GSAMday-to-day responsibility for implementing and maintaining internal controls and procedures related to the valuation of the Fund’s investments. To assess the continuing appropriateness of pricing sources and methodologies, GSAM regularly performs price verification procedures and issues challenges as necessary to third party pricing vendors or brokers, and any differences are reviewed in accordance with the Valuation Procedures.
A. Level 1 and Level 2 Fair Value Investments — The valuation techniques and significant inputs used in determining the fair values for investments classified as Level 1 and Level 2 are as follows:
Equity Securities —Equity securities traded on a U.S. securities exchange or the NASDAQ system, or those located on certain foreign exchanges, including but not limited to the Americas, are valued daily at their last sale price or official closing price on the principal exchange or system on which they are traded. If there is no sale or official closing price or such price is believed by GSAM to not represent fair value, equity securities are valued at the last bid price for long positions and at the last ask price for short positions. To the extent these investments are actively traded, they are classified as Level 1 of the fair value hierarchy, otherwise they are generally classified as Level 2.
Unlisted equity securities for which market quotations are available are valued at the last sale price on the valuation date, or if no sale occurs, at the last bid price, and are generally classified as Level 2. Securities traded on certain foreign securities exchanges are valued daily at fair value determined by an independent fair value service (if available) under Valuation Procedures approved by the Trustees and consistent with applicable regulatory guidance. The independent fair value service takes into account multiple factors including, but not limited to, movements in the securities markets, certain depositary receipts, futures contracts and foreign currency exchange rates that have occurred subsequent to the close of the foreign securities exchange. These investments are generally classified as Level 2 of the fair value hierarchy.
15
GOLDMAN SACHS VARIABLE INSURANCE TRUST GLOBAL TRENDS ALLOCATION FUND
Notes to Financial Statements(continued)
June 30, 2019 (Unaudited)
3. INVESTMENTS AND FAIR VALUE MEASUREMENTS (continued)
Underlying Funds (including Money Market Funds) — Underlying funds (“Underlying Funds”) include other investment companies and exchange-traded funds (“ETFs”). Investments in the Underlying Funds (except ETFs) are valued at the NAV per share on the day of valuation. ETFs are valued daily at the last sale price or official closing price on the principal exchange or system on which the investment is traded. Because the Fund invests in Underlying Funds that fluctuate in value, the Fund’s shares will correspondingly fluctuate in value. To the extent these investments are actively traded, they are classified as Level 1 of the fair value hierarchy, otherwise they are generally classified as Level 2. For information regarding an Underlying Fund’s accounting policies and investment holdings, please see the Underlying Fund’s shareholder report.
Derivative Contracts — A derivative is an instrument whose value is derived from underlying assets, indices, reference rates or a combination of these factors. The Fund enters into derivative transactions to hedge against changes in interest rates, securities prices, and/or currency exchange rates, to increase total return, or to gain access to certain markets or attain exposure to other underliers. For financial reporting purposes, cash collateral that has been pledged to cover obligations of a Fund and cash collateral received, if any, is reported separately on the Statement of Assets and Liabilities as receivables/payables for collateral on certain derivatives contracts.Non-cash collateral pledged by the Fund, if any, is noted in the Schedule of Investments.
Exchange-traded derivatives, including futures and options contracts, are generally valued at the last sale or settlement price on the exchange where they are principally traded. Exchange-traded options without settlement prices are generally valued at the midpoint of the bid and ask prices on the exchange where they are principally traded (or, in the absence oftwo-way trading, at the last bid price for long positions and the last ask price for short positions). Exchange-traded derivatives typically fall within Level 1 of the fair value hierarchy.Over-the-counter (“OTC”) and centrally cleared derivatives are valued using market transactions and other market evidence, including market-based inputs to models, calibration to market-clearing transactions, broker or dealer quotations, or other alternative pricing sources. Where models are used, the selection of a particular model to value OTC and centrally cleared derivatives depends upon the contractual terms of, and specific risks inherent in, the instrument, as well as the availability of pricing information in the market. Valuation models require a variety of inputs, including contractual terms, market prices, yield curves, credit curves, measures of volatility, voluntary and involuntary prepayment rates, loss severity rates and correlations of such inputs. For OTC and centrally cleared derivatives that trade in liquid markets, model inputs can generally be verified and model selection does not involve significant management judgment. OTC and centrally cleared derivatives are classified within Level 2 of the fair value hierarchy when significant inputs are corroborated by market evidence.
i. Futures Contracts — Futures contracts are contracts to buy or sell a standardized quantity of a specified commodity or security. Upon entering into a futures contract, the Fund deposits cash or securities in an account on behalf of the broker in an amount sufficient to meet the initial margin requirement. Subsequent payments are made or received by the Fund equal to the daily change in the contract value and are recorded as variation margin receivable or payable with a corresponding offset to unrealized gains or losses.
B. Level 3 Fair Value Investments — To the extent that significant inputs to valuation models and other alternative pricing sources are unobservable, or if quotations are not readily available, or if GSAM believes that such quotations do not accurately reflect fair value, the fair value of the Fund’s investments may be determined under Valuation Procedures approved by the Trustees. GSAM, consistent with its procedures and applicable regulatory guidance, may make an adjustment to the most recent valuation prices of either domestic or foreign securities in light of significant events to reflect what it believes to be the fair value of the securities at the time of determining the Fund’s NAV. To the extent investments are valued using single source broker quotations obtained directly from the broker or passed through from third party pricing vendors, such investments are classified as Level 3 investments. GSAM did not develop the unobservable inputs for valuation of Level 3 Assets and Liabilities.
16
GOLDMAN SACHS VARIABLE INSURANCE TRUST GLOBAL TRENDS ALLOCATION FUND
3. INVESTMENTS AND FAIR VALUE MEASUREMENTS (continued)
C. Fair Value Hierarchy — The following is a summary of the Fund’s investments and derivatives classified in the fair value hierarchy as of June 30, 2019:
| | | | | | | | | | | | |
| Investment Type | | Level 1 | | | Level 2 | | | Level 3 | |
| | | |
| Assets | | | | | | | | | | | | |
| Exchange Traded Funds | | $ | 85,050,404 | | | $ | — | | | $ | — | |
| Investment Companies | | | 186,548,453 | | | | — | | | | — | |
| | | |
| Total | | $ | 271,598,857 | | | $ | — | | | $ | — | |
| | | |
| Derivative Type | | | | | | | | | |
| | | |
| Assets(a) | | | | | | | | | | | | |
| Futures Contracts | | $ | 1,912,805 | | | $ | — | | | $ | — | |
| | | |
| Liabilities(a) | | | | | | | | | | | | |
| Futures Contracts | | $ | (83,056 | ) | | $ | — | | | $ | — | |
| (a) | Amount shown represents unrealized gain (loss) at period end. |
For further information regarding security characteristics, see the Schedule of Investments.
4. INVESTMENTS IN DERIVATIVES
The following table sets forth, by certain risk types, the gross value of derivative contracts (not considered to be hedging instruments for accounting disclosure purposes) as of June 30, 2019. These instruments were used as part of the Fund’s investment strategies and to obtain and/or manage exposure related to the risks below. The values in the table below exclude the effects of cash collateral received or posted pursuant to these derivative contracts, and therefore are not representative of the Fund’s net exposure.
| | | | | | | | | | | | | | |
| Risk | | | | Statement of Assets and Liabilities | | Assets(a) | | | Statement of Assets and Liabilities | | Liabilities(a) | |
| Equity | | | | Variation margin on futures contracts | | $ | 118,122 | | | Variation margin on futures contracts | | $ | (83,056 | ) |
| Interest Rate | | | | Variation margin on futures contracts | | | 1,794,683 | | | — | | | — | |
| | | | | |
| Total | | | | | | $ | 1,912,805 | | | | | $ | (83,056 | ) |
| (a) | Includes unrealized gain (loss) on futures contracts described in the Additional Investment Information section of the Schedule of Investments. Only the variation margin as of June 30, 2019 is reported within the Statement of Assets and Liabilities. |
The following table sets forth, by certain risk types, the Fund’s gains (losses) related to these derivatives and their indicative volumes for the six months ended June 30, 2019. These gains (losses) should be considered in the context that these derivative contracts may have been executed to create investment opportunities and/or economically hedge certain investments, and
17
GOLDMAN SACHS VARIABLE INSURANCE TRUST GLOBAL TRENDS ALLOCATION FUND
Notes to Financial Statements(continued)
June 30, 2019 (Unaudited)
4. INVESTMENTS IN DERIVATIVES (continued)
accordingly, certain gains (losses) on such derivative contracts may offset certain (losses) gains attributable to investments. These gains (losses) are included in “Net realized gain (loss)” or “Net change in unrealized gain (loss)” on the Statement of Operations:
| | | | | | | | | | | | | | |
| Risk | | Statement of Operations | | Net Realized
Gain (Loss) | | | Net Change in
Unrealized
Gain (Loss) | | | Average
Number of
Contracts(a) | |
| Equity | | Net realized gain (loss) from futures contracts/Net change in unrealized gain (loss) on futures contracts | | $ | 2,666,313 | | | $ | 694,337 | | | | 887 | |
| Interest Rate | | Net realized gain (loss) from futures contracts/Net change in unrealized gain (loss) on futures contracts | | | 6,195,314 | | | | 347,457 | | | | 994 | |
| | | | |
| Total | | | | $ | 8,861,627 | | | $ | 1,041,794 | | | | 1,881 | |
| (a) | Average number of contracts is based on the average of month end balances for the six months ended June 30, 2019. |
5. AGREEMENTS AND AFFILIATED TRANSACTIONS
A. Management Agreement — Under the Agreement, GSAM manages the Fund, subject to the general supervision of the Trustees.
As compensation for the services rendered pursuant to the Agreement, the assumption of the expenses related thereto and administration of the Fund’s business affairs, including providing facilities, GSAM is entitled to a management fee, accrued daily and paid monthly, equal to an annual percentage rate of the Fund’s average daily net assets.
For the six months ended June 30, 2019, contractual and effective net management fees with GSAM were at the following rates:
| | | | | | | | | | | | | | | | | | | | | | | | | | |
| Contractual Management Rate | | | | | | | |
First
$1 billion | | | Next
$1 billion | | | Next
$3 billion | | | Next
$3 billion | | | Over
$8 billion | | | Effective
Rate | | | Effective Net
Management Rate^ | |
| | | | | | |
| | 0.79% | | | | 0.71 | % | | | 0.68 | % | | | 0.66 | % | | | 0.65 | % | | | 0.79 | % | | | 0.58 | %* |
| ^ | Effective Net Management Rate includes the impact of management fee waivers of affiliated Underlying Funds, if any. |
| * | GSAM agreed to waive a portion of its management fee in order to achieve a net management rate, as defined in the Fund’s most recent prospectus. This waiver will be effective through at least April 30, 2020, and prior to such date GSAM may not terminate the arrangement without approval of the Trustees. For the six months ended June 30, 2019, GSAM waived $211,557 of its management fee. |
The Fund invests in Institutional Shares of the Goldman Sachs Financial Square Government, Goldman Sachs Financial Square Treasury Obligations, and Goldman Sachs Financial Square Treasury Solutions Funds, which are affiliated Underlying Funds. GSAM has agreed to waive a portion of its management fee payable by the Fund in an amount equal to the management fee it earns as an investment adviser to the affiliated Underlying Funds in which the Fund invests, except those management fees it earns from the Fund’s investments of cash collateral received in connection with securities lending transactions in the Goldman Sachs Financial Square Government, Goldman Sachs Financial Square Treasury Obligations, and Goldman Sachs Financial Square Treasury Solutions Funds. For the six months ended June 30, 2019, GSAM waived $163,419 of the Fund’s management fee.
B. Distribution and Service(12b-1) Plan — The Trust, on behalf of Service Shares of the Fund, has adopted a Distribution and Service Plan subject to Rule12b-1 under the Act. Under the Distribution and Service Plan, Goldman Sachs, which serves as distributor, is entitled to a fee accrued daily and paid monthly, for distribution services and personal and account maintenance services, which may then be paid by Goldman Sachs to authorized dealers, equal to, on an annual basis, 0.25% of the Fund’s average daily net assets attributable to Service Shares.
18
GOLDMAN SACHS VARIABLE INSURANCE TRUST GLOBAL TRENDS ALLOCATION FUND
5. AGREEMENTS AND AFFILIATED TRANSACTIONS (continued)
C. Transfer Agency Agreement — Goldman Sachs also serves as the transfer agent of the Fund for a fee pursuant to the Transfer Agency Agreement. The fees charged for such transfer agency services are accrued daily and paid monthly at an annual rate of 0.02% of the average daily net assets of Institutional and Service Shares.
D. Other Expense Agreements and Affiliated Transactions — GSAM has agreed to reduce or limit certain “Other Expenses” of the Fund (excluding acquired fund fees and expenses, transfer agency fees and expenses, service fees and shareholder administration fees (as applicable), taxes, interest, brokerage fees, expenses of shareholder meetings, litigation and indemnification, and extraordinary expenses) to the extent such expenses exceed, on an annual basis, a percentage rate of the average daily net assets of the Fund. Such Other Expense reimbursements, if any, are accrued daily and paid monthly. In addition, the Fund is not obligated to reimburse GSAM for prior fiscal year expense reimbursements, if any. The Other Expense limitation as an annual percentage rate of average daily net assets for the Fund is 0.004%. The Other Expense limitation will remain in place through at least April 30, 2020, and prior to such date GSAM may not terminate the arrangement without the approval of the Trustees. In addition, the Fund has entered into certain offset arrangements with the custodian and the transfer agent, which may result in a reduction of the Fund’s expenses and are received irrespective of the application of the “Other Expense” limitation described above.
For the six months ended June 30, 2019, these expense reductions, including any fee waivers and Other Expense reimbursements, were as follows:
| | | | | | | | | | | | | | |
Management Fee
Waiver | | | Custody Fee
Credits | | | Other Expense
Reimbursement | | | Total Expense
Reductions | |
| | | |
| | $374,976 | | | $ | 15,246 | | | $ | 107,664 | | | $ | 497,886 | |
E. Line of Credit Facility — As of June 30, 2019, the Fund participated in a $580,000,000 committed, unsecured revolving line of credit facility (the “facility”) together with other funds of the Trust and certain registered investment companies having management agreements with GSAM or its affiliates. This facility is to be used for temporary emergency purposes, or to allow for an orderly liquidation of securities to meet redemption requests. The interest rate on borrowings is based on the federal funds rate. The facility also requires a fee to be paid by the Fund based on the amount of the commitment that has not been utilized. For the six months ended June 30, 2019, the Fund did not have any borrowings under the facility. Prior to April 30, 2019 the facility was $770,000,000.
F. Other Transactions with Affiliates — The following table provides information about the Fund’s investments in the Goldman Sachs Financial Square Government, Goldman Sachs Financial Square Treasury Obligations, and Goldman Sachs Financial Square Treasury Solutions Funds as of and for the six months ended June 30, 2019:
| | | | | | | | | | | | | | | | | | | | | | | | |
| Investment Companies | | Beginning
Value as of
December 31, 2018 | | | Purchases
at Cost | | | Proceeds
from Sales | | | Ending
Value as of
June 30, 2019 | | | Shares as of
June 30, 2019 | | | Dividend
Income | |
Goldman Sachs Financial Square Government Fund | | $ | 119,104,588 | | | $ | 16,589,893 | | | $ | (33,804,378 | ) | | $ | 101,890,103 | | | | 101,890,103 | | | $ | 1,229,382 | |
Goldman Sachs Financial Square Treasury Obligations Fund | | | 52,179,797 | | | | 1,215,679 | | | | (11,066,301 | ) | | | 42,329,175 | | | | 42,329,175 | | | | 510,093 | |
Goldman Sachs Financial Square Treasury Solutions Fund | | | 52,179,797 | | | | 1,215,679 | | | | (11,066,301 | ) | | | 42,329,175 | | | | 42,329,175 | | | | 501,932 | |
| | | | | | |
| Total | | $ | 223,464,182 | | | $ | 19,021,251 | | | $ | (55,936,980 | ) | | $ | 186,548,453 | | | | 186,548,453 | | | $ | 2,241,407 | |
As of June 30, 2019, The Goldman Sachs Group, Inc. was the beneficial owner of approximately 12% of the Institutional Shares of the Fund.
19
GOLDMAN SACHS VARIABLE INSURANCE TRUST GLOBAL TRENDS ALLOCATION FUND
Notes to Financial Statements(continued)
June 30, 2019 (Unaudited)
6. PORTFOLIO SECURITIES TRANSACTIONS
The cost of purchases and proceeds from sales and maturities of long-term securities for the six months ended June 30, 2019, were $51,730,758 and $31,996,537, respectively.
7. TAX INFORMATION
As of the Fund’s most recent fiscal year end, December 31, 2018, the Fund’s certain timing differences, on atax-basis were as follows:
| | | | |
| Timing differences (Post October Loss Deferral) | | $ | (2,279,017 | ) |
As of June 30, 2019, the Fund’s aggregate security unrealized gains and losses based on cost for U.S. federal income tax purposes were as follows:
| | | | |
| Tax cost | | $ | 257,854,550 | |
| Gross unrealized gain | | | 21,019,286 | |
| Gross unrealized loss | | | (7,274,979 | ) |
| Net unrealized gain | | $ | 13,744,307 | |
The difference between GAAP-basis andtax-basis unrealized gains (losses) is attributable primarily to wash sales and net mark to market gains (losses) on regulated futures contracts.
GSAM has reviewed the Fund’s tax positions for all open tax years (the current and prior three years, as applicable) and has concluded that no provision for income tax is required in the Fund’s financial statements. Such open tax years remain subject to examination and adjustment by tax authorities.
8. OTHER RISKS
The Fund’s risks include, but are not limited to, the following:
Derivatives Risk — The Fund’s use of derivatives may result in loss. Derivative instruments, which may pose risks in addition to and greater than those associated with investing directly in securities, currencies or other instruments, may be illiquid or less liquid, volatile, difficult to price and leveraged so that small changes in the value of the underlying instruments may produce disproportionate losses to the Fund. Derivatives are also subject to counterparty risk, which is the risk that the other party in the transaction will not fulfill its contractual obligation. The use of derivatives is a highly specialized activity that involves investment techniques and risks different from those associated with investments in more traditional securities and instruments. Losses from derivatives can also result from a lack of correlation between changes in the value of derivative instruments and the portfolio assets (if any) being hedged.
Foreign and Emerging Countries Risk — Investing in foreign markets may involve special risks and considerations not typically associated with investing in the U.S. Foreign securities may be subject to risk of loss because of more or less foreign government regulation, less public information and less economic, political and social stability in the countries in which the Fund invests. The imposition of exchange controls (including repatriation restrictions), confiscations, trade restrictions (including tariffs) and other government restrictions by the U.S. or other governments, or from problems in share registration, settlement or custody, may also result in losses. Foreign risk also involves the risk of negative foreign currency rate fluctuations, which may cause the value of securities denominated in such foreign currency (or other instruments through which the Fund has exposure to foreign currencies) to decline in value. Currency exchange rates may fluctuate significantly over short periods of time. To the extent that the Fund also invests in securities of issuers located in emerging markets, these risks may be more pronounced.
20
GOLDMAN SACHS VARIABLE INSURANCE TRUST GLOBAL TRENDS ALLOCATION FUND
8. OTHER RISKS (continued)
Foreign Custody Risk — If the Fund invests in foreign securities, the Fund may hold such securities and cash with foreign banks, agents, and securities depositories appointed by the Fund’s custodian (each a “Foreign Custodian”). Some foreign custodians may be recently organized or new to the foreign custody business. In some countries, Foreign Custodians may be subject to little or no regulatory oversight over, or independent evaluation of, their operations. Further, the laws of certain countries may place limitations on the Fund’s ability to recover its assets if a Foreign Custodian enters bankruptcy. Investments in emerging markets may be subject to even greater custody risks than investments in more developed markets. Custody services in emerging market countries are very often undeveloped and may be considerably less well regulated than in more developed countries, and thus may not afford the same level of investor protection as would apply in developed countries.
Interest Rate Risk — When interest rates increase, fixed income securities or instruments held by the Fund will generally decline in value. Long-term fixed income securities or instruments will normally have more price volatility because of this risk than short-term fixed income securities or instruments. The risks associated with changing interest rates may have unpredictable effects on the markets and the Fund’s investments. Fluctuations in interest rates may also affect the liquidity of fixed income securities and instruments held by the Fund.
Investments in Other Investment Companies Risk — As a shareholder of another investment company, including an ETF, the Fund will indirectly bear its proportionate share of any net management fees and other expenses paid by such other investment companies, in addition to the fees and expenses regularly borne by the Fund. ETFs are subject to risks that do not apply to conventional mutual funds, including but not limited to the following: (i) the market price of the ETF’s shares may trade at a premium or a discount to their NAV; and (ii) an active trading market for an ETF’s shares may not develop or be maintained.
Large Shareholder Transactions Risk — The Fund may experience adverse effects when certain large shareholders, such as other funds, participating insurance companies, accounts and Goldman Sachs affiliates, purchase or redeem large amounts of shares of the Fund. Such large shareholder redemptions, which may occur rapidly or unexpectedly, may cause the Fund to sell portfolio securities at times when it would not otherwise do so, which may negatively impact the Fund’s NAV and liquidity. These transactions may also accelerate the realization of taxable income to shareholders if such sales of investments resulted in gains, and may also increase transaction costs. In addition, a large redemption could result in the Fund’s current expenses being allocated over a smaller asset base, leading to an increase in the Fund’s expense ratio. Similarly, large Fund share purchases may adversely affect the Fund’s performance to the extent that the Fund is delayed in investing new cash or otherwise maintains a larger cash position than it ordinarily would.
Liquidity Risk — The Fund may make investments that are illiquid or that may become less liquid in response to market developments or adverse investor perceptions. Illiquid investments may be more difficult to value. Liquidity risk may also refer to the risk that the Fund will not be able to pay redemption proceeds within the allowable time period or without significant dilution to remaining investors’ interests because of unusual market conditions, an unusually high volume of redemption requests, or other reasons. To meet redemption requests, the Fund may be forced to sell investments at an unfavorable time and/or under unfavorable conditions. If the Fund is forced to sell securities at an unfavorable time and/or under unfavorable conditions, such sales may adversely affect the Fund’s NAV and dilute remaining investors’ interests. Liquidity risk may be the result of, among other things, the reduced number and capacity of traditional market participants to make a market in fixed income securities or the lack of an active market. The potential for liquidity risk may be magnified by a rising interest rate environment or other circumstances where investor redemptions from fixed income mutual funds may be higher than normal, potentially causing increased supply in the market due to selling activity. These risks may be more pronounced in connection with the Fund’s investments in securities of issuers located in emerging market countries. Redemptions by large shareholders may have a negative impact on the Fund’s liquidity.
Market and Credit Risks — In the normal course of business, the Fund trades financial instruments and enters into financial transactions where risk of potential loss exists due to changes in the market (market risk). Additionally, the Fund may also be exposed to credit risk in the event that an issuer or guarantor fails to perform or that an institution or entity with which the Fund has unsettled or open transactions defaults.
21
GOLDMAN SACHS VARIABLE INSURANCE TRUST GLOBAL TRENDS ALLOCATION FUND
Notes to Financial Statements(continued)
June 30, 2019 (Unaudited)
9. INDEMNIFICATIONS
Under the Trust’s organizational documents, its Trustees, officers, employees and agents are indemnified, to the extent permitted by the Act and state law, against certain liabilities that may arise out of performance of their duties to the Fund. Additionally, in the course of business, the Fund enters into contracts that contain a variety of indemnification clauses. The Fund’s maximum exposure under these arrangements is unknown, as this would involve future claims that may be made against the Fund that have not yet occurred. However, GSAM believes the risk of loss under these arrangements to be remote.
10. SUBSEQUENT EVENTS
Subsequent events after the Statement of Assets and Liabilities date have been evaluated, and GSAM has concluded that there is no impact requiring adjustment or disclosure in the financial statements.
11. SUMMARY OF SHARE TRANSACTIONS
Share activity is as follows:
| | | | | | | | | | | | | | | | |
| | | For the Six Months Ended
June 30, 2019
(Unaudited) | | | For the Fiscal Year Ended
December 31, 2018 | |
| | | Shares | | | Dollars | | | Shares | | | Dollars | |
| Institutional Shares | | | | | | | | | | | | | | | | |
| Shares sold | | | — | | | $ | — | | | | 18,378 | | | $ | 229,900 | |
| Reinvestment of distributions | | | — | | | | — | | | | 535 | | | | 6,273 | |
| Shares redeemed | | | — | | | | — | | | | (157 | ) | | | (1,900 | ) |
| | | | — | | | | — | | | | 18,756 | | | | 234,273 | |
| Service Shares | | | | | | | | | | | | | | | | |
| Shares sold | | | 1,271,663 | | | | 15,431,542 | | | | 3,407,784 | | | | 42,420,508 | |
| Reinvestment of distributions | | | — | | | | — | | | | 775,283 | | | | 9,086,313 | |
| Shares redeemed | | | (7,985,978 | ) | | | (96,184,335 | ) | | | (2,858,297 | ) | | | (35,608,460 | ) |
| | | | (6,714,315 | ) | | | (80,752,793 | ) | | | 1,324,770 | | | | 15,898,361 | |
| | | | |
| NET INCREASE (DECREASE) | | | (6,714,315 | ) | | $ | (80,752,793 | ) | | | 1,343,526 | | | $ | 16,132,634 | |
22
GOLDMAN SACHS VARIABLE INSURANCE TRUST GLOBAL TRENDS ALLOCATION FUND
| | |
| Fund Expenses — Six Month Period Ended June 30, 2019 (Unaudited) | | |
As a shareholder of Institutional or Service Shares of the Fund, you incur ongoing costs, including management fees, distribution and/or service(12b-1) fees (with respect to Service Shares) and other Fund expenses. This example is intended to help you understand your ongoing costs (in dollars) of investing in Institutional Shares and Service Shares of the Fund and to compare these costs with the ongoing costs of investing in other mutual funds.
The example is based on an investment of $1,000 invested at the beginning of the period and held for the entire period from January 1, 2019 through June 30, 2019, which represents a period of 181 days of a 365 day year.
Actual Expenses— The first line under each share class in the table below provides information about actual account values and actual expenses. You may use the information in this line, together with the amount you invested, to estimate the expenses that you paid over the period. Simply divide your account value by $1,000 (for example, an $8,600 account value divided by $1,000=8.6), then multiply the result by the number in the first line under the heading entitled “Expenses Paid” to estimate the expenses you paid on your account during this period.
Hypothetical Example for Comparison Purposes— The second line under each share class in the table below provides information about hypothetical account values and hypothetical expenses based on the Fund’s actual net expense ratio and an assumed rate of return of 5% per year before expenses, which is not the Fund’s actual return. The hypothetical account values and expenses may not be used to estimate the actual ending account balance or expenses you paid for the period. You may use this information to compare the ongoing costs of investing in the Fund and other funds. To do so, compare this 5% hypothetical example with the 5% hypothetical examples that appear in the shareholder reports of the other funds.
Please note that the expenses shown in the table are meant to highlight your ongoing costs only. As a shareholder of the Fund, you do not incur any transaction costs, such as sales charges, redemption fees, or exchange fees, but shareholders of other funds may incur such costs. The second line of the table is useful in comparing ongoing costs only and will not help you determine the relative total costs of owning different funds whose shareholders may incur transaction costs.
| | | | | | | | | | | | |
| Share Class | | Beginning
Account Value
01/01/19 | | | Ending
Account Value
06/30/19 | | | Expenses Paid
for the
6 Months
Ended
06/30/19* | |
| Institutional | | | | | | | | | | | | |
| | | | |
| Actual | | $ | 1,000 | | | $ | 1,070.40 | | | $ | 3.03 | |
| Hypothetical 5% return | | | 1,000 | | | | 1,021.87 | + | | | 2.96 | |
| Service | | | | | | | | | | | | |
| | | | |
| Actual | | | 1,000 | | | | 1,067.90 | | | | 4.31 | |
| Hypothetical 5% return | | | 1,000 | | | | 1,020.63 | + | | | 4.21 | |
| | + | Hypothetical expenses are based on the Fund’s actual annualized net expense ratios and an assumed rate of return of 5% per year before expenses. | |
| | * | Expenses are calculated using the Fund’s annualized net expense ratio for each class, which represents the ongoing expenses as a percentage of net assets for the six months ended June 30, 2019. Expenses are calculated by multiplying the annualized net expense ratio by the average account value for the period; then multiplying the result by the number of days in the most recent fiscal half year; and then dividing that result by the number of days in the fiscal year. The annualized net expense ratios for the period were 0.59% and 0.84% for Institutional and Service Shares, respectively. | |
23
GOLDMAN SACHS VARIABLE INSURANCE TRUST GLOBAL TRENDS ALLOCATION FUND
Statement Regarding Basis for Approval of Management Agreement (Unaudited)
Background
The Goldman Sachs Global Trends Allocation Fund (the “Fund”) is an investment portfolio ofGoldman Sachs Variable Insurance Trust (the “Trust”). The Board of Trustees oversees the management of the Trust and reviews the investment performance and expenses of the Fund at regularly scheduled meetings held throughout the year. In addition, the Board of Trustees determines annually whether to approve the continuance of the Trust’s investment management agreement (the “Management Agreement”) withGoldman Sachs Asset Management, L.P. (the “Investment Adviser”) on behalf of the Fund.
The Management Agreement was most recently approved for continuation until June 30, 2020 by the Board of Trustees, including those Trustees who are not parties to the Management Agreement or “interested persons” (as defined in the Investment Company Act of 1940, as amended) of any party thereto (the “Independent Trustees”), at a meeting held onJune 11-12, 2019 (the “Annual Meeting”).
The review process undertaken by the Trustees spans the course of the year and culminates with the Annual Meeting. To assist the Trustees in their deliberations, the Trustees have established a Contract Review Committee (the “Committee”), comprised of the Independent Trustees. The Committee held four meetings over the course of the year since the Management Agreement was last approved. At those Committee meetings, regularly scheduled Board or other committee meetings, and/or the Annual Meeting, matters relevant to the renewal of the Management Agreement were considered by the Board, or the Independent Trustees, as applicable. With respect to the Fund, such matters included:
| | (a) | | the nature and quality of the advisory, administrative, and other services provided to the Fund by the Investment Adviser and its affiliates, including information about: |
| | (i) | | the structure, staff, and capabilities of the Investment Adviser and its portfolio management teams; |
| | (ii) | | the groups within the Investment Adviser and its affiliates that support the portfolio management teams or provide other types of necessary services, including fund services groups (e.g., accounting and financial reporting, tax, shareholder services, and operations); controls and risk management groups (e.g., legal, compliance, valuation oversight, credit risk management, internal audit, compliance testing, market risk analysis, finance, and central funding); sales and distribution support groups, and others (e.g., information technology and training); |
| | (iii) | | trends in employee headcount; |
| | (iv) | | the Investment Adviser’s financial resources and ability to hire and retain talented personnel and strengthen its operations; and |
| | (v) | | the parent company’s support of the Investment Adviser and its mutual fund business, as expressed by the firm’s senior management; |
| | (b) | | information on the investment performance of the Fund, including comparisons to the performance of similar mutual funds, as provided by a third-party mutual fund data provider engaged as part of the contract review process (the “Outside Data Provider”), and a benchmark performance index; and information on general investment outlooks in the markets in which the Fund invests; |
| | (c) | | information provided by the Investment Adviser indicating the Investment Adviser’s views on whether the Fund’s peer group and/or benchmark index had high, medium, or low relevance given the Fund’s particular investment strategy; |
| | (d) | | the terms of the Management Agreement and other agreements with affiliated service providers entered into by the Trust on behalf of the Fund; |
| | (e) | | fee and expense information for the Fund, including: |
| | (i) | | the relative management fee and expense levels of the Fund as compared to those of comparable funds managed by other advisers, as provided by the Outside Data Provider; |
| | (ii) | | the Fund’s expense trends over time; and |
| | (iii) | | to the extent the Investment Adviser manages other types of accounts (such as bank collective trusts, private wealth management accounts, institutional separate accounts,sub-advised mutual funds, andnon-U.S. funds) having investment objectives and policies similar to those of the Fund, comparative information on the advisory fees charged and services provided to those accounts by the Investment Adviser; |
| | (f) | | with respect to the extensive investment performance and expense comparison data provided by the Outside Data Provider, its processes in producing that data for the Fund; |
| | (g) | | the undertakings of the Investment Adviser and its affiliates to implement fee waivers and/or expense limitations; |
| | (h) | | information relating to the profitability of the Management Agreement and the transfer agency and distribution and service arrangements of the Fund to the Investment Adviser and its affiliates; |
| | (i) | | whether the Fund’s existing management fee schedule adequately addressed any economies of scale; |
24
GOLDMAN SACHS VARIABLE INSURANCE TRUST GLOBAL TRENDS ALLOCATION FUND
Statement Regarding Basis for Approval of Management Agreement (Unaudited) (continued)
| | (j) | | a summary of the“fall-out” benefits derived by the Investment Adviser and its affiliates from their relationships with the Fund, including the fees received by the Investment Adviser’s affiliates from the Fund for transfer agency, securities lending, portfolio trading, distribution and other services; |
| | (k) | | a summary of potential benefits derived by the Fund as a result of its relationship with the Investment Adviser; |
| | (l) | | information regarding commissions paid by the Fund and broker oversight, other information regarding portfolio trading, and how the Investment Adviser carries out its duty to seek best execution; |
| | (m) | | the manner in which portfolio manager compensation is determined; and the number and types of accounts managed by the portfolio managers; |
| | (n) | | the nature and quality of the services provided to the Fund by its unaffiliated service providers, and the Investment Adviser’s general oversight and evaluation (including reports on due diligence) of those service providers as part of the administrative services provided under the Management Agreement; and |
| | (o) | | the Investment Adviser’s processes and policies addressing various types of potential conflicts of interest; its approach to risk management; the annual review of the effectiveness of the Fund’s compliance program; and periodic compliance reports. |
The Trustees also received an overview of the Fund’s distribution arrangements. They received information regarding the Fund’s assets, share purchase and redemption activity, and payment of distribution and service fees. Information was also provided to the Trustees relating to revenue sharing payments made by and services provided by the Investment Adviser and its affiliates to intermediaries that promote the sale, distribution, and/or servicing of Fund shares. The Independent Trustees also discussed the broad range of other investment choices that are available to Fund investors, including the availability of comparable funds managed by other advisers.
The presentations made at the Board and Committee meetings and at the Annual Meeting encompassed the Fund and other mutual funds for which the Board of Trustees has responsibility. In evaluating the Management Agreement at the Annual Meeting, the Trustees relied upon their knowledge, resulting from their meetings and other interactions throughout the year, of the Investment Adviser and its affiliates, their services, and the Fund. In conjunction with these meetings, the Trustees received written materials and oral presentations on the topics covered, and the Investment Adviser addressed the questions and concerns of the Trustees, including concerns regarding the investment performance of certain of the funds they oversee. The Independent Trustees were advised by their independent legal counsel regarding their responsibilities and other regulatory requirements related to the approval and continuation of mutual fund investment management agreements under applicable law. In addition, the Investment Adviser and its affiliates provided the Independent Trustees with a written response to a formal request for information sent on behalf of the Independent Trustees by their independent legal counsel. During the course of their deliberations, the Independent Trustees met in executive sessions with their independent legal counsel, without representatives of the Investment Adviser or its affiliates present.
Nature, Extent, and Quality of the Services Provided Under the Management Agreement
As part of their review, the Trustees considered the nature, extent, and quality of the services provided to the Fund by the Investment Adviser. In this regard, the Trustees considered both the investment advisory services andnon-advisory services that are provided by the Investment Adviser and its affiliates. The Trustees noted the transition in the leadership and changes in personnel of various of the Investment Adviser’s portfolio management teams that had occurred in recent periods, and the ongoing recruitment efforts aimed at bringing high quality investment talent to the Investment Adviser. They also noted the Investment Adviser’s commitment to maintaining high quality systems and expending substantial resources to respond to ongoing changes to the regulatory and control environment in which the Fund and its service providers operate, as well as the efforts of the Investment Adviser and its affiliates to combat cyber security risks. The Trustees concluded that the Investment Adviser continued to commit substantial financial and operational resources to the Fund and expressed confidence that the Investment Adviser would continue to do so in the future. The Trustees also recognized that the Investment Adviser had made significant commitments to address regulatory compliance requirements applicable to the Fund and the Investment Adviser and its affiliates.
Investment Performance
The Trustees also considered the investment performance of the Fund. In this regard, they compared the investment performance of the Fund to its peers usingrankings and ratings compiled by the Outside Data Provider as of December 31, 2018, and updated performance information prepared by the Investment Adviser using the peer group identified by the Outside Data Provider as of March 31, 2019. The information on the Fund’s investment performance was provided for theone-, three-, and five-year periods ending on the applicable dates.The Trustees also reviewed the Fund’s investment performance relative to its
25
GOLDMAN SACHS VARIABLE INSURANCE TRUST GLOBAL TRENDS ALLOCATION FUND
Statement Regarding Basis for Approval of Management Agreement (Unaudited) (continued)
performance benchmark. As part of this review, they considered the investment performance trends of the Fund over time, and reviewed the investment performance of the Fund in light of its investment objective and policies and market conditions.
In addition, the Trustees considered materials prepared and presentations made by the Investment Adviser’s senior management and portfolio management personnel in which Fund performance was assessed. The Trustees also considered the Investment Adviser’s periodic reports with respect to the Fund’s risk profile, and how the Investment Adviser’s approach to risk monitoring and management influences portfolio management. They noted the efforts of the Fund’s portfolio management team to continue to enhance the investment model used in managing the Fund.
The Trustees observed that the Fund’s Institutional Shares had placed in the top half of the Fund’s peer group for theone- and three-year periods and in the third quartile for the five-year period; had underperformed the Fund’s benchmark index for theone-, three-, and five-year periods; and had outperformed the average performance of a group of competitor funds, as determined by the Investment Adviser, for theone-year period and underperformed for the three- and five-year periods ended March 31, 2019.
Costs of Services Provided and Competitive Information
The Trustees considered the contractual terms of the Management Agreement and the fee rates payable by the Fund thereunder. In this regard, the Trustees considered information on the services rendered by the Investment Adviser to the Fund, which included both advisory and administrative services that were directed to the needs and operations of the Fund as a registered mutual fund.
In particular, the Trustees reviewed analyses prepared by the Outside Data Provider regarding the expense rankings of the Fund. The analyses provided a comparison of the Fund’s management fee and breakpoints to those of a relevant peer group and category universe; an expense analysis which compared the Fund’s overall net and gross expenses to a peer group and a category universe; and data comparing the Fund’s net expenses to the peer and category medians. The analyses also compared the Fund’s other expenses and fee waivers/reimbursements to those of the peer group and category medians. The Trustees concluded that the comparisons provided by the Outside Data Provider were useful in evaluating the reasonableness of the management fees and total expenses paid by the Fund.
In addition, the Trustees considered the Investment Adviser’s undertakings to implement fee waivers and/or expense limitations. They also considered, to the extent that the Investment Adviser manages other types of accounts having investment objectives and policies similar to those of the Fund, comparative fee information for services provided by the Investment Adviser to those accounts, and information that indicated that services provided to the Fund differed in various significant respects from the services provided to other types of accounts which, in many cases, operated under less stringent legal and regulatory structures, required fewer services from the Investment Adviser to a smaller number of client contact points, and were less time-intensive.
In addition, the Trustees noted that shareholders are able to redeem their Fund shares at any time if shareholders believe that the Fund fees and expenses are too high or if they are dissatisfied with the performance of the Fund.
Profitability
The Trustees reviewed the Fund’s contribution to the Investment Adviser’s revenues andpre-tax profit margins. In this regard the Trustees noted that they had received, among other things, profitability analyses and summaries, revenue and expense schedules by Fund and by function (i.e., investment management, transfer agency and distribution and service), and information on the Investment Adviser’s expense allocation methodology. They observed that the profitability and expense figures are substantially similar to those used by the Investment Adviser for many internal purposes, including compensation decisions among various business groups, and are thus subject to a vigorous internal debate about how certain revenue and expenses should be allocated. The Trustees also noted that the internal audit group within the Goldman Sachs organization periodically audits the expense allocation methodology and that the internal audit group was satisfied with the reasonableness, consistency, and accuracy of the Investment Adviser’s expense allocation methodology. Profitability data for the Fund was provided for 2018 and 2017, and the Trustees considered this information in relation to the Investment Adviser’s overall profitability.
26
GOLDMAN SACHS VARIABLE INSURANCE TRUST GLOBAL TRENDS ALLOCATION FUND
Statement Regarding Basis for Approval of Management Agreement (Unaudited) (continued)
Economies of Scale
The Trustees considered the information that had been provided regarding whether there have been economies of scale with respect to the management of the Fund. The Trustees also considered the breakpoints in the fee rate payable under the Management Agreement for the Fund at the following annual percentage rates of the average daily net assets of the Fund:
| | | | |
| |
| First $1 billion | | | 0.79 | % |
| |
| Next $1 billion | | | 0.71 | |
| |
| Next $3 billion | | | 0.68 | |
| |
| Next $3 billion | | | 0.66 | |
| |
| Over $8 billion | | | 0.65 | |
The Trustees noted that the breakpoints were designed to share potential economies of scale, if any, with the Fund and its shareholders as assets under management reach those asset levels. The Trustees considered the amounts of assets in the Fund; the Fund’s recent share purchase and redemption activity; the information provided by the Investment Adviser relating to the costs of the services provided by the Investment Adviser and its affiliates and their realized profits; information comparing fee rates charged by the Investment Adviser with fee rates charged to other funds in the peer group; and the Investment Adviser’s undertakings to waive a portion of its management fee and to limit certain expenses of the Fund that exceed specified levels. Upon reviewing these matters at the Annual Meeting, the Trustees concluded that the fee breakpoints represented a means of assuring that benefits of scalability, if any, would be passed along to shareholders at the specified asset levels.
Other Benefits to the Investment Adviser and Its Affiliates
The Trustees also considered the other benefits derived by the Investment Adviser and its affiliates from their relationships with the Fund as stated above, including: (a) transfer agency fees received by Goldman Sachs & Co. LLC (“Goldman Sachs”); (b) brokerage and futures commissions earned by Goldman Sachs for executing securities and futures transactions on behalf of the Fund; (c) trading efficiencies resulting from aggregation of orders of the Fund with those for other funds or accounts managed by the Investment Adviser; (d) fees earned by Goldman Sachs Agency Lending (“GSAL”), an affiliate of the Investment Adviser, as securities lending agent (and fees earned by the Investment Adviser for managing the fund in which the Fund’s cash collateral is invested); (e) the Investment Adviser’s ability to leverage the infrastructure designed to service the Fund on behalf of its other clients; (f) the Investment Adviser’s ability to cross-market other products and services to Fund shareholders; (g) Goldman Sachs’ retention of certain fees as Fund Distributor; (h) the Investment Adviser’s ability to negotiate better pricing with custodians on behalf of its other clients, as a result of the relationship with the Fund; and (i) the possibility that the working relationship between the Investment Adviser and the Fund’s third-party service providers may cause those service providers to be more likely to do business with other areas of Goldman Sachs. In the course of considering the foregoing, the Independent Trustees requested and received further information quantifying certain of thesefall-out benefits.
Other Benefits to the Fund and Its Shareholders
The Trustees also noted that the Fund receives certain other potential benefits as a result of its relationship with the Investment Adviser, including: (a) trading efficiencies resulting from aggregation of orders of the Fund with those of other funds or accounts managed by the Investment Adviser; (b) enhanced servicing from vendors due to the volume of business generated by the Investment Adviser and its affiliates; (c) enhanced servicing from broker-dealers due to the volume of business generated by the Investment Adviser and its affiliates; (d) the Investment Adviser’s ability to negotiate favorable terms with derivatives counterparties on behalf of the Fund as a result of the size and reputation of the Goldman Sachs organization; (e) the advantages received from the Investment Adviser’s knowledge and experience gained from managing other accounts and products; (f) the Investment Adviser’s ability to hire and retain qualified personnel to provide services to the Fund because of the reputation of the Goldman Sachs organization; (g) the Fund’s access, through the Investment Adviser, to certain firm-wide resources (e.g., proprietary risk management systems and databases), subject to certain restrictions; (h) the Fund’s ability to participate in the securities lending program administered by GSAL, as measured by the revenue received by the Fund in connection with the program; and (i) the Fund’s access to certain affiliated distribution channels. In addition, the Trustees noted the competitive nature of the mutual fund marketplace, and considered that many of the Fund’s shareholders invested in the Fund in part because of the Fund’s relationship with the Investment Adviser and that those shareholders have a general expectation that the relationship will continue.
27
GOLDMAN SACHS VARIABLE INSURANCE TRUST GLOBAL TRENDS ALLOCATION FUND
Statement Regarding Basis for Approval of Management Agreement (Unaudited) (continued)
Conclusion
In connection with their consideration of the Management Agreement, the Trustees gave weight to each of the factors described above, but did not identify any particular factor as controlling their decision. After deliberation and consideration of all of the information provided, including the factors described above, the Trustees concluded, in the exercise of their business judgment, that the management fees paid by the Fund were reasonable in light of the services provided to it by the Investment Adviser, the Investment Adviser’s costs and the Fund’s current and reasonably foreseeable asset levels. The Trustees unanimously concluded that the Investment Adviser’s continued management likely would benefit the Fund and its shareholders and that the Management Agreement should be approved and continued with respect to the Fund until June 30, 2020.
28
| | |
| TRUSTEES | | OFFICERS |
| Jessica Palmer,Chair | | James A. McNamara,President |
| Kathryn A. Cassidy | | Joseph F. DiMaria,Principal Financial Officer, |
| Diana M. Daniels | | Principal Accounting Officer and Treasurer |
James A. McNamara | | Caroline L. Kraus,Secretary |
Roy W. Templin | | |
Gregory G. Weaver | | |
GOLDMAN SACHS & CO. LLC
Distributor and Transfer Agent
GOLDMAN SACHS ASSET MANAGEMENT, L.P.
Investment Adviser
200 West Street, New York
New York 10282
Visit our web site at www.GSAMFUNDS.com to obtain the most recentmonth-end returns.
The reports concerning the Fund included in this shareholder report may contain certain forward-looking statements about the factors that may affect the performance of the Fund in the future. These statements are based on Fund management’s predictions and expectations concerning certain future events and their expected impact on the Fund, such as performance of the economy as a whole and of specific industry sectors, changes in the levels of interest rates, the impact of developing world events, and other factors that may influence the future performance of the Fund. Management believes these forward-looking statements to be reasonable, although they are inherently uncertain and difficult to predict. Actual events may cause adjustments in portfolio management strategies from those currently expected to be employed.
A description of the policies and procedures that the Fund uses to determine how to vote proxies relating to portfolio securities and information regarding how the Fund voted proxies relating to portfolio securities for the12-month period ended June 30, 2019 is available (i) without charge, upon request by calling1-800-621-2550; and (ii) on the Securities and Exchange Commission (“SEC”) web site athttp://www.sec.gov.
The Fund will file its portfolio holdings information for each month in a fiscal quarter within 60 days after the end of the relevant fiscal quarter on Form N-PORT. Portfolio holdings information for the third month of each fiscal quarter will be made available on the SEC’s web site at http://www.sec.gov. Portfolio holdings information may be obtained upon request and without charge by calling 1-800-526-7384 (for Retail Shareholders) or 1-800-621-2550 (for Institutional Shareholders).
Views and opinions expressed are for informational purposes only and do not constitute a recommendation by GSAM to buy, sell, or hold any security. Views and opinions are current as of the date of this presentation and may be subject to change, they should not be construed as investment advice.
Goldman Sachs & Co. LLC (“Goldman Sachs”) does not provide legal, tax or accounting advice. Any statement contained in this communication (including any attachments) concerning U.S. tax matters was not intended or written to be used, and cannot be used, for the purpose of avoiding penalties under the Internal Revenue Code, and was written to support the promotion or marketing of transaction or matter addressed. Clients of Goldman Sachs should obtain their own independent tax advice based on their particular circumstances.
The website links provided are for your convenience only and are not an endorsement or recommendation by GSAM of any of these websites or the products or services offered. GSAM is not responsible for the accuracy and validity of the content of these websites.
Fund holdings and allocations shown are as of June 30, 2019 and may not be representative of future investments. Fund holdings should not be relied on in making investment decisions and should not be construed as research or investment advice regarding particular securities. Current and future holdings are subject to risk.
References to indices, benchmarks or other measures of relative market performance over a specified period of time are provided for your information only and do not imply that the portfolio will achieve similar results. The index composition may not reflect the manner in which a portfolio is constructed. While an adviser seeks to design a portfolio which reflects appropriate risk and return features, portfolio characteristics may deviate from those of the benchmark.
The portfolio risk management process includes an effort to monitor and manage risk, but does not imply low risk.
Shares of the Goldman Sachs VIT Funds are offered to separate accounts of participating life insurance companies for the purpose of funding variable annuity contracts and variable life insurance policies. Shares of the Fund are not offered directly to the general public. The variable annuity contracts and variable life insurance policies are described in the separate prospectuses issued by participating insurance companies. You should refer to those prospectuses for information about surrender charges, mortality and expense risk fees and other charges that may be assessed by participating insurance companies under the variable annuity contracts or variable life insurance policies. Such fees or charges, if any, may affect the return you may realize with respect to your investments. Ask your representative for more complete information. Please consider a fund’s objectives, risks and charges and expenses, and read the prospectus carefully before investing. The prospectus contains this and other information about the Fund.
This material is not authorized for distribution to prospective investors unless preceded or accompanied by a current prospectus or summary prospectus, if applicable. Investors should consider the Fund’s objective, risks, and charges and expenses, and read the summary prospectus, if available, and/or the prospectus carefully before investing or sending money. The summary prospectus, if available, and the prospectus contain this and other information about the Fund and may be obtained from your authorized dealer or from Goldman Sachs & Co. LLC by calling1-800-621-2550.
This report is prepared for the general information of contract owners and is not an offer of shares of the Goldman Sachs Variable Insurance Trust — Goldman Sachs Global Trends Allocation Fund.
© 2019 Goldman Sachs. All rights reserved.
VITNAVSAR-19/175365-OTU-1025426
Goldman
SachsVariable Insurance Trust
Goldman Sachs
Large Cap Value Fund
Beginning on or after January 1, 2021, you may not receive paper copies of the Fund’s annual and semi-annual shareholder reports from the insurance company that offers your variable insurance contract or your financial intermediary, unless you specifically request paper copies of the reports from the insurance company or from your financial intermediary. Instead, the reports will be made available on a website, and you will be notified by mail each time a report is posted and provided with a website link to access the report.
If you already elected to receive shareholder reports electronically, you will not be affected by this change and you need not take any action. At any time, you may elect to receive reports and certain communications from the insurance company electronically by contacting your insurance company or your financial intermediary.
You may elect to receive all future shareholder reports in paper free of charge. You can inform the insurance company or your financial intermediary that you wish to receive paper copies of reports. Your election to receive reports in paper will apply to all Goldman Sachs Funds available under your contract and may apply to all funds held with your financial intermediary.
Semi-Annual Report
June 30, 2019

GOLDMAN SACHS VARIABLE INSURANCE TRUST LARGE CAP VALUE FUND
INVESTMENT OBJECTIVE
The Fund seeks long-term capital appreciation.
Portfolio Management Discussion and Analysis
Below, the Goldman Sachs Value Portfolio Management Team discusses the Goldman Sachs Variable Insurance Trust — Goldman Sachs Large Cap Value Fund’s (the “Fund”) performance and positioning for thesix-month period ended June 30, 2019 (the “Reporting Period”).
How did the Fund perform during the Reporting Period?
During the Reporting Period, the Fund’s Institutional and Service Shares generated cumulative total returns of 16.04% and 15.91%, respectively. These returns compare to the 16.24% cumulative total return of the Fund’s benchmark, the Russell 1000® Value Index (with dividends reinvested) (the “Russell Index”), during the same time period.
What economic and market factors most influenced the equity markets as a whole during the Reporting Period?
Representing the U.S. equity market, the S&P 500® Index returned 18.54% during the Reporting Period, rallying strongly following negative absolute returns posted in 2018. While 2018 was the worst calendar year since 2008, the first half of 2019 was the strongest first half for the S&P 500® Index since 1997.
During the first quarter of 2019, the S&P 500® Index rose 13.65%. After a volatile end to 2018, the rally to begin 2019 marked the best first quarter performance for the S&P 500® Index since 1998. Federal Reserve (“Fed”) commentary provided a supportive background for U.S. equities, as Fed Chair Jerome Powell reiterated a “patient” approach to monetary policy that included a pause in interest rate hikes and a nearing end to the Fed’s balance sheet runoff. The U.S. unemployment rate remained well below trend at 3.8% in February 2019, and wages grew 3.4% year over year. Housing data showed strength in the first calendar quarter, with new home sales reaching 667,000 in February, bringing the three-month average up to 630,000. Strength in housing data could be partially attributed to a steep decline in mortgage rates resulting from a more cautious Fed. The University of Michigan Consumer Sentiment Index was also a point of significant strength in the U.S. economy, steadily climbing in each month of the first quarter of 2019 and eventually reaching 98.4 in March, its highest level in six months. Economic growth concerns that had dominated the fourth quarter of 2018 failed to completely disappear, however, as fourth quarter 2018 Gross Domestic Product (“GDP”) growth was revised down 0.4% in March 2019 to 2.2%. While the revision was further evidence of a slowing U.S. economy, the result was largely priced in by equity markets and thus had a limited effect on stock prices outside of the financials sector, which historically tends to be more rate sensitive.
The S&P 500® Index rose a solid but more moderate 4.30% during the second quarter of 2019. Trade tensions between the U.S. and China dominated headlines and broadly added noise to the markets. (Noise refers to market activity that can confuse or misrepresent genuine underlying trends.) In April 2019, there was an optimistic consensus outlook on a possible trade deal, but this optimism faded in May when the U.S. President threatened to raise current tariffs and impose new duties on $300 billion of additional Chinese imports. Also, sanctions were temporarily placed on a Chinese telecommunications giant, until they were lifted in June 2019, when any additional tariffs or compromise were postponed. Also during the second quarter, the markets kept a close eye on the Fed. After steadily raising short-term interest rates since 2015 to a range of 2.25% to 2.50%, the Fed alluded to a more accommodative approach. Following the Fed’s statement, the market consensus actually priced in at least one interest rate cut by the end of 2019, if not sooner. Economic indicators were mixed during the second quarter, with consumer sentiment remaining elevated, while nonfarm payrolls and manufacturing indices across the board fell short.
For the Reporting Period overall, all 11 sectors posted positive absolute returns, with 10 of the 11 generating double-digit gains. Information technology, consumer discretionary and industrials were the best performing sectors in the S&P 500® Index, as measured by total return, while the weakest performing sectors in the S&P 500® Index during the Reporting Period were health care, energy and utilities.
Within the U.S. equity market, all capitalization segments posted double-digit positive returns, led bymid-cap stocks, as measured by the Russell Midcap® Index, followed bylarge-cap stocks, as measured by the Russell 1000® Index, and thensmall-cap stocks, as measured by the Russell 2000® Index. From a style perspective, growth-oriented stocks significantly outpaced value-oriented stocks across the capitalization spectrum. (All as measured by the FTSE Russell indices.)
1
GOLDMAN SACHS VARIABLE INSURANCE TRUST LARGE CAP VALUE FUND
What key factors were responsible for the Fund’s performance during the Reporting Period?
The Fund posted double-digit gains but modestly underperformed the Russell Index during the Reporting Period. Stock selection overall contributed positively, while sector allocation as a whole detracted from the Fund’s performance relative to the Russell Index during the Reporting Period.
Which equity market sectors most significantly affected Fund performance?
Stock selection in the health care, financials and energy sectors detracted most from the Fund’s relative results. Offsetting these detractors was stock selection in the information technology, utilities and communication services sectors, which contributed most positively.
Which stocks detracted significantly from the Fund’s performance during the Reporting Period?
Among those companies detracting most from the Fund’s results relative to the Russell Index were positions in Medtronic, Pfizer and Marathon Petroleum.
Medtronic is a medical technology company engaged in the development, manufacture, distribution and sale of device-based medical therapies and services. We decided to exit the Fund’s position in the stock at the end of May 2019 after reassessing the competitive landscape in the medical technology industry and determining that we believed better risk/reward opportunities could be found elsewhere. Prior to exiting the position, the stock was down slightly, but its share price rose following our exit, leading it to be a top relative detractor. Despite the stock rising following our sale of the shares, we continued to believe it was prudent to allocate capital to what we saw as more attractive companies.
Pharmaceutical company Pfizer’s stock trailed the broader equity market along with other large biopharmaceutical companies, as concerns around drug pricing and Brexit uncertainty pressured the industry. (Brexit is the U.K.’s path out of the European Union.) More specific to Pfizer, its management cautioned that its 2019 earnings growth would likely come in slightly softer than the company had previously anticipated, which led investors to reduce positions. Its stock also fell in April 2019, as continued concerns around the Medicare for All proposals and the impact such a program might have weighed on the stock. While the company’s near-term estimates have come down, we still believed at the end of the Reporting Period in Pfizer’s long-term growth potential and its pipeline. Notably, 2020 marks the first year Pfizer will shed the majority of its patent expirations, paving the way for a more unobstructed path to growth, in our view. With this in mind, we felt at the end of the Reporting Period that Pfizer was well positioned to grow through improving market share, early mover advantage in some lines of therapy, and exposure to international markets. Overall, we believed Pfizer remained an attractively valued, high quality company with a healthy balance sheet poised for ongoing growth.
Nearly all of crude oil refining company Marathon Petroleum’s stock price decline came in May 2019. Early in the month, the company reported quarterly results that missed on earnings per share market expectations, driven primarily by weakness in refining and retail margins. On the positive side, Marathon Petroleum continued to buy back shares and also reported strong operating cash flow and capital expenditures. Despite the mixed reports, we remained positive on the company at the end of the Reporting Period and felt its acquisition of fellow petroleum refiner Andeavor seemed to be going well and on track to unlock further synergies for the combined company, now the largest U.S. refiner by capacity. Furthermore, we were positive on the outlook for both the industry and the business and on the company management’s ability to achieve synergy targets and focus on returning capital to shareholders. We maintained our belief that Marathon Petroleum is a high quality company with what we consider to be a strong balance sheet, stable free cash flow and robust return on equity, and we were positive on its prospects ahead.
What were some of the Fund’s best-performing individual stocks?
Relative to the Russell Index, the Fund benefited most from positions in Marvell Technology Group, McDonald’s and Facebook.
Marvell Technology Group, an integrated circuit designer, developer and seller, saw its stock gain rather steadily to start 2019 and then rise even faster in April 2019 on the back of China trade headlines that boosted the semiconductor industry as a whole. Strong first quarter 2019 results featuring above consensus revenue and earnings per share and a positive outlook on the future of the firm’s 5G (fifth-generation) capabilities boosted the company’s share price later in the Reporting Period. Marvell Technology Group also announced the sale of its connectivity assets to NXP Semiconductors, marking the divestiture of an arm that offered few synergies to other, stronger segments of the firm, which the market received positively. This deal fits into a broader pattern of strategic transactions that Marvell Technology Group’s management team has been pursuing. At the end of the Reporting Period, we believed these strategic acquisitions and divestitures, its enhanced position in 5G, and what we saw as its improved financial flexibility may be indicators of potential performance going forward.
2
GOLDMAN SACHS VARIABLE INSURANCE TRUST LARGE CAP VALUE FUND
Shares of fast-food restaurant retailer McDonald’s traded lower in January 2019 after the company released its fourth quarter 2018 results, in which its earnings per share beat consensus expectations but missed on revenues. We used this selloff as a buying opportunity, as we were not overly concerned by these results, and initiated a Fund position in the stock. McDonald’s stock then rose through the remainder of the Reporting Period along with the restaurant industry overall. Longer term, we remained positive on many of the strategic initiatives McDonald’s has been rolling out. Namely, we feel that modernized restaurants, a revamped value menu and a shift toward fresh beef hamburgers can potentially drive market share gains moving forward. With what we view as McDonald’s strong balance sheet, robust free cash flow and healthy return on equity, we believed its shares were attractively valued at the end of the Reporting Period and poised for further appreciation.
Social media giant Facebook’s shares spiked at the end of January 2019 after the company released a strong earnings report for the fourth quarter of 2018. Facebook beat consensus expectations for revenues and earnings per share and posted solid active user figures, underscoring that consumers and advertisers may not be fazed by recent scrutiny from policymakers and privacy advocates. Additionally, its management’s dialogue marked a shift in tone from focusing on defensive areas, like data security, to more offensive initiatives pertaining to product development. Its stock continued to rise and then jumped again in April 2019 following a better than consensus expected earnings release in which the company reported solid revenue growth and improved expense guidance in the first quarter of 2019. The results appeared to be driven by ongoing advertising success and healthy user growth and engagement across platforms, two bright spots that tie directly to our investment thesis on the company. At the end of the Reporting Period, we continued to monitor any potential headline or political risks going forward, but we remained confident in Facebook’s advertising platform, with Instagram stories and the monetization of messaging apps as particular points of strength. Overall, we continued to view Facebook as one of the more intriguing risk/reward opportunities within the online industry.
How did the Fund use derivatives and similar instruments during the Reporting Period?
During the Reporting Period, we did not use derivatives as part of an active management strategy.
Did the Fund make any significant purchases or sales during the Reporting Period?
During the Reporting Period, in addition to the purchase of McDonald’s, already mentioned, we initiated a Fund position in Walt Disney. We are positive on the new initiatives the company is implanting, including its newdirect-to-consumer streaming service, Disney+, which the company expects to launch in the U.S. inmid-November 2019 and to make available in nearly all major regions of the world within the next two years. We are also positive on the company’s acquisition of the regional sports networks under Walt Disney-owned Fox Sports. Further, we are confident in Walt Disney’s ability to maintain strong performance going forward via new entertainment platforms as well as existing segments that we expect to do well.
Conversely, in addition to the sale of Medtronic, already mentioned, we eliminated the Fund’s position in Twenty-First Century Fox. The company completed a merger with Walt Disney in March 2019, and as part of the merger, a piece of the company was spun off to create “New Fox”, or FOXA, while the remaining assets were absorbed by Walt Disney. At the end of the Reporting Period, the Fund held some of the new company, FOXA, but had exited its holding in Twenty-First Century Fox.
Were there any notable changes in the Fund’s weightings during the Reporting Period?
In constructing the Fund’s portfolio, we focus on picking stocks rather than on making industry or sector bets. We seek to outpace the benchmark index by overweighting stocks that we expect to outperform and underweighting those that we think may lag. Consequently, changes in its sector weights are generally the direct result of individual stock selection or of stock appreciation or depreciation. That said, during the Reporting Period, the Fund’s exposure compared to the Russell Index to communication services, industrials, financials and real estate increased. The Fund’s allocations compared to the Russell Index in health care and information technology decreased.
How was the Fund positioned relative to its benchmark index at the end of the Reporting Period?
At the end of June 2019, the Fund had overweighted positions relative to the Russell Index in the communication services and industrials sectors. On the same date, the Fund had underweighted positions compared to the Russell Index in information technology and health care and was rather neutrally weighted to the Russell Index in the financials, real estate, materials, consumer staples, energy, utilities and consumer discretionary sectors.
Were there any changes to the Fund’s portfolio management team during the Reporting Period?
There were no changes to the Fund’s portfolio management team during the Reporting Period.
3
GOLDMAN SACHS VARIABLE INSURANCE TRUST LARGE CAP VALUE FUND
What is the Fund’s tactical view and strategy for the months ahead?
Following a strong start for the U.S. equity markets during the first half of 2019, we continued to view U.S. equities as the most favorable asset class at the end of the Reporting Period, offering what we saw as reasonable valuations relative to solid macroeconomic and corporate fundamentals. After a significant repricing of assets and market expectations in the fourth quarter of 2018, the U.S. equity markets rebounded with the strongest first half of a calendar year since 1997 despite geopolitical tensions and trade relations oscillating between positive and negative developments. U.S. equities were buoyed by declining10-year U.S. Treasury rates, as investors expected potential interest rate cuts, a dramatic shift from the Fed’s actions at this point in 2018. While we were encouraged by the strong start to 2019, we also expected to see more signals of an aging economic cycle moving forward, which may be challenging to navigate and require even more selectivity by stock pickers. Yet without clearer indications of deteriorating fundamentals, we believed it too early to position for a downturn in global economic growth or corporate earnings.
That said, at the end of the Reporting Period, we expected choppier conditions for the remainder of 2019. Within this more volatile backdrop, we believed a thorough understanding of both market and company-specific variables may well be crucial to navigating the evolving landscape. Still, our investment philosophy does not and will not change based on short-term fluctuations in markets. We intend to maintain our focus on high quality companies with what we consider to be strong market positions and experienced management teams. In our opinion, emphasizing these durable businesses can potentially set the Fund up to perform well amidst heightened volatility.
Indeed, regardless of market direction, we remain committed to our core philosophy and process. We intend to maintain a long-term time horizon, rather than forecast the next quarter. As always, we maintain our focus on undervalued companies that we believe have comparatively greater control of their own destiny, such as innovators with differentiated products, companies with low cost structures or companies that have been investing in their own businesses and may be poised to gain market share.
4
GOLDMAN SACHS VARIABLE INSURANCE TRUST LARGE CAP VALUE FUND
Index Definitions
The Russell 1000® Value Index is an unmanaged market capitalization weighted index of the 1000 largest U.S. companies with lower price-to-book ratios and lower forecasted growth values. The figures for the index do not include any deduction for fees, expenses or taxes.
The Russell 2000® Index is an unmanaged index of common stock prices that measures the performance of the 2000 smallest companies in the Russell 3000® Index. The figures for the index do not include any deduction for fees, expenses or taxes.
The S&P 500® Index is the Standard & Poor’s composite index of 500 stocks, an unmanaged index of common stock prices. The figures for the index do not include any deduction for fees, expenses or taxes.
The Russell Midcap® Index measures the performance of the 800 smallest companies in the Russell 1000® Index, which represent approximately 25% of the total market capitalization of the Russell 1000® Index.
The Russell 1000® Index measures the performance of the 1,000 largest companies in the Russell 3000® Index, which represent approximately 92% of the total market capitalization of the Russell 3000® Index.
It is not possible to invest directly in an index.
5
FUND BASICS
Large Cap Value Fund
as of June 30, 2019
STANDARDIZED TOTAL RETURNS1
| | | | | | | | | | | | | | | | | | |
| | | | | |
| For the period ended 6/30/19 | | One Year | | | Five Years | | | Ten Years | | | Since Inception | | | Inception Date |
| Institutional | | | 8.38 | %�� | | | 5.22 | % | | | 10.78 | % | | | 5.10 | % | | 1/12/98 |
| Service | | | 8.19 | | | | 4.95 | | | | 10.48 | | | | 4.39 | | | 7/24/07 |
| 1 | The Standardized Total Returns are average annual total returns as of the most recent calendar quarter-end. They assume reinvestment of all distributions at net asset value (“NAV”). Because Institutional Shares and Service Shares do not involve a sales charge, such a charge is not applied to their Standardized Total Returns. |
Total return figures in the above chart represent past performance and do not indicate future results, which will vary. The investment return and principal value of an investment will fluctuate and, therefore, an investor’s shares, when redeemed, may be worth more or less than their original cost. Current performance may be lower or higher than the total return figures in the above chart. Please visit www.GSAMFUNDS.com to obtain the most recent month-end returns.Performance reflects fee waivers and/or expense limitations in effect during the periods shown. In their absence, performance would be reduced.
EXPENSE RATIOS2
| | | | | | | | |
| | |
| | | Net Expense Ratio (Current) | | | Gross Expense Ratio (Before Waivers) | |
| Institutional | | | 0.71 | % | | | 0.80 | % |
| Service | | | 0.96 | | | | 1.05 | |
| 2 | The expense ratios of the Fund, both current (net of any fee waivers and/or expense limitations) and before waivers (gross of any fee waivers and/or expense limitations) are as set forth above according to the most recent publicly available Prospectuses for the Fund and may differ from the expense ratios disclosed in the Financial Highlights in this report. Pursuant to a contractual arrangement, the Fund’s fee waivers and/or expense limitations will remain in place through at least April 30, 2020, and prior to such date, the Investment Adviser may not terminate the arrangements without the approval of the Fund’s Board of Trustees. If these arrangements are discontinued in the future, the expense ratios may change without shareholder approval. |
TOP TEN HOLDINGS AS OF 6/30/193
| | | | | | |
| | |
| Holding | | % of Net Assets | | | Line of Business |
| JPMorgan Chase & Co. | | | 3.8% | | | Banks |
| Berkshire Hathaway, Inc. Class B | | | 3.7 | | | Diversified Financials |
| Johnson & Johnson | | | 3.2 | | | Pharmaceuticals, Biotechnology & Life Sciences |
| Bank of America Corp. | | | 2.9 | | | Banks |
| Chevron Corp. | | | 2.8 | | | Energy |
| Procter & Gamble Co. (The) | | | 2.8 | | | Household & Personal Products |
| Verizon Communications, Inc. | | | 2.7 | | | Telecommunication Services |
| Walt Disney Co. (The) | | | 2.3 | | | Media & Entertainment |
| Walmart, Inc. | | | 2.2 | | | Food & Staples Retailing |
| Exxon Mobil Corp. | | | 2.0 | | | Energy |
| 3 | The top 10 holdings may not be representative of the Fund’s future investments. |
6
FUND BASICS
FUND VS. BENCHMARK SECTOR ALLOCATIONS4
As of June 30, 2019
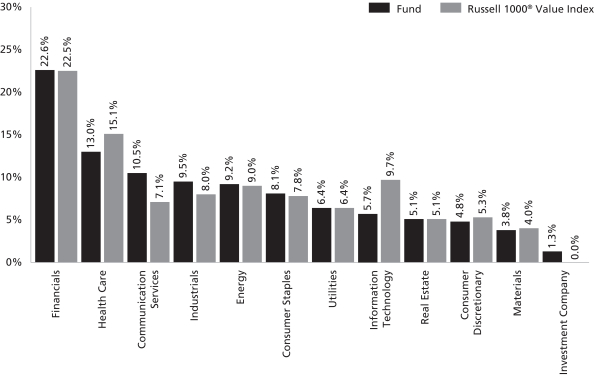
| 4 | The Fund is actively managed and, as such, its composition may differ over time. Consequently, the Fund’s overall sector allocations may differ from percentages contained in the graph above. The graph categorizes investments using Global Industry Classification Standard (“GICS”); however, the sector classifications used by the portfolio management team may differ from GICS. The percentage shown for each investment category reflects the value of investments in that category as a percentage of market value. Underlying sector allocations of exchange traded funds and investment companies held by the Fund are not reflected in the graph above. |
7
GOLDMAN SACHS VARIABLE INSURANCE TRUST LARGE CAP VALUE FUND
Schedule of Investments
June 30, 2019 (Unaudited)
| | | | | | | | |
| Shares | | |
Description | | Value | |
|
| Common Stocks – 99.0% | |
| Automobiles & Components – 0.6% | |
| | 35,331 | | | Aptiv plc | | $ | 2,855,805 | |
| | |
| Banks – 9.7% | |
| | 469,774 | | | Bank of America Corp. | | | 13,623,446 | |
| | 27,662 | | | First Republic Bank | | | 2,701,194 | |
| | 157,577 | | | JPMorgan Chase & Co. | | | 17,617,109 | |
| | 30,905 | | | M&T Bank Corp. | | | 5,256,013 | |
| | 136,211 | | | Wells Fargo & Co. | | | 6,445,505 | |
| | | | | | | | |
| | | | | | | 45,643,267 | |
| | |
| Capital Goods – 7.2% | |
| | 11,161 | | | Boeing Co. (The) | | | 4,062,716 | |
| | 26,086 | | | Deere & Co. | | | 4,322,711 | |
| | 417,311 | | | General Electric Co. | | | 4,381,765 | |
| | 37,610 | | | Honeywell International, Inc. | | | 6,566,330 | |
| | 75,737 | | | ITT, Inc. | | | 4,959,259 | |
| | 12,496 | | | Northrop Grumman Corp. | | | 4,037,582 | |
| | 37,296 | | | Stanley Black & Decker, Inc. | | | 5,393,375 | |
| | | | | | | | |
| | | | | | | 33,723,738 | |
| | |
| Commercial & Professional Services – 0.6% | |
| | 28,807 | | | Waste Connections, Inc. | | | 2,753,373 | |
| | |
| Consumer Durables & Apparel – 1.3% | |
| | 55,706 | | | DR Horton, Inc. | | | 2,402,600 | |
| | 36,628 | | | PVH Corp. | | | 3,466,474 | |
| | | | | | | | |
| | | | | | | 5,869,074 | |
| | |
| Consumer Services – 2.0% | |
| | 32,050 | | | McDonald’s Corp. | | | 6,655,503 | |
| | 22,988 | | | Royal Caribbean Cruises Ltd. | | | 2,786,375 | |
| | | | | | | | |
| | | | | | | 9,441,878 | |
| | |
| Diversified Financials – 8.1% | |
| | 32,000 | | | American Express Co. | | | 3,950,080 | |
| | 80,643 | | | Berkshire Hathaway, Inc. Class B* | | | 17,190,668 | |
| | 10,051 | | | BlackRock, Inc. | | | 4,716,934 | |
| | 45,499 | | | Intercontinental Exchange, Inc. | | | 3,910,184 | |
| | 117,659 | | | Morgan Stanley | | | 5,154,641 | |
| | 31,382 | | | Northern Trust Corp. | | | 2,824,380 | |
| | | | | | | | |
| | | | | | | 37,746,887 | |
| | |
| Energy – 9.3% | |
| | 48,361 | | | Cheniere Energy, Inc.* | | | 3,310,310 | |
| | 104,924 | | | Chevron Corp. | | | 13,056,743 | |
| | 36,915 | | | Concho Resources, Inc. | | | 3,808,890 | |
| | 22,225 | | | Diamondback Energy, Inc. | | | 2,421,858 | |
| | 54,847 | | | EOG Resources, Inc. | | | 5,109,547 | |
| | 124,288 | | | Exxon Mobil Corp. | | | 9,524,189 | |
| | 110,743 | | | Marathon Petroleum Corp. | | | 6,188,319 | |
| | | | | | | | |
| | | | | | | 43,419,856 | |
| | |
| Food & Staples Retailing – 2.2% | |
| | 95,004 | | | Walmart, Inc. | | | 10,496,992 | |
| | |
|
| Common Stocks – (continued) | |
| Food, Beverage & Tobacco – 3.1% | |
| | 78,884 | | | Altria Group, Inc. | | | 3,735,157 | |
| | 81,535 | | | Conagra Brands, Inc. | | | 2,162,308 | |
| | 18,379 | | | Constellation Brands, Inc. Class A | | | 3,619,560 | |
| | 94,975 | | | Mondelez International, Inc. Class A | | | 5,119,153 | |
| | | | | | | | |
| | | | | | | 14,636,178 | |
| | |
| Health Care Equipment & Services – 5.6% | |
| | 82,700 | | | Boston Scientific Corp.* | | | 3,554,446 | |
| | 10,684 | | | Cooper Cos., Inc. (The) | | | 3,599,333 | |
| | 78,598 | | | CVS Health Corp. | | | 4,282,805 | |
| | 40,444 | | | Danaher Corp. | | | 5,780,256 | |
| | 13,259 | | | Humana, Inc. | | | 3,517,613 | |
| | 48,456 | | | Zimmer Biomet Holdings, Inc. | | | 5,705,209 | |
| | | | | | | | |
| | | | | | | 26,439,662 | |
| | |
| Household & Personal Products – 2.8% | |
| | 118,946 | | | Procter & Gamble Co. (The) | | | 13,042,429 | |
| | |
| Insurance – 4.9% | |
| | 46,765 | | | Allstate Corp. (The) | | | 4,755,533 | |
| | 36,915 | | | American Financial Group, Inc. | | | 3,782,680 | |
| | 70,967 | | | American International Group, Inc. | | | 3,781,122 | |
| | 32,050 | | | Arthur J Gallagher & Co. | | | 2,807,260 | |
| | 32,908 | | | Chubb Ltd. | | | 4,847,019 | |
| | 30,905 | | | Torchmark Corp. | | | 2,764,761 | |
| | | | | | | | |
| | | | | | | 22,738,375 | |
| | |
| Materials – 3.8% | |
| | 30,047 | | | Celanese Corp. | | | 3,239,066 | |
| | 80,101 | | | DuPont de Nemours, Inc. | | | 6,013,182 | |
| | 29,737 | | | Linde plc | | | 5,971,190 | |
| | 11,924 | | | Martin Marietta Materials, Inc. | | | 2,743,832 | |
| | | | | | | | |
| | | | | | | 17,967,270 | |
| | |
| Media & Entertainment – 6.9% | |
| | 96,108 | | | Activision Blizzard, Inc. | | | 4,536,297 | |
| | 3,721 | | | Alphabet, Inc. Class A* | | | 4,029,099 | |
| | 170,464 | | | Comcast Corp. Class A | | | 7,207,218 | |
| | 13,068 | | | Facebook, Inc. Class A* | | | 2,522,124 | |
| | 92,620 | | | Fox Corp. Class A | | | 3,393,597 | |
| | 76,200 | | | Walt Disney Co. (The) | | | 10,640,568 | |
| | | | | | | | |
| | | | | | | 32,328,903 | |
| | |
| Pharmaceuticals, Biotechnology & Life Sciences – 7.4% | |
| | 14,881 | | | Alexion Pharmaceuticals, Inc.* | | | 1,949,113 | |
| | 76,309 | | | AstraZeneca plc ADR | | | 3,150,036 | |
| | 28,807 | | | BioMarin Pharmaceutical, Inc.* | | | 2,467,320 | |
| | 130,488 | | | Elanco Animal Health, Inc.* | | | 4,410,494 | |
| | 17,111 | | | Eli Lilly & Co. | | | 1,895,728 | |
| | 105,974 | | | Johnson & Johnson | | | 14,760,059 | |
| | 134,589 | | | Pfizer, Inc. | | | 5,830,395 | |
| | | | | | | | |
| | | | | | | 34,463,145 | |
| | |
| | |
| 8 | | The accompanying notes are an integral part of these financial statements. |
GOLDMAN SACHS VARIABLE INSURANCE TRUST LARGE CAP VALUE FUND
| | | | | | | | |
Shares | | | Description | | Value | |
|
| Common Stocks – (continued) | |
| Real Estate Investment Trusts – 5.1% | |
| | 27,567 | | | Alexandria Real Estate Equities, Inc. | | $ | 3,889,428 | |
| | 27,662 | | | AvalonBay Communities, Inc. | | | 5,620,365 | |
| | 23,561 | | | Extra Space Storage, Inc. | | | 2,499,822 | |
| | 95,863 | | | Hudson Pacific Properties, Inc. | | | 3,189,362 | |
| | 50,841 | | | Prologis, Inc. | | | 4,072,364 | |
| | 65,339 | | | Ventas, Inc. | | | 4,465,921 | |
| | | | | | | | |
| | | | | | | 23,737,262 | |
| | |
| Retailing – 0.9% | |
| | 10,397 | | | Advance Auto Parts, Inc. | | | 1,602,594 | |
| | 26,613 | | | Ross Stores, Inc. | | | 2,637,880 | |
| | | | | | | | |
| | | | | | | 4,240,474 | |
| | |
| Semiconductors & Semiconductor Equipment – 3.3% | |
| | 33,672 | | | Advanced Micro Devices, Inc.* | | | 1,022,619 | |
| | 157,005 | | | Intel Corp. | | | 7,515,829 | |
| | 120,556 | | | Marvell Technology Group Ltd. | | | 2,877,672 | |
| | 36,144 | | | Texas Instruments, Inc. | | | 4,147,885 | |
| | | | | | | | |
| | | | | | | 15,564,005 | |
| | |
| Software & Services – 2.4% | |
| | 37,948 | | | Citrix Systems, Inc. | | | 3,724,217 | |
| | 28,849 | | | Fidelity National Information Services, Inc. | | | 3,539,195 | |
| | 31,286 | | | Microsoft Corp. | | | 4,191,073 | |
| | | | | | | | |
| | | | | | | 11,454,485 | |
| | |
| Telecommunication Services – 3.6% | |
| | 138,309 | | | AT&T, Inc. | | | 4,634,734 | |
| | 217,514 | | | Verizon Communications, Inc. | | | 12,426,575 | |
| | | | | | | | |
| | | | | | | 17,061,309 | |
| | |
| Transportation – 1.8% | |
| | 18,052 | | | Norfolk Southern Corp. | | | 3,598,305 | |
| | 27,567 | | | Union Pacific Corp. | | | 4,661,856 | |
| | | | | | | | |
| | | | | | | 8,260,161 | |
| | |
| Utilities – 6.4% | |
| | 70,586 | | | Ameren Corp. | | | 5,301,714 | |
| | 34,721 | | | American Water Works Co., Inc. | | | 4,027,636 | |
| | 98,820 | | | CMS Energy Corp. | | | 5,722,666 | |
| | 42,829 | | | NextEra Energy, Inc. | | | 8,773,949 | |
| | 101,777 | | | Xcel Energy, Inc. | | | 6,054,714 | |
| | | | | | | | |
| | | | | | | 29,880,679 | |
| | |
| | TOTAL COMMON STOCKS | |
| | (Cost $410,675,993) | | $ | 463,765,207 | |
| | |
| Shares | | | Dividend
Rate | | Value | |
|
| Investment Company(a)– 1.3% | |
| Goldman Sachs Financial Square Government Fund —
Institutional Shares |
|
| | 6,173,065 | | | 2.308% | | $ | 6,173,065 | |
| | (Cost $6,173,065) | |
| | |
| | TOTAL INVESTMENTS – 100.3% | |
| | (Cost $416,849,058) | | $ | 469,938,272 | |
| | |
| LIABILITIES IN EXCESS OF
OTHER ASSETS – (0.3)% | | | (1,416,491 | ) |
| | |
| | NET ASSETS – 100.0% | | $ | 468,521,781 | |
| | |
| | |
| The percentage shown for each investment category reflects the value of investments in that category as a percentage of net assets. |
| |
| * | | Non-income producing security. |
| |
| (a) | | Represents an Affiliated Issuer. |
| | |
| |
| Investment Abbreviation: |
| ADR | | —American Depositary Receipt |
| | |
| The accompanying notes are an integral part of these financial statements. | | 9 |
GOLDMAN SACHS VARIABLE INSURANCE TRUST LARGE CAP VALUE FUND
Statement of Assets and Liabilities
June 30, 2019 (Unaudited)
| | | | |
| | | | |
| Assets: | | | |
Investments in unaffiliated issuers, at value (cost $410,675,993) | | $ | 463,765,207 | |
Investments in affiliated issuers, at value (cost $6,173,065) | | | 6,173,065 | |
Cash | | | 384,836 | |
Receivables: | | | | |
Investments sold | | | 27,286,841 | |
Dividends | | | 416,782 | |
Reimbursement from investment adviser | | | 22,929 | |
Fund shares sold | | | 8,212 | |
Other assets | | | 1,216 | |
| |
| Total assets | | | 498,059,088 | |
| | | | |
| | | | |
| Liabilities: | | | |
Payables: | | | | |
Investments purchased | | | 28,417,282 | |
Fund shares redeemed | | | 671,284 | |
Management fees | | | 262,017 | |
Distribution and Service fees and Transfer Agency fees | | | 70,258 | |
Accrued expenses | | | 116,466 | |
| |
| Total liabilities | | | 29,537,307 | |
| | | | |
| | | | |
| Net Assets: | | | |
Paid-in capital | | | 400,156,457 | |
Total distributable earnings (loss) | | | 68,365,324 | |
| |
| NET ASSETS | | $ | 468,521,781 | |
Net Assets: | | | | |
Institutional | | $ | 161,218,006 | |
Service | | | 307,303,775 | |
| |
Total Net Assets | | $ | 468,521,781 | |
Shares outstanding $0.001 par value (unlimited shares authorized): | | | | |
Institutional | | | 18,120,115 | |
Service | | | 34,572,947 | |
Net asset value, offering and redemption price per share: | | | | |
Institutional | | | $8.90 | |
Service | | | 8.89 | |
| | |
| 10 | | The accompanying notes are an integral part of these financial statements. |
GOLDMAN SACHS VARIABLE INSURANCE TRUST LARGE CAP VALUE FUND
Statement of Operations
For the Six Months Ended June 30, 2019 (Unaudited)
| | | | |
| | | | |
| Investment income: | |
Dividends — unaffiliated issuers (net of foreign taxes withheld of $3,114) | | $ | 5,168,216 | |
Dividends — affiliated issuers | | | 31,365 | |
Securities lending income — unaffiliated issuer | | | 19,664 | |
| |
| Total investment income | | | 5,219,245 | |
| | | | |
| | | | |
| Expenses: | | | |
Management fees | | | 1,663,687 | |
Distribution and Service fees — Service Shares | | | 379,288 | |
Transfer Agency fees(a) | | | 46,210 | |
Professional fees | | | 44,770 | |
Custody, accounting and administrative services | | | 43,319 | |
Printing and mailing costs | | | 42,579 | |
Trustee fees | | | 8,349 | |
Registration fees | | | 620 | |
Other | | | 8,852 | |
| |
| Total expenses | | | 2,237,674 | |
| |
Less — expense reductions | | | (212,588 | ) |
| |
| Net expenses | | | 2,025,086 | |
| |
| NET INVESTMENT INCOME | | | 3,194,159 | |
| |
| | | | |
| Realized and unrealized gain: | | | |
Net realized gain from investments — unaffiliated issuers | | | 9,618,406 | |
Net change in unrealized gain on investments — unaffiliated issuers | | | 54,790,676 | |
| |
| Net realized and unrealized gain | | | 64,409,082 | |
| |
| NET INCREASE IN NET ASSETS RESULTING FROM OPERATIONS | | $ | 67,603,241 | |
(a) Institutional and Service Shares incurred Transfer Agency fees of $15,869 and $30,341, respectively.
| | |
| The accompanying notes are an integral part of these financial statements. | | 11 |
GOLDMAN SACHS VARIABLE INSURANCE TRUST LARGE CAP VALUE FUND
Statements of Changes in Net Assets
| | | | | | | | |
| | | For the
Six Months Ended
June 30, 2019
(Unaudited) | | | For the
Fiscal Year Ended
December 31, 2018 | |
| | | | | | | | |
| From operations: | |
Net investment income | | $ | 3,194,159 | | | $ | 5,902,274 | |
Net realized gain | | | 9,618,406 | | | | 38,681,430 | |
Net change in unrealized gain (loss) | | | 54,790,676 | | | | (85,485,686 | ) |
| | |
| Net increase (decrease) in net assets resulting from operations | | | 67,603,241 | | | | (40,901,982 | ) |
| |
| | | | | | | | |
| Distributions to shareholders: | | | | | | |
From distributable earnings: | | | | | | | | |
Institutional Shares | | | — | | | | (11,515,289 | ) |
Service Shares | | | — | | | | (20,776,605 | ) |
| | |
| Total distributions to shareholders | | | — | | | | (32,291,894 | ) |
| |
| | | | | | | | |
| From share transactions: | | | | | | |
Proceeds from sales of shares | | | 8,524,009 | | | | 25,313,246 | |
Reinvestment of distributions | | | — | | | | 32,291,894 | |
Cost of shares redeemed | | | (41,459,624 | ) | | | (97,515,109 | ) |
| | |
| Net decrease in net assets resulting from share transactions | | | (32,935,615 | ) | | | (39,909,969 | ) |
| | |
| TOTAL INCREASE (DECREASE) | | | 34,667,626 | | | | (113,103,845 | ) |
| |
| | | | | | | | |
| Net Assets: | | | | | | |
| | |
Beginning of period | | | 433,854,155 | | | | 546,958,000 | |
| | |
End of period | | $ | 468,521,781 | | | $ | 433,854,155 | |
| | |
| 12 | | The accompanying notes are an integral part of these financial statements. |
GOLDMAN SACHS VARIABLE INSURANCE TRUST LARGE CAP VALUE FUND
Financial Highlights
Selected Data for a Share Outstanding Throughout Each Period
| | | | | | | | | | | | | | | | | | | | | | | | |
| | | Goldman Sachs Large Cap Value Fund | |
| | | Institutional Shares | |
| | | Six Months Ended
June 30, 2019
(Unaudited) | | | Year Ended December 31, | |
| | | 2018 | | | 2017 | | | 2016 | | | 2015 | | | 2014 | |
| | | | | | | | | | | | | | | | | | | | | | | | |
| Per Share Data | | | | | | | | | | | | | | | | | | |
| | | | | | |
Net asset value, beginning of period | | $ | 7.67 | | | $ | 9.06 | | | $ | 10.16 | | | $ | 9.39 | | | $ | 11.39 | | | $ | 12.59 | |
| | | | | | |
Net investment income(a) | | | 0.07 | | | | 0.12 | | | | 0.16 | | | | 0.18 | | | | 0.15 | | | | 0.16 | |
| | | | | | |
Net realized and unrealized gain (loss) | | | 1.16 | | | | (0.88 | ) | | | 0.83 | | | | 0.91 | | | | (0.67 | ) | | | 1.38 | |
| | | | | | |
Total from investment operations | | | 1.23 | | | | (0.76 | ) | | | 0.99 | | | | 1.09 | | | | (0.52 | ) | | | 1.54 | |
| | | | | | |
Distributions to shareholders from net investment income | | | — | | | | (0.12 | ) | | | (0.18 | ) | | | (0.22 | ) | | | (0.16 | ) | | | (0.19 | ) |
| | | | | | |
Distributions to shareholders from net realized gains | | | — | | | | (0.51 | ) | | | (1.91 | ) | | | (0.10 | ) | | | (1.32 | ) | | | (2.55 | ) |
| | | | | | |
Total distributions | | | — | | | | (0.63 | ) | | | (2.09 | ) | | | (0.32 | ) | | | (1.48 | ) | | | (2.74 | ) |
| | | | | | |
Net asset value, end of period | | $ | 8.90 | | | $ | 7.67 | | | $ | 9.06 | | | $ | 10.16 | | | $ | 9.39 | | | $ | 11.39 | |
| | | | | | |
Total return(b) | | | 16.04 | % | | | (8.46 | )% | | | 9.85 | % | | | 11.55 | % | | | (4.41 | )% | | | 12.94 | % |
| | | | | | |
Net assets, end of period (in 000s) | | $ | 161,218 | | | $ | 150,963 | | | $ | 188,182 | | | $ | 243,875 | | | $ | 279,910 | | | $ | 326,543 | |
| | | | | | |
Ratio of net expenses to average net assets | | | 0.71 | %(c) | | | 0.71 | % | | | 0.72 | % | | | 0.74 | % | | | 0.74 | % | | | 0.75 | % |
| | | | | | |
Ratio of total expenses to average net assets | | | 0.80 | %(c) | | | 0.81 | % | | | 0.81 | % | | | 0.81 | % | | | 0.81 | % | | | 0.80 | % |
| | | | | | |
Ratio of net investment income to average net assets | | | 1.54 | %(c) | | | 1.32 | % | | | 1.50 | % | | | 1.91 | % | | | 1.38 | % | | | 1.21 | % |
| | | | | | |
Portfolio turnover rate(d) | | | 34 | % | | | 125 | % | | | 127 | % | | | 130 | % | | | 83 | % | | | 72 | % |
| (a) | Calculated based on the average shares outstanding methodology. |
| (b) | Assumes investment at the net asset value at the beginning of the period, reinvestment of all distributions, a complete redemption of the investment at the net asset value at the end of the period and no sales or redemption charges (if any). Total returns would be reduced if a sales or redemption charge was taken into account. Returns do not reflect the impact of taxes to shareholders relating to Fund distributions or the redemption of Fund shares. Total returns for periods less than one full year are not annualized. |
| (d) | The Fund’s portfolio turnover rate is calculated in accordance with regulatory requirements, without regard to transactions involving short term investments. If such transactions were included, the Fund’s portfolio turnover rate may be higher. |
| | |
| The accompanying notes are an integral part of these financial statements. | | 13 |
GOLDMAN SACHS VARIABLE INSURANCE TRUST LARGE CAP VALUE FUND
Financial Highlights(continued)
Selected Data for a Share Outstanding Throughout Each Period
| | | | | | | | | | | | | | | | | | | | | | | | |
| | | Goldman Sachs Large Cap Value Fund | |
| | | Service Shares | |
| | | Six Months Ended
June 30, 2019
(Unaudited) | | | Year Ended December 31, | |
| | | 2018 | | | 2017 | | | 2016 | | | 2015 | | | 2014 | |
| | | | | | | | | | | | | | | | | | | | | | | | |
| Per Share Data | | | | | | | | | | | | | | | | | | |
| | | | | | |
Net asset value, beginning of period | | $ | 7.67 | | | $ | 9.06 | | | $ | 10.16 | | | $ | 9.39 | | | $ | 11.38 | | | $ | 12.58 | |
| | | | | | |
Net investment income(a) | | | 0.05 | | | | 0.10 | | | | 0.13 | | | | 0.16 | | | | 0.13 | | | | 0.13 | |
| | | | | | |
Net realized and unrealized gain (loss) | | | 1.17 | | | | (0.88 | ) | | | 0.83 | | | | 0.90 | | | | (0.67 | ) | | | 1.37 | |
| | | | | | |
Total from investment operations | | | 1.22 | | | | (0.78 | ) | | | 0.96 | | | | 1.06 | | | | (0.54 | ) | | | 1.50 | |
| | | | | | |
Distributions to shareholders from net investment income | | | — | | | | (0.10 | ) | | | (0.15 | ) | | | (0.19 | ) | | | (0.13 | ) | | | (0.15 | ) |
| | | | | | |
Distributions to shareholders from net realized gains | | | — | | | | (0.51 | ) | | | (1.91 | ) | | | (0.10 | ) | | | (1.32 | ) | | | (2.55 | ) |
| | | | | | |
Total distributions | | | — | | | | (0.61 | ) | | | (2.06 | ) | | | (0.29 | ) | | | (1.45 | ) | | | (2.70 | ) |
| | | | | | |
Net asset value, end of period | | $ | 8.89 | | | $ | 7.67 | | | $ | 9.06 | | | $ | 10.16 | | | $ | 9.39 | | | $ | 11.38 | |
| | | | | | |
Total return(b) | | | 15.91 | % | | | (8.72 | )% | | | 9.56 | % | | | 11.25 | % | | | (4.58 | )% | | | 12.61 | % |
| | | | | | |
Net assets, end of period (in 000s) | | $ | 307,304 | | | $ | 282,891 | | | $ | 358,776 | | | $ | 531,553 | | | $ | 610,689 | | | $ | 692,741 | |
| | | | | | |
Ratio of net expenses to average net assets | | | 0.96 | %(c) | | | 0.96 | % | | | 0.97 | % | | | 0.99 | % | | | 0.99 | % | | | 1.00 | % |
| | | | | | |
Ratio of total expenses to average net assets | | | 1.05 | %(c) | | | 1.06 | % | | | 1.06 | % | | | 1.06 | % | | | 1.06 | % | | | 1.05 | % |
| | | | | | |
Ratio of net investment income to average net assets | | | 1.30 | %(c) | | | 1.07 | % | | | 1.26 | % | | | 1.66 | % | | | 1.13 | % | | | 0.96 | % |
| | | | | | |
Portfolio turnover rate(d) | | | 34 | % | | | 125 | % | | | 127 | % | | | 130 | % | | | 83 | % | | | 72 | % |
| (a) | Calculated based on the average shares outstanding methodology. |
| (b) | Assumes investment at the net asset value at the beginning of the period, reinvestment of all distributions, a complete redemption of the investment at the net asset value at the end of the period and no sales or redemption charges (if any). Total returns would be reduced if a sales or redemption charge was taken into account. Returns do not reflect the impact of taxes to shareholders relating to Fund distributions or the redemption of Fund shares. Total returns for periods less than one full year are not annualized. |
| (d) | The Fund’s portfolio turnover rate is calculated in accordance with regulatory requirements, without regard to transactions involving short term investments. If such transactions were included, the Fund’s portfolio turnover rate may be higher. |
| | |
| 14 | | The accompanying notes are an integral part of these financial statements. |
GOLDMAN SACHS VARIABLE INSURANCE TRUST LARGE CAP VALUE FUND
Notes to Financial Statements
June 30, 2019 (Unaudited)
1. ORGANIZATION
Goldman Sachs Variable Insurance Trust (the “Trust” or “VIT”) is a Delaware statutory trust registered under the Investment Company Act of 1940, as amended (the “Act”), as anopen-end management investment company. The Trust includes the Goldman Sachs Large Cap Value Fund (the “Fund”). The Fund is a diversified portfolio under the Act offering two classes of shares — Institutional and Service Shares. Shares of the Trust are offered to separate accounts of participating life insurance companies for the purpose of funding variable annuity contracts and variable life insurance policies.
Goldman Sachs Asset Management, L.P. (“GSAM”), an affiliate of Goldman Sachs & Co. LLC (“Goldman Sachs”), serves as investment adviser to the Fund pursuant to a management agreement (the “Agreement”) with the Trust.
2. SIGNIFICANT ACCOUNTING POLICIES
The financial statements have been prepared in accordance with accounting principles generally accepted in the United States of America (“GAAP”) and require management to make estimates and assumptions that may affect the reported amounts and disclosures. Actual results may differ from those estimates and assumptions.
A. Investment Valuation — The Fund’s valuation policy is to value investments at fair value.
B. Investment Income and Investments —Investment income includes interest income, dividend income, and securities lending income, if any. Interest income is accrued daily and adjusted for amortization of premiums and accretion of discounts. Dividend income is recognized onex-dividend date or, for certain foreign securities, as soon as such information is obtained subsequent to theex-dividend date. Investment transactions are reflected on trade date. Realized gains and losses are calculated using identified cost. Investment transactions are recorded on the following business day for daily net asset value (“NAV”) calculations. Investment income is recorded net of any foreign withholding taxes, less any amounts reclaimable. The Fund may file withholding tax reclaims in certain jurisdictions to recover a portion of amounts previously withheld. Any foreign capital gains tax is accrued daily based upon net unrealized gains, and is payable upon sale of such investments. Distributions received from the Fund’s investments in United States (“U.S.”) real estate investment trusts (“REITs”) may be characterized as ordinary income, net capital gain or a return of capital. A return of capital is recorded by the Fund as a reduction to the cost basis of the REIT.
C. Class Allocations and Expenses — Investment income, realized and unrealized gain (loss), if any, andnon-class specific expenses of the Fund are allocated daily based upon the proportion of net assets of each class.Non-class specific expenses directly incurred by the Fund are charged to the Fund, while such expenses incurred by the Trust are allocated across the Fund on a straight-line and/orpro-rata basis depending upon the nature of the expenses. Class specific expenses, where applicable, are borne by the respective share classes and include Distribution and Service and Transfer Agency fees.
D. Federal Taxes and Distributions to Shareholders — It is the Fund’s policy to comply with the requirements of the Internal Revenue Code of 1986, as amended (the “Code”), applicable to regulated investment companies and to distribute each year substantially all of its investment company taxable income and capital gains to its shareholders. Accordingly, the Fund is not required to make any provisions for the payment of federal income tax. Distributions to shareholders are recorded on theex-dividend date. Income and capital gains distributions, if any, are declared and paid at least annually.
Net capital losses, if any, are carried forward to future fiscal years and may be used to the extent allowed by the Code to offset any future capital gains. Losses that are carried forward will retain their character as either short-term or long-term capital losses. Utilization of capital loss carryforwards will reduce the requirement of future capital gains distributions.
The characterization of distributions to shareholders for financial reporting purposes is determined in accordance with federal income tax rules, which may differ from GAAP. The source of the Fund’s distributions may be shown in the accompanying financial statements as either from distributable earnings or capital. Certain components of the Fund’s net assets on the Statement of Assets and Liabilities reflect permanent GAAP/tax differences based on the appropriate tax character.
E. Commission Recapture — GSAM, on behalf of certain Funds, may direct portfolio trades, subject to seeking best execution, to various brokers who have agreed to rebate a portion of the commissions generated. Such rebates are made directly to the Fund as
15
GOLDMAN SACHS VARIABLE INSURANCE TRUST LARGE CAP VALUE FUND
Notes to Financial Statements(continued)
June 30, 2019 (Unaudited)
2. SIGNIFICANT ACCOUNTING POLICIES (continued)
cash payments and are included in net realized gain (loss) from investments on the Statement of Operations. As of June 30, 2019, there was no commission recaptured for the Fund.
3. INVESTMENTS AND FAIR VALUE MEASUREMENTS
U.S. GAAP defines the fair value of a financial instrument as the amount that would be received to sell an asset or paid to transfer a liability in an orderly transaction between market participants at the measurement date (i.e., the exit price); the Fund’s policy is to use the market approach. GAAP establishes a fair value hierarchy that prioritizes the inputs to valuation techniques used to measure fair value. The hierarchy gives the highest priority to unadjusted quoted prices in active markets for identical assets or liabilities (Level 1 measurements) and the lowest priority to unobservable inputs (Level 3 measurements). The levels used for classifying investments are not necessarily an indication of the risk associated with investing in these investments. The three levels of the fair value hierarchy are described below:
Level 1 — Unadjusted quoted prices in active markets that are accessible at the measurement date for identical, unrestricted assets or liabilities;
Level 2 — Quoted prices in markets that are not active or financial instruments for which significant inputs are observable (including, but not limited to, quoted prices for similar investments, interest rates, foreign exchange rates, volatility and credit spreads), either directly or indirectly;
Level 3 — Prices or valuations that require significant unobservable inputs (including GSAM’s assumptions in determining fair value measurement).
The Board of Trustees (“Trustees”) has approved Valuation Procedures that govern the valuation of the portfolio investments held by the Fund, including investments for which market quotations are not readily available. The Trustees have delegated to GSAMday-to-day responsibility for implementing and maintaining internal controls and procedures related to the valuation of the Fund’s investments. To assess the continuing appropriateness of pricing sources and methodologies, GSAM regularly performs price verification procedures and issues challenges as necessary to third party pricing vendors or brokers, and any differences are reviewed in accordance with the Valuation Procedures.
A. Level 1 and Level 2 Fair Value Investments — The valuation techniques and significant inputs used in determining the fair values for investments classified as Level 1 and Level 2 are as follows:
Equity Securities — Equity securities traded on a U.S. securities exchange or the NASDAQ system, or those located on certain foreign exchanges, including but not limited to the Americas, are valued daily at their last sale price or official closing price on the principal exchange or system on which they are traded. If there is no sale or official closing price or such price is believed by GSAM to not represent fair value, equity securities are valued at the last bid price for long positions and at the last ask price for short positions. To the extent these investments are actively traded, they are classified as Level 1 of the fair value hierarchy, otherwise they are generally classified as Level 2.
Unlisted equity securities for which market quotations are available are valued at the last sale price on the valuation date, or if no sale occurs, at the last bid price, and are generally classified as Level 2.
Money Market Funds— Investments in the Goldman Sachs Financial Square Government Fund (“Underlying Fund”) are valued at the NAV of the Institutional Share class on the day of valuation. These investments are generally classified as Level 1 of the fair value hierarchy. For information regarding the Underlying Fund’s accounting policies and investment holdings, please see the Underlying Fund’s shareholder report.
B. Level 3 Fair Value Investments — To the extent that significant inputs to valuation models and other alternative pricing sources are unobservable, or if quotations are not readily available, or if GSAM believes that such quotations do not accurately reflect fair value, the fair value of the Fund’s investments may be determined under Valuation Procedures approved by the
16
GOLDMAN SACHS VARIABLE INSURANCE TRUST LARGE CAP VALUE FUND
3. INVESTMENTS AND FAIR VALUE MEASUREMENTS (continued)
Trustees. GSAM, consistent with its procedures and applicable regulatory guidance, may make an adjustment to the most recent valuation prices of either domestic or foreign securities in light of significant events to reflect what it believes to be the fair value of the securities at the time of determining the Fund’s NAV. To the extent investments are valued using single source broker quotations obtained directly from the broker or passed through from third party pricing vendors, such investments are classified as Level 3 investments. GSAM did not develop the unobservable inputs for valuation of Level 3 Assets and Liabilities.
C. Fair Value Hierarchy — The following is a summary of the Fund’s investments classified in the fair value hierarchy as of June 30, 2019:
| | | | | | | | | | | | |
| Investment Type | | Level 1 | | | Level 2 | | | Level 3 | |
| | | |
| Assets | | | | | | | | | | | | |
| Common Stock and/or Other Equity Investments(a) | | | | | | | | | | | | |
Europe | | $ | 9,121,226 | | | $ | — | | | $ | — | |
North America | | | 454,643,981 | | | | — | | | | — | |
| Investment Company | | | 6,173,065 | | | | — | | | | — | |
| | | |
| Total | | $ | 469,938,272 | | | $ | — | | | $ | — | |
| (a) | Amounts are disclosed by continent to highlight the impact of time zone differences between local market close and the calculation of NAV. Security valuations are based on the principal exchange or system on which they are traded, which may differ from country of domicile. |
For further information regarding security characteristics, see the Schedule of Investments.
4. AGREEMENTS AND AFFILIATED TRANSACTIONS
A. Management Agreement — Under the Agreement, GSAM manages the Fund, subject to the general supervision of the Trustees.
As compensation for the services rendered pursuant to the Agreement, the assumption of the expenses related thereto and administration of the Fund’s business affairs, including providing facilities, GSAM is entitled to a management fee, accrued daily and paid monthly, equal to an annual percentage rate of the Fund’s average daily net assets.
For the six months ended June 30, 2019, contractual and effective net management fees with GSAM were at the following rates:
| | | | | | | | | | | | | | | | | | | | | | | | | | |
| Contractual Management Rate | | | | | | | |
First
$1 billion | | | Next
$1 billion | | | Next
$3 billion | | | Next
$3 billion | | | Over
$8 billion | | | Effective
Rate | | | Effective Net
Management Rate^ | |
| | | | | | |
| | 0.72% | | | | 0.65 | % | | | 0.62 | % | | | 0.60 | % | | | 0.59 | % | | | 0.72 | % | | | 0.69 | %* |
| ^ | Effective Net Management Rate includes the impact of management fee waivers of affiliated Underlying Funds, if any. |
| * | GSAM agreed to waive a portion of its management fee in order to achieve a net management rate, as defined in the Fund’s most recent prospectuses. This waiver will be effective through at least April 30, 2020, and prior to such date GSAM may not terminate the arrangement without approval of the Trustees. For the six months ended June 30, 2019, GSAM waived $69,319 of its management fee. |
The Fund invests in Institutional Shares of the Goldman Sachs Financial Square Government Fund, which is an affiliated Underlying Fund. GSAM has agreed to waive a portion of its management fee payable by the Fund in an amount equal to the management fee it earns as an investment adviser to the affiliated Underlying Fund in which the Fund invests, except those management fees it earns from the Fund’s investments of cash collateral received in connection with securities lending transactions in the Goldman Sachs Financial Square Government Fund. For the six months ended June 30, 2019, GSAM waived $2,111 of the Fund’s management fee.
17
GOLDMAN SACHS VARIABLE INSURANCE TRUST LARGE CAP VALUE FUND
Notes to Financial Statements(continued)
June 30, 2019 (Unaudited)
4. AGREEMENTS AND AFFILIATED TRANSACTIONS (continued)
B. Distribution and Service(12b-1) Plan — The Trust, on behalf of Service Shares of the Fund, has adopted a Distribution and Service Plan subject to Rule12b-1 under the Act. Under the Distribution and Service Plan, Goldman Sachs, which serves as distributor, is entitled to a fee accrued daily and paid monthly, for distribution services and personal and account maintenance services, which may then be paid by Goldman Sachs to authorized dealers, equal to, on an annual basis, 0.25% of the Fund’s average daily net assets attributable to Service Shares.
C. Transfer Agency Agreement — Goldman Sachs also serves as the transfer agent of the Fund for a fee pursuant to the Transfer Agency Agreement. The fees charged for such transfer agency services are accrued daily and paid monthly at an annual rate of 0.02% of the average daily net assets of Institutional and Service Shares.
D. Other Expense Agreements and Affiliated Transactions — GSAM has agreed to reduce or limit certain “Other Expenses” of the Fund (excluding acquired fund fees and expenses, transfer agency fees and expenses, service fees and shareholder administration fees (as applicable), taxes, interest, brokerage fees, expenses of shareholder meetings, litigation and indemnification, and extraordinary expenses) to the extent such expenses exceed, on an annual basis, a percentage rate of the average daily net assets of the Fund. Such Other Expense reimbursements, if any, are accrued daily and paid monthly. In addition, the Fund is not obligated to reimburse GSAM for prior fiscal year expense reimbursements, if any. The Other Expense limitation as an annual percentage rate of average daily net assets for the Fund is 0.004%. The Other Expense limitation will remain in place through at least April 30, 2020, and prior to such date GSAM may not terminate the arrangement without the approval of the Trustees. In addition, the Fund has entered into certain offset arrangements with the custodian and the transfer agent, which may result in a reduction of the Fund’s expenses and are received irrespective of the application of the “Other Expense” limitation described above.
For the six months ended June 30, 2019, these expense reductions, including any fee waivers and Other Expense reimbursements, were as follows:
| | | | | | | | | | | | | | |
Management
Fee Waiver | | | Custody
Fee Credits | | | Other Expense
Reimbursement | | | Total Expense
Reductions | |
| | | |
| $ | 71,430 | | | $ | 1,918 | | | $ | 139,240 | | | $ | 212,588 | |
E. Line of Credit Facility — As of June 30, 2019, the Fund participated in a $580,000,000 committed, unsecured revolving line of credit facility (the “facility”) together with other funds of the Trust and certain registered investment companies having management agreements with GSAM or its affiliates. This facility is to be used for temporary emergency purposes, or to allow for an orderly liquidation of securities to meet redemption requests. The interest rate on borrowings is based on the federal funds rate. The facility also requires a fee to be paid by the Fund based on the amount of the commitment that has not been utilized. For the six months ended June 30, 2019, the Fund did not have any borrowings under the facility. Prior to April 30, 2019 the facility was $770,000,000.
F. Other Transactions with Affiliates — For the six months ended June 30, 2019, Goldman Sachs earned $657 in brokerage commissions from portfolio transactions.
The following table provides information about the Fund’s investments in the Goldman Sachs Financial Square Government Fund as of and for the six months ended June 30, 2019:
| | | | | | | | | | | | | | | | | | | | | | |
Beginning
Value as of
December 31, 2018 | | | Purchases
at Cost | | | Proceeds
from Sales | | | Ending
Value as of
June 30, 2019 | | | Shares as of
June 30, 2019 | | | Dividend Income from
Affiliated Investment
Company | |
| | | | | |
| $ | 2,443,839 | | | $ | 30,256,666 | | | $ | (26,527,440 | ) | | $ | 6,173,065 | | | | 6,173,065 | | | $ | 31,365 | |
18
GOLDMAN SACHS VARIABLE INSURANCE TRUST LARGE CAP VALUE FUND
5. PORTFOLIO SECURITIES TRANSACTIONS
The cost of purchases and proceeds from sales and maturities of long-term securities for the six months ended June 30, 2019, were $157,425,501 and $182,091,762 respectively.
6. SECURITIES LENDING
The Fund may lend its securities through a securities lending agent, the Bank of New York Mellon (“BNYM”), to certain qualified borrowers. In accordance with the Fund’s securities lending procedures, the Fund receives cash collateral at least equal to the market value of the securities on loan. The market value of the loaned securities is determined at the close of business of the Fund, at their last sale price or official closing price on the principal exchange or system on which they are traded, and any additional required collateral is delivered to the Fund on the next business day. As with other extensions of credit, the Fund may experience delay in the recovery of its securities or incur a loss should the borrower of the securities breach its agreement with the Fund or become insolvent at a time when the collateral is insufficient to cover the cost of repurchasing securities on loan. Dividend income received from securities on loan may not be subject to withholding taxes and therefore withholding taxes paid may differ from the amounts listed in the Statement of Operations. Loans of securities are terminable at any time and as such 1) the remaining contractual maturities of the outstanding securities lending transactions are considered to be overnight and continuous and 2) the borrower, after notice, is required to return borrowed securities within the standard time period for settlement of securities transactions.
The Fund invests the cash collateral received in connection with securities lending transactions in the Goldman Sachs Financial Square Government Fund (“Government Money Market Fund”), an affiliated series of the Goldman Sachs Trust. The Government Money Market Fund is registered under the Act as an open end investment company, is subject to Rule2a-7 under the Act, and is managed by GSAM, for which GSAM may receive a management fee of up to 0.16% on an annualized basis of the average daily net assets of the Government Money Market Fund.
In the event of a default by a borrower with respect to any loan, BNYM may exercise any and all remedies provided under the applicable borrower agreement to make the Fund whole. These remedies include purchasing replacement securities by applying the collateral held from the defaulting broker against the purchase cost of the replacement securities. If BNYM is unable to purchase replacement securities, BNYM will indemnify the Fund by paying the Fund an amount equal to the market value of the securities loaned minus the value of cash collateral received from the borrower for the loan, subject to an exclusion for any shortfalls resulting from a loss of value in such cash collateral due to reinvestment risk. The Fund may enter into master netting agreements with borrowers, which provide the right, in the event of a default (including bankruptcy or insolvency), for thenon-defaulting party to liquidate the collateral and calculate net exposure to the defaulting party or request additional collateral. However, in the event of a default by a borrower, a resolution authority could determine that such rights are not enforceable due to the restrictions or prohibitions against the right ofset-off that may be imposed in accordance with a particular jurisdiction’s bankruptcy or insolvency laws. The Fund’s loaned securities were all subject to enforceable Securities Lending Agreements and the value of the collateral was at least equal to the value of the cash received. The amounts of the Fund’s overnight and continuous agreements, which represent the gross amounts of recognized liabilities for securities lending transactions outstanding as of June 30, 2019, are disclosed as “Payable upon return of securities loaned” on the Statement of Assets and Liabilities, where applicable. The Fund did not have securities on loan as of June 30, 2019.
Both the Fund and BNYM received compensation relating to the lending of the Fund’s securities. The amounts earned, if any, by the Fund for the six months ended June 30, 2019, are reported under Investment Income on the Statement of Operations.
The following table provides information about the Fund’s investment in the Government Money Market Fund for the six months ended June 30, 2019:
| | | | | | | | | | | | | | |
Beginning
Value as of
December 31, 2018 | | | Purchases
at Cost | | | Proceeds
from Sales | | | Ending
Value as of
June 30, 2019 | |
| | | |
| $ | — | | | $ | 7,899,221 | | | $ | (7,899,221 | ) | | $ | — | |
19
GOLDMAN SACHS VARIABLE INSURANCE TRUST LARGE CAP VALUE FUND
Notes to Financial Statements(continued)
June 30, 2019 (Unaudited)
7. TAX INFORMATION
As of the Fund’s most recent fiscal year end, December 31, 2018, the Fund’s certain timing differences, on atax-basis were as follows:
| | | | |
| Timing differences (Deferred Dividend/Post October Loss Deferral) | | $ | (3,115,385 | ) |
As of June 30, 2019, the Fund’s aggregate security unrealized gains and losses based on cost for U.S. federal income tax purposes were as follows:
| | | | |
| Tax cost | | $ | 417,348,577 | |
| Gross unrealized gain | | | 65,290,536 | |
| Gross unrealized loss | | | (12,700,841 | ) |
| Net unrealized gain | | $ | 52,589,695 | |
The difference between GAAP-basis andtax-basis unrealized gains (losses) is attributable primarily to wash sales.
GSAM has reviewed the Fund’s tax positions for all open tax years (the current and prior three years, as applicable) and has concluded that no provision for income tax is required in the Fund’s financial statements. Such open tax years remain subject to examination and adjustment by tax authorities.
8. OTHER RISKS
The Fund’s risks include, but are not limited to, the following:
Investments in Other Investment Companies Risk — As a shareholder of another investment company, the Fund will indirectly bear its proportionate share of any net management fees and other expenses paid by such other investment companies, in addition to the fees and expenses regularly borne by the Fund.
Large Shareholder Transactions Risk — The Fund may experience adverse effects when certain large shareholders, such as other funds, participating insurance companies, accounts and Goldman Sachs affiliates, purchase or redeem large amounts of shares of the Fund. Such large shareholder redemptions, which may occur rapidly or unexpectedly, may cause the Fund to sell portfolio securities at times when it would not otherwise do so, which may negatively impact the Fund’s NAV and liquidity. These transactions may also accelerate the realization of taxable income to shareholders if such sales of investments resulted in gains, and may also increase transaction costs. In addition, a large redemption could result in the Fund’s current expenses being allocated over a smaller asset base, leading to an increase in the Fund’s expense ratio. Similarly, large Fund share purchases may adversely affect the Fund’s performance to the extent that the Fund is delayed in investing new cash or otherwise maintains a larger cash position than it ordinarily would.
Liquidity Risk — The Fund may make investments that are illiquid or that may become less liquid in response to market developments or adverse investor perceptions. Illiquid investments may be more difficult to value. Liquidity risk may also refer to the risk that the Fund will not be able to pay redemption proceeds within the allowable time period or without significant dilution to remaining investors’ interests because of unusual market conditions, an unusually high volume of redemption requests, or other reasons. To meet redemption requests, the Fund may be forced to sell investments at an unfavorable time and/or under unfavorable conditions. If the Fund is forced to sell securities at an unfavorable time and/or under unfavorable conditions, such sales may adversely affect the Fund’s NAV and dilute remaining investors’ interests. Redemptions by large shareholders may have a negative impact on the Fund’s liquidity.
Market and Credit Risks — In the normal course of business, the Fund trades financial instruments and enters into financial transactions where risk of potential loss exists due to changes in the market (market risk). Additionally, the Fund may also be
20
GOLDMAN SACHS VARIABLE INSURANCE TRUST LARGE CAP VALUE FUND
8. OTHER RISKS (continued)
exposed to credit risk in the event that an issuer or guarantor fails to perform or that an institution or entity with which the Fund has unsettled or open transactions defaults.
9. INDEMNIFICATIONS
Under the Trust’s organizational documents, its Trustees, officers, employees and agents are indemnified, to the extent permitted by the Act and state law, against certain liabilities that may arise out of performance of their duties to the Fund. Additionally, in the course of business, the Fund enters into contracts that contain a variety of indemnification clauses. The Fund’s maximum exposure under these arrangements is unknown, as this would involve future claims that may be made against the Fund that have not yet occurred. However, GSAM believes the risk of loss under these arrangements to be remote.
10. SUBSEQUENT EVENTS
Subsequent events after the Statement of Assets and Liabilities date have been evaluated, and GSAM has concluded that there is no impact requiring adjustment or disclosure in the financial statements.
21
GOLDMAN SACHS VARIABLE INSURANCE TRUST LARGE CAP VALUE FUND
Notes to Financial Statements(continued)
June 30, 2019 (Unaudited)
11. SUMMARY OF SHARE TRANSACTIONS
Share activity is as follows:
| | | | | | | | | | | | | | | | |
| | | For the Six Months Ended
June 30, 2019
(Unaudited) | | | For the Fiscal Year Ended
December 31, 2018 | |
| | | Shares | | | Dollars | | | Shares | | | Dollars | |
| Institutional Shares | | | | | | | | | | | | | | | | |
| Shares sold | | | 205,858 | | | $ | 1,741,087 | | | | 854,945 | | | $ | 7,399,623 | |
| Reinvestment of distributions | | | — | | | | — | | | | 1,482,019 | | | | 11,515,289 | |
| Shares redeemed | | | (1,767,958 | ) | | | (14,959,837 | ) | | | (3,417,525 | ) | | | (30,831,738 | ) |
| | | | (1,562,100 | ) | | | (13,218,750 | ) | | | (1,080,561 | ) | | | (11,916,826 | ) |
| Service Shares | | | | | | | | | | | | | | | | |
| Shares sold | | | 805,674 | | | | 6,782,922 | | | | 2,024,327 | | | | 17,913,623 | |
| Reinvestment of distributions | | | — | | | | — | | | | 2,673,952 | | | | 20,776,605 | |
| Shares redeemed | | | (3,105,114 | ) | | | (26,499,787 | ) | | | (7,416,119 | ) | | | (66,683,371 | ) |
| | | | (2,299,440 | ) | | | (19,716,865 | ) | | | (2,717,840 | ) | | | (27,993,143 | ) |
| | | | |
| NET DECREASE | | | (3,861,540 | ) | | $ | (32,935,615 | ) | | | (3,798,401 | ) | | $ | (39,909,969 | ) |
22
GOLDMAN SACHS VARIABLE INSURANCE TRUST LARGE CAP VALUE FUND
| | |
| Fund Expenses — Six Month Period Ended June 30, 2019 (Unaudited) | | |
As a shareholder of Institutional or Service Shares of the Fund, you incur ongoing costs, including management fees, distribution and/or service(12b-1) fees (with respect to Service Shares) and other Fund expenses. This example is intended to help you understand your ongoing costs (in dollars) of investing in Institutional Shares and Service Shares of the Fund and to compare these costs with the ongoing costs of investing in other mutual funds.
The example is based on an investment of $1,000 invested at the beginning of the period and held for the entire period from January 1, 2019 through June 30, 2019, which represents a period of 181 days of a 365 day year.
Actual Expenses — The first line under each share class in the table below provides information about actual account values and actual expenses. You may use the information in this line, together with the amount you invested, to estimate the expenses that you paid over the period. Simply divide your account value by $1,000 (for example, an $8,600 account value divided by $1,000=8.6), then multiply the result by the number in the first line under the heading entitled “Expenses Paid” to estimate the expenses you paid on your account during this period.
Hypothetical Example for Comparison Purposes — The second line under each share class in the table below provides information about hypothetical account values and hypothetical expenses based on the Fund’s actual net expense ratio and an assumed rate of return of 5% per year before expenses, which is not the Fund’s actual return. The hypothetical account values and expenses may not be used to estimate the actual ending account balance or expenses you paid for the period. You may use this information to compare the ongoing costs of investing in the Fund and other funds. To do so, compare this 5% hypothetical example with the 5% hypothetical examples that appear in the shareholder reports of the other funds.
Please note that the expenses shown in the table are meant to highlight your ongoing costs only. As a shareholder of the Fund, you do not incur any transaction costs, such as sales charges, redemption fees, or exchange fees, but shareholders of other funds may incur such costs. The second line of the table is useful in comparing ongoing costs only and will not help you determine the relative total costs of owning different funds whose shareholders may incur transaction costs.
| | | | | | | | | | | | |
| Share Class | | Beginning
Account Value
01/01/19 | | | Ending
Account Value
06/30/19 | | | Expenses Paid
for the
6 Months
Ended
06/30/19* | |
| Institutional | | | | | | | | | | | | |
| | | | |
| Actual | | $ | 1,000 | | | $ | 1,160.40 | | | $ | 3.80 | |
| Hypothetical 5% return | | | 1,000 | | | | 1,021.27 | + | | | 3.56 | |
| Service | | | | | | | | | | | | |
| | | | |
| Actual | | | 1,000 | | | | 1,159.10 | | | | 5.14 | |
| Hypothetical 5% return | | | 1,000 | | | | 1,020.03 | + | | | 4.81 | |
| | + | Hypothetical expenses are based on the Fund’s actual annualized net expense ratios and an assumed rate of return of 5% per year before expenses. | |
| | * | Expenses are calculated using the Fund’s annualized net expense ratio for each class, which represents the ongoing expenses as a percentage of net assets for the six months ended June 30, 2019. Expenses are calculated by multiplying the annualized net expense ratio by the average account value for the period; then multiplying the result by the number of days in the most recent fiscal half year; and then dividing that result by the number of days in the fiscal year. The annualized net expense ratios for the period were 0.71% and 0.96% for Institutional and Service Shares, respectively. | |
23
GOLDMAN SACHS VARIABLE INSURANCE TRUST LARGE CAP VALUE FUND
Statement Regarding Basis for Approval of Management Agreement (Unaudited)
Background
The Goldman Sachs Large Cap Value Fund (the “Fund”) is an investment portfolio of Goldman Sachs Variable Insurance Trust (the “Trust”). The Board of Trustees oversees the management of the Trust and reviews the investment performance and expenses of the Fund at regularly scheduled meetings held throughout the year. In addition, the Board of Trustees determines annually whether to approve the continuance of the Trust’s investment management agreement (the “Management Agreement”) with Goldman Sachs Asset Management, L.P. (the “Investment Adviser”) on behalf of the Fund.
The Management Agreement was most recently approved for continuation until June 30, 2020 by the Board of Trustees, including those Trustees who are not parties to the Management Agreement or “interested persons” (as defined in the Investment Company Act of 1940, as amended) of any party thereto (the “Independent Trustees”), at a meeting held onJune 11-12, 2019 (the “Annual Meeting”).
The review process undertaken by the Trustees spans the course of the year and culminates with the Annual Meeting. To assist the Trustees in their deliberations, the Trustees have established a Contract Review Committee (the “Committee”), comprised of the Independent Trustees. The Committee held four meetings over the course of the year since the Management Agreement was last approved. At those Committee meetings, regularly scheduled Board or other committee meetings, and/or the Annual Meeting, matters relevant to the renewal of the Management Agreement were considered by the Board, or the Independent Trustees, as applicable. With respect to the Fund, such matters included:
| | (a) | | the nature and quality of the advisory, administrative, and other services provided to the Fund by the Investment Adviser and its affiliates, including information about: |
| | (i) | | the structure, staff, and capabilities of the Investment Adviser and its portfolio management teams; |
| | (ii) | | the groups within the Investment Adviser and its affiliates that support the portfolio management teams or provide other types of necessary services, including fund services groups (e.g., accounting and financial reporting, tax, shareholder services, and operations); controls and risk management groups (e.g., legal, compliance, valuation oversight, credit risk management, internal audit, compliance testing, market risk analysis, finance, and central funding); sales and distribution support groups, and others (e.g., information technology and training); |
| | (iii) | | trends in employee headcount; |
| | (iv) | | the Investment Adviser’s financial resources and ability to hire and retain talented personnel and strengthen its operations; and |
| | (v) | | the parent company’s support of the Investment Adviser and its mutual fund business, as expressed by the firm’s senior management; |
| | (b) | | information on the investment performance of the Fund, including comparisons to the performance of similar mutual funds, as provided by a third-party mutual fund data provider engaged as part of the contract review process (the “Outside Data Provider”), and a benchmark performance index; and information on general investment outlooks in the markets in which the Fund invests; |
| | (c) | | information provided by the Investment Adviser indicating the Investment Adviser’s views on whether the Fund’s peer group and/or benchmark index had high, medium, or low relevance given the Fund’s particular investment strategy; |
| | (d) | | the terms of the Management Agreement and other agreements with affiliated service providers entered into by the Trust on behalf of the Fund; |
| | (e) | | fee and expense information for the Fund, including: |
| | (i) | | the relative management fee and expense levels of the Fund as compared to those of comparable funds managed by other advisers, as provided by the Outside Data Provider; |
| | (ii) | | the Fund’s expense trends over time; and |
| | (iii) | | to the extent the Investment Adviser manages other types of accounts (such as bank collective trusts, private wealth management accounts, institutional separate accounts,sub-advised mutual funds, andnon-U.S. funds) having investment objectives and policies similar to those of the Fund, comparative information on the advisory fees charged and services provided to those accounts by the Investment Adviser; |
| | (f) | | with respect to the extensive investment performance and expense comparison data provided by the Outside Data Provider, its processes in producing that data for the Fund; |
| | (g) | | the undertakings of the Investment Adviser and its affiliates to implement fee waivers and/or expense limitations; |
| | (h) | | information relating to the profitability of the Management Agreement and the transfer agency and distribution and service arrangements of the Fund to the Investment Adviser and its affiliates; |
| | (i) | | whether the Fund’s existing management fee schedule adequately addressed any economies of scale; |
24
GOLDMAN SACHS VARIABLE INSURANCE TRUST LARGE CAP VALUE FUND
Statement Regarding Basis for Approval of Management Agreement (Unaudited) (continued)
| | (j) | | a summary of the“fall-out” benefits derived by the Investment Adviser and its affiliates from their relationships with the Fund, including the fees received by the Investment Adviser’s affiliates from the Fund for transfer agency, portfolio trading, distribution and other services; |
| | (k) | | a summary of potential benefits derived by the Fund as a result of its relationship with the Investment Adviser; |
| | (l) | | information regarding commissions paid by the Fund and broker oversight, an update on the Investment Adviser’s soft dollars practices, other information regarding portfolio trading, and how the Investment Adviser carries out its duty to seek best execution; |
| | (m) | | the manner in which portfolio manager compensation is determined; and the number and types of accounts managed by the portfolio managers; |
| | (n) | | the nature and quality of the services provided to the Fund by its unaffiliated service providers, and the Investment Adviser’s general oversight and evaluation (including reports on due diligence) of those service providers as part of the administrative services provided under the Management Agreement; and |
| | (o) | | the Investment Adviser’s processes and policies addressing various types of potential conflicts of interest; its approach to risk management; the annual review of the effectiveness of the Fund’s compliance program; and periodic compliance reports. |
The Trustees also received an overview of the Fund’s distribution arrangements. They received information regarding the Fund’s assets, share purchase and redemption activity, and payment of distribution and service fees. Information was also provided to the Trustees relating to revenue sharing payments made by and services provided by the Investment Adviser and its affiliates to intermediaries that promote the sale, distribution, and/or servicing of Fund shares. The Independent Trustees also discussed the broad range of other investment choices that are available to Fund investors, including the availability of comparable funds managed by other advisers.
The presentations made at the Board and Committee meetings and at the Annual Meeting encompassed the Fund and other mutual funds for which the Board of Trustees has responsibility. In evaluating the Management Agreement at the Annual Meeting, the Trustees relied upon their knowledge, resulting from their meetings and other interactions throughout the year, of the Investment Adviser and its affiliates, their services, and the Fund. In conjunction with these meetings, the Trustees received written materials and oral presentations on the topics covered, and the Investment Adviser addressed the questions and concerns of the Trustees, including concerns regarding the investment performance of certain of the funds they oversee. The Independent Trustees were advised by their independent legal counsel regarding their responsibilities and other regulatory requirements related to the approval and continuation of mutual fund investment management agreements under applicable law. In addition, the Investment Adviser and its affiliates provided the Independent Trustees with a written response to a formal request for information sent on behalf of the Independent Trustees by their independent legal counsel. During the course of their deliberations, the Independent Trustees met in executive sessions with their independent legal counsel, without representatives of the Investment Adviser or its affiliates present.
Nature, Extent, and Quality of the Services Provided Under the Management Agreement
As part of their review, the Trustees considered the nature, extent, and quality of the services provided to the Fund by the Investment Adviser. In this regard, the Trustees considered both the investment advisory services andnon-advisory services that are provided by the Investment Adviser and its affiliates. The Trustees noted the transition in the leadership and changes in personnel of various of the Investment Adviser’s portfolio management teams that had occurred in recent periods, and the ongoing recruitment efforts aimed at bringing high quality investment talent to the Investment Adviser. They also noted the Investment Adviser’s commitment to maintaining high quality systems and expending substantial resources to respond to ongoing changes to the regulatory and control environment in which the Fund and its service providers operate, as well as the efforts of the Investment Adviser and its affiliates to combat cyber security risks. The Trustees concluded that the Investment Adviser continued to commit substantial financial and operational resources to the Fund and expressed confidence that the Investment Adviser would continue to do so in the future. The Trustees also recognized that the Investment Adviser had made significant commitments to address regulatory compliance requirements applicable to the Fund and the Investment Adviser and its affiliates.
Investment Performance
The Trustees also considered the investment performance of the Fund. In this regard, they compared the investment performance of the Fund to its peers usingrankings and ratings compiled by the Outside Data Provider as of December 31, 2018, and updated performance information prepared by the Investment Adviser using the peer group identified by the Outside Data Provider as of March 31, 2019. The information on the Fund’s investment performance was provided for theone-, three-, five-, and
25
GOLDMAN SACHS VARIABLE INSURANCE TRUST LARGE CAP VALUE FUND
Statement Regarding Basis for Approval of Management Agreement (Unaudited) (continued)
ten-year periods ending on the applicable dates. The Trustees also reviewed the Fund’s investment performance relative to its performance benchmark. As part of this review, they considered the investment performance trends of the Fund over time, and reviewed the investment performance of the Fund in light of its investment objective and policies and market conditions.
In addition, the Trustees considered materials prepared and presentations made by the Investment Adviser’s senior management and portfolio management personnel in which Fund performance was assessed. The Trustees also considered the Investment Adviser’s periodic reports with respect to the Fund’s risk profile, and how the Investment Adviser’s approach to risk monitoring and management influences portfolio management.
The Trustees noted that the Fund’s Institutional Shares had placed in the top half of the Fund’s peer group for theone-year period and in the fourth quartile for the three-, five-, andten-year periods, and had outperformed the Fund’s benchmark index for theone-year period and underperformed for the three-, five-, andten-year periods ended March 31, 2019.They also noted that the Fund had experienced certain portfolio management changes in 2018.
Costs of Services Provided and Competitive Information
The Trustees considered the contractual terms of the Management Agreement and the fee rates payable by the Fund thereunder. In this regard, the Trustees considered information on the services rendered by the Investment Adviser to the Fund, which included both advisory and administrative services that were directed to the needs and operations of the Fund as a registered mutual fund.
In particular, the Trustees reviewed analyses prepared by the Outside Data Provider regarding the expense rankings of the Fund. The analyses provided a comparison of the Fund’s management fee and breakpoints to those of a relevant peer group and category universe; an expense analysis which compared the Fund’s overall net and gross expenses to a peer group and a category universe; and data comparing the Fund’s net expenses to the peer and category medians. The analyses also compared the Fund’s other expenses and fee waivers/reimbursements to those of the peer group and category medians. The Trustees concluded that the comparisons provided by the Outside Data Provider were useful in evaluating the reasonableness of the management fees and total expenses paid by the Fund.
In addition, the Trustees considered the Investment Adviser’s undertakings to implement fee waivers and/or expense limitations.The Trustees also noted that certain changes were being made to existing fee waiver or expense limitation arrangements of the Fund that would have the effect of decreasing total Fund expenses, with such changes taking effect in connection with the Fund’s next annual registration statement update.They also considered, to the extent that the Investment Adviser manages other types of accounts having investment objectives and policies similar to those of the Fund, comparative fee information for services provided by the Investment Adviser to those accounts, and information that indicated that services provided to the Fund differed in various significant respects from the services provided to other types of accounts which, in many cases, operated under less stringent legal and regulatory structures, required fewer services from the Investment Adviser to a smaller number of client contact points, and were less time-intensive.
In addition, the Trustees noted that shareholders are able to redeem their Fund shares at any time if shareholders believe that the Fund fees and expenses are too high or if they are dissatisfied with the performance of the Fund.
Profitability
The Trustees reviewed the Fund’s contribution to the Investment Adviser’s revenues andpre-tax profit margins. In this regard the Trustees noted that they had received, among other things, profitability analyses and summaries, revenue and expense schedules by Fund and by function (i.e., investment management, transfer agency and distribution and service), and information on the Investment Adviser’s expense allocation methodology. They observed that the profitability and expense figures are substantially similar to those used by the Investment Adviser for many internal purposes, including compensation decisions among various business groups, and are thus subject to a vigorous internal debate about how certain revenue and expenses should be allocated. The Trustees also noted that the internal audit group within the Goldman Sachs organization periodically audits the expense allocation methodology and that the internal audit group was satisfied with the reasonableness, consistency, and accuracy of the Investment Adviser’s expense allocation methodology. Profitability data for the Fund was provided for 2018 and 2017, and the Trustees considered this information in relation to the Investment Adviser’s overall profitability.
26
GOLDMAN SACHS VARIABLE INSURANCE TRUST LARGE CAP VALUE FUND
Statement Regarding Basis for Approval of Management Agreement (Unaudited) (continued)
Economies of Scale
The Trustees considered the information that had been provided regarding whether there have been economies of scale with respect to the management of the Fund. The Trustees also considered the breakpoints in the fee rate payable under the Management Agreement for the Fund at the following annual percentage rates of the average daily net assets of the Fund:
| | | | |
| |
| First $1 billion | | | 0.72 | % |
| |
| Next $1 billion | | | 0.65 | |
| |
| Next $3 billion | | | 0.62 | |
| |
| Next $3 billion | | | 0.60 | |
| |
| Over $8 billion | | | 0.59 | |
The Trustees noted that the breakpoints were designed to share potential economies of scale, if any, with the Fund and its shareholders as assets under management reach those asset levels. The Trustees considered the amounts of assets in the Fund; the Fund’s recent share purchase and redemption activity; the information provided by the Investment Adviser relating to the costs of the services provided by the Investment Adviser and its affiliates and their realized profits; information comparing fee rates charged by the Investment Adviser with fee rates charged to other funds in the peer group; and the Investment Adviser’s undertakings to waive a portion of its management fee and to limit certain expenses of the Fund that exceed a specified level. Upon reviewing these matters at the Annual Meeting, the Trustees concluded that the fee breakpoints represented a means of assuring that benefits of scalability, if any, would be passed along to shareholders at the specified asset levels.
Other Benefits to the Investment Adviser and Its Affiliates
The Trustees also considered the other benefits derived by the Investment Adviser and its affiliates from their relationships with the Fund as stated above, including: (a) transfer agency fees received by Goldman Sachs & Co. LLC (“Goldman Sachs”); (b) brokerage and futures commissions earned by Goldman Sachs for executing securities and futures transactions on behalf of the Fund; (c) research received by the Investment Adviser from broker-dealers in exchange for executing certain transactions on behalf of the Fund; (d) trading efficiencies resulting from aggregation of orders of the Fund with those for other funds or accounts managed by the Investment Adviser; (e) fees earned by the Investment Adviser for managing the fund in which the Fund’s securities lending cash collateral is invested; (f) the Investment Adviser’s ability to leverage the infrastructure designed to service the Fund on behalf of its other clients; (g) the Investment Adviser’s ability to cross-market other products and services to Fund shareholders; (h) Goldman Sachs’ retention of certain fees as Fund Distributor; (i) the Investment Adviser’s ability to negotiate better pricing with custodians on behalf of its other clients, as a result of the relationship with the Fund; and (j) the possibility that the working relationship between the Investment Adviser and the Fund’s third-party service providers may cause those service providers to be more likely to do business with other areas of Goldman Sachs. In the course of considering the foregoing, the Independent Trustees requested and received further information quantifying certain of thesefall-out benefits.
Other Benefits to the Fund and Its Shareholders
The Trustees also noted that the Fund receives certain other potential benefits as a result of its relationship with the Investment Adviser, including: (a) trading efficiencies resulting from aggregation of orders of the Fund with those of other funds or accounts managed by the Investment Adviser; (b) enhanced servicing from vendors due to the volume of business generated by the Investment Adviser and its affiliates; (c) enhanced servicing from broker-dealers due to the volume of business generated by the Investment Adviser and its affiliates; (d) the Investment Adviser’s ability to negotiate favorable terms with derivatives counterparties on behalf of the Fund as a result of the size and reputation of the Goldman Sachs organization; (e) the advantages received from the Investment Adviser’s knowledge and experience gained from managing other accounts and products; (f) the Investment Adviser’s ability to hire and retain qualified personnel to provide services to the Fund because of the reputation of the Goldman Sachs organization; (g) the Fund’s access, through the Investment Adviser, to certain firm-wide resources (e.g., proprietary risk management systems and databases), subject to certain restrictions; and (h) the Fund’s access to certain affiliated distribution channels. In addition, the Trustees noted the competitive nature of the mutual fund marketplace, and considered that many of the Fund’s shareholders invested in the Fund in part because of the Fund’s relationship with the Investment Adviser and that those shareholders have a general expectation that the relationship will continue.
27
GOLDMAN SACHS VARIABLE INSURANCE TRUST LARGE CAP VALUE FUND
Statement Regarding Basis for Approval of Management Agreement (Unaudited) (continued)
Conclusion
In connection with their consideration of the Management Agreement, the Trustees gave weight to each of the factors described above, but did not identify any particular factor as controlling their decision. After deliberation and consideration of all of the information provided, including the factors described above, the Trustees concluded, in the exercise of their business judgment, that the management fees paid by the Fund were reasonable in light of the services provided to it by the Investment Adviser, the Investment Adviser’s costs and the Fund’s current and reasonably foreseeable asset levels. The Trustees unanimously concluded that the Investment Adviser’s continued management likely would benefit the Fund and its shareholders and that the Management Agreement should be approved and continued with respect to the Fund until June 30, 2020.
28
| | |
| TRUSTEES | | OFFICERS |
| Jessica Palmer,Chair | | James A. McNamara,President |
| Kathryn A. Cassidy | | Joseph F. DiMaria,Principal Financial Officer, |
| Diana M. Daniels | | Principal Accounting Officer and Treasurer |
| James A. McNamara | | Caroline L. Kraus,Secretary |
| Roy W. Templin | | |
| Gregory G. Weaver | | |
GOLDMAN SACHS & CO. LLC
Distributor and Transfer Agent
GOLDMAN SACHS ASSET MANAGEMENT, L.P.
Investment Adviser
200 West Street, New York
New York 10282
Visit our web site at www.GSAMFUNDS.com to obtain the most recentmonth-end returns.
The reports concerning the Fund included in this shareholder report may contain certain forward-looking statements about the factors that may affect the performance of the Fund in the future. These statements are based on Fund management’s predictions and expectations concerning certain future events and their expected impact on the Fund, such as performance of the economy as a whole and of specific industry sectors, changes in the levels of interest rates, the impact of developing world events, and other factors that may influence the future performance of the Fund. Management believes these forward-looking statements to be reasonable, although they are inherently uncertain and difficult to predict. Actual events may cause adjustments in portfolio management strategies from those currently expected to be employed.
A description of the policies and procedures that the Fund uses to determine how to vote proxies relating to portfolio securities and information regarding how the Fund voted proxies relating to portfolio securities for the12-month period ended June 30 is available (i) without charge, upon request by calling1-800-621-2550; and (ii) on the Securities and Exchange Commission (“SEC”) web site athttp://www.sec.gov.
The Fund will file its portfolio holdings information for each month in a fiscal quarter within 60 days after the end of the relevant fiscal quarter on Form N-PORT. Portfolio holdings information for the third month of each fiscal quarter will be made available on the SEC’s web site at http://www.sec.gov. Portfolio holdings information may be obtained upon request and without charge by calling 1-800-526-7384 (for Retail Shareholders) or 1-800-621-2550 (for Institutional Shareholders).
Views and opinions expressed are for informational purposes only and do not constitute a recommendation by GSAM to buy, sell, or hold any security. Views and opinions are current as of the date of this presentation and may be subject to change, they should not be construed as investment advice.
Goldman Sachs & Co. LLC (“Goldman Sachs”) does not provide legal, tax or accounting advice. Any statement contained in this communication (including any attachments) concerning U.S. tax matters was not intended or written to be used, and cannot be used, for the purpose of avoiding penalties under the Internal Revenue Code, and was written to support the promotion or marketing of transaction or matter addressed. Clients of Goldman Sachs should obtain their own independent tax advice based on their particular circumstances.
The website links provided are for your convenience only and are not an endorsement or recommendation by GSAM of any of these websites or the products or services offered. GSAM is not responsible for the accuracy and validity of the content of these websites.
Fund holdings and allocations shown are as of June 30, 2019 and may not be representative of future investments. Fund holdings should not be relied on in making investment decisions and should not be construed as research or investment advice regarding particular securities. Current and future holdings are subject to risk.
References to indices, benchmarks or other measures of relative market performance over a specified period of time are provided for your information only and do not imply that the portfolio will achieve similar results. The index composition may not reflect the manner in which a portfolio is constructed. While an adviser seeks to design a portfolio which reflects appropriate risk and return features, portfolio characteristics may deviate from those of the benchmark.
The Global Industry Classification Standard (“GICS”) was developed by and is the exclusive property and a service mark of Morgan Stanley Capital International Inc. (“MSCI”) and Standard & Poor’s, a division of The McGraw-Hill Companies, Inc. (“S&P”) and is licensed for use by Goldman Sachs. Neither MSCI, S&P nor any other party involved in making or compiling the GICS or any GICS classifications makes any express or implied warranties or representations with respect to such standard or classification (or the results to be obtained by the use thereof), and all such parties hereby expressly disclaim all warranties of originality, accuracy, completeness, merchantability or fitness for a particular purpose with respect to any of such standard or classification. Without limiting any of the foregoing, in no event shall MSCI, S&P, any of their affiliates or any third party involved in making or compiling the GICS or any GICS classifications have any liability for any direct, indirect, special, punitive, consequential or any other damages (including lost profits) even if notified of the possibility of such damages.
The portfolio risk management process includes an effort to monitor and manage risk, but does not imply low risk.
Shares of the Goldman Sachs VIT Funds are offered to separate accounts of participating life insurance companies for the purpose of funding variable annuity contracts and variable life insurance policies. Shares of the Fund are not offered directly to the general public. The variable annuity contracts and variable life insurance policies are described in the separate prospectuses issued by participating insurance companies. You should refer to those prospectuses for information about surrender charges, mortality and expense risk fees and other charges that may be assessed by participating insurance companies under the variable annuity contracts or variable life insurance policies. Such fees or charges, if any, may affect the return you may realize with respect to your investments. Ask your representative for more complete information. Please consider a fund’s objectives, risks and charges and expenses, and read the prospectus carefully before investing. The prospectus contains this and other information about the Fund.
This material is not authorized for distribution to prospective investors unless preceded or accompanied by a current prospectus or summary prospectus, if applicable. Investors should consider the Fund’s objective, risks, and charges and expenses, and read the summary prospectus, if available, and/or the prospectus carefully before investing or sending money. The summary prospectus, if available, and the prospectus contain this and other information about the Fund and may be obtained from your authorized dealer or from Goldman Sachs & Co. LLC by calling1-800-621-2550.
This report is prepared for the general information of contract owners and is not an offer of shares of the Goldman Sachs Variable Insurance Trust — Goldman Sachs Large Cap Value Fund.
© 2019 Goldman Sachs. All rights reserved.
VITLCVSAR-19/175369-OTU-1025571
Goldman
SachsVariable Insurance Trust
Goldman Sachs
Mid Cap Value Fund
Beginning on or after January 1, 2021, you may not receive paper copies of the Fund’s annual and semi-annual shareholder reports from the insurance company that offers your variable insurance contract or your financial intermediary, unless you specifically request paper copies of the reports from the insurance company or from your financial intermediary. Instead, the reports will be made available on a website, and you will be notified by mail each time a report is posted and provided with a website link to access the report.
If you already elected to receive shareholder reports electronically, you will not be affected by this change and you need not take any action. At any time, you may elect to receive reports and certain communications from the insurance company electronically by contacting your insurance company or your financial intermediary.
You may elect to receive all future shareholder reports in paper free of charge. You can inform the insurance company or your financial intermediary that you wish to receive paper copies of reports. Your election to receive reports in paper will apply to all Goldman Sachs Funds available under your contract and may apply to all funds held with your financial intermediary.
Semi-Annual Report
June 30, 2019

GOLDMAN SACHS VARIABLE INSURANCE TRUST MID CAP VALUE FUND
INVESTMENT OBJECTIVE
The Fund seeks long-term capital appreciation.
Portfolio Management Discussion and Analysis
Below, the Goldman Sachs Value Portfolio Management Team discusses the Goldman Sachs Variable Insurance Trust — Goldman Sachs Mid Cap Value Fund’s (the “Fund”) performance and positioning for thesix-month period ended June 30, 2019 (the “Reporting Period”).
How did the Fund perform during the Reporting Period?
During the Reporting Period, the Fund’s Institutional and Service Shares generated cumulative total returns of 20.71% and 20.60%, respectively. These returns compare to the 18.02% cumulative total return of the Fund’s benchmark, the Russell Midcap® Value Index (with dividends reinvested) (the “Russell Index”), during the same time period.
What economic and market factors most influenced the equity markets as a whole during the Reporting Period?
Representing the U.S. equity market, the S&P 500® Index returned 18.54% during the Reporting Period, rallying strongly following negative absolute returns posted in 2018. While 2018 was the worst calendar year since 2008, the first half of 2019 was the strongest first half for the S&P 500® Index since 1997.
During the first quarter of 2019, the S&P 500® Index rose 13.65%. After a volatile end to 2018, the rally to begin 2019 marked the best first quarter performance for the S&P 500® Index since 1998. Federal Reserve (“Fed”) commentary provided a supportive background for U.S. equities, as Fed Chair Jerome Powell reiterated a “patient” approach to monetary policy that included a pause in interest rate hikes and a nearing end to the Fed’s balance sheet runoff. The U.S. unemployment rate remained well below trend at 3.8% in February 2019, and wages grew 3.4% year over year. Housing data showed strength in the first calendar quarter, with new home sales reaching 667,000 in February, bringing the three-month average up to 630,000. Strength in housing data could be partially attributed to a steep decline in mortgage rates resulting from a more cautious Fed. The University of Michigan Consumer Sentiment Index was also a point of significant strength in the U.S. economy, steadily climbing in each month of the first quarter of 2019 and eventually reaching 98.4 in March, its highest level in six months. Economic growth concerns that had dominated the fourth quarter of 2018 failed to completely disappear, however, as fourth quarter 2018 Gross Domestic Product (“GDP”) growth was revised down 0.4% in March 2019 to 2.2%. While the revision was further evidence of a slowing U.S. economy, the result was largely priced in by equity markets and thus had a limited effect on stock prices outside of the financials sector, which historically tends to be more rate sensitive.
The S&P 500® Index rose a solid but more moderate 4.30% during the second quarter of 2019. Trade tensions between the U.S. and China dominated headlines and broadly added noise to the markets. (Noise refers to market activity that can confuse or misrepresent genuine underlying trends.) In April 2019, there was an optimistic consensus outlook on a possible trade deal, but this optimism faded in May when the U.S. President threatened to raise current tariffs and impose new duties on $300 billion of additional Chinese imports. Also, sanctions were temporarily placed on a Chinese telecommunications giant, until they were lifted in June 2019, when any additional tariffs or compromise were postponed. Also during the second quarter, the markets kept a close eye on the Fed. After steadily raising short-term interest rates since 2015 to a range of 2.25% to 2.50%, the Fed alluded to a more accommodative approach. Following the Fed’s statement, the market consensus actually priced in at least one interest rate cut by the end of 2019, if not sooner. Economic indicators were mixed during the second quarter, with consumer sentiment remaining elevated, while nonfarm payrolls and manufacturing indices across the board fell short.
For the Reporting Period overall, all 11 sectors posted positive absolute returns, with 10 of the 11 generating double-digit gains. Information technology, consumer discretionary and industrials were the best performing sectors in the S&P 500® Index, as measured by total return, while the weakest performing sectors in the S&P 500® Index during the Reporting Period were health care, energy and utilities.
Within the U.S. equity market, all capitalization segments posted double-digit positive returns, led bymid-cap stocks, as measured by the Russell Midcap® Index, followed bylarge-cap stocks, as measured by the Russell 1000® Index, and thensmall-cap stocks, as measured by the Russell 2000® Index. From a style perspective, growth-oriented stocks significantly outpaced value-oriented stocks across the capitalization spectrum. (All as measured by the FTSE Russell indices.)
1
GOLDMAN SACHS VARIABLE INSURANCE TRUST MID CAP VALUE FUND
What key factors were responsible for the Fund’s performance during the Reporting Period?
The Fund outperformed the Russell Index during the Reporting Period due primarily to stock selection overall. Sector allocation as a whole also contributed positively, albeit more modestly, to the Fund’s performance relative to the Russell Index during the Reporting Period.
Which equity market sectors most significantly affected Fund performance?
Contributing most positively to the Fund’s relative results during the Reporting Period was effective stock selection in the real estate, materials and consumer staples sectors. Such positive contributors were only partially offset by stock selection in the financials and energy sectors, which detracted. Allocation positioning in the energy and industrials sectors also dampened the Fund’s relative results.
What were some of the Fund’s best-performing individual stocks?
The Fund benefited most relative to the Russell Index from positions in Marvell Technology Group, L3 Harris Technologies and ITT.
Marvell Technology Group, an integrated circuit designer, developer and seller, saw its stock gain rather steadily to start 2019 and then rise even faster in April 2019 on the back of China trade headlines that boosted the semiconductor industry as a whole. Strong first quarter 2019 results featuring above consensus revenue and earnings per share and a positive outlook on the future of the firm’s 5G (fifth-generation) capabilities boosted the company’s share price later in the Reporting Period. Marvell Technology Group also announced the sale of its connectivity assets to NXP Semiconductors, marking the divestiture of an arm that offered few synergies to other, stronger segments of the firm, which the market received positively. This deal fits into a broader pattern of strategic transactions that Marvell Technology Group’s management team has been pursuing. At the end of the Reporting Period, we believed these strategic acquisitions and divestitures, its enhanced position in 5G, and what we saw as its improved financial flexibility may be indicators of potential performance going forward.
L3 Harris Technologies is a technology-based tactical communications, geospatial systems, air traffic management and avionics firm. In late June 2019, defense technology company L3 Technologies, in which the Fund held a position, merged with defense company Harris to form L3 Harris Technologies. As separate entities, each firm posted strong first quarter 2019top-line growth and each raised revenue and earnings per share guidance for calendar year 2019. At the end of the Reporting Period, we believed positive results from Harris and recovery in growth within the L3 Technologies portfolio were indicators of potentially strong performance ahead. We expected the value creation resulting from the merging of these two firms to play out during the next three years or so. In our view, their combined portfolio remained well aligned with the Department of Defense’s spending priorities and should, we feel, continue to benefit as should spending moves from readiness toward modernization, as the government has indicated.
ITT engages in the manufacture and sale of engineered components and customized technology solutions in the energy, transportation and industrial markets. Its stock rose through much of the Reporting Period, highlighted by a strong earnings announcement in February 2019, in which its earnings per share were higher than market estimates, its free cash conversion was solid, and the company announced additional share buybacks. At the end of the Reporting Period, we remained positive on the company, as we felt the industry was in a solidup-cycle with strong operating momentum. We were also positive on ITT’s management team and felt it was effectively implementing the company’s plans to drive growth.
Which stocks detracted significantly from the Fund’s performance during the Reporting Period?
Detracting from the Fund’s results relative to the Russell Index were positions in Marathon Petroleum, Evergy and Worldpay.
Nearly all of crude oil refining company Marathon Petroleum’s stock price decline came in May 2019. Early in the month, the company reported quarterly results that missed on earnings per share market expectations, driven primarily by weakness in refining and retail margins. On the positive side, Marathon Petroleum continued to buy back shares and also reported strong operating cash flow and capital expenditures. Despite the mixed reports, we remained positive on the company at the end of the Reporting Period and felt its acquisition of fellow petroleum refiner Andeavor seemed to be going well and on track to unlock further synergies for the combined company, now the largest U.S. refiner by capacity. Furthermore, we were positive on the outlook for both the industry and the business and on the company management’s ability to achieve synergy targets and focus on returning capital to shareholders. We maintained our belief that Marathon Petroleum is a high quality company with what we consider to be a strong balance sheet, stable free cash flow and robust return on equity, and we were positive on its prospects ahead.
2
GOLDMAN SACHS VARIABLE INSURANCE TRUST MID CAP VALUE FUND
Utility company Evergy disappointed on its fourth quarter 2018 earnings and on lowering its longer-term growth outlook, which caused a dramatic share price decline on the day of its results announcement. We lost confidence in its management’s ability to appropriately plan and execute that plan and thus decided to exit the position, as we think Evergy’s growth rate may materially lag its peers in the medium term.
Worldpay is a payment processing technology and solutions company. The Fund did not hold a position in Worldpay at the start of 2019, but it was a constituent of the Russell Index when it was acquired by Fidelity Information Services, driving appreciation of its stock price and thus detracting from the Fund’s performance relative to the Russell Index. Following the announcement of the acquisition, we added Worldpay to the Fund’s portfolio given the lower leverage on Fidelity Information Services’ balance sheet and access to a wide geographic footprint that could provide, in our view, an opportunity for growth ahead.
How did the Fund use derivatives and similar instruments during the Reporting Period?
During the Reporting Period, we did not use derivatives.
Did the Fund make any significant purchases or sales during the Reporting Period?
In addition to those purchases already mentioned, we initiated a Fund position in AMETEK, a manufacturer of electronic instruments and electromechanical devices. We are confident in its management team’s ability to execute and deliver compounding returns to its shareholders, evidenced by its commitment to share buybacks and what we saw as effective acquisitions. Additionally, we believe the company’s diverse set of businesses provide a defensive aspect that has historically enabled it to perform well amid volatile market conditions.
We established a Fund position in Ameren. The company operates as a public utility holding company that provides electric and natural gas services in Missouri and Illinois. We are positive on Ameren given what we see as its strong growth profile and attractive dividend yield. Furthermore, we believe regulation changes in Missouri during the last year or so may help drive more investment in the state and consequently lead to higher rate base growth. Further, we believe Ameren’s management team is well respected and has executed well over the years.
Conversely, in addition to those sales already mentioned, we exited the Fund’s position in Signature Bank. The company reported weak results inmid-April 2019, including a decline in net interest margin and missing consensus expectations on earnings per share. Given the optimism heading into its report that Signature Bank would be well positioned to better weather the lower interest rate environment relative to its peers, we decided to sell the position and allocate capital to companies we saw as having better prospects of sound execution.
Were there any notable changes in the Fund’s weightings during the Reporting Period?
In constructing the Fund’s portfolio, we focus on picking stocks rather than on making industry or sector bets. We seek to outpace the benchmark index by overweighting stocks that we expect to outperform and underweighting those that we think may lag. Consequently, changes in its sector weights are generally the direct result of individual stock selection or of stock appreciation or depreciation. That said, during the Reporting Period, the Fund’s exposure to consumer staples and communication services increased and its exposure to financials and information technology decreased compared to the Russell Index.
How was the Fund positioned relative to its benchmark index at the end of the Reporting Period?
At the end of June 2019, the Fund had an overweighted position relative to the Russell Index in materials. On the same date, the Fund had underweighted positions compared to the Russell Index in industrials financials, utilities and real estate and was rather neutrally weighted to the Russell Index in consumer staples, communication services, health care, energy, consumer discretionary, and information technology.
Were there any changes to the Fund’s portfolio management team during the Reporting Period?
There were no changes to the Fund’s portfolio management team during the Reporting Period.
What is the Fund’s tactical view and strategy for the months ahead?
Following a strong start for the U.S. equity markets during the first half of 2019, we continued to view U.S. equities as the most favorable asset class at the end of the Reporting Period, offering what we saw as reasonable valuations relative to solid macroeconomic and corporate fundamentals. After a significant repricing of assets and market expectations in the fourth quarter of 2018, the U.S. equity markets rebounded with the strongest first half of a calendar year since 1997 despite geopolitical tensions and trade relations oscillating between positive and negative developments. U.S. equities were buoyed by declining10-year U.S.
3
GOLDMAN SACHS VARIABLE INSURANCE TRUST MID CAP VALUE FUND
Treasury rates, as investors expected potential interest rate cuts, a dramatic shift from the Fed’s actions at this point in 2018. While we were encouraged by the strong start to 2019, we also expected to see more signals of an aging economic cycle moving forward, which may be challenging to navigate and require even more selectivity by stock pickers. Yet without clearer indications of deteriorating fundamentals, we believed it too early to position for a downturn in global economic growth or corporate earnings.
That said, at the end of the Reporting Period, we expected choppier conditions for the remainder of 2019. Within this more volatile backdrop, we believed a thorough understanding of both market and company-specific variables may well be crucial to navigating the evolving landscape. Still, our investment philosophy does not and will not change based on short-term fluctuations in markets. We intend to maintain our focus on high quality companies with what we consider to be strong market positions and experienced management teams. In our opinion, emphasizing these durable businesses can potentially set the Fund up to perform well amidst heightened volatility.
Indeed, regardless of market direction, we remain committed to our core philosophy and process. We intend to maintain a long-term time horizon, rather than forecast the next quarter. As always, we maintain our focus on undervalued companies that we believe have comparatively greater control of their own destiny, such as innovators with differentiated products, companies with low cost structures or companies that have been investing in their own businesses and may be poised to gain market share.
4
GOLDMAN SACHS VARIABLE INSURANCE TRUST MID CAP VALUE FUND
Index Definitions
The Russell Midcap Value® Index is an unmanaged index of common stock prices that measures the performance of those Russell Midcap companies with lower price-to-book ratios and lower forecasted growth values. The index figures do not reflect any deduction for fees, expenses or taxes.
The Russell 2000® Index is an unmanaged index of common stock prices that measures the performance of the 2000 smallest companies in the Russell 3000® Index. The figures for the index do not include any deduction for fees, expenses or taxes.
The S&P 500® Index is the Standard & Poor’s composite index of 500 stocks, an unmanaged index of common stock prices. The figures for the index do not include any deduction for fees, expenses or taxes.
The Russell Midcap® Index measures the performance of the 800 smallest companies in the Russell 1000® Index, which represent approximately 25% of the total market capitalization of the Russell 1000® Index.
The Russell 1000® Index measures the performance of the 1,000 largest companies in the Russell 3000® Index, which represent approximately 92% of the total market capitalization of the Russell 3000® Index.
It is not possible to invest directly in an index.
5
FUND BASICS
Mid Cap Value Fund
as of June 30, 2019
STANDARDIZED TOTAL RETURNS1
| | | | | | | | | | | | | | | | | | |
| | | | | |
| For the period ended 6/30/19 | | One Year | | | Five Years | | | Ten Years | | | Since Inception | | | Inception Date |
| Institutional | | | 7.58 | % | | | 5.26 | % | | | 12.61 | % | | | 8.55 | % | | 5/01/98 |
| Service | | | 7.38 | | | | 5.01 | | | | 12.33 | | | | 6.89 | | | 1/09/06 |
| 1 | The Standardized Total Returns are average annual total returns as of the most recent calendar quarter-end. They assume reinvestment of all distributions at net asset value (“NAV”). Because Institutional Shares and Service Shares do not involve a sales charge, such a charge is not applied to their Standardized Total Returns. |
Total return figures in the above chart represent past performance and do not indicate future results, which will vary. The investment return and principal value of an investment will fluctuate and, therefore, an investor’s shares, when redeemed, may be worth more or less than their original cost. Current performance may be lower or higher than the total return figures in the above chart. Please visit www.GSAMFUNDS.com to obtain the most recent month-end returns.Performance reflects fee waivers and/or expense limitations in effect during the periods shown. In their absence, performance would be reduced.
EXPENSE RATIOS2
| | | | | | | | |
| | |
| | | Net Expense Ratio (Current) | | | Gross Expense Ratio (Before Waivers) | |
| Institutional | | | 0.84 | % | | | 0.85 | % |
| Service | | | 1.09 | | | | 1.10 | |
| 2 | The expense ratios of the Fund, both current (net of any fee waivers and/or expense limitations) and before waivers (gross of any fee waivers and/or expense limitations) are as set forth above according to the most recent publicly available Prospectuses for the Fund and may differ from the expense ratios disclosed in the Financial Highlights in this report. Pursuant to a contractual arrangement, the Fund’s fee waivers and/or expense limitations will remain in place through at least April 30, 2020, and prior to such date, the Investment Adviser may not terminate the arrangements without the approval of the Fund’s Board of Trustees. If these arrangements are discontinued in the future, the expense ratios may change without shareholder approval. |
TOP TEN HOLDINGS AS OF 6/30/193
| | | | | | |
| | |
| Holding | | % of Net Assets | | | Line of Business |
| Xcel Energy, Inc. | | | 2.1 | % | | Utilities |
| Sempra Energy | | | 2.0 | | | Utilities |
| L3 Technologies, Inc. | | | 2.0 | | | Capital Goods |
| Zimmer Biomet Holdings, Inc. | | | 1.9 | | | Health Care Equipment & Services |
| M&T Bank Corp. | | | 1.9 | | | Banks |
| ITT, Inc. | | | 1.6 | | | Capital Goods |
| Ventas, Inc. (REIT) | | | 1.6 | | | Real Estate |
| Cooper Cos., Inc. (The) | | | 1.6 | | | Health Care Equipment & Services |
| Stanley Black & Decker, Inc. | | | 1.6 | | | Capital Goods |
| CMS Energy Corp. | | | 1.6 | | | Utilities |
| 3 | The top 10 holdings may not be representative of the Fund’s future investments. |
6
FUND BASICS
FUND vs. BENCHMARK SECTOR ALLOCATIONS4
As of June 30, 2019
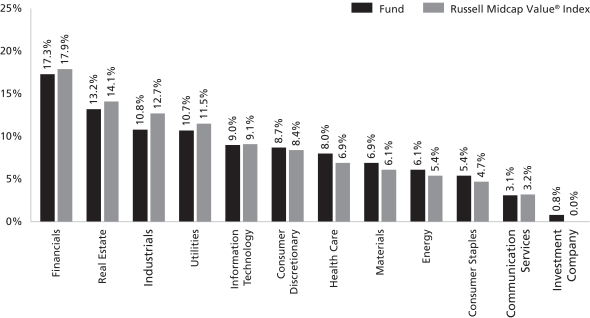
| 4 | The Fund is actively managed and, as such, its composition may differ over time. Consequently, the Fund’s overall sector allocations may differ from percentages contained in the graph above. The graph categorizes investments using Global Industry Classification Standard (“GICS”); however, the sector classifications used by the portfolio management team may differ from GICS. The percentage shown for each investment category reflects the value of investments in that category as a percentage of market value. Underlying sector allocations of exchange traded funds and investment companies held by the Fund are not reflected in the graph above. |
7
GOLDMAN SACHS VARIABLE INSURANCE TRUST MID CAP VALUE FUND
Schedule of Investments
June 30, 2019 (Unaudited)
| | | | | | | | |
Shares | | | Description | | Value | |
|
| Common Stocks – 98.2% | |
| Automobiles & Components – 0.8% | |
| | 47,130 | | | Aptiv plc | | $ | 3,809,518 | |
| | |
| Banks – 6.5% | | | |
| | 164,392 | | | Citizens Financial Group, Inc. | | | 5,812,901 | |
| | 43,515 | | | Comerica, Inc. | | | 3,160,930 | |
| | 44,871 | | | First Republic Bank | | | 4,381,653 | |
| | 55,148 | | | M&T Bank Corp. | | | 9,379,020 | |
| | 100,464 | | | SunTrust Banks, Inc. | | | 6,314,163 | |
| | 105,715 | | | Synovus Financial Corp. | | | 3,700,025 | |
| | | | | | | | |
| | | | | | | 32,748,692 | |
| | |
| Capital Goods – 9.4% | | | |
| | 42,739 | | | AMETEK, Inc. | | | 3,882,411 | |
| | 32,535 | | | Carlisle Cos., Inc. | | | 4,568,239 | |
| | 69,979 | | | Flowserve Corp. | | | 3,687,194 | |
| | 50,046 | | | Fortive Corp. | | | 4,079,750 | |
| | 20,905 | | | Ingersoll-Rand plc | | | 2,648,036 | |
| | 126,269 | | | ITT, Inc. | | | 8,268,094 | |
| | 40,243 | | | L3 Technologies, Inc. | | | 9,866,376 | |
| | 15,403 | | | Rockwell Automation, Inc. | | | 2,523,474 | |
| | 54,733 | | | Stanley Black & Decker, Inc. | | | 7,914,939 | |
| | | | | | | | |
| | | | | | | 47,438,513 | |
| | |
| Consumer Durables & Apparel – 1.8% | | | |
| | 36,528 | | | Capri Holdings Ltd.* | | | 1,266,791 | |
| | 101,346 | | | DR Horton, Inc. | | | 4,371,053 | |
| | 36,957 | | | PVH Corp. | | | 3,497,610 | |
| | | | | | | | |
| | | | | | | 9,135,454 | |
| | |
| Consumer Services – 3.2% | | | |
| | 170,007 | | | MGM Resorts International | | | 4,857,100 | |
| | 49,448 | | | Restaurant Brands International, Inc. | | | 3,438,614 | |
| | 53,524 | | | Royal Caribbean Cruises Ltd. | | | 6,487,644 | |
| | 12,449 | | | Wynn Resorts Ltd. | | | 1,543,551 | |
| | | | | | | | |
| | | | | | | 16,326,909 | |
| | |
| Diversified Financials – 3.7% | | | |
| | 29,604 | | | Cboe Global Markets, Inc. | | | 3,067,862 | |
| | 25,646 | | | Evercore, Inc. Class A | | | 2,271,466 | |
| | 42,963 | | | Northern Trust Corp. | | | 3,866,670 | |
| | 46,721 | | | Raymond James Financial, Inc. | | | 3,950,261 | |
| | 116,658 | | | Starwood Property Trust, Inc. (REIT) | | | 2,650,470 | |
| | 28,280 | | | T. Rowe Price Group, Inc. | | | 3,102,599 | |
| | | | | | | | |
| | | | | | | 18,909,328 | |
| | |
| Energy – 5.2% | | | |
| | 95,018 | | | Cheniere Energy, Inc.* | | | 6,503,982 | |
| | 45,333 | | | Concho Resources, Inc. | | | 4,677,459 | |
| | 58,139 | | | Diamondback Energy, Inc. | | | 6,335,407 | |
| | 34,840 | | | Hess Corp. | | | 2,214,779 | |
| | 67,111 | | | Marathon Petroleum Corp. | | | 3,750,163 | |
| | 157,835 | | | Parsley Energy, Inc. Class A* | | | 3,000,443 | |
| | | | | | | | |
| | | | | | | 26,482,233 | |
| | |
|
| Common Stocks – (continued) | |
| Food & Staples Retailing – 1.6% | | | |
| | 79,843 | | | Grocery Outlet Holding Corp.* | | | 2,625,238 | |
| | 157,293 | | | US Foods Holding Corp.* | | | 5,624,797 | |
| | | | | | | | |
| | | | | | | 8,250,035 | |
| | |
| Food, Beverage & Tobacco – 3.8% | | | |
| | 42,045 | | | Bunge Ltd. | | | 2,342,327 | |
| | 71,744 | | | Coca-Cola European Partners plc | | | 4,053,536 | |
| | 112,244 | | | Conagra Brands, Inc. | | | 2,976,711 | |
| | 13,516 | | | Constellation Brands, Inc. Class A | | | 2,661,841 | |
| | 57,069 | | | Lamb Weston Holdings, Inc. | | | 3,615,892 | |
| | 159,794 | | | Nomad Foods Ltd.* | | | 3,413,200 | |
| | | | | | | | |
| | | | | | | 19,063,507 | |
| | |
| Health Care Equipment & Services – 5.5% | | | |
| | 138,298 | | | Change Healthcare, Inc.* | | | 2,019,151 | |
| | 24,118 | | | Cooper Cos., Inc. (The) | | | 8,125,113 | |
| | 43,033 | | | DENTSPLY SIRONA, Inc. | | | 2,511,406 | |
| | 29,883 | | | Laboratory Corp. of America Holdings* | | | 5,166,771 | |
| | 83,584 | | | Zimmer Biomet Holdings, Inc. | | | 9,841,180 | |
| | | | | | | | |
| | | | | | | 27,663,621 | |
| | |
| Insurance – 7.1% | | | |
| | 30,070 | | | American Financial Group, Inc. | | | 3,081,273 | |
| | 116,589 | | | Arch Capital Group Ltd.* | | | 4,323,120 | |
| | 15,947 | | | Hanover Insurance Group, Inc. (The) | | | 2,046,000 | |
| | 90,939 | | | Hartford Financial Services Group, Inc. (The) | | | 5,067,121 | |
| | 51,913 | | | Lincoln National Corp. | | | 3,345,793 | |
| | 4,395 | | | Markel Corp.* | | | 4,788,792 | |
| | 23,195 | | | Reinsurance Group of America, Inc. | | | 3,619,116 | |
| | 40,025 | | | Torchmark Corp. | | | 3,580,636 | |
| | 30,572 | | | Willis Towers Watson plc | | | 5,855,761 | |
| | | | | | | | |
| | | | | | | 35,707,612 | |
| | |
| Materials – 6.9% | | | |
| | 40,810 | | | Ball Corp. | | | 2,856,292 | |
| | 59,787 | | | Celanese Corp. | | | 6,445,039 | |
| | 120,270 | | | Corteva, Inc.* | | | 3,556,384 | |
| | 323,153 | | | Freeport-McMoRan, Inc. | | | 3,751,806 | |
| | 28,943 | | | Martin Marietta Materials, Inc. | | | 6,660,074 | |
| | 83,665 | | | Newmont Goldcorp Corp. | | | 3,218,593 | |
| | 43,045 | | | Packaging Corp. of America | | | 4,103,049 | |
| | 57,304 | | | WR Grace & Co. | | | 4,361,407 | |
| | | | | | | | |
| | | | | | | 34,952,644 | |
| | |
| Media & Entertainment – 2.6% | | | |
| | 169,506 | | | Fox Corp. Class A | | | 6,210,700 | |
| | 103,636 | | | Liberty Media Corp-Liberty SiriusXM Class A* | | | 3,918,477 | |
| | 47,614 | | | Live Nation Entertainment, Inc.* | | | 3,154,427 | |
| | | | | | | | |
| | | | | | | 13,283,604 | |
| | |
| | |
| 8 | | The accompanying notes are an integral part of these financial statements. |
GOLDMAN SACHS VARIABLE INSURANCE TRUST MID CAP VALUE FUND
| | | | | | | | |
Shares | | | Description | | Value | |
|
| Common Stocks – (continued) | |
| Pharmaceuticals, Biotechnology & Life Sciences – 2.5% | |
| | 79,429 | | | Agilent Technologies, Inc. | | $ | 5,930,963 | |
| | 116,143 | | | Alder Biopharmaceuticals, Inc.* | | | 1,367,003 | |
| | 26,713 | | | BioMarin Pharmaceutical, Inc.* | | | 2,287,969 | |
| | 87,381 | | | Elanco Animal Health, Inc.* | | | 2,953,478 | |
| | | | | | | | |
| | | | | | | 12,539,413 | |
| | |
| Real Estate – 13.2% | | | |
| | 46,652 | | | Alexandria Real Estate Equities, Inc. (REIT) | | | 6,582,131 | |
| | 38,299 | | | AvalonBay Communities, Inc. (REIT) | | | 7,781,591 | |
| | 34,982 | | | Boston Properties, Inc. (REIT) | | | 4,512,678 | |
| | 59,937 | | | Camden Property Trust (REIT) | | | 6,256,823 | |
| | 137,673 | | | Cushman & Wakefield plc* | | | 2,461,593 | |
| | 61,363 | | | CyrusOne, Inc. (REIT) | | | 3,541,872 | |
| | 46,921 | | | Equity LifeStyle Properties, Inc. (REIT) | | | 5,693,394 | |
| | 18,668 | | | Essex Property Trust, Inc. (REIT) | | | 5,449,749 | |
| | 23,280 | | | Extra Space Storage, Inc. (REIT) | | | 2,470,008 | |
| | 90,553 | | | HCP, Inc. (REIT) | | | 2,895,885 | |
| | 77,275 | | | Hudson Pacific Properties, Inc. (REIT) | | | 2,570,939 | |
| | 39,816 | | | Prologis, Inc. (REIT) | | | 3,189,262 | |
| | 31,444 | | | Ryman Hospitality Properties, Inc. (REIT) | | | 2,549,794 | |
| | 11,100 | | | SBA Communications Corp. (REIT)* | | | 2,495,724 | |
| | 119,565 | | | Ventas, Inc. (REIT) | | | 8,172,268 | |
| | | | | | | | |
| | | | | | | 66,623,711 | |
| | |
| Retailing – 2.9% | | | |
| | 25,237 | | | Advance Auto Parts, Inc. | | | 3,890,031 | |
| | 13,011 | | | Burlington Stores, Inc.* | | | 2,213,822 | |
| | 35,462 | | | Dollar General Corp. | | | 4,793,044 | |
| | 30,034 | | | Expedia Group, Inc. | | | 3,995,423 | |
| | | | | | | | |
| | | | | | | 14,892,320 | |
| | |
| Semiconductors & Semiconductor Equipment – 2.7% | | | |
| | 46,327 | | | Advanced Micro Devices, Inc.* | | | 1,406,951 | |
| | 20,468 | | | Analog Devices, Inc. | | | 2,310,223 | |
| | 315,821 | | | Marvell Technology Group Ltd. | | | 7,538,647 | |
| | 26,369 | | | NXP Semiconductors NV | | | 2,573,878 | |
| | | | | | | | |
| | | | | | | 13,829,699 | |
| | |
| Software & Services – 3.7% | | | |
| | 14,791 | | | Alliance Data Systems Corp. | | | 2,072,663 | |
| | 39,609 | | | Citrix Systems, Inc. | | | 3,887,227 | |
| | 57,796 | | | Fidelity National Information Services, Inc. | | | 7,090,413 | |
| | 45,555 | | | GoDaddy, Inc. Class A* | | | 3,195,683 | |
| | 25,309 | | | PTC, Inc.* | | | 2,271,736 | |
| | | | | | | | |
| | | | | | | 18,517,722 | |
| | |
| Technology Hardware & Equipment – 2.6% | | | |
| | 18,330 | | | F5 Networks, Inc.* | | | 2,669,398 | |
| | 60,281 | | | National Instruments Corp. | | | 2,531,199 | |
| | 386,139 | | | Viavi Solutions, Inc.* | | | 5,131,787 | |
| | 59,150 | | | Western Digital Corp. | | | 2,812,583 | |
| | | | | | | | |
| | | | | | | 13,144,967 | |
| | |
|
| Common Stocks – (continued) | |
| Telecommunication Services – 0.4% | | | |
| | 190,454 | | | CenturyLink, Inc. | | | 2,239,739 | |
| | |
| Transportation – 1.4% | | | |
| | 165,402 | | | JetBlue Airways Corp.* | | | 3,058,283 | |
| | 28,237 | | | Old Dominion Freight Line, Inc. | | | 4,214,655 | |
| | | | | | | | |
| | | | | | | 7,272,938 | |
| | |
| Utilities – 10.7% | | | |
| | 79,002 | | | Ameren Corp. | | | 5,933,840 | |
| | 47,448 | | | American Water Works Co., Inc. | | | 5,503,968 | |
| | 58,087 | | | Atmos Energy Corp. | | | 6,131,664 | |
| | 135,967 | | | CMS Energy Corp. | | | 7,873,849 | |
| | 55,081 | | | PG&E Corp.* | | | 1,262,456 | |
| | 113,578 | | | Public Service Enterprise Group, Inc. | | | 6,680,658 | |
| | 73,972 | | | Sempra Energy | | | 10,166,712 | |
| | 178,934 | | | Xcel Energy, Inc. | | | 10,644,784 | |
| | | | | | | | |
| | | | | | | 54,197,931 | |
| | |
| | TOTAL COMMON STOCKS
| | | | |
| | (Cost $432,622,365) | | $ | 497,030,110 | |
| | |
| | | | | | | | |
|
| Master Limited Partnership – 0.9% | |
| Energy – 0.9% | | | |
| | 145,024 | | | Viper Energy Partners LP | | $ | 4,469,640 | |
| | (Cost $4,714,627) | | | | |
| | |
| | | | | | | | |
| Shares | | | Dividend
Rate | | Value | |
|
| Investment Company(a) – 0.8% | |
| Goldman Sachs Financial Square Government Fund —
Institutional Shares |
|
| | 4,120,785 | | | 2.308% | | $ | 4,120,785 | |
| | (Cost $4,120,785) | | | | |
| | |
| | TOTAL INVESTMENTS – 99.9%
| |
| | (Cost $441,457,777) | | $ | 505,620,535 | |
| | |
| OTHER ASSETS IN EXCESS OF
LIABILITIES – 0.1% | | | 252,961 | |
| | |
| | NET ASSETS – 100.0% | | $ | 505,873,496 | |
| | |
| | |
| The percentage shown for each investment category reflects the value of investments in that category as a percentage of net assets. |
| |
| * | | Non-income producing security. |
| |
| (a) | | Represents an Affiliated Issuer. |
| | |
| |
| Investment Abbreviation: |
| REIT | | —Real Estate Investment Trust |
| | |
| The accompanying notes are an integral part of these financial statements. | | 9 |
GOLDMAN SACHS VARIABLE INSURANCE TRUST MID CAP VALUE FUND
Statement of Assets and Liabilities
June 30, 2019 (Unaudited)
| | | | |
| | | | |
| Assets: | | | |
Investments in unaffiliated issuers, at value (cost $437,336,992) | | $ | 501,499,750 | |
Investments in affiliated issuers, at value (cost $4,120,785) | | | 4,120,785 | |
Cash | | | 733,451 | |
Receivables: | | | | |
Investments sold | | | 32,919,152 | |
Dividends | | | 858,347 | |
Securities lending income | | | 10,704 | |
Reimbursement from investment adviser | | | 7,080 | |
Other assets | | | 1,120 | |
| |
| Total assets | | | 540,150,389 | |
| | | | |
| | | | |
| Liabilities: | | | |
Payables: | | | | |
Investments purchased | | | 32,510,286 | |
Fund shares redeemed | | | 1,282,047 | |
Management fees | | | 316,710 | |
Distribution and Service fees and Transfer Agency fees | | | 43,326 | |
Accrued expenses | | | 124,524 | |
| |
| Total liabilities | | | 34,276,893 | |
| | | | |
| | | | |
| Net Assets: | | | |
Paid-in capital | | | 433,705,221 | |
Total distributable earnings (loss) | | | 72,168,275 | |
| |
| NET ASSETS | | $ | 505,873,496 | |
Net Assets: | | | | |
Institutional | | $ | 332,271,544 | |
Service | | | 173,601,952 | |
| |
Total Net Assets | | $ | 505,873,496 | |
Shares outstanding $0.001 par value (unlimited shares authorized): | | | | |
Institutional | | | 21,354,579 | |
Service | | | 11,068,795 | |
Net asset value, offering and redemption price per share: | | | | |
Institutional | | | $15.56 | |
Service | | | 15.68 | |
| | |
| 10 | | The accompanying notes are an integral part of these financial statements. |
GOLDMAN SACHS VARIABLE INSURANCE TRUST MID CAP VALUE FUND
Statement of Operations
For the Six Months Ended June 30, 2019 (Unaudited)
| | | | |
| | | | |
| Investment income: | | | |
Dividends — unaffiliated issuers (net of foreign taxes withheld of $14,719) | | $ | 4,119,544 | |
Dividends — affiliated issuers | | | 97,488 | |
Securities lending income — unaffiliated issuer | | | 25,021 | |
| |
| Total investment income | | | 4,242,053 | |
| | | | |
| | | | |
| Expenses: | | | |
Management fees | | | 1,801,730 | |
Distribution and Service fees — Service Shares | | | 175,922 | |
Printing and mailing costs | | | 72,313 | |
Transfer Agency fees(a) | | | 46,794 | |
Custody, accounting and administrative services | | | 45,042 | |
Professional fees | | | 44,770 | |
Trustee fees | | | 8,343 | |
Registration fees | | | 620 | |
Other | | | 10,254 | |
| |
| Total expenses | | | 2,205,788 | |
| |
Less — expense reductions | | | (63,825 | ) |
| |
| Net expenses | | | 2,141,963 | |
| |
| NET INVESTMENT INCOME | | | 2,100,090 | |
| | | | |
| | | | |
| Realized and unrealized gain: | | | |
Net realized gain from investments — unaffiliated issuers | | | 13,098,580 | |
Net change in unrealized gain on investments — unaffiliated issuers | | | 65,743,511 | |
| |
| Net realized and unrealized gain | | | 78,842,091 | |
| |
| NET INCREASE IN NET ASSETS RESULTING FROM OPERATIONS | | $ | 80,942,181 | |
(a) Institutional and Service Shares incurred Transfer Agency fees of $32,722 and $14,072, respectively.
| | |
| The accompanying notes are an integral part of these financial statements. | | 11 |
GOLDMAN SACHS VARIABLE INSURANCE TRUST MID CAP VALUE FUND
Statements of Changes in Net Assets
| | | | | | | | |
| | | For the
Six Months Ended
June 30, 2019
(Unaudited) | | | For the
Fiscal Year Ended
December 31, 2018 | |
| | | | | | | | |
| From operations: | | | | | | |
Net investment income | | $ | 2,100,090 | | | $ | 3,835,266 | |
Net realized gain | | | 13,098,580 | | | | 46,703,975 | |
Net change in unrealized gain (loss) | | | 65,743,511 | | | | (100,296,769 | ) |
| | |
| Net increase (decrease) in net assets resulting from operations | | | 80,942,181 | | | | (49,757,528 | ) |
| | | | | | | | |
| | | | | | | | |
| Distributions to shareholders: | | | | | | |
From distributable earnings: | | | | | | | | |
Institutional Shares | | | — | | | | (45,878,403 | ) |
Service Shares | | | — | | | | (11,008,040 | ) |
| | |
| Total distributions to shareholders | | | — | | | | (56,886,443 | ) |
| | | | | | | | |
| | | | | | | | |
| From share transactions: | | | | | | |
Proceeds from sales of shares | | | 91,396,334 | | | | 33,413,557 | |
Proceeds paid in connection within-kind transactions | | | — | | | | (93,560,594 | ) |
Reinvestment of distributions | | | — | | | | 56,886,443 | |
Cost of shares redeemed | | | (43,356,478 | ) | | | (283,084,971 | ) |
| | |
| Net increase (decrease) in net assets resulting from share transactions | | | 48,039,856 | | | | (286,345,565 | ) |
| | |
| TOTAL INCREASE (DECREASE) | | | 128,982,037 | | | | (392,989,536 | ) |
| | | | | | | | |
| | | | | | | | |
| Net Assets: | | | | | | |
| | |
Beginning of period | | | 376,891,459 | | | | 769,880,995 | |
| | |
End of period | | $ | 505,873,496 | | | $ | 376,891,459 | |
| | |
| 12 | | The accompanying notes are an integral part of these financial statements. |
GOLDMAN SACHS VARIABLE INSURANCE TRUST MID CAP VALUE FUND
Financial Highlights
Selected Data for a Share Outstanding Throughout Each Period
| | | | | | | | | | | | | | | | | | | | | | | | |
| | | Goldman Sachs Mid Cap Value Fund | |
| | | Institutional Shares | |
| | | Six Months Ended
June 30, 2019
(Unaudited) | | | Year Ended December 31, | |
| | | 2018 | | | 2017 | | | 2016 | | | 2015 | | | 2014 | |
| | | | | | | | | | | | | | | | | | | | | | | | |
| Per Share Data | | | | | | | | | | | | | | | | | | |
| | | | | | |
Net asset value, beginning of period | | $ | 12.89 | | | $ | 16.93 | | | $ | 16.23 | | | $ | 14.49 | | | $ | 17.43 | | | $ | 18.64 | |
| | | | | | |
Net investment income(a) | | | 0.07 | | | | 0.13 | | | | 0.12 | | | | 0.16 | | | | 0.13 | | | | 0.12 | |
| | | | | | |
Net realized and unrealized gain (loss) | | | 2.60 | | | | (1.86 | ) | | | 1.68 | | | | 1.80 | | | | (1.75 | ) | | | 2.31 | |
| | | | | | |
Total from investment operations | | | 2.67 | | | | (1.73 | ) | | | 1.80 | | | | 1.96 | | | | (1.62 | ) | | | 2.43 | |
| | | | | | |
Distributions to shareholders from net investment income | | | — | | | | (0.23 | ) | | | (0.13 | ) | | | (0.21 | ) | | | (0.07 | ) | | | (0.21 | ) |
| | | | | | |
Distributions to shareholders from net realized gains | | | — | | | | (2.08 | ) | | | (0.97 | ) | | | (0.01 | ) | | | (1.25 | ) | | | (3.43 | ) |
| | | | | | |
Total distributions | | | — | | | | (2.31 | ) | | | (1.10 | ) | | | (0.22 | ) | | | (1.32 | ) | | | (3.64 | ) |
| | | | | | |
Net asset value, end of period | | $ | 15.56 | | | $ | 12.89 | | | $ | 16.93 | | | $ | 16.23 | | | $ | 14.49 | | | $ | 17.43 | |
| | | | | | |
Total return(b) | | | 20.71 | % | | | (10.46 | )% | | | 11.07 | % | | | 13.49 | % | | | (9.24 | )% | | | 13.57 | % |
| | | | | | |
Net assets, end of period (in 000s) | | $ | 332,272 | | | $ | 300,056 | | | $ | 388,709 | | | $ | 437,085 | | | $ | 535,459 | | | $ | 692,068 | |
| | | | | | |
Ratio of net expenses to average net assets | | | 0.84 | %(c) | | | 0.84 | % | | | 0.84 | % | | | 0.84 | % | | | 0.84 | % | | | 0.83 | % |
| | | | | | |
Ratio of total expenses to average net assets | | | 0.87 | %(c) | | | 0.86 | % | | | 0.87 | % | | | 0.87 | % | | | 0.87 | % | | | 0.87 | % |
| | | | | | |
Ratio of net investment income to average net assets | | | 0.93 | %(c) | | | 0.75 | % | | | 0.71 | % | | | 1.08 | % | | | 0.74 | % | | | 0.62 | % |
| | | | | | |
Portfolio turnover rate(d) | | | 56 | % | | | 109 | % | | | 134 | % | | | 149 | % | | | 94 | % | | | 88 | % |
| (a) | Calculated based on the average shares outstanding methodology. |
| (b) | Assumes investment at the net asset value at the beginning of the period, reinvestment of all distributions, a complete redemption of the investment at the net asset value at the end of the period and no sales or redemption charges (if any). Total returns would be reduced if a sales or redemption charge was taken into account. Returns do not reflect the impact of taxes to shareholders relating to Fund distributions or the redemption of Fund shares. Total returns for periods less than one full year are not annualized. |
| (d) | The Fund’s portfolio turnover rate is calculated in accordance with regulatory requirements, without regard to transactions involving short term investments. If such transactions were included, the Fund’s portfolio turnover rate may be higher. |
| | |
| The accompanying notes are an integral part of these financial statements. | | 13 |
GOLDMAN SACHS VARIABLE INSURANCE TRUST MID CAP VALUE FUND
Financial Highlights(continued)
Selected Data for a Share Outstanding Throughout Each Period
| | | | | | | | | | | | | | | | | | | | | | | | |
| | | Goldman Sachs Mid Cap Value Fund | |
| | | Service Shares | |
| | | Six Months Ended
June 30, 2019
(Unaudited) | | | Year Ended December 31, | |
| | | 2018 | | | 2017 | | | 2016 | | | 2015 | | | 2014 | |
| | | | | | | | | | | | | | | | | | | | | | | | |
| Per Share Data | | | | | | | | | | | | | | | | | | |
| | | | | | |
Net asset value, beginning of period | | $ | 13.01 | | | $ | 16.95 | | | $ | 16.25 | | | $ | 14.51 | | | $ | 17.45 | | | $ | 18.66 | |
| | | | | | |
Net investment income(a) | | | 0.06 | | | | 0.07 | | | | 0.08 | | | | 0.12 | | | | 0.08 | | | | 0.07 | |
| | | | | | |
Net realized and unrealized gain (loss) | | | 2.61 | | | | (1.84 | ) | | | 1.68 | | | | 1.81 | | | | (1.75 | ) | | | 2.31 | |
| | | | | | |
Total from investment operations | | | 2.67 | | | | (1.77 | ) | | | 1.76 | | | | 1.93 | | | | (1.67 | ) | | | 2.38 | |
| | | | | | |
Distributions to shareholders from net investment income | | | — | | | | (0.09 | ) | | | (0.09 | ) | | | (0.18 | ) | | | (0.02 | ) | | | (0.16 | ) |
| | | | | | |
Distributions to shareholders from net realized gains | | | — | | | | (2.08 | ) | | | (0.97 | ) | | | (0.01 | ) | | | (1.25 | ) | | | (3.43 | ) |
| | | | | | |
Total distributions | | | — | | | | (2.17 | ) | | | (1.06 | ) | | | (0.19 | ) | | | (1.27 | ) | | | (3.59 | ) |
| | | | | | |
Net asset value, end of period | | $ | 15.68 | | | $ | 13.01 | | | $ | 16.95 | | | $ | 16.25 | | | $ | 14.51 | | | $ | 17.45 | |
| | | | | | |
Total return(b) | | | 20.60 | % | | | (10.70 | )% | | | 10.85 | % | | | 13.24 | % | | | (9.52 | )% | | | 13.29 | % |
| | | | | | |
Net assets, end of period (in 000s) | | $ | 173,602 | | | $ | 76,835 | | | $ | 381,172 | | | $ | 371,366 | | | $ | 265,545 | | | $ | 362,501 | |
| | | | | | |
Ratio of net expenses to average net assets | | | 1.09 | %(c) | | | 1.09 | % | | | 1.09 | % | | | 1.09 | % | | | 1.09 | % | | | 1.08 | % |
| | | | | | |
Ratio of total expenses to average net assets | | | 1.12 | %(c) | | | 1.11 | % | | | 1.12 | % | | | 1.12 | % | | | 1.12 | % | | | 1.12 | % |
| | | | | | |
Ratio of net investment income to average net assets | | | 0.82 | %(c) | | | 0.42 | % | | | 0.47 | % | | | 0.78 | % | | | 0.48 | % | | | 0.38 | % |
| | | | | | |
Portfolio turnover rate(d) | | | 56 | % | | | 109 | % | | | 134 | % | | | 149 | % | | | 94 | % | | | 88 | % |
| (a) | Calculated based on the average shares outstanding methodology. |
| (b) | Assumes investment at the net asset value at the beginning of the period, reinvestment of all distributions, a complete redemption of the investment at the net asset value at the end of the period and no sales or redemption charges (if any). Total returns would be reduced if a sales or redemption charge was taken into account. Returns do not reflect the impact of taxes to shareholders relating to Fund distributions or the redemption of Fund shares. Total returns for periods less than one full year are not annualized. |
| (d) | The Fund’s portfolio turnover rate is calculated in accordance with regulatory requirements, without regard to transactions involving short term investments. If such transactions were included, the Fund’s portfolio turnover rate may be higher. |
| | |
| 14 | | The accompanying notes are an integral part of these financial statements. |
GOLDMAN SACHS VARIABLE INSURANCE TRUST MID CAP VALUE FUND
Notes to Financial Statements
June 30, 2019 (Unaudited)
1. ORGANIZATION
Goldman Sachs Variable Insurance Trust (the “Trust” or “VIT”) is a Delaware statutory trust registered under the Investment Company Act of 1940, as amended (the “Act”), as anopen-end management investment company. The Trust includes the Goldman Sachs Mid Cap Value Fund (the “Fund”). The Fund is a diversified portfolio under the Act offering two classes of shares — Institutional and Service Shares. Shares of the Trust are offered to separate accounts of participating life insurance companies for the purpose of funding variable annuity contracts and variable life insurance policies.
Goldman Sachs Asset Management, L.P. (“GSAM”), an affiliate of Goldman Sachs & Co. LLC (“Goldman Sachs”), serves as investment adviser to the Fund pursuant to a management agreement (the “Agreement”) with the Trust.
2. SIGNIFICANT ACCOUNTING POLICIES
The financial statements have been prepared in accordance with accounting principles generally accepted in the United States of America (“GAAP”) and require management to make estimates and assumptions that may affect the reported amounts and disclosures. Actual results may differ from those estimates and assumptions.
A. Investment Valuation — The Fund’s valuation policy is to value investments at fair value.
B. Investment Income and Investments — Investment income includes interest income, dividend income, and securities lending income, if any. Interest income is accrued daily and adjusted for amortization of premiums and accretion of discounts. Dividend income is recognized onex-dividend date or, for certain foreign securities, as soon as such information is obtained subsequent to theex-dividend date. Investment transactions are reflected on trade date. Realized gains and losses are calculated using identified cost. Investment transactions are recorded on the following business day for daily net asset value (“NAV”) calculations. Investment income is recorded net of any foreign withholding taxes, less any amounts reclaimable. The Fund may file withholding tax reclaims in certain jurisdictions to recover a portion of amounts previously withheld. Any foreign capital gains tax is accrued daily based upon net unrealized gains, and is payable upon sale of such investments. Distributions received from the Fund’s investments in United States (“U.S.”) real estate investment trusts (“REITs”) may be characterized as ordinary income, net capital gain or a return of capital. A return of capital is recorded by the Fund as a reduction to the cost basis of the REIT. Distributions from master limited partnerships (“MLPs”) are generally recorded based on the characterization reported on the MLP’s tax return. The Fund records itspro-rata share of the income/loss and capital gains/losses, allocated from the underlying partnerships and adjusts the cost basis of the underlying partnerships accordingly.
C. Class Allocations and Expenses — Investment income, realized and unrealized gain (loss), if any, andnon-class specific expenses of the Fund are allocated daily based upon the proportion of net assets of each class.Non-class specific expenses directly incurred by the Fund are charged to the Fund, while such expenses incurred by the Trust are allocated across the Fund on a straight-line and/orpro-rata basis depending upon the nature of the expenses. Class specific expenses, where applicable, are borne by the respective share classes and include Distribution and Service and Transfer Agency fees.
D. Federal Taxes and Distributions to Shareholders — It is the Fund’s policy to comply with the requirements of the Internal Revenue Code of 1986, as amended (the “Code”), applicable to regulated investment companies and to distribute each year substantially all of its investment company taxable income and capital gains to its shareholders. Accordingly, the Fund is not required to make any provisions for the payment of federal income tax. Distributions to shareholders are recorded on theex-dividend date. Income and capital gains distributions, if any, are declared and paid at least annually.
Net capital losses, if any, are carried forward to future fiscal years and may be used to the extent allowed by the Code to offset any future capital gains. Losses that are carried forward will retain their character as either short-term or long-term capital losses. Utilization of capital loss carryforwards will reduce the requirement of future capital gains distributions.
The characterization of distributions to shareholders for financial reporting purposes is determined in accordance with federal income tax rules, which may differ from GAAP. The source of the Fund’s distributions may be shown in the accompanying financial statements as either from distributable earnings or capital. Certain components of the Fund’s net assets on the Statement of Assets and Liabilities reflect permanent GAAP/tax differences based on the appropriate tax character.
15
GOLDMAN SACHS VARIABLE INSURANCE TRUST MID CAP VALUE FUND
Notes to Financial Statements(continued)
June 30, 2019 (Unaudited)
2. SIGNIFICANT ACCOUNTING POLICIES (continued)
E. In-Kind Transactions — The Fund may allow investors, under certain circumstances, to purchase shares with securities instead of cash. In addition, the Trust reserves the right to redeem an investor’s shares by distributing securities instead of cash. These are known asin-kind transactions. Securities included as part ofin-kind purchases and redemptions of Fund shares are valued in the same manner as they are valued for purposes of computing the Fund’s NAV, in accordance with the Fund’s Valuation Procedures, and such valuations are as of the date the trade is submitted pursuant to the procedures specified in the Fund’s prospectus.
F. Commission Recapture — GSAM, on behalf of certain Funds, may direct portfolio trades, subject to seeking best execution, to various brokers who have agreed to rebate a portion of the commissions generated. Such rebates are made directly to the Fund as cash payments and are included in net realized gain (loss) from investments on the Statement of Operations. As of June 30, 2019, there was no commission recaptured for the Fund.
3. INVESTMENTS AND FAIR VALUE MEASUREMENTS
U.S. GAAP defines the fair value of a financial instrument as the amount that would be received to sell an asset or paid to transfer a liability in an orderly transaction between market participants at the measurement date (i.e., the exit price); the Fund’s policy is to use the market approach. GAAP establishes a fair value hierarchy that prioritizes the inputs to valuation techniques used to measure fair value. The hierarchy gives the highest priority to unadjusted quoted prices in active markets for identical assets or liabilities (Level 1 measurements) and the lowest priority to unobservable inputs (Level 3 measurements). The levels used for classifying investments are not necessarily an indication of the risk associated with investing in these investments. The three levels of the fair value hierarchy are described below:
Level 1 — Unadjusted quoted prices in active markets that are accessible at the measurement date for identical, unrestricted assets or liabilities;
Level 2 — Quoted prices in markets that are not active or financial instruments for which significant inputs are observable (including, but not limited to, quoted prices for similar investments, interest rates, foreign exchange rates, volatility and credit spreads), either directly or indirectly;
Level 3 — Prices or valuations that require significant unobservable inputs (including GSAM’s assumptions in determining fair value measurement).
The Board of Trustees (“Trustees”) has approved Valuation Procedures that govern the valuation of the portfolio investments held by the Fund, including investments for which market quotations are not readily available. The Trustees have delegated to GSAMday-to-day responsibility for implementing and maintaining internal controls and procedures related to the valuation of the Fund’s investments. To assess the continuing appropriateness of pricing sources and methodologies, GSAM regularly performs price verification procedures and issues challenges as necessary to third party pricing vendors or brokers, and any differences are reviewed in accordance with the Valuation Procedures.
A. Level 1 and Level 2 Fair Value Investments —The valuation techniques and significant inputs used in determining the fair values for investments classified as Level 1 and Level 2 are as follows:
Equity Securities —Equity securities traded on a U.S. securities exchange or the NASDAQ system, or those located on certain foreign exchanges, including but not limited to the Americas, are valued daily at their last sale price or official closing price on the principal exchange or system on which they are traded. If there is no sale or official closing price or such price is believed by GSAM to not represent fair value, equity securities are valued at the last bid price for long positions and at the last ask price for short positions. To the extent these investments are actively traded, they are classified as Level 1 of the fair value hierarchy, otherwise they are generally classified as Level 2.
Unlisted equity securities for which market quotations are available are valued at the last sale price on the valuation date, or if no sale occurs, at the last bid price, and are generally classified as Level 2.
16
GOLDMAN SACHS VARIABLE INSURANCE TRUST MID CAP VALUE FUND
3. INVESTMENTS AND FAIR VALUE MEASUREMENTS (continued)
Money Market Funds — Investments in the Goldman Sachs Financial Square Government Fund (“Underlying Fund”) are valued at the NAV of the Institutional Share class on the day of valuation. These investments are generally classified as Level 1 of the fair value hierarchy. For information regarding the Underlying Fund’s accounting policies and investment holdings, please see the Underlying Fund’s shareholder report.
B. Level 3 Fair Value Investments — To the extent that significant inputs to valuation models and other alternative pricing sources are unobservable, or if quotations are not readily available, or if GSAM believes that such quotations do not accurately reflect fair value, the fair value of the Fund’s investments may be determined under Valuation Procedures approved by the Trustees. GSAM, consistent with its procedures and applicable regulatory guidance, may make an adjustment to the most recent valuation prices of either domestic or foreign securities in light of significant events to reflect what it believes to be the fair value of the securities at the time of determining the Fund’s NAV. To the extent investments are valued using single source broker quotations obtained directly from the broker or passed through from third party pricing vendors, such investments are classified as Level 3 investments. GSAM did not develop the unobservable inputs for valuation of Level 3 Assets and Liabilities.
C. Fair Value Hierarchy —The following is a summary of the Fund’s investments classified in the fair value hierarchy as of June 30, 2019:
| | | | | | | | | | | | |
| Investment Type | | Level 1 | | | Level 2 | | | Level 3 | |
| | | |
| Assets | | | | | | | | | | | | |
| Common Stock and/or Other Equity Investments(a) | | | | | | | | | | | | |
Europe | | $ | 10,040,614 | | | $ | — | | | $ | — | |
North America | | | 486,989,496 | | | | — | | | | — | |
| Investment Company | | | 4,120,785 | | | | — | | | | — | |
| Master Limited Partnership | | | 4,469,640 | | | | — | | | | — | |
| | | |
| Total | | $ | 505,620,535 | | | $ | — | | | $ | — | |
| (a) | Amounts are disclosed by continent to highlight the impact of time zone differences between local market close and the calculation of NAV. Security valuations are based on the principal exchange or system on which they are traded, which may differ from country of domicile. |
For further information regarding security characteristics, see the Schedule of Investments.
4. AGREEMENTS AND AFFILIATED TRANSACTIONS
A. Management Agreement — Under the Agreement, GSAM manages the Fund, subject to the general supervision of the Trustees.
As compensation for the services rendered pursuant to the Agreement, the assumption of the expenses related thereto and administration of the Fund’s business affairs, including providing facilities, GSAM is entitled to a management fee, accrued daily and paid monthly, equal to an annual percentage rate of the Fund’s average daily net assets.
For the six months ended June 30, 2019, contractual and effective net management fees with GSAM were at the following rates:
| | | | | | | | | | | | | | | | | | | | | | |
| Contractual Management Rate | | | | | | | |
First
$2 billion | | | Next
$3 billion | | | Next
$3 billion | | | Over
$8 billion | | | Effective
Rate | | | Effective Net
Management Rate^ | |
| | | | | |
| | 0.77% | | | | 0.69 | % | | | 0.66 | % | | | 0.65 | % | | | 0.77 | % | | | 0.77 | % |
| ^ | Effective Net Management Rate includes the impact of management fee waivers of affiliated Underlying Funds, if any. |
17
GOLDMAN SACHS VARIABLE INSURANCE TRUST MID CAP VALUE FUND
Notes to Financial Statements(continued)
June 30, 2019 (Unaudited)
4. AGREEMENTS AND AFFILIATED TRANSACTIONS (continued)
The Fund invests in Institutional Shares of the Goldman Sachs Financial Square Government Fund, which is an affiliated Underlying Fund. GSAM has agreed to waive a portion of its management fee payable by the Fund in an amount equal to the management fee it earns as an investment adviser to the affiliated Underlying Fund in which the Fund invests, except those management fees it earns from the Fund’s investments of cash collateral received in connection with securities lending transactions in the Goldman Sachs Financial Square Government Fund. For the six months ended June 30, 2019, GSAM waived $6,673 of the Fund’s management fee.
B. Distribution and Service(12b-1) Plan— The Trust, on behalf of Service Shares of the Fund, has adopted a Distribution and Service Plan subject to Rule12b-1 under the Act. Under the Distribution and Service Plan, Goldman Sachs, which serves as distributor, is entitled to a fee accrued daily and paid monthly, for distribution services and personal and account maintenance services, which may then be paid by Goldman Sachs to authorized dealers, equal to, on an annual basis, 0.25% of the Fund’s average daily net assets attributable to Service Shares.
C. Transfer Agency Agreement— Goldman Sachs also serves as the transfer agent of the Fund for a fee pursuant to the Transfer Agency Agreement. The fees charged for such transfer agency services are accrued daily and paid monthly at an annual rate of 0.02% of the average daily net assets of Institutional and Service Shares.
D. Other Expense Agreements and Affiliated Transactions— GSAM has agreed to reduce or limit certain “Other Expenses” of the Fund (excluding acquired fund fees and expenses, transfer agency fees and expenses, service fees and shareholder administration fees (as applicable), taxes, interest, brokerage fees, expenses of shareholder meetings, litigation and indemnification, and extraordinary expenses) to the extent such expenses exceed, on an annual basis, a percentage rate of the average daily net assets of the Fund. Such Other Expense reimbursements, if any, are accrued daily and paid monthly. In addition, the Fund is not obligated to reimburse GSAM for prior fiscal year expense reimbursements, if any. The Other Expense limitation as an annual percentage rate of average daily net assets for the Fund is 0.054%. The Other Expense limitation will remain in place through at least April 30, 2020, and prior to such date GSAM may not terminate the arrangement without the approval of the Trustees. In addition, the Fund has entered into certain offset arrangements with the custodian and the transfer agent, which may result in a reduction of the Fund’s expenses and are received irrespective of the application of the “Other Expense” limitation described above.
For the six months ended June 30, 2019, these expense reductions, including any fee waivers and Other Expense reimbursements, were as follows:
| | | | | | | | | | | | | | |
Management Fee
Waiver | | | Custody Fee
Credits | | | Other Expense
Reimbursement | | | Total Expense
Reductions | |
| | | |
| $ | 6,673 | | | $ | 2,284 | | | $ | 54,868 | | | $ | 63,825 | |
E. Line of Credit Facility— As of June 30, 2019, the Fund participated in a $580,000,000 committed, unsecured revolving line of credit facility (the “facility”) together with other funds of the Trust and certain registered investment companies having management agreements with GSAM or its affiliates. This facility is to be used for temporary emergency purposes, or to allow for an orderly liquidation of securities to meet redemption requests. The interest rate on borrowings is based on the federal funds rate. The facility also requires a fee to be paid by the Fund based on the amount of the commitment that has not been utilized. For the six months ended June 30, 2019, the Fund did not have any borrowings under the facility. Prior to April 30, 2019 the facility was $770,000,000.
F. Other Transactions with Affiliates — For the six months ended June 30, 2019, Goldman Sachs earned $321 in brokerage commissions from portfolio transactions.
18
GOLDMAN SACHS VARIABLE INSURANCE TRUST MID CAP VALUE FUND
4. AGREEMENTS AND AFFILIATED TRANSACTIONS (continued)
The following table provides information about the Fund’s investments in the Goldman Sachs Financial Square Government Fund as of and for the six months ended June 30, 2019:
| | | | | | | | | | | | | | | | | | | | | | |
Beginning
Value as of
December 31, 2018 | | | Purchases
at Cost | | | Proceeds
from Sales | | | Ending
Value as of
June 30, 2019 | | |
Shares as of
June 30, 2019 | | | Dividend Income
from Affiliated
Investment Company | |
| | | | | |
| | $1,868,218 | | | $ | 129,643,152 | | | $ | (127,390,585 | ) | | $ | 4,120,785 | | | | 4,120,785 | | | $ | 97,488 | |
5. PORTFOLIO SECURITIES TRANSACTIONS
The cost of purchases and proceeds from sales and maturities of long-term securities for the six months ended June 30, 2019, were $309,291,484 and $255,402,064 respectively.
6. SECURITIES LENDING
The Fund may lend its securities through a securities lending agent, the Bank of New York Mellon (“BNYM”), to certain qualified borrowers. In accordance with the Fund’s securities lending procedures, the Fund receives cash collateral at least equal to the market value of the securities on loan. The market value of the loaned securities is determined at the close of business of the Fund, at their last sale price or official closing price on the principal exchange or system on which they are traded, and any additional required collateral is delivered to the Fund on the next business day. As with other extensions of credit, the Fund may experience delay in the recovery of its securities or incur a loss should the borrower of the securities breach its agreement with the Fund or become insolvent at a time when the collateral is insufficient to cover the cost of repurchasing securities on loan. Dividend income received from securities on loan may not be subject to withholding taxes and therefore withholding taxes paid may differ from the amounts listed in the Statement of Operations. Loans of securities are terminable at any time and as such 1) the remaining contractual maturities of the outstanding securities lending transactions are considered to be overnight and continuous and 2) the borrower, after notice, is required to return borrowed securities within the standard time period for settlement of securities transactions.
The Fund invests the cash collateral received in connection with securities lending transactions in the Goldman Sachs Financial Square Government Fund (“Government Money Market Fund”), an affiliated series of the Goldman Sachs Trust. The Government Money Market Fund is registered under the Act as an open end investment company, is subject to Rule2a-7 under the Act, and is managed by GSAM, for which GSAM may receive a management fee of up to 0.16% on an annualized basis of the average daily net assets of the Government Money Market Fund.
In the event of a default by a borrower with respect to any loan, BNYM may exercise any and all remedies provided under the applicable borrower agreement to make the Fund whole. These remedies include purchasing replacement securities by applying the collateral held from the defaulting broker against the purchase cost of the replacement securities. If BNYM is unable to purchase replacement securities, BNYM will indemnify the Fund by paying the Fund an amount equal to the market value of the securities loaned minus the value of cash collateral received from the borrower for the loan, subject to an exclusion for any shortfalls resulting from a loss of value in such cash collateral due to reinvestment risk. The Fund may enter into master netting agreements with borrowers, which provide the right, in the event of a default (including bankruptcy or insolvency), for thenon-defaulting party to liquidate the collateral and calculate net exposure to the defaulting party or request additional collateral. However, in the event of a default by a borrower, a resolution authority could determine that such rights are not enforceable due to the restrictions or prohibitions against the right ofset-off that may be imposed in accordance with a particular jurisdiction’s bankruptcy or insolvency laws. The Fund’s loaned securities were all subject to enforceable Securities Lending Agreements and the value of the collateral
19
GOLDMAN SACHS VARIABLE INSURANCE TRUST MID CAP VALUE FUND
Notes to Financial Statements(continued)
June 30, 2019 (Unaudited)
6. SECURITIES LENDING (continued)
was at least equal to the value of the cash received. The amounts of the Fund’s overnight and continuous agreements, which represent the gross amounts of recognized liabilities for securities lending transactions outstanding as of June 30, 2019, are disclosed as “Payable upon return of securities loaned” on the Statement of Assets and Liabilities, where applicable. The Fund did not have securities on loan as of June 30, 2019.
Both the Fund and BNYM received compensation relating to the lending of the Fund’s securities. The amounts earned, if any, by the Fund for the six months ended June 30, 2019, are reported under Investment Income on the Statement of Operations.
The following table provides information about the Fund’s investment in the Government Money Market Fund for the six months ended June 30, 2019:
| | | | | | | | | | | | | | |
Market Value
December 31, 2018 | | | Purchases
at Cost | | | Proceeds
from Sales | | | Market Value
June 30, 2019 | |
| | | |
| $ | — | | | $ | 2,718,516 | | | $ | (2,718,516 | ) | | $ | — | |
7. TAX INFORMATION
As of the Fund’s most recent fiscal year end, December 31, 2018, the Fund’s certain timing differences, on atax-basis were as follows:
| | | | |
| |
| Timing differences (Post October Loss Deferral/Deferred Dividend) | | $ | (3,247,996 | ) |
As of June 30, 2019, the Fund’s aggregate security unrealized gains and losses based on cost for U.S. federal income tax purposes were as follows:
| | | | |
| Tax cost | | $ | 445,891,876 | |
| Gross unrealized gain | | | 69,720,166 | |
| Gross unrealized loss | | | (9,991,507 | ) |
| Net unrealized gain | | $ | 59,728,659 | |
The difference between GAAP-basis andtax-basis unrealized gains (losses) is attributable primarily to wash sales and differences in the tax treatment of underlying fund investments.
GSAM has reviewed the Fund’s tax positions for all open tax years (the current and prior three years, as applicable) and has concluded that no provision for income tax is required in the Fund’s financial statements. Such open tax years remain subject to examination and adjustment by tax authorities.
8. OTHER RISKS
The Fund’s risks include, but are not limited to, the following:
Investments in Other Investment Companies Risk — As a shareholder of another investment company, the Fund will indirectly bear its proportionate share of any net management fees and other expenses paid by such other investment companies, in addition to the fees and expenses regularly borne by the Fund.
Large Shareholder Transactions Risk — The Fund may experience adverse effects when certain large shareholders, such as other funds, participating insurance companies, accounts and Goldman Sachs affiliates, purchase or redeem large amounts of shares of the Fund. Such large shareholder redemptions, which may occur rapidly or unexpectedly, may cause the Fund to sell portfolio securities at times when it would not otherwise do so, which may negatively impact the Fund’s NAV and liquidity. These
20
GOLDMAN SACHS VARIABLE INSURANCE TRUST MID CAP VALUE FUND
8. OTHER RISKS (continued)
transactions may also accelerate the realization of taxable income to shareholders if such sales of investments resulted in gains, and may also increase transaction costs. In addition, a large redemption could result in the Fund’s current expenses being allocated over a smaller asset base, leading to an increase in the Fund’s expense ratio. Similarly, large Fund share purchases may adversely affect the Fund’s performance to the extent that the Fund is delayed in investing new cash or otherwise maintains a larger cash position than it ordinarily would.
Liquidity Risk — The Fund may make investments that are illiquid or that may become less liquid in response to market developments or adverse investor perceptions. Illiquid investments may be more difficult to value. Liquidity risk may also refer to the risk that the Fund will not be able to pay redemption proceeds within the allowable time period or without significant dilution to remaining investors’ interests because of unusual market conditions, an unusually high volume of redemption requests, or other reasons. To meet redemption requests, the Fund may be forced to sell investments at an unfavorable time and/or under unfavorable conditions. If the Fund is forced to sell securities at an unfavorable time and/or under unfavorable conditions, such sales may adversely affect the Fund’s NAV and dilute remaining investors’ interests. Redemptions by large shareholders may have a negative impact on the Fund’s liquidity.
Market and Credit Risks — In the normal course of business, the Fund trades financial instruments and enters into financial transactions where risk of potential loss exists due to changes in the market (market risk). Additionally, the Fund may also be exposed to credit risk in the event that an issuer or guarantor fails to perform or that an institution or entity with which the Fund has unsettled or open transactions defaults.
Master Limited Partnership Risk — Investments in securities of MLPs involve risks that differ from investments in common stock, including risks related to limited control and limited rights to vote on matters affecting the MLP, risks related to potential conflicts of interest between the MLP and the MLP’s general partner, cash flow risks, dilution risks, limited liquidity and risks related to the general partner’s right to require unit-holders to sell their common units at an undesirable time or price.
9. INDEMNIFICATIONS
Under the Trust’s organizational documents, its Trustees, officers, employees and agents are indemnified, to the extent permitted by the Act and state law, against certain liabilities that may arise out of performance of their duties to the Fund. Additionally, in the course of business, the Fund enters into contracts that contain a variety of indemnification clauses. The Fund’s maximum exposure under these arrangements is unknown, as this would involve future claims that may be made against the Fund that have not yet occurred. However, GSAM believes the risk of loss under these arrangements to be remote.
10. SUBSEQUENT EVENTS
Subsequent events after the Statement of Assets and Liabilities date have been evaluated, and GSAM has concluded that there is no impact requiring adjustment or disclosure in the financial statements.
21
GOLDMAN SACHS VARIABLE INSURANCE TRUST MID CAP VALUE FUND
Notes to Financial Statements(continued)
June 30, 2019 (Unaudited)
11. SUMMARY OF SHARE TRANSACTIONS
Share activity is as follows:
| | | | | | | | | | | | | | | | |
| | | For the Six Months Ended
June 30, 2019
(Unaudited) | | | For the Fiscal Year Ended
December 31, 2018 | |
| | | Shares | | | Dollars | | | Shares | | | Dollars | |
| Institutional Shares | | | | | | | | | | | | | | | | |
| Shares sold | | | 276,038 | | | $ | 4,000,616 | | | | 447,011 | | | $ | 7,502,741 | |
| Reinvestment of distributions | | | — | | | | — | | | | 3,486,201 | | | | 45,878,403 | |
| Shares redeemed | | | (2,192,680 | ) | | | (32,513,822 | ) | | | (3,628,101 | ) | | | (61,276,824 | ) |
| | | | (1,916,642 | ) | | | (28,513,206 | ) | | | 305,111 | | | | (7,895,680 | ) |
| Service Shares | | | | | | | | | | | | | | | | |
| Shares sold | | | 5,909,073 | | | | 87,395,718 | | | | 1,545,842 | | | | 25,910,816 | |
| Reinvestment of distributions | | | — | | | | — | | | | 828,918 | | | | 11,008,040 | |
| Shares redeemed | | | (744,893 | ) | | | (10,842,656 | ) | | | (13,353,565 | ) | | | (221,808,147 | ) |
| Shares redeemed in connection within-kind transactions | | | — | | | | — | | | | (5,605,787 | ) | | | (93,560,594 | ) |
| | | | 5,164,180 | | | | 76,553,062 | | | | (16,584,592 | ) | | | (278,449,885 | ) |
| | | | |
| NET INCREASE (DECREASE) | | | 3,247,538 | | | $ | 48,039,856 | | | | (16,279,481 | ) | | $ | (286,345,565 | ) |
22
GOLDMAN SACHS VARIABLE INSURANCE TRUST MID CAP VALUE FUND
| | |
| Fund Expenses — Six Month Period Ended June 30, 2019 (Unaudited) | | |
As a shareholder of Institutional or Service Shares of the Fund, you incur ongoing costs, including management fees, distribution and/or service(12b-1) fees (with respect to Service Shares) and other Fund expenses. This example is intended to help you understand your ongoing costs (in dollars) of investing in Institutional Shares and Service Shares of the Fund and to compare these costs with the ongoing costs of investing in other mutual funds.
The example is based on an investment of $1,000 invested at the beginning of the period and held for the entire period from January 1, 2019 through June 30, 2019, which represents a period of 181 days of a 365 day year.
Actual Expenses — The first line under each share class in the table below provides information about actual account values and actual expenses. You may use the information in this line, together with the amount you invested, to estimate the expenses that you paid over the period. Simply divide your account value by $1,000 (for example, an $8,600 account value divided by $1,000=8.6), then multiply the result by the number in the first line under the heading entitled “Expenses Paid” to estimate the expenses you paid on your account during this period.
Hypothetical Example for Comparison Purposes — The second line under each share class in the table below provides information about hypothetical account values and hypothetical expenses based on the Fund’s actual net expense ratio and an assumed rate of return of 5% per year before expenses, which is not the Fund’s actual return. The hypothetical account values and expenses may not be used to estimate the actual ending account balance or expenses you paid for the period. You may use this information to compare the ongoing costs of investing in the Fund and other funds. To do so, compare this 5% hypothetical example with the 5% hypothetical examples that appear in the shareholder reports of the other funds.
Please note that the expenses shown in the table are meant to highlight your ongoing costs only. As a shareholder of the Fund you do not incur any transaction costs, such as sales charges, redemption fees, or exchange fees, but shareholders of other funds may incur such costs. The second line of the table is useful in comparing ongoing costs only and will not help you determine the relative total costs of owning different funds whose shareholders may incur transaction costs.
| | | | | | | | | | | | |
| Share Class | | Beginning
Account Value
01/01/19 | | | Ending
Account Value
06/30/19 | | | Expenses Paid
for the
6 Months
Ended
06/30/19* | |
| Institutional | | | | | | | | | | | | |
| | | | |
| Actual | | $ | 1,000 | | | $ | 1,207.10 | | | $ | 4.60 | |
| Hypothetical 5% return | | | 1,000 | | | | 1,020.63 | + | | | 4.21 | |
| Service | | | | | | | | | | | | |
| | | | |
| Actual | | | 1,000 | | | | 1,206.00 | | | | 5.96 | |
| Hypothetical 5% return | | | 1,000 | | | | 1,019.39 | + | | | 5.46 | |
| | + | Hypothetical expenses are based on the Fund’s actual annualized net expense ratios and an assumed rate of return of 5% per year before expenses. | |
| | * | Expenses are calculated using the Fund’s annualized net expense ratio for each class, which represents the ongoing expenses as a percentage of net assets for the six months ended June 30, 2019. Expenses are calculated by multiplying the annualized net expense ratio by the average account value for the period; then multiplying the result by the number of days in the most recent fiscal half year; and then dividing that result by the number of days in the fiscal year. The annualized net expense ratios for the period were 0.84% and 1.09% for Institutional and Service Shares, respectively. | |
23
GOLDMAN SACHS VARIABLE INSURANCE TRUST MID CAP VALUE FUND
Statement Regarding Basis for Approval of Management Agreement (Unaudited)
Background
The Goldman Sachs Mid Cap Value Fund (the “Fund”) is an investment portfolio of Goldman Sachs Variable Insurance Trust (the “Trust”). The Board of Trustees oversees the management of the Trust and reviews the investment performance and expenses of the Fund at regularly scheduled meetings held throughout the year. In addition, the Board of Trustees determines annually whether to approve the continuance of the Trust’s investment management agreement (the “Management Agreement”) with Goldman Sachs Asset Management, L.P. (the “Investment Adviser”) on behalf of the Fund.
The Management Agreement was most recently approved for continuation until June 30, 2020 by the Board of Trustees, including those Trustees who are not parties to the Management Agreement or “interested persons” (as defined in the Investment Company Act of 1940, as amended) of any party thereto (the “Independent Trustees”), at a meeting held onJune 11-12, 2019 (the “Annual Meeting”).
The review process undertaken by the Trustees spans the course of the year and culminates with the Annual Meeting. To assist the Trustees in their deliberations, the Trustees have established a Contract Review Committee (the “Committee”), comprised of the Independent Trustees. The Committee held four meetings over the course of the year since the Management Agreement was last approved. At those Committee meetings, regularly scheduled Board or other committee meetings, and/or the Annual Meeting, matters relevant to the renewal of the Management Agreement were considered by the Board, or the Independent Trustees, as applicable. With respect to the Fund, such matters included:
| | (a) | | the nature and quality of the advisory, administrative, and other services provided to the Fund by the Investment Adviser and its affiliates, including information about: |
| | (i) | | the structure, staff, and capabilities of the Investment Adviser and its portfolio management teams; |
| | (ii) | | the groups within the Investment Adviser and its affiliates that support the portfolio management teams or provide other types of necessary services, including fund services groups (e.g., accounting and financial reporting, tax, shareholder services, and operations); controls and risk management groups (e.g., legal, compliance, valuation oversight, credit risk management, internal audit, compliance testing, market risk analysis, finance, and central funding); sales and distribution support groups, and others (e.g., information technology and training); |
| | (iii) | | trends in employee headcount; |
| | (iv) | | the Investment Adviser’s financial resources and ability to hire and retain talented personnel and strengthen its operations; and |
| | (v) | | the parent company’s support of the Investment Adviser and its mutual fund business, as expressed by the firm’s senior management; |
(b) information on the investment performance of the Fund, including comparisons to the performance of similar mutual funds, as provided by a third-party mutual fund data provider engaged as part of the contract review process (the “Outside Data Provider”), a benchmark performance index and a composite of accounts with comparable investment strategies managed by the Investment Adviser; and information on general investment outlooks in the markets in which the Fund invests;
(c) information provided by the Investment Adviser indicating the Investment Adviser’s views on whether the Fund’s peer group and/or benchmark index had high, medium, or low relevance given the Fund’s particular investment strategy;
(d) the terms of the Management Agreement and other agreements with affiliated service providers entered into by the Trust on behalf of the Fund;
(e) fee and expense information for the Fund, including:
| | (i) | | the relative management fee and expense levels of the Fund as compared to those of comparable funds managed by other advisers, as provided by the Outside Data Provider; |
| | (ii) | | the Fund’s expense trends over time; and |
| | (iii) | | to the extent the Investment Adviser manages other types of accounts (such as bank collective trusts, private wealth management accounts, institutional separate accounts,sub-advised mutual funds, andnon-U.S. funds) having investment objectives and policies similar to those of the Fund, comparative information on the advisory fees charged and services provided to those accounts by the Investment Adviser; |
| | (f) | | with respect to the extensive investment performance and expense comparison data provided by the Outside Data Provider, its processes in producing that data for the Fund; |
| | (g) | | the undertakings of the Investment Adviser and its affiliates to implement fee waivers and/or expense limitations; |
| | (h) | | information relating to the profitability of the Management Agreement and the transfer agency and distribution and service arrangements of the Fund to the Investment Adviser and its affiliates; |
(i) whether the Fund’s existing management fee schedule adequately addressed any economies of scale;
24
GOLDMAN SACHS VARIABLE INSURANCE TRUST MID CAP VALUE FUND
Statement Regarding Basis for Approval of Management Agreement (Unaudited) (continued)
| | (j) | | a summary of the“fall-out” benefits derived by the Investment Adviser and its affiliates from their relationships with the Fund, including the fees received by the Investment Adviser’s affiliates from the Fund for transfer agency, portfolio trading, distribution and other services; |
| | (k) | | a summary of potential benefits derived by the Fund as a result of its relationship with the Investment Adviser; |
| | (l) | | information regarding commissions paid by the Fund and broker oversight, an update on the Investment Adviser’s soft dollars practices, other information regarding portfolio trading, and how the Investment Adviser carries out its duty to seek best execution; |
| | (m) | | the manner in which portfolio manager compensation is determined; and the number and types of accounts managed by the portfolio managers; |
| | (n) | | the nature and quality of the services provided to the Fund by its unaffiliated service providers, and the Investment Adviser’s general oversight and evaluation (including reports on due diligence) of those service providers as part of the administrative services provided under the Management Agreement; and |
| | (o) | | the Investment Adviser’s processes and policies addressing various types of potential conflicts of interest; its approach to risk management; the annual review of the effectiveness of the Fund’s compliance program; and periodic compliance reports. |
The Trustees also received an overview of the Fund’s distribution arrangements. They received information regarding the Fund’s assets, share purchase and redemption activity, and payment of distribution and service fees. Information was also provided to the Trustees relating to revenue sharing payments made by and services provided by the Investment Adviser and its affiliates to intermediaries that promote the sale, distribution, and/or servicing of Fund shares. The Independent Trustees also discussed the broad range of other investment choices that are available to Fund investors, including the availability of comparable funds managed by other advisers.
The presentations made at the Board and Committee meetings and at the Annual Meeting encompassed the Fund and other mutual funds for which the Board of Trustees has responsibility. In evaluating the Management Agreement at the Annual Meeting, the Trustees relied upon their knowledge, resulting from their meetings and other interactions throughout the year, of the Investment Adviser and its affiliates, their services, and the Fund. In conjunction with these meetings, the Trustees received written materials and oral presentations on the topics covered, and the Investment Adviser addressed the questions and concerns of the Trustees, including concerns regarding the investment performance of certain of the funds they oversee. The Independent Trustees were advised by their independent legal counsel regarding their responsibilities and other regulatory requirements related to the approval and continuation of mutual fund investment management agreements under applicable law. In addition, the Investment Adviser and its affiliates provided the Independent Trustees with a written response to a formal request for information sent on behalf of the Independent Trustees by their independent legal counsel. During the course of their deliberations, the Independent Trustees met in executive sessions with their independent legal counsel, without representatives of the Investment Adviser or its affiliates present.
Nature, Extent, and Quality of the Services Provided Under the Management Agreement
As part of their review, the Trustees considered the nature, extent, and quality of the services provided to the Fund by the Investment Adviser. In this regard, the Trustees considered both the investment advisory services andnon-advisory services that are provided by the Investment Adviser and its affiliates. The Trustees noted the transition in the leadership and changes in personnel of various of the Investment Adviser’s portfolio management teams that had occurred in recent periods, and the ongoing recruitment efforts aimed at bringing high quality investment talent to the Investment Adviser. They also noted the Investment Adviser’s commitment to maintaining high quality systems and expending substantial resources to respond to ongoing changes to the regulatory and control environment in which the Fund and its service providers operate, as well as the efforts of the Investment Adviser and its affiliates to combat cyber security risks. The Trustees concluded that the Investment Adviser continued to commit substantial financial and operational resources to the Fund and expressed confidence that the Investment Adviser would continue to do so in the future. The Trustees also recognized that the Investment Adviser had made significant commitments to address regulatory compliance requirements applicable to the Fund and the Investment Adviser and its affiliates.
Investment Performance
The Trustees also considered the investment performance of the Fund. In this regard, they compared the investment performance ofthe Fund to its peers usingrankings and ratings compiled by the Outside Data Provider as of December 31, 2018, and updated performance information prepared by the Investment Adviser using the peer group identified by the Outside Data Provider as of March 31, 2019. The information on the Fund’s investment performance was providedfor theone-, three-, five-, andten-year periods ending on the applicable dates. The Trustees also reviewed the Fund’s investment performance relative to its performance benchmark. As part of this review, they considered the investment performance trends of the Fund overtime, and
25
GOLDMAN SACHS VARIABLE INSURANCE TRUST MID CAP VALUE FUND
Statement Regarding Basis for Approval of Management Agreement (Unaudited) (continued)
reviewed the investment performance of the Fund in light of its investment objective and policies and market conditions. The Trustees also received information comparing the Fund’s performance to that of a composite of accounts with comparable investment strategies managed by the Investment Adviser.
In addition, the Trustees considered materials prepared and presentations made by the Investment Adviser’s senior management and portfolio management personnel in which Fund performance was assessed. The Trustees also considered the Investment Adviser’s periodic reports with respect to the Fund’s risk profile, and how the Investment Adviser’s approach to risk monitoring and management influences portfolio management.
The Trustees observed that the Fund’s Institutional Shares had placed in the top half of its peer group for theone-year period and in the third quartile for the three-, five-, andten-year periods, and had outperformed the Fund’s benchmark index for theone-year period and underperformed for the three-, five-, andten-year periods ended March 31, 2019. They also noted that the Fund had experienced certain portfolio management changes in 2018.
Costs of Services Provided and Competitive Information
The Trustees considered the contractual terms of the Management Agreement and the fee rates payable by the Fund thereunder. In this regard, the Trustees considered information on the services rendered by the Investment Adviser to the Fund, which included both advisory and administrative services that were directed to the needs and operations of the Fund as a registered mutual fund.
In particular, the Trustees reviewed analyses prepared by the Outside Data Provider regarding the expense rankings of the Fund. The analyses provided a comparison of the Fund’s management fee and breakpoints to those of a relevant peer group and category universe; an expense analysis which compared the Fund’s overall net and gross expenses to a peer group and a category universe; and data comparing the Fund’s net expenses to the peer and category medians. The analyses also compared the Fund’s other expenses and fee waivers/reimbursements to those of the peer group and category medians. The Trustees concluded that the comparisons provided by the Outside Data Provider were useful in evaluating the reasonableness of the management fees and total expenses paid by the Fund.
In addition, the Trustees considered the Investment Adviser’s undertakings to implement fee waivers and/or expense limitations. They also considered, to the extent that the Investment Adviser manages other types of accounts having investment objectives and policies similar to those of the Fund, comparative fee information for services provided by the Investment Adviser to those accounts, and information that indicated that services provided to the Fund differed in various significant respects from the services provided to other types of accounts which, in many cases, operated under less stringent legal and regulatory structures, required fewer services from the Investment Adviser to a smaller number of client contact points, and were less time-intensive.
In addition, the Trustees noted that shareholders are able to redeem their Fund shares at any time if shareholders believe that the Fund fees and expenses are too high or if they are dissatisfied with the performance of the Fund.
Profitability
The Trustees reviewed the Fund’s contribution to the Investment Adviser’s revenues andpre-tax profit margins. In this regard the Trustees noted that they had received, among other things, profitability analyses and summaries, revenue and expense schedules by Fund and by function (i.e., investment management, transfer agency and distribution and service), and information on the Investment Adviser’s expense allocation methodology. They observed that the profitability and expense figures are substantially similar to those used by the Investment Adviser for many internal purposes, including compensation decisions among various business groups, and are thus subject to a vigorous internal debate about how certain revenue and expenses should be allocated. The Trustees also noted that the internal audit group within the Goldman Sachs organization periodically audits the expense allocation methodology and that the internal audit group was satisfied with the reasonableness, consistency, and accuracy of the Investment Adviser’s expense allocation methodology. Profitability data for the Fund was provided for 2018 and 2017, and the Trustees considered this information in relation to the Investment Adviser’s overall profitability.
Economies of Scale
The Trustees considered the information that had been provided regarding whether there have been economies of scale with respect to the management of the Fund. The Trustees also considered the breakpoints in the fee rate payable under the Management Agreement for the Fund at the following annual percentage rates of the average daily net assets of the Fund:
| | | | |
| |
| First $2 billion | | | 0.77 | % |
| |
| Next $3 billion | | | 0.69 | |
| |
| Next $3 billion | | | 0.66 | |
| |
| Over $8 billion | | | 0.65 | |
26
GOLDMAN SACHS VARIABLE INSURANCE TRUST MID CAP VALUE FUND
Statement Regarding Basis for Approval of Management Agreement (Unaudited) (continued)
The Trustees noted that the breakpoints were designed to share potential economies of scale, if any, with the Fund and its shareholders as assets under management reach those asset levels. The Trustees considered the amounts of assets in the Fund; the Fund’s recent share purchase and redemption activity; the information provided by the Investment Adviser relating to the costs of the services provided by the Investment Adviser and its affiliates and their realized profits; information comparing fee rates charged by the Investment Adviser with fee rates charged to other funds in the peer group; and the Investment Adviser’s undertaking to limit certain expenses of the Fund that exceed a specified level. Upon reviewing these matters at the Annual Meeting, the Trustees concluded that the fee breakpoints represented a means of assuring that benefits of scalability, if any, would be passed along to shareholders at the specified asset levels.
Other Benefits to the Investment Adviser and Its Affiliates
The Trustees also considered the other benefits derived by the Investment Adviser and its affiliates from their relationships with the Fund as stated above, including: (a) transfer agency fees received by Goldman Sachs & Co. LLC (“Goldman Sachs”); (b) brokerage and futures commissions earned by Goldman Sachs for executing securities and futures transactions on behalf of the Fund; (c) research received by the Investment Adviser from broker-dealers in exchange for executing certain transactions on behalf of the Fund; (d) trading efficiencies resulting from aggregation of orders of the Fund with those for other funds or accounts managed by the Investment Adviser; (e) fees earned by the Investment Adviser for managing the fund in which the Fund’s securities lending cash collateral is invested; (f) the Investment Adviser’s ability to leverage the infrastructure designed to service the Fund on behalf of its other clients; (g) the Investment Adviser’s ability to cross-market other products and services to Fund shareholders; (h) Goldman Sachs’ retention of certain fees as Fund Distributor; (i) the Investment Adviser’s ability to negotiate better pricing with custodians on behalf of its other clients, as a result of the relationship with the Fund; and (j) the possibility that the working relationship between the Investment Adviser and the Fund’s third-party service providers may cause those service providers to be more likely to do business with other areas of Goldman Sachs. In the course of considering the foregoing, the Independent Trustees requested and received further information quantifying certain of thesefall-out benefits.
Other Benefits to the Fund and Its Shareholders
The Trustees also noted that the Fund receives certain other potential benefits as a result of its relationship with the Investment Adviser, including: (a) trading efficiencies resulting from aggregation of orders of the Fund with those of other funds or accounts managed by the Investment Adviser; (b) enhanced servicing from vendors due to the volume of business generated by the Investment Adviser and its affiliates; (c) enhanced servicing from broker-dealers due to the volume of business generated by the Investment Adviser and its affiliates; (d) the Investment Adviser’s ability to negotiate favorable terms with derivatives counterparties on behalf of the Fund as a result of the size and reputation of the Goldman Sachs organization; (e) the advantages received from the Investment Adviser’s knowledge and experience gained from managing other accounts and products; (f) the Investment Adviser’s ability to hire and retain qualified personnel to provide services to the Fund because of the reputation of the Goldman Sachs organization; (g) the Fund’s access, through the Investment Adviser, to certain firm-wide resources (e.g., proprietary risk management systems and databases), subject to certain restrictions; and (h) the Fund’s access to certain affiliated distribution channels. In addition, the Trustees noted the competitive nature of the mutual fund marketplace, and considered that many of the Fund’s shareholders invested in the Fund in part because of the Fund’s relationship with the Investment Adviser and that those shareholders have a general expectation that the relationship will continue.
Conclusion
In connection with their consideration of the Management Agreement, the Trustees gave weight to each of the factors described above, but did not identify any particular factor as controlling their decision. After deliberation and consideration of all of the information provided, including the factors described above, the Trustees concluded, in the exercise of their business judgment, that the management fees paid by the Fund were reasonable in light of the services provided to it by the Investment Adviser, the Investment Adviser’s costs and the Fund’s current and reasonably foreseeable asset levels. The Trustees unanimously concluded that the Investment Adviser’s continued management likely would benefit the Fund and its shareholders and that the Management Agreement should be approved and continued with respect to the Fund until June 30, 2020.
27
| | |
| TRUSTEES | | OFFICERS |
Jessica Palmer,Chair Kathryn A. Cassidy Diana M. Daniels James A. McNamara Roy W. Templin Gregory G. Weaver | | James A. McNamara,President Joseph F. DiMaria,Principal Financial Officer, Principal Accounting Officer and Treasurer Caroline L. Kraus,Secretary |
GOLDMAN SACHS & CO. LLC
Distributor and Transfer Agent
GOLDMAN SACHS ASSET MANAGEMENT, L.P.
Investment Adviser
200 West Street, New York
New York 10282
Visit our web site at www.GSAMFUNDS.com to obtain the most recentmonth-end returns.
The reports concerning the Fund included in this shareholder report may contain certain forward-looking statements about the factors that may affect the performance of the Fund in the future. These statements are based on Fund management’s predictions and expectations concerning certain future events and their expected impact on the Fund, such as performance of the economy as a whole and of specific industry sectors, changes in the levels of interest rates, the impact of developing world events, and other factors that may influence the future performance of the Fund. Management believes these forward-looking statements to be reasonable, although they are inherently uncertain and difficult to predict. Actual events may cause adjustments in portfolio management strategies from those currently expected to be employed.
A description of the policies and procedures that the Fund uses to determine how to vote proxies relating to portfolio securities and information regarding how the Fund voted proxies relating to portfolio securities for the12-month period ended June 30 is available (i) without charge, upon request by calling1-800-621-2550; and (ii) on the Securities and Exchange Commission (“SEC”) web site athttp://www.sec.gov.
The Fund will file its portfolio holdings information for each month in a fiscal quarter within 60 days after the end of the relevant fiscal quarter on Form N-PORT. Portfolio holdings information for the third month of each fiscal quarter will be made available on the SEC’s web site at http://www.sec.gov. Portfolio holdings information may be obtained upon request and without charge by calling 1-800-526-7384 (for Retail Shareholders) or 1-800-621-2550 (for Institutional Shareholders).
Views and opinions expressed are for informational purposes only and do not constitute a recommendation by GSAM to buy, sell, or hold any security. Views and opinions are current as of the date of this presentation and may be subject to change, they should not be construed as investment advice.
Goldman Sachs & Co. LLC (“Goldman Sachs”) does not provide legal, tax or accounting advice. Any statement contained in this communication (including any attachments) concerning U.S. tax matters was not intended or written to be used, and cannot be used, for the purpose of avoiding penalties under the Internal Revenue Code, and was written to support the promotion or marketing of transaction or matter addressed. Clients of Goldman Sachs should obtain their own independent tax advice based on their particular circumstances.
The website links provided are for your convenience only and are not an endorsement or recommendation by GSAM of any of these websites or the products or services offered. GSAM is not responsible for the accuracy and validity of the content of these websites.
Fund holdings and allocations shown are as of June 30, 2019 and may not be representative of future investments. Fund holdings should not be relied on in making investment decisions and should not be construed as research or investment advice regarding particular securities. Current and future holdings are subject to risk.
References to indices, benchmarks or other measures of relative market performance over a specified period of time are provided for your information only and do not imply that the portfolio will achieve similar results. The index composition may not reflect the manner in which a portfolio is constructed. While an adviser seeks to design a portfolio which reflects appropriate risk and return features, portfolio characteristics may deviate from those of the benchmark.
The Global Industry Classification Standard (“GICS”) was developed by and is the exclusive property and a service mark of Morgan Stanley Capital International Inc. (“MSCI”) and Standard & Poor’s, a division of The McGraw-Hill Companies, Inc. (“S&P”) and is licensed for use by Goldman Sachs. Neither MSCI, S&P nor any other party involved in making or compiling the GICS or any GICS classifications makes any express or implied warranties or representations with respect to such standard or classification (or the results to be obtained by the use thereof), and all such parties hereby expressly disclaim all warranties of originality, accuracy, completeness, merchantability or fitness for a particular purpose with respect to any of such standard or classification. Without limiting any of the foregoing, in no event shall MSCI, S&P, any of their affiliates or any third party involved in making or compiling the GICS or any GICS classifications have any liability for any direct, indirect, special, punitive, consequential or any other damages (including lost profits) even if notified of the possibility of such damages.
The portfolio risk management process includes an effort to monitor and manage risk, but does not imply low risk.
Shares of the Goldman Sachs VIT Funds are offered to separate accounts of participating life insurance companies for the purpose of funding variable annuity contracts and variable life insurance policies. Shares of the Fund are not offered directly to the general public. The variable annuity contracts and variable life insurance policies are described in the separate prospectuses issued by participating insurance companies. You should refer to those prospectuses for information about surrender charges, mortality and expense risk fees and other charges that may be assessed by participating insurance companies under the variable annuity contracts or variable life insurance policies. Such fees or charges, if any, may affect the return you may realize with respect to your investments. Ask your representative for more complete information. Please consider a fund’s objectives, risks and charges and expenses, and read the prospectus carefully before investing. The prospectus contains this and other information about the Fund.
This material is not authorized for distribution to prospective investors unless preceded or accompanied by a current prospectus or summary prospectus, if applicable. Investors should consider the Fund’s objective, risks, and charges and expenses, and read the summary prospectus, if available, and/or the prospectus carefully before investing or sending money. The summary prospectus, if available, and the prospectus contain this and other information about the Fund and may be obtained from your authorized dealer or from Goldman Sachs & Co. LLC by calling1-800-621-2550.
This report is prepared for the general information of contract owners and is not an offer of shares of the Goldman Sachs Variable Insurance Trust — Goldman Sachs Mid Cap Value Fund.
© 2019 Goldman Sachs. All rights reserved.
VITMCVSAR-19/175370-OTU-1025569
Goldman
SachsVariable Insurance Trust
Goldman Sachs Government
Money Market Fund
Beginning on or after January 1, 2021, you may not receive paper copies of the Fund’s annual and semi-annual shareholder reports from the insurance company that offers your variable insurance contract or your financial intermediary, unless you specifically request paper copies of the reports from the insurance company or from your financial intermediary. Instead, the reports will be made available on a website, and you will be notified by mail each time a report is posted and provided with a website link to access the report.
If you already elected to receive shareholder reports electronically, you will not be affected by this change and you need not take any action. At any time, you may elect to receive reports and certain communications from the insurance company electronically by contacting your insurance company or your financial intermediary.
You may elect to receive all future shareholder reports in paper free of charge. You can inform the insurance company or your financial intermediary that you wish to receive paper copies of reports. Your election to receive reports in paper will apply to all Goldman Sachs Funds available under your contract and may apply to all funds held with your financial intermediary.
Semi-Annual Report
June 30, 2019

You could lose money by investing in the Fund. Although the Fund seeks to preserve the value of your investment at $1.00 per share, it cannot guarantee it will do so. An investment in the Fund is not a deposit of the bank and is not insured or guaranteed by the Federal Deposit Insurance Corporation or any other government agency. The Fund’s sponsor has no legal obligation to provide financial support to the Fund, and you should not expect that the sponsor will provide financial support to the Fund at any time.
GOLDMAN SACHS VARIABLE INSURANCE TRUST GOVERNMENT MONEY MARKET FUND
INVESTMENT OBJECTIVE
The Fund seeks to maximize current income to the extent consistent with the preservation of capital and the maintenance of liquidity by investing exclusively in high quality money market instruments.
Portfolio Management Discussion and Analysis
Below, the Goldman Sachs Money Market Portfolio Management Team discusses the Goldman Sachs Variable Insurance Trust — Goldman Sachs Government Money Market Fund’s (the “Fund”) performance and positioning for thesix-month period ended June 30, 2019 (the “Reporting Period”).
How did the Fund perform during the Reporting Period?
The Fund’s Institutional Shares’ standardized7-day current yield was 2.27% and their standardized7-day effective yield was 2.30% as of June 30, 2019. The Institutional Shares’one-month simple average yield was 2.29% as of June 30, 2019. The Institutional Shares’7-day distribution yield as of June 30, 2019 was 2.31%.
The Fund’s Service Shares’ standardized7-day current yield was 2.02% and their standardized7-day effective yield was 2.04% as of June 30, 2019. The Service Shares’one-month simple average yield was 2.04% as of June 30, 2019. The Service Shares’7-day distribution yield as of June 30, 2019 was 2.06%.
The yields represent past performance. Past performance does not guarantee future results. Current performance may be lower or higher than the performance quoted above.
Yields will fluctuate as market conditions change. The yield quotations more closely reflect the current earnings of the Fund than total return quotations.
What economic and market factors most influenced the money markets as a whole during the Reporting Period?
The Reporting Period was one wherein money market yields rose. In a rather significant shift from their stance in 2018, both the U.S. Federal Reserve (the “Fed”) and the European Central Bank (“ECB”) kept their respective monetary policies unchanged during the Reporting Period and adopted an increasingly dovish bias as the months progressed in an effort to maintain financial stability following the heightened market volatility of the fourth quarter of 2018. (Dovish tends to imply lower interest rates; opposite of hawkish.) For example, in January 2019, the Fed left its monetary policy unchanged and also eliminated language about “further gradual increases in rates,” cementing investor expectations for a near-term pause in rate hikes. Fed Chair Jerome Powell emphasized that the U.S. central bank would be largely guided by inflation indicators as well as by the global economic growth backdrop and the potential for financial market volatility. In March 2019, the Fed paused its near-term fed funds rate increases, announcing it expected no rate increases during 2019 and only one in 2020. In the subsequent months of the Reporting Period, the release of minutes from the Fed’s meetings confirmed policymakers’ dovish tilt. At the Fed’s June 2019 meeting, the median projected hiking path in the U.S. declined, with eight Fed participants projecting interest rate cuts in 2019.
Similarly, the ECB extended its forward guidance, noting that its interest rates would remain unchanged through 2019. In June 2019, a dovish speech by outgoing ECB President Mario Draghi signaled forthcoming easing in the Euro area, as concerns around the global economic growth outlook lingered. Other developed markets’ central banks also turned dovish.
Other significant events that influenced the money markets during the Reporting Period included the continuation of the Fed’s balance sheet normalization as well as corporate tax reform and the regulatory backdrop. (Balance sheet normalization refers to the steps the Fed is taking to reverse quantitative easing and removed the substantial monetary accommodation it has provided to the economy since the financial crisis began in 2007.) The Fed said it expected to slow its balance sheet runoff plan beginning in May 2019 and stop it completely by September 2019. Further, the management teams of multinational corporations faced increased pressure to make decisions regarding cash investments due to aone-time repatriation tax and considerations of excess cash returning to the U.S. It appeared that many investors began looking at cash flow management practices, investment policies and new investment options, including various money market mutual funds.
During the Reporting Period overall, the money market yield curve, or spectrum of maturities, flattened, meaning yields on shorter-term maturities rose more than those on longer-term maturities. However, the money market yield curve actually inverted toward
1
GOLDMAN SACHS VARIABLE INSURANCE TRUST GOVERNMENT MONEY MARKET FUND
the end of the Reporting Period — meaning yields on shorter-term maturities were higher than those on longer-term maturities, as the market priced in an increasingly dovish Fed.
What key factors were responsible for the Fund’s performance during the Reporting Period?
While the targeted federal funds rate remained steady at a range of 2.25% to 2.50%, the Fund’s yields rose during the Reporting Period due primarily to the economic and market factors discussed above. As the money market yield curve flattened and then inverted, there remained little difference in yields between maturities. The Fund remained highly liquid throughout.
We felt comfortable that the Fund was appropriately positioned given the interest rate environment during the Reporting Period, as we sought to take advantage of anticipated interest rate movements throughout. It should be noted that regardless of interest rate conditions, we aim to manage the Fund consistently. Our investment approach has always beentri-fold — to seek preservation of capital, daily liquidity and maximization of yield potential. We manage interest and credit risk daily. Whether interest rates are historically low, high orin-between, we intend to continue to use our actively managed approach to provide the best possible return within the framework of the Fund’s guidelines and objectives.
How did you manage the Fund’s weighted average maturity during the Reporting Period?
On December 31, 2018, the Fund’s weighted average maturity was 45 days. During the first quarter of 2019, we targeted a weighted average maturity for the Fund in a 22 to 31 day range. During the second quarter of 2019, we maintained a weighted average maturity for the Fund in a 19 to 28 day range, moving down to a weighted average maturity of 19 days by the end of June 2019.
Throughout the Reporting Period, we focused on U.S. government agency securities, U.S. government repurchase agreements and U.S. Treasuries when and where we saw what we considered to be attractive opportunities.
The weighted average maturity of a money market fund is a measure of its price sensitivity to changes in interest rates. Also known as effective maturity, weighted average maturity measures the weighted average of the maturity date of bonds held by the Fund taking into consideration any available maturity shortening features.
How did you manage the Fund’s weighted average life during the Reporting Period?
During the Reporting Period, we managed the weighted average life of the Fund below 120 days. The weighted average life of the Fund was 84 days as of June 30, 2019. The weighted average life of a money market fund is a measure of a money market fund’s price sensitivity to changes in liquidity and/or credit risk.
Under amendments to SEC Rule2a-7 that became effective in May 2010, the maximum allowable weighted average life of a money market fund is 120 days. While one of the goals of the SEC’s money market fund rule is to reinforce conservative investment practices across the money market fund industry, our security selection process has long emphasized conservative investment choices.
How was the Fund invested during the Reporting Period?
The Fund had investments in U.S. government agency securities, U.S. government repurchase agreements, U.S. Treasury securities and U.S. Treasury repurchase agreements during the Reporting Period.
Throughout, we stayed true to our investment discipline, favoring liquidity and high quality credits over added yield. The primary focal points for our team are consistently managing interest rate risk and credit risk. We were able to navigate interest rate risk by adjusting the Fund’s weighted average maturity longer or shorter as market conditions shifted and to mitigate potential credit risk by buying high quality, creditworthy names, strategies which added to the Fund’s performance during the Reporting Period.
Did you make any changes in the Fund’s portfolio during the Reporting Period?
As indicated earlier, we made adjustments to the Fund’s weighted average maturity and to specific security type composition allocations based on then-current market conditions, our near-term view, and anticipated and actual Fed monetary policy statements. That said, there were no significant changes in the Fund’s investment exposures during the Reporting Period.
What is the Fund’s tactical view and strategy for the months ahead?
At the end of the Reporting Period, we expected the Fed to deliver what might be considered “insurance interest rate cuts” during the second half of 2019 due to slowing economic growth against a backdrop of subdued inflation and elevated policy and political uncertainty. Similarly, we saw heightened prospects for monetary policy easing by the ECB.
2
GOLDMAN SACHS VARIABLE INSURANCE TRUST GOVERNMENT MONEY MARKET FUND
Looking ahead, our strategy continues to be flexibly guided by shifting market conditions, positioning the Fund to seek to take advantage of anticipated interest rate movements. More specifically, at the end of the Reporting Period, we intended to adjust duration guided by the context of market pricing in relation to our own expectations. As always, we intend to continue to use our actively managed approach to seek the best possible return within the framework of the Fund’s investment guidelines and objectives. In addition, we will continue to manage interest, liquidity and credit risk daily.
We will, of course, continue to closely monitor economic data, Fed policy, and any shifts in the money market yield curve, as we strive to strategically navigate the interest rate environment.
3
FUND BASICS
FUND COMPOSITION†
Security Type
(Percentage of Net Assets)
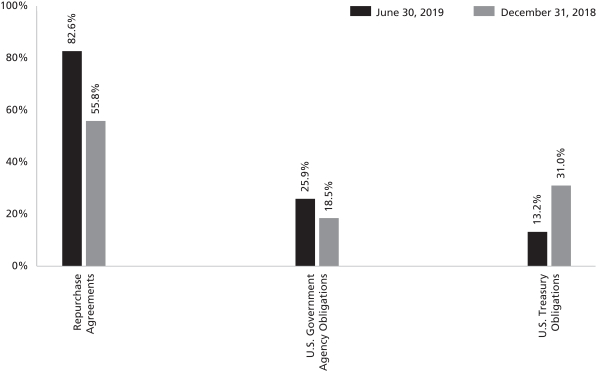
| † | The Fund is actively managed and, as such, its portfolio composition may differ over time. The percentage shown for each investment category reflects the value (based on amortized cost) of investments in that category as a percentage of net assets. Figures in the above chart may not sum to 100% due to the exclusion of other assets and liabilities. |
4
GOLDMAN SACHS VARIABLE INSURANCE TRUST GOVERNMENT MONEY MARKET FUND
Schedule of Investments
June 30, 2019 (Unaudited)
| | | | | | | | | | | | | | |
Principal
Amount | | | Interest
Rate | | | Maturity
Date | | | Amortized Cost | |
|
| U.S. Government Agency Obligations – 25.9% | |
| | Federal Farm Credit Bank (1 Mo. LIBOR + 0.01%) | |
| $ | 1,800,000 | | | | 2.412 | %(a) | | | 06/29/20 | | | $ | 1,800,000 | |
| | Federal Farm Credit Bank (3 Mo. LIBOR – 0.14%) | |
| | 1,700,000 | | | | 2.179 | (a) | | | 09/30/19 | | | | 1,699,979 | |
| | Federal Farm Credit Bank (3 Mo. LIBOR – 0.26%) | |
| | 250,000 | | | | 2.324 | (a) | | | 07/10/19 | | | | 250,000 | |
| | Federal Farm Credit Bank (3 Mo. U.S. T-Bill MMY + 0.07%)(a) | |
| | 1,300,000 | | | | 2.161 | | | | 11/20/19 | | | | 1,299,985 | |
| | 650,000 | | | | 2.161 | | | | 11/29/19 | | | | 650,000 | |
| | 650,000 | | | | 2.166 | | | | 02/18/20 | | | | 650,000 | |
| | Federal Farm Credit Bank (3 Mo. U.S. T-Bill MMY + 0.08%)(a) | |
| | 800,000 | | | | 2.171 | | | | 10/18/19 | | | | 799,993 | |
| | 650,000 | | | | 2.171 | | | | 12/26/19 | | | | 649,987 | |
| | Federal Farm Credit Bank (3 Mo. U.S. T-Bill MMY + 0.09%) | |
| | 800,000 | | | | 2.181 | (a) | | | 07/05/19 | | | | 800,000 | |
| | Federal Farm Credit Bank (3 Mo. U.S. T-Bill MMY + 0.13%) | |
| | 100,000 | | | | 2.226 | (a) | | | 11/12/20 | | | | 100,013 | |
| | Federal Farm Credit Bank (3 Mo. U.S. T-Bill MMY + 0.15%) | |
| | 200,000 | | | | 2.241 | (a) | | | 04/23/21 | | | | 200,000 | |
| | Federal Farm Credit Bank (FEDL01 + 0.11%) | |
| | 800,000 | | | | 2.490 | (a) | | | 08/13/20 | | | | 799,911 | |
| | Federal Farm Credit Bank (FEDL01 + 0.12%) | |
| | 1,900,000 | | | | 2.500 | (a) | | | 04/23/21 | | | | 1,900,000 | |
| | Federal Farm Credit Bank (Prime Rate – 2.88%) | |
| | 1,000,000 | | | | 2.620 | (a) | | | 05/07/20 | | | | 999,932 | |
| | Federal Farm Credit Bank (Prime Rate – 2.90%) | |
| | 600,000 | | | | 2.600 | (a) | | | 01/30/20 | | | | 600,000 | |
| | Federal Farm Credit Bank (Prime Rate – 2.93%) | |
| | 1,200,000 | | | | 2.570 | (a) | | | 11/06/20 | | | | 1,200,000 | |
| | Federal Farm Credit Bank (Prime Rate – 2.94%) | |
| | 1,500,000 | | | | 2.565 | (a) | | | 10/30/20 | | | | 1,500,000 | |
| | Federal Farm Credit Bank (Prime Rate – 2.95%)(a) | |
| | 100,000 | | | | 2.550 | | | | 04/30/20 | | | | 100,000 | |
| | 2,700,000 | | | | 2.550 | | | | 03/15/21 | | | | 2,700,000 | |
| | Federal Farm Credit Bank (Prime Rate – 2.96%)(a) | |
| | 200,000 | | | | 2.540 | | | | 03/13/20 | | | | 199,895 | |
| | 2,200,000 | | | | 2.540 | | | | 03/29/21 | | | | 2,200,000 | |
| | Federal Farm Credit Bank (Prime Rate – 2.97%) | |
| | 1,700,000 | | | | 2.535 | (a) | | | 04/08/21 | | | | 1,700,000 | |
| | Federal Farm Credit Bank (Prime Rate – 2.98%)(a) | |
| | 300,000 | | | | 2.520 | | | | 11/12/20 | | | | 299,797 | |
| | 1,300,000 | | | | 2.525 | | | | 02/26/21 | | | | 1,300,000 | |
| | Federal Farm Credit Bank (Prime Rate – 3.08%) | |
| | 1,600,000 | | | | 2.420 | (a) | | | 07/17/19 | | | | 1,599,993 | |
| | Federal Farm Credit Bank (SOFR + 0.12%) | |
| | 800,000 | | | | 2.540 | (a) | | | 03/18/21 | | | | 800,000 | |
| | Federal Home Loan Bank | |
| | 4,600,000 | | | | 2.495 | | | | 05/28/20 | | | | 4,600,000 | |
| | Federal Home Loan Bank (1 Mo. LIBOR – 0.02%)(a) | |
| | 9,300,000 | | | | 2.384 | | | | 12/27/19 | | | | 9,300,000 | |
| | 3,100,000 | | | | 2.399 | | | | 01/07/20 | | | | 3,100,000 | |
| | Federal Home Loan Bank (1 Mo. LIBOR – 0.03%)(a) | |
| | 10,000,000 | | | | 2.382 | | | | 01/10/20 | | | | 10,000,000 | |
| | 4,100,000 | | | | 2.353 | | | | 01/21/20 | | | | 4,100,000 | |
| | |
|
| U.S. Government Agency Obligations – (continued) | |
| | Federal Home Loan Bank (1 Mo. LIBOR – 0.04%)(a) | |
| 6,000,000 | | | | 2.342 | % | | | 10/18/19 | | | | 6,000,000 | |
| | 4,000,000 | | | | 2.364 | | | | 10/25/19 | | | | 4,000,000 | |
| | Federal Home Loan Bank (1 Mo. LIBOR – 0.05%)(a) | |
| | 6,000,000 | | | | 2.369 | | | | 10/07/19 | | | | 6,000,000 | |
| | 5,200,000 | | | | 2.349 | | | | 10/15/19 | | | | 5,200,000 | |
| | Federal Home Loan Bank (3 Mo. LIBOR – 0.07%) | |
| | 6,500,000 | | | | 2.522 | (a) | | | 04/01/21 | | | | 6,500,000 | |
| | Federal Home Loan Bank (3 Mo. LIBOR – 0.08%) | |
| | 3,300,000 | | | | 2.344 | (a) | | | 03/19/21 | | | | 3,300,000 | |
| | Federal Home Loan Bank (3 Mo. LIBOR – 0.16%) | |
| | 3,800,000 | | | | 2.405 | (a) | | | 08/04/20 | | | | 3,800,000 | |
| | Federal Home Loan Bank (3 Mo. U.S. T-Bill + 0.07%) | |
| | 10,700,000 | | | | 2.201 | (a) | | | 01/30/20 | | | | 10,700,938 | |
| | Federal Home Loan Bank (Prime Rate – 2.94%) | |
| | 800,000 | | | | 2.560 | (a) | | | 02/26/21 | | | | 800,000 | |
| | Federal Home Loan Bank (SOFR + 0.03%) | |
| | 7,400,000 | | | | 2.450 | (a) | | | 10/09/19 | | | | 7,400,000 | |
| | Federal Home Loan Bank Discount Notes | |
| | 5,000,000 | | | | 2.461 | | | | 08/12/19 | | | | 4,985,942 | |
| | 7,300,000 | | | | 2.417 | | | | 08/14/19 | | | | 7,278,854 | |
| | 3,300,000 | | | | 2.426 | | | | 08/14/19 | | | | 3,290,409 | |
| | 200,000 | | | | 2.457 | | | | 08/15/19 | | | | 199,399 | |
| | 5,000,000 | | | | 2.463 | | | | 08/19/19 | | | | 4,983,599 | |
| | 6,900,000 | | | | 2.430 | | | | 08/23/19 | | | | 6,875,518 | |
| | 5,500,000 | | | | 2.464 | | | | 08/26/19 | | | | 5,479,381 | |
| | 2,000,000 | | | | 2.465 | | | | 09/03/19 | | | | 1,991,431 | |
| | 3,200,000 | | | | 2.427 | | | | 09/10/19 | | | | 3,185,011 | |
| | 3,100,000 | | | | 2.427 | | | | 09/12/19 | | | | 3,085,070 | |
| | 1,200,000 | | | | 2.474 | | | | 09/27/19 | | | | 1,192,931 | |
| | 600,000 | | | | 2.482 | | | | 09/27/19 | | | | 596,454 | |
| | 3,600,000 | | | | 2.145 | | | | 10/31/19 | | | | 3,574,380 | |
| | 3,100,000 | | | | 2.495 | | | | 05/20/20 | | | | 3,100,000 | |
| | Federal National Mortgage Association (SOFR + 0.12%) | |
| | 6,000,000 | | | | 2.540 | (a) | | | 07/30/19 | | | | 6,000,000 | |
| | Federal National Mortgage Association (SOFR + 0.16%) | |
| | 750,000 | | | | 2.580 | (a) | | | 01/30/20 | | | | 750,000 | |
| | Overseas Private Investment Corp. (3 Mo. U.S. T-Bill + 0.00%) | |
| | 5,219,830 | | | | 2.350 | (a) | | | 07/07/19 | | | | 5,219,829 | |
| | |
| TOTAL U.S. GOVERNMENT AGENCY
OBLIGATIONS |
| | $ | 173,388,631 | |
| | |
| | | | | | | | | | | | | | |
|
| U.S. Treasury Obligations – 13.2% | |
| | United States Treasury Bills | |
| $ | 13,300,000 | | | | 2.442 | % | | | 11/07/19 | | | $ | 13,186,573 | |
| | 100,000 | | | | 2.401 | | | | 11/21/19 | | | | 99,071 | |
| | 100,000 | | | | 2.051 | | | | 11/29/19 | | | | 99,159 | |
| | 700,000 | | | | 2.187 | | | | 11/29/19 | | | | 693,731 | |
| | 11,100,000 | | | | 2.313 | | | | 12/05/19 | | | | 10,990,839 | |
| | 3,800,000 | | | | 2.183 | | | | 12/19/19 | | | | 3,761,554 | |
| | 100,000 | | | | 2.077 | | | | 12/26/19 | | | | 98,998 | |
| | 3,000,000 | | | | 2.080 | | | | 12/26/19 | | | | 2,969,888 | |
| | 900,000 | | | | 2.100 | | | | 12/26/19 | | | | 890,878 | |
| | |
| | |
| The accompanying notes are an integral part of these financial statements. | | 5 |
GOLDMAN SACHS VARIABLE INSURANCE TRUST GOVERNMENT MONEY MARKET FUND
Schedule of Investments(continued)
June 30, 2019 (Unaudited)
| | | | | | | | | | | | | | |
Principal
Amount | | | Interest
Rate | | | Maturity
Date | | | Amortized Cost | |
|
| U.S. Treasury Obligations – (continued) | |
| United States Treasury Floating Rate Note (3 Mo. U.S. T-Bill
MMY + 0.04%) |
|
| $ | 8,800,000 | | | | 2.139 | % | | | 07/31/20 | | | $ | 8,799,301 | |
| United States Treasury Floating Rate Note (3 Mo. U.S. T-Bill
MMY + 0.05%) |
|
| | 15,000,000 | | | | 2.141 | | | | 10/31/20 | | | | 15,000,199 | |
| United States Treasury Floating Rate Note (3 Mo. U.S. T-Bill
MMY + 0.12%) |
|
| | 8,800,000 | | | | 2.211 | | | | 01/31/21 | | | | 8,790,964 | |
| United States Treasury Floating Rate Note (3 Mo. U.S. T-Bill
MMY + 0.14%) |
|
| | 13,675,000 | | | | 2.235 | | | | 04/30/21 | | | | 13,657,268 | |
| | United States Treasury Notes | |
| | 900,000 | | | | 3.625 | | | | 02/15/20 | | | | 906,939 | |
| | 500,000 | | | | 1.375 | | | | 02/29/20 | | | | 496,786 | |
| | 1,100,000 | | | | 1.375 | | | | 03/31/20 | | | | 1,092,254 | |
| | 900,000 | | | | 2.250 | | | | 03/31/20 | | | | 899,396 | |
| | 1,100,000 | | | | 1.500 | | | | 04/15/20 | | | | 1,093,146 | |
| | 1,200,000 | | | | 2.375 | | | | 04/30/20 | | | | 1,200,815 | |
| | 3,300,000 | | | | 3.500 | | | | 05/15/20 | | | | 3,334,925 | |
| | |
| TOTAL U.S. TREASURY
OBLIGATIONS |
| | $ | 88,062,684 | |
| | |
| TOTAL INVESTMENTS BEFORE
REPURCHASE AGREEMENTS |
| | $ | 261,451,315 | |
| | |
| | | | | | | | | | | | | | |
|
| Repurchase Agreements(b) – 82.6% | |
| | BNP Paribas | |
| $ | 5,000,000 | | | | 2.480 | %(c) | | | 07/07/19 | | | $ | 5,000,000 | |
| | Maturity Value: $5,062,000 | |
| | Settlement Date: 02/27/19 | |
| Collateralized by a U.S. Treasury Bond, 2.250%, due 08/15/46, a
U.S. Treasury Floating Rate Note, 2.144%, due 10/31/19, U.S.
Treasury Inflation-Indexed Notes, 0.125%, due 04/15/20 to
04/15/21, U.S. Treasury Interest-Only Stripped Securities,
0.000%, due 05/15/22 to 02/15/49 and U.S. Treasury Notes,
0.750% to 1.500%, due 08/15/19 to 07/15/20. The aggregate
market value of the collateral, including accrued interest, was
$5,100,023. |
|
| | 10,000,000 | | | | 2.490 | (c) | | | 07/07/19 | | | | 10,000,000 | |
| | Maturity Value: $10,125,192 | |
| | Settlement Date: 03/22/19 | |
| Collateralized by Federal Home Loan Mortgage Corp., 4.000% to
7.500%, due 10/01/20 to 06/01/47, Federal National Mortgage
Association, 3.500% to 6.000%, due 11/01/30 to 06/01/51,
Government National Mortgage Association, 3.500% to
6.000%, due 02/15/37 to 06/20/49, a U.S. Treasury Bill,
0.000%, due 07/18/19, U.S. Treasury Interest-Only Stripped
Securities, 0.000%, due 02/15/44 to 05/15/44 and a U.S.
Treasury Note, 2.375%, due 02/29/24. The aggregate market
value of the collateral, including accrued interest, was
$10,275,407. |
|
| | |
|
| Repurchase Agreements(b) – (continued) | |
| | BNP Paribas – (continued) | |
| $ | 5,000,000 | | | | 2.500 | %(c) | | | 07/07/19 | | | $ | 5,000,000 | |
| | Maturity Value: $5,062,500 | |
| | Settlement Date: 02/27/19 | |
| Collateralized by Federal Home Loan Mortgage Corp., 4.000% to
5.500%, due 06/01/33 to 04/01/49, Federal National Mortgage
Association, 4.000% to 5.000%, due 10/01/40 to 02/01/49,
Government National Mortgage Association, 3.500% to
6.500%, due 04/20/36 to 11/20/48, a U.S. Treasury Bond,
8.125%, due 08/15/19 and U.S. Treasury Notes, 1.500% to
2.125%, due 07/15/20 to 03/31/24. The aggregate market value
of the collateral, including accrued interest, was $5,118,499. |
|
| | |
| | Joint Repurchase Agreement Account III | |
| | 514,700,000 | | | | 2.506 | | | | 07/01/19 | | | | 514,700,000 | |
| | Maturity Value: $514,807,475 | |
| | |
| | Royal Bank of Canada-New York Branch | |
| | 5,000,000 | | | | 2.440 | (c) | | | 07/07/19 | | | | 5,000,000 | |
| | Maturity Value: $5,030,500 | |
| | Settlement Date: 04/10/19 | |
| Collateralized by Federal Home Loan Mortgage Corp., 3.500%,
due 01/01/44 to 03/01/49, Federal National Mortgage
Association, 3.500% to 4.500%, due 05/01/43 to 04/01/49 and
Government National Mortgage Association, 5.000%, due
07/20/48. The aggregate market value of the collateral,
including accrued interest, was $5,100,002. |
|
| | 5,000,000 | | | | 2.450 | (c) | | | 07/07/19 | | | | 5,000,000 | |
| | Maturity Value: $5,031,306 | |
| | Settlement Date: 05/01/19 | |
| Collateralized by Federal Home Loan Mortgage Corp., 3.500% to
4.000%, due 01/01/44 to 04/01/49, Federal National Mortgage
Association, 3.000% to 4.500%, due 11/01/32 to 04/01/49 and
Government National Mortgage Association, 4.000%, due
10/20/44. The aggregate market value of the collateral,
including accrued interest, was $5,099,999. |
|
| | 8,000,000 | | | | 2.450 | (c) | | | 07/07/19 | | | | 8,000,000 | |
| | Maturity Value: $8,051,722 | |
| | Settlement Date: 04/04/19 | |
| Collateralized by Federal Home Loan Mortgage Corp., 3.500% to
4.500%, due 01/01/44 to 04/01/49 and Federal National
Mortgage Association, 3.500% to 4.500%, due 02/01/41 to
04/01/49. The aggregate market value of the collateral,
including accrued interest, was $8,160,002. |
|
| | |
| | TOTAL REPURCHASE AGREEMENTS | | | $ | 552,700,000 | |
| | |
| | TOTAL INVESTMENTS – 121.7% | | | $ | 814,151,315 | |
| | |
| LIABILITIES IN EXCESS OF
OTHER ASSETS – (21.7)% |
| | | (145,406,545 | ) |
| | |
| | NET ASSETS – 100.0% | | | $ | 668,744,770 | |
| | |
| | |
| 6 | | The accompanying notes are an integral part of these financial statements. |
GOLDMAN SACHS VARIABLE INSURANCE TRUST GOVERNMENT MONEY MARKET FUND
Schedule of Investments(continued)
June 30, 2019 (Unaudited)
| | |
| The percentage shown for each investment category reflects the value of investments in that category as a percentage of net assets. |
| |
| (a) | | Variable or floating rate security. Except for floating rate notes (for which final maturity is disclosed), maturity date disclosed is the next interest reset date. Interest rate disclosed is that which is in effect on June 30, 2019. |
| |
| (b) | | Unless noted, all repurchase agreements were entered into on June 30, 2019. Additional information on Joint Repurchase Agreement Account III appears in the Additional Investment Information section. |
| |
| (c) | | The instrument is subject to a demand feature. |
Interest rates represent either the stated coupon rate, annualized yield on date of purchase for discounted securities, or, for floating rate securities, the current reset rate, which is based upon current interest rate indices. |
| Maturity dates represent either the final legal maturity date on the security, the demand date for puttable securities, the date of the next interest rate reset for variable rate securities, or the prerefunded date for those types of securities. |
| | |
| |
| Investment Abbreviations: |
| FEDL01 | | —US Federal Funds Effective Rate |
| LIBOR | | —London Interbank Offered Rates |
| MMY | | —Money Market Yield |
| Prime | | —Federal Reserve Bank Prime Loan Rate US |
| SOFR | | —Secured Overnight Financing Rate |
| T-Bill | | —Treasury Bill |
| | |
| The accompanying notes are an integral part of these financial statements. | | 7 |
GOLDMAN SACHS VARIABLE INSURANCE TRUST GOVERNMENT MONEY MARKET FUND
Schedule of Investments(continued)
June 30, 2019 (Unaudited)
ADDITIONAL INVESTMENT INFORMATION
JOINT REPURCHASE AGREEMENT ACCOUNT III — At June 30, 2019, the Fund had undivided interests in the Joint Repurchase Agreement Account III, with a maturity date of July 1, 2019, as follows:
| | | | | | | | | | | | | |
| Principal Amount | | Maturity Value | | Collateral Value |
| | | $514,700,000 | | | | $ | 514,807,475 | | | | $ | 530,022,489 | |
REPURCHASE AGREEMENTS —At June 30, 2019, the Principal Amounts of the Fund’s interest in the Joint Repurchase Agreement Account III were as follows:
| | | | | | | | |
| Counterparty | | Interest
Rate | | | Principal
Amount | |
ABN Amro Bank N.V. | | | 2.520 | % | | $ | 55,858,915 | |
Bank of America, N.A. | | | 2.500 | | | | 39,899,225 | |
Bank of Nova Scotia (The) | | | 2.520 | | | | 191,516,279 | |
BOFA Securities, Inc. | | | 2.500 | | | | 135,657,364 | |
Wells Fargo Securities, LLC. | | | 2.520 | | | | 91,768,217 | |
| | |
| TOTAL | | | | | | $ | 514,700,000 | |
At June 30, 2019, the Joint Repurchase Agreement Account III was fully collateralized by:
| | | | | | |
| Issuer | | Interest
Rates | | | Maturity
Dates |
| Federal Home Loan Mortgage Corp. | | | 2.500 to 7.000 | % | | 11/01/20 to 07/01/49 |
| Federal National Mortgage Association | | | 2.500 to 6.500 | | | 02/01/21 to 07/01/49 |
| Government National Mortgage Association | | | 3.000 to 4.000 | | | 06/20/44 to 05/20/45 |
| U.S. Treasury Note | | | 2.250 to 2.875 | | | 03/31/21 to 05/15/28 |
| | |
| 8 | | The accompanying notes are an integral part of these financial statements. |
GOLDMAN SACHS VARIABLE INSURANCE TRUST GOVERNMENT MONEY MARKET FUND
Statement of Assets and Liabilities
June 30, 2019 (Unaudited)
| | | | |
| | | | |
| Assets: | | | |
Investments based on amortized cost | | $ | 261,451,315 | |
Repurchase agreements based on amortized cost | | | 552,700,000 | |
Cash | | | 46,784 | |
Receivables: | | | | |
Investment securities sold | | | 4,040,618 | |
Interest | | | 947,800 | |
Fund shares sold | | | 183,106 | |
Reimbursement from investment adviser | | | 14,585 | |
Other assets | | | 2,100 | |
| |
| Total assets | | | 819,386,308 | |
| | | | |
| | | | |
| Liabilities: | | | |
Payables: | | | | |
Fund shares redeemed | | | 150,357,672 | |
Management fees | | | 89,150 | |
Distribution and Service fees and Transfer Agency fees | | | 84,033 | |
Accrued expenses | | | 110,683 | |
| |
| Total liabilities | | | 150,641,538 | |
| | | | |
| | | | |
| Net Assets: | | | |
Paid-in capital | | | 668,715,589 | |
Total distributable earnings (loss) | | | 29,181 | |
| |
| NET ASSETS | | $ | 668,744,770 | |
| |
Net asset value, offering and redemption price per share | | $ | 1.00 | |
Net Assets: | | | | |
Institutional Shares | | $ | 312,317,985 | |
Service Shares | | | 356,426,785 | |
| |
Total Net Assets | | $ | 668,744,770 | |
Shares of beneficial interest outstanding $0.001 par value (unlimited shares authorized): | | | | |
Institutional Shares | | | 312,295,748 | |
Service Shares | | | 356,419,822 | |
| | |
| The accompanying notes are an integral part of these financial statements. | | 9 |
GOLDMAN SACHS VARIABLE INSURANCE TRUST GOVERNMENT MONEY MARKET FUND
Statement of Operations
For the Six Months Ended June 30, 2019 (Unaudited)
| | | | |
| | | | |
| Investment Income: | | | |
| |
Interest | | $ | 8,782,042 | |
| | | | |
| | | | |
| Expenses: | | | |
Management fees | | | 566,979 | |
Distribution and Service fees — Service Shares | | | 438,789 | |
Transfer Agency fees(a) | | | 70,872 | |
Professional fees | | | 43,219 | |
Printing and mailing costs | | | 33,757 | |
Custody, accounting and administrative services | | | 28,308 | |
Trustee fees | | | 8,646 | �� |
Other | | | 2,932 | |
| |
| Total expenses | | | 1,193,502 | |
| |
Less — expense reductions | | | (104,749 | ) |
| |
| Net expenses | | | 1,088,753 | |
| |
| NET INVESTMENT INCOME | | | 7,693,289 | |
| |
| NET REALIZED GAIN FROM INVESTMENT TRANSACTIONS | | | 110,447 | |
| |
| NET INCREASE IN NET ASSETS RESULTING FROM OPERATIONS | | $ | 7,803,736 | |
(a) Institutional and Service Shares incurred Transfer Agency fees of $35,769 and $35,103, respectively.
| | |
| 10 | | The accompanying notes are an integral part of these financial statements. |
GOLDMAN SACHS VARIABLE INSURANCE TRUST GOVERNMENT MONEY MARKET FUND
Statements of Changes in Net Assets
| | | | | | | | |
| | | For the
Six Months Ended
June 30, 2019
(Unaudited) | | | For the
Fiscal Year Ended
December 31, 2018 | |
| | | | | | | | |
| From operations: | |
Net investment income | | $ | 7,693,289 | | | $ | 10,023,268 | |
Net realized gain (loss) from investment transactions | | | 110,447 | | | | (46,644 | ) |
| | |
| Net increase in net assets resulting from operations | | | 7,803,736 | | | | 9,976,624 | |
| |
| | | | | | | | |
| Distributions to shareholders: | | | | | | |
From distributable earnings: | | | | | | | | |
Institutional Shares | | | (4,136,095 | ) | | | (4,862,159 | ) |
Service Shares | | | (3,623,045 | ) | | | (5,123,116 | ) |
| | |
| Total distributions to shareholders | | | (7,759,140 | ) | | | (9,985,275 | ) |
| |
| | | | | | | | |
| From share transactions (at $1.00 per share): | | | | | | |
Proceeds from sales of shares | | | 450,001,970 | | | | 791,066,132 | |
Reinvestment of distributions | | | 7,759,140 | | | | 9,982,588 | |
Cost of shares redeemed | | | (569,160,398 | ) | | | (677,694,987 | ) |
| | |
| Net increase (decrease) in net assets resulting from share transactions | | | (111,399,288 | ) | | | 123,353,733 | |
| | |
| TOTAL INCREASE (DECREASE) | | | (111,354,692 | ) | | | 123,345,082 | |
| |
| | | | | | | | |
| Net assets: | | | | | | |
| | |
Beginning of period | | | 780,099,462 | | | | 656,754,380 | |
| | |
End of period | | $ | 668,744,770 | | | $ | 780,099,462 | |
| | |
| The accompanying notes are an integral part of these financial statements. | | 11 |
GOLDMAN SACHS VARIABLE INSURANCE TRUST GOVERNMENT MONEY MARKET FUND
Financial Highlights
Selected Data for a Share Outstanding Throughout Each Period
| | | | | | | | | | | | | | | | | | | | | | | | |
| | | Goldman Sachs Government Money Market Fund | |
| | | Institutional Shares | |
| | | Six Months Ended
June 30, 2019
(Unaudited) | | | Year Ended December 31, | |
| | | 2018 | | | 2017 | | | 2016 | | | 2015 | | | 2014 | |
| | | | | | | | | | | | | | | | | | | | | | | | |
| Per Share Data: | | | | | | | | | | | | | | | | | | |
| | | | | | |
Net asset value, beginning of period | | $ | 1.00 | | | $ | 1.00 | | | $ | 1.00 | | | $ | 1.00 | | | $ | 1.00 | | | $ | 1.00 | |
| | | | | | |
Net investment income(a) | | | 0.011 | | | | 0.017 | | | | 0.008 | | | | 0.003 | | | | — | (b) | | | — | (b) |
| | | | | | |
Distributions to shareholders from net investment income(c) | | | (0.011 | ) | | | (0.017 | ) | | | (0.008 | ) | | | (0.003 | ) | | | — | (b) | | | — | (b) |
| | | | | | |
Net asset value, end of period | | $ | 1.00 | | | $ | 1.00 | | | $ | 1.00 | | | $ | 1.00 | | | $ | 1.00 | | | $ | 1.00 | |
| | | | | | |
Total return(d) | | | 1.15 | % | | | 1.74 | % | | | 0.76 | % | | | 0.29 | % | | | 0.02 | % | | | 0.01 | % |
| | | | | | |
Net assets, end of period (in 000’s) | | $ | 312,318 | | | $ | 411,447 | | | $ | 302,507 | | | $ | 206,987 | | | $ | 1,143 | | | $ | 773 | |
| | | | | | |
Ratio of net expenses to average net assets | | | 0.18 | %(e) | | | 0.18 | % | | | 0.18 | % | | | 0.19 | % | | | 0.23 | % | | | 0.23 | % |
| | | | | | |
Ratio of total expenses to average net assets | | | 0.21 | %(e) | | | 0.23 | % | | | 0.27 | % | | | 0.30 | % | | | 0.31 | % | | | 0.31 | % |
| | | | | | |
Ratio of net investment income to average net assets | | | 2.30 | %(e) | | | 1.73 | % | | | 0.76 | % | | | 0.31 | % | | | 0.03 | % | | | 0.03 | % |
| (a) | Calculated based on the average shares outstanding methodology. |
| (b) | Amount is less than $0.0005 per share. |
| (c) | Distributions may not coincide with the current year net investment income or net realized gains as distributions may be paid from current or prior year earnings. |
| (d) | Assumes reinvestment of all distributions. |
| | |
| 12 | | The accompanying notes are an integral part of these financial statements. |
GOLDMAN SACHS VARIABLE INSURANCE TRUST GOVERNMENT MONEY MARKET FUND
Financial Highlights(continued)
Selected Data for a Share Outstanding Throughout Each Period
| | | | | | | | | | | | | | | | | | | | | | | | |
| | | Goldman Sachs Government Money Market Fund | |
| | | Service Shares | |
| | | Six Months Ended
June 30, 2019
(Unaudited) | | | Year Ended December 31, | |
| | | 2018 | | | 2017 | | | 2016 | | | 2015 | | | 2014 | |
| | | | | | | | | | | | | | | | | | | | | | | | |
| Per Share Data: | | | | | | | | | | | | | | | | | | |
| | | | | | |
Net asset value, beginning of period | | $ | 1.00 | | | $ | 1.00 | | | $ | 1.00 | | | $ | 1.00 | | | $ | 1.00 | | | $ | 1.00 | |
| | | | | | |
Net investment income(a) | | | 0.010 | | | | 0.015 | | | | 0.005 | | | | — | (b) | | | — | (b) | | | — | (b) |
| | | | | | |
Distributions to shareholders from net investment income(c) | | | (0.010 | ) | | | (0.015 | ) | | | (0.005 | ) | | | — | (b) | | | — | (b) | | | — | (b) |
| | | | | | |
Net asset value, end of period | | $ | 1.00 | | | $ | 1.00 | | | $ | 1.00 | | | $ | 1.00 | | | $ | 1.00 | | | $ | 1.00 | |
| | | | | | |
Total return(d) | | | 1.03 | % | | | 1.48 | % | | | 0.51 | % | | | 0.04 | % | | | 0.01 | % | | | 0.01 | % |
| | | | | | |
Net assets, end of period (in 000’s) | | $ | 356,427 | | | $ | 368,652 | | | $ | 354,248 | | | $ | 375,580 | | | $ | 328,202 | | | $ | 305,994 | |
| | | | | | |
Ratio of net expenses to average net assets | | | 0.43 | %(e) | | | 0.43 | % | | | 0.43 | % | | | 0.44 | % | | | 0.26 | % | | | 0.24 | % |
| | | | | | |
Ratio of total expenses to average net assets | | | 0.46 | %(e) | | | 0.48 | % | | | 0.52 | % | | | 0.55 | % | | | 0.56 | % | | | 0.56 | % |
| | | | | | |
Ratio of net investment income to average net assets | | | 2.04 | %(e) | | | 1.48 | % | | | 0.51 | % | | | 0.03 | % | | | 0.01 | % | | | — | %(f) |
| (a) | Calculated based on the average shares outstanding methodology. |
| (b) | Amount is less than $0.0005 per share. |
| (c) | Distributions may not coincide with the current year net investment income or net realized gains as distributions may be paid from current or prior year earnings. |
| (d) | Assumes reinvestment of all distributions. |
| (f) | Amount is less than 0.005% of average net assets. |
| | |
| The accompanying notes are an integral part of these financial statements. | | 13 |
GOLDMAN SACHS VARIABLE INSURANCE TRUST GOVERNMENT MONEY MARKET FUND
Notes to Financial Statements
June 30, 2019 (Unaudited)
1. ORGANIZATION
Goldman Sachs Variable Insurance Trust (the “Trust” or “VIT”) is a Delaware statutory trust registered under the Investment Company Act of 1940, as amended (the “Act”), as anopen-end management investment company. The Trust includes the Goldman Sachs Government Money Market Fund (the “Fund”). The Fund is a diversified portfolio under the Act offering two classes of shares — Institutional and Service Shares. Shares of the Trust are offered to separate accounts of participating life insurance companies for the purpose of funding variable annuity contracts and variable life insurance policies.
Goldman Sachs Asset Management, L.P. (“GSAM”), an affiliate of Goldman Sachs & Co. LLC (“Goldman Sachs”), serves as investment adviser to the Fund pursuant to a management agreement (the “Agreement”) with the Trust.
2. SIGNIFICANT ACCOUNTING POLICIES
The financial statements have been prepared in accordance with accounting principles generally accepted in the United States of America (“GAAP”) and require management to make estimates and assumptions that may affect the reported amounts and disclosures. Actual results may differ from those estimates and assumptions.
A. Investment Valuation — The investment valuation policy of the Fund is to use theamortized-cost method permitted byRule 2a-7 under the Act for valuing portfolio securities. Theamortized-cost method of valuation involves valuing a security at its cost and thereafter applying a constant accretion or amortization to maturity of any discount or premium. Normally, a security’s amortized cost will approximate its market value. Under procedures and tolerances approved by the Board of Trustees (“Trustees”), GSAM evaluates daily the difference between the Fund’s net asset value (“NAV”) per share using the amortized costs of its portfolio securities and the Fund’s NAV per share using market-based values of its portfolio securities. The market-based value of a portfolio security is determined, where readily available, on the basis of market quotations provided by pricing services or securities dealers, or, where accurate market quotations are not readily available, on the basis of the security’s fair value as determined in accordance with Valuation Procedures approved by the Trustees. The pricing services may use valuation models or matrix pricing, which may consider (among other things): (i) yield or price with respect to debt securities that are considered comparable in characteristics such as rating, interest rate and maturity date or (ii) quotations from securities dealers to determine current value.
B. Investment Income and Investments — Interest income is accrued daily and adjusted for amortization of premiums and accretion of discounts. Investment transactions are reflected on trade date. Realized gains and losses are calculated using identified cost.
C. Class Allocations and Expenses — Investment income, realized and unrealized gain (loss), if any, andnon-class specific expenses of the Fund are allocated daily based upon the proportion of net assets of each class. Class specific expenses, where applicable, are borne by the respective share classes and include Distribution and Service and Transfer Agency fees.Non-class specific expenses directly incurred by the Fund are charged to the Fund, while such expenses incurred by the Trust are allocated across the applicable Funds on a straight-line and/orpro-rata basis depending upon the nature of the expenses.
D. Federal Taxes and Distributions to Shareholders — It is the Fund’s policy to comply with the requirements of the Internal Revenue Code of 1986, as amended (the “Code”), applicable to regulated investment companies (mutual funds) and to distribute each year substantially all of its investment company taxable andtax-exempt income and capital gains to its shareholders. Accordingly, the Fund is not required to make any provisions for the payment of federal income tax. Distributions to shareholders are declared and recorded daily and paid monthly by the Fund and may include short-term capital gains. Long-term capital gain distributions, if any, are declared and paid at least annually. The Fund may defer or accelerate the timing of the distributions of short-term capital gains (or any portion thereof).
The characterization of distributions to shareholders for financial reporting purposes is determined in accordance with federal income tax rules, which may differ from GAAP. The source of the Fund’s distributions may be shown in the accompanying financial statements as either from distributable earnings or capital. Certain components of the Fund’s net assets on the Statement of Assets and Liabilities reflect permanent GAAP/tax differences based on the appropriate tax character.
14
GOLDMAN SACHS VARIABLE INSURANCE TRUST GOVERNMENT MONEY MARKET FUND
Notes to Financial Statements(continued)
June 30, 2019 (Unaudited)
2. SIGNIFICANT ACCOUNTING POLICIES (continued)
As of December 31, 2018, the components of accumulated earnings on a tax basis were as follows:
| | | | |
| Perpetual Short-term Capital loss carryforward | | | (43,959 | ) |
| Timing differences (Post October Loss Deferral/Distributions Payable) | | | (16,173 | ) |
The amortized cost for the Fund stated in the accompanying Statement of Assets and Liabilities also represents aggregate cost for U.S. federal income tax purposes.
GSAM has reviewed the Fund’s tax positions for all open tax years (the current and prior three years, as applicable) and has concluded that no provision for income tax is required in the Fund’s financial statements. Such open tax years remain subject to examination and adjustment by tax authorities.
E. Forward Commitments — A forward commitment involves entering into a contract to purchase or sell securities, typically on an extended settlement basis, for a fixed price at a future date. The purchase of securities on a forward commitment basis involves a risk of loss if the value of the security to be purchased declines before the settlement date. Conversely, the sale of securities on a forward commitment basis involves the risk that the value of the securities sold may increase before the settlement date. Although the Fund will generally purchase securities on a forward commitment basis with the intention of acquiring the securities for its portfolio, the Fund may dispose of forward commitments prior to settlement which may result in a realized gain or loss.
F. Repurchase Agreements — Repurchase agreements involve the purchase of securities subject to the seller’s agreement to repurchase the securities at a mutually agreed upon date and price, under the terms of a Master Repurchase Agreement (“MRA”). During the term of a repurchase agreement, the value of the underlying securities held as collateral on behalf of the Fund, including accrued interest, is required to exceed the value of the repurchase agreement, including accrued interest. The gross value of repurchase agreements is included in the Statement of Assets and Liabilities for financial reporting purposes. The underlying securities for all repurchase agreements are held at the Fund’s custodian or designatedsub-custodians undertri-party repurchase agreements.
An MRA governs transactions between the Fund and select counterparties. An MRA contains provisions for, among other things, initiation of the transaction, income payments, events of default, and maintenance of securities for repurchase agreements. An MRA also permits offsetting with collateral to create one single net payment in the event of default or similar events, including the bankruptcy or insolvency of a counterparty.
If the seller defaults, the Fund could suffer a loss to the extent that the proceeds from the sale of the underlying securities and other collateral held by the Fund are less than the repurchase price and the Fund’s costs associated with delay and enforcement of the repurchase agreement. In addition, in the event of default or insolvency of the seller, a court could determine that the Fund’s interest in the collateral is not enforceable, resulting in additional losses to the Fund.
Pursuant to exemptive relief granted by the Securities and Exchange Commission (“SEC”) and terms and conditions contained therein, the Fund, together with other funds of the Trust and registered investment companies having management agreements with GSAM or its affiliates, may transfer uninvested cash into joint accounts, the daily aggregate balance of which is invested in one or more repurchase agreements. Under these joint accounts, the Fund maintainspro-rata credit exposure to the underlying repurchase agreements’ counterparties. With the exception of certain transaction fees, the Fund is not subject to any expenses in relation to these investments.
3. INVESTMENTS AND FAIR VALUE MEASUREMENTS
U.S. GAAP defines the fair value of a financial instrument as the amount that would be received to sell an asset or paid to transfer a liability in an orderly transaction between market participants at the measurement date (i.e., the exit price); the Fund’s policy is to use the market approach. GAAP establishes a fair value hierarchy that prioritizes the inputs to valuation techniques used to measure fair value. The hierarchy gives the highest priority to unadjusted quoted prices in active markets for identical assets or liabilities (Level 1 measurements) and the lowest priority to unobservable inputs (Level 3 measurements). The levels used for classifying
15
GOLDMAN SACHS VARIABLE INSURANCE TRUST GOVERNMENT MONEY MARKET FUND
Notes to Financial Statements(continued)
June 30, 2019 (Unaudited)
3. INVESTMENTS AND FAIR VALUE MEASUREMENTS (continued)
investments are not necessarily an indication of the risk associated with investing in these investments. The three levels of the fair value hierarchy are described below:
Level 1 — Unadjusted quoted prices in active markets that are accessible at the measurement date for identical, unrestricted assets or liabilities;
Level 2 — Quoted prices in markets that are not active or financial instruments for which significant inputs are observable (including, but not limited to, quoted prices for similar investments, interest rates, foreign exchange rates, volatility and credit spreads), either directly or indirectly;
Level 3 — Prices or valuations that require significant unobservable inputs (including GSAM’s assumptions in determining fair value measurement).
The Trustees have approved Valuation Procedures that govern the valuation of the portfolio investments held by the Fund, including investments for which market quotations are not readily available. The Trustees have delegated to GSAMday-to-day responsibility for implementing and maintaining internal controls and procedures related to the valuation (including both the amortized cost and market-based methods of valuation) of the Fund’s investments. To assess the continuing appropriateness of pricing sources and methodologies related to the market-based method of valuation, GSAM regularly performs price verification procedures and issues challenges as necessary to third party pricing vendors or brokers, and any differences are reviewed in accordance with the Valuation Procedures.
As of June 30, 2019, all investments and repurchase agreements are classified as Level 2 of the fair value hierarchy. Please refer to the Schedule of Investments for further detail.
4. AGREEMENTS AND AFFILIATED TRANSACTIONS
A. Management Agreement — Under the Agreement, GSAM manages the Fund, subject to the general supervision of the Trustees.
As compensation for the services rendered pursuant to the Agreement, the assumption of the expenses related thereto and administration of the Fund’s business affairs, including providing facilities, GSAM is entitled to a management fee, accrued daily and paid monthly, equal to an annual percentage rate of the Fund’s average daily net assets.
B. Distribution and Service(12b-1) Plan — The Trust, on behalf of Service Shares of the Fund, has adopted a Distribution and Service Plan subject to Rule12b-1 under the Act. Under the Distribution and Service Plan, Goldman Sachs, which serves as distributor (the “Distributor”), is entitled to a fee accrued daily and paid monthly, for distribution services and personal and account maintenance services, which may then be paid by Goldman Sachs to authorized dealers, equal to, on an annual basis, 0.25% of the Fund’s average daily net assets attributable to Service Shares.
C. Transfer Agency Agreement — Goldman Sachs also serves as the transfer agent of the Fund for a fee pursuant to a Transfer Agency Agreement. The fee charged for such transfer agency services is accrued daily and paid monthly at an annual rate of 0.02% of the Fund’s average daily net assets of Institutional and Service Shares.
D. Other Expense Agreements — GSAM has agreed to reduce or limit certain “Other Expenses” of the Fund (excluding transfer agency fees and expenses, taxes, interest, brokerage fees, expenses of shareholder meetings, litigation and indemnification, and extraordinary expenses) to the extent such expenses exceed, on an annual basis, 0.004% of the average daily net assets of the Fund. Such Other Expense reimbursements, if any, are accrued daily and paid monthly. In addition, the Fund is not obligated to reimburse GSAM for prior fiscal year expense reimbursements, if any. This Other Expense limitation will remain in place through at least April 30, 2020, and prior to such date GSAM may not terminate the arrangement without the approval of the Trustees. In addition, the Fund has entered into certain offset arrangements with the custodian and the transfer agent, which may result in a reduction of the Fund’s expenses and are received irrespective of the application of the “Other Expense” limitation described
16
GOLDMAN SACHS VARIABLE INSURANCE TRUST GOVERNMENT MONEY MARKET FUND
Notes to Financial Statements(continued)
June 30, 2019 (Unaudited)
4. AGREEMENTS AND AFFILIATED TRANSACTIONS (continued)
above. For the six months ended June 30, 2019, these expense reductions, including any fee waivers and Other Expense reimbursements, were as follows:
| | | | | | | | | | | | | | |
| Custody Fee Credits | | | Transfer Agency Fees | | | Other Expense Reimbursements | | | Total Expense Reductions | |
| | | |
| $ | 2,061 | | | $ | 6 | | | $ | 102,682 | | | $ | 104,749 | |
E. Contractual and Net Fund Expenses— During the six months ended June 30, 2019, GSAM, as the investment adviser, and Goldman Sachs, as distributor and transfer agent, voluntarily agreed to waive a portion of management fees, distribution and service plan fees and transfer agency fees attributable to the Fund. These waivers may be modified or terminated at any time at the option of GSAM or Goldman Sachs (as applicable). The following table outlines such fees (net of waivers) and Other Expenses (net of reimbursements and custodian and transfer agency fee credit reductions) in order to determine the Fund’s net annualized expenses for the fiscal period. The Fund is not obligated to reimburse Goldman Sachs for prior fiscal year fee waivers, if any.
| | | | | | | | | | | | | | | | |
| | | Institutional Shares | | | Service Shares | |
| Fee/Expense Type | | Contractual rate,
if any | | | Ratio of net expenses to
average net assets
for the six months ended
June 30, 2019 | | | Contractual rate,
if any | | | Ratio of net expenses to
average net assets
for the six months ended
June 30, 2019 | |
| Management Fee | | | 0.16 | % | | | 0.16 | % | | | 0.16 | % | | | 0.16 | % |
| Distribution and Service Fees | | | N/A | | | | N/A | | | | 0.25 | | | | 0.25 | |
| Transfer Agency Fees | | | 0.02 | | | | 0.02 | | | | 0.02 | | | | 0.02 | |
| Other Expenses | | | — | | | | 0.00 | (a) | | | — | | | | 0.00 | (a) |
| Net Expenses | | | | | | | 0.18 | % | | | | | | | 0.43 | % |
| (a) | Amount is less than 0.005% of average net assets. |
| N/A | - Fees not applicable to respective share class. |
F. Other Transactions with Affiliates — The Fund may purchase securities from, or sell securities to, an affiliated fund provided the affiliation is solely due to having a common investment adviser, common officers, or common Trustees. For the six months ended June 30, 2019, the purchases at cost with an affiliated fund in compliance with Rule17a-7 under the Act for the Fund were $37,366,382.
G. Line of Credit Facility — As of June 30, 2019, the Fund participated in a $580,000,000 committed, unsecured revolving line of credit facility (the “facility”) together with other funds of the Trust and registered investment companies having management agreements with GSAM or its affiliates. This facility is to be used for temporary emergency purposes, or to allow for an orderly liquidation of securities to meet redemption requests. The interest rate on borrowings is based on the federal funds rate. The facility also requires a fee to be paid by the Fund based on the amount of the commitment that has not been utilized. For the six months ended June 30, 2019, the Fund did not have any borrowings under the facility. Prior to April 30, 2019 the facility was $770,000,000.
5. OTHER RISKS
The Fund’s risks include, but are not limited to, the following:
Large Shareholder Transactions Risk — The Fund may experience adverse effects when certain large shareholders, such as other funds, participating insurance companies, accounts and Goldman Sachs affiliates, purchase or redeem large amounts of shares of the Fund. Such large shareholder redemptions, which may occur rapidly or unexpectedly, may cause the Fund to sell portfolio securities at times when it would not otherwise do so, which may negatively impact the Fund’s NAV and liquidity. These
17
GOLDMAN SACHS VARIABLE INSURANCE TRUST GOVERNMENT MONEY MARKET FUND
Notes to Financial Statements(continued)
June 30, 2019 (Unaudited)
5. OTHER RISKS (continued)
transactions may also accelerate the realization of taxable income to shareholders if such sales of investments resulted in gains, and may also increase transaction costs. In addition, a large redemption could result in the Fund’s current expenses being allocated over a smaller asset base, leading to an increase in the Fund’s expense ratio. Similarly, large Fund share purchases may adversely affect the Fund’s performance to the extent that the Fund is delayed in investing new cash or otherwise maintains a larger cash position than it ordinarily would.
Interest Rate Risk — When interest rates increase, the Fund’s yield will tend to be lower than prevailing market rates, and the market value of its securities or instruments may also be adversely affected. A low interest rate environment poses additional risks to the Fund, because low yields on the Fund’s portfolio holdings may have an adverse impact on the Fund’s ability to provide a positive yield to its shareholders, pay expenses out of Fund assets, or, at times, maintain a stable $1.00 share price. The risks associated with changing interest rates may have unpredictable effects on the markets and the Fund’s investments. Fluctuations in interest rates may also affect the liquidity of fixed income securities and instruments held by the Fund.
Market and Credit Risks — In the normal course of business, the Fund trades financial instruments and enters into financial transactions where risk of potential loss exists due to changes in the market (market risk). Additionally, the Fund may also be exposed to credit risk in the event that an issuer or guarantor fails to perform or that an institution or entity with which the Fund has unsettled or open transactions defaults.
Credit/Default Risk — An issuer or guarantor of a security held by the Fund, or a bank or other financial institution that has entered into a repurchase agreement with the Fund, may default on its obligation to pay interest and repay principal or default on any other obligation. Additionally, the credit quality of securities may deteriorate rapidly, which may impair the Fund’s liquidity and cause significant deterioration in NAV.
6. INDEMNIFICATIONS
Under the Trust’s organizational documents, its Trustees, officers, employees and agents are indemnified, to the extent permitted by the Act and state law, against certain liabilities that may arise out of performance of their duties to the Fund. Additionally, in the course of business, the Fund enters into contracts that contain a variety of indemnification clauses. The Fund’s maximum exposure under these arrangements is unknown, as this would involve future claims that may be made against the Fund that have not yet occurred. However, GSAM believes the risk of loss under these arrangements to be remote.
7. SUBSEQUENT EVENTS
Subsequent events after the Statement of Assets and Liabilities date have been evaluated and GSAM has concluded that there is no impact requiring adjustment or disclosure in the financial statements.
18
GOLDMAN SACHS VARIABLE INSURANCE TRUST GOVERNMENT MONEY MARKET FUND
Notes to Financial Statements(continued)
June 30, 2019 (Unaudited)
8. SUMMARY OF SHARE TRANSACTIONS
Share activity is as follows:
| | | | | | | | |
| | | For the Six Months Ended
June 30, 2019
(Unaudited) | | | For the Fiscal Year Ended
December 31, 2018 | |
| Institutional Shares* | | | | | | | | |
| Shares sold | | | 351,810,877 | | | | 576,263,982 | |
| Reinvestment of distributions | | | 4,136,146 | | | | 4,859,363 | |
| Shares redeemed | | | (455,106,725 | ) | | | (472,178,302 | ) |
| | | | (99,159,702 | ) | | | 108,945,043 | |
| Service Shares* | | | | | | | | |
| Shares sold | | | 98,191,093 | | | | 214,802,150 | |
| Reinvestment of distributions | | | 3,622,994 | | | | 5,123,225 | |
| Shares redeemed | | | (114,053,673 | ) | | | (205,516,685 | ) |
| | | | (12,239,586 | ) | | | 14,408,690 | |
| | |
| NET INCREASE (DECREASE) IN SHARES | | | (111,399,288 | ) | | | 123,353,733 | |
| * | Valued at $1.00 per share. |
19
GOLDMAN SACHS VARIABLE INSURANCE TRUST GOVERNMENT MONEY MARKET FUND
| | |
| Fund Expenses — Six Month Period Ended June 30, 2019 (Unaudited) | | |
As a shareholder of Institutional Shares and Service Shares of the Fund, you incur ongoing costs, including management fees; distribution and service(12b-1) fees (with respect to Service Shares); and other Fund expenses. This example is intended to help you understand your ongoing costs (in dollars) of investing in the Fund and to compare these costs with the ongoing costs of investing in other mutual funds.
The example is based on an investment of $1,000 invested at the beginning of the period and held for the entire period from January 1, 2019 through June 30, 2019, which represents a period of 181 days of a 365 day year.
Actual Expenses — The first line in the table below provides information about actual account values and actual expenses. You may use the information in this line, together with the amount you invested, to estimate the expenses that you paid over the period. Simply divide your account value by $1,000 (for example, an $8,600 account value divided by $1,000=8.6), then multiply the result by the number in the first line under the heading entitled “Expenses Paid” to estimate the expenses you paid on your account during this period.
Hypothetical Example for Comparison Purposes — The second line in the table below provides information about hypothetical account values and hypothetical expenses based on the Fund’s actual net expense ratio and an assumed rate of return of 5% per year before expenses, which is not the Fund’s actual return. The hypothetical account values and expenses may not be used to estimate the actual ending account balance or expenses you paid for the period. You may use this information to compare the ongoing costs of investing in the Fund and other funds. To do so, compare this 5% hypothetical example with the 5% hypothetical examples that appear in the shareholder reports of the other funds.
Please note that the expenses shown in the table are meant to highlight your ongoing costs only and do not reflect any transactional costs, such as sales charges, redemption fees, or exchange fees. Therefore, the second line of the table is useful in comparing ongoing costs only and will not help you determine the relative total costs of owning different funds. In addition, if these transactional costs were included, your costs would have been higher.
| | | | | | | | | | | | |
| Share Class | | Beginning
Account Value
1/1/19 | | | Ending
Account Value
6/30/19 | | | Expenses Paid
for the
6 Months
Ended
6/30/19* | |
| Institutional Shares | | | | | | | | | | | | |
| | | | |
| Actual | | $ | 1,000.00 | | | $ | 1,011.53 | | | $ | 0.90 | |
| Hypothetical 5% return | | $ | 1,000.00 | | | $ | 1,023.90 | + | | $ | 0.90 | |
| Service Shares | | | | | | | | | | | | |
| | | | |
| Actual | | $ | 1,000.00 | | | $ | 1,010.28 | | | $ | 2.14 | |
| Hypothetical 5% return | | $ | 1,000.00 | | | $ | 1,022.66 | + | | $ | 2.16 | |
| | * | Expenses are calculated using the Fund’s annualized net expense ratio for each class, which represents the ongoing expenses as a percentage of net assets for the six months ended June 30, 2019. Expenses are calculated by multiplying the annualized net expense ratio by the average account value for the period; then multiplying the result by the number of days in the most recent fiscal half year (or, since inception, if shorter); and then dividing that result by the number of days in the period. The annualized net expense ratios for the period were 0.18% and 0.43% for Institutional Shares and Service Shares, respectively. | |
| | + | Hypothetical expenses are based on the Fund’s actual annualized net expense ratio and an assumed rate of return of 5% per year before expenses. | |
20
GOLDMAN SACHS VARIABLE INSURANCE TRUST GOVERNMENT MONEY MARKET FUND
Statement Regarding Basis for Approval of Management Agreement (Unaudited)
Background
The Goldman Sachs Government Money Market Fund (the “Fund”) is an investment portfolio of Goldman Sachs Variable Insurance Trust (the “Trust”). The Board of Trustees oversees the management of the Trust and reviews the investment performance and expenses of the Fund at regularly scheduled meetings held throughout the year. In addition, the Board of Trustees determines annually whether to approve the continuance of the Trust’s investment management agreement (the “Management Agreement”) with Goldman Sachs Asset Management, L.P. (the “Investment Adviser”) on behalf of the Fund.
The Management Agreement was most recently approved for continuation until June 30, 2020 by the Board of Trustees, including those Trustees who are not parties to the Management Agreement or “interested persons” (as defined in the Investment Company Act of 1940, as amended) of any party thereto (the “Independent Trustees”), at a meeting held onJune 11-12, 2019 (the “Annual Meeting”).
The review process undertaken by the Trustees spans the course of the year and culminates with the Annual Meeting. To assist the Trustees in their deliberations, the Trustees have established a Contract Review Committee (the “Committee”), comprised of the Independent Trustees. The Committee held four meetings over the course of the year since the Management Agreement was last approved. At those Committee meetings, regularly scheduled Board or other committee meetings, and/or the Annual Meeting, matters relevant to the renewal of the Management Agreement were considered by the Board, or the Independent Trustees, as applicable. With respect to the Fund, such matters included:
| | (a) | | the nature and quality of the advisory, administrative, and other services provided to the Fund by the Investment Adviser and its affiliates, including information about: |
| | (i) | | the structure, staff, and capabilities of the Investment Adviser and its portfolio management teams; |
| | (ii) | | the groups within the Investment Adviser and its affiliates that support the portfolio management teams or provide other types of necessary services, including fund services groups (e.g., accounting and financial reporting, tax, shareholder services, and operations); controls and risk management groups (e.g., legal, compliance, valuation oversight, credit risk management, internal audit, compliance testing, market risk analysis, finance, and central funding); sales and distribution support groups, and others (e.g., information technology and training); |
| | (iii) | | trends in employee headcount; |
| | (iv) | | the Investment Adviser’s financial resources and ability to hire and retain talented personnel and strengthen its operations; and |
| | (v) | | the parent company’s support of the Investment Adviser and its mutual fund business, as expressed by the firm’s senior management; |
| | (b) | | information on the investment performance of the Fund, including comparisons to the performance of similar mutual funds, as provided by a third-party mutual fund data provider engaged as part of the contract review process (the “Outside Data Provider”); and information on general investment outlooks in the markets in which the Fund invests; |
| | (c) | | information provided by the Investment Adviser indicating the Investment Adviser’s views on whether the Fund’s peer group and/or benchmark index had high, medium, or low relevance given the Fund’s particular investment strategy; |
| | (d) | | the terms of the Management Agreement and other agreements with affiliated service providers entered into by the Trust on behalf of the Fund; |
| | (e) | | fee and expense information for the Fund, including: |
| | (i) | | the relative management fee and expense levels of the Fund as compared to those of comparable funds managed by other advisers, as provided by the Outside Data Provider; |
| | (ii) | | the Fund’s expense trends over time; and |
| | (iii) | | to the extent the Investment Adviser manages other types of accounts (such as bank collective trusts, private wealth management accounts, institutional separate accounts,sub-advised mutual funds, andnon-U.S. funds) having investment objectives and policies similar to those of the Fund, comparative information on the advisory fees charged and services provided to those accounts by the Investment Adviser; |
| | (f) | | with respect to the extensive investment performance and expense comparison data provided by the Outside Data Provider, its processes in producing that data for the Fund; |
| | (g) | | the undertakings of the Investment Adviser and its affiliates to implement fee waivers and/or expense limitations; |
| | (h) | | information relating to the profitability of the Management Agreement and the transfer agency and distribution and service arrangements of the Fund to the Investment Adviser and its affiliates; |
| | (i) | | whether the Fund’s existing management fee schedule adequately addressed any economies of scale; |
21
GOLDMAN SACHS VARIABLE INSURANCE TRUST GOVERNMENT MONEY MARKET FUND
Statement Regarding Basis for Approval of Management Agreement (Unaudited) (continued)
| | (j) | | a summary of the“fall-out” benefits derived by the Investment Adviser and its affiliates from their relationships with the Fund, including the fees received by the Investment Adviser’s affiliates from the Fund for transfer agency, distribution and other services; |
| | (k) | | a summary of potential benefits derived by the Fund as a result of its relationship with the Investment Adviser; |
| | (l) | | information regarding portfolio trading and how the Investment Adviser carries out its duty to seek best execution; |
| | (m) | | the nature and quality of the services provided to the Fund by its unaffiliated service providers, and the Investment Adviser’s general oversight and evaluation (including reports on due diligence) of those service providers as part of the administrative services provided under the Management Agreement; and |
| | (n) | | the Investment Adviser’s processes and policies addressing various types of potential conflicts of interest; its approach to risk management; the annual review of the effectiveness of the Fund’s compliance program; and periodic compliance reports. |
The Trustees also received an overview of the Fund’s distribution arrangements. They received information regarding the Fund’s assets, share purchase and redemption activity, and payment of distribution and service fees. Information was also provided to the Trustees relating to revenue sharing payments made by and services provided by the Investment Adviser and its affiliates to intermediaries that promote the sale, distribution, and/or servicing of Fund shares. The Independent Trustees also discussed the broad range of other investment choices that are available to Fund investors, including the availability of comparable funds managed by other advisers.
The presentations made at the Board and Committee meetings and at the Annual Meeting encompassed the Fund and other mutual funds for which the Board of Trustees has responsibility. In evaluating the Management Agreement at the Annual Meeting, the Trustees relied upon their knowledge, resulting from their meetings and other interactions throughout the year, of the Investment Adviser and its affiliates, their services, and the Fund. In conjunction with these meetings, the Trustees received written materials and oral presentations on the topics covered, and the Investment Adviser addressed the questions and concerns of the Trustees, including concerns regarding the investment performance of certain of the funds they oversee. The Independent Trustees were advised by their independent legal counsel regarding their responsibilities and other regulatory requirements related to the approval and continuation of mutual fund investment management agreements under applicable law. In addition, the Investment Adviser and its affiliates provided the Independent Trustees with a written response to a formal request for information sent on behalf of the Independent Trustees by their independent legal counsel. During the course of their deliberations, the Independent Trustees met in executive sessions with their independent legal counsel, without representatives of the Investment Adviser or its affiliates present.
Nature, Extent, and Quality of the Services Provided Under the Management Agreement
As part of their review, the Trustees considered the nature, extent, and quality of the services provided to the Fund by the Investment Adviser. In this regard, the Trustees considered both the investment advisory services andnon-advisory services that are provided by the Investment Adviser and its affiliates. The Trustees noted the transition in the leadership and changes in personnel of various of the Investment Adviser’s portfolio management teams that had occurred in recent periods, and the ongoing recruitment efforts aimed at bringing high quality investment talent to the Investment Adviser. They also noted the Investment Adviser’s commitment to maintaining high quality systems and expending substantial resources to respond to ongoing changes to the regulatory and control environment in which the Fund and its service providers operate, as well as the efforts of the Investment Adviser and its affiliates to combat cyber security risks. The Trustees concluded that the Investment Adviser continued to commit substantial financial and operational resources to the Fund and expressed confidence that the Investment Adviser would continue to do so in the future. The Trustees also recognized that the Investment Adviser had made significant commitments to address regulatory compliance requirements applicable to the Fund and the Investment Adviser and its affiliates.
Investment Performance
The Trustees also considered the investment performance of the Fund. In this regard, they compared the investment performance of the Fund to its peers using rankings compiled by the Outside Data Provider as of December 31, 2018. The information on the Fund’s investment performance was provided for theone-, three-, five-, andten-year periods ending on the applicable dates.
In addition, the Trustees considered materials prepared and presentations made by the Investment Adviser’s senior management and portfolio management personnel in which Fund performance was assessed. The Trustees also considered the Investment Adviser’s periodic reports with respect to the Fund’s risk profile, and how the Investment Adviser’s approach to risk monitoring and management influences portfolio management.
22
GOLDMAN SACHS VARIABLE INSURANCE TRUST GOVERNMENT MONEY MARKET FUND
Statement Regarding Basis for Approval of Management Agreement (Unaudited) (continued)
The Trustees considered the performance of the Fund in light of its investment policies and strategy. They noted that, although the Fund has operated in a challenging yield environment since 2009, yields had improved, thereby reducing the amount of fees waived and/or reimbursed by the Investment Adviser. They also acknowledged the uncertainty of the future interest rate environment. The Trustees considered that, during the relevant period, the Investment Adviser had voluntarily waived fees in order to maintain a competitive yield. They observed that the Investment Adviser had previously made certain contractual management fee waivers permanent in February 2018, lowering the Fund’s contractual management fee schedule, and had also reduced its voluntary management fee waiver throughout the year with the rise in interest rates. They also acknowledged the growth of the Fund in recent periods. The Trustees also considered that the Fund had maintained a stable net asset value per share. In light of these considerations, the Trustees believed that the Fund was providing investment performance within a competitive range for investors.
Costs of Services Provided and Competitive Information
The Trustees considered the contractual terms of the Management Agreement and the fee rates payable by the Fund thereunder. In this regard, the Trustees considered information on the services rendered by the Investment Adviser to the Fund, which included both advisory and administrative services that were directed to the needs and operations of the Fund as a registered mutual fund.
In particular, the Trustees reviewed analyses prepared by the Outside Data Provider regarding the expense rankings of the Fund. The analyses provided a comparison of the Fund’s management fee to those of a relevant peer group and category universe; an expense analysis which compared the Fund’s overall net and gross expenses to a peer group and a category universe; and data comparing the Fund’s net expenses to the peer and category medians. The analyses also compared the Fund’s other expenses and fee waivers/reimbursements to those of the peer group and category medians. The Trustees concluded that the comparisons provided by the Outside Data Provider were useful in evaluating the reasonableness of the management fees and total expenses paid by the Fund.
In addition, the Trustees considered the Investment Adviser’s undertakings to implement fee waivers and/or expense limitations. They noted that the Investment Adviser and Goldman Sachs had waived fees and reimbursed expenses for the Fund in order to maintain a competitive yield. They observed that the Investment Adviser had made its previous contractual management fee waiver permanent in February 2018, lowering the Fund’s contractual management fee schedule, and had also reduced its voluntary management fee waiver for the Fund throughout the year with the rise in interest rates. They also considered, to the extent that the Investment Adviser manages other types of accounts having investment objectives and policies similar to those of the Fund, comparative fee information for services provided by the Investment Adviser to those accounts, and information that indicated that services provided to the Fund differed in various significant respects from the services provided to other types of accounts which, in many cases, operated under less stringent legal and regulatory structures, required fewer services from the Investment Adviser to a smaller number of client contact points, and were less time-intensive.
In addition, the Trustees noted that shareholders are able to redeem their Fund shares at any time if shareholders believe that the Fund fees and expenses are too high or if they are dissatisfied with the performance of the Fund.
Profitability
The Trustees reviewed the Fund’s contribution to the Investment Adviser’s revenues andpre-tax profit margins. In this regard the Trustees noted that they had received, among other things, profitability analyses and summaries, revenue and expense schedules by Fund and by function (i.e., investment management, transfer agency and distribution and service), and information on the Investment Adviser’s expense allocation methodology. They observed that the profitability and expense figures are substantially similar to those used by the Investment Adviser for many internal purposes, including compensation decisions among various business groups, and are thus subject to a vigorous internal debate about how certain revenue and expenses should be allocated. The Trustees also noted that the internal audit group within the Goldman Sachs organization periodically audits the expense allocation methodology and that the internal audit group was satisfied with the reasonableness, consistency, and accuracy of the Investment Adviser’s expense allocation methodology. Profitability data for the Fund was provided for 2018 and 2017, and the Trustees considered this information in relation to the Investment Adviser’s overall profitability.
Economies of Scale
The Trustees considered the information that had been provided regarding whether there have been economies of scale with respect to the management of the Fund.
23
GOLDMAN SACHS VARIABLE INSURANCE TRUST GOVERNMENT MONEY MARKET FUND
Statement Regarding Basis for Approval of Management Agreement (Unaudited) (continued)
The Trustees noted that the Fund does not have management fee breakpoints. They considered the asset levels in the Fund; the Fund’s recent purchase and redemption activity; the information provided by the Investment Adviser relating to the costs of the services provided by the Investment Adviser and its affiliates and their realized profits; information comparing the contractual fee rates charged by the Investment Adviser with fee rates charged to other money market funds in the peer group; and the Investment Adviser’s undertaking to limit certain expenses of the Fund that exceed a specified level. They considered a report prepared by the Outside Data Provider, which surveyed money market funds’ management fee arrangements and use of breakpoints. The Trustees also considered the competitive nature of the money market fund business and the competitiveness of the fees charged to the Fund by the Investment Adviser.
Other Benefits to the Investment Adviser and Its Affiliates
The Trustees also considered the other benefits derived by the Investment Adviser and its affiliates from their relationships with the Fund as stated above, including: (a) transfer agency fees received by Goldman Sachs & Co. LLC (“Goldman Sachs”); (b) trading efficiencies resulting from aggregation of orders of the Fund with those for other funds or accounts managed by the Investment Adviser; (c) the Investment Adviser’s ability to leverage the infrastructure designed to service the Fund on behalf of its other clients; (d) the Investment Adviser’s ability to cross-market other products and services to Fund shareholders; (e) Goldman Sachs’ retention of certain fees as Fund Distributor; (f) Goldman Sachs’ ability to engage in principal transactions with the Fund under exemptive orders from the U.S. Securities and Exchange Commission permitting such trades; (g) the Investment Adviser’s ability to negotiate better pricing with custodians on behalf of its other clients, as a result of the relationship with the Fund; and (h) the possibility that the working relationship between the Investment Adviser and the Fund’s third-party service providers may cause those service providers to be more likely to do business with other areas of Goldman Sachs. In the course of considering the foregoing, the Independent Trustees requested and received further information quantifying certain of thesefall-out benefits.
Other Benefits to the Fund and Its Shareholders
The Trustees also noted that the Fund receives certain other potential benefits as a result of its relationship with the Investment Adviser, including: (a) trading efficiencies resulting from aggregation of orders of the Fund with those of other funds or accounts managed by the Investment Adviser; (b) enhanced servicing from vendors due to the volume of business generated by the Investment Adviser and its affiliates; (c) enhanced servicing from broker-dealers due to the volume of business generated by the Investment Adviser and its affiliates; (d) the advantages received from the Investment Adviser’s knowledge and experience gained from managing other accounts and products; (e) the Investment Adviser’s ability to hire and retain qualified personnel to provide services to the Fund because of the reputation of the Goldman Sachs organization; (f) the Fund’s access, through the Investment Adviser, to certain firm-wide resources (e.g., proprietary risk management systems and databases), subject to certain restrictions; and (g) the Fund’s access to certain affiliated distribution channels. In addition, the Trustees noted the competitive nature of the mutual fund marketplace, and considered that many of the Fund’s shareholders invested in the Fund in part because of the Fund’s relationship with the Investment Adviser and that those shareholders have a general expectation that the relationship will continue.
Conclusion
In connection with their consideration of the Management Agreement, the Trustees gave weight to each of the factors described above, but did not identify any particular factor as controlling their decision. After deliberation and consideration of all of the information provided, including the factors described above, the Trustees concluded, in the exercise of their business judgment, that the management fees paid by the Fund were reasonable in light of the services provided to it by the Investment Adviser, the Investment Adviser’s costs and the Fund’s current and reasonably foreseeable asset levels. The Trustees unanimously concluded that the Investment Adviser’s continued management likely would benefit the Fund and its shareholders and that the Management Agreement should be approved and continued with respect to the Fund until June 30, 2020.
24
| | |
TRUSTEES Jessica Palmer,Chair Kathryn A. Cassidy Diana M. Daniels James A. McNamara Roy W. Templin Gregory G. Weaver | | OFFICERS James A. McNamara,President Joseph F. DiMaria,Principal Financial Officer, Principal Accounting Officer and Treasurer Caroline L. Kraus,Secretary |
GOLDMAN SACHS & CO. LLC
Distributor and Transfer Agent
GOLDMAN SACHS ASSET MANAGEMENT, L.P.
Investment Adviser
200 West Street, New York
New York 10282
Visit our web site at www.GSAMFUNDS.com to obtain the most recentmonth-end returns.
The reports concerning the Fund included in this shareholder report may contain certain forward-looking statements about the factors that may affect the performance of the Fund in the future. These statements are based on Fund management’s predictions and expectations concerning certain future events and their expected impact on the Fund, such as performance of the economy as a whole and of specific industry sectors, changes in the levels of interest rates, the impact of developing world events, and other factors that may influence the future performance of the Fund. Management believes these forward-looking statements to be reasonable, although they are inherently uncertain and difficult to predict. Actual events may cause adjustments in portfolio management strategies from those currently expected to be employed.
A description of the policies and procedures that the Fund uses to determine how to vote proxies relating to portfolio securities and information regarding how the Fund voted proxies relating to portfolio securities during the most recent12-month period ended June 30 is available (i) without charge, upon request by calling1-800-621-2550; and (ii) on the Securities and Exchange Commission (“SEC”) Web site athttp://www.sec.gov.
Views and opinions expressed are for informational purposes only and do not constitute a recommendation by GSAM to buy, sell, or hold any security. Views and opinions are current as of the date of this presentation and may be subject to change, they should not be construed as investment advice.
Goldman Sachs & Co. LLC (“Goldman Sachs”) does not provide legal, tax or accounting advice. Any statement contained in this communication (including any attachments) concerning U.S. tax matters was not intended or written to be used, and cannot be used, for the purpose of avoiding penalties under the Internal Revenue Code, and was written to support the promotion or marketing of transaction or matter addressed. Clients of Goldman Sachs should obtain their own independent tax advice based on their particular circumstances.
The web site links provided are for your convenience only and are not an endorsement or recommendation by GSAM of any of these web sites or the products or services offered. GSAM is not responsible for the accuracy and validity of the content of these web sites.
Fund holdings and allocations shown are as of June 30, 2019 and may not be representative of future investments. Fund holdings should not be relied on in making investment decisions and should not be construed as research or investment advice regarding particular securities. Current and future holdings are subject to risk.
The portfolio risk management process includes an effort to monitor and manage risk, but does not imply low risk.
Shares of the Goldman Sachs VIT Funds are offered to separate accounts of participating life insurance companies for the purpose of funding variable annuity contracts and variable life insurance policies. Shares of the Fund are not offered directly to the general public. The variable annuity contracts and variable life insurance policies are described in the separate prospectuses issued by participating insurance companies. You should refer to those prospectuses for information about surrender charges, mortality and expense risk fees and other charges that may be assessed by participating insurance companies under the variable annuity contracts or variable life insurance policies. Such fees or charges, if any, may affect the return you may realize with respect to your investments. Ask your representative for more complete information. Please consider a fund’s objectives, risks and charges and expenses, and read the prospectus carefully before investing. The prospectus contains this and other information about the Fund.
This material is not authorized for distribution to prospective investors unless preceded or accompanied by a current prospectus or summary prospectus, if applicable. Investors should consider the Fund’s objective, risks, and charges and expenses, and read the summary prospectus, if available, and/or the prospectus carefully before investing or sending money. The summary prospectus, if available, and the prospectus contain this and other information about the Fund and may be obtained from your authorized dealer or from Goldman Sachs & Co. LLC by calling1-800-621-2550.
This report is prepared for the general information of contract owners and is not an offer of shares of the Goldman Sachs Variable Insurance Trust — Goldman Sachs Government Money Market Fund.
© 2019 Goldman Sachs. All rights reserved.
VITMMSAR-19/175366-OTU-1025424
Goldman
SachsVariable Insurance Trust
Goldman Sachs
Multi-Strategy
Alternatives Portfolio
Beginning on or after January 1, 2021, you may not receive paper copies of the Portfolio’s annual and semi-annual shareholder reports from the insurance company that offers your variable insurance contract or your financial intermediary, unless you specifically request paper copies of the reports from the insurance company or from your financial intermediary. Instead, the reports will be made available on a website, and you will be notified by mail each time a report is posted and provided with a website link to access the report.
If you already elected to receive shareholder reports electronically, you will not be affected by this change and you need not take any action. At any time, you may elect to receive reports and certain communications from the insurance company electronically by contacting your insurance company or your financial intermediary.
You may elect to receive all future shareholder reports in paper free of charge. You can inform the insurance company or your financial intermediary that you wish to receive paper copies of reports. Your election to receive reports in paper will apply to all Goldman Sachs Funds available under your contract and may apply to all funds held with your financial intermediary.

Semi-Annual Report
June 30, 2019
GOLDMAN SACHS VARIABLE INSURANCE TRUST MULTI-STRATEGY ALTERNATIVES PORTFOLIO
INVESTMENT OBJECTIVE
The Portfolio seeks long-term growth of capital.
Portfolio Management Discussion and Analysis
Below, the Goldman Sachs Global Portfolio Solutions Team discusses the Goldman Sachs Variable Insurance Trust — Goldman Sachs Multi-Strategy Alternatives Portfolio’s (the “Portfolio”) performance and positioning for thesix-month period ended June 30, 2019 (the “Reporting Period”).
How did the Portfolio perform during the Reporting Period?
During the Reporting Period, the Portfolio’s Institutional, Service and Advisor Shares generated cumulative total returns of 7.29%, 7.16% and 7.07%, respectively. These returns compare to the 1.43% cumulative total return of the Portfolio’s benchmark, the ICE BofAMLU.S. Dollar Three-Month LIBOR Constant Maturity Index (the “LIBOR Index”), during the same period.
Please note that the Portfolio’s benchmark being the LIBOR Index is a means of emphasizing that the Portfolio has an unconstrained strategy. That said, this Portfolio employs a benchmark agnostic strategy and thus comparisons to a benchmark index are not particularly relevant.
What economic and market factors most influenced the Portfolio during the Reporting Period?
The capital markets and the Portfolio were influenced most during the Reporting Period by global economic data, central bank monetary policy and geopolitics.
During the first quarter of 2019, when the Reporting Period started, risk assets broadly rebounded from asell-off in the fourth quarter of 2018, as investor sentiment turned positive on a combination of dovish global central bank policy, tentative stabilization in Chinese economic growth and seemingly promising developments in U.S.-China trade talks. (Dovish tends to suggest lower interest rates; opposite of hawkish.) Although global economic growth continued to decelerate during the first calendar quarter, a few “green shoots” began to emerge. (Green shoots is a term used to describe signs of economic recovery or positive data during an economic downturn.) Indications of a bottoming in Chinese credit growth, a modestpick-up in fixed asset investment, and an uptick in March 2019 manufacturing data made investors hopeful for a recovery in Chinese and global economic growth. As inflationary pressures remained rather muted, the U.S. Federal Reserve (the “Fed”) and the European Central Bank (“ECB”) each made a dovish shift and then maintained monetary policy stances that were broadly supportive of economic growth. More specifically, the Fed signaled it would make no additional short-term interest rate hikes during 2019, and the ECB indicated it was reluctant to raise interest rates during the calendar year. Global equities, as measured by the MSCI ACWI Investable Market Index, were up 12.86% during the first calendar quarter, led by a rally in U.S. stocks. Emerging markets equities overall underperformed developed markets equities, but Chinese stocks, as represented by the MSCI China Index, rose more than 17%. In fixed income, the10-year U.S. Treasury yield fell during the first quarter of 2019.
In the second quarter of 2019, continued weakness in global economic growth and low levels of inflation led the Fed and ECB to indicate they might ease monetary policy. In June, the Fed signaled its next policy move was more likely to be an interest rate cut than an interest rate hike. The Fed’s dot plot, which shows interest rate projections of the members of the Federal Open Market Committee, revealed that policymakers expected to keep interest rates stable during 2019, followed by a 25 basis point cut in 2020. (A basis point is 1/100th of a percentage point.) Meanwhile, the ECB hinted that interest rate cuts and quantitative easing were on the table should economic data disappoint in the near term. Global equities were volatile during the second calendar quarter overall, though they rose 3.88%, as measured by the MSCI ACWI Investable Market Index. In May 2019, global equities had suffered a significant decline amid headwinds from U.S.-China trade negotiations. They then recovered in June, driven by dovish central bank actions and market expectations of a pause in U.S.-China trade tensions ahead of the G20 meeting at month end. (Also known as Group of 20 nations, the G20 is a forum attended by finance ministers and central bank governors from the world’s highly developed economies consisting of 19 countries and the European Union.) In fixed income, the10-year U.S. Treasury yield and the10-year German government bond yield fell during the second quarter of 2019 in response to global economic growth weakness and dovish central bank policies.
What key factors were responsible for the Portfolio’s performance during the Reporting Period?
The Portfolio’s performance is driven by four sources of return: long-term strategic asset allocation to market exposures, medium-term cycle-aware allocation, short-term tactical allocation and excess returns from investments in Underlying Funds. Long-term
1
GOLDMAN SACHS VARIABLE INSURANCE TRUST MULTI-STRATEGY ALTERNATIVES PORTFOLIO
strategic asset allocation is the process by which the Portfolio’s assets are allocated across underlying asset classes and strategies in a way that considers the risks of each underlying asset class and strategy. Medium-term cycle-aware allocation is the process by which we adjust the portfolio for changes in the business or economic cycle. Short-term tactical allocation is the implementation of tactical market views with the goal of improving the Portfolio’s risk-adjusted return. The risk-adjusted return on an investment takes into account the risk associated with that investment relative to other potential investments. Excess returns from investments in Underlying Funds is by how much the Underlying Funds outperform or underperform their respective benchmark indices.
During the Reporting Period, the Portfolio generated positive absolute returns, driven primarily by strategic asset allocation and by security selection within the Underlying Funds. This was partially offset by medium-term cycle-aware allocation and short-term tactical asset allocation, which diminished the Portfolio’s performance.
Strategic asset allocation added to the Portfolio’s results during the Reporting Period. Allocations to fixed income had the greatest positive impact, driven primarily by our long U.S. interest rate options strategy, through which we seek to profit if interest rates fall, remain constant or rise less than anticipated. This strategy bolstered performance as U.S. Treasury yields fell during the Reporting Period. (Our long U.S. interest rate options strategy is a macroeconomic hedge that buys put options on short-term interest rates. A put option is an option contract giving the owner the right, but not the obligation, to sell a specified amount of an underlying asset at a specified price within a specified time.) An allocation to emerging markets debt further enhanced the Portfolio’s returns amid the rally in risk assets. In addition, a strategic allocation to U.S. high yield corporate bonds contributed positively to the Portfolio’s performance as credit spreads narrowed during the Reporting Period. (Credit spreads are yield differentials between corporate bonds and U.S. Treasury securities of comparable maturity). Within equities, the Portfolio benefited from our strategic allocation to emerging markets stocks, as investor sentiment was buoyed by seemingly constructive U.S.-China trade talks and the Fed’s dovish stance. In addition, the Portfolio’s allocation to U.S. real estate securities was advantageous. As for the Portfolio’s allocations to liquid alternatives strategies, they had a positive impact on performance. Finally, the Portfolio’s volatility selling strategy added to returns during the Reporting Period. (Our volatility selling strategy seeks to benefit from changes in the level of market implied volatility (i.e., expectations of future volatility) in equity markets.)
Medium-term cycle-aware allocation detracted from the Portfolio’s performance. During the Reporting Period, the Portfolio held two medium-term cycle-aware views. The first was to have a short duration position, which we expressed through a short position in long-maturity German government bonds and short positions in specific segments of the U.S. Treasury yield curve. (Duration is a measure of the Portfolio’s sensitivity to changes in interest rates. Yield curve is a spectrum of interest rates based on maturities of varying lengths.) The Portfolio’s short position in thetwo-year segment of the U.S. Treasury yield curve hurt returns most, as U.S. yields fell during the Reporting Period. The Portfolio’s short position in long-maturity German government bonds also had a negative impact on performance, as Germany’s long-term interest rates fell during the Reporting Period in response to slower European economic growth and dovish ECB monetary policy. The second medium-term cycle-aware view, which was to hold a long position in local emerging markets debt versus high yield corporate bonds, detracted slightly from the Portfolio’s performance, as high yield corporate bonds slightly outperformed local emerging markets debt during the Reporting Period.
Short-term tactical allocation had a negative impact on performance during the Reporting Period, as the Goldman Sachs Tactical Exposure Fund (the “Underlying Tactical Fund”) underperformed its benchmark index.
Overall, security selection within the Underlying Funds added to the Portfolio’s performance during the Reporting Period. The Goldman Sachs Managed Futures Strategy Fund outperformed its benchmark index the most, followed by the Goldman Sachs Absolute Return Tracker Fund, which also outpaced its benchmark index. In addition, the Goldman Sachs Emerging Markets Debt Fund and the Goldman Sachs Local Emerging Markets Debt Fund outperformed their respective benchmark indices. Conversely, the Goldman Sachs Alternative Premia Fund and the Goldman Sachs Long Short Credit Strategies Fund underperformed their respective benchmark indices during the Reporting Period.
How was the Portfolio positioned at the beginning of the Reporting Period?
At the beginning of the Reporting Period, the Portfolio was positioned, in terms of its total net assets, with 65.5% in liquid alternative strategies, 30.6% in real assets/satellite asset classes and 3.9% in cash. Liquid alternatives strategies generally include, but are not limited to, momentum or trend trading strategies (investment decisions based on trends in asset prices over time), hedge fund beta (long-term total returns consistent with investment results that approximate the return and risk patterns of a diversified universe of hedge funds), managed risk investment strategies (which seek to manage extreme risk scenarios by implementing daily and monthly risk targets across a diversified mix of asset classes), emerging markets debt and unconstrained fixed income strategies (which have the ability to move across various fixed income sectors). Real assets generally include, but are not limited to, commodities, global real estate securities, infrastructure and master limited partnerships. The strategic asset allocation of the
2
GOLDMAN SACHS VARIABLE INSURANCE TRUST MULTI-STRATEGY ALTERNATIVES PORTFOLIO
Portfolio reflects a risk-based allocation approach to increase diversification across the Portfolio. The Portfolio had-7.6% of its total net assets invested in tactical exposures at the beginning of the Reporting Period.
How did you manage the Portfolio’s allocations during the Reporting Period?
During the Reporting Period, we made no changes to the Portfolio’s strategic allocation. We consider the Portfolio’s strategic asset allocation and underlying active security selection strategies the largest drivers of risk and performance.
Within the medium-term cycle-aware allocation, we sought to adjust the Portfolio’s exposure for what we considered to be medium-term changes to the business or economic cycle. In January 2019, we removed our medium-term cycle-aware view that the Portfolio be overweight emerging markets equities versus developed markets equities. We had expected to see the start of a rebound in China’s economic data by the end of 2018 in response to policy initiatives that sought to stimulate growth, but fresh data releases showed continued deterioration. Although we continued to believe Chinese economic data would recover, we thought the likely timing had been pushed into the future and that market uncertainty around it had increased. In March 2019, we reduced the Portfolio’s short position in long-maturity German government bonds, as Germany’s long-term interest rates fell. We also moderated our view that the Portfolio have exposure to emerging markets debt versus high yield corporate bonds.
Finally, in a risk management move during the first week of June 2019, we reduced the Portfolio’s long equity exposure, and we increased its cash position. In our opinion, the U.S. economic cycle had matured substantially, and the increased uncertainty associated with this phase of the economic cycle reduced our confidence level in risk assets.
Effective on or around June 28, 2019, we changed the Portfolio’s Underlying Tactical Fund from the Goldman Sachs Tactical Exposure Fund to the Goldman Sachs Tactical Tilt Overlay Fund.
How was the Portfolio positioned at the end of the Reporting Period?
At the end of the Reporting Period, the Portfolio was positioned, in terms of its total net assets, with 66.0% in liquid alternative strategies, 30.6% in real assets/satellite asset classes and 3.4% in cash. The Portfolio had-1.0% of its total net assets invested in tactical exposures.
How did the Portfolio use derivatives and similar instruments during the Reporting Period?
During the Reporting Period, derivatives were used primarily to express our views across developed and emerging markets equities. More specifically, the Portfolio employed equity index futures to affect long exposures to U.S.large-cap equities, international equities and emerging markets equities (each had a positive impact). Within fixed income during the Reporting Period, the Portfolio used interest rate futures, specifically Eurodollar futures, to express views on the U.S. Treasury yield curve (negative impact). Eurodollar futures are contracts that have underlying assets linked to time deposits denominated in U.S. dollars at banks outside the U.S. The Portfolio also used bond futures to affect a short position in German government bonds (negative impact). Finally, the Portfolio utilized interest rate options in a macroeconomic hedge that seeks to profit if interest rates fall, remain constant or rise less than anticipated (positive impact).
Additionally, some of the Underlying Funds used derivatives during the Reporting Period to apply their active investment views with greater versatility and potentially to afford greater risk management precision. As market conditions warranted during the Reporting Period, some of these Underlying Funds engaged in forward foreign currency exchange contracts, financial futures contracts, options, swap contracts and structured securities to attempt to enhance portfolio return and for hedging purposes.
Were there any changes to the Portfolio’s portfolio management team during the Reporting Period?
Effective February 19, 2019, Raymond Chan no longer served as a portfolio manager of the Portfolio, and Neil Nuttall became a portfolio manager of the Portfolio. By design, all investment decisions for the Portfolio are performed within aco-lead or team structure, with multiple subject matter experts. This strategic decision making has been the cornerstone of our approach and ensures continuity in the Portfolio. At the end of the Reporting Period, the portfolio managers for the Portfolio remained Neil Nuttall and Christopher Lvoff.
What is the Portfolio’s tactical view and strategy for the months ahead?
At the end of the Reporting Period, we emphasized three macro themes. First, we believed the U.S. economy was in “rollover,” meaning we expected increased economic weakness. The economic “green shoots” we had expected to grow during the Reporting Period had instead started to wither. Trade risks also remained elevated, in our view. Our research shows that economic rollovers are characterized by high risks of recession and severe equity declines as well as by episodes of “false positives” and premature warning signals. Second, at the end of the Reporting Period, we believed global economic uncertainty had increased overall.
3
GOLDMAN SACHS VARIABLE INSURANCE TRUST MULTI-STRATEGY ALTERNATIVES PORTFOLIO
Although we thought the risk of recession had risen, we did not think it was time to position the Portfolio for such a scenario. Third, we considered a dynamic investment approach particularly important, and we planned to address increased economic uncertainty through the Portfolio’s positioning and its level of risk exposure.
At the asset class level at the end of the Reporting Period, we expected a continuation of the equity bull market, assuming the global economy continued to expand over the medium term. However, we thought the upside was likely to be limited by moderately elevated equity valuations and limitations to corporate earnings growth. In the near term, we considered equities less attractive than we did earlier in the economic cycle. As for fixed income, we believed yields reflected the market’s increased perception of recessionary risk. At the end of the Reporting Period,10-year U.S. Treasury yields were lower than we expected, and we thought there was potential for them to rise in the near term. Overall, we did not consider the risk/reward of fixed income particularly attractive, because there tends to be upward pressure on credit spreads in the late stage of an economic cycle; spreads were rather tight at the end of the Reporting Period; and we perceived risks to the macro outlook. (Credit spreads are yield differentials between corporate bonds and U.S. Treasury securities of comparable maturity.) Accordingly, we favored equities over fixed income at the end of the Reporting Period.
4
GOLDMAN SACHS VARIABLE INSURANCE TRUST MULTI-STRATEGY ALTERNATIVES PORTFOLIO
Index Definitions
ICE BofAML U.S. Dollar Three-Month LIBOR Constant Maturity Index is based on the assumed purchase of a synthetic instrument having three months to maturity and with a coupon equal to the closing quote for three-month LIBOR. That issue is sold the following day (priced at a yield equal to the current day closing three-month LIBOR rate) and is rolled into a new three-month instrument. The index, therefore, will always have a constant maturity equal to exactly three months.
MSCI ACWI Investable Market Indexcaptures large, mid and small cap representation across 23 developed markets and 26 emerging markets countries.
MSCI China Index captures large and mid cap representation across China H shares, B shares, Red chips, P chips and foreign listings.
It is not possible to invest directly in an unmanaged index.
5
FUND BASICS
Multi-Strategy Alternatives Portfolio
as of June 30, 2019
STANDARDIZED TOTAL RETURNS1
| | | | | | | | | | | | | | | | |
| | | | |
| For the period ended 6/30/19 | | One Year | | | Five Years | | | Since Inception | | | Inception Date | |
| Institutional | | | 3.81 | % | | | -0.25 | % | | | 0.14 | % | | | 4/25/14 | |
| Service | | | 3.70 | | | | -0.49 | | | | -0.09 | | | | 4/25/14 | |
| Advisor | | | 3.45 | | | | -0.62 | | | | -0.24 | | | | 4/25/14 | |
| 1 | The Standardized Total Returns are average annual total returns as of the most recent calendar quarter-end. They assume reinvestment of all distributions at net asset value (“NAV”). Because Institutional, Service and Advisor Shares do not involve a sales charge, such a charge is not applied to their Standardized Total Returns. |
Total return figures in the above chart represent past performance and do not indicate future results, which will vary. The investment return and principal value of an investment will fluctuate and, therefore, an investor’s shares, when redeemed, may be worth more or less than their original cost. Current performance may be lower or higher than the total return figures in the above chart. Please visit www.GSAMFUNDS.com to obtain the most recentmonth-end returns.Performance reflects fee waivers and/or expense limitations in effect during the periods shown. In their absence, performance would be reduced.
EXPENSE RATIOS2
| | | | | | | | |
| | |
| | | Net Expense Ratio (Current) | | | Gross Expense Ratio (Before Waivers) | |
| Institutional | | | 1.05 | % | | | 2.36 | % |
| Service | | | 1.30 | | | | 2.61 | |
| Advisor | | | 1.45 | | | | 2.76 | |
| 2 | The expense ratios of the Portfolio, both current (net of any fee waivers and/or expense limitations) and before waivers (gross of any fee waivers and/or expense limitations) are as set forth above according to the most recent publicly available Prospectuses for the Portfolio and may differ from the expense ratios disclosed in the Financial Highlights of this report. Pursuant to a contractual arrangement, the Portfolio’s fee waivers and/or expense limitations will remain in place through at least April 30, 2020, and prior to such date, the Investment Adviser may not terminate the arrangements without the approval of the Portfolio’s Board of Trustees. If these arrangements are discontinued in the future, the expense ratios may change without shareholder approval. |
6
FUND BASICS
OVERALL UNDERLYING FUND AND ETF WEIGHTINGS3
Percentage of Net Assets
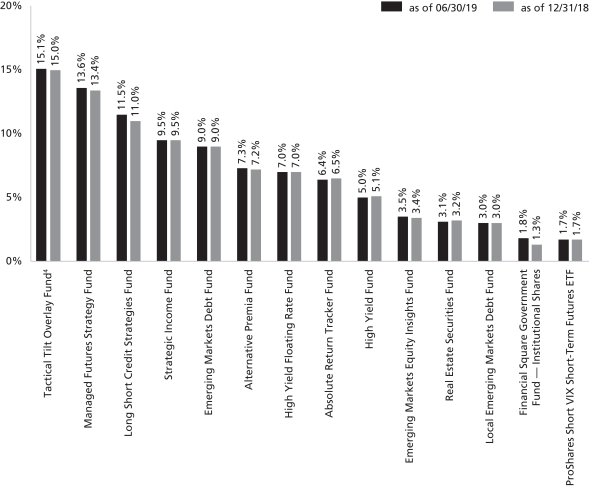
| 3 | The Portfolio is actively managed and, as such, its composition may differ over time. The percentage shown for each Underlying Fund and exchange traded fund (“ETF”) reflects the value of that Underlying Fund or ETF as a percentage of net assets of the Portfolio. Figures in the graph above may not sum to 100% due to rounding and/or exclusion of other assets and liabilities. Underlying sector allocations of exchange traded funds and investment companies held by the Portfolio are not reflected in the graph above. Investments in the securities lending reinvestment vehicle have been excluded from the graph and represented 0.8% of the Portfolio’s net assets at June 30, 2019. The graph depicts the Portfolio’s investments but may not represent the Portfolio’s market exposure due to the exclusion of certain derivatives, if any, as listed in the Additional Investment Information section of the Schedule of Investments. |
| 4 | The underlying percentage as of December 31, 2018 represents the investment in Tactical Exposure Fund, which was transitioned to Tactical Tilt Overlay Fund prior to June 30, 2019. |
7
GOLDMAN SACHS VARIABLE INSURANCE TRUST MULTI-STRATEGY ALTERNATIVES PORTFOLIO
Schedule of Investments
June 30, 2019 (Unaudited)
| | | | | | | | |
| Shares | | |
Description | | Value | |
|
| Underlying Funds (Class R6 Shares)(a) – 94.1% | |
| Equity – 28.2% | |
| | 261,735 | | | Goldman Sachs Tactical Tilt Overlay Fund | | $ | 2,570,235 | |
| | 112,177 | | | Goldman Sachs Absolute Return Tracker Fund | | | 1,094,850 | |
| | 62,835 | | | Goldman Sachs Emerging Markets Equity Insights Fund | | | 601,332 | |
| | 34,967 | | | Goldman Sachs Real Estate Securities Fund | | | 533,595 | |
| | | | | | | | |
| | | | | | | 4,800,012 | |
| | |
| Fixed Income – 65.9% | |
| | 213,425 | | | Goldman Sachs Managed Futures Strategy Fund | | | 2,307,119 | |
| | 224,778 | | | Goldman Sachs Long Short Credit Strategies Fund | | | 1,964,557 | |
| | 174,385 | | | Goldman Sachs Strategic Income Fund | | | 1,625,270 | |
| | 122,601 | | | Goldman Sachs Emerging Markets Debt Fund | | | 1,532,510 | |
| | 153,064 | | | Goldman Sachs Alternative Premia Fund | | | 1,245,941 | |
| | 127,595 | | | Goldman Sachs High Yield Floating Rate Fund | | | 1,199,388 | |
| | 133,029 | | | Goldman Sachs High Yield Fund | | | 852,716 | |
| | 83,720 | | | Goldman Sachs Local Emerging Markets Debt Fund | | | 504,830 | |
| | | | | | | | |
| | | | | | | 11,232,331 | |
| | |
| | TOTAL UNDERLYING FUNDS (CLASS R6 SHARES) | |
| | (Cost $16,188,623) | | $ | 16,032,343 | |
| | |
| | | | | | | | |
|
| Exchange Traded Fund(b) – 1.7% | |
| | 5,295 | | | ProShares Short VIX Short-Term Futures ETF | | $ | 285,242 | |
| | (Cost $251,189) | | | | |
| | |
| | | | | | | | |
| Shares | | Dividend
Rate | | | Value | |
|
| Investment Company(a) – 1.8% | |
Goldman Sachs Financial Square Government Fund — Institutional Shares | |
| 298,898 | | | 2.308 | % | | $ | 298,898 | |
| (Cost $298,898) | | | | | |
| |
| TOTAL INVESTMENTS BEFORE SECURITIES LENDING REINVESTMENT VEHICLE | |
| (Cost $16,738,710) | | | $ | 16,616,483 | |
| |
| | | | | | | | |
|
| Securities Lending Reinvestment Vehicle(a) – 0.8% | |
Goldman Sachs Financial Square Government Fund — Institutional Shares | |
| 141,700 | | | 2.308 | % | | $ | 141,700 | |
| (Cost $141,700) | |
| |
| TOTAL INVESTMENTS – 98.4% | |
| (Cost $16,880,410) | | | $ | 16,758,183 | |
| |
OTHER ASSETS IN EXCESS OF LIABILITIES – 1.6% | | | | 266,293 | |
| |
| NET ASSETS – 100.0% | | | $ | 17,024,476 | |
| |
| | |
| The percentage shown for each investment category reflects the value of investments in that category as a percentage of net assets. |
| |
| (a) | | Represents an Affiliated Issuer. |
| |
| (b) | | All or a portion of security is on loan. |
| | |
| |
| Currency Abbreviation: |
| USD | | —United States Dollar |
| | |
| 8 | | The accompanying notes are an integral part of these financial statements. |
GOLDMAN SACHS VARIABLE INSURANCE TRUST MULTI-STRATEGY ALTERNATIVES PORTFOLIO
ADDITIONAL INVESTMENT INFORMATION
FUTURES CONTRACTS — At June 30, 2019, the Portfolio had the following futures contracts:
| | | | | | | | | | | | | | | | |
| Description | | Number of
Contracts | | | Expiration
Date | | | Notional
Amount | | | Unrealized
Appreciation/
(Depreciation) | |
| | | | |
Long position contracts: | | | | | | | | | | | | | | | | |
| MSCI Emerging MarketsE-Mini Index | | | 9 | | | | 09/20/2019 | | | $ | 474,030 | | | $ | 20,373 | |
S&P 500E-Mini Index | | | 1 | | | | 09/20/2019 | | | | 147,210 | | | | 2,473 | |
| | | | |
| Total | | | | | | | | | | | | | | $ | 22,846 | |
| | | | |
Short position contracts: | | | | | | | | | | | | | | | | |
3 Month Eurodollar | | | (32) | | | | 09/14/2020 | | | $ | (7,875,200 | ) | | $ | (76,927 | ) |
| | | | |
| Total Futures Contracts | | | | | | | | | | | | | | $ | (54,081 | ) |
PURCHASED OPTIONS CONTRACTS — At June 30, 2019, the Portfolio had the following purchased options contracts:
| | | | | | | | | | | | | | | | | | | | | | | | | | | | | | |
| Description | | Counterparty | | | Exercise Price | | | Expiration
Date | | Number of
Contracts | | | Notional
Amount | | | Value | | | Premiums
Paid
(Received)
by the
Portfolio | | | Unrealized
Appreciation/
Depreciation | |
| | |
Purchased options contracts: | | | | | | | | | |
| | |
Calls | | | | | | | | | |
| 3 Month Eurodollar | | | Barclays Bank PLC | | | | 97.75 USD | | | 09/16/2019 | | | 5 | | | $ | 1,250,000 | | | $ | 3,375 | | | $ | 3,136 | | | $ | 239 | |
| | | | | | | 98.50 USD | | | 06/15/2020 | | | 5 | | | | 1,250,000 | | | | 2,750 | | | | 2,512 | | | | 238 | |
| | | | | | | 97.50 USD | | | 09/14/2020 | | | 5 | | | | 1,250,000 | | | | 12,125 | | | | 3,881 | | | | 8,244 | |
| | | | | | | 97.50 USD | | | 12/14/2020 | | | 5 | | | | 1,250,000 | | | | 12,250 | | | | 4,769 | | | | 7,481 | |
| | | | | | | 97.00 USD | | | 03/15/2021 | | | 2 | | | | 500,000 | | | | 7,375 | | | | 3,580 | | | | 3,795 | |
| | | | | | | 98.25 USD | | | 03/15/2021 | | | 40 | | | | 10,000,000 | | | | 47,500 | | | | 46,293 | | | | 1,207 | |
| | | | | | | 97.00 USD | | | 06/14/2021 | | | 1 | | | | 250,000 | | | | 3,631 | | | | 1,852 | | | | 1,779 | |
| | | | | | | 98.00 USD | | | 06/14/2021 | | | 10 | | | | 2,500,000 | | | | 15,687 | | | | 8,146 | | | | 7,541 | |
| | | | | | | 98.25 USD | | | 06/14/2021 | | | 36 | | | | 9,000,000 | | | | 43,200 | | | | 43,808 | | | | (608 | ) |
| | | | | | | 97.00 USD | | | 09/13/2021 | | | 2 | | | | 500,000 | | | | 7,200 | | | | 4,905 | | | | 2,295 | |
| | | | | | | 98.25 USD | | | 09/13/2021 | | | 34 | | | | 8,500,000 | | | | 41,438 | | | | 40,616 | | | | 822 | |
| | | | | | | 98.50 USD | | | 12/13/2021 | | | 22 | | | | 5,500,000 | | | | 20,625 | | | | 21,426 | | | | (801 | ) |
| | | | | | | | 98.50 USD | | | 03/16/2020 | | | 8 | | | | 2,000,000 | | | | 2,800 | | | | 2,719 | | | | 81 | |
| | | | | | | | |
Total purchased options contracts | | | | | | | | | | | | | 175 | | | | | | | $ | 219,956 | | | $ | 187,643 | | | $ | 32,313 | |
| | |
| The accompanying notes are an integral part of these financial statements. | | 9 |
GOLDMAN SACHS VARIABLE INSURANCE TRUST MULTI-STRATEGY ALTERNATIVES PORTFOLIO
Statement of Assets and Liabilities
June 30, 2019 (Unaudited)
| | | | |
| | | | |
| Assets: | | | |
Investments in affiliated Underlying Funds, at value (cost $16,487,521) | | $ | 16,331,241 | |
Investments in unaffiliated Funds, at value (cost $251,189)(a) | | | 285,242 | |
Investments in affiliated securities lending reinvestment vehicle, at value (cost $141,700) | | | 141,700 | |
Purchased Options, at value (premiums paid $187,643) | | | 219,956 | |
Cash | | | 275,558 | |
Receivables: | | | | |
Investments sold | | | 243,725 | |
Collateral on certain derivative contracts(b) | | | 25,740 | |
Portfolio shares sold | | | 19,836 | |
Dividends | | | 19,316 | |
Reimbursement from investment adviser | | | 14,274 | |
Variation margin on futures | | | 1,771 | |
Other assets | | | 278 | |
| |
| Total assets | | | 17,578,637 | |
| | | | |
| | | | |
| Liabilities: | | | |
Payables: | | | | |
Investments purchased | | | 281,427 | |
Payable upon return of securities loaned | | | 141,700 | |
Portfolio shares redeemed | | | 35,866 | |
Distribution and Service fees and Transfer Agency fees | | | 5,271 | |
Accrued expenses | | | 89,897 | |
| |
| Total liabilities | | | 554,161 | |
| |
| | | | |
| Net Assets: | | | |
Paid-in capital | | | 18,144,561 | |
Total distributable earnings (loss) | | | (1,120,085 | ) |
| |
| NET ASSETS | | $ | 17,024,476 | |
Net Assets: | | | | |
Institutional | | $ | 1,104,036 | |
Service | | | 1,474,313 | |
Advisor | | | 14,446,127 | |
| |
Total Net Assets | | $ | 17,024,476 | |
Shares outstanding $0.001 par value (unlimited shares authorized): | | | | |
Institutional | | | 120,874 | |
Service | | | 161,501 | |
Advisor | | | 1,589,470 | |
Net asset value, offering and redemption price per share: | | | | |
Institutional | | | $9.13 | |
Service | | | 9.13 | |
Advisor | | | 9.09 | |
(a) Includes loaned securities having a market value of $138,892.
(b) Includes amount segregated for initial margin on future transactions.
| | |
| 10 | | The accompanying notes are an integral part of these financial statements. |
GOLDMAN SACHS VARIABLE INSURANCE TRUST MULTI-STRATEGY ALTERNATIVES PORTFOLIO
Statement of Operations
For the Six Months Ended June 30, 2019 (Unaudited)
| | | | |
| | | | |
| Investment income: | | | |
Dividends from affiliated Underlying Funds | | $ | 154,236 | |
Dividends from unaffiliated Funds | | | 1,136 | |
Securities lending income — unaffiliated issuer | | | 587 | |
| |
| Total investment income | | | 155,959 | |
| | | | |
| | | | |
| Expenses: | | | |
Custody, accounting and administrative services | | | 37,690 | |
Professional fees | | | 35,879 | |
Distribution and Service fees(a) | | | 28,739 | |
Printing and mailing costs | | | 28,405 | |
Management fees | | | 11,728 | |
Trustee fees | | | 7,942 | |
Transfer Agency fees(a) | | | 1,564 | |
Registration fees | | | 345 | |
Other | | | 3,160 | |
| |
| Total expenses | | | 155,452 | |
| |
Less — expense reductions | | | (109,605 | ) |
| |
| Net expenses | | | 45,847 | |
| |
| NET INVESTMENT INCOME | | | 110,112 | |
| | | | |
| | | | |
| Realized and unrealized gain (loss): | | | |
Net realized gain (loss) from: | | | | |
Investments in affiliated Underlying Funds | | | (139,841 | ) |
Investments in unaffiliated Funds | | | (2,002 | ) |
Futures contracts | | | 45,654 | |
Purchased options | | | 147,355 | |
Foreign currency transactions | | | 3,054 | |
Net change in unrealized gain (loss) on: | | | | |
Investments in affiliated Underlying Funds | | | 888,367 | |
Investments in unaffiliated Funds | | | 70,659 | |
Futures contracts | | | (76,863 | ) |
Purchased options | | | 29,969 | |
Foreign currency translation | | | (2,313 | ) |
| |
| Net realized and unrealized gain | | | 964,039 | |
| |
| NET INCREASE IN NET ASSETS RESULTING FROM OPERATIONS | | $ | 1,074,151 | |
(a) Class specific Distribution and/or Service, and Transfer Agency fees were as follows:
| | | | | | | | | | | | | | | | | | |
Distribution and/or
Service Fees | | | Transfer Agency Fees | |
Service | | | Advisor | | | Institutional | | | Service | | | Advisor | |
| $ | 1,307 | | | $ | 27,432 | | | $ | 88 | | | $ | 105 | | | $ | 1,371 | |
| | |
| The accompanying notes are an integral part of these financial statements. | | 11 |
GOLDMAN SACHS VARIABLE INSURANCE TRUST MULTI-STRATEGY ALTERNATIVES PORTFOLIO
Statements of Changes in Net Assets
| | | | | | | | |
| | | For the
Six Months Ended
June 30, 2019
(Unaudited) | | | For the
Fiscal Year Ended
December 31, 2018 | |
| | | | | | | | |
| From operations: | | | | | | |
Net investment income | | $ | 110,112 | | | $ | 330,087 | |
Net realized gain (loss) | | | 54,220 | | | | (556,892 | ) |
Net change in unrealized gain (loss) | | | 909,819 | | | | (1,017,669 | ) |
| | |
| Net increase (decrease) in net assets resulting from operations | | | 1,074,151 | | | | (1,244,474 | ) |
| | | | | | | | |
| | | | | | | | |
| Distributions to shareholders: | | | | | | |
From distributable earnings: | | | | | | | | |
Institutional Shares | | | — | | | | (20,403 | ) |
Service Shares | | | — | | | | (20,381 | ) |
Advisor Shares | | | — | | | | (318,314 | ) |
| | |
| Total distributions to shareholders | | | — | | | | (359,098 | ) |
| | | | | | | | |
| | | | | | | | |
| From share transactions: | | | | | | |
Proceeds from sales of shares | | | 2,566,186 | | | | 6,168,668 | |
Reinvestment of distributions | | | — | | | | 359,098 | |
Cost of shares redeemed | | | (1,631,986 | ) | | | (5,978,711 | ) |
| | |
| Net increase in net assets resulting from share transactions | | | 934,200 | | | | 549,055 | |
| | |
| TOTAL INCREASE (DECREASE) | | | 2,008,351 | | | | (1,054,517 | ) |
| | | | | | | | |
| | | | | | | | |
| Net Assets: | | | | | | |
| | |
Beginning of period | | | 15,016,125 | | | | 16,070,642 | |
| | |
End of period | | $ | 17,024,476 | | | $ | 15,016,125 | |
| | |
| 12 | | The accompanying notes are an integral part of these financial statements. |
GOLDMAN SACHS VARIABLE INSURANCE TRUST MULTI-STRATEGY ALTERNATIVES PORTFOLIO
Financial Highlights
Selected Data for a Share Outstanding Throughout Each Period
| | | | | | | | | | | | | | | | | | | | | | | | |
| | | Goldman Sachs Multi-Strategy Alternatives Portfolio | |
| | | Institutional Shares | |
| | | Six Months Ended
June 30, 2019
(Unaudited) | | | Year Ended December 31, | | | For the period
April 25, 2014*
to
December 31, 2014 | |
| | 2018 | | | 2017 | | | 2016 | | | 2015 | |
| | | | | | | | | | | | | | | | | | | | | | | | |
| Per Share Data | | | | | | | | | | | | | | | | | | |
| | | | | | |
Net asset value, beginning of period | | $ | 8.51 | | | $ | 9.39 | | | $ | 9.10 | | | $ | 9.15 | | | $ | 9.81 | | | $ | 10.00 | |
| | | | | | |
Net investment income(a)(b) | | | 0.08 | | | | 0.24 | | | | 0.21 | | | | 0.11 | | | | 0.20 | | | | 0.09 | |
| | | | | | |
Net realized and unrealized gain (loss) | | | 0.54 | | | | (0.87 | ) | | | 0.30 | | | | (0.06 | ) | | | (0.65 | ) | | | (0.16 | ) |
| | | | | | |
Total from investment operations | | | 0.62 | | | | (0.63 | ) | | | 0.51 | | | | 0.05 | | | | (0.45 | ) | | | (0.07 | ) |
| | | | | | |
Distributions to shareholders from net investment income | | | — | | | | (0.25 | ) | | | (0.22 | ) | | | (0.10 | ) | | | (0.20 | ) | | | (0.12 | ) |
| | | | | | |
Distributions to shareholders from net realized gains | | | — | | | | — | | | | — | | | | — | | | | (0.01 | ) | | | — | (c) |
| | | | | | |
Total distributions | | | — | | | | (0.25 | ) | | | (0.22 | ) | | | (0.10 | ) | | | (0.21 | ) | | | (0.12 | ) |
| | | | | | |
Net asset value, end of period | | $ | 9.13 | | | $ | 8.51 | | | $ | 9.39 | | | $ | 9.10 | | | $ | 9.15 | | | $ | 9.81 | |
| | | | | | |
Total return(d) | | | 7.29 | % | | | (6.74 | )% | | | 5.60 | % | | | 0.52 | % | | | (4.51 | )% | | | (0.67 | )% |
| | | | | | |
Net assets, end of period (in 000s) | | $ | 1,104 | | | $ | 745 | | | $ | 453 | | | $ | 309 | | | $ | 958 | | | $ | 1,003 | |
| | | | | | |
Ratio of net expenses to average net assets(e) | | | 0.22 | %(f) | | | 0.22 | % | | | 0.21 | % | | | 0.24 | % | | | 0.22 | % | | | 0.22 | %(f) |
| | | | | | |
Ratio of total expenses to average net assets(e) | | | 1.60 | %(f) | | | 1.57 | % | | | 1.47 | % | | | 2.37 | % | | | 4.40 | % | | | 24.63 | %(f) |
| | | | | | |
Ratio of net investment income to average net assets(b) | | | 1.78 | %(f) | | | 2.62 | % | | | 2.20 | % | | | 1.17 | % | | | 2.02 | % | | | 1.30 | %(f) |
| | | | | | |
Portfolio turnover rate(g) | | | 22 | % | | | 61 | % | | | 53 | % | | | 44 | % | | | 53 | % | | | 25 | % |
| * | Commencement of Operations. |
| (a) | Calculated based on the average shares outstanding methodology. |
| (b) | Recognition of net investment income by the Portfolio is affected by the timing of declaration of dividends by the Underlying Funds in which the Portfolio invests. |
| (c) | Amount is less than $0.005 per share. |
| (d) | Assumes investment at the net asset value at the beginning of the period, reinvestment of all distributions, a complete redemption of the investment at the net asset value at the end of the period and no sales or redemption charges (if any). Total returns would be reduced if a sales or redemption charge was taken into account. Returns do not reflect the impact of taxes to shareholders relating to Portfolio distributions or the redemption of Portfolio shares. Total returns for periods less than one full year are not annualized. |
| (e) | Expense ratios exclude the expenses of the Underlying Funds in which the Portfolio invests. |
| (g) | The portfolio turnover rate is calculated in accordance with regulatory requirements, without regard to transactions involving short term investments and certain derivatives. If such transactions were included, the portfolio turnover rate may be higher. |
| | |
| The accompanying notes are an integral part of these financial statements. | | 13 |
GOLDMAN SACHS VARIABLE INSURANCE TRUST MULTI-STRATEGY ALTERNATIVES PORTFOLIO
Financial Highlights(continued)
Selected Data for a Share Outstanding Throughout Each Period
| | | | | | | | | | | | | | | | | | | | | | | | |
| | | Goldman Sachs Multi-Strategy Alternatives Portfolio | |
| | | Service Shares | |
| | | Six Months Ended
June 30, 2019
(Unaudited) | | | Year Ended December 31, | | | For the period
April 25, 2014*
to
December 31, 2014 | |
| | 2018 | | | 2017 | | | 2016 | | | 2015 | |
| | | | | | | | | | | | | | | | | | | | | | | | |
| Per Share Data | | | | | | | | | | | | | | | | | | |
| | | | | | |
Net asset value, beginning of period | | $ | 8.52 | | | $ | 9.41 | | | $ | 9.13 | | | $ | 9.14 | | | $ | 9.81 | | | $ | 10.00 | |
| | | | | | |
Net investment income(a)(b) | | | 0.07 | | | | 0.28 | | | | 0.27 | | | | 0.08 | | | | 0.24 | | | | 0.07 | |
| | | | | | |
Net realized and unrealized gain (loss) | | | 0.54 | | | | (0.93 | ) | | | 0.22 | | | | (0.05 | ) | | | (0.71 | ) | | | (0.16 | ) |
| | | | | | |
Total from investment operations | | | 0.61 | | | | (0.65 | ) | | | 0.49 | | | | 0.03 | | | | (0.47 | ) | | | (0.09 | ) |
| | | | | | |
Distributions to shareholders from net investment income | | | — | | | | (0.24 | ) | | | (0.21 | ) | | | (0.04 | ) | | | (0.19 | ) | | | (0.10 | ) |
| | | | | | |
Distributions to shareholders from net realized gains | | | — | | | | — | | | | — | | | | — | | | | (0.01 | ) | | | — | (c) |
| | | | | | |
Total distributions | | | — | | | | (0.24 | ) | | | (0.21 | ) | | | (0.04 | ) | | | (0.20 | ) | | | (0.10 | ) |
| | | | | | |
Net asset value, end of period | | $ | 9.13 | | | $ | 8.52 | | | $ | 9.41 | | | $ | 9.13 | | | $ | 9.14 | | | $ | 9.81 | |
| | | | | | |
Total return(d) | | | 7.16 | % | | | (6.93 | )% | | | 5.37 | % | | | 0.28 | % | | | (4.76 | )% | | | (0.85 | )% |
| | | | | | |
Net assets, end of period (in 000s) | | $ | 1,474 | | | $ | 811 | | | $ | 105 | | | $ | 34 | | | $ | 22 | | | $ | 10 | |
| | | | | | |
Ratio of net expenses to average net assets(e) | | | 0.47 | %(f) | | | 0.47 | % | | | 0.46 | % | | | 0.46 | % | | | 0.48 | % | | | 0.49 | %(f) |
| | | | | | |
Ratio of total expenses to average net assets(e) | | | 1.86 | %(f) | | | 1.95 | % | | | 1.73 | % | | | 1.97 | % | | | 3.33 | % | | | 25.05 | %(f) |
| | | | | | |
Ratio of net investment income to average net assets(b) | | | 1.53 | %(f) | | | 3.08 | % | | | 2.88 | % | | | 0.92 | % | | | 2.54 | % | | | 1.02 | %(f) |
| | | | | | |
Portfolio turnover rate(g) | | | 22 | % | | | 61 | % | | | 53 | % | | | 44 | % | | | 53 | % | | | 25 | % |
| * | Commencement of Operations. |
| (a) | Calculated based on the average shares outstanding methodology. |
| (b) | Recognition of net investment income by the Portfolio is affected by the timing of declaration of dividends by the Underlying Funds in which the Portfolio invests. |
| (c) | Amount is less than $0.005 per share. |
| (d) | Assumes investment at the net asset value at the beginning of the period, reinvestment of all distributions, a complete redemption of the investment at the net asset value at the end of the period and no sales or redemption charges (if any). Total returns would be reduced if a sales or redemption charge was taken into account. Returns do not reflect the impact of taxes to shareholders relating to Portfolio distributions or the redemption of Portfolio shares. Total returns for periods less than one full year are not annualized. |
| (e) | Expense ratios exclude the expenses of the Underlying Funds in which the Portfolio invests. |
| (g) | The portfolio turnover rate is calculated in accordance with regulatory requirements, without regard to transactions involving short term investments and certain derivatives. If such transactions were included, the portfolio turnover rate may be higher. |
| | |
| 14 | | The accompanying notes are an integral part of these financial statements. |
GOLDMAN SACHS VARIABLE INSURANCE TRUST MULTI-STRATEGY ALTERNATIVES PORTFOLIO
Financial Highlights(continued)
Selected Data for a Share Outstanding Throughout Each Period
| | | | | | | | | | | | | | | | | | | | | | | | |
| | | Goldman Sachs Multi-Strategy Alternatives Portfolio | |
| | | Advisor Shares | |
| | | Six Months Ended
June 30, 2019
(Unaudited) | | | Year Ended December 31, | | | For the period
April 25, 2014*
to
December 31, 2014 | |
| | 2018 | | | 2017 | | | 2016 | | | 2015 | |
| | | | | | | | | | | | | | | | | | | | | | | | |
| Per Share Data | | | | | | | | | | | | | | | | | | |
| | | | | | |
Net asset value, beginning of period | | $ | 8.49 | | | $ | 9.36 | | | $ | 9.08 | | | $ | 9.12 | | | $ | 9.79 | | | $ | 10.00 | |
| | | | | | |
Net investment income(a)(b) | | | 0.06 | | | | 0.17 | | | | 0.17 | | | | 0.10 | | | | 0.21 | | | | 0.11 | |
| | | | | | |
Net realized and unrealized gain (loss) | | | 0.54 | | | | (0.83 | ) | | | 0.30 | | | | (0.07 | ) | | | (0.69 | ) | | | (0.21 | ) |
| | | | | | |
Total from investment operations | | | 0.60 | | | | (0.66 | ) | | | 0.47 | | | | 0.03 | | | | (0.48 | ) | | | (0.10 | ) |
| | | | | | |
Distributions to shareholders from net investment income | | | — | | | | (0.21 | ) | | | (0.19 | ) | | | (0.07 | ) | | | (0.18 | ) | | | (0.11 | ) |
| | | | | | |
Distributions to shareholders from net realized gains | | | — | | | | — | | | | — | | | | — | | | | (0.01 | ) | | | — | (c) |
| | | | | | |
Total distributions | | | — | | | | (0.21 | ) | | | (0.19 | ) | | | (0.07 | ) | | | (0.19 | ) | | | (0.11 | ) |
| | | | | | |
Net asset value, end of period | | $ | 9.09 | | | $ | 8.49 | | | $ | 9.36 | | | $ | 9.08 | | | $ | 9.12 | | | $ | 9.79 | |
| | | | | | |
Total return(d) | | | 7.07 | % | | | (7.09 | )% | | | 5.14 | % | | | 0.27 | % | | | (4.89 | )% | | | (0.97 | )% |
| | | | | | |
Net assets, end of period (in 000s) | | $ | 14,446 | | | $ | 13,460 | | | $ | 15,512 | | | $ | 10,778 | | | $ | 9,666 | | | $ | 3,246 | |
| | | | | | |
Ratio of net expenses to average net assets(e) | | | 0.62 | %(f) | | | 0.62 | % | | | 0.61 | % | | | 0.61 | % | | | 0.62 | % | | | 0.62 | %(f) |
| | | | | | |
Ratio of total expenses to average net assets(e) | | | 2.02 | %(f) | | | 1.93 | % | | | 1.88 | % | | | 2.58 | % | | | 3.51 | % | | | 16.16 | %(f) |
| | | | | | |
Ratio of net investment income to average net assets(b) | | | 1.37 | %(f) | | | 1.92 | % | | | 1.78 | % | | | 1.06 | % | | | 2.16 | % | | | 1.66 | %(f) |
| | | | | | |
Portfolio turnover rate(g) | | | 22 | % | | | 61 | % | | | 53 | % | | | 44 | % | | | 53 | % | | | 25 | % |
| * | Commencement of Operations. |
| (a) | Calculated based on the average shares outstanding methodology. |
| (b) | Recognition of net investment income by the Portfolio is affected by the timing of declaration of dividends by the Underlying Funds in which the Portfolio invests. |
| (c) | Amount is less than $0.005 per share. |
| (d) | Assumes investment at the net asset value at the beginning of the period, reinvestment of all distributions, a complete redemption of the investment at the net asset value at the end of the period and no sales or redemption charges (if any). Total returns would be reduced if a sales or redemption charge was taken into account. Returns do not reflect the impact of taxes to shareholders relating to Portfolio distributions or the redemption of Portfolio shares. Total returns for periods less than one full year are not annualized. |
| (e) | Expense ratios exclude the expenses of the Underlying Funds in which the Portfolio invests. |
| (g) | The portfolio turnover rate is calculated in accordance with regulatory requirements, without regard to transactions involving short term investments and certain derivatives. If such transactions were included, the portfolio turnover rate may be higher. |
| | |
| The accompanying notes are an integral part of these financial statements. | | 15 |
GOLDMAN SACHS VARIABLE INSURANCE TRUST MULTI-STRATEGY ALTERNATIVES PORTFOLIO
Notes to Financial Statements
June 30, 2019 (Unaudited)
1. ORGANIZATION
Goldman Sachs Variable Insurance Trust (the “Trust” or “VIT”) is a Delaware statutory trust registered under the Investment Company Act of 1940, as amended (the “Act”), as anopen-end management investment company. The Trust includes the Goldman Sachs Multi-Strategy Alternatives Portfolio (the “Portfolio”). The Portfolio is a diversified portfolio under the Act offering three classes of shares — Institutional, Service and Advisor Shares. Shares of the Trust are offered to separate accounts of participating life insurance companies for the purpose of funding variable annuity contracts and variable life insurance policies.
Goldman Sachs Asset Management, L.P. (“GSAM”), an affiliate of Goldman Sachs & Co. LLC (“Goldman Sachs”), serves as investment adviser to the Portfolio pursuant to a management agreement (the “Agreement”) with the Trust.
The Portfolio invests primarily in a combination of domestic and international equity and fixed income underlying funds (“Underlying Funds”) which are registered under the Act, for which GSAM acts as investment adviser. Additionally, this Portfolio may invest a portion of its assets directly in other securities and instruments, including unaffiliated exchange traded funds (“Unaffiliated Funds”).
2. SIGNIFICANT ACCOUNTING POLICIES
The financial statements have been prepared in accordance with accounting principles generally accepted in the United States of America (“GAAP”) and require management to make estimates and assumptions that may affect the reported amounts and disclosures. Actual results may differ from those estimates and assumptions.
A. Investment Valuation — The valuation policy of the Portfolio and Underlying Funds is to value investments at fair value.
B. Investment Income and Investments — Investment income includes interest income, dividend income, and securities lending income, if any. Interest income is accrued daily and adjusted for amortization of premiums and accretion of discounts. Dividend income is recognized onex-dividend date or, for certain foreign securities, as soon as such information is obtained subsequent to theex-dividend date. Investment transactions are reflected on trade date. Realized gains and losses are calculated using identified cost. Investment transactions are recorded on the following business day for daily net asset value (“NAV”) calculations. Income distributions are recognized as capital gains or income in the financial statements in accordance with the character that is distributed. Distributions received from the Portfolios investments in Goldman Sachs Real Estate Securities Fund (the “Underlying Fund invested in REITs”) may be characterized as ordinary income, net capital gain or a return of capital. A return of capital is recorded by the Portfolio as a reduction to the cost basis of the REIT.
For derivative contracts, realized gains and losses are recorded upon settlement of the contract.
C. Class Allocations and Expenses — Investment income, realized and unrealized gain (loss), if any, andnon-class specific expenses of each Portfolio are allocated daily based upon the proportion of net assets of each class.Non-class specific expenses directly incurred by the Portfolio are charged to the Portfolio, while such expenses incurred by the Trust are allocated across the applicable Portfolios on a straight-line and/orpro-rata basis depending upon the nature of the expenses. Class specific expenses, where applicable, are borne by the respective share classes and include Distribution and Service and Transfer Agency. Expenses included in the accompanying financial statements reflect the expenses of each Portfolio and do not include any expenses associated with the Underlying Funds (“Underlying Funds”). Because the Underlying Funds have varied expense and fee levels and the Portfolio may own different proportions of the Underlying Funds at different times, the amount of fees and expenses incurred indirectly by the Portfolio will vary.
D. Federal Taxes and Distributions to Shareholders — It is the Portfolio’s policy to comply with the requirements of the Internal Revenue Code of 1986, as amended (the “Code”), applicable to regulated investment companies and to distribute each year substantially all of its investment company taxable income and capital gains to its shareholders. Accordingly, the Portfolio is not required to make any provisions for the payment of federal income tax. Distributions to shareholders are recorded on theex-dividend date. Income and capital gains distributions, if any, are declared and paid at least annually.
16
GOLDMAN SACHS VARIABLE INSURANCE TRUST MULTI-STRATEGY ALTERNATIVES PORTFOLIO
2. SIGNIFICANT ACCOUNTING POLICIES (continued)
Net capital losses, if any, are carried forward to future fiscal years and may be used to the extent allowed by the Code to offset any future capital gains. Losses that are carried forward will retain their character as either short-term or long-term capital losses. Utilization of capital loss carryforwards will reduce the requirement of future capital gains distributions.
The characterization of distributions to shareholders for financial reporting purposes is determined in accordance with federal income tax rules, which may differ from GAAP. The source of the Portfolio’s distributions may be shown in the accompanying financial statements as either from distributable earnings or capital. Certain components of the Portfolio’s net assets on the Statement of Assets and Liabilities reflect permanent GAAP/tax differences based on the appropriate tax character.
E. Foreign Currency Translation — The accounting records and reporting currency of the Portfolio are maintained in United States (“U.S.”) dollars. Assets and liabilities denominated in foreign currencies are translated into U.S. dollars using the current exchange rates at the close of each business day. The effect of changes in foreign currency exchange rates on investments is included within net realized and unrealized gain (loss) on investments. Changes in the value of other assets and liabilities as a result of fluctuations in foreign exchange rates are included in the Statement of Operations within net change in unrealized gain (loss) on foreign currency translation. Transactions denominated in foreign currencies are translated into U.S. dollars on the date the transaction occurred, the effects of which are included within net realized gain (loss) on foreign currency transactions.
3. INVESTMENTS AND FAIR VALUE MEASUREMENTS
U.S. GAAP defines the fair value of a financial instrument as the amount that would be received to sell an asset or paid to transfer a liability in an orderly transaction between market participants at the measurement date (i.e., the exit price); the Portfolio’s policy is to use the market approach. GAAP establishes a fair value hierarchy that prioritizes the inputs to valuation techniques used to measure fair value. The hierarchy gives the highest priority to unadjusted quoted prices in active markets for identical assets or liabilities (Level 1 measurements) and the lowest priority to unobservable inputs (Level 3 measurements). The levels used for classifying investments are not necessarily an indication of the risk associated with investing in these investments. The three levels of the fair value hierarchy are described below:
Level 1 — Unadjusted quoted prices in active markets that are accessible at the measurement date for identical, unrestricted assets or liabilities;
Level 2 — Quoted prices in markets that are not active or financial instruments for which significant inputs are observable (including, but not limited to, quoted prices for similar investments, interest rates, foreign exchange rates, volatility and credit spreads), either directly or indirectly;
Level 3 — Prices or valuations that require significant unobservable inputs (including GSAM’s assumptions in determining fair value measurement).
The Board of Trustees (“Trustees”) has approved Valuation Procedures that govern the valuation of the portfolio investments held by the Portfolio, including investments for which market quotations are not readily available. The Trustees have delegated to GSAMday-to-day responsibility for implementing and maintaining internal controls and procedures related to the valuation of the Portfolio’s investments. To assess the continuing appropriateness of pricing sources and methodologies, GSAM regularly performs price verification procedures and issues challenges as necessary to third party pricing vendors or brokers, and any differences are reviewed in accordance with the Valuation Procedures.
A. Level 1 and Level 2 Fair Value Investments — The valuation techniques and significant inputs used in determining the fair values for investments classified as Level 1 and Level 2 are as follows:
Underlying Funds (including Money Market Funds) — Underlying funds (“Underlying Funds”) include other investment companies and exchange-traded funds (“ETFs”). Investments in the Underlying Funds (except ETFs) are valued at the NAV per share on the day of valuation. ETFs are valued daily at the last sale price or official closing price on the principal exchange or system on which the investment is traded. Because the Portfolio invests in Underlying Funds that fluctuate in value, the Portfolio’s
17
GOLDMAN SACHS VARIABLE INSURANCE TRUST MULTI-STRATEGY ALTERNATIVES PORTFOLIO
Notes to Financial Statements(continued)
June 30, 2019 (Unaudited)
3. INVESTMENTS AND FAIR VALUE MEASUREMENTS (continued)
shares will correspondingly fluctuate in value. To the extent these investments are actively traded, they are classified as Level 1 of the fair value hierarchy, otherwise they are generally classified as Level 2. For information regarding an Underlying Fund’s accounting policies and investment holdings, please see the Underlying Fund’s shareholder report.
Derivative Contracts — A derivative is an instrument whose value is derived from underlying assets, indices, reference rates or a combination of these factors. The Portfolio enters into derivative transactions to hedge against changes in interest rates, securities prices, and/or currency exchange rates, to increase total return, or to gain access to certain markets or attain exposure to other underliers. For financial reporting purposes, cash collateral that has been pledged to cover obligations of a Fund and cash collateral received, if any, is reported separately on the Statement of Assets and Liabilities as receivables/payables for collateral on certain derivatives contracts.Non-cash collateral pledged by the Fund, if any, is noted in the Schedule of Investments.
Exchange-traded derivatives, including futures and options contracts, are generally valued at the last sale or settlement price on the exchange where they are principally traded. Exchange-traded options without settlement prices are generally valued at the midpoint of the bid and ask prices on the exchange where they are principally traded (or, in the absence oftwo-way trading, at the last bid price for long positions and the last ask price for short positions). Exchange-traded derivatives typically fall within Level 1 of the fair value hierarchy.Over-the-counter (“OTC”) and centrally cleared derivatives are valued using market transactions and other market evidence, including market-based inputs to models, calibration to market-clearing transactions, broker or dealer quotations, or other alternative pricing sources. Where models are used, the selection of a particular model to value OTC and centrally cleared derivatives depends upon the contractual terms of, and specific risks inherent in, the instrument, as well as the availability of pricing information in the market. Valuation models require a variety of inputs, including contractual terms, market prices, yield curves, credit curves, measures of volatility, voluntary and involuntary prepayment rates, loss severity rates and correlations of such inputs. For OTC and centrally cleared derivatives that trade in liquid markets, model inputs can generally be verified and model selection does not involve significant management judgment. OTC and centrally cleared derivatives are classified within Level 2 of the fair value hierarchy when significant inputs are corroborated by market evidence.
i. Futures Contracts — Futures contracts are contracts to buy or sell a standardized quantity of a specified commodity or security. Upon entering into a futures contract, the Portfolio deposits cash or securities in an account on behalf of the broker in an amount sufficient to meet the initial margin requirement. Subsequent payments are made or received by the Portfolio equal to the daily change in the contract value and are recorded as variation margin receivable or payable with a corresponding offset to unrealized gains or losses.
ii. Options — When the Portfolio writes call or put options, an amount equal to the premium received is recorded as a liability and is subsequentlymarked-to-market to reflect the current value of the option written. Swaptions are options on interest rate and or credit default, swap contracts.
Upon the purchase of a call option or a put option by the Portfolio, the premium paid is recorded as an investment and subsequentlymarked-to-market to reflect the current value of the option. Certain options may be purchased with premiums to be determined on a future date. The premiums for these options are based upon implied volatility parameters at specified terms.
B. Level 3 Fair Value Investments — To the extent that significant inputs to valuation models and other alternative pricing sources are unobservable, or if quotations are not readily available, or if GSAM believes that such quotations do not accurately reflect fair value, the fair value of the Portfolio’s investments may be determined under Valuation Procedures approved by the Trustees. GSAM, consistent with its procedures and applicable regulatory guidance, may make an adjustment to the most recent valuation prices of either domestic or foreign securities in light of significant events to reflect what it believes to be the fair value of the securities at the time ofdetermining the Portfolio’s NAV. To the extent investments are valued using single source broker quotations obtained directly from the broker or passed through from third party pricing vendors, such investments are classified as Level 3 investments. GSAM did not develop the unobservable inputs for valuation of Level 3 Assets and Liabilities.
18
GOLDMAN SACHS VARIABLE INSURANCE TRUST MULTI-STRATEGY ALTERNATIVES PORTFOLIO
3. INVESTMENTS AND FAIR VALUE MEASUREMENTS (continued)
C. Fair Value Hierarchy — The following is a summary of the Portfolio’s investments and derivatives classified in the fair value hierarchy as of June 30, 2019:
| | | | | | | | | | | | |
| Investment Type | | Level 1 | | | Level 2 | | | Level 3 | |
| | | |
| Assets | | | | | | | | | | | | |
| Equity Underlying Funds | | $ | 4,800,012 | | | $ | — | | | $ | — | |
| Fixed Income Underlying Funds | | | 11,232,331 | | | | — | | | | — | |
| Exchange Traded Fund | | | 285,242 | | | | — | | | | — | |
| Investment Company | | | 298,898 | | | | — | | | | — | |
| Securities Lending Reinvestment Vehicle | | | 141,700 | | | | — | | | | — | |
| | | |
| Total | | $ | 16,758,183 | | | $ | — | | | $ | — | |
| | | |
| Derivative Type | | | | | | | | | |
| | | |
| Assets | | | | | | | | | | | | |
| Futures Contracts(a) | | $ | 22,846 | | | $ | — | | | $ | — | |
| Purchased Options Contracts | | | 219,956 | | | | — | | | | — | |
| | | |
| Total | | $ | 242,802 | | | $ | — | | | $ | — | |
| | | |
| Liabilities(a) | | | | | | | | | | | | |
| Futures Contracts | | $ | (76,927 | ) | | $ | — | | | $ | — | |
| (a) | Amount shown represents unrealized gain (loss) at period end. |
For further information regarding security characteristics, see the Schedule of Investments.
4. INVESTMENTS IN DERIVATIVES
The following table sets forth, by certain risk types, the gross value of derivative contracts (not considered to be hedging instruments for accounting disclosure purposes) as of June 30, 2019. These instruments were used as part of the Portfolio’s investment strategies and to obtain and/or manage exposure related to the risks below. The values in the table below exclude the effects of cash collateral received or posted pursuant to these derivative contracts, and therefore are not representative of the Portfolio’s net exposure.
| | | | | | | | | | | | | | |
| Risk | | | | Statement of Assets and Liabilities | | Assets(a) | | | Statement of Assets and Liabilities | | Liabilities(a) | |
| Equity | | | | Variation margin on futures contracts | | $ | 22,846 | | | — | | $ | — | |
| Interest Rate | | | | Purchased options contracts at value | | | 219,956 | | | Variation margin on futures contracts | | | (76,927 | ) |
| | | | | |
| Total | | | | | | $ | 242,802 | | | | | $ | (76,927 | ) |
| (a) | Includes unrealized gain (loss) on futures contracts described in the Additional Investment Information section of the Schedule of Investments. Only the variation margin as of June 30, 2019 is reported within the Statement of Assets and Liabilities. |
19
GOLDMAN SACHS VARIABLE INSURANCE TRUST MULTI-STRATEGY ALTERNATIVES PORTFOLIO
Notes to Financial Statements(continued)
June 30, 2019 (Unaudited)
4. INVESTMENTS IN DERIVATIVES (continued)
The following table sets forth, by certain risk types, the Portfolio’s gains (losses) related to these derivatives and their indicative volumes for the six months ended June 30, 2019. These gains (losses) should be considered in the context that these derivative contracts may have been executed to create investment opportunities and/or economically hedge certain investments, and accordingly, certain gains (losses) on such derivative contracts may offset certain (losses) gains attributable to investments. These gains (losses) are included in “Net realized gain (loss)” or “Net change in unrealized gain (loss)” on the Statement of Operations.
| | | | | | | | | | | | | | |
| Risk | | Statement of Operations | | Net
Realized
Gain (Loss) | | | Net Change in
Unrealized
Gain (Loss) | | | Average
Number of
Contracts(a) | |
| Equity | | Net realized gain (loss) from futures contracts/Net change in unrealized gain (loss) on futures contracts | | $ | 70,764 | | | $ | 16,346 | | | | 12 | |
| Interest Rate | | Net realized gain (loss) from futures contracts and purchased options/Net change in unrealized gain (loss) on futures contracts and purchased options | | | 122,245 | | | | (63,240 | ) | | | 295 | |
| | | | |
| Total | | | | $ | 193,009 | | | $ | (46,894 | ) | | | 307 | |
| (a) | Average number of contracts is based on the average of month end balances for the six months ended June 30, 2019. |
5. AGREEMENTS AND AFFILIATED TRANSACTIONS
A. Management Agreement — Under the Agreement, GSAM manages the Portfolio, subject to the general supervision of the Trustees.
As compensation for the services rendered pursuant to the Agreement, the assumption of the expenses related thereto and administration of the Portfolio’s business affairs, including providing facilities, GSAM is entitled to a management fee, accrued daily and paid monthly, equal to an annual percentage rate of 0.15% of the Portfolio’s average daily net assets. GSAM has agreed to waive all of its management fee. The management fee waiver will remain in effect through at least April 30, 2020, and prior to such date, GSAM may not terminate the arrangement without the approval of the Board of Trustees. For the six months ended June 30, 2019, GSAM waived $11,728 of its management fee.
The Portfolio invests in Institutional Shares of the Goldman Sachs Financial Square Government Fund, which is an affiliated Underlying Fund. GSAM has agreed to waive a portion of its management fee payable by the Portfolio in an amount equal to the management fee it earns as an investment adviser to the affiliated Underlying Fund in which the Portfolio invests, except those management fees it earns from the Portfolio’s investments of cash collateral received in connection with securities lending transactions in the Goldman Sachs Financial Square Government Fund. For the six months ended June 30, 2019, GSAM waived $213 of the Portfolio’s management fee.
B. Distribution and/or Service(12b-1) Plans —The Trust, on behalf of Service Shares of the Portfolio, has adopted a Distribution and Service Plan subject to Rule12b-1 under the Act. Under the Distribution and Service Plan, Goldman Sachs, which serves as distributor (the “Distributor”), is entitled to a fee accrued daily and paid monthly, for distribution services and personal and account maintenance services, which may then be paid by Goldman Sachs to authorized dealers, equal to, on an annual basis, 0.25% of the Portfolio’s average daily net assets attributable to Service Shares.
The Trust, on behalf of Advisor Shares of the Portfolio, has adopted a Distribution Plan subject to Rule12b-1 under the Act. Under the Distribution Plan, Goldman Sachs as Distributor is entitled to a fee accrued daily and paid monthly for distribution services, which may then be paid by Goldman Sachs to authorized dealers, equal to, on an annual basis, 0.15% of the Portfolio’s average daily net assets attributable to Advisor Shares.
20
GOLDMAN SACHS VARIABLE INSURANCE TRUST MULTI-STRATEGY ALTERNATIVES PORTFOLIO
5. AGREEMENTS AND AFFILIATED TRANSACTIONS (continued)
C. Service Plans — The Trust, on behalf of Advisor Shares of the Portfolio, has adopted a Service Plan to allow Advisor Shares to compensate service organizations (including Goldman Sachs) for providing varying levels of personal and account maintenance and administration services to their customers who are beneficial owners of such shares. The Service Plans each provide for compensation to the service organizations equal to 0.25% of the average daily net assets attributable to Advisor Shares of the Portfolio.
D. Transfer Agency Agreement — Goldman Sachs also serves as the transfer agent of the Portfolio for a fee pursuant to the Transfer Agency Agreement. The fees charged for such transfer agency services are accrued daily and paid monthly at an annual rate of 0.02% of the average daily net assets of Institutional, Service and Advisor Shares.
E. Other Expense Agreements and Affiliated Transactions — GSAM has agreed to reduce or limit certain “Other Expenses” of the Portfolio (excluding acquired fund fees and expenses, transfer agency fees and expenses, service fees and shareholder administration fees (as applicable), taxes, interest, brokerage fees, expenses of shareholder meetings, litigation and indemnification, and extraordinary expenses) to the extent such expenses exceed, on an annual basis, a percentage rate of the average daily net assets of the Portfolio. Such Other Expense reimbursements, if any, are accrued daily and paid monthly. In addition, the Portfolio is not obligated to reimburse GSAM for prior fiscal year expense reimbursements, if any. The Other Expense limitation as an annual percentage rate of average daily net assets for the Portfolio is 0.204%. The Other Expense limitation will remain in place through at least April 30, 2020, and prior to such date GSAM may not terminate the arrangement without the approval of the Trustees. In addition, the Portfolio has entered into certain offset arrangements with the custodian and the transfer agent, which may result in a reduction of the Portfolio’s expenses and are received irrespective of the application of the “Other Expense” limitation described above.
For the six months ended June 30, 2019, these expense reductions, including any fee waivers and Other Expense reimbursements, were as follows:
| | | | | | | | | | | | | | |
Management Fee
Waiver | | | Custody Fee
Credits | | | Other Expense
Reimbursement | | | Total
Expense
Reductions | |
| | | |
| $ | 11,941 | | | $ | 199 | | | $ | 97,465 | | | $ | 109,605 | |
F. Line of Credit Facility — As of June 30, 2019, the Portfolio participated in a $580,000,000 committed, unsecured revolving line of credit facility (the “facility”) together with other funds of the Trust and certain registered investment companies having management agreements with GSAM or its affiliates. This facility is to be used for temporary emergency purposes, or to allow for an orderly liquidation of securities to meet redemption requests. The interest rate on borrowings is based on the federal funds rate. The facility also requires a fee to be paid by the Portfolio based on the amount of the commitment that has not been utilized. For the six months ended June 30, 2019, the Portfolio did not have any borrowings under the facility. Prior to April 30, 2019 the facility was $770,000,000.
21
GOLDMAN SACHS VARIABLE INSURANCE TRUST MULTI-STRATEGY ALTERNATIVES PORTFOLIO
Notes to Financial Statements(continued)
June 30, 2019 (Unaudited)
5. AGREEMENTS AND AFFILIATED TRANSACTIONS (continued)
G. Other Transactions with Affiliates — The Portfolio invests primarily in Class R6 Shares of the Underlying Funds. These Underlying Funds are considered to be affiliated with the Portfolios. The tables below show the transactions in and earnings from investments in these Underlying Funds for the six months ended June 30, 2019:
| | | | | | | | | | | | | | | | | | | | | | | | | | | | | | | | |
| Underlying Funds | | Beginning
Value as of
December 31,
2018 | | | Purchases
at Cost | | | Proceeds
from Sales | | | Net Realized
Gain (Loss)
from Affiliated
Investment
Company | | | Change in
Unrealized
Appreciation
(Depreciation) | | | Ending Value
as of
June 30, 2019 | | |
Shares
as of
June 30,
2019 | | | Dividend
Income
from
Affiliated
Investment
Company | |
Goldman Sachs Alternative Premia Fund | | $ | 1,088,711 | | | $ | 190,000 | | | $ | (39,999 | ) | | $ | (1,708 | ) | | $ | 8,937 | | | $ | 1,245,941 | | | | 153,064 | | | $ | — | |
Goldman Sachs Absolute Return Tracker Fund | | | 977,566 | | | | 85,000 | | | | (40,001 | ) | | | 580 | | | | 71,705 | | | | 1,094,850 | | | | 112,117 | | | | — | |
Goldman Sachs Emerging Markets Debt Fund | | | 1,354,777 | | | | 122,022 | | | | (75,000 | ) | | | (6,139 | ) | | | 136,850 | | | | 1,532,510 | | | | 122,601 | | | | 31,565 | |
Goldman Sachs Emerging Markets Equity Insights Fund | | | 511,446 | | | | 100,000 | | | | (60,000 | ) | | | (3,130 | ) | | | 53,016 | | | | 601,332 | | | | 62,835 | | | | — | |
Goldman Sachs Financial Square Government Fund (Institutional Shares) | | | 191,106 | | | | 2,352,499 | | | | (2,244,707 | ) | | | — | | | | — | | | | 298,898 | | | | 298,898 | | | | 3,116 | |
Goldman Sachs High Yield Floating Rate Fund | | | 1,048,669 | | | | 149,770 | | | | (30,000 | ) | | | (1,255 | ) | | | 32,204 | | | | 1,199,388 | | | | 127,595 | | | | 29,403 | |
Goldman Sachs High Yield Fund | | | 763,723 | | | | 63,393 | | | | (30,000 | ) | | | (1,836 | ) | | | 57,436 | | | | 852,716 | | | | 133,029 | | | | 23,117 | |
Goldman Sachs Local Emerging Markets Debt Fund | | | 448,457 | | | | 41,401 | | | | (20,000 | ) | | | (1,128 | ) | | | 36,100 | | | | 504,830 | | | | 83,720 | | | | 11,282 | |
Goldman Sachs Long Short Credit Strategies Fund | | | 1,644,600 | | | | 289,386 | | | | (30,000 | ) | | | (3,063 | ) | | | 63,634 | | | | 1,964,557 | | | | 224,778 | | | | 25,174 | |
Goldman Sachs Managed Futures Strategy Fund | | | 2,017,781 | | | | 205,000 | | | | (30,000 | ) | | | (1,715 | ) | | | 116,053 | | | | 2,307,119 | | | | 213,425 | | | | — | |
Goldman Sachs Real Estate Securities Fund | | | 479,541 | | | | 4,908 | | | | (30,000 | ) | | | (9,302 | ) | | | 88,448 | | | | 533,595 | | | | 34,967 | | | | 4,909 | |
Goldman Sachs Strategic Income Fund | | | 1,428,213 | | | | 192,698 | | | | (40,000 | ) | | | (1,632 | ) | | | 45,991 | | | | 1,625,270 | | | | 174,385 | | | | 25,670 | |
Goldman Sachs Tactical Exposure Fund | | | 2,247,480 | | | | 218,000 | | | | (2,528,725 | ) | | | (109,513 | ) | | | 172,758 | | | | — | | | | — | | | | — | |
Goldman Sachs Tactical Tilt Overlay Fund | | | — | | | | 2,565,000 | | | | — | | | | — | | | | 5,235 | | | | 2,570,235 | | | | 261,735 | | | | — | |
| | | | | | | | |
| Total | | $ | 14,202,070 | | | $ | 6,579,077 | | | $ | (5,198,432 | ) | | $ | (139,841 | ) | | $ | 888,367 | | | $ | 16,331,241 | | | | | | | $ | 154,236 | |
6. PORTFOLIO SECURITIES TRANSACTIONS
The cost of purchases and proceeds from sales and maturities of long-term securities for the six months ended June 30, 2019, were $4,549,612 and $3,387,392, respectively.
22
GOLDMAN SACHS VARIABLE INSURANCE TRUST MULTI-STRATEGY ALTERNATIVES PORTFOLIO
7. SECURITIES LENDING
The Portfolio may lend its securities through a securities lending agent, the Bank of New York Mellon (“BNYM”), to certain qualified borrowers. In accordance with the Portfolio’s securities lending procedures, the Portfolio receives cash collateral at least equal to the market value of the securities on loan. The market value of the loaned securities is determined at the close of business of the Portfolio, at their last sale price or official closing price on the principal exchange or system on which they are traded, and any additional required collateral is delivered to the Portfolio on the next business day. As with other extensions of credit, the Portfolio may experience delay in the recovery of its securities or incur a loss should the borrower of the securities breach its agreement with the Portfolio or become insolvent at a time when the collateral is insufficient to cover the cost of repurchasing securities on loan. Dividend income received from securities on loan may not be subject to withholding taxes and therefore withholding taxes paid may differ from the amounts listed in the Statement of Operations. Loans of securities are terminable at any time and as such 1) the remaining contractual maturities of the outstanding securities lending transactions are considered to be overnight and continuous and 2) the borrower, after notice, is required to return borrowed securities within the standard time period for settlement of securities transactions.
The Portfolio invests the cash collateral received in connection with securities lending transactions in the Goldman Sachs Financial Square Government Fund (“Government Money Market Fund”), an affiliated series of the Goldman Sachs Trust. The Government Money Market Fund is registered under the Act as an open end investment company, is subject to Rule2a-7 under the Act, and is managed by GSAM, for which GSAM may receive a management fee of up to 0.16% on an annualized basis of the average daily net assets of the Government Money Market Fund.
In the event of a default by a borrower with respect to any loan, BNYM may exercise any and all remedies provided under the applicable borrower agreement to make the Portfolio whole. These remedies include purchasing replacement securities by applying the collateral held from the defaulting broker against the purchase cost of the replacement securities. If BNYM is unable to purchase replacement securities, BNYM will indemnify the Portfolio by paying the Portfolio an amount equal to the market value of the securities loaned minus the value of cash collateral received from the borrower for the loan, subject to an exclusion for any shortfalls resulting from a loss of value in such cash collateral due to reinvestment risk. The Portfolio may enter into master netting agreements with borrowers, which provide the right, in the event of a default (including bankruptcy or insolvency), for thenon-defaulting party to liquidate the collateral and calculate net exposure to the defaulting party or request additional collateral. However, in the event of a default by a borrower, a resolution authority could determine that such rights are not enforceable due to the restrictions or prohibitions against the right ofset-off that may be imposed in accordance with a particular jurisdiction’s bankruptcy or insolvency laws. The Portfolio’s loaned securities were all subject to enforceable Securities Lending Agreements and the value of the collateral was at least equal to the value of the cash received. The amounts of the Portfolio’s overnight and continuous agreements, which represent the gross amounts of recognized liabilities for securities lending transactions outstanding as of June 30, 2019, are disclosed as “Payable upon return of securities loaned” on the Statement of Assets and Liabilities, where applicable.
Both the Portfolio and BNYM received compensation relating to the lending of the Portfolio’s securities. The amounts earned, if any, by the Portfolio for the six months ended June 30, 2019, are reported under Investment Income on the Statement of Operations.
The following table provides information about the Portfolio’s investment in the Government Money Market Fund for the six months ended June 30, 2019:
| | | | | | | | | | | | | | |
Beginning
Value as of
December 31, 2018 | | | Purchases
at Cost | | | Proceeds
from Sales | | | Ending
Value as of
June 30, 2019 | |
| | | |
| $ | 191,250 | | | $ | 1,586,998 | | | $ | (1,636,548 | ) | | $ | 141,700 | |
23
GOLDMAN SACHS VARIABLE INSURANCE TRUST MULTI-STRATEGY ALTERNATIVES PORTFOLIO
Notes to Financial Statements(continued)
June 30, 2019 (Unaudited)
8. TAX INFORMATION
As of the Portfolio’s most recent fiscal year end, December 31, 2018, the Portfolio’s capital loss carryforwards and certain timing differences, on atax-basis were as follows:
| | | | |
| Capital loss carryforwards: | | | | |
Perpetual Short-term | | $ | (514,168 | ) |
Perpetual Long-term | | | (369,817 | ) |
| Total capital loss carryforwards | | $ | (883,985 | ) |
| Timing differences (Qualified Late Year Loss Deferral/Post October Loss Deferral) | | | (23,546 | ) |
As of June 30, 2019, the Portfolio’s aggregate security unrealized gains and losses based on cost for U.S. federal income tax purposes were as follows:
| | | | |
| Tax cost | | $ | 17,176,689 | |
| Gross unrealized gain | | | 272,140 | |
| Gross unrealized loss | | | (690,646 | ) |
| Net unrealized loss | | $ | (418,506 | ) |
The difference between GAAP-basis andtax-basis unrealized gains (losses) is attributable primarily to wash sales, net mark to market gains (losses) on regulated futures and options contracts and differences in the tax treatment of partnership investments.
GSAM has reviewed the Portfolio’s tax position for all open tax years (the current and prior three years, as applicable) and has concluded that no provision for income tax is required in the Portfolio’s financial statements. Such open tax years remain subject to examination and adjustment by tax authorities.
9. OTHER RISKS
The Portfolio’s risks include, but are not limited to, the following:
Derivatives Risk — The Portfolio’s use of derivatives may result in loss. Derivative instruments, which may pose risks in addition to and greater than those associated with investing directly in securities, currencies or other instruments, may be illiquid or less liquid, volatile, difficult to price and leveraged so that small changes in the value of the underlying instruments may produce disproportionate losses to the Portfolio. Derivatives are also subject to counterparty risk, which is the risk that the other party in the transaction will not fulfill its contractual obligation. The use of derivatives is a highly specialized activity that involves investment techniques and risks different from those associated with investments in more traditional securities and instruments. Losses from derivatives can also result from a lack of correlation between changes in the value of derivative instruments and the portfolio assets (if any) being hedged.
Interest Rate Risk — When interest rates increase, fixed income securities or instruments held by the Portfolio will generally decline in value. Long-term fixed income securities or instruments will normally have more price volatility because of this risk than short-term fixed income securities or instruments. The risks associated with changing interest rates may have unpredictable effects on the markets and the Portfolio’s investments. Fluctuations in interest rates may also affect the liquidity of fixed income securities and instruments held by the Portfolio.
Investments in the Underlying Funds — The investments of the Portfolio are concentrated in the Underlying Funds, and the Portfolio’s investment performance is directly related to the investment performance of the Underlying Funds it holds. The Portfolio is subject to the risk factors associated with the investments of the Underlying Funds in direct proportion to the amount of assets allocated to each. To the extent that the Portfolio has a relative concentration of its portfolio in a single Underlying Fund, the
24
GOLDMAN SACHS VARIABLE INSURANCE TRUST MULTI-STRATEGY ALTERNATIVES PORTFOLIO
9. OTHER RISKS (continued)
Portfolio may be more susceptible to adverse developments affecting that Underlying Fund, and may be more susceptible to losses because of these developments.
Investments in Other Investment Companies Risk — As a shareholder of another investment company, including an exchange-traded fund (“ETF”), the Portfolio will indirectly bear its proportionate share of any net management fees and other expenses paid by such other investment companies, in addition to the fees and expenses regularly borne by the Portfolio. ETFs are subject to risks that do not apply to conventional mutual funds, including but not limited to the following: (i) the market price of the ETF’s shares may trade at a premium or a discount to their NAV; and (ii) an active trading market for an ETF’s shares may not develop or be maintained.
Large Shareholder Transactions Risk — The Portfolio or an Underlying Fund may experience adverse effects when certain large shareholders, such as other funds, participating insurance companies, accounts and Goldman Sachs affiliates, purchase or redeem large amounts of shares of the Portfolio or an Underlying Fund. Such large shareholder redemptions, which may occur rapidly or unexpectedly, may cause the Portfolio or an Underlying Fund to sell portfolio securities at times when it would not otherwise do so, which may negatively impact the Portfolio’s or an Underlying Fund’s NAV and liquidity. These transactions may also accelerate the realization of taxable income to shareholders if such sales of investments resulted in gains, and may also increase transaction costs. In addition, a large redemption could result in the Portfolio’s or an Underlying Fund’s current expenses being allocated over a smaller asset base, leading to an increase in the Portfolio’s or an Underlying Fund’s expense ratio. Similarly, large Portfolio or Underlying Fund share purchases may adversely affect the Portfolio’s or an Underlying Fund’s performance to the extent that the Portfolio or an Underlying Fund is delayed in investing new cash or otherwise maintains a larger cash position than it ordinarily would.
Liquidity Risk — The Underlying Funds may make investments that are illiquid or that may become less liquid in response to market developments or adverse investor perceptions. Illiquid investments may be more difficult to value. Liquidity risk may also refer to the risk that the Portfolio will not be able to pay redemption proceeds within the allowable time period or without significant dilution to remaining investors’ interests because of unusual market conditions, an unusually high volume of redemption requests, or other reasons. To meet redemption requests, the Portfolio may be forced to sell investments at an unfavorable time and/or under unfavorable conditions. If the Portfolio is forced to sell securities at an unfavorable time and/or under unfavorable conditions, such sales may adversely affect the Portfolio’s NAV and dilute remaining investors’ interests. These risks may be more pronounced in connection with the Portfolio’s investments in securities of issuers located in emerging market countries. Redemptions by large shareholders may have a negative impact on the Portfolio’s liquidity.
Market and Credit Risks — In the normal course of business, the Portfolio and the Underlying Funds trade financial instruments and enters into financial transactions where risk of potential loss exists due to changes in the market (market risk). Additionally, the Portfolio and the Underlying Funds may also be exposed to credit risk in the event that an issuer or guarantor fails to perform or that an institution or entity with which the Portfolio or the Underlying Funds have unsettled or open transactions defaults.
10. INDEMNIFICATIONS
Under the Trust’s organizational documents, its Trustees, officers, employees and agents are indemnified, to the extent permitted by the Act and state law, against certain liabilities that may arise out of performance of their duties to the Portfolio. Additionally, in the course of business, the Portfolio enters into contracts that contain a variety of indemnification clauses. The Portfolio’s maximum exposure under these arrangements is unknown, as this would involve future claims that may be made against the Portfolio that have not yet occurred. However, GSAM believes the risk of loss under these arrangements to be remote.
25
GOLDMAN SACHS VARIABLE INSURANCE TRUST MULTI-STRATEGY ALTERNATIVES PORTFOLIO
Notes to Financial Statements(continued)
June 30, 2019 (Unaudited)
11. SUBSEQUENT EVENTS
Subsequent events after the Statement of Assets and Liabilities date have been evaluated, and GSAM has concluded that there is no impact requiring adjustment or disclosure in the financial statements.
12. SUMMARY OF SHARE TRANSACTIONS
Share activity is as follows:
| | | | | | | | | | | | | | | | |
| | | For the Six Months Ended
June 30, 2019
(Unaudited) | | | For the Fiscal Year Ended
December 31, 2018 | |
| | | Shares | | | Dollars | | | Shares | | | Dollars | |
| Institutional Shares | | | | | | | | | | | | | | | | |
| Shares sold | | | 36,609 | | | $ | 328,901 | | | | 53,822 | | | $ | 488,301 | |
| Reinvestment of distributions | | | — | | | | — | | | | 2,400 | | | | 20,403 | |
| Shares redeemed | | | (3,294 | ) | | | (29,488 | ) | | | (16,933 | ) | | | (153,669 | ) |
| | | | 33,315 | | | | 299,413 | | | | 39,289 | | | | 355,035 | |
| Service Shares | | | | | | | | | | | | | | | | |
| Shares sold | | | 80,338 | | | | 719,847 | | | | 84,312 | | | | 762,281 | |
| Reinvestment of distributions | | | — | | | | — | | | | 2,398 | | | | 20,381 | |
| Shares redeemed | | | (14,064 | ) | | | (125,804 | ) | | | (2,657 | ) | | | (23,809 | ) |
| | | | 66,274 | | | | 594,043 | | | | 84,053 | | | | 758,853 | |
| Advisor Shares | | | | | | | | | | | | | | | | |
| Shares sold | | | 171,535 | | | | 1,517,438 | | | | 539,263 | | | | 4,918,086 | |
| Reinvestment of distributions | | | — | | | | — | | | | 37,581 | | | | 318,314 | |
| Shares redeemed | | | (168,285 | ) | | | (1,476,694 | ) | | | (648,355 | ) | | | (5,801,233 | ) |
| | | | 3,250 | | | | 40,744 | | | | (71,511 | ) | | | (564,833 | ) |
| | | | |
| NET INCREASE | | | 102,839 | | | $ | 934,200 | | | | 51,831 | | | $ | 549,055 | |
26
GOLDMAN SACHS VARIABLE INSURANCE TRUST MULTI-STRATEGY ALTERNATIVES PORTFOLIO
| | |
| Portfolio Expenses — Six Month Period Ended June 30, 2019 (Unaudited) | | |
As a shareholder of Institutional, Service or Advisor Shares of the Portfolio, you incur ongoing costs, including management fees, distribution and/or service(12b-1) fees (with respect to Service and Advisor Shares) and other Portfolio expenses. This example is intended to help you understand your ongoing costs (in dollars) of investing in Institutional Shares, Service Shares and Advisor Shares of the Portfolio and to compare these costs with the ongoing costs of investing in other mutual funds.
The example is based on an investment of $1,000 invested at the beginning of the period and held for the entire period from January 1, 2019 through June 30, 2019, which represents a period of 181 days of a 365 day year.
Actual Expenses— The first line under each share class in the table below provides information about actual account values and actual expenses. You may use the information in this line, together with the amount you invested, to estimate the expenses that you paid over the period. Simply divide your account value by $1,000 (for example, an $8,600 account value divided by $1,000=8.6), then multiply the result by the number in the first line under the heading entitled “Expenses Paid” to estimate the expenses you paid on your account during this period.
Hypothetical Example for Comparison Purposes —The second line under each share class in the table below provides information about hypothetical account values and hypothetical expenses based on the Portfolio’s actual net expense ratio and an assumed rate of return of 5% per year before expenses, which is not the Portfolio’s actual return. The hypothetical account values and expenses may not be used to estimate the actual ending account balance or expenses you paid for the period. You may use this information to compare the ongoing costs of investing in the Portfolio and other funds. To do so, compare this 5% hypothetical example with the 5% hypothetical examples that appear in the shareholder reports of the other funds.
Please note that the expenses shown in the table are meant to highlight your ongoing costs only. As a shareholder of the Portfolio you do not incur any transaction costs, such as sales charges, redemption fees, or exchange fees, but shareholders of other funds may incur such costs. The second line of the table is useful in comparing ongoing costs only and will not help you determine the relative total costs of owning different funds whose shareholders may incur transaction costs.
| | | | | | | | | | | | |
| Share Class | | Beginning
Account Value
01/01/19 | | | Ending
Account Value
06/30/19 | | | Expenses
Paid for the
6 Months
Ended
06/30/19* | |
| Institutional | | | | | | | | | | | | |
| | | | |
| Actual | | $ | 1,000 | | | $ | 1,072.90 | | | $ | 1.13 | |
| Hypothetical 5% return | | | 1,000 | | | | 1,023.70 | + | | | 1.10 | |
| Service | | | | | | | | | | | | |
| | | | |
| Actual | | | 1,000 | | | | 1,071.60 | | | | 2.41 | |
| Hypothetical 5% return | | | 1,000 | | | | 1,022.46 | + | | | 2.36 | |
| Advisor | | | | | | | | | | | | |
| | | | |
| Actual | | | 1,000 | | | | 1,070.70 | | | | 3.18 | |
| Hypothetical 5% return | | | 1,000 | | | | 1,021.72 | + | | | 3.11 | |
| | + | Hypothetical expenses are based on the Portfolio’s actual annualized net expense ratios and an assumed rate of return of 5% per year before expenses. | |
| | * | Expenses are calculated using the Portfolio’s annualized net expense ratio for each class, which represents the ongoing expenses as a percentage of net assets for the six months ended June 30, 2019. Expenses are calculated by multiplying the annualized net expense ratio by the average account value for the period; then multiplying the result by the number of days in the most recent fiscal half year; and then dividing that result by the number of days in the fiscal year. The annualized net expense ratios for the period were 0.22%, 0.47% and 0.62% for Institutional, Service and Advisor Shares, respectively. | |
27
GOLDMAN SACHS VARIABLE INSURANCE TRUST MULTI-STRATEGY ALTERNATIVES PORTFOLIO
Statement Regarding Basis for Approval of Management Agreement (Unaudited)
Background
The Goldman Sachs Multi-Strategy Alternatives Portfolio (the “Portfolio”) is an investment portfolio of Goldman Sachs Variable Insurance Trust (the “Trust”). The Board of Trustees oversees the management of the Trust and reviews the investment performance and expenses of the Portfolio at regularly scheduled meetings held throughout the year. In addition, the Board of Trustees determines annually whether to approve the continuance of the Trust’s investment management agreement (the “Management Agreement”) with Goldman Sachs Asset Management, L.P. (the “Investment Adviser”) on behalf of the Portfolio.
The Management Agreement was most recently approved for continuation until June 30, 2020 by the Board of Trustees, including those Trustees who are not parties to the Management Agreement or “interested persons” (as defined in the Investment Company Act of 1940, as amended) of any party thereto (the “Independent Trustees”), at a meeting held onJune 11-12, 2019 (the “Annual Meeting”).
The review process undertaken by the Trustees spans the course of the year and culminates with the Annual Meeting. To assist the Trustees in their deliberations, the Trustees have established a Contract Review Committee (the “Committee”), comprised of the Independent Trustees. The Committee held four meetings over the course of the year since the Management Agreement was last approved. At those Committee meetings, regularly scheduled Board or other committee meetings, and/or the Annual Meeting, matters relevant to the renewal of the Management Agreement were considered by the Board, or the Independent Trustees, as applicable. With respect to the Portfolio, such matters included:
| | (a) | | the nature and quality of the advisory, administrative, and other services provided to the Portfolio and the underlying funds in which it invests (the “Underlying Funds”) by the Investment Adviser and its affiliates, including information about: |
| | (i) | | the structure, staff, and capabilities of the Investment Adviser and its portfolio management teams; |
| | (ii) | | the groups within the Investment Adviser and its affiliates that support the portfolio management teams or provide other types of necessary services, including fund services groups (e.g., accounting and financial reporting, tax, shareholder services, and operations); controls and risk management groups (e.g., legal, compliance, valuation oversight, credit risk management, internal audit, compliance testing, market risk analysis, finance, and central funding); sales and distribution support groups, and others (e.g., information technology and training); |
| | (iii) | | trends in employee headcount; |
| | (iv) | | the Investment Adviser’s financial resources and ability to hire and retain talented personnel and strengthen its operations; and |
| | (v) | | the parent company’s support of the Investment Adviser and its mutual fund business, as expressed by the firm’s senior management; |
| | (b) | | information on the investment performance of the Portfolio and Underlying Funds, including comparisons to the performance of similar mutual funds, as provided by a third-party mutual fund data provider engaged as part of the contract review process (the “Outside Data Provider”), and a benchmark performance index; and information on general investment outlooks in the markets in which the Underlying Funds invest; |
| | (c) | | information provided by the Investment Adviser indicating the Investment Adviser’s views on whether the Portfolio’s peer group and/or benchmark index had high, medium, or low relevance given the Portfolio’s particular investment strategy; |
| | (d) | | the terms of the Management Agreement and other agreements with affiliated service providers entered into by the Trust on behalf of the Portfolio; |
| | (e) | | fee and expense information for the Portfolio, including: |
| | (i) | | the relative management fee and expense levels of the Portfolio as compared to those of comparable funds managed by other advisers, as provided by the Outside Data Provider; |
| | (ii) | | the Portfolio’s expense trends over time; and |
| | (iii) | | to the extent the Investment Adviser manages other types of accounts (such as bank collective trusts, private wealth management accounts, institutional separate accounts,sub-advised mutual funds, andnon-U.S. funds) having investment objectives and policies similar to those of the Portfolio, comparative information on the advisory fees charged and services provided to those accounts by the Investment Adviser; |
| | (f) | | with respect to the extensive investment performance and expense comparison data provided by the Outside Data Provider, its processes in producing that data for the Portfolio; |
| | (g) | | the undertakings of the Investment Adviser and its affiliates to implement fee waivers and/or expense limitations with respect to the Portfolio and the Underlying Funds; |
28
GOLDMAN SACHS VARIABLE INSURANCE TRUST MULTI-STRATEGY ALTERNATIVES PORTFOLIO
Statement Regarding Basis for Approval of Management Agreement (Unaudited) (continued)
| | (h) | | information relating to the profitability of the Management Agreement and the transfer agency and distribution and service arrangements of the Portfolio to the Investment Adviser and its affiliates; |
| | (i) | | whether the Portfolio’s existing management fee schedule, together with the management fee schedules of the Underlying Funds, adequately addressed any economies of scale; |
| | (j) | | a summary of the“fall-out” benefits derived by the Investment Adviser and its affiliates from their relationships with the Portfolio and/or the Underlying Funds, including the fees received by the Investment Adviser’s affiliates from the Portfolio and/or the Underlying Funds for transfer agency, securities lending, portfolio trading, distribution and other services; |
| | (k) | | a summary of potential benefits derived by the Portfolio and/or the Underlying Funds as a result of their relationship with the Investment Adviser; |
| | (l) | | with respect to the applicable Underlying Funds, information regarding commissions paid by the Underlying Equity Funds and broker oversight, an update on the Investment Adviser’s soft dollars practices, other information regarding portfolio trading, and how the Investment Adviser carries out its duty to seek best execution; |
| | (m) | | the manner in which portfolio manager compensation is determined; and the number and types of accounts managed by the portfolio managers; |
| | (n) | | the nature and quality of the services provided to the Portfolio and the Underlying Funds by their unaffiliated service providers, and the Investment Adviser’s general oversight and evaluation (including reports on due diligence) of those service providers as part of the administrative services provided under the Management Agreement; and |
| | (o) | | the Investment Adviser’s processes and policies addressing various types of potential conflicts of interest; its approach to risk management; the annual review of the effectiveness of the Portfolio’s compliance program; and periodic compliance reports. |
The Trustees also received an overview of the Portfolio’s distribution arrangements. They received information regarding the Portfolio’s assets, share purchase and redemption activity, and payment of distribution and service fees. Information was also provided to the Trustees relating to revenue sharing payments made by and services provided by the Investment Adviser and its affiliates to intermediaries that promote the sale, distribution, and/or servicing of Portfolio shares. The Independent Trustees also discussed the broad range of other investment choices that are available to Portfolio investors, including the availability of comparable funds managed by other advisers.
The presentations made at the Board and Committee meetings and at the Annual Meeting encompassed the Portfolio and other mutual funds for which the Board of Trustees has responsibility. In evaluating the Management Agreement at the Annual Meeting, the Trustees relied upon their knowledge, resulting from their meetings and other interactions throughout the year, of the Investment Adviser and its affiliates, their services, and the Portfolio. In conjunction with these meetings, the Trustees received written materials and oral presentations on the topics covered, and the Investment Adviser addressed the questions and concerns of the Trustees, including concerns regarding the investment performance of certain of the funds they oversee. The Independent Trustees were advised by their independent legal counsel regarding their responsibilities and other regulatory requirements related to the approval and continuation of mutual fund investment management agreements under applicable law. In addition, the Investment Adviser and its affiliates provided the Independent Trustees with a written response to a formal request for information sent on behalf of the Independent Trustees by their independent legal counsel. During the course of their deliberations, the Independent Trustees met in executive sessions with their independent legal counsel, without representatives of the Investment Adviser or its affiliates present.
Nature, Extent, and Quality of the Services Provided Under the Management Agreement
As part of their review, the Trustees considered the nature, extent, and quality of the services provided to the Portfolio and the Underlying Funds by the Investment Adviser. In this regard, the Trustees considered both the investment advisory services andnon-advisory services that are provided by the Investment Adviser and its affiliates. The Trustees noted the transition in the leadership and changes in personnel of various of the Investment Adviser’s portfolio management teams that had occurred in recent periods, and the ongoing recruitment efforts aimed at bringing high quality investment talent to the Investment Adviser. They also noted the Investment Adviser’s commitment to maintaining high quality systems and expending substantial resources to respond to ongoing changes to the regulatory and control environment in which the Portfolio and the Underlying Funds and their service providers operate, as well as the efforts of the Investment Adviser and its affiliates to combat cyber security risks. The Trustees concluded that the Investment Adviser continued to commit substantial financial and operational resources to the Portfolio and expressed confidence that the Investment Adviser would continue to do so in the future. The Trustees also recognized that the Investment Adviser had made significant commitments to address regulatory compliance requirements applicable to the Portfolio, the Underlying Funds, and the Investment Adviser and its affiliates.
29
GOLDMAN SACHS VARIABLE INSURANCE TRUST MULTI-STRATEGY ALTERNATIVES PORTFOLIO
Statement Regarding Basis for Approval of Management Agreement (Unaudited) (continued)
Investment Performance
The Trustees also considered the investment performance of the Portfolio and the Underlying Funds. In this regard, they compared the investment performance of the Portfolioto its peers usingrankings and ratings compiled by the Outside Data Provider as of December 31, 2018, and updated performance information prepared by the Investment Adviser using the peer group identified by the Outside Data Provider as of March 31, 2019. The information on the Portfolio’s investment performance was provided for theone- and three-year periods ending on the applicable dates. The Trustees also reviewed the Portfolio’s investment performance relative to its performance benchmark. As part of this review, they considered the investment performance trends of the Portfolio over time, and reviewed the investment performance of the Portfolio in light of its investment objective and policies and market conditions.
In addition, the Trustees considered materials prepared and presentations made by the Investment Adviser’s senior management and portfolio management personnel in which Portfolio performance was assessed. The Trustees also considered the Investment Adviser’s periodic reports with respect to the Underlying Funds’ risk profiles, and how the Investment Adviser’s approach to risk monitoring and management influences portfolio management.
The Trustees noted that the Portfolio’s Institutional Shares had placed in the third quartile of the Portfolio’s peer group for theone- and three-year periods, had underperformed the Portfolio’s LIBOR-based benchmark index by 3.13% for theone-year period and outperformed by 0.33% for the three-year period, and had underperformed the average performance of a group of competitor funds, as determined by the Investment Adviser, for theone- and three-year periods ending March 31, 2019. They also noted that the Portfolio had experienced certain portfolio management changes in the first half of 2019.
Costs of Services Provided and Competitive Information
The Trustees considered the contractual terms of the Management Agreement and the fee rates payable by the Portfolio thereunder. In this regard, the Trustees considered information on the services rendered by the Investment Adviser to the Portfolio, which included both advisory and administrative services that were directed to the needs and operations of the Portfolio as a registered mutual fund.
In particular, the Trustees reviewed analyses prepared by the Outside Data Provider regarding the expense rankings of the Portfolio. The analyses provided a comparison of the Portfolio’s management fee to those of a relevant peer group and category universe; an expense analysis which compared the Portfolio’s overall net and gross expenses to a peer group and a category universe; and data comparing the Portfolio’s net expenses to the peer and category medians. The analyses also compared the Portfolio’s other expenses and fee waivers/reimbursements to those of the peer group and category medians. The Trustees concluded that the comparisons provided by the Outside Data Provider were useful in evaluating the reasonableness of the management fees and total expenses paid by the Portfolio.
In addition, the Trustees considered the Investment Adviser’s undertakings to implement fee waivers and/or expense limitations with respect to the Portfolio and the Underlying Funds. They also considered, to the extent that the Investment Adviser manages other types of accounts having investment objectives and policies similar to those of the Portfolio, comparative fee information for services provided by the Investment Adviser to those accounts, and information that indicated that services provided to the Portfolio differed in various significant respects from the services provided to other types of accounts which, in many cases, operated under less stringent legal and regulatory structures, required fewer services from the Investment Adviser to a smaller number of client contact points, and were less time-intensive.
In addition, the Trustees noted that shareholders are able to redeem their Portfolio shares at any time if shareholders believe that the Portfolio fees and expenses are too high or if they are dissatisfied with the performance of the Portfolio.
Profitability
The Trustees reviewed the Portfolio’s contribution to the Investment Adviser’s revenues andpre-tax profit margins. In this regard the Trustees noted that they had received, among other things, profitability analyses and summaries, revenue and expense schedules by Portfolio and by function (i.e., investment management, transfer agency and distribution and service), and information on the Investment Adviser’s expense allocation methodology. They observed that the profitability and expense figures are substantially similar to those used by the Investment Adviser for many internal purposes, including compensation decisions among various business groups, and are thus subject to a vigorous internal debate about how certain revenue and expenses should be allocated. The Trustees also noted that the internal audit group within the Goldman Sachs organization periodically audits the expense allocation methodology and that the internal audit group was satisfied with the reasonableness, consistency, and accuracy of the Investment Adviser’s expense allocation methodology. Profitability data for the Portfolio was provided for 2018 and 2017, and the Trustees considered this information in relation to the Investment Adviser’s overall profitability.
30
GOLDMAN SACHS VARIABLE INSURANCE TRUST MULTI-STRATEGY ALTERNATIVES PORTFOLIO
Statement Regarding Basis for Approval of Management Agreement (Unaudited) (continued)
Economies of Scale
The Trustees considered the information that had been provided regarding whether there have been economies of scale with respect to the management of the Portfolio. The Trustees noted that, although the Portfolio itself does not have breakpoints in its management fee schedule, any benefits of the breakpoints in the management fee schedules of certain Underlying Funds, when reached, would pass through to the shareholders in the Portfolio at the specified asset levels. The Trustees considered the amounts of assets in the Portfolio; the Portfolio’s recent purchase and redemption activity; the information provided by the Investment Adviser relating to the costs of the services provided by the Investment Adviser and its affiliates and the profits realized by them; information comparing the fee rates charged by the Investment Adviser with fee rates charged to other funds in the peer groups; and the Investment Adviser’s undertaking to limit certain expenses of the Portfolio and Underlying Funds that exceed specified levels. They also considered the services provided to the Portfolio under the Management Agreement and the fees and expenses borne by the Underlying Funds, and determined that the management fees payable by the Portfolio were not duplicative of the management fees paid at the Underlying Fund level.
Other Benefits to the Investment Adviser and Its Affiliates
The Trustees also considered the other benefits derived by the Investment Adviser and its affiliates from their relationships with the Portfolio and/or the Underlying Funds as stated above, including: (a) transfer agency fees received by Goldman Sachs & Co. LLC (“Goldman Sachs”); (b) brokerage and futures commissions earned by Goldman Sachs for executing securities and futures transactions on behalf of certain Underlying Funds; (c) research received by the Investment Adviser from broker-dealers in exchange for executing certain transactions on behalf of certain Underlying Funds (d) trading efficiencies resulting from aggregation of orders of the Underlying Funds with those for other funds or accounts managed by the Investment Adviser; (e) fees earned by Goldman Sachs Agency Lending (“GSAL”), an affiliate of the Investment Adviser, as securities lending agent for certain Underlying Funds (and fees earned by the Investment Adviser for managing the fund in which the Portfolio’s and those Underlying Funds’ securities lending cash collateral is invested); (f) the Investment Adviser’s ability to leverage the infrastructure designed to service the Portfolio on behalf of its other clients; (g) the Investment Adviser’s ability to cross-market other products and services to Portfolio shareholders; (h) Goldman Sachs’ retention of certain fees as Portfolio Distributor; (i) the Investment Adviser’s ability to negotiate better pricing with custodians on behalf of its other clients, as a result of the relationship with the Portfolio and Underlying Funds; and (j) the possibility that the working relationship between the Investment Adviser and the Portfolio’s and Underlying Funds’ third-party service providers may cause those service providers to be more likely to do business with other areas of Goldman Sachs. In the course of considering the foregoing, the Independent Trustees requested and received further information quantifying certain of thesefall-out benefits.
Other Benefits to the Portfolio and Its Shareholders
The Trustees also noted that the Portfolio and/or the Underlying Funds receive certain other potential benefits as a result of their relationship with the Investment Adviser, including: (a) trading efficiencies resulting from aggregation of orders of the Underlying Funds with those of other funds or accounts managed by the Investment Adviser; (b) enhanced servicing from vendors due to the volume of business generated by the Investment Adviser and its affiliates; (c) with respect to the Underlying Funds, enhanced servicing from broker-dealers due to the volume of business generated by the Investment Adviser and its affiliates; (d) with respect to certain Underlying Funds, the Investment Adviser’s ability to negotiate favorable terms with derivatives counterparties as a result of the size and reputation of the Goldman Sachs organization; (e) the advantages received from the Investment Adviser’s knowledge and experience gained from managing other accounts and products; (f) the Investment Adviser’s ability to hire and retain qualified personnel to provide services to the Portfolio and the Underlying Funds because of the reputation of the Goldman Sachs organization; (g) the Portfolio’s and Underlying Funds’ access, through the Investment Adviser, to certain firm-wide resources (e.g., proprietary risk management systems and databases), subject to certain restrictions; (h) with respect to certain Underlying Funds, the ability to participate in the securities lending program administered by GSAL, as measured by the revenue received by the Underlying Funds in connection with the program; and (i) the Portfolio’s access to certain affiliated distribution channels. In addition, the Trustees noted the competitive nature of the mutual fund marketplace, and considered that many of the Portfolio’s shareholders invested in the Portfolio in part because of the Portfolio’s relationship with the Investment Adviser and that those shareholders have a general expectation that the relationship will continue.
Conclusion
In connection with their consideration of the Management Agreement, the Trustees gave weight to each of the factors described above, but did not identify any particular factor as controlling their decision. After deliberation and consideration of all of
31
GOLDMAN SACHS VARIABLE INSURANCE TRUST MULTI-STRATEGY ALTERNATIVES PORTFOLIO
Statement Regarding Basis for Approval of Management Agreement (Unaudited) (continued)
the information provided, including the factors described above, the Trustees concluded, in the exercise of their business judgment, that the management fees paid by the Portfolio were reasonable in light of the services provided to it by the Investment Adviser, the Investment Adviser’s costs and the Portfolio’s current and reasonably foreseeable asset levels. The Trustees unanimously concluded that the Investment Adviser’s continued management likely would benefit the Portfolio and its shareholders and that the Management Agreement should be approved and continued with respect to the Portfolio until June 30, 2020.
32
| | |
| TRUSTEES | | OFFICERS |
| Jessica Palmer,Chair | | James A. McNamara,President |
| Kathryn A. Cassidy | | Joseph F. DiMaria,Principal Financial Officer, |
| Diana M. Daniels | | Principal Accounting Officer and Treasurer |
| James A. McNamara | | Caroline L. Kraus,Secretary |
| Roy W. Templin | | |
| Gregory G. Weaver | | |
GOLDMAN SACHS & CO. LLC
Distributor and Transfer Agent
GOLDMAN SACHS ASSET MANAGEMENT, L.P.
Investment Adviser
200 West Street, New York
New York 10282
Visit our web site at www.GSAMFUNDS.com to obtain the most recentmonth-end returns.
The reports concerning the Portfolio included in this shareholder report may contain certain forward-looking statements about the factors that may affect the performance of the Portfolio in the future. These statements are based on Portfolio management’s predictions and expectations concerning certain future events and their expected impact on the Portfolio, such as performance of the economy as a whole and of specific industry sectors, changes in the levels of interest rates, the impact of developing world events, and other factors that may influence the future performance of the Portfolio. Management believes these forward-looking statements to be reasonable, although they are inherently uncertain and difficult to predict. Actual events may cause adjustments in portfolio management strategies from those currently expected to be employed.
A description of the policies and procedures that the Portfolio uses to determine how to vote proxies relating to portfolio securities and information regarding how the Portfolio voted proxies relating to portfolio securities for the12-month period ended June 30 is available (i)��without charge, upon request by calling1-800-621-2550; and (ii) on the Securities and Exchange Commission (“SEC”) web site athttp://www.sec.gov.
The Portfolio will file its portfolio holdings information for each month in a fiscal quarter within 60 days after the end of the relevant fiscal quarter on Form N-PORT. Portfolio holdings information for the third month of each fiscal quarter will be made available on the SEC’s web site at http://www.sec.gov. Portfolio holdings information may be obtained upon request and without charge by calling1-800-526-7384 (for Retail Shareholders) or 1-800-621-2550 (for Institutional Shareholders).
Views and opinions expressed are for informational purposes only and do not constitute a recommendation by GSAM to buy, sell, or hold any security. Views and opinions are current as of the date of this presentation and may be subject to change, they should not be construed as investment advice.
Goldman Sachs & Co. LLC (“Goldman Sachs”) does not provide legal, tax or accounting advice. Any statement contained in this communication (including any attachments) concerning U.S. tax matters was not intended or written to be used, and cannot be used, for the purpose of avoiding penalties under the Internal Revenue Code, and was written to support the promotion or marketing of transactions or matters addressed. Clients of Goldman Sachs should obtain their own independent tax advice based on their particular circumstances.
The website links provided are for your convenience only and are not an endorsement or recommendation by GSAM of any of these websites or the products or services offered. GSAM is not responsible for the accuracy and validity of the content of these websites.
Portfolio holdings and allocations shown are as of June 30, 2019 and may not be representative of future investments. Portfolio holdings should not be relied on in making investment decisions and should not be construed as research or investment advice regarding particular securities. Current and future holdings are subject to risk.
References to indices, benchmarks or other measures of relative market performance over a specified period of time are provided for your information only and do not imply that the portfolio will achieve similar results. The index composition may not reflect the manner in which a portfolio is constructed. While an adviser seeks to design a portfolio which reflects appropriate risk and return features, portfolio characteristics may deviate from those of the benchmark.
The Global Industry Classification Standard (“GICS”) was developed by and is the exclusive property and a service mark of Morgan Stanley Capital International Inc. (“MSCI”) and Standard & Poor’s, a division of The McGraw-Hill Companies, Inc. (“S&P”) and is licensed for use by Goldman Sachs. Neither MSCI, S&P nor any other party involved in making or compiling the GICS or any GICS classifications makes any express or implied warranties or representations with respect to such standard or classification (or the results to be obtained by the use thereof), and all such parties hereby expressly disclaim all warranties of originality, accuracy, completeness, merchantability or fitness for a particular purpose with respect to any of such standard or classification. Without limiting any of the foregoing, in no event shall MSCI, S&P, any of their affiliates or any third party involved in making or compiling the GICS or any GICS classifications have any liability for any direct, indirect, special, punitive, consequential or any other damages (including lost profits) even if notified of the possibility of such damages.
The portfolio risk management process includes an effort to monitor and manage risk, but does not imply low risk.
Diversification does not protect an investor from market risk and does not ensure a profit.
Shares of the Goldman Sachs VIT Funds are offered to separate accounts of participating life insurance companies for the purpose of funding variable annuity contracts and variable life insurance policies. Shares of the Portfolio are not offered directly to the general public. The variable annuity contracts and variable life insurance policies are described in the separate prospectuses issued by participating insurance companies. You should refer to those prospectuses for information about surrender charges, mortality and expense risk fees and other charges that may be assessed by participating insurance companies under the variable annuity contracts or variable life insurance policies. Such fees or charges, if any, may affect the return you may realize with respect to your investments. Ask your representative for more complete information. Please consider a fund’s objectives, risks and charges and expenses, and read the prospectus carefully before investing. The prospectus contains this and other information about the Portfolio.
This material is not authorized for distribution to prospective investors unless preceded or accompanied by a current prospectus or summary prospectus, if applicable. Investors should consider the Portfolio’s objective, risks, and charges and expenses, and read the summary prospectus, if available, and/or the prospectus carefully before investing or sending money. The summary prospectus, if available, and the prospectus contain this and other information about the Portfolio and may be obtained from your authorized dealer or from Goldman Sachs & Co. LLC by calling1-800-621-2550.
This report is prepared for the general information of contract owners and is not an offer of shares of the Goldman Sachs Variable Insurance Trust — Goldman Sachs Multi-Strategy Alternatives Portfolio.
© 2019 Goldman Sachs. All rights reserved.
VITMSASAR-19/175373-OTU-1025567
Goldman
SachsVariable Insurance Trust
Goldman Sachs Core Fixed Income Fund
Goldman Sachs Equity Index Fund
Goldman Sachs Growth Opportunities Fund
Goldman Sachs High Quality Floating Rate Fund
Beginning on or after January 1, 2021, you may not receive paper copies of the Funds’ annual and semi-annual shareholder reports from the insurance company that offers your variable insurance contract or your financial intermediary, unless you specifically request paper copies of the reports from the insurance company or from your financial intermediary. Instead, the reports will be made available on a website, and you will be notified by mail each time a report is posted and provided with a website link to access the report.
If you already elected to receive shareholder reports electronically, you will not be affected by this change and you need not take any action. At any time, you may elect to receive reports and certain communications from the insurance company electronically by contacting your insurance company or your financial intermediary.
You may elect to receive all future shareholder reports in paper free of charge. You can inform the insurance company or your financial intermediary that you wish to receive paper copies of reports. Your election to receive reports in paper will apply to all Goldman Sachs Funds available under your contract and may apply to all funds held with your financial intermediary.
Semi-Annual Report
June 30, 2019

MARKET REVIEW
Goldman Sachs Variable Insurance Trust Funds
Market Review
During the six months ended June 30, 2019 (the “Reporting Period”), the performance of the U.S. equity and fixed income markets were influenced most by central bank monetary policy, U.S. and global economic data, and geopolitical issues.
Equity Markets
During the first quarter of 2019, when the Reporting Period started, U.S. equities, as represented by the S&P 500® Index, rose 13.65%. After a volatile end to 2018, the rally to begin 2019 marked the best first quarter performance for the S&P 500® Index since 1998. Federal Reserve (“Fed”) commentary provided a supportive background for U.S. equities, as Fed Chair Jerome Powell reiterated a “patient” approach to monetary policy that included a pause in interest rate hikes and a plan to end quantitative tightening, or the shrinking of the Fed’s balance sheet as securities mature, by the end of the 2019 calendar year. The U.S. unemployment rate remained well below trend at 3.8% in February 2019, and wages grew 3.4% year over year. Housing data showed strength in the first calendar quarter, with new home sales reaching 667,000 in February, bringing the three-month average up to 630,000. Strength in housing data could be partially attributed to a steep decline in mortgage rates resulting from a more cautious Fed. The University of Michigan Consumer Sentiment Index was also a point of significant strength in the U.S. economy, steadily climbing in each month of the first quarter of 2019 and eventually reaching 98.4% in March, its highest level in six months. Economic growth concerns that had dominated the fourth quarter of 2018 failed to completely disappear, however, as fourth quarter 2018 Gross Domestic Product (“GDP”) growth was revised down 0.4% in March 2019 to 2.2%. While the revision was further evidence of a slowing U.S. economy, the result was largely priced in by the U.S. equity market and thus had a limited effect on stock prices outside of the financials sector, which historically tends to be more interest rate sensitive.
The S&P 500® Index rose a solid but more moderate 4.30% during the second quarter of 2019. Trade tensions between the U.S. and China dominated headlines and broadly added noise to the markets. (Noise refers to market activity that can confuse or misrepresent genuine underlying trends.) In April 2019, investors grew optimistic about a possible U.S.-China trade deal, but this optimism faded in May when the U.S. President threatened to raise current tariffs and impose new duties on $300 billion of additional Chinese imports. Also, sanctions were temporarily placed on a Chinese telecommunications giant, until they were lifted in June 2019, when any additional tariffs or compromise were postponed. During the second calendar quarter, the markets kept a close eye on the Fed, which said it might take a more accommodative approach to monetary policy. Following the Fed’s statement, the market consensus actually priced in at least one interest rate cut by the end of 2019. U.S. economic indicators were mixed during the second calendar quarter, with consumer sentiment remaining elevated but nonfarm payroll data and manufacturing indices falling short of consensus expectations.
The S&P 500® Index returned 18.54% during the Reporting Period overall. All 11 of its sectors posted positive absolute returns, with 10 of the 11 generating double-digit gains. Information technology, consumer discretionary and industrials were the best performing sectors in the S&P 500® Index, as measured by total return, while the weakest performing sectors in the S&P 500® Index during the Reporting Period were health care, energy and utilities.
Within the U.S. equity market, all capitalization segments posted double-digit positive returns, led bymid-cap stocks, as measured by the Russell Midcap® Index, followed bylarge-cap stocks, as measured by the Russell 1000® Index, and thensmall-cap stocks, as measured by the Russell 2000® Index. From a style perspective, growth-oriented stocks significantly outpaced value-oriented stocks across the capitalization spectrum. (All as measured by the FTSE Russell indices.)
Fixed Income Markets
In the first quarter of 2019, spread, ornon-government bond, sectors broadly posted gains, as dovish pivots by global central banks boosted investor sentiment and helped fuel rallies in both sovereign government bonds and riskier segments of the fixed income market. (Dovish tends to suggest lower interest rates; opposite of hawkish.) Notably, high yield corporate bonds recorded their strongest start to a calendar year on record. The Fed kept its monetary policy unchanged during the first calendar quarter, with its dot plot projecting no interest rate hikes at all during 2019. (The “dot plot” shows interest rate projections of the members of the Federal Open Market Committee.) Meanwhile, the European Central Bank (“ECB”) extended its forward guidance, noting that its interest rates would remain unchanged through 2019. Other developed markets’ central banks — namely, those of Australia,
1
MARKET REVIEW
New Zealand, Switzerland and, to some degree, the U.K. — also turned dovish. The U.S. economy continued to benefit from strength in household consumption, which was underpinned by a healthy labor market. The U.S. dollar strengthened relative to many major currencies during the first quarter of 2019.
In the second calendar quarter, most spread sectors recorded gains. The quarter started off on a positive note in April 2019, as developed markets’ central banks kept monetary policy unchanged. In the U.S., the Fed provided dovish commentary around household spending and inflation, though this was counterbalanced somewhat by the observation that inflation softness might be due to “transitory factors.” The Bank of Japan clarified its forward guidance to signal unchanged monetary policy through the spring of 2020, while the Bank of England maintained its guidance around interest rate hikes occurring at a gradual pace and to a limited extent. Meanwhile, statements by Sweden’s Riksbank and the Bank of Canada were rather dovish, as they generally focused on external risks. However, in May 2019, spread sectors were challenged by the escalation of U.S.-China trade tensions. That same month, market speculation about possible 2019 Fed rate cuts increased due to an accumulation of factors, including soft inflation and weakness in U.S. economic data, continued U.S. growth headwinds from unresolved U.S.-China trade negotiations and subdued global economic activity, particularly in the manufacturing sector. During June 2019, spread sector performance improved on raised prospects of ongoing monetary policy accommodation by global central banks, particularly the Fed. At its June meeting, the U.S. central bank left interest rates unchanged, with eight of the 12 members on the Federal Open Market Committee projecting rate cuts during the 2019 calendar year. In Europe, a dovish speech by outgoing ECB President Mario Draghi signaled forthcoming easing. The U.S. dollar weakened versus many major currencies during the second quarter of 2019.
For the Reporting Period overall, spread sector performance was largely positive. High yield corporate bonds, sovereign emerging markets debt and investment grade corporate bonds outpaced U.S. Treasury securities. Commercial mortgage-backed securities and agency securities also outperformed U.S. Treasuries, albeit to a lesser extent. Mortgage-backed securities and asset backed securities underperformed U.S. Treasuries. During the Reporting Period, U.S. Treasury yields fell along the curve, with those on maturities of one year through seven years dropping more than those on shorter- or longer-term maturities. (Yield curve is a spectrum of interest rates based on maturities of varying lengths.) The yield on the bellwether10-year U.S. Treasury dropped approximately 69 basis points to end the Reporting Period at 2.00%. During the Reporting Period, the U.S. Treasury yield curve partially inverted. More specifically, the spread between the yields on three-month and10-year U.S. Treasury securities inverted for the first time since 2007, meaning three-month yields were higher than those of10-year U.S. Treasury securities. (A full inversion occurs when shorter-term yields exceed all longer-term yields.)
Looking Ahead
Equity Markets
Following a strong start for the U.S. equity markets during the first half of 2019, we continued to view U.S. equities as the most favorable asset class at the end of the Reporting Period, offering what we saw as reasonable valuations relative to solid macroeconomic and corporate fundamentals. After a significant repricing of assets and market expectations in the fourth quarter of 2018, the U.S. equity markets rebounded with the strongest first half of a calendar year since 1997, despite geopolitical tensions and trade relations oscillating between positive and negative developments. U.S. equities were buoyed by declining10-year U.S. Treasury rates, as investors expected potential interest rate cuts, a dramatic shift from the Fed’s actions in mid 2018. While we were encouraged by the strong start to 2019, we also expected to see more signals of an aging economic cycle moving forward, which may be challenging to navigate and require even more selectivity by stock pickers. Yet without clearer indications of deteriorating fundamentals, we believed it too early to position for a downturn in global economic growth or corporate earnings.
That said, at the end of the Reporting Period, we expected choppier conditions for the remainder of 2019. Within this more volatile backdrop, we believed a thorough understanding of both market and company-specific variables may well be crucial to navigating the evolving landscape.
Fixed Income Markets
At the end of the Reporting Period, we expected global economic growth to weaken, rather than rebound. Manufacturing activity was contracting and was nearing recessionary territory, in our view, driven in large part by escalating U.S.-China trade tensions.
2
MARKET REVIEW
However, we thought some of the risks to economic growth could be offset by resilient household consumption due to strong labor markets and service sector activity. Overall, we expected trend-like global economic growth through the end of 2019.
As for global inflation, we expected it to remain muted, with economic weakness tempering upward pressures. Inflation in both the Eurozone and Japan is likely to remain well below respective central bank targets, in our opinion. Meanwhile, the Fed has expressed concerns about inflation becoming anchored at below-target levels.
Regarding monetary policy, we note that certain central banks appeared at the end of the Reporting Period to be shifting from gradual normalization toward potentially rapid easing. In the U.S., we expect the Fed to deliver “insurance interest rate cuts” in 2019. We believe the rationale would be that proactive — rather than reactive — easing might prevent weakness when the economy is faced with elevated uncertainty, such as the U.S.-China trade conflict. Indeed, Fed Chair Jerome Powell noted in June 2019 that “an ounce of prevention is worth more than a pound of cure.” In addition, we see rising prospects for monetary policy easing by the ECB. We expect other central banks across the developed and emerging markets to respond by maintaining accommodative stances or cutting interest rates.
3
GOLDMAN SACHS VARIABLE INSURANCE TRUST – GOLDMAN SACHS CORE FIXED INCOME FUND
INVESTMENT OBJECTIVE
The Fund seeks a total return consisting of capital appreciation and income that exceeds the total return of the Bloomberg Barclays U.S. Aggregate Bond Index.
Portfolio Management Discussion and Analysis
Below, the Goldman Sachs Fixed Income Portfolio Management Team discusses the Goldman Sachs Variable Insurance Trust — Goldman Sachs Core Fixed Income Fund’s (the “Fund”) performance and positioning for thesix-month period ended June 30, 2019 (the “Reporting Period”).
How did the Fund perform during the Reporting Period?
During the Reporting Period, the Fund’s Institutional and Service Shares generated cumulative total returns of 6.76% and 6.64%, respectively. This compares to the 6.11% cumulative total return of the Fund’s benchmark, the Bloomberg Barclays U.S. Aggregate Bond Index (the “Bloomberg Barclays Index”), during the same time period.
What key factors were responsible for the Fund’s performance during the Reporting Period?
During the Reporting Period, the Fund’stop-down country strategy contributed positively to relative performance, led by a long position in the U.S. versus a short position in the U.K. In addition, long positions in Europe versus short positions in other developed markets bolstered returns. Within ourtop-down currency strategy, the Fund benefited from its long position in the euro as well as from its tactical positions overall in the British pound and Norwegian krone. These gains were offset somewhat by a short position in the Australian dollar and tactical positions in the New Zealand dollar.
Ourtop-down cross-sector strategy added to the Fund’s relative results. In our cross-sector strategy, we invest Fund assets across a variety of fixed income sectors, including some that may not be included in the Bloomberg Barclays Index. Ourbottom-up individual issue selection also added to relative returns.
The Fund’s combined tactical duration and yield curve positioning detracted from relative performance during the Reporting Period. (Duration is a measure of the Fund’s sensitivity to changes in interest rates. Yield curve is a spectrum of interest rates based on maturities of varying lengths.)
Which fixed income market sectors most affected Fund performance during the Reporting Period?
During the Reporting Period, the Fund was helped by its overweight position versus the Bloomberg Barclays Index in investment grade corporate bonds, especially its positioning in longer duration maturities. Allocations to collateralized loan obligations (“CLOs”) also proved beneficial. These positive results were offset slightly by an underweight in emerging markets corporate bonds, which detracted.
As for individual issue selection, the Fund’s holdings in the securitized sector added to its relative returns, specifically its investments in pass-through mortgage securities and adjustable-rate mortgage-backed securities. (Pass-through mortgage securities consist of a pool of residential mortgage loans, in which homeowners’ monthly payments of principal, interest and prepayments pass from the mortgage servicer through a government agency or investment bank to investors.) Within corporate credit, the Fund benefited from our selection of various maturities along the yield curve as well as our selection of high quality bonds. These gains were partially offset by selection of government bonds within the government/swaps sector, which dampened relative results.
Did the Fund’s duration and yield curve positioning strategy help or hurt its results during the Reporting Period?
The Fund’s combined duration and yield curve positioning detracted from results. For most of the Reporting Period, the Fund held a shorter duration position compared to that of the Bloomberg Barclays Index, which hurt performance as interest rates fell.
How did the Fund use derivatives and similar instruments during the Reporting Period?
As market conditions warranted during the Reporting Period, currency transactions were carried out using primarilyover-the-counter (“OTC”) forward foreign exchange contracts. Currency transactions were used as we sought both to enhance returns and to hedge the Fund’s portfolio against currency exchange rate fluctuations. OTC forward foreign exchange contracts had a positive impact on Fund performance during the Reporting Period. In addition, futures contracts were employed as warranted to facilitate specific duration, yield curve and country strategies. During the Reporting Period, futures contracts had a positive impact
4
GOLDMAN SACHS VARIABLE INSURANCE TRUST – GOLDMAN SACHS CORE FIXED INCOME FUND
on the Fund’s results. Swaptions (options on interest rate swap contracts), which were used to express our interest rate views and to hedge volatility and yield curve risks in the Fund, did not have a meaningful impact on the Fund’s performance during the Reporting Period. Interest rate swaps, which were used to manage exposure to fluctuations in interest rates, added to the Fund’s performance during the Reporting Period.
Additionally, the Fund employed credit default swaps to implement specific credit-related investment strategies, including management of the Fund’s exposure to credit spreads. Credit default swaps had a positive impact on the Fund’s results during the Reporting Period. Overall, we employ derivatives and similar instruments for the efficient management of the Fund’s portfolio. Derivatives and similar instruments allow us to manage interest rate, credit and currency risks more effectively by allowing us both to hedge and to apply active investment views with greater versatility and to afford greater risk management precision than we would otherwise be able to implement.
Were there any notable changes in the Fund’s weightings during the Reporting Period?
During the Reporting Period, we increased the Fund’s overweight relative to the Bloomberg Barclays Index in investment grade corporate bonds. In addition, we increased its overweight position in residential mortgage-backed securities and reduced its overweight in asset-based securities (“ABS”). We also decreased the Fund’s underweight position in U.S. government securities during the Reporting Period.
Were there any changes to the Fund’s portfolio management team during the Reporting Period?
Effective January 1, 2019, Jonathan Beinner no longer served as a portfolio manager for the Fund, and Ashish Shah became a portfolio manager for the Fund. By design, all investment decisions for the Fund are performed within aco-lead or team structure, with multiple subject matter experts. This strategic decision making has been the cornerstone of our approach and ensures continuity in the Fund. At the end of the Reporting Period, the portfolio managers for the Fund were Ashish Shah and Michael Swell.
How was the Fund positioned relative to the Bloomberg Barclays Index at the end of the Reporting Period?
At the end of the Reporting Period, the Fund was overweight ABS andnon-agency mortgage-backed securities compared to the Bloomberg Barclays Index. It was also overweight pass-through mortgage securities and corporate credit. The Fund was underweight U.S. government securities relative to the Bloomberg Barclays Index. The Fund was relatively neutral versus the Bloomberg Barclays Index in quasi-government bonds and commercial mortgage-backed securities at the end of the Reporting Period.
5
FUND BASICS
Core Fixed Income Fund
as of June 30, 2019
STANDARDIZED TOTAL RETURNS1
| | | | | | | | | | | | | | | | | | |
| | | | | |
| For the period ended 6/30/19 | | One Year | | | Five Years | | | Ten Years | | | Since Inception | | | Inception Date |
| Institutional | | | 8.18 | % | | | 2.96 | % | | | N/A | | | | 2.66 | % | | 4/30/13 |
| Service | | | 7.91 | | | | 2.69 | | | | 4.55 | % | | | 3.87 | | | 1/09/06 |
| 1 | The Standardized Total Returns are average annual total returns as of the most recent calendar quarter-end. They assume reinvestment of all distributions at net asset value (“NAV”). Because Institutional and Service Shares do not involve a sales charge, such a charge is not applied to their Standardized Total Returns. |
Total return figures in the above chart represent past performance and do not indicate future results, which will vary. The investment return and principal value of an investment will fluctuate and, therefore, an investor’s shares, when redeemed, may be worth more or less than their original cost. Current performance may be lower or higher than the total return figures in the above chart. Please visit www.GSAMFUNDS.com to obtain the most recent month-end returns.Performance reflects fee waivers and/or expense limitations in effect during the periods shown. In their absence, performance would be reduced.
EXPENSE RATIOS2
| | | | | | | | |
| | |
| | | Net Expense Ratio (Current) | | | Gross Expense Ratio (Before Waivers) | |
| Institutional | | | 0.42 | % | | | 0.94 | % |
| Service | | | 0.67 | | | | 1.19 | |
| 2 | The expense ratios of the Fund, both current (net of any fee waivers and/or expense limitations) and before waivers (gross of any fee waivers and/or expense limitations) are as set forth above according to the most recent publicly available Prospectus for the Fund and may differ from the expense ratios disclosed in the Financial Highlights in this report. Pursuant to a contractual arrangement, the Fund’s fee waivers and/or expense limitations will remain in place through at least April 30, 2020, and prior to such date, the Investment Adviser may not terminate the arrangements without the approval of the Fund’s Board of Trustees. If these arrangements are discontinued in the future, the expense ratios may change without shareholder approval. |
6
FUND BASICS
FUND COMPOSITION3
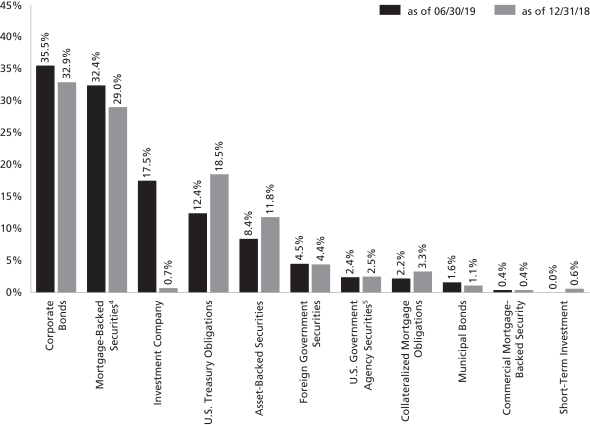
| 3 | The percentage shown for each investment category reflects the value of investments in that category as a percentage of net assets. Figures in the above graph may not sum to 100% due to the exclusion of other assets and liabilities. Short-Term Investments represent investments in commercial paper. Underlying sector allocations of investment companies held by the Fund are not reflected in the graph above. The graph depicts the Fund’s investments but may not represent the Fund’s market exposure due to the exclusion of certain derivatives, if any, as listed in the Additional Investment Information section of the Schedule of Investments. |
| 4 | “Mortgage-Backed Securities” are guaranteed by the Government National Mortgage Association (“GNMA”), the Federal Home Loan Mortgage Corp. (“FHLMC”) or Uniform Mortgage-Backed Securities (“UMBS”). GNMA instruments are backed by the full faith and credit of the United States Government. |
| 5 | “U.S. Government Agency Securities” include agency securities offered by companies such as the Federal National Mortgage Association (“FNMA”) and the Federal Home Loan Bank (“FHLB”), which operate under a government charter. While they are required to report to a government regulator, their assets are not explicitly guaranteed by the government and they otherwise operate like any other publicly traded company. |
7
GOLDMAN SACHS VARIABLE INSURANCE TRUST – GOLDMAN SACHS EQUITY INDEX FUND
INVESTMENT OBJECTIVE
The Fund seeks to achieve investment results that correspond to the aggregate price and yield performance of a benchmark index that measures the investment returns of large capitalization stocks.
Portfolio Management Discussion and Analysis
Below, SSgA Funds Management, Inc. (“SSgA”), the Fund’s Subadvisor, discusses the Goldman Sachs Variable Insurance Trust — Goldman Sachs Equity Index Fund’s (the “Fund”) performance and positioning for thesix-month period ended June 30, 2019 (the “Reporting Period”).
How did the Fund perform during the Reporting Period?
During the Reporting Period, the Fund’s Service Shares generated a cumulative total return of 18.30%. This compares to the 18.54% cumulative total return of the Fund’s benchmark, the Standard & Poor’s 500® Index (with dividends reinvested) (the “S&P 500® Index”), during the same time period.
During the Reporting Period, which sectors and which industries in the S&P 500® Index were the strongest contributors to the Fund’s performance?
All 11 sectors in the S&P 500®Index recorded gains during the Reporting Period. In terms of total return, the sectors that made the strongest positive contributions to the S&P 500® Index and to the Fund were information technology, consumer discretionary and industrials. The largest sector by weighting in the S&P 500® Index at the end of the Reporting Period was information technology at a weighting of 20.80%. The industries with the strongest performance in terms of total return were aluminum, miscellaneous commercial services, electronic production equipment, financial publishing/services and construction materials.
On the basis of impact (which takes both total returns and weightings into account), the strongest performing sectors were information technology, financials and consumer discretionary. The strongest performing industries on the basis of impact were packaged software, telecommunications equipment, Internet software/services, medical specialties and Internet retail.
Which sectors and industries in the S&P 500® Index were the weakest contributors to the Fund’s performance?
In terms of total return, during the Reporting Period, the weakest performing sectors were utilities, energy and health care. The industries with the weakest performance in terms of total return were department stores, food retail, specialty telecommunications, drugstore chains and managed health care.
On the basis of impact the sectors that made the weakest contributions to the S&P 500® Index and to the Fund were utilities, materials and real estate. The industries with the weakest performance on the basis of impact were drugstore chains, managed health care, department stores, food retail and specialty telecommunications.
Which individual stocks were the top detractors, and which were the greatest positive contributors?
On the basis of impact, the stocks that made the strongest contribution during the Reporting Period were Microsoft, Apple, Amazon.com, Facebook and Visa. The weakest performers were AbbVie, CVS Health, Biogen, Cigna and PG&E.
How did the Fund use derivatives and similar instruments during the Reporting Period?
During the Reporting Period, the Fund did not use derivatives as part of an active management strategy to add value to the Fund’s results. However, equity index futures were used to equitize the Fund’s cash holdings. In other words, we put the Fund’s cash holdings to work by using them as collateral for the purchase of equity index futures. We also used these equity index futures to provide liquidity for daily cash flow requirements. Equity index futures had a neutral impact on the Fund’s performance during the Reporting Period.
Were there any changes to the Fund’s portfolio management team during the Reporting Period?
There were no changes to the Fund’s portfolio management team during the Reporting Period.
What changes were made to the makeup of the S&P 500® Index during the Reporting Period?
Four stocks were removed from the S&P 500® Index during the Reporting Period. They were Brighthouse Financial, Fluor, Kontoor Brands and Mattel. There were four stocks added to the S&P 500® Index during the Reporting Period. They were Bemis, Corteva, Dow and Kontoor Brands.
8
GOLDMAN SACHS VARIABLE INSURANCE TRUST – GOLDMAN SACHS EQUITY INDEX FUND
The source of the data included in the above Portfolio Management Discussion and Analysis with respect to the Goldman Sachs Equity Index Fund is FactSet as of June 30, 2019.
Characteristics presented are calculated using the month end market value of holdings, except for beta and standard deviation, if shown, which use month end return values. Averages reflect the market weight of securities in the portfolio. Market data, prices, and dividend estimates for characteristics calculations provided by FactSet Research Systems, Inc. All other portfolio data provided by SSgA. Characteristics are as of the date indicated, are subject to change, and should not be relied upon as current thereafter.
Past performance is not a guarantee of future results.
Index returns are unmanaged and do not reflect the deduction of any fees or expenses. Index returns reflect all items of income, gain and loss and the reinvestment of dividends and other income.
SSgA may have or may seek investment management or other business relationships with companies discussed in this material or affiliates of those companies, such as their officers, directors and pension plans.
The views expressed in this material are the views of SSgA’s Global Equity Beta Solutions Team through the period ended June 30, 2019 and are subject to change based on market and other conditions. All information has been obtained from sources believed to be reliable, but its accuracy is not guaranteed. There is no representation or warranty as to the current accuracy, reliability or completeness of, nor liability for, decisions based on such information and it should not be relied on as such. This document contains certain statements that may be deemed forward-looking statements. Please note that any such statements are not guarantees of any future performance and actual results or developments may differ materially from those projected.
9
FUND BASICS
Equity Index Fund
as of June 30, 2019
STANDARDIZED TOTAL RETURNS1
| | | | | | | | | | | | | | | | | | |
| | | | | |
| For the period ended 6/30/19 | | One Year | | | Five Years | | | Ten Years | | | Since Inception | | | Inception Date |
| Service | | | 9.89 | % | | | 10.21 | % | | | 14.23 | % | | | 8.21 | % | | 1/09/06 |
| 1 | The Standardized Total Returns are average annual total returns as of the most recent calendar quarter-end. They assume reinvestment of all distributions at net asset value (“NAV”). Because Service Shares do not involve a sales charge, such a charge is not applied to their Standardized Total Returns. |
Total return figures in the above chart represent past performance and do not indicate future results, which will vary. The investment return and principal value of an investment will fluctuate and, therefore, an investor’s shares, when redeemed, may be worth more or less than their original cost. Current performance may be lower or higher than the total return figures in the above chart. Please visit www.GSAMFUNDS.com to obtain the most recent month-end returns.Performance reflects fee waivers and/or expense limitations in effect during the periods shown. In their absence, performance would be reduced.
EXPENSE RATIOS2
| | | | | | | | |
| | |
| | | Net Expense Ratio (Current) | | | Gross Expense Ratio (Before Waivers) | |
| Service | | | 0.48 | % | | | 0.72 | % |
| 2 | The expense ratios of the Fund, both current (net of any fee waivers and/or expense limitations) and before waivers (gross of any fee waivers and/or expense limitations) are as set forth above according to the most recent publicly available Prospectus for the Fund and may differ from the expense ratios disclosed in the Financial Highlights in this report. Pursuant to a contractual arrangement, the Fund’s fee waivers and/or expense limitations will remain in place through at least April 30, 2020, and prior to such date, the Investment Adviser may not terminate the arrangements without the approval of the Fund’s Board of Trustees. If these arrangements are discontinued in the future, the expense ratios may change without shareholder approval. |
TOP TEN HOLDINGS AS OF 6/30/193
| | | | | | |
| | |
| Holding | | % of Net Assets | | | Line of Business |
| Microsoft Corp. | | | 4.2% | | | Software & Services |
| Apple, Inc. | | | 3.5 | | | Technology Hardware & Equipment |
| Amazon.com, Inc. | | | 3.2 | | | Retailing |
| Facebook, Inc. Class A | | | 1.9 | | | Media & Entertainment |
| Berkshire Hathaway, Inc. Class B | | | 1.7 | | | Diversified Financials |
| Johnson & Johnson | | | 1.5 | | | Pharmaceuticals, Biotechnology & Life Sciences |
| JPMorgan Chase & Co. | | | 1.5 | | | Banks |
| Alphabet, Inc. Class C | | | 1.3 | | | Media & Entertainment |
| Exxon Mobil Corp. | | | 1.3 | | | Energy |
| Alphabet, Inc. Class A | | | 1.3 | | | Media & Entertainment |
| 3 | The top 10 holdings may not be representative of the Fund’s future investments. |
10
FUND BASICS
FUND VS. BENCHMARK SECTOR ALLOCATIONS4
As of June 30, 2019
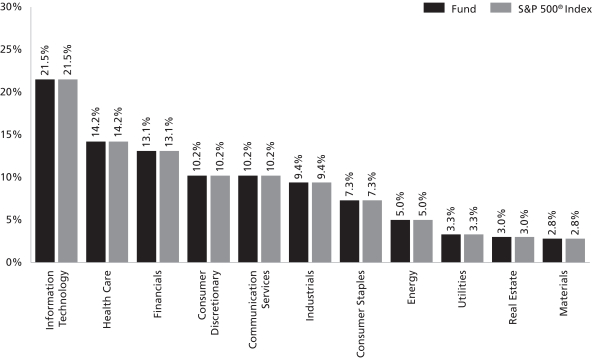
| 4 | The graph categorizes investments using Global Industry Classification Standard (“GICS”); however, the sector classifications used by the portfolio management team may differ from GICS. The percentage shown for each investment category reflects the value of investments in that category as a percentage of market value (excluding short-term investments, if any). The graph depicts the Fund’s investments but may not represent the Fund’s market exposure due to the exclusion of certain derivatives, if any, as listed in the Additional Investment Information section of the Schedule of Investments. |
11
GOLDMAN SACHS VARIABLE INSURANCE TRUST – GOLDMAN SACHS GROWTH OPPORTUNITIES FUND
INVESTMENT OBJECTIVE
The Fund seeks long-term growth of capital.
Portfolio Management Discussion and Analysis
Below, the Goldman Sachs Growth Investment Team discusses the Goldman Sachs Variable Insurance Trust — Goldman Sachs Growth Opportunities Fund’s (the “Fund”) performance and positioning for thesix-month period ended June 30, 2019 (the “Reporting Period”).
How did the Fund perform during the Reporting Period?
During the Reporting Period, the Fund’s Institutional and Service Shares generated cumulative total returns of 26.05% and 25.89%, respectively. These returns compare to the 26.08% cumulative total return of the Fund’s benchmark, the Russell Midcap® Growth Index (with dividends reinvested) (the “Russell Index”), during the same time period.
What key factors were responsible for the Fund’s performance during the Reporting Period?
The Fund posted robust double-digit absolute gains but modestly underperformed the Russell Index during the Reporting Period, driven by sector positioning. These results were offset by security selection, which contributed positively.
Which equity market sectors helped and hurt Fund performance?
Ourbottom-up approach focuses on security selection, and therefore, we do not make active sector-level investment decisions. That said, on a sector level, stock selection in the information technology and financials sectors detracted from relative performance. A slight underweight compared to the Russell Index in the energy sector also hurt returns. The Fund benefited from effective stock selection in the industrials and health care sectors as well as from its underweight position in the communication services sector during the Reporting Period.
Which individual stocks detracted from the Fund’s performance during the Reporting Period?
GoDaddy, Citrix Systems and Global Payments detracted most from the Fund’s relative returns during the Reporting Period.
The Fund’s top detractor was web hosting service company GoDaddy. Its shares slid in early May 2019 following an earnings release in which the company reportedin-line results across all key metrics. In our view, investors were disappointed following a lengthy period of upside surprises. At the end of the Reporting Period, we continued to believe GoDaddy’s end markets are steady and present a favorable long-term growth opportunity. Overall, we also remained positive on GoDaddy at the end of the Reporting Period, as we believe it is a high quality growth company that has demonstrated an ability to deliver consistent earnings growth over time. In addition, we considered it a well-diversified business led by a strong management team.
Another notable detractor was Citrix Systems, a software company that provides server, application and desktop virtualization, networking, software as a service, and cloud computing technologies. Its stock came under pressure in January 2019 following the company’s fourth quarter 2018 earnings release. While revenue, operating margins and earnings per share exceeded investor expectations, these results were overshadowed by slightly weaker than market expected guidance. The company’s management explained that the guidance was driven by softer than company expected Netscaler hardware demand. Also, in May 2019, Citrix Systems’ shares fell along with the equity market as a whole. Despite the stock’s weakness during the Reporting Period, we were encouraged by the company’s continued transitioning of its installed base to a subscription-based model. At the end of the Reporting Period, we continued to view Citrix Systems as a high quality growth software company that was trading at an attractive valuation.
Another key detractor from the Fund’s relative returns was Global Payments, a worldwide provider of payment technology and software solutions. We sold the stock in February 2019 following an extended period of strong performance, deciding to realize gains and allocate the capital to what we saw as other high quality growth names in the payments industry. However, after the Fund’s exit, the stock price appreciated, continuing to rise through the end of the Reporting Period. As a result, the Fund’s underweight position relative to the Russell Index hampered relative performance. That said, we continue to believe there are other stocks in the payments industry that may offer high quality characteristics in the event of an economic downturn.
12
GOLDMAN SACHS VARIABLE INSURANCE TRUST – GOLDMAN SACHS GROWTH OPPORTUNITIES FUND
Which individual stocks added to the Fund’s relative performance during the Reporting Period?
During the Reporting Period, the Fund benefited most relative to the Russell Index from its investments in Spark Therapeutics, HEICO and Marvell Technology Group.
Commercial gene therapy firm Spark Therapeutics added most to relative performance during the Reporting Period. Its shares spiked late in February 2019 following news that Swiss drug maker Roche Holding had agreed to acquire Spark Therapeutics for approximately $115 per share, representing a total equity value of approximately $5 billion. The stock, which had had a market value of slightly less than $2 billion at the market close before the announcement, more than doubled after the announcement. As a result, we felt Spark Therapeutics’ valuation had become less attractive, and we chose to sell the Fund’s position, taking profits, and reallocate the capital to what we considered to be more appealing risk/reward opportunities.
Aerospace, defense and electronics manufacturer HEICO’s stock climbed in May 2019, as the company reported strong first calendar quarter earnings, withtop- and bottom-line growth beating consensus expectations. Its management noted positive industry trends and a strong business climate as key contributors to growth, leading to a 20% increase in its sales during the first quarter of 2019. HEICO raised its full year 2019 guidance across the board, with revenue, earnings and cash flow expectations all higher. In addition, later in the Reporting Period, HEICO acquired a leading surveillance technology firm, and the company’s management indicated that future transactions could be announced in the near term. At the end of the Reporting Period, we believed the prospects of continued acquisitions and positive industry outlooks were signals of HEICO’s potential future growth and performance.
Marvell Technology Group, an integrated circuit designer, developer and seller, was another leading contributor to relative performance during the Reporting Period. Its stock rose steadily to start 2019 and then rose even faster in April, as gains came on the back of China trade headlines that boosted the semiconductor industry as a whole. Strong first quarter 2019 results, featuring above consensus revenue and earnings per share and a positive outlook on the future of the firm’s 5G (fifth generation) capabilities, boosted its share price later in the Reporting Period. Marvell Technology Group also announced the sale of its connectivity assets to NXP Semiconductors, marking the divestiture of an arm that offered few synergies to other, stronger segments of the company, a move the market received positively. The deal fits into a broader pattern of strategic transactions that Marvell Technology Group’s management has been pursuing. At the end of the Reporting Period, we believed these strategic acquisitions and divestitures, the company’s enhanced positioning in 5G and its improved financial flexibility were indicators of its stock’s potential future performance.
Did the Fund make any significant purchases or sales during the Reporting Period?
Among the positions initiated by the Fund during the Reporting Period was an investment in O’Reilly Automotive, which owns and operates U.S. automotive parts retail outlets. We were positive on the company’s solid earnings announcement in February 2019, which provided strong comparable store sales guidance and first calendar quarter trends. In our view, demand for automotive parts may well remain robust due to increasing miles driven amid low unemployment and stable fuel prices. Overall, we consider O’Reilly Automotive a “best in class” operator. Strong demand drivers, including the 2019 tax refund season, further supported our robusttop-line growth outlook for the company, leading to the purchase of its stock.
The Fund established a position in integrated circuits and electronic device developer, Cadence Design Systems. The company’s products include electronic design automation (“EDA”), software and emulation hardware. We view ongoing momentum across EDA and the company’s entry into system analysis via the Clarity 3D Solver tool as key drivers of its future potential returns.
In addition to the sale of Global Payments, already mentioned, the Fund exited its position in Dunkin’ Brands Group. After the company reported fourth quarter 2018 earnings, in which it beat consensus earnings per share estimates but missed on revenues, we noticed a significant disconnect between the results and its management’s optimism about the business. Our outlook is more negative, as the company had exhausted numerous strategies during 2018 but both store traffic and comparable store sales remained soft. Given its stock’s previously solid performance, we elected to sell the position and allocate the gains to other businesses with what we felt were more promising long-term growth prospects.
Were there any notable changes in the Fund’s weightings during the Reporting Period?
Changes to the Fund’s sector weightings relative to the Russell Index are due to our stock selection. As a result of these decisions during the Reporting Period, the Fund moved from an underweight in the industrials sector to a rather neutral position versus the Russell Index. It also shifted from a neutral position in the financials sector to an underweight position relative to the Russell Index.
13
GOLDMAN SACHS VARIABLE INSURANCE TRUST – GOLDMAN SACHS GROWTH OPPORTUNITIES FUND
How did the Fund use derivatives and similar instruments during the Reporting Period?
The Fund did not use derivatives or similar instruments within its investment process during the Reporting Period.
Were there any changes to the Fund’s portfolio management team during the Reporting Period?
There were no changes to the Fund’s portfolio management team during the Reporting Period. However, effective July 17, 2019, after the close of the Reporting Period, portfolio managers Steven M. Barry, Managing Director, Chief Investment Officer, Fundamental Equity U.S. Equity, and Stephen E. Becker, CFA, Managing Director, each became Managing Director, Co-Chief Investment Officer of Fundamental Equity U.S. Equity. As of the same date, Jenny Chang became a portfolio manager for the Fund. Effective July 17, 2019, the portfolio managers for the Fund were Steven M. Barry and Jenny Chang.
How was the Fund positioned relative to the Russell Index at the end of the Reporting Period?
As mentioned, the Fund’s sector positioning relative to the Russell Index is the result of our stock selection, as we take a purebottom-up, research-intensive approach to investing. From that perspective, then, at the end of the Reporting Period, the Fund’s portfolio was broadly diversified with overweight positions compared to the Russell Index in the consumer staples, health care and energy sectors. The Fund had smaller weightings than the Russell Index in the financials, communication services and information technology sectors. At the end of the Reporting Period, the Fund was relatively neutral compared to the Russell Index in the industrials, real estate, materials, utilities and consumer discretionary sectors. The Fund had no exposure to the utilities sector at the end of the Reporting Period.
14
FUND BASICS
Growth Opportunities Fund
as of June 30, 2019
STANDARDIZED TOTAL RETURNS1
| | | | | | | | | | | | | | | | | | |
| | | | | |
| For the period ended 6/30/2019 | | One Year | | | Five Years | | | Ten Years | | | Since Inception | | | Inception Date |
| Institutional | | | 16.17 | % | | | 9.46 | % | | | N/A | | | | 11.65 | % | | 4/30/13 |
| Service | | | 15.90 | | | | 9.27 | | | | 14.32 | % | | | 9.48 | | | 1/09/06 |
| 1 | The Standardized Total Returns are average annual total returns as of the most recent calendar quarter-end. They assume reinvestment of all distributions at net asset value (“NAV”). Because Institutional and Service Shares do not involve a sales charge, such a charge is not applied to their Standardized Total Returns. |
Total return figures in the above chart represent past performance and do not indicate future results, which will vary. The investment return and principal value of an investment will fluctuate and, therefore, an investor’s shares, when redeemed, may be worth more or less than their original cost. Current performance may be lower or higher than the total return figures in the above chart. Please visit www.GSAMFUNDS.com to obtain the most recent month-end returns.Performance reflects fee waivers and/or expense limitations in effect during the periods shown. In their absence, performance would be reduced.
EXPENSE RATIOS2
| | | | | | | | |
| | |
| | | Net Expense Ratio (Current) | | | Gross Expense Ratio (Before Waivers) | |
| Institutional | | | 0.85 | % | | | 1.13 | % |
| Service | | | 1.01 | | | | 1.38 | |
| 2 | The expense ratios of the Fund, both current (net of any fee waivers and/or expense limitations) and before waivers (gross of any fee waivers and/or expense limitations) are as set forth above according to the most recent publicly available Prospectus for the Fund and may differ from the expense ratios disclosed in the Financial Highlights in this report. Pursuant to a contractual arrangement, the Fund’s fee waivers and/or expense limitations will remain in place through at least April 30, 2020, and prior to such date, the Investment Adviser may not terminate the arrangements without the approval of the Fund’s Board of Trustees. If these arrangements are discontinued in the future, the expense ratios may change without shareholder approval. |
TOP TEN HOLDINGS AS OF 6/30/193
| | | | | | |
| | |
| Holding | | % of Net Assets | | | Line of Business |
| Dollar General Corp. | | | 2.6% | | | Retailing |
| Amphenol Corp. Class A | | | 2.2 | | | Technology Hardware & Equipment |
| Fiserv, Inc. | | | 2.1 | | | Software & Services |
| Ingersoll-Rand plc | | | 2.0 | | | Capital Goods |
| Harris Corp. | | | 1.9 | | | Capital Goods |
| SBA Communications Corp. | | | 1.9 | | | Real Estate Investment Trusts |
| Total System Services, Inc. | | | 1.9 | | | Software & Services |
| Bright Horizons Family Solutions, Inc. | | | 1.8 | | | Consumer Services |
| Martin Marietta Materials, Inc. | | | 1.7 | | | Materials |
| IDEXX Laboratories, Inc. | | | 1.6 | | | Health Care Equipment & Services |
| 3 | The top 10 holdings may not be representative of the Fund’s future investments. |
15
FUND BASICS
FUND VS. BENCHMARK SECTOR ALLOCATIONS4
As of June 30, 2019
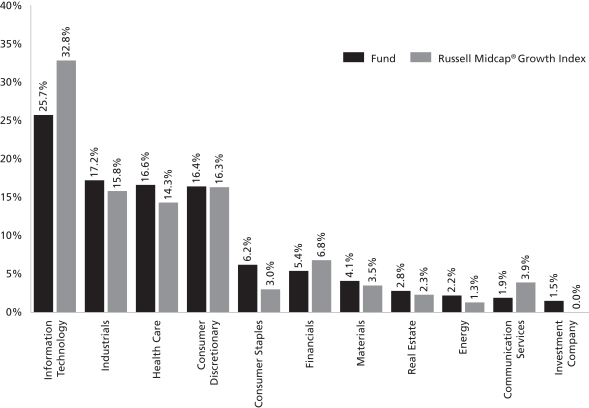
| 4 | The Fund is actively managed and, as such, its composition may differ over time. Consequently, the Fund’s overall sector allocations may differ from percentages contained in the graph above. The graph categorizes investments using Global Industry Classification Standard (“GICS”); however, the sector classifications used by the portfolio management team may differ from GICS. The percentage shown for each investment category reflects the value of investments in that category as a percentage of market value (excluding investments in the securities lending reinvestment vehicle, if any). Underlying sector allocations of exchange traded funds and investment companies held by the Fund are not reflected in the graph above. Investments in the securities lending reinvestment vehicle represented 0.5% of the Fund’s net assets at June 30, 2019. |
16
GOLDMAN SACHS VARIABLE INSURANCE TRUST – GOLDMAN SACHS HIGH QUALITY FLOATING RATE FUND
INVESTMENT OBJECTIVE
The Fund seeks to provide a high level of current income, consistent with low volatility of principal.
Portfolio Management Discussion and Analysis
Below, the Goldman Sachs Fixed Income Portfolio Management Team discusses the Goldman Sachs High Quality Floating Rate Fund’s (the “Fund”) performance and positioning for thesix-month period ended June 30, 2019 (the “Reporting Period”).
How did the Fund perform during the Reporting Period?
During the Reporting Period, the Fund’s Institutional, Service and Advisor Shares generated cumulative total returns of 1.32%, 1.20% and 1.12%, respectively. These returns compare to the 1.24% cumulative total return of the Fund’s benchmark, the ICE BofAML Three-Month U.S. Treasury Bill Index (the “ICE BofAML Index”), during the Reporting Period.
We note that the Fund’s benchmark being the ICE BofAML Index is a means of emphasizing that the Fund has an unconstrained strategy. That said, this Fund employs a benchmark agnostic strategy and thus comparisons to a benchmark index are not particularly relevant.
What key factors had the greatest impact on the Fund’s performance during the Reporting Period?
During the Reporting Period, our individual issue selection added most to the Fund’s relative returns. Ourtop-down cross-sector strategy also contributed positively. In our cross-sector strategy, we invest Fund assets based on a discipline of valuing each fixed income sector in the context of all investment opportunities within the Fund’s universe.
The Fund’s combined tactical duration and yield curve positioning detracted from results. Duration is a measure of the Fund’s sensitivity to changes in interest rates. Yield curve is a spectrum of interest rates based on maturities of varying lengths.
Which fixed income market sectors helped or hurt Fund performance during the Reporting Period?
Our cross-sector strategy bolstered relative performance. The Fund benefited from its exposure to collateralized loan obligations (“CLOs”) and asset backed securities (“ABS”), which outperformed short-term U.S. Treasuries during the Reporting Period. Positioning among U.S. Treasury securities also added to returns, as spreads, or yield differentials, between U.S. Treasuries of different maturities narrowed.
Individual issue selection enhanced the Fund’s relative returns during the Reporting Period. In particular, the Fund was helped by selection within the securitized sector, highlighted by its investments in CLOs and mortgage-backed securities. Within the government/swaps sector, individual issue selection of U.S. government securities added further to relative performance.
Did the Fund’s duration and yield curve positioning strategy help or hurt its results during the Reporting Period?
The Fund’s combined tactical duration and yield curve positioning detracted from performance. More specifically, the Fund was hurt by its exposure to the three-month segment of the U.S. Treasury yield curve during the Reporting Period.
Were there any notable changes in the Fund’s weightings during the Reporting Period?
During the Reporting Period, we increased the Fund’s exposure to ABS, maintaining a focus on Federal Family Education Loan Program (“FFELP”) student loan ABS. We also increased the Fund’s exposure to residential mortgage-backed securities during the Reporting Period. We eliminated the Fund’s exposure to U.S. Treasuries by the end of the Reporting Period.
How did the Fund use derivatives and similar instruments during the Reporting Period?
As market conditions warranted, the Fund used Treasury futures and Eurodollar futures to hedge interest rate exposure and to facilitate duration management. (Eurodollar futures are contracts that have underlying assets linked to time deposits denominated in U.S. dollars at banks outside the U.S.) During the Reporting Period, the use of futures overall had a negative impact on performance. The Fund also employed interest rate swaps to manage interest risk, which had a negative impact on performance during the Reporting Period.
17
GOLDMAN SACHS VARIABLE INSURANCE TRUST – GOLDMAN SACHS HIGH QUALITY FLOATING RATE FUND
How was the Fund positioned relative to the ICE BofAML Index at the end of the Reporting Period?
At the end of the Reporting Period, the Fund had no exposure to U.S. government securities, which comprise 100% of the ICE BofAML Index. The Fund had positions in ABS, agency collateralized mortgage obligations, residential mortgage-backed securities and agency mortgage-backed securities, none of which are represented in the ICE BofAML Index.
18
FUND BASICS
High Quality Floating Rate Fund
as of June 30, 2019
STANDARDIZED TOTAL RETURNS1
| | | | | | | | | | | | | | | | | | |
| | | | | |
| For the period ended 6/30/19 | | One Year | | | Five Years | | | Ten Years | | | Since Inception | | | Inception Date |
| Institutional | | | 2.13 | % | | | 1.17 | % | | | N/A | | | | 1.06 | % | | 4/30/13 |
| Service | | | 1.88 | | | | 0.93 | | | | 2.33 | % | | | 2.95 | | | 1/09/06 |
| Advisor | | | 1.71 | | | | N/A | | | | N/A | | | | 0.86 | | | 10/15/14 |
| 1 | The Standardized Total Returns are average annual total returns as of the most recent calendar quarter-end. They assume reinvestment of all distributions at net asset value (“NAV”). Because Institutional, Service and Advisor Shares do not involve a sales charge, such a charge is not applied to their Standardized Total Returns. |
Total return figures in the above chart represent past performance and do not indicate future results, which will vary. The investment return and principal value of an investment will fluctuate and, therefore, an investor’s shares, when redeemed, may be worth more or less than their original cost. Current performance may be lower or higher than the total return figures in the above chart. Please visit www.GSAMFUNDS.com to obtain the most recent month-end returns.Performance reflects fee waivers and/or expense limitations in effect during the periods shown. In their absence, performance would be reduced.
EXPENSE RATIOS2
| | | | | | | | |
| | |
| | | Net Expense Ratio (Current) | | | Gross Expense Ratio (Before Waivers) | |
| Institutional | | | 0.36 | % | | | 0.64 | % |
| Service | | | 0.61 | | | | 0.89 | |
| Advisor | | | 0.76 | | | | 1.04 | |
| 2 | The expense ratios of the Fund, both current (net of any fee waivers and/or expense limitations) and before waivers (gross of any fee waivers and/or expense limitations) are as set forth above according to the most recent publicly available Prospectus for the Fund and may differ from the expense ratios disclosed in the Financial Highlights in this report. Pursuant to a contractual arrangement, the Fund’s fee waivers and/or expense limitations will remain in place through at least April 30, 2020, and prior to such date, the Investment Adviser may not terminate the arrangements without the approval of the Fund’s Board of Trustees. If these arrangements are discontinued in the future, the expense ratios may change without shareholder approval. |
19
FUND BASICS
FUND COMPOSITION3
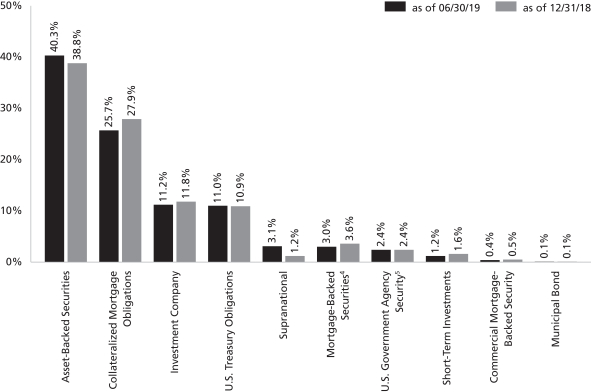
| 3 | The percentage shown for each investment category reflects the value of investments in that category as a percentage of net assets. Figures in the above graph may not sum to 100% due to the exclusion of other assets and liabilities. Short-Term Investments represent investments in commercial paper. Underlying sector allocations of investment companies held by the Fund are not reflected in the graph above. The graph depicts the Fund’s investments but may not represent the Fund’s market exposure due to the exclusion of certain derivatives, if any, as listed in the Additional Investment Information section of the Schedule of Investments. |
| 4 | Mortgage-backed securities guaranteed by the Government National Mortgage Association (“GNMA”), the Federal National Mortgage Association (“FNMA”) or the Federal Home Loan Mortgage Corp. (“FHLMC”). GNMA instruments are backed by the full faith and credit of the United States Government. |
| 5 | “U.S. Government Agency Security” include agency securities offered by companies such as FNMA and Federal Home Loan Bank (“FHLB”) which operate under a government charter. While they are required to report to a government regulator, their assets are not explicitly guaranteed by the government and they otherwise operate like any other publicly traded company. |
20
GOLDMAN SACHS VARIABLE INSURANCE TRUST FUNDS
Index Definitions
Bloomberg Barclays U.S. Aggregate Bond Index represents an unmanaged diversified portfolio of fixed income securities, including U.S. Treasuries, investment-grade corporate bonds and mortgage-backed and asset-backed securities.
ICE BofAML Three-Month U.S. Treasury Bill Index measures total return on cash, including price and interest income, based on short-term government Treasury Bills of about90-day maturity, as reported by Bank of America Merrill Lynch.
Russell Midcap® Growth Index is an unmanaged index that measures the performance of those companies in the Russell Midcap® Index with higherprice-to-book ratios and higher forecasted growth values.
Russell Midcap® Index measures the performance of themid-cap segment of the U.S. equity universe. The Russell Midcap® Index is a subset of the Russell 1000® Index. The Russell Midcap® Index includes approximately 800 of the smallest securities based on a combination of their market cap and current index membership. The Russell Midcap® Index represents approximately 31% of the total market capitalization of the Russell 1000® Index companies. The Russell Midcap® Index is constructed to provide a comprehensive and unbiased barometer for themid-cap segment. The Russell Midcap® Index is completely reconstituted annually to ensure larger stocks do not distort the performance and characteristics of the truemid-cap opportunity set.
Russell 1000® Indexmeasures the performance of thelarge-cap segment of the U.S. equity universe. The Russell 1000® Index is a subset of the Russell 3000® Index and includes approximately 1000 of the largest securities based on a combination of their market cap and current index membership. The Russell 1000® Index represents approximately 92% of the U.S. market. The Russell 1000® Index is constructed to provide a comprehensive and unbiased barometer for thelarge-cap segment and is completely reconstituted annually to ensure new and growing equities are reflected.
Russell 2000® Index measures the performance of thesmall-cap segment of the U.S. equity universe. The Russell 2000® Index is a subset of the Russell 3000® Index representing approximately 10% of the total market capitalization of that index. The Russell 2000® Index includes approximately 2000 of the smallest securities based on a combination of their market cap and current index membership. The Russell 2000® Index is constructed to provide a comprehensive and unbiasedsmall-cap barometer and is completely reconstituted annually to ensure larger stocks do not distort the performance and characteristics of the truesmall-cap opportunity set.
S&P 500® Index is a U.S. stock market index based on the market capitalizations of 500 large companies having common stock listed on the New York Stock Exchange or NASDAQ. The S&P 500® Index components and their weightings are determined by S&P Dow Jones Indices.
It is not possible to invest directly in an index.
21
GOLDMAN SACHS VARIABLE INSURANCE TRUST CORE FIXED INCOME FUND
Schedule of Investments
June 30, 2019 (Unaudited)
| | | | | | | | | | | | |
Principal
Amount | | | Interest
Rate | | Maturity
Date | | | Value | |
|
| Corporate Bonds – 35.5% | |
| Automobiles & Components(a) – 0.1% | |
| | General Motors Co. | |
| $ | 25,000 | | | 4.000% | | | 04/01/2025 | | | $ | 25,450 | |
| | |
| Banks – 8.2% | |
| | American Express Co.(a) | |
| | 25,000 | | | 3.625 | | | 12/05/2024 | | | | 26,224 | |
| | Bank of America Corp. | |
| | 75,000 | | | 4.125 | | | 01/22/2024 | | | | 80,129 | |
| | 75,000 | | | (3 Mo. LIBOR + 0.94%),
3.864(a)(b) | | | 07/23/2024 | | | | 78,724 | |
| | 50,000 | | | 4.200(a) | | | 08/26/2024 | | | | 53,111 | |
| | 45,000 | | | 3.248(a) | | | 10/21/2027 | | | | 46,007 | |
| | 75,000 | | | (3 Mo. LIBOR + 1.58%),
3.824(a)(b) | | | 01/20/2028 | | | | 79,213 | |
| | 25,000 | | | (3 Mo. LIBOR + 1.37%),
3.593(a)(b) | | | 07/21/2028 | | | | 26,006 | |
| | 85,000 | | | (3 Mo. LIBOR + 1.04%),
3.419(a)(b) | | | 12/20/2028 | | | | 87,555 | |
| | 50,000 | | | (3 Mo. LIBOR + 1.31%),
4.271(a)(b) | | | 07/23/2029 | | | | 54,523 | |
| | Bank of America Corp. Series L(a) | |
| | 25,000 | | | 4.183 | | | 11/25/2027 | | | | 26,484 | |
| | Citigroup, Inc. | |
| | 220,000 | | | 3.400 | | | 05/01/2026 | | | | 227,685 | |
| | 25,000 | | | 4.125 | | | 07/25/2028 | | | | 26,401 | |
| | Deutsche Bank AG | |
| | 115,000 | | | 2.700 | | | 07/13/2020 | | | | 114,403 | |
| | Discover Financial Services(a) | |
| | 75,000 | | | 3.750 | | | 03/04/2025 | | | | 77,717 | |
| | GE Capital International Funding Co. Unlimited Co. | |
| | 200,000 | | | 3.373 | | | 11/15/2025 | | | | 202,472 | |
| | General Motors Financial Co., Inc.(a) | |
| | 25,000 | | | 4.300 | | | 07/13/2025 | | | | 25,735 | |
| | Huntington Bancshares, Inc.(a) | |
| | 50,000 | | | 4.000 | | | 05/15/2025 | | | | 53,371 | |
| | JPMorgan Chase & Co.(a) | |
| | 155,000 | | | 4.400 | | | 07/22/2020 | | | | 158,403 | |
| | 95,000 | | | 2.700 | | | 05/18/2023 | | | | 95,952 | |
| | 200,000 | | | (3 Mo. LIBOR + 1.00%),
4.023(b) | | | 12/05/2024 | | | | 212,322 | |
| | 100,000 | | | (3 Mo. LIBOR + 1.25%),
3.960(b) | | | 01/29/2027 | | | | 106,917 | |
| | 15,000 | | | 3.625 | | | 12/01/2027 | | | | 15,473 | |
| | 75,000 | | | (3 Mo. LIBOR + 1.34%),
3.782(b) | | | 02/01/2028 | | | | 79,420 | |
| | 45,000 | | | (3 Mo. LIBOR + 0.95%),
3.509(b) | | | 01/23/2029 | | | | 46,608 | |
| | JPMorgan Chase & Co. Series Z(a)(b) | |
| | 85,000 | | | (3 Mo. LIBOR + 3.80%),
5.300 | | | 12/31/2049 | | | | 85,919 | |
| | Mizuho Financial Group, Inc. | |
| | 250,000 | | | 2.601 | | | 09/11/2022 | | | | 250,832 | |
| | Morgan Stanley(a) | |
| | 50,000 | | | (3 Mo. LIBOR + 1.40%),
3.981(b) | | | 10/24/2023 | | | | 50,946 | |
| | |
|
| Corporate Bonds – (continued) | |
| Banks – (continued) | |
| | Morgan Stanley(a) – (continued) | |
| 50,000 | | | (3 Mo. LIBOR + 0.85%),
3.737%(b) | | | 04/24/2024 | | | | 52,116 | |
| | 225,000 | | | 3.700 | | | 10/23/2024 | | | | 237,310 | |
| | 25,000 | | | 3.625 | | | 01/20/2027 | | | | 26,175 | |
| | 100,000 | | | (3 Mo. LIBOR + 1.63%),
4.431(b) | | | 01/23/2030 | | | | 110,519 | |
| | Morgan Stanley Series F | |
| | 35,000 | | | 3.875 | | | 04/29/2024 | | | | 37,085 | |
| | Nuveen LLC(a)(c) | |
| | 25,000 | | | 4.000 | | | 11/01/2028 | | | | 27,428 | |
| | Royal Bank of Canada(b) | |
| | 50,000 | | | (3 Mo. LIBOR + 0.39%),
2.973 | | | 04/30/2021 | | | | 50,134 | |
| | Santander UK plc | |
| | 200,000 | | | 2.875 | | | 06/18/2024 | | | | 200,911 | |
| | Standard Chartered plc(a)(b)(c) | |
| | 200,000 | | | (3 Mo. LIBOR + 1.15%),
4.247 | | | 01/20/2023 | | | | 206,411 | |
| | Wells Fargo & Co. | |
| | 175,000 | | | 3.000 | | | 10/23/2026 | | | | 176,595 | |
| | Westpac Banking Corp.(a)(b) | |
| | 25,000 | | | (5 Yr. Swap Rate + 2.24%),
4.322 | | | 11/23/2031 | | | | 25,844 | |
| | | | | | | | | | | | |
| | | | | | | | | | | 3,539,080 | |
| | |
| Capital Goods – 1.4% | |
| | Air Lease Corp.(a) | |
| | 75,000 | | | 3.750 | | | 06/01/2026 | | | | 76,844 | |
| | Boeing Co. (The)(a) | |
| | 50,000 | | | 3.450 | | | 11/01/2028 | | | | 52,696 | |
| | Hubbell, Inc.(a) | |
| | 45,000 | | | 3.500 | | | 02/15/2028 | | | | 45,468 | |
| | Northrop Grumman Corp.(a) | |
| | 75,000 | | | 2.930 | | | 01/15/2025 | | | | 76,478 | |
| | 75,000 | | | 3.250 | | | 01/15/2028 | | | | 76,979 | |
| | 25,000 | | | 4.750 | | | 06/01/2043 | | | | 28,964 | |
| | Roper Technologies, Inc. | |
| | 50,000 | | | 4.200 | | | 09/15/2028 | | | | 53,476 | |
| | Stanley Black & Decker, Inc.(a) | |
| | 50,000 | | | 4.250 | | | 11/15/2028 | | | | 55,616 | |
| | United Technologies Corp.(a) | |
| | 25,000 | | | (3 Mo. LIBOR + 0.65%),
3.175(b) | | | 08/16/2021 | | | | 25,026 | |
| | 25,000 | | | 3.350 | | | 08/16/2021 | | | | 25,546 | |
| | 50,000 | | | 3.950 | | | 08/16/2025 | | | | 53,848 | |
| | 25,000 | | | 2.650 | | | 11/01/2026 | | | | 25,104 | |
| | | | | | | | | | | | |
| | | | | | | | | | | 596,045 | |
| | |
| Consumer Services(a) – 0.4% | |
| | Marriott International, Inc. | |
| | 85,000 | | | 2.300 | | | 01/15/2022 | | | | 84,684 | |
| | Starbucks Corp. | |
| | 75,000 | | | 3.800 | | | 08/15/2025 | | | | 79,999 | |
| | | | | | | | | | | | |
| | | | | | | | | | | 164,683 | |
| | |
| | |
| 22 | | The accompanying notes are an integral part of these financial statements. |
GOLDMAN SACHS VARIABLE INSURANCE TRUST CORE FIXED INCOME FUND
| | | | | | | | | | | | | | |
Principal
Amount | | | Interest
Rate | | | Maturity
Date | | | Value | |
|
| Corporate Bonds – (continued) | |
| Electric – 2.5% | |
| | Alliant Energy Finance LLC(a)(c) | |
| $ | 25,000 | | | | 3.750 % | | | | 06/15/2023 | | | $ | 25,925 | |
| | Arizona Public Service Co.(a) | |
| | 45,000 | | | | 2.950 | | | | 09/15/2027 | | | | 45,514 | |
| | Berkshire Hathaway Energy Co.(a) | |
| | 25,000 | | | | 3.250 | | | | 04/15/2028 | | | | 25,737 | |
| | Dominion Energy, Inc. | |
| | 50,000 | | | | 3.071 | | | | 08/15/2024 | | | | 50,385 | |
| | Emera US Finance LP(a) | |
| | 45,000 | | | | 2.700 | | | | 06/15/2021 | | | | 45,140 | |
| | Entergy Corp.(a) | |
| | 45,000 | | | | 2.950 | | | | 09/01/2026 | | | | 44,985 | |
| | Exelon Corp.(a) | |
| | 45,000 | | | | 3.497 | | | | 06/01/2022 | | | | 46,072 | |
| | Florida Power & Light Co.(a) | |
| | 68,000 | | | | 4.125 | | | | 02/01/2042 | | | | 75,062 | |
| | MidAmerican Energy Co.(a) | |
| | 25,000 | | | | 3.650 | | | | 04/15/2029 | | | | 26,956 | |
| | NiSource, Inc.(a) | |
| | 50,000 | | | | 3.650 | | | | 06/15/2023 | | | | 51,746 | |
| | 95,000 | | | | 3.490 | | | | 05/15/2027 | | | | 98,185 | |
| | NRG Energy, Inc.(a)(c) | |
| | 75,000 | | | | 3.750 | | | | 06/15/2024 | | | | 77,073 | |
| | Progress Energy, Inc.(a) | |
| | 120,000 | | | | 7.000 | | | | 10/30/2031 | | | | 161,696 | |
| | Sempra Energy(a)(b) | |
| | 70,000 | | |
| (3 Mo. LIBOR + 0.50%),
3.097 |
| | | 01/15/2021 | | | | 69,766 | |
| | Southern California Edison Co. Series A(a) | |
| | 50,000 | | | | 4.200 | | | | 03/01/2029 | | | | 53,124 | |
| | Southern Co. (The)(a) | |
| | 60,000 | | | | 3.250 | | | | 07/01/2026 | | | | 60,879 | |
| | Vistra Operations Co. LLC(a)(c) | |
| | 100,000 | | | | 3.550 | | | | 07/15/2024 | | | | 100,748 | |
| | | | | | | | | | | | | | |
| | | | | | | | | | | | | 1,058,993 | |
| | |
| Energy – 4.1% | |
| | Anadarko Petroleum Corp.(a) | |
| | 15,000 | | | | 5.550 | | | | 03/15/2026 | | | | 16,851 | |
| | 30,000 | | | | 6.450 | | | | 09/15/2036 | | | | 36,866 | |
| | BP Capital Markets America, Inc.(a) | |
| | 75,000 | | | | 3.224 | | | | 04/14/2024 | | | | 77,604 | |
| | 25,000 | | | | 4.234 | | | | 11/06/2028 | | | | 27,756 | |
| | Cenovus Energy, Inc.(a) | |
| | 25,000 | | | | 4.250 | | | | 04/15/2027 | | | | 25,846 | |
| | Continental Resources, Inc.(a) | |
| | 150,000 | | | | 4.500 | | | | 04/15/2023 | | | | 157,626 | |
| | Devon Energy Corp.(a) | |
| | 29,000 | | | | 5.850 | | | | 12/15/2025 | | | | 34,552 | |
| | 25,000 | | | | 5.600 | | | | 07/15/2041 | | | | 29,884 | |
| | 5,000 | | | | 4.750 | | | | 05/15/2042 | | | | 5,470 | |
| | Diamondback Energy, Inc.(a)(c) | |
| | 100,000 | | | | 4.750 | | | | 11/01/2024 | | | | 102,500 | |
| | |
|
| Corporate Bonds – (continued) | |
| Energy – (continued) | |
| | Energy Transfer Operating LP(a) | |
| 25,000 | | | | 4.650 | | | | 06/01/2021 | | | | 25,926 | |
| | 75,000 | | | | 4.200 | | | | 09/15/2023 | | | | 78,599 | |
| | 25,000 | | | | 5.250 | | | | 04/15/2029 | | | | 27,921 | |
| | 25,000 | | | | 5.300 | | | | 04/15/2047 | | | | 26,088 | |
| | 25,000 | | | | 6.000 | | | | 06/15/2048 | | | | 28,592 | |
| | Enterprise Products Operating LLC(a)(b) | |
| | 40,000 | | |
| (3 Mo. LIBOR + 2.78%),
5.298 |
| | | 06/01/2067 | | | | 36,800 | |
| | EQM Midstream Partners LP(a) | |
| | 100,000 | | | | 4.750 | | | | 07/15/2023 | | | | 103,674 | |
| | 25,000 | | | | 5.500 | | | | 07/15/2028 | | | | 26,308 | |
| | Kinder Morgan Energy Partners LP(a) | |
| | 25,000 | | | | 5.400 | | | | 09/01/2044 | | | | 27,883 | |
| | Kinder Morgan, Inc.(a) | |
| | 145,000 | | | | 3.050 | | | | 12/01/2019 | | | | 145,225 | |
| | Marathon Oil Corp.(a) | |
| | 25,000 | | | | 4.400 | | | | 07/15/2027 | | | | 26,523 | |
| | Marathon Petroleum Corp.(a) | |
| | 25,000 | | | | 3.625 | | | | 09/15/2024 | | | | 25,892 | |
| | 25,000 | | | | 3.800 | | | | 04/01/2028 | | | | 25,442 | |
| | MPLX LP(a) | |
| | 25,000 | | | | 4.800 | | | | 02/15/2029 | | | | 27,495 | |
| | 35,000 | | | | 4.500 | | | | 04/15/2038 | | | | 35,314 | |
| | 25,000 | | | | 5.500 | | | | 02/15/2049 | | | | 28,267 | |
| | Newfield Exploration Co.(a) | |
| | 50,000 | | | | 5.625 | | | | 07/01/2024 | | | | 55,250 | |
| | Petroleos Mexicanos | |
| | 60,000 | | | | 6.375 | | | | 02/04/2021 | | | | 61,635 | |
| | 20,000 | | | | 6.750(a) | | | | 09/21/2047 | | | | 17,741 | |
| | Phillips 66(a) | |
| | 60,000 | | | | 3.900 | | | | 03/15/2028 | | | | 63,096 | |
| | Pioneer Natural Resources Co.(a) | |
| | 25,000 | | | | 3.950 | | | | 07/15/2022 | | | | 25,991 | |
| | Plains All American Pipeline LP(a) | |
| | 15,000 | | | | 3.650 | | | | 06/01/2022 | | | | 15,364 | |
| | 35,000 | | | | 3.850 | | | | 10/15/2023 | | | | 36,122 | |
| | 45,000 | | | | 4.500 | | | | 12/15/2026 | | | | 47,866 | |
| | Sabine Pass Liquefaction LLC(a) | |
| | 75,000 | | | | 5.625 | | | | 03/01/2025 | | | | 83,911 | |
| | 75,000 | | | | 5.000 | | | | 03/15/2027 | | | | 82,232 | |
| | Western Midstream Operating LP(a) | |
| | 25,000 | | | | 5.450 | | | | 04/01/2044 | | | | 23,517 | |
| | 25,000 | | | | 5.300 | | | | 03/01/2048 | | | | 23,198 | |
| | | | | | | | | | | | | | |
| | | | | | | | | | | | | 1,746,827 | |
| | |
| Food & Beverage – 2.4% | |
| | Anheuser-Busch Cos. LLC(a) | |
| | 35,000 | | | | 4.700 | | | | 02/01/2036 | | | | 38,479 | |
| | 35,000 | | | | 4.900 | | | | 02/01/2046 | | | | 38,909 | |
| | Anheuser-Busch InBev Finance, Inc.(a) | |
| | 37,000 | | | | 2.650 | | | | 02/01/2021 | | | | 37,189 | |
| | |
| | |
| The accompanying notes are an integral part of these financial statements. | | 23 |
GOLDMAN SACHS VARIABLE INSURANCE TRUST CORE FIXED INCOME FUND
Schedule of Investments(continued)
June 30, 2019 (Unaudited)
| | | | | | | | | | | | |
Principal
Amount | | | Interest
Rate | | Maturity
Date | | | Value | |
|
| Corporate Bonds – (continued) | |
| Food & Beverage – (continued) | |
| | Anheuser-Busch InBev Worldwide, Inc.(a) | |
| $ | 50,000 | | | 4.150 % | | | 01/23/2025 | | | $ | 54,122 | |
| | 125,000 | | | 4.000 | | | 04/13/2028 | | | | 134,607 | |
| | 150,000 | | | 4.750 | | | 01/23/2029 | | | | 169,992 | |
| | Constellation Brands, Inc.(a) | |
| | 75,000 | | | (3 Mo. LIBOR + 0.70%),
3.218(b) | | | 11/15/2021 | | | | 75,001 | |
| | 50,000 | | | 4.250 | | | 05/01/2023 | | | | 53,129 | |
| | 50,000 | | | 4.400 | | | 11/15/2025 | | | | 54,694 | |
| | 25,000 | | | 3.700 | | | 12/06/2026 | | | | 26,185 | |
| | 50,000 | | | 3.600 | | | 02/15/2028 | | | | 51,565 | |
| | Keurig Dr Pepper, Inc.(a) | |
| | 50,000 | | | 4.057 | | | 05/25/2023 | | | | 52,491 | |
| | Mars, Inc.(a)(c) | |
| | 25,000 | | | 2.700 | | | 04/01/2025 | | | | 25,495 | |
| | 25,000 | | | 3.200 | | | 04/01/2030 | | | | 25,936 | |
| | Smithfield Foods, Inc.(a)(c) | |
| | 125,000 | | | 2.700 | | | 01/31/2020 | | | | 124,618 | |
| | Tyson Foods, Inc.(a) | |
| | 50,000 | | | 3.900 | | | 09/28/2023 | | | | 52,618 | |
| | | | | | | | | | | | |
| | | | | | | | | | | 1,015,030 | |
| | |
| Health Care Equipment & Services – 1.5% | |
| | Becton Dickinson and Co.(a) | |
| | 93,000 | | | (3 Mo. LIBOR + 0.88%),
3.194(b) | | | 12/29/2020 | | | | 93,005 | |
| | 95,000 | | | 2.894 | | | 06/06/2022 | | | | 96,246 | |
| | 25,000 | | | 3.363 | | | 06/06/2024 | | | | 25,775 | |
| | Cigna Corp.(a)(c) | |
| | 150,000 | | | 3.750 | | | 07/15/2023 | | | | 156,104 | |
| | CVS Health Corp.(a) | |
| | 45,000 | | | 4.125 | | | 05/15/2021 | | | | 46,206 | |
| | 75,000 | | | 3.500 | | | 07/20/2022 | | | | 77,032 | |
| | 50,000 | | | 3.700 | | | 03/09/2023 | | | | 51,643 | |
| | 50,000 | | | 3.875 | | | 07/20/2025 | | | | 52,185 | |
| | 25,000 | | | 4.780 | | | 03/25/2038 | | | | 26,046 | |
| | UnitedHealth Group, Inc.(a) | |
| | 35,000 | | | 4.625 | | | 07/15/2035 | | | | 40,191 | |
| | | | | | | | | | | | |
| | | | | | | | | | | 664,433 | |
| | |
| Life Insurance – 0.6% | |
| | American International Group, Inc.(a) | |
| | 125,000 | | | 3.900 | | | 04/01/2026 | | | | 130,730 | |
| | 25,000 | | | 4.200 | | | 04/01/2028 | | | | 26,652 | |
| | Marsh & McLennan Cos., Inc. | |
| | 50,000 | | | 4.375 | | | 03/15/2029 | | | | 55,145 | |
| | Principal Financial Group, Inc. | |
| | 50,000 | | | 3.100 | | | 11/15/2026 | | | | 50,501 | |
| | | | | | | | | | | | |
| | | | | | | | | | | 263,028 | |
| | |
| Materials(a) – 0.4% | |
| | DuPont de Nemours, Inc. | |
| | 50,000 | | | 4.205 | | | 11/15/2023 | | | | 53,521 | |
| | 50,000 | | | 4.493 | | | 11/15/2025 | | | | 55,308 | |
| | |
|
| Corporate Bonds – (continued) | |
| Materials(a) – (continued) | |
| | Ecolab, Inc. | |
| 4,000 | | | 5.500 | | | 12/08/2041 | | | | 5,104 | |
| | Huntsman International LLC | |
| | 25,000 | | | 4.500 | | | 05/01/2029 | | | | 25,744 | |
| | Sherwin-Williams Co. (The) | |
| | 25,000 | | | 3.450 | | | 06/01/2027 | | | | 25,657 | |
| | | | | | | | | | | | |
| | | | | | | | | | | 165,334 | |
| | |
| Media & Entertainment(a) – 1.8% | |
| | CCO Safari II LLC | |
| | 65,000 | | | 4.464 | | | 07/23/2022 | | | | 68,243 | |
| | 92,000 | | | 4.500 | | | 02/01/2024 | | | | 97,931 | |
| | 70,000 | | | 4.908 | | | 07/23/2025 | | | | 75,965 | |
| | Comcast Corp. | |
| | 125,000 | | | 3.700 | | | 04/15/2024 | | | | 132,581 | |
| | 45,000 | | | 3.375 | | | 08/15/2025 | | | | 47,032 | |
| | 25,000 | | | 3.300 | | | 02/01/2027 | | | | 25,987 | |
| | 25,000 | | | 3.150 | | | 02/15/2028 | | | | 25,632 | |
| | 125,000 | | | 4.150 | | | 10/15/2028 | | | | 137,666 | |
| | 25,000 | | | 4.250 | | | 10/15/2030 | | | | 27,857 | |
| | Fox Corp.(c) | |
| | 25,000 | | | 4.030 | | | 01/25/2024 | | | | 26,559 | |
| | 25,000 | | | 4.709 | | | 01/25/2029 | | | | 27,925 | |
| | Time Warner Cable LLC | |
| | 15,000 | | | 5.000 | | | 02/01/2020 | | | | 15,210 | |
| | Walt Disney Co. (The)(c) | |
| | 25,000 | | | 3.700 | | | 09/15/2024 | | | | 26,584 | |
| | 25,000 | | | 6.150 | | | 03/01/2037 | | | | 33,920 | |
| | | | | | | | | | | | |
| | | | | | | | | | | 769,092 | |
| | |
| Metals and Mining(a)(c) – 0.2% | |
| | Glencore Funding LLC | |
| | 75,000 | | | 4.125 | | | 03/12/2024 | | | | 77,651 | |
| | 25,000 | | | 4.625 | | | 04/29/2024 | | | | 26,450 | |
| | | | | | | | | | | | |
| | | | | | | | | | | 104,101 | |
| | |
| Pharmaceuticals, Biotechnology & Life Sciences(a) – 2.5% | |
| | AbbVie, Inc. | |
| | 45,000 | | | 2.500 | | | 05/14/2020 | | | | 44,993 | |
| | 75,000 | | | 3.375 | | | 11/14/2021 | | | | 76,498 | |
| | 50,000 | | | 3.750 | | | 11/14/2023 | | | | 52,137 | |
| | Amgen, Inc. | |
| | 70,000 | | | 3.125 | | | 05/01/2025 | | | | 71,570 | |
| | Bayer US Finance II LLC(c) | |
| | 200,000 | | | 3.875 | | | 12/15/2023 | | | | 207,268 | |
| | Bayer US Finance LLC | |
| | 200,000 | | | 3.000 | | | 10/08/2021 | | | | 201,474 | |
| | Celgene Corp. | |
| | 125,000 | | | 3.875 | | | 08/15/2025 | | | | 133,541 | |
| | Elanco Animal Health, Inc.(c) | |
| | 50,000 | | | 3.912 | | | 08/27/2021 | | | | 51,183 | |
| | 25,000 | | | 4.272 | | | 08/28/2023 | | | | 26,285 | |
| | Pfizer, Inc. | |
| | 75,000 | | | 3.450 | | | 03/15/2029 | | | | 79,305 | |
| | |
| | |
| 24 | | The accompanying notes are an integral part of these financial statements. |
GOLDMAN SACHS VARIABLE INSURANCE TRUST CORE FIXED INCOME FUND
| | | | | | | | | | | | |
Principal
Amount | | | Interest
Rate | | Maturity
Date | | | Value | |
|
| Corporate Bonds – (continued) | |
| Pharmaceuticals, Biotechnology & Life Sciences(a) – (continued) | |
| | Teva Pharmaceutical Finance Netherlands III BV | |
| $ | 30,000 | | | 2.200 % | | | 07/21/2021 | | | $ | 28,425 | |
| | Thermo Fisher Scientific, Inc. | |
| | 35,000 | | | 3.000 | | | 04/15/2023 | | | | 35,815 | |
| | 15,000 | | | 3.650 | | | 12/15/2025 | | | | 15,790 | |
| | Zoetis, Inc. | |
| | 45,000 | | | 3.000 | | | 09/12/2027 | | | | 45,226 | |
| | | | | | | | | | | | |
| | | | | | | | | | | 1,069,510 | |
| | |
| Pipelines(a) – 0.3% | |
| | Columbia Pipeline Group, Inc. | |
| | 35,000 | | | 3.300 | | | 06/01/2020 | | | | 35,236 | |
| | Sunoco Logistics Partners Operations LP | |
| | 15,000 | | | 4.250 | | | 04/01/2024 | | | | 15,719 | |
| | Williams Cos., Inc. (The) | |
| | 25,000 | | | 3.600 | | | 03/15/2022 | | | | 25,643 | |
| | 25,000 | | | 3.900 | | | 01/15/2025 | | | | 26,162 | |
| | 35,000 | | | 4.000 | | | 09/15/2025 | | | | 36,987 | |
| | | | | | | | | | | | |
| | | | | | | | | | | 139,747 | |
| | |
| Property/Casualty Insurance(a) – 0.2% | |
| | Arch Capital Group US, Inc. | |
| | 36,000 | | | 5.144 | | | 11/01/2043 | | | | 42,870 | |
| | XLIT Ltd. | |
| | 45,000 | | | 4.450 | | | 03/31/2025 | | | | 48,438 | |
| | | | | | | | | | | | |
| | | | | | | | | | | 91,308 | |
| | |
| Real Estate Investment Trusts(a) – 1.9% | |
| | Alexandria Real Estate Equities, Inc. | |
| | 25,000 | | | 3.800 | | | 04/15/2026 | | | | 26,223 | |
| | American Campus Communities Operating Partnership LP | |
| | 95,000 | | | 4.125 | | | 07/01/2024 | | | | 100,283 | |
| | American Homes 4 Rent LP | |
| | 75,000 | | | 4.900 | | | 02/15/2029 | | | | 81,589 | |
| | American Tower Corp. | |
| | 75,000 | | | 3.375 | | | 05/15/2024 | | | | 77,058 | |
| | Crown Castle International Corp. | |
| | 25,000 | | | 2.250 | | | 09/01/2021 | | | | 24,887 | |
| | 85,000 | | | 3.150 | | | 07/15/2023 | | | | 86,625 | |
| | 60,000 | | | 3.650 | | | 09/01/2027 | | | | 61,829 | |
| | CubeSmart LP | |
| | 45,000 | | | 4.000 | | | 11/15/2025 | | | | 47,207 | |
| | HCP, Inc. | |
| | 10,000 | | | 2.625 | | | 02/01/2020 | | | | 10,009 | |
| | Healthcare Trust of America Holdings LP | |
| | 35,000 | | | 3.375 | | | 07/15/2021 | | | | 35,401 | |
| | Kilroy Realty LP | |
| | 25,000 | | | 4.750 | | | 12/15/2028 | | | | 27,718 | |
| | National Retail Properties, Inc. | |
| | 45,000 | | | 4.000 | | | 11/15/2025 | | | | 47,545 | |
| | Office Properties Income Trust | |
| | 25,000 | | | 3.600 | | | 02/01/2020 | | | | 25,058 | |
| | Ventas Realty LP | |
| | 45,000 | | | 3.500 | | | 02/01/2025 | | | | 46,476 | |
| | |
|
| Corporate Bonds – (continued) | |
| Real Estate Investment Trusts(a) – (continued) | |
| | VEREIT Operating Partnership LP | |
| $ | 50,000 | | | 4.625% | | | 11/01/2025 | | | $ | 53,735 | |
| | 50,000 | | | 3.950 | | | 08/15/2027 | | | | 51,499 | |
| | WP Carey, Inc. | |
| | 25,000 | | | 3.850 | | | 07/15/2029 | | | | 25,302 | |
| | | | | | | | | | | | |
| | | | | | | | | | | 828,444 | |
| | |
| Retailing(a) – 0.8% | |
| | Alimentation Couche-Tard, Inc.(c) | |
| | 45,000 | | | 2.700 | | | 07/26/2022 | | | | 45,065 | |
| | Amazon.com, Inc. | |
| | 35,000 | | | 5.200 | | | 12/03/2025 | | | | 40,846 | |
| | 45,000 | | | 4.800 | | | 12/05/2034 | | | | 55,208 | |
| | 15,000 | | | 3.875 | | | 08/22/2037 | | | | 16,517 | |
| | Dollar Tree, Inc. | |
| | 50,000 | | | 4.000 | | | 05/15/2025 | | | | 51,961 | |
| | 50,000 | | | 4.200 | | | 05/15/2028 | | | | 51,726 | |
| | Expedia Group, Inc. | |
| | 35,000 | | | 3.800 | | | 02/15/2028 | | | | 35,598 | |
| | Home Depot, Inc. (The) | |
| | 25,000 | | | 3.900 | | | 12/06/2028 | | | | 27,530 | |
| | 25,000 | | | 4.250 | | | 04/01/2046 | | | | 28,132 | |
| | | | | | | | | | | | |
| | | | | | | | | | | 352,583 | |
| | |
| Software & Services(a) – 0.5% | |
| | Fiserv, Inc. | |
| | 25,000 | | | 3.800 | | | 10/01/2023 | | | | 26,302 | |
| | 100,000 | | | 2.750 | | | 07/01/2024 | | | | 100,847 | |
| | 50,000 | | | 3.200 | | | 07/01/2026 | | | | 51,114 | |
| | 25,000 | | | 4.200 | | | 10/01/2028 | | | | 27,025 | |
| | | | | | | | | | | | |
| | | | | | | | | | | 205,288 | |
| | |
| Technology(a) – 2.3% | |
| | Apple, Inc. | |
| | 225,000 | | | 2.450 | | | 08/04/2026 | | | | 224,448 | |
| | Broadcom Corp. | |
| | 50,000 | | | 2.650 | | | 01/15/2023 | | | | 49,309 | |
| | 125,000 | | | 3.625 | | | 01/15/2024 | | | | 126,308 | |
| | 50,000 | | | 3.125 | | | 01/15/2025 | | | | 48,813 | |
| | Broadcom, Inc.(c) | |
| | 100,000 | | | 3.125 | | | 10/15/2022 | | | | 100,531 | |
| | 50,000 | | | 3.625 | | | 10/15/2024 | | | | 50,243 | |
| | 50,000 | | | 4.250 | | | 04/15/2026 | | | | 50,599 | |
| | Dell International LLC(c) | |
| | 45,000 | | | 5.450 | | | 06/15/2023 | | | | 48,480 | |
| | 50,000 | | | 6.020 | | | 06/15/2026 | | | | 55,039 | |
| | Hewlett Packard Enterprise Co. | |
| | 45,000 | | | 4.900 | | | 10/15/2025 | | | | 49,358 | |
| | 25,000 | | | 6.350 | | | 10/15/2045 | | | | 27,646 | |
| | Microchip Technology, Inc. | |
| | 25,000 | | | 3.922 | | | 06/01/2021 | | | | 25,462 | |
| | NXP BV(c) | |
| | 50,000 | | | 3.875 | | | 06/18/2026 | | | | 51,305 | |
| | Oracle Corp. | |
| | 70,000 | | | 2.500 | | | 05/15/2022 | | | | 70,683 | |
| | |
| | |
| The accompanying notes are an integral part of these financial statements. | | 25 |
GOLDMAN SACHS VARIABLE INSURANCE TRUST CORE FIXED INCOME FUND
Schedule of Investments(continued)
June 30, 2019 (Unaudited)
| | | | | | | | | | | | |
Principal
Amount | | | Interest
Rate | | Maturity
Date | | | Value | |
|
| Corporate Bonds – (continued) | |
| Technology(a) – (continued) | |
| | QUALCOMM, Inc. | |
| $ | 25,000 | | | 2.600 % | | | 01/30/2023 | | | $ | 25,052 | |
| | | | | | | | | | | | |
| | | | | | | | | | | 1,003,276 | |
| | |
| Tobacco(a) – 0.3% | |
| | Altria Group, Inc. | |
| | 75,000 | | | 3.800 | | | 02/14/2024 | | | | 78,199 | |
| | BAT Capital Corp. | |
| | 25,000 | | | 3.222 | | | 08/15/2024 | | | | 25,193 | |
| | 25,000 | | | 4.540 | | | 08/15/2047 | | | | 23,218 | |
| | | | | | | | | | | | |
| | | | | | | | | | | 126,610 | |
| | |
| Transportation – 0.8% | |
| | Avolon Holdings Funding Ltd.(a)(c) | |
| | 25,000 | | | 3.950 | | | 07/01/2024 | | | | 25,600 | |
| | Burlington Northern Santa Fe LLC(a) | |
| | 25,000 | | | 4.050 | | | 06/15/2048 | | | | 27,535 | |
| | Delta Air Lines, Inc. | |
| | 150,000 | | | 3.400 | | | 04/19/2021 | | | | 152,283 | |
| | FedEx Corp.(a) | |
| | 45,000 | | | 3.400 | | | 02/15/2028 | | | | 46,375 | |
| | Penske Truck Leasing Co. LP(a)(c) | |
| | 70,000 | | | 3.375 | | | 02/01/2022 | | | | 71,315 | |
| | | | | | | | | | | | |
| | | | | | | | | | | 323,108 | |
| | |
| Wireless Telecommunications – 2.3% | |
| | American Tower Corp.(a) | |
| | 45,000 | | | 4.700 | | | 03/15/2022 | | | | 47,464 | |
| | AT&T, Inc.(a) | |
| | 60,000 | | | 3.200 | | | 03/01/2022 | | | | 61,249 | |
| | 105,000 | | | 3.800 | | | 03/15/2022 | | | | 108,807 | |
| | 50,000 | | | 3.000 | | | 06/30/2022 | | | | 50,848 | |
| | 120,000 | | | 3.600 | | | 02/17/2023 | | | | 124,551 | |
| | 70,000 | | | 3.400 | | | 05/15/2025 | | | | 71,815 | |
| | 110,000 | | | 4.250 | | | 03/01/2027 | | | | 117,554 | |
| | 25,000 | | | 4.900 | | | 08/15/2037 | | | | 26,988 | |
| | Verizon Communications, Inc. | |
| | 25,000 | | | 3.376 | | | 02/15/2025 | | | | 26,085 | |
| | 145,000 | | | 4.329(a) | | | 09/21/2028 | | | | 160,381 | |
| | 62,000 | | | 5.012 | | | 04/15/2049 | | | | 73,672 | |
| | Vodafone Group plc(a) | |
| | 100,000 | | | 3.750 | | | 01/16/2024 | | | | 104,567 | |
| | | | | | | | | | | | |
| | | | | | | | | | | 973,981 | |
| | |
| | TOTAL CORPORATE BONDS | |
| | (Cost $14,593,137) | | | $ | 15,225,951 | |
| | |
| | | | | | | | | | | | |
|
| Mortgage-Backed Securities – 32.4% | |
| FHLMC – 0.1% | |
| $ | 3,321 | | | 4.500% | | | 07/01/2024 | | | $ | 3,455 | |
| | 19,480 | | | 4.500 | | | 11/01/2024 | | | | 20,299 | |
| | 4,311 | | | 4.500 | | | 12/01/2024 | | | | 4,497 | |
| | 7,470 | | | 7.500 | | | 12/01/2029 | | | | 8,727 | |
| | 2,199 | | | 5.000 | | | 10/01/2033 | | | | 2,379 | |
| | 3,383 | | | 5.000 | | | 07/01/2035 | | | | 3,661 | |
| | |
|
| Mortgage-Backed Securities – (continued) | |
| FHLMC – (continued) | |
| 4,592 | | | | 5.000 | | | | 12/01/2035 | | | | 5,020 | |
| | 957 | | | | 5.000 | | | | 03/01/2038 | | | | 1,032 | |
| | 2,995 | | | | 5.000 | | | | 06/01/2041 | | | | 3,241 | |
| | | | | | | | | | | | | | |
| | | | | | | | | | | | | 52,311 | |
| | |
| | GNMA – 24.0% | |
| | 1,438 | | | | 7.000 | | | | 10/15/2025 | | | | 1,460 | |
| | 5,799 | | | | 7.000 | | | | 11/15/2025 | | | | 6,207 | |
| | 836 | | | | 7.000 | | | | 02/15/2026 | | | | 855 | |
| | 2,746 | | | | 7.000 | | | | 04/15/2026 | | | | 2,921 | |
| | 2,694 | | | | 7.000 | | | | 03/15/2027 | | | | 2,883 | |
| | 17,529 | | | | 7.000 | | | | 11/15/2027 | | | | 18,055 | |
| | 174 | | | | 7.000 | | | | 01/15/2028 | | | | 174 | |
| | 9,739 | | | | 7.000 | | | | 02/15/2028 | | | | 10,784 | |
| | 1,574 | | | | 7.000 | | | | 03/15/2028 | | | | 1,588 | |
| | 877 | | | | 7.000 | | | | 04/15/2028 | | | | 884 | |
| | 137 | | | | 7.000 | | | | 05/15/2028 | | | | 152 | |
| | 2,647 | | | | 7.000 | | | | 06/15/2028 | | | | 2,902 | |
| | 5,082 | | | | 7.000 | | | | 07/15/2028 | | | | 5,568 | |
| | 10,059 | | | | 7.000 | | | | 09/15/2028 | | | | 10,835 | |
| | 1,958 | | | | 7.000 | | | | 11/15/2028 | | | | 2,082 | |
| | 1,264 | | | | 7.500 | | | | 11/15/2030 | | | | 1,266 | |
| | 108,763 | | | | 6.000 | | | | 08/20/2034 | | | | 125,021 | |
| | 105,327 | | | | 5.000 | | | | 06/15/2040 | | | | 113,389 | |
| | 494,144 | | | | 4.000 | | | | 08/20/2043 | | | | 521,578 | |
| | 239,470 | | | | 4.000 | | | | 10/20/2045 | | | | 252,540 | |
| | 894,469 | | | | 4.500 | | | | 09/20/2048 | | | | 933,843 | |
| | 973,712 | | | | 5.000 | | | | 12/20/2048 | | | | 1,019,944 | |
| | 5,000,000 | | | | 4.500 | | | | TBA-30yr | (d) | | | 5,212,096 | |
| | 2,000,000 | | | | 3.500 | | | | TBA-30yr | (d) | | | 2,064,072 | |
| | | | | | | | | | | | | | |
| | | | | | | | | | | | | 10,311,099 | |
| | |
| UMBS – 5.9% | |
| | UMBS | |
| | 319 | | | | 5.000 | | | | 06/01/2023 | | | | 331 | |
| | 26,496 | | | | 5.500 | | | | 09/01/2023 | | | | 27,467 | |
| | 8,038 | | | | 5.500 | | | | 10/01/2023 | | | | 8,337 | |
| | 1,491 | | | | 4.500 | | | | 07/01/2024 | | | | 1,547 | |
| | 47,921 | | | | 4.500 | | | | 11/01/2024 | | | | 49,884 | |
| | 21,934 | | | | 4.500 | | | | 12/01/2024 | | | | 22,858 | |
| | 6,855 | | | | 9.000 | | | | 11/01/2025 | | | | 7,661 | |
| | 29,333 | | | | 7.000 | | | | 08/01/2026 | | | | 32,463 | |
| | 13,271 | | | | 8.000 | | | | 10/01/2029 | | | | 15,448 | |
| | 1,152 | | | | 8.500 | | | | 04/01/2030 | | | | 1,358 | |
| | 2,143 | | | | 8.000 | | | | 05/01/2030 | | | | 2,254 | |
| | 25 | | | | 8.500 | | | | 06/01/2030 | | | | 25 | |
| | 6,424 | | | | 8.000 | | | | 08/01/2032 | | | | 7,531 | |
| | 9,002 | | | | 4.500 | | | | 08/01/2039 | | | | 9,775 | |
| | 40,827 | | | | 3.000 | | | | 01/01/2043 | | | | 41,818 | |
| | 170,507 | | | | 3.000 | | | | 03/01/2043 | | | | 174,659 | |
| | 235,336 | | | | 3.000 | | | | 04/01/2043 | | | | 241,125 | |
| | 176,554 | | | | 3.000 | | | | 05/01/2043 | | | | 180,897 | |
| | 564,950 | | | | 4.500 | | | | 04/01/2045 | | | | 613,657 | |
| | 62,913 | | | | 4.500 | | | | 05/01/2045 | | | | 68,297 | |
| | 395,702 | | | | 4.000 | | | | 02/01/2048 | | | | 416,640 | |
| | 523,814 | | | | 4.000 | | | | 03/01/2048 | | | | 551,532 | |
| | 43,431 | | | | 4.000 | | | | 07/01/2048 | | | | 45,931 | |
| | | | | | | | | | | | | | |
| | | | | | | | | | | | | 2,521,495 | |
| | |
| | |
| 26 | | The accompanying notes are an integral part of these financial statements. |
GOLDMAN SACHS VARIABLE INSURANCE TRUST CORE FIXED INCOME FUND
| | | | | | | | | | | | | | |
Principal
Amount | | | Interest
Rate | | | Maturity
Date | | | Value | |
|
| Mortgage-Backed Securities – (continued) | |
| UMBS, 30 Year, Single Family – 2.4% | |
| | UMBS, 30 Year, Single Family | |
| $ | 1,000,000 | | | | 4.000 % | | | | TBA-30yr | (d) | | $ | 1,033,453 | |
| | |
| | TOTAL MORTGAGE-BACKED SECURITIES | |
| | (Cost $13,821,887) | | | $ | 13,918,358 | |
| | |
| | | | | | | | | | | | | | |
|
| Collateralized Mortgage Obligations – 2.2% | |
| Adjustable Rate Non-Agency(a)(b) – 2.0% | |
| | Alternative Loan Trust Series 2005-38, Class A1 | |
| $ | 84,768 | | | | 4.004% | | | | 09/25/2035 | | | $ | 84,094 | |
| | Harben Finance plc Series 2017-1X, Class A | |
| GBP | 77,953 | | | | 1.604 | | | | 08/20/2056 | | | | 98,836 | |
| | Lehman XS Trust Series 2005-7N, Class 1A1A | |
| $ | 142,798 | | | | 2.944 | | | | 12/25/2035 | | | | 140,703 | |
| | London Wall Mortgage Capital plc Series 2017-FL1, Class A | |
| GBP | 70,793 | | | | 1.656 | | | | 11/15/2049 | | | | 89,747 | |
| MASTR Adjustable Rate Mortgages Trust Series 2006-OA2,
Class 4A1A |
|
| $ | 184,474 | | | | 3.354 | | | | 12/25/2046 | | | | 273,319 | |
| | Ripon Mortgages plc Series 1X, Class A2 | |
| GBP | 140,628 | | | | 1.604 | | | | 08/20/2056 | | | | 178,300 | |
| | | | | | | | | | | | | | |
| | | | | | | | | | | | | 864,999 | |
| | |
| Sequential Fixed Rate – 0.2% | |
| | FNMA REMIC Series 2012-111, Class B | |
| $ | 11,999 | | | | 7.000 | | | | 10/25/2042 | | | | 13,938 | |
| | FNMA REMIC Series 2012-153, Class B | |
| | 32,686 | | | | 7.000 | | | | 07/25/2042 | | | | 38,175 | |
| | | | | | | | | | | | | | |
| | | | | | | | | | | | | 52,113 | |
| | |
| | TOTAL COLLATERALIZED MORTGAGE OBLIGATIONS | |
| | (Cost $806,964) | | | $ | 917,112 | |
| | |
| | | | | | | | | | | | | | |
|
| Commercial Mortgage-Backed Security(a)(b)(c) – 0.4% | |
| Adjustable Rate Non-Agency – 0.4% | |
| | Exantas Capital Corp. Ltd. Series 2018-RSO6, Class A | |
| $ | 149,911 | | | | 3.224% | | | | 06/15/2035 | | | $ | 150,099 | |
| | (Cost $149,911) | | | | | |
| | |
| | | | | | | | | | | | | | |
|
| U.S. Government Agency Securities – 2.4% | |
| | FHLB | | | | | | | | | | | | | |
| $ | 100,000 | | | | 3.375% | | | | 12/08/2023 | | | $ | 106,391 | |
| | FNMA | | | | | | | | | | | | | |
| | 400,000 | | | | 1.875 | | | | 09/24/2026 | | | | 395,850 | |
| | 400,000 | | | | 6.250 | | | | 05/15/2029 | | | | 540,202 | |
| | |
| | TOTAL U.S. GOVERNMENT AGENCY SECURITIES | |
| | (Cost $1,012,670) | | | $ | 1,042,443 | |
| | |
|
| Asset-Backed Securities(a) – 8.4% | |
| Automobile – 0.2% | |
| | Ally Master Owner Trust Series 2018-1, Class A2 | |
| $ | 100,000 | | | | 2.700 | | | | 01/17/2023 | | | $ | 100,656 | |
| | |
| Collateralized Debt Obligations(b)(c) – 1.5% | |
| Arbor Realty Commercial Real Estate Notes Ltd.
Series 2018-FL1, Class A |
|
| | 200,000 | | | | 3.544 | | | | 06/15/2028 | | | | 200,435 | |
| | KREF Ltd. Series 2018-FL1, Class A | |
| | 150,000 | | | | 3.494 | | | | 06/15/2036 | | | | 150,281 | |
| Orix Credit Alliance Owner Trust Ltd. Series 2018-CRE1,
Class A |
|
| | 125,000 | | | | 3.574 | | | | 06/15/2036 | | | | 125,156 | |
| | TPG Real Estate Finance Issuer Ltd. Series 2018-FL2, Class A | |
| | 175,000 | | | | 3.524 | | | | 11/15/2037 | | | | 175,328 | |
| | | | | | | | | | | | | | |
| | | | | | | | | | | | | 651,200 | |
| | |
| Collateralized Loan Obligations(b)(c) – 2.1% | |
| | CBAM Ltd. Series 2018-5A, Class A | |
| | 525,000 | | | | 3.608 | | | | 04/17/2031 | | | | 518,475 | |
| | Cutwater Ltd. Series 2014-1A, Class A1AR | |
| | 372,869 | | | | 3.847 | | | | 07/15/2026 | | | | 372,961 | |
| | | | | | | | | | | | | | |
| | | | | | | | | | | | | 891,436 | |
| | |
| Home Equity(b) –0.2% | |
| | GMACM Home Equity Loan Trust Series 2007-HE3, Class 1A1 | |
| | 7,044 | | | | 7.000 | | | | 09/25/2037 | | | | 7,093 | |
| | GMACM Home Equity Loan Trust Series 2007-HE3, Class 2A1 | |
| | 54,456 | | | | 7.000 | | | | 09/25/2037 | | | | 56,570 | |
| | | | | | | | | | | | | | |
| | | | | | | | | | | | | 63,663 | |
| | |
| Student Loans(b) –4.4% | |
| | Academic Loan Funding Trust Series 2012-1A, Class A2(c) | |
| | 453,276 | | | | 3.504 | | | | 12/27/2044 | | | | 458,344 | |
| | Chase Education Loan Trust Series 2007-A, Class A3 | |
| | 11,043 | | | | 2.400 | | | | 12/28/2023 | | | | 11,029 | |
| | ECMC Group Student Loan Trust Series 2016-1A, Class A(c) | |
| | 365,976 | | | | 3.754 | | | | 07/26/2066 | | | | 368,699 | |
| | EFS Volunteer No. 2 LLC Series 2012-1, Class A2(c) | |
| | 550,000 | | | | 3.754 | | | | 03/25/2036 | | | | 553,523 | |
| | Nelnet Student Loan Trust Series 2006-2, Class A5 | |
| | 43,924 | | | | 2.680 | | | | 01/25/2030 | | | | 43,912 | |
| | Northstar Education Finance, Inc. Series 2007-1, Class A1 | |
| | 41,969 | | | | 2.680 | | | | 04/28/2030 | | | | 41,712 | |
| | Scholar Funding Trust Series 2010-A, Class A(c) | |
| | 107,187 | | | | 3.332 | | | | 10/28/2041 | | | | 105,964 | |
| | SLM Student Loan Trust Series 2003-7A, Class A5A(c) | |
| | 324,793 | | | | 3.610 | | | | 12/15/2033 | | | | 324,083 | |
| | | | | | | | | | | | | | |
| | | | | | | | | | | | | 1,907,266 | |
| | |
| | TOTAL ASSET-BACKED SECURITIES | |
| | (Cost $3,606,835) | | | $ | 3,614,221 | |
| | |
| | | | | | | | | | | | | | |
| | |
| The accompanying notes are an integral part of these financial statements. | | 27 |
GOLDMAN SACHS VARIABLE INSURANCE TRUST CORE FIXED INCOME FUND
Schedule of Investments(continued)
June 30, 2019 (Unaudited)
| | | | | | | | | | | | | | |
Principal
Amount | | | Interest
Rate | | | Maturity
Date | | | Value | |
|
| Foreign Government Securities – 4.5% | |
| | Indonesia Government International Note(c) | |
| $ | 230,000 | | | | 4.750 | % | | | 01/08/2026 | | | $ | 250,484 | |
| | Israel Government AID Bond(e) | |
| | 400,000 | | | | 5.500 | | | | 09/18/2023 | | | | 456,794 | |
| | 200,000 | | | | 5.500 | | | | 12/04/2023 | | | | 229,910 | |
| | 100,000 | | | | 5.500 | | | | 04/26/2024 | | | | 115,925 | |
| | Kuwait International Government Bond | |
| | 500,000 | | | | 3.500 | | | | 03/20/2027 | | | | 531,875 | |
| | Mexico Government Bond | |
| EUR | 100,000 | | | | 1.625 | | | | 04/08/2026 | | | | 116,571 | |
| | United Arab Emirates Government International Bond(c) | |
| $ | 220,000 | | | | 3.125 | | | | 10/11/2027 | | | | 227,975 | |
| | |
| | TOTAL FOREIGN GOVERNMENT SECURITIES | |
| | (Cost $1,856,617) | | | | | | | $ | 1,929,534 | |
| | |
| | | | | | | | | | | | | | |
|
| | Municipal Bonds – 1.6% | |
| California – 0.4% | |
| | California State Various Purpose GO Bonds Series 2010 | |
| $ | 105,000 | | | | 7.625 | % | | | 03/01/2040 | | | $ | 165,684 | |
| | |
| | Illinois – 0.9% | |
| | Illinois State GO Bonds for Build America Bonds Series 2010-5 | |
| | 100,000 | | | | 7.350 | | | | 07/01/2035 | | | | 117,923 | |
| | Illinois State GO Bonds Pension Funding Series 2003 | |
| | 25,000 | | | | 5.100 | | | | 06/01/2033 | | | | 26,327 | |
| | Illinois State GO Bonds Series 2015-B(f) | |
| | 199,000 | | | | 7.750 | | | | 01/01/2025 | | | | 256,316 | |
| | | | | | | | | | | | | | |
| | | | | | | | | | | | | 400,566 | |
| | |
| | Ohio – 0.3% | |
| American Municipal Power, Inc. RB Build America Bond
Series 2010 E RMKT |
|
| | 100,000 | | | | 6.270 | | | | 02/15/2050 | | | | 134,309 | |
| | |
| | TOTAL MUNICIPAL BONDS | |
| | (Cost $582,015) | | | $ | 700,559 | |
| | |
| | | | | | | | | | | | | | |
|
| | U.S. Treasury Obligations – 12.4% | |
| | U.S. Treasury Bonds | |
| $ | 410,000 | | | | 3.750 | % | | | 11/15/2043 | | | $ | 504,364 | |
| | 1,250,000 | | | | 2.875 | | | | 11/15/2046 | | | | 1,335,937 | |
| | 120,000 | | | | 3.000 | | | | 05/15/2047 | | | | 131,269 | |
| | 150,000 | | | | 2.750 | | | | 11/15/2047 | | | | 156,328 | |
| | 1,310,000 | | | | 3.000 | | | | 02/15/2048 | | | | 1,432,813 | |
| | U.S. Treasury Inflation Linked Notes | |
| | 91,625 | | | | 0.750 | | | | 07/15/2028 | | | | 95,526 | |
| | U.S. Treasury Notes | |
| | 370,000 | | | | 1.875 | | | | 06/30/2026 | | | | 369,982 | |
| | 80,000 | | | | 2.875 | | | | 08/15/2028 | | | | 85,925 | |
| | U.S. Treasury STRIPS Bonds(g) | |
| | 1,800,000 | | | | 0.000 | | | | 02/15/2036 | | | | 1,207,617 | |
| | |
| | TOTAL U.S. TREASURY OBLIGATIONS | |
| | (Cost $5,002,366) | | | $ | 5,319,761 | |
| | |
| | | | | | |
| Shares | | Dividend
Rate | | Value | |
|
| Investment Company(h) – 17.5% | |
Goldman Sachs Financial Square Government Fund — Institutional Shares | |
| 7,501,840 | | 2.308% | | $ | 7,501,840 | |
| (Cost $7,501,840) | | | | |
| |
| TOTAL INVESTMENTS – 117.3% | |
| (Cost $48,934,242) | | $ | 50,319,878 | |
| |
LIABILITIES IN EXCESS OF
OTHER ASSETS –(17.3)% | | | (7,405,448 | ) |
| |
| NET ASSETS – 100.0% | | $ | 42,914,430 | |
| |
| | |
| The percentage shown for each investment category reflects the value of investments in that category as a percentage of net assets. |
| |
| (a) | | Securities with “Call” features. Maturity dates disclosed are the final maturity dates. |
| |
| (b) | | Variable rate security. Except for floating rate notes (for which final maturity is disclosed), maturity date disclosed is the next interest reset date. Interest rate disclosed is that which is in effect on June 30, 2019. |
| |
| (c) | | Exempt from registration under Rule 144A of the Securities Act of 1933. |
| |
| (d) | | TBA (To Be Announced) Securities are purchased on a forward commitment basis with an approximate principal amount and no defined maturity date. The actual principal and maturity date will be determined upon settlement when the specific mortgage pools are assigned. Total market value of TBA securities (excluding forward sales contracts, if any) amounts to $8,309,621 which represents approximately 19.4% of net assets as of June 30, 2019. |
| |
| (e) | | Guaranteed by the United States Government. Total market value of these securities amounts to $802,629, which represents 1.9% of net assets as of June 30, 2019. |
| |
| (f) | | Pre-refunded security. Maturity date disclosed is pre-refunding date. |
| |
| (g) | | Issued with a zero coupon. Income is recognized through the accretion of discount. |
| |
| (h) | | Represents an Affiliated Issuer. |
| | |
| |
| Investment Abbreviations: |
| BA | | —Banker Acceptance Rate |
| BBR | | —Bank Bill Reference Rate |
| EURIBOR | | —Euro Interbank Offer Rate |
| FHLB | | —Federal Home Loan Bank |
| FHLMC | | —Federal Home Loan Mortgage Corp. |
| FNMA | | —Federal National Mortgage Association |
| GNMA | | —Government National Mortgage Association |
| GO | | —General Obligation |
| LIBOR | | —London Interbank Offered Rate |
| Mo. | | —Month |
| NIBOR | | —Norwegian Interbank Offered Rate |
| RB | | —Revenue Bond |
| REMIC | | —Real Estate Mortgage Investment Conduit |
| RMKT | | —Remarketed |
| SONIA | | —Sterling Overnight Index Average |
| STIBOR | | —Stockholm Interbank Offered Rate |
| STRIPS | | —Separate Trading of Registered Interest and Principal of Securities |
| UMBS | | —Uniform Mortgage-Backed Securities |
| Yr. | | —Year |
| | |
| 28 | | The accompanying notes are an integral part of these financial statements. |
GOLDMAN SACHS VARIABLE INSURANCE TRUST CORE FIXED INCOME FUND
| | |
| |
| Currency Abbreviations: |
| AUD | | —Australian Dollar |
| CAD | | —Canadian Dollar |
| CHF | | —Swiss Franc |
| EUR | | —Euro |
| GBP | | —British Pound |
| JPY | | —Japanese Yen |
| NOK | | —Norwegian Krone |
| NZD | | —New Zealand Dollar |
| SEK | | —Swedish Krona |
| USD | | —United States Dollar |
ADDITIONAL INVESTMENT INFORMATION
FORWARD FOREIGN CURRENCY EXCHANGE CONTRACTS — At June 30, 2019, the Fund had the following forward foreign currency exchange contracts:
FORWARD FOREIGN CURRENCY EXCHANGE CONTRACTS WITH UNREALIZED GAIN
| | | | | | | | | | | | | | | | |
| Counterparty | | Currency
Purchased | | | Currency
Sold | | | Settlement
Date | | | Unrealized
Gain | |
Morgan Stanley Co., Inc. | | AUD | 814,484 | | | USD | 567,637 | | | | 09/18/2019 | | | $ | 4,210 | |
| | CAD | 258,925 | | | USD | 194,218 | | | | 07/05/2019 | | | | 3,517 | |
| | CAD | 673,586 | | | USD | 509,287 | | | | 09/18/2019 | | | | 5,307 | |
| | EUR | 13,380 | | | GBP | 11,933 | | | | 09/18/2019 | | | | 102 | |
| | EUR | 94,685 | | | NOK | 919,686 | | | | 09/18/2019 | | | | 296 | |
| | EUR | 775,399 | | | USD | 873,256 | | | | 07/10/2019 | | | | 9,048 | |
| | EUR | 86,995 | | | USD | 98,657 | | | | 09/18/2019 | | | | 888 | |
| | GBP | 16,539 | | | SEK | 194,061 | | | | 09/18/2019 | | | | 62 | |
| | GBP | 89,772 | | | USD | 113,927 | | | | 09/18/2019 | | | | 485 | |
| | JPY | 11,613,101 | | | USD | 105,181 | | | | 07/01/2019 | | | | 2,533 | |
| | JPY | 11,613,101 | | | USD | 108,192 | | | | 09/05/2019 | | | | 53 | |
| | JPY | 13,968,927 | | | USD | 129,831 | | | | 09/18/2019 | | | | 491 | |
| | NOK | 2,539,761 | | | EUR | 258,790 | | | | 09/18/2019 | | | | 3,190 | |
| | NZD | 1,030,639 | | | USD | 679,555 | | | | 09/18/2019 | | | | 13,037 | |
| | SEK | 868,681 | | | EUR | 81,301 | | | | 09/18/2019 | | | | 1,098 | |
| | SEK | 135,768 | | | NOK | 124,239 | | | | 09/18/2019 | | | | 108 | |
| | SEK | 149,291 | | | USD | 15,739 | | | | 09/18/2019 | | | | 428 | |
| | USD | 115,869 | | | AUD | 163,475 | | | | 07/03/2019 | | | | 1,098 | |
| | USD | 87,183 | | | CHF | 84,410 | | | | 09/18/2019 | | | | 92 | |
| | USD | 50,543 | | | EUR | 44,088 | | | | 09/18/2019 | | | | 95 | |
| | USD | 742,436 | | | GBP | 564,969 | | | | 07/08/2019 | | | | 24,731 | |
| | USD | 16,979 | | | GBP | 13,272 | | | | 09/18/2019 | | | | 64 | |
| | USD | 130,975 | | | JPY | 13,997,211 | | | | 09/18/2019 | | | | 390 | |
| | USD | 152,078 | | | SEK | 1,410,504 | | | | 07/17/2019 | | | | 6 | |
| | | USD | 75,218 | | | SEK | 692,922 | | | | 09/18/2019 | | | | 176 | |
| | | | |
| TOTAL | | | | | | | | | | | | | | $ | 71,505 | |
| | |
| The accompanying notes are an integral part of these financial statements. | | 29 |
GOLDMAN SACHS VARIABLE INSURANCE TRUST CORE FIXED INCOME FUND
Schedule of Investments(continued)
June 30, 2019 (Unaudited)
ADDITIONAL INVESTMENT INFORMATION (continued)
FORWARD FOREIGN CURRENCY EXCHANGE CONTRACTS WITH UNREALIZED LOSS
| | | | | | | | | | | | | | | | |
| Counterparty | | Currency
Purchased | | | Currency
Sold | | | Settlement
Date | | | Unrealized
Loss | |
Morgan Stanley Co., Inc. | | AUD | 31,842 | | | CHF | 21,830 | | | | 09/18/2019 | | | $ | (116 | ) |
| | AUD | 206,843 | | | USD | 146,608 | | | | 07/03/2019 | | | | (1,389 | ) |
| | CAD | 108,774 | | | USD | 83,220 | | | | 09/18/2019 | | | | (38 | ) |
| | EUR | 30,970 | | | SEK | 329,520 | | | | 09/18/2019 | | | | (249 | ) |
| | GBP | 17,589 | | | CAD | 29,484 | | | | 09/18/2019 | | | | (131 | ) |
| | GBP | 130,331 | | | EUR | 146,054 | | | | 09/18/2019 | | | | (1,020 | ) |
| | GBP | 253,000 | | | USD | 332,472 | | | | 07/08/2019 | | | | (11,075 | ) |
| | GBP | 23,410 | | | USD | 29,922 | | | | 09/18/2019 | | | | (87 | ) |
| | JPY | 2,687,288 | | | USD | 25,098 | | | | 09/18/2019 | | | | (27 | ) |
| | NOK | 268,994 | | | USD | 31,678 | | | | 09/18/2019 | | | | (76 | ) |
| | SEK | 1,223,000 | | | USD | 131,861 | | | | 07/17/2019 | | | | (5 | ) |
| | USD | 232,715 | | | AUD | 332,187 | | | | 09/18/2019 | | | | (1,055 | ) |
| | USD | 205,525 | | | CAD | 274,000 | | | | 07/05/2019 | | | | (3,722 | ) |
| | USD | 172,608 | | | CAD | 227,451 | | | | 09/18/2019 | | | | (1,330 | ) |
| | USD | 105,091 | | | CHF | 103,190 | | | | 09/18/2019 | | | | (614 | ) |
| | USD | 924,754 | | | EUR | 821,000 | | | | 07/10/2019 | | | | (9,439 | ) |
| | USD | 682,143 | | | EUR | 599,601 | | | | 09/18/2019 | | | | (3,953 | ) |
| | USD | 17,175 | | | GBP | 13,497 | | | | 09/18/2019 | | | | (26 | ) |
| | USD | 81,160 | | | JPY | 8,960,919 | | | | 07/01/2019 | | | | (1,954 | ) |
| | USD | 83,483 | | | JPY | 8,960,919 | | | | 09/05/2019 | | | | (41 | ) |
| | USD | 80,455 | | | JPY | 8,642,377 | | | | 09/18/2019 | | | | (173 | ) |
| | USD | 65,672 | | | NOK | 563,198 | | | | 09/18/2019 | | | | (495 | ) |
| | USD | 123,812 | | | NZD | 186,577 | | | | 09/18/2019 | | | | (1,717 | ) |
| | | USD | 77,393 | | | SEK | 725,007 | | | | 09/18/2019 | | | | (1,124 | ) |
| | | | |
| TOTAL | | | | | | | | | | | | | | $ | (39,856 | ) |
| | |
| 30 | | The accompanying notes are an integral part of these financial statements. |
GOLDMAN SACHS VARIABLE INSURANCE TRUST CORE FIXED INCOME FUND
ADDITIONAL INVESTMENT INFORMATION (continued)
FUTURES CONTRACTS —At June 30, 2019, the Fund had the following futures contracts:
| | | | | | | | | | | | | | | | |
| Description | | Number of
Contracts | | | Expiration
Date | | | Notional
Amount | | | Unrealized
Appreciation/
(Depreciation) | |
| | | | |
Long position contracts: | | | | | | | | | | | | | | | | |
| Australia 3 Year Bond | | | 5 | | | | 09/16/2019 | | | $ | 403,445 | | | $ | 191 | |
| Euro-Bund | | | 3 | | | | 09/06/2019 | | | | 589,200 | | | | 5,662 | |
| Long Gilt | | | 1 | | | | 09/26/2019 | | | | 165,550 | | | | (319 | ) |
| U.S. Treasury 2 Year Note | | | 30 | | | | 09/30/2019 | | | | 6,454,219 | | | | 33,613 | |
| U.S. Treasury 5 Year Note | | | 28 | | | | 09/30/2019 | | | | 3,307,281 | | | | 51,911 | |
U.S. Treasury Long Bond | | | 14 | | | | 09/19/2019 | | | | 2,177,000 | | | | 49,594 | |
| | | | |
| Total | | | | | | | | | | | | | | $ | 140,652 | |
| | | | |
Short position contracts: | | | | | | | | | | | | | | | | |
| 3 Month Eurodollar | | | (1 | ) | | | 09/16/2019 | | | $ | (244,975 | ) | | $ | (1,977 | ) |
| 3 Month Eurodollar | | | (17 | ) | | | 12/16/2019 | | | | (4,168,612 | ) | | | (35,803 | ) |
| Australia 10 Year Bond | | | (2 | ) | | | 09/16/2019 | | | | (201,213 | ) | | | (405 | ) |
| Euro-OAT | | | (2 | ) | | | 09/06/2019 | | | | (375,129 | ) | | | (5,949 | ) |
| U.S. Treasury 10 Year Ultra Note | | | (9 | ) | | | 09/19/2019 | | | | (1,242,422 | ) | | | (25,036 | ) |
U.S. Treasury Ultra Bond | | | (4 | ) | | | 09/19/2019 | | | | (709,625 | ) | | | (20,087 | ) |
| | | | |
| Total | | | | | | | | | | | | | | $ | (89,257 | ) |
| | | | |
| Total Futures Contracts | | | | | | | | | | | | | | $ | 51,395 | |
SWAP CONTRACTS — At June 30, 2019, the Fund had the following swap contracts:
CENTRALLY CLEARED CREDIT DEFAULT SWAP CONTRACTS
| | | | | | | | | | | | | | | | | | | | | | | | | | |
| Reference Obligation/Index | | Financing
Rate
Received
(Paid) by
the Fund | | | Credit
Spread at
June 30,
2019(a) | | | Termination
Date | | Notional
Amount
(000’s) | | | Value | | | Upfront
Premium
(Received)
Paid | | | Unrealized
Appreciation/
(Depreciation) | |
| |
Protection Sold(b): | | | | | |
| iTraxx Europe Index | | | 1.000 | % | | | 0.523 | % | | 06/20/2024 | | EUR | 260 | | | $ | 7,110 | | | $ | 6,835 | | | $ | 275 | |
| Prudential Financial, Inc. | | | 1.000 | | | | 0.564 | | | 06/20/2024 | | USD | 75 | | | | 1,576 | | | | 1,261 | | | | 315 | |
| Republic of Colombia | | | 1.000 | | | | 0.916 | | | 06/20/2024 | | USD | 190 | | | | 772 | | | | 685 | | | | 87 | |
| United Mexican States | | | 1.000 | | | | 1.106 | | | 06/20/2024 | | USD | 20 | | | | (95 | ) | | | (296 | ) | | | 201 | |
| Markit CDX North America Investment Grade Index | | | 1.000 | | | | 0.475 | | | 12/20/2023 | | USD | 700 | | | | 15,914 | | | | 6,630 | | | | 9,284 | |
| Markit CDX North America Investment Grade Index | | | 1.000 | | | | 0.545 | | | 06/20/2024 | | USD | 950 | | | | 20,631 | | | | 13,710 | | | | 6,921 | |
| | | | | | | |
| TOTAL | | | | | | | | | | | | | | | | $ | 45,908 | | | $ | 28,825 | | | $ | 17,083 | |
| (a) | Credit spread on the referenced obligation, together with the period of expiration, are indicators of payment/performance risk. The likelihood of a credit event occurring which would require a fund or its counterparty to make a payment or otherwise be required to perform under the swap contract is generally greater as the credit spread and term of the swap contract increase. |
| (b) | Payments received quarterly. |
| | |
| The accompanying notes are an integral part of these financial statements. | | 31 |
GOLDMAN SACHS VARIABLE INSURANCE TRUST CORE FIXED INCOME FUND
Schedule of Investments(continued)
June 30, 2019 (Unaudited)
ADDITIONAL INVESTMENT INFORMATION (continued)
CENTRALLY CLEARED INTEREST RATE SWAP CONTRACTS
| | | | | | | | | | | | | | | | | | | | | | | | |
Payments Made by the Fund | | Payments
Received by the Fund | | | Termination
Date | | | Notional
Amount
(000’s) | | | Value | | | Upfront
Premium
(Received)
Paid | | | Unrealized
Appreciation/
(Depreciation) | |
| 0.727%(b) | | | 1 Day SONIA | | | | 11/07/2019 | | | GBP | 1,860 | (a) | | $ | (154 | ) | | $ | 10 | | | $ | (164 | ) |
| 3 Month BBR(c) | | | 1.500% | | | | 09/18/2021 | | | NZD | 1,770 | (a) | | | 4,372 | | | | 2,288 | | | | 2,084 | |
| 1.750(d) | | | 3 Month LIBOR | | | | 09/18/2021 | | | USD | 680 | (a) | | | (514 | ) | | | 515 | | | | (1,029 | ) |
| 1.100 (e) | | | 1 Day SONIA | | | | 08/01/2023 | | | GBP | 40 | | | | (1,065 | ) | | | (340 | ) | | | (725 | ) |
| 3 Month BA(d) | | | 2.750 | | | | 09/18/2024 | | | CAD | 960 | (a) | | | 36,768 | | | | 36,024 | | | | 744 | |
| 6 Month EURIBOR(d) | | | 0.500 | | | | 09/18/2024 | | | EUR | 1,430 | (a) | | | 58,857 | | | | 50,236 | | | | 8,621 | |
| 0.250(e) | | | 3 Month STIBOR | | | | 09/18/2024 | | | SEK | 12,350 | (a) | | | (8,558 | ) | | | (5,009 | ) | | | (3,549 | ) |
| 2.000(d) | | | 3 Month LIBOR | | | | 09/18/2024 | | | USD | 670 | (a) | | | (8,325 | ) | | | (7,255 | ) | | | (1,070 | ) |
| 6 Month BBR(d) | | | 1.750 | | | | 09/18/2026 | | | AUD | 190 | (a) | | | 3,295 | | | | 1,731 | | | | 1,564 | |
| 1.500(d) | | | 6 Month LIBOR | | | | 09/18/2026 | | | GBP | 100 | (a) | | | (4,577 | ) | | | (4,755 | ) | | | 178 | |
| 1.900(d) | | | 6 Month LIBOR | | | | 08/03/2028 | | | GBP | 180 | (a) | | | (8,182 | ) | | | (308 | ) | | | (7,874 | ) |
| 6 Month LIBOR(d) | | | 1.050 | | | | 08/07/2028 | | | CHF | 280 | (a) | | | 15,171 | | | | (235 | ) | | | 15,406 | |
| 6 Month EURIBOR(d) | | | 1.200 | | | | 02/12/2029 | | | EUR | 350 | (a) | | | 13,723 | | | | 2,106 | | | | 11,617 | |
| 1.500(d) | | | 6 Month LIBOR | | | | 02/12/2029 | | | GBP | 540 | (a) | | | (10,424 | ) | | | (856 | ) | | | (9,568 | ) |
| 3 Month LIBOR(c) | | | 2.800 | | | | 02/12/2029 | | | USD | 370 | (a) | | | 10,755 | | | | 1,414 | | | | 9,341 | |
| 6 Month EURIBOR(d) | | | 1.200 | | | | 02/21/2029 | | | EUR | 240 | (a) | | | 9,350 | | | | 1,640 | | | | 7,710 | |
| 2.300(e) | | | 6 Month NIBOR | | | | 02/21/2029 | | | NOK | 2,570 | (a) | | | (5,028 | ) | | | (693 | ) | | | (4,335 | ) |
| 0.900(e) | | | 6 Month EURIBOR | | | | 05/20/2029 | | | EUR | 1,260 | (a) | | | (24,376 | ) | | | (6,220 | ) | | | (18,156 | ) |
| 3 Month LIBOR(c) | | | 2.500 | | | | 05/20/2029 | | | USD | 1,240 | (a) | | | 18,084 | | | | 5,431 | | | | 12,653 | |
| 6 Month BBR(d) | | | 2.000 | | | | 09/18/2029 | | | AUD | 270 | (a) | | | 7,399 | | | | 7,828 | | | | (429 | ) |
| 6 Month EURIBOR(d) | | | 1.000 | | | | 09/18/2029 | | | EUR | 40 | (a) | | | 3,677 | | | | 3,049 | | | | 628 | |
| 1.500(d) | | | 6 Month LIBOR | | | | 09/18/2029 | | | GBP | 100 | (a) | | | (5,370 | ) | | | (5,665 | ) | | | 295 | |
| 1.800(e) | | | 6 Month NIBOR | | | | 09/18/2029 | | | NOK | 720 | (a) | | | 417 | | | | 177 | | | | 240 | |
| 0.750(e) | | | 3 Month STIBOR | | | | 09/18/2029 | | | SEK | 310 | (a) | | | (607 | ) | | | (348 | ) | | | (259 | ) |
| | | | | | |
| TOTAL | | | | | | | | | | | | | | $ | 104,688 | | | $ | 80,765 | | | $ | 23,923 | |
| (a) | Represents forward starting interest rate swaps whose effective dates of commencement of accruals and cash flows occur subsequent to June 30, 2019. |
| (b) | Payments made at the termination date. |
| (c) | Payments made quarterly. |
| (d) | Payments made semi-annually. |
| (e) | Payments made annually. |
| | |
| 32 | | The accompanying notes are an integral part of these financial statements. |
GOLDMAN SACHS VARIABLE INSURANCE TRUST EQUITY INDEX FUND
Schedule of Investments
June 30, 2019 (Unaudited)
| | | | | | | | |
| Shares | | | Description | | Value | |
|
| Common Stocks – 99.3% | |
| Automobiles & Components – 0.5% | |
| | 1,838 | | | Aptiv plc | | $ | 148,565 | |
| | 1,437 | | | BorgWarner, Inc. | | | 60,325 | |
| | 27,721 | | | Ford Motor Co. | | | 283,586 | |
| | 9,145 | | | General Motors Co. | | | 352,357 | |
| | 1,096 | | | Harley-Davidson, Inc. | | | 39,270 | |
| | | | | | | | |
| | | | | | | 884,103 | |
| | |
| Banks – 5.4% | |
| | 62,071 | | | Bank of America Corp. | | | 1,800,059 | |
| | 5,309 | | | BB&T Corp. | | | 260,831 | |
| | 16,218 | | | Citigroup, Inc. | | | 1,135,746 | |
| | 3,212 | | | Citizens Financial Group, Inc. | | | 113,576 | |
| | 1,154 | | | Comerica, Inc. | | | 83,827 | |
| | 5,333 | | | Fifth Third Bancorp | | | 148,791 | |
| | 1,133 | | | First Republic Bank | | | 110,637 | |
| | 7,565 | | | Huntington Bancshares, Inc. | | | 104,548 | |
| | 22,781 | | | JPMorgan Chase & Co. | | | 2,546,916 | |
| | 7,100 | | | KeyCorp | | | 126,025 | |
| | 973 | | | M&T Bank Corp. | | | 165,478 | |
| | 2,606 | | | People’s United Financial, Inc. | | | 43,729 | |
| | 3,189 | | | PNC Financial Services Group, Inc. (The) | | | 437,786 | |
| | 7,021 | | | Regions Financial Corp. | | | 104,894 | |
| | 3,135 | | | SunTrust Banks, Inc. | | | 197,035 | |
| | 365 | | | SVB Financial Group* | | | 81,975 | |
| | 10,593 | | | US Bancorp | | | 555,073 | |
| | 28,380 | | | Wells Fargo & Co. | | | 1,342,942 | |
| | 1,283 | | | Zions Bancorp NA | | | 58,992 | |
| | | | | | | | |
| | | | | | | 9,418,860 | |
| | |
| Capital Goods – 6.6% | |
| | 4,058 | | | 3M Co. | | | 703,414 | |
| | 666 | | | Allegion plc | | | 73,626 | |
| | 1,583 | | | AMETEK, Inc. | | | 143,800 | |
| | 982 | | | AO Smith Corp. | | | 46,311 | |
| | 2,732 | | | Arconic, Inc. | | | 70,540 | |
| | 3,687 | | | Boeing Co. (The) | | | 1,342,105 | |
| | 4,036 | | | Caterpillar, Inc. | | | 550,066 | |
| | 1,023 | | | Cummins, Inc. | | | 175,281 | |
| | 2,227 | | | Deere & Co. | | | 369,036 | |
| | 1,030 | | | Dover Corp. | | | 103,206 | |
| | 2,941 | | | Eaton Corp. plc | | | 244,926 | |
| | 4,274 | | | Emerson Electric Co. | | | 285,161 | |
| | 3,994 | | | Fastenal Co. | | | 130,164 | |
| | 906 | | | Flowserve Corp. | | | 47,737 | |
| | 2,038 | | | Fortive Corp. | | | 166,138 | |
| | 1,039 | | | Fortune Brands Home & Security, Inc. | | | 59,358 | |
| | 1,901 | | | General Dynamics Corp. | | | 345,640 | |
| | 60,946 | | | General Electric Co. | | | 639,933 | |
| | 836 | | | Harris Corp. | | | 158,113 | |
| | 5,103 | | | Honeywell International, Inc. | | | 890,933 | |
| | 286 | | | Huntington Ingalls Industries, Inc. | | | 64,276 | |
| | 2,110 | | | Illinois Tool Works, Inc. | | | 318,209 | |
| | 1,702 | | | Ingersoll-Rand plc | | | 215,592 | |
| | 807 | | | Jacobs Engineering Group, Inc. | | | 68,103 | |
| | 5,609 | | | Johnson Controls International plc | | | 231,708 | |
| | |
|
| Common Stocks – (continued) | |
| Capital Goods – (continued) | |
| | 553 | | | L3 Technologies, Inc. | | | 135,579 | |
| | 1,721 | | | Lockheed Martin Corp. | | | 625,652 | |
| | 2,060 | | | Masco Corp. | | | 80,834 | |
| | 1,195 | | | Northrop Grumman Corp. | | | 386,116 | |
| | 2,473 | | | PACCAR, Inc. | | | 177,215 | |
| | 908 | | | Parker-Hannifin Corp. | | | 154,369 | |
| | 1,073 | | | Pentair plc | | | 39,916 | |
| | 1,029 | | | Quanta Services, Inc. | | | 39,297 | |
| | 1,982 | | | Raytheon Co. | | | 344,630 | |
| | 844 | | | Rockwell Automation, Inc. | | | 138,273 | |
| | 723 | | | Roper Technologies, Inc. | | | 264,806 | |
| | 398 | | | Snap-on, Inc. | | | 65,925 | |
| | 1,075 | | | Stanley Black & Decker, Inc. | | | 155,456 | |
| | 1,710 | | | Textron, Inc. | | | 90,698 | |
| | 341 | | | TransDigm Group, Inc.* | | | 164,976 | |
| | 549 | | | United Rentals, Inc.* | | | 72,814 | |
| | 5,693 | | | United Technologies Corp. | | | 741,229 | |
| | 963 | | | Wabtec Corp. | | | 69,105 | |
| | 324 | | | WW Grainger, Inc. | | | 86,907 | |
| | 1,258 | | | Xylem, Inc. | | | 105,219 | |
| | | | | | | | |
| | | | | | | 11,382,392 | |
| | |
| Commercial & Professional Services – 0.7% | |
| | 593 | | | Cintas Corp. | | | 140,713 | |
| | 1,399 | | | Copart, Inc.* | | | 104,561 | |
| | 843 | | | Equifax, Inc. | | | 114,008 | |
| | 2,597 | | | IHS Markit Ltd.* | | | 165,481 | |
| | 2,557 | | | Nielsen Holdings plc | | | 57,788 | |
| | 1,483 | | | Republic Services, Inc. | | | 128,487 | |
| | 814 | | | Robert Half International, Inc. | | | 46,406 | |
| | 1,077 | | | Rollins, Inc. | | | 38,632 | |
| | 1,132 | | | Verisk Analytics, Inc. | | | 165,793 | |
| | 2,719 | | | Waste Management, Inc. | | | 313,691 | |
| | | | | | | | |
| | | | | | | 1,275,560 | |
| | |
| Consumer Durables & Apparel – 1.1% | |
| | 1,057 | | | Capri Holdings Ltd.* | | | 36,657 | |
| | 2,376 | | | DR Horton, Inc. | | | 102,477 | |
| | 839 | | | Garmin Ltd. | | | 66,952 | |
| | 2,697 | | | Hanesbrands, Inc. | | | 46,442 | |
| | 815 | | | Hasbro, Inc. | | | 86,129 | |
| | 931 | | | Leggett & Platt, Inc. | | | 35,723 | |
| | 2,065 | | | Lennar Corp. Class A | | | 100,070 | |
| | 421 | | | Mohawk Industries, Inc.* | | | 62,085 | |
| | 2,664 | | | Newell Brands, Inc. | | | 41,079 | |
| | 8,873 | | | NIKE, Inc. Class B | | | 744,888 | |
| | 1,728 | | | PulteGroup, Inc. | | | 54,639 | |
| | 525 | | | PVH Corp. | | | 49,686 | |
| | 358 | | | Ralph Lauren Corp. | | | 40,665 | |
| | 2,140 | | | Tapestry, Inc. | | | 67,902 | |
| | 1,254 | | | Under Armour, Inc. Class A* | | | 31,789 | |
| | 1,232 | | | Under Armour, Inc. Class C* | | | 27,351 | |
| | 2,257 | | | VF Corp. | | | 197,149 | |
| | 464 | | | Whirlpool Corp. | | | 66,055 | |
| | | | | | | | |
| | | | | | | 1,857,738 | |
| | |
| | |
| The accompanying notes are an integral part of these financial statements. | | 33 |
GOLDMAN SACHS VARIABLE INSURANCE TRUST EQUITY INDEX FUND
Schedule of Investments(continued)
June 30, 2019 (Unaudited)
| | | | | | | | |
| Shares | | | Description | | Value | |
|
| Common Stocks – (continued) | |
| Consumer Services – 1.9% | |
| | 2,767 | | | Carnival Corp. | | $ | 128,804 | |
| | 168 | | | Chipotle Mexican Grill, Inc.* | | | 123,124 | |
| | 875 | | | Darden Restaurants, Inc. | | | 106,514 | |
| | 1,374 | | | H&R Block, Inc. | | | 40,258 | |
| | 2,060 | | | Hilton Worldwide Holdings, Inc. | | | 201,344 | |
| | 1,974 | | | Marriott International, Inc. Class A | | | 276,933 | |
| | 5,381 | | | McDonald’s Corp. | | | 1,117,418 | |
| | 3,644 | | | MGM Resorts International | | | 104,109 | |
| | 1,502 | | | Norwegian Cruise Line Holdings Ltd.* | | | 80,552 | |
| | 1,210 | | | Royal Caribbean Cruises Ltd. | | | 146,664 | |
| | 8,538 | | | Starbucks Corp. | | | 715,741 | |
| | 689 | | | Wynn Resorts Ltd. | | | 85,429 | |
| | 2,178 | | | Yum! Brands, Inc. | | | 241,039 | |
| | | | | | | | |
| | | | | | | 3,367,929 | |
| | |
| Diversified Financials – 5.1% | |
| | 380 | | | Affiliated Managers Group, Inc. | | | 35,013 | |
| | 4,793 | | | American Express Co. | | | 591,648 | |
| | 945 | | | Ameriprise Financial, Inc. | | | 137,176 | |
| | 6,158 | | | Bank of New York Mellon Corp. (The) | | | 271,876 | |
| | 13,658 | | | Berkshire Hathaway, Inc. Class B* | | | 2,911,476 | |
| | 831 | | | BlackRock, Inc. | | | 389,988 | |
| | 3,269 | | | Capital One Financial Corp. | | | 296,629 | |
| | 784 | | | Cboe Global Markets, Inc. | | | 81,246 | |
| | 8,332 | | | Charles Schwab Corp. (The) | | | 334,863 | |
| | 2,509 | | | CME Group, Inc. | | | 487,022 | |
| | 2,326 | | | Discover Financial Services | | | 180,474 | |
| | 1,705 | | | E*TRADE Financial Corp. | | | 76,043 | |
| | 2,129 | | | Franklin Resources, Inc. | | | 74,089 | |
| | 2,420 | | | Goldman Sachs Group, Inc. (The)(a) | | | 495,132 | |
| | 3,967 | | | Intercontinental Exchange, Inc. | | | 340,924 | |
| | 2,721 | | | Invesco Ltd. | | | 55,672 | |
| | 1,803 | | | Jefferies Financial Group, Inc. | | | 34,672 | |
| | 264 | | | MarketAxess Holdings, Inc. | | | 84,855 | |
| | 1,176 | | | Moody’s Corp. | | | 229,685 | |
| | 9,071 | | | Morgan Stanley | | | 397,400 | |
| | 594 | | | MSCI, Inc. | | | 141,841 | |
| | 835 | | | Nasdaq, Inc. | | | 80,302 | |
| | 1,522 | | | Northern Trust Corp. | | | 136,980 | |
| | 924 | | | Raymond James Financial, Inc. | | | 78,124 | |
| | 1,740 | | | S&P Global, Inc. | | | 396,355 | |
| | 2,713 | | | State Street Corp. | | | 152,091 | |
| | 4,672 | | | Synchrony Financial | | | 161,978 | |
| | 1,674 | | | T. Rowe Price Group, Inc. | | | 183,655 | |
| | | | | | | | |
| | | | | | | 8,837,209 | |
| | |
| Energy – 5.0% | |
| | 3,534 | | | Anadarko Petroleum Corp. | | | 249,359 | |
| | 2,555 | | | Apache Corp. | | | 74,018 | |
| | 3,714 | | | Baker Hughes a GE Co. | | | 91,476 | |
| | 3,095 | | | Cabot Oil & Gas Corp. | | | 71,061 | |
| | 13,317 | | | Chevron Corp. | | | 1,657,168 | |
| | 696 | | | Cimarex Energy Co. | | | 41,294 | |
| | 1,428 | | | Concho Resources, Inc. | | | 147,341 | |
| | 8,016 | | | ConocoPhillips | | | 488,976 | |
| | |
|
| Common Stocks – (continued) | |
| Energy – (continued) | |
| | 2,868 | | | Devon Energy Corp. | | | 81,795 | |
| | 1,111 | | | Diamondback Energy, Inc. | | | 121,066 | |
| | 4,085 | | | EOG Resources, Inc. | | | 380,559 | |
| | 29,709 | | | Exxon Mobil Corp. | | | 2,276,601 | |
| | 6,174 | | | Halliburton Co. | | | 140,397 | |
| | 800 | | | Helmerich & Payne, Inc. | | | 40,496 | |
| | 1,795 | | | Hess Corp. | | | 114,108 | |
| | 1,140 | | | HollyFrontier Corp. | | | 52,759 | |
| | 13,750 | | | Kinder Morgan, Inc. | | | 287,100 | |
| | 5,720 | | | Marathon Oil Corp. | | | 81,281 | |
| | 4,677 | | | Marathon Petroleum Corp. | | | 261,351 | |
| | 2,775 | | | National Oilwell Varco, Inc. | | | 61,688 | |
| | 3,360 | | | Noble Energy, Inc. | | | 75,264 | |
| | 5,233 | | | Occidental Petroleum Corp. | | | 263,115 | |
| | 2,873 | | | ONEOK, Inc. | | | 197,691 | |
| | 2,920 | | | Phillips 66 | | | 273,137 | |
| | 1,190 | | | Pioneer Natural Resources Co. | | | 183,093 | |
| | 9,736 | | | Schlumberger Ltd. | | | 386,909 | |
| | 2,968 | | | TechnipFMC plc | | | 76,990 | |
| | 2,963 | | | Valero Energy Corp. | | | 253,662 | |
| | 8,522 | | | Williams Cos., Inc. (The) | | | 238,957 | |
| | | | | | | | |
| | | | | | | 8,668,712 | |
| | |
| Food & Staples Retailing – 1.5% | |
| | 3,087 | | | Costco Wholesale Corp. | | | 815,771 | |
| | 5,682 | | | Kroger Co. (The) | | | 123,356 | |
| | 3,351 | | | Sysco Corp. | | | 236,983 | |
| | 5,581 | | | Walgreens Boots Alliance, Inc. | | | 305,113 | |
| | 9,811 | | | Walmart, Inc. | | | 1,084,017 | |
| | | | | | | | |
| | | | | | | 2,565,240 | |
| | |
| Food, Beverage & Tobacco – 3.9% | |
| | 13,128 | | | Altria Group, Inc. | | | 621,611 | |
| | 3,934 | | | Archer-Daniels-Midland Co. | | | 160,507 | |
| | 1,128 | | | Brown-Forman Corp. Class B | | | 62,525 | |
| | 1,352 | | | Campbell Soup Co. | | | 54,175 | |
| | 27,065 | | | Coca-Cola Co. (The) | | | 1,378,150 | |
| | 3,405 | | | Conagra Brands, Inc. | | | 90,301 | |
| | 1,180 | | | Constellation Brands, Inc. Class A | | | 232,389 | |
| | 4,146 | | | General Mills, Inc. | | | 217,748 | |
| | 985 | | | Hershey Co. (The) | | | 132,019 | |
| | 1,987 | | | Hormel Foods Corp. | | | 80,553 | |
| | 818 | | | JM Smucker Co. (The) | | | 94,225 | |
| | 1,817 | | | Kellogg Co. | | | 97,337 | |
| | 4,451 | | | Kraft Heinz Co. (The) | | | 138,159 | |
| | 1,072 | | | Lamb Weston Holdings, Inc. | | | 67,922 | |
| | 873 | | | McCormick & Co., Inc.(Non-Voting) | | | 135,324 | |
| | 1,300 | | | Molson Coors Brewing Co. Class B | | | 72,800 | |
| | 10,188 | | | Mondelez International, Inc. Class A | | | 549,133 | |
| | 2,747 | | | Monster Beverage Corp.* | | | 175,341 | |
| | 9,879 | | | PepsiCo, Inc. | | | 1,295,433 | |
| | 10,896 | | | Philip Morris International, Inc. | | | 855,663 | |
| | 2,107 | | | Tyson Foods, Inc. Class A | | | 170,119 | |
| | | | | | | | |
| | | | | | | 6,681,434 | |
| | |
| | |
| 34 | | The accompanying notes are an integral part of these financial statements. |
GOLDMAN SACHS VARIABLE INSURANCE TRUST EQUITY INDEX FUND
| | | | | | | | |
| Shares | | | Description | | Value | |
|
| Common Stocks – (continued) | |
| Health Care Equipment & Services – 6.3% | |
| | 12,316 | | | Abbott Laboratories | | $ | 1,035,776 | |
| | 319 | | | ABIOMED, Inc.* | | | 83,096 | |
| | 514 | | | Align Technology, Inc.* | | | 140,682 | |
| | 1,093 | | | AmerisourceBergen Corp. | | | 93,189 | |
| | 1,809 | | | Anthem, Inc. | | | 510,518 | |
| | 3,319 | | | Baxter International, Inc. | | | 271,826 | |
| | 1,892 | | | Becton Dickinson and Co. | | | 476,803 | |
| | 9,703 | | | Boston Scientific Corp.* | | | 417,035 | |
| | 2,112 | | | Cardinal Health, Inc. | | | 99,475 | |
| | 2,888 | | | Centene Corp.* | | | 151,447 | |
| | 2,258 | | | Cerner Corp. | | | 165,511 | |
| | 2,687 | | | Cigna Corp. | | | 423,337 | |
| | 344 | | | Cooper Cos., Inc. (The) | | | 115,890 | |
| | 9,073 | | | CVS Health Corp. | | | 494,388 | |
| | 4,425 | | | Danaher Corp. | | | 632,421 | |
| | 887 | | | DaVita, Inc.* | | | 49,903 | |
| | 1,552 | | | DENTSPLY SIRONA, Inc. | | | 90,575 | |
| | 1,450 | | | Edwards Lifesciences Corp.* | | | 267,873 | |
| | 1,896 | | | HCA Healthcare, Inc. | | | 256,282 | |
| | 1,038 | | | Henry Schein, Inc.* | | | 72,556 | |
| | 1,906 | | | Hologic, Inc.* | | | 91,526 | |
| | 942 | | | Humana, Inc. | | | 249,913 | |
| | 607 | | | IDEXX Laboratories, Inc.* | | | 167,125 | |
| | 801 | | | Intuitive Surgical, Inc.* | | | 420,165 | |
| | 685 | | | Laboratory Corp. of America Holdings* | | | 118,437 | |
| | 1,357 | | | McKesson Corp. | | | 182,367 | |
| | 9,425 | | | Medtronic plc | | | 917,901 | |
| | 952 | | | Quest Diagnostics, Inc. | | | 96,923 | |
| | 1,005 | | | ResMed, Inc. | | | 122,640 | |
| | 2,179 | | | Stryker Corp. | | | 447,959 | |
| | 315 | | | Teleflex, Inc. | | | 104,312 | |
| | 6,671 | | | UnitedHealth Group, Inc. | | | 1,627,791 | |
| | 570 | | | Universal Health Services, Inc. Class B | | | 74,322 | |
| | 653 | | | Varian Medical Systems, Inc.* | | | 88,893 | |
| | 360 | | | WellCare Health Plans, Inc.* | | | 102,625 | |
| | 1,414 | | | Zimmer Biomet Holdings, Inc. | | | 166,484 | |
| | | | | | | | |
| | | | | | | 10,827,966 | |
| | |
| Household & Personal Products – 1.9% | |
| | 1,696 | | | Church & Dwight Co., Inc. | | | 123,910 | |
| | 901 | | | Clorox Co. (The) | | | 137,952 | |
| | 6,014 | | | Colgate-Palmolive Co. | | | 431,023 | |
| | 1,935 | | | Coty, Inc. Class A | | | 25,929 | |
| | 1,535 | | | Estee Lauder Cos., Inc. (The) Class A | | | 281,074 | |
| | 2,426 | | | Kimberly-Clark Corp. | | | 323,337 | |
| | 17,687 | | | Procter & Gamble Co. (The) | | | 1,939,380 | |
| | | | | | | | |
| | | | | | | 3,262,605 | |
| | |
| Insurance – 2.5% | |
| | 5,228 | | | Aflac, Inc. | | | 286,547 | |
| | 2,309 | | | Allstate Corp. (The) | | | 234,802 | |
| | 6,081 | | | American International Group, Inc. | | | 323,996 | |
| | 1,671 | | | Aon plc | | | 322,470 | |
| | 1,281 | | | Arthur J Gallagher & Co. | | | 112,203 | |
| | 411 | | | Assurant, Inc. | | | 43,722 | |
| | |
|
| Common Stocks – (continued) | |
| Insurance – (continued) | |
| | 3,201 | | | Chubb Ltd. | | | 471,475 | |
| | 1,064 | | | Cincinnati Financial Corp. | | | 110,305 | |
| | 279 | | | Everest Re Group Ltd. | | | 68,963 | |
| | 2,505 | | | Hartford Financial Services Group, Inc. (The) | | | 139,579 | |
| | 1,412 | | | Lincoln National Corp. | | | 91,003 | |
| | 1,951 | | | Loews Corp. | | | 106,661 | |
| | 3,534 | | | Marsh & McLennan Cos., Inc. | | | 352,516 | |
| | 6,718 | | | MetLife, Inc. | | | 333,683 | |
| | 1,855 | | | Principal Financial Group, Inc. | | | 107,442 | |
| | 4,099 | | | Progressive Corp. (The) | | | 327,633 | |
| | 2,850 | | | Prudential Financial, Inc. | | | 287,850 | |
| | 747 | | | Torchmark Corp. | | | 66,827 | |
| | 1,868 | | | Travelers Cos., Inc. (The) | | | 279,303 | |
| | 1,503 | | | Unum Group | | | 50,426 | |
| | 899 | | | Willis Towers Watson plc | | | 172,194 | |
| | | | | | | | |
| | | | | | | 4,289,600 | |
| | |
| Materials – 2.8% | |
| | 1,554 | | | Air Products & Chemicals, Inc. | | | 351,779 | |
| | 738 | | | Albemarle Corp. | | | 51,963 | |
| | 11,388 | | | Amcor plc* | | | 130,848 | |
| | 573 | | | Avery Dennison Corp. | | | 66,285 | |
| | 2,335 | | | Ball Corp. | | | 163,427 | |
| | 895 | | | Celanese Corp. | | | 96,481 | |
| | 1,551 | | | CF Industries Holdings, Inc. | | | 72,447 | |
| | 5,348 | | | Corteva, Inc.* | | | 158,140 | |
| | 5,290 | | | Dow, Inc. | | | 260,850 | |
| | 5,249 | | | DuPont de Nemours, Inc. | | | 394,042 | |
| | 991 | | | Eastman Chemical Co. | | | 77,130 | |
| | 1,768 | | | Ecolab, Inc. | | | 349,074 | |
| | 913 | | | FMC Corp. | | | 75,733 | |
| | 10,285 | | | Freeport-McMoRan, Inc. | | | 119,409 | |
| | 695 | | | International Flavors & Fragrances, Inc. | | | 100,838 | |
| | 2,773 | | | International Paper Co. | | | 120,126 | |
| | 3,803 | | | Linde plc | | | 763,642 | |
| | 2,158 | | | LyondellBasell Industries NV Class A | | | 185,869 | |
| | 449 | | | Martin Marietta Materials, Inc. | | | 103,319 | |
| | 2,585 | | | Mosaic Co. (The) | | | 64,703 | |
| | 5,667 | | | Newmont Goldcorp Corp. | | | 218,010 | |
| | 2,124 | | | Nucor Corp. | | | 117,032 | |
| | 644 | | | Packaging Corp. of America | | | 61,386 | |
| | 1,670 | | | PPG Industries, Inc. | | | 194,906 | |
| | 1,071 | | | Sealed Air Corp. | | | 45,817 | |
| | 576 | | | Sherwin-Williams Co. (The) | | | 263,975 | |
| | 927 | | �� | Vulcan Materials Co. | | | 127,286 | |
| | 1,834 | | | Westrock Co. | | | 66,886 | |
| | | | | | | | |
| | | | | | | 4,801,403 | |
| | |
| Media & Entertainment – 8.1% | |
| | 5,325 | | | Activision Blizzard, Inc. | | | 251,340 | |
| | 2,099 | | | Alphabet, Inc. Class A* | | | 2,272,797 | |
| | 2,159 | | | Alphabet, Inc. Class C* | | | 2,333,685 | |
| | 2,417 | | | CBS Corp.(Non-Voting) Class B | | | 120,608 | |
| | |
| | |
| The accompanying notes are an integral part of these financial statements. | | 35 |
GOLDMAN SACHS VARIABLE INSURANCE TRUST EQUITY INDEX FUND
Schedule of Investments(continued)
June 30, 2019 (Unaudited)
| | | | | | | | |
| Shares | | | Description | | Value | |
|
| Common Stocks – (continued) | |
| Media & Entertainment – (continued) | |
| | 1,223 | | | Charter Communications, Inc. Class A* | | $ | 483,305 | |
| | 31,767 | | | Comcast Corp. Class A | | | 1,343,109 | |
| | 1,181 | | | Discovery, Inc. Class A* | | | 36,257 | |
| | 2,496 | | | Discovery, Inc. Class C* | | | 71,011 | |
| | 1,615 | | | DISH Network Corp. Class A* | | | 62,032 | |
| | 2,096 | | | Electronic Arts, Inc.* | | | 212,241 | |
| | 16,932 | | | Facebook, Inc. Class A* | | | 3,267,876 | |
| | 2,439 | | | Fox Corp. Class A | | | 89,365 | |
| | 1,210 | | | Fox Corp. Class B | | | 44,201 | |
| | 2,670 | | | Interpublic Group of Cos., Inc. (The) | | | 60,315 | |
| | 3,069 | | | Netflix, Inc.* | | | 1,127,305 | |
| | 2,809 | | | News Corp. Class A | | | 37,894 | |
| | 1,017 | | | News Corp. Class B | | | 14,197 | |
| | 1,593 | | | Omnicom Group, Inc. | | | 130,547 | |
| | 776 | | | Take-Two Interactive Software, Inc.* | | | 88,099 | |
| | 693 | | | TripAdvisor, Inc.* | | | 32,079 | |
| | 5,157 | | | Twitter, Inc.* | | | 179,979 | |
| | 2,426 | | | Viacom, Inc. Class B | | | 72,465 | |
| | 12,240 | | | Walt Disney Co. (The) | | | 1,709,194 | |
| | | | | | | | |
| | | | | | | 14,039,901 | |
| | |
| Pharmaceuticals, Biotechnology & Life Sciences – 7.8% | |
| | 10,337 | | | AbbVie, Inc. | | | 751,707 | |
| | 2,232 | | | Agilent Technologies, Inc. | | | 166,663 | |
| | 1,583 | | | Alexion Pharmaceuticals, Inc.* | | | 207,341 | |
| | 2,184 | | | Allergan plc | | | 365,667 | |
| | 4,274 | | | Amgen, Inc. | | | 787,613 | |
| | 1,375 | | | Biogen, Inc.* | | | 321,571 | |
| | 11,452 | | | Bristol-Myers Squibb Co. | | | 519,348 | |
| | 4,904 | | | Celgene Corp.* | | | 453,326 | |
| | 6,065 | | | Eli Lilly & Co. | | | 671,941 | |
| | 8,950 | | | Gilead Sciences, Inc. | | | 604,662 | |
| | 1,026 | | | Illumina, Inc.* | | | 377,722 | |
| | 1,248 | | | Incyte Corp.* | | | 106,030 | |
| | 1,094 | | | IQVIA Holdings, Inc.* | | | 176,025 | |
| | 18,704 | | | Johnson & Johnson | | | 2,605,093 | |
| | 18,116 | | | Merck & Co., Inc. | | | 1,519,027 | |
| | 177 | | | Mettler-Toledo International, Inc.* | | | 148,680 | |
| | 3,648 | | | Mylan NV* | | | 69,458 | |
| | 1,164 | | | Nektar Therapeutics* | | | 41,415 | |
| | 783 | | | PerkinElmer, Inc. | | | 75,434 | |
| | 944 | | | Perrigo Co. plc | | | 44,953 | |
| | 38,913 | | | Pfizer, Inc. | | | 1,685,711 | |
| | 550 | | | Regeneron Pharmaceuticals, Inc.* | | | 172,150 | |
| | 2,828 | | | Thermo Fisher Scientific, Inc. | | | 830,527 | |
| | 1,794 | | | Vertex Pharmaceuticals, Inc.* | | | 328,984 | |
| | 504 | | | Waters Corp.* | | | 108,481 | |
| | 3,350 | | | Zoetis, Inc. | | | 380,192 | |
| | | | | | | | |
| | | | | | | 13,519,721 | |
| | |
| Real Estate – 3.0% | |
| | 783 | | | Alexandria Real Estate Equities, Inc. (REIT) | | | 110,473 | |
| | 3,108 | | | American Tower Corp. (REIT) | | | 635,431 | |
| | |
|
| Common Stocks – (continued) | |
| Real Estate – (continued) | |
| | 1,113 | | | Apartment Investment & Management Co. Class A (REIT) | | | 55,784 | |
| | 983 | | | AvalonBay Communities, Inc. (REIT) | | | 199,726 | |
| | 1,091 | | | Boston Properties, Inc. (REIT) | | | 140,739 | |
| | 2,242 | | | CBRE Group, Inc. Class A* | | | 115,015 | |
| | 2,910 | | | Crown Castle International Corp. (REIT) | | | 379,318 | |
| | 1,454 | | | Digital Realty Trust, Inc. (REIT) | | | 171,267 | |
| | 2,616 | | | Duke Realty Corp. (REIT) | | | 82,692 | |
| | 589 | | | Equinix, Inc. (REIT) | | | 297,027 | |
| | 2,613 | | | Equity Residential (REIT) | | | 198,379 | |
| | 466 | | | Essex Property Trust, Inc. (REIT) | | | 136,039 | |
| | 877 | | | Extra Space Storage, Inc. (REIT) | | | 93,050 | |
| | 515 | | | Federal Realty Investment Trust (REIT) | | | 66,311 | |
| | 3,435 | | | HCP, Inc. (REIT) | | | 109,851 | |
| | 5,203 | | | Host Hotels & Resorts, Inc. (REIT) | | | 94,799 | |
| | 1,947 | | | Iron Mountain, Inc. (REIT) | | | 60,941 | |
| | 3,014 | | | Kimco Realty Corp. (REIT) | | | 55,699 | |
| | 813 | | | Macerich Co. (The) (REIT) | | | 27,227 | |
| | 801 | | | Mid-America Apartment Communities, Inc. (REIT) | | | 94,326 | |
| | 4,462 | | | Prologis, Inc. (REIT) | | | 357,406 | |
| | 1,047 | | | Public Storage (REIT) | | | 249,364 | |
| | 2,120 | | | Realty Income Corp. (REIT) | | | 146,216 | |
| | 1,187 | | | Regency Centers Corp. (REIT) | | | 79,220 | |
| | 786 | | | SBA Communications Corp. (REIT)* | | | 176,724 | |
| | 2,171 | | | Simon Property Group, Inc. (REIT) | | | 346,839 | |
| | 620 | | | SL Green Realty Corp. (REIT) | | | 49,829 | |
| | 1,934 | | | UDR, Inc. (REIT) | | | 86,817 | |
| | 2,465 | | | Ventas, Inc. (REIT) | | | 168,483 | |
| | 1,238 | | | Vornado Realty Trust (REIT) | | | 79,356 | |
| | 2,721 | | | Welltower, Inc. (REIT) | | | 221,843 | |
| | 5,267 | | | Weyerhaeuser Co. (REIT) | | | 138,733 | |
| | | | | | | | |
| | | | | | | 5,224,924 | |
| | |
| Retailing – 6.6% | |
| | 512 | | | Advance Auto Parts, Inc. | | | 78,920 | |
| | 2,906 | | | Amazon.com, Inc.* | | | 5,502,889 | |
| | 177 | | | AutoZone, Inc.* | | | 194,606 | |
| | 1,665 | | | Best Buy Co., Inc. | | | 116,100 | |
| | 303 | | | Booking Holdings, Inc.* | | | 568,037 | |
| | 1,183 | | | CarMax, Inc.* | | | 102,720 | |
| | 1,846 | | | Dollar General Corp. | | | 249,505 | |
| | 1,649 | | | Dollar Tree, Inc.* | | | 177,086 | |
| | 5,694 | | | eBay, Inc. | | | 224,913 | |
| | 811 | | | Expedia Group, Inc. | | | 107,887 | |
| | 788 | | | Foot Locker, Inc. | | | 33,033 | |
| | 1,637 | | | Gap, Inc. (The) | | | 29,417 | |
| | 1,009 | | | Genuine Parts Co. | | | 104,512 | |
| | 7,756 | | | Home Depot, Inc. (The) | | | 1,613,015 | |
| | 1,173 | | | Kohl’s Corp. | | | 55,776 | |
| | 1,575 | | | L Brands, Inc. | | | 41,108 | |
| | 2,207 | | | LKQ Corp.* | | | 58,728 | |
| | 5,478 | | | Lowe’s Cos., Inc. | | | 552,785 | |
| | |
| | |
| 36 | | The accompanying notes are an integral part of these financial statements. |
GOLDMAN SACHS VARIABLE INSURANCE TRUST EQUITY INDEX FUND
| | | | | | | | |
| Shares | | | Description | | Value | |
|
| Common Stocks – (continued) | |
| Retailing – (continued) | |
| | 2,233 | | | Macy’s, Inc. | | $ | 47,920 | |
| | 696 | | | Nordstrom, Inc. | | | 22,175 | |
| | 557 | | | O’Reilly Automotive, Inc.* | | | 205,711 | |
| | 2,630 | | | Ross Stores, Inc. | | | 260,686 | |
| | 3,634 | | | Target Corp. | | | 314,741 | |
| | 764 | | | Tiffany & Co. | | | 71,541 | |
| | 8,651 | | | TJX Cos., Inc. (The) | | | 457,465 | |
| | 842 | | | Tractor Supply Co. | | | 91,610 | |
| | 402 | | | Ulta Beauty, Inc.* | | | 139,450 | |
| | | | | | | | |
| | | | | | | 11,422,336 | |
| | |
| Semiconductors & Semiconductor Equipment – 3.7% | |
| | 6,188 | | | Advanced Micro Devices, Inc.* | | | 187,930 | |
| | 2,598 | | | Analog Devices, Inc. | | | 293,236 | |
| | 6,628 | | | Applied Materials, Inc. | | | 297,664 | |
| | 2,782 | | | Broadcom, Inc. | | | 800,827 | |
| | 31,561 | | | Intel Corp. | | | 1,510,825 | |
| | 1,151 | | | KLA-Tencor Corp. | | | 136,048 | |
| | 1,083 | | | Lam Research Corp. | | | 203,431 | |
| | 1,915 | | | Maxim Integrated Products, Inc. | | | 114,555 | |
| | 1,674 | | | Microchip Technology, Inc. | | | 145,136 | |
| | 7,809 | | | Micron Technology, Inc.* | | | 301,349 | |
| | 4,252 | | | NVIDIA Corp. | | | 698,306 | |
| | 846 | | | Qorvo, Inc.* | | | 56,352 | |
| | 8,492 | | | QUALCOMM, Inc. | | | 645,986 | |
| | 1,255 | | | Skyworks Solutions, Inc. | | | 96,974 | |
| | 6,590 | | | Texas Instruments, Inc. | | | 756,268 | |
| | 1,760 | | | Xilinx, Inc. | | | 207,539 | |
| | | | | | | | |
| | | | | | | 6,452,426 | |
| | |
| Software & Services – 12.0% | |
| | 4,468 | | | Accenture plc Class A | | | 825,552 | |
| | 3,420 | | | Adobe, Inc.* | | | 1,007,703 | |
| | 1,148 | | | Akamai Technologies, Inc.* | | | 92,001 | |
| | 302 | | | Alliance Data Systems Corp. | | | 42,319 | |
| | 580 | | | ANSYS, Inc.* | | | 118,796 | |
| | 1,547 | | | Autodesk, Inc.* | | | 252,006 | |
| | 3,054 | | | Automatic Data Processing, Inc. | | | 504,918 | |
| | 800 | | | Broadridge Financial Solutions, Inc. | | | 102,144 | |
| | 1,976 | | | Cadence Design Systems, Inc.* | | | 139,921 | |
| | 896 | | | Citrix Systems, Inc. | | | 87,934 | |
| | 4,048 | | | Cognizant Technology Solutions Corp. Class A | | | 256,603 | |
| | 1,896 | | | DXC Technology Co. | | | 104,564 | |
| | 2,249 | | | Fidelity National Information Services, Inc. | | | 275,907 | |
| | 2,756 | | | Fiserv, Inc.* | | | 251,237 | |
| | 607 | | | FleetCor Technologies, Inc.* | | | 170,476 | |
| | 1,047 | | | Fortinet, Inc.* | | | 80,441 | |
| | 649 | | | Gartner, Inc.* | | | 104,450 | |
| | 1,106 | | | Global Payments, Inc. | | | 177,104 | |
| | 6,252 | | | International Business Machines Corp. | | | 862,151 | |
| | 1,822 | | | Intuit, Inc. | | | 476,143 | |
| | 524 | | | Jack Henry & Associates, Inc. | | | 70,174 | |
| | 6,327 | | | Mastercard, Inc. Class A | | | 1,673,681 | |
| | |
|
| Common Stocks – (continued) | |
| Software & Services – (continued) | |
| | 53,850 | | | Microsoft Corp. | | | 7,213,746 | |
| | 17,105 | | | Oracle Corp. | | | 974,472 | |
| | 2,277 | | | Paychex, Inc. | | | 187,374 | |
| | 8,244 | | | PayPal Holdings, Inc.* | | | 943,608 | |
| | 1,242 | | | Red Hat, Inc.* | | | 233,198 | |
| | 5,485 | | | salesforce.com, Inc.* | | | 832,239 | |
| | 4,396 | | | Symantec Corp. | | | 95,657 | |
| | 1,046 | | | Synopsys, Inc.* | | | 134,610 | |
| | 1,145 | | | Total System Services, Inc. | | | 146,869 | |
| | 730 | | | VeriSign, Inc.* | | | 152,687 | |
| | 12,271 | | | Visa, Inc. Class A | | | 2,129,632 | |
| | 3,108 | | | Western Union Co. (The) | | | 61,818 | |
| | | | | | | | |
| | | | | | | 20,782,135 | |
| | |
| Technology Hardware & Equipment – 5.6% | |
| | 2,073 | | | Amphenol Corp. Class A | | | 198,884 | |
| | 30,715 | | | Apple, Inc. | | | 6,079,113 | |
| | 366 | | | Arista Networks, Inc.* | | | 95,021 | |
| | 30,175 | | | Cisco Systems, Inc. | | | 1,651,478 | |
| | 5,580 | | | Corning, Inc. | | | 185,423 | |
| | 399 | | | F5 Networks, Inc.* | | | 58,106 | |
| | 1,002 | | | FLIR Systems, Inc. | | | 54,208 | |
| | 9,708 | | | Hewlett Packard Enterprise Co. | | | 145,135 | |
| | 10,637 | | | HP, Inc. | | | 221,143 | |
| | 242 | | | IPG Photonics Corp.* | | | 37,328 | |
| | 2,510 | | | Juniper Networks, Inc. | | | 66,841 | |
| | 1,287 | | | Keysight Technologies, Inc.* | | | 115,585 | |
| | 1,169 | | | Motorola Solutions, Inc. | | | 194,907 | |
| | 1,739 | | | NetApp, Inc. | | | 107,296 | |
| | 1,846 | | | Seagate Technology plc | | | 86,984 | |
| | 2,383 | | | TE Connectivity Ltd. | | | 228,244 | |
| | 2,010 | | | Western Digital Corp. | | | 95,576 | |
| | 1,356 | | | Xerox Corp. | | | 48,016 | |
| | | | | | | | |
| | | | | | | 9,669,288 | |
| | |
| Telecommunication Services – 2.0% | |
| | 51,058 | | | AT&T, Inc. | | | 1,710,954 | |
| | 6,771 | | | CenturyLink, Inc. | | | 79,627 | |
| | 28,962 | | | Verizon Communications, Inc. | | | 1,654,599 | |
| | | | | | | | |
| | | | | | | 3,445,180 | |
| | |
| Transportation – 2.0% | |
| | 861 | | | Alaska Air Group, Inc. | | | 55,027 | |
| | 2,803 | | | American Airlines Group, Inc. | | | 91,406 | |
| | 930 | | | CH Robinson Worldwide, Inc. | | | 78,445 | |
| | 5,471 | | | CSX Corp. | | | 423,291 | |
| | 4,142 | | | Delta Air Lines, Inc. | | | 235,059 | |
| | 1,215 | | | Expeditors International of Washington, Inc. | | | 92,170 | |
| | 1,676 | | | FedEx Corp. | | | 275,182 | |
| | 620 | | | JB Hunt Transport Services, Inc. | | | 56,674 | |
| | 710 | | | Kansas City Southern | | | 86,492 | |
| | 1,872 | | | Norfolk Southern Corp. | | | 373,146 | |
| | 3,477 | | | Southwest Airlines Co. | | | 176,562 | |
| | 4,961 | | | Union Pacific Corp. | | | 838,955 | |
| | |
| | |
| The accompanying notes are an integral part of these financial statements. | | 37 |
GOLDMAN SACHS VARIABLE INSURANCE TRUST EQUITY INDEX FUND
Schedule of Investments(continued)
June 30, 2019 (Unaudited)
| | | | | | | | |
Shares | | | Description | | Value | |
|
| Common Stocks – (continued) | |
| Transportation – (continued) | |
| | 1,558 | | | United Continental Holdings, Inc.* | | $ | 136,403 | |
| | 4,868 | | | United Parcel Service, Inc. Class B | | | 502,718 | |
| | | | | | | | |
| | | | | | | 3,421,530 | |
| | |
| Utilities – 3.3% | |
| | 4,791 | | | AES Corp. | | | 80,297 | |
| | 1,695 | | | Alliant Energy Corp. | | | 83,190 | |
| | 1,705 | | | Ameren Corp. | | | 128,062 | |
| | 3,487 | | | American Electric Power Co., Inc. | | | 306,891 | |
| | 1,274 | | | American Water Works Co., Inc. | | | 147,784 | |
| | 846 | | | Atmos Energy Corp. | | | 89,304 | |
| | 3,522 | | | CenterPoint Energy, Inc. | | | 100,835 | |
| | 2,018 | | | CMS Energy Corp. | | | 116,862 | |
| | 2,254 | | | Consolidated Edison, Inc. | | | 197,631 | |
| | 5,601 | | | Dominion Energy, Inc. | | | 433,069 | |
| | 1,263 | | | DTE Energy Co. | | | 161,512 | |
| | 5,095 | | | Duke Energy Corp. | | | 449,583 | |
| | 2,314 | | | Edison International | | | 155,987 | |
| | 1,320 | | | Entergy Corp. | | | 135,868 | |
| | 1,788 | | | Evergy, Inc. | | | 107,548 | |
| | 2,259 | | | Eversource Energy | | | 171,142 | |
| | 6,847 | | | Exelon Corp. | | | 328,245 | |
| | 3,522 | | | FirstEnergy Corp. | | | 150,777 | |
| | 3,370 | | | NextEra Energy, Inc. | | | 690,378 | |
| | 2,594 | | | NiSource, Inc. | | | 74,707 | |
| | 2,040 | | | NRG Energy, Inc. | | | 71,645 | |
| | 791 | | | Pinnacle West Capital Corp. | | | 74,425 | |
| | |
| | 5,074 | | | PPL Corp. | | | 157,345 | |
| | 3,511 | | | Public Service Enterprise Group, Inc. | | | 206,517 | |
| | 1,920 | | | Sempra Energy | | | 263,885 | |
| | 7,245 | | | Southern Co. (The) | | | 400,504 | |
| | 2,184 | | | WEC Energy Group, Inc. | | | 182,080 | |
| | 3,602 | | | Xcel Energy, Inc. | | | 214,283 | |
| | | | | | | | |
| | | | | | | 5,680,356 | |
| | |
| | TOTAL COMMON STOCKS – 99.3%
| | | | |
| | (Cost $59,646,412) | | $ | 171,778,548 | |
| | |
| | | | | | | | | | | | |
Principal
Amount | | | Interest
Rate | | Maturity
Date | | | Value | |
|
| Short-Term Investment(b) – 0.0% | |
| U.S. Treasury Obligation – 0.0% | |
| | U.S. Treasury Bills | |
| $ | 75,000 | | | 2.107% | | | 11/29/2019 | | | $ | 74,350 | |
| | (Cost $74,288) | | | | | |
| | |
| | TOTAL INVESTMENTS – 99.3% | |
| | (Cost $59,720,700) | | | | | | $ | 171,852,898 | |
| | |
| OTHER ASSETS IN EXCESS
OF LIABILITIES – 0.7% | | | | | | | 1,116,819 | |
| | |
| | NET ASSETS –100.0% | | | | | | $ | 172,969,717 | |
| | |
| | |
| The percentage shown for each investment category reflects the value of investments in that category as a percentage of net assets. |
| |
| * | | Non-income producing security. |
| |
| (a) | | Represents an Affiliated Issuer. |
| |
| (b) | | All or a portion of security is segregated as collateral for initial margin requirements on futures transactions. |
| | |
| |
| Investment Abbreviation: |
| REIT | | —Real Estate Investment Trust |
ADDITIONAL INVESTMENT INFORMATION
FUTURES CONTRACTS — At June 30, 2019, the Fund had the following futures contracts:
| | | | | | | | | | | | | | |
| Description | | Number of
Contracts | | | Expiration
Date | | Notional
Amount | | | Unrealized
Appreciation/
(Depreciation) | |
Long position contracts: | | | | | |
| S&P 500 E-Mini Index | | | 8 | | | 09/20/2019 | | $ | 1,177,680 | | | $ | 19,957 | |
| | |
| 38 | | The accompanying notes are an integral part of these financial statements. |
GOLDMAN SACHS VARIABLE INSURANCE TRUST GROWTH OPPORTUNITIES FUND
Schedule of Investments
June 30, 2019 (Unaudited)
| | | | | | | | |
Shares | | | Description | | Value | |
|
| Common Stocks – 95.1% | |
| Automobiles & Components – 0.5% | |
| | 4,704 | | | Aptiv plc | | $ | 380,224 | |
| | |
| Banks – 0.9% | |
| | 7,164 | | | First Republic Bank | | | 699,565 | |
| | |
| Capital Goods – 12.4% | |
| | 6,385 | | | AMETEK, Inc. | | | 580,013 | |
| | 12,699 | | | Fortive Corp. | | | 1,035,223 | |
| | 7,649 | | | Harris Corp. | | | 1,446,655 | |
| | 6,917 | | | HEICO Corp. | | | 925,564 | |
| | 3,545 | | | HEICO Corp. Class A | | | 366,447 | |
| | 6,435 | | | IDEX Corp. | | | 1,107,721 | |
| | 11,929 | | | Ingersoll-Rand plc | | | 1,511,047 | |
| | 3,392 | | | Rockwell Automation, Inc. | | | 555,711 | |
| | 1,513 | | | Roper Technologies, Inc. | | | 554,151 | |
| | 9,027 | | | Sensata Technologies Holding plc* | | | 442,323 | |
| | 8,819 | | | Xylem, Inc. | | | 737,621 | |
| | | | | | | | |
| | | | | | | 9,262,476 | |
| | |
| Commercial & Professional Services – 2.9% | |
| | 4,131 | | | Cintas Corp. | | | 980,245 | |
| | 8,192 | | | Verisk Analytics, Inc. | | | 1,199,800 | |
| | | | | | | | |
| | | | | | | 2,180,045 | |
| | |
| Consumer Durables & Apparel – 2.7% | |
| | 9,425 | | | DR Horton, Inc. | | | 406,500 | |
| | 6,227 | | | Lululemon Athletica, Inc.* | | | 1,122,168 | |
| | 4,984 | | | PVH Corp. | | | 471,686 | |
| | | | | | | | |
| | | | | | | 2,000,354 | |
| | |
| Consumer Services – 4.4% | |
| | 8,894 | | | Bright Horizons Family Solutions, Inc.* | | | 1,341,838 | |
| | 10,315 | | | Choice Hotels International, Inc. | | | 897,508 | |
| | 3,585 | | | Domino’s Pizza, Inc. | | | 997,634 | |
| | | | | | | | |
| | | | | | | 3,236,980 | |
| | |
| Diversified Financials – 4.3% | |
| | 5,335 | | | Cboe Global Markets, Inc. | | | 552,866 | |
| | 4,334 | | | MSCI, Inc. | | | 1,034,916 | |
| | 9,545 | | | Northern Trust Corp. | | | 859,050 | |
| | 6,963 | | | T. Rowe Price Group, Inc. | | | 763,911 | |
| | | | | | | | |
| | | | | | | 3,210,743 | |
| | |
| Energy – 2.1% | |
| | 11,680 | | | Cheniere Energy, Inc.* | | | 799,496 | |
| | 3,410 | | | Concho Resources, Inc. | | | 351,844 | |
| | 3,670 | | | Diamondback Energy, Inc. | | | 399,920 | |
| | | | | | | | |
| | | | | | | 1,551,260 | |
| | |
| Food & Staples Retailing – 0.5% | |
| | 12,201 | | | Grocery Outlet Holding Corp.* | | | 401,169 | |
| | |
| Food, Beverage & Tobacco – 4.3% | |
| | 20,855 | | | Brown-Forman Corp. Class B | | | 1,155,993 | |
| | 3,584 | | | Lamb Weston Holdings, Inc. | | | 227,082 | |
| | |
|
| Common Stocks – (continued) | |
| Food, Beverage & Tobacco – (continued) | |
| | 7,419 | | | McCormick & Co., Inc.(Non-Voting) | | | 1,150,019 | |
| | 10,256 | | | Monster Beverage Corp.* | | | 654,641 | |
| | | | | | | | |
| | | | | | | 3,187,735 | |
| | |
| Health Care Equipment & Services – 9.2% | |
| | 2,895 | | | Align Technology, Inc.* | | | 792,361 | |
| | 10,658 | | | Centene Corp.* | | | 558,905 | |
| | 1,618 | | | Cooper Cos., Inc. (The) | | | 545,088 | |
| | 2,989 | | | Edwards Lifesciences Corp.* | | | 552,188 | |
| | 2,433 | | | Guardant Health, Inc.* | | | 210,041 | |
| | 4,421 | | | IDEXX Laboratories, Inc.* | | | 1,217,234 | |
| | 2,558 | | | Molina Healthcare, Inc.* | | | 366,152 | |
| | 3,398 | | | Teleflex, Inc. | | | 1,125,248 | |
| | 2,313 | | | Veeva Systems, Inc. Class A* | | | 374,960 | |
| | 3,305 | | | West Pharmaceutical Services, Inc. | | | 413,621 | |
| | 5,751 | | | Zimmer Biomet Holdings, Inc. | | | 677,123 | |
| | | | | | | | |
| | | | | | | 6,832,921 | |
| | |
| Household & Personal Products – 1.1% | |
| | 3,532 | | | Church & Dwight Co., Inc. | | | 258,048 | |
| | 3,820 | | | Clorox Co. (The) | | | 584,880 | |
| | | | | | | | |
| | | | | | | 842,928 | |
| | |
| Materials – 4.0% | |
| | 8,869 | | | Ashland Global Holdings, Inc. | | | 709,254 | |
| | 8,179 | | | Ball Corp. | | | 572,448 | |
| | 3,639 | | | Celanese Corp. | | | 392,284 | |
| | 5,490 | | | Martin Marietta Materials, Inc. | | | 1,263,304 | |
| | | | | | | | |
| | | | | | | 2,937,290 | |
| | |
| Media & Entertainment – 1.8% | |
| | 2,995 | | | IAC/InterActiveCorp* | | | 651,502 | |
| | 2,719 | | | Spotify Technology SA* | | | 397,572 | |
| | 8,605 | | | Twitter, Inc.* | | | 300,315 | |
| | | | | | | | |
| | | | | | | 1,349,389 | |
| | |
| Pharmaceuticals, Biotechnology & Life Sciences – 6.8% | |
| | 2,016 | | | Adaptive Biotechnologies Corp.* | | | 97,373 | |
| | 7,629 | | | Agilent Technologies, Inc. | | | 569,657 | |
| | 7,011 | | | Agios Pharmaceuticals, Inc.* | | | 349,709 | |
| | 14,703 | | | Alder Biopharmaceuticals, Inc.* | | | 173,054 | |
| | 6,935 | | | BioMarin Pharmaceutical, Inc.* | | | 593,983 | |
| | 20,366 | | | Elanco Animal Health, Inc.* | | | 688,371 | |
| | 2,786 | | | Exact Sciences Corp.* | | | 328,859 | |
| | 1,248 | | | Illumina, Inc.* | | | 459,451 | |
| | 5,620 | | | Incyte Corp.* | | | 477,475 | |
| | 561 | | | Mettler-Toledo International, Inc.* | | | 471,240 | |
| | 20,376 | | | Moderna, Inc.* | | | 298,305 | |
| | 1,378 | | | Sarepta Therapeutics, Inc.* | | | 209,387 | |
| | 3,271 | | | Zoetis, Inc. | | | 371,226 | |
| | | | | | | | |
| | | | | | | 5,088,090 | |
| | |
| | |
| The accompanying notes are an integral part of these financial statements. | | 39 |
GOLDMAN SACHS VARIABLE INSURANCE TRUST GROWTH OPPORTUNITIES FUND
Schedule of Investments(continued)
June 30, 2019 (Unaudited)
| | | | | | | | |
Shares | | | Description | | Value | |
|
| Common Stocks – (continued) | |
| Real Estate Investment Trusts – 2.7% | |
| | 5,044 | | | Equity LifeStyle Properties, Inc. | | $ | 612,039 | |
| | 6,327 | | | SBA Communications Corp.* | | | 1,422,563 | |
| | | | | | | | |
| | | | | | | 2,034,602 | |
| | |
| Retailing – 8.3% | |
| | 4,351 | | | Burlington Stores, Inc.* | | | 740,323 | |
| | 14,099 | | | Dollar General Corp. | | | 1,905,621 | |
| | 8,519 | | | Expedia Group, Inc. | | | 1,133,283 | |
| | 1,127 | | | Five Below, Inc.* | | | 135,262 | |
| | 2,996 | | | O’Reilly Automotive, Inc.* | | | 1,106,483 | |
| | 5,163 | | | Ross Stores, Inc. | | | 511,756 | |
| | 1,962 | | | Ulta Beauty, Inc.* | | | 680,598 | |
| | | | | | | | |
| | | | | | | 6,213,326 | |
| | |
| Semiconductors & Semiconductor Equipment – 5.3% | |
| | 24,296 | | | Advanced Micro Devices, Inc.* | | | 737,869 | |
| | 3,279 | | | Analog Devices, Inc. | | | 370,101 | |
| | 47,525 | | | Marvell Technology Group Ltd. | | | 1,134,422 | |
| | 5,160 | | | Microchip Technology, Inc. | | | 447,372 | |
| | 8,350 | | | MKS Instruments, Inc. | | | 650,381 | |
| | 1,628 | | | Monolithic Power Systems, Inc. | | | 221,050 | |
| | 3,160 | | | Xilinx, Inc. | | | 372,627 | |
| | | | | | | | |
| | | | | | | 3,933,822 | |
| | |
| Software & Services – 16.7% | |
| | 7,453 | | | Atlassian Corp. plc Class A* | | | 975,150 | |
| | 2,232 | | | Autodesk, Inc.* | | | 363,593 | |
| | 17,800 | | | Black Knight, Inc.* | | | 1,070,670 | |
| | 10,582 | | | Cadence Design Systems, Inc.* | | | 749,311 | |
| | 7,618 | | | Ceridian HCM Holding, Inc.* | | | 382,424 | |
| | 9,977 | | | Citrix Systems, Inc. | | | 979,143 | |
| | 4,271 | | | Coupa Software, Inc.* | | | 540,751 | |
| | 9,124 | | | Fidelity National Information Services, Inc. | | | 1,119,332 | |
| | 17,254 | | | Fiserv, Inc.* | | | 1,572,875 | |
| | 16,940 | | | GoDaddy, Inc. Class A* | | | 1,188,341 | |
| | 11,558 | | | PTC, Inc.* | | | 1,037,446 | |
| | 806 | | | Slack Technologies, Inc. Class A* | | | 30,225 | |
| | 6,143 | | | Splunk, Inc.* | | | 772,482 | |
| | 1,547 | | | Tableau Software, Inc. Class A* | | | 256,833 | |
| | 10,999 | | | Total System Services, Inc. | | | 1,410,842 | |
| | | | | | | | |
| | | | | | | 12,449,418 | |
| | |
| Technology Hardware & Equipment – 2.9% | |
| | 16,820 | | | Amphenol Corp. Class A | | | 1,613,711 | |
| | 12,226 | | | National Instruments Corp. | | | 513,369 | |
| | | | | | | | |
| | | | | | | 2,127,080 | |
| | |
| Transportation – 1.3% | |
| | 5,338 | | | Lyft, Inc. Class A*(a) | | | 350,760 | |
| | 4,045 | | | Old Dominion Freight Line, Inc. | | | 603,757 | |
| | | | | | | | |
| | | | | | | 954,517 | |
| | |
| | TOTAL COMMON STOCKS | |
| | (Cost $52,929,580) | | $ | 70,873,934 | |
| | |
| Shares | | | Dividend
Rate | | Value | |
|
| | Investment Company(b) – 1.5% | |
| Goldman Sachs Financial Square Government Fund —
Institutional Shares |
|
| | 1,092,324 | | | 2.308% | | $ | 1,092,324 | |
| (Cost $1,092,324) | | | |
| | |
| TOTAL INVESTMENTS BEFORE SECURITIES LENDING
REINVESTMENT VEHICLE
|
|
| | (Cost $54,021,904) | | $ | 71,966,258 | |
| | |
| | | | | | | | |
|
| | Securities Lending Reinvestment Vehicle(b) – 0.5% | |
| Goldman Sachs Financial Square Government Fund —
Institutional Shares |
|
| | 352,707 | | | 2.308% | | $ | 352,707 | |
| | (Cost $352,707) | | | | |
| | |
| | TOTAL INVESTMENTS – 97.1% | |
| | (Cost $54,374,611) | | $ | 72,318,965 | |
| | |
| OTHER ASSETS IN EXCESS OF
LIABILITIES – 2.9% | | | 2,159,442 | |
| | |
| | NET ASSETS – 100.0% | | $ | 74,478,407 | |
| | |
| | |
| The percentage shown for each investment category reflects the value of investments in that category as a percentage of net assets. |
| |
| * | | Non-income producing security. |
| |
| (a) | | All or a portion of security is on loan. |
| |
| (b) | | Represents an Affiliated Issuer. |
| | |
| 40 | | The accompanying notes are an integral part of these financial statements. |
GOLDMAN SACHS VARIABLE INSURANCE TRUST HIGH QUALITY FLOATING RATE FUND
Schedule of Investments
June 30, 2019 (Unaudited)
| | | | | | | | | | | | | | |
Principal
Amount | | | Interest
Rate | | | Maturity
Date | | | Value | |
|
| Mortgage-Backed Securities – 3.0% | |
| Adjustable Rate FHLMC(a) – 1.0% | |
| $ | 108,141 | | | | 4.625 | % | | | 05/01/2035 | | | $ | 113,705 | |
| | 17,595 | | | | 4.534 | | | | 09/01/2035 | | | | 18,485 | |
| | 104,536 | | | | 4.788 | | | | 12/01/2036 | | | | 109,480 | |
| | 133,865 | | | | 5.180 | | | | 04/01/2037 | | | | 141,121 | |
| | 254,934 | | | | 4.628 | | | | 01/01/2038 | | | | 267,690 | |
| | 177,393 | | | | 4.746 | | | | 01/01/2038 | | | | 186,504 | |
| | | | | | | | | | | | | | |
| | | | | | | | | | | | | 836,985 | |
| | |
| Adjustable Rate FNMA(a) – 1.3% | |
| | 38,793 | | | | 4.138 | | | | 05/01/2033 | | | | 40,305 | |
| | 72,705 | | | | 4.708 | | | | 05/01/2035 | | | | 76,507 | |
| | 301,821 | | | | 4.684 | | | | 06/01/2035 | | | | 317,790 | |
| | 380,795 | | | | 4.387 | | | | 11/01/2035 | | | | 397,106 | |
| | 56,824 | | | | 4.669 | | | | 12/01/2035 | | | | 59,594 | |
| | 179,869 | | | | 4.916 | | | | 03/01/2037 | | | | 189,356 | |
| | | | | | | | | | | | | | |
| | | | | | | | | | | | | 1,080,658 | |
| | |
| Adjustable Rate GNMA(a) – 0.2% | |
| | 185,560 | | | | 3.625 | | | | 04/20/2033 | | | | 190,794 | |
| | |
| Agency Multi-Family – 0.5% | |
| | FNMA | |
| | 25,823 | | | | 3.416 | | | | 10/01/2020 | | | | 26,151 | |
| | 39,747 | | | | 3.619 | | | | 12/01/2020 | | | | 40,495 | |
| | 227,716 | | | | 3.771 | | | | 12/01/2020 | | | | 232,062 | |
| | 86,614 | | | | 4.381 | | | | 06/01/2021 | | | | 89,822 | |
| | | | | | | | | | | | | | |
| | | | | | | | | | | | | 388,530 | |
| | |
| | TOTAL MORTGAGE-BACKED SECURITIES | |
| | (Cost $2,514,934) | | | $ | 2,496,967 | |
| | |
| | | | | | | | | | | | | | |
|
| Collateralized Mortgage Obligations(a) – 25.7% | |
| Adjustable RateNon-Agency(b) – 0.2% | |
| | Holmes Master Issuer plc Series2018-1A, Class A2 | |
| $ | 177,143 | | | | 2.957 | % | | | 10/15/2054 | | | $ | 177,183 | |
| | |
| Agency Multi-Family – 4.0% | |
| FHLMC Multifamily Structured Pass-Through Certificates
REMIC Series J15L, Class AFL(c) |
|
| | 401,706 | | | | 2.781 | | | | 08/25/2025 | | | | 400,906 | |
| FHLMC Multifamily Structured Pass-Through Certificates
REMIC Series KF03, Class A |
|
| | 11,709 | | | | 2.770 | | | | 01/25/2021 | | | | 11,709 | |
| FHLMC Multifamily Structured Pass-Through Certificates
REMIC Series KF32, Class A(c) |
|
| | 903,528 | | | | 2.801 | | | | 05/25/2024 | | | | 902,412 | |
| FHLMC Multifamily Structured Pass-Through Certificates
REMIC Series KF42, Class A(c) |
|
| | 382,827 | | | | 2.680 | | | | 12/25/2024 | | | | 380,485 | |
| FHLMC Multifamily Structured Pass-Through Certificates
REMIC Series KP04, Class AG1(c) |
|
| | 1,350,000 | | | | 2.651 | | | | 07/25/2020 | | | | 1,347,522 | |
| FHLMC Multifamily Structured Pass-Through Certificates
REMIC Series KS02, Class A(c) |
|
| | 205,645 | | | | 2.810 | | | | 08/25/2023 | | | | 205,545 | |
| | | | | | | | | | | | | | |
| | | | | | | | | | | | | 3,248,579 | |
| | |
|
| Collateralized Mortgage Obligations(a) – (continued) | |
| Regular Floater – 21.5% | |
| | FHLMC REMIC Series 3049, Class FP | |
| 165,546 | | | | 2.744 | | | | 10/15/2035 | | | | 164,919 | |
| | FHLMC REMIC Series 3208, Class FB(c) | |
| | 100,556 | | | | 2.794 | | | | 08/15/2036 | | | | 100,429 | |
| | FHLMC REMIC Series 3208, Class FD(c) | |
| | 149,828 | | | | 2.794 | | | | 08/15/2036 | | | | 149,640 | |
| | FHLMC REMIC Series 3208, Class FG(c) | |
| | 603,335 | | | | 2.794 | | | | 08/15/2036 | | | | 602,575 | |
| | FHLMC REMIC Series 3307, Class FT | |
| | 929,869 | | | | 2.634 | | | | 07/15/2034 | | | | 925,932 | |
| | FHLMC REMIC Series 3311, Class KF | |
| | 1,658,409 | | | | 2.734 | | | | 05/15/2037 | | | | 1,654,962 | |
| | FHLMC REMIC Series 3371, Class FA(c) | |
| | 379,843 | | | | 2.994 | | | | 09/15/2037 | | | | 382,886 | |
| | FHLMC REMIC Series 4174, Class FB(c) | |
| | 668,160 | | | | 2.694 | | | | 05/15/2039 | | | | 666,029 | |
| | FHLMC REMIC Series 4320, Class FD | |
| | 334,973 | | | | 2.794 | | | | 07/15/2039 | | | | 334,296 | |
| | FHLMC REMIC Series 4477, Class FG | |
| | 408,793 | | | | 2.786 | | | | 10/15/2040 | | | | 407,179 | |
| | FHLMC REMIC Series 4508, Class CF | |
| | 318,205 | | | | 2.794 | | | | 09/15/2045 | | | | 318,205 | |
| | FHLMC REMIC Series 4631, Class GF | |
| | 2,056,998 | | | | 2.894 | | | | 11/15/2046 | | | | 2,055,972 | |
| | FHLMC REMIC Series 4637, Class QF | |
| | 1,896,891 | | | | 3.440 | | | | 04/15/2044 | | | | 1,898,258 | |
| | FNMA REMIC Series2006-82, Class F | |
| | 151,298 | | | | 2.974 | | | | 09/25/2036 | | | | 152,165 | |
| | FNMA REMIC Series2006-96, Class FA | |
| | 497,167 | | | | 2.704 | | | | 10/25/2036 | | | | 495,558 | |
| | FNMA REMIC Series2007-33, Class HF | |
| | 87,877 | | | | 2.754 | | | | 04/25/2037 | | | | 87,552 | |
| | FNMA REMIC Series2007-36, Class F | |
| | 144,003 | | | | 2.634 | | | | 04/25/2037 | | | | 142,901 | |
| | FNMA REMIC Series2007-85, Class FC | |
| | 398,211 | | | | 2.944 | | | | 09/25/2037 | | | | 400,445 | |
| | FNMA REMIC Series2008-8, Class FB | |
| | 310,329 | | | | 3.224 | | | | 02/25/2038 | | | | 313,120 | |
| | FNMA REMIC Series2011-63, Class FG | |
| | 334,993 | | | | 2.854 | | | | 07/25/2041 | | | | 335,257 | |
| | FNMA REMIC Series2012-35, Class QF | |
| | 1,060,272 | | | | 2.804 | | | | 04/25/2042 | | | | 1,060,573 | |
| | FNMA REMIC Series2016-1, Class FT | |
| | 1,047,431 | | | | 2.754 | | | | 02/25/2046 | | | | 1,041,499 | |
| | FNMA REMIC Series2017-45, Class FA | |
| | 581,712 | | | | 2.806 | | | | 06/25/2047 | | | | 580,835 | |
| | FNMA REMIC Series2017-96, Class FC | |
| | 1,151,879 | | | | 2.804 | | | | 12/25/2057 | | | | 1,149,216 | |
| | GNMA REMIC Series2005-48, Class AF | |
| | 505,496 | | | | 2.583 | | | | 06/20/2035 | | | | 501,151 | |
| | GNMA REMIC Series2012-98, Class FA | |
| | 477,462 | | | | 2.783 | | | | 08/20/2042 | | | | 476,702 | |
| | NCUA Guaranteed Notes Trust Series2010-R1, Class 1A(c) | |
| | 97,763 | | | | 2.869 | | | | 10/07/2020 | | | | 97,828 | |
| | |
| | |
| The accompanying notes are an integral part of these financial statements. | | 41 |
GOLDMAN SACHS VARIABLE INSURANCE TRUST HIGH QUALITY FLOATING RATE FUND
Schedule of Investments(continued)
June 30, 2019 (Unaudited)
| | | | | | | | | | | | |
Principal
Amount | | | Interest
Rate | | Maturity
Date | | | Value | |
|
| Collateralized Mortgage Obligations(a) – (continued) | |
| Regular Floater – (continued) | |
| | NCUA Guaranteed Notes Trust Series2010-R2, Class 2A(c) | |
| $ | 270,132 | | | 2.889 % | | | 11/05/2020 | | | $ | 270,418 | |
| | NCUA Guaranteed Notes Trust Series2011-R1, Class 1A(c) | |
| | 762,522 | | | 2.869 | | | 01/08/2020 | | | | 762,766 | |
| | | | | | | | | | | | |
| | | | | | | | | | | 17,529,268 | |
| | |
| | TOTAL COLLATERALIZED MORTGAGE OBLIGATIONS
| |
| | (Cost $20,984,440) | | | $ | 20,955,030 | |
| | |
| | | | | | | | | | | | |
|
| Commercial Mortgage-Backed Security(a) – 0.4% | |
| Agency Multi-Family – 0.4% | |
| | FNMA ACES REMIC Series2017-M13, Class FA | |
| $ | 326,528 | | | 2.842% | | | 10/25/2024 | | | $ | 324,379 | |
| | (Cost $326,172) | | | | | |
| | |
| | | | | | | | | | | | |
|
| U.S. Government Agency Security(a) – 2.4% | |
| | FNMA | |
| | $2,000,000 | | | (SOFR + 0.16%),
2.660% | | | 01/30/2020 | | | $ | 2,001,760 | |
| | (Cost $2,000,000) | | | | | |
| | |
| | | | | | | | | | | | |
|
| Asset-Backed Securities – 40.3% | |
| Automobile(c) – 9.0% | |
| | Ally Master Owner Trust Series2017-3, Class A1(a) | |
| $ | 1,350,000 | | | 2.824% | | | 06/15/2022 | | | $ | 1,351,769 | |
| | Ally Master Owner Trust Series2018-1, Class A2 | |
| | 800,000 | | | 2.700 | | | 01/17/2023 | | | | 805,249 | |
| | Chesapeake Funding II LLC Series2016-2A, Class A2(a)(b) | |
| | 94,709 | | | 3.394 | | | 06/15/2028 | | | | 94,817 | |
| | Chesapeake Funding II LLC Series2017-3A, Class A2(a)(b) | |
| | 297,686 | | | 2.734 | | | 08/15/2029 | | | | 297,339 | |
| Ford Credit Floorplan Master Owner Trust A Series2015-2,
Class A2(a) |
|
| | 1,210,000 | | | 2.964 | | | 01/15/2022 | | | | 1,211,778 | |
| GMF Floorplan Owner Revolving Trust Series2017-2,
Class A2(a)(b) |
|
| | 900,000 | | | 2.824 | | | 07/15/2022 | | | | 900,780 | |
| | Mercedes-Benz Master Owner Trust Series2018-AA, Class A(a)(b) | |
| | 1,500,000 | | | 2.654 | | | 05/16/2022 | | | | 1,500,514 | |
| | Nissan Master Owner Trust Receivables Series2017-C, Class A(a) | |
| | 300,000 | | | 2.714 | | | 10/17/2022 | | | | 300,042 | |
| | Nissan Master Owner Trust Receivables Series2019-A, Class A(a) | |
| | 850,000 | | | 2.954 | | | 02/15/2024 | | | | 852,979 | |
| | | | | | | | | | | | |
| | | | | | | | | | | 7,315,267 | |
| | |
| Collateralized Loan Obligations(a)(b)(c) – 7.5% | |
| Benefit Street Partners CLO VII Ltd. Series 2015-VIIA,
Class A1AR |
|
| | 1,000,000 | | | 3.381 | | | 07/18/2027 | | | | 997,057 | |
| | |
|
| Asset-Backed Securities – (continued) | |
| Collateralized Loan Obligations(a)(b)(c) – (continued) | |
| | Bowman Park CLO Ltd. Series2014-1A, Class AR | |
| 219,861 | | | 3.704 | | | 11/23/2025 | | | | 219,921 | |
| | CBAM Ltd. Series2018-5A, Class A | |
| | 1,100,000 | | | 3.608 | | | 04/17/2031 | | | | 1,086,328 | |
| | Cutwater Ltd. Series2014-1A, Class A1AR | |
| | 237,280 | | | 3.847 | | | 07/15/2026 | | | | 237,339 | |
| | Dryden 64 CLO Ltd. Series2018-64A, Class A | |
| | 600,000 | | | 3.571 | | | 04/18/2031 | | | | 595,811 | |
| | Halcyon Loan Advisors Funding Ltd. Series2014-1A, Class A1R | |
| | 141,805 | | | 3.731 | | | 04/18/2026 | | | | 141,847 | |
| | Madison Park Funding XXX Ltd. Series2018-30A, Class A | |
| | 1,100,000 | | | 3.347 | | | 04/15/2029 | | | | 1,089,131 | |
| | Parallel Ltd. Series2015-1A, Class AR | |
| | 300,000 | | | 3.441 | | | 07/20/2027 | | | | 299,876 | |
| | Pikes Peak CLO 2 Series2018-2A, Class A | |
| | 800,000 | | | 3.891 | | | 01/18/2032 | | | | 795,267 | |
| | Symphony CLO XII Ltd. Series2013-12A, Class AR | |
| | 203,709 | | | 3.627 | | | 10/15/2025 | | | | 203,710 | |
| | Trinitas CLO II Ltd. Series2014-2A, Class A1R | |
| | 228,234 | | | 3.777 | | | 07/15/2026 | | | | 228,506 | |
| | WhiteHorse IX Ltd. Series2014-9A, Class AR | |
| | 267,867 | | | 3.748 | | | 07/17/2026 | | | | 268,151 | |
| | | | | | | | | | | | |
| | | | | | | | | | | 6,162,944 | |
| | |
| Credit Card(a)(c) – 7.8% | |
| | CARDS II Trust Series2018-1A, Class A(b) | |
| | 2,200,000 | | | 2.744 | | | 04/17/2023 | | | | 2,201,031 | |
| | Citibank Credit Card Issuance Trust Series2017-A5, Class A5 | |
| | 1,400,000 | | | 3.024 | | | 04/22/2026 | | | | 1,408,885 | |
| | Citibank Credit Card Issuance Trust Series2017-A7, Class A7 | |
| | 500,000 | | | 2.782 | | | 08/08/2024 | | | | 500,980 | |
| | Evergreen Credit Card Trust Series2019-1, Class A(b) | |
| | 1,000,000 | | | 2.874 | | | 01/15/2023 | | | | 1,002,905 | |
| | Golden Credit Card Trust Series2019-1A, Class A(b) | |
| | 350,000 | | | 2.844 | | | 12/15/2022 | | | | 350,655 | |
| | Trillium Credit Card Trust II Series2018-1A, Class A(b) | |
| | 900,000 | | | 2.652 | | | 02/27/2023 | | | | 900,044 | |
| | | | | | | | | | | | |
| | | | | | | | | | | 6,364,500 | |
| | |
| Student Loans(a) – 16.0% | |
| | Academic Loan Funding Trust Series2013-1A, Class A(b)(c) | |
| | 396,018 | | | 3.204 | | | 12/26/2044 | | | | 393,276 | |
| | Access Group, Inc. Series2015-1, Class A(b)(c) | |
| | 159,749 | | | 3.104 | | | 07/25/2056 | | | | 158,402 | |
| Access to Loans for Learning Student Loan Corp. Series2013-I,
Class A(c) |
|
| | 395,569 | | | 3.204 | | | 02/25/2041 | | | | 392,141 | |
| Brazos Higher Education Authority, Inc. Series2011-1,
Class A2(c) |
|
| | 824,299 | | | 3.321 | | | 02/25/2030 | | | | 824,237 | |
| | ECMC Group Student Loan Trust Series2016-1A, Class A(b)(c) | |
| | 213,486 | | | 3.754 | | | 07/26/2066 | | | | 215,074 | |
| | ECMC Group Student Loan Trust Series2018-1A, Class A(b)(c) | |
| | 571,642 | | | 3.154 | | | 02/27/2068 | | | | 569,840 | |
| | |
| | |
| 42 | | The accompanying notes are an integral part of these financial statements. |
GOLDMAN SACHS VARIABLE INSURANCE TRUST HIGH QUALITY FLOATING RATE FUND
| | | | | | | | | | | | |
Principal
Amount | | | Interest
Rate | | Maturity
Date | | | Value | |
|
| Asset-Backed Securities – (continued) | |
| Student Loans(a) – (continued) | |
| | Edsouth Indenture No. 1 LLC Series2010-1, Class A1(b)(c) | |
| $ | 242,256 | | | 3.430 % | | | 07/25/2023 | | | $ | 242,291 | |
| | Edsouth Indenture No. 4 LLC Series2013-1, Class A(b)(c) | |
| | 112,270 | | | 2.974 | | | 02/26/2029 | | | | 111,247 | |
| | Edsouth Indenture No. 5 LLC Series2014-1, Class A(b)(c) | |
| | 199,939 | | | 3.104 | | | 02/25/2039 | | | | 197,872 | |
| | Education Loan Asset-Backed Trust I Series2013-1, Class A1(b)(c) | |
| | 114,616 | | | 3.204 | | | 06/25/2026 | | | | 114,766 | |
| | Education Loan Asset-Backed Trust I Series2013-1, Class A2(b)(c) | |
| | 500,000 | | | 3.204 | | | 04/26/2032 | | | | 496,045 | |
| | Educational Funding of the South, Inc. Series2011-1, Class A2(c) | |
| | 372,303 | | | 3.230 | | | 04/25/2035 | | | | 369,221 | |
| | Educational Funding of the South, Inc. Series2012-1, Class A | |
| | 264,535 | | | 3.480 | | | 03/25/2036 | | | | 267,091 | |
| | Higher Education Funding I Series2014-1, Class A(b)(c) | |
| | 272,737 | | | 3.571 | | | 05/25/2034 | | | | 274,564 | |
| | Illinois Student Assistance Commission Series2010-1, Class A3 | |
| | 185,774 | | | 3.480 | | | 07/25/2045 | | | | 187,147 | |
| Kentucky Higher Education Student Loan Corp. Series2013-2,
Class A1(c) |
|
| | 558,961 | | | 3.040 | | | 09/01/2028 | | | | 553,247 | |
| Kentucky Higher Education Student Loan Corp. Series2015-1,
Class A1 |
|
| | 523,143 | | | 3.190 | | | 12/01/2031 | | | | 516,929 | |
| Montana Higher Education Student Assistance Corp. Series
2012-1, Class A2(c) |
|
| | 511,940 | | | 3.383 | | | 05/20/2030 | | | | 511,939 | |
| | Navient Student Loan Trust Series2016-5A, Class A(b)(c) | |
| | 957,759 | | | 3.654 | | | 06/25/2065 | | | | 968,627 | |
| | Navient Student Loan Trust Series2016-7A, Class A(b)(c) | |
| | 210,591 | | | 3.554 | | | 03/25/2066 | | | | 211,616 | |
| | Nelnet Student Loan Trust Series2006-1, Class A5(c) | |
| | 464,904 | | | 2.634 | | | 08/23/2027 | | | | 464,146 | |
| | Nelnet Student Loan Trust Series2006-2, Class A5(c) | |
| | 57,101 | | | 2.680 | | | 01/25/2030 | | | | 57,086 | |
| | Nelnet Student Loan Trust Series2013-5A, Class A(b)(c) | |
| | 72,420 | | | 3.034 | | | 01/25/2037 | | | | 71,855 | |
| | Nelnet Student Loan Trust Series2014-3A, Class A(b)(c) | |
| | 586,405 | | | 2.984 | | | 06/25/2041 | | | | 578,281 | |
| New Hampshire Higher Education Loan Corp. Series2011-1,
Class A3(c) |
|
| | 197,692 | | | 3.430 | | | 10/25/2037 | | | | 198,854 | |
| North Carolina State Education Assistance Authority Series
2010-1, Class A1(c) |
|
| | 93,661 | | | 3.480 | | | 07/25/2041 | | | | 93,163 | |
| Panhandle-Plains Higher Education Authority, Inc. Series2011-1,
Class A2(c) |
|
| | 22,418 | | | 3.542 | | | 07/01/2024 | | | | 22,436 | |
| Pennsylvania Higher Education Assistance Agency Series2006-1,
Class A3(c) |
|
| | 443,689 | | | 2.720 | | | 10/25/2035 | | | | 433,746 | |
| | Scholar Funding Trust Series2010-A, Class A(b)(c) | |
| | 220,329 | | | 3.332 | | | 10/28/2041 | | | | 217,814 | |
| | Scholar Funding Trust Series2011-A, Class A(b)(c) | |
| | 189,643 | | | 3.482 | | | 10/28/2043 | | | | 188,415 | |
| | |
| | SLM Student Loan Trust Series2005-5, Class A4(c) | |
| 882,077 | | | 2.720 | | | 10/25/2028 | | | | 876,278 | |
| | SLM Student Loan Trust Series2007-1, Class A5(c) | |
| | 743,307 | | | 2.670 | | | 01/26/2026 | | | | 741,112 | |
| | SLM Student Loan Trust Series2008-5, Class A4(c) | |
| | 66,643 | | | 4.280 | | | 07/25/2023 | | | | 67,401 | |
| | SLM Student Loan Trust Series2012-3, Class A(c) | |
| | 768,819 | | | 3.054 | | | 12/27/2038 | | | | 767,444 | |
| South Texas Higher Education Authority, Inc. Series2012-1,
Class A2 |
|
| | 64,419 | | | 3.442 | | | 10/01/2024 | | | | 64,459 | |
| | Utah State Board of Regents Series2015-1, Class A(c) | |
| | 294,091 | | | 3.030 | | | 02/25/2043 | | | | 291,826 | |
| | Utah State Board of Regents Series2016-1, Class A | |
| | 344,209 | | | 3.154 | | | 09/25/2056 | | | | 344,641 | |
| | Wachovia Student Loan Trust Series2005-1, Class A5(c) | |
| | 5,274 | | | 2.710 | | | 01/26/2026 | | | | 5,272 | |
| | | | | | | | | | | | |
| | | | | | | | | | | 13,059,801 | |
| | |
| | TOTAL ASSET-BACKED SECURITIES
| |
| | (Cost $32,857,353) | | | $ | 32,902,512 | |
| | |
| | | | | | | | | | | | |
|
| Supranational(a)– 3.1% | |
| | European Investment Bank(b) | |
| $ | 1,530,000 | | | (SOFR + 0.29%),
2.703% | | | 06/10/2022 | | | $ | 1,531,019 | |
| | International Bank for Reconstruction & Development | |
| | 1,000,000 | | | (SOFR + 0.22%),
2.640 | | | 08/21/2020 | | | | 1,000,756 | |
| | |
| | TOTAL SUPRANATIONAL
| |
| | (Cost $2,530,000) | | | $ | 2,531,775 | |
| | |
| | | | | | | | | | | | |
|
| Municipal Bond(a)(b)(c) – 0.1% | |
| New York – 0.1% | |
| Freddie Mac Multifamily ML Certificates RB Pass Through
Series 2017 |
|
| $ | 96,460 | | | (1 Mo. LIBOR +
0.50%), 2.904% | | | 01/25/2033 | | | $ | 95,778 | |
| | (Cost $96,460) | | | | | |
| | |
| | | | | | | | | | | | |
|
| U.S. Treasury Obligations – 11.0% | |
| | U.S. Treasury Bonds | |
| $ | 220,000 | | | 3.750% | | | 11/15/2043 | | | $ | 270,634 | |
| | U.S. Treasury Notes(a) | |
| | 1,500,000 | | | (3 Mo. U.S. T-Bill
MMY + 0.03%), 2.129 | | | 04/30/2020 | | | | 1,498,978 | |
| | 2,300,000 | | | (3 Mo. U.S.T-Bill
MMY + 0.04%), 2.139 | | | 07/31/2020 | | | | 2,297,670 | |
| | |
| | |
| The accompanying notes are an integral part of these financial statements. | | 43 |
GOLDMAN SACHS VARIABLE INSURANCE TRUST HIGH QUALITY FLOATING RATE FUND
Schedule of Investments(continued)
June 30, 2019 (Unaudited)
| | | | | | | | | | | | |
Principal
Amount | | | Interest
Rate | | Maturity
Date | | | Value | |
|
| U.S. Treasury Obligations – (continued) | |
| | U.S. Treasury Notes(a) – (continued) | |
| $ | 4,900,000 | | | (3 Mo. U.S. T-Bill
MMY + 0.05%), 2.141% | | | 10/31/2020 | | | $ | 4,892,790 | |
| | |
| | TOTAL U.S. TREASURY OBLIGATIONS
| |
| | (Cost $8,936,114) | | | $ | 8,960,072 | |
| | |
| | | | | | | | | | |
| Shares | | | Dividend
Rate | | | Value | |
|
| Investment Company(d) – 11.2% | |
| Goldman Sachs Financial Square Government Fund —
Institutional Shares |
|
| | 9,130,382 | | | | 2.308 | % | | $ | 9,130,382 | |
| | (Cost $9,130,382) | | | | | |
| | |
| | | | | | | | | | | | | | |
Principal
Amount | | | Interest
Rate | | | Maturity
Date | | | Value | |
|
| Short-Term Investments – 1.2% | |
| Commercial Paper – 1.2% | |
| | VW Credit, Inc. | |
| $ | 300,000 | | | | 3.280 | % | | | 12/06/2019 | | | $ | 296,469 | |
| | 700,000 | | | | 2.601 | | | | 03/30/2020 | | | | 685,279 | |
| | |
| | TOTAL SHORT-TERM INVESTMENTS | |
| | (Cost $982,250) | | | $ | 981,748 | |
| | |
| | TOTAL INVESTMENTS – 98.4% | |
| | (Cost $80,358,105) | | | $ | 80,380,403 | |
| | |
| OTHER ASSETS IN EXCESS OF
LIABILITIES –1.6% |
| | | 1,270,465 | |
| | |
| | NET ASSETS – 100.0% | | | $ | 81,650,868 | |
| | |
| | |
| The percentage shown for each investment category reflects the value of investments in that category as a percentage of net assets. |
| |
| (a) | | Variable rate security. Except for floating rate notes (for which final maturity is disclosed), maturity date disclosed is the next interest reset date. Interest rate disclosed is that which is in effect on June 30, 2019. |
| |
| (b) | | Exempt from registration under Rule 144A of the Securities Act of 1933. |
| |
| (c) | | Securities with “Call” features. Maturity dates disclosed are the final maturity dates. |
| |
| (d) | | Represents an Affiliated Issuer. |
| | |
| |
| Investment Abbreviations: |
| ACES | | —Alternative Credit Enhancement Securities |
| FHLMC | | —Federal Home Loan Mortgage Corp. |
| FNMA | | —Federal National Mortgage Association |
| GNMA | | —Government National Mortgage Association |
| LIBOR | | —London Interbank Offered Rate |
| MMY | | —Money Market Yield |
| Mo. | | —Month |
| RB | | —Revenue Bond |
| REMIC | | —Real Estate Mortgage Investment Conduit |
| SOFR | | —Secured Overnight Financing Rate |
| T-Bill | | —Treasury Bill |
| U.S. | | —United States |
| | |
| 44 | | The accompanying notes are an integral part of these financial statements. |
GOLDMAN SACHS VARIABLE INSURANCE TRUST HIGH QUALITY FLOATING RATE FUND
|
ADDITIONAL INVESTMENT INFORMATION |
FUTURES CONTRACTS— At June 30, 2019, the Fund had the following futures contracts:
| | | | | | | | | | | | | | | | |
| Description | | Number of
Contracts | | | Expiration
Date | | | Notional
Amount | | | Unrealized
Appreciation/
(Depreciation) | |
| |
Long position contracts: | | | | | |
| U.S. Treasury 5 Year Note | | | 13 | | | | 09/30/2019 | | | $ | 1,535,523 | | | $ | 21,273 | |
| U.S. Treasury 10 Year Note | | | 8 | | | | 09/19/2019 | | | | 1,023,250 | | | | 22,082 | |
U.S. Treasury 10 Year Ultra Note | | | 3 | | | | 09/19/2019 | | | | 414,141 | | | | 9,384 | |
| | | | |
| Total | | | | | | | | | | | | | | $ | 52,739 | |
| |
Short position contracts: | | | | | |
| 3 Month Eurodollar | | | (2 | ) | | | 03/16/2020 | | | $ | (491,400 | ) | | $ | (3,105 | ) |
| 3 Month Eurodollar | | | (1 | ) | | | 06/15/2020 | | | | (245,938 | ) | | | (1,635 | ) |
| U.S. Treasury 2 Year Note | | | (5 | ) | | | 09/30/2019 | | | | (1,075,703 | ) | | | (6,117 | ) |
U.S. Treasury Long Bond | | | (12 | ) | | | 09/19/2019 | | | | (1,866,000 | ) | | | (49,881 | ) |
| | | | |
| Total | | | | | | | | | | | | | | $ | (60,738 | ) |
| | | | |
| Total Futures Contracts | | | | | | | | | | | | | | $ | (7,999 | ) |
SWAP CONTRACTS — At June 30, 2019, the Fund had the following swap contracts:
CENTRALLY CLEARED INTEREST RATE SWAP CONTRACTS
| | | | | | | | | | | | | | | | | | | | | | | | |
Payments
Made by
the Fund(a) | | Payments
Received by
the Fund | | | Termination
Date | | | Notional
Amount
(000’s)(b) | | | Value | | | Upfront
Premium
(Received)
Paid | | | Unrealized
Appreciation/
(Depreciation) | |
| | | | | | |
1.390% | | | 1 Day Federal Funds | | | | 11/30/2023 | | | USD | 200 | | | $ | 643 | | | $ | 495 | | | $ | 148 | |
| (a) | Payments made annually. |
| (b) | Represents forward starting interest rate swaps whose effective dates of commencement of accruals and cash flows occur subsequent to June 30, 2019. |
| | |
| The accompanying notes are an integral part of these financial statements. | | 45 |
GOLDMAN SACHS VARIABLE INSURANCE TRUST FUNDS
Statements of Assets and Liabilities
June 30, 2019 (Unaudited)
| | | | | | | | | | | | | | | | |
| | | Core Fixed Income
Fund | | | Equity Index Fund | | | Growth
Opportunities
Fund | | | High Quality
Floating Rate
Fund | |
| | | | | | | | | | | | | | | | |
| Assets: | | | | | | | | | | | | |
Investments in unaffiliated issuers, at value (cost $41,432,402, $59,460,940, $52,929,580 and $71,227,723)(a) | | $ | 42,818,038 | | | $ | 171,357,766 | | | $ | 70,873,934 | | | $ | 71,250,021 | |
Investments in affiliated issuers, at value (cost $7,501,840, $259,760, $1,092,324 and $9,130,382) | | | 7,501,840 | | | | 495,132 | | | | 1,092,324 | | | | 9,130,382 | |
Investments in affiliated securities lending reinvestment vehicle, at value (cost $0, $0, $352,707 and $0) | | | — | | | | — | | | | 352,707 | | | | — | |
Cash | | | 631,315 | | | | 1,158,463 | | | | 167,126 | | | | 1,156,321 | |
Foreign currencies, at value (cost $40,433, $0, $0 and $0) | | | 41,108 | | | | — | | | | — | | | | — | |
Receivables: | | | | | | | | | | | | | | | | |
Investments sold on an extended-settlement basis | | | 2,113,770 | | | | — | | | | — | | | | 28,253 | |
Collateral on certain derivative contracts(b) | | | 400,613 | | | | — | | | | — | | | | 22,564 | |
Investments sold | | | 339,286 | | | | — | | | | 4,713,030 | | | | — | |
Interest and dividends | | | 258,046 | | | | 141,868 | | | | 22,101 | | | | 198,286 | |
Reimbursement from investment adviser | | | 20,994 | | | | 21,151 | | | | 18,921 | | | | 16,033 | |
Fund shares sold | | | 13,464 | | | | 31,023 | | | | 12 | | | | 716 | |
Securities lending income | | | — | | | | — | | | | 6,053 | | | | — | |
Unrealized gain on forward foreign currency exchange contracts | | | 71,505 | | | | — | | | | — | | | | — | |
Variation margin on futures | | | 2,496 | | | | 5,314 | | | | — | | | | 2,617 | |
Variation margin on swaps | | | 2,914 | | | | — | | | | — | | | | — | |
Other assets | | | 273 | | | | 558 | | | | 322 | | | | 379 | |
| | | | |
| Total assets | | | 54,215,662 | | | | 173,211,275 | | | | 77,246,530 | | | | 81,805,572 | |
| | | | | | | | | | | | | | | | |
| | | | | | | | | | | | | | | | |
| Liabilities: | | | | | | | | | | | | |
Unrealized loss on forward foreign currency exchange contracts | | | 39,856 | | | | — | | | | — | | | | — | |
Variation margin on swaps | | | — | | | | — | | | | — | | | | 91 | |
Payables: | | | | | | | | | | | | | | | | |
Investments purchased on an extended-settlement basis | | | 10,397,243 | | | | — | | | | — | | | | — | |
Investments purchased | | | 725,755 | | | | 84,855 | | | | 2,198,874 | | | | — | |
Fund shares redeemed | | | 13,398 | | | | 12 | | | | 63,639 | | | | 15,925 | |
Management fees | | | 13,153 | | | | 29,317 | | | | 49,774 | | | | 19,676 | |
Distribution and Service fees and Transfer Agency fees | | | 8,358 | | | | 37,694 | | | | 10,808 | | | | 18,556 | |
Payable upon return of securities loaned | | | — | | | | — | | | | 352,707 | | | | — | |
Accrued expenses | | | 103,469 | | | | 89,680 | | | | 92,321 | | | | 100,456 | |
| | | | |
| Total liabilities | | | 11,301,232 | | | | 241,558 | | | | 2,768,123 | | | | 154,704 | |
| | | | | | | | | | | | | | | | |
| | | | | | | | | | | | | | | | |
| Net Assets: | | | | | | | | | | | | |
Paid-in capital | | | 43,467,189 | | | | 59,281,124 | | | | 46,533,547 | | | | 82,925,844 | |
Total distributable earnings (loss) | | | (552,759 | ) | | | 113,688,593 | | | | 27,944,860 | | | | (1,274,976 | ) |
| | | | |
| NET ASSETS | | $ | 42,914,430 | | | $ | 172,969,717 | | | $ | 74,478,407 | | | $ | 81,650,868 | |
Net Assets: | | | | | | | | | | | | | | | | |
Institutional | | $ | 5,404,337 | | | $ | — | | | $ | 79,590 | | | $ | 2,283,192 | |
Service | | | 37,510,093 | | | | 172,969,717 | | | | 74,398,817 | | | | 72,542,130 | |
Advisor | | | — | | | | — | | | | — | | | | 6,825,546 | |
| | | | |
Total Net Assets | | $ | 42,914,430 | | | $ | 172,969,717 | | | $ | 74,478,407 | | | $ | 81,650,868 | |
Shares outstanding $0.001 par value (unlimited shares authorized): | | | | | | | | | | | | | | | | |
Institutional | | | 504,102 | | | | — | | | | 6,006 | | | | 220,265 | |
Service | | | 3,497,869 | | | | 10,135,015 | | | | 5,815,329 | | | | 7,011,718 | |
Advisor | | | — | | | | — | | | | — | | | | 659,042 | |
Net asset value, offering and redemption price per share: | | | | | | | | | | | | | | | | |
Institutional | | | $10.72 | | | | — | | | | $13.25 | | | | $10.37 | |
Service | | | 10.72 | | | | 17.07 | | | | 12.79 | | | | 10.35 | |
Advisor | | | — | | | | — | | | | — | | | | 10.36 | |
(a) Includes loaned securities having a market value of $344,887 for the Growth Opportunities Fund.
(b) Segregated for initial margin and/or collateral on transactions as follows:
| | | | | | | | | | | | |
Fund | | Forwards | | | Futures | | | Swaps | |
Core Fixed Income | | $ | 210,000 | | | $ | 60,955 | | | $ | 129,658 | |
High Quality Floating Rate | | | — | | | | 19,249 | | | | 3,315 | |
| | |
| 46 | | The accompanying notes are an integral part of these financial statements. |
GOLDMAN SACHS VARIABLE INSURANCE TRUST FUNDS
Statements of Operations
For the Six Months Ended June 30, 2019 (Unaudited)
| | | | | | | | | | | | | | | | |
| | | Core Fixed Income
Fund | | | Equity Index Fund | | | Growth
Opportunities
Fund | | | High Quality
Floating Rate
Fund | |
| | | | | | | | | | | | | | | | |
| Investment income: | | | | | | | | | | | | |
| | | | |
Interest | | $ | 644,344 | | | $ | 875 | | | $ | — | | | $ | 1,046,071 | |
Dividends — affiliated issuers | | | 24,290 | | | | 4,047 | | | | 13,287 | | | | 96,853 | |
Dividends — unaffiliated issuers | | | — | | | | 1,701,872 | | | | 242,319 | | | | — | |
Securities lending income — affiliated issuer | | | — | | | | 2 | | | | — | | | | — | |
Securities lending income — unaffiliated issuer | | | — | | | | — | | | | 31,944 | | | | — | |
| | | | |
| Total investment income | | | 668,634 | | | | 1,706,796 | | | | 287,550 | | | | 1,142,924 | |
| | | | | | | | | | | | | | | | |
| | | | | | | | | | | | | | | | |
| Expenses: | | | | | | | | | | | | |
| | | | |
Management fees | | | 78,846 | | | | 251,247 | | | | 306,272 | | | | 125,730 | |
Professional fees | | | 56,935 | | | | 44,751 | | | | 44,770 | | | | 50,438 | |
Distribution and Service fees(a) | | | 45,318 | | | | 209,372 | | | | 87,919 | | | | 103,790 | |
Custody, accounting and administrative services | | | 40,607 | | | | 36,960 | | | | 39,030 | | | | 38,226 | |
Printing and mailing costs | | | 23,987 | | | | 23,032 | | | | 21,185 | | | | 19,019 | |
Trustee fees | | | 7,963 | | | | 8,078 | | | | 7,989 | | | | 8,000 | |
Transfer Agency fees(a) | | | 3,942 | | | | 16,748 | | | | 7,040 | | | | 8,111 | |
Other | | | 3,665 | | | | 20,079 | | | | 3,932 | | | | 3,518 | |
| | | | |
| Total expenses | | | 261,263 | | | | 610,267 | | | | 518,137 | | | | 356,832 | |
| | | | |
Less — expense reductions | | | (134,723 | ) | | | (205,893 | ) | | | (162,450 | ) | | | (113,457 | ) |
| | | | |
| Net expenses | | | 126,540 | | | | 404,374 | | | | 355,687 | | | | 243,375 | |
| | | | |
| NET INVESTMENT INCOME (LOSS) | | | 542,094 | | | | 1,302,422 | | | | (68,137 | ) | | | 899,549 | |
| | | | | | | | | | | | | | | | |
| | | | | | | | | | | | | | | | |
| Realized and unrealized gain (loss): | | | | | | | | | | | | |
| | | | |
Net realized gain (loss) from: | | | | | | | | | | | | | | | | |
Investments — unaffiliated issuers (including commissions recaptured of $0, $0, $331 and $0) | | | 144,512 | | | | 4,360,911 | | | | 7,872,967 | | | | 778 | |
Investments — affiliated issuers | | | — | | | | 8,002 | | | | — | | | | — | |
Futures contracts | | | 47,681 | | | | 102,620 | | | | — | | | | (111,799 | ) |
Purchased options | | | (1,157 | ) | | | — | | | | — | | | | — | |
Swap contracts | | | 56,974 | | | | — | | | | — | | | | (16,156 | ) |
Forward foreign currency exchange contracts | | | 982 | | | | — | | | | — | | | | — | |
Foreign currency transactions | | | 13,248 | | | | — | | | | — | | | | — | |
Net change in unrealized gain on: | | | | | | | | | | | | | | | | |
Investments — unaffiliated issuers | | | 1,657,961 | | | | 21,865,791 | | | | 7,960,784 | | | | 97,005 | |
Investments — affiliated issuers | | | — | | | | 85,882 | | | | — | | | | — | |
Futures contracts | | | 62,082 | | | | 69,150 | | | | — | | | | 60,598 | |
Swap contracts | | | 46,730 | | | | — | | | | — | | | | 148 | |
Forward foreign currency exchange contracts | | | 40,974 | | | | — | | | | — | | | | — | |
Foreign currency translation | | | 197 | | | | — | | | | — | | | | — | |
| | | | |
| Net realized and unrealized gain | | | 2,070,184 | | | | 26,492,356 | | | | 15,833,751 | | | | 30,574 | |
| | | | |
| NET INCREASE IN NET ASSETS RESULTING FROM OPERATIONS | | $ | 2,612,278 | | | $ | 27,794,778 | | | $ | 15,765,614 | | | $ | 930,123 | |
(a) Class specific Distribution and/or Service, and Transfer Agency fees were as follows:
| | | | | | | | | | | | | | | | | | | | |
| | | Distribution and/or
Service Fees | | | Transfer Agency Fees | |
Fund | | Service | | | Advisor | | | Institutional | | | Service | | | Advisor | |
Core Fixed Income | | $ | 45,318 | | | | N/A | | | $ | 317 | | | $ | 3,625 | | | | N/A | |
Equity Index | | | 209,372 | | | | N/A | | | | N/A | | | | 16,748 | | | | N/A | |
Growth Opportunities | | | 87,919 | | | | N/A | | | | 7 | | | | 7,033 | | | | N/A | |
High Quality Floating Rate | | | 89,827 | | | $ | 13,963 | | | | 227 | | | | 7,186 | �� | | $ | 698 | |
| | |
| The accompanying notes are an integral part of these financial statements. | | 47 |
GOLDMAN SACHS VARIABLE INSURANCE TRUST FUNDS
Statements of Changes in Net Assets
| | | | | | | | | | | | | | | | |
| | | Core Fixed Income Fund | | | Equity Index Fund | |
| | | For the
Six Months Ended
June 30, 2019
(Unaudited) | | | For the
Fiscal Year Ended
December 31, 2018 | | | For the
Six Months Ended
June 30, 2019
(Unaudited) | | | For the
Fiscal Year Ended
December 31, 2018 | |
| | | | | | | | | | | | | | | | |
| From operations: | | | | | | | | | | | | |
Net investment income | | $ | 542,094 | | | $ | 1,225,144 | | | $ | 1,302,422 | | | $ | 2,596,973 | |
Net realized gain (loss) | | | 262,240 | | | | (1,538,377 | ) | | | 4,471,533 | | | | 11,623,359 | |
Net change in unrealized gain (loss) | | | 1,807,944 | | | | (1,585,058 | ) | | | 22,020,823 | | | | (21,598,071 | ) |
| | | | |
| Net increase (decrease) in net assets resulting from operations | | | 2,612,278 | | | | (1,898,291 | ) | | | 27,794,778 | | | | (7,377,739 | ) |
| | | | | | | | | | | | | | | | |
| | | | | | | | | | | | | | | | |
| Distributions to shareholders: | | | | | | | | | | | | |
From distributable earnings: | | | | | | | | | | | | | | | | |
Institutional Shares | | | (64,608 | ) | | | (14,101 | ) | | | — | | | | — | |
Service Shares | | | (573,419 | ) | | | (1,241,765 | ) | | | — | | | | (13,646,931 | ) |
| | | | |
| Total distributions to shareholders | | | (638,027 | ) | | | (1,255,866 | ) | | | — | | | | (13,646,931 | ) |
| | | | | | | | | | | | | | | | |
| | | | | | | | | | | | | | | | |
| From share transactions: | | | | | | | | | | | | |
Proceeds from sales of shares | | | 3,128,660 | | | | 5,175,072 | | | | 1,730,047 | | | | 4,433,966 | |
Reinvestment of distributions | | | 638,027 | | | | 1,255,866 | | | | — | | | | 13,646,931 | |
Cost of shares redeemed | | | (1,899,961 | ) | | | (73,392,129 | ) | | | (11,653,377 | ) | | | (20,993,560 | ) |
| | | | |
| Net increase (decrease) in net assets resulting from share transactions | | | 1,866,726 | | | | (66,961,191 | ) | | | (9,923,330 | ) | | | (2,912,663 | ) |
| | | | |
| TOTAL INCREASE (DECREASE) | | | 3,840,977 | | | | (70,115,348 | ) | | | 17,871,448 | | | | (23,937,333 | ) |
| | | | | | | | | | | | | | | | |
| | | | | | | | | | | | | | | | |
| Net assets: | | | | | | | | | | | | |
| | | | |
Beginning of period | | | 39,073,453 | | | | 109,188,801 | | | | 155,098,269 | | | | 179,035,602 | |
| | | | |
End of period | | $ | 42,914,430 | | | $ | 39,073,453 | | | $ | 172,969,717 | | | $ | 155,098,269 | |
| | |
| 48 | | The accompanying notes are an integral part of these financial statements. |
GOLDMAN SACHS VARIABLE INSURANCE TRUST FUNDS
| | | | | | | | | | | | | | | | |
| | | Growth Opportunities Fund | | | High Quality Floating Rate Fund | |
| | | For the
Six Months Ended
June 30, 2019
(Unaudited) | | | For the
Fiscal Year Ended
December 31, 2018 | | | For the
Six Months Ended
June 30, 2019
(Unaudited) | | | For the
Fiscal Year Ended
December 31, 2018 | |
| | | | | | | | | | | | | | | | |
| From operations: | | | | | | | | | | | | |
Net investment income (loss) | | $ | (68,137 | ) | | $ | (222,316 | ) | | $ | 899,549 | | | $ | 1,379,037 | |
Net realized gain (loss) | | | 7,872,967 | | | | 38,998,411 | | | | (127,177 | ) | | | 78,835 | |
Net change in unrealized gain (loss) | | | 7,960,784 | | | | (38,082,096 | ) | | | 157,751 | | | | (331,356 | ) |
| | | | |
| Net increase in net assets resulting from operations | | | 15,765,614 | | | | 693,999 | | | | 930,123 | | | | 1,126,516 | |
| | | | | | | | | | | | | | | | |
| | | | | | | | | | | | | | | | |
| Distributions to shareholders: | | | | | | | | | | | | |
From distributable earnings: | | | | | | | | | | | | | | | | |
Institutional Shares | | | — | | | | (37,921 | ) | | | (31,894 | ) | | | (12,809 | ) |
Service Shares | | | — | | | | (39,325,197 | ) | | | (931,287 | ) | | | (1,323,812 | ) |
Advisor Shares | | | — | | | | — | | | | (83,655 | ) | | | (107,740 | ) |
| | | | |
| Total distributions to shareholders | | | — | | | | (39,363,118 | ) | | | (1,046,836 | ) | | | (1,444,361 | ) |
| | | | | | | | | | | | | | | | |
| | | | | | | | | | | | | | | | |
| From share transactions: | | | | | | | | | | | | |
Proceeds from sales of shares | | | 7,213,575 | | | | 2,826,810 | | | | 5,671,214 | | | | 21,196,717 | |
Reinvestment of distributions | | | — | | | | 39,363,118 | | | | 1,046,836 | | | | 1,444,361 | |
Cost of shares redeemed | | | (8,470,410 | ) | | | (114,387,857 | ) | | | (7,244,854 | ) | | | (11,359,427 | ) |
| | | | |
| Net increase (decrease) in net assets resulting from share transactions | | | (1,256,835 | ) | | | (72,197,929 | ) | | | (526,804 | ) | | | 11,281,651 | |
| | | | |
| TOTAL INCREASE (DECREASE) | | | 14,508,779 | | | | (110,867,048 | ) | | | (643,517 | ) | | | 10,963,806 | |
| | | | | | | | | | | | | | | | |
| | | | | | | | | | | | | | | | |
| Net Assets: | | | | | | | | | | | | |
| | | | |
Beginning of period | | | 59,969,628 | | | | 170,836,676 | | | | 82,294,385 | | | | 71,330,579 | |
| | | | |
End of period | | $ | 74,478,407 | | | $ | 59,969,628 | | | $ | 81,650,868 | | | $ | 82,294,385 | |
| | |
| The accompanying notes are an integral part of these financial statements. | | 49 |
GOLDMAN SACHS VARIABLE INSURANCE TRUST CORE FIXED INCOME FUND
Financial Highlights
Selected Data for a Share Outstanding Throughout Each Period
| | | | | | | | | | | | | | | | | | | | | | | | |
| | | Goldman Sachs Core Fixed Income Fund | |
| | | Institutional Shares | |
| | | Six Months Ended
June 30, 2019
(Unaudited) | | | Year Ended December 31, | |
| | | 2018 | | | 2017 | | | 2016 | | | 2015 | | | 2014 | |
| | | | | | | | | | | | | | | | | | | | | | | | |
| Per Share Data | | | | | | | | | | | | | | | | | | |
| | | | | | |
Net asset value, beginning of period | | $ | 10.20 | | | $ | 10.66 | | | $ | 10.61 | | | $ | 10.53 | | | $ | 10.75 | | | $ | 10.48 | |
| | | | | | |
Net investment income(a) | | | 0.15 | | | | 0.29 | | | | 0.23 | | | | 0.24 | | | | 0.27 | | | | 0.25 | |
| | | | | | |
Net realized and unrealized gain (loss) | | | 0.55 | | | | (0.37 | ) | | | 0.13 | | | | 0.08 | | | | (0.20 | ) | | | 0.34 | |
| | | | | | |
Total from investment operations | | | 0.70 | | | | (0.08 | ) | | | 0.36 | | | | 0.32 | | | | 0.07 | | | | 0.59 | |
| | | | | | |
Distributions to shareholders from net investment income | | | (0.18 | ) | | | (0.38 | ) | | | (0.31 | ) | | | (0.24 | ) | | | (0.29 | ) | | | (0.32 | ) |
| | | | | | |
Net asset value, end of period | | $ | 10.72 | | | $ | 10.20 | | | $ | 10.66 | | | $ | 10.61 | | | $ | 10.53 | | | $ | 10.75 | |
| | | | | | |
Total return(b) | | | 6.76 | % | | | (0.58 | )% | | | 3.40 | % | | | 2.98 | % | | | 0.60 | % | | | 5.68 | % |
| | | | | | |
Net assets, end of period (in 000s) | | $ | 5,405 | | | $ | 2,657 | | | $ | 241 | | | $ | 90 | | | $ | 26 | | | $ | 26 | |
| | | | | | |
Ratio of net expenses to average net assets | | | 0.41 | %(c) | | | 0.42 | % | | | 0.42 | % | | | 0.43 | % | | | 0.42 | % | | | 0.44 | % |
| | | | | | |
Ratio of total expenses to average net assets | | | 1.09 | %(c) | | | 1.06 | % | | | 0.65 | % | | | 0.65 | % | | | 0.74 | % | | | 0.65 | % |
| | | | | | |
Ratio of net investment income to average net assets | | | 2.95 | %(c) | | | 2.88 | % | | | 2.18 | % | | | 2.28 | % | | | 2.53 | % | | | 2.31 | % |
| | | | | | |
Portfolio turnover rate(d) | | | 156 | % | | | 406 | % | | | 229 | % | | | 329 | % | | | 376 | % | | | 353 | % |
| (a) | Calculated based on the average shares outstanding methodology. |
| (b) | Assumes investment at the net asset value at the beginning of the period, reinvestment of all distributions, a complete redemption of the investment at the net asset value at the end of the period and no sales or redemption charges (if any). Total returns would be reduced if a sales or redemption charge was taken into account. Returns do not reflect the impact of taxes to shareholders relating to Fund distributions or the redemption of Fund shares. Total returns for periods less than one full year are not annualized. |
| (d) | The Fund’s portfolio turnover rate is calculated in accordance with regulatory requirements, without regard to transactions involving short term investments and certain derivatives. If such transactions were included, the Fund’s portfolio turnover rate may be higher. |
| | |
| 50 | | The accompanying notes are an integral part of these financial statements. |
GOLDMAN SACHS VARIABLE INSURANCE TRUST CORE FIXED INCOME FUND
| | | | | | | | | | | | | | | | | | | | | | | | |
| | | Goldman Sachs Core Fixed Income Fund | |
| | | Service Shares | |
| | | Six Months Ended
June 30, 2019
(Unaudited) | | | Year Ended December 31, | |
| | | 2018 | | | 2017 | | | 2016 | | | 2015 | | | 2014 | |
| | | | | | | | | | | | | | | | | | | | | | | | |
| Per Share Data | | | | | | | | | | | | | | | | | | |
| | | | | | |
Net asset value, beginning of period | | $ | 10.21 | | | $ | 10.65 | | | $ | 10.60 | | | $ | 10.53 | | | $ | 10.76 | | | $ | 10.47 | |
| | | | | | |
Net investment income(a) | | | 0.14 | | | | 0.25 | | | | 0.21 | | | | 0.22 | | | | 0.24 | | | | 0.22 | |
| | | | | | |
Net realized and unrealized gain (loss) | | | 0.54 | | | | (0.34 | ) | | | 0.12 | | | | 0.07 | | | | (0.21 | ) | | | 0.36 | |
| | | | | | |
Total from investment operations | | | 0.68 | | | | (0.09 | ) | | | 0.33 | | | | 0.29 | | | | 0.03 | | | | 0.58 | |
| | | | | | |
Distributions to shareholders from net investment income | | | (0.17 | ) | | | (0.35 | ) | | | (0.28 | ) | | | (0.22 | ) | | | (0.26 | ) | | | (0.29 | ) |
| | | | | | |
Net asset value, end of period | | $ | 10.72 | | | $ | 10.21 | | | $ | 10.65 | | | $ | 10.60 | | | $ | 10.53 | | | $ | 10.76 | |
| | | | | | |
Total return(b) | | | 6.64 | % | | | (0.83 | )% | | | 3.14 | % | | | 2.70 | % | | | 0.27 | % | | | 5.61 | % |
| | | | | | |
Net assets, end of period (in 000s) | | $ | 37,510 | | | $ | 36,416 | | | $ | 108,948 | | | $ | 110,476 | | | $ | 104,924 | | | $ | 107,063 | |
| | | | | | |
Ratio of net expenses to average net assets | | | 0.66 | %(c) | | | 0 .67 | % | | | 0 .67 | % | | | 0 .67 | % | | | 0 .67 | % | | | 0 .68 | % |
| | | | | | |
Ratio of total expenses to average net assets | | | 1.35 | %(c) | | | 1 .18 | % | | | 0 .90 | % | | | 0 .91 | % | | | 0 .99 | % | | | 0 .91 | % |
| | | | | | |
Ratio of net investment income to average net assets | | | 2.74 | %(c) | | | 2 .46 | % | | | 1 .95 | % | | | 2 .05 | % | | | 2 .27 | % | | | 2 .06 | % |
| | | | | | |
Portfolio turnover rate(d) | | | 156 | % | | | 406 | % | | | 229 | % | | | 329 | % | | | 376 | % | | | 353 | % |
| (a) | Calculated based on the average shares outstanding methodology. |
| (b) | Assumes investment at the net asset value at the beginning of the period, reinvestment of all distributions, a complete redemption of the investment at the net asset value at the end of the period and no sales or redemption charges (if any). Total returns would be reduced if a sales or redemption charge was taken into account. Returns do not reflect the impact of taxes to shareholders relating to Fund distributions or the redemption of Fund shares. Total returns for periods less than one full year are not annualized. |
| (d) | The Fund’s portfolio turnover rate is calculated in accordance with regulatory requirements, without regard to transactions involving short term investments and certain derivatives. If such transactions were included, the Fund’s portfolio turnover rate may be higher. |
| | |
| The accompanying notes are an integral part of these financial statements. | | 51 |
GOLDMAN SACHS VARIABLE INSURANCE TRUST EQUITY INDEX FUND
Financial Highlights(continued)
Selected Data for a Share Outstanding Throughout Each Period
| | | | | | | | | | | | | | | | | | | | | | | | |
| | | Goldman Sachs Equity Index Fund | |
| | | Service Shares | |
| | | Six Months Ended
June 30, 2019
(Unaudited) | | | Year Ended December 31, | |
| | | 2018 | | | 2017 | | | 2016 | | | 2015 | | | 2014 | |
| | | | | | | | | | | | | | | | | | | | | | | | |
| Per Share Data | | | | | | | | | | | | | | | | | | |
| | | | | | |
Net asset value, beginning of period | | $ | 14.43 | | | $ | 16.60 | | | $ | 14.49 | | | $ | 13.91 | | | $ | 14.91 | | | $ | 13.68 | |
| | | | | | |
Net investment income(a) | | | 0.13 | | | | 0.25 | | | | 0.24 | | | | 0.25 | | | | 0.32 | | | | 0.22 | |
| | | | | | |
Net realized and unrealized gain (loss) | | | 2.51 | | | | (1.04 | ) | | | 2.85 | | | | 1.35 | | | | (0.18 | ) | | | 1.58 | |
| | | | | | |
Total from investment operations | | | 2.64 | | | | (0.79 | ) | | | 3.09 | | | | 1.60 | | | | 0.14 | | | | 1.80 | |
| | | | | | |
Distributions to shareholders from net investment income | | | — | | | | (0.27 | ) | | | (0.26 | ) | | | (0.33 | ) | | | (0.28 | ) | | | (0.25 | ) |
| | | | | | |
Distributions to shareholders from net realized gains | | | — | | | | (1.11 | ) | | | (0.72 | ) | | | (0.69 | ) | | | (0.86 | ) | | | (0.32 | ) |
| | | | | | |
Total distributions | | | — | | | | (1.38 | ) | | | (0.98 | ) | | | (1.02 | ) | | | (1.14 | ) | | | (0.57 | ) |
| | | | | | |
Net asset value, end of period | | $ | 17.07 | | | $ | 14.43 | | | $ | 16.60 | | | $ | 14.49 | | | $ | 13.91 | | | $ | 14.91 | |
| | | | | | |
Total return(b) | | | 18.30 | % | | | (4.87 | )% | | | 21.29 | % | | | 11.41 | % | | | 0.94 | % | | | 13.22 | % |
| | | | | | |
Net assets, end of period (in 000s) | | $ | 172,970 | | | $ | 155,098 | | | $ | 179,036 | | | $ | 165,551 | | | $ | 169,295 | | | $ | 190,009 | |
| | | | | | |
Ratio of net expenses to average net assets | | | 0.48 | %(c) | | | 0.48 | % | | | 0.48 | % | | | 0.48 | % | | | 0.48 | % | | | 0.49 | % |
| | | | | | |
Ratio of total expenses to average net assets | | | 0.73 | %(c) | | | 0.72 | % | | | 0.71 | % | | | 0.73 | % | | | 0.70 | % | | | 0.71 | % |
| | | | | | |
Ratio of net investment income to average net assets | | | 1.58 | %(c) | | | 1.48 | % | | | 1.53 | % | | | 1.73 | % | | | 2.15 | % | | | 1.55 | % |
| | | | | | |
Portfolio turnover rate(d) | | | 1 | % | | | 4 | % | | | 2 | % | | | 3 | % | | | 4 | % | | | 2 | % |
| (a) | Calculated based on the average shares outstanding methodology. |
| (b) | Assumes investment at the net asset value at the beginning of the period, reinvestment of all distributions, a complete redemption of the investment at the net asset value at the end of the period and no sales or redemption charges (if any). Total returns would be reduced if a sales or redemption charge was taken into account. Returns do not reflect the impact of taxes to shareholders relating to Fund distributions or the redemption of Fund shares. Total returns for periods less than one full year are not annualized. |
| (d) | The Fund’s portfolio turnover rate is calculated in accordance with regulatory requirements, without regard to transactions involving short term investments and certain derivatives. If such transactions were included, the Fund’s portfolio turnover rate may be higher. |
| | |
| 52 | | The accompanying notes are an integral part of these financial statements. |
GOLDMAN SACHS VARIABLE INSURANCE TRUST GROWTH OPPORTUNITIES FUND
| | | | | | | | | | | | | | | | | | | | | | | | |
| | | Goldman Sachs Growth Opportunities Fund | |
| | | Institutional Shares | |
| | | Six Months Ended
June 30, 2019
(Unaudited)* | | | Year Ended December 31,* | |
| | | 2018 | | | 2017 | | | 2016 | | | 2015 | | | 2014 | |
| | | | | | | | | | | | | | | | | | | | | | | | |
| Per Share Data | | | | | | | | | | | | | | | | | | |
| | | | | | |
Net asset value, beginning of period | | $ | 10.51 | | | $ | 31.13 | | | $ | 27.13 | | | $ | 26.86 | | | $ | 30.89 | | | $ | 34.35 | |
| | | | | | |
Net investment loss(a) | | | — | (b) | | | (0.02 | ) | | | (0.04 | ) | | | (0.07 | ) | | | (0.06 | ) | | | (0.08 | ) |
| | | | | | |
Net realized and unrealized gain (loss) | | | 2.74 | | | | (1.30 | ) | | | 7.40 | | | | 0.52 | | | | (1.55 | ) | | | 3.80 | |
| | | | | | |
Total from investment operations | | | 2.74 | | | | (1.32 | ) | | | 7.36 | | | | 0.45 | | | | (1.61 | ) | | | 3.72 | |
| | | | | | |
Distributions to shareholders from net realized gains | | | — | | | | (19.30 | ) | | | (3.36 | ) | | | (0.18 | ) | | | (2.42 | ) | | | (7.18 | ) |
| | | | | | |
Net asset value, end of period | | $ | 13.25 | | | $ | 10.51 | | | $ | 31.13 | | | $ | 27.13 | | | $ | 26.86 | | | $ | 30.89 | |
| | | | | | |
Total return(c) | | | 26.05 | % | | | (4.17 | )% | | | 27.14 | % | | | 1.71 | % | | | (5.20 | )% | | | 11.32 | % |
| | | | | | |
Net assets, end of period (in 000s) | | $ | 80 | | | $ | 59 | | | $ | 52 | | | $ | 3,518 | | | $ | 32 | | | $ | 33 | |
| | | | | | |
Ratio of net expenses to average net assets | | | 0.85 | %(d) | | | 0.85 | % | | | 0.87 | % | | | 0.89 | % | | | 0.93 | % | | | 1.01 | % |
| | | | | | |
Ratio of total expenses to average net assets | | | 1.22 | %(d) | | | 1 .20 | % | | | 1.14 | % | | | 1.16 | % | | | 1.14 | % | | | 1.15 | % |
| | | | | | |
Ratio of net investment loss to average net assets | | | (0.03 | )%(d) | | | (0.08 | )% | | | (0.13 | )% | | | (0.26 | )% | | | (0.19 | )% | | | (0.24 | )% |
| | | | | | |
Portfolio turnover rate(e) | | | 45 | % | | | 59 | % | | | 57 | % | | | 63 | % | | | 57 | % | | | 62 | % |
| * | All per share amounts representing data prior to May 17, 2019 have been restated to reflect a 4 to 1 reverse stock split which occurred on that date. |
| (a) | Calculated based on the average shares outstanding methodology. |
| (b) | Amount is less than $0.005 per share. |
| (c) | Assumes investment at the net asset value at the beginning of the period, reinvestment of all distributions, a complete redemption of the investment at the net asset value at the end of the period and no sales or redemption charges (if any). Total returns would be reduced if a sales or redemption charge was taken into account. Returns do not reflect the impact of taxes to shareholders relating to Fund distributions or the redemption of Fund shares. Total returns for periods less than one full year are not annualized. |
| (e) | The Fund’s portfolio turnover rate is calculated in accordance with regulatory requirements, without regard to transactions involving short term investments. If such transactions were included, the Fund’s portfolio turnover rate may be higher. |
| | |
| The accompanying notes are an integral part of these financial statements. | | 53 |
GOLDMAN SACHS VARIABLE INSURANCE TRUST GROWTH OPPORTUNITIES FUND
Financial Highlights(continued)
Selected Data for a Share Outstanding Throughout Each Period
| | | | | | | | | | | | | | | | | | | | | | | | |
| | | Goldman Sachs Growth Opportunities Fund | |
| | | Service Shares | |
| | | Six Months Ended
June 30, 2019
(Unaudited)* | | | Year Ended December 31,* | |
| | 2018 | | | 2017 | | | 2016 | | | 2015 | | | 2014 | |
| | | | | | | | | | | | | | | | | | | | | | | | |
| Per Share Data | | | | | | | | | | | | | | | | | | |
| | | | | | |
Net asset value, beginning of period | | $ | 10.15 | | | $ | 30.80 | | | $ | 26.92 | | | $ | 26.71 | | | $ | 30.78 | | | $ | 34.31 | |
| | | | | | |
Net investment loss(a) | | | — | (b) | | | (0.07 | ) | | | (0.08 | ) | | | (0.10 | ) | | | (0.11 | ) | | | (0.14 | ) |
| | | | | | |
Net realized and unrealized gain (loss) | | | 2.64 | | | | (1.28 | ) | | | 7.32 | | | | 0.49 | | | | (1.54 | ) | | | 3.79 | |
| | | | | | |
Total from investment operations | | | 2.64 | | | | (1.35 | ) | | | 7.24 | | | | 0.39 | | | | (1.65 | ) | | | 3.65 | |
| | | | | | |
Distributions to shareholders from net realized gains | | | — | | | | (19.30 | ) | | | (3.36 | ) | | | (0.18 | ) | | | (2.42 | ) | | | (7.18 | ) |
| | | | | | |
Net asset value, end of period | | $ | 12.79 | | | $ | 10.15 | | | $ | 30.80 | | | $ | 26.92 | | | $ | 26.71 | | | $ | 30.78 | |
| | | | | | |
Total return(c) | | | 25.89 | % | | | (4.34 | )% | | | 26.92 | % | | | 1.42 | % | | | (5.20 | )% | | | 11.10 | % |
| | | | | | |
Net assets, end of period (in 000s) | | $ | 74,399 | | | $ | 59,910 | | | $ | 170,785 | | | $ | 155,924 | | | $ | 168,653 | | | $ | 201,519 | |
| | | | | | |
Ratio of net expenses to average net assets | | | 1.01 | %(d) | | | 1.01 | % | | | 1.02 | % | | | 1.05 | % | | | 1.09 | % | | | 1.17 | % |
| | | | | | |
Ratio of total expenses to average net assets | | | 1.47 | %(d) | | | 1.44 | % | | | 1.39 | % | | | 1.40 | % | | | 1.40 | % | | | 1.39 | % |
| | | | | | |
Ratio of net investment loss to average net assets | | | (0.19 | )%(d) | | | (0.24 | )% | | | (0.26 | )% | | | (0.37 | )% | | | (0.36 | )% | | | (0.39 | )% |
| | | | | | |
Portfolio turnover rate(e) | | | 45 | % | | | 59 | % | | | 57 | % | | | 63 | % | | | 57 | % | | | 62 | % |
| * | All per share amounts representing data prior to May 17, 2019 have been restated to reflect a 4 to 1 reverse stock split which occurred on that date. |
| (a) | Calculated based on the average shares outstanding methodology. |
| (b) | Amount is less than $0.005 per share. |
| (c) | Assumes investment at the net asset value at the beginning of the period, reinvestment of all distributions, a complete redemption of the investment at the net asset value at the end of the period and no sales or redemption charges (if any). Total returns would be reduced if a sales or redemption charge was taken into account. Returns do not reflect the impact of taxes to shareholders relating to Fund distributions or the redemption of Fund shares. Total returns for periods less than one full year are not annualized. |
| (e) | The Fund’s portfolio turnover rate is calculated in accordance with regulatory requirements, without regard to transactions involving short term investments. If such transactions were included, the Fund’s portfolio turnover rate may be higher. |
| | |
| 54 | | The accompanying notes are an integral part of these financial statements. |
GOLDMAN SACHS VARIABLE INSURANCE TRUST HIGH QUALITY FLOATING RATE FUND
| | | | | | | | | | | | | | | | | | | | | | | | |
| | | Goldman Sachs High Quality Floating Rate Fund | |
| | | Institutional Shares | |
| | | Six Months Ended
June 30, 2019
(Unaudited) | | | Year Ended December 31, | |
| | 2018 | | | 2017 | | | 2016 | | | 2015 | | | 2014 | |
| | | | | | | | | | | | | | | | | | | | | | | | |
| Per Share Data | | | | | | | | | | | | | | | | | | |
| | | | | | |
Net asset value, beginning of period | | $ | 10.38 | | | $ | 10.42 | | | $ | 10.41 | | | $ | 10.40 | | | $ | 10.49 | | | $ | 10.51 | |
| | | | | | |
Net investment income(a) | | | 0.13 | | | | 0.24 | | | | 0.14 | | | | 0.11 | | | | 0.06 | | | | 0.05 | |
| | | | | | |
Net realized and unrealized gain (loss) | | | 0.01 | | | | (0.06 | ) | | | 0.03 | | | | 0.03 | | | | (0.08 | ) | | | (0.03 | ) |
| | | | | | |
Total from investment operations | | | 0.14 | | | | 0.18 | | | | 0.17 | | | | 0.14 | | | | (0.02 | ) | | | 0.02 | |
| | | | | | |
Distributions to shareholders from net investment income | | | (0.15 | ) | | | (0.22 | ) | | | (0.16 | ) | | | (0.13 | ) | | | (0.07 | ) | | | (0.04 | ) |
| | | | | | |
Net asset value, end of period | | $ | 10.37 | | | $ | 10.38 | | | $ | 10.42 | | | $ | 10.41 | | | $ | 10.40 | | | $ | 10.49 | |
| | | | | | |
Total return(b) | | | 1.32 | % | | | 1.75 | % | | | 1.62 | % | | | 1.35 | % | | | (0.16 | )% | | | 0.17 | % |
| | | | | | |
Net assets, end of period (in 000s) | | $ | 2,283 | | | $ | 2,326 | | | $ | 57 | | | $ | 25 | | | $ | 25 | | | $ | 25 | |
| | | | | | |
Ratio of net expenses to average net assets | | | 0.34 | %(c) | | | 0.34 | % | | | 0.36 | % | | | 0.39 | % | | | 0.38 | % | | | 0.40 | % |
| | | | | | |
Ratio of total expenses to average net assets | | | 0.62 | %(c) | | | 0.63 | % | | | 0.72 | % | | | 0.78 | % | | | 0.81 | % | | | 0.70 | % |
| | | | | | |
Ratio of net investment income to average net assets | | | 2.50 | %(c) | | | 2.28 | % | | | 1.33 | % | | | 1.03 | % | | | 0.54 | % | | | 0.51 | % |
| | | | | | |
Portfolio turnover rate(d) | | | 9 | % | | | 36 | % | | | 38 | % | | | 47 | % | | | 14 | % | | | 17 | % |
| (a) | Calculated based on the average shares outstanding methodology. |
| (b) | Assumes investment at the net asset value at the beginning of the period, reinvestment of all distributions, a complete redemption of the investment at the net asset value at the end of the period and no sales or redemption charges (if any). Total returns would be reduced if a sales or redemption charge was taken into account. Returns do not reflect the impact of taxes to shareholders relating to Fund distributions or the redemption of Fund shares. Total returns for periods less than one full year are not annualized. |
| (d) | The Fund’s portfolio turnover rate is calculated in accordance with regulatory requirements, without regard to transactions involving short term investments and certain derivatives. If such transactions were included, the Fund’s portfolio turnover rate may be higher. |
| | |
| The accompanying notes are an integral part of these financial statements. | | 55 |
GOLDMAN SACHS VARIABLE INSURANCE TRUST HIGH QUALITY FLOATING RATE FUND
Financial Highlights(continued)
Selected Data for a Share Outstanding Throughout Each Period
| | | | | | | | | | | | | | | | | | | | | | | | |
| | | Goldman Sachs High Quality Floating Rate Fund | |
| | | Service Shares | |
| | | Six Months Ended
June 30, 2019
(Unaudited) | | | Year Ended December 31, | |
| | 2018 | | | 2017 | | | 2016 | | | 2015 | | | 2014 | |
| | | | | | | | | | | | | | | | | | | | | | | | |
| Per Share Data | | | | | | | | | | | | | | | | | | |
| | | | | | |
Net asset value, beginning of period | | $ | 10.36 | | | $ | 10.40 | | | $ | 10.38 | | | $ | 10.38 | | | $ | 10.47 | | | $ | 10.51 | |
| | | | | | |
Net investment income(a) | | | 0.11 | | | | 0.19 | | | | 0.11 | | | | 0.08 | | | | 0.03 | | | | 0.03 | |
| | | | | | |
Net realized and unrealized gain (loss) | | | 0.01 | | | | (0.03 | ) | | | 0.04 | | | | 0.02 | | | | (0.07 | ) | | | (0.04 | ) |
| | | | | | |
Total from investment operations | | | 0.12 | | | | 0.16 | | | | 0.15 | | | | 0.10 | | | | (0.04 | ) | | | (0.01 | ) |
| | | | | | |
Distributions to shareholders from net investment income | | | (0.13 | ) | | | (0.20 | ) | | | (0.13 | ) | | | (0.10 | ) | | | (0.05 | ) | | | (0.03 | ) |
| | | | | | |
Net asset value, end of period | | $ | 10.35 | | | $ | 10.36 | | | $ | 10.40 | | | $ | 10.38 | | | $ | 10.38 | | | $ | 10.47 | |
| | | | | | |
Total return(b) | | | 1.20 | % | | | 1.50 | % | | | 1.47 | % | | | 1.00 | % | | | (0.42 | )% | | | (0.09 | )% |
| | | | | | |
Net assets, end of period (in 000s) | | $ | 72,542 | | | $ | 72,784 | | | $ | 66,548 | | | $ | 66,710 | | | $ | 69,625 | | | $ | 74,892 | |
| | | | | | |
Ratio of net expenses to average net assets | | | 0.59 | %(c) | | | 0 .60 | % | | | 0 .61 | % | | | 0 .65 | % | | | 0 .64 | % | | | 0 .66 | % |
| | | | | | |
Ratio of total expenses to average net assets | | | 0.87 | %(c) | | | 0 .91 | % | | | 0 .97 | % | | | 1 .04 | % | | | 1 .05 | % | | | 0 .96 | % |
| | | | | | |
Ratio of net investment income to average net assets | | | 2.25 | %(c) | | | 1 .82 | % | | | 1 .08 | % | | | 0 .77 | % | | | 0 .28 | % | | | 0 .25 | % |
| | | | | | |
Portfolio turnover rate(d) | | | 9 | % | | | 36 | % | | | 38 | % | | | 47 | % | | | 14 | % | | | 17 | % |
| (a) | Calculated based on the average shares outstanding methodology. |
| (b) | Assumes investment at the net asset value at the beginning of the period, reinvestment of all distributions, a complete redemption of the investment at the net asset value at the end of the period and no sales or redemption charges (if any). Total returns would be reduced if a sales or redemption charge was taken into account. Returns do not reflect the impact of taxes to shareholders relating to Fund distributions or the redemption of Fund shares. Total returns for periods less than one full year are not annualized. |
| (d) | The Fund’s portfolio turnover rate is calculated in accordance with regulatory requirements, without regard to transactions involving short term investments and certain derivatives. If such transactions were included, the Fund’s portfolio turnover rate may be higher. |
| | |
| 56 | | The accompanying notes are an integral part of these financial statements. |
GOLDMAN SACHS VARIABLE INSURANCE TRUST HIGH QUALITY FLOATING RATE FUND
| | | | | | | | | | | | | | | | | | | | | | | | |
| | | Goldman Sachs High Quality Floating Rate Fund | |
| | | Advisor Shares | |
| | | Six Months Ended
June 30, 2019
(Unaudited) | | | Year Ended December 31, | | | For the Period
October 15, 2014*
to
December 31, 2014 | |
| | 2018 | | | 2017 | | | 2016 | | | 2015 | |
| | | | | | | | | | | | | | | | | | | | | | | | |
| Per Share Data | | | | | | | | | | | | | | | | | | |
| | | | | | |
Net asset value, beginning of period | | $ | 10.37 | | | $ | 10.41 | | | $ | 10.40 | | | $ | 10.40 | | | $ | 10.49 | | | $ | 10.51 | |
| | | | | | |
Net investment income(a) | | | 0.11 | | | | 0.18 | | | | 0.10 | | | | 0.06 | | | | 0.01 | | | | — | (b) |
| | | | | | |
Net realized and unrealized gain (loss) | | | 0.01 | | | | (0.04 | ) | | | 0.03 | | | | 0.03 | | | | (0.06 | ) | | | (0.02 | ) |
| | | | | | |
Total from investment operations | | | 0.12 | | | | 0.14 | | | | 0.13 | | | | 0.09 | | | | (0.05 | ) | | | (0.02 | ) |
| | | | | | |
Distributions to shareholders from net investment income | | | (0.13 | ) | | | (0.18 | ) | | | (0.12 | ) | | | (0.09 | ) | | | (0.04 | ) | | | — | |
| | | | | | |
Net asset value, end of period | | $ | 10.36 | | | $ | 10.37 | | | $ | 10.41 | | | $ | 10.40 | | | $ | 10.40 | | | $ | 10.49 | |
| | | | | | |
Total return(c) | | | 1.12 | % | | | 1.37 | % | | | 1.26 | % | | | 0.96 | % | | | (0.57 | )% | | | (0.10 | )%(d) |
| | | | | | |
Net assets, end of period (in 000s) | | $ | 6,826 | | | $ | 7,184 | | | $ | 4,726 | | | $ | 1,658 | | | $ | 1,315 | | | $ | 10 | |
| | | | | | |
Ratio of net expenses to average net assets | | | 0.74 | %(e) | | | 0.75 | % | | | 0.76 | % | | | 0.80 | % | | | 0.78 | % | | | 0.77 | %(e) |
| | | | | | |
Ratio of total expenses to average net assets | | | 1.02 | %(e) | | | 1.05 | % | | | 1.12 | % | | | 1.18 | % | | | 1.25 | % | | | 1.13 | %(e) |
| | | | | | |
Ratio of net investment income to average net assets | | | 2.10 | %(e) | | | 1.69 | % | | | 0.96 | % | | | 0.62 | % | | | 0.12 | % | | | 0.15 | %(e) |
| | | | | | |
Portfolio turnover rate(f) | | | 9 | % | | | 36 | % | | | 38 | % | | | 47 | % | | | 14 | % | | | 17 | % |
| * | Commencement of Operations. |
| (a) | Calculated based on the average shares outstanding methodology. |
| (b) | Amount is less than $0.005 per share. |
| (c) | Assumes investment at the net asset value at the beginning of the period, reinvestment of all distributions, a complete redemption of the investment at the net asset value at the end of the period and no sales or redemption charges (if any). Total returns would be reduced if a sales or redemption charge was taken into account. Returns do not reflect the impact of taxes to shareholders relating to Fund distributions or the redemption of Fund shares. Total returns for periods less than one full year are not annualized. |
| (d) | Represents cumulative total returns. |
| (f) | The Fund’s portfolio turnover rate is calculated in accordance with regulatory requirements, without regard to transactions involving short term investments and certain derivatives. If such transactions were included, the Fund’s portfolio turnover rate may be higher. |
| | |
| The accompanying notes are an integral part of these financial statements. | | 57 |
GOLDMAN SACHS VARIABLE INSURANCE TRUST FUNDS
Notes to Financial Statements
June 30, 2019 (Unaudited)
1. ORGANIZATION
Goldman Sachs Variable Insurance Trust (the “Trust” or “VIT”) is a Delaware statutory trust registered under the Investment Company Act of 1940, as amended (the “Act”), as anopen-end management investment company. The following table lists those series of the Trust that are included in this report (collectively, the “Funds” or individually a “Fund”), along with their corresponding share classes and respective diversification status under the Act:
| | | | |
| Fund | | Share Classes Offered | | Diversified/ Non-diversified |
High Quality Floating Rate | | Institutional, Service and Advisor | | Diversified |
Core Fixed Income and Growth Opportunities | | Institutional and Service | | Diversified |
Equity Index | | Service | | Diversified |
Shares of the Trust are offered to a separate account of participating life insurance companies for the purpose of funding variable annuity contracts and variable life insurance policies.
Goldman Sachs Asset Management, L.P. (“GSAM”), an affiliate of Goldman Sachs & Co. LLC (“Goldman Sachs”), serves as investment adviser to the Funds pursuant to management agreements (the “Agreements”) with the Trust.
The Growth Opportunities Fund processed a4-for-1 reverse stock split effective at the close of business on May 17, 2019. The stock split had no impact on the overall value of a shareholder’s investment in the Fund.
2. SIGNIFICANT ACCOUNTING POLICIES
The financial statements have been prepared in accordance with accounting principles generally accepted in the United States of America (“GAAP”) and require management to make estimates and assumptions that may affect the reported amounts and disclosures. Actual results may differ from those estimates and assumptions.
A. Investment Valuation —The Funds’ valuation policy is to value investments at fair value.
B. Investment Income and Investments —Investment income includes interest income, dividend income, and securities lending income, if any. Interest income is accrued daily and adjusted for amortization of premiums and accretion of discounts. Dividend income is recognized onex-dividend date or, for certain foreign securities, as soon as such information is obtained subsequent to theex-dividend date. Investment transactions are reflected on trade date. Realized gains and losses are calculated using identified cost. Investment transactions are recorded on the following business day for daily net asset value (“NAV”) calculations. Distributions received from the Funds’ investments in United States (“U.S.”) real estate investment trusts (“REITs”) may be characterized as ordinary income, net capital gain or a return of capital. A return of capital is recorded by the Funds as a reduction to the cost basis of the REIT.
For derivative contracts, realized gains and losses are recorded upon settlement of the contract. Upfront payments, if any, are made or received upon entering into a swap agreement and are reflected in the Statements of Assets and Liabilities. Upfront payments are recognized over the contract’s term/event as realized gains or losses, with the exception of forward starting swap contracts whose realized gains or losses are recognized from the effective start date. For securities with paydown provisions, principal payments received are treated as a proportionate reduction to the cost basis of the securities, and excess or shortfall amounts are recorded as income. For treasury inflation protected securities (“TIPS”), adjustments to principal due to inflation/deflation are reflected as increases/decreases to interest income with a corresponding adjustment to cost.
C. Class Allocations and Expenses —Investment income, realized and unrealized gain (loss), if any, andnon-class specific expenses of each Fund are allocated daily based upon the proportion of net assets of each class.Non-class specific expenses directly incurred by a Fund are charged to that Fund, while such expenses incurred by the Trust are allocated across the applicableFunds on a straight-line and/orpro-rata basis depending upon the nature of the expenses. Class-specific expenses, where applicable, are borne by the respective share classes and include Distribution and Service and Transfer Agency fees.
58
GOLDMAN SACHS VARIABLE INSURANCE TRUST FUNDS
2. SIGNIFICANT ACCOUNTING POLICIES (continued)
D. Federal Taxes and Distributions to Shareholders —It is each Fund’s policy to comply with the requirements of the Internal Revenue Code of 1986, as amended (the “Code”), applicable to regulated investment companies and to distribute each year substantially all of its investment company taxable income and capital gains to its shareholders. Accordingly, each Fund is not required to make any provisions for the payment of federal income tax. Distributions to shareholders are recorded on theex-dividend date. Income and capital gains distributions, if any, are declared and paid according to the following schedule:
| | | | |
| Fund | | Income Distributions Declared/Paid | | Capital Gains Distributions
Declared/Paid |
Core Fixed Income and High Quality Floating Rate | | Quarterly | | Annually |
Equity Index and Growth Opportunities | | Annually | | Annually |
Net capital losses, if any, are carried forward to future fiscal years and may be used to the extent allowed by the Code to offset any future capital gains. Losses that are carried forward will retain their character as either short-term or long-term capital losses. Utilization of capital loss carryforwards will reduce the requirement of future capital gains distributions.
The characterization of distributions to shareholders for financial reporting purposes is determined in accordance with federal income tax rules, which may differ from GAAP. The source of each Fund’s distributions may be shown in the accompanying financial statements as either from distributable earnings or capital. Certain components of the Funds’ net assets on the Statements of Assets and Liabilities reflect permanent GAAP/tax differences based on the appropriate tax character.
E. Foreign Currency Translation —The accounting records and reporting currency of a Fund are maintained in U.S. dollars. Assets and liabilities denominated in foreign currencies are translated into U.S. dollars using the current exchange rates at the close of each business day. The effect of changes in foreign currency exchange rates on investments is included within net realized and unrealized gain (loss) on investments. Changes in the value of other assets and liabilities as a result of fluctuations in foreign exchange rates are included in the Statements of Operations within net change in unrealized gain (loss) on foreign currency translation. Transactions denominated in foreign currencies are translated into U.S. dollars on the date the transaction occurred, the effects of which are included within net realized gain (loss) on foreign currency transactions.
F. Commission Recapture —GSAM, on behalf of certain Funds, may direct portfolio trades, subject to seeking best execution, to various brokers who have agreed to rebate a portion of the commissions generated. Such rebates are made directly to a Fund as cash payments and are included in net realized gain (loss) from investments on the Statements of Operations.
3. INVESTMENTS AND FAIR VALUE MEASUREMENTS
U.S. GAAP defines the fair value of a financial instrument as the amount that would be received to sell an asset or paid to transfer a liability in an orderly transaction between market participants at the measurement date (i.e., the exit price); the Funds’ policy is to use the market approach. GAAP establishes a fair value hierarchy that prioritizes the inputs to valuation techniques used to measure fair value. The hierarchy gives the highest priority to unadjusted quoted prices in active markets for identical assets or liabilities (Level 1 measurements) and the lowest priority to unobservable inputs (Level 3 measurements). The levels used for classifying investments are not necessarily an indication of the risk associated with investing in these investments. The three levels of the fair value hierarchy are described below:
Level 1 — Unadjusted quoted prices in active markets that are accessible at the measurement date for identical, unrestricted assets or liabilities;
Level 2 — Quoted prices in markets that are not active or financial instruments for which significant inputs are observable (including, but not limited to, quoted prices for similar investments, interest rates, foreign exchange rates, volatility and credit spreads), either directly or indirectly;
59
GOLDMAN SACHS VARIABLE INSURANCE TRUST FUNDS
Notes to Financial Statements(continued)
June 30, 2019 (Unaudited)
3. INVESTMENTS AND FAIR VALUE MEASUREMENTS (continued)
Level 3 — Prices or valuations that require significant unobservable inputs (including GSAM’s assumptions in determining fair value measurement).
The Board of Trustees (“Trustees”) have approved Valuation Procedures that govern the valuation of the portfolio investments held by the Funds, including investments for which market quotations are not readily available. The Trustees have delegated to GSAMday-to-day responsibility for implementing and maintaining internal controls and procedures related to the valuation of the Funds’ investments. To assess the continuing appropriateness of pricing sources and methodologies, GSAM regularly performs price verification procedures and issues challenges as necessary to third party pricing vendors or brokers, and any differences are reviewed in accordance with the Valuation Procedures.
A. Level 1 and Level 2 Fair Value Investments —The valuation techniques and significant inputs used in determining the fair values for investments classified as Level 1 and Level 2 are as follows:
Equity Securities —Equity securities traded on a U.S. securities exchange or the NASDAQ system, or those located on certain foreign exchanges, including but not limited to the Americas, are valued daily at their last sale price or official closing price on the principal exchange or system on which they are traded. If there is no sale or official closing price or such price is believed by GSAM to not represent fair value, equity securities are valued at the last bid price for long positions and at the last ask price for short positions. To the extent these investments are actively traded, they are classified as Level 1 of the fair value hierarchy, otherwise they are generally classified as Level 2.
Unlisted equity securities for which market quotations are available are valued at the last sale price on the valuation date, or if no sale occurs, at the last bid price, and are generally classified as Level 2.
Money Market Funds —Investments in the Goldman Sachs Financial Square Government Fund (“Underlying Fund”) are valued at the NAV of the Institutional Share class on the day of valuation. These investments are generally classified as Level 1 of the fair value hierarchy. For information regarding the Underlying Fund’s accounting policies and investment holdings, please see the Underlying Fund’s shareholder report.
Debt Securities — Debt securities for which market quotations are readily available are valued daily on the basis of quotations supplied by dealers or an independent pricing service approved by the Trustees. The pricing services may use valuation models or matrix pricing, which consider: (i) yield or price with respect to bonds that are considered comparable in characteristics such as rating, interest rate and maturity date or (ii) quotations from securities dealers to determine current value. With the exception of treasury securities of G8 countries, which are generally classified as Level 1, these investments are generally classified as Level 2 of the fair value hierarchy.
i. Commercial Paper — Commercial paper normally represents short-term unsecured promissory notes issued in bearer form by banks or bank holding companies, corporations, finance companies and other issuers. Commercial paper consists of direct U.S. dollar-denominated obligations of domestic or foreign issuers. Asset-backed commercial paper is issued by a special purpose entity that is organized to issue the commercial paper and to purchase trade receivables or other financial assets.
ii. Mortgage-Backed and Asset-Backed Securities — Mortgage-backed securities represent direct or indirect participations in, or are collateralized by and payable from, mortgage loans secured by residential and/or commercial real estate property. Asset-backed securities include securities whose principal and interest payments are collateralized by pools of other assets or receivables. The value of certain mortgage-backed and asset-backed securities (including adjustable rate mortgage loans) may be particularly sensitive to changes in prevailing interest rates. The value of these securities may also fluctuate in response to the market’s perception of the creditworthiness of the issuers.
Asset-backed securities may present credit risks that are not presented by mortgage-backed securities because they generally do not have the benefit of a security interest in collateral that is comparable to mortgage assets. Some asset-backed securities may only have a subordinated claim on collateral.
60
GOLDMAN SACHS VARIABLE INSURANCE TRUST FUNDS
3. INVESTMENTS AND FAIR VALUE MEASUREMENTS (continued)
Stripped mortgage-backed securities are usually structured with two different classes: one that receives substantially all interest payments (interest-only, or “IO” and/or high coupon rate with relatively low principal amount, or “IOette”), and the other that receives substantially all principal payments (principal-only, or “PO”) from a pool of mortgage loans. Little to no principal will be received at the maturity of an IO; as a result, periodic adjustments are recorded to reduce the cost of the security until maturity. These adjustments are included in interest income.
iii. Mortgage Dollar Rolls — Mortgage dollar rolls are transactions whereby a Fund sells mortgage-backed-securities and simultaneously contracts with the same counterparty to repurchase similar securities on a specified future date. During the settlement period, a Fund will not be entitled to accrue interest and receive principal payments on the securities sold. The Funds account for mortgage dollar roll transactions as purchases and sales and realize gains and losses on these transactions.
iv. Treasury Inflation Protected Securities — TIPS are treasury securities in which the principal amount is adjusted daily to keep pace with inflation, as measured by the U.S. Consumer Pricing Index for Urban Consumers. The repayment of the original bond principal upon maturity is guaranteed by the full faith and credit of the U.S. Government.
v. When-Issued Securities and Forward Commitments —When-issued securities, including TBA (“To Be Announced”) securities, are securities that are authorized but not yet issued in the market and purchased in order to secure what is considered to be an advantageous price or yield to a Fund. A forward commitment involves entering into a contract to purchase or sell securities, typically on an extended settlement basis, for a fixed price at a future date. The purchase of securities on a when-issued or forward commitment basis involves a risk of loss if the value of the security to be purchased declines before the settlement date. Conversely, the sale of securities on a forward commitment basis involves the risk that the value of the securities sold may increase before the settlement date. Although a Fund will generally purchase securities on a when-issued or forward commitment basis with the intention of acquiring the securities for its portfolio, the Fund may dispose of when-issued securities or forward commitments prior to settlement, which may result in a realized gain or loss. For financial reporting purposes, cash collateral that has been pledged to cover obligations of a Fund and cash collateral received, if any, is reported separately on the Statements of Assets and Liabilities as receivables/payables for collateral on other investments.Non-cash collateral pledged by a Fund, if any, is noted in the Schedules of Investments.
Derivative Contracts —A derivative is an instrument whose value is derived from underlying assets, indices, reference rates or a combination of these factors. A Fund enters into derivative transactions to hedge against changes in interest rates, securities prices, and/or currency exchange rates, to increase total return, or to gain access to certain markets or attain exposure to other underliers. For financial reporting purposes, cash collateral that has been pledged to cover obligations of a Fund and cash collateral received, if any, is reported separately on the Statements of Assets and Liabilities as receivables/payables for collateral on certain derivatives contracts.Non-cash collateral pledged by a Fund, if any, is noted in the Schedules of Investments.
Exchange-traded derivatives, including futures and options contracts, are generally valued at the last sale or settlement price on the exchange where they are principally traded. Exchange-traded options without settlement prices are generally valued at the midpoint of the bid and ask prices on the exchange where they are principally traded (or, in the absence oftwo-way trading, at the last bid price for long positions and the last ask price for short positions). Exchange-traded derivatives typically fall within Level 1 of the fair value hierarchy.Over-the-counter (“OTC”) and centrally cleared derivatives are valued using market transactions and other market evidence, including market-based inputs to models, calibration to market-clearing transactions, broker or dealer quotations, or other alternative pricing sources. Where models are used, the selection of a particular model to value OTC and centrally cleared derivatives depends upon the contractual terms of, and specific risks inherent in, the instrument, as well as the availability of pricing information in the market. Valuation models require a variety of inputs, including contractual terms, market prices, yield curves, credit curves, measures of volatility, voluntary and involuntary prepayment rates, loss severity rates and correlations of such inputs. For OTC and centrally cleared derivatives that trade in liquid markets, model inputs can generally be
61
GOLDMAN SACHS VARIABLE INSURANCE TRUST FUNDS
Notes to Financial Statements(continued)
June 30, 2019 (Unaudited)
3. INVESTMENTS AND FAIR VALUE MEASUREMENTS (continued)
verified and model selection does not involve significant management judgment. OTC and centrally cleared derivatives are classified within Level 2 of the fair value hierarchy when significant inputs are corroborated by market evidence.
i. Forward Contracts — A forward contract is a contract between two parties to buy or sell an asset at a specified price on a future date. A forward contract settlement can occur on a cash or delivery basis. Forward contracts aremarked-to-market daily using independent vendor prices, and the change in value, if any, is recorded as an unrealized gain or loss. Cash and certain investments may be used to collateralize forward contracts.
Aforward foreign currency exchange contractis a forward contract in which a Fund agrees to receive or deliver a fixed quantity of one currency for another, at apre-determined price at a future date. All forward foreign currency exchange contracts aremarked-to-market daily at the applicable forward rate.Non-deliverable forward foreign currency exchange contracts are settled with the counterparty in cash without the delivery of foreign currency.
ii. Futures Contracts — Futures contracts are contracts to buy or sell a standardized quantity of a specified commodity or security. Upon entering into a futures contract, a Fund deposits cash or securities in an account on behalf of the broker in an amount sufficient to meet the initial margin requirement. Subsequent payments are made or received by a Fund equal to the daily change in the contract value and are recorded as variation margin receivable or payable with a corresponding offset to unrealized gains or losses.
iii. Options — When a Fund writes call or put options, an amount equal to the premium received is recorded as a liability and is subsequentlymarked-to-market to reflect the current value of the option written. Swaptions are options on interest rate and or credit default, swap contracts.
Upon the purchase of a call option or a put option by a Fund, the premium paid is recorded as an investment and subsequentlymarked-to-market to reflect the current value of the option. Certain options may be purchased with premiums to be determined on a future date. The premiums for these options are based upon implied volatility parameters at specified terms.
iv. Swap Contracts — Bilateral swap contracts are agreements in which a Fund and a counterparty agree to exchange periodic payments on a specified notional amount or make a net payment upon termination. Bilateral swap transactions are privately negotiated in the OTC market and payments are settled through direct payments between a Fund and the counterparty. By contrast, certain swap transactions are subject to mandatory central clearing. These swaps are executed through a derivatives clearing member (“DCM”), acting in an agency capacity, and submitted to a central counterparty (“CCP”) (“centrally cleared swaps”), in which case all payments are settled with the CCP through the DCM. Swaps aremarked-to-market daily using pricing vendor quotations, counterparty or clearinghouse prices or model prices, and the change in value, if any, is recorded as an unrealized gain or loss. Upon entering into a swap contract, a Fund is required to satisfy an initial margin requirement by delivering cash or securities to the counterparty (or in some cases, segregated in a triparty account on behalf of the counterparty), which can be adjusted by anymark-to-market gains or losses pursuant to bilateral or centrally cleared arrangements. For centrally cleared swaps the daily change in valuation, if any, is recorded as a receivable or payable for variation margin.
An interest rate swap is an agreement that obligates two parties to exchange a series of cash flows at specified intervals, based upon or calculated by reference to changes in interest rates on a specified notional principal amount. The payment flows are usually netted against each other, with the difference being paid by one party to the other.
A credit default swap is an agreement that involves one party (the buyer of protection) making a stream of payments to another party (the seller of protection) in exchange for the right to receive protection on a reference security or obligation, including a group of assets or exposure to the performance of an index. A Fund’s investment in credit default swaps may involve greater risks than if the Fund had invested in the referenced obligation directly. Credit events are contract specific but may include bankruptcy, failure to pay, restructuring and obligation acceleration. If a Fund buys protection through a credit default swap and no credit event occurs, its payments are limited to the periodic payments previously made to the counterparty. Upon the occurrence of a specified credit event, a Fund, as a buyer of credit protection, is entitled to receive an
62
GOLDMAN SACHS VARIABLE INSURANCE TRUST FUNDS
3. INVESTMENTS AND FAIR VALUE MEASUREMENTS (continued)
amount equal to the notional amount of the swap and deliver to the seller the defaulted reference obligation in a physically settled trade. A Fund may also receive a net settlement amount in the form of cash or securities equal to the notional amount of the swap reduced by the recovery value of the reference obligation in a cash settled trade.
As a seller of protection, a Fund generally receives a payment stream throughout the term of the swap, provided that there is no credit event. In addition, if a Fund sells protection through a credit default swap, a Fund could suffer a loss because the value of the referenced obligation and the premium payments received may be less than the notional amount of the swap paid to the buyer of protection. Upon the occurrence of a specified credit event, a Fund, as a seller of credit protection, may be required to take possession of the defaulted reference obligation and pay the buyer an amount equal to the notional amount of the swap in a physically settled trade. A Fund may also pay a net settlement amount in the form of cash or securities equal to the notional amount of the swap reduced by the recovery value of the reference obligation in a cash settled trade. Recovery values are at times established through the credit event auction process in which market participants are ensured that a transparent price has been set for the defaulted security or obligation. In addition, a Fund is entitled to a return of any assets, which have been pledged as collateral to the counterparty upon settlement.
The maximum potential amount of future payments (undiscounted) that a Fund as seller of protection could be required to make under a credit default swap would be an amount equal to the notional amount of the agreement. These potential amounts would be partially offset by any recovery values of the respective referenced obligations or net amounts received from a settlement of a credit default swap for the same reference security or obligation where a Fund bought credit protection.
B. Level 3 Fair Value Investments —To the extent that significant inputs to valuation models and other alternative pricing sources are unobservable, or if quotations are not readily available, or if GSAM believes that such quotations do not accurately reflect fair value, the fair value of a Fund’s investments may be determined under Valuation Procedures approved by the Trustees. GSAM, consistent with its procedures and applicable regulatory guidance, may make an adjustment to the most recent valuation prices of either domestic or foreign securities in light of significant events to reflect what it believes to be the fair value of the securities at the time of determining a Fund’s NAV. To the extent investments are valued using single source broker quotations obtained directly from the broker or passed through from third party pricing vendors, such investments are classified as Level 3 investments. GSAM did not develop the unobservable inputs for valuation of Level 3 Assets and Liabilities.
C. Fair Value Hierarchy —The following is a summary of the Funds’ investments and derivatives classified in the fair value hierarchy as of June 30, 2019:
| | | | | | | | | | | | |
| | | |
| CORE FIXED INCOME | | | | | | | | | |
| Investment Type | | Level 1 | | | Level 2 | | | Level 3 | |
| | | |
| Assets | | | | | | | | | | | | |
| Fixed Income | | | | | | | | | | | | |
Corporate Bonds | | $ | — | | | $ | 15,225,951 | | | $ | — | |
Mortgage-Backed Securities | | | — | | | | 13,918,358 | | | | — | |
Collateralized Mortgage Obligations | | | — | | | | 917,112 | | | | — | |
Commercial Mortgage-Backed Security | | | — | | | | 150,099 | | | | — | |
U.S. Treasury Obligations and/or Other U.S. Government Agencies | | | 5,319,761 | | | | 1,042,443 | | | | — | |
Asset-Backed Securities | | | — | | | | 3,614,221 | | | | — | |
Foreign Government Securities | | | — | | | | 1,929,534 | | | | — | |
Municipal Bonds | | | — | | | | 700,559 | | | | — | |
| Investment Company | | | 7,501,840 | | | | — | | | | — | |
| | | |
| Total | | $ | 12,821,601 | | | $ | 37,498,277 | | | $ | — | |
63
GOLDMAN SACHS VARIABLE INSURANCE TRUST FUNDS
Notes to Financial Statements(continued)
June 30, 2019 (Unaudited)
3. INVESTMENTS AND FAIR VALUE MEASUREMENTS (continued)
| | | | | | | | | | | | |
| | | |
| CORE FIXED INCOME (continued) | | | | | | | | | |
| Derivative Type | | Level 1 | | | Level 2 | | | Level 3 | |
| | | |
| Assets(a) | | | | | | | | | | | | |
| Forward Foreign Currency Exchange Contracts | | $ | — | | | $ | 71,505 | | | $ | — | |
| Futures Contracts | | | 140,971 | | | | — | | | | — | |
| Credit Default Swap Contracts | | | — | | | | 17,083 | | | | — | |
| Interest Rate Swap Contracts | | | — | | | | 71,081 | | | | — | |
| | | |
| Total | | $ | 140,971 | | | $ | 159,669 | | | $ | — | |
| | | |
| Liabilities(a) | | | | | | | | | | | | |
| Forward Foreign Currency Exchange Contracts | | $ | — | | | $ | (39,856 | ) | | $ | — | |
| Futures Contracts | | | (89,576 | ) | | | — | | | | — | |
| Interest Rate Swap Contracts | | | — | | | | (47,158 | ) | | | — | |
| | | |
| Total | | $ | (89,576 | ) | | $ | (87,014 | ) | | $ | — | |
| | | |
| EQUITY INDEX | | | | | | | | | |
| Investment Type | | Level 1 | | | Level 2 | | | Level 3 | |
| | | |
| Assets | | | | | | | | | | | | |
| Common Stock and/or Other Equity Investments(b) | | | | | | | | | | | | |
Europe | | $ | 971,480 | | | $ | — | | | $ | — | |
North America | | | 170,807,068 | | | | — | | | | — | |
Short-Term Investment | | | 74,350 | | | | — | | | | — | |
| | | |
| Total | | $ | 171,852,898 | | | $ | — | | | $ | — | |
| | | |
| Derivative Type | | | | | | | | | |
| | | |
| Assets(a) | | | | | | | | | | | | |
| Futures Contracts | | $ | 19,957 | | | $ | — | | | $ | — | |
| | | |
| GROWTH OPPORTUNITIES | | | | | | | | | |
| Investment Type | | Level 1 | | | Level 2 | | | Level 3 | |
| | | |
| Assets | | | | | | | | | | | | |
| Common Stock and/or Other Equity Investments(b) | | | | | | | | | | | | |
North America | | $ | 70,873,934 | | | $ | — | | | $ | — | |
| Investment Company | | | 1,092,324 | | | | — | | | | — | |
| Securities Lending Reinvestment Vehicle | | | 352,707 | | | | — | | | | — | |
| | | |
| Total | | $ | 72,318,965 | | | $ | — | | | $ | — | |
| (a) | Amount shown represents unrealized gain (loss) at period end. |
| (b) | Amounts are disclosed by continent to highlight the impact of time zone differences between local market close and the calculation of NAV. Security valuations are based on the principal exchange or system on which they are traded, which may differ from country of domicile. |
64
GOLDMAN SACHS VARIABLE INSURANCE TRUST FUNDS
3. INVESTMENTS AND FAIR VALUE MEASUREMENTS (continued)
| | | | | | | | | | | | |
| | | |
| HIGH QUALITY FLOATING RATE | | | | | | | | | |
| Investment Type | | Level 1 | | | Level 2 | | | Level 3 | |
| | | |
| Assets | | | | | | | | | | | | |
| Fixed Income | | | | | | | | | | | | |
U.S. Treasury Obligations and/or Other U.S. Government Agencies | | $ | 8,960,072 | | | $ | 2,001,760 | | | $ | — | |
Mortgage-Backed Securities | | | — | | | | 2,496,967 | | | | — | |
Collateralized Mortgage Obligations | | | — | | | | 20,955,030 | | | | — | |
Commercial Mortgage-Backed Security | | | — | | | | 324,379 | | | | — | |
Asset-Backed Securities | | | — | | | | 32,902,512 | | | | — | |
Municipal Bond | | | — | | | | 95,778 | | | | — | |
Supranational | | | — | | | | 2,531,775 | | | | — | |
| Investment Company | | | 9,130,382 | | | | — | | | | — | |
| Short Term Investments | | | — | | | | 981,748 | | | | — | |
| | | |
| Total | | $ | 18,090,454 | | | $ | 62,289,949 | | | $ | — | |
| | | |
| Derivative Type | | | | | | | | | |
| | | |
| Assets(a) | | | | | | | | | | | | |
| Futures Contracts | | $ | 52,739 | | | $ | — | | | $ | — | |
| Interest Rate Swap Contract | | | — | | | | 148 | | | | — | |
| | | |
| Total | | $ | 52,739 | | | $ | 148 | | | $ | — | |
| | | |
| Liabilities(a) | | | | | | | | | | | | |
| Futures Contracts | | $ | (60,738 | ) | | $ | — | | | $ | — | |
| (a) | Amount shown represents unrealized gain (loss) at period end. |
For further information regarding security characteristics, see the Schedules of Investments.
4. INVESTMENTS IN DERIVATIVES
The following tables set forth, by certain risk types, the gross value of derivative contracts (not considered to be hedging instruments for accounting disclosure purposes) as of June 30, 2019. These instruments were used as part of the Funds’ investment strategies and to obtain and/or manage exposure related to the risks below. The values in the tables below exclude the effects of cash collateral received or posted pursuant to these derivative contracts, and therefore are not representative of the Funds’ net exposure.
Core Fixed Income
| | | | | | | | | | | | | | |
| Risk | | | | Statements of Assets and Liabilities | | Assets | | | Statements of Assets and Liabilities | | Liabilities | |
| Interest Rate | | | | Variation margin on futures and swaps
contracts | | $ | 212,052 | (a) | | Variation margin on futures and swaps
contracts | | $ | (136,734 | )(a) |
| Credit | | | | Variation margin on Swap contracts | | | 17,083 | (a) | | — | | | — | |
| Currency | | | | Receivables for unrealized gain on forward foreign currency exchange contracts | | | 71,505 | | | Payable for unrealized loss on forward foreign currency exchange contracts | | | (39,856 | ) |
| | | | | |
| Total | | | | | | $ | 300,640 | | | | | $ | (176,590 | ) |
| (a) | Includes unrealized gain (loss) on futures contracts and centrally cleared swap contracts described in the Additional Investment Information sections of the Schedules of Investments. Only the variation margin as of June 30, 2019 is reported within the Statements of Assets and Liabilities. |
65
GOLDMAN SACHS VARIABLE INSURANCE TRUST FUNDS
Notes to Financial Statements(continued)
June 30, 2019 (Unaudited)
4. INVESTMENTS IN DERIVATIVES (continued)
| | | | | | | | | | | | | | |
| | | | | | | | | | | | | | |
| Fund | | Risk | | Statements of Assets and Liabilities | | Assets(a) | | | Statements of Assets and Liabilities | | Liabilities(a) | |
| Equity Index | | Equity | | Variation margin on futures contracts | | $ | 19,957 | | | — | | $ | — | |
| | | | | |
| High Quality Floating Rate | | Interest Rate | | Variation margin on futures and swap contracts | | | 52,887 | | | Variation margin on futures contracts | | | (60,738 | ) |
| (a) | Includes unrealized gain (loss) on futures contracts and centrally cleared swap contracts described in the Additional Investment Information sections of the Schedules of Investments. Only the variation margin as of June 30, 2019 is reported within the Statements of Assets and Liabilities. |
The following tables set forth, by certain risk types, the Funds’ gains (losses) related to these derivatives and their indicative volumes for the six months ended June 30, 2019. These gains (losses) should be considered in the context that these derivative contracts may have been executed to create investment opportunities and/or economically hedge certain investments, and accordingly, certain gains (losses) on such derivative contracts may offset certain (losses) gains attributable to investments. These gains (losses) are included in “Net realized gain (loss)” or “Net change in unrealized gain (loss)” on the Statements of Operations:
Core Fixed Income
| | | | | | | | | | | | | | |
| Risk | | Statements of Operations | | Net
Realized
Gain (Loss) | | | Net Change in
Unrealized
Gain (Loss) | | | Average
Number of
Contracts(a) | |
| Interest Rate | | Net realized gain (loss) from futures contracts, purchased options and swap contracts/Net change in unrealized gain (loss) on futures contracts and swap contracts | | $ | 91,681 | | | $ | 67,900 | | | | 170 | |
| Credit | | Net realized gain (loss) from swap contracts/Net change in unrealized gain (loss) on swap contracts | | | 11,817 | | | | 40,912 | | | | 4 | |
| Currency | | Net realized gain (loss) from forward foreign currency exchange contracts/Net change in unrealized gain (loss) on forward foreign currency exchange contracts | | | 982 | | | | 40,974 | | | | 241 | |
| | | | |
| Total | | | | $ | 104,480 | | | $ | 149,786 | | | | 415 | |
Equity Index
| | | | | | | | | | | | | | |
| Risk | | Statements of Operations | | Net Realized
Gain (Loss) | | | Net Change in
Unrealized
Gain (Loss) | | | Average
Number of
Contracts(a) | |
| Equity | | Net realized gain (loss) from futures contracts/Net change in unrealized gain (loss) on futures contracts | | $ | 102,620 | | | $ | 69,150 | | | | 8 | |
High Quality Floating Rate
| | | | | | | | | | | | | | |
| Risk | | Statements of Operations | | Net Realized
Gain (Loss) | | | Net Change in
Unrealized
Gain (Loss) | | | Average
Number of
Contracts(a) | |
| Interest Rate | | Net realized gain (loss) from futures contracts and swap contracts/Net change in unrealized gain (loss) on futures contracts and swap contracts | | $ | (127,955 | ) | | $ | 60,746 | | | | 45 | |
| (a) | Average number of contracts is based on the average of month end balances for the six months ended June 30, 2019. |
66
GOLDMAN SACHS VARIABLE INSURANCE TRUST FUNDS
5. AGREEMENTS AND AFFILIATED TRANSACTIONS
A. Management Agreements —Under the Agreements, GSAM manages the Funds, subject to the general supervision of the Trustees.
As compensation for the services rendered pursuant to the Agreements, the assumption of the expenses related thereto and administration of the Funds’ business affairs, including providing facilities, GSAM is entitled to a management fee, accrued daily and paid monthly, equal to an annual percentage rate of each Fund’s average daily net assets.
For the six months ended June 30, 2019, contractual and effective net management fees with GSAM were at the following rates:
| | | | | | | | | | | | | | | | | | | | | | | | | | | | |
Contractual Management Rate | | | | | | | |
| Fund | | First
$1 billion | | | Next
$1 billion | | | Next
$3 billion | | | Next
$3 billion | | | Over
$8 billion | | | Effective
Rate | | | Effective Net
Management
Rate^ | |
| Core Fixed Income | | | 0.40 | % | | | 0.36 | % | | | 0.34 | % | | | 0.33 | % | | | 0.32 | % | | | 0.40 | % | | | 0.39 | % |
| Growth Opportunities | | | 0.87 | | | | 0.87 | | | | 0.78 | | | | 0.74 | | | | 0.73 | | | | 0.87 | | | | 0.83 | * |
| High Quality Floating Rate | | | 0.31 | | | | 0.28 | | | | 0.27 | | | | 0.26 | | | | 0.25 | | | | 0.31 | | | | 0.29 | |
| ^ | Effective Net Management Rate includes the impact of management fee waivers of affiliated Underlying Funds, if any. The Effective Net Management Rate may not correlate to the Contractual Management Rate as a result of management fee waivers that may be in effect from time to time. |
| * | GSAM agreed to waive a portion of its management fee in order to achieve net management rate, as defined in the Fund’s most recent prospectuses. This waiver will be effective through at least April 30, 2020, and prior to such date GSAM may not terminate the arrangement without approval of the Trustees. |
The Core Fixed Income, Growth Opportunities and High Quality Floating Rate Funds invest in Institutional Shares of the Goldman Sachs Financial Square Government Fund, which is an affiliated Underlying Fund. GSAM has agreed to waive a portion of its management fee payable by the Funds in an amount equal to the management fee it earns as an investment adviser to the affiliated Underlying Fund in which the Funds invest, except those management fees it earns from the Growth Opportunities Fund’s investments of cash collateral received in connection with securities lending transactions in the Goldman Sachs Financial Square Government Fund. For the six months ended June 30, 2019, GSAM waived $1,618, $909, and $6,594 of the Core Fixed Income, Growth Opportunities and High Quality Floating Rate Funds’ management fees, respectively.
The Agreement for the Equity Index Fund provides for a contractual management fee at an annual rate equal to 0.30% of the Fund’s average daily net assets. For the six months ended June 30, 2019, GSAM agreed to waive a portion of its management fee in order to achieve the following effective annual rates which will remain in effect through at least April 30, 2020, and prior to such date GSAM may not terminate the arrangement without the approval of the Trustees:
| | | | | | |
| Net Management Rate |
| Fund | | $0-$400 million | | Over $400 million | | Effective Rate |
| Equity Index | | 0.21% | | 0.20% | | 0.21% |
As authorized by the Agreement for the Equity Index Fund, GSAM has entered into aSub-advisory Agreement with SSgA Funds Management, Inc. (“SSgA”) which serves as thesub-adviser to the Fund and provides theday-to-day advice regarding the Fund’s portfolio transactions. As compensation for its services, SSgA is entitled to a fee, accrued daily and paid monthly by GSAM, at the following annual rates of the Fund’s average daily net assets: 0.03% on the first $50 million, 0.02% on the next $200 million, 0.01% on the next $750 million and 0.008% over $1 billion. The effectiveSub-advisory fee was 0.02% for the six months ended June 30, 2019.
B. Distribution and/or Service(12b-1) Plans —The Trust, on behalf of Service Shares of each applicable Fund, has adopted a Distribution and Service Plan subject to Rule12b-1 under the Act. Under the Distribution and Service Plan, Goldman Sachs, which serves as distributor (the “Distributor”), is entitled to a fee accrued daily and paid monthly, for distribution services and personal
67
GOLDMAN SACHS VARIABLE INSURANCE TRUST FUNDS
Notes to Financial Statements(continued)
June 30, 2019 (Unaudited)
5. AGREEMENTS AND AFFILIATED TRANSACTIONS (continued)
and account maintenance services, which may then be paid by Goldman Sachs to authorized dealers, equal to, on an annual basis, 0.25% of the Fund’s average daily net assets attributable to Service Shares. For the six months ended June 30, 2019 for the Growth Opportunities Fund, Goldman Sachs agreed to waive distribution and services fees so as not to exceed an annual rate of 0.16% of average daily net assets of the Fund. This distribution and service fee waiver will remain in place through at least April 30, 2020, and prior to such date Goldman Sachs may not terminate the arrangement without the approval of the Trustees.
The Trust, on behalf of Advisor Shares of each applicable Fund, has adopted a Distribution Plan subject to Rule12b-1 under the Act. Under the Distribution Plan, Goldman Sachs as Distributor is entitled to a fee accrued daily and paid monthly for distribution services, which may then be paid by Goldman Sachs to authorized dealers, equal to, on an annual basis, 0.15% of the Fund’s average daily net assets attributable to Advisor Shares.
C. Service Plans —The Trust, on behalf of Advisor Shares of each applicable Fund, has adopted a Service Plan to allow Advisor Shares to compensate service organizations (including Goldman Sachs) for providing varying levels of personal and account maintenance and administration services to their customers who are beneficial owners of such shares. The Service Plans each provide for compensation to the service organizations equal to 0.25% of the average daily net assets attributable to Advisor Shares of the Fund.
D. Transfer Agency Agreement —Goldman Sachs also serves as the transfer agent of the Funds for a fee pursuant to the Transfer Agency Agreement. The fees charged for such transfer agency services are accrued daily and paid monthly at an annual rate of 0.02% of the average daily net assets of Institutional, Service and Advisor Shares.
E. Other Expense Agreements and Affiliated Transactions —GSAM has agreed to reduce or limit certain “Other Expenses” of the Funds (excluding acquired fund fees and expenses, transfer agency fees and expenses, service fees and shareholder administration fees (as applicable), taxes, interest, brokerage fees, expenses of shareholder meetings, litigation and indemnification, and extraordinary expenses) to the extent such expenses exceed, on an annual basis, a percentage rate of the average daily net assets of each Fund. Such Other Expense reimbursements, if any, are accrued daily and paid monthly. In addition, the Funds are not obligated to reimburse GSAM for prior fiscal year expense reimbursements, if any. The Other Expense limitations as an annual percentage rate of average daily net assets for the Core Fixed Income, Equity Index, Growth Opportunities and High Quality Floating Rate Funds are 0.004%, 0.004%, 0.004% and 0.034%, respectively. These Other Expense limitations will remain in place through at least April 30, 2020, and prior to such date GSAM may not terminate the arrangements without the approval of the Trustees. In addition, the Funds have entered into certain offset arrangements with the custodian and the transfer agent, which may result in a reduction of the Funds’ expenses and are received irrespective of the application of the “Other Expense” limitations described above.
For the six months ended June 30, 2019, these expense reductions, including any fee waivers and Other Expense reimbursements, were as follows:
| | | | | | | | | | | | | | | | | | | | |
| Fund | | Management
Fee Waiver | | | Distribution and
Service Fee
Waiver | | | Custody Fee
Credits | | | Other Expense
Reimbursement | | | Total Expense
Reductions | |
| Core Fixed Income | | $ | 1,618 | | | $ | — | | | $ | 737 | | | $ | 132,368 | | | $ | 134,723 | |
| Equity Index | | | 75,375 | | | | — | | | | 971 | | | | 129,547 | | | | 205,893 | |
| Growth Opportunities | | | 14,991 | | | | 31,651 | | | | 311 | | | | 115,497 | | | | 162,450 | |
| High Quality Floating Rate | | | 6,594 | | | | — | | | | 1,450 | | | | 105,413 | | | | 113,457 | |
F. Line of Credit Facility —As of June 30, 2019, the Funds participated in a $580,000,000 committed, unsecured revolving line of credit facility (the “facility”) together with other funds of the Trust and certain registered investment companies having management agreements with GSAM or its affiliates. This facility is to be used for temporary emergency purposes, or to allow for an orderly liquidation of securities to meet redemption requests. The interest rate on borrowings is based on the federal funds rate.
68
GOLDMAN SACHS VARIABLE INSURANCE TRUST FUNDS
5. AGREEMENTS AND AFFILIATED TRANSACTIONS (continued)
The facility also requires a fee to be paid by the Funds based on the amount of the commitment that has not been utilized. For the six months ended June 30, 2019, the Funds did not have any borrowings under the facility. Prior to April 30, 2019 the facility was $770,000,000.
G. Other Transactions with Affiliates —For the six months ended June 30, 2019, Goldman Sachs earned $319 in brokerage commissions from portfolio transactions, including futures transactions executed with Goldman Sachs as the Futures Commission Merchant, on behalf of the Growth Opportunities Fund.
The following table provides information about the investment in shares of issuers of which a Fund is an affiliate as of and for the six months ended June 30, 2019:
| | | | | | | | | | | | | | | | | | | | | | | | | | | | | | | | | | | | |
| Fund | | | Name of Affiliated Issuer | | Beginning Value as of
December 31,
2018 | | | Purchases at Cost | | | Proceeds from Sales | | | Net
Realized
Gain
(Loss) | | | Change in
Unrealized
Appreciation
(Depreciation) | | | Ending
Value as of
June 30, 2019 | | | Shares
as of
June 30, 2019 | | | Dividend
Income from
Affiliated
Issuer | |
| | | | | | | | | |
| | Equity Index | | | Goldman Sachs Group, Inc. (The) | | $ | 421,300 | | | $ | — | | | $ | (20,052 | ) | | $ | 8,002 | | | $ | 85,882 | | | $ | 495,132 | | | | 2,420 | | | $ | 4,047 | |
The following table provides information about the Funds’ investment in the Goldman Sachs Financial Square Government Fund as of and for the six months ended June 30, 2019:
| | | | | | | | | | | | | | | | | | | | | | | | |
| Fund | | Beginning
Value as of
December 31,
2018 | | | Purchases at Cost | | | Proceeds
from Sales | | | Ending
Value as of
June 30, 2019 | | | Shares as of June 30, 2019 | | | Dividend
Income from
Affiliated
Investment
Company | |
| Core Fixed Income | | $ | 275,823 | | | $ | 12,434,472 | | | | $(5,208,455) | | | $ | 7,501,840 | | | | 7,501,840 | | | $ | 24,290 | |
| Growth Opportunities | | | 1,640,990 | | | | 17,444,670 | | | | (17,993,336 | ) | | | 1,092,324 | | | | 1,092,324 | | | | 13,287 | |
| High Quality Floating Rate | | | 9,734,004 | | | | 11,212,942 | | | | (11,816,564 | ) | | | 9,130,382 | | | | 9,130,382 | | | | 96,853 | |
As of June 30, 2019, The Goldman Sachs Group, Inc. was the beneficial owner of approximately 62% of the Institutional Shares of the Growth Opportunities Fund.
6. PORTFOLIO SECURITIES TRANSACTIONS
The cost of purchases and proceeds from sales and maturities of long-term securities for the six months ended June 30, 2019, were as follows:
| | | | | | | | | | | | | | | | | | | | |
| Fund | | | | | Purchases of U.S.
Government and
Agency Obligations | | | Purchases
(Excluding U.S.
Government and
Agency Obligations) | | | Sales and
Maturities of U.S.
Government and
Agency Obligations | | | Sales and
Maturities
(Excluding U.S.
Government and
Agency Obligations) | |
| Core Fixed Income | | | | | | $ | 82,852,311 | | | $ | 4,475,028 | | | $ | 79,327,277 | | | $ | 4,059,891 | |
| Equity Index | | | | | | | — | | | | 1,828,932 | | | | — | | | | 10,574,127 | |
| Growth Opportunities | | | | | | | — | | | | 31,150,676 | | | | — | | | | 33,601,917 | |
| High Quality Floating Rate | | | | | | | — | | | | 6,361,437 | | | | 2,257,069 | | | | 4,204,164 | |
69
GOLDMAN SACHS VARIABLE INSURANCE TRUST FUNDS
Notes to Financial Statements(continued)
June 30, 2019 (Unaudited)
7. SECURITIES LENDING
The Growth Opportunities Fund may lend its securities through a securities lending agent, the Bank of New York Mellon (“BNYM”), to certain qualified borrowers. Pursuant to exemptive relief granted by the Securities and Exchange Commission (“SEC”) and the terms and conditions contained therein, the Equity Index Fund may lend its securities through a securities lending agent, Goldman Sachs Agency Lending (“GSAL”), a wholly-owned subsidiary of Goldman Sachs, to certain qualified borrowers including Goldman Sachs and affiliates. In accordance with the Funds’ securities lending procedures, the Funds receive cash collateral at least equal to the market value of the securities on loan. The market value of the loaned securities is determined at the close of business of the Funds, at their last sale price or official closing price on the principal exchange or system on which they are traded, and any additional required collateral is delivered to the Funds on the next business day. As with other extensions of credit, the Funds may experience delay in the recovery of their securities or incur a loss should the borrower of the securities breach its agreement with the Funds or become insolvent at a time when the collateral is insufficient to cover the cost of repurchasing securities on loan. Dividend income received from securities on loan may not be subject to withholding taxes and therefore withholding taxes paid may differ from the amounts listed in the Statements of Operations. Loans of securities are terminable at any time and as such 1) the remaining contractual maturities of the outstanding securities lending transactions are considered to be overnight and continuous and 2) the borrower, after notice, is required to return borrowed securities within the standard time period for settlement of securities transactions.
The Equity Index and Growth Opportunities Funds invest the cash collateral received in connection with securities lending transactions in the Goldman Sachs Financial Square Government Fund (“Government Money Market Fund”), an affiliated series of the Goldman Sachs Trust. The Government Money Market Fund is registered under the Act as an open end investment company, is subject to Rule2a-7 under the Act, and is managed by GSAM, for which GSAM may receive a management fee of up to 0.16% on an annualized basis of the average daily net assets of the Government Money Market Fund.
In the event of a default by a borrower with respect to any loan, GSAL will and BNYM may exercise any and all remedies provided under the applicable borrower agreement to make the Funds whole. These remedies include purchasing replacement securities by applying the collateral held from the defaulting broker against the purchase cost of the replacement securities. If GSAL or BNYM are unable to purchase replacement securities, GSAL and/or BNYM will indemnify the Funds by paying the Funds an amount equal to the market value of the securities loaned minus the value of cash collateral received from the borrower for the loan, subject to an exclusion for any shortfalls resulting from a loss of value in such cash collateral due to reinvestment risk. The Funds may enter into master netting agreements with borrowers, which provide the right, in the event of a default (including bankruptcy or insolvency), for thenon-defaulting party to liquidate the collateral and calculate net exposure to the defaulting party or request additional collateral. However, in the event of a default by a borrower, a resolution authority could determine that such rights are not enforceable due to the restrictions or prohibitions against the right ofset-off that may be imposed in accordance with a particular jurisdiction’s bankruptcy or insolvency laws. The Funds’ loaned securities were all subject to enforceable Securities Lending Agreements and the value of the collateral was at least equal to the value of the cash received. The amounts of the Funds’ overnight and continuous agreements, which represent the gross amounts of recognized liabilities for securities lending transactions outstanding as of June 30, 2019 are disclosed as “Payable upon return of securities loaned” on the Statements of Assets and Liabilities, where applicable. The Equity Index Fund did not have securities on loan as of June 30, 2019.
Each of the Equity Index and Growth Opportunities Funds and GSAL and BNYM received compensation relating to the lending of the Funds’ securities. The amounts earned, if any, by the Funds’ for the six months ended June 30, 2019, are reported under Investment Income on the Statements of Operations.
70
GOLDMAN SACHS VARIABLE INSURANCE TRUST FUNDS
7. SECURITIES LENDING (continued)
The following table provides information about the Fund’s investment in the Government Money Market Fund for the six months ended June 30, 2019:
| | | | | | | | | | | | | | | | | | |
| Fund | | | | Beginning
Value as of
December 31, 2018 | | | Purchases
at Cost | | | Proceeds
from Sales | | | Ending
Value as of
June 30, 2019 | |
| Equity Index | | | | $ | — | | | $ | 177,050 | | | $ | (177,050 | ) | | $ | — | |
| Growth Opportunities | | | | | 193,706 | | | | 5,820,807 | | | | (5,661,806 | ) | | | 352,707 | |
8. TAX INFORMATION
As of the Funds’ most recent fiscal year end, December 31, 2018, the Funds’ capital loss carryforwards and certain timing differences, on atax-basis were as follows:
| | | | | | | | | | | | | | | | |
| | | Core Fixed Income | | | Equity Index | | | Growth Opportunities | | | High Quality Floating Rate | |
| Capital loss carryforwards: | | | | | | | | | | | | | | | | |
Perpetual short-term | | $ | (1,042,210) | | | $ | — | | | $ | — | | | $ | (166,128) | |
Perpetual long-term | | | (1,165,002) | | | | — | | | | — | | | | (969,533) | |
| Total capital loss carryforwards | | $ | (2,207,212) | | | $ | — | | | $ | — | | | $ | (1,135,661) | |
Timing differences (§ 857 (b)(9) deferred dividend,
post October loss deferral, and straddle loss deferrals) | | $ | (143,546) | | | $ | (129,576) | | | $ | (239,899) | | | $ | (106,038) | |
As of June 30, 2019, the Funds’ aggregate security unrealized gains and losses based on cost for U.S. federal income tax purposes were as follows:
| | | | | | | | | | | | | | | | |
| | | Core Fixed Income | | | Equity Index | | | Growth Opportunities | | | High Quality Floating Rate | |
| Tax cost | | $ | 48,911,447 | | | $ | 64,688,959 | | | $ | 55,132,525 | | | $ | 80,289,506 | |
| Gross unrealized gain | | | 1,831,526 | | | | 114,919,660 | | | | 18,439,694 | | | | 350,717 | |
| Gross unrealized loss | | | (423,095 | ) | | | (7,755,721 | ) | | | (1,253,254 | ) | | | (259,820 | ) |
| Net unrealized security gain | | $ | 1,408,431 | | | $ | 107,163,939 | | | $ | 17,186,440 | | | $ | 90,897 | |
The difference between GAAP-basis andtax-basis unrealized gains (losses) is attributable primarily to wash sales, net mark to market gains (losses) on regulated futures and foreign currency contracts, and differences in the tax treatment of underlying fund investments, real estate investment trust investments, partnership investments and swap transactions.
GSAM has reviewed the Funds’ tax positions for all open tax years (the current and prior three years, as applicable) and has concluded that no provision for income tax is required in the Funds’ financial statements. Such open tax years remain subject to examination and adjustment by tax authorities.
9. OTHER RISKS
The Funds’ risks include, but are not limited to, the following:
Derivatives Risk — The Funds’ use of derivatives may result in loss. Derivative instruments, which may pose risks in addition to and greater than those associated with investing directly in securities, currencies or other instruments, may be illiquid or less liquid,
71
GOLDMAN SACHS VARIABLE INSURANCE TRUST FUNDS
Notes to Financial Statements(continued)
June 30, 2019 (Unaudited)
9. OTHER RISKS (continued)
volatile, difficult to price and leveraged so that small changes in the value of the underlying instruments may produce disproportionate losses to the Funds. Derivatives are also subject to counterparty risk, which is the risk that the other party in the transaction will not fulfill its contractual obligation. The use of derivatives is a highly specialized activity that involves investment techniques and risks different from those associated with investments in more traditional securities and instruments. Losses from derivatives can also result from a lack of correlation between changes in the value of derivative instruments and the portfolio assets (if any) being hedged.
Interest Rate Risk — When interest rates increase, fixed income securities or instruments held by a Fund will generally decline in value. Long-term fixed income securities or instruments will normally have more price volatility because of this risk than short-term fixed income securities or instruments. The risks associated with changing interest rates may have unpredictable effects on the markets and a Fund’s investments. Fluctuations in interest rates may also affect the liquidity of fixed income securities and instruments held by the Funds.
Investments in Other Investment Companies Risk — As a shareholder of another investment company, a Fund will indirectly bear its proportionate share of any net management fees and other expenses paid by such other investment companies, in addition to the fees and expenses regularly borne by the Fund.
Large Shareholder Transactions Risk — AFund may experience adverse effects when certain large shareholders, such as other funds, participating insurance companies, accounts and Goldman Sachs affiliates, purchase or redeem large amounts of shares of the Fund. Such large shareholder redemptions, which may occur rapidly or unexpectedly, may cause a Fund to sell portfolio securities at times when it would not otherwise do so, which may negatively impact a Fund’s NAV and liquidity. These transactions may also accelerate the realization of taxable income to shareholders if such sales of investments resulted in gains, and may also increase transaction costs. In addition, a large redemption could result in a Fund’s current expenses being allocated over a smaller asset base, leading to an increase in the Fund’s expense ratio. Similarly, large Fund share purchases may adversely affect a Fund’s performance to the extent that the Fund is delayed in investing new cash or otherwise maintains a larger cash position than it ordinarily would.
Liquidity Risk — A Fund may make investments that are illiquid or that may become less liquid in response to market developments or adverse investor perceptions. Illiquid investments may be more difficult to value. Liquidity risk may also refer to the risk that a Fund will not be able to pay redemption proceeds within the allowable time period or without significant dilution to remaining investors’ interests because of unusual market conditions, an unusually high volume of redemption requests, or other reasons. To meet redemption requests, a Fund may be forced to sell investments at an unfavorable time and/or under unfavorable conditions. If a Fund is forced to sell securities at an unfavorable time and/or under unfavorable conditions, such sales may adversely affect the Fund’s NAV and dilute remaining investors’ interests. Liquidity risk may be the result of, among other things, the reduced number and capacity of traditional market participants to make a market in fixed income securities or the lack of an active market. The potential for liquidity risk may be magnified by a rising interest rate environment or other circumstances where investor redemptions from fixed income mutual funds may be higher than normal, potentially causing increased supply in the market due to selling activity. Redemptions by large shareholders may have a negative impact on a Fund’s liquidity.
Market and Credit Risks — In the normal course of business, a Fund trades financial instruments and enters into financial transactions where risk of potential loss exists due to changes in the market (market risk). Additionally, a Fund may also be exposed to credit risk in the event that an issuer or guarantor fails to perform or that an institution or entity with which the Fund has unsettled or open transactions defaults.
10. INDEMNIFICATIONS
Under the Trust’s organizational documents, its Trustees, officers, employees and agents are indemnified, to the extent permitted by the Act and state law, against certain liabilities that may arise out of performance of their duties to the Funds. Additionally, in the
72
GOLDMAN SACHS VARIABLE INSURANCE TRUST FUNDS
10. INDEMNIFICATIONS (continued)
course of business, the Funds enter into contracts that contain a variety of indemnification clauses. The Funds’ maximum exposure under these arrangements is unknown, as this would involve future claims that may be made against the Funds that have not yet occurred. However, GSAM believes the risk of loss under these arrangements to be remote.
11. OTHER MATTERS
The Funds have adopted Financial Accounting Standards Board Accounting Standards Update 2017-08 to amend the amortization period for certain purchased callable debt securities held at a premium. Under the new standard, the Funds have changed the amortization period for the premium on certain purchased callable debt securities with non-contingent call features to the earliest call date. In accordance with the transition provisions of the standard, the Funds applied the amendments on a modified retrospective basis beginning with the fiscal period ended June 30, 2019. This change in accounting policy has been made to comply with the newly issued accounting standard and had no impact on total distributable earnings (loss) or the net asset value of the Funds. Upon evaluation, GSAM has concluded that the change in accounting principle does not materially impact the financial statement amounts.
12. SUBSEQUENT EVENTS
Subsequent events after the Statements of Assets and Liabilities date have been evaluated, and GSAM has concluded that there is no impact requiring adjustment or disclosure in the financial statements.
13. SUMMARY OF SHARE TRANSACTIONS
Share activity is as follows:
| | | | | | | | | | | | | | | | |
| | | Core Fixed Income Fund | |
| | | For the Six Months Ended
June 30, 2019
(Unaudited) | | | For the Fiscal Year Ended
December 31, 2018 | |
| | | Shares | | | Dollars | | | Shares | | | Dollars | |
| Institutional Shares | | | | | | | | | | | | | | | | |
| Shares sold | | | 245,443 | | | $ | 2,597,245 | | | | 239,264 | | | $ | 2,398,042 | |
| Reinvestment of distributions | | | 6,086 | | | | 64,608 | | | | 1,385 | | | | 14,101 | |
| Shares redeemed | | | (7,787 | ) | | | (80,952 | ) | | | (2,860 | ) | | | (29,294 | ) |
| | | | 243,742 | | | | 2,580,901 | | | | 237,789 | | | | 2,382,849 | |
| Service Shares | | | | | | | | | | | | | | | | |
| Shares sold | | | 50,724 | | | | 531,415 | | | | 269,492 | | | | 2,777,030 | |
| Reinvestment of distributions | | | 54,215 | | | | 573,419 | | | | 121,784 | | | | 1,241,765 | |
| Shares redeemed | | | (174,916 | ) | | | (1,819,009 | ) | | | (7,052,075 | ) | | | (73,362,835 | ) |
| | | | (69,977 | ) | | | (714,175 | ) | | | (6,660,799 | ) | | | (69,344,040 | ) |
| | | | |
| NET INCREASE (DECREASE) | | | 173,765 | | | $ | 1,866,726 | | | | (6,423,010 | ) | | $ | (66,961,191 | ) |
73
GOLDMAN SACHS VARIABLE INSURANCE TRUST FUNDS
Notes to Financial Statements(continued)
June 30, 2019 (Unaudited)
13. SUMMARY OF SHARE TRANSACTIONS (continued)
| | | | | | | | | | | | | | | | |
| | | Equity Index Fund | |
| | | For the Six Months Ended
June 30, 2019
(Unaudited) | | | For the Fiscal Year Ended
December 31, 2018 | |
| | | Shares | | | Dollars | | | Shares | | | Dollars | |
| Service Shares | | | | | | | | | | | | | | | | |
| Shares sold | | | 108,048 | | | $ | 1,730,047 | | | | 255,683 | | | $ | 4,433,966 | |
| Reinvestment of distributions | | | — | | | | — | | | | 931,531 | | | | 13,646,931 | |
| Shares redeemed | | | (720,415 | ) | | | (11,653,377 | ) | | | (1,225,406 | ) | | | (20,993,560 | ) |
| | | | |
| NET DECREASE | | | (612,367 | ) | | $ | (9,923,330 | ) | | | (38,192 | ) | | $ | (2,912,663 | ) |
| | | | | | | | | | | | | | | | |
| | | Growth Opportunities Fund | |
| | | For the Six Months Ended
June 30, 2019
(Unaudited) | | | For the Fiscal Year Ended
December 31, 2018 | |
| | | Shares | | | Dollars | | | Shares | | | Dollars | |
| Institutional Shares | | | | | | | | | | | | | | | | |
| Shares sold | | | 1,506 | | | $ | 4,361 | | | | 1,452 | | | $ | 10,553 | |
| Reinvestment of distributions | | | — | | | | — | | | | 14,418 | | | | 37,921 | |
| Shares redeemed | | | — | | | | — | | | | — | | | | (6 | ) |
| Stock split share adjustment | | | (18,018 | ) | | | — | | | | — | | | | — | |
| | | | (16,512 | ) | | | 4,361 | | | | 15,870 | | | | 48,468 | |
| Service Shares | | | | | | | | | | | | | | | | |
| Shares sold | | | 2,446,760 | | | | 7,209,214 | | | | 400,481 | | | | 2,816,257 | |
| Reinvestment of distributions | | | — | | | | — | | | | 15,482,361 | | | | 39,325,197 | |
| Shares redeemed | | | (2,466,230 | ) | | | (8,470,410 | ) | | | (14,466,620 | ) | | | (114,387,851 | ) |
| Stock split share adjustment | | | (17,764,276 | ) | | | — | | | | — | | | | — | |
| | | | (17,783,746 | ) | | | (1,261,196 | ) | | | 1,416,222 | | | | (72,246,397 | ) |
| | | | |
| NET INCREASE (DECREASE) | | | (17,800,258 | ) | | $ | (1,256,835 | ) | | | 1,432,092 | | | $ | (72,197,929 | ) |
74
GOLDMAN SACHS VARIABLE INSURANCE TRUST FUNDS
13. SUMMARY OF SHARE TRANSACTIONS (continued)
| | | | | | | | | | | | | | | | |
| | | High Quality Floating Rate Fund | |
| | | For the Six Months Ended
June 30, 2019
(Unaudited) | | | For the Fiscal Year Ended
December 31, 2018 | |
| | | Shares | | | Dollars | | | Shares | | | Dollars | |
| Institutional Shares | | | | | | | | | | | | | | | | |
| Shares sold | | | (1 | ) | | $ | — | | | | 220,421 | | | $ | 2,298,983 | |
| Reinvestment of distributions | | | 3,079 | | | | 31,894 | | | | 1,234 | | | | 12,809 | |
| Shares redeemed | | | (6,906 | ) | | | (71,886 | ) | | | (2,992 | ) | | | (31,202 | ) |
| | | | (3,828 | ) | | | (39,992 | ) | | | 218,663 | | | | 2,280,590 | |
| Service Shares | | | | | | | | | | | | | | | | |
| Shares sold | | | 357,512 | | | | 3,710,070 | | | | 1,428,964 | | | | 14,877,058 | |
| Reinvestment of distributions | | | 90,066 | | | | 931,287 | | | | 127,506 | | | | 1,323,812 | |
| Shares redeemed | | | (460,369 | ) | | | (4,778,454 | ) | | | (930,951 | ) | | | (9,686,886 | ) |
| | | | (12,791 | ) | | | (137,097 | ) | | | 625,519 | | | | 6,513,984 | |
| Advisor Shares | | | | | | | | | | | | | | | | |
| Shares sold | | | 188,682 | | | | 1,961,144 | | | | 385,926 | | | | 4,020,676 | |
| Reinvestment of distributions | | | 8,079 | | | | 83,655 | | | | 10,367 | | | | 107,740 | |
| Shares redeemed | | | (230,353 | ) | | | (2,394,514 | ) | | | (157,560 | ) | | | (1,641,339 | ) |
| | | | (33,592 | ) | | | (349,715 | ) | | | 238,733 | | | | 2,487,077 | |
| | | | |
| NET INCREASE (DECREASE) | | | (50,211 | ) | | $ | (526,804 | ) | | | 1,082,915 | | | $ | 11,281,651 | |
75
GOLDMAN SACHS VARIABLE INSURANCE TRUST FUNDS
| | |
| Fund Expenses — Six Month Period Ended June 30, 2019 (Unaudited) | | |
As a shareholder of Institutional, Service or Advisor Shares of the Funds, you incur ongoing costs, including management fees, distribution and/or service(12b-1) fees (with respect to Service and Advisor Shares) and other Fund expenses. This example is intended to help you understand your ongoing costs (in dollars) of investing in Institutional Shares, Service Shares and Advisor Shares of the Funds and to compare these costs with the ongoing costs of investing in other mutual funds.
The example is based on an investment of $1,000 invested at the beginning of the period and held for the entire period from January 1, 2019 through June 30, 2019, which represents a period of 181 days of a 365 day year.
Actual Expenses— The first line under each share class in the table below provides information about actual account values and actual expenses. You may use the information in this line, together with the amount you invested, to estimate the expenses that you paid over the period. Simply divide your account value by $1,000 (for example, an $8,600 account value divided by $1,000=8.6), then multiply the result by the number in the first line under the heading entitled “Expenses Paid” to estimate the expenses you paid on your account during this period.
Hypothetical Example for Comparison Purposes— The second line under each share class in the table below provides information about hypothetical account values and hypothetical expenses based on the Funds’ actual net expense ratio and an assumed rate of return of 5% per year before expenses, which is not the Funds’ actual return. The hypothetical account values and expenses may not be used to estimate the actual ending account balance or expenses you paid for the period. You may use this information to compare the ongoing costs of investing in the Funds and other funds. To do so, compare this 5% hypothetical example with the 5% hypothetical examples that appear in the shareholder reports of the other funds.
Please note that the expenses shown in the table are meant to highlight your ongoing costs only. As a shareholder of the Funds you do not incur any transaction costs, such as sales charges, redemption fees, or exchange fees, but shareholders of other funds may incur such costs. The second line of the table is useful in comparing ongoing costs only and will not help you determine the relative total costs of owning different funds whose shareholders may incur transaction costs.
| | | | | | | | | | | | | | | | | | | | | | | | | | | | | | | | | | | | | | | | | | | | | | | | |
| | | Core Fixed Income Fund | | | Equity Index Fund | | | Growth Opportunities Fund | | | High Quality Floating Rate Fund | |
| Share Class | | Beginning
Account
Value
01/01/19 | | | Ending
Account
Value
06/30/19 | | | Expenses
Paid for the
6 Months
Ended
06/30/19* | | | Beginning
Account
Value
01/01/19 | | | Ending
Account
Value
06/30/19 | | | Expenses
Paid for the
6 Months
Ended
06/30/19* | | | Beginning
Account
Value
01/01/19 | | | Ending
Account
Value
06/30/19 | | | Expenses
Paid for the
6 Months
Ended
06/30/19* | | | Beginning
Account
Value
01/01/19 | | | Ending
Account
Value
06/30/19 | | | Expenses
Paid for the
6 Months
Ended
06/30/19* | |
| Institutional | | | | | | | | | | | | | | | | | | | | | | | | | | | | | | | | | | | | | | | | | | | | | | | | |
| | | | | | | | | | | | | |
Actual | | $ | 1,000 | | | $ | 1,067.60 | | | $ | 2.10 | | | | N/A | | | | N/A | | | | N/A | | | $ | 1,000 | | | $ | 1,260.50 | | | $ | 4.76 | | | $ | 1,000 | | | $ | 1,013.20 | | | $ | 1.70 | |
Hypothetical 5% return | | | 1,000 | | | | 1,022.76 | + | | | 2.06 | | | | N/A | | | | N/A | | | | N/A | | | | 1,000 | | | | 1,020.58 | + | | | 4.26 | | | | 1,000 | | | | 1,023.11 | + | | | 1.71 | |
| Service | | | | | | | | | | | | | | | | | | | | | | | | | | | | | | | | | | | | | | | | | | | | | | | | |
| | | | | | | | | | | | | |
Actual | | | 1,000 | | | | 1,066.40 | | | | 3.38 | | | $ | 1,000 | | | $ | 1,183.00 | | | $ | 2.60 | | | | 1,000 | | | | 1,258.90 | | | | 5.66 | | | | 1,000 | | | | 1,012.00 | | | | 2.94 | |
Hypothetical 5% return | | | 1,000 | | | | 1,021.52 | + | | | 3.31 | | | | 1,000 | | | | 1,022.41 | + | | | 2.41 | | | | 1,000 | | | | 1,019.79 | + | | | 5.06 | | | | 1,000 | | | | 1,021.87 | + | | | 2.96 | |
| Advisor | | | | | | | | | | | | | | | | | | | | | | | | | | | | | | | | | | | | | | | | | | | | | | | | |
| | | | | | | | | | | | | |
Actual | | | N/A | | | | N/A | | | | N/A | | | | N/A | | | | N/A | | | | N/A | | | | N/A | | | | N/A | | | | N/A | | | | 1,000 | | | | 1,011.20 | | | | 3.69 | |
Hypothetical 5% return | | | N/A | | | | N/A | | | | N/A | | | | N/A | | | | N/A | | | | N/A | | | | N/A | | | | N/A | | | | N/A | | | | 1,000 | | | | 1,021.12 | + | | | 3.71 | |
| | + | Hypothetical expenses are based on each Fund’s actual annualized net expense ratios and an assumed rate of return of 5% per year before expenses. | |
| | * | Expenses are calculated using each Fund’s annualized net expense ratio for each class, which represents the ongoing expenses as a percentage of net assets for the six months ended June 30, 2019. Expenses are calculated by multiplying the annualized net expense ratio by the average account value for the period; then multiplying the result by the number of days in the most recent fiscal half year; and then dividing that result by the number of days in the fiscal year. The annualized net expense ratios for the period were as follows: | |
| | | | | | | | | | | | |
| | | |
| Fund | | Institutional | | | Service | | | Advisor | |
| Core Fixed Income | | | 0.41 | % | | | 0.66 | % | | | N/A | |
| Equity Index | | | N/A | | | | 0.48 | | | | N/A | |
| Growth Opportunities | | | 0.85 | | | | 1.01 | | | | N/A | |
| High Quality Floating Rate | | | 0.34 | | | | 0.59 | | | | 0.74 | % |
76
GOLDMAN SACHS VARIABLE INSURANCE TRUST FUNDS
Statement Regarding Basis for Approval of Management Agreements (Unaudited)
Background
The Goldman Sachs Core Fixed Income, Goldman Sachs Equity Index, Goldman Sachs Growth Opportunities and Goldman Sachs High Quality Floating Rate Funds (the “Funds”) are investment portfolios of Goldman Sachs Variable Insurance Trust (the “Trust”). The Board of Trustees oversees the management of the Trust and reviews the investment performance and expenses of the Funds at regularly scheduled meetings held throughout the year. In addition, the Board of Trustees determines annually whether to approve the continuance of the Trust’s investment management agreements (the “Management Agreements”) with Goldman Sachs Asset Management, L.P. (the “Investment Adviser”) on behalf of the Funds and thesub-advisory agreement (the“Sub-Advisory Agreement,” and together with the Management Agreements, the “Agreements”) between the Investment Adviser and SSgA Funds Management, Inc. (the“Sub-Adviser”) on behalf of the Equity Index Fund.
The Agreements were most recently approved for continuation until June 30, 2020 by the Board of Trustees, including those Trustees who are not parties to the Agreements or “interested persons” (as defined in the Investment Company Act of 1940, as amended) of any party thereto (the “Independent Trustees”), at a meeting held onJune 11-12, 2019 (the “Annual Meeting”).
The review process undertaken by the Trustees spans the course of the year and culminates with the Annual Meeting. To assist the Trustees in their deliberations, the Trustees have established a Contract Review Committee (the “Committee”), comprised of the Independent Trustees. The Committee held four meetings over the course of the year since the Agreements were last approved. At those Committee meetings, regularly scheduled Board or other committee meetings, and/or the Annual Meeting, matters relevant to the renewal of the Agreements were considered by the Board, or the Independent Trustees, as applicable. With respect to each Fund, such matters included:
| | (a) | | the nature and quality of the advisory, administrative, and other services provided to the Fund by the Investment Adviser and its affiliates, including information about: |
| | (i) | | the structure, staff, and capabilities of the Investment Adviser and its portfolio management teams; |
| | (ii) | | the groups within the Investment Adviser and its affiliates that support the portfolio management teams or provide other types of necessary services, including fund services groups (e.g., accounting and financial reporting, tax, shareholder services, and operations); controls and risk management groups (e.g., legal, compliance, valuation oversight, credit risk management, internal audit, compliance testing, market risk analysis, finance, and central funding); sales and distribution support groups, and others (e.g., information technology and training); |
| | (iii) | | trends in employee headcount; |
| | (iv) | | the Investment Adviser’s financial resources and ability to hire and retain talented personnel and strengthen its operations; and |
| | (v) | | the parent company’s support of the Investment Adviser and its mutual fund business, as expressed by the firm’s senior management; |
| | (b) | | information on the investment performance of the Fund, including comparisons to the performance of similar mutual funds, as provided by a third-party mutual fund data provider engaged as part of the contract review process (the “Outside Data Provider”), a benchmark performance index, and (in the case of the Core Fixed Income Fund) a composite of accounts with comparable investment strategies managed by the Investment Adviser; and information on general investment outlooks in the markets in which the Fund invests; |
| | (c) | | information provided by the Investment Adviser indicating the Investment Adviser’s views on whether the Fund’s peer group and/or benchmark index had high, medium, or low relevance given the Fund’s particular investment strategy; |
| | (d) | | the terms of the Agreements and other agreements with affiliated service providers entered into by the Trust on behalf of the Fund; |
| | (e) | | fee and expense information for the Fund, including: |
| | (i) | | the relative management fee and expense levels of the Fund as compared to those of comparable funds managed by other advisers, as provided by the Outside Data Provider; |
| | (ii) | | the Fund’s expense trends over time; and |
| | (iii) | | to the extent the Investment Adviser manages other types of accounts (such as bank collective trusts, private wealth management accounts, institutional separate accounts,sub-advised mutual funds, andnon-U.S. funds) having investment objectives and policies similar to those of the Fund, comparative information on the advisory fees charged and services provided to those accounts by the Investment Adviser; |
| | (f) | | with respect to the extensive investment performance and expense comparison data provided by the Outside Data Provider, its processes in producing that data for the Fund; |
| | (g) | | the undertakings of the Investment Adviser and its affiliates to implement fee waivers and/or expense limitations; |
77
GOLDMAN SACHS VARIABLE INSURANCE TRUST FUNDS
Statement Regarding Basis for Approval of Management Agreements (Unaudited) (continued)
| | (h) | | information relating to the profitability of the Management Agreements and the transfer agency and distribution and service arrangements of the Fund to the Investment Adviser and its affiliates; |
| | (i) | | whether the Fund’s existing management fee schedule adequately addressed any economies of scale; |
| | (j) | | a summary of the“fall-out” benefits derived by the Investment Adviser and its affiliates from their relationships with the Fund, including the fees received by the Investment Adviser’s affiliates from the Fund for transfer agency, securities lending (in the case of the Equity Index Fund), portfolio trading, distribution and other services; |
| | (k) | | a summary of potential benefits derived by the Fund as a result of its relationship with the Investment Adviser; |
| | (l) | | information regarding commissions paid by the Equity Index and Growth Opportunities Funds (the “Equity Funds”) and broker oversight, an update on the Investment Adviser’s soft dollars practices (with respect to the Growth Opportunities Fund), other information regarding portfolio trading, and how the Investment Adviser carries out its duty to seek best execution; |
| | (m) | | the manner in which portfolio manager compensation is determined; and the number and types of accounts managed by the portfolio managers; |
| | (n) | | the nature and quality of the services provided to the Fund by its unaffiliated service providers (including theSub-Adviser for the Equity Index Fund), and the Investment Adviser’s general oversight and evaluation (including reports on due diligence) of those service providers as part of the administrative services provided under the Management Agreements; and |
| | (o) | | the Investment Adviser’s processes and policies addressing various types of potential conflicts of interest; its approach to risk management; the annual review of the effectiveness of the Fund’s compliance program; and periodic compliance reports. |
The Trustees also received an overview of the Funds’ distribution arrangements. They received information regarding the Funds’ assets, share purchase and redemption activity, and payment of distribution and service fees. Information was also provided to the Trustees relating to revenue sharing payments made by and services provided by the Investment Adviser and its affiliates to intermediaries that promote the sale, distribution, and/or servicing of Fund shares. The Independent Trustees also discussed the broad range of other investment choices that are available to Fund investors, including the availability of comparable funds managed by other advisers.
The presentations made at the Board and Committee meetings and at the Annual Meeting encompassed the Funds and other mutual funds for which the Board of Trustees has responsibility. In evaluating the Management Agreements at the Annual Meeting, the Trustees relied upon their knowledge, resulting from their meetings and other interactions throughout the year, of the Investment Adviser and its affiliates, their services, and the Funds. In conjunction with these meetings, the Trustees received written materials and oral presentations on the topics covered, and the Investment Adviser addressed the questions and concerns of the Trustees, including concerns regarding the investment performance of certain of the funds they oversee. The Independent Trustees were advised by their independent legal counsel regarding their responsibilities and other regulatory requirements related to the approval and continuation of mutual fund investment management agreements under applicable law. In addition, the Investment Adviser and its affiliates provided the Independent Trustees with a written response to a formal request for information sent on behalf of the Independent Trustees by their independent legal counsel. During the course of their deliberations, the Independent Trustees met in executive sessions with their independent legal counsel, without representatives of the Investment Adviser or its affiliates present.
Nature, Extent, and Quality of the Services Provided Under the Management Agreements
As part of their review, the Trustees considered the nature, extent, and quality of the services provided to the Funds by the Investment Adviser. In this regard, the Trustees considered both the investment advisory services andnon-advisory services (including, with respect to the Equity Index Fund, the Investment Adviser’s oversight of theSub-Adviser) that are provided by the Investment Adviser and its affiliates. The Trustees noted the transition in the leadership and changes in personnel of various of the Investment Adviser’s portfolio management teams that had occurred in recent periods, and the ongoing recruitment efforts aimed at bringing high quality investment talent to the Investment Adviser. They also noted the Investment Adviser’s commitment to maintaining high quality systems and expending substantial resources to respond to ongoing changes to the regulatory and control environment in which the Funds and their service providers operate, as well as the efforts of the Investment Adviser and its affiliates to combat cyber security risks. The Trustees concluded that the Investment Adviser continued to commit substantial financial and operational resources to the Funds and expressed confidence that the Investment Adviser would continue to do so in the future. The Trustees also recognized that the Investment Adviser had made significant commitments to address regulatory compliance requirements applicable to the Funds and the Investment Adviser and its affiliates.
78
GOLDMAN SACHS VARIABLE INSURANCE TRUST FUNDS
Statement Regarding Basis for Approval of Management Agreements (Unaudited) (continued)
Investment Performance
The Trustees also considered the investment performance of the Funds. In this regard, they compared the investment performance of each Fund to its peers usingrankings and ratings compiled by the Outside Data Provider as of December 31, 2018, and updated performance information prepared by the Investment Adviser using the peer group identified by the Outside Data Provider as of March 31, 2019. The information on each Fund’s investment performance was provided for theone-, three-, five-, andten-year periods ending on the applicable dates. The Trustees also reviewed each Fund’s investment performance relative to its performance benchmark. As part of this review, they considered the investment performance trends of the Funds over time, and reviewed the investment performance of each Fund in light of its investment objective and policies and market conditions. The Trustees also received information comparing the Core Fixed Income Fund’s performance to that of a composite of accounts with comparable investment strategies managed by the Investment Adviser.
In addition, the Trustees considered materials prepared and presentations made by the Investment Adviser’s senior management and portfolio management personnel in which Fund performance was assessed. The Trustees also considered the Investment Adviser’s periodic reports with respect to the Funds’ risk profiles, and how the Investment Adviser’s approach to risk monitoring and management influences portfolio management.
The Trustees observed that the Core Fixed Income Fund’s Institutional Shares had placed in the top half of the Fund’s peer group for theone-, five-, andten-year periods and in the third quartile for the three-year period, and had outperformed the Fund’s benchmark index for theone- and three-year periods and underperformed for the five-year period ended March 31, 2019. The Trustees noted that the Core Fixed Income Fund had experienced certain portfolio management changes in 2018 and the first half of 2019. The Trustees observed that the Equity Index Fund’s Service Shares had placed in the top half of the Fund’s peer group for theone-, three-, five-, andten-year periods, and had underperformed the Fund’s benchmark index by an amount approximately equal to Fund fees and expenses for theone-, three-, five-, andten-year periods ended March 31, 2019. The Trustees noted that the Growth Opportunities Fund’s Institutional Shares had placed in the top half of the Fund’s peer group for theten-year period and in the third quartile for theone-, three-, and five-year periods, and had underperformed the Fund’s benchmark index for theone-, three-, and five-year periods ended March 31, 2019. They also noted that the Growth Opportunities Fund had experienced certain portfolio management changes in 2018. The Trustees observed that the High Quality Floating Rate Fund’s Institutional Shares had placed in the top half of the Fund’s peer group for the three- andten-year periods, the third quartile for the five-year period, and the fourth quartile for theone-year period, and had outperformed the Fund’s benchmark index for the three- and five-year periods and underperformed for theone-year period ended March 31, 2019.
Costs of Services Provided and Competitive Information
The Trustees considered the contractual terms of the Agreements and the fee rates payable by each Fund under the Management Agreements and, with respect to the Equity Index Fund, payable by the Investment Adviser under theSub-Advisory Agreement. In this regard, the Trustees considered information on the services rendered by the Investment Adviser to the Funds, which included both advisory and administrative services that were directed to the needs and operations of the Funds as registered mutual funds.
In particular, the Trustees reviewed analyses prepared by the Outside Data Provider regarding the expense rankings of the Funds. The analyses provided a comparison of each Fund’s management fee and breakpoints (as applicable) to those of a relevant peer group and category universe; an expense analysis which compared each Fund’s overall net and gross expenses to a peer group and a category universe; and data comparing each Fund’s net expenses to the peer and category medians. The analyses also compared each Fund’s other expenses and fee waivers/reimbursements to those of the peer group and category medians. The Trustees concluded that the comparisons provided by the Outside Data Provider were useful in evaluating the reasonableness of the management fees and total expenses paid by the Funds.
In addition, the Trustees considered the Investment Adviser’s undertakings to implement fee waivers and/or expense limitations. They also considered, to the extent that the Investment Adviser manages other types of accounts having investment objectives and policies similar to those of the Funds, comparative fee information for services provided by the Investment Adviser to those accounts, and information that indicated that services provided to the Funds differed in various significant respects from the services provided to other types of accounts which, in many cases, operated under less stringent legal and regulatory structures, required fewer services from the Investment Adviser to a smaller number of client contact points, and were less time-intensive.
In addition, the Trustees noted that shareholders are able to redeem their Fund shares at any time if shareholders believe that the Fund fees and expenses are too high or if they are dissatisfied with the performance of the Fund.
79
GOLDMAN SACHS VARIABLE INSURANCE TRUST FUNDS
Statement Regarding Basis for Approval of Management Agreements (Unaudited) (continued)
Profitability
The Trustees reviewed each Fund’s contribution to the Investment Adviser’s revenues andpre-tax profit margins. In this regard the Trustees noted that they had received, among other things, profitability analyses and summaries, revenue and expense schedules by Fund and by function (i.e., investment management, transfer agency and distribution and service), and information on the Investment Adviser’s expense allocation methodology. They observed that the profitability and expense figures are substantially similar to those used by the Investment Adviser for many internal purposes, including compensation decisions among various business groups, and are thus subject to a vigorous internal debate about how certain revenue and expenses should be allocated. The Trustees also noted that the internal audit group within the Goldman Sachs organization periodically audits the expense allocation methodology and that the internal audit group was satisfied with the reasonableness, consistency, and accuracy of the Investment Adviser’s expense allocation methodology. Profitability data for each Fund was provided for 2018 and 2017, and the Trustees considered this information in relation to the Investment Adviser’s overall profitability.
Economies of Scale
The Trustees considered the information that had been provided regarding whether there have been economies of scale with respect to the management of the Funds. The Trustees also considered the breakpoints in the fee rate payable under the Management Agreement for each of the Core Fixed Income, High Quality Floating Rate and Growth Opportunities Funds at the following annual percentage rates of the average daily net assets of the Funds:
| | | | | | | | |
| | | Core Fixed
Income Fund | | | High Quality
Floating
Rate Fund | |
| | |
| First $1 billion | | | 0.40 | % | | | 0.31 | % |
| | |
| Next $1 billion | | | 0.36 | | | | 0.28 | |
| | |
| Next $3 billion | | | 0.34 | | | | 0.27 | |
| | |
| Next $3 billion | | | 0.33 | | | | 0.26 | |
| | |
| Over $8 billion | | | 0.32 | | | | 0.25 | |
| | | | |
| | | Growth
Opportunities
Fund | |
| |
| First $2 billion | | | 0.87 | % |
| |
| Next $3 billion | | | 0.78 | |
| |
| Next $3 billion | | | 0.74 | |
| |
| Over $8 billion | | | 0.73 | |
The Trustees noted that the breakpoints were designed to share potential economies of scale, if any, with the Funds and their shareholders as assets under management reach those asset levels. The Trustees considered the amounts of assets in the Funds; the Funds’ recent share purchase and redemption activity; the information provided by the Investment Adviser relating to the costs of the services provided by the Investment Adviser and its affiliates and their realized profits; information comparing fee rates charged by the Investment Adviser with fee rates charged to other funds in the peer groups; and the Investment Adviser’s undertakings to waive a portion of its management fee (with respect to the Equity Index and Growth Opportunities Funds) and to limit certain expenses of the Funds that exceed specified levels as well as Goldman Sachs & Co. LLC’s (“Goldman Sachs”) undertaking to waive a portion of the distribution and service fees paid by the Growth Opportunities Fund’s Service Shares.. Upon reviewing these matters at the Annual Meeting, the Trustees concluded that the fee breakpoints represented a means of assuring that benefits of scalability, if any, would be passed along to shareholders at the specified asset levels.
With respect to the Equity Index Fund, the Trustees noted that, while its Management Agreement did not have breakpoints, the Investment Adviser had agreed to waive a portion of its management fee in order to achieve the following effective annual rates: 0.21% on the first $400 million of average daily net assets and 0.20% of average daily net assets in excess of $400 million. The Trustees noted that, in addition to the Investment Adviser’s management fee waiver mentioned above, the Fund’s total expenses were further reduced by the Investment Adviser’s undertaking to limit certain expenses of the Fund that exceed a specified level.
80
GOLDMAN SACHS VARIABLE INSURANCE TRUST FUNDS
Statement Regarding Basis for Approval of Management Agreements (Unaudited) (continued)
Other Benefits to the Investment Adviser and Its Affiliates
The Trustees also considered the other benefits derived by the Investment Adviser and its affiliates from their relationships with the Funds as stated above, including: (a) transfer agency fees received by Goldman Sachs; (b) brokerage and futures commissions earned by Goldman Sachs for executing securities transactions on behalf of the Equity Funds and futures transactions on behalf of the Funds; (c) research received by the Investment Adviser from broker-dealers in exchange for executing certain transactions on behalf of the Growth Opportunities Fund; (d) trading efficiencies resulting from aggregation of orders of the Funds with those for other funds or accounts managed by the Investment Adviser; (e) fees earned by Goldman Sachs Agency Lending (“GSAL”), an affiliate of the Investment Adviser, as securities lending agent for the Equity Index Fund (and fees earned by the Investment Adviser for managing the fund in which the Equity Index and Growth Opportunities Funds’ securities lending cash collateral is invested); (f) the Investment Adviser’s ability to leverage the infrastructure designed to service the Funds on behalf of its other clients; (g) the Investment Adviser’s ability to cross-market other products and services to Fund shareholders; (h) Goldman Sachs’ retention of certain fees as Fund Distributor; (i) the Investment Adviser’s ability to negotiate better pricing with custodians on behalf of its other clients, as a result of the relationship with the Funds; and (j) the possibility that the working relationship between the Investment Adviser and the Funds’ third-party service providers may cause those service providers to be more likely to do business with other areas of Goldman Sachs. In the course of considering the foregoing, the Independent Trustees requested and received further information quantifying certain of thesefall-out benefits.
Other Benefits to the Funds and Their Shareholders
The Trustees also noted that the Funds receive certain other potential benefits as a result of their relationship with the Investment Adviser, including: (a) trading efficiencies resulting from aggregation of orders of the Funds with those of other funds or accounts managed by the Investment Adviser; (b) enhanced servicing from vendors due to the volume of business generated by the Investment Adviser and its affiliates; (c) enhanced servicing from broker-dealers due to the volume of business generated by the Investment Adviser and its affiliates; (d) the Investment Adviser’s ability to negotiate favorable terms with derivatives counterparties on behalf of the Funds as a result of the size and reputation of the Goldman Sachs organization; (e) the advantages received from the Investment Adviser’s knowledge and experience gained from managing other accounts and products; (f) the Investment Adviser’s ability to hire and retain qualified personnel to provide services to the Funds because of the reputation of the Goldman Sachs organization; (g) the Funds’ access, through the Investment Adviser, to certain firm-wide resources (e.g., proprietary risk management systems and databases), subject to certain restrictions; (h) the Equity Index Fund’s ability to participate in the securities lending program administered by GSAL, as measured by the revenue received by the Fund in connection with the program; and (i) the Funds’ access to certain affiliated distribution channels. In addition, the Trustees noted the competitive nature of the mutual fund marketplace, and considered that many of the Funds’ shareholders invested in the Funds in part because of the Funds’ relationship with the Investment Adviser and that those shareholders have a general expectation that the relationship will continue.
Conclusion
In connection with their consideration of the Agreements, the Trustees gave weight to each of the factors described above, but did not identify any particular factor as controlling their decision. After deliberation and consideration of all of the information provided, including the factors described above, the Trustees concluded, in the exercise of their business judgment, that the management fees paid by each of the Funds were reasonable in light of the services provided to it by the Investment Adviser, the Investment Adviser’s costs and each Fund’s current and reasonably foreseeable asset levels. The Trustees unanimously concluded that the Investment Adviser’s continued management likely would benefit each Fund and its shareholders and that the Management Agreements should be approved and continued with respect to each Fund until June 30, 2020.
81
GOLDMAN SACHS VARIABLE INSURANCE TRUST FUNDS
Statement Regarding Basis for Approval of Management Agreements (Unaudited) (continued)
Sub-Advisory Agreement for the Equity Index Fund
Nature, Extent, and Quality of the Services Provided Under theSub-Advisory Agreement and Investment Performance.In evaluating theSub-Advisory Agreement, the Trustees relied upon materials furnished and presentations made by the Investment Adviser and theSub-Adviser. In evaluating the nature, extent, and quality of services provided by theSub-Adviser, the Trustees considered information on the services provided to the Equity Index Fund by theSub-Adviser, including information about theSub-Adviser’s (a) personnel and organizational structure; (b) experience in index investing and track record in tracking the performance of the Fund’s benchmark in line with the investment objective of the Fund; (c) policies and procedures in place to address potential conflicts of interest; and (d) compliance program and code of ethics. The Trustees reviewed the services provided to the Fund under theSub-Advisory Agreement. They noted that the Fund’s Service Shares had placed in the top half of the Fund’s peer group and had underperformed the Fund’s benchmark index by an amount approximately equal to Fund fees and expenses for theone-, three-, five-, andten-year periods ended March 31, 2019.
Costs of Services Provided.The Trustees reviewed the terms of theSub-Advisory Agreement, including the schedule of fees payable to theSub-Adviser. They considered the breakpoints in thesub-advisory fee rate payable under theSub-Advisory Agreement at the following annual percentage rates of the average daily net assets of the Fund:
| | | | |
Average Daily
Net Assets | | Sub-Advisory
Fee Annual
Rate | |
| |
| First $50 Million | | | 0.030 | % |
| |
| Next $200 Million | | | 0.020 | % |
| |
| Next $750 Million | | | 0.010 | % |
| |
| Over $1 Billion | | | 0.008 | % |
The Trustees noted that theSub-Adviser’s compensation is paid by the Investment Adviser, not by the Fund, and that the retention of theSub-Adviser does not increase the fees incurred by the Fund for advisory services. They considered the Investment Adviser’s belief that the relationship between the management fees paid by the Fund and thesub-advisory fees paid by the Investment Adviser is appropriate given the level of services the Investment Adviser provides to the Fund and the significant differences in cost drivers and risks associated with the respective services offered by the Investment Adviser and theSub-Adviser, as well as the management fee waivers and expense limitations that substantially reduce the fees retained by the Investment Adviser.
Conclusion.After deliberation and consideration of the information provided, the Trustees concluded that thesub-advisory fee to be paid by the Investment Adviser to theSub-Adviser with respect to the Equity Index Fund is reasonable in light of the services to be provided by theSub-Adviser and the Fund’s reasonably foreseeable asset levels, and that theSub-Advisory Agreement should be approved and continued until June 30, 2020.
82
| | |
| TRUSTEES | | OFFICERS |
| Jessica Palmer,Chair | | James A. McNamara,President |
| Kathryn A. Cassidy | | Joseph F. DiMaria,Principal Financial Officer, |
| Diana M. Daniels | | Principal Accounting Officer and Treasurer |
| James A. McNamara | | Caroline L. Kraus,Secretary |
| Roy W. Templin | | |
Gregory G. Weaver | | |
GOLDMAN SACHS & CO. LLC
Distributor and Transfer Agent
GOLDMAN SACHS ASSET MANAGEMENT, L.P.
Investment Adviser
200 West Street, New York,
New York 10282
Visit our web site at www.GSAMFUNDS.com to obtain the most recentmonth-end returns.
The reports concerning the Funds included in this shareholder report may contain certain forward-looking statements about the factors that may affect the performance of the Funds in the future. These statements are based on Fund management’s predictions and expectations concerning certain future events and their expected impact on the Funds, such as performance of the economy as a whole and of specific industry sectors, changes in the levels of interest rates, the impact of developing world events, and other factors that may influence the future performance of the Funds. Management believes these forward-looking statements to be reasonable, although they are inherently uncertain and difficult to predict. Actual events may cause adjustments in portfolio management strategies from those currently expected to be employed.
A description of the policies and procedures that the Funds use to determine how to vote proxies relating to portfolio securities and information regarding how the Funds voted proxies relating to portfolio securities for the12-month period ended June 30 is available (i) without charge, upon request by calling1-800-621-2550; and (ii) on the Securities and Exchange Commission (“SEC”) web site athttp://www.sec.gov.
The Funds will file portfolio holdings information for each month in a fiscal quarter within 60 days after the end of the relevant fiscal quarter on Form N-PORT. Portfolio holdings information for the third month of each fiscal quarter will be made available on the SEC’s web site at http://www.sec.gov. Portfolio holdings information may be obtained upon request and without charge by calling 1-800-526-7384 (for Retail Shareholders) or 1-800-621-2550 (for Institutional Shareholders).
Views and opinions expressed are for informational purposes only and do not constitute a recommendation by GSAM to buy, sell, or hold any security. Views and opinions are current as of the date of this presentation and may be subject to change, they should not be construed as investment advice.
Goldman Sachs & Co. LLC (“Goldman Sachs”) does not provide legal, tax or accounting advice. Any statement contained in this communication (including any attachments) concerning U.S. tax matters was not intended or written to be used, and cannot be used, for the purpose of avoiding penalties under the Internal Revenue Code, and was written to support the promotion or marketing of transactions or matters addressed. Clients of Goldman Sachs should obtain their own independent tax advice based on their particular circumstances.
The website links provided are for your convenience only and are not an endorsement or recommendation by GSAM of any of these websites or the products or services offered. GSAM is not responsible for the accuracy and validity of the content of these websites.
Fund holdings and allocations shown are as of June 30, 2019 and may not be representative of future investments. Fund holdings should not be relied on in making investment decisions and should not be construed as research or investment advice regarding particular securities. Current and future holdings are subject to risk.
References to indices, benchmarks or other measures of relative market performance over a specified period of time are provided for your information only and do not imply that the portfolio will achieve similar results. The index composition may not reflect the manner in which a portfolio is constructed. While an adviser seeks to design a portfolio which reflects appropriate risk and return features, portfolio characteristics may deviate from those of the benchmark.
The Global Industry Classification Standard (“GICS”) was developed by and is the exclusive property and a service mark of Morgan Stanley Capital International Inc. (“MSCI”) and Standard & Poor’s, a division of The McGraw-Hill Companies, Inc. (“S&P”) and is licensed for use by Goldman Sachs. Neither MSCI, S&P nor any other party involved in making or compiling the GICS or any GICS classifications makes any express or implied warranties or representations with respect to such standard or classification (or the results to be obtained by the use thereof), and all such parties hereby expressly disclaim all warranties of originality, accuracy, completeness, merchantability or fitness for a particular purpose with respect to any of such standard or classification. Without limiting any of the foregoing, in no event shall MSCI, S&P, any of their affiliates or any third party involved in making or compiling the GICS or any GICS classifications have any liability for any direct, indirect, special, punitive, consequential or any other damages (including lost profits) even if notified of the possibility of such damages.
The portfolio risk management process includes an effort to monitor and manage risk, but does not imply low risk.
Shares of the Goldman Sachs VIT Funds are offered to separate accounts of participating life insurance companies for the purpose of funding variable annuity contracts and variable life insurance policies. Shares of the Funds are not offered directly to the general public. The variable annuity contracts and variable life insurance policies are described in the separate prospectuses issued by participating insurance companies. You should refer to those prospectuses for information about surrender charges, mortality and expense risk fees and other charges that may be assessed by participating insurance companies under the variable annuity contracts or variable life insurance policies. Such fees or charges, if any, may affect the return you may realize with respect to your investments. Ask your representative for more complete information. Please consider a fund’s objectives, risks and charges and expenses, and read the prospectus carefully before investing. The prospectus contains this and other information about the Funds.
This material is not authorized for distribution to prospective investors unless preceded or accompanied by a current prospectus or summary prospectus, if applicable. Investors should consider the Funds’ objective, risks, and charges and expenses, and read the summary prospectus, if available, and/or the prospectus carefully before investing or sending money. The summary prospectus, if available, and the prospectus contain this and other information about the Funds and may be obtained from your authorized dealer or from Goldman Sachs & Co. LLC by calling1-800-621-2550.
This report is prepared for the general information of contract owners and is not an offer of shares of the Goldman Sachs Variable Insurance Trust Funds.
© 2019 Goldman Sachs. All rights reserved.
VITMLTISAR-19/175371-OTU-1025432
Goldman
SachsVariable Insurance Trust
Goldman Sachs
Small Cap Equity Insights Fund
Beginning on or after January 1, 2021, you may not receive paper copies of the Fund’s annual and semi-annual shareholder reports from the insurance company that offers your variable insurance contract or your financial intermediary, unless you specifically request paper copies of the reports from the insurance company or from your financial intermediary. Instead, the reports will be made available on a website, and you will be notified by mail each time a report is posted and provided with a website link to access the report.
If you already elected to receive shareholder reports electronically, you will not be affected by this change and you need not take any action. At any time, you may elect to receive reports and certain communications from the insurance company electronically by contacting your insurance company or your financial intermediary.
You may elect to receive all future shareholder reports in paper free of charge. You can inform the insurance company or your financial intermediary that you wish to receive paper copies of reports. Your election to receive reports in paper will apply to all Goldman Sachs Funds available under your contract and may apply to all funds held with your financial intermediary.
Semi-Annual Report
June 30, 2019

GOLDMAN SACHS VARIABLE INSURANCE TRUST SMALL CAP EQUITY INSIGHTS FUND
INVESTMENT OBJECTIVE
The Fund seeks long-term growth of capital.
Portfolio Management Discussion and Analysis
Below, the Goldman Sachs Quantitative Investment Strategies Team discusses the Goldman Sachs Variable Insurance Trust — Goldman Sachs Small Cap Equity Insights Fund’s (the “Fund”) performance and positioning for thesix-month period ended June 30, 2019 (the “Reporting Period”).
How did the Fund perform during the Reporting Period?
During the Reporting Period, the Fund’s Institutional and Service Shares generated cumulative total returns of 16.30% and 16.15%, respectively. These returns compare to the 16.98% cumulative total return of the Fund’s benchmark, the Russell 2000® Index (with dividends reinvested) (the “Russell Index”) during the same time period.
What economic and market factors most influenced the equity markets as a whole during the Reporting Period?
Representing the U.S. equity market, the S&P 500® Index returned 18.54% during the Reporting Period, rallying strongly following negative absolute returns posted in 2018. While 2018 was the worst calendar year since 2008, the first half of 2019 was the strongest first half for the S&P 500® Index since 1997.
During the first quarter of 2019, the S&P 500® Index rose 13.65%. After a volatile end to 2018, the rally to begin 2019 marked the best first quarter performance for the S&P 500® Index since 1998. Federal Reserve (“Fed”) commentary provided a supportive background for U.S. equities, as Fed Chair Jerome Powell reiterated a “patient” approach to monetary policy that included a pause in interest rate hikes and a nearing end to the Fed’s balance sheet runoff. The U.S. unemployment rate remained well below trend at 3.8% in February 2019, and wages grew 3.4% year over year. Housing data showed strength in the first calendar quarter, with new home sales reaching 667,000 in February, bringing the three-month average up to 630,000. Strength in housing data could be partially attributed to a steep decline in mortgage rates resulting from a more cautious Fed. The University of Michigan Consumer Sentiment Index was also a point of significant strength in the U.S. economy, steadily climbing in each month of the first quarter of 2019 and eventually reaching 98.4 in March, its highest level in six months. Economic growth concerns that had dominated the fourth quarter of 2018 failed to completely disappear, however, as fourth quarter 2018 Gross Domestic Product (“GDP”) growth was revised down 0.4% in March 2019 to 2.2%. While the revision was further evidence of a slowing U.S. economy, the result was largely priced in by equity markets and thus had a limited effect on stock prices outside of the financials sector, which historically tends to be more rate sensitive.
The S&P 500® Index rose a solid but more moderate 4.30% during the second quarter of 2019. Trade tensions between the U.S. and China dominated headlines and broadly added noise to the markets. (Noise refers to market activity that can confuse or misrepresent genuine underlying trends.) In April 2019, there was an optimistic consensus outlook on a possible trade deal, but this optimism faded in May when the U.S. President threatened to raise current tariffs and impose new duties on $300 billion of additional Chinese imports. Also, sanctions were temporarily placed on a Chinese telecommunications giant, until they were lifted in June 2019, when any additional tariffs or compromise were postponed. Also during the second quarter of 2019, the markets kept a close eye on the Fed. After steadily raising short-term interest rates since 2015 to a range of 2.25% to 2.50%, the Fed alluded to a more accommodative approach. Following the Fed’s statement, the market consensus actually priced in at least one interest rate cut by the end of 2019, if not sooner. Economic indicators were mixed during the second quarter of 2019, with consumer sentiment remaining elevated, while nonfarm payrolls and manufacturing indices across the board fell short.
For the Reporting Period overall, all 11 sectors posted positive absolute returns, with 10 of the 11 generating double-digit gains. Information technology, consumer discretionary and industrials were the best performing sectors in the S&P 500® Index, as measured by total return, while the weakest performing sectors in the S&P 500® Index during the Reporting Period were health care, energy and utilities.
Within the U.S. equity market, all capitalization segments posted double-digit positive returns, led bymid-cap stocks, as measured by the Russell Midcap® Index, followed bylarge-cap stocks, as measured by the Russell 1000® Index, and thensmall-cap stocks, as measured by the Russell 2000® Index. From a style perspective, growth-oriented stocks significantly outpaced value-oriented stocks across the capitalization spectrum. (All as measured by the FTSE Russell indices.)
1
GOLDMAN SACHS VARIABLE INSURANCE TRUST SMALL CAP EQUITY INSIGHTS FUND
What key factors were responsible for the Fund’s performance during the Reporting Period?
The Fund uses a quantitative style of management, in combination with a qualitative overlay, that emphasizes fundamentally-based stock selection, careful portfolio construction and efficient implementation. The Fund’s investments are selected using fundamental research and a variety of quantitative techniques based on certain investment themes, namely Fundamental Mispricings, High Quality Business Models, Sentiment Analysis and Market Themes & Trends.
During the Reporting Period, the Fund posted double-digit absolute gains but modestly underperformed the Russell Index on a relative basis. Two of our quantitative model’s four investment themes detracted from performance, while two contributed positively. Stock selection overall, driven by these investment themes, dampened relative returns.
What impact did the Fund’s investment themes have on performance during the Reporting Period?
In keeping with our investment approach, we use our quantitative model and four investment themes to take a long-term view of market patterns and look for inefficiencies, selecting stocks for the Fund and overweighting or underweighting the ones chosen by the model. Over time and by design, the performance of any one of the model’s investment themes tends to have a low correlation with the model’s other themes, demonstrating the diversification benefit of the Fund’s theme-driven quantitative model. The variance in performance supports our research indicating that the diversification provided by the Fund’s different investment themes is a significant investment advantage over the long term, even though the Fund may experience underperformance in the short term. Of course, diversification does not protect an investor from market risk nor does it ensure a profit.
During the Reporting Period, two of our four investment themes — High Quality Business Models and Fundamental Mispricings — detracted from the Fund’s relative performance. The other two investment themes — Sentiment Analysis and Market Themes & Trends — contributed positively. High Quality Business Models seeks to identify companies that are generating high quality revenues with sustainable business models and aligned management incentives. Fundamental Mispricing seeks to identify high quality businesses trading at a fair price, which we believe may lead to strong performance over the long run. Sentiment Analysis seeks to identify stocks experiencing improvements in their overall market sentiment. Market Themes & Trends seeks to identify companies positively positioned to benefit from themes and trends in the market and macroeconomic environment.
How did the Fund’s sector and industry allocations affect relative performance?
In constructing the Fund’s portfolio, we focus on picking stocks rather than making sector or industry bets. Consequently, the Fund is similar to its benchmark, the Russell Index, in terms of its sector and industry allocations and style. Changes in its sector or industry weights generally do not have a meaningful impact on relative performance.
Did stock selection help or hurt Fund performance during the Reporting Period?
We seek to outpace the Russell Index by overweighting stocks that we expect to outperform and underweighting those that we think may lag. At the same time, we strive to maintain a risk profile similar to the Russell Index. The Fund’s investments are selected using fundamental research and a variety of quantitative techniques based on our investment themes. For example, the Fund aims to hold a basket of stocks with better Fundamental Mispricings characteristics than the benchmark index.
During the Reporting Period, stock selection overall hampered the Fund’s performance, with investments in the information technology, consumer discretionary and financials sectors detracting most from results relative to the Russell Index. Holdings in the health care, communication services and real estate sectors added to the Fund’s relative returns.
Which individual positions detracted from the Fund’s results during the Reporting Period?
Detracting most from the Fund’s results relative to the Russell Index were overweight positions in biofuels and renewable chemicals producer Renewable Energy Group, shoe designer and manufacturer Crocs and institutional financial services provider Moelis & Co. The overweight in Renewable Energy Group was established primarily as a result of our Fundamental Mispricings and Market Themes & Trends investment themes. Largely because of our High Quality Business Models and Market Themes & Trends investment themes, the Fund was overweight Crocs. The Fund’s overweight in Moelis & Co. was driven primarily by our High Quality Business Models investment theme.
Which individual stock positions contributed the most to the Fund’s relative returns during the Reporting Period?
The Fund benefited most from overweight positions in oncology-focused molecular test developer Veracyte, television broadcasting company Sinclair Broadcast Group and biotechnology and pharmaceuticals company Array BioPharma. The overweight in Veracyte was established predominantly due to our Market Themes & Trends and High Quality Business Models
2
GOLDMAN SACHS VARIABLE INSURANCE TRUST SMALL CAP EQUITY INSIGHTS FUND
investment themes. The overweight in Sinclair Broadcast Group was driven by our High Quality Business Models and Market Themes & Trends investment themes. The Fund was overweight Array BioPharma largely because of our Sentiment Analysis investment theme.
How did the Fund use derivatives during the Reporting Period?
During the Reporting Period, we did not use derivatives as part of an active management strategy to add value to the Fund’s results. However, we used equity index futures contracts, on an opportunistic basis, to equitize the Fund’s excess cash holdings. In other words, we put the Fund’s excess cash holdings to work by using them as collateral for the purchase of stock futures. The use of these futures contracts did not have a material impact on the Fund’s performance during the Reporting Period.
Did you make any enhancements to your quantitative models during the Reporting Period?
We continuously look for ways to improve our investment process. During the Reporting Period, we made numerous enhancements to our models. As example, in the second quarter of 2019, we introduced a number of new signals.
First, within our Sentiment Analysis investment theme, we added a suite of signals that utilizes data from the short selling market as an indicator of the market sentiment surrounding individual names.
Second, within our Market Themes & Trends investment theme, we added a signal that examines the cross-holdings of pooled vehicles to identify thematic trends in the market. Also within our Market Themes & Trends investment theme, we added a signal that examines internet linkages between companies to identify thematic trends.
Finally, within our Fundamental Mispricings investment theme, we added a signal that we believe to be predictive of industry rotations.
What was the Fund’s sector positioning relative to its benchmark index at the end of the Reporting Period?
As of June 30, 2019, the Fund was overweight the energy, materials, industrials and consumer staples sectors relative to the Russell Index. The Fund was underweight information technology, health care and utilities and was rather neutrally weighted in consumer discretionary, communication services, financials and real estate compared to the Russell Index on the same date.
Were there any changes to the Fund’s portfolio management team during the Reporting Period?
There were no changes to the Fund’s portfolio management team during the Reporting Period.
What is your strategy going forward for the Fund?
Looking ahead, we continue to believe that less expensive stocks should outpace more expensive stocks, and stocks with good momentum are likely to outperform those with poor momentum. We intend to maintain our focus on seeking companies about which fundamental research analysts are becoming more positive as well as profitable companies with sustainable earnings and a track record of using their capital to enhance shareholder value. As such, we anticipate remaining fully invested with long-term performance likely to be the result of stock selection rather than sector or capitalization allocations.
We stand behind our investment philosophy that sound economic investment principles, coupled with a disciplined quantitative approach, can provide strong, uncorrelated returns over the long term. Our research agenda is robust, and we continue to enhance our existing models, add new proprietary forecasting signals and improve our trading execution as we seek to provide the most value to our shareholders.
3
GOLDMAN SACHS VARIABLE INSURANCE TRUST SMALL CAP EQUITY INSIGHTS FUND
Index Definitions
TheRussell 2000® Index is an unmanaged index of common stock prices that measures the performance of the 2000 smallest companies in the Russell 3000® Index. The figures for the index do not include any deduction for fees, expenses or taxes.
TheS&P 500® Index is the Standard & Poor’s composite index of 500 stocks, an unmanaged index of common stock prices. The figures for the index do not include any deduction for fees, expenses or taxes.
TheRussell Midcap® Index measures the performance of the 800 smallest companies in the Russell 1000® Index, which represents approximately 25% of the total market capitalization of the Russell 1000 Index.
TheRussell 1000® Index measures the performance of the 1,000 largest companies in the Russell 3000® Index, which represents approximately 92% of the total market capitalization of the Russell 3000 Index.
It is not possible to invest directly in an index.
4
FUND BASICS
Small Cap Equity Insights Fund
as of June 30, 2019
STANDARDIZED TOTAL RETURNS1
| | | | | | | | | | | | | | | | | | |
| | | | | |
| For the period ended 6/30/19 | | One Year | | | Five Years | | | Ten Years | | | Since Inception | | | Inception Date |
| Institutional | | | -4.18 | % | | | 8.02 | % | | | 14.57 | % | | | 6.94 | % | | 2/13/98 |
| Service | | | -4.47 | | | | 7.74 | | | | 14.28 | | | | 7.51 | | | 8/31/07 |
| 1 | The Standardized Total Returns are average annual total returns as of the most recent calendar quarter-end. They assume reinvestment of all distributions at net asset value (“NAV”). Because Institutional Shares and Service Shares do not involve a sales charge, such a charge is not applied to their Standardized Total Returns. |
Total return figures in the above chart represent past performance and do not indicate future results, which will vary. The investment return and principal value of an investment will fluctuate and, therefore, an investor’s shares, when redeemed, may be worth more or less than their original cost. Current performance may be lower or higher than the total return figures in the above chart. Please visit www.GSAMFUNDS.com to obtain the most recent month-end returns.Performance reflects fee waivers and/or expense limitations in effect during the periods shown. In their absence, performance would be reduced.
EXPENSE RATIOS2
| | | | | | | | |
| | |
| | | Net Expense Ratio (Current) | | | Gross Expense Ratio (Before Waivers) | |
| Institutional | | | 0.81 | % | | | 0.96 | % |
| Service | | | 1.06 | | | | 1.21 | |
| 2 | The expense ratios of the Fund, both current (net of any fee waivers and/or expense limitations) and before waivers (gross of any fee waivers and/or expense limitations) are as set forth above according to the most recent publicly available Prospectuses for the Fund and may differ from the expense ratios disclosed in the Financial Highlights in this report. Pursuant to a contractual arrangement, the Fund’s fee waivers and/or expense limitations will remain in place through at least April 30, 2020, and prior to such date, the Investment Adviser may not terminate the arrangements without the approval of the Fund’s Board of Trustees. If these arrangements are discontinued in the future, the expense ratios may change without shareholder approval. |
TOP TEN HOLDINGS AS OF 6/30/193,4
| | | | | | |
| | |
| Holding | | % of Net Assets | | | Line of Business |
| Portland General Electric Co. | | | 0.9% | | | Utilities |
| Repligen Corp. | | | 0.9 | | | Pharmaceuticals, Biotechnology & Life Sciences |
| Rexford Industrial Realty, Inc. (REIT) | | | 0.8 | | | Real Estate |
| First Industrial Realty Trust, Inc. (REIT) | | | 0.8 | | | Real Estate |
| Terreno Realty Corp. (REIT) | | | 0.8 | | | Real Estate |
| Delek US Holdings, Inc. | | | 0.8 | | | Energy |
| Wingstop, Inc. | | | 0.8 | | | Consumer Services |
| Insperity, Inc. | | | 0.8 | | | Commercial & Professional Services |
| Argo Group International Holdings Ltd. | | | 0.8 | | | Insurance |
| Cogent Communications Holdings, Inc. | | | 0.8 | | | Telecommunication Services |
| 3 | The top 10 holdings may not be representative of the Fund’s future investments. |
| 4 | The Fund’s overall top ten holdings differ from the table above due to the exclusion of the Goldman Sachs Financial Square Government Fund (a securities lending reinvestment vehicle) which represents 0.8% of the Fund’s net assets as of 06/30/2019. |
5
FUND BASICS
Small Cap Equity Insights Fund(continued)
as of June 30, 2019
FUND VS. BENCHMARK SECTOR ALLOCATIONS5
As of June 30, 2019
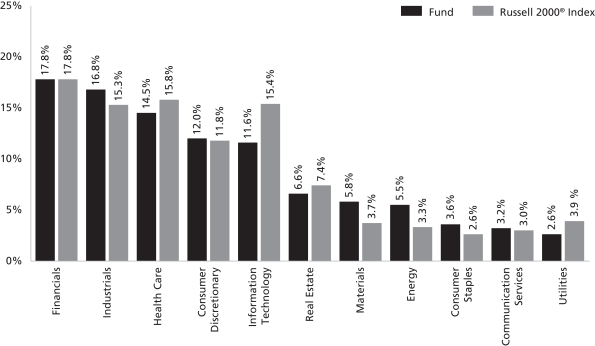
| 5 | The Fund is actively managed and, as such, its composition may differ over time. Consequently, the Fund’s overall sector allocations may differ from percentages contained in the graph above. The graph categorizes investments using Global Industry Classification Standard (“GICS”); however, the sector classifications used by the portfolio management team may differ from GICS. The percentage shown for each investment category reflects the value of investments in that category as a percentage of market value (excluding investments in the securities lending reinvestment vehicle, if any). Investments in the securities lending reinvestment vehicle represented 0.8% of the Fund’s net assets at June 30, 2019. The graph depicts the Fund’s investments but may not represent the Fund’s market exposure due to the exclusion of certain derivatives, if any, as listed in the Additional Investment Information section of the Schedule of Investments. |
6
GOLDMAN SACHS VARIABLE INSURANCE TRUST SMALL CAP EQUITY INSIGHTS FUND
Schedule of Investments
June 30, 2019 (Unaudited)
| | | | | | | | |
| Shares | | | Description | | Value | |
|
| Common Stocks – 97.8% | |
| Automobiles & Components – 0.2% | |
| | 971 | | | Gentherm, Inc.* | | $ | 40,617 | |
| | 1,164 | | | Modine Manufacturing Co.* | | | 16,657 | |
| | 1,950 | | | Standard Motor Products, Inc. | | | 88,413 | |
| | | | | | | | |
| | | | | | | 145,687 | |
| | |
| Banks – 11.3% | | | |
| | 5,747 | | | 1st Source Corp. | | | 266,661 | |
| | 410 | | | ACNB Corp. | | | 16,224 | |
| | 1,353 | | | Allegiance Bancshares, Inc.* | | | 45,109 | |
| | 6,734 | | | Amalgamated Bank Class A | | | 117,508 | |
| | 6,704 | | | Bancorp, Inc. (The)* | | | 59,800 | |
| | 637 | | | Banner Corp. | | | 34,494 | |
| | 3,313 | | | Boston Private Financial Holdings, Inc. | | | 39,988 | |
| | 24,917 | | | Cadence Bancorp | | | 518,274 | |
| | 7,243 | | | Cathay General Bancorp | | | 260,096 | |
| | 20,596 | | | Central Pacific Financial Corp. | | | 617,056 | |
| | 378 | | | Century Bancorp, Inc. Class A | | | 33,226 | |
| | 1,991 | | | Columbia Banking System, Inc. | | | 72,034 | |
| | 27,967 | | | CVB Financial Corp. | | | 588,146 | |
| | 650 | | | Enterprise Bancorp, Inc. | | | 20,611 | |
| | 5,191 | | | Equity Bancshares, Inc. Class A* | | | 138,392 | |
| | 4,753 | | | Federal Agricultural Mortgage Corp. Class C | | | 345,353 | |
| | 921 | | | Financial Institutions, Inc. | | | 26,847 | |
| | 11,139 | | | First Bancorp | | | 405,682 | |
| | 38,879 | | | First Commonwealth Financial Corp. | | | 523,700 | |
| | 4,373 | | | First Financial Corp. | | | 175,620 | |
| | 13,102 | | | First Foundation, Inc. | | | 176,091 | |
| | 6,418 | | | First Internet Bancorp | | | 138,244 | |
| | 9,403 | | | Heartland Financial USA, Inc. | | | 420,596 | |
| | 25,343 | | | Hilltop Holdings, Inc. | | | 539,046 | |
| | 622 | | | Independent Bank Group, Inc. | | | 34,185 | |
| | 16,087 | | | International Bancshares Corp. | | | 606,641 | |
| | 52,731 | | | Investors Bancorp, Inc. | | | 587,951 | |
| | 738 | | | Lakeland Bancorp, Inc. | | | 11,919 | |
| | 2,006 | | | Macatawa Bank Corp. | | | 20,582 | |
| | 4,969 | | | Mercantile Bank Corp. | | | 161,890 | |
| | 583 | | | Metropolitan Bank Holding Corp.* | | | 25,652 | |
| | 11,717 | | | National Bank Holdings Corp. Class A | | | 425,327 | |
| | 420 | | | NBT Bancorp, Inc. | | | 15,754 | |
| | 16,954 | | | NMI Holdings, Inc. Class A* | | | 481,324 | |
| | 4,167 | | | Pacific Premier Bancorp, Inc. | | | 128,677 | |
| | 1,516 | | | Parke Bancorp, Inc. | | | 36,308 | |
| | 770 | | | Peapack Gladstone Financial Corp. | | | 21,652 | |
| | 660 | | | Preferred Bank | | | 31,185 | |
| | 723 | | | Provident Financial Services, Inc. | | | 17,533 | |
| | 24,852 | | | Radian Group, Inc. | | | 567,868 | |
| | 1,756 | | | Riverview Bancorp, Inc. | | | 14,996 | |
| | 3,828 | | | Sandy Spring Bancorp, Inc. | | | 133,521 | |
| | 541 | | | Seacoast Banking Corp. of Florida* | | | 13,763 | |
| | 3,977 | | | Sierra Bancorp | | | 107,856 | |
| | 6,535 | | | Southern National Bancorp of Virginia, Inc. | | | 100,051 | |
| | 800 | | | Territorial Bancorp, Inc. | | | 24,720 | |
| | 1,182 | | | Towne Bank | | | 32,245 | |
| | |
|
| Common Stocks – (continued) | |
| Banks – (continued) | | | |
| | 12,532 | | | TriCo Bancshares | | | 473,710 | |
| | 518 | | | Triumph Bancorp, Inc.* | | | 15,048 | |
| | 20,737 | | | TrustCo Bank Corp. | | | 164,237 | |
| | 2,916 | | | UMB Financial Corp. | | | 191,931 | |
| | 3,909 | | | United Community Financial Corp. | | | 37,409 | |
| | 1,697 | | | Univest Financial Corp. | | | 44,563 | |
| | 248 | | | Washington Trust Bancorp, Inc. | | | 12,941 | |
| | 1,899 | | | WesBanco, Inc. | | | 73,206 | |
| | 7,948 | | | WSFS Financial Corp. | | | 328,252 | |
| | | | | | | | |
| | | | | | | 10,521,695 | |
| | |
| Capital Goods – 10.4% | | | |
| | 7,751 | | | Aegion Corp.* | | | 142,618 | |
| | 12,521 | | | Aerojet Rocketdyne Holdings, Inc.* | | | 560,565 | |
| | 7,746 | | | Albany International Corp. Class A | | | 642,221 | |
| | 3,802 | | | Astronics Corp.* | | | 152,916 | |
| | 3,520 | | | Barnes Group, Inc. | | | 198,317 | |
| | 12,515 | | | BMC Stock Holdings, Inc.* | | | 265,318 | |
| | 19,637 | | | Builders FirstSource, Inc.* | | | 331,080 | |
| | 1,341 | | | Columbus McKinnon Corp. | | | 56,282 | |
| | 9,224 | | | Comfort Systems USA, Inc. | | | 470,332 | |
| | 21,021 | | | Continental Building Products, Inc.* | | | 558,528 | |
| | 2,907 | | | CSW Industrials, Inc. | | | 198,112 | |
| | 1,476 | | | Ducommun, Inc.* | | | 66,523 | |
| | 1,377 | | | DXP Enterprises, Inc.* | | | 52,175 | |
| | 5,205 | | | Enphase Energy, Inc.* | | | 94,887 | |
| | 3,847 | | | EnPro Industries, Inc. | | | 245,593 | |
| | 805 | | | ESCO Technologies, Inc. | | | 66,509 | |
| | 1,665 | | | Franklin Electric Co., Inc. | | | 79,088 | |
| | 1,193 | | | GMS, Inc.* | | | 26,246 | |
| | 7,425 | | | Great Lakes Dredge & Dock Corp.* | | | 81,972 | |
| | 2,939 | | | Harsco Corp.* | | | 80,646 | |
| | 1,126 | | | Herc Holdings, Inc.* | | | 51,605 | |
| | 721 | | | Hillenbrand, Inc. | | | 28,530 | |
| | 614 | | | Hurco Cos., Inc. | | | 21,834 | |
| | 14,262 | | | JELD-WEN Holding, Inc.* | | | 302,782 | |
| | 4,589 | | | Kaman Corp. | | | 292,273 | |
| | 6,176 | | | Kennametal, Inc. | | | 228,450 | |
| | 9,424 | | | Kratos Defense & Security Solutions, Inc.* | | | 215,715 | |
| | 1,686 | | | Mercury Systems, Inc.* | | | 118,610 | |
| | 642 | | | Meritor, Inc.* | | | 15,569 | |
| | 26,805 | | | Milacron Holdings Corp.* | | | 369,909 | |
| | 4,149 | | | Miller Industries, Inc. | | | 127,582 | |
| | 3,402 | | | Moog, Inc. Class A | | | 318,461 | |
| | 2,846 | | | MRC Global, Inc.* | | | 48,724 | |
| | 343 | | | Powell Industries, Inc. | | | 13,034 | |
| | 607 | | | Proto Labs, Inc.* | | | 70,424 | |
| | 2,332 | | | Quanex Building Products Corp. | | | 44,052 | |
| | 322 | | | Raven Industries, Inc. | | | 11,553 | |
| | 1,245 | | | RBC Bearings, Inc.* | | | 207,679 | |
| | 4,552 | | | Rexnord Corp.* | | | 137,561 | |
| | 2,756 | | | Rush Enterprises, Inc. Class A | | | 100,649 | |
| | 9,859 | | | Simpson Manufacturing Co., Inc. | | | 655,229 | |
| | 9,389 | | | SPX FLOW, Inc.* | | | 393,024 | |
| | |
| | |
| The accompanying notes are an integral part of these financial statements. | | 7 |
GOLDMAN SACHS VARIABLE INSURANCE TRUST SMALL CAP EQUITY INSIGHTS FUND
Schedule of Investments(continued)
June 30, 2019 (Unaudited)
| | | | | | | | |
| Shares | | | Description | | Value | |
|
| Common Stocks – (continued) | |
| Capital Goods – (continued) | | | |
| | 2,392 | | | Tennant Co. | | $ | 146,390 | |
| | 8,033 | | | Titan Machinery, Inc.* | | | 165,319 | |
| | 13,521 | | | TriMas Corp.* | | | 418,745 | |
| | 2,090 | | | Vectrus, Inc.* | | | 84,770 | |
| | 7,061 | | | Watts Water Technologies, Inc. Class A | | | 657,944 | |
| | 6,873 | | | Wesco Aircraft Holdings, Inc.* | | | 76,290 | |
| | | | | | | | |
| | | | | | | 9,692,635 | |
| | |
| Commercial & Professional Services – 5.0% | | | |
| | 1,877 | | | Barrett Business Services, Inc. | | | 155,040 | |
| | 14,353 | | | CBIZ, Inc.* | | | 281,175 | |
| | 2,261 | | | Covanta Holding Corp. | | | 40,495 | |
| | 4,052 | | | CRA International, Inc. | | | 155,313 | |
| | 819 | | | Franklin Covey Co.* | | | 27,846 | |
| | 3,491 | | | Heidrick & Struggles International, Inc. | | | 104,625 | |
| | 2,795 | | | Huron Consulting Group, Inc.* | | | 140,812 | |
| | 5,954 | | | Insperity, Inc. | | | 727,222 | |
| | 895 | | | Kelly Services, Inc. Class A | | | 23,440 | |
| | 16,480 | | | Kforce, Inc. | | | 578,283 | |
| | 13,568 | | | Korn Ferry | | | 543,670 | |
| | 853 | | | Matthews International Corp. Class A | | | 29,727 | |
| | 7,765 | | | McGrath RentCorp | | | 482,595 | |
| | 10,304 | | | Navigant Consulting, Inc. | | | 238,950 | |
| | 1,588 | | | PICO Holdings, Inc.* | | | 18,453 | |
| | 6,953 | | | Tetra Tech, Inc. | | | 546,158 | |
| | 5,951 | | | TriNet Group, Inc.* | | | 403,478 | |
| | 7,239 | | | TrueBlue, Inc.* | | | 159,692 | |
| | | | | | | | |
| | | | | | | 4,656,974 | |
| | |
| Consumer Durables & Apparel – 2.8% | | | |
| | 20,111 | | | American Outdoor Brands Corp.* | | | 181,200 | |
| | 1,017 | | | Bassett Furniture Industries, Inc. | | | 15,509 | |
| | 16,852 | | | Callaway Golf Co. | | | 289,180 | |
| | 12,455 | | | Crocs, Inc.* | | | 245,986 | |
| | 1,365 | | | Deckers Outdoor Corp.* | | | 240,199 | |
| | 1,675 | | | Ethan Allen Interiors, Inc. | | | 35,276 | |
| | 612 | | | Helen of Troy Ltd.* | | | 79,921 | |
| | 2,832 | | | Installed Building Products, Inc.* | | | 167,711 | |
| | 832 | | | Johnson Outdoors, Inc. Class A | | | 62,042 | |
| | 13,870 | | | KB Home | | | 356,875 | |
| | 434 | | | Malibu Boats, Inc. Class A* | | | 16,861 | |
| | 6,917 | | | MasterCraft Boat Holdings, Inc.* | | | 135,504 | |
| | 9,299 | | | Meritage Homes Corp.* | | | 477,411 | |
| | 5,325 | | | Taylor Morrison Home Corp. Class A* | | | 111,612 | |
| | 1,467 | | | Universal Electronics, Inc.* | | | 60,176 | |
| | 19,770 | | | Vista Outdoor, Inc.* | | | 175,558 | |
| | | | | | | | |
| | | | | | | 2,651,021 | |
| | |
| Consumer Services – 3.4% | | | |
| | 1,504 | | | American Public Education, Inc.* | | | 44,488 | |
| | 10,588 | | | Chegg, Inc.* | | | 408,591 | |
| | 279 | | | Cracker Barrel Old Country Store, Inc. | | | 47,634 | |
| | 8,239 | | | Dave & Buster’s Entertainment, Inc. | | | 333,432 | |
| | 5,790 | | | Denny’s Corp.* | | | 118,869 | |
| | 7,587 | | | Everi Holdings, Inc.* | | | 90,513 | |
| | 7,779 | | | Fiesta Restaurant Group, Inc.* | | | 102,216 | |
| | |
|
| Common Stocks – (continued) | |
| Consumer Services – (continued) | | | |
| | 16,417 | | | K12, Inc.* | | | 499,241 | |
| | 12,930 | | | Laureate Education, Inc. Class A* | | | 203,130 | |
| | 15,012 | | | Scientific Games Corp. Class A* | | | 297,538 | |
| | 8,225 | | | SeaWorld Entertainment, Inc.* | | | 254,975 | |
| | 763 | | | Twin River Worldwide Holdings, Inc.* | | | 22,699 | |
| | 7,680 | | | Wingstop, Inc. | | | 727,680 | |
| | | | | | | | |
| | | | | | | 3,151,006 | |
| | |
| Diversified Financials – 3.2% | | | |
| | 53,326 | | | Anworth Mortgage Asset Corp. (REIT) | | | 202,106 | |
| | 19,666 | | | Artisan Partners Asset Management, Inc. Class A | | | 541,208 | |
| | 40,878 | | | BrightSphere Investment Group plc | | | 466,418 | |
| | 7,451 | | | Cannae Holdings, Inc.* | | | 215,930 | |
| | 17,376 | | | Enova International, Inc.* | | | 400,517 | |
| | 4,468 | | | FGL Holdings | | | 37,531 | |
| | 3,244 | | | Great Ajax Corp. (REIT) | | | 45,416 | |
| | 2,212 | | | Green Dot Corp. Class A* | | | 108,167 | |
| | 1,712 | | | Greenhill & Co., Inc. | | | 23,266 | |
| | 1,861 | | | Houlihan Lokey, Inc. | | | 82,870 | |
| | 13,657 | | | On Deck Capital, Inc.* | | | 56,677 | |
| | 9,147 | | | Oppenheimer Holdings, Inc. Class A | | | 248,981 | |
| | 4,371 | | | Piper Jaffray Cos. | | | 324,634 | |
| | 2,264 | | | Regional Management Corp.* | | | 59,702 | |
| | 3,731 | | | Westwood Holdings Group, Inc. | | | 131,331 | |
| | | | | | | | |
| | | | | | | 2,944,754 | |
| | |
| Energy – 5.4% | | | |
| | 4,228 | | | Arch Coal, Inc. Class A | | | 398,320 | |
| | 1,227 | | | Brigham Minerals, Inc. Class A* | | | 26,331 | |
| | 5,597 | | | Clean Energy Fuels Corp.* | | | 14,944 | |
| | 8,266 | | | CONSOL Energy, Inc.* | | | 219,958 | |
| | 5,198 | | | CVR Energy, Inc. | | | 259,848 | |
| | 18,596 | | | Delek US Holdings, Inc. | | | 753,510 | |
| | 56,218 | | | Denbury Resources, Inc.* | | | 69,710 | |
| | 19,439 | | | DHT Holdings, Inc. | | | 114,885 | |
| | 1,164 | | | Exterran Corp.* | | | 16,552 | |
| | 4,749 | | | Forum Energy Technologies, Inc.* | | | 16,242 | |
| | 13,414 | | | FTS International, Inc.* | | | 74,850 | |
| | 7,460 | | | GasLog Ltd. | | | 107,424 | |
| | 18,294 | | | Golar LNG Ltd. | | | 338,073 | |
| | 10,885 | | | Green Plains, Inc. | | | 117,340 | |
| | 30,417 | | | Helix Energy Solutions Group, Inc.* | | | 262,499 | |
| | 1,296 | | | International Seaways, Inc.* | | | 24,624 | |
| | 15,525 | | | Matrix Service Co.* | | | 314,537 | |
| | 22,791 | | | Newpark Resources, Inc.* | | | 169,109 | |
| | 4,933 | | | Oceaneering International, Inc.* | | | 100,584 | |
| | 513 | | | PDC Energy, Inc.* | | | 18,499 | |
| | 8,189 | | | Peabody Energy Corp. | | | 197,355 | |
| | 12,646 | | | Renewable Energy Group, Inc.* | | | 200,566 | |
| | 7,353 | | | Scorpio Tankers, Inc. | | | 217,061 | |
| | 11,481 | | | SEACOR Holdings, Inc.* | | | 545,462 | |
| | 23,828 | | | Superior Energy Services, Inc.* | | | 30,976 | |
| | 4,014 | | | Teekay Corp. | | | 13,808 | |
| | 10,294 | | | World Fuel Services Corp. | | | 370,172 | |
| | | | | | | | |
| | | | | | | 4,993,239 | |
| | |
| | |
| 8 | | The accompanying notes are an integral part of these financial statements. |
GOLDMAN SACHS VARIABLE INSURANCE TRUST SMALL CAP EQUITY INSIGHTS FUND
| | | | | | | | |
| Shares | | | Description | | Value | |
|
| Common Stocks – (continued) | |
| Food & Staples Retailing – 0.4% | | | |
| | 5,747 | | | Ingles Markets, Inc. Class A | | $ | 178,904 | |
| | 3,685 | | | Village Super Market, Inc. Class A | | | 97,689 | |
| | 1,655 | | | Weis Markets, Inc. | | | 60,259 | |
| | | | | | | | |
| | | | | | | 336,852 | |
| | |
| Food, Beverage & Tobacco – 3.1% | | | |
| | 172 | | | Boston Beer Co., Inc. (The) Class A* | | | 64,975 | |
| | 1,208 | | | Coca-Cola Consolidated, Inc. | | | 361,494 | |
| | 30,409 | | | Darling Ingredients, Inc.* | | | 604,835 | |
| | 10,816 | | | Dean Foods Co. | | | 9,992 | |
| | 2,413 | | | Fresh Del Monte Produce, Inc. | | | 65,030 | |
| | 10,773 | | | Freshpet, Inc.* | | | 490,279 | |
| | 2,657 | | | Hostess Brands, Inc.* | | | 38,367 | |
| | 4,278 | | | J&J Snack Foods Corp. | | | 688,544 | |
| | 1,005 | | | John B Sanfilippo & Son, Inc. | | | 80,089 | |
| | 3,224 | | | National Beverage Corp.(a) | | | 143,887 | |
| | 1,719 | | | Universal Corp. | | | 104,464 | |
| | 28,247 | | | Vector Group Ltd. | | | 275,408 | |
| | | | | | | | |
| | | | | | | 2,927,364 | |
| | |
| Health Care Equipment & Services – 4.6% | | | |
| | 30,064 | | | Allscripts Healthcare Solutions, Inc.* | | | 349,644 | |
| | 683 | | | BioTelemetry, Inc.* | | | 32,887 | |
| | 2,228 | | | Computer Programs & Systems, Inc. | | | 61,916 | |
| | 6,513 | | | Ensign Group, Inc. (The) | | | 370,720 | |
| | 8,607 | | | GenMark Diagnostics, Inc.* | | | 55,860 | |
| | 1,491 | | | Glaukos Corp.* | | | 112,421 | |
| | 930 | | | Haemonetics Corp.* | | | 111,916 | |
| | 5,446 | | | HealthEquity, Inc.* | | | 356,168 | |
| | 8,804 | | | HMS Holdings Corp.* | | | 285,162 | |
| | 877 | | | Integer Holdings Corp.* | | | 73,598 | |
| | 1,348 | | | LivaNova plc* | | | 97,002 | |
| | 537 | | | Mesa Laboratories, Inc. | | | 131,211 | |
| | 3,388 | | | NextGen Healthcare, Inc.* | | | 67,421 | |
| | 1,619 | | | Novocure Ltd.* | | | 102,369 | |
| | 7,688 | | | Omnicell, Inc.* | | | 661,399 | |
| | 3,624 | | | Orthofix Medical, Inc.* | | | 191,637 | |
| | 229 | | | Providence Service Corp. (The)* | | | 13,131 | |
| | 8,833 | | | STAAR Surgical Co.* | | | 259,514 | |
| | 285 | | | Surmodics, Inc.* | | | 12,304 | |
| | 5,395 | | | Tandem Diabetes Care, Inc.* | | | 348,085 | |
| | 17,282 | | | Tenet Healthcare Corp.* | | | 357,046 | |
| | 8,873 | | | Triple-S Management Corp. Class B* | | | 211,621 | |
| | 976 | | | Varex Imaging Corp.* | | | 29,914 | |
| | | | | | | | |
| | | | | | | 4,292,946 | |
| | |
| Household & Personal Products – 0.0% | | | |
| | 1,971 | | | Central Garden & Pet Co. Class A* | | | 48,565 | |
| | |
| Insurance – 2.9% | | | |
| | 22,887 | | | American Equity Investment Life Holding Co. | | | 621,611 | |
| | 5,180 | | | AMERISAFE, Inc. | | | 330,329 | |
| | 9,639 | | | Argo Group International Holdings Ltd. | | | 713,768 | |
| | 4,036 | | | Employers Holdings, Inc. | | | 170,602 | |
| | 5,564 | | | FBL Financial Group, Inc. Class A | | | 354,983 | |
| | 10,804 | | | Genworth Financial, Inc. Class A* | | | 40,083 | |
| | |
|
| Common Stocks – (continued) | |
| Insurance – (continued) | | | |
| | 563 | | | James River Group Holdings Ltd. | | | 26,405 | |
| | 2,775 | | | National General Holdings Corp. | | | 63,658 | |
| | 103 | | | National Western Life Group, Inc. Class A | | | 26,471 | |
| | 1,015 | | | Safety Insurance Group, Inc. | | | 96,557 | |
| | 6,942 | | | Trupanion, Inc.*(a) | | | 250,814 | |
| | | | | | | | |
| | | | | | | 2,695,281 | |
| | |
| Materials – 5.6% | | | |
| | 28,265 | | | AK Steel Holding Corp.* | | | 66,988 | |
| | 12,600 | | | Boise Cascade Co. | | | 354,186 | |
| | 11,284 | | | Carpenter Technology Corp. | | | 541,406 | |
| | 3,376 | | | Chase Corp. | | | 363,393 | |
| | 33,399 | | | Ferro Corp.* | | | 527,704 | |
| | 504 | | | Haynes International, Inc. | | | 16,032 | |
| | 1,180 | | | HB Fuller Co. | | | 54,752 | |
| | 4,570 | | | Innophos Holdings, Inc. | | | 133,033 | |
| | 2,227 | | | Innospec, Inc. | | | 203,191 | |
| | 1,313 | | | Kaiser Aluminum Corp. | | | 128,162 | |
| | 3,925 | | | Kraton Corp.* | | | 121,950 | |
| | 20,223 | | | Louisiana-Pacific Corp. | | | 530,247 | |
| | 5,853 | | | Materion Corp. | | | 396,892 | |
| | 6,202 | | | Minerals Technologies, Inc. | | | 331,869 | |
| | 6,158 | | | OMNOVA Solutions, Inc.* | | | 38,364 | |
| | 3,554 | | | PH Glatfelter Co. | | | 59,991 | |
| | 9,060 | | | PolyOne Corp. | | | 284,393 | |
| | 122 | | | Quaker Chemical Corp. | | | 24,751 | |
| | 6,787 | | | Schnitzer Steel Industries, Inc. Class A | | | 177,616 | |
| | 4,428 | | | SunCoke Energy, Inc.* | | | 39,321 | |
| | 9,584 | | | Trinseo SA | | | 405,787 | |
| | 2,915 | | | Tronox Holdings plc Class A | | | 37,254 | |
| | 13,172 | | | Warrior Met Coal, Inc. | | | 344,053 | |
| | 1,352 | | | Worthington Industries, Inc. | | | 54,432 | |
| | | | | | | | |
| | | | | | | 5,235,767 | |
| | |
| Media & Entertainment – 1.8% | | | |
| | 10,410 | | | Cars.com, Inc.* | | | 205,285 | |
| | 4,163 | | | Central European Media Enterprises Ltd. Class A* | | | 18,151 | |
| | 4,023 | | | Entravision Communications Corp. Class A | | | 12,552 | |
| | 17,096 | | | EW Scripps Co. (The) Class A | | | 261,398 | |
| | 24,226 | | | Glu Mobile, Inc.* | | | 173,943 | |
| | 2,456 | | | IMAX Corp.* | | | 49,611 | |
| | 1,590 | | | Liberty Latin America Ltd. Class A* | | | 27,396 | |
| | 11,729 | | | Liberty TripAdvisor Holdings, Inc. Class A* | | | 145,439 | |
| | 1,622 | | | Loral Space & Communications, Inc.* | | | 55,975 | |
| | 9,113 | | | Meet Group, Inc. (The)* | | | 31,713 | |
| | 1,297 | | | Meredith Corp. | | | 71,413 | |
| | 11,974 | | | MSG Networks, Inc. Class A* | | | 248,341 | |
| | 20,238 | | | New Media Investment Group, Inc. | | | 191,047 | |
| | 617 | | | Scholastic Corp. | | | 20,509 | |
| | 1,942 | | | TechTarget, Inc.* | | | 41,267 | |
| | 3,485 | | | Yelp, Inc.* | | | 119,117 | |
| | | | | | | | |
| | | | | | | 1,673,157 | |
| | |
| | |
| The accompanying notes are an integral part of these financial statements. | | 9 |
GOLDMAN SACHS VARIABLE INSURANCE TRUST SMALL CAP EQUITY INSIGHTS FUND
Schedule of Investments(continued)
June 30, 2019 (Unaudited)
| | | | | | | | |
| Shares | | | Description | | Value | |
|
| Common Stocks – (continued) | |
| Pharmaceuticals, Biotechnology & Life Sciences – 9.5% | | | |
| | 4,559 | | | ACADIA Pharmaceuticals, Inc.* | | $ | 121,862 | |
| | 4,421 | | | Acceleron Pharma, Inc.* | | | 181,615 | |
| | 6,332 | | | Amicus Therapeutics, Inc.* | | | 79,023 | |
| | 5,052 | | | Anika Therapeutics, Inc.* | | | 205,212 | |
| | 2,633 | | | Arena Pharmaceuticals, Inc.* | | | 154,373 | |
| | 10,419 | | | Array BioPharma, Inc.* | | | 482,712 | |
| | 11,239 | | | Arrowhead Pharmaceuticals, Inc.*(a) | | | 297,833 | |
| | 2,760 | | | Assertio Therapeutics, Inc.* | | | 9,522 | |
| | 2,378 | | | Audentes Therapeutics, Inc.* | | | 90,031 | |
| | 5,450 | | | Blueprint Medicines Corp.* | | | 514,099 | |
| | 10,030 | | | CareDx, Inc.* | | | 360,980 | |
| | 2,341 | | | Coherus Biosciences, Inc.* | | | 51,736 | |
| | 1,227 | | | Cyclerion Therapeutics, Inc.* | | | 14,049 | |
| | 1,242 | | | Dicerna Pharmaceuticals, Inc.* | | | 19,561 | |
| | 4,667 | | | Editas Medicine, Inc.* | | | 115,462 | |
| | 712 | | | Enanta Pharmaceuticals, Inc.* | | | 60,079 | |
| | 4,546 | | | Esperion Therapeutics, Inc.* | | | 211,480 | |
| | 3,546 | | | FibroGen, Inc.* | | | 160,208 | |
| | 3,289 | | | Fluidigm Corp.* | | | 40,520 | |
| | 787 | | | G1 Therapeutics, Inc.* | | | 24,129 | |
| | 9,436 | | | Genomic Health, Inc.* | | | 548,892 | |
| | 5,206 | | | Global Blood Therapeutics, Inc.* | | | 273,836 | |
| | 31,229 | | | Halozyme Therapeutics, Inc.* | | | 536,514 | |
| | 1,287 | | | Intercept Pharmaceuticals, Inc.* | | | 102,407 | |
| | 8,378 | | | Invitae Corp.* | | | 196,883 | |
| | 7,956 | | | Mallinckrodt plc* | | | 73,036 | |
| | 1,490 | | | Mirati Therapeutics, Inc.* | | | 153,470 | |
| | 382 | | | MyoKardia, Inc.* | | | 19,153 | |
| | 5,196 | | | Myriad Genetics, Inc.* | | | 144,345 | |
| | 14,799 | | | Natera, Inc.* | | | 408,156 | |
| | 4,236 | | | Pacira BioSciences, Inc.* | | | 184,224 | |
| | 5,712 | | | PDL BioPharma, Inc.* | | | 17,936 | |
| | 8,847 | | | Phibro Animal Health Corp. Class A | | | 281,069 | |
| | 38,611 | | | Pieris Pharmaceuticals, Inc.* | | | 181,472 | |
| | 10,748 | | | Prestige Consumer Healthcare, Inc.* | | | 340,497 | |
| | 7,854 | | | Prothena Corp. plc* | | | 83,017 | |
| | 3,230 | | | PTC Therapeutics, Inc.* | | | 145,350 | |
| | 2,254 | | | Puma Biotechnology, Inc.* | | | 28,648 | |
| | 1,933 | | | Radius Health, Inc.* | | | 47,088 | |
| | 9,359 | | | Repligen Corp.* | | | 804,406 | |
| | 3,162 | | | Ultragenyx Pharmaceutical, Inc.* | | | 200,787 | |
| | 4,487 | | | Vanda Pharmaceuticals, Inc.* | | | 63,222 | |
| | 22,031 | | | Veracyte, Inc.* | | | 628,104 | |
| | 7,806 | | | Voyager Therapeutics, Inc.* | | | 212,479 | |
| | | | | | | | |
| | | | | | | 8,869,477 | |
| | |
| Real Estate – 6.5% | | | |
| | 4,765 | | | Alexander & Baldwin, Inc. (REIT) | | | 110,071 | |
| | 13,221 | | | Cedar Realty Trust, Inc. (REIT) | | | 35,036 | |
| | 1,374 | | | CorePoint Lodging, Inc. (REIT) | | | 17,024 | |
| | 962 | | | EastGroup Properties, Inc. (REIT) | | | 111,573 | |
| | 798 | | | Essential Properties Realty Trust, Inc. (REIT) | | | 15,992 | |
| | 20,668 | | | First Industrial Realty Trust, Inc. (REIT) | | | 759,342 | |
| | 10,101 | | | Gladstone Commercial Corp. (REIT) | | | 214,343 | |
| | 8,381 | | | Hersha Hospitality Trust (REIT) | | | 138,622 | |
| | |
|
| Common Stocks – (continued) | |
| Real Estate – (continued) | | | |
| | 6,024 | | | Independence Realty Trust, Inc. (REIT) | | | 69,698 | |
| | 10,107 | | | Kennedy-Wilson Holdings, Inc. | | | 207,901 | |
| | 60,085 | | | Lexington Realty Trust (REIT) | | | 565,400 | |
| | 16,040 | | | National Storage Affiliates Trust (REIT) | | | 464,198 | |
| | 1,653 | | | Newmark Group, Inc. Class A | | | 14,844 | |
| | 9,211 | | | NexPoint Residential Trust, Inc. (REIT) | | | 381,335 | |
| | 21,034 | | | Physicians Realty Trust (REIT) | | | 366,833 | |
| | 19,434 | | | Piedmont Office Realty Trust, Inc. Class A (REIT) | | | 387,320 | |
| | 468 | | | Retail Value, Inc. (REIT) | | | 16,286 | |
| | 19,535 | | | Rexford Industrial Realty, Inc. (REIT) | | | 788,628 | |
| | 34,787 | | | RLJ Lodging Trust (REIT) | | | 617,121 | |
| | 15,402 | | | Terreno Realty Corp. (REIT) | | | 755,314 | |
| | | | | | | | |
| | | | | | | 6,036,881 | |
| | |
| Retailing – 5.4% | | | |
| | 2,294 | | | Aaron’s, Inc. | | | 140,874 | |
| | 14,401 | | | Abercrombie & Fitch Co. Class A | | | 230,992 | |
| | 15,246 | | | American Eagle Outfitters, Inc. | | | 257,657 | |
| | 2,979 | | | America’sCar-Mart, Inc.* | | | 256,432 | |
| | 1,259 | | | Asbury Automotive Group, Inc.* | | | 106,184 | |
| | 2,500 | | | Boot Barn Holdings, Inc.* | | | 89,100 | |
| | 2,695 | | | Cato Corp. (The) Class A | | | 33,202 | |
| | 10,103 | | | Citi Trends, Inc. | | | 147,706 | |
| | 6,530 | | | Conn’s, Inc.* | | | 116,365 | |
| | 1,825 | | | Container Store Group, Inc. (The)* | | | 13,359 | |
| | 10,203 | | | Core-Mark Holding Co., Inc. | | | 405,263 | |
| | 2,995 | | | Genesco, Inc.* | | | 126,659 | |
| | 6,548 | | | Group 1 Automotive, Inc. | | | 536,216 | |
| | 11,649 | | | Groupon, Inc.* | | | 41,703 | |
| | 4,984 | | | Hudson Ltd. Class A* | | | 68,729 | |
| | 9,224 | | | Liberty Expedia Holdings, Inc. Class A* | | | 440,815 | |
| | 6,933 | | | Monro, Inc. | | | 591,385 | |
| | 6,922 | | | Murphy USA, Inc.* | | | 581,656 | |
| | 12,532 | | | Office Depot, Inc. | | | 25,816 | |
| | 1,736 | | | PetMed Express, Inc. | | | 27,203 | |
| | 6,516 | | | Rent-A-Center, Inc.* | | | 173,521 | |
| | 8,664 | | | Sally Beauty Holdings, Inc.* | | | 115,578 | |
| | 3,493 | | | Shutterstock, Inc. | | | 136,891 | |
| | 3,310 | | | Sleep Number Corp.* | | | 133,691 | |
| | 3,168 | | | Sonic Automotive, Inc. Class A | | | 73,973 | |
| | 1,488 | | | Stitch Fix, Inc. Class A* | | | 47,601 | |
| | 11,120 | | | Tilly’s, Inc. Class A | | | 84,846 | |
| | | | | | | | |
| | | | | | | 5,003,417 | |
| | |
| Semiconductors & Semiconductor Equipment – 2.8% | | | |
| | 2,004 | | | Ambarella, Inc.* | | | 88,437 | |
| | 5,494 | | | Amkor Technology, Inc.* | | | 40,985 | |
| | 5,169 | | | Cirrus Logic, Inc.* | | | 225,885 | |
| | 13,230 | | | Diodes, Inc.* | | | 481,175 | |
| | 13,368 | | | Inphi Corp.* | | | 669,737 | |
| | 2,824 | | | Lattice Semiconductor Corp.* | | | 41,202 | |
| | 7,692 | | | MaxLinear, Inc. Class A* | | | 180,301 | |
| | 28,849 | | | Rambus, Inc.* | | | 347,342 | |
| | 6,867 | | | Semtech Corp.* | | | 329,959 | |
| | 8,010 | | | Xperi Corp. | | | 164,926 | |
| | | | | | | | |
| | | | | | | 2,569,949 | |
| | |
| | |
| 10 | | The accompanying notes are an integral part of these financial statements. |
GOLDMAN SACHS VARIABLE INSURANCE TRUST SMALL CAP EQUITY INSIGHTS FUND
| | | | | | | | |
| Shares | | | Description | | Value | |
|
| Common Stocks – (continued) | |
| Software & Services – 4.2% | | | |
| | 819 | | | ACI Worldwide, Inc.* | | $ | 28,124 | |
| | 4,566 | | | Avaya Holdings Corp.* | | | 54,381 | |
| | 12,451 | | | Bottomline Technologies DE, Inc.* | | | 550,832 | |
| | 15,914 | | | Box, Inc. Class A* | | | 280,246 | |
| | 1,482 | | | Cardtronics plc Class A* | | | 40,488 | |
| | 2,007 | | | CommVault Systems, Inc.* | | | 99,587 | |
| | 8,201 | | | Conduent, Inc.* | | | 78,648 | |
| | 11,374 | | | Cornerstone OnDemand, Inc.* | | | 658,896 | |
| | 1,610 | | | Everbridge, Inc.* | | | 143,966 | |
| | 764 | | | Five9, Inc.* | | | 39,186 | |
| | 503 | | | I3 Verticals, Inc. Class A* | | | 14,813 | |
| | 1,072 | | | KBR, Inc. | | | 26,736 | |
| | 128 | | | MicroStrategy, Inc. Class A* | | | 18,344 | |
| | 1,386 | | | Mitek Systems, Inc.* | | | 13,777 | |
| | 6,597 | | | MobileIron, Inc.* | | | 40,901 | |
| | 841 | | | Paysign, Inc.* | | | 11,244 | |
| | 25,320 | | | Perspecta, Inc. | | | 592,741 | |
| | 1,424 | | | Presidio, Inc. | | | 19,466 | |
| | 9,729 | | | Progress Software Corp. | | | 424,379 | |
| | 328 | | | PROS Holdings, Inc.* | | | 20,749 | |
| | 786 | | | SPS Commerce, Inc.* | | | 80,337 | |
| | 8,143 | | | SVMK, Inc.* | | | 134,441 | |
| | 6,800 | | | Sykes Enterprises, Inc.* | | | 186,728 | |
| | 651 | | | Upland Software, Inc.* | | | 29,640 | |
| | 1,303 | | | Varonis Systems, Inc.* | | | 80,708 | |
| | 3,550 | | | Workiva, Inc.* | | | 206,220 | |
| | 2,526 | | | Zuora, Inc. Class A* | | | 38,698 | |
| | | | | | | | |
| | | | | | | 3,914,276 | |
| | |
| Technology Hardware & Equipment – 4.4% | | | |
| | 8,167 | | | Acacia Communications, Inc.* | | | 385,156 | |
| | 3,669 | | | AVX Corp. | | | 60,905 | |
| | 7,846 | | | Belden, Inc. | | | 467,386 | |
| | 1,128 | | | Benchmark Electronics, Inc. | | | 28,335 | |
| | 821 | | | Comtech Telecommunications Corp. | | | 23,078 | |
| | 1,085 | | | CTS Corp. | | | 29,924 | |
| | 1,639 | | | ePlus, Inc.* | | | 112,993 | |
| | 18,170 | | | Extreme Networks, Inc.* | | | 117,560 | |
| | 7,799 | | | Fabrinet* | | | 387,376 | |
| | 5,474 | | | Fitbit, Inc. Class A* | | | 24,086 | |
| | 8,005 | | | Harmonic, Inc.* | | | 44,428 | |
| | 10,034 | | | Insight Enterprises, Inc.* | | | 583,979 | |
| | 1,413 | | | Itron, Inc.* | | | 88,411 | |
| | 2,413 | | | Knowles Corp.* | | | 44,182 | |
| | 3,850 | | | NetScout Systems, Inc.* | | | 97,752 | |
| | 2,595 | | | Novanta, Inc.* | | | 244,709 | |
| | 1,909 | | | OSI Systems, Inc.* | | | 215,011 | |
| | 5,653 | | | PC Connection, Inc. | | | 197,742 | |
| | 138 | | | Rogers Corp.* | | | 23,816 | |
| | 590 | | | Sanmina Corp.* | | | 17,865 | |
| | 937 | | | Tech Data Corp.* | | | 98,010 | |
| | 2,376 | | | Viavi Solutions, Inc.* | | | 31,577 | |
| | 26,871 | | | Vishay Intertechnology, Inc. | | | 443,909 | |
| | 7,269 | | | Vishay Precision Group, Inc.* | | | 295,339 | |
| | | | | | | | |
| | | | | | | 4,063,529 | |
| | |
|
| Common Stocks – (continued) | |
| Telecommunication Services – 1.3% | | | |
| | 11,801 | | | Cogent Communications Holdings, Inc. | | | 700,508 | |
| | 6,541 | | | Iridium Communications, Inc.* | | | 152,144 | |
| | 3,838 | | | Ooma, Inc.* | | | 40,222 | |
| | 8,872 | | | ORBCOMM, Inc.* | | | 64,322 | |
| | 2,164 | | | Shenandoah Telecommunications Co. | | | 83,357 | |
| | 8,105 | | | Spok Holdings, Inc. | | | 121,899 | |
| | 6,531 | | | Vonage Holdings Corp.* | | | 73,996 | |
| | | | | | | | |
| | | | | | | 1,236,448 | |
| | |
| Transportation – 1.0% | | | |
| | 735 | | | Atlas Air Worldwide Holdings, Inc.* | | | 32,811 | |
| | 3,433 | | | Avis Budget Group, Inc.* | | | 120,704 | |
| | 2,989 | | | Covenant Transportation Group, Inc. Class A* | | | 43,968 | |
| | 13,555 | | | Echo Global Logistics, Inc.* | | | 282,893 | |
| | 7,587 | | | Heartland Express, Inc. | | | 137,097 | |
| | 10,552 | | | Marten Transport Ltd. | | | 191,519 | |
| | 2,676 | | | SkyWest, Inc. | | | 162,353 | |
| | | | | | | | |
| | | | | | | 971,345 | |
| | |
| Utilities – 2.6% | | | |
| | 7,191 | | | Avista Corp. | | | 320,718 | |
| | 1,421 | | | El Paso Electric Co. | | | 92,933 | |
| | 730 | | | Northwest Natural Holding Co. | | | 50,735 | |
| | 6,935 | | | NorthWestern Corp. | | | 500,360 | |
| | 5,900 | | | Pattern Energy Group, Inc. Class A | | | 136,231 | |
| | 14,935 | | | Portland General Electric Co.(b) | | | 809,029 | |
| | 572 | | | Southwest Gas Holdings, Inc. | | | 51,263 | |
| | 7,012 | | | Unitil Corp. | | | 419,949 | |
| | 962 | | | York Water Co. (The) | | | 34,363 | |
| | | | | | | | |
| | | | | | | 2,415,581 | |
| | |
| TOTAL INVESTMENTS BEFORE SECURITIES LENDING
REINVESTMENT VEHICLE |
|
| | (Cost $85,436,757) | | $ | 91,047,846 | |
| | |
| | | | | | | | |
| Shares | | | Dividend Rate | | Value | |
|
| Securities Lending Reinvestment Vehicle(c) – 0.8% | |
| Goldman Sachs Financial Square Government Fund —
Institutional Shares |
|
| | 716,500 | | | 2.308% | | $ | 716,500 | |
| | (Cost $716,500) | |
| | |
| | TOTAL INVESTMENTS – 98.6% | | | | |
| | (Cost $86,153,257) | | $ | 91,764,346 | |
| | |
| OTHER ASSETS IN EXCESS
OF LIABILITIES – 1.4% | | | 1,338,932 | |
| | |
| | NET ASSETS – 100.0% | | $ | 93,103,278 | |
| | |
| | |
| The accompanying notes are an integral part of these financial statements. | | 11 |
GOLDMAN SACHS VARIABLE INSURANCE TRUST SMALL CAP EQUITY INSIGHTS FUND
Schedule of Investments(continued)
June 30, 2019 (Unaudited)
| | |
| The percentage shown for each investment category reflects the value of investments in that category as a percentage of net assets. |
| |
| * | | Non-income producing security. |
| |
| (a) | | All or a portion of security is on loan. |
| |
| (b) | | All or a portion of security is segregated as collateral for initial margin requirements on futures transactions. |
| |
| (c) | | Represents an Affiliated Issuer. |
| | |
| |
| Investment Abbreviation: |
| REIT | | —Real Estate Investment Trust |
ADDITIONAL INVESTMENT INFORMATION
FUTURES CONTRACTS — At June 30, 2019, the Fund had the following futures contracts:
| | | | | | | | | | | | | | | | |
| Description | | Number of
Contracts | | | Expiration
Date | | | Notional
Amount | | | Unrealized
Appreciation/
(Depreciation) | |
| | | | |
Long position contracts: | | | | | | | | | | | | | | | | |
| Russell 2000E-Mini Index | | | 9 | | | | 09/20/2019 | | | $ | 705,195 | | | $ | 17,350 | |
| | |
| 12 | | The accompanying notes are an integral part of these financial statements. |
GOLDMAN SACHS VARIABLE INSURANCE TRUST SMALL CAP EQUITY INSIGHTS FUND
Statement of Assets and Liabilities
June 30, 2019 (Unaudited)
| | | | |
| | | | |
| Assets: | | | |
Investments in unaffiliated issuers, at value (cost $85,436,757)(a) | | $ | 91,047,846 | |
Investments in affiliated securities lending reinvestment vehicle, at value (cost $716,500) | | | 716,500 | |
Cash | | | 854,145 | |
Receivables: | | | | |
Investments sold | | | 12,094,032 | |
Dividends | | | 73,924 | |
Reimbursement from investment adviser | | | 14,140 | |
Fund shares sold | | | 4,538 | |
Securities lending income | | | 1,310 | |
| Variation margin on futures | | | 7,785 | |
Other assets | | | 366 | |
| |
| Total assets | | | 104,814,586 | |
| | | | |
| | | | |
| Liabilities: | | | |
Payables: | | | | |
Investments purchased | | | 10,663,883 | |
Payable upon return of securities loaned | | | 716,500 | |
Fund shares redeemed | | | 192,833 | |
Management fees | | | 52,586 | |
Distribution and Service fees and Transfer Agency fees | | | 5,126 | |
Accrued expenses | | | 80,380 | |
| |
| Total liabilities | | | 11,711,308 | |
| | | | |
| | | | |
| Net Assets: | | | |
Paid-in capital | | | 86,638,002 | |
Total distributable earnings (loss) | | | 6,465,276 | |
| |
| NET ASSETS | | $ | 93,103,278 | |
Net Assets: | | | | |
Institutional | | $ | 75,502,804 | |
Service | | | 17,600,474 | |
| |
Total Net Assets | | $ | 93,103,278 | |
Shares outstanding $0.001 par value (unlimited shares authorized): | | | | |
Institutional | | | 6,260,353 | |
Service | | | 1,473,584 | |
Net asset value, offering and redemption price per share: | | | | |
Institutional | | | $12.06 | |
Service | | | 11.94 | |
(a) Includes loaned securities having a market value of $685,657.
| | |
| The accompanying notes are an integral part of these financial statements. | | 13 |
GOLDMAN SACHS VARIABLE INSURANCE TRUST SMALL CAP EQUITY INSIGHTS FUND
Statement of Operations
For the Six Months Ended June 30, 2019 (Unaudited)
| | | | |
| | | | |
| Investment income: | | | |
Dividends — unaffiliated issuers | | $ | 679,706 | |
Securities lending income — affiliated issuer | | | 10,699 | |
Dividends — affiliated issuers | | | 1,095 | |
| |
| Total investment income | | | 691,500 | |
| | | | |
| | | | |
| Expenses: | | | |
Management fees | | | 326,627 | |
Professional fees | | | 46,106 | |
Custody, accounting and administrative services | | | 45,281 | |
Printing and mailing costs | | | 24,104 | |
Distribution and Service fees — Service Shares | | | 22,466 | |
Transfer Agency fees(a) | | | 9,331 | |
Trustee fees | | | 8,012 | |
Registration fees | | | 635 | |
Other | | | 5,083 | |
| |
| Total expenses | | | 487,645 | |
| |
Less — expense reductions | | | (86,699 | ) |
| |
| Net expenses | | | 400,946 | |
| |
| NET INVESTMENT INCOME | | | 290,554 | |
| | | | |
| | | | |
| Realized and unrealized gain: | | | |
Net realized gain from: | | | | |
Investments — unaffiliated issuers | | | 409,190 | |
Futures contracts | | | 33,489 | |
Net change in unrealized gain on: | | | | |
Investments — unaffiliated issuers | | | 12,926,460 | |
Futures contracts | | | 17,350 | |
| |
| Net realized and unrealized gain | | | 13,386,489 | |
| |
| NET INCREASE IN NET ASSETS RESULTING FROM OPERATIONS | | $ | 13,677,043 | |
(a) Institutional and Service Shares incurred Transfer Agency fees of $7,534 and $1,797, respectively.
| | |
| 14 | | The accompanying notes are an integral part of these financial statements. |
GOLDMAN SACHS VARIABLE INSURANCE TRUST SMALL CAP EQUITY INSIGHTS FUND
Statements of Changes in Net Assets
| | | | | | | | |
| | | For the
Six Months Ended
June 30, 2019
(Unaudited) | | | For the
Fiscal Year Ended
December 31, 2018 | |
| | | | | | | | |
| From operations: | | | | | | |
Net investment income | | $ | 290,554 | | | $ | 408,340 | |
Net realized gain | | | 442,679 | | | | 12,769,646 | |
Net change in unrealized gain (loss) | | | 12,943,810 | | | | (20,846,496 | ) |
| | |
| Net increase (decrease) in net assets resulting from operations | | | 13,677,043 | | | | (7,668,510 | ) |
| | | | | | | | |
| | | | | | | | |
| Distributions to shareholders: | | | | | | |
From distributable earnings: | | | | | | | | |
Institutional Shares | | | — | | | | (11,874,335 | ) |
Service Shares | | | — | | | | (2,807,539 | ) |
| | |
| Total distributions to shareholders | | | — | | | | (14,681,874 | ) |
| | | | | | | | |
| | | | | | | | |
| From share transactions: | | | | | | |
Proceeds from sales of shares | | | 2,959,747 | | | | 12,578,607 | |
Reinvestment of distributions | | | — | | | | 14,681,874 | |
Cost of shares redeemed | | | (9,021,224 | ) | | | (17,743,096 | ) |
| | |
| Net increase (decrease) in net assets resulting from share transactions | | | (6,061,477 | ) | | | 9,517,385 | |
| | |
| TOTAL INCREASE (DECREASE) | | | 7,615,566 | | | | (12,832,999 | ) |
| | | | | | | | |
| | | | | | | | |
| Net assets: | | | | | | |
| | |
Beginning of period | | | 85,487,712 | | | | 98,320,711 | |
| | |
End of period | | $ | 93,103,278 | | | $ | 85,487,712 | |
| | |
| The accompanying notes are an integral part of these financial statements. | | 15 |
GOLDMAN SACHS VARIABLE INSURANCE TRUST SMALL CAP EQUITY INSIGHTS FUND
Financial Highlights
Selected Data for a Share Outstanding Throughout Each Period
| | | | | | | | | | | | | | | | | | | | | | | | |
| | | Goldman Sachs Small Cap Equity Insights Fund | |
| | | Institutional Shares | |
| | | Six Months Ended
June 30, 2019
(Unaudited) | | | Year Ended December 31, | |
| | | 2018 | | | 2017 | | | 2016 | | | 2015 | | | 2014 | |
| | | | | | | | | | | | | | | | | | | | | | | | |
| Per Share Data | | | | | | | | | | | | | | | | | | |
| | | | | | |
Net asset value, beginning of period | | $ | 10.37 | | | $ | 13.66 | | | $ | 13.79 | | | $ | 11.60 | | | $ | 13.67 | | | $ | 15.07 | |
| | | | | | |
Net investment income(a) | | | 0.04 | | | | 0.07 | (b) | | | 0.08 | | | | 0.11 | | | | 0.08 | (c) | | | 0.08 | |
| | | | | | |
Net realized and unrealized gain (loss) | | | 1.65 | | | | (1.21 | ) | | | 1.53 | | | | 2.59 | | | | (0.37 | ) | | | 0.90 | |
| | | | | | |
Total from investment operations | | | 1.69 | | | | (1.14 | ) | | | 1.61 | | | | 2.70 | | | | (0.29 | ) | | | 0.98 | |
| | | | | | |
Distributions to shareholders from net investment income | | | — | | | | (0.07 | ) | | | (0.08 | ) | | | (0.15 | ) | | | (0.04 | ) | | | (0.12 | ) |
| | | | | | |
Distributions to shareholders from net realized gains | | | — | | | | (2.08 | ) | | | (1.66 | ) | | | (0.36 | ) | | | (1.74 | ) | | | (2.26 | ) |
| | | | | | |
Total distributions | | | — | | | | (2.15 | ) | | | (1.74 | ) | | | (0.51 | ) | | | (1.78 | ) | | | (2.38 | ) |
| | | | | | |
Net asset value, end of period | | $ | 12.06 | | | $ | 10.37 | | | $ | 13.66 | | | $ | 13.79 | | | $ | 11.60 | | | $ | 13.67 | |
| | | | | | |
Total return(d) | | | 16.30 | % | | | (8.62 | )% | | | 11.57 | % | | | 23.13 | % | | | (2.13 | )% | | | 6.93 | % |
| | | | | | |
Net assets, end of period (in 000s) | | $ | 75,503 | | | $ | 68,951 | | | $ | 77,815 | | | $ | 77,421 | | | $ | 73,270 | | | $ | 89,043 | |
| | | | | | |
Ratio of net expenses to average net assets | | | 0.81 | %(e) | | | 0.81 | % | | | 0.81 | % | | | 0.81 | % | | | 0.81 | % | | | 0.83 | % |
| | | | | | |
Ratio of total expenses to average net assets | | | 1.00 | %(e) | | | 0.98 | % | | | 1.00 | % | | | 1.04 | % | | | 0.99 | % | | | 1.04 | % |
| | | | | | |
Ratio of net investment income to average net assets | | | 0.67 | %(e) | | | 0.46 | %(b) | | | 0.53 | % | | | 0.95 | % | | | 0.59 | %(c) | | | 0.53 | % |
| | | | | | |
Portfolio turnover rate(f) | | | 60 | % | | | 116 | % | | | 110 | % | | | 119 | % | | | 124 | % | | | 119 | % |
| (a) | Calculated based on the average shares outstanding methodology. |
| (b) | Reflects income recognized from special dividends which amounted to $0.02 per share and 0.17% of average net assets. |
| (c) | Reflects income recognized from special dividends which amounted to $0.02 per share and 0.15% of average net assets. |
| (d) | Assumes investment at the net asset value at the beginning of the period, reinvestment of all distributions, a complete redemption of the investment at the net asset value at the end of the period and no sales or redemption charges (if any). Total returns would be reduced if a sales or redemption charge was taken into account. Returns do not reflect the impact of taxes to shareholders relating to Fund distributions or the redemption of Fund shares. Total returns for periods less than one full year are not annualized. |
| (f) | The Fund’s portfolio turnover rate is calculated in accordance with regulatory requirements, without regard to transactions involving short term investments and certain derivatives. If such transactions were included, the Fund’s portfolio turnover rate may be higher. |
| | |
| 16 | | The accompanying notes are an integral part of these financial statements. |
GOLDMAN SACHS VARIABLE INSURANCE TRUST SMALL CAP EQUITY INSIGHTS FUND
| | | | | | | | | | | | | | | | | | | | | | | | |
| | | Goldman Sachs Small Cap Equity Insights Fund | |
| | | Service Shares | |
| | | Six Months Ended
June 30, 2019
(Unaudited) | | | Year Ended December 31, | |
| | | 2018 | | | 2017 | | | 2016 | | | 2015 | | | 2014 | |
| | | | | | | | | | | | | | | | | | | | | | | | |
| Per Share Data | | | | | | | | | | | | | | | | | | |
| | | | | | |
Net asset value, beginning of period | | $ | 10.28 | | | $ | 13.55 | | | $ | 13.70 | | | $ | 11.52 | | | $ | 13.60 | | | $ | 15.00 | |
| | | | | | |
Net investment income(a) | | | 0.02 | | | | 0.03 | (b) | | | 0.04 | | | | 0.08 | | | | 0.05 | (c) | | | 0.04 | |
| | | | | | |
Net realized and unrealized gain (loss) | | | 1.64 | | | | (1.19 | ) | | | 1.51 | | | | 2.58 | | | | (0.39 | ) | | | 0.90 | |
| | | | | | |
Total from investment operations | | | 1.66 | | | | (1.16 | ) | | | 1.55 | | | | 2.66 | | | | (0.34 | ) | | | 0.94 | |
| | | | | | |
Distributions to shareholders from net investment income | | | — | | | | (0.03 | ) | | | (0.04 | ) | | | (0.12 | ) | | | — | (d) | | | (0.08 | ) |
| | | | | | |
Distributions to shareholders from net realized gains | | | — | | | | (2.08 | ) | | | (1.66 | ) | | | (0.36 | ) | | | (1.74 | ) | | | (2.26 | ) |
| | | | | | |
Total distributions | | | — | | | | (2.11 | ) | | | (1.70 | ) | | | (0.48 | ) | | | (1.74 | ) | | | (2.34 | ) |
| | | | | | |
Net asset value, end of period | | $ | 11.94 | | | $ | 10.28 | | | $ | 13.55 | | | $ | 13.70 | | | $ | 11.52 | | | $ | 13.60 | |
| | | | | | |
Total return(e) | | | 16.15 | % | | | (8.82 | )% | | | 11.22 | % | | | 22.92 | % | | | (2.49 | )% | | | 6.69 | % |
| | | | | | |
Net assets, end of period (in 000s) | | $ | 17,600 | | | $ | 16,537 | | | $ | 20,505 | | | $ | 20,437 | | | $ | 19,488 | | | $ | 23,744 | |
| | | | | | |
Ratio of net expenses to average net assets | | | 1.06 | %(f) | | | 1.06 | % | | | 1.06 | % | | | 1.06 | % | | | 1.06 | % | | | 1.08 | % |
| | | | | | |
Ratio of total expenses to average net assets | | | 1.25 | %(f) | | | 1.23 | % | | | 1.25 | % | | | 1.29 | % | | | 1.24 | % | | | 1.29 | % |
| | | | | | |
Ratio of net investment income to average net assets | | | 0.42 | %(f) | | | 0.19 | %(b) | | | 0.28 | % | | | 0.70 | % | | | 0.34 | %(c) | | | 0.28 | % |
| | | | | | |
Portfolio turnover rate(g) | | | 60 | % | | | 116 | % | | | 110 | % | | | 119 | % | | | 124 | % | | | 119 | % |
| (a) | Calculated based on the average shares outstanding methodology. |
| (b) | Reflects income recognized from special dividends which amounted to $0.02 per share and 0.17% of average net assets. |
| (c) | Reflects income recognized from special dividends which amounted to $0.02 per share and 0.15% of average net assets. |
| (d) | Amount is less than $0.005 per share. |
| (e) | Assumes investment at the net asset value at the beginning of the period, reinvestment of all distributions, a complete redemption of the investment at the net asset value at the end of the period and no sales or redemption charges (if any). Total returns would be reduced if a sales or redemption charge was taken into account. Returns do not reflect the impact of taxes to shareholders relating to Fund distributions or the redemption of Fund shares. Total returns for periods less than one full year are not annualized. |
| (g) | The Fund’s portfolio turnover rate is calculated in accordance with regulatory requirements, without regard to transactions involving short term investments and certain derivatives. If such transactions were included, the Fund’s portfolio turnover rate may be higher. |
| | |
| The accompanying notes are an integral part of these financial statements. | | 17 |
GOLDMAN SACHS VARIABLE INSURANCE TRUST SMALL CAP EQUITY INSIGHTS FUND
Notes to Financial Statements
June 30, 2019 (Unaudited)
1. ORGANIZATION
Goldman Sachs Variable Insurance Trust (the “Trust” or “VIT”) is a Delaware statutory trust registered under the Investment Company Act of 1940, as amended (the “Act”), as anopen-end management investment company. The Trust includes the Goldman Sachs Small Cap Equity Insights Fund (the “Fund”). The Fund is a diversified portfolio under the Act offering two classes of shares — Institutional and Service Shares. Shares of the Trust are offered to separate accounts of participating life insurance companies for the purpose of funding variable annuity contracts and variable life insurance policies.
Goldman Sachs Asset Management, L.P. (“GSAM”), an affiliate of Goldman Sachs & Co. LLC (“Goldman Sachs”), serves as investment adviser to the Fund pursuant to a management agreement (the “Agreement”) with the Trust.
2. SIGNIFICANT ACCOUNTING POLICIES
The financial statements have been prepared in accordance with accounting principles generally accepted in the United States of America (“GAAP”) and require management to make estimates and assumptions that may affect the reported amounts and disclosures. Actual results may differ from those estimates and assumptions.
A. Investment Valuation — The Fund’s valuation policy is to value investments at fair value.
B. Investment Income and Investments— Investment income includes interest income, dividend income, and securities lending income, if any. Interest income is accrued daily and adjusted for amortization of premiums and accretion of discounts. Dividend income is recognized onex-dividend date or, for certain foreign securities, as soon as such information is obtained subsequent to theex-dividend date. Investment transactions are reflected on trade date. Realized gains and losses are calculated using identified cost. Investment transactions are recorded on the following business day for daily net asset value (“NAV”) calculations. Investment income is recorded net of any foreign withholding taxes, less any amounts reclaimable. The Fund may file withholding tax reclaims in certain jurisdictions to recover a portion of amounts previously withheld. Any foreign capital gains tax is accrued daily based upon net unrealized gains, and is payable upon sale of such investments. Distributions received from the Fund’s investments in United States (“U.S.”) real estate investment trusts (“REITs”) may be characterized as ordinary income, net capital gain or a return of capital. A return of capital is recorded by the Fund as a reduction to the cost basis of the REIT.
For derivative contracts, realized gains and losses are recorded upon settlement of the contract.
C. Class Allocations and Expenses — Investment income, realized and unrealized gain (loss), if any, andnon-class specific expenses of the Fund are allocated daily based upon the proportion of net assets of each class.Non-class specific expenses directly incurred by the Fund are charged to the Fund, while such expenses incurred by the Trust are allocated across the Fund on a straight-line and/orpro-rata basis depending upon the nature of the expenses. Class-specific expenses, where applicable, are borne by the respective share classes and include Distribution and Service and Transfer Agency fees.
D. Federal Taxes and Distributions to Shareholders— It is the Fund’s policy to comply with the requirements of the Internal Revenue Code of 1986, as amended (the “Code”), applicable to regulated investment companies and to distribute each year substantially all of its investment company taxable income and capital gains to its shareholders. Accordingly, the Fund is not required to make any provisions for the payment of federal income tax. Distributions to shareholders are recorded on theex-dividend date. Income and capital gains distributions, if any, are declared and paid at least annually.
Net capital losses, if any, are carried forward to future fiscal years and may be used to the extent allowed by the Code to offset any future capital gains. Losses that are carried forward will retain their character as either short-term or long-term capital losses. Utilization of capital loss carryforwards will reduce the requirement of future capital gains distributions.
The characterization of distributions to shareholders for financial reporting purposes is determined in accordance with federal income tax rules, which may differ from GAAP. The source of the Fund’s distributions may be shown in the accompanying financial statements as either from distributable earnings or capital. Certain components of the Fund’s net assets on the Statement of Assets and Liabilities reflect permanent GAAP/tax differences based on the appropriate tax character.
18
GOLDMAN SACHS VARIABLE INSURANCE TRUST SMALL CAP EQUITY INSIGHTS FUND
3. INVESTMENTS AND FAIR VALUE MEASUREMENTS
U.S. GAAP defines the fair value of a financial instrument as the amount that would be received to sell an asset or paid to transfer a liability in an orderly transaction between market participants at the measurement date (i.e., the exit price); the Fund’s policy is to use the market approach. GAAP establishes a fair value hierarchy that prioritizes the inputs to valuation techniques used to measure fair value. The hierarchy gives the highest priority to unadjusted quoted prices in active markets for identical assets or liabilities (Level 1 measurements) and the lowest priority to unobservable inputs (Level 3 measurements). The levels used for classifying investments are not necessarily an indication of the risk associated with investing in these investments. The three levels of the fair value hierarchy are described below:
Level 1 — Unadjusted quoted prices in active markets that are accessible at the measurement date for identical, unrestricted assets or liabilities;
Level 2 — Quoted prices in markets that are not active or financial instruments for which significant inputs are observable (including, but not limited to, quoted prices for similar investments, interest rates, foreign exchange rates, volatility and credit spreads), either directly or indirectly;
Level 3 — Prices or valuations that require significant unobservable inputs (including GSAM’s assumptions in determining fair value measurement).
The Board of Trustees (“Trustees”) has approved Valuation Procedures that govern the valuation of the portfolio investments held by the Fund, including investments for which market quotations are not readily available. The Trustees have delegated to GSAMday-to-day responsibility for implementing and maintaining internal controls and procedures related to the valuation of the Fund’s investments. To assess the continuing appropriateness of pricing sources and methodologies, GSAM regularly performs price verification procedures and issues challenges as necessary to third party pricing vendors or brokers, and any differences are reviewed in accordance with the Valuation Procedures.
A. Level 1 and Level 2 Fair Value Investments— The valuation techniques and significant inputs used in determining the fair values for investments classified as Level 1 and Level 2 are as follows:
Equity Securities— Equity securities traded on a U.S. securities exchange or the NASDAQ system, or those located on certain foreign exchanges, including but not limited to the Americas, are valued daily at their last sale price or official closing price on the principal exchange or system on which they are traded. If there is no sale or official closing price or such price is believed by GSAM to not represent fair value, equity securities are valued at the last bid price for long positions and at the last ask price for short positions. To the extent these investments are actively traded, they are classified as Level 1 of the fair value hierarchy, otherwise they are generally classified as Level 2.
Unlisted equity securities for which market quotations are available are valued at the last sale price on the valuation date, or if no sale occurs, at the last bid price, and are generally classified as Level 2.
Money Market Funds— Investments in the Goldman Sachs Financial Square Government Fund (“Underlying Fund”) are valued at the NAV of the Institutional Share class on the day of valuation. These investments are generally classified as Level 1 of the fair value hierarchy. For information regarding the Underlying Fund’s accounting policies and investment holdings, please see the Underlying Fund’s shareholder report.
Derivative Contracts— A derivative is an instrument whose value is derived from underlying assets, indices, reference rates or a combination of these factors. The Fund enters into derivative transactions to hedge against changes in interest rates, securities prices, and/or currency exchange rates, to increase total return, or to gain access to certain markets or attain exposure to other underliers. For financial reporting purposes, cash collateral that has been pledged to cover obligations of a Fund and cash collateral received, if any, is reported separately on the Statement of Assets and Liabilities as receivables/payables for collateral on certain derivatives contracts.Non-cash collateral pledged by the Fund, if any, is noted in the Schedule of Investments.
Exchange-traded derivatives, including futures and options contracts, are generally valued at the last sale or settlement price on the exchange where they are principally traded. Exchange-traded options without settlement prices are generally valued at the midpoint of the bid and ask prices on the exchange where they are principally traded (or, in the absence oftwo-way trading, at the
19
GOLDMAN SACHS VARIABLE INSURANCE TRUST SMALL CAP EQUITY INSIGHTS FUND
Notes to Financial Statements(continued)
June 30, 2019 (Unaudited)
3. INVESTMENTS AND FAIR VALUE MEASUREMENTS (continued)
last bid price for long positions and the last ask price for short positions). Exchange-traded derivatives typically fall within Level 1 of the fair value hierarchy.Over-the-counter (“OTC”) and centrally cleared derivatives are valued using market transactions and other market evidence, including market-based inputs to models, calibration to market-clearing transactions, broker or dealer quotations, or other alternative pricing sources. Where models are used, the selection of a particular model to value OTC and centrally cleared derivatives depends upon the contractual terms of, and specific risks inherent in, the instrument, as well as the availability of pricing information in the market. Valuation models require a variety of inputs, including contractual terms, market prices, yield curves, credit curves, measures of volatility, voluntary and involuntary prepayment rates, loss severity rates and correlations of such inputs. For OTC and centrally cleared derivatives that trade in liquid markets, model inputs can generally be verified and model selection does not involve significant management judgment. OTC and centrally cleared derivatives are classified within Level 2 of the fair value hierarchy when significant inputs are corroborated by market evidence.
i. Futures Contracts— Futures contracts are contracts to buy or sell a standardized quantity of a specified commodity or security. Upon entering into a futures contract, the Fund deposits cash or securities in an account on behalf of the broker in an amount sufficient to meet the initial margin requirement. Subsequent payments are made or received by the Fund equal to the daily change in the contract value and are recorded as variation margin receivable or payable with a corresponding offset to unrealized gains or losses.
B.�� Level 3 Fair Value Investments— To the extent that significant inputs to valuation models and other alternative pricing sources are unobservable, or if quotations are not readily available, or if GSAM believes that such quotations do not accurately reflect fair value, the fair value of the Fund’s investments may be determined under Valuation Procedures approved by the Trustees. GSAM, consistent with its procedures and applicable regulatory guidance, may make an adjustment to the most recent valuation prices of either domestic or foreign securities in light of significant events to reflect what it believes to be the fair value of the securities at the time of determining the Fund’s NAV. To the extent investments are valued using single source broker quotations obtained directly from the broker or passed through from third party pricing vendors, such investments are classified as Level 3 investments. GSAM did not develop the unobservable inputs for valuation of Level 3 Assets and Liabilities.
C. Fair Value Hierarchy— The following is a summary of the Fund’s investments and derivatives classified in the fair value hierarchy as of June 30, 2019:
| | | | | | | | | | | | |
| Investment Type | | Level 1 | | | Level 2 | | | Level 3 | |
| | | |
| Assets | | | | | | | | | | | | |
| Common Stock and/or Other Equity Investments(a) | | | | | | | | | | | | |
Asia | | $ | 387,376 | | | $ | — | | | $ | — | |
Europe | | | 425,653 | | | | — | | | | — | |
North America | | | 90,207,421 | | | | — | | | | — | |
South America | | | 27,396 | | | | | | | | | |
| Securities Lending Reinvestment Vehicle | | | 716,500 | | | | — | | | | — | |
| | | |
| Total | | $ | 91,764,346 | | | $ | — | | | $ | — | |
| | | |
| Derivative Type | | | | | | | | | |
| | | |
| Assets(b) | | | | | | | | | | | | |
| Futures Contracts | | $ | 17,350 | | | $ | — | | | $ | — | |
| (a) | Amounts are disclosed by continent to highlight the impact of time zone differences between local market close and the calculation of net asset value. Security valuations are based on the principal exchange or system on which they are traded, which may differ from country of domicile. |
| (b) | Amount shown represents unrealized gain (loss) at period end. |
For further information regarding security characteristics, see the Schedule of Investments.
20
GOLDMAN SACHS VARIABLE INSURANCE TRUST SMALL CAP EQUITY INSIGHTS FUND
4. INVESTMENTS IN DERIVATIVES
The following table sets forth, by certain risk types, the gross value of derivative contracts (not considered to be hedging instruments for accounting disclosure purposes) as of June 30, 2019. These instruments were used as part of the Fund’s investment strategies and to obtain and/or manage exposure related to the risks below. The values in the table below exclude the effects of cash collateral received or posted pursuant to these derivative contracts, and therefore are not representative of the Fund’s net exposure.
| | | | | | | | | | | | | | |
| Risk | | | | Statement of Assets and Liabilities | | Assets(a) | | | Statement of Assets and Liabilities | | Liabilities | |
| | | | | |
| Equity | | | | Variation margin on futures contracts | | $ | 17,350 | | | — | | $ | — | |
| (a) | Includes unrealized gain (loss) on futures contracts described in the Additional Investment Information section of the Schedule of Investments. Only the variation margin as of June 30, 2019 is reported within the Statement of Assets and Liabilities. |
The following table sets forth, by certain risk types, the Fund’s gains (losses) related to these derivatives and their indicative volumes for the six months ended June 30, 2019. These gains (losses) should be considered in the context that these derivative contracts may have been executed to create investment opportunities and/or economically hedge certain investments, and accordingly, certain gains (losses) on such derivative contracts may offset certain (losses) gains attributable to investments. These gains (losses) are included in “Net realized gain (loss)” or “Net change in unrealized gain (loss)” on the Statement of Operations:
| | | | | | | | | | | | | | |
| Risk | | Statement of Operations | | Net
Realized
Gain (Loss) | | | Net Change in
Unrealized
Gain (Loss) | | | Average
Number of
Contracts(a) | |
| | | | |
| Equity | | Net realized gain (loss) from futures contracts/Net change in unrealized gain (loss) on futures contracts | | $ | 33,489 | | | $ | 17,350 | | | | 2 | |
| (a) | Average number of contracts is based on the average of month end balances for the six months ended June 30, 2019. |
5. AGREEMENTS AND AFFILIATED TRANSACTIONS
A. Management Agreement— Under the Agreement, GSAM manages the Fund, subject to the general supervision of the Trustees.
As compensation for the services rendered pursuant to the Agreement, the assumption of the expenses related thereto and administration of the Fund’s business affairs, including providing facilities, GSAM is entitled to a management fee, accrued daily and paid monthly, equal to an annual percentage rate of the Fund’s average daily net assets.
For the six months ended June 30, 2019, contractual and effective net management fees with GSAM were at the following rates:
| | | | | | | | | | | | | | | | | | | | | | |
| Contractual Management Rate | | | | | | | |
First
$2 billion | | | Next
$3 billion | | | Next
$3 billion | | | Over
$8 billion | | | Effective
Rate | | | Effective Net
Management
Rate^ | |
| | | | | |
| | 0.70% | | | | 0.63 | % | | | 0.60 | % | | | 0.59 | % | | | 0.70 | % | | | 0.70 | % |
| ^ | Effective Net Management Rate includes the impact of management fee waivers of affiliated Underlying Funds, if any. |
The Fund invests in Institutional Shares of the Goldman Sachs Financial Square Government Fund, which is an affiliated Underlying Fund. GSAM has agreed to waive a portion of its management fee payable by the Fund in an amount equal to the management fee it earns as an investment adviser to the affiliated Underlying Fund in which the Fund invests, except those management fees it earns from the Fund’s investments of cash collateral received in connection with securities lending transactions
21
GOLDMAN SACHS VARIABLE INSURANCE TRUST SMALL CAP EQUITY INSIGHTS FUND
Notes to Financial Statements(continued)
June 30, 2019 (Unaudited)
5. AGREEMENTS AND AFFILIATED TRANSACTIONS (continued)
in the Goldman Sachs Financial Square Government Fund. For the six months ended June 30, 2019, GSAM waived $76 of the Fund’s management fee.
B. Distribution and Service(12b-1) Plan— The Trust, on behalf of Service Shares of the Fund, has adopted a Distribution and Service Plan subject to Rule12b-1 under the Act. Under the Distribution and Service Plan, Goldman Sachs, which serves as distributor, is entitled to a fee accrued daily and paid monthly, for distribution services and personal and account maintenance services, which may then be paid by Goldman Sachs to authorized dealers, equal to, on an annual basis, 0.25% of the Fund’s average daily net assets attributable to Service Shares.
C. Transfer Agency Agreement— Goldman Sachs also serves as the transfer agent of the Fund for a fee pursuant to the Transfer Agency Agreement. The fees charged for such transfer agency services are accrued daily and paid monthly at an annual rate of 0.02% of the average daily net assets of Institutional and Service Shares.
D. Other Expense Agreements and Affiliated Transactions— GSAM has agreed to reduce or limit certain “Other Expenses” of the Fund (excluding acquired fund fees and expenses, transfer agency fees and expenses, service fees and shareholder administration fees (as applicable), taxes, interest, brokerage fees, expenses of shareholder meetings, litigation and indemnification, and extraordinary expenses) to the extent such expenses exceed, on an annual basis, a percentage rate of the average daily net assets of the Fund. Such Other Expense reimbursements, if any, are accrued daily and paid monthly. In addition, the Fund is not obligated to reimburse GSAM for prior fiscal year expense reimbursements, if any. The Other Expense limitation as an annual percentage rate of average daily net assets for the Fund is 0.094%. The Other Expense limitation will remain in place through at least April 30, 2020, and prior to such date GSAM may not terminate the arrangement without the approval of the Trustees. In addition, the Fund has entered into certain offset arrangements with the custodian and the transfer agent, which may result in a reduction of the Fund’s expenses and are received irrespective of the application of the “Other Expense” limitation described above.
For the six months ended June 30, 2019, these expense reductions, including any fee waivers and Other Expense reimbursements, were as follows:
| | | | | | | | | | | | | | |
Management
Fee Waiver | | | Custody Fee
Credits | | | Other Expense
Reimbursement | | | Total Expense
Reductions | |
| | | |
| | $76 | | | $ | 1,299 | | | $ | 85,324 | | | $ | 86,699 | |
E. Line of Credit Facility— As of June 30, 2019, the Fund participated in a $580,000,000 committed, unsecured revolving line of credit facility (the “facility”) together with other funds of the Trust and certain registered investment companies having management agreements with GSAM or its affiliates. This facility is to be used for temporary emergency purposes, or to allow for an orderly liquidation of securities to meet redemption requests. The interest rate on borrowings is based on the federal funds rate. The facility also requires a fee to be paid by the Fund based on the amount of the commitment that has not been utilized. For the six months ended June 30, 2019, the Fund did not have any borrowings under the facility. Prior to April 30, 2019 the facility was $770,000,000.
F. Other Transactions with Affiliates — The following table provides information about the Fund’s investments in the Goldman Sachs Financial Square Government Fund as of and for the six months ended June 30, 2019:
| | | | | | | | | | | | | | | | | | | | | | |
Beginning
Value as of
December 31, 2018 | | | Purchases
at Cost | | | Proceeds
from Sales | | | Ending
Value as of
June 30, 2019 | | | Shares as of
June 30, 2019 | | | Dividend Income
from Affiliated
Investment Company | |
| | | | | |
| | $— | | | $ | 2,012,696 | | | $ | (2,012,696 | ) | | $ | — | | | | — | | | $ | 1,095 | |
22
GOLDMAN SACHS VARIABLE INSURANCE TRUST SMALL CAP EQUITY INSIGHTS FUND
6. PORTFOLIO SECURITIES TRANSACTIONS
The cost of purchases and proceeds from sales and maturities of long-term securities for the six months ended June 30, 2019, were $55,172,504 and $61,851,534 respectively.
7. SECURITIES LENDING
Pursuant to exemptive relief granted by the Securities and Exchange Commission (“SEC”) and the terms and conditions contained therein, the Fund may lend its securities through a securities lending agent, Goldman Sachs Agency Lending (“GSAL”), a wholly-owned subsidiary of Goldman Sachs, to certain qualified borrowers including Goldman Sachs and affiliates. In accordance with the Fund’s securities lending procedures, the Fund receives cash collateral at least equal to the market value of the securities on loan. The market value of the loaned securities is determined at the close of business of the Fund, at their last sale price or official closing price on the principal exchange or system on which they are traded, and any additional required collateral is delivered to the Fund on the next business day. As with other extensions of credit, the Fund may experience delay in the recovery of its securities or incur a loss should the borrower of the securities breach its agreement with the Fund or become insolvent at a time when the collateral is insufficient to cover the cost of repurchasing securities on loan. Dividend income received from securities on loan may not be subject to withholding taxes and therefore withholding taxes paid may differ from the amounts listed in the Statement of Operations. Loans of securities are terminable at any time and as such 1) the remaining contractual maturities of the outstanding securities lending transactions are considered to be overnight and continuous and 2) the borrower, after notice, is required to return borrowed securities within the standard time period for settlement of securities transactions.
The Fund invests the cash collateral received in connection with securities lending transactions in the Goldman Sachs Financial Square Government Fund (“Government Money Market Fund”), an affiliated series of the Goldman Sachs Trust. The Government Money Market Fund is registered under the Act as an open end investment company, is subject to Rule2a-7 under the Act, and is managed by GSAM, for which GSAM may receive a management fee of up to 0.16% on an annualized basis of the average daily net assets of the Government Money Market Fund.
In the event of a default by a borrower with respect to any loan, GSAL will exercise any and all remedies provided under the applicable borrower agreement to make the Fund whole. These remedies include purchasing replacement securities by applying the collateral held from the defaulting broker against the purchase cost of the replacement securities. If GSAL is unable to purchase replacement securities, GSAL will indemnify the Fund by paying the Fund an amount equal to the market value of the securities loaned minus the value of cash collateral received from the borrower for the loan, subject to an exclusion for any shortfalls resulting from a loss of value in such cash collateral due to reinvestment risk. The Fund may enter into master netting agreements with borrowers, which provide the right, in the event of a default (including bankruptcy or insolvency), for thenon-defaulting party to liquidate the collateral and calculate net exposure to the defaulting party or request additional collateral. However, in the event of a default by a borrower, a resolution authority could determine that such rights are not enforceable due to the restrictions or prohibitions against the right ofset-off that may be imposed in accordance with a particular jurisdiction’s bankruptcy or insolvency laws. The Fund’s loaned securities were all subject to enforceable Securities Lending Agreements and the value of the collateral was at least equal to the value of the cash received. The amounts of the Fund’s overnight and continuous agreements, which represent the gross amounts of recognized liabilities for securities lending transactions outstanding as of June 30, 2019, are disclosed as “Payable upon return of securities loaned” on the Statement of Assets and Liabilities, where applicable.
Both the Fund and GSAL received compensation relating to the lending of the Fund’s securities. The amounts earned, if any, by the Fund for the six months ended June 30, 2019, are reported under Investment Income on the Statement of Operations.
23
GOLDMAN SACHS VARIABLE INSURANCE TRUST SMALL CAP EQUITY INSIGHTS FUND
Notes to Financial Statements(continued)
June 30, 2019 (Unaudited)
7. SECURITIES LENDING (continued)
The table below details securities lending activity with affiliates of Goldman Sachs:
| | | | | | | | | | |
| For the Six Months ended June 30, 2019 | | | | |
Earnings of GSAL
Relating to
Securities
Loaned | | | Amount Received
by the Fund from Lending to Goldman Sachs | | | Amount Payable to
Goldman Sachs
Upon Return of
Securities Loaned as of
June 30, 2019 | |
| | |
| $ | 1,204 | | | $ | 508 | | | $ | 169,912 | |
The following table provides information about the Fund’s investment in the Government Money Market Fund for the six months ended June 30, 2019:
| | | | | | | | | | | | |
Beginning
Value as of
December 31, 2018 | | | Purchases
at Cost | | | Proceeds
from Sales | | Ending
Value as of
June 30, 2019 | |
| | | |
| | $993,085 | | | $ | 5,518,509 | | | $(5,795,094) | | $ | 716,500 | |
8. TAX INFORMATION
As of the Fund’s most recent fiscal year end, December 31, 2018, the Fund’s certain timing differences, on atax-basis were as follows:
| | | | |
| |
| Timing differences (§ 857(b)(9) Deferred Dividend/ Post October Loss Deferral) | | $ | (667,178) | |
As of June 30, 2019, the Fund’s aggregate security unrealized gains and losses based on cost for U.S. federal income tax purposes were as follows:
| | | | |
| Tax cost | | $ | 86,296,308 | |
| Gross unrealized gain | | | 10,720,698 | |
| Gross unrealized loss | | | (5,252,660 | ) |
| Net unrealized gain | | $ | 5,468,038 | |
The difference between GAAP-basis andtax-basis unrealized gains (losses) is attributable primarily to wash sales.
GSAM has reviewed the Fund’s tax positions for all open tax years (the current and prior three years, as applicable) and has concluded that no provision for income tax is required in the Fund’s financial statements. Such open tax years remain subject to examination and adjustment by tax authorities.
9. OTHER RISKS
The Fund’s risks include, but are not limited to, the following:
Derivatives Risk— The Fund’s use of derivatives may result in loss. Derivative instruments, which may pose risks in addition to and greater than those associated with investing directly in securities, currencies or other instruments, may be illiquid or less liquid, volatile, difficult to price and leveraged so that small changes in the value of the underlying instruments may produce disproportionate losses to the Fund. Derivatives are also subject to counterparty risk, which is the risk that the other party in the transaction will not fulfill its contractual obligation. The use of derivatives is a highly specialized activity that involves investment techniques and risks different from those associated with investments in more traditional securities and instruments. Losses from
24
GOLDMAN SACHS VARIABLE INSURANCE TRUST SMALL CAP EQUITY INSIGHTS FUND
9. OTHER RISKS (continued)
derivatives can also result from a lack of correlation between changes in the value of derivative instruments and the portfolio assets (if any) being hedged.
Investments in Other Investment Companies Risk— As a shareholder of another investment company, the Fund will indirectly bear its proportionate share of any net management fees and other expenses paid by such other investment companies, in addition to the fees and expenses regularly borne by the Fund.
Large Shareholder Transactions Risk— The Fund may experience adverse effects when certain large shareholders, such as other funds, participating insurance companies, accounts and Goldman Sachs affiliates, purchase or redeem large amounts of shares of the Fund. Such large shareholder redemptions, which may occur rapidly or unexpectedly, may cause the Fund to sell portfolio securities at times when it would not otherwise do so, which may negatively impact the Fund’s NAV and liquidity. These transactions may also accelerate the realization of taxable income to shareholders if such sales of investments resulted in gains, and may also increase transaction costs. In addition, a large redemption could result in the Fund’s current expenses being allocated over a smaller asset base, leading to an increase in the Fund’s expense ratio. Similarly, large Fund share purchases may adversely affect the Fund’s performance to the extent that the Fund is delayed in investing new cash or otherwise maintains a larger cash position than it ordinarily would.
Liquidity Risk— The Fund may make investments that are illiquid or that may become less liquid in response to market developments or adverse investor perceptions. Illiquid investments may be more difficult to value. Liquidity risk may also refer to the risk that the Fund will not be able to pay redemption proceeds within the allowable time period or without significant dilution to remaining investors’ interests because of unusual market conditions, an unusually high volume of redemption requests, or other reasons. To meet redemption requests, the Fund may be forced to sell investments at an unfavorable time and/or under unfavorable conditions. If the Fund is forced to sell securities at an unfavorable time and/or under unfavorable conditions, such sales may adversely affect the Fund’s NAV and dilute remaining investors’ interests. Redemptions by large shareholders may have a negative impact on the Fund’s liquidity.
Market and Credit Risks— In the normal course of business, the Fund trades financial instruments and enters into financial transactions where risk of potential loss exists due to changes in the market (market risk). Additionally, the Fund may also be exposed to credit risk in the event that an issuer or guarantor fails to perform or that an institution or entity with which the Fund has unsettled or open transactions defaults.
10. INDEMNIFICATIONS
Under the Trust’s organizational documents, its Trustees, officers, employees and agents are indemnified, to the extent permitted by the Act and state law, against certain liabilities that may arise out of performance of their duties to the Fund. Additionally, in the course of business, the Fund enters into contracts that contain a variety of indemnification clauses. The Fund’s maximum exposure under these arrangements is unknown, as this would involve future claims that may be made against the Fund that have not yet occurred. However, GSAM believes the risk of loss under these arrangements to be remote.
11. SUBSEQUENT EVENTS
Subsequent events after the Statement of Assets and Liabilities date have been evaluated, and GSAM has concluded that there is no impact requiring adjustment or disclosure in the financial statements.
25
GOLDMAN SACHS VARIABLE INSURANCE TRUST SMALL CAP EQUITY INSIGHTS FUND
Notes to Financial Statements(continued)
June 30, 2019 (Unaudited)
12. SUMMARY OF SHARE TRANSACTIONS
Share activity is as follows:
| | | | | | | | | | | | | | | | |
| | | For the Six Months Ended
June 30, 2019
(Unaudited) | | | For the Fiscal Year Ended
December 31, 2018 | |
| | | Shares | | | Dollars | | | Shares | | | Dollars | |
| Institutional Shares | | | | | | | | | | | | | | | | |
| Shares sold | | | 205,351 | | | $ | 2,416,355 | | | | 746,343 | | | $ | 10,751,346 | |
| Reinvestment of distributions | | | — | | | | — | | | | 1,125,530 | | | | 11,874,335 | |
| Shares redeemed | | | (592,859 | ) | | | (6,955,275 | ) | | | (921,549 | ) | | | (13,354,939 | ) |
| | | | (387,508 | ) | | | (4,538,920 | ) | | | 950,324 | | | | 9,270,742 | |
| Service Shares | | | | | | | | | | | | | | | | |
| Shares sold | | | 47,245 | | | | 543,392 | | | | 128,444 | | | | 1,827,261 | |
| Reinvestment of distributions | | | — | | | | — | | | | 268,407 | | | | 2,807,539 | |
| Shares redeemed | | | (181,611 | ) | | | (2,065,949 | ) | | | (301,678 | ) | | | (4,388,157 | ) |
| | | | (134,366 | ) | | | (1,522,557 | ) | | | 95,173 | | | | 246,643 | |
| | | | |
| NET INCREASE (DECREASE) | | | (521,874 | ) | | $ | (6,061,477) | | | | 1,045,497 | | | $ | 9,517,385 | |
26
GOLDMAN SACHS VARIABLE INSURANCE TRUST SMALL CAP EQUITY INSIGHTS FUND
| | |
| Fund Expenses — Six Month Period Ended June 30, 2019 (Unaudited) | | |
As a shareholder of Institutional or Service Shares of the Fund, you incur ongoing costs, including management fees, distribution and/or service(12b-1) fees (with respect to Service Shares) and other Fund expenses. This example is intended to help you understand your ongoing costs (in dollars) of investing in Institutional Shares and Service Shares of the Fund and to compare these costs with the ongoing costs of investing in other mutual funds.
The example is based on an investment of $1,000 invested at the beginning of the period and held for the entire period from January 1, 2019 through June 30, 2019, which represents a period of 181 days of a 365 day year.
Actual Expenses— The first line under each share class in the table below provides information about actual account values and actual expenses. You may use the information in this line, together with the amount you invested, to estimate the expenses that you paid over the period. Simply divide your account value by $1,000 (for example, an $8,600 account value divided by $1,000=8.6), then multiply the result by the number in the first line under the heading entitled “Expenses Paid” to estimate the expenses you paid on your account during this period.
Hypothetical Example for Comparison Purposes— The second line under each share class in the table below provides information about hypothetical account values and hypothetical expenses based on the Fund’s actual net expense ratio and an assumed rate of return of 5% per year before expenses, which is not the Fund’s actual return. The hypothetical account values and expenses may not be used to estimate the actual ending account balance or expenses you paid for the period. You may use this information to compare the ongoing costs of investing in the Fund and other funds. To do so, compare this 5% hypothetical example with the 5% hypothetical examples that appear in the shareholder reports of the other funds.
Please note that the expenses shown in the table are meant to highlight your ongoing costs only. As a shareholder of the Fund you do not incur any transaction costs, such as sales charges, redemption fees, or exchange fees, but shareholders of other funds may incur such costs. The second line of the table is useful in comparing ongoing costs only and will not help you determine the relative total costs of owning different funds whose shareholders may incur transaction costs.
| | | | | | | | | | | | |
| Share Class | | Beginning
Account Value
01/01/19 | | | Ending
Account Value
06/30/19 | | | Expenses
Paid for the
6 Months
Ended
06/30/19* | |
| Institutional | | | | | | | | | | | | |
| | | | |
| Actual | | $ | 1,000 | | | $ | 1,163.00 | | | $ | 4.34 | |
| Hypothetical 5% return | | | 1,000 | | | | 1,020.78 | + | | | 4.06 | |
| Service | | | | | | | | | | | | |
| | | | |
| Actual | | | 1,000 | | | | 1,161.50 | | | | 5.68 | |
| Hypothetical 5% return | | | 1,000 | | | | 1,019.54 | + | | | 5.31 | |
| | + | Hypothetical expenses are based on the Fund’s actual annualized net expense ratios and an assumed rate of return of 5% per year before expenses. | |
| | * | Expenses are calculated using the Fund’s annualized net expense ratio for each class, which represents the ongoing expenses as a percentage of net assets for the six months ended June 30, 2019. Expenses are calculated by multiplying the annualized net expense ratio by the average account value for the period; then multiplying the result by the number of days in the most recent fiscal half year; and then dividing that result by the number of days in the fiscal year. The annualized net expense ratios for the period were 0.81% and 1.06% for Institutional and Service Shares, respectively. | |
27
GOLDMAN SACHS VARIABLE INSURANCE TRUST SMALL CAP EQUITY INSIGHTS FUND
Statement Regarding Basis for Approval of Management Agreement (Unaudited)
Background
The Goldman Sachs Small Cap Equity Insights Fund (the “Fund”) is an investment portfolio of Goldman Sachs Variable Insurance Trust (the “Trust”). The Board of Trustees oversees the management of the Trust and reviews the investment performance and expenses of the Fund at regularly scheduled meetings held throughout the year. In addition, the Board of Trustees determines annually whether to approve the continuance of the Trust’s investment management agreement (the “Management Agreement”) with Goldman Sachs Asset Management, L.P. (the “Investment Adviser”) on behalf of the Fund.
The Management Agreement was most recently approved for continuation until June 30, 2020 by the Board of Trustees, including those Trustees who are not parties to the Management Agreement or “interested persons” (as defined in the Investment Company Act of 1940, as amended) of any party thereto (the “Independent Trustees”), at a meeting held onJune 11-12, 2019 (the “Annual Meeting”).
The review process undertaken by the Trustees spans the course of the year and culminates with the Annual Meeting. To assist the Trustees in their deliberations, the Trustees have established a Contract Review Committee (the “Committee”), comprised of the Independent Trustees. The Committee held four meetings over the course of the year since the Management Agreement was last approved. At those Committee meetings, regularly scheduled Board or other committee meetings, and/or the Annual Meeting, matters relevant to the renewal of the Management Agreement were considered by the Board, or the Independent Trustees, as applicable. With respect to the Fund, such matters included:
| | (a) | | the nature and quality of the advisory, administrative, and other services provided to the Fund by the Investment Adviser and its affiliates, including information about: |
| | (i) | | the structure, staff, and capabilities of the Investment Adviser and its portfolio management teams; |
| | (ii) | | the groups within the Investment Adviser and its affiliates that support the portfolio management teams or provide other types of necessary services, including fund services groups (e.g., accounting and financial reporting, tax, shareholder services, and operations); controls and risk management groups (e.g., legal, compliance, valuation oversight, credit risk management, internal audit, compliance testing, market risk analysis, finance, and central funding); sales and distribution support groups, and others (e.g., information technology and training); |
| | (iii) | | trends in employee headcount; |
| | (iv) | | the Investment Adviser’s financial resources and ability to hire and retain talented personnel and strengthen its operations; and |
| | (v) | | the parent company’s support of the Investment Adviser and its mutual fund business, as expressed by the firm’s senior management; |
| | (b) | | information on the investment performance of the Fund, including comparisons to the performance of similar mutual funds, as provided by a third-party mutual fund data provider engaged as part of the contract review process (the “Outside Data Provider”), and a benchmark performance index; and information on general investment outlooks in the markets in which the Fund invests; |
| | (c) | | information provided by the Investment Adviser indicating the Investment Adviser’s views on whether the Fund’s peer group and/or benchmark index had high, medium, or low relevance given the Fund’s particular investment strategy; |
| | (d) | | the terms of the Management Agreement and other agreements with affiliated service providers entered into by the Trust on behalf of the Fund; |
| | (e) | | fee and expense information for the Fund, including: |
| | (i) | | the relative management fee and expense levels of the Fund as compared to those of comparable funds managed by other advisers, as provided by the Outside Data Provider; |
| | (ii) | | the Fund’s expense trends over time; and |
| | (iii) | | to the extent the Investment Adviser manages other types of accounts (such as bank collective trusts, private wealth management accounts, institutional separate accounts,sub-advised mutual funds, andnon-U.S. funds) having investment objectives and policies similar to those of the Fund, comparative information on the advisory fees charged and services provided to those accounts by the Investment Adviser; |
| | (f) | | with respect to the extensive investment performance and expense comparison data provided by the Outside Data Provider, its processes in producing that data for the Fund; |
| | (g) | | the undertakings of the Investment Adviser and its affiliates to implement fee waivers and/or expense limitations; |
| | (h) | | information relating to the profitability of the Management Agreement and the transfer agency and distribution and service arrangements of the Fund to the Investment Adviser and its affiliates; |
| | (i) | | whether the Fund’s existing management fee schedule adequately addressed any economies of scale; |
28
GOLDMAN SACHS VARIABLE INSURANCE TRUST SMALL CAP EQUITY INSIGHTS FUND
Statement Regarding Basis for Approval of Management Agreement (Unaudited) (continued)
| | (j) | | a summary of the“fall-out” benefits derived by the Investment Adviser and its affiliates from their relationships with the Fund, including the fees received by the Investment Adviser’s affiliates from the Fund for transfer agency, securities lending, portfolio trading, distribution and other services; |
| | (k) | | a summary of potential benefits derived by the Fund as a result of its relationship with the Investment Adviser; |
| | (l) | | information regarding commissions paid by the Fund and broker oversight, other information regarding portfolio trading, and how the Investment Adviser carries out its duty to seek best execution; |
| | (m) | | the manner in which portfolio manager compensation is determined; and the number and types of accounts managed by the portfolio managers; |
| | (n) | | the nature and quality of the services provided to the Fund by its unaffiliated service providers, and the Investment Adviser’s general oversight and evaluation (including reports on due diligence) of those service providers as part of the administrative services provided under the Management Agreement; and |
| | (o) | | the Investment Adviser’s processes and policies addressing various types of potential conflicts of interest; its approach to risk management; the annual review of the effectiveness of the Fund’s compliance program; and periodic compliance reports. |
The Trustees also received an overview of the Fund’s distribution arrangements. They received information regarding the Fund’s assets, share purchase and redemption activity, and payment of distribution and service fees. Information was also provided to the Trustees relating to revenue sharing payments made by and services provided by the Investment Adviser and its affiliates to intermediaries that promote the sale, distribution, and/or servicing of Fund shares. The Independent Trustees also discussed the broad range of other investment choices that are available to Fund investors, including the availability of comparable funds managed by other advisers.
The presentations made at the Board and Committee meetings and at the Annual Meeting encompassed the Fund and other mutual funds for which the Board of Trustees has responsibility. In evaluating the Management Agreement at the Annual Meeting, the Trustees relied upon their knowledge, resulting from their meetings and other interactions throughout the year, of the Investment Adviser and its affiliates, their services, and the Fund. In conjunction with these meetings, the Trustees received written materials and oral presentations on the topics covered, and the Investment Adviser addressed the questions and concerns of the Trustees, including concerns regarding the investment performance of certain of the funds they oversee. The Independent Trustees were advised by their independent legal counsel regarding their responsibilities and other regulatory requirements related to the approval and continuation of mutual fund investment management agreements under applicable law. In addition, the Investment Adviser and its affiliates provided the Independent Trustees with a written response to a formal request for information sent on behalf of the Independent Trustees by their independent legal counsel. During the course of their deliberations, the Independent Trustees met in executive sessions with their independent legal counsel, without representatives of the Investment Adviser or its affiliates present.
Nature, Extent, and Quality of the Services Provided Under the Management Agreement
As part of their review, the Trustees considered the nature, extent, and quality of the services provided to the Fund by the Investment Adviser. In this regard, the Trustees considered both the investment advisory services andnon-advisory services that are provided by the Investment Adviser and its affiliates. The Trustees noted the transition in the leadership and changes in personnel of various of the Investment Adviser’s portfolio management teams that had occurred in recent periods, and the ongoing recruitment efforts aimed at bringing high quality investment talent to the Investment Adviser. They also noted the Investment Adviser’s commitment to maintaining high quality systems and expending substantial resources to respond to ongoing changes to the regulatory and control environment in which the Fund and its service providers operate, as well as the efforts of the Investment Adviser and its affiliates to combat cyber security risks. The Trustees concluded that the Investment Adviser continued to commit substantial financial and operational resources to the Fund and expressed confidence that the Investment Adviser would continue to do so in the future. The Trustees also recognized that the Investment Adviser had made significant commitments to address regulatory compliance requirements applicable to the Fund and the Investment Adviser and its affiliates.
Investment Performance
The Trustees also considered the investment performance of the Fund. In this regard, they compared the investment performance of the Fund to its peers usingrankings and ratings compiled by the Outside Data Provider as of December 31, 2018, and updated performance information prepared by the Investment Adviser using the peer group identified by the Outside Data Provider as of March 31, 2019. The information on the Fund’s investment performance was provided for theone-, three-, five-, andten-year periods ending on the applicable dates. The Trustees also reviewed the Fund’s investment performance relative to its
29
GOLDMAN SACHS VARIABLE INSURANCE TRUST SMALL CAP EQUITY INSIGHTS FUND
Statement Regarding Basis for Approval of Management Agreement (Unaudited) (continued)
performance benchmark. As part of this review, they considered the investment performance trends of the Fund over time, and reviewed the investment performance of the Fund in light of its investment objective and policies and market conditions.
In addition, the Trustees considered materials prepared and presentations made by the Investment Adviser’s senior management and portfolio management personnel in which Fund performance was assessed. The Trustees also considered the Investment Adviser’s periodic reports with respect to the Fund’s risk profile, and how the Investment Adviser’s approach to risk monitoring and management influences portfolio management. They noted the efforts of the Fund’s portfolio management team to continue to enhance the investment model used in managing the Fund.
The Trustees observed that the Fund’s Institutional Shares had placed in the top half of the Fund’s peer group for theone-, three-, five-, andten-year periods, and had outperformed the Fund’s benchmark index for theone-, five-, andten-year periods and underperformed for the three-year period ended March 31, 2019.
Costs of Services Provided and Competitive Information
The Trustees considered the contractual terms of the Management Agreement and the fee rates payable by the Fund thereunder. In this regard, the Trustees considered information on the services rendered by the Investment Adviser to the Fund, which included both advisory and administrative services that were directed to the needs and operations of the Fund as a registered mutual fund.
In particular, the Trustees reviewed analyses prepared by the Outside Data Provider regarding the expense rankings of the Fund. The analyses provided a comparison of the Fund’s management fee andbreakpoints to those of a relevant peer group and category universe; an expense analysis which compared the Fund’s overall net and gross expenses to a peer group and a category universe; and data comparing the Fund’s net expenses to the peer and category medians. The analyses also compared the Fund’s other expenses and fee waivers/reimbursements to those of the peer group and category medians. The Trustees concluded that the comparisons provided by the Outside Data Provider were useful in evaluating the reasonableness of the management fees and total expenses paid by the Fund.
In addition, the Trustees considered the Investment Adviser’s undertakings to implement fee waivers and/or expense limitations. They also considered, to the extent that the Investment Adviser manages other types of accounts having investment objectives and policies similar to those of the Fund, comparative fee information for services provided by the Investment Adviser to those accounts, and information that indicated that services provided to the Fund differed in various significant respects from the services provided to other types of accounts which, in many cases, operated under less stringent legal and regulatory structures, required fewer services from the Investment Adviser to a smaller number of client contact points, and were less time-intensive.
In addition, the Trustees noted that shareholders are able to redeem their Fund shares at any time if shareholders believe that the Fund fees and expenses are too high or if they are dissatisfied with the performance of the Fund.
Profitability
The Trustees reviewed the Fund’s contribution to the Investment Adviser’s revenues andpre-tax profit margins. In this regard the Trustees noted that they had received, among other things, profitability analyses and summaries, revenue and expense schedules by Fund and by function (i.e., investment management, transfer agency and distribution and service), and information on the Investment Adviser’s expense allocation methodology. They observed that the profitability and expense figures are substantially similar to those used by the Investment Adviser for many internal purposes, including compensation decisions among various business groups, and are thus subject to a vigorous internal debate about how certain revenue and expenses should be allocated. The Trustees also noted that the internal audit group within the Goldman Sachs organization periodically audits the expense allocation methodology and that the internal audit group was satisfied with the reasonableness, consistency, and accuracy of the Investment Adviser’s expense allocation methodology. Profitability data for the Fund was provided for 2018 and 2017, and the Trustees considered this information in relation to the Investment Adviser’s overall profitability.
Economies of Scale
The Trustees considered the information that had been provided regarding whether there have been economies of scale with respect to the management of the Fund. The Trustees also considered the breakpoints in the fee rate payable under the Management Agreement for the Fund at the following annual percentage rates of the average daily net assets of the Fund:
| | | | |
| |
| First $2 billion | | | 0.70 | % |
| |
| Next $3 billion | | | 0.63 | |
| |
| Next $3 billion | | | 0.60 | |
| |
| Over $8 billion | | | 0.59 | |
30
GOLDMAN SACHS VARIABLE INSURANCE TRUST SMALL CAP EQUITY INSIGHTS FUND
Statement Regarding Basis for Approval of Management Agreement (Unaudited) (continued)
The Trustees noted that the breakpoints were designed to share potential economies of scale, if any, with the Fund and its shareholders as assets under management reach those asset levels. The Trustees considered the amounts of assets in the Fund; the Fund’s recent share purchase and redemption activity; the information provided by the Investment Adviser relating to the costs of the services provided by the Investment Adviser and its affiliates and their realized profits; information comparing fee rates charged by the Investment Adviser with fee rates charged to other funds in the peer group; and the Investment Adviser’s undertaking to limit certain expenses of the Fund that exceed a specified level. Upon reviewing these matters at the Annual Meeting, the Trustees concluded that the fee breakpoints represented a means of assuring that benefits of scalability, if any, would be passed along to shareholders at the specified asset levels.
Other Benefits to the Investment Adviser and Its Affiliates
The Trustees also considered the other benefits derived by the Investment Adviser and its affiliates from their relationships with the Fund as stated above, including: (a) transfer agency fees received by Goldman Sachs & Co. LLC (“Goldman Sachs”); (b) brokerage and futures commissions earned by Goldman Sachs for executing securities and futures transactions on behalf of the Fund; (c) trading efficiencies resulting from aggregation of orders of the Fund with those for other funds or accounts managed by the Investment Adviser; (d) fees earned by Goldman Sachs Agency Lending (“GSAL”), an affiliate of the Investment Adviser, as securities lending agent (and fees earned by the Investment Adviser for managing the fund in which the Fund’s cash collateral is invested); (e) the Investment Adviser’s ability to leverage the infrastructure designed to service the Fund on behalf of its other clients; (f) the Investment Adviser’s ability to cross-market other products and services to Fund shareholders; (g) Goldman Sachs’ retention of certain fees as Fund Distributor; (h) the Investment Adviser’s ability to negotiate better pricing with custodians on behalf of its other clients, as a result of the relationship with the Fund; and (i) the possibility that the working relationship between the Investment Adviser and the Fund’s third-party service providers may cause those service providers to be more likely to do business with other areas of Goldman Sachs. In the course of considering the foregoing, the Independent Trustees requested and received further information quantifying certain of thesefall-out benefits.
Other Benefits to the Fund and Its Shareholders
The Trustees also noted that the Fund receives certain potential benefits as a result of its relationship with the Investment Adviser, including: (a) trading efficiencies resulting from aggregation of orders of the Fund with those of other funds or accounts managed by the Investment Adviser; (b) enhanced servicing from vendors because of the volume of business generated by the Investment Adviser and its affiliates; (c) enhanced servicing from broker-dealers because of the volume of business generated by the Investment Adviser and its affiliates; (d) the Investment Adviser’s ability to negotiate favorable terms with derivatives counterparties on behalf of the Fund as a result of the size and reputation of the Goldman Sachs organization; (e) the Investment Adviser’s knowledge and experience gained from managing other accounts and products; (f) the Investment Adviser’s ability to hire and retain qualified personnel to provide services to the Fund because of the reputation of the Goldman Sachs organization; (g) the Fund’s access, through the Investment Adviser, to certain firmwide resources (e.g., proprietary risk management systems and databases), subject to certain restrictions; (h) the Fund’s ability to participate in the securities lending program administered by GSAL, as measured by the revenue received by the Fund in connection with the program; and (i) the Fund’s access to certain affiliated distribution channels. In addition, the Trustees noted the competitive nature of the mutual fund marketplace, and considered that many of the Fund’s shareholders invested in the Fund in part because of the Fund’s relationship with the Investment Adviser and that those shareholders have a general expectation that the relationship will continue.
Conclusion
In connection with their consideration of the Management Agreement, the Trustees gave weight to each of the factors described above, but did not identify any particular factor as controlling their decision. After deliberation and consideration of all of the information provided, including the factors described above, the Trustees concluded, in the exercise of their business judgment, that the management fees paid by the Fund were reasonable in light of the services provided to it by the Investment Adviser, the Investment Adviser’s costs and the Fund’s current and reasonably foreseeable asset levels. The Trustees unanimously concluded that the Investment Adviser’s continued management likely would benefit the Fund and its shareholders and that the Management Agreement should be approved and continued with respect to the Fund until June 30, 2020.
31
| | |
| TRUSTEES | | OFFICERS |
Jessica Palmer,Chair Kathryn A. Cassidy Diana M. Daniels James A. McNamara Roy W. Templin Gregory G. Weaver | | James A. McNamara,President Joseph F. DiMaria,Principal Financial Officer, Principal Accounting Officer and Treasurer Caroline L. Kraus,Secretary |
GOLDMAN SACHS & CO. LLC
Distributor and Transfer Agent
GOLDMAN SACHS ASSET MANAGEMENT, L.P.
Investment Adviser
200 West Street, New York
New York 10282
Visit our web site at www.GSAMFUNDS.com to obtain the most recentmonth-end returns.
The reports concerning the Fund included in this shareholder report may contain certain forward-looking statements about the factors that may affect the performance of the Fund in the future. These statements are based on Fund management’s predictions and expectations concerning certain future events and their expected impact on the Fund, such as performance of the economy as a whole and of specific industry sectors, changes in the levels of interest rates, the impact of developing world events, and other factors that may influence the future performance of the Fund. Management believes these forward-looking statements to be reasonable, although they are inherently uncertain and difficult to predict. Actual events may cause adjustments in portfolio management strategies from those currently expected to be employed.
A description of the policies and procedures that the Fund uses to determine how to vote proxies relating to portfolio securities and information regarding how the Fund voted proxies relating to portfolio securities for the12-month period ended June 30 is available (i) without charge, upon request by calling1-800-621-2550; and (ii) on the Securities and Exchange Commission (“SEC”) web site athttp://www.sec.gov.
The Fund will file its portfolio holdings information for each month in a fiscal quarter within 60 days after the end of the relevant fiscal quarter on Form N-PORT. Portfolio holdings information for the third month of each fiscal quarter will be made available on the SEC’s web site at http://www.sec.gov. Portfolio holdings information may be obtained upon request and without charge by calling 1-800-526-7384 (for Retail Shareholders) or 1-800-621-2550 (for Institutional Shareholders).
Views and opinions expressed are for informational purposes only and do not constitute a recommendation by GSAM to buy, sell, or hold any security. Views and opinions are current as of the date of this presentation and may be subject to change, they should not be construed as investment advice.
Goldman Sachs & Co. LLC (“Goldman Sachs”) does not provide legal, tax or accounting advice. Any statement contained in this communication (including any attachments) concerning U.S. tax matters was not intended or written to be used, and cannot be used, for the purpose of avoiding penalties under the Internal Revenue Code, and was written to support the promotion or marketing of transaction or matter addressed. Clients of Goldman Sachs should obtain their own independent tax advice based on their particular circumstances.
The website links provided are for your convenience only and are not an endorsement or recommendation by GSAM of any of these websites or the products or services offered. GSAM is not responsible for the accuracy and validity of the content of these websites.
Fund holdings and allocations shown are as of June 30, 2019 and may not be representative of future investments. Fund holdings should not be relied on in making investment decisions and should not be construed as research or investment advice regarding particular securities. Current and future holdings are subject to risk.
References to indices, benchmarks or other measures of relative market performance over a specified period of time are provided for your information only and do not imply that the portfolio will achieve similar results. The index composition may not reflect the manner in which a portfolio is constructed. While an adviser seeks to design a portfolio which reflects appropriate risk and return features, portfolio characteristics may deviate from those of the benchmark.
The Global Industry Classification Standard (“GICS”) was developed by and is the exclusive property and a service mark of Morgan Stanley Capital International Inc. (“MSCI”) and Standard & Poor’s, a division of The McGraw-Hill Companies, Inc. (“S&P”) and is licensed for use by Goldman Sachs. Neither MSCI, S&P nor any other party involved in making or compiling the GICS or any GICS classifications makes any express or implied warranties or representations with respect to such standard or classification (or the results to be obtained by the use thereof), and all such parties hereby expressly disclaim all warranties of originality, accuracy, completeness, merchantability or fitness for a particular purpose with respect to any of such standard or classification. Without limiting any of the foregoing, in no event shall MSCI, S&P, any of their affiliates or any third party involved in making or compiling the GICS or any GICS classifications have any liability for any direct, indirect, special, punitive, consequential or any other damages (including lost profits) even if notified of the possibility of such damages.
The portfolio risk management process includes an effort to monitor and manage risk, but does not imply low risk.
Shares of the Goldman Sachs VIT Funds are offered to separate accounts of participating life insurance companies for the purpose of funding variable annuity contracts and variable life insurance policies. Shares of the Fund are not offered directly to the general public. The variable annuity contracts and variable life insurance policies are described in the separate prospectuses issued by participating insurance companies. You should refer to those prospectuses for information about surrender charges, mortality and expense risk fees and other charges that may be assessed by participating insurance companies under the variable annuity contracts or variable life insurance policies. Such fees or charges, if any, may affect the return you may realize with respect to your investments. Ask your representative for more complete information. Please consider a fund’s objectives, risks and charges and expenses, and read the prospectus carefully before investing. The prospectus contains this and other information about the Fund.
This material is not authorized for distribution to prospective investors unless preceded or accompanied by a current prospectus or summary prospectus, if applicable. Investors should consider the Funds’ objective, risks, and charges and expenses, and read the summary prospectus, if available, and/or the prospectus carefully before investing or sending money. The summary prospectus, if available, and the prospectus contain this and other information about the Funds and may be obtained from your authorized dealer or from Goldman Sachs & Co. LLC by calling 1-800-621-2550.
This report is prepared for the general information of contract owners and is not an offer of shares of the Goldman Sachs Variable Insurance Trust — Goldman Sachs Small Cap Equity Insights Fund.
© 2019 Goldman Sachs. All rights reserved.
VITSCSAR-19/175375-OTU-1025428
Goldman
SachsVariable Insurance Trust
Goldman Sachs
Strategic Growth Fund
Beginning on or after January 1, 2021, you may not receive paper copies of the Fund’s annual and semi-annual shareholder reports from the insurance company that offers your variable insurance contract or your financial intermediary, unless you specifically request paper copies of the reports from the insurance company or from your financial intermediary. Instead, the reports will be made available on a website, and you will be notified by mail each time a report is posted and provided with a website link to access the report.
If you already elected to receive shareholder reports electronically, you will not be affected by this change and you need not take any action. At any time, you may elect to receive reports and certain communications from the insurance company electronically by contacting your insurance company or your financial intermediary.
You may elect to receive all future shareholder reports in paper free of charge. You can inform the insurance company or your financial intermediary that you wish to receive paper copies of reports. Your election to receive reports in paper will apply to all Goldman Sachs Funds available under your contract and may apply to all funds held with your financial intermediary.
Semi-Annual Report
June 30, 2019

GOLDMAN SACHS VARIABLE INSURANCE TRUST STRATEGIC GROWTH FUND
INVESTMENT OBJECTIVE
The Fund seeks long-term growth of capital.
Portfolio Management Discussion and Analysis
Below, the Goldman Sachs Fundamental Equity U.S. Equity Portfolio Management Team discusses the Goldman Sachs Variable Insurance Trust — Goldman Sachs Strategic Growth Fund’s (the “Fund”) performance and positioning for thesix-month period ended June 30, 2019 (the “Reporting Period”).
How did the Fund perform during the Reporting Period?
During the Reporting Period, the Fund’s Institutional and Service Shares generated cumulative total returns of 22.29% and 22.19%, respectively. These returns compare to the 21.49% cumulative total return of the Fund’s benchmark, the Russell 1000® Growth Index (with dividends reinvested) (the “Russell Index”), during the same time period.
What economic and market factors most influenced the equity markets as a whole during the Reporting Period?
Representing the U.S. equity market, the S&P 500® Index returned 18.54% during the Reporting Period, rallying strongly following negative absolute returns posted in 2018. While 2018 was the worst calendar year since 2008, the first half of 2019 was the strongest first half for the S&P 500® Index since 1997.
During the first quarter of 2019, the S&P 500® Index rose 13.65%. After a volatile end to 2018, the rally to begin 2019 marked the best first quarter performance for the S&P 500® Index since 1998. Federal Reserve (“Fed”) commentary provided a supportive background for U.S. equities, as Fed Chair Jerome Powell reiterated a “patient” approach to monetary policy that included a pause in interest rate hikes and a nearing end to the Fed’s balance sheet runoff. The U.S. unemployment rate remained well below trend at 3.8% in February 2019, and wages grew 3.4% year over year. Housing data showed strength in the first calendar quarter, with new home sales reaching 667,000 in February, bringing the three-month average up to 630,000. Strength in housing data could be partially attributed to a steep decline in mortgage rates resulting from a more cautious Fed. The University of Michigan Consumer Sentiment Index was also a point of significant strength in the U.S. economy, steadily climbing in each month of the first quarter of 2019 and eventually reaching 98.4 in March, its highest level in six months. Economic growth concerns that had dominated the fourth quarter of 2018 failed to completely disappear, however, as fourth quarter 2018 Gross Domestic Product (“GDP”) growth was revised down 0.4% in March 2019 to 2.2%. While the revision was further evidence of a slowing U.S. economy, the result was largely priced in by equity markets and thus had a limited effect on stock prices outside of the financials sector, which historically tends to be more rate sensitive.
The S&P 500® Index rose a solid but more moderate 4.30% during the second quarter of 2019. Trade tensions between the U.S. and China dominated headlines and broadly added noise to the markets. (Noise refers to market activity that can confuse or misrepresent genuine underlying trends.) In April 2019, there was an optimistic consensus outlook on a possible trade deal, but this
optimism faded in May when the U.S. President threatened to raise current tariffs and impose new duties on $300 billion of additional Chinese imports. Also, sanctions were temporarily placed on a Chinese telecommunications giant, until they were lifted in June 2019, when any additional tariffs or compromise were postponed. Also during the second quarter of 2019, the markets kept a close eye on the Fed. After steadily raising short-term interest rates since 2015 to a range of 2.25% to 2.50%, the Fed alluded to a more accommodative approach. Following the Fed’s statement, the market consensus actually priced in at least one interest rate cut by the end of 2019, if not sooner. Economic indicators were mixed during the second quarter of 2019, with consumer sentiment remaining elevated, while nonfarm payrolls and manufacturing indices across the board fell short.
For the Reporting Period overall, all 11 sectors posted positive absolute returns, with 10 of the 11 generating double-digit gains. Information technology, consumer discretionary and industrials were the best performing sectors in the S&P 500® Index, as measured by total return, while the weakest performing sectors in the S&P 500® Index during the Reporting Period were health care, energy and utilities.
Within the U.S. equity market, all capitalization segments posted double-digit positive returns, led bymid-cap stocks, as measured by the Russell Midcap® Index, followed bylarge-cap stocks, as measured by the Russell 1000® Index, and thensmall-cap stocks, as measured by the Russell 2000® Index. From a style perspective, growth-oriented stocks significantly outpaced value-oriented stocks across the capitalization spectrum. (All as measured by the FTSE Russell indices.)
1
GOLDMAN SACHS VARIABLE INSURANCE TRUST STRATEGIC GROWTH FUND
What key factors were responsible for the Fund’s performance during the Reporting Period?
The Fund outperformed the Russell Index during the Reporting Period attributable primarily to stock selection overall. Sector allocation as a whole detracted from performance, albeit modestly.
Which equity market sectors most significantly affected Fund performance?
Contributing most positively to the Fund’s relative results during the Reporting Period was effective stock selection in the health care, consumer staples and communication services sectors. The sector that detracted most from the Fund’s relative results during the Reporting Period was financials, wherein stock selection hurt most. Having an overweighted allocation to energy, which was the second-weakest sector in the Russell Index during the Reporting Period, and having an underweighted allocation to information technology, which was the best performing sector in the Russell Index during the Reporting Period, also dampened relative results.
What were some of the Fund’s best-performing individual stocks?
Among those stocks the Fund benefited most from relative to the Russell Index were underweight positions in research-based biopharmaceutical company AbbVie and diversified health care company UnitedHealth Group and an overweight position in social media giant Facebook.
In late January 2019, AbbVie’s stock fell sharply after the company reported its fourth quarter 2018 results, in which several negative headlines provoked a selloff. First, AbbVie missed revenue and earnings consensus estimates. Second, Humira, an immunology drug that constitutes the majority of the company’s revenues, saw biosimilar competition in Europe significantly erode its international revenues. Finally, AbbVie announced relatively weak 2019 guidance, highlighting concerns that Humira may face heightened pressures in the U.S. ahead of its patent expiration in 2023. Toward the end of the Reporting Period, the company also announced it would be acquiring pharmaceutical company Allergan, which caused AbbVie’s stock to drop, as investors digested the news and its potential implications. At the end of the Reporting Period, we maintained an underweight position in AbbVie and planned to monitor potential headwinds and developments going forward.
While posting a rather flat return for the Reporting Period overall, shares of UnitedHealth Group dropped in February 2019, along with other managed care stocks, when pharmaceutical company executives testified before the U.S. Congress to address criticism over excessive drug pricing. During the hearings, the executives deflected the blame to insurance companies and pharmacy benefit managers (“PBMs”), such as UnitedHealth Group, arguing that the rebates PBMs collect from drug makers should be eliminated. Its stock also declined in April 2019 despite reporting solid earnings that beat consensus estimates on most metrics. The weakness was caused, in our view, by persistent concerns around the Medicare for All proposals and the impact such a plan might have. At the end of the Reporting Period, we continued to believe UnitedHealth Group is awell-run health care company that provides a wide range of services, including health benefit plans, health management services and pharmacy care services. However, given that UnitedHealth Group derives a portion of its revenue from rebates and given the uncertainty around health care ahead of the U.S. elections, we remained somewhat cautious and maintained an underweight position in the company, intending to monitor the landscape ahead for the company.
Facebook’s shares spiked at the end of January 2019 after the company released a strong earnings report for the fourth quarter of 2018. Facebook beat consensus expectations for revenues and earnings per share and posted solid active user figures, underscoring that consumers and advertisers may not be fazed by recent scrutiny from policymakers and privacy advocates. Additionally, its management’s dialogue marked a shift in tone from focusing on defensive areas, like data security, to more offensive initiatives pertaining to product development. Its stock continued to rise and then jumped again in April 2019 following a better than consensus expected earnings release in which the company reported solid revenue growth and improved expense guidance in the first quarter of 2019. The results appeared to be driven by ongoing advertising success and healthy user growth and engagement across platforms, two bright spots that tie directly to our investment thesis on the company. At the end of the Reporting Period, we continued to monitor any potential headline or political risks going forward, but we remained confident in Facebook’s advertising platform, with Instagram stories and the monetization of messaging apps as particular points of strength. Overall, we continued to view Facebook as one of the more intriguing risk/reward opportunities within the online industry.
Which stocks detracted significantly from the Fund’s performance during the Reporting Period?
Detracting from the Fund’s results relative to the Russell Index were positions in health insurance company Humana, pharmaceutical company Eli Lilly and crude oil refining company Marathon Petroleum.
Shares of Humana fell late in February 2019, along with other managed care stocks, as pharmaceutical company executives testified before the U.S. Congress to address criticism over excessive drug pricing. During the hearings, the executives deflected
2
GOLDMAN SACHS VARIABLE INSURANCE TRUST STRATEGIC GROWTH FUND
part of the blame to insurance companies, such as Humana, arguing that the rebates insurance companies collect from drug makers should be eliminated. Humana’s stock also declined in April 2019, as concerns around the Medicare for All proposals and the impact such a program might have weighed on its stock. At the end of the Reporting Period, we believed the company still had opportunities for growth ahead, as we see it as a potential beneficiary from Medicare patient growth and the aging of our population. However, given that Humana derives a portion of its revenue from rebates, we remained somewhat cautious and intended to monitor developments on this front going forward.
Shares of Eli Lilly slumped in April 2019 along with other biopharmaceutical stocks, as investors seemed to intensify their profit-taking after a first quarter 2019 rally in the industry. Weighing on sentiment was the generally negative view held by the U.S. Congress on elevated drug prices and the U.S. Administration’s stated priority to address the situation. In our opinion, themid-April 2019 selloff was likely partially a product of heightened investor fear and other emotional factors. For the rest of the second calendar quarter, Eli Lilly’s shares were largely range-bound, with little fundamental data driving its performance. At the end of the Reporting Period, we maintained our belief that Eli Lilly has strong risk/reward prospects versus its peers, and we saw upside potential to its diabetes franchise. We were optimistic about its management’s commitment to creating shareholder value through increased dividends and share repurchases. Overall, we viewed Eli Lilly as a high quality pharmaceutical business with leading franchises, a robust drug pipeline and an improving financial profile.
Nearly all of Marathon Petroleum’s stock price decline came in May 2019. Early in the month, the company reported quarterly results that missed on earnings per share market expectations, driven primarily by weakness in refining and retail margins. On the positive side, Marathon Petroleum continued to buy back shares and also reported strong operating cash flow and capital expenditures. Despite the mixed reports, we remained positive on the company at the end of the Reporting Period and felt its acquisition of fellow petroleum refiner Andeavor seemed to be going well and on track to unlock further synergies for the combined company, now the largest U.S. refiner by capacity. Furthermore, we were positive on the outlook for both the industry and the business and on the company management’s ability to achieve synergy targets and focus on returning capital to shareholders. We maintained our belief that Marathon Petroleum is a high quality company with what we consider to be a strong balance sheet, stable free cash flow and robust return on equity, and we were positive on its prospects ahead.
How did the Fund use derivatives and similar instruments during the Reporting Period?
During the Reporting Period, we did not use derivatives as part of an active management strategy.
Did the Fund make any significant purchases or sales during the Reporting Period?
Among the purchases initiated during the Reporting Period, we established a Fund position in Accenture. We feel that in recent years Accenture has repositioned itself as a leading information technology implementation company in digital and new age technologies, including cloud,software-as-a-service, analytics and securities. In our opinion, the company’s existing client relationships and strong consulting practice have facilitated its early involvement in deals, a key competitive advantage versus its peers. Further, balanced capital allocation to thoughtful acquisitions and capital returns have enabled the company to invest in growth initiatives, in our view.
We initiated a Fund position in pharmaceutical company AstraZeneca. We are encouraged by AstraZeneca’s momentum in product sales growth and strong operating leverage. At the time of purchase, we liked the company and felt it hadbest-in-class top and bottom line growth potential over the next several years. Additionally, AstraZeneca has multiple phase 3 readouts across different drugs scheduled throughout 2019, which we believe could continue to drive growth. (The main focus of phase 3 drug trials is to demonstrate and confirm the preliminary evidence gathered in the previous trials that the drug is, a safe, beneficial and effective treatment for the intended indication. Phase 3 is the last phase of testing to be completed before the drug’s details and clinical trial results are submitted to the regulatory authorities for approval of the drug’s release on the open market.)
Conversely, we eliminated the Fund’s position in specialty finance company Global Payments. Following an extended period of strong performance, we decided to realize gains and allocate capital to what we considered to be other high quality growth names in the payments industry. We felt that, as we get deeper in the economic cycle, there may be other names in the industry that could provide high quality characteristics in the event of a downturn.
We sold the Fund’s position in semiconductor company NVIDIA. Its stock experienced volatility during the Reporting Period due to continued trade uncertainties and concerns around data centers, gaming and crypto demand, which are all keyend-markets for the company. The company also reported disappointing earnings during the Reporting Period, which further pressured its stock. While we believe NVIDIA is a high quality advanced chip designer, we decided to exit the position in favor of companies we saw as having more favorable near-term risk/reward profiles.
3
GOLDMAN SACHS VARIABLE INSURANCE TRUST STRATEGIC GROWTH FUND
Were there any notable changes in the Fund’s weightings during the Reporting Period?
In constructing the Fund’s portfolio, we focus on picking stocks rather than on making industry or sector bets. We seek to outpace the benchmark index by overweighting stocks that we expect to outperform and underweighting those that we think may lag. Consequently, changes in its sector weights are generally the direct result of individual stock selection or of stock appreciation or depreciation. That said, during the Reporting Period, the Fund’s exposure to health care and information technology increased compared to the Russell Index. The Fund’s allocation compared to the Russell Index in industrials and consumer discretionary decreased.
How was the Fund positioned relative to its benchmark index at the end of the Reporting Period?
At the end of June 2019, the Fund had overweighted positions relative to the Russell Index in the health care, energy and information technology sectors. On the same date, the Fund had underweighted positions compared to the Russell Index in consumer discretionary, industrials and financials and was rather neutrally weighted to the Russell Index in communication services, materials, consumer staples and real estate. The Fund had no exposure to the utilities sector at the end of the Reporting Period.
Were there any changes to the Fund’s portfolio management team during the Reporting Period?
There were no changes to the Fund’s portfolio management team during the Reporting Period. However, effective July 17, 2019, after the close of the Reporting Period, portfolio managers Steven M. Barry, Managing Director, Chief Investment Officer, Fundamental Equity U.S. Equity, and Stephen E. Becker, CFA, Managing Director, each became Managing Director, Co-Chief Investment Officer of Fundamental Equity U.S. Equity, continuing as portfolio managers of the Fund. Steven M. Barry has managed the Fund since 2000, and Stephen E. Becker has managed the Fund since 2013.
What is the Fund’s tactical view and strategy for the months ahead?
Following a strong start for the U.S. equity markets during the first half of 2019, we continued to view U.S. equities as the most favorable asset class at the end of the Reporting Period, offering what we saw as reasonable valuations relative to solid macroeconomic and corporate fundamentals. After a significant repricing of assets and market expectations in the fourth quarter of 2018, the U.S. equity markets rebounded with the strongest first half of a calendar year since 1997 despite geopolitical tensions and trade relations oscillating between positive and negative developments. U.S. equities were buoyed by declining10-year U.S. Treasury rates, as investors expected potential interest rate cuts, a dramatic shift from the Fed’s actions at this point in 2018. While we were encouraged by the strong start to 2019, we also expected to see more signals of an aging economic cycle moving forward, which may be challenging to navigate and require even more selectivity by stock pickers. Yet without clearer indications of deteriorating fundamentals, we believed it too early to position for a downturn in global economic growth or corporate earnings.
That said, at the end of the Reporting Period, we expected choppier conditions for the remainder of 2019. Within this more volatile backdrop, we believed a thorough understanding of both market and company-specific variables may well be crucial to navigating the evolving landscape. Still, our investment philosophy does not and will not change based on short-term fluctuations in markets. We intend to maintain our focus on high quality companies with what we consider to be strong market positions and experienced management teams. In our opinion, emphasizing these durable businesses can potentially set the Fund up to perform well amidst heightened volatility.
Indeed, regardless of market direction, we remain committed to our core philosophy and process. We intend to maintain a long-term time horizon, rather than forecast the next quarter. As always, we maintain our focus on seeking companies that we believe will generate long-term growth in today’s ever-changing market conditions.
4
GOLDMAN SACHS VARIABLE INSURANCE TRUST STRATEGIC GROWTH FUND
Index Definitions
The Russell 1000® Growth Index is an unmanaged market capitalization weighted index of the 1000 largest U.S. companies with higher price-to-book ratios and higher forecasted growth values. The figures for the index do not include any deduction for fees, expenses or taxes.
The Russell 2000® Index is an unmanaged index of common stock prices that measures the performance of the 2000 smallest companies in the Russell 3000® Index. The figures for the index do not include any deduction for fees, expenses or taxes.
The S&P 500® Index is the Standard & Poor’s composite index of 500 stocks, an unmanaged index of common stock prices. The figures for the index do not include any deduction for fees, expenses or taxes.
The Russell Midcap® Index measures the performance of the 800 smallest companies in the Russell 1000® Index, which represent approximately 25% of the total market capitalization of the Russell 1000® Index.
The Russell 1000® Index measures the performance of the 1,000 largest companies in the Russell 3000® Index, which represent approximately 92% of the total market capitalization of the Russell 3000® Index.
The University of Michigan Consumer Sentiment Index is a monthly survey of U.S. consumer confidence levels conducted by the University of Michigan. It is based on telephone surveys that gather information on consumer expectations regarding the overall economy.
It is not possible to invest directly in an index.
5
FUND BASICS
Strategic Growth Fund
as of June 30, 2019
STANDARDIZED TOTAL RETURNS1
| | | | | | | | | | | | | | | | | | |
| | | | | |
| For the period ended 6/30/19 | | One Year | | | Five Years | | | Ten Years | | | Since Inception | | | Inception Date |
| Institutional | | | 10.96 | % | | | 12.60 | % | | | 14.69 | % | | | 6.74 | % | | 4/30/98 |
| Service | | | 10.67 | | | | 12.33 | | | | 14.40 | | | | 8.84 | | | 1/09/06 |
| 1 | The Standardized Total Returns are average annual total returns as of the most recent calendar quarter-end. They assume reinvestment of all distributions at net asset value (“NAV”). Because Institutional Shares and Service Shares do not involve a sales charge, such a charge is not applied to their Standardized Total Returns. |
Total return figures in the above chart represent past performance and do not indicate future results, which will vary. The investment return and principal value of an investment will fluctuate and, therefore, an investor’s shares, when redeemed, may be worth more or less than their original cost. Current performance may be lower or higher than the total return figures in the above chart. Please visit www.GSAMFUNDS.com to obtain the most recent month-end returns.Performance reflects fee waivers and/or expense limitations in effect during the periods shown. In their absence, performance would be reduced.
EXPENSE RATIOS2
| | | | | | | | |
| | |
| | | Net Expense Ratio (Current) | | | Gross Expense Ratio (Before Waivers) | |
| Institutional | | | 0.74 | % | | | 0.80 | % |
| Service | | | 0.99 | | | | 1.05 | |
| 2 | The expense ratios of the Fund, both current (net of any fee waivers and/or expense limitations) and before waivers (gross of any fee waivers and/or expense limitations) are as set forth above according to the most recent publicly available Prospectuses for the Fund and may differ from the expense ratios disclosed in the Financial Highlights in this report. Pursuant to a contractual arrangement, the Fund’s fee waivers and/or expense limitations will remain in place through at least April 30, 2020, and prior to such date, the Investment Adviser may not terminate the arrangements without the approval of the Fund’s Board of Trustees. If these arrangements are discontinued in the future, the expense ratios may change without shareholder approval. |
TOP TEN HOLDINGS AS OF 6/30/193
| | | | | | |
| | |
| Holding | | % of Net Assets | | | Line of Business |
| Microsoft Corp. | | | 7.7% | | | Software & Services |
| Apple, Inc. | | | 6.1 | | | Technology Hardware & Equipment |
| Amazon.com, Inc. | | | 5.2 | | | Retailing |
| Facebook, Inc. Class A | | | 4.2 | | | Media & Entertainment |
| Visa, Inc. Class A | | | 3.4 | | | Software & Services |
| Alphabet, Inc. Class A | | | 2.9 | | | Media & Entertainment |
| Mastercard, Inc. Class A | | | 2.4 | | | Software & Services |
| Cisco Systems, Inc. | | | 2.3 | | | Technology Hardware & Equipment |
| Alphabet, Inc. Class C | | | 2.2 | | | Media & Entertainment |
| Boeing Co. (The) | | | 2.0 | | | Capital Goods |
| 3 | The top 10 holdings may not be representative of the Fund’s future investments. |
6
FUND BASICS
FUND vs. BENCHMARK SECTOR ALLOCATIONS4
As of June 30, 2019
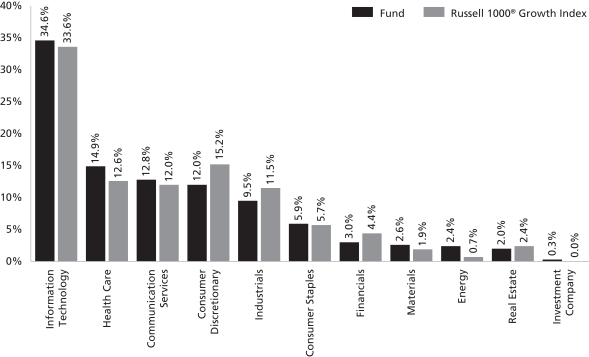
| 4 | The Fund is actively managed and, as such, its composition may differ over time. Consequently, the Fund’s overall sector allocations may differ from percentages contained in the graph above. The graph categorizes investments using Global Industry Classification Standard (“GICS”); however, the sector classifications used by the portfolio management team may differ from GICS. The percentage shown for each investment category reflects the value of investments in that category as a percentage of market value (excluding investments in the securities lending reinvestment vehicle, if any). Underlying sector allocations of exchange traded funds and investment companies held by the Fund are not reflected in the graph above. Investments in the securities lending reinvestment vehicle represented 0.4% of the Fund’s net assets at June 30, 2019. |
7
GOLDMAN SACHS VARIABLE INSURANCE TRUST STRATEGIC GROWTH FUND
Schedule of Investments
June 30, 2019 (Unaudited)
| | | | | | | | |
| Shares | | | Description | | Value | |
|
| Common Stocks – 99.6% | |
| Automobiles & Components – 0.6% | |
| | 24,469 | | | Aptiv plc | | $ | 1,977,829 | |
| | |
| Banks – 0.9% | |
| | 31,252 | | | First Republic Bank | | | 3,051,758 | |
| | |
| Capital Goods – 6.5% | |
| | 18,951 | | | Boeing Co. (The) | | | 6,898,353 | |
| | 11,162 | | | Deere & Co. | | | 1,849,655 | |
| | 31,252 | | | Fortive Corp. | | | 2,547,663 | |
| | 31,552 | | | Honeywell International, Inc. | | | 5,508,664 | |
| | 14,851 | | | Northrop Grumman Corp. | | | 4,798,507 | |
| | 7,315 | | | Stanley Black & Decker, Inc. | | | 1,057,822 | |
| | | | | | | | |
| | | | | | | 22,660,664 | |
| | |
| Consumer Durables & Apparel – 2.3% | |
| | 71,365 | | | NIKE, Inc. Class B | | | 5,991,092 | |
| | 21,362 | | | PVH Corp. | | | 2,021,699 | |
| | | | | | | | |
| | | | | | | 8,012,791 | |
| | |
| Consumer Services – 2.2% | |
| | 1,263 | | | Chipotle Mexican Grill, Inc.* | | | 925,627 | |
| | 32,019 | | | Dunkin’ Brands Group, Inc. | | | 2,550,634 | |
| | 20,725 | | | McDonald’s Corp. | | | 4,303,754 | |
| | | | | | | | |
| | | | | | | 7,780,015 | |
| | |
| Diversified Financials – 1.9% | |
| | 18,432 | | | Cboe Global Markets, Inc. | | | 1,910,108 | |
| | 30,009 | | | Intercontinental Exchange, Inc. | | | 2,578,974 | |
| | 22,962 | | | Northern Trust Corp. | | | 2,066,580 | |
| | | | | | | | |
| | | | | | | 6,555,662 | |
| | |
| Energy – 2.3% | |
| | 41,128 | | | Cheniere Energy, Inc.* | | | 2,815,211 | |
| | 15,940 | | | Diamondback Energy, Inc. | | | 1,736,982 | |
| | 15,308 | | | EOG Resources, Inc. | | | 1,426,093 | |
| | 39,553 | | | Marathon Petroleum Corp. | | | 2,210,222 | |
| | | | | | | | |
| | | | | | | 8,188,508 | |
| | |
| Food & Staples Retailing – 1.0% | |
| | 31,025 | | | Walmart, Inc. | | | 3,427,952 | |
| | |
| Food, Beverage & Tobacco – 4.2% | |
| | 35,492 | | | Brown-Forman Corp. Class B | | | 1,967,321 | |
| | 97,890 | | | Coca-Cola Co. (The) | | | 4,984,559 | |
| | 12,677 | | | McCormick & Co., Inc.(Non-Voting) | | | 1,965,062 | |
| | 39,630 | | | Mondelez International, Inc. Class A | | | 2,136,057 | |
| | 54,601 | | | Monster Beverage Corp.* | | | 3,485,182 | |
| | | | | | | | |
| | | | | | | 14,538,181 | |
| | |
| Health Care Equipment & Services – 6.9% | |
| | 6,451 | | | Align Technology, Inc.* | | | 1,765,639 | |
| | 112,393 | | | Boston Scientific Corp.* | | | 4,830,651 | |
| | 22,623 | | | Danaher Corp. | | | 3,233,279 | |
| | 11,465 | | | Guardant Health, Inc.* | | | 989,774 | |
| | 16,140 | | | Humana, Inc. | | | 4,281,942 | |
| | |
|
| Common Stocks – (continued) | |
| Health Care Equipment & Services – (continued) | |
| | 6,426 | | | Intuitive Surgical, Inc.* | | | 3,370,758 | |
| | 13,243 | | | UnitedHealth Group, Inc. | | | 3,231,425 | |
| | 19,469 | | | West Pharmaceutical Services, Inc. | | | 2,436,545 | |
| | | | | | | | |
| | | | | | | 24,140,013 | |
| | |
| Household & Personal Products – 0.7% | |
| | 32,398 | | | Colgate-Palmolive Co. | | | 2,321,965 | |
| | |
| Insurance – 0.3% | |
| | 892 | | | Markel Corp.* | | | 971,923 | |
| | |
| Materials – 2.6% | |
| | 18,931 | | | Corteva, Inc.* | | | 559,790 | |
| | 18,931 | | | DuPont de Nemours, Inc. | | | 1,421,150 | |
| | 17,434 | | | Ecolab, Inc. | | | 3,442,169 | |
| | 6,619 | | | Martin Marietta Materials, Inc. | | | 1,523,098 | |
| | 4,263 | | | Sherwin-Williams Co. (The) | | | 1,953,690 | |
| | | | | | | | |
| | | | | | | 8,899,897 | |
| | |
| Media & Entertainment – 12.8% | |
| | 9,390 | | | Alphabet, Inc. Class A* | | | 10,167,492 | |
| | 7,103 | | | Alphabet, Inc. Class C* | | | 7,677,704 | |
| | 80,048 | | | Comcast Corp. Class A | | | 3,384,429 | |
| | 33,739 | | | Electronic Arts, Inc.* | | | 3,416,411 | |
| | 75,940 | | | Facebook, Inc. Class A* | | | 14,656,420 | |
| | 14,737 | | | Netflix, Inc.* | | | 5,413,195 | |
| | | | | | | | |
| | | | | | | 44,715,651 | |
| | |
| Pharmaceuticals, Biotechnology & Life Sciences – 8.0% | |
| | 10,419 | | | AbbVie, Inc. | | | 757,670 | |
| | 21,992 | | | Agilent Technologies, Inc. | | | 1,642,143 | |
| | 16,520 | | | Agios Pharmaceuticals, Inc.* | | | 824,018 | |
| | 81,468 | | | AstraZeneca plc ADR | | | 3,362,999 | |
| | 25,533 | | | BioMarin Pharmaceutical, Inc.* | | | 2,186,901 | |
| | 43,491 | | | Elanco Animal Health, Inc.* | | | 1,469,996 | |
| | 37,315 | | | Eli Lilly & Co. | | | 4,134,129 | |
| | 13,454 | | | Illumina, Inc.* | | | 4,953,090 | |
| | 26,892 | | | Incyte Corp.* | | | 2,284,744 | |
| | 16,991 | | | Vertex Pharmaceuticals, Inc.* | | | 3,115,809 | |
| | 27,632 | | | Zoetis, Inc. | | | 3,135,956 | |
| | | | | | | | |
| | | | | | | 27,867,455 | |
| | |
| Real Estate Investment Trusts – 2.0% | |
| | 20,095 | | | American Tower Corp. | | | 4,108,423 | |
| | 6,001 | | | Equinix, Inc. | | | 3,026,244 | |
| | | | | | | | |
| | | | | | | 7,134,667 | |
| | |
| Retailing – 6.9% | |
| | 7,828 | | | Alibaba Group Holding Ltd. ADR* | | | 1,326,454 | |
| | 9,577 | | | Amazon.com, Inc.* | | | 18,135,294 | |
| | 45,885 | | | Ross Stores, Inc. | | | 4,548,121 | |
| | | | | | | | |
| | | | | | | 24,009,870 | |
| | |
| | |
| 8 | | The accompanying notes are an integral part of these financial statements. |
GOLDMAN SACHS VARIABLE INSURANCE TRUST STRATEGIC GROWTH FUND
| | | | | | | | |
Shares | | | Description | | Value | |
|
| Common Stocks – (continued) | |
| Semiconductors & Semiconductor Equipment – 3.6% | |
| | 15,900 | | | Analog Devices, Inc. | | $ | 1,794,633 | |
| | 79,219 | | | Marvell Technology Group Ltd. | | | 1,890,958 | |
| | 31,745 | | | NXP Semiconductors NV | | | 3,098,629 | |
| | 50,684 | | | Texas Instruments, Inc. | | | 5,816,496 | |
| | | | | | | | |
| | | | | | | 12,600,716 | |
| | |
| Software & Services – 21.5% | |
| | 27,885 | | | Accenture plc Class A | | | 5,152,311 | |
| | 20,388 | | | Adobe, Inc.* | | | 6,007,324 | |
| | 11,620 | | | Atlassian Corp. plc Class A* | | | 1,520,361 | |
| | 22,826 | | | Fidelity National Information Services, Inc. | | | 2,800,294 | |
| | 17,827 | | | Intuit, Inc. | | | 4,658,730 | |
| | 32,029 | | | Mastercard, Inc. Class A | | | 8,472,631 | |
| | 201,076 | | | Microsoft Corp. | | | 26,936,141 | |
| | 38,339 | | | salesforce.com, Inc.* | | | 5,817,177 | |
| | 7,513 | | | ServiceNow, Inc.* | | | 2,062,844 | |
| | 67,650 | | | Visa, Inc. Class A | | | 11,740,658 | |
| | | | | | | | |
| | | | | | | 75,168,471 | |
| | |
| Technology Hardware & Equipment – 9.4% | |
| | 38,255 | | | Amphenol Corp. Class A | | | 3,670,184 | |
| | 107,338 | | | Apple, Inc. | | | 21,244,337 | |
| | 144,238 | | | Cisco Systems, Inc. | | | 7,894,146 | |
| | | | | | | | |
| | | | | | | 32,808,667 | |
| | |
| Transportation – 3.0% | |
| | 52,728 | | | CSX Corp. | | | 4,079,565 | |
| | 22,181 | | | Lyft, Inc. Class A*(a) | | | 1,457,514 | |
| | 28,615 | | | Union Pacific Corp. | | | 4,839,083 | |
| | | | | | | | |
| | | | | | | 10,376,162 | |
| | |
| | TOTAL COMMON STOCKS | |
| | (Cost $218,110,313) | | $ | 347,208,816 | |
| | |
| | | | | | | | |
| Shares | | Dividend
Rate | | | Value | |
|
| Investment Company(b)– 0.3% | |
Goldman Sachs Financial Square Government Fund — Institutional Shares | |
| 1,080,055 | | | 2.308 | % | | $ | 1,080,055 | |
| (Cost $1,080,055) | |
| |
| TOTAL INVESTMENTS BEFORE SECURITIES LENDING REINVESTMENT VEHICLE | |
| (Cost $219,190,368) | | | $ | 348,288,871 | |
| |
|
| Securities Lending Reinvestment Vehicle(b)– 0.4% | |
Goldman Sachs Financial Square Government Fund — Institutional Shares | |
| 1,465,763 | | | 2.308 | % | | $ | 1,465,763 | |
| (Cost $1,465,763) | |
| |
| TOTAL INVESTMENTS – 100.3% | |
| (Cost $220,656,131) | | | $ | 349,754,634 | |
| |
LIABILITIES IN EXCESS OF OTHER ASSETS – (0.3)% | | | | (959,807 | ) |
| |
| NET ASSETS – 100.0% | | | $ | 348,794,827 | |
| |
| | |
| The percentage shown for each investment category reflects the value of investments in that category as a percentage of net assets. |
| |
| * | | Non-income producing security. |
| |
| (a) | | All or a portion of security is on loan. |
| |
| (b) | | Represents an Affiliated Issuer. |
| | |
| |
| Investment Abbreviation: |
| ADR | | — American Depositary Receipt |
| | |
| The accompanying notes are an integral part of these financial statements. | | 9 |
GOLDMAN SACHS VARIABLE INSURANCE TRUST STRATEGIC GROWTH FUND
Statement of Assets and Liabilities
June 30, 2019 (Unaudited)
| | | | |
| | | | |
| Assets: | | | |
Investments in unaffiliated issuers, at value (cost $218,110,313)(a) | | $ | 347,208,816 | |
Investments in affiliated issuers, at value (cost $1,080,055) | | | 1,080,055 | |
Investments in affiliated securities lending reinvestment vehicle, at value (cost $1,465,763) | | | 1,465,763 | |
Cash | | | 350,960 | |
Receivables: | | | | |
Investments sold | | | 9,114,792 | |
Dividends | | | 171,890 | |
Fund shares sold | | | 70,744 | |
Reimbursement from investment adviser | | | 19,089 | |
Securities lending income | | | 12,732 | |
Other assets | | | 747 | |
| |
| Total assets | | | 359,495,588 | |
| | | | |
| | | | |
| Liabilities: | | | |
Payables: | | | | |
Investments purchased | | | 8,831,637 | |
Payable upon return of securities loaned | | | 1,465,763 | |
Management fees | | | 200,057 | |
Fund shares redeemed | | | 60,063 | |
Distribution and Service fees and Transfer Agency fees | | | 52,243 | |
Accrued expenses | | | 90,998 | |
| |
| Total liabilities | | | 10,700,761 | |
| | | | |
| | | | |
| Net Assets: | | | |
Paid-in capital | | | 193,624,823 | |
Total distributable earnings (loss) | | | 155,170,004 | |
| |
| NET ASSETS | | $ | 348,794,827 | |
Net Assets: | | | | |
Institutional | | $ | 118,801,171 | |
Service | | | 229,993,656 | |
| |
Total Net Assets | | $ | 348,794,827 | |
Shares outstanding $0.001 par value (unlimited shares authorized): | | | | |
Institutional | | | 9,935,608 | |
Service | | | 19,247,215 | |
Net asset value, offering and redemption price per share: | | | | |
Institutional | | | $11.96 | |
Service | | | 11.95 | |
(a) Includes loaned securities having a market value of $1,433,264.
| | |
| 10 | | The accompanying notes are an integral part of these financial statements. |
GOLDMAN SACHS VARIABLE INSURANCE TRUST STRATEGIC GROWTH FUND
Statement of Operations
For the Six Months Ended June 30, 2019 (Unaudited)
| | | | |
| | | | |
| Investment income: | | | |
Dividends — unaffiliated issuers (net of foreign taxes withheld of $2,407) | | $ | 1,668,325 | |
Securities lending income — unaffiliated issuer | | | 57,641 | |
Dividends — affiliated issuers | | | 42,594 | |
| |
| Total investment income | | | 1,768,560 | |
| | | | |
| | | | |
| Expenses: | | | |
Management fees | | | 1,132,845 | |
Distribution and Service fees — Service Shares | | | 256,750 | |
Professional fees | | | 44,770 | |
Custody, accounting and administrative services | | | 40,909 | |
Printing and mailing costs | | | 38,489 | |
Transfer Agency fees(a) | | | 31,908 | |
Trustee fees | | | 8,188 | |
Registration fees | | | 620 | |
Other | | | 7,272 | |
| |
| Total expenses | | | 1,561,751 | |
Less — expense reductions | | | (121,769 | ) |
| |
| Net expenses | | | 1,439,982 | |
| |
| NET INVESTMENT INCOME | | | 328,578 | |
| | | | |
| | | | |
| Realized and unrealized gain: | | | |
Net realized gain from investments — unaffiliated issuers (including commissions recaptured of $347) | | | 7,373,385 | |
Net change in unrealized gain on investments — unaffiliated issuers | | | 49,660,652 | |
| |
| Net realized and unrealized gain | | | 57,034,037 | |
| |
| NET INCREASE IN NET ASSETS RESULTING FROM OPERATIONS | | $ | 57,362,615 | |
(a) Institutional and Service Shares incurred Transfer Agency fees of $11,370 and $20,538, respectively.
| | |
| The accompanying notes are an integral part of these financial statements. | | 11 |
GOLDMAN SACHS VARIABLE INSURANCE TRUST STRATEGIC GROWTH FUND
Statements of Changes in Net Assets
| | | | | | | | |
| | | For the
Six Months Ended
June 30, 2019
(Unaudited) | | | For the
Fiscal Year Ended
December 31, 2018 | |
| | | | | | | | |
| From operations: | |
Net investment income | | $ | 328,578 | | | $ | 471,254 | |
Net realized gain | | | 7,373,385 | | | | 130,943,811 | |
Net change in unrealized gain (loss) | | | 49,660,652 | | | | (119,739,252 | ) |
| | |
| Net increase in net assets resulting from operations | | | 57,362,615 | | | | 11,675,813 | |
| |
| | | | | | | | |
| Distributions to shareholders: | | | | | | |
From distributable earnings: | | | | | | | | |
Institutional Shares | | | — | | | | (51,500,129 | ) |
Service Shares | | | — | | | | (70,247,289 | ) |
| | |
| Total distributions to shareholders | | | — | | | | (121,747,418 | ) |
| |
| | | | | | | | |
| From share transactions: | | | | | | |
Proceeds from sales of shares | | | 86,789,136 | | | | 30,210,299 | |
Reinvestment of distributions | | | — | | | | 121,747,418 | |
Cost of shares redeemed | | | (36,969,756 | ) | | | (341,645,863 | ) |
| | |
| Net increase (decrease) in net assets resulting from share transactions | | | 49,819,380 | | | | (189,688,146 | ) |
| | |
| TOTAL INCREASE (DECREASE) | | | 107,181,995 | | | | (299,759,751 | ) |
| |
| | | | | | | | |
| Net Assets: | | | | | | |
| | |
Beginning of period | | | 241,612,832 | | | | 541,372,583 | |
| | |
End of period | | $ | 348,794,827 | | | $ | 241,612,832 | |
| | |
| 12 | | The accompanying notes are an integral part of these financial statements. |
GOLDMAN SACHS VARIABLE INSURANCE TRUST STRATEGIC GROWTH FUND
Financial Highlights
Selected Data for a Share Outstanding Throughout Each Period
| | | | | | | | | | | | | | | | | | | | | | | | |
| | | Goldman Sachs Strategic Growth Fund | |
| | | Institutional Shares | |
| | | Six Months Ended
June 30, 2019
(Unaudited) | | | Year Ended December 31, | |
| | | 2018 | | | 2017 | | | 2016 | | | 2015 | | | 2014 | |
| | | | | | | | | | | | | | | | | | | | | | | | |
| Per Share Data | | | | | | | | | | | | | | | | | | |
| | | | | | |
Net asset value, beginning of period | | $ | 9.78 | | | $ | 19.73 | | | $ | 15.83 | | | $ | 15.62 | | | $ | 16.16 | | | $ | 17.64 | |
| | | | | | |
Net investment income(a) | | | 0.02 | | | | 0.06 | | | | 0.09 | | | | 0.07 | | | | 0.09 | (b) | | | 0.07 | |
| | | | | | |
Net realized and unrealized gain (loss) | | | 2.16 | | | | (0.18 | ) | | | 4.77 | | | | 0.24 | | | | 0.46 | | | | 2.24 | |
| | | | | | |
Total from investment operations | | | 2.18 | | | | (0.12 | ) | | | 4.86 | | | | 0.31 | | | | 0.55 | | | | 2.31 | |
| | | | | | |
Distributions to shareholders from net investment income | | | — | | | | (0.10 | ) | | | (0.10 | ) | | | (0.10 | ) | | | (0.06 | ) | | | (0.07 | ) |
| | | | | | |
Distributions to shareholders from net realized gains | | | — | | | | (9.73 | ) | | | (0.86 | ) | | | — | (c) | | | (1.03 | ) | | | (3.72 | ) |
| | | | | | |
Total distributions | | | — | | | | (9.83 | ) | | | (0.96 | ) | | | (0.10 | ) | | | (1.09 | ) | | | (3.79 | ) |
| | | | | | |
Net asset value, end of period | | $ | 11.96 | | | $ | 9.78 | | | $ | 19.73 | | | $ | 15.83 | | | $ | 15.62 | | | $ | 16.16 | |
| | | | | | |
Total return(d) | | | 22.29 | % | | | (1.04 | )% | | | 30.66 | % | | | 1.98 | % | | | 3.40 | % | | | 13.64 | % |
| | | | | | |
Net assets, end of period (in 000s) | | $ | 118,801 | | | $ | 102,199 | | | $ | 115,693 | | | $ | 98,090 | | | $ | 109,801 | | | $ | 119,934 | |
| | | | | | |
Ratio of net expenses to average net assets | | | 0.74 | %(e) | | | 0.74 | % | | | 0.76 | % | | | 0.79 | % | | | 0.79 | % | | | 0.79 | % |
| | | | | | |
Ratio of total expenses to average net assets | | | 0.82 | %(e) | | | 0.82 | % | | | 0.82 | % | | | 0.84 | % | | | 0.83 | % | | | 0.81 | % |
| | | | | | |
Ratio of net investment income to average net assets | | | 0.35 | %(e) | | | 0.30 | % | | | 0.48 | % | | | 0.48 | % | | | 0.55 | %(b) | | | 0.37 | % |
| | | | | | |
Portfolio turnover rate(f) | | | 22 | % | | | 41 | % | | | 37 | % | | | 72 | % | | | 56 | % | | | 48 | % |
| (a) | Calculated based on the average shares outstanding methodology. |
| (b) | Reflects income recognized from special dividends which amounted to $0.03 per share and 0.20% of average net assets. |
| (c) | Amount is less than $0.005 per share. |
| (d) | Assumes investment at the net asset value at the beginning of the period, reinvestment of all distributions, a complete redemption of the investment at the net asset value at the end of the period and no sales or redemption charges (if any). Total returns would be reduced if a sales or redemption charge was taken into account. Returns do not reflect the impact of taxes to shareholders relating to Fund distributions or the redemption of Fund shares. Total returns for periods less than one full year are not annualized. |
| (f) | The Fund’s portfolio turnover rate is calculated in accordance with regulatory requirements, without regard to transactions involving short term investments. If such transactions were included, the Fund’s portfolio turnover rate may be higher. |
| | |
| The accompanying notes are an integral part of these financial statements. | | 13 |
GOLDMAN SACHS VARIABLE INSURANCE TRUST STRATEGIC GROWTH FUND
Financial Highlights(continued)
Selected Data for a Share Outstanding Throughout Each Period
| | | | | | | | | | | | | | | | | | | | | | | | |
| | | Goldman Sachs Strategic Growth Fund | |
| | | Service Shares | |
| | | Six Months Ended
June 30, 2019
(Unaudited) | | | Year Ended December 31, | |
| | | 2018 | | | 2017 | | | 2016 | | | 2015 | | | 2014 | |
| | | | | | | | | | | | | | | | | | | | | | | | |
| Per Share Data | | | | | | | | | | | | | | | | | | |
| | | | | | |
Net asset value, beginning of period | | $ | 9.78 | | | $ | 19.68 | | | $ | 15.79 | | | $ | 15.59 | | | $ | 16.13 | | | $ | 17.61 | |
| | | | | | |
Net investment income(a) | | | 0.01 | | | | 0.01 | | | | 0.04 | | | | 0.03 | | | | 0.05 | (b) | | | 0.02 | |
| | | | | | |
Net realized and unrealized gain (loss) | | | 2.16 | | | | (0.18 | ) | | | 4.76 | | | | 0.23 | | | | 0.46 | | | | 2.24 | |
| | | | | | |
Total from investment operations | | | 2.17 | | | | (0.17 | ) | | | 4.80 | | | | 0.26 | | | | 0.51 | | | | 2.26 | |
| | | | | | |
Distributions to shareholders from net investment income | | | — | | | | — | | | | (0.05 | ) | | | (0.06 | ) | | | (0.02 | ) | | | (0.02 | ) |
| | | | | | |
Distributions to shareholders from net realized gains | | | — | | | | (9.73 | ) | | | (0.86 | ) | | | — | (c) | | | (1.03 | ) | | | (3.72 | ) |
| | | | | | |
Total distributions | | | — | | | | (9.73 | ) | | | (0.91 | ) | | | (0.06 | ) | | | (1.05 | ) | | | (3.74 | ) |
| | | | | | |
Net asset value, end of period | | $ | 11.95 | | | $ | 9.78 | | | $ | 19.68 | | | $ | 15.79 | | | $ | 15.59 | | | $ | 16.13 | |
| | | | | | |
Total return(d) | | | 22.19 | % | | | (1.32 | )% | | | 30.36 | % | | | 1.69 | % | | | 3.14 | % | | | 13.38 | % |
| | | | | | |
Net assets, end of period (in 000s) | | $ | 229,994 | | | $ | 139,414 | | | $ | 425,679 | | | $ | 368,242 | | | $ | 360,966 | | | $ | 394,747 | |
| | | | | | |
Ratio of net expenses to average net assets | | | 0.99 | %(e) | | | 0.99 | % | | | 1.01 | % | | | 1.04 | % | | | 1.04 | % | | | 1.04 | % |
| | | | | | |
Ratio of total expenses to average net assets | | | 1.07 | %(e) | | | 1.07 | % | | | 1.07 | % | | | 1.08 | % | | | 1.08 | % | | | 1.08 | % |
| | | | | | |
Ratio of net investment income to average net assets | | | 0.13 | %(e) | | | 0.04 | % | | | 0.23 | % | | | 0.22 | % | | | 0.29 | %(b) | | | 0.12 | % |
| | | | | | |
Portfolio turnover rate(f) | | | 22 | % | | | 41 | % | | | 37 | % | | | 72 | % | | | 56 | % | | | 48 | % |
| (a) | Calculated based on the average shares outstanding methodology. |
| (b) | Reflects income recognized from special dividends which amounted to $0.03 per share and 0.20% of average net assets. |
| (c) | Amount is less than $0.005 per share. |
| (d) | Assumes investment at the net asset value at the beginning of the period, reinvestment of all distributions, a complete redemption of the investment at the net asset value at the end of the period and no sales or redemption charges (if any). Total returns would be reduced if a sales or redemption charge was taken into account. Returns do not reflect the impact of taxes to shareholders relating to Fund distributions or the redemption of Fund shares. Total returns for periods less than one full year are not annualized. |
| (f) | The Fund’s portfolio turnover rate is calculated in accordance with regulatory requirements, without regard to transactions involving short term investments. If such transactions were included, the Fund’s portfolio turnover rate may be higher. |
| | |
| 14 | | The accompanying notes are an integral part of these financial statements. |
GOLDMAN SACHS VARIABLE INSURANCE TRUST STRATEGIC GROWTH FUND
Notes to Financial Statements
June 30, 2019 (Unaudited)
1. ORGANIZATION
Goldman Sachs Variable Insurance Trust (the “Trust” or “VIT”) is a Delaware statutory trust registered under the Investment Company Act of 1940, as amended (the “Act”), as anopen-end management investment company. The Trust includes the Goldman Sachs Strategic Growth Fund (the “Fund”). The Fund is a diversified portfolio under the Act offering two classes of shares — Institutional and Service Shares. Shares of the Trust are offered to separate accounts of participating life insurance companies for the purpose of funding variable annuity contracts and variable life insurance policies.
Goldman Sachs Asset Management, L.P. (“GSAM”), an affiliate of Goldman Sachs & Co. LLC (“Goldman Sachs”), serves as investment adviser to the Fund pursuant to a management agreement (the “Agreement”) with the Trust.
2. SIGNIFICANT ACCOUNTING POLICIES
The financial statements have been prepared in accordance with accounting principles generally accepted in the United States of America (“GAAP”) and require management to make estimates and assumptions that may affect the reported amounts and disclosures. Actual results may differ from those estimates and assumptions.
A. Investment Valuation — The Fund’s valuation policy is to value investments at fair value.
B. Investment Income and Investments —Investment income includes interest income, dividend income, and securities lending income, if any. Interest income is accrued daily and adjusted for amortization of premiums and accretion of discounts. Dividend income is recognized onex-dividend date or, for certain foreign securities, as soon as such information is obtained subsequent to theex-dividend date. Investment transactions are reflected on trade date. Realized gains and losses are calculated using identified cost. Investment transactions are recorded on the following business day for daily net asset value (“NAV”) calculations. Distributions received from the Fund’s investments in United States (“U.S.”) real estate investment trusts (“REITs”) may be characterized as ordinary income, net capital gain or a return of capital. A return of capital is recorded by the Fund as a reduction to the cost basis of the REIT.
C. Class Allocations and Expenses — Investment income, realized and unrealized gain (loss), if any, andnon-class specific expenses of the Fund are allocated daily based upon the proportion of net assets of each class.Non-class specific expenses directly incurred by the Fund are charged to the Fund, while such expenses incurred by the Trust are allocated across the Fund on a straight-line and/orpro-rata basis depending upon the nature of the expenses. Class specific expenses, where applicable, are borne by the respective share classes and include Distribution and Service and Transfer Agency fees.
D. Federal Taxes and Distributions to Shareholders — It is the Fund’s policy to comply with the requirements of the Internal Revenue Code of 1986, as amended (the “Code”), applicable to regulated investment companies and to distribute each year substantially all of its investment company taxable income and capital gains to its shareholders. Accordingly, the Fund is not required to make any provisions for the payment of federal income tax. Distributions to shareholders are recorded on theex-dividend date. Income and capital gains distributions, if any, are declared and paid at least annually.
Net capital losses, if any, are carried forward to future fiscal years and may be used to the extent allowed by the Code to offset any future capital gains. Losses that are carried forward will retain their character as either short-term or long-term capital losses. Utilization of capital loss carryforwards will reduce the requirement of future capital gains distributions.
The characterization of distributions to shareholders for financial reporting purposes is determined in accordance with federal income tax rules, which may differ from GAAP. The source of the Fund’s distributions may be shown in the accompanying financial statements as either from distributable earnings or capital. Certain components of the Fund’s net assets on the Statement of Assets and Liabilities reflect permanent GAAP/tax differences based on the appropriate tax character.
E. Commission Recapture — GSAM, on behalf of certain Funds, may direct portfolio trades, subject to seeking best execution, to various brokers who have agreed to rebate a portion of the commissions generated. Such rebates are made directly to the Fund as cash payments and are included in net realized gain (loss) from investments on the Statement of Operations.
15
GOLDMAN SACHS VARIABLE INSURANCE TRUST STRATEGIC GROWTH FUND
Notes to Financial Statements(continued)
June 30, 2019 (Unaudited)
3. INVESTMENTS AND FAIR VALUE MEASUREMENTS
U.S. GAAP defines the fair value of a financial instrument as the amount that would be received to sell an asset or paid to transfer a liability in an orderly transaction between market participants at the measurement date (i.e., the exit price); the Fund’s policy is to use the market approach. GAAP establishes a fair value hierarchy that prioritizes the inputs to valuation techniques used to measure fair value. The hierarchy gives the highest priority to unadjusted quoted prices in active markets for identical assets or liabilities (Level 1 measurements) and the lowest priority to unobservable inputs (Level 3 measurements). The levels used for classifying investments are not necessarily an indication of the risk associated with investing in these investments. The three levels of the fair value hierarchy are described below:
Level 1 — Unadjusted quoted prices in active markets that are accessible at the measurement date for identical, unrestricted assets or liabilities;
Level 2 — Quoted prices in markets that are not active or financial instruments for which significant inputs are observable (including, but not limited to, quoted prices for similar investments, interest rates, foreign exchange rates, volatility and credit spreads), either directly or indirectly;
Level 3 — Prices or valuations that require significant unobservable inputs (including GSAM’s assumptions in determining fair value measurement).
The Board of Trustees (“Trustees”) has approved Valuation Procedures that govern the valuation of the portfolio investments held by the Fund, including investments for which market quotations are not readily available. The Trustees have delegated to GSAMday-to-day responsibility for implementing and maintaining internal controls and procedures related to the valuation of the Fund’s investments. To assess the continuing appropriateness of pricing sources and methodologies, GSAM regularly performs price verification procedures and issues challenges as necessary to third party pricing vendors or brokers, and any differences are reviewed in accordance with the Valuation Procedures.
A. Level 1 and Level 2 Fair Value Investments — The valuation techniques and significant inputs used in determining the fair values for investments classified as Level 1 and Level 2 are as follows:
Equity Securities — Equity securities traded on a U.S. securities exchange or the NASDAQ system, or those located on certain foreign exchanges, including but not limited to the Americas, are valued daily at their last sale price or official closing price on the principal exchange or system on which they are traded. If there is no sale or official closing price or such price is believed by GSAM to not represent fair value, equity securities are valued at the last bid price for long positions and at the last ask price for short positions. To the extent these investments are actively traded, they are classified as Level 1 of the fair value hierarchy, otherwise they are generally classified as Level 2.
Unlisted equity securities for which market quotations are available are valued at the last sale price on the valuation date, or if no sale occurs, at the last bid price, and are generally classified as Level 2.
Money Market Funds— Investments in the Goldman Sachs Financial Square Government Fund (“Underlying Fund”) are valued at the NAV of the Institutional Share class on the day of valuation. These investments are generally classified as Level 1 of the fair value hierarchy. For information regarding the Underlying Fund’s accounting policies and investment holdings, please see the Underlying Fund’s shareholder report.
B. Level 3 Fair Value Investments — To the extent that significant inputs to valuation models and other alternative pricing sources are unobservable, or if quotations are not readily available, or if GSAM believes that such quotations do not accurately reflect fair value, the fair value of the Fund’s investments may be determined under Valuation Procedures approved by the Trustees. GSAM, consistent with its procedures and applicable regulatory guidance, may make an adjustment to the most recent valuation prices of either domestic or foreign securities in light of significant events to reflect what it believes to be the fair value of the securities at the time of determining the Fund’s NAV. To the extent investments are valued using single source broker quotations obtained directly from the broker or passed through from third party pricing vendors, such investments are classified as Level 3 investments. GSAM did not develop the unobservable inputs for valuation of Level 3 Assets and Liabilities.
16
GOLDMAN SACHS VARIABLE INSURANCE TRUST STRATEGIC GROWTH FUND
3. INVESTMENTS AND FAIR VALUE MEASUREMENTS (continued)
C. Fair Value Hierarchy — The following is a summary of the Fund’s investments classified in the fair value hierarchy as of June 30, 2019:
| | | | | | | | | | | | |
| Investment Type | | Level 1 | | | Level 2 | | | Level 3 | |
| | | |
| Assets | | | | | | | | | | | | |
| Common Stock and/or Other Equity Investments(a) | | | | | | | | | | | | |
Asia | | $ | 1,326,454 | | | $ | — | | | $ | — | |
Europe | | | 6,461,628 | | | | — | | | | — | |
North America | | | 339,420,734 | | | | — | | | | — | |
| Investment Company | | | 1,080,055 | | | | — | | | | — | |
| Securities Lending Reinvestment Vehicle | | | 1,465,763 | | | | — | | | | — | |
| | | |
| Total | | $ | 349,754,634 | | | $ | — | | | $ | — | |
| (a) | Amounts are disclosed by continent to highlight the impact of time zone differences between local market close and the calculation of NAV. Security valuations are based on the principal exchange or system on which they are traded, which may differ from country of domicile. |
For further information regarding security characteristics, see the Schedule of Investments.
4. AGREEMENTS AND AFFILIATED TRANSACTIONS
A. Management Agreement — Under the Agreement, GSAM manages the Fund, subject to the general supervision of the Trustees.
As compensation for the services rendered pursuant to the Agreement, the assumption of the expenses related thereto and administration of the Fund’s business affairs, including providing facilities, GSAM is entitled to a management fee, accrued daily and paid monthly, equal to an annual percentage rate of the Fund’s average daily net assets.
For the six months ended June 30, 2019, contractual and effective net management fees with GSAM were at the following rates:
| | | | | | | | | | | | | | | | | | | | | | | | | | |
| Contractual Management Rate | | | | | | Effective Net
Management Rate^ | |
First
$1 billion | | | Next
$1 billion | | | Next
$3 billion | | | Next
$3 billion | | | Over
$8 billion | | | Effective
Rate | |
| | | | | | |
| | 0.71% | | | | 0.64 | % | | | 0.61 | % | | | 0.59 | % | | | 0.58 | % | | | 0.71 | % | | | 0.71 | % |
| ^ | Effective Net Management Rate includes the impact of management fee waivers of affiliated Underlying Funds, if any. |
The Fund invests in Institutional Shares of the Goldman Sachs Financial Square Government Fund, which is an affiliated Underlying Fund. GSAM has agreed to waive a portion of its management fee payable by the Fund in an amount equal to the management fee it earns as an investment adviser to the affiliated Underlying Fund in which the Fund invests, except those management fees it earns from the Fund’s investments of cash collateral received in connection with securities lending transactions in the Goldman Sachs Financial Square Government Fund. For the six months ended June 30, 2019, GSAM waived $3,015 of the Fund’s management fee.
B. Distribution and Service(12b-1) Plan — The Trust, on behalf of Service Shares of the Fund, has adopted a Distribution and Service Plan subject to Rule12b-1 under the Act. Under the Distribution and Service Plan, Goldman Sachs, which serves as distributor, is entitled to a fee accrued daily and paid monthly, for distribution services and personal and account maintenance services, which may then be paid by Goldman Sachs to authorized dealers, equal to, on an annual basis, 0.25% of the Fund’s average daily net assets attributable to Service Shares.
17
GOLDMAN SACHS VARIABLE INSURANCE TRUST STRATEGIC GROWTH FUND
Notes to Financial Statements(continued)
June 30, 2019 (Unaudited)
4. AGREEMENTS AND AFFILIATED TRANSACTIONS (continued)
C. Transfer Agency Agreement — Goldman Sachs also serves as the transfer agent of the Fund for a fee pursuant to the Transfer Agency Agreement. The fees charged for such transfer agency services are accrued daily and paid monthly at an annual rate of 0.02% of the average daily net assets of Institutional and Service Shares.
D. Other Expense Agreements and Affiliated Transactions — GSAM has agreed to reduce or limit certain “Other Expenses” of the Fund (excluding acquired fund fees and expenses, transfer agency fees and expenses, service fees and shareholder administration fees (as applicable), taxes, interest, brokerage fees, expenses of shareholder meetings, litigation and indemnification, and extraordinary expenses) to the extent such expenses exceed, on an annual basis, a percentage rate of the average daily net assets of the Fund. Such Other Expense reimbursements, if any, are accrued daily and paid monthly. In addition, the Fund is not obligated to reimburse GSAM for prior fiscal year expense reimbursements, if any. The Other Expense limitation as an annual percentage rate of average daily net assets for the Fund is 0.014%. The Other Expense limitation will remain in place through at least April 30, 2020, and prior to such date GSAM may not terminate the arrangement without the approval of the Trustees. In addition, the Fund has entered into certain offset arrangements with the custodian and the transfer agent, which may result in a reduction of the Fund’s expenses and are received irrespective of the application of the “Other Expense” limitation described above.
For the six months ended June 30, 2019, these expense reductions, including any fee waivers and Other Expense reimbursements, were as follows:
| | | | | | | | | | | | |
Management
Fee Waiver | | Custody
Fee Credits | | | Other Expense
Reimbursement | | | Total Expense Reductions | |
| $3,015 | | $ | 866 | | | $ | 117,888 | | | $ | 121,769 | |
E. Line of Credit Facility — As of June 30, 2019, the Fund participated in a $580,000,000 committed, unsecured revolving line of credit facility (the “facility”) together with other funds of the Trust and certain registered investment companies having management agreements with GSAM or its affiliates. This facility is to be used for temporary emergency purposes, or to allow for an orderly liquidation of securities to meet redemption requests. The interest rate on borrowings is based on the federal funds rate. The facility also requires a fee to be paid by the Fund based on the amount of the commitment that has not been utilized. For the six months ended June 30, 2019, the Fund did not have any borrowings under the facility. Prior to April 30, 2019 the facility was $770,000,000.
F. Other Transactions with Affiliates — The following table provides information about the Fund’s investments in the Goldman Sachs Financial Square Government Fund as of and for the six months ended June 30, 2019:
| | | | | | | | | | | | | | | | | | | | |
Beginning
Value as of
December 31, 2018 | | Purchases
at Cost | | | Proceeds
from Sales | | | Ending
Value as of
June 30, 2019 | | | Shares as of
June 30, 2019 | | | Dividend Income
from Affiliated
Investment Company | |
| $— | | $ | 81,799,525 | | | $ | (80,719,470) | | | $ | 1,080,055 | | | | 1,080,055 | | | $ | 42,594 | |
5. PORTFOLIO SECURITIES TRANSACTIONS
The cost of purchases and proceeds from sales and maturities of long-term securities for the six months ended June 30, 2019, were $119,271,976 and $68,893,508, respectively.
18
GOLDMAN SACHS VARIABLE INSURANCE TRUST STRATEGIC GROWTH FUND
6. SECURITIES LENDING
The Fund may lend its securities through a securities lending agent, the Bank of New York Mellon (“BNYM”), to certain qualified borrowers. In accordance with the Fund’s securities lending procedures, the Fund receives cash collateral at least equal to the market value of the securities on loan. The market value of the loaned securities is determined at the close of business of the Fund, at their last sale price or official closing price on the principal exchange or system on which they are traded, and any additional required collateral is delivered to the Fund on the next business day. As with other extensions of credit, the Fund may experience delay in the recovery of its securities or incur a loss should the borrower of the securities breach its agreement with the Fund or become insolvent at a time when the collateral is insufficient to cover the cost of repurchasing securities on loan. Dividend income received from securities on loan may not be subject to withholding taxes and therefore withholding taxes paid may differ from the amounts listed in the Statement of Operations. Loans of securities are terminable at any time and as such 1) the remaining contractual maturities of the outstanding securities lending transactions are considered to be overnight and continuous and 2) the borrower, after notice, is required to return borrowed securities within the standard time period for settlement of securities transactions.
The Fund invests the cash collateral received in connection with securities lending transactions in the Goldman Sachs Financial Square Government Fund (“Government Money Market Fund”), an affiliated series of the Goldman Sachs Trust. The Government Money Market Fund is registered under the Act as an open end investment company, is subject to Rule2a-7 under the Act, and is managed by GSAM, for which GSAM may receive a management fee of up to 0.16% on an annualized basis of the average daily net assets of the Government Money Market Fund.
In the event of a default by a borrower with respect to any loan, BNYM may exercise any and all remedies provided under the applicable borrower agreement to make the Fund whole. These remedies include purchasing replacement securities by applying the collateral held from the defaulting broker against the purchase cost of the replacement securities. If BNYM is unable to purchase replacement securities, BNYM will indemnify the Fund by paying the Fund an amount equal to the market value of the securities loaned minus the value of cash collateral received from the borrower for the loan, subject to an exclusion for any shortfalls resulting from a loss of value in such cash collateral due to reinvestment risk. The Fund may enter into master netting agreements with borrowers, which provide the right, in the event of a default (including bankruptcy or insolvency), for thenon-defaulting party to liquidate the collateral and calculate net exposure to the defaulting party or request additional collateral. However, in the event of a default by a borrower, a resolution authority could determine that such rights are not enforceable due to the restrictions or prohibitions against the right ofset-off that may be imposed in accordance with a particular jurisdiction’s bankruptcy or insolvency laws. The Fund’s loaned securities were all subject to enforceable Securities Lending Agreements and the value of the collateral was at least equal to the value of the cash received. The amounts of the Fund’s overnight and continuous agreements, which represent the gross amounts of recognized liabilities for securities lending transactions outstanding as of June 30, 2019 are disclosed as “Payable upon return of securities loaned” on the Statement of Assets and Liabilities, where applicable.
Both the Fund and BNYM received compensation relating to the lending of the Fund’s securities. The amounts earned, if any, by the Fund for the six months ended June 30, 2019, are reported under Investment Income on the Statement of Operations.
The following table provides information about the Fund’s investment in the Government Money Market Fund for the six months ended June 30, 2019:
| | | | | | | | | | | | | | |
Beginning
Value as of December 31, 2018 | | | Purchases
at Cost | | | Proceeds
from Sales | | | Ending
Value as of
June 30, 2019 | |
| | | |
| $ | — | | | $ | 13,617,515 | | | $ | (12,151,752 | ) | | $ | 1,465,763 | |
19
GOLDMAN SACHS VARIABLE INSURANCE TRUST STRATEGIC GROWTH FUND
Notes to Financial Statements(continued)
June 30, 2019 (Unaudited)
7. TAX INFORMATION
As of the Fund’s most recent fiscal year end, December 31, 2018, the Fund’s certain timing differences, on atax-basis were as follows:
| | | | |
| Timing Differences (Post October Loss Deferral) | | $ | (1,577,639 | ) |
As of June 30, 2019, the Fund’s aggregate security unrealized gains and losses based on cost for U.S. federal income tax purposes were as follows:
| | | | |
| Tax cost | | $ | 222,064,153 | |
| Gross unrealized gain | | | 131,226,236 | |
| Gross unrealized loss | | | (3,535,755 | ) |
| Net unrealized gain | | $ | 127,690,481 | |
The difference between GAAP-basis andtax-basis unrealized gains (losses) is attributable primarily to wash sales and differences in the tax treatment of underlying fund investments.
GSAM has reviewed the Fund’s tax positions for all open tax years (the current and prior three years, as applicable) and has concluded that no provision for income tax is required in the Fund’s financial statements. Such open tax years remain subject to examination and adjustment by tax authorities.
8. OTHER RISKS
The Fund’s risks include, but are not limited to, the following:
Investments in Other Investment Companies Risk — As a shareholder of another investment company, the Fund will indirectly bear its proportionate share of any net management fees and other expenses paid by such other investment companies, in addition to the fees and expenses regularly borne by the Fund.
Large Shareholder Transactions Risk — The Fund may experience adverse effects when certain large shareholders, such as other funds, participating insurance companies, accounts and Goldman Sachs affiliates, purchase or redeem large amounts of shares of the Fund. Such large shareholder redemptions, which may occur rapidly or unexpectedly, may cause the Fund to sell portfolio securities at times when it would not otherwise do so, which may negatively impact the Fund’s NAV and liquidity. These transactions may also accelerate the realization of taxable income to shareholders if such sales of investments resulted in gains, and may also increase transaction costs. In addition, a large redemption could result in the Fund’s current expenses being allocated over a smaller asset base, leading to an increase in the Fund’s expense ratio. Similarly, large Fund share purchases may adversely affect the Fund’s performance to the extent that the Fund is delayed in investing new cash or otherwise maintains a larger cash position than it ordinarily would.
Liquidity Risk— The Fund may make investments that are illiquid or that may become less liquid in response to market developments or adverse investor perceptions. Illiquid investments may be more difficult to value. Liquidity risk may also refer to the risk that the Fund will not be able to pay redemption proceeds within the allowable time period or without significant dilution to remaining investors’ interests because of unusual market conditions, an unusually high volume of redemption requests, or other reasons. To meet redemption requests, the Fund may be forced to sell investments at an unfavorable time and/or under unfavorable conditions. If the Fund is forced to sell securities at an unfavorable time and/or under unfavorable conditions, such sales may adversely affect the Fund’s NAV and dilute remaining investors’ interests. Redemptions by large shareholders may have a negative impact on the Fund’s liquidity.
Market and Credit Risks — In the normal course of business, the Fund trades financial instruments and enters into financial transactions where risk of potential loss exists due to changes in the market (market risk). Additionally, the Fund may also be exposed to credit risk in the event that an issuer or guarantor fails to perform or that an institution or entity with which the Fund has unsettled or open transactions defaults.
20
GOLDMAN SACHS VARIABLE INSURANCE TRUST STRATEGIC GROWTH FUND
9. INDEMNIFICATIONS
Under the Trust’s organizational documents, its Trustees, officers, employees and agents are indemnified, to the extent permitted by the Act and state law, against certain liabilities that may arise out of performance of their duties to the Fund. Additionally, in the course of business, the Fund enters into contracts that contain a variety of indemnification clauses. The Fund’s maximum exposure under these arrangements is unknown, as this would involve future claims that may be made against the Fund that have not yet occurred. However, GSAM believes the risk of loss under these arrangements to be remote.
10. SUBSEQUENT EVENTS
Subsequent events after the Statement of Assets and Liabilities date have been evaluated, and GSAM has concluded that there is no impact requiring adjustment or disclosure in the financial statements.
11. SUMMARY OF SHARE TRANSACTIONS
Share activity is as follows:
| | | | | | | | | | | | | | | | |
| | | For the Six Months Ended
June 30, 2019
(Unaudited) | | | For the Fiscal Year Ended
December 31, 2018 | |
| | | Shares | | | Dollars | | | Shares | | | Dollars | |
| Institutional Shares | | | | | | | | | | | | | | | | |
| Shares sold | | | 129,354 | | | $ | 1,450,346 | | | | 707,283 | | | $ | 15,560,038 | |
| Reinvestment of distributions | | | — | | | | — | | | | 5,223,137 | | | | 51,500,129 | |
| Shares redeemed | | | (647,494 | ) | | | (7,321,853 | ) | | | (1,339,125 | ) | | | (28,892,999 | ) |
| | | | (518,140 | ) | | | (5,871,507 | ) | | | 4,591,295 | | | | 38,167,168 | |
| Service Shares | | | | | | | | | | | | | | | | |
| Shares sold | | | 7,716,159 | | | | 85,338,790 | | | | 700,489 | | | | 14,650,261 | |
| Reinvestment of distributions | | | — | | | | — | | | | 7,117,253 | | | | 70,247,289 | |
| Shares redeemed | | | (2,721,084 | ) | | | (29,647,903 | ) | | | (15,191,101 | ) | | | (312,752,864 | ) |
| | | | 4,995,075 | | | | 55,690,887 | | | | (7,373,359 | ) | | | (227,855,314 | ) |
| | | | |
| NET INCREASE (DECREASE) | | | 4,476,935 | | | $ | 49,819,380 | | | | (2,782,064 | ) | | $ | (189,688,146) | |
21
GOLDMAN SACHS VARIABLE INSURANCE TRUST STRATEGIC GROWTH FUND
| | |
| Fund Expenses — Six Month Period Ended June 30, 2019 (Unaudited) | | |
As a shareholder of Institutional or Service Shares of the Fund, you incur ongoing costs, including management fees, distribution and/or service(12b-1) fees (with respect to Service Shares) and other Fund expenses. This example is intended to help you understand your ongoing costs (in dollars) of investing in Institutional Shares and Service Shares of the Fund and to compare these costs with the ongoing costs of investing in other mutual funds.
The example is based on an investment of $1,000 invested at the beginning of the period and held for the entire period from January 1, 2019 through June 30, 2019, which represents a period of 181 days of a 365 day year.
Actual Expenses— The first line under each share class in the table below provides information about actual account values and actual expenses. You may use the information in this line, together with the amount you invested, to estimate the expenses that you paid over the period. Simply divide your account value by $1,000 (for example, an $8,600 account value divided by $1,000=8.6), then multiply the result by the number in the first line under the heading entitled “Expenses Paid” to estimate the expenses you paid on your account during this period.
Hypothetical Example for Comparison Purposes— The second line under each share class in the table below provides information about hypothetical account values and hypothetical expenses based on the Fund’s actual net expense ratio and an assumed rate of return of 5% per year before expenses, which is not the Fund’s actual return. The hypothetical account values and expenses may not be used to estimate the actual ending account balance or expenses you paid for the period. You may use this information to compare the ongoing costs of investing in the Fund and other funds. To do so, compare this 5% hypothetical example with the 5% hypothetical examples that appear in the shareholder reports of the other funds.
Please note that the expenses shown in the table are meant to highlight your ongoing costs only. As a shareholder of the Fund you do not incur any transaction costs, such as sales charges, redemption fees, or exchange fees, but shareholders of other funds may incur such costs. The second line of the table is useful in comparing ongoing costs only and will not help you determine the relative total costs of owning different funds whose shareholders may incur transaction costs.
| | | | | | | | | | | | |
| Share Class | | Beginning
Account Value
01/01/19 | | | Ending
Account Value
06/30/19 | | | Expenses Paid
for the
6 Months
Ended
06/30/19* | |
| Institutional | | | | | | | | | | | | |
| | | | |
| Actual | | $ | 1,000 | | | $ | 1,222.90 | | | $ | 4.08 | |
| Hypothetical 5% return | | | 1,000 | | | | 1,021.12 | + | | | 3.71 | |
| Service | | | | | | | | | | | | |
| | | | |
| Actual | | | 1,000 | | | | 1,221.90 | | | | 5.45 | |
| Hypothetical 5% return | | | 1,000 | | | | 1,019.89 | + | | | 4.96 | |
| | + | Hypothetical expenses are based on the Fund’s actual annualized net expense ratios and an assumed rate of return of 5% per year before expenses. | |
| | * | Expenses are calculated using the Fund’s annualized net expense ratio for each class, which represents the ongoing expenses as a percentage of net assets for the six months ended June 30, 2019. Expenses are calculated by multiplying the annualized net expense ratio by the average account value for the period; then multiplying the result by the number of days in the most recent fiscal half year; and then dividing that result by the number of days in the fiscal year. The annualized net expense ratios for the period were 0.74%, and 0.99% for Institutional and Service Shares, respectively. | |
22
GOLDMAN SACHS VARIABLE INSURANCE TRUST STRATEGIC GROWTH FUND
Statement Regarding Basis for Approval of Management Agreement (Unaudited)
Background
The Goldman Sachs Strategic Growth Fund (the “Fund”) is an investment portfolio of Goldman Sachs Variable Insurance Trust (the “Trust”). The Board of Trustees oversees the management of the Trust and reviews the investment performance and expenses of the Fund at regularly scheduled meetings held throughout the year. In addition, the Board of Trustees determines annually whether to approve the continuance of the Trust’s investment management agreement (the “Management Agreement”) with Goldman Sachs Asset Management, L.P. (the “Investment Adviser”) on behalf of the Fund.
The Management Agreement was most recently approved for continuation until June 30, 2020 by the Board of Trustees, including those Trustees who are not parties to the Management Agreement or “interested persons” (as defined in the Investment Company Act of 1940, as amended) of any party thereto (the “Independent Trustees”), at a meeting held onJune 11-12, 2019 (the “Annual Meeting”).
The review process undertaken by the Trustees spans the course of the year and culminates with the Annual Meeting. To assist the Trustees in their deliberations, the Trustees have established a Contract Review Committee (the “Committee”), comprised of the Independent Trustees. The Committee held four meetings over the course of the year since the Management Agreement was last approved. At those Committee meetings, regularly scheduled Board or other committee meetings, and/or the Annual Meeting, matters relevant to the renewal of the Management Agreement were considered by the Board, or the Independent Trustees, as applicable. With respect to the Fund, such matters included:
| | (a) | | the nature and quality of the advisory, administrative, and other services provided to the Fund by the Investment Adviser and its affiliates, including information about: |
| | (i) | | the structure, staff, and capabilities of the Investment Adviser and its portfolio management teams; |
| | (ii) | | the groups within the Investment Adviser and its affiliates that support the portfolio management teams or provide other types of necessary services, including fund services groups (e.g., accounting and financial reporting, tax, shareholder services, and operations); controls and risk management groups (e.g., legal, compliance, valuation oversight, credit risk management, internal audit, compliance testing, market risk analysis, finance, and central funding); sales and distribution support groups, and others (e.g., information technology and training); |
| | (iii) | | trends in employee headcount; |
| | (iv) | | the Investment Adviser’s financial resources and ability to hire and retain talented personnel and strengthen its operations; and |
| | (v) | | the parent company’s support of the Investment Adviser and its mutual fund business, as expressed by the firm’s senior management; |
| | (b) | | information on the investment performance of the Fund, including comparisons to the performance of similar mutual funds, as provided by a third-party mutual fund data provider engaged as part of the contract review process (the “Outside Data Provider”), a benchmark performance index, and a composite of accounts with comparable investment strategies managed by the Investment Adviser; and information on general investment outlooks in the markets in which the Fund invests; |
| | (c) | | information provided by the Investment Adviser indicating the Investment Adviser’s views on whether the Fund’s peer group and/or benchmark index had high, medium, or low relevance given the Fund’s particular investment strategy; |
| | (d) | | the terms of the Management Agreement and other agreements with affiliated service providers entered into by the Trust on behalf of the Fund; |
| | (e) | | fee and expense information for the Fund, including: |
| | (i) | | the relative management fee and expense levels of the Fund as compared to those of comparable funds managed by other advisers, as provided by the Outside Data Provider; |
| | (ii) | | the Fund’s expense trends over time; and |
| | (iii) | | to the extent the Investment Adviser manages other types of accounts (such as bank collective trusts, private wealth management accounts, institutional separate accounts,sub-advised mutual funds, andnon-U.S. funds) having investment objectives and policies similar to those of the Fund, comparative information on the advisory fees charged and services provided to those accounts by the Investment Adviser; |
| | (f) | | with respect to the extensive investment performance and expense comparison data provided by the Outside Data Provider, its processes in producing that data for the Fund; |
| | (g) | | the undertakings of the Investment Adviser and its affiliates to implement fee waivers and/or expense limitations; |
| | (h) | | information relating to the profitability of the Management Agreement and the transfer agency and distribution and service arrangements of the Fund to the Investment Adviser and its affiliates; |
| | (i) | | whether the Fund’s existing management fee schedule adequately addressed any economies of scale; |
23
GOLDMAN SACHS VARIABLE INSURANCE TRUST STRATEGIC GROWTH FUND
Statement Regarding Basis for Approval of Management Agreement (Unaudited) (continued)
| | (j) | | a summary of the“fall-out” benefits derived by the Investment Adviser and its affiliates from their relationships with the Fund, including the fees received by the Investment Adviser’s affiliates from the Fund for transfer agency, portfolio trading, distribution and other services; |
| | (k) | | a summary of potential benefits derived by the Fund as a result of its relationship with the Investment Adviser; |
| | (l) | | information regarding commissions paid by the Fund and broker oversight, an update on the Investment Adviser’s soft dollars practices, other information regarding portfolio trading, and how the Investment Adviser carries out its duty to seek best execution; |
| | (m) | | the manner in which portfolio manager compensation is determined; and the number and types of accounts managed by the portfolio managers; |
| | (n) | | the nature and quality of the services provided to the Fund by its unaffiliated service providers, and the Investment Adviser’s general oversight and evaluation (including reports on due diligence) of those service providers as part of the administrative services provided under the Management Agreement; and |
| | (o) | | the Investment Adviser’s processes and policies addressing various types of potential conflicts of interest; its approach to risk management; the annual review of the effectiveness of the Fund’s compliance program; and periodic compliance reports. |
The Trustees also received an overview of the Fund’s distribution arrangements. They received information regarding the Fund’s assets, share purchase and redemption activity, and payment of distribution and service fees. Information was also provided to the Trustees relating to revenue sharing payments made by and services provided by the Investment Adviser and its affiliates to intermediaries that promote the sale, distribution, and/or servicing of Fund shares. The Independent Trustees also discussed the broad range of other investment choices that are available to Fund investors, including the availability of comparable funds managed by other advisers.
The presentations made at the Board and Committee meetings and at the Annual Meeting encompassed the Fund and other mutual funds for which the Board of Trustees has responsibility. In evaluating the Management Agreement at the Annual Meeting, the Trustees relied upon their knowledge, resulting from their meetings and other interactions throughout the year, of the Investment Adviser and its affiliates, their services, and the Fund. In conjunction with these meetings, the Trustees received written materials and oral presentations on the topics covered, and the Investment Adviser addressed the questions and concerns of the Trustees, including concerns regarding the investment performance of certain of the funds they oversee. The Independent Trustees were advised by their independent legal counsel regarding their responsibilities and other regulatory requirements related to the approval and continuation of mutual fund investment management agreements under applicable law. In addition, the Investment Adviser and its affiliates provided the Independent Trustees with a written response to a formal request for information sent on behalf of the Independent Trustees by their independent legal counsel. During the course of their deliberations, the Independent Trustees met in executive sessions with their independent legal counsel, without representatives of the Investment Adviser or its affiliates present.
Nature, Extent, and Quality of the Services Provided Under the Management Agreement
As part of their review, the Trustees considered the nature, extent, and quality of the services provided to the Fund by the Investment Adviser. In this regard, the Trustees considered both the investment advisory services andnon-advisory services that are provided by the Investment Adviser and its affiliates. The Trustees noted the transition in the leadership and changes in personnel of various of the Investment Adviser’s portfolio management teams that had occurred in recent periods, and the ongoing recruitment efforts aimed at bringing high quality investment talent to the Investment Adviser. They also noted the Investment Adviser’s commitment to maintaining high quality systems and expending substantial resources to respond to ongoing changes to the regulatory and control environment in which the Fund and its service providers operate, as well as the efforts of the Investment Adviser and its affiliates to combat cyber security risks. The Trustees concluded that the Investment Adviser continued to commit substantial financial and operational resources to the Fund and expressed confidence that the Investment Adviser would continue to do so in the future. The Trustees also recognized that the Investment Adviser had made significant commitments to address regulatory compliance requirements applicable to the Fund and the Investment Adviser and its affiliates.
Investment Performance
The Trustees also considered the investment performance of the Fund. In this regard, they compared the investment performance ofthe Fund to its peers usingrankings and ratings compiled by the Outside Data Provider as of December 31, 2018, and updated performance information prepared by the Investment Adviser using the peer group identified by the Outside Data Provider as of March 31, 2019. The information on the Fund’s investment performance was provided for theone-, three-, five-, and
24
GOLDMAN SACHS VARIABLE INSURANCE TRUST STRATEGIC GROWTH FUND
Statement Regarding Basis for Approval of Management Agreement (Unaudited) (continued)
ten-year periods ending on the applicable dates. The Trustees also reviewed the Fund’s investment performance relative to its performance benchmark. As part of this review, they considered the investment performance trends of the Fund over time, and reviewed the investment performance of the Fund in light of its investment objective and policies and market conditions. The Trustees also received information comparing the Fund’s performance to that of a composite of accounts with comparable investment strategies managed by the Investment Adviser.
In addition, the Trustees considered materials prepared and presentations made by the Investment Adviser’s senior management and portfolio management personnel in which Fund performance was assessed. The Trustees also considered the Investment Adviser’s periodic reports with respect to the Fund’s risk profile, and how the Investment Adviser’s approach to risk monitoring and management influences portfolio management.
The Trustees observed that the Fund’s Institutional Shares had placed in the top half of the Fund’s peer group and had underperformed the Fund’s benchmark index for theone-, three-, five-, andten-year periods ended March 31, 2019. They also noted that the Fund had experienced certain portfolio management changes in 2018.
Costs of Services Provided and Competitive Information
The Trustees considered the contractual terms of the Management Agreement and the fee rates payable by the Fund thereunder. In this regard, the Trustees considered information on the services rendered by the Investment Adviser to the Fund, which included both advisory and administrative services that were directed to the needs and operations of the Fund as a registered mutual fund.
In particular, the Trustees reviewed analyses prepared by the Outside Data Provider regarding the expense rankings of the Fund. The analyses provided a comparison of the Fund’s management fee and breakpoints to those of a relevant peer group and category universe; an expense analysis which compared the Fund’s overall net and gross expenses to a peer group and a category universe; and data comparing the Fund’s net expenses to the peer and category medians. The analyses also compared the Fund’s other expenses and fee waivers/reimbursements to those of the peer group and category medians. The Trustees concluded that the comparisons provided by the Outside Data Provider were useful in evaluating the reasonableness of the management fees and total expenses paid by the Fund.
In addition, the Trustees considered the Investment Adviser’s undertakings to implement fee waivers and/or expense limitations. They also considered, to the extent that the Investment Adviser manages other types of accounts having investment objectives and policies similar to those of the Fund, comparative fee information for services provided by the Investment Adviser to those accounts, and information that indicated that services provided to the Fund differed in various significant respects from the services provided to other types of accounts which, in many cases, operated under less stringent legal and regulatory structures, required fewer services from the Investment Adviser to a smaller number of client contact points, and were less time-intensive.
In addition, the Trustees noted that shareholders are able to redeem their Fund shares at any time if shareholders believe that the Fund fees and expenses are too high or if they are dissatisfied with the performance of the Fund.
Profitability
The Trustees reviewed the Fund’s contribution to the Investment Adviser’s revenues andpre-tax profit margins. In this regard the Trustees noted that they had received, among other things, profitability analyses and summaries, revenue and expense schedules by Fund and by function (i.e., investment management, transfer agency and distribution and service), and information on the Investment Adviser’s expense allocation methodology. They observed that the profitability and expense figures are substantially similar to those used by the Investment Adviser for many internal purposes, including compensation decisions among various business groups, and are thus subject to a vigorous internal debate about how certain revenue and expenses should be allocated. The Trustees also noted that the internal audit group within the Goldman Sachs organization periodically audits the expense allocation methodology and that the internal audit group was satisfied with the reasonableness, consistency, and accuracy of the Investment Adviser’s expense allocation methodology. Profitability data for the Fund was provided for 2018 and 2017, and the Trustees considered this information in relation to the Investment Adviser’s overall profitability.
25
GOLDMAN SACHS VARIABLE INSURANCE TRUST STRATEGIC GROWTH FUND
Statement Regarding Basis for Approval of Management Agreement (Unaudited) (continued)
Economies of Scale
The Trustees considered the information that had been provided regarding whether there have been economies of scale with respect to the management of the Fund. The Trustees also considered the breakpoints in the fee rate payable under the Management Agreement for the Fund at the following annual percentage rates of the average daily net assets of the Fund:
| | | | |
| |
| First $1 billion | | | 0.71 | % |
| |
| Next $1 billion | | | 0.64 | |
| |
| Next $3 billion | | | 0.61 | |
| |
| Next $3 billion | | | 0.59 | |
| |
| Over $8 billion | | | 0.58 | |
The Trustees noted that the breakpoints were designed to share potential economies of scale, if any, with the Fund and its shareholders as assets under management reach those asset levels. The Trustees considered the amounts of assets in the Fund; the Fund’s recent share purchase and redemption activity; the information provided by the Investment Adviser relating to the costs of the services provided by the Investment Adviser and its affiliates and their realized profits; information comparing fee rates charged by the Investment Adviser with fee rates charged to other funds in the peer group; and the Investment Adviser’s undertaking to limit certain expenses of the Fund that exceed a specified level. Upon reviewing these matters at the Annual Meeting, the Trustees concluded that the fee breakpoints represented a means of assuring that benefits of scalability, if any, would be passed along to shareholders at the specified asset levels.
Other Benefits to the Investment Adviser and Its Affiliates
The Trustees also considered the other benefits derived by the Investment Adviser and its affiliates from their relationships with the Fund as stated above, including: (a) transfer agency fees received by Goldman Sachs & Co. LLC (“Goldman Sachs”); (b) brokerage and futures commissions earned by Goldman Sachs for executing securities and futures transactions on behalf of the Fund; (c) research received by the Investment Adviser from broker-dealers in exchange for executing certain transactions on behalf of the Fund; (d) trading efficiencies resulting from aggregation of orders of the Fund with those for other funds or accounts managed by the Investment Adviser; (e) fees earned by the Investment Adviser for managing the fund in which the Fund’s securities lending cash collateral is invested; (f) the Investment Adviser’s ability to leverage the infrastructure designed to service the Fund on behalf of its other clients; (g) the Investment Adviser’s ability to cross-market other products and services to Fund shareholders; (h) Goldman Sachs’ retention of certain fees as Fund Distributor; (i) the Investment Adviser’s ability to negotiate better pricing with custodians on behalf of its other clients, as a result of the relationship with the Fund; and (j) the possibility that the working relationship between the Investment Adviser and the Fund’s third-party service providers may cause those service providers to be more likely to do business with other areas of Goldman Sachs. In the course of considering the foregoing, the Independent Trustees requested and received further information quantifying certain of thesefall-out benefits.
Other Benefits to the Fund and Its Shareholders
The Trustees also noted that the Fund receives certain other potential benefits as a result of its relationship with the Investment Adviser, including: (a) trading efficiencies resulting from aggregation of orders of the Fund with those of other funds or accounts managed by the Investment Adviser; (b) enhanced servicing from vendors due to the volume of business generated by the Investment Adviser and its affiliates; (c) enhanced servicing from broker-dealers due to the volume of business generated by the Investment Adviser and its affiliates; (d) the Investment Adviser’s ability to negotiate favorable terms with derivatives counterparties on behalf of the Fund as a result of the size and reputation of the Goldman Sachs organization; (e) the advantages received from the Investment Adviser’s knowledge and experience gained from managing other accounts and products; (f) the Investment Adviser’s ability to hire and retain qualified personnel to provide services to the Fund because of the reputation of the Goldman Sachs organization; (g) the Fund’s access, through the Investment Adviser, to certain firm-wide resources (e.g., proprietary risk management systems and databases), subject to certain restrictions; and (h) the Fund’s access to certain affiliated distribution channels. In addition, the Trustees noted the competitive nature of the mutual fund marketplace, and considered that many of the Fund’s shareholders invested in the Fund in part because of the Fund’s relationship with the Investment Adviser and that those shareholders have a general expectation that the relationship will continue.
26
GOLDMAN SACHS VARIABLE INSURANCE TRUST STRATEGIC GROWTH FUND
Statement Regarding Basis for Approval of Management Agreement (Unaudited) (continued)
Conclusion
In connection with their consideration of the Management Agreement, the Trustees gave weight to each of the factors described above, but did not identify any particular factor as controlling their decision. After deliberation and consideration of all of the information provided, including the factors described above, the Trustees concluded, in the exercise of their business judgment, that the management fees paid by the Fund were reasonable in light of the services provided to it by the Investment Adviser, the Investment Adviser’s costs and the Fund’s current and reasonably foreseeable asset levels. The Trustees unanimously concluded that the Investment Adviser’s continued management likely would benefit the Fund and its shareholders and that the Management Agreement should be approved and continued with respect to the Fund until June 30, 2020.
27
| | |
| TRUSTEES | | OFFICERS |
| Jessica Palmer,Chair | | James A. McNamara,President |
| Kathryn A. Cassidy | | Joseph F. DiMaria,Principal Financial Officer, |
| Diana M. Daniels | | Principal Accounting Officer and Treasurer |
| James A. McNamara | | Caroline L. Kraus,Secretary |
| Roy W. Templin | | |
Gregory G. Weaver | | |
GOLDMAN SACHS & CO. LLC
Distributor and Transfer Agent
GOLDMAN SACHS ASSET MANAGEMENT, L.P.
Investment Adviser
200 West Street, New York
New York 10282
Visit our web site at www.GSAMFUNDS.com to obtain the most recentmonth-end returns.
The reports concerning the Fund included in this shareholder report may contain certain forward-looking statements about the factors that may affect the performance of the Fund in the future. These statements are based on Fund management’s predictions and expectations concerning certain future events and their expected impact on the Fund, such as performance of the economy as a whole and of specific industry sectors, changes in the levels of interest rates, the impact of developing world events, and other factors that may influence the future performance of the Fund. Management believes these forward-looking statements to be reasonable, although they are inherently uncertain and difficult to predict. Actual events may cause adjustments in portfolio management strategies from those currently expected to be employed.
A description of the policies and procedures that the Fund uses to determine how to vote proxies relating to portfolio securities and information regarding how the Fund voted proxies relating to portfolio securities for the12-month period ended June 30 is available (i) without charge, upon request by calling1-800-621-2550; and (ii) on the Securities and Exchange Commission (“SEC”) web site athttp://www.sec.gov.
The Fund will file its portfolio holdings information for each month in a fiscal quarter within 60 days after the end of the relevant fiscal quarter on Form N-PORT. Portfolio holdings information for the third month of each fiscal quarter will be made available on the SEC’s web site at http://www.sec.gov. Portfolio holdings information may be obtained upon request and without charge by calling 1-800-526-7384 (for Retail Shareholders) or 1-800-621-2550 (for Institutional Shareholders).
Views and opinions expressed are for informational purposes only and do not constitute a recommendation by GSAM to buy, sell, or hold any security. Views and opinions are current as of the date of this presentation and may be subject to change, they should not be construed as investment advice.
Goldman Sachs & Co. LLC (“Goldman Sachs”) does not provide legal, tax or accounting advice. Any statement contained in this communication (including any attachments) concerning U.S. tax matters was not intended or written to be used, and cannot be used, for the purpose of avoiding penalties under the Internal Revenue Code, and was written to support the promotion or marketing of transaction or matter addressed. Clients of Goldman Sachs should obtain their own independent tax advice based on their particular circumstances.
The website links provided are for your convenience only and are not an endorsement or recommendation by GSAM of any of these websites or the products or services offered. GSAM is not responsible for the accuracy and validity of the content of these websites.
Fund holdings and allocations shown are as of June 30, 2019 and may not be representative of future investments. Fund holdings should not be relied on in making investment decisions and should not be construed as research or investment advice regarding particular securities. Current and future holdings are subject to risk.
References to indices, benchmarks or other measures of relative market performance over a specified period of time are provided for your information only and do not imply that the portfolio will achieve similar results. The index composition may not reflect the manner in which a portfolio is constructed. While an adviser seeks to design a portfolio which reflects appropriate risk and return features, portfolio characteristics may deviate from those of the benchmark.
The Global Industry Classification Standard (“GICS”) was developed by and is the exclusive property and a service mark of Morgan Stanley Capital International Inc. (“MSCI”) and Standard & Poor’s, a division of The McGraw-Hill Companies, Inc. (“S&P”) and is licensed for use by Goldman Sachs. Neither MSCI, S&P nor any other party involved in making or compiling the GICS or any GICS classifications makes any express or implied warranties or representations with respect to such standard or classification (or the results to be obtained by the use thereof), and all such parties hereby expressly disclaim all warranties of originality, accuracy, completeness, merchantability or fitness for a particular purpose with respect to any of such standard or classification. Without limiting any of the foregoing, in no event shall MSCI, S&P, any of their affiliates or any third party involved in making or compiling the GICS or any GICS classifications have any liability for any direct, indirect, special, punitive, consequential or any other damages (including lost profits) even if notified of the possibility of such damages.
The portfolio risk management process includes an effort to monitor and manage risk, but does not imply low risk.
Shares of the Goldman Sachs VIT Funds are offered to separate accounts of participating life insurance companies for the purpose of funding variable annuity contracts and variable life insurance policies. Shares of the Fund are not offered directly to the general public. The variable annuity contracts and variable life insurance policies are described in the separate prospectuses issued by participating insurance companies. You should refer to those prospectuses for information about surrender charges, mortality and expense risk fees and other charges that may be assessed by participating insurance companies under the variable annuity contracts or variable life insurance policies. Such fees or charges, if any, may affect the return you may realize with respect to your investments. Ask your representative for more complete information. Please consider a fund’s objectives, risks and charges and expenses, and read the prospectus carefully before investing. The prospectus contains this and other information about the Fund.
This material is not authorized for distribution to prospective investors unless preceded or accompanied by a current prospectus or summary prospectus, if applicable. Investors should consider the Fund’s objective, risks, and charges and expenses, and read the summary prospectus, if available, and/or the prospectus carefully before investing or sending money. The summary prospectus, if available, and the prospectus contain this and other information about the Fund and may be obtained from your authorized dealer or from Goldman Sachs & Co. LLC by calling1-800-621-2550.
This report is prepared for the general information of contract owners and is not an offer of shares of the Goldman Sachs Variable Insurance Trust — Goldman Sachs Strategic Growth Fund.
© 2019 Goldman Sachs. All rights reserved.
VITGRWSAR-19/175376-OTU-1025573
Goldman
SachsVariable Insurance Trust
Goldman Sachs
International Equity Insights Fund
Beginning on or after January 1, 2021, you may not receive paper copies of the Fund’s annual and semi-annual shareholder reports from the insurance company that offers your variable insurance contract or your financial intermediary, unless you specifically request paper copies of the reports from the insurance company or from your financial intermediary. Instead, the reports will be made available on a website, and you will be notified by mail each time a report is posted and provided with a website link to access the report.
If you already elected to receive shareholder reports electronically, you will not be affected by this change and you need not take any action. At any time, you may elect to receive reports and certain communications from the insurance company electronically by contacting your insurance company or your financial intermediary.
You may elect to receive all future shareholder reports in paper free of charge. You can inform the insurance company or your financial intermediary that you wish to receive paper copies of reports. Your election to receive reports in paper will apply to all Goldman Sachs Funds available under your contract and may apply to all funds held with your financial intermediary.
Semi-Annual Report
June 30, 2019

GOLDMAN SACHS VARIABLE INSURANCE TRUST INTERNATIONAL EQUITY INSIGHTS FUND
INVESTMENT OBJECTIVE
The Fund seeks long-term growth of capital.
Portfolio Management Discussion and Analysis
Below, the Goldman Sachs Quantitative Investment Strategies Team discuss the Goldman Sachs Variable Insurance Trust — Goldman Sachs International Equity Insights Fund’s (the “Fund”) performance and positioning for thesix-month period ended June 30, 2019 (the “Reporting Period”).
How did the Fund perform during the Reporting Period?
During the Reporting Period, the Fund’s Institutional and Service Shares generated cumulative total returns of 12.29% and 12.10%, respectively. These returns compare to the 14.03% cumulative total return of the Fund’s benchmark, the MSCI Europe, Australasia, Far East (EAFE) Standard Index (net, USD, unhedged) (the “MSCI EAFE Index”), during the same time period.
What economic and market factors most influenced the international equity markets as a whole during the Reporting Period?
International equities, as measured by the MSCI EAFE Index, posted a return of 14.03% in U.S. dollar terms for the Reporting Period as a whole.
During the first quarter of 2019, international developed equity markets rebounded across all regions, recovering from weakness in 2018. The U.S. Federal Reserve (the “Fed”) shifted to a dovish stance amidst slower economic growth. (Dovish tends to suggest lower interest rates; opposite of hawkish.) In addition, there was seemingly significant progress made in the trade talks between China and the U.S., paving the way for a potential resolution. European equities remained resilient despite the overhang of Brexit and slowing economic data in the region. (Brexit is the popular term for the U.K.’s path out of the European Union.) Japanese equities gained during the first quarter of 2019, as fears around the extent of the global economic growth slowdown eased and the yen gradually weakened.
International developed equity markets continued to advance during the second quarter of 2019, albeit more modestly so than in the prior quarter. International developed equity markets were supported by the U.S. Fed’s signals of its dovish outlook for the remainder of the calendar year. Equities also performed well in April 2019 while awaiting U.S.-China trade talks to reconvene at the G20 Summit scheduled for the end of June 2019. (Also known as Group of 20 nations, the G20 is a forum attended by finance ministers and central bank governors from the world’s highly developed economies consisting of 19 countries and the European Union.) However, negotiations were halted in May 2019 following the increase of tariffs from 10% to 25% on $200 billion of Chinese goods by the U.S. This degradation of trade talks contributed to a volatile May, and the MSCI EAFE Index declined 4.80% for the month. On June 18, 2019, the U.S. President announced that he and President Xi of China would be meeting on the sidelines of the G20 Summit in Osaka, Japan on June 29th to discuss the ongoing trade impasse, resulting in an immediate positive market reaction. The result was both sides agreeing to restart negotiations, and the U.S. agreeing to put plans for the additional tariffs of 25% on all remaining imports from China on an indefinite hold. In an additional positive surprise, the U.S. agreed to lift restrictions it had put in place on Chinese technology firm Huawei, allowing it to purchase equipmentnon-threatening to U.S. national security from U.S. firms. The outcome of the G20 Summit was similar to the previous one held in Buenos Aires in 2018, i.e. it led to a temporary truce in trade tensions, a delay in raising tariffs, but no firm resolution.
For the Reporting Period overall, all 11 sectors of the MSCI EAFE Index gained, with information technology leading the way, followed by materials and industrials. Communication services, utilities and energy were the weakest performers on the basis of total return during the Reporting Period.
From a country perspective, all equity markets in the MSCI EAFE Index posted a positive absolute return during the Reporting Period. Switzerland, New Zealand and the Netherlands were the strongest individual country constituents in the MSCI EAFE Index on a relative basis during the Reporting Period. Israel, Japan and Finland posted positive absolute returns but most significantly lagged the MSCI EAFE Index on a relative basis during the Reporting Period.
1
GOLDMAN SACHS VARIABLE INSURANCE TRUST INTERNATIONAL EQUITY INSIGHTS FUND
What key factors were responsible for the Fund’s performance during the Reporting Period?
The Fund uses a quantitative style of management, in combination with a qualitative overlay, that emphasizes fundamentally-based stock selection, careful portfolio construction and efficient implementation. The Fund’s investments are selected using fundamental research and a variety of quantitative techniques based on certain investment themes, namely Fundamental Mispricings, High Quality Business Models, Sentiment Analysis and Market Themes & Trends.
During the Reporting Period, the Fund posted double-digit absolute gains but underperformed the MSCI EAFE Index, with three of our quantitative model’s four investment themes detracting from results. Stock selection driven by these investment themes diminished relative performance.
What impact did the Fund’s investment themes have on performance during the Reporting Period?
In keeping with our investment approach, we use our quantitative model and four investment themes to take a long-term view of market patterns and look for inefficiencies, selecting stocks for the Fund and overweighting or underweighting the ones chosen by the model. Over time and by design, the performance of any one of the model’s investment themes tends to have a low correlation with the model’s other themes, demonstrating the diversification benefit of the Fund’s theme-driven quantitative model. The variance in performance supports our research indicating that the diversification provided by the Fund’s different investment themes is a significant investment advantage over the long term, even though the Fund may experience underperformance in the short term. Of course, diversification does not protect an investor from market risk nor does it ensure a profit.
During the Reporting Period, three of our four investment themes — Fundamental Mispricings, High Quality Business Models and Market Themes & Trends — detracted from the Fund’s relative performance. The other investment theme — Sentiment Analysis — contributed positively. Fundamental Mispricing seeks to identify high quality businesses trading at a fair price, which we believe may lead to strong performance over the long run. High Quality Business Models seeks to identify companies that are generating high quality revenues with sustainable business models and aligned management incentives. Market Themes & Trends seeks to identify companies positively positioned to benefit from themes and trends in the market and macroeconomic environment. Sentiment Analysis seeks to identify stocks experiencing improvements in their overall market sentiment.
How did the Fund’s sector and industry allocations affect relative performance during the Reporting Period?
In constructing the Fund’s portfolio, we focus on picking stocks rather than making sector or industry bets. Consequently, the Fund is similar to its benchmark, the MSCI EAFE Index, in terms of its sector and industry allocations and style. Changes in its sector or industry weights generally do not have a meaningful impact on relative performance.
Did stock selection help or hurt Fund performance during the Reporting Period?
We seek to outpace the MSCI EAFE Index by overweighting stocks that we expect to outperform and underweighting those that we think may lag. At the same time, we strive to maintain a risk profile similar to the MSCI EAFE Index. The Fund’s investments are selected using fundamental research and a variety of quantitative techniques based on our investment themes. For example, the Fund aims to hold a basket of stocks with better Fundamental Mispricings characteristics than the benchmark index.
During the Reporting Period, stock selection hampered the Fund’s performance, with investments in the consumer staples, industrials and utilities sectors detracting most from results relative to the MSCI EAFE Index. Holdings in the information technology, financials and health care sectors added to the Fund’s relative returns.
Which individual positions detracted from the Fund’s results during the Reporting Period?
Detracting most from the Fund’s results relative to the MSCI EAFE Index were overweight positions in U.K.-based transportation services provider International Consolidated Airlines Group and U.K.-based tobacco company Imperial Brands and an underweight position in France-based diversified luxury goods producer LVMH Moet Hennessy Louis Vuitton. The overweights in International Consolidated Airlines Group and Imperial Brands were each implemented primarily because of our High Quality Business Models and Sentiment Analysis investment themes. An underweight in LVMH Moet Hennessy Louis Vuitton was established due mainly to our Fundamental Mispricings and High Quality Business Models investment themes.
Which individual stock positions contributed the most to the Fund’s relative returns during the Reporting Period?
The Fund benefited most from overweight positions in adidas, a Germany-based sports shoes, apparel and equipment manufacturer; 3i Group, a U.K.-based asset management company; and Koninklijke DSM, a Netherlands-based life sciences and materials sciences company. The overweight in adidas was fueled mainly by our Market Themes & Trends and High Quality Business Models investment themes. Driven by our Sentiment Analysis, Fundamental Mispricings and High Quality Business Models
2
GOLDMAN SACHS VARIABLE INSURANCE TRUST INTERNATIONAL EQUITY INSIGHTS FUND
investment themes, the Fund benefited from its overweight in 3i Group. An overweight in Koninklijke DSM was established primarily because of our Sentiment Analysis and Market Themes & Trends investment themes.
What impact did country selection have on the Fund’s relative performance during the Reporting Period?
To construct the Fund’s portfolio, we focus on security selection rather than on making country bets. As a result, the Fund is similar to the MSCI EAFE Index in terms of its country allocation. Changes in the Fund’s country weightings are generally the result of our stock picking.
Did you make any enhancements to your quantitative models during the Reporting Period?
We continuously look for ways to improve our investment process. During the Reporting Period, we made numerous enhancements to our models. As example, in the second quarter of 2019, we introduced a number of new signals.
First, within our Sentiment Analysis investment theme, we added a suite of signals that utilizes data from the short selling market as an indicator of the market sentiment surrounding individual names.
Second, within our Market Themes & Trends investment theme, we added a signal that examines the cross-holdings of pooled vehicles to identify thematic trends in the market. Also within our Market Themes & Trends investment theme, we added a signal that examines internet linkages between companies to identify thematic trends.
Finally, within our Fundamental Mispricings investment theme, we added a signal that we believe to be predictive of industry rotations.
How did the Fund use derivatives during the Reporting Period?
During the Reporting Period, we did not use derivatives as part of an active management strategy to add value to the Fund’s results. However, we used equity index futures contracts, on an opportunistic basis, to equitize the Fund’s excess cash holdings. In other words, we put the Fund’s excess cash holdings to work by using them as collateral for the purchase of stock futures. The use of these futures contracts did not have a material impact on the Fund’s performance during the second part of the Reporting Period.
What were the Fund’s sector and country weightings at the end of the Reporting Period?
As of June 30, 2019, the Fund was overweight the industrials, information technology, real estate and health care sectors relative to the MSCI EAFE Index. The Fund was underweight consumer staples, energy, financials, consumer discretionary and materials and rather neutral to the MSCI EAFE Index in utilities and communication services on the same date.
In terms of countries, the Fund was overweight relative to the MSCI EAFE Index in Norway, Japan and Sweden. Compared to the MSCI EAFE Index, the Fund was underweight in Germany, the U.K. and Australia and was relatively neutral compared to the MSCI EAFE Index in the remaining constituents of the MSCI EAFE Index at the end of the Reporting Period.
Were there any changes to the Fund’s portfolio management team during the Reporting Period?
There were no changes to the Fund’s portfolio management team during the Reporting Period.
What is your strategy going forward for the Fund?
Looking ahead, we continue to believe that less expensive stocks should outpace more expensive stocks, and stocks with good momentum are likely to outperform those with poor momentum. We intend to maintain our focus on seeking companies about which fundamental research analysts are becoming more positive as well as profitable companies with sustainable earnings and a track record of using their capital to enhance shareholder value. As such, we anticipate remaining fully invested with long-term performance likely to be the result of stock selection rather than sector or capitalization allocations.
We stand behind our investment philosophy that sound economic investment principles, coupled with a disciplined quantitative approach, can provide strong, uncorrelated returns over the long term. Our research agenda is robust, and we continue to enhance our existing models, add new proprietary forecasting signals and improve our trading execution as we seek to provide the most value to our shareholders.
3
GOLDMAN SACHS VARIABLE INSURANCE TRUST INTERNATIONAL EQUITY INSIGHTS FUND
Index Definitions
The MSCI EAFE Standard Index is a market capitalization-weighted composite of securities in 21 developed markets. The MSCI EAFE Standard Index approximates the minimum possible dividend reinvestment. The dividend is reinvested after deduction for withholding tax, applying the rate to non-resident individuals who do not benefit from double taxation treaties. MSCI uses withholding tax rates applicable to Luxembourg holding companies, as Luxembourg applies the highest rates. The MSCI EAFE Standard Index is unmanaged and the figures for the Index do not include any deduction for fees or expenses.
It is not possible to invest directly in an index.
4
FUND BASICS
International Equity Insights Fund
as of June 30, 2019
STANDARDIZED TOTAL RETURNS1
| | | | | | | | | | | | | | | | | | |
| | | | | |
| For the period ended 6/30/19 | | One Year | | | Five Years | | | Ten Years | | | Since Inception | | | Inception Date |
| Institutional | | | -3.42 | % | | | 0.99 | % | | | 6.25 | % | | | 3.59 | % | | 1/12/98 |
| Service | | | -3.72 | | | | 0.71 | | | | 5.98 | | | | 1.89 | | | 1/09/06 |
| 1 | The Standardized Total Returns are average annual total returns as of the most recent calendar quarter-end. They assume reinvestment of all distributions at net asset value (“NAV”). Because Institutional Shares and Service Shares do not involve a sales charge, such a charge is not applied to their Standardized Total Returns. |
Total return figures in the above chart represent past performance and do not indicate future results, which will vary. The investment return and principal value of an investment will fluctuate and, therefore, an investor’s shares, when redeemed, may be worth more or less than their original cost. Current performance may be lower or higher than the total return figures in the above chart. Please visit www.GSAMFUNDS.com to obtain the most recent month-end returns.
Performance reflects fee waivers and/or expense limitations in effect during the periods shown. In their absence, performance would be reduced.
EXPENSE RATIOS2
| | | | | | | | | | | | |
| | | |
| | | Net Expense Ratio (Current) | | | Gross Expense Ratio (Before Waivers) | | | | |
| Institutional | | | 0.87 | % | | | 1.19 | % | | | | |
| Service | | | 1.12 | | | | 1.44 | | | | | |
| 2 | The expense ratios of the Fund, both current (net of any fee waivers and/or expense limitations) and before waivers (gross of any fee waivers and/or expense limitations) are as set forth above according to the most recent publicly available Prospectuses for the Fund and may differ from the expense ratios disclosed in the Financial Highlights in this report. Pursuant to a contractual arrangement, the Fund’s fee waivers and/or expense limitations will remain in place through at least April 30, 2020, and prior to such date, the Investment Adviser may not terminate the arrangements without the approval of the Fund’s Board of Trustees. If these arrangements are discontinued in the future, the expense ratios may change without shareholder approval. |
TOP TEN HOLDINGS AS OF 6/30/193
| | | | | | | | |
| | | |
| Holding | | % of
Net Assets | | | Line of Business | | Country |
| Roche Holding AG | | | 2.3% | | | Pharmaceuticals, Biotechnology & Life Sciences | | Switzerland |
| AIA Group Ltd. | | | 1.6 | | | Insurance | | Hong Kong |
| Novo Nordisk A/S Class B | | | 1.4 | | | Pharmaceuticals, Biotechnology & Life Sciences | | Denmark |
| Diageo plc | | | 1.3 | | | Food, Beverage & Tobacco | | United Kingdom |
| adidas AG | | | 1.2 | | | Consumer Durables & Apparel | | Germany |
| Safran SA | | | 1.2 | | | Capital Goods | | France |
| Air Liquide SA | | | 1.1 | | | Materials | | France |
| Schneider Electric SE | | | 1.1 | | | Capital Goods | | France |
| Nestle SA (Registered) | | | 1.1 | | | Food, Beverage & Tobacco | | Switzerland |
| Wolters Kluwer NV | | | 1.0 | | | Commercial & Professional Services | | Netherlands |
| 3 | The top 10 holdings may not be representative of the Fund’s future investments. |
5
FUND BASICS
International Equity Insights Fund(continued)
as of June 30, 2019
FUND VS. BENCHMARK SECTOR ALLOCATIONS4
As of June 30, 2019
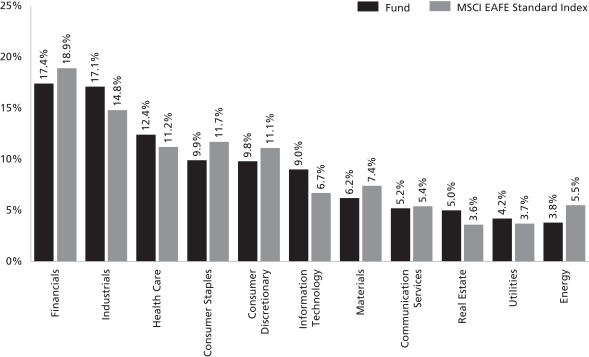
| 4 | The Fund is actively managed and, as such, its composition may differ over time. Consequently, the Fund’s overall sector allocations may differ from percentages contained in the graph above. The graph categorizes investments using Global Industry Classification Standard (“GICS”); however, the sector classifications used by the portfolio management team may differ from GICS. The percentage shown for each investment category reflects the value of investments in that category as a percentage of market value (excluding investments in the securities lending reinvestment vehicle, if any). Investments in the securities lending reinvestment vehicle represented 0.4% of the Fund’s net assets at June 30, 2019. The graph depicts the Fund’s investments but may not represent the Fund’s market exposure due to the exclusion of certain derivatives, if any, as listed in the Additional Investment Information section of the Schedule of Investments. |
6
GOLDMAN SACHS VARIABLE INSURANCE TRUST INTERNATIONAL EQUITY INSIGHTS FUND
Schedule of Investments
June 30, 2019 (Unaudited)
| | | | | | | | |
Shares | | | Description | | Value | |
|
| Common Stocks – 96.8% | |
| Australia – 6.9% | |
| | 10,050 | | | Altium Ltd. (Software & Services) | | $ | 242,599 | |
| | 10,951 | | | ASX Ltd. (Diversified Financials) | | | 634,468 | |
| | 2,927 | | | Aurizon Holdings Ltd. (Transportation) | | | 11,111 | |
| | 33,352 | | | Australia & New Zealand Banking Group Ltd. (Banks) | | | 662,015 | |
| | 29,742 | | | BHP Group plc (Materials) | | | 760,633 | |
| | 80,910 | | | Boral Ltd. (Materials) | | | 291,795 | |
| | 7,006 | | | CIMIC Group Ltd. (Capital Goods) | | | 220,307 | |
| | 89,317 | | | Coca-Cola Amatil Ltd. (Food, Beverage & Tobacco) | | | 641,209 | |
| | 3,966 | | | Commonwealth Bank of Australia (Banks) | | | 230,776 | |
| | 34,772 | | | Evolution Mining Ltd. (Materials) | | | 106,569 | |
| | 18,785 | | | Fortescue Metals Group Ltd. (Materials) | | | 119,465 | |
| | 43,035 | | | Goodman Group (REIT) | | | 454,871 | |
| | 46,719 | | | Insurance Australia Group Ltd. (Insurance) | | | 271,249 | |
| | 1,796 | | | Magellan Financial Group Ltd. (Diversified Financials) | | | 64,477 | |
| | 10,198 | | | QBE Insurance Group Ltd. (Insurance) | | | 84,839 | |
| | 1,169 | | | Rio Tinto Ltd. (Materials) | | | 85,600 | |
| | 10,103 | | | Rio Tinto plc ADR (Materials) | | | 629,821 | |
| | 12,894 | | | Vicinity Centres (REIT) | | | 22,200 | |
| | 26,745 | | | Woodside Petroleum Ltd. (Energy) | | | 685,971 | |
| | | | | | | | |
| | | | | | | 6,219,975 | |
| | |
| Austria – 0.4% | |
| | 8,139 | | | OMV AG (Energy) | | | 396,733 | |
| | |
| Belgium – 1.1% | |
| | 360 | | | Anheuser-Busch InBev SA/NV (Food, Beverage & Tobacco) | | | 31,857 | |
| | 6,116 | | | KBC Group NV (Banks) | | | 401,365 | |
| | 6,316 | | | UCB SA (Pharmaceuticals, Biotechnology & Life Sciences) | | | 524,162 | |
| | 66 | | | Warehouses De Pauw CVA (REIT) | | | 11,107 | |
| | | | | | | | |
| | | | | | | 968,491 | |
| | |
| China – 0.6% | |
| | 1,400 | | | ENN Energy Holdings Ltd. (Utilities) | | | 13,624 | |
| | 483,000 | | | Towngas China Co. Ltd. (Utilities)* | | | 347,936 | |
| | 174,200 | | | Yangzijiang Shipbuilding Holdings Ltd. (Capital Goods) | | | 197,363 | |
| | | | | | | | |
| | | | | | | 558,923 | |
| | |
| Denmark – 2.6% | |
| | 4,887 | | | Carlsberg A/S Class B (Food, Beverage & Tobacco) | | | 648,492 | |
| | 9,283 | | | GN Store Nord A/S (Health Care Equipment & Services) | | | 433,957 | |
| | 23,878 | | | Novo Nordisk A/S Class B (Pharmaceuticals, Biotechnology & Life Sciences) | | | 1,219,621 | |
| | |
|
| Common Stocks – (continued) | |
| Denmark – (continued) | |
| | 462 | | | Vestas Wind Systems A/S (Capital Goods) | | | 40,025 | |
| | | | | | | | |
| | | | | | | 2,342,095 | |
| | |
| Finland – 0.1% | |
| | 2,512 | | | Valmet OYJ (Capital Goods) | | | 62,668 | |
| | |
| France – 10.8% | |
| | 7,206 | | | Air Liquide SA (Materials) | | | 1,007,892 | |
| | 2,453 | | | Arkema SA (Materials) | | | 228,042 | |
| | 17,441 | | | BNP Paribas SA (Banks) | | | 826,796 | |
| | 1,277 | | | Christian Dior SE (Consumer Durables & Apparel) | | | 669,679 | |
| | 2,319 | | | Dassault Systemes SE (Software & Services) | | | 369,893 | |
| | 5,937 | | | Eiffage SA (Capital Goods) | | | 586,751 | |
| | 919 | | | Gecina SA (REIT) | | | 137,521 | |
| | 252 | | | Ipsen SA (Pharmaceuticals, Biotechnology & Life Sciences) | | | 34,372 | |
| | 1,442 | | | Kering SA (Consumer Durables & Apparel) | | | 851,101 | |
| | 8,057 | | | Lagardere SCA (Media & Entertainment) | | | 209,908 | |
| | 6,070 | | | Legrand SA (Capital Goods) | | | 443,770 | |
| | 873 | | | Pernod Ricard SA (Food, Beverage & Tobacco) | | | 160,786 | |
| | 20,169 | | | Peugeot SA (Automobiles & Components) | | | 496,409 | |
| | 7,281 | | | Publicis Groupe SA (Media & Entertainment) | | | 384,297 | |
| | 7,446 | | | Safran SA (Capital Goods) | | | 1,089,289 | |
| | 10,941 | | | Schneider Electric SE (Capital Goods) | | | 989,973 | |
| | 6,796 | | | SCOR SE (Insurance) | | | 297,929 | |
| | 1,587 | | | Societe Generale SA (Banks) | | | 40,055 | |
| | 2,965 | | | Teleperformance (Commercial & Professional Services) | | | 594,058 | |
| | 5,122 | | | TOTAL SA (Energy) | | | 287,312 | |
| | | | | | | | |
| | | | | | | 9,705,833 | |
| | |
| Germany – 5.9% | |
| | 3,542 | | | adidas AG (Consumer Durables & Apparel) | | | 1,095,789 | |
| | 543 | | | Allianz SE (Registered) (Insurance) | | | 130,959 | |
| | 7,310 | | | CANCOM SE (Software & Services) | | | 388,005 | |
| | 7,491 | | | Covestro AG (Materials)(a) | | | 381,364 | |
| | 307 | | | Deutsche Boerse AG (Diversified Financials) | | | 43,339 | |
| | 1,470 | | | Deutsche Post AG (Registered) (Transportation) | | | 48,358 | |
| | 52,781 | | | E.ON SE (Utilities) | | | 572,680 | |
| | 20,035 | | | Evotec SE (Pharmaceuticals, Biotechnology & Life Sciences)* | | | 560,934 | |
| | 1,582 | | | GEA Group AG (Capital Goods) | | | 44,898 | |
| | 16,219 | | | Infineon Technologies AG (Semiconductors & Semiconductor Equipment) | | | 288,206 | |
| | |
| | |
| The accompanying notes are an integral part of these financial statements. | | 7 |
GOLDMAN SACHS VARIABLE INSURANCE TRUST INTERNATIONAL EQUITY INSIGHTS FUND
Schedule of Investments(continued)
June 30, 2019 (Unaudited)
| | | | | | | | |
Shares | | | Description | | Value | |
|
| Common Stocks – (continued) | |
| Germany – (continued) | |
| | 3,756 | | | Merck KGaA (Pharmaceuticals, Biotechnology & Life Sciences) | | $ | 392,319 | |
| | 3,648 | | | Nemetschek SE (Software & Services) | | | 219,766 | |
| | 21,657 | | | ProSiebenSat.1 Media SE (Media & Entertainment) | | | 339,269 | |
| | 4,154 | | | RWE AG (Utilities) | | | 102,502 | |
| | 2,013 | | | RWE AG (Preference) (Non-Voting) (Utilities)(b) | | | 49,820 | |
| | 279 | | | SAP SE (Software & Services) | | | 38,249 | |
| | 3,327 | | | Wirecard AG (Software & Services) | | | 561,652 | |
| | | | | | | | |
| | | | | | | 5,258,109 | |
| | |
| Hong Kong – 4.4% | |
| | 132,000 | | | AIA Group Ltd. (Insurance) | | | 1,425,455 | |
| | 44,000 | | | CK Asset Holdings Ltd. (Real Estate) | | | 344,699 | |
| | 26,000 | | | CK Hutchison Holdings Ltd. (Capital Goods) | | | 256,458 | |
| | 55,500 | | | CLP Holdings Ltd. (Utilities) | | | 611,599 | |
| | 18,827 | | | Hong Kong Exchanges & Clearing Ltd. (Diversified Financials) | | | 665,348 | |
| | 50,500 | | | Kerry Properties Ltd. (Real Estate) | | | 212,126 | |
| | 114,000 | | | NWS Holdings Ltd. (Capital Goods) | | | 234,472 | |
| | 70,000 | | | Swire Pacific Ltd. Class B (Real Estate) | | | 132,781 | |
| | 10,500 | | | Yue Yuen Industrial Holdings Ltd. (Consumer Durables & Apparel) | | | 28,800 | |
| | | | | | | | |
| | | | | | | 3,911,738 | |
| | |
| Italy – 2.3% | |
| | 1,850 | | | Avio SpA (Capital Goods) | | | 30,545 | |
| | 732 | | | DiaSorin SpA (Health Care Equipment & Services) | | | 85,038 | |
| | 17,609 | | | Eni SpA (Energy) | | | 292,790 | |
| | 27,625 | | | Iren SpA (Utilities) | | | 71,809 | |
| | 21,246 | | | Leonardo SpA (Capital Goods) | | | 269,538 | |
| | 49,139 | | | Mediobanca Banca di Credito Finanziario SpA (Banks) | | | 506,711 | |
| | 5,137 | | | Moncler SpA (Consumer Durables & Apparel) | | | 220,179 | |
| | 55,599 | | | Terna Rete Elettrica Nazionale SpA (Utilities) | | | 354,256 | |
| | 21,046 | | | UniCredit SpA (Banks) | | | 259,052 | |
| | | | | | | | |
| | | | | | | 2,089,918 | |
| | |
| Japan – 24.5% | |
| | 3,100 | | | AEON Financial Service Co. Ltd. (Diversified Financials) | | | 50,034 | |
| | 32,500 | | | Ajinomoto Co., Inc. (Food, Beverage & Tobacco) | | | 563,834 | |
| | 2,900 | | | Asahi Group Holdings Ltd. (Food, Beverage & Tobacco) | | | 130,554 | |
| | 900 | | | Asahi Kasei Corp. (Materials) | | | 9,621 | |
| | 46,800 | | | Astellas Pharma, Inc. (Pharmaceuticals, Biotechnology & Life Sciences) | | | 666,936 | |
| | |
|
| Common Stocks – (continued) | |
| Japan – (continued) | |
| | 13,400 | | | Benesse Holdings, Inc. (Consumer Services) | | | 312,721 | |
| | 3,500 | | | Central Japan Railway Co. (Transportation) | | | 701,778 | |
| | 14,700 | | | Chubu Electric Power Co., Inc. (Utilities) | | | 206,496 | |
| | 2,300 | | | Computer Institute of Japan Ltd. (Software & Services) | | | 21,474 | |
| | 22,900 | | | Daiwa House Industry Co. Ltd. (Real Estate) | | | 669,154 | |
| | 36 | | | Daiwa House REIT Investment Corp. (REIT) | | | 86,898 | |
| | 9,900 | | | DeNA Co. Ltd. (Media & Entertainment) | | | 189,809 | |
| | 7,600 | | | East Japan Railway Co. (Transportation) | | | 711,693 | |
| | 2,200 | | | Eisai Co. Ltd. (Pharmaceuticals, Biotechnology & Life Sciences) | | | 124,688 | |
| | 2,100 | | | ESCRIT, Inc. (Consumer Services) | | | 14,715 | |
| | 1,700 | | | Fuji Electric Co. Ltd. (Capital Goods) | | | 58,916 | |
| | 700 | | | Fujimori Kogyo Co. Ltd. (Materials) | | | 18,826 | |
| | 8,800 | | | Fujitsu Ltd. (Software & Services) | | | 614,999 | |
| | 900 | | | Heiwa Corp. (Consumer Durables & Apparel) | | | 18,515 | |
| | 24,200 | | | Hitachi Ltd. (Technology Hardware & Equipment) | | | 890,384 | |
| | 7,100 | | | Hulic Co. Ltd. (Real Estate) | | | 57,160 | |
| | 1,500 | | | IBJ, Inc. (Consumer Services) | | | 12,560 | |
| | 3,400 | | | ISB Corp. (Software & Services) | | | 52,632 | |
| | 9,300 | | | Japan Airlines Co. Ltd. (Transportation) | | | 296,816 | |
| | 72 | | | Japan Retail Fund Investment Corp. (REIT) | | | 145,628 | |
| | 3,000 | | | Japan Tobacco, Inc. (Food, Beverage & Tobacco) | | | 66,131 | |
| | 20,900 | | | JXTG Holdings, Inc. (Energy) | | | 104,164 | |
| | 10,400 | | | Kao Corp. (Household & Personal Products) | | | 793,565 | |
| | 19,100 | | | KDDI Corp. (Telecommunication Services) | | | 486,032 | |
| | 10,200 | | | Konami Holdings Corp. (Media & Entertainment) | | | 479,795 | |
| | 2,500 | | | Kyocera Corp. (Technology Hardware & Equipment) | | | 163,809 | |
| | 7,200 | | | LIXIL Group Corp. (Capital Goods) | | | 114,214 | |
| | 800 | | | Mandom Corp. (Household & Personal Products) | | | 19,399 | |
| | 2,600 | | | Matsumotokiyoshi Holdings Co. Ltd. (Food & Staples Retailing) | | | 76,369 | |
| | 500 | | | Media Do Holdings Co. Ltd. (Retailing) | | | 14,083 | |
| | 14,100 | | | Mitsubishi Heavy Industries Ltd. (Capital Goods) | | | 614,930 | |
| | 1,500 | | | Mitsubishi Materials Corp. (Materials) | | | 42,733 | |
| | 24,000 | | | Mitsui & Co. Ltd. (Capital Goods) | | | 391,750 | |
| | 26,900 | | | Mitsui Fudosan Co. Ltd. (Real Estate) | | | 653,783 | |
| | |
| | |
| 8 | | The accompanying notes are an integral part of these financial statements. |
GOLDMAN SACHS VARIABLE INSURANCE TRUST INTERNATIONAL EQUITY INSIGHTS FUND
| | | | | | | | |
Shares | | | Description | | Value | |
|
| Common Stocks – (continued) | |
| Japan – (continued) | |
| | 3,100 | | | MS&AD Insurance Group Holdings, Inc. (Insurance) | | $ | 98,538 | |
| | 4,300 | | | NEC Networks & System Integration Corp. (Software & Services) | | | 109,761 | |
| | 5,800 | | | Nexon Co. Ltd. (Media & Entertainment)* | | | 84,736 | |
| | 2,100 | | | Nippon Telegraph & Telephone Corp. (Telecommunication Services) | | | 97,838 | |
| | 600 | | | Nissin Foods Holdings Co. Ltd. (Food, Beverage & Tobacco) | | | 38,701 | |
| | 7,400 | | | Nomura Real Estate Holdings, Inc. (Real Estate) | | | 159,389 | |
| | 12,900 | | | Nomura Research Institute Ltd. (Software & Services) | | | 207,448 | |
| | 1,000 | | | NS Solutions Corp. (Software & Services) | | | 31,819 | |
| | 38,300 | | | NTT Data Corp. (Software & Services) | | | 511,384 | |
| | 6,900 | | | NTT DOCOMO, Inc. (Telecommunication Services) | | | 160,990 | |
| | 4,100 | | | Obayashi Corp. (Capital Goods) | | | 40,503 | |
| | 500 | | | OBIC Business Consultants Co. Ltd. (Software & Services) | | | 22,725 | |
| | 1,600 | | | Obic Co. Ltd. (Software & Services) | | | 181,832 | |
| | 45,000 | | | ORIX Corp. (Diversified Financials) | | | 672,520 | |
| | 28,900 | | | Osaka Gas Co. Ltd. (Utilities) | | | 504,362 | |
| | 8,700 | | | PC Depot Corp. (Retailing) | | | 34,580 | |
| | 2,900 | | | Pola Orbis Holdings, Inc. (Household & Personal Products) | | | 81,264 | |
| | 6,200 | | | Rohto Pharmaceutical Co. Ltd. (Pharmaceuticals, Biotechnology & Life Sciences) | | | 168,804 | |
| | 2,600 | | | Santen Pharmaceutical Co. Ltd. (Pharmaceuticals, Biotechnology & Life Sciences) | | | 43,225 | |
| | 46,500 | | | Sega Sammy Holdings, Inc. (Consumer Durables & Apparel) | | | 566,123 | |
| | 700 | | | Seibu Holdings, Inc. (Transportation) | | | 11,686 | |
| | 1,600 | | | Sekisui Chemical Co. Ltd. (Consumer Durables & Apparel) | | | 24,092 | |
| | 4,100 | | | Shin Nippon Biomedical Laboratories Ltd. (Pharmaceuticals, Biotechnology & Life Sciences)* | | | 26,642 | |
| | 13,500 | | | Shionogi & Co. Ltd. (Pharmaceuticals, Biotechnology & Life Sciences) | | | 780,068 | |
| | 15,600 | | | SoftBank Group Corp. (Telecommunication Services) | | | 751,379 | |
| | 16,200 | | | Sony Corp. (Consumer Durables & Apparel) | | | 851,310 | |
| | 19,700 | | | Subaru Corp. (Automobiles & Components) | | | 479,639 | |
| | 5,200 | | | Sumitomo Corp. (Capital Goods) | | | 78,978 | |
| | 16,100 | | | Sumitomo Heavy Industries Ltd. (Capital Goods) | | | 556,221 | |
| | |
|
| Common Stocks – (continued) | |
| Japan – (continued) | |
| | 1,500 | | | Sumitomo Mitsui Financial Group, Inc. (Banks) | | | 53,169 | |
| | 17,500 | | | Sumitomo Mitsui Trust Holdings, Inc. (Banks) | | | 635,803 | |
| | 4,600 | | | Sumitomo Realty & Development Co. Ltd. (Real Estate) | | | 164,564 | |
| | 2,400 | | | Sundrug Co. Ltd. (Food & Staples Retailing) | | | 65,090 | |
| | 2,300 | | | System Integrator Corp. (Software & Services) | | | 14,292 | |
| | 12,900 | | | Taisei Corp. (Capital Goods) | | | 469,902 | |
| | 3,900 | | | TDK Corp. (Technology Hardware & Equipment) | | | 303,786 | |
| | 11,700 | | | TIS, Inc. (Software & Services) | | | 597,914 | |
| | 1,300 | | | Tokio Marine Holdings, Inc. (Insurance) | | | 65,228 | |
| | 1,900 | | | Toshiba Corp. (Capital Goods) | | | 59,232 | |
| | 9,900 | | | Toyota Motor Corp. (Automobiles & Components) | | | 614,432 | |
| | 161 | | | United Urban Investment Corp. (REIT) | | | 269,859 | |
| | 192,800 | | | Yahoo Japan Corp. (Media & Entertainment) | | | 567,130 | |
| | 10,500 | | | Yamada Denki Co. Ltd. (Retailing) | | | 46,470 | |
| | 1,200 | | | Yamatane Corp. (Food & Staples Retailing) | | | 15,307 | |
| | 3,200 | | | Zuken, Inc. (Software & Services) | | | 53,628 | |
| | | | | | | | |
| | | | | | | 22,019,961 | |
| | |
| Netherlands – 5.4% | |
| | 23,086 | | | ABN AMRO Bank NV CVA (Banks)(a) | | | 493,983 | |
| | 7,300 | | | Akzo Nobel NV (Materials) | | | 685,983 | |
| | 3,440 | | | ASML Holding NV (Semiconductors & Semiconductor Equipment) | | | 715,829 | |
| | 10,804 | | | ASR Nederland NV (Insurance) | | | 438,981 | |
| | 1,977 | | | BE Semiconductor Industries NV (Semiconductors & Semiconductor Equipment) | | | 50,730 | |
| | 1,142 | | | Euronext NV (Diversified Financials)(a) | | | 86,403 | |
| | 2,428 | | | Koninklijke Philips NV (Health Care Equipment & Services) | | | 105,559 | |
| | 2,398 | | | NXP Semiconductors NV (Semiconductors & Semiconductor Equipment) | | | 234,069 | |
| | 4,083 | | | Randstad NV (Commercial & Professional Services) | | | 224,086 | |
| | 14,905 | | | Royal Dutch Shell plc Class A (Energy) | | | 485,355 | |
| | 10,605 | | | Royal Dutch Shell plc Class B (Energy) | | | 347,491 | |
| | 246 | | | Sligro Food Group NV (Food & Staples Retailing) | | | 9,161 | |
| | 12,623 | | | Wolters Kluwer NV (Commercial & Professional Services) | | | 918,340 | |
| | | | | | | | |
| | | | | | | 4,795,970 | |
| | |
| | |
| The accompanying notes are an integral part of these financial statements. | | 9 |
GOLDMAN SACHS VARIABLE INSURANCE TRUST INTERNATIONAL EQUITY INSIGHTS FUND
Schedule of Investments(continued)
June 30, 2019 (Unaudited)
| | | | | | | | |
Shares | | | Description | | Value | |
|
| Common Stocks – (continued) | |
| New Zealand – 0.0% | |
| | 3,151 | | | Trustpower Ltd. (Utilities) | | $ | 15,679 | |
| | |
| Norway – 2.2% | |
| | 4,614 | | | Aker BP ASA (Energy) | | | 133,073 | |
| | 3,782 | | | Austevoll Seafood ASA (Food, Beverage & Tobacco) | | | 39,752 | |
| | 33,863 | | | DNB ASA (Banks) | | | 630,991 | |
| | 7,494 | | | Kongsberg Gruppen ASA (Capital Goods) | | | 104,751 | |
| | 37,445 | | | Leroy Seafood Group ASA (Food, Beverage & Tobacco) | | | 248,070 | |
| | 4,654 | | | Mowi ASA (Food, Beverage & Tobacco) | | | 108,899 | |
| | 9,264 | | | Orkla ASA (Food, Beverage & Tobacco) | | | 82,217 | |
| | 8,165 | | | Salmar ASA (Food, Beverage & Tobacco) | | | 355,445 | |
| | 23,882 | | | SpareBank 1 SR-Bank ASA (Banks) | | | 291,149 | |
| | | | | | | | |
| | | | | | | 1,994,347 | |
| | |
| Portugal – 0.6% | |
| | 136,841 | | | EDP - Energias de Portugal SA (Utilities) | | | 520,056 | |
| | |
| Singapore – 0.6% | |
| | 84,900 | | | Singapore Exchange Ltd. (Diversified Financials) | | | 497,389 | |
| | |
| Spain – 3.8% | |
| | 8,242 | | | ACS Actividades de Construccion y Servicios SA (Capital Goods) | | | 329,754 | |
| | 139,011 | | | Banco Bilbao Vizcaya Argentaria SA (Banks) | | | 775,359 | |
| | 98,509 | | | Banco Santander SA (Banks) | | | 456,555 | |
| | 8,153 | | | Enagas SA (Energy) | | | 217,576 | |
| | 5,982 | | | Iberdrola SA (Utilities) | | | 59,558 | |
| | 38,265 | | | Merlin Properties Socimi SA (REIT) | | | 530,410 | |
| | 22,966 | | | Repsol SA (Energy) | | | 360,402 | |
| | 82,550 | | | Telefonica SA (Telecommunication Services) | | | 678,834 | |
| | | | | | | | |
| | | | | | | 3,408,448 | |
| | |
| Sweden – 4.1% | |
| | 18,388 | | | Atlas Copco AB Class A (Capital Goods) | | | 589,255 | |
| | 1,235 | | | Atlas Copco AB Class B (Capital Goods) | | | 35,507 | |
| | 12,662 | | | Biotage AB (Pharmaceuticals, Biotechnology & Life Sciences) | | | 148,663 | |
| | 20,218 | | | Boliden AB (Materials) | | | 518,065 | |
| | 21,927 | | | Electrolux ABSeries B (Consumer Durables & Apparel) | | | 562,067 | |
| | 28,371 | | | Sandvik AB (Capital Goods) | | | 521,347 | |
| | 11,040 | | | Swedish Match AB (Food, Beverage & Tobacco) | | | 466,752 | |
| | |
|
| Common Stocks – (continued) | |
| Sweden – (continued) | |
| | 32,528 | | | Telefonaktiebolaget LM Ericsson Class B (Technology Hardware & Equipment) | | | 308,747 | |
| | 31,180 | | | Volvo AB Class B (Capital Goods) | | | 495,440 | |
| | | | | | | | |
| | | | | | | 3,645,843 | |
| | |
| Switzerland – 9.0% | |
| | 10,798 | | | Adecco Group AG (Registered) (Commercial & Professional Services) | | | 648,932 | |
| | 66 | | | Baloise Holding AG (Registered) (Insurance) | | | 11,689 | |
| | 1,904 | | | BKW AG (Utilities) | | | 127,225 | |
| | 3,056 | | | Coca-Cola HBC AG (Food, Beverage & Tobacco)* | | | 115,441 | |
| | 1,818 | | | Galenica AG (Health Care Equipment & Services)(a) | | | 91,353 | |
| | 10,326 | | | LafargeHolcim Ltd. (Registered) (Materials)* | | | 504,906 | |
| | 2,350 | | | Lonza Group AG (Registered) (Pharmaceuticals, Biotechnology & Life Sciences)* | | | 793,343 | |
| | 9,274 | | | Nestle SA (Registered) (Food, Beverage & Tobacco) | | | 960,065 | |
| | 4,877 | | | Novartis AG (Registered) (Pharmaceuticals, Biotechnology & Life Sciences) | | | 445,230 | |
| | 112 | | | Partners Group Holding AG (Diversified Financials) | | | 88,079 | |
| | 7,315 | | | Roche Holding AG (Pharmaceuticals, Biotechnology & Life Sciences) | | | 2,056,889 | |
| | 966 | | | Siegfried Holding AG (Registered) (Pharmaceuticals, Biotechnology & Life Sciences)* | | | 336,593 | |
| | 2,709 | | | Sonova Holding AG (Registered) (Health Care Equipment & Services)(c) | | | 616,565 | |
| | 2,697 | | | Tecan Group AG (Registered) (Pharmaceuticals, Biotechnology & Life Sciences) | | | 700,429 | |
| | 3,161 | | | Temenos AG (Registered) (Software & Services)* | | | 565,990 | |
| | | | | | | | |
| | | | | | | 8,062,729 | |
| | |
| United Kingdom – 11.3% | |
| | 50,984 | | | 3i Group plc (Diversified Financials) | | | 721,319 | |
| | 12,792 | | | Abcam plc (Pharmaceuticals, Biotechnology & Life Sciences) | | | 239,454 | |
| | 4,249 | | | Ashtead Group plc (Capital Goods) | | | 121,740 | |
| | 115,855 | | | Aviva plc (Insurance) | | | 613,633 | |
| | 28,184 | | | Barratt Developments plc (Consumer Durables & Apparel) | | | 205,095 | |
| | 421 | | | BP plc ADR (Energy) | | | 17,556 | |
| | 18,303 | | | British American Tobacco plc (Food, Beverage & Tobacco) | | | 639,067 | |
| | |
| | |
| 10 | | The accompanying notes are an integral part of these financial statements. |
GOLDMAN SACHS VARIABLE INSURANCE TRUST INTERNATIONAL EQUITY INSIGHTS FUND
| | | | | | | | |
Shares | | | Description | | Value | |
|
| Common Stocks – (continued) | |
| United Kingdom – (continued) | |
| | 34,650 | | | BT Group plc (Telecommunication Services) | | $ | 86,636 | |
| | 27,762 | | | Diageo plc (Food, Beverage & Tobacco) | | | 1,194,884 | |
| | 131,915 | | | Direct Line Insurance Group plc (Insurance) | | | 556,059 | |
| | 28,396 | | | Experian plc (Commercial & Professional Services) | | | 860,103 | |
| | 16,252 | | | Fiat Chrysler Automobiles NV (Automobiles & Components) | | | 225,552 | |
| | 26,740 | | | Great Portland Estates plc (REIT) | | | 232,401 | |
| | 22,193 | | | HSBC Holdings plc (Banks) | | | 185,229 | |
| | 22,800 | | | Imperial Brands plc (Food, Beverage & Tobacco) | | | 535,006 | |
| | 64,772 | | | International Consolidated Airlines Group SA (Transportation) | | | 392,691 | |
| | 5,457 | | | Intertek Group plc (Commercial & Professional Services) | | | 381,499 | |
| | 208,202 | | | Legal & General Group plc (Insurance) | | | 713,303 | |
| | 554,203 | | | Lloyds Banking Group plc (Banks) | | | 398,040 | |
| | 11,882 | | | National Grid plc (Utilities) | | | 126,363 | |
| | 9,292 | | | Next plc (Retailing) | | | 650,690 | |
| | 2,801 | | | Pearson plc (Media & Entertainment) | | | 29,142 | |
| | 12,781 | | | Persimmon plc (Consumer Durables & Apparel) | | | 324,701 | |
| | 8,063 | | | Smith & Nephew plc (Health Care Equipment & Services) | | | 175,085 | |
| | 478 | | | Unilever NV CVA (Household & Personal Products) | | | 29,042 | |
| | 7,892 | | | Unilever plc ADR (Household & Personal Products) | | | 489,067 | |
| | | | | | | | |
| | | | | | | 10,143,357 | |
| | |
| United States – 0.2% | |
| | 4,457 | | | Carnival plc ADR (Consumer Services) | | | 201,768 | |
| | |
| | TOTAL COMMON STOCKS | | | | |
| | (Cost $86,205,776) | | $ | 86,820,030 | |
| | |
| | | | | | | | | | | | |
| Units | | | Description | | Expiration
Month | | | Value | |
|
| Right* – 0.0% | |
| Spain – 0.0% | |
| | 13,553 | | | ACS Actividades de Construccion y Servicios SA (Capital Goods) | | | 07/2019 | | | $ | 21,267 | |
| | (Cost $22,612) | | | | | | | | |
| | |
| TOTAL INVESTMENTS BEFORE SECURITIES LENDING
REINVESTMENT VEHICLE |
|
| | (Cost $86,228,388) | | | $ | 86,841,297 | |
| | |
| | | | | | | | |
| Shares | | | Dividend Rate | | Value | |
|
| Securities Lending Reinvestment Vehicle(d)– 0.4% | |
| Goldman Sachs Financial Square Government Fund —
Institutional Shares |
|
| | 375,643 | | | 2.308% | | $ | 375,643 | |
| (Cost $375,643) | |
| | |
| | TOTAL INVESTMENTS – 97.2% | | | | |
| | (Cost $86,604,031) | | $ | 87,216,940 | |
| | |
| OTHER ASSETS IN EXCESS OF
LIABILITIES – 2.8% | | | 2,530,428 | |
| | |
| | NET ASSETS – 100.0% | | $ | 89,747,368 | |
| | |
| | |
| The percentage shown for each investment category reflects the value of investments in that category as a percentage of net assets. |
| |
| * | | Non-income producing security. |
| |
| (a) | | Exempt from registration under Rule 144A of the Securities Act of 1933. |
| |
| (b) | | Preference Shares are a special type of equity investment that shares in the earnings of the company, has limited voting rights, and receives a greater dividend than applicable Common Shares. |
| |
| (c) | | All or a portion of security is on loan. |
| |
| (d) | | Represents an Affiliated Issuer. |
| | |
| |
| Investment Abbreviations: |
| ADR | | —American Depositary Receipt |
| CVA | | —Dutch Certification |
| REIT | | —Real Estate Investment Trust |
| | |
| The accompanying notes are an integral part of these financial statements. | | 11 |
GOLDMAN SACHS VARIABLE INSURANCE TRUST INTERNATIONAL EQUITY INSIGHTS FUND
Schedule of Investments(continued)
June 30, 2019 (Unaudited)
ADDITIONAL INVESTMENT INFORMATION
FUTURES CONTRACTS — At June 30, 2019, the Fund had the following futures contracts:
| | | | | | | | | | | | | | |
| Description | | Number of
Contracts | | | Expiration
Date | | Notional
Amount | | | Unrealized
Appreciation/
(Depreciation) | |
| | |
Long position contracts: | | | | | | | | |
| EURO STOXX 50 Index | | | 9 | | | 09/20/2019 | | $ | 354,707 | | | $ | 9,631 | |
| FTSE 100 Index | | | 2 | | | 09/20/2019 | | | 187,165 | | | | 2,326 | |
| SPI 200 Index | | | 1 | | | 09/19/2019 | | | 115,119 | | | | 1,454 | |
TOPIX Index | | | 1 | | | 09/12/2019 | | | 143,857 | | | | 916 | |
| |
| Total Futures Contracts | | | $ | 14,327 | |
| | |
| 12 | | The accompanying notes are an integral part of these financial statements. |
GOLDMAN SACHS VARIABLE INSURANCE TRUST INTERNATIONAL EQUITY INSIGHTS FUND
Statement of Assets and Liabilities
June 30, 2019 (Unaudited)
| | | | |
| | | | |
| Assets: | | | |
Investments in unaffiliated issuers, at value (cost $86,228,388)(a) | | $ | 86,841,297 | |
Investments in affiliated securities lending reinvestment vehicle, at value (cost $375,643) | | | 375,643 | |
Cash | | | 1,239,173 | |
Foreign currencies, at value (cost $1,361,560) | | | 1,359,440 | |
Receivables: | | | | |
Investments sold | | | 2,912,983 | |
Foreign tax reclaims | | | 435,389 | |
Dividends | | | 132,304 | |
Collateral on certain derivative contracts | | | 42,225 | |
Reimbursement from investment adviser | | | 32,144 | |
Fund shares sold | | | 17,344 | |
Securities lending income | | | 2,465 | |
Variation margin on futures | | | 3,395 | |
Other assets | | | 357 | |
| |
| Total assets | | | 93,394,159 | |
| | | | |
| | | | |
| Liabilities: | | | |
Payables: | | | | |
Investments purchased | | | 2,821,144 | |
Payable upon return of securities loaned | | | 375,643 | |
Fund shares redeemed | | | 225,603 | |
Management fees | | | 58,536 | |
Distribution and Service fees and Transfer Agency fees | | | 11,083 | |
Accrued expenses | | | 154,782 | |
| |
| Total liabilities | | | 3,646,791 | |
| | | | |
| | | | |
| Net Assets: | | | |
Paid-in capital | | | 93,671,030 | |
Total distributable earnings (loss) | | | (3,923,662 | ) |
| |
| NET ASSETS | | $ | 89,747,368 | |
Net Assets: | | | | |
Institutional | | $ | 41,836,729 | |
Service | | | 47,910,639 | |
| |
Total Net Assets | | $ | 89,747,368 | |
Shares outstanding $0.001 par value (unlimited shares authorized): | | | | |
Institutional | | | 5,265,843 | |
Service | | | 6,011,273 | |
Net asset value, offering and redemption price per share: | | | | |
Institutional | | | $7.94 | |
Service | | | 7.97 | |
(a) Includes loaned securities having a market value of $361,049.
| | |
| The accompanying notes are an integral part of these financial statements. | | 13 |
GOLDMAN SACHS VARIABLE INSURANCE TRUST INTERNATIONAL EQUITY INSIGHTS FUND
Statement of Operations
For the Six Months Ended June 30, 2019 (Unaudited)
| | | | |
| | | | |
| Investment income: | | | |
Dividends — unaffiliated issuers (net of foreign taxes withheld of $200,429) | | $ | 1,846,042 | |
Securities lending income — affiliated issuer | | | 9,085 | |
| |
| Total investment income | | | 1,855,127 | |
| | | | |
| | | | |
| Expenses: | | | |
Management fees | | | 352,899 | |
Professional fees | | | 81,171 | |
Custody, accounting and administrative services | | | 64,401 | |
Distribution and Service fees — Service Shares | | | 58,394 | |
Printing and mailing costs | | | 37,766 | |
Transfer Agency fees(a) | | | 8,713 | |
Trustee fees | | | 8,007 | |
Registration fees | | | 635 | |
Other | | | 6,567 | |
| |
| Total expenses | | | 618,553 | |
| |
Less — expense reductions | | | (179,956 | ) |
| |
| Net expenses | | | 438,597 | |
| |
| NET INVESTMENT INCOME | | | 1,416,530 | |
| | | | |
| | | | |
| Realized and unrealized gain (loss): | | | |
Net realized gain (loss) from: | | | | |
Investments — unaffiliated issuers | | | (4,009,068 | ) |
Futures contracts | | | 165,581 | |
Foreign currency transactions | | | (27,613 | ) |
Net change in unrealized gain on: | | | | |
Investments — unaffiliated issuers | | | 12,240,874 | |
Futures contracts | | | 50,861 | |
Foreign currency translation | | | 20,510 | |
| |
| Net realized and unrealized gain | | | 8,441,145 | |
| |
| NET INCREASE IN NET ASSETS RESULTING FROM OPERATIONS | | $ | 9,857,675 | |
(a) Institutional and Service Shares incurred Transfer Agency fees of $4,042 and $4,671, respectively.
| | |
| 14 | | The accompanying notes are an integral part of these financial statements. |
GOLDMAN SACHS VARIABLE INSURANCE TRUST INTERNATIONAL EQUITY INSIGHTS FUND
Statements of Changes in Net Assets
| | | | | | | | |
| | | For the
Six Months Ended
June 30, 2019
(Unaudited) | | | For the
Fiscal Year Ended
December 31, 2018 | |
| | | | | | | | |
| From operations: | |
Net investment income | | $ | 1,416,530 | | | $ | 1,622,663 | |
Net realized gain (loss) | | | (3,871,100 | ) | | | 19,596,686 | |
Net change in unrealized gain (loss) | | | 12,312,245 | | | | (37,795,771 | ) |
| | |
| Net increase (decrease) in net assets resulting from operations | | | 9,857,675 | | | | (16,576,422 | ) |
| | | | | | | | |
| | | | | | | | |
| Distributions to shareholders: | |
From distributable earnings: | | | | | | | | |
Institutional Shares | | | — | | | | (8,500,382 | ) |
Service Shares | | | — | | | | (9,678,544 | ) |
| | |
| Total distributions to shareholders | | | — | | | | (18,178,926 | ) |
| | | | | | | | |
| | | | | | | | |
| From share transactions: | | | | | | |
Proceeds from sales of shares | | | 3,466,987 | | | | 12,142,507 | |
Reinvestment of distributions | | | — | | | | 18,178,926 | |
Cost of shares redeemed | | | (5,329,354 | ) | | | (79,104,015 | ) |
| | |
| Net decrease in net assets resulting from share transactions | | | (1,862,367 | ) | | | (48,782,582 | ) |
| | |
| TOTAL INCREASE (DECREASE) | | | 7,995,308 | | | | (83,537,930 | ) |
| | | | | | | | |
| | | | | | | | |
| Net Assets: | | | | | | |
| | |
Beginning of period | | | 81,752,060 | | | | 165,289,990 | |
| | |
End of period | | $ | 89,747,368 | | | $ | 81,752,060 | |
| | |
| The accompanying notes are an integral part of these financial statements. | | 15 |
GOLDMAN SACHS VARIABLE INSURANCE TRUST INTERNATIONAL EQUITY INSIGHTS FUND
Financial Highlights
Selected Data for a Share Outstanding Throughout Each Period
| | | | | | | | | | | | | | | | | | | | | | | | |
| | | Goldman Sachs International Equity Insights Fund | |
| | | Institutional Shares | |
| | | Six Months Ended
June 30, 2019
(Unaudited) | | | Year Ended December 31, | |
| | 2018 | | | 2017 | | | 2016 | | | 2015 | | | 2014 | |
| | | | | | | | | | | | | | | | | | | | | | | | |
| Per Share Data | | | | | | | | | | | | | | | | | | |
| | | | | | |
Net asset value, beginning of period | | $ | 7.08 | | | $ | 10.88 | | | $ | 8.75 | | | $ | 9.19 | | | $ | 9.26 | | | $ | 10.43 | |
| | | | | | |
Net investment income(a) | | | 0.13 | | | | 0.19 | | | | 0.17 | | | | 0.17 | (b) | | | 0.14 | (c) | | | 0.39 | (d) |
| | | | | | |
Net realized and unrealized gain (loss) | | | 0.73 | | | | (1.94 | ) | | | 2.16 | | | | (0.42 | ) | | | (0.04 | ) | | | (1.18 | ) |
| | | | | | |
Total from investment operations | | | 0.86 | | | | (1.75 | ) | | | 2.33 | | | | (0.25 | ) | | | 0.10 | | | | (0.79 | ) |
| | | | | | |
Distributions to shareholders from net investment income | | | — | | | | (0.21 | ) | | | (0.20 | ) | | | (0.19 | ) | | | (0.17 | ) | | | (0.38 | ) |
| | | | | | |
Distributions to shareholders from net realized gains | | | — | | | | (1.84 | ) | | | — | | | | — | | | | — | | | | — | |
| | | | | | |
Total distributions | | | — | | | | (2.05 | ) | | | (0.20 | ) | | | (0.19 | ) | | | (0.17 | ) | | | (0.38 | ) |
| | | | | | |
Net asset value, end of period | | $ | 7.94 | | | $ | 7.08 | | | $ | 10.88 | | | $ | 8.75 | | | $ | 9.19 | | | $ | 9.26 | |
| | | | | | |
Total return(e) | | | 12.29 | % | | | (16.28 | )% | | | 26.60 | % | | | (2.72 | )% | | | 1.05 | % | | | (7.54 | )% |
| | | | | | |
Net assets, end of period (in 000s) | | $ | 41,837 | | | $ | 37,829 | | | $ | 41,512 | | | $ | 37,061 | | | $ | 41,737 | | | $ | 46,871 | |
| | | | | | |
Ratio of net expenses to average net assets | | | 0.87 | %(f) | | | 0.87 | % | | | 0.87 | % | | | 0.89 | % | | | 0.89 | % | | | 0.99 | % |
| | | | | | |
Ratio of total expenses to average net assets | | | 1.29 | %(f) | | | 1.23 | % | | | 1.02 | % | | | 1.06 | % | | | 1.06 | % | | | 1.04 | % |
| | | | | | |
Ratio of net investment income to average net assets | | | 3.38 | %(f) | | | 1.79 | % | | | 1.69 | % | | | 1.94 | %(b) | | | 1.42 | %(c) | | | 3.75 | %(d) |
| | | | | | |
Portfolio turnover rate(g) | | | 61 | % | | | 156 | % | | | 23 | % | | | 39 | % | | | 58 | % | | | 74 | % |
| (a) | Calculated based on the average shares outstanding methodology. |
| (b) | Reflects income recognized from corporate actions which amounted to $0.03 per share and 0.36% of average net assets. |
| (c) | Reflects income recognized from a corporate action which amounted to $0.02 per share and 0.17% of average net assets. |
| (d) | Reflects income recognized from a corporate action which amounted to $0.22 per share and 2.10% of average net assets. |
| (e) | Assumes investment at the net asset value at the beginning of the period, reinvestment of all distributions, a complete redemption of the investment at the net asset value at the end of the period and no sales or redemption charges (if any). Total returns would be reduced if a sales or redemption charge was taken into account. Returns do not reflect the impact of taxes to shareholders relating to Fund distributions or the redemption of Fund shares. Total returns for periods less than one full year are not annualized. |
| (g) | The Fund’s portfolio turnover rate is calculated in accordance with regulatory requirements, without regard to transactions involving short term investments and certain derivatives. If such transactions were included, the Fund’s portfolio turnover rate may be higher. |
| | |
| 16 | | The accompanying notes are an integral part of these financial statements. |
GOLDMAN SACHS VARIABLE INSURANCE TRUST INTERNATIONAL EQUITY INSIGHTS FUND
| | | | | | | | | | | | | | | | | | | | | | | | |
| | | Goldman Sachs International Equity Insights Fund | |
| | | Service Shares | |
| | | Six Months Ended
June 30, 2019
(Unaudited) | | | Year Ended December 31, | |
| | | 2018 | | | 2017 | | | 2016 | | | 2015 | | | 2014 | |
| | | | | | | | | | | | | | | | | | | | | | | | |
| Per Share Data | | | | | | | | | | | | | | | | | | |
| | | | | | |
Net asset value, beginning of period | | $ | 7.11 | | | $ | 10.91 | | | $ | 8.78 | | | $ | 9.21 | | | $ | 9.28 | | | $ | 10.44 | |
| | | | | | |
Net investment income(a) | | | 0.12 | | | | 0.14 | | | | 0.14 | | | | 0.15 | (b) | | | 0.12 | (c) | | | 0.36 | (d) |
| | | | | | |
Net realized and unrealized gain (loss) | | | 0.74 | | | | (1.93 | ) | | | 2.16 | | | | (0.42 | ) | | | (0.05 | ) | | | (1.17 | ) |
| | | | | | |
Total from investment operations | | | 0.86 | | | | (1.79 | ) | | | 2.30 | | | | (0.27 | ) | | | 0.07 | | | | (0.81 | ) |
| | | | | | |
Distributions to shareholders from net investment income | | | — | | | | (0.17 | ) | | | (0.17 | ) | | | (0.16 | ) | | | (0.14 | ) | | | (0.35 | ) |
| | | | | | |
Distributions to shareholders from net realized gains | | | — | | | | (1.84 | ) | | | — | | | | — | | | | — | | | | — | |
| | | | | | |
Total distributions | | | — | | | | (2.01 | ) | | | (0.17 | ) | | | (0.16 | ) | | | (0.14 | ) | | | (0.35 | ) |
| | | | | | |
Net asset value, end of period | | $ | 7.97 | | | $ | 7.11 | | | $ | 10.91 | | | $ | 8.78 | | | $ | 9.21 | | | $ | 9.28 | |
| | | | | | |
Total return(e) | | | 12.10 | % | | | (16.55 | )% | | | 26.21 | % | | | (2.86 | )% | | | 0.77 | % | | | (7.70 | )% |
| | | | | | |
Net assets, end of period (in 000s) | | $ | 47,911 | | | $ | 43,923 | | | $ | 123,778 | | | $ | 105,362 | | | $ | 116,811 | | | $ | 126,230 | |
| | | | | | |
Ratio of net expenses to average net assets | | | 1.12 | %(f) | | | 1.12 | % | | | 1.12 | % | | | 1.14 | % | | | 1.14 | % | | | 1.24 | % |
| | | | | | |
Ratio of total expenses to average net assets | | | 1.53 | %(f) | | | 1.43 | % | | | 1.27 | % | | | 1.31 | % | | | 1.31 | % | | | 1.29 | % |
| | | | | | |
Ratio of net investment income to average net assets | | | 3.13 | %(f) | | | 1.30 | % | | | 1.44 | % | | | 1.68 | %(b) | | | 1.18 | %(c) | | | 3.47 | %(d) |
| | | | | | |
Portfolio turnover rate(g) | | | 61 | % | | | 156 | % | | | 23 | % | | | 39 | % | | | 58 | % | | | 74 | % |
| (a) | Calculated based on the average shares outstanding methodology. |
| (b) | Reflects income recognized from corporate actions which amounted to $0.03 per share and 0.36% of average net assets. |
| (c) | Reflects income recognized from a corporate action which amounted to $0.02 per share and 0.17% of average net assets. |
| (d) | Reflects income recognized from a corporate action which amounted to $0.22 per share and 2.10% of average net assets. |
| (e) | Assumes investment at the net asset value at the beginning of the period, reinvestment of all distributions, a complete redemption of the investment at the net asset value at the end of the period and no sales or redemption charges (if any). Total returns would be reduced if a sales or redemption charge was taken into account. Returns do not reflect the impact of taxes to shareholders relating to Fund distributions or the redemption of Fund shares. Total returns for periods less than one full year are not annualized. |
| (g) | The Fund’s portfolio turnover rate is calculated in accordance with regulatory requirements, without regard to transactions involving short term investments and certain derivatives. If such transactions were included, the Fund’s portfolio turnover rate may be higher. |
| | |
| The accompanying notes are an integral part of these financial statements. | | 17 |
GOLDMAN SACHS VARIABLE INSURANCE TRUST INTERNATIONAL EQUITY INSIGHTS FUND
Notes to Financial Statements
June 30, 2019 (Unaudited)
1. ORGANIZATION
Goldman Sachs Variable Insurance Trust (the “Trust” or “VIT”) is a Delaware statutory trust registered under the Investment Company Act of 1940, as amended (the “Act”), as anopen-end management investment company. The Trust includes the Goldman Sachs International Equity Insights Fund (the “Fund”). The Fund is a diversified portfolio under the Act offering two classes of shares — Institutional and Service Shares. Shares of the Trust are offered to separate accounts of participating life insurance companies for the purpose of funding variable annuity contracts and variable life insurance policies.
Goldman Sachs Asset Management, L.P. (“GSAM”), an affiliate of Goldman Sachs & Co. LLC (“Goldman Sachs”), serves as investment adviser to the Fund pursuant to a management agreement (the “Agreement”) with the Trust.
2. SIGNIFICANT ACCOUNTING POLICIES
The financial statements have been prepared in accordance with accounting principles generally accepted in the United States of America (“GAAP”) and require management to make estimates and assumptions that may affect the reported amounts and disclosures. Actual results may differ from those estimates and assumptions.
A. Investment Valuation — The Fund’s valuation policy is to value investments at fair value.
B. Investment Income and Investments — Investment income includes interest income, dividend income, and securities lending income, if any. Interest income is accrued daily and adjusted for amortization of premiums and accretion of discounts. Dividend income is recognized onex-dividend date or, for certain foreign securities, as soon as such information is obtained subsequent to theex-dividend date. Investment transactions are reflected on trade date. Realized gains and losses are calculated using identified cost. Investment transactions are recorded on the following business day for daily net asset value (“NAV”) calculations. Investment income is recorded net of any foreign withholding taxes, less any amounts reclaimable. The Fund may file withholding tax reclaims in certain jurisdictions to recover a portion of amounts previously withheld. Any foreign capital gains tax is accrued daily based upon net unrealized gains, and is payable upon sale of such investments.
For derivative contracts, realized gains and losses are recorded upon settlement of the contract.
C. Class Allocations and Expenses — Investment income, realized and unrealized gain (loss), if any, andnon-class specific expenses of the Fund are allocated daily based upon the proportion of net assets of each class.Non-class specific expenses directly incurred by the Fund are charged to the Fund, while such expenses incurred by the Trust are allocated across the Fund on a straight-line and/orpro-rata basis depending upon the nature of the expenses. Class-specific expenses, where applicable, are borne by the respective share classes and include Distribution and Service and Transfer Agency fees.
D. Federal Taxes and Distributions to Shareholders — It is the Fund’s policy to comply with the requirements of the Internal Revenue Code of 1986, as amended (the “Code”), applicable to regulated investment companies and to distribute each year substantially all of its investment company taxable income and capital gains to its shareholders. Accordingly, the Fund is not required to make any provisions for the payment of federal income tax. Distributions to shareholders are recorded on theex-dividend date. Income and capital gains distributions, if any, are declared and paid at least annually.
Net capital losses, if any, are carried forward to future fiscal years and may be used to the extent allowed by the Code to offset any future capital gains. Losses that are carried forward will retain their character as either short-term or long-term capital losses. Utilization of capital loss carryforwards will reduce the requirement of future capital gains distributions.
The characterization of distributions to shareholders for financial reporting purposes is determined in accordance with federal income tax rules, which may differ from GAAP. The source of the Fund’s distributions may be shown in the accompanying financial statements as either from distributable earnings or capital. Certain components of the Fund’s net assets on the Statement of Assets and Liabilities reflect permanent GAAP/tax differences based on the appropriate tax character.
E. Foreign Currency Translation — The accounting records and reporting currency of the Fund are maintained in United States (“U.S.”) dollars. Assets and liabilities denominated in foreign currencies are translated into U.S. dollars using the current exchange rates at the close of each business day. The effect of changes in foreign currency exchange rates on investments is included within
18
GOLDMAN SACHS VARIABLE INSURANCE TRUST INTERNATIONAL EQUITY INSIGHTS FUND
2. SIGNIFICANT ACCOUNTING POLICIES (continued)
net realized and unrealized gain (loss) on investments. Changes in the value of other assets and liabilities as a result of fluctuations in foreign exchange rates are included in the Statement of Operations within net change in unrealized gain (loss) on foreign currency translation. Transactions denominated in foreign currencies are translated into U.S. dollars on the date the transaction occurred, the effects of which are included within net realized gain (loss) on foreign currency transactions.
3. INVESTMENTS AND FAIR VALUE MEASUREMENTS
U.S. GAAP defines the fair value of a financial instrument as the amount that would be received to sell an asset or paid to transfer a liability in an orderly transaction between market participants at the measurement date (i.e., the exit price); the Fund’s policy is to use the market approach. GAAP establishes a fair value hierarchy that prioritizes the inputs to valuation techniques used to measure fair value. The hierarchy gives the highest priority to unadjusted quoted prices in active markets for identical assets or liabilities (Level 1 measurements) and the lowest priority to unobservable inputs (Level 3 measurements). The levels used for classifying investments are not necessarily an indication of the risk associated with investing in these investments. The three levels of the fair value hierarchy are described below:
Level 1 — Unadjusted quoted prices in active markets that are accessible at the measurement date for identical, unrestricted assets or liabilities;
Level 2 — Quoted prices in markets that are not active or financial instruments for which significant inputs are observable (including, but not limited to, quoted prices for similar investments, interest rates, foreign exchange rates, volatility and credit spreads), either directly or indirectly;
Level 3 — Prices or valuations that require significant unobservable inputs (including GSAM’s assumptions in determining fair value measurement).
The Board of Trustees (“Trustees”) has approved Valuation Procedures that govern the valuation of the portfolio investments held by the Fund, including investments for which market quotations are not readily available. The Trustees have delegated to GSAMday-to-day responsibility for implementing and maintaining internal controls and procedures related to the valuation of the Fund’s investments. To assess the continuing appropriateness of pricing sources and methodologies, GSAM regularly performs price verification procedures and issues challenges as necessary to third party pricing vendors or brokers, and any differences are reviewed in accordance with the Valuation Procedures.
A. Level 1 and Level 2 Fair Value Investments —The valuation techniques and significant inputs used in determining the fair values for investments classified as Level 1 and Level 2 are as follows:
Equity Securities — Equity securities traded on a U.S. securities exchange or the NASDAQ system, or those located on certain foreign exchanges, including but not limited to the Americas, are valued daily at their last sale price or official closing price on the principal exchange or system on which they are traded. If there is no sale or official closing price or such price is believed by GSAM to not represent fair value, equity securities are valued at the last bid price for long positions and at the last ask price for short positions. To the extent these investments are actively traded, they are classified as Level 1 of the fair value hierarchy, otherwise they are generally classified as Level 2.
Unlisted equity securities for which market quotations are available are valued at the last sale price on the valuation date, or if no sale occurs, at the last bid price, and are generally classified as Level 2. Securities traded on certain foreign securities exchanges are valued daily at fair value determined by an independent fair value service (if available) under Valuation Procedures approved by the Trustees and consistent with applicable regulatory guidance. The independent fair value service takes into account multiple factors including, but not limited to, movements in the securities markets, certain depositary receipts, futures contracts and foreign currency exchange rates that have occurred subsequent to the close of the foreign securities exchange. These investments are generally classified as Level 2 of the fair value hierarchy.
19
GOLDMAN SACHS VARIABLE INSURANCE TRUST INTERNATIONAL EQUITY INSIGHTS FUND
Notes to Financial Statements(continued)
June 30, 2019 (Unaudited)
3. INVESTMENTS AND FAIR VALUE MEASUREMENTS (continued)
Money Market Funds — Investments in the Goldman Sachs Financial Square Government Fund (“Underlying Fund”) are valued at the NAV of the Institutional Share class on the day of valuation. These investments are generally classified as Level 1 of the fair value hierarchy. For information regarding the Underlying Fund’s accounting policies and investment holdings, please see the Underlying Fund’s shareholder report.
Derivative Contracts — A derivative is an instrument whose value is derived from underlying assets, indices, reference rates or a combination of these factors. The Fund enters into derivative transactions to hedge against changes in interest rates, securities prices, and/or currency exchange rates, to increase total return, or to gain access to certain markets or attain exposure to other underliers. For financial reporting purposes, cash collateral that has been pledged to cover obligations of a Fund and cash collateral received, if any, is reported separately on the Statement of Assets and Liabilities as receivables/payables for collateral on certain derivatives contracts.Non-cash collateral pledged by the Fund, if any, is noted in the Schedule of Investments.
Exchange-traded derivatives, including futures and options contracts, are generally valued at the last sale or settlement price on the exchange where they are principally traded. Exchange-traded options without settlement prices are generally valued at the midpoint of the bid and ask prices on the exchange where they are principally traded (or, in the absence oftwo-way trading, at the last bid price for long positions and the last ask price for short positions). Exchange-traded derivatives typically fall within Level 1 of the fair value hierarchy.Over-the-counter (“OTC”) and centrally cleared derivatives are valued using market transactions and other market evidence, including market-based inputs to models, calibration to market-clearing transactions, broker or dealer quotations, or other alternative pricing sources. Where models are used, the selection of a particular model to value OTC and centrally cleared derivatives depends upon the contractual terms of, and specific risks inherent in, the instrument, as well as the availability of pricing information in the market. Valuation models require a variety of inputs, including contractual terms, market prices, yield curves, credit curves, measures of volatility, voluntary and involuntary prepayment rates, loss severity rates and correlations of such inputs. For OTC and centrally cleared derivatives that trade in liquid markets, model inputs can generally be verified and model selection does not involve significant management judgment. OTC and centrally cleared derivatives are classified within Level 2 of the fair value hierarchy when significant inputs are corroborated by market evidence.
i. Futures Contracts — Futures contracts are contracts to buy or sell a standardized quantity of a specified commodity or security. Upon entering into a futures contract, the Fund deposits cash or securities in an account on behalf of the broker in an amount sufficient to meet the initial margin requirement. Subsequent payments are made or received by the Fund equal to the daily change in the contract value and are recorded as variation margin receivable or payable with a corresponding offset to unrealized gains or losses.
B. Level 3 Fair Value Investments — To the extent that significant inputs to valuation models and other alternative pricing sources are unobservable, or if quotations are not readily available, or if GSAM believes that such quotations do not accurately reflect fair value, the fair value of the Fund’s investments may be determined under Valuation Procedures approved by the Trustees. GSAM, consistent with its procedures and applicable regulatory guidance, may make an adjustment to the most recent valuation prices of either domestic or foreign securities in light of significant events to reflect what it believes to be the fair value of the securities at the time of determining the Fund’s NAV. To the extent investments are valued using single source broker quotations obtained directly from the broker or passed through from third party pricing vendors, such investments are classified as Level 3 investments. GSAM did not develop the unobservable inputs for valuation of Level 3 Assets and Liabilities.
20
GOLDMAN SACHS VARIABLE INSURANCE TRUST INTERNATIONAL EQUITY INSIGHTS FUND
3. INVESTMENTS AND FAIR VALUE MEASUREMENTS (continued)
C. Fair Value Hierarchy — The following is a summary of the Fund’s investments and derivatives classified in the fair value hierarchy as of June 30, 2019:
| | | | | | | | | | | | |
| Investment Type | | Level 1 | | | Level 2 | | | Level 3 | |
| | | |
| Assets | | | | | | | | | | | | |
| Common Stock and/or Other Equity Investments(a) | | | | | | | | | | | | |
Asia | | $ | — | | | $ | 26,988,011 | | | $ | — | |
Australia and Oceania | | | 629,821 | | | | 5,605,833 | | | | — | |
Europe | | | 740,692 | | | | 52,675,172 | | | | — | |
North America | | | 201,768 | | | | — | | | | — | |
| Securities Lending Reinvestment Vehicle | | | 375,643 | | | | — | | | | — | |
| | | |
| Total | | $ | 1,947,924 | | | $ | 85,269,016 | | | $ | — | |
| | | |
| Derivative Type | | | | | | | | | |
| | | |
| Assets(b) | | | | | | | | | | | | |
| Futures Contracts | | $ | 14,327 | | | $ | — | | | $ | — | |
| (a) | Amounts are disclosed by continent to highlight the impact of time zone differences between local market close and the calculation of NAV. Security valuations are based on the principal exchange or system on which they are traded, which may differ from country of domicile. The Fund utilizes fair value model prices provided by an independent fair value service for certain international equity securities, resulting in a Level 2 classification. |
| (b) | Amount shown represents unrealized gain (loss) at period end. |
For further information regarding security characteristics, see the Schedule of Investments.
4. INVESTMENTS IN DERIVATIVES
The following table sets forth, by certain risk types, the gross value of derivative contracts (not considered to be hedging instruments for accounting disclosure purposes) as of June 30, 2019. These instruments were used as part of the Fund’s investment strategies and to obtain and/or manage exposure related to the risks below. The values in the table below exclude the effects of cash collateral received or posted pursuant to these derivative contracts, and therefore are not representative of the Fund’s net exposure.
| | | | | | | | | | | | |
| Risk | | Statement of Assets and Liabilities | | Assets(a) | | | Statement of Assets and Liabilities | | Liabilities | |
| | | | |
| Equity | | Variation margin on futures contracts | | $ | 14,327 | | | — | | $ | — | |
| (a) | Includes unrealized gain (loss) on futures contracts described in the Additional Investment Information section of the Schedule of Investments. Only the variation margin as of June 30, 2019 is reported within the Statement of Assets and Liabilities. |
The following table sets forth, by certain risk types, the Fund’s gains (losses) related to these derivatives and their indicative volumes for the six months ended June 30, 2019. These gains (losses) should be considered in the context that these derivative contracts may have been executed to create investment opportunities and/or economically hedge certain investments, and accordingly, certain gains (losses) on such derivative contracts may offset certain (losses) gains attributable to investments. These gains (losses) are included in “Net realized gain (loss)” or “Net change in unrealized gain (loss)” on the Statement of Operations:
| | | | | | | | | | | | | | |
| Risk | | Statement of Operations | | Net
Realized
Gain (Loss) | | | Net Change in
Unrealized
Gain (Loss) | | | Average
Number of
Contracts(a) | |
| | | | |
| Equity | | Net realized gain (loss) from futures contracts/Net change in unrealized gain (loss) on futures contracts | | $ | 165,581 | | | $ | 50,861 | | | | 26 | |
| (a) | Average number of contracts is based on the average of month end balances for the six months ended June 30, 2019. |
21
GOLDMAN SACHS VARIABLE INSURANCE TRUST INTERNATIONAL EQUITY INSIGHTS FUND
Notes to Financial Statements(continued)
June 30, 2019 (Unaudited)
5. AGREEMENTS AND AFFILIATED TRANSACTIONS
A. Management Agreement — Under the Agreement, GSAM manages the Fund, subject to the general supervision of the Trustees.
As compensation for the services rendered pursuant to the Agreement, the assumption of the expenses related thereto and administration of the Fund’s business affairs, including providing facilities, GSAM is entitled to a management fee, accrued daily and paid monthly, equal to an annual percentage rate of the Fund’s average daily net assets.
For the six months ended June 30, 2019, contractual and effective net management fees with GSAM were at the following rates:
| | | | | | | | | | | | | | | | | | | | | | | | | | |
| Contractual Management Rate | | | | | | Effective Net
Management
Rate^ | |
First
$1 billion | | | Next
$1 billion | | | Next
$3 billion | | | Next
$3 billion | | | Over
$8 billion | | | Effective
Rate | |
| | 0.81 | % | | | 0.73 | % | | | 0.69 | % | | | 0.68 | % | | | 0.67 | % | | | 0.81 | % | | | 0.81 | % |
| ^ | Effective Net Management Rate includes the impact of management fee waivers of affiliated Underlying Funds, if any. |
B. Distribution and Service(12b-1) Plan — The Trust, on behalf of Service Shares of the Fund, has adopted a Distribution and Service Plan subject to Rule12b-1 under the Act. Under the Distribution and Service Plan, Goldman Sachs, which serves as distributor, is entitled to a fee accrued daily and paid monthly, for distribution services and personal and account maintenance services, which may then be paid by Goldman Sachs to authorized dealers, equal to, on an annual basis, 0.25% of the Fund’s average daily net assets attributable to Service Shares.
C. Transfer Agency Agreement — Goldman Sachs also serves as the transfer agent of the Fund for a fee pursuant to the Transfer Agency Agreement. The fees charged for such transfer agency services are accrued daily and paid monthly at an annual rate of 0.02% of the average daily net assets of Institutional and Service Shares.
D. Other Expense Agreements and Affiliated Transactions — GSAM has agreed to reduce or limit certain “Other Expenses” of the Fund (excluding acquired fund fees and expenses, transfer agency fees and expenses, service fees and shareholder administration fees (as applicable), taxes, interest, brokerage fees, expenses of shareholder meetings, litigation and indemnification, and extraordinary expenses) to the extent such expenses exceed, on an annual basis, a percentage rate of the average daily net assets of the Fund. Such Other Expense reimbursements, if any, are accrued daily and paid monthly. In addition, the Fund is not obligated to reimburse GSAM for prior fiscal year expense reimbursements, if any. The Other Expense limitation as an annual percentage rate of average daily net assets for the Fund is 0.044%. The Other Expense limitation will remain in place through at least April 30, 2020, and prior to such date GSAM may not terminate the arrangement without the approval of the Trustees. In addition, the Fund has entered into certain offset arrangements with the custodian and the transfer agent, which may result in a reduction of the Fund’s expenses and are received irrespective of the application of the “Other Expense” limitation described above.
For the six months ended June 30, 2019, these expense reductions, including any fee waivers and Other Expense reimbursements, were as follows:
| | | | | | | | | | |
Custody Fee Credits | | | Other Expense
Reimbursement | | | Total Expense
Reductions | |
| | |
| $ | 591 | | | $ | 179,365 | | | $ | 179,956 | |
E. Line of Credit Facility — As of June 30, 2019, the Fund participated in a $580,000,000 committed, unsecured revolving line of credit facility (the “facility”) together with other funds of the Trust and certain registered investment companies having management agreements with GSAM or its affiliates. This facility is to be used for temporary emergency purposes, or to allow for an orderly liquidation of securities to meet redemption requests. The interest rate on borrowings is based on the federal funds rate. The facility also requires a fee to be paid by the Fund based on the amount of the commitment that has not been utilized. For the six months ended June 30, 2019, the Fund did not have any borrowings under the facility. Prior to April 30, 2019 the facility was $770,000,000.
22
GOLDMAN SACHS VARIABLE INSURANCE TRUST INTERNATIONAL EQUITY INSIGHTS FUND
6. PORTFOLIO SECURITIES TRANSACTIONS
The cost of purchases and proceeds from sales and maturities of long-term securities for the six months ended June 30, 2019, were $52,017,973 and $52,183,961, respectively.
7. SECURITIES LENDING
Pursuant to exemptive relief granted by the Securities and Exchange Commission (“SEC”) and the terms and conditions contained therein, the Fund may lend its securities through a securities lending agent, Goldman Sachs Agency Lending (“GSAL”), a wholly-owned subsidiary of Goldman Sachs, to certain qualified borrowers including Goldman Sachs and affiliates. In accordance with the Fund’s securities lending procedures, the Fund receives cash collateral at least equal to the market value of the securities on loan. The market value of the loaned securities is determined at the close of business of the Fund, at their last sale price or official closing price on the principal exchange or system on which they are traded, and any additional required collateral is delivered to the Fund on the next business day. As with other extensions of credit, the Fund may experience delay in the recovery of its securities or incur a loss should the borrower of the securities breach its agreement with the Fund or become insolvent at a time when the collateral is insufficient to cover the cost of repurchasing securities on loan. Dividend income received from securities on loan may not be subject to withholding taxes and therefore withholding taxes paid may differ from the amounts listed in the Statement of Operations. Loans of securities are terminable at any time and as such 1) the remaining contractual maturities of the outstanding securities lending transactions are considered to be overnight and continuous and 2) the borrower, after notice, is required to return borrowed securities within the standard time period for settlement of securities transactions.
The Fund invests the cash collateral received in connection with securities lending transactions in the Goldman Sachs Financial Square Government Fund (“Government Money Market Fund”), an affiliated series of the Goldman Sachs Trust. The Government Money Market Fund is registered under the Act as an open end investment company, is subject to Rule2a-7 under the Act, and is managed by GSAM, for which GSAM may receive a management fee of up to 0.16% on an annualized basis of the average daily net assets of the Government Money Market Fund.
In the event of a default by a borrower with respect to any loan, GSAL will exercise any and all remedies provided under the applicable borrower agreement to make the Fund whole. These remedies include purchasing replacement securities by applying the collateral held from the defaulting broker against the purchase cost of the replacement securities. If GSAL is unable to purchase replacement securities, GSAL will indemnify the Fund by paying the Fund an amount equal to the market value of the securities loaned minus the value of cash collateral received from the borrower for the loan, subject to an exclusion for any shortfalls resulting from a loss of value in such cash collateral due to reinvestment risk. The Fund may enter into master netting agreements with borrowers, which provide the right, in the event of a default (including bankruptcy or insolvency), for thenon-defaulting party to liquidate the collateral and calculate net exposure to the defaulting party or request additional collateral. However, in the event of a default by a borrower, a resolution authority could determine that such rights are not enforceable due to the restrictions or prohibitions against the right ofset-off that may be imposed in accordance with a particular jurisdiction’s bankruptcy or insolvency laws. The Fund’s loaned securities were all subject to enforceable Securities Lending Agreements and the value of the collateral was at least equal to the value of the cash received. The amounts of the Fund’s overnight and continuous agreements, which represent the gross amounts of recognized liabilities for securities lending transactions outstanding as of June 30, 2019, are disclosed as “Payable upon return of securities loaned” on the Statement of Assets and Liabilities, where applicable.
Both the Fund and GSAL received compensation relating to the lending of the Fund’s securities. The amounts earned, if any, by the Fund for the six months ended June 30, 2019, are reported under Investment Income on the Statement of Operations.
23
GOLDMAN SACHS VARIABLE INSURANCE TRUST INTERNATIONAL EQUITY INSIGHTS FUND
Notes to Financial Statements(continued)
June 30, 2019 (Unaudited)
7. SECURITIES LENDING (continued)
The table below details securities lending activity with affiliates of Goldman Sachs:
| | | | |
| For the Six months ended June 30, 2019 | | |
Earnings of GSAL Relating to Securities Loaned | | Amount Received by the Fund from Lending to Goldman Sachs | | Amount Payable to
Goldman Sachs
Upon Return of
Securities Loaned as of
June 30, 2019 |
| | |
| $1,003 | | $546 | | $— |
The following table provides information about the Fund’s investment in the Government Money Market Fund for the six months ended June 30, 2019:
| | | | | | | | | | | | | | |
Beginning Value as of
December 31, 2018 | | | Purchases at
Cost | | | Proceeds
from Sales | | | Ending Value as of
June 30, 2019 | |
| | | |
| $ | 431,989 | | | $ | 3,919,243 | | | $ | (3,975,589 | ) | | $ | 375,643 | |
8. TAX INFORMATION
As of the Fund’s most recent fiscal year end, December 31, 2018, the Fund’s certain timing differences, on atax-basis were as follows:
| | | | |
| |
| Timing differences (Qualified Late Year Loss Deferral/Post October Loss Deferral) | | $ | (2,120,967 | ) |
As of June 30, 2019, the Fund’s aggregate security unrealized gains and losses based on cost for U.S. federal income tax purposes were as follows:
| | | | |
| Tax cost | | $ | 86,625,792 | |
| Gross unrealized gain | | | 5,577,873 | |
| Gross unrealized loss | | | (4,986,725 | ) |
| Net unrealized gain | | $ | 591,148 | |
The difference between GAAP-basis andtax-basis unrealized gains (losses) is attributable primarily to wash sales, net mark to market gains/(losses) on regulated futures and passive foreign investment company investments.
GSAM has reviewed the Fund’s tax positions for all open tax years (the current and prior three years, as applicable) and has concluded that no provision for income tax is required in the Fund’s financial statements. Such open tax years remain subject to examination and adjustment by tax authorities.
9. OTHER RISKS
The Fund’s risks include, but are not limited to, the following:
Derivatives Risk — The Fund’s use of derivatives may result in loss. Derivative instruments, which may pose risks in addition to and greater than those associated with investing directly in securities, currencies or other instruments, may be illiquid or less liquid, volatile, difficult to price and leveraged so that small changes in the value of the underlying instruments may produce disproportionate losses to the Fund. Derivatives are also subject to counterparty risk, which is the risk that the other party in the transaction will not fulfill its contractual obligation. The use of derivatives is a highly specialized activity that involves investment
24
GOLDMAN SACHS VARIABLE INSURANCE TRUST INTERNATIONAL EQUITY INSIGHTS FUND
9. OTHER RISKS (continued)
techniques and risks different from those associated with investments in more traditional securities and instruments. Losses from derivatives can also result from a lack of correlation between changes in the value of derivative instruments and the portfolio assets (if any) being hedged.
Foreign and Emerging Countries Risk — Investing in foreign markets may involve special risks and considerations not typically associated with investing in the U.S. Foreign securities may be subject to risk of loss because of more or less foreign government regulation, less public information and less economic, political and social stability in the countries in which the Fund invests. The imposition of exchange controls (including repatriation restrictions), confiscations, trade restrictions (including tariffs) and other government restrictions by the U.S. or other governments, or from problems in share registration, settlement or custody, may also result in losses. Foreign risk also involves the risk of negative foreign currency rate fluctuations, which may cause the value of securities denominated in such foreign currency (or other instruments through which the Fund has exposure to foreign currencies) to decline in value. Currency exchange rates may fluctuate significantly over short periods of time. To the extent that the Fund also invests in securities of issuers located in emerging markets, these risks may be more pronounced.
Foreign Custody Risk — If the Fund invests in foreign securities, the Fund may hold such securities and cash with foreign banks, agents, and securities depositories appointed by the Fund’s custodian (each a “Foreign Custodian”). Some foreign custodians may be recently organized or new to the foreign custody business. In some countries, Foreign Custodians may be subject to little or no regulatory oversight over, or independent evaluation of, their operations. Further, the laws of certain countries may place limitations on the Fund’s ability to recover its assets if a Foreign Custodian enters bankruptcy. Investments in emerging markets may be subject to even greater custody risks than investments in more developed markets. Custody services in emerging market countries are very often undeveloped and may be considerably less well regulated than in more developed countries, and thus may not afford the same level of investor protection as would apply in developed countries.
Investments in Other Investment Companies Risk — As a shareholder of another investment company, the Fund will indirectly bear its proportionate share of any net management fees and other expenses paid by such other investment companies, in addition to the fees and expenses regularly borne by the Fund.
Large Shareholder Transactions Risk — The Fund may experience adverse effects when certain large shareholders, such as other funds, participating insurance companies, accounts and Goldman Sachs affiliates, purchase or redeem large amounts of shares of the Fund. Such large shareholder redemptions, which may occur rapidly or unexpectedly, may cause the Fund to sell portfolio securities at times when it would not otherwise do so, which may negatively impact the Fund’s NAV and liquidity. These transactions may also accelerate the realization of taxable income to shareholders if such sales of investments resulted in gains, and may also increase transaction costs. In addition, a large redemption could result in the Fund’s current expenses being allocated over a smaller asset base, leading to an increase in the Fund’s expense ratio. Similarly, large Fund share purchases may adversely affect the Fund’s performance to the extent that the Fund is delayed in investing new cash or otherwise maintains a larger cash position than it ordinarily would.
Liquidity Risk — The Fund may make investments that are illiquid or that may become less liquid in response to market developments or adverse investor perceptions. Illiquid investments may be more difficult to value. Liquidity risk may also refer to the risk that the Fund will not be able to pay redemption proceeds within the allowable time period or without significant dilution to remaining investors’ interests because of unusual market conditions, an unusually high volume of redemption requests, or other reasons. To meet redemption requests, the Fund may be forced to sell investments at an unfavorable time and/or under unfavorable conditions. If the Fund is forced to sell securities at an unfavorable time and/or under unfavorable conditions, such sales may adversely affect the Fund’s NAV and dilute remaining investors’ interests. These risks may be more pronounced in connection with the Fund’s investments in securities of issuers located in emerging market countries. Redemptions by large shareholders may have a negative impact on the Fund’s liquidity.
25
GOLDMAN SACHS VARIABLE INSURANCE TRUST INTERNATIONAL EQUITY INSIGHTS FUND
Notes to Financial Statements(continued)
June 30, 2019 (Unaudited)
9. OTHER RISKS (continued)
Market and Credit Risks — In the normal course of business, the Fund trades financial instruments and enters into financial transactions where risk of potential loss exists due to changes in the market (market risk). Additionally, the Fund may also be exposed to credit risk in the event that an issuer or guarantor fails to perform or that an institution or entity with which the Fund has unsettled or open transactions defaults.
10. INDEMNIFICATIONS
Under the Trust’s organizational documents, its Trustees, officers, employees and agents are indemnified, to the extent permitted by the Act and state law, against certain liabilities that may arise out of performance of their duties to the Fund. Additionally, in the course of business, the Fund enters into contracts that contain a variety of indemnification clauses. The Fund’s maximum exposure under these arrangements is unknown, as this would involve future claims that may be made against the Fund that have not yet occurred. However, GSAM believes the risk of loss under these arrangements to be remote.
11. SUBSEQUENT EVENTS
Subsequent events after the Statement of Assets and Liabilities date have been evaluated, and GSAM has concluded that there is no impact requiring adjustment or disclosure in the financial statements.
12. SUMMARY OF SHARE TRANSACTIONS
Share activity is as follows:
| | | | | | | | | | | | | | | | |
| | | For the Six Months Ended
June 30, 2019
(Unaudited) | | | For the Fiscal Year Ended
December 31, 2018 | |
| | | Shares | | | Dollars | | | Shares | | | Dollars | |
| Institutional Shares | | | | | | | | | | | | | | | | |
| Shares sold | | | 179,572 | | | $ | 1,391,498 | | | | 745,548 | | | $ | 7,784,495 | |
| Reinvestment of distributions | | | — | | | | — | | | | 1,192,199 | | | | 8,500,382 | |
| Shares redeemed | | | (258,658 | ) | | | (1,988,086 | ) | | | (407,538 | ) | | | (4,306,214 | ) |
| | | | (79,086 | ) | | | (596,588 | ) | | | 1,530,209 | | | | 11,978,663 | |
| Service Shares | | | | | | | | | | | | | | | | |
| Shares sold | | | 264,813 | | | | 2,075,489 | | | | 420,689 | | | | 4,358,012 | |
| Reinvestment of distributions | | | — | | | | — | | | | 1,351,752 | | | | 9,678,544 | |
| Shares redeemed | | | (432,327 | ) | | | (3,341,268 | ) | | | (6,939,757 | ) | | | (74,797,801 | ) |
| | | | (167,514 | ) | | | (1,265,779 | ) | | | (5,167,316 | ) | | | (60,761,245 | ) |
| | | | |
| NET DECREASE | | | (246,600 | ) | | $ | (1,862,367 | ) | | | (3,637,107 | ) | | $ | (48,782,582 | ) |
26
GOLDMAN SACHS VARIABLE INSURANCE TRUST INTERNATIONAL EQUITY INSIGHTS FUND
| | |
| Fund Expenses — Six Month Period Ended June 30, 2019 (Unaudited) | | |
As a shareholder of Institutional or Service Shares of the Fund, you incur ongoing costs, including management fees, distribution and/or service(12b-1) fees (with respect to Service Shares) and other Fund expenses. This example is intended to help you understand your ongoing costs (in dollars) of investing in Institutional Shares and Service Shares of the Fund and to compare these costs with the ongoing costs of investing in other mutual funds.
The example is based on an investment of $1,000 invested at the beginning of the period and held for the entire period from January 1, 2019 through June 30, 2019, which represents a period of 181 days of a 365 day year.
Actual Expenses— The first line under each share class in the table below provides information about actual account values and actual expenses. You may use the information in this line, together with the amount you invested, to estimate the expenses that you paid over the period. Simply divide your account value by $1,000 (for example, an $8,600 account value divided by $1,000=8.6), then multiply the result by the number in the first line under the heading entitled “Expenses Paid” to estimate the expenses you paid on your account during this period.
Hypothetical Example for Comparison Purposes — The second line under each share class in the table below provides information about hypothetical account values and hypothetical expenses based on the Fund’s actual net expense ratio and an assumed rate of return of 5% per year before expenses, which is not the Fund’s actual return. The hypothetical account values and expenses may not be used to estimate the actual ending account balance or expenses you paid for the period. You may use this information to compare the ongoing costs of investing in the Fund and other funds. To do so, compare this 5% hypothetical example with the 5% hypothetical examples that appear in the shareholder reports of the other funds.
Please note that the expenses shown in the table are meant to highlight your ongoing costs only. As a shareholder of the Fund you do not incur any transaction costs, such as sales charges, redemption fees, or exchange fees, but shareholders of other funds may incur such costs. The second line of the table is useful in comparing ongoing costs only and will not help you determine the relative total costs of owning different funds whose shareholders may incur transaction costs.
| | | | | | | | | | | | |
| Share Class | | Beginning
Account Value
01/01/19 | | | Ending
Account Value
06/30/19 | | | Expenses Paid
for the
6 Months
Ended
06/30/19* | |
| Institutional | | | | | | | | | | | | |
| | | | |
| Actual | | $ | 1,000 | | | $ | 1,122.90 | | | $ | 4.58 | |
| Hypothetical 5% return | | | 1,000 | | | | 1,020.48 | + | | | 4.36 | |
| Service | | | | | | | | | | | | |
| | | | |
| Actual | | | 1,000 | | | | 1,121.00 | | | | 5.89 | |
| Hypothetical 5% return | | | 1,000 | | | | 1,019.24 | + | | | 5.61 | |
| | + | Hypothetical expenses are based on the Fund’s actual annualized net expense ratios and an assumed rate of return of 5% per year before expenses. | |
| | * | Expenses are calculated using the Fund’s annualized net expense ratio for each class, which represents the ongoing expenses as a percentage of net assets for the six months ended June 30, 2019. Expenses are calculated by multiplying the annualized net expense ratio by the average account value for the period; then multiplying the result by the number of days in the most recent fiscal half year; and then dividing that result by the number of days in the fiscal year. The annualized net expense ratios for the period were 0.87% and 1.12% for Institutional and Service Shares, respectively. | |
27
GOLDMAN SACHS VARIABLE INSURANCE TRUST INTERNATIONAL EQUITY INSIGHTS FUND
Statement Regarding Basis for Approval of Management Agreement (Unaudited)
Background
The Goldman Sachs International Equity Insights Fund (the “Fund”) is an investment portfolio of Goldman Sachs Variable Insurance Trust (the “Trust”). The Board of Trustees oversees the management of the Trust and reviews the investment performance and expenses of the Fund at regularly scheduled meetings held throughout the year. In addition, the Board of Trustees determines annually whether to approve the continuance of the Trust’s investment management agreement (the “Management Agreement”) with Goldman Sachs Asset Management, L.P. (the “Investment Adviser”) on behalf of the Fund.
The Management Agreement was most recently approved for continuation until June 30, 2020 by the Board of Trustees, including those Trustees who are not parties to the Management Agreement or “interested persons” (as defined in the Investment Company Act of 1940, as amended) of any party thereto (the “Independent Trustees”), at a meeting held onJune 11-12, 2019 (the “Annual Meeting”).
The review process undertaken by the Trustees spans the course of the year and culminates with the Annual Meeting. To assist the Trustees in their deliberations, the Trustees have established a Contract Review Committee (the “Committee”), comprised of the Independent Trustees. The Committee held four meetings over the course of the year since the Management Agreement was last approved. At those Committee meetings, regularly scheduled Board or other committee meetings, and/or the Annual Meeting, matters relevant to the renewal of the Management Agreement were considered by the Board, or the Independent Trustees, as applicable. With respect to the Fund, such matters included:
| | (a) | | the nature and quality of the advisory, administrative, and other services provided to the Fund by the Investment Adviser and its affiliates, including information about: |
| | (i) | | the structure, staff, and capabilities of the Investment Adviser and its portfolio management teams; |
| | (ii) | | the groups within the Investment Adviser and its affiliates that support the portfolio management teams or provide other types of necessary services, including fund services groups (e.g., accounting and financial reporting, tax, shareholder services, and operations); controls and risk management groups (e.g., legal, compliance, valuation oversight, credit risk management, internal audit, compliance testing, market risk analysis, finance, and central funding); sales and distribution support groups, and others (e.g., information technology and training); |
| | (iii) | | trends in employee headcount; |
| | (iv) | | the Investment Adviser’s financial resources and ability to hire and retain talented personnel and strengthen its operations; and |
| | (v) | | the parent company’s support of the Investment Adviser and its mutual fund business, as expressed by the firm’s senior management; |
| | (b) | | information on the investment performance of the Fund, including comparisons to the performance of similar mutual funds, as provided by a third-party mutual fund data provider engaged as part of the contract review process (the “Outside Data Provider”), and a benchmark performance index; and information on general investment outlooks in the markets in which the Fund invests; |
| | (c) | | information provided by the Investment Adviser indicating the Investment Adviser’s views on whether the Fund’s peer group and/or benchmark index had high, medium, or low relevance given the Fund’s particular investment strategy; |
| | (d) | | the terms of the Management Agreement and other agreements with affiliated service providers entered into by the Trust on behalf of the Fund; |
| | (e) | | fee and expense information for the Fund, including: |
| | (i) | | the relative management fee and expense levels of the Fund as compared to those of comparable funds managed by other advisers, as provided by the Outside Data Provider; |
| | (ii) | | the Fund’s expense trends over time; and |
| | (iii) | | to the extent the Investment Adviser manages other types of accounts (such as bank collective trusts, private wealth management accounts, institutional separate accounts,sub-advised mutual funds, andnon-U.S. funds) having investment objectives and policies similar to those of the Fund, comparative information on the advisory fees charged and services provided to those accounts by the Investment Adviser; |
| | (f) | | with respect to the extensive investment performance and expense comparison data provided by the Outside Data Provider, its processes in producing that data for the Fund; |
| | (g) | | the undertakings of the Investment Adviser and its affiliates to implement fee waivers and/or expense limitations; |
| | (h) | | information relating to the profitability of the Management Agreement and the transfer agency and distribution and service arrangements of the Fund to the Investment Adviser and its affiliates; |
| | (i) | | whether the Fund’s existing management fee schedule adequately addressed any economies of scale; |
28
GOLDMAN SACHS VARIABLE INSURANCE TRUST INTERNATIONAL EQUITY INSIGHTS FUND
Statement Regarding Basis for Approval of Management Agreement (Unaudited) (continued)
| | (j) | | a summary of the“fall-out” benefits derived by the Investment Adviser and its affiliates from their relationships with the Fund, including the fees received by the Investment Adviser’s affiliates from the Fund for transfer agency, securities lending, portfolio trading, distribution and other services; |
| | (k) | | a summary of potential benefits derived by the Fund as a result of its relationship with the Investment Adviser; |
| | (l) | | information regarding commissions paid by the Fund and broker oversight, other information regarding portfolio trading, and how the Investment Adviser carries out its duty to seek best execution; |
| | (m) | | the manner in which portfolio manager compensation is determined; and the number and types of accounts managed by the portfolio managers; |
| | (n) | | the nature and quality of the services provided to the Fund by its unaffiliated service providers, and the Investment Adviser’s general oversight and evaluation (including reports on due diligence) of those service providers as part of the administrative services provided under the Management Agreement; and |
| | (o) | | the Investment Adviser’s processes and policies addressing various types of potential conflicts of interest; its approach to risk management; the annual review of the effectiveness of the Fund’s compliance program; and periodic compliance reports. |
The Trustees also received an overview of the Fund’s distribution arrangements. They received information regarding the Fund’s assets, share purchase and redemption activity, and payment of distribution and service fees. Information was also provided to the Trustees relating to revenue sharing payments made by and services provided by the Investment Adviser and its affiliates to intermediaries that promote the sale, distribution, and/or servicing of Fund shares. The Independent Trustees also discussed the broad range of other investment choices that are available to Fund investors, including the availability of comparable funds managed by other advisers.
The presentations made at the Board and Committee meetings and at the Annual Meeting encompassed the Fund and other mutual funds for which the Board of Trustees has responsibility. In evaluating the Management Agreement at the Annual Meeting, the Trustees relied upon their knowledge, resulting from their meetings and other interactions throughout the year, of the Investment Adviser and its affiliates, their services, and the Fund. In conjunction with these meetings, the Trustees received written materials and oral presentations on the topics covered, and the Investment Adviser addressed the questions and concerns of the Trustees, including concerns regarding the investment performance of certain of the funds they oversee. The Independent Trustees were advised by their independent legal counsel regarding their responsibilities and other regulatory requirements related to the approval and continuation of mutual fund investment management agreements under applicable law. In addition, the Investment Adviser and its affiliates provided the Independent Trustees with a written response to a formal request for information sent on behalf of the Independent Trustees by their independent legal counsel. During the course of their deliberations, the Independent Trustees met in executive sessions with their independent legal counsel, without representatives of the Investment Adviser or its affiliates present.
Nature, Extent, and Quality of the Services Provided Under the Management Agreement
As part of their review, the Trustees considered the nature, extent, and quality of the services provided to the Fund by the Investment Adviser. In this regard, the Trustees considered both the investment advisory services andnon-advisory services that are provided by the Investment Adviser and its affiliates. The Trustees noted the transition in the leadership and changes in personnel of various of the Investment Adviser’s portfolio management teams that had occurred in recent periods, and the ongoing recruitment efforts aimed at bringing high quality investment talent to the Investment Adviser. They also noted the Investment Adviser’s commitment to maintaining high quality systems and expending substantial resources to respond to ongoing changes to the regulatory and control environment in which the Fund and its service providers operate, as well as the efforts of the Investment Adviser and its affiliates to combat cyber security risks. The Trustees concluded that the Investment Adviser continued to commit substantial financial and operational resources to the Fund and expressed confidence that the Investment Adviser would continue to do so in the future. The Trustees also recognized that the Investment Adviser had made significant commitments to address regulatory compliance requirements applicable to the Fund and the Investment Adviser and its affiliates.
Investment Performance
The Trustees also considered the investment performance of the Fund. In this regard, they compared the investment performance of the Fund to its peers usingrankings and ratings compiled by the Outside Data Provider as of December 31, 2018, and updated performance information prepared by the Investment Adviser using the peer group identified by the Outside Data Provider as of March 31, 2019. The information on the Fund’s investment performance was provided for theone-, three-, five-, andten-year periods ending on the applicable dates. The Trustees also reviewed the Fund’s investment performance relative to its
29
GOLDMAN SACHS VARIABLE INSURANCE TRUST INTERNATIONAL EQUITY INSIGHTS FUND
Statement Regarding Basis for Approval of Management Agreement (Unaudited) (continued)
performance benchmark. As part of this review, they considered the investment performance trends of the Fund over time, and reviewed the investment performance of the Fund in light of its investment objective and policies and market conditions.
In addition, the Trustees considered materials prepared and presentations made by the Investment Adviser’s senior management and portfolio management personnel in which Fund performance was assessed. The Trustees also considered the Investment Adviser’s periodic reports with respect to the Fund’s risk profile, and how the Investment Adviser’s approach to risk monitoring and management influences portfolio management. They noted the efforts of the Fund’s portfolio management team to continue to enhance the investment model used in managing the Fund.
The Trustees observed that the Fund’s Institutional Shares had placed in the third quartile of the Fund’s peer group for theten-year period and in the fourth quartile for theone-, three-, and five-year periods, and had underperformed the Fund’s benchmark index for theone-, three-, five-, andten-year periods ended March 31, 2019. They also noted that in April 2018 the Fund had been repositioned from the VIT Strategic International Equity Fund, which involved changes to the Fund’s investment strategy and portfolio management. The Trustees considered that the Fund had experienced certain portfolio management changes in 2018.
Costs of Services Provided and Competitive Information
The Trustees considered the contractual terms of the Management Agreement and the fee rates payable by the Fund thereunder. In this regard, the Trustees considered information on the services rendered by the Investment Adviser to the Fund, which included both advisory and administrative services that were directed to the needs and operations of the Fund as a registered mutual fund.
In particular, the Trustees reviewed analyses prepared by the Outside Data Provider regarding the expense rankings of the Fund. The analyses provided a comparison of the Fund’s management fee and breakpoints to those of a relevant peer group and category universe; an expense analysis which compared the Fund’s overall net and gross expenses to a peer group and a category universe; and data comparing the Fund’s net expenses to the peer and category medians. The analyses also compared the Fund’s other expenses and fee waivers/reimbursements to those of the peer group and category medians. The Trustees concluded that the comparisons provided by the Outside Data Provider were useful in evaluating the reasonableness of the management fees and total expenses paid by the Fund.
In addition, the Trustees considered the Investment Adviser’s undertakings to implement fee waivers and/or expense limitations. They also considered, to the extent that the Investment Adviser manages other types of accounts having investment objectives and policies similar to those of the Fund, comparative fee information for services provided by the Investment Adviser to those accounts, and information that indicated that services provided to the Fund differed in various significant respects from the services provided to other types of accounts which, in many cases, operated under less stringent legal and regulatory structures, required fewer services from the Investment Adviser to a smaller number of client contact points, and were less time-intensive.
In addition, the Trustees noted that shareholders are able to redeem their Fund shares at any time if shareholders believe that the Fund fees and expenses are too high or if they are dissatisfied with the performance of the Fund.
Profitability
The Trustees reviewed the Fund’s contribution to the Investment Adviser’s revenues andpre-tax profit margins. In this regard the Trustees noted that they had received, among other things, profitability analyses and summaries, revenue and expense schedules by Fund and by function (i.e., investment management, transfer agency and distribution and service), and information on the Investment Adviser’s expense allocation methodology. They observed that the profitability and expense figures are substantially similar to those used by the Investment Adviser for many internal purposes, including compensation decisions among various business groups, and are thus subject to a vigorous internal debate about how certain revenue and expenses should be allocated. The Trustees also noted that the internal audit group within the Goldman Sachs organization periodically audits the expense allocation methodology and that the internal audit group was satisfied with the reasonableness, consistency, and accuracy of the Investment Adviser’s expense allocation methodology. Profitability data for the Fund was provided for 2018 and 2017, and the Trustees considered this information in relation to the Investment Adviser’s overall profitability.
30
GOLDMAN SACHS VARIABLE INSURANCE TRUST INTERNATIONAL EQUITY INSIGHTS FUND
Statement Regarding Basis for Approval of Management Agreement (Unaudited) (continued)
Economies of Scale
The Trustees considered the information that had been provided regarding whether there have been economies of scale with respect to the management of the Fund. The Trustees also considered the breakpoints in the fee rate payable under the Management Agreement for the Fund at the following annual percentage rates of the average daily net assets of the Fund:
| | | | |
| |
| First $1 billion | | | 0.81 | % |
| |
| Next $1 billion | | | 0.73 | |
| |
| Next $3 billion | | | 0.69 | |
| |
| Next $3 billion | | | 0.68 | |
| |
| Over $8 billion | | | 0.67 | |
The Trustees noted that the breakpoints were designed to share potential economies of scale, if any, with the Fund and its shareholders as assets under management reach those asset levels. The Trustees considered the amounts of assets in the Fund; the Fund’s recent share purchase and redemption activity; the information provided by the Investment Adviser relating to the costs of the services provided by the Investment Adviser and its affiliates and their realized profits; information comparing fee rates charged by the Investment Adviser with fee rates charged to other funds in the peer group; and the Investment Adviser’s undertaking to limit certain expenses of the Fund that exceed a specified level. Upon reviewing these matters at the Annual Meeting, the Trustees concluded that the fee breakpoints represented a means of assuring that benefits of scalability, if any, would be passed along to shareholders at the specified asset levels.
Other Benefits to the Investment Adviser and Its Affiliates
The Trustees also considered the other benefits derived by the Investment Adviser and its affiliates from their relationships with the Fund as stated above, including: (a) transfer agency fees received by Goldman Sachs & Co. LLC (“Goldman Sachs”); (b) brokerage and futures commissions earned by Goldman Sachs for executing securities and futures transactions on behalf of the Fund; (c) trading efficiencies resulting from aggregation of orders of the Fund with those for other funds or accounts managed by the Investment Adviser; (d) fees earned by Goldman Sachs Agency Lending (“GSAL”), an affiliate of the Investment Adviser, as securities lending agent (and fees earned by the Investment Adviser for managing the fund in which the Fund’s cash collateral is invested); (e) the Investment Adviser’s ability to leverage the infrastructure designed to service the Fund on behalf of its other clients; (f) the Investment Adviser’s ability to cross-market other products and services to Fund shareholders; (g) Goldman Sachs’ retention of certain fees as Fund Distributor; (h) the Investment Adviser’s ability to negotiate better pricing with custodians on behalf of its other clients, as a result of the relationship with the Fund; and (i) the possibility that the working relationship between the Investment Adviser and the Fund’s third-party service providers may cause those service providers to be more likely to do business with other areas of Goldman Sachs. In the course of considering the foregoing, the Independent Trustees requested and received further information quantifying certain of thesefall-out benefits.
Other Benefits to the Fund and Its Shareholders
The Trustees also noted that the Fund receives certain potential benefits as a result of its relationship with the Investment Adviser, including: (a) trading efficiencies resulting from aggregation of orders of the Fund with those of other funds or accounts managed by the Investment Adviser; (b) enhanced servicing from vendors because of the volume of business generated by the Investment Adviser and its affiliates; (c) enhanced servicing from broker-dealers because of the volume of business generated by the Investment Adviser and its affiliates; (d) the Investment Adviser’s ability to negotiate favorable terms with derivatives counterparties on behalf of the Fund as a result of the size and reputation of the Goldman Sachs organization; (e) the Investment Adviser’s knowledge and experience gained from managing other accounts and products; (f) the Investment Adviser’s ability to hire and retain qualified personnel to provide services to the Fund because of the reputation of the Goldman Sachs organization; (g) the Fund’s access, through the Investment Adviser, to certain firmwide resources (e.g., proprietary risk management systems and databases), subject to certain restrictions; (h) the Fund’s ability to participate in the securities lending program administered by GSAL, as measured by the revenue received by the Fund in connection with the program; and (i) the Fund’s access to certain affiliated distribution channels. In addition, the Trustees noted the competitive nature of the mutual fund marketplace, and considered that many of the Fund’s shareholders invested in the Fund in part because of the Fund’s relationship with the Investment Adviser and that those shareholders have a general expectation that the relationship will continue.
31
GOLDMAN SACHS VARIABLE INSURANCE TRUST INTERNATIONAL EQUITY INSIGHTS FUND
Statement Regarding Basis for Approval of Management Agreement (Unaudited) (continued)
Conclusion
In connection with their consideration of the Management Agreement, the Trustees gave weight to each of the factors described above, but did not identify any particular factor as controlling their decision. After deliberation and consideration of all of the information provided, including the factors described above, the Trustees concluded, in the exercise of their business judgment, that the management fees paid by the Fund were reasonable in light of the services provided to it by the Investment Adviser, the Investment Adviser’s costs and the Fund’s current and reasonably foreseeable asset levels. The Trustees unanimously concluded that the Investment Adviser’s continued management likely would benefit the Fund and its shareholders and that the Management Agreement should be approved and continued with respect to the Fund until June 30, 2020.
32
| | |
| TRUSTEES | | OFFICERS |
| Jessica Palmer,Chair | | James A. McNamara,President |
| Kathryn A. Cassidy | | Joseph F. DiMaria,Principal Financial Officer, |
| Diana M. Daniels | | Principal Accounting Officer and Treasurer |
| James A. McNamara | | Caroline L. Kraus,Secretary |
| Roy W. Templin |
| Gregory G. Weaver |
| | |
GOLDMAN SACHS & CO. LLC
Distributor and Transfer Agent
GOLDMAN SACHS ASSET MANAGEMENT, L.P.
Investment Adviser
200 West Street, New York
New York 10282
Visit our web site at www.GSAMFUNDS.com to obtain the most recentmonth-end returns.
The reports concerning the Fund included in this shareholder report may contain certain forward-looking statements about the factors that may affect the performance of the Fund in the future. These statements are based on Fund management’s predictions and expectations concerning certain future events and their expected impact on the Fund, such as performance of the economy as a whole and of specific industry sectors, changes in the levels of interest rates, the impact of developing world events, and other factors that may influence the future performance of the Fund. Management believes these forward-looking statements to be reasonable, although they are inherently uncertain and difficult to predict. Actual events may cause adjustments in portfolio management strategies from those currently expected to be employed.
A description of the policies and procedures that the Fund uses to determine how to vote proxies relating to portfolio securities and information regarding how the Fund voted proxies relating to portfolio securities during the most recent12-month period ended June 30 is available (i) without charge, upon request by calling1-800-621-2550; and (ii) on the Securities and Exchange Commission (“SEC”) web site athttp://www.sec.gov.
The Fund will file its portfolio holdings information for each month in a fiscal quarter within 60 days after the end of the relevant fiscal quarter on Form N-PORT. Portfolio holdings information for the third month of each fiscal quarter will be made available on the SEC’s web site at http://www.sec.gov. Portfolio holdings information may be obtained upon request and without charge by calling 1-800-526-7384 (for Retail Shareholders) or 1-800-621-2550 (for Institutional Shareholders).
Views and opinions expressed are for informational purposes only and do not constitute a recommendation by GSAM to buy, sell, or hold any security. Views and opinions are current as of the date of this presentation and may be subject to change, they should not be construed as investment advice.
Goldman Sachs & Co. LLC (“Goldman Sachs”) does not provide legal, tax or accounting advice. Any statement contained in this communication (including any attachments) concerning U.S. tax matters was not intended or written to be used, and cannot be used, for the purpose of avoiding penalties under the Internal Revenue Code, and was written to support the promotion or marketing of transaction or matter addressed. Clients of Goldman Sachs should obtain their own independent tax advice based on their particular circumstances.
The website links provided are for your convenience only and are not an endorsement or recommendation by GSAM of any of these websites or the products or services offered. GSAM is not responsible for the accuracy and validity of the content of these websites.
Economic and market forecasts presented herein reflect our judgment as of the date of this presentation and are subject to change without notice. These forecasts do not take into account the specific investment objectives, restrictions, tax and financial situation or other needs of any specific client. Actual data will vary and may not be reflected here. These forecasts are subject to high levels of uncertainty that may affect actual performance. Accordingly, these forecasts should be viewed as merely representative of a broad range of possible outcomes. These forecasts are estimated, based on assumptions, and are subject to significant revision and may change materially as economic and market conditions change. Goldman Sachs has no obligation to provide updates or changes to these forecasts. Case studies and examples are for illustrative purposes only.
Fund holdings and allocations shown are as of June 30, 2019 and may not be representative of future investments. Fund holdings should not be relied on in making investment decisions and should not be construed as research or investment advice regarding particular securities. Current and future holdings are subject to risk.
References to indices, benchmarks or other measures of relative market performance over a specified period of time are provided for your information only and do not imply that the portfolio will achieve similar results. The index composition may not reflect the manner in which a portfolio is constructed. While an adviser seeks to design a portfolio which reflects appropriate risk and return features, portfolio characteristics may deviate from those of the benchmark.
The Global Industry Classification Standard (“GICS”) was developed by and is the exclusive property and a service mark of Morgan Stanley Capital International Inc. (“MSCI”) and Standard & Poor’s, a division of The McGraw-Hill Companies, Inc. (“S&P”) and is licensed for use by Goldman Sachs. Neither MSCI, S&P nor any other party involved in making or compiling the GICS or any GICS classifications makes any express or implied warranties or representations with respect to such standard or classification (or the results to be obtained by the use thereof), and all such parties hereby expressly disclaim all warranties of originality, accuracy, completeness, merchantability or fitness for a particular purpose with respect to any of such standard or classification. Without limiting any of the foregoing, in no event shall MSCI, S&P, any of their affiliates or any third party involved in making or compiling the GICS or any GICS classifications have any liability for any direct, indirect, special, punitive, consequential or any other damages (including lost profits) even if notified of the possibility of such damages.
The portfolio risk management process includes an effort to monitor and manage risk, but does not imply low risk.
Shares of the Goldman Sachs VIT Funds are offered to separate accounts of participating life insurance companies for the purpose of funding variable annuity contracts and variable life insurance policies. Shares of the Fund are not offered directly to the general public. The variable annuity contracts and variable life insurance policies are described in the separate prospectuses issued by participating insurance companies. You should refer to those prospectuses for information about surrender charges, mortality and expense risk fees and other charges that may be assessed by participating insurance companies under the variable annuity contracts or variable life insurance policies. Such fees or charges, if any, may affect the return you may realize with respect to your investments. Ask your representative for more complete information. Please consider a fund’s objectives, risks and charges and expenses, and read the prospectus carefully before investing. The prospectus contains this and other information about the Fund.
This material is not authorized for distribution to prospective investors unless preceded or accompanied by a current prospectus or summary prospectus, if applicable. Investors should consider the Fund’s objective, risks, and charges and expenses, and read the summary prospectus, if available, and/or the prospectus carefully before investing or sending money. The summary prospectus, if available, and the prospectus contain this and other information about the Fund and may be obtained from your authorized dealer or from Goldman Sachs & Co. LLC by calling 1-800-621-2550
This report is prepared for the general information of contract owners and is not an offer of shares of the Goldman Sachs Variable Insurance Trust — Goldman Sachs International Equity Insights Fund.
© 2019 Goldman Sachs. All rights reserved.
VITINTLSAR-19/175367-OTU-1025442
Goldman
SachsVariable Insurance Trust
Goldman Sachs
U.S. Equity Insights Fund
Beginning on or after January 1, 2021, you may not receive paper copies of the Fund’s annual and semi-annual shareholder reports from the insurance company that offers your variable insurance contract or your financial intermediary, unless you specifically request paper copies of the reports from the insurance company or from your financial intermediary. Instead, the reports will be made available on a website, and you will be notified by mail each time a report is posted and provided with a website link to access the report.
If you already elected to receive shareholder reports electronically, you will not be affected by this change and you need not take any action. At any time, you may elect to receive reports and certain communications from the insurance company electronically by contacting your insurance company or your financial intermediary.
You may elect to receive all future shareholder reports in paper free of charge. You can inform the insurance company or your financial intermediary that you wish to receive paper copies of reports. Your election to receive reports in paper will apply to all Goldman Sachs Funds available under your contract and may apply to all funds held with your financial intermediary.
Semi-Annual Report
June 30, 2019

GOLDMAN SACHS VARIABLE INSURANCE TRUST U.S. EQUITY INSIGHTS FUND
INVESTMENT OBJECTIVE
The Fund seeks long-term growth of capital and dividend income.
Portfolio Management Discussion and Analysis
Below, the Goldman Sachs Quantitative Investment Strategies Team discusses the Goldman Sachs Variable Insurance Trust — Goldman Sachs U.S. Equity Insights Fund’s (the “Fund”) performance and positioning for thesix-month period ended June 30, 2019 (the “Reporting Period”).
How did the Fund perform during the Reporting Period?
During the Reporting Period, the Fund’s Institutional and Service Shares generated cumulative total returns of 15.37% and 15.21%, respectively. These returns compare to the 18.54% cumulative total return of the Fund’s benchmark, the Standard & Poor’s 500® Index (with dividends reinvested) (the “S&P 500® Index”) during the same time period.
What economic and market factors most influenced the equity markets as a whole during the Reporting Period?
Representing the U.S. equity market, the S&P 500® Index returned 18.54% during the Reporting Period, rallying strongly following negative absolute returns posted in 2018. While 2018 was the worst calendar year since 2008, the first half of 2019 was the strongest first half for the S&P 500® Index since 1997.
During the first quarter of 2019, the S&P 500® Index rose 13.65%. After a volatile end to 2018, the rally to begin 2019 marked the best first quarter performance for the S&P 500® Index since 1998. Federal Reserve (“Fed”) commentary provided a supportive background for U.S. equities, as Fed Chair Jerome Powell reiterated a “patient” approach to monetary policy that included a pause in interest rate hikes and a nearing end to the Fed’s balance sheet runoff. The U.S. unemployment rate remained well below trend at 3.8% in February 2019, and wages grew 3.4% year over year. Housing data showed strength in the first calendar quarter, with new home sales reaching 667,000 in February, bringing the three-month average up to 630,000. Strength in housing data could be partially attributed to a steep decline in mortgage rates resulting from a more cautious Fed. The University of Michigan Consumer Sentiment Index was also a point of significant strength in the U.S. economy, steadily climbing in each month of the first quarter of 2019 and eventually reaching 98.4 in March, its highest level in six months. Economic growth concerns that had dominated the fourth quarter of 2018 failed to completely disappear, however, as fourth quarter 2018 Gross Domestic Product (“GDP”) growth was revised down 0.4% in March 2019 to 2.2%. While the revision was further evidence of a slowing U.S. economy, the result was largely priced in by equity markets and thus had a limited effect on stock prices outside of the financials sector, which historically tends to be more rate sensitive.
The S&P 500® Index rose a solid but more moderate 4.30% during the second quarter of 2019. Trade tensions between the U.S. and China dominated headlines and broadly added noise to the markets. (Noise refers to market activity that can confuse or misrepresent genuine underlying trends.) In April 2019, there was an optimistic consensus outlook on a possible trade deal, but this optimism faded in May when the U.S. President threatened to raise current tariffs and impose new duties on $300 billion of additional Chinese imports. Also, sanctions were temporarily placed on a Chinese telecommunications giant, until they were lifted in June 2019, when any additional tariffs or compromise were postponed. Also during the second quarter, the markets kept a close eye on the Fed. After steadily raising short-term interest rates since 2015 to a range of 2.25% to 2.50%, the Fed alluded to a more accommodative approach. Following the Fed’s statement, the market consensus actually priced in at least one interest rate cut by the end of 2019, if not sooner. Economic indicators were mixed during the second quarter, with consumer sentiment remaining elevated, while nonfarm payrolls and manufacturing indices across the board fell short.
For the Reporting Period overall, all 11 sectors posted positive absolute returns, with 10 of the 11 generating double-digit gains. Information technology, consumer discretionary and industrials were the best performing sectors in the S&P 500® Index, as measured by total return, while the weakest performing sectors in the S&P 500® Index during the Reporting Period were health care, energy and utilities.
Within the U.S. equity market, all capitalization segments posted double-digit positive returns, led bymid-cap stocks, as measured by the Russell Midcap® Index, followed bylarge-cap stocks, as measured by the Russell 1000® Index, and thensmall-cap stocks, as measured by the Russell 2000® Index. From a style perspective, growth-oriented stocks significantly outpaced value-oriented stocks across the capitalization spectrum. (All as measured by the FTSE Russell indices.)
1
GOLDMAN SACHS VARIABLE INSURANCE TRUST U.S. EQUITY INSIGHTS FUND
What key factors were responsible for the Fund’s performance during the Reporting Period?
The Fund uses a quantitative style of management, in combination with a qualitative overlay, that emphasizes fundamentally-based stock selection, careful portfolio construction and efficient implementation. The Fund’s investments are selected using fundamental research and a variety of quantitative techniques based on certain investment themes, namely Fundamental Mispricings, High Quality Business Models, Sentiment Analysis and Market Themes & Trends.
During the Reporting Period, the Fund posted double-digit absolute gains but underperformed the S&P 500® Index, with all four of our quantitative model’s investment themes detracting from results. Stock selection driven by these investment themes diminished relative performance.
What impact did the Fund’s investment themes have on performance during the Reporting Period?
In keeping with our investment approach, we use our quantitative model and four investment themes to take a long-term view of market patterns and look for inefficiencies, selecting stocks for the Fund and overweighting or underweighting the ones chosen by the model. Over time and by design, the performance of any one of the model’s investment themes tends to have a low correlation with the model’s other themes, demonstrating the diversification benefit of the Fund’s theme-driven quantitative model. The variance in performance supports our research indicating that the diversification provided by the Fund’s different investment themes is a significant investment advantage over the long term, even though the Fund may experience underperformance in the short term. Of course, diversification does not protect an investor from market risk nor does it ensure a profit.
During the Reporting Period, all four of our investment themes — Fundamental Mispricings, High Quality Business Models, Sentiment Analysis and Market Themes & Trends — detracted from the Fund’s relative performance. Fundamental Mispricing seeks to identify high quality businesses trading at a fair price, which we believe may lead to strong performance over the long run. High Quality Business Models seeks to identify companies that are generating high quality revenues with sustainable business models and aligned management incentives. Sentiment Analysis seeks to identify stocks experiencing improvements in their overall market sentiment. Market Themes & Trends seeks to identify companies positively positioned to benefit from themes and trends in the market and macroeconomic environment.
How did the Fund’s sector and industry allocations affect relative performance?
In constructing the Fund’s portfolio, we focus on picking stocks rather than making sector or industry bets. Consequently, the Fund is similar to its benchmark, the S&P 500® Index, in terms of its sector and industry allocations and style. Changes in its sector or industry weights generally do not have a meaningful impact on relative performance.
Did stock selection help or hurt Fund performance during the Reporting Period?
We seek to outpace the S&P 500® Index by overweighting stocks that we expect to outperform and underweighting those that we think may lag. At the same time, we strive to maintain a risk profile similar to the S&P 500® Index. The Fund’s investments are selected using fundamental research and a variety of quantitative techniques based on our investment themes. For example, the Fund aims to hold a basket of stocks with better Fundamental Mispricings characteristics than the benchmark index.
During the Reporting Period, stock selection hampered the Fund’s performance, with investments in the health care, energy and utilities sectors detracting most from results relative to the S&P 500® Index. On the positive side, the Fund benefited from stock selection in financials and, to a lesser extent, real estate.
Which individual positions detracted from the Fund’s results during the Reporting Period?
Detracting most from the Fund’s results relative to the S&P 500® Index were overweight positions in institutional financial services provider State Street, specialty pharmaceuticals company Mylan and energy company ConocoPhillips. The Fund had an overweight position in State Street driven primarily by our Fundamental Mispricings investment theme. The Fund’s overweight in Mylan was largely due to our Sentiment Analysis and Fundamental Mispricings investment themes. Mainly because of our High Quality Business Models and Sentiment Analysis investment themes, the Fund was overweight ConocoPhillips.
Which individual stock positions contributed the most to the Fund’s relative returns during the Reporting Period?
The Fund benefited most from overweight positions in discount retailer Target, insurance company Progressive and diversified financials institution Citigroup. The overweight in Target was established primarily because of our Sentiment Analysis and High Quality Business Models theme. The Fund was overweight Progressive due to our High Quality Business Models and Sentiment Analysis themes. The Fund’s overweight in Citigroup was driven mainly by our Fundamental Mispricings theme.
2
GOLDMAN SACHS VARIABLE INSURANCE TRUST U.S. EQUITY INSIGHTS FUND
How did the Fund use derivatives during the Reporting Period?
During the Reporting Period, we did not use derivatives as part of an active management strategy to add value to the Fund’s results. However, we used equity index futures contracts, on an opportunistic basis, to equitize the Fund’s excess cash holdings. In other words, we put the Fund’s excess cash holdings to work by using them as collateral for the purchase of stock futures. The use of these futures contracts did not have an impact on the Fund’s performance during the Reporting Period.
Did you make any enhancements to your quantitative models during the Reporting Period?
We continuously look for ways to improve our investment process. During the Reporting Period, we made numerous enhancements to our models. As example, in the second quarter of 2019, we introduced a number of new signals.
First, within our Sentiment Analysis investment theme, we added a suite of signals that utilizes data from the short selling market as an indicator of the market sentiment surrounding individual names.
Second, within our Market Themes & Trends investment theme, we added a signal that examines the cross-holdings of pooled vehicles to identify thematic trends in the market. Also within our Market Themes & Trends investment theme, we added a signal that examines internet linkages between companies to identify thematic trends.
Finally, within our Fundamental Mispricings investment theme, we added a signal that we believe to be predictive of industry rotations.
What was the Fund’s sector positioning relative to its benchmark index at the end of the Reporting Period?
As of June 30, 2019, the Fund was overweight the consumer discretionary and utilities sectors relative to the S&P 500® Index. The Fund was underweight communication services, consumer staples and health care and was rather neutrally weighted in financials, energy, industrials, real estate, materials and information technology compared to the benchmark index on the same date.
Were there any changes to the Fund’s portfolio management team during the Reporting Period?
There were no changes to the Fund’s portfolio management team during the Reporting Period.
What is your strategy going forward for the Fund?
Looking ahead, we continue to believe that less expensive stocks should outpace more expensive stocks, and stocks with good momentum are likely to outperform those with poor momentum. We intend to maintain our focus on seeking companies about which fundamental research analysts are becoming more positive as well as profitable companies with sustainable earnings and a track record of using their capital to enhance shareholder value. As such, we anticipate remaining fully invested with long-term performance likely to be the result of stock selection rather than sector or capitalization allocations.
We stand behind our investment philosophy that sound economic investment principles, coupled with a disciplined quantitative approach, can provide strong, uncorrelated returns over the long term. Our research agenda is robust, and we continue to enhance our existing models, add new proprietary forecasting signals and improve our trading execution as we seek to provide the most value to our shareholders.
3
GOLDMAN SACHS VARIABLE INSURANCE TRUST U.S. EQUITY INSIGHTS FUND
Index Definitions
S&P 500®Indexis the Standard & Poor’s composite index of 500 stocks, an unmanaged index of common stock prices. The figures for the index do not include any deduction for fees, expenses or taxes.
Russell 2000®Indexis an unmanaged index of common stock prices that measures the performance of the 2000 smallest companies in the Russell 3000®Index. The figures for the index do not include any deduction for fees, expenses or taxes.
Russell Midcap®Indexmeasures the performance of the 800 smallest companies in the Russell 1000®Index, which represents approximately 25% of the total market capitalization of the Russell 1000® Index.
Russell 1000®Indexmeasures the performance of the 1,000 largest companies in the Russell 3000®Index, which represents approximately 92% of the total market capitalization of the Russell 3000® Index.
It is not possible to invest directly in an index.
4
FUND BASICS
U.S. Equity Insights Fund
as of June 30, 2019
STANDARDIZED TOTAL RETURNS1
| | | | | | | | | | | | | | | | | | |
| | | | | |
| For the period ended 6/30/19 | | One Year | | | Five Years | | | Ten Years | | | Since Inception | | | Inception Date |
| Institutional | | | 4.15 | % | | | 9.79 | % | | | 14.40 | % | | | 6.44 | % | | 02/13/98 |
| Service | | | 3.89 | | | | 9.55 | | | | 14.16 | | | | 7.21 | | | 01/09/06 |
| 1 | The Standardized Total Returns are average annual total returns as of the most recent calendar quarter-end. They assume reinvestment of all distributions at net asset value (“NAV”). Because Institutional and Service Shares do not involve a sales charge, such a charge is not applied to their Standardized Total Returns. |
Total return figures in the above chart represent past performance and do not indicate future results, which will vary. The investment return and principal value of an investment will fluctuate and, therefore, an investor’s shares, when redeemed, may be worth more or less than their original cost. Current performance may be lower or higher than the total return figures in the above chart. Please visit www.GSAMFUNDS.com to obtain the most recentmonth-end returns.Performance reflects fee waivers and/or expense limitations in effect during the periods shown. In their absence, performance would be reduced.
EXPENSE RATIOS2
| | | | | | | | |
| | |
| | | Net Expense Ratio (Current) | | | Gross Expense Ratio (Before Waivers) | |
| Institutional | | | 0.56 | % | | | 0.72 | % |
| Service | | | 0.77 | | | | 0.97 | |
| 2 | The expense ratios of the Fund, both current (net of any fee waivers and/or expense limitations) and before waivers (gross of any fee waivers and/or expense limitations) are as set forth above according to the most recent publicly available Prospectuses for the Fund and may differ from the expense ratios disclosed in the Financial Highlights in this report. Pursuant to a contractual arrangement, the Fund’s fee waivers and/or expense limitations will remain in place through at least April 30, 2020, and prior to such date, the Investment Adviser may not terminate the arrangements without the approval of the Fund’s Board of Trustees. If these arrangements are discontinued in the future, the expense ratios may change without shareholder approval. |
TOP TEN HOLDINGS AS OF 6/30/193
| | | | | | |
| | |
| Holding | | % of Net Assets | | | Line of Business |
| Apple, Inc. | | | 4.4% | | | Technology Hardware & Equipment |
| Amazon.com, Inc. | | | 3.3 | | | Retailing |
| Microsoft Corp. | | | 3.2 | | | Software & Services |
| Visa, Inc. Class A | | | 2.2 | | | Software & Services |
| Facebook, Inc. Class A | | | 1.9 | | | Media & Entertainment |
| PayPal Holdings, Inc. | | | 1.5 | | | Software & Services |
| Union Pacific Corp. | | | 1.5 | | | Transportation |
| McDonald’s Corp. | | | 1.5 | | | Consumer Services |
| Alphabet, Inc. Class C | | | 1.5 | | | Media & Entertainment |
| Starbucks Corp. | | | 1.4 | | | Consumer Services |
| 3 | The top 10 holdings may not be representative of the Fund’s future investments. |
5
FUND BASICS
U.S. Equity Insights Fund(continued)
as of June 30, 2019
FUND vs. BENCHMARK SECTOR ALLOCATIONS4
As of June 30, 2019
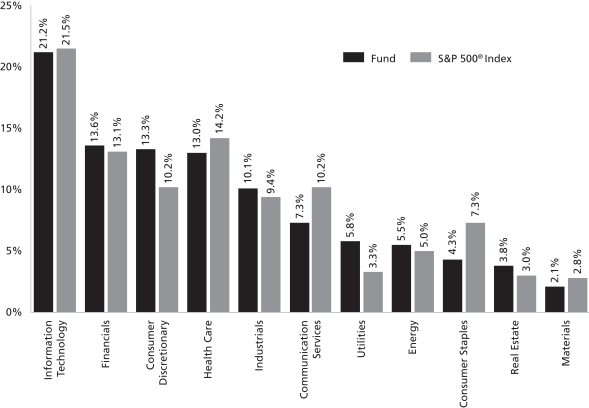
| 4 | The Fund is actively managed and, as such, its composition may differ over time. Consequently, the Fund’s overall sector allocations may differ from percentages contained in the graph above. The graph categorizes investments using Global Industry Classification Standard (“GICS”); however, the sector classifications used by the portfolio management team may differ from GICS. The percentage shown for each investment category reflects the value of investments in that category as a percentage of market value. |
6
GOLDMAN SACHS VARIABLE INSURANCE TRUST U.S. EQUITY INSIGHTS FUND
Schedule of Investments
June 30, 2019 (Unaudited)
| | | | | | | | |
| Shares | | | Description | | Value | |
|
| Common Stocks – 99.3% | |
| Automobiles & Components – 1.2% | |
| | 96,771 | | | General Motors Co. | | $ | 3,728,587 | |
| | |
| Banks – 5.9% | |
| | 11,454 | | | Bank of America Corp. | | | 332,166 | |
| | 3,908 | | | CIT Group, Inc. | | | 205,326 | |
| | 63,129 | | | Citigroup, Inc. | | | 4,420,924 | |
| | 19,534 | | | Citizens Financial Group, Inc. | | | 690,722 | |
| | 38,598 | | | Comerica, Inc. | | | 2,803,759 | |
| | 113,441 | | | Fifth Third Bancorp | | | 3,165,004 | |
| | 13,566 | | | JPMorgan Chase & Co. | | | 1,516,679 | |
| | 15,272 | | | Popular, Inc. | | | 828,353 | |
| | 4,999 | | | Signature Bank | | | 604,079 | |
| | 11,084 | | | Western Alliance Bancorp* | | | 495,676 | |
| | 66,724 | | | Zions Bancorp NA | | | 3,067,970 | |
| | | | | | | | |
| | | | | | | 18,130,658 | |
| | |
| Capital Goods – 5.8% | |
| | 1,111 | | | Allegion plc | | | 122,821 | |
| | 11,954 | | | Allison Transmission Holdings, Inc. | | | 554,068 | |
| | 7,483 | | | AMETEK, Inc. | | | 679,756 | |
| | 6,494 | | | Boeing Co. (The) | | | 2,363,881 | |
| | 22,267 | | | Caterpillar, Inc. | | | 3,034,769 | |
| | 2,143 | | | Cummins, Inc. | | | 367,182 | |
| | 2,958 | | | Eaton Corp. plc | | | 246,342 | |
| | 17,544 | | | Harris Corp. | | | 3,318,097 | |
| | 6,635 | | | HEICO Corp. | | | 887,829 | |
| | 2,863 | | | Ingersoll-Rand plc | | | 362,656 | |
| | 38,764 | | | Johnson Controls International plc | | | 1,601,341 | |
| | 12,081 | | | Masco Corp. | | | 474,058 | |
| | 15,546 | | | Parker-Hannifin Corp. | | | 2,642,976 | |
| | 11,433 | | | Spirit AeroSystems Holdings, Inc. Class A | | | 930,303 | |
| | 724 | | | Teledyne Technologies, Inc.* | | | 198,282 | |
| | | | | | | | |
| | | | | | | 17,784,361 | |
| | |
| Commercial & Professional Services – 0.6% | |
| | 1,109 | | | CoStar Group, Inc.* | | | 614,453 | |
| | 4,435 | | | IHS Markit Ltd.* | | | 282,598 | |
| | 8,877 | | | Waste Management, Inc. | | | 1,024,139 | |
| | | | | | | | |
| | | | | | | 1,921,190 | |
| | |
| Consumer Durables & Apparel – 0.2% | |
| | 5,491 | | | Ralph Lauren Corp. | | | 623,723 | |
| | |
| Consumer Services – 4.8% | |
| | 49,784 | | | Carnival Corp. | | | 2,317,445 | |
| | 1,187 | | | Chipotle Mexican Grill, Inc.* | | | 869,929 | |
| | 5,336 | | | Hilton Worldwide Holdings, Inc. | | | 521,541 | |
| | 22,715 | | | Las Vegas Sands Corp. | | | 1,342,229 | |
| | 21,913 | | | McDonald’s Corp. | | | 4,550,454 | |
| | 52,889 | | | Starbucks Corp. | | | 4,433,685 | |
| | 6,429 | | | Yum! Brands, Inc. | | | 711,497 | |
| | | | | | | | |
| | | | | | | 14,746,780 | |
| | |
| Diversified Financials – 5.2% | |
| | 102,417 | | | Ally Financial, Inc. | | | 3,173,903 | |
| | 18,410 | | | Berkshire Hathaway, Inc. Class B* | | | 3,924,460 | |
| | |
|
| Common Stocks – (continued) | |
| Diversified Financials – (continued) | |
| | 6,606 | | | MSCI, Inc. | | | 1,577,447 | |
| | 19,469 | | | State Street Corp. | | | 1,091,432 | |
| | 97,250 | | | Synchrony Financial | | | 3,371,657 | |
| | 51,402 | | | Voya Financial, Inc. | | | 2,842,530 | |
| | | | | | | | |
| | | | | | | 15,981,429 | |
| | |
| Energy – 5.4% | |
| | 63,071 | | | ConocoPhillips | | | 3,847,331 | |
| | 13,955 | | | Exxon Mobil Corp. | | | 1,069,372 | |
| | 3,943 | | | Helmerich & Payne, Inc. | | | 199,595 | |
| | 26,531 | | | Kinder Morgan, Inc. | | | 553,967 | |
| | 48,206 | | | Marathon Oil Corp. | | | 685,007 | |
| | 16,297 | | | Occidental Petroleum Corp. | | | 819,413 | |
| | 38,238 | | | Phillips 66 | | | 3,576,782 | |
| | 93,718 | | | TechnipFMC plc | | | 2,431,045 | |
| | 40,867 | | | Valero Energy Corp. | | | 3,498,624 | |
| | | | | | | | |
| | | | | | | 16,681,136 | |
| | |
| Food & Staples Retailing – 0.3% | |
| | 39,245 | | | Kroger Co. (The) | | | 852,009 | |
| | |
| Food, Beverage & Tobacco – 3.0% | |
| | 8,339 | | | Lamb Weston Holdings, Inc. | | | 528,359 | |
| | 45,902 | | | Mondelez International, Inc. Class A | | | 2,474,118 | |
| | 41,792 | | | Monster Beverage Corp.* | | | 2,667,584 | |
| | 45,227 | | | Philip Morris International, Inc. | | | 3,551,676 | |
| | | | | | | | |
| | | | | | | 9,221,737 | |
| | |
| Health Care Equipment & Services – 4.4% | |
| | 9,043 | | | Align Technology, Inc.* | | | 2,475,069 | |
| | 14,120 | | | Anthem, Inc. | | | 3,984,805 | |
| | 2,431 | | | Cigna Corp. | | | 383,004 | |
| | 19,287 | | | HCA Healthcare, Inc. | | | 2,607,024 | |
| | 13,999 | | | McKesson Corp. | | | 1,881,326 | |
| | 837 | | | Molina Healthcare, Inc.* | | | 119,808 | |
| | 14,789 | | | Universal Health Services, Inc. Class B | | | 1,928,338 | |
| | 804 | | | Varian Medical Systems, Inc.* | | | 109,448 | |
| | | | | | | | |
| | | | | | | 13,488,822 | |
| | |
| Household & Personal Products – 1.0% | |
| | 38,450 | | | Colgate-Palmolive Co. | | | 2,755,711 | |
| | 3,546 | | | Procter & Gamble Co. (The) | | | 388,819 | |
| | | | | | | | |
| | | | | | | 3,144,530 | |
| | |
| Insurance – 2.5% | |
| | 907 | | | Allstate Corp. (The) | | | 92,233 | |
| | 939 | | | Aon plc | | | 181,208 | |
| | 48,137 | | | Athene Holding Ltd. Class A* | | | 2,072,779 | |
| | 12,539 | | | Brighthouse Financial, Inc.* | | | 460,056 | |
| | 46,244 | | | Progressive Corp. (The) | | | 3,696,283 | |
| | 33,772 | | | Unum Group | | | 1,133,051 | |
| | | | | | | | |
| | | | | | | 7,635,610 | |
| | |
| Materials – 2.0% | |
| | 8,069 | | | Air Products & Chemicals, Inc. | | | 1,826,580 | |
| | 11,104 | | | Alcoa Corp.* | | | 259,945 | |
| | |
| | |
| The accompanying notes are an integral part of these financial statements. | | 7 |
GOLDMAN SACHS VARIABLE INSURANCE TRUST U.S. EQUITY INSIGHTS FUND
Schedule of Investments(continued)
June 30, 2019 (Unaudited)
| | | | | | | | |
| Shares | | | Description | | Value | |
|
| Common Stocks – (continued) | |
| Materials – (continued) | |
| | 2,403 | | | Ball Corp. | | $ | 168,186 | |
| | 5,339 | | | Eastman Chemical Co. | | | 415,534 | |
| | 5,527 | | | Sealed Air Corp. | | | 236,445 | |
| | 7,488 | | | Sherwin-Williams Co. (The) | | | 3,431,675 | |
| | | | | | | | |
| | | | | | | 6,338,365 | |
| | |
| Media & Entertainment – 6.0% | |
| | 4,059 | | | Alphabet, Inc. Class A* | | | 4,395,085 | |
| | 4,182 | | | Alphabet, Inc. Class C* | | | 4,520,366 | |
| | 30,094 | | | Facebook, Inc. Class A* | | | 5,808,142 | |
| | 974 | | | Madison Square Garden Co. (The) Class A* | | | 272,662 | |
| | 2,198 | | | Match Group, Inc. | | | 147,860 | |
| | 5,417 | | | Netflix, Inc.* | | | 1,989,772 | |
| | 98,374 | | | News Corp. Class A | | | 1,327,065 | |
| | 2,057 | | | Twitter, Inc.* | | | 71,789 | |
| | | | | | | | |
| | | | | | | 18,532,741 | |
| | |
| Pharmaceuticals, Biotechnology & Life Sciences – 8.6% | |
| | 38,193 | | | AbbVie, Inc. | | | 2,777,395 | |
| | 13,001 | | | Agilent Technologies, Inc. | | | 970,785 | |
| | 8,667 | | | Alexion Pharmaceuticals, Inc.* | | | 1,135,204 | |
| | 4,799 | | | Amgen, Inc. | | | 884,360 | |
| | 4,921 | | | Biogen, Inc.* | | | 1,150,874 | |
| | 51,655 | | | Bristol-Myers Squibb Co. | | | 2,342,554 | |
| | 30,600 | | | Eli Lilly & Co. | | | 3,390,174 | |
| | 62,365 | | | Gilead Sciences, Inc. | | | 4,213,379 | |
| | 19,927 | | | Incyte Corp.* | | | 1,692,998 | |
| | 12,542 | | | Johnson & Johnson | | | 1,746,850 | |
| | 37,188 | | | Merck & Co., Inc. | | | 3,118,214 | |
| | 21,969 | | | Pfizer, Inc. | | | 951,697 | |
| | 2,702 | | | Thermo Fisher Scientific, Inc. | | | 793,523 | |
| | 6,765 | | | Vertex Pharmaceuticals, Inc.* | | | 1,240,566 | |
| | | | | | | | |
| | | | | | | 26,408,573 | |
| | |
| Real Estate Investment Trusts – 3.8% | |
| | 17,958 | | | American Homes 4 Rent Class A | | | 436,559 | |
| | 15,027 | | | American Tower Corp. | | | 3,072,270 | |
| | 28,960 | | | Camden Property Trust | | | 3,023,134 | |
| | 72,392 | | | Duke Realty Corp. | | | 2,288,311 | |
| | 793 | | | Equity LifeStyle Properties, Inc. | | | 96,223 | |
| | 473 | | | Lamar Advertising Co. Class A | | | 38,176 | |
| | 18,143 | | | Prologis, Inc. | | | 1,453,254 | |
| | 16,647 | | | STORE Capital Corp. | | | 552,514 | |
| | 4,894 | | | Sun Communities, Inc. | | | 627,362 | |
| | | | | | | | |
| | | | | | | 11,587,803 | |
| | |
| Retailing – 7.0% | |
| | 5,424 | | | Amazon.com, Inc.* | | | 10,271,049 | |
| | 1,537 | | | AutoZone, Inc.* | | | 1,689,885 | |
| | 539 | | | Booking Holdings, Inc.* | | | 1,010,469 | |
| | 89,007 | | | eBay, Inc. | | | 3,515,776 | |
| | 1,185 | | | Expedia Group, Inc. | | | 157,641 | |
| | 14,795 | | | Lowe’s Cos., Inc. | | | 1,492,963 | |
| | 41,216 | | | Target Corp. | | | 3,569,718 | |
| | | | | | | | |
| | | | | | | 21,707,501 | |
| | |
|
| Common Stocks – (continued) | |
| Semiconductors & Semiconductor Equipment – 1.7% | |
| | 20,441 | | | Intel Corp. | | | 978,511 | |
| | 32,268 | | | NXP Semiconductors NV | | | 3,149,679 | |
| | 10,228 | | | Xilinx, Inc. | | | 1,206,086 | |
| | | | | | | | |
| | | | | | | 5,334,276 | |
| | |
| Software & Services – 12.9% | |
| | 27,211 | | | Citrix Systems, Inc. | | | 2,670,488 | |
| | 2,342 | | | Fidelity National Information Services, Inc. | | | 287,317 | |
| | 18,495 | | | International Business Machines Corp. | | | 2,550,461 | |
| | 686 | | | Intuit, Inc. | | | 179,272 | |
| | 7,097 | | | Mastercard, Inc. Class A | | | 1,877,369 | |
| | 74,127 | | | Microsoft Corp. | | | 9,930,053 | |
| | 44,299 | | | Oracle Corp. | | | 2,523,714 | |
| | 7,078 | | | Palo Alto Networks, Inc.* | | | 1,442,213 | |
| | 41,173 | | | PayPal Holdings, Inc.* | | | 4,712,662 | |
| | 8,009 | | | salesforce.com, Inc.* | | | 1,215,206 | |
| | 11,197 | | | ServiceNow, Inc.* | | | 3,074,360 | |
| | 12,133 | | | VeriSign, Inc.* | | | 2,537,738 | |
| | 39,966 | | | Visa, Inc. Class A | | | 6,936,099 | |
| | | | | | | | |
| | | | | | | 39,936,952 | |
| | |
| Technology Hardware & Equipment – 6.4% | |
| | 68,295 | | | Apple, Inc. | | | 13,516,946 | |
| | 258 | | | Arista Networks, Inc.* | | | 66,982 | |
| | 1,088 | | | CDW Corp. | | | 120,768 | |
| | 2,250 | | | Cisco Systems, Inc. | | | 123,143 | |
| | 4,164 | | | Jabil, Inc. | | | 131,582 | |
| | 37,396 | | | Keysight Technologies, Inc.* | | | 3,358,535 | |
| | 13,786 | | | Motorola Solutions, Inc. | | | 2,298,540 | |
| | | | | | | | |
| | | | | | | 19,616,496 | |
| | |
| Telecommunication Services – 1.1% | |
| | 5,129 | | | Telephone & Data Systems, Inc. | | | 155,921 | |
| | 4,299 | | | T-Mobile US, Inc.* | | | 318,728 | |
| | 53,677 | | | Verizon Communications, Inc. | | | 3,066,567 | |
| | | | | | | | |
| | | | | | | 3,541,216 | |
| | |
| Transportation – 3.7% | |
| | 30,254 | | | CSX Corp. | | | 2,340,752 | |
| | 2,333 | | | Delta Air Lines, Inc. | | | 132,398 | |
| | 16,533 | | | Norfolk Southern Corp. | | | 3,295,523 | |
| | 18,418 | | | Southwest Airlines Co. | | | 935,266 | |
| | 27,368 | | | Union Pacific Corp. | | | 4,628,202 | |
| | | | | | | | |
| | | | | | | 11,332,141 | |
| | |
| Utilities – 5.8% | |
| | 124,102 | | | AES Corp. | | | 2,079,950 | |
| | 25,412 | | | Ameren Corp. | | | 1,908,695 | |
| | 23,165 | | | DTE Energy Co. | | | 2,962,340 | |
| | 74,376 | | | Exelon Corp. | | | 3,565,586 | |
| | 45,009 | | | FirstEnergy Corp. | | | 1,926,835 | |
| | |
| | |
| 8 | | The accompanying notes are an integral part of these financial statements. |
GOLDMAN SACHS VARIABLE INSURANCE TRUST U.S. EQUITY INSIGHTS FUND
| | | | | | | | |
| Shares | | | Description | | Value | |
|
| Common Stocks – (continued) | |
| Utilities – (continued) | |
| | 58,907 | | | NRG Energy, Inc. | | $ | 2,068,814 | |
| | 108,311 | | | PPL Corp. | | | 3,358,724 | |
| | | | | | | | |
| | | | | | | 17,870,944 | |
| | |
| | TOTAL INVESTMENTS – 99.3% | |
| | (Cost $258,239,691) | | $ | 306,147,580 | |
| | |
| OTHER ASSETS IN EXCESS OF
LIABILITIES – 0.7% | | | 2,154,919 | |
| | |
| | NET ASSETS – 100.0% | | $ | 308,302,499 | |
| | |
| | |
| The percentage shown for each investment category reflects the value of investments in that category as a percentage of net assets. |
| |
| * | | Non-income producing security. |
| | |
| The accompanying notes are an integral part of these financial statements. | | 9 |
GOLDMAN SACHS VARIABLE INSURANCE TRUST U.S. EQUITY INSIGHTS FUND
Statement of Assets and Liabilities
June 30, 2019 (Unaudited)
| | | | |
| | | | |
| Assets: | | | |
Investments in unaffiliated issuers, at value (cost $258,239,691) | | $ | 306,147,580 | |
Cash | | | 1,240,391 | |
Receivables: | | | | |
Investments sold | | | 15,955,421 | |
Dividends | | | 313,434 | |
Fund shares sold | | | 26,531 | |
Reimbursement from investment adviser | | | 23,345 | |
Other assets | | | 876 | |
| |
| Total assets | | | 323,707,578 | |
| | | | |
| | | | |
| Liabilities: | | | |
Payables: | | | | |
Investments purchased | | | 14,956,945 | |
Fund shares redeemed | | | 188,726 | |
Management fees | | | 134,748 | |
Distribution and Service fees and Transfer Agency fees | | | 14,607 | |
Accrued expenses | | | 110,053 | |
| |
| Total liabilities | | | 15,405,079 | |
| | | | |
| | | | |
| Net Assets: | | | |
Paid-in capital | | | 258,062,639 | |
Total distributable earnings (loss) | | | 50,239,860 | |
| |
| NET ASSETS | | $ | 308,302,499 | |
Net Assets: | | | | |
Institutional | | $ | 251,486,681 | |
Service | | | 56,815,818 | |
| |
Total Net Assets | | $ | 308,302,499 | |
Shares outstanding $0.001 par value (unlimited shares authorized): | | | | |
Institutional | | | 14,505,087 | |
Service | | | 3,261,143 | |
Net asset value, offering and redemption price per share: | | | | |
Institutional | | | $17.34 | |
Service | | | 17.42 | |
| | |
| 10 | | The accompanying notes are an integral part of these financial statements. |
GOLDMAN SACHS VARIABLE INSURANCE TRUST U.S. EQUITY INSIGHTS FUND
Statement of Operations
For the Six Months Ended June 30, 2019 (Unaudited)
| | | | |
| | | | |
| Investment income: | | | |
Dividends — unaffiliated issuers (net of foreign taxes withheld of $2,268) | | $ | 2,987,955 | |
Dividends — affiliated issuers | | | 91 | |
Securities lending income — affiliated issuer | | | 33 | |
| |
| Total investment income | | | 2,988,079 | |
| | | | |
| | | | |
| Expenses: | | | |
Management fees | | | 952,896 | |
Distribution and Service fees — Service Shares | | | 70,107 | |
Professional fees | | | 46,437 | |
Custody, accounting and administrative services | | | 44,825 | |
Printing and mailing costs | | | 39,653 | |
Transfer Agency fees(a) | | | 30,736 | |
Trustee fees | | | 8,211 | |
Registration fees | | | 635 | |
Other | | | 7,014 | |
| |
| Total expenses | | | 1,200,514 | |
| |
Less — expense reductions | | | (278,260 | ) |
| |
| Net expenses | | | 922,254 | |
| |
| NET INVESTMENT INCOME | | | 2,065,825 | |
| | | | |
| | | | |
| Realized and unrealized gain: | | | |
Net realized gain from investments — unaffiliated issuers | | | 1,601,877 | |
| |
Net change in unrealized gain on investments — unaffiliated issuers | | | 39,869,739 | |
| |
| Net realized and unrealized gain | | | 41,471,616 | |
| |
| NET INCREASE IN NET ASSETS RESULTING FROM OPERATIONS | | $ | 43,537,441 | |
(a) Institutional and Service Shares incurred Transfer Agency fees of $25,128 and $5,608, respectively.
| | |
| The accompanying notes are an integral part of these financial statements. | | 11 |
GOLDMAN SACHS VARIABLE INSURANCE TRUST U.S. EQUITY INSIGHTS FUND
Statements of Changes in Net Assets
| | | | | | | | |
| | | For the
Six Months Ended
June 30, 2019
(Unaudited) | | | For the
Fiscal Year Ended
December 31, 2018 | |
| | | | | | | | |
| From operations: | | | | | | |
Net investment income | | $ | 2,065,825 | | | $ | 3,755,838 | |
Net realized gain | | | 1,601,877 | | | | 37,947,854 | |
Net change in unrealized gain (loss) | | | 39,869,739 | | | | (58,964,079 | ) |
| | |
| Net increase (decrease) in net assets resulting from operations | | | 43,537,441 | | | | (17,260,387 | ) |
| | | | | | | | |
| | | | | | | | |
| Distributions to shareholders: | |
From distributable earnings: | | | | | | | | |
Institutional Shares | | | — | | | | (41,717,467 | ) |
Service Shares | | | — | | | | (9,387,391 | ) |
| | |
| Total distributions to shareholders | | | — | | | | (51,104,858 | ) |
| | | | | | | | |
| | | | | | | | |
| From share transactions: | | | | | | |
Proceeds from sales of shares | | | 4,489,469 | | | | 23,858,438 | |
Reinvestment of distributions | | | — | | | | 51,104,858 | |
Cost of shares redeemed | | | (28,485,343 | ) | | | (137,999,297 | ) |
| | |
| Net decrease in net assets resulting from share transactions | | | (23,995,874 | ) | | | (63,036,001 | ) |
| | |
| TOTAL INCREASE (DECREASE) | | | 19,541,567 | | | | (131,401,246 | ) |
| | | | | | | | |
| | | | | | | | |
| Net Assets: | | | | | | |
| | |
Beginning of period | | | 288,760,932 | | | | 420,162,178 | |
| | |
End of period | | $ | 308,302,499 | | | $ | 288,760,932 | |
| | |
| 12 | | The accompanying notes are an integral part of these financial statements. |
GOLDMAN SACHS VARIABLE INSURANCE TRUST U.S. EQUITY INSIGHTS FUND
Financial Highlights
Selected Data for a Share Outstanding Throughout Each Period
| | | | | | | | | | | | | | | | | | | | | | | | |
| | | Goldman Sachs U.S. Equity Insights Fund | |
| | | Institutional Shares | |
| | | Six Months Ended
June 30, 2019
(Unaudited) | | | Year Ended December 31, | |
| | | 2018 | | | 2017 | | | 2016 | | | 2015 | | | 2014 | |
| | | | | | | | | | | | | | | | | | | | | | | | |
| Per Share Data | | | | | | | | | | | | | | | | | | |
| | | | | | |
Net asset value, beginning of period | | $ | 15.03 | | | $ | 19.41 | | | $ | 17.65 | | | $ | 16.71 | | | $ | 18.12 | | | $ | 16.52 | |
| | | | | | |
Net investment income(a) | | | 0.12 | | | | 0.22 | | | | 0.28 | | | | 0.22 | | | | 0.23 | | | | 0.21 | |
| | | | | | |
Net realized and unrealized gain (loss) | | | 2.19 | | | | (1.38 | ) | | | 3.98 | | | | 1.58 | | | | (0.27 | ) | | | 2.47 | |
| | | | | | |
Total from investment operations | | | 2.31 | | | | (1.16 | ) | | | 4.26 | | | | 1.80 | | | | (0.04 | ) | | | 2.68 | |
| | | | | | |
Distributions to shareholders from net investment income | | | — | | | | (0.25 | ) | | | (0.28 | ) | | | (0.23 | ) | | | (0.25 | ) | | | (0.26 | ) |
| | | | | | |
Distributions to shareholders from net realized gains | | | — | | | | (2.97 | ) | | | (2.22 | ) | | | (0.63 | ) | | | (1.12 | ) | | | (0.82 | ) |
| | | | | | |
Total distributions | | | — | | | | (3.22 | ) | | | (2.50 | ) | | | (0.86 | ) | | | (1.37 | ) | | | (1.08 | ) |
| | | | | | |
Net asset value, end of period | | $ | 17.34 | | | $ | 15.03 | | | $ | 19.41 | | | $ | 17.65 | | | $ | 16.71 | | | $ | 18.12 | |
| | | | | | |
Total return(b) | | | 15.37 | % | | | (6.19 | )% | | | 24.07 | % | | | 10.70 | % | | | (0.20 | )% | | | 16.37 | % |
| | | | | | |
Net assets, end of period (in 000s) | | $ | 251,487 | | | $ | 235,553 | | | $ | 277,952 | | | $ | 255,565 | | | $ | 269,238 | | | $ | 312,370 | |
| | | | | | |
Ratio of net expenses to average net assets | | | 0.56 | %(c) | | | 0.58 | % | | | 0.62 | % | | | 0.64 | % | | | 0.64 | % | | | 0.65 | % |
| | | | | | |
Ratio of total expenses to average net assets | | | 0.73 | %(c) | | | 0.73 | % | | | 0.70 | % | | | 0.70 | % | | | 0.71 | % | | | 0.71 | % |
| | | | | | |
Ratio of net investment income to average net assets | | | 1.38 | %(c) | | | 1.12 | % | | | 1.42 | % | | | 1.25 | % | | | 1.29 | % | | | 1.21 | % |
| | | | | | |
Portfolio turnover rate(d) | | | 91 | % | | | 160 | % | | | 184 | % | | | 204 | % | | | 200 | % | | | 214 | % |
| (a) | Calculated based on the average shares outstanding methodology. |
| (b) | Assumes investment at the net asset value at the beginning of the period, reinvestment of all distributions, a complete redemption of the investment at the net asset value at the end of the period and no sales or redemption charges (if any). Total returns would be reduced if a sales or redemption charge was taken into account. Returns do not reflect the impact of taxes to shareholders relating to Fund distributions or the redemption of Fund shares. Total returns for periods less than one full year are not annualized. |
| (d) | The Fund’s portfolio turnover rate is calculated in accordance with regulatory requirements, without regard to transactions involving short term investments and certain derivatives. If such transactions were included, the Fund’s portfolio turnover rate may be higher. |
| | |
| The accompanying notes are an integral part of these financial statements. | | 13 |
GOLDMAN SACHS VARIABLE INSURANCE TRUST U.S. EQUITY INSIGHTS FUND
Financial Highlights(continued)
Selected Data for a Share Outstanding Throughout Each Period
| | | | | | | | | | | | | | | | | | | | | | | | |
| | | Goldman Sachs U.S. Equity Insights Fund | |
| | | Service Shares | |
| | | Six Months Ended
June 30, 2019
(Unaudited) | | | Year Ended December 31, | |
| | | 2018 | | | 2017 | | | 2016 | | | 2015 | | | 2014 | |
| | | | | | | | | | | | | | | | | | | | | | | | |
| Per Share Data | | | | | | | | | | | | | | | | | | |
| | | | | | |
Net asset value, beginning of period | | $ | 15.12 | | | $ | 19.48 | | | $ | 17.71 | | | $ | 16.77 | | | $ | 18.17 | | | $ | 16.55 | |
| | | | | | |
Net investment income(a) | | | 0.10 | | | | 0.18 | | | | 0.24 | | | | 0.18 | | | | 0.20 | | | | 0.18 | |
| | | | | | |
Net realized and unrealized gain (loss) | | | 2.20 | | | | (1.37 | ) | | | 3.99 | | | | 1.59 | | | | (0.28 | ) | | | 2.47 | |
| | | | | | |
Total from investment operations | | | 2.30 | | | | (1.19 | ) | | | 4.23 | | | | 1.77 | | | | (0.08 | ) | | | 2.65 | |
| | | | | | |
Distributions to shareholders from net investment income | | | — | | | | (0.20 | ) | | | (0.24 | ) | | | (0.20 | ) | | | (0.20 | ) | | | (0.21 | ) |
| | | | | | |
Distributions to shareholders from net realized gains | | | — | | | | (2.97 | ) | | | (2.22 | ) | | | (0.63 | ) | | | (1.12 | ) | | | (0.82 | ) |
| | | | | | |
Total distributions | | | — | | | | (3.17 | ) | | | (2.46 | ) | | | (0.83 | ) | | | (1.32 | ) | | | (1.03 | ) |
| | | | | | |
Net asset value, end of period | | $ | 17.42 | | | $ | 15.12 | | | $ | 19.48 | | | $ | 17.71 | | | $ | 16.77 | | | $ | 18.17 | |
| | | | | | |
Total return(b) | | | 15.21 | % | | | (6.36 | )% | | | 23.80 | % | | | 10.44 | % | | | (0.41 | )% | | | 16.18 | % |
| | | | | | |
Net assets, end of period (in 000s) | | $ | 56,816 | | | $ | 53,208 | | | $ | 142,210 | | | $ | 120,387 | | | $ | 122,531 | | | $ | 138,725 | |
| | | | | | |
Ratio of net expenses to average net assets | | | 0.77 | %(c) | | | 0.79 | % | | | 0.82 | % | | | 0.85 | % | | | 0.85 | % | | | 0.86 | % |
| | | | | | |
Ratio of total expenses to average net assets | | | 0.98 | %(c) | | | 0.97 | % | | | 0.95 | % | | | 0.95 | % | | | 0.96 | % | | | 0.96 | % |
| | | | | | |
Ratio of net investment income to average net assets | | | 1.17 | %(c) | | | 0.88 | % | | | 1.21 | % | | | 1.04 | % | | | 1.08 | % | | | 1.01 | % |
| | | | | | |
Portfolio turnover rate(d) | | | 91 | % | | | 160 | % | | | 184 | % | | | 204 | % | | | 200 | % | | | 214 | % |
| (a) | Calculated based on the average shares outstanding methodology. |
| (b) | Assumes investment at the net asset value at the beginning of the period, reinvestment of all distributions, a complete redemption of the investment at the net asset value at the end of the period and no sales or redemption charges (if any). Total returns would be reduced if a sales or redemption charge was taken into account. Returns do not reflect the impact of taxes to shareholders relating to Fund distributions or the redemption of Fund shares. Total returns for periods less than one full year are not annualized. |
| (d) | The Fund’s portfolio turnover rate is calculated in accordance with regulatory requirements, without regard to transactions involving short term investments and certain derivatives. If such transactions were included, the Fund’s portfolio turnover rate may be higher. |
| | |
| 14 | | The accompanying notes are an integral part of these financial statements. |
GOLDMAN SACHS VARIABLE INSURANCE TRUST U.S. EQUITY INSIGHTS FUND
Notes to Financial Statements
June 30, 2019 (Unaudited)
1. ORGANIZATION
Goldman Sachs Variable Insurance Trust (the “Trust” or “VIT”) is a Delaware statutory trust registered under the Investment Company Act of 1940, as amended (the “Act”), as anopen-end management investment company. The Trust includes the Goldman Sachs U.S. Equity Insights Fund (the “Fund”). The Fund is a diversified portfolio under the Act offering two classes of shares — Institutional and Service Shares. Shares of the Trust are offered to separate accounts of participating life insurance companies for the purpose of funding variable annuity contracts and variable life insurance policies.
Goldman Sachs Asset Management, L.P. (“GSAM”), an affiliate of Goldman Sachs & Co. LLC (“Goldman Sachs”), serves as investment adviser to the Fund pursuant to a management agreement (the “Agreement”) with the Trust.
2. SIGNIFICANT ACCOUNTING POLICIES
The financial statements have been prepared in accordance with accounting principles generally accepted in the United States of America (“GAAP”) and require management to make estimates and assumptions that may affect the reported amounts and disclosures. Actual results may differ from those estimates and assumptions.
A. Investment Valuation — The Fund’s valuation policy is to value investments at fair value.
B. Investment Income and Investments —Investment income includes interest income, dividend income, and securities lending income, if any. Interest income is accrued daily and adjusted for amortization of premiums and accretion of discounts. Dividend income is recognized onex-dividend date or, for certain foreign securities, as soon as such information is obtained subsequent to theex-dividend date. Investment transactions are reflected on trade date. Realized gains and losses are calculated using identified cost. Investment transactions are recorded on the following business day for daily net asset value (“NAV”) calculations. Investment income is recorded net of any foreign withholding taxes, less any amounts reclaimable. The Fund may file withholding tax reclaims in certain jurisdictions to recover a portion of amounts previously withheld. Any foreign capital gains tax is accrued daily based upon net unrealized gains, and is payable upon sale of such investments. Distributions received from the Fund’s investments in United States (“U.S.”) real estate investment trusts (“REITs”) may be characterized as ordinary income, net capital gain or a return of capital. A return of capital is recorded by the Fund as a reduction to the cost basis of the REIT.
C. Class Allocations and Expenses — Investment income, realized and unrealized gain (loss), if any, andnon-class specific expenses of the Fund are allocated daily based upon the proportion of net assets of each class.Non-class specific expenses directly incurred by the Fund are charged to the Fund, while such expenses incurred by the Trust are allocated across the Fund on a straight-line and/orpro-rata basis depending upon the nature of the expenses. Class-specific expenses, where applicable, are borne by the respective share classes and include Distribution and Service and Transfer Agency fees.
D. Federal Taxes and Distributions to Shareholders — It is the Fund’s policy to comply with the requirements of the Internal Revenue Code of 1986, as amended (the “Code”), applicable to regulated investment companies and to distribute each year substantially all of its investment company taxable income and capital gains to its shareholders. Accordingly, the Fund is not required to make any provisions for the payment of federal income tax. Distributions to shareholders are recorded on theex-dividend date. Income and capital gains distributions, if any, are declared and paid at least annually.
Net capital losses, if any, are carried forward to future fiscal years and may be used to the extent allowed by the Code to offset any future capital gains. Losses that are carried forward will retain their character as either short-term or long-term capital losses. Utilization of capital loss carryforwards will reduce the requirement of future capital gains distributions.
The characterization of distributions to shareholders for financial reporting purposes is determined in accordance with federal income tax rules, which may differ from GAAP. The source of the Fund’s distributions may be shown in the accompanying financial statements as either from distributable earnings or capital. Certain components of the Fund’s net assets on the Statement of Assets and Liabilities reflect permanent GAAP/tax differences based on the appropriate tax character.
15
GOLDMAN SACHS VARIABLE INSURANCE TRUST U.S. EQUITY INSIGHTS FUND
Notes to Financial Statements(continued)
June 30, 2019 (Unaudited)
3. INVESTMENTS AND FAIR VALUE MEASUREMENTS
U.S. GAAP defines the fair value of a financial instrument as the amount that would be received to sell an asset or paid to transfer a liability in an orderly transaction between market participants at the measurement date (i.e., the exit price); the Fund’s policy is to use the market approach. GAAP establishes a fair value hierarchy that prioritizes the inputs to valuation techniques used to measure fair value. The hierarchy gives the highest priority to unadjusted quoted prices in active markets for identical assets or liabilities (Level 1 measurements) and the lowest priority to unobservable inputs (Level 3 measurements). The levels used for classifying investments are not necessarily an indication of the risk associated with investing in these investments. The three levels of the fair value hierarchy are described below:
Level 1 — Unadjusted quoted prices in active markets that are accessible at the measurement date for identical, unrestricted assets or liabilities;
Level 2 — Quoted prices in markets that are not active or financial instruments for which significant inputs are observable (including, but not limited to, quoted prices for similar investments, interest rates, foreign exchange rates, volatility and credit spreads), either directly or indirectly;
Level 3 — Prices or valuations that require significant unobservable inputs (including GSAM’s assumptions in determining fair value measurement).
The Board of Trustees (“Trustees”) has approved Valuation Procedures that govern the valuation of the portfolio investments held by the Fund, including investments for which market quotations are not readily available. The Trustees have delegated to GSAMday-to-day responsibility for implementing and maintaining internal controls and procedures related to the valuation of the Fund’s investments. To assess the continuing appropriateness of pricing sources and methodologies, GSAM regularly performs price verification procedures and issues challenges as necessary to third party pricing vendors or brokers, and any differences are reviewed in accordance with the Valuation Procedures.
A. Level 1 and Level 2 Fair Value Investments —The valuation techniques and significant inputs used in determining the fair values for investments classified as Level 1 and Level 2 are as follows:
Equity Securities —Equity securities traded on a U.S. securities exchange or the NASDAQ system, or those located on certain foreign exchanges, including but not limited to the Americas, are valued daily at their last sale price or official closing price on the principal exchange or system on which they are traded. If there is no sale or official closing price or such price is believed by GSAM to not represent fair value, equity securities are valued at the last bid price for long positions and at the last ask price for short positions. To the extent these investments are actively traded, they are classified as Level 1 of the fair value hierarchy, otherwise they are generally classified as Level 2.
Unlisted equity securities for which market quotations are available are valued at the last sale price on the valuation date, or if no sale occurs, at the last bid price, and are generally classified as Level 2.
Money Market Funds — Investments in the Goldman Sachs Financial Square Government Fund (“Underlying Fund”) are valued at the NAV of the Institutional Share class on the day of valuation. These investments are generally classified as Level 1 of the fair value hierarchy. For information regarding the Underlying Fund’s accounting policies and investment holdings, please see the Underlying Fund’s shareholder report.
B. Level 3 Fair Value Investments —To the extent that significant inputs to valuation models and other alternative pricing sources are unobservable, or if quotations are not readily available, or if GSAM believes that such quotations do not accurately reflect fair value, the fair value of the Fund’s investments may be determined under Valuation Procedures approved by the Trustees. GSAM, consistent with its procedures and applicable regulatory guidance, may make an adjustment to the most recent valuation prices of either domestic or foreign securities in light of significant events to reflect what it believes to be the fair value of the securities at the time of determining the Fund’s NAV. To the extent investments are valued using single source broker quotations obtained directly from the broker or passed through from third party pricing vendors, such investments are classified as Level 3 investments. GSAM did not develop the unobservable inputs for valuation of Level 3 Assets and Liabilities.
16
GOLDMAN SACHS VARIABLE INSURANCE TRUST U.S. EQUITY INSIGHTS FUND
3. INVESTMENTS AND FAIR VALUE MEASUREMENTS (continued)
C. Fair Value Hierarchy —The following is a summary of the Fund’s investments and derivatives classified in the fair value hierarchy as of June 30, 2019:
| | | | | | | | | | | | |
| Investment Type | | Level 1 | | | Level 2 | | | Level 3 | |
| | | |
| Assets | | | | | | | | | | | | |
| Common Stock(a) | | | | | | | | | | | | |
Europe | | $ | 5,580,724 | | | $ | — | | | $ | — | |
North America | | | 300,566,856 | | | | — | | | | — | |
| | | |
| Total | | $ | 306,147,580 | | | $ | — | | | $ | — | |
| (a) | Amounts are disclosed by continent to highlight the impact of time zone differences between local market close and the calculation of NAV. Security valuations are based on the principal exchange or system on which they are traded, which may differ from country of domicile. |
For further information regarding security characteristics, see the Schedule of Investments.
4. AGREEMENTS AND AFFILIATED TRANSACTIONS
A. Management Agreement — Under the Agreement, GSAM manages the Fund, subject to the general supervision of the Trustees.
As compensation for the services rendered pursuant to the Agreement, the assumption of the expenses related thereto and administration of the Fund’s business affairs, including providing facilities, GSAM is entitled to a management fee, accrued daily and paid monthly, equal to an annual percentage rate of the Fund’s average daily net assets.
For the six months ended June 30, 2019, contractual and effective net management fees with GSAM were at the following rates:
| | | | | | | | | | | | | | | | | | | | | | | | |
| | | Contractual Management Rate | | | | | | | |
First
$1 billion | | Next
$1 billion | | | Next
$3 billion | | | Next
$3 billion | | | Over
$8 billion | | | Effective
Rate | | | Effective Net
Management Rate^ | |
| 0.62% | | | 0.59 | % | | | 0.56 | % | | | 0.55 | % | | | 0.54 | % | | | 0.62 | % | | | 0.54 | %* |
| ^ | Effective Net Management Rate includes the impact of management fee waivers of affiliated Underlying Funds, if any. |
| * | GSAM agreed to waive a portion of its management fee in order to achieve a net management rate, as defined in the Fund’s most recent prospectus. This waiver will be effective through at least April 30, 2020, and prior to such date GSAM may not terminate the arrangement without approval of the Trustees. For the six months ended June 30, 2019, GSAM waived $122,955 of its management fee. |
The Fund invests in Institutional Shares of the Goldman Sachs Financial Square Government Fund, which is an affiliated Underlying Fund. GSAM has agreed to waive a portion of its management fee payable by the Fund in an amount equal to the management fee it earns as an investment adviser to the affiliated Underlying Fund in which the Fund invests, except those management fees it earns from the Fund’s investments of cash collateral received in connection with securities lending transactions in the Goldman Sachs Financial Square Government Fund. For the six months ended June 30, 2019, GSAM waived $4 of the Fund’s management fee.
B. Distribution and/or Service(12b-1) Plan — The Trust, on behalf of Service Shares of the Fund, has adopted a Distribution and Service Plan subject to Rule12b-1 under the Act. Under the Distribution and Service Plan, Goldman Sachs, which serves as distributor, is entitled to a fee accrued daily and paid monthly, for distribution services and personal and account maintenance services, which may then be paid by Goldman Sachs to authorized dealers, equal to, on an annual basis, 0.25% of the Fund’s average daily net assets attributable to Service Shares. Goldman Sachs has agreed to waive distribution and service fees so as not to exceed an annual rate of 0.21% of average daily net assets attributable to Service Shares. This distribution and service fee waiver will remain in place through at least April 30, 2020, and prior to such date Goldman Sachs may not terminate the arrangement
17
GOLDMAN SACHS VARIABLE INSURANCE TRUST U.S. EQUITY INSIGHTS FUND
Notes to Financial Statements(continued)
June 30, 2019 (Unaudited)
4. AGREEMENTS AND AFFILIATED TRANSACTIONS (continued)
without the approval of the Trustees. For the six months ended June 30, 2019, Goldman Sachs waived $11,217 in distribution and service fees for the Fund’s Service Shares.
C. Transfer Agency Agreement — Goldman Sachs also serves as the transfer agent of the Fund for a fee pursuant to the Transfer Agency Agreement. The fees charged for such transfer agency services are accrued daily and paid monthly at an annual rate of 0.02% of the average daily net assets of Institutional and Service Shares.
D. Other Expense Agreements and Affiliated Transactions — GSAM has agreed to reduce or limit certain “Other Expenses” of the Fund (excluding acquired fund fees and expenses, transfer agency fees and expenses, service fees and shareholder administration fees (as applicable), taxes, interest, brokerage fees, expenses of shareholder meetings, litigation and indemnification, and extraordinary expenses) to the extent such expenses exceed, on an annual basis, a percentage rate of the average daily net assets of the Fund. Such Other Expense reimbursements, if any, are accrued daily and paid monthly. In addition, the Fund is not obligated to reimburse GSAM for prior fiscal year expense reimbursements, if any. The Other Expense limitation as an annual percentage rate of average daily net assets for the Fund is 0.004%. The Other Expense limitation will remain in place through at least April 30, 2020, and prior to such date GSAM may not terminate the arrangement without the approval of the Trustees. In addition, the Fund has entered into certain offset arrangements with the custodian and the transfer agent, which may result in a reduction of the Fund’s expenses and are received irrespective of the application of the “Other Expense” limitation described above.
For the six months ended June 30, 2019, these expense reductions, including any fee waivers and Other Expense reimbursements, were as follows:
| | | | | | | | | | | | | | | | |
Management Fee
Waiver | | Distribution and
Service Fee Waiver | | | Custody Fee
Credits | | | Other Expense
Reimbursement | | | Total Expense
Reductions | |
| $122,959 | | $ | 11,217 | | | $ | 3,461 | | | $ | 140,623 | | | $ | 278,260 | |
E. Line of Credit Facility — As of June 30, 2019, the Fund participated in a $580,000,000 committed, unsecured revolving line of credit facility (the “facility”) together with other funds of the Trust and certain registered investment companies having management agreements with GSAM or its affiliates. This facility is to be used for temporary emergency purposes, or to allow for an orderly liquidation of securities to meet redemption requests. The interest rate on borrowings is based on the federal funds rate. The facility also requires a fee to be paid by the Fund based on the amount of the commitment that has not been utilized. For the six months ended June 30, 2019, the Fund did not have any borrowings under the facility. Prior to April 30, 2019 the facility was $770,000,000.
F. Other Transactions with Affiliates — The following table provides information about the Fund’s investments in the Goldman Sachs Financial Square Government Fund as of and for the six months ended June 30, 2019:
| | | | | | | | | | | | | | | | | | | | |
Beginning
Value as of
December 31, 2018 | | Purchases
at Cost | | | Proceeds
from Sales | | | Ending
Value as of
June 30, 2019 | | | Shares as of
June 30, 2019 | | | Dividend Income
from Affiliated
Investment Company | |
| $— | | $ | 722,341 | | | $ | (722,341 | ) | | $ | — | | | | — | | | $ | 91 | |
5. PORTFOLIO SECURITIES TRANSACTIONS
The cost of purchases and proceeds from sales and maturities of long-term securities for the six months ended June 30, 2019, were $276,448,584 and $298,774,361, respectively.
18
GOLDMAN SACHS VARIABLE INSURANCE TRUST U.S. EQUITY INSIGHTS FUND
6. SECURITIES LENDING
Pursuant to exemptive relief granted by the Securities and Exchange Commission (“SEC”) and the terms and conditions contained therein, the Fund may lend its securities through a securities lending agent, Goldman Sachs Agency Lending (“GSAL”), a wholly-owned subsidiary of Goldman Sachs, to certain qualified borrowers including Goldman Sachs and affiliates. In accordance with the Fund’s securities lending procedures, the Fund receives cash collateral at least equal to the market value of the securities on loan. The market value of the loaned securities is determined at the close of business of the Fund, at their last sale price or official closing price on the principal exchange or system on which they are traded, and any additional required collateral is delivered to the Fund on the next business day. As with other extensions of credit, the Fund may experience delay in the recovery of its securities or incur a loss should the borrower of the securities breach its agreement with the Fund or become insolvent at a time when the collateral is insufficient to cover the cost of repurchasing securities on loan. Dividend income received from securities on loan may not be subject to withholding taxes and therefore withholding taxes paid may differ from the amounts listed in the Statement of Operations. Loans of securities are terminable at any time and as such 1) the remaining contractual maturities of the outstanding securities lending transactions are considered to be overnight and continuous and 2) the borrower, after notice, is required to return borrowed securities within the standard time period for settlement of securities transactions.
The Fund invests the cash collateral received in connection with securities lending transactions in the Goldman Sachs Financial Square Government Fund (“Government Money Market Fund”), an affiliated series of the Goldman Sachs Trust. The Government Money Market Fund is registered under the Act as an open end investment company, is subject to Rule2a-7 under the Act, and is managed by GSAM, for which GSAM may receive a management fee of up to 0.16% on an annualized basis of the average daily net assets of the Government Money Market Fund.
In the event of a default by a borrower with respect to any loan, GSAL will exercise any and all remedies provided under the applicable borrower agreement to make the Fund whole. These remedies include purchasing replacement securities by applying the collateral held from the defaulting broker against the purchase cost of the replacement securities. If GSAL is unable to purchase replacement securities, GSAL will indemnify the Fund by paying the Fund an amount equal to the market value of the securities loaned minus the value of cash collateral received from the borrower for the loan, subject to an exclusion for any shortfalls resulting from a loss of value in such cash collateral due to reinvestment risk. The Fund may enter into master netting agreements with borrowers, which provide the right, in the event of a default (including bankruptcy or insolvency), for thenon-defaulting party to liquidate the collateral and calculate net exposure to the defaulting party or request additional collateral. However, in the event of a default by a borrower, a resolution authority could determine that such rights are not enforceable due to the restrictions or prohibitions against the right ofset-off that may be imposed in accordance with a particular jurisdiction’s bankruptcy or insolvency laws. The Fund’s loaned securities were all subject to enforceable Securities Lending Agreements and the value of the collateral was at least equal to the value of the cash received. The amounts of the Fund’s overnight and continuous agreements, which represent the gross amounts of recognized liabilities for securities lending transactions outstanding as of June 30, 2019, are disclosed as “Payable upon return of securities loaned” on the Statement of Assets and Liabilities, where applicable. The Fund did not have securities on loan as of June 30, 2019.
Both the Fund and GSAL received compensation relating to the lending of the Fund’s securities. The amounts earned, if any, by the Fund for the six months ended June 30, 2019, are reported under Investment Income on the Statement of Operations.
The table below details securities lending activity with affiliates of Goldman Sachs:
| | | | | | | | | | |
| For the Six Months ended June 30, 2019 | | | | |
Earnings of GSAL
Relating to
Securities
Loaned | | | Amount Received
by the Fund from Lending to
Goldman Sachs | | | Amount Payable to
Goldman Sachs Upon Return of
Securities Loaned as of
June 30, 2019 | |
| | |
| $ | 4 | | | $ | 7 | | | $ | — | |
19
GOLDMAN SACHS VARIABLE INSURANCE TRUST U.S. EQUITY INSIGHTS FUND
Notes to Financial Statements(continued)
June 30, 2019 (Unaudited)
6. SECURITIES LENDING (continued)
The following table provides information about the Fund’s investment in the Government Money Market Fund for the six months ended June 30, 2019:
| | | | | | | | | | | | | | |
Beginning
Value as of
December 31, 2018 | | | Purchases
at Cost | | | Proceeds
from Sales | | | Ending
Value as of
June 30, 2019 | |
| | | | |
| $ | — | | | $ | 265,125 | | | $ | (265,125 | ) | | $ | — | |
7. TAX INFORMATION
As of the Fund’s most recent fiscal year end, December 31, 2018, the Fund’s certain timing differences, on atax-basis were as follows:
| | | | |
| Timing differences (§857 (b)(9) Deferred Dividend/Post October Loss Deferral) | | $ | (658,536 | ) |
As of June 30, 2019, the Fund’s aggregate security unrealized gains and losses based on cost for U.S. federal income tax purposes were as follows:
| | | | |
| Tax cost | | $ | 259,214,916 | |
| Gross unrealized gain | | | 51,863,131 | |
| Gross unrealized loss | | | (4,930,467 | ) |
| Net unrealized gain | | $ | 46,932,664 | |
The difference between GAAP-basis andtax-basis unrealized gains (losses) is attributable primarily to wash sales.
GSAM has reviewed the Fund’s tax positions for all open tax years (the current and prior three years, as applicable) and has concluded that no provision for income tax is required in the Fund’s financial statements. Such open tax years remain subject to examination and adjustment by tax authorities.
8. OTHER RISKS
The Fund’s risks include, but are not limited to, the following:
Investments in Other Investment Companies Risk — As a shareholder of another investment company, the Fund will indirectly bear its proportionate share of any net management fees and other expenses paid by such other investment companies, in addition to the fees and expenses regularly borne by the Fund.
Large Shareholder Transactions Risk — The Fund may experience adverse effects when certain large shareholders, such as other funds, participating insurance companies, accounts and Goldman Sachs affiliates, purchase or redeem large amounts of shares of the Fund. Such large shareholder redemptions, which may occur rapidly or unexpectedly, may cause the Fund to sell portfolio securities at times when it would not otherwise do so, which may negatively impact the Fund’s NAV and liquidity. These transactions may also accelerate the realization of taxable income to shareholders if such sales of investments resulted in gains, and may also increase transaction costs. In addition, a large redemption could result in the Fund’s current expenses being allocated over a smaller asset base, leading to an increase in the Fund’s expense ratio. Similarly, large Fund share purchases may adversely affect the Fund’s performance to the extent that the Fund is delayed in investing new cash or otherwise maintains a larger cash position than it ordinarily would.
Liquidity Risk — The Fund may make investments that are illiquid or that may become less liquid in response to market developments or adverse investor perceptions. Illiquid investments may be more difficult to value. Liquidity risk may also refer to
20
GOLDMAN SACHS VARIABLE INSURANCE TRUST U.S. EQUITY INSIGHTS FUND
8. OTHER RISKS (continued)
the risk that the Fund will not be able to pay redemption proceeds within the allowable time period or without significant dilution to remaining investors’ interests because of unusual market conditions, an unusually high volume of redemption requests, or other reasons. To meet redemption requests, the Fund may be forced to sell investments at an unfavorable time and/or under unfavorable conditions. If the Fund is forced to sell securities at an unfavorable time and/or under unfavorable conditions, such sales may adversely affect the Fund’s NAV and dilute remaining investors’ interests. Redemptions by large shareholders may have a negative impact on the Fund’s liquidity.
Market and Credit Risks — In the normal course of business, the Fund trades financial instruments and enters into financial transactions where risk of potential loss exists due to changes in the market (market risk). Additionally, the Fund may also be exposed to credit risk in the event that an issuer or guarantor fails to perform or that an institution or entity with which the Fund has unsettled or open transactions defaults.
9. INDEMNIFICATIONS
Under the Trust’s organizational documents, its Trustees, officers, employees and agents are indemnified, to the extent permitted by the Act and state law, against certain liabilities that may arise out of performance of their duties to the Fund. Additionally, in the course of business, the Fund enters into contracts that contain a variety of indemnification clauses. The Fund’s maximum exposure under these arrangements is unknown, as this would involve future claims that may be made against the Fund that have not yet occurred. However, GSAM believes the risk of loss under these arrangements to be remote.
10. SUBSEQUENT EVENTS
Subsequent events after the Statement of Assets and Liabilities date have been evaluated, and GSAM has concluded that there is no impact requiring adjustment or disclosure in the financial statements.
11. SUMMARY OF SHARE TRANSACTIONS
Share activity is as follows:
| | | | | | | | | | | | | | | | |
| | | For the Six Months Ended
June 30, 2019
(Unaudited) | | | For the Fiscal Year Ended
December 31, 2018 | |
| | | Shares | | | Dollars | | | Shares | | | Dollars | |
| Institutional Shares | | | | | | | | | | | | | | | | |
| Shares sold | | | 89,807 | | | $ | 1,509,747 | | | | 416,442 | | | $ | 8,122,674 | |
| Reinvestment of distributions | | | — | | | | — | | | | 2,739,164 | | | | 41,717,467 | |
| Shares redeemed | | | (1,259,064 | ) | | | (21,196,025 | ) | | | (1,798,863 | ) | | | (36,105,931 | ) |
| | | | (1,169,257 | ) | | | (19,686,278 | ) | | | 1,356,743 | | | | 13,734,210 | |
| Service Shares | | | | | | | | | | | | | | | | |
| Shares sold | | | 177,445 | | | | 2,979,722 | | | | 774,115 | | | | 15,735,764 | |
| Reinvestment of distributions | | | — | | | | — | | | | 612,754 | | | | 9,387,391 | |
| Shares redeemed | | | (436,117 | ) | | | (7,289,318 | ) | | | (5,165,531 | ) | | | (101,893,366 | ) |
| | | | (258,672 | ) | | | (4,309,596 | ) | | | (3,778,662 | ) | | | (76,770,211 | ) |
| | | | |
| NET DECREASE | | | (1,427,929 | ) | | $ | (23,995,874 | ) | | | (2,421,919 | ) | | $ | (63,036,001 | ) |
21
GOLDMAN SACHS VARIABLE INSURANCE TRUST U.S. EQUITY INSIGHTS FUND
| | |
| Fund Expenses — Six Month Period Ended June 30, 2019 (Unaudited) | | |
As a shareholder of Institutional or Service Shares of the Fund, you incur ongoing costs, including management fees, distribution and/or service(12b-1) fees (with respect to Service Shares) and other Fund expenses. This example is intended to help you understand your ongoing costs (in dollars) of investing in Institutional Shares and Service Shares of the Fund and to compare these costs with the ongoing costs of investing in other mutual funds.
The example is based on an investment of $1,000 invested at the beginning of the period and held for the entire period from January 1, 2019 through June 30, 2019, which represents a period of 181 days of a 365 day year.
Actual Expenses — The first line under each share class in the table below provides information about actual account values and actual expenses. You may use the information in this line, together with the amount you invested, to estimate the expenses that you paid over the period. Simply divide your account value by $1,000 (for example, an $8,600 account value divided by $1,000=8.6), then multiply the result by the number in the first line under the heading entitled “Expenses Paid” to estimate the expenses you paid on your account during this period.
Hypothetical Example for Comparison Purposes — The second line under each share class in the table below provides information about hypothetical account values and hypothetical expenses based on the Fund’s actual net expense ratio and an assumed rate of return of 5% per year before expenses, which is not the Fund’s actual return. The hypothetical account values and expenses may not be used to estimate the actual ending account balance or expenses you paid for the period. You may use this information to compare the ongoing costs of investing in the Fund and other funds. To do so, compare this 5% hypothetical example with the 5% hypothetical examples that appear in the shareholder reports of the other funds.
Please note that the expenses shown in the table are meant to highlight your ongoing costs only. As a shareholder of the Fund you do not incur any transaction costs, such as sales charges, redemption fees, or exchange fees, but shareholders of other funds may incur such costs. The second line of the table is useful in comparing ongoing costs only and will not help you determine the relative total costs of owning different funds whose shareholders may incur transaction costs.
| | | | | | | | | | | | |
| Share Class | | Beginning
Account Value
01/01/19 | | | Ending
Account Value
06/30/19 | | | Expenses Paid for the
6 Months
Ended
06/30/19* | |
| Institutional | | | | | | | | | | | | |
| | | | |
| Actual | | $ | 1,000 | | | $ | 1,153.70 | | | $ | 2.99 | |
| Hypothetical 5% return | | | 1,000 | | | | 1,022.02 | + | | | 2.81 | |
| Service | | | | | | | | | | | | |
| | | | |
| Actual | | | 1,000 | | | | 1,152.10 | | | | 4.11 | |
| Hypothetical 5% return | | | 1,000 | | | | 1,020.98 | + | | | 3.86 | |
| | + | Hypothetical expenses are based on the Fund’s actual annualized net expense ratios and an assumed rate of return of 5% per year before expenses. | |
| | * | Expenses are calculated using the Fund’s annualized net expense ratio for each class, which represents the ongoing expenses as a percentage of net assets for the six months ended June 30, 2019. Expenses are calculated by multiplying the annualized net expense ratio by the average account value for the period; then multiplying the result by the number of days in the most recent fiscal half year; and then dividing that result by the number of days in the fiscal year. The annualized net expense ratios for the period were 0.56% and 0.77% for Institutional and Service Shares, respectively. | |
22
GOLDMAN SACHS VARIABLE INSURANCE TRUST U.S. EQUITY INSIGHTS FUND
Statement Regarding Basis for Approval of Management Agreement (Unaudited)
Background
The Goldman Sachs U.S. Equity Insights Fund (the “Fund”) is an investment portfolio of Goldman Sachs Variable Insurance Trust (the “Trust”). The Board of Trustees oversees the management of the Trust and reviews the investment performance and expenses of the Fund at regularly scheduled meetings held throughout the year. In addition, the Board of Trustees determines annually whether to approve the continuance of the Trust’s investment management agreement (the “Management Agreement”) with Goldman Sachs Asset Management, L.P. (the “Investment Adviser”) on behalf of the Fund.
The Management Agreement was most recently approved for continuation until June 30, 2020 by the Board of Trustees, including those Trustees who are not parties to the Management Agreement or “interested persons” (as defined in the Investment Company Act of 1940, as amended) of any party thereto (the “Independent Trustees”), at a meeting held onJune 11-12, 2019 (the “Annual Meeting”).
The review process undertaken by the Trustees spans the course of the year and culminates with the Annual Meeting. To assist the Trustees in their deliberations, the Trustees have established a Contract Review Committee (the “Committee”), comprised of the Independent Trustees. The Committee held four meetings over the course of the year since the Management Agreement was last approved. At those Committee meetings, regularly scheduled Board or other committee meetings, and/or the Annual Meeting, matters relevant to the renewal of the Management Agreement were considered by the Board, or the Independent Trustees, as applicable. With respect to the Fund, such matters included:
| | (a) | | the nature and quality of the advisory, administrative, and other services provided to the Fund by the Investment Adviser and its affiliates, including information about: |
| | (i) | | the structure, staff, and capabilities of the Investment Adviser and its portfolio management teams; |
| | (ii) | | the groups within the Investment Adviser and its affiliates that support the portfolio management teams or provide other types of necessary services, including fund services groups (e.g., accounting and financial reporting, tax, shareholder services, and operations); controls and risk management groups (e.g., legal, compliance, valuation oversight, credit risk management, internal audit, compliance testing, market risk analysis, finance, and central funding); sales and distribution support groups, and others (e.g., information technology and training); |
| | (iii) | | trends in employee headcount; |
| | (iv) | | the Investment Adviser’s financial resources and ability to hire and retain talented personnel and strengthen its operations; and |
| | (v) | | the parent company’s support of the Investment Adviser and its mutual fund business, as expressed by the firm’s senior management; |
| | (b) | | information on the investment performance of the Fund, including comparisons to the performance of similar mutual funds, as provided by a third-party mutual fund data provider engaged as part of the contract review process (the “Outside Data Provider”), and a benchmark performance index, and a composite of accounts with comparable investment strategies managed by the Investment Adviser; and information on general investment outlooks in the markets in which the Fund invests; |
| | (c) | | information provided by the Investment Adviser indicating the Investment Adviser’s views on whether the Fund’s peer group and/or benchmark index had high, medium, or low relevance given the Fund’s particular investment strategy; |
| | (d) | | the terms of the Management Agreement and other agreements with affiliated service providers entered into by the Trust on behalf of the Fund; |
| | (e) | | fee and expense information for the Fund, including: |
| | (i) | | the relative management fee and expense levels of the Fund as compared to those of comparable funds managed by other advisers, as provided by the Outside Data Provider; |
| | (ii) | | the Fund’s expense trends over time; and |
| | (iii) | | to the extent the Investment Adviser manages other types of accounts (such as bank collective trusts, private wealth management accounts, institutional separate accounts,sub-advised mutual funds, andnon-U.S. funds) having investment objectives and policies similar to those of the Fund, comparative information on the advisory fees charged and services provided to those accounts by the Investment Adviser; |
| | (f) | | with respect to the extensive investment performance and expense comparison data provided by the Outside Data Provider, its processes in producing that data for the Fund; |
| | (g) | | the undertakings of the Investment Adviser and its affiliates to implement fee waivers and/or expense limitations; |
| | (h) | | information relating to the profitability of the Management Agreement and the transfer agency and distribution and service arrangements of the Fund to the Investment Adviser and its affiliates; |
| | (i) | | whether the Fund’s existing management fee schedule adequately addressed any economies of scale; |
23
GOLDMAN SACHS VARIABLE INSURANCE TRUST U.S. EQUITY INSIGHTS FUND
Statement Regarding Basis for Approval of Management Agreement (Unaudited) (continued)
| | (j) | | a summary of the“fall-out” benefits derived by the Investment Adviser and its affiliates from their relationships with the Fund, including the fees received by the Investment Adviser’s affiliates from the Fund for transfer agency, securities lending, portfolio trading, distribution and other services; |
| | (k) | | a summary of potential benefits derived by the Fund as a result of its relationship with the Investment Adviser; |
| | (l) | | information regarding commissions paid by the Fund and broker oversight, other information regarding portfolio trading, and how the Investment Adviser carries out its duty to seek best execution; |
| | (m) | | the manner in which portfolio manager compensation is determined; and the number and types of accounts managed by the portfolio managers; |
| | (n) | | the nature and quality of the services provided to the Fund by its unaffiliated service providers, and the Investment Adviser’s general oversight and evaluation (including reports on due diligence) of those service providers as part of the administrative services provided under the Management Agreement; and |
| | (o) | | the Investment Adviser’s processes and policies addressing various types of potential conflicts of interest; its approach to risk management; the annual review of the effectiveness of the Fund’s compliance program; and periodic compliance reports. |
The Trustees also received an overview of the Fund’s distribution arrangements. They received information regarding the Fund’s assets, share purchase and redemption activity, and payment of distribution and service fees. Information was also provided to the Trustees relating to revenue sharing payments made by and services provided by the Investment Adviser and its affiliates to intermediaries that promote the sale, distribution, and/or servicing of Fund shares. The Independent Trustees also discussed the broad range of other investment choices that are available to Fund investors, including the availability of comparable funds managed by other advisers.
The presentations made at the Board and Committee meetings and at the Annual Meeting encompassed the Fund and other mutual funds for which the Board of Trustees has responsibility. In evaluating the Management Agreement at the Annual Meeting, the Trustees relied upon their knowledge, resulting from their meetings and other interactions throughout the year, of the Investment Adviser and its affiliates, their services, and the Fund. In conjunction with these meetings, the Trustees received written materials and oral presentations on the topics covered, and the Investment Adviser addressed the questions and concerns of the Trustees, including concerns regarding the investment performance of certain of the funds they oversee. The Independent Trustees were advised by their independent legal counsel regarding their responsibilities and other regulatory requirements related to the approval and continuation of mutual fund investment management agreements under applicable law. In addition, the Investment Adviser and its affiliates provided the Independent Trustees with a written response to a formal request for information sent on behalf of the Independent Trustees by their independent legal counsel. During the course of their deliberations, the Independent Trustees met in executive sessions with their independent legal counsel, without representatives of the Investment Adviser or its affiliates present.
Nature, Extent, and Quality of the Services Provided Under the Management Agreement
As part of their review, the Trustees considered the nature, extent, and quality of the services provided to the Fund by the Investment Adviser. In this regard, the Trustees considered both the investment advisory services andnon-advisory services that are provided by the Investment Adviser and its affiliates. The Trustees noted the transition in the leadership and changes in personnel of various of the Investment Adviser’s portfolio management teams that had occurred in recent periods, and the ongoing recruitment efforts aimed at bringing high quality investment talent to the Investment Adviser. They also noted the Investment Adviser’s commitment to maintaining high quality systems and expending substantial resources to respond to ongoing changes to the regulatory and control environment in which the Fund and its service providers operate, as well as the efforts of the Investment Adviser and its affiliates to combat cyber security risks. The Trustees concluded that the Investment Adviser continued to commit substantial financial and operational resources to the Fund and expressed confidence that the Investment Adviser would continue to do so in the future. The Trustees also recognized that the Investment Adviser had made significant commitments to address regulatory compliance requirements applicable to the Fund and the Investment Adviser and its affiliates.
Investment Performance
The Trustees also considered the investment performance of the Fund. In this regard, they compared the investment performance of the Fund to its peers usingrankings and ratings compiled by the Outside Data Provider as of December 31, 2018, and updated performance information prepared by the Investment Adviser using the peer group identified by the Outside Data Provider as of March 31, 2019. The information on the Fund’s investment performance was provided for theone-, three-, five-, andten-year periods ending on the applicable dates. The Trustees also reviewed the Fund’s investment performance relative to its
24
GOLDMAN SACHS VARIABLE INSURANCE TRUST U.S. EQUITY INSIGHTS FUND
Statement Regarding Basis for Approval of Management Agreement (Unaudited) (continued)
performance benchmark. As part of this review, they considered the investment performance trends of the Fund over time, and reviewed the investment performance of the Fund in light of its investment objective and policies and market conditions. The Trustees also received information comparing the Fund’s performance to that of a composite of accounts with comparable investment strategies managed by the Investment Adviser.
In addition, the Trustees considered materials prepared and presentations made by the Investment Adviser’s senior management and portfolio management personnel in which Fund performance was assessed. The Trustees also considered the Investment Adviser’s periodic reports with respect to the Fund’s risk profile, and how the Investment Adviser’s approach to risk monitoring and management influences portfolio management. They noted the efforts of the Fund’s portfolio management team to continue to enhance the investment model used in managing the Fund.
The Trustees observed that the Fund’s Institutional Shares had placed in the top half of the Fund’s peer group for the three-, five-, andten-year periods and in the third quartile for theone-year period, and had underperformed the Fund’s benchmark index for theone-, three-, five-, andten-year periods ended March 31, 2019.
Costs of Services Provided and Competitive Information
The Trustees considered the contractual terms of the Management Agreement and the fee rates payable by the Fund thereunder. In this regard, the Trustees considered information on the services rendered by the Investment Adviser to the Fund, which included both advisory and administrative services that were directed to the needs and operations of the Fund as a registered mutual fund.
In particular, the Trustees reviewed analyses prepared by the Outside Data Provider regarding the expense rankings of the Fund. The analyses provided a comparison of the Fund’s management fee and breakpoints to those of a relevant peer group and category universe; an expense analysis which compared the Fund’s overall net and gross expenses to a peer group and a category universe; and data comparing the Fund’s net expenses to the peer and category medians. The analyses also compared the Fund’s other expenses and fee waivers/reimbursements to those of the peer group and category medians. The Trustees concluded that the comparisons provided by the Outside Data Provider were useful in evaluating the reasonableness of the management fees and total expenses paid by the Fund.
In addition, the Trustees considered the Investment Adviser’s undertakings to implement fee waivers and/or expense limitations. They also considered, to the extent that the Investment Adviser manages other types of accounts having investment objectives and policies similar to those of the Fund, comparative fee information for services provided by the Investment Adviser to those accounts, and information that indicated that services provided to the Fund differed in various significant respects from the services provided to other types of accounts which, in many cases, operated under less stringent legal and regulatory structures, required fewer services from the Investment Adviser to a smaller number of client contact points, and were less time-intensive.
In addition, the Trustees noted that shareholders are able to redeem their Fund shares at any time if shareholders believe that the Fund fees and expenses are too high or if they are dissatisfied with the performance of the Fund.
Profitability
The Trustees reviewed the Fund’s contribution to the Investment Adviser’s revenues andpre-tax profit margins. In this regard the Trustees noted that they had received, among other things, profitability analyses and summaries, revenue and expense schedules by Fund and by function (i.e., investment management, transfer agency and distribution and service), and information on the Investment Adviser’s expense allocation methodology. They observed that the profitability and expense figures are substantially similar to those used by the Investment Adviser for many internal purposes, including compensation decisions among various business groups, and are thus subject to a vigorous internal debate about how certain revenue and expenses should be allocated. The Trustees also noted that the internal audit group within the Goldman Sachs organization periodically audits the expense allocation methodology and that the internal audit group was satisfied with the reasonableness, consistency, and accuracy of the Investment Adviser’s expense allocation methodology. Profitability data for the Fund was provided for 2018 and 2017, and the Trustees considered this information in relation to the Investment Adviser’s overall profitability.
25
GOLDMAN SACHS VARIABLE INSURANCE TRUST U.S. EQUITY INSIGHTS FUND
Statement Regarding Basis for Approval of Management Agreement (Unaudited) (continued)
Economies of Scale
The Trustees considered the information that had been provided regarding whether there have been economies of scale with respect to the management of the Fund. The Trustees also considered the breakpoints in the fee rate payable under the Management Agreement for the Fund at the following annual percentage rates of the average daily net assets of the Fund:
| | | | |
| |
| First $1 billion | | | 0.62 | % |
| |
| Next $1 billion | | | 0.59 | |
| |
| Next $3 billion | | | 0.56 | |
| |
| Next $3 billion | | | 0.55 | |
| |
| Over $8 billion | | | 0.54 | |
The Trustees noted that the breakpoints were designed to share potential economies of scale, if any, with the Fund and its shareholders as assets under management reach those asset levels. The Trustees considered the amounts of assets in the Fund; the Fund’s recent share purchase and redemption activity; the information provided by the Investment Adviser relating to the costs of the services provided by the Investment Adviser and its affiliates and their realized profits; information comparing fee rates charged by the Investment Adviser with fee rates charged to other funds in the peer group; and the Investment Adviser’s undertakings to waive a portion of its management fee and to limit certain expenses of the Fund that exceed a specified level as well as Goldman Sachs & Co. LLC’s (“Goldman Sachs”) undertaking to waive a portion of the distribution and service fees paid by the Fund’s Service Shares. Upon reviewing these matters at the Annual Meeting, the Trustees concluded that the fee breakpoints represented a means of assuring that benefits of scalability, if any, would be passed along to shareholders at the specified asset levels.
Other Benefits to the Investment Adviser and Its Affiliates
The Trustees also considered the other benefits derived by the Investment Adviser and its affiliates from their relationships with the Fund as stated above, including: (a) transfer agency fees received by Goldman Sachs; (b) brokerage and futures commissions earned by Goldman Sachs for executing securities and futures transactions on behalf of the Fund; (c) trading efficiencies resulting from aggregation of orders of the Fund with those for other funds or accounts managed by the Investment Adviser; (d) fees earned by Goldman Sachs Agency Lending (“GSAL”), an affiliate of the Investment Adviser, as securities lending agent (and fees earned by the Investment Adviser for managing the fund in which the Fund’s cash collateral is invested); (e) the Investment Adviser’s ability to leverage the infrastructure designed to service the Fund on behalf of its other clients; (f) the Investment Adviser’s ability to cross-market other products and services to Fund shareholders; (g) Goldman Sachs’ retention of certain fees as Fund Distributor; (h) the Investment Adviser’s ability to negotiate better pricing with custodians on behalf of its other clients, as a result of the relationship with the Fund; and (i) the possibility that the working relationship between the Investment Adviser and the Fund’s third-party service providers may cause those service providers to be more likely to do business with other areas of Goldman Sachs. In the course of considering the foregoing, the Independent Trustees requested and received further information quantifying certain of thesefall-out benefits.
Other Benefits to the Fund and Its Shareholders
The Trustees also noted that the Fund receives certain potential benefits as a result of its relationship with the Investment Adviser, including: (a) trading efficiencies resulting from aggregation of orders of the Fund with those of other funds or accounts managed by the Investment Adviser; (b) enhanced servicing from vendors because of the volume of business generated by the Investment Adviser and its affiliates; (c) enhanced servicing from broker-dealers because of the volume of business generated by the Investment Adviser and its affiliates; (d) the Investment Adviser’s ability to negotiate favorable terms with derivatives counterparties on behalf of the Fund as a result of the size and reputation of the Goldman Sachs organization; (e) the Investment Adviser’s knowledge and experience gained from managing other accounts and products; (f) the Investment Adviser’s ability to hire and retain qualified personnel to provide services to the Fund because of the reputation of the Goldman Sachs organization; (g) the Fund’s access, through the Investment Adviser, to certain firmwide resources (e.g., proprietary risk management systems and databases), subject to certain restrictions; (h) the Fund’s ability to participate in the securities lending program administered by GSAL, as measured by the revenue received by the Fund in connection with the program; and (i) the Fund’s access to certain affiliated distribution channels. In addition, the Trustees noted the competitive nature of the mutual fund marketplace, and considered that many of the Fund’s shareholders invested in the Fund in part because of the Fund’s relationship with the Investment Adviser and that those shareholders have a general expectation that the relationship will continue.
26
GOLDMAN SACHS VARIABLE INSURANCE TRUST U.S. EQUITY INSIGHTS FUND
Statement Regarding Basis for Approval of Management Agreement (Unaudited) (continued)
Conclusion
In connection with their consideration of the Management Agreement, the Trustees gave weight to each of the factors described above, but did not identify any particular factor as controlling their decision. After deliberation and consideration of all of the information provided, including the factors described above, the Trustees concluded, in the exercise of their business judgment, that the management fees paid by the Fund were reasonable in light of the services provided to it by the Investment Adviser, the Investment Adviser’s costs and the Fund’s current and reasonably foreseeable asset levels. The Trustees unanimously concluded that the Investment Adviser’s continued management likely would benefit the Fund and its shareholders and that the Management Agreement should be approved and continued with respect to the Fund until June 30, 2020.
27
| | |
| TRUSTEES | | OFFICERS |
| Jessica Palmer,Chair | | James A. McNamara,President |
| Kathryn A. Cassidy | | Joseph F. DiMaria,Principal Financial Officer, |
| Diana M. Daniels | | Principal Accounting Officer and Treasurer |
| James A. McNamara | | Caroline L. Kraus,Secretary |
| Roy W. Templin | | |
| Gregory G. Weaver | | |
GOLDMAN SACHS & CO. LLC
Distributor and Transfer Agent
GOLDMAN SACHS ASSET MANAGEMENT, L.P.
Investment Adviser
200 West Street, New York
New York 10282
Visit our web site at www.GSAMFUNDS.com to obtain the most recentmonth-end returns.
The reports concerning the Fund included in this shareholder report may contain certain forward-looking statements about the factors that may affect the performance of the Fund in the future. These statements are based on Fund management’s predictions and expectations concerning certain future events and their expected impact on the Fund, such as performance of the economy as a whole and of specific industry sectors, changes in the levels of interest rates, the impact of developing world events, and other factors that may influence the future performance of the Fund. Management believes these forward-looking statements to be reasonable, although they are inherently uncertain and difficult to predict. Actual events may cause adjustments in portfolio management strategies from those currently expected to be employed.
A description of the policies and procedures that the Fund uses to determine how to vote proxies relating to portfolio securities and information regarding how the Fund voted proxies relating to portfolio securities for the12-month period ended June 30 is available (i) without charge, upon request by calling1-800-621-2550; and (ii) on the Securities and Exchange Commission (“SEC”) web site athttp://www.sec.gov.
The Fund will file its portfolio holdings information for each month in a fiscal quarter within 60 days after the end of the relevant fiscal quarter on Form N-PORT. Portfolio holdings information for the third month of each fiscal quarter will be made available on the SEC’s web site at http://www.sec.gov. Portfolio holdings information may be obtained upon request and without charge by calling 1-800-526-7384 (for Retail Shareholders) or 1-800-621-2550 (for Institutional Shareholders).
Views and opinions expressed are for informational purposes only and do not constitute a recommendation by GSAM to buy, sell, or hold any security. Views and opinions are current as of the date of this presentation and may be subject to change, they should not be construed as investment advice.
Goldman Sachs & Co. LLC (“Goldman Sachs”) does not provide legal, tax or accounting advice. Any statement contained in this communication (including any attachments) concerning U.S. tax matters was not intended or written to be used, and cannot be used, for the purpose of avoiding penalties under the Internal Revenue Code, and was written to support the promotion or marketing of transaction or matter addressed. Clients of Goldman Sachs should obtain their own independent tax advice based on their particular circumstances.
The website links provided are for your convenience only and are not an endorsement or recommendation by GSAM of any of these websites or the products or services offered. GSAM is not responsible for the accuracy and validity of the content of these websites.
Fund holdings and allocations shown are as of June 30, 2019 and may not be representative of future investments. Fund holdings should not be relied on in making investment decisions and should not be construed as research or investment advice regarding particular securities. Current and future holdings are subject to risk.
References to indices, benchmarks or other measures of relative market performance over a specified period of time are provided for your information only and do not imply that the portfolio will achieve similar results. The index composition may not reflect the manner in which a portfolio is constructed. While an adviser seeks to design a portfolio which reflects appropriate risk and return features, portfolio characteristics may deviate from those of the benchmark.
The Global Industry Classification Standard (“GICS”) was developed by and is the exclusive property and a service mark of Morgan Stanley Capital International Inc. (“MSCI”) and Standard & Poor’s, a division of The McGraw-Hill Companies, Inc. (“S&P”) and is licensed for use by Goldman Sachs. Neither MSCI, S&P nor any other party involved in making or compiling the GICS or any GICS classifications makes any express or implied warranties or representations with respect to such standard or classification (or the results to be obtained by the use thereof), and all such parties hereby expressly disclaim all warranties of originality, accuracy, completeness, merchantability or fitness for a particular purpose with respect to any of such standard or classification. Without limiting any of the foregoing, in no event shall MSCI, S&P, any of their affiliates or any third party involved in making or compiling the GICS or any GICS classifications have any liability for any direct, indirect, special, punitive, consequential or any other damages (including lost profits) even if notified of the possibility of such damages.
The portfolio risk management process includes an effort to monitor and manage risk, but does not imply low risk.
Shares of the Goldman Sachs VIT Funds are offered to separate accounts of participating life insurance companies for the purpose of funding variable annuity contracts and variable life insurance policies. Shares of the Fund are not offered directly to the general public. The variable annuity contracts and variable life insurance policies are described in the separate prospectuses issued by participating insurance companies. You should refer to those prospectuses for information about surrender charges, mortality and expense risk fees and other charges that may be assessed by participating insurance companies under the variable annuity contracts or variable life insurance policies. Such fees or charges, if any, may affect the return you may realize with respect to your investments. Ask your representative for more complete information. Please consider a fund’s objectives, risks and charges and expenses, and read the prospectus carefully before investing. The prospectus contains this and other information about the Fund.
This material is not authorized for distribution to prospective investors unless preceded or accompanied by a current prospectus or summary prospectus, if applicable. Investors should consider the Fund’s objective, risks, and charges and expenses, and read the summary prospectus, if available, and/or the prospectus carefully before investing or sending money. The summary prospectus, if available, and the prospectus contain this and other information about the Fund and may be obtained from your authorized dealer or from Goldman Sachs & Co. LLC by calling1-800-621-2550.
This report is prepared for the general information of contract owners and is not an offer of shares of the Goldman Sachs Variable Insurance Trust — Goldman Sachs U.S. Equity Insights Fund.
© 2019 Goldman Sachs. All rights reserved.
VITUSSAR-19/175377-OTU-1025575
| | (a) | | As of the end of the period covered by this report, the registrant has adopted a code of ethics that applies to the registrant’s principal executive officer, principal financial officer, principal accounting officer or controller, or persons performing similar functions, regardless of whether these individuals are employed by the registrant or a third party (the “Code of Ethics”). |
| | (b) | | During the period covered by this report, no amendments were made to the provisions of the Code of Ethics. |
| | (c) | | During the period covered by this report, the registrant did not grant any waivers, including an implicit waiver, from any provision of the Code of Ethics. |
| | (d) | | A copy of the Code of Ethics is available as provided in Item 13(a)(1) of this report. |
| ITEM 3. | AUDIT COMMITTEE FINANCIAL EXPERT. |
| | The registrant’s board of trustees has determined that the registrant has at least one “audit committee financial expert” (as defined in Item 3 of FormN-CSR) serving on its audit committee. Gregory G. Weaver is the “audit committee financial expert” and is “independent” (as each term is defined in Item 3 of FormN-CSR). |
| ITEM 4. | PRINCIPAL ACCOUNTANT FEES AND SERVICES. |
| | The information required by this Item is only required in an annual report on thisForm N-CSR. |
| ITEM 5. | AUDIT COMMITTEE OF LISTED REGISTRANTS. |
Not applicable.
| ITEM 6. | SCHEDULE OF INVESTMENTS |
Schedule of Investments is included as part of the Reports to Shareholders filed under Item 1.
| ITEM 7. | DISCLOSURE OF PROXY VOTING POLICIES AND PROCEDURES FORCLOSED-END MANAGEMENT INVESTMENT COMPANIES. |
Not applicable.
| ITEM 8. | PORTFOLIO MANAGERS OFCLOSED-END MANAGEMENT INVESTMENT COMPANIES |
Not applicable.
| ITEM 9. | PURCHASES OF EQUITY SECURITIES BYCLOSED-END MANAGEMENT INVESTMENT COMPANY AND AFFILIATED PURCHASERS |
Not applicable.
| ITEM 10. | SUBMISSION OF MATTERS TO A VOTE OF SECURITY HOLDERS. |
There have been no material changes to the procedures by which shareholders may recommend nominees to the registrant’s board of trustees.
| ITEM 11. | CONTROLS AND PROCEDURES. |
| | (a) | | The registrant’s principal executive and principal financial officers or persons performing similar functions have concluded that the registrant’s disclosure controls and procedures (as defined in Rule30a-3(c) under the Investment Company Act of 1940, as amended (the “1940 Act”)) are effective as of a date within 90 days of the filing date of this report that includes the disclosure required by this paragraph, based on the evaluation of these controls and procedures required by Rule30a-3(b) under the 1940 Act and15d-15(b) under the Securities Exchange Act of 1934, as amended. |
| | (b) | | There were no changes in the registrant’s internal control over financial reporting (as defined in Rule30a-3(d) under the 1940 Act) that occurred during the period covered by this report that have materially affected, or are reasonably likely to materially affect the registrant’s internal control over financial reporting. |
| ITEM 12. | DISCLOSURE OF SECURITIES LENDING ACTIVITIES FOR CLOSED-END MANAGEMENT INVESTMENT COMPANIES |
Not applicable.
| | | | |
| (a)(1) | | | | Goldman Sachs Variable Insurance Trust’s Code of Ethics for Principal Executive and Senior Financial Officers is incorporated by reference to Exhibit 12(a)(1) of the registrant’sForm N-CSR filed on February 27, 2015. |
| | |
| (a)(3) | | | | Not applicable to open-end investment companies. |
| | |
| (a)(4) | | | | There was no change in the registrant’s independent public accountant for the period covered by this report. |
| | |
| (a)(2) | | Exhibit 99.CERT | | Certifications pursuant to Section 302 of the Sarbanes-Oxley Act of 2002 filed herewith |
| | |
| | Exhibit 99.906CERT | | Certifications pursuant to Section 906 of the Sarbanes-Oxley Act of 2002 filed herewith |
SIGNATURES
Pursuant to the requirements of the Securities Exchange Act of 1934 and the Investment Company Act of 1940, the registrant has duly caused this report to be signed on its behalf by the undersigned, thereunto duly authorized.
Goldman Sachs Variable Insurance Trust
| | |
/s/ James A. McNamara |
By: James A. McNamara |
President/Chief Executive Officer of |
Goldman Sachs Variable Insurance Trust |
|
Date: August 23, 2019 |
Pursuant to the requirements of the Securities Exchange Act of 1934 and the Investment Company Act of 1940, the report has been signed below by the following persons on behalf of the registrant and in the capacities and on the dates indicated.
| | |
/s/ James A. McNamara |
By: James A. McNamara |
President/Chief Executive Officer of |
Goldman Sachs Variable Insurance Trust |
|
Date: August 23, 2019 |
|
/s/ Joseph F. DiMaria |
By: Joseph F. DiMaria |
Principal Financial Officer of |
Goldman Sachs Variable Insurance Trust |
|
Date: August 23, 2019 |