UNITED STATES
SECURITIES AND EXCHANGE COMMISSION
Washington, D.C. 20549
FORM N-CSR
CERTIFIED SHAREHOLDER REPORT OF REGISTERED
MANAGEMENT INVESTMENT COMPANIES
Investment Company Act file number 811-08361
Goldman Sachs Variable Insurance Trust
(Exact name of registrant as specified in charter)
71 South Wacker Drive, Chicago, Illinois 60606-6303
(Address of principal executive offices) (Zip code)
Caroline Kraus
Goldman Sachs & Co. LLC
200 West Street
New York, NY 10282
Copies to:
Stephen H. Bier, Esq.
Dechert LLP
1095 Avenue of the Americas
New York, NY 10036
(Name and address of agents for service)
Registrant’s telephone number, including area code: (312) 655-4400
Date of fiscal year end: December 31
Date of reporting period: June 30, 2022
| ITEM 1. | REPORTS TO STOCKHOLDERS. |
The Semi-Annual Report to Shareholders is filed herewith. |
Goldman
Sachs Variable Insurance Trust
Goldman Sachs Multi-Strategy Alternatives Portfolio
Goldman Sachs Trend Driven Allocation Fund*
| * | Effective after the close of business on December 31, 2021, the Goldman Sachs Global Trends Allocation Fund was renamed the Goldman Sachs Trend Driven Allocation Fund and changed its principal investment strategy effective after the close of business on January 31, 2022. |
Semi-Annual Report
June 30, 2022

Goldman Sachs Variable Insurance Trust
| ∎ | GOLDMAN SACHS MULTI-STRATEGY ALTERNATIVES PORTFOLIO |
| ∎ | GOLDMAN SACHS TREND DRIVEN ALLOCATION FUND |
| 1 | ||||
| 3 | ||||
| 7 | ||||
| 10 | ||||
| 13 | ||||
Goldman Sachs Trend Driven Allocation Fund (formerly, Goldman Sachs Global Trends Allocation Fund) | 16 | |||
| 18 | ||||
| 39 | ||||
| NOT FDIC-INSURED | May Lose Value | No Bank Guarantee | ||
Goldman Sachs Variable Insurance Trust – Goldman Sachs VIT Multi-Asset Strategies Funds
The following are highlights both of key factors affecting the global capital markets and of any key changes made to the Goldman Sachs VIT Multi Asset Strategies Funds (the “Funds”) during the six months ended June 30, 2022 (the “Reporting Period”). A fuller review of the markets and these changes will appear in the Funds’ annual shareholder report covering the 12 months ended December 31, 2022.
Market and Economic Review
| • | Overall, the global capital markets struggled during the Reporting Period. |
| • | Economic uncertainty and market volatility was largely fueled by a rapid change in perceptions of upside inflation risk and the U.S. Federal Reserve’s (“Fed”) efforts to head off a potential recession. |
| • | Global equities, as represented by the MSCI All Country World Index, returned -20.18%. |
| • | Global fixed income, as represented by the Bloomberg Global Aggregate Bond Index, returned -13.91%. |
| • | In the first quarter of 2022, when the Reporting Period began, rapidly evolving expectations for inflation and Fed policy had already complicated the macro outlook, but the Russian invasion of Ukraine in February significantly increased market uncertainty and volatility. |
| • | Valuations broadly fell across multiple asset classes, with global equities suffering substantial declines. |
| • | Credit spreads (i.e., yield differentials between corporate bonds and U.S. Treasury securities of comparable maturity) widened as bond yields rose in response to inflationary pressures. |
| • | During the second quarter of 2022, investor concerns around slower economic growth accelerated; the Russia/Ukraine conflict led to a surge in commodity prices; and the risks of a potential policy miscalculation by the Fed increased. |
| • | Unexpectedly higher inflation data, released in early June, brought consumer confidence into focus and eroded the narrative in some parts of the market that suggested the U.S. economy had experienced peak inflation. |
| • | Most global equity markets fell into bear market territory during the second calendar quarter. (A bear market is a condition in which securities prices fall 20% or more from recent highs amid widespread pessimism and negative investor sentiment.) |
| • | Bond yields rose as Fed interest rate hikes came faster than investors had previously anticipated. Rising short-term interest rates and expectations for further monetary policy tightening hurt duration-sensitive assets, while concerns about the economic outlook pushed credit spreads wider. |
Fund Changes and Highlights
Goldman Sachs Trend Driven Allocation Fund
| • | Effective January 1, 2022, the Fund’s name (previously, the Goldman Sachs Global Trends Allocation Fund) was changed to the Goldman Sachs Trend Driven Allocation Fund. |
| • | After the close of business on January 31, 2022, the Fund’s principal investment strategy changed. |
| • | As of that time, the Fund primarily seeks to achieve its investment objective by investing in a portfolio of U.S. and non-U.S. equity securities and U.S. fixed income securities. |
| • | Goldman Sachs Asset Management, L.P. (the “Investment Adviser”) makes investment decisions based upon its analysis of “trends” from around the world. Trends are used by the Investment Adviser to allocate the Fund’s relative weighting to equity and fixed income securities. The trends analyzed by the Investment Adviser are based on, but are not limited to, relative considerations around the prices and volatility of the underlying markets. |
| 1 |
MARKET REVIEW
| • | As a result of the trends analysis, the Investment Adviser may allocate more of the Fund’s assets to investments with relatively strong recent trends and allocate assets away from investments with relatively poor recent trends. |
| • | In addition, the Investment Adviser seeks to manage volatility and limit losses by allocating the Fund’s assets away from risky investments in distressed or volatile market environments. While the Investment Adviser attempts to manage the Fund’s volatility, there can be no guarantee that the Fund will be successful. |
| • | Effective as of the close of business on June 23, 2022, Federico Gilly no longer served as a portfolio manager for the Fund. Oliver Bunn, Vice President, continues to serve as a portfolio manager for the Fund. Additionally, effective the same date, James Park, Managing Director, began serving as a portfolio manager for the Fund. Mr. Park is a senior portfolio manager on the Alternative Investment Strategies team within Goldman Sachs Asset Management’s Quantitative Investment Strategies platform. He joined Goldman Sachs in 2004. |
| 2 |
FUND BASICS
Multi-Strategy Alternatives Portfolio
as of June 30, 2022
PERFORMANCE REVIEW
| January 1, 2022 – June 30, 2022 | Fund Total Return (based on NAV)1 | ICE BAML 3-Mo US Treasury Bill Index2 | ||||||
| Institutional | -6.96 | % | -0.01 | % | ||||
| Service | -7.07 | -0.01 | ||||||
| Advisor | -7.09 | -0.01 | ||||||
| 1 | The net asset value (“NAV”) represents the net assets of the class of the Fund (ex-dividend) divided by the total number of shares of the class outstanding. The Fund’s performance assumes the reinvestment of dividends and other distributions. The Fund’s performance does not reflect the deduction of any applicable sales charges. |
| 2 | The ICE BofA 3 Month U.S. Treasury Index measures the performance of a single issue of outstanding treasury bill which matures closest to, but not beyond, three months from the rebalancing date. The issue is purchased at the beginning of the month and held for a full month; at the end of the month that issue is sold and rolled into a newly selected issue. |
The comparison to the ICE BofA 3-Month U.S. Treasury Bill Index is a means of emphasizing that the Fund has an unconstrained strategy. The Fund employs a benchmark agnostic strategy. Benchmark performance may not be comparable to the Fund’s performance. |
The returns set forth in the table above represent past performance. Past performance does not guarantee future results. The Fund’s investment return and principal value will fluctuate so that an investor’s shares, when redeemed, may be worth more or less than their original cost. Current performance may be lower or higher than the performance quoted above. Please visit our web site at www.GSAMFUNDS.com to obtain the most recent month-end returns. Performance reflects applicable fee waivers and/or expense limitations in effect during the periods shown. In their absence, performance would be reduced. Returns do not reflect the deduction of taxes that a shareholder would pay on Fund distributions or the redemption of Fund shares.
| 3 |
FUND BASICS
OVERALL UNDERLYING FUND AND ETF WEIGHTINGS4
Percentage of Net Assets
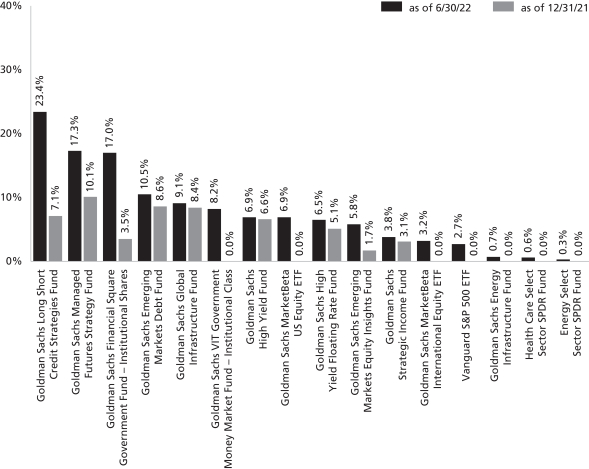
| 4 | The Portfolio is actively managed and, as such, its composition may differ over time. The percentage shown for each Underlying Fund and exchange traded fund (“ETF”) reflects the value of that Underlying Fund or ETF as a percentage of net assets of the Portfolio. Figures in the graph above may not sum to 100% due to rounding and/or exclusion of other assets and liabilities. Underlying sector allocations of exchange traded funds and investment companies held by the Portfolio are not reflected in the graph above. The graph depicts the Portfolio’s investments but may not represent the Portfolio’s market exposure due to the exclusion of certain derivatives, if any, as listed in the Additional Investment Information section of the Schedule of Investments. |
For more information about your Portfolio, please refer to www.GSAMFUNDS.com. There, you can learn more about your Portfolio’s investment strategies, holdings, and performance.
| 4 |
FUND BASICS
Trend Driven Allocation Fund
as of June 30, 2022
PERFORMANCE REVIEW
| January 1, 2022 – June 30, 2022 | Fund Total Return (based on NAV)1 | 60% MSCI World / 40% Bloomberg U.S. Treasury Index2 | MSCI World Index (Net, USD, Hedged)3 | Bloomberg U.S. Treasury Index (Total Return, USD, Unhedged)4 | ||||||||||
| Institutional | -15.25 | % | -14.44 | % | -18.00 | % | -9.14% | |||||||
| Service | -15.32 | -14.44 | -18.00 | -9.14 | ||||||||||
| 1 | The net asset value (“NAV”) represents the net assets of the class of the Fund (ex-dividend) divided by the total number of shares of the class outstanding. The Fund’s performance assumes the reinvestment of dividends and other distributions. The Fund’s performance does not reflect the deduction of any applicable sales charges. |
| 2 | The Fund’s blended benchmark index is comprised of 60% the MSCI World Index and 40% the Bloomberg U.S. Treasury Index. It is not possible to invest directly in an unmanaged index. |
| 3 | MSCI World Index is a broad global equity index that represents large and mid-cap equity performance across 23 developed markets countries. It covers approximately 85% of the free float-adjusted market capitalization in each country. It is not possible to invest directly in an unmanaged index. |
| 4 | Bloomberg U.S. Treasury Index measures U.S. dollar-denominated, fixed-rate, nominal debt issued by the U.S. Treasury. Treasury bills are excluded by the maturity constraint. It is not possible to invest directly in an unmanaged index. |
The returns set forth in the table above represent past performance. Past performance does not guarantee future results. The Fund’s investment return and principal value will fluctuate so that an investor’s shares, when redeemed, may be worth more or less than their original cost. Current performance may be lower or higher than the performance quoted above. Please visit our web site at www.GSAMFUNDS.com to obtain the most recent month-end returns. Performance reflects applicable fee waivers and/or expense limitations in effect during the periods shown. In their absence, performance would be reduced. Returns do not reflect the deduction of taxes that a shareholder would pay on Fund distributions or the redemption of Fund shares.
| 5 |
FUND BASICS
FUND COMPOSITION5
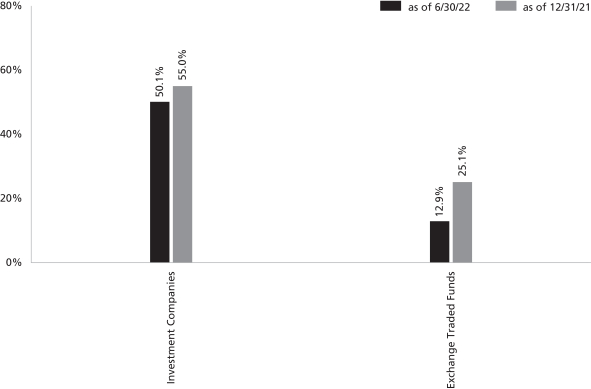
| 5 | The percentage shown for each investment category reflects the value of investments in that category as a percentage of net assets. Figures in the above graph may not sum to 100% due to the exclusion of other assets and liabilities. The underlying composition of exchange traded funds and investment companies held by the Fund are not reflected in the graph above. Consequently, the Fund’s overall composition may differ from the percentages contained in the graph above. The graph depicts the Fund’s investments but may not represent the Fund’s market exposure due to the exclusion of certain derivatives, if any, as listed in the Additional Investment Information section of the Schedule of Investments. |
For more information about your Fund, please refer to www.GSAMFUNDS.com. There, you can learn more about your Fund’s investment strategies, holdings, and performance.
| 6 |
GOLDMAN SACHS VARIABLE INSURANCE TRUST MULTI-STRATEGY ALTERNATIVES PORTFOLIO
June 30, 2022 (Unaudited)
| Shares | Description | Value | ||||||
| Underlying Funds (Class R6 Shares)(a) – 94.1% | ||||||||
| Equity – 25.6% | ||||||||
| 272,177 | Goldman Sachs Global Infrastructure Fund | $ | 3,434,869 | |||||
| 50,190 | Goldman Sachs MarketBeta US Equity ETF | 2,584,283 | ||||||
| 267,276 | Goldman Sachs Emerging Markets Equity Insights Fund | 2,167,605 | ||||||
| 26,817 | Goldman Sachs MarketBeta International Equity ETF | 1,202,453 | ||||||
| 26,301 | Goldman Sachs Energy Infrastructure Fund | 262,480 | ||||||
|
| |||||||
| 9,651,690 | ||||||||
|
| |||||||
| Fixed Income – 68.5% | ||||||||
| 1,133,283 | Goldman Sachs Long Short Credit Strategies Fund | 8,839,611 | ||||||
| 532,195 | Goldman Sachs Managed Futures Strategy Fund | 6,508,748 | ||||||
| 434,073 | Goldman Sachs Emerging Markets Debt Fund | 3,971,771 | ||||||
| 492,423 | Goldman Sachs High Yield Fund | 2,609,845 | ||||||
| 280,813 | Goldman Sachs High Yield Floating Rate Fund | 2,434,650 | ||||||
| 165,833 | Goldman Sachs Strategic Income Fund | 1,446,065 | ||||||
|
| |||||||
| 25,810,690 | ||||||||
|
| |||||||
| TOTAL UNDERLYING FUNDS (CLASS R6 SHARES) | ||||||||
| (Cost $36,928,753) | $ | 35,462,380 | ||||||
|
| |||||||
| Exchange Traded Funds – 3.6% | ||||||||
| 1,808 | Energy Select Sector SPDR Fund | $ | 129,290 | |||||
| 1,854 | Health Care Select Sector SPDR Fund | 237,757 | ||||||
| Exchange Traded Funds – (continued) | ||||||||
| 2,914 | Vanguard S&P 500 ETF | 1,010,808 | ||||||
|
| |||||||
| TOTAL EXCHANGE TRADED FUNDS | ||||||||
| (Cost $1,481,914) | $ | 1,377,855 | ||||||
|
| |||||||
| Shares | Dividend Rate | Value | ||||||
| Investment Companies (Institutional Shares)(a) – 25.2% | ||||||||
Goldman Sachs Financial Square Government Fund |
| |||||||
| 6,407,591 | 1.367 | % | $ | 6,407,591 | ||||
Goldman Sachs VIT Government Money Market Fund |
| |||||||
| 3,105,284 | 1.347 | % | 3,105,284 | |||||
| ||||||||
| TOTAL INVESTMENT COMPANIES |
| |||||||
| (Cost $9,512,875) |
| 9,512,875 | ||||||
| ||||||||
| TOTAL INVESTMENTS – 122.9% |
| |||||||
| (Cost $47,923,542) |
| $ | 46,353,110 | |||||
| ||||||||
LIABILITIES IN EXCESS OF OTHER ASSETS – (22.9)% |
| (8,655,674 | ) | |||||
| ||||||||
| NET ASSETS – 100.0% |
| $ | 37,697,436 | |||||
| ||||||||
| The percentage shown for each investment category reflects the value of investments in that category as a percentage of net assets. | ||
| (a) | Represents an affiliated issuer. | |
| Currency Abbreviations: | ||
| USD | —United States Dollar | |
ADDITIONAL INVESTMENT INFORMATION
FUTURES CONTRACTS — At June 30, 2022, the Fund had the following futures contracts:
| Description | Number of Contracts | Expiration Date | Notional Amount | Unrealized Appreciation/ (Depreciation) | ||||||||||||
Long position contracts: | ||||||||||||||||
| EURO STOXX Bank Index | 35 | 09/16/22 | $ | 148,005 | $ | (2,656 | ) | |||||||||
U.S. Treasury 2 Year Note | 10 | 09/30/22 | 2,112,343 | (14,140 | ) | |||||||||||
| Total Futures Contracts | $ | (16,796 | ) | |||||||||||||
| The accompanying notes are an integral part of these financial statements. | 7 |
GOLDMAN SACHS VARIABLE INSURANCE TRUST MULTI-STRATEGY ALTERNATIVES PORTFOLIO
Schedule of Investments (continued)
June 30, 2022 (Unaudited)
ADDITIONAL INVESTMENT INFORMATION (continued)
PURCHASED OPTIONS CONTRACTS — At June 30, 2022, the Fund had the following purchased option contracts:
| Description | Exercise Price | Expiration Date | Number of Contracts | Notional Amount | Value | Premiums Paid (Received) by the Portfolio | Unrealized Appreciation/ (Depreciation) | |||||||||||||||||||||
Purchased options contracts: |
| |||||||||||||||||||||||||||
Calls | ||||||||||||||||||||||||||||
3 Month Eurodollar | 98.25 USD | 09/19/2022 | 4 | $ | 967,950 | $ | 100 | $ | 9,559 | $ | (9,459 | ) | ||||||||||||||||
3 Month Eurodollar | 99.00 USD | 09/19/2022 | 12 | 2,903,850 | 150 | 9,178 | (9,028 | ) | ||||||||||||||||||||
3 Month Eurodollar | 98.00 USD | 12/19/2022 | 4 | 963,100 | 350 | 9,959 | (9,609 | ) | ||||||||||||||||||||
3 Month Eurodollar | 98.75 USD | 12/19/2022 | 12 | 2,889,300 | 525 | 11,128 | (10,603 | ) | ||||||||||||||||||||
3 Month Eurodollar | 97.25 USD | 12/18/2023 | 26 | 6,298,825 | 36,887 | 31,103 | 5,784 | |||||||||||||||||||||
3 Month Eurodollar | 97.50 USD | 03/18/2024 | 66 | 16,008,300 | 89,512 | 82,303 | 7,209 | |||||||||||||||||||||
3 Month Eurodollar | 97.50 USD | 06/17/2024 | 57 | 13,838,175 | 88,350 | 79,195 | 9,155 | |||||||||||||||||||||
3 Month Eurodollar | 95.88 USD | 09/18/2023 | 17 | 4,112,087 | 51,744 | 46,602 | 5,142 | |||||||||||||||||||||
3 Month Eurodollar | 95.88 USD | 06/19/2023 | 17 | 4,104,013 | 43,350 | 42,627 | 723 | |||||||||||||||||||||
3 Month Eurodollar | 95.88 USD | 03/13/2023 | 11 | 2,650,450 | 22,000 | 28,126 | (6,126 | ) | ||||||||||||||||||||
3 Month Eurodollar | 97.75 USD | 03/13/2023 | 15 | 3,614,250 | 3,750 | 52,830 | (49,080 | ) | ||||||||||||||||||||
3 Month Eurodollar | 97.75 USD | 06/19/2023 | 7 | 1,689,888 | 3,369 | 28,546 | (25,177 | ) | ||||||||||||||||||||
3 Month Eurodollar | 99.00 USD | 12/19/2022 | 39 | 9,390,225 | 1,219 | 55,537 | (54,318 | ) | ||||||||||||||||||||
| TOTAL | $ | 69,430,413 | $ | 341,306 | $ | 486,693 | $ | (145,387 | ) | |||||||||||||||||||
| 8 | The accompanying notes are an integral part of these financial statements. |
GOLDMAN SACHS VARIABLE INSURANCE TRUST TREND DRIVEN ALLOCATION FUND
Schedule of Investments
June 30, 2022 (Unaudited)
| Shares | Description | Value | ||||||
| Exchange Traded Funds – 12.9% | ||||||||
| 97,965 | iShares Core S&P 500 ETF | |||||||
| (Cost $19,997,911) | $ | 37,143,429 | ||||||
|
| |||||||
| Shares | Dividend Rate | Value | ||||||
| Investment Companies (Institutional Shares)(a) – 50.1% | ||||||||
Goldman Sachs Financial Square Government Fund |
| |||||||
| 57,777,966 | 1.358 | % | $ | 57,777,966 | ||||
Goldman Sachs Financial Square Treasury Instruments Fund |
| |||||||
| 28,907,426 | 1.054 | % | 28,907,426 | |||||
Goldman Sachs Financial Square Treasury Obligations Fund |
| |||||||
| 28,908,241 | 1.375 | % | 28,908,241 | |||||
Goldman Sachs Financial Square Treasury Solutions Fund |
| |||||||
| 28,907,426 | 1.357 | % | 28,907,426 | |||||
| ||||||||
| TOTAL INVESTMENT COMPANIES |
| |||||||
| (Cost $144,501,059) |
| $ | 144,501,059 | |||||
| ||||||||
| TOTAL INVESTMENTS – 63.0% |
| |||||||
| (Cost $164,498,970) |
| $ | 181,644,488 | |||||
| ||||||||
OTHER ASSETS IN EXCESS OF LIABILITIES – 37.0% |
| 106,554,297 | ||||||
| ||||||||
| NET ASSETS – 100.0% |
| $ | 288,198,785 | |||||
| ||||||||
| The percentage shown for each investment category reflects the value of investments in that category as a percentage of net assets. | ||
| (a) | Represents an affiliated issuer. | |
ADDITIONAL INVESTMENT INFORMATION
FUTURES CONTRACTS — At June 30, 2022, the Fund had the following futures contracts:
| Description | Number of Contracts | Expiration Date | Notional Amount | Unrealized Appreciation/ (Depreciation) | ||||||||||||
Long position contracts: | ||||||||||||||||
| EURO STOXX 50 Index | 129 | 09/16/22 | $ | 4,767,368 | $ | (93,661 | ) | |||||||||
| FTSE 100 Index | 22 | 09/16/22 | 1,918,824 | (24,116 | ) | |||||||||||
| TOPIX Index | 22 | 09/08/22 | 3,131,941 | (96,526 | ) | |||||||||||
U.S. Treasury 10 Year Note | 210 | 09/21/22 | 24,671,029 | 177,877 | ||||||||||||
| Total Futures Contracts | $ | (36,426 | ) | |||||||||||||
| The accompanying notes are an integral part of these financial statements. | 9 |
GOLDMAN SACHS VARIABLE INSURANCE TRUST MULTI-ASSET STRATEGIES FUNDS
Statements of Assets and Liabilities
June 30, 2022 (Unaudited)
| Multi-Strategy Alternatives Portfolio | Trend Driven Allocation Fund | |||||||
| Assets: | ||||||||
Investments in unaffiliated issuers, at value (cost $1,481,914 and $19,997,911, respectively) | $ | 1,377,855 | $ | 37,143,429 | ||||
Investments in affiliated issuers, at value (cost $46,441,628 and $144,501,059, respectively) | 44,975,255 | 144,501,059 | ||||||
Purchased Options, at value (premiums paid $486,693 and $—, respectively) | 341,306 | — | ||||||
Cash | 661,252 | 100,079,677 | ||||||
Foreign currency, at value (cost $— and $203,430, respectively) | — | 295,311 | ||||||
Receivables: | ||||||||
Investments sold | 696,139 | 5,245,923 | ||||||
Dividends | 73,945 | 122,667 | ||||||
Collateral on certain derivative contracts | 19,773 | 1,168,833 | ||||||
Reimbursement from investment adviser | 7,203 | 21,509 | ||||||
Securities lending income | 1,078 | 905 | ||||||
Fund shares sold | 927 | 330,499 | ||||||
Variation margin on futures contracts | 1,417 | 447,990 | ||||||
Other assets | 3,820 | 30,230 | ||||||
| Total assets | 48,159,970 | 289,388,032 | ||||||
| Liabilities: | ||||||||
Payables: | ||||||||
Fund shares redeemed | 10,211,662 | 48,382 | ||||||
Investments purchased | 75,390 | 836,715 | ||||||
Distribution and Service fees and Transfer Agency fees | 51,565 | 72,218 | ||||||
Management fees | — | 154,078 | ||||||
Accrued expenses | 123,917 | 77,854 | ||||||
| Total liabilities | 10,462,534 | 1,189,247 | ||||||
| Net Assets: | ||||||||
Paid-in capital | 40,444,874 | 298,405,788 | ||||||
Total distributable loss | (2,747,438 | ) | (10,207,003 | ) | ||||
| NET ASSETS | $ | 37,697,436 | $ | 288,198,785 | ||||
Net Assets: | ||||||||
Advisor | $ | 20,753,362 | $ | — | ||||
Institutional | 2,295,664 | 547,018 | ||||||
Service | 14,648,410 | 287,651,767 | ||||||
Total Net Assets | $ | 37,697,436 | $ | 288,198,785 | ||||
Shares outstanding $0.001 par value (unlimited number of shares authorized): | ||||||||
Advisor | 2,296,222 | — | ||||||
Institutional | 252,433 | 49,957 | ||||||
Service | 1,614,163 | 26,417,617 | ||||||
Net asset value, offering and redemption price per share: | ||||||||
Advisor | $9.04 | $— | ||||||
Institutional | 9.09 | 10.95 | ||||||
Service | 9.07 | 10.89 | ||||||
| 10 | The accompanying notes are an integral part of these financial statements. |
GOLDMAN SACHS VARIABLE INSURANCE TRUST MULTI-ASSET STRATEGIES FUNDS
Statements of Operations
For the Six Months Ended June 30, 2022 (Unaudited)
| Multi-Strategy Alternatives Portfolio | Trend Driven Allocation Fund | |||||||
| Investment income: | ||||||||
Dividends — affiliated Underlying Funds | $ | 378,164 | $ | 240,271 | ||||
Dividends — unaffiliated issuers | 9,968 | 398,967 | ||||||
Securities lending income — affiliated issuer | 1,805 | 5,790 | ||||||
| Total investment income | 389,937 | 645,028 | ||||||
| Expenses: | ||||||||
Distribution and/or Service (12b-1) fees(a) | 59,946 | 397,743 | ||||||
Professional fees | 38,675 | 61,834 | ||||||
Custody, accounting and administrative services | 37,472 | 36,695 | ||||||
Management fees | 28,543 | 1,258,528 | ||||||
Printing and mailing costs | 11,608 | 9,890 | ||||||
Trustee fees | 10,983 | 18,183 | ||||||
Transfer Agency fees(a) | 3,806 | 31,861 | ||||||
Other | 645 | 880 | ||||||
| Total expenses | 191,678 | 1,815,614 | ||||||
Less — expense reductions | (93,328 | ) | (370,492 | ) | ||||
| Net expenses | 98,350 | 1,445,122 | ||||||
| NET INVESTMENT INCOME (LOSS) | 291,587 | (800,094 | ) | |||||
| Realized and unrealized gain (loss): | ||||||||
Net realized gain (loss) from: | ||||||||
Investments — unaffiliated issuers | (11,557 | ) | 6,108,729 | |||||
Investments — affiliated Underlying Funds | (1,073,889 | ) | — | |||||
Futures contracts | (394,714 | ) | (30,904,295 | ) | ||||
Purchased options | (9,471 | ) | — | |||||
Foreign currency transactions | 8,515 | (1,050,452 | ) | |||||
Net change in unrealized gain (loss) on: | ||||||||
Investments — unaffiliated issuers | (104,059 | ) | (24,999,151 | ) | ||||
Investments — affiliated Underlying Funds | (1,822,203 | ) | — | |||||
Futures contracts | (38,407 | ) | (2,879,666 | ) | ||||
Purchased options | (89,541 | ) | — | |||||
Foreign currency translations | 7,047 | 1,060,013 | ||||||
| Net realized and unrealized loss | (3,528,279 | ) | (52,664,822 | ) | ||||
| NET DECREASE IN NET ASSETS RESULTING FROM OPERATIONS | $ | (3,236,692 | ) | $ | (53,464,916 | ) | ||
| (a) | Class specific Distribution and/or Service and Transfer Agency fees were as follows: |
| Distribution and/or Service (12b-1) Fees | Transfer Agency Fees | |||||||||||||||||||
Fund | Advisor | Service | Advisor | Institutional | Service | |||||||||||||||
Multi-Strategy Alternatives | $ | 41,073 | $ | 18,873 | $ | 2,054 | $ | 242 | $ | 1,510 | ||||||||||
Trend Driven Allocation | — | 397,743 | — | 42 | 31,819 | |||||||||||||||
| The accompanying notes are an integral part of these financial statements. | 11 |
GOLDMAN SACHS VARIABLE INSURANCE TRUST MULTI-ASSET STRATEGIES FUNDS
Statements of Changes in Net Assets
| Multi-Strategy Alternatives Portfolio | Trend Driven Allocation Fund | |||||||||||||||
| For the Six Months Ended June 30, 2022 (Unaudited) | For the Fiscal Year Ended December 31, 2021 | For the Six Months Ended June 30, 2022 (Unaudited) | For the Fiscal Year Ended December 31, 2021 | |||||||||||||
| From operations: | ||||||||||||||||
Net investment income (loss) | $ | 291,587 | $ | 519,664 | $ | (800,094 | ) | $ | (2,029,491 | ) | ||||||
Net realized gain (loss) | (1,481,116 | ) | 460,329 | (25,846,018 | ) | 44,004,366 | ||||||||||
Net change in unrealized gain (loss) | (2,047,163 | ) | 137,496 | (26,818,804 | ) | 10,247,601 | ||||||||||
| Net increase (decrease) in net assets resulting from operations | (3,236,692 | ) | 1,117,489 | (53,464,916 | ) | 52,222,476 | ||||||||||
| Distributions to shareholders: | ||||||||||||||||
From distributable earnings: | ||||||||||||||||
Advisor Shares | — | (268,995 | ) | — | — | |||||||||||
Institutional Shares | — | (41,966 | ) | — | (40,198 | ) | ||||||||||
Service Shares | — | (96,854 | ) | — | (43,019,719 | ) | ||||||||||
| Total distributions to shareholders | — | (407,815 | ) | — | (43,059,917 | ) | ||||||||||
| From share transactions: | ||||||||||||||||
Proceeds from sales of shares | 44,217,538 | 9,602,512 | 18,029,324 | 16,311,964 | ||||||||||||
Reinvestment of distributions | — | 407,815 | — | 43,059,917 | ||||||||||||
Cost of shares redeemed | (32,921,058 | ) | (3,772,014 | ) | (34,018,324 | ) | (46,955,103 | ) | ||||||||
| Net increase (decrease) in net assets resulting from share transactions | 11,296,480 | 6,238,313 | (15,989,000 | ) | 12,416,778 | |||||||||||
| TOTAL INCREASE (DECREASE) | 8,059,788 | 6,947,987 | (69,453,916 | ) | 21,579,337 | |||||||||||
| Net Assets: | ||||||||||||||||
Beginning of period | 29,637,648 | 22,689,661 | 357,652,701 | 336,073,364 | ||||||||||||
End of period | $ | 37,697,436 | $ | 29,637,648 | $ | 288,198,785 | $ | 357,652,701 | ||||||||
| 12 | The accompanying notes are an integral part of these financial statements. |
GOLDMAN SACHS VARIABLE INSURANCE TRUST MULTI-STRATEGY ALTERNATIVES PORTFOLIO
Selected Data for a Share Outstanding Throughout Each Period
| (a) | Calculated based on the average shares outstanding methodology. |
| (b) | Recognition of net investment income by the Portfolio is affected by the timing of declaration of dividends by the Underlying Funds in which the Portfolio invests. |
| (c) | Assumes investment at the NAV at the beginning of the period, reinvestment of all dividends and distributions, a complete redemption of the investment at the NAV at the end of the period and no sales or redemption charges (if any). Total returns would be reduced if a sales or redemption charge was taken into account. Returns do not reflect the impact of taxes to shareholders relating to Portfolio distributions or the redemption of Portfolio shares. Total returns for periods less than one full year are not annualized. |
| (d) | Expense ratios exclude the expenses of the Underlying Funds in which the Portfolio invests. |
| (e) | Annualized. |
| (f) | The portfolio turnover rate is calculated in accordance with regulatory requirements, without regard to transactions involving short term investments and certain derivatives. If such transactions were included, the portfolio turnover rate may be higher. |
| The accompanying notes are an integral part of these financial statements. | 13 |
GOLDMAN SACHS VARIABLE INSURANCE TRUST MULTI-STRATEGY ALTERNATIVES PORTFOLIO
Financial Highlights (continued)
Selected Data for a Share Outstanding Throughout Each Period
| Goldman Sachs Multi-Strategy Alternatives Portfolio | ||||||||||||||||||||||||
| Service Shares | ||||||||||||||||||||||||
| Six Months Ended June 30, 2022 (Unaudited) | Year Ended December 31, | |||||||||||||||||||||||
| 2021 | 2020 | 2019 | 2018 | 2017 | ||||||||||||||||||||
| Per Share Data | ||||||||||||||||||||||||
Net asset value, beginning of period | $ | 9.76 | $ | 9.45 | $ | 9.02 | $ | 8.52 | $ | 9.41 | $ | 9.13 | ||||||||||||
Net investment income(a)(b) | 0.08 | 0.20 | 0.23 | 0.32 | 0.28 | 0.27 | ||||||||||||||||||
Net realized and unrealized gain (loss) | (0.77 | ) | 0.26 | 0.38 | 0.43 | (0.93 | ) | 0.22 | ||||||||||||||||
Total from investment operations | (0.69 | ) | 0.46 | 0.61 | 0.75 | (0.65 | ) | 0.49 | ||||||||||||||||
Distributions to shareholders from net investment income | — | (0.15 | ) | (0.18 | ) | (0.25 | ) | (0.24 | ) | (0.21 | ) | |||||||||||||
Net asset value, end of period | $ | 9.07 | $ | 9.76 | $ | 9.45 | $ | 9.02 | $ | 8.52 | $ | 9.41 | ||||||||||||
Total Return(c) | (7.07 | )% | 4.84 | % | 6.70 | % | 8.82 | % | (6.93 | )% | 5.37 | % | ||||||||||||
Net assets, end of period (in 000’s) | $ | 14,648 | $ | 6,538 | $ | 3,472 | $ | 2,857 | $ | 811 | $ | 105 | ||||||||||||
Ratio of net expenses to average net assets(d) | 0.45 | %(e) | 0.47 | % | 0.46 | % | 0.51 | % | 0.47 | % | 0.46 | % | ||||||||||||
Ratio of total expenses to average net assets(d) | 0.88 | %(e) | 1.28 | % | 1.65 | % | 1.86 | % | 1.95 | % | 1.73 | % | ||||||||||||
Ratio of net investment income to average net assets | 1.75 | %(e) | 2.04 | % | 2.51 | % | 3.54 | % | 3.08 | % | 2.88 | % | ||||||||||||
Portfolio turnover rate(f) | 103 | % | 25 | % | 5 | % | 26 | % | 61 | % | 53 | % | ||||||||||||
| (a) | Calculated based on the average shares outstanding methodology. |
| (b) | Recognition of net investment income by the Portfolio is affected by the timing of declaration of dividends by the Underlying Funds in which the Portfolio invests. |
| (c) | Assumes investment at the NAV at the beginning of the period, reinvestment of all dividends and distributions, a complete redemption of the investment at the NAV at the end of the period and no sales or redemption charges (if any). Total returns would be reduced if a sales or redemption charge was taken into account. Returns do not reflect the impact of taxes to shareholders relating to Portfolio distributions or the redemption of Portfolio shares. Total returns for periods less than one full year are not annualized. |
| (d) | Expense ratios exclude the expenses of the Underlying Funds in which the Portfolio invests. |
| (e) | Annualized. |
| (f) | The portfolio turnover rate is calculated in accordance with regulatory requirements, without regard to transactions involving short term investments and certain derivatives. If such transactions were included, the portfolio turnover rate may be higher. |
| 14 | The accompanying notes are an integral part of these financial statements. |
GOLDMAN SACHS VARIABLE INSURANCE TRUST MULTI-STRATEGY ALTERNATIVES PORTFOLIO
Financial Highlights (continued)
Selected Data for a Share Outstanding Throughout Each Period
| Goldman Sachs Multi-Strategy Alternatives Portfolio | ||||||||||||||||||||||||
| Advisor Shares | ||||||||||||||||||||||||
| Six Months Ended June 30, 2022 (Unaudited) | Year Ended December 31, | |||||||||||||||||||||||
| 2021 | 2020 | 2019 | 2018 | 2017 | ||||||||||||||||||||
| Per Share Data | ||||||||||||||||||||||||
Net asset value, beginning of period | $ | 9.73 | $ | 9.42 | $ | 8.99 | $ | 8.49 | $ | 9.36 | $ | 9.08 | ||||||||||||
Net investment income(a)(b) | 0.06 | 0.18 | 0.20 | 0.24 | 0.17 | 0.17 | ||||||||||||||||||
Net realized and unrealized gain (loss) | (0.75 | ) | 0.26 | 0.39 | 0.49 | (0.83 | ) | 0.30 | ||||||||||||||||
Total from investment operations | (0.69 | ) | 0.44 | 0.59 | 0.73 | (0.66 | ) | 0.47 | ||||||||||||||||
Distributions to shareholders from net investment income | — | (0.13 | ) | (0.16 | ) | (0.23 | ) | (0.21 | ) | (0.19 | ) | |||||||||||||
Net asset value, end of period | $ | 9.04 | $ | 9.73 | $ | 9.42 | $ | 8.99 | $ | 8.49 | $ | 9.36 | ||||||||||||
Total Return(c) | (7.09 | )% | 4.66 | % | 6.56 | % | 8.60 | % | (7.09 | )% | 5.14 | % | ||||||||||||
Net assets, end of period (in 000’s) | $ | 20,753 | $ | 20,585 | $ | 17,698 | $ | 15,410 | $ | 13,460 | $ | 15,512 | ||||||||||||
Ratio of net expenses to average net assets(d) | 0.60 | %(e) | 0.62 | % | 0.61 | % | 0.64 | % | 0.62 | % | 0.61 | % | ||||||||||||
Ratio of total expenses to average net assets(d) | 1.13 | %(e) | 1.44 | % | 1.79 | % | 2.01 | % | 1.93 | % | 1.88 | % | ||||||||||||
Ratio of net investment income to average net assets | 1.35 | %(e) | 1.89 | % | 2.28 | % | 2.61 | % | 1.92 | % | 1.78 | % | ||||||||||||
Portfolio turnover rate(f) | 103 | % | 25 | % | 5 | % | 26 | % | 61 | % | 53 | % | ||||||||||||
| (a) | Calculated based on the average shares outstanding methodology. |
| (b) | Recognition of net investment income by the Portfolio is affected by the timing of declaration of dividends by the Underlying Funds in which the Portfolio invests. |
| (c) | Assumes investment at the NAV at the beginning of the period, reinvestment of all dividends and distributions, a complete redemption of the investment at the NAV at the end of the period and no sales or redemption charges (if any). Total returns would be reduced if a sales or redemption charge was taken into account. Returns do not reflect the impact of taxes to shareholders relating to Portfolio distributions or the redemption of Portfolio shares. Total returns for periods less than one full year are not annualized. |
| (d) | Expense ratios exclude the expenses of the Underlying Funds in which the Portfolio invests. |
| (e) | Annualized. |
| (f) | The portfolio turnover rate is calculated in accordance with regulatory requirements, without regard to transactions involving short term investments and certain derivatives. If such transactions were included, the portfolio turnover rate may be higher. |
| The accompanying notes are an integral part of these financial statements. | 15 |
GOLDMAN SACHS VARIABLE INSURANCE TRUST TREND DRIVEN ALLOCATION FUND
Financial Highlights (continued)
Selected Data for a Share Outstanding Throughout Each Period
| (a) | Calculated based on the average shares outstanding methodology. |
| (b) | Assumes investment at the NAV at the beginning of the period, reinvestment of all dividends and distributions, a complete redemption of the investment at the NAV at the end of the period and no sales or redemption charges (if any). Total returns would be reduced if a sales or redemption charge was taken into account. Returns do not reflect the impact of taxes to shareholders relating to Fund distributions or the redemption of Fund shares. Total returns for periods less than one full year are not annualized. |
| (c) | Annualized. |
| (d) | The Fund’s portfolio turnover rate is calculated in accordance with regulatory requirements, without regard to transactions involving short term investments and certain derivatives. If such transactions were included, the Fund’s portfolio turnover rate may be higher. |
| 16 | The accompanying notes are an integral part of these financial statements. |
GOLDMAN SACHS VARIABLE INSURANCE TRUST TREND DRIVEN ALLOCATION FUND
Financial Highlights (continued)
Selected Data for a Share Outstanding Throughout Each Period
| Goldman Sachs Trend Driven Allocation Fund | ||||||||||||||||||||||||
| Service Shares | ||||||||||||||||||||||||
| Six Months Ended June 30, 2022 (Unaudited) | Year Ended December 31, | |||||||||||||||||||||||
| 2021 | 2020 | 2019 | 2018 | 2017 | ||||||||||||||||||||
| Per Share Data | ||||||||||||||||||||||||
Net asset value, beginning of period | $ | 12.86 | $ | 12.59 | $ | 12.30 | $ | 11.64 | $ | 12.45 | $ | 11.32 | ||||||||||||
Net investment income (loss)(a) | (0.03 | ) | (0.08 | ) | (0.01 | ) | 0.11 | 0.08 | 0.03 | |||||||||||||||
Net realized and unrealized gain (loss) | (1.94 | ) | 2.10 | 0.51 | 1.28 | (0.62 | ) | 1.46 | ||||||||||||||||
Total from investment operations | (1.97 | ) | 2.02 | 0.50 | 1.39 | (0.54 | ) | 1.49 | ||||||||||||||||
Distributions to shareholders from net investment income | — | — | (0.03 | ) | (0.19 | ) | (0.08 | ) | (0.04 | ) | ||||||||||||||
Distributions to shareholders from net realized gains | — | (1.75 | ) | (0.18 | ) | (0.54 | ) | (0.19 | ) | (0.32 | ) | |||||||||||||
Total distributions | — | (1.75 | ) | (0.21 | ) | (0.73 | ) | (0.27 | ) | (0.36 | ) | |||||||||||||
Net asset value, end of period | $ | 10.89 | $ | 12.86 | $ | 12.59 | $ | 12.30 | $ | 11.64 | $ | 12.45 | ||||||||||||
Total Return(b) | (15.32 | )% | 16.17 | % | 4.10 | % | 11.94 | % | (4.34 | )% | 13.11 | % | ||||||||||||
Net assets, end of period (in 000’s) | $ | 287,652 | $ | 357,316 | $ | 335,784 | $ | 345,219 | $ | 395,842 | $ | 406,867 | ||||||||||||
Ratio of net expenses to average net assets | 0.91 | %(c) | 0.92 | % | 0.85 | % | 0.84 | % | 0.81 | % | 0.93 | % | ||||||||||||
Ratio of total expenses to average net assets | 1.14 | %(c) | 1.14 | % | 1.15 | % | 1.14 | % | 1.11 | % | 1.11 | % | ||||||||||||
Ratio of net investment income (loss) to average net assets | (0.50 | )%(c) | (0.58 | )% | (0.12 | )% | 0.91 | % | 0.63 | % | 0.21 | % | ||||||||||||
Portfolio turnover rate(d) | 124 | % | 12 | % | 168 | % | 61 | % | 60 | % | 64 | % | ||||||||||||
| (a) | Calculated based on the average shares outstanding methodology. |
| (b) | Assumes investment at the NAV at the beginning of the period, reinvestment of all dividends and distributions, a complete redemption of the investment at the NAV at the end of the period and no sales or redemption charges (if any). Total returns would be reduced if a sales or redemption charge was taken into account. Returns do not reflect the impact of taxes to shareholders relating to Fund distributions or the redemption of Fund shares. Total returns for periods less than one full year are not annualized. |
| (c) | Annualized. |
| (d) | The Fund’s portfolio turnover rate is calculated in accordance with regulatory requirements, without regard to transactions involving short term investments and certain derivatives. If such transactions were included, the Fund’s portfolio turnover rate may be higher. |
| The accompanying notes are an integral part of these financial statements. | 17 |
GOLDMAN SACHS VARIABLE INSURANCE TRUST MULTI-ASSET STRATEGIES FUNDS
June 30, 2022 (Unaudited)
1. ORGANIZATION
Goldman Sachs Variable Insurance Trust (the “Trust” or “VIT”) is a Delaware statutory trust registered under the Investment Company Act of 1940, as amended (the “Act”), as an open-end management investment company. The following table lists those series of the Trust that are included in this report (collectively, the “Funds” or individually a “Fund”), along with their corresponding share classes and respective diversification status under the Act:
| Fund | Share Classes Offered | Diversified/ Non-diversified | ||
Multi-Strategy Alternatives | Institutional, Service and Advisor | Diversified | ||
Trend Driven Allocation | Institutional and Service | Diversified |
Goldman Sachs Asset Management, L.P. (“GSAM”), an affiliate of Goldman Sachs & Co. LLC (“Goldman Sachs”), serves as investment adviser to the Funds pursuant to management agreements (the “Agreements”) with the Trust.
The Multi-Strategy Alternatives Portfolio invests primarily in a combination of domestic and international equity and fixed income underlying funds (“Underlying Funds”) which are registered under the Act, for which GSAM acts as investment adviser. Additionally, the Multi-Strategy Alternatives Portfolio may invest a portion of its assets directly in other securities and instruments, including unaffiliated exchange traded funds (“Unaffiliated Funds”). The Trend Driven Allocation Fund may invest in one or a combination of the following securities and instruments: pooled investment vehicles, including exchange-traded funds (“ETFs”) and other investment companies; equity securities of U.S. and non-U.S. issuers; U.S. fixed income securities; and derivatives that provide exposure to a broad spectrum of asset classes and geographic regions.
2. SIGNIFICANT ACCOUNTING POLICIES
The financial statements have been prepared in accordance with accounting principles generally accepted in the United States of America (“GAAP”) and require management to make estimates and assumptions that may affect the reported amounts and disclosures. Actual results may differ from those estimates and assumptions. Each Fund is an investment company under GAAP and follows the accounting and reporting guidance applicable to investment companies.
A. Investment Valuation — The valuation policy of the Funds and Underlying Funds is to value investments at fair value.
B. Investment Income and Investments — Investment income includes interest income, dividend income, and securities lending income, if any. Interest income is accrued daily and adjusted for amortization of premiums and accretion of discounts. Dividend income is recognized on ex-dividend date or, for certain foreign securities, as soon as such information is obtained subsequent to the ex-dividend date. Non-cash dividends, if any, are recorded at the fair market value of the securities received. Investment transactions are reflected on trade date. Realized gains and losses are calculated using identified cost. Investment transactions are recorded on the following business day for daily net asset value (“NAV”) calculations. Investment income is recorded net of any foreign withholding taxes, less any amounts reclaimable. The Funds may file withholding tax reclaims in certain jurisdictions to recover a portion of amounts previously withheld. Any foreign capital gains tax is accrued daily based upon net unrealized gains, and is payable upon sale of such investments. Income distributions are recognized as capital gains or income in the financial statements in accordance with the character that is distributed.
For derivative contracts, unrealized gains and losses are recorded daily and become realized gains and losses upon disposition or termination of the contract.
C. Class Allocations and Expenses — Investment income, realized and unrealized gain (loss), if any, and non-class specific expenses of each Fund are allocated daily based upon the proportion of net assets of each class. Non-class specific expenses directly incurred by a Fund are charged to that Fund, while such expenses incurred by the Trust are allocated across the applicable Funds on a straight-line and/or pro-rata basis depending upon the nature of the expenses. Class specific expenses, where applicable, are borne by the respective share classes and include Distribution and Service and Transfer Agency fees. Expenses included in the accompanying financial statements reflect the expenses of each Fund and do not include any expenses associated with the
| 18 |
GOLDMAN SACHS VARIABLE INSURANCE TRUST MULTI-ASSET STRATEGIES FUNDS
2. SIGNIFICANT ACCOUNTING POLICIES (continued)
Underlying Funds. Because the Underlying Funds have varied expense and fee levels and each Fund may own different proportions of the Underlying Funds at different times, the amount of fees and expenses incurred indirectly by the Funds will vary.
D. Federal Taxes and Distributions to Shareholders — It is each Fund’s policy to comply with the requirements of the Internal Revenue Code of 1986, as amended (the “Code”), applicable to regulated investment companies and to distribute each year substantially all of its investment company taxable income and capital gains to its shareholders. Accordingly, each Fund is not required to make any provisions for the payment of federal income tax. Distributions to shareholders are recorded on the ex-dividend date. Income and capital gains distributions, if any, are declared and paid at least annually.
Net capital losses, if any, are carried forward to future fiscal years and may be used to the extent allowed by the Code to offset any future capital gains. Losses that are carried forward will retain their character as either short-term or long-term capital losses. Utilization of capital loss carryforwards will reduce the requirement of future capital gains distributions.
The characterization of distributions to shareholders for financial reporting purposes is determined in accordance with federal income tax rules, which may differ from GAAP. The source of each Fund’s distributions may be shown in the accompanying financial statements as either from distributable earnings or capital. Certain components of the Funds’ net assets on the Statements of Assets and Liabilities reflect permanent GAAP/tax differences based on the appropriate tax character.
E. Foreign Currency Translation — The accounting records and reporting currency of a Fund are maintained in U.S. dollars. Assets and liabilities denominated in foreign currencies are translated into U.S. dollars using the current exchange rates at the close of each business day. The effect of changes in foreign currency exchange rates on investments is included within net realized and unrealized gain (loss) on investments. Changes in the value of other assets and liabilities as a result of fluctuations in foreign exchange rates are included in the Statements of Operations within net change in unrealized gain (loss) on foreign currency translation. Transactions denominated in foreign currencies are translated into U.S. dollars on the date the transaction occurred, the effects of which are included within net realized gain (loss) on foreign currency transactions.
3. INVESTMENTS AND FAIR VALUE MEASUREMENTS
U.S. GAAP defines the fair value of a financial instrument as the amount that would be received to sell an asset or paid to transfer a liability in an orderly transaction between market participants at the measurement date (i.e., the exit price); the Funds’ policy is to use the market approach. GAAP establishes a fair value hierarchy that prioritizes the inputs to valuation techniques used to measure fair value. The hierarchy gives the highest priority to unadjusted quoted prices in active markets for identical assets or liabilities (Level 1 measurements) and the lowest priority to unobservable inputs (Level 3 measurements). The level in the fair value hierarchy within which the fair value measurement in its entirety falls shall be determined based on the lowest level input that is significant to the fair value measurement in its entirety. The levels used for classifying investments are not necessarily an indication of the risk associated with investing in these investments. The three levels of the fair value hierarchy are described below:
Level 1 — Unadjusted quoted prices in active markets that are accessible at the measurement date for identical, unrestricted assets or liabilities;
Level 2 — Quoted prices in markets that are not active or financial instruments for which significant inputs are observable (including, but not limited to, quoted prices for similar investments, interest rates, foreign exchange rates, volatility and credit spreads), either directly or indirectly;
Level 3 — Prices or valuations that require significant unobservable inputs (including GSAM’s assumptions in determining fair value measurement).
The Board of Trustees (“Trustees”) has approved Valuation Procedures that govern the valuation of the portfolio investments held by the Funds, including investments for which market quotations are not readily available. The Trustees have delegated to GSAM day-to-day responsibility for implementing and maintaining internal controls and procedures related to the valuation of the Funds’ investments. To assess the continuing appropriateness of pricing sources and methodologies, GSAM regularly performs price
| 19 |
GOLDMAN SACHS VARIABLE INSURANCE TRUST MULTI-ASSET STRATEGIES FUNDS
Notes to Financial Statements (continued)
June 30, 2022 (Unaudited)
3. INVESTMENTS AND FAIR VALUE MEASUREMENTS (continued)
verification procedures and issues challenges as necessary to third party pricing vendors or brokers, and any differences are reviewed in accordance with the Valuation Procedures.
A. Level 1 and Level 2 Fair Value Investments — The valuation techniques and significant inputs used in determining the fair values for investments classified as Level 1 and Level 2 are as follows:
Equity Securities — Equity securities traded on a United States (“U.S.”) securities exchange or the NASDAQ system, or those located on certain foreign exchanges, including but not limited to the Americas, are valued daily at their last sale price or official closing price on the principal exchange or system on which they are traded. If there is no sale or official closing price or such price is believed by GSAM to not represent fair value, equity securities will be valued at the valid closing bid price for long positions and at the valid closing ask price for short positions (i.e. where there is sufficient volume, during normal exchange trading hours). If no valid bid/ask price is available, the equity security will be valued pursuant to the Valuation Procedures approved by the Trustees and consistent with applicable regulatory guidance. To the extent these investments are actively traded, they are classified as Level 1 of the fair value hierarchy, otherwise they are generally classified as Level 2. Certain equity securities containing unique attributes may be classified as Level 2.
Unlisted equity securities for which market quotations are available are valued at the last sale price on the valuation date, or if no sale occurs, at the last bid price for long positions or the last ask price for short positions, and are generally classified as Level 2. Securities traded on certain foreign securities exchanges are valued daily at fair value determined by an independent fair value service (if available) under Fair Valuation Procedures approved by the Trustees and consistent with applicable regulatory guidance. The independent fair value service takes into account multiple factors including, but not limited to, movements in the securities markets, certain depositary receipts, futures contracts and foreign currency exchange rates that have occurred subsequent to the close of the foreign securities exchange. These investments are generally classified as Level 2 of the fair value hierarchy.
Underlying Funds (including Money Market Funds) — Underlying Funds include other investment companies and exchange-traded funds (“ETFs”). Investments in the Underlying Funds (except ETFs) are valued at the NAV per share on the day of valuation. ETFs are valued daily at the last sale price or official closing price on the principal exchange or system on which the investment is traded. Because the Funds invest in Underlying Funds that fluctuate in value, each Fund’s shares will correspondingly fluctuate in value. Underlying Funds are generally classified as Level 1 of the fair value hierarchy. To the extent that underlying ETF’s are actively traded, they are classified as Level 1 of the fair value hierarchy, otherwise they are generally classified as Level 2. For information regarding an Underlying Fund’s accounting policies and investment holdings, please see the Underlying Fund’s shareholder report.
Derivative Contracts — A derivative is an instrument whose value is derived from underlying assets, indices, reference rates or a combination of these factors. A Fund enters into derivative transactions to hedge against changes in interest rates, securities prices, and/or currency exchange rates, to increase total return, or to gain access to certain markets or attain exposure to other underliers. For financial reporting purposes, cash collateral that has been pledged to cover obligations of a Fund and cash collateral received, if any, is reported separately on the Statements of Assets and Liabilities as receivables/payables for collateral on certain derivatives contracts. Non-cash collateral pledged by a Fund, if any, is noted in the Schedules of Investments.
Exchange-traded derivatives, including futures and options contracts, are generally valued at the last sale or settlement price on the exchange where they are principally traded. Exchange-traded options without settlement prices are generally valued at the midpoint of the bid and ask prices on the exchange where they are principally traded (or, in the absence of two-way trading, at the last bid price for long positions and the last ask price for short positions). Exchange-traded derivatives typically fall within Level 1 of the fair value hierarchy. Over-the-counter (“OTC”) and centrally cleared derivatives are valued using market transactions and other market evidence, including market-based inputs to models, calibration to market-clearing transactions, broker or dealer quotations, or other alternative pricing sources. Where models are used, the selection of a particular model to value OTC and centrally cleared derivatives depends upon the contractual terms of, and specific risks inherent in, the instrument, as well as the availability of pricing information in the market. Valuation models require a variety of inputs, including contractual terms, market prices, yield curves, credit curves, measures of volatility, voluntary and involuntary prepayment rates, loss severity rates and
| 20 |
GOLDMAN SACHS VARIABLE INSURANCE TRUST MULTI-ASSET STRATEGIES FUNDS
3. INVESTMENTS AND FAIR VALUE MEASUREMENTS (continued)
correlations of such inputs. For OTC and centrally cleared derivatives that trade in liquid markets, model inputs can generally be verified and model selection does not involve significant management judgment. OTC and centrally cleared derivatives are classified within Level 2 of the fair value hierarchy when significant inputs are corroborated by market evidence.
i. Futures Contracts — Futures contracts are contracts to buy or sell a standardized quantity of a specified commodity or security. Upon entering into a futures contract, a Fund deposits cash or securities in an account on behalf of the broker in an amount sufficient to meet the initial margin requirement. Subsequent payments are made or received by a Fund equal to the daily change in the contract value and are recorded as variation margin receivable or payable with a corresponding offset to unrealized gains or losses.
ii. Options — When the Multi-Strategy Alternatives Portfolio writes call or put options, an amount equal to the premium received is recorded as a liability and is subsequently marked-to-market to reflect the current value of the option written. Swaptions are options on swap contracts.
Upon the purchase of a call option or a put option by the Multi-Strategy Alternatives Portfolio, the premium paid is recorded as an investment and subsequently marked-to-market to reflect the current value of the option. Certain options may be purchased with premiums to be determined on a future date. The premiums for these options are based upon implied volatility parameters at specified terms.
B. Level 3 Fair Value Investments — To the extent that significant inputs to valuation models and other alternative pricing sources are unobservable, or if quotations are not readily available, or if GSAM believes that such quotations do not accurately reflect fair value, the fair value of a Fund’s investments may be determined under Valuation Procedures approved by the Trustees. GSAM, consistent with its procedures and applicable regulatory guidance, may make an adjustment to the most recent valuation prices of either domestic or foreign securities in light of significant events to reflect what it believes to be the fair value of the securities at the time of determining a Fund’s NAV. To the extent investments are valued using single source broker quotations obtained directly from the broker or passed through from third party pricing vendors, such investments are classified as Level 3 investments.
C. Fair Value Hierarchy — The following is a summary of the Funds’ investments and derivatives classified in the fair value hierarchy as of June 30, 2022:
| MULTI-STRATEGY ALTERNATIVES PORTFOLIO | ||||||||||||
| Investment Type | Level 1 | Level 2 | Level 3 | |||||||||
| Assets | ||||||||||||
| Fixed Income Underlying Funds | $ | 25,810,690 | $ | — | $ | — | ||||||
| Investment Companies | 9,512,875 | — | — | |||||||||
| Equity Underlying Funds | 9,651,690 | — | — | |||||||||
| Exchange Traded Funds | 1,377,855 | — | — | |||||||||
| Total | $ | 46,353,110 | $ | — | $ | — | ||||||
| Derivative Type | ||||||||||||
| Assets | ||||||||||||
Purchased Options Contracts | $ | 341,306 | $ | — | $ | — | ||||||
| Liabilities(a) | ||||||||||||
| Futures Contracts | $ | (16,796 | ) | $ | — | $ | — | |||||
| (a) | Amount shown represents unrealized gain (loss) at period end. |
| 21 |
GOLDMAN SACHS VARIABLE INSURANCE TRUST MULTI-ASSET STRATEGIES FUNDS
Notes to Financial Statements (continued)
June 30, 2022 (Unaudited)
3. INVESTMENTS AND FAIR VALUE MEASUREMENTS (continued)
| TREND DRIVEN ALLOCATION FUND | ||||||||||||
| Investment Type | Level 1 | Level 2 | Level 3 | |||||||||
| Assets | ||||||||||||
| Exchange Traded Funds | $ | 37,143,429 | $ | — | $ | — | ||||||
| Investment Companies | 144,501,059 | — | — | |||||||||
| Total | $ | 181,644,488 | $ | — | $ | — | ||||||
| Derivative Type | ||||||||||||
| Assets(a) | ||||||||||||
| Futures Contracts | $ | 177,877 | $ | — | $ | — | ||||||
| Liabilities(a) | ||||||||||||
| Futures Contracts | $ | (214,303 | ) | $ | — | $ | — | |||||
| (a) | Amount shown represents unrealized gain (loss) at period end. |
For further information regarding security characteristics, see the Schedules of Investments.
4. INVESTMENTS IN DERIVATIVES
The following tables set forth, by certain risk types, the gross value of derivative contracts (not considered to be hedging instruments for accounting disclosure purposes) as of June 30, 2022. These instruments were used as part of the Funds’ investment strategies and to obtain and/or manage exposure related to the risks below. The values in the tables below exclude the effects of cash collateral received or posted pursuant to these derivative contracts, and therefore are not representative of the Funds’ net exposure.
Multi-Strategy Alternatives
| Risk | Statements of Assets and Liabilities | Assets | Statements of Assets and Liabilities | Liabilities | ||||||||||
| Equity | $ | — | Variation margin on futures contracts | $ | (2,656 | )(a) | ||||||||
| Interest Rate | Purchased options contracts, at value | 341,306 | Variation margin on futures contracts | (14,140 | ) | |||||||||
| Total | $ | 341,306 | $ | (16,796 | ) | |||||||||
Trend Driven Allocation
| Risk | Statements of Assets and Liabilities | Assets | Statements of Assets and Liabilities | Liabilities | ||||||||||
| Equity | $ | — | Variation margin on futures contracts | $ | (214,303 | )(a) | ||||||||
| Interest Rate | Variation margin on futures contracts | | 177,877 | (a) | — | |||||||||
| Total | $ | 177,877 | $ | (214,303 | ) | |||||||||
| (a) | Includes unrealized gain (loss) on futures contracts described in the Additional Investment Information sections of the Schedules of Investments. Only the variation margin as of June 30, 2022, is reported within the Statements of Assets and Liabilities. |
| 22 |
GOLDMAN SACHS VARIABLE INSURANCE TRUST MULTI-ASSET STRATEGIES FUNDS
4. INVESTMENTS IN DERIVATIVES (continued)
The following tables set forth, by certain risk types, the Funds’ gains (losses) related to these derivatives and their indicative volumes for the six months ended June 30, 2022. These gains (losses) should be considered in the context that these derivative contracts may have been executed to create investment opportunities and/or economically hedge certain investments, and accordingly, certain gains (losses) on such derivative contracts may offset certain (losses) gains attributable to investments. These gains (losses) are included in “Net realized gain (loss)” or “Net change in unrealized gain (loss)” on the Statements of Operations.
Multi-Strategy Alternatives
| Risk | Statement of Operations | Net Realized Gain (Loss) | Net Change in Unrealized Gain (Loss) | |||||||
| Equity | Net realized gain (loss) from futures contracts/Net change in unrealized gain (loss) on futures contracts | $ | (270,328 | ) | $ | (7,015 | ) | |||
| Interest Rate | Net realized gain (loss) from futures contracts and purchased options/Net change in unrealized gain (loss) on futures contracts and purchased options | (133,857 | ) | (120,933 | ) | |||||
| Total | $ | (404,185 | ) | $ | (127,948 | ) | ||||
Trend Driven Allocation
| Risk | Statement of Operations | Net Realized Gain (Loss) | Net Change in Unrealized Gain (Loss) | |||||||
| Equity | Net realized gain (loss) from futures contracts/Net change in unrealized gain (loss) on futures contracts | $ | (21,370,886 | ) | $ | (3,941,932 | ) | |||
| Interest Rate | Net realized gain (loss) from futures contracts/Net change in unrealized gain (loss) on futures contracts | (9,533,409 | ) | 1,062,266 | ||||||
| Total | $ | (30,904,295 | ) | $ | (2,879,666 | ) | ||||
For the six months ended June 30, 2022, the relevant values for each derivative type were as follows:
| Average Number of Contracts(1) | ||||||||
| Fund | Futures Contracts | Purchased Options | ||||||
| Multi-Strategy Alternatives | 52 | 178 | ||||||
| Trend Driven Allocation | 1,194 | — | ||||||
| (1) | Amounts disclosed represent average number of contracts for futures and purchased options contracts, based on absolute values, which is indicative of volume of this derivative type, for the months that the Funds held such derivatives during the six months ended June 30, 2022. |
5. AGREEMENTS AND AFFILIATED TRANSACTIONS
A. Management Agreement — Under the Agreement, GSAM manages the Funds, subject to the general supervision of the Trustees.
As compensation for the services rendered pursuant to the Agreement, the assumption of the expenses related thereto and administration of the Multi-Strategy Alternatives Portfolio’s and Trend Driven Allocation Fund’s business affairs, including providing facilities, GSAM is entitled to a management fee, accrued daily and paid monthly, equal to an annual percentage rate of each Fund’s average daily net assets.
| 23 |
GOLDMAN SACHS VARIABLE INSURANCE TRUST MULTI-ASSET STRATEGIES FUNDS
Notes to Financial Statements (continued)
June 30, 2022 (Unaudited)
5. AGREEMENTS AND AFFILIATED TRANSACTIONS (continued)
For the six months ended June 30, 2022, contractual and effective net management fees with GSAM were at the following rates:
| Contractual Management Rate | ||||||||||||||||||||||||||||
| Fund | First $1 billion | Next $1 billion | Next $3 billion | Next $3 billion | Over $8 billion | Effective Rate | Effective Net Management Rate^ | |||||||||||||||||||||
| Multi-Strategy Alternatives | 0.15 | % | 0.15 | % | 0.15 | % | 0.15 | % | 0.15 | % | 0.15 | % | 0.00 | %* | ||||||||||||||
| Trend Driven Allocation | 0.79 | % | 0.71 | % | 0.68 | % | 0.66 | % | 0.65 | % | 0.79 | % | 0.65 | %** | ||||||||||||||
| ^ | Effective Net Management Rate includes the impact of management fee waivers of affiliated Underlying Funds, if any. |
| * | GSAM agreed to waive a portion of its management fees in order to achieve a net management rate, as defined in the Fund’s most recent prospectus. This waiver will be effective through at least April 29, 2023, and prior to such date GSAM may not terminate the arrangement without approval of the Trustees. For the six months ended June 30, 2022, GSAM waived $28,543 of its management fee. |
| ** | GSAM agreed to waive a portion of its management fees in order to achieve a net management rate, as defined in the Fund’s most recent prospectus. This waiver will be effective through at least April 29, 2023, and prior to such date GSAM may not terminate the arrangement without approval of the Trustees. For the six months ended June 30, 2022, GSAM waived $191,170 of its management fee. |
The Multi-Strategy Alternatives Portfolio invests in Institutional Shares of the Goldman Sachs Financial Square Government and Goldman Sachs VIT Government Money Market Funds and Trend Driven Allocation Fund invests in Institutional Shares of the Goldman Sachs Financial Square Government, Goldman Sachs Financial Square Treasury Instruments, Goldman Sachs Financial Square Treasury Obligations, and Goldman Sachs Financial Square Treasury Solutions Funds, which are affiliated Underlying Funds. GSAM has agreed to waive a portion of its management fee payable by the Funds in an amount equal to the management fee it earns as an investment adviser to the affiliated Underlying Fund in which the Funds invest, except those management fees it earns from the Funds’ investments of cash collateral received in connection with securities lending transactions in the Goldman Sachs Financial Square Government Fund. For the six months ended June 30, 2022, GSAM waived $4,224 and $58,212 of the Multi-Strategy Alternatives Portfolio’s and Trend Driven Allocation Fund’s management fee, respectively.
B. Distribution and/or Service (12b-1) Plans — The Trust, on behalf of Service Shares of the Funds has adopted a Distribution and Service Plan subject to Rule 12b-1 under the Act. Under the Distribution and Service Plan, Goldman Sachs, which serves as distributor (the “Distributor”), is entitled to a fee accrued daily and paid monthly, for distribution services and personal and account maintenance services, which may then be paid by Goldman Sachs to authorized dealers, equal to, on an annual basis, 0.25% of the Funds’ average daily net assets attributable to Service Shares.
The Trust, on behalf of Advisor Shares of the Multi-Strategy Alternatives Portfolio, has adopted a Distribution Plan subject to Rule 12b-1 under the Act. Under the Distribution Plan, Goldman Sachs as Distributor is entitled to a fee accrued daily and paid monthly for distribution services, which may then be paid by Goldman Sachs to authorized dealers, equal to, on an annual basis, 0.15% of the Multi-Strategy Alternatives Portfolio’s average daily net assets attributable to Advisor Shares.
C. Service Plans — The Trust, on behalf of Advisor Shares of the Multi-Strategy Alternatives Portfolio, has adopted a Service Plan to allow Advisor Shares to compensate service organizations (including Goldman Sachs) for providing varying levels of personal and account maintenance and administration services to their customers who are beneficial owners of such shares. The Service Plans each provide for compensation to the service organizations equal to 0.25% of the average daily net assets attributable to Advisor Shares of the Multi-Strategy Alternatives Portfolio.
D. Transfer Agency Agreement — Goldman Sachs also serves as the transfer agent of the Funds for a fee pursuant to the Transfer Agency Agreement. The fees charged for such transfer agency services are accrued daily and paid monthly at an annual rate of 0.02% of the average daily net assets of Institutional, Service and Advisor Shares.
E. Other Expense Agreements and Affiliated Transactions — GSAM has agreed to reduce or limit certain “Other Expenses” of the Funds (excluding acquired fund fees and expenses, transfer agency fees and expenses, service fees and
| 24 |
GOLDMAN SACHS VARIABLE INSURANCE TRUST MULTI-ASSET STRATEGIES FUNDS
5. AGREEMENTS AND AFFILIATED TRANSACTIONS (continued)
shareholder administration fees (as applicable), taxes, interest, brokerage fees, expenses of shareholder meetings, litigation and indemnification, and extraordinary expenses) to the extent such expenses exceed, on an annual basis, a percentage rate of the average daily net assets of each Fund. Such Other Expense reimbursements, if any, are accrued daily and paid monthly. In addition, the Funds are not obligated to reimburse GSAM for prior fiscal year expense reimbursements, if any. The Other Expense limitations as an annual percentage rate of average daily net assets for the Multi-Strategy Alternatives Portfolio and Trend Driven Allocation Fund are 0.204% and 0.004%, respectively. These Other Expense limitations will remain in place through at least April 29, 2023, and prior to such date GSAM may not terminate the arrangements without the approval of the Trustees. In addition, the Funds have entered into certain offset arrangements with the custodian and the transfer agent, which may result in a reduction of the Funds’ expenses and are received irrespective of the application of the “Other Expense” limitations described above.
For the six months ended June 30, 2022, these expense reductions, including any fee waivers and Other Expense reimbursements, were as follows:
| Fund | Management Fee Waiver | Other Expense Reimbursement | Total Expense Reductions | |||||||||
| Multi-Strategy Alternatives | $ | 28,543 | $ | 64,785 | $ | 93,328 | ||||||
| Trend Driven Allocation | $ | 191,170 | $ | 179,322 | $ | 370,492 | ||||||
F. Line of Credit Facility — As of June 30, 2022, the Funds participated in a $1,250,000,000 committed, unsecured revolving line of credit facility (the “facility”) together with other funds of the Trust and certain registered investment companies having management agreements with GSAM or its affiliates. This facility is to be used for temporary emergency purposes, or to allow for an orderly liquidation of securities to meet redemption requests. The interest rate on borrowings is based on the federal funds rate. The facility also requires a fee to be paid by the Funds based on the amount of the commitment that has not been utilized. For the six months ended June 30, 2022, the Funds did not have any borrowings under the facility. Prior to April 22, 2022, the facility was $1,000,000,000.
G. Other Transactions with Affiliates — The following table provides information about Goldman Sachs Variable Insurance Trust Trend Driven Allocation Fund’s investments in the Goldman Sachs Financial Square Government, Goldman Sachs Financial Square Treasury Instruments, Goldman Sachs Financial Square Treasury Obligations, and Goldman Sachs Financial Square Treasury Solutions Funds as of and for the six months ended June 30, 2022.
| Investment Companies | Beginning Value as of December 31, 2021 | Purchases at Cost | Proceeds from Sales | Ending Value as of June 30, 2022 | Shares as of June 30, 2022 | Dividend Income | ||||||||||||||||||
Goldman Sachs Financial Square Government Fund | $ | 107,548,515 | $ | 17,522,812 | $ | (67,293,361 | ) | $ | 57,777,966 | 57,777,966 | $ | 110,006 | ||||||||||||
Goldman Sachs Financial Square Treasury Instruments Fund | 17,641,672 | 15,596,999 | (4,331,245 | ) | 28,907,426 | 28,907,426 | 39,900 | |||||||||||||||||
Goldman Sachs Financial Square Treasury Obligations Fund | 35,780,380 | — | (6,872,139 | ) | 28,908,241 | 28,908,241 | 41,727 | |||||||||||||||||
Goldman Sachs Financial Square Treasury Solutions Fund | 35,779,565 | — | (6,872,139 | ) | 28,907,426 | 28,907,426 | 48,638 | |||||||||||||||||
| Total | $ | 196,750,132 | $ | 33,119,811 | $ | (85,368,884 | ) | $ | 144,501,059 | 144,501,059 | $ | 240,271 | ||||||||||||
As of June 30, 2022, The Goldman Sachs Group, Inc. was the beneficial owner of approximately 12% of the Institutional Shares of the Trend Driven Allocation Fund.
| 25 |
GOLDMAN SACHS VARIABLE INSURANCE TRUST MULTI-ASSET STRATEGIES FUNDS
Notes to Financial Statements (continued)
June 30, 2022 (Unaudited)
5. AGREEMENTS AND AFFILIATED TRANSACTIONS (continued)
The Multi-Strategy Alternatives Portfolio invests primarily in Class R6 and Institutional Shares of the Underlying Funds. These Underlying Funds are considered to be affiliated with the Multi-Strategy Alternatives Portfolio. The tables below show the transactions in and earnings from investments in these Underlying Funds for the six months ended June 30, 2022:
| Underlying Funds | Beginning Value as of December 31, 2021 | Purchases at Cost | Proceeds from Sales | Net Realized Gain (Loss) | Change in Unrealized Gain (Loss) | Market Value 06/30/2022 | Shares as of June 30, 2022 | Dividend Income | ||||||||||||||||||||||||
Goldman Sachs Absolute Return Tracker Fund | $ | 2,125,889 | $ | — | $ | (2,123,715 | ) | $ | 81,069 | $ | (83,243 | ) | $ | — | — | $ | — | |||||||||||||||
Goldman Sachs Alternative Premia Fund | 2,688,531 | — | (2,600,514 | ) | (359,303 | ) | 271,286 | — | — | — | ||||||||||||||||||||||
Goldman Sachs Dynamic Global Equity Fund | 2,391,987 | — | (2,374,414 | ) | 49,017 | (66,590 | ) | — | — | — | ||||||||||||||||||||||
Goldman Sachs Emerging Markets Debt Fund | 2,551,140 | 3,884,143 | (1,600,000 | ) | (426,493 | ) | (437,019 | ) | 3,971,771 | 434,073 | 73,068 | |||||||||||||||||||||
Goldman Sachs Emerging Markets Equity Insights Fund | 501,367 | 2,896,170 | (940,000 | ) | (87,760 | ) | (202,172 | ) | 2,167,605 | 267,276 | — | |||||||||||||||||||||
Goldman Sachs Energy Infrastructure Fund | — | 271,905 | — | — | (9,425 | ) | 262,480 | 26,301 | 5,026 | |||||||||||||||||||||||
Goldman Sachs Financial Square Government Fund (Institutional Shares) | 1,042,574 | 42,261,637 | (36,896,620 | ) | — | — | 6,407,591 | 6,407,591 | 11,244 | |||||||||||||||||||||||
Goldman Sachs Global Infrastructure Fund | 2,503,260 | 3,316,857 | (2,100,000 | ) | (62,351 | ) | (222,897 | ) | 3,434,869 | 272,177 | 36,857 | |||||||||||||||||||||
Goldman Sachs High Yield Floating Rate Fund | 1,514,507 | 2,726,069 | (1,610,000 | ) | (63,877 | ) | (132,049 | ) | 2,434,650 | 280,813 | 41,521 | |||||||||||||||||||||
Goldman Sachs High Yield Fund | 1,960,245 | 2,780,779 | (1,650,000 | ) | (211,371 | ) | (269,808 | ) | 2,609,845 | 492,423 | 59,927 | |||||||||||||||||||||
Goldman Sachs Long Short Credit Strategies Fund | 2,101,630 | 11,317,619 | (3,700,000 | ) | (242,002 | ) | (637,636 | ) | 8,839,611 | 1,133,283 | 99,788 | |||||||||||||||||||||
Goldman Sachs Managed Futures Strategy Fund | 2,991,500 | 5,502,280 | (2,800,000 | ) | 230,513 | 584,455 | 6,508,748 | 532,195 | — | |||||||||||||||||||||||
Goldman Sachs MarketBeta US Equity ETF | — | 4,891,930 | (1,959,100 | ) | (98,742 | ) | (249,805 | ) | 2,584,283 | 50,190 | 13,404 | |||||||||||||||||||||
Goldman Sachs MarketBeta International Equity ETF | — | 2,360,928 | (949,470 | ) | (91,636 | ) | (117,369 | ) | 1,202,453 | 26,817 | 21,030 | |||||||||||||||||||||
Goldman Sachs Strategic Income Fund | 905,551 | 1,126,928 | (500,000 | ) | (18,028 | ) | (68,386 | ) | 1,446,065 | 165,833 | 11,928 | |||||||||||||||||||||
Goldman Sachs Tactical Tilt Overlay Fund | 5,839,260 | — | (5,884,790 | ) | 227,075 | (181,545 | ) | — | — | — | ||||||||||||||||||||||
Goldman Sachs VIT Government Money Market Fund (Institutional Class) | — | 3,105,284 | — | — | — | 3,105,284 | 3,105,284 | 4,371 | ||||||||||||||||||||||||
| Total | $ | 29,117,441 | $ | 86,442,529 | $ | (67,688,623 | ) | $ | (1,073,889 | ) | $ | (1,822,203 | ) | $ | 44,975,255 | 13,194,256 | $ | 378,164 | ||||||||||||||
| 26 |
GOLDMAN SACHS VARIABLE INSURANCE TRUST MULTI-ASSET STRATEGIES FUNDS
6. PORTFOLIO SECURITIES TRANSACTIONS
The cost of purchases and proceeds from sales and maturities of long-term securities for the six months ended June 30, 2022, were as follows:
| Fund | Purchases | Sales and Maturities | ||||||||
| Multi-Strategy Alternatives | 42,689,482 | 30,913,659 | ||||||||
| Trend Driven Allocation | 94,651,506 | 128,674,485 | ||||||||
7. SECURITIES LENDING
The Multi-Strategy Alternatives Portfolio may lend its securities through a securities lending agent, the Bank of New York Mellon (“BNYM”), to certain qualified borrowers. Pursuant to exemptive relief granted by the Securities and Exchange Commission (“SEC”) and the terms and conditions contained therein, the Trend Driven Allocation Fund may lend its securities through a securities lending agent, Goldman Sachs Agency Lending (“GSAL”), a wholly-owned subsidiary of Goldman Sachs, to certain qualified borrowers including Goldman Sachs and affiliates. In accordance with the Funds’ securities lending procedures, the Funds receive cash collateral at least equal to the market value of the securities on loan. The market value of the loaned securities is determined at the close of business of the Funds at their last sale price or official closing price on the principal exchange or system on which they are traded, and any additional required collateral is delivered to the Funds on the next business day. As with other extensions of credit, the Funds may experience delay in the recovery of their securities or incur a loss should the borrower of the securities breach its agreement with the Funds or become insolvent at a time when the collateral is insufficient to cover the cost of repurchasing securities on loan. Dividend income received from securities on loan may not be subject to withholding taxes and therefore withholding taxes paid may differ from the amounts listed in the Statements of Operations. Loans of securities are terminable at any time and as such 1) the remaining contractual maturities of the outstanding securities lending transactions are considered to be overnight and continuous and 2) the borrower, after notice, is required to return borrowed securities within the standard time period for settlement of securities transactions.
The Funds invest the cash collateral received in connection with securities lending transactions in the Goldman Sachs Financial Square Government Fund (“Government Money Market Fund”), an affiliated series of the Goldman Sachs Trust. The Government Money Market Fund is registered under the Act as an open end investment company, is subject to Rule 2a-7 under the Act, and is managed by GSAM, for which GSAM may receive a management fee of up to 0.16% on an annualized basis of the average daily net assets of the Government Money Market Fund.
In the event of a default by a borrower with respect to any loan, GSAL will, and BNYM may, exercise any and all remedies provided under the applicable borrower agreement to make the Funds whole. These remedies include purchasing replacement securities by applying the collateral held from the defaulting broker against the purchase cost of the replacement securities. If GSAL or BNYM are unable to purchase replacement securities, GSAL and/or BNYM will indemnify the Funds by paying the Funds an amount equal to the market value of the securities loaned minus the value of cash collateral received from the borrower for the loan, subject to an exclusion for any shortfalls resulting from a loss of value in such cash collateral due to reinvestment risk. The Funds’ master netting agreements with certain borrowers provide the right, in the event of a default (including bankruptcy or insolvency), for the non-defaulting party to liquidate the collateral and calculate net exposure to the defaulting party or request additional collateral. However, in the event of a default by a borrower, a resolution authority could determine that such rights are not enforceable due to the restrictions or prohibitions against the right of set-off that may be imposed in accordance with a particular jurisdiction’s bankruptcy or insolvency laws. The Funds’ loaned securities were all subject to enforceable Securities Lending Agreements and the value of the collateral was at least equal to the value of the cash received. The amounts of the Funds’ overnight and continuous agreements, which represent the gross amounts of recognized liabilities for securities lending transactions
| 27 |
GOLDMAN SACHS VARIABLE INSURANCE TRUST MULTI-ASSET STRATEGIES FUNDS
Notes to Financial Statements (continued)
June 30, 2022 (Unaudited)
7. SECURITIES LENDING (continued)
outstanding as of June 30, 2022, are disclosed as “Payable upon return of securities loaned” on the Statements of Assets and Liabilities, where applicable. The Funds did not have securities on loan as of June 30, 2022.
| For the six months ended June 30, 2022 | ||||||||||
| Fund | Earnings of GSAL Relating to Securities Loaned | Amounts Received by the Fund from Lending to Goldman Sachs | ||||||||
| Trend Driven Allocation | $ | 643 | $ | 3,049 | ||||||
The following table provides information about the Funds’ investment in the Government Money Market Fund for the six months ended June 30, 2022.
| Fund | Beginning Value as of December 31, 2021 | Purchases at Cost | Proceeds from Sales | Ending value as of June 30, 2022 | ||||||||||||
| Multi-Strategy Alternatives | $ | — | $ | 3,086,635 | $ | (3,086,635 | ) | $ | — | |||||||
| Trend Driven Allocation | $ | — | $ | 36,218,546 | $ | (36,218,546 | ) | — | ||||||||
8. TAX INFORMATION
As of the Funds’ most recent fiscal year end, December 31, 2021, the Funds’ capital loss carryforwards and certain timing differences, on a tax-basis were as follows:
| Multi-Strategy Alternatives | Trend Driven Allocation | |||||||
| Capital loss carryforwards: | ||||||||
Perpetual Short-term | $ | (207,367) | $ | — | ||||
Perpetual Long-term | (193,227) | — | ||||||
| Total Capital loss carryforwards | $ | (400,594) | $ | — | ||||
| Timing differences (Qualified late year ordinary loss deferral and Straddle loss deferral) | $ | (22,106) | $ | (7,053,130) | ||||
As of June 30, 2022, the Funds’ aggregate security unrealized gains and losses based on cost for U.S. federal income tax purposes were as follows:
| Multi-Strategy Alternatives | Trend Driven Allocation | |||||||
| Tax cost | $ | 48,520,302 | $ | 169,534,057 | ||||
| Gross unrealized gain | 691,022 | 12,110,431 | ||||||
| Gross unrealized loss | (2,858,214 | ) | — | |||||
| Net unrealized gain (loss) | $ | (2,167,192 | ) | $ | 12,110,431 | |||
The difference between GAAP-basis and tax-basis unrealized gains (losses) is attributable primarily to wash sales, net mark to market gains (losses) on regulated futures and options contracts.
| 28 |
GOLDMAN SACHS VARIABLE INSURANCE TRUST MULTI-ASSET STRATEGIES FUNDS
8. TAX INFORMATION (continued)
GSAM has reviewed the Funds’ tax positions for all open tax years (the current and prior three years, as applicable) and has concluded that no provision for income tax is required in the Funds’ financial statements. Such open tax years remain subject to examination and adjustment by tax authorities.
9. OTHER RISK
The Funds’ and Underlying Fund’s risks include, but are not limited to, the following:
Derivatives Risk — The Funds’ use of derivatives may result in loss. Derivative instruments, which may pose risks in addition to and greater than those associated with investing directly in securities, currencies or other instruments, may be illiquid or less liquid, volatile, difficult to price and leveraged so that small changes in the value of the underlying instruments may produce disproportionate losses to the Funds. Derivatives are also subject to counterparty risk, which is the risk that the other party in the transaction will not fulfill its contractual obligation. The use of derivatives is a highly specialized activity that involves investment techniques and risks different from those associated with investments in more traditional securities and instruments. Losses from derivatives can also result from a lack of correlation between changes in the value of derivative instruments and the portfolio assets (if any) being hedged.
Foreign and Emerging Countries Risk — Investing in foreign markets may involve special risks and considerations not typically associated with investing in the U.S. Foreign securities may be subject to risk of loss because of more or less foreign government regulation; less public information; less stringent investor protections; less stringent accounting, corporate governance, financial reporting and disclosure standards; and less economic, political and social stability in the countries in which the Funds or an Underlying Fund invests. The imposition of exchange controls (including repatriation restrictions), confiscations of assets and property, trade restrictions (including tariffs) and other government restrictions by the U.S. or other governments, or problems with registration, settlement or custody, may also result in losses. Foreign risk also involves the risk of negative foreign currency rate fluctuations, which may cause the value of securities denominated in such foreign currency (or other instruments through which the Funds or an Underlying Fund has exposure to foreign currencies) to decline in value. Currency exchange rates may fluctuate significantly over short periods of time. To the extent that the Funds or an Underlying Fund also invests in securities of issuers located in, or economically tied to, emerging markets, these risks may be more pronounced.
Interest Rate Risk — When interest rates increase, fixed income securities or instruments held by the Fund will generally decline in value. The Fund may face a heightened level of interest rate risk in connection with the type and extent of certain monetary policy changes made by the Federal Reserve, such as target interest rate changes. Long-term fixed income securities or instruments will normally have more price volatility because of this risk than short-term fixed income securities or instruments. A wide variety of market factors can cause interest rates to rise, including central bank monetary policy, rising inflation and changes in general economic conditions. The risks associated with changing interest rates may have unpredictable effects on the markets and the Fund’s investments. Fluctuations in interest rates may also affect the liquidity of fixed income securities and instruments held by the Fund. A sudden or unpredictable increase in interest rates may cause volatility in the market and may decrease the liquidity of the Fund’s investments, which would make it harder for the Fund to sell its investments at an advantageous time.
Investments in Other Investment Companies Risk — As a shareholder of another investment company, including an ETF, the Funds will indirectly bear its proportionate share of any net management fees and other expenses paid by such other investment companies, in addition to the fees and expenses regularly borne by the Fund. ETF’s are subject to risks that do not apply to conventional mutual funds, including but not limited to the following: (i) the market price of the ETF’s shares may trade at a premium or a discount to their NAV; and (ii) an active trading market for an ETF’s shares may not develop or be maintained.
Investments in the Underlying Funds Risk — The investments of the Multi-Strategy Alternatives Portfolio may be concentrated in one or more Underlying Funds (including ETFs and other registered investment companies) subject to statutory limitations prescribed by the Act or exemptive relief or regulations thereunder. The Multi-Strategy Alternatives Portfolio’s investment performance is directly related to the investment performance of the Underlying Funds it holds. The Multi-Strategy
| 29 |
GOLDMAN SACHS VARIABLE INSURANCE TRUST MULTI-ASSET STRATEGIES FUNDS
Notes to Financial Statements (continued)
June 30, 2022 (Unaudited)
9. OTHER RISK (continued)
Alternatives Portfolio is subject to the risk factors associated with the investments of the Underlying Funds and will be affected by the investment policies and practices of the Underlying Funds in direct proportion to the amount of assets allocated to each. If the Multi-Strategy Alternatives Portfolio has a relative concentration of its portfolio in a single Underlying Fund, it may be more susceptible to adverse developments affecting that Underlying Fund, and may be more susceptible to losses because of these developments. A strategy used by the Underlying Funds may fail to produce the intended results.
Large Shareholder Transactions Risk — A Fund or an Underlying Fund may experience adverse effects when certain large shareholders, such as other funds, participating insurance companies, accounts and Goldman Sachs affiliates, purchase or redeem large amounts of shares of the Fund or an Underlying Fund. Such large shareholder redemptions, which may occur rapidly or unexpectedly, may cause a Fund or an Underlying Fund to sell portfolio securities at times when it would not otherwise do so, which may negatively impact a Fund’s or Underlying Fund’s NAV and liquidity. These transactions may also accelerate the realization of taxable income to shareholders if such sales of investments resulted in gains, and may also increase transaction costs. In addition, a large redemption could result in a Fund’s or Underlying Fund’s current expenses being allocated over a smaller asset base, leading to an increase in the Fund’s or Underlying Fund’s expense ratio. Similarly, large Fund or an Underlying Fund share purchases may adversely affect a Fund’s or Underlying Fund’s performance to the extent that the Fund or an Underlying Fund is delayed in investing new cash or otherwise maintains a larger cash position than it ordinarily would.
Liquidity Risk — A Fund or an Underlying Fund may make investments that are illiquid or that may become less liquid in response to market developments or adverse investor perceptions. Illiquid investments may be more difficult to value. Liquidity risk may also refer to the risk that a Fund or an Underlying Fund will not be able to pay redemption proceeds within the allowable time period or without significant dilution to remaining investors’ interests because of unusual market conditions, an unusually high volume of redemption requests, or other reasons. To meet redemption requests, a Fund or an Underlying Fund may be forced to sell investments at an unfavorable time and/or under unfavorable conditions. If a Fund or an Underlying Fund is forced to sell securities at an unfavorable time and/or under unfavorable conditions, such sales may adversely affect the Fund’s or Underlying Fund’s NAV and dilute remaining investors’ interests. Liquidity risk may be the result of, among other things, the reduced number and capacity of traditional market participants to make a market in fixed income securities or the lack of an active market. The potential for liquidity risk may be magnified by a rising interest rate environment or other circumstances where investor redemptions from fixed income funds may be higher than normal, potentially causing increased supply in the market due to selling activity. These risks may be more pronounced in connection with the Funds’ investments in securities of issuers located in emerging market countries. Redemptions by large shareholders may have a negative impact on a Fund’s or Underlying Fund’s liquidity.
Market and Credit Risks — In the normal course of business, a Fund or an Underlying Fund trades financial instruments and enters into financial transactions where risk of potential loss exists due to changes in the market (market risk). The value of the securities in which a Fund or an Underlying Fund invests may go up or down in response to the prospects of individual companies, particular sectors or governments and/or general economic conditions throughout the world due to increasingly interconnected global economies and financial markets. Events such as war, acts of terrorism, social unrest, natural disasters, the spread of infectious illness or other public health threats could also significantly impact a Fund and/or an Underlying Fund and their investments. Additionally, a Fund and/or an Underlying Fund may also be exposed to credit risk in the event that an issuer or guarantor fails to perform or that an institution or entity with which the Fund and the Underlying Fund have unsettled or open transactions defaults.
10. INDEMNIFICATIONS
Under the Trust’s organizational documents, its Trustees, officers, employees and agents are indemnified, to the extent permitted by the Act and state law, against certain liabilities that may arise out of performance of their duties to the Funds. Additionally, in the course of business, the Funds enter into contracts that contain a variety of indemnification clauses. The Funds’ maximum exposure under these arrangements is unknown, as this would involve future claims that may be made against the Funds that have not yet occurred. However, GSAM believes the risk of loss under these arrangements to be remote.
| 30 |
GOLDMAN SACHS VARIABLE INSURANCE TRUST MULTI-ASSET STRATEGIES FUNDS
11. SUBSEQUENT EVENTS
Subsequent events after the Statements of Assets and Liabilities date have been evaluated, and GSAM has concluded that there is no impact requiring adjustment or disclosure in the financial statements.
12. SUMMARY OF SHARE TRANSACTIONS
Share activity is as follows:
| Multi-Strategy Alternatives Portfolio | ||||||||||||||||
| For the Six Months Ended June 30, 2022 (Unaudited) | For the Fiscal Year Ended December 31, 2021 | |||||||||||||||
| Shares | Dollars | Shares | Dollars | |||||||||||||
| Institutional Shares | ||||||||||||||||
| Shares sold | 20,429 | $ | 195,153 | 154,388 | $ | 1,520,126 | ||||||||||
| Reinvestment of distributions | — | — | 4,291 | 41,966 | ||||||||||||
| Shares redeemed | (25,347 | ) | (239,341 | ) | (62,051 | ) | (611,039 | ) | ||||||||
| (4,918 | ) | (44,188 | ) | 96,628 | 951,053 | |||||||||||
| Service Shares | ||||||||||||||||
| Shares sold | 4,330,811 | 41,100,454 | 428,346 | 4,203,235 | ||||||||||||
| Reinvestment of distributions | — | — | 9,924 | 96,854 | ||||||||||||
| Shares redeemed | (3,386,258 | ) | (31,461,159 | ) | (136,031 | ) | (1,336,716 | ) | ||||||||
| 944,553 | 9,639,295 | 302,239 | 2,963,373 | |||||||||||||
| Advisor Share | ||||||||||||||||
| Shares sold | 310,586 | 2,921,931 | 396,642 | 3,879,151 | ||||||||||||
| Reinvestment of distributions | — | — | 27,617 | 268,995 | ||||||||||||
| Shares redeemed | (129,561 | ) | (1,220,558 | ) | (187,371 | ) | (1,824,259 | ) | ||||||||
| 181,025 | 1,701,373 | 236,888 | 2,323,887 | |||||||||||||
| NET INCREASE | 1,120,660 | $ | 11,296,480 | 635,755 | $ | 6,238,313 | ||||||||||
| Trend Driven Allocation Fund | ||||||||||||||||
| For the Six Months Ended June 30, 2022 (Unaudited) | For the Fiscal Year Ended December 31, 2021 | |||||||||||||||
| Shares | Dollars | Shares | Dollars | |||||||||||||
| Institutional Shares | ||||||||||||||||
| Shares sold | 25,027 | $ | 296,815 | — | $ | — | ||||||||||
| Reinvestment of distributions | — | — | 3,134 | 40,198 | ||||||||||||
| Shares redeemed | (1,125 | ) | (12,872 | ) | — | — | ||||||||||
| 23,902 | 283,943 | 3,134 | 40,198 | |||||||||||||
| Service Shares | ||||||||||||||||
| Shares sold | 1,523,449 | 17,732,509 | 1,197,442 | 16,311,964 | ||||||||||||
| Reinvestment of distributions | — | — | 3,368,811 | 43,019,719 | ||||||||||||
| Shares redeemed | (2,891,241 | ) | (34,005,452 | ) | (3,449,473 | ) | (46,955,103 | ) | ||||||||
| (1,367,792 | ) | (16,272,943 | ) | 1,116,780 | 12,376,580 | |||||||||||
| NET INCREASE (DECREASE) | (1,343,890 | ) | $ | (15,989,000 | ) | 1,119,914 | $ | 12,416,778 | ||||||||
| 31 |
GOLDMAN SACHS VARIABLE INSURANCE TRUST MULTI-ASSET STRATEGIES FUNDS
Statement Regarding Basis for Approval of Management Agreement (Unaudited)
Background
The Goldman Sachs Multi-Strategy Alternatives Portfolio and Goldman Sachs Trend Driven Allocation Fund (formerly, Goldman Sachs Global Trends Allocation Fund) (the “Funds”) are investment portfolios of Goldman Sachs Variable Insurance Trust (the “Trust”). The Board of Trustees oversees the management of the Trust and reviews the investment performance and expenses of the Funds at regularly scheduled meetings held throughout the year. In addition, the Board of Trustees determines annually whether to approve the continuance of the Trust’s investment management agreement (the “Management Agreement”) with Goldman Sachs Asset Management, L.P. (the “Investment Adviser”) on behalf of the Funds.
The Management Agreement was most recently approved for continuation until June 30, 2023 by the Board of Trustees, including those Trustees who are not parties to the Management Agreement or “interested persons” (as defined in the Investment Company Act of 1940, as amended) of any party thereto (the “Independent Trustees”), at a meeting held on June 14-15, 2022 (the “Annual Meeting”).
The review process undertaken by the Trustees spans the course of the year and culminates with the Annual Meeting. To assist the Trustees in their deliberations, the Trustees have established a Contract Review Committee (the “Committee”), comprised of the Independent Trustees. The Committee held two meetings over the course of the year since the Management Agreement was last approved. At those Committee meetings, regularly scheduled Board or other committee meetings, and/or the Annual Meeting, matters relevant to the renewal of the Management Agreement were considered by the Board, or the Independent Trustees, as applicable. With respect to each Fund, such matters included:
| (a) | the nature and quality of the advisory, administrative, and other services provided to the Fund and the underlying funds in which the Multi-Strategy Alternatives Portfolio invests (the “Underlying Funds”) by the Investment Adviser and its affiliates, including information about: |
| (i) | the structure, staff, and capabilities of the Investment Adviser and its portfolio management teams; |
| (ii) | the groups within the Investment Adviser and its affiliates that support the portfolio management teams or provide other types of necessary services, including fund services groups (e.g., accounting and financial reporting, tax, shareholder services, and operations); controls and risk management groups (e.g., legal, compliance, valuation oversight, credit risk management, internal audit, compliance testing, market risk analysis, finance, and central funding); sales and distribution support groups, and others (e.g., information technology and training); |
| (iii) | trends in employee headcount; |
| (iv) | the Investment Adviser’s financial resources and ability to hire and retain talented personnel and strengthen its operations; and |
| (v) | the parent company’s support of the Investment Adviser and its mutual fund business, as expressed by the firm’s senior management; |
| (b) | information on the investment performance of the Fund and Underlying Funds, including comparisons to the performance of similar mutual funds, as provided by a third-party mutual fund data provider engaged as part of the contract review process (the “Outside Data Provider”), and a benchmark performance index; and information on general investment outlooks in the markets in which the Fund and Underlying Funds invest; |
| (c) | information provided by the Investment Adviser indicating the Investment Adviser’s views on whether the Fund’s peer group and/or benchmark index had high, medium, or low relevance given the Fund’s particular investment strategy; |
| (d) | the terms of the Management Agreement and other agreements with affiliated service providers entered into by the Trust on behalf of the Fund; |
| (e) | fee and expense information for the Fund, including: |
| (i) | the relative management fee and expense levels of the Fund as compared to those of comparable funds managed by other advisers, as provided by the Outside Data Provider; |
| (ii) | the Fund’s expense trends over time; and |
| (iii) | to the extent the Investment Adviser manages other types of accounts (such as bank collective trusts, private wealth management accounts, institutional separate accounts, sub-advised mutual funds, and non-U.S. funds) having investment objectives and policies similar to those of the Fund, comparative information on the advisory fees charged and services provided to those accounts by the Investment Adviser; |
| (f) | with respect to the extensive investment performance and expense comparison data provided by the Outside Data Provider, its processes in producing that data for the Fund; |
| (g) | the undertakings of the Investment Adviser and its affiliates to implement fee waivers and/or expense limitations; |
| (h) | information relating to the profitability of the Management Agreement and the transfer agency and distribution and service arrangements of the Fund to the Investment Adviser and its affiliates; |
| 32 |
GOLDMAN SACHS VARIABLE INSURANCE TRUST MULTI-ASSET STRATEGIES FUNDS
Statement Regarding Basis for Approval of Management Agreement (Unaudited) (continued)
| (i) | whether the Fund’s existing management fee schedule, together with the management fee schedules of the Underlying Funds, adequately addressed any economies of scale; |
| (j) | a summary of the “fall-out” benefits derived by the Investment Adviser and its affiliates from their relationships with the Fund and/or the Underlying Funds, including the fees received by the Investment Adviser’s affiliates from the Fund and/or the Underlying Funds for transfer agency, securities lending, portfolio trading, distribution and other services, as applicable; |
| (k) | a summary of potential benefits derived by the Fund and/or the Underlying Funds as a result of its relationship with the Investment Adviser; |
| (l) | information regarding commissions paid by the Fund and/or the Underlying Funds and broker oversight, an update on the Investment Adviser’s soft dollars practices, other information regarding portfolio trading, and how the Investment Adviser carries out its duty to seek best execution; |
| (m) | the manner in which portfolio manager compensation is determined; and the number and types of accounts managed by the portfolio managers; |
| (n) | the nature and quality of the services provided to the Fund and the Underlying Funds by its unaffiliated service providers, and the Investment Adviser’s general oversight and evaluation (including reports on due diligence) of those service providers as part of the administrative services provided under the Management Agreement; and |
| (o) | the Investment Adviser’s processes and policies addressing various types of potential conflicts of interest; its approach to risk management; the annual review of the effectiveness of the Fund’s compliance program; and periodic compliance reports. |
The Trustees also received an overview of the Funds’ distribution arrangements. They received information regarding the Funds’ assets, share purchase and redemption activity, and payment of distribution and service fees, as applicable. Information was also provided to the Trustees relating to revenue sharing payments made by and services provided by the Investment Adviser and its affiliates to intermediaries that promote the sale, distribution, and/or servicing of Fund shares. The Independent Trustees also discussed the broad range of other investment choices that are available to Fund investors, including the availability of comparable funds managed by other advisers.
The presentations made at the Board and Committee meetings and at the Annual Meeting encompassed the Funds and other mutual funds for which the Board of Trustees has responsibility. In evaluating the Management Agreement at the Annual Meeting, the Trustees relied upon their knowledge, resulting from their meetings and other interactions throughout the year, of the Investment Adviser and its affiliates, their services, and the Funds. In conjunction with these meetings, the Trustees received written materials and oral presentations on the topics covered, and the Investment Adviser addressed the questions and concerns of the Trustees, including concerns regarding the investment performance of certain of the funds they oversee. The Independent Trustees were advised by their independent legal counsel regarding their responsibilities and other regulatory requirements related to the approval and continuation of mutual fund investment management agreements under applicable law. In addition, the Investment Adviser and its affiliates provided the Independent Trustees with a written response to a formal request for information sent on behalf of the Independent Trustees by their independent legal counsel. During the course of their deliberations, the Independent Trustees met in executive sessions with their independent legal counsel, without representatives of the Investment Adviser or its affiliates present.
Nature, Extent, and Quality of the Services Provided Under the Management Agreement
As part of their review, the Trustees considered the nature, extent, and quality of the services provided to the Funds and the Underlying Funds by the Investment Adviser. In this regard, the Trustees considered both the investment advisory services and non-advisory services that are provided by the Investment Adviser and its affiliates. The Trustees noted the transition in the leadership and changes in personnel of various of the Investment Adviser’s portfolio management teams that had occurred in recent periods, and the ongoing recruitment efforts aimed at bringing high quality investment talent to the Investment Adviser. They also noted the Investment Adviser’s commitment to maintaining high quality systems and expending substantial resources to respond to ongoing changes to the market, regulatory and control environment in which the Funds, the Underlying Funds, and their service providers operate, including developments associated with the COVID-19 pandemic, geopolitical events, and economic sanctions, as well as the efforts of the Investment Adviser and its affiliates to combat cyber security risks. The Trustees also considered information regarding the Investment Adviser’s business continuity planning and remote operations capabilities. The Trustees concluded that the Investment Adviser continued to commit substantial financial and operational resources to the Funds and expressed confidence that the Investment Adviser would continue to do so in the future. The Trustees also recognized that the
| 33 |
GOLDMAN SACHS VARIABLE INSURANCE TRUST MULTI-ASSET STRATEGIES FUNDS
Statement Regarding Basis for Approval of Management Agreement (Unaudited) (continued)
Investment Adviser had made significant commitments to address regulatory compliance requirements applicable to the Funds, the Underlying Funds, and the Investment Adviser and its affiliates.
Investment Performance
The Trustees also considered the investment performance of the Funds and the Underlying Funds. In this regard, they compared the investment performance of each Fund to its peers using rankings and ratings compiled by the Outside Data Provider as of December 31, 2021, and updated performance information prepared by the Investment Adviser using the peer group identified by the Outside Data Provider as of March 31, 2022. The information on each Fund’s investment performance was provided for the one-, three-, and five-year periods ending on the applicable dates. The Trustees also reviewed each Fund’s investment performance relative to its performance benchmark. As part of this review, they considered the investment performance trends of the Funds over time, and reviewed the investment performance of each Fund in light of its investment objective and policies and market conditions.
In addition, the Trustees considered materials prepared and presentations made by the Investment Adviser’s senior management and portfolio management personnel in which Fund performance was assessed. The Trustees also considered the Investment Adviser’s periodic reports with respect to the Funds’ and the Underlying Funds’ risk profiles, and how the Investment Adviser’s approach to risk monitoring and management influences portfolio management. For the Trend Driven Allocation Fund, they noted the efforts of the Fund’s portfolio management team to continue to enhance the investment models used in managing the Fund.
The Trustees noted that the Trend Driven Allocation Fund’s Institutional Shares had placed in the top half of the Fund’s peer group for the one-year period and in the third quartile for the three- and five-year periods; had underperformed the Fund’s benchmark index for the one-, three-, and five-year periods; and had outperformed the Fund’s Competitor Fund Average for the one- and three-year periods and underperformed for the five-year period ended March 31, 2022. The Trustees also noted that in December 2021 the Fund had been repositioned from the Global Trends Allocation Fund, which involved changes to the Fund’s investment strategy and name, and that in April 2015 the Fund had been repositioned from the Global Markets Navigator Fund, which involved changes to the Fund’s investment objective, investment strategy, and benchmark. The Trustees noted that the VIT Multi-Strategy Alternatives Portfolio’s Institutional Shares had placed in the top half of the Fund’s peer group for the one-, three-, and five-year periods, and had outperformed the Fund’s benchmark index for the one-, three-, and five-year periods ended March 31, 2022.
Costs of Services Provided and Competitive Information
The Trustees considered the contractual terms of the Management Agreement and the fee rates payable by each Fund thereunder. In this regard, the Trustees considered information on the services rendered by the Investment Adviser to the Funds, which included both advisory and administrative services that were directed to the needs and operations of the Funds as registered mutual funds.
In particular, the Trustees reviewed analyses prepared by the Outside Data Provider regarding the expense rankings of the Funds. The analyses provided a comparison of each Fund’s management fee and (in the case of the Trend Driven Allocation Fund) breakpoints to those of a relevant peer group and category universe; an expense analysis which compared each Fund’s overall net and gross expenses to a peer group and a category universe; and data comparing each Fund’s net expenses to the peer and category medians. The analyses also compared each Fund’s other expenses and fee waivers/reimbursements to those of the peer group and category medians. The Trustees concluded that the comparisons provided by the Outside Data Provider were useful in evaluating the reasonableness of the management fees and total expenses paid by the Funds.
In addition, the Trustees considered the Investment Adviser’s undertakings to implement fee waivers and/or expense limitations with respect to the Funds and the Underlying Funds. They also considered, to the extent that the Investment Adviser manages other types of accounts having investment objectives and policies similar to those of the Funds, comparative fee information for services provided by the Investment Adviser to those accounts, and information that indicated that services provided to the Funds differed in various significant respects from the services provided to other types of accounts which, in many cases, operated under less stringent legal and regulatory structures, required fewer services from the Investment Adviser to a smaller number of client contact points, and were less time-intensive.
In addition, the Trustees noted that shareholders are able to redeem their shares at any time if shareholders believe that the Fund fees and expenses are too high or if they are dissatisfied with the performance of the Fund.
| 34 |
GOLDMAN SACHS VARIABLE INSURANCE TRUST MULTI-ASSET STRATEGIES FUNDS
Statement Regarding Basis for Approval of Management Agreement (Unaudited) (continued)
Profitability
The Trustees reviewed each Fund’s contribution to the Investment Adviser’s revenues and pre-tax profit margins. In this regard the Trustees noted that they had received, among other things, profitability analyses and summaries, revenue and expense schedules by Fund and by function (i.e., investment management, transfer agency and distribution and service), and information on the Investment Adviser’s expense allocation methodology. They observed that the profitability and expense figures are substantially similar to those used by the Investment Adviser for many internal purposes, including compensation decisions among various business groups, and are thus subject to a vigorous internal debate about how certain revenue and expenses should be allocated. The Trustees also noted that the internal audit group within the Goldman Sachs organization periodically audits the expense allocation methodology and that the internal audit group was satisfied with the reasonableness, consistency, and accuracy of the Investment Adviser’s expense allocation methodology. Profitability data for each Fund was provided for 2021 and 2020, and the Trustees considered this information in relation to the Investment Adviser’s overall profitability.
Economies of Scale
The Trustees considered the information that had been provided regarding whether there have been economies of scale with respect to the management of the Funds. For the Trend Driven Allocation Fund, the Trustees also considered the breakpoints in the fee rate payable under the Management Agreement for the Fund at the following annual percentage rates of the average daily net assets of the Fund:
| First $1 billion | 0.79 | % | ||
| Next $1 billion | 0.71 | |||
| Next $3 billion | 0.68 | |||
| Next $3 billion | 0.66 | |||
| Over $8 billion | 0.65 | |||
The Trustees noted that the breakpoints were designed to share potential economies of scale, if any, with the Trend Driven Allocation Fund and its shareholders as assets under management reach those asset levels. The Trustees considered the amounts of assets in the Trend Driven Allocation Fund; the Fund’s recent share purchase and redemption activity; the information provided by the Investment Adviser relating to the costs of the services provided by the Investment Adviser and its affiliates and their realized profits; information comparing fee rates charged by the Investment Adviser with fee rates charged to other funds in the peer group; and the Investment Adviser’s undertakings to waive a portion of its management fee and to limit certain expenses of the Funds that exceed specified levels. Upon reviewing these matters at the Annual Meeting, the Trustees concluded that the fee breakpoints represented a means of assuring that benefits of scalability, if any, would be passed along to shareholders at the specified asset levels.
For the Multi-Strategy Alternatives Portfolio, the Trustees noted that, although the Fund itself does not have breakpoints in its management fee schedule, any benefits of the breakpoints in the management fee schedules of certain Underlying Funds, when reached, would pass through to the shareholders in the Fund at the specified asset levels. The Trustees considered the amount of assets in the Multi-Strategy Alternatives Portfolio; the Fund’s recent purchase and redemption activity; the information provided by the Investment Adviser relating to the costs of the services provided by the Investment Adviser and its affiliates and the profits realized by them; information comparing the fee rates charged by the Investment Adviser with fee rates charged to other funds in the peer groups; and the Investment Adviser’s undertaking to limit certain expenses of the Fund and Underlying Funds that exceed specified levels. They also considered the services provided to the Multi-Strategy Alternatives Portfolio under the Management Agreement and the fees and expenses borne by the Underlying Funds, and considered the Investment Adviser’s finding that the management fees payable by the Fund were not duplicative of the management fees paid at the Underlying Fund level.
Other Benefits to the Investment Adviser and Its Affiliates
The Trustees also considered the other benefits derived by the Investment Adviser and its affiliates from their relationships with the Funds and/or the Underlying Funds as stated above, including: (a) transfer agency fees received by Goldman Sachs & Co. LLC (“Goldman Sachs”); (b) brokerage and futures commissions earned by Goldman Sachs for executing securities and futures transactions on behalf of the Funds and certain Underlying Funds; (c) research received by the Investment Adviser from broker-dealers in exchange for executing certain transactions on behalf of certain Underlying Funds; (d) trading efficiencies resulting from aggregation of orders of the Funds or Underlying Funds with those for other funds or accounts managed by the Investment Adviser; (e) fees earned by Goldman Sachs Agency Lending (“GSAL”), an affiliate of the Investment Adviser, as securities lending agent for the Funds and certain Underlying Funds (and fees earned by the Investment Adviser for managing the fund in which the Funds’
| 35 |
GOLDMAN SACHS VARIABLE INSURANCE TRUST MULTI-ASSET STRATEGIES FUNDS
Statement Regarding Basis for Approval of Management Agreement (Unaudited) (continued)
and those Underlying Funds’ securities lending cash collateral is invested); (f) the Investment Adviser’s ability to leverage the infrastructure designed to service the Funds on behalf of its other clients; (g) the Investment Adviser’s ability to cross-market other products and services to Fund shareholders; (h) Goldman Sachs’ retention of certain fees as Fund Distributor; (i) the Investment Adviser’s ability to negotiate better pricing with custodians on behalf of its other clients, as a result of the relationship with the Funds and the Underlying Funds; (j) the investment of cash and cash collateral in money market funds managed by the Investment Adviser that will result in increased assets under management for those money market funds; (k) the investment in exchange-traded funds (“ETFs”) managed by the Investment Adviser that will result in increased assets under management for those ETFs and may facilitate the development of the Investment Adviser’s ETF advisory business; and (l) the possibility that the working relationship between the Investment Adviser and the Funds’ and the Underlying Funds’ third-party service providers may cause those service providers to be more likely to do business with other areas of Goldman Sachs. In the course of considering the foregoing, the Independent Trustees requested and received further information quantifying certain of these fall-out benefits.
Other Benefits to the Funds and Their Shareholders
The Trustees also noted that the Funds and/or the Underlying Funds (as applicable) receive certain other potential benefits as a result of their relationship with the Investment Adviser, including: (a) trading efficiencies resulting from aggregation of orders of the Funds with those of other funds or accounts managed by the Investment Adviser; (b) enhanced servicing from vendors due to the volume of business generated by the Investment Adviser and its affiliates; (c) enhanced servicing from broker-dealers due to the volume of business generated by the Investment Adviser and its affiliates; (d) the Investment Adviser’s ability to negotiate favorable terms with derivatives counterparties on behalf of the Funds and the Underlying Funds as a result of the size and reputation of the Goldman Sachs organization; (e) the advantages received from the Investment Adviser’s knowledge and experience gained from managing other accounts and products; (f) the Investment Adviser’s ability to hire and retain qualified personnel to provide services to the Funds and the Underlying Funds because of the reputation of the Goldman Sachs organization; (g) the Funds’ and Underlying Funds’ access, through the Investment Adviser, to certain firm-wide resources (e.g., proprietary risk management systems and databases), subject to certain restrictions; (h) the Funds’ and Underlying Funds’ ability to participate in the securities lending program administered by GSAL, as measured by the revenue received by the Funds in connection with the program; and (i) the Funds’ access to certain affiliated distribution channels. In addition, the Trustees noted the competitive nature of the mutual fund marketplace, and considered that many of the Funds’ shareholders invested in the Funds in part because of the Funds’ relationship with the Investment Adviser and that those shareholders have a general expectation that the relationship will continue.
Conclusion
In connection with their consideration of the Management Agreement, the Trustees gave weight to each of the factors described above, but did not identify any particular factor as controlling their decision. After deliberation and consideration of all of the information provided, including the factors described above, the Trustees concluded, in the exercise of their business judgment, that the management fees paid by each of the Funds were reasonable in light of the services provided to it by the Investment Adviser, the Investment Adviser’s costs and each Fund’s current and reasonably foreseeable asset levels. The Trustees unanimously concluded that the Investment Adviser’s continued management likely would benefit each Fund and its shareholders and that the Management Agreement should be approved and continued with respect to each Fund until June 30, 2023.
| 36 |
GOLDMAN SACHS VARIABLE INSURANCE TRUST MULTI-ASSET STRATEGIES FUNDS
Liquidity Risk Management Program (Unaudited)
Each Fund has adopted and implemented a liquidity risk management program (the “Program”) in accordance with Rule 22e-4 under the 1940 Act. The Program seeks to assess and manage each Fund’s liquidity risk, i.e., the risk that a Fund is unable to satisfy redemption requests without significantly diluting remaining investors’ interests in the Fund. The Board of Trustees of the Trust has designated GSAM, each Fund’s investment adviser, to administer the Program. Certain aspects of the Program rely on third parties to perform certain functions, including the provision of market data and application of models.
The Program is comprised of various components designed to support the assessment and/or management of liquidity risk, including: (1) the periodic assessment (no less frequently than annually) of certain factors that influence a Fund’s liquidity risk; (2) the periodic classification (no less frequently than monthly) of a Fund’s investments into one of four liquidity categories that reflect an estimate of their liquidity under current market conditions; (3) a 15% limit on the acquisition of “illiquid investments” (as defined under Rule 22e-4); (4) for a Fund that does not invest primarily in “highly liquid investments” (as defined under Rule 22e-4), the determination of a minimum percentage of the Fund’s assets that will generally be invested in highly liquid investments (a “Highly Liquid Investment Minimum”); and (5) periodic reporting to the Board of Trustees.
At a meeting of the Board of Trustees on February 8-9, 2022, GSAM provided a written report to the Board addressing the operation, and the adequacy and effectiveness of the implementation, of the Program, including, as applicable, the operation of any Highly Liquid Investment Minimum and any material changes to the Program, for the period from January 1, 2021 through December 31, 2021 (the “Reporting Period”). Among other things, the annual report discussed: (1) the results of stress tests designed to assess liquidity under a hypothetical stressed scenario involving elevated redemptions; (2) an assessment of the methodologies used to classify investments into one of four liquidity categories; and (3) the impact of local holidays in non-U.S. jurisdictions. The report concluded that the Program continues to be reasonably designed to assess and manage liquidity risk and was adequately and effectively implemented during the Reporting Period.
There can be no assurance that the Program will achieve its objectives under all circumstances in the future. Please refer to your Fund’s prospectus for more information regarding the Fund’s exposure to liquidity risk and other risks to which it may be subject.
| 37 |
GOLDMAN SACHS VARIABLE INSURANCE TRUST MULTI-ASSET STRATEGIES FUNDS
Impact of Russian Invasion of Ukraine (Unaudited)
The Russian invasion of Ukraine has negatively affected the global economy and has resulted in significant disruptions in financial markets and increased macroeconomic uncertainty. In addition, governments around the world have responded to Russia’s invasion by imposing economic sanctions and export controls on certain industry sectors, companies and individuals in or associated with Russia. Russia has imposed its own restrictions against investors and countries outside Russia and has proposed additional measures aimed at non-Russian-owned businesses. Businesses in the U.S. and globally have experienced shortages in materials and increased costs for transportation, energy and raw materials due, in part, to the negative effects of the war on the global economy. The escalation or continuation of the war between Russia and Ukraine or other hostilities presents heightened risks relating to cyber-attacks, the frequency and volume of failures to settle securities transactions, supply chain disruptions, inflation, as well as the potential for increased volatility in commodity, currency and other financial markets. The extent and duration of the war, sanctions and resulting market disruptions, as well as the potential adverse consequences for the Funds’ operations are difficult to predict.
| 38 |
GOLDMAN SACHS VARIABLE INSURANCE TRUST MULTI-ASSET STRATEGIES FUNDS
| Fund Expenses — Six Month Period Ended June 30, 2022 (Unaudited) |
As a shareholder of Institutional, Service or Advisor Shares of the Funds, you incur ongoing costs, including management fees, distribution and/or service (12b-1) fees (with respect to Service and Advisor Shares) and other Fund expenses. This example is intended to help you understand your ongoing costs (in dollars) of investing in the Institutional Shares, Service Shares and Advisor Shares of the Funds and to compare these costs with the ongoing costs of investing in other mutual funds.
The example is based on an investment of $1,000 invested at the beginning of the period and held for the entire period from January 1, 2022 through June 30, 2022, which represents a period of 181 days of a 365 day year.
Actual Expenses — The first line under each share class in the table below provides information about actual account values and actual expenses. You may use the information in this line, together with the amount you invested, to estimate the expenses that you paid over the period. Simply divide your account value by $1,000 (for example, an $8,600 account value divided by $1,000=8.6), then multiply the result by the number in the first line under the heading entitled “Expenses Paid” to estimate the expenses you paid on your account during this period.
Hypothetical Example for Comparison Purposes — The second line under each share class in the table below provides information about hypothetical account values and hypothetical expenses based on the Funds’ actual net expense ratio and an assumed rate of return of 5% per year before expenses, which is not the Funds’ actual return. The hypothetical account values and expenses may not be used to estimate the actual ending account balance or expenses you paid for the period. You may use this information to compare the ongoing costs of investing in the Funds and other funds. To do so, compare this 5% hypothetical example with the 5% hypothetical examples that appear in the shareholder reports of the other funds.
Please note that the expenses shown in the table are meant to highlight your ongoing costs only. As a shareholder of the Funds you do not incur any transaction costs, such as sales charges, redemption fees, or exchange fees, but shareholders of other funds may incur such costs. The second line of the table is useful in comparing ongoing costs only and will not help you determine the relative total costs of owning different funds whose shareholders may incur transaction costs.
| Multi-Strategy Alternatives Portfolio | Trend Driven Allocation Fund | |||||||||||||||||||||||
| Share Class | Beginning Account Value 1/1/22 | Ending Account Value 6/30/22 | Expenses Paid for the 6 months ended 6/30/2022* | Beginning Account Value 1/1/22 | Ending Account Value 6/30/22 | Expenses Paid for the 6 months ended 6/30/2022* | ||||||||||||||||||
| Institutional | ||||||||||||||||||||||||
Actual | $ | 1,000.00 | $ | 930.40 | $ | 0.96 | $ | 1,000.00 | $ | 847.52 | $ | 3.02 | ||||||||||||
Hypothetical 5% return | 1,000.00 | 1,023.80 | + | 1.00 | 1,000.00 | 1,021.52 | + | 3.31 | ||||||||||||||||
| Service | ||||||||||||||||||||||||
Actual | 1,000.00 | 929.30 | 2.15 | 1,000.00 | 846.81 | 4.17 | ||||||||||||||||||
Hypothetical 5% return | 1,000.00 | 1,022.56 | + | 2.26 | 1,000.00 | 1,020.28 | + | 4.56 | ||||||||||||||||
| Advisor | ||||||||||||||||||||||||
Actual | 1,000.00 | 929.09 | 2.87 | 1,000.00 | N/A | N/A | ||||||||||||||||||
Hypothetical 5% return | 1,000.00 | 1,021.82 | + | 3.01 | 1,000.00 | N/A | N/A | |||||||||||||||||
| + | Hypothetical expenses are based on each Fund’s actual annualized net expense ratios and an assumed rate of return of 5% per year before expenses. |
| * | Expenses are calculated using each Fund’s annualized net expense ratio for each class, which represents the ongoing expenses as a percentage of net assets for the six months ended June 30, 2022. Expenses are calculated by multiplying the annualized net expense ratio by the average account value for the period; then multiplying the result by the number of days in the most recent fiscal half year; and then dividing that result by the number of days in the fiscal year. The annualized net expense ratios for the period were as follows: |
| Fund | Institutional Shares | Service Shares | Advisor Shares | |||||||||
Multi-Strategy Alternatives | 0.20 | % | 0.45 | % | 0.60 | % | ||||||
Trend Driven Allocation | 0.66 | 0.91 | N/A | |||||||||
39
| TRUSTEES | OFFICERS | |
| Jessica Palmer, Chair | James A. McNamara, President | |
| Dwight L. Bush | Joseph F. DiMaria, | |
| Kathryn A. Cassidy | Principal Financial Officer, | |
| John G. Chou | Principal Accounting Officer and Treasurer | |
| Diana M. Daniels | Caroline L. Kraus, Secretary | |
Joaquin Delgado | ||
Eileen H. Dowling | ||
James A. McNamara | ||
Gregory G. Weaver | ||
| Paul C. Wirth |
GOLDMAN SACHS & CO. LLC
Distributor and Transfer Agent
GOLDMAN SACHS ASSET MANAGEMENT, L.P.
Investment Adviser
200 West Street, New York
New York 10282
Visit our web site at www.GSAMFUNDS.com to obtain the most recent month-end returns.
The reports concerning the Funds included in this shareholder report may contain certain forward-looking statements about the factors that may affect the performance of the Funds in the future. These statements are based on Fund management’s predictions and expectations concerning certain future events and their expected impact on the Funds, such as performance of the economy as a whole and of specific industry sectors, changes in the levels of interest rates, the impact of developing world events, and other factors that may influence the future performance of the Funds. Management believes these forward-looking statements to be reasonable, although they are inherently uncertain and difficult to predict. Actual events may cause adjustments in portfolio management strategies from those currently expected to be employed.
A description of the policies and procedures that the Funds uses to determine how to vote proxies relating to portfolio securities and information regarding how a Fund voted proxies relating to portfolio securities for the 12-month period ended June 30 is available (i) without charge, upon request by calling 1-800-621-2550; and (ii) on the Securities and Exchange Commission (“SEC”) web site at http://www.sec.gov.
The Funds will file portfolio holdings information for each month in a fiscal quarter within 60 days after the end of the relevant fiscal quarter on Form N-PORT. Portfolio holdings information for the third month of each fiscal quarter will be made available on the SEC’s web site at http://www.sec.gov. Portfolio holdings information may be obtained upon request and without charge by calling 1-800-526-7384 (for Retail Shareholders) or 1-800-621-2550 (for Institutional Shareholders).
Views and opinions expressed are for informational purposes only and do not constitute a recommendation by GSAM to buy, sell, or hold any security. Views and opinions are current as of the date of this presentation and may be subject to change, they should not be construed as investment advice.
Goldman Sachs & Co. LLC (“Goldman Sachs”) does not provide legal, tax or accounting advice. Any statement contained in this communication (including any attachments) concerning U.S. tax matters was not intended or written to be used, and cannot be used, for the purpose of avoiding penalties under the Internal Revenue Code, and was written to support the promotion or marketing of transaction or matter addressed. Clients of Goldman Sachs should obtain their own independent tax advice based on their particular circumstances.
The website links provided are for your convenience only and are not an endorsement or recommendation by GSAM of any of these websites or the products or services offered. GSAM is not responsible for the accuracy and validity of the content of these websites.
Fund holdings and allocations shown are as of June 30, 2022 and may not be representative of future investments. Fund holdings should not be relied on in making investment decisions and should not be construed as research or investment advice regarding particular securities. Current and future holdings are subject to risk.
References to indices, benchmarks or other measures of relative market performance over a specified period of time are provided for your information only and do not imply that the portfolio will achieve similar results. The index composition may not reflect the manner in which a portfolio is constructed. While an adviser seeks to design a portfolio which reflects appropriate risk and return features, portfolio characteristics may deviate from those of the benchmark.
The portfolio risk management process includes an effort to monitor and manage risk, but does not imply low risk.
Shares of the Goldman Sachs VIT Funds are offered to separate accounts of participating life insurance companies for the purpose of funding variable annuity contracts and variable life insurance policies. Shares of the Funds are not offered directly to the general public. The variable annuity contracts and variable life insurance policies are described in the separate prospectuses issued by participating insurance companies. You should refer to those prospectuses for information about surrender charges, mortality and expense risk fees and other charges that may be assessed by participating insurance companies under the variable annuity contracts or variable life insurance policies. Such fees or charges, if any, may affect the return you may realize with respect to your investments. Ask your representative for more complete information. Please consider the Fund’s objectives, risks and charges and expenses, and read the prospectus carefully before investing. The prospectus contains this and other information about the Fund.
This material is not authorized for distribution to prospective investors unless preceded or accompanied by a current prospectus or summary prospectus, if applicable. Investors should consider the Fund’s objective, risks, and charges and expenses, and read the summary prospectus, if available, and/or the prospectus carefully before investing or sending money. The summary prospectus, if available, and the prospectus contain this and other information about the Fund and may be obtained from your authorized dealer or from Goldman Sachs & Co. LLC by calling 1-800-621-2550.
This report is prepared for the general information of contract owners and is not an offer of shares of the Goldman Sachs Variable Insurance Trust — Goldman Sachs Multi-Strategy Alternatives Portfolio and Trend Driven Allocation Fund.
© 2022 Goldman Sachs. All rights reserved.
VITFOFSAR-22 287750-OTU-08/2022
Goldman
Sachs Variable Insurance Trust
Goldman Sachs Core Fixed Income Fund
Semi-Annual Report
June 30, 2022

Goldman Sachs Variable Insurance Trust
| ∎ | GOLDMAN SACHS CORE FIXED INCOME FUND |
| 1 | ||||
| 3 | ||||
| 5 | ||||
| 21 | ||||
| 24 | ||||
| 26 | ||||
| 45 | ||||
| NOT FDIC-INSURED | May Lose Value | No Bank Guarantee | ||
MARKET REVIEW
Goldman Sachs Variable Insurance Trust – Goldman Sachs Core Fixed Income Fund
The following are highlights both of key factors affecting the U.S. fixed income market and of any key changes made to the Goldman Sachs VIT Core Fixed Income Fund (the “Fund”) during the six months ended June 30, 2022 (the “Reporting Period”). A fuller review of the market and these changes will appear in the Fund’s annual shareholder report covering the 12 months ended December 31, 2022.
Market and Economic Review
| • | During the Reporting Period, the U.S. fixed income market was challenged by rising interest rates, as persistently high inflation shifted investor expectations about the scope and timing of Federal Reserve (“Fed”) monetary policy action. The Bloomberg U.S. Aggregate Bond Index,1 representing the broad U.S. fixed income market, returned -10.35% during the Reporting Period. |
| • | Inflation increased, driven by supply and demand imbalances, higher energy prices, government and central bank stimulus measures, and the effects of economic reopening amid the persistent overhangs of the COVID-19 pandemic. |
| • | Inflation surged to new multi-decade highs in February 2022, with energy and commodity prices in particular jumping in response to Russia’s invasion of Ukraine. |
| • | U.S. consumer inflation reached its highest level in nearly four decades during May 2022 and then hit a new high in June, as rising energy and food costs pushed up prices. |
| • | When the Reporting Period began in January 2022, the Fed maintained the targeted federal funds (“fed funds”) rate in a range between 0% and 0.25% but signaled the possibility of a more aggressive interest rate hike path amid growing inflationary pressures. |
| • | In March 2022, Fed officials hiked short-term interest rates, raising the targeted fed funds rate by 25 basis points in the first U.S. rate increase since the end of 2018. (A basis point is 1/100th of a percentage point.) |
| • | In May 2022, the Fed lifted the targeted fed funds rate by 50 basis points to a range between 0.75% and 1.00%. |
| • | On June 15th, Fed policymakers raised the targeted fed funds rate by 75 basis points to a range between 1.50% to 1.75% — the largest single rate increase since 1994 — and signaled they would continue tightening monetary policy at an aggressive pace. |
| • | During the Reporting Period, the Fed scaled back its large-scale asset purchase program, ending it entirely in March 2022. |
| • | On June 1st, the Fed began to reduce the size of its balance sheet. |
| • | U.S. Treasury yields rose across the maturity spectrum during the Reporting Period overall. |
| • | The front, or shortest-term, end of the U.S. Treasury yield curve steepened, as yields on maturities of one year and less surged upward in response to the Fed’s short-term rate hikes. (Yield curve is a spectrum of interest rates based on maturities of varying lengths. A steepening yield curve is one wherein the differential in yields between longer-term and shorter-term maturities widens; opposite of a flattening yield curve.) |
| • | The 2-30 year portion of the U.S. Treasury yield curve flattened, as investors priced in the Fed’s outlook for short-term interest rates. |
| • | Yields on maturities between two years and 10 years climbed, reaching approximately similar levels by the end of the Reporting Period. |
| 1 | The Bloomberg U.S. Aggregate Bond Index is a broad-based fixed income index that includes bonds of investment grade quality or better, including corporate bonds, U.S. Treasury securities, mortgage-backed securities, asset backed securities and municipal bonds. |
| 1 |
MARKET REVIEW
| • | After the Fed’s March 2022 rate hike, the U.S. Treasury yield curve inverted between two-year and 10-year maturities. That inversion reversed during the second calendar quarter though the U.S. Treasury yield curve was inverted in other smaller segments at the end of the Reporting Period. (Historically, protracted yield curve inversions have preceded U.S. economic recessions.) |
| • | For the Reporting Period as a whole, the yield on the bellwether 10-year U.S. Treasury rose approximately 146 basis points to end June 2022 at 2.98%. |
| • | During the Reporting Period overall, U.S. spread, or non-government bond, sectors broadly recorded absolute declines. On a relative basis, U.S. corporate bonds, both high yield and investment grade, underperformed U.S. Treasury securities the most. Securitized bonds overall, including U.S. mortgage-backed securities, commercial mortgage-backed securities and asset backed securities, modestly outperformed U.S. Treasury securities during the Reporting Period. Municipal bonds also modestly outpaced U.S. Treasury securities during the Reporting Period. |
Fund Changes and Highlights
No material changes were made to the Fund during the Reporting Period.
| 2 |
FUND BASICS
as of June 30, 2022
PERFORMANCE REVIEW
| January 1, 2022 – June 30, 2022 | Fund Total Return (based on NAV)1 | Bloomberg U.S. Aggregate Bond Index2 | ||||||
| Institutional | -11.25 | % | -10.35 | % | ||||
| Service | -11.45 | -10.35 | ||||||
| 1 | The net asset value (“NAV”) represents the net assets of the class of the Fund (ex-dividend) divided by the total number of shares of the class outstanding. The Fund’s performance assumes the reinvestment of dividends and other distributions. The Fund’s performance does not reflect the deduction of any applicable sales charges. |
| 2 | Bloomberg U.S. Aggregate Bond Index represents an unmanaged diversified portfolio of fixed income securities, including U.S. Treasuries, investment-grade corporate bonds and mortgage-backed and asset-backed securities. It is not possible to invest directly in an unmanaged index. |
The returns set forth in the table above represent past performance. Past performance does not guarantee future results. The Fund’s investment return and principal value will fluctuate so that an investor’s shares, when redeemed, may be worth more or less than their original cost. Current performance may be lower or higher than the performance quoted above. Please visit our web site at www.GSAMFUNDS.com to obtain the most recent month-end returns. Performance reflects applicable fee waivers and/or expense limitations in effect during the periods shown. In their absence, performance would be reduced. Returns do not reflect the deduction of taxes that a shareholder would pay on Fund distributions or the redemption of Fund shares.
| 3 |
FUND BASICS
FUND COMPOSITION3
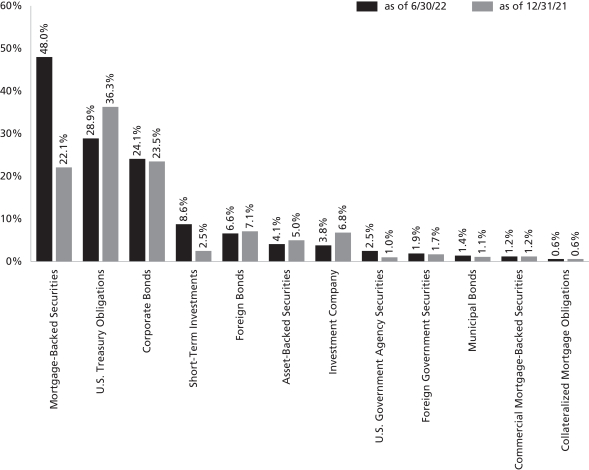
| 3 | The percentage shown for each investment category reflects the value of investments in that category as a percentage of net assets. Short-Term Investments represent investments in commercial paper. Figures in the above graph may not sum to 100% due to the exclusion of other assets and liabilities. Underlying sector allocations of investment companies held by the Fund are not reflected in the graph above. The graph depicts the Fund’s investments but may not represent the Fund’s market exposure due to the exclusion of certain derivatives, if any, as listed in the Additional Investment Information section of the Schedule of Investments. |
| 4 | “Mortgage-Backed Securities” are guaranteed by the Government National Mortgage Association (“GNMA”), the Federal Home Loan Mortgage Corp. (“FHLMC”) or Uniform Mortgage-Backed Securities (“UMBS”). GNMA instruments are backed by the full faith and credit of the United States Government. |
| 5 | “U.S. Government Agency Securities” include agency securities offered by companies such as Federal Home Loan Bank (“FHLB”), Federal Home Loan Mortgage Corp. (“FHLMC”) and the Federal National Mortgage Association (“FNMA”), which operate under a government charter. While they are required to report to a government regulator, their assets are not explicitly guaranteed by the government and they otherwise operate like any other publicly traded company. |
For more information about your Fund, please refer to www.GSAMFUNDS.com. There, you can learn more about your Fund’s investment strategies, holdings, and performance.
| 4 |
GOLDMAN SACHS VARIABLE INSURANCE TRUST CORE FIXED INCOME FUND
June 30, 2022 (Unaudited)
| Principal Amount | Interest Rate | Maturity Date | Value | |||||||||||
| Mortgage-Backed Securities – 48.0% | ||||||||||||||
FHLMC | ||||||||||||||
| $ | 3,899 | 7.500 | % | 12/01/29 | $ | 4,254 | ||||||||
| 1,157 | 5.000 | 10/01/33 | 1,214 | |||||||||||
| 1,633 | 5.000 | 07/01/35 | 1,722 | |||||||||||
| 2,405 | 5.000 | 12/01/35 | 2,525 | |||||||||||
| 465 | 5.000 | 03/01/38 | 489 | |||||||||||
| 937 | 5.000 | 06/01/41 | 987 | |||||||||||
| 5,662 | 4.500 | 08/01/48 | 5,758 | |||||||||||
| 6,274 | 4.500 | 11/01/48 | 6,361 | |||||||||||
| 660,599 | 3.000 | 09/01/49 | 623,820 | |||||||||||
| 491,506 | 4.000 | 03/01/50 | 490,304 | |||||||||||
| 999,997 | 2.500 | 05/01/51 | 902,068 | |||||||||||
| 933,979 | 2.500 | 09/01/51 | 843,459 | |||||||||||
| 985,249 | 4.500 | 04/01/52 | 992,970 | |||||||||||
| 627,776 | 4.500 | 06/01/52 | 636,212 | |||||||||||
| 372,224 | 4.500 | 06/01/52 | 377,933 | |||||||||||
FNMA | ||||||||||||||
| 488 | 5.500 | 09/01/23 | 492 | |||||||||||
| 529 | 5.500 | 09/01/23 | 533 | |||||||||||
| 387 | 5.500 | 10/01/23 | 389 | |||||||||||
| 450 | 4.500 | 07/01/24 | 454 | |||||||||||
| 2,285 | 9.000 | 11/01/25 | 2,363 | |||||||||||
| 13,550 | 7.000 | 08/01/26 | 14,183 | |||||||||||
| 4,617 | 8.000 | 10/01/29 | 4,988 | |||||||||||
| 915 | 8.500 | 04/01/30 | 1,018 | |||||||||||
| 1,721 | 8.000 | 05/01/30 | 1,798 | |||||||||||
| 3,530 | 8.000 | 08/01/32 | 3,886 | |||||||||||
| 4,458 | 4.500 | 08/01/39 | 4,608 | |||||||||||
| 16,393 | 3.000 | 01/01/43 | 15,669 | |||||||||||
| 8,155 | 3.000 | 01/01/43 | 7,795 | |||||||||||
| 23,087 | 3.000 | 03/01/43 | 22,067 | |||||||||||
| 9,851 | 3.000 | 03/01/43 | 9,416 | |||||||||||
| 71,671 | 3.000 | 03/01/43 | 68,504 | |||||||||||
| 87,640 | 3.000 | 04/01/43 | 83,767 | |||||||||||
| 17,111 | 3.000 | 04/01/43 | 16,355 | |||||||||||
| 20,729 | 3.000 | 04/01/43 | 19,813 | |||||||||||
| 9,346 | 3.000 | 04/01/43 | 8,933 | |||||||||||
| 11,943 | 3.000 | 04/01/43 | 11,415 | |||||||||||
| 11,695 | 3.000 | 05/01/43 | 11,178 | |||||||||||
| 49,604 | 3.000 | 05/01/43 | 47,412 | |||||||||||
| 44,582 | 3.000 | 05/01/43 | 42,612 | |||||||||||
| 320,398 | 4.000 | 12/01/44 | 323,719 | |||||||||||
| 279,674 | 4.500 | 04/01/45 | 288,945 | |||||||||||
| 35,127 | 4.500 | 05/01/45 | 36,357 | |||||||||||
| 981,426 | 3.500 | 07/01/45 | 960,723 | |||||||||||
| 644,519 | 4.000 | 08/01/45 | 649,187 | |||||||||||
| 153,452 | 4.000 | 02/01/48 | 153,748 | |||||||||||
| 185,832 | 4.000 | 03/01/48 | 186,133 | |||||||||||
| 11,891 | 4.000 | 07/01/48 | 11,922 | |||||||||||
| 3,640 | 4.000 | 07/01/48 | 3,644 | |||||||||||
| 332,721 | 4.500 | 07/01/48 | 338,656 | |||||||||||
| 204,619 | 4.000 | 08/01/48 | 204,886 | |||||||||||
| 176,041 | 5.000 | 11/01/48 | 182,483 | |||||||||||
| 4,000,000 | 3.000 | TBA-30yr | (a) | 3,729,998 | ||||||||||
| 1,000,000 | 4.000 | TBA-30yr | (a) | 989,218 | ||||||||||
| 1,000,000 | 4.500 | TBA-30yr | (a) | 1,003,672 | ||||||||||
|
| |||||||||||||
| Mortgage-Backed Securities – (continued) | ||||||||||||||
FNMA – (continued) | ||||||||||||||
| 3,000,000 | 2.000 | TBA-30yr | (a) | 2,602,365 | ||||||||||
| 5,000,000 | 2.500 | TBA-30yr | (a) | 4,494,115 | ||||||||||
| 1,000,000 | 3.500 | TBA-30yr | (a) | 961,575 | ||||||||||
| 1,000,000 | 4.000 | TBA-30yr | (a) | 985,901 | ||||||||||
| 3,000,000 | 5.000 | TBA-30yr | (a) | 3,061,890 | ||||||||||
| 1,000,000 | 3.500 | TBA-30yr | (a) | 1,002,070 | ||||||||||
FNMA Series 2012-111, Class B | ||||||||||||||
| 5,887 | 7.000 | 10/25/42 | 6,490 | |||||||||||
FNMA Series 2012-153, Class B | ||||||||||||||
| 15,957 | 7.000 | 07/25/42 | 17,552 | |||||||||||
FTMA | ||||||||||||||
| 487,301 | 4.000 | 01/01/46 | 490,374 | |||||||||||
GNMA | ||||||||||||||
| 386 | 7.000 | 10/15/25 | 387 | |||||||||||
| 2,114 | 7.000 | 11/15/25 | 2,149 | |||||||||||
| 149 | 7.000 | 02/15/26 | 150 | |||||||||||
| 727 | 7.000 | 04/15/26 | 735 | |||||||||||
| 743 | 7.000 | 04/15/26 | 762 | |||||||||||
| 785 | 7.000 | 03/15/27 | 796 | |||||||||||
| 152 | 7.000 | 11/15/27 | 152 | |||||||||||
| 351 | 7.000 | 11/15/27 | 354 | |||||||||||
| 1,746 | 7.000 | 11/15/27 | 1,836 | |||||||||||
| 4,356 | 7.000 | 02/15/28 | 4,506 | |||||||||||
| 631 | 7.000 | 04/15/28 | 639 | |||||||||||
| 82 | 7.000 | 05/15/28 | 86 | |||||||||||
| 1,755 | 7.000 | 06/15/28 | 1,832 | |||||||||||
| 715 | 7.000 | 07/15/28 | 750 | |||||||||||
| 1,910 | 7.000 | 07/15/28 | 1,990 | |||||||||||
| 7,340 | 7.000 | 09/15/28 | 7,654 | |||||||||||
| 52,622 | 6.000 | 08/20/34 | 57,207 | |||||||||||
| 42,707 | 5.000 | 06/15/40 | 45,398 | |||||||||||
| 191,452 | 4.000 | 08/20/43 | 193,623 | |||||||||||
| 71,917 | 4.000 | 10/20/45 | 72,598 | |||||||||||
| 216,676 | 3.500 | 04/20/47 | 212,740 | |||||||||||
| 269,389 | 3.500 | 12/20/47 | 264,496 | |||||||||||
| 39,500 | 5.000 | 08/20/48 | 40,670 | |||||||||||
| 122,723 | 4.500 | 09/20/48 | 125,459 | |||||||||||
| 134,087 | 5.000 | 10/20/48 | 137,974 | |||||||||||
| 375,821 | 5.000 | 11/20/48 | 386,715 | |||||||||||
| 47,310 | 5.000 | 12/20/48 | 48,666 | |||||||||||
| 287,420 | 4.500 | 01/20/49 | 293,738 | |||||||||||
| 39,967 | 4.500 | 03/20/49 | 40,836 | |||||||||||
| 784,748 | 3.000 | 08/20/49 | 748,195 | |||||||||||
| 255,681 | 4.500 | 10/20/49 | 261,089 | |||||||||||
| 253,794 | 4.500 | 03/20/50 | 258,758 | |||||||||||
| 767,383 | 3.500 | 02/20/51 | 750,141 | |||||||||||
| 1,000,000 | 2.000 | TBA-30yr | (a) | 888,940 | ||||||||||
| 1,000,000 | 2.000 | TBA-30yr | (a) | 886,958 | ||||||||||
| 1,000,000 | 2.500 | TBA-30yr | (a) | 914,615 | ||||||||||
| 4,000,000 | 3.000 | TBA-30yr | (a) | 3,768,664 | ||||||||||
| 2,000,000 | 4.500 | TBA-30yr | (a) | 2,029,070 | ||||||||||
| 2,000,000 | 4.500 | TBA-30yr | (a) | 2,021,460 | ||||||||||
| 951,772 | 3.000 | 11/20/51 | 900,803 | |||||||||||
| 4,000,000 | 2.000 | TBA-30yr | (a) | 3,807,216 | ||||||||||
| 1,000,000 | 5.000 | TBA-30yr | (a) | 1,024,382 | ||||||||||
|
| |||||||||||||
| TOTAL MORTGAGE-BACKED SECURITIES | ||||||||||||||
| (Cost $48,918,833) | $ | 48,180,536 | ||||||||||||
|
| |||||||||||||
| The accompanying notes are an integral part of these financial statements. | 5 |
GOLDMAN SACHS VARIABLE INSURANCE TRUST CORE FIXED INCOME FUND
Schedule of Investments (continued)
June 30, 2022 (Unaudited)
| Principal Amount | Interest Rate | Maturity Date | Value | |||||||||||
| Corporate Bonds – 24.1% | ||||||||||||||
| Aerospace/Defense – 0.5% | ||||||||||||||
Boeing Co. (The)(b) | ||||||||||||||
| $ | 50,000 | 3.450 | % | 11/01/28 | $ | 44,629 | ||||||||
| 25,000 | 5.150 | 05/01/30 | 23,985 | |||||||||||
| 25,000 | 3.250 | 02/01/35 | 19,030 | |||||||||||
| 100,000 | 5.805 | 05/01/50 | 92,083 | |||||||||||
Northrop Grumman Corp.(b) | ||||||||||||||
| 50,000 | 2.930 | 01/15/25 | 48,953 | |||||||||||
| 75,000 | 3.250 | 01/15/28 | 71,252 | |||||||||||
| 25,000 | 4.750 | 06/01/43 | 23,964 | |||||||||||
| 50,000 | 5.250 | 05/01/50 | 52,807 | |||||||||||
Raytheon Technologies Corp.(b) | ||||||||||||||
| 50,000 | 3.950 | 08/16/25 | 50,210 | |||||||||||
| 50,000 | 4.125 | 11/16/28 | 49,397 | |||||||||||
| 25,000 | 4.050 | 05/04/47 | 22,191 | |||||||||||
|
| |||||||||||||
| 498,501 | ||||||||||||||
|
| |||||||||||||
| Agriculture – 0.1% | ||||||||||||||
Archer-Daniels-Midland Co(b). | ||||||||||||||
| 25,000 | 3.250 | 03/27/30 | 23,521 | |||||||||||
| 100,000 | 2.900 | 03/01/32 | 90,419 | |||||||||||
|
| |||||||||||||
| 113,940 | ||||||||||||||
|
| |||||||||||||
| Auto Manufacturers – 0.4% | ||||||||||||||
General Motors Co. | ||||||||||||||
| 50,000 | 5.400 | 10/02/23 | 50,764 | |||||||||||
| 25,000 | 4.000 | 04/01/25 | 24,663 | |||||||||||
General Motors Financial Co., Inc.(b) | ||||||||||||||
| 125,000 | 4.300 | 07/13/25 | 123,038 | |||||||||||
| 125,000 | 1.500 | 06/10/26 | 109,283 | |||||||||||
| 125,000 | 2.350 | 01/08/31 | 97,089 | |||||||||||
|
| |||||||||||||
| 404,837 | ||||||||||||||
|
| |||||||||||||
| Banks – 5.6% | ||||||||||||||
Bank of America Corp.(b) | ||||||||||||||
(SOFR + 1.05%) | ||||||||||||||
| 400,000 | 2.551 | (c) | 02/04/28 | 364,004 | ||||||||||
(3 Mo. LIBOR + 1.04%) | ||||||||||||||
| 85,000 | 3.419 | (c) | 12/20/28 | 79,174 | ||||||||||
(SOFR + 2.15%) | ||||||||||||||
| 175,000 | 2.592 | (c) | 04/29/31 | 148,423 | ||||||||||
(SOFR + 1.22%) | ||||||||||||||
| 110,000 | 2.299 | (c) | 07/21/32 | 88,913 | ||||||||||
(SOFR + 1.33%) | ||||||||||||||
| 75,000 | 2.972 | (c) | 02/04/33 | 63,928 | ||||||||||
(SOFR + 1.83%) | ||||||||||||||
| 340,000 | 4.571 | (c) | 04/27/33 | 330,899 | ||||||||||
| | (US Treasury Yield Curve Rate T-Note Constant Maturity + | | ||||||||||||
| 100,000 | 2.482 | (c) | 09/21/36 | 77,765 | ||||||||||
Bank of America Corp.(c), GMTN | ||||||||||||||
(3 Mo. LIBOR + 1.37%) | ||||||||||||||
| 25,000 | 3.593 | 07/21/28 | 23,596 | |||||||||||
Bank of America Corp., Series L | ||||||||||||||
| 25,000 | 4.183 | 11/25/27 | 24,326 | |||||||||||
|
| |||||||||||||
| Corporate Bonds – (continued) | ||||||||||||||
| Banks – (continued) | ||||||||||||||
Bank of America Corp., MTN | ||||||||||||||
| 75,000 | 4.125 | 01/22/24 | 75,853 | |||||||||||
| 65,000 | 4.200 | 08/26/24 | 65,144 | |||||||||||
| 45,000 | 3.248 | (b) | 10/21/27 | 42,449 | ||||||||||
(3 Mo. LIBOR + 1.58%) | ||||||||||||||
| 75,000 | 3.824 | (b)(c) | 01/20/28 | 71,913 | ||||||||||
(3 Mo. LIBOR + 1.31%) | ||||||||||||||
| 50,000 | 4.271 | (b)(c) | 07/23/29 | 48,084 | ||||||||||
(3 Mo. LIBOR + 1.19%) | ||||||||||||||
| 50,000 | 2.884 | (b)(c) | 10/22/30 | 43,733 | ||||||||||
(SOFR + 1.53%) | ||||||||||||||
| 50,000 | 1.898 | (b)(c) | 07/23/31 | 40,004 | ||||||||||
Citigroup, Inc. | ||||||||||||||
| 220,000 | 3.400 | 05/01/26 | 212,878 | |||||||||||
| 150,000 | 4.450 | 09/29/27 | 147,475 | |||||||||||
| 25,000 | 4.125 | 07/25/28 | 24,002 | |||||||||||
(SOFR + 1.42%) | ||||||||||||||
| 75,000 | 2.976 | (b)(c) | 11/05/30 | 65,451 | ||||||||||
(SOFR + 1.35%) | ||||||||||||||
| 200,000 | 3.057 | (b)(c) | 01/25/33 | 169,880 | ||||||||||
Fifth Third Bancorp | ||||||||||||||
| 30,000 | 2.375 | (b) | 01/28/25 | 28,745 | ||||||||||
Huntington Bancshares, Inc. | ||||||||||||||
| 50,000 | 4.000 | (b) | 05/15/25 | 49,770 | ||||||||||
JPMorgan Chase & Co.(b) | ||||||||||||||
(3 Mo. LIBOR + 0.73%) | ||||||||||||||
| 25,000 | 3.559 | (c) | 04/23/24 | 24,930 | ||||||||||
(3 Mo. LIBOR + 0.89%) | ||||||||||||||
| 25,000 | 3.797 | (c) | 07/23/24 | 24,928 | ||||||||||
(3 Mo. LIBOR + 1.00%) | ||||||||||||||
| 50,000 | 4.023 | (c) | 12/05/24 | 49,836 | ||||||||||
(SOFR + 1.16%) | ||||||||||||||
| 125,000 | 2.301 | (c) | 10/15/25 | 119,142 | ||||||||||
(3 Mo. LIBOR + 1.25%) | ||||||||||||||
| 100,000 | 3.960 | (c) | 01/29/27 | 97,832 | ||||||||||
| 15,000 | 3.625 | 12/01/27 | 14,407 | |||||||||||
(3 Mo. LIBOR + 1.34%) | ||||||||||||||
| 972,000 | 3.782 | (c) | 02/01/28 | 932,730 | ||||||||||
(3 Mo. LIBOR + 0.95%) | ||||||||||||||
| 45,000 | 3.509 | (c) | 01/23/29 | 42,124 | ||||||||||
(SOFR + 3.79%) | ||||||||||||||
| 25,000 | 4.493 | (c) | 03/24/31 | 24,416 | ||||||||||
(SOFR + 2.04%) | ||||||||||||||
| 25,000 | 2.522 | (c) | 04/22/31 | 21,312 | ||||||||||
(SOFR + 1.26%) | ||||||||||||||
| 150,000 | 2.963 | (c) | 01/25/33 | 128,798 | ||||||||||
JPMorgan Chase & Co.(c), Series HH | ||||||||||||||
(SOFR + 3.13%) | ||||||||||||||
| 74,000 | 4.600 | (b) | 08/01/69 | 62,753 | ||||||||||
KeyCorp(c) | ||||||||||||||
(SOFR + 2.06%) | ||||||||||||||
| 220,000 | 4.789 | (b) | 06/01/33 | 216,890 | ||||||||||
Morgan Stanley | ||||||||||||||
(3 Mo. LIBOR + 1.40%) | ||||||||||||||
| 50,000 | 2.584 | (b)(c) | 10/24/23 | 50,008 | ||||||||||
|
| |||||||||||||
| 6 | The accompanying notes are an integral part of these financial statements. |
GOLDMAN SACHS VARIABLE INSURANCE TRUST CORE FIXED INCOME FUND
| Principal Amount | Interest Rate | Maturity Date | Value | |||||||||||
| Corporate Bonds – (continued) | ||||||||||||||
| Banks – (continued) | ||||||||||||||
Morgan Stanley – (continued) | ||||||||||||||
(3 Mo. LIBOR + 0.85%) | ||||||||||||||
| $ | 25,000 | 3.737 | % (b)(c) | 04/24/24 | $ | 24,933 | ||||||||
| 25,000 | 3.625 | 01/20/27 | 24,263 | |||||||||||
| 20,000 | 3.950 | 04/23/27 | 19,388 | |||||||||||
(SOFR + 1.00%) | ||||||||||||||
| 200,000 | 2.475 | (b)(c) | 01/21/28 | 181,912 | ||||||||||
(SOFR + 1.36%) | ||||||||||||||
| 150,000 | 2.484 | (b)(c) | 09/16/36 | 115,340 | ||||||||||
Morgan Stanley, Series F | ||||||||||||||
| 25,000 | 3.875 | 04/29/24 | 25,071 | |||||||||||
Morgan Stanley, GMTN | ||||||||||||||
| 225,000 | 3.700 | 10/23/24 | 224,502 | |||||||||||
(3 Mo. LIBOR + 1.63%) | ||||||||||||||
| 25,000 | 4.431 | (b)(c) | 01/23/30 | 24,265 | ||||||||||
(SOFR + 1.14%) | ||||||||||||||
| 400,000 | 2.699 | (b)(c) | 01/22/31 | 346,776 | ||||||||||
Morgan Stanley, MTN(b) | ||||||||||||||
(SOFR + 1.15%) | ||||||||||||||
| 75,000 | 2.720 | (c) | 07/22/25 | 72,351 | ||||||||||
(SOFR + 3.12%) | ||||||||||||||
| 50,000 | 3.622 | (c) | 04/01/31 | 45,971 | ||||||||||
(SOFR + 1.03%) | ||||||||||||||
| 75,000 | 1.794 | (c) | 02/13/32 | 59,052 | ||||||||||
US Bancorp(c) | ||||||||||||||
| | (US Treasury Yield Curve Rate T-Note Constant Maturity + | | ||||||||||||
| 100,000 | 3.700 | (b) | 10/31/39 | 77,091 | ||||||||||
Wells Fargo & Co. | ||||||||||||||
| 175,000 | 3.000 | 10/23/26 | 165,235 | |||||||||||
Wells Fargo & Co., GMTN | ||||||||||||||
| 50,000 | 4.300 | 07/22/27 | 49,404 | |||||||||||
Wells Fargo & Co., MTN | ||||||||||||||
| 25,000 | 3.750 | (b) | 01/24/24 | 25,048 | ||||||||||
(SOFR + 4.50%) | ||||||||||||||
| 25,000 | 5.013 | (b)(c) | 04/04/51 | 24,522 | ||||||||||
|
| |||||||||||||
| 5,601,639 | ||||||||||||||
|
| |||||||||||||
| Beverages – 0.2% | ||||||||||||||
Constellation Brands, Inc.(b) | ||||||||||||||
| 50,000 | 4.400 | 11/15/25 | 50,233 | |||||||||||
| 50,000 | 3.600 | 02/15/28 | 47,418 | |||||||||||
| 25,000 | 3.150 | 08/01/29 | 22,519 | |||||||||||
Keurig Dr Pepper, Inc.(b) | ||||||||||||||
| 25,000 | 3.800 | 05/01/50 | 19,811 | |||||||||||
| 100,000 | 4.500 | 04/15/52 | 88,069 | |||||||||||
|
| |||||||||||||
| 228,050 | ||||||||||||||
|
| |||||||||||||
| Biotechnology – 0.1% | ||||||||||||||
Amgen, Inc. | ||||||||||||||
| 70,000 | 3.125 | (b) | 05/01/25 | 68,727 | ||||||||||
Royalty Pharma PLC | ||||||||||||||
| 75,000 | 1.200 | (b) | 09/02/25 | 67,194 | ||||||||||
|
| |||||||||||||
| 135,921 | ||||||||||||||
|
| |||||||||||||
| Corporate Bonds – (continued) | ||||||||||||||
| Building Materials – 0.4% | ||||||||||||||
Carrier Global Corp.(b) | ||||||||||||||
| $ | 150,000 | 2.493 | % | 02/15/27 | $ | 136,889 | ||||||||
| 75,000 | 2.722 | 02/15/30 | 64,821 | |||||||||||
Martin Marietta Materials, Inc. | ||||||||||||||
| 175,000 | 3.200 | (b) | 07/15/51 | 123,779 | ||||||||||
Masco Corp. | ||||||||||||||
| 50,000 | 1.500 | (b) | 02/15/28 | 41,982 | ||||||||||
|
| |||||||||||||
| 367,471 | ||||||||||||||
|
| |||||||||||||
| Chemicals – 0.4% | ||||||||||||||
DuPont de Nemours, Inc.(b) | ||||||||||||||
| 25,000 | 4.205 | 11/15/23 | 25,150 | |||||||||||
| 50,000 | 4.493 | 11/15/25 | 50,350 | |||||||||||
Ecolab, Inc. | ||||||||||||||
| 4,000 | 2.750 | (b) | 08/18/55 | 2,800 | ||||||||||
Huntsman International LLC(b) | ||||||||||||||
| 25,000 | 4.500 | 05/01/29 | 23,522 | |||||||||||
| 25,000 | 2.950 | 06/15/31 | 20,765 | |||||||||||
International Flavors & Fragrances, Inc.(b) | ||||||||||||||
| 75,000 | 1.832 | (d) | 10/15/27 | 64,576 | ||||||||||
| 150,000 | 2.300 | (d) | 11/01/30 | 123,371 | ||||||||||
| 50,000 | 3.268 | (d) | 11/15/40 | 37,984 | ||||||||||
Sherwin-Williams Co. (The)(b) | ||||||||||||||
| 25,000 | 3.450 | 06/01/27 | 23,859 | |||||||||||
| 50,000 | 2.950 | 08/15/29 | 44,778 | |||||||||||
|
| |||||||||||||
| 417,155 | ||||||||||||||
|
| |||||||||||||
| Commercial Services – 0.6% | ||||||||||||||
CoStar Group, Inc.(d) | ||||||||||||||
| 100,000 | 2.800 | (b) | 07/15/30 | 84,057 | ||||||||||
Emory University, Series 2020 | ||||||||||||||
| 140,000 | 2.143 | (b) | 09/01/30 | 122,649 | ||||||||||
Global Payments, Inc. | ||||||||||||||
| 50,000 | 2.650 | 02/15/25 | 47,682 | |||||||||||
PayPal Holdings, Inc.(b) | ||||||||||||||
| 150,000 | 1.650 | 06/01/25 | 141,483 | |||||||||||
| 125,000 | 2.650 | 10/01/26 | 118,560 | |||||||||||
S&p Global, Inc.(d) | ||||||||||||||
| 75,000 | 4.250 | (b) | 05/01/29 | 74,286 | ||||||||||
|
| |||||||||||||
| 588,717 | ||||||||||||||
|
| |||||||||||||
| Computers – 0.8% | ||||||||||||||
Amdocs Ltd. | ||||||||||||||
| 50,000 | 2.538 | (b) | 06/15/30 | 42,370 | ||||||||||
Apple, Inc. | ||||||||||||||
| 325,000 | 2.450 | (b) | 08/04/26 | 311,895 | ||||||||||
Dell International LLC / EMC Corp(b) | ||||||||||||||
| 18,000 | 5.450 | 06/15/23 | 18,208 | |||||||||||
| 75,000 | 5.850 | 07/15/25 | 77,403 | |||||||||||
| 100,000 | 6.020 | 06/15/26 | 103,719 | |||||||||||
| 25,000 | 5.300 | 10/01/29 | 24,657 | |||||||||||
Hewlett Packard Enterprise Co.(b) | ||||||||||||||
| 150,000 | 4.450 | 10/02/23 | 151,252 | |||||||||||
| 45,000 | 4.900 | 10/15/25 | 45,789 | |||||||||||
| 25,000 | 6.350 | 10/15/45 | 25,148 | |||||||||||
|
| |||||||||||||
| 800,441 | ||||||||||||||
|
| |||||||||||||
| The accompanying notes are an integral part of these financial statements. | 7 |
GOLDMAN SACHS VARIABLE INSURANCE TRUST CORE FIXED INCOME FUND
Schedule of Investments (continued)
June 30, 2022 (Unaudited)
| Principal Amount | Interest Rate | Maturity Date | Value | |||||||||||
| Corporate Bonds – (continued) | ||||||||||||||
| Diversified Financial Services – 0.6% | ||||||||||||||
Air Lease Corp.(b) | ||||||||||||||
| $ | 75,000 | 2.300 | % | 02/01/25 | $ | 70,118 | ||||||||
| 75,000 | 3.375 | 07/01/25 | 70,686 | |||||||||||
| 75,000 | 2.875 | 01/15/26 | 68,858 | |||||||||||
Air Lease Corp., GMTN | ||||||||||||||
| 75,000 | 3.750 | (b) | 06/01/26 | 70,601 | ||||||||||
Ally Financial, Inc. | ||||||||||||||
| 25,000 | 1.450. | (b) | 10/02/23 | 24,181 | ||||||||||
American Express Co.(b) | ||||||||||||||
| 20,000 | 2.500 | 07/30/24 | 19,495 | |||||||||||
| 25,000 | 3.625 | 12/05/24 | 24,868 | |||||||||||
Aviation Capital Group LLC(d) | ||||||||||||||
| 50,000 | 1.950 | (b) | 01/30/26 | 43,734 | ||||||||||
Capital One Financial Corp. | ||||||||||||||
| 25,000 | 3.500 | 06/15/23 | 24,877 | |||||||||||
| 45,000 | 3.300 | (b) | 10/30/24 | 43,963 | ||||||||||
Discover Financial Services | ||||||||||||||
| 75,000 | 3.750 | (b) | 03/04/25 | 73,885 | ||||||||||
Intercontinental Exchange, Inc. | ||||||||||||||
| 50,000 | 3.000 | (b) | 06/15/50 | 36,481 | ||||||||||
Mastercard, Inc. | ||||||||||||||
| 25,000 | 3.300 | (b) | 03/26/27 | 24,585 | ||||||||||
Nuveen LLC(d) | ||||||||||||||
| 25,000 | 4.000 | (b) | 11/01/28 | 24,412 | ||||||||||
Raymond James Financial, Inc. | ||||||||||||||
| 25,000 | 4.650 | (b) | 04/01/30 | 24,569 | ||||||||||
|
| |||||||||||||
| 645,313 | ||||||||||||||
|
| |||||||||||||
| Electric – 1.2% | ||||||||||||||
Alliant Energy Finance LLC(d) | ||||||||||||||
| 25,000 | 3.750 | (b) | 06/15/23 | 24,991 | ||||||||||
American Electric Power Co., Inc. | ||||||||||||||
| 50,000 | 2.300 | (b) | 03/01/30 | 42,069 | ||||||||||
Arizona Public Service Co. | ||||||||||||||
| 45,000 | 2.950 | (b) | 09/15/27 | 42,200 | ||||||||||
Avangrid, Inc. | ||||||||||||||
| 25,000 | 3.200 | (b) | 04/15/25 | 24,283 | ||||||||||
Berkshire Hathaway Energy Co.(b) | ||||||||||||||
| 25,000 | 3.250 | 04/15/28 | 23,757 | |||||||||||
| 50,000 | 3.700 | 07/15/30 | 47,979 | |||||||||||
Dominion Energy, Inc.(e) | ||||||||||||||
| 50,000 | 3.071 | 08/15/24 | 48,829 | |||||||||||
Dominion Energy, Inc., Series C | ||||||||||||||
| 25,000 | 3.375 | (b) | 04/01/30 | 22,862 | ||||||||||
Entergy Corp. | ||||||||||||||
| 45,000 | 2.950 | (b) | 09/01/26 | 42,682 | ||||||||||
Exelon Corp.(b) | ||||||||||||||
| 50,000 | 4.050 | 04/15/30 | 47,982 | |||||||||||
| 25,000 | 4.700 | 04/15/50 | 23,317 | |||||||||||
FirstEnergy Corp. | ||||||||||||||
| 100,000 | 2.650 | (b) | 03/01/30 | 82,523 | ||||||||||
FirstEnergy Corp., Series B | ||||||||||||||
| 50,000 | 2.250 | (b) | 09/01/30 | 40,185 | ||||||||||
Florida Power & Light Co. | ||||||||||||||
| 68,000 | 4.125 | (b) | 02/01/42 | 64,033 | ||||||||||
|
| |||||||||||||
| Corporate Bonds – (continued) | ||||||||||||||
| Electric – (continued) | ||||||||||||||
MidAmerican Energy Co. | ||||||||||||||
| 25,000 | 3.650 | (b) | 04/15/29 | 24,328 | ||||||||||
NextEra Energy Capital Holdings, Inc. | ||||||||||||||
| 70,000 | 1.900 | (b) | 06/15/28 | 60,926 | ||||||||||
NRG Energy, Inc.(d) | ||||||||||||||
| 75,000 | 3.750 | (b) | 06/15/24 | 73,521 | ||||||||||
Ohio Power Co., Series P | ||||||||||||||
| 25,000 | 2.600 | (b) | 04/01/30 | 22,072 | ||||||||||
Pacific Gas and Electric Co.(b) | ||||||||||||||
| 25,000 | 2.100 | 08/01/27 | 20,997 | |||||||||||
| 50,000 | 2.500 | 02/01/31 | 38,430 | |||||||||||
| 25,000 | 3.300 | 08/01/40 | 17,277 | |||||||||||
| 25,000 | 3.500 | 08/01/50 | 16,697 | |||||||||||
Progress Energy, Inc. | ||||||||||||||
| 95,000 | 7.000 | 10/30/31 | 106,856 | |||||||||||
Southern California Edison Co., Series A | ||||||||||||||
| 50,000 | 4.200 | (b) | 03/01/29 | 48,152 | ||||||||||
Southern Co. (The) | ||||||||||||||
| 60,000 | 3.250 | (b) | 07/01/26 | 57,468 | ||||||||||
Virginia Electric and Power Co. | ||||||||||||||
| 75,000 | 2.450 | (b) | 12/15/50 | 50,346 | ||||||||||
Vistra Operations Co. LLC(d) | ||||||||||||||
| 125,000 | 3.550 | (b) | 07/15/24 | 120,638 | ||||||||||
|
| |||||||||||||
| 1,235,400 | ||||||||||||||
|
| |||||||||||||
| Entertainment – 0.3% | ||||||||||||||
Magallanes, Inc.(b) | ||||||||||||||
| 250,000 | 4.054 | (d) | 03/15/29 | 229,193 | ||||||||||
| 75,000 | 4.279(d) | 03/15/32 | 67,004 | |||||||||||
|
| |||||||||||||
| 296,197 | ||||||||||||||
|
| |||||||||||||
| Environmental Control – 0.2% | ||||||||||||||
Republic Services, Inc.(b) | ||||||||||||||
| 75,000 | 2.500 | 08/15/24 | 72,656 | |||||||||||
| 100,000 | 1.750 | 02/15/32 | 78,700 | |||||||||||
Waste Management, Inc. | ||||||||||||||
| 50,000 | 1.150 | (b) | 03/15/28 | 42,555 | ||||||||||
|
| |||||||||||||
| 193,911 | ||||||||||||||
|
| |||||||||||||
| Food – 0.2% | ||||||||||||||
Kraft Heinz Foods Co. | ||||||||||||||
| 95,000 | 3.750 | (b) | 04/01/30 | 87,790 | ||||||||||
Mars, Inc.(b) | ||||||||||||||
| 25,000 | 2.700 | (d) | 04/01/25 | 24,422 | ||||||||||
| 25,000 | 3.200 | (d) | 04/01/30 | 23,118 | ||||||||||
Sysco Corp. | ||||||||||||||
| 25,000 | 6.600 | (b) | 04/01/50 | 28,817 | ||||||||||
Tyson Foods, Inc. | ||||||||||||||
| 50,000 | 3.900 | (b) | 09/28/23 | 50,167 | ||||||||||
|
| |||||||||||||
| 214,314 | ||||||||||||||
|
| |||||||||||||
| Gas – 0.2% | ||||||||||||||
East Ohio Gas Co. (The)(b) | ||||||||||||||
| 25,000 | 1.300 | (d) | 06/15/25 | 22,982 | ||||||||||
| 25,000 | 2.000 | (d) | 06/15/30 | 20,763 | ||||||||||
|
| |||||||||||||
| 8 | The accompanying notes are an integral part of these financial statements. |
GOLDMAN SACHS VARIABLE INSURANCE TRUST CORE FIXED INCOME FUND
| Principal Amount | Interest Rate | Maturity Date | Value | |||||||||||
| Corporate Bonds – (continued) | ||||||||||||||
| Gas – (continued) | ||||||||||||||
NiSource, Inc. (b) | ||||||||||||||
| $ | 95,000 | 3.490 | % | 05/15/27 | $ | 90,950 | ||||||||
| 25,000 | 3.600 | 05/01/30 | 22,910 | |||||||||||
|
| |||||||||||||
| 157,605 | ||||||||||||||
|
| |||||||||||||
| Hand/Machine Tools – 0.0% | ||||||||||||||
Stanley Black & Decker, Inc. | ||||||||||||||
| 50,000 | 4.250 | (b) | 11/15/28 | 49,815 | ||||||||||
|
| |||||||||||||
| Healthcare – Products – 0.1% | ||||||||||||||
Baxter International, Inc. | ||||||||||||||
| 100,000 | 2.272 | (b) | 12/01/28 | 87,550 | ||||||||||
|
| |||||||||||||
| Healthcare – Services – 0.2% | ||||||||||||||
Centene Corp. | ||||||||||||||
| 110,000 | 2.625 | (b) | 08/01/31 | 88,275 | ||||||||||
HCA, Inc. | ||||||||||||||
| 80,000 | 3.500 | (b) | 09/01/30 | 68,220 | ||||||||||
|
| |||||||||||||
| 156,495 | ||||||||||||||
|
| |||||||||||||
| Healthcare-Products – 0.3% | ||||||||||||||
DH Europe Finance II Sarl(b) | ||||||||||||||
| 75,000 | 2.200 | 11/15/24 | 71,981 | |||||||||||
| 25,000 | 2.600 | 11/15/29 | 22,390 | |||||||||||
| 75,000 | 3.250 | 11/15/39 | 62,220 | |||||||||||
STERIS Irish FinCo UnLtd Co. | ||||||||||||||
| 75,000 | 2.700 | (b) | 03/15/31 | 63,312 | ||||||||||
Stryker Corp. | ||||||||||||||
| 100,000 | 1.950 | (b) | 06/15/30 | 83,174 | ||||||||||
Thermo Fisher Scientific, Inc. | ||||||||||||||
| 25,000 | 1.750 | (b) | 10/15/28 | 21,874 | ||||||||||
|
| |||||||||||||
| 324,951 | ||||||||||||||
|
| |||||||||||||
| Healthcare-Services – 0.4% | ||||||||||||||
Adventist Health System | ||||||||||||||
| 30,000 | 2.952 | (b) | 03/01/29 | 27,489 | ||||||||||
Banner Health | ||||||||||||||
| 120,000 | 2.338 | (b) | 01/01/30 | 105,910 | ||||||||||
Baylor Scott & White Holdings, Series 2021 | ||||||||||||||
| 40,000 | 1.777 | (b) | 11/15/30 | 32,956 | ||||||||||
Centene Corp. | ||||||||||||||
| 150,000 | 4.250 | 12/15/27 | 140,064 | |||||||||||
Rush Obligated Group, Series 2020 | ||||||||||||||
| 60,000 | 3.922 | (b) | 11/15/29 | 57,722 | ||||||||||
Stanford Health Care, Series 2020 | ||||||||||||||
| 40,000 | 3.310 | (b) | 08/15/30 | 37,014 | ||||||||||
Sutter Health, Series 20A | ||||||||||||||
| 40,000 | 2.294 | (b) | 08/15/30 | 34,340 | ||||||||||
|
| |||||||||||||
| 435,495 | ||||||||||||||
|
| |||||||||||||
| Home Builders – 0.1% | ||||||||||||||
Lennar Corp. | ||||||||||||||
| 70,000 | 4.750 | (b) | 11/29/27 | 68,178 | ||||||||||
|
| |||||||||||||
| Insurance – 0.4% | ||||||||||||||
American International Group, Inc. | ||||||||||||||
| 25,000 | 3.400 | (b) | 06/30/30 | 22,939 | ||||||||||
|
| |||||||||||||
| Corporate Bonds – (continued) | ||||||||||||||
| Insurance – (continued) | ||||||||||||||
Arch Capital Group US, Inc. | ||||||||||||||
| 36,000 | 5.144 | 11/01/43 | 34,930 | |||||||||||
Berkshire Hathaway Finance Corp. | ||||||||||||||
| 75,000 | 1.850 | (b) | 03/12/30 | 64,143 | ||||||||||
Corebridge Financial, Inc.(d) | ||||||||||||||
| 120,000 | 3.900 | (b) | 04/05/32 | 107,681 | ||||||||||
Marsh & McLennan Cos., Inc. | ||||||||||||||
| 50,000 | 4.375 | (b) | 03/15/29 | 49,406 | ||||||||||
Principal Financial Group, Inc.(b) | ||||||||||||||
| 50,000 | 3.100 | 11/15/26 | 47,446 | |||||||||||
| 75,000 | 2.125 | 06/15/30 | 61,846 | |||||||||||
Willis North America, Inc. | ||||||||||||||
| 25,000 | 2.950 | (b) | 09/15/29 | 21,410 | ||||||||||
|
| |||||||||||||
| 409,801 | ||||||||||||||
|
| |||||||||||||
| Internet – 0.6% | ||||||||||||||
Amazon.com, Inc.(b) | ||||||||||||||
| 335,000 | 5.200 | 12/03/25 | 351,630 | |||||||||||
| 45,000 | 4.800 | 12/05/34 | 47,196 | |||||||||||
| 15,000 | 3.875 | 08/22/37 | 14,174 | |||||||||||
| 50,000 | 3.100 | 05/12/51 | 39,439 | |||||||||||
Expedia Group, Inc.(b) | ||||||||||||||
| 25,000 | 4.625 | 08/01/27 | 24,023 | |||||||||||
| 35,000 | 3.800 | 02/15/28 | 31,923 | |||||||||||
| 50,000 | 2.950 | 03/15/31 | 39,856 | |||||||||||
Netflix, Inc.(d) | ||||||||||||||
| 90,000 | 4.875 | (b) | 06/15/30 | 82,597 | ||||||||||
|
| |||||||||||||
| 630,838 | ||||||||||||||
|
| |||||||||||||
| Iron/Steel – 0.1% | ||||||||||||||
Steel Dynamics, Inc.(b) | ||||||||||||||
| 20,000 | 2.400 | 06/15/25 | 18,939 | |||||||||||
| 50,000 | 1.650 | 10/15/27 | 42,884 | |||||||||||
|
| |||||||||||||
| 61,823 | ||||||||||||||
|
| |||||||||||||
| Lodging – 0.2% | ||||||||||||||
Hyatt Hotels Corp. | ||||||||||||||
| 75,000 | 1.800 | (b) | 10/01/24 | 70,985 | ||||||||||
Marriott International, Inc./Md, Series HH | ||||||||||||||
| 125,000 | 2.850 | (b) | 04/15/31 | 103,694 | ||||||||||
|
| |||||||||||||
| 174,679 | ||||||||||||||
|
| |||||||||||||
| Machinery-Diversified – 0.2% | ||||||||||||||
Otis Worldwide Corp.(b) | ||||||||||||||
| 25,000 | 2.293 | 04/05/27 | 22,678 | |||||||||||
| 150,000 | 2.565 | 02/15/30 | 129,678 | |||||||||||
|
| |||||||||||||
| 152,356 | ||||||||||||||
|
| |||||||||||||
| Media – 1.0% | ||||||||||||||
| | Charter Communications Operating LLC / Charter | | ||||||||||||
| 320,000 | 4.908 | 07/23/25 | 320,822 | |||||||||||
Comcast Corp.(b) | ||||||||||||||
| 25,000 | 3.700 | 04/15/24 | 25,075 | |||||||||||
| 45,000 | 3.375 | 08/15/25 | 44,469 | |||||||||||
|
| |||||||||||||
| The accompanying notes are an integral part of these financial statements. | 9 |
GOLDMAN SACHS VARIABLE INSURANCE TRUST CORE FIXED INCOME FUND
Schedule of Investments (continued)
June 30, 2022 (Unaudited)
| Principal Amount | Interest Rate | Maturity Date | Value | |||||||||||
| Corporate Bonds – (continued) | ||||||||||||||
| Media – (continued) | ||||||||||||||
Comcast Corp.(b) – (continued) | ||||||||||||||
| $ | 50,000 | 3.950 | % | 10/15/25 | $ | 50,255 | ||||||||
| 25,000 | 3.300 | 02/01/27 | 24,312 | |||||||||||
| 75,000 | 3.300 | 04/01/27 | 72,625 | |||||||||||
| 225,000 | 3.150 | 02/15/28 | 214,470 | |||||||||||
| 125,000 | 4.150 | 10/15/28 | 124,683 | |||||||||||
| 25,000 | 3.750 | 04/01/40 | 21,927 | |||||||||||
| 25,000 | 4.700 | 10/15/48 | 24,245 | |||||||||||
Fox Corp.(b) | ||||||||||||||
| 25,000 | 4.030 | 01/25/24 | 24,999 | |||||||||||
| 25,000 | 4.709 | 01/25/29 | 24,548 | |||||||||||
Walt Disney Co. (The) | ||||||||||||||
| 25,000 | 3.700 | (b) | 09/15/24 | 25,037 | ||||||||||
|
| |||||||||||||
| 997,467 | ||||||||||||||
|
| |||||||||||||
| Mining – 0.1% | ||||||||||||||
Newmont Corp. | ||||||||||||||
| 75,000 | 2.250 | (b) | 10/01/30 | 62,382 | ||||||||||
|
| |||||||||||||
| Miscellaneous Manufacturing – 0.1% | ||||||||||||||
General Electric Co., MTN | ||||||||||||||
| 50,000 | 6.750 | 03/15/32 | 55,934 | |||||||||||
|
| |||||||||||||
| Oil & Gas – 0.1% | ||||||||||||||
Continental Resources, Inc. | ||||||||||||||
| 31,000 | 4.500 | (b) | 04/15/23 | 31,111 | ||||||||||
Phillips 66 | ||||||||||||||
| 50,000 | 3.700 | 04/06/23 | 50,044 | |||||||||||
| 25,000 | 1.300 | (b) | 02/15/26 | 22,520 | ||||||||||
|
| |||||||||||||
| 103,675 | ||||||||||||||
|
| |||||||||||||
| Packaging & Containers – 0.0% | ||||||||||||||
Berry Global, Inc. | ||||||||||||||
| 50,000 | 1.570 | (b) | 01/15/26 | 44,640 | ||||||||||
|
| |||||||||||||
| Pharmaceuticals – 1.0% | ||||||||||||||
AbbVie, Inc.(b) | ||||||||||||||
| 125,000 | 4.050 | (b) | 11/21/39 | 111,403 | ||||||||||
| 200,000 | 4.250 | 11/21/49 | 177,274 | |||||||||||
Becton Dickinson and Co.(b) | ||||||||||||||
| 12,000 | 3.363 | 06/06/24 | 11,876 | |||||||||||
| 100,000 | 2.823 | 05/20/30 | 87,907 | |||||||||||
Bristol-Myers Squibb Co.(b) | ||||||||||||||
| 75,000 | 2.950 | 03/15/32 | 68,845 | |||||||||||
| 25,000 | 4.250 | 10/26/49 | 23,490 | |||||||||||
Cigna Corp.(b) | ||||||||||||||
| 50,000 | 2.400 | 03/15/30 | 42,931 | |||||||||||
| 75,000 | 4.900 | 12/15/48 | 72,006 | |||||||||||
| 150,000 | 3.400 | 03/15/50 | 114,710 | |||||||||||
CVS Health Corp.(b) | ||||||||||||||
| 25,000 | 2.625 | 08/15/24 | 24,462 | |||||||||||
| 25,000 | 5.125 | 07/20/45 | 24,135 | |||||||||||
Pfizer, Inc. | ||||||||||||||
| 75,000 | 3.450 | (b) | 03/15/29 | 72,948 | ||||||||||
Zoetis, Inc.(b) | ||||||||||||||
| 45,000 | 3.000 | 09/12/27 | 42,455 | |||||||||||
| 150,000 | 2.000 | 05/15/30 | 125,475 | |||||||||||
|
| |||||||||||||
| 999,917 | ||||||||||||||
|
| |||||||||||||
| Corporate Bonds – (continued) | ||||||||||||||
| Pipelines – 0.7% | ||||||||||||||
Energy Transfer L.P.(b) | ||||||||||||||
| 15,000 | 4.250 | 04/01/24 | 14,954 | |||||||||||
| 50,000 | 2.900 | 05/15/25 | 47,573 | |||||||||||
| 25,000 | 5.250 | 04/15/29 | 24,774 | |||||||||||
| 5,000 | 6.000 | 06/15/48 | 4,700 | |||||||||||
Energy Transfer LP, Series 5Y | ||||||||||||||
| 75,000 | 4.200 | (b) | 09/15/23 | 75,001 | ||||||||||
MPLX L.P.(b) | ||||||||||||||
| 75,000 | 2.650 | 08/15/30 | 62,616 | |||||||||||
| 35,000 | 4.500 | 04/15/38 | 30,680 | |||||||||||
| 25,000 | 5.500 | 02/15/49 | 23,220 | |||||||||||
Plains All American Pipeline LP / PAA Finance Corp.(b) | ||||||||||||||
| 35,000 | 3.850 | 10/15/23 | 34,820 | |||||||||||
| 25,000 | 3.800 | 09/15/30 | 22,121 | |||||||||||
Sabine Pass Liquefaction LLC(b) | ||||||||||||||
| 75,000 | 5.625 | 03/01/25 | 76,625 | |||||||||||
| 75,000 | 5.000 | 03/15/27 | 75,311 | |||||||||||
Targa Resources Corp. | ||||||||||||||
| 55,000 | 4.200 | (b) | 02/01/33 | 49,817 | ||||||||||
Western Midstream Operating L.P.(b) | ||||||||||||||
| 75,000 | 3.600 | 02/01/25 | 69,371 | |||||||||||
| 25,000 | 5.450 | 04/01/44 | 20,760 | |||||||||||
| 20,000 | 5.300 | 03/01/48 | 16,130 | |||||||||||
Williams Cos., Inc. (The)(b) | ||||||||||||||
| 25,000 | 3.900 | 01/15/25 | 24,715 | |||||||||||
| 35,000 | 4.000 | 09/15/25 | 34,485 | |||||||||||
|
| |||||||||||||
| 707,673 | ||||||||||||||
|
| |||||||||||||
| Real Estate Investment Trusts – 1.8% | ||||||||||||||
Alexandria Real Estate Equities, Inc. | ||||||||||||||
| 25,000 | 3.375 | (b) | 08/15/31 | 22,063 | ||||||||||
American Campus Communities Operating Partnership L.P. | ||||||||||||||
| 95,000 | 4.125 | (b) | 07/01/24 | 95,371 | ||||||||||
American Homes 4 Rent L.P.(b) | ||||||||||||||
| 50,000 | 4.900 | 02/15/29 | 48,792 | |||||||||||
| 30,000 | 2.375 | 07/15/31 | 23,967 | |||||||||||
American Tower Corp.(b) | ||||||||||||||
| 75,000 | 3.375 | 05/15/24 | 73,878 | |||||||||||
| 100,000 | 2.400 | 03/15/25 | 94,496 | |||||||||||
| 75,000 | 2.100 | 06/15/30 | 59,925 | |||||||||||
Crown Castle International Corp.(b) | ||||||||||||||
| 85,000 | 3.150 | 07/15/23 | 84,049 | |||||||||||
| 60,000 | 3.650 | 09/01/27 | 56,753 | |||||||||||
CubeSmart L.P.(b) | ||||||||||||||
| 45,000 | 4.000 | 11/15/25 | 44,416 | |||||||||||
| 125,000 | 2.500 | 02/15/32 | 101,526 | |||||||||||
Duke Realty L.P. | ||||||||||||||
| 25,000 | 1.750 | (b) | 07/01/30 | 20,408 | ||||||||||
Essex Portfolio L.P. | ||||||||||||||
| 50,000 | 3.000 | 01/15/30 | 44,252 | |||||||||||
Healthcare Realty Trust, Inc. | ||||||||||||||
| 25,000 | 2.050 | (b) | 03/15/31 | 19,603 | ||||||||||
Host Hotels & Resorts L.P., Series J | ||||||||||||||
| 75,000 | 2.900 | (b) | 12/15/31 | 59,533 | ||||||||||
|
| |||||||||||||
| 10 | The accompanying notes are an integral part of these financial statements. |
GOLDMAN SACHS VARIABLE INSURANCE TRUST CORE FIXED INCOME FUND
| Principal Amount | Interest Rate | Maturity Date | Value | |||||||||||
| Corporate Bonds – (continued) | ||||||||||||||
| Real Estate Investment Trusts – (continued) | ||||||||||||||
Invitation Homes Operating Partnership L.P.(b) | ||||||||||||||
| $ | 75,000 | 2.300 | % | 11/15/28 | $ | 63,071 | ||||||||
| 195,000 | 2.000 | 08/15/31 | 150,156 | |||||||||||
Kilroy Realty LP | ||||||||||||||
| 25,000 | 4.750 | (b) | 12/15/28 | 24,516 | ||||||||||
Mid-America Apartments L.P.(b) | ||||||||||||||
| 50,000 | 1.700 | 02/15/31 | 39,550 | |||||||||||
| 100,000 | 2.875 | 09/15/51 | 69,541 | |||||||||||
National Retail Properties, Inc.(b) | ||||||||||||||
| 35,000 | 3.900 | 06/15/24 | 34,927 | |||||||||||
| 45,000 | 4.000 | 11/15/25 | 44,759 | |||||||||||
Realty Income Corp.(b) | ||||||||||||||
| 50,000 | 4.625 | 11/01/25 | 50,684 | |||||||||||
| 25,000 | 3.950 | 08/15/27 | 24,434 | |||||||||||
| 25,000 | 3.400 | 01/15/28 | 23,619 | |||||||||||
| 50,000 | 2.850 | 12/15/32 | 42,849 | |||||||||||
Regency Centers L.P. | ||||||||||||||
| 100,000 | 2.950 | (b) | 09/15/29 | 87,913 | ||||||||||
Spirit Realty L.P. | ||||||||||||||
| 75,000 | 3.400 | (b) | 01/15/30 | 64,779 | ||||||||||
UDR, Inc. | ||||||||||||||
| 25,000 | 2.100 | (b) | 08/01/32 | 19,495 | ||||||||||
UDR, Inc., MTN | ||||||||||||||
| 100,000 | 1.900 | (b) | 03/15/33 | 75,653 | ||||||||||
Ventas Realty L.P. | ||||||||||||||
| 45,000 | 3.500 | (b) | 02/01/25 | 43,943 | ||||||||||
WP Carey, Inc.(b) | ||||||||||||||
| 20,000 | 4.600 | 04/01/24 | 20,113 | |||||||||||
| 30,000 | 4.000 | 02/01/25 | 29,896 | |||||||||||
| 25,000 | 3.850 | 07/15/29 | 23,312 | |||||||||||
| 25,000 | 2.400 | 02/01/31 | 20,419 | |||||||||||
|
| |||||||||||||
| 1,802,661 | ||||||||||||||
|
| |||||||||||||
| REITS – 0.1% | ||||||||||||||
Vici Properties L.P. | ||||||||||||||
| 135,000 | 4.750 | (b) | 02/15/28 | 128,959 | ||||||||||
|
| |||||||||||||
| Retail – 0.9% | ||||||||||||||
7-Eleven, Inc.(d) | ||||||||||||||
| 100,000 | 1.300 | (b) | 02/10/28 | 83,272 | ||||||||||
AutoNation, Inc. | ||||||||||||||
| 25,000 | 1.950 | (b) | 08/01/28 | 20,872 | ||||||||||
Dollar Tree, Inc.(b) | ||||||||||||||
| 50,000 | 4.000 | 05/15/25 | 49,817 | |||||||||||
| 50,000 | 4.200 | 05/15/28 | 48,533 | |||||||||||
Home Depot, Inc. (The) (b) | ||||||||||||||
| 25,000 | 3.900 | 12/06/28 | 25,010 | |||||||||||
| 25,000 | 4.250 | 04/01/46 | 23,543 | |||||||||||
Lowe’s Cos., Inc.(b) | ||||||||||||||
| 75,000 | 1.700 | 09/15/28 | 63,935 | |||||||||||
| 100,000 | 1.700 | 10/15/30 | 80,315 | |||||||||||
| 250,000 | 3.750 | 04/01/32 | 232,007 | |||||||||||
| 25,000 | 3.000 | 10/15/50 | 17,431 | |||||||||||
| 50,000 | 4.250 | 04/01/52 | 43,278 | |||||||||||
McDonald’s Corp., MTN | ||||||||||||||
| 25,000 | 4.200 | (b) | 04/01/50 | 22,469 | ||||||||||
|
| |||||||||||||
| Corporate Bonds – (continued) | ||||||||||||||
| Retail – (continued) | ||||||||||||||
Starbucks Corp. | ||||||||||||||
| 75,000 | 3.800 | (b) | 08/15/25 | 74,832 | ||||||||||
Target Corp. | ||||||||||||||
| 50,000 | 2.950 | (b) | 01/15/52 | 37,819 | ||||||||||
Tractor Supply Co. | ||||||||||||||
| 50,000 | 1.750 | (b) | 11/01/30 | 39,261 | ||||||||||
Walgreens Boots Alliance, Inc. | ||||||||||||||
| 41,000 | 4.100 | (b) | 04/15/50 | 32,353 | ||||||||||
|
| |||||||||||||
| 894,747 | ||||||||||||||
|
| |||||||||||||
| Semiconductors – 0.6% | ||||||||||||||
Applied Materials, Inc. | ||||||||||||||
| 25,000 | 1.750 | (b) | 06/01/30 | 21,034 | ||||||||||
Broadcom, Inc.(b) | ||||||||||||||
| 125,000 | 4.150 | (d) | 04/15/32 | 113,167 | ||||||||||
| 100,000 | 3.419 | (d) | 04/15/33 | 82,667 | ||||||||||
| 199,000 | 3.137 | (d) | 11/15/35 | 152,006 | ||||||||||
| 100,000 | 3.500 | (d) | 02/15/41 | 75,412 | ||||||||||
Intel Corp. | ||||||||||||||
| 75,000 | 3.050 | (b) | 08/12/51 | 55,849 | ||||||||||
Micron Technology, Inc. | ||||||||||||||
| 50,000 | 2.703 | (b) | 04/15/32 | 39,928 | ||||||||||
Skyworks Solutions, Inc. | ||||||||||||||
| 25,000 | 3.000 | (b) | 06/01/31 | 20,370 | ||||||||||
|
| |||||||||||||
| 560,433 | ||||||||||||||
|
| |||||||||||||
| Software – 0.9% | ||||||||||||||
Adobe, Inc.(b) | ||||||||||||||
| 50,000 | 2.150 | 02/01/27 | 46,755 | |||||||||||
| 75,000 | 2.300 | 02/01/30 | 66,282 | |||||||||||
Fiserv, Inc.(b) | ||||||||||||||
| 100,000 | 2.750 | 07/01/24 | 97,617 | |||||||||||
| 25,000 | 4.200 | 10/01/28 | 24,152 | |||||||||||
Intuit, Inc. | ||||||||||||||
| 25,000 | 1.350 | (b) | 07/15/27 | 21,883 | ||||||||||
Oracle Corp.(b) | ||||||||||||||
| 125,000 | 2.875 | 03/25/31 | 102,992 | |||||||||||
| 50,000 | 3.850 | 04/01/60 | 34,498 | |||||||||||
Roper Technologies, Inc. | ||||||||||||||
| 50,000 | 4.200 | (b) | 09/15/28 | 48,924 | ||||||||||
ServiceNow, Inc. | ||||||||||||||
| 125,000 | 1.400 | (b) | 09/01/30 | 97,759 | ||||||||||
Take-Two Interactive Software, Inc. | ||||||||||||||
| 85,000 | 3.700 | (b) | 04/14/27 | 82,473 | ||||||||||
VMware, Inc.(b) | ||||||||||||||
| 25,000 | 1.800 | 08/15/28 | 20,770 | |||||||||||
| 100,000 | 2.200 | 08/15/31 | 78,660 | |||||||||||
Workday, Inc.(b) | ||||||||||||||
| 75,000 | 3.500 | 04/01/27 | 71,852 | |||||||||||
| 50,000 | 3.700 | 04/01/29 | 46,864 | |||||||||||
| 25,000 | 3.800 | 04/01/32 | 22,860 | |||||||||||
|
| |||||||||||||
| 864,341 | ||||||||||||||
|
| |||||||||||||
| The accompanying notes are an integral part of these financial statements. | 11 |
GOLDMAN SACHS VARIABLE INSURANCE TRUST CORE FIXED INCOME FUND
Schedule of Investments (continued)
June 30, 2022 (Unaudited)
| Principal Amount | Interest Rate | Maturity Date | Value | |||||||||||
| Corporate Bonds – (continued) | ||||||||||||||
| Telecommunications – 2.2% | ||||||||||||||
AT&T, Inc.(b) | ||||||||||||||
| $ | 288,000 | 2.300 | % | 06/01/27 | $ | 263,032 | ||||||||
| 150,000 | 4.350 | 03/01/29 | 147,825 | |||||||||||
| 50,000 | 2.750 | 06/01/31 | 43,210 | |||||||||||
| 128,000 | 2.550 | 12/01/33 | 103,810 | |||||||||||
| 25,000 | 4.900 | 08/15/37 | 24,775 | |||||||||||
| 60,000 | 4.850 | 03/01/39 | 57,245 | |||||||||||
| 75,000 | 3.500 | 06/01/41 | 59,948 | |||||||||||
| 25,000 | 4.350 | 06/15/45 | 21,818 | |||||||||||
| 25,000 | 5.150 | 11/15/46 | 24,680 | |||||||||||
| 25,000 | 4.500 | 03/09/48 | 22,238 | |||||||||||
| 25,000 | 3.650 | 06/01/51 | 19,541 | |||||||||||
| 25,000 | 3.500 | 09/15/53 | 18,959 | |||||||||||
T-Mobile USA, Inc.(b) | ||||||||||||||
| 75,000 | 3.500 | 04/15/25 | 73,432 | |||||||||||
| 75,000 | 1.500 | 02/15/26 | 67,837 | |||||||||||
| 150,000 | 3.750 | 04/15/27 | 144,297 | |||||||||||
| 175,000 | 2.050 | 02/15/28 | 152,086 | |||||||||||
| 100,000 | 3.875 | 04/15/30 | 93,363 | |||||||||||
| 75,000 | 2.875 | 02/15/31 | 62,260 | |||||||||||
| 75,000 | 3.500 | 04/15/31 | 64,932 | |||||||||||
| 25,000 | 3.000 | 02/15/41 | 18,573 | |||||||||||
Verizon Communications, Inc. | ||||||||||||||
| 145,000 | 4.329 | 09/21/28 | 144,313 | |||||||||||
| 200,000 | 3.875 | (b) | 02/08/29 | 193,366 | ||||||||||
| 50,000 | 3.150 | (b) | 03/22/30 | 45,455 | ||||||||||
| 125,000 | 2.550 | (b) | 03/21/31 | 106,902 | ||||||||||
| 153,000 | 2.355 | (b) | 03/15/32 | 126,922 | ||||||||||
| 50,000 | 4.862 | 08/21/46 | 49,273 | |||||||||||
| 90,000 | 2.987 | (b) | 10/30/56 | 62,513 | ||||||||||
|
| |||||||||||||
| 2,212,605 | ||||||||||||||
|
| |||||||||||||
| Transportation – 0.2% | ||||||||||||||
Burlington Northern Santa Fe LLC | ||||||||||||||
| 25,000 | 4.050 | (b) | 06/15/48 | 22,824 | ||||||||||
FedEx Corp.(b) | ||||||||||||||
| 45,000 | 3.400 | 02/15/28 | 42,962 | |||||||||||
| 75,000 | 5.250 | 05/15/50 | 74,851 | |||||||||||
Union Pacific Corp. | ||||||||||||||
| 125,000 | 2.800 | (b) | 02/14/32 | 111,160 | ||||||||||
|
| |||||||||||||
| 251,797 | ||||||||||||||
|
| |||||||||||||
| TOTAL CORPORATE BONDS | ||||||||||||||
| (Cost $26,809,087) | $ | 24,138,624 | ||||||||||||
|
| |||||||||||||
| Foreign Bonds – 6.6% | ||||||||||||||
| Agriculture – 0.1% | ||||||||||||||
BAT Capital Corp. (United Kingdom)(b) | ||||||||||||||
| $ | 25,000 | 3.222 | % | 08/15/24 | $ | 24,318 | ||||||||
| 100,000 | 2.259 | 03/25/28 | 83,689 | |||||||||||
| 25,000 | 4.540 | 08/15/47 | 18,370 | |||||||||||
|
| |||||||||||||
| 126,377 | ||||||||||||||
|
| |||||||||||||
| Foreign Bonds – (continued) | ||||||||||||||
| Banks – 2.7% | ||||||||||||||
Banco Santander SA (Spain) | ||||||||||||||
| 200,000 | 2.746 | 05/28/25 | 189,717 | |||||||||||
Barclays PLC(c) (United Kingdom) | ||||||||||||||
(SOFR + 2.71%) | ||||||||||||||
| 200,000 | 2.852 | (b) | 05/07/26 | 188,900 | ||||||||||
BNP Paribas SA (France) | ||||||||||||||
| 200,000 | 3.375 | (b)(d) | 01/09/25 | 195,445 | ||||||||||
(SOFR + 1.00%) | ||||||||||||||
| 200,000 | 1.323 | (c)(d) | 01/13/27 | 176,620 | ||||||||||
BPCE SA(c)(d) (France) | ||||||||||||||
(SOFR + 1.73%) | ||||||||||||||
| 250,000 | 3.116 | (b) | 10/19/32 | 201,237 | ||||||||||
Credit Suisse AG (Switzerland) | ||||||||||||||
| 250,000 | 1.250 | 08/07/26 | 218,617 | |||||||||||
Credit Suisse Group AG (Switzerland) | ||||||||||||||
| 250,000 | 4.550 | 04/17/26 | 244,125 | |||||||||||
Deutsche Bank AG(c) (Germany) | ||||||||||||||
(SOFR + 2.16%) | ||||||||||||||
| 150,000 | 2.222 | (b) | 09/18/24 | 144,955 | ||||||||||
HSBC Holdings PLC(c) (United Kingdom) | ||||||||||||||
(SOFR + 1.54%) | ||||||||||||||
| 200,000 | 1.645 | (b) | 04/18/26 | 183,468 | ||||||||||
ING Groep NV(c)(d) (Netherlands) | ||||||||||||||
(US 1 Year CMT T-Note + 1.10%) | ||||||||||||||
| 200,000 | 1.400 | (b) | 07/01/26 | 181,556 | ||||||||||
Macquarie Bank Ltd.(c)(d) (Australia) | ||||||||||||||
| | (US Treasury Yield Curve Rate T-Note Constant Maturity + | | ||||||||||||
| 200,000 | 3.052 | (b) | 03/03/36 | 160,480 | ||||||||||
Macquarie Group Ltd.(c)(d) (Australia) | ||||||||||||||
(SOFR + 1.07%) | ||||||||||||||
| 50,000 | 1.340 | (b) | 01/12/27 | 44,068 | ||||||||||
NatWest Group PLC (United Kingdom) | ||||||||||||||
| 200,000 | 3.875 | 09/12/23 | 199,495 | |||||||||||
Toronto-Dominion Bank (The) (Canada) | ||||||||||||||
| 175,000 | 4.456 | 06/08/32 | 173,045 | |||||||||||
UBS Group AG(c)(d) (Switzerland) | ||||||||||||||
(US 1 Year CMT T-Note + 1.10%) | ||||||||||||||
| 200,000 | 2.746 | (b) | 02/11/33 | 162,777 | ||||||||||
Westpac Banking Corp.(c) (Australia) | ||||||||||||||
| | (US Treasury Yield Curve Rate T-Note Constant Maturity + | | ||||||||||||
| 25,000 | 4.110 | (b) | 07/24/34 | 22,872 | ||||||||||
Westpac Banking Corp.(c), GMTN (Australia) | ||||||||||||||
(US 5 Year Swap + 2.24%) | ||||||||||||||
| 25,000 | 4.322 | (b) | 11/23/31 | 24,078 | ||||||||||
|
| |||||||||||||
| 2,711,455 | ||||||||||||||
|
| |||||||||||||
| Beverages – 0.7% | ||||||||||||||
| | Anheuser-Busch Cos. LLC / Anheuser-Busch InBev Worldwide, | | ||||||||||||
| 35,000 | 4.700 | 02/01/36 | 33,597 | |||||||||||
| 210,000 | 4.900 | 02/01/46 | 198,066 | |||||||||||
|
| |||||||||||||
| 12 | The accompanying notes are an integral part of these financial statements. |
GOLDMAN SACHS VARIABLE INSURANCE TRUST CORE FIXED INCOME FUND
| Principal Amount | Interest Rate | Maturity Date | Value | |||||||||||
| Foreign Bonds – (continued) | ||||||||||||||
| Beverages – (continued) | ||||||||||||||
Anheuser-Busch InBev Worldwide, Inc. (Belgium)(b) | ||||||||||||||
| $ | 175,000 | 4.750 | % | 01/23/29 | $ | 178,336 | ||||||||
| 25,000 | 4.950 | 01/15/42 | 23,826 | |||||||||||
| 100,000 | 4.600 | 04/15/48 | 90,040 | |||||||||||
| 25,000 | 5.550 | 01/23/49 | 25,547 | |||||||||||
| 25,000 | 4.500 | 06/01/50 | 22,461 | |||||||||||
JDE Peet’s NV(d) (Netherlands) | ||||||||||||||
| 150,000 | 1.375 | (b) | 01/15/27 | 129,132 | ||||||||||
|
| |||||||||||||
| 701,005 | ||||||||||||||
|
| |||||||||||||
| Biotechnology – 0.1% | ||||||||||||||
CSL Finance PLC (Australia)(b) | ||||||||||||||
| 25,000 | 3.850 | (d) | 04/27/27 | 24,784 | ||||||||||
| 75,000 | 4.250 | (d) | 04/27/32 | 73,333 | ||||||||||
|
| |||||||||||||
| 98,117 | ||||||||||||||
|
| |||||||||||||
| Commercial Services – 0.2% | ||||||||||||||
DP World Crescent Ltd., Series E (United Arab Emirates) | ||||||||||||||
| 200,000 | 3.875 | 07/18/29 | 185,000 | |||||||||||
|
| |||||||||||||
| Diversified Financial Services – 0.7% | ||||||||||||||
| | AerCap Ireland Capital DAC / AerCap Global Aviation Trust | | ||||||||||||
| 250,000 | 2.450 | 10/29/26 | 217,638 | |||||||||||
| 225,000 | 3.000 | 10/29/28 | 189,287 | |||||||||||
| 150,000 | 3.300 | 01/30/32 | 119,537 | |||||||||||
Avolon Holdings Funding Ltd. (Ireland)(b) | ||||||||||||||
| 25,000 | 3.950 | (d) | 07/01/24 | 24,094 | ||||||||||
| 100,000 | 2.875 | (d) | 02/15/25 | 92,102 | ||||||||||
| 25,000 | 4.250 | (d) | 04/15/26 | 23,272 | ||||||||||
|
| |||||||||||||
| 665,930 | ||||||||||||||
|
| |||||||||||||
| Electric – 0.2% | ||||||||||||||
Enel Finance International NV(d) (Italy) | ||||||||||||||
| 200,000 | 1.875 | (b) | 07/12/28 | 168,236 | ||||||||||
|
| |||||||||||||
| Engineering & Construction – 0.1% | ||||||||||||||
Cellnex Finance Co. SA, Series E (Spain) | ||||||||||||||
| 100,000 | 1.250 | 01/15/29 | 78,113 | |||||||||||
|
| |||||||||||||
| Internet – 0.2% | ||||||||||||||
Tencent Holdings Ltd. (China) | ||||||||||||||
| 200,000 | 3.595 | (b) | 01/19/28 | 190,256 | ||||||||||
|
| |||||||||||||
| Machinery-Construction & Mining – 0.2% | ||||||||||||||
Weir Group PLC (The)(d) (United Kingdom) | ||||||||||||||
| 200,000 | 2.200 | (b) | 05/13/26 | 175,237 | ||||||||||
|
| |||||||||||||
| Mining – 0.3% | ||||||||||||||
Glencore Funding LLC (Australia)(b) | ||||||||||||||
| 75,000 | 4.125 | (d) | 03/12/24 | 74,618 | ||||||||||
| 25,000 | 4.625 | (d) | 04/29/24 | 25,048 | ||||||||||
| 75,000 | 1.625 | (d) | 04/27/26 | 66,678 | ||||||||||
| 150,000 | 2.625 | (d) | 09/23/31 | 120,966 | ||||||||||
Newcrest Finance Pty Ltd.(d) (Australia) | ||||||||||||||
| 25,000 | 3.250 | (b) | 05/13/30 | 22,053 | ||||||||||
Teck Resources Ltd. (Canada) | ||||||||||||||
| 25,000 | 3.900 | (b) | 07/15/30 | 22,993 | ||||||||||
|
| |||||||||||||
| 332,356 | ||||||||||||||
|
| |||||||||||||
| Foreign Bonds – (continued) | ||||||||||||||
| Oil & Gas – 0.4% | ||||||||||||||
Saudi Arabian Oil Co. (Saudi Arabia) | ||||||||||||||
| 480,000 | 3.500 | 04/16/29 | 457,800 | |||||||||||
|
| |||||||||||||
| Pharmaceuticals – 0.2% | ||||||||||||||
Bayer US Finance II LLC(d) (Germany) | ||||||||||||||
| 200,000 | 3.875 | (b) | 12/15/23 | 199,567 | ||||||||||
|
| |||||||||||||
| Pipelines – 0.2% | ||||||||||||||
Enbridge, Inc. (Canada) | ||||||||||||||
| 125,000 | 2.500 | (b) | 08/01/33 | 101,086 | ||||||||||
Galaxy Pipeline Assets Bidco Ltd. (United Arab Emirates) | ||||||||||||||
| 196,522 | 2.940 | 09/30/40 | 159,920 | |||||||||||
|
| |||||||||||||
| 261,006 | ||||||||||||||
|
| |||||||||||||
| Semiconductors – 0.2% | ||||||||||||||
NXP BV / NXP Funding LLC / NXP USA, Inc. (China)(b) | ||||||||||||||
| 25,000 | 3.400 | 05/01/30 | 22,271 | |||||||||||
| 125,000 | 2.500 | 05/11/31 | 102,790 | |||||||||||
| 125,000 | 2.650 | 02/15/32 | 102,732 | |||||||||||
|
| |||||||||||||
| 227,793 | ||||||||||||||
|
| |||||||||||||
| Transportation – 0.1% | ||||||||||||||
Canadian Pacific Railway Co. (Canada)(b) | ||||||||||||||
| 25,000 | 2.050 | 03/05/30 | 21,161 | |||||||||||
| 50,000 | 2.450 | 12/02/31 | 42,897 | |||||||||||
|
| |||||||||||||
| 64,058 | ||||||||||||||
|
| |||||||||||||
| TOTAL FOREIGN BONDS | ||||||||||||||
| (Cost $7,436,053) | $ | 6,642,306 | ||||||||||||
|
| |||||||||||||
| Asset-Backed Securities – 4.1% | ||||||||||||||
| Collateralized Loan Obligations – 3.9% | ||||||||||||||
Cathedral Lake VI Ltd., Series 2021-6A, Class B(c)(d) | ||||||||||||||
(3 Mo. LIBOR + 1.950%) (Cayman Islands) | ||||||||||||||
| $ | 300,000 | 3.134 | % | 04/25/34 | $ | 282,439 | ||||||||
Cathedral Lake VIII Ltd., Series 2021-8A, Class C(c)(d) | ||||||||||||||
(3 Mo. LIBOR + 2.620%) (Cayman Islands) | ||||||||||||||
| 200,000 | 3.683 | 01/20/35 | 184,904 | |||||||||||
CBAM Ltd., Series 2018-5A, Class A(c)(d) | ||||||||||||||
(3 Mo. LIBOR + 1.020%) (Cayman Islands) | ||||||||||||||
| 525,000 | 2.064 | 04/17/31 | 513,730 | |||||||||||
CFIP CLO Ltd., Series 2021-1A, Class A(c)(d) | ||||||||||||||
(3 Mo. LIBOR + 1.220%) (Cayman Islands) | ||||||||||||||
| 700,000 | 2.283 | 01/20/35 | 668,631 | |||||||||||
CFIP CLO Ltd., Series 2021-1A, Class C1(c)(d) | ||||||||||||||
(3 Mo. LIBOR + 2.400%) (Cayman Islands) | ||||||||||||||
| 300,000 | 3.463 | 01/20/35 | 275,143 | |||||||||||
Crown City CLO I, Series 2020-1A, Class A1AR(c)(d) | ||||||||||||||
(3 Mo. LIBOR + 1.190%) (Cayman Islands) | ||||||||||||||
| 250,000 | 2.253 | 07/20/34 | 240,337 | |||||||||||
Diameter Capital CLO 1 Ltd., Series 2021-1A, Class A1A(c)(d) | ||||||||||||||
(3 Mo. LIBOR + 1.240%) | ||||||||||||||
| 425,000 | 2.284 | 07/15/36 | 409,358 | |||||||||||
|
| |||||||||||||
| The accompanying notes are an integral part of these financial statements. | 13 |
GOLDMAN SACHS VARIABLE INSURANCE TRUST CORE FIXED INCOME FUND
Schedule of Investments (continued)
June 30, 2022 (Unaudited)
| Principal Amount | Interest Rate | Maturity Date | Value | |||||||||||
| Asset-Backed Securities – (continued) | ||||||||||||||
| Collateralized Loan Obligations – (continued) | ||||||||||||||
HalseyPoint CLO 3 Ltd., Series 2020-3A, Class A1A(c)(d) | ||||||||||||||
(3 Mo. LIBOR + 1.450%) (Cayman Islands) | ||||||||||||||
| $ | 250,000 | 2.736 | % | 11/30/32 | $ | 245,871 | ||||||||
Jamestown CLO XV Ltd., Series 2020-15A, Class A(c)(d) | ||||||||||||||
(3 Mo. LIBOR + 1.340%) (Cayman Islands) | ||||||||||||||
| 300,000 | 2.384 | 04/15/33 | 292,958 | |||||||||||
Marble Point CLO XVII Ltd., Series 2020-1A, Class A(c)(d) | ||||||||||||||
(3 Mo. LIBOR + 1.300%) (Cayman Islands) | ||||||||||||||
| 500,000 | 2.363 | 04/20/33 | 486,115 | |||||||||||
Venture 39 CLO Ltd., Series 2020-39A, Class A1(c)(d) | ||||||||||||||
(3 Mo. LIBOR + 1.280%) (Cayman Islands) | ||||||||||||||
| 275,000 | 2.324 | 04/15/33 | 265,942 | |||||||||||
|
| |||||||||||||
| 3,865,428 | ||||||||||||||
|
| |||||||||||||
| Collateralized Debt Obligations – 0.2% | ||||||||||||||
| | Arbor Realty Commercial Real Estate Notes Ltd., | | ||||||||||||
(SOFR + 1.450%) (Cayman Islands) | ||||||||||||||
| 250,000 | 2.229 | 01/15/37 | 243,740 | |||||||||||
|
| |||||||||||||
| Home Equity – 0.0% | ||||||||||||||
| | GMACM Home Equity Loan Trust, Series 2007-HE3, | | ||||||||||||
| 21,602 | 7.000 | 09/25/37 | 21,284 | |||||||||||
|
| |||||||||||||
| TOTAL ASSET-BACKED SECURITIES | ||||||||||||||
| (Cost $4,293,392) | $ | 4,130,452 | ||||||||||||
|
| |||||||||||||
| U.S. Government Agency Securities – 2.5% | ||||||||||||||
Federal Farm Credit Banks Funding Corp. | ||||||||||||||
| $ | 460,000 | 2.900 | %(f) | 04/12/32 | $ | 439,868 | ||||||||
| 230,000 | 3.300 | (f) | 05/19/32 | 227,646 | ||||||||||
| 600,000 | 2.850 | (f) | 03/28/34 | 554,931 | ||||||||||
| 340,000 | 3.080 | (f) | 03/30/37 | 308,760 | ||||||||||
Federal Home Loan Banks | ||||||||||||||
| 100,000 | 3.375 | (f) | 12/08/23 | 100,478 | ||||||||||
Federal National Mortgage Associations | ||||||||||||||
| 400,000 | 1.875 | (f) | 09/24/26 | 380,911 | ||||||||||
| 400,000 | 6.250 | (f) | 05/15/29 | 474,486 | ||||||||||
|
| |||||||||||||
| TOTAL U.S. GOVERNMENT AGENCY SECURITIES | ||||||||||||||
| (Cost $2,607,838) | $ | 2,487,080 | ||||||||||||
|
| |||||||||||||
| Foreign Government Securities – 1.9% | ||||||||||||||
| Sovereign – 1.9% | ||||||||||||||
Abu Dhabi Government International Bond(d) | ||||||||||||||
| $ | 220,000 | 3.125 | % | 10/11/27 | $ | 214,748 | ||||||||
Hungary Government International Bond(d) | ||||||||||||||
| 200,000 | 5.500 | 06/16/34 | 193,863 | |||||||||||
Indonesia Government International Bond | ||||||||||||||
| 200,000 | 3.050 | 03/12/51 | 151,772 | |||||||||||
Israel Government AID Bond(g) | ||||||||||||||
| 200,000 | 5.500 | 12/04/23 | 206,660 | |||||||||||
| 100,000 | 5.500 | 04/26/24 | 104,028 | |||||||||||
|
| |||||||||||||
| Foreign Government Securities – (continued) | ||||||||||||||
| Sovereign – (continued) | ||||||||||||||
Israel Government International Bond | ||||||||||||||
| 200,000 | 3.250 | 01/17/28 | 195,225 | |||||||||||
Mexico Government International Bond | ||||||||||||||
| 400,000 | 3.250 | (b) | 04/16/30 | 351,825 | ||||||||||
| 110,000 | 1.450 | 10/25/33 | 78,408 | |||||||||||
| 200,000 | 4.280 | (b) | 08/14/41 | 158,089 | ||||||||||
Peruvian Government International Bond(b) | ||||||||||||||
| 50,000 | 3.230 | 07/28/21 | 30,744 | |||||||||||
Romanian Government International Bond(d) | ||||||||||||||
| 120,000 | 3.000 | 02/27/27 | 106,017 | |||||||||||
| 10,000 | 2.124 | 07/16/31 | 7,400 | |||||||||||
| 30,000 | 2.625 | 12/02/40 | 18,191 | |||||||||||
| 10,000 | 4.625 | 04/03/49 | 7,419 | |||||||||||
Romanian Government International Bond, Series E | ||||||||||||||
| 70,000 | 2.875 | 03/11/29 | 60,336 | |||||||||||
Uruguay Government International Bond | ||||||||||||||
| 50,000 | 4.375 | (b) | 01/23/31 | 50,634 | ||||||||||
|
| |||||||||||||
| 1,935,359 | ||||||||||||||
|
| |||||||||||||
| TOTAL FOREIGN GOVERNMENT SECURITIES | ||||||||||||||
| (Cost $2,234,317) | $ | 1,935,359 | ||||||||||||
|
| |||||||||||||
| Municipal Bonds – 1.4% | ||||||||||||||
| Arizona – 0.0% | ||||||||||||||
City of Tucson AZ | ||||||||||||||
| $ | 25,000 | 1.932 | %(b) | 07/01/31 | $ | 20,806 | ||||||||
|
| |||||||||||||
| California – 0.7% | ||||||||||||||
Bay Area Toll Authority | ||||||||||||||
| 30,000 | 1.633 | (b) | 04/01/28 | 26,671 | ||||||||||
California Health Facilities Financing Authority(b) | ||||||||||||||
| 125,000 | 3.478 | 06/01/29 | 120,523 | |||||||||||
| 100,000 | 3.790 | 06/01/32 | 95,723 | |||||||||||
California Statewide Communities Development Authority | ||||||||||||||
| 50,000 | 1.877 | 02/01/31 | 40,376 | |||||||||||
Municipal Improvement Corp. of Los Angeles(b) | ||||||||||||||
| 35,000 | 1.648 | 11/01/28 | 30,460 | |||||||||||
| 80,000 | 2.074 | 11/01/30 | 67,859 | |||||||||||
Port of Oakland | ||||||||||||||
| 80,000 | 2.199 | (b) | 05/01/31 | 67,579 | ||||||||||
San Francisco Municipal Transportation Agency | ||||||||||||||
| 30,000 | 1.302 | 03/01/28 | 26,033 | |||||||||||
San Jose Financing Authority(b) | ||||||||||||||
| 25,000 | 1.812 | 06/01/29 | 21,606 | |||||||||||
| 25,000 | 1.862 | 06/01/30 | 21,149 | |||||||||||
State of California | ||||||||||||||
| 105,000 | 7.625 | (b) | 03/01/40 | 141,925 | ||||||||||
|
| |||||||||||||
| 659,904 | ||||||||||||||
|
| |||||||||||||
| Florida – 0.1% | ||||||||||||||
State Board of Administration Finance Corp. | ||||||||||||||
| 70,000 | 2.154 | (b) | 07/01/30 | 60,811 | ||||||||||
|
| |||||||||||||
| 14 | The accompanying notes are an integral part of these financial statements. |
GOLDMAN SACHS VARIABLE INSURANCE TRUST CORE FIXED INCOME FUND
| Principal Amount | Interest Rate | Maturity Date | Value | |||||||||||
| Municipal Bonds – (continued) | ||||||||||||||
| Illinois – 0.2% | ||||||||||||||
Chicago O’Hare International Airport | ||||||||||||||
| $ | 85,000 | 2.346 | % (b) | 01/01/30 | $ | 74,367 | ||||||||
State of Illinois GO Bonds | ||||||||||||||
| 25,000 | 5.100 | 06/01/33 | 25,152 | |||||||||||
| 100,000 | 7.350 | (b) | 07/01/35 | 109,080 | ||||||||||
|
| |||||||||||||
| 208,599 | ||||||||||||||
|
| |||||||||||||
| Louisiana – 0.2% | ||||||||||||||
City of New Orleans LA Water System Revenue | ||||||||||||||
| 25,000 | 1.008 | (b) | 12/01/26 | 21,751 | ||||||||||
| | Louisiana Local Government Environmental Facilities & | | ||||||||||||
| 140,000 | 4.275 | 02/01/36 | 139,220 | |||||||||||
|
| |||||||||||||
| 160,971 | ||||||||||||||
|
| |||||||||||||
| New York – 0.0% | ||||||||||||||
City of New York NY | ||||||||||||||
| 40,000 | 1.940 | (b) | 03/01/29 | 35,184 | ||||||||||
Metropolitan Transportation Authority | ||||||||||||||
| 25,000 | 5.989 | (b) | 11/15/30 | 27,413 | ||||||||||
| | New York City Transitional Finance Authority Future Tax | | ||||||||||||
| 10,000 | 3.590 | (b) | 08/01/27 | 9,905 | ||||||||||
|
| |||||||||||||
| 72,502 | ||||||||||||||
|
| |||||||||||||
| Ohio – 0.1% | ||||||||||||||
American Municipal Power, Inc. | ||||||||||||||
| 100,000 | 6.270 | (b) | 02/15/50 | 115,514 | ||||||||||
|
| |||||||||||||
| Texas – 0.1% | ||||||||||||||
City of Houston TX Airport System Revenue | ||||||||||||||
| 30,000 | 2.235 | 07/01/29 | 26,484 | |||||||||||
| 40,000 | 2.285 | 07/01/30 | 34,725 | |||||||||||
|
| |||||||||||||
| 61,209 | ||||||||||||||
|
| |||||||||||||
| TOTAL MUNICIPAL BONDS | ||||||||||||||
| (Cost $1,414,454) | $ | 1,360,316 | ||||||||||||
|
| |||||||||||||
| Commercial Mortgage-Backed Securities – 1.2% | ||||||||||||||
3650R Commercial Mortgage Trust Series 2021-PF1, Class AS | ||||||||||||||
| $ | 150,000 | 2.778 | % | 11/15/54 | $ | 126,587 | ||||||||
| | Banc of America Commercial Mortgage Trust Series 2016-UB10, | | ||||||||||||
| 100,000 | 3.000 | 07/15/49 | 84,831 | |||||||||||
BANK Series 2019-BN21, Class A5 | ||||||||||||||
| 150,000 | 2.851 | 10/17/52 | 136,526 | |||||||||||
BANK Series 2021-BN32, Class A5 | ||||||||||||||
| 150,000 | 2.643 | 04/15/54 | 132,187 | |||||||||||
| | BX Trust Series 2021-ARIA, Class C(c) (1 Mo. LIBOR + | | ||||||||||||
| 150,000 | 2.970 | 10/15/36 | 140,336 | |||||||||||
| | Cantor Commercial Real Estate Lending Series 2019-CF3, | | ||||||||||||
| 100,000 | 3.006 | 01/15/53 | 91,168 | |||||||||||
|
| |||||||||||||
| Commercial Mortgage-Backed Securities – (continued) | ||||||||||||||
DOLP Trust Series 2021-NYC, Class A(d) | ||||||||||||||
| 200,000 | 2.956 | 05/10/41 | 172,983 | |||||||||||
| | EQUS Mortgage Trust Series 2021-EQAZ, Class A(c) (1 Mo. | | ||||||||||||
| 200,000 | 2.079 | 10/15/38 | 191,211 | |||||||||||
| | Taubman Centers Commercial Mortgage Trust 2022-Dpm | | ||||||||||||
| 150,000 | 3.465 | 05/15/37 | 142,886 | |||||||||||
|
| |||||||||||||
| TOTAL COMMERCIAL MORTGAGE-BACKED SECURITIES | ||||||||||||||
| (Cost $1,366,043) | $ | 1,218,715 | ||||||||||||
|
| |||||||||||||
| Collateralized Mortgage Obligations – 0.6% | ||||||||||||||
| | Alternative Loan Trust Series 2005-38, Class A1(c) (1 Year CMT | | ||||||||||||
| $ | 45,286 | 1.976 | % | 09/25/35 | $ | 41,430 | ||||||||
| | Connecticut Avenue Securities Trust Series 2021-R01, | | ||||||||||||
| 44,000 | 2.476 | 10/25/41 | 41,544 | |||||||||||
| | Connecticut Avenue Securities Trust Series 2021-R03, | | ||||||||||||
| 42,000 | 2.576 | 12/25/41 | 37,616 | |||||||||||
| | Connecticut Avenue Securities Trust 2022-R05 Series 2022-R05, | | ||||||||||||
| 50,004 | 2.826 | 04/25/42 | 49,701 | |||||||||||
| | Connecticut Avenue Securities Trust 2022-R05 Series 2022-R05, | | ||||||||||||
| 36,000 | 3.926 | 04/25/42 | 34,088 | |||||||||||
| | Federal Home Loan Mortgage Corporation Series 2020-DNA5, | | ||||||||||||
| 17,732 | 3.726 | 10/25/50 | 17,771 | |||||||||||
| | Federal Home Loan Mortgage Corporation Series 2021-DNA5, | | ||||||||||||
| 28,344 | 2.576 | 01/25/34 | 27,337 | |||||||||||
| | Federal Home Loan Mortgage Corporation Series 2022-DNA1, | | ||||||||||||
| 100,000 | 1.926 | 01/25/42 | 96,481 | |||||||||||
| | Federal Home Loan Mortgage Corporation Series 2022-DNA3, | | ||||||||||||
| 40,016 | 2.926 | 04/25/42 | 39,182 | |||||||||||
JPMorgan Mortgage Trust Series 2021-6, Class A3(c)(d) | ||||||||||||||
| 96,888 | 2.500 | 10/25/51 | 82,752 | |||||||||||
| | Lehman XS Trust Series 2005-7N, Class 1A1A(c) (1 Mo. LIBOR | | ||||||||||||
| 84,000 | 2.164 | 12/25/35 | 77,974 | |||||||||||
| | London Wall Mortgage Capital PLC Series 2017-FL1, Class A(c) | | ||||||||||||
| 11,562 | 1.571 | 11/15/49 | 14,068 | |||||||||||
| | Wells Fargo Mortgage Backed Securities Trust Series 2019-3, | | ||||||||||||
| 7,120 | 3.500 | 07/25/49 | 6,976 | |||||||||||
|
| |||||||||||||
| TOTAL COLLATERALIZED MORTGAGE OBLIGATIONS | ||||||||||||||
| (Cost $580,330) | $ | 566,920 | ||||||||||||
|
| |||||||||||||
| The accompanying notes are an integral part of these financial statements. | 15 |
GOLDMAN SACHS VARIABLE INSURANCE TRUST CORE FIXED INCOME FUND
Schedule of Investments (continued)
June 30, 2022 (Unaudited)
| Principal Amount | Interest Rate | Maturity Date | Value | |||||||||||
| U.S. Treasury Obligations – 28.9% | ||||||||||||||
U.S. Treasury Bonds | ||||||||||||||
| $ | 1,640,000 | 3.125 | %(f) | 11/15/41 | $ | 1,573,375 | ||||||||
| 1,550,000 | 2.750 | (f) | 08/15/42 | 1,388,945 | ||||||||||
| 2,310,000 | 2.750 | (f) | 11/15/42 | 2,066,728 | ||||||||||
| 2,930,000 | 2.375 | (f) | 11/15/49 | 2,474,019 | ||||||||||
| 3,200,000 | 2.000 | (f) | 02/15/50 | 2,480,000 | ||||||||||
U.S. Treasury Notes | ||||||||||||||
| 2,945,000 | 0.125 | (f) | 01/31/23 | 2,903,011 | ||||||||||
| 720,000 | 0.125 | (f) | 03/31/23 | 705,937 | ||||||||||
| 1,030,000 | 0.375 | (f) | 12/31/25 | 938,507 | ||||||||||
| 4,050,000 | 0.750 | (f) | 03/31/26 | 3,719,988 | ||||||||||
| 3,830,000 | 0.750 | (f) | 04/30/26 | 3,510,734 | ||||||||||
| 1,720,000 | 0.625 | (f) | 07/31/26 | 1,559,691 | ||||||||||
| 1,150,000 | 3.250 | (f) | 06/30/27 | 1,161,320 | ||||||||||
| 630,000 | 1.250 | (f) | 03/31/28 | 569,166 | ||||||||||
| 970,000 | 2.875 | (f) | 05/15/28 | 958,633 | ||||||||||
| 1,180,000 | 1.250 | (f) | 06/30/28 | 1,061,447 | ||||||||||
| 780,000 | 3.125 | (f) | 11/15/28 | 781,523 | ||||||||||
| 1,160,000 | 3.250 | (f) | 06/30/29 | 1,173,775 | ||||||||||
|
| |||||||||||||
| TOTAL U.S. TREASURY OBLIGATIONS | ||||||||||||||
| (Cost $32,241,907) | $ | 29,026,799 | ||||||||||||
|
| |||||||||||||
| Shares | Dividend Rate | Value | ||||||||||||
| Investment Company – 3.8%(h) | ||||||||||||||
| | Goldman Sachs Financial Square Government Fund – | | ||||||||||||
| 3,764,134 | 1.367% | $ | 3,764,134 | |||||||||||
| (Cost $3,764,134) | ||||||||||||||
|
| |||||||||||||
| Principal Amount | Interest Rate | Maturity Date | Value | |||||||||||
| Short-Term Investments(d) – 8.6% | ||||||||||||||
| Certificate of Deposits – 1.7% | ||||||||||||||
Cooeperatieve Rabobank U.A. | ||||||||||||||
| $ | 988,000 | 1.500 | %(f) | 10/17/22 | $ | 985,777 | ||||||||
Versailles Commercial Paper LLC (SOFR + 0.43%) | ||||||||||||||
| 770,000 | 0.100 | (f) | 10/28/22 | 770,000 | ||||||||||
|
| |||||||||||||
| Commercial Paper – 6.9% | ||||||||||||||
AT&T, Inc. | ||||||||||||||
| 800,000 | 0.932 | 08/16/22 | 797,744 | |||||||||||
Banque et Caisse d’Epargne de l’Etat | ||||||||||||||
| 500,000 | 0.915 | 07/01/22 | 499,980 | |||||||||||
BASF SE | ||||||||||||||
| 494,000 | 1.738 | 09/06/22 | 492,049 | |||||||||||
BNZ International Funding Ltd.(c) (SOFR + 0.700%)(d) | ||||||||||||||
| 501,000 | 1.461 | 09/09/22 | 501,344 | |||||||||||
Liberty Street Funding LLC | ||||||||||||||
| 1,401,000 | 2.553 | 10/12/22 | 1,391,305 | |||||||||||
|
| |||||||||||||
| Principal Amount | Interest Rate | Maturity Date | Value | |||||||||||
| Short-Term Investments(d) – (continued) | ||||||||||||||
| Commercial Paper – (continued) | ||||||||||||||
LMA SA | ||||||||||||||
| $ | 1,000,000 | 1.222 | 07/27/22 | 998,720 | ||||||||||
Old Line Funding LLC | ||||||||||||||
| 503,000 | 1.119 | 07/08/22 | 502,824 | |||||||||||
Royal Bank of Canada (c) (FEDL01 + 0.430%)(d) | ||||||||||||||
| 467,000 | 0.000 | 12/23/22 | 466,999 | |||||||||||
Salisbury Receivables Co LLC | ||||||||||||||
| 254,000 | 1.424 | 08/08/22 | 253,510 | |||||||||||
Versailles Commercial Paper LLC | ||||||||||||||
| 1,000,000 | 1.119 | 07/12/22 | 999,460 | |||||||||||
|
| |||||||||||||
| TOTAL SHORT-TERM INVESTMENTS | ||||||||||||||
| (Cost $8,663,786) | $ | 8,659,712 | ||||||||||||
|
| |||||||||||||
| TOTAL INVESTMENTS – 131.7% | ||||||||||||||
| (Cost $140,330,174) | $ | 132,110,953 | ||||||||||||
|
| |||||||||||||
| | LIABILITIES IN EXCESS OF | (31,766,892 | ) | |||||||||||
|
| |||||||||||||
| NET ASSETS – 100.0% | $ | 100,344,061 | ||||||||||||
|
| |||||||||||||
| The percentage shown for each investment category reflects the value of investments in that category as a percentage of net assets. | ||
| (a) | TBA (To Be Announced) Securities are purchased on a forward commitment basis with an approximate principal amount and no defined maturity date. The actual principal and maturity date will be determined upon settlement when the specific mortgage pools are assigned. Total market value of TBA securities (excluding forward sales contracts, if any) amounts to $34,172,109 which represents approximately 34.1% of the Fund’s net assets as of June 30, 2022. | |
| (b) | Securities with “Call” features. Maturity dates disclosed are the final maturity date. | |
| (c) | Variable rate security. Interest rate or distribution rate disclosed is that which is in effect on June 30, 2022. | |
| (d) | Exempt from registration under Rule 144A of the Securities Act of 1933. | |
| (e) | Step coupon. | |
| (f) | Interest rates represent either the stated coupon rate, annualized yield on date of purchase for discounted securities, or, for floating rate securities, the current reset rate, which is based upon current interest rate indices. | |
| (g) | Guaranteed by the United States Government. Total market value of $310,688, which represents 0.3% of net assets as of June 30, 2022. | |
| (h) | Represents an affiliated issuer. | |
| 16 | The accompanying notes are an integral part of these financial statements. |
GOLDMAN SACHS VARIABLE INSURANCE TRUST CORE FIXED INCOME FUND
| Investment Abbreviations: | ||
| CLO | —Collateralized Loan Obligation | |
| CMT | —Constant Maturity Treasury Index | |
| FEDL01 | —Fed Funds Rate | |
| FHLMC | —Federal Home Loan Mortgage Corp. | |
| FNMA | —Federal National Mortgage Association | |
| GNMA | —Government National Mortgage Association | |
| GMTN | —Global Medium Term Note | |
| GO | —General Obligation | |
| LIBOR | —London Interbank Offered Rate | |
| LP | —Limited Partnership | |
| Mo. | —Month | |
| MTN | —Medium Term Note | |
| PLC | —Public Limited Company | |
| REIT | —Real Estate Investment Trust | |
| SOFR | —Secured Overnight Financing Rate | |
| SONIA | —Sterling Overnight Index Average | |
| TSFR1M | —1 Month Secured Financing Rate | |
| Currency Abbreviations: | ||
| AUD | —Australian Dollar | |
| CAD | —Canadian Dollar | |
| CHF | —Swiss Franc | |
| EUR | —Euro | |
| GBP | —British Pound | |
| JPY | —Japanese Yen | |
| NOK | —Norwegian Krone | |
| NZD | —New Zealand Dollar | |
| SEK | —Swedish Krona | |
| USD | —United States Dollar | |
ADDITIONAL INVESTMENT INFORMATION
FORWARD FOREIGN CURRENCY EXCHANGE CONTRACTS — At June 30, 2022, the Fund had the following forward foreign currency exchange contracts:
FORWARD FOREIGN CURRENCY EXCHANGE CONTRACTS WITH UNREALIZED GAIN
| Counterparty | Currency Purchased | Currency Sold | Settlement Date | Unrealized Gain | ||||||||||||
BNP Paribas Securities | USD | 172,757 | SEK | 1,623,002 | 7/1/2022 | $ | 14,102 | |||||||||
BNP Paribas Securities | USD | 160,204 | SEK | 1,623,002 | 9/26/2022 | 974 | ||||||||||
JPMorgan Chase Bank, N.A | USD | 982,248 | EUR | 927,476 | 7/28/2022 | 8,780 | ||||||||||
Morgan Stanley Co., Inc. | USD | 89,035 | AUD | 120,366 | 7/14/2022 | 5,947 | ||||||||||
Morgan Stanley Co., Inc. | USD | 69,959 | JPY | 8,925,682 | 7/15/2022 | 4,134 | ||||||||||
Morgan Stanley Co., Inc. | USD | 15,883 | CHF | 15,062 | 7/20/2022 | 90 | ||||||||||
Morgan Stanley Co., Inc. | USD | 226,473 | CAD | 288,050 | 7/21/2022 | 2,699 | ||||||||||
Morgan Stanley Co., Inc. | USD | 262,889 | GBP | 214,055 | 9/22/2022 | 1,911 | ||||||||||
| TOTAL |
| $ | 38,637 | |||||||||||||
FORWARD FOREIGN CURRENCY EXCHANGE CONTRACTS WITH UNREALIZED LOSS
| Counterparty | Currency Purchased | Currency Sold | Settlement Date | Unrealized Loss | ||||||||||||
BNP Paribas Securities | SEK | 1,653,000 | USD | 175,951 | 7/1/2022 | $ | (14,363 | ) | ||||||||
BNP Paribas Securities | SEK | 1,653,000 | USD | 163,165 | 9/26/2022 | (992 | ) | |||||||||
JPMorgan Chase Bank, N.A | EUR | 657,440 | USD | 696,265 | 7/28/2022 | (6,224 | ) | |||||||||
Morgan Stanley Co., Inc. | JPY | 11,613,101 | USD | 91,022 | 7/15/2022 | (5,378 | ) | |||||||||
Morgan Stanley Co., Inc. | CAD | 258,925 | USD | 203,574 | 7/21/2022 | (2,426 | ) | |||||||||
Morgan Stanley Co., Inc. | GBP | 305,018 | USD | 374,603 | 9/22/2022 | (2,723 | ) | |||||||||
| TOTAL | $ | (32,106 | ) | |||||||||||||
| The accompanying notes are an integral part of these financial statements. | 17 |
GOLDMAN SACHS VARIABLE INSURANCE TRUST CORE FIXED INCOME FUND
Schedule of Investments (continued)
June 30, 2022 (Unaudited)
ADDITIONAL INVESTMENT INFORMATION (continued)
FORWARD SALES CONTRACTS — At June 30, 2022, the Fund had the following forward sales contracts:
| Description | Interest Rate | Maturity Date(a) | Settlement Date | Principal Amount | Value | |||||||||||||||
| Federal National Mortgage Association | 3.000 | % | TBA-30yr | 07/15/51 | $ | (4,000,000 | ) | $ | (3,723,604 | ) | ||||||||||
| Federal National Mortgage Association | 3.000 | TBA-30yr | 06/15/51 | (4,000,000 | ) | (3,729,998 | ) | |||||||||||||
| Federal National Mortgage Association | 3.500 | TBA-30yr | 03/15/52 | (1,000,000 | ) | (1,002,070 | ) | |||||||||||||
| Federal National Mortgage Association | 4.000 | TBA-30yr | 06/15/51 | (1,000,000 | ) | (989,218 | ) | |||||||||||||
| Government National Mortgage Association | 2.000 | TBA-30yr | 03/15/52 | (4,000,000 | ) | (3,807,216 | ) | |||||||||||||
Government National Mortgage Association | 2.000 | TBA-30yr | 06/15/51 | (1,000,000 | ) | (888,940 | ) | |||||||||||||
| Total (Proceed Receivable $(14,285,488) |
| $ | (14,141,046 | ) | ||||||||||||||||
| (a) | TBA (To Be Announced) Securities are purchased on a forward commitment basis with an approximate principal amount and no defined maturity date. The actual principal and maturity date will be determined upon settlement when the specific mortgage pools are assigned. |
FUTURES CONTRACTS — At June 30, 2022, the Fund had the following futures contracts:
| Description | Number of Contracts | Expiration Date | Notional Amount | Unrealized Appreciation/ (Depreciation) | ||||||||||||
Long position contracts: |
| |||||||||||||||
| U.S. Treasury 10 Year Note | 7 | 09/21/22 | $ | 826,028 | $ | 2,269 | ||||||||||
| U.S. Treasury 2 Year Note | 27 | 09/30/22 | 5,686,406 | (21,258 | ) | |||||||||||
U.S. Treasury Long Bond | 1 | 09/21/22 | 136,814 | 1,249 | ||||||||||||
| Total | (17,740 | ) | ||||||||||||||
Short position contracts: |
| |||||||||||||||
| Euro Bund Future | (2 | ) | 09/08/22 | (259,910 | ) | (443 | ) | |||||||||
| Long Gilt Future | (4 | ) | 09/28/22 | 535,534 | 21,307 | |||||||||||
U.S. Treasury 5 Year Note | (1 | ) | 09/30/22 | (112,124 | ) | 31 | ||||||||||
| Total | 20,895 | |||||||||||||||
| Total Futures Contracts | $ | 3,155 | ||||||||||||||
SWAP CONTRACTS — At June 30, 2022, the Fund had the following swap contracts:
OVER THE COUNTER CREDIT DEFAULT SWAP CONTRACTS
| Reference Obligation/Index(a) | Financing Rate Received (Paid) by the Fund | Credit Spread at June 30, 2022(b) | Counterparty | Termination Date | Notional Amount (000’s) | Value | Upfront Premium (Received) Paid | Unrealized Appreciation/ (Depreciation) | ||||||||||||||||||||||||
Protection Sold: | ||||||||||||||||||||||||||||||||
| Prudential Financial, Inc. | 1.000 | % | 1.125 | % | Bank of America NA | 06/20/2024 | 75 | $ | 844 | $ | — | $ | 844 | |||||||||||||||||||
| General Electric Co. | 1.000 | 1.965 | 06/20/2026 | 175 | (3,438 | ) | — | (3,438 | ) | |||||||||||||||||||||||
| Nordstrom, Inc. | 1.000 | 3.877 | 06/20/2024 | 225 | (8,724 | ) | (429 | ) | (8,295 | ) | ||||||||||||||||||||||
| ICE CD JWN | 1.000 | 6.220 | 12/20/2024 | 100 | (6,220 | ) | (1,928 | ) | (4,292 | ) | ||||||||||||||||||||||
| ICE CD MEX | 1.000 | 3.366 | 06/20/2027 | 210 | (7,069 | ) | (3,794 | ) | (3,275 | ) | ||||||||||||||||||||||
| Republic of Indonesia | 1.000 | 1.980 | 06/20/2027 | 200 | (3,959 | ) | 367 | (4,326 | ) | |||||||||||||||||||||||
| Republic of Chile | 1.000 | 0.587 | 06/20/2027 | 90 | (529 | ) | 39 | (568 | ) | |||||||||||||||||||||||
| 18 | The accompanying notes are an integral part of these financial statements. |
GOLDMAN SACHS VARIABLE INSURANCE TRUST CORE FIXED INCOME FUND
ADDITIONAL INVESTMENT INFORMATION (continued)
OVER THE COUNTER CREDIT DEFAULT SWAP CONTRACTS (continued)
| Reference Obligation/Index(a) | Financing Rate Received (Paid) by the Fund | Credit Spread at June 30, 2022(b) | Counterparty | Termination Date | Notional Amount (000’s) | Value | Upfront Premium (Received) Paid | Unrealized Appreciation/ (Depreciation) | ||||||||||||||||||||||||
| Markit CDX North America Investment Grade Index | 1.000 | % | 0.110 | % | Bank of America NA | 06/20/2025 | 4,500 | $ | 4,960 | $ | 13,291 | $ | (8,331 | ) | ||||||||||||||||||
| Markit CMBX North American BBB- | 3.000 | 16.109 | 11/18/2054 | 100 | (16,109 | ) | (27,006 | ) | 10,897 | |||||||||||||||||||||||
| Markit CDX North America Investment Grade Index | 1.000 | 0.659 | 12/20/2025 | 575 | 3,792 | — | 3,792 | |||||||||||||||||||||||||
| Markit CDX North America Investment Grade Index | 1.000 | 0.434 | 06/20/2026 | 7,025 | 30,481 | 76,963 | (46,482 | ) | ||||||||||||||||||||||||
| ICE CDX Investment Grade Index | 1.000 | 0.222 | 12/20/2026 | 13,100 | 29,123 | 233,808 | (204,685 | ) | ||||||||||||||||||||||||
| ICE CDX Investment Grade Index | 1.000 | 0.026 | 06/20/2027 | 2,600 | (667 | ) | 19,470 | (20,137 | ) | |||||||||||||||||||||||
| TOTAL | $ | 22,485 | $ | 310,781 | $ | (288,296 | ) | |||||||||||||||||||||||||
| (a) | Payments received quarterly. |
| (b) | Credit spread on the referenced obligation, together with the period of expiration, are indicators of payment/performance risk. The likelihood of a credit event occurring which would require a fund or its counterparty to make a payment or otherwise be required to perform under the swap contract is generally greater as the credit spread and term of the swap contract increase. |
CENTRALLY CLEARED INTEREST RATE SWAP CONTRACTS
Payments Made by the Fund(a) | Payments Received by | Termination Date | Notional Amounts (000’s) | Value | Upfront Premium Paid (Received) | Unrealized Appreciation/ (Depreciation) | ||||||||||||||||||
| 1.2500%(b) | 6 Month NIBOR | 12/15/2022 | NZD | 600 | $ | (3,469 | ) | $ | (662 | ) | $ | (2,807 | ) | |||||||||||
| 1 Day ESTRON(c) | 1.750% | 09/21/2024 | EUR | 1,040 | (4,008 | ) | 3,235 | (7,243 | ) | |||||||||||||||
| 2.2500(c) | 3 Month STIBOR | 09/21/2024 | SEK | 10,840 | (10,715 | ) | (8,196 | ) | (2,519 | ) | ||||||||||||||
| 1 Day SOFR(c) | 1.730 | 02/08/2026 | USD | 6,200 | 103,583 | 61,982 | 41,601 | |||||||||||||||||
| 1 Day ESTRON(c) | 0.750 | 09/21/2027 | EUR | 20 | 1,156 | 1,103 | 53 | |||||||||||||||||
| 1 Day SOFR(c) | 0.000 | 09/21/2027 | USD | 1,350 | 4,517 | 12,114 | (7,597 | ) | ||||||||||||||||
| 1 Day SONIO(c) | 0.000 | 09/21/2027 | GBP | 300 | 13,168 | 12,588 | 580 | |||||||||||||||||
| 2.5000(c) | 3 Month STIBOR | 09/21/2027 | SEK | 4,240 | (5,651 | ) | (3,428 | ) | (2,223 | ) | ||||||||||||||
| 3.5000(b) | 6 Month BBR | 09/21/2027 | AUD | 1,340 | (18,446 | ) | (19,176 | ) | 730 | |||||||||||||||
| 3.7500(b) | NFIX3FR | 09/21/2027 | NZD | 480 | (4,610 | ) | (4,969 | ) | 359 | |||||||||||||||
| 12 Month BOJDTR(c) | 0.000 | 05/26/2032 | JPY | 108,000 | 9,924 | 574 | 9,350 | |||||||||||||||||
| 2.0000(c) | 1 Day ESTRON | 05/26/2032 | EUR | 370 | (9,568 | ) | (1,090 | ) | (8,478 | ) | ||||||||||||||
| 0.000(c) | 1 Day SONIO | 06/07/2032 | GBP | 440 | (15,838 | ) | 4,051 | (19,889 | ) | |||||||||||||||
| NFIX3FR (b) | 3.750 | 09/21/2032 | NZD | 80 | 1,597 | 1,602 | (5 | ) | ||||||||||||||||
| 0.000(c) | 1 Day SOFR | 09/21/2032 | CHF | 540 | (24,411 | ) | (23,934 | ) | (477 | ) | ||||||||||||||
| 1 Day SOFR(c) | 0.000 | 09/21/2032 | USD | 360 | 2,129 | 4,225 | (2,096 | ) | ||||||||||||||||
| 1 Day SONIO(c) | 0.000 | 09/21/2032 | GBP | 290 | 26,169 | 28,261 | (2,092 | ) | ||||||||||||||||
| 1.0000(c) | 1 Day ESTRON | 09/21/2032 | EUR | 430 | (50,258 | ) | (51,231 | ) | 973 | |||||||||||||||
| 12 Month BOJDTR(c) | 0.000 | 09/21/2032 | JPY | 24,710 | 9,151 | 8,197 | 954 | |||||||||||||||||
| 3 Month STIBOR(c) | 2.500 | 09/21/2032 | SEK | 7,120 | 19,579 | 17,782 | 1,797 | |||||||||||||||||
| 3.0000(c) | 6 Month NIBOR | 09/21/2032 | NOK | 2,290 | (5,988 | ) | 1,888 | (7,876 | ) | |||||||||||||||
| 3.2500(b) | 3 Month BA | 09/21/2032 | CAD | 510 | (14,775 | ) | (15,974 | ) | 1,199 | |||||||||||||||
| 3.7500(b) | 6 Month BBR | 09/21/2032 | AUD | 40 | (894 | ) | (1,562 | ) | 668 | |||||||||||||||
| TOTAL | $ | 22,342 | $ | 27,380 | $ | (5,038 | ) | |||||||||||||||||
| (a) | Represents forward starting interest rate swaps whose effective dates of commencement of accruals and cash flows occur subsequent to June 30, 2022. |
| (b) | Payments made semi-annually. |
| (c) | Payments made annually. |
| The accompanying notes are an integral part of these financial statements. | 19 |
GOLDMAN SACHS VARIABLE INSURANCE TRUST CORE FIXED INCOME FUND
Schedule of Investments (continued)
June 30, 2022 (Unaudited)
ADDITIONAL INVESTMENT INFORMATION (continued)
PURCHASED & WRITTEN OPTIONS CONTRACTS — At June 30, 2022, the Fund had the following purchased & written options contracts:
| Description | Counterparty | Exercise Price | Expiration Date | Number of Contracts | Notional Amount | Value | Premiums Paid (Received) by Fund | Unrealized Appreciation/ (Depreciation) | ||||||||||||||||||||||
Purchased Option Contracts |
| |||||||||||||||||||||||||||||
Puts |
| |||||||||||||||||||||||||||||
| 6M IRS | JPMorgan Bank | $ | 0.30 | 09/09/2022 | 1,370,000 | $ | 1,370,000 | $ | 14 | $ | 2,662 | $ | (2,648 | ) | ||||||||||||||||
| 6M IRS | JPMorgan Bank | 0.28 | 09/09/2022 | 1,060,000 | 1,060,000 | 10 | 2,022 | (2,012 | ) | |||||||||||||||||||||
| 6M IRS | Morgan Stanley Co., Inc. | 0.54 | 11/17/2022 | 2,600,000 | 2,600,000 | 160 | 6,113 | (5,953 | ) | |||||||||||||||||||||
| Total Purchased Option Contracts |
| 5,030,000 | 184 | 10,797 | $ | (10,613 | ) | |||||||||||||||||||||||
Written Option Contracts |
| |||||||||||||||||||||||||||||
Puts |
| |||||||||||||||||||||||||||||
| 6M IRS | JPMorgan Bank | $ | 0.40 | 09/09/2022 | (140,000 | ) | $ | (140,000 | ) | $ | (4 | ) | $ | 2,636 | $ | 2,632 | ||||||||||||||
| 6M IRS | JPMorgan Bank | 0.36 | 09/09/2022 | (110,000 | ) | (110,000 | ) | (3 | ) | 2,032 | 2,029 | |||||||||||||||||||
6M IRS | Morgan Stanley Co., Inc. | 0.60 | 11/17/2022 | (270,000 | ) | (270,000 | ) | (165 | ) | 6,144 | 5,979 | |||||||||||||||||||
| Total Written Option Contracts |
| (520,000 | ) | (172 | ) | 10,812 | $ | 10,640 | ||||||||||||||||||||||
| 20 | The accompanying notes are an integral part of these financial statements. |
GOLDMAN SACHS VARIABLE INSURANCE TRUST CORE FIXED INCOME FUND
Statement of Assets and Liabilities
June 30, 2022 (Unaudited)
| Core Fixed Income Fund | ||||
| Assets: | ||||
Investments in unaffiliated issuers, at value (cost $136,566,040) | $ | 128,346,819 | ||
Investments in affiliated issuers, at value (cost $3,764,134) | 3,764,134 | |||
Purchased options, at value (premiums paid $10,797) | 184 | |||
Receivables: | ||||
Investments sold on an extended-settlement basis | 17,519,573 | |||
Collateral on certain derivative contracts(a) | 1,104,959 | |||
Interest and Dividends | 520,357 | |||
Fund shares sold | 227,764 | |||
Reimbursement from investment adviser | 12,868 | |||
Unrealized gain on swap contracts | 14,932 | |||
Upfront premiums paid on swap contracts | 343,531 | |||
Unrealized gain on forward foreign currency exchange contracts | 38,637 | |||
Variation margin on futures contracts | 63,396 | |||
Other assets | 487 | |||
| Total assets | 151,957,641 | |||
| Liabilities: | ||||
Variation margin on futures contracts | 25,353 | |||
Unrealized loss on swap contracts | 272,072 | |||
Unrealized loss on forward foreign currency exchange contracts | 32,106 | |||
Upfront payments received on swap contracts | 27,006 | |||
Written options, at value (premiums received $10,812) | 172 | |||
Payables: | ||||
Investments purchased | 33,713,757 | |||
Collateral on certain derivative contracts(a) | 14,141,046 | |||
Foreign bank overdraft (cost $3,622,020) | 3,127,993 | |||
Management fees | 31,771 | |||
Fund shares redeemed | 30,572 | |||
Distribution and Service fees and Transfer Agency fees | 18,436 | |||
Accrued expenses | 193,296 | |||
| Total liabilities | 51,613,580 | |||
| Net Assets: | ||||
Paid-in capital | 112,576,827 | |||
Total distributable loss | (12,232,766 | ) | ||
| NET ASSETS | $ | 100,344,061 | ||
Net Assets: | ||||
Institutional | $ | 29,749,559 | ||
Service | 70,594,502 | |||
Total Net Assets | $ | 100,344,061 | ||
Shares outstanding $0.001 par value (unlimited number of shares authorized): | ||||
Institutional | 3,042,832 | |||
Service | 7,225,588 | |||
Net asset value, offering and redemption price per share: | ||||
Institutional | $9.78 | |||
Service | 9.77 | |||
(a) Segregated for initial margin and/or collateral as follows:
| Fund | Futures | Swaps | ||||||
Core Fixed Income | $ | 1,104,959 | $ | (14,141,046 | ) | |||
| The accompanying notes are an integral part of these financial statements. | 21 |
GOLDMAN SACHS VARIABLE INSURANCE TRUST CORE FIXED INCOME FUND
Statement of Operations
For the Six Months Ended June 30, 2022 (Unaudited)
| Core Fixed Income Fund | ||||
| Investment income: | ||||
Interest | $ | 1,031,225 | ||
Dividends — affiliated issuers | 10,411 | |||
| Total investment income | 1,041,636 | |||
| Expenses: | ||||
Management fees | 197,942 | |||
Distribution and Service fees — Service | 87,777 | |||
Professional fees | 82,468 | |||
Custody, accounting and administrative services | 42,305 | |||
Printing and mailing costs | 13,232 | |||
Trustee fees | 10,573 | |||
Transfer Agency fees(a) | 9,897 | |||
Other | 371 | |||
| Total expenses | 444,534 | |||
Less — expense reductions | (152,040 | ) | ||
| Net expenses | 292,494 | |||
| NET INVESTMENT INCOME | 749,142 | |||
| Realized and unrealized gain (loss): | ||||
Net realized gain (loss) from: | ||||
Investments — unaffiliated issuers | (2,402,178 | ) | ||
Forward Sales Contracts | 430,156 | |||
Futures contracts | (1,335,214 | ) | ||
Swap contracts | 63,314 | |||
Written options | 3,609 | |||
Purchased options | (2,944 | ) | ||
Forward foreign currency exchange contracts | 27,557 | |||
Foreign currency transactions | (139 | ) | ||
Net change in unrealized gain (loss) on: | ||||
Investments — unaffiliated issuers | (9,139,313 | ) | ||
Forward Sales Contracts | 146,208 | |||
Futures contracts | (48,775 | ) | ||
Written options | 5,282 | |||
Purchased options | (1,036 | ) | ||
Swap contracts | (540,399 | ) | ||
Forward foreign currency exchange contracts | 3,766 | |||
Foreign currency translations | (8,024 | ) | ||
| Net realized and unrealized loss | (12,798,130 | ) | ||
| NET DECREASE IN NET ASSETS RESULTING FROM OPERATIONS | $ | (12,048,988 | ) | |
(a) Class specific Distribution and/or Service and Transfer Agency fees were as follows:
| Transfer Agency Fees | ||||||
Institutional | Service | |||||
| $ | 2,875 | $ | 7,022 | |||
| 22 | The accompanying notes are an integral part of these financial statements. |
GOLDMAN SACHS VARIABLE INSURANCE TRUST CORE FIXED INCOME FUND
Statements of Changes in Net Assets
| Core Fixed Income Fund | ||||||||
| For the Six Months Ended June 30, 2022 (Unaudited) | For the Fiscal Year Ended December 31, 2021 | |||||||
| From operations: | ||||||||
Net investment income | $ | 749,142 | $ | 769,313 | ||||
Net realized loss | (3,215,839 | ) | (403,832 | ) | ||||
Net change in unrealized loss | (9,582,291 | ) | (1,969,524 | ) | ||||
| Net decrease in net assets resulting from operations | (12,048,988 | ) | (1,604,043 | ) | ||||
| Distributions to shareholders: | ||||||||
From distributable earnings: | ||||||||
Institutional Shares | (288,353 | ) | (368,886 | ) | ||||
Service Shares | (616,443 | ) | (758,578 | ) | ||||
| Total distributions to shareholders | (904,796 | ) | (1,127,464 | ) | ||||
| From share transactions: | ||||||||
Proceeds from sales of shares | 15,003,355 | 46,513,298 | ||||||
Reinvestment of distributions | 904,796 | 1,127,464 | ||||||
Cost of shares redeemed | (5,656,258 | ) | (13,688,105 | ) | ||||
| Net increase in net assets resulting from share transactions | 10,251,893 | 33,952,657 | ||||||
| TOTAL INCREASE (DECREASE) | (2,701,891 | ) | 31,221,150 | |||||
| Net Assets: | ||||||||
Beginning of period | 103,045,952 | 71,824,802 | ||||||
End of period | $ | 100,344,061 | $ | 103,045,952 | ||||
| The accompanying notes are an integral part of these financial statements. | 23 |
GOLDMAN SACHS VARIABLE INSURANCE TRUST CORE FIXED INCOME FUND
Selected Data for a Share Outstanding Throughout Each Period
| (a) | Calculated based on the average shares outstanding methodology. |
| (b) | Assumes investment at the NAV at the beginning of the period, reinvestment of all dividends and distributions, a complete redemption of the investment at the NAV at the end of the period and no sales or redemption charges (if any). Total returns would be reduced if a sales or redemption charge was taken into account. Returns do not reflect the impact of taxes to shareholders relating to Fund distributions or the redemption of Fund shares. Total returns for periods less than one full year are not annualized. |
| (c) | Annualized. |
| (d) | The Fund’s portfolio turnover rate is calculated in accordance with regulatory requirements, without regard to transactions involving short term investments and certain derivatives. If such transactions were included, the Fund’s portfolio turnover rate may be higher. |
| 24 | The accompanying notes are an integral part of these financial statements. |
GOLDMAN SACHS VARIABLE INSURANCE TRUST CORE FIXED INCOME FUND
Financial Highlights (continued)
Selected Data for a Share Outstanding Throughout Each Period
| Goldman Sachs Core Fixed Income Fund | ||||||||||||||||||||||||
| Service Shares | ||||||||||||||||||||||||
| Six Months Ended June 30, 2022 (Unaudited) | Year Ended December 31, | |||||||||||||||||||||||
| 2021 | 2020 | 2019 | 2018 | 2017 | ||||||||||||||||||||
| Per Share Data | ||||||||||||||||||||||||
Net asset value, beginning of period | $ | 11.13 | $ | 11.53 | $ | 10.85 | $ | 10.21 | $ | 10.65 | $ | 10.60 | ||||||||||||
Net investment income(a) | 0.07 | 0.09 | 0.16 | 0.25 | 0.25 | 0.21 | ||||||||||||||||||
Net realized and unrealized gain (loss) | (1.34 | ) | (0.34 | ) | 0.85 | 0.66 | (0.34 | ) | 0.12 | |||||||||||||||
Total from investment operations | (1.27 | ) | (0.25 | ) | 1.01 | 0.91 | (0.09 | ) | 0.33 | |||||||||||||||
Distributions to shareholders from net investment income | (0.09 | ) | (0.13 | ) | (0.23 | ) | (0.27 | ) | (0.35 | ) | (0.28 | ) | ||||||||||||
Distributions to shareholders from net realized gains | — | (0.02 | ) | (0.10 | ) | — | — | — | ||||||||||||||||
Total distributions | (0.09 | ) | (0.15 | ) | (0.33 | ) | (0.27 | ) | (0.35 | ) | (0.28 | ) | ||||||||||||
Net asset value, end of period | $ | 9.77 | $ | 11.13 | $ | 11.53 | $ | 10.85 | $ | 10.21 | $ | 10.65 | ||||||||||||
Total Return(b) | (11.45 | )% | (2.23 | )% | 9.37 | % | 9.00 | % | (0.83 | )% | 3.14 | % | ||||||||||||
Net assets, end of period (in 000’s) | $ | 70,595 | $ | 71,867 | $ | 46,631 | $ | 37,524 | $ | 36,416 | $ | 108,948 | ||||||||||||
Ratio of net expenses to average net assets | 0.66 | %(c) | 0.66 | % | 0.66 | % | 0.68 | % | 0.67 | % | 0.67 | % | ||||||||||||
Ratio of total expenses to average net assets | 0.97 | %(c) | 1.06 | % | 1.18 | % | 1.35 | % | 1.18 | % | 0.90 | % | ||||||||||||
Ratio of net investment income to average net assets | 1.65 | %(c) | 0.85 | % | 1.39 | % | 2.33 | % | 2.46 | % | 1.95 | % | ||||||||||||
Portfolio turnover rate(d) | 349 | % | 513 | % | 501 | % | 556 | % | 406 | % | 229 | % | ||||||||||||
| (a) | Calculated based on the average shares outstanding methodology. |
| (b) | Assumes investment at the NAV at the beginning of the period, reinvestment of all dividends and distributions, a complete redemption of the investment at the NAV at the end of the period and no sales or redemption charges (if any). Total returns would be reduced if a sales or redemption charge was taken into account. Returns do not reflect the impact of taxes to shareholders relating to Fund distributions or the redemption of Fund shares. Total returns for periods less than one full year are not annualized. |
| (c) | Annualized. |
| (d) | The Fund’s portfolio turnover rate is calculated in accordance with regulatory requirements, without regard to transactions involving short term investments and certain derivatives. If such transactions were included, the Fund’s portfolio turnover rate may be higher. |
| The accompanying notes are an integral part of these financial statements. | 25 |
GOLDMAN SACHS VARIABLE INSURANCE TRUST CORE FIXED INCOME FUND
June 30, 2022 (Unaudited)
1. ORGANIZATION
Goldman Sachs Variable Insurance Trust (the “Trust” or “VIT”) is a Delaware statutory trust registered under the Investment Company Act of 1940, as amended (the “Act”), as an open-end management investment company. The following table lists the series of the Trust that is included in this report (the “Fund”), along with its corresponding share classes and respective diversification status under the Act:
| Fund | Share Classes Offered | Diversified/ Non-diversified | ||
Core Fixed Income | Institutional and Service | Diversified |
Shares of the Trust are offered to a separate account of participating life insurance companies for the purpose of funding variable annuity contracts and variable life insurance policies.
Goldman Sachs Asset Management, L.P. (“GSAM”), an affiliate of Goldman Sachs & Co. LLC (“Goldman Sachs”), serves as investment adviser to the Fund pursuant to management agreements (the “Agreements”) with the Trust.
2. SIGNIFICANT ACCOUNTING POLICIES
The financial statements have been prepared in accordance with accounting principles generally accepted in the United States of America (“GAAP”) and require management to make estimates and assumptions that may affect the reported amounts and disclosures. Actual results may differ from those estimates and assumptions. The Fund is an investment company under GAAP and follows the accounting and reporting guidance applicable to investment companies.
| A. Investment | Valuation — The Fund’s valuation policy is to value investments at fair value. |
B. Investment Income and Investments — Investment income includes interest income, dividend income, and securities lending income, if any. Interest income is accrued daily and adjusted for amortization of premiums and accretion of discounts. Dividend income is recognized on ex-dividend date or, for certain foreign securities, as soon as such information is obtained subsequent to the ex-dividend date. Non-cash dividends, if any, are recorded at the fair market value of the securities received. Investment transactions are reflected on trade date. Realized gains and losses are calculated using identified cost. Investment transactions are recorded on the following business day for daily net asset value (“NAV”) calculations.
For derivative contracts, unrealized gains and losses are recorded daily and become realized gains and losses upon disposition or termination of the contract. Upfront payments, if any, are made or received upon entering into a swap agreement and are reflected in the Statements of Assets and Liabilities. Upfront payments are recognized over the contract’s term/event as realized gains or losses, with the exception of forward starting swap contracts whose realized gains or losses are recognized from the effective start date. For securities with paydown provisions, principal payments received are treated as a proportionate reduction to the cost basis of the securities, and excess or shortfall amounts are recorded as income. For treasury inflation protected securities (“TIPS”), adjustments to principal due to inflation/ deflation are reflected as increases/decreases to interest income with a corresponding adjustment to cost.
C. Class Allocations and Expenses — Investment income, realized and unrealized gain (loss), if any, and non-class specific expenses of the Fund are allocated daily based upon the proportion of net assets of each class. Non-class specific expenses directly incurred by the Fund are charged to the Fund, while such expenses incurred by the Trust are allocated across the Fund on a straight-line and/or pro-rata basis depending upon the nature of the expenses. Class specific expenses, where applicable, are borne by the respective share classes and include Distribution and Service and Transfer Agency fees.
D. Federal Taxes and Distributions to Shareholders — It is the Fund’s policy to comply with the requirements of the Internal Revenue Code of 1986, as amended (the “Code”), applicable to regulated investment companies and to distribute each year substantially all of its investment company taxable income and capital gains to its shareholders. Accordingly, the Fund is not
| 26 |
GOLDMAN SACHS VARIABLE INSURANCE TRUST CORE FIXED INCOME FUND
2. SIGNIFICANT ACCOUNTING POLICIES (continued)
required to make any provisions for the payment of federal income tax. Distributions to shareholders are recorded on the ex-dividend date. Income and capital gains distributions, if any, are declared and paid according to the following schedule:
| Fund | Income Distributions Declared/Paid | Capital Gains Distributions Declared/Paid | ||
Core Fixed Income | Quarterly | Annually |
Net capital losses, if any, are carried forward to future fiscal years and may be used to the extent allowed by the Code to offset any future capital gains. Losses that are carried forward will retain their character as either short-term or long-term capital losses. Utilization of capital loss carryforwards will reduce the requirement of future capital gains distributions.
The characterization of distributions to shareholders for financial reporting purposes is determined in accordance with federal income tax rules, which may differ from GAAP. The source of the Fund’s distributions may be shown in the accompanying financial statements as either from distributable earnings or capital. Certain components of the Fund’s net assets on the Statement of Assets and Liabilities reflect permanent GAAP/tax differences based on the appropriate tax character.
E. Foreign Currency Translation — The accounting records and reporting currency of the Fund are maintained in U.S. dollars. Assets and liabilities denominated in foreign currencies are translated into U.S. dollars using the current exchange rates at the close of each business day. The effect of changes in foreign currency exchange rates on investments is included within net realized and unrealized gain (loss) on investments. Changes in the value of other assets and liabilities as a result of fluctuations in foreign exchange rates are included in the Statement of Operations within net change in unrealized gain (loss) on foreign currency translation. Transactions denominated in foreign currencies are translated into U.S. dollars on the date the transaction occurred, the effects of which are included within net realized gain (loss) on foreign currency transactions.
3. INVESTMENTS AND FAIR VALUE MEASUREMENTS
U.S. GAAP defines the fair value of a financial instrument as the amount that would be received to sell an asset or paid to transfer a liability in an orderly transaction between market participants at the measurement date (i.e., the exit price); the Fund’s policy is to use the market approach. GAAP establishes a fair value hierarchy that prioritizes the inputs to valuation techniques used to measure fair value. The hierarchy gives the highest priority to unadjusted quoted prices in active markets for identical assets or liabilities (Level 1 measurements) and the lowest priority to unobservable inputs (Level 3 measurements). The level in the fair value hierarchy within which the fair value measurement in its entirety falls shall be determined based on the lowest level input that is significant to the fair value measurement in its entirety. The levels used for classifying investments are not necessarily an indication of the risk associated with investing in these investments. The three levels of the fair value hierarchy are described below:
Level 1 — Unadjusted quoted prices in active markets that are accessible at the measurement date for identical, unrestricted assets or liabilities;
Level 2 — Quoted prices in markets that are not active or financial instruments for which significant inputs are observable (including, but not limited to, quoted prices for similar investments, interest rates, foreign exchange rates, volatility and credit spreads), either directly or indirectly;
Level 3 — Prices or valuations that require significant unobservable inputs (including GSAM’s assumptions in determining fair value measurement).
The Board of Trustees (“Trustees”) has approved Valuation Procedures that govern the valuation of the portfolio investments held by the Fund, including investments for which market quotations are not readily available. The Trustees have delegated to GSAM day-to-day responsibility for implementing and maintaining internal controls and procedures related to the valuation of the Fund’s investments. To assess the continuing appropriateness of pricing sources and methodologies, GSAM regularly performs price verification procedures and issues challenges as necessary to third party pricing vendors or brokers, and any differences are reviewed in accordance with the Valuation Procedures.
| 27 |
GOLDMAN SACHS VARIABLE INSURANCE TRUST CORE FIXED INCOME FUND
Notes to Financial Statements (continued)
June 30, 2022 (Unaudited)
3. INVESTMENTS AND FAIR VALUE MEASUREMENTS (continued)
A. Level 1 and Level 2 Fair Value Investments — The valuation techniques and significant inputs used in determining the fair values for investments classified as Level 1 and Level 2 are as follows:
Money Market Funds — Investments in the Goldman Sachs Financial Square Government Fund (“Underlying Fund”) are valued at the NAV per share of the Institutional Share class on the day of valuation. These investments are generally classified as Level 1 of the fair value hierarchy. For information regarding the Underlying Fund’s accounting policies and investment holdings, please see the Underlying Fund’s shareholder report.
Debt Securities — Debt securities for which market quotations are readily available are valued daily on the basis of quotations supplied by dealers or an independent pricing service approved by the Trustees. The pricing services may use valuation models or matrix pricing, which consider: (i) yield or price with respect to bonds that are considered comparable in characteristics such as rating, interest rate and maturity date or (ii) quotations from securities dealers to determine current value. With the exception of treasury securities of G7 countries, which are generally classified as Level 1, these investments are generally classified as Level 2 of the fair value hierarchy.
i. Mortgage-Backed and Asset-Backed Securities — Mortgage-backed securities represent direct or indirect participations in, or are collateralized by and payable from, mortgage loans secured by residential and/or commercial real estate property. Asset-backed securities include securities whose principal and interest payments are collateralized by pools of other assets or receivables. The value of certain mortgage-backed and asset-backed securities (including adjustable rate mortgage loans) may be particularly sensitive to changes in prevailing interest rates. The value of these securities may also fluctuate in response to the market’s perception of the creditworthiness of the issuers.
Asset-backed securities may present credit risks that are not presented by mortgage-backed securities because they generally do not have the benefit of a security interest in collateral that is comparable to mortgage assets. Some asset-backed securities may only have a subordinated claim on collateral.
Stripped mortgage-backed securities are usually structured with two different classes: one that receives substantially all interest payments (interest-only, or “IO” and/or high coupon rate with relatively low principal amount, or “IOette”), and the other that receives substantially all principal payments (principal-only, or “PO”) from a pool of mortgage loans. Little to no principal will be received at the maturity of an IO; as a result, periodic adjustments are recorded to reduce the cost of the security until maturity. These adjustments are included in interest income.
ii. Mortgage Dollar Rolls — Mortgage dollar rolls are transactions whereby the Fund sells mortgage-backed-securities and simultaneously contracts with the same counterparty to repurchase similar securities on a specified future date. During the settlement period, the Fund will not be entitled to accrue interest and receive principal payments on the securities sold. The Fund accounts for mortgage dollar roll transactions as purchases and sales and realize gains and losses on these transactions.
iii. Treasury Inflation Protected Securities — TIPS are treasury securities in which the principal amount is adjusted daily to keep pace with inflation, as measured by the U.S. Consumer Pricing Index for Urban Consumers. The repayment of the original bond principal upon maturity is guaranteed by the full faith and credit of the U.S. Government.
iv. When-Issued Securities and Forward Commitments — When-issued securities, including TBA (“To Be Announced”) securities, are securities that are authorized but not yet issued in the market and purchased in order to secure what is considered to be an advantageous price or yield to the Fund. A forward commitment involves entering into a contract to purchase or sell securities, typically on an extended settlement basis, for a fixed price at a future date. The purchase of securities on a when-issued or forward commitment basis involves a risk of loss if the value of the security to be purchased declines before the settlement date. Conversely, the sale of securities on a forward commitment basis involves the risk that the value of the securities sold may increase before the settlement date. Although the Fund will generally purchase securities on a when-issued or forward commitment basis with the intention of acquiring the securities for its portfolio, the Fund may dispose of when-issued securities or forward commitments prior to settlement, which may result in a realized gain or loss. For financial reporting purposes, cash collateral that has been pledged to cover obligations of the Fund and cash collateral
| 28 |
GOLDMAN SACHS VARIABLE INSURANCE TRUST CORE FIXED INCOME FUND
3. INVESTMENTS AND FAIR VALUE MEASUREMENTS (continued)
received, if any, is reported separately on the Statement of Assets and Liabilities as receivables/payables for collateral on other investments. Non-cash collateral pledged by the Fund, if any, is noted in the Schedules of Investments.
Derivative Contracts — A derivative is an instrument whose value is derived from underlying assets, indices, reference rates or a combination of these factors. The Fund enters into derivative transactions to hedge against changes in interest rates, securities prices, and/or currency exchange rates, to increase total return, or to gain access to certain markets or attain exposure to other underliers. For financial reporting purposes, cash collateral that has been pledged to cover obligations of the Fund and cash collateral received, if any, is reported separately on the Statement of Assets and Liabilities as receivables/payables for collateral on certain derivatives contracts. Non-cash collateral pledged by the Fund, if any, is noted in the Schedules of Investments.
Exchange-traded derivatives, including futures and options contracts, are generally valued at the last sale or settlement price on the exchange where they are principally traded. Exchange-traded options without settlement prices are generally valued at the midpoint of the bid and ask prices on the exchange where they are principally traded (or, in the absence of two-way trading, at the last bid price for long positions and the last ask price for short positions). Exchange-traded derivatives typically fall within Level 1 of the fair value hierarchy. Over-the-counter (“OTC”) and centrally cleared derivatives are valued using market transactions and other market evidence, including market-based inputs to models, calibration to market-clearing transactions, broker or dealer quotations, or other alternative pricing sources. Where models are used, the selection of a particular model to value OTC and centrally cleared derivatives depends upon the contractual terms of, and specific risks inherent in, the instrument, as well as the availability of pricing information in the market. Valuation models require a variety of inputs, including contractual terms, market prices, yield curves, credit curves, measures of volatility, voluntary and involuntary prepayment rates, loss severity rates and correlations of such inputs. For OTC and centrally cleared derivatives that trade in liquid markets, model inputs can generally be verified and model selection does not involve significant management judgment. OTC and centrally cleared derivatives are classified within Level 2 of the fair value hierarchy when significant inputs are corroborated by market evidence.
i. Forward Contracts — A forward contract is a contract between two parties to buy or sell an asset at a specified price on a future date. A forward contract settlement can occur on a cash or delivery basis. Forward contracts are marked-to-market daily using independent vendor prices, and the change in value, if any, is recorded as an unrealized gain or loss. Cash and certain investments may be used to collateralize forward contracts.
A forward foreign currency exchange contract is a forward contract in which the Fund agrees to receive or deliver a fixed quantity of one currency for another, at a pre-determined price at a future date. All forward foreign currency exchange contracts are marked to market daily by using the outright forward rates or interpolating based upon maturity dates, where available. Non-deliverable forward foreign currency exchange contracts are settled with the counterparty in cash without the delivery of foreign currency.
ii. Futures Contracts — Futures contracts are contracts to buy or sell a standardized quantity of a specified commodity or security. Upon entering into a futures contract, the Fund deposits cash or securities in an account on behalf of the broker in an amount sufficient to meet the initial margin requirement. Subsequent payments are made or received by the Fund equal to the daily change in the contract value and are recorded as variation margin receivable or payable with a corresponding offset to unrealized gains or losses.
iii. Options — When the Fund writes call or put options, an amount equal to the premium received is recorded as a liability and is subsequently marked-to-market to reflect the current value of the option written. Swaptions are options on swap contracts.
Upon the purchase of a call option or a put option by the Fund, the premium paid is recorded as an investment and subsequently marked-to-market to reflect the current value of the option. Certain options may be purchased with premiums to be determined on a future date. The premiums for these options are based upon implied volatility parameters at specified terms.
| 29 |
GOLDMAN SACHS VARIABLE INSURANCE TRUST CORE FIXED INCOME FUND
Notes to Financial Statements (continued)
June 30, 2022 (Unaudited)
3. INVESTMENTS AND FAIR VALUE MEASUREMENTS (continued)
iv. Swap Contracts — Bilateral swap contracts are agreements in which the Fund and a counterparty agree to exchange periodic payments on a specified notional amount or make a net payment upon termination. Bilateral swap transactions are privately negotiated in the OTC market and payments are settled through direct payments between the Fund and the counterparty. By contrast, certain swap transactions are subject to mandatory central clearing. These swaps are executed through a derivatives clearing member (“DCM”), acting in an agency capacity, and submitted to a central counterparty (“CCP”) (“centrally cleared swaps”), in which case all payments are settled with the CCP through the DCM. Swaps are marked-to-market daily using pricing vendor quotations, counterparty or clearinghouse prices or model prices, and the change in value, if any, is recorded as an unrealized gain or loss. Upon entering into a swap contract, the Fund is required to satisfy an initial margin requirement by delivering cash or securities to the counterparty (or in some cases, segregated in a triparty account on behalf of the counterparty), which can be adjusted by any mark-to-market gains or losses pursuant to bilateral or centrally cleared arrangements. For centrally cleared swaps the daily change in valuation, if any, is recorded as a receivable or payable for variation margin.
An interest rate swap is an agreement that obligates two parties to exchange a series of cash flows at specified intervals, based upon or calculated by reference to changes in interest rates on a specified notional principal amount. The payment flows are usually netted against each other, with the difference being paid by one party to the other.
A credit default swap is an agreement that involves one party (the buyer of protection) making a stream of payments to another party (the seller of protection) in exchange for the right to receive protection on a reference security or obligation, including a group of assets or exposure to the performance of an index. The Fund’s investment in credit default swaps may involve greater risks than if the Fund had invested in the referenced obligation directly. Credit events are contract specific but may include bankruptcy, failure to pay, restructuring and obligation acceleration. If the Fund buys protection through a credit default swap and no credit event occurs, its payments are limited to the periodic payments previously made to the counterparty. Upon the occurrence of a specified credit event, the Fund, as a buyer of credit protection, is entitled to receive an amount equal to the notional amount of the swap and deliver to the seller the defaulted reference obligation in a physically settled trade. The Fund may also receive a net settlement amount in the form of cash or securities equal to the notional amount of the swap reduced by the recovery value of the reference obligation in a cash settled trade.
As a seller of protection, the Fund generally receives a payment stream throughout the term of the swap, provided that there is no credit event. In addition, if the Fund sells protection through a credit default swap, the Fund could suffer a loss because the value of the referenced obligation and the premium payments received may be less than the notional amount of the swap paid to the buyer of protection. Upon the occurrence of a specified credit event, the Fund, as a seller of credit protection, may be required to take possession of the defaulted reference obligation and pay the buyer an amount equal to the notional amount of the swap in a physically settled trade. The Fund may also pay a net settlement amount in the form of cash or securities equal to the notional amount of the swap reduced by the recovery value of the reference obligation in a cash settled trade. Recovery values are at times established through the credit event auction process in which market participants are ensured that a transparent price has been set for the defaulted security or obligation. In addition, the Fund is entitled to a return of any assets, which have been pledged as collateral to the counterparty upon settlement.
The maximum potential amount of future payments (undiscounted) that the Fund as seller of protection could be required to make under a credit default swap would be an amount equal to the notional amount of the agreement. These potential amounts would be partially offset by any recovery values of the respective referenced obligations or net amounts received from a settlement of a credit default swap for the same reference security or obligation where the Fund bought credit protection.
B. Level 3 Fair Value Investments — To the extent that significant inputs to valuation models and other alternative pricing sources are unobservable, or if quotations are not readily available, or if GSAM believes that such quotations do not accurately reflect fair value, the fair value of the Fund’s investments may be determined under Valuation Procedures approved by the Trustees. GSAM, consistent with its procedures and applicable regulatory guidance, may make an adjustment to the most recent valuation prices of either domestic or foreign securities in light of significant events to reflect what it believes to be the fair value of the securities at the time of determining the Fund’s NAV. To the extent investments are valued using single source broker quotations obtained directly from the broker or passed through from third party pricing vendors, such investments are classified as Level 3 investments.
| 30 |
GOLDMAN SACHS VARIABLE INSURANCE TRUST CORE FIXED INCOME FUND
3. INVESTMENTS AND FAIR VALUE MEASUREMENTS (continued)
C. Fair Value Hierarchy — The following is a summary of the Fund’s investments and derivatives classified in the fair value hierarchy as of June 30, 2022:
| CORE FIXED INCOME FUND | ||||||||||||
| Investment Type | Level 1 | Level 2 | Level 3 | |||||||||
| Assets | ||||||||||||
| Fixed Income | ||||||||||||
Mortgage-Backed Securities | $ | — | $ | 48,180,536 | $ | — | ||||||
U.S. Treasury Obligations | 29,026,799 | — | — | |||||||||
Corporate Bonds | — | 24,138,624 | — | |||||||||
Commercial Paper | — | 6,903,935 | — | |||||||||
Foreign Bonds | — | 6,642,306 | — | |||||||||
Asset- Backed Securities | — | 4,130,452 | — | |||||||||
U.S. Government Agency Securities | — | 2,487,080 | — | |||||||||
Foreign Government Securities | — | 1,935,359 | — | |||||||||
Municipal Bonds | — | 1,360,316 | — | |||||||||
Commercial Mortgage-Backed Securities | — | 1,218,715 | — | |||||||||
Collateralized Mortgage Obligations | — | 566,920 | — | |||||||||
| Investment Company | 3,764,134 | — | — | |||||||||
| Certificate of Deposit | — | 1,755,777 | — | |||||||||
| Total | $ | 32,790,933 | $ | 99,320,020 | $ | — | ||||||
| Liabilities | ||||||||||||
| Forward Sales Contracts | $ | — | $ | (14,141,046 | ) | $ | — | |||||
| Derivative Type | ||||||||||||
| Assets | ||||||||||||
| Credit Default Swap Contracts(a) | $ | — | $ | 15,533 | $ | — | ||||||
| Forward Foreign Currency Contracts(a) | — | 38,637 | — | |||||||||
| Futures Contracts(a) | 24,856 | — | — | |||||||||
| Interest Rate Swap Contracts(a) | — | 58,264 | — | |||||||||
| Purchased Options Contracts | — | 184 | — | |||||||||
| Total | $ | 24,856 | $ | 112,618 | $ | — | ||||||
| Derivative Type | ||||||||||||
| Liabilities | ||||||||||||
| Credit Default Swap Contracts(a) | $ | — | $ | (303,829 | ) | $ | — | |||||
| Forward Foreign Currency Contracts(a) | — | (32,106 | ) | — | ||||||||
| Futures Contracts(a) | (21,701 | ) | — | — | ||||||||
| Interest Rate Swap Contracts(a) | — | (63,302 | ) | — | ||||||||
| Purchased Options Contracts | — | (172 | ) | — | ||||||||
| Total | $ | (21,701 | ) | $ | (399,409 | ) | $ | — | ||||
| (a) | Amount shown represents unrealized gain (loss) at period end. |
For further information regarding security characteristics, see the Schedules of Investments.
| 31 |
GOLDMAN SACHS VARIABLE INSURANCE TRUST CORE FIXED INCOME FUND
Notes to Financial Statements (continued)
June 30, 2022 (Unaudited)
4. INVESTMENTS IN DERIVATIVES
The following tables set forth, by certain risk types, the gross value of derivative contracts (not considered to be hedging instruments for accounting disclosure purposes) as of June 30, 2022. These instruments were used as part of the Fund’s investment strategies and to obtain and/or manage exposure related to the risks below. The values in the tables below exclude the effects of cash collateral received or posted pursuant to these derivative contracts, and therefore are not representative of the Fund’s net exposure.
Core Fixed Income Fund
| Risk | Statements of Assets and Liabilities | Assets | Statements of Assets and Liabilities | Liabilities | ||||||||||
| Interest Rate | Purchased options at value, variation margin on futures and swaps contracts | $ | 83,304 | (a) | Written options at value, variation margin on futures and swaps contracts | $ | (85,175 | )(a) | ||||||
| Credit | Receivable for unrealized gain on swap contracts | 14,932 | Payable for unrealized loss on swap contracts | (272,072 | ) | |||||||||
| Currency | Receivables for unrealized gain on forward foreign currency exchange contracts | 38,637 | Payable for unrealized loss on forward foreign currency exchange contracts | (32,106 | ) | |||||||||
| Total | $ | 136,873 | $ | (389,353 | ) | |||||||||
| (a) | Includes unrealized gain (loss) on futures contracts and centrally cleared swap contracts described in the Additional Investment Information sections of the Consolidated Schedule of Investments. Only the variation margin as of June 30, 2022, is reported within the Consolidated Statements of Assets and Liabilities. |
The following tables set forth, by certain risk types, the Fund’s gains (losses) related to these derivatives and their indicative volumes for the six months ended June 30, 2022. These gains (losses) should be considered in the context that these derivative contracts may have been executed to create investment opportunities and/or economically hedge certain investments, and accordingly, certain gains (losses) on such derivative contracts may offset certain (losses) gains attributable to investments. These gains (losses) are included in “Net realized gain (loss)” or “Net change in unrealized gain (loss)” on the Statements of Operations:
| Risk | Statement of Operations | Net Realized Gain (Loss) | Net Change in Unrealized Gain (Loss) | |||||||
| Credit | Net realized gain (loss) from swap contracts/Net change in unrealized gain (loss) on swap contracts | $ | 138,496 | $ | (519,475 | ) | ||||
| Currency | Net realized gain (loss) from forward foreign currency exchange contracts/Net change in unrealized gain (loss) on forward foreign currency exchange contracts | 27,557 | 3,766 | |||||||
| Interest Rate | Net realized gain (loss) from futures contracts, swap contracts, written options, and purchased options/Net change in unrealized gain (loss) on futures contracts, swap contracts and purchased options | (1,409,731 | ) | (65,453 | ) | |||||
| Total | $ | (1,243,678 | ) | $ | (581,162 | ) | ||||
| Average number of Contracts or Notional Amounts(1) | ||||||||||||||||||||
| Risk | Futures Contracts | Forward Contracts | Swap Agreements | Purchased Options | Written Options | |||||||||||||||
| Core Fixed Income Fund | 80 | $ | 30,879,532 | $ | 277,899,167 | $ | 5,030,000 | $ | 520,000 | |||||||||||
| (1) | Amounts disclosed represent average number of contracts for futures contracts, purchased options and written options, notional amounts for forward contracts and swap contracts, based on absolute values, which is indicative of volume of this derivative type, for the months that the Fund held such derivatives during the six months ended June 30, 2022. |
| 32 |
GOLDMAN SACHS VARIABLE INSURANCE TRUST CORE FIXED INCOME FUND
5. AGREEMENTS AND AFFILIATED TRANSACTIONS
A. Management Agreement — Under the Agreement, GSAM manages the Fund, subject to the general supervision of the Trustees.
As compensation for the services rendered pursuant to the Agreement, the assumption of the expenses related thereto and administration of the Fund’s business affairs, including providing facilities, GSAM is entitled to a management fee, accrued daily and paid monthly, equal to an annual percentage rate of the Fund’s average daily net assets.
For the six months ended June 30, 2022, contractual and effective net management fees with GSAM were at the following rates:
| Contractual Management Rate | Effective Net Management Rate^ | |||||||||||||||||||||||||||
| Fund | First $1 billion | Next $1 billion | Next $3 billion | Next $3 billion | Over $8 billion | Effective Rate | ||||||||||||||||||||||
| Core Fixed Income Fund | 0.40 | % | 0.36 | % | 0.34 | % | 0.33 | % | 0.32 | % | 0.40 | % | 0.39 | % | ||||||||||||||
| ^ | Effective Net Management Rate includes the impact of management fee waivers of affiliated underlying funds, if any. The Effective Net Management Rate may not correlate to the Contractual Management Rate as a result of management fee waivers that may be in effect from time to time. |
The Fund invests in Institutional Shares of the Goldman Sachs Financial Square Government Fund, which is an affiliated Underlying Fund. GSAM has agreed to waive a portion of its management fee payable by the Fund in an amount equal to the management fee it earns as an investment adviser to the affiliated Underlying Fund in which the Fund invest. For the six months ended June 30, 2022, GSAM waived $5,101 of the Fund’s management fee.
B. Distribution and/or Service (12b-1) Plans — The Trust, on behalf of Service Shares of the Fund, has adopted Distribution and Service Plan subject to Rule 12b-1 under the Act. Under the Distribution and Service Plan, Goldman Sachs, which serves as distributor (the “Distributor”), is entitled to a fee accrued daily and paid monthly for distribution services and personal and account maintenance services, which may then be paid by Goldman Sachs to authorized dealers, equal to, on an annual basis, 0.25% of the Fund’s average daily net assets attributable to Service Shares.
C. Transfer Agency Agreement — Goldman Sachs also serves as the transfer agent of the Fund for a fee pursuant to the Transfer Agency Agreement. The fees charged for such transfer agency services are accrued daily and paid monthly at an annual rate of 0.02% of the average daily net assets of Institutional and Service Shares.
D. Other Expense Agreements and Affiliated Transactions — GSAM has agreed to reduce or limit certain “Other Expenses” of the Fund (excluding acquired fund fees and expenses, transfer agency fees and expenses, service fees and shareholder administration fees (as applicable), taxes, interest, brokerage fees, expenses of shareholder meetings, litigation and indemnification, and extraordinary expenses) to the extent such expenses exceed, on an annual basis, a percentage rate of the average daily net assets of the Fund. Such Other Expense reimbursements, if any, are accrued daily and paid monthly. In addition, the Fund is not obligated to reimburse GSAM for prior fiscal year expense reimbursements, if any. The Other Expense limitations as an annual percentage rate of average daily net assets for the Fund is 0.004%. These Other Expense limitations will remain in place through at least April 29, 2023, and prior to such date GSAM may not terminate the arrangements without the approval of the Trustees. In addition, the Fund has entered into certain offset arrangements with the custodian and the transfer agent, which may result in a reduction of the Fund’s expenses and are received irrespective of the application of the “Other Expense” limitations described above.
For the six months ended June 30, 2022, these expense reductions, including any fee waivers and Other Expense reimbursements, were as follows:
| Fund | Management Fee Waiver | Other Expense Reimbursement | Total Expense Reductions | |||||||||
| Core Fixed Income Fund | $ | 5,101 | $ | 146,939 | $ | 152,040 | ||||||
| 33 |
GOLDMAN SACHS VARIABLE INSURANCE TRUST CORE FIXED INCOME FUND
Notes to Financial Statements (continued)
June 30, 2022 (Unaudited)
5. AGREEMENTS AND AFFILIATED TRANSACTIONS (continued)
E. Line of Credit Facility — As of June 30, 2022, the Fund participated in a $1,250,000,000 committed, unsecured revolving line of credit facility (the “facility”) together with other funds of the Trust and certain registered investment companies having management agreements with GSAM or its affiliates. This facility is to be used for temporary emergency purposes, or to allow for an orderly liquidation of securities to meet redemption requests. The interest rate on borrowings is based on the federal funds rate. The facility also requires a fee to be paid by the Fund based on the amount of the commitment that has not been utilized. For the six months ended June 30, 2022, the Fund did not have any borrowings under the facility. Prior to April 22, 2022, the facility was $1,000,000,000.
F. Other Transactions with Affiliates — The following table provides information about the Fund’s investment in the Goldman Sachs Financial Square Government Fund as of and for the six months ended June 30, 2022:
| Fund | Beginning Value as of December 31, 2021 | Purchases at Cost | Proceeds from Sales | Ending Value as of June 30, 2022 | Shares as of June 30, 2022 | Dividend Income | ||||||||||||||||||
| Core Fixed Income Fund | $ | 7,004,192 | $ | 34,268,565 | $ | (37,508,623 | ) | $ | 3,764,134 | 3,764,134 | $ | 10,411 | ||||||||||||
6. PORTOLIO SECURITIES TRANSCTIONS
The cost of purchases and proceeds from sales and maturities of long-term securities for the six months ended June 30, 2022, were as follows:
| Fund | Purchases of U.S. Government and Agency Obligations | Purchases (Excluding U.S. Government and Agency Obligations) | Sales and Maturities of U.S. Government and Agency Obligations | Sales and Maturities (Excluding U.S. Government and Agency Obligations) | ||||||||||||||||
| Core Fixed Income Fund | $ | 326,360,274 | $ | 54,837,410 | $ | 314,909,181 | $ | 37,616,085 | ||||||||||||
7. TAX INFORMATION
As of the Fund’s most recent fiscal year end, December 31, 2021, the Fund’s capital loss carryforwards and certain timing differences, on a tax-basis were as follows:
| Core Fixed Income Fund | ||||
| Capital loss carryforwards: | ||||
Perpetual Short-term | $ | (353,719 | ) | |
Perpetual Long-term | (65,428 | ) | ||
| Total Capital loss carryforwards | $ | (419,147 | ) | |
| Timing differences (Late year ordinary loss deferral, post October loss deferral, and straddle loss deferrals) | $ | (161,044 | ) | |
| 34 |
GOLDMAN SACHS VARIABLE INSURANCE TRUST CORE FIXED INCOME FUND
7. TAX INFORMATION (continued)
As of June 30, 2022, the Fund’s aggregate security unrealized gains and losses based on cost for U.S. federal income tax purposes were as follows:
| Core Fixed Income Fund | ||||
| Tax cost | $ | 140,327,065 | ||
| Gross unrealized gain | 325,388 | |||
| Gross unrealized loss | (8,541,500 | ) | ||
| Net unrealized gain (loss) | $ | (8,216,112 | ) | |
The difference between GAAP-basis and tax-basis unrealized gains (losses) is attributable primarily to wash sales, net mark to market gains (losses) on regulated futures and foreign currency contracts, and differences in the tax treatment of market discount accretion and premium amortization and swap transactions.
GSAM has reviewed the Fund’s tax positions for all open tax years (the current and prior three years, as applicable) and has concluded that no provision for income tax is required in the Fund’s financial statements. Such open tax years remain subject to examination and adjustment by tax authorities.
8. OTHER RISKS
The Fund’s risks include, but are not limited to, the following:
Derivatives Risk — The Fund’s use of derivatives may result in loss. Derivative instruments, which may pose risks in addition to and greater than those associated with investing directly in securities, currencies or other instruments, may be illiquid or less liquid, volatile, difficult to price and leveraged so that small changes in the value of the underlying instruments may produce disproportionate losses to the Fund. Derivatives are also subject to counterparty risk, which is the risk that the other party in the transaction will not fulfill its contractual obligation. The use of derivatives is a highly specialized activity that involves investment techniques and risks different from those associated with investments in more traditional securities and instruments. Losses from derivatives can also result from a lack of correlation between changes in the value of derivative instruments and the portfolio assets (if any) being hedged.
Floating and Variable Rate Obligations Risk — Floating rate and variable rate obligations are debt instruments issued by companies or other entities with interest rates that reset periodically (typically, daily, monthly, quarterly, or semiannually) in response to changes in the market rate of interest on which the interest rate is based. For floating and variable rate obligations, there may be a lag between an actual change in the underlying interest rate benchmark and the reset time for an interest payment of such an obligation, which could harm or benefit the Fund, depending on the interest rate environment or other circumstances. In a rising interest rate environment, for example, a floating or variable rate obligation that does not reset immediately would prevent the Fund from taking full advantage of rising interest rates in a timely manner. However, in a declining interest rate environment, the Fund may benefit from a lag due to an obligation’s interest rate payment not being immediately impacted by a decline in interest rates.
Interest Rate Risk — When interest rates increase, fixed income securities or instruments held by the Fund will generally decline in value. The Fund may face a heightened level of interest rate risk in connection with the type and extent of certain monetary policy changes made by the Federal Reserve, such as target interest rate changes. Long-term fixed income securities or instruments will normally have more price volatility because of this risk than short-term fixed income securities or instruments. A wide variety of market factors can cause interest rates to rise, including central bank monetary policy, rising inflation and changes in general economic conditions. The risks associated with changing interest rates may have unpredictable effects on the markets and the Fund’s investments. Fluctuations in interest rates may also affect the liquidity of fixed income securities and instruments held by the Fund. A sudden or unpredictable increase in interest rates may cause volatility in the market and may decrease the liquidity of the Fund’s investments, which would make it harder for the Fund to sell its investments at an advantageous time.
| 35 |
GOLDMAN SACHS VARIABLE INSURANCE TRUST CORE FIXED INCOME FUND
Notes to Financial Statements (continued)
June 30, 2022 (Unaudited)
8. OTHER RISKS (continued)
Investments in Other Investment Companies Risk — As a shareholder of another investment company, the Fund will indirectly bear its proportionate share of any net management fees and other expenses paid by such other investment companies, in addition to the fees and expenses regularly borne by the Fund.
Large Shareholder Transactions Risk — The Fund may experience adverse effects when certain large shareholders, such as other funds, participating insurance companies, accounts and Goldman Sachs affiliates, purchase or redeem large amounts of shares of the Fund. Such large shareholder redemptions, which may occur rapidly or unexpectedly, may cause the Fund to sell portfolio securities at times when it would not otherwise do so, which may negatively impact the Fund’s NAV and liquidity. These transactions may also accelerate the realization of taxable income to shareholders if such sales of investments resulted in gains, and may also increase transaction costs. In addition, a large redemption could result in the Fund’s current expenses being allocated over a smaller asset base, leading to an increase in the Fund’s expense ratio. Similarly, large Fund share purchases may adversely affect the Fund’s performance to the extent that the Fund is delayed in investing new cash or otherwise maintains a larger cash position than it ordinarily would.
Liquidity Risk — The Fund may make investments that are illiquid or that may become less liquid in response to market developments or adverse investor perceptions. Illiquid investments may be more difficult to value. Liquidity risk may also refer to the risk that the Fund will not be able to pay redemption proceeds within the allowable time period or without significant dilution to remaining investors’ interests because of unusual market conditions, an unusually high volume of redemption requests, or other reasons. To meet redemption requests, the Fund may be forced to sell investments at an unfavorable time and/or under unfavorable conditions. If the Fund is forced to sell securities at an unfavorable time and/or under unfavorable conditions, such sales may adversely affect the Fund’s NAV and dilute remaining investors’ interests. Liquidity risk may be the result of, among other things, the reduced number and capacity of traditional market participants to make a market in fixed income securities or the lack of an active market. The potential for liquidity risk may be magnified by a rising interest rate environment or other circumstances where investor redemptions from fixed income funds may be higher than normal, potentially causing increased supply in the market due to selling activity. Redemptions by large shareholders may have a negative impact on the Fund’s liquidity.
Market and Credit Risks — In the normal course of business, the Fund trades financial instruments and enters into financial transactions where risk of potential loss exists due to changes in the market (market risk). The value of the securities in which the Fund invests may go up or down in response to the prospects of individual companies, particular sectors or governments and/or general economic conditions throughout the world due to increasingly interconnected global economies and financial markets. Events such as war, acts of terrorism, social unrest, natural disasters, the spread of infectious illness or other public health threats could also significantly impact the Fund and its investments. Additionally, the Fund may also be exposed to credit risk in the event that an issuer or guarantor fails to perform or that an institution or entity with which the Fund has unsettled or open transactions defaults.
9. SUBSEQUENT EVENTS
Subsequent events after the Statement of Assets and Liabilities date have been evaluated, and GSAM has concluded that there is no impact requiring adjustment or disclosure in the financial statements.
| 36 |
GOLDMAN SACHS VARIABLE INSURANCE TRUST CORE FIXED INCOME FUND
10. SUMMARY OF SHARE TRANSACTIONS
| Core Fixed Income Fund | ||||||||||||||||
| For the Fiscal Year Ended June 30, 2022 (Unaudited) | For the Fiscal Year Ended December 31, 2021 | |||||||||||||||
| Shares | Dollars | Shares | Dollars | |||||||||||||
| Institutional Shares | ||||||||||||||||
| Shares sold | 466,621 | $ | 4,771,340 | 1,500,925 | $ | 16,820,030 | ||||||||||
| Reinvestment of distributions | 28,813 | 288,353 | 33,172 | 368,886 | ||||||||||||
| Shares redeemed | (252,781 | ) | (2,742,084 | ) | (919,193 | ) | (10,321,960 | ) | ||||||||
| 242,653 | 2,317,609 | 614,904 | 6,866,956 | |||||||||||||
| Service Shares | ||||||||||||||||
| Shares sold | 987,433 | 10,232,015 | 2,646,702 | 29,693,268 | ||||||||||||
| Reinvestment of distributions | 61,597 | 616,443 | 68,220 | 758,578 | ||||||||||||
| Shares redeemed | (281,804 | ) | (2,914,174 | ) | (300,466 | ) | (3,366,145 | ) | ||||||||
| 767,226 | 7,934,284 | 2,414,456 | 27,085,701 | |||||||||||||
| NET INCREASE | 1,009,879 | $ | 10,251,893 | 3,029,360 | $ | 33,952,657 | ||||||||||
| 37 |
GOLDMAN SACHS VARIABLE INSURANCE TRUST CORE FIXED INCOME FUND
Statement Regarding Basis for Approval of Management Agreement (Unaudited)
Background
The Goldman Sachs Core Fixed Income (the “Fund”) is an investment portfolio of Goldman Sachs Variable Insurance Trust (the “Trust”). The Board of Trustees oversees the management of the Trust and reviews the investment performance and expenses of the Fund at regularly scheduled meetings held throughout the year. In addition, the Board of Trustees determines annually whether to approve the continuance of the Trust’s investment management agreement (the “Management Agreement”) with Goldman Sachs Asset Management, L.P. (the “Investment Adviser”) on behalf of the Fund.
The Management Agreement was most recently approved for continuation until June 30, 2023 by the Board of Trustees, including those Trustees who are not parties to the Management Agreement or “interested persons” (as defined in the Investment Company Act of 1940, as amended) of any party thereto (the “Independent Trustees”), at a meeting held on June 14-15, 2022 (the “Annual Meeting”).
The review process undertaken by the Trustees spans the course of the year and culminates with the Annual Meeting. To assist the Trustees in their deliberations, the Trustees have established a Contract Review Committee (the “Committee”), comprised of the Independent Trustees. The Committee held two meetings over the course of the year since the Management Agreement was last approved. At those Committee meetings, regularly scheduled Board or other committee meetings, and/or the Annual Meeting, matters relevant to the renewal of the Management Agreement were considered by the Board, or the Independent Trustees, as applicable. With respect to the Fund, such matters included:
| (a) | the nature and quality of the advisory, administrative, and other services provided to the Fund by the Investment Adviser and its affiliates, including information about: |
| (i) | the structure, staff, and capabilities of the Investment Adviser and its portfolio management teams; |
| (ii) | the groups within the Investment Adviser and its affiliates that support the portfolio management teams or provide other types of necessary services, including fund services groups (e.g., accounting and financial reporting, tax, shareholder services, and operations); controls and risk management groups (e.g., legal, compliance, valuation oversight, credit risk management, internal audit, compliance testing, market risk analysis, finance, and central funding); sales and distribution support groups, and others (e.g., information technology and training); |
| (iii) | trends in employee headcount; |
| (iv) | the Investment Adviser’s financial resources and ability to hire and retain talented personnel and strengthen its operations; and |
| (v) | the parent company’s support of the Investment Adviser and its mutual fund business, as expressed by the firm’s senior management; |
| (b) | information on the investment performance of the Fund, including comparisons to the performance of similar mutual funds, as provided by a third-party mutual fund data provider engaged as part of the contract review process (the “Outside Data Provider”), a benchmark performance index, and a composite of accounts with comparable investment strategies managed by the Investment Adviser; and information on general investment outlooks in the markets in which the Fund invests; |
| (c) | information provided by the Investment Adviser indicating the Investment Adviser’s views on whether the Fund’s peer group and/or benchmark index had high, medium, or low relevance given the Fund’s particular investment strategy; |
| (d) | the terms of the Management Agreement and other agreements with affiliated service providers entered into by the Trust on behalf of the Fund; |
| (e) | fee and expense information for the Fund, including: |
| (i) | the relative management fee and expense levels of the Fund as compared to those of comparable funds managed by other advisers, as provided by the Outside Data Provider; |
| (ii) | the Fund’s expense trends over time; and |
| (iii) | to the extent the Investment Adviser manages other types of accounts (such as bank collective trusts, private wealth management accounts, institutional separate accounts, sub-advised mutual funds, and non-U.S. funds) having investment objectives and policies similar to those of the Fund, comparative information on the advisory fees charged and services provided to those accounts by the Investment Adviser; |
| (f) | with respect to the extensive investment performance and expense comparison data provided by the Outside Data Provider, its processes in producing that data for the Fund; |
| (g) | the undertakings of the Investment Adviser and its affiliates to implement fee waivers and/or expense limitations; |
| (h) | information relating to the profitability of the Management Agreement and the transfer agency and distribution and service arrangements of the Fund to the Investment Adviser and its affiliates; |
| (i) | whether the Fund’s existing management fee schedule adequately addressed any economies of scale; |
| 38 |
GOLDMAN SACHS VARIABLE INSURANCE TRUST CORE FIXED INCOME FUND
Statement Regarding Basis for Approval of Management Agreement (Unaudited) (continued)
| (j) | a summary of the “fall-out” benefits derived by the Investment Adviser and its affiliates from their relationships with the Fund, including the fees received by the Investment Adviser’s affiliates from the Fund for transfer agency, portfolio trading, distribution and other services; |
| (k) | a summary of potential benefits derived by the Fund as a result of its relationship with the Investment Adviser; |
| (l) | information regarding portfolio trading and how the Investment Adviser carries out its duty to seek best execution; |
| (m) | the manner in which portfolio manager compensation is determined; and the number and types of accounts managed by the portfolio managers; |
| (n) | the nature and quality of the services provided to the Fund by its unaffiliated service providers, and the Investment Adviser’s general oversight and evaluation (including reports on due diligence) of those service providers as part of the administrative services provided under the Management Agreement; and |
| (o) | the Investment Adviser’s processes and policies addressing various types of potential conflicts of interest; its approach to risk management; the annual review of the effectiveness of the Fund’s compliance program; and periodic compliance reports. |
The Trustees also received an overview of the Fund’s distribution arrangements. They received information regarding the Fund’s assets, share purchase and redemption activity, and payment of distribution and service fees. Information was also provided to the Trustees relating to revenue sharing payments made by and services provided by the Investment Adviser and its affiliates to intermediaries that promote the sale, distribution, and/or servicing of Fund shares. The Independent Trustees also discussed the broad range of other investment choices that are available to Fund investors, including the availability of comparable funds managed by other advisers.
The presentations made at the Board and Committee meetings and at the Annual Meeting encompassed the Fund and other mutual funds for which the Board of Trustees has responsibility. In evaluating the Management Agreement at the Annual Meeting, the Trustees relied upon their knowledge, resulting from their meetings and other interactions throughout the year, of the Investment Adviser and its affiliates, their services, and the Fund. In conjunction with these meetings, the Trustees received written materials and oral presentations on the topics covered, and the Investment Adviser addressed the questions and concerns of the Trustees, including concerns regarding the investment performance of certain of the funds they oversee. The Independent Trustees were advised by their independent legal counsel regarding their responsibilities and other regulatory requirements related to the approval and continuation of mutual fund investment management agreements under applicable law. In addition, the Investment Adviser and its affiliates provided the Independent Trustees with a written response to a formal request for information sent on behalf of the Independent Trustees by their independent legal counsel. During the course of their deliberations, the Independent Trustees met in executive sessions with their independent legal counsel, without representatives of the Investment Adviser or its affiliates present.
Nature, Extent, and Quality of the Services Provided Under the Management Agreement
As part of their review, the Trustees considered the nature, extent, and quality of the services provided to the Fund by the Investment Adviser. In this regard, the Trustees considered both the investment advisory services and non-advisory services that are provided by the Investment Adviser and its affiliates. The Trustees noted the transition in the leadership and changes in personnel of various of the Investment Adviser’s portfolio management teams that had occurred in recent periods, and the ongoing recruitment efforts aimed at bringing high quality investment talent to the Investment Adviser. They also noted the Investment Adviser’s commitment to maintaining high quality systems and expending substantial resources to respond to ongoing changes to the market, regulatory and control environment in which the Fund and its service providers operate, including developments associated with the COVID-19 pandemic, geopolitical events, and economic sanctions, as well as the efforts of the Investment Adviser and its affiliates to combat cyber security risks. The Trustees also considered information regarding the Investment Adviser’s business continuity planning and remote operations capabilities. The Trustees concluded that the Investment Adviser continued to commit substantial financial and operational resources to the Fund and expressed confidence that the Investment Adviser would continue to do so in the future. The Trustees also recognized that the Investment Adviser had made significant commitments to address regulatory compliance requirements applicable to the Fund and the Investment Adviser and its affiliates.
Investment Performance
The Trustees also considered the investment performance of the Fund. In this regard, they compared the investment performance of the fund to its peers using rankings and ratings compiled by the Outside Data Provider as of December 31, 2021, and updated performance information prepared by the Investment Adviser using the peer group identified by the Outside Data Provider as of March 31, 2022. The information on the Fund’s investment performance was provided for the one-, three- and
| 39 |
GOLDMAN SACHS VARIABLE INSURANCE TRUST CORE FIXED INCOME FUND
Statement Regarding Basis for Approval of Management Agreement (Unaudited) (continued)
five-year periods ending on the applicable dates. The Trustees also reviewed the Fund’s investment performance relative to its performance benchmark. As part of this review, they considered the investment performance trends of the Fund over time, and reviewed the investment performance of the Fund in light of its investment objective and policies and market conditions. The Trustees also received information comparing the Fund’s performance to that of a composite of accounts with comparable investment strategies managed by the Investment Adviser.
In addition, the Trustees considered materials prepared and presentations made by the Investment Adviser’s senior management and portfolio management personnel in which Fund performance was assessed. The Trustees also considered the Investment Adviser’s periodic reports with respect to the Fund’s risk profile, and how the Investment Adviser’s approach to risk monitoring and management influences portfolio management.
The Trustees observed that the Fund’s Institutional Shares had placed in the top half of the Fund’s peer group for the three- and five- year periods, and in the third quartile for the one-year period, and had outperformed the Fund’s benchmark index for the three- and five-year periods and underperformed for the one-year period ended March 31, 2022.
Costs of Services Provided and Competitive Information
The Trustees considered the contractual terms of the Management Agreement and the fee rates payable by the Fund thereunder. In this regard, the Trustees considered information on the services rendered by the Investment Adviser to the Fund, which included both advisory and administrative services that were directed to the needs and operations of the Fund as a registered mutual fund.
In particular, the Trustees reviewed analyses prepared by the Outside Data Provider regarding the expense rankings of the Fund. The analyses provided a comparison of the Fund’s management fee and breakpoints to those of a relevant peer group and category universe; an expense analysis which compared the Fund’s overall net and gross expenses to a peer group and a category universe; and data comparing the Fund’s net expenses to the peer and category medians. The analyses also compared the Fund’s other expenses and fee waivers/reimbursements to those of the peer group and category medians. The Trustees concluded that the comparisons provided by the Outside Data Provider were useful in evaluating the reasonableness of the management fees and total expenses paid by the Fund.
In addition, the Trustees considered the Investment Adviser’s undertakings to implement fee waivers and/or expense limitations. They also considered, to the extent that the Investment Adviser manages other types of accounts having investment objectives and policies similar to those of the Fund, comparative fee information for services provided by the Investment Adviser to those accounts, and information that indicated that services provided to the Fund differed in various significant respects from the services provided to other types of accounts which, in many cases, operated under less stringent legal and regulatory structures, required fewer services from the Investment Adviser to a smaller number of client contact points, and were less time-intensive.
In addition, the Trustees noted that shareholders are able to redeem their shares at any time if shareholders believe that the Fund fees and expenses are too high or if they are dissatisfied with the performance of the Fund.
Profitability
The Trustees reviewed the Fund’s contribution to the Investment Adviser’s revenues and pre-tax profit margins. In this regard the Trustees noted that they had received, among other things, profitability analyses and summaries, revenue and expense schedules by Fund and by function (i.e., investment management, transfer agency and distribution and service), and information on the Investment Adviser’s expense allocation methodology. They observed that the profitability and expense figures are substantially similar to those used by the Investment Adviser for many internal purposes, including compensation decisions among various business groups, and are thus subject to a vigorous internal debate about how certain revenue and expenses should be allocated. The Trustees also noted that the internal audit group within the Goldman Sachs organization periodically audits the expense allocation methodology and that the internal audit group was satisfied with the reasonableness, consistency, and accuracy of the Investment Adviser’s expense allocation methodology. Profitability data for the Fund was provided for 2021 and 2020, and the Trustees considered this information in relation to the Investment Adviser’s overall profitability.
| 40 |
GOLDMAN SACHS VARIABLE INSURANCE TRUST CORE FIXED INCOME FUND
Statement Regarding Basis for Approval of Management Agreement (Unaudited) (continued)
Economies of Scale
The Trustees considered the information that had been provided regarding whether there have been economies of scale with respect to the management of the Fund. The Trustees also considered the breakpoints in the fee rate payable under the Management Agreement for the Fund at the following annual percentage rates of the average daily net assets of the Fund:
| First $1 billion | 0.40 | % | ||
| Next $1 billion | 0.36 | |||
| Next $3 billion | 0.34 | |||
| Next $3 billion | 0.33 | |||
| Over $8 billion | 0.32 | |||
The Trustees noted that the breakpoints were designed to share potential economies of scale, if any, with the Fund and its shareholders as assets under management reach those asset levels. The Trustees considered the amount of assets in the Fund; the Fund’s recent share purchase and redemption activity; the information provided by the Investment Adviser relating to the costs of the services provided by the Investment Adviser and its affiliates and their realized profits; information comparing fee rates charged by the Investment Adviser with fee rates charged to other funds in the peer group; and the Investment Adviser’s undertaking to limit certain expenses of the Fund that exceed specified levels. Upon reviewing these matters at the Annual Meeting, the Trustees concluded that the fee breakpoints represented a means of assuring that benefits of scalability, if any, would be passed along to shareholders at the specified asset levels.
Other Benefits to the Investment Adviser and Its Affiliates
The Trustees also considered the other benefits derived by the Investment Adviser and its affiliates from their relationships with the Fund as stated above, including: (a) transfer agency fees received by Goldman Sachs & Co. LLC (“Goldman Sachs”); (b) futures commissions earned by Goldman Sachs for executing futures transactions on behalf of the Fund; (c) trading efficiencies resulting from aggregation of orders of the Fund with those for other funds or accounts managed by the Investment Adviser; (d) the Investment Adviser’s ability to leverage the infrastructure designed to service the Fund on behalf of its other clients; (e) the Investment Adviser’s ability to cross-market other products and services to Fund shareholders; (f) Goldman Sachs’ retention of certain fees as Fund Distributor; (g) the Investment Adviser’s ability to negotiate better pricing with custodians on behalf of its other clients, as a result of the relationship with the Fund; (h) the investment of cash and cash collateral in money market funds managed by the Investment Adviser that will result in increased assets under management for those money market funds; (i) the investment in exchange-traded funds (“ETFs”) managed by the Investment Adviser that will result in increased assets under management for those ETFs and may facilitate the development of the Investment Adviser’s ETF advisory business; and (j) the possibility that the working relationship between the Investment Adviser and the Fund’s third-party service providers may cause those service providers to be more likely to do business with other areas of Goldman Sachs. In the course of considering the foregoing, the Independent Trustees requested and received further information quantifying certain of these fall-out benefits.
Other Benefits to the Fund and Its Shareholders
The Trustees also noted that the Fund receives certain other potential benefits as a result of its relationship with the Investment Adviser, including: (a) trading efficiencies resulting from aggregation of orders of the Fund with those of other funds or accounts managed by the Investment Adviser; (b) enhanced servicing from vendors due to the volume of business generated by the Investment Adviser and its affiliates; (c) enhanced servicing from broker-dealers due to the volume of business generated by the Investment Adviser and its affiliates; (d) the Investment Adviser’s ability to negotiate favorable terms with derivatives counterparties on behalf of the Fund as a result of the size and reputation of the Goldman Sachs organization; (e) the advantages received from the Investment Adviser’s knowledge and experience gained from managing other accounts and products; (f) the Investment Adviser’s ability to hire and retain qualified personnel to provide services to the Fund because of the reputation of the Goldman Sachs organization; (g) the Fund’s access, through the Investment Adviser, to certain firm-wide resources (e.g., proprietary risk management systems and databases), subject to certain restrictions; and (h) the Fund’s access to certain affiliated distribution channels. In addition, the Trustees noted the competitive nature of the mutual fund marketplace, and considered that many of the Fund’s shareholders invested in the Fund in part because of the Fund’s relationship with the Investment Adviser and that those shareholders have a general expectation that the relationship will continue.
| 41 |
GOLDMAN SACHS VARIABLE INSURANCE TRUST CORE FIXED INCOME FUND
Statement Regarding Basis for Approval of Management Agreement (Unaudited) (continued)
Conclusion
In connection with their consideration of the Management Agreement, the Trustees gave weight to each of the factors described above, but did not identify any particular factor as controlling their decision. After deliberation and consideration of all of the information provided, including the factors described above, the Trustees concluded, in the exercise of their business judgment, that the management fees paid by the Fund were reasonable in light of the services provided to it by the Investment Adviser, the Investment Adviser’s costs and the Fund’s current and reasonably foreseeable asset levels. The Trustees unanimously concluded that the Investment Adviser’s continued management likely would benefit the Fund and its shareholders and that the Management Agreement should be approved and continued with respect to the Fund until June 30, 2023.
| 42 |
GOLDMAN SACHS VARIABLE INSURANCE TRUST CORE FIXED INCOME FUND
Liquidity Risk Management Program (Unaudited)
The Fund has adopted and implemented a liquidity risk management program (the “Program”) in accordance with Rule 22e-4 under the 1940 Act. The Program seeks to assess and manage the Fund’s liquidity risk, i.e., the risk that the Fund is unable to satisfy redemption requests without significantly diluting remaining investors’ interests in the Fund. The Board of Trustees of the Trust has designated GSAM, the Fund’s investment adviser, to administer the Program. Certain aspects of the Program rely on third parties to perform certain functions, including the provision of market data and application of models.
The Program is comprised of various components designed to support the assessment and/or management of liquidity risk, including: (1) the periodic assessment (no less frequently than annually) of certain factors that influence the Fund’s liquidity risk; (2) the periodic classification (no less frequently than monthly) of the Fund’s investments into one of four liquidity categories that reflect an estimate of their liquidity under current market conditions; (3) a 15% limit on the acquisition of “illiquid investments” (as defined under Rule 22e-4); (4) for the Fund that does not invest primarily in “highly liquid investments” (as defined under Rule 22e-4), the determination of a minimum percentage of the Fund’s assets that will generally be invested in highly liquid investments (a “Highly Liquid Investment Minimum”); and (5) periodic reporting to the Board of Trustees.
At a meeting of the Board of Trustees on February 8-9, 2022, GSAM provided a written report to the Board addressing the operation, and the adequacy and effectiveness of the implementation, of the Program, including, as applicable, the operation of any Highly Liquid Investment Minimum and any material changes to the Program, for the period from January 1, 2021 through December 31, 2021 (the “Reporting Period”). Among other things, the annual report discussed: (1) the results of stress tests designed to assess liquidity under a hypothetical stressed scenario involving elevated redemptions; (2) an assessment of the methodologies used to classify investments into one of four liquidity categories; and (3) the impact of local holidays in non-U.S. jurisdictions. The report concluded that the Program continues to be reasonably designed to assess and manage liquidity risk and was adequately and effectively implemented during the Reporting Period.
There can be no assurance that the Program will achieve its objectives under all circumstances in the future. Please refer to your Fund’s prospectus for more information regarding the Fund’s exposure to liquidity risk and other risks to which it may be subject.
| 43 |
GOLDMAN SACHS VARIABLE INSURANCE TRUST CORE FIXED INCOME FUND
Impact of Russian Invasion of Ukraine (Unaudited)
The Russian invasion of Ukraine has negatively affected the global economy and has resulted in significant disruptions in financial markets and increased macroeconomic uncertainty. In addition, governments around the world have responded to Russia’s invasion by imposing economic sanctions and export controls on certain industry sectors, companies and individuals in or associated with Russia. Russia has imposed its own restrictions against investors and countries outside Russia and has proposed additional measures aimed at non-Russian-owned businesses. Businesses in the U.S. and globally have experienced shortages in materials and increased costs for transportation, energy and raw materials due, in part, to the negative effects of the war on the global economy. The escalation or continuation of the war between Russia and Ukraine or other hostilities presents heightened risks relating to cyber-attacks, the frequency and volume of failures to settle securities transactions, supply chain disruptions, inflation, as well as the potential for increased volatility in commodity, currency and other financial markets. The extent and duration of the war, sanctions and resulting market disruptions, as well as the potential adverse consequences for the Fund’s operations are difficult to predict.
| 44 |
GOLDMAN SACHS VARIABLE INSURANCE TRUST CORE FIXED INCOME FUND
| Fund Expenses — Six Month Period Ended June 30, 2022 (Unaudited) |
As a shareholder of Institutional Shares and Service Shares of the Fund, you incur ongoing costs, including management fees; distribution and service (12b-1) fees (with respect to Service Shares); and other Fund expenses. This example is intended to help you understand your ongoing costs (in dollars) of investing in the Fund and to compare these costs with the ongoing costs of investing in other mutual funds.
The example is based on an investment of $1,000 invested at the beginning of the period and held for the entire period from January 1, 2022 through June 30, 2022, which represents a period of 181 days of a 365 day year.
Actual Expenses — The first line in the table below provides information about actual account values and actual expenses. You may use the information in this line, together with the amount you invested, to estimate the expenses that you paid over the period. Simply divide your account value by $1,000 (for example, an $8,600 account value divided by $1,000=8.6), then multiply the result by the number in the first line under the heading entitled “Expenses Paid” to estimate the expenses you paid on your account during this period.
Hypothetical Example for Comparison Purposes — The second line in the table below provides information about hypothetical account values and hypothetical expenses based on the Fund’s actual net expense ratio and an assumed rate of return of 5% per year before expenses, which is not the Fund’s actual return. The hypothetical account values and expenses may not be used to estimate the actual ending account balance or expenses you paid for the period. You may use this information to compare the ongoing costs of investing in the Fund and other funds. To do so, compare this 5% hypothetical example with the 5% hypothetical examples that appear in the shareholder reports of the other funds.
Please note that the expenses shown in the table are meant to highlight your ongoing costs only and do not reflect any transactional costs, such as sales charges, redemption fees, or exchange fees. Therefore, the second line of the table is useful in comparing ongoing costs only and will not help you determine the relative total costs of owning different funds. In addition, if these transactional costs were included, your costs would have been higher.
| Share Class | Beginning Account Value 1/1/22 | Ending Account Value 6/30/22 | Expenses Paid 6 Months 6/30/22* | |||||||||
| Institutional Shares | ||||||||||||
| Actual | $ | 1,000.00 | $ | 887.50 | $ | 1.92 | ||||||
| Hypothetical 5% return | 1,000.00 | 1,022.76 | + | 2.06 | ||||||||
| Service Shares | ||||||||||||
| Actual | 1,000.00 | 885.54 | 3.09 | |||||||||
| Hypothetical 5% return | 1,000.00 | 1,021.52 | + | 3.31 | ||||||||
| * | Expenses are calculated using the Fund’s annualized net expense ratio for each class, which represents the ongoing expenses as a percentage of net assets for the six months ended June 30, 2022. Expenses are calculated by multiplying the annualized net expense ratio by the average account value for the period; then multiplying the result by the number of days in the most recent fiscal half year (or, since inception, if shorter); and then dividing that result by the number of days in the period. The annualized net expense ratios for the period were 0.41% and 0.66% for Institutional Shares and Service Shares, respectively. |
| + | Hypothetical expenses are based on the Fund’s actual annualized net expense ratio and an assumed rate of return of 5% per year before expenses. |
| 45 |
| TRUSTEES | OFFICERS | |
| Jessica Palmer, Chair | James A. McNamara, President | |
| Dwight L. Bush | Joseph F. DiMaria, Principal Financial Officer, Principal Accounting Officer and Treasurer Caroline L. Kraus, Secretary | |
| Kathryn A. Cassidy | ||
| John G. Chou | ||
| Diana M. Daniels | ||
| Joaquin Delgado | ||
| Eileen H. Dowling | ||
| James A. McNamara | ||
| Gregory G. Weaver | ||
| Paul C. Wirth |
GOLDMAN SACHS & CO. LLC
Distributor and Transfer Agent
GOLDMAN SACHS ASSET MANAGEMENT, L.P.
Investment Adviser
200 West Street, New York,
New York 10282
Visit our web site at www.GSAMFUNDS.com to obtain the most recent month-end returns.
The reports concerning the Fund included in this shareholder report may contain certain forward-looking statements about the factors that may affect the performance of the Fund in the future. These statements are based on Fund management’s predictions and expectations concerning certain future events and their expected impact on the Fund, such as performance of the economy as a whole and of specific industry sectors, changes in the levels of interest rates, the impact of developing world events, and other factors that may influence the future performance of the Fund. Management believes these forward-looking statements to be reasonable, although they are inherently uncertain and difficult to predict. Actual events may cause adjustments in portfolio management strategies from those currently expected to be employed.
A description of the policies and procedures that the Fund uses to determine how to vote proxies relating to portfolio securities and information regarding how the Fund voted proxies relating to portfolio securities for the 12-month period ended June 30 is available (i) without charge, upon request by calling 1-800-621-2550; and (ii) on the Securities and Exchange Commission (“SEC”) web site at http://www.sec.gov.
The Fund will file portfolio holdings information for each month in a fiscal quarter within 60 days after the end of the relevant fiscal quarter on Form N-PORT. Portfolio holdings information for the third month of each fiscal quarter will be made available on the SEC’s web site at http://www.sec.gov. Portfolio holdings information may be obtained upon request and without charge by calling 1-800-526-7384 (for Retail Shareholders) or 1-800-621-2550 (for Institutional Shareholders).
Views and opinions expressed are for informational purposes only and do not constitute a recommendation by GSAM to buy, sell, or hold any security. Views and opinions are current as of the date of this presentation and may be subject to change, they should not be construed as investment advice.
Goldman Sachs & Co. LLC (“Goldman Sachs”) does not provide legal, tax or accounting advice. Any statement contained in this communication (including any attachments) concerning U.S. tax matters was not intended or written to be used, and cannot be used, for the purpose of avoiding penalties under the Internal Revenue Code, and was written to support the promotion or marketing of transactions or matters addressed. Clients of Goldman Sachs should obtain their own independent tax advice based on their particular circumstances.
The website links provided are for your convenience only and are not an endorsement or recommendation by GSAM of any of these websites or the products or services offered. GSAM is not responsible for the accuracy and validity of the content of these websites.
Fund holdings and allocations shown are as of June 30, 2022 and may not be representative of future investments. Fund holdings should not be relied on in making investment decisions and should not be construed as research or investment advice regarding particular securities. Current and future holdings are subject to risk.
References to indices, benchmarks or other measures of relative market performance over a specified period of time are provided for your information only and do not imply that the portfolio will achieve similar results. The index composition may not reflect the manner in which a portfolio is constructed. While an adviser seeks to design a portfolio which reflects appropriate risk and return features, portfolio characteristics may deviate from those of the benchmark.
The Global Industry Classification Standard (“GICS”) was developed by and is the exclusive property and a service mark of Morgan Stanley Capital International Inc. (“MSCI”) and Standard & Poor’s, a division of The McGraw-Hill Companies, Inc. (“S&P”) and is licensed for use by Goldman Sachs. Neither MSCI, S&P nor any other party involved in making or compiling the GICS or any GICS classifications makes any express or implied warranties or representations with respect to such standard or classification (or the results to be obtained by the use thereof), and all such parties hereby expressly disclaim all warranties of originality, accuracy, completeness, merchantability or fitness for a particular purpose with respect to any of such standard or classification. Without limiting any of the foregoing, in no event shall MSCI, S&P, any of their affiliates or any third party involved in making or compiling the GICS or any GICS classifications have any liability for any direct, indirect, special, punitive, consequential or any other damages (including lost profits) even if notified of the possibility of such damages.
The portfolio risk management process includes an effort to monitor and manage risk, but does not imply low risk.
Shares of the Goldman Sachs VIT Funds are offered to separate accounts of participating life insurance companies for the purpose of funding variable annuity contracts and variable life insurance policies. Shares of the Funds are not offered directly to the general public. The variable annuity contracts and variable life insurance policies are described in the separate prospectuses issued by participating insurance companies. You should refer to those prospectuses for information about surrender charges, mortality and expense risk fees and other charges that may be assessed by participating insurance companies under the variable annuity contracts or variable life insurance policies. Such fees or charges, if any, may affect the return you may realize with respect to your investments. Ask your representative for more complete information. Please consider a Fund’s objectives, risks and charges and expenses, and read the prospectus carefully before investing. The prospectus contains this and other information about the Funds.
This material is not authorized for distribution to prospective investors unless preceded or accompanied by a current prospectus or summary prospectus, if applicable. Investors should consider the Funds’ objective, risks, and charges and expenses, and read the summary prospectus, if available, and/or the prospectus carefully before investing or sending money. The summary prospectus, if available, and the prospectus contain this and other information about the Funds and may be obtained from your authorized dealer or from Goldman Sachs & Co. LLC by calling 1-800-621-2550.
This report is prepared for the general information of contract owners and is not an offer of shares of the Goldman Sachs Variable Insurance Trust Core Fixed Income Fund.
© 2022 Goldman Sachs. All rights reserved.
VITFISAR-22 287748-OTU-08/2022
Goldman
Sachs Variable Insurance Trust
Goldman Sachs Equity Index Fund
Goldman Sachs International Equity Insights Fund
Goldman Sachs Large Cap Value Fund
Goldman Sachs Mid Cap Growth Fund* (formerly, Goldman Sachs Growth Opportunities Fund)
Goldman Sachs Mid Cap Value Fund
Goldman Sachs Small Cap Equity Insights Fund
Goldman Sachs Strategic Growth Fund
Goldman Sachs U.S. Equity Insights Fund
| * | Effective after the close of business on April 29, 2022, the Goldman Sachs Growth Opportunities Fund was renamed the Goldman Sachs Mid Cap Growth Fund. |
Semi-Annual Report
June 30, 2022

Goldman Sachs Variable Insurance Trust
| ∎ | GOLDMAN SACHS EQUITY INDEX FUND |
| ∎ | GOLDMAN SACHS INTERNATIONAL EQUITY INSIGHTS FUND |
| ∎ | GOLDMAN SACHS LARGE CAP VALUE FUND |
| ∎ | GOLDMAN SACHS MID CAP GROWTH FUND |
| ∎ | GOLDMAN SACHS MID CAP VALUE FUND |
| ∎ | GOLDMAN SACHS SMALL CAP EQUITY INSIGHTS FUND |
| ∎ | GOLDMAN SACHS STRATEGIC GROWTH FUND |
| ∎ | GOLDMAN SACHS U.S. EQUITY INSIGHTS FUND |
| 1 | ||||
| 4 | ||||
| 20 | ||||
| 50 | ||||
| 58 | ||||
| 59 | ||||
| 61 | ||||
Goldman Sachs Mid Cap Growth Fund (formerly, Goldman Sachs Growth Opportunities Fund) | 63 | |||
| 65 | ||||
| 67 | ||||
| 69 | ||||
| 71 | ||||
| 73 | ||||
| 101 | ||||
| NOT FDIC-INSURED | May Lose Value | No Bank Guarantee | ||
Goldman Sachs Variable Insurance Trust Equity Funds
The following are highlights both of key factors affecting the U.S. and international equity markets and of any key changes made to the Goldman Sachs VIT Equity Funds (the “Funds”) during the six months ended June 30, 2022 (the “Reporting Period”). Attribution highlights are provided for those Funds that materially outperformed or underperformed their respective benchmark during the Reporting Period. A fuller review will appear in the Funds’ annual shareholder report covering the 12 months ended December 31, 2022.
Market and Economic Review
U.S. Equities
| • | Overall, U.S. equities struggled during the Reporting Period. The Standard & Poor’s 500® Index (the “S&P 500 Index”) ended the Reporting Period with a return of -19.96%, its worst showing in the first half of a calendar year since 1970 and erasing nearly all the gains achieved in 2021. The Russell 3000® Index generated a return of -21.10%. |
| • | Inflationary pressures, shifting U.S. Federal Reserve (“Fed”) policy, COVID-19 pandemic overhangs and ongoing war between Russia and Ukraine were the primary concerns pressuring the U.S. equity markets during the Reporting Period. |
| • | During the first quarter of 2022, the S&P 500 Index returned -4.95%, marking the first quarterly decline since the first quarter of 2020. |
| • | Among the major economic and geopolitical developments were the dramatic repricing of the Fed interest rate hike path and accelerated expectations for a more aggressive balance sheet runoff phase due to concerns about elevated and persistent inflation pressures. |
| • | The hawkish Fed policy shift drove a large increase in bond yields, and U.S. Treasuries suffered one of their worst quarters on record. (Hawkish suggests higher interest rates; opposite of dovish.) |
| • | COVID-19, and more specifically, the Omicron variants, was still an overhang, with resurgent cases bringing back supply-chain issues and worker shortages. |
| • | Amid this backdrop, dampened corporate earnings momentum played into the bearish narrative for the U.S. equities markets. (Bearish refers to an expected downward movement in the prices of securities.) |
| • | Growth equities meaningfully lagged value equities as a potential by-product of anticipated higher interest rates in the near term. |
| • | During the second quarter of 2022, the S&P 500 Index returned -16.10%. |
| • | Inflation, the Fed’s policy response and recession worries were at the core of investors’ narratives, resulting in a broad risk-off, or heightened risk aversion, atmosphere. |
| • | Geopolitical overhang also remained a concern, as it affected energy prices, leading to low consumer sentiment and potentially changing consumer spending trends. |
| • | On the other hand, equity inflows, buyback strength, insider buying, resilient consumer spending and some hints of cooling in the labor market were seen by the consensus as tailwinds. |
| • | In late May/early June 2022, it remained unclear whether a rebound seen in the U.S. equity markets from the May 20, 2022 year-to-date lows represented the start of a recovery or a bear-market rally. |
| • | This question was quickly answered later in the month after the release of a higher than consensus expected May Consumer Price Index report, which sent the S&P 500 Index to new year-to-date lows. |
| • | Moreover, following a 25 basis point hike in March 2022 and a 50 basis point increase in May 2022, the Fed agreed to a 75 basis point interest rate hike during its June 2022 meeting, wherein Fed Chair Powell asserted |
| 1 |
MARKET REVIEW
| the Fed’s unconditional commitment to price stability with a policy response evolving based on incoming data. (A basis point is 1/100th of a percentage point.) |
| • | At the end of the quarter, investors were looking ahead to the second quarter corporate earnings reporting season with some caution, as input price pressures and consumption trends factored into analyst arguments for downward revisions to earnings estimates. |
| • | During the Reporting Period overall, all segments of the U.S. equity markets declined, but small-cap stocks were weakest, followed by mid-cap stocks and large-cap stocks. Value stocks meaningfully outperformed growth stocks on a relative basis across the capitalization spectrum during the Reporting Period. |
| • | Ten of the 11 sectors of the S&P 500 Index declined during the Reporting Period. The best performing sector by far within the S&P 500 Index during the Reporting Period was energy, the only one to produce a positive total return. Still, utilities, consumer staples and health care also produced total returns that notably outpaced the broad S&P 500 Index. The weakest performing sectors during the Reporting Period were consumer discretionary, communication services and information technology. |
International Equities
| • | Representing the developed international equity markets, the MSCI EAFE Index (net) returned -19.57% for the Reporting Period, in line with the U.S. equity market, as represented by the -19.96% return of the S&P 500 Index. |
| • | During the first quarter of 2022, the MSCI EAFE Index (net) returned -5.91%. |
| • | International equity prices faced pressures from global concerns around rising inflation, planned interest rate hikes by the Fed, rising bond yields, valuation concerns, and Russia’s late February invasion of Ukraine. |
| • | Major countries around the world took a public stance condemning Russia’s action and imposed various economic sanctions, including removal of Russian financial institutions from bank connectivity network SWIFT, banning transactions with the Russian central bank and halting trading of Russian securities. Such sanctions boosted the price of crude oil in the global markets. |
| • | Driven by increased market volatility, the Fed signaled a slower than anticipated pace of monetary policy tightening while retaining a cautionary focus on rising inflation. |
| • | Hopes around the success of diplomatic talks and peaceful negotiations between Russia and Ukraine led to some market recovery toward the end of the quarter. |
| • | Still, beyond the broader concerns around the geopolitical crisis, the impact on commodity prices reinforced worries about supply-side inflation and a potential stagflation scenario—particularly in Europe. (Stagflation is characterized by slow economic growth and high inflation.) However, the corporate earnings season retained its overall strength. |
| • | Other macroeconomic uncertainties included those around regulation in China, the status of Chinese shares listed in the U.S., and slowing economic growth in China, all exacerbated by the imposition of lockdowns and manufacturing halts due to a rise in COVID-19 cases, leading, in turn, to further supply-chain issues. |
| • | During the second quarter of 2022, the MSCI EAFE Index (net) returned -14.51%. |
| • | All major regions performed roughly in line with each other, as inflationary pressures persisted, and odds of a U.S. recession grew. |
| • | Supply-chain issues worsened as China initially instituted lockdowns following a surge in COVID-19 cases. However, as the quarter progressed, China began easing its COVID-19-induced restrictions, mitigating the disruption. |
| • | In the Euro area, the geopolitical crisis of the ongoing war in Ukraine remained on the forefront of concerns, in part due to worries about potential gas shortages due to reduced supply from Russia. This was particularly |
| 2 |
MARKET REVIEW
| concerning for countries with high energy dependence, such as Italy, Spain and Germany. Germany triggered an emergency plan in June 2022 that allowed utilities to pass on cost increases to consumers. |
| • | The Bank of England introduced a 25 basis point interest rate hike in June despite negative economic growth in the country. |
| • | Japanese equities fell, as the yen significantly weakened against the U.S. dollar, driven by concerns around a U.S. recession, currency markets and monetary policy. Inflation was also a headwind for Japan, with its inflation at the highest since 2008 and its consumer confidence index falling to its lowest level since January 2021. |
| • | The best performing sector within the MSCI EAFE Index during the Reporting Period was energy, the only sector to post a positive total return for the Reporting Period. The weakest performing sectors were information technology, industrials and consumer discretionary. |
| • | All of the country constituents of the MSCI EAFE Index posted negative total returns during the Reporting Period. On a relative basis, however, Hong Kong, Portugal, Norway and the U.K. were the best performing countries within the MSCI EAFE Index during the Reporting Period. The weakest performing countries during the Reporting Period were Ireland, Austria, Sweden and the Netherlands. |
Fund Changes and Highlights
Goldman Sachs Equity Index Fund
| • | Effective June 16, 2022, Melissa Kapitulik no longer served as a portfolio manager for the Fund. As of that date, John Law became a portfolio manager for the Fund, joining Michael Feehily and Michael Finocchi. |
Goldman Sachs Mid Cap Growth Fund (formerly, Goldman Sachs Growth Opportunities Fund)
| • | Effective after the close of business on April 29, 2022, the Board of Trustees of the Goldman Sachs Variable Insurance Trust approved changes to the Fund’s name and principal investment strategy. The Fund’s name changed to the Goldman Sachs Mid Cap Growth Fund. |
Goldman Sachs Strategic Growth Fund
| • | The Fund underperformed its benchmark, the Russell 1000® Growth Index (with dividends reinvested) (the “Russell Index”), during the Reporting Period. |
| • | Stock selection overall detracted from the Fund’s performance during the Reporting Period, especially in the information technology sector. To a lesser degree, stock selection in the communication services and consumer discretionary sectors also hurt. |
| • | Having a neutral allocation to communication services, which was the worst performing sector in the Russell Index during the Reporting Period, and having no exposure to energy, which was the only sector in the Russell Index to post a positive return during the Reporting Period, further dampened the Fund’s relative results. |
| • | These detractors were only partially offset by the positive contributions made by effective stock selection in industrials; having an overweighted allocation to health care, which outpaced the Russell Index during the Reporting Period; and having a position, albeit modest, in cash during a Reporting Period when the Russell Index experienced a double-digit decline. |
| 3 |
FUND BASICS
as of June 30, 2022
PERFORMANCE REVIEW
| January 1, 2022–June 30, 2022 | Fund Total Return (based on NAV)1 | S&P 500 Index2 | ||||
| Service | -20.23 | % | -19.96% | |||
| 1 | The net asset value (“NAV”) represents the net assets of the class of the Fund (ex-dividend) divided by the total number of shares of the class outstanding. The Fund’s performance assumes the reinvestment of dividends and other distributions. The Fund’s performance does not reflect the deduction of any applicable sales charges. |
| 2 | S&P 500® Index is a U.S. stock market index based on the market capitalizations of 500 large companies having common stock listed on the New York Stock Exchange or NASDAQ. The S&P 500® Index components and their weightings are determined by S&P Dow Jones Indices. It is not possible to invest directly in an unmanaged index. |
The returns set forth in the table above represent past performance. Past performance does not guarantee future results. The Fund’s investment return and principal value will fluctuate so that an investor’s shares, when redeemed, may be worth more or less than their original cost. Current performance may be lower or higher than the performance quoted above. Please visit our web site at www.GSAMFUNDS.com to obtain the most recent month-end returns. Performance reflects applicable fee waivers and/or expense limitations in effect during the periods shown. In their absence, performance would be reduced. Returns do not reflect the deduction of taxes that a shareholder would pay on Fund distributions or the redemption of Fund shares.
TOP TEN HOLDINGS AS OF 6/30/223
| Holding | % of Net Assets | Line of Business | ||||
| Apple, Inc. | 6.6% | Technology Hardware & Equipment | ||||
| Microsoft Corp. | 6.0 | Software & Services | ||||
| Amazon.com, Inc. | 2.9 | Retailing | ||||
| Alphabet, Inc., Class A | 2.1 | Media & Entertainment | ||||
| Alphabet, Inc., Class C | 1.9 | Media & Entertainment | ||||
| Tesla, Inc. | 1.8 | Automobiles & Components | ||||
| Berkshire Hathaway, Inc., Class B | 1.6 | Diversified Financials | ||||
| UnitedHealth Group, Inc. | 1.5 | Health Care Equipment & Services | ||||
| Johnson & Johnson | 1.5 | Pharmaceuticals, Biotechnology & Life Sciences | ||||
| NVIDIA Corp. | 1.2 | Semiconductors & Semiconductor Equipment | ||||
| 3 | The top 10 holdings may not be representative of the Fund’s future investments. |
| 4 |
FUND BASICS
FUND VS. BENCHMARK SECTOR ALLOCATIONS4
As of June 30, 2022
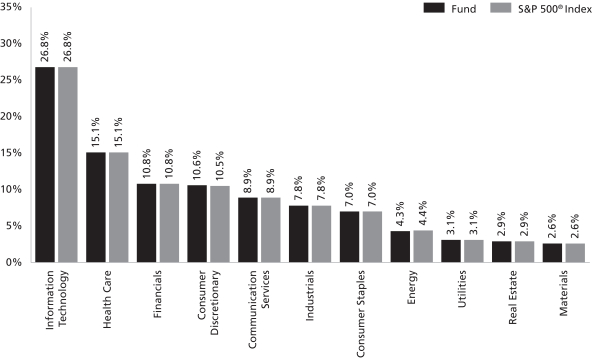
| 4 | The Fund’s composition may differ over time. Consequently, the Fund’s overall sector allocations may differ from percentages contained in the graph above. The graph categorizes investments using Global Industry Classification Standard (“GICS”); however, the sector classifications used by the portfolio management team may differ from GICS. The percentage shown for each investment category reflects the value of investments in that category as a percentage of market value (excluding investments in the securities lending reinvestment vehicle, if any). The graph depicts the Fund’s investments but may not represent the Fund’s market exposure due to the exclusion of certain derivatives, if any, as listed in the Additional Investment Information section of the Schedule of Investments. |
For more information about your Fund, please refer to www.GSAMFUNDS.com. There, you can learn more about your Fund’s investment strategies, holdings, and performance.
| 5 |
FUND BASICS
International Equity Insights Fund
as of June 30, 2022
PERFORMANCE REVIEW
| January 1, 2022–June 30, 2022 | Fund Total Return (based on NAV)1 | MSCI EAFE Standard Index2 | ||||||
| Institutional | -18.12 | % | -19.57 | % | ||||
| Service | -18.15 | -19.57 | ||||||
| 1 | The net asset value (“NAV”) represents the net assets of the class of the Fund (ex-dividend) divided by the total number of shares of the class outstanding. The Fund’s performance assumes the reinvestment of dividends and other distributions. The Fund’s performance does not reflect the deduction of any applicable sales charges. |
| 2 | The MSCI EAFE Standard Index is a market capitalization-weighted composite of securities in 21 developed markets. The MSCI EAFE Standard Index approximates the minimum possible dividend reinvestment. The dividend is reinvested after deduction for withholding tax, applying the rate to non-resident individuals who do not benefit from double taxation treaties. MSCI uses withholding tax rates applicable to Luxembourg holding companies, as Luxembourg applies the highest rates. The MSCI EAFE Standard Index is unmanaged and the figures for the Index do not include any deduction for fees or expenses. |
The returns set forth in the table above represent past performance. Past performance does not guarantee future results. The Fund’s investment return and principal value will fluctuate so that an investor’s shares, when redeemed, may be worth more or less than their original cost. Current performance may be lower or higher than the performance quoted above. Please visit our web site at www.GSAMFUNDS.com to obtain the most recent month-end returns. Performance reflects applicable fee waivers and/or expense limitations in effect during the periods shown. In their absence, performance would be reduced. Returns do not reflect the deduction of taxes that a shareholder would pay on Fund distributions or the redemption of Fund shares.
TOP TEN HOLDINGS AS OF 6/30/223
| Holding | % of Net Assets | Line of Business | Country | |||||
| Novo Nordisk A/S, Class B | 2.0% | Pharmaceuticals, Biotechnology & Life Sciences | Denmark | |||||
| Shell PLC | 1.8 | Energy | Netherlands | |||||
| ASML Holding NV | 1.7 | Semiconductors & Semiconductor Equipment | Netherlands | |||||
| GSK PLC ADR | 1.5 | Pharmaceuticals, Biotechnology & Life Sciences | United States | |||||
| British American Tobacco PLC | 1.4 | Food, Beverage & Tobacco | United Kingdom | |||||
| Commonwealth Bank of Australia | 1.4 | Banks | Australia | |||||
| Diageo PLC | 1.4 | Food, Beverage & Tobacco | United Kingdom | |||||
| Sanofi | 1.4 | Pharmaceuticals, Biotechnology & Life Sciences | France | |||||
| Nestle SA | 1.1 | Food, Beverage & Tobacco | United States | |||||
| Cie Financiere Richemont SA | 1.1 | Consumer Durables & Apparel | Switzerland | |||||
| 3 | The top 10 holdings may not be representative of the Fund’s future investments. |
| 6 |
FUND BASICS
FUND VS. BENCHMARK SECTOR ALLOCATIONS4
As of June 30, 2022
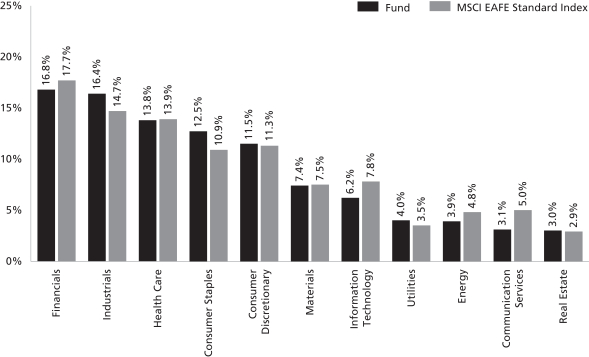
| 4 | The Fund is actively managed and, as such, its composition may differ over time. Consequently, the Fund’s overall sector allocations may differ from percentages contained in the graph above. The graph categorizes investments using Global Industry Classification Standard (“GICS”); however, the sector classifications used by the portfolio management team may differ from GICS. The percentage shown for each investment category reflects the value of investments in that category as a percentage of market value (excluding investments in the securities lending reinvestment vehicle, if any). Investments in the securities lending reinvestment vehicle represented 1.4% of the Fund’s net assets at June 30, 2022. |
For more information about your Fund, please refer to www.GSAMFUNDS.com. There, you can learn more about your Fund’s investment strategies, holdings, and performance.
| 7 |
FUND BASICS
Large Cap Value Fund
as of June 30, 2022
PERFORMANCE REVIEW
| January 1, 2022–June 30, 2022 | Fund Total Return (based on NAV)1 | Russell 1000 Value Index2 | ||||||
| Institutional | -13.04 | % | -12.86 | % | ||||
| Service | -13.23 | -12.86 | ||||||
| 1 | The net asset value (“NAV”) represents the net assets of the class of the Fund (ex-dividend) divided by the total number of shares of the class outstanding. The Fund’s performance assumes the reinvestment of dividends and other distributions. The Fund’s performance does not reflect the deduction of any applicable sales charges. |
| 2 | The Russell 1000® Value Index (with dividends reinvested) is an unmanaged market capitalization weighted index of the 1000 largest U.S. companies with lower price-to-book ratios and lower forecasted growth values. The figures for the Russell 1000® Value Index do not include any deduction for fees, expenses or taxes. It is not possible to invest directly in an unmanaged index. |
The returns set forth in the table above represent past performance. Past performance does not guarantee future results. The Fund’s investment return and principal value will fluctuate so that an investor’s shares, when redeemed, may be worth more or less than their original cost. Current performance may be lower or higher than the performance quoted above. Please visit our web site at www.GSAMFUNDS.com to obtain the most recent month-end returns. Performance reflects applicable fee waivers and/or expense limitations in effect during the periods shown. In their absence, performance would be reduced. Returns do not reflect the deduction of taxes that a shareholder would pay on Fund distributions or the redemption of Fund shares.
TOP TEN HOLDINGS AS OF 6/30/223
| Holding | % of Net Assets | Line of Business | ||||
| Johnson & Johnson | 4.0% | Pharmaceuticals, Biotechnology & Life Sciences | ||||
| JPMorgan Chase & Co. | 2.9 | Banks | ||||
| Bristol-Myers Squibb Co. | 2.5 | Pharmaceuticals, Biotechnology & Life Sciences | ||||
| Bank of America Corp. | 2.4 | Banks | ||||
| AT&T, Inc. | 2.2 | Telecommunication Services | ||||
| Chevron Corp. | 2.1 | Energy | ||||
| NextEra Energy, Inc. | 2.1 | Utilities | ||||
| ConocoPhillips | 1.9 | Energy | ||||
| Humana, Inc. | 1.8 | Health Care Equipment & Services | ||||
| L3Harris Technologies, Inc. | 1.8 | Capital Goods | ||||
| 3 | The top 10 holdings may not be representative of the Fund’s future investments. |
| 8 |
FUND BASICS
FUND VS. BENCHMARK SECTOR ALLOCATIONS4
As of June 30, 2022
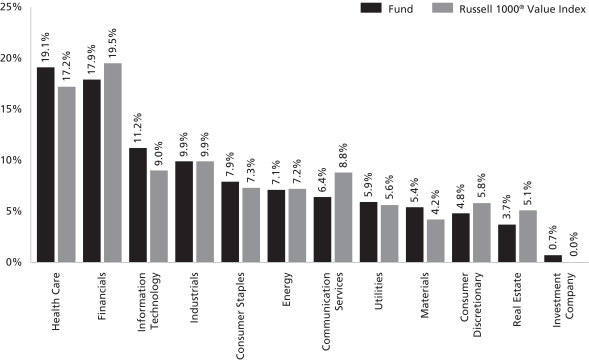
| 4 | The Fund is actively managed and, as such, its composition may differ over time. Consequently, the Fund’s overall sector allocations may differ from percentages contained in the graph above. The graph categorizes investments using Global Industry Classification Standard (“GICS”); however, the sector classifications used by the portfolio management team may differ from GICS. The percentage shown for each investment category reflects the value of investments in that category as a percentage of market value. Underlying sector allocations of exchange traded funds and investment companies held by the Fund are not reflected in the graph above. |
For more information about your Fund, please refer to www.GSAMFUNDS.com. There, you can learn more about your Fund’s investment strategies, holdings, and performance.
| 9 |
FUND BASICS
Mid Cap Growth Fund (formerly, Growth Opportunities Fund)
as of June 30, 2022
PERFORMANCE REVIEW
| January 1, 2022–June 30, 2022 | Fund Total Return (based on NAV)1 | Russell Midcap Growth Index2 | ||||||
| Institutional | -31.34 | % | -31.00 | % | ||||
| Service | -31.39 | -31.00 | ||||||
| 1 | The net asset value (“NAV”) represents the net assets of the class of the Fund (ex-dividend) divided by the total number of shares of the class outstanding. The Fund’s performance assumes the reinvestment of dividends and other distributions. The Fund’s performance does not reflect the deduction of any applicable sales charges. |
| 2 | Russell Midcap® Growth Index is an unmanaged index that measures the performance of those companies in the Russell Midcap® Index with higher price-to-book ratios and higher forecasted growth values. It is not possible to invest directly in an unmanaged index. |
The returns set forth in the table above represent past performance. Past performance does not guarantee future results. The Fund’s investment return and principal value will fluctuate so that an investor’s shares, when redeemed, may be worth more or less than their original cost. Current performance may be lower or higher than the performance quoted above. Please visit our web site at www.GSAMFUNDS.com to obtain the most recent month-end returns. Performance reflects applicable fee waivers and/or expense limitations in effect during the periods shown. In their absence, performance would be reduced. Returns do not reflect the deduction of taxes that a shareholder would pay on Fund distributions or the redemption of Fund shares.
TOP TEN HOLDINGS AS OF 6/30/223, 4
| Holding | % of Net Assets | Line of Business | ||||
| Cadence Design Systems, Inc. | 3.3% | Software & Services | ||||
| Veeva Systems, Inc., Class A | 2.4 | Health Care Equipment & Services | ||||
| Rockwell Automation, Inc. | 2.3 | Capital Goods | ||||
| Dexcom, Inc. | 2.2 | Health Care Equipment & Services | ||||
| West Pharmaceutical Services, Inc. | 2.2 | Pharmaceuticals, Biotechnology & Life Sciences | ||||
| Insulet Corp. | 2.2 | Health Care Equipment & Services | ||||
| Lululemon Athletica, Inc. | 2.1 | Consumer Durables & Apparel | ||||
| Keysight Technologies, Inc. | 2.0 | Technology Hardware & Equipment | ||||
| Verisk Analytics, Inc. | 1.9 | Commercial & Professional Services | ||||
| Ball Corp. | 1.9 | Materials | ||||
| 3 | The top 10 holdings may not be representative of the Fund’s future investments. |
| 4 | The top 10 holdings exclude investments in money market funds. |
| 10 |
FUND BASICS
FUND VS. BENCHMARK SECTOR ALLOCATIONS5
As of June 30, 2022
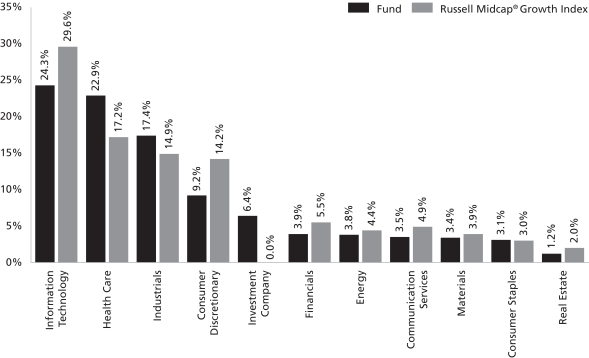
| 5 | The Fund is actively managed and, as such, its composition may differ over time. Consequently, the Fund’s overall sector allocations may differ from percentages contained in the graph above. The graph categorizes investments using Global Industry Classification Standard (“GICS”); however, the sector classifications used by the portfolio management team may differ from GICS. The percentage shown for each investment category reflects the value of investments in that category as a percentage of market value (excluding investments in the securities lending reinvestment vehicle, if any). Investments in the securities lending reinvestment vehicle represented 0.9% of the Fund’s net assets at June 30, 2022. Underlying sector allocations of exchange traded funds and investment companies held by the Fund are not reflected in the graph above. |
For more information about your Fund, please refer to www.GSAMFUNDS.com. There, you can learn more about your Fund’s investment strategies, holdings, and performance.
| 11 |
FUND BASICS
Mid Cap Value Fund
as of June 30, 2022
PERFORMANCE REVIEW
| January 1, 2022–June 30, 2022 | Fund Total Return (based on NAV)1 | Russell Midcap® Value Index2 | ||||||
| Institutional | -16.55 | % | -16.23 | % | ||||
| Service | -16.63 | -16.23 | ||||||
| 1 | The net asset value (“NAV”) represents the net assets of the class of the Fund (ex-dividend) divided by the total number of shares of the class outstanding. The Fund’s performance assumes the reinvestment of dividends and other distributions. The Fund’s performance does not reflect the deduction of any applicable sales charges. |
| 2 | The Russell Midcap Value® Index is an unmanaged index of common stock prices that measures the performance of those Russell Midcap companies with lower price-to-book ratios and lower forecasted growth values. The Russell Midcap Value Index figures do not reflect any deduction for fees, expenses or taxes. It is not possible to invest directly in an unmanaged index. |
The returns set forth in the table above represent past performance. Past performance does not guarantee future results. The Fund’s investment return and principal value will fluctuate so that an investor’s shares, when redeemed, may be worth more or less than their original cost. Current performance may be lower or higher than the performance quoted above. Please visit our web site at www.GSAMFUNDS.com to obtain the most recent month-end returns. Performance reflects applicable fee waivers and/or expense limitations in effect during the periods shown. In their absence, performance would be reduced. Returns do not reflect the deduction of taxes that a shareholder would pay on Fund distributions or the redemption of Fund shares.
TOP TEN HOLDINGS AS OF 6/30/223
| Holding | % of Net Assets | Line of Business | ||||
| Ball Corp. | 1.7% | Materials | ||||
| Cummins, Inc. | 1.7 | Capital Goods | ||||
| Xcel Energy, Inc. | 1.7 | Utilities | ||||
| Ameren Corp. | 1.7 | Utilities | ||||
| AvalonBay Communities, Inc. REIT | 1.7 | Real Estate | ||||
| Motorola Solutions, Inc. | 1.6 | Technology Hardware & Equipment | ||||
| AES Corp. (The) | 1.5 | Utilities | ||||
| Zimmer Biomet Holdings, Inc. | 1.5 | Health Care Equipment & Services | ||||
| M&T Bank Corp. | 1.4 | Banks | ||||
| Principal Financial Group, Inc. | 1.4 | Insurance | ||||
| 3 | The top 10 holdings may not be representative of the Fund’s future investments. |
| 12 |
FUND BASICS
FUND vs. BENCHMARK SECTOR ALLOCATIONS4
As of June 30, 2022
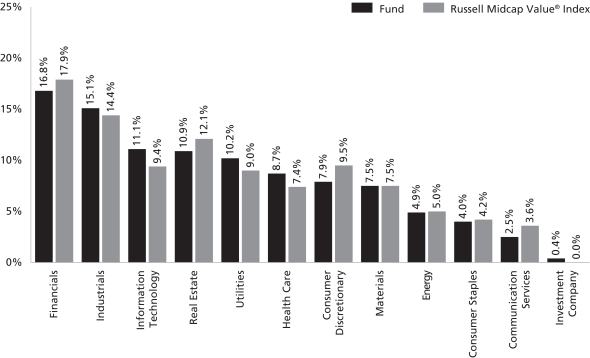
| 4 | The Fund is actively managed and, as such, its composition may differ over time. Consequently, the Fund’s overall sector allocations may differ from percentages contained in the graph above. The graph categorizes investments using Global Industry Classification Standard (“GICS”); however, the sector classifications used by the portfolio management team may differ from GICS. The percentage shown for each investment category reflects the value of investments in that category as a percentage of market value (excluding investments in the securities lending reinvestment vehicle, if any). Underlying sector allocations of exchange traded funds and investment companies held by the Fund are not reflected in the graph above. |
For more information about your Fund, please refer to www.GSAMFUNDS.com. There, you can learn more about your Fund’s investment strategies, holdings, and performance.
| 13 |
FUND BASICS
Small Cap Equity Insights Fund
as of June 30, 2022
PERFORMANCE REVIEW
| January 1, 2022–June 30, 2022 | Fund Total Return (based on NAV)1 | Russell 2000® Index2 | ||||||
| Institutional | -22.32 | % | -23.43 | % | ||||
| Service | -22.43 | -23.43 | ||||||
| 1 | The net asset value (“NAV”) represents the net assets of the class of the Fund (ex-dividend) divided by the total number of shares of the class outstanding. The Fund’s performance assumes the reinvestment of dividends and other distributions. The Fund’s performance does not reflect the deduction of any applicable sales charges. |
| 2 | The Russell 2000® Index (with dividends reinvested) is an unmanaged index of common stock prices that measures the performance of the 2000 smallest companies in the Russell 3000® Index. The figures for the Russell 2000® Index do not include any deduction for fees, expenses or taxes. It is not possible to invest directly in an unmanaged index. |
The returns set forth in the table above represent past performance. Past performance does not guarantee future results. The Fund’s investment return and principal value will fluctuate so that an investor’s shares, when redeemed, may be worth more or less than their original cost. Current performance may be lower or higher than the performance quoted above. Please visit our web site at www.GSAMFUNDS.com to obtain the most recent month-end returns. Performance reflects applicable fee waivers and/or expense limitations in effect during the periods shown. In their absence, performance would be reduced. Returns do not reflect the deduction of taxes that a shareholder would pay on Fund distributions or the redemption of Fund shares.
TOP TEN HOLDINGS AS OF 6/30/223,4
| Holding | % of Net Assets | Line of Business | ||||
| Medpace Holdings, Inc. | 0.8% | Pharmaceuticals, Biotechnology & Life Sciences | ||||
| Alkermes PLC | 0.8 | Pharmaceuticals, Biotechnology & Life Sciences | ||||
| Murphy USA, Inc. | 0.8 | Retailing | ||||
| Group 1 Automotive, Inc. | 0.8 | Retailing | ||||
| Mueller Industries, Inc. | 0.7 | Capital Goods | ||||
| CommVault Systems, Inc. | 0.7 | Software & Services | ||||
| Power Integrations, Inc. | 0.7 | Semiconductors & Semiconductor Equipment | ||||
| Sanderson Farms, Inc. | 0.7 | Food, Beverage & Tobacco | ||||
| Patterson Cos., Inc. | 0.7 | Health Care Equipment & Services | ||||
| Vishay Intertechnology, Inc. | 0.7 | Technology Hardware & Equipment | ||||
| 3 | The top 10 holdings may not be representative of the Fund’s future investments. |
| 4 | The top 10 holdings exclude investments in money market funds. |
| 14 |
FUND BASICS
FUND VS. BENCHMARK SECTOR ALLOCATIONS5
As of June 30, 2022
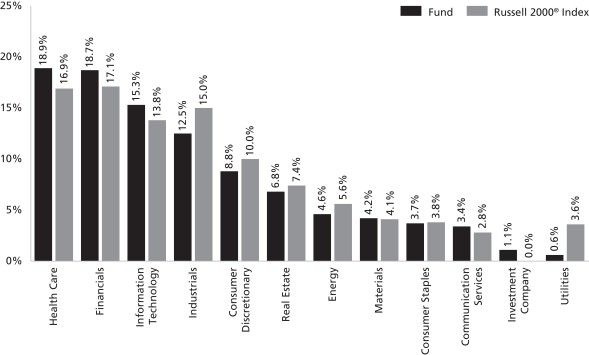
| 5 | The Fund is actively managed and, as such, its composition may differ over time. Consequently, the Fund’s overall sector allocations may differ from percentages contained in the graph above. The graph categorizes investments using Global Industry Classification Standard (“GICS”); however, the sector classifications used by the portfolio management team may differ from GICS. The percentage shown for each investment category reflects the value of investments in that category as a percentage of market value (excluding investments in the securities lending reinvestment vehicle, if any). Underlying sector allocations of exchange traded funds and investment companies held by the Fund are not reflected in the graph above. Investments in the securities lending reinvestment vehicle represented 1.4% of the Fund’s net assets at June 30, 2022. The graph depicts the Fund’s investments but may not represent the Fund’s market exposure due to the exclusion of certain derivatives, if any, as listed in the Additional Investment Information section of the Schedule of Investments. |
For more information about your Fund, please refer to www.GSAMFUNDS.com. There, you can learn more about your Fund’s investment strategies, holdings, and performance.
| 15 |
FUND BASICS
Strategic Growth Fund
as of June 30, 2022
PERFORMANCE REVIEW
| January 1, 2022–June 30, 2022 | Fund Total Return (based on NAV)1 | Russell 1000® Growth Index2 | ||||||
| Institutional | -31.45 | % | -28.07 | % | ||||
| Service | -31.54 | -28.07 | ||||||
| 1 | The net asset value (“NAV”) represents the net assets of the class of the Fund (ex-dividend) divided by the total number of shares of the class outstanding. The Fund’s performance assumes the reinvestment of dividends and other distributions. The Fund’s performance does not reflect the deduction of any applicable sales charges. |
| 2 | The Russell 1000® Growth Index (with dividends reinvested) is an unmanaged market capitalization weighted index of the 1000 largest U.S. companies with higher price-to-book ratios and higher forecasted growth values. The figures for the index do not include any deduction for fees, expenses or taxes. It is not possible to invest directly in an unmanaged index. |
The returns set forth in the table above represent past performance. Past performance does not guarantee future results. The Fund’s investment return and principal value will fluctuate so that an investor’s shares, when redeemed, may be worth more or less than their original cost. Current performance may be lower or higher than the performance quoted above. Please visit our web site at www.GSAMFUNDS.com to obtain the most recent month-end returns. Performance reflects applicable fee waivers and/or expense limitations in effect during the periods shown. In their absence, performance would be reduced. Returns do not reflect the deduction of taxes that a shareholder would pay on Fund distributions or the redemption of Fund shares.
TOP TEN HOLDINGS AS OF 6/30/223
| Holding | % of Net Assets | Line of Business | ||||
| Apple, Inc. | 12.3% | Technology Hardware & Equipment | ||||
| Microsoft Corp. | 11.1 | Software & Services | ||||
| Amazon.com, Inc. | 5.8 | Retailing | ||||
| Alphabet, Inc., Class A | 3.8 | Media & Entertainment | ||||
| Alphabet, Inc., Class C | 3.1 | Media & Entertainment | ||||
| Tesla, Inc. | 2.8 | Automobiles & Components | ||||
| Mastercard, Inc., Class A | 2.7 | Software & Services | ||||
| Eli Lilly & Co. | 2.5 | Pharmaceuticals, Biotechnology & Life Sciences | ||||
| NVIDIA Corp. | 2.4 | Semiconductors & Semiconductor Equipment | ||||
| UnitedHealth Group, Inc. | 2.1 | Health Care Equipment & Services | ||||
| 3 | The top 10 holdings may not be representative of the Fund’s future investments. |
| 16 |
FUND BASICS
FUND vs. BENCHMARK SECTOR ALLOCATIONS4
As of June 30, 2022
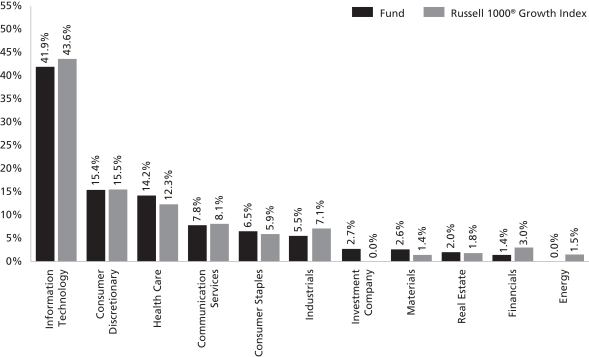
| 4 | The Fund is actively managed and, as such, its composition may differ over time. Consequently, the Fund’s overall sector allocations may differ from percentages contained in the graph above. The graph categorizes investments using Global Industry Classification Standard (“GICS”); however, the sector classifications used by the portfolio management team may differ from GICS. The percentage shown for each investment category reflects the value of investments in that category as a percentage of market value (excluding investments in the securities lending reinvestment vehicle, if any). Underlying sector allocations of exchange traded funds and investment companies held by the Fund are not reflected in the graph above. |
For more information about your Fund, please refer to www.GSAMFUNDS.com. There, you can learn more about your Fund’s investment strategies, holdings, and performance.
| 17 |
FUND BASICS
U.S. Equity Insights Fund
as of June 30, 2022
PERFORMANCE REVIEW
| January 1, 2022–June 30, 2022 | Fund Total Return (based on NAV)1 | S&P 500 Index2 | ||||||
| Institutional | -21.34 | % | -19.96 | % | ||||
| Service | -21.40 | -19.96 | ||||||
| 1 | The net asset value (“NAV”) represents the net assets of the class of the Fund (ex-dividend) divided by the total number of shares of the class outstanding. The Fund’s performance assumes the reinvestment of dividends and other distributions. The Fund’s performance does not reflect the deduction of any applicable sales charges. |
| 2 | The S&P 500® Index is the Standard & Poor’s composite index of 500 stocks, an unmanaged index of common stock prices. The figures for the index do not include any deduction for fees, expenses or taxes. It is not possible to invest directly in an unmanaged index. |
The returns set forth in the table above represent past performance. Past performance does not guarantee future results. The Fund’s investment return and principal value will fluctuate so that an investor’s shares, when redeemed, may be worth more or less than their original cost. Current performance may be lower or higher than the performance quoted above. Please visit our web site at www.GSAMFUNDS.com to obtain the most recent month-end returns. Performance reflects applicable fee waivers and/or expense limitations in effect during the periods shown. In their absence, performance would be reduced. Returns do not reflect the deduction of taxes that a shareholder would pay on Fund distributions or the redemption of Fund shares.
TOP TEN HOLDINGS AS OF 6/30/223
| Holding | % of Net Assets | Line of Business | ||||
| Microsoft Corp. | 7.0% | Software & Services | ||||
| Apple, Inc. | 5.6 | Technology Hardware & Equipment | ||||
| Alphabet, Inc., Class C | 3.5 | Media & Entertainment | ||||
| Berkshire Hathaway, Inc., Class B | 2.6 | Diversified Financials | ||||
| Amazon.com, Inc. | 2.2 | Retailing | ||||
| Tesla, Inc. | 1.8 | Automobiles & Components | ||||
| Merck & Co., Inc. | 1.7 | Pharmaceuticals, Biotechnology & Life Sciences | ||||
| AbbVie, Inc. | 1.6 | Pharmaceuticals, Biotechnology & Life Sciences | ||||
| Union Pacific Corp. | 1.4 | Transportation | ||||
| Elevance Health, Inc. | 1.4 | Health Care Equipment & Services | ||||
| 3 | The top 10 holdings may not be representative of the Fund’s future investments. |
| 18 |
FUND BASICS
FUND vs. BENCHMARK SECTOR ALLOCATIONS4
As of June 30, 2022
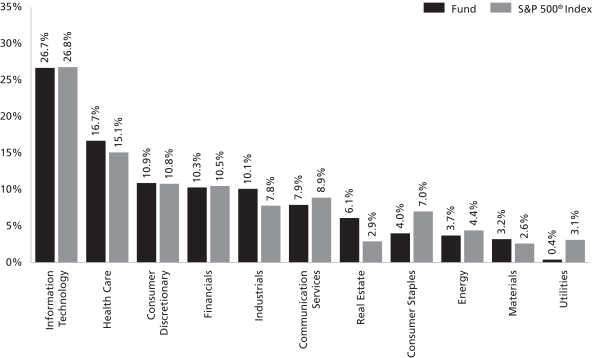
| 4 | The Fund is actively managed and, as such, its composition may differ over time. Consequently, the Fund’s overall sector allocations may differ from percentages contained in the graph above. The graph categorizes investments using Global Industry Classification Standard (“GICS”); however, the sector classifications used by the portfolio management team may differ from GICS. The percentage shown for each investment category reflects the value of investments in that category as a percentage of market value. |
For more information about your Fund, please refer to www.GSAMFUNDS.com. There, you can learn more about
your Fund’s investment strategies, holdings, and performance.
| 19 |
GOLDMAN SACHS VARIABLE INSURANCE TRUST EQUITY INDEX FUND
June 30, 2022 (Unaudited)
| Shares | Description | Value | ||||||
| Common Stocks – 100.1% | ||||||||
| Automobiles & Components – 2.2% | ||||||||
| 1,390 | Aptiv PLC* | $ | 123,807 | |||||
| 1,305 | BorgWarner, Inc. | 43,548 | ||||||
| 20,374 | Ford Motor Co. | 226,763 | ||||||
| 7,556 | General Motors Co.* | 239,979 | ||||||
| 4,389 | Tesla, Inc.* | 2,955,640 | ||||||
|
| |||||||
| 3,589,737 | ||||||||
|
| |||||||
| Banks – 3.7% | ||||||||
| 37,109 | Bank of America Corp. | 1,155,203 | ||||||
| 10,127 | Citigroup, Inc. | 465,741 | ||||||
| 2,243 | Citizens Financial Group, Inc. | 80,053 | ||||||
| 682 | Comerica, Inc. | 50,045 | ||||||
| 3,506 | Fifth Third Bancorp | 117,801 | ||||||
| 939 | First Republic Bank | 135,404 | ||||||
| 7,612 | Huntington Bancshares, Inc. | 91,572 | ||||||
| 15,357 | JPMorgan Chase & Co. | 1,729,352 | ||||||
| 4,899 | KeyCorp | 84,410 | ||||||
| 926 | M&T Bank Corp. | 147,595 | ||||||
| 2,181 | PNC Financial Services Group, Inc. (The) | 344,096 | ||||||
| 5,010 | Regions Financial Corp. | 93,937 | ||||||
| 333 | Signature Bank | 59,677 | ||||||
| 311 | SVB Financial Group* | 122,842 | ||||||
| 6,927 | Truist Financial Corp. | 328,548 | ||||||
| 7,088 | US Bancorp | 326,190 | ||||||
| 19,888 | Wells Fargo & Co. | 779,013 | ||||||
| 808 | Zions Bancorp NA | 41,127 | ||||||
|
| |||||||
| 6,152,606 | ||||||||
|
| |||||||
| Capital Goods – 5.3% | ||||||||
| 2,986 | 3M Co. | 386,418 | ||||||
| 728 | A O Smith Corp. | 39,807 | ||||||
| 475 | Allegion PLC | 46,502 | ||||||
| 1,216 | AMETEK, Inc. | 133,626 | ||||||
| 2,890 | Boeing Co. (The)* | 395,121 | ||||||
| 4,527 | Carrier Global Corp. | 161,433 | ||||||
| 2,799 | Caterpillar, Inc. | 500,349 | ||||||
| 754 | Cummins, Inc. | 145,922 | ||||||
| 1,459 | Deere & Co. | 436,927 | ||||||
| 774 | Dover Corp. | 93,902 | ||||||
| 2,065 | Eaton Corp. PLC | 260,169 | ||||||
| 3,092 | Emerson Electric Co. | 245,938 | ||||||
| 3,045 | Fastenal Co. | 152,006 | ||||||
| 1,881 | Fortive Corp. | 102,289 | ||||||
| 676 | Fortune Brands Home & Security, Inc. | 40,479 | ||||||
| 341 | Generac Holdings, Inc.* | 71,808 | ||||||
| 1,209 | General Dynamics Corp. | 267,491 | ||||||
| 5,737 | General Electric Co. | 365,275 | ||||||
| 3,553 | Honeywell International, Inc. | 617,547 | ||||||
| 1,980 | Howmet Aerospace, Inc. | 62,271 | ||||||
| 219 | Huntington Ingalls Industries, Inc. | 47,703 | ||||||
| 386 | IDEX Corp. | 70,109 | ||||||
| 1,500 | Illinois Tool Works, Inc. | 273,375 | ||||||
| 2,139 | Ingersoll Rand, Inc. | 90,009 | ||||||
| 3,679 | Johnson Controls International PLC | 176,151 | ||||||
| 1,022 | L3Harris Technologies, Inc. | 247,017 | ||||||
|
| |||||||
| Common Stocks – (continued) | ||||||||
| Capital Goods – (continued) | ||||||||
| 1,243 | Lockheed Martin Corp. | 534,440 | ||||||
| 1,280 | Masco Corp. | 64,768 | ||||||
| 291 | Nordson Corp. | 58,910 | ||||||
| 762 | Northrop Grumman Corp. | 364,670 | ||||||
| 2,262 | Otis Worldwide Corp. | 159,856 | ||||||
| 1,852 | PACCAR, Inc. | 152,494 | ||||||
| 668 | Parker-Hannifin Corp. | 164,361 | ||||||
| 883 | Pentair PLC | 40,415 | ||||||
| 770 | Quanta Services, Inc. | 96,512 | ||||||
| 7,777 | Raytheon Technologies Corp. | 747,447 | ||||||
| 619 | Rockwell Automation, Inc. | 123,373 | ||||||
| 268 | Snap-on, Inc. | 52,804 | ||||||
| 792 | Stanley Black & Decker, Inc. | 83,049 | ||||||
| 1,098 | Textron, Inc. | 67,055 | ||||||
| 1,236 | Trane Technologies PLC | 160,519 | ||||||
| 277 | TransDigm Group, Inc.* | 148,658 | ||||||
| 380 | United Rentals, Inc.* | 92,306 | ||||||
| 936 | Westinghouse Air Brake Technologies Corp. | 76,827 | ||||||
| 228 | W.W. Grainger, Inc. | 103,610 | ||||||
| 967 | Xylem, Inc. | 75,600 | ||||||
|
| |||||||
| 8,797,318 | ||||||||
|
| |||||||
| Commercial & Professional Services – 0.8% | ||||||||
| 451 | Cintas Corp. | 168,462 | ||||||
| 1,144 | Copart, Inc.* | 124,307 | ||||||
| 647 | Equifax, Inc. | 118,259 | ||||||
| 690 | Jacobs Engineering Group, Inc. | 87,720 | ||||||
| 714 | Leidos Holdings, Inc. | 71,907 | ||||||
| 1,932 | Nielsen Holdings PLC | 44,861 | ||||||
| 1,088 | Republic Services, Inc. | 142,386 | ||||||
| 552 | Robert Half International, Inc. | 41,339 | ||||||
| 1,137 | Rollins, Inc. | 39,704 | ||||||
| 817 | Verisk Analytics, Inc. | 141,414 | ||||||
| 2,021 | Waste Management, Inc. | 309,173 | ||||||
|
| |||||||
| 1,289,532 | ||||||||
|
| |||||||
| Consumer Durables & Apparel – 0.9% | ||||||||
| 1,658 | D.R. Horton, Inc. | 109,743 | ||||||
| 804 | Garmin Ltd. | 78,993 | ||||||
| 665 | Hasbro, Inc. | 54,450 | ||||||
| 1,395 | Lennar Corp., Class A | 98,445 | ||||||
| 277 | Mohawk Industries, Inc.* | 34,373 | ||||||
| 2,039 | Newell Brands, Inc. | 38,822 | ||||||
| 6,653 | NIKE, Inc., Class B | 679,936 | ||||||
| 17 | NVR, Inc.* | 68,070 | ||||||
| 1,244 | PulteGroup, Inc. | 49,300 | ||||||
| 353 | PVH Corp. | 20,086 | ||||||
| 249 | Ralph Lauren Corp. | 22,323 | ||||||
| 1,407 | Tapestry, Inc. | 42,942 | ||||||
| 1,740 | VF Corp. | 76,856 | ||||||
| 310 | Whirlpool Corp. | 48,010 | ||||||
|
| |||||||
| 1,422,349 | ||||||||
|
| |||||||
| Consumer Services – 1.8% | ||||||||
| 214 | Booking Holdings, Inc.* | 374,284 | ||||||
| 1,118 | Caesars Entertainment, Inc.* | 42,819 | ||||||
|
| |||||||
| 20 | The accompanying notes are an integral part of these financial statements. |
GOLDMAN SACHS VARIABLE INSURANCE TRUST EQUITY INDEX FUND
| Shares | Description | Value | ||||||
| Common Stocks – (continued) | ||||||||
| Consumer Services – (continued) | ||||||||
| 4,349 | Carnival Corp.* | $ | 37,619 | |||||
| 146 | Chipotle Mexican Grill, Inc.* | 190,860 | ||||||
| 676 | Darden Restaurants, Inc. | 76,469 | ||||||
| 195 | Domino’s Pizza, Inc. | 75,994 | ||||||
| 764 | Expedia Group, Inc.* | 72,450 | ||||||
| 1,463 | Hilton Worldwide Holdings, Inc. | 163,037 | ||||||
| 1,811 | Las Vegas Sands Corp.* | 60,832 | ||||||
| 1,433 | Marriott International, Inc., Class A | 194,902 | ||||||
| 3,880 | McDonald’s Corp. | 957,894 | ||||||
| 1,793 | MGM Resorts International | 51,907 | ||||||
| 2,072 | Norwegian Cruise Line Holdings Ltd.* | 23,041 | ||||||
| 848 | Penn National Gaming, Inc.* | 25,796 | ||||||
| 1,164 | Royal Caribbean Cruises Ltd.* | 40,635 | ||||||
| 6,003 | Starbucks Corp. | 458,569 | ||||||
| 517 | Wynn Resorts Ltd.* | 29,459 | ||||||
| 1,489 | Yum! Brands, Inc. | 169,016 | ||||||
|
| |||||||
| 3,045,583 | ||||||||
|
| |||||||
| Diversified Financials – 4.9% | ||||||||
| 3,180 | American Express Co. | 440,812 | ||||||
| 580 | Ameriprise Financial, Inc. | 137,855 | ||||||
| 3,889 | Bank of New York Mellon Corp. (The) | 162,210 | ||||||
| 9,462 | Berkshire Hathaway, Inc., Class B* | 2,583,315 | ||||||
| 750 | BlackRock, Inc. | 456,780 | ||||||
| 2,062 | Capital One Financial Corp. | 214,840 | ||||||
| 569 | Cboe Global Markets, Inc. | 64,405 | ||||||
| 7,825 | Charles Schwab Corp. (The) | 494,384 | ||||||
| 1,889 | CME Group, Inc. | 386,678 | ||||||
| 1,495 | Discover Financial Services | 141,397 | ||||||
| 200 | FactSet Research Systems, Inc. | 76,914 | ||||||
| 1,440 | Franklin Resources, Inc. | 33,566 | ||||||
| 1,776 | Goldman Sachs Group, Inc. (The)(a) | 527,508 | ||||||
| 2,956 | Intercontinental Exchange, Inc. | 277,982 | ||||||
| 1,729 | Invesco Ltd. | 27,889 | ||||||
| 209 | MarketAxess Holdings, Inc. | 53,506 | ||||||
| 846 | Moody’s Corp. | 230,087 | ||||||
| 7,303 | Morgan Stanley | 555,466 | ||||||
| 421 | MSCI, Inc. | 173,515 | ||||||
| 603 | Nasdaq, Inc. | 91,982 | ||||||
| 1,104 | Northern Trust Corp. | 106,514 | ||||||
| 973 | Raymond James Financial, Inc. | 86,996 | ||||||
| 1,821 | S&P Global, Inc. | 613,786 | ||||||
| 1,942 | State Street Corp. | 119,724 | ||||||
| 2,566 | Synchrony Financial | 70,873 | ||||||
| 1,212 | T. Rowe Price Group, Inc. | 137,695 | ||||||
|
| |||||||
| 8,266,679 | ||||||||
|
| |||||||
| Energy – 4.4% | ||||||||
| 1,724 | APA Corp. | 60,168 | ||||||
| 4,625 | Baker Hughes Co. | 133,524 | ||||||
| 10,309 | Chevron Corp. | 1,492,537 | ||||||
| 6,751 | ConocoPhillips | 606,307 | ||||||
| 4,326 | Coterra Energy, Inc. | 111,567 | ||||||
| 3,281 | Devon Energy Corp. | 180,816 | ||||||
|
| |||||||
| Common Stocks – (continued) | ||||||||
| Energy – (continued) | ||||||||
| 873 | Diamondback Energy, Inc. | 105,764 | ||||||
| 3,051 | EOG Resources, Inc. | 336,952 | ||||||
| 22,028 | Exxon Mobil Corp. | 1,886,478 | ||||||
| 4,722 | Halliburton Co. | 148,082 | ||||||
| 1,438 | Hess Corp. | 152,342 | ||||||
| 10,313 | Kinder Morgan, Inc. | 172,846 | ||||||
| 3,713 | Marathon Oil Corp. | 83,468 | ||||||
| 2,839 | Marathon Petroleum Corp. | 233,394 | ||||||
| 4,620 | Occidental Petroleum Corp. | 272,026 | ||||||
| 2,302 | ONEOK, Inc. | 127,761 | ||||||
| 2,431 | Phillips 66 | 199,318 | ||||||
| 1,186 | Pioneer Natural Resources Co. | 264,573 | ||||||
| 7,310 | Schlumberger NV | 261,406 | ||||||
| 2,127 | Valero Energy Corp. | 226,057 | ||||||
| 6,283 | Williams Cos., Inc. (The) | 196,092 | ||||||
|
| |||||||
| 7,251,478 | ||||||||
|
| |||||||
| Food & Staples Retailing – 1.5% | ||||||||
| 2,323 | Costco Wholesale Corp. | 1,113,367 | ||||||
| 3,470 | Kroger Co. (The) | 164,235 | ||||||
| 2,649 | Sysco Corp. | 224,397 | ||||||
| 3,815 | Walgreens Boots Alliance, Inc. | 144,589 | ||||||
| 7,378 | Walmart, Inc. | 897,017 | ||||||
|
| |||||||
| 2,543,605 | ||||||||
|
| |||||||
| Food, Beverage & Tobacco – 3.7% | ||||||||
| 9,551 | Altria Group, Inc. | 398,945 | ||||||
| 2,929 | Archer-Daniels-Midland Co. | 227,290 | ||||||
| 944 | Brown-Forman Corp., Class B | 66,231 | ||||||
| 1,039 | Campbell Soup Co. | 49,924 | ||||||
| 20,292 | Coca-Cola Co. (The) | 1,276,570 | ||||||
| 2,559 | Conagra Brands, Inc. | 87,620 | ||||||
| 852 | Constellation Brands, Inc., Class A | 198,567 | ||||||
| 3,163 | General Mills, Inc. | 238,648 | ||||||
| 767 | Hershey Co. (The) | 165,028 | ||||||
| 1,469 | Hormel Foods Corp. | 69,572 | ||||||
| 587 | J M Smucker Co. (The) | 75,142 | ||||||
| 1,361 | Kellogg Co. | 97,094 | ||||||
| 3,870 | Keurig Dr Pepper, Inc. | 136,959 | ||||||
| 3,750 | Kraft Heinz Co. (The) | 143,025 | ||||||
| 724 | Lamb Weston Holdings, Inc. | 51,737 | ||||||
| 1,311 | McCormick & Co., Inc. | 109,141 | ||||||
| 1,037 | Molson Coors Beverage Co., Class B | 56,527 | ||||||
| 7,298 | Mondelez International, Inc., Class A | 453,133 | ||||||
| 1,934 | Monster Beverage Corp.* | 179,282 | ||||||
| 7,249 | PepsiCo, Inc. | 1,208,118 | ||||||
| 8,123 | Philip Morris International, Inc. | 802,065 | ||||||
| 1,564 | Tyson Foods, Inc., Class A | 134,598 | ||||||
|
| |||||||
| 6,225,216 | ||||||||
|
| |||||||
| Health Care Equipment & Services – 6.2% | ||||||||
| 9,187 | Abbott Laboratories | 998,167 | ||||||
| 241 | ABIOMED, Inc.* | 59,650 | ||||||
| 392 | Align Technology, Inc.* | 92,775 | ||||||
| 787 | AmerisourceBergen Corp. | 111,345 | ||||||
| 2,593 | Baxter International, Inc. | 166,548 | ||||||
|
| |||||||
| The accompanying notes are an integral part of these financial statements. | 21 |
GOLDMAN SACHS VARIABLE INSURANCE TRUST EQUITY INDEX FUND
Schedule of Investments (continued)
June 30, 2022 (Unaudited)
| Shares | Description | Value | ||||||
| Common Stocks – (continued) | ||||||||
| Health Care Equipment & Services – (continued) | ||||||||
| 1,496 | Becton Dickinson and Co. | $ | 368,809 | |||||
| 7,462 | Boston Scientific Corp.* | 278,109 | ||||||
| 1,471 | Cardinal Health, Inc. | 76,889 | ||||||
| 3,057 | Centene Corp.* | 258,653 | ||||||
| 1,665 | Cigna Corp. | 438,761 | ||||||
| 254 | Cooper Cos., Inc. (The) | 79,532 | ||||||
| 6,865 | CVS Health Corp. | 636,111 | ||||||
| 329 | DaVita, Inc.* | 26,307 | ||||||
| 1,188 | DENTSPLY SIRONA, Inc. | 42,447 | ||||||
| 2,052 | Dexcom, Inc.* | 152,936 | ||||||
| 3,262 | Edwards Lifesciences Corp.* | 310,184 | ||||||
| 1,264 | Elevance Health, Inc. | 609,981 | ||||||
| 1,194 | HCA Healthcare, Inc. | 200,664 | ||||||
| 742 | Henry Schein, Inc.* | 56,941 | ||||||
| 1,290 | Hologic, Inc.* | 89,397 | ||||||
| 658 | Humana, Inc. | 307,990 | ||||||
| 448 | IDEXX Laboratories, Inc.* | 157,127 | ||||||
| 1,866 | Intuitive Surgical, Inc.* | 374,525 | ||||||
| 486 | Laboratory Corp. of America Holdings | 113,899 | ||||||
| 763 | McKesson Corp. | 248,898 | ||||||
| 7,044 | Medtronic PLC | 632,199 | ||||||
| 314 | Molina Healthcare, Inc.* | 87,797 | ||||||
| 613 | Quest Diagnostics, Inc. | 81,517 | ||||||
| 777 | ResMed, Inc. | 162,882 | ||||||
| 525 | STERIS PLC | 108,229 | ||||||
| 1,769 | Stryker Corp. | 351,907 | ||||||
| 243 | Teleflex, Inc. | 59,742 | ||||||
| 4,907 | UnitedHealth Group, Inc. | 2,520,382 | ||||||
| 336 | Universal Health Services, Inc., Class B | 33,839 | ||||||
| 1,105 | Zimmer Biomet Holdings, Inc. | 116,091 | ||||||
|
| |||||||
| 10,411,230 | ||||||||
|
| |||||||
| Household & Personal Products – 1.7% | ||||||||
| 1,291 | Church & Dwight Co., Inc. | 119,624 | ||||||
| 654 | Clorox Co. (The) | 92,201 | ||||||
| 4,398 | Colgate-Palmolive Co. | 352,456 | ||||||
| 1,217 | Estee Lauder Cos., Inc. (The), Class A | 309,933 | ||||||
| 1,758 | Kimberly-Clark Corp. | 237,594 | ||||||
| 12,520 | Procter & Gamble Co. (The) | 1,800,251 | ||||||
|
| |||||||
| 2,912,059 | ||||||||
|
| |||||||
| Insurance – 2.2% | ||||||||
| 3,146 | Aflac, Inc. | 174,068 | ||||||
| 1,426 | Allstate Corp. (The) | 180,717 | ||||||
| 4,157 | American International Group, Inc. | 212,548 | ||||||
| 1,105 | Aon PLC, Class A | 297,996 | ||||||
| 1,107 | Arthur J Gallagher & Co. | 180,485 | ||||||
| 273 | Assurant, Inc. | 47,188 | ||||||
| 1,241 | Brown & Brown, Inc. | 72,400 | ||||||
| 2,209 | Chubb Ltd. | 434,245 | ||||||
| 805 | Cincinnati Financial Corp. | 95,779 | ||||||
| 202 | Everest Re Group Ltd. | 56,617 | ||||||
| 496 | Globe Life, Inc. | 48,345 | ||||||
|
| |||||||
| Common Stocks – (continued) | ||||||||
| Insurance – (continued) | ||||||||
| 1,695 | Hartford Financial Services Group, Inc. (The) | 110,904 | ||||||
| 875 | Lincoln National Corp. | 40,924 | ||||||
| 1,037 | Loews Corp. | 61,453 | ||||||
| 2,616 | Marsh & McLennan Cos., Inc. | 406,134 | ||||||
| 3,591 | MetLife, Inc. | 225,479 | ||||||
| 1,205 | Principal Financial Group, Inc. | 80,482 | ||||||
| 3,049 | Progressive Corp. (The) | 354,507 | ||||||
| 1,962 | Prudential Financial, Inc. | 187,724 | ||||||
| 1,266 | Travelers Cos., Inc. (The) | 214,119 | ||||||
| 1,063 | W R Berkley Corp. | 72,560 | ||||||
| 585 | Willis Towers Watson PLC | 115,473 | ||||||
|
| |||||||
| 3,670,147 | ||||||||
|
| |||||||
| Materials – 2.6% | ||||||||
| 1,156 | Air Products and Chemicals, Inc. | 277,995 | ||||||
| 611 | Albemarle Corp. | 127,687 | ||||||
| 8,010 | Amcor PLC | 99,564 | ||||||
| 446 | Avery Dennison Corp. | 72,194 | ||||||
| 1,712 | Ball Corp. | 117,734 | ||||||
| 581 | Celanese Corp. | 68,331 | ||||||
| 1,135 | CF Industries Holdings, Inc. | 97,304 | ||||||
| 3,817 | Corteva, Inc. | 206,652 | ||||||
| 3,778 | Dow, Inc. | 194,983 | ||||||
| 2,679 | DuPont de Nemours, Inc. | 148,899 | ||||||
| 699 | Eastman Chemical Co. | 62,749 | ||||||
| 1,303 | Ecolab, Inc. | 200,349 | ||||||
| 657 | FMC Corp. | 70,306 | ||||||
| 7,633 | Freeport-McMoRan, Inc. | 223,342 | ||||||
| 1,346 | International Flavors & Fragrances, Inc. | 160,336 | ||||||
| 2,014 | International Paper Co. | 84,246 | ||||||
| 2,641 | Linde PLC (United Kingdom) | 759,367 | ||||||
| 1,364 | LyondellBasell Industries NV, Class A | 119,295 | ||||||
| 331 | Martin Marietta Materials, Inc. | 99,048 | ||||||
| 1,883 | Mosaic Co. (The) | 88,934 | ||||||
| 4,182 | Newmont Corp. | 249,540 | ||||||
| 1,377 | Nucor Corp. | 143,773 | ||||||
| 492 | Packaging Corp. of America | 67,650 | ||||||
| 1,225 | PPG Industries, Inc. | 140,066 | ||||||
| 786 | Sealed Air Corp. | 45,368 | ||||||
| 1,267 | Sherwin-Williams Co. (The) | 283,694 | ||||||
| 703 | Vulcan Materials Co. | 99,896 | ||||||
| 1,424 | Westrock Co. | 56,732 | ||||||
|
| |||||||
| 4,366,034 | ||||||||
|
| |||||||
| Media & Entertainment – 7.5% | ||||||||
| 4,079 | Activision Blizzard, Inc. | 317,591 | ||||||
| 1,572 | Alphabet, Inc., Class A* | 3,425,797 | ||||||
| 1,443 | Alphabet, Inc., Class C* | 3,156,490 | ||||||
| 608 | Charter Communications, Inc., Class A* | 284,866 | ||||||
| 23,354 | Comcast Corp., Class A | 916,411 | ||||||
| 1,329 | DISH Network Corp., Class A* | 23,829 | ||||||
| 1,452 | Electronic Arts, Inc. | 176,636 | ||||||
|
| |||||||
| 22 | The accompanying notes are an integral part of these financial statements. |
GOLDMAN SACHS VARIABLE INSURANCE TRUST EQUITY INDEX FUND
| Shares | Description | Value | ||||||
| Common Stocks – (continued) | ||||||||
| Media & Entertainment – (continued) | ||||||||
| 1,657 | Fox Corp., Class A | $ | 53,289 | |||||
| 729 | Fox Corp., Class B | 21,651 | ||||||
| 2,116 | Interpublic Group of Cos., Inc. (The) | 58,254 | ||||||
| 692 | Live Nation Entertainment, Inc.* | 57,145 | ||||||
| 1,518 | Match Group, Inc.* | 105,789 | ||||||
| 11,993 | Meta Platforms, Inc., Class A* | 1,933,871 | ||||||
| 2,308 | Netflix, Inc.* | 403,600 | ||||||
| 2,000 | News Corp., Class A | 31,160 | ||||||
| 566 | News Corp., Class B | 8,994 | ||||||
| 1,112 | Omnicom Group, Inc. | 70,734 | ||||||
| 3,198 | Paramount Global, Class B | 78,927 | ||||||
| 829 | Take-Two Interactive Software, Inc.* | 101,577 | ||||||
| 3,948 | Twitter, Inc.* | 147,616 | ||||||
| 9,499 | Walt Disney Co. (The)* | 896,706 | ||||||
| 11,622 | Warner Bros Discovery, Inc.* | 155,967 | ||||||
|
| |||||||
| 12,426,900 | ||||||||
|
| |||||||
| Pharmaceuticals, Biotechnology & Life Sciences – 8.9% | ||||||||
| 9,229 | AbbVie, Inc. | 1,413,514 | ||||||
| 1,549 | Agilent Technologies, Inc. | 183,975 | ||||||
| 2,803 | Amgen, Inc. | 681,970 | ||||||
| 772 | Biogen, Inc.* | 157,442 | ||||||
| 115 | Bio-Rad Laboratories, Inc., Class A* | 56,925 | ||||||
| 208 | Bio-Techne Corp. | 72,101 | ||||||
| 11,171 | Bristol-Myers Squibb Co. | 860,167 | ||||||
| 930 | Catalent, Inc.* | 99,780 | ||||||
| 268 | Charles River Laboratories International, Inc.* | 57,344 | ||||||
| 3,395 | Danaher Corp. | 860,700 | ||||||
| 4,122 | Eli Lilly & Co. | 1,336,476 | ||||||
| 6,588 | Gilead Sciences, Inc. | 407,204 | ||||||
| 819 | Illumina, Inc.* | 150,991 | ||||||
| 953 | Incyte Corp.* | 72,399 | ||||||
| 986 | IQVIA Holdings, Inc.* | 213,952 | ||||||
| 13,755 | Johnson & Johnson | 2,441,650 | ||||||
| 13,235 | Merck & Co., Inc. | 1,206,635 | ||||||
| 121 | Mettler-Toledo International, Inc.* | 139,001 | ||||||
| 1,799 | Moderna, Inc.* | 256,987 | ||||||
| 1,257 | Organon & Co. | 42,424 | ||||||
| 673 | PerkinElmer, Inc. | 95,714 | ||||||
| 29,308 | Pfizer, Inc. | 1,536,618 | ||||||
| 554 | Regeneron Pharmaceuticals, Inc.* | 327,486 | ||||||
| 2,046 | Thermo Fisher Scientific, Inc. | 1,111,551 | ||||||
| 1,326 | Vertex Pharmaceuticals, Inc.* | 373,654 | ||||||
| 6,562 | Viatris, Inc. | 68,704 | ||||||
| 325 | Waters Corp.* | 107,568 | ||||||
| 385 | West Pharmaceutical Services, Inc. | 116,412 | ||||||
| 2,468 | Zoetis, Inc. | 424,225 | ||||||
|
| |||||||
| 14,873,569 | ||||||||
|
| |||||||
| Real Estate – 2.9% | ||||||||
| 752 | Alexandria Real Estate Equities, Inc. REIT | 109,062 | ||||||
| 2,371 | American Tower Corp. REIT | 606,004 | ||||||
| 739 | AvalonBay Communities, Inc. REIT | 143,551 | ||||||
|
| |||||||
| Common Stocks – (continued) | ||||||||
| Real Estate – (continued) | ||||||||
| 769 | Boston Properties, Inc. REIT | 68,426 | ||||||
| 543 | Camden Property Trust REIT | 73,023 | ||||||
| 1,688 | CBRE Group, Inc., Class A* | 124,254 | ||||||
| 2,267 | Crown Castle International Corp. REIT | 381,717 | ||||||
| 1,496 | Digital Realty Trust, Inc. REIT | 194,226 | ||||||
| 2,032 | Duke Realty Corp. REIT | 111,658 | ||||||
| 472 | Equinix, Inc. REIT | 310,113 | ||||||
| 1,825 | Equity Residential REIT | 131,801 | ||||||
| 341 | Essex Property Trust, Inc. REIT | 89,175 | ||||||
| 714 | Extra Space Storage, Inc. REIT | 121,466 | ||||||
| 378 | Federal Realty Investment Trust REIT | 36,190 | ||||||
| 2,791 | Healthpeak Properties, Inc. REIT | 72,315 | ||||||
| 3,710 | Host Hotels & Resorts, Inc. REIT | 58,173 | ||||||
| 1,557 | Iron Mountain, Inc. REIT | 75,810 | ||||||
| 3,188 | Kimco Realty Corp. REIT | 63,027 | ||||||
| 608 | Mid-America Apartment Communities, Inc. REIT | 106,199 | ||||||
| 3,849 | Prologis, Inc. REIT | 452,835 | ||||||
| 790 | Public Storage REIT | 247,009 | ||||||
| 2,992 | Realty Income Corp. REIT | 204,234 | ||||||
| 784 | Regency Centers Corp. REIT | 46,499 | ||||||
| 568 | SBA Communications Corp. REIT | 181,788 | ||||||
| 1,720 | Simon Property Group, Inc. REIT | 163,262 | ||||||
| 1,468 | UDR, Inc. REIT | 67,587 | ||||||
| 2,094 | Ventas, Inc. REIT | 107,694 | ||||||
| 5,053 | VICI Properties, Inc. REIT | 150,529 | ||||||
| 862 | Vornado Realty Trust REIT | 24,645 | ||||||
| 2,269 | Welltower, Inc. REIT | 186,852 | ||||||
| 3,856 | Weyerhaeuser Co. REIT | 127,711 | ||||||
|
| |||||||
| 4,836,835 | ||||||||
|
| |||||||
| Retailing – 5.7% | ||||||||
| 330 | Advance Auto Parts, Inc. | 57,120 | ||||||
| 45,760 | Amazon.com, Inc.* | 4,860,170 | ||||||
| 104 | AutoZone, Inc.* | 223,508 | ||||||
| 1,302 | Bath & Body Works, Inc. | 35,050 | ||||||
| 1,035 | Best Buy Co., Inc. | 67,472 | ||||||
| 873 | CarMax, Inc.* | 78,989 | ||||||
| 1,191 | Dollar General Corp. | 292,319 | ||||||
| 1,193 | Dollar Tree, Inc.* | 185,929 | ||||||
| 2,937 | eBay, Inc. | 122,385 | ||||||
| 686 | Etsy, Inc.* | 50,222 | ||||||
| 752 | Genuine Parts Co. | 100,016 | ||||||
| 5,422 | Home Depot, Inc. (The) | 1,487,092 | ||||||
| 1,417 | LKQ Corp. | 69,561 | ||||||
| 3,450 | Lowe’s Cos., Inc. | 602,611 | ||||||
| 350 | O’Reilly Automotive, Inc.* | 221,116 | ||||||
| 214 | Pool Corp. | 75,163 | ||||||
| 1,879 | Ross Stores, Inc. | 131,962 | ||||||
| 2,426 | Target Corp. | 342,624 | ||||||
| 6,196 | TJX Cos., Inc. (The) | 346,047 | ||||||
| 604 | Tractor Supply Co. | 117,085 | ||||||
| 269 | Ulta Beauty, Inc.* | 103,694 | ||||||
|
| |||||||
| 9,570,135 | ||||||||
|
| |||||||
| The accompanying notes are an integral part of these financial statements. | 23 |
GOLDMAN SACHS VARIABLE INSURANCE TRUST EQUITY INDEX FUND
Schedule of Investments (continued)
June 30, 2022 (Unaudited)
| Shares | Description | Value | ||||||
| Common Stocks – (continued) | ||||||||
| Semiconductors & Semiconductor Equipment – 5.2% | ||||||||
| 8,525 | Advanced Micro Devices, Inc.* | $ | 651,907 | |||||
| 2,727 | Analog Devices, Inc. | 398,387 | ||||||
| 4,644 | Applied Materials, Inc. | 422,511 | ||||||
| 2,133 | Broadcom, Inc. | 1,036,233 | ||||||
| 715 | Enphase Energy, Inc.* | 139,597 | ||||||
| 21,238 | Intel Corp. | 794,513 | ||||||
| 785 | KLA Corp. | 250,478 | ||||||
| 727 | Lam Research Corp. | 309,811 | ||||||
| 2,870 | Microchip Technology, Inc. | 166,690 | ||||||
| 5,841 | Micron Technology, Inc. | 322,890 | ||||||
| 228 | Monolithic Power Systems, Inc. | 87,561 | ||||||
| 13,062 | NVIDIA Corp. | 1,980,069 | ||||||
| 1,385 | NXP Semiconductors NV (China) | 205,021 | ||||||
| 2,280 | ON Semiconductor Corp.* | 114,707 | ||||||
| 572 | Qorvo, Inc.* | 53,951 | ||||||
| 5,876 | QUALCOMM, Inc. | 750,600 | ||||||
| 866 | Skyworks Solutions, Inc. | 80,226 | ||||||
| 269 | SolarEdge Technologies, Inc.* | 73,620 | ||||||
| 834 | Teradyne, Inc. | 74,685 | ||||||
| 4,834 | Texas Instruments, Inc. | 742,744 | ||||||
|
| |||||||
| 8,656,201 | ||||||||
|
| |||||||
| Software & Services – 13.4% | ||||||||
| 3,297 | Accenture PLC, Class A | 915,412 | ||||||
| 2,461 | Adobe, Inc.* | 900,874 | ||||||
| 854 | Akamai Technologies, Inc.* | 77,996 | ||||||
| 462 | ANSYS, Inc.* | 110,552 | ||||||
| 1,156 | Autodesk, Inc.* | 198,786 | ||||||
| 2,185 | Automatic Data Processing, Inc. | 458,937 | ||||||
| 608 | Broadridge Financial Solutions, Inc. | 86,670 | ||||||
| 1,466 | Cadence Design Systems, Inc.* | 219,944 | ||||||
| 740 | Ceridian HCM Holding, Inc.* | 34,839 | ||||||
| 675 | Citrix Systems, Inc. | 65,590 | ||||||
| 2,727 | Cognizant Technology Solutions Corp., Class A | 184,045 | ||||||
| 1,300 | DXC Technology Co.* | 39,403 | ||||||
| 300 | EPAM Systems, Inc.* | 88,434 | ||||||
| 3,170 | Fidelity National Information Services, Inc. | 290,594 | ||||||
| 3,026 | Fiserv, Inc.* | 269,223 | ||||||
| 397 | FleetCor Technologies, Inc.* | 83,414 | ||||||
| 3,457 | Fortinet, Inc.* | 195,597 | ||||||
| 433 | Gartner, Inc.* | 104,712 | ||||||
| 1,473 | Global Payments, Inc. | 162,973 | ||||||
| 4,690 | International Business Machines Corp. | 662,181 | ||||||
| 1,489 | Intuit, Inc. | 573,920 | ||||||
| 396 | Jack Henry & Associates, Inc. | 71,288 | ||||||
| 4,489 | Mastercard, Inc., Class A | 1,416,190 | ||||||
| 39,136 | Microsoft Corp. | 10,051,299 | ||||||
| 3,011 | NortonLifeLock, Inc. | 66,122 | ||||||
| 8,261 | Oracle Corp. | 577,196 | ||||||
| 1,666 | Paychex, Inc. | 189,707 | ||||||
| 247 | Paycom Software, Inc.* | 69,190 | ||||||
| 6,037 | PayPal Holdings, Inc.* | 421,624 | ||||||
| 564 | PTC, Inc.* | 59,976 | ||||||
|
| |||||||
| Common Stocks – (continued) | ||||||||
| Software & Services – (continued) | ||||||||
| 551 | Roper Technologies, Inc. | 217,452 | ||||||
| 5,137 | Salesforce, Inc.* | 847,810 | ||||||
| 1,048 | ServiceNow, Inc.* | 498,345 | ||||||
| 800 | Synopsys, Inc.* | 242,960 | ||||||
| 218 | Tyler Technologies, Inc.* | 72,481 | ||||||
| 514 | VeriSign, Inc.* | 86,008 | ||||||
| 8,605 | Visa, Inc., Class A | 1,694,238 | ||||||
|
| |||||||
| 22,305,982 | ||||||||
|
| |||||||
| Technology Hardware & Equipment – 8.3% | ||||||||
| 3,111 | Amphenol Corp., Class A | 200,286 | ||||||
| 80,459 | Apple, Inc. | 11,000,354 | ||||||
| 1,188 | Arista Networks, Inc.* | 111,363 | ||||||
| 714 | CDW Corp. | 112,498 | ||||||
| 21,797 | Cisco Systems, Inc. | 929,424 | ||||||
| 3,906 | Corning, Inc. | 123,078 | ||||||
| 333 | F5, Inc.* | 50,962 | ||||||
| 6,870 | Hewlett Packard Enterprise Co. | 91,096 | ||||||
| 5,463 | HP, Inc. | 179,077 | ||||||
| 1,635 | Juniper Networks, Inc. | 46,598 | ||||||
| 941 | Keysight Technologies, Inc.* | 129,717 | ||||||
| 868 | Motorola Solutions, Inc. | 181,933 | ||||||
| 1,176 | NetApp, Inc. | 76,722 | ||||||
| 1,075 | Seagate Technology Holdings PLC | 76,798 | ||||||
| 1,692 | TE Connectivity Ltd. (Switzerland) | 191,450 | ||||||
| 251 | Teledyne Technologies, Inc.* | 94,153 | ||||||
| 1,357 | Trimble, Inc.* | 79,018 | ||||||
| 1,631 | Western Digital Corp.* | 73,118 | ||||||
| 283 | Zebra Technologies Corp., Class A* | 83,188 | ||||||
|
| |||||||
| 13,830,833 | ||||||||
|
| |||||||
| Telecommunication Services – 1.4% | ||||||||
| 37,415 | AT&T, Inc. | 784,218 | ||||||
| 4,795 | Lumen Technologies, Inc. | 52,313 | ||||||
| 3,062 | T-Mobile US, Inc.* | 411,962 | ||||||
| 22,020 | Verizon Communications, Inc. | 1,117,515 | ||||||
|
| |||||||
| 2,366,008 | ||||||||
|
| |||||||
| Transportation – 1.8% | ||||||||
| 699 | Alaska Air Group, Inc.* | 27,995 | ||||||
| 3,269 | American Airlines Group, Inc.* | 41,451 | ||||||
| 697 | C.H. Robinson Worldwide, Inc. | 70,655 | ||||||
| 11,408 | CSX Corp. | 331,516 | ||||||
| 3,380 | Delta Air Lines, Inc.* | 97,918 | ||||||
| 882 | Expeditors International of Washington, Inc. | 85,960 | ||||||
| 1,263 | FedEx Corp. | 286,335 | ||||||
| 435 | J.B. Hunt Transport Services, Inc. | 68,499 | ||||||
| 1,255 | Norfolk Southern Corp. | 285,249 | ||||||
| 481 | Old Dominion Freight Line, Inc. | 123,271 | ||||||
| 3,159 | Southwest Airlines Co.* | 114,103 | ||||||
| 3,295 | Union Pacific Corp. | 702,758 | ||||||
| 1,662 | United Airlines Holdings, Inc.* | 58,868 | ||||||
| 3,820 | United Parcel Service, Inc., Class B | 697,303 | ||||||
|
| |||||||
| 2,991,881 | ||||||||
|
| |||||||
| 24 | The accompanying notes are an integral part of these financial statements. |
GOLDMAN SACHS VARIABLE INSURANCE TRUST EQUITY INDEX FUND
| Shares | Description | Value | ||||||
| Common Stocks – (continued) | ||||||||
| Utilities – 3.1% | ||||||||
| 3,430 | AES Corp. (The) | $ | 72,064 | |||||
| 1,324 | Alliant Energy Corp. | 77,600 | ||||||
| 1,349 | Ameren Corp. | 121,896 | ||||||
| 2,625 | American Electric Power Co., Inc. | 251,842 | ||||||
| 968 | American Water Works Co., Inc. | 144,009 | ||||||
| 682 | Atmos Energy Corp. | 76,452 | ||||||
| 3,377 | CenterPoint Energy, Inc. | 99,892 | ||||||
| 1,515 | CMS Energy Corp. | 102,262 | ||||||
| 1,823 | Consolidated Edison, Inc. | 173,367 | ||||||
| 1,673 | Constellation Energy Corp. | 95,796 | ||||||
| 4,222 | Dominion Energy, Inc. | 336,958 | ||||||
| 1,001 | DTE Energy Co. | 126,877 | ||||||
| 4,044 | Duke Energy Corp. | 433,557 | ||||||
| 2,001 | Edison International | 126,543 | ||||||
| 1,074 | Entergy Corp. | 120,975 | ||||||
| 1,244 | Evergy, Inc. | 81,171 | ||||||
| 1,769 | Eversource Energy | 149,427 | ||||||
| 5,094 | Exelon Corp. | 230,860 | ||||||
| 2,868 | FirstEnergy Corp. | 110,103 | ||||||
| 10,265 | NextEra Energy, Inc. | 795,127 | ||||||
| 2,089 | NiSource, Inc. | 61,605 | ||||||
| 1,276 | NRG Energy, Inc. | 48,705 | ||||||
| 601 | Pinnacle West Capital Corp. | 43,945 | ||||||
| 3,789 | PPL Corp. | 102,796 | ||||||
| 2,617 | Public Service Enterprise Group, Inc. | 165,604 | ||||||
| 1,665 | Sempra Energy | 250,200 | ||||||
| 5,544 | Southern Co. (The) | 395,343 | ||||||
| 1,633 | WEC Energy Group, Inc. | 164,345 | ||||||
| 2,805 | Xcel Energy, Inc. | 198,482 | ||||||
|
| |||||||
| 5,157,803 | ||||||||
|
| |||||||
| TOTAL INVESTMENTS – 100.1% | ||||||||
| (Cost $47,957,974) | $ | 166,959,720 | ||||||
|
| |||||||
| | LIABILITIES IN EXCESS OF | (154,897 | ) | |||||
|
| |||||||
| NET ASSETS – 100.0% | $ | 166,804,823 | ||||||
|
| |||||||
| The percentage shown for each investment category reflects the value of investments in that category as a percentage of net assets. | ||
| * | Non-income producing security. | |
| (a) | Represents an affiliated issuer. | |
| Investment Abbreviations: | ||
| PLC | —Public Limited Company | |
| REIT | —Real Estate Investment Trust | |
ADDITIONAL INVESTMENT INFORMATION
FUTURES CONTRACTS — At June 30, 2022, the Fund had the following futures contracts:
| Description | Number of Contracts | Expiration Date | Notional Amount | Unrealized Appreciation/ (Depreciation) | ||||||||||||
Long position contracts: | ||||||||||||||||
| S&P 500 E-Mini Index | 4 | 09/16/22 | $ | 748,755 | $ | 9,145 | ||||||||||
| The accompanying notes are an integral part of these financial statements. | 25 |
GOLDMAN SACHS VARIABLE INSURANCE TRUST INTERNATIONAL EQUITY INSIGHTS FUND
Schedule of Investments
June 30, 2022 (Unaudited)
| Shares | Description | Value | ||||||
| Common Stocks – 95.8% | ||||||||
| Australia – 10.4% | ||||||||
| 27,635 | Aristocrat Leisure Ltd. (Consumer Services) | $ | 657,327 | |||||
| 221,604 | Aurizon Holdings Ltd. (Transportation) | 582,826 | ||||||
| 51,288 | Australia & New Zealand Banking Group Ltd. (Banks) | 781,153 | ||||||
| 3,040 | BHP Group Ltd. (Materials) | 87,046 | ||||||
| 34,859 | BHP Group Ltd. (Materials) | 972,020 | ||||||
| 7,036 | Challenger Ltd. (Diversified Financials) | 33,311 | ||||||
| 32,622 | Charter Hall Group REIT (Real Estate) | 244,702 | ||||||
| 20,241 | Commonwealth Bank of Australia (Banks) | 1,264,588 | ||||||
| 23,171 | Computershare Ltd. (Software & Services) | 395,139 | ||||||
| 42,765 | Glencore PLC (Materials)* | 231,634 | ||||||
| 12,419 | Incitec Pivot Ltd. (Materials) | 28,580 | ||||||
| 11,731 | National Australia Bank Ltd. (Banks) | 222,453 | ||||||
| 14,246 | Rio Tinto PLC ADR (Materials)(a) | 869,006 | ||||||
| 30,748 | Suncorp Group Ltd. (Insurance) | 234,476 | ||||||
| 248,815 | Telstra Corp. Ltd. (Telecommunication Services) | 661,792 | ||||||
| 80,544 | Treasury Wine Estates Ltd. (Food, Beverage & Tobacco) | 631,643 | ||||||
| 18,569 | Wesfarmers Ltd. (Retailing) | 537,090 | ||||||
| 49,874 | Westpac Banking Corp. (Banks) | 672,746 | ||||||
| 14,091 | Woodside Energy Group Ltd. (Energy) | 309,699 | ||||||
|
| |||||||
| 9,417,231 | ||||||||
|
| |||||||
| Belgium – 0.4% | ||||||||
| 1,778 | D’ieteren Group (Retailing) | 261,270 | ||||||
| 1,778 | KBC Group NV (Banks) | 100,032 | ||||||
|
| |||||||
| 361,302 | ||||||||
|
| |||||||
| Canada – 0.3% | ||||||||
| 25,117 | International Petroleum Corp. (Energy)* | 244,150 | ||||||
|
| |||||||
| China – 0.1% | ||||||||
| 39,800 | Chow Tai Fook Jewellery Group Ltd. (Retailing)* | 75,178 | ||||||
| 15,000 | SITC International Holdings Co. Ltd. (Transportation) | 42,663 | ||||||
|
| |||||||
| 117,841 | ||||||||
|
| |||||||
| Denmark – 4.3% | ||||||||
| 177 | AP Moller – Maersk A/S, Class A (Transportation) | 410,809 | ||||||
| 110 | AP Moller – Maersk A/S, Class B (Transportation) | 258,236 | ||||||
| 3,240 | Carlsberg AS, Class B (Food, Beverage & Tobacco) | 414,081 | ||||||
| 3,327 | D/S Norden A/S (Transportation) | 115,905 | ||||||
| 1,162 | Genmab A/S (Pharmaceuticals, Biotechnology & Life Sciences)* | 377,005 | ||||||
|
| |||||||
| Common Stocks – (continued) | ||||||||
| Denmark – (continued) | ||||||||
| 16,034 | Novo Nordisk A/S, Class B (Pharmaceuticals, Biotechnology & Life Sciences) | 1,778,209 | ||||||
| 929 | Orsted AS (Utilities)(b) | 97,846 | ||||||
| 1,911 | Pandora A/S (Consumer Durables & Apparel) | 121,411 | ||||||
| 3,424 | Solar A/S, Class B (Capital Goods) | 293,920 | ||||||
|
| |||||||
| 3,867,422 | ||||||||
|
| |||||||
| Finland – 1.9% | ||||||||
| 20,550 | Kesko OYJ, Class B (Food & Staples Retailing) | 486,333 | ||||||
| 26,367 | Nokia OYJ (Technology Hardware & Equipment) | 122,212 | ||||||
| 80,162 | Nordea Bank Abp (Banks) | 708,113 | ||||||
| 3,953 | Sampo OYJ, Class A (Insurance) | 172,751 | ||||||
| 12,037 | Stora Enso OYJ, Class R (Materials) | 190,728 | ||||||
|
| |||||||
| 1,680,137 | ||||||||
|
| |||||||
| France – 8.6% | ||||||||
| 2,239 | Arkema SA (Materials) | 200,284 | ||||||
| 1,776 | Cie de Saint-Gobain (Capital Goods) | 76,740 | ||||||
| 3,055 | Covivio REIT (Real Estate) | 170,676 | ||||||
| 3,329 | Dassault Aviation SA (Capital Goods) | 519,866 | ||||||
| 18,708 | Dassault Systemes (Software & Services) | 692,961 | ||||||
| 13,688 | Electricite de France SA (Utilities)(a) | 112,431 | ||||||
| 563 | Gecina SA REIT (Real Estate) | 52,837 | ||||||
| 565 | Hermes International (Consumer Durables & Apparel) | 635,867 | ||||||
| 1,887 | Ipsen SA (Pharmaceuticals, Biotechnology & Life Sciences) | 178,667 | ||||||
| 1,037 | Kering (Consumer Durables & Apparel) | 537,402 | ||||||
| 1,122 | Legrand SA (Capital Goods) | 83,307 | ||||||
| 953 | LVMH Moet Hennessy Louis Vuitton SE (Consumer Durables & Apparel) | 584,073 | ||||||
| 4,455 | Pernod Ricard SA (Food, Beverage & Tobacco) | 823,618 | ||||||
| 667 | Publicis Groupe SA (Media & Entertainment)* | 32,804 | ||||||
| 2,081 | Rothschild & Co. (Diversified Financials) | 70,570 | ||||||
| 6,327 | Safran SA (Capital Goods) | 629,951 | ||||||
| 12,077 | Sanofi (Pharmaceuticals, Biotechnology & Life Sciences) | 1,217,919 | ||||||
| 164 | Sartorius Stedim Biotech (Pharmaceuticals, Biotechnology & Life Sciences) | 51,745 | ||||||
| 23,776 | Societe Generale SA (Banks) | 525,681 | ||||||
| 4,612 | Thales SA (Capital Goods) | 566,248 | ||||||
|
| |||||||
| 7,763,647 | ||||||||
|
| |||||||
| 26 | The accompanying notes are an integral part of these financial statements. |
GOLDMAN SACHS VARIABLE INSURANCE TRUST INTERNATIONAL EQUITY INSIGHTS FUND
| Shares | Description | Value | ||||||
| Common Stocks – (continued) | ||||||||
| Germany – 8.4% | ||||||||
| 17,564 | BASF SE (Materials) | $ | 768,465 | |||||
| 16,151 | Bayer AG (Pharmaceuticals, Biotechnology & Life Sciences) | 964,480 | ||||||
| 5,384 | Bayerische Motoren Werke AG (Automobiles & Components) | 417,371 | ||||||
| 1,445 | Brenntag SE (Capital Goods) | 94,616 | ||||||
| 7,902 | Commerzbank AG (Banks)* | 56,066 | ||||||
| 6,284 | Covestro AG (Materials)(b) | 218,361 | ||||||
| 21,690 | Deutsche Post AG (Transportation) | 818,932 | ||||||
| 76,460 | E.ON SE (Utilities) | 644,029 | ||||||
| 912 | Hapag-Lloyd AG (Transportation)(a)(b) | 238,443 | ||||||
| 20,584 | K+S AG (Materials) | 500,971 | ||||||
| 14,574 | Mercedes-Benz Group AG (Automobiles & Components) | 846,435 | ||||||
| 4,204 | Merck KGaA (Pharmaceuticals, Biotechnology & Life Sciences) | 713,088 | ||||||
| 430 | MTU Aero Engines AG (Capital Goods) | 78,772 | ||||||
| 2,908 | Muenchener Rueckversicherungs-Gesellschaft AG in Muenchen (Insurance) | 687,880 | ||||||
| 3,634 | RWE AG (Utilities) | 134,407 | ||||||
| 2,105 | Wacker Chemie AG (Materials) | 305,271 | ||||||
|
| |||||||
| 7,487,587 | ||||||||
|
| |||||||
| Hong Kong – 0.8% | ||||||||
| 900 | Jardine Matheson Holdings Ltd. (Capital Goods) | 47,250 | ||||||
| 55,500 | Sun Hung Kai Properties Ltd. (Real Estate) | 657,123 | ||||||
|
| |||||||
| 704,373 | ||||||||
|
| |||||||
| Indonesia – 0.1% | ||||||||
| 67,300 | First Resources Ltd. (Food, Beverage & Tobacco) | 79,111 | ||||||
|
| |||||||
| Ireland – 0.0% | ||||||||
| 4,331 | Kenmare Resources PLC (Materials) | 22,776 | ||||||
|
| |||||||
| Italy – 1.2% | ||||||||
| 87,786 | A2A SpA (Utilities) | 111,711 | ||||||
| 5,554 | ACEA SpA (Utilities) | 82,333 | ||||||
| 3,828 | BFF Bank SpA (Diversified Financials)(b) | 25,761 | ||||||
| 12,147 | Davide Campari-Milano NV (Food, Beverage & Tobacco) | 128,147 | ||||||
| 56,005 | Leonardo SpA (Capital Goods) | 568,216 | ||||||
| 549 | Reply SpA (Software & Services) | 66,787 | ||||||
| 6,117 | Snam SpA (Utilities) | 32,092 | ||||||
| 11,902 | Terna — Rete Elettrica Nazionale (Utilities) | 93,576 | ||||||
|
| |||||||
| 1,108,623 | ||||||||
|
| |||||||
| Japan – 25.4% | ||||||||
| 97,200 | Acom Co. Ltd. (Diversified Financials) | 227,062 | ||||||
| 2,900 | Air Water, Inc. (Materials) | 36,543 | ||||||
|
| |||||||
| Common Stocks – (continued) | ||||||||
| Japan – (continued) | ||||||||
| 7,600 | ASKA Pharmaceutical Holdings Co. Ltd. (Pharmaceuticals, Biotechnology & Life Sciences) | 56,276 | ||||||
| 5,900 | Central Japan Railway Co. (Transportation) | 678,104 | ||||||
| 7,400 | Citizen Watch Co. Ltd. (Technology Hardware & Equipment) | 30,104 | ||||||
| 3,000 | Coca-Cola Bottlers Japan Holdings, Inc. (Food, Beverage & Tobacco) | 35,861 | ||||||
| 2,000 | Daiwa House Industry Co. Ltd. (Real Estate) | 46,774 | ||||||
| 120,200 | Daiwa Securities Group, Inc. (Diversified Financials) | 538,211 | ||||||
| 2,200 | Eisai Co. Ltd. (Pharmaceuticals, Biotechnology & Life Sciences) | 93,016 | ||||||
| 4,400 | Fujikura Ltd. (Capital Goods) | 24,924 | ||||||
| 2,900 | Fujitsu Ltd. (Software & Services) | 362,871 | ||||||
| 1,800 | Fuyo General Lease Co. Ltd. (Diversified Financials) | 102,141 | ||||||
| 3,100 | G-Tekt Corp. (Automobiles & Components) | 29,112 | ||||||
| 28,200 | H2O Retailing Corp. (Retailing) | 217,634 | ||||||
| 400 | Hankyu Hanshin Holdings, Inc. (Transportation) | 10,925 | ||||||
| 6,800 | Hisamitsu Pharmaceutical Co., Inc. (Pharmaceuticals, Biotechnology & Life Sciences) | 175,777 | ||||||
| 5,800 | Inui Global Logistics Co. Ltd. (Commercial & Professional Services) | 74,722 | ||||||
| 11,000 | J Front Retailing Co. Ltd. (Retailing) | 93,906 | ||||||
| 44,300 | Japan Tobacco, Inc. (Food, Beverage & Tobacco) | 767,665 | ||||||
| 6,000 | Kansai Electric Power Co., Inc. (The) (Utilities) | 59,391 | ||||||
| 6,400 | KDDI Corp. (Telecommunication Services) | 201,820 | ||||||
| 5,100 | Kissei Pharmaceutical Co. Ltd. (Pharmaceuticals, Biotechnology & Life Sciences) | 99,819 | ||||||
| 2,400 | Kokuyo Co. Ltd. (Commercial & Professional Services) | 30,408 | ||||||
| 7,600 | Konami Group Corp. (Media & Entertainment) | 421,052 | ||||||
| 2,800 | Kurabo Industries Ltd. (Consumer Durables & Apparel) | 40,082 | ||||||
| 1,500 | Lawson, Inc. (Food & Staples Retailing) | 49,921 | ||||||
| 8,700 | Mandom Corp. (Household & Personal Products) | 102,492 | ||||||
| 70,100 | Marubeni Corp. (Capital Goods) | 628,908 | ||||||
| 22,500 | Mitsubishi Corp. (Capital Goods) | 670,076 | ||||||
| 48,900 | Mitsubishi Estate Co. Ltd. (Real Estate) | 708,725 | ||||||
| 6,800 | Mitsubishi Gas Chemical Co., Inc. (Materials) | 98,368 | ||||||
|
| |||||||
| The accompanying notes are an integral part of these financial statements. | 27 |
GOLDMAN SACHS VARIABLE INSURANCE TRUST INTERNATIONAL EQUITY INSIGHTS FUND
Schedule of Investments (continued)
June 30, 2022 (Unaudited)
| Shares | Description | Value | ||||||
| Common Stocks – (continued) | ||||||||
| Japan – (continued) | ||||||||
| 135,500 | Mitsubishi HC Capital, Inc. (Diversified Financials) | $ | 625,383 | |||||
| 8,100 | Mitsubishi Pencil Co. Ltd. (Commercial & Professional Services) | 87,663 | ||||||
| 1,800 | Mitsubishi Research Institute, Inc. (Software & Services) | 54,740 | ||||||
| 5,300 | Mitsubishi Shokuhin Co. Ltd. (Food & Staples Retailing) | 148,022 | ||||||
| 35,000 | Mitsui & Co. Ltd. (Capital Goods) | 769,109 | ||||||
| 35,100 | Mitsui Fudosan Co. Ltd. (Real Estate) | 754,118 | ||||||
| 17,500 | MS&AD Insurance Group Holdings, Inc. (Insurance) | 536,609 | ||||||
| 13,200 | NEC Corp. (Software & Services) | 515,024 | ||||||
| 27,600 | NGK Insulators Ltd. (Capital Goods) | 371,841 | ||||||
| 5,500 | Nippon Express Holdings, Inc. (Transportation) | 299,602 | ||||||
| 4,100 | Nippon Suisan Kaisha Ltd. (Food, Beverage & Tobacco) | 17,333 | ||||||
| 17,400 | Nippon Telegraph & Telephone Corp. (Telecommunication Services) | 499,957 | ||||||
| 2,600 | Nippon Yusen KK (Transportation) | 178,269 | ||||||
| 46,100 | Nissan Motor Co. Ltd. (Automobiles & Components) | 180,556 | ||||||
| 2,400 | Nisshin Oillio Group Ltd. (The) (Food, Beverage & Tobacco) | 55,522 | ||||||
| 800 | NS Solutions Corp. (Software & Services) | 21,368 | ||||||
| 38,500 | NTT Data Corp. (Software & Services) | 534,104 | ||||||
| 6,700 | Obayashi Corp. (Capital Goods) | 48,731 | ||||||
| 40,400 | ORIX Corp. (Diversified Financials) | 677,098 | ||||||
| 15,800 | Osaka Gas Co. Ltd. (Utilities) | 302,811 | ||||||
| 9,000 | Otsuka Holdings Co. Ltd. (Pharmaceuticals, Biotechnology & Life Sciences) | 321,270 | ||||||
| 15,600 | Ricoh Co. Ltd. (Technology Hardware & Equipment) | 121,792 | ||||||
| 1,900 | Ricoh Leasing Co. Ltd. (Diversified Financials) | 48,927 | ||||||
| 700 | S Foods, Inc. (Food, Beverage & Tobacco) | 16,136 | ||||||
| 76,400 | Santen Pharmaceutical Co. Ltd. (Pharmaceuticals, Biotechnology & Life Sciences) | 602,716 | ||||||
| 1,700 | Sanyo Electric Railway Co. Ltd. (Retailing) | 27,143 | ||||||
| 5,900 | Sato Holdings Corp. (Commercial & Professional Services) | 81,248 | ||||||
| 6,900 | SCREEN Holdings Co. Ltd. (Semiconductors & Semiconductor Equipment) | 468,181 | ||||||
| 5,800 | Seiko Epson Corp. (Technology Hardware & Equipment) | 82,052 | ||||||
| 13,000 | Shionogi & Co. Ltd. (Pharmaceuticals, Biotechnology & Life Sciences) | 663,500 | ||||||
|
| |||||||
| Common Stocks – (continued) | ||||||||
| Japan – (continued) | ||||||||
| 5,600 | SoftBank Group Corp. (Telecommunication Services) | 217,048 | ||||||
| 16,900 | Sompo Holdings, Inc. (Insurance) | 746,438 | ||||||
| 5,100 | Square Enix Holdings Co. Ltd. (Media & Entertainment) | 226,372 | ||||||
| 23,200 | Subaru Corp. (Automobiles & Components) | 410,372 | ||||||
| 51,700 | Sumitomo Corp. (Capital Goods) | 702,781 | ||||||
| 4,200 | Sumitomo Pharma Co. Ltd. (Pharmaceuticals, Biotechnology & Life Sciences) | 33,731 | ||||||
| 400 | Taisei Corp. (Capital Goods) | 12,472 | ||||||
| 31,000 | Takeda Pharmaceutical Co. Ltd. (Pharmaceuticals, Biotechnology & Life Sciences) | 870,739 | ||||||
| 13,900 | Takuma Co. Ltd. (Capital Goods) | 136,270 | ||||||
| 13,200 | Toho Gas Co. Ltd. (Utilities) | 318,857 | ||||||
| 12,000 | Tokai Corp. (Health Care Equipment & Services) | 147,366 | ||||||
| 14,600 | Tokio Marine Holdings, Inc. (Insurance) | 851,355 | ||||||
| 8,900 | Tokyo Century Corp. (Diversified Financials) | 295,677 | ||||||
| 36,400 | Tokyo Gas Co. Ltd. (Utilities) | 754,355 | ||||||
| 200 | Tokyu Corp. (Transportation) | 2,361 | ||||||
| 22,800 | TOPPAN, Inc. (Commercial & Professional Services) | 380,394 | ||||||
| 41,900 | Tosoh Corp. (Materials) | 521,183 | ||||||
| 5,700 | Toyota Motor Corp. (Automobiles & Components) | 87,947 | ||||||
| 11,600 | Toyota Tsusho Corp. (Capital Goods) | 378,193 | ||||||
| 4,400 | Tsumura & Co. (Pharmaceuticals, Biotechnology & Life Sciences) | 98,964 | ||||||
|
| |||||||
| 23,016,390 | ||||||||
|
| |||||||
| Luxembourg – 0.6% | ||||||||
| 7,240 | Eurofins Scientific SE (Pharmaceuticals, Biotechnology & Life Sciences) | 571,802 | ||||||
|
| |||||||
| Netherlands – 6.7% | ||||||||
| 305 | Adyen NV (Software & Services)*(b) | 440,156 | ||||||
| 559 | ASM International NV (Semiconductors & Semiconductor Equipment) | 139,083 | ||||||
| 3,207 | ASML Holding NV (Semiconductors & Semiconductor Equipment) | 1,515,109 | ||||||
| 786 | ASR Nederland NV (Insurance) | 31,689 | ||||||
| 5,572 | Heineken Holding NV (Food, Beverage & Tobacco) | 404,776 | ||||||
| 7,731 | Heineken NV (Food, Beverage & Tobacco) | 703,689 | ||||||
| 28,312 | ING Groep NV (Banks) | 278,919 | ||||||
| 27,886 | Koninklijke Ahold Delhaize NV (Food & Staples Retailing) | 725,846 | ||||||
| 4,798 | OCI NV (Materials) | 157,834 | ||||||
|
| |||||||
| 28 | The accompanying notes are an integral part of these financial statements. |
GOLDMAN SACHS VARIABLE INSURANCE TRUST INTERNATIONAL EQUITY INSIGHTS FUND
| Shares | Description | Value | ||||||
| Common Stocks – (continued) | ||||||||
| Netherlands – (continued) | ||||||||
| 62,878 | Shell PLC (Energy) | $ | 1,631,530 | |||||
| 511 | Sligro Food Group NV (Food & Staples Retailing)* | 9,666 | ||||||
|
| |||||||
| 6,038,297 | ||||||||
|
| |||||||
| New Zealand – 0.1% | ||||||||
| 24,383 | Spark New Zealand Ltd. (Telecommunication Services) | 72,972 | ||||||
|
| |||||||
| Norway – 2.4% | ||||||||
| 12,362 | Aker BP ASA (Energy) | 428,131 | ||||||
| 12,461 | Aker BP ASA SDR (Energy)* | 431,505 | ||||||
| 14,786 | BW Offshore Ltd. (Energy) | 40,081 | ||||||
| 30,532 | Golden Ocean Group Ltd. (Transportation) | 361,041 | ||||||
| 1,234 | Kongsberg Gruppen ASA (Capital Goods) | 44,381 | ||||||
| 4,506 | Mowi ASA (Food, Beverage & Tobacco) | 103,042 | ||||||
| 81,440 | MPC Container Ships ASA (Transportation) | 162,448 | ||||||
| 31,023 | Odfjell Drilling Ltd. (Energy)* | 73,182 | ||||||
| 19,476 | Stolt-Nielsen Ltd. (Transportation) | 412,714 | ||||||
| 21,290 | Wallenius Wilhelmsen ASA (Transportation) | 115,603 | ||||||
|
| |||||||
| 2,172,128 | ||||||||
|
| |||||||
| Portugal – 0.3% | ||||||||
| 26,154 | Galp Energia SGPS SA (Energy) | 306,028 | ||||||
|
| |||||||
| Singapore – 0.3% | ||||||||
| 89,800 | Singapore Technologies Engineering Ltd. (Capital Goods) | 264,355 | ||||||
|
| |||||||
| South Africa – 0.9% | ||||||||
| 22,036 | Anglo American PLC (Materials) | 787,756 | ||||||
|
| |||||||
| Spain – 0.3% | ||||||||
| 7,839 | Bankinter SA (Banks) | 49,032 | ||||||
| 3,443 | Merlin Properties Socimi SA REIT (Real Estate) | 33,343 | ||||||
| 8,576 | Red Electrica Corp. SA (Utilities) | 162,340 | ||||||
|
| |||||||
| 244,715 | ||||||||
|
| |||||||
| Sweden – 4.5% | ||||||||
| 21,429 | Atlas Copco AB, Class B (Capital Goods) | 179,552 | ||||||
| 10,721 | Boliden AB (Materials) | 342,863 | ||||||
| 14,955 | Epiroc AB, Class B (Capital Goods) | 202,661 | ||||||
| 7,701 | Getinge AB, Class B (Health Care Equipment & Services) | 178,481 | ||||||
| 980 | Industrivarden AB, Class A (Diversified Financials) | 22,155 | ||||||
| 2,712 | Investor AB, Class A (Diversified Financials) | 48,845 | ||||||
| 43,186 | Investor AB, Class B (Diversified Financials) | 712,214 | ||||||
|
| |||||||
| Common Stocks – (continued) | ||||||||
| Sweden – (continued) | ||||||||
| 52,259 | Skandinaviska Enskilda Banken AB, Class A (Banks) | 514,847 | ||||||
| 51,677 | SSAB AB, Class B (Materials) | 214,730 | ||||||
| 6,332 | Svenska Cellulosa AB SCA, Class B (Materials) | 95,138 | ||||||
| 46,591 | Swedbank AB, Class A (Banks) | 590,895 | ||||||
| 6,358 | Tele2 AB, Class B (Telecommunication Services) | 72,499 | ||||||
| 58,983 | Telia Co. AB (Telecommunication Services) | 226,383 | ||||||
| 44,571 | Volvo AB, Class B (Capital Goods) | 693,498 | ||||||
|
| |||||||
| 4,094,761 | ||||||||
|
| |||||||
| Switzerland – 5.6% | ||||||||
| 2,807 | Baloise Holding AG (Insurance) | 459,487 | ||||||
| 4 | Chocoladefabriken Lindt & Spruengli AG (Food, Beverage & Tobacco) | 419,421 | ||||||
| 28 | Chocoladefabriken Lindt & Spruengli AG (Food, Beverage & Tobacco) | 285,097 | ||||||
| 9,120 | Cie Financiere Richemont SA (Consumer Durables & Apparel) | 980,976 | ||||||
| 1,709 | DKSH Holding AG (Commercial & Professional Services) | 141,409 | ||||||
| 2,401 | Julius Baer Group Ltd. (Diversified Financials) | 111,382 | ||||||
| 2,690 | Kuehne + Nagel International AG (Transportation) | 639,151 | ||||||
| 1,584 | Lonza Group AG (Pharmaceuticals, Biotechnology & Life Sciences) | 846,074 | ||||||
| 1,167 | Novartis AG (Pharmaceuticals, Biotechnology & Life Sciences) | 98,939 | ||||||
| 1,237 | Swatch Group AG (The) (Consumer Durables & Apparel) | 55,193 | ||||||
| 59,597 | UBS Group AG (Diversified Financials) | 963,489 | ||||||
| 1,241 | Valiant Holding AG (Banks) | 109,178 | ||||||
|
| |||||||
| 5,109,796 | ||||||||
|
| |||||||
| United Kingdom – 7.9% | ||||||||
| 9,553 | 3i Group PLC (Diversified Financials) | 129,480 | ||||||
| 3,120 | AstraZeneca PLC ADR (Pharmaceuticals, Biotechnology & Life Sciences) | 206,138 | ||||||
| 109,003 | Aviva PLC (Insurance) | 533,926 | ||||||
| 14,559 | BAE Systems PLC (Capital Goods) | 147,395 | ||||||
| 30,013 | British American Tobacco PLC (Food, Beverage & Tobacco) | 1,286,486 | ||||||
| 3,042 | Clarkson PLC (Transportation) | 111,061 | ||||||
| 14,068 | Compass Group PLC (Consumer Services) | 288,836 | ||||||
| 907 | DCC PLC (Capital Goods) | 56,430 | ||||||
| 29,104 | Diageo PLC (Food, Beverage & Tobacco) | 1,257,081 | ||||||
| 34,752 | Imperial Brands PLC (Food, Beverage & Tobacco) | 778,019 | ||||||
|
| |||||||
| The accompanying notes are an integral part of these financial statements. | 29 |
GOLDMAN SACHS VARIABLE INSURANCE TRUST INTERNATIONAL EQUITY INSIGHTS FUND
Schedule of Investments (continued)
June 30, 2022 (Unaudited)
| Shares | Description | Value | ||||||
| Common Stocks – (continued) | ||||||||
| United Kingdom – (continued) | ||||||||
| 3,743 | Inchcape PLC (Retailing) | $ | 31,808 | |||||
| 5,658 | InterContinental Hotels Group PLC (Consumer Services) | 300,711 | ||||||
| 74,894 | M&G PLC (Diversified Financials) | 177,553 | ||||||
| 106,362 | Melrose Industries PLC (Capital Goods) | 195,095 | ||||||
| 66,973 | NatWest Group PLC (Banks) | 178,266 | ||||||
| 8,859 | Next PLC (Retailing) | 632,890 | ||||||
| 5,170 | Odfjell Technology Ltd. (Energy)* | 10,708 | ||||||
| 36,311 | SSE PLC (Utilities) | 716,610 | ||||||
| 16,504 | UK Commercial Property REIT Ltd. REIT (Real Estate) | 15,085 | ||||||
| 7,712 | Vodafone Group PLC ADR (Telecommunication Services) | 120,153 | ||||||
| 688 | Whitbread PLC (Consumer Services) | 20,863 | ||||||
|
| |||||||
| 7,194,594 | ||||||||
|
| |||||||
| United States – 4.3% | ||||||||
| 665 | Ferguson PLC (Capital Goods) | 74,495 | ||||||
| 31,504 | GSK PLC ADR (Pharmaceuticals, Biotechnology & Life Sciences) | 1,371,369 | ||||||
| 8,394 | Nestle SA (Food, Beverage & Tobacco) | 981,030 | ||||||
| 2,177 | Roche Holding AG (Pharmaceuticals, Biotechnology & Life Sciences) | 727,771 | ||||||
| 57,480 | Stellantis NV (Automobiles & Components) | 713,600 | ||||||
|
| |||||||
| 3,868,265 | ||||||||
|
| |||||||
| TOTAL COMMON STOCKS | ||||||||
| (Cost $93,195,194) | $ | 86,596,059 | ||||||
|
| |||||||
| Shares | Description | Rate | Value | |||||||||
| Preferred Stocks – 2.3% | ||||||||||||
| Germany – 2.3% | ||||||||||||
| 4,700 | Bayerische Motoren Werke AG (Automobiles & Components) | 8.32% | $ | 335,230 | ||||||||
| 9,496 | Henkel AG & Co. KGaA (Household & Personal Products) | 3.06 | 587,619 | |||||||||
| 8,714 | Porsche Automobil Holding SE (Automobiles & Components) | 3.89 | 579,577 | |||||||||
| 4,963 | Volkswagen AG (Automobiles & Components) | 5.85 | 668,217 | |||||||||
|
| |||||||||||
| TOTAL PREFERRED STOCKS | ||||||||||||
| (Cost $2,596,503) | $ | 2,170,643 | ||||||||||
|
| |||||||||||
| | TOTAL INVESTMENTS BEFORE SECURITIES LENDING REINVESTMENT VEHICLE | | ||||||||||
| (Cost $95,791,697) | $ | 88,766,702 | ||||||||||
|
| |||||||||||
| Shares | Dividend Rate | Value | ||||||||||
| Securities Lending Reinvestment Vehicle – 1.4%(c) | ||||||||||||
| | Goldman Sachs Financial Square Government Fund — | | ||||||||||
| 1,270,901 | 1.367% | $ | 1,270,901 | |||||||||
| (Cost $1,270,901) | ||||||||||||
|
| |||||||||||
| TOTAL INVESTMENTS – 99.5% | ||||||||||||
| (Cost $97,062,598) | $ | 90,037,603 | ||||||||||
|
| |||||||||||
| | OTHER ASSETS IN EXCESS OF | | 460,270 | |||||||||
|
| |||||||||||
| NET ASSETS – 100.0% | $ | 90,497,873 | ||||||||||
|
| |||||||||||
| The percentage shown for each investment category reflects the value of investments in that category as a percentage of net assets. | ||
| * | Non-income producing security. | |
| (a) | All or a portion of security is on loan. | |
| (b) | Exempt from registration under Rule 144A of the Securities Act of 1933. | |
| (c) | Represents an affiliated issuer. | |
| Investment Abbreviations: | ||
| ADR | —American Depositary Receipt | |
| PLC | —Public Limited Company | |
| REIT | —Real Estate Investment Trust | |
| SDR | —Swedish Depositary Receipt | |
| Sector | % of Total Market Value | |||
| Financials | 16.8 | % | ||
| Industrials | 16.4 | |||
| Health Care | 13.8 | |||
| Consumer Staples | 12.5 | |||
| Consumer Discretionary | 11.5 | |||
| Materials | 7.4 | |||
| Information Technology | 6.2 | |||
| Utilities | 4.0 | |||
| Energy | 3.9 | |||
| Communication Services | 3.1 | |||
| Real Estate | 3.0 | |||
Securities Lending Reinvestment Vehicle | 1.4 | |||
| TOTAL INVESTMENTS | 100.0 | % | ||
| 30 | The accompanying notes are an integral part of these financial statements. |
GOLDMAN SACHS VARIABLE INSURANCE TRUST INTERNATIONAL EQUITY INSIGHTS FUND
ADDITIONAL INVESTMENT INFORMATION
FUTURES CONTRACTS — At June 30, 2022, the Fund had the following futures contracts:
| Description | Number of Contracts | Expiration Date | Notional Amount | Unrealized (Depreciation) | ||||||||||||
Long position contracts: | ||||||||||||||||
| EURO STOXX 50 Index | 9 | 09/16/22 | $ | 327,990 | $ | (5,597 | ) | |||||||||
| FTSE 100 Index | 1 | 09/16/22 | 86,915 | (573 | ) | |||||||||||
TOPIX Index | 1 | 09/08/22 | 146,277 | (4,358 | ) | |||||||||||
| Total Futures Contracts |
| $ | (10,528 | ) | ||||||||||||
| The accompanying notes are an integral part of these financial statements. | 31 |
GOLDMAN SACHS VARIABLE INSURANCE TRUST LARGE CAP VALUE FUND
Schedule of Investments
June 30, 2022 (Unaudited)
| Shares | Description | Value | ||||||
| Common Stocks – 99.1% | ||||||||
| Automobiles & Components – 1.3% | ||||||||
| 155,409 | General Motors Co.* | $ | 4,935,790 | |||||
|
| |||||||
| Banks – 6.5% | ||||||||
| 287,214 | Bank of America Corp. | 8,940,972 | ||||||
| 96,527 | JPMorgan Chase & Co. | 10,869,905 | ||||||
| 14,115 | M&T Bank Corp. | 2,249,790 | ||||||
| 54,621 | Truist Financial Corp. | 2,590,674 | ||||||
|
| |||||||
| 24,651,341 | ||||||||
|
| |||||||
| Capital Goods – 6.3% | ||||||||
| 23,697 | Caterpillar, Inc. | 4,236,076 | ||||||
| 35,766 | Eaton Corp. PLC | 4,506,158 | ||||||
| 79,303 | General Electric Co. | 5,049,222 | ||||||
| 17,728 | Illinois Tool Works, Inc. | 3,230,928 | ||||||
| 28,346 | L3Harris Technologies, Inc. | 6,851,228 | ||||||
|
| |||||||
| 23,873,612 | ||||||||
|
| |||||||
| Commercial & Professional Services – 0.7% | ||||||||
| 21,246 | Waste Connections, Inc. | 2,633,654 | ||||||
|
| |||||||
| Consumer Services – 1.6% | ||||||||
| 23,839 | McDonald’s Corp. | 5,885,372 | ||||||
|
| |||||||
| Diversified Financials – 6.5% | ||||||||
| 15,771 | Berkshire Hathaway, Inc., Class B* | 4,305,799 | ||||||
| 8,832 | BlackRock, Inc. | 5,379,041 | ||||||
| 80,141 | Charles Schwab Corp. (The) | 5,063,308 | ||||||
| 85,452 | Morgan Stanley | 6,499,479 | ||||||
| 23,997 | Nasdaq, Inc. | 3,660,503 | ||||||
|
| |||||||
| 24,908,130 | ||||||||
|
| |||||||
| Energy – 7.1% | ||||||||
| 27,361 | Chesapeake Energy Corp. | 2,218,977 | ||||||
| 56,328 | Chevron Corp. | 8,155,168 | ||||||
| 82,293 | ConocoPhillips | 7,390,734 | ||||||
| 99,617 | Devon Energy Corp. | 5,489,893 | ||||||
| 36,730 | Hess Corp. | 3,891,176 | ||||||
|
| |||||||
| 27,145,948 | ||||||||
|
| |||||||
| Food & Staples Retailing – 1.7% | ||||||||
| 53,762 | Walmart, Inc. | 6,536,384 | ||||||
|
| |||||||
| Food, Beverage & Tobacco – 3.9% | ||||||||
| 51,632 | Archer-Daniels-Midland Co. | 4,006,643 | ||||||
| 61,724 | Coca-Cola Co. (The) | 3,883,057 | ||||||
| 15,543 | Constellation Brands, Inc., Class A | 3,622,452 | ||||||
| 46,136 | General Mills, Inc. | 3,480,961 | ||||||
|
| |||||||
| 14,993,113 | ||||||||
|
| |||||||
| Health Care Equipment & Services – 8.7% | ||||||||
| 135,231 | Boston Scientific Corp.* | 5,040,059 | ||||||
| 47,088 | Centene Corp.* | 3,984,116 | ||||||
| 9,257 | Cooper Cos., Inc. (The) | 2,898,552 | ||||||
| 51,393 | CVS Health Corp. | 4,762,075 | ||||||
| 14,830 | Humana, Inc. | 6,941,478 | ||||||
| 51,774 | Medtronic PLC | 4,646,717 | ||||||
| 45,703 | Zimmer Biomet Holdings, Inc. | 4,801,557 | ||||||
|
| |||||||
| 33,074,554 | ||||||||
|
| |||||||
| Common Stocks – (continued) | ||||||||
| Household & Personal Products – 2.2% | ||||||||
| 52,960 | Colgate-Palmolive Co. | 4,244,215 | ||||||
| 29,357 | Procter & Gamble Co. (The) | 4,221,243 | ||||||
|
| |||||||
| 8,465,458 | ||||||||
|
| |||||||
| Insurance – 4.9% | ||||||||
| 25,390 | Chubb Ltd. | 4,991,166 | ||||||
| 35,309 | Globe Life, Inc. | 3,441,568 | ||||||
| 83,997 | MetLife, Inc. | 5,274,172 | ||||||
| 42,562 | Progressive Corp. (The) | 4,948,684 | ||||||
|
| |||||||
| 18,655,590 | ||||||||
|
| |||||||
| Materials – 5.3% | ||||||||
| 41,461 | Ashland Global Holdings, Inc. | 4,272,556 | ||||||
| 61,991 | Ball Corp. | 4,263,121 | ||||||
| 58,864 | Freeport-McMoRan, Inc. | 1,722,361 | ||||||
| 19,191 | Linde PLC (United Kingdom) | 5,517,988 | ||||||
| 15,197 | Martin Marietta Materials, Inc. | 4,547,550 | ||||||
|
| |||||||
| 20,323,576 | ||||||||
|
| |||||||
| Media & Entertainment – 4.2% | ||||||||
| 1,733 | Alphabet, Inc., Class A* | 3,776,658 | ||||||
| 48,552 | Comcast Corp., Class A | 1,905,180 | ||||||
| 16,197 | Electronic Arts, Inc. | 1,970,365 | ||||||
| 34,927 | Meta Platforms, Inc., Class A* | 5,631,979 | ||||||
| 93,513 | New York Times Co. (The), Class A | 2,609,013 | ||||||
|
| |||||||
| 15,893,195 | ||||||||
|
| |||||||
| Pharmaceuticals, Biotechnology & Life Sciences – 10.4% | ||||||||
| 4,190 | Argenx SE ADR (Netherlands) * | 1,587,507 | ||||||
| 50,574 | AstraZeneca PLC ADR (United Kingdom) | 3,341,424 | ||||||
| 88,930 | Avantor, Inc.* | 2,765,723 | ||||||
| 4,946 | Biogen, Inc.* | 1,008,687 | ||||||
| 125,629 | Bristol-Myers Squibb Co. | 9,673,433 | ||||||
| 60,686 | Gilead Sciences, Inc. | 3,751,002 | ||||||
| 85,176 | Johnson & Johnson | 15,119,592 | ||||||
| 13,089 | Neurocrine Biosciences, Inc.* | 1,275,916 | ||||||
| 6,201 | Seagen, Inc.* | 1,097,205 | ||||||
|
| |||||||
| 39,620,489 | ||||||||
|
| |||||||
| Real Estate – 3.7% | ||||||||
| 19,075 | Alexandria Real Estate Equities, Inc. REIT | 2,766,447 | ||||||
| 14,702 | American Tower Corp. REIT | 3,757,684 | ||||||
| 17,550 | AvalonBay Communities, Inc. REIT | 3,409,088 | ||||||
| 27,040 | Boston Properties, Inc. REIT | 2,406,019 | ||||||
| 5,689 | Public Storage REIT | 1,778,780 | ||||||
|
| |||||||
| 14,118,018 | ||||||||
|
| |||||||
| Retailing – 1.9% | ||||||||
| 61,601 | Ross Stores, Inc. | 4,326,238 | ||||||
| 21,721 | Target Corp. | 3,067,657 | ||||||
|
| |||||||
| 7,393,895 | ||||||||
|
| |||||||
| Semiconductors & Semiconductor Equipment – 2.1% | ||||||||
| 8,946 | KLA Corp. | 2,854,489 | ||||||
| 32,899 | ON Semiconductor Corp.* | 1,655,149 | ||||||
|
| |||||||
| 32 | The accompanying notes are an integral part of these financial statements. |
GOLDMAN SACHS VARIABLE INSURANCE TRUST LARGE CAP VALUE FUND
| Shares | Description | Value | ||||||
| Common Stocks – (continued) | ||||||||
| Semiconductors & Semiconductor Equipment – (continued) | ||||||||
| 15,726 | Texas Instruments, Inc. | $ | 2,416,300 | |||||
| 19,500 | Wolfspeed, Inc.* | 1,237,275 | ||||||
|
| |||||||
| 8,163,213 | ||||||||
|
| |||||||
| Software & Services – 7.1% | ||||||||
| 9,177 | Adobe, Inc.* | 3,359,332 | ||||||
| 57,231 | Cognizant Technology Solutions Corp., Class A | 3,862,520 | ||||||
| 46,389 | Fidelity National Information Services, Inc. | 4,252,480 | ||||||
| 46,635 | International Business Machines Corp. | 6,584,396 | ||||||
| 38,590 | PayPal Holdings, Inc.* | 2,695,125 | ||||||
| 37,167 | Salesforce, Inc.* | 6,134,042 | ||||||
|
| |||||||
| 26,887,895 | ||||||||
|
| |||||||
| Technology Hardware & Equipment – 2.0% | ||||||||
| 128,125 | Cisco Systems, Inc. | 5,463,250 | ||||||
| 14,351 | Keysight Technologies, Inc.* | 1,978,285 | ||||||
|
| |||||||
| 7,441,535 | ||||||||
|
| |||||||
| Telecommunication Services – 2.2% | ||||||||
| 398,175 | AT&T, Inc. | 8,345,748 | ||||||
|
| |||||||
| Transportation – 2.9% | ||||||||
| 24,840 | Norfolk Southern Corp. | 5,645,883 | ||||||
| 11,503 | Old Dominion Freight Line, Inc. | 2,947,989 | ||||||
| 72,852 | United Airlines Holdings, Inc.* | 2,580,418 | ||||||
| �� |
|
| ||||||
| 11,174,290 | ||||||||
|
| |||||||
| Utilities – 5.9% | ||||||||
| 58,031 | Ameren Corp. | 5,243,681 | ||||||
| 21,922 | Atmos Energy Corp. | 2,457,456 | ||||||
| 36,722 | CMS Energy Corp. | 2,478,735 | ||||||
| 100,768 | NextEra Energy, Inc. | 7,805,490 | ||||||
| 62,012 | Xcel Energy, Inc. | 4,387,969 | ||||||
|
| |||||||
| 22,373,331 | ||||||||
|
| |||||||
| TOTAL COMMON STOCKS | ||||||||
| (Cost $344,515,073) | $ | 377,494,131 | ||||||
|
| |||||||
| Shares | Dividend Rate | Value | ||||||
| Investment Company – 0.7%(a) | ||||||||
| | Goldman Sachs Financial Square Government Fund — | | ||||||
| 2,738,674 | 1.367% | $ | 2,738,674 | |||||
| (Cost $2,738,674) | ||||||||
|
| |||||||
| TOTAL INVESTMENTS – 99.8% | ||||||||
| (Cost $347,253,747) | $ | 380,232,805 | ||||||
|
| |||||||
| | OTHER ASSETS IN EXCESS OF | 784,304 | ||||||
|
| |||||||
| NET ASSETS – 100.0% | $ | 381,017,109 | ||||||
|
| |||||||
| The percentage shown for each investment category reflects the value of investments in that category as a percentage of net assets. | ||
| * | Non-income producing security. | |
| (a) | Represents an affiliated issuer. | |
| Investment Abbreviations: | ||
| ADR | —American Depositary Receipt | |
| PLC | —Public Limited Company | |
| REIT | —Real Estate Investment Trust | |
| The accompanying notes are an integral part of these financial statements. | 33 |
GOLDMAN SACHS VARIABLE INSURANCE TRUST MID CAP GROWTH FUND
Schedule of Investments
June 30, 2022 (Unaudited)
| Shares | Description | Value | ||||||
| Common Stocks – 93.9% | ||||||||
| Automobiles & Components – 1.3% | ||||||||
| 7,267 | Aptiv PLC* | $ | 647,272 | |||||
|
| |||||||
| Banks – 1.3% | ||||||||
| 4,459 | First Republic Bank | 642,988 | ||||||
|
| |||||||
| Capital Goods – 10.7% | ||||||||
| 5,596 | AMETEK, Inc. | 614,944 | ||||||
| 25,209 | AZEK Co., Inc. (The)* | 421,999 | ||||||
| 4,213 | Chart Industries, Inc.* | 705,172 | ||||||
| 3,216 | Cummins, Inc. | 622,392 | ||||||
| 7,724 | Fortive Corp. | 420,031 | ||||||
| 6,693 | ITT, Inc. | 450,037 | ||||||
| 6,006 | Rockwell Automation, Inc. | 1,197,056 | ||||||
| 5,718 | Trane Technologies PLC | 742,597 | ||||||
| 3,251 | Woodward, Inc. | 300,685 | ||||||
|
| |||||||
| 5,474,913 | ||||||||
|
| |||||||
| Commercial & Professional Services – 5.0% | ||||||||
| 11,270 | CoStar Group, Inc.* | 680,821 | ||||||
| 11,342 | TransUnion | 907,246 | ||||||
| 5,596 | Verisk Analytics, Inc. | 968,612 | ||||||
|
| |||||||
| 2,556,679 | ||||||||
|
| |||||||
| Consumer Durables & Apparel – 2.1% | ||||||||
| 3,871 | Lululemon Athletica, Inc.* | 1,055,273 | ||||||
|
| |||||||
| Consumer Services – 1.8% | ||||||||
| 9,465 | Expedia Group, Inc.* | 897,566 | ||||||
|
| |||||||
| Diversified Financials – 2.6% | ||||||||
| 6,840 | Ares Management Corp., Class A | 388,922 | ||||||
| 1,249 | MSCI, Inc. | 514,775 | ||||||
| 8,167 | TPG, Inc.(a) | 195,273 | ||||||
| 3,779 | Tradeweb Markets, Inc., Class A | 257,917 | ||||||
|
| |||||||
| 1,356,887 | ||||||||
|
| |||||||
| Energy – 3.8% | ||||||||
| 5,873 | Cheniere Energy, Inc. | 781,285 | ||||||
| 5,681 | Devon Energy Corp. | 313,080 | ||||||
| 1,913 | Diamondback Energy, Inc. | 231,760 | ||||||
| 3,564 | Hess Corp. | 377,570 | ||||||
| 4,423 | Targa Resources Corp. | 263,921 | ||||||
|
| |||||||
| 1,967,616 | ||||||||
|
| |||||||
| Food, Beverage & Tobacco – 3.1% | ||||||||
| 9,112 | McCormick & Co., Inc. | 758,574 | ||||||
| 61,711 | Utz Brands, Inc. | 852,846 | ||||||
|
| |||||||
| 1,611,420 | ||||||||
|
| |||||||
| Health Care Equipment & Services – 10.3% | ||||||||
| 1,025 | Align Technology, Inc.* | 242,587 | ||||||
| 4,384 | AmerisourceBergen Corp. | 620,248 | ||||||
| 15,040 | Dexcom, Inc.* | 1,120,931 | ||||||
| 2,660 | IDEXX Laboratories, Inc.* | 932,942 | ||||||
| 5,031 | Insulet Corp.* | 1,096,456 | ||||||
| 6,202 | Veeva Systems, Inc., Class A* | 1,228,244 | ||||||
|
| |||||||
| 5,241,408 | ||||||||
|
| |||||||
| Common Stocks – (continued) | ||||||||
| Materials – 3.4% | ||||||||
| 3,563 | Ashland Global Holdings, Inc. | 367,167 | ||||||
| 13,974 | Ball Corp. | 960,992 | ||||||
| 1,451 | Martin Marietta Materials, Inc. | 434,197 | ||||||
|
| |||||||
| 1,762,356 | ||||||||
|
| |||||||
| Media & Entertainment – 3.5% | ||||||||
| 8,785 | Live Nation Entertainment, Inc.* | 725,465 | ||||||
| 18,481 | Snap, Inc., Class A* | 242,656 | ||||||
| 5,417 | Twitter, Inc.* | 202,542 | ||||||
| 46,705 | Warner Bros Discovery, Inc.* | 626,781 | ||||||
|
| |||||||
| 1,797,444 | ||||||||
|
| |||||||
| Pharmaceuticals, Biotechnology & Life Sciences – 13.0% | ||||||||
| 2,843 | Alnylam Pharmaceuticals, Inc.* | 414,652 | ||||||
| 1,383 | Argenx SE ADR (Netherlands) * | 523,991 | ||||||
| 15,255 | Avantor, Inc.* | 474,431 | ||||||
| 1,396 | Biogen, Inc.* | 284,700 | ||||||
| 7,283 | Catalent, Inc.* | 781,393 | ||||||
| 831 | Mettler-Toledo International, Inc.* | 954,628 | ||||||
| 7,832 | Neurocrine Biosciences, Inc.* | 763,463 | ||||||
| 5,487 | Sarepta Therapeutics, Inc.* | 411,306 | ||||||
| 5,109 | Seagen, Inc.* | 903,986 | ||||||
| 3,703 | West Pharmaceutical Services, Inc. | 1,119,676 | ||||||
|
| |||||||
| 6,632,226 | ||||||||
|
| |||||||
| Real Estate – 1.2% | ||||||||
| 4,748 | Ryman Hospitality Properties, Inc. REIT* | 360,990 | ||||||
| 795 | SBA Communications Corp. REIT | 254,440 | ||||||
|
| |||||||
| 615,430 | ||||||||
|
| |||||||
| Retailing – 4.3% | ||||||||
| 2,693 | Burlington Stores, Inc.* | 366,867 | ||||||
| 12,038 | Etsy, Inc.* | 881,302 | ||||||
| 176 | O’Reilly Automotive, Inc.* | 111,190 | ||||||
| 1,337 | RH* | 283,792 | ||||||
| 1,396 | Ulta Beauty, Inc.* | 538,130 | ||||||
|
| |||||||
| 2,181,281 | ||||||||
|
| |||||||
| Semiconductors & Semiconductor Equipment – 6.3% | ||||||||
| 3,111 | Enphase Energy, Inc.* | 607,392 | ||||||
| 7,121 | Entegris, Inc. | 656,058 | ||||||
| 8,466 | Microchip Technology, Inc. | 491,705 | ||||||
| 4,868 | MKS Instruments, Inc. | 499,603 | ||||||
| 12,498 | ON Semiconductor Corp.* | 628,774 | ||||||
| 5,540 | Wolfspeed, Inc.* | 351,513 | ||||||
|
| |||||||
| 3,235,045 | ||||||||
|
| |||||||
| Software & Services – 14.7% | ||||||||
| 10,940 | AppLovin Corp., Class A*(a) | 376,774 | ||||||
| 3,051 | Atlassian Corp. PLC, Class A* | 571,757 | ||||||
| 6,242 | Bill.com Holdings, Inc.* | 686,245 | ||||||
| 11,366 | Cadence Design Systems, Inc.* | 1,705,241 | ||||||
| 5,667 | Datadog, Inc., Class A* | 539,725 | ||||||
| 16,732 | Dynatrace, Inc.* | 659,910 | ||||||
| 2,862 | HubSpot, Inc.* | 860,460 | ||||||
|
| |||||||
| 34 | The accompanying notes are an integral part of these financial statements. |
GOLDMAN SACHS VARIABLE INSURANCE TRUST MID CAP GROWTH FUND
| Shares | Description | Value | ||||||
| Common Stocks – (continued) | ||||||||
| Software & Services – (continued) | ||||||||
| 1,258 | Palo Alto Networks, Inc.* | $ | 621,377 | |||||
| 2,170 | Paycom Software, Inc.* | 607,860 | ||||||
| 6,817 | Qualtrics International, Inc., Class A* | 85,281 | ||||||
| 5,288 | Zscaler, Inc.* | 790,609 | ||||||
|
| |||||||
| 7,505,239 | ||||||||
|
| |||||||
| Technology Hardware & Equipment – 3.6% | ||||||||
| 12,588 | Amphenol Corp., Class A | 810,416 | ||||||
| 7,312 | Keysight Technologies, Inc.* | 1,007,959 | ||||||
|
| |||||||
| 1,818,375 | ||||||||
|
| |||||||
| Transportation – 1.9% | ||||||||
| 2,628 | Old Dominion Freight Line, Inc. | 673,504 | ||||||
| 1,608 | Saia, Inc.* | 302,304 | ||||||
|
| |||||||
| 975,808 | ||||||||
|
| |||||||
| TOTAL COMMON STOCKS | ||||||||
| (Cost $46,995,331) | $ | 47,975,226 | ||||||
|
| |||||||
| Shares | Dividend Rate | Value | ||||||
| Investment Company – 6.5%(b) | ||||||||
| | Goldman Sachs Financial Square Government Fund — | | ||||||
| 3,320,691 | 1.367% | 3,320,691 | ||||||
| (Cost $3,320,691) | ||||||||
|
| |||||||
| | TOTAL INVESTMENTS BEFORE SECURITIES LENDING REINVESTMENT VEHICLE | | ||||||
| (Cost $50,316,022) | $ | 51,295,917 | ||||||
|
| |||||||
| Securities Lending Reinvestment Vehicle – 0.9%(b) | ||||||||
| | Goldman Sachs Financial Square Government Fund — | | ||||||
| 465,693 | 1.367% | $ | 465,693 | |||||
| (Cost $465,693) | ||||||||
|
| |||||||
| TOTAL INVESTMENTS – 101.3% | ||||||||
| (Cost $50,781,715) | $ | 51,761,610 | ||||||
|
| |||||||
| | LIABILITIES IN EXCESS OF | (689,480 | ) | |||||
|
| |||||||
| NET ASSETS – 100.0% | $ | 51,072,130 | ||||||
|
| |||||||
| The percentage shown for each investment category reflects the value of investments in that category as a percentage of net assets. | ||
| * | Non-income producing security. | |
| (a) | All or a portion of security is on loan. | |
| (b) | Represents an affiliated issuer. | |
| Investment Abbreviations: | ||
| ADR | —American Depositary Receipt | |
| PLC | —Public Limited Company | |
| REIT | —Real Estate Investment Trust | |
| The accompanying notes are an integral part of these financial statements. | 35 |
GOLDMAN SACHS VARIABLE INSURANCE TRUST MID CAP VALUE FUND
Schedule of Investments
June 30, 2022 (Unaudited)
| Shares | Description | Value | ||||||
| Common Stocks – 99.0% | ||||||||
| Automobiles & Components – 1.0% | ||||||||
| 39,994 | Aptiv PLC* | $ | 3,562,266 | |||||
|
| |||||||
| Banks – 5.1% | ||||||||
| 104,695 | Citizens Financial Group, Inc. | 3,736,565 | ||||||
| 65,974 | East West Bancorp, Inc. | 4,275,115 | ||||||
| 21,160 | First Republic Bank | 3,051,272 | ||||||
| 33,725 | M&T Bank Corp. | 5,375,428 | ||||||
| 39,120 | Pinnacle Financial Partners, Inc. | 2,828,767 | ||||||
|
| |||||||
| 19,267,147 | ||||||||
|
| |||||||
| Capital Goods – 12.9% | ||||||||
| 30,798 | Allegion PLC | 3,015,124 | ||||||
| 43,041 | AMETEK, Inc. | 4,729,775 | ||||||
| 19,152 | Chart Industries, Inc.* | 3,205,662 | ||||||
| 33,368 | Cummins, Inc. | 6,457,709 | ||||||
| 81,035 | Fastenal Co. | 4,045,267 | ||||||
| 78,866 | Fortive Corp. | 4,288,733 | ||||||
| 76,077 | ITT, Inc. | 5,115,417 | ||||||
| 19,288 | L3Harris Technologies, Inc. | 4,661,910 | ||||||
| 13,550 | Rockwell Automation, Inc. | 2,700,651 | ||||||
| 22,418 | Trane Technologies PLC | 2,911,426 | ||||||
| 6,863 | TransDigm Group, Inc.* | 3,683,166 | ||||||
| 39,635 | Woodward, Inc. | 3,665,841 | ||||||
|
| |||||||
| 48,480,681 | ||||||||
|
| |||||||
| Consumer Durables & Apparel – 2.0% | ||||||||
| 49,819 | Capri Holdings Ltd.* | 2,043,077 | ||||||
| 7,158 | Deckers Outdoor Corp.* | 1,827,795 | ||||||
| 52,815 | Lennar Corp., Class A | 3,727,155 | ||||||
|
| |||||||
| 7,598,027 | ||||||||
|
| |||||||
| Consumer Services – 2.2% | ||||||||
| 7,477 | Domino’s Pizza, Inc. | 2,913,861 | ||||||
| 27,160 | Expedia Group, Inc.* | 2,575,583 | ||||||
| 22,690 | Yum! Brands, Inc. | 2,575,542 | ||||||
|
| |||||||
| 8,064,986 | ||||||||
|
| |||||||
| Diversified Financials – 3.8% | ||||||||
| 34,032 | Apollo Global Management, Inc. | 1,649,871 | ||||||
| 65,327 | Carlyle Group, Inc. (The) | 2,068,253 | ||||||
| 4,949 | MSCI, Inc. | 2,039,730 | ||||||
| 27,323 | Nasdaq, Inc. | 4,167,851 | ||||||
| 49,760 | Raymond James Financial, Inc. | 4,449,042 | ||||||
|
| |||||||
| 14,374,747 | ||||||||
|
| |||||||
| Energy – 4.9% | ||||||||
| 116,257 | Baker Hughes Co. | 3,356,339 | ||||||
| 29,840 | Cheniere Energy, Inc. | 3,969,615 | ||||||
| 36,690 | Chesapeake Energy Corp. | 2,975,559 | ||||||
| 53,625 | Devon Energy Corp. | 2,955,274 | ||||||
| 15,660 | Diamondback Energy, Inc. | 1,897,209 | ||||||
| 144,158 | Marathon Oil Corp. | 3,240,672 | ||||||
|
| |||||||
| 18,394,668 | ||||||||
|
| |||||||
| Food & Staples Retailing – 0.9% | ||||||||
| 69,585 | Performance Food Group Co.* | 3,199,518 | ||||||
|
| |||||||
| Common Stocks – (continued) | ||||||||
| Food, Beverage & Tobacco – 3.1% | ||||||||
| 89,779 | Coca-Cola Europacific Partners PLC (United Kingdom) | 4,633,494 | ||||||
| 29,446 | Lamb Weston Holdings, Inc. | 2,104,211 | ||||||
| 54,676 | McCormick & Co., Inc. | 4,551,777 | ||||||
| 17,185 | Utz Brands, Inc. | 237,497 | ||||||
|
| |||||||
| 11,526,979 | ||||||||
|
| |||||||
| Health Care Equipment & Services – 6.0% | ||||||||
| 36,157 | AmerisourceBergen Corp. | 5,115,492 | ||||||
| 58,903 | Centene Corp.* | 4,983,783 | ||||||
| 14,107 | Cooper Cos., Inc. (The) | 4,417,184 | ||||||
| 16,797 | Quest Diagnostics, Inc. | 2,233,665 | ||||||
| 54,068 | Zimmer Biomet Holdings, Inc. | 5,680,384 | ||||||
|
| |||||||
| 22,430,508 | ||||||||
|
| |||||||
| Insurance – 7.7% | ||||||||
| 35,258 | Allstate Corp. (The) | 4,468,246 | ||||||
| 17,148 | American Financial Group, Inc. | 2,380,314 | ||||||
| 98,501 | Arch Capital Group Ltd.* | 4,480,811 | ||||||
| 23,556 | Arthur J Gallagher & Co. | 3,840,570 | ||||||
| 49,799 | Globe Life, Inc. | 4,853,909 | ||||||
| 1,220 | Markel Corp.* | 1,577,765 | ||||||
| 79,872 | Principal Financial Group, Inc. | 5,334,651 | ||||||
| 57,614 | Unum Group | 1,960,028 | ||||||
|
| |||||||
| 28,896,294 | ||||||||
|
| |||||||
| Materials – 7.4% | ||||||||
| 76,020 | Allegheny Technologies, Inc.* | 1,726,414 | ||||||
| 44,357 | Ashland Global Holdings, Inc. | 4,570,989 | ||||||
| 94,557 | Ball Corp. | 6,502,685 | ||||||
| 63,237 | Corteva, Inc. | 3,423,651 | ||||||
| 13,862 | Martin Marietta Materials, Inc. | 4,148,065 | ||||||
| 26,328 | PPG Industries, Inc. | 3,010,344 | ||||||
| 68,395 | Steel Dynamics, Inc. | 4,524,329 | ||||||
|
| |||||||
| 27,906,477 | ||||||||
|
| |||||||
| Media & Entertainment – 2.5% | ||||||||
| 33,303 | Electronic Arts, Inc. | 4,051,310 | ||||||
| 33,435 | Live Nation Entertainment, Inc.* | 2,761,062 | ||||||
| 198,364 | Warner Bros Discovery, Inc.* | 2,662,045 | ||||||
|
| |||||||
| 9,474,417 | ||||||||
|
| |||||||
| Pharmaceuticals, Biotechnology & Life Sciences – 2.7% | ||||||||
| 5,309 | Argenx SE ADR (Netherlands) * | 2,011,474 | ||||||
| 10,183 | Biogen, Inc.* | 2,076,721 | ||||||
| 41,891 | Catalent, Inc.* | 4,494,486 | ||||||
| 13,767 | Neurocrine Biosciences, Inc.* | 1,342,007 | ||||||
|
| |||||||
| 9,924,688 | ||||||||
|
| |||||||
| Real Estate – 10.9% | ||||||||
| 35,790 | Alexandria Real Estate Equities, Inc. REIT | 5,190,624 | ||||||
| 90,001 | Americold Realty Trust, Inc. REIT | 2,703,630 | ||||||
| 31,985 | AvalonBay Communities, Inc. REIT | 6,213,086 | ||||||
| 42,744 | CubeSmart REIT | 1,826,024 | ||||||
| 32,394 | Duke Realty Corp. REIT | 1,780,050 | ||||||
|
| |||||||
| 36 | The accompanying notes are an integral part of these financial statements. |
GOLDMAN SACHS VARIABLE INSURANCE TRUST MID CAP VALUE FUND
| Shares | Description | Value | ||||||
| Common Stocks – (continued) | ||||||||
| Real Estate – (continued) | ||||||||
| 44,263 | Equity LifeStyle Properties, Inc. REIT | $ | 3,119,214 | |||||
| 28,308 | Equity Residential REIT | 2,044,404 | ||||||
| 13,286 | Essex Property Trust, Inc. REIT | 3,474,422 | ||||||
| 104,405 | Healthpeak Properties, Inc. REIT | 2,705,134 | ||||||
| 80,623 | Invitation Homes, Inc. REIT | 2,868,566 | ||||||
| 44,666 | Regency Centers Corp. REIT | 2,649,140 | ||||||
| 70,461 | Ventas, Inc. REIT | 3,623,809 | ||||||
| 86,399 | VICI Properties, Inc. REIT | 2,573,826 | ||||||
|
| |||||||
| 40,771,929 | ||||||||
|
| |||||||
| Retailing – 2.7% | ||||||||
| 49,539 | Academy Sports & Outdoors, Inc. | 1,760,616 | ||||||
| 12,607 | Burlington Stores, Inc.* | 1,717,452 | ||||||
| 30,667 | Etsy, Inc.* | 2,245,131 | ||||||
| 4,459 | O’Reilly Automotive, Inc.* | 2,817,018 | ||||||
| 8,271 | RH* | 1,755,602 | ||||||
|
| |||||||
| 10,295,819 | ||||||||
|
| |||||||
| Semiconductors & Semiconductor Equipment – 2.3% | ||||||||
| 36,069 | MKS Instruments, Inc. | 3,701,761 | ||||||
| 100,667 | ON Semiconductor Corp.* | 5,064,557 | ||||||
|
| |||||||
| 8,766,318 | ||||||||
|
| |||||||
| Software & Services – 3.5% | ||||||||
| 14,304 | Bill.com Holdings, Inc.* | 1,572,582 | ||||||
| 22,579 | Cadence Design Systems, Inc.* | 3,387,527 | ||||||
| 67,411 | Dynatrace, Inc.* | 2,658,690 | ||||||
| 4,998 | EPAM Systems, Inc.* | 1,473,311 | ||||||
| 36,386 | Global Payments, Inc. | 4,025,747 | ||||||
|
| |||||||
| 13,117,857 | ||||||||
|
| |||||||
| Technology Hardware & Equipment – 5.2% | ||||||||
| 80,094 | Juniper Networks, Inc. | 2,282,679 | ||||||
| 28,358 | Keysight Technologies, Inc.* | 3,909,150 | ||||||
| 29,205 | Motorola Solutions, Inc. | 6,121,368 | ||||||
| 310,199 | Viavi Solutions, Inc.* | 4,103,933 | ||||||
| 139,329 | Vontier Corp. | 3,203,174 | ||||||
|
| |||||||
| 19,620,304 | ||||||||
|
| |||||||
| Transportation – 2.1% | ||||||||
| 48,541 | Knight-Swift Transportation Holdings, Inc. | 2,246,963 | ||||||
| 8,976 | Old Dominion Freight Line, Inc. | 2,300,369 | ||||||
| 8,399 | Saia, Inc.* | 1,579,012 | ||||||
| 48,029 | United Airlines Holdings, Inc.* | 1,701,187 | ||||||
|
| |||||||
| 7,827,531 | ||||||||
|
| |||||||
| Utilities – 10.1% | ||||||||
| 273,540 | AES Corp. (The) | 5,747,075 | ||||||
| 69,467 | Ameren Corp. | 6,277,038 | ||||||
| 18,171 | American Water Works Co., Inc. | 2,703,300 | ||||||
| 70,272 | CMS Energy Corp. | 4,743,360 | ||||||
| 41,120 | NextEra Energy Partners LP | 3,049,459 | ||||||
| 77,997 | Public Service Enterprise Group, Inc. | 4,935,650 | ||||||
|
| |||||||
| Common Stocks – (continued) | ||||||||
| Utilities – (continued) | ||||||||
| 40,445 | WEC Energy Group, Inc. | 4,070,385 | ||||||
| 91,171 | Xcel Energy, Inc. | 6,451,260 | ||||||
|
| |||||||
| 37,977,527 | ||||||||
|
| |||||||
| TOTAL COMMON STOCKS | ||||||||
| (Cost $342,309,738) | $ | 371,478,688 | ||||||
|
| |||||||
| Shares | Dividend Rate | Value | ||||||
| Investment Company – 0.4%(a) | ||||||||
| | Goldman Sachs Financial Square Government Fund — | | ||||||
| 1,408,277 | 1.367% | $ | 1,408,277 | |||||
| (Cost $1,408,277) | ||||||||
|
| |||||||
| TOTAL INVESTMENTS – 99.4% | ||||||||
| (Cost $343,718,015) | $ | 372,886,965 | ||||||
|
| |||||||
| | OTHER ASSETS IN EXCESS OF | 2,267,416 | ||||||
|
| |||||||
| NET ASSETS – 100.0% | $ | 375,154,381 | ||||||
|
| |||||||
| The percentage shown for each investment category reflects the value of investments in that category as a percentage of net assets. | ||
| * | Non-income producing security. | |
| (a) | Represents an affiliated issuer. | |
| Investment Abbreviations: | ||
| ADR | —American Depositary Receipt | |
| LP | —Limited Partnership | |
| PLC | —Public Limited Company | |
| REIT | —Real Estate Investment Trust | |
| The accompanying notes are an integral part of these financial statements. | 37 |
GOLDMAN SACHS VARIABLE INSURANCE TRUST SMALL CAP EQUITY INSIGHTS FUND
Schedule of Investments
June 30, 2022 (Unaudited)
| Shares | Description | Value | ||||||
| Common Stocks – 97.5% | ||||||||
| Automobiles & Components – 0.3% | ||||||||
| 1,321 | Fisker, Inc.* | $ | 11,321 | |||||
| 17,530 | Goodyear Tire & Rubber Co. (The)* | 187,746 | ||||||
| 1,542 | Holley, Inc.* | 16,191 | ||||||
| 9,301 | Luminar Technologies, Inc.* | 55,155 | ||||||
|
| |||||||
| 270,413 | ||||||||
|
| |||||||
| Banks – 10.6% | ||||||||
| 3,587 | 1st Source Corp. | 162,850 | ||||||
| 7,058 | Ameris Bancorp | 283,590 | ||||||
| 15,821 | Bancorp, Inc. (The)* | 308,826 | ||||||
| 887 | BayCom Corp. | 18,343 | ||||||
| 1,042 | Berkshire Hills Bancorp, Inc. | 25,810 | ||||||
| 6,460 | Business First Bancshares, Inc. | 137,663 | ||||||
| 8,711 | Cadence Bank | 204,534 | ||||||
| 6,126 | Capital Bancorp, Inc. | 132,934 | ||||||
| 4,022 | Capital City Bank Group, Inc. | 112,174 | ||||||
| 40,573 | Capitol Federal Financial, Inc. | 372,460 | ||||||
| 1,394 | Capstar Financial Holdings, Inc. | 27,350 | ||||||
| 24,607 | Central Pacific Financial Corp. | 527,820 | ||||||
| 22,372 | Columbia Banking System, Inc. | 640,958 | ||||||
| 5,490 | Community Bank System, Inc. | 347,407 | ||||||
| 13,921 | CrossFirst Bankshares, Inc.* | 183,757 | ||||||
| 300 | Eagle Bancorp, Inc. | 14,223 | ||||||
| 409 | Essent Group Ltd. | 15,910 | ||||||
| 6,489 | First Bancorp, Inc. (The) | 195,514 | ||||||
| 4,360 | First Bancshares, Inc. (The) | 124,696 | ||||||
| 9,435 | First Financial Bancorp | 183,039 | ||||||
| 15,230 | First Financial Bankshares, Inc. | 598,082 | ||||||
| 2,216 | FVCBankcorp, Inc.* | 41,727 | ||||||
| 1,515 | Great Southern Bancorp, Inc. | 88,718 | ||||||
| 8,614 | Guaranty Bancshares, Inc. | 312,257 | ||||||
| 9,350 | Hancock Whitney Corp. | 414,486 | ||||||
| 19,820 | Hanmi Financial Corp. | 444,761 | ||||||
| 491 | HarborOne Bancorp, Inc. | 6,771 | ||||||
| 4,370 | Home Bancorp, Inc. | 149,148 | ||||||
| 2,425 | HomeTrust Bancshares, Inc. | 60,625 | ||||||
| 44,979 | Hope Bancorp, Inc. | 622,509 | ||||||
| 5,271 | Independent Bank Corp. | 101,625 | ||||||
| 17,321 | International Bancshares Corp. | 694,226 | ||||||
| 14,370 | Macatawa Bank Corp. | 127,031 | ||||||
| 13,190 | Merchants Bancorp | 299,017 | ||||||
| 5,074 | Metrocity Bankshares, Inc. | 103,053 | ||||||
| 1,488 | Northeast Bank | 54,357 | ||||||
| 16,498 | OFG Bancorp (Puerto Rico) | 419,049 | ||||||
| 10,260 | Origin Bancorp, Inc. | 398,088 | ||||||
| 3,076 | PCB Bancorp | 57,460 | ||||||
| 1,459 | PCSB Financial Corp. | 27,852 | ||||||
| 1,697 | Peoples Financial Services Corp. | 94,760 | ||||||
| 2,574 | Sierra Bancorp | 55,933 | ||||||
| 698 | Silvergate Capital Corp., Class A* | 37,364 | ||||||
| 387 | South Plains Financial, Inc. | 9,342 | ||||||
| 3,783 | Southern First Bancshares, Inc.* | 164,901 | ||||||
| 254 | Texas Capital Bancshares, Inc.* | 13,371 | ||||||
| 4,617 | Towne Bank | 125,352 | ||||||
|
| |||||||
| Common Stocks – (continued) | ||||||||
| Banks – (continued) | ||||||||
| 8,477 | TrustCo Bank Corp. | 261,431 | ||||||
| 22,150 | Trustmark Corp. | 646,559 | ||||||
| 550 | UMB Financial Corp. | 47,355 | ||||||
| 18,355 | United Community Banks, Inc. | 554,137 | ||||||
|
| |||||||
| 11,051,205 | ||||||||
|
| |||||||
| Capital Goods – 8.5% | ||||||||
| 1,167 | AAR Corp.* | 48,827 | ||||||
| 5,452 | Applied Industrial Technologies, Inc. | 524,319 | ||||||
| 5,377 | Arcosa, Inc. | 249,654 | ||||||
| 4,097 | Argan, Inc. | 152,900 | ||||||
| 4,427 | Atkore, Inc.* | 367,485 | ||||||
| 18 | AZZ, Inc. | 735 | ||||||
| 4,479 | Bloom Energy Corp., Class A* | 73,903 | ||||||
| 637 | CIRCOR International, Inc.* | 10,440 | ||||||
| 8,096 | Columbus McKinnon Corp. | 229,684 | ||||||
| 1,914 | Douglas Dynamics, Inc. | 55,008 | ||||||
| 3,155 | Dycom Industries, Inc.* | 293,541 | ||||||
| 6,464 | Encore Wire Corp. | 671,739 | ||||||
| 21,999 | Fluor Corp.* | 535,456 | ||||||
| 9,287 | FTC Solar, Inc.*(a) | 33,619 | ||||||
| 13,053 | FuelCell Energy, Inc.* | 48,949 | ||||||
| 1,097 | Gibraltar Industries, Inc.* | 42,509 | ||||||
| 2,354 | GMS, Inc.* | 104,753 | ||||||
| 3,827 | GrafTech International Ltd. | 27,057 | ||||||
| 10,434 | H&E Equipment Services, Inc. | 302,273 | ||||||
| 3,030 | Herc Holdings, Inc. | 273,154 | ||||||
| 2,411 | Hudson Technologies, Inc.* | 18,107 | ||||||
| 3,576 | Janus International Group, Inc.* | 32,291 | ||||||
| 742 | John Bean Technologies Corp. | 81,932 | ||||||
| 26,657 | Kennametal, Inc. | 619,242 | ||||||
| 2,776 | Kratos Defense & Security Solutions, Inc.* | 38,531 | ||||||
| 1,879 | McGrath RentCorp | 142,804 | ||||||
| 18,851 | Microvast Holdings, Inc.* | 41,849 | ||||||
| 4,602 | Miller Industries, Inc. | 104,327 | ||||||
| 31,558 | MRC Global, Inc.* | 314,318 | ||||||
| 14,153 | Mueller Industries, Inc. | 754,213 | ||||||
| 3,818 | Nikola Corp.*(a) | 18,174 | ||||||
| 10,168 | NOW, Inc.* | 99,443 | ||||||
| 426 | Powell Industries, Inc. | 9,956 | ||||||
| 14,539 | Primoris Services Corp. | 316,369 | ||||||
| 1,502 | Rush Enterprises, Inc., Class A | 72,396 | ||||||
| 6,134 | Shoals Technologies Group, Inc., Class A* | 101,088 | ||||||
| 601 | Shyft Group, Inc. (The) | 11,173 | ||||||
| 3,838 | Stem, Inc.* | 27,480 | ||||||
| 9,331 | Sterling Infrastructure, Inc.* | 204,536 | ||||||
| 20,774 | Terex Corp. | 568,584 | ||||||
| 8,538 | Thermon Group Holdings, Inc.* | 119,959 | ||||||
| 5,049 | Titan International, Inc.* | 76,240 | ||||||
| 8,285 | Titan Machinery, Inc.* | 185,667 | ||||||
| 8,771 | Tutor Perini Corp.* | 77,009 | ||||||
| 5,111 | UFP Industries, Inc. | 348,264 | ||||||
|
| |||||||
| 38 | The accompanying notes are an integral part of these financial statements. |
GOLDMAN SACHS VARIABLE INSURANCE TRUST SMALL CAP EQUITY INSIGHTS FUND
| Shares | Description | Value | ||||||
| Common Stocks – (continued) | ||||||||
| Capital Goods – (continued) | ||||||||
| 7,039 | V2X, Inc.* | $ | 235,525 | |||||
| 2,207 | Virgin Galactic Holdings, Inc.* | 13,286 | ||||||
| 12,812 | Wabash National Corp. | 173,987 | ||||||
|
| |||||||
| 8,852,755 | ||||||||
|
| |||||||
| Commercial & Professional Services – 1.7% | ||||||||
| 6,987 | BrightView Holdings, Inc.* | 83,844 | ||||||
| 2,081 | Casella Waste Systems, Inc., Class A* | 151,247 | ||||||
| 16,635 | Ennis, Inc. | 336,526 | ||||||
| 1,538 | Forrester Research, Inc.* | 73,578 | ||||||
| 655 | Franklin Covey Co.* | 30,248 | ||||||
| 3,319 | Healthcare Services Group, Inc. | 57,784 | ||||||
| 21,628 | Heritage-Crystal Clean, Inc.* | 583,091 | ||||||
| 547 | Insperity, Inc. | 54,607 | ||||||
| 7,322 | Matthews International Corp., Class A | 209,922 | ||||||
| 21,722 | Pitney Bowes, Inc. | 78,633 | ||||||
| 855 | TriNet Group, Inc.* | 66,365 | ||||||
| 512 | UniFirst Corp. | 88,156 | ||||||
|
| |||||||
| 1,814,001 | ||||||||
|
| |||||||
| Consumer Durables & Apparel – 1.8% | ||||||||
| 6,008 | Allbirds, Inc., Class A* | 23,611 | ||||||
| 157 | Cavco Industries, Inc.* | 30,770 | ||||||
| 4,353 | Crocs, Inc.* | 211,861 | ||||||
| 3,070 | Dream Finders Homes, Inc., Class A* | 32,665 | ||||||
| 6,137 | Fossil Group, Inc.* | 31,728 | ||||||
| 1,050 | G-III Apparel Group Ltd.* | 21,242 | ||||||
| 8,855 | Green Brick Partners, Inc.* | 173,292 | ||||||
| 1,963 | Installed Building Products, Inc. | 163,243 | ||||||
| 9,662 | Latham Group, Inc.* | 66,958 | ||||||
| 1,902 | Legacy Housing Corp.* | 24,821 | ||||||
| 1,839 | LGI Homes, Inc.* | 159,809 | ||||||
| 9,305 | M/I Homes, Inc.* | 369,036 | ||||||
| 804 | Meritage Homes Corp.* | 58,290 | ||||||
| 2,959 | Movado Group, Inc. | 91,522 | ||||||
| 1,861 | Skyline Champion Corp.* | 88,249 | ||||||
| 8,491 | Smith & Wesson Brands, Inc. | 111,487 | ||||||
| 1,687 | Solo Brands, Inc., Class A* | 6,849 | ||||||
| 4,931 | Steven Madden Ltd. | 158,828 | ||||||
|
| |||||||
| 1,824,261 | ||||||||
|
| |||||||
| Consumer Services – 2.7% | ||||||||
| 1,202 | Biglari Holdings, Inc., Class B* | 147,485 | ||||||
| 11,245 | Chuy’s Holdings, Inc.* | 224,000 | ||||||
| 12,213 | Dave & Buster’s Entertainment, Inc.* | 400,342 | ||||||
| 3,034 | Duolingo, Inc.*(a) | 265,627 | ||||||
| 1,470 | Everi Holdings, Inc.* | 23,976 | ||||||
| 52 | Graham Holdings Co., Class B | 29,476 | ||||||
| 9,123 | Hilton Grand Vacations, Inc.* | 325,965 | ||||||
| 19,153 | International Game Technology PLC | 355,480 | ||||||
| 337 | RCI Hospitality Holdings, Inc. | 16,297 | ||||||
| 16,875 | Red Rock Resorts, Inc., Class A | 562,950 | ||||||
| 455 | Shake Shack, Inc., Class A* | 17,963 | ||||||
| 11,556 | Stride, Inc.* | 471,369 | ||||||
|
| |||||||
| 2,840,930 | ||||||||
|
| |||||||
| Common Stocks – (continued) | ||||||||
| Diversified Financials – 3.8% | ||||||||
| 2,422 | A-Mark Precious Metals, Inc. | 78,109 | ||||||
| 1,293 | Arbor Realty Trust, Inc. REIT | 16,951 | ||||||
| 202 | Atlanticus Holdings Corp.* | 7,104 | ||||||
| 21,442 | Banco Latinoamericano de Comercio Exterior SA, Class E (Panama) | 284,535 | ||||||
| 1,838 | BrightSpire Capital, Inc. REIT | 13,877 | ||||||
| 59,310 | Chimera Investment Corp. REIT | 523,114 | ||||||
| 11,845 | Dynex Capital, Inc. REIT | 188,572 | ||||||
| 8,711 | FirstCash Holdings, Inc. | 605,502 | ||||||
| 5,223 | Focus Financial Partners, Inc., Class A* | 177,895 | ||||||
| 1,621 | Hannon Armstrong Sustainable Infrastructure Capital, Inc. REIT | 61,371 | ||||||
| 1,388 | Houlihan Lokey, Inc. | 109,555 | ||||||
| 14,245 | Invesco Mortgage Capital, Inc. REIT | 209,117 | ||||||
| 11,730 | Moelis & Co., Class A | 461,576 | ||||||
| 251 | Nelnet, Inc., Class A | 21,398 | ||||||
| 2,380 | Nexpoint Real Estate Finance, Inc. REIT | 48,243 | ||||||
| 990 | Oportun Financial Corp.* | 8,187 | ||||||
| 13,163 | Oppenheimer Holdings, Inc., Class A | 434,906 | ||||||
| 5,338 | Regional Management Corp. | 199,481 | ||||||
| 26,629 | TPG RE Finance Trust, Inc. REIT | 239,927 | ||||||
| 18,983 | Two Harbors Investment Corp. REIT | 94,535 | ||||||
| 836 | Virtus Investment Partners, Inc. | 142,973 | ||||||
|
| |||||||
| 3,926,928 | ||||||||
|
| |||||||
| Energy – 4.6% | ||||||||
| 2,093 | Callon Petroleum Co.* | 82,046 | ||||||
| 25,342 | Centennial Resource Development, Inc., Class A* | 151,545 | ||||||
| 10,838 | CNX Resources Corp.* | 178,394 | ||||||
| 2,741 | Comstock Resources, Inc.* | 33,111 | ||||||
| 1,132 | CONSOL Energy, Inc.* | 55,898 | ||||||
| 8,466 | Delek US Holdings, Inc.* | 218,761 | ||||||
| 6,325 | Dorian LPG Ltd. | 96,140 | ||||||
| 35,180 | Equitrans Midstream Corp. | 223,745 | ||||||
| 3,052 | Frontline Ltd. (Norway) * | 27,041 | ||||||
| 17,157 | Golar LNG Ltd. (Cameroon) * | 390,322 | ||||||
| 34,706 | Helix Energy Solutions Group, Inc.* | 107,589 | ||||||
| 1,443 | HighPeak Energy, Inc.(a) | 36,970 | ||||||
| 27,723 | Kosmos Energy Ltd. (Ghana) * | 171,605 | ||||||
| 9,290 | Liberty Energy, Inc.* | 118,540 | ||||||
| 24,579 | Magnolia Oil & Gas Corp., Class A | 515,913 | ||||||
| 2,436 | Matador Resources Co.(b) | 113,493 | ||||||
| 13,857 | Murphy Oil Corp. | 418,343 | ||||||
| 1,893 | Oceaneering International, Inc.* | 20,217 | ||||||
| 26,340 | Oil States International, Inc.* | 142,763 | ||||||
| 6,062 | PBF Energy, Inc., Class A* | 175,919 | ||||||
| 1,703 | Ranger Oil Corp., Class A* | 55,978 | ||||||
| 1,040 | REX American Resources Corp.* | 88,192 | ||||||
| 23,597 | RPC, Inc.* | 163,055 | ||||||
| 6,798 | SandRidge Energy, Inc.* | 106,525 | ||||||
| 6,800 | Scorpio Tankers, Inc. (Monaco) | 234,668 | ||||||
|
| |||||||
| The accompanying notes are an integral part of these financial statements. | 39 |
GOLDMAN SACHS VARIABLE INSURANCE TRUST SMALL CAP EQUITY INSIGHTS FUND
Schedule of Investments (continued)
June 30, 2022 (Unaudited)
| Shares | Description | Value | ||||||
| Common Stocks – (continued) | ||||||||
| Energy – (continued) | ||||||||
| 17,942 | SM Energy Co. | $ | 613,437 | |||||
| 13,192 | Teekay Corp. (Bermuda) * | 37,993 | ||||||
| 991 | Teekay Tankers Ltd., Class A (Bermuda) * | 17,471 | ||||||
| 29,343 | Tellurian, Inc.* | 87,442 | ||||||
| 14,316 | TETRA Technologies, Inc.* | 58,123 | ||||||
| 960 | World Fuel Services Corp. | 19,642 | ||||||
|
| |||||||
| 4,760,881 | ||||||||
|
| |||||||
| Food & Staples Retailing – 0.8% | ||||||||
| 5,873 | Chefs’ Warehouse, Inc. (The)* | 228,401 | ||||||
| 4,755 | Ingles Markets, Inc., Class A | 412,496 | ||||||
| 1,537 | PriceSmart, Inc. | 110,096 | ||||||
| 700 | Weis Markets, Inc. | 52,178 | ||||||
|
| |||||||
| 803,171 | ||||||||
|
| |||||||
| Food, Beverage & Tobacco – 1.9% | ||||||||
| 635 | B&G Foods, Inc. | 15,100 | ||||||
| 797 | Beyond Meat, Inc.* | 19,080 | ||||||
| 2,727 | BRC, Inc., Class A*(a) | 22,252 | ||||||
| 8,522 | Cal-Maine Foods, Inc. | 421,072 | ||||||
| 1,151 | Coca-Cola Consolidated, Inc. | 649,049 | ||||||
| 1,892 | National Beverage Corp. | 92,595 | ||||||
| 3,323 | Sanderson Farms, Inc. | 716,206 | ||||||
| 1,052 | Utz Brands, Inc. | 14,539 | ||||||
|
| |||||||
| 1,949,893 | ||||||||
|
| |||||||
| Health Care Equipment & Services – 7.1% | ||||||||
| 569 | Addus HomeCare Corp.* | 47,386 | ||||||
| 4,821 | AMN Healthcare Services, Inc.* | 528,912 | ||||||
| 2,649 | AngioDynamics, Inc.* | 51,258 | ||||||
| 179 | Apollo Medical Holdings, Inc.* | 6,908 | ||||||
| 4,425 | Artivion, Inc.* | 83,544 | ||||||
| 23,025 | Avanos Medical, Inc.* | 629,503 | ||||||
| 3,276 | Aveanna Healthcare Holdings, Inc.* | 7,404 | ||||||
| 2,593 | Axonics, Inc.* | 146,945 | ||||||
| 81,252 | Brookdale Senior Living, Inc.* | 368,884 | ||||||
| 52,150 | Cano Health, Inc.* | 228,417 | ||||||
| 1,236 | Cardiovascular Systems, Inc.* | 17,749 | ||||||
| 963 | Castle Biosciences, Inc.* | 21,138 | ||||||
| 3,941 | Cerus Corp.* | 20,848 | ||||||
| 22,682 | Community Health Systems, Inc.* | 85,058 | ||||||
| 300 | CorVel Corp.* | 44,181 | ||||||
| 11,400 | Cross Country Healthcare, Inc.* | 237,462 | ||||||
| 6,445 | Evolent Health, Inc., Class A* | 197,926 | ||||||
| 1,175 | Glaukos Corp.* | 53,369 | ||||||
| 25,152 | Hanger, Inc.* | 360,177 | ||||||
| 331 | Inari Medical, Inc.* | 22,505 | ||||||
| 3,275 | Inspire Medical Systems, Inc.* | 598,244 | ||||||
| 202 | iRadimed Corp. | 6,856 | ||||||
| 2,349 | Joint Corp. (The)* | 35,963 | ||||||
| 1,813 | Lantheus Holdings, Inc.* | 119,712 | ||||||
| 5,655 | LeMaitre Vascular, Inc. | 257,585 | ||||||
| 3,587 | LivaNova PLC* | 224,080 | ||||||
| 257 | Merit Medical Systems, Inc.* | 13,947 | ||||||
|
| |||||||
| Common Stocks – (continued) | ||||||||
| Health Care Equipment & Services – (continued) | ||||||||
| 363 | National Research Corp. | 13,896 | ||||||
| 8,497 | Neogen Corp.*(a) | 204,693 | ||||||
| 5,298 | NextGen Healthcare, Inc.* | 92,397 | ||||||
| 11,175 | Nutex Health, Inc.*(a) | 36,039 | ||||||
| 3,800 | OPKO Health, Inc.* | 9,614 | ||||||
| 1,194 | Option Care Health, Inc.* | 33,181 | ||||||
| 1,481 | Owens & Minor, Inc. | 46,577 | ||||||
| 23,320 | Patterson Cos., Inc. | 706,596 | ||||||
| 972 | Pennant Group, Inc. (The)* | 12,451 | ||||||
| 1,868 | Phreesia, Inc.* | 46,719 | ||||||
| 3,854 | Pulmonx Corp.* | 56,731 | ||||||
| 10,386 | Schrodinger, Inc.* | 274,294 | ||||||
| 16,843 | Select Medical Holdings Corp. | 397,832 | ||||||
| 1,686 | Shockwave Medical, Inc.* | 322,313 | ||||||
| 2,200 | Simulations Plus, Inc. | 108,526 | ||||||
| 2,023 | STAAR Surgical Co.* | 143,491 | ||||||
| 1,599 | Surgery Partners, Inc.* | 46,243 | ||||||
| 6,678 | Surmodics, Inc.* | 248,622 | ||||||
| 2,273 | Utah Medical Products, Inc. | 195,251 | ||||||
|
| |||||||
| 7,411,427 | ||||||||
|
| |||||||
| Household & Personal Products – 1.1% | ||||||||
| 18,582 | Energizer Holdings, Inc. | 526,800 | ||||||
| 2,987 | WD-40 Co. | 601,462 | ||||||
|
| |||||||
| 1,128,262 | ||||||||
|
| |||||||
| Insurance – 4.3% | ||||||||
| 14,631 | American Equity Investment Life Holding Co. | 535,056 | ||||||
| 11,577 | AMERISAFE, Inc. | 602,120 | ||||||
| 15,163 | Argo Group International Holdings Ltd. | 558,908 | ||||||
| 11,368 | BRP Group, Inc., Class A* | 274,537 | ||||||
| 11,613 | Crawford & Co., Class A | 90,581 | ||||||
| 13,429 | Employers Holdings, Inc. | 562,541 | ||||||
| 56,651 | Genworth Financial, Inc., Class A* | 199,978 | ||||||
| 7,713 | Goosehead Insurance, Inc., Class A | 352,253 | ||||||
| 887 | Investors Title Co. | 139,161 | ||||||
| 348 | Kinsale Capital Group, Inc. | 79,915 | ||||||
| 170 | National Western Life Group, Inc., Class A | 34,459 | ||||||
| 5,894 | Palomar Holdings, Inc.* | 379,574 | ||||||
| 3,316 | ProAssurance Corp. | 78,357 | ||||||
| 11,687 | Stewart Information Services Corp. | 581,428 | ||||||
|
| |||||||
| 4,468,868 | ||||||||
|
| |||||||
| Materials – 4.2% | ||||||||
| 5,620 | 5E Advanced Materials, Inc.* | 68,451 | ||||||
| 3,698 | Alpha Metallurgical Resources, Inc. | 477,523 | ||||||
| 2,922 | American Vanguard Corp. | 65,307 | ||||||
| 4,133 | Avient Corp. | 165,651 | ||||||
| 24,089 | Century Aluminum Co.* | 177,536 | ||||||
| 566 | Clearwater Paper Corp.* | 19,034 | ||||||
| 9,356 | Diversey Holdings Ltd.* | 61,750 | ||||||
| 14,532 | FutureFuel Corp. | 105,793 | ||||||
|
| |||||||
| 40 | The accompanying notes are an integral part of these financial statements. |
GOLDMAN SACHS VARIABLE INSURANCE TRUST SMALL CAP EQUITY INSIGHTS FUND
| Shares | Description | Value | ||||||
| Common Stocks – (continued) | ||||||||
| Materials – (continued) | ||||||||
| 948 | Ingevity Corp.* | $ | 59,857 | |||||
| 6,587 | Innospec, Inc. | 630,969 | ||||||
| 1,790 | Intrepid Potash, Inc.* | 81,069 | ||||||
| 5,424 | Livent Corp.* | 123,070 | ||||||
| 7,407 | LSB Industries, Inc.* | 102,661 | ||||||
| 4,858 | Minerals Technologies, Inc. | 297,990 | ||||||
| 3,101 | Novagold Resources, Inc. (Canada) * | 14,916 | ||||||
| 2,504 | Pactiv Evergreen, Inc. | 24,940 | ||||||
| 2,502 | Piedmont Lithium, Inc.* | 91,098 | ||||||
| 13,840 | Ramaco Resources, Inc. | 181,996 | ||||||
| 8,204 | Ryerson Holding Corp. | 174,663 | ||||||
| 1,110 | Sensient Technologies Corp. | 89,422 | ||||||
| 9,802 | Summit Materials, Inc., Class A* | 228,288 | ||||||
| 36,656 | SunCoke Energy, Inc. | 249,627 | ||||||
| 370 | TimkenSteel Corp.* | 6,923 | ||||||
| 14,479 | Tronox Holdings PLC, Class A | 243,247 | ||||||
| 857 | United States Lime & Minerals, Inc. | 90,499 | ||||||
| 18,769 | Warrior Met Coal, Inc. | 574,519 | ||||||
|
| |||||||
| 4,406,799 | ||||||||
|
| |||||||
| Media & Entertainment – 2.9% | ||||||||
| 13,375 | Audacy, Inc.* | 12,602 | ||||||
| 7,054 | Bumble, Inc., Class A* | 198,570 | ||||||
| 14,814 | Cargurus, Inc.* | 318,353 | ||||||
| 35,171 | Cinemark Holdings, Inc.* | 528,268 | ||||||
| 29,161 | Clear Channel Outdoor Holdings, Inc.* | 31,202 | ||||||
| 130 | Daily Journal Corp.* | 33,644 | ||||||
| 2,473 | DHI Group, Inc.* | 12,291 | ||||||
| 16,206 | Eventbrite, Inc., Class A* | 166,436 | ||||||
| 29,989 | EW Scripps Co. (The), Class A* | 373,963 | ||||||
| 5,690 | fuboTV, Inc.*(a) | 14,054 | ||||||
| 1,367 | Gray Television, Inc. | 23,089 | ||||||
| 23,953 | IMAX Corp.* | 404,566 | ||||||
| 8,189 | PubMatic, Inc., Class A* | 130,123 | ||||||
| 3,393 | QuinStreet, Inc.* | 34,134 | ||||||
| 3,222 | Scholastic Corp. | 115,895 | ||||||
| 4,697 | TechTarget, Inc.* | 308,687 | ||||||
| 14,074 | Vimeo, Inc.* | 84,725 | ||||||
| 4,955 | WideOpenWest, Inc.* | 90,231 | ||||||
| 9,590 | ZipRecruiter, Inc., Class A* | 142,124 | ||||||
|
| |||||||
| 3,022,957 | ||||||||
|
| |||||||
| Pharmaceuticals, Biotechnology & Life Sciences – 11.7% | ||||||||
| 12,451 | ACADIA Pharmaceuticals, Inc.* | 175,435 | ||||||
| 3,282 | Adaptive Biotechnologies Corp.* | 26,551 | ||||||
| 4,299 | Alector, Inc.* | 43,678 | ||||||
| 28,093 | Alkermes PLC* | 836,890 | ||||||
| 978 | Allogene Therapeutics, Inc.* | 11,149 | ||||||
| 7,471 | ALX Oncology Holdings, Inc.* | 60,440 | ||||||
| 34,270 | Amicus Therapeutics, Inc.* | 368,060 | ||||||
| 31,655 | Amneal Pharmaceuticals, Inc.* | 100,663 | ||||||
| 14,431 | Amphastar Pharmaceuticals, Inc.* | 502,054 | ||||||
| 1,309 | Anika Therapeutics, Inc.* | 29,217 | ||||||
| 1,064 | Apellis Pharmaceuticals, Inc.* | 48,114 | ||||||
|
| |||||||
| Common Stocks – (continued) | ||||||||
| Pharmaceuticals, Biotechnology & Life Sciences – (continued) | ||||||||
| 16,484 | Arbutus Biopharma Corp.* | 44,672 | ||||||
| 1,972 | Arcturus Therapeutics Holdings, Inc.* | 31,039 | ||||||
| 13,219 | Arcus Biosciences, Inc.* | 334,969 | ||||||
| 11,533 | Arrowhead Pharmaceuticals, Inc.* | 406,077 | ||||||
| 8,196 | Arvinas, Inc.* | 344,970 | ||||||
| 22,169 | Aurinia Pharmaceuticals, Inc. (Canada) *(a) | 222,798 | ||||||
| 1,361 | Avid Bioservices, Inc.* | 20,769 | ||||||
| 1,108 | Avidity Biosciences, Inc.* | 16,099 | ||||||
| 3,309 | Beam Therapeutics, Inc.*(a) | 128,091 | ||||||
| 9,578 | BioCryst Pharmaceuticals, Inc.* | 101,335 | ||||||
| 3,837 | Bluebird Bio, Inc.* | 15,885 | ||||||
| 4,338 | Blueprint Medicines Corp.* | 219,112 | ||||||
| 7,150 | Bridgebio Pharma, Inc.* | 64,922 | ||||||
| 518 | CareDx, Inc.* | 11,127 | ||||||
| 48,041 | Catalyst Pharmaceuticals, Inc.* | 336,767 | ||||||
| 3,071 | ChemoCentryx, Inc.* | 76,099 | ||||||
| 33,797 | Codexis, Inc.* | 353,517 | ||||||
| 1,390 | Cogent Biosciences, Inc.* | 12,538 | ||||||
| 5,270 | CTI BioPharma Corp.* | 31,462 | ||||||
| 1,908 | Cullinan Oncology, Inc.* | 24,461 | ||||||
| 1,389 | Day One Biopharmaceuticals, Inc.* | 24,863 | ||||||
| 5,790 | Denali Therapeutics, Inc.* | 170,400 | ||||||
| 1,331 | Design Therapeutics, Inc.* | 18,634 | ||||||
| 17,702 | Dynavax Technologies Corp.* | 222,868 | ||||||
| 7,204 | Eagle Pharmaceuticals, Inc.* | 320,074 | ||||||
| 20,538 | Endo International PLC* | 9,565 | ||||||
| 24,731 | Erasca, Inc.*(a) | 137,752 | ||||||
| 11,292 | Fate Therapeutics, Inc.* | 279,816 | ||||||
| 3,395 | Global Blood Therapeutics, Inc.* | 108,470 | ||||||
| 8,207 | Gossamer Bio, Inc.* | 68,693 | ||||||
| 24,533 | Heron Therapeutics, Inc.* | 68,447 | ||||||
| 991 | IGM Biosciences, Inc.* | 17,868 | ||||||
| 5,036 | Innoviva, Inc.* | 74,331 | ||||||
| 4,449 | Inotiv, Inc.* | 42,710 | ||||||
| 7,997 | Insmed, Inc.* | 157,701 | ||||||
| 3,254 | Instil Bio, Inc.* | 15,033 | ||||||
| 1,799 | Intellia Therapeutics, Inc.* | 93,116 | ||||||
| 4,295 | Intercept Pharmaceuticals, Inc.*(a) | 59,314 | ||||||
| 2,220 | Intra-Cellular Therapies, Inc.* | 126,718 | ||||||
| 5,972 | iTeos Therapeutics, Inc.* | 123,023 | ||||||
| 12,153 | IVERIC bio, Inc.* | 116,912 | ||||||
| 10,494 | KalVista Pharmaceuticals, Inc.* | 103,261 | ||||||
| 244 | Karuna Therapeutics, Inc.* | 30,868 | ||||||
| 3,593 | Keros Therapeutics, Inc.* | 99,275 | ||||||
| 9,109 | Kezar Life Sciences, Inc.* | 75,331 | ||||||
| 4,285 | Kodiak Sciences, Inc.* | 32,737 | ||||||
| 4,196 | Kronos Bio, Inc.* | 15,273 | ||||||
| 1,800 | Kura Oncology, Inc.* | 32,994 | ||||||
| 592 | Madrigal Pharmaceuticals, Inc.* | 42,375 | ||||||
| 23,207 | MannKind Corp.* | 88,419 | ||||||
| 5,691 | Medpace Holdings, Inc.* | 851,772 | ||||||
| 8,952 | MeiraGTx Holdings PLC* | 67,767 | ||||||
| 5,923 | NGM Biopharmaceuticals, Inc.* | 75,933 | ||||||
|
| |||||||
| The accompanying notes are an integral part of these financial statements. | 41 |
GOLDMAN SACHS VARIABLE INSURANCE TRUST SMALL CAP EQUITY INSIGHTS FUND
Schedule of Investments (continued)
June 30, 2022 (Unaudited)
| Shares | Description | Value | ||||||
| Common Stocks – (continued) | ||||||||
| Pharmaceuticals, Biotechnology & Life Sciences – (continued) | ||||||||
| 2,567 | Nkarta, Inc.*(a) | $ | 31,625 | |||||
| 36,595 | Organogenesis Holdings, Inc.* | 178,584 | ||||||
| 1,436 | Pacific Biosciences of California, Inc.* | 6,347 | ||||||
| 1,547 | Phathom Pharmaceuticals, Inc.*(a) | 13,057 | ||||||
| 27,193 | Phibro Animal Health Corp., Class A | 520,202 | ||||||
| 5,380 | Point Biopharma Global, Inc.*(a) | 36,638 | ||||||
| 10,444 | Prestige Consumer Healthcare, Inc.* | 614,107 | ||||||
| 2,321 | Protagonist Therapeutics, Inc.* | 18,359 | ||||||
| 7,497 | Prothena Corp. PLC (Ireland) * | 203,544 | ||||||
| 4,598 | PTC Therapeutics, Inc.* | 184,196 | ||||||
| 4,507 | Radius Health, Inc.* | 46,738 | ||||||
| 2,871 | Rallybio Corp.* | 21,676 | ||||||
| 572 | REVOLUTION Medicines, Inc.* | 11,148 | ||||||
| 11,963 | Seres Therapeutics, Inc.* | 41,033 | ||||||
| 853 | SpringWorks Therapeutics, Inc.* | 21,001 | ||||||
| 1,588 | Supernus Pharmaceuticals, Inc.* | 45,925 | ||||||
| 20,753 | Sutro Biopharma, Inc.* | 108,123 | ||||||
| 11,407 | Travere Therapeutics, Inc.* | 276,392 | ||||||
| 1,170 | Tricida, Inc.* | 11,326 | ||||||
| 388 | Twist Bioscience Corp.* | 13,564 | ||||||
| 41,140 | Vanda Pharmaceuticals, Inc.* | 448,426 | ||||||
| 5,163 | Vir Biotechnology, Inc.* | 131,502 | ||||||
| 12,053 | Xencor, Inc.* | 329,891 | ||||||
| 2,481 | Zentalis Pharmaceuticals, Inc.* | 69,716 | ||||||
|
| |||||||
| 12,154,393 | ||||||||
|
| |||||||
| Real Estate – 6.8% | ||||||||
| 29,107 | Alexander & Baldwin, Inc. REIT | 522,471 | ||||||
| 14,277 | Apple Hospitality REIT, Inc. REIT | 209,444 | ||||||
| 22,189 | Armada Hoffler Properties, Inc. REIT | 284,907 | ||||||
| 35,224 | Chatham Lodging Trust REIT* | 368,091 | ||||||
| 28,057 | City Office REIT, Inc. REIT | 363,338 | ||||||
| 544 | Community Healthcare Trust, Inc. REIT | 19,698 | ||||||
| 27,064 | DiamondRock Hospitality Co. REIT* | 222,195 | ||||||
| 8,732 | Empire State Realty Trust, Inc., Class A REIT | 61,386 | ||||||
| 12,276 | Essential Properties Realty Trust, Inc. REIT | 263,811 | ||||||
| 27,550 | Franklin Street Properties Corp. REIT | 114,883 | ||||||
| 26,039 | Global Medical REIT, Inc. REIT | 292,418 | ||||||
| 5,374 | Healthcare Realty Trust, Inc. REIT | 146,173 | ||||||
| 15,492 | Macerich Co. (The) REIT | 134,935 | ||||||
| 4,747 | Newmark Group, Inc., Class A | 45,903 | ||||||
| 9,664 | NexPoint Residential Trust, Inc. REIT | 604,097 | ||||||
| 33,890 | Outfront Media, Inc. REIT | 574,436 | ||||||
| 910 | Pebblebrook Hotel Trust REIT | 15,079 | ||||||
| 45,515 | RLJ Lodging Trust REIT | 502,030 | ||||||
| 1,076 | Saul Centers, Inc. REIT | 50,690 | ||||||
| 21,283 | SITE Centers Corp. REIT | 286,682 | ||||||
| 12,257 | St Joe Co. (The) | 484,887 | ||||||
| 17,274 | STAG Industrial, Inc. REIT | 533,421 | ||||||
| 8,122 | Tanger Factory Outlet Centers, Inc. REIT | 115,495 | ||||||
|
| |||||||
| Common Stocks – (continued) | ||||||||
| Real Estate – (continued) | ||||||||
| 11,185 | Terreno Realty Corp. REIT | 623,340 | ||||||
| 3,320 | Universal Health Realty Income Trust REIT | 176,657 | ||||||
| 1,150 | Xenia Hotels & Resorts, Inc. REIT* | 16,710 | ||||||
|
| |||||||
| 7,033,177 | ||||||||
|
| |||||||
| Retailing – 4.0% | ||||||||
| 1,218 | Aaron’s Co., Inc. (The) | 17,722 | ||||||
| 25,650 | aka Brands Holding Corp.* | 70,794 | ||||||
| 7,752 | Arko Corp. | 63,256 | ||||||
| 1,995 | Asbury Automotive Group, Inc.* | 337,833 | ||||||
| 5,130 | Boot Barn Holdings, Inc.* | 353,508 | ||||||
| 12,904 | Buckle, Inc. (The) | 357,312 | ||||||
| 2,605 | Build-A-Bear Workshop, Inc. | 42,774 | ||||||
| 15,075 | CarParts.com, Inc.* | 104,620 | ||||||
| 3,455 | EVgo, Inc.*(a) | 20,765 | ||||||
| 4,635 | Group 1 Automotive, Inc. | 787,023 | ||||||
| 6,196 | Liquidity Services, Inc.* | 83,274 | ||||||
| 3,472 | Lulu’s Fashion Lounge Holdings, Inc.* | 37,671 | ||||||
| 318 | MarineMax, Inc.* | 11,486 | ||||||
| 3,497 | Murphy USA, Inc. | 814,346 | ||||||
| 305 | Overstock.com, Inc.* | 7,628 | ||||||
| 3,224 | PetMed Express, Inc. | 64,158 | ||||||
| 1,933 | Poshmark, Inc., Class A* | 19,543 | ||||||
| 8,670 | Rent-A-Center, Inc. | 168,632 | ||||||
| 7,203 | Revolve Group, Inc.* | 186,630 | ||||||
| 2,901 | Sally Beauty Holdings, Inc.* | 34,580 | ||||||
| 2,309 | Shoe Carnival, Inc. | 49,897 | ||||||
| 9,709 | Sonic Automotive, Inc., Class A | 355,641 | ||||||
| 3,650 | TravelCenters of America, Inc.* | 125,816 | ||||||
| 8,861 | Volta, Inc.*(a) | 11,519 | ||||||
| 3,233 | Warby Parker, Inc., Class A*(a) | 36,404 | ||||||
|
| |||||||
| 4,162,832 | ||||||||
|
| |||||||
| Semiconductors & Semiconductor Equipment – 3.4% | ||||||||
| 763 | Ambarella, Inc.* | 49,946 | ||||||
| 2,192 | Amkor Technology, Inc. | 37,154 | ||||||
| 8,572 | Axcelis Technologies, Inc.* | 470,089 | ||||||
| 2,258 | AXT, Inc.* | 13,232 | ||||||
| 9,418 | Cohu, Inc.* | 261,350 | ||||||
| 300 | CyberOptics Corp.* | 10,482 | ||||||
| 8,990 | Diodes, Inc.* | 580,484 | ||||||
| 5,613 | FormFactor, Inc.* | 217,392 | ||||||
| 3,290 | Kulicke & Soffa Industries, Inc. (Singapore) | 140,845 | ||||||
| 13,534 | MaxLinear, Inc.* | 459,885 | ||||||
| 709 | PDF Solutions, Inc.* | 15,251 | ||||||
| 9,633 | Power Integrations, Inc. | 722,571 | ||||||
| 4,570 | Semtech Corp.* | 251,213 | ||||||
| 341 | SiTime Corp.* | 55,593 | ||||||
| 2,855 | Ultra Clean Holdings, Inc.* | 84,993 | ||||||
| 5,471 | Veeco Instruments, Inc.* | 106,137 | ||||||
|
| |||||||
| 3,476,617 | ||||||||
|
| |||||||
| 42 | The accompanying notes are an integral part of these financial statements. |
GOLDMAN SACHS VARIABLE INSURANCE TRUST SMALL CAP EQUITY INSIGHTS FUND
| Shares | Description | Value | ||||||
| Common Stocks – (continued) | ||||||||
| Software & Services – 8.6% | ||||||||
| 11,851 | A10 Networks, Inc. | $ | 170,417 | |||||
| 15,558 | ACI Worldwide, Inc.* | 402,797 | ||||||
| 4,215 | Alarm.com Holdings, Inc.* | 260,740 | ||||||
| 3,577 | Altair Engineering, Inc., Class A* | 187,793 | ||||||
| 6,250 | American Software, Inc., Class A | 101,000 | ||||||
| 6,502 | Amplitude, Inc., Class A* | 92,914 | ||||||
| 9,471 | Asana, Inc., Class A* | 166,500 | ||||||
| 13,324 | BigCommerce Holdings, Inc.Series 1* | 215,849 | ||||||
| 3,163 | Cass Information Systems, Inc. | 106,909 | ||||||
| 14,609 | Clear Secure, Inc., Class A* | 292,180 | ||||||
| 11,653 | CommVault Systems, Inc.* | 732,974 | ||||||
| 10,995 | Conduent, Inc.* | 47,498 | ||||||
| 725 | Domo, Inc., Class B* | 20,155 | ||||||
| 53,225 | E2open Parent Holdings, Inc.* | 414,091 | ||||||
| 2,241 | Ebix, Inc. | 37,873 | ||||||
| 3,832 | Envestnet, Inc.* | 202,215 | ||||||
| 8,264 | EVERTEC, Inc. (Puerto Rico) | 304,776 | ||||||
| 14,325 | Evo Payments, Inc., Class A* | 336,924 | ||||||
| 4,670 | ExlService Holdings, Inc.* | 688,031 | ||||||
| 3,581 | Hackett Group, Inc. (The) | 67,932 | ||||||
| 7,967 | I3 Verticals, Inc., Class A* | 199,334 | ||||||
| 5,686 | Instructure Holdings, Inc.* | 129,072 | ||||||
| 10,788 | LiveRamp Holdings, Inc.* | 278,438 | ||||||
| 1,406 | Maximus, Inc. | 87,889 | ||||||
| 161 | MicroStrategy, Inc., Class A*(a) | 26,452 | ||||||
| 881 | PagerDuty, Inc.* | 21,831 | ||||||
| 7,399 | Perficient, Inc.* | 678,414 | ||||||
| 5,900 | Q2 Holdings, Inc.* | 227,563 | ||||||
| 24,075 | Rackspace Technology, Inc.* | 172,618 | ||||||
| 10,052 | Rapid7, Inc.* | 671,474 | ||||||
| 12,807 | Rimini Street, Inc.* | 76,970 | ||||||
| 1,661 | Sapiens International Corp. NV (Israel) | 40,180 | ||||||
| 2,634 | SecureWorks Corp., Class A* | 28,605 | ||||||
| 1,121 | Sprout Social, Inc., Class A* | 65,097 | ||||||
| 3,642 | SPS Commerce, Inc.* | 411,728 | ||||||
| 11,878 | Telos Corp.* | 95,974 | ||||||
| 3,810 | Tenable Holdings, Inc.* | 173,012 | ||||||
| 850 | Tucows, Inc., Class A* | 37,834 | ||||||
| 15,815 | Unisys Corp.* | 190,254 | ||||||
| 5,366 | Varonis Systems, Inc.* | 157,331 | ||||||
| 24,612 | Yext, Inc.* | 117,645 | ||||||
| 4,991 | Zeta Global Holdings Corp., Class A* | 22,559 | ||||||
| 18,949 | Zuora, Inc., Class A* | 169,594 | ||||||
|
| |||||||
| 8,929,436 | ||||||||
|
| |||||||
| Technology Hardware & Equipment – 3.4% | ||||||||
| 4,806 | Belden, Inc. | 256,016 | ||||||
| 2,670 | Clearfield, Inc.* | 165,406 | ||||||
| 2,402 | CompoSecure, Inc.* | 12,490 | ||||||
| 17,020 | CTS Corp. | 579,531 | ||||||
| 9,531 | ePlus, Inc.* | 506,287 | ||||||
| 4,406 | Fabrinet (Thailand) * | 357,327 | ||||||
| 43,563 | Harmonic, Inc.* | 377,691 | ||||||
| 3,513 | PC Connection, Inc. | 154,748 | ||||||
|
| |||||||
| Common Stocks – (continued) | ||||||||
| Technology Hardware & Equipment – (continued) | ||||||||
| 1,880 | ScanSource, Inc.* | 58,543 | ||||||
| 1,057 | Super Micro Computer, Inc.* | 42,650 | ||||||
| 12,509 | TTM Technologies, Inc.* | 156,362 | ||||||
| 39,583 | Vishay Intertechnology, Inc. | 705,369 | ||||||
| 4,237 | Vishay Precision Group, Inc.* | 123,424 | ||||||
|
| |||||||
| 3,495,844 | ||||||||
|
| |||||||
| Telecommunication Services – 0.5% | ||||||||
| 3,842 | Cogent Communications Holdings, Inc. | 233,440 | ||||||
| 56,893 | Globalstar, Inc.* | 69,978 | ||||||
| 5,268 | Iridium Communications, Inc.* | 197,866 | ||||||
| 1,458 | Ooma, Inc.* | 17,263 | ||||||
| 2,688 | Starry Group Holdings, Inc., Class A* | 11,075 | ||||||
|
| |||||||
| 529,622 | ||||||||
|
| |||||||
| Transportation – 2.2% | ||||||||
| 1,390 | ArcBest Corp. | 97,814 | ||||||
| 32,682 | Costamare, Inc. (Monaco) | 395,452 | ||||||
| 4,303 | Eagle Bulk Shipping, Inc. | 223,240 | ||||||
| 414 | Forward Air Corp. | 38,071 | ||||||
| 15,471 | Genco Shipping & Trading Ltd. | 298,900 | ||||||
| 7,889 | Heartland Express, Inc. | 109,736 | ||||||
| 4,939 | Marten Transport Ltd. | 83,074 | ||||||
| 5,974 | Matson, Inc. | 435,385 | ||||||
| 1,484 | PAM Transportation Services, Inc.* | 40,647 | ||||||
| 93,121 | Safe Bulkers, Inc. (Greece) | 355,722 | ||||||
| 1,240 | Saia, Inc.* | 233,120 | ||||||
|
| |||||||
| 2,311,161 | ||||||||
|
| |||||||
| Utilities – 0.6% | ||||||||
| 692 | American States Water Co. | 56,405 | ||||||
| 2,546 | MGE Energy, Inc. | 198,155 | ||||||
| 2,830 | Montauk Renewables, Inc.* | 28,442 | ||||||
| 3,621 | ONE Gas, Inc. | 293,989 | ||||||
|
| |||||||
| 576,991 | ||||||||
|
| |||||||
| TOTAL COMMON STOCKS | ||||||||
| (Cost $111,045,783) | $ | 101,202,824 | ||||||
|
| |||||||
| Shares | Dividend Rate | Value | ||||||
| Investment Company – 1.1%(c) | ||||||||
| | Goldman Sachs Financial Square Government Fund — | | ||||||
| 1,133,027 | 1.367% | $ | 1,133,027 | |||||
| (Cost $1,133,027) | ||||||||
|
| |||||||
| | TOTAL INVESTMENTS BEFORE SECURITIES LENDING REINVESTMENT VEHICLE | | ||||||
| (Cost $112,178,810) | $ | 102,335,851 | ||||||
|
| |||||||
| The accompanying notes are an integral part of these financial statements. | 43 |
GOLDMAN SACHS VARIABLE INSURANCE TRUST SMALL CAP EQUITY INSIGHTS FUND
Schedule of Investments (continued)
June 30, 2022 (Unaudited)
| Shares | Dividend Rate | Value | ||||||
| Securities Lending Reinvestment Vehicle – 1.4%(c) | ||||||||
| | Goldman Sachs Financial Square Government Fund — | | ||||||
| 1,451,080 | 1.367% | $ | 1,451,080 | |||||
| (Cost $1,451,080) | ||||||||
|
| |||||||
| TOTAL INVESTMENTS – 100.0% | ||||||||
| (Cost $113,629,890) | $ | 103,786,931 | ||||||
|
| |||||||
| | OTHER ASSETS IN EXCESS OF | 26,392 | ||||||
|
| |||||||
| NET ASSETS – 100.0% | $ | 103,813,323 | ||||||
|
| |||||||
| The percentage shown for each investment category reflects the value of investments in that category as a percentage of net assets. | ||
| * | Non-income producing security. | |
| (a) | All or a portion of security is on loan. | |
| (b) | All or a portion of security is pledged as collateral for futures. | |
| (c) | Represents an affiliated issuer. | |
| Investment Abbreviations: | ||
| PLC | —Public Limited Company | |
| REIT | —Real Estate Investment Trust | |
ADDITIONAL INVESTMENT INFORMATION
FUTURES CONTRACTS — At June 30, 2022, the Fund had the following futures contracts:
| Description | Number of Contracts | Expiration Date | Notional Amount | Unrealized Appreciation/ (Depreciation) | ||||||||||||
Long position contracts: | ||||||||||||||||
| Russell 2000 E-Mini Index | 22 | 09/16/22 | $ | 1,972,527 | $ | (93,727 | ) | |||||||||
| 44 | The accompanying notes are an integral part of these financial statements. |
GOLDMAN SACHS VARIABLE INSURANCE TRUST STRATEGIC GROWTH FUND
Schedule of Investments
June 30, 2022 (Unaudited)
| Shares | Description | Value | ||||||
| Common Stocks – 97.2% | ||||||||
| Automobiles & Components – 3.4% | ||||||||
| 14,661 | Aptiv PLC* | $ | 1,305,855 | |||||
| 10,315 | Tesla, Inc.* | 6,946,328 | ||||||
|
| |||||||
| 8,252,183 | ||||||||
|
| |||||||
| Capital Goods – 1.6% | ||||||||
| 11,520 | Boeing Co. (The)* | 1,575,014 | ||||||
| 7,616 | Deere & Co. | 2,280,764 | ||||||
|
| |||||||
| 3,855,778 | ||||||||
|
| |||||||
| Commercial & Professional Services – 1.2% | ||||||||
| 16,743 | Verisk Analytics, Inc. | 2,898,046 | ||||||
|
| |||||||
| Consumer Durables & Apparel – 2.4% | ||||||||
| 8,508 | Lululemon Athletica, Inc.* | 2,319,366 | ||||||
| 34,571 | NIKE, Inc., Class B | 3,533,156 | ||||||
|
| |||||||
| 5,852,522 | ||||||||
|
| |||||||
| Consumer Services – 2.1% | ||||||||
| 1,534 | Chipotle Mexican Grill, Inc.* | 2,005,337 | ||||||
| 12,983 | McDonald’s Corp. | 3,205,243 | ||||||
|
| |||||||
| 5,210,580 | ||||||||
|
| |||||||
| Diversified Financials – 1.4% | ||||||||
| 43,669 | Charles Schwab Corp. (The) | 2,759,007 | ||||||
| 8,046 | Intercontinental Exchange, Inc. | 756,646 | ||||||
|
| |||||||
| 3,515,653 | ||||||||
|
| |||||||
| Food, Beverage & Tobacco – 4.1% | ||||||||
| 57,376 | Coca-Cola Co. (The) | 3,609,524 | ||||||
| 34,170 | McCormick & Co., Inc. | 2,844,652 | ||||||
| 26,680 | Mondelez International, Inc., Class A | 1,656,561 | ||||||
| 22,425 | Monster Beverage Corp.* | 2,078,798 | ||||||
|
| |||||||
| 10,189,535 | ||||||||
|
| |||||||
| Health Care Equipment & Services – 6.6% | ||||||||
| 71,262 | Boston Scientific Corp.* | 2,655,934 | ||||||
| 4,885 | Humana, Inc. | 2,286,522 | ||||||
| 7,166 | Insulet Corp.* | 1,561,758 | ||||||
| 13,642 | Intuitive Surgical, Inc.* | 2,738,086 | ||||||
| 9,960 | UnitedHealth Group, Inc. | 5,115,755 | ||||||
| 8,946 | Veeva Systems, Inc., Class A* | 1,771,666 | ||||||
|
| |||||||
| 16,129,721 | ||||||||
|
| |||||||
| Household & Personal Products – 2.3% | ||||||||
| 7,715 | Estee Lauder Cos., Inc. (The), Class A | 1,964,779 | ||||||
| 26,238 | Procter & Gamble Co. (The) | 3,772,762 | ||||||
|
| |||||||
| 5,737,541 | ||||||||
|
| |||||||
| Materials – 2.6% | ||||||||
| 7,842 | Ecolab, Inc. | 1,205,786 | ||||||
| 6,258 | Linde PLC (United Kingdom) | 1,799,363 | ||||||
| 3,898 | Martin Marietta Materials, Inc. | 1,166,438 | ||||||
| 9,497 | Sherwin-Williams Co. (The) | 2,126,473 | ||||||
|
| |||||||
| 6,298,060 | ||||||||
|
| |||||||
| Media & Entertainment – 7.8% | ||||||||
| 4,283 | Alphabet, Inc., Class A* | 9,333,771 | ||||||
|
| |||||||
| Common Stocks – (continued) | ||||||||
| Media & Entertainment – (continued) | ||||||||
| 3,418 | Alphabet, Inc., Class C* | 7,476,704 | ||||||
| 17,878 | Live Nation Entertainment, Inc.* | 1,476,365 | ||||||
| 59,253 | Snap, Inc., Class A* | 777,992 | ||||||
|
| |||||||
| 19,064,832 | ||||||||
|
| |||||||
| Pharmaceuticals, Biotechnology & Life Sciences – 7.6% | ||||||||
| 5,018 | Alnylam Pharmaceuticals, Inc.* | 731,875 | ||||||
| 5,947 | Argenx SE ADR (Netherlands) * | 2,253,199 | ||||||
| 8,832 | BioMarin Pharmaceutical, Inc.* | 731,908 | ||||||
| 12,458 | Danaher Corp. | 3,158,352 | ||||||
| 19,226 | Eli Lilly & Co. | 6,233,646 | ||||||
| 7,971 | Sarepta Therapeutics, Inc.* | 597,506 | ||||||
| 16,019 | Seagen, Inc.* | 2,834,402 | ||||||
| 7,007 | West Pharmaceutical Services, Inc. | 2,118,707 | ||||||
|
| |||||||
| 18,659,595 | ||||||||
|
| |||||||
| Real Estate – 1.9% | ||||||||
| 10,852 | American Tower Corp. REIT | 2,773,662 | ||||||
| 3,038 | Equinix, Inc. REIT | 1,996,027 | ||||||
|
| |||||||
| �� | 4,769,689 | |||||||
|
| |||||||
| Retailing – 7.5% | ||||||||
| 132,823 | Amazon.com, Inc.* | 14,107,131 | ||||||
| 12,427 | Etsy, Inc.* | 909,780 | ||||||
| 5,438 | RH* | 1,154,270 | ||||||
| 32,325 | Ross Stores, Inc. | 2,270,185 | ||||||
|
| |||||||
| 18,441,366 | ||||||||
|
| |||||||
| Semiconductors & Semiconductor Equipment – 4.9% | ||||||||
| 10,168 | KLA Corp. | 3,244,405 | ||||||
| 66,477 | Marvell Technology, Inc. | 2,893,744 | ||||||
| 38,581 | NVIDIA Corp. | 5,848,494 | ||||||
|
| |||||||
| 11,986,643 | ||||||||
|
| |||||||
| Software & Services – 23.8% | ||||||||
| 14,480 | Accenture PLC, Class A | 4,020,372 | ||||||
| 11,387 | Adobe, Inc.* | 4,168,325 | ||||||
| 7,582 | Atlassian Corp. PLC, Class A* | 1,420,867 | ||||||
| 10,875 | Bill.com Holdings, Inc.* | 1,195,597 | ||||||
| 3,887 | HubSpot, Inc.* | 1,168,627 | ||||||
| 21,205 | Mastercard, Inc., Class A | 6,689,753 | ||||||
| 105,772 | Microsoft Corp. | 27,165,423 | ||||||
| 26,979 | PayPal Holdings, Inc.* | 1,884,213 | ||||||
| 39,872 | Qualtrics International, Inc., Class A* | 498,799 | ||||||
| 4,101 | ServiceNow, Inc.* | 1,950,107 | ||||||
| 14,197 | Snowflake, Inc., Class A* | 1,974,235 | ||||||
| 8,085 | Splunk, Inc.* | 715,199 | ||||||
| 15,190 | Visa, Inc., Class A | 2,990,759 | ||||||
| 11,727 | Workday, Inc., Class A* | 1,636,855 | ||||||
| 5,654 | Zscaler, Inc.* | 845,330 | ||||||
|
| |||||||
| 58,324,461 | ||||||||
|
| |||||||
| Technology Hardware & Equipment – 13.2% | ||||||||
| 33,068 | Amphenol Corp., Class A | 2,128,918 | ||||||
| 220,522 | Apple, Inc. | 30,149,768 | ||||||
|
| |||||||
| 32,278,686 | ||||||||
|
| |||||||
| The accompanying notes are an integral part of these financial statements. | 45 |
GOLDMAN SACHS VARIABLE INSURANCE TRUST STRATEGIC GROWTH FUND
Schedule of Investments (continued)
June 30, 2022 (Unaudited)
| Shares | Description | Value | ||||||
| Common Stocks – (continued) | ||||||||
| Transportation – 2.8% | ||||||||
| 8,831 | Old Dominion Freight Line, Inc. | $ | 2,263,209 | |||||
| 9,030 | Union Pacific Corp. | 1,925,918 | ||||||
| 14,166 | United Parcel Service, Inc., Class B | 2,585,862 | ||||||
|
| |||||||
| 6,774,989 | ||||||||
|
| |||||||
| TOTAL COMMON STOCKS | ||||||||
| (Cost $128,824,546) | $ | 238,239,880 | ||||||
|
| |||||||
| Shares | Dividend Rate | Value | ||||||
| Investment Company – 2.7%(a) | ||||||||
| | Goldman Sachs Financial Square Government Fund — | | ||||||
| 6,641,484 | 1.367% | $ | 6,641,484 | |||||
| (Cost $6,641,484) | ||||||||
|
| |||||||
| TOTAL INVESTMENTS – 99.9% | ||||||||
| (Cost $135,466,030) | $ | 244,881,364 | ||||||
|
| |||||||
| | OTHER ASSETS IN EXCESS OF | 197,126 | ||||||
|
| |||||||
| NET ASSETS – 100.0% | $ | 245,078,490 | ||||||
|
| |||||||
| The percentage shown for each investment category reflects the value of investments in that category as a percentage of net assets. | ||
| * | Non-income producing security. | |
| (a) | Represents an affiliated issuer. | |
| Investment Abbreviations: | ||
| ADR | —American Depositary Receipt | |
| PLC | —Public Limited Company | |
| REIT | —Real Estate Investment Trust | |
| 46 | The accompanying notes are an integral part of these financial statements. |
GOLDMAN SACHS VARIABLE INSURANCE TRUST U.S. EQUITY INSIGHTS FUND
Schedule of Investments
June 30, 2022 (Unaudited)
| Shares | Description | Value | ||||||
| Common Stocks – 99.0% | ||||||||
| Automobiles & Components – 3.3% | ||||||||
| 102,887 | Ford Motor Co. | $ | 1,145,133 | |||||
| 102,142 | General Motors Co.* | 3,244,030 | ||||||
| 7,834 | Tesla, Inc.* | 5,275,572 | ||||||
|
| |||||||
| 9,664,735 | ||||||||
|
| |||||||
| Banks – 0.3% | ||||||||
| 7,352 | East West Bancorp, Inc. | 476,409 | ||||||
| 1,029 | JPMorgan Chase & Co. | 115,876 | ||||||
| 6,482 | KeyCorp | 111,685 | ||||||
| 886 | Signature Bank | 158,780 | ||||||
|
| |||||||
| 862,750 | ||||||||
|
| |||||||
| Capital Goods – 4.7% | ||||||||
| 6,484 | 3M Co. | 839,094 | ||||||
| 5,696 | AECOM | 371,493 | ||||||
| 1,366 | AMETEK, Inc. | 150,110 | ||||||
| 18,994 | Caterpillar, Inc. | 3,395,367 | ||||||
| 5,866 | Emerson Electric Co. | 466,582 | ||||||
| 15,500 | General Dynamics Corp. | 3,429,375 | ||||||
| 8,824 | Howmet Aerospace, Inc. | 277,515 | ||||||
| 45,986 | Otis Worldwide Corp. | 3,249,831 | ||||||
| 1,258 | PACCAR, Inc. | 103,584 | ||||||
| 3,544 | Parker-Hannifin Corp. | 872,001 | ||||||
| 1,593 | Textron, Inc. | 97,284 | ||||||
| 2,159 | United Rentals, Inc.* | 524,443 | ||||||
|
| |||||||
| 13,776,679 | ||||||||
|
| |||||||
| Commercial & Professional Services – 1.4% | ||||||||
| 1,690 | Cintas Corp. | 631,266 | ||||||
| 11,507 | Republic Services, Inc. | 1,505,921 | ||||||
| 13,310 | Waste Management, Inc. | 2,036,164 | ||||||
|
| |||||||
| 4,173,351 | ||||||||
|
| |||||||
| Consumer Durables & Apparel – 0.5% | ||||||||
| 3,366 | Capri Holdings Ltd.* | 138,040 | ||||||
| 8,097 | Garmin Ltd. | 795,530 | ||||||
| 3,710 | Whirlpool Corp. | 574,568 | ||||||
|
| |||||||
| 1,508,138 | ||||||||
|
| |||||||
| Consumer Services – 1.3% | ||||||||
| 1,796 | Boyd Gaming Corp. | 89,351 | ||||||
| 5,909 | Hilton Worldwide Holdings, Inc. | 658,499 | ||||||
| 13,795 | Marriott International, Inc., Class A | 1,876,258 | ||||||
| 14,999 | Wyndham Hotels & Resorts, Inc. | 985,734 | ||||||
|
| |||||||
| 3,609,842 | ||||||||
|
| |||||||
| Diversified Financials – 9.5% | ||||||||
| 5,259 | Ameriprise Financial, Inc. | 1,249,959 | ||||||
| 150,744 | Annaly Capital Management, Inc. REIT | 890,897 | ||||||
| 75,307 | Bank of New York Mellon Corp. (The) | 3,141,055 | ||||||
| 27,369 | Berkshire Hathaway, Inc., Class B* | 7,472,284 | ||||||
| 30,885 | Capital One Financial Corp. | 3,217,908 | ||||||
| 5,197 | Cboe Global Markets, Inc. | 588,249 | ||||||
| 60,218 | Charles Schwab Corp. (The) | 3,804,573 | ||||||
|
| |||||||
| Common Stocks – (continued) | ||||||||
| Diversified Financials – (continued) | ||||||||
| 1,029 | CME Group, Inc. | 210,636 | ||||||
| 29,739 | Equitable Holdings, Inc. | 775,296 | ||||||
| 26,206 | Intercontinental Exchange, Inc. | 2,464,412 | ||||||
| 6,178 | Northern Trust Corp. | 596,054 | ||||||
| 1,189 | Raymond James Financial, Inc. | 106,309 | ||||||
| 3,700 | State Street Corp. | 228,105 | ||||||
| 4,551 | Stifel Financial Corp. | 254,947 | ||||||
| 80,381 | Synchrony Financial | 2,220,123 | ||||||
| 8,642 | Voya Financial, Inc. | 514,458 | ||||||
|
| |||||||
| 27,735,265 | ||||||||
|
| |||||||
| Energy – 3.7% | ||||||||
| 23,202 | ConocoPhillips | 2,083,771 | ||||||
| 32,512 | Exxon Mobil Corp. | 2,784,328 | ||||||
| 178,513 | Kinder Morgan, Inc. | 2,991,878 | ||||||
| 18,493 | Marathon Oil Corp. | 415,723 | ||||||
| 3,966 | Marathon Petroleum Corp. | 326,045 | ||||||
| 6,310 | ONEOK, Inc. | 350,205 | ||||||
| 6,231 | Pioneer Natural Resources Co. | 1,390,011 | ||||||
| 11,121 | Schlumberger NV | 397,687 | ||||||
|
| |||||||
| 10,739,648 | ||||||||
|
| |||||||
| Food & Staples Retailing – 0.1% | ||||||||
| 2,067 | Casey’s General Stores, Inc. | 382,354 | ||||||
|
| |||||||
| Food, Beverage & Tobacco – 1.3% | ||||||||
| 27,710 | Altria Group, Inc. | 1,157,447 | ||||||
| 7,130 | Archer-Daniels-Midland Co. | 553,288 | ||||||
| 11,025 | Campbell Soup Co. | 529,751 | ||||||
| 18,660 | Keurig Dr Pepper, Inc. | 660,377 | ||||||
| 14,962 | Mondelez International, Inc., Class A | 928,991 | ||||||
|
| |||||||
| 3,829,854 | ||||||||
|
| |||||||
| Health Care Equipment & Services – 6.8% | ||||||||
| 14,349 | Abbott Laboratories | 1,559,019 | ||||||
| 31,892 | Centene Corp.* | 2,698,382 | ||||||
| 2,582 | Cigna Corp. | 680,408 | ||||||
| 8,507 | Elevance Health, Inc. | 4,105,308 | ||||||
| 14,806 | Envista Holdings Corp.* | 570,623 | ||||||
| 6,045 | HCA Healthcare, Inc. | 1,015,923 | ||||||
| 3,876 | Humana, Inc. | 1,814,239 | ||||||
| 4,136 | Medtronic PLC | 371,206 | ||||||
| 11,754 | Molina Healthcare, Inc.* | 3,286,536 | ||||||
| 5,987 | UnitedHealth Group, Inc. | 3,075,103 | ||||||
| 7,063 | Universal Health Services, Inc., Class B | 711,315 | ||||||
|
| |||||||
| 19,888,062 | ||||||||
|
| |||||||
| Household & Personal Products – 2.5% | ||||||||
| 25,470 | Kimberly-Clark Corp. | 3,442,271 | ||||||
| 26,417 | Procter & Gamble Co. (The) | 3,798,500 | ||||||
|
| |||||||
| 7,240,771 | ||||||||
|
| |||||||
| Insurance – 0.4% | ||||||||
| 736 | Globe Life, Inc. | 71,738 | ||||||
| 2,809 | Lincoln National Corp. | 131,377 | ||||||
|
| |||||||
| The accompanying notes are an integral part of these financial statements. | 47 |
GOLDMAN SACHS VARIABLE INSURANCE TRUST U.S. EQUITY INSIGHTS FUND
Schedule of Investments (continued)
June 30, 2022 (Unaudited)
| Shares | Description | Value | ||||||
| Common Stocks – (continued) | ||||||||
| Insurance – (continued) | ||||||||
| 2,247 | Marsh & McLennan Cos., Inc. | $ | 348,847 | |||||
| 9,678 | MetLife, Inc. | 607,681 | ||||||
|
| |||||||
| 1,159,643 | ||||||||
|
| |||||||
| Materials – 3.2% | ||||||||
| 5,777 | Air Products and Chemicals, Inc. | 1,389,253 | ||||||
| 33,062 | CF Industries Holdings, Inc. | 2,834,405 | ||||||
| 19,870 | Dow, Inc. | 1,025,491 | ||||||
| 73,124 | Freeport-McMoRan, Inc. | 2,139,608 | ||||||
| 1,037 | International Flavors & Fragrances, Inc. | 123,527 | ||||||
| 18,045 | International Paper Co. | 754,822 | ||||||
| 1,352 | Linde PLC (United Kingdom) | 388,741 | ||||||
| 11,838 | Mosaic Co. (The) | 559,109 | ||||||
| 873 | Nucor Corp. | 91,150 | ||||||
| 254 | Packaging Corp. of America | 34,925 | ||||||
|
| |||||||
| 9,341,031 | ||||||||
|
| |||||||
| Media & Entertainment – 7.8% | ||||||||
| 304 | Alphabet, Inc., Class A* | 662,495 | ||||||
| 4,697 | Alphabet, Inc., Class C* | 10,274,453 | ||||||
| 6,388 | Charter Communications, Inc., Class A* | 2,992,970 | ||||||
| 12,585 | Liberty Broadband Corp., Class C* | 1,455,329 | ||||||
| 13,524 | Live Nation Entertainment, Inc.* | 1,116,812 | ||||||
| 23,111 | Meta Platforms, Inc., Class A* | 3,726,649 | ||||||
| 50,578 | News Corp., Class A | 788,005 | ||||||
| 6,172 | Take-Two Interactive Software, Inc.* | 756,255 | ||||||
| 2,775 | Walt Disney Co. (The)* | 261,960 | ||||||
| 44,575 | Warner Bros Discovery, Inc.* | 598,196 | ||||||
|
| |||||||
| 22,633,124 | ||||||||
|
| |||||||
| Pharmaceuticals, Biotechnology & Life Sciences – 9.7% | ||||||||
| 30,615 | AbbVie, Inc. | 4,688,993 | ||||||
| 19,436 | Agilent Technologies, Inc. | 2,308,414 | ||||||
| 978 | Amgen, Inc. | 237,947 | ||||||
| 1,589 | Avantor, Inc.* | 49,418 | ||||||
| 12,839 | Biogen, Inc.* | 2,618,386 | ||||||
| 59,386 | Gilead Sciences, Inc. | 3,670,649 | ||||||
| 6,740 | Horizon Therapeutics PLC* | 537,582 | ||||||
| 4,065 | Incyte Corp.* | 308,818 | ||||||
| 1,422 | IQVIA Holdings, Inc.* | 308,560 | ||||||
| 7,223 | Johnson & Johnson | 1,282,155 | ||||||
| 54,726 | Merck & Co., Inc. | 4,989,369 | ||||||
| 2,153 | Mettler-Toledo International, Inc.* | 2,473,302 | ||||||
| 1,461 | Perrigo Co. PLC | 59,273 | ||||||
| 2,769 | Pfizer, Inc. | 145,179 | ||||||
| 10,909 | QIAGEN NV* | 514,905 | ||||||
| 7,272 | Thermo Fisher Scientific, Inc. | 3,950,732 | ||||||
| 618 | Vertex Pharmaceuticals, Inc.* | 174,146 | ||||||
|
| |||||||
| 28,317,828 | ||||||||
|
| |||||||
| Real Estate – 6.0% | ||||||||
| 23,188 | Camden Property Trust REIT | 3,118,322 | ||||||
| 978 | Crown Castle International Corp. REIT | 164,676 | ||||||
|
| |||||||
| Common Stocks – (continued) | ||||||||
| Real Estate – (continued) | ||||||||
| 7,968 | CubeSmart REIT | 340,393 | ||||||
| 6,643 | Equity LifeStyle Properties, Inc. REIT | 468,132 | ||||||
| 6,351 | Extra Space Storage, Inc. REIT | 1,080,432 | ||||||
| 35,164 | First Industrial Realty Trust, Inc. REIT | 1,669,587 | ||||||
| 5,569 | Healthpeak Properties, Inc. REIT | 144,293 | ||||||
| 22,616 | Host Hotels & Resorts, Inc. REIT | 354,619 | ||||||
| 25,914 | Life Storage, Inc. REIT | 2,893,557 | ||||||
| 10,615 | Mid-America Apartment Communities, Inc. REIT | 1,854,122 | ||||||
| 24,076 | Park Hotels & Resorts, Inc. REIT | 326,711 | ||||||
| 3,916 | Prologis, Inc. REIT | 460,718 | ||||||
| 7,330 | Public Storage REIT | 2,291,871 | ||||||
| 1,226 | Rexford Industrial Realty, Inc. REIT | 70,605 | ||||||
| 5,556 | SBA Communications Corp. REIT | 1,778,198 | ||||||
| 17,077 | STORE Capital Corp. REIT | 445,368 | ||||||
|
| |||||||
| 17,461,604 | ||||||||
|
| |||||||
| Retailing – 5.7% | ||||||||
| 61,460 | Amazon.com, Inc.* | 6,527,666 | ||||||
| 11,551 | AutoNation, Inc.* | 1,290,940 | ||||||
| 1,560 | AutoZone, Inc.* | 3,352,627 | ||||||
| 3,559 | Dollar General Corp. | 873,521 | ||||||
| 1,288 | Dollar Tree, Inc.* | 200,735 | ||||||
| 2,434 | Home Depot, Inc. (The) | 667,573 | ||||||
| 62,220 | LKQ Corp. | 3,054,380 | ||||||
| 6,113 | Penske Automotive Group, Inc. | 639,970 | ||||||
|
| |||||||
| 16,607,412 | ||||||||
|
| |||||||
| Semiconductors & Semiconductor Equipment – 4.2% | ||||||||
| 6,114 | Applied Materials, Inc. | 556,252 | ||||||
| 3,441 | Broadcom, Inc. | 1,671,672 | ||||||
| 1,370 | Lam Research Corp. | 583,826 | ||||||
| 1,406 | Microchip Technology, Inc. | 81,660 | ||||||
| 30,207 | Micron Technology, Inc. | 1,669,843 | ||||||
| 21,910 | NVIDIA Corp. | 3,321,337 | ||||||
| 8,126 | ON Semiconductor Corp.* | 408,819 | ||||||
| 4,088 | QUALCOMM, Inc. | 522,201 | ||||||
| 21,682 | Texas Instruments, Inc. | 3,331,439 | ||||||
|
| |||||||
| 12,147,049 | ||||||||
|
| |||||||
| Software & Services – 15.3% | ||||||||
| 489 | Adobe, Inc.* | 179,003 | ||||||
| 14,300 | Fortinet, Inc.* | 809,094 | ||||||
| 13,114 | Gartner, Inc.* | 3,171,359 | ||||||
| 22,949 | International Business Machines Corp. | 3,240,169 | ||||||
| 1,678 | Intuit, Inc. | 646,768 | ||||||
| 79,401 | Microsoft Corp. | 20,392,559 | ||||||
| 52,425 | Oracle Corp. | 3,662,935 | ||||||
| 3,389 | Palo Alto Networks, Inc.* | 1,673,963 | ||||||
| 2,628 | Paycom Software, Inc.* | 736,155 | ||||||
| 3,851 | PayPal Holdings, Inc.* | 268,954 | ||||||
| 2,085 | Roper Technologies, Inc. | 822,845 | ||||||
| 3,039 | ServiceNow, Inc.* | 1,445,105 | ||||||
|
| |||||||
| 48 | The accompanying notes are an integral part of these financial statements. |
GOLDMAN SACHS VARIABLE INSURANCE TRUST U.S. EQUITY INSIGHTS FUND
| Shares | Description | Value | ||||||
| Common Stocks – (continued) | ||||||||
| Software & Services – (continued) | ||||||||
| 8,489 | Synopsys, Inc.* | $ | 2,578,109 | |||||
| 18,939 | VeriSign, Inc.* | 3,169,063 | ||||||
| 1,775 | Visa, Inc., Class A | 349,480 | ||||||
| 12,378 | VMware, Inc., Class A | 1,410,845 | ||||||
|
| |||||||
| 44,556,406 | ||||||||
|
| |||||||
| Technology Hardware & Equipment – 7.0% | ||||||||
| 118,954 | Apple, Inc. | 16,263,391 | ||||||
| 53,339 | Cisco Systems, Inc. | 2,274,375 | ||||||
| 24,058 | Dell Technologies, Inc., Class C | 1,111,720 | ||||||
| 31,989 | Hewlett Packard Enterprise Co. | 424,174 | ||||||
| 938 | Teledyne Technologies, Inc.* | 351,853 | ||||||
|
| |||||||
| 20,425,513 | ||||||||
|
| |||||||
| Telecommunication Services – 0.1% | ||||||||
| 10,447 | Liberty Global PLC, Class C (United Kingdom) * | 230,774 | ||||||
|
| |||||||
| Transportation – 3.8% | ||||||||
| 119,226 | CSX Corp. | 3,464,708 | ||||||
| 2,797 | Knight-Swift Transportation Holdings, Inc. | 129,473 | ||||||
| 14,563 | Norfolk Southern Corp. | 3,310,024 | ||||||
| 19,657 | Union Pacific Corp. | 4,192,445 | ||||||
|
| |||||||
| 11,096,650 | ||||||||
|
| |||||||
| Utilities – 0.4% | ||||||||
| 16,848 | CMS Energy Corp. | 1,137,240 | ||||||
|
| |||||||
| TOTAL INVESTMENTS – 99.0% | ||||||||
| (Cost $264,644,819) | $ | 288,525,723 | ||||||
|
| |||||||
| | OTHER ASSETS IN EXCESS OF | 2,970,914 | ||||||
|
| |||||||
| NET ASSETS – 100.0% | $ | 291,496,637 | ||||||
|
| |||||||
| The percentage shown for each investment category reflects the value of investments in that category as a percentage of net assets. | ||
| * | Non-income producing security. | |
| Investment Abbreviations: | ||
| PLC | —Public Limited Company | |
| REIT | —Real Estate Investment Trust | |
ADDITIONAL INVESTMENT INFORMATION
FUTURES CONTRACTS — At June 30, 2022, the Fund had the following futures contracts:
| Description | Number of Contracts | Expiration Date | Notional Amount | Unrealized Appreciation/ (Depreciation) | ||||||||||||
Long position contracts: | ||||||||||||||||
| S&P 500 E-Mini Index | 3 | 09/16/22 | $ | 585,028 | $ | (16,603 | ) | |||||||||
| The accompanying notes are an integral part of these financial statements. | 49 |
GOLDMAN SACHS VARIABLE INSURANCE TRUST EQUITY FUNDS
Statements of Assets and Liabilities
June 30, 2022 (Unaudited)
| Equity Index Fund | International Equity Insights Fund | Large Cap Value Fund | Mid Cap Growth Fund | |||||||||||||
| Assets: | ||||||||||||||||
Investments in unaffiliated issuers, at value (cost $47,774,296, $95,791,697, $344,515,073 and $46,995,331, respectively)(a) | $ | 166,432,212 | $ | 88,766,702 | $ | 377,494,131 | $ | 47,975,226 | ||||||||
Investments in affiliated issuers, at value (cost $183,678, $—, $2,738,674 and $3,320,691, respectively) | 527,508 | — | 2,738,674 | 3,320,691 | ||||||||||||
Investments in affiliated securities lending reinvestment vehicle, at value which equals cost | — | 1,270,901 | — | 465,693 | ||||||||||||
Cash | — | — | 586,103 | — | ||||||||||||
Foreign currency, at value (cost $—, $1,553,288, $— and $—, respectively) | — | 1,512,581 | �� | — | — | |||||||||||
Variation margin on futures contracts | — | 30,929 | — | — | ||||||||||||
Receivables: | ||||||||||||||||
Investments sold | 425,129 | 136,649 | 63,097 | 1,051,029 | ||||||||||||
Dividends | 131,661 | 124,718 | 379,385 | 10,549 | ||||||||||||
Collateral on certain derivative contracts | 42,000 | 48,453 | — | — | ||||||||||||
Reimbursement from investment adviser | 17,609 | 8,586 | 15,476 | 11,349 | ||||||||||||
Securities lending income | 2 | 715 | — | 130 | ||||||||||||
Foreign tax reclaims | — | 326,594 | 1,536 | — | ||||||||||||
Fund shares sold | — | 1,857 | 548,663 | 890 | ||||||||||||
Other assets | 854 | 10,536 | 1,272 | 48,398 | ||||||||||||
| Total assets | 167,576,975 | 92,239,221 | 381,828,337 | 52,883,955 | ||||||||||||
| Liabilities: | ||||||||||||||||
Variation margin on futures contracts | 6,350 | — | — | — | ||||||||||||
Payables: | ||||||||||||||||
Due to custodian | 449,332 | 18,083 | — | 422,193 | ||||||||||||
Fund shares redeemed | 86,565 | 44,227 | 350,306 | 140,366 | ||||||||||||
Distribution and Service fees and Transfer Agency fees | 42,494 | 8,698 | 30,238 | 12,352 | ||||||||||||
Management fees | 29,825 | 84,797 | 221,341 | 34,385 | ||||||||||||
Investments purchased | — | — | 1,542 | 615,907 | ||||||||||||
Payable upon return of securities loaned | — | 1,270,901 | — | 465,693 | ||||||||||||
Accrued expenses | 157,586 | 314,642 | 207,801 | 120,929 | ||||||||||||
| Total liabilities | 772,152 | 1,741,348 | 811,228 | 1,811,825 | ||||||||||||
| Net Assets: | ||||||||||||||||
Paid-in capital | 43,917,429 | 101,794,009 | 312,322,870 | 48,677,348 | ||||||||||||
Total distributable earnings (loss) | 122,887,394 | (11,296,136 | ) | 68,694,239 | 2,394,782 | |||||||||||
| NET ASSETS | $ | 166,804,823 | $ | 90,497,873 | $ | 381,017,109 | $ | 51,072,130 | ||||||||
Net Assets: | ||||||||||||||||
Institutional | $ | — | $ | 57,490,143 | $ | 142,897,068 | $ | 1,069,275 | ||||||||
Service | 166,804,823 | 33,007,730 | 238,120,041 | 50,002,855 | ||||||||||||
Total Net Assets | $ | 166,804,823 | $ | 90,497,873 | $ | 381,017,109 | $ | 51,072,130 | ||||||||
Shares outstanding $0.001 par value (unlimited number of shares authorized): | ||||||||||||||||
Institutional | — | 7,659,936 | 16,481,656 | 119,634 | ||||||||||||
Service | 9,255,155 | 4,382,694 | 27,490,748 | 5,990,234 | ||||||||||||
Net asset value, offering and redemption price per share: | ||||||||||||||||
Institutional | $— | $7.51 | $8.67 | $8.94 | ||||||||||||
Service | 18.02 | 7.53 | 8.66 | 8.35 | ||||||||||||
| (a) | Includes loaned securities having a market value of $—, $1,167,159, $— and $441,900. |
| 50 | The accompanying notes are an integral part of these financial statements. |
GOLDMAN SACHS VARIABLE INSURANCE TRUST EQUITY FUNDS
Statements of Assets and Liabilities (continued)
June 30, 2022 (Unaudited)
| Mid Cap Value Fund | Small Cap Equity Insights Fund | Strategic Growth Fund | U.S. Equity Insights Fund | |||||||||||||
| Assets: | ||||||||||||||||
Investments in unaffiliated issuers, at value (cost $342,309,738, $111,045,783, $128,824,546 and $264,644,819, respectively)(a) | $ | 371,478,688 | $ | 101,202,824 | $ | 238,239,880 | $ | 288,525,723 | ||||||||
Investments in affiliated issuers, at value (cost $1,408,277, $1,133,027, $6,641,484 and $—, respectively) | 1,408,277 | 1,133,027 | 6,641,484 | — | ||||||||||||
Investments in affiliated securities lending reinvestment vehicle, at value which equals cost | — | 1,451,080 | — | — | ||||||||||||
Cash | 734,549 | 815,713 | 785,592 | 2,660,430 | ||||||||||||
Receivables: | ||||||||||||||||
Investments sold | 4,607,985 | 910,879 | — | — | ||||||||||||
Dividends | 452,648 | 87,472 | 94,820 | 237,163 | ||||||||||||
Fund shares sold | 215,461 | 86,805 | 247,407 | 599,447 | ||||||||||||
Reimbursement from investment adviser | 2,169 | 13,776 | 16,046 | 18,843 | ||||||||||||
Securities lending income | — | 2,392 | — | — | ||||||||||||
Collateral on certain derivative contracts | — | — | — | 34,653 | ||||||||||||
Other assets | 64,750 | 1,120 | 1,455 | 18,371 | ||||||||||||
| Total assets | 378,964,527 | 105,705,088 | 246,026,684 | 292,094,630 | ||||||||||||
| Liabilities: | ||||||||||||||||
Variation margin on futures contracts | — | 14,740 | — | 4,762 | ||||||||||||
Payables: | ||||||||||||||||
Investments purchased | 2,953,153 | 73,113 | 260,761 | — | ||||||||||||
Management fees | 242,647 | 62,207 | 147,376 | 133,959 | ||||||||||||
Fund shares redeemed | 206,582 | 145,093 | 309,690 | 222,133 | ||||||||||||
Distribution and Service fees and Transfer Agency fees | 25,509 | 6,309 | 34,241 | 17,614 | ||||||||||||
Payable upon return of securities loaned | — | 1,451,080 | — | — | ||||||||||||
Accrued expenses | 382,255 | 139,223 | 196,126 | 219,525 | ||||||||||||
| Total liabilities | 3,810,146 | 1,891,765 | 948,194 | 597,993 | ||||||||||||
| Net Assets: | ||||||||||||||||
Paid-in capital | 288,721,055 | 119,628,677 | 94,834,349 | 272,457,135 | ||||||||||||
Total distributable earnings (loss) | 86,433,326 | (15,815,354 | ) | 150,244,141 | 19,039,502 | |||||||||||
| NET ASSETS | $ | 375,154,381 | $ | 103,813,323 | $ | 245,078,490 | $ | 291,496,637 | ||||||||
Net Assets: | ||||||||||||||||
Institutional | $ | 301,216,855 | $ | 84,356,820 | $ | 127,164,428 | $ | 247,131,889 | ||||||||
Service | 73,937,526 | 19,456,503 | 117,914,062 | 44,364,748 | ||||||||||||
Total Net Assets | $ | 375,154,381 | $ | 103,813,323 | $ | 245,078,490 | $ | 291,496,637 | ||||||||
Shares outstanding $0.001 par value (unlimited number of shares authorized): | ||||||||||||||||
Institutional | 18,490,888 | 8,300,509 | 11,157,787 | 15,660,803 | ||||||||||||
Service | 4,498,606 | 1,939,831 | 10,403,923 | 2,790,355 | ||||||||||||
Net asset value, offering and redemption price per share: | ||||||||||||||||
Institutional | $16.29 | $10.16 | $11.40 | $15.78 | ||||||||||||
Service | 16.44 | 10.03 | 11.33 | 15.90 | ||||||||||||
| (a) | Includes loaned securities having a market value of $—, $1,371,472, $— and $—. |
| The accompanying notes are an integral part of these financial statements. | 51 |
GOLDMAN SACHS VARIABLE INSURANCE TRUST EQUITY FUNDS
Statements of Operations
For the Six Months Ended June 30, 2022 (Unaudited)
| Equity Index Fund | International Equity Insights Fund | Large Cap Value Fund | Mid Cap Growth Fund | |||||||||||||
| Investment income: | ||||||||||||||||
Dividends — unaffiliated issuers (net of foreign withholding taxes of $417, $327,348, $434 and $—, respectively) | $ | 1,473,043 | $ | 3,096,316 | $ | 4,533,941 | $ | 152,888 | ||||||||
Dividends — affiliated issuers | 7,182 | 85 | 5,011 | 5,678 | ||||||||||||
Securities lending income — affiliated issuer | 30 | 7,931 | 664 | 1,616 | ||||||||||||
| Total investment income | 1,480,255 | 3,104,332 | 4,539,616 | 160,182 | ||||||||||||
| Expenses: | ||||||||||||||||
Management fees | 287,969 | 408,206 | 1,580,220 | 254,408 | ||||||||||||
Distribution and/or Service (12b-1) fees | 239,974 | 48,449 | 344,419 | 71,775 | ||||||||||||
Professional fees | 50,982 | 27,379 | 45,975 | 45,946 | ||||||||||||
Custody, accounting and administrative services | 35,800 | 30,178 | 46,569 | 9,184 | ||||||||||||
Transfer Agency fees(a) | 19,198 | 10,079 | 43,895 | 5,848 | ||||||||||||
Printing and mailing costs | 13,948 | 9,937 | 18,263 | 6,421 | ||||||||||||
Trustee fees | 10,959 | 10,579 | 11,283 | 11,391 | ||||||||||||
Other | 569 | 392 | 1,117 | 365 | ||||||||||||
| Total expenses | 659,399 | 545,199 | 2,091,741 | 405,338 | ||||||||||||
Less — expense reductions | (194,804 | ) | (66,367 | ) | (231,877 | ) | (119,176 | ) | ||||||||
| Net expenses | 464,595 | 478,832 | 1,859,864 | 286,162 | ||||||||||||
| NET INVESTMENT INCOME (LOSS) | 1,015,660 | 2,625,500 | 2,679,752 | (125,980 | ) | |||||||||||
| Realized and unrealized gain (loss): | ||||||||||||||||
Net realized gain (loss) from: | ||||||||||||||||
Investments — unaffiliated issuers | 5,590,515 | (6,226,886 | ) | 28,026,126 | (167,192 | ) | ||||||||||
Investments — affiliated issuers | 7,776 | — | — | — | ||||||||||||
Futures contracts | (186,421 | ) | (67,015 | ) | — | — | ||||||||||
Foreign currency transactions | — | (91,506 | ) | (568 | ) | — | ||||||||||
Net change in unrealized gain (loss) on: | ||||||||||||||||
Investments — unaffiliated issuers | (49,597,876 | ) | (15,895,318 | ) | (90,138,827 | ) | (23,154,214 | ) | ||||||||
Investments — affiliated issuers | (164,048 | ) | — | — | — | |||||||||||
Futures contracts | (4,758 | ) | (13,316 | ) | — | — | ||||||||||
Foreign currency translations | — | (71,471 | ) | (25 | ) | — | ||||||||||
| Net realized and unrealized loss | (44,354,812 | ) | (22,365,512 | ) | (62,113,294 | ) | (23,321,406 | ) | ||||||||
| NET DECREASE IN NET ASSETS RESULTING FROM OPERATIONS | $ | (43,339,152 | ) | $ | (19,740,012 | ) | $ | (59,433,542 | ) | $ | (23,447,386 | ) | ||||
| (a) | Class specific Transfer Agency fees were as follows: |
| Transfer Agency Fees | ||||||||
Fund | Institutional | Service | ||||||
Equity Index Fund | $ | — | $ | 19,198 | ||||
International Equity Insights Fund | 6,203 | 3,876 | ||||||
Large Cap Value Fund | 16,341 | 27,554 | ||||||
Mid Cap Growth Fund | 106 | 5,742 | ||||||
| 52 | The accompanying notes are an integral part of these financial statements. |
GOLDMAN SACHS VARIABLE INSURANCE TRUST EQUITY FUNDS
Statements of Operations (continued)
For the Six Months Ended June 30, 2022 (Unaudited)
| Mid Cap Value Fund | Small Cap Equity Insights Fund | Strategic Growth Fund | U.S. Equity Insights Fund | |||||||||||||
| Investment income: | ||||||||||||||||
Dividends — unaffiliated issuers (net of foreign withholding taxes of $—, $2,084, $— and $—, respectively) | $ | 4,063,679 | $ | 777,766 | $ | 760,960 | $ | 2,152,505 | ||||||||
Dividends — affiliated issuers | 8,621 | 2,386 | 8,742 | 116 | ||||||||||||
Securities lending income — affiliated issuer | 230 | 10,773 | 1,836 | — | ||||||||||||
| Total investment income | 4,072,530 | 790,925 | 771,538 | 2,152,621 | ||||||||||||
| Expenses: | ||||||||||||||||
Management fees | 1,809,748 | 408,125 | 1,080,827 | 1,034,643 | ||||||||||||
Distribution and/or Service (12b-1) fees | 158,785 | 25,646 | 191,225 | 65,926 | ||||||||||||
Transfer Agency fees(a) | 47,007 | 11,661 | 30,446 | 33,376 | ||||||||||||
Professional fees | 46,014 | 47,397 | 50,315 | 46,942 | ||||||||||||
Printing and mailing costs | 38,769 | 12,337 | 14,165 | 13,041 | ||||||||||||
Custody, accounting and administrative services | 22,279 | 54,945 | 40,559 | 44,846 | ||||||||||||
Trustee fees | 11,505 | 10,917 | 11,348 | 11,338 | ||||||||||||
Other | 2,839 | 403 | 1,047 | 841 | ||||||||||||
| Total expenses | 2,136,946 | 571,431 | 1,419,932 | 1,250,953 | ||||||||||||
Less — expense reductions | (21,346 | ) | (71,843 | ) | (98,315 | ) | (254,392 | ) | ||||||||
| Net expenses | 2,115,600 | 499,588 | 1,321,617 | 996,561 | ||||||||||||
| NET INVESTMENT INCOME (LOSS) | 1,956,930 | 291,337 | (550,079 | ) | 1,156,060 | |||||||||||
| Realized and unrealized gain (loss): | ||||||||||||||||
Net realized gain (loss) from: | ||||||||||||||||
Investments — unaffiliated issuers | 39,177,828 | (6,683,656 | ) | 35,109,034 | (6,815,521 | ) | ||||||||||
Futures contracts | — | (220,895 | ) | — | 68,697 | |||||||||||
Net change in unrealized gain (loss) on: | ||||||||||||||||
Investments — unaffiliated issuers | (126,684,278 | ) | (22,822,377 | ) | (157,336,315 | ) | (74,299,077 | ) | ||||||||
Futures contracts | — | (103,902 | ) | — | (16,603 | ) | ||||||||||
| Net realized and unrealized loss | (87,506,450 | ) | (29,830,830 | ) | (122,227,281 | ) | (81,062,504 | ) | ||||||||
| NET DECREASE IN NET ASSETS RESULTING FROM OPERATIONS | $ | (85,549,520 | ) | $ | (29,539,493 | ) | $ | (122,777,360 | ) | $ | (79,906,444 | ) | ||||
| (a) | Class specific Transfer Agency fees were as follows: |
| Transfer Agency Fees | ||||||||
Fund | Institutional | Service | ||||||
Mid Cap Value Fund | $ | 34,304 | $ | 12,703 | ||||
Small Cap Equity Insights Fund | 9,609 | 2,052 | ||||||
Strategic Growth Fund | 15,148 | 15,298 | ||||||
U.S. Equity Insights Fund | 28,102 | 5,274 | ||||||
| The accompanying notes are an integral part of these financial statements. | 53 |
GOLDMAN SACHS VARIABLE INSURANCE TRUST EQUITY FUNDS
Statements of Changes in Net Assets
| Equity Index Fund | International Equity Insights Fund | |||||||||||||||
| For the Six Months Ended June 30, 2022 (Unaudited) | For the Fiscal Year Ended December 31, 2021 | For the Six Months Ended June 30, 2022 (Unaudited) | For the Fiscal Year Ended December 31, 2021 | |||||||||||||
| From operations: | ||||||||||||||||
Net investment income | $ | 1,015,660 | $ | 1,849,037 | $ | 2,625,500 | $ | 2,199,515 | ||||||||
Net realized gain (loss) | 5,411,870 | 12,272,760 | (6,385,407 | ) | 14,733,699 | |||||||||||
Net change in unrealized gain (loss) | (49,766,682 | ) | 36,594,319 | (15,980,105 | ) | (5,336,245 | ) | |||||||||
| Net increase (decrease) in net assets resulting from operations | (43,339,152 | ) | 50,716,116 | (19,740,012 | ) | 11,596,969 | ||||||||||
| Distributions to shareholders: | ||||||||||||||||
From distributable earnings: | ||||||||||||||||
Institutional Shares | — | — | — | (3,288,959 | ) | |||||||||||
Service Shares | — | (16,050,234 | ) | — | (2,232,384 | ) | ||||||||||
| Total distributions to shareholders | — | (16,050,234 | ) | — | (5,521,343 | ) | ||||||||||
| From share transactions: | ||||||||||||||||
Proceeds from sales of shares | 558,638 | 8,243,921 | 13,847,440 | 14,541,209 | ||||||||||||
Reinvestment of distributions | — | 16,050,234 | — | 5,521,343 | ||||||||||||
Cost of shares redeemed | (11,326,957 | ) | (23,750,642 | ) | (11,160,331 | ) | (16,387,138 | ) | ||||||||
| Net increase (decrease) in net assets resulting from share transactions | (10,768,319 | ) | 543,513 | 2,687,109 | 3,675,414 | |||||||||||
| TOTAL INCREASE (DECREASE) | (54,107,471 | ) | 35,209,395 | (17,052,903 | ) | 9,751,040 | ||||||||||
| Net Assets: | ||||||||||||||||
Beginning of period | 220,912,294 | 185,702,899 | 107,550,776 | 97,799,736 | ||||||||||||
End of period | $ | 166,804,823 | $ | 220,912,294 | $ | 90,497,873 | $ | 107,550,776 | ||||||||
| 54 | The accompanying notes are an integral part of these financial statements. |
GOLDMAN SACHS VARIABLE INSURANCE TRUST EQUITY FUNDS
Statements of Changes in Net Assets (continued)
| Large Cap Value Fund | Mid Cap Growth Fund | |||||||||||||||
| For the Six Months Ended June 30, 2022 (Unaudited) | For the Fiscal Year Ended December 31, 2021 | For the Six Months Ended June 30, 2022 (Unaudited) | For the Fiscal Year Ended December 31, 2021 | |||||||||||||
| From operations: | ||||||||||||||||
Net investment income (loss) | $ | 2,679,752 | $ | 4,451,628 | $ | (125,980 | ) | $ | (494,618 | ) | ||||||
Net realized gain (loss) | 28,025,558 | 71,561,668 | (167,192 | ) | 13,222,693 | |||||||||||
Net change in unrealized gain (loss) | (90,138,852 | ) | 26,553,600 | (23,154,214 | ) | (3,912,879 | ) | |||||||||
| Net increase (decrease) in net assets resulting from operations | (59,433,542 | ) | 102,566,896 | (23,447,386 | ) | 8,815,196 | ||||||||||
| Distributions to shareholders: | ||||||||||||||||
From distributable earnings: | ||||||||||||||||
Institutional Shares | — | (23,694,892 | ) | — | (67,989 | ) | ||||||||||
Service Shares | — | (40,039,323 | ) | — | (13,375,264 | ) | ||||||||||
| Total distributions to shareholders | — | (63,734,215 | ) | — | (13,443,253 | ) | ||||||||||
| From share transactions: | ||||||||||||||||
Proceeds from sales of shares | 8,816,323 | 16,916,259 | 4,960,755 | 3,372,373 | ||||||||||||
Reinvestment of distributions | — | 63,734,215 | — | 13,443,253 | ||||||||||||
Cost of shares redeemed | (55,627,748 | ) | (91,861,106 | ) | (7,909,745 | ) | (17,004,840 | ) | ||||||||
| Net decrease in net assets resulting from share transactions | (46,811,425 | ) | (11,210,632 | ) | (2,948,990 | ) | (189,214 | ) | ||||||||
| TOTAL INCREASE (DECREASE) | (106,244,967 | ) | 27,622,049 | (26,396,376 | ) | (4,817,271 | ) | |||||||||
| Net Assets: | ||||||||||||||||
Beginning of period | 487,262,076 | 459,640,027 | 77,468,506 | 82,285,777 | ||||||||||||
End of period | $ | 381,017,109 | $ | 487,262,076 | $ | 51,072,130 | $ | 77,468,506 | ||||||||
| The accompanying notes are an integral part of these financial statements. | 55 |
GOLDMAN SACHS VARIABLE INSURANCE TRUST EQUITY FUNDS
Statements of Changes in Net Assets (continued)
| Mid Cap Value Fund | Small Cap Equity Insights Fund | |||||||||||||||
| For the Six Months Ended June 30, 2022 (Unaudited) | For the Fiscal Year Ended December 31, 2021 | For the Six Months Ended June 30, 2022 (Unaudited) | For the Fiscal Year Ended December 31, 2021 | |||||||||||||
| From operations: | ||||||||||||||||
Net investment income | $ | 1,956,930 | $ | 2,016,725 | $ | 291,337 | $ | 374,184 | ||||||||
Net realized gain (loss) | 39,177,828 | 99,516,679 | (6,904,551 | ) | 26,133,672 | |||||||||||
Net change in unrealized gain (loss) | (126,684,278 | ) | 38,869,211 | (22,926,279 | ) | (1,898,924 | ) | |||||||||
| Net increase (decrease) in net assets resulting from operations | (85,549,520 | ) | 140,402,615 | (29,539,493 | ) | 24,608,932 | ||||||||||
| Distributions to shareholders: | ||||||||||||||||
From distributable earnings: | ||||||||||||||||
Institutional Shares | — | (51,237,122 | ) | — | (23,948,283 | ) | ||||||||||
Service Shares | — | (22,180,324 | ) | — | (4,659,058 | ) | ||||||||||
| Total distributions to shareholders | — | (73,417,446 | ) | — | (28,607,341 | ) | ||||||||||
| From share transactions: | ||||||||||||||||
Proceeds from sales of shares | 33,406,936 | 13,454,928 | 11,643,088 | 30,972,672 | ||||||||||||
Reinvestment of distributions | — | 73,417,446 | — | 28,607,341 | ||||||||||||
Cost of shares redeemed | (125,300,658 | ) | (87,544,935 | ) | (9,120,213 | ) | (26,877,758 | ) | ||||||||
| Net increase (decrease) in net assets resulting from share transactions | (91,893,722 | ) | (672,561 | ) | 2,522,875 | 32,702,255 | ||||||||||
| TOTAL INCREASE (DECREASE) | (177,443,242 | ) | 66,312,608 | (27,016,618 | ) | 28,703,846 | ||||||||||
| Net Assets: | ||||||||||||||||
Beginning of period | 552,597,623 | 486,285,015 | 130,829,941 | 102,126,095 | ||||||||||||
End of period | $ | 375,154,381 | $ | 552,597,623 | $ | 103,813,323 | $ | 130,829,941 | ||||||||
| 56 | The accompanying notes are an integral part of these financial statements. |
GOLDMAN SACHS VARIABLE INSURANCE TRUST EQUITY FUNDS
Statements of Changes in Net Assets (continued)
| Strategic Growth Fund | U.S. Equity Insights Fund | |||||||||||||||
| For the Six Months Ended June 30, 2022 (Unaudited) | For the Fiscal Year Ended December 31, 2021 | For the Six Months Ended June 30, 2022 (Unaudited) | For the Fiscal Year Ended December 31, 2021 | |||||||||||||
| From operations: | ||||||||||||||||
Net investment income (loss) | $ | (550,079 | ) | $ | (1,856,695 | ) | $ | 1,156,060 | $ | 2,738,157 | ||||||
Net realized gain (loss) | 35,109,034 | 54,667,136 | (6,746,824 | ) | 77,080,399 | |||||||||||
Net change in unrealized gain (loss) | (157,336,315 | ) | 33,677,090 | (74,315,680 | ) | 10,800,923 | ||||||||||
| Net increase (decrease) in net assets resulting from operations | (122,777,360 | ) | 86,487,531 | (79,906,444 | ) | 90,619,479 | ||||||||||
| Distributions to shareholders: | ||||||||||||||||
From distributable earnings: | ||||||||||||||||
Institutional Shares | — | (22,122,701 | ) | — | (71,715,395 | ) | ||||||||||
Service Shares | — | (31,302,896 | ) | — | (13,647,143 | ) | ||||||||||
| Total distributions to shareholders | — | (53,425,597 | ) | — | (85,362,538 | ) | ||||||||||
| From share transactions: | ||||||||||||||||
Proceeds from sales of shares | 10,939,932 | 14,745,884 | 14,534,063 | 24,061,285 | ||||||||||||
Reinvestment of distributions | — | 53,425,597 | — | 85,362,538 | ||||||||||||
Cost of shares redeemed | (93,010,804 | ) | (76,950,698 | ) | (22,448,318 | ) | (57,104,159 | ) | ||||||||
| Net increase (decrease) in net assets resulting from share transactions | (82,070,872 | ) | (8,779,217 | ) | (7,914,255 | ) | 52,319,664 | |||||||||
| TOTAL INCREASE (DECREASE) | (204,848,232 | ) | 24,282,717 | (87,820,699 | ) | 57,576,605 | ||||||||||
| Net Assets: | ||||||||||||||||
Beginning of period | 449,926,722 | 425,644,005 | 379,317,336 | 321,740,731 | ||||||||||||
End of period | $ | 245,078,490 | $ | 449,926,722 | $ | 291,496,637 | $ | 379,317,336 | ||||||||
| The accompanying notes are an integral part of these financial statements. | 57 |
GOLDMAN SACHS VARIABLE INSURANCE TRUST EQUITY INDEX FUND
Selected Share Data for a Share Outstanding Throughout Each Period
| Goldman Sachs Equity Index Fund | ||||||||||||||||||||||||
| Service Shares | ||||||||||||||||||||||||
| Six Months Ended June 30, 2022 (Unaudited) | Year Ended December 31, | |||||||||||||||||||||||
| 2021 | 2020 | 2019 | 2018 | 2017 | ||||||||||||||||||||
| Per Share Data | ||||||||||||||||||||||||
Net asset value, beginning of period | $ | 22.59 | $ | 19.01 | $ | 17.50 | $ | 14.43 | $ | 16.60 | $ | 14.49 | ||||||||||||
Net investment income(a) | 0.11 | 0.20 | 0.22 | 0.25 | 0.25 | 0.24 | ||||||||||||||||||
Net realized and unrealized gain (loss) | (4.68 | ) | 5.14 | 2.89 | 4.18 | (1.04 | ) | 2.85 | ||||||||||||||||
Total from investment operations | (4.57 | ) | 5.34 | 3.11 | 4.43 | (0.79 | ) | 3.09 | ||||||||||||||||
Distributions to shareholders from net investment income | — | (0.22 | ) | (0.23 | ) | (0.26 | ) | (0.27 | ) | (0.26 | ) | |||||||||||||
Distributions to shareholders from net realized gains | — | (1.54 | ) | (1.37 | ) | (1.10 | ) | (1.11 | ) | (0.72 | ) | |||||||||||||
Total distributions | — | (1.76 | ) | (1.60 | ) | (1.36 | ) | (1.38 | ) | (0.98 | ) | |||||||||||||
Net asset value, end of period | $ | 18.02 | $ | 22.59 | $ | 19.01 | $ | 17.50 | $ | 14.43 | $ | 16.60 | ||||||||||||
Total Return(b) | (20.23 | )% | 28.20 | % | 17.84 | % | 30.85 | % | (4.87 | )% | 21.29 | % | ||||||||||||
Net assets, end of period (in 000’s) | $ | 166,805 | $ | 220,912 | $ | 185,703 | $ | 179,542 | $ | 155,098 | $ | 179,036 | ||||||||||||
Ratio of net expenses to average net assets | 0.48 | %(c) | 0.48 | % | 0.48 | % | 0.50 | % | 0.48 | % | 0.48 | % | ||||||||||||
Ratio of total expenses to average net assets | 0.69 | %(c) | 0.70 | % | 0.76 | % | 0.78 | % | 0.72 | % | 0.71 | % | ||||||||||||
Ratio of net investment income to average net assets | 1.06 | %(c)�� | 0.91 | % | 1.28 | % | 1.48 | % | 1.48 | % | 1.53 | % | ||||||||||||
Portfolio turnover rate(d) | 1 | % | 4 | % | 4 | % | 3 | % | 4 | % | 2 | % | ||||||||||||
| (a) | Calculated based on the average shares outstanding methodology. |
| (b) | Assumes investment at the NAV at the beginning of the period, reinvestment of all dividends and distributions, a complete redemption of the investment at the NAV at the end of the period and no sales or redemption charges (if any). Total returns would be reduced if a sales or redemption charge was taken into account. Returns do not reflect the impact of taxes to shareholders relating to Fund distributions or the redemption of Fund shares. Total returns for periods less than one full year are not annualized. |
| (c) | Annualized. |
| (d) | The Fund’s portfolio turnover rate is calculated in accordance with regulatory requirements, without regard to transactions involving short term investments and certain derivatives. If such transactions were included, the Fund’s portfolio turnover rate may be higher. |
| 58 | The accompanying notes are an integral part of these financial statements. |
GOLDMAN SACHS VARIABLE INSURANCE TRUST INTERNATIONAL EQUITY INSIGHTS FUND
Financial Highlights (continued)
Selected Share Data for a Share Outstanding Throughout Each Period
| (a) | Calculated based on the average shares outstanding methodology. |
| (b) | Amount is less than $0.005 per share. |
| (c) | Assumes investment at the NAV at the beginning of the period, reinvestment of all dividends and distributions, a complete redemption of the investment at the NAV at the end of the period and no sales or redemption charges (if any). Total returns would be reduced if a sales or redemption charge was taken into account. Returns do not reflect the impact of taxes to shareholders relating to Fund distributions or the redemption of Fund shares. Total returns for periods less than one full year are not annualized. |
| (d) | Annualized. |
| (e) | The Fund’s portfolio turnover rate is calculated in accordance with regulatory requirements, without regard to transactions involving short term investments and certain derivatives. If such transactions were included, the Fund’s portfolio turnover rate may be higher. |
| The accompanying notes are an integral part of these financial statements. | 59 |
GOLDMAN SACHS VARIABLE INSURANCE TRUST INTERNATIONAL EQUITY INSIGHTS FUND
Financial Highlights (continued)
Selected Share Data for a Share Outstanding Throughout Each Period
| Goldman Sachs International Equity Insights Fund | ||||||||||||||||||||||||
| Service Shares | ||||||||||||||||||||||||
| Six Months Ended June 30, 2022 (Unaudited) | Year Ended December 31, | |||||||||||||||||||||||
| 2021 | 2020 | 2019 | 2018 | 2017 | ||||||||||||||||||||
| Per Share Data | ||||||||||||||||||||||||
Net asset value, beginning of period | $ | 9.20 | $ | 8.66 | $ | 8.23 | $ | 7.11 | $ | 10.91 | $ | 8.78 | ||||||||||||
Net investment income(a) | 0.20 | 0.19 | 0.10 | 0.15 | 0.14 | 0.14 | ||||||||||||||||||
Net realized and unrealized gain (loss) | (1.87 | ) | 0.83 | 0.44 | 1.15 | (1.93 | ) | 2.16 | ||||||||||||||||
Total from investment operations | (1.67 | ) | 1.02 | 0.54 | 1.30 | (1.79 | ) | 2.30 | ||||||||||||||||
Distributions to shareholders from net investment income | — | (0.25 | ) | (0.11 | ) | (0.18 | ) | (0.17 | ) | (0.17 | ) | |||||||||||||
Distributions to shareholders from net realized gains | — | (0.23 | ) | — | — | (b) | (1.84 | ) | — | |||||||||||||||
Total distributions | — | (0.48 | ) | (0.11 | ) | (0.18 | ) | (2.01 | ) | (0.17 | ) | |||||||||||||
Net asset value, end of period | $ | 7.53 | $ | 9.20 | $ | 8.66 | $ | 8.23 | $ | 7.11 | $ | 10.91 | ||||||||||||
Total Return(c) | (18.15 | )% | 11.81 | % | 6.53 | % | 18.23 | % | (16.55 | )% | 26.21 | % | ||||||||||||
Net assets, end of period (in 000’s) | $ | 33,008 | $ | 44,372 | $ | 47,685 | $ | 48,884 | $ | 43,923 | $ | 123,778 | ||||||||||||
Ratio of net expenses to average net assets | 1.11 | %(d) | 1.10 | % | 1.12 | % | 1.15 | % | 1.12 | % | 1.12 | % | ||||||||||||
Ratio of total expenses to average net assets | 1.24 | %(d) | 1.40 | % | 1.61 | % | 1.55 | % | 1.43 | % | 1.27 | % | ||||||||||||
Ratio of net investment income to average net assets | 4.85 | %(d) | 1.97 | % | 1.30 | % | 1.89 | % | 1.30 | % | 1.44 | % | ||||||||||||
Portfolio turnover rate(e) | 84 | % | 167 | % | 175 | % | 146 | % | 156 | % | 23 | % | ||||||||||||
| (a) | Calculated based on the average shares outstanding methodology. |
| (b) | Amount is less than $0.005 per share. |
| (c) | Assumes investment at the NAV at the beginning of the period, reinvestment of all dividends and distributions, a complete redemption of the investment at the NAV at the end of the period and no sales or redemption charges (if any). Total returns would be reduced if a sales or redemption charge was taken into account. Returns do not reflect the impact of taxes to shareholders relating to Fund distributions or the redemption of Fund shares. Total returns for periods less than one full year are not annualized. |
| (d) | Annualized. |
| (e) | The Fund’s portfolio turnover rate is calculated in accordance with regulatory requirements, without regard to transactions involving short term investments and certain derivatives. If such transactions were included, the Fund’s portfolio turnover rate may be higher. |
| 60 | The accompanying notes are an integral part of these financial statements. |
GOLDMAN SACHS VARIABLE INSURANCE TRUST LARGE CAP VALUE FUND
Financial Highlights (continued)
Selected Share Data for a Share Outstanding Throughout Each Period
| (a) | Calculated based on the average shares outstanding methodology. |
| (b) | Assumes investment at the NAV at the beginning of the period, reinvestment of all dividends and distributions, a complete redemption of the investment at the NAV at the end of the period and no sales or redemption charges (if any). Total returns would be reduced if a sales or redemption charge was taken into account. Returns do not reflect the impact of taxes to shareholders relating to Fund distributions or the redemption of Fund shares. Total returns for periods less than one full year are not annualized. |
| (c) | Annualized. |
| (d) | The Fund’s portfolio turnover rate is calculated in accordance with regulatory requirements, without regard to transactions involving short term investments. If such transactions were included, the Fund’s portfolio turnover rate may be higher. |
| The accompanying notes are an integral part of these financial statements. | 61 |
GOLDMAN SACHS VARIABLE INSURANCE TRUST LARGE CAP VALUE FUND
Financial Highlights (continued)
Selected Share Data for a Share Outstanding Throughout Each Period
| Goldman Sachs Large Cap Value Fund | ||||||||||||||||||||||||
| Service Shares | ||||||||||||||||||||||||
| Six Months Ended June 30, 2022 (Unaudited) | Year Ended December 31, | |||||||||||||||||||||||
| 2021 | 2020 | 2019 | 2018 | 2017 | ||||||||||||||||||||
| Per Share Data | ||||||||||||||||||||||||
Net asset value, beginning of period | $ | 9.98 | $ | 9.27 | $ | 9.19 | $ | 7.67 | $ | 9.06 | $ | 10.16 | ||||||||||||
Net investment income(a) | 0.05 | 0.09 | 0.10 | 0.11 | 0.10 | 0.13 | ||||||||||||||||||
Net realized and unrealized gain (loss) | (1.37 | ) | 2.09 | 0.24 | 1.85 | (0.88 | ) | 0.83 | ||||||||||||||||
Total from investment operations | (1.32 | ) | 2.18 | 0.34 | 1.96 | (0.78 | ) | 0.96 | ||||||||||||||||
Distributions to shareholders from net investment income | — | (0.10 | ) | (0.10 | ) | (0.11 | ) | (0.10 | ) | (0.15 | ) | |||||||||||||
Distributions to shareholders from net realized gains | — | (1.37 | ) | (0.16 | ) | (0.33 | ) | (0.51 | ) | (1.91 | ) | |||||||||||||
Total distributions | — | (1.47 | ) | (0.26 | ) | (0.44 | ) | (0.61 | ) | (2.06 | ) | |||||||||||||
Net asset value, end of period | $ | 8.66 | $ | 9.98 | $ | 9.27 | $ | 9.19 | $ | 7.67 | $ | 9.06 | ||||||||||||
Total Return(b) | (13.23 | )% | 23.93 | % | 3.73 | % | 25.61 | % | (8.72 | )% | 9.56 | % | ||||||||||||
Net assets, end of period (in 000’s) | $ | 238,120 | $ | 307,721 | $ | 299,564 | $ | 306,058 | $ | 282,891 | $ | 358,776 | ||||||||||||
Ratio of net expenses to average net assets | 0.93 | %(c) | 0.92 | % | 0.94 | % | 0.98 | % | 0.96 | % | 0.97 | % | ||||||||||||
Ratio of total expenses to average net assets | 1.05 | %(c) | 1.04 | % | 1.06 | % | 1.08 | % | 1.06 | % | 1.06 | % | ||||||||||||
Ratio of net investment income to average net assets | 1.13 | %(c) | 0.84 | % | 1.21 | % | 1.21 | % | 1.07 | % | 1.26 | % | ||||||||||||
Portfolio turnover rate(d) | 27 | % | 54 | % | 58 | % | 58 | % | 125 | % | 127 | % | ||||||||||||
| (a) | Calculated based on the average shares outstanding methodology. |
| (b) | Assumes investment at the NAV at the beginning of the period, reinvestment of all dividends and distributions, a complete redemption of the investment at the NAV at the end of the period and no sales or redemption charges (if any). Total returns would be reduced if a sales or redemption charge was taken into account. Returns do not reflect the impact of taxes to shareholders relating to Fund distributions or the redemption of Fund shares. Total returns for periods less than one full year are not annualized. |
| (c) | Annualized. |
| (d) | The Fund’s portfolio turnover rate is calculated in accordance with regulatory requirements, without regard to transactions involving short term investments. If such transactions were included, the Fund’s portfolio turnover rate may be higher. |
| 62 | The accompanying notes are an integral part of these financial statements. |
GOLDMAN SACHS VARIABLE INSURANCE TRUST MID CAP GROWTH FUND
Financial Highlights (continued)
Selected Share Data for a Share Outstanding Throughout Each Period
| Goldman Sachs Mid Cap Growth Fund | ||||||||||||||||||||||||
| Institutional Shares | ||||||||||||||||||||||||
| Six Months Ended June 30, 2022 (Unaudited) | Year Ended December 31,(a) | |||||||||||||||||||||||
| 2021 | 2020 | 2019 | 2018 | 2017 | ||||||||||||||||||||
| Per Share Data | ||||||||||||||||||||||||
Net asset value, beginning of period | $ | 13.05 | $ | 13.93 | $ | 11.50 | $ | 10.51 | $ | 31.13 | $ | 27.13 | ||||||||||||
Net investment loss(b) | (0.01 | )(c) | (0.07 | ) | (0.04 | ) | (0.01 | ) | (0.02 | ) | (0.04 | ) | ||||||||||||
Net realized and unrealized gain (loss) | (4.10 | ) | 1.71 | 5.06 | 3.59 | (1.30 | ) | 7.40 | ||||||||||||||||
Total from investment operations | (4.11 | ) | 1.64 | 5.02 | 3.58 | (1.32 | ) | 7.36 | ||||||||||||||||
Distributions to shareholders from net realized gains | — | (2.52 | ) | (2.59 | ) | (2.59 | ) | (19.30 | ) | (3.36 | ) | |||||||||||||
Net asset value, end of period | $ | 8.94 | $ | 13.05 | $ | 13.93 | $ | 11.50 | $ | 10.51 | $ | 31.13 | ||||||||||||
Total Return(d) | (31.34 | )% | 11.65 | % | 44.33 | % | 34.35 | % | (4.17 | )% | 27.14 | % | ||||||||||||
Net assets, end of period (in 000’s) | $ | 1,069 | $ | 483 | $ | 151 | $ | 94 | $ | 59 | $ | 52 | ||||||||||||
Ratio of net expenses to average net assets | 0.83 | %(e) | 0.83 | % | 0.85 | % | 0.88 | % | 0.85 | % | 0.87 | % | ||||||||||||
Ratio of total expenses to average net assets | 1.13 | %(e) | 1.33 | % | 1.23 | % | 1.26 | % | 1.20 | % | 1.14 | % | ||||||||||||
Ratio of net investment loss to average net assets | (0.23 | )%(c)(e) | (0.47 | )% | (0.34 | )% | (0.12 | )% | (0.08 | )% | (0.13 | )% | ||||||||||||
Portfolio turnover rate(f) | 38 | % | 50 | % | 71 | % | 75 | % | 59 | % | 57 | % | ||||||||||||
| (a) | All per share amounts representing data prior to May 17, 2019 have been restated to reflect a 4 to 1 reverse stock split which occurred on that date. |
| (b) | Calculated based on the average shares outstanding methodology. |
| (c) | Reflects income recognized from special dividends which amounted to $0.01 per share and 0.14% of average net assets. |
| (d) | Assumes investment at the NAV at the beginning of the period, reinvestment of all dividends and distributions, a complete redemption of the investment at the NAV at the end of the period and no sales or redemption charges (if any). Total returns would be reduced if a sales or redemption charge was taken into account. Returns do not reflect the impact of taxes to shareholders relating to Fund distributions or the redemption of Fund shares. Total returns for periods less than one full year are not annualized. |
| (e) | Annualized. |
| (f) | The Fund’s portfolio turnover rate is calculated in accordance with regulatory requirements, without regard to transactions involving short term investments. If such transactions were included, the Fund’s portfolio turnover rate may be higher. |
| The accompanying notes are an integral part of these financial statements. | 63 |
GOLDMAN SACHS VARIABLE INSURANCE TRUST MID CAP GROWTH FUND
Financial Highlights (continued)
Selected Share Data for a Share Outstanding Throughout Each Period
| Goldman Sachs Mid Cap Growth Fund | ||||||||||||||||||||||||
| Service Shares | ||||||||||||||||||||||||
| Six Months Ended June 30, 2022 (Unaudited) | Year Ended December 31,(a) | |||||||||||||||||||||||
| 2021 | 2020 | 2019 | 2018 | 2017 | ||||||||||||||||||||
| Per Share Data | ||||||||||||||||||||||||
Net asset value, beginning of period | $ | 12.20 | $ | 13.19 | $ | 11.00 | $ | 10.15 | $ | 30.80 | $ | 26.92 | ||||||||||||
Net investment loss(b) | (0.02 | )(c) | (0.09 | ) | (0.06 | ) | (0.02 | ) | (0.07 | ) | (0.08 | ) | ||||||||||||
Net realized and unrealized gain (loss) | (3.83 | ) | 1.62 | 4.84 | 3.46 | (1.28 | ) | 7.32 | ||||||||||||||||
Total from investment operations | (3.85 | ) | 1.53 | 4.78 | 3.44 | (1.35 | ) | 7.24 | ||||||||||||||||
Distributions to shareholders from net realized gains | — | (2.52 | ) | (2.59 | ) | (2.59 | ) | (19.30 | ) | (3.36 | ) | |||||||||||||
Net asset value, end of period | $ | 8.35 | $ | 12.20 | $ | 13.19 | $ | 11.00 | $ | 10.15 | $ | 30.80 | ||||||||||||
Total Return(d) | (31.39 | )% | 11.48 | % | 44.16 | % | 34.06 | % | (4.34 | )% | 26.92 | % | ||||||||||||
Net assets, end of period (in 000’s) | $ | 50,003 | $ | 76,986 | $ | 82,134 | $ | 73,406 | $ | 59,910 | $ | 170,785 | ||||||||||||
Ratio of net expenses to average net assets | 0.98 | %(e) | 0.99 | % | 1.01 | % | 1.04 | % | 1.01 | % | 1.02 | % | ||||||||||||
Ratio of total expenses to average net assets | 1.39 | %(e) | 1.43 | % | 1.48 | % | 1.51 | % | 1.44 | % | 1.39 | % | ||||||||||||
Ratio of net investment loss to average net assets | (0.43 | )%(c)(e) | (0.62 | )% | (0.50 | )% | (0.28 | )% | (0.24 | )% | (0.26 | )% | ||||||||||||
Portfolio turnover rate(f) | 38 | % | 50 | % | 71 | % | 75 | % | 59 | % | 57 | % | ||||||||||||
| (a) | All per share amounts representing data prior to May 17, 2019 have been restated to reflect a 4 to 1 reverse stock split which occurred on that date. |
| (b) | Calculated based on the average shares outstanding methodology. |
| (c) | Reflects income recognized from special dividends which amounted to $0.01 per share and 0.14% of average net assets. |
| (d) | Assumes investment at the NAV at the beginning of the period, reinvestment of all dividends and distributions, a complete redemption of the investment at the NAV at the end of the period and no sales or redemption charges (if any). Total returns would be reduced if a sales or redemption charge was taken into account. Returns do not reflect the impact of taxes to shareholders relating to Fund distributions or the redemption of Fund shares. Total returns for periods less than one full year are not annualized. |
| (e) | Annualized. |
| (f) | The Fund’s portfolio turnover rate is calculated in accordance with regulatory requirements, without regard to transactions involving short term investments. If such transactions were included, the Fund’s portfolio turnover rate may be higher. |
| 64 | The accompanying notes are an integral part of these financial statements. |
GOLDMAN SACHS VARIABLE INSURANCE TRUST MID CAP VALUE FUND
Financial Highlights (continued)
Selected Share Data for a Share Outstanding Throughout Each Period
| (a) | Calculated based on the average shares outstanding methodology. |
| (b) | Assumes investment at the NAV at the beginning of the period, reinvestment of all dividends and distributions, a complete redemption of the investment at the NAV at the end of the period and no sales or redemption charges (if any). Total returns would be reduced if a sales or redemption charge was taken into account. Returns do not reflect the impact of taxes to shareholders relating to Fund distributions or the redemption of Fund shares. Total returns for periods less than one full year are not annualized. |
| (c) | Annualized. |
| (d) | The Fund’s portfolio turnover rate is calculated in accordance with regulatory requirements, without regard to transactions involving short term investments and certain derivatives. If such transactions were included, the Fund’s portfolio turnover rate may be higher. |
| The accompanying notes are an integral part of these financial statements. | 65 |
GOLDMAN SACHS VARIABLE INSURANCE TRUST MID CAP VALUE FUND
Financial Highlights (continued)
Selected Share Data for a Share Outstanding Throughout Each Period
| Goldman Sachs Mid Cap Value Fund | ||||||||||||||||||||||||
| Service Shares | ||||||||||||||||||||||||
| Six Months Ended June 30, 2022 (Unaudited) | Year Ended December 31, | |||||||||||||||||||||||
| 2021 | 2020 | 2019 | 2018 | 2017 | ||||||||||||||||||||
| Per Share Data | ||||||||||||||||||||||||
Net asset value, beginning of period | $ | 19.73 | $ | 17.39 | $ | 16.37 | $ | 13.01 | $ | 16.95 | $ | 16.25 | ||||||||||||
Net investment income(a) | 0.05 | 0.04 | 0.06 | 0.10 | 0.07 | 0.08 | ||||||||||||||||||
Net realized and unrealized gain (loss) | (3.34 | ) | 5.24 | 1.28 | 3.95 | (1.84 | ) | 1.68 | ||||||||||||||||
Total from investment operations | (3.29 | ) | 5.28 | 1.34 | 4.05 | (1.77 | ) | 1.76 | ||||||||||||||||
Distributions to shareholders from net investment income | — | (0.05 | ) | (0.07 | ) | (0.09 | ) | (0.09 | ) | (0.09 | ) | |||||||||||||
Distributions to shareholders from net realized gains | — | (2.89 | ) | (0.25 | ) | (0.60 | ) | (2.08 | ) | (0.97 | ) | |||||||||||||
Total distributions | — | (2.94 | ) | (0.32 | ) | (0.69 | ) | (2.17 | ) | (1.06 | ) | |||||||||||||
Net asset value, end of period | $ | 16.44 | $ | 19.73 | $ | 17.39 | $ | 16.37 | $ | 13.01 | $ | 16.95 | ||||||||||||
Total Return(b) | (16.63 | )% | 30.57 | % | 8.17 | % | 31.17 | % | (10.70 | )% | 10.85 | % | ||||||||||||
Net assets, end of period (in 000’s) | $ | 73,938 | $ | 169,283 | $ | 158,909 | $ | 174,896 | $ | 76,835 | $ | 381,172 | ||||||||||||
Ratio of net expenses to average net assets | 1.08 | %(c) | 1.08 | % | 1.09 | % | 1.12 | % | 1.09 | % | 1.09 | % | ||||||||||||
Ratio of total expenses to average net assets | 1.09 | %(c) | 1.10 | % | 1.14 | % | 1.16 | % | 1.11 | % | 1.12 | % | ||||||||||||
Ratio of net investment income to average net assets | 0.53 | %(c) | 0.21 | % | 0.39 | % | 0.66 | % | 0.42 | % | 0.47 | % | ||||||||||||
Portfolio turnover rate(d) | 43 | % | 63 | % | 111 | % | 89 | % | 109 | % | 134 | % | ||||||||||||
| (a) | Calculated based on the average shares outstanding methodology. |
| (b) | Assumes investment at the NAV at the beginning of the period, reinvestment of all dividends and distributions, a complete redemption of the investment at the NAV at the end of the period and no sales or redemption charges (if any). Total returns would be reduced if a sales or redemption charge was taken into account. Returns do not reflect the impact of taxes to shareholders relating to Fund distributions or the redemption of Fund shares. Total returns for periods less than one full year are not annualized. |
| (c) | Annualized. |
| (d) | The Fund’s portfolio turnover rate is calculated in accordance with regulatory requirements, without regard to transactions involving short term investments and certain derivatives. If such transactions were included, the Fund’s portfolio turnover rate may be higher. |
| 66 | The accompanying notes are an integral part of these financial statements. |
GOLDMAN SACHS VARIABLE INSURANCE TRUST SMALL CAP EQUITY INSIGHTS FUND
Financial Highlights (continued)
Selected Share Data for a Share Outstanding Throughout Each Period
| (a) | Calculated based on the average shares outstanding methodology. |
| (b) | Reflects income recognized from special dividends which amounted to $0.03 per share and 0.22% of average net assets. |
| (c) | Reflects income recognized from special dividends which amounted to $0.02 per share and 0.17% of average net assets. |
| (d) | Assumes investment at the NAV at the beginning of the period, reinvestment of all dividends and distributions, a complete redemption of the investment at the NAV at the end of the period and no sales or redemption charges (if any). Total returns would be reduced if a sales or redemption charge was taken into account. Returns do not reflect the impact of taxes to shareholders relating to Fund distributions or the redemption of Fund shares. Total returns for periods less than one full year are not annualized. |
| (e) | Annualized. |
| (f) | The Fund’s portfolio turnover rate is calculated in accordance with regulatory requirements, without regard to transactions involving short term investments and certain derivatives. If such transactions were included, the Fund’s portfolio turnover rate may be higher. |
| The accompanying notes are an integral part of these financial statements. | 67 |
GOLDMAN SACHS VARIABLE INSURANCE TRUST SMALL CAP EQUITY INSIGHTS FUND
Financial Highlights (continued)
Selected Share Data for a Share Outstanding Throughout Each Period
| Goldman Sachs Small Cap Equity Insights Fund | ||||||||||||||||||||||||
| Service Shares | ||||||||||||||||||||||||
| Six Months Ended June 30, 2022 (Unaudited) | Year Ended December 31, | |||||||||||||||||||||||
| 2021 | 2020 | 2019 | 2018 | 2017 | ||||||||||||||||||||
| Per Share Data | ||||||||||||||||||||||||
Net asset value, beginning of period | $ | 12.93 | $ | 13.39 | $ | 12.51 | $ | 10.28 | $ | 13.55 | $ | 13.70 | ||||||||||||
Net investment income(a) | 0.02 | 0.01 | (b) | 0.02 | 0.03 | 0.03 | (c) | 0.04 | ||||||||||||||||
Net realized and unrealized gain (loss) | (2.92 | ) | 3.14 | 1.02 | 2.49 | (1.19 | ) | 1.51 | ||||||||||||||||
Total from investment operations | (2.90 | ) | 3.15 | 1.04 | 2.52 | (1.16 | ) | 1.55 | ||||||||||||||||
Distributions to shareholders from net investment income | — | (0.04 | ) | — | (0.03 | ) | (0.03 | ) | (0.04 | ) | ||||||||||||||
Distributions to shareholders from net realized gains | — | (3.57 | ) | (0.16 | ) | (0.26 | ) | (2.08 | ) | (1.66 | ) | |||||||||||||
Total distributions | — | (3.61 | ) | (0.16 | ) | (0.29 | ) | (2.11 | ) | (1.70 | ) | |||||||||||||
Net asset value, end of period | $ | 10.03 | $ | 12.93 | $ | 13.39 | $ | 12.51 | $ | 10.28 | $ | 13.55 | ||||||||||||
Total Return(d) | (22.43 | )% | 23.50 | % | 8.34 | % | 24.53 | % | (8.82 | )% | 11.22 | % | ||||||||||||
Net assets, end of period (in 000’s) | $ | 19,457 | $ | 22,114 | $ | 17,239 | $ | 15,742 | $ | 16,537 | $ | 20,505 | ||||||||||||
Ratio of net expenses to average net assets | 1.06 | %(e) | 1.06 | % | 1.06 | % | 1.10 | % | 1.06 | % | 1.06 | % | ||||||||||||
Ratio of total expenses to average net assets | 1.19 | %(e) | 1.18 | % | 1.33 | % | 1.30 | % | 1.23 | % | 1.25 | % | ||||||||||||
Ratio of net investment income to average net assets | 0.31 | %(e) | 0.09 | %(b) | 0.22 | % | 0.27 | % | 0.19 | %(c) | 0.28 | % | ||||||||||||
Portfolio turnover rate(f) | 85 | % | 172 | % | 147 | % | 125 | % | 116 | % | 110 | % | ||||||||||||
| (a) | Calculated based on the average shares outstanding methodology. |
| (b) | Reflects income recognized from special dividends which amounted to $0.03 per share and 0.22% of average net assets. |
| (c) | Reflects income recognized from special dividends which amounted to $0.02 per share and 0.17% of average net assets. |
| (d) | Assumes investment at the NAV at the beginning of the period, reinvestment of all dividends and distributions, a complete redemption of the investment at the NAV at the end of the period and no sales or redemption charges (if any). Total returns would be reduced if a sales or redemption charge was taken into account. Returns do not reflect the impact of taxes to shareholders relating to Fund distributions or the redemption of Fund shares. Total returns for periods less than one full year are not annualized. |
| (e) | Annualized. |
| (f) | The Fund’s portfolio turnover rate is calculated in accordance with regulatory requirements, without regard to transactions involving short term investments and certain derivatives. If such transactions were included, the Fund’s portfolio turnover rate may be higher. |
| 68 | The accompanying notes are an integral part of these financial statements. |
GOLDMAN SACHS VARIABLE INSURANCE TRUST STRATEGIC GROWTH FUND
Financial Highlights (continued)
Selected Share Data for a Share Outstanding Throughout Each Period
| (a) | Calculated based on the average shares outstanding methodology. |
| (b) | Amount is less than $0.005 per share. |
| (c) | Assumes investment at the NAV at the beginning of the period, reinvestment of all dividends and distributions, a complete redemption of the investment at the NAV at the end of the period and no sales or redemption charges (if any). Total returns would be reduced if a sales or redemption charge was taken into account. Returns do not reflect the impact of taxes to shareholders relating to Fund distributions or the redemption of Fund shares. Total returns for periods less than one full year are not annualized. |
| (d) | Annualized. |
| (e) | The Fund’s portfolio turnover rate is calculated in accordance with regulatory requirements, without regard to transactions involving short term investments. If such transactions were included, the Fund’s portfolio turnover rate may be higher. |
| The accompanying notes are an integral part of these financial statements. | 69 |
GOLDMAN SACHS VARIABLE INSURANCE TRUST STRATEGIC GROWTH FUND
Financial Highlights (continued)
Selected Share Data for a Share Outstanding Throughout Each Period
| Goldman Sachs Strategic Growth Fund | ||||||||||||||||||||||||
| Service Shares | ||||||||||||||||||||||||
| Six Months Ended June 30, 2022 (Unaudited) | Year Ended December 31, | |||||||||||||||||||||||
| 2021 | 2020 | 2019 | 2018 | 2017 | ||||||||||||||||||||
| Per Share Data | ||||||||||||||||||||||||
Net asset value, beginning of period | $ | 16.55 | $ | 15.41 | $ | 11.91 | $ | 9.78 | $ | 19.68 | $ | 15.79 | ||||||||||||
Net investment income (loss)(a) | (0.03 | ) | (0.09 | ) | (0.03 | ) | 0.01 | 0.01 | 0.04 | |||||||||||||||
Net realized and unrealized gain (loss) | (5.19 | ) | 3.44 | 4.78 | 3.43 | (0.18 | ) | 4.76 | ||||||||||||||||
Total from investment operations | (5.22 | ) | 3.35 | 4.75 | 3.44 | (0.17 | ) | 4.80 | ||||||||||||||||
Distributions to shareholders from net investment income | — | — | — | (0.01 | ) | — | (0.05 | ) | ||||||||||||||||
Distributions to shareholders from net realized gains | — | (2.21 | ) | (1.25 | ) | (1.30 | ) | (9.73 | ) | (0.86 | ) | |||||||||||||
Total distributions | — | (2.21 | ) | (1.25 | ) | (1.31 | ) | (9.73 | ) | (0.91 | ) | |||||||||||||
Net asset value, end of period | $ | 11.33 | $ | 16.55 | $ | 15.41 | $ | 11.91 | $ | 9.78 | $ | 19.68 | ||||||||||||
Total Return(b) | (31.54 | )% | 21.56 | % | 39.98 | % | 35.32 | % | (1.32 | )% | 30.36 | % | ||||||||||||
Net assets, end of period (in 000’s) | $ | 117,914 | $ | 262,782 | $ | 257,714 | $ | 241,375 | $ | 139,414 | $ | 425,679 | ||||||||||||
Ratio of net expenses to average net assets | 0.99 | %(c) | 0.98 | % | 0.99 | % | 1.02 | % | 0.99 | % | 1.01 | % | ||||||||||||
Ratio of total expenses to average net assets | 1.06 | %(c) | 1.04 | % | 1.06 | % | 1.10 | % | 1.07 | % | 1.07 | % | ||||||||||||
Ratio of net investment income (loss) to average net assets | (0.50 | )%(c) | (0.52 | )% | (0.24 | )% | 0.04 | % | 0.04 | % | 0.23 | % | ||||||||||||
Portfolio turnover rate(d) | 17 | % | 20 | % | 45 | % | 44 | % | 41 | % | 37 | % | ||||||||||||
| (a) | Calculated based on the average shares outstanding methodology. |
| (b) | Assumes investment at the NAV at the beginning of the period, reinvestment of all dividends and distributions, a complete redemption of the investment at the NAV at the end of the period and no sales or redemption charges (if any). Total returns would be reduced if a sales or redemption charge was taken into account. Returns do not reflect the impact of taxes to shareholders relating to Fund distributions or the redemption of Fund shares. Total returns for periods less than one full year are not annualized. |
| (c) | Annualized. |
| (d) | The Fund’s portfolio turnover rate is calculated in accordance with regulatory requirements, without regard to transactions involving short term investments. If such transactions were included, the Fund’s portfolio turnover rate may be higher. |
| 70 | The accompanying notes are an integral part of these financial statements. |
GOLDMAN SACHS VARIABLE INSURANCE TRUST U.S. EQUITY INSIGHTS FUND
Financial Highlights (continued)
Selected Share Data for a Share Outstanding Throughout Each Period
| (a) | Calculated based on the average shares outstanding methodology. |
| (b) | Assumes investment at the NAV at the beginning of the period, reinvestment of all dividends and distributions, a complete redemption of the investment at the NAV at the end of the period and no sales or redemption charges (if any). Total returns would be reduced if a sales or redemption charge was taken into account. Returns do not reflect the impact of taxes to shareholders relating to Fund distributions or the redemption of Fund shares. Total returns for periods less than one full year are not annualized. |
| (c) | Annualized. |
| (d) | The Fund’s portfolio turnover rate is calculated in accordance with regulatory requirements, without regard to transactions involving short term investments and certain derivatives. If such transactions were included, the Fund’s portfolio turnover rate may be higher. |
| The accompanying notes are an integral part of these financial statements. | 71 |
GOLDMAN SACHS VARIABLE INSURANCE TRUST U.S. EQUITY INSIGHTS FUND
Financial Highlights (continued)
Selected Share Data for a Share Outstanding Throughout Each Period
| Goldman Sachs U.S. Equity Insights Fund | ||||||||||||||||||||||||
| Service Shares | ||||||||||||||||||||||||
| Six Months Ended June 30, 2022 (Unaudited) | Year Ended December 31, | |||||||||||||||||||||||
| 2021 | 2020 | 2019 | 2018 | 2017 | ||||||||||||||||||||
| Per Share Data | ||||||||||||||||||||||||
Net asset value, beginning of period | $ | 20.23 | $ | 20.21 | $ | 18.04 | $ | 15.12 | $ | 19.48 | $ | 17.71 | ||||||||||||
Net investment income(a) | 0.05 | 0.14 | 0.12 | 0.18 | 0.18 | 0.24 | ||||||||||||||||||
Net realized and unrealized gain (loss) | (4.38 | ) | 5.64 | 2.99 | 3.58 | (1.37 | ) | 3.99 | ||||||||||||||||
Total from investment operations | (4.33 | ) | 5.78 | 3.11 | 3.76 | (1.19 | ) | 4.23 | ||||||||||||||||
Distributions to shareholders from net investment income | — | (0.14 | ) | (0.12 | ) | (0.19 | ) | (0.20 | ) | (0.24 | ) | |||||||||||||
Distributions to shareholders from net realized gains | — | (5.62 | ) | (0.82 | ) | (0.65 | ) | (2.97 | ) | (2.22 | ) | |||||||||||||
Total distributions | — | (5.76 | ) | (0.94 | ) | (0.84 | ) | (3.17 | ) | (2.46 | ) | |||||||||||||
Net asset value, end of period | $ | 15.90 | $ | 20.23 | $ | 20.21 | $ | 18.04 | $ | 15.12 | $ | 19.48 | ||||||||||||
Total Return(b) | (21.40 | )% | 29.11 | % | 17.27 | % | 24.93 | % | (6.36 | )% | 23.80 | % | ||||||||||||
Net assets, end of period (in 000’s) | $ | 44,365 | $ | 61,849 | $ | 54,149 | $ | 55,201 | $ | 53,208 | $ | 142,210 | ||||||||||||
Ratio of net expenses to average net assets | 0.77 | %(c) | 0.77 | % | 0.77 | % | 0.79 | % | 0.79 | % | 0.82 | % | ||||||||||||
Ratio of total expenses to average net assets | 0.96 | %(c) | 0.93 | % | 1.00 | % | 1.01 | % | 0.97 | % | 0.95 | % | ||||||||||||
Ratio of net investment income to average net assets | 0.51 | %(c) | 0.60 | % | 0.63 | % | 1.03 | % | 0.88 | % | 1.21 | % | ||||||||||||
Portfolio turnover rate(d) | 100 | % | 206 | % | 203 | % | 187 | % | 160 | % | 184 | % | ||||||||||||
| (a) | Calculated based on the average shares outstanding methodology. |
| (b) | Assumes investment at the NAV at the beginning of the period, reinvestment of all dividends and distributions, a complete redemption of the investment at the NAV at the end of the period and no sales or redemption charges (if any). Total returns would be reduced if a sales or redemption charge was taken into account. Returns do not reflect the impact of taxes to shareholders relating to Fund distributions or the redemption of Fund shares. Total returns for periods less than one year are not annualized. |
| (c) | Annualized. |
| (d) | The Fund’s portfolio turnover rate is calculated in accordance with regulatory requirements, without regard to transactions involving short term investments and certain derivatives. If such transactions were included, the Fund’s portfolio turnover rate may be higher. |
| 72 | The accompanying notes are an integral part of these financial statements. |
GOLDMAN SACHS VARIABLE INSURANCE TRUST EQUITY FUNDS
June 30, 2022 (Unaudited)
1. ORGANIZATION
Goldman Sachs Variable Insurance Trust (the “Trust” or “VIT”) is a Delaware statutory trust registered under the Investment Company Act of 1940, as amended (the “Act”), as an open-end management investment company. The following table lists those series of the Trust that are included in this report (collectively, the “Funds” or individually a “Fund”), along with their corresponding share classes and respective diversification status under the Act:
| Fund | Share Classes Offered | Diversified/ Non-diversified | ||
Equity Index | Service | Diversified | ||
International Equity Insights | Institutional and Service | Diversified | ||
Large Cap Value | Institutional and Service | Diversified | ||
Mid Cap Growth* | Institutional and Service | Diversified | ||
Mid Cap Value | Institutional and Service | Diversified | ||
Small Cap Equity Insights | Institutional and Service | Diversified | ||
Strategic Growth | Institutional and Service | Non-Diversified | ||
U.S. Equity Insights | Institutional and Service | Diversified |
| * | Effective April 29, 2022, the Fund changed its name from Growth Opportunities to Mid Cap Growth. |
Shares of the Trust are offered to separate accounts of participating life insurance companies for the purpose of funding variable annuity contracts and variable life insurance policies.
Goldman Sachs Asset Management, L.P. (“GSAM” or the “Investment Adviser”), an affiliate of Goldman Sachs & Co. LLC (“Goldman Sachs”), serves as investment adviser to the Funds pursuant to management agreements (the “Agreements”) with the Trust.
2. SIGNIFICANT ACCOUNTING POLICIES
The financial statements have been prepared in accordance with accounting principles generally accepted in the United States of America (“GAAP”) and require management to make estimates and assumptions that may affect the reported amounts and disclosures. Actual results may differ from those estimates and assumptions. Each Fund is an investment company under GAAP and follows the accounting and reporting guidance applicable to investment companies.
A. Investment Valuation — The Funds’ valuation policy is to value investments at fair value.
B. Investment Income and Investments — Investment income includes interest income, dividend income, and securities lending income, if any. Interest income is accrued daily and adjusted for amortization of premiums and accretion of discounts. Dividend income is recognized on ex-dividend date or, for certain foreign securities, as soon as such information is obtained subsequent to the ex-dividend date. Non-cash dividends, if any, are recorded at the fair market value of the securities received. Investment transactions are reflected on trade date. Realized gains and losses are calculated using identified cost. Investment transactions are recorded on the following business day for daily net asset value (“NAV”) calculations. Investment income is recorded net of any foreign withholding taxes, less any amounts reclaimable. The Funds may file withholding tax reclaims in certain jurisdictions to recover a portion of amounts previously withheld. Any foreign capital gains tax is accrued daily based upon net unrealized gains, and is payable upon sale of such investments. Distributions received from the Funds’ investments in United States (“U.S.”) real estate investment trusts (“REITs”) may be characterized as ordinary income, net capital gain and/or a return of capital. A return of capital is recorded by the Funds as a reduction to the cost basis of the REIT.
For derivatives contracts, unrealized gains and losses are recorded daily and become realized gains and losses upon disposition or termination of the contract.
C. Class Allocations and Expenses — Investment income, realized and unrealized gain (loss), if any, and non-class specific expenses of each Fund are allocated daily based upon the proportion of net assets of each class. Non-class specific expenses
| 73 |
GOLDMAN SACHS VARIABLE INSURANCE TRUST EQUITY FUNDS
Notes to Financial Statements (continued)
June 30, 2022 (Unaudited)
2. SIGNIFICANT ACCOUNTING POLICIES (continued)
directly incurred by a Fund are charged to that Fund, while such expenses incurred by the Trust are allocated across the applicable Funds on a straight-line and/or pro-rata basis depending upon the nature of the expenses. Class specific expenses, where applicable, are borne by the respective share classes and include Distribution and Service and Transfer Agency fees.
D. Federal Taxes and Distributions to Shareholders — It is each Fund’s policy to comply with the requirements of the Internal Revenue Code of 1986, as amended (the “Code”), applicable to regulated investment companies and to distribute each year substantially all of its investment company taxable income and capital gains to its shareholders. Accordingly, each Fund is not required to make any provisions for the payment of federal income tax. Distributions to shareholders are recorded on the ex-dividend date. Income and capital gains distributions, if any, are declared and paid at least annually.
Net capital losses, if any, are carried forward to future fiscal years and may be used to the extent allowed by the Code to offset any future capital gains. Losses that are carried forward will retain their character as either short-term or long-term capital losses. Utilization of capital loss carryforwards will reduce the requirement of future capital gains distributions.
The characterization of distributions to shareholders for financial reporting purposes is determined in accordance with federal income tax rules, which may differ from GAAP. The source of each Fund’s distributions may be shown in the accompanying financial statements as either from distributable earnings or capital. Certain components of the Funds’ net assets on the Statements of Assets and Liabilities reflect permanent GAAP/tax differences based on the appropriate tax character.
E. Foreign Currency Translation — The accounting records and reporting currency of a Fund are maintained in U.S. dollars. Assets and liabilities denominated in foreign currencies are translated into U.S. dollars using the current exchange rates at the close of each business day. The effect of changes in foreign currency exchange rates on investments is included within net realized and unrealized gain (loss) on investments. Changes in the value of other assets and liabilities as a result of fluctuations in foreign exchange rates are included in the Statements of Operations within net change in unrealized gain (loss) on foreign currency translation. Transactions denominated in foreign currencies are translated into U.S. dollars on the date the transaction occurred, the effects of which are included within net realized gain (loss) on foreign currency transactions.
3. INVESTMENTS AND FAIR VALUE MEASUREMENTS
U.S. GAAP defines the fair value of a financial instrument as the amount that would be received to sell an asset or paid to transfer a liability in an orderly transaction between market participants at the measurement date (i.e., the exit price); the Funds’ policy is to use the market approach. GAAP establishes a fair value hierarchy that prioritizes the inputs to valuation techniques used to measure fair value. The hierarchy gives the highest priority to unadjusted quoted prices in active markets for identical assets or liabilities (Level 1 measurements) and the lowest priority to unobservable inputs (Level 3 measurements). The level in the fair value hierarchy within which the fair value measurement in its entirety falls shall be determined based on the lowest level input that is significant to the fair value measurement in its entirety. The levels used for classifying investments are not necessarily an indication of the risk associated with investing in these investments. The three levels of the fair value hierarchy are described below:
Level 1 — Unadjusted quoted prices in active markets that are accessible at the measurement date for identical, unrestricted assets or liabilities;
Level 2 — Quoted prices in markets that are not active or financial instruments for which significant inputs are observable (including, but not limited to, quoted prices for similar investments, interest rates, foreign exchange rates, volatility and credit spreads), either directly or indirectly;
Level 3 — Prices or valuations that require significant unobservable inputs (including GSAM’s assumptions in determining fair value measurement).
The Board of Trustees (“Trustees”) has approved Valuation Procedures that govern the valuation of the portfolio investments held by the Funds, including investments for which market quotations are not readily available. The Trustees have delegated to GSAM day-to-day responsibility for implementing and maintaining internal controls and procedures related to the valuation of the Funds’ investments. To assess the continuing appropriateness of pricing sources and methodologies, GSAM regularly performs price
| 74 |
GOLDMAN SACHS VARIABLE INSURANCE TRUST EQUITY FUNDS
3. INVESTMENTS AND FAIR VALUE MEASUREMENTS (continued)
verification procedures and issues challenges as necessary to third party pricing vendors or brokers, and any differences are reviewed in accordance with the Valuation Procedures.
A. Level 1 and Level 2 Fair Value Investments — The valuation techniques and significant inputs used in determining the fair values for investments classified as Level 1 and Level 2 are as follows:
Equity Securities — Equity securities traded on a U.S. securities exchange or the NASDAQ system, or those located on certain foreign exchanges, including but not limited to the Americas, are valued daily at their last sale price or official closing price on the principal exchange or system on which they are traded. If there is no sale or official closing price or such price is believed by GSAM to not represent fair value, equity securities will be valued at the valid closing bid price for long positions and at the valid closing ask price for short positions (i.e. where there is sufficient volume, during normal exchange trading hours). If no valid bid/ask price is available, the equity security will be valued pursuant to the Valuation Procedures approved by the Trustees and consistent with applicable regulatory guidance. To the extent these investments are actively traded, they are classified as Level 1 of the fair value hierarchy, otherwise they are generally classified as Level 2. Certain equity securities containing unique attributes may be classified as Level 2.
Unlisted equity securities for which market quotations are available are valued at the last sale price on the valuation date, or if no sale occurs, at the last bid price for long positions or the last ask price for short positions, and are generally classified as Level 2. Securities traded on certain foreign securities exchanges are valued daily at fair value determined by an independent fair value service (if available) under Fair Valuation Procedures approved by the Trustees and consistent with applicable regulatory guidance. The independent fair value service takes into account multiple factors including, but not limited to, movements in the securities markets, certain depositary receipts, futures contracts and foreign currency exchange rates that have occurred subsequent to the close of the foreign securities exchange. These investments are generally classified as Level 2 of the fair value hierarchy.
Money Market Funds — Investments in the Goldman Sachs Financial Square Government Fund (“Underlying Money Market Fund”) are valued at the NAV per share of the Institutional Share class on the day of valuation. These investments are generally classified as Level 1 of the fair value hierarchy. For information regarding the Underlying Money Market Fund’s accounting policies and investment holdings, please see the Underlying Money Market Fund’s shareholder report.
Derivative Contracts — A derivative is an instrument whose value is derived from underlying assets, indices, reference rates or a combination of these factors. A Fund enters into derivative transactions to hedge against changes in interest rates, securities prices, and/or currency exchange rates, to increase total return, or to gain access to certain markets or attain exposure to other underliers. For financial reporting purposes, cash collateral that has been pledged to cover obligations of a Fund and cash collateral received, if any, is reported separately on the Statements of Assets and Liabilities as receivables/payables for collateral on certain derivatives contracts. Non-cash collateral pledged by a Fund, if any, is noted in the Schedules of Investments.
Exchange-traded derivatives, including futures and options contracts, are generally valued at the last sale or settlement price on the exchange where they are principally traded. Exchange-traded options without settlement prices are generally valued at the midpoint of the bid and ask prices on the exchange where they are principally traded (or, in the absence of two-way trading, at the last bid price for long positions and the last ask price for short positions). Exchange-traded derivatives typically fall within Level 1 of the fair value hierarchy. Over-the-counter (“OTC”) and centrally cleared derivatives are valued using market transactions and other market evidence, including market-based inputs to models, calibration to market-clearing transactions, broker or dealer quotations, or other alternative pricing sources. Where models are used, the selection of a particular model to value OTC and centrally cleared derivatives depends upon the contractual terms of, and specific risks inherent in, the instrument, as well as the availability of pricing information in the market. Valuation models require a variety of inputs, including contractual terms, market prices, yield curves, credit curves, measures of volatility, voluntary and involuntary prepayment rates, loss severity rates and correlations of such inputs. For OTC and centrally cleared derivatives that trade in liquid markets, model inputs can generally be verified and model selection does not involve significant management judgment. OTC and centrally cleared derivatives are classified within Level 2 of the fair value hierarchy when significant inputs are corroborated by market evidence.
i. Futures Contracts — Futures contracts are contracts to buy or sell a standardized quantity of a specified commodity or security. Upon entering into a futures contract, a Fund deposits cash or securities in an account on behalf of the broker in an
| 75 |
GOLDMAN SACHS VARIABLE INSURANCE TRUST EQUITY FUNDS
Notes to Financial Statements (continued)
June 30, 2022 (Unaudited)
3. INVESTMENTS AND FAIR VALUE MEASUREMENTS (continued)
amount sufficient to meet the initial margin requirement. Subsequent payments are made or received by a Fund equal to the daily change in the contract value and are recorded as variation margin receivable or payable with a corresponding offset to unrealized gains or losses.
B. Level 3 Fair Value Investments — To the extent that significant inputs to valuation models and other alternative pricing sources are unobservable, or if quotations are not readily available, or if GSAM believes that such quotations do not accurately reflect fair value, the fair value of a Fund’s investments may be determined under Valuation Procedures approved by the Trustees. GSAM, consistent with its procedures and applicable regulatory guidance, may make an adjustment to the most recent valuation prices of either domestic or foreign securities in light of significant events to reflect what it believes to be the fair value of the securities at the time of determining a Fund’s NAV. To the extent investments are valued using single source broker quotations obtained directly from the broker or passed through from third party pricing vendors, such investments are classified as Level 3 investments.
C. Fair Value Hierarchy — The following is a summary of the Funds’ investments and derivatives classified in the fair value hierarchy as of June 30, 2022:
| EQUITY INDEX FUND | ||||||||||||
| Investment Type | Level 1 | Level 2 | Level 3 | |||||||||
| Assets | ||||||||||||
| Common Stock and/or Other Equity Investments(a) | ||||||||||||
Asia | $ | 205,021 | $ | — | $ | — | ||||||
Europe | 950,817 | — | — | |||||||||
North America | 165,803,882 | — | — | |||||||||
| Total | $ | 166,959,720 | $ | — | $ | — | ||||||
| Derivative Type | ||||||||||||
| Assets(b) | ||||||||||||
| Futures Contracts | $ | 9,145 | $ | — | $ | — | ||||||
| INTERNATIONAL EQUITY INSIGHTS FUND | ||||||||||||
| Investment Type | Level 1 | Level 2 | Level 3 | |||||||||
| Assets | ||||||||||||
| Common Stock and/or Other Equity Investments(a) | ||||||||||||
Africa | $ | — | $ | 787,756 | $ | — | ||||||
Asia | 47,250 | 24,134,820 | — | |||||||||
Europe | 779,196 | 49,415,062 | — | |||||||||
North America | 1,371,369 | 2,741,046 | — | |||||||||
Oceania | 869,006 | 8,621,197 | — | |||||||||
| Securities Lending Reinvestment Vehicle | 1,270,901 | — | — | |||||||||
| Total | $ | 4,337,722 | $ | 85,699,881 | $ | — | ||||||
| Derivative Type | ||||||||||||
| Liabilities(b) | ||||||||||||
| Futures Contracts | $ | (10,528 | ) | $ | — | $ | — | |||||
| (a) | Amounts are disclosed by continent to highlight the impact of time zone differences between local market close and the calculation of NAV. Security valuations are based on the principal exchange or system on which they are traded, which may differ from country of domicile noted in table. The Fund utilizes fair value model prices provided by an independent third party fair value service for certain international equity securities resulting in a Level 2 classification. |
| (b) | Amount shown represents unrealized gain (loss) at period end. |
| 76 |
GOLDMAN SACHS VARIABLE INSURANCE TRUST EQUITY FUNDS
3. INVESTMENTS AND FAIR VALUE MEASUREMENTS (continued)
| LARGE CAP VALUE FUND | ||||||||||||
| Investment Type | Level 1 | Level 2 | Level 3 | |||||||||
| Assets | ||||||||||||
| Common Stock and/or Other Equity Investments(a) | ||||||||||||
Europe | $ | 10,446,919 | $ | — | $ | — | ||||||
North America | 367,047,212 | — | — | |||||||||
| Investment Company | 2,738,674 | — | — | |||||||||
| Total | $ | 380,232,805 | $ | — | $ | — | ||||||
| MID CAP GROWTH FUND | ||||||||||||
| Investment Type | Level 1 | Level 2 | Level 3 | |||||||||
| Assets | ||||||||||||
| Common Stock and/or Other Equity Investments(a) | ||||||||||||
Europe | $ | 523,991 | $ | — | $ | — | ||||||
North America | 47,451,235 | — | — | |||||||||
| Investment Company | 3,320,691 | — | — | |||||||||
| Securities Lending Reinvestment Vehicle | 465,693 | — | — | |||||||||
| Total | $ | 51,761,610 | $ | — | $ | — | ||||||
| MID CAP VALUE FUND | ||||||||||||
| Investment Type | Level 1 | Level 2 | Level 3 | |||||||||
| Assets | ||||||||||||
| Common Stock and/or Other Equity Investments(a) | ||||||||||||
Europe | $ | 6,644,968 | $ | — | $ | — | ||||||
North America | 364,833,720 | — | — | |||||||||
| Investment Company | 1,408,277 | — | — | |||||||||
| Total | $ | 372,886,965 | $ | — | $ | — | ||||||
| SMALL CAP EQUITY INSIGHTS FUND | ||||||||||||
| Investment Type | Level 1 | Level 2 | Level 3 | |||||||||
| Assets | ||||||||||||
| Common Stock and/or Other Equity Investments(a) | ||||||||||||
Africa | $ | 561,927 | $ | — | $ | — | ||||||
Asia | 538,352 | — | — | |||||||||
Europe | 1,216,427 | — | — | |||||||||
North America | 98,886,118 | — | — | |||||||||
| Investment Company | 1,133,027 | — | — | |||||||||
| Securities Lending Reinvestment Vehicle | 1,451,080 | — | — | |||||||||
| Total | $ | 103,786,931 | $ | — | $ | — | ||||||
| Derivative Type | ||||||||||||
| Liabilities(b) | ||||||||||||
| Futures Contracts | $ | (93,727 | ) | $ | — | $ | — | |||||
| (a) | Amounts are disclosed by continent to highlight the impact of time zone differences between local market close and the calculation of NAV. Security valuations are based on the principal exchange or system on which they are traded, which may differ from country of domicile noted in table. |
| (b) | Amount shown represents unrealized gain (loss) at period end. |
| 77 |
GOLDMAN SACHS VARIABLE INSURANCE TRUST EQUITY FUNDS
Notes to Financial Statements (continued)
June 30, 2022 (Unaudited)
3. INVESTMENTS AND FAIR VALUE MEASUREMENTS (continued)
| STRATEGIC GROWTH FUND | ||||||||||||
| Investment Type | Level 1 | Level 2 | Level 3 | |||||||||
| Assets | ||||||||||||
| Common Stock and/or Other Equity Investments(a) | ||||||||||||
Europe | $ | 4,052,562 | $ | — | $ | — | ||||||
North America | 234,187,318 | — | — | |||||||||
| Investment Company | 6,641,484 | — | — | |||||||||
| Total | $ | 244,881,364 | $ | — | $ | — | ||||||
| U.S. EQUITY INSIGHTS FUND | ||||||||||||
| Investment Type | Level 1 | Level 2 | Level 3 | |||||||||
| Assets | ||||||||||||
| Common Stock and/or Other Equity Investments(a) | ||||||||||||
Europe | $ | 619,515 | $ | — | $ | — | ||||||
North America | 287,906,208 | — | — | |||||||||
| Total | $ | 288,525,723 | $ | — | $ | — | ||||||
| Derivative Type | ||||||||||||
| Liabilities(b) | ||||||||||||
Futures Contracts | $ | (16,603 | ) | $ | — | $ | — | |||||
| (a) | Amounts are disclosed by continent to highlight the impact of time zone differences between local market close and the calculation of NAV. Security valuations are based on the principal exchange or system on which they are traded, which may differ from country of domicile noted in table. |
| (b) | Amount shown represents unrealized gain (loss) at period end. |
For further information regarding security characteristics, see the Schedules of Investments.
4. INVESTMENTS IN DERIVATIVES
The following table sets forth, by certain risk types, the gross value of derivative contracts (not considered to be hedging instruments for accounting disclosure purposes) as of June 30, 2022. These instruments were used as part of the Funds’ investment strategies and to obtain and/or manage exposure related to the risks below. The values in the tables below exclude the effects of cash collateral received or posted pursuant to these derivative contracts, and therefore are not representative of the Funds’ net exposure.
| Fund | Risk | Statements of Assets and Liabilities | Assets(a) | Statements of Assets and Liabilities | Liabilities(a) | |||||||||
| Equity Index | Equity | Variation margin on futures contracts | $ | 9,145 | — | $ | — | |||||||
| International Equity Insights | Equity | — | — | Variation margin on futures contracts | (10,528 | ) | ||||||||
| Small Cap Equity Insights | Equity | — | — | Variation margin on futures contracts | (93,727 | ) | ||||||||
| U.S. Equity Insights | Equity | — | — | Variation margin on futures contracts | (16,603 | ) | ||||||||
| (a) | Includes unrealized gain (loss) on futures contracts described in the Additional Investment Information sections of the Schedules of Investments. Only the variation margin as of June 30, 2022 is reported within the Statements of Assets and Liabilities. |
| 78 |
GOLDMAN SACHS VARIABLE INSURANCE TRUST EQUITY FUNDS
4. INVESTMENTS IN DERIVATIVES (continued)
The following tables set forth, by certain risk types, the Funds’ gains (losses) related to these derivatives and their indicative volumes for the six months ended June 30, 2022. These gains (losses) should be considered in the context that these derivative contracts may have been executed to create investment opportunities and/or economically hedge certain investments, and accordingly, certain gains (losses) on such derivative contracts may offset certain (losses) gains attributable to investments. These gains (losses) are included in “Net realized gain (loss)” or “Net change in unrealized gain (loss)” on the Statements of Operations:
Equity Index
| Risk | Statement of Operations | Net Realized Gain (Loss) | Net Change in Unrealized Gain (Loss) | |||||
| Equity | Net realized gain (loss) from futures contracts/Net change in unrealized gain (loss) on futures contracts | $(186,421) | $ | (4,758 | ) | |||
International Equity Insights
| Risk | Statement of Operations | Net Realized Gain (Loss) | Net Change in Unrealized Gain (Loss) | |||||
| Equity | Net realized gain (loss) from futures contracts/Net change in unrealized gain (loss) on futures contracts | $(67,015) | $ | (13,316 | ) | |||
Small Cap Equity Insights
| Risk | Statement of Operations | Net Realized Gain (Loss) | Net Change in Unrealized Gain (Loss) | |||||
| Equity | Net realized gain (loss) from futures contracts/Net change in unrealized gain (loss) on futures contracts | $(220,895) | $ | (103,902 | ) | |||
U.S. Equity Insights
| Risk | Statement of Operations | Net Realized Gain (Loss) | Net Change in Unrealized Gain (Loss) | |||||
| Equity | Net realized gain (loss) from futures contracts/Net change in unrealized gain (loss) on futures contracts | $68,697 | $ | (16,603 | ) | |||
For the six months ended June 30, 2022, the relevant values for each derivative type were as follows:
| Average Number of Contracts(1) | ||||
| Fund | Futures Contracts | |||
| Equity Index | 5 | |||
| International Equity Insights | 22 | |||
| Small Cap Equity Insights | 15 | |||
| U.S. Equity Insights | 7 | |||
| (1) | Amounts disclosed represent average number of contracts for futures contracts, based on absolute values, which is indicative of volume of this derivative type, for the months that the Fund held such derivatives during the six months ended June 30, 2022. |
| 79 |
GOLDMAN SACHS VARIABLE INSURANCE TRUST EQUITY FUNDS
Notes to Financial Statements (continued)
June 30, 2022 (Unaudited)
5. AGREEMENTS AND AFFILIATED TRANSACTIONS
A. Management Agreements — Under the Agreements, GSAM manages the Funds, subject to the general supervision of the Trustees.
As compensation for the services rendered pursuant to the Agreements, the assumption of the expenses related thereto and administration of the Funds’ business affairs, including providing facilities, GSAM is entitled to a management fee, accrued daily and paid monthly, equal to an annual percentage rate of each Fund’s average daily net assets.
For the six months ended June 30, 2022, contractual and effective net management fees with GSAM were at the following rates:
| Contractual Management Rate | Effective Rate | Effective Net Management Rate^ | ||||||||||||||||||||||||||
| Fund | First $1 billion | Next $1 billion | Next $3 billion | Next $3 billion | Over $8 billion | |||||||||||||||||||||||
| International Equity Insights | 0.81 | % | 0.73 | % | 0.69 | % | 0.68 | % | 0.67 | % | 0.81 | % | 0.80 | %*# | ||||||||||||||
| Large Cap Value | 0.72 | 0.65 | 0.62 | 0.60 | 0.59 | 0.72 | 0.68 | * | ||||||||||||||||||||
| Mid Cap Growth | 0.87 | 0.87 | 0.78 | 0.74 | 0.73 | 0.87 | 0.81 | * | ||||||||||||||||||||
| Mid Cap Value | 0.77 | 0.77 | 0.69 | 0.66 | 0.65 | 0.77 | 0.77 | |||||||||||||||||||||
| Small Cap Equity Insights | 0.70 | 0.70 | 0.63 | 0.60 | 0.59 | 0.70 | 0.70 | |||||||||||||||||||||
| Strategic Growth | 0.71 | 0.64 | 0.61 | 0.59 | 0.58 | 0.71 | 0.71 | |||||||||||||||||||||
| U.S. Equity Insights | 0.62 | 0.59 | 0.56 | 0.55 | 0.54 | 0.62 | 0.54 | * | ||||||||||||||||||||
| ^ | Effective Net Management Rate includes the impact of management fee waivers of affiliated Underlying Funds, if any. The Effective Net Management Rate may not correlate to the Contractual Management Rate as a result of management fee waivers that may be in effect from time to time. |
| * | GSAM agreed to waive a portion of its management fee in order to achieve an effective net management rate as defined in the Funds’ most recent prospectus. This waiver will remain in effect through at least April 29, 2023, and prior to such date GSAM may not terminate the arrangement without approval of the Trustees. |
| # | GSAM began waiving management fees on International Equity Insights to 0.79% effective April 29, 2022. |
The International Equity Insights, Large Cap Value, Mid Cap Growth, Mid Cap Value, Small Cap Equity Insights, Strategic Growth and U.S. Equity Insights Funds invest in Institutional Shares of the Goldman Sachs Financial Square Government Fund, which is an affiliated Underlying Fund. GSAM has agreed to waive a portion of its management fee payable by the Funds in an amount equal to the management fee it earns as an investment adviser to the affiliated Underlying Fund in which the Funds invest, except those management fees it earns from the Funds’ investments of cash collateral received in connection with securities lending transactions in the Goldman Sachs Financial Square Government Fund. For the six months ended June 30, 2022, with respect to the Funds’ investments in an affiliated Underlying Fund GSAM waived $2,103, $1,551, $3,182, $642, and $2,193 of the Large Cap Value, Mid Cap Growth, Mid Cap Value, Small Cap Equity Insights, and Strategic Growth Funds’ management fees, respectively.
The Investment Adviser has agreed to waive a portion of its management fee in order to achieve an effective net management fee rate of 0.54% as an annual percentage rate of the U.S. Equity Insights Fund’s average daily net assets.
The Agreement for the Equity Index Fund provides for a contractual management fee at an annual rate equal to 0.30% of the Fund’s average daily net assets. The Investment Adviser has agreed to waive a portion of the management fee equal to 0.09% of the annual contractual rate applicable to the Equity Index Fund’s average daily net assets between $0 and $400 million and 0.10% of the annual contractual rate applicable to the Fund’s average daily net assets in excess of $400 million. This management fee waiver will remain in effect through at least April 29, 2023, and prior to such date the Investment Adviser may not terminate the arrangement without the approval of the Board of Trustees. For the six months ended June 30, 2022, the Fund paid GSAM an Effective Net Management Rate of 0.21%.
As authorized by the Agreement for the Equity Index Fund, GSAM has entered into a Sub-advisory Agreement with SSgA Funds Management, Inc. (“SSgA”) which serves as the sub-adviser to the Fund and provides the day-to-day advice regarding the Fund’s portfolio transactions. As compensation for its services, SSgA is entitled to a fee, accrued daily and paid monthly by GSAM, at the following annual rates of the Fund’s average daily net assets: 0.03% on the first $50 million, 0.02% on the next $200 million, 0.01% on the next $750 million and 0.008% over $1 billion. The effective Sub-advisory fee was 0.02% for the six months ended June 30, 2022.
| 80 |
GOLDMAN SACHS VARIABLE INSURANCE TRUST EQUITY FUNDS
5. AGREEMENTS AND AFFILIATED TRANSACTIONS (continued)
B. Distribution and/or Service (12b-1) Plans — The Trust, on behalf of Service Shares of each Fund, has adopted a Distribution and Service Plan subject to Rule 12b-1 under the Act. Under the Distribution and Service Plan, Goldman Sachs, which serves as distributor (the “Distributor”), is entitled to a fee accrued daily and paid monthly for distribution services and personal and account maintenance services, which may then be paid by Goldman Sachs to authorized dealers, equal to, on an annual basis, 0.25% of the Funds’ average daily net assets attributable to Service Shares. For the six months ended June 30, 2022 for the U.S. Equity Insights Fund, Goldman Sachs agreed to waive distribution and services fees so as not to exceed an annual rate of 0.21% of average daily net assets of the Fund. For the six months ended June 30, 2022 for the Mid Cap Growth Fund, Goldman Sachs agreed to waive distribution and services fees so as not to exceed an annual rate of 0.15% of average daily net assets of the Fund. These distribution and service fee waivers will remain in place through at least April 29, 2023, and prior to such date Goldman Sachs may not terminate the arrangement without the approval of the Trustees.
C. Transfer Agency Agreement — Goldman Sachs also serves as the transfer agent of the Funds for a fee pursuant to the Transfer Agency Agreement. The fees charged for such transfer agency services are accrued daily and paid monthly at an annual rate of 0.02% of the average daily net assets of Institutional and Service Shares. Goldman Sachs has agreed to waive its transfer agency fee attributable to the Service Shares of the Large Cap Value Fund. This arrangement will remain in place through at least April 29, 2023, and prior to such date Goldman Sachs may not terminate the arrangement without approval of the Board of Trustees.
D. Other Expense Agreements and Affiliated Transactions — GSAM has agreed to reduce or limit certain “Other Expenses” of the Funds (excluding acquired fund fees and expenses, transfer agency fees and expenses, service fees and shareholder administration fees (as applicable), taxes, interest, brokerage fees, expenses of shareholder meetings, litigation and indemnification, and extraordinary expenses) to the extent such expenses exceed, on an annual basis, a percentage rate of the average daily net assets of each Fund. Such Other Expense reimbursements, if any, are accrued daily and paid monthly. In addition, the Funds are not obligated to reimburse GSAM for prior fiscal year expense reimbursements, if any. The Other Expense limitations as an annual percentage rate of average daily net assets for the Equity Index, International Equity Insights, Large Cap Value, Mid Cap Growth, Mid Cap Value, Small Cap Equity Insights, Strategic Growth and U.S. Equity Insights Funds are 0.004%, 0.004%, 0.004%, 0.004%, 0.054%, 0.094%, 0.014% and 0.004%, respectively. Prior to April 29, 2022, the Other Expense limitation was 0.044% for the International Equity Insights Fund. These Other Expense limitations will remain in place through at least April 29, 2023, and prior to such date GSAM may not terminate the arrangements without the approval of the Trustees. In addition, the Funds have entered into certain offset arrangements with the custodian and the transfer agent, which may result in a reduction of the Funds’ expenses and are received irrespective of the application of the “Other Expense” limitations described above.
For the six months ended June 30, 2022, these expense reductions, including any fee waivers and Other Expense reimbursements, were as follows:
| Fund | Management Fee Waiver | Distribution and Service Fee Waiver | Transfer Agency Waiver/Credits | Other Expense Reimbursement | Total Expense Reductions | |||||||||||||||
| Equity Index | $ | 86,391 | $ | — | $ | — | $ | 108,413 | $ | 194,804 | ||||||||||
| International Equity Insights | 3,359 | — | — | 63,008 | 66,367 | |||||||||||||||
| Large Cap Value | 89,895 | — | 27,554 | 114,428 | 231,877 | |||||||||||||||
| Mid Cap Growth | 19,098 | 28,710 | — | 71,368 | 119,176 | |||||||||||||||
| Mid Cap Value | 3,182 | — | — | 18,164 | 21,346 | |||||||||||||||
| Small Cap Equity Insights | 642 | — | — | 71,201 | 71,843 | |||||||||||||||
| Strategic Growth | 2,193 | — | — | 96,122 | 98,315 | |||||||||||||||
| U.S. Equity Insights | 133,511 | 10,548 | — | 110,333 | 254,392 | |||||||||||||||
| 81 |
GOLDMAN SACHS VARIABLE INSURANCE TRUST EQUITY FUNDS
Notes to Financial Statements (continued)
June 30, 2022 (Unaudited)
5. AGREEMENTS AND AFFILIATED TRANSACTIONS (continued)
E. Line of Credit Facility — As of June 30, 2022, the Funds participated in a $1,250,000,000 committed, unsecured revolving line of credit facility (the “facility”) together with other funds of the Trust and certain registered investment companies having management agreements with GSAM or its affiliates. This facility is to be used for temporary emergency purposes, or to allow for an orderly liquidation of securities to meet redemption requests. The interest rate on borrowings is based on the federal funds rate. The facility also requires a fee to be paid by the Funds based on the amount of the commitment that has not been utilized. For the six months ended June 30, 2022, the Funds did not have any borrowings under the facility. Prior to April 22, 2022, the facility was $1,000,000,000.
F. Other Transactions with Affiliates — For the six months ended June 30, 2022, Goldman Sachs earned $553 and $344 in brokerage commissions from portfolio transactions, including futures transactions executed with Goldman Sachs as the Futures Commission Merchant, on behalf of the Large Cap Value and Mid Cap Growth Funds, respectively.
The following table provides information about the investment in shares of issuers of which a Fund is an affiliate as of and for the six months ended June 30, 2022:
| Fund | Name of Affiliated Issuer | Beginning Value as of December 31, 2021 | Purchases at Cost | Proceeds from Sales | Net Realized Gain (Loss) | Change in Unrealized Appreciation (Depreciation) | Ending Value as of June 30, 2022 | Shares as of June 30, 2022 | Dividend Income | |||||||||||||||||||||||||
| Equity Index | Goldman Sachs Group, Inc. (The) | $ | 711,926 | $ | — | $ | (28,146 | ) | $ | 7,776 | $ | (164,048 | ) | $ | 527,508 | 1,776 | $ | 7,182 | ||||||||||||||||
The following table provides information about the Funds’ investment in the Goldman Sachs Financial Square Government Fund as of and for the six months ended June 30, 2022:
| Fund | Beginning December 31, 2021 | Purchases at Cost | Proceeds from Sales | Ending June 30, 2022 | Shares as of June 30, 2022 | Dividend Income | ||||||||||||||||||
| International Equity Insights | $ | — | $ | 6,725,016 | $ | (6,725,016 | ) | $ | — | $ | — | $ | 85 | |||||||||||
| Large Cap Value | 2,751,464 | 43,101,833 | (43,114,623 | ) | 2,738,674 | 2,738,674 | 5,011 | |||||||||||||||||
| Mid Cap Growth | 933,690 | 11,914,035 | (9,527,034 | ) | 3,320,691 | 3,320,691 | 5,678 | |||||||||||||||||
| Mid Cap Value | 4,761,405 | 64,309,128 | (67,662,256 | ) | 1,408,277 | 1,408,277 | 8,621 | |||||||||||||||||
| Small Cap Equity Insights | — | 11,023,078 | (9,890,051 | ) | 1,133,027 | 1,133,027 | 2,386 | |||||||||||||||||
| Strategic Growth | 4,509,290 | 31,457,808 | (29,325,614 | ) | 6,641,484 | 6,641,484 | 8,742 | |||||||||||||||||
| U.S. Equity Insights | — | 4,853,670 | (4,853,670 | ) | — | — | 116 | |||||||||||||||||
As of June 30, 2022, The Goldman Sachs Group, Inc. was the beneficial owner of approximately 5% of the Institutional Shares of the Mid Cap Growth Fund.
| 82 |
GOLDMAN SACHS VARIABLE INSURANCE TRUST EQUITY FUNDS
6. PORTFOLIO SECURITIES TRANSACTIONS
The cost of purchases and proceeds from sales and maturities of long-term securities for the six months ended June 30, 2022, were as follows:
| Fund | Purchases | Sales and Maturities | ||||||||||||||||||||||
| Equity Index | $ | 1,023,234 | $ | 10,486,747 | ||||||||||||||||||||
| International Equity Insights | 88,519,198 | 83,155,522 | ||||||||||||||||||||||
| Large Cap Value | 116,965,642 | 162,664,830 | ||||||||||||||||||||||
| Mid Cap Growth | 22,419,481 | 27,665,927 | ||||||||||||||||||||||
| Mid Cap Value | 205,349,473 | 294,361,460 | ||||||||||||||||||||||
| Small Cap Equity Insights | 100,318,139 | 98,524,360 | ||||||||||||||||||||||
| Strategic Growth | 54,451,297 | 138,778,805 | ||||||||||||||||||||||
| U.S. Equity Insights | 335,356,221 | 343,896,914 | ||||||||||||||||||||||
7. SECURITIES LENDING
The Large Cap Value, Mid Cap Growth, Mid Cap Value and Strategic Growth Funds may lend their securities through a securities lending agent, the Bank of New York Mellon (“BNYM”), to certain qualified borrowers. Pursuant to exemptive relief granted by the Securities and Exchange Commission (“SEC”) and the terms and conditions contained therein, the Equity Index, International Equity Insights, Small Cap Equity Insights and U. S. Equity Insights Funds may lend their securities through a securities lending agent, Goldman Sachs Agency Lending (“GSAL”), a wholly-owned subsidiary of Goldman Sachs, to certain qualified borrowers including Goldman Sachs and affiliates. In accordance with the Funds’ securities lending procedures, the Funds receive cash collateral at least equal to the market value of the securities on loan. The market value of the loaned securities is determined at the close of business of the Funds, at their last sale price or official closing price on the principal exchange or system on which they are traded, and any additional required collateral is delivered to the Funds on the next business day. As with other extensions of credit, the Funds may experience delay in the recovery of their securities or incur a loss should the borrower of the securities breach its agreement with the Funds or become insolvent at a time when the collateral is insufficient to cover the cost of repurchasing securities on loan. Dividend income received from securities on loan may not be subject to withholding taxes and therefore withholding taxes paid may differ from the amounts listed in the Statements of Operations. Loans of securities are terminable at any time and as such 1) the remaining contractual maturities of the outstanding securities lending transactions are considered to be overnight and continuous and 2) the borrower, after notice, is required to return borrowed securities within the standard time period for settlement of securities transactions.
The Equity Index, International Equity Insights, Large Cap Value, Mid Cap Growth, Mid Cap Value, Small Cap Equity Insights, Strategic Growth and U.S. Equity Insights Funds invest the cash collateral received in connection with securities lending transactions in the Goldman Sachs Financial Square Government Fund (“Government Money Market Fund”), an affiliated series of the Goldman Sachs Trust. The Government Money Market Fund is registered under the Act as an open end investment company, is subject to Rule 2a-7 under the Act, and is managed by GSAM, for which GSAM may receive a management fee of up to 0.16% on an annualized basis of the average daily net assets of the Government Money Market Fund.
In the event of a default by a borrower with respect to any loan, GSAL will, and BNYM may, exercise any and all remedies provided under the applicable borrower agreement to make the Funds whole. These remedies include purchasing replacement securities by applying the collateral held from the defaulting broker against the purchase cost of the replacement securities. If GSAL or BNYM are unable to purchase replacement securities, GSAL and/or BNYM will indemnify the Funds by paying the
| 83 |
GOLDMAN SACHS VARIABLE INSURANCE TRUST EQUITY FUNDS
Notes to Financial Statements (continued)
June 30, 2022 (Unaudited)
7. SECURITIES LENDING (continued)
Funds an amount equal to the market value of the securities loaned minus the value of cash collateral received from the borrower for the loan, subject to an exclusion for any shortfalls resulting from a loss of value in such cash collateral due to reinvestment risk. The Funds’ master netting agreements with certain borrowers provide the right, in the event of a default (including bankruptcy or insolvency), for the non-defaulting party to liquidate the collateral and calculate net exposure to the defaulting party or request additional collateral. However, in the event of a default by a borrower, a resolution authority could determine that such rights are not enforceable due to the restrictions or prohibitions against the right of set-off that may be imposed in accordance with a particular jurisdiction’s bankruptcy or insolvency laws. The Funds’ loaned securities were all subject to enforceable Securities Lending Agreements and the value of the collateral was at least equal to the value of the cash received. The amounts of the Funds’ overnight and continuous agreements, which represent the gross amounts of recognized liabilities for securities lending transactions outstanding as of June 30, 2022, are disclosed as “Payable upon return of securities loaned” on the Statements of Assets and Liabilities, where applicable.
Each of the Funds, GSAL and BNYM received compensation relating to the lending of the Funds’ securities. The amounts earned, if any, by the Funds’ for the six months ended June 30, 2022, are reported under Investment Income on the Statements of Operations.
The table below details securities lending activity with affiliates of Goldman Sachs:
| For the six months ended June 30, 2022 | Amounts payable to Goldman Sachs Upon Return of Securities Loaned as of June 30, 2022 | |||||||||||
| Fund | Earnings of GSAL Relating to Securities Loaned | Amounts Received by the Funds from Lending to Goldman Sachs | ||||||||||
| Equity Index | $ | 3 | $ | 13 | $ | — | ||||||
| International Equity Insights | 886 | — | — | |||||||||
| Small Cap Equity Insights | 1,218 | 781 | 172,125 | |||||||||
The following table provides information about the Funds’ investment in the Government Money Market Fund for the six months ended June 30, 2022:
| Fund | Beginning Value as of December 31, 2021 | Purchases at Cost | Proceeds from Sales | Ending Value as of June 30, 2022 | ||||||||||||
| Equity Index | $ | — | $ | 336,000 | $ | (336,000 | ) | $ | — | |||||||
| International Equity Insights | — | 11,649,993 | (10,379,092 | ) | 1,270,901 | |||||||||||
| Large Cap Value | — | 3,126,169 | (3,126,169 | ) | — | |||||||||||
| Mid Cap Growth | 688,836 | 3,929,020 | (4,152,163 | ) | 465,693 | |||||||||||
| Mid Cap Value | — | 4,546,726 | (4,546,726 | ) | — | |||||||||||
| Small Cap Equity Insights | 1,845,983 | 8,304,536 | (8,699,439 | ) | 1,451,080 | |||||||||||
| Strategic Growth | 858,041 | 5,305,308 | (6,163,349 | ) | — | |||||||||||
| 84 |
GOLDMAN SACHS VARIABLE INSURANCE TRUST EQUITY FUNDS
8. TAX INFORMATION
As of the Funds’ most recent fiscal year end, December 31, 2021, the Funds’ certain timing differences, on a tax-basis were as follows:
| Equity Index | International Equity Insights | Large Cap Value | Mid Cap Growth | |||||||||||||
| Timing differences (Real Estate Investment Trusts, late year ordinary loss deferral, post October loss deferral, and straddle loss deferrals) | $ | 4,736 | $ | (215,504 | ) | $ | 53,518 | $ | 2,663 | |||||||
| Mid Cap Value | Small Cap Equity Insights | Strategic Growth | U.S. Equity Insights | |||||||||||||
| Timing differences (Real Estate Investment Trusts, late year ordinary loss deferral, post October loss deferral, and straddle loss deferrals) | $ | 122,921 | $ | (229,579 | ) | $ | — | $ | 4,020 | |||||||
As of June 30, 2022, the Funds’ aggregate security unrealized gains and losses based on cost for U.S. federal income tax purposes were as follows:
| Equity Index | International Equity Insights | Large Cap Value | Mid Cap Growth | |||||||||||||
| Tax cost | $ | 51,856,516 | $ | 97,550,719 | $ | 348,929,607 | $ | 51,019,748 | ||||||||
Gross unrealized gain | 121,898,467 | 2,782,014 | 59,836,421 | 7,079,321 | ||||||||||||
| Gross unrealized loss | (6,795,263 | ) | (10,295,130 | ) | (28,533,223 | ) | (6,337,459 | ) | ||||||||
| Net unrealized gain (loss) | $ | 115,103,204 | $ | (7,513,116 | ) | $ | 31,303,198 | $ | 741,862 | |||||||
| Mid Cap Value | Small Cap Equity Insights | Strategic Growth | U.S. Equity Insights | |||||||||||||
| Tax cost | $ | 349,655,838 | $ | 113,908,735 | $ | 137,053,896 | $ | 265,702,158 | ||||||||
Gross unrealized gain | 49,350,411 | 5,075,249 | 119,190,800 | 47,187,285 | ||||||||||||
| Gross unrealized loss | (26,119,284 | ) | (15,197,053 | ) | (11,363,332 | ) | (24,363,720 | ) | ||||||||
| Net unrealized gain (loss) | $ | 23,231,127 | $ | (10,121,804 | ) | $ | 107,827,468 | $ | 22,823,565 | |||||||
The difference between GAAP-basis and tax-basis unrealized gains (losses) is attributable primarily to wash sales, net mark to market gains (losses) on regulated futures and foreign currency contracts, and differences in the tax treatment of real estate investment trust investments and passive foreign investment company investments.
GSAM has reviewed the Funds’ tax positions for all open tax years (the current and prior three years, as applicable) and has concluded that no provision for income tax is required in the Funds’ financial statements. Such open tax years remain subject to examination and adjustment by tax authorities.
9. OTHER RISKS
The Funds’ risks include, but are not limited to, the following:
Derivatives Risk — A Fund’s use of derivatives may result in loss. Derivative instruments, which may pose risks in addition to and greater than those associated with investing directly in securities, currencies or other instruments, may be illiquid or less liquid, volatile, difficult to price and leveraged so that small changes in the value of the underlying instruments may produce disproportionate losses to the Funds. Derivatives are also subject to counterparty risk, which is the risk that the other party in the transaction will not fulfill its contractual obligation. The use of derivatives is a highly specialized activity that involves investment
| 85 |
GOLDMAN SACHS VARIABLE INSURANCE TRUST EQUITY FUNDS
Notes to Financial Statements (continued)
June 30, 2022 (Unaudited)
9. OTHER RISKS (continued)
techniques and risks different from those associated with investments in more traditional securities and instruments. Losses from derivatives can also result from a lack of correlation between changes in the value of derivative instruments and the portfolio assets (if any) being hedged.
Foreign and Emerging Countries Risk — Investing in foreign markets may involve special risks and considerations not typically associated with investing in the U.S. Foreign securities may be subject to risk of loss because of more or less foreign government regulation; less public information; less stringent investor protections; less stringent accounting, corporate governance, financial reporting and disclosure standards; and less economic, political and social stability in the countries in which a Fund invests. The imposition of sanctions, exchange controls (including repatriation restrictions), confiscation of assets and property, trade restrictions (including tariffs) and other government restrictions by the U.S. or other governments, or from problems in registration, settlement or custody, may also result in losses. The type and severity of sanctions and other similar measures, including counter sanctions and other retaliatory actions, that may be imposed could vary broadly in scope, and their impact is impossible to predict. For example, the imposition of sanctions and other similar measures could, among other things, cause a decline in the value and/or liquidity of securities issued by the sanctioned country or companies located in or economically tied to the sanctioned country and increase market volatility and disruption in the sanctioned country and throughout the world. Sanctions and other similar measures could limit or prevent a Fund from buying and selling securities (in the sanctioned country and other markets), significantly delay or prevent the settlement of securities transactions, and significantly impact a Fund’s liquidity and performance. Foreign risk also involves the risk of negative foreign currency exchange rate fluctuations, which may cause the value of securities denominated in such foreign currency (or other instruments through which a Fund has exposure to foreign currencies) to decline in value. Currency exchange rates may fluctuate significantly over short periods of time. To the extent that a Fund also invests in securities of issuers located in, or economically tied to, emerging markets, these risks may be more pronounced.
Foreign Custody Risk — A Fund invests in foreign securities, and as such the Fund may hold such securities and cash with foreign banks, agents, and securities depositories appointed by the Fund’s custodian (each a “Foreign Custodian”). Some foreign custodians may be recently organized or new to the foreign custody business. In some countries, Foreign Custodians may be subject to little or no regulatory oversight over, or independent evaluation of, their operations. Further, the laws of certain countries may place limitations on a Fund’s ability to recover its assets if a Foreign Custodian enters bankruptcy. Investments in emerging markets may be subject to even greater custody risks than investments in more developed markets. Custody services in emerging market countries are very often undeveloped and may be considerably less well regulated than in more developed countries, and thus may not afford the same level of investor protection as would apply in developed countries.
Investments in Other Investment Companies Risk — As a shareholder of another investment company, a Fund will indirectly bear its proportionate share of any net management fees and other expenses paid by such other investment companies, in addition to the fees and expenses regularly borne by the Fund.
Large Shareholder Transactions Risk — A Fund may experience adverse effects when certain large shareholders, such as other funds, participating insurance companies, accounts and Goldman Sachs affiliates, purchase or redeem large amounts of shares of the Fund. Such large shareholder redemptions, which may occur rapidly or unexpectedly, may cause a Fund to sell portfolio securities at times when it would not otherwise do so, which may negatively impact a Fund’s NAV and liquidity. These transactions may also accelerate the realization of taxable income to shareholders if such sales of investments resulted in gains, and may also increase transaction costs. In addition, a large redemption could result in a Fund’s current expenses being allocated over a smaller asset base, leading to an increase in the Fund’s expense ratio. Similarly, large Fund share purchases may adversely affect a Fund’s performance to the extent that the Fund is delayed in investing new cash or otherwise maintains a larger cash position than it ordinarily would.
Liquidity Risk — A Fund may make investments that are illiquid or that may become less liquid in response to market developments or adverse investor perceptions. Illiquid investments may be more difficult to value. Liquidity risk may also refer to the risk that a Fund will not be able to pay redemption proceeds within the allowable time period or without significant dilution to remaining investors’ interests because of unusual market conditions, an unusually high volume of redemption requests, or other reasons. To meet redemption requests, a Fund may be forced to sell investments at an unfavorable time and/or under unfavorable
| 86 |
GOLDMAN SACHS VARIABLE INSURANCE TRUST EQUITY FUNDS
9. OTHER RISKS (continued)
conditions. If a Fund is forced to sell securities at an unfavorable time and/or under unfavorable conditions, such sales may adversely affect the Fund’s NAV and dilute remaining investors’ interests. These risks may be more pronounced in connection with a Fund`s investments in securities of issuers located in emerging market countries. Redemptions by large shareholders may have a negative impact on a Fund’s liquidity.
Market and Credit Risks — In the normal course of business, a Fund trades financial instruments and enters into financial transactions where risk of potential loss exists due to changes in the market (market risk). The value of the securities in which a Fund invests may go up or down in response to the prospects of individual companies, particular sectors or governments and/or general economic conditions throughout the world due to increasingly interconnected global economies and financial markets. Events such as war, acts of terrorism, social unrest, natural disasters, the spread of infectious illness or other public health threats could also significantly impact a Fund and its investments. Additionally, a Fund may also be exposed to credit risk in the event that an issuer or guarantor fails to perform or that an institution or entity with which the Fund has unsettled or open transactions defaults.
Non-Diversification Risk — The Strategic Growth Fund is non-diversified, meaning that it is permitted to invest a larger percentage of its assets in one or more issuers or in fewer issuers than diversified mutual funds. Thus, the Fund may be more susceptible to adverse developments affecting any single issuer held in its portfolio, and may be more susceptible to greater losses because of these developments.
10. INDEMNIFICATIONS
Under the Trust’s organizational documents, its Trustees, officers, employees and agents are indemnified, to the extent permitted by the Act and state law, against certain liabilities that may arise out of performance of their duties to the Funds. Additionally, in the course of business, the Funds enter into contracts that contain a variety of indemnification clauses. The Funds’ maximum exposure under these arrangements is unknown, as this would involve future claims that may be made against the Funds that have not yet occurred. However, GSAM believes the risk of loss under these arrangements to be remote.
11. SUBSEQUENT EVENTS
Subsequent events after the Statements of Assets and Liabilities date have been evaluated, and GSAM has concluded that there is no impact requiring adjustment or disclosure in the financial statements.
12. SUMMARY OF SHARE TRANSACTIONS
Share activity is as follows:
| Equity Index Fund | ||||||||||||||||
| For the Six Months Ended June 30, 2022 (Unaudited) | For the Fiscal Year Ended December 31, 2021 | |||||||||||||||
| Shares | Dollars | Shares | Dollars | |||||||||||||
| Service Shares | ||||||||||||||||
| Shares sold | 27,960 | $ | 558,638 | 361,708 | $ | 8,243,921 | ||||||||||
| Reinvestment of distributions | — | — | 720,711 | 16,050,234 | ||||||||||||
| Shares redeemed | (552,466 | ) | (11,326,957 | ) | (1,070,042 | ) | (23,750,642 | ) | ||||||||
| NET INCREASE (DECREASE) | (524,506 | ) | $ | (10,768,319 | ) | 12,377 | $ | 543,513 | ||||||||
| 87 |
GOLDMAN SACHS VARIABLE INSURANCE TRUST EQUITY FUNDS
Notes to Financial Statements (continued)
June 30, 2022 (Unaudited)
12. SUMMARY OF SHARE TRANSACTIONS (continued)
| International Equity Insights Fund | ||||||||||||||||
| For the Six Months Ended June 30, 2022 (Unaudited) | For the Fiscal Year Ended December 31, 2021 | |||||||||||||||
| Shares | Dollars | Shares | Dollars | |||||||||||||
| Institutional Shares | ||||||||||||||||
| Shares sold | 1,223,952 | $ | 10,266,700 | 1,279,391 | $ | 12,019,024 | ||||||||||
| Reinvestment of distributions | — | — | 363,020 | 3,288,959 | ||||||||||||
| Shares redeemed | (460,725 | ) | (3,851,682 | ) | (559,940 | ) | (5,229,023 | ) | ||||||||
| 763,227 | 6,415,018 | 1,082,471 | 10,078,960 | |||||||||||||
| Service Shares | ||||||||||||||||
| Shares sold | 392,437 | 3,580,740 | 272,671 | 2,522,185 | ||||||||||||
| Reinvestment of distributions | — | — | 245,317 | 2,232,384 | ||||||||||||
| Shares redeemed | (830,815 | ) | (7,308,649 | ) | (1,206,056 | ) | (11,158,115 | ) | ||||||||
| (438,378 | ) | (3,727,909 | ) | (688,068 | ) | (6,403,546 | ) | |||||||||
| NET INCREASE | 324,849 | $ | 2,687,109 | 394,403 | $ | 3,675,414 | ||||||||||
| Large Cap Value Fund | ||||||||||||||||
| For the Six Months Ended June 30, 2022 (Unaudited) | For the Fiscal Year Ended December 31, 2021 | |||||||||||||||
| Shares | Dollars | Shares | Dollars | |||||||||||||
| Institutional Shares | ||||||||||||||||
| Shares sold | 544,739 | $ | 5,197,846 | 1,017,136 | $ | 10,601,007 | ||||||||||
| Reinvestment of distributions | — | — | 2,432,740 | 23,694,892 | ||||||||||||
| Shares redeemed | (2,066,391 | ) | (20,008,198 | ) | (2,709,781 | ) | (28,139,387 | ) | ||||||||
| (1,521,652 | ) | (14,810,352 | ) | 740,095 | 6,156,512 | |||||||||||
| Service Shares | ||||||||||||||||
| Shares sold | 380,878 | 3,618,477 | 603,933 | 6,315,252 | ||||||||||||
| Reinvestment of distributions | — | — | 4,106,597 | 40,039,323 | ||||||||||||
| Shares redeemed | (3,731,862 | ) | (35,619,550 | ) | (6,168,949 | ) | (63,721,719 | ) | ||||||||
| (3,350,984 | ) | (32,001,073 | ) | (1,458,419 | ) | (17,367,144 | ) | |||||||||
| NET DECREASE | (4,872,636 | ) | $ | (46,811,425 | ) | (718,324 | ) | $ | (11,210,632 | ) | ||||||
| 88 |
GOLDMAN SACHS VARIABLE INSURANCE TRUST EQUITY FUNDS
12. SUMMARY OF SHARE TRANSACTIONS (continued)
| Mid Cap Growth Fund | ||||||||||||||||
| For the Six Months Ended June 30, 2022 (Unaudited) | For the Fiscal Year Ended December 31, 2021 | |||||||||||||||
| Shares | Dollars | Shares | Dollars | |||||||||||||
| Institutional Shares | ||||||||||||||||
| Shares sold | 82,652 | $ | 879,904 | 20,939 | $ | 308,042 | ||||||||||
| Reinvestment of distributions | — | — | 5,182 | 67,989 | ||||||||||||
| Shares redeemed | — | — | — | — | ||||||||||||
| 82,652 | 879,904 | 26,121 | 376,031 | |||||||||||||
| Service Shares | ||||||||||||||||
| Shares sold | 431,616 | 4,080,851 | 231,649 | 3,064,331 | ||||||||||||
| Reinvestment of distributions | — | — | 1,090,968 | 13,375,264 | ||||||||||||
| Shares redeemed | (752,540 | ) | (7,909,745 | ) | (1,240,070 | ) | (17,004,840 | ) | ||||||||
| (320,924 | ) | (3,828,894 | ) | 82,547 | (565,245 | ) | ||||||||||
| NET INCREASE (DECREASE) | (238,272 | ) | $ | (2,948,990 | ) | 108,668 | $ | (189,214 | ) | |||||||
| Mid Cap Value Fund | ||||||||||||||||
| For the Six Months Ended June 30, 2022 (Unaudited) | For the Fiscal Year Ended December 31, 2021 | |||||||||||||||
| Shares | Dollars | Shares | Dollars | |||||||||||||
| Institutional Shares | ||||||||||||||||
| Shares sold | 365,810 | $ | 6,636,578 | 543,557 | $ | 10,751,501 | ||||||||||
| Reinvestment of distributions | — | — | 2,669,991 | 51,237,122 | ||||||||||||
| Shares redeemed | (1,503,935 | ) | (27,535,524 | ) | (2,580,959 | ) | (51,043,863 | ) | ||||||||
| (1,138,125 | ) | (20,898,946 | ) | 632,589 | 10,944,760 | |||||||||||
| Service Shares | ||||||||||||||||
| Shares sold | 1,421,193 | 26,770,358 | 135,902 | 2,703,427 | ||||||||||||
| Reinvestment of distributions | — | — | 1,143,905 | 22,180,324 | ||||||||||||
| Shares redeemed | (5,503,767 | ) | (97,765,134 | ) | (1,838,658 | ) | (36,501,072 | ) | ||||||||
| (4,082,574 | ) | (70,994,776 | ) | (558,851 | ) | (11,617,321 | ) | |||||||||
| NET INCREASE (DECREASE) | (5,220,699 | ) | $ | (91,893,722 | ) | 73,738 | $ | (672,561 | ) | |||||||
| 89 |
GOLDMAN SACHS VARIABLE INSURANCE TRUST EQUITY FUNDS
Notes to Financial Statements (continued)
June 30, 2022 (Unaudited)
12. SUMMARY OF SHARE TRANSACTIONS (continued)
| Small Cap Equity Insights Fund | ||||||||||||||||
| For the Six Months Ended June 30, 2022 (Unaudited) | For the Fiscal Year Ended December 31, 2021 | |||||||||||||||
| Shares | Dollars | Shares | Dollars | |||||||||||||
| Institutional Shares | ||||||||||||||||
| Shares sold | 669,236 | $ | 7,873,828 | 1,618,659 | $ | 25,450,651 | ||||||||||
| Reinvestment of distributions | — | — | 1,829,510 | 23,948,283 | ||||||||||||
| Shares redeemed | (677,990 | ) | (7,927,373 | ) | (1,420,214 | ) | (22,244,412 | ) | ||||||||
| (8,754 | ) | (53,545 | ) | 2,027,955 | 27,154,522 | |||||||||||
| Service Shares | ||||||||||||||||
| Shares sold | 335,067 | 3,769,260 | 362,412 | 5,522,021 | ||||||||||||
| Reinvestment of distributions | — | — | 360,051 | 4,659,058 | ||||||||||||
| Shares redeemed | (105,706 | ) | (1,192,840 | ) | (299,332 | ) | (4,633,346 | ) | ||||||||
| 229,361 | 2,576,420 | 423,131 | 5,547,733 | |||||||||||||
| NET INCREASE | 220,607 | $ | 2,522,875 | 2,451,086 | $ | 32,702,255 | ||||||||||
| Strategic Growth Fund | ||||||||||||||||
| For the Six Months Ended June 30, 2022 (Unaudited) | For the Fiscal Year Ended December 31, 2021 | |||||||||||||||
| Shares | Dollars | Shares | Dollars | |||||||||||||
| Institutional Shares | ||||||||||||||||
| Shares sold | 354,997 | $ | 4,689,582 | 481,598 | $ | 7,976,739 | ||||||||||
| Reinvestment of distributions | — | — | 1,313,700 | 22,122,701 | ||||||||||||
| Shares redeemed | (453,379 | ) | (6,162,976 | ) | (1,421,500 | ) | (24,042,181 | ) | ||||||||
| (98,382 | ) | (1,473,394 | ) | 373,798 | 6,057,259 | |||||||||||
| Service Shares | ||||||||||||||||
| Shares sold | 485,763 | 6,250,350 | 406,058 | 6,769,145 | ||||||||||||
| Reinvestment of distributions | — | — | 1,866,601 | 31,302,896 | ||||||||||||
| Shares redeemed | (5,955,675 | ) | (86,847,828 | ) | (3,121,407 | ) | (52,908,517 | ) | ||||||||
| (5,469,912 | ) | (80,597,478 | ) | (848,748 | ) | (14,836,476 | ) | |||||||||
| NET DECREASE | (5,568,294 | ) | $ | (82,070,872 | ) | (474,950 | ) | $ | (8,779,217 | ) | ||||||
| 90 |
GOLDMAN SACHS VARIABLE INSURANCE TRUST EQUITY FUNDS
12. SUMMARY OF SHARE TRANSACTIONS (continued)
| U.S. Equity Insights Fund | ||||||||||||||||
| For the Six Months Ended June 30, 2022 (Unaudited) | For the Fiscal Year Ended December 31, 2021 | |||||||||||||||
| Shares | Dollars | Shares | Dollars | |||||||||||||
| Institutional Shares | ||||||||||||||||
| Shares sold | 792,214 | $ | 14,013,277 | 887,900 | $ | 20,340,436 | ||||||||||
| Reinvestment of distributions | — | — | 3,644,075 | 71,715,395 | ||||||||||||
| Shares redeemed | (955,468 | ) | (17,182,587 | ) | (2,036,401 | ) | (46,216,943 | ) | ||||||||
| (163,254 | ) | (3,169,310 | ) | 2,495,574 | 45,838,888 | |||||||||||
| Service Shares | ||||||||||||||||
| Shares sold | 28,708 | 520,786 | 163,388 | 3,720,849 | ||||||||||||
| Reinvestment of distributions | — | — | 687,514 | 13,647,143 | ||||||||||||
| Shares redeemed | (294,938 | ) | (5,265,731 | ) | (474,227 | ) | (10,887,216 | ) | ||||||||
| (266,230 | ) | (4,744,945 | ) | 376,675 | 6,480,776 | |||||||||||
| NET INCREASE (DECREASE) | (429,484 | ) | $ | (7,914,255 | ) | 2,872,249 | $ | 52,319,664 | ||||||||
| 91 |
GOLDMAN SACHS VARIABLE INSURANCE TRUST EQUITY FUNDS
Statement Regarding Basis for Approval of Management Agreements (Unaudited)
Background
The Goldman Sachs Equity Index, Goldman Sachs Mid Cap Growth (formerly, Goldman Sachs Growth Opportunities Fund), Goldman Sachs International Equity Insights, Goldman Sachs Mid Cap Value, Goldman Sachs Large Cap Value, Goldman Sachs Small Cap Equity Insights, Goldman Sachs Strategic Growth, and Goldman Sachs U.S. Equity Insights (the “Funds”) are investment portfolios of Goldman Sachs Variable Insurance Trust (the “Trust”). The Board of Trustees oversees the management of the Trust and reviews the investment performance and expenses of the Funds at regularly scheduled meetings held throughout the year. In addition, the Board of Trustees determines annually whether to approve the continuance of the Trust’s investment management agreements (the “Management Agreements”) with Goldman Sachs Asset Management, L.P. (the “Investment Adviser”) on behalf of the Funds and the sub-advisory agreement (the “Sub-Advisory Agreement,” and together with the Management Agreements, the “Agreements”) between the Investment Adviser and SSgA Funds Management, Inc. (the “Sub-Adviser”) on behalf of the Equity Index Fund.
The Agreements were most recently approved for continuation until June 30, 2023 by the Board of Trustees, including those Trustees who are not parties to the Agreements or “interested persons” (as defined in the Investment Company Act of 1940, as amended) of any party thereto (the “Independent Trustees”), at a meeting held on June 14-15, 2022 (the “Annual Meeting”).
The review process undertaken by the Trustees spans the course of the year and culminates with the Annual Meeting. To assist the Trustees in their deliberations, the Trustees have established a Contract Review Committee (the “Committee”), comprised of the Independent Trustees. The Committee held two meetings over the course of the year since the Agreements were last approved. At those Committee meetings, regularly scheduled Board or other committee meetings, and/or the Annual Meeting, matters relevant to the renewal of the Agreements were considered by the Board, or the Independent Trustees, as applicable. With respect to each Fund, such matters included:
| (a) | the nature and quality of the advisory, administrative, and other services provided to the Fund by the Investment Adviser and its affiliates, including information about: |
| (i) | the structure, staff, and capabilities of the Investment Adviser and its portfolio management teams; |
| (ii) | the groups within the Investment Adviser and its affiliates that support the portfolio management teams or provide other types of necessary services, including fund services groups (e.g., accounting and financial reporting, tax, shareholder services, and operations); controls and risk management groups (e.g., legal, compliance, valuation oversight, credit risk management, internal audit, compliance testing, market risk analysis, finance, and central funding); sales and distribution support groups, and others (e.g., information technology and training); |
| (iii) | trends in employee headcount; |
| (iv) | the Investment Adviser’s financial resources and ability to hire and retain talented personnel and strengthen its operations; and |
| (v) | the parent company’s support of the Investment Adviser and its mutual fund business, as expressed by the firm’s senior management; |
| (b) | information on the investment performance of the Fund, including comparisons to the performance of similar mutual funds, as provided by a third-party mutual fund data provider engaged as part of the contract review process (the “Outside Data Provider”), a benchmark performance index, and in the case of the Mid Cap Value Fund, Strategic Growth Fund, and U.S. Equity Insights Fund, a composite of accounts with comparable investment strategies managed by the Investment Adviser; and information on general investment outlooks in the markets in which the Fund invests; |
| (c) | information provided by the Investment Adviser indicating the Investment Adviser’s views on whether the Fund’s peer group and/or benchmark index had high, medium, or low relevance given the Fund’s particular investment strategy; |
| (d) | the terms of the Agreements and other agreements with affiliated service providers entered into by the Trust on behalf of the Fund; |
| (e) | fee and expense information for the Fund, including: |
| (i) | the relative management fee and expense levels of the Fund as compared to those of comparable funds managed by other advisers, as provided by the Outside Data Provider; |
| (ii) | the Fund’s expense trends over time; and |
| (iii) | to the extent the Investment Adviser manages other types of accounts (such as bank collective trusts, private wealth management accounts, institutional separate accounts, sub-advised mutual funds, and non-U.S. funds) having investment objectives and policies similar to those of the Fund, comparative information on the advisory fees charged and services provided to those accounts by the Investment Adviser; |
| (f) | with respect to the extensive investment performance and expense comparison data provided by the Outside Data Provider, its processes in producing that data for the Fund; |
| 92 |
GOLDMAN SACHS VARIABLE INSURANCE TRUST EQUITY FUNDS
Statement Regarding Basis for Approval of Management Agreements (Unaudited) (continued)
| (g) | the undertakings of the Investment Adviser and its affiliates to implement fee waivers and/or expense limitations; |
| (h) | information relating to the profitability of the Agreements and the transfer agency and distribution and service arrangements of the Fund to the Investment Adviser and its affiliates; |
| (i) | whether the Fund’s existing management fee schedule adequately addressed any economies of scale; |
| (j) | a summary of the “fall-out” benefits derived by the Investment Adviser and its affiliates from their relationships with the Fund, including the fees received by the Investment Adviser’s affiliates from the Fund for transfer agency, securities lending (in the case of the Equity Index Fund, International Equity Insights Fund, Small Cap Equity Insights Fund, and U.S. Equity Insights Fund), portfolio trading, distribution and other services; |
| (k) | a summary of potential benefits derived by the Fund as a result of its relationship with the Investment Adviser; |
| (l) | information regarding commissions paid by the Fund and broker oversight, an update on the Investment Adviser’s soft dollars practices (in the case of the Equity Index Fund, Mid Cap Growth Fund, Mid Cap Value Fund, Large Cap Value Fund, and Strategic Growth Fund), other information regarding portfolio trading, and how the Investment Adviser carries out its duty to seek best execution; |
| (m) | the manner in which portfolio manager compensation is determined; and the number and types of accounts managed by the portfolio managers; |
| (n) | the nature and quality of the services provided to the Fund by its unaffiliated service providers (including the Sub-Adviser for the Equity Index Fund), and the Investment Adviser’s general oversight and evaluation (including reports on due diligence) of those service providers as part of the administrative services provided under the Agreements; and |
| (o) | the Investment Adviser’s processes and policies addressing various types of potential conflicts of interest; its approach to risk management; the annual review of the effectiveness of the Fund’s compliance program; and periodic compliance reports. |
The Trustees also received an overview of the Funds’ distribution arrangements. They received information regarding the Funds’ assets, share purchase and redemption activity, and payment of distribution and service fees. Information was also provided to the Trustees relating to revenue sharing payments made by and services provided by the Investment Adviser and its affiliates to intermediaries that promote the sale, distribution, and/or servicing of Fund shares. The Independent Trustees also discussed the broad range of other investment choices that are available to Fund investors, including the availability of comparable funds managed by other advisers.
The presentations made at the Board and Committee meetings and at the Annual Meeting encompassed the Funds and other mutual funds for which the Board of Trustees has responsibility. In evaluating the Agreements at the Annual Meeting, the Trustees relied upon their knowledge, resulting from their meetings and other interactions throughout the year, of the Investment Adviser and its affiliates, their services, and the Funds. In conjunction with these meetings, the Trustees received written materials and oral presentations on the topics covered, and the Investment Adviser addressed the questions and concerns of the Trustees, including concerns regarding the investment performance of certain of the funds they oversee. The Independent Trustees were advised by their independent legal counsel regarding their responsibilities and other regulatory requirements related to the approval and continuation of mutual fund investment management agreements under applicable law. In addition, the Investment Adviser and its affiliates provided the Independent Trustees with a written response to a formal request for information sent on behalf of the Independent Trustees by their independent legal counsel. During the course of their deliberations, the Independent Trustees met in executive sessions with their independent legal counsel, without representatives of the Investment Adviser or its affiliates present.
Nature, Extent, and Quality of the Services Provided Under the Agreements
As part of their review, the Trustees considered the nature, extent, and quality of the services provided to the Funds by the Investment Adviser. In this regard, the Trustees considered both the investment advisory services and non-advisory services that are provided by the Investment Adviser and its affiliates (including, with respect to the Equity Index Fund, the Investment Adviser’s oversight of the Sub-Adviser). The Trustees noted the transition in the leadership and changes in personnel of various of the Investment Adviser’s portfolio management teams that had occurred in recent periods, and the ongoing recruitment efforts aimed at bringing high quality investment talent to the Investment Adviser. They also noted the Investment Adviser’s commitment to maintaining high quality systems and expending substantial resources to respond to ongoing changes to the market, regulatory and control environment in which the Funds and their service providers operate, including developments associated with the COVID-19 pandemic, geopolitical events, and economic sanctions, as well as the efforts of the Investment Adviser and its affiliates to combat cyber security risks. The Trustees also considered information regarding the Investment Adviser’s business continuity planning and remote operations capabilities. The Trustees concluded that the Investment Adviser continued to commit substantial financial and operational resources to the Funds and expressed confidence that the Investment Adviser would continue to do so in the future. The
| 93 |
GOLDMAN SACHS VARIABLE INSURANCE TRUST EQUITY FUNDS
Statement Regarding Basis for Approval of Management Agreements (Unaudited) (continued)
Trustees also recognized that the Investment Adviser had made significant commitments to address regulatory compliance requirements applicable to the Funds and the Investment Adviser and its affiliates.
Investment Performance
The Trustees also considered the investment performance of the Funds. In this regard, they compared the investment performance of each Fund to its peers using rankings and ratings compiled by the Outside Data Provider as of December 31, 2021, and updated performance information prepared by the Investment Adviser using the peer group identified by the Outside Data Provider as of March 31, 2022. The information on each Fund’s investment performance was provided for the one-, three-, five-, and ten-year periods ending on the applicable dates, to the extent that each Fund had been in existence for those periods. The Trustees also reviewed each Fund’s investment performance relative to its performance benchmark. As part of this review, they considered the investment performance trends of the Funds over time, and reviewed the investment performance of each Fund in light of its investment objective and policies and market conditions. The Trustees also received information comparing the performance of the Mid Cap Value Fund, Strategic Growth Fund, and U.S. Equity Insights Fund to that of composites of accounts with comparable investment strategies managed by the Investment Adviser.
In addition, the Trustees considered materials prepared and presentations made by the Investment Adviser’s senior management and portfolio management personnel in which Fund performance was assessed. The Trustees also considered the Investment Adviser’s periodic reports with respect to the Funds’ risk profiles, and how the Investment Adviser’s approach to risk monitoring and management influences portfolio management. In the case of International Equity Insights Fund, Small Cap Equity Insights Fund, and U.S. Equity Insights Fund, they noted the efforts of the Funds’ portfolio management team to continue to enhance the investment models used in managing the Funds.
The Trustees noted that the Equity Index Fund’s Service Shares had placed in the top half of the Fund’s peer group for the one-, three-, five-, and ten-year periods, and had underperformed the Fund’s benchmark index for the one-, three-, five-, and ten-year periods ended March 31, 2022. They also observed that the amount that the Equity Index Fund underperformed the benchmark index was approximately equal to Fund fees and expenses for the one-, three-, five-, and ten-year periods ended March 31, 2022. They considered that the Mid Cap Growth Fund’s Institutional Shares had placed in the top half of the Fund’s peer group for the three- and five-year periods, and in the third quartile for the one- and ten-year periods, and had outperformed the Fund’s benchmark index for the three- and five-year periods and underperformed for the one- and ten-year period ended March 31, 2022. The Trustees observed that the International Equity Insights Fund’s Institutional Shares had placed in the top half of the Fund’s peer group for the one-year period, and in the third quartile for the three-, five-, and ten-year periods, and had outperformed the Fund’s benchmark index for the one-year period and underperformed for the three-, five-, and ten-year periods ended March 31, 2022. They noted that the Mid Cap Value Fund’s Institutional Shares had placed in the top half of the Fund’s peer group for the one-, three-, and five-year periods, and in the third quartile for the ten-year period, and had outperformed the Fund’s benchmark index for the one-, three-, and five-year periods and underperformed for the ten-year period ended March 31, 2022. The Trustees considered that the Large Cap Value Fund’s Institutional Shares had placed in the top half of the Fund’s peer group for the one-year period, in the third quartile for the three- and ten-year periods, and in the fourth quartile for the five-year period, and had outperformed the Fund’s benchmark index for the one- and three-year periods and underperformed for the five- and ten-year periods ended March 31, 2022. They observed that the Small Cap Equity Insights Fund’s Institutional Shares had placed in the third quartile of the Fund’s peer group for the one-, five-, and ten-year periods, and in the fourth quartile for the three-year period, and had outperformed the Fund’s benchmark index for the one-year period and underperformed for the three-, five-, and ten-year periods ended March 31, 2022. They considered that the Strategic Growth Fund’s Institutional Shares had placed in the top half of the Fund’s peer group for the one-, three-, five-, and ten-year periods, and had underperformed the Fund’s benchmark index for the one-, three-, five-, and ten-year periods ended March 31, 2022. The Trustees observed that the U.S. Equity Insights Fund’s Institutional Shares had placed in the top half of the Fund’s peer group for the one- and ten-year periods, and in the third quartile for the three- and five-year periods, and had underperformed the Fund’s benchmark index for the one-, three-, five-, and ten-year periods ended March 31, 2022.
Costs of Services Provided and Competitive Information
The Trustees considered the contractual terms of the Agreements and the fee rates payable by each Fund under the Management Agreement and, with respect to the Equity Index Fund, payable by the Investment Adviser under the Sub-Advisory Agreement. In this regard, the Trustees considered information on the services rendered by the Investment Adviser to the Funds, which included both advisory and administrative services that were directed to the needs and operations of the Funds as registered mutual funds.
| 94 |
GOLDMAN SACHS VARIABLE INSURANCE TRUST EQUITY FUNDS
Statement Regarding Basis for Approval of Management Agreements (Unaudited) (continued)
In particular, the Trustees reviewed analyses prepared by the Outside Data Provider regarding the expense rankings of the Funds. The analyses provided a comparison of each Fund’s management fee and (with the exception of the Equity Index Fund) breakpoints to those of a relevant peer group and category universe; an expense analysis which compared each Fund’s overall net and gross expenses to a peer group and a category universe; and data comparing each Fund’s net expenses to the peer and category medians. The analyses also compared each Fund’s other expenses and fee waivers/reimbursements to those of the peer group and category medians. The Trustees concluded that the comparisons provided by the Outside Data Provider were useful in evaluating the reasonableness of the management fees and total expenses paid by the Funds.
In addition, the Trustees considered the Investment Adviser’s undertakings to implement fee waivers and/or expense limitations. The Trustees also noted that certain changes were being made to existing fee waiver or expense limitation arrangements of the Mid Cap Growth Fund that would have the effect of decreasing total Fund expenses, with such changes taking effect in connection with the Fund’s next annual registration statement update. They also considered, to the extent that the Investment Adviser manages other types of accounts having investment objectives and policies similar to those of the Funds, comparative fee information for services provided by the Investment Adviser to those accounts, and information that indicated that services provided to the Funds differed in various significant respects from the services provided to other types of accounts which, in many cases, operated under less stringent legal and regulatory structures, required fewer services from the Investment Adviser to a smaller number of client contact points, and were less time-intensive.
In addition, the Trustees noted that shareholders are able to redeem their shares at any time if shareholders believe that the Fund fees and expenses are too high or if they are dissatisfied with the performance of the Fund.
Profitability
The Trustees reviewed each Fund’s contribution to the Investment Adviser’s revenues and pre-tax profit margins. In this regard the Trustees noted that they had received, among other things, profitability analyses and summaries, revenue and expense schedules by Fund and by function (i.e., investment management, transfer agency and distribution and service), and information on the Investment Adviser’s expense allocation methodology. They observed that the profitability and expense figures are substantially similar to those used by the Investment Adviser for many internal purposes, including compensation decisions among various business groups, and are thus subject to a vigorous internal debate about how certain revenue and expenses should be allocated. The Trustees also noted that the internal audit group within the Goldman Sachs organization periodically audits the expense allocation methodology and that the internal audit group was satisfied with the reasonableness, consistency, and accuracy of the Investment Adviser’s expense allocation methodology. Profitability data for each Fund was provided for 2021 and 2020, and the Trustees considered this information in relation to the Investment Adviser’s overall profitability.
Economies of Scale
The Trustees considered the information that had been provided regarding whether there have been economies of scale with respect to the management of the Funds. The Trustees also considered the breakpoints in the fee rate payable under the Management Agreement for each of the Funds (with the exception of the Equity Index Fund) at the following annual percentage rates of the average daily net assets of the Funds:
| International Equity Insights Fund | Large Cap Value Fund | Strategic Growth Fund | U.S. Equity Insights Fund | |||||||||||||
| First $1 billion | 0.81 | % | 0.72 | % | 0.71 | % | 0.62 | % | ||||||||
| Next $1 billion | 0.73 | 0.65 | 0.64 | 0.59 | ||||||||||||
| Next $3 billion | 0.69 | 0.62 | 0.61 | 0.56 | ||||||||||||
| Next $3 billion | 0.68 | 0.60 | 0.59 | 0.55 | ||||||||||||
| Over $8 billion | 0.67 | 0.59 | 0.58 | 0.54 | ||||||||||||
| Mid Cap Growth Fund | Mid Cap Value Fund | Small Cap Equity Insights Fund | ||||||||||
| First $2 billion | 0.87 | % | 0.77 | % | 0.70 | % | ||||||
| Next $3 billion | 0.78 | 0.69 | 0.63 | |||||||||
| Next $3 billion | 0.74 | 0.66 | 0.60 | |||||||||
| Over $8 billion | 0.73 | 0.65 | 0.59 | |||||||||
| 95 |
GOLDMAN SACHS VARIABLE INSURANCE TRUST EQUITY FUNDS
Statement Regarding Basis for Approval of Management Agreements (Unaudited) (continued)
The Trustees noted that the breakpoints were designed to share potential economies of scale, if any, with the Funds and their shareholders as assets under management reach those asset levels. The Trustees considered the amounts of assets in the Funds; the Funds’ recent share purchase and redemption activity; the information provided by the Investment Adviser relating to the costs of the services provided by the Investment Adviser and its affiliates and their realized profits; information comparing fee rates charged by the Investment Adviser with fee rates charged to other funds in the peer groups; and the Investment Adviser’s undertakings to waive a portion of its management fee (with respect to the Equity Index Fund, Mid Cap Growth Fund, International Equity Insights Fund, Large Cap Value Fund, and U.S. Equity Insights Fund) and to limit certain expenses of the Funds that exceed specified levels as well as Goldman Sachs & Co. LLC’s (“Goldman Sachs”) undertaking to waive a portion of the transfer agency fees paid by the Large Cap Value Fund and the distribution and service fees paid by the Mid Cap Growth Fund’s Service Shares. Upon reviewing these matters at the Annual Meeting, the Trustees concluded that the fee breakpoints represented a means of assuring that benefits of scalability, if any, would be passed along to shareholders at the specified asset levels.
With respect to the Equity Index Fund, the Trustees noted that, while its Management Agreement did not have fee breakpoints, the Investment Adviser had agreed to waive a portion of its management fee in order to achieve the following effective rates: 0.21% on the first $400 million of average daily net assets and 0.20% of average daily net assets in excess of $400 million. The Trustees noted that, in addition to the Investment Adviser’s management fee waiver mentioned above, the Fund’s total expenses were further reduced by the Investment Adviser’s undertaking to limit certain expenses of the Fund that exceed a specified level.
Other Benefits to the Investment Adviser and Its Affiliates
The Trustees also considered the other benefits derived by the Investment Adviser and its affiliates from their relationships with the Funds as stated above, including: (a) transfer agency fees received by Goldman Sachs; (b) brokerage and futures commissions earned by Goldman Sachs for executing securities and futures transactions on behalf of the Funds; (c) research received by the Investment Adviser from broker-dealers in exchange for executing certain transactions on behalf of the Equity Index Fund, Mid Cap Growth Fund, Mid Cap Value Fund, Large Cap Value Fund, and Strategic Growth Fund; (d) trading efficiencies resulting from aggregation of orders of the Funds with those for other funds or accounts managed by the Investment Adviser; (e) fees earned by Goldman Sachs Agency Lending (“GSAL”), an affiliate of the Investment Adviser, as securities lending agent for the Equity Index Fund, International Equity Insights Fund, Small Cap Equity Insights Fund, and U.S. Equity Insights Fund and fees earned by the Investment Adviser for managing the fund in which the Funds’ securities lending cash collateral of the Mid Cap Growth Fund, Mid Cap Value Fund, Large Cap Value Fund, and Strategic Growth Fund is invested; (f) the Investment Adviser’s ability to leverage the infrastructure designed to service the Funds on behalf of its other clients; (g) the Investment Adviser’s ability to cross-market other products and services to Fund shareholders; (h) Goldman Sachs’ retention of certain fees as Fund Distributor; (i) the Investment Adviser’s ability to negotiate better pricing with custodians on behalf of its other clients, as a result of the relationship with the Funds; (j) the investment of cash and cash collateral in money market funds managed by the Investment Adviser that will result in increased assets under management for those money market funds; (k) the investment in exchange-traded funds (“ETFs”) managed by the Investment Adviser that will result in increased assets under management for those ETFs and may facilitate the development of the Investment Adviser’s ETF advisory business; and (l) the possibility that the working relationship between the Investment Adviser and the Funds’ third-party service providers may cause those service providers to be more likely to do business with other areas of Goldman Sachs. In the course of considering the foregoing, the Independent Trustees requested and received further information quantifying certain of these fall-out benefits.
Other Benefits to the Funds and Their Shareholders
The Trustees also noted that the Funds receive certain other potential benefits as a result of their relationship with the Investment Adviser, including: (a) trading efficiencies resulting from aggregation of orders of the Funds with those of other funds or accounts managed by the Investment Adviser; (b) enhanced servicing from vendors due to the volume of business generated by the Investment Adviser and its affiliates; (c) enhanced servicing from broker-dealers due to the volume of business generated by the Investment Adviser and its affiliates; (d) the Investment Adviser’s ability to negotiate favorable terms with derivatives counterparties on behalf of the Funds as a result of the size and reputation of the Goldman Sachs organization; (e) the advantages received from the Investment Adviser’s knowledge and experience gained from managing other accounts and products; (f) the Investment Adviser’s ability to hire and retain qualified personnel to provide services to the Funds because of the reputation of the Goldman Sachs organization; (g) the Funds’ access, through the Investment Adviser, to certain firm-wide resources (e.g., proprietary risk management systems and databases), subject to certain restrictions; (h) the ability of the Equity Index Fund, International Equity Insights Fund, Small Cap Equity Insights Fund, and U.S. Equity Insights Fund to participate in the securities lending program administered by GSAL, as measured by the revenue received by the Funds in connection with the program; and
| 96 |
GOLDMAN SACHS VARIABLE INSURANCE TRUST EQUITY FUNDS
Statement Regarding Basis for Approval of Management Agreements (Unaudited) (continued)
(i) the Funds’ access to certain affiliated distribution channels. In addition, the Trustees noted the competitive nature of the mutual fund marketplace, and considered that many of the Funds’ shareholders invested in the Funds in part because of the Funds’ relationship with the Investment Adviser and that those shareholders have a general expectation that the relationship will continue.
Conclusion
In connection with their consideration of the Agreements, the Trustees gave weight to each of the factors described above, but did not identify any particular factor as controlling their decision. After deliberation and consideration of all of the information provided, including the factors described above, the Trustees concluded, in the exercise of their business judgment, that the management fees paid by each of the Funds were reasonable in light of the services provided to it by the Investment Adviser, the Investment Adviser’s costs and each Fund’s current and reasonably foreseeable asset levels. The Trustees unanimously concluded that the Investment Adviser’s continued management likely would benefit each Fund and its shareholders and that the Agreements should be approved and continued with respect to each Fund until June 30, 2023.
| 97 |
GOLDMAN SACHS VARIABLE INSURANCE TRUST EQUITY FUNDS
Sub-Advisory Agreement for the Equity Index Fund
Nature, Extent, and Quality of the Services Provided Under the Sub-Advisory Agreement and Investment Performance. In evaluating the Sub-Advisory Agreement, the Trustees relied upon materials furnished and presentations made by the Investment Adviser and the Sub-Adviser. In evaluating the nature, extent, and quality of services provided by the Sub-Adviser, the Trustees considered information on the services provided to the Equity Index Fund by the Sub-Adviser, including information about the Sub-Adviser’s (a) personnel and organizational structure; (b) experience in index investing and track record in tracking the performance of the Fund’s benchmark in line with the investment objective of the Fund; (c) policies and procedures in place to address potential conflicts of interest; and (d) compliance program and code of ethics. The Trustees reviewed the services provided to the Fund under the Sub-Advisory Agreement. They noted that the Fund’s Service Shares had placed in the top half of the Fund’s peer group for the one-, three-, five-, and ten-year periods, and had underperformed the Fund’s benchmark index for the one-, three-, five-, and ten-year periods ended March 31, 2022.
Costs of Services Provided. The Trustees reviewed the terms of the Sub-Advisory Agreement, including the schedule of fees payable to the Sub-Adviser. They considered the breakpoints in the sub-advisory fee rate payable under the Sub-Advisory Agreement at the following annual percentage rates of the average daily net assets of the Fund:
| Average Daily Net Assets | Sub-Advisory Fee Annual Rate | |||
| First $50 Million | 0.030 | % | ||
| Next $200 Million | 0.020 | |||
| Next $750 Million | 0.010 | |||
| Over $1 Billion | 0.008 | |||
The Trustees noted that the Sub-Adviser’s compensation is paid by the Investment Adviser, not by the Fund, and that the retention of the Sub-Adviser does not increase the fees incurred by the Fund for advisory services. They considered the Investment Adviser’s belief that the relationship between the management fees paid by the Fund and the sub-advisory fees paid by the Investment Adviser is appropriate given the level of services the Investment Adviser provides to the Fund and the significant differences in cost drivers and risks associated with the respective services offered by the Investment Adviser and the Sub-Adviser, as well as the management fee waivers and expense limitations that substantially reduce the fees retained by the Investment Adviser.
Conclusion. After deliberation and consideration of the information provided, the Trustees concluded that the sub-advisory fee to be paid by the Investment Adviser to the Sub-Adviser with respect to the Equity Index Fund is reasonable in light of the services to be provided by the Sub-Adviser and the Fund’s reasonably foreseeable asset levels, and that the Sub-Advisory Agreement should be approved and continued until June 30, 2023.
| 98 |
GOLDMAN SACHS VARIABLE INSURANCE TRUST EQUITY FUNDS
Liquidity Risk Management Program (Unaudited)
Each Fund has adopted and implemented a liquidity risk management program (the “Program”) in accordance with Rule 22e-4 under the 1940 Act. The Program seeks to assess and manage each Fund’s liquidity risk, i.e., the risk that a Fund is unable to satisfy redemption requests without significantly diluting remaining investors’ interests in the Fund. The Board of Trustees of the Trust has designated GSAM, each Fund’s investment adviser, to administer the Program. Certain aspects of the Program rely on third parties to perform certain functions, including the provision of market data and application of models.
The Program is comprised of various components designed to support the assessment and/or management of liquidity risk, including: (1) the periodic assessment (no less frequently than annually) of certain factors that influence a Fund’s liquidity risk; (2) the periodic classification (no less frequently than monthly) of a Fund’s investments into one of four liquidity categories that reflect an estimate of their liquidity under current market conditions; (3) a 15% limit on the acquisition of “illiquid investments” (as defined under Rule 22e-4); (4) for a Fund that does not invest primarily in “highly liquid investments” (as defined under Rule 22e-4), the determination of a minimum percentage of the Fund’s assets that will generally be invested in highly liquid investments (a “Highly Liquid Investment Minimum”); and (5) periodic reporting to the Board of Trustees.
At a meeting of the Board of Trustees on February 8-9, 2022, GSAM provided a written report to the Board addressing the operation, and the adequacy and effectiveness of the implementation, of the Program, including, as applicable, the operation of any Highly Liquid Investment Minimum and any material changes to the Program, for the period from January 1, 2021 through December 31, 2021 (the “Reporting Period”). Among other things, the annual report discussed: (1) the results of stress tests designed to assess liquidity under a hypothetical stressed scenario involving elevated redemptions; (2) an assessment of the methodologies used to classify investments into one of four liquidity categories; and (3) the impact of local holidays in non-U.S. jurisdictions. The report concluded that the Program continues to be reasonably designed to assess and manage liquidity risk and was adequately and effectively implemented during the Reporting Period.
There can be no assurance that the Program will achieve its objectives under all circumstances in the future. Please refer to your Fund’s prospectus for more information regarding the Fund’s exposure to liquidity risk and other risks to which it may be subject.
| 99 |
GOLDMAN SACHS VARIABLE INSURANCE TRUST EQUITY FUNDS
Impact of Russian Invasion of Ukraine (Unaudited)
The Russian invasion of Ukraine has negatively affected the global economy and has resulted in significant disruptions in financial markets and increased macroeconomic uncertainty. In addition, governments around the world have responded to Russia’s invasion by imposing economic sanctions and export controls on certain industry sectors, companies and individuals in or associated with Russia. Russia has imposed its own restrictions against investors and countries outside Russia and has proposed additional measures aimed at non-Russian-owned businesses. Businesses in the U.S. and globally have experienced shortages in materials and increased costs for transportation, energy and raw materials due, in part, to the negative effects of the war on the global economy. The escalation or continuation of the war between Russia and Ukraine or other hostilities presents heightened risks relating to cyber-attacks, the frequency and volume of failures to settle securities transactions, supply chain disruptions, inflation, as well as the potential for increased volatility in commodity, currency and other financial markets. The extent and duration of the war, sanctions and resulting market disruptions, as well as the potential adverse consequences for the Funds’ operations are difficult to predict.
| 100 |
GOLDMAN SACHS VARIABLE INSURANCE TRUST EQUITY FUNDS
| Fund Expenses — Six Month Period Ended June 30, 2022 (Unaudited) |
As a shareholder of Institutional or Service Shares of the Funds, you incur ongoing costs, including management fees, distribution and/or service (12b-1) fees (with respect to Service Shares) and other Fund expenses. This example is intended to help you understand your ongoing costs (in dollars) of investing in the Institutional Shares and Service Shares of the Funds and to compare these costs with the ongoing costs of investing in other mutual funds.
The example is based on an investment of $1,000 invested at the beginning of the period and held for the entire period from January 1, 2022 through June 30, 2022, which represents a period of 181 days of a 365 day year.
Actual Expenses — The first line under each share class in the table below provides information about actual account values and actual expenses. You may use the information in this line, together with the amount you invested, to estimate the expenses that you paid over the period. Simply divide your account value by $1,000 (for example, an $8,600 account value divided by $1,000=8.6), then multiply the result by the number in the first line under the heading entitled “Expenses Paid” to estimate the expenses you paid on your account during this period.
Hypothetical Example for Comparison Purposes — The second line under each share class in the table below provides information about hypothetical account values and hypothetical expenses based on the Funds’ actual net expense ratio and an assumed rate of return of 5% per year before expenses, which is not the Funds’ actual return. The hypothetical account values and expenses may not be used to estimate the actual ending account balance or expenses you paid for the period. You may use this information to compare the ongoing costs of investing in the Funds and other funds. To do so, compare this 5% hypothetical example with the 5% hypothetical examples that appear in the shareholder reports of the other funds.
Please note that the expenses shown in the table are meant to highlight your ongoing costs only. As a shareholder of the Funds you do not incur any transaction costs, such as sales charges, redemption fees, or exchange fees, but shareholders of other funds may incur such costs. The second line of the table is useful in comparing ongoing costs only and will not help you determine the relative total costs of owning different funds whose shareholders may incur transaction costs.
| Equity Index Fund | International Equity Insights Fund | Large Cap Value Fund | Mid Cap Growth Fund | |||||||||||||||||||||||||||||||||||||||||||||
| Share Class | Beginning Account Value 1/1/22 | Ending Account Value 6/30/22 | Expenses Paid for the 6 months ended 6/30/2022* | Beginning Account Value 1/1/22 | Ending Account Value 6/30/22 | Expenses Paid for the 6 months ended 6/30/2022* | Beginning Account Value 1/1/22 | Ending Account Value 6/30/22 | Expenses Paid for the 6 months ended 6/30/2022* | Beginning Account Value 1/1/22 | Ending Account Value 6/30/22 | Expenses Paid for the 6 months ended 6/30/2022* | ||||||||||||||||||||||||||||||||||||
| Institutional | ||||||||||||||||||||||||||||||||||||||||||||||||
Actual | N/A | N/A | N/A | $ | 1,000.00 | $ | 818.78 | $ | 3.83 | $ | 1,000.00 | $ | 869.61 | $ | 3.24 | $ | 1,000.00 | $ | 686.59 | $ | 3.55 | |||||||||||||||||||||||||||
Hypothetical 5% return | N/A | N/A | N/A | 1,000.00 | 1,020.58 | + | 4.26 | 1,000.00 | 1,021.32 | + | 3.51 | 1,000.00 | 1,020.58 | + | 4.26 | |||||||||||||||||||||||||||||||||
| Service | ||||||||||||||||||||||||||||||||||||||||||||||||
Actual | $ | 1,000.00 | 797.70 | 2.14 | 1,000.00 | 818.48 | 5.00 | 1,000.00 | 867.74 | 4.31 | 1,000.00 | 686.07 | 4.10 | |||||||||||||||||||||||||||||||||||
Hypothetical 5% return | 1,000.00 | 1,022.41 | + | 2.41 | 1,000.00 | 1,019.29 | + | 5.56 | 1,000.00 | 1,020.18 | + | 4.66 | 1,000.00 | 1,019.93 | + | 4.91 | ||||||||||||||||||||||||||||||||
| + | Hypothetical expenses are based on each Fund’s actual annualized net expense ratios and an assumed rate of return of 5% per year before expenses. |
| * | Expenses are calculated using each Fund’s annualized net expense ratio for each class, which represents the ongoing expenses as a percentage of net assets for the six months ended June 30, 2022. Expenses are calculated by multiplying the annualized net expense ratio by the average account value for the period; then multiplying the result by the number of days in the most recent fiscal half year; and then dividing that result by the number of days in the fiscal year. The annualized net expense ratios for the period were as follows: |
| Fund | Institutional Shares | Service Shares | ||||
| Equity Index Fund | N/A | 0.48 | % | |||
| International Equity Insights Fund | 0.85% | 1.11 | ||||
| Large Cap Value Fund | 0.70 | 0.93 | ||||
| Mid Cap Growth Fund | 0.85 | 0.98 | ||||
101
GOLDMAN SACHS VARIABLE INSURANCE TRUST EQUITY FUNDS
| Fund Expenses — Six Month Period Ended June 30, 2022 (Unaudited) (continued) |
As a shareholder of Institutional or Service Shares of the Funds, you incur ongoing costs, including management fees, distribution and/or service (12b-1) fees (with respect to Service and Advisor Shares) and other Fund expenses. This example is intended to help you understand your ongoing costs (in dollars) of investing in the Institutional Shares and Service Shares of the Funds and to compare these costs with the ongoing costs of investing in other mutual funds.
The example is based on an investment of $1,000 invested at the beginning of the period and held for the entire period from January 1, 2022 through June 30, 2022, which represents a period of 181 days of a 365 day year.
Actual Expenses — The first line under each share class in the table below provides information about actual account values and actual expenses. You may use the information in this line, together with the amount you invested, to estimate the expenses that you paid over the period. Simply divide your account value by $1,000 (for example, an $8,600 account value divided by $1,000=8.6), then multiply the result by the number in the first line under the heading entitled “Expenses Paid” to estimate the expenses you paid on your account during this period.
Hypothetical Example for Comparison Purposes — The second line under each share class in the table below provides information about hypothetical account values and hypothetical expenses based on the Funds’ actual net expense ratio and an assumed rate of return of 5% per year before expenses, which is not the Funds’ actual return. The hypothetical account values and expenses may not be used to estimate the actual ending account balance or expenses you paid for the period. You may use this information to compare the ongoing costs of investing in the Funds and other funds. To do so, compare this 5% hypothetical example with the 5% hypothetical examples that appear in the shareholder reports of the other funds.
Please note that the expenses shown in the table are meant to highlight your ongoing costs only. As a shareholder of the Funds you do not incur any transaction costs, such as sales charges, redemption fees, or exchange fees, but shareholders of other funds may incur such costs. The second line of the table is useful in comparing ongoing costs only and will not help you determine the relative total costs of owning different funds whose shareholders may incur transaction costs.
| Mid Cap Value Fund | Small Cap Equity Insights Fund | Strategic Growth Fund | U.S. Equity Insights Fund | |||||||||||||||||||||||||||||||||||||||||||||
| Share Class | Beginning Account Value 1/1/22 | Ending Account Value 6/30/22 | Expenses Paid for the 6 months ended 6/30/2022* | Beginning Account Value 1/1/22 | Ending Account Value 6/30/22 | Expenses Paid for the 6 months ended 6/30/2022* | Beginning Account Value 1/1/22 | Ending Account Value 6/30/22 | Expenses Paid for the 6 months ended 6/30/2022* | Beginning Account Value 1/1/22 | Ending Account Value 6/30/22 | Expenses Paid for the 6 months ended 6/30/2022* | ||||||||||||||||||||||||||||||||||||
| Institutional | ||||||||||||||||||||||||||||||||||||||||||||||||
Actual | $ | 1,000.00 | $ | 834.53 | $ | 3.78 | $ | 1,000.00 | $ | 776.76 | $ | 3.57 | $ | 1,000.00 | $ | 685.51 | $ | 3.09 | $ | 1,000.00 | $ | 786.64 | $ | 2.48 | ||||||||||||||||||||||||
Hypothetical 5% return | 1,000.00 | 1,020.68 | + | 4.16 | 1,000.00 | 1,020.78 | + | 4.06 | 1,000.00 | 1,021.12 | + | 3.71 | 1,000.00 | 1,022.02 | + | 2.81 | ||||||||||||||||||||||||||||||||
| Service | ||||||||||||||||||||||||||||||||||||||||||||||||
Actual | 1,000.00 | 833.67 | 4.96 | 1,000.00 | 775.72 | 4.67 | 1,000.00 | 684.59 | 4.14 | 1,000.00 | 785.96 | 3.41 | ||||||||||||||||||||||||||||||||||||
Hypothetical 5% return | 1,000.00 | 1,019.39 | + | 5.46 | 1,000.00 | 1,019.54 | + | 5.31 | 1,000.00 | 1,019.89 | + | 4.96 | 1,000.00 | 1,020.98 | + | 3.86 | ||||||||||||||||||||||||||||||||
| + | Hypothetical expenses are based on each Fund’s actual annualized net expense ratios and an assumed rate of return of 5% per year before expenses. |
| * | Expenses are calculated using each Fund’s annualized net expense ratio for each class, which represents the ongoing expenses as a percentage of net assets for the six months ended June 30, 2022. Expenses are calculated by multiplying the annualized net expense ratio by the average account value for the period; then multiplying the result by the number of days in the most recent fiscal half year; and then dividing that result by the number of days in the fiscal year. The annualized net expense ratios for the period were as follows: |
| Fund | Institutional Shares | Service Shares | ||||
| Mid Cap Value Fund | 0.83% | 1.09 | % | |||
| Small Cap Equity Insights Fund | 0.81 | 1.06 | ||||
| Strategic Growth Fund | 0.74 | 0.99 | ||||
| U.S. Equity Insights Fund | 0.56 | 0.77 | ||||
102
| TRUSTEES | OFFICERS | |
| Jessica Palmer, Chair | James A. McNamara, President | |
| Dwight L. Bush | Joseph F. DiMaria, Principal Financial Officer, Principal Accounting Officer and Treasurer Caroline L. Kraus, Secretary | |
| Kathryn A. Cassidy | ||
| John G. Chou | ||
| Diana M. Daniels | ||
| Joaquin Delgado | ||
| Eileen H. Dowling | ||
| James A. McNamara | ||
| Gregory G. Weaver | ||
| Paul C. Wirth |
GOLDMAN SACHS & CO. LLC
Distributor and Transfer Agent
GOLDMAN SACHS ASSET MANAGEMENT, L.P.
Investment Adviser
200 West Street, New York,
New York 10282
Visit our web site at www.GSAMFUNDS.com to obtain the most recent month-end returns.
The reports concerning the Funds included in this shareholder report may contain certain forward-looking statements about the factors that may affect the performance of the Funds in the future. These statements are based on Fund management’s predictions and expectations concerning certain future events and their expected impact on the Funds, such as performance of the economy as a whole and of specific industry sectors, changes in the levels of interest rates, the impact of developing world events, and other factors that may influence the future performance of the Funds. Management believes these forward-looking statements to be reasonable, although they are inherently uncertain and difficult to predict. Actual events may cause adjustments in portfolio management strategies from those currently expected to be employed.
A description of the policies and procedures that the Funds use to determine how to vote proxies relating to portfolio securities and information regarding how the Funds voted proxies relating to portfolio securities for the 12-month period ended June 30 is available (i) without charge, upon request by calling 1-800-621-2550; and (ii) on the Securities and Exchange Commission (“SEC”) web site at http://www.sec.gov.
The Funds will file portfolio holdings information for each month in a fiscal quarter within 60 days after the end of the relevant fiscal quarter on Form N-PORT. Portfolio holdings information for the third month of each fiscal quarter will be made available on the SEC’s web site at http://www.sec.gov. Portfolio holdings information may be obtained upon request and without charge by calling 1-800-526-7384 (for Retail Shareholders) or 1-800-621-2550 (for Institutional Shareholders).
Views and opinions expressed are for informational purposes only and do not constitute a recommendation by GSAM to buy, sell, or hold any security. Views and opinions are current as of the date of this presentation and may be subject to change, they should not be construed as investment advice.
Goldman Sachs & Co. LLC (“Goldman Sachs”) does not provide legal, tax or accounting advice. Any statement contained in this communication (including any attachments) concerning U.S. tax matters was not intended or written to be used, and cannot be used, for the purpose of avoiding penalties under the Internal Revenue Code, and was written to support the promotion or marketing of transactions or matters addressed. Clients of Goldman Sachs should obtain their own independent tax advice based on their particular circumstances.
The website links provided are for your convenience only and are not an endorsement or recommendation by GSAM of any of these websites or the products or services offered. GSAM is not responsible for the accuracy and validity of the content of these websites.
Fund holdings and allocations shown are as of June 30, 2022 and may not be representative of future investments. Fund holdings should not be relied on in making investment decisions and should not be construed as research or investment advice regarding particular securities. Current and future holdings are subject to risk.
References to indices, benchmarks or other measures of relative market performance over a specified period of time are provided for your information only and do not imply that the portfolio will achieve similar results. The index composition may not reflect the manner in which a portfolio is constructed. While an adviser seeks to design a portfolio which reflects appropriate risk and return features, portfolio characteristics may deviate from those of the benchmark.
The Global Industry Classification Standard (“GICS”) was developed by and is the exclusive property and a service mark of Morgan Stanley Capital International Inc. (“MSCI”) and Standard & Poor’s, a division of The McGraw-Hill Companies, Inc. (“S&P”) and is licensed for use by Goldman Sachs. Neither MSCI, S&P nor any other party involved in making or compiling the GICS or any GICS classifications makes any express or implied warranties or representations with respect to such standard or classification (or the results to be obtained by the use thereof), and all such parties hereby expressly disclaim all warranties of originality, accuracy, completeness, merchantability or fitness for a particular purpose with respect to any of such standard or classification. Without limiting any of the foregoing, in no event shall MSCI, S&P, any of their affiliates or any third party involved in making or compiling the GICS or any GICS classifications have any liability for any direct, indirect, special, punitive, consequential or any other damages (including lost profits) even if notified of the possibility of such damages.
The portfolio risk management process includes an effort to monitor and manage risk, but does not imply low risk.
Shares of the Goldman Sachs VIT Funds are offered to separate accounts of participating life insurance companies for the purpose of funding variable annuity contracts and variable life insurance policies. Shares of the Funds are not offered directly to the general public. The variable annuity contracts and variable life insurance policies are described in the separate prospectuses issued by participating insurance companies. You should refer to those prospectuses for information about surrender charges, mortality and expense risk fees and other charges that may be assessed by participating insurance companies under the variable annuity contracts or variable life insurance policies. Such fees or charges, if any, may affect the return you may realize with respect to your investments. Ask your representative for more complete information. Please consider a Fund’s objectives, risks and charges and expenses, and read the prospectus carefully before investing. The prospectus contains this and other information about the Funds.
This material is not authorized for distribution to prospective investors unless preceded or accompanied by a current prospectus or summary prospectus, if applicable. Investors should consider the Funds’ objective, risks, and charges and expenses, and read the summary prospectus, if available, and/or the prospectus carefully before investing or sending money. The summary prospectus, if available, and the prospectus contain this and other information about the Funds and may be obtained from your authorized dealer or from Goldman Sachs & Co. LLC by calling 1-800-621-2550.
This report is prepared for the general information of contract owners and is not an offer of shares of the Goldman Sachs Variable Insurance Trust Funds.
© 2022 Goldman Sachs. All rights reserved.
VITEQTYSAR-22 287746-OTU-08/2022
Goldman
Sachs Variable Insurance Trust
Goldman Sachs Government
Money Market Fund
Semi-Annual Report
June 30, 2022

Goldman Sachs Government Money Market Fund
| 1 | ||||
| 4 | ||||
| 7 | ||||
| 10 | ||||
| 12 | ||||
| 23 | ||||
You could lose money by investing in the Fund. Although the Fund seeks to preserve the value of your investment at $1.00 per share, it cannot guarantee it will do so. An investment in the Fund is not a deposit of the bank and is not insured or guaranteed by the Federal Deposit Insurance Corporation or any other government agency. The Fund’s sponsor has no legal obligation to provide financial support to the Fund, and you should not expect that the sponsor will provide financial support to the Fund at any time.
MARKET REVIEW
VIT Government Money Market Fund
The following are highlights both of key factors affecting the money markets and of any key changes made to the Goldman Sachs VIT Government Money Market Fund (the “Fund”) during the six months ended June 30, 2022 (the “Reporting Period”). A fuller review will appear in the Fund’s annual shareholder report covering the 12 months ended December 31, 2022.
| • | U.S. Federal Reserve (“Fed”) policy had the greatest influence on the money markets during the Reporting Period. |
| • | When the Reporting Period began in December 2021, the Fed maintained the targeted federal funds (“fed funds”) rate in a range between 0% and 0.25% but signaled the possibility of a more aggressive interest rate hike path amid continuing inflationary pressures. |
| • | In March 2022, Fed policymakers hiked short-term interest rates, raising the targeted fed funds rate by 25 basis points in the first U.S. rate increase since the end of 2018. (A basis point is 1/100th of a percentage point.) |
| • | Fed officials forecast six more rate hikes by the end of 2022. |
| • | Fed Chair Jerome Powell asserted a need to “move expeditiously” along the path to monetary policy normalization given persistently elevated inflation. |
| • | The Fed acknowledged inflationary pressures could be exacerbated by ongoing geopolitical tensions, such as those surrounding Russia’s invasion of Ukraine. |
| • | In May 2022, as widely anticipated, the Fed lifted the targeted fed funds rate by 50 basis points to a range between 0.75% and 1.00%. |
| • | On June 15, 2022, Fed policymakers raised the targeted fed funds rate by another 75 basis points to a range between 1.50% to 1.75% — the largest single rate increase since 1994 — and signaled they would likely continue tightening monetary policy at an aggressive pace as it seeks to tackle persistently elevated inflation. |
| • | It was announced in June that after coming down slightly in April 2022, the Consumer Price Index hit a new four-decade high of 8.6% in May 2022. |
| • | At the June meeting, the Fed reinforced that its policymakers were “highly attentive” to inflation risks and were “strongly committed to returning inflation to its 2% objective” this calendar year. |
| • | The median dot plot projection at the end of June called for a federal funds rate midpoint of 3.4% by the end of 2022, an increase of 150 basis points since March 2022 and of 250 basis points since December 2021. (The dot plot shows interest rate projections of the members of the Federal Open Market Committee (“FOMC”).) |
| • | During the Reporting Period overall, the Fed scaled back its large-scale asset purchase program, ending it entirely in March 2022. |
| • | In May 2022, the Fed announced it would start reducing the size of its balance sheet beginning June 1, 2022 but expected to maintain ample reserves to ensure it could continue to effectively control short-term interest rates. |
| • | Since June 1, 2022, the Fed has progressively been phasing in a run-off cap of $95 billion. (To ensure a gradual decline in the balance sheet, the monthly amounts of securities that were allowed to mature and not be replaced were capped, and amounts above the cap would be reinvested and left on the balance sheet.) |
| • | The money market yield curve steepened during the Reporting Period, as the Fed raised short-term interest rates. |
| • | In this environment, the yields of money market funds increased significantly. |
Fund Changes and Highlights
No material changes were made to the Fund during the Reporting Period.
| 1 |
Government Money Market Fund
as of June 30, 2022
PERFORMANCE REVIEW1
| January 1, 2022 – June 30, 2022 | Fund Total Return (based on NAV)2 | SEC 7-Day Current Yield3 | iMoneyNet Institutional Average4 | |||||||||
| Institutional Shares | 0.17 | % | 1.37 | % | 0.24 | % | ||||||
| Service Shares | 0.10 | 1.12 | 0.24 | |||||||||
The returns represent past performance. Past performance does not guarantee future results. The Fund’s investment returns will fluctuate. Current performance may be lower or higher than the performance quoted above. Please visit our web site at www.GSAMFUNDS.com to obtain the most recent month-end returns. Performance reflects applicable fee waivers and/or expense limitations in effect during the periods shown. In their absence, performance would be reduced. Returns do not reflect the deduction of taxes that a shareholder would pay on Fund distributions or the redemption of Fund shares.
| 1 | The investment adviser may contractually agree to waive or reimburse certain fees and expenses until a specified date. The investment adviser may also voluntarily waive certain fees and expenses, and such voluntary waivers may be discontinued or modified at any time without notice. The performance shown above reflects any waivers or reimbursements that were in effect for all or a portion of the periods shown. When waivers or reimbursements are in place, the Fund’s operating expenses are reduced and the Fund’s yield and total returns to the shareholder are increased. |
| 2 | The net asset value (NAV) represents the net assets of the class of the Fund (ex-dividend) divided by the total number of shares of the class outstanding. The Fund’s total return reflects the reinvestment of dividends and other distributions. |
| 3 | The SEC 7-Day Current Yield is calculated in accordance with securities industry regulations and does not include net capital gains. SEC 7-Day Current Yield may differ slightly from the actual distribution rate of the Fund because of the exclusion of distributed capital gains, which are non-recurring. The SEC 7-Day Current Yield more closely reflects the Fund’s current earnings than do the Fund Total Return figures. |
| 4 | Source: iMoneyNet, Inc. June 2022. The iMoneyNet Institutional Average represents total return. Government & Agencies Institutional — Category includes the most broadly based of the government institutional funds. These funds may generally invest in U.S. treasuries, U.S. agencies, repurchase agreements, or government-backed floating rate notes. |
YIELD SUMMARY AS OF JUNE 30, 2022
| Funds | 7-Day Dist. Yield5 | SEC 7-Day Effective Yield6 | 30-Day Average Yield7 | Weighted Avg. Maturity (days)8 | Weighted Avg. Life (days)9 | |||||||||||||||
| Institutional Shares | 1.34 | % | 1.38 | % | 0.99 | % | 5 | 48 | ||||||||||||
| Service Shares | 1.09 | 1.13 | 0.74 | 5 | 48 | |||||||||||||||
The Yields represent past performance. Past performance does not guarantee future results. Current performance may be lower or higher than the performance quoted above.
Yields reflect fee waivers and expense limitations in effect and will fluctuate as market conditions change. Please visit our Web site at www.GSAMFUNDS.com to obtain the most recent month-end performance.
| 5 | The 7-Day Distribution Yield is an annualized measure of the Fund’s dividends per share, divided by the price per share. This yield includes capital gain/loss distribution, if any. This is not an SEC Yield. |
| 6 | The SEC 7-Day Effective Yield is calculated in accordance with securities industry regulations and does not include net capital gains. The SEC 7-Day Effective Yield assumes reinvestment of dividends for one year. |
| 7 | The 30-Day Average Yield is a net annualized yield of 30 days back from the current date listed. This yield includes capital gain/loss distribution. This is not an SEC Yield. |
| 8 | The Fund’s weighted average maturity (WAM) is an average of the effective maturities of all securities held in the portfolio, weighted by each security’s percentage of net assets. This must not exceed 60 days as calculated under SEC Rule 2a-7. |
| 9 | The Fund’s weighted average life (WAL) is an average of the final maturities of all securities held in the portfolio, weighted by each security’s percentage of net assets. This must not exceed 120 days as calculated under SEC Rule 2a-7. |
For more information about your Fund, please refer to www.GSAMFUNDS.com. There, you can learn more about your Fund’s investment strategies, holdings, and performance.
| 2 |
FUND BASICS
FUND COMPOSITION†
Security Type
(Percentage of Net Assets)
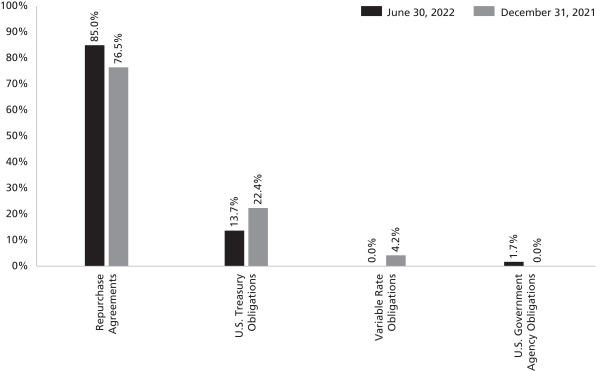
| † | The Fund is actively managed and, as such, its portfolio composition may differ over time. The percentage shown for each investment category reflects the value (based on amortized cost) of investments in that category as a percentage of net assets. Figures in the above chart may not sum to 100% due to the exclusion of other assets and liabilities. |
For more information about your Fund, please refer to www.GSAMFUNDS.com. There, you can learn more about your Fund’s investment strategies, holdings, and performance.
| 3 |
GOLDMAN SACHS VARIABLE INSURANCE TRUST GOVERNMENT MONEY MARKET FUND
June 30, 2022 (Unaudited)
| Principal Amount | Interest Rate | Maturity Date | Amortized Cost | |||||||||||
| U.S. Government Agency Obligations – 1.7% | ||||||||||||||
Federal Farm Credit Bank (3 Mo. U.S. T-Bill MMY + 0.02%) | ||||||||||||||
| $ | 900,000 | 1.879 | %(a) | 04/05/23 | $ | 899,982 | ||||||||
| 500,000 | 1.881 | (a) | 05/12/23 | 500,000 | ||||||||||
Federal Farm Credit Bank (3 Mo. U.S. T-Bill MMY + 0.04%) | ||||||||||||||
| 1,500,000 | 1.894 | (a) | 10/23/23 | 1,499,920 | ||||||||||
| 3,000,000 | 1.899 | (a) | 10/30/23 | 2,999,879 | ||||||||||
Federal Farm Credit Bank (3 Mo. U.S. T-Bill MMY + 0.06%) | ||||||||||||||
| 200,000 | 1.914 | (a) | 01/31/23 | 200,042 | ||||||||||
Federal Farm Credit Bank (Prime Rate – 3.10%) | ||||||||||||||
| 1,600,000 | 1.650 | (a) | 12/02/22 | 1,600,000 | ||||||||||
Federal Farm Credit Bank (Prime Rate – 3.11%) | ||||||||||||||
| 1,200,000 | 1.640 | (a) | 11/21/22 | 1,199,981 | ||||||||||
Federal Farm Credit Bank (Prime Rate – 3.13%) | ||||||||||||||
| 500,000 | 1.625 | (a) | 02/01/23 | 500,000 | ||||||||||
Federal Farm Credit Bank (Prime Rate – 3.15%) | ||||||||||||||
| 900,000 | 1.605 | (a) | 04/13/23 | 899,978 | ||||||||||
Federal Farm Credit Bank (Prime Rate – 3.17%) | ||||||||||||||
| 400,000 | 1.585 | (a) | 11/25/22 | 400,000 | ||||||||||
Federal Home Loan Bank (SOFR + 0.17%) | ||||||||||||||
| 4,200,000 | 1.710 | (a) | 07/21/22 | 4,200,000 | ||||||||||
Federal Home Loan Bank Discount Notes | ||||||||||||||
| 8,000,000 | 2.425 | 12/13/22 | 7,913,833 | |||||||||||
| | U.S. International Development Finance Corp. (3 Mo. U.S. | | ||||||||||||
| 6,646,224 | 1.750 | 07/06/22 | 6,646,225 | |||||||||||
|
| |||||||||||||
| | TOTAL U.S. GOVERNMENT AGENCY OBLIGATIONS | | $ | 29,459,840 | ||||||||||
|
| |||||||||||||
| U.S. Treasury Obligations – 13.7% | ||||||||||||||
United States Treasury Bills | ||||||||||||||
| $ | 1,900,000 | 0.925 | % | 08/09/22 | $ | 1,898,127 | ||||||||
| 400,000 | 1.007 | 08/09/22 | 399,571 | |||||||||||
| 100,000 | 2.093 | 10/25/22 | 99,339 | |||||||||||
| 5,800,000 | 1.450 | 11/03/22 | 5,771,403 | |||||||||||
| 9,975,000 | 2.214 | 12/15/22 | 9,875,050 | |||||||||||
| 500,000 | 2.453 | 12/22/22 | 494,224 | |||||||||||
| 600,000 | 2.463 | 12/22/22 | 593,040 | |||||||||||
| 500,000 | 2.478 | 12/22/22 | 494,164 | |||||||||||
| 700,000 | 2.488 | 12/22/22 | 691,795 | |||||||||||
| 800,000 | 2.489 | 12/22/22 | 790,623 | |||||||||||
| 2,000,000 | 2.493 | 12/22/22 | 1,976,510 | |||||||||||
| 300,000 | 2.494 | 12/22/22 | 296,477 | |||||||||||
| 900,000 | 2.514 | 12/22/22 | 889,343 | |||||||||||
| | United States Treasury Floating Rate Note (3 Mo. U.S. T-Bill | | ||||||||||||
| 2,000,000 | 1.888 | (a) | 07/31/22 | 2,000,000 | ||||||||||
| | United States Treasury Floating Rate Note (3 Mo. U.S. T-Bill | | ||||||||||||
| 60,000,000 | 0.079 | (a) | 04/30/23 | 60,002,009 | ||||||||||
| 28,300,000 | 0.064 | (a) | 07/31/23 | 28,301,738 | ||||||||||
| | United States Treasury Floating Rate Note (3 Mo. U.S. T-Bill | | ||||||||||||
| 70,400,000 | 0.120 | (a) | 10/31/23 | 70,402,148 | ||||||||||
|
| |||||||||||||
| U.S. Treasury Obligations – (continued) | ||||||||||||||
| | United States Treasury Floating Rate Note (3 Mo. U.S. T-Bill | | ||||||||||||
| 28,600,000 | 0.064 | %(a) | 01/31/23 | 28,602,679 | ||||||||||
| | United States Treasury Floating Rate Note (3 Mo. U.S. T-Bill | | ||||||||||||
| 14,075,000 | 0.155 | (a) | 07/31/22 | 14,076,849 | ||||||||||
| 7,000,000 | 1.914 | (a) | 10/31/22 | 7,002,070 | ||||||||||
United States Treasury Notes | ||||||||||||||
| 1,500,000 | 0.125 | 01/31/23 | 1,493,135 | |||||||||||
| 400,000 | 1.375 | 02/15/23 | 398,992 | |||||||||||
| 3,200,000 | 2.000 | 02/15/23 | 3,223,424 | |||||||||||
| 500,000 | 0.125 | 02/28/23 | 497,294 | |||||||||||
| 600,000 | 2.625 | 02/28/23 | 606,995 | |||||||||||
|
| |||||||||||||
| | TOTAL U.S. TREASURY OBLIGATIONS | | $ | 240,876,999 | ||||||||||
|
| |||||||||||||
| | TOTAL INVESTMENTS BEFORE REPURCHASE AGREEMENTS | | $ | 270,336,839 | ||||||||||
|
| |||||||||||||
| Repurchase Agreements(b) – 85.0% | ||||||||||||||
Bank of Montreal | ||||||||||||||
| $ | 250,000 | 0.100 | %(c) | 07/07/22 | $ | 250,000 | ||||||||
Maturity Value: $250,253 | ||||||||||||||
Settlement Date: 07/30/21 | ||||||||||||||
| | Collateralized by Federal National Mortgage Association, 4.000%, | | ||||||||||||
|
| |||||||||||||
BNP Paribas | ||||||||||||||
| 2,500,000 | 1.470 | 07/01/22 | 2,500,000 | |||||||||||
Maturity Value: $2,500,102 | ||||||||||||||
| | Collateralized by a U.S. Treasury Bond, 2.875%, due 05/15/49, a | | ||||||||||||
| 7,000,000 | 0.720 | (c) | 07/07/22 | 7,000,000 | ||||||||||
Maturity Value: $7,025,480 | ||||||||||||||
Settlement Date: 03/08/22 | ||||||||||||||
| | Collateralized by U.S. Treasury Bonds, 3.125% to 6.125%, due | | ||||||||||||
|
| |||||||||||||
| 4 | The accompanying notes are an integral part of these financial statements. |
GOLDMAN SACHS VARIABLE INSURANCE TRUST GOVERNMENT MONEY MARKET FUND
| Principal Amount | Interest Rate | Maturity Date | Amortized Cost | |||||||||||
| Repurchase Agreements(b) – (continued) | ||||||||||||||
BNP Paribas – (continued) | ||||||||||||||
| $ | 14,000,000 | 0.730 | %(c) | 07/07/22 | $ | 14,000,000 | ||||||||
Maturity Value: $14,051,668 | ||||||||||||||
Settlement Date: 03/08/22 | ||||||||||||||
| | Collateralized by Federal Home Loan Bank, 3.740%, due | | ||||||||||||
| 4,000,000 | 0.770 | (c) | 07/07/22 | 4,000,000 | ||||||||||
Maturity Value: $4,015,485 | ||||||||||||||
Settlement Date: 03/11/22 | ||||||||||||||
| | Collateralized by a U.S. Treasury Floating Rate Note, 1.683%, | | ||||||||||||
| 4,000,000 | 0.780 | (c) | 07/07/22 | 4,000,000 | ||||||||||
Maturity Value: $4,015,687 | ||||||||||||||
Settlement Date: 03/11/22 | ||||||||||||||
| | Collateralized by Federal National Mortgage Association, 2.500%, | | ||||||||||||
| 5,000,000 | 0.820 | (c) | 07/07/22 | 5,000,000 | ||||||||||
Maturity Value: $5,020,956 | ||||||||||||||
Settlement Date: 03/15/22 | ||||||||||||||
| | Collateralized by a U.S. Treasury Inflation-Indexed Bond, | | ||||||||||||
| 6,000,000 | 0.820 | (c) | 07/07/22 | 6,000,000 | ||||||||||
Maturity Value: $6,025,147 | ||||||||||||||
Settlement Date: 03/15/22 | ||||||||||||||
| | Collateralized by Government National Mortgage Association, | | ||||||||||||
|
| |||||||||||||
| Repurchase Agreements(b) – (continued) | ||||||||||||||
BofA Securities, Inc. | ||||||||||||||
| 3,000,000 | 0.860 | %(c) | 07/07/22 | 3,000,000 | ||||||||||
Maturity Value: $3,013,115 | ||||||||||||||
Settlement Date: 03/17/22 | ||||||||||||||
| | Collateralized by Federal Home Loan Mortgage Corp., 0.000%, | | ||||||||||||
|
| |||||||||||||
Joint Account III | ||||||||||||||
| 1,404,900,000 | 1.549 | 07/01/22 | 1,404,900,000 | |||||||||||
Maturity Value: $1,404,960,458 | ||||||||||||||
|
| |||||||||||||
Royal Bank of Canada | ||||||||||||||
| 20,000,000 | 0.730 | (c) | 07/07/22 | 20,000,000 | ||||||||||
Maturity Value: $20,073,811 | ||||||||||||||
Settlement Date: 03/10/22 | ||||||||||||||
| | Collateralized by Federal Home Loan Mortgage Corp., 2.000% to | | ||||||||||||
| 20,000,000 | 0.740 | (c) | 07/07/22 | 20,000,000 | ||||||||||
Maturity Value: $20,074,822 | ||||||||||||||
Settlement Date: 03/11/22 | ||||||||||||||
| | Collateralized by Federal Home Loan Mortgage Corp., 2.000% to | | ||||||||||||
| 7,000,000 | 0.840 | (c) | 07/07/22 | 7,000,000 | ||||||||||
Maturity Value: $7,030,870 | ||||||||||||||
Settlement Date: 03/17/22 | ||||||||||||||
| | Collateralized by Federal Home Loan Mortgage Corp., 2.500% to | | ||||||||||||
|
| |||||||||||||
| TOTAL REPURCHASE AGREEMENTS | $ | 1,497,650,000 | ||||||||||||
|
| |||||||||||||
| TOTAL INVESTMENTS – 100.4% | $ | 1,767,986,839 | ||||||||||||
|
| |||||||||||||
| | LIABILITIES IN EXCESS OF | | (6,933,776 | ) | ||||||||||
|
| |||||||||||||
| NET ASSETS – 100.0% | $ | 1,761,053,063 | ||||||||||||
|
| |||||||||||||
| The percentage shown for each investment category reflects the value of investments in that category as a percentage of net assets. | ||
| (a) | Variable or floating rate security. Except for floating rate notes (for which final maturity is disclosed), maturity date disclosed is the next interest reset date. Interest rate disclosed is that which is in effect on June 30, 2022. | |
| (b) | Unless noted, all repurchase agreements were entered into on June 30, 2022. Additional information on Joint Repurchase Agreement Account III appears in the Additional Investment Information section. | |
| (c) | The instrument is subject to a demand feature. | |
| The accompanying notes are an integral part of these financial statements. | 5 |
GOLDMAN SACHS VARIABLE INSURANCE TRUST GOVERNMENT MONEY MARKET FUND
Schedule of Investments (continued)
June 30, 2022 (Unaudited)
| Interest rates represent either the stated coupon rate, annualized yield on date of purchase for discounted securities, or, for floating rate securities, the current reset rate, which is based upon current interest rate indices. | ||
| Maturity dates represent either the final legal maturity date on the security, the demand date for puttable securities, the date of the next interest rate reset for variable rate securities, or the prerefunded date for those types of securities. | ||
| Investment Abbreviations: | ||
| MMY | —Money Market Yield | |
| Prime | —Federal Reserve Bank Prime Loan Rate US | |
| SOFR | —Secured Overnight Financing Rate | |
| T-Bill | —Treasury Bill | |
| USD | —United States Dollar | |
ADDITIONAL INVESTMENT INFORMATION
JOINT REPURCHASE AGREEMENT ACCOUNT III — At June 30, 2022, the Fund had undivided interests in the Joint Repurchase Agreement Account III, with a maturity date of July 1, 2022, as follows:
| Principal Amount | Maturity Value | Collateral Value | |||||||||||
| $1,404,900,000 | $ | 1,404,960,458 | $ | 1,446,995,900 | |||||||||
REPURCHASE AGREEMENTS — At June 30, 2022, the Principal Amounts of the Fund’s interest in the Joint Repurchase Agreement Account III were as follows:
| Counterparty | Interest Rate | Principal Amount | ||||||
ABN Amro Bank N.V. | 1.550 | % | $ | 413,205,883 | ||||
Bank of America, N.A. | 1.550 | 275,470,588 | ||||||
Bank of Montreal | 1.550 | 110,188,235 | ||||||
BofA Securities, Inc. | 1.550 | 275,470,588 | ||||||
Credit Agricole Corporate and Investment Bank | 1.540 | 220,376,471 | ||||||
Wells Fargo Securities LLC | 1.560 | 110,188,235 | ||||||
| TOTAL | $ | 1,404,900,000 | ||||||
At June 30, 2022, the Joint Repurchase Agreement Account III was fully collateralized by:
| Issuer | Interest Rates | Maturity Dates | ||||||
| Federal Farm Credit bank | 1.180 to 1.960 | % | 11/07/22 to 04/20/27 | |||||
| Federal Home Loan Bank | 2.125 to 3.250 | 03/10/23 to 03/13/26 | ||||||
| Federal Home Loan Mortgage Corp. | 0.550 to 6.500 | 09/02/25 to 06/01/52 | ||||||
| Federal National Mortgage Association | 1.500 to 6.000 | 10/01/23 to 06/01/57 | ||||||
| Government National Mortgage Association | 2.000 to 6.050 | 06/15/28 to 06/20/52 | ||||||
| 6 | The accompanying notes are an integral part of these financial statements. |
GOLDMAN SACHS VARIABLE INSURANCE TRUST GOVERNMENT MONEY MARKET FUND
Statement of Assets and Liabilities
June 30, 2022 (Unaudited)
| Assets: | ||||
Investments based on amortized cost | $ | 270,336,839 | ||
Repurchase agreements based on amortized cost | 1,497,650,000 | |||
Cash | 43,638 | |||
Receivables: | ||||
Fund shares sold | 1,071,046 | |||
Interest | 789,103 | |||
Reimbursement from investment advisor | 17,604 | |||
Other assets | 22,683 | |||
| Total assets | 1,769,930,913 | |||
| Liabilities: | ||||
Payables: | ||||
Fund shares redeemed | 8,250,245 | |||
Distribution and Service fees and Transfer Agency fees | 337,470 | |||
Management fees | 191,637 | |||
Accrued expenses | 98,498 | |||
| Total liabilities | 8,877,850 | |||
| Net Assets: | ||||
Paid-in capital | 1,761,129,616 | |||
Total distributable earnings (loss) | (76,553 | ) | ||
| NET ASSETS | $ | 1,761,053,063 | ||
Net asset value, offering and redemption price per share | $ | 1.00 | ||
Net Assets: | ||||
Institutional Shares | $ | 1,122,682,099 | ||
Service Shares | 638,370,964 | |||
Total Net Assets | $ | 1,761,053,063 | ||
Shares outstanding $0.001 par value (unlimited number of shares authorized): | ||||
Institutional Shares | 1,122,730,774 | |||
Service Shares | 638,398,823 | |||
| The accompanying notes are an integral part of these financial statements. | 7 |
GOLDMAN SACHS VARIABLE INSURANCE TRUST GOVERNMENT MONEY MARKET FUND
Statement of Operations
For the Six Months Ended June 30, 2022 (Unaudited)
| Investment Income: | ||||
Interest income | $ | 3,845,069 | ||
| Expenses: | ||||
Management fees | 1,043,826 | |||
Distribution and Service fees — Service Shares | 693,860 | |||
Transfer Agency fees(a) | 130,466 | |||
Professional fees | 65,758 | |||
Custody, accounting and administrative services | 34,294 | |||
Printing and mailing fees | 23,447 | |||
Trustee fees | 10,681 | |||
Other | 3,125 | |||
| Total expenses | 2,005,457 | |||
Less — expense reductions | (529,322 | ) | ||
| Net expenses | 1,476,135 | |||
| NET INVESTMENT INCOME | $ | 2,368,934 | ||
| Net realized loss from investment transactions | (174,567 | ) | ||
| NET INCREASE IN NET ASSETS RESULTING FROM OPERATIONS | $ | 2,194,367 | ||
(a) Institutional and Service Shares incurred Transfer Agency fees of $74,962 and $55,504, respectively.
| 8 | The accompanying notes are an integral part of these financial statements. |
GOLDMAN SACHS VARIABLE INSURANCE TRUST GOVERNMENT MONEY MARKET FUND
Statements of Changes in Net Assets
| For the Six Months Ended June 30, 2022 (Unaudited) | For the Fiscal Year Ended December 31, 2021 | |||||||
| From operations: | ||||||||
Net investment income | $ | 2,368,934 | $ | 49,734 | ||||
Net realized gain (loss) from investment transactions | (174,567 | ) | 5,853 | |||||
| Net increase in net assets resulting from operations | 2,194,367 | 55,587 | ||||||
| Distributions to shareholders: | ||||||||
From distributable earnings: | ||||||||
Institutional Shares | (1,678,307 | ) | (34,324 | ) | ||||
Service Shares | (593,008 | ) | (32,088 | ) | ||||
| Total distributions to shareholders | (2,271,315 | ) | (66,412 | ) | ||||
| From share transactions (at $1.00 per share): | ||||||||
Proceeds from sales of shares | 1,119,332,951 | 690,873,762 | ||||||
Reinvestment of distributions | 2,271,315 | 66,343 | ||||||
Cost of shares redeemed | (385,232,848 | ) | (827,803,075 | ) | ||||
| Net increase (decrease) in net assets resulting from share transactions | 736,371,418 | (136,862,970 | ) | |||||
| TOTAL INCREASE (DECREASE) | 736,294,470 | (136,873,795 | ) | |||||
| Net assets: | ||||||||
Beginning of period | 1,024,758,593 | 1,161,632,388 | ||||||
End of period | $ | 1,761,053,063 | $ | 1,024,758,593 | ||||
| The accompanying notes are an integral part of these financial statements. | 9 |
GOLDMAN SACHS VARIABLE INSURANCE TRUST GOVERNMENT MONEY MARKET FUND
Selected Data for a Share Outstanding Throughout Each Period
| Goldman Sachs Government Money Market Fund | ||||||||||||||||||||||||
| Institutional Shares | ||||||||||||||||||||||||
| Six Months Ended June 30, 2022 (Unaudited) | Year Ended December 31, | |||||||||||||||||||||||
| 2021 | 2020 | 2019 | 2018 | 2017 | ||||||||||||||||||||
| Per Share Data: | ||||||||||||||||||||||||
Net asset value, beginning of period | $ | 1.00 | $ | 1.00 | $ | 1.00 | $ | 1.00 | $ | 1.00 | $ | 1.00 | ||||||||||||
Net investment income(a) | 0.002 | — | (b) | 0.004 | 0.021 | 0.017 | 0.008 | |||||||||||||||||
Distributions to shareholders from net investment income(c) | (0.002 | ) | — | (b) | (0.004 | ) | (0.021 | ) | (0.017 | ) | (0.008 | ) | ||||||||||||
Net asset value, end of period | $ | 1.00 | $ | 1.00 | $ | 1.00 | $ | 1.00 | $ | 1.00 | $ | 1.00 | ||||||||||||
Total return(d) | 0.17 | % | 0.01 | % | 0.43 | % | 2.11 | % | 1.74 | % | 0.76 | % | ||||||||||||
Net assets, end of period (in 000’s) | $ | 1,122,682 | $ | 523,751 | $ | 582,216 | $ | 363,783 | $ | 411,447 | $ | 302,507 | ||||||||||||
Ratio of net expenses to average net assets | 0.16 | %(e) | 0.09 | % | 0.18 | % | 0.18 | % | 0.18 | % | 0.18 | % | ||||||||||||
Ratio of total expenses to average net assets | 0.20 | %(e) | 0.21 | % | 0.20 | % | 0.21 | % | 0.23 | % | 0.27 | % | ||||||||||||
Ratio of net investment income to average net assets | 0.46 | %(e) | — | %(f) | 0.35 | % | 2.06 | % | 1.73 | % | 0.76 | % | ||||||||||||
| (a) | Calculated based on the average shares outstanding methodology. |
| (b) | Amount is less than $0.0005 per share. |
| (c) | Distributions may not coincide with the current year net investment income or net realized gains as distributions may be paid from current or prior year earnings. |
| (d) | Assumes reinvestment of all distributions. Returns do not reflect the deduction of taxes that a shareholder would pay on Fund distributions. Total returns for periods less than one full year are not annualized. |
| (e) | Annualized. |
| (f) | Amount is less than 0.005%. |
| 10 | The accompanying notes are an integral part of these financial statements. |
GOLDMAN SACHS VARIABLE INSURANCE TRUST GOVERNMENT MONEY MARKET FUND
Financial Highlights (continued)
Selected Data for a Share Outstanding Throughout Each Period
| Goldman Sachs Government Money Market Fund | ||||||||||||||||||||||||
| Service Shares | ||||||||||||||||||||||||
| Six Months Ended June 30, 2022 (Unaudited) | Year Ended December 31, | |||||||||||||||||||||||
| 2021 | 2020 | 2019 | 2018 | 2017 | ||||||||||||||||||||
| Per Share Data: | ||||||||||||||||||||||||
Net asset value, beginning of period | $ | 1.00 | $ | 1.00 | $ | 1.00 | $ | 1.00 | $ | 1.00 | $ | 1.00 | ||||||||||||
Net investment income(a) | 0.001 | — | (b) | 0.003 | 0.018 | 0.015 | 0.005 | |||||||||||||||||
Distributions to shareholders from net investment income(c) | (0.001 | ) | — | (b) | (0.003 | ) | (0.018 | ) | (0.015 | ) | (0.005 | ) | ||||||||||||
Net asset value, end of period | $ | 1.00 | $ | 1.00 | $ | 1.00 | $ | 1.00 | $ | 1.00 | $ | 1.00 | ||||||||||||
Total return(d) | 0.10 | % | 0.01 | % | 0.27 | % | 1.86 | % | 1.48 | % | 0.51 | % | ||||||||||||
Net assets, end of period (in 000’s) | $ | 638,371 | $ | 501,008 | $ | 579,416 | $ | 350,112 | $ | 368,652 | $ | 354,248 | ||||||||||||
Ratio of net expenses to average net assets | 0.32 | %(e) | 0.09 | % | 0.33 | % | 0.43 | % | 0.43 | % | 0.43 | % | ||||||||||||
Ratio of total expenses to average net assets | 0.45 | %(e) | 0.46 | % | 0.45 | % | 0.46 | % | 0.48 | % | 0.52 | % | ||||||||||||
Ratio of net investment income to average net assets | 0.23 | %(e) | — | %(f) | 0.19 | % | 1.81 | % | 1.48 | % | 0.51 | % | ||||||||||||
| (a) | Calculated based on the average shares outstanding methodology. |
| (b) | Amount is less than $0.0005 per share. |
| (c) | Distributions may not coincide with the current year net investment income or net realized gains as distributions may be paid from current or prior year earnings. |
| (d) | Assumes reinvestment of all distributions. Returns do not reflect the deduction of taxes that a shareholder would pay on Fund distributions. Total returns for periods less than one full year are not annualized. |
| (e) | Annualized. |
| (f) | Amount is less than 0.005%. |
| The accompanying notes are an integral part of these financial statements. | 11 |
GOLDMAN SACHS VARIABLE INSURANCE TRUST GOVERNMENT MONEY MARKET FUND
June 30, 2022 (Unaudited)
1. ORGANIZATION
Goldman Sachs Variable Insurance Trust (the “Trust” or “VIT”) is a Delaware statutory trust registered under the Investment Company Act of 1940, as amended (the “Act”), as an open-end management investment company. The Trust includes the Goldman Sachs Government Money Market Fund (the “Fund”). The Fund is a diversified portfolio under the Act offering two classes of shares — Institutional Shares and Service Shares. Shares of the Trust are offered to separate accounts of participating life insurance companies for the purpose of funding variable annuity contracts and variable life insurance policies.
Goldman Sachs Asset Management, L.P. (“GSAM”), an affiliate of Goldman Sachs & Co. LLC (“Goldman Sachs”), serves as investment adviser to the Fund pursuant to a management agreement (the “Agreement”) with the Trust.
2. SIGNIFICANT ACCOUNTING POLICIES
The financial statements have been prepared in accordance with accounting principles generally accepted in the United States of America (“GAAP”) and require management to make estimates and assumptions that may affect the reported amounts and disclosures. Actual results may differ from those estimates and assumptions. The Fund is an investment company under GAAP and follows the accounting and reporting guidance applicable to investment companies.
A. Investment Valuation — The investment valuation policy of the Fund is to use the amortized-cost method permitted by Rule 2a-7 under the Act for valuing portfolio securities. The amortized-cost method of valuation involves valuing a security at its cost and thereafter applying a constant accretion or amortization to maturity of any discount or premium. Normally, a security’s amortized cost will approximate its market value. Under procedures and tolerances approved by the Board of Trustees (“Trustees”), GSAM evaluates daily the difference between the Fund’s net asset value (“NAV”) per share using the amortized costs of its portfolio securities and the Fund’s NAV per share using market-based values of its portfolio securities. The market-based value of a portfolio security is determined, where readily available, on the basis of market quotations provided by pricing services or securities dealers, or, where accurate market quotations are not readily available, on the basis of the security’s fair value as determined in accordance with Valuation Procedures approved by the Trustees. The pricing services may use valuation models or matrix pricing, which may consider (among other things): (i) yield or price with respect to debt securities that are considered comparable in characteristics such as rating, interest rate and maturity date or (ii) quotations from securities dealers to determine current value.
B. Investment Income and Investments — Interest income is accrued daily and adjusted for amortization of premiums and accretion of discounts. Investment transactions are reflected on trade date. Realized gains and losses are calculated using identified cost.
C. Class Allocations and Expenses — Investment income, realized and unrealized gain (loss), if any, and non-class specific expenses of the Fund are allocated daily based upon the proportion of net assets of each class. Class specific expenses, where applicable, are borne by the respective share classes and include Distribution and Service and Transfer Agency fees. Non-class specific expenses directly incurred by the Fund are charged to the Fund, while such expenses incurred by the Trust are allocated across the Fund on a straight-line and/or pro-rata basis depending upon the nature of the expenses.
D. Federal Taxes and Distributions to Shareholders — It is the Fund’s policy to comply with the requirements of the Internal Revenue Code of 1986, as amended (the “Code”), applicable to regulated investment companies (mutual funds) and to distribute each year substantially all of its investment company taxable and tax-exempt income and capital gains to its shareholders. Accordingly, the Fund is not required to make any provisions for the payment of federal income tax. Distributions to shareholders are declared and recorded daily and paid monthly by the Fund and may include short-term capital gains. Long-term capital gain distributions, if any, are declared and paid annually. The Fund may defer or accelerate the timing of the distribution of short-term capital gains (or any portion thereof).
The characterization of distributions to shareholders for financial reporting purposes is determined in accordance with federal income tax rules, which may differ from GAAP. The source of the Fund’s distributions may be shown in the accompanying financial statements as either from distributable earnings or capital. Certain components of the Fund’s net assets on the Statement of Assets and Liabilities reflect permanent GAAP/tax differences based on the appropriate tax character.
| 12 |
GOLDMAN SACHS VARIABLE INSURANCE TRUST GOVERNMENT MONEY MARKET FUND
2. SIGNIFICANT ACCOUNTING POLICIES (continued)
As of December 31, 2021, the Fund’s certain timing differences on a tax basis were as follows:
| Timing differences (Distributions Payable) | $ | (25 | ) |
The amortized cost for the Fund stated in the accompanying Statement of Assets and Liabilities also represents aggregate cost for U.S. federal income tax purposes.
GSAM has reviewed the Fund’s tax positions for all open tax years (the current and prior three years, as applicable) and had concluded that no provision for income tax is required in the Fund’s financial statements. Such open tax years remain subject to examination and adjustment by tax authorities.
E. Forward Commitments — A forward commitment involves entering into a contract to purchase or sell securities, typically on an extended settlement basis, for a fixed price at a future date. The purchase of securities on a forward commitment basis involves a risk of loss if the value of the security to be purchased declines before the settlement date. Conversely, the sale of securities on a forward commitment basis involves the risk that the value of the securities sold may increase before the settlement date. Although the Fund will generally purchase securities on a forward commitment basis with the intention of acquiring the securities for its portfolio, the Fund may dispose of forward commitments prior to settlement which may result in a realized gain or loss.
F. Repurchase Agreements — Repurchase agreements involve the purchase of securities subject to the seller’s agreement to repurchase the securities at a mutually agreed upon date and price, under the terms of a Master Repurchase Agreement (“MRA”). During the term of a repurchase agreement, the value of the underlying securities held as collateral on behalf of the Fund, including accrued interest, is required to exceed the value of the repurchase agreement, including accrued interest. The gross value of repurchase agreements is included in the Statement of Assets and Liabilities for financial reporting purposes. The underlying securities for all repurchase agreements are held at the Fund’s custodian or designated sub-custodians under tri-party repurchase agreements.
An MRA governs transactions between the Fund and select counterparties. An MRA contains provisions for, among other things, initiation of the transaction, income payments, events of default, and maintenance of securities for repurchase agreements. An MRA also permits offsetting with collateral to create one single net payment in the event of default or similar events, including the bankruptcy or insolvency of a counterparty.
If the seller defaults, the Fund could suffer a loss to the extent that the proceeds from the sale of the underlying securities and other collateral held by the Fund are less than the repurchase price and the Fund’s costs associated with delay and enforcement of the repurchase agreement. In addition, in the event of default or insolvency of the seller, a court could determine that the Fund’s interest in the collateral is not enforceable, resulting in additional losses to the Fund.
Pursuant to exemptive relief granted by the Securities and Exchange Commission (“SEC”) and terms and conditions contained therein, the Fund, together with other funds of the Trust and registered investment companies having management agreements with GSAM or its affiliates, may transfer uninvested cash into joint accounts, the daily aggregate balance of which is invested in one or more repurchase agreements. Under these joint accounts, the Fund maintains pro-rata credit exposure to the underlying repurchase agreements’ counterparties. With the exception of certain transaction fees, the Fund is not subject to any expenses in relation to these investments.
3. INVESTMENTS AND FAIR VALUE MEASUREMENTS
U.S. GAAP defines the fair value of a financial instrument as the amount that would be received to sell an asset or paid to transfer a liability in an orderly transaction between market participants at the measurement date (i.e., the exit price); the Fund’s policy is to use the market approach. GAAP establishes a fair value hierarchy that prioritizes the inputs to valuation techniques used to measure fair value. The hierarchy gives the highest priority to unadjusted quoted prices in active markets for identical assets or liabilities (Level 1 measurements) and the lowest priority to unobservable inputs (Level 3 measurements). The level in the fair value hierarchy within which the fair value measurement in its entirety falls shall be determined based on the lowest level input that is
| 13 |
GOLDMAN SACHS VARIABLE INSURANCE TRUST GOVERNMENT MONEY MARKET FUND
Notes to Financial Statements (continued)
June 30, 2022 (Unaudited)
3. INVESTMENTS AND FAIR VALUE MEASUREMENTS (continued)
significant to the fair value measurement in its entirety. The levels used for classifying investments are not necessarily an indication of the risk associated with investing in these investments. The three levels of the fair value hierarchy are described below:
Level 1 — Unadjusted quoted prices in active markets that are accessible at the measurement date for identical, unrestricted assets or liabilities;
Level 2 — Quoted prices in markets that are not active or financial instruments for which significant inputs are observable (including, but not limited to, quoted prices for similar investments, interest rates, foreign exchange rates, volatility and credit spreads), either directly or indirectly;
Level 3 — Prices or valuations that require significant unobservable inputs (including GSAM’s assumptions in determining fair value measurement).
The Trustees have approved Valuation Procedures that govern the valuation of the portfolio investments held by the Fund, including investments for which market quotations are not readily available. The Trustees have delegated to GSAM day-to-day responsibility for implementing and maintaining internal controls and procedures related to the valuation (including both the amortized cost and market-based methods of valuation) of the Fund’s investments. To assess the continuing appropriateness of pricing sources and methodologies related to the market-based method of valuation, GSAM regularly performs price verification procedures and issues challenges as necessary to third party pricing vendors or brokers, and any differences are reviewed in accordance with the Valuation Procedures.
As of June 30, 2022, all investments and repurchase agreements are classified as Level 2 of the fair value hierarchy. Please refer to the Schedule of Investments for further detail.
4. AGREEMENTS AND AFFILIATED TRANSACTIONS
A. Management Agreement — Under the Agreement, GSAM manages the Fund, subject to the general supervision of the Trustees.
As compensation for the services rendered pursuant to the Agreement, the assumption of the expenses related thereto and administration of the Fund’s business affairs, including providing facilities, GSAM is entitled to a management fee, accrued daily and paid monthly, equal to an annual percentage rate of the Fund’s average daily net assets.
B. Distribution and Service (12b-1) Plan — The Trust, on behalf of the Service Shares of the Fund, has adopted a Distribution and Service Plan subject to Rule 12b-1 under the Act. Under the Distribution and Service Plan, Goldman Sachs, which serves as distributor (the “Distributor”), is entitled to a fee accrued daily and paid monthly, for distribution services and personal and account maintenance services, which may then be paid by Goldman Sachs to authorized dealers, equal to, on an annual basis, 0.25% of the Fund’s average daily net assets attributable to Service Shares.
C. Transfer Agency Agreement — Goldman Sachs also serves as the transfer agent of the Fund for a fee pursuant to a Transfer Agency Agreement. The fee charged for such transfer agency services is accrued daily and paid monthly at an annual rate of 0.02% of the Fund’s average daily net assets of Institutional Shares and Service Shares.
D. Other Expense Agreements — GSAM has agreed to limit certain “Other Expenses” of the Fund (excluding acquired fund fees and expenses, transfer agency fees and expenses, taxes, interest, brokerage fees, expenses of shareholder meetings, litigation and indemnification, and extraordinary expenses) to the extent that such expenses exceed, on an annual basis, 0.004% of the average daily net assets of the Fund. Such Other Expense reimbursements, if any, are accrued daily and paid monthly. In addition, the Fund is not obligated to reimburse GSAM for prior fiscal year expense reimbursements, if any. This Other Expense limitation will remain in place through at least April 29, 2023, and prior to such date GSAM may not terminate the arrangement without the approval of the Trustees. In addition, the Fund has entered into certain offset arrangements with the custodian and the transfer agent, which may result in a reduction of the Fund’s expenses and are received irrespective of the application of the “Other
| 14 |
GOLDMAN SACHS VARIABLE INSURANCE TRUST GOVERNMENT MONEY MARKET FUND
4. AGREEMENTS AND AFFILIATED TRANSACTIONS ( continued)
Expense” limitation described above. For the six months ended June 30, 2022, these expense reductions, including any fee waiver and Other Expense reimbursements, were as follows:
| Management Fee Waivers | Distribution, Administration, Service and/or Shareholder Administration Plans Fee Waivers | Transfer Agency Waiver | Other Expense | Total Expense Reductions | ||||||||||||||
| $ | 121,035 | $ | 257,929 | $ | 39,149 | $ | 111,209 | $ | 529,322 | |||||||||
E. Contractual and Net Fund Expenses — The investment adviser may contractually agree to waive or reimburse certain fees and expenses until a specified date. The investment adviser or transfer agent may also voluntarily waive certain fees and expenses, and such voluntary waivers may be discontinued or modified at any time without notice. The following table outlines such fees (net of waivers) and Other Expenses (net of reimbursements and custodian and transfer agency fee credit reductions) in order to determine the Fund’s net annualized expenses for the fiscal year. The Fund is not obligated to reimburse Goldman Sachs for prior fiscal year fee waivers, if any.
| Institutional Shares | Service Shares | |||||||||||||||
| Fee/Expense Type | Contractual rate, if any | Ratio of net expenses to average net assets for the six months ended June 30, 2022 | Contractual rate, if any | Ratio of net expenses to average net assets for the six months ended June 30, 2022 | ||||||||||||
| Management Fee | 0.16 | % | 0.14 | % | 0.16 | % | 0.14 | % | ||||||||
| Distribution and Service Fees | N/A | N/A | 0.25 | 0.16 | ||||||||||||
| Transfer Agency Fees | 0.02 | 0.01 | 0.02 | 0.01 | ||||||||||||
| Other Expenses | — | 0.01 | (a) | — | 0.01 | (a) | ||||||||||
| Net Expenses | 0.16 | % | 0.32 | % | ||||||||||||
| (a) | Amount is less than 0.005% of average net assets. |
| N/A—Fees | not applicable to respective share class. |
F. Other Transactions with Affiliates — The Fund may purchase securities from, or sell securities to, an affiliated fund provided the affiliation is solely due to having a common investment adviser, common officers, or common Trustees.
G. Line of Credit Facility — As of June 30, 2022, the Fund participated in a $1,250,000,000 committed, unsecured revolving line of credit facility (the “facility”) together with other funds of the Trust and registered investment companies having management agreements with GSAM or its affiliates. This facility is to be used for temporary emergency purposes, or to allow for an orderly liquidation of securities to meet redemption requests. The interest rate on borrowings is based on the federal funds rate. The facility also requires a fee to be paid by the Fund based on the amount of the commitment that has not been utilized. For the six months ended June 30, 2022, the Fund did not have any borrowings under the facility. Prior to April 22, 2022, the facility was $1,000,000,000.
5. OTHER RISKS
The Fund’s risks include, but are not limited to, the following:
Floating and Variable Rate Obligations Risk — Floating rate and variable rate obligations are debt instruments issued by companies or other entities with interest rates that reset periodically (typically, daily, monthly, quarterly, or semiannually) in response to changes in the market rate of interest on which the interest rate is based. For floating and variable rate obligations, there may be a lag between an actual change in the underlying interest rate benchmark and the reset time for an interest payment of such
| 15 |
GOLDMAN SACHS VARIABLE INSURANCE TRUST GOVERNMENT MONEY MARKET FUND
Notes to Financial Statements (continued)
June 30, 2022 (Unaudited)
5. OTHER RISKS (continued)
an obligation, which could harm or benefit a Fund, depending on the interest rate environment or other circumstances. In a rising interest rate environment, for example, a floating or variable rate obligation that does not reset immediately would prevent a Fund from taking full advantage of rising interest rates in a timely manner. However, in a declining interest rate environment, a Fund may benefit from a lag due to an obligation’s interest rate payment not being immediately impacted by a decline in interest rates.
Interest Rate Risk — When interest rates increase, the Fund’s yield will tend to be lower than prevailing market rates, and the market value of its investments will generally decline. The Fund may face a heightened level of interest rate risk in connection with the type and extent of certain monetary policy changes made by the Federal Reserve, such as target interest rate changes. A wide variety of market factors can cause interest rates to rise, including central bank monetary policy, rising inflation and changes in general economic conditions. The risks associated with changing interest rates may have unpredictable effects on the markets and the Fund’s investments. A low interest rate environment poses additional risks to the Fund, because low yields on the Fund’s portfolio holdings may have an adverse impact on the Fund’s ability to provide a positive yield to its shareholders, pay expenses out of current income, or minimize the volatility of the Fund’s NAV per share and/ or achieve its investment objective. Fluctuations in interest rates may also affect the liquidity of the Fund’s investments. A sudden or unpredictable increase in interest rates may cause volatility in the market and may decrease the liquidity of the Fund’s investments, which would make it harder for the Fund to sell its investments at an advantageous time.
Large Shareholder Transactions Risk — The Fund may experience adverse effects when certain large shareholders, such as other funds, participating insurance companies, accounts and Goldman Sachs affiliates, purchase or redeem large amounts of shares of the Fund. Such large shareholder redemptions, which may occur rapidly or unexpectedly, may cause the Fund to sell portfolio securities at times when it would not otherwise do so, which may negatively impact the Fund’s NAV and liquidity. These transactions may also accelerate the realization of taxable income to shareholders if such sales of investments resulted in gains, and may also increase transaction costs. In addition, a large redemption could result in the Fund’s current expenses being allocated over a smaller asset base, leading to an increase in the Fund’s expense ratio. Similarly, large Fund share purchases may adversely affect the Fund’s performance to the extent that the Fund is delayed in investing new cash or otherwise maintains a larger cash position than it ordinarily would.
Market and Credit Risks — In the normal course of business, the Fund trades financial instruments and enter into financial transactions where risk of potential loss exists due to changes in the market (market risk). The value of the securities in which the Fund invests may go up or down in response to the prospects of individual companies, particular sectors or governments and/or general economic conditions throughout the world due to increasingly interconnected global economies and financial markets. Events such as war, acts of terrorism, social unrest, natural disasters, the spread of infectious illness or other public health threats could also significantly impact the Fund and its investments. Additionally, the Fund may also be exposed to credit risk in the event that an issuer or guarantor fails to perform or that an institution or entity with which the Fund has unsettled or open transactions defaults.
6. IDEMNIFICATIONS
Under the Trust’s organizational documents, its Trustees, officers, employees and agents are indemnified, to the extent permitted by the Act and state law, against certain liabilities that may arise out of performance of their duties to the Fund. Additionally, in the course of business, the Fund enters into contracts that contain a variety of indemnification clauses. The Fund’s maximum exposure under these arrangements is unknown, as this would involve future claims that may be made against the Fund that have not yet occurred. However, GSAM believes the risk of loss under these arrangements to be remote.
7. SUBSEQUENT EVENTS
Subsequent events after the Statement of Assets and Liabilities date have been evaluated and GSAM has concluded that there is no impact requiring adjustment or disclosure in the financial statements.
| 16 |
GOLDMAN SACHS VARIABLE INSURANCE TRUST GOVERNMENT MONEY MARKET FUND
8. SUMMARY OF SHARE TRANSACTIONS
Share activity is as follows:
| For the Six Months Ended June 30, 2022 (Unaudited) | For the Fiscal Year Ended December 31, 2021 | |||||||
| Institutional Shares* | ||||||||
| Shares sold | 873,381,382 | 496,281,091 | ||||||
| Reinvestment of distributions | 1,678,265 | 34,294 | ||||||
| Shares redeemed | (276,079,577 | ) | (554,775,442 | ) | ||||
| 598,980,070 | (58,460,057 | ) | ||||||
| Service Shares* | ||||||||
| Shares sold | 245,951,569 | 194,592,671 | ||||||
| Reinvestment of distributions | 593,050 | 32,049 | ||||||
| Shares redeemed | (109,153,271 | ) | (273,027,633 | ) | ||||
| 137,391,348 | (78,402,913 | ) | ||||||
| NET INCREASE (DECREASE) IN SHARES | 736,371,418 | (136,862,970 | ) | |||||
| * | Valued at $1.00 per share. |
| 17 |
GOLDMAN SACHS VARIABLE INSURANCE TRUST GOVERNMENT MONEY MARKET FUND
Statement Regarding Basis for Approval of Management Agreement (Unaudited)
Background
The Goldman Sachs Government Money Market Fund (the “Fund”) is an investment portfolio of Goldman Sachs Variable Insurance Trust (the “Trust”). The Board of Trustees oversees the management of the Trust and reviews the investment performance and expenses of the Fund at regularly scheduled meetings held throughout the year. In addition, the Board of Trustees determines annually whether to approve the continuance of the Trust’s investment management agreement (the “Management Agreement”) with Goldman Sachs Asset Management, L.P. (the “Investment Adviser”) on behalf of the Fund.
The Management Agreement was most recently approved for continuation until June 30, 2023 by the Board of Trustees, including those Trustees who are not parties to the Management Agreement or “interested persons” (as defined in the Investment Company Act of 1940, as amended) of any party thereto (the “Independent Trustees”), at a meeting held on June 14-15, 2022 (the “Annual Meeting”).
The review process undertaken by the Trustees spans the course of the year and culminates with the Annual Meeting. To assist the Trustees in their deliberations, the Trustees have established a Contract Review Committee (the “Committee”), comprised of the Independent Trustees. The Committee held two meetings over the course of the year since the Management Agreement was last approved. At those Committee meetings, regularly scheduled Board or other committee meetings, and/or the Annual Meeting, matters relevant to the renewal of the Management Agreement were considered by the Board, or the Independent Trustees, as applicable. With respect to the Fund, such matters included:
| (a) | the nature and quality of the advisory, administrative, and other services provided to the Fund by the Investment Adviser and its affiliates, including information about: |
| (i) | the structure, staff, and capabilities of the Investment Adviser and its portfolio management teams; |
| (ii) | the groups within the Investment Adviser and its affiliates that support the portfolio management teams or provide other types of necessary services, including fund services groups (e.g., accounting and financial reporting, tax, shareholder services, and operations); controls and risk management groups (e.g., legal, compliance, valuation oversight, credit risk management, internal audit, compliance testing, market risk analysis, finance, and central funding); sales and distribution support groups, and others (e.g., information technology and training); |
| (iii) | trends in employee headcount; |
| (iv) | the Investment Adviser’s financial resources and ability to hire and retain talented personnel and strengthen its operations; and |
| (v) | the parent company’s support of the Investment Adviser and its mutual fund business, as expressed by the firm’s senior management; |
| (b) | information on the investment performance of the Fund, including comparisons to the performance of similar mutual funds, as provided by a third-party mutual fund data provider engaged as part of the contract review process (the “Outside Data Provider”), and information on general investment outlooks in the markets in which the Fund invests; |
| (c) | the terms of the Management Agreement and other agreements with affiliated service providers entered into by the Trust on behalf of the Fund; |
| (d) | fee and expense information for the Fund, including: |
| (i) | the relative management fee and expense levels of the Fund as compared to those of comparable funds managed by other advisers, as provided by the Outside Data Provider; |
| (ii) | the Fund’s expense trends over time; and |
| (iii) | to the extent the Investment Adviser manages other types of accounts (such as bank collective trusts, private wealth management accounts, institutional separate accounts, sub-advised mutual funds, and non-U.S. funds) having investment objectives and policies similar to those of the Fund, comparative information on the advisory fees charged and services provided to those accounts by the Investment Adviser; |
| (e) | with respect to the extensive investment performance and expense comparison data provided by the Outside Data Provider, its processes in producing that data for the Fund; |
| (f) | the undertakings of the Investment Adviser and its affiliates to implement fee waivers and/or expense limitations; |
| (g) | information relating to the profitability of the Management Agreement and the transfer agency and distribution and service arrangements of the Fund to the Investment Adviser and its affiliates; |
| (h) | whether the Fund’s existing management fee schedule adequately addressed any economies of scale; |
| (i) | a summary of the “fall-out” benefits derived by the Investment Adviser and its affiliates from their relationships with the Fund, including the fees received by the Investment Adviser’s affiliates from the Fund for transfer agency, distribution and other services; |
| (j) | a summary of potential benefits derived by the Fund as a result of its relationship with the Investment Adviser; |
| 18 |
GOLDMAN SACHS VARIABLE INSURANCE TRUST GOVERNMENT MONEY MARKET FUND
Statement Regarding Basis for Approval of Management Agreement (Unaudited) (continued)
| (k) | information regarding portfolio trading and how the Investment Adviser carries out its duty to seek best execution; |
| (l) | the nature and quality of the services provided to the Fund by its unaffiliated service providers, and the Investment Adviser’s general oversight and evaluation (including reports on due diligence) of those service providers as part of the administrative services provided under the Management Agreement; and |
| (m) | the Investment Adviser’s processes and policies addressing various types of potential conflicts of interest; its approach to risk management; the annual review of the effectiveness of the Fund’s compliance program; and periodic compliance reports. |
The Trustees also received an overview of the Fund’s distribution arrangements. They received information regarding the Fund’s assets, share purchase and redemption activity, and payment of distribution and service fees. Information was also provided to the Trustees relating to revenue sharing payments made by and services provided by the Investment Adviser and its affiliates to intermediaries that promote the sale, distribution, and/or servicing of Fund shares. The Independent Trustees also discussed the broad range of other investment choices that are available to Fund investors, including the availability of comparable funds managed by other advisers.
The presentations made at the Board and Committee meetings and at the Annual Meeting encompassed the Fund and other mutual funds for which the Board of Trustees has responsibility. In evaluating the Management Agreement at the Annual Meeting, the Trustees relied upon their knowledge, resulting from their meetings and other interactions throughout the year, of the Investment Adviser and its affiliates, their services, and the Fund. In conjunction with these meetings, the Trustees received written materials and oral presentations on the topics covered, and the Investment Adviser addressed the questions and concerns of the Trustees, including concerns regarding the investment performance of certain of the funds they oversee. The Independent Trustees were advised by their independent legal counsel regarding their responsibilities and other regulatory requirements related to the approval and continuation of mutual fund investment management agreements under applicable law. In addition, the Investment Adviser and its affiliates provided the Independent Trustees with a written response to a formal request for information sent on behalf of the Independent Trustees by their independent legal counsel. During the course of their deliberations, the Independent Trustees met in executive sessions with their independent legal counsel, without representatives of the Investment Adviser or its affiliates present.
Nature, Extent, and Quality of the Services Provided Under the Management Agreement
As part of their review, the Trustees considered the nature, extent, and quality of the services provided to the Fund by the Investment Adviser. In this regard, the Trustees considered both the investment advisory services and non-advisory services that are provided by the Investment Adviser and its affiliates. The Trustees noted the transition in the leadership and changes in personnel of various of the Investment Adviser’s portfolio management teams that had occurred in recent periods, and the ongoing recruitment efforts aimed at bringing high quality investment talent to the Investment Adviser. They also noted the Investment Adviser’s commitment to maintaining high quality systems and expending substantial resources to respond to ongoing changes to the market, regulatory and control environment in which the Fund and its service providers operate, including developments associated with the COVID-19 pandemic, geopolitical events, and economic sanctions, as well as the efforts of the Investment Adviser and its affiliates to combat cyber security risks. The Trustees also considered information regarding the Investment Adviser’s business continuity planning and remote operations capabilities. The Trustees concluded that the Investment Adviser continued to commit substantial financial and operational resources to the Fund and expressed confidence that the Investment Adviser would continue to do so in the future. The Trustees also recognized that the Investment Adviser had made significant commitments to address regulatory compliance requirements applicable to the Fund and the Investment Adviser and its affiliates.
Investment Performance
The Trustees also considered the investment performance of the Fund. In this regard, they compared the investment performance of the Fund to its peers using rankings compiled by the Outside Data Provider as of December 31, 2021. The information on the Fund’s investment performance was provided for the one-, three-, five-, and ten-year periods ending on the applicable dates.
In addition, the Trustees considered materials prepared and presentations made by the Investment Adviser’s senior management and portfolio management personnel in which Fund performance was assessed. The Trustees also considered the Investment Adviser’s periodic reports with respect to the Fund’s risk profile, and how the Investment Adviser’s approach to risk monitoring and management influences portfolio management.
The Trustees considered the performance of the Fund in light of its investment policies and strategies. They noted that the Fund has operated in a generally challenging yield environment since 2009. The Trustees considered that yields had improved by
| 19 |
GOLDMAN SACHS VARIABLE INSURANCE TRUST GOVERNMENT MONEY MARKET FUND
Statement Regarding Basis for Approval of Management Agreement (Unaudited) (continued)
early 2020, although they noted that yields had subsequently decreased to near zero following the market disruptions related to the COVID-19 pandemic and related actions by the Federal Reserve, including two emergency interest rate cuts in March 2020. As a result, although the Investment Adviser was generally able to reduce the amount of fees waived and/or reimbursed through 2019 and early 2020, they acknowledged that the Investment Adviser had increased the amount of fees waived and/or reimbursed through late 2020 and 2021 in order to maintain a competitive, non-negative yield for the Fund in the then near-zero yield environment. The Trustees also considered that, since March 2022, the Federal Reserve has implemented a series of interest rate increases in response to inflationary pressures impacting the broader economy, and the Investment Adviser has subsequently been able to again reduce the amount of fees waived and/or reimbursed relative to such amounts waived and/or reimbursed through late 2020 and 2021. The Trustees acknowledged, however, that the interest rate environment remains uncertain in light of broader economic conditions, although they noted that indications from the Federal Reserve suggest further interest rate increases in the near term. The Trustees considered that, during the relevant period, the Investment Adviser had voluntarily waived fees for the Fund in order to maintain a competitive yield. The Trustees also considered that the Fund had maintained a stable net asset value per share. In light of these considerations, the Trustees believed that the Fund was providing investment performance within a competitive range for investors.
Costs of Services Provided and Competitive Information
The Trustees considered the contractual terms of the Management Agreement and the fee rates payable by the Fund thereunder. In this regard, the Trustees considered information on the services rendered by the Investment Adviser to the Fund, which included both advisory and administrative services that were directed to the needs and operations of the Fund as a registered mutual fund.
In particular, the Trustees reviewed analyses prepared by the Outside Data Provider regarding the expense rankings of the Fund. The analyses provided a comparison of the Fund’s management fee to those of a relevant peer group and category universe; an expense analysis which compared the Fund’s overall net and gross expenses to a peer group and a category universe; and data comparing the Fund’s net expenses to the peer and category medians. The analyses also compared the Fund’s other expenses and fee waivers/reimbursements to those of the peer group and category medians. The Trustees concluded that the comparisons provided by the Outside Data Provider were useful in evaluating the reasonableness of the management fees and total expenses paid by the Fund.
In addition, the Trustees considered the Investment Adviser’s undertakings to implement fee waivers and/or expense limitations. They noted that the Investment Adviser and Goldman Sachs had waived fees and/or reimbursed expenses for the Fund for a portion of the year in order to maintain a competitive yield. They also considered, to the extent that the Investment Adviser manages other types of accounts having investment objectives and policies similar to those of the Fund, comparative fee information for services provided by the Investment Adviser to those accounts, and information that indicated that services provided to the Fund differed in various significant respects from the services provided to other types of accounts which, in many cases, operated under less stringent legal and regulatory structures, required fewer services from the Investment Adviser to a smaller number of client contact points, and were less time-intensive.
In addition, the Trustees noted that shareholders are able to redeem their shares at any time if shareholders believe that the Fund fees and expenses are too high or if they are dissatisfied with the performance of the Fund.
Profitability
The Trustees reviewed the Fund’s contribution to the Investment Adviser’s revenues and pre-tax profit margins. In this regard the Trustees noted that they had received, among other things, profitability analyses and summaries, revenue and expense schedules by Fund and by function (i.e., investment management, transfer agency and distribution and service), and information on the Investment Adviser’s expense allocation methodology. They observed that the profitability and expense figures are substantially similar to those used by the Investment Adviser for many internal purposes, including compensation decisions among various business groups, and are thus subject to a vigorous internal debate about how certain revenue and expenses should be allocated. The Trustees also noted that the internal audit group within the Goldman Sachs organization periodically audits the expense allocation methodology and that the internal audit group was satisfied with the reasonableness, consistency, and accuracy of the Investment Adviser’s expense allocation methodology. Profitability data for the Fund was provided for 2021 and 2020, and the Trustees considered this information in relation to the Investment Adviser’s overall profitability.
| 20 |
GOLDMAN SACHS VARIABLE INSURANCE TRUST GOVERNMENT MONEY MARKET FUND
Statement Regarding Basis for Approval of Management Agreement (Unaudited) (continued)
Economies of Scale
The Trustees considered the information that had been provided regarding whether there have been economies of scale with respect to the management of the Fund.
The Trustees noted that the Fund does not have management fee breakpoints. They considered the asset levels in the Fund; the Fund’s recent purchase and redemption activity; the information provided by the Investment Adviser relating to the costs of the services provided by the Investment Adviser and its affiliates and their realized profits; information comparing the contractual fee rates charged by the Investment Adviser with fee rates charged to other money market funds in the peer group; and the Investment Adviser’s undertaking to limit certain expenses of the Fund that exceed a specified level. They considered a report prepared by the Outside Data Provider, which surveyed money market funds’ management fee arrangements and use of breakpoints. The Trustees also considered the competitive nature of the money market fund business and the competitiveness of the fees charged to the Fund by the Investment Adviser.
Other Benefits to the Investment Adviser and Its Affiliates
The Trustees also considered the other benefits derived by the Investment Adviser and its affiliates from their relationships with the Fund as stated above, including: (a) transfer agency fees received by Goldman Sachs & Co. LLC (“Goldman Sachs”); (b) trading efficiencies resulting from aggregation of orders of the Fund with those for other funds or accounts managed by the Investment Adviser; (c) the Investment Adviser’s ability to leverage the infrastructure designed to service the Fund on behalf of its other clients; (d) the Investment Adviser’s ability to cross-market other products and services to Fund shareholders; (e) Goldman Sachs’ retention of certain fees as Fund Distributor; (f) Goldman Sachs’ ability to engage in principal transactions with the Fund under exemptive orders from the U.S. Securities and Exchange Commission permitting such trades; (g) the Investment Adviser’s ability to negotiate better pricing with custodians on behalf of its other clients, as a result of the relationship with the Fund; and (h) the possibility that the working relationship between the Investment Adviser and the Fund’s third-party service providers may cause those service providers to be more likely to do business with other areas of Goldman Sachs. In the course of considering the foregoing, the Independent Trustees requested and received further information quantifying certain of these fall-out benefits.
Other Benefits to the Fund and Its Shareholders
The Trustees also noted that the Fund receives certain other potential benefits as a result of its relationship with the Investment Adviser, including: (a) trading efficiencies resulting from aggregation of orders of the Fund with those of other funds or accounts managed by the Investment Adviser; (b) enhanced servicing from vendors due to the volume of business generated by the Investment Adviser and its affiliates; (c) enhanced servicing from broker-dealers due to the volume of business generated by the Investment Adviser and its affiliates; (d) the advantages received from the Investment Adviser’s knowledge and experience gained from managing other accounts and products; (e) the Investment Adviser’s ability to hire and retain qualified personnel to provide services to the Fund because of the reputation of the Goldman Sachs organization; (f) the Fund’s access, through the Investment Adviser, to certain firm-wide resources (e.g., proprietary risk management systems and databases), subject to certain restrictions; and (g) the Fund’s access to certain affiliated distribution channels. In addition, the Trustees noted the competitive nature of the mutual fund marketplace, and considered that many of the Fund’s shareholders invested in the Fund in part because of the Fund’s relationship with the Investment Adviser and that those shareholders have a general expectation that the relationship will continue.
Conclusion
In connection with their consideration of the Management Agreement, the Trustees gave weight to each of the factors described above, but did not identify any particular factor as controlling their decision. After deliberation and consideration of all of the information provided, including the factors described above, the Trustees concluded, in the exercise of their business judgment, that the management fees paid by the Fund were reasonable in light of the services provided to it by the Investment Adviser, the Investment Adviser’s costs and the Fund’s current and reasonably foreseeable asset levels. The Trustees unanimously concluded that the Investment Adviser’s continued management likely would benefit the Fund and its shareholders and that the Management Agreement should be approved and continued with respect to the Fund until June 30, 2023.
| 21 |
GOLDMAN SACHS VARIABLE INSURANCE TRUST GOVERNMENT MONEY MARKET FUND
Impact of Russian Invasion of Ukraine (Unaudited)
The Russian invasion of Ukraine has negatively affected the global economy and has resulted in significant disruptions in financial markets and increased macroeconomic uncertainty. In addition, governments around the world have responded to Russia’s invasion by imposing economic sanctions and export controls on certain industry sectors, companies and individuals in or associated with Russia. Russia has imposed its own restrictions against investors and countries outside Russia and has proposed additional measures aimed at non-Russian-owned businesses. Businesses in the U.S. and globally have experienced shortages in materials and increased costs for transportation, energy and raw materials due, in part, to the negative effects of the war on the global economy. The escalation or continuation of the war between Russia and Ukraine or other hostilities presents heightened risks relating to cyber-attacks, the frequency and volume of failures to settle securities transactions, supply chain disruptions, inflation, as well as the potential for increased volatility in commodity, currency and other financial markets. The extent and duration of the war, sanctions and resulting market disruptions, as well as the potential adverse consequences for the Fund’s operations are difficult to predict.
| 22 |
GOLDMAN SACHS VARIABLE INSURANCE TRUST GOVERNMENT MONEY MARKET FUND
| Fund Expenses — Six Month Period Ended June 30, 2022 (Unaudited) |
As a shareholder of Institutional Shares and Service Shares of the Fund, you incur ongoing costs, including management fees; distribution and service (12b-1) fees (with respect to Service Shares); and other Fund expenses. This example is intended to help you understand your ongoing costs (in dollars) of investing in the Fund and to compare these costs with the ongoing costs of investing in other mutual funds.
The example is based on an investment of $1,000 invested at the beginning of the period and held for the entire period from January 1, 2022 through June 30, 2022, which represents a period of 181 days of a 365 day year.
Actual Expenses — The first line in the table below provides information about actual account values and actual expenses. You may use the information in this line, together with the amount you invested, to estimate the expenses that you paid over the period. Simply divide your account value by $1,000 (for example, an $8,600 account value divided by $1,000=8.6), then multiply the result by the number in the first line under the heading entitled “Expenses Paid” to estimate the expenses you paid on your account during this period.
Hypothetical Example for Comparison Purposes — The second line in the table below provides information about hypothetical account values and hypothetical expenses based on the Fund’s actual net expense ratio and an assumed rate of return of 5% per year before expenses, which is not the Fund’s actual return. The hypothetical account values and expenses may not be used to estimate the actual ending account balance or expenses you paid for the period. You may use this information to compare the ongoing costs of investing in the Fund and other funds. To do so, compare this 5% hypothetical example with the 5% hypothetical examples that appear in the shareholder reports of the other funds.
Please note that the expenses shown in the table are meant to highlight your ongoing costs only and do not reflect any transactional costs, such as sales charges, redemption fees, or exchange fees. Therefore, the second line of the table is useful in comparing ongoing costs only and will not help you determine the relative total costs of owning different funds. In addition, if these transactional costs were included, your costs would have been higher.
| Share Class | Beginning Account Value 1/1/22 | Ending Account Value 6/30/22 | Expenses Paid 6 Months 6/30/22* | |||||||||
| Institutional Shares | ||||||||||||
| Actual | $ | 1,000.00 | $ | 1,001.71 | $ | 0.79 | ||||||
| Hypothetical 5% return | $ | 1,000.00 | $ | 1,024.00 | + | $ | 0.80 | |||||
| Service Shares | ||||||||||||
| Actual | $ | 1,000.00 | $ | 1,000.96 | $ | 1.59 | ||||||
| Hypothetical 5% return | $ | 1,000.00 | $ | 1,023.21 | + | $ | 1.61 | |||||
| * | Expenses are calculated using the Fund’s annualized net expense ratio for each class, which represents the ongoing expenses as a percentage of net assets for the six months ended June 30, 2022. Expenses are calculated by multiplying the annualized net expense ratio by the average account value for the period; then multiplying the result by the number of days in the most recent fiscal half year (or, since inception, if shorter); and then dividing that result by the number of days in the period. The annualized net expense ratios for the period were 0.16% and 0.32% for Institutional Shares and Service Shares, respectively. |
| + | Hypothetical expenses are based on the Fund’s actual annualized net expense ratio and an assumed rate of return of 5% per year before expenses. |
| 23 |
TRUSTEES Jessica Palmer, Chair Dwight L. Bush Kathryn A. Cassidy John G. Chou Diana M. Daniels Joaquin Delgado Eileen H. Dowling James A. McNamara Gregory G. Weaver Paul C. Wirth | OFFICERS James A. McNamara, President Joseph F. DiMaria, Principal Financial Officer, Principal Accounting Officer and Treasurer Caroline L. Kraus, Secretary |
GOLDMAN SACHS & CO. LLC
Distributor and Transfer Agent
GOLDMAN SACHS ASSET MANAGEMENT, L.P.
Investment Adviser
200 West Street, New York
New York 10282
Visit our web site at www.GSAMFUNDS.com to obtain the most recent month-end returns.
The reports concerning the Fund included in this shareholder report may contain certain forward-looking statements about the factors that may affect the performance of the Fund in the future. These statements are based on Fund management’s predictions and expectations concerning certain future events and their expected impact on the Fund, such as performance of the economy as a whole and of specific industry sectors, changes in the levels of interest rates, the impact of developing world events, and other factors that may influence the future performance of the Fund. Management believes these forward-looking statements to be reasonable, although they are inherently uncertain and difficult to predict. Actual events may cause adjustments in portfolio management strategies from those currently expected to be employed.
A description of the policies and procedures that the Fund uses to determine how to vote proxies relating to portfolio securities and information regarding how the Fund voted proxies relating to portfolio securities during the most recent 12-month period ended June 30 is available (i) without charge, upon request by calling 1-800-621-2550; and (ii) on the Securities and Exchange Commission (“SEC”) Web site at http://www.sec.gov.
Views and opinions expressed are for informational purposes only and do not constitute a recommendation by GSAM to buy, sell, or hold any security. Views and opinions are current as of the date of this presentation and may be subject to change, they should not be construed as investment advice.
Goldman Sachs & Co. LLC (“Goldman Sachs”) does not provide legal, tax or accounting advice. Any statement contained in this communication (including any attachments) concerning U.S. tax matters was not intended or written to be used, and cannot be used, for the purpose of avoiding penalties under the Internal Revenue Code, and was written to support the promotion or marketing of transaction or matter addressed. Clients of Goldman Sachs should obtain their own independent tax advice based on their particular circumstances.
The web site links provided are for your convenience only and are not an endorsement or recommendation by GSAM of any of these web sites or the products or services offered. GSAM is not responsible for the accuracy and validity of the content of these web sites.
Fund holdings and allocations shown are as of June 30, 2022 and may not be representative of future investments. Fund holdings should not be relied on in making investment decisions and should not be construed as research or investment advice regarding particular securities. Current and future holdings are subject to risk.
The portfolio risk management process includes an effort to monitor and manage risk, but does not imply low risk.
Shares of the Goldman Sachs VIT Funds are offered to separate accounts of participating life insurance companies for the purpose of funding variable annuity contracts and variable life insurance policies. Shares of the Fund are not offered directly to the general public. The variable annuity contracts and variable life insurance policies are described in the separate prospectuses issued by participating insurance companies. You should refer to those prospectuses for information about surrender charges, mortality and expense risk fees and other charges that may be assessed by participating insurance companies under the variable annuity contracts or variable life insurance policies. Such fees or charges, if any, may affect the return you may realize with respect to your investments. Ask your representative for more complete information. Please consider the Fund’s objectives, risks and charges and expenses, and read the prospectus carefully before investing. The prospectus contains this and other information about the Fund.
This material is not authorized for distribution to prospective investors unless preceded or accompanied by a current prospectus or summary prospectus, if applicable. Investors should consider the Fund’s objective, risks, and charges and expenses, and read the summary prospectus, if available, and/or the prospectus carefully before investing or sending money. The summary prospectus, if available, and the prospectus contain this and other information about the Fund and may be obtained from your authorized dealer or from Goldman Sachs & Co. LLC by calling 1-800-621-2550.
This report is prepared for the general information of contract owners and is not an offer of shares of the Goldman Sachs Variable Insurance Trust — Goldman Sachs Government Money Market Fund.
© 2022 Goldman Sachs. All rights reserved.
287749-OTU-08/2022 VITMMSAR-22
| ITEM 2. | CODE OF ETHICS. |
| (a) | As of the end of the period covered by this report, the registrant has adopted a code of ethics that applies to the registrant’s principal executive officer, principal financial officer, principal accounting officer or controller, or persons performing similar functions, regardless of whether these individuals are employed by the registrant or a third party (the “Code of Ethics”). |
| (b) | Not applicable. |
| (c) | During the period covered by this report, no amendments were made to the provisions of the Code of Ethics. |
| (d) | During the period covered by this report, the registrant did not grant any waivers, including an implicit waiver, from any provision of the Code of Ethics. |
| (e) | Not applicable. |
| (f) | A copy of the Code of Ethics is available as provided in Item 13(a)(1) of this report. |
| ITEM 3. | AUDIT COMMITTEE FINANCIAL EXPERT. |
The registrant’s board of trustees has determined that the registrant has at least one “audit committee financial expert” (as defined in Item 3 of Form N-CSR) serving on its audit committee. Gregory G. Weaver is the “audit committee financial expert” and is “independent” (as each term is defined in Item 3 of Form N-CSR). |
| ITEM 4. | PRINCIPAL ACCOUNTANT FEES AND SERVICES. |
The information required by this Item is only required in an annual report on this Form N-CSR. |
| ITEM 5. | AUDIT COMMITTEE OF LISTED REGISTRANTS. |
Not applicable.
| ITEM 6. | SCHEDULE OF INVESTMENTS. |
Schedule of Investments is included as part of the Reports to Shareholders filed under Item 1.
| ITEM 7. | DISCLOSURE OF PROXY VOTING POLICIES AND PROCEDURES FOR CLOSED-END MANAGEMENT INVESTMENT COMPANIES. |
Not applicable.
| ITEM 8. | PORTFOLIO MANAGERS OF CLOSED-END MANAGEMENT INVESTMENT COMPANIES. |
Not applicable.
| ITEM 9. | PURCHASES OF EQUITY SECURITIES BY CLOSED-END MANAGEMENT INVESTMENT COMPANY AND AFFILIATED PURCHASERS. |
Not applicable.
| ITEM 10. | SUBMISSION OF MATTERS TO A VOTE OF SECURITY HOLDERS. |
There have been no material changes to the procedures by which shareholders may recommend nominees to the registrant’s board of trustees.
| ITEM 11. | CONTROLS AND PROCEDURES. |
| (a) | The registrant’s principal executive and principal financial officers or persons performing similar functions have concluded that the registrant’s disclosure controls and procedures (as defined in Rule 30a-3(c) under the Investment Company Act of 1940, as amended (the “1940 Act”)) are effective as of a date within 90 days of the filing date of this report that includes the disclosure required by this paragraph, based on the evaluation of these controls and procedures required by Rule 30a-3(b) under the 1940 Act and 15d-15(b) under the Securities Exchange Act of 1934, as amended. |
| (b) | There were no changes in the registrant’s internal control over financial reporting (as defined in Rule 30a-3(d) under the 1940 Act) that occurred during the period covered by this report that have materially affected, or are reasonably likely to materially affect, the registrant’s internal control over financial reporting. |
| ITEM 12. | DISCLOSURE OF SECURITIES LENDING ACTIVITIES FOR CLOSED-END MANAGEMENT INVESTMENT COMPANIES. |
Not applicable.
| ITEM 13. | EXHIBITS. |
| (a)(1) | Goldman Sachs Variable Insurance Trust’s Code of Ethics for Principal Executive and Senior Financial Officers is filed herewith. | |||
| (a)(2) | Exhibit 99.CERT | Certifications pursuant to Section 302 of the Sarbanes-Oxley Act of 2002 filed herewith. | ||
| (a)(3) | Not applicable to open-end investment companies. | |||
| (a)(4) | There was no change in the registrant’s independent public accountant for the period covered by this report. | |||
| (b) | Exhibit 99.906CERT | Certifications pursuant to Section 906 of the Sarbanes-Oxley Act of 2002 filed herewith. | ||
SIGNATURES
Pursuant to the requirements of the Securities Exchange Act of 1934 and the Investment Company Act of 1940, the registrant has duly caused this report to be signed on its behalf by the undersigned, thereunto duly authorized.
Goldman Sachs Variable Insurance Trust
/s/ James A. McNamara | ||
By: James A. McNamara | ||
President/Chief Executive Officer of | ||
Goldman Sachs Variable Insurance Trust | ||
Date: August 24, 2022 | ||
Pursuant to the requirements of the Securities Exchange Act of 1934 and the Investment Company Act of 1940, the report has been signed below by the following persons on behalf of the registrant and in the capacities and on the dates indicated.
/s/ James A. McNamara | ||
By: James A. McNamara | ||
President/Chief Executive Officer of | ||
Goldman Sachs Variable Insurance Trust | ||
Date: August 24, 2022 | ||
/s/ Joseph F. DiMaria | ||
By: Joseph F. DiMaria | ||
Principal Financial Officer of | ||
Goldman Sachs Variable Insurance Trust | ||
Date: August 24, 2022 | ||