UNITED STATES
SECURITIES AND EXCHANGE COMMISSION
Washington, D.C. 20549
FORM N-CSR
CERTIFIED SHAREHOLDER REPORT OF REGISTERED
MANAGEMENT INVESTMENT COMPANIES
Investment Company Act file number 811-08361
Goldman Sachs Variable Insurance Trust
(Exact name of registrant as specified in charter)
71 South Wacker Drive, Chicago, Illinois 60606-6303
(Address of principal executive offices) (Zip code)
Caroline Kraus
Goldman Sachs & Co. LLC
200 West Street
New York, NY 10282
Copies to:
Stephen H. Bier, Esq.
Dechert LLP
1095 Avenue of the Americas
New York, NY 10036
(Name and address of agents for service)
Registrant’s telephone number, including area code: (312) 655-4400
Date of fiscal year end: December 31
Date of reporting period: June 30, 2023
| ITEM 1. | REPORTS TO STOCKHOLDERS. |
| | The Semi-Annual Report to Shareholders is filed herewith. |
Goldman
Sachs Variable Insurance Trust
Goldman Sachs Multi-Strategy Alternatives Portfolio
Goldman Sachs Trend Driven Allocation Fund
Semi-Annual Report
June 30, 2023

Goldman Sachs Variable Insurance Trust
| ∎ | | GOLDMAN SACHS MULTI-STRATEGY ALTERNATIVES PORTFOLIO |
| ∎ | | GOLDMAN SACHS TREND DRIVEN ALLOCATION FUND |
| | | | |
| | | |
| NOT FDIC-INSURED | | May Lose Value | | No Bank Guarantee |
MARKET REVIEW
Goldman Sachs Variable Insurance Trust – Goldman Sachs VIT Multi-Asset Strategies Funds
The following are highlights both of key factors affecting the global capital markets and of any key changes made to the Goldman Sachs VIT Multi Asset Strategies Funds (the “Funds”) during the six months ended June 30, 2023 (the “Reporting Period”). A fuller review of the markets and these changes will appear in the Funds’ annual shareholder report covering the 12 months ended December 31, 2023.
Market and Economic Review
| • | | Overall, the global capital markets generated gains during the Reporting Period. |
| | • | | Global equities, as represented by the MSCI All Country World Index (Net, USD, Unhedged), returned 13.93%. |
| | • | | Global fixed income, as represented by the Bloomberg Global Aggregate Index (Gross, USD, Hedged), returned 2.97%. |
| • | | During the first quarter of 2023, when the Reporting Period started, investors focused on the evolution of the European energy crisis, the speed of China’s economic reopening and the pace of disinflation in the U.S. |
| | • | | U.S. inflation was not moderating as quickly as U.S. Federal Reserve (“Fed”) policymakers had hoped, and they maintained a hawkish stance, raising short-term interest rates twice during the quarter — by 25 basis points each time. (Hawkish tends to suggest higher interest rates; opposite of dovish. A basis point is 1/100th of a percentage point.) |
| | • | | In March 2023, investor sentiment was dominated by worries about the U.S. and European banking sectors. Swift responses from U.S. and European policymakers rather quickly calmed nerves, but the turmoil made the Fed’s decisions on interest rates more complex given its objective of mitigating downside risks to economic growth while combating persistent inflation amid a tight labor market. |
| | • | | Investor concerns about a potential European energy crisis eased, while China’s economy continued to reopen after the Chinese government had finally lifted its stringent zero-COVID policy in January 2023. |
| | • | | For the first quarter overall, global equities generated solidly positive returns, with developed markets equities outperforming emerging markets equities. |
| | • | | There was substantial dispersion of returns across broad equity indices, with growth equities materially outperforming value equities. |
| | • | | Within developed equity markets, non-U.S. equities outpaced U.S. equities. |
| | • | | In the U.S. equity market, information technology equities broadly outperformed financials and energy equities. |
| | • | | As for global fixed income, yields broadly declined during the first quarter, leading to positive bond returns. |
| | • | | Late in the quarter, turmoil in the U.S. and European banking sectors drove a broad flight to quality in government securities. |
| • | | During the second quarter of 2023, as economic growth remained resilient, many market participants reconsidered their previous expectations of a global economic slowdown. |
| | • | | Central banks focused on combating inflation, which decreased but remained elevated. |
| | • | | The Fed raised interest rates by another 25 basis points, while the European Central Bank and Bank of England raised interest rates 50 basis points and 75 basis points, respectively. |
| | • | | In June 2023, according to the Fed’s median dot plot projection, policymakers increased their estimate for the peak federal funds rate to 5.6%, up from 5.1% in March. (The dot plot shows interest rate projections of the members of the Federal Open Market Committee.) |
MARKET REVIEW
| | • | | For the second quarter overall, global equities recorded positive returns, with developed markets equities outperforming emerging markets equities on the back of better than consensus expected first quarter corporate earnings in the developed markets. |
| | • | | European equities, while posting positive returns, underperformed other developed equity markets, such as Japan and the U.S. |
| | • | | In the U.S., equity gains were fueled by rallies in the information technology and consumer discretionary sectors. The advance in the technology sector was driven in part by market expectations of artificial intelligence (“AI”) potential and the growing demand for AI processors. |
| | • | | Regarding global fixed income, performance was broadly negative during the second quarter as bond yields increased. |
| | • | | Duration-sensitive assets sold off as higher interest rates and expectations for further monetary policy tightening weighed on market sentiment. |
| | • | | As banking sector stress eased during the quarter, non-government bond sectors strengthened. |
Fund Changes and Highlights
No material changes were made to the Funds during the Reporting Period.
FUND BASICS
Multi-Strategy Alternatives Portfolio
as of June 30, 2023
PERFORMANCE REVIEW
| | | | | | | | |
| | |
| January 1, 2023 – June 30, 2023 | | Fund Total Return
(based on NAV)1 | | | ICE BAML 3-Mo US
Treasury Bill Index2 | |
| Institutional | | | 3.41 | % | | | 2.27 | % |
| Service | | | 3.41 | | | | 2.27 | |
| Advisor | | | 3.19 | | | | 2.27 | |
| 1 | The net asset value (“NAV”) represents the net assets of the class of the Fund (ex-dividend) divided by the total number of shares of the class outstanding. The Fund’s performance assumes the reinvestment of dividends and other distributions. The Fund’s performance does not reflect the deduction of any applicable sales charges. |
| 2 | The ICE BofA 3-Month U.S. Treasury Bill Index measures the performance of a single issue of outstanding treasury bill which matures closest to, but not beyond, three months from the rebalancing date. The issue is purchased at the beginning of the month and held for a full month; at the end of the month that issue is sold and rolled into a newly selected issue. |
| | The comparison to the ICE BofA 3-Month U.S. Treasury Bill Index is a means of emphasizing that the Fund has an unconstrained strategy. The Fund employs a benchmark agnostic strategy. Benchmark performance may not be comparable to the Fund’s performance. |
The returns set forth in the table above represent past performance. Past performance does not guarantee future results. The Fund’s investment return and principal value will fluctuate so that an investor’s shares, when redeemed, may be worth more or less than their original cost. Current performance may be lower or higher than the performance quoted above. Please visit our web site at www.GSAMFUNDS.com to obtain the most recent month-end returns. Performance reflects applicable fee waivers and/or expense limitations in effect during the periods shown. In their absence, performance would be reduced. Returns do not reflect the deduction of taxes that a shareholder would pay on Fund distributions or the redemption of Fund shares.
FUND BASICS
OVERALL UNDERLYING FUND AND ETF WEIGHTINGS4
Percentage of Net Assets
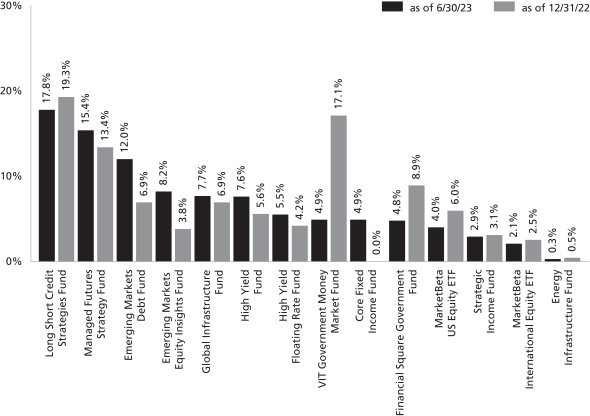
| 4 | The Fund is actively managed and, as such, its composition may differ over time. The percentage shown for each Underlying Fund and exchange traded fund (“ETF”) reflects the value of that Underlying Fund or ETF as a percentage of net assets of the Fund. Figures in the graph above may not sum to 100% due to rounding and/or exclusion of other assets and liabilities. Underlying sector allocations of exchange traded funds and investment companies held by the Fund are not reflected in the graph above. The graph depicts the Fund’s investments but may not represent the Fund’s market exposure due to the exclusion of certain derivatives, if any, as listed in the Additional Investment Information section of the Schedule of Investments. |
For more information about your Fund, please refer to www.GSAMFUNDS.com. There, you can learn more about your Fund’s investment strategies, holdings, and performance.
FUND BASICS
Trend Driven Allocation Fund
as of June 30, 2023
PERFORMANCE REVIEW
| | | | | | | | | | | | | | |
| | | | |
| January 1, 2023 – June 30, 2023 | | Fund Total Return
(based on NAV)1 | | | 60% MSCI World / 40%
Bloomberg U.S.
Treasury Index2 | | | MSCI World Index
(Net, USD, Hedged)3 | | | Bloomberg U.S. Treasury
Index (Total Return,
USD, Unhedged)4 |
| Institutional | | | 11.13 | % | | | 9.89 | % | | | 15.66 | % | | 1.59% |
| Service | | | 10.91 | | | | 9.89 | | | | 15.66 | | | 1.59 |
| 1 | The net asset value (“NAV”) represents the net assets of the class of the Fund (ex-dividend) divided by the total number of shares of the class outstanding. The Fund’s performance assumes the reinvestment of dividends and other distributions. The Fund’s performance does not reflect the deduction of any applicable sales charges. |
| 2 | The Fund’s blended benchmark index is comprised of 60% the MSCI World Index and 40% the Bloomberg U.S. Treasury Index. It is not possible to invest directly in an unmanaged index. |
| 3 | MSCI World Index is a broad global equity index that represents large and mid-cap equity performance across 23 developed markets countries. It covers approximately 85% of the free float-adjusted market capitalization in each country. It is not possible to invest directly in an unmanaged index. |
| 4 | Bloomberg U.S. Treasury Index measures U.S. dollar-denominated, fixed-rate, nominal debt issued by the U.S. Treasury. Treasury bills are excluded by the maturity constraint. It is not possible to invest directly in an unmanaged index. |
The returns set forth in the table above represent past performance. Past performance does not guarantee future results. The Fund’s investment return and principal value will fluctuate so that an investor’s shares, when redeemed, may be worth more or less than their original cost. Current performance may be lower or higher than the performance quoted above. Please visit our web site at www.GSAMFUNDS.com to obtain the most recent month-end returns. Performance reflects applicable fee waivers and/or expense limitations in effect during the periods shown. In their absence, performance would be reduced. Returns do not reflect the deduction of taxes that a shareholder would pay on Fund distributions or the redemption of Fund shares.
FUND BASICS
FUND COMPOSITION5
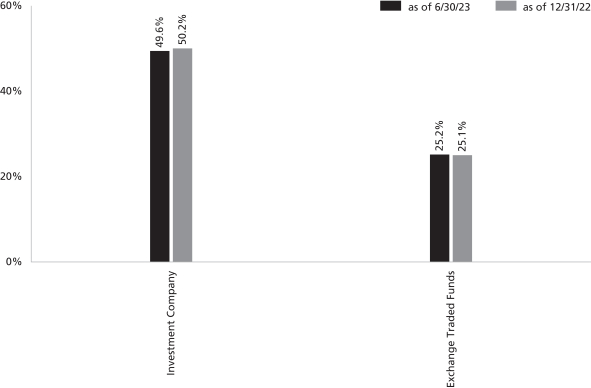
| 5 | The percentage shown for each investment category reflects the value of investments in that category as a percentage of net assets. Figures in the above graph may not sum to 100% due to the exclusion of other assets and liabilities. The underlying composition of exchange traded funds and investment companies held by the Fund are not reflected in the graph above. Consequently, the Fund’s overall composition may differ from the percentages contained in the graph above. The graph depicts the Fund’s investments but may not represent the Fund’s market exposure due to the exclusion of certain derivatives, if any, as listed in the Additional Investment Information section of the Schedule of Investments. |
For more information about your Fund, please refer to www.GSAMFUNDS.com. There, you can learn more about your Fund’s investment strategies, holdings, and performance.
GOLDMAN SACHS VARIABLE INSURANCE TRUST MULTI-STRATEGY ALTERNATIVES PORTFOLIO
Schedule of Investments
June 30, 2023 (Unaudited)
| | | | | | | | |
| Shares | | |
Description | | Value | |
|
| Underlying Funds (Class R6 Shares)(a) – 82.3% | |
| Equity – 16.2% | |
| | 380,143 | | | Goldman Sachs Emerging Markets Equity Insights Fund | | $ | 3,025,942 | |
| | 232,763 | | | Goldman Sachs Global Infrastructure Fund | | | 2,839,705 | |
| | 10,267 | | | Goldman Sachs Energy Infrastructure Fund | | | 111,298 | |
| | | | | | | | |
| | | | | | | 5,976,945 | |
| | |
| Fixed Income – 66.1% | |
| | 849,075 | | | Goldman Sachs Long Short Credit Strategies Fund | | | 6,537,878 | |
| | 557,648 | | | Goldman Sachs Managed Futures Strategy Fund | | | 5,676,854 | |
| | 487,910 | | | Goldman Sachs Emerging Markets Debt Fund | | | 4,415,581 | |
| | 519,115 | | | Goldman Sachs High Yield Fund | | | 2,813,605 | |
| | 231,931 | | | Goldman Sachs High Yield Floating Rate Fund | | | 2,034,033 | |
| | 194,610 | | | Goldman Sachs Core Fixed Income Fund | | | 1,786,518 | |
| | 121,685 | | | Goldman Sachs Strategic Income Fund | | | 1,082,998 | |
| | | | | | | | |
| | | | | | | 24,347,467 | |
| | |
| | TOTAL UNDERLYING FUNDS (CLASS R6 SHARES) | |
| | (Cost $30,521,642) | | $ | 30,324,412 | |
| | |
| | | | | | | | |
|
| Exchange Traded Funds(a) – 6.1% | |
| | 15,147 | | | Goldman Sachs MarketBeta International Equity ETF | | $ | 780,676 | |
| | 24,031 | | | Goldman Sachs MarketBeta US Equity ETF | | | 1,458,442 | |
| | |
| | TOTAL EXCHANGE TRADED FUNDS | |
| | (Cost $1,937,155) | | $ | 2,239,118 | |
| | |
| Shares | | Dividend
Rate | | | Value | |
|
| Investment Companies (Institutional Shares)(a) – 9.7% | |
Goldman Sachs Financial Square Government Fund | |
| 1,766,059 | | | 5.022 | % | | $ | 1,766,059 | |
Goldman Sachs VIT Government Money Market Fund | |
| 1,794,388 | | | 5.021 | | | | 1,794,388 | |
| |
| Total Investment Companies | |
| (Cost $3,560,447) | | | $ | 3,560,447 | |
| |
| TOTAL INVESTMENTS – 98.1% | |
| (Cost $36,019,244) | | | $ | 36,123,977 | |
| |
OTHER ASSETS IN EXCESS OF LIABILITIES – 1.9% | | | | 700,905 | |
| |
| NET ASSETS – 100.0% | | | $ | 36,824,882 | |
| |
| | |
| The percentage shown for each investment category reflects the value of investments in that category as a percentage of net assets. |
| |
| (a) | | Represents an affiliated issuer. |
ADDITIONAL INVESTMENT INFORMATION
FUTURES CONTRACTS — At June 30, 2023, the Fund had the following futures contracts:
| | | | | | | | | | | | | | | | |
| Description | | Number of
Contracts | | | Expiration
Date | | | Notional
Amount | | | Unrealized
Appreciation/
(Depreciation) | |
| | | | |
Long position contracts: | | | | | | | | | | | | | | | | |
| U.S. Treasury 10 Year Note | | | 9 | | | | 09/20/23 | | | $ | 1,010,813 | | | $ | (17,261 | ) |
U.S. Treasury 2 Year Note | | | 7 | | | | 09/29/23 | | | | 1,423,734 | | | | (18,129 | ) |
| | | | |
| Total Futures Contracts | | | | | | | | | | | | | | $ | (35,390 | ) |
| | |
| The accompanying notes are an integral part of these financial statements. | | 7 |
GOLDMAN SACHS VARIABLE INSURANCE TRUST MULTI-STRATEGY ALTERNATIVES PORTFOLIO
Schedule of Investments (continued)
June 30, 2023 (Unaudited)
ADDITIONAL INVESTMENT INFORMATION (continued)
PURCHASED OPTIONS CONTRACTS — At June 30, 2023, the Fund had the following purchased option contracts:
| | | | | | | | | | | | | | | | | | | | | | | | | | | | |
| Description | | Exercise
Price | | | Expiration
Date | | | Number of
Contracts | | | Notional
Amount | | | Value | | | Premiums
Paid
(Received)
by the
Fund | | | Unrealized
Appreciation/
(Depreciation) | |
|
Purchased options contracts: | |
| | | | | | | |
Calls | | | | | | | | | | | | | | | | | | | | | | | | | | | | |
3 Month Secured Overnight Financing Rate | | | 97.25 USD | | | | 09/15/2023 | | | | 11 | | | $ | 2,601,500 | | | $ | 344 | | | $ | 15,164 | | | $ | (14,821 | ) |
3 Month Secured Overnight Financing Rate | | | 97.50 USD | | | | 12/15/2023 | | | | 29 | | | | 4,683,500 | | | | 1,994 | | | | 35,748 | | | | (33,754 | ) |
3 Month Secured Overnight Financing Rate | | | 95.00 USD | | | | 03/15/2024 | | | | 8 | | | | 1,897,700 | | | | 8,300 | | | | 23,424 | | | | (15,124 | ) |
3 Month Secured Overnight Financing Rate | | | 97.75 USD | | | | 03/15/2024 | | | | 46 | | | | 10,911,775 | | | | 6,037 | | | | 54,441 | | | | (48,403 | ) |
3 Month Secured Overnight Financing Rate | | | 98.50 USD | | | | 06/14/2024 | | | | 15 | | | | 3,571,500 | | | | 2,250 | | | | 2,285 | | | | (35 | ) |
3 Month Secured Overnight Financing Rate | | | 97.25 USD | | | | 06/14/2024 | | | | 8 | | | | 1,904,800 | | | | 3,150 | | | | 7,667 | | | | (4,517 | ) |
3 Month Secured Overnight Financing Rate | | | 97.75 USD | | | | 06/14/2024 | | | | 40 | | | | 9,524,000 | | | | 11,000 | | | | 53,460 | | | | (42,460 | ) |
3 Month Secured Overnight Financing Rate | | | 97.25 USD | | | | 12/13/2024 | | | | 21 | | | | 5,038,687 | | | | 16,800 | | | | 33,519 | | | | (16,718 | ) |
3 Month Secured Overnight Financing Rate | | | 96.25 USD | | | | 12/13/2024 | | | | 1 | | | | 239,938 | | | | 1,519 | | | | 1,574 | | | | (56 | ) |
3 Month Secured Overnight Financing Rate | | | 97.00 USD | | | | 03/14/2025 | | | | 18 | | | | 4,329,450 | | | | 20,587 | | | | 23,892 | | | | (3,304 | ) |
3 Month Secured Overnight Financing Rate | | | 97.25 USD | | | | 03/14/2025 | | | | 18 | | | | 4,329,450 | | | | 17,550 | | | | 32,665 | | | | (15,115 | ) |
3 Month Secured Overnight Financing Rate | | | 96.50 USD | | | | 03/14/2025 | | | | 1 | | | | 240,525 | | | | 1,575 | | | | 1,693 | | | | (118 | ) |
3 Month Secured Overnight Financing Rate | | | 97.25 USD | | | | 06/13/2025 | | | | 24 | | | | 5,781,600 | | | | 26,700 | | | | 29,712 | | | | (3,012 | ) |
3 Month Secured Overnight Financing Rate | | | 97.50 USD | | | | 09/12/2025 | | | | 28 | | | | 6,752,200 | | | | 28,350 | | | | 31,565 | | | | (3,215 | ) |
3 Month Secured Overnight Financing Rate | | | 97.50 USD | | | | 12/12/2025 | | | | 26 | | | | 6,274,775 | | | | 28,275 | | | | 31,260 | | | | (2,985 | ) |
3 Month Secured Overnight Financing Rate | | | 96.63 USD | | | | 06/13/2025 | | | | 1 | | | | 240,900 | | | | 1,669 | | | | 1,723 | | | | (54 | ) |
3 Month Secured Overnight Financing Rate | | | 96.63 USD | | | | 09/12/2025 | | | | 1 | | | | 241,150 | | | | 1,806 | | | | 1,860 | | | | (54 | ) |
3 Month Secured Overnight Financing Rate | | | 95.38 USD | | | | 03/15/2024 | | | | 5 | | | | 1,186,063 | | | | 3,969 | | | | 15,921 | | | | (11,952 | ) |
3 Month Secured Overnight Financing Rate | | | 95.38 USD | | | | 06/14/2024 | | | | 5 | | | | 1,190,500 | | | | 6,844 | | | | 18,376 | | | | (11,532 | ) |
3 Month Secured Overnight Financing Rate | | | 95.38 USD | | | | 09/13/2024 | | | | 5 | | | | 1,195,375 | | | | 9,844 | | | | 20,390 | | | | (10,547 | ) |
3 Month Secured Overnight Financing Rate | | | 95.13 USD | | | | 06/14/2024 | | | | 4 | | | | 952,400 | | | | 6,425 | | | | 14,119 | | | | (7,694 | ) |
| | |
| 8 | | The accompanying notes are an integral part of these financial statements. |
GOLDMAN SACHS VARIABLE INSURANCE TRUST MULTI-STRATEGY ALTERNATIVES PORTFOLIO
ADDITIONAL INVESTMENT INFORMATION (continued)
PURCHASED OPTIONS CONTRACTS (continued)
| | | | | | | | | | | | | | | | | | | | | | | | | | | | |
| Description | | Exercise
Price | | | Expiration
Date | | | Number of
Contracts | | | Notional
Amount | | | Value | | | Premiums
Paid
(Received)
by the
Fund | | | Unrealized
Appreciation/
(Depreciation) | |
3 Month Secured Overnight Financing Rate | | | 97.25 USD | | | | 09/13/2024 | | | | 12 | | | $ | 2,868,900 | | | $ | 7,275 | | | $ | 15,979 | | | $ | (8,704 | ) |
3 Month Secured Overnight Financing Rate | | | 95.25 USD | | | | 09/13/2024 | | | | 4 | | | | 956,300 | | | | 8,500 | | | | 15,996 | | | | (7,496 | ) |
| | | | | | | |
3 Month Secured Overnight Financing Rate | | | 96.00 USD | | | | 09/13/2024 | | | | 1 | | | | 239,075 | | | | 1,356 | | | | 1,421 | | | | (65 | ) |
| | | | | | | |
| TOTAL | | | | | | | | | | | | | | $ | 77,152,063 | | | $ | 222,119 | | | $ | 483,854 | | | $ | (261,735 | ) |
| | |
| The accompanying notes are an integral part of these financial statements. | | 9 |
GOLDMAN SACHS VARIABLE INSURANCE TRUST TREND DRIVEN ALLOCATION FUND
Schedule of Investments
June 30, 2023 (Unaudited)
| | | | | | | | |
| Shares | | |
Description | | Value | |
|
| Exchange Traded Funds – 25.2% | |
| | 83,765 | | | iShares Core S&P 500 ETF | | $ | 37,334,898 | |
| | 84,300 | | | Vanguard S&P 500 ETF | | | 34,333,704 | |
| | |
| | TOTAL EXCHANGE TRADED FUNDS | |
| | (Cost $46,207,643) | | $ | 71,668,602 | |
| | |
| | | | | | | | |
| | | | | | | | |
| Shares | | Dividend
Rate | | | Value | |
|
| Investment Companies (Institutional Shares)(a) – 49.6% | |
Goldman Sachs Financial Square Government Fund | |
| 56,629,654 | | | 5.022 | % | | $ | 56,629,654 | |
Goldman Sachs Financial Square Treasury Instruments Fund | |
| 28,025,039 | | | 4.997 | | | | 28,025,039 | |
Goldman Sachs Financial Square Treasury Obligations Fund | |
| 28,025,854 | | | 5.000 | | | | 28,025,854 | |
Goldman Sachs Financial Square Treasury Solutions Fund | |
| 28,025,039 | | | 4.993 | | | | 28,025,039 | |
| |
| Total Investment Companies | |
| (Cost $140,705,586) | | | $ | 140,705,586 | |
| |
| TOTAL INVESTMENTS – 74.8% | |
| (Cost $186,913,229) | | | $ | 212,374,188 | |
| |
OTHER ASSETS IN EXCESS OF LIABILITIES – 25.2% | | | | 71,554,809 | |
| |
| NET ASSETS – 100.0% | | | $ | 283,928,997 | |
| |
| | |
| The percentage shown for each investment category reflects the value of investments in that category as a percentage of net assets. |
| |
| (a) | | Represents an affiliated issuer. |
ADDITIONAL INVESTMENT INFORMATION
FUTURES CONTRACTS — At June 30, 2023, the Fund had the following futures contracts:
| | | | | | | | | | | | | | | | |
| Description | | Number of
Contracts | | | Expiration
Date | | | Notional
Amount | | | Unrealized
Appreciation/
(Depreciation) | |
| | | | |
Long position contracts: | | | | | | | | | | | | | | | | |
| EURO STOXX 50 Index | | | 418 | | | | 09/15/23 | | | $ | 20,192,510 | | | $ | 108,855 | |
| FTSE 100 Index | | | 89 | | | | 09/15/23 | | | | 8,524,164 | | | | (94,161 | ) |
| S&P 500 E-Mini Index | | | 378 | | | | 09/15/23 | | | | 84,827,925 | | | | 1,899,479 | |
| TOPIX Index | | | 80 | | | | 09/07/23 | | | | 12,685,124 | | | | 348,758 | |
U.S. Treasury 10 Year Note | | | 767 | | | | 09/20/23 | | | | 86,143,688 | | | | (1,398,505 | ) |
| | | | |
| Total Futures Contracts | | | | | | | | | | | | | | $ | 864,426 | |
| | |
| 10 | | The accompanying notes are an integral part of these financial statements. |
GOLDMAN SACHS VARIABLE INSURANCE TRUST MULTI-ASSET STRATEGIES FUNDS
Statements of Assets and Liabilities
June 30, 2023 (Unaudited)
| | | | | | | | |
| | | Multi-Strategy
Alternatives Portfolio | | | Trend Driven
Allocation Fund | |
| | | | | | | | |
| Assets: | | | | | | |
Investments in unaffiliated issuers, at value (cost $0 and $46,207,643, respectively) | | $ | — | | | $ | 71,668,602 | |
Investments in affiliated issuers, at value (cost $36,019,244 and $140,705,586, respectively) | | | 36,123,977 | | | | 140,705,586 | |
Purchased Options, at value (premiums paid $483,854 and $—, respectively) | | | 222,119 | | | | — | |
Cash | | | 555,484 | | | | 60,828,900 | |
Foreign currency, at value (cost $— and $205,882, respectively) | | | — | | | | 216,246 | |
Receivables: | | | | | | | | |
Reimbursement from investment adviser | | | 13,235 | | | | 21,437 | |
Fund shares sold | | | 4,641 | | | | 214,502 | |
Due from broker | | | 3,548 | | | | 9,011,007 | |
Dividends | | | — | | | | 473,933 | |
Variation margin on futures contracts | | | 841 | | | | 1,378,893 | |
Other assets | | | 577 | | | | 653 | |
| | |
| Total assets | | | 36,924,422 | | | | 284,519,759 | |
| | | | | | | | |
| | | | | | | | |
| Liabilities: | | | | | | |
Payables: | | | | | | | | |
Distribution and Service fees and Transfer Agency fees | | | 29,614 | | | | 69,393 | |
Fund shares redeemed | | | 12,560 | | | | 283,010 | |
Management fees | | | — | | | | 147,388 | |
Accrued expenses | | | 57,366 | | | | 90,971 | |
| | |
| Total liabilities | | | 99,540 | | | | 590,762 | |
| | | | | | | | |
| | | | | | | | |
| Net Assets: | | | | | | |
Paid-in capital | | | 39,892,784 | | | | 287,642,693 | |
Total distributable earnings (loss) | | | (3,067,902 | ) | | | (3,713,696 | ) |
| | |
| NET ASSETS | | $ | 36,824,882 | | | $ | 283,928,997 | |
Net Assets: | | | | | | | | |
Advisor | | $ | 23,579,307 | | | $ | — | |
Institutional | | | 1,943,872 | | | | 432,034 | |
Service | | | 11,301,703 | | | | 283,496,963 | |
| | |
Total Net Assets | | $ | 36,824,882 | | | $ | 283,928,997 | |
Shares outstanding $0.001 par value (unlimited number of shares authorized): | | | | | | | | |
Advisor | | | 2,605,667 | | | | — | |
Institutional | | | 213,362 | | | | 38,653 | |
Service | | | 1,241,061 | | | | 25,580,525 | |
Net asset value, offering and redemption price per share: | | | | | | | | |
Advisor | | | $9.05 | | | | $— | |
Institutional | | | 9.11 | | | | 11.18 | |
Service | | | 9.11 | | | | 11.08 | |
| | |
| The accompanying notes are an integral part of these financial statements. | | 11 |
GOLDMAN SACHS VARIABLE INSURANCE TRUST MULTI-ASSET STRATEGIES FUNDS
Statements of Operations
For the Six Months Ended June 30, 2023 (Unaudited)
| | | | | | | | |
| | | Multi-Strategy
Alternatives Portfolio | | | Trend Driven
Allocation Fund | |
| | | | | | | | |
| Investment income: | | | | | | |
Dividends — affiliated Underlying Funds | | $ | 667,409 | | | $ | 3,186,919 | |
Dividends — unaffiliated issuers | | | 603 | | | | 671,158 | |
Securities lending income — affiliated issuer | | | 5,794 | | | | — | |
| | |
| Total investment income | | | 673,806 | | | | 3,858,077 | |
| | | | | | | | |
| | | | | | | | |
| Expenses: | | | | | | |
Distribution and/or Service (12b-1) fees(a) | | | 59,588 | | | | 342,595 | |
Custody, accounting and administrative services | | | 34,494 | | | | 26,325 | |
Professional fees | | | 27,961 | | | | 44,408 | |
Management fees | | | 26,832 | | | | 1,084,446 | |
Printing and mailing costs | | | 15,711 | | | | 17,442 | |
Trustee fees | | | 13,354 | | | | 19,517 | |
Transfer Agency fees(a) | | | 3,578 | | | | 27,454 | |
Other | | | 10,290 | | | | 22,869 | |
| | |
| Total expenses | | | 191,808 | | | | 1,585,056 | |
| | |
Less — expense reductions | | | (94,213 | ) | | | (333,756 | ) |
| | |
| Net expenses | | | 97,595 | | | | 1,251,300 | |
| | |
| NET INVESTMENT INCOME | | | 576,211 | | | | 2,606,777 | |
| | | | | | | | |
| | | | | | | | |
| Realized and unrealized gain (loss): | | | | | | |
Net realized gain (loss) from: | | | | | | | | |
Investments — unaffiliated issuers | | | 10,585 | | | | 1,317,730 | |
Investments — affiliated Underlying Funds | | | (109,979 | ) | | | — | |
Futures contracts | | | 22,113 | | | | 9,756,077 | |
Purchased options | | | (82,432 | ) | | | — | |
Foreign currency transactions | | | 20 | | | | 102,477 | |
Net change in unrealized gain (loss) on: | | | | | | | | |
Investments — unaffiliated issuers | | | — | | | | 9,125,368 | |
Investments — affiliated Underlying Funds | | | 874,007 | | | | — | |
Futures contracts | | | (29,169 | ) | | | 6,107,626 | |
Purchased Options | | | (37,286 | ) | | | — | |
Forward foreign currency exchange contracts | | | 150 | | | | — | |
Foreign currency translations | | | (1,590 | ) | | | (276,542 | ) |
| | |
| Net realized and unrealized gain | | | 646,419 | | | | 26,132,736 | |
| | |
| NET INCREASE IN NET ASSETS RESULTING FROM OPERATIONS | | $ | 1,222,630 | | | $ | 28,739,513 | |
(a) Class specific Distribution and/or Service and Transfer Agency fees were as follows:
| | | | | | | | | | | | | | | | | | | | |
| | | Distribution and/or
Service (12b-1) Fees | | | Transfer Agency Fees | |
Fund | | Advisor | | | Service | | | Advisor | | | Institutional | | | Service | |
Multi-Strategy Alternatives Portfolio | | $ | 45,972 | | | $ | 13,616 | | | $ | 2,299 | | | $ | 190 | | | $ | 1,089 | |
Trend Driven Allocation Fund | | | — | | | | 342,595 | | | | — | | | | 47 | | | | 27,407 | |
| | |
| 12 | | The accompanying notes are an integral part of these financial statements. |
GOLDMAN SACHS VARIABLE INSURANCE TRUST MULTI-ASSET STRATEGIES FUNDS
Statements of Changes in Net Assets
| | | | | | | | | | | | | | | | |
| | | Multi-Strategy Alternatives Portfolio | | | Trend Driven Allocation Fund | |
| | | For the
Six Months Ended
June 30, 2023
(Unaudited) | | | For the Fiscal
Year Ended
December 31, 2022 | | | For the
Six Months Ended
June 30, 2023
(Unaudited) | | | For the Fiscal
Year Ended
December 31, 2022 | |
| | | | | | | | | | | | | | | | |
| From operations: | | | | | | | | | | | | |
Net investment income | | $ | 576,211 | | | $ | 1,559,129 | | | $ | 2,606,777 | | | $ | 404,319 | |
Net realized gain (loss) | | | (159,693 | ) | | | (3,743,647 | ) | | | 11,176,284 | | | | (33,971,393 | ) |
Net change in unrealized gain (loss) | | | 806,112 | | | | (1,315,124 | ) | | | 14,956,452 | | | | (32,715,194 | ) |
| | | | |
| Net increase (decrease) in net assets resulting from operations | | | 1,222,630 | | | | (3,499,642 | ) | | | 28,739,513 | | | | (66,282,268 | ) |
| | | | | | | | | | | | | | | | |
| | | | | | | | | | | | | | | | |
| Distributions to shareholders: | | | | | | | | | | | | |
From distributable earnings: | | | | | | | | | | | | | | | | |
Advisor Shares | | | — | | | | (806,855 | ) | | | — | | | | — | |
Institutional Shares | | | — | | | | (84,430 | ) | | | — | | | | (20,604 | ) |
Service Shares | | | — | | | | (388,859 | ) | | | — | | | | (10,871,371 | ) |
| | | | |
| Total distributions to shareholders | | | — | | | | (1,280,144 | ) | | | — | | | | (10,891,975 | ) |
| | | | | | | | | | | | | | | | |
| | | | | | | | | | | | | | | | |
| From share transactions: | | | | | | | | | | | | |
Proceeds from sales of shares | | | 4,498,041 | | | | 76,038,713 | | | | 7,456,106 | | | | 25,924,207 | |
Reinvestment of distributions | | | — | | | | 1,280,144 | | | | — | | | | 10,891,975 | |
Cost of shares redeemed | | | (5,654,979 | ) | | | (65,417,529 | ) | | | (19,706,097 | ) | | | (49,855,165 | ) |
| | | | |
| Net increase (decrease) in net assets resulting from share transactions | | | (1,156,938 | ) | | | 11,901,328 | | | | (12,249,991 | ) | | | (13,038,983 | ) |
| | | | |
| TOTAL INCREASE (DECREASE) | | | 65,692 | | | | 7,121,542 | | | | 16,489,522 | | | | (90,213,226 | ) |
| | | | | | | | | | | | | | | | |
| | | | | | | | | | | | | | | | |
| Net Assets: | | | | | | | | | | | | |
| | | | |
Beginning of period | | | 36,759,190 | | | | 29,637,648 | | | | 267,439,475 | | | | 357,652,701 | |
| | | | |
End of period | | $ | 36,824,882 | | | $ | 36,759,190 | | | $ | 283,928,997 | | | $ | 267,439,475 | |
| | |
| The accompanying notes are an integral part of these financial statements. | | 13 |
GOLDMAN SACHS VARIABLE INSURANCE TRUST MULTI-STRATEGY ALTERNATIVES PORTFOLIO
Financial Highlights
Selected Data for a Share Outstanding Throughout Each Period
| | | | | | | | | | | | | | | | | | | | | | | | |
| | | Goldman Sachs Multi-Strategy Alternatives Portfolio | |
| | | Institutional Shares | |
| | | Six Months Ended
June 30, 2023
(Unaudited) | | | Year Ended December 31, | |
| | | 2022 | | | 2021 | | | 2020 | | | 2019 | | | 2018 | |
| | | | | | | | | | | | | | | | | | | | | | | | |
| Per Share Data: | | | | | | | | | | | | | | | | | | |
| | | | | | |
Net asset value, beginning of period | | $ | 8.81 | | | $ | 9.77 | | | $ | 9.46 | | | $ | 9.02 | | | $ | 8.51 | | | $ | 9.39 | |
| | | | | | |
Net investment income(a)(b) | | | 0.16 | | | | 0.38 | | | | 0.23 | | | | 0.25 | | | | 0.30 | | | | 0.24 | |
| | | | | | |
Net realized and unrealized gain (loss) | | | 0.14 | | | | (0.99 | ) | | | 0.25 | | | | 0.39 | | | | 0.48 | | | | (0.87 | ) |
| | | | | | |
Total from investment operations | | | 0.30 | | | | (0.61 | ) | | | 0.48 | | | | 0.64 | | | | 0.78 | | | | (0.63 | ) |
| | | | | | |
Distributions to shareholders from net investment income | | | — | | | | (0.35 | ) | | | (0.17 | ) | | | (0.20 | ) | | | (0.27 | ) | | | (0.25 | ) |
| | | | | | |
Net asset value, end of period | | $ | 9.11 | | | $ | 8.81 | | | $ | 9.77 | | | $ | 9.46 | | | $ | 9.02 | | | $ | 8.51 | |
| | | | | | |
Total Return(c) | | | 3.41 | % | | | (6.24 | )% | | | 5.03 | % | | | 7.05 | % | | | 9.11 | % | | | (6.74 | )% |
| | | | | | |
Net assets, end of period (in 000’s) | | $ | 1,944 | | | $ | 2,203 | | | $ | 2,515 | | | $ | 1,520 | | | $ | 1,309 | | | $ | 745 | |
| | | | | | |
Ratio of net expenses to average net assets(d) | | | 0.21 | %(e) | | | 0.20 | % | | | 0.22 | % | | | 0.21 | % | | | 0.25 | % | | | 0.22 | % |
| | | | | | |
Ratio of total expenses to average net assets(d) | | | 0.74 | %(e) | | | 0.69 | % | | | 1.02 | % | | | 1.39 | % | | | 1.60 | % | | | 1.57 | % |
| | | | | | |
Ratio of net investment income to average net assets | | | 3.55 | %(e) | | | 4.08 | % | | | 2.29 | % | | | 2.73 | % | | | 3.30 | % | | | 2.62 | % |
| | | | | | |
Portfolio turnover rate(f) | | | 14 | % | | | 199 | % | | | 25 | % | | | 5 | % | | | 26 | % | | | 61 | % |
| (a) | Calculated based on the average shares outstanding methodology. |
| (b) | Recognition of net investment income by the Fund is affected by the timing of declaration of dividends by the Underlying Funds in which the Fund invests. |
| (c) | Assumes investment at the NAV at the beginning of the period, reinvestment of all dividends and distributions, a complete redemption of the investment at the NAV at the end of the period and no sales or redemption charges (if any). Total returns would be reduced if a sales or redemption charge was taken into account. Returns do not reflect the impact of taxes to shareholders relating to Fund distributions or the redemption of Fund shares. Total returns for periods less than one full year are not annualized. |
| (d) | Expense ratios exclude the expenses of the Underlying Funds in which the Fund invests. |
| (f) | The Fund’s portfolio turnover rate is calculated in accordance with regulatory requirements, without regard to transactions involving short term investments and certain derivatives. If such transactions were included, the Fund’s portfolio turnover rate may be higher. |
| | |
| 14 | | The accompanying notes are an integral part of these financial statements. |
GOLDMAN SACHS VARIABLE INSURANCE TRUST MULTI-STRATEGY ALTERNATIVES PORTFOLIO
Financial Highlights (continued)
Selected Data for a Share Outstanding Throughout Each Period
| | | | | | | | | | | | | | | | | | | | | | | | |
| | | Goldman Sachs Multi-Strategy Alternatives Portfolio | |
| | | Service Shares | |
| | | Six Months Ended
June 30, 2023
(Unaudited) | | | Year Ended December 31, | |
| | | 2022 | | | 2021 | | | 2020 | | | 2019 | | | 2018 | |
| | | | | | | | | | | | | | | | | | | | | | | | |
| Per Share Data: | | | | | | | | | | | | | | | | | | |
| | | | | | |
Net asset value, beginning of period | | $ | 8.81 | | | $ | 9.76 | | | $ | 9.45 | | | $ | 9.02 | | | $ | 8.52 | | | $ | 9.41 | |
| | | | | | |
Net investment income(a)(b) | | | 0.15 | | | | 0.31 | | | | 0.20 | | | | 0.23 | | | | 0.32 | | | | 0.28 | |
| | | | | | |
Net realized and unrealized gain (loss) | | | 0.15 | | | | (0.95 | ) | | | 0.26 | | | | 0.38 | | | | 0.43 | | | | (0.93 | ) |
| | | | | | |
Total from investment operations | | | 0.30 | | | | (0.64 | ) | | | 0.46 | | | | 0.61 | | | | 0.75 | | | | (0.65 | ) |
| | | | | | |
Distributions to shareholders from net investment income | | | — | | | | (0.31 | ) | | | (0.15 | ) | | | (0.18 | ) | | | (0.25 | ) | | | (0.24 | ) |
| | | | | | |
Net asset value, end of period | | $ | 9.11 | | | $ | 8.81 | | | $ | 9.76 | | | $ | 9.45 | | | $ | 9.02 | | | $ | 8.52 | |
| | | | | | |
Total Return(c) | | | 3.41 | % | | | (6.54 | )% | | | 4.84 | % | | | 6.70 | % | | | 8.82 | % | | | (6.93 | )% |
| | | | | | |
Net assets, end of period (in 000’s) | | $ | 11,302 | | | $ | 11,356 | | | $ | 6,538 | | | $ | 3,472 | | | $ | 2,857 | | | $ | 811 | |
| | | | | | |
Ratio of net expenses to average net assets(d) | | | 0.46 | %(e) | | | 0.45 | % | | | 0.47 | % | | | 0.46 | % | | | 0.51 | % | | | 0.47 | % |
| | | | | | |
Ratio of total expenses to average net assets(d) | | | 0.99 | %(e) | | | 0.88 | % | | | 1.28 | % | | | 1.65 | % | | | 1.86 | % | | | 1.95 | % |
| | | | | | |
Ratio of net investment income to average net assets | | | 3.31 | %(e) | | | 3.34 | % | | | 2.04 | % | | | 2.51 | % | | | 3.54 | % | | | 3.08 | % |
| | | | | | |
Portfolio turnover rate(f) | | | 14 | % | | | 199 | % | | | 25 | % | | | 5 | % | | | 26 | % | | | 61 | % |
| (a) | Calculated based on the average shares outstanding methodology. |
| (b) | Recognition of net investment income by the Fund is affected by the timing of declaration of dividends by the Underlying Funds in which the Fund invests. |
| (c) | Assumes investment at the NAV at the beginning of the period, reinvestment of all dividends and distributions, a complete redemption of the investment at the NAV at the end of the period and no sales or redemption charges (if any). Total returns would be reduced if a sales or redemption charge was taken into account. Returns do not reflect the impact of taxes to shareholders relating to Fund distributions or the redemption of Fund shares. Total returns for periods less than one full year are not annualized. |
| (d) | Expense ratios exclude the expenses of the Underlying Funds in which the Fund invests. |
| (f) | The Fund’s portfolio turnover rate is calculated in accordance with regulatory requirements, without regard to transactions involving short term investments and certain derivatives. If such transactions were included, the Fund’s portfolio turnover rate may be higher. |
| | |
| The accompanying notes are an integral part of these financial statements. | | 15 |
GOLDMAN SACHS VARIABLE INSURANCE TRUST MULTI-STRATEGY ALTERNATIVES PORTFOLIO
Financial Highlights (continued)
Selected Data for a Share Outstanding Throughout Each Period
| | | | | | | | | | | | | | | | | | | | | | | | |
| | | Goldman Sachs Multi-Strategy Alternatives Portfolio | |
| | | Advisor Shares | |
| | | Six Months Ended
June 30, 2023
(Unaudited) | | | Year Ended December 31, | |
| | | 2022 | | | 2021 | | | 2020 | | | 2019 | | | 2018 | |
| | | | | | | | | | | | | | | | | | | | | | | | |
| Per Share Data: | | | | | | | | | | | | | | | | | | |
| | | | | | |
Net asset value, beginning of period | | $ | 8.77 | | | $ | 9.73 | | | $ | 9.42 | | | $ | 8.99 | | | $ | 8.49 | | | $ | 9.36 | |
| | | | | | |
Net investment income(a)(b) | | | 0.14 | | | | 0.37 | | | | 0.18 | | | | 0.20 | | | | 0.24 | | | | 0.17 | |
| | | | | | |
Net realized and unrealized gain (loss) | | | 0.14 | | | | (1.01 | ) | | | 0.26 | | | | 0.39 | | | | 0.49 | | | | (0.83 | ) |
| | | | | | |
Total from investment operations | | | 0.28 | | | | (0.64 | ) | | | 0.44 | | | | 0.59 | | | | 0.73 | | | | (0.66 | ) |
| | | | | | |
Distributions to shareholders from net investment income | | | — | | | | (0.32 | ) | | | (0.13 | ) | | | (0.16 | ) | | | (0.23 | ) | | | (0.21 | ) |
| | | | | | |
Net asset value, end of period | | $ | 9.05 | | | $ | 8.77 | | | $ | 9.73 | | | $ | 9.42 | | | $ | 8.99 | | | $ | 8.49 | |
| | | | | | |
Total Return(c) | | | 3.19 | % | | | (6.61 | )% | | | 4.66 | % | | | 6.56 | % | | | 8.60 | % | | | (7.09 | )% |
| | | | | | |
Net assets, end of period (in 000’s) | | $ | 23,579 | | | $ | 23,200 | | | $ | 20,585 | | | $ | 17,698 | | | $ | 15,410 | | | $ | 13,460 | |
| | | | | | |
Ratio of net expenses to average net assets(d) | | | 0.61 | %(e) | | | 0.60 | % | | | 0.62 | % | | | 0.61 | % | | | 0.64 | % | | | 0.62 | % |
| | | | | | |
Ratio of total expenses to average net assets(d) | | | 1.14 | %(e) | | | 1.09 | % | | | 1.44 | % | | | 1.79 | % | | | 2.01 | % | | | 1.93 | % |
| | | | | | |
Ratio of net investment income to average net assets | | | 3.15 | %(e) | | | 3.99 | % | | | 1.89 | % | | | 2.28 | % | | | 2.61 | % | | | 1.92 | % |
| | | | | | |
Portfolio turnover rate(f) | | | 14 | % | | | 199 | % | | | 25 | % | | | 5 | % | | | 26 | % | | | 61 | % |
| (a) | Calculated based on the average shares outstanding methodology. |
| (b) | Recognition of net investment income by the Fund is affected by the timing of declaration of dividends by the Underlying Funds in which the Fund invests. |
| (c) | Assumes investment at the NAV at the beginning of the period, reinvestment of all dividends and distributions, a complete redemption of the investment at the NAV at the end of the period and no sales or redemption charges (if any). Total returns would be reduced if a sales or redemption charge was taken into account. Returns do not reflect the impact of taxes to shareholders relating to Fund distributions or the redemption of Fund shares. Total returns for periods less than one full year are not annualized. |
| (d) | Expense ratios exclude the expenses of the Underlying Funds in which the Fund invests. |
| (f) | The Fund’s portfolio turnover rate is calculated in accordance with regulatory requirements, without regard to transactions involving short term investments and certain derivatives. If such transactions were included, the Fund’s portfolio turnover rate may be higher. |
| | |
| 16 | | The accompanying notes are an integral part of these financial statements. |
GOLDMAN SACHS VARIABLE INSURANCE TRUST TREND DRIVEN ALLOCATION FUND
Financial Highlights (continued)
Selected Data for a Share Outstanding Throughout Each Period
| | | | | | | | | | | | | | | | | | | | | | | | |
| | | Goldman Sachs Trend Driven Allocation Fund | |
| | | Institutional Shares | |
| | | Six Months Ended
June 30, 2023
(Unaudited) | | | Year Ended December 31, | |
| | | 2022 | | | 2021 | | | 2020 | | | 2019 | | | 2018 | |
| | | | | | | | | | | | | | | | | | | | | | | | |
| Per Share Data: | | | | | | | | | | | | | | | | | | |
| | | | | | |
Net asset value, beginning of period | | $ | 10.06 | | | $ | 12.92 | | | $ | 12.61 | | | $ | 12.32 | | | $ | 11.65 | | | $ | 12.46 | |
| | | | | | |
Net investment income (loss)(a) | | | 0.11 | | | | 0.07 | | | | (0.04 | ) | | | 0.02 | | | | 0.15 | | | | 0.14 | |
| | | | | | |
Net realized and unrealized gain (loss) | | | 1.01 | | | | (2.51 | ) | | | 2.10 | | | | 0.52 | | | | 1.28 | | | | (0.64 | ) |
| | | | | | |
Total from investment operations | | | 1.12 | | | | (2.44 | ) | | | 2.06 | | | | 0.54 | | | | 1.43 | | | | (0.50 | ) |
| | | | | | |
Distributions to shareholders from net investment income | | | — | | | | — | | | | — | | | | (0.07 | ) | | | (0.22 | ) | | | (0.12 | ) |
| | | | | | |
Distributions to shareholders from net realized gains | | | — | | | | (0.42 | ) | | | (1.75 | ) | | | (0.18 | ) | | | (0.54 | ) | | | (0.19 | ) |
| | | | | | |
Total distributions | | | — | | | | (0.42 | ) | | | (1.75 | ) | | | (0.25 | ) | | | (0.76 | ) | | | (0.31 | ) |
| | | | | | |
Net asset value, end of period | | $ | 11.18 | | | $ | 10.06 | | | $ | 12.92 | | | $ | 12.61 | | | $ | 12.32 | | | $ | 11.65 | |
| | | | | | |
Total Return(b) | | | 11.13 | % | | | (19.00 | )% | | | 16.46 | % | | | 4.35 | % | | | 12.29 | % | | | (4.08 | )% |
| | | | | | |
Net assets, end of period (in 000’s) | | $ | 432 | | | $ | 506 | | | $ | 337 | | | $ | 289 | | | $ | 277 | | | $ | 247 | |
| | | | | | |
Ratio of net expenses to average net assets | | | 0.66 | %(c) | | | 0.66 | % | | | 0.65 | % | | | 0.60 | % | | | 0.59 | % | | | 0.51 | % |
| | | | | | |
Ratio of total expenses to average net assets | | | 0.90 | %(c) | | | 0.92 | % | | | 0.87 | % | | | 0.90 | % | | | 0.89 | % | | | 0.86 | % |
| | | | | | |
Ratio of net investment income (loss) to average net assets | | | 2.15 | %(c) | | | 0.63 | % | | | (0.32 | )% | | | 0.13 | % | | | 1.18 | % | | | 1.13 | % |
| | | | | | |
Portfolio turnover rate(d) | | | 6 | % | | | 344 | % | | | 12 | % | | | 168 | % | | | 61 | % | | | 60 | % |
| (a) | Calculated based on the average shares outstanding methodology. |
| (b) | Assumes investment at the NAV at the beginning of the period, reinvestment of all dividends and distributions, a complete redemption of the investment at the NAV at the end of the period and no sales or redemption charges (if any). Total returns would be reduced if a sales or redemption charge was taken into account. Returns do not reflect the impact of taxes to shareholders relating to Fund distributions or the redemption of Fund shares. Total returns for periods less than one full year are not annualized. |
| (d) | The Fund’s portfolio turnover rate is calculated in accordance with regulatory requirements, without regard to transactions involving short term investments and certain derivatives. If such transactions were included, the Fund’s portfolio turnover rate may be higher. |
| | |
| The accompanying notes are an integral part of these financial statements. | | 17 |
GOLDMAN SACHS VARIABLE INSURANCE TRUST TREND DRIVEN ALLOCATION FUND
Financial Highlights (continued)
Selected Data for a Share Outstanding Throughout Each Period
| | | | | | | | | | | | | | | | | | | | | | | | |
| | | Goldman Sachs Trend Driven Allocation Fund | |
| | | Service Shares | |
| | | Six Months Ended
June 30, 2023
(Unaudited) | | | Year Ended December 31, | |
| | | 2022 | | | 2021 | | | 2020 | | | 2019 | | | 2018 | |
| | | | | | | | | | | | | | | | | | | | | | | | |
| Per Share Data: | | | | | | | | | | | | | | | | | | |
| | | | | | |
Net asset value, beginning of period | | $ | 9.99 | | | $ | 12.86 | | | $ | 12.59 | | | $ | 12.30 | | | $ | 11.64 | | | $ | 12.45 | |
| | | | | | |
Net investment income (loss)(a) | | | 0.10 | | | | 0.02 | | | | (0.08 | ) | | | (0.01 | ) | | | 0.11 | | | | 0.08 | |
| | | | | | |
Net realized and unrealized gain (loss) | | | 0.99 | | | | (2.47 | ) | | | 2.10 | | | | 0.51 | | | | 1.28 | | | | (0.62 | ) |
| | | | | | |
Total from investment operations | | | 1.09 | | | | (2.45 | ) | | | 2.02 | | | | 0.50 | | | | 1.39 | | | | (0.54 | ) |
| | | | | | |
Distributions to shareholders from net investment income | | | — | | | | — | | | | — | | | | (0.03 | ) | | | (0.19 | ) | | | (0.08 | ) |
| | | | | | |
Distributions to shareholders from net realized gains | | | — | | | | (0.42 | ) | | | (1.75 | ) | | | (0.18 | ) | | | (0.54 | ) | | | (0.19 | ) |
| | | | | | |
Total distributions | | | — | | | | (0.42 | ) | | | (1.75 | ) | | | (0.21 | ) | | | (0.73 | ) | | | (0.27 | ) |
| | | | | | |
Net asset value, end of period | | $ | 11.08 | | | $ | 9.99 | | | $ | 12.86 | | | $ | 12.59 | | | $ | 12.30 | | | $ | 11.64 | |
| | | | | | |
Total Return(b) | | | 10.91 | % | | | (19.16 | )% | | | 16.17 | % | | | 4.10 | % | | | 11.94 | % | | | (4.34 | )% |
| | | | | | |
Net assets, end of period (in 000’s) | | $ | 283,497 | | | $ | 266,934 | | | $ | 357,316 | | | $ | 335,784 | | | $ | 345,219 | | | $ | 395,842 | |
| | | | | | |
Ratio of net expenses to average net assets | | | 0.91 | %(c) | | | 0.91 | % | | | 0.92 | % | | | 0.85 | % | | | 0.84 | % | | | 0.81 | % |
| | | | | | |
Ratio of total expenses to average net assets | | | 1.16 | %(c) | | | 1.17 | % | | | 1.14 | % | | | 1.15 | % | | | 1.14 | % | | | 1.11 | % |
| | | | | | |
Ratio of net investment income (loss) to average net assets | | | 1.90 | %(c) | | | 0.13 | % | | | (0.58 | )% | | | (0.12 | )% | | | 0.91 | % | | | 0.63 | % |
| | | | | | |
Portfolio turnover rate(d) | | | 6 | % | | | 344 | % | | | 12 | % | | | 168 | % | | | 61 | % | | | 60 | % |
| (a) | Calculated based on the average shares outstanding methodology. |
| (b) | Assumes investment at the NAV at the beginning of the period, reinvestment of all dividends and distributions, a complete redemption of the investment at the NAV at the end of the period and no sales or redemption charges (if any). Total returns would be reduced if a sales or redemption charge was taken into account. Returns do not reflect the impact of taxes to shareholders relating to Fund distributions or the redemption of Fund shares. Total returns for periods less than one full year are not annualized. |
| (d) | The Fund’s portfolio turnover rate is calculated in accordance with regulatory requirements, without regard to transactions involving short term investments and certain derivatives. If such transactions were included, the Fund’s portfolio turnover rate may be higher. |
| | |
| 18 | | The accompanying notes are an integral part of these financial statements. |
GOLDMAN SACHS VARIABLE INSURANCE TRUST MULTI-ASSET STRATEGIES FUNDS
Notes to Financial Statements
June 30, 2023 (Unaudited)
1. ORGANIZATION
Goldman Sachs Variable Insurance Trust (the “Trust” or “VIT”) is a Delaware statutory trust registered under the Investment Company Act of 1940, as amended (the “Act”), as an open-end management investment company. The following table lists those series of the Trust that are included in this report (collectively, the “Funds” or individually a “Fund”), along with their corresponding share classes and respective diversification status under the Act:
| | | | |
| Fund | | Share Classes Offered | | Diversified/
Non-diversified |
Multi-Strategy Alternatives | | Institutional, Service and Advisor | | Diversified |
Trend Driven Allocation | | Institutional and Service | | Diversified |
Goldman Sachs Asset Management, L.P. (“GSAM”), an affiliate of Goldman Sachs & Co. LLC (“Goldman Sachs”), serves as investment adviser to the Funds pursuant to management agreements (the “Agreements”) with the Trust.
The Multi-Strategy Alternatives Portfolio invests primarily in a combination of domestic and international equity and fixed income underlying funds (“Underlying Funds”) which are registered under the Act, for which GSAM acts as investment adviser. Additionally, the Multi-Strategy Alternatives Portfolio may invest a portion of its assets directly in other securities and instruments, including unaffiliated exchange traded funds (“Unaffiliated Funds”). The Trend Driven Allocation Fund may invest in one or a combination of the following securities and instruments: pooled investment vehicles, including exchange-traded funds (“ETFs”) and other investment companies; equity securities of U.S. and non-U.S. issuers; U.S. fixed income securities; and derivatives that provide exposure to a broad spectrum of asset classes and geographic regions.
2. SIGNIFICANT ACCOUNTING POLICIES
The financial statements have been prepared in accordance with accounting principles generally accepted in the United States of America (“GAAP”) and require management to make estimates and assumptions that may affect the reported amounts and disclosures. Actual results may differ from those estimates and assumptions. Each Fund is an investment company under GAAP and follows the accounting and reporting guidance applicable to investment companies.
A. Investment Valuation — The valuation policy of the Funds and Underlying Funds is to value investments at fair value.
B. Investment Income and Investments — Investment income includes interest income, dividend income, and securities lending income, if any. Interest income is accrued daily and adjusted for amortization of premiums and accretion of discounts. Dividend income is recognized on ex-dividend date or, for certain foreign securities, as soon as such information is obtained subsequent to the ex-dividend date. Non-cash dividends, if any, are recorded at the fair market value of the securities received. Investment transactions are reflected on trade date. Realized gains and losses are calculated using identified cost. Investment transactions are recorded on the following business day for daily net asset value (“NAV”) calculations. Investment income is recorded net of any foreign withholding taxes, less any amounts reclaimable. The Funds may file withholding tax reclaims in certain jurisdictions to recover a portion of amounts previously withheld.
For derivative contracts, unrealized gains and losses are recorded daily and become realized gains and losses upon disposition or termination of the contract.
C. Class Allocations and Expenses — Investment income, realized and unrealized gain (loss), if any, and non-class specific expenses of each Fund are allocated daily based upon the proportion of net assets of each class. Non-class specific expenses directly incurred by a Fund are charged to that Fund, while such expenses incurred by the Trust are allocated across the applicable Funds on a straight-line and/or pro-rata basis depending upon the nature of the expenses. Class specific expenses, where applicable, are borne by the respective share classes and include Distribution and Service and Transfer Agency fees. Expenses included in the accompanying financial statements reflect the expenses of each Fund and do not include any expenses associated with the Underlying Funds. Because the Underlying Funds have varied expense and fee levels and each Fund may own different proportions of the Underlying Funds at different times, the amount of fees and expenses incurred indirectly by the Funds will vary.
GOLDMAN SACHS VARIABLE INSURANCE TRUST MULTI-ASSET STRATEGIES FUNDS
Notes to Financial Statements (continued)
June 30, 2023 (Unaudited)
2. SIGNIFICANT ACCOUNTING POLICIES (continued)
D. Federal Taxes and Distributions to Shareholders — It is each Fund’s policy to comply with the requirements of the Internal Revenue Code of 1986, as amended (the “Code”), applicable to regulated investment companies and to distribute each year substantially all of its investment company taxable income and capital gains to its shareholders. Accordingly, each Fund is not required to make any provisions for the payment of federal income tax. Distributions to shareholders are recorded on the ex-dividend date. Income and capital gains distributions, if any, are declared and paid at least annually.
Net capital losses, if any, are carried forward to future fiscal years and may be used to the extent allowed by the Code to offset any future capital gains. Losses that are carried forward will retain their character as either short-term or long-term capital losses. Utilization of capital loss carryforwards will reduce the requirement of future capital gains distributions.
The characterization of distributions to shareholders for financial reporting purposes is determined in accordance with federal income tax rules, which may differ from GAAP. The source of each Fund’s distributions may be shown in the accompanying financial statements as either from distributable earnings or capital. Certain components of the Funds’ net assets on the Statements of Assets and Liabilities reflect permanent GAAP/tax differences based on the appropriate tax character.
E. Foreign Currency Translation — The accounting records and reporting currency of a Fund are maintained in U.S. dollars. Assets and liabilities denominated in foreign currencies are translated into U.S. dollars using the current exchange rates at the close of each business day. The effect of changes in foreign currency exchange rates on investments is included within net realized and unrealized gain (loss) on investments. Changes in the value of other assets and liabilities as a result of fluctuations in foreign exchange rates are included in the Statements of Operations within net change in unrealized gain (loss) on foreign currency translation. Transactions denominated in foreign currencies are translated into U.S. dollars on the date the transaction occurred, the effects of which are included within net realized gain (loss) on foreign currency transactions.
3. INVESTMENTS AND FAIR VALUE MEASUREMENTS
U.S. GAAP defines the fair value of a financial instrument as the amount that would be received to sell an asset or paid to transfer a liability in an orderly transaction between market participants at the measurement date (i.e., the exit price); the Funds’ policy is to use the market approach. GAAP establishes a fair value hierarchy that prioritizes the inputs to valuation techniques used to measure fair value. The hierarchy gives the highest priority to unadjusted quoted prices in active markets for identical assets or liabilities (Level 1 measurements) and the lowest priority to unobservable inputs (Level 3 measurements). The level in the fair value hierarchy within which the fair value measurement in its entirety falls shall be determined based on the lowest level input that is significant to the fair value measurement in its entirety. The levels used for classifying investments are not necessarily an indication of the risk associated with investing in these investments. The three levels of the fair value hierarchy are described below:
Level 1 — Unadjusted quoted prices in active markets that are accessible at the measurement date for identical, unrestricted assets or liabilities;
Level 2 — Quoted prices in markets that are not active or financial instruments for which significant inputs are observable (including, but not limited to, quoted prices for similar investments, interest rates, foreign exchange rates, volatility and credit spreads), either directly or indirectly;
Level 3 — Prices or valuations that require significant unobservable inputs (including GSAM’s assumptions in determining fair value measurement).
The Board of Trustees (“Trustees”) has approved Valuation Procedures that govern the valuation of the portfolio investments held by the Funds, including investments for which market quotations are not readily available. With respect to the Funds’ investments that do not have readily available market quotations, the Trustees have designated the Adviser as the valuation designee to perform fair valuations pursuant to Rule 2a-5 under the Investment Company Act of 1940 (the “Valuation Designee”). GSAM has day-to-day responsibility for implementing and maintaining internal controls and procedures related to the valuation of the Funds’ investments. To assess the continuing appropriateness of pricing sources and methodologies, GSAM regularly performs price verification procedures and issues challenges as necessary to third party pricing vendors or brokers, and any differences are reviewed in accordance with the Valuation Procedures.
GOLDMAN SACHS VARIABLE INSURANCE TRUST MULTI-ASSET STRATEGIES FUNDS
3. INVESTMENTS AND FAIR VALUE MEASUREMENTS (continued)
A. Level 1 and Level 2 Fair Value Investments — The valuation techniques and significant inputs used in determining the fair values for investments classified as Level 1 and Level 2 are as follows:
Underlying Funds (including Money Market Funds) — Underlying funds (“Underlying Funds”) include exchange-traded funds (“ETFs”) and other investment companies. Investments in the Underlying Funds (except ETFs) are valued at the NAV per share on the day of valuation. ETFs are valued daily at the last sale price or official closing price on the principal exchange or system on which the investment is traded. Because the Funds invest in Underlying Funds that fluctuate in value, each Fund’s shares will correspondingly fluctuate in value. Underlying Funds are generally classified as Level 1 of the fair value hierarchy. To the extent that underlying ETFs are actively traded, they are classified as Level 1 of the fair value hierarchy, otherwise they are generally classified as Level 2. For information regarding an Underlying Fund’s accounting policies and investment holdings, please see the Underlying Fund’s shareholder report.
Derivative Contracts — A derivative is an instrument whose value is derived from underlying assets, indices, reference rates or a combination of these factors. A Fund enters into derivative transactions to hedge against changes in interest rates, securities prices, and/or currency exchange rates, to increase total return, or to gain access to certain markets or attain exposure to other underliers. For financial reporting purposes, cash collateral that has been pledged to cover obligations of a Fund and cash collateral received, if any, is reported separately on the Statements of Assets and Liabilities as either due to broker/receivable for collateral on certain derivative contracts. Non-cash collateral pledged by a Fund, if any, is noted in the Schedules of Investments.
Exchange-traded derivatives, including futures and options contracts, are generally valued at the last sale or settlement price on the exchange where they are principally traded. Exchange-traded options without settlement prices are generally valued at the midpoint of the bid and ask prices on the exchange where they are principally traded (or, in the absence of two-way trading, at the last bid price for long positions and the last ask price for short positions). Exchange-traded derivatives typically fall within Level 1 of the fair value hierarchy. Over-the-counter (“OTC”) and centrally cleared derivatives are valued using market transactions and other market evidence, including market-based inputs to models, calibration to market-clearing transactions, broker or dealer quotations, or other alternative pricing sources. Where models are used, the selection of a particular model to value OTC and centrally cleared derivatives depends upon the contractual terms of, and specific risks inherent in, the instrument, as well as the availability of pricing information in the market. Valuation models require a variety of inputs, including contractual terms, market prices, yield curves, credit curves, measures of volatility, voluntary and involuntary prepayment rates, loss severity rates and correlations of such inputs. For OTC and centrally cleared derivatives that trade in liquid markets, model inputs can generally be verified and model selection does not involve significant management judgment. OTC and centrally cleared derivatives are classified within Level 2 of the fair value hierarchy when significant inputs are corroborated by market evidence.
i. Futures Contracts — Futures contracts are contracts to buy or sell a standardized quantity of a specified commodity or security. Upon entering into a futures contract, a Fund deposits cash or securities in an account on behalf of the broker in an amount sufficient to meet the initial margin requirement. Subsequent payments are made or received by a Fund equal to the daily change in the contract value and are recorded as variation margin receivable or payable with a corresponding offset to unrealized gains or losses.
ii. Options — When the Multi-Strategy Alternatives Portfolio writes call or put options, an amount equal to the premium received is recorded as a liability and is subsequently marked-to-market to reflect the current value of the option written. Swaptions are options on swap contracts.
Upon the purchase of a call option or a put option by the Multi-Strategy Alternatives Portfolio, the premium paid is recorded as an investment and subsequently marked-to-market to reflect the current value of the option. Certain options may be purchased with premiums to be determined on a future date. The premiums for these options are based upon implied volatility parameters at specified terms.
B. Level 3 Fair Value Investments — To the extent that significant inputs to valuation models and other alternative pricing sources are unobservable, or if quotations are not readily available, or if GSAM believes that such quotations do not accurately reflect fair value, the fair value of a Fund’s investments may be determined under the Valuation Procedures. GSAM, consistent with its procedures and applicable regulatory guidance, may make an adjustment to the most recent valuation prices of either domestic or
GOLDMAN SACHS VARIABLE INSURANCE TRUST MULTI-ASSET STRATEGIES FUNDS
Notes to Financial Statements (continued)
June 30, 2023 (Unaudited)
3. INVESTMENTS AND FAIR VALUE MEASUREMENTS (continued)
foreign securities in light of significant events to reflect what it believes to be the fair value of the securities at the time of determining a Fund’s NAV. To the extent investments are valued using single source broker quotations obtained directly from the broker or passed through from third party pricing vendors, such investments are classified as Level 3 investments.
C. Fair Value Hierarchy — The following is a summary of the Funds’ investments and derivatives classified in the fair value hierarchy as of June 30, 2023:
| | | | | | | | | | | | |
| | | |
| MULTI-STRATEGY ALTERNATIVES PORTFOLIO | | | | | | | | | |
| Investment Type | | Level 1 | | | Level 2 | | | Level 3 | |
| | | |
| Assets | | | | | | | | | | | | |
Fixed Income Underlying Funds | | $ | 24,347,467 | | | $ | — | | | $ | — | |
Equity Underlying Funds | | | 5,976,945 | | | | — | | | | — | |
Investment Companies | | | 3,560,447 | | | | — | | | | — | |
Exchange Traded Funds | | | 2,239,118 | | | | — | | | | — | |
| | | |
| Total | | $ | 36,123,977 | | | $ | — | | | $ | — | |
| | | |
| Derivative Type | | | | | | | | | |
| | | |
| Assets | | | | | | | | | | | | |
| Purchased Options | | $ | 222,119 | | | $ | — | | | $ | — | |
| | | |
| Total | | $ | 222,119 | | | $ | — | | | $ | — | |
| | | |
| Derivative Type | | | | | | | | | |
| | | |
| Liabilities(a) | | | | | | | | | | | | |
| Futures Contracts | | $ | (35,390 | ) | | $ | — | | | $ | — | |
| | | |
| Total | | $ | (35,390 | ) | | $ | — | | | $ | — | |
| | | |
| TREND DRIVEN ALLOCATION FUND | | | | | | | | | |
| Investment Type | | Level 1 | | | Level 2 | | | Level 3 | |
| | | |
| Assets | | | | | | | | | | | | |
Exchange Traded Funds | | $ | 71,668,602 | | | $ | — | | | $ | — | |
Investment Companies | | | 140,705,586 | | | | — | | | | — | |
| | | |
| Total | | $ | 212,374,188 | | | $ | — | | | $ | — | |
| | | |
| Derivative Type | | | | | | | | | |
| | | |
| Assets(a) | | | | | | | | | | | | |
| Futures Contracts | | $ | 2,357,092 | | | $ | — | | | $ | — | |
| | | |
| Total | | $ | 2,357,092 | | | $ | — | | | $ | — | |
| | | |
| Derivative Type | | | | | | | | | |
| | | |
| Liabilities(a) | | | | | | | | | | | | |
| Futures Contracts | | $ | (1,492,666 | ) | | $ | — | | | $ | — | |
| | | |
| Total | | $ | (1,492,666 | ) | | $ | — | | | $ | — | |
| (a) | Amount shown represents unrealized gain (loss) at period end. |
GOLDMAN SACHS VARIABLE INSURANCE TRUST MULTI-ASSET STRATEGIES FUNDS
4. INVESTMENTS IN DERIVATIVES
The following tables set forth, by certain risk types, the gross value of derivative contracts (not considered to be hedging instruments for accounting disclosure purposes) as of June 30, 2023. These instruments were used as part of the Funds’ investment strategies and to obtain and/or manage exposure related to the risks below. The values in the tables below exclude the effects of cash collateral received or posted pursuant to these derivative contracts, and therefore are not representative of the Funds’ net exposure.
Multi-Strategy Alternatives
| | | | | | | | | | | | | | |
| Risk | | | | Statements of Assets and Liabilities | | Assets | | | Statements of Assets and Liabilities | | Liabilities | |
| Interest Rate | | | | — | | $ | — | | | Variation margin on futures contracts | | $ | (35,390 | )(a) |
| Interest Rate | | | | Purchased options contracts, at value | | | 222,119 | | | — | | | — | |
| | | | | |
| Total | | | | | | $ | 222,119 | | | | | $ | (35,390 | ) |
Trend Driven Allocation
| | | | | | | | | | | | | | |
| Risk | | | | Statements of Assets and Liabilities | | Assets | | | Statements of Assets and Liabilities | | Liabilities | |
| Equity | | | | Variation margin on futures contracts | | $ | 2,357,092 | (a) | | Variation margin on futures contracts | | $ | (94,161 | )(a) |
| Interest Rate | | | | — | | | — | | | Variation margin on futures contracts | |
| (1,398,505
| )(a)
|
| | | | | |
| Total | | | | | | $ | 2,357,092 | | | | | $ | (1,492,666 | ) |
| (a) | Includes unrealized gain (loss) on futures contracts described in the Additional Investment Information sections of the Schedules of Investments. Only the variation margin as of June 30, 2023, is reported within the Statements of Assets and Liabilities. |
The following tables set forth, by certain risk types, the Funds’ gains (losses) related to these derivatives and their indicative volumes for the six months ended June 30, 2023. These gains (losses) should be considered in the context that these derivative contracts may have been executed to create investment opportunities and/or economically hedge certain investments, and accordingly, certain gains (losses) on such derivative contracts may offset certain (losses) gains attributable to investments. These gains (losses) are included in “Net realized gain (loss)” or “Net change in unrealized gain (loss)” on the Statements of Operations:
Multi-Strategy Alternatives
| | | | | | | | | | |
| Risk | | Statement of Operations | | Net
Realized
Gain (Loss) | | | Net Change in
Unrealized
Gain (Loss) | |
| Equity | | Net realized gain (loss) from futures contracts and purchased options/Net change in unrealized gain (loss) on futures contracts and purchased options | | $ | 29,827 | | | $ | (1,435 | ) |
| Interest Rate | | Net realized gain (loss) from futures contracts and purchased options/Net change in unrealized gain (loss) on futures contracts and purchased options | | | (90,146 | ) | | | (65,020 | ) |
| | | |
| Total | | | | $ | (60,319 | ) | | $ | (66,455 | ) |
GOLDMAN SACHS VARIABLE INSURANCE TRUST MULTI-ASSET STRATEGIES FUNDS
Notes to Financial Statements (continued)
June 30, 2023 (Unaudited)
4. INVESTMENTS IN DERIVATIVES (continued)
Trend Driven Allocation
| | | | | | | | | | |
| Risk | | Statement of Operations | | Net
Realized
Gain (Loss) | | | Net Change in
Unrealized
Gain (Loss) | |
| Equity | | Net realized gain (loss) from futures contracts/Net change in unrealized gain (loss) on futures contracts | | $ | 10,109,265 | | | $ | 6,623,252 | |
| Interest Rate | | Net realized gain (loss) from futures contracts/Net change in unrealized gain (loss) on futures contracts | | | (353,188 | ) | | | (515,626 | ) |
| | | |
| Total | | | | $ | (9,727,248 | ) | | $ | 6,107,626 | |
For the six months ended June 30, 2023, the relevant values for each derivative type were as follows:
| | | | | | | | |
| | | Average Number of Contracts(1) | |
| Fund | | Futures Contracts | | | Purchased Options | |
| Multi-Strategy Alternatives | | | 33 | | | | 258 | |
| Trend Driven Allocation | | | 1,759 | | | | — | |
| (1) | Amounts disclosed represent average number of contracts for futures and purchased options contracts, based on absolute values, which is indicative of volume of this derivative type, for the months that the Funds held such derivatives during the six months ended June 30, 2023. |
5. AGREEMENTS AND AFFILIATED TRANSACTIONS
A. Management Agreement — Under the Agreement, GSAM manages the Funds, subject to the general supervision of the Trustees.
As compensation for the services rendered pursuant to the Agreement, the assumption of the expenses related thereto and administration of the Funds’ business affairs, including providing facilities, GSAM is entitled to a management fee, accrued daily and paid monthly, equal to an annual percentage rate of each Fund’s average daily net assets.
For the six months ended June 30, 2023, contractual and effective net management fees with GSAM were at the following rates:
| | | | | | | | | | | | | | | | | | | | | | | | | | | | |
| | | Contractual Management Rate | | | Effective
Rate | | | Effective Net
Management Rate^ | |
| Fund | | First
$1 billion | | | Next
$1 billion | | | Next
$3 billion | | | Next
$3 billion | | | Over
$8 billion | |
| Multi-Strategy Alternatives | | | 0.15 | % | | | 0.15 | % | | | 0.15 | % | | | 0.15 | % | | | 0.15 | % | | | 0.15 | % | | | — | %* |
| Trend Driven Allocation | | | 0.79 | | | | 0.71 | | | | 0.68 | | | | 0.66 | | | | 0.65 | | | | 0.79 | | | | 0.64 | ** |
| ^ | Effective Net Management Rate includes the impact of management fee waivers of affiliated Underlying Funds, if any. |
| * | GSAM agreed to waive a portion of its management fees in order to achieve a net management rate, as defined in the Fund’s most recent prospectus. This waiver will be effective through at least April 28, 2024, and prior to such date GSAM may not terminate the arrangement without approval of the trustees. |
| ** | GSAM agreed to waive a portion of its management fees in order to achieve a net management rate, as defined in the Fund’s most recent prospectus. This waiver will be effective through at least April 28, 2024, and prior to such date GSAM may not terminate the arrangement without approval of the trustees. |
The Multi-Strategy Alternatives Portfolio invests in Institutional Shares of the Goldman Sachs Financial Square Government and Goldman Sachs VIT Government Money Market Funds and Trend Driven Allocation Fund invests in Institutional Shares of the Goldman Sachs Financial Square Government, Goldman Sachs Financial Square Treasury Instruments, Goldman Sachs Financial Square Treasury Obligations, and Goldman Sachs Financial Square Treasury Solutions Funds, which are affiliated Underlying Funds. GSAM has agreed to waive a portion of its management fee payable by the Funds in an amount equal to the management
GOLDMAN SACHS VARIABLE INSURANCE TRUST MULTI-ASSET STRATEGIES FUNDS
5. AGREEMENTS AND AFFILIATED TRANSACTIONS (continued)
fee it earns as an investment adviser to the affiliated Underlying Fund in which the Funds invest, except those management fees it earns from the Funds’ investments of cash collateral received in connection with securities lending transactions in the Goldman Sachs Financial Square Government Fund. For the six months ended June 30, 2023, GSAM waived $1,980 and $43,960 of the Multi-Strategy Alternatives Portfolio’s and Trend Driven Allocation Fund’s management fee, respectively.
B. Distribution and/or Service (12b-1) Plans — The Trust, on behalf of Service Shares of the Funds has adopted a Distribution and Service Plan subject to Rule 12b-1 under the Act. Under the Distribution and Service Plan, Goldman Sachs, which serves as distributor (the “Distributor”), is entitled to a fee accrued daily and paid monthly, for distribution services and personal and account maintenance services, which may then be paid by Goldman Sachs to authorized dealers, equal to, on an annual basis, 0.25% of the Funds’ average daily net assets attributable to Service Shares.
The Trust, on behalf of Advisor Shares of the Multi-Strategy Alternatives Portfolio, has adopted a Distribution Plan subject to Rule 12b-1 under the Act. Under the Distribution Plan, Goldman Sachs as Distributor is entitled to a fee accrued daily and paid monthly for distribution services, which may then be paid by Goldman Sachs to authorized dealers, equal to, on an annual basis, 0.15% of the Multi-Strategy Alternatives Portfolio’s average daily net assets attributable to Advisor Shares.
C. Service Plans — The Trust, on behalf of Advisor Shares of the Multi-Strategy Alternatives Portfolio, has adopted a Service Plan to allow Advisor Shares to compensate service organizations (including Goldman Sachs) for providing varying levels of personal and account maintenance and administration services to their customers who are beneficial owners of such shares. The Service Plans each provide for compensation to the service organizations equal to 0.25% of the average daily net assets attributable to Advisor Shares of the Multi-Strategy Alternatives Portfolio.
D. Transfer Agency Agreement — Goldman Sachs also serves as the transfer agent of the Funds for a fee pursuant to the Transfer Agency Agreement. The fees charged for such transfer agency services are accrued daily and paid monthly at an annual rate of 0.02% of the average daily net assets of Institutional, Service and Advisor Shares.
E. Other Expense Agreements and Affiliated Transactions — GSAM has agreed to reduce or limit certain “Other Expenses” of the Funds (excluding acquired fund fees and expenses, transfer agency fees and expenses, service fees and shareholder administration fees (as applicable), taxes, interest, brokerage fees, expenses of shareholder meetings, litigation and indemnification, and extraordinary expenses) to the extent such expenses exceed, on an annual basis, a percentage rate of the average daily net assets of each Fund. Such Other Expense reimbursements, if any, are accrued daily and paid monthly. In addition, the Funds are not obligated to reimburse GSAM for prior fiscal year expense reimbursements, if any. The Other Expense limitations as an annual percentage rate of average daily net assets for the Multi-Strategy Alternatives Portfolio and Trend Driven Allocation Fund are 0.204% and 0.004%, respectively. These Other Expense limitations will remain in place through at least April 28, 2024, and prior to such date GSAM may not terminate the arrangements without the approval of the Trustees. In addition, the Funds have entered into certain offset arrangements with the custodian and the transfer agent, which may result in a reduction of the Funds’ expenses and are received irrespective of the application of the “Other Expense” limitations described above.
For the six months ended June 30, 2023, these expense reductions, including any fee waivers and Other Expense reimbursements, were as follows:
| | | | | | | | | | | | |
| Fund | | Management
Fee Waiver | | | Other Expense
Reimbursement | | | Total
Expense
Reductions | |
| Multi-Strategy Alternatives | | $ | 28,813 | | | $ | 65,400 | | | $ | 94,213 | |
| Trend Driven Allocation | | | 208,686 | | | | 125,070 | | | | 333,756 | |
F. Line of Credit Facility — As of June 30, 2023, the Funds participated in a $1,110,000,000 committed, unsecured revolving line of credit facility (the “facility”) together with other funds of the Trust and certain registered investment companies having management agreements with GSAM or its affiliates. This facility is to be used for temporary emergency purposes, or to allow for
GOLDMAN SACHS VARIABLE INSURANCE TRUST MULTI-ASSET STRATEGIES FUNDS
Notes to Financial Statements (continued)
June 30, 2023 (Unaudited)
5. AGREEMENTS AND AFFILIATED TRANSACTIONS (continued)
an orderly liquidation of securities to meet redemption requests. The interest rate on borrowings is based on the federal funds rate. The facility also requires a fee to be paid by the Funds based on the amount of the commitment that has not been utilized. For the six months ended June 30, 2023, the Funds did not have any borrowings under the facility. Prior to April 19, 2023, the facility was $1,250,000,000.
G. Other Transactions with Affiliates — The following table provides information about Goldman Sachs Variable Insurance Trust Trend Driven Allocation Fund’s investments in the Goldman Sachs Financial Square Government, Goldman Sachs Financial Square Treasury Instruments, Goldman Sachs Financial Square Treasury Obligations, and Goldman Sachs Financial Square Treasury Solutions Funds as of and for the six months ended June 30, 2023.
| | | | | | | | | | | | | | | | | | | | | | | | |
| Investment Companies | | Beginning
Value as of
December 31,
2022 | | | Purchases
at Cost | | | Proceeds
from Sales | | | Ending
Value as of
June 30, 2023 | | | Shares as of
June 30, 2023 | | | Dividend
Income | |
Goldman Sachs Financial Square Government Fund | | $ | 53,931,471 | | | $ | 16,672,275 | | | $ | (13,974,092 | ) | | $ | 56,629,654 | | | | 56,629,654 | | | $ | 1,278,944 | |
Goldman Sachs Financial Square Treasury Instruments Fund | | | 26,776,391 | | | | 1,248,648 | | | | — | | | | 28,025,039 | | | | 28,025,039 | | | | 623,778 | |
Goldman Sachs Financial Square Treasury Obligations Fund | | | 26,777,206 | | | | 1,248,648 | | | | — | | | | 28,025,854 | | | | 28,025,854 | | | | 642,099 | |
Goldman Sachs Financial Square Treasury Solutions Fund | | | 26,776,391 | | | | 1,248,648 | | | | — | | | | 28,025,039 | | | | 28,025,039 | | | | 642,098 | |
| | | | | | |
| Total | | $ | 134,261,459 | | | $ | 20,418,219 | | | $ | (13,974,092 | ) | | $ | 140,705,586 | | | | | | | $ | 3,186,919 | |
The Multi-Strategy Alternatives Portfolio invests primarily in Class R6 and Institutional Shares of the Underlying Funds. These Underlying Funds are considered to be affiliated with the Multi-Strategy Alternatives Portfolio. The tables below show the transactions in and earnings from investments in these Underlying Funds for the six months ended June 30, 2023:
| | | | | | | | | | | | | | | | | | | | | | | | | | | | | | | | |
| Underlying Funds | | Beginning
Value as of
December 31,
2022 | | | Purchases
at Cost | | | Proceeds
from
Sales | | | Net
Realized
Gain
(Loss) | | | Change in
Unrealized
Gain (Loss) | | | Market
Value
06/30/2023 | | | Shares as of
June 30,
2023 | | | Dividend
Income | |
Goldman Sachs Core Fixed Income Fund | | $ | — | | | $ | 1,809,770 | | | $ | — | | | $ | — | | | $ | (23,252 | ) | | $ | 1,786,518 | | | | 194,610 | | | $ | 9,770 | |
Goldman Sachs Emerging Markets Debt Fund | | | 2,550,458 | | | | 1,990,909 | | | | (200,000 | ) | | | (10,686 | ) | | | 84,900 | | | | 4,415,581 | | | | 487,910 | | | | 90,909 | |
Goldman Sachs Emerging Markets Equity Insights Fund | | | 1,401,569 | | | | 1,700,000 | | | | (200,000 | ) | | | (576 | ) | | | 124,949 | | | | 3,025,942 | | | | 380,143 | | | | — | |
Goldman Sachs Energy Infrastructure Fund | | | 166,361 | | | | 2,333 | | | | (60,000 | ) | | | 2,337 | | | | 267 | | | | 111,298 | | | | 10,267 | | | | 2,333 | |
Goldman Sachs Financial Square Government Fund (Institutional Shares) | | | 3,276,259 | | | | 12,084,659 | | | | (13,594,859 | ) | | | — | | | | — | | | | 1,766,059 | | | | 1,766,059 | | | | 57,638 | |
Goldman Sachs Global Infrastructure Fund | | | 2,544,911 | | | | 487,139 | | | | (200,000 | ) | | | 8,245 | | | | (590 | ) | | | 2,839,705 | | | | 232,763 | | | | 37,139 | |
GOLDMAN SACHS VARIABLE INSURANCE TRUST MULTI-ASSET STRATEGIES FUNDS
5. AGREEMENTS AND AFFILIATED TRANSACTIONS (continued)
| | | | | | | | | | | | | | | | | | | | | | | | | | | | | | | | |
| Underlying Funds | | Beginning
Value as of
December 31,
2022 | | | Purchases
at Cost | | | Proceeds
from
Sales | | | Net
Realized
Gain
(Loss) | | | Change in
Unrealized
Gain (Loss) | | | Market
Value
06/30/2023 | | | Shares as of
June 30,
2023 | | | Dividend
Income | |
Goldman Sachs High Yield Floating Rate Fund | | $ | 1,539,318 | | | $ | 669,030 | | | $ | (200,000 | ) | | $ | (3,986 | ) | | $ | 29,671 | | | $ | 2,034,033 | | | | 231,931 | | | $ | 69,030 | |
Goldman Sachs High Yield Fund | | | 2,057,530 | | | | 868,042 | | | | (150,000 | ) | | | (10,316 | ) | | | 48,349 | | | | 2,813,605 | | | | 519,115 | | | | 68,042 | |
Goldman Sachs Long Short Credit Strategies Fund | | | 7,094,397 | | | | 267,121 | | | | (900,000 | ) | | | (63,512 | ) | | | 139,872 | | | | 6,537,878 | | | | 849,075 | | | | 167,121 | |
Goldman Sachs Managed Futures Strategy Fund | | | 4,930,459 | | | | 1,000,000 | | | | (300,000 | ) | | | (53,486 | ) | | | 99,881 | | | | 5,676,854 | | | | 557,648 | | | | — | |
Goldman Sachs MarketBeta US Equity ETF | | | 2,196,208 | | | | — | | | | (1,026,923 | ) | | | (4,804 | ) | | | 293,961 | | | | 1,458,442 | | | | 24,031 | | | | 14,079 | |
Goldman Sachs MarketBeta International Equity ETF | | | 928,624 | | | | — | | | | (239,705 | ) | | | 27,362 | | | | 64,395 | | | | 780,676 | | | | 15,147 | | | | 16,930 | |
Goldman Sachs Strategic Income Fund | | | 1,146,354 | | | | 25,597 | | | | (100,000 | ) | | | (557 | ) | | | 11,604 | | | | 1,082,998 | | | | 121,685 | | | | 25,597 | |
Goldman Sachs VIT Government Money Market Fund (Institutional Shares) Overlay Fund | | | 6,285,567 | | | | 108,821 | | | | (4,600,000 | ) | | | — | | | | — | | | | 1,794,388 | | | | 1,794,388 | | | | 108,821 | |
| | | | | | | | |
| Total | | $ | 36,118,015 | | | $ | 21,013,421 | | | $ | (21,771,487 | ) | | $ | (109,979 | ) | | $ | 874,007 | | | $ | 36,123,977 | | | | | | | $ | 667,409 | |
6. PORTFOLIO SECURITIES TRANSACTIONS
The cost of purchases and proceeds from sales and maturities of long-term securities for the six months ended June 30, 2023, were as follows:
| | | | | | | | | | |
| Fund | | | | Purchases | | | Sales and Maturities | |
| Multi-Strategy Alternatives | | | | $ | 9,451,471 | | | $ | 4,003,801 | |
| Trend Driven Allocation | | | | | 4,511,462 | | | | 10,349,946 | |
7. SECURITIES LENDING
The Multi-Strategy Alternatives Portfolio may lend its securities through a securities lending agent, the Bank of New York Mellon (“BNYM”), to certain qualified borrowers. Pursuant to exemptive relief granted by the Securities and Exchange Commission (“SEC”) and the terms and conditions contained therein, the Trend Driven Allocation Fund may lend its securities through a securities lending agent, Goldman Sachs Agency Lending (“GSAL”), a wholly-owned subsidiary of Goldman Sachs, to certain qualified borrowers including Goldman Sachs and affiliates. In accordance with the Funds’ securities lending procedures, the Funds receive cash collateral at least equal to the market value of the securities on loan. The market value of the loaned securities is determined at the close of business of the Funds at their last sale price or official closing price on the principal exchange or system on which they are traded, and any additional required collateral is delivered to the Funds on the next business day. As with other extensions of credit, the Funds may experience delay in the recovery of their securities or incur a loss should the borrower of the
GOLDMAN SACHS VARIABLE INSURANCE TRUST MULTI-ASSET STRATEGIES FUNDS
Notes to Financial Statements (continued)
June 30, 2023 (Unaudited)
7. SECURITIES LENDING (continued)
securities breach its agreement with the Funds or become insolvent at a time when the collateral is insufficient to cover the cost of repurchasing securities on loan. Dividend income received from securities on loan may not be subject to withholding taxes and therefore withholding taxes paid may differ from the amounts listed in the Statements of Operations. Loans of securities are terminable at any time and as such 1) the remaining contractual maturities of the outstanding securities lending transactions are considered to be overnight and continuous and 2) the borrower, after notice, is required to return borrowed securities within the standard time period for settlement of securities transactions.
The Funds invest the cash collateral received in connection with securities lending transactions in the Goldman Sachs Financial Square Government Fund (“Government Money Market Fund”), an affiliated series of the Goldman Sachs Trust. The Government Money Market Fund is registered under the Act as an open end investment company, is subject to Rule 2a-7 under the Act, and is managed by GSAM, for which GSAM may receive a management fee of up to 0.16% on an annualized basis of the average daily net assets of the Government Money Market Fund.
In the event of a default by a borrower with respect to any loan, GSAL will, and BNYM may, exercise any and all remedies provided under the applicable borrower agreement to make the Funds whole. These remedies include purchasing replacement securities by applying the collateral held from the defaulting broker against the purchase cost of the replacement securities. If GSAL or BNYM are unable to purchase replacement securities, GSAL and/or BNYM will indemnify the Funds by paying the Funds an amount equal to the market value of the securities loaned minus the value of cash collateral received from the borrower for the loan, subject to an exclusion for any shortfalls resulting from a loss of value in such cash collateral due to reinvestment risk. The Funds’ master netting agreements with certain borrowers provide the right, in the event of a default (including bankruptcy or insolvency), for the non-defaulting party to liquidate the collateral and calculate net exposure to the defaulting party or request additional collateral. However, in the event of a default by a borrower, a resolution authority could determine that such rights are not enforceable due to the restrictions or prohibitions against the right of set-off that may be imposed in accordance with a particular jurisdiction’s bankruptcy or insolvency laws. The Funds’ loaned securities were all subject to enforceable Securities Lending Agreements and the value of the collateral was at least equal to the value of the cash received. The amounts of the Funds’ overnight and continuous agreements, which represent the gross amounts of recognized liabilities for securities lending transactions outstanding as of June 30, 2023, are disclosed as “Payable upon return of securities loaned” on the Statements of Assets and Liabilities, where applicable. The Funds did not have securities on loan as of June 30, 2023.
The Funds, GSAL and BNYM received compensation relating to the lending of the Funds’ securities. The amounts earned, if any, by the Funds for the six months ended June 30, 2023, are reported under Investment Income on the Statements of Operations.
The Funds did not have any securities lending activity with affiliates of Goldman Sachs for the six months ended June 30, 2023.
The following table provides information about the Funds’ investment in the Government Money Market Fund for the six months ended June 30, 2023.
| | | | | | | | | | | | | | | | |
| Fund | | Beginning
Value as of
December 31,
2022 | | | Purchases
at Cost | | | Proceeds
from Sales | | | Ending
value as of
June 30, 2023 | |
| Multi-Strategy Alternatives | | $ | 911,315 | | | $ | 3,365,601 | | | $ | (4,276,916 | ) | | $ | — | |
GOLDMAN SACHS VARIABLE INSURANCE TRUST MULTI-ASSET STRATEGIES FUNDS
8. TAX INFORMATION
As of June 30, 2023, the Funds’ capital loss carryforwards and certain timing differences, on a tax-basis were as follows:
| | | | | | | | |
| | | Multi-Strategy
Alternatives | | | Trend Driven
Allocation | |
| Capital loss carryforwards: | | | | | | | | |
Perpetual Short-term | | $ | (1,748,216 | ) | | $ | (7,200,950 | ) |
Perpetual Long-term | | | (1,812,000 | ) | | | (30,925,043 | ) |
| Total Capital loss carryforwards | | | (3,560,216 | ) | | | (38,125,993 | ) |
| Timing differences (Qualified late year ordinary loss deferral and Straddle loss deferral) | | $ | — | | | $ | (4,120,292 | ) |
As of June 30, 2023, the Funds’ aggregate security unrealized gains and losses based on cost for U.S. federal income tax purposes were as follows:
| | | | | | | | |
| | | Multi-Strategy
Alternatives | | | Trend Driven | |
| Tax cost | | $ | 37,537,223 | | | $ | 188,861,609 | |
Gross unrealized gain | | | 540,466 | | | | 23,512,579 | |
| Gross unrealized loss | | | (1,953,712 | ) | | | — | |
| Net unrealized gain (loss) | | $ | (1,413,246 | ) | | $ | 23,512,579 | |
The difference between GAAP-basis and tax-basis unrealized gains (losses) is attributable primarily to wash sales, net mark to market gains (losses) on regulated futures, options contracts and foreign currency contracts.
GSAM has reviewed the Funds’ tax positions for all open tax years (the current and prior three years, as applicable) and has concluded that no provision for income tax is required in the Funds’ financial statements. Such open tax years remain subject to examination and adjustment by tax authorities.
9. OTHER RISK
The Funds’ and Underlying Fund’s risks include, but are not limited to, the following:
Derivatives Risk — The Funds’ use of derivatives and other similar instruments (collectively referred to in this paragraph as “derivatives”) may result in loss, including due to adverse market movements. Derivatives, which may pose risks in addition to and greater than those associated with investing directly in securities, currencies or other assets and instruments, may increase market exposure and be illiquid or less liquid, volatile, difficult to price and leveraged so that small changes in the value of the underlying assets or instruments may produce disproportionate losses to the Funds. Certain derivatives are also subject to counterparty risk, which is the risk that the other party in the transaction will not, or lacks the capacity or authority to, fulfill its contractual obligations, liquidity risk, which includes the risk that the Funds will not be able to exit the derivative when it is advantageous to do so, and risks arising from margin requirements, which include the risk that the Funds will be required to pay additional margin or set aside additional collateral to maintain open derivative positions. The use of derivatives is a highly specialized activity that involves investment techniques and risks different from those associated with investments in more traditional securities and instruments. Losses from derivatives can also result from a lack of correlation between changes in the value of derivative instruments and the portfolio assets (if any) being hedged.
Foreign and Emerging Countries Risk — Investing in foreign markets may involve special risks and considerations not typically associated with investing in the U.S. Foreign securities may be subject to risk of loss because of more or less foreign government regulation; less public information; less stringent investor protections; less stringent accounting, corporate governance,
GOLDMAN SACHS VARIABLE INSURANCE TRUST MULTI-ASSET STRATEGIES FUNDS
Notes to Financial Statements (continued)
June 30, 2023 (Unaudited)
9. OTHER RISK (continued)
financial reporting and disclosure standards; and less economic, political and social stability in the countries in which the Funds or an Underlying Fund invests. The imposition of sanctions, exchange controls (including repatriation restrictions), confiscations of assets and property, trade restrictions (including tariffs) and other government restrictions by the U.S. or other governments, or from problems in share registration, settlement or custody, may also result in losses. The type and severity of sanctions and other similar measures, including counter sanctions and other retaliatory actions, that may be imposed could vary broadly in scope, and their impact is impossible to predict. For example, the imposition of sanctions and other similar measures could, among other things, cause a decline in the value and/or liquidity of securities issued by the sanctioned country or companies located in or economically tied to the sanctioned country and increase market volatility and disruption in the sanctioned country and throughout the world. Sanctions and other similar measures could limit or prevent a Fund or an Underlying Fund from buying and selling securities (in the sanctioned country and other markets), significantly delay or prevent the settlement of securities transactions, and significantly impact a Fund or Underlying Fund’s liquidity and performance. Foreign risk also involves the risk of negative foreign currency rate fluctuations, which may cause the value of securities denominated in such foreign currency (or other instruments through which the Funds or an Underlying Fund has exposure to foreign currencies) to decline in value. Currency exchange rates may fluctuate significantly over short periods of time. To the extent that the Funds or an Underlying Fund also invests in securities of issuers located in, or economically tied to, emerging markets, these risks may be more pronounced.
Interest Rate Risk — When interest rates increase, fixed income securities or instruments held by a Fund will generally decline in value. Long-term fixed income securities or instruments will normally have more price volatility because of this risk than short-term fixed income securities or instruments. A wide variety of market factors can cause interest rates to rise, including central bank monetary policy, rising inflation and changes in general economic conditions. Changing interest rates may have unpredictable effects on the markets, may result in heightened market volatility and may detract from the Fund’s performance. In addition, changes in monetary policy may exacerbate the risks associated with changing interest rates. Funds with longer average portfolio durations will generally be more sensitive to changes in interest rates than funds with a shorter average portfolio duration. Fluctuations in interest rates may also affect the liquidity of fixed income securities and instruments held by the Fund. A sudden or unpredictable increase in interest rates may cause volatility in the market and may decrease the liquidity of the Fund’s investments, which would make it harder for the Fund to sell its investments at an advantageous time.
Investments in Other Investment Companies Risk — As a shareholder of another investment company, including an ETF, the Funds will indirectly bear its proportionate share of any net management fees and other expenses paid by such other investment companies, in addition to the fees and expenses regularly borne by the Fund. ETFs are subject to risks that do not apply to conventional mutual funds, including but not limited to the following: (i) the market price of the ETF’s shares may trade at a premium or a discount to their NAV; and (ii) an active trading market for an ETF’s shares may not develop or be maintained.
Investments in the Underlying Funds Risk — The investments of the Multi-Strategy Alternatives Portfolio may be concentrated in one or more Underlying Funds (including ETFs and other registered investment companies) subject to statutory limitations prescribed by the Act or exemptive relief or regulations thereunder. The Multi-Strategy Alternatives Portfolio’s investment performance is directly related to the investment performance of the Underlying Funds it holds. The Multi-Strategy Alternatives Portfolio is subject to the risk factors associated with the investments of the Underlying Funds and will be affected by the investment policies and practices of the Underlying Funds in direct proportion to the amount of assets allocated to each. If the Multi-Strategy Alternatives Portfolio has a relative concentration of its portfolio in a single Underlying Fund, it may be more susceptible to adverse developments affecting that Underlying Fund, and may be more susceptible to losses because of these developments. A strategy used by the Underlying Funds may fail to produce the intended results.
Large Shareholder Transactions Risk — A Fund or an Underlying Fund may experience adverse effects when certain large shareholders, such as other funds, participating insurance companies, accounts and Goldman Sachs affiliates, purchase or redeem large amounts of shares of the Fund or an Underlying Fund. Such large shareholder redemptions, which may occur rapidly or unexpectedly, may cause a Fund or an Underlying Fund to sell portfolio securities at times when it would not otherwise do so, which may negatively impact a Fund’s or Underlying Fund’s NAV and liquidity. These transactions may also accelerate the
GOLDMAN SACHS VARIABLE INSURANCE TRUST MULTI-ASSET STRATEGIES FUNDS
9. OTHER RISK (continued)
realization of taxable income to shareholders if such sales of investments resulted in gains, and may also increase transaction costs. In addition, a large redemption could result in a Fund’s or Underlying Fund’s current expenses being allocated over a smaller asset base, leading to an increase in the Fund’s or Underlying Fund’s expense ratio. Similarly, large Fund or an Underlying Fund share purchases may adversely affect a Fund’s or Underlying Fund’s performance to the extent that the Fund or an Underlying Fund is delayed in investing new cash or otherwise maintains a larger cash position than it ordinarily would.
Liquidity Risk — A Fund or an Underlying Fund may make investments that are illiquid or that may become less liquid in response to market developments or adverse investor perceptions. Illiquid investments may be more difficult to value. Liquidity risk may also refer to the risk that a Fund or an Underlying Fund will not be able to pay redemption proceeds within the allowable time period or without significant dilution to remaining investors’ interests because of unusual market conditions, declining prices of the securities sold, an unusually high volume of redemption requests, or other reasons. To meet redemption requests, a Fund or an Underlying Fund may be forced to sell investments at an unfavorable time and/or under unfavorable conditions. If a Fund or an Underlying Fund is forced to sell securities at an unfavorable time and/or under unfavorable conditions, such sales may adversely affect the Fund’s or Underlying Fund’s NAV and dilute remaining investors’ interests. Liquidity risk may be the result of, among other things, the reduced number and capacity of traditional market participants to make a market in fixed income securities or the lack of an active market. The potential for liquidity risk may be magnified by a rising interest rate environment or other circumstances where investor redemptions from fixed income funds may be higher than normal, potentially causing increased supply in the market due to selling activity. These risks may be more pronounced in connection with the Funds’ investments in securities of issuers located in emerging market countries. Redemptions by large shareholders may have a negative impact on a Fund’s or Underlying Fund’s liquidity.
Market and Credit Risks — In the normal course of business, a Fund or an Underlying Fund trades financial instruments and enters into financial transactions where risk of potential loss exists due to changes in the market (market risk). The value of the securities in which a Fund or an Underlying Fund invests may go up or down in response to the prospects of individual companies, particular sectors or governments and/or general economic conditions throughout the world due to increasingly interconnected global economies and financial markets. Events such as war, military conflict, acts of terrorism, social unrest, natural disasters, recessions, inflation, rapid interest rate changes, supply chain disruptions, sanctions, the spread of infectious illness or other public health threats could also significantly impact a Fund and/or an Underlying Fund and their investments. Additionally, a Fund and/or an Underlying Fund may also be exposed to credit risk in the event that an issuer or guarantor fails to perform or that an institution or entity with which the Fund and the Underlying Fund has unsettled or open transactions defaults.
10. INDEMNIFICATIONS
Under the Trust’s organizational documents, its Trustees, officers, employees and agents are indemnified, to the extent permitted by the Act and state law, against certain liabilities that may arise out of performance of their duties to the Funds. Additionally, in the course of business, the Funds enter into contracts that contain a variety of indemnification clauses. The Funds’ maximum exposure under these arrangements is unknown, as this would involve future claims that may be made against the Funds that have not yet occurred. However, GSAM believes the risk of loss under these arrangements to be remote.
11. SUBSEQUENT EVENTS
Subsequent events after the Statements of Assets and Liabilities date have been evaluated, and GSAM has concluded that there is no impact requiring adjustment or disclosure in the financial statements.
GOLDMAN SACHS VARIABLE INSURANCE TRUST MULTI-ASSET STRATEGIES FUNDS
Notes to Financial Statements (continued)
June 30, 2023 (Unaudited)
12. SUMMARY OF SHARE TRANSACTIONS
Share activity is as follows:
| | | | | | | | | | | | | | | | |
| | | Multi-Strategy Alternatives Portfolio | |
| | | For the Six Months Ended
June 30, 2023
(Unaudited) | | | For the Fiscal Year Ended
December 31, 2022 | |
| | | Shares | | | Dollars | | | Shares | | | Dollars | |
| Institutional Shares | | | | | | | | | | | | | | | | |
| Shares sold | | | 6,683 | | | $ | 59,856 | | | | 27,388 | | | $ | 258,170 | |
| Reinvestment of distributions | | | — | | | | — | | | | 9,562 | | | | 84,430 | |
| Shares redeemed | | | (43,479 | ) | | | (385,957 | ) | | | (44,143 | ) | | | (411,218 | ) |
| | | | (36,796 | ) | | | (326,101 | ) | | | (7,193 | ) | | | (68,618 | ) |
| Service Shares | | | | | | | | | | | | | | | | |
| Shares sold | | | 298,109 | | | | 2,657,598 | | | | 7,434,585 | | | | 69,525,534 | |
| Reinvestment of distributions | | | — | | | | — | | | | 43,989 | | | | 388,859 | |
| Shares redeemed | | | (345,381 | ) | | | (3,115,639 | ) | | | (6,859,851 | ) | | | (62,785,354 | ) |
| | | | (47,272 | ) | | | (458,041 | ) | | | 618,723 | | | | 7,129,039 | |
| Advisor Share | | | | | | | | | | | | | | | | |
| Shares sold | | | 199,986 | | | | 1,780,587 | | | | 680,336 | | | | 6,255,009 | |
| Reinvestment of distributions | | | — | | | | — | | | | 91,792 | | | | 806,855 | |
| Shares redeemed | | | (240,858 | ) | | | (2,153,383 | ) | | | (240,786 | ) | | | (2,220,957 | ) |
| | | | (40,872 | ) | | | (372,796 | ) | | | 531,342 | | | | 4,840,907 | |
| | | | |
| NET INCREASE (DECREASE) | | | (124,940 | ) | | $ | (1,156,938 | ) | | | 1,142,872 | | | $ | 11,901,328 | |
| | | | | | | | | | | | | | | | |
| | | Trend Driven Allocation Fund | |
| | | For the Six Months Ended
June 30, 2023
(Unaudited) | | | For the Fiscal Year Ended
December 31, 2022 | |
| | | Shares | | | Dollars | | | Shares | | | Dollars | |
| Institutional Shares | | | | | | | | | | | | | | | | |
| Shares sold | | | 1,130 | | | $ | 12,091 | | | | 25,026 | | | $ | 296,816 | |
| Reinvestment of distributions | | | — | | | | — | | | | 1,959 | | | | 20,604 | |
| Shares redeemed | | | (12,758 | ) | | | (136,606 | ) | | | (2,759 | ) | | | (30,602 | ) |
| | | | (11,628 | ) | | | (124,515 | ) | | | 24,226 | | | | 286,818 | |
| Service Shares | | | | | | | | | | | | | | | | |
| Shares sold | | | 705,089 | | | | 7,444,015 | | | | 2,260,227 | | | | 25,627,391 | |
| Reinvestment of distributions | | | — | | | | — | | | | 1,041,319 | | | | 10,871,371 | |
| Shares redeemed | | | (1,851,284 | ) | | | (19,569,491 | ) | | | (4,360,235 | ) | | | (49,824,563 | ) |
| | | | (1,146,195 | ) | | | (12,125,476 | ) | | | (1,058,689 | ) | | | (13,325,801 | ) |
| | | | |
| NET INCREASE (DECREASE) | | | (1,157,823 | ) | | $ | (12,249,991 | ) | | | (1,034,463 | ) | | $ | (13,038,983 | ) |
GOLDMAN SACHS VARIABLE INSURANCE TRUST MULTI-ASSET STRATEGIES FUNDS
Statement Regarding Basis for Approval of Management Agreement (Unaudited)
Background
The Goldman Sachs Multi-Strategy Alternatives Portfolio and Goldman Sachs Trend Driven Allocation Fund (the “Funds”) are investment portfolios of Goldman Sachs Variable Insurance Trust (the “Trust”). The Board of Trustees oversees the management of the Trust and reviews the investment performance and expenses of the Funds at regularly scheduled meetings held throughout the year. In addition, the Board of Trustees determines annually whether to approve the continuance of the Trust’s investment management agreement (the “Management Agreement”) with Goldman Sachs Asset Management, L.P. (the “Investment Adviser”) on behalf of the Funds.
The Management Agreement was most recently approved for continuation until June 30, 2024 by the Board of Trustees, including those Trustees who are not parties to the Management Agreement or “interested persons” (as defined in the Investment Company Act of 1940, as amended) of any party thereto (the “Independent Trustees”), at a meeting held on June 13-14, 2023 (the “Annual Meeting”).
The review process undertaken by the Trustees spans the course of the year and culminates with the Annual Meeting. To assist the Trustees in their deliberations, the Trustees have established a Contract Review Committee (the “Committee”), comprised of the Independent Trustees. The Committee held two meetings over the course of the year since the Management Agreement was last approved. At those Committee meetings, regularly scheduled Board or other committee meetings, and/or the Annual Meeting, matters relevant to the renewal of the Management Agreement were considered by the Board, or the Independent Trustees, as applicable. With respect to each Fund, such matters included:
| | (a) | | the nature and quality of the advisory, administrative, and other services provided to the Fund and the underlying funds in which the Multi-Strategy Alternatives Portfolio invests (the “Underlying Funds”) by the Investment Adviser and its affiliates, including information about: |
| | (i) | | the structure, staff, and capabilities of the Investment Adviser and its portfolio management teams; |
| | (ii) | | the groups within the Investment Adviser and its affiliates that support the portfolio management teams or provide other types of necessary services, including fund services groups (e.g., accounting and financial reporting, tax, shareholder services, and operations); controls and risk management groups (e.g., legal, compliance, valuation oversight, credit risk management, internal audit, compliance testing, market risk analysis, finance, and central funding); sales and distribution support groups, and others (e.g., information technology and training); |
| | (iii) | | trends in employee headcount; |
| | (iv) | | the Investment Adviser’s financial resources and ability to hire and retain talented personnel and strengthen its operations; and |
| | (v) | | the parent company’s support of the Investment Adviser and its mutual fund business, as expressed by the firm’s senior management; |
| | (b) | | information on the investment performance of the Fund and Underlying Funds, including comparisons to the performance of similar mutual funds, as provided by a third-party mutual fund data provider engaged as part of the contract review process (the “Outside Data Provider”), and a benchmark performance index; and information on general investment outlooks in the markets in which the Fund and Underlying Funds invest; |
| | (c) | | information provided by the Investment Adviser indicating the Investment Adviser’s views on whether the Fund’s peer group and/or benchmark index had high, medium, or low relevance given the Fund’s particular investment strategy; |
| | (d) | | the terms of the Management Agreement and other agreements with affiliated service providers entered into by the Trust on behalf of the Fund; |
| | (e) | | fee and expense information for the Fund, including: |
| | (i) | | the relative management fee and expense levels of the Fund as compared to those of comparable funds managed by other advisers, as provided by the Outside Data Provider; |
| | (ii) | | the Fund’s expense trends over time; and |
| | (iii) | | to the extent the Investment Adviser manages other types of accounts (such as bank collective trusts, private wealth management accounts, institutional separate accounts, sub-advised mutual funds, and non-U.S. funds) having investment objectives and policies similar to those of the Fund, comparative information on the advisory fees charged and services provided to those accounts by the Investment Adviser; |
| | (f) | | with respect to the extensive investment performance and expense comparison data provided by the Outside Data Provider, its processes in producing that data for the Fund; |
| | (g) | | the undertakings of the Investment Adviser and its affiliates to implement fee waivers and/or expense limitations; |
| | (h) | | information relating to the profitability of the Management Agreement and the transfer agency and distribution and service arrangements of the Fund to the Investment Adviser and its affiliates; |
GOLDMAN SACHS VARIABLE INSURANCE TRUST MULTI-ASSET STRATEGIES FUNDS
Statement Regarding Basis for Approval of Management Agreement (Unaudited) (continued)
| | (i) | | whether the Fund’s existing management fee schedule, together with the management fee schedules of the Underlying Funds, adequately addressed any economies of scale; |
| | (j) | | a summary of the “fall-out” benefits derived by the Investment Adviser and its affiliates from their relationships with the Fund and/or the Underlying Funds, including the fees received by the Investment Adviser’s affiliates from the Fund and/or the Underlying Funds for transfer agency, securities lending, portfolio trading, distribution and other services, as applicable; |
| | (k) | | a summary of potential benefits derived by the Fund and/or the Underlying Funds as a result of its relationship with the Investment Adviser; |
| | (l) | | information regarding commissions paid by the Fund and/or the Underlying Funds and broker oversight, an update on the Investment Adviser’s soft dollars practices, other information regarding portfolio trading, and how the Investment Adviser carries out its duty to seek best execution; |
| | (m) | | the manner in which portfolio manager compensation is determined; and the number and types of accounts managed by the portfolio managers; |
| | (n) | | the nature and quality of the services provided to the Fund and the Underlying Funds by its unaffiliated service providers, and the Investment Adviser’s general oversight and evaluation (including reports on due diligence) of those service providers as part of the administrative services provided under the Management Agreement; and |
| | (o) | | the Investment Adviser’s processes and policies addressing various types of potential conflicts of interest; its approach to risk management; the annual review of the effectiveness of the Fund’s compliance program; and periodic compliance reports. |
The Trustees also received an overview of the Funds’ distribution arrangements. They received information regarding the Funds’ assets, share purchase and redemption activity, and payment of distribution and service fees, as applicable. Information was also provided to the Trustees relating to revenue sharing payments made by and services provided by the Investment Adviser and its affiliates to intermediaries that promote the sale, distribution, and/or servicing of Fund shares. The Independent Trustees also discussed the broad range of other investment choices that are available to Fund investors, including the availability of comparable funds managed by other advisers.
The presentations made at the Board and Committee meetings and at the Annual Meeting encompassed the Funds and other mutual funds for which the Board of Trustees has responsibility. In evaluating the Management Agreement at the Annual Meeting, the Trustees relied upon their knowledge, resulting from their meetings and other interactions throughout the year, of the Investment Adviser and its affiliates, their services, and the Funds. In conjunction with these meetings, the Trustees received written materials and oral presentations on the topics covered, and the Investment Adviser addressed the questions and concerns of the Trustees, including concerns regarding the investment performance of certain of the funds they oversee. The Independent Trustees were advised by their independent legal counsel regarding their responsibilities and other regulatory requirements related to the approval and continuation of mutual fund investment management agreements under applicable law. In addition, the Investment Adviser and its affiliates provided the Independent Trustees with a written response to a formal request for information sent on behalf of the Independent Trustees by their independent legal counsel. During the course of their deliberations, the Independent Trustees met in executive sessions with their independent legal counsel, without representatives of the Investment Adviser or its affiliates present.
Nature, Extent, and Quality of the Services Provided Under the Management Agreement
As part of their review, the Trustees considered the nature, extent, and quality of the services provided to the Funds and the Underlying Funds by the Investment Adviser. In this regard, the Trustees considered both the investment advisory services and non-advisory services that are provided by the Investment Adviser and its affiliates. The Trustees noted the transition in the leadership and changes in personnel of various of the Investment Adviser’s portfolio management teams that had occurred in recent periods, and the ongoing recruitment efforts aimed at bringing high quality investment talent to the Investment Adviser. They also noted the Investment Adviser’s commitment to maintaining high quality systems and expending substantial resources to respond to ongoing changes to the market, regulatory and control environment in which the Funds, the Underlying Funds, and their service providers operate, including developments associated with the COVID-19 pandemic, geopolitical events, and economic sanctions, as well as the efforts of the Investment Adviser and its affiliates to combat cyber security risks. The Trustees also considered information regarding the Investment Adviser’s business continuity planning and remote operations capabilities. The Trustees concluded that the Investment Adviser continued to commit substantial financial and operational resources to the Funds and expressed confidence that the Investment Adviser would continue to do so in the future. The Trustees also recognized that the Investment Adviser had made significant commitments to address regulatory compliance requirements applicable to the Funds, the Underlying Funds, and the Investment Adviser and its affiliates.
GOLDMAN SACHS VARIABLE INSURANCE TRUST MULTI-ASSET STRATEGIES FUNDS
Statement Regarding Basis for Approval of Management Agreement (Unaudited) (continued)
Investment Performance
The Trustees also considered the investment performance of the Funds and the Underlying Funds. In this regard, they compared the investment performance of each Fund to its peers using rankings and ratings compiled by the Outside Data Provider as of December 31, 2022, and updated performance information prepared by the Investment Adviser using the peer group identified by the Outside Data Provider as of March 31, 2023. The information on each Fund’s investment performance was provided for the one-, three-, and five-year periods ending on the applicable dates. The Trustees also reviewed each Fund’s investment performance relative to its performance benchmark. As part of this review, they considered the investment performance trends of the Funds over time, and reviewed the investment performance of each Fund in light of its investment objective and policies and market conditions.
In addition, the Trustees considered materials prepared and presentations made by the Investment Adviser’s senior management and portfolio management personnel in which Fund performance was assessed. The Trustees also considered the Investment Adviser’s periodic reports with respect to the Funds’ and the Underlying Funds’ risk profiles, and how the Investment Adviser’s approach to risk monitoring and management influences portfolio management. For the Trend Driven Allocation Fund, they noted the efforts of the Fund’s portfolio management team to continue to enhance the investment models used in managing the Fund.
The Trustees observed that the Trend Driven Allocation Fund’s Institutional Shares had placed in the third quartile of the Fund’s peer group for the one-, five- and ten-year periods, and in the fourth quartile for the three-year period, and had underperformed the Fund’s benchmark index for the one-, three-, and five-year periods ended March 31, 2023. They noted that the Fund had underperformed the average performance of a group of competitor funds, as determined by the Investment Adviser, for the one-, three-, and five-year periods ended December 31, 2022. The Trustees also observed that in December 2021 the Fund had been repositioned from the Global Trends Allocation Fund, which involved changes to the Fund’s investment strategy and name, and that in April 2015 the Fund had been repositioned from the Global Markets Navigator Fund, which involved changes to the Fund’s investment objective, investment strategy, and benchmark. They further noted that the Fund had experienced certain portfolio management changes in 2022.
The Trustees observed that the Multi-Strategy Alternatives Portfolio’s Institutional Shares had placed in the top half of the Fund’s peer group for the five-year period, in the third quartile for three-year period, and in the fourth quartile for the one-year period, and had outperformed the Fund’s benchmark index for the three- and five-year periods and underperformed the one-year period ended March 31, 2023. They noted that the Multi-Strategy Alternatives Portfolio had experienced certain portfolio management changes in early 2022 and a benchmark index change in 2021.
Costs of Services Provided and Competitive Information
The Trustees considered the contractual terms of the Management Agreement and the fee rates payable by each Fund thereunder. In this regard, the Trustees considered information on the services rendered by the Investment Adviser to the Funds, which included both advisory and administrative services that were directed to the needs and operations of the Funds as registered mutual funds.
In particular, the Trustees reviewed analyses prepared by the Outside Data Provider regarding the expense rankings of the Funds. The analyses provided a comparison of each Fund’s management fee and (in the case of the Trend Driven Allocation Fund) breakpoints to those of a relevant peer group and category universe; an expense analysis which compared each Fund’s overall net and gross expenses to a peer group and a category universe; and data comparing each Fund’s net expenses to the peer and category medians. The analyses also compared each Fund’s other expenses and fee waivers/reimbursements to those of the peer group and category medians. The Trustees concluded that the comparisons provided by the Outside Data Provider were useful in evaluating the reasonableness of the management fees and total expenses paid by the Funds.
In addition, the Trustees considered the Investment Adviser’s undertakings to implement fee waivers and/or expense limitations with respect to the Funds and the Underlying Funds. They also considered, to the extent that the Investment Adviser manages other types of accounts having investment objectives and policies similar to those of the Funds, comparative fee information for services provided by the Investment Adviser to those accounts, and information that indicated that services provided to the Funds differed in various significant respects from the services provided to other types of accounts which, in many cases, operated under less stringent legal and regulatory structures, required fewer services from the Investment Adviser to a smaller number of client contact points, and were less time-intensive.
In addition, the Trustees noted that shareholders are able to redeem their shares at any time if shareholders believe that the Fund fees and expenses are too high or if they are dissatisfied with the performance of the Fund.
GOLDMAN SACHS VARIABLE INSURANCE TRUST MULTI-ASSET STRATEGIES FUNDS
Statement Regarding Basis for Approval of Management Agreement (Unaudited) (continued)
Profitability
The Trustees reviewed each Fund’s contribution to the Investment Adviser’s revenues and pre-tax profit margins. In this regard the Trustees noted that they had received, among other things, profitability analyses and summaries, revenue and expense schedules by Fund and by function (i.e., investment management, transfer agency and distribution and service), and information on the Investment Adviser’s expense allocation methodology. They observed that the profitability and expense figures are substantially similar to those used by the Investment Adviser for many internal purposes, including compensation decisions among various business groups, and are thus subject to a vigorous internal debate about how certain revenue and expenses should be allocated. The Trustees also noted that the internal audit group within the Goldman Sachs organization periodically audits the expense allocation methodology and that the internal audit group was satisfied with the reasonableness, consistency, and accuracy of the Investment Adviser’s expense allocation methodology. Profitability data for each Fund was provided for 2022 and 2021, and the Trustees considered this information in relation to the Investment Adviser’s overall profitability.
Economies of Scale
The Trustees considered the information that had been provided regarding whether there have been economies of scale with respect to the management of the Funds. For the Trend Driven Allocation Fund, the Trustees also considered the breakpoints in the fee rate payable under the Management Agreement for the Fund at the following annual percentage rates of the average daily net assets of the Fund:
| | | | |
| |
| First $1 billion | | | 0.79 | % |
| |
| Next $1 billion | | | 0.71 | |
| |
| Next $3 billion | | | 0.68 | |
| |
| Next $3 billion | | | 0.66 | |
| |
| Over $8 billion | | | 0.65 | |
The Trustees noted that the breakpoints were designed to share potential economies of scale, if any, with the Trend Driven Allocation Fund and its shareholders as assets under management reach those asset levels. The Trustees considered the amounts of assets in the Trend Driven Allocation Fund; the Fund’s recent share purchase and redemption activity; the information provided by the Investment Adviser relating to the costs of the services provided by the Investment Adviser and its affiliates and their realized profits; information comparing fee rates charged by the Investment Adviser with fee rates charged to other funds in the peer group; and the Investment Adviser’s undertakings to waive a portion of its management fee and to limit certain expenses of the Funds that exceed specified levels. Upon reviewing these matters at the Annual Meeting, the Trustees concluded that the fee breakpoints represented a means of assuring that benefits of scalability, if any, would be passed along to shareholders at the specified asset levels.
For the Multi-Strategy Alternatives Portfolio, the Trustees noted that, although the Fund itself does not have breakpoints in its management fee schedule, any benefits of the breakpoints in the management fee schedules of certain Underlying Funds, when reached, would pass through to the shareholders in the Fund at the specified asset levels. The Trustees considered the amount of assets in the Multi-Strategy Alternatives Portfolio; the Fund’s recent purchase and redemption activity; the information provided by the Investment Adviser relating to the costs of the services provided by the Investment Adviser and its affiliates and the profits realized by them; information comparing the fee rates charged by the Investment Adviser with fee rates charged to other funds in the peer groups; and the Investment Adviser’s undertaking to limit certain expenses of the Fund and Underlying Funds that exceed specified levels. They also considered the services provided to the Multi-Strategy Alternatives Portfolio under the Management Agreement and the fees and expenses borne by the Underlying Funds and considered the Investment Adviser’s finding that the management fees payable by the Fund were not duplicative of the management fees paid at the Underlying Fund level.
Other Benefits to the Investment Adviser and Its Affiliates
The Trustees also considered the other benefits derived by the Investment Adviser and its affiliates from their relationships with the Funds and/or the Underlying Funds as stated above, including: (a) transfer agency fees received by Goldman Sachs & Co. LLC (“Goldman Sachs”); (b) brokerage and futures commissions earned by Goldman Sachs for executing securities and futures transactions on behalf of the Funds and certain Underlying Funds; (c) research received by the Investment Adviser from broker-dealers in exchange for executing certain transactions on behalf of certain Underlying Funds; (d) trading efficiencies resulting from aggregation of orders of the Funds or Underlying Funds with those for other funds or accounts managed by the Investment Adviser; (e) fees earned by Goldman Sachs Agency Lending (“GSAL”), an affiliate of the Investment Adviser, as securities lending agent for the Trend Driven Allocation Fund and certain Underlying Funds (and fees earned by the Investment Adviser for managing the
GOLDMAN SACHS VARIABLE INSURANCE TRUST MULTI-ASSET STRATEGIES FUNDS
Statement Regarding Basis for Approval of Management Agreement (Unaudited) (continued)
fund in which the Funds’ and those Underlying Funds’ securities lending cash collateral is invested); (f) the Investment Adviser’s ability to leverage the infrastructure designed to service the Funds on behalf of its other clients; (g) the Investment Adviser’s ability to cross-market other products and services to Fund shareholders; (h) Goldman Sachs’ retention of certain fees as Fund Distributor; (i) the Investment Adviser’s ability to negotiate better pricing with custodians on behalf of its other clients, as a result of the relationship with the Funds and the Underlying Funds; (j) the investment of cash and cash collateral in money market funds managed by the Investment Adviser that will result in increased assets under management for those money market funds; (k) the investment in exchange-traded funds (“ETFs”) managed by the Investment Adviser that will result in increased assets under management for those ETFs and may facilitate the development of the Investment Adviser’s ETF advisory business; and (l) the possibility that the working relationship between the Investment Adviser and the Funds’ and the Underlying Funds’ third-party service providers may cause those service providers to be more likely to do business with other areas of Goldman Sachs. In the course of considering the foregoing, the Independent Trustees requested and received further information quantifying certain of these fall-out benefits.
Other Benefits to the Funds and Their Shareholders
The Trustees also noted that the Funds and/or the Underlying Funds (as applicable) receive certain other potential benefits as a result of their relationship with the Investment Adviser, including: (a) trading efficiencies resulting from aggregation of orders of the Funds with those of other funds or accounts managed by the Investment Adviser; (b) enhanced servicing from vendors due to the volume of business generated by the Investment Adviser and its affiliates; (c) enhanced servicing from broker-dealers due to the volume of business generated by the Investment Adviser and its affiliates; (d) the Investment Adviser’s ability to negotiate favorable terms with derivatives counterparties on behalf of the Funds and the Underlying Funds as a result of the size and reputation of the Goldman Sachs organization; (e) the advantages received from the Investment Adviser’s knowledge and experience gained from managing other accounts and products; (f) the Investment Adviser’s ability to hire and retain qualified personnel to provide services to the Funds and the Underlying Funds because of the reputation of the Goldman Sachs organization; (g) the Funds’ and Underlying Funds’ access, through the Investment Adviser, to certain firm-wide resources (e.g., proprietary risk management systems and databases), subject to certain restrictions; (h) the Trend Driven Allocation Fund’s and certain Underlying Funds’ ability to participate in the securities lending program administered by GSAL, as measured by the revenue received by the Funds in connection with the program; and (i) the Funds’ access to certain affiliated distribution channels. In addition, the Trustees noted the competitive nature of the mutual fund marketplace, and considered that many of the Funds’ shareholders invested in the Funds in part because of the Funds’ relationship with the Investment Adviser and that those shareholders have a general expectation that the relationship will continue.
Conclusion
In connection with their consideration of the Management Agreement, the Trustees gave weight to each of the factors described above, but did not identify any particular factor as controlling their decision. After deliberation and consideration of all of the information provided, including the factors described above, the Trustees concluded, in the exercise of their business judgment, that the management fees paid by each of the Funds were reasonable in light of the services provided to it by the Investment Adviser, the Investment Adviser’s costs and each Fund’s current and reasonably foreseeable asset levels. The Trustees unanimously concluded that the Investment Adviser’s continued management likely would benefit each Fund and its shareholders and that the Management Agreement should be approved and continued with respect to each Fund until June 30, 2024.
GOLDMAN SACHS VARIABLE INSURANCE TRUST MULTI-ASSET STRATEGIES FUNDS
Liquidity Risk Management Program (Unaudited)
Each Fund has adopted and implemented a liquidity risk management program (the “Program”) in accordance with Rule 22e-4 under the 1940 Act. The Program seeks to assess and manage each Fund’s liquidity risk, i.e., the risk that a Fund is unable to satisfy redemption requests without significantly diluting remaining investors’ interests in the Fund. The Board of Trustees of the Trust has designated GSAM, each Fund’s investment adviser, to administer the Program. Certain aspects of the Program rely on third parties to perform certain functions, including the provision of market data and application of models.
The Program is comprised of various components designed to support the assessment and/or management of liquidity risk, including: (1) the periodic assessment (no less frequently than annually) of certain factors that influence a Fund’s liquidity risk; (2) the periodic classification (no less frequently than monthly) of a Fund’s investments into one of four liquidity categories that reflect an estimate of their liquidity under current market conditions; (3) a 15% limit on the acquisition of “illiquid investments” (as defined under Rule 22e-4); (4) for a Fund that does not invest primarily in “highly liquid investments” (as defined under Rule 22e-4), the determination of a minimum percentage of the Fund’s assets that will generally be invested in highly liquid investments (a “Highly Liquid Investment Minimum”); and (5) periodic reporting to the Board of Trustees.
At a meeting of the Board of Trustees on February 14-15, 2023, GSAM provided a written report to the Board addressing the operation, and the adequacy and effectiveness of the implementation, of the Program, including, as applicable, the operation of any Highly Liquid Investment Minimum and any material changes to the Program, for the period from January 1, 2022 through December 31, 2022 (the “Reporting Period”). Among other things, the annual report discussed: (1) the results of stress tests designed to assess liquidity under a hypothetical stressed scenario involving elevated redemptions; (2) an assessment of the methodologies used to classify investments into one of four liquidity categories; (3) the impact of local holidays in non-U.S. jurisdictions; and (4) the impact of geopolitical, market and economic developments and events on liquidity and liquidity risk. The report concluded that the Program continues to be reasonably designed to assess and manage liquidity risk and was adequately and effectively implemented during the Reporting Period.
There can be no assurance that the Program will achieve its objectives under all circumstances in the future. Please refer to your Fund’s prospectus for more information regarding the Fund’s exposure to liquidity risk and other risks to which it may be subject.
GOLDMAN SACHS VARIABLE INSURANCE TRUST MULTI-ASSET STRATEGIES FUNDS
| | |
| Fund Expenses — Six Month Period Ended June 30, 2023 (Unaudited) | | |
As a shareholder of Institutional, Service or Advisor Shares of the Funds, you incur ongoing costs, including management fees, distribution and/or service (12b-1) fees (with respect to Service and Advisor Shares) and other Fund expenses. This example is intended to help you understand your ongoing costs (in dollars) of investing in the Institutional Shares, Service Shares and Advisor Shares of the Funds and to compare these costs with the ongoing costs of investing in other mutual funds.
The example is based on an investment of $1,000 invested at the beginning of the period and held for the entire period from January 1, 2023 through June 30, 2023, which represents a period of 181 days of a 365 day year.
Actual Expenses — The first line under each share class in the table below provides information about actual account values and actual expenses. You may use the information in this line, together with the amount you invested, to estimate the expenses that you paid over the period. Simply divide your account value by $1,000 (for example, an $8,600 account value divided by $1,000=8.6), then multiply the result by the number in the first line under the heading entitled “Expenses Paid” to estimate the expenses you paid on your account during this period.
Hypothetical Example for Comparison Purposes — The second line under each share class in the table below provides information about hypothetical account values and hypothetical expenses based on the Funds’ actual net expense ratio and an assumed rate of return of 5% per year before expenses, which is not the Funds’ actual return. The hypothetical account values and expenses may not be used to estimate the actual ending account balance or expenses you paid for the period. You may use this information to compare the ongoing costs of investing in the Funds and other funds. To do so, compare this 5% hypothetical example with the 5% hypothetical examples that appear in the shareholder reports of the other funds.
Please note that the expenses shown in the table are meant to highlight your ongoing costs only. As a shareholder of the Funds you do not incur any transaction costs, such as sales charges, redemption fees, or exchange fees, but shareholders of other funds may incur such costs. The second line of the table is useful in comparing ongoing costs only and will not help you determine the relative total costs of owning different funds whose shareholders may incur transaction costs.
| | | | | | | | | | | | | | | | | | | | | | | | |
| | | Multi-Strategy Alternatives Portfolio | | | Trend Driven Allocation Fund | |
| Share Class | | Beginning
Account
Value
1/1/23 | | | Ending
Account
Value
6/30/23 | | | Expenses
Paid for the
6 months
ended
6/30/23* | | | Beginning
Account
Value
1/1/23 | | | Ending
Account
Value
6/30/23 | | | Expenses
Paid for the
6 months
ended
6/30/23* | |
| Institutional | | | | | | | | | | | | | | | | | | | | | | | | |
| | | | | | | |
Actual | | $ | 1,000.00 | | | $ | 1,034.05 | | | $ | 1.07 | | | $ | 1,000.00 | | | $ | 1,111.33 | | | $ | 3.47 | |
Hypothetical 5% return | | | 1,000.00 | | | | 1,023.74 | + | | | 1.07 | | | | 1,000.00 | | | | 1,021.51 | + | | | 3.32 | |
| Service | | | | | | | | | | | | | | | | | | | | | | | | |
| | | | | | | |
Actual | | | 1,000.00 | | | | 1,034.05 | | | | 2.33 | | | | 1,000.00 | | | | 1,109.11 | | | | 4.77 | |
Hypothetical 5% return | | | 1,000.00 | | | | 1,022.50 | + | | | 2.32 | | | | 1,000.00 | | | | 1,020.27 | + | | | 4.57 | |
| Advisor | | | | | | | | | | | | | | | | | | | | | | | | |
| | | | | | | |
Actual | | | 1,000.00 | | | | 1,031.93 | | | | 3.09 | | | | N/A | | | | N/A | | | | N/A | |
Hypothetical 5% return | | | 1,000.00 | | | | 1,021.76 | + | | | 3.07 | | | | N/A | | | | N/A | | | | N/A | |
| | + | Hypothetical expenses are based on each Fund’s actual annualized net expense ratios and an assumed rate of return of 5% per year before expenses. | |
| | * | Expenses are calculated using each Fund’s annualized net expense ratio for each class, which represents the ongoing expenses as a percentage of net assets for the six months ended June 30, 2023. Expenses are calculated by multiplying the annualized net expense ratio by the average account value for the period; then multiplying the result by the number of days in the most recent fiscal half year; and then dividing that result by the number of days in the fiscal year. The annualized net expense ratios for the period were as follows: | |
| | | | | | | | | | | | |
| | | |
Fund | | Institutional
Shares | | | Service
Shares | | | Advisor
Shares | |
Multi-Strategy Alternatives Portfolio | | | 0.21 | % | | | 0.46 | % | | | 0.61 | % |
Trend Driven Allocation Fund | | | 0.66 | | | | 0.91 | | | | N/A | |
39
| | |
TRUSTEES | | OFFICERS |
Gregory G. Weaver, Chair | | James A. McNamara, President |
Dwight L. Bush | | Joseph F. DiMaria, Principal Financial Officer, Principal Accounting Officer and Treasurer Caroline L. Kraus, Secretary |
Kathryn A. Cassidy |
John G. Chou |
Joaquin Delgado |
Eileen H. Dowling |
James A. McNamara | | |
Paul C. Wirth | | |
GOLDMAN SACHS & CO. LLC
Distributor and Transfer Agent
GOLDMAN SACHS ASSET MANAGEMENT, L.P.
Investment Adviser
200 West Street, New York,
New York 10282
Visit our web site at www.GSAMFUNDS.com to obtain the most recent month-end returns.
The reports concerning the Funds included in this shareholder report may contain certain forward-looking statements about the factors that may affect the performance of the Funds in the future. These statements are based on Funds management’s predictions and expectations concerning certain future events and their expected impact on the Funds, such as performance of the economy as a whole and of specific industry sectors, changes in the levels of interest rates, the impact of developing world events, and other factors that may influence the future performance of the Funds. Management believes these forward-looking statements to be reasonable, although they are inherently uncertain and difficult to predict. Actual events may cause adjustments in portfolio management strategies from those currently expected to be employed.
A description of the policies and procedures that the Funds uses to determine how to vote proxies relating to portfolio securities and information regarding how the Funds voted proxies relating to portfolio securities for the 12-month period ended June 30 is available (i) without charge, upon request by calling 1-800-621-2550; and (ii) on the Securities and Exchange Commission (“SEC”) web site at http://www.sec.gov.
The Funds will file portfolio holdings information for each month in a fiscal quarter within 60 days after the end of the relevant fiscal quarter on Form N-PORT. Portfolio holdings information for the third month of each fiscal quarter will be made available on the SEC’s web site at http://www.sec.gov. Portfolio holdings information may be obtained upon request and without charge by calling 1-800-526-7384 (for Retail Shareholders) or 1-800-621-2550 (for Institutional Shareholders).
Views and opinions expressed are for informational purposes only and do not constitute a recommendation by GSAM to buy, sell, or hold any security. Views and opinions are current as of the date of this presentation and may be subject to change, they should not be construed as investment advice.
Goldman Sachs & Co. LLC (“Goldman Sachs”) does not provide legal, tax or accounting advice. Any statement contained in this communication (including any attachments) concerning U.S. tax matters was not intended or written to be used, and cannot be used, for the purpose of avoiding penalties under the Internal Revenue Code, and was written to support the promotion or marketing of transactions or matters addressed. Clients of Goldman Sachs should obtain their own independent tax advice based on their particular circumstances.
The website links provided are for your convenience only and are not an endorsement or recommendation by GSAM of any of these websites or the products or services offered. GSAM is not responsible for the accuracy and validity of the content of these websites.
Funds holdings and allocations shown are as of June 30, 2023 and may not be representative of future investments. Funds holdings should not be relied on in making investment decisions and should not be construed as research or investment advice regarding particular securities. Current and future holdings are subject to risk.
References to indices, benchmarks or other measures of relative market performance over a specified period of time are provided for your information only and do not imply that the portfolio will achieve similar results. The index composition may not reflect the manner in which a portfolio is constructed. While an adviser seeks to design a portfolio which reflects appropriate risk and return features, portfolio characteristics may deviate from those of the benchmark.
The Global Industry Classification Standard (“GICS”) was developed by and is the exclusive property and a service mark of Morgan Stanley Capital International Inc. (“MSCI”) and Standard & Poor’s, a division of The McGraw-Hill Companies, Inc. (“S&P”) and is licensed for use by Goldman Sachs. Neither MSCI, S&P nor any other party involved in making or compiling the GICS or any GICS classifications makes any express or implied warranties or representations with respect to such standard or classification (or the results to be obtained by the use thereof), and all such parties hereby expressly disclaim all warranties of originality, accuracy, completeness, merchantability or fitness for a particular purpose with respect to any of such standard or classification. Without limiting any of the foregoing, in no event shall MSCI, S&P, any of their affiliates or any third party involved in making or compiling the GICS or any GICS classifications have any liability for any direct, indirect, special, punitive, consequential or any other damages (including lost profits) even if notified of the possibility of such damages.
The portfolio risk management process includes an effort to monitor and manage risk, but does not imply low risk.
Shares of the Goldman Sachs VIT Funds are offered to separate accounts of participating life insurance companies for the purpose of funding variable annuity contracts and variable life insurance policies. Shares of the Funds are not offered directly to the general public. The variable annuity contracts and variable life insurance policies are described in the separate prospectuses issued by participating insurance companies. You should refer to those prospectuses for information about surrender charges, mortality and expense risk fees and other charges that may be assessed by participating insurance companies under the variable annuity contracts or variable life insurance policies. Such fees or charges, if any, may affect the return you may realize with respect to your investments. Ask your representative for more complete information. Please consider a Fund’s objectives, risks and charges and expenses, and read the prospectus carefully before investing. The prospectus contains this and other information about the Funds.
This material is not authorized for distribution to prospective investors unless preceded or accompanied by a current prospectus or summary prospectus, if applicable. Investors should consider the Funds’ objective, risks, and charges and expenses, and read the summary prospectus, if available, and/or the prospectus carefully before investing or sending money. The summary prospectus, if available, and the prospectus contain this and other information about the Funds and may be obtained from your authorized dealer or from Goldman Sachs & Co. LLC by calling 1-800-621-2550.
This report is prepared for the general information of contract owners and is not an offer of shares of the Goldman Sachs Variable Insurance Trust — Goldman Sachs Multi-Strategy Alternatives Portfolio and Trend Driven Allocation Fund.
© 2023 Goldman Sachs. All rights reserved.
VITFOFSAR-23 330605-OTU-08/2023
Goldman
Sachs Variable Insurance Trust
Goldman Sachs Government
Money Market Fund
Semi-Annual Report
June 30, 2023

Goldman Sachs Government Money Market Fund
You could lose money by investing in the Fund. Although the Fund seeks to preserve the value of your investment at $1.00 per share, it cannot guarantee it will do so. An investment in the Fund is not a deposit of the bank and is not insured or guaranteed by the Federal Deposit Insurance Corporation or any other government agency. The Fund’s sponsor has no legal obligation to provide financial support to the Fund, and you should not expect that the sponsor will provide financial support to the Fund at any time.
MARKET REVIEW
Goldman Sachs VIT Government Money Market Fund
The following are highlights both of key factors affecting the money markets and of any key changes made to the Goldman Sachs VIT Government Money Market Fund (the “Fund”) during the six months ended June 30, 2023 (the “Reporting Period”). A fuller review will appear in the Fund’s annual shareholder report covering the 12 months ended December 31, 2023.
Market and Economic Review
| • | | U.S. Federal Reserve (“Fed”) policy had the greatest influence on the money markets during the Reporting Period. |
| • | | When the Reporting Period began in January 2023, money market yields rallied on prospects of the Fed nearing an end to its interest rate hiking cycle given evidence of reduced U.S. inflation levels and improved economic growth prospects. |
| | • | | Two-year U.S. Treasury yields fell by approximately 20 basis points in January. (Remember, there is usually an inverse relationship between bond prices and yield movements, so that bond prices rise when yields decrease and vice versa. A basis point is 1/100th of a percentage point.) |
| | • | | Money market volatility moderated amid a “Goldilocks” backdrop of easing inflation and rather steady economic growth and in anticipation of a slower pace of monetary policy tightening. |
| • | | In February 2023, this “Goldilocks” scenario was interrupted by strength in economic growth and labor market data, which, in turn, generated higher yield volatility as markets anticipated a bumpier path to lowered inflation and a higher-for-longer interest rate environment. |
| | • | | The Fed stepped down its pace of interest rate increases from the 50 basis points it had hiked in December 2022 to 25 basis points, with Fed Chair Powell suggesting further rate hikes would be determined meeting by meeting. |
| | • | | Still, money market yields sold off as concerns around the persistence of inflation led many market participants to anticipate further rate tightening by the Fed. |
| | • | | Two-year U.S. Treasury yields rose to a high of 4.8% to end the month. |
| • | | In early March 2023, amid strong U.S. economic data, the Fed initially suggested it might tighten monetary policy more than it had previously anticipated, which caused two-year U.S. Treasury yields to breach 5% for the first time since 2007. |
| | • | | However, yield momentum reversed sharply as the month progressed as investors sought “safe haven” securities amid banking stress in the U.S. and internationally. Short-term U.S. Treasury yields fell by more than 100 basis points from their cycle peak earlier in the month. |
| | • | | At its late-March meeting, Fed policymakers grappled with a challenging trade-off given the firm macroeconomic backdrop, such as resilient labor markets, and yet still-elevated inflation—all set against rising financial stability concerns. Ultimately, the Fed implemented another 25 basis point interest rate hike, projected a weak economic outlook for the rest of 2023, and struck a more cautious tone on the forward path for the targeted federal funds (“fed funds”) rate. |
| • | | Although money market yields remained broadly unchanged during April 2023, sticky inflation data, ongoing banking sector stress, a looming U.S. debt ceiling deadline, signs of moderating economic growth and lingering investor concerns around credit tightening drove volatile swings within the money markets. |
| • | | In early May 2023, the Fed raised the fed funds rate by 25 basis points to a range between 5.00% and 5.25%. |
| | • | | Policymakers signaled a willingness to pause future interest rate hikes given that inflation had begun to moderate and because tighter credit conditions driven by banking sector stress were “likely to weigh on economic activity, hiring and inflation.” |
| | • | | Money market yields sold off in May on concerns surrounding resolution of the U.S. debt ceiling and amid banking sector stress. U.S./China tensions, speculation about Fed policy, corporate earnings and a growing focus on the rise of artificial intelligence (“AI”) also drove market volatility. |
MARKET REVIEW
| • | | In early June 2023, resolution of U.S. debt ceiling negotiations led to risk relief and market optimism, with investor focus returning to the outlook of the economy and Fed monetary policy amid a persistently resilient U.S. labor market. |
| | • | | At its June meeting, the Fed left the target range for the fed funds rate unchanged, but Fed officials suggested they were inclined to implement another interest rate hike in July 2023 if economic activity and inflation did not cool as much as they “need to see.” |
| | • | | Fed Chair Powell noted the resilience in U.S. housing data and stated that a strong majority of Fed officials expected “two or more hikes” from that point — a sharpening of his language relative to “somewhat further” in his Congressional testimony given that same month. |
| • | | The money market yield curve inverted during the Reporting Period, as the Fed raised short-term interest rates, meaning shorter-maturity yields were higher than longer-maturity yields. The three-month node of the U.S. Treasury yield curve rose 90 basis points during the Reporting Period; the six-month node rose 70 basis points; and the one-year node rose 68 basis points. Two-year U.S. Treasury yields increased 47 basis points during the Reporting Period to close June 2023 at 4.87%. |
| • | | In this environment, the yields of money market funds increased. |
Fund Changes and Highlights
No material changes were made to the Fund during the Reporting Period.
FUND BASICS
Government Money Market Fund
as of June 30, 2023
PERFORMANCE REVIEW1
| | | | | | | | | | | | |
| | | |
| January 1, 2023 – June 30, 2023 | | Fund Total Return (based on NAV)2 | | | SEC 7-Day
Current Yield3 | | | iMoneyNet Institutional
Average4 | |
| Institutional Shares | | | 2.33 | % | | | 5.00 | % | | | 4.45 | % |
| Service Shares | | | 2.21 | | | | 4.75 | | | | 4.45 | |
The returns represent past performance. Past performance does not guarantee future results. The Fund’s investment returns will fluctuate. Current performance may be lower or higher than the performance quoted above. Please visit our web site at www.GSAMFUNDS.com to obtain the most recent month-end returns. Performance reflects applicable fee waivers and/or expense limitations in effect during the periods shown. In their absence, performance would be reduced. Returns do not reflect the deduction of taxes that a shareholder would pay on Fund distributions or the redemption of Fund shares.
| 1 | The investment adviser may contractually agree to waive or reimburse certain fees and expenses until a specified date. The investment adviser may also voluntarily waive certain fees and expenses, and such voluntary waivers may be discontinued or modified at any time without notice. The performance shown above reflects any waivers or reimbursements that were in effect for all or a portion of the periods shown. When waivers or reimbursements are in place, the Fund’s operating expenses are reduced and the Fund’s yield and total returns to the shareholder are increased. |
| 2 | The net asset value (NAV) represents the net assets of the class of the Fund (ex-dividend) divided by the total number of shares of the class outstanding. The Fund’s total return reflects the reinvestment of dividends and other distributions. |
| 3 | The SEC 7-Day Current Yield is calculated in accordance with securities industry regulations and does not include net capital gains. SEC 7-Day Current Yield may differ slightly from the actual distribution rate of the Fund because of the exclusion of distributed capital gains, which are non-recurring. The SEC 7-Day Current Yield more closely reflects the Fund’s current earnings than do the Fund Total Return figures. |
| 4 | Source: iMoneyNet, Inc. June 2023. The iMoneyNet Institutional Average represents total return. Government & Agencies Institutional — Category includes the most broadly based of the government institutional funds. These funds may generally invest in U.S. treasuries, U.S. agencies, repurchase agreements, or government-backed floating rate notes. |
YIELD SUMMARY AS OF JUNE 30, 2023
| | | | | | | | | | | | | | | | | | | | |
| | | | | |
| Funds | | 7-Day Dist. Yield5 | | | SEC 7-Day Effective Yield6 | | | 30-Day Average Yield7 | | | Weighted Avg. Maturity (days)8 | | | Weighted Avg. Life (days)9 | |
| Institutional Shares | | | 5.01 | % | | | 5.12 | % | | | 5.00 | % | | | 30 | | | | 78 | |
| Service Shares | | | 4.76 | | | | 4.86 | | | | 4.75 | | | | 30 | | | | 78 | |
The Yields represent past performance. Past performance does not guarantee future results. Current performance may be lower or higher than the performance quoted above.
Yields reflect fee waivers and expense limitations in effect and will fluctuate as market conditions change. Please visit our Web site at www.GSAMFUNDS.com to obtain the most recent month-end performance.
| 5 | The 7-Day Distribution Yield is an annualized measure of the Fund’s dividends per share, divided by the price per share. This yield includes capital gain/loss distribution, if any. This is not an SEC Yield. |
| 6 | The SEC 7-Day Effective Yield is calculated in accordance with securities industry regulations and does not include net capital gains. The SEC 7-Day Effective Yield assumes reinvestment of dividends for one year. |
| 7 | The 30-Day Average Yield is a net annualized yield of 30 days back from the current date listed. This yield includes capital gain/loss distribution. This is not an SEC Yield. |
| 8 | The Fund’s weighted average maturity (WAM) is an average of the effective maturities of all securities held in the portfolio, weighted by each security’s percentage of net assets. This must not exceed 60 days as calculated under SEC Rule 2a-7. |
| 9 | The Fund’s weighted average life (WAL) is an average of the final maturities of all securities held in the portfolio, weighted by each security’s percentage of net assets. This must not exceed 120 days as calculated under SEC Rule 2a-7. |
For more information about your Fund, please refer to www.GSAMFUNDS.com. There, you can learn more about your Fund’s investment strategies, holdings, and performance.
FUND BASICS
FUND COMPOSITION†
Security Type
(Percentage of Net Assets)
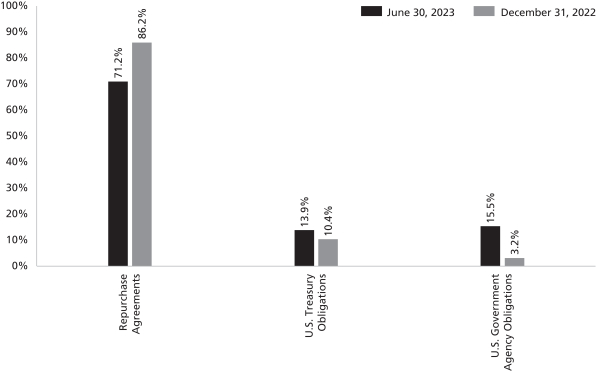
| † | The Fund is actively managed and, as such, its portfolio composition may differ over time. The percentage shown for each investment category reflects the value (based on amortized cost) of investments in that category as a percentage of net assets. Figures in the above chart may not sum to 100% due to the exclusion of other assets and liabilities. |
For more information about your Fund, please refer to www.GSAMFUNDS.com. There, you can learn more about your Fund’s investment strategies, holdings, and performance.
GOLDMAN SACHS VARIABLE INSURANCE TRUST GOVERNMENT MONEY MARKET FUND
Schedule of Investments
June 30, 2023 (Unaudited)
| | | | | | | | | | | | | | |
Principal
Amount | | | Interest
Rate | | | Maturity
Date | | | Amortized
Cost | |
|
| U.S. Government Agency Obligations – 15.5% | |
| Federal Farm Credit Banks Funding Corp. (3 Mo. U.S. T-Bill
MMY + 0.04%) |
|
| $ | 1,500,000 | | | | 5.284 | %(a) | | | 10/23/23 | | | $ | 1,499,981 | |
| | 3,000,000 | | | | 5.289 | (a) | | | 10/30/23 | | | | 2,999,970 | |
| | Federal Farm Credit Banks Funding Corp. (FEDL01 + 0.08%) | |
| | 1,300,000 | | | | 5.152 | (a) | | | 09/13/24 | | | | 1,298,850 | |
| | Federal Farm Credit Banks Funding Corp. (FEDL01 + 0.14%) | |
| | 700,000 | | | | 5.210 | (a) | | | 09/17/24 | | | | 699,992 | |
| | 200,000 | | | | 5.212 | (a) | | | 11/14/24 | | | | 199,947 | |
| | Federal Farm Credit Banks Funding Corp. (Prime Rate – 3.00%) | |
| | 1,818,000 | | | | 5.251 | (a) | | | 03/22/24 | | | | 1,817,740 | |
| | 1,200,000 | | | | 5.250 | (a) | | | 01/24/25 | | | | 1,199,911 | |
| | Federal Farm Credit Banks Funding Corp. (Prime Rate – 3.01%) | |
| | 1,585,000 | | | | 5.245 | (a) | | | 02/10/25 | | | | 1,584,926 | |
| | Federal Farm Credit Banks Funding Corp. (SOFR + 0.06%) | |
| | 500,000 | | | | 5.127 | (a) | | | 04/29/24 | | | | 499,629 | |
| | 500,000 | | | | 5.129 | (a) | | | 07/22/24 | | | | 499,477 | |
| | Federal Farm Credit Banks Funding Corp. (SOFR + 0.11%) | |
| | 3,838,000 | | | | 5.165 | (a) | | | 06/07/24 | | | | 3,837,831 | |
| | Federal Farm Credit Banks Funding Corp. (SOFR + 0.14%) | |
| | 1,781,000 | | | | 5.203 | (a) | | | 11/26/24 | | | | 1,780,280 | |
| | 1,978,000 | | | | 5.202 | (a) | | | 11/26/24 | | | | 1,977,200 | |
| | Federal Farm Credit Banks Funding Corp. (SOFR + 0.15%) | |
| | 1,173,000 | | | | 5.210 | (a) | | | 01/03/25 | | | | 1,173,000 | |
| | 807,000 | | | | 5.210 | (a) | | | 02/14/25 | | | | 807,000 | |
| | Federal Farm Credit Banks Funding Corp. (SOFR + 0.16%) | |
| | 2,100,000 | | | | 5.215 | (a) | | | 04/05/24 | | | | 2,099,969 | |
| | 476,000 | | | | 5.220 | (a) | | | 01/30/25 | | | | 476,000 | |
| | 2,482,000 | | | | 5.215 | (a) | | | 02/10/25 | | | | 2,482,000 | |
| | 768,000 | | | | 5.220 | (a) | | | 04/10/25 | | | | 768,000 | |
| | Federal Farm Credit Banks Funding Corp. (SOFR + 0.17%) | |
| | 4,300,000 | | | | 5.225 | (a) | | | 06/27/24 | | | | 4,299,833 | |
| | 1,909,000 | | | | 5.230 | (a) | | | 01/23/25 | | | | 1,909,000 | |
| | 3,442,000 | | | | 5.225 | (a) | | | 02/06/25 | | | | 3,442,000 | |
| | Federal Farm Credit Banks Funding Corp. (SOFR + 0.18%) | |
| | 4,300,000 | | | | 5.240 | (a) | | | 10/16/24 | | | | 4,300,000 | |
| | 2,100,000 | | | | 5.240 | (a) | | | 12/19/24 | | | | 2,100,255 | |
| | 2,350,000 | | | | 5.238 | (a) | | | 12/19/24 | | | | 2,350,285 | |
| | 2,500,000 | | | | 5.240 | (a) | | | 01/03/25 | | | | 2,500,000 | |
| | 5,337,000 | | | | 5.240 | (a) | | | 01/17/25 | | | | 5,337,000 | |
| | 4,794,000 | | | | 5.240 | (a) | | | 03/07/25 | | | | 4,794,000 | |
| | Federal Farm Credit Banks Funding Corp. (SOFR + 0.19%) | |
| | 2,400,000 | | | | 5.250 | (a) | | | 11/25/24 | | | | 2,400,000 | |
| | 5,300,000 | | | | 5.250 | (a) | | | 12/27/24 | | | | 5,300,000 | |
| | Federal Farm Credit Banks Funding Corp. (SOFR + 0.20%) | |
| | 1,804,000 | | | | 5.255 | (a) | | | 06/02/25 | | | | 1,804,000 | |
| | Federal Farm Credit Discount Notes | |
| | 400,000 | | | | 4.947 | | | | 01/12/24 | | | | 389,925 | |
| | Federal Home Loan Bank Discount Notes | |
| | 5,100,000 | | | | 4.881 | | | | 07/26/23 | | | | 5,083,354 | |
| | 2,273,000 | | | | 5.403 | | | | 09/15/23 | | | | 2,247,808 | |
| | 6,167,000 | | | | 5.184 | | | | 09/19/23 | | | | 6,098,334 | |
| | 9,452,000 | | | | 5.195 | | | | 09/19/23 | | | | 9,346,757 | |
| | 1,663,000 | | | | 5.394 | | | | 09/19/23 | | | | 1,644,483 | |
| | 12,331,000 | | | | 5.186 | | | | 09/22/23 | | | | 12,189,420 | |
| | |
|
| U.S. Government Agency Obligations – (continued) | |
| | Federal Home Loan Bank Discount Notes – (continued) | |
| 1,490,000 | | | | 4.945 | | | | 01/12/24 | | | | 1,452,471 | |
| | 3,857,000 | | | | 5.059 | | | | 02/06/24 | | | | 3,744,918 | |
| | 65,000 | | | | 5.060 | | | | 02/06/24 | | | | 63,111 | |
| | 4,212,000 | | | | 5.070 | | | | 02/06/24 | | | | 4,089,602 | |
| | 4,000,000 | | | | 5.092 | | | | 02/08/24 | | | | 3,882,093 | |
| | 2,035,000 | | | | 5.093 | | | | 02/09/24 | | | | 1,974,745 | |
| | Federal Home Loan Banks | |
| | 5,230,000 | | | | 4.667 | | | | 11/14/23 | | | | 5,229,866 | |
| | 2,400,000 | | | | 4.692 | | | | 11/15/23 | | | | 2,399,721 | |
| | 2,400,000 | | | | 4.697 | | | | 11/17/23 | | | | 2,399,764 | |
| | 1,800,000 | | | | 4.742 | | | | 11/24/23 | | | | 1,799,711 | |
| | 2,100,000 | | | | 4.690 | | | | 11/29/23 | | | | 2,099,912 | |
| | 18,400,000 | | | | 5.340 | | | | 04/23/24 | | | | 18,400,000 | |
| | 20,990,000 | | | | 5.330 | | | | 04/26/24 | | | | 20,990,000 | |
| | 19,510,000 | | | | 5.340 | | | | 04/26/24 | | | | 19,510,000 | |
| | 13,150,000 | | | | 5.370 | | | | 05/21/24 | | | | 13,150,000 | |
| | 6,905,000 | | | | 5.300 | | | | 05/22/24 | | | | 6,905,000 | |
| | 15,210,000 | | | | 5.360 | | | | 06/11/24 | | | | 15,210,000 | |
| | 9,505,000 | | | | 5.375 | | | | 06/11/24 | | | | 9,505,000 | |
| | 6,595,000 | | | | 5.490 | | | | 07/15/24 | | | | 6,595,000 | |
| | 6,620,000 | | | | 5.520 | | | | 07/15/24 | | | | 6,620,000 | |
| | 10,305,000 | | | | 5.500 | | | | 07/19/24 | | | | 10,305,000 | |
| | 9,800,000 | | | | 5.620 | (b) | | | 07/30/24 | | | | 9,800,000 | |
| | Federal Home Loan Banks (SOFR + 0.06%) | |
| | 200,000 | | | | 5.128 | (a) | | | 07/01/24 | | | | 199,801 | |
| | Federal Home Loan Banks (SOFR + 0.08%) | |
| | 11,500,000 | | | | 5.140 | (a) | | | 07/20/23 | | | | 11,500,000 | |
| | 400,000 | | | | 5.140 | (a) | | | 03/01/24 | | | | 399,813 | |
| | Federal Home Loan Banks (SOFR + 0.09%) | |
| | 25,800,000 | | | | 5.150 | (a) | | | 08/24/23 | | | | 25,800,000 | |
| | Federal Home Loan Banks (SOFR + 0.11%) | |
| | 11,760,000 | | | | 5.165 | (a) | | | 07/21/23 | | | | 11,760,000 | |
| | 11,760,000 | | | | 5.170 | (a) | | | 08/18/23 | | | | 11,760,000 | |
| | Federal Home Loan Banks (SOFR + 0.12%) | |
| | 19,715,000 | | | | 5.180 | (a) | | | 09/20/23 | | | | 19,715,000 | |
| | Federal Home Loan Banks (SOFR + 0.15%) | |
| | 3,600,000 | | | | 5.210 | (a) | | | 02/23/24 | | | | 3,600,000 | |
| | Federal Home Loan Banks (SOFR + 0.16%) | |
| | 4,000,000 | | | | 5.220 | (a) | | | 02/03/25 | | | | 4,000,000 | |
| | Federal Home Loan Banks (SOFR + 0.17%) | |
| | 4,010,000 | | | | 5.225 | (a) | | | 01/17/25 | | | | 4,010,000 | |
| | Federal Home Loan Banks (SOFR + 0.19%) | |
| | 14,400,000 | | | | 5.250 | (a) | | | 11/22/24 | | | | 14,400,000 | |
| | Federal Home Loan Mortgage Corp. | |
| | 7,387,000 | | | | 5.400 | | | | 06/11/24 | | | | 7,387,000 | |
| | 7,387,000 | | | | 5.380 | | | | 06/12/24 | | | | 7,387,000 | |
| | Federal National Mortgage Association | |
| | 9,632,000 | | | | 5.505 | | | | 07/26/24 | | | | 9,632,000 | |
| | 9,894,000 | | | | 5.600 | (b) | | | 07/31/24 | | | | 9,894,000 | |
| U.S. International Development Finance Corp. (3 Mo. U.S.
T-Bill + 0.00%) |
|
| | 650,000 | | | | 5.380 | (a) | | | 07/07/23 | | | | 650,000 | |
| | 2,025,000 | | | | 5.380 | (a) | | | 07/07/23 | | | | 2,025,000 | |
| | 3,209,593 | | | | 5.380 | (a) | | | 07/07/23 | | | | 3,209,592 | |
| | |
| TOTAL U.S. GOVERNMENT AGENCY
OBLIGATIONS |
| | $ | 418,693,277 | |
| | |
| | |
| The accompanying notes are an integral part of these financial statements. | | 5 |
GOLDMAN SACHS VARIABLE INSURANCE TRUST GOVERNMENT MONEY MARKET FUND
Schedule of Investments (continued)
June 30, 2023 (Unaudited)
| | | | | | | | | | | | | | |
Principal
Amount | | | Interest
Rate | | | Maturity
Date | | | Amortized
Cost | |
|
| U.S. Treasury Obligations – 13.9% | |
| | United States Treasury Bills | |
| $ | 3,849,100 | | | | 5.353 | % | | | 07/13/23 | | | $ | 3,842,364 | |
| | 23,699,800 | | | | 5.255 | | | | 07/20/23 | | | | 23,635,383 | |
| | 87,444,300 | | | | 5.363 | | | | 09/07/23 | | | | 86,582,017 | |
| | 9,246,100 | | | | 5.290 | | | | 09/14/23 | | | | 9,146,897 | |
| | 1,176,100 | | | | 5.468 | | | | 12/07/23 | | | | 1,148,829 | |
| | 6,700,000 | | | | 4.827 | | | | 04/18/24 | | | | 6,453,820 | |
| United States Treasury Floating Rate Note (3 Mo. U.S. T-Bill
MMY + 0.03%) |
|
| | 80,554,600 | | | | 5.277 | (a) | | | 07/31/23 | | | | 80,558,740 | |
| United States Treasury Floating Rate Note (3 Mo. U.S. T-Bill
MMY + 0.04%) |
|
| | 7,650,500 | | | | 5.282 | (a) | | | 10/31/23 | | | | 7,650,804 | |
| | 45,457,100 | | | | 5.284 | (a) | | | 10/31/23 | | | | 45,458,910 | |
| | 4,639,400 | | | | 5.285 | (a) | | | 07/31/24 | | | | 4,640,054 | |
| United States Treasury Floating Rate Note (3 Mo. U.S. T-Bill
MMY + 0.17%) |
|
| | 27,003,000 | | | | 5.415 | (a) | | | 04/30/25 | | | | 27,010,107 | |
| | 26,357,700 | | | | 5.418 | (a) | | | 04/30/25 | | | | 26,364,637 | |
| United States Treasury Floating Rate Note (3 Mo. U.S. T-Bill
MMY + 0.20%) |
|
| | 52,807,800 | | | | 5.445 | (a) | | | 01/31/25 | | | | 52,809,450 | |
| | |
| TOTAL U.S. TREASURY
OBLIGATIONS |
| | $ | 375,302,012 | |
| | |
| TOTAL INVESTMENTS BEFORE
REPURCHASE AGREEMENTS |
| | $ | 793,995,289 | |
| | |
| | | | | | | | | | | | | | |
|
| Repurchase Agreements(c) – 71.2% | |
| | BNP Paribas | |
| $ | 2,500,000 | | | | 5.050 | % | | | 07/03/23 | | | $ | 2,500,000 | |
| | Maturity Value: $2,501,052 | |
| Collateralized by U.S. Treasury Bonds, 2.750% to 6.000%, due
02/15/26 to 05/15/44, U.S. Treasury Floating Rate Notes,
5.174% to 5.418%, due 04/30/24 to 04/30/25, U.S. Treasury
Inflation-Indexed Bonds, 2.375% to 3.625%, due 01/15/27 to
04/15/28, a U.S. Treasury Inflation-Indexed Note, 0.125%, due
07/15/24, U.S. Treasury Interest-Only Stripped Securities,
0.000%, due 05/15/25 to 11/15/47, U.S. Treasury Notes,
0.375% to 4.000%, due 03/31/24 to 02/15/31 and U.S. Treasury
Principal-Only Stripped Securities, 0.000%, due 11/15/42 to
05/15/51. The aggregate market value of the collateral,
including accrued interest, was $2,550,044. |
|
| | Joint Account III | |
| | 1,917,300,000 | | | | 5.060 | | | | 07/03/23 | | | | 1,917,300,000 | |
| | Maturity Value: $1,918,108,462 | |
| | |
| | TOTAL REPURCHASE AGREEMENTS | | | $ | 1,919,800,000 | |
| | |
| | TOTAL INVESTMENTS – 100.6% | | | $ | 2,713,795,289 | |
| | |
| LIABILITIES IN EXCESS OF
OTHER ASSETS – (0.6)% |
| | | (16,532,611 | ) |
| | |
| | NET ASSETS – 100.0% | | | $ | 2,697,262,678 | |
| | |
| | |
| The percentage shown for each investment category reflects the value of investments in that category as a percentage of net assets. |
| |
| (a) | | Variable or floating rate security. Except for floating rate notes (for which final maturity is disclosed), maturity date disclosed is the next interest reset date. Interest rate disclosed is that which is in effect on June 30, 2023. |
| |
| (b) | | All or a portion represents a forward commitment. Forward settling repurchase agreements will be collateralized at settlement. |
| |
| (c) | | Unless noted, all repurchase agreements were entered into on June 30, 2023. Additional information on Joint Repurchase Agreement Account III appears in the Additional Investment Information section. |
|
| Interest rates represent either the stated coupon rate, annualized yield on date of purchase for discounted securities, or, for floating rate securities, the current reset rate, which is based upon current interest rate indices. |
|
| Maturity dates represent either the final legal maturity date on the security, the demand date for puttable securities, the date of the next interest rate reset for variable rate securities, or the prerefunded date for those types of securities. |
| | |
| |
| Investment Abbreviations: |
| FEDL01 | | —US Federal Funds Effective Rate |
| MMY | | —Money Market Yield |
| Prime | | —Federal Reserve Bank Prime Loan Rate US |
| SOFR | | —Secured Overnight Financing Rate |
| T-Bill | | —Treasury Bill |
| | |
| 6 | | The accompanying notes are an integral part of these financial statements. |
GOLDMAN SACHS VARIABLE INSURANCE TRUST GOVERNMENT MONEY MARKET FUND
ADDITIONAL INVESTMENT INFORMATION
JOINT REPURCHASE AGREEMENT ACCOUNT III — At June 30, 2023, the Fund had undivided interests in the Joint Repurchase Agreement Account III, with a maturity date of July 3, 2023, as follows:
| | | | | | | | | | | | | |
| Principal Amount | | Maturity Value | | Collateral Value |
| | | $1,917,300,000 | | | | $ | 1,918,108,462 | | | | $ | 1,973,405,069 | |
REPURCHASE AGREEMENTS — At June 30, 2023, the Principal Amounts of the Fund’s interest in the Joint Repurchase Agreement Account III were as follows:
| | | | | | | | |
| Counterparty | | Interest
Rate | | | Principal
Amount | |
ABN Amro Bank N.V. | | | 5.060 | % | | $ | 377,173,771 | |
Bank of America, N.A. | | | 5.060 | | | | 314,311,475 | |
Bank of Montreal | | | 5.060 | | | | 125,724,590 | |
BofA Securities, Inc. | | | 5.060 | | | | 314,311,475 | |
Credit Agricole Corporate and Investment Bank | | | 5.060 | | | | 282,880,328 | |
Wells Fargo Securities, LLC | | | 5.060 | | | | 502,898,361 | |
| | |
| TOTAL | | | | | | $ | 1,917,300,000 | |
At June 30, 2023, the Joint Repurchase Agreement Account III was fully collateralized by $47,146,721 and the following:
| | | | | | | | |
| Issuer | | Interest
Rates | | | Maturity
Dates | |
| Federal Home Loan Mortgage Corp. | | | 3.000 to 6.500 | % | | | 08/01/46 to 02/01/53 | |
| Federal National Mortgage Association | | | 1.500 to 7.000 | | | | 01/01/24 to 02/01/57 | |
| Government National Mortgage Association | | | 2.000 to 6.000 | | | | 11/20/45 to 06/20/53 | |
| | |
| The accompanying notes are an integral part of these financial statements. | | 7 |
GOLDMAN SACHS VARIABLE INSURANCE TRUST GOVERNMENT MONEY MARKET FUND
Statement of Assets and Liabilities
June 30, 2023 (Unaudited)
| | | | |
| | | | |
| Assets: | | | |
Investments based on amortized cost | | $ | 793,995,289 | |
Repurchase agreements based on amortized cost | | | 1,919,800,000 | |
Cash | | | 16,177 | |
Receivables: | | | | |
Interest | | | 5,003,251 | |
Fund shares sold | | | 913,195 | |
Investments sold | | | 278,868 | |
Reimbursement from investment advisor | | | 22,417 | |
Other assets | | | 152,153 | |
| |
| Total assets | | | 2,720,181,350 | |
| |
| | | | |
| Liabilities: | | | |
Payables: | | | | |
Investments purchased | | | 21,706,453 | |
Fund shares redeemed | | | 560,827 | |
Management fees | | | 338,307 | |
Distribution and Service fees and Transfer Agency fees | | | 208,876 | |
Accrued expenses | | | 104,209 | |
| |
| Total liabilities | | | 22,918,672 | |
| |
| | | | |
| Net Assets: | | | |
Paid-in capital | | | 2,697,202,793 | |
Total distributable earnings (loss) | | | 59,885 | |
| |
| NET ASSETS | | $ | 2,697,262,678 | |
| |
Net asset value, offering and redemption price per share | | $ | 1.00 | |
Net Assets: | | | | |
Institutional Shares | | $ | 1,888,826,455 | |
Service Shares | | | 808,436,223 | |
| |
Total Net Assets | | $ | 2,697,262,678 | |
Shares outstanding $0.001 par value (unlimited number of shares authorized): | | | | |
Institutional Shares | | | 1,888,784,512 | |
Service Shares | | | 808,418,262 | |
| | |
| 8 | | The accompanying notes are an integral part of these financial statements. |
GOLDMAN SACHS VARIABLE INSURANCE TRUST GOVERNMENT MONEY MARKET FUND
Statement of Operations
For the Six Months Ended June 30, 2023 (Unaudited)
| | | | |
| | | | |
| Investment income: | |
| |
Interest income | | $ | 51,762,495 | |
| |
| | | | |
| Expenses: | | | |
Management fees | | | 1,701,925 | |
Distribution and Service fees — Service Shares | | | 896,442 | |
Transfer Agency fees(a) | | | 212,721 | |
Printing and mailing fees | | | 77,758 | |
Professional fees | | | 56,387 | |
Custody, accounting and administrative services | | | 34,682 | |
Trustee fees | | | 13,725 | |
Other | | | 7,892 | |
| |
| Total expenses | | | 3,001,532 | |
| |
Less — expense reductions | | | (147,897 | ) |
| |
| Net expenses | | | 2,853,635 | |
| |
| NET INVESTMENT INCOME | | $ | 48,908,860 | |
| |
| Net realized gain from investment transactions | | | 93,817 | |
| |
| NET INCREASE IN NET ASSETS RESULTING FROM OPERATIONS | | $ | 49,002,677 | |
(a) Institutional and Service Shares incurred Transfer Agency fees of $141,011 and $71,710, respectively.
| | |
| The accompanying notes are an integral part of these financial statements. | | 9 |
GOLDMAN SACHS VARIABLE INSURANCE TRUST GOVERNMENT MONEY MARKET FUND
Statements of Changes in Net Assets
| | | | | | | | |
| | | For the
Six Months Ended
June 30, 2023
(Unaudited) | | | For the
Fiscal Year Ended
December 31, 2022 | |
| | | | | | | | |
| From operations: | |
Net investment income | | $ | 48,908,860 | | | $ | 27,763,477 | |
Net realized gain (loss) from investment transactions | | | 93,817 | | | | (219,781 | ) |
| | |
| Net increase in net assets resulting from operations | | | 49,002,677 | | | | 27,543,696 | |
| |
| | | | | | | | |
| Distributions to shareholders: | | | | | | |
From distributable earnings: | | | | | | | | |
Institutional Shares | | | (33,048,518 | ) | | | (18,642,223 | ) |
Service Shares | | | (15,884,420 | ) | | | (8,911,722 | ) |
| | |
| Total distributions to shareholders | | | (48,932,938 | ) | | | (27,553,945 | ) |
| |
| | | | | | | | |
| From share transactions (at $1.00 per share): | | | | | | |
Proceeds from sales of shares | | | 1,596,108,738 | | | | 2,307,084,458 | |
Reinvestment of distributions | | | 48,690,001 | | | | 27,550,932 | |
Cost of shares redeemed | | | (1,460,366,093 | ) | | | (846,623,441 | ) |
| | |
| Net increase in net assets resulting from share transactions | | | 184,432,646 | | | | 1,488,011,949 | |
| | |
| TOTAL INCREASE | | | 184,502,385 | | | | 1,488,001,700 | |
| |
| | | | | | | | |
| Net assets: | | | | | | |
| | |
Beginning of period | | | 2,512,760,293 | | | | 1,024,758,593 | |
| | |
End of period | | $ | 2,697,262,678 | | | $ | 2,512,760,293 | |
| | |
| 10 | | The accompanying notes are an integral part of these financial statements. |
GOLDMAN SACHS VARIABLE INSURANCE TRUST GOVERNMENT MONEY MARKET FUND
Financial Highlights
Selected Data for a Share Outstanding Throughout Each Period
| | | | | | | | | | | | | | | | | | | | | | | | |
| | | Goldman Sachs Government Money Market Fund | |
| | | Institutional Shares | |
| | | Six Months Ended
June 30, 2023
(Unaudited) | | | Year Ended December 31, | |
| | | 2022 | | | 2021 | | | 2020 | | | 2019 | | | 2018 | |
| | | | | | | | | | | | | | | | | | | | | | | | |
| Per Share Data: | | | | | | | | | | | | | | | | | | |
| | | | | | |
Net asset value, beginning of period | | $ | 1.00 | | | $ | 1.00 | | | $ | 1.00 | | | $ | 1.00 | | | $ | 1.00 | | | $ | 1.00 | |
| | | | | | |
Net investment income(a) | | | 0.023 | | | | 0.016 | | | | — | (b) | | | 0.004 | | | | 0.021 | | | | 0.017 | |
| | | | | | |
Distributions to shareholders from net investment income(c) | | | (0.023 | ) | | | (0.016 | ) | | | — | (b) | | | (0.004 | ) | | | (0.021 | ) | | | (0.017 | ) |
| | | | | | |
Net asset value, end of period | | $ | 1.00 | | | $ | 1.00 | | | $ | 1.00 | | | $ | 1.00 | | | $ | 1.00 | | | $ | 1.00 | |
| | | | | | |
Total return(d) | | | 2.33 | % | | | 1.58 | % | | | 0.01 | % | | | 0.43 | % | | | 2.11 | % | | | 1.74 | % |
| | | | | | |
Net assets, end of period (in 000’s) | | $ | 1,888,826 | | | $ | 1,834,293 | | | $ | 523,751 | | | $ | 582,216 | | | $ | 363,783 | | | $ | 411,447 | |
| | | | | | |
Ratio of net expenses to average net assets | | | 0.18 | %(e) | | | 0.17 | % | | | 0.09 | % | | | 0.18 | % | | | 0.18 | % | | | 0.18 | % |
| | | | | | |
Ratio of total expenses to average net assets | | | 0.20 | %(e) | | | 0.20 | % | | | 0.21 | % | | | 0.20 | % | | | 0.21 | % | | | 0.23 | % |
| | | | | | |
Ratio of net investment income to average net assets | | | 4.68 | %(e) | | | 1.92 | % | | | — | %(f) | | | 0.35 | % | | | 2.06 | % | | | 1.73 | % |
| (a) | Calculated based on the average shares outstanding methodology. |
| (b) | Amount is less than $0.0005 per share. |
| (c) | Distributions may not coincide with the current year net investment income or net realized gains as distributions may be paid from current or prior year earnings. |
| (d) | Assumes reinvestment of all distributions. Returns do not reflect the deduction of taxes that a shareholder would pay on Fund distributions. Total returns for periods less than one full year are not annualized. |
| (f) | Amount is less than 0.005%. |
| | |
| The accompanying notes are an integral part of these financial statements. | | 11 |
GOLDMAN SACHS VARIABLE INSURANCE TRUST GOVERNMENT MONEY MARKET FUND
Financial Highlights (continued)
Selected Data for a Share Outstanding Throughout Each Period
| | | | | | | | | | | | | | | | | | | | | | | | |
| | | Goldman Sachs Government Money Market Fund | |
| | | Service Shares | |
| | | Six Months Ended
June 30, 2023
(Unaudited) | | | Year Ended December 31, | |
| | | 2022 | | | 2021 | | | 2020 | | | 2019 | | | 2018 | |
| | | | | | | | | | | | | | | | | | | | | | | | |
| Per Share Data: | | | | | | | | | | | | | | | | | | |
| | | | | | |
Net asset value, beginning of period | | $ | 1.00 | | | $ | 1.00 | | | $ | 1.00 | | | $ | 1.00 | | | $ | 1.00 | | | $ | 1.00 | |
| | | | | | |
Net investment income(a) | | | 0.022 | | | | 0.014 | | | | — | (b) | | | 0.003 | | | | 0.018 | | | | 0.015 | |
| | | | | | |
Distributions to shareholders from net investment income(c) | | | (0.022 | ) | | | (0.014 | ) | | | — | (b) | | | (0.003 | ) | | | (0.018 | ) | | | (0.015 | ) |
| | | | | | |
Net asset value, end of period | | $ | 1.00 | | | $ | 1.00 | | | $ | 1.00 | | | $ | 1.00 | | | $ | 1.00 | | | $ | 1.00 | |
| | | | | | |
Total return(d) | | | 2.21 | % | | | 1.37 | % | | | 0.01 | % | | | 0.27 | % | | | 1.86 | % | | | 1.48 | % |
| | | | | | |
Net assets, end of period (in 000’s) | | $ | 808,436 | | | $ | 678,468 | | | $ | 501,008 | | | $ | 579,416 | | | $ | 350,112 | | | $ | 368,652 | |
| | | | | | |
Ratio of net expenses to average net assets | | | 0.43 | %(e) | | | 0.38 | % | | | 0.09 | % | | | 0.33 | % | | | 0.43 | % | | | 0.43 | % |
| | | | | | |
Ratio of total expenses to average net assets | | | 0.45 | %(e) | | | 0.45 | % | | | 0.46 | % | | | 0.45 | % | | | 0.46 | % | | | 0.48 | % |
| | | | | | |
Ratio of net investment income to average net assets | | | 4.43 | %(e) | | | 1.48 | % | | | — | %(f) | | | 0.19 | % | | | 1.81 | % | | | 1.48 | % |
| (a) | Calculated based on the average shares outstanding methodology. |
| (b) | Amount is less than $0.0005 per share. |
| (c) | Distributions may not coincide with the current year net investment income or net realized gains as distributions may be paid from current or prior year earnings. |
| (d) | Assumes reinvestment of all distributions. Returns do not reflect the deduction of taxes that a shareholder would pay on Fund distributions. Total returns for periods less than one full year are not annualized. |
| (f) | Amount is less than 0.005%. |
| | |
| 12 | | The accompanying notes are an integral part of these financial statements. |
GOLDMAN SACHS VARIABLE INSURANCE TRUST GOVERNMENT MONEY MARKET FUND
Notes to Financial Statements
June 30, 2023 (Unaudited)
1. ORGANIZATION
Goldman Sachs Variable Insurance Trust (the “Trust” or “VIT”) is a Delaware statutory trust registered under the Investment Company Act of 1940, as amended (the “Act”), as an open-end management investment company. The Trust includes the Goldman Sachs Government Money Market Fund (the “Fund”). The Fund is a diversified portfolio under the Act offering two classes of shares — Institutional and Service Shares. Shares of the Trust are offered to separate accounts of participating life insurance companies for the purpose of funding variable annuity contracts and variable life insurance policies.
Goldman Sachs Asset Management, L.P. (“GSAM”), an affiliate of Goldman Sachs & Co. LLC (“Goldman Sachs”), serves as investment adviser to the Fund pursuant to a management agreement (the “Agreement”) with the Trust.
2. SIGNIFICANT ACCOUNTING POLICIES
The financial statements have been prepared in accordance with accounting principles generally accepted in the United States of America (“GAAP”) and require management to make estimates and assumptions that may affect the reported amounts and disclosures. Actual results may differ from those estimates and assumptions. The Fund is an investment company under GAAP and follows the accounting and reporting guidance applicable to investment companies.
A. Investment Valuation — The investment valuation policy of the Fund is to use the amortized-cost method permitted by Rule 2a-7 under the Act for valuing portfolio securities. The amortized-cost method of valuation involves valuing a security at its cost and thereafter applying a constant accretion or amortization to maturity of any discount or premium. Normally, a security’s amortized cost will approximate its market value. Under procedures and tolerances approved by the Board of Trustees (“Trustees”), GSAM evaluates daily the difference between the Fund’s net asset value (“NAV”) per share using the amortized costs of its portfolio securities and the Fund’s NAV per share using market-based values of its portfolio securities. The market-based value of a portfolio security is determined, where readily available, on the basis of market quotations provided by pricing services or securities dealers, or, where accurate market quotations are not readily available, on the basis of the security’s fair value as determined in accordance with the Valuation Procedures. The pricing services may use valuation models or matrix pricing, which may consider (among other things): (i) yield or price with respect to debt securities that are considered comparable in characteristics such as rating, interest rate and maturity date or (ii) quotations from securities dealers to determine current value.
B. Investment Income and Investments — Interest income is accrued daily and adjusted for amortization of premiums and accretion of discounts. Investment transactions are reflected on trade date. Realized gains and losses are calculated using identified cost.
C. Class Allocations and Expenses — Investment income, realized and unrealized gain (loss), if any, and non-class specific expenses of the Fund are allocated daily based upon the proportion of net assets of each class. Class specific expenses, where applicable, are borne by the respective share classes and include Distribution and Service and Transfer Agency fees. Non-class specific expenses directly incurred by the Fund are charged to the Fund, while such expenses incurred by the Trust are allocated across the Fund on a straight-line and/or pro-rata basis depending upon the nature of the expenses.
D. Federal Taxes and Distributions to Shareholders — It is the Fund’s policy to comply with the requirements of the Internal Revenue Code of 1986, as amended (the “Code”), applicable to regulated investment companies (mutual funds) and to distribute each year substantially all of its investment company taxable and tax-exempt income and capital gains to its shareholders. Accordingly, the Fund is not required to make any provisions for the payment of federal income tax. Distributions to shareholders are declared and recorded daily and paid monthly by the Fund and may include short-term capital gains. Long-term capital gain distributions, if any, are declared and paid annually. The Fund may defer or accelerate the timing of the distribution of short-term capital gains (or any portion thereof).
The characterization of distributions to shareholders for financial reporting purposes is determined in accordance with federal income tax rules, which may differ from GAAP. The source of the Fund’s distributions may be shown in the accompanying financial statements as either from distributable earnings or capital. Certain components of the Fund’s net assets on the Statement of Assets and Liabilities reflect permanent GAAP/tax differences based on the appropriate tax character.
GOLDMAN SACHS VARIABLE INSURANCE TRUST GOVERNMENT MONEY MARKET FUND
Notes to Financial Statements (continued)
June 30, 2023 (Unaudited)
2. SIGNIFICANT ACCOUNTING POLICIES (continued)
As of the Fund’s most recent fiscal year end, December 31, 2022, the Fund’s capital loss carryforwards and certain timing differences, on a tax-basis were as follows:
| | | | |
| Capital loss carryforward: Perpetual Short-Term | | $ | (210,225 | ) |
| Timing differences (Distributions Payable and Post-October Capital Loss Deferral) | | | (10,517 | ) |
The amortized cost for the Fund stated in the accompanying Statement of Assets and Liabilities also represents aggregate cost for U.S. federal income tax purposes.
GSAM has reviewed the Fund’s tax positions for all open tax years (the current and prior three years, as applicable) and has concluded that no provision for income tax is required in the Fund’s financial statements. Such open tax years remain subject to examination and adjustment by tax authorities.
E. Forward Commitments — A forward commitment involves entering into a contract to purchase or sell securities, typically on an extended settlement basis, for a fixed price at a future date. The purchase of securities on a forward commitment basis involves a risk of loss if the value of the security to be purchased declines before the settlement date. Conversely, the sale of securities on a forward commitment basis involves the risk that the value of the securities sold may increase before the settlement date. Although the Fund will generally purchase securities on a forward commitment basis with the intention of acquiring the securities for its portfolio, the Fund may dispose of forward commitments prior to settlement which may result in a realized gain or loss.
F. Repurchase Agreements — Repurchase agreements involve the purchase of securities subject to the seller’s agreement to repurchase the securities at a mutually agreed upon date and price, under the terms of a Master Repurchase Agreement (“MRA”). During the term of a repurchase agreement, the value of the underlying securities held as collateral on behalf of the Fund, including accrued interest, is required to exceed the value of the repurchase agreement, including accrued interest. The gross value of repurchase agreements is included in the Statement of Assets and Liabilities for financial reporting purposes. The underlying securities for all repurchase agreements are held at the Fund’s custodian or designated sub-custodians under tri-party repurchase agreements.
An MRA governs transactions between the Fund and select counterparties. An MRA contains provisions for, among other things, initiation of the transaction, income payments, events of default, and maintenance of securities for repurchase agreements. An MRA also permits offsetting with collateral to create one single net payment in the event of default or similar events, including the bankruptcy or insolvency of a counterparty.
If the seller defaults, the Fund could suffer a loss to the extent that the proceeds from the sale of the underlying securities and other collateral held by the Fund are less than the repurchase price and the Fund’s costs associated with delay and enforcement of the repurchase agreement. In addition, in the event of default or insolvency of the seller, a court could determine that the Fund’s interest in the collateral is not enforceable, resulting in additional losses to the Fund.
Pursuant to exemptive relief granted by the Securities and Exchange Commission (“SEC”) and terms and conditions contained therein, the Fund, together with other funds of the Trust and registered investment companies having management agreements with GSAM or its affiliates, may transfer uninvested cash into joint accounts, the daily aggregate balance of which is invested in one or more repurchase agreements. Under these joint accounts, the Fund maintains pro-rata credit exposure to the underlying repurchase agreements’ counterparties. With the exception of certain transaction fees, the Fund is not subject to any expenses in relation to these investments.
3. INVESTMENTS AND FAIR VALUE MEASUREMENTS
U.S. GAAP defines the fair value of a financial instrument as the amount that would be received to sell an asset or paid to transfer a liability in an orderly transaction between market participants at the measurement date (i.e., the exit price); the Fund’s policy is to use the market approach. GAAP establishes a fair value hierarchy that prioritizes the inputs to valuation techniques used to measure fair value.
GOLDMAN SACHS VARIABLE INSURANCE TRUST GOVERNMENT MONEY MARKET FUND
3. INVESTMENTS AND FAIR VALUE MEASUREMENTS (continued)
The hierarchy gives the highest priority to unadjusted quoted prices in active markets for identical assets or liabilities (Level 1 measurements) and the lowest priority to unobservable inputs (Level 3 measurements). The level in the fair value hierarchy within which the fair value measurement in its entirety falls shall be determined based on the lowest level input that is significant to the fair value measurement in its entirety. The levels used for classifying investments are not necessarily an indication of the risk associated with investing in these investments. The three levels of the fair value hierarchy are described below:
Level 1 — Unadjusted quoted prices in active markets that are accessible at the measurement date for identical, unrestricted assets or liabilities;
Level 2 — Quoted prices in markets that are not active or financial instruments for which significant inputs are observable (including, but not limited to, quoted prices for similar investments, interest rates, foreign exchange rates, volatility and credit spreads), either directly or indirectly;
Level 3 — Prices or valuations that require significant unobservable inputs (including GSAM’s assumptions in determining fair value measurement).
The Trustees have approved Valuation Procedures that govern the valuation of the portfolio investments held by the Fund, including investments for which market quotations are not readily available. With respect to the Fund’s investments that do not have readily available market quotations, the Trustees have designated the Adviser as the valuation designee to perform fair valuations pursuant to Rule 2a-5 under the Investment Company Act of 1940 (the “Valuation Designee”). GSAM has day-to-day responsibility for implementing and maintaining internal controls and procedures related to the valuation (including both the amortized cost and market-based methods of valuation) of the Fund’s investments. To assess the continuing appropriateness of pricing sources and methodologies related to the market-based method of valuation, GSAM regularly performs price verification procedures and issues challenges as necessary to third party pricing vendors or brokers, and any differences are reviewed in accordance with the Valuation Procedures.
As of June 30, 2023, all investments, including repurchase agreements, are classified as Level 2 of the fair value hierarchy. Please refer to the Schedule of Investments for further detail.
4. AGREEMENTS AND AFFILIATED TRANSACTIONS
A. Management Agreement — Under the Agreement, GSAM manages the Fund, subject to the general supervision of the Trustees.
As compensation for the services rendered pursuant to the Agreement, the assumption of the expenses related thereto and administration of the Fund’s business affairs, including providing facilities, GSAM is entitled to a management fee, accrued daily and paid monthly, equal to an annual percentage rate of the Fund’s average daily net assets.
B. Distribution and Service (12b-1) Plan — The Trust, on behalf of the Service Shares of the Fund, has adopted a Distribution and Service Plan subject to Rule 12b-1 under the Act. Under the Distribution and Service Plan, Goldman Sachs, which serves as distributor (the “Distributor”), is entitled to a fee accrued daily and paid monthly, for distribution services and personal and account maintenance services, which may then be paid by Goldman Sachs to authorized dealers, equal to, on an annual basis, 0.25% of the Fund’s average daily net assets attributable to Service Shares.
C. Transfer Agency Agreement — Goldman Sachs also serves as the transfer agent of the Fund for a fee pursuant to a Transfer Agency Agreement. The fee charged for such transfer agency services is accrued daily and paid monthly at an annual rate of 0.02% of the Fund’s average daily net assets of Institutional Shares and Service Shares.
D. Other Expense Agreements — GSAM has agreed to limit certain “Other Expenses” of the Fund (excluding acquired fund fees and expenses, transfer agency fees and expenses, taxes, interest, brokerage fees, expenses of shareholder meetings, litigation and indemnification, and extraordinary expenses) to the extent that such expenses exceed, on an annual basis, 0.004% of the average daily net assets of the Fund. Such Other Expense reimbursements, if any, are accrued daily and paid monthly. In addition,
GOLDMAN SACHS VARIABLE INSURANCE TRUST GOVERNMENT MONEY MARKET FUND
Notes to Financial Statements (continued)
June 30, 2023 (Unaudited)
4. AGREEMENTS AND AFFILIATED TRANSACTIONS (continued)
the Fund is not obligated to reimburse GSAM for prior fiscal year expense reimbursements, if any. This Other Expense limitation will remain in place through at least April 28, 2024, and prior to such date GSAM may not terminate the arrangement without the approval of the Trustees. In addition, the Fund has entered into certain offset arrangements with the custodian and the transfer agent, which may result in a reduction of the Fund’s expenses and are received irrespective of the application of the “Other Expense” limitation described above. For the six months ended June 30, 2023, these expense reductions, including any fee waiver and Other Expense reimbursements, were as follows:
| | | | | | |
Other
Expense
Reimbursements | | | | Total Expense
Reductions | |
| | |
| $147,897 | | | | $ | 147,897 | |
E. Contractual and Net Fund Expenses — The investment adviser may contractually agree to waive or reimburse certain fees and expenses until a specified date. The investment adviser or transfer agent may also voluntarily waive certain fees and expenses, and such voluntary waivers may be discontinued or modified at any time without notice. The following table outlines such fees (net of waivers) and Other Expenses (net of reimbursements and custodian and transfer agency fee credit reductions) in order to determine the Fund’s net annualized expenses for the fiscal year. The Fund is not obligated to reimburse GSAM or Goldman Sachs for prior fiscal year fee waivers and/or expense reimbursements, if any.
| | | | | | | | | | | | | | | | |
| | | Institutional Shares | | | Service Shares | |
| Fee/Expense Type | | Contractual rate,
if any | | | Ratio of net expenses to average net assets
for the six months ended June 30, 2023 | | | Contractual rate,
if any | | | Ratio of net expenses to average net assets
for the six months ended June 30, 2023 | |
| Management Fee | | | 0.16 | % | | | 0.16 | % | | | 0.16 | % | | | 0.16 | % |
| Distribution and Service Fees | | | N/A | | | | N/A | | | | 0.25 | | | | 0.25 | |
| Transfer Agency Fees | | | 0.02 | | | | 0.02 | | | | 0.02 | | | | 0.02 | |
| Other Expenses | | | — | | | | 0.02 | | | | — | | | | 0.02 | |
| Total Annual Fund Operating Expenses | | | | | | | 0.20 | | | | | | | | 0.45 | |
| Expense Reimbursements | | | | | | | (0.02 | ) | | | | | | | (0.02 | ) |
| Net Expenses | | | | | | | 0.18 | % | | | | | | | 0.43 | % |
| N/A | - Fees not applicable to respective share class. |
F. Other Transactions with Affiliates — The Fund may purchase securities from, or sell securities to, an affiliated fund provided the affiliation is solely due to having a common investment adviser, common officers, or common Trustees.
For the six months ended June 30, 2023, the purchase and sale transactions and related net realized gain (loss) for the Fund with affiliated funds in compliance with Rule 17a-7 under the Act were as follows:
| | | | | | | | | | |
| Purchases | | | | Sales | | | | Net Realized Gain (Loss) | |
| | | | |
| $— | | | | $699,821 | | | | $ | (179 | ) |
G. Line of Credit Facility — As of June 30, 2023, the Fund participated in a $1,110,000,000 committed, unsecured revolving line of credit facility (the “facility”) together with other funds of the Trust and certain registered investment companies having
GOLDMAN SACHS VARIABLE INSURANCE TRUST GOVERNMENT MONEY MARKET FUND
4. AGREEMENTS AND AFFILIATED TRANSACTIONS (continued)
management agreements with GSAM or its affiliates. This facility is to be used for temporary emergency purposes, or to allow for an orderly liquidation of securities to meet redemption requests. The interest rate on borrowings is based on the federal funds rate. The facility also requires a fee to be paid by the Fund based on the amount of the commitment that has not been utilized. For the six months ended June 30, 2023, the Fund did not have any borrowings under the facility. Prior to April 19, 2023, the facility was $1,250,000,000.
5. OTHER RISKS
The Fund’s risks include, but are not limited to, the following:
Floating and Variable Rate Obligations Risk — Floating rate and variable rate obligations are debt instruments issued by companies or other entities with interest rates that reset periodically (typically, daily, monthly, quarterly, or semiannually) in response to changes in the market rate of interest on which the interest rate is based. Such market rates are generally the Secured Overnight Financing Rate, the Prime Rate of a designated U.S. bank, the Federal Funds Rate, or another base lending rate used by commercial lenders. For floating and variable rate obligations, there may be a lag between an actual change in the underlying interest rate benchmark and the reset time for an interest payment of such an obligation, which could harm or benefit the Fund, depending on the interest rate environment or other circumstances. In a rising interest rate environment, for example, a floating or variable rate obligation that does not reset immediately would prevent the Fund from taking full advantage of rising interest rates in a timely manner. However, in a declining interest rate environment, the Fund may benefit from a lag due to an obligation’s interest rate payment not being immediately impacted by a decline in interest rates.
Interest Rate Risk — When interest rates increase, the Fund’s yield will tend to be lower than prevailing market rates, and the market value of its investments will generally decline. A wide variety of market factors can cause interest rates to rise, including central bank monetary policy, rising inflation and changes in general economic conditions. Changing interest rates may have unpredictable effects on the markets, may result in heightened market volatility and may detract from the Fund’s performance. In addition, changes in monetary policy may exacerbate the risks associated with changing interest rates. Funds with longer average portfolio durations will generally be more sensitive to changes in interest rates than funds with a shorter average portfolio duration. Fluctuations in interest rates may also affect the liquidity of the Fund’s investments. A sudden or unpredictable increase in interest rates may cause volatility in the market and may decrease the liquidity of the Fund’s investments, which would make it harder for the Fund to sell its investments at an advantageous time.
Large Shareholder Transactions Risk — The Fund may experience adverse effects when certain large shareholders, such as other funds, participating insurance companies, accounts and Goldman Sachs affiliates, purchase or redeem large amounts of shares of the Fund. Such large shareholder redemptions, which may occur rapidly or unexpectedly, may cause the Fund to sell portfolio securities at times when it would not otherwise do so, which may negatively impact the Fund’s NAV and liquidity. Similarly, large Fund share purchases may adversely affect a Fund’s performance to the extent that the Fund is delayed in investing new cash or otherwise maintains a larger cash position than it ordinarily would. These transactions may also accelerate the realization of taxable income to shareholders if such sales of investments resulted in gains, and may also increase transaction costs. In addition, a large redemption could result in the Fund’s current expenses being allocated over a smaller asset base, leading to an increase in the Fund’s expense ratio.
Market and Credit Risks — In the normal course of business, the Fund trades financial instruments and enter into financial transactions where risk of potential loss exists due to changes in the market (market risk). The value of the securities in which the Fund invests may go up or down in response to the prospects of individual companies, particular sectors or governments and/or general economic conditions throughout the world due to increasingly interconnected global economies and financial markets. Events such as war, military conflict, acts of terrorism, social unrest, natural disasters, recessions, inflation, rapid interest rate
GOLDMAN SACHS VARIABLE INSURANCE TRUST GOVERNMENT MONEY MARKET FUND
Notes to Financial Statements (continued)
June 30, 2023 (Unaudited)
5. OTHER RISKS (continued)
changes, supply chain disruptions, sanctions, the spread of infectious illness or other public health threats could also significantly impact the Fund and its investments. Additionally, the Fund may also be exposed to credit risk in the event that an issuer or guarantor fails to perform or that an institution or entity with which the Fund has unsettled or open transactions defaults.
6. INDEMNIFICATION
Under the Trust’s organizational documents, its Trustees, officers, employees and agents are indemnified, to the extent permitted by the Act and state law, against certain liabilities that may arise out of performance of their duties to the Fund. Additionally, in the course of business, the Fund enters into contracts that contain a variety of indemnification clauses. The Fund’s maximum exposure under these arrangements is unknown, as this would involve future claims that may be made against the Fund that have not yet occurred. However, GSAM believes the risk of loss under these arrangements to be remote.
7. SUBSEQUENT EVENTS
Subsequent events after the Statement of Assets and Liabilities date have been evaluated and GSAM has concluded that there is no impact requiring adjustment or disclosure in the financial statements.
8. SUMMARY OF SHARE TRANSACTIONS
Share activity is as follows:
| | | | | | | | |
| | | For the Six Months Ended
June 30, 2023
(Unaudited) | | | For the Fiscal Year Ended
December 31, 2022 | |
| Institutional Shares* | | | | | | | | |
| Shares sold | | | 1,357,445,298 | | | | 1,919,889,511 | |
| Reinvestment of distributions | | | 32,804,474 | | | | 18,639,420 | |
| Shares redeemed | | | (1,335,765,124 | ) | | | (627,979,771 | ) |
| | | | 54,484,648 | | | | 1,310,549,160 | |
| Service Shares* | | | | | | | | |
| Shares sold | | | 238,663,440 | | | | 387,194,947 | |
| Reinvestment of distributions | | | 15,885,527 | | | | 8,911,512 | |
| Shares redeemed | | | (124,600,969 | ) | | | (218,643,670 | ) |
| | | | 129,947,998 | | | | 177,462,789 | |
| | |
| NET INCREASE IN SHARES | | | 184,432,646 | | | | 1,488,011,949 | |
| * | Valued at $1.00 per share. |
GOLDMAN SACHS VARIABLE INSURANCE TRUST GOVERNMENT MONEY MARKET FUND
Statement Regarding Basis for Approval of Management Agreement (Unaudited)
Background
The Goldman Sachs Government Money Market Fund (the “Fund”) is an investment portfolio of Goldman Sachs Variable Insurance Trust (the “Trust”). The Board of Trustees oversees the management of the Trust and reviews the investment performance and expenses of the Fund at regularly scheduled meetings held throughout the year. In addition, the Board of Trustees determines annually whether to approve the continuance of the Trust’s investment management agreement (the “Management Agreement”) with Goldman Sachs Asset Management, L.P. (the “Investment Adviser”) on behalf of the Fund.
The Management Agreement was most recently approved for continuation until June 30, 2024 by the Board of Trustees, including those Trustees who are not parties to the Management Agreement or “interested persons” (as defined in the Investment Company Act of 1940, as amended) of any party thereto (the “Independent Trustees”), at a meeting held on June 13-14, 2023 (the “Annual Meeting”).
The review process undertaken by the Trustees spans the course of the year and culminates with the Annual Meeting. To assist the Trustees in their deliberations, the Trustees have established a Contract Review Committee (the “Committee”), comprised of the Independent Trustees. The Committee held two meetings over the course of the year since the Management Agreement was last approved. At those Committee meetings, regularly scheduled Board or other committee meetings, and/or the Annual Meeting, matters relevant to the renewal of the Management Agreement were considered by the Board, or the Independent Trustees, as applicable. With respect to the Fund, such matters included:
| | (a) | | the nature and quality of the advisory, administrative, and other services provided to the Fund by the Investment Adviser and its affiliates, including information about: |
| | (i) | | the structure, staff, and capabilities of the Investment Adviser and its portfolio management teams; |
| | (ii) | | the groups within the Investment Adviser and its affiliates that support the portfolio management teams or provide other types of necessary services, including fund services groups (e.g., accounting and financial reporting, tax, shareholder services, and operations); controls and risk management groups (e.g., legal, compliance, valuation oversight, credit risk management, internal audit, compliance testing, market risk analysis, finance, and central funding); sales and distribution support groups, and others (e.g., information technology and training); |
| | (iii) | | trends in employee headcount; |
| | (iv) | | the Investment Adviser’s financial resources and ability to hire and retain talented personnel and strengthen its operations; and |
| | (v) | | the parent company’s support of the Investment Adviser and its mutual fund business, as expressed by the firm’s senior management; |
| | (b) | | information on the investment performance of the Fund, including comparisons to the performance of similar mutual funds, as provided by a third-party mutual fund data provider engaged as part of the contract review process (the “Outside Data Provider”); and information on general investment outlooks in the markets in which the Fund invests; |
| | (c) | | the terms of the Management Agreement and other agreements with affiliated service providers entered into by the Trust on behalf of the Fund; |
| | (d) | | fee and expense information for the Fund, including: |
| | (i) | | the relative management fee and expense levels of the Fund as compared to those of comparable funds managed by other advisers, as provided by the Outside Data Provider; |
| | (ii) | | the Fund’s expense trends over time; and |
| | (iii) | | to the extent the Investment Adviser manages other types of accounts (such as bank collective trusts, private wealth management accounts, institutional separate accounts, sub-advised mutual funds, and non-U.S. funds) having investment objectives and policies similar to those of the Fund, comparative information on the advisory fees charged and services provided to those accounts by the Investment Adviser; |
| | (e) | | with respect to the extensive investment performance and expense comparison data provided by the Outside Data Provider, its processes in producing that data for the Fund; |
| | (f) | | the undertakings of the Investment Adviser and its affiliates to implement fee waivers and/or expense limitations; |
| | (g) | | information relating to the profitability of the Management Agreement and the transfer agency and distribution and service arrangements of the Fund to the Investment Adviser and its affiliates; |
| | (h) | | whether the Fund’s existing management fee schedule adequately addressed any economies of scale; |
| | (i) | | a summary of the “fall-out” benefits derived by the Investment Adviser and its affiliates from their relationships with the Fund, including the fees received by the Investment Adviser’s affiliates from the Fund for transfer agency, distribution and other services; |
| | (j) | | a summary of potential benefits derived by the Fund as a result of its relationship with the Investment Adviser; |
GOLDMAN SACHS VARIABLE INSURANCE TRUST GOVERNMENT MONEY MARKET FUND
Statement Regarding Basis for Approval of Management Agreement (Unaudited) (continued)
| | (k) | | information regarding portfolio trading and how the Investment Adviser carries out its duty to seek best execution; |
| | (l) | | the nature and quality of the services provided to the Fund by its unaffiliated service providers, and the Investment Adviser’s general oversight and evaluation (including reports on due diligence) of those service providers as part of the administrative services provided under the Management Agreement; and |
| | (m) | | the Investment Adviser’s processes and policies addressing various types of potential conflicts of interest; its approach to risk management; the annual review of the effectiveness of the Fund’s compliance program; and periodic compliance reports. |
The Trustees also received an overview of the Fund’s distribution arrangements. They received information regarding the Fund’s assets, share purchase and redemption activity, and payment of distribution and service fees. Information was also provided to the Trustees relating to revenue sharing payments made by and services provided by the Investment Adviser and its affiliates to intermediaries that promote the sale, distribution, and/or servicing of Fund shares. The Independent Trustees also discussed the broad range of other investment choices that are available to Fund investors, including the availability of comparable funds managed by other advisers.
The presentations made at the Board and Committee meetings and at the Annual Meeting encompassed the Fund and other mutual funds for which the Board of Trustees has responsibility. In evaluating the Management Agreement at the Annual Meeting, the Trustees relied upon their knowledge, resulting from their meetings and other interactions throughout the year, of the Investment Adviser and its affiliates, their services, and the Fund. In conjunction with these meetings, the Trustees received written materials and oral presentations on the topics covered, and the Investment Adviser addressed the questions and concerns of the Trustees, including concerns regarding the investment performance of certain of the funds they oversee. The Independent Trustees were advised by their independent legal counsel regarding their responsibilities and other regulatory requirements related to the approval and continuation of mutual fund investment management agreements under applicable law. In addition, the Investment Adviser and its affiliates provided the Independent Trustees with a written response to a formal request for information sent on behalf of the Independent Trustees by their independent legal counsel. During the course of their deliberations, the Independent Trustees met in executive sessions with their independent legal counsel, without representatives of the Investment Adviser or its affiliates present.
Nature, Extent, and Quality of the Services Provided Under the Management Agreement
As part of their review, the Trustees considered the nature, extent, and quality of the services provided to the Fund by the Investment Adviser. In this regard, the Trustees considered both the investment advisory services and non-advisory services that are provided by the Investment Adviser and its affiliates. The Trustees noted the transition in the leadership and changes in personnel of various of the Investment Adviser’s portfolio management teams that had occurred in recent periods, and the ongoing recruitment efforts aimed at bringing high quality investment talent to the Investment Adviser. They also noted the Investment Adviser’s commitment to maintaining high quality systems and expending substantial resources to respond to ongoing changes to the market, regulatory and control environment in which the Fund and its service providers operate, including developments associated with the COVID-19 pandemic, geopolitical events, and economic sanctions, as well as the efforts of the Investment Adviser and its affiliates to combat cyber security risks. The Trustees also considered information regarding the Investment Adviser’s business continuity planning and remote operations capabilities. The Trustees concluded that the Investment Adviser continued to commit substantial financial and operational resources to the Fund and expressed confidence that the Investment Adviser would continue to do so in the future. The Trustees also recognized that the Investment Adviser had made significant commitments to address regulatory compliance requirements applicable to the Fund and the Investment Adviser and its affiliates.
Investment Performance
The Trustees also considered the investment performance of the Fund. In this regard, they compared the investment performance of the Fund to its peers using rankings compiled by the Outside Data Provider as of December 31, 2022. The information on the Fund’s investment performance was provided for the one-, three-, five-, and ten-year periods ending on the applicable dates.
In addition, the Trustees considered materials prepared and presentations made by the Investment Adviser’s senior management and portfolio management personnel in which Fund performance was assessed. The Trustees also considered the Investment Adviser’s periodic reports with respect to the Fund’s risk profile, and how the Investment Adviser’s approach to risk monitoring and management influences portfolio management.
The Trustees considered the performance of the Fund in light of its investment policies and strategies. The Trustees considered that, since March 2022, the Federal Reserve had implemented a series of interest rate increases in response to inflationary pressures
GOLDMAN SACHS VARIABLE INSURANCE TRUST GOVERNMENT MONEY MARKET FUND
Statement Regarding Basis for Approval of Management Agreement (Unaudited) (continued)
impacting the broader economy, and the Fund’s yield has improved compared to other recent periods as a result. They noted that the Investment Adviser had subsequently been able to reduce the amount of fees waived and/or reimbursed relative to such amounts waived and/or reimbursed during recent challenging yield environments, including the near-zero interest rate environment following the market disruptions related to the COVID-19 pandemic and related actions by the Federal Reserve. The Trustees acknowledged, however, that the interest rate environment remained uncertain in light of broader economic conditions. The Trustees considered that, during the relevant period, the Investment Adviser had voluntarily waived fees for the Fund in order to maintain a competitive yield. The Trustees also considered that the Fund had maintained a stable net asset value per share. In addition, the Trustees observed that the U.S. Securities and Exchange Commission (“SEC”) was likely to adopt certain reforms to the regulatory framework governing money market funds and that compliance with those reforms could require a significant investment of resources by the Investment Adviser. In light of these considerations, the Trustees believed that the Fund was providing investment performance within a competitive range for investors.
Costs of Services Provided and Competitive Information
The Trustees considered the contractual terms of the Management Agreement and the fee rates payable by the Fund thereunder. In this regard, the Trustees considered information on the services rendered by the Investment Adviser to the Fund, which included both advisory and administrative services that were directed to the needs and operations of the Fund as a registered mutual fund.
In particular, the Trustees reviewed analyses prepared by the Outside Data Provider regarding the expense rankings of the Fund. The analyses provided a comparison of the Fund’s management fee to those of a relevant peer group and category universe; an expense analysis which compared the Fund’s overall net and gross expenses to a peer group and a category universe; and data comparing the Fund’s net expenses to the peer and category medians. The analyses also compared the Fund’s other expenses and fee waivers/reimbursements to those of the peer group and category medians. The Trustees concluded that the comparisons provided by the Outside Data Provider were useful in evaluating the reasonableness of the management fees and total expenses paid by the Fund.
In addition, the Trustees considered the Investment Adviser’s undertakings to implement fee waivers and/or expense limitations. They noted that the Investment Adviser and Goldman Sachs had waived fees and/or reimbursed expenses for the Fund for a portion of the year in order to maintain a competitive yield. They also considered, to the extent that the Investment Adviser manages other types of accounts having investment objectives and policies similar to those of the Fund, comparative fee information for services provided by the Investment Adviser to those accounts, and information that indicated that services provided to the Fund differed in various significant respects from the services provided to other types of accounts which, in many cases, operated under less stringent legal and regulatory structures, required fewer services from the Investment Adviser to a smaller number of client contact points, and were less time-intensive.
In addition, the Trustees noted that shareholders are able to redeem their shares at any time if shareholders believe that the Fund fees and expenses are too high or if they are dissatisfied with the performance of the Fund.
Profitability
The Trustees reviewed the Fund’s contribution to the Investment Adviser’s revenues and pre-tax profit margins. In this regard the Trustees noted that they had received, among other things, profitability analyses and summaries, revenue and expense schedules by Fund and by function (i.e., investment management, transfer agency and distribution and service), and information on the Investment Adviser’s expense allocation methodology. They observed that the profitability and expense figures are substantially similar to those used by the Investment Adviser for many internal purposes, including compensation decisions among various business groups, and are thus subject to a vigorous internal debate about how certain revenue and expenses should be allocated. The Trustees also noted that the internal audit group within the Goldman Sachs organization periodically audits the expense allocation methodology and that the internal audit group was satisfied with the reasonableness, consistency, and accuracy of the Investment Adviser’s expense allocation methodology. Profitability data for the Fund was provided for 2022 and 2021, and the Trustees considered this information in relation to the Investment Adviser’s overall profitability.
Economies of Scale
The Trustees considered the information that had been provided regarding whether there have been economies of scale with respect to the management of the Fund.
The Trustees noted that the Fund does not have management fee breakpoints. They considered the asset levels in the Fund; the Fund’s recent purchase and redemption activity; the information provided by the Investment Adviser relating to the costs of the
GOLDMAN SACHS VARIABLE INSURANCE TRUST GOVERNMENT MONEY MARKET FUND
Statement Regarding Basis for Approval of Management Agreement (Unaudited) (continued)
services provided by the Investment Adviser and its affiliates and their realized profits; information comparing the contractual fee rates charged by the Investment Adviser with fee rates charged to other money market funds in the peer group; and the Investment Adviser’s undertaking to limit certain expenses of the Fund that exceed a specified level. They considered a report prepared by the Outside Data Provider, which surveyed money market funds’ management fee arrangements and use of breakpoints. The Trustees also considered the competitive nature of the money market fund business and the competitiveness of the fees charged to the Fund by the Investment Adviser.
Other Benefits to the Investment Adviser and Its Affiliates
The Trustees also considered the other benefits derived by the Investment Adviser and its affiliates from their relationships with the Fund as stated above, including: (a) transfer agency fees received by Goldman Sachs & Co. LLC (“Goldman Sachs”); (b) trading efficiencies resulting from aggregation of orders of the Fund with those for other funds or accounts managed by the Investment Adviser; (c) the Investment Adviser’s ability to leverage the infrastructure designed to service the Fund on behalf of its other clients; (d) the Investment Adviser’s ability to cross-market other products and services to Fund shareholders; (e) Goldman Sachs’ retention of certain fees as Fund Distributor; (f) Goldman Sachs’ ability to engage in principal transactions with the Fund under exemptive orders from the SEC permitting such trades; (g) the Investment Adviser’s ability to negotiate better pricing with custodians on behalf of its other clients, as a result of the relationship with the Fund; and (h) the possibility that the working relationship between the Investment Adviser and the Fund’s third-party service providers may cause those service providers to be more likely to do business with other areas of Goldman Sachs. In the course of considering the foregoing, the Independent Trustees requested and received further information quantifying certain of these fall-out benefits.
Other Benefits to the Fund and Its Shareholders
The Trustees also noted that the Fund receives certain other potential benefits as a result of its relationship with the Investment Adviser, including: (a) trading efficiencies resulting from aggregation of orders of the Fund with those of other funds or accounts managed by the Investment Adviser; (b) enhanced servicing from vendors due to the volume of business generated by the Investment Adviser and its affiliates; (c) enhanced servicing from broker-dealers due to the volume of business generated by the Investment Adviser and its affiliates; (d) the advantages received from the Investment Adviser’s knowledge and experience gained from managing other accounts and products; (e) the Investment Adviser’s ability to hire and retain qualified personnel to provide services to the Fund because of the reputation of the Goldman Sachs organization; (f) the Fund’s access, through the Investment Adviser, to certain firm-wide resources (e.g., proprietary risk management systems and databases), subject to certain restrictions; and (g) the Fund’s access to certain affiliated distribution channels. In addition, the Trustees noted the competitive nature of the mutual fund marketplace, and considered that many of the Fund’s shareholders invested in the Fund in part because of the Fund’s relationship with the Investment Adviser and that those shareholders have a general expectation that the relationship will continue.
Conclusion
In connection with their consideration of the Management Agreement, the Trustees gave weight to each of the factors described above, but did not identify any particular factor as controlling their decision. After deliberation and consideration of all of the information provided, including the factors described above, the Trustees concluded, in the exercise of their business judgment, that the management fees paid by the Fund were reasonable in light of the services provided to it by the Investment Adviser, the Investment Adviser’s costs and the Fund’s current and reasonably foreseeable asset levels. The Trustees unanimously concluded that the Investment Adviser’s continued management likely would benefit the Fund and its shareholders and that the Management Agreement should be approved and continued with respect to the Fund until June 30, 2024.
GOLDMAN SACHS VARIABLE INSURANCE TRUST GOVERNMENT MONEY MARKET FUND
| | |
| Fund Expenses — Six Month Period Ended June 30, 2023 (Unaudited) | | |
As a shareholder of Institutional Shares and Service Shares of the Fund, you incur ongoing costs, including management fees; distribution and service (12b-1) fees (with respect to Service Shares); and other Fund expenses. This example is intended to help you understand your ongoing costs (in dollars) of investing in the Fund and to compare these costs with the ongoing costs of investing in other mutual funds.
The example is based on an investment of $1,000 invested at the beginning of the period and held for the entire period from January 1, 2023 through June 30, 2023, which represents a period of 181 days of a 365 day year.
Actual Expenses — The first line in the table below provides information about actual account values and actual expenses. You may use the information in this line, together with the amount you invested, to estimate the expenses that you paid over the period. Simply divide your account value by $1,000 (for example, an $8,600 account value divided by $1,000=8.6), then multiply the result by the number in the first line under the heading entitled “Expenses Paid” to estimate the expenses you paid on your account during this period.
Hypothetical Example for Comparison Purposes — The second line in the table below provides information about hypothetical account values and hypothetical expenses based on the Fund’s actual net expense ratio and an assumed rate of return of 5% per year before expenses, which is not the Fund’s actual return. The hypothetical account values and expenses may not be used to estimate the actual ending account balance or expenses you paid for the period. You may use this information to compare the ongoing costs of investing in the Fund and other funds. To do so, compare this 5% hypothetical example with the 5% hypothetical examples that appear in the shareholder reports of the other funds.
Please note that the expenses shown in the table are meant to highlight your ongoing costs only and do not reflect any transactional costs, such as sales charges, redemption fees, or exchange fees. Therefore, the second line of the table is useful in comparing ongoing costs only and will not help you determine the relative total costs of owning different funds. In addition, if these transactional costs were included, your costs would have been higher.
| | | | | | | | | | | | |
| Share Class | | Beginning
Account Value
1/1/23 | | | Ending Account Value
6/30/23 | | | Expenses Paid for the 6 Months Ended 6/30/23* | |
| Institutional Shares | | | | | | | | | | | | |
| | | | |
| Actual | | $ | 1,000.00 | | | $ | 1,023.32 | | | $ | 0.90 | |
| Hypothetical 5% return | | $ | 1,000.00 | | | $ | 1,023.90 | + | | $ | 0.90 | |
| Service Shares | | | | | | | | | | | | |
| | | | |
| Actual | | $ | 1,000.00 | | | $ | 1,022.06 | | | $ | 2.16 | |
| Hypothetical 5% return | | $ | 1,000.00 | | | $ | 1,022.66 | + | | $ | 2.16 | |
| | * | Expenses are calculated using the Fund’s annualized net expense ratio for each class, which represents the ongoing expenses as a percentage of net assets for the six months ended June 30, 2023. Expenses are calculated by multiplying the annualized net expense ratio by the average account value for the period; then multiplying the result by the number of days in the most recent fiscal half year (or, since inception, if shorter); and then dividing that result by the number of days in the period. The annualized net expense ratios for the period were 0.18% and 0.43% for Institutional Shares and Service Shares, respectively. | |
| | + | Hypothetical expenses are based on the Fund’s actual annualized net expense ratio and an assumed rate of return of 5% per year before expenses. | |
| | |
| TRUSTEES | | OFFICERS |
| Gregory G. Weaver, Chair | | James A. McNamara, President |
| Dwight L. Bush | | Joseph F. DiMaria, Principal Financial Officer, Principal Accounting Officer and Treasurer Caroline L. Kraus, Secretary |
| Kathryn A. Cassidy |
| John G. Chou |
| Joaquin Delgado |
| Eileen H. Dowling |
| James A. McNamara | | |
| Paul C. Wirth | | |
GOLDMAN SACHS & CO. LLC
Distributor and Transfer Agent
GOLDMAN SACHS ASSET MANAGEMENT, L.P.
Investment Adviser
200 West Street, New York,
New York 10282
Visit our web site at www.GSAMFUNDS.com to obtain the most recent month-end returns.
The reports concerning the Fund included in this shareholder report may contain certain forward-looking statements about the factors that may affect the performance of the Fund in the future. These statements are based on Fund management’s predictions and expectations concerning certain future events and their expected impact on the Fund, such as performance of the economy as a whole and of specific industry sectors, changes in the levels of interest rates, the impact of developing world events, and other factors that may influence the future performance of the Fund. Management believes these forward-looking statements to be reasonable, although they are inherently uncertain and difficult to predict. Actual events may cause adjustments in portfolio management strategies from those currently expected to be employed.
A description of the policies and procedures that the Fund uses to determine how to vote proxies relating to portfolio securities and information regarding how the Fund voted proxies relating to portfolio securities for the 12-month period ended June 30 is available (i) without charge, upon request by calling 1-800-621-2550; and (ii) on the Securities and Exchange Commission (“SEC”) web site at http://www.sec.gov.
Views and opinions expressed are for informational purposes only and do not constitute a recommendation by GSAM to buy, sell, or hold any security. Views and opinions are current as of the date of this presentation and may be subject to change, they should not be construed as investment advice.
Goldman Sachs & Co. LLC (“Goldman Sachs”) does not provide legal, tax or accounting advice. Any statement contained in this communication (including any attachments) concerning U.S. tax matters was not intended or written to be used, and cannot be used, for the purpose of avoiding penalties under the Internal Revenue Code, and was written to support the promotion or marketing of transactions or matters addressed. Clients of Goldman Sachs should obtain their own independent tax advice based on their particular circumstances.
The website links provided are for your convenience only and are not an endorsement or recommendation by GSAM of any of these websites or the products or services offered. GSAM is not responsible for the accuracy and validity of the content of these websites.
Fund holdings and allocations shown are as of June 30, 2023 and may not be representative of future investments. Fund holdings should not be relied on in making investment decisions and should not be construed as research or investment advice regarding particular securities. Current and future holdings are subject to risk.
The portfolio risk management process includes an effort to monitor and manage risk, but does not imply low risk.
Shares of the Goldman Sachs VIT Funds are offered to separate accounts of participating life insurance companies for the purpose of funding variable annuity contracts and variable life insurance policies. Shares of the Funds are not offered directly to the general public. The variable annuity contracts and variable life insurance policies are described in the separate prospectuses issued by participating insurance companies. You should refer to those prospectuses for information about surrender charges, mortality and expense risk fees and other charges that may be assessed by participating insurance companies under the variable annuity contracts or variable life insurance policies. Such fees or charges, if any, may affect the return you may realize with respect to your investments. Ask your representative for more complete information. Please consider a Fund’s objectives, risks and charges and expenses, and read the prospectus carefully before investing. The prospectus contains this and other information about the Funds.
This material is not authorized for distribution to prospective investors unless preceded or accompanied by a current prospectus or summary prospectus, if applicable. Investors should consider the Fund’s objective, risks, and charges and expenses, and read the summary prospectus, if available, and/or the prospectus carefully before investing or sending money. The summary prospectus, if available, and the prospectus contain this and other information about the Fund and may be obtained from your authorized dealer or from Goldman Sachs & Co. LLC by calling 1-800-621-2550.
This report is prepared for the general information of contract owners and is not an offer of shares of the Goldman Sachs Variable Insurance Trust — Goldman Sachs Government Money Market Fund.
© 2023 Goldman Sachs. All rights reserved.
VITMMSAR-23 330595-OTU-08/2023
Goldman
Sachs Variable Insurance Trust
Goldman Sachs Core Fixed Income Fund
Semi-Annual Report
June 30, 2023

Goldman Sachs Variable Insurance Trust
| ∎ | | GOLDMAN SACHS CORE FIXED INCOME FUND |
| | | | |
| | | |
| NOT FDIC-INSURED | | May Lose Value | | No Bank Guarantee |
MARKET REVIEW
Goldman Sachs Variable Insurance Trust – Goldman Sachs Core Fixed Income Fund
The following are highlights both of key factors affecting the U.S. fixed income market and of any key changes made to the Goldman Sachs VIT Core Fixed Income Fund (the “Fund”) during the six months ended June 30, 2023 (the “Reporting Period”). A fuller review of the market and these changes will appear in the Fund’s annual shareholder report covering the 12 months ended December 31, 2023.
Market and Economic Review
| • | | The capital markets were rather volatile during the Reporting Period overall, with the U.S. fixed income market broadly influenced by U.S. Federal Reserve (“Fed”) monetary policy, inflationary trends and other macroeconomic data, geopolitical events, and U.S. and European banking stress. The Bloomberg U.S. Aggregate Bond Index, representing the broad U.S. fixed income market, returned 2.09% during the Reporting Period. |
| • | | When the Reporting Period began in January 2023, riskier segments of the U.S. fixed income market performed well, with notable strength from high yield corporate bonds. Investors seemed optimistic the Fed might be nearing the end of its interest rate hiking schedule. Overall, signs of disinflation tempered fears of renewed aggressive monetary policy tightening. |
| • | | In February 2023, U.S. spread, or non-government bond, sectors produced modestly negative returns overall, as the release of unexpectedly strong U.S. economic and labor market data raised concerns about the stickiness of inflation. This led market participants to anticipate further Fed tightening and fueled a rise in rate volatility. |
| | • | | At the beginning of the month, the Fed stepped down its pace of interest rate increases to 25 basis points but also indicated policymakers thought “ongoing” rate hikes would be appropriate, a modestly hawkish surprise. (A basis point is 1/100th of a percentage point. Hawkish tends to suggest higher interest rates; opposite of dovish.) |
| • | | U.S. spread sectors generated mixed returns overall during March 2023, as rate volatility continued. |
| | • | | Early in the month, after Fed Chair Jerome Powell opened the door to tighter Fed monetary policy, markets repriced the terminal federal funds rate higher and for longer. (A terminal rate is the ultimate interest rate level that a central bank targets for a cycle of rate hikes or cuts.) The two-year U.S. Treasury yield rose in response, breaching 5% for the first time since 2007. |
| | • | | The momentum reversed sharply mid-month, as a broad flight to quality ensued amid U.S. and European banking stress. Short-term U.S. Treasury yields fell by more than 100 basis points. |
| | • | | In this environment, Fed officials grappled with a difficult trade-off between the firm macroeconomic backdrop, including resilient labor markets and elevated inflation, and rising financial stability concerns. |
| | • | | Ultimately, at its March meeting, the Fed implemented a 25 basis point rate hike, projected a weak economic outlook for the rest of 2023, and struck a more cautious tone on the forward path for the federal funds target rate. |
| • | | In April 2023, yields fluctuated in response to sticky inflation data, signs of moderating economic growth, developments in the banking sector and concerns over tightening credit conditions. The performance of U.S. spread sectors was rather flat overall, with better than consensus expected earnings and robust supply and demand providing support for investment grade and high yield corporate bonds. |
| • | | In May 2023, U.S. spread sectors weakened on concerns surrounding U.S. debt ceiling negotiations and banking sector stress. Heightened U.S./China geopolitical tensions, speculation about Fed policy, the outlook for corporate earnings and the growing focus on the rise of artificial intelligence also drove market volatility. |
| | • | | At its policy meeting near the beginning of May, the Fed raised the federal funds rate by another 25 basis points, with policymakers signaling a willingness to pause further interest rate actions based on signs U.S. inflation was beginning to moderate and that tighter credit conditions from recent banking sector stress were “likely to weigh on economic activity, hiring, and inflation.” |
MARKET REVIEW
| • | | U.S. spread sectors broadly strengthened in June 2023, as investors priced in the view the U.S. would avoid recession and the Fed would stop tightening. |
| | • | | At its policy meeting that same month, the Fed opted for a hawkish pause. In other words, the Fed halted monetary policy action for the first time in more than a year but still maintained higher-for-longer messaging on interest rates. |
| | • | | According to the Fed’s median dot plot projection, which shows the interest rate projections of the members of the Federal Open Market Committee, policymakers increased their estimate for the peak federal funds rate at the end of 2023 from 5.1% to 5.6%. |
| • | | During the Reporting Period, the U.S. Treasury yield curve generally maintained an inverted slope, meaning yields on shorter-term maturities were higher than those on longer-term maturities. (Yield curve is a spectrum of interest rates based on maturities of varying lengths.) |
| | • | | Yields on maturities of five years and less climbed in response to the Fed’s hawkish monetary policy. |
| | • | | The seven- to 30-year portion of the U.S. Treasury yield curve ended the Reporting Period near where it started, though yields on maturities of 10 years and longer edged down as investors speculated the Fed was approaching the end of its interest rate hiking cycle. |
| | • | | The yield on the bellwether 10-year U.S. Treasury fell approximately seven basis points to end June 2023 at 3.81%. |
| | • | | The inversion in the U.S. Treasury yield curve between two-year and 30-year maturities increased during the Reporting Period. Historically, protracted yield curve inversions have preceded U.S. economic recessions. |
| • | | During the Reporting Period overall, virtually all U.S. fixed income sectors broadly recorded gains on an absolute basis. |
| • | | On a relative basis, U.S. corporate bonds, both high yield and investment grade, outperformed U.S. Treasury securities. In addition, emerging markets debt and municipal bonds outperformed U.S. Treasury securities. Securitized bonds overall, including U.S. mortgage-backed securities, commercial mortgage-backed securities and asset backed securities, more modestly outperformed U.S. Treasury securities during the Reporting Period. |
Fund Changes and Highlights
No material changes were made to the Fund during the Reporting Period.
FUND BASICS
Core Fixed Income Fund
as of June 30, 2023
PERFORMANCE REVIEW
| | | | | | | | |
| | |
| January 1, 2023 – June 30, 2023 | | Fund Total Return
(based on NAV)1 | | | Bloomberg
U.S. Aggregate
Bond Index2 | |
| Institutional | | | 2.50 | % | | | 2.09 | % |
| Service | | | 2.39 | | | | 2.09 | |
| 1 | The net asset value (“NAV”) represents the net assets of the class of the Fund (ex-dividend) divided by the total number of shares of the class outstanding. The Fund’s performance assumes the reinvestment of dividends and other distributions. The Fund’s performance does not reflect the deduction of any applicable sales charges. |
| 2 | Bloomberg U.S. Aggregate Bond Index represents an unmanaged diversified portfolio of fixed income securities, including U.S. Treasuries, investment-grade corporate bonds and mortgage-backed and asset-backed securities. It is not possible to invest directly in an unmanaged index. |
The returns set forth in the table above represent past performance. Past performance does not guarantee future results. The Fund’s investment return and principal value will fluctuate so that an investor’s shares, when redeemed, may be worth more or less than their original cost. Current performance may be lower or higher than the performance quoted above. Please visit our web site at www.GSAMFUNDS.com to obtain the most recent month-end returns. Performance reflects applicable fee waivers and/or expense limitations in effect during the periods shown. In their absence, performance would be reduced. Returns do not reflect the deduction of taxes that a shareholder would pay on Fund distributions or the redemption of Fund shares.
FUND BASICS
FUND COMPOSITION3
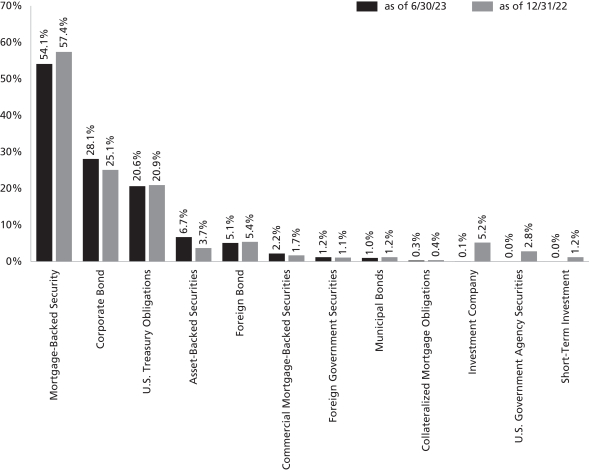
| 3 | The percentage shown for each investment category reflects the value of investments in that category as a percentage of net assets. Short-Term Investments represent investments in commercial paper. Figures in the above graph may not sum to 100% due to the exclusion of other assets and liabilities. Underlying sector allocations of investment companies held by the Fund are not reflected in the graph above. The graph depicts the Fund’s investments but may not represent the Fund’s market exposure due to the exclusion of certain derivatives, if any, as listed in the Additional Investment Information section of the Schedule of Investments. |
| 4 | “Mortgage-Backed Securities” are guaranteed by the Government National Mortgage Association (“GNMA”), the Federal Home Loan Mortgage Corp. (“FHLMC”) or Uniform Mortgage-Backed Securities (“UMBS”). GNMA instruments are backed by the full faith and credit of the United States Government. |
| 5 | “U.S. Government Agency Securities” include agency securities offered by companies such as Federal Home Loan Bank (“FHLB”), FHLMC and the Federal National Mortgage Association (“FNMA”), which operate under a government charter. While they are required to report to a government regulator, their assets are not explicitly guaranteed by the government and they otherwise operate like any other publicly traded company. |
For more information about your Fund, please refer to www.GSAMFUNDS.com. There, you can learn more about your Fund’s investment strategies, holdings, and performance.
GOLDMAN SACHS VARIABLE INSURANCE TRUST CORE FIXED INCOME FUND
Schedule of Investments
June 30, 2023 (Unaudited)
| | | | | | | | | | | | | | |
Principal
Amount | | | Interest
Rate | | | Maturity
Date | | | Value | |
|
| Mortgage-Backed Securities – 54.1% | |
| | FHLMC | |
| $ | 3,303 | | | | 7.500 | % | | | 12/01/29 | | | $ | 3,452 | |
| | 996 | | | | 5.000 | | | | 10/01/33 | | | | 994 | |
| | 1,376 | | | | 5.000 | | | | 07/01/35 | | | | 1,377 | |
| | 1,963 | | | | 5.000 | | | | 12/01/35 | | | | 1,961 | |
| | 406 | | | | 5.000 | | | | 03/01/38 | | | | 409 | |
| | 894 | | | | 5.000 | | | | 06/01/41 | | | | 899 | |
| | 4,681 | | | | 4.500 | | | | 08/01/48 | | | | 4,569 | |
| | 5,433 | | | | 4.500 | | | | 11/01/48 | | | | 5,303 | |
| | 589,039 | | | | 3.000 | | | | 09/01/49 | | | | 526,935 | |
| | 427,945 | | | | 4.000 | | | | 03/01/50 | | | | 407,463 | |
| | 886,276 | | | | 4.500 | | | | 03/01/50 | | | | 863,957 | |
| | 297,112 | | | | 3.000 | | | | 10/01/50 | | | | 264,579 | |
| | 969,975 | | | | 2.500 | | | | 02/01/51 | | | | 825,852 | |
| | 1,949,481 | | | | 2.000 | | | | 05/01/51 | | | | 1,592,304 | |
| | 925,237 | | | | 2.500 | | | | 05/01/51 | | | | 792,099 | |
| | 922,397 | | | | 2.500 | | | | 05/01/51 | | | | 783,679 | |
| | 869,366 | | | | 2.500 | | | | 09/01/51 | | | | 742,365 | |
| | 3,941,743 | | | | 2.000 | | | | 03/01/52 | | | | 3,213,391 | |
| | 1,956,849 | | | | 2.000 | | | | 04/01/52 | | | | 1,596,487 | |
| | 777,357 | | | | 4.500 | | | | 04/01/52 | | | | 748,732 | |
| | 598,889 | | | | 4.500 | | | | 06/01/52 | | | | 578,492 | |
| | 406,984 | | | | 6.000 | | | | 12/01/52 | | | | 419,361 | |
| | FNMA | |
| | 6 | | | | 5.500 | | | | 09/01/23 | | | | 6 | |
| | 6 | | | | 5.500 | | | | 10/01/23 | | | | 6 | |
| | 112 | | | | 4.500 | | | | 07/01/24 | | | | 111 | |
| | 895 | | | | 9.000 | | | | 11/01/25 | | | | 900 | |
| | 9,600 | | | | 7.000 | | | | 08/01/26 | | | | 9,669 | |
| | 2,964 | | | | 8.000 | | | | 10/01/29 | | | | 3,070 | |
| | 825 | | | | 8.500 | | | | 04/01/30 | | | | 870 | |
| | 1,554 | | | | 8.000 | | | | 05/01/30 | | | | 1,592 | |
| | 3,061 | | | | 8.000 | | | | 08/01/32 | | | | 3,255 | |
| | 3,789 | | | | 4.500 | | | | 08/01/39 | | | | 3,715 | |
| | 13,360 | | | | 3.000 | | | | 01/01/43 | | | | 12,167 | |
| | 7,229 | | | | 3.000 | | | | 01/01/43 | | | | 6,580 | |
| | 8,154 | | | | 3.000 | | | | 03/01/43 | | | | 7,429 | |
| | 20,835 | | | | 3.000 | | | | 03/01/43 | | | | 18,891 | |
| | 63,558 | | | | 3.000 | | | | 03/01/43 | | | | 57,620 | |
| | 18,587 | | | | 3.000 | | | | 04/01/43 | | | | 16,849 | |
| | 78,147 | | | | 3.000 | | | | 04/01/43 | | | | 70,842 | |
| | 15,148 | | | | 3.000 | | | | 04/01/43 | | | | 13,731 | |
| | 10,555 | | | | 3.000 | | | | 04/01/43 | | | | 9,571 | |
| | 8,163 | | | | 3.000 | | | | 04/01/43 | | | | 7,415 | |
| | 42,960 | | | | 3.000 | | | | 05/01/43 | | | | 38,943 | |
| | 39,021 | | | | 3.000 | | | | 05/01/43 | | | | 35,367 | |
| | 10,076 | | | | 3.000 | | | | 05/01/43 | | | | 9,132 | |
| | 283,448 | | | | 4.000 | | | | 12/01/44 | | | | 272,007 | |
| | 239,469 | | | | 4.500 | | | | 04/01/45 | | | | 236,357 | |
| | 29,711 | | | | 4.500 | | | | 05/01/45 | | | | 29,306 | |
| | 871,441 | | | | 3.500 | | | | 07/01/45 | | | | 808,723 | |
| | 569,721 | | | | 4.000 | | | | 08/01/45 | | | | 546,726 | |
| | 138,354 | | | | 4.000 | | | | 02/01/48 | | | | 132,510 | |
| | 162,866 | | | | 4.000 | | | | 03/01/48 | | | | 155,987 | |
| | 10,099 | | | | 4.000 | | | | 07/01/48 | | | | 9,682 | |
| | |
|
| Mortgage-Backed Securities – (continued) | |
| | FNMA – (continued) | |
| 2,991 | | | | 4.000 | | | | 07/01/48 | | | | 2,862 | |
| | 276,012 | | | | 4.500 | | | | 07/01/48 | | | | 269,406 | |
| | 182,950 | | | | 4.000 | | | | 08/01/48 | | | | 174,994 | |
| | 147,758 | | | | 5.000 | | | | 11/01/48 | | | | 148,011 | |
| | 1,970,020 | | | | 2.000 | | | | 10/01/50 | | | | 1,615,235 | |
| | 596,758 | | | | 3.000 | | | | 10/01/50 | | | | 531,415 | |
| | 458,233 | | | | 3.000 | | | | 10/01/50 | | | | 409,061 | |
| | 604,063 | | | | 3.000 | | | | 10/01/50 | | | | 539,242 | |
| | 1,969,563 | | | | 2.000 | | | | 11/01/50 | | | | 1,614,861 | |
| | 76,721 | | | | 2.500 | | | | 03/01/51 | | | | 65,825 | |
| | 97,043 | | | | 2.500 | | | | 09/01/51 | | | | 83,139 | |
| | 388,244 | | | | 2.500 | | | | 10/01/51 | | | | 332,496 | |
| | 227,507 | | | | 2.500 | | | | 11/01/51 | | | | 194,725 | |
| | 176,240 | | | | 2.500 | | | | 11/01/51 | | | | 150,880 | |
| | 1,960,389 | | | | 2.000 | | | | 03/01/52 | | | | 1,599,375 | |
| | 1,991,997 | | | | 2.500 | | | | 04/01/52 | | | | 1,689,015 | |
| | 1,914,645 | | | | 2.000 | | | | 06/01/52 | | | | 1,561,457 | |
| | 1,504,250 | | | | 6.000 | | | | 11/01/52 | | | | 1,539,654 | |
| | 964,914 | | | | 5.500 | | | | 04/01/53 | | | | 961,625 | |
| | 3,000,000 | | | | 3.500 | | | | TBA-30yr | (a) | | | 2,732,578 | |
| | 4,000,000 | | | | 4.000 | | | | TBA-30yr | (a) | | | 3,752,812 | |
| | 10,000,000 | | | | 5.000 | | | | TBA-30yr | (a) | | | 9,795,180 | |
| | 1,004,382 | | | | 3.500 | | | | 09/01/62 | | | | 901,651 | |
| | FNMA Series 2012-111, Class B | |
| | 5,045 | | | | 7.000 | | | | 10/25/42 | | | | 5,414 | |
| | FNMA Series 2012-153, Class B | |
| | 13,641 | | | | 7.000 | | | | 07/25/42 | | | | 14,676 | |
| | FTMA | |
| | 432,162 | | | | 4.000 | | | | 01/01/46 | | | | 412,559 | |
| | GNMA | |
| | 1,467 | | | | 7.000 | | | | 11/15/25 | | | | 1,471 | |
| | 13 | | | | 7.000 | | | | 02/15/26 | | | | 13 | |
| | 472 | | | | 7.000 | | | | 04/15/26 | | | | 473 | |
| | 557 | | | | 7.000 | | | | 04/15/26 | | | | 558 | |
| | 640 | | | | 7.000 | | | | 03/15/27 | | | | 643 | |
| | 277 | | | | 7.000 | | | | 11/15/27 | | | | 277 | |
| | 1,408 | | | | 7.000 | | | | 11/15/27 | | | | 1,434 | |
| | 3,326 | | | | 7.000 | | | | 02/15/28 | | | | 3,362 | |
| | 537 | | | | 7.000 | | | | 04/15/28 | | | | 538 | |
| | 69 | | | | 7.000 | | | | 05/15/28 | | | | 70 | |
| | 1,399 | | | | 7.000 | | | | 06/15/28 | | | | 1,419 | |
| | 1,461 | | | | 7.000 | | | | 07/15/28 | | | | 1,480 | |
| | 618 | | | | 7.000 | | | | 07/15/28 | | | | 629 | |
| | 6,307 | | | | 7.000 | | | | 09/15/28 | | | | 6,400 | |
| | 45,387 | | | | 6.000 | | | | 08/20/34 | | | | 46,229 | |
| | 39,676 | | | | 5.000 | | | | 06/15/40 | | | | 40,020 | |
| | 166,581 | | | | 4.000 | | | | 08/20/43 | | | | 160,349 | |
| | 62,769 | | | | 4.000 | | | | 10/20/45 | | | | 60,583 | |
| | 187,900 | | | | 3.500 | | | | 04/20/47 | | | | 175,659 | |
| | 232,740 | | | | 3.500 | | | | 12/20/47 | | | | 217,577 | |
| | 957,071 | | | | 4.000 | | | | 07/20/48 | | | | 916,571 | |
| | 32,168 | | | | 5.000 | | | | 08/20/48 | | | | 32,132 | |
| | 103,423 | | | | 4.500 | | | | 09/20/48 | | | | 101,243 | |
| | 111,403 | | | | 5.000 | | | | 10/20/48 | | | | 111,278 | |
| | |
| | |
| The accompanying notes are an integral part of these financial statements. | | 5 |
GOLDMAN SACHS VARIABLE INSURANCE TRUST CORE FIXED INCOME FUND
Schedule of Investments (continued)
June 30, 2023 (Unaudited)
| | | | | | | | | | | | | | |
Principal
Amount | | | Interest
Rate | | | Maturity
Date | | | Value | |
|
| Mortgage-Backed Securities – (continued) | |
| | GNMA – (continued) | |
| $ | 309,390 | | | | 5.000 | % | | | 11/20/48 | | | $ | 309,044 | |
| | 39,310 | | | | 5.000 | | | | 12/20/48 | | | | 39,205 | |
| | 240,670 | | | | 4.500 | | | | 01/20/49 | | | | 235,446 | |
| | 33,295 | | | | 4.500 | | | | 03/20/49 | | | | 32,572 | |
| | 672,746 | | | | 3.000 | | | | 08/20/49 | | | | 607,282 | |
| | 217,481 | | | | 4.500 | | | | 10/20/49 | | | | 212,678 | |
| | 434,663 | | | | 3.000 | | | | 03/20/50 | | | | 391,827 | |
| | 216,203 | | | | 4.500 | | | | 03/20/50 | | | | 210,108 | |
| | 677,772 | | | | 3.500 | | | | 02/20/51 | | | | 632,349 | |
| | 105,468 | | | | 2.500 | | | | 06/20/51 | | | | 90,262 | |
| | 127,438 | | | | 2.500 | | | | 09/20/51 | | | | 109,065 | |
| | 271,634 | | | | 2.500 | | | | 09/20/51 | | | | 233,491 | |
| | 80,273 | | | | 2.500 | | | | 09/20/51 | | | | 69,001 | |
| | 206,988 | | | | 2.500 | | | | 10/20/51 | | | | 177,147 | |
| | 861,176 | | | | 3.000 | | | | 11/20/51 | | | | 771,744 | |
| | 109,378 | | | | 2.500 | | | | 12/20/51 | | | | 93,574 | |
| | 82,593 | | | | 2.500 | | | | 01/20/52 | | | | 70,659 | |
| | 998,268 | | | | 2.500 | | | | 01/20/52 | | | | 853,410 | |
| | 519,100 | | | | 3.000 | | | | 02/20/52 | | | | 464,130 | |
| | 973,393 | | | | 4.500 | | | | 09/20/52 | | | | 939,717 | |
| | 967,018 | | | | 4.500 | | | | 10/20/52 | | | | 933,865 | |
| | 1,000,000 | | | | 2.000 | | | | TBA-30yr | (a) | | | 839,978 | |
| | 1,000,000 | | | | 4.000 | | | | TBA-30yr | (a) | | | 945,528 | |
| | 1,000,000 | | | | 4.500 | | | | TBA-30yr | (a) | | | 964,864 | |
| | 2,000,000 | | | | 5.000 | | | | TBA-30yr | (a) | | | 1,965,088 | |
| | 4,000,000 | | | | 5.500 | | | | TBA-30yr | (a) | | | 3,982,401 | |
| | GNMA Series 2021-135, Class A | |
| | 1,003,827 | | | | 2.000 | | | | 08/20/51 | | | | 834,442 | |
| | |
| | TOTAL MORTGAGE-BACKED SECURITIES | |
| | (Cost $67,415,822) | | | $ | 65,881,122 | |
| | |
| | | | | | | | | | | | | | |
|
| Corporate Bonds – 28.1% | |
| Aerospace/Defense – 0.8% | |
| | Boeing Co. (The) | |
| $ | 50,000 | | | | 3.450 | %(b) | | | 11/01/28 | | | $ | 45,389 | |
| | 25,000 | | | | 5.150 | (b) | | | 05/01/30 | | | | 24,762 | |
| | 25,000 | | | | 3.250 | (b) | | | 02/01/35 | | | | 20,266 | |
| | 325,000 | | | | 5.705 | (b) | | | 05/01/40 | | | | 324,063 | |
| | 100,000 | | | | 5.805 | (b) | | | 05/01/50 | | | | 99,459 | |
| | Lockheed Martin Corp.(b) | |
| | 150,000 | | | | 5.250 | | | | 01/15/33 | | | | 155,509 | |
| | Northrop Grumman Corp. | |
| | 50,000 | | | | 2.930 | (b) | | | 01/15/25 | | | | 48,068 | |
| | 75,000 | | | | 3.250 | (b) | | | 01/15/28 | | | | 70,142 | |
| | 25,000 | | | | 4.750 | | | | 06/01/43 | | | | 23,389 | |
| | 50,000 | | | | 5.250 | (b) | | | 05/01/50 | | | | 50,925 | |
| | Raytheon Technologies Corp. | |
| | 50,000 | | | | 3.950 | (b) | | | 08/16/25 | | | | 48,987 | |
| | 50,000 | | | | 4.125 | (b) | | | 11/16/28 | | | | 48,158 | |
| | 25,000 | | | | 4.050 | (b) | | | 05/04/47 | | | | 21,247 | |
| | | | | | | | | | | | | | |
| | | | | | | | | | | | | 980,364 | |
| | |
|
| Corporate Bonds – (continued) | |
| Agriculture – 0.4% | |
| | Archer-Daniels-Midland Co. | |
| 25,000 | | | | 3.250 | %(b) | | | 03/27/30 | | | | 22,930 | |
| | 100,000 | | | | 2.900 | (b) | | | 03/01/32 | | | | 87,087 | |
| | Cargill, Inc.(b)(c) | |
| | 200,000 | | | | 4.750 | | | | 04/24/33 | | | | 197,051 | |
| | Philip Morris International, Inc. | |
| | 50,000 | | | | 5.625 | (b) | | | 11/17/29 | | | | 50,946 | |
| | 100,000 | | | | 5.750 | (b) | | | 11/17/32 | | | | 102,482 | |
| | | | | | | | | | | | | | |
| | | | | | | | | | | | | 460,496 | |
| | |
| Auto Manufacturers – 0.5% | |
| | General Motors Co. | |
| | 25,000 | | | | 4.000 | | | | 04/01/25 | | | | 24,297 | |
| | General Motors Financial Co., Inc. | |
| | 125,000 | | | | 4.300 | (b) | | | 07/13/25 | | | | 121,263 | |
| | 125,000 | | | | 1.500 | (b) | | | 06/10/26 | | | | 110,539 | |
| | 125,000 | | | | 2.350 | (b) | | | 01/08/31 | | | | 98,118 | |
| | 358,000 | | | | 2.700 | (b) | | | 06/10/31 | | | | 285,418 | |
| | | | | | | | | | | | | | |
| | | | | | | | | | | | | 639,635 | |
| | |
| Banks – 6.1% | |
| | Bank of America Corp. | |
| | (SOFR + 1.29%) | |
| | 140,000 | | | | 5.080 | (b)(d) | | | 01/20/27 | | | | 138,368 | |
| | (3M U.S. T-Bill MMY + 1.30%) | |
| | 85,000 | | | | 3.419 | (b)(d) | | | 12/20/28 | | | | 78,145 | |
| | (SOFR + 1.63%) | |
| | 370,000 | | | | 5.202 | (b)(d) | | | 04/25/29 | | | | 366,032 | |
| | (SOFR + 2.15%) | |
| | 175,000 | | | | 2.592 | (b)(d) | | | 04/29/31 | | | | 147,066 | |
| | (SOFR + 1.22%) | |
| | 110,000 | | | | 2.299 | (b)(d) | | | 07/21/32 | | | | 87,936 | |
| | (SOFR + 1.83%) | |
| | 390,000 | | | | 4.571 | (b)(d) | | | 04/27/33 | | | | 366,479 | |
| | (US 5 Year CMT T-Note + 1.20%) | |
| | 100,000 | | | | 2.482 | (b)(d) | | | 09/21/36 | | | | 76,368 | |
| | Bank of America Corp.(d), GMTN | |
| | (3M U.S. T-Bill MMY + 1.63%) | |
| | 25,000 | | | | 3.593 | | | | 07/21/28 | | | | 23,290 | |
| | Bank of America Corp.(b), Series L | |
| | 25,000 | | | | 4.183 | | | | 11/25/27 | | | | 23,758 | |
| | Bank of America Corp., MTN | |
| | 45,000 | | | | 3.248 | (b) | | | 10/21/27 | | | | 41,924 | |
| | (3M U.S. T-Bill MMY + 1.84%) | |
| | 75,000 | | | | 3.824 | (b)(d) | | | 01/20/28 | | | | 71,016 | |
| | (SOFR + 1.05%) | |
| | 400,000 | | | | 2.551 | (b)(d) | | | 02/04/28 | | | | 361,060 | |
| | (SOFR + 2.04%) | |
| | 305,000 | | | | 4.948 | (b)(d) | | | 07/22/28 | | | | 299,588 | |
| | (3M U.S. T-Bill MMY + 1.57%) | |
| | 50,000 | | | | 4.271 | (b)(d) | | | 07/23/29 | | | | 47,421 | |
| | (3M U.S. T-Bill MMY + 1.45%) | |
| | 50,000 | | | | 2.884 | (b)(d) | | | 10/22/30 | | | | 43,062 | |
| | |
| | |
| 6 | | The accompanying notes are an integral part of these financial statements. |
GOLDMAN SACHS VARIABLE INSURANCE TRUST CORE FIXED INCOME FUND
| | | | | | | | | | | | | | |
Principal
Amount | | | Interest
Rate | | | Maturity
Date | | | Value | |
|
| Corporate Bonds – (continued) | |
| Banks – (continued) | |
| | Bank of America Corp., MTN – (continued) | |
| | (SOFR + 1.53%) | |
| $ | 50,000 | | | | 1.898 | %(b)(d) | | | 07/23/31 | | | $ | 39,803 | |
| | (SOFR + 1.33%) | |
| | 75,000 | | | | 2.972 | (b)(d) | | | 02/04/33 | | | | 62,442 | |
| | (SOFR + 2.16%) | |
| | 73,000 | | | | 5.015 | (b)(d) | | | 07/22/33 | | | | 71,257 | |
| | Bank of New York Mellon Corp. (The)(b)(d) | |
| | (SOFR + 1.76%) | |
| | 20,000 | | | | 4.596 | | | | 07/26/30 | | | | 19,292 | |
| | Citigroup, Inc. | |
| | 220,000 | | | | 3.400 | | | | 05/01/26 | | | | 209,262 | |
| | 150,000 | | | | 4.450 | | | | 09/29/27 | | | | 143,237 | |
| | (SOFR + 1.42%) | |
| | 75,000 | | | | 2.976 | (b)(d) | | | 11/05/30 | | | | 65,128 | |
| | (SOFR + 1.35%) | |
| | 200,000 | | | | 3.057 | (b) (d) | | | 01/25/33 | | | | 166,823 | |
| | (SOFR + 2.09%) | |
| | 165,000 | | | | 4.910 | (b)(d) | | | 05/24/33 | | | | 159,558 | |
| | Fifth Third Bancorp(b) | |
| | 30,000 | | | | 2.375 | | | | 01/28/25 | | | | 28,153 | |
| | Huntington Bancshares, Inc.(b) | |
| | 50,000 | | | | 4.000 | | | | 05/15/25 | | | | 47,923 | |
| | JPMorgan Chase & Co. | |
| | (3M U.S. T-Bill MMY + 1.15%) | |
| | 25,000 | | | | 3.797 | (b)(d) | | | 07/23/24 | | | | 24,968 | |
| | (3M U.S. T-Bill MMY + 1.26%) | |
| | 50,000 | | | | 4.023 | (b)(d) | | | 12/05/24 | | | | 49,561 | |
| | (SOFR + 1.16%) | |
| | 125,000 | | | | 2.301 | (b)(d) | | | 10/15/25 | | | | 119,159 | |
| | (3M U.S. T-Bill MMY + 1.51%) | |
| | 100,000 | | | | 3.960 | (b)(d) | | | 01/29/27 | | | | 96,257 | |
| | 15,000 | | | | 3.625 | (b) | | | 12/01/27 | | | | 14,078 | |
| | (3M U.S. T-Bill MMY + 1.60%) | |
| | 972,000 | | | | 3.782 | (b)(d) | | | 02/01/28 | | | | 926,372 | |
| | (3M U.S. T-Bill MMY + 0.95%) | |
| | 45,000 | | | | 3.509 | (b)(d) | | | 01/23/29 | | | | 41,673 | |
| | (3M U.S. T-Bill MMY + 3.79%) | |
| | 25,000 | | | | 4.493 | (b)(d) | | | 03/24/31 | | | | 24,014 | |
| | (SOFR + 2.04%) | |
| | 25,000 | | | | 2.522 | (b)(d) | | | 04/22/31 | | | | 21,173 | |
| | (SOFR + 1.26%) | |
| | 150,000 | | | | 2.963 | (b)(d) | | | 01/25/33 | | | | 126,443 | |
| | (SOFR + 2.08%) | |
| | 165,000 | | | | 4.912 | (b)(d) | | | 07/25/33 | | | | 161,318 | |
| | JPMorgan Chase & Co.(b)(d), Series HH | |
| | (SOFR + 3.13%) | |
| | 74,000 | | | | 4.600 | | | | 08/01/69 | | | | 69,068 | |
| | Morgan Stanley | |
| | 25,000 | | | | 3.625 | | | | 01/20/27 | | | | 23,749 | |
| | (SOFR + 1.30%) | |
| | 213,000 | | | | 5.050 | (b)(d) | | | 01/28/27 | | | | 211,207 | |
| | 20,000 | | | | 3.950 | | | | 04/23/27 | | | | 18,948 | |
| | (SOFR + 1.00%) | |
| | 200,000 | | | | 2.475 | (b)(d) | | | 01/21/28 | | | | 180,591 | |
| | |
|
| Corporate Bonds – (continued) | |
| Banks – (continued) | |
| | Morgan Stanley – (continued) | |
| | (SOFR + 1.59%) | |
| 305,000 | | | | 5.164 | %(b)(d) | | | 04/20/29 | | | | 301,643 | |
| | (SOFR + 2.08%) | |
| | 165,000 | | | | 4.889 | (b)(d) | | | 07/20/33 | | | | 158,706 | |
| | (SOFR + 1.36%) | |
| | 150,000 | | | | 2.484 | (b)(d) | | | 09/16/36 | | | | 113,535 | |
| | Morgan Stanley, GMTN | |
| | (3M U.S. T-Bill MMY + 1.89%) | |
| | 25,000 | | | | 4.431 | (b)(d) | | | 01/23/30 | | | | 23,809 | |
| | (SOFR + 1.14%) | |
| | 400,000 | | | | 2.699 | (b)(d) | | | 01/22/31 | | | | 340,503 | |
| | Morgan Stanley, MTN | |
| | (SOFR + 1.15%) | |
| | 75,000 | | | | 2.720 | (b)(d) | | | 07/22/25 | | | | 72,323 | |
| | (SOFR + 3.12%) | |
| | 50,000 | | | | 3.622 | (b)(d) | | | 04/01/31 | | | | 45,086 | |
| | (SOFR + 1.03%) | |
| | 75,000 | | | | 1.794 | (b)(d) | | | 02/13/32 | | | | 58,188 | |
| | Truist Financial Corp.(b)(d), MTN | |
| | (SOFR + 2.05%) | |
| | 50,000 | | | | 6.047 | | | | 06/08/27 | | | | 50,027 | |
| | US Bancorp(b)(d) | |
| | (SOFR + 2.02%) | |
| | 145,000 | | | | 5.775 | | | | 06/12/29 | | | | 144,943 | |
| | Wells Fargo & Co. | |
| | 175,000 | | | | 3.000 | | | | 10/23/26 | | | | 162,612 | |
| | Wells Fargo & Co., GMTN | |
| | 50,000 | | | | 4.300 | | | | 07/22/27 | | | | 47,996 | |
| | Wells Fargo & Co., MTN | |
| | 25,000 | | | | 3.750 | (b) | | | 01/24/24 | | | | 24,703 | |
| | (SOFR + 1.98%) | |
| | 215,000 | | | | 4.808 | (b)(d) | | | 07/25/28 | | | | 210,223 | |
| | (SOFR + 2.10%) | |
| | 408,000 | | | | 4.897 | (b)(d) | | | 07/25/33 | | | | 391,103 | |
| | (3M U.S. T-Bill MMY + 4.50%) | |
| | 25,000 | | | | 5.013 | (b)(d) | | | 04/04/51 | | | | 23,213 | |
| | | | | | | | | | | | | | |
| | | | | | | | | | | | | 7,461,583 | |
| | |
| Beverages – 0.5% | |
| | Constellation Brands, Inc. | |
| | 50,000 | | | | 4.400 | (b) | | | 11/15/25 | | | | 48,981 | |
| | 50,000 | | | | 3.600 | (b) | | | 02/15/28 | | | | 46,964 | |
| | 25,000 | | | | 3.150 | (b) | | | 08/01/29 | | | | 22,572 | |
| | 100,000 | | | | 2.250 | (b) | | | 08/01/31 | | | | 81,810 | |
| | 90,000 | | | | 4.750 | (b) | | | 05/09/32 | | | | 87,340 | |
| | Keurig Dr Pepper, Inc. | |
| | 225,000 | | | | 4.597 | (b) | | | 05/25/28 | | | | 220,492 | |
| | 25,000 | | | | 3.800 | (b) | | | 05/01/50 | | | | 19,733 | |
| | 100,000 | | | | 4.500 | (b) | | | 04/15/52 | | | | 88,098 | |
| | | | | | | | | | | | | | |
| | | | | | | | | | | | | 615,990 | |
| | |
| Biotechnology – 0.6% | |
| | Amgen, Inc. | |
| | 70,000 | | | | 3.125 | (b) | | | 05/01/25 | | | | 67,080 | |
| | 239,000 | | | | 5.250 | (b) | | | 03/02/30 | | | | 239,643 | |
| | |
| | |
| The accompanying notes are an integral part of these financial statements. | | 7 |
GOLDMAN SACHS VARIABLE INSURANCE TRUST CORE FIXED INCOME FUND
Schedule of Investments (continued)
June 30, 2023 (Unaudited)
| | | | | | | | | | | | | | |
Principal
Amount | | | Interest
Rate | | | Maturity
Date | | | Value | |
|
| Corporate Bonds – (continued) | |
| Biotechnology – (continued) | |
| | Amgen, Inc. – (continued) | |
| $ | 100,000 | | | | 4.200 | %(b) | | | 03/01/33 | | | $ | 93,319 | |
| | 238,000 | | | | 5.250 | (b) | | | 03/02/33 | | | | 238,240 | |
| | Royalty Pharma PLC(b) | |
| | 75,000 | | | | 1.200 | | | | 09/02/25 | | | | 67,730 | |
| | | | | | | | | | | | | | |
| | | | | | | | | | | | | 706,012 | |
| | |
| Building Materials – 0.3% | |
| | Carrier Global Corp. | |
| | 150,000 | | | | 2.493 | (b) | | | 02/15/27 | | | | 136,821 | |
| | 75,000 | | | | 2.722 | (b) | | | 02/15/30 | | | | 64,636 | |
| Johnson Controls International PLC / Tyco Fire & Security
Finance SCA(b) |
|
| | 25,000 | | | | 4.900 | | | | 12/01/32 | | | | 24,784 | |
| | Martin Marietta Materials, Inc.(b) | |
| | 175,000 | | | | 3.200 | | | | 07/15/51 | | | | 122,026 | |
| | Masco Corp.(b) | |
| | 50,000 | | | | 1.500 | | | | 02/15/28 | | | | 42,585 | |
| | | | | | | | | | | | | | |
| | | | | | | | | | | | | 390,852 | |
| | |
| Chemicals – 0.3% | |
| | DuPont de Nemours, Inc.(b) | |
| | 50,000 | | | | 4.493 | | | | 11/15/25 | | | | 48,981 | |
| | Ecolab, Inc.(b) | |
| | 4,000 | | | | 2.750 | | | | 08/18/55 | | | | 2,568 | |
| | Huntsman International LLC(b) | |
| | 25,000 | | | | 4.500 | | | | 05/01/29 | | | | 22,890 | |
| | International Flavors & Fragrances, Inc. | |
| | 75,000 | | | | 1.832 | (b)(c) | | | 10/15/27 | | | | 63,263 | |
| | 150,000 | | | | 2.300 | (b)(c) | | | 11/01/30 | | | | 118,875 | |
| | 50,000 | | | | 3.268 | (b)(c) | | | 11/15/40 | | | | 35,012 | |
| | Sherwin-Williams Co. (The) | |
| | 25,000 | | | | 3.450 | (b) | | | 06/01/27 | | | | 23,580 | |
| | 50,000 | | | | 2.950 | (b) | | | 08/15/29 | | | | 44,219 | |
| | | | | | | | | | | | | | |
| | | | | | | | | | | | | 359,388 | |
| | |
| Commercial Services – 0.5% | |
| | CoStar Group, Inc.(b)(c) | |
| | 100,000 | | | | 2.800 | | | | 07/15/30 | | | | 82,972 | |
| | Emory University,(b) Series 2020 | |
| | 140,000 | | | | 2.143 | | | | 09/01/30 | | | | 117,560 | |
| | Global Payments, Inc.(b) | |
| | 50,000 | | | | 2.650 | | | | 02/15/25 | | | | 47,444 | |
| | PayPal Holdings, Inc. | |
| | 150,000 | | | | 1.650 | (b) | | | 06/01/25 | | | | 140,397 | |
| | 75,000 | | | | 2.650 | (b) | | | 10/01/26 | | | | 69,742 | |
| | 25,000 | | | | 2.850 | (b) | | | 10/01/29 | | | | 22,197 | |
| | S&P Global, Inc.(b) | |
| | 75,000 | | | | 4.250 | | | | 05/01/29 | | | | 73,163 | |
| | | | | | | | | | | | | | |
| | | | | | | | | | | | | 553,475 | |
| | |
| Computers – 0.6% | |
| | Apple, Inc.(b) | |
| | 325,000 | | | | 2.450 | | | | 08/04/26 | | | | 304,490 | |
| | |
|
| Corporate Bonds – (continued) | |
| Computers – (continued) | |
| | Dell International LLC / EMC Corp. | |
| 52,000 | | | | 5.850 | %(b) | | | 07/15/25 | | | | 52,186 | |
| | 125,000 | | | | 6.020 | (b) | | | 06/15/26 | | | | 126,794 | |
| | 25,000 | | | | 5.300 | (b) | | | 10/01/29 | | | | 24,803 | |
| | Hewlett Packard Enterprise Co. | |
| | 150,000 | | | | 4.450 | (b) | | | 10/02/23 | | | | 149,415 | |
| | 45,000 | | | | 4.900 | (b) | | | 10/15/25 | | | | 44,388 | |
| | | | | | | | | | | | | | |
| | | | | | | | | | | | | 702,076 | |
| | |
| Cosmetics / Personal Care – 0.1% | |
| | Colgate-Palmolive Co.(b) | |
| | 100,000 | | | | 3.250 | | | | 08/15/32 | | | | 91,742 | |
| | |
| Diversified Financial Services – 0.5% | |
| | Air Lease Corp.(b) | |
| | 75,000 | | | | 3.375 | | | | 07/01/25 | | | | 70,925 | |
| | Air Lease Corp.(b), GMTN | |
| | 75,000 | | | | 3.750 | | | | 06/01/26 | | | | 70,941 | |
| | Air Lease Corp., MTN | |
| | 75,000 | | | | 2.300 | (b) | | | 02/01/25 | | | | 70,622 | |
| | 75,000 | | | | 2.875 | (b) | | | 01/15/26 | | | | 69,445 | |
| | Ally Financial, Inc.(b) | |
| | 25,000 | | | | 1.450 | | | | 10/02/23 | | | | 24,642 | |
| | American Express Co. | |
| | 20,000 | | | | 2.500 | (b) | | | 07/30/24 | | | | 19,338 | |
| | 25,000 | | | | 3.625 | (b) | | | 12/05/24 | | | | 24,289 | |
| | Aviation Capital Group LLC(b)(c) | |
| | 50,000 | | | | 1.950 | | | | 01/30/26 | | | | 44,508 | |
| | Capital One Financial Corp.(b) | |
| | 45,000 | | | | 3.300 | | | | 10/30/24 | | | | 43,237 | |
| | Discover Financial Services(b) | |
| | 75,000 | | | | 3.750 | | | | 03/04/25 | | | | 71,666 | |
| | Intercontinental Exchange, Inc.(b) | |
| | 50,000 | | | | 3.000 | | | | 06/15/50 | | | | 34,685 | |
| | Mastercard, Inc.(b) | |
| | 25,000 | | | | 3.300 | | | | 03/26/27 | | | | 23,881 | |
| | Nuveen LLC(b)(c) | |
| | 25,000 | | | | 4.000 | | | | 11/01/28 | | | | 23,594 | |
| | | | | | | | | | | | | | |
| | | | | | | | | | | | | 591,773 | |
| | |
| Electric – 1.2% | |
| | American Electric Power Co., Inc.(b) | |
| | 50,000 | | | | 2.300 | | | | 03/01/30 | | | | 41,537 | |
| | Arizona Public Service Co.(b) | |
| | 45,000 | | | | 2.950 | | | | 09/15/27 | | | | 40,937 | |
| | Avangrid, Inc.(b) | |
| | 25,000 | | | | 3.200 | | | | 04/15/25 | | | | 23,790 | |
| | Berkshire Hathaway Energy Co. | |
| | 25,000 | | | | 3.250 | (b) | | | 04/15/28 | | | | 23,001 | |
| | 50,000 | | | | 3.700 | (b) | | | 07/15/30 | | | | 45,887 | |
| | Dominion Energy, Inc.(e) | |
| | 50,000 | | | | 3.071 | | | | 08/15/24 | | | | 48,307 | |
| | Dominion Energy, Inc.(b), Series C | |
| | 25,000 | | | | 3.375 | | | | 04/01/30 | | | | 22,378 | |
| | |
| | |
| 8 | | The accompanying notes are an integral part of these financial statements. |
GOLDMAN SACHS VARIABLE INSURANCE TRUST CORE FIXED INCOME FUND
| | | | | | | | | | | | | | |
Principal
Amount | | | Interest
Rate | | | Maturity
Date | | | Value | |
|
| Corporate Bonds – (continued) | |
| Electric – (continued) | |
| | Entergy Corp.(b) | |
| $ | 45,000 | | | | 2.950 | % | | | 09/01/26 | | | $ | 41,554 | |
| | Exelon Corp. | |
| | 50,000 | | | | 4.050 | (b) | | | 04/15/30 | | | | 46,867 | |
| | 25,000 | | | | 4.700 | (b) | | | 04/15/50 | | | | 22,138 | |
| | FirstEnergy Corp.(b) | |
| | 100,000 | | | | 2.650 | | | | 03/01/30 | | | | 84,596 | |
| | FirstEnergy Corp.(b), Series B | |
| | 50,000 | | | | 2.250 | | | | 09/01/30 | | | | 40,437 | |
| | Florida Power & Light Co.(b) | |
| | 68,000 | | | | 4.125 | | | | 02/01/42 | | | | 59,672 | |
| | MidAmerican Energy Co.(b) | |
| | 25,000 | | | | 3.650 | | | | 04/15/29 | | | | 23,241 | |
| | NextEra Energy Capital Holdings, Inc.(b) | |
| | 70,000 | | | | 1.900 | | | | 06/15/28 | | | | 60,012 | |
| | NRG Energy, Inc.(b)(c) | |
| | 75,000 | | | | 3.750 | | | | 06/15/24 | | | | 72,480 | |
| | Ohio Power Co.(b), Series P | |
| | 25,000 | | | | 2.600 | | | | 04/01/30 | | | | 21,450 | |
| | Pacific Gas and Electric Co. | |
| | 25,000 | | | | 2.100 | (b) | | | 08/01/27 | | | | 21,441 | |
| | 50,000 | | | | 2.500 | (b) | | | 02/01/31 | | | | 39,223 | |
| | 25,000 | | | | 3.300 | (b) | | | 08/01/40 | | | | 16,873 | |
| | 25,000 | | | | 3.500 | (b) | | | 08/01/50 | | | | 15,945 | |
| | Progress Energy, Inc. | |
| | 95,000 | | | | 7.000 | | | | 10/30/31 | | | | 103,979 | |
| | Southern California Edison Co.(b), Series A | |
| | 50,000 | | | | 4.200 | | | | 03/01/29 | | | | 47,538 | |
| | Southern Co. (The)(b) | |
| | 60,000 | | | | 3.250 | | | | 07/01/26 | | | | 56,489 | |
| | Virginia Electric and Power Co.(b) | |
| | 75,000 | | | | 2.450 | | | | 12/15/50 | | | | 45,043 | |
| | Vistra Operations Co. LLC(b)(c) | |
| | 125,000 | | | | 3.550 | | | | 07/15/24 | | | | 120,728 | |
| | Xcel Energy, Inc.(b) | |
| | 250,000 | | | | 3.350 | | | | 12/01/26 | | | | 234,719 | |
| | | | | | | | | | | | | | |
| | | | | | | | | | | | | 1,420,262 | |
| | |
| Entertainment – 0.5% | |
| | Warnermedia Holdings, Inc. | |
| | 250,000 | | | | 4.054 | (b) | | | 03/15/29 | | | | 228,470 | |
| | 375,000 | | | | 4.279 | (b) | | | 03/15/32 | | | | 332,275 | |
| | | | | | | | | | | | | | |
| | | | | | | | | | | | | 560,745 | |
| | |
| Environmental Control – 0.3% | |
| | Republic Services, Inc. | |
| | 75,000 | | | | 2.500 | (b) | | | 08/15/24 | | | | 72,370 | |
| | 100,000 | | | | 1.750 | (b) | | | 02/15/32 | | | | 78,462 | |
| | Waste Connections, Inc.(b) | |
| | 51,000 | | | | 4.200 | | | | 01/15/33 | | | | 47,941 | |
| | Waste Management, Inc. | |
| | 75,000 | | | | 3.150 | (b) | | | 11/15/27 | | | | 70,384 | |
| | 50,000 | | | | 1.150 | (b) | | | 03/15/28 | | | | 42,592 | |
| | 50,000 | | | | 4.150 | (b) | | | 04/15/32 | | | | 47,629 | |
| | | | | | | | | | | | | | |
| | | | | | | | | | | | | 359,378 | |
| | |
|
| Corporate Bonds – (continued) | |
| Food – 0.2% | |
| | General Mills, Inc.(b) | |
| 75,000 | | | | 4.200 | | | | 04/17/28 | | | | 72,859 | |
| | Kraft Heinz Foods Co.(b) | |
| | 95,000 | | | | 3.750 | | | | 04/01/30 | | | | 88,198 | |
| | Mars, Inc. | |
| | 25,000 | | | | 2.700 | (b)(c) | | | 04/01/25 | | | | 23,844 | |
| | 25,000 | | | | 3.200 | (b)(c) | | | 04/01/30 | | | | 22,641 | |
| | Sysco Corp.(b) | |
| | 25,000 | | | | 6.600 | | | | 04/01/50 | | | | 28,503 | |
| | Tyson Foods, Inc. | |
| | 50,000 | | | | 3.900 | | | | 09/28/23 | | | | 49,827 | |
| | | | | | | | | | | | | | |
| | | | | | | | | | | | | 285,872 | |
| | |
| Gas – 0.1% | |
| | East Ohio Gas Co. (The) | |
| | 25,000 | | | | 1.300 | (b)(c) | | | 06/15/25 | | | | 22,915 | |
| | 25,000 | | | | 2.000 | (b)(c) | | | 06/15/30 | | | | 20,126 | |
| | NiSource, Inc. | |
| | 95,000 | | | | 3.490 | (b) | | | 05/15/27 | | | | 89,519 | |
| | 25,000 | | | | 3.600 | (b) | | | 05/01/30 | | | | 22,521 | |
| | | | | | | | | | | | | | |
| | | | | | | | | | | | | 155,081 | |
| | |
| Hand/Machine Tools – 0.0% | |
| | Stanley Black & Decker, Inc.(b) | |
| | 24,000 | | | | 4.250 | | | | 11/15/28 | | | | 22,861 | |
| | |
| Healthcare – Products – 0.4% | |
| | DH Europe Finance II Sarl | |
| | 75,000 | | | | 2.200 | (b) | | | 11/15/24 | | | | 71,795 | |
| | 25,000 | | | | 2.600 | (b) | | | 11/15/29 | | | | 22,008 | |
| | 75,000 | | | | 3.250 | (b) | | | 11/15/39 | | | | 61,104 | |
| | GE Healthcare Technologies, Inc.(b) | |
| | 100,000 | | | | 6.377 | | | | 11/22/52 | | | | 111,225 | |
| | STERIS Irish FinCo UnLtd Co.(b) | |
| | 75,000 | | | | 2.700 | | | | 03/15/31 | | | | 62,618 | |
| | Stryker Corp.(b) | |
| | 100,000 | | | | 1.950 | | | | 06/15/30 | | | | 83,586 | |
| | Thermo Fisher Scientific, Inc.(b) | |
| | 25,000 | | | | 1.750 | | | | 10/15/28 | | | | 21,539 | |
| | | | | | | | | | | | | | |
| | | | | | | | | | | | | 433,875 | |
| | |
| Healthcare – Services – 1.6% | |
| | Adventist Health System(b) | |
| | 30,000 | | | | 2.952 | | | | 03/01/29 | | | | 26,256 | |
| | Banner Health(b) | |
| | 120,000 | | | | 2.338 | | | | 01/01/30 | | | | 102,103 | |
| | Baylor Scott & White Holdings,(b) Series 2021 | |
| | 40,000 | | | | 1.777 | | | | 11/15/30 | | | | 31,809 | |
| | Centene Corp. | |
| | 150,000 | | | | 4.250 | (b) | | | 12/15/27 | | | | 140,359 | |
| | 110,000 | | | | 2.625 | (b) | | | 08/01/31 | | | | 87,637 | |
| | CommonSpirit Health(b) | |
| | 225,000 | | | | 6.461 | | | | 11/01/52 | | | | 255,898 | |
| | HCA, Inc.(b) | |
| | 80,000 | | | | 3.500 | | | | 09/01/30 | | | | 70,076 | |
| | |
| | |
| The accompanying notes are an integral part of these financial statements. | | 9 |
GOLDMAN SACHS VARIABLE INSURANCE TRUST CORE FIXED INCOME FUND
Schedule of Investments (continued)
June 30, 2023 (Unaudited)
| | | | | | | | | | | | | | |
Principal
Amount | | | Interest
Rate | | | Maturity
Date | | | Value | |
|
| Corporate Bonds – (continued) | |
| Healthcare – Services – (continued) | |
| | Humana, Inc.(b) | |
| $ | 50,000 | | | | 5.500 | % | | | 03/15/53 | | | $ | 49,780 | |
| | Rush Obligated Group,(b) Series 2020 | |
| | 60,000 | | | | 3.922 | | | | 11/15/29 | | | | 55,288 | |
| | Stanford Health Care,(b) Series 2020 | |
| | 40,000 | | | | 3.310 | | | | 08/15/30 | | | | 35,933 | |
| | Sutter Health,(b) Series 20A | |
| | 40,000 | | | | 2.294 | | | | 08/15/30 | | | | 33,067 | |
| | UnitedHealth Group, Inc. | |
| | 275,000 | | | | 5.300 | (b) | | | 02/15/30 | | | | 281,506 | |
| | 525,000 | | | | 5.350 | (b) | | | 02/15/33 | | | | 545,448 | |
| | 100,000 | | | | 5.875 | (b) | | | 02/15/53 | | | | 110,932 | |
| | 168,000 | | | | 5.050 | (b) | | | 04/15/53 | | | | 166,779 | |
| | | | | | | | | | | | | | |
| | | | | | | | | | | | | 1,992,871 | |
| | |
| Home Builders – 0.1% | |
| | Lennar Corp.(b) | |
| | 70,000 | | | | 4.750 | | | | 11/29/27 | | | | 68,065 | |
| | |
| Insurance – 0.2% | |
| | American International Group, Inc. | |
| | 25,000 | | | | 3.400 | | | | 06/30/30 | | | | 22,157 | |
| | Arch Capital Group US, Inc. | |
| | 36,000 | | | | 5.144 | | | | 11/01/43 | | | | 32,712 | |
| | Berkshire Hathaway Finance Corp.(b) | |
| | 75,000 | | | | 1.850 | | | | 03/12/30 | | | | 63,765 | |
| | Marsh & McLennan Cos., Inc.(b) | |
| | 50,000 | | | | 4.375 | | | | 03/15/29 | | | | 48,584 | |
| | Principal Financial Group, Inc. | |
| | 50,000 | | | | 3.100 | (b) | | | 11/15/26 | | | | 46,218 | |
| | 75,000 | | | | 2.125 | (b) | | | 06/15/30 | | | | 60,930 | |
| | Willis North America, Inc.(b) | |
| | 25,000 | | | | 2.950 | | | | 09/15/29 | | | | 21,550 | |
| | | | | | | | | | | | | | |
| | | | | | | | | | | | | 295,916 | |
| | |
| Internet – 0.7% | |
| | Amazon.com, Inc. | |
| | 335,000 | | | | 5.200 | (b) | | | 12/03/25 | | | | 336,008 | |
| | 45,000 | | | | 4.800 | (b) | | | 12/05/34 | | | | 45,968 | |
| | 15,000 | | | | 3.875 | (b) | | | 08/22/37 | | | | 13,697 | |
| | 50,000 | | | | 3.100 | (b) | | | 05/12/51 | | | | 37,259 | |
| | Expedia Group, Inc. | |
| | 14,000 | | | | 4.625 | (b) | | | 08/01/27 | | | | 13,585 | |
| | 35,000 | | | | 3.800 | (b) | | | 02/15/28 | | | | 32,768 | |
| | 14,000 | | | | 2.950 | (b) | | | 03/15/31 | | | | 11,849 | |
| | Meta Platforms, Inc. | |
| | 250,000 | | | | 3.500 | (b) | | | 08/15/27 | | | | 237,372 | |
| | 88,000 | | | | 3.850 | (b) | | | 08/15/32 | | | | 81,734 | |
| | Netflix, Inc.(b)(c) | |
| | 90,000 | | | | 4.875 | | | | 06/15/30 | | | | 88,693 | |
| | | | | | | | | | | | | | |
| | | | | | | | | | | | | 898,933 | |
| | |
| Iron/Steel – 0.1% | |
| | Steel Dynamics, Inc. | |
| | 20,000 | | | | 2.400 | (b) | | | 06/15/25 | | | | 18,702 | |
| | |
|
| Corporate Bonds – (continued) | |
| Iron/Steel – (continued) | |
| | Steel Dynamics, Inc. – (continued) | |
| 50,000 | | | | 1.650 | %(b) | | | 10/15/27 | | | | 42,709 | |
| | | | | | | | | | | | | | |
| | | | | | | | | | | | | 61,411 | |
| | |
| Lodging – 0.2% | |
| | Hyatt Hotels Corp.(b) | |
| | 75,000 | | | | 1.800 | | | | 10/01/24 | | | | 71,491 | |
| | Marriott International, Inc.(b) | |
| | 125,000 | | | | 5.000 | | | | 10/15/27 | | | | 124,086 | |
| | Marriott International, Inc.(b), Series HH | |
| | 125,000 | | | | 2.850 | | | | 04/15/31 | | | | 105,110 | |
| | | | | | | | | | | | | | |
| | | | | | | | | | | | | 300,687 | |
| | |
| Machinery-Diversified – 0.1% | |
| | Otis Worldwide Corp. | |
| | 25,000 | | | | 2.293 | (b) | | | 04/05/27 | | | | 22,699 | |
| | 150,000 | | | | 2.565 | (b) | | | 02/15/30 | | | | 129,354 | |
| | | | | | | | | | | | | | |
| | | | | | | | | | | | | 152,053 | |
| | |
| Media – 0.8% | |
| Charter Communications Operating LLC / Charter
Communications Operating Capital(b) |
|
| | 320,000 | | | | 4.908 | | | | 07/23/25 | | | | 313,810 | |
| | Comcast Corp. | |
| | 45,000 | | | | 3.375 | (b) | | | 08/15/25 | | | | 43,445 | |
| | 50,000 | | | | 3.950 | (b) | | | 10/15/25 | | | | 48,723 | |
| | 25,000 | | | | 3.300 | (b) | | | 02/01/27 | | | | 23,734 | |
| | 75,000 | | | | 3.300 | (b) | | | 04/01/27 | | | | 70,940 | |
| | 225,000 | | | | 3.150 | (b) | | | 02/15/28 | | | | 210,014 | |
| | 125,000 | | | | 4.150 | (b) | | | 10/15/28 | | | | 121,122 | |
| | 25,000 | | | | 3.750 | (b) | | | 04/01/40 | | | | 21,061 | |
| | 25,000 | | | | 4.700 | (b) | | | 10/15/48 | | | | 23,508 | |
| | Fox Corp. | |
| | 25,000 | | | | 4.030 | (b) | | | 01/25/24 | | | | 24,724 | |
| | 25,000 | | | | 4.709 | (b) | | | 01/25/29 | | | | 24,312 | |
| | Walt Disney Co. (The)(b) | |
| | 25,000 | | | | 3.700 | | | | 09/15/24 | | | | 24,475 | |
| | | | | | | | | | | | | | |
| | | | | | | | | | | | | 949,868 | |
| | |
| Mining – 0.1% | |
| | Newmont Corp.(b) | |
| | 75,000 | | | | 2.250 | | | | 10/01/30 | | | | 61,588 | |
| | |
| Miscellaneous Manufacturing – 0.2% | |
| | Eaton Corp.(b) | |
| | 175,000 | | | | 4.150 | | | | 03/15/33 | | | | 166,231 | |
| | General Electric Co., MTN | |
| | 50,000 | | | | 6.750 | | | | 03/15/32 | | | | 56,402 | |
| | | | | | | | | | | | | | |
| | | | | | | | | | | | | 222,633 | |
| | |
| Oil & Gas – 0.1% | |
| | Occidental Petroleum Corp. | |
| | 69,000 | | | | 7.875 | | | | 09/15/31 | | | | 76,959 | |
| | Phillips 66(b) | |
| | 25,000 | | | | 1.300 | | | | 02/15/26 | | | | 22,614 | |
| | | | | | | | | | | | | | |
| | | | | | | | | | | | | 99,573 | |
| | |
| | |
| 10 | | The accompanying notes are an integral part of these financial statements. |
GOLDMAN SACHS VARIABLE INSURANCE TRUST CORE FIXED INCOME FUND
| | | | | | | | | | | | | | |
Principal
Amount | | | Interest
Rate | | | Maturity
Date | | | Value | |
|
| Corporate Bonds – (continued) | |
| Packaging & Containers – 0.0% | |
| | Berry Global, Inc.(b) | |
| $ | 50,000 | | | | 1.570 | % | | | 01/15/26 | | | $ | 45,127 | |
| | |
| Pharmaceuticals – 1.6% | |
| | AbbVie, Inc. | |
| | 49,000 | | | | 4.300 | (b) | | | 05/14/36 | | | | 45,055 | |
| | 125,000 | | | | 4.050 | (b) | | | 11/21/39 | | | | 108,796 | |
| | 148,000 | | | | 4.250 | (b) | | | 11/21/49 | | | | 127,527 | |
| | AmerisourceBergen Corp.(b) | |
| | 75,000 | | | | 3.450 | | | | 12/15/27 | | | | 70,209 | |
| | Becton Dickinson and Co. | |
| | 12,000 | | | | 3.363 | (b) | | | 06/06/24 | | | | 11,745 | |
| | 100,000 | | | | 2.823 | (b) | | | 05/20/30 | | | | 87,427 | |
| | Bristol-Myers Squibb Co. | |
| | 75,000 | | | | 2.950 | (b) | | | 03/15/32 | | | | 66,245 | |
| | 25,000 | | | | 4.250 | (b) | | | 10/26/49 | | | | 22,193 | |
| | Cigna Group (The) | |
| | 50,000 | | | | 2.400 | (b) | | | 03/15/30 | | | | 42,479 | |
| | 250,000 | | | | 2.375 | (b) | | | 03/15/31 | | | | 209,825 | |
| | 125,000 | | | | 4.800 | (b) | | | 08/15/38 | | | | 117,989 | |
| | 75,000 | | | | 4.900 | (b) | | | 12/15/48 | | | | 69,757 | |
| | CVS Health Corp. | |
| | 25,000 | | | | 2.625 | (b) | | | 08/15/24 | | | | 24,180 | |
| | 350,000 | | | | 2.125 | (b) | | | 09/15/31 | | | | 280,922 | |
| | 175,000 | | | | 4.780 | (b) | | | 03/25/38 | | | | 161,320 | |
| | 7,000 | | | | 5.125 | (b) | | | 07/20/45 | | | | 6,469 | |
| | Pfizer Investment Enterprises Pte Ltd.(b) | |
| | 275,000 | | | | 4.750 | | | | 05/19/33 | | | | 274,078 | |
| | Pfizer, Inc.(b) | |
| | 75,000 | | | | 3.450 | | | | 03/15/29 | | | | 70,598 | |
| | Zoetis, Inc. | |
| | 45,000 | | | | 3.000 | (b) | | | 09/12/27 | | | | 41,918 | |
| | 150,000 | | | | 2.000 | (b) | | | 05/15/30 | | | | 125,192 | |
| | | | | | | | | | | | | | |
| | | | | | | | | | | | | 1,963,924 | |
| | |
| Pipelines – 1.2% | |
| | Cheniere Energy Partners LP(b)(c) | |
| | 75,000 | | | | 5.950 | | | | 06/30/33 | | | | 75,303 | |
| | Energy Transfer LP | |
| | 15,000 | | | | 4.250 | (b) | | | 04/01/24 | | | | 14,772 | |
| | 50,000 | | | | 2.900 | (b) | | | 05/15/25 | | | | 47,464 | |
| | 25,000 | | | | 5.250 | (b) | | | 04/15/29 | | | | 24,403 | |
| | 275,000 | | | | 5.750 | (b) | | | 02/15/33 | | | | 276,746 | |
| | 5,000 | | | | 6.000 | (b) | | | 06/15/48 | | | | 4,747 | |
| | Energy Transfer LP,(b) Series 5Y | |
| | 75,000 | | | | 4.200 | | | | 09/15/23 | | | | 74,737 | |
| | Kinder Morgan, Inc.(b) | |
| | 275,000 | | | | 4.300 | | | | 03/01/28 | | | | 263,194 | |
| | MPLX LP | |
| | 75,000 | | | | 2.650 | (b) | | | 08/15/30 | | | | 62,819 | |
| | 35,000 | | | | 4.500 | (b) | | | 04/15/38 | | | | 30,162 | |
| | 25,000 | | | | 5.500 | (b) | | | 02/15/49 | | | | 22,781 | |
| | Plains All American Pipeline LP / PAA Finance Corp. | |
| | 35,000 | | | | 3.850 | (b) | | | 10/15/23 | | | | 34,777 | |
| | 25,000 | | | | 3.800 | (b) | | | 09/15/30 | | | | 22,199 | |
| | |
|
| Corporate Bonds – (continued) | |
| Pipelines – (continued) | |
| | Sabine Pass Liquefaction LLC | |
| 75,000 | | | | 5.625 | %(b) | | | 03/01/25 | | | | 74,750 | |
| | 75,000 | | | | 5.000 | (b) | | | 03/15/27 | | | | 73,844 | |
| | Targa Resources Corp.(b) | |
| | 55,000 | | | | 4.200 | | | | 02/01/33 | | | | 48,765 | |
| | Western Midstream Operating LP | |
| | 75,000 | | | | 3.350 | (b) | | | 02/01/25 | | | | 71,748 | |
| | 25,000 | | | | 5.450 | (b) | | | 04/01/44 | | | | 21,235 | |
| | 20,000 | | | | 5.300 | (b) | | | 03/01/48 | | | | 16,735 | |
| | Williams Cos., Inc. (The) | |
| | 25,000 | | | | 3.900 | (b) | | | 01/15/25 | | | | 24,296 | |
| | 35,000 | | | | 4.000 | (b) | | | 09/15/25 | | | | 33,815 | |
| | 125,000 | | | | 5.650 | (b) | | | 03/15/33 | | | | 126,708 | |
| | | | | | | | | | | | | | |
| | | | | | | | | | | | | 1,446,000 | |
| | |
| Real Estate Investment Trusts – 1.4% | |
| | Agree LP(b) | |
| | 170,000 | | | | 4.800 | | | | 10/01/32 | | | | 158,043 | |
| | Alexandria Real Estate Equities, Inc.(b) | |
| | 25,000 | | | | 3.375 | | | | 08/15/31 | | | | 21,451 | |
| | American Homes 4 Rent LP | |
| | 50,000 | | | | 4.900 | (b) | | | 02/15/29 | | | | 47,935 | |
| | 30,000 | | | | 2.375 | (b) | | | 07/15/31 | | | | 23,887 | |
| | American Tower Corp. | |
| | 75,000 | | | | 3.375 | (b) | | | 05/15/24 | | | | 73,406 | |
| | 100,000 | | | | 2.400 | (b) | | | 03/15/25 | | | | 94,275 | |
| | 75,000 | | | | 2.100 | (b) | | | 06/15/30 | | | | 60,741 | |
| | Crown Castle, Inc. | |
| | 85,000 | | | | 3.150 | (b) | | | 07/15/23 | | | | 84,924 | |
| | 60,000 | | | | 3.650 | (b) | | | 09/01/27 | | | | 56,088 | |
| | CubeSmart LP | |
| | 45,000 | | | | 4.000 | (b) | | | 11/15/25 | | | | 42,686 | |
| | 60,000 | | | | 2.500 | (b) | | | 02/15/32 | | | | 47,652 | |
| | Essex Portfolio LP(b) | |
| | 50,000 | | | | 3.000 | | | | 01/15/30 | | | | 42,794 | |
| | Healthcare Realty Holdings LP(b) | |
| | 25,000 | | | | 2.050 | | | | 03/15/31 | | | | 18,621 | |
| | Host Hotels & Resorts LP,(b) Series J | |
| | 42,000 | | | | 2.900 | | | | 12/15/31 | | | | 33,172 | |
| | Invitation Homes Operating Partnership LP | |
| | 75,000 | | | | 2.300 | (b) | | | 11/15/28 | | | | 63,836 | |
| | 195,000 | | | | 2.000 | (b) | | | 08/15/31 | | | | 151,198 | |
| | Kilroy Realty LP(b) | |
| | 20,000 | | | | 4.750 | | | | 12/15/28 | | | | 17,725 | |
| | Mid-America Apartments L.P.(b) | |
| | 50,000 | | | | 1.700 | | | | 02/15/31 | | | | 39,570 | |
| | National Retail Properties, Inc. | |
| | 35,000 | | | | 3.900 | (b) | | | 06/15/24 | | | | 34,274 | |
| | 45,000 | | | | 4.000 | (b) | | | 11/15/25 | | | | 42,835 | |
| | Prologis L.P. | |
| | 25,000 | | | | 1.750 | (b) | | | 07/01/30 | | | | 20,110 | |
| | 125,000 | | | | 4.625 | (b) | | | 01/15/33 | | | | 122,116 | |
| | Realty Income Corp.(b) | |
| | 25,000 | | | | 3.950 | | | | 08/15/27 | | | | 23,766 | |
| | |
| | |
| The accompanying notes are an integral part of these financial statements. | | 11 |
GOLDMAN SACHS VARIABLE INSURANCE TRUST CORE FIXED INCOME FUND
Schedule of Investments (continued)
June 30, 2023 (Unaudited)
| | | | | | | | | | | | | | |
Principal
Amount | | | Interest
Rate | | | Maturity
Date | | | Value | |
|
| Corporate Bonds – (continued) | |
| Real Estate Investment Trusts – (continued) | |
| | Regency Centers LP(b) | |
| $ | 100,000 | | | | 2.950 | % | | | 09/15/29 | | | $ | 85,755 | |
| | Spirit Realty LP(b) | |
| | 75,000 | | | | 3.400 | | | | 01/15/30 | | | | 63,951 | |
| | UDR, Inc., MTN | |
| | 25,000 | | | | 2.100 | (b) | | | 08/01/32 | | | | 19,010 | |
| | 100,000 | | | | 1.900 | (b) | | | 03/15/33 | | | | 73,938 | |
| | Ventas Realty LP(b) | |
| | 45,000 | | | | 3.500 | | | | 02/01/25 | | | | 43,098 | |
| | WP Carey, Inc. | |
| | 20,000 | | | | 4.600 | (b) | | | 04/01/24 | | | | 19,725 | |
| | 30,000 | | | | 4.000 | (b) | | | 02/01/25 | | | | 29,122 | |
| | 25,000 | | | | 3.850 | (b) | | | 07/15/29 | | | | 22,645 | |
| | 25,000 | | | | 2.400 | (b) | | | 02/01/31 | | | | 20,067 | |
| | | | | | | | | | | | | | |
| | | | | | | | | | | | | 1,698,416 | |
| | |
| Retail – 1.3% | |
| | 7-Eleven, Inc. (b)(c) | |
| | 100,000 | | | | 1.300 | | | | 02/10/28 | | | | 84,493 | |
| | AutoNation, Inc. | |
| | 83,000 | | | | 4.500 | (b) | | | 10/01/25 | | | | 79,956 | |
| | 25,000 | | | | 1.950 | (b) | | | 08/01/28 | | | | 20,423 | |
| | Dollar Tree, Inc. | |
| | 50,000 | | | | 4.000 | (b) | | | 05/15/25 | | | | 48,443 | |
| | 50,000 | | | | 4.200 | (b) | | | 05/15/28 | | | | 47,397 | |
| | Home Depot, Inc. (The) | |
| | 25,000 | | | | 3.900 | (b) | | | 12/06/28 | | | | 24,196 | |
| | 150,000 | | | | 3.250 | (b) | | | 04/15/32 | | | | 134,793 | |
| | 25,000 | | | | 4.250 | (b) | | | 04/01/46 | | | | 22,169 | |
| | Lowe’s Cos., Inc. | |
| | 25,000 | | | | 3.100 | (b) | | | 05/03/27 | | | | 23,348 | |
| | 75,000 | | | | 1.700 | (b) | | | 09/15/28 | | | | 63,771 | |
| | 300,000 | | | | 3.750 | (b) | | | 04/01/32 | | | | 271,253 | |
| | 375,000 | | | | 5.000 | (b) | | | 04/15/33 | | | | 370,942 | |
| | 25,000 | | | | 3.000 | (b) | | | 10/15/50 | | | | 16,379 | |
| | 50,000 | | | | 4.250 | (b) | | | 04/01/52 | | | | 40,798 | |
| | McDonald’s Corp., MTN | |
| | 79,000 | | | | 4.600 | (b) | | | 09/09/32 | | | | 78,248 | |
| | 25,000 | | | | 4.200 | (b) | | | 04/01/50 | | | | 21,625 | |
| | Starbucks Corp. | |
| | 75,000 | | | | 3.800 | (b) | | | 08/15/25 | | | | 72,639 | |
| | 100,000 | | | | 4.000 | (b) | | | 11/15/28 | | | | 95,985 | |
| | 68,000 | | | | 3.000 | (b) | | | 02/14/32 | | | | 59,037 | |
| | Tractor Supply Co.(b) | |
| | 50,000 | | | | 1.750 | | | | 11/01/30 | | | | 39,637 | |
| | Walgreens Boots Alliance, Inc.(b) | |
| | 41,000 | | | | 4.100 | | | | 04/15/50 | | | | 29,194 | |
| | | | | | | | | | | | | | |
| | | | | | | | | | | | | 1,644,726 | |
| | |
| Semiconductors – 0.6% | |
| | Applied Materials, Inc.(b) | |
| | 25,000 | | | | 1.750 | | | | 06/01/30 | | | | 20,884 | |
| | Broadcom, Inc. | |
| | 74,000 | | | | 4.150 | (b)(c) | | | 04/15/32 | | | | 67,008 | |
| | 100,000 | | | | 3.419 | (b)(c) | | | 04/15/33 | | | | 83,718 | |
| | |
|
| Corporate Bonds – (continued) | |
| Semiconductors – (continued) | |
| | Broadcom, Inc. – (continued) | |
| 50,000 | | | | 3.469 | %(b)(c) | | | 04/15/34 | | | | 40,981 | |
| | 162,000 | | | | 3.137 | (b)(c) | | | 11/15/35 | | | | 124,170 | |
| | 100,000 | | | | 3.500 | (b)(c) | | | 02/15/41 | | | | 74,857 | |
| | Intel Corp. | |
| | 175,000 | | | | 5.200 | (b) | | | 02/10/33 | | | | 176,631 | |
| | 75,000 | | | | 3.050 | (b) | | | 08/12/51 | | | | 50,277 | |
| | Micron Technology, Inc.(b) | |
| | 50,000 | | | | 2.703 | | | | 04/15/32 | | | | 39,483 | |
| | | | | | | | | | | | | | |
| | | | | | | | | | | | | 678,009 | |
| | |
| Software – 1.6% | |
| | Adobe, Inc. | |
| | 50,000 | | | | 2.150 | (b) | | | 02/01/27 | | | | 45,965 | |
| | 75,000 | | | | 2.300 | (b) | | | 02/01/30 | | | | 65,802 | |
| | Fiserv, Inc. | |
| | 100,000 | | | | 2.750 | (b) | | | 07/01/24 | | | | 97,035 | |
| | 25,000 | | | | 4.200 | (b) | | | 10/01/28 | | | | 23,955 | |
| | Intuit, Inc.(b) | |
| | 25,000 | | | | 1.350 | | | | 07/15/27 | | | | 21,914 | |
| | Oracle Corp. | |
| | 150,000 | | | | 4.500 | (b) | | | 05/06/28 | | | | 145,976 | |
| | 34,000 | | | | 2.950 | (b) | | | 04/01/30 | | | | 29,681 | |
| | 175,000 | | | | 4.650 | (b) | | | 05/06/30 | | | | 169,263 | |
| | 275,000 | | | | 2.875 | (b) | | | 03/25/31 | | | | 234,372 | |
| | 250,000 | | | | 6.250 | (b) | | | 11/09/32 | | | | 265,238 | |
| | 157,000 | | | | 4.900 | (b) | | | 02/06/33 | | | | 152,413 | |
| | 225,000 | | | | 6.900 | (b) | | | 11/09/52 | | | | 252,128 | |
| | 50,000 | | | | 3.850 | (b) | | | 04/01/60 | | | | 35,075 | |
| | Roper Technologies, Inc.(b) | |
| | 50,000 | | | | 4.200 | | | | 09/15/28 | | | | 48,069 | |
| | ServiceNow, Inc.(b) | |
| | 125,000 | | | | 1.400 | | | | 09/01/30 | | | | 99,050 | |
| | Take-Two Interactive Software, Inc.(b) | |
| | 85,000 | | | | 3.700 | | | | 04/14/27 | | | | 80,525 | |
| | VMware, Inc. | |
| | 25,000 | | | | 1.800 | (b) | | | 08/15/28 | | | | 20,999 | |
| | 100,000 | | | | 2.200 | (b) | | | 08/15/31 | | | | 78,580 | |
| | Workday, Inc. | |
| | 75,000 | | | | 3.500 | (b) | | | 04/01/27 | | | | 71,088 | |
| | 25,000 | | | | 3.800 | (b) | | | 04/01/32 | | | | 22,497 | |
| | | | | | | | | | | | | | |
| | | | | | | | | | | | | 1,959,625 | |
| | |
| Telecommunications – 1.9% | |
| | AT&T, Inc. | |
| | 288,000 | | | | 2.300 | (b) | | | 06/01/27 | | | | 259,156 | |
| | 150,000 | | | | 4.350 | (b) | | | 03/01/29 | | | | 144,032 | |
| | 50,000 | | | | 2.750 | (b) | | | 06/01/31 | | | | 42,198 | |
| | 478,000 | | | | 2.550 | (b) | | | 12/01/33 | | | | 374,080 | |
| | 25,000 | | | | 4.900 | (b) | | | 08/15/37 | | | | 23,454 | |
| | 60,000 | | | | 4.850 | (b) | | | 03/01/39 | | | | 55,279 | |
| | 75,000 | | | | 3.500 | (b) | | | 06/01/41 | | | | 57,622 | |
| | 25,000 | | | | 4.350 | (b) | | | 06/15/45 | | | | 20,946 | |
| | 25,000 | | | | 5.150 | (b) | | | 11/15/46 | | | | 23,270 | |
| | |
| | |
| 12 | | The accompanying notes are an integral part of these financial statements. |
GOLDMAN SACHS VARIABLE INSURANCE TRUST CORE FIXED INCOME FUND
| | | | | | | | | | | | | | |
Principal
Amount | | | Interest
Rate | | | Maturity
Date | | | Value | |
|
| Corporate Bonds – (continued) | |
| Telecommunications – (continued) | |
| | AT&T, Inc. – (continued) | |
| $ | 25,000 | | | | 4.500 | %(b) | | | 03/09/48 | | | $ | 21,157 | |
| | 25,000 | | | | 3.650 | (b) | | | 06/01/51 | | | | 18,343 | |
| | 25,000 | | | | 3.500 | (b) | | | 09/15/53 | | | | 17,699 | |
| | T-Mobile USA, Inc. | |
| | 49,000 | | | | 3.500 | (b) | | | 04/15/25 | | | | 47,147 | |
| | 75,000 | | | | 1.500 | (b) | | | 02/15/26 | | | | 67,813 | |
| | 153,000 | | | | 3.750 | (b) | | | 04/15/27 | | | | 144,943 | |
| | 25,000 | | | | 4.750 | (b) | | | 02/01/28 | | | | 24,301 | |
| | 175,000 | | | | 2.050 | (b) | | | 02/15/28 | | | | 152,008 | |
| | 83,000 | | | | 3.875 | (b) | | | 04/15/30 | | | | 76,510 | |
| | 75,000 | | | | 2.875 | (b) | | | 02/15/31 | | | | 63,594 | |
| | 75,000 | | | | 3.500 | (b) | | | 04/15/31 | | | | 66,148 | |
| | 500,000 | | | | 5.200 | (b) | | | 01/15/33 | | | | 496,851 | |
| | 25,000 | | | | 3.000 | (b) | | | 02/15/41 | | | | 18,255 | |
| | Verizon Communications, Inc. | |
| | 108,000 | | | | 4.329 | | | | 09/21/28 | | | | 104,065 | |
| | 50,000 | | | | 2.550 | (b) | | | 03/21/31 | | | | 41,759 | |
| | | | | | | | | | | | | | |
| | | | | | | | | | | | | 2,360,630 | |
| | |
| Transportation – 0.4% | |
| | Burlington Northern Santa Fe LLC(b) | |
| | 25,000 | | | | 4.050 | | | | 06/15/48 | | | | 21,399 | |
| | CSX Corp. | |
| | 175,000 | | | | 3.800 | (b) | | | 03/01/28 | | | | 167,112 | |
| | 100,000 | | | | 4.100 | (b) | | | 11/15/32 | | | | 94,622 | |
| | FedEx Corp. | |
| | 45,000 | | | | 3.400 | (b) | | | 02/15/28 | | | | 41,906 | |
| | 75,000 | | | | 5.250 | (b) | | | 05/15/50 | | | | 72,068 | |
| | Union Pacific Corp.(b) | |
| | 125,000 | | | | 2.800 | | | | 02/14/32 | | | | 107,852 | |
| | | | | | | | | | | | | | |
| | | | | | | | | | | | | 504,959 | |
| | |
| | TOTAL CORPORATE BONDS | |
| | (Cost $36,790,456) | | | $ | 34,196,474 | |
| | |
| | | | | | | | | | | | | | |
|
| Asset-Backed Securities – 6.7% | |
| Collateralized Loan Obligations – 3.3% | |
| | Cathedral Lake VIII Ltd., Series 2021-8A, Class C(c)(d) | |
| | (3 Mo. LIBOR + 2.620%) (Cayman Islands) | |
| $ | 200,000 | | | | 7.870 | % | | | 01/20/35 | | | $ | 192,171 | |
| | CBAM Ltd., Series 2018-5A, Class A(c)(d) | |
| | (3 Mo. LIBOR + 1.020%) (Cayman Islands) | |
| | 525,000 | | | | 6.280 | | | | 04/17/31 | | | | 518,759 | |
| | CFIP CLO Ltd., Series 2021-1A, Class A(c)(d) | |
| | (3 Mo. LIBOR + 1.220%) (Cayman Islands) | |
| | 700,000 | | | | 6.470 | | | | 01/20/35 | | | | 681,141 | |
| | CFIP CLO Ltd., Series 2021-1A, Class C1(c)(d) | |
| | (3 Mo. LIBOR + 2.400%) (Cayman Islands) | |
| | 300,000 | | | | 7.650 | | | | 01/20/35 | | | | 284,666 | |
| | Crown City CLO I, Series 2020-1A, Class A1AR(c)(d) | |
| | (3 Mo. LIBOR + 1.190%) (Cayman Islands) | |
| | 250,000 | | | | 6.440 | | | | 07/20/34 | | | | 244,603 | |
| | |
|
| Asset-Backed Securities – (continued) | |
| Collateralized Loan Obligations – (continued) | |
| | Diameter Capital CLO 1 Ltd., Series 2021-1A, Class A1A(c)(d) | |
| | (3 Mo. LIBOR + 1.240%) | |
| 425,000 | | | | 6.500 | | | | 07/15/36 | | | | 417,102 | |
| | HalseyPoint CLO Ltd., Series 2020-3A, Class A1A(c)(d) | |
| | (3M USD LIBOR + 1.450%) (Cayman Islands) | |
| | 250,000 | | | | 6.749 | | | | 11/30/32 | | | | 247,697 | |
| | Jamestown CLO XV Ltd., Series 2020-15A, Class A(c)(d) | |
| | (3 Mo. LIBOR + 1.340%) (Cayman Islands) | |
| | 300,000 | | | | 6.600 | | | | 04/15/33 | | | | 296,468 | |
| | Marble Point CLO XVII Ltd., Series 2020-1A, Class A(c)(d) | |
| | (3 Mo. LIBOR + 1.300%) (Cayman Islands) | |
| | 500,000 | | | | 6.550 | | | | 04/20/33 | | | | 490,211 | |
| | Pikes Peak CLO Ltd., Series 2023-12A, Class A(c)(d) | |
| | (TSFR3M + 2.100%) (United Kingdom) | |
| | 350,000 | | | | 7.037 | | | | 04/20/36 | | | | 351,316 | |
| | Venture CLO Ltd., Series 2020-39A, Class A1(c)(d) | |
| | (3 Mo. LIBOR + 1.280%) (Cayman Islands) | |
| | 275,000 | | | | 6.540 | | | | 04/15/33 | | | | 269,343 | |
| | | | | | | | | | | | | | |
| | | | | | | | | | | | | 3,993,477 | |
| | |
| Diversified Financial Services – 3.2% | |
| | Barclays Dryrock Issuance Trust, Series 2023-1, Class A | |
| | 600,000 | | | | 4.720 | | | | 02/15/29 | | | | 591,161 | |
| Benefit Street Partners CLO Xxx Ltd., Series 2023-30A,
Class A(c)(d) |
|
| | (TSFR3M + 2.100%) (United Kingdom) | |
| | 350,000 | | | | 6.805 | | | | 04/25/36 | | | | 351,252 | |
| Capital One Multi-Asset Execution Trust, Series 2022-A3,
Class A |
|
| | 300,000 | | | | 4.950 | | | | 10/15/27 | | | | 298,078 | |
| | Discover Card Execution Note Trust, Series 2023-A1, Class A | |
| | 300,000 | | | | 4.310 | | | | 03/15/28 | | | | 293,471 | |
| | Halseypoint CLO 7 Ltd., Series 2023-7A, Class A(c)(d) | |
| | (TSFR3M + 2.250%) (United Kingdom) | |
| | 600,000 | | | | 7.509 | | | | 07/20/36 | | | | 600,000 | |
| Hyundai Auto Lease Securitization Trust 2021-B, Series 2021-B,
Class A4(c) |
|
| | 300,000 | | | | 0.380 | | | | 08/15/25 | | | | 295,667 | |
| Hyundai Auto Lease Securitization Trust 2022-A, Series 2022-A,
Class A4(c) |
|
| | 300,000 | | | | 1.320 | | | | 12/15/25 | | | | 289,206 | |
| Hyundai Auto Receivables Trust 2023-A, Series 2023-A,
Class A2A |
|
| | 300,000 | | | | 5.190 | | | | 12/15/25 | | | | 298,918 | |
| Nissan Auto Receivables 2023-A Owner Trust, Series 2023-A,
Class A2A |
|
| | 300,000 | | | | 5.340 | | | | 02/17/26 | | | | 298,884 | |
| | Toyota Lease Owner Trust 2023-A, Series 2023-A, Class A2(c) | |
| | 300,000 | | | | 5.300 | | | | 08/20/25 | | | | 298,978 | |
| World Omni Auto Receivables Trust 2023-B, Series 2023-B,
Class A2A |
|
| | 300,000 | | | | 5.250 | | | | 11/16/26 | | | | 298,887 | |
| | | | | | | | | | | | | | |
| | | | | | | | | | | | | 3,914,502 | |
| | |
| | |
| The accompanying notes are an integral part of these financial statements. | | 13 |
GOLDMAN SACHS VARIABLE INSURANCE TRUST CORE FIXED INCOME FUND
Schedule of Investments (continued)
June 30, 2023 (Unaudited)
| | | | | | | | | | | | | | |
Principal
Amount | | | Interest
Rate | | | Maturity
Date | | | Value | |
|
| Asset-Backed Securities – (continued) | |
| Collateralized Debt Obligations – 0.2% | |
| Arbor Realty Commercial Real Estate Notes Ltd.,
Series 2022-FL1, Class A(c)(d) |
|
| | (SOFR + 1.450%) (Cayman Islands) | |
| $ | 250,000 | | | | 6.517 | % | | | 01/15/37 | | | $ | 245,474 | |
| | |
| | TOTAL ASSET-BACKED SECURITIES | |
| | (Cost $8,254,497) | | | $ | 8,153,453 | |
| | |
| | | | | | | | | | | | | | |
|
| Foreign Bonds – 5.1% | |
| Agriculture – 0.1% | |
| | BAT Capital Corp. (United Kingdom) | |
| $ | 25,000 | | | | 3.222 | %(b) | | | 08/15/24 | | | $ | 24,256 | |
| | 100,000 | | | | 2.259 | (b) | | | 03/25/28 | | | | 85,725 | |
| | 25,000 | | | | 4.540 | (b) | | | 08/15/47 | | | | 18,447 | |
| | | | | | | | | | | | | | |
| | | | | | | | | | | | | 128,428 | |
| | |
| Banks – 2.1% | |
| | Banco Santander SA (Spain) | |
| | 200,000 | | | | 2.746 | | | | 05/28/25 | | | | 187,862 | |
| | Barclays PLC(d) (United Kingdom) | |
| | (SOFR + 2.71%) | |
| | 200,000 | | | | 2.852 | (b) | | | 05/07/26 | | | | 187,488 | |
| | BNP Paribas SA (France) | |
| | 200,000 | | | | 3.375 | (c) | | | 01/09/25 | | | | 192,168 | |
| | (SOFR + 1.00%) | |
| | 200,000 | | | | 1.323 | (b)(c)(d) | | | 01/13/27 | | | | 177,496 | |
| | BPCE SA(b)(c)(d) (France) | |
| | (SOFR + 1.73%) | |
| | 250,000 | | | | 3.116 | | | | 10/19/32 | | | | 193,467 | |
| | Credit Suisse AG (Switzerland) | |
| | 250,000 | | | | 1.250 | | | | 08/07/26 | | | | 215,205 | |
| | Credit Suisse Group AG(c)(d) (Switzerland) | |
| | (SOFR + 5.02%) | |
| | 250,000 | | | | 9.016 | (b) | | | 11/15/33 | | | | 299,079 | |
| | Deutsche Bank AG(d) (Germany) | |
| | (SOFR + 2.16%) | |
| | 150,000 | | | | 2.222 | (b) | | | 09/18/24 | | | | 148,198 | |
| | HSBC Holdings PLC(d) (United Kingdom) | |
| | (SOFR + 1.54%) | |
| | 200,000 | | | | 1.645 | (b) | | | 04/18/26 | | | | 184,673 | |
| | ING Groep NV(c)(d) (Netherlands) | |
| | (US 1 Year CMT T-Note + 1.10%) | |
| | 200,000 | | | | 1.400 | (b) | | | 07/01/26 | | | | 182,263 | |
| | Macquarie Group Ltd.(c)(d) (Australia) | |
| | (SOFR + 1.07%) | |
| | 50,000 | | | | 1.340 | (b) | | | 01/12/27 | | | | 44,488 | |
| | Toronto-Dominion Bank (The) (Canada) | |
| | 175,000 | | | | 4.456 | | | | 06/08/32 | | | | 166,250 | |
| | UBS Group AG (Switzerland) | |
| | 250,000 | | | | 4.550 | | | | 04/17/26 | | | | 240,235 | |
| | (US 1 Year CMT T-Note + 1.10%) | |
| | 200,000 | | | | 2.746 | (b)(c)(d) | | | 02/11/33 | | | | 155,456 | |
| | |
|
| Foreign Bonds – (continued) | |
| Banks – (continued) | |
| | Westpac Banking Corp.(d) (Australia) | |
| (US Treasury Yield Curve Rate T-Note Constant Maturity
+ 2.00%) |
|
| 25,000 | | | | 4.110 | %(b) | | | 07/24/34 | | | | 21,812 | |
| | Westpac Banking Corp.(d), GMTN (Australia) | |
| | (5 Year USD Swap + 2.24%) | |
| | 25,000 | | | | 4.322 | (b) | | | 11/23/31 | | | | 23,170 | |
| | | | | | | | | | | | | | |
| | | | | | | | | | | | | 2,619,310 | |
| | |
| Beverages – 0.7% | |
| Anheuser-Busch Cos. LLC / Anheuser-Busch InBev Worldwide,
Inc. (Belgium) |
|
| | 335,000 | | | | 4.700 | (b) | | | 02/01/36 | | | | 326,188 | |
| | 115,000 | | | | 4.900 | (b) | | | 02/01/46 | | | | 109,836 | |
| | Anheuser-Busch InBev Worldwide, Inc. (Belgium) | |
| | 175,000 | | | | 4.750 | (b) | | | 01/23/29 | | | | 174,344 | |
| | 25,000 | | | | 8.200 | | | | 01/15/39 | | | | 32,659 | |
| | 25,000 | | | | 4.950 | | | | 01/15/42 | | | | 24,386 | |
| | 100,000 | | | | 4.600 | (b) | | | 04/15/48 | | | | 92,850 | |
| | 25,000 | | | | 4.500 | (b) | | | 06/01/50 | | | | 23,105 | |
| | JDE Peet’s NV(c) (Netherlands) | |
| | 150,000 | | | | 1.375 | (b) | | | 01/15/27 | | | | 130,168 | |
| | | | | | | | | | | | | | |
| | | | | | | | | | | | | 913,536 | |
| | |
| Biotechnology – 0.0% | |
| | CSL Finance PLC(c) (Australia) | |
| | 25,000 | | | | 3.850 | (b) | | | 04/27/27 | | | | 23,887 | |
| | |
| Commercial Services – 0.2% | |
| | DP World Crescent Ltd., Series EMTN (United Arab Emirates) | |
| | 200,000 | | | | 3.875 | | | | 07/18/29 | | | | 188,842 | |
| | |
| Diversified Financial Services – 0.5% | |
| AerCap Ireland Capital DAC / AerCap Global Aviation Trust
(Ireland) |
|
| | 250,000 | | | | 2.450 | (b) | | | 10/29/26 | | | | 223,488 | |
| | 225,000 | | | | 3.000 | (b) | | | 10/29/28 | | | | 195,148 | |
| | Avolon Holdings Funding Ltd. (Ireland) | |
| | 25,000 | | | | 3.950 | (b)(c) | | | 07/01/24 | | | | 24,254 | |
| | 100,000 | | | | 2.875 | (b)(c) | | | 02/15/25 | | | | 93,305 | |
| | 25,000 | | | | 4.250 | (b)(c) | | | 04/15/26 | | | | 23,283 | |
| | | | | | | | | | | | | | |
| | | | | | | | | | | | | 559,478 | |
| | |
| Electric – 0.2% | |
| | Korea Hydro & Nuclear Power Co. Ltd.(c) (South Korea) | |
| | 220,000 | | | | 4.250 | | | | 07/27/27 | | | | 213,885 | |
| | |
| Machinery-Construction & Mining – 0.1% | |
| | Weir Group PLC (The)(c) (United Kingdom) | |
| | 200,000 | | | | 2.200 | (b) | | | 05/13/26 | | | | 179,033 | |
| | |
| Mining – 0.3% | |
| | Glencore Funding LLC (Australia) | |
| | 75,000 | | | | 4.125 | (b)(c) | | | 03/12/24 | | | | 74,068 | |
| | 25,000 | | | | 4.625 | (c) | | | 04/29/24 | | | | 24,685 | |
| | 75,000 | | | | 1.625 | (b)(c) | | | 04/27/26 | | | | 67,620 | |
| | 150,000 | | | | 2.625 | (b)(c) | | | 09/23/31 | | | | 120,688 | |
| | |
| | |
| 14 | | The accompanying notes are an integral part of these financial statements. |
GOLDMAN SACHS VARIABLE INSURANCE TRUST CORE FIXED INCOME FUND
| | | | | | | | | | | | | | |
Principal
Amount | | | Interest
Rate | | | Maturity
Date | | | Value | |
|
| Foreign Bonds – (continued) | |
| Mining – (continued) | |
| | Newcrest Finance Pty Ltd.(c) (Australia) | |
| $ | 25,000 | | | | 3.250 | %(b) | | | 05/13/30 | | | $ | 22,087 | |
| | Teck Resources Ltd. (Canada) | |
| | 18,000 | | | | 3.900 | (b) | | | 07/15/30 | | | | 16,378 | |
| | | | | | | | | | | | | | |
| | | | | | | | | | | | | 325,526 | |
| | |
| Oil & Gas – 0.2% | |
| | Saudi Arabian Oil Co. (Saudi Arabia) | |
| | 220,000 | | | | 3.500 | | | | 04/16/29 | | | | 202,147 | |
| | |
| Pharmaceuticals – 0.2% | |
| | Bayer US Finance II LLC(c) (Germany) | |
| | 200,000 | | | | 3.875 | (b) | | | 12/15/23 | | | | 197,891 | |
| | |
| Pipelines – 0.3% | |
| | Enbridge, Inc. (Canada) | |
| | 111,000 | | | | 5.700 | (b) | | | 03/08/33 | | | | 112,524 | |
| | 125,000 | | | | 2.500 | (b) | | | 08/01/33 | | | | 97,998 | |
| | Galaxy Pipeline Assets Bidco Ltd. (United Arab Emirates) | |
| | 189,970 | | | | 2.940 | | | | 09/30/40 | | | | 152,217 | |
| | | | | | | | | | | | | | |
| | | | | | | | | | | | | 362,739 | |
| | |
| Semiconductors – 0.2% | |
| | NXP BV / NXP Funding LLC / NXP USA, Inc. (China) | |
| | 25,000 | | | | 3.400 | (b) | | | 05/01/30 | | | | 22,143 | |
| | 125,000 | | | | 2.500 | (b) | | | 05/11/31 | | | | 101,885 | |
| | 125,000 | | | | 2.650 | (b) | | | 02/15/32 | | | | 101,065 | |
| | | | | | | | | | | | | | |
| | | | | | | | | | | | | 225,093 | |
| | |
| Transportation – 0.0% | |
| | Canadian Pacific Railway Co. (Canada) | |
| | 25,000 | | | | 2.050 | (b) | | | 03/05/30 | | | | 20,982 | |
| | |
| | TOTAL FOREIGN BONDS | |
| | (Cost $6,726,533) | | | $ | 6,160,777 | |
| | |
| | | | | | | | | | | | | | |
|
| U.S. Government Agency Securities – 2.6% | |
| | Federal Farm Credit Banks Funding Corp. | |
| $ | 460,000 | | | | 2.900 | %(f) | | | 04/12/32 | | | $ | 412,036 | |
| | 230,000 | | | | 3.300 | (f) | | | 05/19/32 | | | | 211,000 | |
| | 130,000 | | | | 3.500 | (f) | | | 09/01/32 | | | | 121,728 | |
| | 600,000 | | | | 2.850 | (f) | | | 03/28/34 | | | | 517,288 | |
| | 340,000 | | | | 3.080 | (f) | | | 03/30/37 | | | | 290,350 | |
| | Federal Home Loan Banks | |
| | 100,000 | | | | 3.375 | (f) | | | 12/08/23 | | | | 99,115 | |
| | 250,000 | | | | 3.375 | (f) | | | 09/10/32 | | | | 229,086 | |
| | 430,000 | | | | 4.750 | (f) | | | 12/10/32 | | | | 444,014 | |
| | Federal National Mortgage Associations | |
| | 400,000 | | | | 1.875 | (f) | | | 09/24/26 | | | | 369,159 | |
| | 400,000 | | | | 6.250 | (f) | | | 05/15/29 | | | | 442,395 | |
| | |
| | TOTAL U.S. GOVERNMENT AGENCY SECURITIES | |
| | (Cost $3,424,917) | | | $ | 3,136,171 | |
| | |
| | | | | | | | | | | | | | |
|
| Commercial Mortgage-Backed Securities – 2.2% | |
| | 3650R Commercial Mortgage Trust Series 2021-PF1, Class AS(d) | |
| $ | 150,000 | | | | 2.778 | % | | | 11/15/54 | | | $ | 114,187 | |
| | BANK Series 2019-BN21, Class A5 | |
| | 150,000 | | | | 2.851 | | | | 10/17/52 | | | | 127,991 | |
| | BANK Series 2021-BN32, Class A5 | |
| | 150,000 | | | | 2.643 | | | | 04/15/54 | | | | 124,746 | |
| | BANK Series 2022-BNK43, Class A5 | |
| | 200,000 | | | | 4.399 | | | | 08/15/55 | | | | 187,400 | |
| | BANK5 Series 2023-5YR2, Class A3 | |
| | 250,000 | | | | 6.656 | | | | 06/15/28 | | | | 257,725 | |
| | BBCMS Mortgage Trust Series 2022-C17, Class A5 | |
| | 450,000 | | | | 4.441 | | | | 09/15/55 | | | | 423,131 | |
| BX Commercial Mortgage Trust 2023-VLT2 Series 2023-VLT2,
Class A(d) (TSFR1M + 2.281%)(c) |
|
| | 250,000 | | | | 7.428 | | | | 06/15/40 | | | | 248,993 | |
| | Bx Trust Series 2022-PSB, Class A(d) (TSFR1M + 2.451%)(c) | |
| | 89,262 | | | | 7.598 | | | | 08/15/39 | | | | 88,816 | |
| BX Trust Series 2021-ARIA, Class C(d) (1 Mo. LIBOR +
1.646%)(c) |
|
| | 150,000 | | | | 6.839 | | | | 10/15/36 | | | | 144,064 | |
| Cantor Commercial Real Estate Lending Series 2019-CF3,
Class A4 |
|
| | 100,000 | | | | 3.006 | | | | 01/15/53 | | | | 85,777 | |
| Citigroup Commercial Mortgage Trust 2023-PRM3
Series 2023-PRM3, Class A(d)(c) |
|
| | 200,000 | | | | 6.360 | | | | 07/10/28 | | | | 203,736 | |
| | DOLP Trust Series 2021-NYC, Class A(c) | |
| | 200,000 | | | | 2.956 | | | | 05/10/41 | | | | 156,087 | |
| EQUS Mortgage Trust Series 2021-EQAZ, Class A(d)
(1 Mo. LIBOR + 0.755%)(c) |
|
| | 199,996 | | | | 5.948 | | | | 10/15/38 | | | | 194,257 | |
| Freddie Mac Multifamily Structured Pass Through Certificates
Series K152, Class A2(d) |
|
| | 200,000 | | | | 3.780 | | | | 11/25/32 | | | | 190,907 | |
| Freddie Mac Multifamily Structured Pass Through Certificates
Series KF153, Class AS(d) (SOFR + 0.680%) |
|
| | 200,000 | | | | 5.721 | | | | 02/25/33 | | | | 199,291 | |
| | |
| | TOTAL COMMERCIAL MORTGAGE-BACKED SECURITIES | |
| | (Cost $2,987,972) | | | $ | 2,747,108 | |
| | |
| | | | | | | | | | | | | | |
|
| Foreign Government Securities – 1.2% | |
| Sovereign – 1.2% | |
| | Indonesia Government International Bond(b) | |
| $ | 200,000 | | | | 4.850 | % | | | 01/11/33 | | | $ | 198,775 | |
| | 200,000 | | | | 3.050 | | | | 03/12/51 | | | | 145,710 | |
| | Israel Government AID Bond | |
| | 200,000 | | | | 5.500 | (g) | | | 12/04/23 | | | | 199,868 | |
| | 100,000 | | | | 5.500 | (g) | | | 04/26/24 | | | | 99,805 | |
| | Mexico Government International Bond(b) | |
| | 400,000 | | | | 3.250 | | | | 04/16/30 | | | | 355,564 | |
| | 110,000 | | | | 1.450 | | | | 10/25/33 | | | | 88,639 | |
| | 200,000 | | | | 4.280 | | | | 08/14/41 | | | | 165,391 | |
| | |
| | |
| The accompanying notes are an integral part of these financial statements. | | 15 |
GOLDMAN SACHS VARIABLE INSURANCE TRUST CORE FIXED INCOME FUND
Schedule of Investments (continued)
June 30, 2023 (Unaudited)
| | | | | | | | | | | | | | |
Principal
Amount | | | Interest
Rate | | | Maturity
Date | | | Value | |
|
| Foreign Government Securities – (continued) | |
| Sovereign – (continued) | |
| | Peruvian Government International Bond(b) | |
| $ | 50,000 | | | | 3.230 | % | | | 07/28/21 | | | $ | 30,003 | |
| | Romanian Government International Bond(c) | |
| | 40,000 | | | | 3.000 | | | | 02/27/27 | | | | 36,250 | |
| | 10,000 | | | | 2.124 | | | | 07/16/31 | | | | 8,241 | |
| | 30,000 | | | | 2.625 | | | | 12/02/40 | | | | 19,848 | |
| | 10,000 | | | | 4.625 | | | | 04/03/49 | | | | 8,389 | |
| | Romanian Government International Bond, Series EMTN | |
| | 50,000 | | | | 2.875 | | | | 03/11/29 | | | | 47,344 | |
| | Uruguay Government International Bond(b) | |
| | 50,000 | | | | 4.375 | | | | 01/23/31 | | | | 49,292 | |
| | | | | | | | | | | | | | |
| | | | | | | | | | | | | 1,453,119 | |
| | |
| | TOTAL FOREIGN GOVERNMENT SECURITIES | |
| | (Cost $1,687,445) | | | $ | 1,453,119 | |
| | |
| | | | | | | | | | | | | | |
|
| Municipal Bonds – 1.0% | |
| Arizona – 0.0% | |
| | City of Tucson AZ | |
| $ | 25,000 | | | | 1.932 | %(b) | | | 07/01/31 | | | $ | 20,258 | |
| | |
| California – 0.5% | |
| | California Health Facilities Financing Authority | |
| | 125,000 | | | | 3.478 | (b) | | | 06/01/29 | | | | 115,683 | |
| | 100,000 | | | | 3.790 | (b) | | | 06/01/32 | | | | 91,669 | |
| | California Statewide Communities Development Authority | |
| | 50,000 | | | | 1.877 | | | | 02/01/31 | | | | 39,171 | |
| | Municipal Improvement Corp. of Los Angeles | |
| | 35,000 | | | | 1.648 | (b) | | | 11/01/28 | | | | 29,617 | |
| | 80,000 | | | | 2.074 | (b) | | | 11/01/30 | | | | 65,756 | |
| | Port of Oakland | |
| | 80,000 | | | | 2.199 | (b) | | | 05/01/31 | | | | 66,698 | |
| | San Francisco Municipal Transportation Agency | |
| | 30,000 | | | | 1.302 | | | | 03/01/28 | | | | 25,261 | |
| | San Jose Financing Authority | |
| | 25,000 | | | | 1.812 | (b) | | | 06/01/29 | | | | 21,199 | |
| | 25,000 | | | | 1.862 | (b) | | | 06/01/30 | | | | 20,730 | |
| | State of California | |
| | 105,000 | | | | 7.625 | (b) | | | 03/01/40 | | | | 131,984 | |
| | | | | | | | | | | | | | |
| | | | | | | | | | | | | 607,768 | |
| | |
| Florida – 0.0% | |
| | State Board of Administration Finance Corp. | |
| | 70,000 | | | | 2.154 | (b) | | | 07/01/30 | | | | 58,346 | |
| | |
| Illinois – 0.2% | |
| | Chicago O’Hare International Airport | |
| | 85,000 | | | | 2.346 | (b) | | | 01/01/30 | | | | 73,195 | |
| | State of Illinois GO Bonds | |
| | 25,000 | | | | 5.100 | | | | 06/01/33 | | | | 24,567 | |
| | 92,857 | | | | 7.350 | (b) | | | 07/01/35 | | | | 100,075 | |
| | | | | | | | | | | | | | |
| | | | | | | | | | | | | 197,837 | |
| | |
|
| Municipal Bonds – (continued) | |
| Louisiana – 0.1% | |
| | City of New Orleans LA Water System Revenue | |
| 25,000 | | | | 1.008 | %(b) | | | 12/01/26 | | | | 21,703 | |
| Louisiana Local Government Environmental Facilities &
Community Development Auth, Series 2022-ELL A3 |
|
| | 140,000 | | | | 4.275 | | | | 02/01/36 | | | | 131,685 | |
| | | | | | | | | | | | | | |
| | | | | | | | | | | | | 153,388 | |
| | |
| New York – 0.0% | |
| | City of New York NY | |
| | 40,000 | | | | 1.940 | (b) | | | 03/01/29 | | | | 34,256 | |
| | Metropolitan Transportation Authority | |
| | 25,000 | | | | 5.989 | (b) | | | 11/15/30 | | | | 26,283 | |
| New York City Transitional Finance Authority Future Tax
Secured Revenue |
|
| | 10,000 | | | | 3.590 | (b) | | | 08/01/27 | | | | 9,549 | |
| | | | | | | | | | | | | | |
| | | | | | | | | | | | | 70,088 | |
| | |
| Ohio – 0.1% | |
| | American Municipal Power, Inc. | |
| | 95,000 | | | | 6.270 | (b) | | | 02/15/50 | | | | 104,201 | |
| | |
| Texas – 0.1% | |
| | City of Houston TX Airport System Revenue | |
| | 30,000 | | | | 2.235 | | | | 07/01/29 | | | | 25,980 | |
| | 40,000 | | | | 2.285 | | | | 07/01/30 | | | | 34,008 | |
| | | | | | | | | | | | | | |
| | | | | | | | | | | | | 59,988 | |
| | |
| | TOTAL MUNICIPAL BONDS | |
| | (Cost $1,370,760) | | | $ | 1,271,874 | |
| | |
| | | | | | | | | | | | | | |
|
| Collateralized Mortgage Obligations – 0.3% | |
| Alternative Loan Trust Series 2005-38, Class A1(d) (1 Year CMT
+ 1.500%) |
|
| $ | 39,491 | | | | 5.476 | % | | | 09/25/35 | | | $ | 36,531 | |
| Connecticut Avenue Securities Trust Series 2021-R01,
Class 1M2(d) (SOFR + 1.550%)(c) |
|
| | 44,000 | | | | 6.617 | | | | 10/25/41 | | | | 43,128 | |
| Connecticut Avenue Securities Trust Series 2021-R03,
Class 1M2(d) (SOFR + 1.650%)(c) |
|
| | 42,000 | | | | 6.717 | | | | 12/25/41 | | | | 40,636 | |
| Connecticut Avenue Securities Trust Series 2022-R05,
Class 2M1(d) (SOFR + 1.900%)(c) |
|
| | 37,494 | | | | 6.967 | | | | 04/25/42 | | | | 37,579 | |
| Connecticut Avenue Securities Trust Series 2022-R05,
Class 2M2(d) (SOFR + 3.000%)(c) |
|
| | 36,000 | | | | 8.067 | | | | 04/25/42 | | | | 35,870 | |
| Federal Home Loan Mortgage Corporation Series 2020-DNA5,
Class M2(d) (SOFR + 2.800%)(c) |
|
| | 11,818 | | | | 7.867 | | | | 10/25/50 | | | | 11,988 | |
| Federal Home Loan Mortgage Corporation Series 2021-DNA5,
Class M2(d) (SOFR + 1.650%)(c) |
|
| | 21,873 | | | | 6.717 | | | | 01/25/34 | | | | 21,842 | |
| | |
| | |
| 16 | | The accompanying notes are an integral part of these financial statements. |
GOLDMAN SACHS VARIABLE INSURANCE TRUST CORE FIXED INCOME FUND
| | | | | | | | | | | | | | |
Principal
Amount | | | Interest
Rate | | | Maturity
Date | | | Value | |
|
| Collateralized Mortgage Obligations – (continued) | |
| Federal Home Loan Mortgage Corporation Series 2022-DNA1,
Class M1A(d) (SOFR + 1.000%)(c) |
|
| $ | 80,508 | | | | 6.067 | % | | | 01/25/42 | | | $ | 79,213 | |
| Federal Home Loan Mortgage Corporation Series 2022-DNA3,
Class M1A(d) (SOFR + 2.000%)(c) |
|
| | 31,412 | | | | 7.067 | | | | 04/25/42 | | | | 31,451 | |
| | JPMorgan Mortgage Trust Series 2021-6, Class A3(d)(c) | |
| | 91,423 | | | | 2.500 | | | | 10/25/51 | | | | 73,463 | |
| Wells Fargo Mortgage Backed Securities Trust Series 2019-3,
Class A1(d)(c) |
|
| | 6,173 | | | | 3.500 | | | | 07/25/49 | | | | 5,478 | |
| | |
| | TOTAL COLLATERALIZED MORTGAGE OBLIGATIONS | |
| | (Cost $443,801) | | | $ | 417,179 | |
| | |
| | | | | | | | | | | | | | |
|
| U.S. Treasury Obligations – 18.0% | |
| | U.S. Treasury Bonds | |
| $ | 1,640,000 | | | | 3.125 | %(f) | | | 11/15/41 | | | $ | 1,444,738 | |
| | 1,550,000 | | | | 2.750 | (f) | | | 08/15/42 | | | | 1,277,297 | |
| | 2,310,000 | | | | 2.750 | (f) | | | 11/15/42 | | | | 1,900,336 | |
| | 230,000 | | | | 3.000 | (f) | | | 02/15/49 | | | | 194,566 | |
| | 230,000 | | | | 2.875 | (f) | | | 05/15/49 | | | | 190,181 | |
| | 420,000 | | | | 2.250 | (f) | | | 08/15/49 | | | | 305,353 | |
| | 2,930,000 | | | | 2.375 | (f) | | | 11/15/49 | | | | 2,189,259 | |
| | 610,000 | | | | 2.000 | (f) | | | 02/15/50 | | | | 418,231 | |
| | 480,000 | | | | 2.375 | (f) | | | 05/15/51 | | | | 357,000 | |
| | 170,000 | | | | 2.000 | (f) | | | 08/15/51 | | | | 115,919 | |
| | 160,000 | | | | 2.250 | (f) | | | 02/15/52 | | | | 115,675 | |
| | 1,630,000 | | | | 4.000 | (f) | | | 11/15/52 | | | | 1,675,334 | |
| | U.S. Treasury Notes | |
| | 620,000 | | | | 2.500 | (f) | | | 05/31/24 | | | | 603,798 | |
| | 620,000 | | | | 3.000 | (f) | | | 06/30/24 | | | | 605,372 | |
| | 1,250,000 | | | | 3.000 | (f) | | | 07/31/24 | | | | 1,218,457 | |
| | 620,000 | | | | 4.250 | (f) | | | 09/30/24 | | | | 611,814 | |
| | 620,000 | | | | 4.250 | (f) | | | 12/31/24 | | | | 611,378 | |
| | 636,000 | | | | 0.375 | (f) | | | 12/31/25 | | | | 573,245 | |
| | 4,050,000 | | | | 0.750 | (f) | | | 03/31/26 | | | | 3,660,504 | |
| | 1,720,000 | | | | 0.625 | (f) | | | 07/31/26 | | | | 1,532,412 | |
| | 140,000 | | | | 1.250 | (f) | | | 03/31/28 | | | | 122,500 | |
| | 970,000 | | | | 2.875 | (f) | | | 05/15/28 | | | | 915,362 | |
| | 1,180,000 | | | | 1.250 | (f) | | | 06/30/28 | | | | 1,027,337 | |
| | 250,000 | | | | 3.125 | (f) | | | 11/15/28 | | | | 238,184 | |
| | |
| | TOTAL U.S. TREASURY OBLIGATIONS | |
| | (Cost $25,106,605) | | | $ | 21,904,252 | |
| | |
| | | | | | |
Shares | | Dividend
Rate | | Value | |
|
| Investment Company – 0.1%(h) | |
Goldman Sachs Financial Square Government Fund — Institutional Shares | |
| 156,880 | | 5.022% | | $ | 156,880 | |
| (Cost $156,880) | |
| |
| TOTAL INVESTMENTS – 119.4% | |
| (Cost $154,365,688) | | $ | 145,478,409 | |
| |
LIABILITIES IN EXCESS OF
ASSETS – (19.4)% | | | (23,665,664 | ) |
| |
| NET ASSETS – 100.0% | | $ | 121,812,745 | |
| |
| | |
| The percentage shown for each investment category reflects the value of investments in that category as a percentage of net assets. |
| |
| (a) | | TBA (To Be Announced) Securities are purchased on a forward commitment basis with an approximate principal amount and no defined maturity date. The actual principal and maturity date will be determined upon settlement when the specific mortgage pools are assigned. Total market value of TBA securities (excluding forward sales contracts, if any) amounts to $24,978,429 which represents approximately 20.5% of the Fund’s net assets as of June 30, 2023. |
| |
| (b) | | Securities with “Call” features. Maturity dates disclosed are the final maturity date. |
| |
| (c) | | Exempt from registration under Rule 144A of the Securities Act of 1933. |
| |
| (d) | | Variable rate security. Except for floating rate notes (for which final maturity is disclosed), maturity date disclosed is the next interest reset date. Interest rate or distribution rate disclosed is that which is in effect on June 30, 2023. |
| |
| (e) | | Step coupon. |
| |
| (f) | | Interest rates represent either the stated coupon rate, annualized yield on date of purchase for discounted securities, or, for floating rate securities, the current reset rate, which is based upon current interest rate indices. |
| |
| (g) | | Guaranteed by the United States Government. Total market value of $299,673, which represents 0.2% of net assets as of June 30, 2023. |
| |
| (h) | | Represents an affiliated issuer. |
| | |
| The accompanying notes are an integral part of these financial statements. | | 17 |
GOLDMAN SACHS VARIABLE INSURANCE TRUST CORE FIXED INCOME FUND
Schedule of Investments (continued)
June 30, 2023 (Unaudited)
| | |
| |
| Investment Abbreviations: |
| CLO | | —Collateralized Loan Obligation |
| CMT | | —Constant Maturity Treasury Index |
| ESTRON | | —Euro Short-Term Rate |
| FHLMC | | —Federal Home Loan Mortgage Corp. |
| FNMA | | —Federal National Mortgage Association |
| GNMA | | —Government National Mortgage Association |
| GMTN | | —Global Medium Term Note |
| GO | | —General Obligation |
| LIBOR | | —London Interbank Offered Rate |
| LP | | —Limited Partnership |
| MMY | | —Money Market Yield |
| MTN | | —Medium Term Note |
| NIBOR | | —Norwegian Interbank Offered Rate |
| PLC | | —Public Limited Company |
| SONIO | | —Sterling Overnight Index Average |
| SOFR | | —Secured Overnight Financing Rate |
| TSFR | | —Term Secured Overnight Financing Rate |
| | |
| |
| Currency Abbreviations: |
| AUD | | —Australian Dollar |
| CAD | | —Canadian Dollar |
| CHF | | —Swiss Franc |
| EUR | | —Euro |
| GBP | | —British Pound |
| JPY | | —Japanese Yen |
| NOK | | —Norwegian Krone |
| NZD | | —New Zealand Dollar |
| SEK | | —Swedish Krona |
| USD | | —United States Dollar |
ADDITIONAL INVESTMENT INFORMATION
FORWARD FOREIGN CURRENCY EXCHANGE CONTRACTS — At June 30, 2023, the Fund had the following forward foreign currency exchange contracts:
FORWARD FOREIGN CURRENCY EXCHANGE CONTRACTS WITH UNREALIZED GAIN
| | | | | | | | | | | | | | | | |
| Counterparty | | Currency
Purchased | | | Currency
Sold | | | Settlement
Date | | | Unrealized
Gain | |
Morgan Stanley Co., Inc. | | GBP | 236,270 | | | USD | 296,393 | | | | 8/8/2023 | | | $ | 3,742 | |
Morgan Stanley Co., Inc. | | USD | 260,409 | | | SEK | 2,771,715 | | | | 8/17/2023 | | | | 2,843 | |
Morgan Stanley Co., Inc. | | CAD | 327,417 | | | USD | 241,502 | | | | 8/29/2023 | | | | 5,884 | |
Morgan Stanley Co., Inc. | | USD | 113,259 | | | JPY | 15,679,426 | | | | 8/31/2023 | | | | 3,558 | |
Morgan Stanley Co., Inc. | | USD | 1,072,104 | | | EUR | 973,144 | | | | 9/19/2023 | | | | 5,932 | |
Morgan Stanley Co., Inc. | | CHF | 325,025 | | | USD | 362,865 | | | | 9/20/2023 | | | | 3,405 | |
Morgan Stanley Co., Inc. | | USD | 116,552 | | | AUD | 173,680 | | | | 9/20/2023 | | | | 590 | |
| | | | |
| TOTAL | | | | | | | | | | | | | | $ | 25,954 | |
FORWARD FOREIGN CURRENCY EXCHANGE CONTRACTS WITH UNREALIZED LOSS
| | | | | | | | | | | | | | | | |
| Counterparty | | Currency
Purchased | | | Currency
Sold | | | Settlement
Date | | | Unrealized
Loss | |
Morgan Stanley Co., Inc. | | USD | 273,455 | | | GBP | 217,984 | | | | 8/8/2023 | | | $ | (3,452 | ) |
Morgan Stanley Co., Inc. | | SEK | 2,653,375 | | | USD | 249,337 | | | | 8/17/2023 | | | | (2,769 | ) |
Morgan Stanley Co., Inc. | | USD | 265,806 | | | CAD | 360,367 | | | | 8/29/2023 | | | | (6,477 | ) |
Morgan Stanley Co., Inc. | | JPY | 17,863,369 | | | USD | 129,035 | | | | 8/31/2023 | | | | (4,053 | ) |
Morgan Stanley Co., Inc. | | EUR | 811,490 | | | USD | 894,011 | | | | 9/19/2023 | | | | (4,946 | ) |
Morgan Stanley Co., Inc. | | JPY | 40,216,940 | | | USD | 293,142 | | | | 9/20/2023 | | | | (10,859 | ) |
Morgan Stanley Co., Inc. | | USD | 168,260 | | | CAD | 223,834 | | | | 9/20/2023 | | | | (918 | ) |
Morgan Stanley Co., Inc. | | USD | 164,201 | | | EUR | 152,269 | | | | 9/20/2023 | | | | (2,633 | ) |
Morgan Stanley Co., Inc. | | USD | 150,822 | | | GBP | 120,297 | | | | 9/20/2023 | | | | (1,986 | ) |
Morgan Stanley Co., Inc. | | USD | 108,562 | | | NOK | 1,188,839 | | | | 9/20/2023 | | | | (2,510 | ) |
Morgan Stanley Co., Inc. | | USD | 116,299 | | | NZD | 190,306 | | | | 9/20/2023 | | | | (452 | ) |
Morgan Stanley Co., Inc. | | USD | 121,834 | | | SEK | 1,312,524 | | | | 9/20/2023 | | | | (337 | ) |
| | | | |
| TOTAL | | | | | | | | | | | | | | $ | (41,392 | ) |
| | |
| 18 | | The accompanying notes are an integral part of these financial statements. |
GOLDMAN SACHS VARIABLE INSURANCE TRUST CORE FIXED INCOME FUND
ADDITIONAL INVESTMENT INFORMATION (continued)
FORWARD SALES CONTRACTS — At June 30, 2023, the Fund had the following forward sales contracts:
| | | | | | | | | | | | | | | | | | | | |
| Description | | Interest
Rate | | | Maturity
Date(a) | | | Settlement
Date | | | Principal
Amount | | | Value | |
| Federal National Mortgage Association | | | 2.000 | % | | | TBA-30yr | | | | 07/15/53 | | | $ | (8,000,000 | ) | | $ | (6,518,552 | ) |
| Federal National Mortgage Association | | | 2.500 | | | | TBA-30yr | | | | 07/15/53 | | | | (1,000,000 | ) | | | (847,408 | ) |
| Federal National Mortgage Association | | | 3.000 | | | | TBA-30yr | | | | 07/15/53 | | | | (4,000,000 | ) | | | (3,519,248 | ) |
| Federal National Mortgage Association | | | 4.500 | | | | TBA-30yr | | | | 07/15/53 | | | | (2,000,000 | ) | | | (1,921,876 | ) |
| Federal National Mortgage Association | | | 5.500 | | | | TBA-30yr | | | | 07/15/53 | | | | (9,000,000 | ) | | | (8,956,750 | ) |
| Federal National Mortgage Association | | | 6.000 | | | | TBA-30yr | | | | 07/15/53 | | | | (2,000,000 | ) | | | (2,017,422 | ) |
| Government National Mortgage Association | | | 3.000 | | | | TBA-30yr | | | | 07/15/53 | | | | (1,000,000 | ) | | | (893,089 | ) |
Government National Mortgage Association | | | 6.000 | | | | TBA-30yr | | | | 07/15/53 | | | | (1,000,000 | ) | | | (1,006,508 | ) |
| | | |
| Total (Proceed Receivable $(25,822,461)) | | | | | | | | | | | $ | (25,680,853 | ) |
| (a) | TBA (To Be Announced) Securities are purchased on a forward commitment basis with an approximate principal amount and no defined maturity date. The actual principal and maturity date will be determined upon settlement when the specific mortgage pools are assigned. |
FUTURES CONTRACTS — At June 30, 2023, the Fund had the following futures contracts:
| | | | | | | | | | | | | | | | |
| Description | | Number of
Contracts | | | Expiration
Date | | | Notional
Amount | | | Unrealized
Appreciation/
(Depreciation) | |
| |
Long position contracts: | | | | | |
| | | | |
| ICE 3MTH SONIA Future | | | 2 | | | | 09/17/24 | | | $ | 596,361 | | | $ | (1,581 | ) |
| ICE 3MTH SONIA Future | | | 20 | | | | 12/17/24 | | | | 5,976,942 | | | | (58,493 | ) |
| U.S. Treasury 2 Year Note | | | 58 | | | | 09/29/23 | | | | 11,796,656 | | | | (87,816 | ) |
| U.S. Treasury 5 Year Note | | | 35 | | | | 09/29/23 | | | | 3,749,922 | | | | (1,532 | ) |
U.S. Treasury Ultra Bond | | | 10 | | | | 09/20/23 | | | | 1,366,250 | | | | 3,834 | |
| | | | |
| Total | | | | | | | | | | | | | | | (145,588 | ) |
| |
Short position contracts: | | | | | |
| | | | |
| 3MO EURO EURIBOR Future | | | (2 | ) | | | 09/18/23 | | | | (524,322 | ) | | | 799 | |
| EURO-BOBL Future | | | (7 | ) | | | 09/07/23 | | | | (883,992 | ) | | | 5,754 | |
| EURO-BUND Future | | | (1 | ) | | | 09/07/23 | | | | (145,970 | ) | | | (989 | ) |
| ICE 3MTH SONIA Future | | | (18 | ) | | | 12/19/23 | | | | (5,375,533 | ) | | | 34,108 | |
| U.S. Treasury 10 Year Ultra Note | | | (11 | ) | | | 09/20/23 | | | | (1,303,844 | ) | | | 5,795 | |
U.S. Treasury Long Bond | | | (1 | ) | | | 09/20/23 | | | | (127,125 | ) | | | (317 | ) |
| | | | |
| Total | | | | | �� | | | | | | | | | | 45,150 | |
| | | | |
| Total Futures Contracts | | | | | | | | | | | | | | $ | (100,438 | ) |
| | |
| The accompanying notes are an integral part of these financial statements. | | 19 |
GOLDMAN SACHS VARIABLE INSURANCE TRUST CORE FIXED INCOME FUND
Schedule of Investments (continued)
June 30, 2023 (Unaudited)
ADDITIONAL INVESTMENT INFORMATION (continued)
SWAP CONTRACTS — At June 30, 2023, the Fund had the following swap contracts:
OVER THE COUNTER CREDIT DEFAULT SWAP CONTRACTS
| | | | | | | | | | | | | | | | | | | | | | | | | | | | | | |
Reference
Obligation/Index(a) | | Financing
Rate
Received
(Paid) by
the Fund | | | Credit
Spread at
June 30,
2023(b) | | | Counterparty | | Termination
Date | | | Notional
Amount
(000’s) | | | Value | | | Upfront
Premium
(Received)
Paid | | | Unrealized
Appreciation/
(Depreciation) | |
Protection Sold: | |
| General Electric Co. | | | 1.000 | % | | | 1.200 | % | | Bank of America NA | | | 06/20/2026 | | | USD | 175 | | | $ | 2,101 | | | $ | — | | | $ | 2,101 | |
| Nordstrom, Inc. | | | 1.000 | | | | 0.252 | | | Bank of America NA | | | 06/20/2024 | | | USD | 225 | | | | (567 | ) | | | (212 | ) | | | (356 | ) |
| ICE CD JWN | | | 1.000 | | | | 1.033 | | | Bank of America NA | | | 12/20/2024 | | | USD | 100 | | | | (1,033 | ) | | | (1,928 | ) | | | 894 | |
| ICE MEX | | | 1.000 | | | | 0.095 | | | | | | 06/20/2028 | | | USD | 210 | | | | (200 | ) | | | (1,860 | ) | | | 1,659 | |
| Republic of Indonesia | | | 1.000 | | | | 0.588 | | | | | | 06/20/2028 | | | USD | 200 | | | | 1,176 | | | | (146 | ) | | | 1,322 | |
| Republic of Chile | | | 1.000 | | | | 1.225 | | | | | | 06/20/2028 | | | USD | 90 | | | | 1,102 | | | | (179 | ) | | | 1,281 | |
| Markit CDX North America Investment Grade Index | | | 1.000 | | | | 1.136 | | | Bank of America NA | | | 06/20/2025 | | | USD | 4,500 | | | | 51,133 | | | | 8,820 | | | | 42,313 | |
| Markit CDX North America Investment Grade Index | | | 1.000 | | | | 1.434 | | | Bank of America NA | | | 12/20/2025 | | | USD | 575 | | | | 8,245 | | | | — | | | | 8,245 | |
| Markit CDX North America Investment Grade Index | | | 1.000 | | | | 1.493 | | | Bank of America NA | | | 06/20/2026 | | | USD | 4,775 | | | | 71,291 | | | | 23,491 | | | | 47,803 | |
| ICE CDX Investment Grade Index | | | 1.000 | | | | 1.507 | | | Bank of America NA | | | 12/20/2026 | | | USD | 2,900 | | | | 43,703 | | | | 45,928 | | | | (2,225 | ) |
| | | | | | | | |
| TOTAL | | | | | | | | | | | | | | | | | | | | $ | 176,951 | | | $ | 73,914 | | | $ | 103,037 | |
| (a) | Payments received quarterly. |
| (b) | Credit spread on the referenced obligation, together with the period of expiration, are indicators of payment/performance risk. The likelihood of a credit event occurring which would require a fund or its counterparty to make a payment or otherwise be required to perform under the swap contract is generally greater as the credit spread and term of the swap contract increase. |
CENTRALLY CLEARED INTEREST RATE SWAP CONTRACTS
| | | | | | | | | | | | | | | | | | | | |
Payments
Made by
the Fund(a) | | Payments
Received by
the Fund | | Termination
Date | | Notional
Amounts
(000’s) | | | Value | | | Upfront
Premium
Paid | | | Unrealized
Appreciation
(Depreciation) | |
| 1 Day SOFR(b) | | 0.000% | | 04/19/2025 | | USD | 250 | | | $ | 2,286 | | | $ | (233 | ) | | $ | 2,519 | |
| 1 Day SOFR(b) | | 0.000 | | 05/14/2025 | | USD | 2,970 | | | | 30,650 | | | | — | | | | 30,650 | |
| 0.000%(c) | | 6 Month NIBOR | | 09/20/2025 | | CAD | 2,520 | | | | (12,374 | ) | | | — | | | | (12,374 | ) |
| 3.500(b) | | 6 Month NIBOR | | 09/20/2025 | | SEK | 9,990 | | | | (8,332 | ) | | | — | | | | (8,332 | ) |
| 6 Month NIBOR(b) | | 0.000 | | 09/20/2025 | | EUR | 930 | | | | 1,044 | | | | — | | | | 1,044 | |
| 6 Month NIBOR(c) | | 5.000 | | 09/20/2025 | | NZD | 1,390 | | | | 5,462 | | | | — | | | | 5,462 | |
| 6 Month NIBOR(d) | | 3.500 | | 09/20/2025 | | AUD | 1,280 | | | | 15,448 | | | | — | | | | 15,448 | |
| 0.000(b) | | FIX3FR | | 04/13/2028 | | EUR | 710 | | | | (12 | ) | | | 9,836 | | | | (9,848 | ) |
| 0.000(b) | | 1 Day ESTRON | | 04/22/2028 | | EUR | 2,510 | | | | 4,276 | | | | 10,319 | | | | (6,043 | ) |
| 12 Month BOJDTR(b) | | 2.852 | | 04/22/2028 | | EUR | 2,510 | | | | (3,065 | ) | | | (8,893 | ) | | | 5,828 | |
| 6 Month NIBOR(b) | | 0.000 | | 09/20/2028 | | GBP | 90 | | | | 7,328 | | | | — | | | | 7,328 | |
| 6 Month NIBOR(b) | | 0.000 | | 09/20/2028 | | JPY | 395,000 | | | | (30,729 | ) | | | (32,247 | ) | | | 1,518 | |
| 1 Day ESTRON(b) | | 2.350 | | 07/04/2029 | | EUR | 90 | | | | 2,647 | | | | — | | | | 2,647 | |
| 0.000(b) | | 12 Month BOJDTR | | 03/31/2030 | | USD | 2,080 | | | | (29,101 | ) | | | 1,587 | | | | (30,688 | ) |
| 1 Day ESTRON(b) | | 0.000 | | 07/28/2032 | | USD | 1,400 | | | | 24,685 | | | | — | | | | 24,685 | |
| 0.000(b) | | 6 Month NIBOR | | 09/20/2033 | | CHF | 880 | | | | 20,274 | | | | 4,469 | | | | 15,805 | |
| 0.000(b) | | 6 Month NIBOR | | 09/20/2033 | | USD | 510 | | | | (174 | ) | | | 2,205 | | | | (2,379 | ) |
| 3.250(b) | | 6 Month NIBOR | | 09/20/2033 | | EUR | 230 | | | | 5,648 | | | | 4,069 | | | | 1,579 | |
| 4.000(c) | | 6 Month NIBOR | | 09/20/2033 | | AUD | 1,110 | | | | (23,794 | ) | | | — | | | | (23,794 | ) |
| 4.500(c) | | 6 Month NIBOR | | 09/20/2033 | | NZD | 280 | | | | 407 | | | | 970 | | | | (563 | ) |
| 6 Month NIBOR(b) | | 0.000 | | 09/20/2033 | | JPY | 225,000 | | | | (20,867 | ) | | | (19,630 | ) | | | (1,237 | ) |
| | |
| 20 | | The accompanying notes are an integral part of these financial statements. |
GOLDMAN SACHS VARIABLE INSURANCE TRUST CORE FIXED INCOME FUND
ADDITIONAL INVESTMENT INFORMATION (continued)
CENTRALLY CLEARED INTEREST RATE SWAP CONTRACTS (continued)
| | | | | | | | | | | | | | | | | | | | | | | | |
Payments
Made by
the Fund(a) | | Payments
Received by
the Fund | | | Termination
Date | | | Notional
Amounts
(000’s) | | | Value | | | Upfront
Premium
Paid | | | Unrealized
Appreciation
(Depreciation) | |
| 6 Month NIBOR(b) | | | 3.000 % | | | | 09/20/2033 | | | SEK | 5,750 | | | $ | 1,237 | | | $ | (5,619 | ) | | $ | 6,856 | |
| 6 Month NIBOR(c) | | | 0.000 | | | | 09/20/2033 | | | CAD | 430 | | | | (9,318 | ) | | | (5,993 | ) | | | (3,325 | ) |
| 6 Month NIBOR(b) | | | 3.500 | | | | 09/20/2033 | | | NOK | 2,570 | | | | 6,719 | | | | — | | | | 6,719 | |
| 2.855%(b) | | | 1 Day ESTRON | | | | 07/04/2037 | | | EUR | 740 | | | | 3,138 | | | | 1,712 | | | | 1,426 | |
| 0.000(b) | | | 1 Day SOFR | | | | 07/28/2037 | | | USD | 3,440 | | | | (45,439 | ) | | | — | | | | (45,439 | ) |
| 2.152(b) | | | 1 Day SONIO | | | | 08/09/2037 | | | EUR | 1,190 | | | | (31,706 | ) | | | — | | | | (31,706 | ) |
| 0.000(b) | | | 1 Day SOFR | | | | 05/10/2038 | | | USD | 1,530 | | | | 3,390 | | | | — | | | | 3,390 | |
| 1 Day ESTRON(b) | | | 1.452 | | | | 08/10/2042 | | | EUR | 3,040 | | | | 97,219 | | | | — | | | | 97,219 | |
| 1 Day SOFR(b) | | | 0.000 | | | | 07/28/2047 | | | USD | 2,830 | | | | 40,202 | | | | — | | | | 40,202 | |
| 1.051(b) | | | 1 Day SONIO | | | | 08/11/2047 | | | EUR | 1,780 | | | | (46,367 | ) | | | — | | | | (46,367 | ) |
| 1 Day ESTRON(b) | | | 1.560 | | | | 07/06/2052 | | | EUR | 570 | | | | 23,688 | | | | (60 | ) | | | 23,748 | |
| 1 Day SOFR(b) | | | 0.000 | | | | 05/11/2053 | | | USD | 1,240 | | | | (7,087 | ) | | | — | | | | (7,087 | ) |
| 6 Month NIBOR(b) | | | 2.500 | | | | 09/20/2053 | | | EUR | 210 | | | | 572 | | | | — | | | | 572 | |
| | | | | | |
| TOTAL | | | | | | | | | | | | | | $ | 27,955 | | | $ | (37,508 | ) | | $ | 65,463 | |
| (a) | Represents forward starting interest rate swaps whose effective dates of commencement of accruals and cash flows occur subsequent to June 30, 2023. |
| (b) | Payments made annually. |
| (c) | Payments made semi-annually. |
| (d) | Payments made quarterly. |
OVER THE COUNTER INTEREST RATE SWAPTIONS — At June 30, 2023, the Fund had the following written option contracts:
| | | | | | | | | | | | | | | | | | | | | | | | | | | | | | | | |
| Description | | Counterparty | | | Exercise
Price | | | Expiration
Date | | | Number of
Contracts | | | Notional
Amount | | | Value | | | Premiums
Paid
(Received)
by Fund | | | Unrealized
Appreciation/
(Depreciation) | |
|
Written Option Contracts | |
|
Puts | |
| 6M IRS | | | Morgan Stanley Co., Inc. | | | | JPY 0.400 | | | | 01/08/2024 | | | | (46,000,000 | ) | | $ | (46,000,000 | ) | | $ | (3,185 | ) | | $ | (1,355 | ) | | $ | (1,830 | ) |
| 3M IRS | | | Morgan Stanley Co., Inc. | | | | 2.908 | | | | 05/14/2024 | | | | (3,450,000 | ) | | | (3,450,000 | ) | | | (52,058 | ) | | | (22,425 | ) | | | (29,633 | ) |
| 3M IRS | | | Morgan Stanley Co., Inc. | | | | 2.935 | | | | 05/14/2024 | | | | (1,150,000 | ) | | | (1,150,000 | ) | | | (17,108 | ) | | | (7,331 | ) | | | (9,777 | ) |
| | | | | | | | |
| Total Puts | | | | | | | | | | | | | | | (50,600,000 | ) | | | | | | | (72,351 | ) | | | (31,111 | ) | | $ | (41,240 | ) |
|
Calls | |
3M IRS | | | Morgan Stanley Co., Inc. | | | | 2.935 | | | | 05/14/2024 | | | | (1,150,000 | ) | | | (1,150,000 | ) | | | (1,734 | ) | | | (7,331 | ) | | | 5,597 | |
3M IRS | | | Morgan Stanley Co., Inc. | | | | 2.908 | | | | 05/14/2024 | | | | (3,450,000 | ) | | | (3,450,000 | ) | | | (5,075 | ) | | | (22,425 | ) | | | 17,350 | |
| | | | | | | | |
| Total Calls | | | | | | | | | | | | | | | (4,600,000 | ) | | | | | | | (6,809 | ) | | | (29,756 | ) | | $ | 22,947 | |
| | | | | | |
| Total Written Option Contracts | | | | | | | | (55,200,000 | ) | | | | | | $ | (79,160 | ) | | | (60,867 | ) | | $ | (18,293 | ) |
| | |
| |
| Abbreviations: |
| 3M IRS | | —3 Months Interest Rate Swaptions |
| 6M IRS | | —6 Months Interest Rate Swaptions |
| | |
| The accompanying notes are an integral part of these financial statements. | | 21 |
GOLDMAN SACHS VARIABLE INSURANCE TRUST CORE FIXED INCOME FUND
Statement of Assets and Liabilities
June 30, 2023 (Unaudited)
| | | | |
| | | Core Fixed
Income Fund | |
| | | | |
| Assets: | | | |
Investments in unaffiliated issuers, at value (cost $128,386,347) | | $ | 145,321,529 | |
Investments in affiliated issuers, at value (cost $156,880) | | | 156,880 | |
Cash | | | 1,853,222 | |
Foreign currency, at value (cost $8,406) | | | 8,420 | |
Receivables: | | | | |
Investments sold on an extended-settlement basis | | | 39,397,656 | |
Collateral on certain derivative contracts(a) | | | 887,538 | |
Interest and Dividends | | | 813,530 | |
Fund shares sold | | | 98,343 | |
Reimbursement from investment adviser | | | 16,864 | |
Unrealized gain on forward foreign currency exchange contracts | | | 25,954 | |
Variation margin on futures contracts | | | 14,793 | |
Other assets | | | 1,455 | |
| |
| Total assets | | | 188,596,184 | |
| |
| | | | |
| Liabilities: | | | |
Variation margin on futures contracts | | | 59,592 | |
Forward sale contracts, at value (proceeds received $25,822,461) | | | 25,680,853 | |
Unrealized loss on forward foreign currency exchange contracts | | | 41,392 | |
Written options, at value (premiums received $60,867) | | | 79,160 | |
Payables: | | | | |
Investments purchased | | | 40,695,267 | |
Fund shares redeemed | | | 49,941 | |
Management fees | | | 39,718 | |
Distribution and Service fees and Transfer Agency fees | | | 20,646 | |
Accrued expenses | | | 116,870 | |
| |
| Total liabilities | | | 66,783,439 | |
| |
| | | | |
Net Assets: | | | |
Paid-in capital | | | 137,165,444 | |
Total distributable earnings (loss) | | | (15,352,699 | ) |
| |
| NET ASSETS | | $ | 187,595,553 | |
Net Assets: | | | | |
Institutional | | $ | 42,336,581 | |
Service | | | 79,476,164 | |
| |
Total Net Assets | | $ | 121,812,745 | |
Shares outstanding $0.001 par value (unlimited number of shares authorized): | | | | |
Institutional | | | 4,459,576 | |
Service | | | 8,383,528 | |
Net asset value, offering and redemption price per share: | | | | |
Institutional | | | $9.49 | |
Service | | | 9.48 | |
(a) Segregated for initial margin and/or collateral as follows:
| | | | | | | | |
| Fund | | Futures | | | Swaps | |
| | |
Core Fixed Income Fund | | $ | 288,102 | | | $ | 629,436 | |
| | |
| 22 | | The accompanying notes are an integral part of these financial statements. |
GOLDMAN SACHS VARIABLE INSURANCE TRUST CORE FIXED INCOME FUND
Statement of Operations
For the Six Months Ended June 30, 2023 (Unaudited)
| | | | |
| | | Core Fixed
Income Fund | |
| | | | |
| Investment income: | | | |
Interest | | $ | 2,144,462 | |
Dividends — affiliated issuers | | | 24,030 | |
| |
| Total investment income | | | 2,168,492 | |
| | | | |
| | | | |
| Expenses: | | | |
Management fees | | | 234,123 | |
Distribution and Service fees — Service Shares | | | 96,163 | |
Professional fees | | | 48,072 | |
Custody, accounting and administrative services | | | 39,607 | |
Trustee fees | | | 13,431 | |
Transfer Agency fees(a) | | | 11,706 | |
Printing and mailing costs | | | 9,257 | |
Other | | | 21,268 | |
| |
| Total expenses | | | 473,627 | |
| |
Less — expense reductions | | | (130,046 | ) |
| |
| Net expenses | | | 343,581 | |
| |
| NET INVESTMENT INCOME | | | 1,824,911 | |
| | | | |
| | | | |
| Realized and unrealized gain (loss): | | | |
Net realized gain (loss) from: | | | | |
Investments — unaffiliated issuers | | | (1,216,364 | ) |
Futures contracts | | | (54,314 | ) |
Swap contracts | | | 57,177 | |
Written options | | | 1,648 | |
Purchased options | | | (2,995 | ) |
Forward foreign currency exchange contracts | | | (31,450 | ) |
Foreign currency transactions | | | (1,792 | ) |
Net change in unrealized gain (loss) on: | | | | |
Investments — unaffiliated issuers | | | 2,349,095 | |
Forward Sales Contracts | | | (173,454 | ) |
Futures contracts | | | (33,211 | ) |
Purchased options | | | 5,259 | |
Written options | | | (22,540 | ) |
Swap contracts | | | 25,352 | |
Forward foreign currency exchange contracts | | | 8,691 | |
Foreign currency translations | | | (47,373 | ) |
| |
| Net realized and unrealized gain | | | 863,729 | |
| |
| NET INCREASE IN NET ASSETS RESULTING FROM OPERATIONS | | $ | 2,688,640 | |
(a) Class specific Distribution and/or Service and Transfer Agency fees were as follows:
| | | | | | | | |
| | | Transfer Agency Fees | |
Fund | | Institutional | | | Service | |
| Core Fixed Income Fund | | $ | 4,013 | | | $ | 7,693 | |
| | |
| The accompanying notes are an integral part of these financial statements. | | 23 |
GOLDMAN SACHS VARIABLE INSURANCE TRUST CORE FIXED INCOME FUND
Statements of Changes in Net Assets
| | | | | | | | |
| | | Core Fixed Income Fund | |
| | | For the
Six Months Ended
June 30, 2023
(Unaudited) | | | For the Fiscal
Year Ended
December 31, 2022 | |
| | | | | | | | |
| From operations: | | | | | | |
Net investment income | | $ | 1,824,911 | | | $ | 1,921,787 | |
Net realized loss | | | (1,248,090 | ) | | | (5,191,585 | ) |
Net change in unrealized gain (loss) | | | 2,111,819 | | | | (12,101,618 | ) |
| | |
| Net increase in net assets resulting from operations | | | 2,688,640 | | | | 15,371,416 | |
| | | | | | | | |
| | | | | | | | |
| Distributions to shareholders: | | | | | | |
From distributable earnings: | | | | | | | | |
Institutional Shares | | | (669,892 | ) | | | (498,802 | ) |
Service Shares | | | (1,183,414 | ) | | | (1,038,833 | ) |
| | |
| Total distributions to shareholders | | | (1,853,306 | ) | | | (1,537,635 | ) |
| | | | | | | | |
| | | | | | | | |
| From share transactions: | | | | | | |
Proceeds from sales of shares | | | 12,120,409 | | | | 33,277,943 | |
Reinvestment of distributions | | | 1,853,306 | | | | 1,537,635 | |
Cost of shares redeemed | | | (3,693,447 | ) | | | (10,255,336 | ) |
| | |
| Net increase in net assets resulting from share transactions | | | 10,280,268 | | | | 24,560,242 | |
| | |
| TOTAL INCREASE | | | 11,115,602 | | | | 7,651,191 | |
| | | | | | | | |
| | | | | | | | |
| Net Assets: | | | | | | |
| | |
Beginning of period | | | 110,697,143 | | | | 103,045,952 | |
| | |
End of period | | $ | 121,812,745 | | | $ | 110,697,143 | |
| | |
| 24 | | The accompanying notes are an integral part of these financial statements. |
GOLDMAN SACHS VARIABLE INSURANCE TRUST CORE FIXED INCOME FUND
Financial Highlights
Selected Data for a Share Outstanding Throughout Each Period
| | | | | | | | | | | | | | | | | | | | | | | | |
| | | Goldman Sachs Core Fixed Income Fund | |
| | | Institutional Shares | |
| | | Six Months Ended
June 30, 2023
(Unaudited) | | | Year Ended December 31, | |
| | 2022 | | | 2021 | | | 2020 | | | 2019 | | | 2018 | |
| | | | | | | | | | | | | | | | | | | | | | | | |
| Per Share Data | | | | | | | | | | | | | | | | | | |
| | | | | | |
Net asset value, beginning of period | | $ | 9.41 | | | $ | 11.13 | | | $ | 11.53 | | | $ | 10.85 | | | $ | 10.20 | | | $ | 10.66 | |
| | | | | | |
Net investment income(a) | | | 0.16 | | | | 0.21 | | | | 0.12 | | | | 0.18 | | | | 0.26 | | | | 0.29 | |
| | | | | | |
Net realized and unrealized gain (loss) | | | 0.08 | | | | (1.77 | ) | | | (0.36 | ) | | | 0.86 | | | | 0.69 | | | | (0.37 | ) |
| | | | | | |
Total from investment operations | | | 0.24 | | | | (1.56 | ) | | | (0.24 | ) | | | 1.04 | | | | 0.95 | | | | (0.08 | ) |
| | | | | | |
Distributions to shareholders from net investment income | | | (0.16 | ) | | | (0.16 | ) | | | (0.14 | ) | | | (0.26 | ) | | | (0.30 | ) | | | (0.38 | ) |
| | | | | | |
Distributions to shareholders from net realized gains | | | — | | | | — | | | | (0.02 | ) | | | (0.10 | ) | | | — | | | | — | |
| | | | | | |
Total distributions | | | (0.16 | ) | | | (0.16 | ) | | | (0.16 | ) | | | (0.36 | ) | | | (0.30 | ) | | | (0.38 | ) |
| | | | | | |
Net asset value, end of period | | $ | 9.49 | | | $ | 9.41 | | | $ | 11.13 | | | $ | 11.53 | | | $ | 10.85 | | | $ | 10.20 | |
| | | | | | |
Total Return(b) | | | 2.50 | % | | | (14.03 | )% | | | (2.06 | )% | | | 9.64 | % | | | 9.28 | % | | | (0.58 | )% |
| | | | | | |
Net assets, end of period (in 000’s) | | $ | 42,337 | | | $ | 38,157 | | | $ | 31,179 | | | $ | 25,194 | | | $ | 17,421 | | | $ | 2,657 | |
| | | | | | |
Ratio of net expenses to average net assets | | | 0.42 | %(c) | | | 0.41 | % | | | 0.41 | % | | | 0.41 | % | | | 0.44 | % | | | 0.42 | % |
| | | | | | |
Ratio of total expenses to average net assets | | | 0.64 | %(c) | | | 0.70 | % | | | 0.81 | % | | | 0.93 | % | | | 1.08 | % | | | 1.06 | % |
| | | | | | |
Ratio of net investment income to average net assets | | | 3.28 | %(c) | | | 2.07 | % | | | 1.05 | % | | | 1.61 | % | | | 2.41 | % | | | 2.88 | % |
| | | | | | |
Portfolio turnover rate(d) | | | 425 | % | | | 693 | % | | | 513 | % | | | 501 | % | | | 556 | % | | | 406 | % |
| (a) | Calculated based on the average shares outstanding methodology. |
| (b) | Assumes investment at the NAV at the beginning of the period, reinvestment of all dividends and distributions, a complete redemption of the investment at the NAV at the end of the period and no sales or redemption charges (if any). Total returns would be reduced if a sales or redemption charge was taken into account. Returns do not reflect the impact of taxes to shareholders relating to Fund distributions or the redemption of Fund shares. Total returns for periods less than one full year are not annualized. |
| (d) | The Fund’s portfolio turnover rate is calculated in accordance with regulatory requirements, without regard to transactions involving short term investments and certain derivatives. If such transactions were included, the Fund’s portfolio turnover rate may be higher. |
| | |
| The accompanying notes are an integral part of these financial statements. | | 25 |
GOLDMAN SACHS VARIABLE INSURANCE TRUST CORE FIXED INCOME FUND
Financial Highlights (continued)
Selected Data for a Share Outstanding Throughout Each Period
| | | | | | | | | | | | | | | | | | | | | | | | |
| | | Goldman Sachs Core Fixed Income Fund | |
| | | Service Shares | |
| | | Six Months Ended
June 30, 2023
(Unaudited) | | | Year Ended December 31, | |
| | 2022 | | | 2021 | | | 2020 | | | 2019 | | | 2018 | |
| | | | | | | | | | | | | | | | | | | | | | | | |
| Per Share Data | | | | | | | | | | | | | | | | | | |
| | | | | | |
Net asset value, beginning of period | | $ | 9.40 | | | $ | 11.13 | | | $ | 11.53 | | | $ | 10.85 | | | $ | 10.21 | | | $ | 10.65 | |
| | | | | | |
Net investment income(a) | | | 0.14 | | | | 0.18 | | | | 0.09 | | | | 0.16 | | | | 0.25 | | | | 0.25 | |
| | | | | | |
Net realized and unrealized gain (loss) | | | 0.08 | | | | (1.77 | ) | | | (0.34 | ) | | | 0.85 | | | | 0.66 | | | | (0.34 | ) |
| | | | | | |
Total from investment operations | | | 0.22 | | | | (1.59 | ) | | | (0.25 | ) | | | 1.01 | | | | 0.91 | | | | (0.09 | ) |
| | | | | | |
Distributions to shareholders from net investment income | | | (0.14 | ) | | | (0.14 | ) | | | (0.13 | ) | | | (0.23 | ) | | | (0.27 | ) | | | (0.35 | ) |
| | | | | | |
Distributions to shareholders from net realized gains | | | — | | | | — | | | | (0.02 | ) | | | (0.10 | ) | | | — | | | | — | |
| | | | | | |
Total distributions | | | (0.14 | ) | | | (0.14 | ) | | | (0.15 | ) | | | (0.33 | ) | | | (0.27 | ) | | | (0.35 | ) |
| | | | | | |
Net asset value, end of period | | $ | 9.48 | | | $ | 9.40 | | | $ | 11.13 | | | $ | 11.53 | | | $ | 10.85 | | | $ | 10.21 | |
| | | | | | |
Total Return(b) | | | 2.39 | % | | | (14.28 | )% | | | (2.23 | )% | | | 9.37 | % | | | 9.00 | % | | | (0.83 | )% |
| | | | | | |
Net assets, end of period (in 000’s) | | $ | 79,476 | | | $ | 72,540 | | | $ | 71,867 | | | $ | 46,631 | | | $ | 37,524 | | | $ | 36,416 | |
| | | | | | |
Ratio of net expenses to average net assets | | | 0.67 | %(c) | | | 0.66 | % | | | 0.66 | % | | | 0.66 | % | | | 0.68 | % | | | 0.67 | % |
| | | | | | |
Ratio of total expenses to average net assets | | | 0.89 | %(c) | | | 0.95 | % | | | 1.06 | % | | | 1.18 | % | | | 1.35 | % | | | 1.18 | % |
| | | | | | |
Ratio of net investment income to average net assets | | | 3.03 | %(c) | | | 1.82 | % | | | 0.85 | % | | | 1.39 | % | | | 2.33 | % | | | 2.46 | % |
| | | | | | |
Portfolio turnover rate(d) | | | 425 | % | | | 693 | % | | | 513 | % | | | 501 | % | | | 556 | % | | | 406 | % |
| (a) | Calculated based on the average shares outstanding methodology. |
| (b) | Assumes investment at the NAV at the beginning of the period, reinvestment of all dividends and distributions, a complete redemption of the investment at the NAV at the end of the period and no sales or redemption charges (if any). Total returns would be reduced if a sales or redemption charge was taken into account. Returns do not reflect the impact of taxes to shareholders relating to Fund distributions or the redemption of Fund shares. Total returns for periods less than one full year are not annualized. |
| (d) | The Fund’s portfolio turnover rate is calculated in accordance with regulatory requirements, without regard to transactions involving short term investments and certain derivatives. If such transactions were included, the Fund’s portfolio turnover rate may be higher. |
| | |
| 26 | | The accompanying notes are an integral part of these financial statements. |
GOLDMAN SACHS VARIABLE INSURANCE TRUST CORE FIXED INCOME FUND
Notes to Financial Statements
June 30, 2023 (Unaudited)
1. ORGANIZATION
Goldman Sachs Variable Insurance Trust (the “Trust” or “VIT”) is a Delaware statutory trust registered under the Investment Company Act of 1940, as amended (the “Act”), as an open-end management investment company. The following table lists the series of the Trust that is included in this report (the “Fund”), along with its corresponding share classes and respective diversification status under the Act:
| | | | |
| Fund | | Share Classes Offered | | Diversified/ Non-diversified |
Core Fixed Income | | Institutional and Service | | Diversified |
Shares of the Trust are offered to a separate account of participating life insurance companies for the purpose of funding variable annuity contracts and variable life insurance policies.
Goldman Sachs Asset Management, L.P. (“GSAM”), an affiliate of Goldman Sachs & Co. LLC (“Goldman Sachs”), serves as investment adviser to the Fund pursuant to a management agreement (the “Agreement”) with the Trust.
2. SIGNIFICANT ACCOUNTING POLICIES
The financial statements have been prepared in accordance with accounting principles generally accepted in the United States of America (“GAAP”) and require management to make estimates and assumptions that may affect the reported amounts and disclosures. Actual results may differ from those estimates and assumptions. The Fund is an investment company under GAAP and follows the accounting and reporting guidance applicable to investment companies.
| A. Investment | Valuation — The Fund’s valuation policy is to value investments at fair value. |
B. Investment Income and Investments — Investment income includes interest income, dividend income, and securities lending income, if any. Interest income is accrued daily and adjusted for amortization of premiums and accretion of discounts. Dividend income is recognized on ex-dividend date or, for certain foreign securities, as soon as such information is obtained subsequent to the ex-dividend date. Non-cash dividends, if any, are recorded at the fair market value of the securities received. Investment transactions are reflected on trade date. Realized gains and losses are calculated using identified cost. Investment transactions are recorded on the following business day for daily net asset value (“NAV”) calculations.
For derivative contracts, unrealized gains and losses are recorded daily and become realized gains and losses upon disposition or termination of the contract. Upfront payments, if any, are made or received upon entering into a swap agreement and are reflected in the Statement of Assets and Liabilities. Upfront payments are recognized over the contract’s term/event as realized gains or losses, with the exception of forward starting swap contracts whose realized gains or losses are recognized from the effective start date. For securities with paydown provisions, principal payments received are treated as a proportionate reduction to the cost basis of the securities, and excess or shortfall amounts are recorded as income. For treasury inflation protected securities (“TIPS”), adjustments to principal due to inflation/ deflation are reflected as increases/decreases to interest income with a corresponding adjustment to cost.
C. Class Allocations and Expenses — Investment income, realized and unrealized gain (loss), if any, and non-class specific expenses of the Fund are allocated daily based upon the proportion of net assets of each class. Non-class specific expenses directly incurred by the Fund are charged to the Fund, while such expenses incurred by the Trust are allocated across the Fund on a straight- line and/or pro-rata basis depending upon the nature of the expenses. Class specific expenses, where applicable, are borne by the respective share classes and include Distribution and Service and Transfer Agency fees.
D. Federal Taxes and Distributions to Shareholders — It is the Fund’s policy to comply with the requirements of the Internal Revenue Code of 1986, as amended (the “Code”), applicable to regulated investment companies and to distribute each year substantially all of its investment company taxable income and capital gains to its shareholders. Accordingly, the Fund is not
GOLDMAN SACHS VARIABLE INSURANCE TRUST CORE FIXED INCOME FUND
Notes to Financial Statements (continued)
June 30, 2023 (Unaudited)
2. SIGNIFICANT ACCOUNTING POLICIES (continued)
required to make any provisions for the payment of federal income tax. Distributions to shareholders are recorded on the ex- dividend date. Income and capital gains distributions, if any, are declared and paid according to the following schedule:
| | | | |
| Fund | | Income Distributions
Declared/Paid | | Capital Gains Distributions
Declared/Paid |
Core Fixed Income | | Quarterly | | Annually |
Net capital losses, if any, are carried forward to future fiscal years and may be used to the extent allowed by the Code to offset any future capital gains. Losses that are carried forward will retain their character as either short-term or long-term capital losses. Utilization of capital loss carryforwards will reduce the requirement of future capital gains distributions.
The characterization of distributions to shareholders for financial reporting purposes is determined in accordance with federal income tax rules, which may differ from GAAP. The source of the Fund’s distributions may be shown in the accompanying financial statements as either from distributable earnings or capital. Certain components of the Fund’s net assets on the Statement of Assets and Liabilities reflect permanent GAAP/tax differences based on the appropriate tax character.
E. Foreign Currency Translation — The accounting records and reporting currency of the Fund are maintained in U.S. dollars. Assets and liabilities denominated in foreign currencies are translated into U.S. dollars using the current exchange rates at the close of each business day. The effect of changes in foreign currency exchange rates on investments is included within net realized and unrealized gain (loss) on investments. Changes in the value of other assets and liabilities as a result of fluctuations in foreign exchange rates are included in the Statement of Operations within net change in unrealized gain (loss) on foreign currency translation. Transactions denominated in foreign currencies are translated into U.S. dollars on the date the transaction occurred, the effects of which are included within net realized gain (loss) on foreign currency transactions.
3. INVESTMENTS AND FAIR VALUE MEASUREMENTS
U.S. GAAP defines the fair value of a financial instrument as the amount that would be received to sell an asset or paid to transfer a liability in an orderly transaction between market participants at the measurement date (i.e., the exit price); the Fund’s policy is to use the market approach. GAAP establishes a fair value hierarchy that prioritizes the inputs to valuation techniques used to measure fair value. The hierarchy gives the highest priority to unadjusted quoted prices in active markets for identical assets or liabilities (Level 1 measurements) and the lowest priority to unobservable inputs (Level 3 measurements). The level in the fair value hierarchy within which the fair value measurement in its entirety falls shall be determined based on the lowest level input that is significant to the fair value measurement in its entirety. The levels used for classifying investments are not necessarily an indication of the risk associated with investing in these investments. The three levels of the fair value hierarchy are described below:
Level 1 — Unadjusted quoted prices in active markets that are accessible at the measurement date for identical, unrestricted assets or liabilities;
Level 2 — Quoted prices in markets that are not active or financial instruments for which significant inputs are observable (including, but not limited to, quoted prices for similar investments, interest rates, foreign exchange rates, volatility and credit spreads), either directly or indirectly;
Level 3 — Prices or valuations that require significant unobservable inputs (including GSAM’s assumptions in determining fair value measurement).
The Board of Trustees (“Trustees”) has approved Valuation Procedures that govern the valuation of the portfolio investments held by the Fund, including investments for which market quotations are not readily available. With respect to the Fund’s investments that do not have readily available market quotations, the Trustees have designated the Adviser as the valuation designee to perform fair valuations pursuant to Rule 2a-5 under the Investment Company Act of 1940 (the “Valuation Designee”). GSAM has day-to-day responsibility for implementing and maintaining internal controls and procedures related to the valuation of the Fund’s investments. To assess the continuing appropriateness of pricing sources and methodologies, GSAM regularly performs price
GOLDMAN SACHS VARIABLE INSURANCE TRUST CORE FIXED INCOME FUND
3. INVESTMENTS AND FAIR VALUE MEASUREMENTS (continued)
verification procedures and issues challenges as necessary to third party pricing vendors or brokers, and any differences are reviewed in accordance with the Valuation Procedures.
A. Level 1 and Level 2 Fair Value Investments — The valuation techniques and significant inputs used in determining the fair values for investments classified as Level 1 and Level 2 are as follows:
Money Market Funds — Investments in the Goldman Sachs Financial Square Government Fund (“Underlying Money Market Fund”) are valued at the NAV per share of the Institutional Share class on the day of valuation. These investments are generally classified as Level 1 of the fair value hierarchy. For information regarding the Underlying Money Market Fund’s accounting policies and investment holdings, please see the Underlying Money Market Fund’s shareholder report.
Debt Securities — Debt securities for which market quotations are readily available are valued daily on the basis of quotations supplied by dealers or an independent pricing service. The pricing services may use valuation models or matrix pricing, which consider: (i) yield or price with respect to bonds that are considered comparable in characteristics such as rating, interest rate and maturity date or (ii) quotations from securities dealers to determine current value. With the exception of treasury securities of G7 countries, which are generally classified as Level 1, these investments are generally classified as Level 2 of the fair value hierarchy.
i. Mortgage-Backed and Asset-Backed Securities — Mortgage-backed securities represent direct or indirect participations in, or are collateralized by and payable from, mortgage loans secured by residential and/or commercial real estate property. Asset-backed securities include securities whose principal and interest payments are collateralized by pools of other assets or receivables. The value of certain mortgage-backed and asset-backed securities (including adjustable rate mortgage loans) may be particularly sensitive to changes in prevailing interest rates. The value of these securities may also fluctuate in response to the market’s perception of the creditworthiness of the issuers.
Asset-backed securities may present credit risks that are not presented by mortgage-backed securities because they generally do not have the benefit of a security interest in collateral that is comparable to mortgage assets. Some asset-backed securities may only have a subordinated claim on collateral.
Stripped mortgage-backed securities are usually structured with two different classes: one that receives substantially all interest payments (interest-only, or “IO” and/or high coupon rate with relatively low principal amount, or “IOette”), and the other that receives substantially all principal payments (principal-only, or “PO”) from a pool of mortgage loans. Little to no principal will be received at the maturity of an IO; as a result, periodic adjustments are recorded to reduce the cost of the security until maturity. These adjustments are included in interest income.
ii. Treasury Inflation Protected Securities — TIPS are treasury securities in which the principal amount is adjusted daily to keep pace with inflation, as measured by the U.S. Consumer Pricing Index for Urban Consumers. The repayment of the original bond principal upon maturity is guaranteed by the full faith and credit of the U.S. Government.
iii. When-Issued Securities and Forward Commitments — When-issued securities, including TBA (“To Be Announced”) securities, are securities that are authorized but not yet issued in the market and purchased in order to secure what is considered to be an advantageous price or yield to the Fund. A forward commitment involves entering into a contract to purchase or sell securities, typically on an extended settlement basis, for a fixed price at a future date. The purchase of securities on a when-issued or forward commitment basis involves a risk of loss if the value of the security to be purchased declines before the settlement date. Conversely, the sale of securities on a forward commitment basis involves the risk that the value of the securities sold may increase before the settlement date. Although the Fund will generally purchase securities on a when-issued or forward commitment basis with the intention of acquiring the securities for its portfolio, the Fund may dispose of when-issued securities or forward commitments prior to settlement, which may result in a realized gain or loss. For financial reporting purposes, cash collateral that has been pledged to cover obligations of the Fund and cash collateral received, if any, is reported separately on the Statement of Assets and Liabilities as receivables/payables for collateral on other investments. Non-cash collateral pledged by the Fund, if any, is noted in the Schedule of Investments.
GOLDMAN SACHS VARIABLE INSURANCE TRUST CORE FIXED INCOME FUND
Notes to Financial Statements (continued)
June 30, 2023 (Unaudited)
3. INVESTMENTS AND FAIR VALUE MEASUREMENTS (continued)
Derivative Contracts — A derivative is an instrument whose value is derived from underlying assets, indices, reference rates or a combination of these factors. The Fund enters into derivative transactions to hedge against changes in interest rates, securities prices, and/or currency exchange rates, to increase total return, or to gain access to certain markets or attain exposure to other underliers. For financial reporting purposes, cash collateral that has been pledged to cover obligations of the Fund and cash collateral received, if any, is reported separately on the Statement of Assets and Liabilities as either due to broker/receivable for collateral on certain derivative contracts. Non-cash collateral pledged by the Fund, if any, is noted in the Schedule of Investments.
Exchange-traded derivatives, including futures and options contracts, are generally valued at the last sale or settlement price on the exchange where they are principally traded. Exchange-traded options without settlement prices are generally valued at the midpoint of the bid and ask prices on the exchange where they are principally traded (or, in the absence of two-way trading, at the last bid price for long positions and the last ask price for short positions). Exchange-traded derivatives typically fall within Level 1 of the fair value hierarchy. Over-the-counter (“OTC”) and centrally cleared derivatives are valued using market transactions and other market evidence, including market-based inputs to models, calibration to market-clearing transactions, broker or dealer quotations, or other alternative pricing sources. Where models are used, the selection of a particular model to value OTC and centrally cleared derivatives depends upon the contractual terms of, and specific risks inherent in, the instrument, as well as the availability of pricing information in the market. Valuation models require a variety of inputs, including contractual terms, market prices, yield curves, credit curves, measures of volatility, voluntary and involuntary prepayment rates, loss severity rates and correlations of such inputs. For OTC and centrally cleared derivatives that trade in liquid markets, model inputs can generally be verified and model selection does not involve significant management judgment. OTC and centrally cleared derivatives are classified within Level 2 of the fair value hierarchy when significant inputs are corroborated by market evidence.
i. Forward Contracts — A forward contract is a contract between two parties to buy or sell an asset at a specified price on a future date. A forward contract settlement can occur on a cash or delivery basis. Forward contracts are marked-to-market daily using independent vendor prices, and the change in value, if any, is recorded as an unrealized gain or loss. Cash and certain investments may be used to collateralize forward contracts.
A forward foreign currency exchange contract is a forward contract in which the Fund agrees to receive or deliver a fixed quantity of one currency for another, at a pre-determined price at a future date. All forward foreign currency exchange contracts are marked to market daily by using the outright forward rates or interpolating based upon maturity dates, where available. Non-deliverable forward foreign currency exchange contracts are settled with the counterparty in cash without the delivery of foreign currency.
ii. Futures Contracts — Futures contracts are contracts to buy or sell a standardized quantity of a specified commodity or security. Upon entering into a futures contract, the Fund deposits cash or securities in an account on behalf of the broker in an amount sufficient to meet the initial margin requirement. Subsequent payments are made or received by the Fund equal to the daily change in the contract value and are recorded as variation margin receivable or payable with a corresponding offset to unrealized gains or losses.
iii. Options — When the Fund writes call or put options, an amount equal to the premium received is recorded as a liability and is subsequently marked-to-market to reflect the current value of the option written. Swaptions are options on swap contracts.
Upon the purchase of a call option or a put option by the Fund, the premium paid is recorded as an investment and subsequently marked-to-market to reflect the current value of the option. Certain options may be purchased with premiums to be determined on a future date. The premiums for these options are based upon implied volatility parameters at specified terms.
iv. Swap Contracts — Bilateral swap contracts are agreements in which the Fund and a counterparty agree to exchange periodic payments on a specified notional amount or make a net payment upon termination. Bilateral swap transactions are privately negotiated in the OTC market and payments are settled through direct payments between the Fund and the counterparty. By contrast, certain swap transactions are subject to mandatory central clearing. These swaps are executed
GOLDMAN SACHS VARIABLE INSURANCE TRUST CORE FIXED INCOME FUND
3. INVESTMENTS AND FAIR VALUE MEASUREMENTS (continued)
through a derivatives clearing member (“DCM”), acting in an agency capacity, and submitted to a central counterparty (“CCP”) (“centrally cleared swaps”), in which case all payments are settled with the CCP through the DCM. Swaps are marked-to-market daily using pricing vendor quotations, counterparty or clearinghouse prices or model prices, and the change in value, if any, is recorded as an unrealized gain or loss. Upon entering into a swap contract, the Fund is required to satisfy an initial margin requirement by delivering cash or securities to the counterparty (or in some cases, segregated in a triparty account on behalf of the counterparty), which can be adjusted by any mark-to-market gains or losses pursuant to bilateral or centrally cleared arrangements. For centrally cleared swaps the daily change in valuation, if any, is recorded as a receivable or payable for variation margin.
An interest rate swap is an agreement that obligates two parties to exchange a series of cash flows at specified intervals, based upon or calculated by reference to changes in interest rates on a specified notional principal amount. The payment flows are usually netted against each other, with the difference being paid by one party to the other.
A credit default swap is an agreement that involves one party (the buyer of protection) making a stream of payments to another party (the seller of protection) in exchange for the right to receive protection on a reference security or obligation, including a group of assets or exposure to the performance of an index. The Fund’s investment in credit default swaps may involve greater risks than if the Fund had invested in the referenced obligation directly. Credit events are contract specific but may include bankruptcy, failure to pay, restructuring and obligation acceleration. If the Fund buys protection through a credit default swap and no credit event occurs, its payments are limited to the periodic payments previously made to the counterparty. Upon the occurrence of a specified credit event, the Fund, as a buyer of credit protection, is entitled to receive an amount equal to the notional amount of the swap and deliver to the seller the defaulted reference obligation in a physically settled trade. The Fund may also receive a net settlement amount in the form of cash or securities equal to the notional amount of the swap reduced by the recovery value of the reference obligation in a cash settled trade.
As a seller of protection, the Fund generally receives a payment stream throughout the term of the swap, provided that there is no credit event. In addition, if the Fund sells protection through a credit default swap, the Fund could suffer a loss because the value of the referenced obligation and the premium payments received may be less than the notional amount of the swap paid to the buyer of protection. Upon the occurrence of a specified credit event, the Fund, as a seller of credit protection, may be required to take possession of the defaulted reference obligation and pay the buyer an amount equal to the notional amount of the swap in a physically settled trade. The Fund may also pay a net settlement amount in the form of cash or securities equal to the notional amount of the swap reduced by the recovery value of the reference obligation in a cash settled trade. Recovery values are at times established through the credit event auction process in which market participants are ensured that a transparent price has been set for the defaulted security or obligation. In addition, the Fund is entitled to a return of any assets, which have been pledged as collateral to the counterparty upon settlement.
The maximum potential amount of future payments (undiscounted) that the Fund as seller of protection could be required to make under a credit default swap would be an amount equal to the notional amount of the agreement. These potential amounts would be partially offset by any recovery values of the respective referenced obligations or net amounts received from a settlement of a credit default swap for the same reference security or obligation where the Fund bought credit protection.
B. Level 3 Fair Value Investments — To the extent that significant inputs to valuation models and other alternative pricing sources are unobservable, or if quotations are not readily available, or if GSAM believes that such quotations do not accurately reflect fair value, the fair value of the Fund’s investments may be determined under the Valuation Procedures. GSAM, consistent with its procedures and applicable regulatory guidance, may make an adjustment to the most recent valuation prices of either domestic or foreign securities in light of significant events to reflect what it believes to be the fair value of the securities at the time of determining the Fund’s NAV. To the extent investments are valued using single source broker quotations obtained directly from the broker or passed through from third party pricing vendors, such investments are classified as Level 3 investments.
GOLDMAN SACHS VARIABLE INSURANCE TRUST CORE FIXED INCOME FUND
Notes to Financial Statements (continued)
June 30, 2023 (Unaudited)
3. INVESTMENTS AND FAIR VALUE MEASUREMENTS (continued)
C. Fair Value Hierarchy — The following is a summary of the Fund’s investments and derivatives classified in the fair value hierarchy as of June 30, 2023:
| | | | | | | | | | | | |
| | | |
| CORE FIXED INCOME FUND | | | | | | | | | |
| Investment Type | | Level 1 | | | Level 2 | | | Level 3 | |
| | | |
| Assets | | | | | | | | | | | | |
| Fixed Income | | | | | | | | | | | | |
Mortgage-Backed Securities | | $ | — | | | $ | 65,881,122 | | | $ | — | |
Corporate Bonds | | | — | | | | 34,196,474 | | | | — | |
U.S. Treasury Obligations | | | 21,904,252 | | | | — | | | | — | |
Asset- Backed Securities | | | — | | | | 8,153,453 | | | | — | |
Foreign Bonds | | | — | | | | 6,160,777 | | | | — | |
U.S. Government Agency Securities | | | — | | | | 3,136,171 | | | | — | |
Commercial Mortgage-Backed Securities | | | — | | | | 2,747,108 | | | | — | |
Foreign Government Securities | | | — | | | | 1,453,119 | | | | — | |
Municipal Bonds | | | — | | | | 1,271,874 | | | | — | |
Collateralized Mortgage Obligations | | | — | | | | 417,179 | | | | — | |
| Investment Company | | | 156,880 | | | | — | | | | — | |
| | | |
| Total | | $ | 22,061,132 | | | $ | 123,417,277 | | | $ | — | |
| | | |
| Liabilities | | | | | | | | | | | | |
| Forward Sales Contracts | | $ | — | | | $ | (25,680,853 | ) | | $ | — | |
| | | |
| Derivative Type | | | | | | | | | |
| | | |
| Assets(a) | | | | | | | | | | | | |
| Credit Default Swap Contracts | | $ | — | | | $ | 105,617 | | | $ | — | |
| Forward Foreign Currency Contracts | | | — | | | | 25,954 | | | | — | |
| Futures Contracts | | | 50,290 | | | | — | | | | — | |
| Interest Rate Swap Contracts | | | — | | | | 294,645 | | | | — | |
| | | |
| Total | | $ | 50,290 | | | $ | 426,216 | | | $ | — | |
| | | |
| Liabilities | | | | | | | | | | | | |
| Credit Default Swap Contracts(a) | | $ | — | | | $ | (2,580 | ) | | $ | — | |
| Forward Foreign Currency Contracts(a) | | | — | | | | (41,392 | ) | | | — | |
| Futures Contracts(a) | | | (150,728 | ) | | | — | | | | — | |
| Interest Rate Swap Contracts(a) | | | — | | | | (229,182 | ) | | | — | |
| Written Option Contracts | | | — | | | | (79,160 | ) | | | — | |
| | | |
| Total | | $ | (150,728 | ) | | $ | (352,314 | ) | | $ | — | |
| (a) | Amount shown represents unrealized gain (loss) at period end. |
For further information regarding security characteristics, see the Schedule of Investments.
GOLDMAN SACHS VARIABLE INSURANCE TRUST CORE FIXED INCOME FUND
4. INVESTMENTS IN DERIVATIVES
The following table sets forth, by certain risk types, the gross value of derivative contracts (not considered to be hedging instruments for accounting disclosure purposes) as of June 30, 2023. These instruments were used as part of the Fund’s investment strategies and to obtain and/or manage exposure related to the risks below. The values in the tables below exclude the effects of cash collateral received or posted pursuant to these derivative contracts, and therefore are not representative of the Fund’s net exposure.
Core Fixed Income Fund
| | | | | | | | | | | | | | |
| Risk | | | | Statements of Assets and Liabilities | | Assets | | | Statements of Assets and Liabilities | | Liabilities | |
| Interest Rate | | | | Variation margin on futures and swaps contracts | | $ | 344,935 | (a) | | Variation margin on futures and swaps contracts and written options at value | | $ | (459,070 | )(a) |
| Credit | | | | Unrealized gain on swap contracts | | | 105,618 | (a) | | Unrealized loss on swap contracts | | | (2,581 | )(a) |
| Currency | | | | Receivables for unrealized gain on forward foreign currency exchange contracts forward foreign | | | 25,954 | | | Payable for unrealized loss on forward foreign currency exchange contracts | | | (41,392 | ) |
| | | | | |
| Total | | | | | | $ | 476,507 | | | | | $ | (503,043 | ) |
| (a) | Includes unrealized gain (loss) on futures contracts and centrally cleared swap contracts described in the Additional Investment Information sections of the Consolidated Schedule of Investments. Only the variation margin as of June 30, 2023, is reported within the Consolidated Statement of Assets and Liabilities. |
The following tables set forth, by certain risk types, the Fund’s gains (losses) related to these derivatives and their indicative volumes for the six months ended June 30, 2023. These gains (losses) should be considered in the context that these derivative contracts may have been executed to create investment opportunities and/or economically hedge certain investments, and accordingly, certain gains (losses) on such derivative contracts may offset certain (losses) gains attributable to investments. These gains (losses) are included in “Net realized gain (loss)” or “Net change in unrealized gain (loss)” on the Statement of Operations:
Core Fixed Income Fund
| | | | | | | | | | |
| Risk | | Statement of Operations | | Net
Realized
Gain (Loss) | | | Net Change in
Unrealized
Gain (Loss) | |
| Credit | | Net realized gain (loss) from swap contracts/Net change in unrealized gain (loss) on swap contracts | | $ | (11,641 | ) | | $ | 112,653 | |
| Currency | | Net realized gain (loss) from forward foreign currency exchange contracts/Net change in unrealized gain (loss) on forward foreign currency exchange contractss, written option contracts and purchased options contracts | | | (31,450 | ) | | | 8,691 | |
| Interest Rate | | Net realized gain (loss) from futures contracts, written option, and purchased options/Net change in unrealized gain (loss) on futures contracts and swap contracts | | | 13,157 | | | | (137,682 | ) |
| | | |
| Total | | | | $ | (29,934 | ) | | $ | (16,338 | ) |
| | | | | | | | | | | | | | | | | | | | |
| | | Average number of Contracts or Notional Amounts(1) | |
| Risk | | Futures
Contracts | | | Forward
Contracts | | | Swap
Agreements | | | Purchased
Options | | | Written
Options | |
| Core Fixed Income Fund | | | 159 | | | $ | 73,185,927 | | | $ | 361,988,750 | | | | 390,000 | | | | 50,813,333 | |
| (1) | Amounts disclosed represent average number of contracts for futures contracts, purchased options and written options, notional amounts for forward contracts and swap contracts, based on absolute values, which is indicative of volume of this derivative type, for the months that each Fund held such derivatives during the six months ended June 30, 2023. |
GOLDMAN SACHS VARIABLE INSURANCE TRUST CORE FIXED INCOME FUND
Notes to Financial Statements (continued)
June 30, 2023 (Unaudited)
5. AGREEMENTS AND AFFILIATED TRANSACTIONS
A. Management Agreement — Under the Agreement, GSAM manages the Fund, subject to the general supervision of the Trustees.
As compensation for the services rendered pursuant to the Agreement, the assumption of the expenses related thereto and administration of the Fund’s business affairs, including providing facilities, GSAM is entitled to a management fee, accrued daily and paid monthly, equal to an annual percentage rate of the Fund’s average daily net assets.
For the six months ended June 30, 2023, contractual and effective net management fees with GSAM were at the following rates:
| | | | | | | | | | | | | | | | | | | | | | | | | | | | |
| | | Contractual Management Rate | | | | | | Effective Net
Management
Rate^ | |
| Fund | | First
$1 billion | | | Next
$1 billion | | | Next
$3 billion | | | Next
$3 billion | | | Over
$8 billion | | | Effective Rate | |
| Core Fixed Income Fund | | | 0.40 | % | | | 0.36 | % | | | 0.34 | % | | | 0.33 | % | | | 0.32 | % | | | 0.40 | % | | | 0.40 | % |
| ^ | Effective Net Management Rate includes the impact of management fee waivers of affiliated underlying funds, if any. The Effective Net Management Rate may not correlate to the Contractual Management Rate as a result of management fee waivers that may be in effect from time to time. |
The Fund invests in Institutional Shares of the Goldman Sachs Financial Square Government Fund, which is an affiliated Underlying Fund. GSAM has agreed to waive a portion of its management fee payable by the Fund in an amount equal to the management fee it earns as an investment adviser to the affiliated Underlying Fund in which the Fund invest. For the six months ended June 30, 2023, GSAM waived $933 of the Fund’s management fee.
B. Distribution and/or Service (12b-1) Plans — The Trust, on behalf of Service Shares of the Fund, has adopted a Distribution and Service Plan subject to Rule 12b-1 under the Act. Under the Distribution and Service Plan, Goldman Sachs, which serves as distributor (the “Distributor”), is entitled to a fee accrued daily and paid monthly for distribution services and personal and account maintenance services, which may then be paid by Goldman Sachs to authorized dealers, equal to, on an annual basis, 0.25% of the Fund’s average daily net assets attributable to Service Shares.
C. Transfer Agency Agreement — Goldman Sachs also serves as the transfer agent of the Fund for a fee pursuant to the Transfer Agency Agreement. The fees charged for such transfer agency services are accrued daily and paid monthly at an annual rate of 0.02% of the average daily net assets of Institutional and Service Shares.
D. Other Expense Agreements and Affiliated Transactions — GSAM has agreed to reduce or limit certain “Other Expenses” of the Fund (excluding acquired fund fees and expenses, transfer agency fees and expenses, service fees and shareholder administration fees (as applicable), taxes, interest, brokerage fees, expenses of shareholder meetings, litigation and indemnification, and extraordinary expenses) to the extent such expenses exceed, on an annual basis, a percentage rate of the average daily net assets of the Fund. Such Other Expense reimbursements, if any, are accrued daily and paid monthly. In addition, the Fund is not obligated to reimburse GSAM for prior fiscal year expense reimbursements, if any. The Other Expense limitations as an annual percentage rate of average daily net assets for the Fund is 0.004%. These Other Expense limitations will remain in place through at least April 28, 2024, and prior to such date GSAM may not terminate the arrangements without the approval of the Trustees. In addition, the Fund has entered into certain offset arrangements with the custodian and the transfer agent, which may result in a reduction of the Fund’s expenses and are received irrespective of the application of the “Other Expense” limitations described above.
For the six months ended June 30, 2023, these expense reductions, including any fee waivers and Other Expense reimbursements, were as follows:
| | | | | | | | | | | | |
| Fund | | Management
Fee Waiver | | | Other Expense
Reimbursement | | | Total Expense
Reductions | |
| Core Fixed Income Fund | | $ | 933 | | | $ | 129,113 | | | $ | 130,046 | |
GOLDMAN SACHS VARIABLE INSURANCE TRUST CORE FIXED INCOME FUND
5. AGREEMENTS AND AFFILIATED TRANSACTIONS (continued)
E. Line of Credit Facility — As of June 30, 2023, the Fund participated in a $1,110,000,000 committed, unsecured revolving line of credit facility (the “facility”) together with other funds of the Trust and certain registered investment companies having management agreements with GSAM or its affiliates. This facility is to be used for temporary emergency purposes, or to allow for an orderly liquidation of securities to meet redemption requests. The interest rate on borrowings is based on the federal funds rate. The facility also requires a fee to be paid by the Fund based on the amount of the commitment that has not been utilized. For the six months ended June 30, 2023, the Fund did not have any borrowings under the facility. Prior to April 19, 2023, the facility was $1,250,000,000.
F. Other Transactions with Affiliates — The following table provides information about the Fund’s investment in the Goldman Sachs Financial Square Government Fund as of and for the six months ended June 30, 2023:
| | | | | | | | | | | | | | | | | | | | | | | | |
| Fund | | Beginning
Value as of
December 31,
2022 | | | Purchases
at Cost | | | Proceeds
from Sales | | | Ending
Value as
of June 30,
2023 | | | Shares as of
June 30,
2023 | | | Dividend
Income | |
| Core Fixed Income Fund | | $ | 5,716,986 | | | $ | 17,588,100 | | | $ | (23,148,206 | ) | | $ | 156,880 | | | | 156,880 | | | $ | 24,030 | |
6. PORTOLIO SECURITIES TRANSACTIONS
The cost of purchases and proceeds from sales and maturities of long-term securities for the six months ended June 30, 2023, were as follows:
| | | | | | | | | | | | | | | | | | | | |
| Fund | | | | | Purchases of U.S.
Government and
Agency Obligations | | | Purchases
(Excluding U.S.
Government and
Agency Obligations) | | | Sales and
Maturities of U.S.
Government and
Agency Obligations | | | Sales and
Maturities
(Excluding U.S.
Government and
Agency Obligations) | |
| Core Fixed Income | | | | | | $ | 746,694,824 | | | $ | 15,502,766 | | | $ | 746,948,306 | | | $ | 4,855,679 | |
7. TAX INFORMATION
As of the Fund’s most recent fiscal year end, December 31, 2022, the Fund’s capital loss carryforwards and certain timing differences, on a tax-basis were as follows:
| | | | |
| | | Core Fixed
Income Fund | |
| Capital loss carryforwards: | | | | |
Perpetual Short-term | | $ | (3,676,602 | ) |
Perpetual Long-term | | | (2,032,083 | ) |
| Total Capital loss carryforwards | | $ | (5,708,685 | ) |
| Timing differences (Post October loss deferral, and straddle loss deferrals) | | $ | (92,755 | ) |
GOLDMAN SACHS VARIABLE INSURANCE TRUST CORE FIXED INCOME FUND
Notes to Financial Statements (continued)
June 30, 2023 (Unaudited)
7. TAX INFORMATION (continued)
As of June 30, 2023, the Fund’s aggregate security unrealized gains and losses based on cost for U.S. federal income tax purposes were as follows:
| | | | |
| | | Core Fixed
Income Fund | |
| Tax cost | | $ | 153,992,762 | |
| Gross unrealized gain | | | 499,084 | |
| Gross unrealized loss | | | (9,013,437 | ) |
| Net unrealized gain (loss) | | $ | (8,514,353 | ) |
The difference between GAAP-basis and tax-basis unrealized gains (losses) is attributable primarily to wash sales, net mark to market gains (losses) on regulated futures and foreign currency contracts, and differences in the tax treatment of market discount accretion and premium amortization and swap transactions.
GSAM has reviewed the Fund’s tax positions for all open tax years (the current and prior three years, as applicable) and has concluded that no provision for income tax is required in the Fund’s financial statements. Such open tax years remain subject to examination and adjustment by tax authorities.
8. OTHER RISKS
The Fund’s risks include, but are not limited to, the following:
Derivatives Risk — The Fund’s use of derivatives and other similar instruments (collectively referred to in this paragraph as “derivatives”) may result in loss, including due to adverse market movements. Derivatives, which may pose risks in addition to and greater than those associated with investing directly in securities, currencies or other assets and instruments, may increase market exposure and be illiquid or less liquid, volatile, difficult to price and leveraged so that small changes in the value of the underlying assets or instruments may produce disproportionate losses to the Fund. Certain derivatives are also subject to counterparty risk, which is the risk that the other party in the transaction will not, or lacks the capacity or authority to, fulfill its contractual obligations, liquidity risk, which includes the risk that the Fund will not be able to exit the derivative when it is advantageous to do so, and risks arising from margin requirements, which include the risk that the Fund will be required to pay additional margin or set aside additional collateral to maintain open derivative positions. The use of derivatives is a highly specialized activity that involves investment techniques and risks different from those associated with investments in more traditional securities and instruments. Losses from derivatives can also result from a lack of correlation between changes in the value of derivative instruments and the portfolio assets (if any) being hedged.
Floating and Variable Rate Obligations Risk — Floating rate and variable rate obligations are debt instruments issued by companies or other entities with interest rates that reset periodically (typically, daily, monthly, quarterly, or semiannually) in response to changes in the market rate of interest on which the interest rate is based. Such market rates are generally the Secured Overnight Financing Rate (“SOFR”), a term SOFR rate published by CME Group Benchmark Administration Limited (CBA) calculated using certain derivatives markets (“Term SOFR”), London Interbank Offered Rate (“LIBOR”), the Prime Rate of a designated U.S. bank, the Federal Funds Rate, or another base lending rate used by commercial lenders. For floating and variable rate obligations, there may be a lag between an actual change in the underlying interest rate benchmark and the reset time for an interest payment of such an obligation, which could harm or benefit the Fund, depending on the interest rate environment or other circumstances. In a rising interest rate environment, for example, a floating or variable rate obligation that does not reset immediately would prevent the Fund from taking full advantage of rising interest rates in a timely manner. However, in a declining interest rate environment, the Fund may benefit from a lag due to an obligation’s interest rate payment not being immediately impacted by a decline in interest rates.
GOLDMAN SACHS VARIABLE INSURANCE TRUST CORE FIXED INCOME FUND
8. OTHER RISKS (continued)
Some floating or variable rate obligations or investments of the Fund may reference (or may have previously referenced) the London Interbank Offered Rate (“LIBOR”). As a result of benchmark reforms, publication of most LIBOR settings has ceased. Some LIBOR settings continue to be published but only on a temporary, synthetic and non-representative basis and are expected to cease being published in September 2024. Regulated entities have generally ceased entering into new LIBOR contracts in connection with regulatory guidance or prohibitions. Public and private sector actors have worked to establish alternative reference rates, like SOFR or Term SOFR, to be used in place of LIBOR. There is no assurance that any such alternative reference rate will be similar to or produce the same value or economic equivalence as LIBOR or that it will have the same volume or liquidity as did LIBOR which may affect the value, volatility, liquidity or return on certain of the Fund’s floating and variable rate obligations and investments and result in costs incurred in connection with changing reference rates used for positions, closing out positions and entering into new trades. Certain of the Fund’s obligations or investments may have transitioned from LIBOR or may transition from LIBOR in the future. The transition from LIBOR to alternative reference rates may result in operational issues for the Fund or its obligations or investments. Any pricing adjustments to the Fund’s obligations or investments resulting from use of an alternative reference rate may also adversely affect the Fund’s performance and/or NAV. No assurances can be given as to the impact of the LIBOR transition (and the timing of any such impact) on the Fund and its obligations and investments.
Interest Rate Risk — When interest rates increase, fixed income securities or instruments held by a Fund will generally decline in value. Long-term fixed income securities or instruments will normally have more price volatility because of this risk than short-term fixed income securities or instruments. A wide variety of market factors can cause interest rates to rise, including central bank monetary policy, rising inflation and changes in general economic conditions. Changing interest rates may have unpredictable effects on the markets, may result in heightened market volatility and may detract from the Fund’s performance. In addition, changes in monetary policy may exacerbate the risks associated with changing interest rates. Funds with longer average portfolio durations will generally be more sensitive to changes in interest rates than funds with a shorter average portfolio duration. Fluctuations in interest rates may also affect the liquidity of fixed income securities and instruments held by the Fund. A sudden or unpredictable increase in interest rates may cause volatility in the market and may decrease the liquidity of the Fund’s investments, which would make it harder for the Fund to sell its investments at an advantageous time.
Investments in Other Investment Companies Risk — As a shareholder of another investment company, the Fund will indirectly bear its proportionate share of any net management fees and other expenses paid by such other investment companies, in addition to the fees and expenses regularly borne by the Fund.
Large Shareholder Transactions Risk — The Fund may experience adverse effects when certain large shareholders, such as other funds, participating insurance companies and Goldman Sachs affiliates, purchase or redeem large amounts of shares of the Fund. Such large shareholder redemptions, which may occur rapidly or unexpectedly, may cause the Fund to sell portfolio securities at times when it would not otherwise do so, which may negatively impact the Fund’s NAV and liquidity. These transactions may also accelerate the realization of taxable income to shareholders if such sales of investments resulted in gains, and may also increase transaction costs. In addition, a large redemption could result in the Fund’s current expenses being allocated over a smaller asset base, leading to an increase in the Fund’s expense ratio. Similarly, large Fund share purchases may adversely affect the Fund’s performance to the extent that the Fund is delayed in investing new cash or otherwise maintains a larger cash position than it ordinarily would.
Liquidity Risk — The Fund may make investments that are illiquid or that may become less liquid in response to market developments or adverse investor perceptions. Illiquid investments may be more difficult to value. Liquidity risk may also refer to the risk that the Fund will not be able to pay redemption proceeds within the allowable time period or without significant dilution to remaining investors’ interests because of unusual market conditions, declining prices of the securities sold, an unusually high volume of redemption requests, or other reasons. To meet redemption requests, the Fund may be forced to sell investments at an unfavorable time and/or under unfavorable conditions. If the Fund is forced to sell securities at an unfavorable time and/or under unfavorable conditions, such sales may adversely affect the Fund’s NAV and dilute remaining investors’ interests. Liquidity risk may be the result of, among other things, the reduced number and capacity of traditional market participants to make a market in
GOLDMAN SACHS VARIABLE INSURANCE TRUST CORE FIXED INCOME FUND
Notes to Financial Statements (continued)
June 30, 2023 (Unaudited)
8. OTHER RISKS (continued)
fixed income securities or the lack of an active market. The potential for liquidity risk may be magnified by a rising interest rate environment or other circumstances where investor redemptions from fixed income funds may be higher than normal, potentially causing increased supply in the market due to selling activity. Redemptions by large shareholders may have a negative impact on the Fund’s liquidity.
Market and Credit Risks — In the normal course of business, the Fund trades financial instruments and enters into financial transactions where risk of potential loss exists due to changes in the market (market risk). The value of the securities in which the Fund invests may go up or down in response to the prospects of individual companies, particular sectors or governments and/or general economic conditions throughout the world due to increasingly interconnected global economies and financial markets. Events such as war, military conflict, acts of terrorism, social unrest, natural disasters, recessions, inflation, rapid interest rate changes, supply chain disruptions, sanctions, the spread of infectious illness or other public health threats could also significantly impact the Fund and its investments. Additionally, the Fund may also be exposed to credit risk in the event that an issuer or guarantor fails to perform or that an institution or entity with which the Fund has unsettled or open transactions defaults.
9. SUBSEQUENT EVENTS
Subsequent events after the Statement of Assets and Liabilities date have been evaluated, and GSAM has concluded that there is no impact requiring adjustment or disclosure in the financial statements.
10. SUMMARY OF SHARE TRANSACTIONS
Share activity is as follows:
| | | | | | | | | | | | | | | | |
| | | Core Fixed Income Fund | |
| | | For the Six Months Ended
June 30, 2023
(Unaudited) | | | For the Fiscal Year Ended
December 31, 2022 | |
| | | Shares | | | Dollars | | | Shares | | | Dollars | |
| Institutional Shares | | | | | | | | | | | | | | | | |
| Shares sold | | | 383,025 | | | $ | 3,685,169 | | | | 1,549,382 | | | $ | 15,081,808 | |
| Reinvestment of distributions | | | 70,311 | | | | 669,891 | | | | 51,565 | | | | 498,803 | |
| Shares redeemed | | | (47,991 | ) | | | (464,016 | ) | | | (346,895 | ) | | | (3,639,227 | ) |
| | | | 405,345 | | | | 3,891,044 | | | | 1,254,052 | | | | 11,941,384 | |
| Service Shares | | | | | | | | | | | | | | | | |
| Shares sold | | | 878,033 | | | | 8,435,240 | | | | 1,821,761 | | | | 18,196,134 | |
| Reinvestment of distributions | | | 124,325 | | | | 1,183,414 | | | | 107,310 | | | | 1,038,833 | |
| Shares redeemed | | | (336,334 | ) | | | (3,229,430 | ) | | | (669,929 | ) | | | (6,616,109 | ) |
| | | | 666,024 | | | | 6,389,224 | | | | 1,259,142 | | | | 12,618,858 | |
| | | | |
| NET INCREASE | | | 1,071,369 | | | $ | 10,280,268 | | | | 2,513,194 | | | $ | 24,560,242 | |
GOLDMAN SACHS VARIABLE INSURANCE TRUST CORE FIXED INCOME FUND
Statement Regarding Basis for Approval of Management Agreement (Unaudited)
Background
The Goldman Sachs Core Fixed Income Fund (the “Fund”) is an investment portfolio of Goldman Sachs Variable Insurance Trust (the “Trust”). The Board of Trustees oversees the management of the Trust and reviews the investment performance and expenses of the Fund at regularly scheduled meetings held throughout the year. In addition, the Board of Trustees determines annually whether to approve the continuance of the Trust’s investment management agreement (the “Management Agreement”) with Goldman Sachs Asset Management, L.P. (the “Investment Adviser”) on behalf of the Fund.
The Management Agreement was most recently approved for continuation until June 30, 2024 by the Board of Trustees, including those Trustees who are not parties to the Management Agreement or “interested persons” (as defined in the Investment Company Act of 1940, as amended) of any party thereto (the “Independent Trustees”), at a meeting held on June 13-14, 2023 (the “Annual Meeting”).
The review process undertaken by the Trustees spans the course of the year and culminates with the Annual Meeting. To assist the Trustees in their deliberations, the Trustees have established a Contract Review Committee (the “Committee”), comprised of the Independent Trustees. The Committee held two meetings over the course of the year since the Management Agreement was last approved. At those Committee meetings, regularly scheduled Board or other committee meetings, and/or the Annual Meeting, matters relevant to the renewal of the Management Agreement were considered by the Board, or the Independent Trustees, as applicable. With respect to the Fund, such matters included:
| | (a) | | the nature and quality of the advisory, administrative, and other services provided to the Fund by the Investment Adviser and its affiliates, including information about: |
| | (i) | | the structure, staff, and capabilities of the Investment Adviser and its portfolio management teams; |
| | (ii) | | the groups within the Investment Adviser and its affiliates that support the portfolio management teams or provide other types of necessary services, including fund services groups (e.g., accounting and financial reporting, tax, shareholder services, and operations); controls and risk management groups (e.g., legal, compliance, valuation oversight, credit risk management, internal audit, compliance testing, market risk analysis, finance, and central funding); sales and distribution support groups, and others (e.g., information technology and training); |
| | (iii) | | trends in employee headcount; |
| | (iv) | | the Investment Adviser’s financial resources and ability to hire and retain talented personnel and strengthen its operations; and |
| | (v) | | the parent company’s support of the Investment Adviser and its mutual fund business, as expressed by the firm’s senior management; |
| | (b) | | information on the investment performance of the Fund, including comparisons to the performance of similar mutual funds, as provided by a third-party mutual fund data provider engaged as part of the contract review process (the “Outside Data Provider”), a benchmark performance index, and a composite of accounts with comparable investment strategies managed by the Investment Adviser; and information on general investment outlooks in the markets in which the Fund invests; |
| | (c) | | information provided by the Investment Adviser indicating the Investment Adviser’s views on whether the Fund’s peer group and/or benchmark index had high, medium, or low relevance given the Fund’s particular investment strategy; |
| | (d) | | the terms of the Management Agreement and other agreements with affiliated service providers entered into by the Trust on behalf of the Fund; |
| | (e) | | fee and expense information for the Fund, including: |
| | (i) | | the relative management fee and expense levels of the Fund as compared to those of comparable funds managed by other advisers, as provided by the Outside Data Provider; |
| | (ii) | | the Fund’s expense trends over time; and |
| | (iii) | | to the extent the Investment Adviser manages other types of accounts (such as bank collective trusts, private wealth management accounts, institutional separate accounts, sub-advised mutual funds, and non-U.S. funds) having investment objectives and policies similar to those of the Fund, comparative information on the advisory fees charged and services provided to those accounts by the Investment Adviser; |
| | (f) | | with respect to the extensive investment performance and expense comparison data provided by the Outside Data Provider, its processes in producing that data for the Fund; |
| | (g) | | the undertakings of the Investment Adviser and its affiliates to implement fee waivers and/or expense limitations; |
| | (h) | | information relating to the profitability of the Management Agreement and the transfer agency and distribution and service arrangements of the Fund to the Investment Adviser and its affiliates; |
| | (i) | | whether the Fund’s existing management fee schedule adequately addressed any economies of scale; |
GOLDMAN SACHS VARIABLE INSURANCE TRUST CORE FIXED INCOME FUND
Statement Regarding Basis for Approval of Management Agreement (Unaudited) (continued)
| | (j) | | a summary of the “fall-out” benefits derived by the Investment Adviser and its affiliates from their relationships with the Fund, including the fees received by the Investment Adviser’s affiliates from the Fund for transfer agency, portfolio trading, distribution and other services; |
| | (k) | | a summary of potential benefits derived by the Fund as a result of its relationship with the Investment Adviser; |
| | (l) | | information regarding portfolio trading and how the Investment Adviser carries out its duty to seek best execution; |
| | (m) | | the manner in which portfolio manager compensation is determined; and the number and types of accounts managed by the portfolio managers; |
| | (n) | | the nature and quality of the services provided to the Fund by its unaffiliated service providers, and the Investment Adviser’s general oversight and evaluation (including reports on due diligence) of those service providers as part of the administrative services provided under the Management Agreement; and |
| | (o) | | the Investment Adviser’s processes and policies addressing various types of potential conflicts of interest; its approach to risk management; the annual review of the effectiveness of the Fund’s compliance program; and periodic compliance reports. |
The Trustees also received an overview of the Fund’s distribution arrangements. They received information regarding the Fund’s assets, share purchase and redemption activity, and payment of distribution and service fees. Information was also provided to the Trustees relating to revenue sharing payments made by and services provided by the Investment Adviser and its affiliates to intermediaries that promote the sale, distribution, and/or servicing of Fund shares. The Independent Trustees also discussed the broad range of other investment choices that are available to Fund investors, including the availability of comparable funds managed by other advisers.
The presentations made at the Board and Committee meetings and at the Annual Meeting encompassed the Fund and other mutual funds for which the Board of Trustees has responsibility. In evaluating the Management Agreement at the Annual Meeting, the Trustees relied upon their knowledge, resulting from their meetings and other interactions throughout the year, of the Investment Adviser and its affiliates, their services, and the Fund. In conjunction with these meetings, the Trustees received written materials and oral presentations on the topics covered, and the Investment Adviser addressed the questions and concerns of the Trustees, including concerns regarding the investment performance of certain of the funds they oversee. The Independent Trustees were advised by their independent legal counsel regarding their responsibilities and other regulatory requirements related to the approval and continuation of mutual fund investment management agreements under applicable law. In addition, the Investment Adviser and its affiliates provided the Independent Trustees with a written response to a formal request for information sent on behalf of the Independent Trustees by their independent legal counsel. During the course of their deliberations, the Independent Trustees met in executive sessions with their independent legal counsel, without representatives of the Investment Adviser or its affiliates present.
Nature, Extent, and Quality of the Services Provided Under the Management Agreement
As part of their review, the Trustees considered the nature, extent, and quality of the services provided to the Fund by the Investment Adviser. In this regard, the Trustees considered both the investment advisory services and non-advisory services that are provided by the Investment Adviser and its affiliates. The Trustees noted the transition in the leadership and changes in personnel of various of the Investment Adviser’s portfolio management teams that had occurred in recent periods, and the ongoing recruitment efforts aimed at bringing high quality investment talent to the Investment Adviser. They also noted the Investment Adviser’s commitment to maintaining high quality systems and expending substantial resources to respond to ongoing changes to the market, regulatory and control environment in which the Fund and its service providers operate, including developments associated with the COVID-19 pandemic, geopolitical events, and economic sanctions, as well as the efforts of the Investment Adviser and its affiliates to combat cyber security risks. The Trustees also considered information regarding the Investment Adviser’s business continuity planning and remote operations capabilities. The Trustees concluded that the Investment Adviser continued to commit substantial financial and operational resources to the Fund and expressed confidence that the Investment Adviser would continue to do so in the future. The Trustees also recognized that the Investment Adviser had made significant commitments to address regulatory compliance requirements applicable to the Fund and the Investment Adviser and its affiliates.
Investment Performance
The Trustees also considered the investment performance of the Fund. In this regard, they compared the investment performance of the Fund to its peers using rankings and ratings compiled by the Outside Data Provider as of December 31, 2022, and updated performance information prepared by the Investment Adviser using the peer group identified by the Outside Data Provider as of March 31, 2023. The information on the Fund’s investment performance was provided for the one-, three- and five-
GOLDMAN SACHS VARIABLE INSURANCE TRUST CORE FIXED INCOME FUND
Statement Regarding Basis for Approval of Management Agreement (Unaudited) (continued)
year periods ending on the applicable dates. The Trustees also reviewed the Fund’s investment performance relative to its performance benchmark. As part of this review, they considered the investment performance trends of the Fund over time, and reviewed the investment performance of the Fund in light of its investment objective and policies and market conditions. The Trustees also received information comparing the Fund’s performance to that of a composite of accounts with comparable investment strategies managed by the Investment Adviser.
In addition, the Trustees considered materials prepared and presentations made by the Investment Adviser’s senior management and portfolio management personnel in which Fund performance was assessed. The Trustees also considered the Investment Adviser’s periodic reports with respect to the Fund’s risk profile, and how the Investment Adviser’s approach to risk monitoring and management influences portfolio management.
The Trustees observed that the Fund’s Institutional Shares had placed in the top half of the Fund’s peer group for the three-, five-, and ten-year periods, and in the third quartile for the one-year period, and had outperformed the Fund’s benchmark index for the three- and five-year periods and underperformed for the one-year period ended March 31, 2023. They also noted that the Fund had experienced certain portfolio management changes in 2021 and 2022.
Costs of Services Provided and Competitive Information
The Trustees considered the contractual terms of the Management Agreement and the fee rates payable by the Fund thereunder. In this regard, the Trustees considered information on the services rendered by the Investment Adviser to the Fund, which included both advisory and administrative services that were directed to the needs and operations of the Fund as a registered mutual fund.
In particular, the Trustees reviewed analyses prepared by the Outside Data Provider regarding the expense rankings of the Fund. The analyses provided a comparison of the Fund’s management fee and breakpoints to those of a relevant peer group and category universe; an expense analysis which compared the Fund’s overall net and gross expenses to a peer group and a category universe; and data comparing the Fund’s net expenses to the peer and category medians. The analyses also compared the Fund’s other expenses and fee waivers/reimbursements to those of the peer group and category medians. The Trustees concluded that the comparisons provided by the Outside Data Provider were useful in evaluating the reasonableness of the management fees and total expenses paid by the Fund.
In addition, the Trustees considered the Investment Adviser’s undertakings to implement fee waivers and/or expense limitations. They also considered, to the extent that the Investment Adviser manages other types of accounts having investment objectives and policies similar to those of the Fund, comparative fee information for services provided by the Investment Adviser to those accounts, and information that indicated that services provided to the Fund differed in various significant respects from the services provided to other types of accounts which, in many cases, operated under less stringent legal and regulatory structures, required fewer services from the Investment Adviser to a smaller number of client contact points, and were less time-intensive.
In addition, the Trustees noted that shareholders are able to redeem their shares at any time if shareholders believe that the Fund fees and expenses are too high or if they are dissatisfied with the performance of the Fund.
Profitability
The Trustees reviewed the Fund’s contribution to the Investment Adviser’s revenues and pre-tax profit margins. In this regard the Trustees noted that they had received, among other things, profitability analyses and summaries, revenue and expense schedules by Fund and by function (i.e., investment management, transfer agency and distribution and service), and information on the Investment Adviser’s expense allocation methodology. They observed that the profitability and expense figures are substantially similar to those used by the Investment Adviser for many internal purposes, including compensation decisions among various business groups, and are thus subject to a vigorous internal debate about how certain revenue and expenses should be allocated. The Trustees also noted that the internal audit group within the Goldman Sachs organization periodically audits the expense allocation methodology and that the internal audit group was satisfied with the reasonableness, consistency, and accuracy of the Investment Adviser’s expense allocation methodology. Profitability data for the Fund was provided for 2022 and 2021, and the Trustees considered this information in relation to the Investment Adviser’s overall profitability.
GOLDMAN SACHS VARIABLE INSURANCE TRUST CORE FIXED INCOME FUND
Statement Regarding Basis for Approval of Management Agreement (Unaudited) (continued)
Economies of Scale
The Trustees considered the information that had been provided regarding whether there have been economies of scale with respect to the management of the Fund. The Trustees also considered the breakpoints in the fee rate payable under the Management Agreement for the Fund at the following annual percentage rates of the average daily net assets of the Fund:
| | | | |
| |
| First $1 billion | | | 0.40 | % |
| |
| Next $1 billion | | | 0.36 | |
| |
| Next $3 billion | | | 0.34 | |
| |
| Next $3 billion | | | 0.33 | |
| |
| Over $8 billion | | | 0.32 | |
The Trustees noted that the breakpoints were designed to share potential economies of scale, if any, with the Fund and its shareholders as assets under management reach those asset levels. The Trustees considered the amount of assets in the Fund; the Fund’s recent share purchase and redemption activity; the information provided by the Investment Adviser relating to the costs of the services provided by the Investment Adviser and its affiliates and their realized profits; information comparing fee rates charged by the Investment Adviser with fee rates charged to other funds in the peer group; and the Investment Adviser’s undertaking to limit certain expenses of the Fund that exceed specified levels. Upon reviewing these matters at the Annual Meeting, the Trustees concluded that the fee breakpoints represented a means of assuring that benefits of scalability, if any, would be passed along to shareholders at the specified asset levels.
Other Benefits to the Investment Adviser and Its Affiliates
The Trustees also considered the other benefits derived by the Investment Adviser and its affiliates from their relationships with the Fund as stated above, including: (a) transfer agency fees received by Goldman Sachs & Co. LLC (“Goldman Sachs”); (b) futures commissions earned by Goldman Sachs for executing futures transactions on behalf of the Fund; (c) trading efficiencies resulting from aggregation of orders of the Fund with those for other funds or accounts managed by the Investment Adviser; (d) the Investment Adviser’s ability to leverage the infrastructure designed to service the Fund on behalf of its other clients; (e) the Investment Adviser’s ability to cross-market other products and services to Fund shareholders; (f) Goldman Sachs’ retention of certain fees as Fund Distributor; (g) the Investment Adviser’s ability to negotiate better pricing with custodians on behalf of its other clients, as a result of the relationship with the Fund; (h) the investment of cash and cash collateral in money market funds managed by the Investment Adviser that will result in increased assets under management for those money market funds; (i) the investment in exchange-traded funds (“ETFs”) managed by the Investment Adviser that will result in increased assets under management for those ETFs and may facilitate the development of the Investment Adviser’s ETF advisory business; and (j) the possibility that the working relationship between the Investment Adviser and the Fund’s third-party service providers may cause those service providers to be more likely to do business with other areas of Goldman Sachs. In the course of considering the foregoing, the Independent Trustees requested and received further information quantifying certain of these fall-out benefits.
Other Benefits to the Fund and Its Shareholders
The Trustees also noted that the Fund receives certain other potential benefits as a result of its relationship with the Investment Adviser, including: (a) trading efficiencies resulting from aggregation of orders of the Fund with those of other funds or accounts managed by the Investment Adviser; (b) enhanced servicing from vendors due to the volume of business generated by the Investment Adviser and its affiliates; (c) enhanced servicing from broker-dealers due to the volume of business generated by the Investment Adviser and its affiliates; (d) the Investment Adviser’s ability to negotiate favorable terms with derivatives counterparties on behalf of the Fund as a result of the size and reputation of the Goldman Sachs organization; (e) the advantages received from the Investment Adviser’s knowledge and experience gained from managing other accounts and products; (f) the Investment Adviser’s ability to hire and retain qualified personnel to provide services to the Fund because of the reputation of the Goldman Sachs organization; (g) the Fund’s access, through the Investment Adviser, to certain firm-wide resources (e.g., proprietary risk management systems and databases), subject to certain restrictions; and (h) the Fund’s access to certain affiliated distribution channels. In addition, the Trustees noted the competitive nature of the mutual fund marketplace, and considered that many of the Fund’s shareholders invested in the Fund in part because of the Fund’s relationship with the Investment Adviser and that those shareholders have a general expectation that the relationship will continue.
GOLDMAN SACHS VARIABLE INSURANCE TRUST CORE FIXED INCOME FUND
Statement Regarding Basis for Approval of Management Agreement (Unaudited) (continued)
Conclusion
In connection with their consideration of the Management Agreement, the Trustees gave weight to each of the factors described above, but did not identify any particular factor as controlling their decision. After deliberation and consideration of all of the information provided, including the factors described above, the Trustees concluded, in the exercise of their business judgment, that the management fees paid by the Fund were reasonable in light of the services provided to it by the Investment Adviser, the Investment Adviser’s costs and the Fund’s current and reasonably foreseeable asset levels. The Trustees unanimously concluded that the Investment Adviser’s continued management likely would benefit the Fund and its shareholders and that the Management Agreement should be approved and continued with respect to the Fund until June 30, 2024.
GOLDMAN SACHS VARIABLE INSURANCE TRUST CORE FIXED INCOME FUND
Liquidity Risk Management Program (Unaudited)
The Fund has adopted and implemented a liquidity risk management program (the “Program”) in accordance with Rule 22e-4 under the 1940 Act. The Program seeks to assess and manage the Fund’s liquidity risk, i.e., the risk that the Fund is unable to satisfy redemption requests without significantly diluting remaining investors’ interests in the Fund. The Board of Trustees of the Trust has designated GSAM, the Fund’s investment adviser, to administer the Program. Certain aspects of the Program rely on third parties to perform certain functions, including the provision of market data and application of models.
The Program is comprised of various components designed to support the assessment and/or management of liquidity risk, including: (1) the periodic assessment (no less frequently than annually) of certain factors that influence the Fund’s liquidity risk;
(2) the periodic classification (no less frequently than monthly) of the Fund’s investments into one of four liquidity categories that reflect an estimate of their liquidity under current market conditions; (3) a 15% limit on the acquisition of “illiquid investments” (as defined under Rule 22e-4); (4) for a Fund that does not invest primarily in “highly liquid investments” (as defined under
Rule 22e-4), the determination of a minimum percentage of the Fund’s assets that will generally be invested in highly liquid investments (a “Highly Liquid Investment Minimum”); and (5) periodic reporting to the Board of Trustees.
At a meeting of the Board of Trustees on February 14-15, 2023, GSAM provided a written report to the Board addressing the operation, and the adequacy and effectiveness of the implementation, of the Program, including, as applicable, the operation of any Highly Liquid Investment Minimum and any material changes to the Program, for the period from January 1, 2022 through December 31, 2022 (the “Reporting Period”). Among other things, the annual report discussed: (1) the results of stress tests designed to assess liquidity under a hypothetical stressed scenario involving elevated redemptions; (2) an assessment of the methodologies used to classify investments into one of four liquidity categories; (3) the impact of local holidays in non-U.S. jurisdictions; and (4) the impact of geopolitical, market and economic developments and events on liquidity and liquidity risk. The report concluded that the Program continues to be reasonably designed to assess and manage liquidity risk and was adequately and effectively implemented during the Reporting Period.
There can be no assurance that the Program will achieve its objectives under all circumstances in the future. Please refer to your Fund’s prospectus for more information regarding the Fund’s exposure to liquidity risk and other risks to which it may be subject.
GOLDMAN SACHS VARIABLE INSURANCE TRUST CORE FIXED INCOME FUND
| | |
| Fund Expenses — Six Month Period Ended June 30, 2023 (Unaudited) | | |
As a shareholder of Institutional Shares and Service Shares of the Fund, you incur ongoing costs, including management fees; distribution and service (12b-1) fees (with respect to Service Shares); and other Fund expenses. This example is intended to help you understand your ongoing costs (in dollars) of investing in the Fund and to compare these costs with the ongoing costs of investing in other mutual funds.
The example is based on an investment of $1,000 invested at the beginning of the period and held for the entire period from January 1, 2023 through June 30, 2023, which represents a period of 181 days of a 365 day year.
Actual Expenses — The first line in the table below provides information about actual account values and actual expenses. You may use the information in this line, together with the amount you invested, to estimate the expenses that you paid over the period. Simply divide your account value by $1,000 (for example, an $8,600 account value divided by $1,000=8.6), then multiply the result by the number in the first line under the heading entitled “Expenses Paid” to estimate the expenses you paid on your account during this period.
Hypothetical Example for Comparison Purposes — The second line in the table below provides information about hypothetical account values and hypothetical expenses based on the Fund’s actual net expense ratio and an assumed rate of return of 5% per year before expenses, which is not the Fund’s actual return. The hypothetical account values and expenses may not be used to estimate the actual ending account balance or expenses you paid for the period. You may use this information to compare the ongoing costs of investing in the Fund and other funds. To do so, compare this 5% hypothetical example with the 5% hypothetical examples that appear in the shareholder reports of the other funds.
Please note that the expenses shown in the table are meant to highlight your ongoing costs only and do not reflect any transactional costs, such as sales charges, redemption fees, or exchange fees. Therefore, the second line of the table is useful in comparing ongoing costs only and will not help you determine the relative total costs of owning different funds. In addition, if these transactional costs were included, your costs would have been higher.
| | | | | | | | | | | | |
| Share Class | | Beginning
Account Value
1/1/23 | | | Ending
Account Value
6/30/23 | | | Expenses Paid for the
6 Months Ended
6/30/23* | |
| Institutional Shares | | | | | | | | | | | | |
| | | | |
| Actual | | $ | 1,000.00 | | | $ | 1,025.04 | | | $ | 2.12 | |
| Hypothetical 5% return | | | 1,000.00 | | | | 1,022.70 | + | | | 2.12 | |
| Service Shares | | | | | | | | | | | | |
| | | | |
| Actual | | | 1,000.00 | | | | 1,023.88 | | | | 3.38 | |
| Hypothetical 5% return | | | 1,000.00 | | | | 1,021.46 | + | | | 3.37 | |
| | * | Expenses are calculated using the Fund’s annualized net expense ratio for each class, which represents the ongoing expenses as a percentage of net assets for the six months ended June 30, 2023. Expenses are calculated by multiplying the annualized net expense ratio by the average account value for the period; then multiplying the result by the number of days in the most recent fiscal half year (or, since inception, if shorter); and then dividing that result by the number of days in the period. The annualized net expense ratios for the period were 0.42% and 0.67% for Institutional Shares and Service Shares, respectively. | |
| | + | Hypothetical expenses are based on the Fund’s actual annualized net expense ratio and an assumed rate of return of 5% per year before expenses. | |
| | |
| TRUSTEES | | OFFICERS |
| Gregory G. Weaver, Chair | | James A. McNamara, President |
| Dwight L. Bush | | Joseph F. DiMaria, Principal Financial Officer, Principal Accounting Officer and Treasurer Caroline L. Kraus, Secretary |
| Kathryn A. Cassidy |
| John G. Chou |
Joaquin Delgado |
| Eileen H. Dowling | | |
| James A. McNamara | | |
Paul C. Wirth | | |
GOLDMAN SACHS & CO. LLC
Distributor and Transfer Agent
GOLDMAN SACHS ASSET MANAGEMENT, L.P.
Investment Adviser
200 West Street, New York,
New York 10282
Visit our web site at www.GSAMFUNDS.com to obtain the most recent month-end returns.
The reports concerning the Fund included in this shareholder report may contain certain forward-looking statements about the factors that may affect the performance of the Fund in the future. These statements are based on Fund management’s predictions and expectations concerning certain future events and their expected impact on the Fund, such as performance of the economy as a whole and of specific industry sectors, changes in the levels of interest rates, the impact of developing world events, and other factors that may influence the future performance of the Fund. Management believes these forward-looking statements to be reasonable, although they are inherently uncertain and difficult to predict. Actual events may cause adjustments in portfolio management strategies from those currently expected to be employed.
A description of the policies and procedures that the Fund uses to determine how to vote proxies relating to portfolio securities and information regarding how the Fund voted proxies relating to portfolio securities for the 12-month period ended June 30 is available (i) without charge, upon request by calling 1-800-621-2550; and (ii) on the Securities and Exchange Commission (“SEC”) web site at http://www.sec.gov.
The Fund will file portfolio holdings information for each month in a fiscal quarter within 60 days after the end of the relevant fiscal quarter on Form N-PORT. Portfolio holdings information for the third month of each fiscal quarter will be made available on the SEC’s web site at http://www.sec.gov. Portfolio holdings information may be obtained upon request and without charge by calling 1-800-526-7384 (for Retail Shareholders) or 1-800-621-2550 (for Institutional Shareholders).
Views and opinions expressed are for informational purposes only and do not constitute a recommendation by GSAM to buy, sell, or hold any security. Views and opinions are current as of the date of this presentation and may be subject to change, they should not be construed as investment advice.
Goldman Sachs & Co. LLC (“Goldman Sachs”) does not provide legal, tax or accounting advice. Any statement contained in this communication (including any attachments) concerning U.S. tax matters was not intended or written to be used, and cannot be used, for the purpose of avoiding penalties under the Internal Revenue Code, and was written to support the promotion or marketing of transactions or matters addressed. Clients of Goldman Sachs should obtain their own independent tax advice based on their particular circumstances.
The website links provided are for your convenience only and are not an endorsement or recommendation by GSAM of any of these websites or the products or services offered. GSAM is not responsible for the accuracy and validity of the content of these websites.
Fund holdings and allocations shown are as of June 30, 2023 and may not be representative of future investments. Fund holdings should not be relied on in making investment decisions and should not be construed as research or investment advice regarding particular securities. Current and future holdings are subject to risk.
References to indices, benchmarks or other measures of relative market performance over a specified period of time are provided for your information only and do not imply that the portfolio will achieve similar results. The index composition may not reflect the manner in which a portfolio is constructed. While an adviser seeks to design a portfolio which reflects appropriate risk and return features, portfolio characteristics may deviate from those of the benchmark.
The Global Industry Classification Standard (“GICS”) was developed by and is the exclusive property and a service mark of Morgan Stanley Capital International Inc. (“MSCI”) and Standard & Poor’s, a division of The McGraw-Hill Companies, Inc. (“S&P”) and is licensed for use by Goldman Sachs. Neither MSCI, S&P nor any other party involved in making or compiling the GICS or any GICS classifications makes any express or implied warranties or representations with respect to such standard or classification (or the results to be obtained by the use thereof), and all such parties hereby expressly disclaim all warranties of originality, accuracy, completeness, merchantability or fitness for a particular purpose with respect to any of such standard or classification. Without limiting any of the foregoing, in no event shall MSCI, S&P, any of their affiliates or any third party involved in making or compiling the GICS or any GICS classifications have any liability for any direct, indirect, special, punitive, consequential or any other damages (including lost profits) even if notified of the possibility of such damages.
The portfolio risk management process includes an effort to monitor and manage risk, but does not imply low risk.
Shares of the Goldman Sachs VIT Funds are offered to separate accounts of participating life insurance companies for the purpose of funding variable annuity contracts and variable life insurance policies. Shares of the Funds are not offered directly to the general public. The variable annuity contracts and variable life insurance policies are described in the separate prospectuses issued by participating insurance companies. You should refer to those prospectuses for information about surrender charges, mortality and expense risk fees and other charges that may be assessed by participating insurance companies under the variable annuity contracts or variable life insurance policies. Such fees or charges, if any, may affect the return you may realize with respect to your investments. Ask your representative for more complete information. Please consider a Fund’s objectives, risks and charges and expenses, and read the prospectus carefully before investing. The prospectus contains this and other information about the Funds.
This material is not authorized for distribution to prospective investors unless preceded or accompanied by a current prospectus or summary prospectus, if applicable. Investors should consider the Funds’ objective, risks, and charges and expenses, and read the summary prospectus, if available, and/or the prospectus carefully before investing or sending money. The summary prospectus, if available, and the prospectus contain this and other information about the Funds and may be obtained from your authorized dealer or from Goldman Sachs & Co. LLC by calling 1-800-621-2550.
This report is prepared for the general information of contract owners and is not an offer of shares of the Goldman Sachs Variable Insurance Trust Core Fixed Income Fund.
© 2023 Goldman Sachs. All rights reserved.
VITFISAR-23/330970-OTU-08/2023
Goldman
Sachs Variable Insurance Trust
Goldman Sachs International Equity Insights Fund
Goldman Sachs Large Cap Value Fund
Goldman Sachs Mid Cap Growth Fund
Goldman Sachs Mid Cap Value Fund
Goldman Sachs Small Cap Equity Insights Fund
Goldman Sachs Strategic Growth Fund
Goldman Sachs U.S. Equity Insights Fund
Semi-Annual Report
June 30, 2023

Goldman Sachs Variable Insurance Trust
| ∎ | | GOLDMAN SACHS INTERNATIONAL EQUITY INSIGHTS FUND |
| ∎ | | GOLDMAN SACHS LARGE CAP VALUE FUND |
| ∎ | | GOLDMAN SACHS MID CAP GROWTH FUND |
| ∎ | | GOLDMAN SACHS MID CAP VALUE FUND |
| ∎ | | GOLDMAN SACHS SMALL CAP EQUITY INSIGHTS FUND |
| ∎ | | GOLDMAN SACHS STRATEGIC GROWTH FUND |
| ∎ | | GOLDMAN SACHS U.S. EQUITY INSIGHTS FUND |
| | | | |
| | | |
| NOT FDIC-INSURED | | May Lose Value | | No Bank Guarantee |
MARKET REVIEW
Goldman Sachs VIT Equity Funds
The following are highlights both of key factors affecting the U.S. and international equity markets and of any key changes made to the Goldman Sachs VIT Equity Funds (the “Funds”) during the six months ended June 30, 2023 (the “Reporting Period”). Attribution highlights are provided for those Funds that materially outperformed or underperformed their respective benchmark during the Reporting Period. A fuller review will appear in the Funds’ annual shareholder report covering the 12 months ended December 31, 2023.
Market and Economic Review
U.S. Equities
| • | | Overall, U.S. equities rallied during the Reporting Period following poor performance in 2022. The Standard & Poor’s 500® Index (the “S&P 500 Index”) ended the Reporting Period with a return of 16.89%, its best first-half showing since 2019 and second best since 1998. The Russell 3000® Index generated a return of 16.17%. |
| • | | The U.S. equity market’s strength was predominantly driven throughout the Reporting Period by disinflation momentum, an upswing in soft economic landing expectations and consumer resilience. (A soft landing, in economics, is a cyclical slowdown in economic growth that avoids recession.) |
| • | | During the first quarter of 2023, the S&P 500 Index returned 7.53%, marking its second straight quarterly gain. |
| | • | | Following a stellar start to the calendar year, February 2023 proved to be a setback for the disinflation path after nonfarm payrolls data illustrated the largest job growth in six months, and the U.S. unemployment rate fell to a 53-year low, in turn pushing market forecasts for the U.S. Federal Reserve’s (“Fed”) terminal rate upward. (The terminal federal funds rate is the ultimate interest rate level the Fed sets as its target for a cycle of rate hikes or cuts.) |
| | • | | The January 2023 Producer Price Index (“PPI”) and core Personal Consumption Expenditure (“PCE”) Index saw their largest monthly increases since mid-2022, illustrating that more work was needed to combat inflation. |
| | • | | The bearish case was further supported by a disappointing fourth quarter 2022 corporate earnings season, as margins came under pressure by persistently high input costs and weaker demand. (Bearish refers to an expected downward movement in the prices of securities.) |
| | • | | Consensus forecasts for the Fed’s interest rate path took a dovish turn in March 2023 due to an abrupt banking crisis that escalated the risk of raising interest rates. Economic data in March also contributed to the dovish sentiment, as February 2023 PPI, PCE and personal income growth data were cooler than expected. (Dovish suggests lower interest rates; opposite of hawkish.) |
| | • | | On the geopolitical front, the most constructive takeaways came from China’s accelerated economic re-opening following its unanticipated zero-COVID policy pivot toward the end of 2022 as well as Europe’s warmer than anticipated weather that helped avoid an energy crisis. |
| • | | During the second quarter of 2023, the S&P 500 Index returned 8.74%, marking its third consecutive quarterly gain. |
| | • | | In addition to those factors that drove strong performance throughout the Reporting Period, second quarter results were boosted by a better than consensus expected first quarter 2023 corporate earnings season and persistent enthusiasm around artificial intelligence (“AI”), including the possibility for a boom in AI-related chipmakers. |
| | • | | In turn, growth stocks significantly outperformed their value counterparts, as mega-cap technology stocks accounted for a vast majority of the S&P 500 Index’s rally in the quarter. |
| | • | | First quarter 2023 corporate earnings metrics, although supported by a lower bar, were well above their one-year averages due to a combination of ongoing pricing power, supply-chain normalization, cost-cutting initiatives and margin expansion. |
| | • | | Disinflation progress was highlighted by a cooler than consensus expected May 2023 Consumer Price Index reading, as the inflation rate fell to 4.0%, the lowest level in more than two years, on the back of lower energy |
MARKET REVIEW
| | prices. The May PPI and headline PCE Index data also came in below consensus market forecasts. Furthermore, transitory inflation pressures, such as supply-chain disruptions, continued to fade throughout the quarter. |
| | • | | The soft landing narrative continued to take form with a still-tight labor market and robust housing market helping to counteract the possibility of a recession. |
| | • | | Despite the S&P 500 Index’s strong second calendar quarter, there were numerous bearish takeaways. |
| | • | | These primarily surrounded the implacable higher-for-longer messaging from the Fed. Although the June Fed meeting left the federal funds rate unchanged, Fed Chair Powell made a hawkish statement that the Fed is open to additional rate hikes before year end. |
| | • | | Concentrated market leadership was another concern for investors that raised doubts about the sustainability of the U.S. equity market rally. |
| | • | | On the geopolitical front, a slower than consensus expected economic recovery in China presented an additional setback for the market. |
| • | | During the Reporting Period overall, all segments of the U.S. equity markets gained ground, but large-cap stocks were strongest, followed by mid-cap stocks and then small-cap stocks. In a reversal from 2022, growth stocks meaningfully outperformed value stocks on a relative basis across the capitalization spectrum during the Reporting Period. |
| • | | Eight of the 11 sectors of the S&P 500 Index gained during the Reporting Period. In another reversal from 2022, the best performing sectors by far within the S&P 500 Index during the Reporting Period were information technology, communication services and consumer discretionary. The weakest performing sectors during the Reporting Period were utilities, energy and health care. |
International Equities
| • | | Representing the developed international equity markets, the MSCI EAFE Index (net) (“MSCI EAFE Index”) returned 11.67%, during the Reporting Period, underperforming the U.S. equity market, as represented by the 16.89% return of the S&P 500 Index. |
| • | | During the first quarter of 2023, the MSCI EAFE Index returned 8.47%. |
| | • | | International equities rose solidly in January 2023, as markets performed well on the back of softening global inflationary pressures in the U.S. and Europe, the slowing pace of central bank interest rate hikes and receding concerns about recession. Additionally, China finally lifted its stringent zero-COVID policy, which increased global hopes around both the resolution of supply-chain disruptions as well as economic recovery driven by strong domestic consumption. |
| | • | | The MSCI EAFE Index then fell in February 2023. Market sentiment was governed by dampening expectations around potential peaking of interest rate hikes and continued geopolitical tensions between Russia and Ukraine one year after Russia’s initial invasion. |
| | • | | International equities gained in March 2023, with market sentiment boosted, as it had been at the start of the new calendar year, by speculation around the potential peaking of inflation, the slowing pace of central bank interest rate hikes and receding concerns about a global recession—all despite banking tensions that arose during the month in the U.S. and internationally. |
| • | | During the second quarter of 2023, the MSCI EAFE Index returned 2.95%. |
| | • | | International equities continued to rise in April 2023, recovering slightly from the banking turmoil that plagued March. |
| | • | | Headline inflation in Europe fell sharply as energy prices continued to decline globally. |
| | • | | China continued to experience reopening-driven economic growth, even as geopolitical concerns around U.S./China tensions weakened investor sentiment toward the country. |
MARKET REVIEW
| | • | | The Japanese equity market rose for the fourth consecutive month, driven largely by new Bank of Japan governor Kazuo Ueda declaring a commitment to an ultra-loose monetary easing policy and famed U.S. investor Warren Buffet declaring he planned to add to his Japanese equity investments. |
| | • | | The MSCI EAFE Index fell in May 2023, as high inflation rates persisted globally, sustained wage growth raised concerns around peak monetary policy rates being higher than earlier expected, and worries around the U.S. debt ceiling loomed over the markets. |
| | • | | International equities rebounded in June 2023, as overall, the global economic outlook eased, reducing the risk of falling into a recession. |
| | • | | The Bank of England hiked its interest rates more than consensus expected to combat sticky inflation, encouraging other central banks to continue policy tightening. |
| | • | | China’s recovery-fueled momentum slowed, leading to its central bank cutting multiple key lending rates. |
| | • | | In Japan, import prices began to ease along with other inflation drivers. |
| • | | Ten of the 11 sectors in the MSCI EAFE Index posted positive returns during the Reporting Period. The best performing sectors within the MSCI EAFE Index during the Reporting Period were information technology, consumer discretionary and industrials. The weakest performing sector and the only one to post a negative absolute return during the Reporting Period was real estate. Energy and materials generated positive total returns but also significantly lagged the MSCI EAFE Index during the Reporting Period. |
| • | | The best performing countries within the MSCI EAFE Index were Ireland, Italy, Spain, the Netherlands and France. The weakest performing countries in the MSCI EAFE Index were Canada, Finland, Norway, Hong Kong and Israel, each of which posted a negative absolute return during the Reporting Period. |
Fund Changes and Highlights
No material changes were made to the Funds during the Reporting Period.
Goldman Sachs VIT Mid Cap Growth Fund
| • | | The Fund underperformed its benchmark, the Russell Mid Cap® Growth Index (with dividends reinvested) (the “Russell Index), during the Reporting Period. |
| • | | Stock selection and sector allocation decisions overall detracted from the Fund’s performance during the Reporting Period. |
| | • | | Stock selection in consumer discretionary, financials and information technology detracted most from the Fund’s relative results during the Reporting Period. |
| | • | | Having an average underweighted allocation to information technology, the second-strongest performing sector in the Russell Index during the Reporting Period, also hurt. |
| | • | | Having a position, albeit modest, in cash during a Reporting Period when the Russell Index experienced a double-digit gain, further dampened results. |
| • | | These detractors were only partially offset by the positive contributions made by effective stock selection in health care, energy and communication services. |
| | • | | Within health care, both stock selection and allocation positioning within the life sciences tools & services industry helped most. |
| | • | | Within energy, stock selection within the oil, gas & consumable fuels industry and having no exposure to the energy equipment & services industry boosted results most. |
| | • | | Within communication services, stock selection and allocation positioning within the media industry added the most value, partially offset by weak stock selection and allocation positioning within the entertainment industry, which detracted. |
MARKET REVIEW
Goldman Sachs VIT Small Cap Equity Insights Fund
| • | | The Fund outperformed its benchmark, the Russell 2000® Index (with dividends reinvested) (the “Russell Index”), during the Reporting Period. |
| • | | During the Reporting Period, the Fund outperformed the Russell Index on a relative basis, with all four of our quantitative model’s investment themes contributing positively. Stock selection overall, driven by these investment themes, boosted relative performance. |
| | • | | High Quality Business Models and Sentiment Analysis bolstered relative results most, followed by Fundamental Mispricings and Market Themes & Trends. |
| | • | | High Quality Business Models seeks to identify companies that are generating high quality revenues with sustainable business models and aligned management incentives. |
| | • | | Sentiment Analysis seeks to identify stocks experiencing improvements in their overall market sentiment. |
| | • | | Fundamental Mispricings seeks to identify high quality businesses trading at a fair price, which we believe may lead to strong performance over the long run. |
| | • | | Market Themes & Trends seeks to identify companies positively positioned to benefit from themes and trends in the market and macroeconomic environment. |
| | • | | Stock selection in the financials, consumer discretionary and consumer staples sectors contributed the most positively to the Fund’s relative returns during the Reporting Period. Conversely, certain individual stock positions, especially in the energy, health care and communication services sectors, detracted from the Fund’s relative returns. |
FUND BASICS
International Equity Insights Fund
as of June 30, 2023
PERFORMANCE REVIEW
| | | | | | | | |
| | |
| January 1, 2023–June 30, 2023 | | Fund Total Return
(based on NAV)1 | | | MSCI EAFE Standard Index2 | |
| Institutional | | | 12.01 | % | | | 11.67 | % |
| Service | | | 11.82 | | | | 11.67 | |
| 1 | The net asset value (“NAV”) represents the net assets of the class of the Fund (ex-dividend) divided by the total number of shares of the class outstanding. The Fund’s performance assumes the reinvestment of dividends and other distributions. The Fund’s performance does not reflect the deduction of any applicable sales charges. |
| 2 | The MSCI EAFE Standard Index is a market capitalization-weighted composite of securities in 21 developed markets. The MSCI EAFE Standard Index approximates the minimum possible dividend reinvestment. The dividend is reinvested after deduction for withholding tax, applying the rate to non-resident individuals who do not benefit from double taxation treaties. MSCI uses withholding tax rates applicable to Luxembourg holding companies, as Luxembourg applies the highest rates. The MSCI EAFE Standard Index is unmanaged and the figures for the Index do not include any deduction for fees or expenses. |
The returns set forth in the table above represent past performance. Past performance does not guarantee future results. The Fund’s investment return and principal value will fluctuate so that an investor’s shares, when redeemed, may be worth more or less than their original cost. Current performance may be lower or higher than the performance quoted above. Please visit our web site at www.GSAMFUNDS.com to obtain the most recent month-end returns. Performance reflects applicable fee waivers and/or expense limitations in effect during the periods shown. In their absence, performance would be reduced. Returns do not reflect the deduction of taxes that a shareholder would pay on Fund distributions or the redemption of Fund shares.
TOP TEN HOLDINGS AS OF 6/30/233
| | | | | | |
| | |
| Holding | | % of Net Assets | | | Line of Business |
| ASML Holding NV | | | 2.6% | | | Semiconductors & Semiconductor Equipment |
| Novo Nordisk A/S, Class B | | | 2.1 | | | Pharmaceuticals, Biotechnology & Life Sciences |
| Roche Holding AG | | | 1.7 | | | Pharmaceuticals, Biotechnology & Life Sciences |
| AstraZeneca PLC ADR | | | 1.4 | | | Pharmaceuticals, Biotechnology & Life Sciences |
| SAP SE | | | 1.4 | | | Software & Services |
| Sanofi | | | 1.3 | | | Pharmaceuticals, Biotechnology & Life Sciences |
| Novartis AG | | | 1.3 | | | Pharmaceuticals, Biotechnology & Life Sciences |
| Shell PLC | | | 1.3 | | | Energy |
| Hermes International | | | 1.2 | | | Consumer Durables & Apparel |
| British American Tobacco PLC | | | 1.1 | | | Food, Beverage & Tobacco |
| 3 | The top 10 holdings may not be representative of the Fund’s future investments. |
FUND BASICS
FUND VS. BENCHMARK SECTOR ALLOCATIONS4
As of June 30, 2023
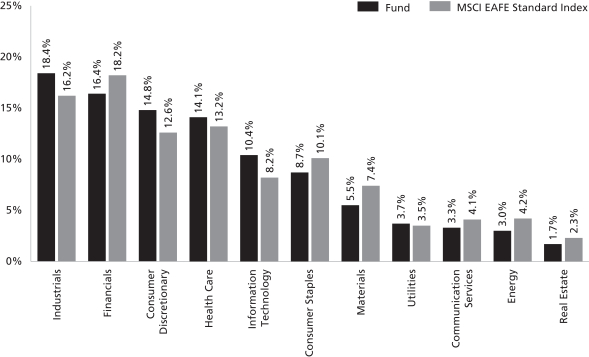
| 4 | The Fund is actively managed and, as such, its composition may differ over time. Consequently, the Fund’s overall sector allocations may differ from percentages contained in the graph above. The graph categorizes investments using Global Industry Classification Standard (“GICS”); however, the sector classifications used by the portfolio management team may differ from GICS. The percentage shown for each investment category reflects the value of investments in that category as a percentage of market value (excluding investments in the securities lending reinvestment vehicle, if any). |
For more information about your Fund, please refer to www.GSAMFUNDS.com. There, you can learn more about your Fund’s investment strategies, holdings, and performance.
FUND BASICS
Large Cap Value Fund
as of June 30, 2023
PERFORMANCE REVIEW
| | | | | | | | |
| | |
| January 1, 2023–June 30, 2023 | | Fund Total Return
(based on NAV)1 | | | Russell 1000 Value Index2 | |
| Institutional | | | 5.40 | % | | | 5.12 | % |
| Service | | | 5.27 | | | | 5.12 | |
| 1 | The net asset value (“NAV”) represents the net assets of the class of the Fund (ex-dividend) divided by the total number of shares of the class outstanding. The Fund’s performance assumes the reinvestment of dividends and other distributions. The Fund’s performance does not reflect the deduction of any applicable sales charges. |
| 2 | The Russell 1000® Value Index (with dividends reinvested) is an unmanaged market capitalization weighted index of the 1000 largest U.S. companies with lower price-to-book ratios and lower forecasted growth values. The figures for the Russell 1000® Value Index do not include any deduction for fees, expenses or taxes. It is not possible to invest directly in an unmanaged index. |
The returns set forth in the table above represent past performance. Past performance does not guarantee future results. The Fund’s investment return and principal value will fluctuate so that an investor’s shares, when redeemed, may be worth more or less than their original cost. Current performance may be lower or higher than the performance quoted above. Please visit our web site at www.GSAMFUNDS.com to obtain the most recent month-end returns. Performance reflects applicable fee waivers and/or expense limitations in effect during the periods shown. In their absence, performance would be reduced. Returns do not reflect the deduction of taxes that a shareholder would pay on Fund distributions or the redemption of Fund shares.
TOP TEN HOLDINGS AS OF 6/30/233
| | | | | | |
| | |
| Holding | | % of Net Assets | | | Line of Business |
| JPMorgan Chase & Co. | | | 3.6% | | | Banks |
| Exxon Mobil Corp. | | | 3.6 | | | Energy |
| Walmart, Inc. | | | 2.7 | | | Consumer Staples Distribution & Retail |
| Johnson & Johnson | | | 2.2 | | | Pharmaceuticals, Biotechnology & Life Sciences |
| Bank of America Corp. | | | 2.0 | | | Banks |
| Eaton Corp. PLC | | | 2.0 | | | Capital Goods |
| Bristol-Myers Squibb Co. | | | 1.9 | | | Pharmaceuticals, Biotechnology & Life Sciences |
| Zimmer Biomet Holdings, Inc. | | | 1.9 | | | Health Care Equipment & Services |
| Oracle Corp. | | | 1.9 | | | Software & Services |
| BlackRock, Inc. | | | 1.9 | | | Financial Services |
| 3 | The top 10 holdings may not be representative of the Fund’s future investments. |
FUND BASICS
FUND VS. BENCHMARK SECTOR ALLOCATIONS4
As of June 30, 2023
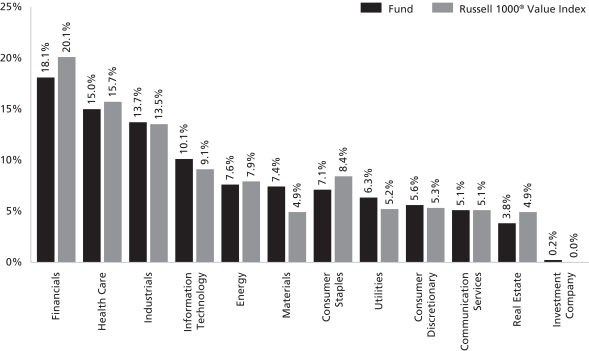
| 4 | The Fund is actively managed and, as such, its composition may differ over time. Consequently, the Fund’s overall sector allocations may differ from percentages contained in the graph above. The graph categorizes investments using Global Industry Classification Standard (“GICS”); however, the sector classifications used by the portfolio management team may differ from GICS. The percentage shown for each investment category reflects the value of investments in that category as a percentage of market value. Underlying sector allocations of exchange traded funds and investment companies held by the Fund are not reflected in the graph above. |
For more information about your Fund, please refer to www.GSAMFUNDS.com. There, you can learn more about your Fund’s investment strategies, holdings, and performance.
FUND BASICS
Mid Cap Growth Fund
as of June 30, 2023
PERFORMANCE REVIEW
| | | | | | | | |
| | |
| January 1, 2023–June 30, 2023 | | Fund Total Return
(based on NAV)1 | | | Russell Midcap
Growth Index2 | |
| Institutional | | | 12.45 | % | | | 15.94 | % |
| Service | | | 12.33 | | | | 15.94 | |
| 1 | The net asset value (“NAV”) represents the net assets of the class of the Fund (ex-dividend) divided by the total number of shares of the class outstanding. The Fund’s performance assumes the reinvestment of dividends and other distributions. The Fund’s performance does not reflect the deduction of any applicable sales charges. |
| 2 | Russell Midcap® Growth Index is an unmanaged index that measures the performance of those companies in the Russell Midcap® Index with higher price-to-book ratios and higher forecasted growth values. It is not possible to invest directly in an unmanaged index. |
The returns set forth in the table above represent past performance. Past performance does not guarantee future results. The Fund’s investment return and principal value will fluctuate so that an investor’s shares, when redeemed, may be worth more or less than their original cost. Current performance may be lower or higher than the performance quoted above. Please visit our web site at www.GSAMFUNDS.com to obtain the most recent month-end returns. Performance reflects applicable fee waivers and/or expense limitations in effect during the periods shown. In their absence, performance would be reduced. Returns do not reflect the deduction of taxes that a shareholder would pay on Fund distributions or the redemption of Fund shares.
TOP TEN HOLDINGS AS OF 6/30/233, 4
| | | | | | |
| | |
| Holding | | % of Net Assets | | | Line of Business |
| Dexcom, Inc. | | | 3.0% | | | Health Care Equipment & Services |
| Rockwell Automation, Inc. | | | 2.7 | | | Capital Goods |
| Trade Desk, Inc. (The), Class A | | | 2.4 | | | Media & Entertainment |
| West Pharmaceutical Services, Inc. | | | 2.2 | | | Pharmaceuticals, Biotechnology & Life Sciences |
| Trane Technologies PLC | | | 2.1 | | | Capital Goods |
| Ross Stores, Inc. | | | 2.0 | | | Consumer Discretionary Distribution & Retail |
| Martin Marietta Materials, Inc. | | | 1.9 | | | Materials |
| Mettler-Toledo International, Inc. | | | 1.9 | | | Pharmaceuticals, Biotechnology & Life Sciences |
| Insulet Corp. | | | 1.8 | | | Health Care Equipment & Services |
| CoStar Group, Inc. | | | 1.8 | | | Real Estate Management & Development |
| 3 | The top 10 holdings may not be representative of the Fund’s future investments. |
| 4 | The top 10 holdings exclude investments in money market funds. |
FUND BASICS
FUND VS. BENCHMARK SECTOR ALLOCATIONS5
As of June 30, 2023
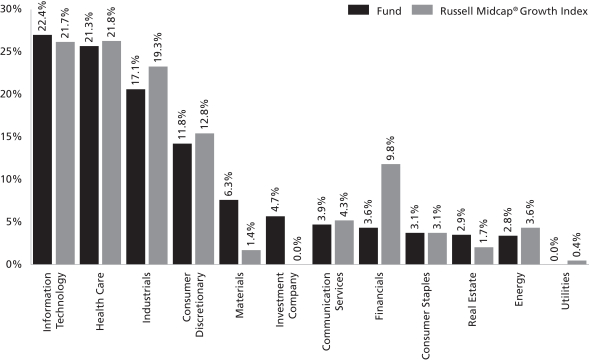
| 5 | The Fund is actively managed and, as such, its composition may differ over time. Consequently, the Fund’s overall sector allocations may differ from percentages contained in the graph above. The graph categorizes investments using Global Industry Classification Standard (“GICS”); however, the sector classifications used by the portfolio management team may differ from GICS. The percentage shown for each investment category reflects the value of investments in that category as a percentage of market value (excluding investments in the securities lending reinvestment vehicle, if any). Underlying sector allocations of exchange traded funds and investment companies held by the Fund are not reflected in the graph above. |
For more information about your Fund, please refer to www.GSAMFUNDS.com. There, you can learn more about your Fund’s investment strategies, holdings, and performance.
FUND BASICS
Mid Cap Value Fund
as of June 30, 2023
PERFORMANCE REVIEW
| | | | | | | | |
| | |
| January 1, 2023–June 30, 2023 | | Fund Total Return
(based on NAV)1 | | | Russell Midcap®
Value Index2 | |
| Institutional | | | 5.37 | % | | | 5.23 | % |
| Service | | | 5.24 | | | | 5.23 | |
| 1 | The net asset value (“NAV”) represents the net assets of the class of the Fund (ex-dividend) divided by the total number of shares of the class outstanding. The Fund’s performance assumes the reinvestment of dividends and other distributions. The Fund’s performance does not reflect the deduction of any applicable sales charges. |
| 2 | The Russell Midcap Value® Index is an unmanaged index of common stock prices that measures the performance of those Russell Midcap companies with lower price-to-book ratios and lower forecasted growth values. The Russell Midcap Value Index figures do not reflect any deduction for fees, expenses or taxes. It is not possible to invest directly in an unmanaged index. |
The returns set forth in the table above represent past performance. Past performance does not guarantee future results. The Fund’s investment return and principal value will fluctuate so that an investor’s shares, when redeemed, may be worth more or less than their original cost. Current performance may be lower or higher than the performance quoted above. Please visit our web site at www.GSAMFUNDS.com to obtain the most recent month-end returns. Performance reflects applicable fee waivers and/or expense limitations in effect during the periods shown. In their absence, performance would be reduced. Returns do not reflect the deduction of taxes that a shareholder would pay on Fund distributions or the redemption of Fund shares.
TOP TEN HOLDINGS AS OF 6/30/233
| | | | | | |
| | |
| Holding | | % of Net Assets | | | Line of Business |
| Martin Marietta Materials, Inc. | | | 2.4% | | | Materials |
| Marvell Technology, Inc. | | | 2.2 | | | Semiconductors & Semiconductor Equipment |
| Zimmer Biomet Holdings, Inc. | | | 2.0 | | | Health Care Equipment & Services |
| Yum! Brands, Inc. | | | 2.0 | | | Consumer Services |
| Cummins, Inc. | | | 1.9 | | | Capital Goods |
| Ross Stores, Inc. | | | 1.9 | | | Consumer Discretionary Distribution & Retail |
| AMETEK, Inc. | | | 1.9 | | | Capital Goods |
| Fortive Corp. | | | 1.7 | | | Capital Goods |
| Ball Corp. | | | 1.7 | | | Materials |
| ITT, Inc. | | | 1.6 | | | Capital Goods |
| 3 | The top 10 holdings may not be representative of the Fund’s future investments. |
FUND BASICS
FUND vs. BENCHMARK SECTOR ALLOCATIONS4
As of June 30, 2023
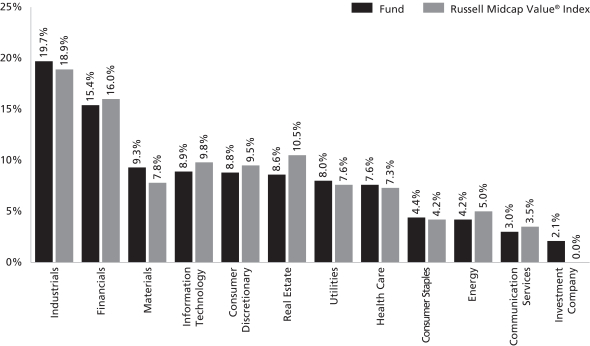
| 4 | The Fund is actively managed and, as such, its composition may differ over time. Consequently, the Fund’s overall sector allocations may differ from percentages contained in the graph above. The graph categorizes investments using Global Industry Classification Standard (“GICS”); however, the sector classifications used by the portfolio management team may differ from GICS. The percentage shown for each investment category reflects the value of investments in that category as a percentage of market value (excluding investments in the securities lending reinvestment vehicle, if any). Underlying sector allocations of exchange traded funds and investment companies held by the Fund are not reflected in the graph above. |
For more information about your Fund, please refer to www.GSAMFUNDS.com. There, you can learn more about your Fund’s investment strategies, holdings, and performance.
FUND BASICS
Small Cap Equity Insights Fund
as of June 30, 2023
PERFORMANCE REVIEW
| | | | | | | | |
| | |
| January 1, 2023–June 30, 2023 | | Fund Total Return
(based on NAV)1 | | | Russell 2000® Index2 | |
| Institutional | | | 10.58 | % | | | 8.09 | % |
| Service | | | 10.52 | | | | 8.09 | |
| 1 | The net asset value (“NAV”) represents the net assets of the class of the Fund (ex-dividend) divided by the total number of shares of the class outstanding. The Fund’s performance assumes the reinvestment of dividends and other distributions. The Fund’s performance does not reflect the deduction of any applicable sales charges. |
| 2 | The Russell 2000® Index (with dividends reinvested) is an unmanaged index of common stock prices that measures the performance of the 2000 smallest companies in the Russell 3000® Index. The figures for the Russell 2000® Index do not include any deduction for fees, expenses or taxes. It is not possible to invest directly in an unmanaged index. |
The returns set forth in the table above represent past performance. Past performance does not guarantee future results. The Fund’s investment return and principal value will fluctuate so that an investor’s shares, when redeemed, may be worth more or less than their original cost. Current performance may be lower or higher than the performance quoted above. Please visit our web site at www.GSAMFUNDS.com to obtain the most recent month-end returns. Performance reflects applicable fee waivers and/or expense limitations in effect during the periods shown. In their absence, performance would be reduced. Returns do not reflect the deduction of taxes that a shareholder would pay on Fund distributions or the redemption of Fund shares.
TOP TEN HOLDINGS AS OF 6/30/233,4
| | | | | | |
| | |
| Holding | | % of Net Assets | | | Line of Business |
| Super Micro Computer, Inc. | | | 1.0% | | | Technology Hardware & Equipment |
| Mueller Industries, Inc. | | | 0.9 | | | Capital Goods |
| American Equity Investment Life Holding Co. | | | 0.9 | | | Insurance |
| Axcelis Technologies, Inc. | | | 0.9 | | | Semiconductors & Semiconductor Equipment |
| Simpson Manufacturing Co., Inc. | | | 0.8 | | | Capital Goods |
| Atkore, Inc. | | | 0.8 | | | Capital Goods |
| Comfort Systems USA, Inc. | | | 0.8 | | | Capital Goods |
| M/I Homes, Inc. | | | 0.8 | | | Consumer Durables & Apparel |
| Asbury Automotive Group, Inc. | | | 0.8 | | | Consumer Discretionary Distribution & Retail |
| CommVault Systems, Inc. | | | 0.8 | | | Software & Services |
| 3 | The top 10 holdings may not be representative of the Fund’s future investments. |
| 4 | The top 10 holdings exclude investments in money market funds. |
FUND BASICS
FUND VS. BENCHMARK SECTOR ALLOCATIONS5
As of June 30, 2023
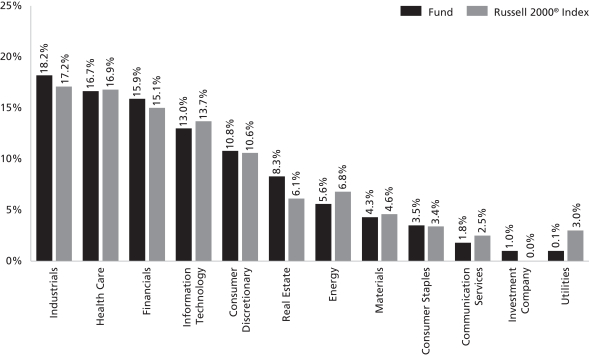
| 5 | The Fund is actively managed and, as such, its composition may differ over time. Consequently, the Fund’s overall sector allocations may differ from percentages contained in the graph above. The graph categorizes investments using Global Industry Classification Standard (“GICS”); however, the sector classifications used by the portfolio management team may differ from GICS. The percentage shown for each investment category reflects the value of investments in that category as a percentage of market value (excluding investments in the securities lending reinvestment vehicle, if any). Underlying sector allocations of exchange traded funds and investment companies held by the Fund are not reflected in the graph above. Investments in the securities lending reinvestment vehicle represented 0.8% of the Fund’s net assets at June 30, 2023. The graph depicts the Fund’s investments but may not represent the Fund’s market exposure due to the exclusion of certain derivatives, if any, as listed in the Additional Investment Information section of the Schedule of Investments. |
For more information about your Fund, please refer to www.GSAMFUNDS.com. There, you can learn more about your Fund’s investment strategies, holdings, and performance.
FUND BASICS
Strategic Growth Fund
as of June 30, 2023
PERFORMANCE REVIEW
| | | | | | | | |
| | |
| January 1, 2023–June 30, 2023 | | Fund Total Return
(based on NAV)1 | | | Russell 1000® Growth Index2 | |
| Institutional | | | 30.11 | % | | | 29.02 | % |
| Service | | | 29.93 | | | | 29.02 | |
| 1 | The net asset value (“NAV”) represents the net assets of the class of the Fund (ex-dividend) divided by the total number of shares of the class outstanding. The Fund’s performance assumes the reinvestment of dividends and other distributions. The Fund’s performance does not reflect the deduction of any applicable sales charges. |
| 2 | The Russell 1000® Growth Index (with dividends reinvested) is an unmanaged market capitalization weighted index of the 1000 largest U.S. companies with higher price-to-book ratios and higher forecasted growth values. The figures for the index do not include any deduction for fees, expenses or taxes. It is not possible to invest directly in an unmanaged index. |
The returns set forth in the table above represent past performance. Past performance does not guarantee future results. The Fund’s investment return and principal value will fluctuate so that an investor’s shares, when redeemed, may be worth more or less than their original cost. Current performance may be lower or higher than the performance quoted above. Please visit our web site at www.GSAMFUNDS.com to obtain the most recent month-end returns. Performance reflects applicable fee waivers and/or expense limitations in effect during the periods shown. In their absence, performance would be reduced. Returns do not reflect the deduction of taxes that a shareholder would pay on Fund distributions or the redemption of Fund shares.
TOP TEN HOLDINGS AS OF 6/30/233
| | | | | | |
| | |
| Holding | | % of Net Assets | | | Line of Business |
| Apple, Inc. | | | 13.6% | | | Technology Hardware & Equipment |
| Microsoft Corp. | | | 11.9 | | | Software & Services |
| NVIDIA Corp. | | | 6.5 | | | Semiconductors & Semiconductor Equipment |
| Amazon.com, Inc. | | | 6.1 | | | Consumer Discretionary Distribution & Retail |
| Alphabet, Inc., Class A | | | 4.1 | | | Media & Entertainment |
| Mastercard, Inc., Class A | | | 3.0 | | | Financial Services |
| Eli Lilly & Co. | | | 2.6 | | | Pharmaceuticals, Biotechnology & Life Sciences |
| Alphabet, Inc., Class C | | | 2.5 | | | Media & Entertainment |
| Tesla, Inc. | | | 2.4 | | | Automobiles & Components |
| Marvell Technology, Inc. | | | 1.9 | | | Semiconductors & Semiconductor Equipment |
| 3 | The top 10 holdings may not be representative of the Fund’s future investments. |
FUND BASICS
FUND vs. BENCHMARK SECTOR ALLOCATIONS4
As of June 30, 2023
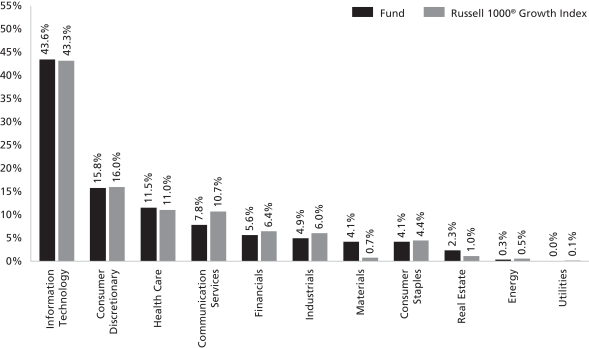
| 4 | The Fund is actively managed and, as such, its composition may differ over time. Consequently, the Fund’s overall sector allocations may differ from percentages contained in the graph above. The graph categorizes investments using Global Industry Classification Standard (“GICS”); however, the sector classifications used by the portfolio management team may differ from GICS. The percentage shown for each investment category reflects the value of investments in that category as a percentage of market value (excluding investments in the securities lending reinvestment vehicle, if any). |
For more information about your Fund, please refer to www.GSAMFUNDS.com. There, you can learn more about your Fund’s investment strategies, holdings, and performance.
FUND BASICS
U.S. Equity Insights Fund
as of June 30, 2023
PERFORMANCE REVIEW
| | | | | | | | |
| | |
| January 1, 2023–June 30, 2023 | | Fund Total Return
(based on NAV)1 | | | S&P 500 Index2 | |
| Institutional | | | 14.42 | % | | | 16.89 | % |
| Service | | | 14.29 | | | | 16.89 | |
| 1 | The net asset value (“NAV”) represents the net assets of the class of the Fund (ex-dividend) divided by the total number of shares of the class outstanding. The Fund’s performance assumes the reinvestment of dividends and other distributions. The Fund’s performance does not reflect the deduction of any applicable sales charges. |
| 2 | The S&P 500® Index is the Standard & Poor’s composite index of 500 stocks, an unmanaged index of common stock prices. The figures for the index do not include any deduction for fees, expenses or taxes. It is not possible to invest directly in an unmanaged index. |
The returns set forth in the table above represent past performance. Past performance does not guarantee future results. The Fund’s investment return and principal value will fluctuate so that an investor’s shares, when redeemed, may be worth more or less than their original cost. Current performance may be lower or higher than the performance quoted above. Please visit our web site at www.GSAMFUNDS.com to obtain the most recent month-end returns. Performance reflects applicable fee waivers and/or expense limitations in effect during the periods shown. In their absence, performance would be reduced. Returns do not reflect the deduction of taxes that a shareholder would pay on Fund distributions or the redemption of Fund shares.
TOP TEN HOLDINGS AS OF 6/30/233
| | | | | | |
| | |
| Holding | | % of Net Assets | | | Line of Business |
| Microsoft Corp. | | | 6.9% | | | Software & Services |
| Apple, Inc. | | | 6.7 | | | Technology Hardware & Equipment |
| NVIDIA Corp. | | | 3.5 | | | Semiconductors & Semiconductor Equipment |
| Berkshire Hathaway, Inc., Class B | | | 2.7 | | | Financial Services |
| Alphabet, Inc., Class C | | | 2.7 | | | Media & Entertainment |
| Amazon.com, Inc. | | | 2.7 | | | Consumer Discretionary Distribution & Retail |
| Alphabet, Inc., Class A | | | 1.8 | | | Media & Entertainment |
| Coca-Cola Co. (The) | | | 1.6 | | | Food, Beverage & Tobacco |
| Tesla, Inc. | | | 1.6 | | | Automobiles & Components |
| Bank of America Corp. | | | 1.5 | | | Banks |
| 3 | The top 10 holdings may not be representative of the Fund’s future investments. |
FUND BASICS
FUND vs. BENCHMARK SECTOR ALLOCATIONS4
As of June 30, 2023
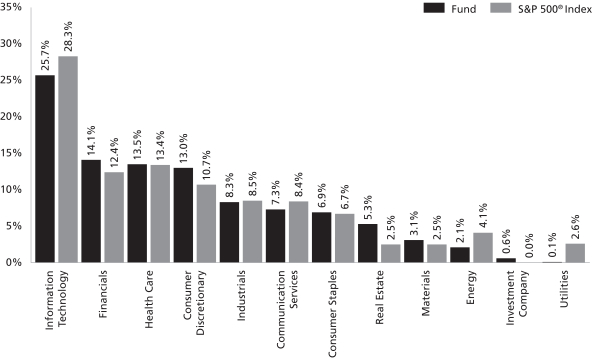
| 4 | The Fund is actively managed and, as such, its composition may differ over time. Consequently, the Fund’s overall sector allocations may differ from percentages contained in the graph above. The graph categorizes investments using Global Industry Classification Standard (“GICS”); however, the sector classifications used by the portfolio management team may differ from GICS. The percentage shown for each investment category reflects the value of investments in that category as a percentage of market value. |
For more information about your Fund, please refer to www.GSAMFUNDS.com. There, you can learn more about
your Fund’s investment strategies, holdings, and performance.
GOLDMAN SACHS VARIABLE INSURANCE TRUST INTERNATIONAL EQUITY INSIGHTS FUND
Schedule of Investments
June 30, 2023 (Unaudited)
| | | | | | | | |
| Shares | | | Description | | Value | |
|
| Common Stocks – 97.9% | |
| Australia – 7.5% | | | |
| | 15,263 | | | ASX Ltd. (Financial Services) | | $ | 642,313 | |
| | 35,864 | | | BHP Group Ltd. (Materials) | | | 1,078,142 | |
| | 15,943 | | | BlueScope Steel Ltd. (Materials) | | | 219,421 | |
| | 4,281 | | | Cochlear Ltd. (Health Care Equipment & Services) | | | 655,884 | |
| | 12,651 | | | Commonwealth Bank of Australia (Banks) | | | 846,944 | |
| | 1,077 | | | Fortescue Metals Group Ltd. (Materials) | | | 15,981 | |
| | 137,403 | | | Glencore PLC (Materials) | | | 779,060 | |
| | 15,709 | | | Goodman Group REIT (Equity Real Estate Investment Trusts) | | | 211,174 | |
| | 2,820 | | | National Australia Bank Ltd. (Banks) | | | 49,598 | |
| | 40,267 | | | Perseus Mining Ltd. (Materials) | | | 44,732 | |
| | 137,195 | | | Qantas Airways Ltd. (Transportation)* | | | 568,552 | |
| | 120,809 | | | Scentre Group REIT (Equity Real Estate Investment Trusts) | | | 213,652 | |
| | 3,532 | | | Seven Group Holdings Ltd. (Capital Goods) | | | 58,248 | |
| | 64,449 | | | Telstra Group Ltd. (Telecommunication Services) | | | 184,885 | |
| | 13,464 | | | WiseTech Global Ltd. (Software & Services) | | | 722,186 | |
| | 37,883 | | | Woodside Energy Group Ltd. (Energy) | | | 876,294 | |
| | 32,734 | | | Woolworths Group Ltd. (Consumer Staples Distribution & Retail) | | | 867,328 | |
| | | | | | | | |
| | | | | | | 8,034,394 | |
| | |
| Austria – 0.6% | | | |
| | 2,172 | | | BAWAG Group AG (Banks)*(a) | | | 100,134 | |
| | 2,814 | | | Erste Group Bank AG (Banks) | | | 98,709 | |
| | 5,333 | | | Raiffeisen Bank International AG (Banks)* | | | 84,629 | |
| | 8,885 | | | Strabag SE (Capital Goods) | | | 361,150 | |
| | | | | | | | |
| | | | | | | 644,622 | |
| | |
| Belgium – 0.5% | | | |
| | 3,506 | | | Anheuser-Busch InBev SA/NV (Food, Beverage & Tobacco) | | | 198,711 | |
| | 685 | | | D’ieteren Group (Consumer Discretionary Distribution & Retail) | | | 121,235 | |
| | 3,739 | | | KBC Ancora (Banks) | | | 170,946 | |
| | 863 | | | Melexis NV (Semiconductors & Semiconductor Equipment) | | | 84,745 | |
| | | | | | | | |
| | | | | | | 575,637 | |
| | |
| China – 0.7% | | | |
| | 9,500 | | | BOC Aviation Ltd. (Capital Goods)(a) | | | 76,999 | |
| | 128,500 | | | BOC Hong Kong Holdings Ltd. (Banks) | | | 393,638 | |
| | 243,100 | | | Yangzijiang Shipbuilding Holdings Ltd. (Capital Goods) | | | 270,468 | |
| | | | | | | | |
| | | | | | | 741,105 | |
| | |
|
| Common Stocks – (continued) | |
| Denmark – 3.0% | | | |
| | 13 | | | AP Moller — Maersk A/S, Class A (Transportation) | | | 22,668 | |
| | 2,036 | | | Carlsberg AS, Class B (Food, Beverage & Tobacco) | | | 326,027 | |
| | 1,011 | | | Genmab A/S (Pharmaceuticals, Biotechnology & Life Sciences)* | | | 383,127 | |
| | 2,941 | | | Jyske Bank A/S (Banks)* | | | 223,729 | |
| | 13,971 | | | Novo Nordisk A/S, Class B (Pharmaceuticals, Biotechnology & Life Sciences) | | | 2,256,873 | |
| | | | | | | | |
| | | | | | | 3,212,424 | |
| | |
| Finland – 1.4% | | | |
| | 10,467 | | | Kone OYJ, Class B (Capital Goods) | | | 546,844 | |
| | 1,948 | | | Konecranes OYJ (Capital Goods) | | | 78,456 | |
| | 26,193 | | | Nokia OYJ (Technology Hardware & Equipment) | | | 109,745 | |
| | 15,766 | | | Sampo OYJ, Class A (Insurance) | | | 708,090 | |
| | | | | | | | |
| | | | | | | 1,443,135 | |
| | |
| France – 11.0% | | | |
| | 4,306 | | | Adevinta ASA (Media & Entertainment)* | | | 28,296 | |
| | 5,348 | | | Airbus SE (Capital Goods) | | | 773,223 | |
| | 21,671 | | | AXA SA (Insurance) | | | 640,407 | |
| | 3,329 | | | Dassault Aviation SA (Capital Goods) | | | 666,969 | |
| | 18,708 | | | Dassault Systemes (Software & Services) | | | 828,970 | |
| | 12,607 | | | Edenred (Financial Services) | | | 844,472 | |
| | 6,278 | | | Eiffage SA (Capital Goods) | | | 655,477 | |
| | 51,921 | | | Engie SA (Utilities) | | | 864,636 | |
| | 2,613 | | | EssilorLuxottica SA (Health Care Equipment & Services) | | | 492,734 | |
| | 573 | | | Hermes International (Consumer Durables & Apparel) | | | 1,245,542 | |
| | 8,975 | | | Legrand SA (Capital Goods) | | | 890,355 | |
| | 663 | | | LVMH Moet Hennessy Louis Vuitton SE (Consumer Durables & Apparel) | | | 625,151 | |
| | 13,130 | | | Rexel SA (Capital Goods) | | | 324,494 | |
| | 5,459 | | | Safran SA (Capital Goods) | | | 855,479 | |
| | 6,044 | | | Societe Generale SA (Banks) | | | 157,182 | |
| | 5,211 | | | Thales SA (Capital Goods) | | | 780,759 | |
| | 6,267 | | | Vinci SA (Capital Goods) | | | 728,197 | |
| | 7,710 | | | Worldline SA (Financial Services)*(a) | | | 282,340 | |
| | | | | | | | |
| | | | | | | 11,684,683 | |
| | |
| Germany – 7.2% | |
| | 8,326 | | | Bayerische Motoren Werke AG (Automobiles & Components) | | | 1,024,157 | |
| | 1,190 | | | Beiersdorf AG (Household & Personal Products) | | | 157,584 | |
| | 553 | | | Carl Zeiss Meditec AG (Health Care Equipment & Services) | | | 59,804 | |
| | 14,273 | | | Deutsche Bank AG (Financial Services) | | | 150,049 | |
| | 183 | | | Deutsche Boerse AG (Financial Services) | | | 33,784 | |
| | |
| | |
| The accompanying notes are an integral part of these financial statements. | | 19 |
GOLDMAN SACHS VARIABLE INSURANCE TRUST INTERNATIONAL EQUITY INSIGHTS FUND
Schedule of Investments (continued)
June 30, 2023 (Unaudited)
| | | | | | | | |
| Shares | | | Description | | Value | |
|
| Common Stocks – (continued) | |
| Germany – (continued) | |
| | 13,341 | | | Deutsche Lufthansa AG (Transportation)* | | $ | 136,793 | |
| | 61,631 | | | E.ON SE (Utilities) | | | 787,300 | |
| | 7,940 | | | Fresenius SE & Co. KGaA (Health Care Equipment & Services) | | | 220,230 | |
| | 4,192 | | | GEA Group AG (Capital Goods) | | | 175,503 | |
| | 1,652 | | | HUGO BOSS AG (Consumer Durables & Apparel) | | | 129,122 | |
| | 26,643 | | | Infineon Technologies AG (Semiconductors & Semiconductor Equipment) | | | 1,097,219 | |
| | 2,251 | | | MTU Aero Engines AG (Capital Goods) | | | 583,840 | |
| | 2,657 | | | Muenchener Rueckversicherungs-Gesellschaft AG in Muenchen (Insurance) | | | 997,472 | |
| | 323 | | | Nemetschek SE (Software & Services) | | | 24,114 | |
| | 10,881 | | | SAP SE (Software & Services) | | | 1,486,426 | |
| | 3,678 | | | Siemens AG (Capital Goods) | | | 613,126 | |
| | | | | | | | |
| | | | | | | 7,676,523 | |
| | |
| Hong Kong – 1.7% | |
| | 33,600 | | | AIA Group Ltd. (Insurance) | | | 341,258 | |
| | 10,700 | | | Hong Kong Exchanges & Clearing Ltd. (Financial Services) | | | 405,413 | |
| | 13,900 | | | Jardine Matheson Holdings Ltd. (Capital Goods) | | | 697,502 | |
| | 24,000 | | | Sun Hung Kai Properties Ltd. (Real Estate Management & Development) | | | 303,231 | |
| | 35,000 | | | Swire Pacific Ltd., Class B (Real Estate Management & Development) | | | 44,164 | |
| | | | | | | | |
| | | | | | | 1,791,568 | |
| | |
| Italy – 2.2% | |
| | 8,158 | | | Banca Mediolanum SpA (Financial Services) | | | 73,794 | |
| | 51,694 | | | Banco BPM SpA (Banks) | | | 240,110 | |
| | 79,599 | | | Enel SpA (Utilities) | | | 536,691 | |
| | 165 | | | Ferrari NV (Automobiles & Components) | | | 53,946 | |
| | 24,014 | | | Leonardo SpA (Capital Goods) | | | 272,676 | |
| | 7,731 | | | Prysmian SpA (Capital Goods) | | | 323,339 | |
| | 549 | | | Reply SpA (Software & Services) | | | 62,417 | |
| | 27,430 | | | UniCredit SpA (Banks) | | | 637,846 | |
| | 23,614 | | | Unipol Gruppo SpA (Insurance) | | | 126,193 | |
| | | | | | | | |
| | | | | | | 2,327,012 | |
| | |
| Japan – 24.4% | |
| | 3,700 | | | Air Water, Inc. (Materials) | | | 51,366 | |
| | 17,000 | | | Aisan Industry Co. Ltd. (Automobiles & Components) | | | 138,749 | |
| | 5,600 | | | Aisin Corp. (Automobiles & Components) | | | 172,933 | |
| | 1,300 | | | Amiyaki Tei Co. Ltd. (Consumer Services) | | | 32,900 | |
| | |
|
| Common Stocks – (continued) | |
| Japan – (continued) | |
| | 4,700 | | | Asahi Kasei Corp. (Materials) | | | 31,824 | |
| | 20,100 | | | Asia Pile Holdings Corp. (Materials) | | | 86,095 | |
| | 49,300 | | | Astellas Pharma, Inc. (Pharmaceuticals, Biotechnology & Life Sciences) | | | 734,199 | |
| | 11,400 | | | Avex, Inc. (Media & Entertainment) | | | 119,658 | |
| | 8,900 | | | Axell Corp. (Semiconductors & Semiconductor Equipment) | | | 102,060 | |
| | 1,000 | | | Canon Marketing Japan, Inc. (Technology Hardware & Equipment) | | | 24,902 | |
| | 1,100 | | | Capcom Co. Ltd. (Media & Entertainment) | | | 43,605 | |
| | 3,400 | | | Chubu Electric Power Co., Inc. (Utilities) | | | 41,478 | |
| | 1,000 | | | Coca-Cola Bottlers Japan Holdings, Inc. (Food, Beverage & Tobacco) | | | 10,608 | |
| | 5,300 | | | Dai Nippon Printing Co. Ltd. (Commercial & Professional Services) | | | 150,550 | |
| | 9,500 | | | Daiwa House Industry Co. Ltd. (Real Estate Management & Development) | | | 251,009 | |
| | 4,800 | | | Doutor Nichires Holdings Co. Ltd. (Consumer Services) | | | 70,315 | |
| | 20,900 | | | Eagle Industry Co. Ltd. (Automobiles & Components) | | | 254,478 | |
| | 300 | | | Enplas Corp. (Technology Hardware & Equipment) | | | 12,222 | |
| | 2,300 | | | FCC Co. Ltd. (Automobiles & Components) | | | 29,953 | |
| | 22,200 | | | Fujikura Ltd. (Capital Goods) | | | 186,396 | |
| | 5,900 | | | Fujitsu Ltd. (Software & Services) | | | 763,949 | |
| | 23,600 | | | Gree, Inc. (Media & Entertainment) | | | 104,996 | |
| | 3,400 | | | H2O Retailing Corp. (Consumer Staples Distribution & Retail) | | | 34,754 | |
| | 17,700 | | | Heiwa Corp. (Consumer Services) | | | 307,839 | |
| | 2,500 | | | Inaba Denki Sangyo Co. Ltd. (Capital Goods) | | | 57,038 | |
| | 14,100 | | | Isetan Mitsukoshi Holdings Ltd. (Consumer Discretionary Distribution & Retail) | | | 143,343 | |
| | 1,600 | | | J Front Retailing Co. Ltd. (Consumer Discretionary Distribution & Retail) | | | 15,346 | |
| | 5,600 | | | Japan Medical Dynamic Marketing, Inc. (Health Care Equipment & Services) | | | 39,683 | |
| | 36,000 | | | Japan Tobacco, Inc. (Food, Beverage & Tobacco) | | | 788,616 | |
| | 51,300 | | | JFE Holdings, Inc. (Materials) | | | 733,414 | |
| | 19,700 | | | JGC Holdings Corp. (Capital Goods) | | | 256,148 | |
| | 7,100 | | | Kamigumi Co. Ltd. (Transportation) | | | 160,985 | |
| | 1,600 | | | Kato Sangyo Co. Ltd. (Consumer Staples Distribution & Retail) | | | 43,965 | |
| | 18,300 | | | KDDI Corp. (Telecommunication Services) | | | 565,161 | |
| | 72,000 | | | Kobe Steel Ltd. (Materials) | | | 663,192 | |
| | 700 | | | Komatsu Ltd. (Capital Goods) | | | 18,934 | |
| | 13,200 | | | Kyoei Steel Ltd. (Materials) | | | 186,572 | |
| | |
| | |
| 20 | | The accompanying notes are an integral part of these financial statements. |
GOLDMAN SACHS VARIABLE INSURANCE TRUST INTERNATIONAL EQUITY INSIGHTS FUND
| | | | | | | | |
| Shares | | | Description | | Value | |
|
| Common Stocks – (continued) | |
| Japan – (continued) | |
| | 1,300 | | | Lion Corp. (Household & Personal Products) | | $ | 12,120 | |
| | 5,600 | | | Mandom Corp. (Household & Personal Products) | | | 56,386 | |
| | 8,400 | | | Maruichi Steel Tube Ltd. (Materials) | | | 192,961 | |
| | 41,400 | | | Mazda Motor Corp. (Automobiles & Components) | | | 400,097 | |
| | 8,800 | | | Mimasu Semiconductor Industry Co. Ltd. (Semiconductors & Semiconductor Equipment) | | | 191,495 | |
| | 4,000 | | | Miraial Co. Ltd. (Semiconductors & Semiconductor Equipment) | | | 44,163 | |
| | 28,700 | | | Mirarth Holdings, Inc. (Real Estate Management & Development) | | | 88,450 | |
| | 17,900 | | | Mitsubishi Corp. (Capital Goods) | | | 865,410 | |
| | 11,000 | | | Mitsubishi Electric Corp. (Capital Goods) | | | 155,505 | |
| | 146,300 | | | Mitsubishi HC Capital, Inc. (Financial Services) | | | 868,643 | |
| | 17,300 | | | Mitsubishi Heavy Industries Ltd. (Capital Goods) | | | 808,001 | |
| | 8,600 | | | Mitsubishi Shokuhin Co. Ltd. (Consumer Staples Distribution & Retail) | | | 221,826 | |
| | 8,300 | | | MIXI, Inc. (Media & Entertainment) | | | 154,497 | |
| | 1,300 | | | Mizuho Leasing Co. Ltd. (Financial Services) | | | 42,471 | |
| | 1,700 | | | MS&AD Insurance Group Holdings, Inc. (Insurance) | | | 60,201 | |
| | 15,200 | | | NEC Corp. (Software & Services) | | | 737,390 | |
| | 10,100 | | | Nexon Co. Ltd. (Media & Entertainment) | | | 193,685 | |
| | 2,500 | | | NIPPON EXPRESS HOLDINGS, Inc. (Transportation) | | | 141,020 | |
| | 2,000 | | | Nippon Kayaku Co. Ltd. (Materials) | | | 17,113 | |
| | 21,100 | | | Nippon Paint Holdings Co. Ltd. (Materials) | | | 174,624 | |
| | 400 | | | Nippon Road Co. Ltd. (The) (Capital Goods) | | | 25,998 | |
| | 4,000 | | | Nippon Sanso Holdings Corp. (Materials) | | | 86,904 | |
| | 9,800 | | | Nippon Steel Corp. (Materials) | | | 205,107 | |
| | 397,500 | | | Nippon Telegraph & Telephone Corp. (Telecommunication Services) | | | 470,364 | |
| | 149,500 | | | Nissan Motor Co. Ltd. (Automobiles & Components) | | | 613,568 | |
| | 2,400 | | | Nisshin Oillio Group Ltd. (The) (Food, Beverage & Tobacco) | | | 57,063 | |
| | 4,600 | | | Niterra Co. Ltd. (Automobiles & Components) | | | 92,293 | |
| | 2,100 | | | Ono Pharmaceutical Co. Ltd. (Pharmaceuticals, Biotechnology & Life Sciences) | | | 37,891 | |
| | 45,600 | | | ORIX Corp. (Financial Services) | | | 831,571 | |
| | 13,500 | | | Osaka Gas Co. Ltd. (Utilities) | | | 206,926 | |
| | |
|
| Common Stocks – (continued) | |
| Japan – (continued) | |
| | 23,500 | | | Otsuka Holdings Co. Ltd. (Pharmaceuticals, Biotechnology & Life Sciences) | | | 862,019 | |
| | 17,800 | | | Renesas Electronics Corp. (Semiconductors & Semiconductor Equipment)* | | | 335,927 | |
| | 1,500 | | | Ricoh Leasing Co. Ltd. (Financial Services) | | | 43,863 | |
| | 2,800 | | | Riken Corp. (Automobiles & Components) | | | 60,879 | |
| | 29,400 | | | Riken Technos Corp. (Materials) | | | 133,979 | |
| | 29,500 | | | Round One Corp. (Consumer Services) | | | 116,860 | |
| | 4,800 | | | Sakata INX Corp. (Materials) | | | 40,585 | |
| | 2,500 | | | Sankyu, Inc. (Transportation) | | | 82,746 | |
| | 6,500 | | | Sanoh Industrial Co. Ltd. (Automobiles & Components) | | | 38,952 | |
| | 68,200 | | | Santen Pharmaceutical Co. Ltd. (Pharmaceuticals, Biotechnology & Life Sciences) | | | 580,877 | |
| | 5,000 | | | Sanyo Special Steel Co. Ltd. (Materials) | | | 99,104 | |
| | 3,300 | | | SBI Holdings, Inc. (Financial Services) | | | 63,644 | |
| | 7,000 | | | SCREEN Holdings Co. Ltd. (Semiconductors & Semiconductor Equipment) | | | 797,294 | |
| | 14,500 | | | Sekisui Chemical Co. Ltd. (Consumer Durables & Apparel) | | | 209,484 | |
| | 10,100 | | | Sekisui House Ltd. (Consumer Durables & Apparel) | | | 204,016 | |
| | 15,400 | | | Seven & i Holdings Co. Ltd. (Consumer Staples Distribution & Retail) | | | 665,313 | |
| | 6,900 | | | Shikoku Electric Power Co., Inc. (Utilities)* | | | 47,023 | |
| | 15,800 | | | Shionogi & Co. Ltd. (Pharmaceuticals, Biotechnology & Life Sciences) | | | 666,436 | |
| | 8,800 | | | SoftBank Group Corp. (Telecommunication Services) | | | 415,005 | |
| | 7,700 | | | Sompo Holdings, Inc. (Insurance) | | | 345,493 | |
| | 1,400 | | | SPK Corp. (Consumer Discretionary Distribution & Retail) | | | 17,446 | |
| | 20,400 | | | Subaru Corp. (Automobiles & Components) | | | 384,209 | |
| | 28,600 | | | Sumitomo Corp. (Capital Goods) | | | 606,748 | |
| | 22,800 | | | Sumitomo Heavy Industries Ltd. (Capital Goods) | | | 546,091 | |
| | 45,200 | | | Sumitomo Pharma Co. Ltd. (Pharmaceuticals, Biotechnology & Life Sciences) | | | 200,922 | |
| | 1,400 | | | Taisho Pharmaceutical Holdings Co. Ltd. (Pharmaceuticals, Biotechnology & Life Sciences) | | | 52,663 | |
| | |
| | |
| The accompanying notes are an integral part of these financial statements. | | 21 |
GOLDMAN SACHS VARIABLE INSURANCE TRUST INTERNATIONAL EQUITY INSIGHTS FUND
Schedule of Investments (continued)
June 30, 2023 (Unaudited)
| | | | | | | | |
| Shares | | | Description | | Value | |
|
| Common Stocks – (continued) | |
| Japan – (continued) | |
| | 2,400 | | | Takashimaya Co. Ltd. (Consumer Discretionary Distribution & Retail) | | $ | 33,549 | |
| | 3,900 | | | Tanseisha Co. Ltd. (Commercial & Professional Services) | | | 21,401 | |
| | 16,900 | | | Tokyo Century Corp. (Financial Services) | | | 610,307 | |
| | 4,300 | | | Tokyo Tekko Co. Ltd. (Materials) | | | 98,478 | |
| | 101,300 | | | Tokyu Fudosan Holdings Corp. (Real Estate Management & Development) | | | 580,632 | |
| | 1,900 | | | TOPPAN, Inc. (Commercial & Professional Services) | | | 41,062 | |
| | 8,800 | | | Toyo Engineering Corp. (Capital Goods)* | | | 36,116 | |
| | 59,900 | | | Toyota Motor Corp. (Automobiles & Components) | | | 962,718 | |
| | 11,800 | | | Tv Tokyo Holdings Corp. (Media & Entertainment) | | | 276,198 | |
| | 9,800 | | | Yamaichi Electronics Co. Ltd. (Semiconductors & Semiconductor Equipment) | | | 162,128 | |
| | 3,100 | | | Yellow Hat Ltd. (Consumer Discretionary Distribution & Retail) | | | 39,918 | |
| | | | | | | | |
| | | | | | | 25,963,063 | |
| | |
| Macau – 0.1% | |
| | 20,000 | | | Sands China Ltd. (Consumer Services)* | | | 68,494 | |
| | |
| Malta – 0.1% | |
| | 4,031 | | | Kambi Group PLC (Consumer Services)* | | | 74,152 | |
| | |
| Netherlands – 6.1% | |
| | 3,768 | | | ASML Holding NV (Semiconductors & Semiconductor Equipment) | | | 2,733,039 | |
| | 491 | | | BE Semiconductor Industries NV (Semiconductors & Semiconductor Equipment) | | | 53,251 | |
| | 839 | | | Euronext NV (Financial Services)(a) | | | 57,064 | |
| | 5,058 | | | EXOR NV (Financial Services) | | | 451,551 | |
| | 5,751 | | | Heineken Holding NV (Food, Beverage & Tobacco) | | | 500,464 | |
| | 2,929 | | | Heineken NV (Food, Beverage & Tobacco) | | | 301,209 | |
| | 20,149 | | | Koninklijke Ahold Delhaize NV (Consumer Staples Distribution & Retail) | | | 686,940 | |
| | 45,103 | | | Shell PLC (Energy) | | | 1,358,648 | |
| | 15,465 | | | Universal Music Group NV (Media & Entertainment) | | | 343,552 | |
| | | | | | | | |
| | | | | | | 6,485,718 | |
| | |
| New Zealand – 0.0% | |
| | 86,128 | | | Air New Zealand Ltd. (Transportation)* | | | 41,347 | |
| | |
|
| Common Stocks – (continued) | |
| Norway – 1.0% | |
| | 35,653 | | | DNB Bank ASA (Banks) | | | 666,736 | |
| | 9,162 | | | Kongsberg Gruppen ASA (Capital Goods) | | | 416,451 | |
| | | | | | | | |
| | | | | | | 1,083,187 | |
| | |
| Portugal – 0.5% | |
| | 19,536 | | | Jeronimo Martins SGPS SA (Consumer Staples Distribution & Retail) | | | 538,189 | |
| | 11,013 | | | NOS SGPS SA (Telecommunication Services) | | | 39,129 | |
| | | | | | | | |
| | | | | | | 577,318 | |
| | |
| Singapore – 0.7% | |
| | 40,100 | | | Oversea-Chinese Banking Corp. Ltd. (Banks) | | | 364,789 | |
| | 69,000 | | | Sembcorp Industries Ltd. (Utilities) | | | 294,014 | |
| | 753 | | | STMicroelectronics NV (Semiconductors & Semiconductor Equipment) | | | 37,562 | |
| | | | | | | | |
| | | | | | | 696,365 | |
| | |
| Spain – 2.6% | |
| | 2,808 | | | Amadeus IT Group SA (Consumer Services)* | | | 213,830 | |
| | 56,847 | | | Banco Bilbao Vizcaya Argentaria SA (Banks) | | | 436,739 | |
| | 42,836 | | | Bankinter SA (Banks) | | | 263,646 | |
| | 56,223 | | | Iberdrola SA (Utilities) | | | 734,205 | |
| | 28,723 | | | Industria de Diseno Textil SA (Consumer Discretionary Distribution & Retail) | | | 1,114,102 | |
| | 4,685 | | | Merlin Properties Socimi SA REIT (Equity Real Estate Investment Trusts) | | | 40,129 | |
| | | | | | | | |
| | | | | | | 2,802,651 | |
| | |
| Sweden – 5.3% | |
| | 12,534 | | | Epiroc AB, Class B (Capital Goods) | | | 202,869 | |
| | 6,084 | | | Evolution AB (Consumer Services)(a) | | | 770,988 | |
| | 37,399 | | | H & M Hennes & Mauritz AB, Class B (Consumer Discretionary Distribution & Retail) | | | 643,162 | |
| | 42,697 | | | Hexagon AB, Class B (Technology Hardware & Equipment) | | | 525,187 | |
| | 2,001 | | | Industrivarden AB, Class A (Financial Services) | | | 55,496 | |
| | 11,817 | | | Investor AB, Class A (Financial Services) | | | 236,498 | |
| | 42,324 | | | Investor AB, Class B (Financial Services) | | | 846,695 | |
| | 3,035 | | | Saab AB, Class B (Capital Goods) | | | 164,303 | |
| | 16,427 | | | Skandinaviska Enskilda Banken AB, Class A (Banks) | | | 181,687 | |
| | 49,640 | | | SSAB AB, Class A (Materials) | | | 353,228 | |
| | 42,242 | | | SSAB AB, Class B (Materials) | | | 292,912 | |
| | |
| | |
| 22 | | The accompanying notes are an integral part of these financial statements. |
GOLDMAN SACHS VARIABLE INSURANCE TRUST INTERNATIONAL EQUITY INSIGHTS FUND
| | | | | | | | |
| Shares | | | Description | | Value | |
|
| Common Stocks – (continued) | |
| Sweden – (continued) | |
| | 44,952 | | | Swedbank AB, Class A (Banks) | | $ | 758,615 | |
| | 8,123 | | | Swedish Orphan Biovitrum AB (Pharmaceuticals, Biotechnology & Life Sciences)* | | | 158,766 | |
| | 18,820 | | | Volvo AB, Class B (Capital Goods) | | | 389,480 | |
| | 24,248 | | | Volvo Car AB, Class B (Automobiles & Components)* | | | 96,476 | |
| | | | | | | | |
| | | | | | | 5,676,362 | |
| | |
| Switzerland – 4.3% | |
| | 27,518 | | | ABB Ltd. (Capital Goods) | | | 1,082,581 | |
| | 25 | | | Chocoladefabriken Lindt & Spruengli AG (Food, Beverage & Tobacco) | | | 314,325 | |
| | 3 | | | Chocoladefabriken Lindt & Spruengli AG (Food, Beverage & Tobacco) | | | 372,357 | |
| | 6,105 | | | Cie Financiere Richemont SA (Consumer Durables & Apparel) | | | 1,037,044 | |
| | 3,224 | | | Julius Baer Group Ltd. (Financial Services) | | | 203,459 | |
| | 13,892 | | | Novartis AG (Pharmaceuticals, Biotechnology & Life Sciences) | | | 1,400,583 | |
| | 616 | | | Sonova Holding AG (Health Care Equipment & Services) | | | 164,372 | |
| | | | | | | | |
| | | | | | | 4,574,721 | |
| | |
| United Kingdom – 8.9% | |
| | 21,532 | | | AstraZeneca PLC ADR (Pharmaceuticals, Biotechnology & Life Sciences) | | | 1,541,045 | |
| | 109,003 | | | Aviva PLC (Insurance) | | | 548,422 | |
| | 1,367 | | | BAE Systems PLC (Capital Goods) | | | 16,119 | |
| | 47,945 | | | Barratt Developments PLC (Consumer Durables & Apparel) | | | 251,986 | |
| | 3,067 | | | Bellway PLC (Consumer Durables & Apparel) | | | 77,549 | |
| | 12,726 | | | BP PLC ADR (Energy) | | | 449,101 | |
| | 36,268 | | | British American Tobacco PLC (Food, Beverage & Tobacco) | | | 1,205,021 | |
| | 7,554 | | | Burberry Group PLC (Consumer Durables & Apparel) | | | 203,833 | |
| | 31,125 | | | Centrica PLC (Utilities) | | | 49,076 | |
| | 29,500 | | | CK Hutchison Holdings Ltd. (Capital Goods) | | | 180,049 | |
| | 33,084 | | | Compass Group PLC (Consumer Services) | | | 926,457 | |
| | 33,369 | | | Imperial Brands PLC (Food, Beverage & Tobacco) | | | 738,606 | |
| | 12,418 | | | Informa PLC (Media & Entertainment) | | | 114,657 | |
| | 6,799 | | | Lancashire Holdings Ltd. (Insurance) | | | 49,909 | |
| | 114,950 | | | NatWest Group PLC (Banks) | | | 351,344 | |
| | 5,186 | | | Next PLC (Consumer Discretionary Distribution & Retail) | | | 454,741 | |
| | 207,937 | | | Rolls-Royce Holdings PLC (Capital Goods)* | | | 399,863 | |
| | 26,756 | | | Smiths Group PLC (Capital Goods) | | | 559,783 | |
| | |
|
| Common Stocks – (continued) | |
| United Kingdom – (continued) | |
| | 11,579 | | | SSE PLC (Utilities) | | | 271,529 | |
| | 72,795 | | | Standard Chartered PLC (Banks) | | | 633,324 | |
| | 7,045 | | | Vesuvius PLC (Capital Goods) | | | 35,691 | |
| | 13,632 | | | Vodafone Group PLC ADR (Telecommunication Services) | | | 128,822 | |
| | 25,593 | | | WPP PLC (Media & Entertainment) | | | 268,261 | |
| | | | | | | | |
| | | | | | | 9,455,188 | |
| | |
| United States – 8.1% | |
| | 7,596 | | | Experian PLC (Commercial & Professional Services) | | | 291,542 | |
| | 30,041 | | | GSK PLC ADR (Pharmaceuticals, Biotechnology & Life Sciences) | | | 1,070,661 | |
| | 2,505 | | | Holcim AG (Materials)* | | | 168,855 | |
| | 8,394 | | | Nestle SA (Food, Beverage & Tobacco) | | | 1,009,728 | |
| | 756 | | | QIAGEN NV (Pharmaceuticals, Biotechnology & Life Sciences)* | | | 33,982 | |
| | 5,762 | | | Roche Holding AG (Pharmaceuticals, Biotechnology & Life Sciences) | | | 1,760,119 | |
| | 96,900 | | | Samsonite International SA (Consumer Durables & Apparel)*(a) | | | 274,013 | |
| | 13,295 | | | Sanofi (Pharmaceuticals, Biotechnology & Life Sciences) | | | 1,431,284 | |
| | 5,276 | | | Schneider Electric SE (Capital Goods) | | | 958,527 | |
| | 62,283 | | | Stellantis NV (Automobiles & Components) | | | 1,094,985 | |
| | 33,715 | | | Tenaris SA (Energy) | | | 504,345 | |
| | | | | | | | |
| | | | | | | 8,598,041 | |
| | |
| | TOTAL COMMON STOCKS | |
| | (Cost $94,896,860) | | $ | 104,227,710 | |
| | |
| | | | | | | | | | | | |
| Shares | | | Description | | Rate | | | Value | |
|
| Preferred Stocks – 0.7% | |
| Germany – 0.7% | | | | |
| | 866 | | | Bayerische Motoren Werke AG (Automobiles & Components) | | | 8.49 | % | | $ | 98,685 | |
| | 4,502 | | | Volkswagen AG (Automobiles & Components) | | | 23.01 | | | | 605,396 | |
| | |
| | TOTAL PREFERRED STOCKS | |
| | (Cost $680,000) | | | $ | 704,081 | |
| | |
| | TOTAL INVESTMENTS – 98.6% | |
| | (Cost $95,576,860) | | | $ | 104,931,791 | |
| | |
| OTHER ASSETS IN EXCESS OF
LIABILITIES – 1.4% |
| | | 1,500,597 | |
| | |
| | NET ASSETS – 100.0% | | | $ | 106,432,388 | |
| | |
| | |
| The accompanying notes are an integral part of these financial statements. | | 23 |
GOLDMAN SACHS VARIABLE INSURANCE TRUST INTERNATIONAL EQUITY INSIGHTS FUND
Schedule of Investments (continued)
June 30, 2023 (Unaudited)
| | |
| The percentage shown for each investment category reflects the value of investments in that category as a percentage of net assets. |
| |
| * | | Non-income producing security. |
| |
| (a) | | Exempt from registration under Rule 144A of the Securities Act of 1933. |
| | |
| |
| Investment Abbreviations: |
| ADR | | —American Depositary Receipt |
| PLC | | —Public Limited Company |
| REIT | | —Real Estate Investment Trust |
| | | | |
| Sector Name | | % of Market
Value | |
Industrials | | | 18.4 | % |
Financials | | | 16.4 | |
Consumer Discretionary | | | 14.8 | |
Health Care | | | 14.1 | |
Information Technology | | | 10.4 | |
Consumer Staples | | | 8.7 | |
Materials | | | 5.5 | |
Utilities | | | 3.7 | |
Communication Services | | | 3.3 | |
Energy | | | 3.0 | |
Real Estate | | | 1.7 | |
| |
| TOTAL INVESTMENTS | | | 100.0 | % |
ADDITIONAL INVESTMENT INFORMATION
FUTURES CONTRACTS — At June 30, 2023, the Fund had the following futures contracts:
| | | | | | | | | | | | | | | | |
| Description | | Number of
Contracts | | | Expiration
Date | | | Notional
Amount | | | Unrealized
Appreciation/
(Depreciation) | |
| | | | |
Long position contracts: | | | | | | | | | | | | | | | | |
| EURO STOXX 50 Index | | | 8 | | | | 09/15/23 | | | $ | 386,460 | | | $ | 6,964 | |
| FTSE 100 Index | | | 1 | | | | 09/15/23 | | | | 95,777 | | | | (721 | ) |
TOPIX Index | | | 1 | | | | 09/07/23 | | | | 158,564 | | | | 5,579 | |
| | | |
| Total Futures Contracts | | | | | | | | | | | $ | 11,822 | |
| | |
| 24 | | The accompanying notes are an integral part of these financial statements. |
GOLDMAN SACHS VARIABLE INSURANCE TRUST LARGE CAP VALUE FUND
Schedule of Investments
June 30, 2023 (Unaudited)
| | | | | | | | |
| Shares | | | Description | | Value | |
|
| Common Stocks – 99.8% | |
| Automobiles & Components – 1.3% | |
| | 47,766 | | | Aptiv PLC* | | $ | 4,876,431 | |
| | |
| Banks – 6.7% | |
| | 267,048 | | | Bank of America Corp. | | | 7,661,607 | |
| | 96,460 | | | JPMorgan Chase & Co. | | | 14,029,143 | |
| | 32,729 | | | M&T Bank Corp. | | | 4,050,541 | |
| | | | | | | | |
| | | | | | | 25,741,291 | |
| | |
| Capital Goods – 9.4% | |
| | 22,893 | | | Caterpillar, Inc. | | | 5,632,822 | |
| | 37,557 | | | Eaton Corp. PLC | | | 7,552,713 | |
| | 62,302 | | | General Electric Co. | | | 6,843,875 | |
| | 12,556 | | | Illinois Tool Works, Inc. | | | 3,141,009 | |
| | 34,953 | | | L3Harris Technologies, Inc. | | | 6,842,749 | |
| | 65,905 | | | Stanley Black & Decker, Inc. | | | 6,175,957 | |
| | | | | | | | |
| | | | | | | 36,189,125 | |
| | |
| Commercial & Professional Services – 0.7% | |
| | 19,561 | | | Waste Connections, Inc. | | | 2,795,854 | |
| | |
| Consumer Discretionary Distribution & Retail – 3.1% | |
| | 22,978 | | | Amazon.com, Inc.* | | | 2,995,412 | |
| | 114,467 | | | Foot Locker, Inc. | | | 3,103,200 | |
| | 50,591 | | | Ross Stores, Inc. | | | 5,672,769 | |
| | | | | | | | |
| | | | | | | 11,771,381 | |
| | |
| Consumer Durables & Apparel – 1.3% | |
| | 45,723 | | | NIKE, Inc., Class B | | | 5,046,447 | |
| | |
| Consumer Staples Distribution & Retail – 2.7% | |
| | 65,620 | | | Walmart, Inc. | | | 10,314,152 | |
| | |
| Energy – 7.6% | |
| | 51,179 | | | Chesapeake Energy Corp. | | | 4,282,659 | |
| | 53,501 | | | EOG Resources, Inc. | | | 6,122,654 | |
| | 130,466 | | | Exxon Mobil Corp. | | | 13,992,479 | |
| | 35,798 | | | Hess Corp. | | | 4,866,738 | |
| | | | | | | | |
| | | | | | | 29,264,530 | |
| | |
| Equity Real Estate Investment Trusts – 3.8% | |
| | 15,361 | | | American Tower Corp. REIT | | | 2,979,112 | |
| | 29,922 | | | AvalonBay Communities, Inc. REIT | | | 5,663,337 | |
| | 49,078 | | | Prologis, Inc. REIT | | | 6,018,435 | |
| | | | | | | | |
| | | | | | | 14,660,884 | |
| | |
| Financial Services – 8.8% | |
| | 37,483 | | | American Express Co. | | | 6,529,539 | |
| | 20,540 | | | Berkshire Hathaway, Inc., Class B* | | | 7,004,140 | |
| | 10,399 | | | BlackRock, Inc. | | | 7,187,165 | |
| | 67,147 | | | Fidelity National Information Services, Inc. | | | 3,672,941 | |
| | 85,650 | | | Nasdaq, Inc. | | | 4,269,652 | |
| | 76,950 | | | PayPal Holdings, Inc.* | | | 5,134,873 | |
| | | | | | | | |
| | | | | | | 33,798,310 | |
| | |
| Food, Beverage & Tobacco – 3.0% | |
| | 96,580 | | | Coca-Cola Co. (The) | | | 5,816,048 | |
| | 158,923 | | | Kraft Heinz Co. (The) | | | 5,641,766 | |
| | | | | | | | |
| | | | | | | 11,457,814 | |
| | |
|
| Common Stocks – (continued) | |
| Health Care Equipment & Services – 7.2% | |
| | 110,314 | | | Boston Scientific Corp.* | | | 5,966,884 | |
| | 43,400 | | | Centene Corp.* | | | 2,927,330 | |
| | 12,396 | | | Cooper Cos., Inc. (The) | | | 4,752,998 | |
| | 100,063 | | | CVS Health Corp. | | | 6,917,355 | |
| | 50,091 | | | Zimmer Biomet Holdings, Inc. | | | 7,293,250 | |
| | | | | | | | |
| | | | | | | 27,857,817 | |
| | |
| Household & Personal Products – 1.5% | |
| | 74,818 | | | Colgate-Palmolive Co. | | | 5,763,979 | |
| | |
| Insurance – 2.6% | |
| | 44,414 | | | Allstate Corp. (The) | | | 4,842,903 | |
| | 48,268 | | | Globe Life, Inc. | | | 5,291,138 | |
| | | | | | | | |
| | | | | | | 10,134,041 | |
| | |
| Materials – 7.3% | |
| | 66,934 | | | Ball Corp. | | | 3,896,228 | |
| | 152,495 | | | Freeport-McMoRan, Inc. | | | 6,099,800 | |
| | 17,731 | | | Linde PLC | | | 6,756,930 | |
| | 13,949 | | | Martin Marietta Materials, Inc. | | | 6,440,114 | |
| | 19,291 | | | Sherwin-Williams Co. (The) | | | 5,122,146 | |
| | | | | | | | |
| | | | | | | 28,315,218 | |
| | |
| Media & Entertainment – 3.4% | |
| | 53,882 | | | Alphabet, Inc., Class A* | | | 6,449,675 | |
| | 46,401 | | | Omnicom Group, Inc. | | | 4,415,055 | |
| | 184,472 | | | Snap, Inc., Class A* | | | 2,184,149 | |
| | | | | | | | |
| | | | | | | 13,048,879 | |
| | |
| Pharmaceuticals, Biotechnology & Life Sciences – 7.8% | |
| | 68,944 | | | AstraZeneca PLC ADR (United Kingdom) | | | 4,934,322 | |
| | 115,526 | | | Bristol-Myers Squibb Co. | | | 7,387,888 | |
| | 72,794 | | | Gilead Sciences, Inc. | | | 5,610,233 | |
| | 51,702 | | | Johnson & Johnson | | | 8,557,715 | |
| | 18,284 | | | Neurocrine Biosciences, Inc.* | | | 1,724,181 | |
| | 7,127 | | | Waters Corp.* | | | 1,899,631 | |
| | | | | | | | |
| | | | | | | 30,113,970 | |
| | |
| Semiconductors & Semiconductor Equipment – 3.6% | |
| | 18,158 | | | Applied Materials, Inc. | | | 2,624,557 | |
| | 6,089 | | | KLA Corp. | | | 2,953,287 | |
| | 88,924 | | | Marvell Technology, Inc. | | | 5,315,876 | |
| | 44,534 | | | Micron Technology, Inc. | | | 2,810,541 | |
| | | | | | | | |
| | | | | | | 13,704,261 | |
| | |
| Software & Services – 4.0% | |
| | 6,983 | | | Adobe, Inc.* | | | 3,414,617 | |
| | 60,372 | | | Oracle Corp. | | | 7,189,702 | |
| | 23,471 | | | Salesforce, Inc.* | | | 4,958,483 | |
| | | | | | | | |
| | | | | | | 15,562,802 | |
| | |
| Technology Hardware & Equipment – 2.5% | |
| | 11,568 | | | Arista Networks, Inc.* | | | 1,874,710 | |
| | 85,777 | | | Dell Technologies, Inc., Class C | | | 4,641,394 | |
| | 18,127 | | | Keysight Technologies, Inc.* | | | 3,035,366 | |
| | | | | | | | |
| | | | | | | 9,551,470 | |
| | |
| | |
| The accompanying notes are an integral part of these financial statements. | | 25 |
GOLDMAN SACHS VARIABLE INSURANCE TRUST LARGE CAP VALUE FUND
Schedule of Investments (continued)
June 30, 2023 (Unaudited)
| | | | | | | | |
| Shares | | | Description | | Value | |
|
| Common Stocks – (continued) | |
| Telecommunication Services – 1.7% | |
| | 414,904 | | | AT&T, Inc. | | $ | 6,617,719 | |
| | |
| Transportation – 3.5% | |
| | 25,835 | | | Norfolk Southern Corp. | | | 5,858,345 | |
| | 11,257 | | | Old Dominion Freight Line, Inc. | | | 4,162,276 | |
| | 65,398 | | | United Airlines Holdings, Inc.* | | | 3,588,388 | |
| | | | | | | | |
| | | | | | | 13,609,009 | |
| | |
| Utilities – 6.3% | |
| | 59,668 | | | Ameren Corp. | | | 4,873,086 | |
| | 30,716 | | | Atmos Energy Corp. | | | 3,573,499 | |
| | 33,771 | | | CMS Energy Corp. | | | 1,984,046 | |
| | 102,909 | | | Exelon Corp. | | | 4,192,513 | |
| | 84,714 | | | NextEra Energy, Inc. | | | 6,285,779 | |
| | 56,925 | | | Xcel Energy, Inc. | | | 3,539,027 | |
| | | | | | | | |
| | | | | | | 24,447,950 | |
| | |
| | TOTAL COMMON STOCKS | |
| | (Cost $333,191,712) | | $ | 384,643,334 | |
| | |
| | | | | | |
| Shares | | Dividend
Rate | | Value | |
|
| Investment Company – 0.2%(a) | |
Goldman Sachs Financial Square Government Fund — Institutional Shares | |
| 855,090 | | 5.022% | | $ | 855,090 | |
| (Cost $855,090) | |
| |
| TOTAL INVESTMENTS – 100.0% | |
| (Cost $334,046,802) | | $ | 385,498,424 | |
| |
OTHER ASSETS IN EXCESS OF LIABILITIES – 0.0% | | | 21,925 | |
| |
| NET ASSETS – 100.0% | | $ | 385,520,349 | |
| |
| | |
| The percentage shown for each investment category reflects the value of investments in that category as a percentage of net assets. |
| |
| * | | Non-income producing security. |
| |
| (a) | | Represents an affiliated issuer. |
| | |
| |
| Investment Abbreviations: |
| ADR | | —American Depositary Receipt |
| PLC | | —Public Limited Company |
| REIT | | —Real Estate Investment Trust |
| | |
| 26 | | The accompanying notes are an integral part of these financial statements. |
GOLDMAN SACHS VARIABLE INSURANCE TRUST MID CAP GROWTH FUND
Schedule of Investments
June 30, 2023 (Unaudited)
| | | | | | | | |
| Shares | | | Description | | Value | |
|
| Common Stocks – 95.2% | |
| Automobiles & Components – 1.5% | |
| | 8,776 | | | Aptiv PLC* | | $ | 895,942 | |
| | |
| Capital Goods – 13.8% | | | |
| | 6,668 | | | AMETEK, Inc. | | | 1,079,416 | |
| | 4,513 | | | Chart Industries, Inc.* | | | 721,132 | |
| | 2,686 | | | Cummins, Inc. | | | 658,500 | |
| | 9,173 | | | Fortive Corp. | | | 685,865 | |
| | 7,975 | | | ITT, Inc. | | | 743,350 | |
| | 1,531 | | | L3Harris Technologies, Inc. | | | 299,724 | |
| | 5,068 | | | Rockwell Automation, Inc. | | | 1,669,652 | |
| | 6,814 | | | Trane Technologies PLC | | | 1,303,246 | |
| | 4,736 | | | Woodward, Inc. | | | 563,158 | |
| | 6,965 | | | Xylem, Inc. | | | 784,398 | |
| | | | | | | | |
| | | | | | | 8,508,441 | |
| | |
| Commercial & Professional Services – 0.8% | | | |
| | 1,628 | | | Paycom Software, Inc. | | | 522,979 | |
| | |
| Consumer Discretionary Distribution & Retail – 5.2% | | | |
| | 7,516 | | | Etsy, Inc.* | | | 635,929 | |
| | 1,497 | | | RH* | | | 493,396 | |
| | 10,879 | | | Ross Stores, Inc. | | | 1,219,862 | |
| | 1,868 | | | Ulta Beauty, Inc.* | | | 879,072 | |
| | | | | | | | |
| | | | | | | 3,228,259 | |
| | |
| Consumer Durables & Apparel – 1.5% | | | |
| | 2,418 | | | Lululemon Athletica, Inc.* | | | 915,213 | |
| | |
| Consumer Services – 3.6% | | | |
| | 2,366 | | | Domino’s Pizza, Inc. | | | 797,318 | |
| | 6,583 | | | Expedia Group, Inc.* | | | 720,115 | |
| | 5,320 | | | Yum! Brands, Inc. | | | 737,086 | |
| | | | | | | | |
| | | | | | | 2,254,519 | |
| | |
| Energy – 2.8% | | | |
| | 6,407 | | | Cheniere Energy, Inc. | | | 976,171 | |
| | 3,472 | | | Hess Corp. | | | 472,018 | |
| | 3,732 | | | Targa Resources Corp. | | | 284,005 | |
| | | | | | | | |
| | | | | | | 1,732,194 | |
| | |
| Equity Real Estate Investment Trusts – 1.2% | | | |
| | 5,584 | | | Ryman Hospitality Properties, Inc. REIT | | | 518,865 | |
| | 870 | | | SBA Communications Corp. REIT | | | 201,631 | |
| | | | | | | | |
| | | | | | | 720,496 | |
| | |
| Financial Services – 3.6% | | | |
| | 5,870 | | | Discover Financial Services | | | 685,910 | |
| | 1,115 | | | Jack Henry & Associates, Inc. | | | 186,573 | |
| | 2,204 | | | MSCI, Inc. | | | 1,034,315 | |
| | 4,503 | | | Tradeweb Markets, Inc., Class A | | | 308,365 | |
| | | | | | | | |
| | | | | | | 2,215,163 | |
| | |
| Food, Beverage & Tobacco – 3.1% | | | |
| | 10,648 | | | McCormick & Co., Inc. | | | 928,825 | |
| | 58,987 | | | Utz Brands, Inc. | | | 965,027 | |
| | | | | | | | |
| | | | | | | 1,893,852 | |
| | |
|
| Common Stocks – (continued) | |
| Health Care Equipment & Services – 10.1% | | | |
| | 1,828 | | | Align Technology, Inc.* | | | 646,454 | |
| | 1,563 | | | Cooper Cos., Inc. (The) | | | 599,301 | |
| | 14,555 | | | Dexcom, Inc.* | | | 1,870,463 | |
| | 3,914 | | | Insulet Corp.* | | | 1,128,563 | |
| | 5,176 | | | Veeva Systems, Inc., Class A* | | | 1,023,450 | |
| | 6,742 | | | Zimmer Biomet Holdings, Inc. | | | 981,635 | |
| | | | | | | | |
| | | | | | | 6,249,866 | |
| | |
| Materials – 6.3% | | | |
| | 9,375 | | | Ashland, Inc. | | | 814,782 | |
| | 1,584 | | | Avery Dennison Corp. | | | 272,131 | |
| | 17,099 | | | Ball Corp. | | | 995,333 | |
| | 2,577 | | | Martin Marietta Materials, Inc. | | | 1,189,775 | |
| | 4,294 | | | PPG Industries, Inc. | | | 636,800 | |
| | | | | | | | |
| | | | | | | 3,908,821 | |
| | |
| Media & Entertainment – 3.9% | | | |
| | 10,373 | | | Live Nation Entertainment, Inc.* | | | 945,084 | |
| | 19,234 | | | Trade Desk, Inc. (The), Class A* | | | 1,485,250 | |
| | | | | | | | |
| | | | | | | 2,430,334 | |
| | |
| Pharmaceuticals, Biotechnology & Life Sciences – 11.1% | |
| | 3,107 | | | Alnylam Pharmaceuticals, Inc.* | | | 590,144 | |
| | 3,500 | | | Apellis Pharmaceuticals, Inc.* | | | 318,850 | |
| | 422 | | | Argenx SE ADR (Netherlands) * | | | 164,466 | |
| | 1,057 | | | Biogen, Inc.* | | | 301,087 | |
| | 4,308 | | | BioMarin Pharmaceutical, Inc.* | | | 373,417 | |
| | 6,156 | | | Exact Sciences Corp.* | | | 578,048 | |
| | 1,167 | | | Illumina, Inc.* | | | 218,801 | |
| | 897 | | | Mettler-Toledo International, Inc.* | | | 1,176,541 | |
| | 5,740 | | | Neurocrine Biosciences, Inc.* | | | 541,282 | |
| | 4,260 | | | Sarepta Therapeutics, Inc.* | | | 487,855 | |
| | 3,972 | | | Seagen, Inc.* | | | 764,451 | |
| | 3,581 | | | West Pharmaceutical Services, Inc. | | | 1,369,625 | |
| | | | | | | | |
| | | | | | | 6,884,567 | |
| | |
| Real Estate Management & Development – 1.8% | | | |
| | 12,310 | | | CoStar Group, Inc.* | | | 1,095,590 | |
| | |
| Semiconductors & Semiconductor Equipment – 6.1% | | | |
| | 5,544 | | | Enphase Energy, Inc.* | | | 928,509 | |
| | 8,475 | | | Entegris, Inc. | | | 939,200 | |
| | 15,544 | | | Marvell Technology, Inc. | | | 929,220 | |
| | 5,391 | | | MKS Instruments, Inc. | | | 582,767 | |
| | 4,068 | | | ON Semiconductor Corp.* | | | 384,751 | |
| | | | | | | | |
| | | | | | | 3,764,447 | |
| | |
| Software & Services – 11.9% | | | |
| | 1,700 | | | ANSYS, Inc.* | | | 561,459 | |
| | 2,009 | | | Cadence Design Systems, Inc.* | | | 471,151 | |
| | 6,986 | | | Crowdstrike Holdings, Inc., Class A* | | | 1,026,034 | |
| | 10,471 | | | Datadog, Inc., Class A* | | | 1,030,137 | |
| | 9,015 | | | DocuSign, Inc.* | | | 460,576 | |
| | 14,582 | | | Dynatrace, Inc.* | | | 750,535 | |
| | 774 | | | Fair Isaac Corp.* | | | 626,329 | |
| | 2,036 | | | HubSpot, Inc.* | | | 1,083,335 | |
| | |
| | |
| The accompanying notes are an integral part of these financial statements. | | 27 |
GOLDMAN SACHS VARIABLE INSURANCE TRUST MID CAP GROWTH FUND
Schedule of Investments (continued)
June 30, 2023 (Unaudited)
| | | | | | | | |
| Shares | | | Description | | Value | |
|
| Common Stocks – (continued) | |
| Software & Services – (continued) | | | |
| | 1,166 | | | MongoDB, Inc.* | | $ | 479,214 | |
| | 6,049 | | | Zscaler, Inc.* | | | 884,969 | |
| | | | | | | | |
| | | | | | | 7,373,739 | |
| | |
| Technology Hardware & Equipment – 4.4% | | | |
| | 11,813 | | | Amphenol Corp., Class A | | | 1,003,515 | |
| | 4,037 | | | Arista Networks, Inc.* | | | 654,236 | |
| | 6,349 | | | Keysight Technologies, Inc.* | | | 1,063,140 | |
| | | | | | | | |
| | | | | | | 2,720,891 | |
| | |
| Transportation – 2.5% | | | |
| | 2,873 | | | Old Dominion Freight Line, Inc. | | | 1,062,292 | |
| | 1,449 | | | Saia, Inc.* | | | 496,152 | |
| | | | | | | | |
| | | | | | | 1,558,444 | |
| | |
| | TOTAL COMMON STOCKS | |
| | (Cost $47,454,765) | | $ | 58,873,757 | |
| | |
| | | | | | |
| Shares | | Dividend
Rate | | Value | |
|
| Investment Company – 4.7%(a) | |
Goldman Sachs Financial Square Government Fund — Institutional Shares | |
| 2,933,066 | | 5.022% | | $ | 2,933,066 | |
| (Cost $2,933,066) | |
| |
| TOTAL INVESTMENTS – 99.9% | |
| (Cost $50,387,831) | | $ | 61,806,823 | |
| |
OTHER ASSETS IN EXCESS OF LIABILITIES – 0.1% | | | 14,968 | |
| |
| NET ASSETS – 100.0% | | $ | 61,821,791 | |
| |
| | |
| The percentage shown for each investment category reflects the value of investments in that category as a percentage of net assets. |
| |
| * | | Non-income producing security. |
| |
| (a) | | Represents an affiliated issuer. |
| | |
| |
| Investment Abbreviations: |
| ADR | | —American Depositary Receipt |
| PLC | | —Public Limited Company |
| REIT | | —Real Estate Investment Trust |
| | |
| 28 | | The accompanying notes are an integral part of these financial statements. |
GOLDMAN SACHS VARIABLE INSURANCE TRUST MID CAP VALUE FUND
Schedule of Investments
June 30, 2023 (Unaudited)
| | | | | | | | |
| Shares | | |
Description | | Value | |
|
| Common Stocks – 98.3% | |
| Automobiles & Components – 0.4% | |
| | 18,525 | | | Aptiv PLC* | | $ | 1,891,217 | |
| | |
| Banks – 2.8% | | | |
| | 76,007 | | | Citizens Financial Group, Inc. | | | 1,982,263 | |
| | 58,367 | | | East West Bancorp, Inc. | | | 3,081,194 | |
| | 34,541 | | | M&T Bank Corp. | | | 4,274,794 | |
| | 47,530 | | | Pinnacle Financial Partners, Inc. | | | 2,692,574 | |
| | | | | | | | |
| | | | | | | 12,030,825 | |
| | |
| Capital Goods – 17.0% | | | |
| | 30,980 | | | Allegion PLC | | | 3,718,220 | |
| | 50,518 | | | AMETEK, Inc. | | | 8,177,854 | |
| | 25,258 | | | Chart Industries, Inc.* | | | 4,035,976 | |
| | 34,089 | | | Cummins, Inc. | | | 8,357,259 | |
| | 38,498 | | | Fastenal Co. | | | 2,270,997 | |
| | 97,134 | | | Fortive Corp. | | | 7,262,709 | |
| | 75,586 | | | ITT, Inc. | | | 7,045,371 | |
| | 13,097 | | | L3Harris Technologies, Inc. | | | 2,564,000 | |
| | 14,826 | | | Rockwell Automation, Inc. | | | 4,884,426 | |
| | 73,124 | | | Stanley Black & Decker, Inc. | | | 6,852,450 | |
| | 22,716 | | | Trane Technologies PLC | | | 4,344,662 | |
| | 2,731 | | | TransDigm Group, Inc. | | | 2,441,978 | |
| | 9,044 | | | United Rentals, Inc. | | | 4,027,926 | |
| | 44,725 | | | Woodward, Inc. | | | 5,318,250 | |
| | 23,647 | | | Xylem, Inc. | | | 2,663,125 | |
| | | | | | | | |
| | | | | | | 73,965,203 | |
| | |
| Consumer Discretionary Distribution & Retail – 4.3% | | | |
| | 10,090 | | | Burlington Stores, Inc.* | | | 1,588,065 | |
| | 33,076 | | | Etsy, Inc.* | | | 2,798,560 | |
| | 118,206 | | | Foot Locker, Inc. | | | 3,204,565 | |
| | 8,732 | | | RH* | | | 2,877,980 | |
| | 73,957 | | | Ross Stores, Inc. | | | 8,292,798 | |
| | | | | | | | |
| | | | | | | 18,761,968 | |
| | |
| Consumer Durables & Apparel – 0.9% | | | |
| | 31,589 | | | Lennar Corp., Class A | | | 3,958,418 | |
| | |
| Consumer Services – 3.2% | | | |
| | 90,419 | | | Las Vegas Sands Corp.* | | | 5,244,302 | |
| | 61,364 | | | Yum! Brands, Inc. | | | 8,501,982 | |
| | | | | | | | |
| | | | | | | 13,746,284 | |
| | |
| Consumer Staples Distribution & Retail – 1.4% | | | |
| | 102,665 | | | Grocery Outlet Holding Corp.* | | | 3,142,575 | |
| | 51,728 | | | Performance Food Group Co.* | | | 3,116,095 | |
| | | | | | | | |
| | | | | | | 6,258,670 | |
| | |
| Energy – 4.3% | | | |
| | 25,697 | | | Cheniere Energy, Inc. | | | 3,915,195 | |
| | 37,355 | | | Chesapeake Energy Corp. | | | 3,125,866 | |
| | 108,941 | | | Devon Energy Corp. | | | 5,266,208 | |
| | 19,927 | | | Diamondback Energy, Inc. | | | 2,617,611 | |
| | 157,592 | | | Marathon Oil Corp. | | | 3,627,768 | |
| | | | | | | | |
| | | | | | | 18,552,648 | |
| | |
|
| Common Stocks – (continued) | |
| Equity Real Estate Investment Trusts – 8.6% | | | |
| | 44,246 | | | Alexandria Real Estate Equities, Inc. REIT | | | 5,021,479 | |
| | 91,486 | | | Americold Realty Trust, Inc. REIT | | | 2,954,998 | |
| | 33,934 | | | AvalonBay Communities, Inc. REIT | | | 6,422,688 | |
| | 82,176 | | | CubeSmart REIT | | | 3,669,980 | |
| | 25,833 | | | EastGroup Properties, Inc. REIT | | | 4,484,609 | |
| | 45,228 | | | Equity LifeStyle Properties, Inc. REIT | | | 3,025,301 | |
| | 81,311 | | | Invitation Homes, Inc. REIT | | | 2,797,098 | |
| | 46,253 | | | Regency Centers Corp. REIT | | | 2,857,048 | |
| | 72,409 | | | Ventas, Inc. REIT | | | 3,422,773 | |
| | 90,618 | | | VICI Properties, Inc. REIT | | | 2,848,124 | |
| | | | | | | | |
| | | | | | | 37,504,098 | |
| | |
| Financial Services – 6.6% | | | |
| | 135,594 | | | Carlyle Group, Inc. (The) | | | 4,332,228 | |
| | 70,605 | | | Fidelity National Information Services, Inc. | | | 3,862,094 | |
| | 20,513 | | | Jack Henry & Associates, Inc. | | | 3,432,440 | |
| | 6,772 | | | MSCI, Inc. | | | 3,178,032 | |
| | 86,167 | | | Nasdaq, Inc. | | | 4,295,425 | |
| | 51,256 | | | Raymond James Financial, Inc. | | | 5,318,835 | |
| | 56,758 | | | Voya Financial, Inc. | | | 4,070,116 | |
| | | | | | | | |
| | | | | | | 28,489,170 | |
| | |
| Food, Beverage & Tobacco – 3.0% | | | |
| | 99,104 | | | Coca-Cola Europacific Partners PLC (United Kingdom) | | | 6,385,271 | |
| | 43,151 | | | McCormick & Co., Inc. | | | 3,764,062 | |
| | 169,804 | | | Utz Brands, Inc. | | | 2,777,993 | |
| | | | | | | | |
| | | | | | | 12,927,326 | |
| | |
| Health Care Equipment & Services – 5.3% | | | |
| | 28,717 | | | AmerisourceBergen Corp. | | | 5,526,012 | |
| | 32,011 | | | Centene Corp.* | | | 2,159,142 | |
| | 17,574 | | | Cooper Cos., Inc. (The) | | | 6,738,399 | |
| | 59,188 | | | Zimmer Biomet Holdings, Inc. | | | 8,617,773 | |
| | | | | | | | |
| | | | | | | 23,041,326 | |
| | |
| Insurance – 6.2% | | | |
| | 46,299 | | | Allstate Corp. (The) | | | 5,048,443 | |
| | 17,244 | | | American Financial Group, Inc. | | | 2,047,725 | |
| | 68,580 | | | Arch Capital Group Ltd.* | | | 5,133,213 | |
| | 23,865 | | | Arthur J Gallagher & Co. | | | 5,240,038 | |
| | 31,636 | | | Globe Life, Inc. | | | 3,467,938 | |
| | 1,247 | | | Markel Group, Inc.* | | | 1,724,826 | |
| | 85,323 | | | Unum Group | | | 4,069,907 | |
| | | | | | | | |
| | | | | | | 26,732,090 | |
| | |
| Materials – 9.3% | | | |
| | 72,237 | | | Ashland, Inc. | | | 6,278,118 | |
| | 69,164 | | | ATI, Inc.* | | | 3,059,124 | |
| | 123,072 | | | Ball Corp. | | | 7,164,021 | |
| | 27,095 | | | Celanese Corp. | | | 3,137,601 | |
| | 22,507 | | | Martin Marietta Materials, Inc. | | | 10,391,257 | |
| | 26,542 | | | PPG Industries, Inc. | | | 3,936,178 | |
| | 60,808 | | | Steel Dynamics, Inc. | | | 6,623,815 | |
| | | | | | | | |
| | | | | | | 40,590,114 | |
| | |
| | |
| The accompanying notes are an integral part of these financial statements. | | 29 |
GOLDMAN SACHS VARIABLE INSURANCE TRUST MID CAP VALUE FUND
Schedule of Investments (continued)
June 30, 2023 (Unaudited)
| | | | | | | | |
| Shares | | |
Description | | Value | |
|
| Common Stocks – (continued) | |
| Media & Entertainment – 3.0% | | | |
| | 41,489 | | | Electronic Arts, Inc. | | $ | 5,381,124 | |
| | 31,207 | | | Live Nation Entertainment, Inc.* | | | 2,843,270 | |
| | 81,998 | | | Match Group, Inc.* | | | 3,431,616 | |
| | 98,380 | | | Warner Bros Discovery, Inc.* | | | 1,233,685 | |
| | | | | | | | |
| | | | | | | 12,889,695 | |
| | |
| Pharmaceuticals, Biotechnology & Life Sciences – 2.3% | |
| | 8,506 | | | Biogen, Inc.* | | | 2,422,934 | |
| | 28,172 | | | BioMarin Pharmaceutical, Inc.* | | | 2,441,949 | |
| | 1,286 | | | Mettler-Toledo International, Inc.* | | | 1,686,769 | |
| | 8,132 | | | Sarepta Therapeutics, Inc.* | | | 931,277 | |
| | 6,407 | | | West Pharmaceutical Services, Inc. | | | 2,450,485 | |
| | | | | | | | |
| | | | | | | 9,933,414 | |
| | |
| Semiconductors & Semiconductor Equipment – 3.1% | | | |
| | 158,749 | | | Marvell Technology, Inc. | | | 9,490,015 | |
| | 37,137 | | | MKS Instruments, Inc. | | | 4,014,510 | |
| | | | | | | | |
| | | | | | | 13,504,525 | |
| | |
| Software & Services – 1.7% | | | |
| | 8,907 | | | ANSYS, Inc.* | | | 2,941,715 | |
| | 34,121 | | | DocuSign, Inc.* | | | 1,743,242 | |
| | 50,183 | | | Dynatrace, Inc.* | | | 2,582,919 | |
| | | | | | | | |
| | | | | | | 7,267,876 | |
| | |
| Technology Hardware & Equipment – 4.2% | | | |
| | 28,580 | | | Keysight Technologies, Inc.* | | | 4,785,721 | |
| | 12,977 | | | Motorola Solutions, Inc. | | | 3,805,895 | |
| | 567,157 | | | Viavi Solutions, Inc.* | | | 6,425,889 | |
| | 10,723 | | | Zebra Technologies Corp., Class A* | | | 3,172,185 | |
| | | | | | | | |
| | | | | | | 18,189,690 | |
| | |
| Transportation – 2.7% | | | |
| | 16,396 | | | Old Dominion Freight Line, Inc. | | | 6,062,421 | |
| | 8,797 | | | Saia, Inc.* | | | 3,012,181 | |
| | 50,489 | | | United Airlines Holdings, Inc.* | | | 2,770,331 | |
| | | | | | | | |
| | | | | | | 11,844,933 | |
| | |
| Utilities – 8.0% | | | |
| | 203,146 | | | AES Corp. (The) | | | 4,211,216 | |
| | 37,412 | | | Ameren Corp. | | | 3,055,438 | |
| | 20,981 | | | American Water Works Co., Inc. | | | 2,995,038 | |
| | 94,600 | | | CMS Energy Corp. | | | 5,557,750 | |
| | 44,275 | | | Eversource Energy | | | 3,139,983 | |
| | 70,426 | | | FirstEnergy Corp. | | | 2,738,163 | |
| | 75,611 | | | NiSource, Inc. | | | 2,067,961 | |
| | 53,877 | | | WEC Energy Group, Inc. | | | 4,754,106 | |
| | 103,592 | | | Xcel Energy, Inc. | | | 6,440,315 | |
| | | | | | | | |
| | | | | | | 34,959,970 | |
| | |
| | TOTAL COMMON STOCKS | |
| | (Cost $360,267,125) | | $ | 427,039,460 | |
| | |
| | | | | | |
| Shares | | Dividend
Rate | | Value | |
|
| Investment Company – 2.1%(a) | |
Goldman Sachs Financial Square Government Fund — Institutional Shares | |
| 8,997,935 | | 5.022% | | $ | 8,997,935 | |
| (Cost $8,997,935) | |
| |
| TOTAL INVESTMENTS – 100.4% | |
| (Cost $369,265,060) | | $ | 436,037,395 | |
| |
LIABILITIES IN EXCESS OF OTHER ASSETS – (0.4)% | | | (1,760,027 | ) |
| |
| NET ASSETS – 100.0% | | $ | 434,277,368 | |
| |
| | |
| The percentage shown for each investment category reflects the value of investments in that category as a percentage of net assets. |
| |
| * | | Non-income producing security. |
| |
| (a) | | Represents an affiliated issuer. |
| | |
| |
| Investment Abbreviations: |
| PLC | | —Public Limited Company |
| REIT | | —Real Estate Investment Trust |
| | |
| 30 | | The accompanying notes are an integral part of these financial statements. |
GOLDMAN SACHS VARIABLE INSURANCE TRUST SMALL CAP EQUITY INSIGHTS FUND
Schedule of Investments
June 30, 2023 (Unaudited)
| | | | | | | | |
| Shares | | |
Description | | Value | |
|
| Common Stocks – 97.5% | |
| Automobiles & Components – 0.6% | |
| | 1,608 | | | Adient PLC* | | $ | 61,619 | |
| | 16,394 | | | American Axle & Manufacturing Holdings, Inc.* | | | 135,578 | |
| | 2,548 | | | Fox Factory Holding Corp.* | | | 276,483 | |
| | 2,959 | | | Luminar Technologies, Inc.*(a) | | | 20,358 | |
| | 2,096 | | | Modine Manufacturing Co.* | | | 69,210 | |
| | 1,247 | | | Visteon Corp.* | | | 179,082 | |
| | | | | | | | |
| | | | | | | 742,330 | |
| | |
| Banks – 6.9% | |
| | 17,298 | | | Amalgamated Financial Corp. | | | 278,325 | |
| | 13,053 | | | Ameris Bancorp | | | 446,543 | |
| | 10,575 | | | Associated Banc-Corp. | | | 171,632 | |
| | 4,175 | | | Axos Financial, Inc.* | | | 164,662 | |
| | 1,555 | | | BancFirst Corp. | | | 143,060 | |
| | 5,025 | | | Bancorp, Inc. (The)* | | | 164,066 | |
| | 25,552 | | | Bank of NT Butterfield & Son Ltd. (The) (Bermuda) | | | 699,103 | |
| | 2,528 | | | Banner Corp. | | | 110,398 | |
| | 6,116 | | | Business First Bancshares, Inc. | | | 92,168 | |
| | 4,475 | | | Carter Bankshares, Inc.* | | | 66,185 | |
| | 19,396 | | | Central Pacific Financial Corp. | | | 304,711 | |
| | 2,753 | | | Community Trust Bancorp, Inc. | | | 97,924 | |
| | 2,380 | | | Enterprise Financial Services Corp. | | | 93,058 | |
| | 4,506 | | | Esquire Financial Holdings, Inc. | | | 206,104 | |
| | 2,569 | | | Financial Institutions, Inc. | | | 40,436 | |
| | 37,467 | | | First BanCorp. (Puerto Rico) | | | 457,847 | |
| | 2,534 | | | First Bancorp, Inc. (The) | | | 61,678 | |
| | 11,628 | | | Glacier Bancorp, Inc. | | | 362,445 | |
| | 10,243 | | | Hancock Whitney Corp. | | | 393,126 | |
| | 1,328 | | | Heartland Financial USA, Inc. | | | 37,011 | |
| | 22,443 | | | Heritage Financial Corp. | | | 362,903 | |
| | 2,784 | | | Home Bancorp, Inc. | | | 92,457 | |
| | 4,850 | | | HomeTrust Bancshares, Inc. | | | 101,317 | |
| | 10,328 | | | International Bancshares Corp. | | | 456,498 | |
| | 14,481 | | | Macatawa Bank Corp. | | | 134,384 | |
| | 4,142 | | | Metrocity Bankshares, Inc. | | | 74,100 | |
| | 12,835 | | | National Bank Holdings Corp., Class A | | | 372,728 | |
| | 1,876 | | | Northeast Bank | | | 78,173 | |
| | 3,958 | | | Northeast Community Bancorp, Inc.(a) | | | 58,895 | |
| | 18,984 | | | Old Second Bancorp, Inc. | | | 247,931 | |
| | 2,113 | | | Origin Bancorp, Inc. | | | 61,911 | |
| | 7,975 | | | Pathward Financial, Inc. | | | 369,721 | |
| | 2,199 | | | Renasant Corp. | | | 57,460 | |
| | 5,932 | | | Seacoast Banking Corp. of Florida | | | 131,097 | |
| | 994 | | | Sierra Bancorp | | | 16,868 | |
| | 10,924 | | | TrustCo Bank Corp. | | | 312,536 | |
| | 7,446 | | | UMB Financial Corp. | | | 453,461 | |
| | 37,331 | | | Valley National Bancorp | | | 289,315 | |
| | 7,600 | | | Veritex Holdings, Inc. | | | 136,268 | |
| | 1,615 | | | Westamerica BanCorp | | | 61,855 | |
| | | | | | | | |
| | | | | | | 8,260,360 | |
| | |
|
| Common Stocks – (continued) | |
| Capital Goods – 13.6% | |
| | 4,828 | | | AAON, Inc. | | | 457,743 | |
| | 6,469 | | | AAR Corp.* | | | 373,649 | |
| | 2,133 | | | AeroVironment, Inc.* | | | 218,163 | |
| | 1,399 | | | Allied Motion Technologies, Inc. | | | 55,876 | |
| | 6,176 | | | Applied Industrial Technologies, Inc. | | | 894,470 | |
| | 3,692 | | | Arcosa, Inc. | | | 279,743 | |
| | 7,367 | | | Array Technologies, Inc.* | | | 166,494 | |
| | 6,375 | | | Atkore, Inc.* | | | 994,117 | |
| | 1,297 | | | Barnes Group, Inc. | | | 54,720 | |
| | 2,290 | | | Chart Industries, Inc.* | | | 365,919 | |
| | 2,722 | | | Columbus McKinnon Corp. | | | 110,649 | |
| | 6,015 | | | Comfort Systems USA, Inc. | | | 987,663 | |
| | 1,914 | | | Douglas Dynamics, Inc. | | | 57,190 | |
| | 2,358 | | | Ducommun, Inc.* | | | 102,738 | |
| | 2,416 | | | Dycom Industries, Inc.* | | | 274,578 | |
| | 4,830 | | | Encore Wire Corp. | | | 898,042 | |
| | 8,590 | | | Franklin Electric Co., Inc. | | | 883,911 | |
| | 79,785 | | | FTC Solar, Inc.* | | | 256,908 | |
| | 8,679 | | | GMS, Inc.* | | | 600,587 | |
| | 7,705 | | | Griffon Corp. | | | 310,511 | |
| | 862 | | | Herc Holdings, Inc. | | | 117,965 | |
| | 642 | | | IES Holdings, Inc.* | | | 36,517 | |
| | 1,988 | | | JELD-WEN Holding, Inc.* | | | 34,870 | |
| | 3,950 | | | Kennametal, Inc. | | | 112,140 | |
| | 7,039 | | | Kratos Defense & Security Solutions, Inc.* | | | 100,939 | |
| | 6,873 | | | Manitowoc Co., Inc. (The)* | | | 129,419 | |
| | 8,466 | | | Masterbrand, Inc.* | | | 98,460 | |
| | 419 | | | Moog, Inc., Class A | | | 45,432 | |
| | 12,281 | | | Mueller Industries, Inc. | | | 1,071,886 | |
| | 953 | | | National Presto Industries, Inc. | | | 69,760 | |
| | 16,490 | | | NEXTracker, Inc., Class A* | | | 656,467 | |
| | 2,315 | | | Northwest Pipe Co.* | | | 70,006 | |
| | 21,762 | | | NOW, Inc.* | | | 225,454 | |
| | 530 | | | Omega Flex, Inc. | | | 55,003 | |
| | 1,493 | | | Parsons Corp.* | | | 71,873 | |
| | 9,327 | | | Powell Industries, Inc. | | | 565,123 | |
| | 4,784 | | | REV Group, Inc. | | | 63,436 | |
| | 12,447 | | | Rush Enterprises, Inc., Class A | | | 756,031 | |
| | 2,708 | | | Shoals Technologies Group, Inc., Class A* | | | 69,216 | |
| | 7,317 | | | Simpson Manufacturing Co., Inc. | | | 1,013,405 | |
| | 12,592 | | | Sterling Infrastructure, Inc.* | | | 702,634 | |
| | 2,749 | | | Titan International, Inc.* | | | 31,559 | |
| | 32,932 | | | Triumph Group, Inc.* | | | 407,369 | |
| | 646 | | | UFP Industries, Inc. | | | 62,694 | |
| | 8,586 | | | Vicor Corp.* | | | 463,644 | |
| | 4,952 | | | Wabash National Corp. | | | 126,969 | |
| | 4,878 | | | Watts Water Technologies, Inc., Class A | | | 896,235 | |
| | | | | | | | |
| | | | | | | 16,398,177 | |
| | |
| Commercial & Professional Services – 3.3% | |
| | 22,319 | | | ACV Auctions, Inc., Class A* | | | 385,449 | |
| | 11,766 | | | Alight, Inc., Class A* | | | 108,718 | |
| | |
| | |
| The accompanying notes are an integral part of these financial statements. | | 31 |
GOLDMAN SACHS VARIABLE INSURANCE TRUST SMALL CAP EQUITY INSIGHTS FUND
Schedule of Investments (continued)
June 30, 2023 (Unaudited)
| | | | | | | | |
| Shares | | |
Description | | Value | |
|
| Common Stocks – (continued) | |
| Commercial & Professional Services – (continued) | |
| | 2,389 | | | BrightView Holdings, Inc.* | | $ | 17,153 | |
| | 4,518 | | | CBIZ, Inc.* | | | 240,719 | |
| | 14,498 | | | Ennis, Inc. | | | 295,469 | |
| | 2,267 | | | ExlService Holdings, Inc.* | | | 342,453 | |
| | 8,359 | | | Exponent, Inc. | | | 780,062 | |
| | 8,980 | | | Franklin Covey Co.* | | | 392,247 | |
| | 22,944 | | | Healthcare Services Group, Inc. | | | 342,554 | |
| | 4,599 | | | IBEX Holdings Ltd.* | | | 97,637 | |
| | 7,290 | | | Legalzoom.com, Inc.* | | | 88,063 | |
| | 574 | | | Montrose Environmental Group, Inc.* | | | 24,177 | |
| | 1,783 | | | NV5 Global, Inc.* | | | 197,503 | |
| | 60,293 | | | Steelcase, Inc., Class A | | | 464,859 | |
| | 5,580 | | | Viad Corp.* | | | 149,990 | |
| | | | | | | | |
| | | | | | | 3,927,053 | |
| | |
| Consumer Discretionary Distribution & Retail – 2.9% | |
| | 3,826 | | | Asbury Automotive Group, Inc.* | | | 919,847 | |
| | 18,349 | | | CarParts.com, Inc.* | | | 77,983 | |
| | 2,464 | | | Carvana Co.*(a) | | | 63,867 | |
| | 3,078 | | | Group 1 Automotive, Inc. | | | 794,432 | |
| | 9,101 | | | Monro, Inc. | | | 369,774 | |
| | 2,283 | | | Overstock.com, Inc.* | | | 74,357 | |
| | 6,086 | | | Sally Beauty Holdings, Inc.* | | | 75,162 | |
| | 8,407 | | | Sonic Automotive, Inc., Class A | | | 400,762 | |
| | 15,634 | | | Urban Outfitters, Inc.* | | | 517,954 | |
| | 16,150 | | | Warby Parker, Inc., Class A* | | | 188,794 | |
| | 143 | | | Winmark Corp. | | | 47,543 | |
| | | | | | | | |
| | | | | | | 3,530,475 | |
| | |
| Consumer Durables & Apparel – 2.7% | |
| | 2,191 | | | Dream Finders Homes, Inc., Class A* | | | 53,877 | |
| | 18,102 | | | G-III Apparel Group Ltd.* | | | 348,826 | |
| | 6,418 | | | Green Brick Partners, Inc.* | | | 364,542 | |
| | 1,284 | | | Hovnanian Enterprises, Inc., Class A* | | | 127,386 | |
| | 6,607 | | | LGI Homes, Inc.* | | | 891,218 | |
| | 10,680 | | | M/I Homes, Inc.* | | | 931,189 | |
| | 2,411 | | | Malibu Boats, Inc., Class A* | | | 141,429 | |
| | 1,630 | | | MasterCraft Boat Holdings, Inc.* | | | 49,959 | |
| | 4,261 | | | Taylor Morrison Home Corp.* | | | 207,809 | |
| | 4,201 | | | Topgolf Callaway Brands Corp.* | | | 83,390 | |
| | | | | | | | |
| | | | | | | 3,199,625 | |
| | |
| Consumer Services – 4.5% | |
| | 151 | | | Biglari Holdings, Inc., Class B* | | | 29,768 | |
| | 1,350 | | | Brinker International, Inc.* | | | 49,410 | |
| | 9,900 | | | Chuy’s Holdings, Inc.* | | | 404,118 | |
| | 39,205 | | | Coursera, Inc.* | | | 510,449 | |
| | 4,741 | | | Dave & Buster’s Entertainment, Inc.* | | | 211,259 | |
| | 5,578 | | | Duolingo, Inc.* | | | 797,319 | |
| | 4,579 | | | Everi Holdings, Inc.* | | | 66,212 | |
| | 33,072 | | | First Watch Restaurant Group, Inc.* | | | 558,917 | |
| | 9,746 | | | Frontdoor, Inc.* | | | 310,898 | |
| | 22,658 | | | International Game Technology PLC | | | 722,564 | |
| | 8,378 | | | Krispy Kreme, Inc. | | | 123,408 | |
| | 21,048 | | | Laureate Education, Inc. | | | 254,470 | |
| | |
|
| Common Stocks – (continued) | |
| Consumer Services – (continued) | |
| | 993 | | | Monarch Casino & Resort, Inc. | | | 69,957 | |
| | 10,197 | | | PlayAGS, Inc.* | | | 57,613 | |
| | 24,043 | | | Portillo’s, Inc., Class A* | | | 541,689 | |
| | 918 | | | Red Rock Resorts, Inc., Class A | | | 42,944 | |
| | 82,615 | | | Sabre Corp.* | | | 263,542 | |
| | 1,356 | | | Shake Shack, Inc., Class A* | | | 105,388 | |
| | 14,037 | | | Xponential Fitness, Inc., Class A* | | | 242,138 | |
| | | | | | | | |
| | | | | | | 5,362,063 | |
| | |
| Consumer Staples Distribution & Retail – 0.8% | |
| | 4,176 | | | Chefs’ Warehouse, Inc. (The)* | | | 149,333 | |
| | 2,984 | | | Natural Grocers by Vitamin Cottage, Inc. | | | 36,584 | |
| | 8,513 | | | PriceSmart, Inc. | | | 630,473 | |
| | 5,686 | | | Sprouts Farmers Market, Inc.* | | | 208,847 | |
| | | | | | | | |
| | | | | | | 1,025,237 | |
| | |
| Energy – 5.6% | |
| | 4,306 | | | Amplify Energy Corp.* | | | 29,152 | |
| | 713 | | | Arch Resources, Inc. | | | 80,398 | |
| | 30,487 | | | Ardmore Shipping Corp. (Ireland) | | | 376,514 | |
| | 8,758 | | | Borr Drilling Ltd. (Mexico) * | | | 65,948 | |
| | 7,462 | | | ChampionX Corp. | | | 231,620 | |
| | 2,350 | | | CONSOL Energy, Inc. | | | 159,353 | |
| | 2,543 | | | Delek US Holdings, Inc. | | | 60,905 | |
| | 57,998 | | | DHT Holdings, Inc. | | | 494,723 | |
| | 3,828 | | | DMC Global, Inc.* | | | 67,985 | |
| | 11,242 | | | Dorian LPG Ltd. | | | 288,357 | |
| | 2,573 | | | Dril-Quip, Inc.* | | | 59,874 | |
| | 28,200 | | | Golar LNG Ltd. (Cameroon) | | | 568,794 | |
| | 940 | | | Green Plains, Inc.* | | | 30,306 | |
| | 17,087 | | | International Seaways, Inc. | | | 653,407 | |
| | 11,922 | | | Kosmos Energy Ltd. (Ghana) * | | | 71,413 | |
| | 1,596 | | | Nabors Industries Ltd.* | | | 148,476 | |
| | 148,134 | | | Nordic American Tankers Ltd. | | | 543,652 | |
| | 4,017 | | | Oil States International, Inc.* | | | 30,007 | |
| | 2,854 | | | Patterson-UTI Energy, Inc. | | | 34,162 | |
| | 4,537 | | | PBF Energy, Inc., Class A | | | 185,745 | |
| | 11,024 | | | Peabody Energy Corp. | | | 238,780 | |
| | 23,160 | | | RPC, Inc. | | | 165,594 | |
| | 15,673 | | | Scorpio Tankers, Inc. (Monaco) | | | 740,236 | |
| | 49,301 | | | Teekay Corp. (Bermuda) * | | | 297,778 | |
| | 15,605 | | | Teekay Tankers Ltd., Class A (Canada) | | | 596,579 | |
| | 4,787 | | | Tidewater, Inc.* | | | 265,391 | |
| | 1,968 | | | Vitesse Energy, Inc. | | | 44,083 | |
| | 2,349 | | | Weatherford International PLC* | | | 156,021 | |
| | | | | | | | |
| | | | | | | 6,685,253 | |
| | |
| Equity Real Estate Investment Trusts – 7.4% | |
| | 6,361 | | | American Assets Trust, Inc. REIT | | | 122,131 | |
| | 5,818 | | | Apple Hospitality REIT, Inc. REIT | | | 87,910 | |
| | 10,377 | | | Centerspace REIT | | | 636,733 | |
| | 47,170 | | | Chatham Lodging Trust REIT | | | 441,511 | |
| | |
| | |
| 32 | | The accompanying notes are an integral part of these financial statements. |
GOLDMAN SACHS VARIABLE INSURANCE TRUST SMALL CAP EQUITY INSIGHTS FUND
| | | | | | | | |
| Shares | | |
Description | | Value | |
|
| Common Stocks – (continued) | |
| Equity Real Estate Investment Trusts – (continued) | |
| | 3,201 | | | Community Healthcare Trust, Inc. REIT | | $ | 105,697 | |
| | 83,311 | | | DiamondRock Hospitality Co. REIT | | | 667,321 | |
| | 21,987 | | | Equity Commonwealth REIT | | | 445,457 | |
| | 23,379 | | | Essential Properties Realty Trust, Inc. REIT | | | 550,342 | |
| | 353 | | | Four Corners Property Trust, Inc. REIT | | | 8,966 | |
| | 46,466 | | | Independence Realty Trust, Inc. REIT | | | 846,611 | |
| | 5,027 | | | Kite Realty Group Trust REIT | | | 112,303 | |
| | 61,362 | | | LXP Industrial Trust REIT | | | 598,280 | |
| | 5,516 | | | Macerich Co. (The) REIT | | | 62,165 | |
| | 14,882 | | | NexPoint Residential Trust, Inc. REIT | | | 676,833 | |
| | 41,989 | | | Outfront Media, Inc. REIT | | | 660,067 | |
| | 3,790 | | | Plymouth Industrial REIT, Inc. REIT | | | 87,246 | |
| | 65,763 | | | RLJ Lodging Trust REIT | | | 675,386 | |
| | 8,772 | | | Ryman Hospitality Properties, Inc. REIT | | | 815,094 | |
| | 45,235 | | | Service Properties Trust REIT | | | 393,092 | |
| | 10,828 | | | SITE Centers Corp. REIT | | | 143,146 | |
| | 48,291 | | | Summit Hotel Properties, Inc. REIT | | | 314,374 | |
| | 1,852 | | | Tanger Factory Outlet Centers, Inc. REIT | | | 40,874 | |
| | 4,767 | | | Terreno Realty Corp. REIT | | | 286,497 | |
| | 8,898 | | | Xenia Hotels & Resorts, Inc. REIT | | | 109,534 | |
| | | | | | | | |
| | | | | | | 8,887,570 | |
| | |
| Financial Services – 4.0% | |
| | 15,770 | | | A-Mark Precious Metals, Inc. | | | 590,350 | |
| | 907 | | | Arbor Realty Trust, Inc. REIT | | | 13,442 | |
| | 41,061 | | | ARMOUR Residential REIT, Inc. REIT | | | 218,855 | |
| | 29,758 | | | Banco Latinoamericano de Comercio Exterior SA, Class E (Panama) | | | 656,461 | |
| | 1,484 | | | Blackstone Mortgage Trust, Inc., Class A REIT | | | 30,882 | |
| | 21,653 | | | BrightSpire Capital, Inc. REIT | | | 145,725 | |
| | 20,406 | | | EVERTEC, Inc. (Puerto Rico) | | | 751,553 | |
| | 6,939 | | | I3 Verticals, Inc., Class A* | | | 158,626 | |
| | 13,556 | | | KKR Real Estate Finance Trust, Inc. REIT | | | 164,977 | |
| | 6,747 | | | LendingClub Corp.* | | | 65,783 | |
| | 33,259 | | | MFA Financial, Inc. REIT | | | 373,831 | |
| | 12,090 | | | Nexpoint Real Estate Finance, Inc. REIT | | | 188,483 | |
| | 18,954 | | | NMI Holdings, Inc., Class A*(b) | | | 489,392 | |
| | 22,986 | | | Open Lending Corp.* | | | 241,583 | |
| | 3,501 | | | Pagseguro Digital Ltd., Class A (Brazil)* | | | 33,049 | |
| | 2,642 | | | Repay Holdings Corp.* | | | 20,687 | |
| | 16,514 | | | StoneCo Ltd., Class A (Brazil)* | | | 210,388 | |
| | 2,479 | | | Two Harbors Investment Corp. REIT | | | 34,409 | |
| | 10,063 | | | Upstart Holdings, Inc.*(a) | | | 360,356 | |
| | | | | | | | |
| | | | | | | 4,748,832 | |
| | |
|
| Common Stocks – (continued) | |
| Food, Beverage & Tobacco – 1.7% | |
| | 2,731 | | | B&G Foods, Inc.(a) | | | 38,016 | |
| | 1,018 | | | Coca-Cola Consolidated, Inc. | | | 647,468 | |
| | 5,916 | | | John B. Sanfilippo & Son, Inc. | | | 693,769 | |
| | 2,232 | | | National Beverage Corp.* | | | 107,917 | |
| | 47,488 | | | Primo Water Corp. | | | 595,500 | |
| | | | | | | | |
| | | | | | | 2,082,670 | |
| | |
| Health Care Equipment & Services – 6.8% | |
| | 6,922 | | | Accolade, Inc.* | | | 93,239 | |
| | 33,757 | | | Alignment Healthcare, Inc.* | | | 194,103 | |
| | 9,650 | | | Alphatec Holdings, Inc.* | | | 173,507 | |
| | 1,254 | | | AMN Healthcare Services, Inc.* | | | 136,836 | |
| | 26,921 | | | AngioDynamics, Inc.* | | | 280,786 | |
| | 15,669 | | | Artivion, Inc.* | | | 269,350 | |
| | 6,452 | | | AtriCure, Inc.* | | | 318,471 | |
| | 43,225 | | | Brookdale Senior Living, Inc.* | | | 182,409 | |
| | 13,981 | | | Cano Health, Inc.* | | | 19,434 | |
| | 2,409 | | | Guardant Health, Inc.* | | | 86,242 | |
| | 1,333 | | | Health Catalyst, Inc.* | | | 16,662 | |
| | 50,068 | | | Hims & Hers Health, Inc.* | | | 470,639 | |
| | 12,607 | | | Inari Medical, Inc.* | | | 732,971 | |
| | 1,638 | | | Inmode Ltd.* | | | 61,179 | |
| | 3,942 | | | iRadimed Corp. | | | 188,191 | |
| | 21,752 | | | Joint Corp. (The)* | | | 293,652 | |
| | 2,233 | | | Lantheus Holdings, Inc.* | | | 187,393 | |
| | 5,371 | | | LeMaitre Vascular, Inc. | | | 361,361 | |
| | 5,172 | | | LivaNova PLC* | | | 265,996 | |
| | 2,435 | | | National HealthCare Corp. | | | 150,532 | |
| | 11,464 | | | NextGen Healthcare, Inc.* | | | 185,946 | |
| | 1,496 | | | Owens & Minor, Inc.* | | | 28,484 | |
| | 17,377 | | | Pediatrix Medical Group, Inc.* | | | 246,927 | |
| | 24,714 | | | Pennant Group, Inc. (The)* | | | 303,488 | |
| | 4,236 | | | PetIQ, Inc.* | | | 64,260 | |
| | 5,305 | | | Phreesia, Inc.* | | | 164,508 | |
| | 10,764 | | | Progyny, Inc.* | | | 423,456 | |
| | 6,888 | | | Pulmonx Corp.* | | | 90,302 | |
| | 20,432 | | | Select Medical Holdings Corp. | | | 650,964 | |
| | 4,169 | | | SI-BONE, Inc.* | | | 112,480 | |
| | 8,507 | | | Surgery Partners, Inc.* | | | 382,730 | |
| | 2,727 | | | Surmodics, Inc.* | | | 85,382 | |
| | 3,419 | | | TransMedics Group, Inc.* | | | 287,128 | |
| | 3,384 | | | Utah Medical Products, Inc. | | | 315,389 | |
| | 12,694 | | | Varex Imaging Corp.* | | | 299,198 | |
| | | | | | | | |
| | | | | | | 8,123,595 | |
| | |
| Household & Personal Products – 0.9% | |
| | 17,939 | | | Beauty Health Co. (The)* | | | 150,150 | |
| | 7,745 | | | elf Beauty, Inc.* | | | 884,711 | |
| | | | | | | | |
| | | | | | | 1,034,861 | |
| | |
| Insurance – 5.0% | |
| | 20,062 | | | American Equity Investment Life Holding Co. | | | 1,045,431 | |
| | 11,338 | | | BRP Group, Inc., Class A* | | | 280,956 | |
| | 35,479 | | | CNO Financial Group, Inc. | | | 839,788 | |
| | |
| | |
| The accompanying notes are an integral part of these financial statements. | | 33 |
GOLDMAN SACHS VARIABLE INSURANCE TRUST SMALL CAP EQUITY INSIGHTS FUND
Schedule of Investments (continued)
June 30, 2023 (Unaudited)
| | | | | | | | |
| Shares | | |
Description | | Value | |
|
| Common Stocks – (continued) | |
| Insurance – (continued) | |
| | 29,733 | | | Crawford & Co., Class A | | $ | 329,739 | |
| | 16,663 | | | Employers Holdings, Inc. | | | 623,363 | |
| | 1,170 | | | Enstar Group Ltd.* | | | 285,761 | |
| | 62,100 | | | Genworth Financial, Inc., Class A* | | | 310,500 | |
| | 13,196 | | | Goosehead Insurance, Inc., Class A* | | | 829,896 | |
| | 3,693 | | | Hippo Holdings, Inc.* | | | 61,045 | |
| | 355 | | | Investors Title Co. | | | 51,830 | |
| | 12,187 | | | James River Group Holdings Ltd. | | | 222,535 | |
| | 14,049 | | | Lemonade, Inc.*(a) | | | 236,726 | |
| | 5,296 | | | Oscar Health, Inc., Class A* | | | 42,686 | |
| | 7,388 | | | Palomar Holdings, Inc.* | | | 428,799 | |
| | 10,411 | | | Stewart Information Services Corp. | | | 428,308 | |
| | | | | | | | |
| | | | | | | 6,017,363 | |
| | |
| Materials – 4.3% | |
| | 9,411 | | | Aspen Aerogels, Inc.* | | | 74,253 | |
| | 11,362 | | | ATI, Inc.* | | | 502,541 | |
| | 13,657 | | | Carpenter Technology Corp. | | | 766,567 | |
| | 82,966 | | | Coeur Mining, Inc.* | | | 235,624 | |
| | 4,223 | | | Commercial Metals Co. | | | 222,383 | |
| | 23,846 | | | Constellium SE* | | | 410,151 | |
| | 8,192 | | | Haynes International, Inc. | | | 416,317 | |
| | 4,951 | | | Innospec, Inc. | | | 497,278 | |
| | 9,241 | | | LSB Industries, Inc.* | | | 91,024 | |
| | 10,705 | | | Minerals Technologies, Inc. | | | 617,572 | |
| | 800 | | | Olympic Steel, Inc. | | | 39,200 | |
| | 12,502 | | | Orion SA (Germany) | | | 265,292 | |
| | 5,153 | | | Piedmont Lithium, Inc.* | | | 297,380 | |
| | 19,349 | | | Summit Materials, Inc., Class A* | | | 732,360 | |
| | | | | | | | |
| | | | | | | 5,167,942 | |
| | |
| Media & Entertainment – 1.7% | |
| | 5,730 | | | Bumble, Inc., Class A* | | | 96,149 | |
| | 130 | | | Daily Journal Corp.* | | | 37,606 | |
| | 7,491 | | | DHI Group, Inc.* | | | 28,691 | |
| | 22,388 | | | EW Scripps Co. (The), Class A* | | | 204,850 | |
| | 14,111 | | | fuboTV, Inc.*(a) | | | 29,351 | |
| | 15,125 | | | Gray Television, Inc. | | | 119,185 | |
| | 1,887 | | | IMAX Corp.* | | | 32,060 | |
| | 2,302 | | | Madison Square Garden Entertainment Corp.* | | | 77,393 | |
| | 9,164 | | | TechTarget, Inc.* | | | 285,275 | |
| | 22,833 | | | Thryv Holdings, Inc.* | | | 561,692 | |
| | 92,711 | | | Vimeo, Inc.* | | | 381,969 | |
| | 3,718 | | | Vivid Seats, Inc., Class A* | | | 29,447 | |
| | 11,289 | | | ZipRecruiter, Inc., Class A* | | | 200,493 | |
| | | | | | | | |
| | | | | | | 2,084,161 | |
| | |
| Pharmaceuticals, Biotechnology & Life Sciences – 9.9% | |
| | 5,921 | | | 89bio, Inc.* | | | 112,203 | |
| | 25,392 | | | ACADIA Pharmaceuticals, Inc.* | | | 608,138 | |
| | 34,353 | | | Adaptive Biotechnologies Corp.* | | | 230,509 | |
| | 21,423 | | | ADMA Biologics, Inc.* | | | 79,051 | |
| | 87,464 | | | Agenus, Inc.* | | | 139,942 | |
| | 13,412 | | | Alkermes PLC* | | | 419,796 | |
| | |
|
| Common Stocks – (continued) | |
| Pharmaceuticals, Biotechnology & Life Sciences – (continued) | |
| | 2,970 | | | Allogene Therapeutics, Inc.*(a) | | | 14,761 | |
| | 3,920 | | | ALX Oncology Holdings, Inc.* | | | 29,439 | |
| | 39,257 | | | Amicus Therapeutics, Inc.* | | | 493,068 | |
| | 4,207 | | | Amphastar Pharmaceuticals, Inc.* | | | 241,776 | |
| | 1,569 | | | Arcturus Therapeutics Holdings, Inc.* | | | 44,999 | |
| | 5,269 | | | Arrowhead Pharmaceuticals, Inc.* | | | 187,893 | |
| | 5,495 | | | Arvinas, Inc.* | | | 136,386 | |
| | 1,435 | | | Astria Therapeutics, Inc.* | | | 11,954 | |
| | 3,894 | | | Atea Pharmaceuticals, Inc.* | | | 14,564 | |
| | 54,790 | | | Aurinia Pharmaceuticals, Inc. (Canada)* | | | 530,367 | |
| | 2,522 | | | Axsome Therapeutics, Inc.* | | | 181,231 | |
| | 2,959 | | | Beam Therapeutics, Inc.* | | | 94,481 | |
| | 10,845 | | | BioCryst Pharmaceuticals, Inc.* | | | 76,349 | |
| | 22,577 | | | Biohaven Ltd.* | | | 540,042 | |
| | 647 | | | Blueprint Medicines Corp.* | | | 40,890 | |
| | 25,550 | | | CareDx, Inc.* | | | 217,175 | |
| | 14,547 | | | Catalyst Pharmaceuticals, Inc.* | | | 195,512 | |
| | 1,025 | | | Celldex Therapeutics, Inc.* | | | 34,778 | |
| | 1,828 | | | Collegium Pharmaceutical, Inc.* | | | 39,284 | |
| | 9,470 | | | CryoPort, Inc.* | | | 163,357 | |
| | 19,623 | | | Deciphera Pharmaceuticals, Inc.* | | | 276,292 | |
| | 6,528 | | | Denali Therapeutics, Inc.* | | | 192,641 | |
| | 5,273 | | | Dyne Therapeutics, Inc.* | | | 59,321 | |
| | 4,299 | | | Eagle Pharmaceuticals, Inc.* | | | 83,573 | |
| | 2,171 | | | Edgewise Therapeutics, Inc.* | | | 16,825 | |
| | 5,471 | | | Enanta Pharmaceuticals, Inc.* | | | 117,079 | |
| | 6,717 | | | Erasca, Inc.* | | | 18,539 | |
| | 6,409 | | | Generation Bio Co.* | | | 35,249 | |
| | 8,175 | | | Harmony Biosciences Holdings, Inc.* | | | 287,678 | |
| | 7,627 | | | Ideaya Biosciences, Inc.* | | | 179,234 | |
| | 1,420 | | | Insmed, Inc.* | | | 29,962 | |
| | 1,003 | | | Intellia Therapeutics, Inc.* | | | 40,902 | |
| | 31,018 | | | Iovance Biotherapeutics, Inc.* | | | 218,367 | |
| | 4,457 | | | iTeos Therapeutics, Inc.* | | | 59,011 | |
| | 751 | | | IVERIC bio, Inc.* | | | 29,544 | |
| | 5,193 | | | KalVista Pharmaceuticals, Inc.* | | | 46,737 | |
| | 27,664 | | | Karyopharm Therapeutics, Inc.* | | | 49,519 | |
| | 11,116 | | | Kiniksa Pharmaceuticals Ltd., Class A* | | | 156,513 | |
| | 32,638 | | | Kodiak Sciences, Inc.* | | | 225,202 | |
| | 5,992 | | | MacroGenics, Inc.* | | | 32,057 | |
| | 758 | | | Madrigal Pharmaceuticals, Inc.* | | | 175,098 | |
| | 7,067 | | | MeiraGTx Holdings PLC* | | | 47,490 | |
| | 445 | | | Mesa Laboratories, Inc. | | | 57,182 | |
| | 13,310 | | | NanoString Technologies, Inc.* | | | 53,906 | |
| | 4,261 | | | Nkarta, Inc.* | | | 9,332 | |
| | 2,459 | | | Nurix Therapeutics, Inc.* | | | 24,565 | |
| | 17,985 | | | Pacific Biosciences of California, Inc.* | | | 239,201 | |
| | 2,732 | | | Phibro Animal Health Corp., Class A | | | 37,428 | |
| | 11,834 | | | PMV Pharmaceuticals, Inc.* | | | 74,081 | |
| | 11,372 | | | Prestige Consumer Healthcare, Inc.* | | | 675,838 | |
| | 259 | | | Prothena Corp. PLC (Ireland)* | | | 17,685 | |
| | |
| | |
| 34 | | The accompanying notes are an integral part of these financial statements. |
GOLDMAN SACHS VARIABLE INSURANCE TRUST SMALL CAP EQUITY INSIGHTS FUND
| | | | | | | | |
| Shares | | |
Description | | Value | |
|
| Common Stocks – (continued) | |
| Pharmaceuticals, Biotechnology & Life Sciences – (continued) | |
| | 10,405 | | | PTC Therapeutics, Inc.* | | $ | 423,171 | |
| | 2,871 | | | Rallybio Corp.* | | | 16,250 | |
| | 7,335 | | | Replimune Group, Inc.* | | | 170,319 | |
| | 16,461 | | | Rocket Pharmaceuticals, Inc.* | | | 327,080 | |
| | 12,336 | | | Sana Biotechnology, Inc.* | | | 73,523 | |
| | 14,011 | | | Selecta Biosciences, Inc.* | | | 15,692 | |
| | 11,278 | | | SpringWorks Therapeutics, Inc.* | | | 295,709 | |
| | 45,539 | | | Sutro Biopharma, Inc.* | | | 211,756 | |
| | 18,558 | | | TG Therapeutics, Inc.* | | | 460,981 | |
| | 2,409 | | | Travere Therapeutics, Inc.* | | | 37,002 | |
| | 48,172 | | | Vanda Pharmaceuticals, Inc.* | | | 317,453 | |
| | 4,925 | | | Vaxcyte, Inc.* | | | 245,955 | |
| | 5,391 | | | Veracyte, Inc.* | | | 137,309 | |
| | 9,712 | | | Vericel Corp.* | | | 364,880 | |
| | 1,425 | | | Vir Biotechnology, Inc.* | | | 34,955 | |
| | 2,439 | | | Viridian Therapeutics, Inc.* | | | 58,024 | |
| | 7,653 | | | X4 Pharmaceuticals, Inc.* | | | 14,847 | |
| | 28,624 | | | Y-mAbs Therapeutics, Inc.* | | | 194,357 | |
| | | | | | | | |
| | | | | | | 11,843,259 | |
| | |
| Real Estate Management & Development – 0.8% | |
| | 10,200 | | | Anywhere Real Estate, Inc.* | | | 68,136 | |
| | 60,364 | | | Compass, Inc., Class A* | | | 211,274 | |
| | 18,884 | | | Newmark Group, Inc., Class A | | | 117,458 | |
| | 46,431 | | | Redfin Corp.* | | | 576,673 | |
| | | | | | | | |
| | | | | | | 973,541 | |
| | |
| Semiconductors & Semiconductor Equipment – 2.1% | |
| | 1,258 | | | Aehr Test Systems* | | | 51,892 | |
| | 273 | | | Ambarella, Inc.* | | | 22,842 | |
| | 5,683 | | | Axcelis Technologies, Inc.* | | | 1,041,864 | |
| | 748 | | | Cohu, Inc.* | | | 31,087 | |
| | 5,961 | | | Diodes, Inc.* | | | 551,333 | |
| | 10,326 | | | FormFactor, Inc.* | | | 353,356 | |
| | 12,743 | | | MaxLinear, Inc.* | | | 402,169 | |
| | 865 | | | Power Integrations, Inc. | | | 81,889 | |
| | 512 | | | Synaptics, Inc.* | | | 43,715 | |
| | | | | | | | |
| | | | | | | 2,580,147 | |
| | |
| Software & Services – 5.6% | |
| | 6,579 | | | Alarm.com Holdings, Inc.* | | | 340,003 | |
| | 1,853 | | | American Software, Inc., Class A | | | 19,475 | |
| | 6,312 | | | Appian Corp., Class A* | | | 300,451 | |
| | 23,751 | | | Asana, Inc., Class A* | | | 523,472 | |
| | 1,047 | | | BlackLine, Inc.* | | | 56,350 | |
| | 558 | | | Box, Inc., Class A* | | | 16,394 | |
| | 1,713 | | | C3.ai, Inc., Class A*(a) | | | 62,405 | |
| | 29,324 | | | Clear Secure, Inc., Class A | | | 679,437 | |
| | 12,441 | | | CommVault Systems, Inc.* | | | 903,465 | |
| | 18,745 | | | Fastly, Inc., Class A* | | | 295,609 | |
| | 3,438 | | | Marathon Digital Holdings, Inc.* | | | 47,651 | |
| | 372 | | | MicroStrategy, Inc., Class A* | | | 127,380 | |
| | 3,792 | | | PagerDuty, Inc.* | | | 85,244 | |
| | 3,341 | | | Perficient, Inc.* | | | 278,405 | |
| | 7,883 | | | PROS Holdings, Inc.* | | | 242,796 | |
| | 4,932 | | | Rapid7, Inc.* | | | 223,321 | |
| | |
|
| Common Stocks – (continued) | |
| Software & Services – (continued) | |
| | 4,505 | | | Red Violet, Inc.*(a) | | | 92,668 | |
| | 2,376 | | | Riot Platforms, Inc.* | | | 28,084 | |
| | 19,908 | | | Sapiens International Corp. NV (Israel) | | | 529,553 | |
| | 13,660 | | | SolarWinds Corp.* | | | 140,152 | |
| | 3,511 | | | Sprout Social, Inc., Class A* | | | 162,068 | |
| | 3,435 | | | SPS Commerce, Inc.* | | | 659,726 | |
| | 6,261 | | | Squarespace, Inc., Class A* | | | 197,472 | |
| | 633 | | | Tenable Holdings, Inc.* | | | 27,567 | |
| | 2,272 | | | Varonis Systems, Inc.* | | | 60,549 | |
| | 26,433 | | | Yext, Inc.* | | | 298,957 | |
| | 23,746 | | | Zeta Global Holdings Corp., Class A* | | | 202,791 | |
| | 13,303 | | | Zuora, Inc., Class A* | | | 145,934 | |
| | | | | | | | |
| | | | | | | 6,747,379 | |
| | |
| Technology Hardware & Equipment – 5.1% | |
| | 6,306 | | | Advanced Energy Industries, Inc. | | | 702,804 | |
| | 2,825 | | | Badger Meter, Inc. | | | 416,857 | |
| | 2,178 | | | ePlus, Inc.* | | | 122,621 | |
| | 4,900 | | | Extreme Networks, Inc.* | | | 127,645 | |
| | 2,471 | | | Fabrinet (Thailand) * | | | 320,933 | |
| | 20,156 | | | Harmonic, Inc.* | | | 325,922 | |
| | 16,325 | | | IonQ, Inc.* | | | 220,877 | |
| | 2,478 | | | Methode Electronics, Inc. | | | 83,062 | |
| | 1,126 | | | Napco Security Technologies, Inc. | | | 39,016 | |
| | 23,366 | | | NetScout Systems, Inc.* | | | 723,178 | |
| | 3,447 | | | nLight, Inc.* | | | 53,153 | |
| | 1,797 | | | PC Connection, Inc. | | | 81,045 | |
| | 10,662 | | | Sanmina Corp.* | | | 642,599 | |
| | 4,892 | | | Super Micro Computer, Inc.* | | | 1,219,331 | |
| | 8,502 | | | TTM Technologies, Inc.* | | | 118,178 | |
| | 65,757 | | | Viavi Solutions, Inc.* | | | 745,027 | |
| | 5,234 | | | Vishay Precision Group, Inc.* | | | 194,443 | |
| | | | | | | | |
| | | | | | | 6,136,691 | |
| | |
| Telecommunication Services – 0.0% | |
| | 700 | | | Bandwidth, Inc., Class A* | | | 9,576 | |
| | 40,720 | | | Globalstar, Inc.* | | | 43,978 | |
| | 630 | | | Ooma, Inc.* | | | 9,431 | |
| | | | | | | | |
| | | | | | | 62,985 | |
| | |
| Transportation – 1.2% | |
| | 21,701 | | | Costamare, Inc. (Monaco) | | | 209,849 | |
| | 5,770 | | | Frontier Group Holdings, Inc.* | | | 55,796 | |
| | 5,147 | | | Joby Aviation, Inc.* | | | 52,808 | |
| | 24,764 | | | Marten Transport Ltd. | | | 532,426 | |
| | 3,699 | | | PAM Transportation Services, Inc.* | | | 99,022 | |
| | 19,572 | | | Sun Country Airlines Holdings, Inc.* | | | 439,979 | |
| | | | | | | | |
| | | | | | | 1,389,880 | |
| | |
| Utilities – 0.1% | |
| | 2,968 | | | Montauk Renewables, Inc.* | | | 22,082 | |
| | 1,073 | | | Ormat Technologies, Inc. | | | 86,334 | |
| | | | | | | | |
| | | | | | | 108,416 | |
| | |
| | TOTAL COMMON STOCKS | | | | |
| | (Cost $107,979,618) | | $ | 117,119,865 | |
| | |
| | |
| The accompanying notes are an integral part of these financial statements. | | 35 |
GOLDMAN SACHS VARIABLE INSURANCE TRUST SMALL CAP EQUITY INSIGHTS FUND
Schedule of Investments (continued)
June 30, 2023 (Unaudited)
| | | | | | | | |
| Shares | | | Dividend
Rate | | Value | |
|
| Investment Company – 1.0%(c) | |
| Goldman Sachs Financial Square Government Fund —
Institutional Shares |
|
| | 1,176,220 | | | 5.022% | | $ | 1,176,220 | |
| | (Cost $1,176,220) | |
| | |
| TOTAL INVESTMENTS BEFORE SECURITIES LENDING
REINVESTMENT VEHICLE |
|
| | (Cost $109,155,838) | | $ | 118,296,085 | |
| | |
| | | | | | | | |
|
| Securities Lending Reinvestment Vehicle – 0.8%(c) | |
| Goldman Sachs Financial Square Government Fund —
Institutional Shares |
|
| | 912,449 | | | 5.022% | | $ | 912,449 | |
| | (Cost $912,449) | |
| | |
| | TOTAL INVESTMENTS – 99.3% | |
| | (Cost $110,068,287) | | $ | 119,208,534 | |
| | |
| OTHER ASSETS IN EXCESS OF
LIABILITIES – 0.7% | | | 897,939 | |
| | |
| | NET ASSETS – 100.0% | | $ | 120,106,473 | |
| | |
| | |
| The percentage shown for each investment category reflects the value of investments in that category as a percentage of net assets. |
| |
| * | | Non-income producing security. |
| |
| (a) | | All or a portion of security is on loan. |
| |
| (b) | | All or portion of security is pledged as collateral for futures contracts. Total market value of securities pledged as collateral on futures contracts amounts to $271,110, which represents approximately 0.2% of net assets as of June 30, 2023. |
| |
| (c) | | Represents an affiliated issuer. |
| | |
| |
| Investment Abbreviations: |
| PLC | | —Public Limited Company |
| REIT | | —Real Estate Investment Trust |
ADDITIONAL INVESTMENT INFORMATION
FUTURES CONTRACTS — At June 30, 2023, the Fund had the following futures contracts:
| | | | | | | | | | | | | | | | |
| Description | | Number of
Contracts | | | Expiration
Date | | | Notional
Amount | | | Unrealized
Appreciation/
(Depreciation) | |
| | | | |
Long position contracts: | | | | | | | | | | | | | | | | |
| Russell 2000 E-Mini Index | | | 20 | | | | 09/15/23 | | | $ | 1,903,700 | | | $ | 17,300 | |
| | |
| 36 | | The accompanying notes are an integral part of these financial statements. |
GOLDMAN SACHS VARIABLE INSURANCE TRUST STRATEGIC GROWTH FUND
Schedule of Investments
June 30, 2023 (Unaudited)
| | | | | | | | |
| Shares | | | Description | | Value | |
|
| Common Stocks – 99.2% | |
| Automobiles & Components – 2.9% | |
| | 17,418 | | | Aptiv PLC* | | $ | 1,778,203 | |
| | 32,866 | | | Tesla, Inc.* | | | 8,603,333 | |
| | | | | | | | |
| | | | | | | 10,381,536 | |
| | |
| Capital Goods – 2.7% | |
| | 4,237 | | | Boeing Co. (The)* | | | 894,685 | |
| | 19,833 | | | Caterpillar, Inc. | | | 4,879,910 | |
| | 2,698 | | | Deere & Co. | | | 1,093,203 | |
| | 8,870 | | | Rockwell Automation, Inc. | | | 2,922,221 | |
| | | | | | | | |
| | | | | | | 9,790,019 | |
| | |
| Commercial & Professional Services – 0.8% | |
| | 19,503 | | | Waste Connections, Inc. | | | 2,787,564 | |
| | |
| Consumer Discretionary Distribution & Retail – 9.3% | |
| | 168,807 | | | Amazon.com, Inc.* | | | 22,005,680 | |
| | 14,760 | | | Etsy, Inc.* | | | 1,248,844 | |
| | 14,959 | | | Lowe’s Cos., Inc. | | | 3,376,246 | |
| | 6,464 | | | RH* | | | 2,130,470 | |
| | 41,605 | | | Ross Stores, Inc. | | | 4,665,169 | |
| | | | | | | | |
| | | | | | | 33,426,409 | |
| | |
| Consumer Durables & Apparel – 2.1% | |
| | 11,079 | | | Lululemon Athletica, Inc.* | | | 4,193,401 | |
| | 31,926 | | | NIKE, Inc., Class B | | | 3,523,673 | |
| | | | | | | | |
| | | | | | | 7,717,074 | |
| | |
| Consumer Services – 1.4% | |
| | 785 | | | Chipotle Mexican Grill, Inc.* | | | 1,679,115 | |
| | 11,062 | | | McDonald’s Corp. | | | 3,301,011 | |
| | | | | | | | |
| | | | | | | 4,980,126 | |
| | |
| Energy – 0.3% | |
| | 7,148 | | | Cheniere Energy, Inc. | | | 1,089,069 | |
| | |
| Equity Real Estate Investment Trusts – 1.5% | |
| | 12,891 | | | American Tower Corp. REIT | | | 2,500,080 | |
| | 3,590 | | | Equinix, Inc. REIT | | | 2,814,345 | |
| | | | | | | | |
| | | | | | | 5,314,425 | |
| | |
| Financial Services – 5.6% | |
| | 39,601 | | | Charles Schwab Corp. (The) | | | 2,244,585 | |
| | 27,841 | | | Mastercard, Inc., Class A | | | 10,949,865 | |
| | 5,915 | | | MSCI, Inc. | | | 2,775,851 | |
| | 17,590 | | | Visa, Inc., Class A | | | 4,177,273 | |
| | | | | | | | |
| | | | | | | 20,147,574 | |
| | |
| Food, Beverage & Tobacco – 2.4% | |
| | 36,697 | | | Coca-Cola Co. (The) | | | 2,209,893 | |
| | 48,912 | | | McCormick & Co., Inc. | | | 4,266,594 | |
| | 8,850 | | | Mondelez International, Inc., Class A | | | 645,519 | |
| | 29,799 | | | Monster Beverage Corp.* | | | 1,711,655 | |
| | | | | | | | |
| | | | | | | 8,833,661 | |
| | |
| Health Care Equipment & Services – 3.5% | |
| | 71,624 | | | Boston Scientific Corp.* | | | 3,874,142 | |
| | 3,893 | | | Humana, Inc. | | | 1,740,677 | |
| | 7,161 | | | Insulet Corp.* | | | 2,064,803 | |
| | |
|
| Common Stocks – (continued) | |
| Health Care Equipment & Services – (continued) | |
| | 11,476 | | | Intuitive Surgical, Inc.* | | | 3,924,103 | |
| | 5,111 | | | Veeva Systems, Inc., Class A* | | | 1,010,598 | |
| | | | | | | | |
| | | | | | | 12,614,323 | |
| | |
| Household & Personal Products – 1.6% | |
| | 9,167 | | | Estee Lauder Cos., Inc. (The), Class A | | | 1,800,216 | |
| | 25,737 | | | Procter & Gamble Co. (The) | | | 3,905,332 | |
| | | | | | | | |
| | | | | | | 5,705,548 | |
| | |
| Materials – 4.1% | |
| | 31,070 | | | Freeport-McMoRan, Inc. | | | 1,242,800 | |
| | 12,041 | | | Linde PLC | | | 4,588,584 | |
| | 6,060 | | | Martin Marietta Materials, Inc. | | | 2,797,842 | |
| | 23,343 | | | Sherwin-Williams Co. (The) | | | 6,198,033 | |
| | | | | | | | |
| | | | | | | 14,827,259 | |
| | |
| Media & Entertainment – 7.7% | |
| | 122,111 | | | Alphabet, Inc., Class A* | | | 14,616,687 | |
| | 75,784 | | | Alphabet, Inc., Class C* | | | 9,167,590 | |
| | 7,489 | | | Meta Platforms, Inc., Class A* | | | 2,149,193 | |
| | 154,031 | | | Snap, Inc., Class A* | | | 1,823,727 | |
| | | | | | | | |
| | | | | | | 27,757,197 | |
| | |
| Pharmaceuticals, Biotechnology & Life Sciences – 7.9% | |
| | 10,096 | | | Alnylam Pharmaceuticals, Inc.* | | | 1,917,634 | |
| | 5,421 | | | Argenx SE ADR (Netherlands)* | | | 2,112,726 | |
| | 49,244 | | | AstraZeneca PLC ADR
(United Kingdom) | | | 3,524,393 | |
| | 3,873 | | | Biogen, Inc.* | | | 1,103,224 | |
| | 23,155 | | | BioMarin Pharmaceutical, Inc.* | | | 2,007,075 | |
| | 19,866 | | | Eli Lilly & Co. | | | 9,316,757 | |
| | 10,147 | | | Exact Sciences Corp.* | | | 952,803 | |
| | 23,095 | | | Gilead Sciences, Inc. | | | 1,779,932 | |
| | 5,556 | | | Illumina, Inc.* | | | 1,041,695 | |
| | 15,475 | | | Sarepta Therapeutics, Inc.* | | | 1,772,197 | |
| | 4,527 | | | Waters Corp.* | | | 1,206,627 | |
| | 4,526 | | | West Pharmaceutical Services, Inc. | | | 1,731,059 | |
| | | | | | | | |
| | | | | | | 28,466,122 | |
| | |
| Real Estate Management & Development – 0.8% | |
| | 32,922 | | | CoStar Group, Inc.* | | | 2,930,058 | |
| | |
| Semiconductors & Semiconductor Equipment – 10.1% | |
| | 13,141 | | | Enphase Energy, Inc.* | | | 2,200,855 | |
| | 7,006 | | | KLA Corp. | | | 3,398,050 | |
| | 115,150 | | | Marvell Technology, Inc. | | | 6,883,667 | |
| | 55,396 | | | NVIDIA Corp. | | | 23,433,616 | |
| | 5,560 | | | ON Semiconductor Corp.* | | | 525,865 | |
| | | | | | | | |
| | | | | | | 36,442,053 | |
| | |
| Software & Services – 19.1% | |
| | 19,708 | | | Accenture PLC, Class A | | | 6,081,495 | |
| | 2,214 | | | Adobe, Inc.* | | | 1,082,624 | |
| | 9,009 | | | Atlassian Corp., Class A* | | | 1,511,800 | |
| | 11,048 | | | Intuit, Inc. | | | 5,062,083 | |
| | 126,400 | | | Microsoft Corp. | | | 43,044,256 | |
| | 35,375 | | | Oracle Corp. | | | 4,212,809 | |
| | |
| | |
| The accompanying notes are an integral part of these financial statements. | | 37 |
GOLDMAN SACHS VARIABLE INSURANCE TRUST STRATEGIC GROWTH FUND
Schedule of Investments (continued)
June 30, 2023 (Unaudited)
| | | | | | | | |
| Shares | | | Description | | Value | |
|
| Common Stocks – (continued) | |
| Software & Services – (continued) | |
| | 19,764 | | | Salesforce, Inc.* | | $ | 4,175,342 | |
| | 1,303 | | | ServiceNow, Inc.* | | | 732,247 | |
| | 18,046 | | | Snowflake, Inc., Class A* | | | 3,175,735 | |
| | | | | | | | |
| | | | | | | 69,078,391 | |
| | |
| Technology Hardware & Equipment – 14.0% | |
| | 17,392 | | | Amphenol Corp., Class A | | | 1,477,451 | |
| | 252,293 | | | Apple, Inc. | | | 48,937,273 | |
| | | | | | | | |
| | | | | | | 50,414,724 | |
| | |
| Transportation – 1.4% | |
| | 13,633 | | | Old Dominion Freight Line, Inc. | | | 5,040,802 | |
| | |
| | TOTAL INVESTMENTS – 99.2% | |
| | (Cost $184,783,619) | | $ | 357,743,934 | |
| | |
| OTHER ASSETS IN EXCESS OF
LIABILITIES – 0.8% | | | 3,002,352 | |
| | |
| | NET ASSETS – 100.0% | | $ | 360,746,286 | |
| | |
| | |
| The percentage shown for each investment category reflects the value of investments in that category as a percentage of net assets. |
| |
| * | | Non-income producing security. |
| | |
| |
| Investment Abbreviations: |
| ADR | | —American Depositary Receipt |
| PLC | | —Public Limited Company |
| REIT | | —Real Estate Investment Trust |
| | |
| 38 | | The accompanying notes are an integral part of these financial statements. |
GOLDMAN SACHS VARIABLE INSURANCE TRUST U.S. EQUITY INSIGHTS FUND
Schedule of Investments
June 30, 2023 (Unaudited)
| | | | | | | | |
| Shares | | | Description | | Value | |
|
| Common Stocks – 98.1% | |
| Automobiles & Components – 2.9% | |
| | 97,193 | | | General Motors Co. | | $ | 3,747,762 | |
| | 2,554 | | | Lear Corp. | | | 366,626 | |
| | 18,736 | | | Tesla, Inc.* | | | 4,904,523 | |
| | 1,332 | | | Thor Industries, Inc. | | | 137,862 | |
| | | | | | | | |
| | | | | | | 9,156,773 | |
| | |
| Banks – 2.9% | |
| | 166,900 | | | Bank of America Corp. | | | 4,788,361 | |
| | 46,092 | | | Citigroup, Inc. | | | 2,122,076 | |
| | 15,069 | | | JPMorgan Chase & Co. | | | 2,191,635 | |
| | | | | | | | |
| | | | | | | 9,102,072 | |
| | |
| Capital Goods – 4.8% | |
| | 23,509 | | | AMETEK, Inc. | | | 3,805,637 | |
| | 4,828 | | | Boeing Co. (The)* | | | 1,019,480 | |
| | 40,809 | | | Howmet Aerospace, Inc. | | | 2,022,494 | |
| | 56,998 | | | Johnson Controls International PLC | | | 3,883,844 | |
| | 8,407 | | | Lockheed Martin Corp. | | | 3,870,415 | |
| | 585 | | | RBC Bearings, Inc.* | | | 127,220 | |
| | 6,570 | | | Textron, Inc. | | | 444,329 | |
| | | | | | | | |
| | | | | | | 15,173,419 | |
| | |
| Commercial & Professional Services – 3.0% | |
| | 6,594 | | | Automatic Data Processing, Inc. | | | 1,449,295 | |
| | 7,146 | | | Cintas Corp. | | | 3,552,134 | |
| | 4,113 | | | Concentrix Corp. | | | 332,125 | |
| | 2,099 | | | Equifax, Inc. | | | 493,895 | |
| | 23,619 | | | Republic Services, Inc. | | | 3,617,722 | |
| | | | | | | | |
| | | | | | | 9,445,171 | |
| | |
| Consumer Discretionary Distribution & Retail – 6.4% | |
| | 64,913 | | | Amazon.com, Inc.* | | | 8,462,059 | |
| | 28,952 | | | CarMax, Inc.* | | | 2,423,282 | |
| | 59,287 | | | Chewy, Inc., Class A* | | | 2,340,058 | |
| | 2,978 | | | Five Below, Inc.* | | | 585,296 | |
| | 58,961 | | | LKQ Corp. | | | 3,435,658 | |
| | 1,134 | | | MercadoLibre, Inc. (Brazil)* | | | 1,343,336 | |
| | 1,010 | | | O’Reilly Automotive, Inc.* | | | 964,853 | |
| | 7,711 | | | Ross Stores, Inc. | | | 864,635 | |
| | | | | | | | |
| | | | | | | 20,419,177 | |
| | |
| Consumer Durables & Apparel – 2.0% | |
| | 2,433 | | | Crocs, Inc.* | | | 273,567 | |
| | 4,525 | | | Garmin Ltd. | | | 471,912 | |
| | 6,940 | | | Lennar Corp., Class A | | | 869,651 | |
| | 9,024 | | | Lululemon Athletica, Inc.* | | | 3,415,584 | |
| | 27,245 | | | Skechers USA, Inc., Class A* | | | 1,434,722 | |
| | | | | | | | |
| | | | | | | 6,465,436 | |
| | |
| Consumer Services – 1.5% | |
| | 5,190 | | | Airbnb, Inc., Class A* | | | 665,150 | |
| | 17,376 | | | Hilton Worldwide Holdings, Inc. | | | 2,529,077 | |
| | 5,754 | | | Norwegian Cruise Line Holdings Ltd.* | | | 125,265 | |
| | 12,949 | | | Starbucks Corp. | | | 1,282,728 | |
| | | | | | | | |
| | | | | | | 4,602,220 | |
| | |
|
| Common Stocks – (continued) | |
| Consumer Staples Distribution & Retail – 1.6% | |
| | 7,114 | | | Costco Wholesale Corp. | | | 3,830,036 | |
| | 12,654 | | | Kroger Co. (The) | | | 594,738 | |
| | 3,385 | | | Walmart, Inc. | | | 532,054 | |
| | | | | | | | |
| | | | | | | 4,956,828 | |
| | |
| Energy – 2.1% | |
| | 20,913 | | | Cheniere Energy, Inc. | | | 3,186,305 | |
| | 4,668 | | | Exxon Mobil Corp. | | | 500,643 | |
| | 8,059 | | | Marathon Petroleum Corp. | | | 939,679 | |
| | 17,297 | | | Valero Energy Corp. | | | 2,028,938 | |
| | | | | | | | |
| | | | | | | 6,655,565 | |
| | |
| Equity Real Estate Investment Trusts – 5.0% | |
| | 1,490 | | | AvalonBay Communities, Inc. REIT | | | 282,012 | |
| | 6,133 | | | Brixmor Property Group, Inc. REIT | | | 134,926 | |
| | 9,902 | | | First Industrial Realty Trust, Inc. REIT | | | 521,241 | |
| | 40,616 | | | Healthpeak Properties, Inc. REIT | | | 816,382 | |
| | 185,097 | | | Host Hotels & Resorts, Inc. REIT | | | 3,115,182 | |
| | 6,340 | | | Lamar Advertising Co., Class A REIT | | | 629,245 | |
| | 5,966 | | | Mid-America Apartment Communities, Inc. REIT | | | 905,997 | |
| | 148,122 | | | Park Hotels & Resorts, Inc. REIT | | | 1,898,924 | |
| | 33,892 | | | Prologis, Inc. REIT | | | 4,156,176 | |
| | 3,940 | | | Rexford Industrial Realty, Inc. REIT | | | 205,747 | |
| | 68,854 | | | Ventas, Inc. REIT | | | 3,254,729 | |
| | | | | | | | |
| | | | | | | 15,920,561 | |
| | |
| Financial Services – 7.0% | |
| | 8,773 | | | Ally Financial, Inc. | | | 236,959 | |
| | 38,911 | | | Bank of New York Mellon Corp. (The) | | | 1,732,318 | |
| | 25,132 | | | Berkshire Hathaway, Inc., Class B* | | | 8,570,012 | |
| | 20,680 | | | CME Group, Inc. | | | 3,831,797 | |
| | 2,187 | | | Moody’s Corp. | | | 760,464 | |
| | 2,539 | | | MSCI, Inc. | | | 1,191,527 | |
| | 7,315 | | | S&P Global, Inc. | | | 2,932,510 | |
| | 50,219 | | | Synchrony Financial | | | 1,703,429 | |
| | 44,283 | | | Toast, Inc., Class A* | | | 999,467 | |
| | 659 | | | Visa, Inc., Class A | | | 156,499 | |
| | | | | | | | |
| | | | | | | 22,114,982 | |
| | |
| Food, Beverage & Tobacco – 4.2% | |
| | 85,076 | | | Coca-Cola Co. (The) | | | 5,123,277 | |
| | 49,057 | | | Kraft Heinz Co. (The) | | | 1,741,523 | |
| | 53,082 | | | Mondelez International, Inc., Class A | | | 3,871,801 | |
| | 43,288 | | | Monster Beverage Corp.* | | | 2,486,463 | |
| | | | | | | | |
| | | | | | | 13,223,064 | |
| | |
| Health Care Equipment & Services – 5.3% | |
| | 34,416 | | | Boston Scientific Corp.* | | | 1,861,562 | |
| | 37,622 | | | Centene Corp.* | | | 2,537,604 | |
| | 27,467 | | | CVS Health Corp. | | | 1,898,794 | |
| | 2,998 | | | Edwards Lifesciences Corp.* | | | 282,801 | |
| | 9,216 | | | Elevance Health, Inc. | | | 4,094,577 | |
| | 8,484 | | | Envista Holdings Corp.* | | | 287,099 | |
| | |
| | |
| The accompanying notes are an integral part of these financial statements. | | 39 |
GOLDMAN SACHS VARIABLE INSURANCE TRUST U.S. EQUITY INSIGHTS FUND
Schedule of Investments (continued)
June 30, 2023 (Unaudited)
| | | | | | | | |
| Shares | | | Description | | Value | |
|
| Common Stocks – (continued) | |
| Health Care Equipment & Services – (continued) | |
| | 1,455 | | | HCA Healthcare, Inc. | | $ | 441,563 | |
| | 2,186 | | | Humana, Inc. | | | 977,426 | |
| | 4,245 | | | Intuitive Surgical, Inc.* | | | 1,451,535 | |
| | 1,801 | | | Penumbra, Inc.* | | | 619,652 | |
| | 4,596 | | | UnitedHealth Group, Inc. | | | 2,209,021 | |
| | | | | | | | |
| | | | | | | 16,661,634 | |
| | |
| Household & Personal Products – 1.0% | |
| | 23,182 | | | Kimberly-Clark Corp. | | | 3,200,507 | |
| | |
| Insurance – 4.1% | |
| | 23,900 | | | Arch Capital Group Ltd.* | | | 1,788,915 | |
| | 17,022 | | | Chubb Ltd. | | | 3,277,756 | |
| | 8,696 | | | Globe Life, Inc. | | | 953,255 | |
| | 56,783 | | | MetLife, Inc. | | | 3,209,943 | |
| | 7,441 | | | Progressive Corp. (The) | | | 984,965 | |
| | 23,673 | | | Prudential Financial, Inc. | | | 2,088,432 | |
| | 3,422 | | | Travelers Cos., Inc. (The) | | | 594,265 | |
| | | | | | | | |
| | | | | | | 12,897,531 | |
| | |
| Materials – 3.0% | |
| | 32,731 | | | Element Solutions, Inc. | | | 628,435 | |
| | 6,282 | | | Linde PLC | | | 2,393,944 | |
| | 11,079 | | | Mosaic Co. (The) | | | 387,765 | |
| | 15,117 | | | Sherwin-Williams Co. (The) | | | 4,013,866 | |
| | 9,613 | | | Vulcan Materials Co. | | | 2,167,155 | |
| | | | | | | | |
| | | | | | | 9,591,165 | |
| | |
| Media & Entertainment – 7.2% | |
| | 47,411 | | | Alphabet, Inc., Class A* | | | 5,675,097 | |
| | 70,087 | | | Alphabet, Inc., Class C* | | | 8,478,424 | |
| | 12,960 | | | Meta Platforms, Inc., Class A* | | | 3,719,261 | |
| | 7,354 | | | Netflix, Inc.* | | | 3,239,364 | |
| | 22,752 | | | Trade Desk, Inc. (The), Class A* | | | 1,756,909 | |
| | | | | | | | |
| | | | | | | 22,869,055 | |
| | |
| Pharmaceuticals, Biotechnology & Life Sciences – 8.0% | |
| | 20,434 | | | AbbVie, Inc. | | | 2,753,073 | |
| | 14,855 | | | Agilent Technologies, Inc. | | | 1,786,314 | |
| | 1,629 | | | BioMarin Pharmaceutical, Inc.* | | | 141,202 | |
| | 66,511 | | | Bristol-Myers Squibb Co. | | | 4,253,379 | |
| | 10,321 | | | Bruker Corp. | | | 762,928 | |
| | 136,174 | | | Elanco Animal Health, Inc.* | | | 1,369,910 | |
| | 25,499 | | | Gilead Sciences, Inc. | | | 1,965,208 | |
| | 32,818 | | | Incyte Corp.* | | | 2,042,921 | |
| | 3,089 | | | Johnson & Johnson | | | 511,291 | |
| | 835 | | | Mettler-Toledo International, Inc.* | | | 1,095,219 | |
| | 10,543 | | | Moderna, Inc.* | | | 1,280,975 | |
| | 7,584 | | | Organon & Co. | | | 157,823 | |
| | 15,247 | | | QIAGEN NV* | | | 686,572 | |
| | 77,653 | | | Royalty Pharma PLC, Class A | | | 2,387,053 | |
| | 1,672 | | | Sarepta Therapeutics, Inc.* | | | 191,477 | |
| | 11,567 | | | Vertex Pharmaceuticals, Inc.* | | | 4,070,543 | |
| | | | | | | | |
| | | | | | | 25,455,888 | |
| | |
| Real Estate Management & Development – 0.2% | |
| | 6,226 | | | CoStar Group, Inc.* | | | 554,114 | |
| | |
|
| Common Stocks – (continued) | |
| Semiconductors & Semiconductor Equipment – 5.2% | |
| | 6,198 | | | Applied Materials, Inc. | | $ | 895,859 | |
| | 9,490 | | | Intel Corp. | | | 317,346 | |
| | 1,363 | | | KLA Corp. | | | 661,082 | |
| | 27,982 | | | Microchip Technology, Inc. | | | 2,506,907 | |
| | 25,848 | | | NVIDIA Corp. | | | 10,934,221 | |
| | 5,511 | | | NXP Semiconductors NV (China) | | | 1,127,992 | |
| | | | | | | | |
| | | | | | | 16,443,407 | |
| | |
| Software & Services – 11.5% | |
| | 13,077 | | | Autodesk, Inc.* | | | 2,675,685 | |
| | 49,829 | | | Fortinet, Inc.* | | | 3,766,574 | |
| | 5,701 | | | Gartner, Inc.* | | | 1,997,117 | |
| | 1,314 | | | Intuit, Inc. | | | 602,062 | |
| | 63,827 | | | Microsoft Corp. | | | 21,735,646 | |
| | 480 | | | Palo Alto Networks, Inc.* | | | 122,645 | |
| | 13,738 | | | Salesforce, Inc.* | | | 2,902,290 | |
| | 2,606 | | | ServiceNow, Inc.* | | | 1,464,494 | |
| | 11,201 | | | Splunk, Inc.* | | | 1,188,314 | |
| | | | | | | | |
| | | | | | | 36,454,827 | |
| | |
| Technology Hardware & Equipment – 8.7% | |
| | 15,743 | | | Amphenol Corp., Class A | | | 1,337,368 | |
| | 109,252 | | | Apple, Inc. | | | 21,191,610 | |
| | 16,842 | | | Arista Networks, Inc.* | | | 2,729,415 | |
| | 78,913 | | | Hewlett Packard Enterprise Co. | | | 1,325,738 | |
| | 2,232 | | | Teledyne Technologies, Inc.* | | | 917,598 | |
| | | | | | | | |
| | | | | | | 27,501,729 | |
| | |
| Transportation – 0.4% | |
| | 401 | | | Ryder System, Inc. | | | 34,001 | |
| | 12,313 | | | Uber Technologies, Inc.* | | | 531,552 | |
| | 4,012 | | | Union Pacific Corp. | | | 820,935 | |
| | | | | | | | |
| | | | | | | 1,386,488 | |
| | |
| Utilities – 0.1% | |
| | 13,219 | | | AES Corp. (The) | | | 274,030 | |
| | |
| | TOTAL COMMON STOCKS | |
| | (Cost $242,485,320) | | $ | 310,525,643 | |
| | |
| | | | | | | | |
| Shares | | | Dividend
Rate | | Value | |
|
| Investment Company – 0.6%(a) | |
| Goldman Sachs Financial Square Government Fund —
Institutional Shares, |
|
| | 1,788,518 | | | 5.022% | | $ | 1,788,518 | |
| | (Cost $1,788,518) | |
| | |
| | TOTAL INVESTMENTS – 98.7% | |
| | (Cost $244,273,838) | | $ | 312,314,161 | |
| | |
| OTHER ASSETS IN EXCESS OF
LIABILITIES – 1.3% | | | 4,211,638 | |
| | |
| | NET ASSETS – 100.0% | | $ | 316,525,799 | |
| | |
| | |
| 40 | | The accompanying notes are an integral part of these financial statements. |
GOLDMAN SACHS VARIABLE INSURANCE TRUST U.S. EQUITY INSIGHTS FUND
| | |
| The percentage shown for each investment category reflects the value of investments in that category as a percentage of net assets. |
| |
| * | | Non-income producing security. |
| |
| (a) | | Represents an affiliated issuer. |
| | |
| |
| Investment Abbreviations: |
| PLC | | —Public Limited Company |
| REIT | | —Real Estate Investment Trust |
| | | | | | | | | | | | | | | | |
ADDITIONAL INVESTMENT INFORMATION FUTURES CONTRACTS — At June 30, 2023, the Fund had the following futures contracts: | |
| Description | | Number of
Contracts | | | Expiration
Date | | | Notional
Amount | | | Unrealized
Appreciation/
(Depreciation) | |
| | | | |
Long position contracts: | | | | | | | | | | | | | | | | |
| S&P 500 E-Mini Index | | | 22 | | | | 09/15/23 | | | $ | 4,937,075 | | | $ | 110,495 | |
| | |
| The accompanying notes are an integral part of these financial statements. | | 41 |
GOLDMAN SACHS VARIABLE INSURANCE TRUST EQUITY FUNDS
Statements of Assets and Liabilities
June 30, 2023 (Unaudited)
| | | | | | | | | | | | | | | | |
| | | International
Equity Insights
Fund | | | Large Cap
Value Fund | | | Mid Cap
Growth Fund | | | Mid Cap
Value Fund | |
| | | | | | | | | | | | | | | | |
| Assets: | | | | | | | | | | | | |
Investments in unaffiliated issuers, at value (cost $95,576,860, $333,191,712, $47,454,765 and $360,267,125, respectively) | | $ | 104,931,791 | | | $ | 384,643,334 | | | $ | 58,873,757 | | | $ | 427,039,460 | |
Investments in affiliated issuers, at value (cost $—, $855,090, $2,933,066 and $8,997,935, respectively) | | | — | | | | 855,090 | | | | 2,933,066 | | | | 8,997,935 | |
Cash | | | 564,939 | | | | 633,071 | | | | 124,320 | | | | 2,394,826 | |
Foreign currency, at value (cost $572,611, $—, $ — and $—, respectively) | | | 566,144 | | | | — | | | | — | | | | — | |
Receivables: | | | | | | | | | | | | | | | | |
Foreign tax reclaims | | | 423,006 | | | | 3,072 | | | | — | | | | — | |
Dividends | | | 152,805 | | | | 220,210 | | | | 15,358 | | | | 510,375 | |
Collateral on certain derivative contracts | | | 41,428 | | | | — | | | | — | | | | — | |
Reimbursement from investment adviser | | | 10,987 | | | | 10,442 | | | | 10,252 | | | | — | |
Fund shares sold | | | 2,592 | | | | 130,225 | | | | 85 | | | | 2,094,760 | |
Securities lending income | | | 674 | | | | — | | | | — | | | | — | |
Investments sold | | | — | | | | 369,847 | | | | — | | | | — | |
Variation margin on futures contracts | | | 5,068 | | | | — | | | | — | | | | — | |
Other assets | | | 45,502 | | | | 1,448 | | | | 103,218 | | | | 2,029 | |
| | | | |
| Total assets | | | 106,744,936 | | | | 386,866,739 | | | | 62,060,056 | | | | 441,039,385 | |
| | | | | | | | | | | | | | | | |
| | | | | | | | | | | | | | | | |
| Liabilities: | | | | | | | | | | | | |
Payables: | | | | | | | | | | | | | | | | |
Management fees | | | 90,853 | | | | 211,189 | | | | 39,562 | | | | 250,766 | |
Fund shares redeemed | | | 62,080 | | | | 543,563 | | | | 54,393 | | | | 225,757 | |
Distribution and Service fees and Transfer Agency fees | | | 9,531 | | | | 57,336 | | | | 14,008 | | | | 28,280 | |
Investments purchased | | | — | | | | 397,669 | | | | — | | | | 6,019,304 | |
Accrued expenses | | | 150,084 | | | | 136,633 | | | | 130,302 | | | | 237,910 | |
| | | | |
| Total liabilities | | | 312,548 | | | | 1,346,390 | | | | 238,265 | | | | 6,762,017 | |
| | | | | | | | | | | | | | | | |
| | | | | | | | | | | | | | | | |
| Net Assets: | | | | | | | | | | | | |
Paid-in capital | | | 104,514,456 | | | | 311,708,176 | | | | 50,628,074 | | | | 369,364,928 | |
Total distributable earnings | | | 1,917,932 | | | | 73,812,173 | | | | 11,193,717 | | | | 64,912,440 | |
| | | | |
| NET ASSETS | | $ | 106,432,388 | | | $ | 385,520,349 | | | $ | 61,821,791 | | | $ | 434,277,368 | |
Net Assets: | | | | | | | | | | | | | | | | |
Institutional | | $ | 68,095,225 | | | $ | 142,973,908 | | | $ | 1,352,793 | | | $ | 318,084,113 | |
Service | | | 38,337,163 | | | | 242,546,441 | | | | 60,468,998 | | | | 116,193,255 | |
| | | | |
Total Net Assets | | $ | 106,432,388 | | | $ | 385,520,349 | | | $ | 61,821,791 | | | $ | 434,277,368 | |
Shares outstanding $0.001 par value (unlimited number of shares authorized): | | | | | | | | | | | | | | | | |
Institutional | | | 7,934,020 | | | | 16,260,966 | | | | 129,137 | | | | 20,277,944 | |
Service | | | 4,450,174 | | | | 27,602,000 | | | | 6,204,739 | | | | 7,327,174 | |
Net asset value, offering and redemption price per share: | | | | | | | | | | | | | | | | |
Institutional | | | $8.58 | | | | $8.79 | | | | $10.48 | | | | $15.69 | |
Service | | | 8.61 | | | | 8.79 | | | | 9.75 | | | | 15.86 | |
| | |
| 42 | | The accompanying notes are an integral part of these financial statements. |
GOLDMAN SACHS VARIABLE INSURANCE TRUST EQUITY FUNDS
Statements of Assets and Liabilities (continued)
June 30, 2023 (Unaudited)
| | | | | | | | | | | | |
| | | Small Cap
Equity Insights
Fund | | | Strategic
Growth Fund | | | U.S. Equity
Insights Fund | |
| | | | | | | | | | | | |
| Assets: | | | | | | | | | |
| | | |
Investments in unaffiliated issuers, at value (cost $107,979,618, $184,783,619 and $242,485,320, respectively)(a) | | $ | 117,119,865 | | | $ | 357,743,934 | | | $ | 310,525,643 | |
Investments in affiliated issuers, at value (cost $1,176,220, $— and $1,788,518, respectively) | | | 1,176,220 | | | | — | | | | 1,788,518 | |
Investments in affiliated securities lending reinvestment vehicle, at value which equals cost | | | 912,449 | | | | — | | | | — | |
Cash | | | 1,879,257 | | | | — | | | | 4,727,747 | |
Receivables: | | | | | | | | | | | | |
Dividends | | | 124,643 | | | | 68,755 | | | | 248,407 | |
Fund shares sold | | | 105,846 | | | | 11,233 | | | | 16,915 | |
Reimbursement from investment adviser | | | 2,793 | | | | 5,970 | | | | 9,458 | |
Securities lending income | | | 1,382 | | | | — | | | | 58 | |
Foreign tax reclaims | | | 1,092 | | | | 999 | | | | 1,006 | |
Investments sold | | | — | | | | 3,785,882 | | | | — | |
Collateral on certain derivative contracts | | | — | | | | — | | | | 271,096 | |
Variation margin on futures contracts | | | 5,600 | | | | — | | | | 57,750 | |
Other assets | | | 1,272 | | | | 792 | | | | 35,656 | |
| | | |
| Total assets | | | 121,330,419 | | | | 361,617,565 | | | | 317,682,254 | |
| | | | | | | | | | | | |
| | | | | | | | | | | | |
| Liabilities: | | | | | | | | | |
Due to custodian (Overdraft) | | | — | | | | 42,555 | | | | — | |
Payables: | | | | | | | | | | | | |
Payable upon return of securities loaned | | | 912,449 | | | | — | | | | — | |
Fund shares redeemed | | | 127,903 | | | | 434,367 | | | | 844,567 | |
Management fees | | | 67,462 | | | | 206,288 | | | | 137,718 | |
Distribution and Service fees and Transfer Agency fees | | | 7,426 | | | | 52,942 | | | | 17,142 | |
Accrued expenses | | | 108,706 | | | | 135,127 | | | | 157,028 | |
| | | |
| Total liabilities | | | 1,223,946 | | | | 871,279 | | | | 1,156,455 | |
| | | | | | | | | | | | |
| | | | | | | | | | | | |
| Net Assets: | | | | | | | | | |
| | | |
Paid-in capital | | | 122,215,960 | | | | 181,266,671 | | | | 255,057,946 | |
Total distributable earnings (loss) | | | (2,109,487 | ) | | | 179,479,615 | | | | 61,467,853 | |
| | | |
| NET ASSETS | | $ | 120,106,473 | | | $ | 360,746,286 | | | $ | 316,525,799 | |
Net Assets: | | | | | | | | | | | | |
Institutional | | $ | 94,692,063 | | | $ | 153,422,708 | | | $ | 272,588,228 | |
Service | | | 25,414,410 | | | | 207,323,578 | | | | 43,937,571 | |
| | | |
Total Net Assets | | $ | 120,106,473 | | | $ | 360,746,286 | | | $ | 316,525,799 | |
Shares outstanding $0.001 par value (unlimited number of shares authorized): | | | | | | | | | | | | |
Institutional | | | 8,231,723 | | | | 12,820,348 | | | | 15,004,420 | |
Service | | | 2,239,457 | | | | 17,490,021 | | | | 2,399,664 | |
Net asset value, offering and redemption price per share: | | | | | | | | | | | | |
Institutional | | | $11.50 | | | | $11.97 | | | | $18.17 | |
Service | | | 11.35 | | | | 11.85 | | | | 18.31 | |
| (a) | Includes loaned securities having a market value of $901,618, $— and $— for Variable Insurance Trust Small Cap Equity Insights Fund, Variable Insurance Trust Strategic Growth Fund and Variable Insurance Trust U.S. Equity Insights Fund, respectively. |
| | |
| The accompanying notes are an integral part of these financial statements. | | 43 |
GOLDMAN SACHS VARIABLE INSURANCE TRUST EQUITY FUNDS
Statements of Operations
For the Six Months Ended June 30, 2023 (Unaudited)
| | | | | | | | | | | | | | | | |
| | | International
Equity Insights
Fund | | | Large Cap
Value Fund | | | Mid Cap
Growth Fund | | | Mid Cap
Value Fund | |
| | | | | | | | | | | | | | | | |
| Investment income: | | | | | | | | | | | | |
Dividends — unaffiliated issuers (net of foreign withholding taxes of $302,574, $4,468, $— and $—, respectively) | | $ | 2,208,706 | | | $ | 3,831,183 | | | $ | 176,583 | | | $ | 3,601,121 | |
Securities lending income — affiliated issuer | | | 10,910 | | | | — | | | | 71 | | | | 347 | |
Dividends — affiliated issuers | | | 1,263 | | | | 62,030 | | | | 50,993 | | | | 118,330 | |
| | | | |
| Total investment income | | | 2,220,879 | | | | 3,893,213 | | | | 227,647 | | | | 3,719,798 | |
| | | | | | | | | | | | | | | | |
| | | | | | | | | | | | | | | | |
| Expenses: | | | | | | | | | | | | |
| | | | |
Management fees | | | 416,147 | | | | 1,358,652 | | | | 249,293 | | | | 1,567,956 | |
Distribution and/or Service (12b-1) fees | | | 47,624 | | | | 295,053 | | | | 70,134 | | | | 123,702 | |
Custody, accounting and administrative services | | | 34,755 | | | | 11,584 | | | | 17,912 | | | | 17,869 | |
Professional fees | | | 33,848 | | | | 37,269 | | | | 41,309 | | | | 37,525 | |
Trustee fees | | | 13,415 | | | | 13,650 | | | | 13,281 | | | | 13,663 | |
Transfer Agency fees(a) | | | 10,275 | | | | 37,740 | | | | 5,731 | | | | 40,726 | |
Printing and mailing costs | | | 7,865 | | | | 8,007 | | | | 5,360 | | | | 15,686 | |
Other | | | 19,997 | | | | 20,757 | | | | 10,101 | | | | 19,497 | |
| | | | |
| Total expenses | | | 583,926 | | | | 1,782,712 | | | | 413,121 | | | | 1,836,624 | |
| | | | |
Less — expense reductions | | | (118,100 | ) | | | (184,886 | ) | | | (133,814 | ) | | | (12,834 | ) |
| | | | |
| Net expenses | | | 465,826 | | | | 1,597,826 | | | | 279,307 | | | | 1,823,790 | |
| | | | |
| NET INVESTMENT INCOME (LOSS) | | | 1,755,053 | | | | 2,295,387 | | | | (51,660 | ) | | | 1,896,008 | |
| | | | | | | | | | | | | | | | |
| | | | | | | | | | | | | | | | |
| Realized and unrealized gain (loss): | | | | | | | | | | | | |
| | | | |
Net realized gain (loss) from: | | | | | | | | | | | | | | | | |
Investments — unaffiliated issuers | | | 2,562,161 | | | | 9,985,719 | | | | 439,558 | | | | 475,835 | |
Futures contracts | | | 121,206 | | | | — | | | | — | | | | — | |
Foreign currency transactions | | | (61,965 | ) | | | (45 | ) | | | — | | | | — | |
Net change in unrealized gain (loss) on: | | | | | | | | | | | | | | | | |
Investments — unaffiliated issuers | | | 6,988,530 | | | | 7,508,464 | | | | 6,155,619 | | | | 15,219,380 | |
Futures contracts | | | 36,654 | | | | — | | | | — | | | | — | |
Foreign currency translations | | | (18,287 | ) | | | 76 | | | | — | | | | — | |
| | | | |
| Net realized and unrealized gain | | | 9,628,299 | | | | 17,494,214 | | | | 6,595,177 | | | | 15,695,215 | |
| | | | |
| NET INCREASE IN NET ASSETS RESULTING FROM OPERATIONS | | $ | 11,383,352 | | | $ | 19,789,601 | | | $ | 6,543,517 | | | $ | 17,591,223 | |
| (a) | Class specific Transfer Agency fees were as follows: |
| | | | | | | | |
| | | Transfer Agency Fees | |
Fund | | Institutional | | | Service | |
International Equity Insights Fund | | $ | 6,465 | | | $ | 3,810 | |
Large Cap Value Fund | | | 14,136 | | | | 23,604 | |
Mid Cap Growth Fund | | | 120 | | | | 5,611 | |
Mid Cap Value Fund | | | 30,830 | | | | 9,896 | |
| | |
| 44 | | The accompanying notes are an integral part of these financial statements. |
GOLDMAN SACHS VARIABLE INSURANCE TRUST EQUITY FUNDS
Statements of Operations (continued)
For the Six Months Ended June 30, 2023 (Unaudited)
| | | | | | | | | | | | |
| | | Small Cap
Equity Insights
Fund | | | Strategic
Growth Fund | | | U.S. Equity
Insights Fund | |
| | | | | | | | | | | | |
| Investment income: | | | | | | | | | |
| | | |
Dividends — unaffiliated issuers (net of foreign withholding taxes of $2,729, $1,470 and $4,456, respectively) | | $ | 1,070,266 | | | $ | 993,245 | | | $ | 2,179,082 | |
Dividends — affiliated issuers | | | 23,428 | | | | 83,720 | | | | 19,552 | |
Securities lending income — affiliated issuer | | | 5,799 | | | | — | | | | 62 | |
| | | |
| Total investment income | | | 1,099,493 | | | | 1,076,965 | | | | 2,198,696 | |
| | | | | | | | | | | | |
| | | | | | | | | | | | |
| Expenses: | | | | | | | | | |
Management fees | | | 398,628 | | | | 1,053,189 | | | | 908,871 | |
Professional fees | | | 38,154 | | | | 37,617 | | | | 38,248 | |
Distribution and/or Service (12b-1) fees | | | 28,716 | | | | 202,153 | | | | 52,510 | |
Printing and mailing costs | | | 13,551 | | | | 7,483 | | | | 8,748 | |
Trustee fees | | | 13,422 | | | | 13,524 | | | | 13,560 | |
Custody, accounting and administrative services | | | 11,624 | | | | 8,743 | | | | 9,634 | |
Transfer Agency fees(a) | | | 11,389 | | | | 29,667 | | | | 29,319 | |
Other | | | 13,717 | | | | 18,075 | | | | 18,421 | |
| | | |
| Total expenses | | | 529,201 | | | | 1,370,451 | | | | 1,079,311 | |
| | | |
Less — expense reductions | | | (37,983 | ) | | | (67,739 | ) | | | (208,423 | ) |
| | | |
| Net expenses | | | 491,218 | | | | 1,302,712 | | | | 870,888 | |
| | | |
| NET INVESTMENT INCOME (LOSS) | | | 608,275 | | | | (225,747 | ) | | | 1,327,808 | |
| | | | | | | | | | | | |
| | | | | | | | | | | | |
| Realized and unrealized gain (loss): | | | | | | | | | |
Net realized gain (loss) from: | | | | | | | | | | | | |
Investments — unaffiliated issuers | | | 1,910,946 | | | | 6,541,505 | | | | 4,991,347 | |
Futures contracts | | | 42,883 | | | | — | | | | 262,832 | |
Foreign currency transactions | | | — | | | | (33 | ) | | | — | |
Net change in unrealized gain (loss) on: | | | | | | | | | | | | |
Investments — unaffiliated issuers | | | 8,960,583 | | | | 72,295,206 | | | | 33,683,553 | |
Futures contracts | | | 58,053 | | | | — | | | | 126,673 | |
Foreign currency translations | | | — | | | | 31 | | | | — | |
| | | |
| Net realized and unrealized gain | | | 10,972,465 | | | | 78,836,709 | | | | 39,064,405 | |
| | | |
| NET INCREASE IN NET ASSETS RESULTING FROM OPERATIONS | | $ | 11,580,740 | | | $ | 78,610,962 | | | $ | 40,392,213 | |
| (a) | Class specific Transfer Agency fees were as follows: |
| | | | | | | | |
| | | Transfer Agency Fees | |
Fund | | Institutional | | | Service | |
Small Cap Equity Insights Fund | | $ | 9,092 | | | $ | 2,297 | |
Strategic Growth Fund | | | 13,495 | | | | 16,172 | |
U.S. Equity Insights Fund | | | 25,118 | | | | 4,201 | |
| | |
| The accompanying notes are an integral part of these financial statements. | | 45 |
GOLDMAN SACHS VARIABLE INSURANCE TRUST EQUITY FUNDS
Statements of Changes in Net Assets
| | | | | | | | | | | | | | | | |
| | | International Equity Insights Fund | | | Large Cap Value Fund | |
| | | For the
Six Months Ended
June 30, 2023
(Unaudited) | | | For the
Fiscal Year Ended
December 31, 2022 | | | For the
Six Months Ended
June 30, 2023
(Unaudited) | | | For the
Fiscal Year Ended
December 31, 2022 | |
| | | | | | | | | | | | | | | | |
| From operations: | | | | | | | | | | | | |
Net investment income | | $ | 1,755,053 | | | $ | 2,825,395 | | | $ | 2,295,387 | | | $ | 5,142,633 | |
Net realized gain (loss) | | | 2,621,402 | | | | (11,194,236 | ) | | | 9,985,674 | | | | 42,900,507 | |
Net change in unrealized gain (loss) | | | 7,006,897 | | | | (6,519,448 | ) | | | 7,508,540 | | | | (79,174,841 | ) |
| | | | |
| Net increase (decrease) in net assets resulting from operations | | | 11,383,352 | | | | (14,888,289 | ) | | | 19,789,601 | | | | (31,131,701 | ) |
| | | | | | | | | | | | | | | | |
| | | | | | | | | | | | | | | | |
| Distributions to shareholders: | | | | | | | | | | | | |
From distributable earnings: | | | | | | | | | | | | | | | | |
Institutional Shares | | | — | | | | (1,971,488 | ) | | | — | | | | (16,379,536 | ) |
Service Shares | | | — | | | | (1,049,519 | ) | | | — | | | | (26,593,972 | ) |
| | | | |
| Total distributions to shareholders | | | — | | | | (3,021,007 | ) | | | — | | | | (42,973,508 | ) |
| | | | | | | | | | | | | | | | |
| | | | | | | | | | | | | | | | |
| From share transactions: | | | | | | | | | | | | |
Proceeds from sales of shares | | | 8,565,104 | | | | 15,434,881 | | | | 10,457,365 | | | | 18,097,425 | |
Reinvestment of distributions | | | — | | | | 3,021,007 | | | | — | | | | 42,973,507 | |
Cost of shares redeemed | | | (6,840,071 | ) | | | (14,773,365 | ) | | | (28,262,253 | ) | | | (90,692,163 | ) |
| | | | |
| Net increase (decrease) in net assets resulting from share transactions | | | 1,725,033 | | | | 3,682,523 | | | | (17,804,888 | ) | | | (29,621,231 | ) |
| | | | |
| TOTAL INCREASE (DECREASE) | | | 13,108,385 | | | | (14,226,773 | ) | | | 1,984,713 | | | | (103,726,440 | ) |
| | | | | | | | | | | | | | | | |
| | | | | | | | | | | | | | | | |
| Net Assets: | | | | | | | | | | | | |
| | | | |
Beginning of period | | | 93,324,003 | | | | 107,550,776 | | | | 383,535,636 | | | | 487,262,076 | |
| | | | |
End of period | | $ | 106,432,388 | | | $ | 93,324,003 | | | $ | 385,520,349 | | | $ | 383,535,636 | |
| | |
| 46 | | The accompanying notes are an integral part of these financial statements. |
GOLDMAN SACHS VARIABLE INSURANCE TRUST EQUITY FUNDS
Statements of Changes in Net Assets (continued)
| | | | | | | | | | | | | | | | |
| | | Mid Cap Growth Fund | | | Mid Cap Value Fund | |
| | | For the
Six Months Ended
June 30, 2023
(Unaudited) | | | For the
Fiscal Year Ended
December 31, 2022 | | | For the
Six Months Ended
June 30, 2023
(Unaudited) | | | For the
Fiscal Year Ended
December 31, 2022 | |
| | | | | | | | | | | | | | | | |
| From operations: | | | | | | | | | | | | |
Net investment income (loss) | | $ | (51,660 | ) | | $ | (199,882 | ) | | $ | 1,896,008 | | | $ | 3,521,135 | |
Net realized gain (loss) | | | 439,558 | | | | (375,140 | ) | | | 475,835 | | | | 41,579,679 | |
Net change in unrealized gain (loss) | | | 6,155,619 | | | | (18,870,736 | ) | | | 15,219,380 | | | | (104,300,273 | ) |
| | | | |
| Net increase (decrease) in net assets resulting from operations | | | 6,543,517 | | | | (19,445,758 | ) | | | 17,591,223 | | | | (59,199,459 | ) |
| | | | | | | | | | | | | | | | |
| | | | | | | | | | | | | | | | |
| Distributions to shareholders: | | | | | | | | | | | | |
From distributable earnings: | | | | | | | | | | | | | | | | |
Institutional Shares | | | — | | | | (39,168 | ) | | | — | | | | (50,260,812 | ) |
Service Shares | | | — | | | | (1,904,522 | ) | | | — | | | | (15,201,358 | ) |
| | | | |
| Total distributions to shareholders | | | — | | | | (1,943,690 | ) | | | — | | | | (65,462,170 | ) |
| | | | | | | | | | | | | | | | |
| | | | | | | | | | | | | | | | |
| From share transactions: | | | | | | | | | | | | |
Proceeds from sales of shares | | | 7,986,572 | | | | 7,276,149 | | | | 107,283,102 | | | | 93,206,792 | |
Reinvestment of distributions | | | — | | | | 1,943,690 | | | | — | | | | 65,462,169 | |
Cost of shares redeemed | | | (5,126,093 | ) | | | (12,881,102 | ) | | | (91,497,399 | ) | | | (185,704,513 | ) |
| | | | |
| Net increase (decrease) in net assets resulting from share transactions | | | 2,860,479 | | | | (3,661,263 | ) | | | 15,785,703 | | | | (27,035,552 | ) |
| | | | |
| TOTAL INCREASE (DECREASE) | | | 9,403,996 | | | | (25,050,711 | ) | | | 33,376,926 | | | | (151,697,181 | ) |
| | | | | | | | | | | | | | | | |
| | | | | | | | | | | | | | | | |
| Net Assets: | | | | | | | | | | | | |
| | | | |
Beginning of period | | | 52,417,795 | | | | 77,468,506 | | | | 400,900,442 | | | | 552,597,623 | |
| | | | |
End of period | | $ | 61,821,791 | | | $ | 52,417,795 | | | $ | 434,277,368 | | | $ | 400,900,442 | |
| | |
| The accompanying notes are an integral part of these financial statements. | | 47 |
GOLDMAN SACHS VARIABLE INSURANCE TRUST EQUITY FUNDS
Statements of Changes in Net Assets (continued)
| | | | | | | | | | | | | | | | |
| | | Small Cap Equity Insights Fund | | | Strategic Growth Fund | |
| | | For the
Six Months Ended
June 30, 2023
(Unaudited) | | | For the
Fiscal Year Ended
December 31, 2022 | | | For the
Six Months Ended
June 30, 2023
(Unaudited) | | | For the
Fiscal Year Ended
December 31, 2022 | |
| | | | | | | | | | | | | | | | |
| From operations: | | | | | | | | | | | | |
Net investment income (loss) | | $ | 608,275 | | | $ | 701,104 | | | $ | (225,747 | ) | | $ | (682,580 | ) |
Net realized gain (loss) | | | 1,953,829 | | | | (13,710,495 | ) | | | 6,541,472 | | | | 40,371,059 | |
Net change in unrealized gain (loss) | | | 9,018,636 | | | | (12,850,682 | ) | | | 72,295,237 | | | | (166,086,540 | ) |
| | | | |
| Net increase (decrease) in net assets resulting from operations | | | 11,580,740 | | | | (25,860,073 | ) | | | 78,610,962 | | | | (126,398,061 | ) |
| | | | | | | | | | | | | | | | |
| | | | | | | | | | | | | | | | |
| Distributions to shareholders: | | | | | | | | | | | | |
From distributable earnings: | | | | | | | | | | | | | | | | |
Institutional Shares | | | — | | | | (1,287,501 | ) | | | — | | | | (23,862,524 | ) |
Service Shares | | | — | | | | (266,792 | ) | | | — | | | | (22,574,843 | ) |
| | | | |
| Total distributions to shareholders | | | — | | | | (1,554,293 | ) | | | — | | | | (46,437,367 | ) |
| | | | | | | | | | | | | | | | |
| | | | | | | | | | | | | | | | |
| From share transactions: | | | | | | | | | | | | |
Proceeds from sales of shares | | | 6,846,419 | | | | 21,488,587 | | | | 85,177,714 | | | | 20,861,765 | |
Reinvestment of distributions | | | — | | | | 1,554,293 | | | | — | | | | 46,437,367 | |
Cost of shares redeemed | | | (7,814,526 | ) | | | (16,964,615 | ) | | | (40,324,297 | ) | | | (107,108,519 | ) |
| | | | |
| Net increase (decrease) in net assets resulting from share transactions | | | (968,107 | ) | | | 6,078,265 | | | | 44,853,417 | | | | (39,809,387 | ) |
| | | | |
| TOTAL INCREASE (DECREASE) | | | 10,612,633 | | | | (21,336,101 | ) | | | 123,464,379 | | | | (212,644,815 | ) |
| | | | | | | | | | | | | | | | |
| | | | | | | | | | | | | | | | |
| Net Assets: | | | | | | | | | | | | |
| | | | |
Beginning of period | | | 109,493,840 | | | | 130,829,941 | | | | 237,281,907 | | | | 449,926,722 | |
| | | | |
End of period | | $ | 120,106,473 | | | $ | 109,493,840 | | | $ | 360,746,286 | | | $ | 237,281,907 | |
| | |
| 48 | | The accompanying notes are an integral part of these financial statements. |
GOLDMAN SACHS VARIABLE INSURANCE TRUST EQUITY FUNDS
Statements of Changes in Net Assets (continued)
| | | | | | | | |
| | | U.S. Equity Insights Fund | |
| | | For the
Six Months Ended
June 30, 2023
(Unaudited) | | | For the
Fiscal Year Ended
December 31, 2022 | |
| | | | | | | | |
| From operations: | | | | | | |
Net investment income | | $ | 1,327,808 | | | $ | 2,624,280 | |
Net realized gain (loss) | | | 5,254,179 | | | | (12,596,431 | ) |
Net change in unrealized gain (loss) | | | 33,810,226 | | | | (63,839,389 | ) |
| | |
| Net increase (decrease) in net assets resulting from operations | | | 40,392,213 | | | | (73,811,540 | ) |
| | | | | | | | |
| | | | | | | | |
| Distributions to shareholders: | | | | | | |
From distributable earnings: | | | | | | | | |
Institutional Shares | | | — | | | | (3,548,809 | ) |
Service Shares | | | — | | | | (509,957 | ) |
| | |
| Total distributions to shareholders | | | — | | | | (4,058,766 | ) |
| | | | | | | | |
| | | | | | | | |
| From share transactions: | | | | | | |
Proceeds from sales of shares | | | 12,631,685 | | | | 19,568,290 | |
Reinvestment of distributions | | | — | | | | 4,058,766 | |
Cost of shares redeemed | | | (20,606,457 | ) | | | (40,965,728 | ) |
| | |
| Net decrease in net assets resulting from share transactions | | | (7,974,772 | ) | | | (17,338,672 | ) |
| | |
| TOTAL INCREASE (DECREASE) | | | 32,417,441 | | | | (95,208,978 | ) |
| | | | | | | | |
| | | | | | | | |
| Net Assets: | | | | | | |
| | |
Beginning of period | | | 284,108,358 | | | | 379,317,336 | |
| | |
End of period | | $ | 316,525,799 | | | $ | 284,108,358 | |
| | |
| The accompanying notes are an integral part of these financial statements. | | 49 |
GOLDMAN SACHS VARIABLE INSURANCE TRUST INTERNATIONAL EQUITY INSIGHTS FUND
Financial Highlights
Selected Data for a Share Outstanding Throughout Each Period
| | | | | | | | | | | | | | | | | | | | | | | | |
| | | Goldman Sachs International Equity Insights Fund | |
| | | Institutional Shares | |
| | | Six Months Ended
June 30, 2023
(Unaudited) | | | Year Ended December 31, | |
| | | 2022 | | | 2021 | | | 2020 | | | 2019 | | | 2018 | |
| | | | | | | | | | | | | | | | | | | | | | | | |
| Per Share Data | | | | | | | | | | | | | | | | | | |
| | | | | | |
Net asset value, beginning of period | | $ | 7.66 | | | $ | 9.16 | | | $ | 8.62 | | | $ | 8.19 | | | $ | 7.08 | | | $ | 10.88 | |
| | | | | | |
Net investment income(a) | | | 0.14 | (b) | | | 0.25 | (c) | | | 0.21 | | | | 0.12 | | | | 0.17 | | | | 0.19 | |
| | | | | | |
Net realized and unrealized gain (loss) | | | 0.78 | | | | (1.49 | ) | | | 0.83 | | | | 0.43 | | | | 1.14 | | | | (1.94 | ) |
| | | | | | |
Total from investment operations | | | 0.92 | | | | (1.24 | ) | | | 1.04 | | | | 0.55 | | | | 1.31 | | | | (1.75 | ) |
| | | | | | |
Distributions to shareholders from net investment income | | | — | | | | (0.26 | ) | | | (0.27 | ) | | | (0.12 | ) | | | (0.20 | ) | | | (0.21 | ) |
| | | | | | |
Distributions to shareholders from net realized gains | | | — | | | | — | | | | (0.23 | ) | | | — | | | | — | (d) | | | (1.84 | ) |
| | | | | | |
Total distributions | | | — | | | | (0.26 | ) | | | (0.50 | ) | | | (0.12 | ) | | | (0.20 | ) | | | (2.05 | ) |
| | | | | | |
Net asset value, end of period | | $ | 8.58 | | | $ | 7.66 | | | $ | 9.16 | | | $ | 8.62 | | | $ | 8.19 | | | $ | 7.08 | |
| | | | | | |
Total Return(e) | | | 12.01 | % | | | (13.55 | )% | | | 12.17 | % | | | 6.79 | % | | | 18.45 | % | | | (16.28 | )% |
| | | | | | |
Net assets, end of period (in 000’s) | | $ | 68,095 | | | $ | 59,170 | | | $ | 63,179 | | | $ | 50,114 | | | $ | 43,632 | | | $ | 37,829 | |
| | | | | | |
Ratio of net expenses to average net assets | | | 0.81 | %(f) | | | 0.83 | % | | | 0.85 | % | | | 0.87 | % | | | 0.90 | % | | | 0.87 | % |
| | | | | | |
Ratio of total expenses to average net assets | | | 1.04 | %(f) | | | 0.99 | % | | | 1.14 | % | | | 1.37 | % | | | 1.31 | % | | | 1.23 | % |
| | | | | | |
Ratio of net investment income to average net assets | | | 3.53 | %(b)(f) | | | 3.09 | %(c) | | | 2.22 | % | | | 1.59 | % | | | 3.21 | % | | | 1.79 | % |
| | | | | | |
Portfolio turnover rate(g) | | | 82 | % | | | 164 | % | | | 167 | % | | | 175 | % | | | 146 | % | | | 156 | % |
| (a) | Calculated based on the average shares outstanding methodology. |
| (b) | Reflects income recognized from special dividends which amounted to $0.02 per share and 0.26% of average net assets. |
| (c) | Reflects income recognized from special dividends which amounted to $0.04 per share and 0.45% of average net assets. |
| (d) | Amount is less than $0.005 per share. |
| (e) | Assumes investment at the NAV at the beginning of the period, reinvestment of all dividends and distributions, a complete redemption of the investment at the NAV at the end of the period and no sales or redemption charges (if any). Total returns would be reduced if a sales or redemption charge was taken into account. Returns do not reflect the impact of taxes to shareholders relating to Fund distributions or the redemption of Fund shares. Total returns for periods less than one full year are not annualized. |
| (g) | The Fund’s portfolio turnover rate is calculated in accordance with regulatory requirements, without regard to transactions involving short term investments and certain derivatives. If such transactions were included, the Fund’s portfolio turnover rate may be higher. |
| | |
| 50 | | The accompanying notes are an integral part of these financial statements. |
GOLDMAN SACHS VARIABLE INSURANCE TRUST INTERNATIONAL EQUITY INSIGHTS FUND
Financial Highlights (continued)
Selected Data for a Share Outstanding Throughout Each Period
| | | | | | | | | | | | | | | | | | | | | | | | |
| | | Goldman Sachs International Equity Insights Fund | |
| | | Service Shares | |
| | | Six Months Ended
June 30, 2023
(Unaudited) | | | Year Ended December 31, | |
| | | 2022 | | | 2021 | | | 2020 | | | 2019 | | | 2018 | |
| | | | | | | | | | | | | | | | | | | | | | | | |
| Per Share Data | | | | | | | | | | | | | | | | | | |
| | | | | | |
Net asset value, beginning of period | | $ | 7.70 | | | $ | 9.20 | | | $ | 8.66 | | | $ | 8.23 | | | $ | 7.11 | | | $ | 10.91 | |
| | | | | | |
Net investment income(a) | | | 0.13 | (b) | | | 0.22 | (c) | | | 0.19 | | | | 0.10 | | | | 0.15 | | | | 0.14 | |
| | | | | | |
Net realized and unrealized gain (loss) | | | 0.78 | | | | (1.48 | ) | | | 0.83 | | | | 0.44 | | | | 1.15 | | | | (1.93 | ) |
| | | | | | |
Total from investment operations | | | 0.91 | | | | (1.26 | ) | | | 1.02 | | | | 0.54 | | | | 1.30 | | | | (1.79 | ) |
| | | | | | |
Distributions to shareholders from net investment income | | | — | | | | (0.24 | ) | | | (0.25 | ) | | | (0.11 | ) | | | (0.18 | ) | | | (0.17 | ) |
| | | | | | |
Distributions to shareholders from net realized gains | | | — | | | | — | | | | (0.23 | ) | | | — | | | | — | (d) | | | (1.84 | ) |
| | | | | | |
Total distributions | | | — | | | | (0.24 | ) | | | (0.48 | ) | | | (0.11 | ) | | | (0.18 | ) | | | (2.01 | ) |
| | | | | | |
Net asset value, end of period | | $ | 8.61 | | | $ | 7.70 | | | $ | 9.20 | | | $ | 8.66 | | | $ | 8.23 | | | $ | 7.11 | |
| | | | | | |
Total Return(e) | | | 11.82 | % | | | (13.72 | )% | | | 11.81 | % | | | 6.53 | % | | | 18.23 | % | | | (16.55 | )% |
| | | | | | |
Net assets, end of period (in 000’s) | | $ | 38,337 | | | $ | 34,154 | | | $ | 44,372 | | | $ | 47,685 | | | $ | 48,884 | | | $ | 43,923 | |
| | | | | | |
Ratio of net expenses to average net assets | | | 1.06 | %(f) | | | 1.09 | % | | | 1.10 | % | | | 1.12 | % | | | 1.15 | % | | | 1.12 | % |
| | | | | | |
Ratio of total expenses to average net assets | | | 1.30 | %(f) | | | 1.25 | % | | | 1.40 | % | | | 1.61 | % | | | 1.55 | % | | | 1.43 | % |
| | | | | | |
Ratio of net investment income to average net assets | | | 3.22 | %(b)(f) | | | 2.74 | %(c) | | | 1.97 | % | | | 1.30 | % | | | 1.89 | % | | | 1.30 | % |
| | | | | | |
Portfolio turnover rate(g) | | | 82 | % | | | 164 | % | | | 167 | % | | | 175 | % | | | 146 | % | | | 156 | % |
| (a) | Calculated based on the average shares outstanding methodology. |
| (b) | Reflects income recognized from special dividends which amounted to $0.02 per share and 0.26% of average net assets. |
| (c) | Reflects income recognized from special dividends which amounted to $0.04 per share and 0.45% of average net assets. |
| (d) | Amount is less than $0.005 per share. |
| (e) | Assumes investment at the NAV at the beginning of the period, reinvestment of all dividends and distributions, a complete redemption of the investment at the NAV at the end of the period and no sales or redemption charges (if any). Total returns would be reduced if a sales or redemption charge was taken into account. Returns do not reflect the impact of taxes to shareholders relating to Fund distributions or the redemption of Fund shares. Total returns for periods less than one full year are not annualized. |
| (g) | The Fund’s portfolio turnover rate is calculated in accordance with regulatory requirements, without regard to transactions involving short term investments and certain derivatives. If such transactions were included, the Fund’s portfolio turnover rate may be higher. |
| | |
| The accompanying notes are an integral part of these financial statements. | | 51 |
GOLDMAN SACHS VARIABLE INSURANCE TRUST LARGE CAP VALUE FUND
Financial Highlights (continued)
Selected Data for a Share Outstanding Throughout Each Period
| | | | | | | | | | | | | | | | | | | | | | | | |
| | | Goldman Sachs Large Cap Value Fund | |
| | | Institutional Shares | |
| | | Six Months Ended
June 30, 2023
(Unaudited) | | | Year Ended December 31, | |
| | | 2022 | | | 2021 | | | 2020 | | | 2019 | | | 2018 | |
| | | | | | | | | | | | | | | | | | | | | | | | |
| Per Share Data | | | | | | | | | | | | | | | | | | |
| | | | | | |
Net asset value, beginning of period | | $ | 8.34 | | | $ | 9.97 | | | $ | 9.27 | | | $ | 9.19 | | | $ | 7.67 | | | $ | 9.06 | |
| | | | | | |
Net investment income(a) | | | 0.06 | | | | 0.13 | | | | 0.11 | | | | 0.12 | | | | 0.13 | | | | 0.12 | |
| | | | | | |
Net realized and unrealized gain (loss) | | | 0.39 | | | | (0.72 | ) | | | 2.09 | | | | 0.24 | | | | 1.86 | | | | (0.88 | ) |
| | | | | | |
Total from investment operations | | | 0.45 | | | | (0.59 | ) | | | 2.20 | | | | 0.36 | | | | 1.99 | | | | (0.76 | ) |
| | | | | | |
Distributions to shareholders from net investment income | | | — | | | | (0.13 | ) | | | (0.13 | ) | | | (0.12 | ) | | | (0.14 | ) | | | (0.12 | ) |
| | | | | | |
Distributions to shareholders from net realized gains | | | — | | | | (0.91 | ) | | | (1.37 | ) | | | (0.16 | ) | | | (0.33 | ) | | | (0.51 | ) |
| | | | | | |
Total distributions | | | — | | | | (1.04 | ) | | | (1.50 | ) | | | (0.28 | ) | | | (0.47 | ) | | | (0.63 | ) |
| | | | | | |
Net asset value, end of period | | $ | 8.79 | | | $ | 8.34 | | | $ | 9.97 | | | $ | 9.27 | | | $ | 9.19 | | | $ | 7.67 | |
| | | | | | |
Total Return(b) | | | 5.40 | % | | | (6.37 | )% | | | 24.13 | % | | | 3.97 | % | | | 25.93 | % | | | (8.46 | )% |
| | | | | | |
Net assets, end of period (in 000’s) | | $ | 142,974 | | | $ | 145,165 | | | $ | 179,541 | | | $ | 160,076 | | | $ | 163,814 | | | $ | 150,963 | |
| | | | | | |
Ratio of net expenses to average net assets | | | 0.70 | %(c) | | | 0.70 | % | | | 0.69 | % | | | 0.71 | % | | | 0.73 | % | | | 0.71 | % |
| | | | | | |
Ratio of total expenses to average net assets | | | 0.79 | %(c) | | | 0.80 | % | | | 0.79 | % | | | 0.81 | % | | | 0.83 | % | | | 0.81 | % |
| | | | | | |
Ratio of net investment income to average net assets | | | 1.36 | %(c) | | | 1.38 | % | | | 1.08 | % | | | 1.44 | % | | | 1.46 | % | | | 1.32 | % |
| | | | | | |
Portfolio turnover rate(d) | | | 37 | % | | | 46 | % | | | 54 | % | | | 58 | % | | | 58 | % | | | 125 | % |
| (a) | Calculated based on the average shares outstanding methodology. |
| (b) | Assumes investment at the NAV at the beginning of the period, reinvestment of all dividends and distributions, a complete redemption of the investment at the NAV at the end of the period and no sales or redemption charges (if any). Total returns would be reduced if a sales or redemption charge was taken into account. Returns do not reflect the impact of taxes to shareholders relating to Fund distributions or the redemption of Fund shares. Total returns for periods less than one full year are not annualized. |
| (d) | The Fund’s portfolio turnover rate is calculated in accordance with regulatory requirements, without regard to transactions involving short term investments and certain derivatives. If such transactions were included, the Fund’s portfolio turnover rate may be higher. |
| | |
| 52 | | The accompanying notes are an integral part of these financial statements. |
GOLDMAN SACHS VARIABLE INSURANCE TRUST LARGE CAP VALUE FUND
Financial Highlights (continued)
Selected Data for a Share Outstanding Throughout Each Period
| | | | | | | | | | | | | | | | | | | | | | | | |
| | | Goldman Sachs Large Cap Value Fund | |
| | | Service Shares | |
| | | Six Months Ended
June 30, 2023
(Unaudited) | | | Year Ended December 31, | |
| | | 2022 | | | 2021 | | | 2020 | | | 2019 | | | 2018 | |
| | | | | | | | | | | | | | | | | | | | | | | | |
| Per Share Data | | | | | | | | | | | | | | | | | | |
| | | | | | |
Net asset value, beginning of period | | $ | 8.35 | | | $ | 9.98 | | | $ | 9.27 | | | $ | 9.19 | | | $ | 7.67 | | | $ | 9.06 | |
| | | | | | |
Net investment income(a) | | | 0.05 | | | | 0.11 | | | | 0.09 | | | | 0.10 | | | | 0.11 | | | | 0.10 | |
| | | | | | |
Net realized and unrealized gain (loss) | | | 0.39 | | | | (0.72 | ) | | | 2.09 | | | | 0.24 | | | | 1.85 | | | | (0.88 | ) |
| | | | | | |
Total from investment operations | | | 0.44 | | | | (0.61 | ) | | | 2.18 | | | | 0.34 | | | | 1.96 | | | | (0.78 | ) |
| | | | | | |
Distributions to shareholders from net investment income | | | — | | | | (0.11 | ) | | | (0.10 | ) | | | (0.10 | ) | | | (0.11 | ) | | | (0.10 | ) |
| | | | | | |
Distributions to shareholders from net realized gains | | | — | | | | (0.91 | ) | | | (1.37 | ) | | | (0.16 | ) | | | (0.33 | ) | | | (0.51 | ) |
| | | | | | |
Total distributions | | | — | | | | (1.02 | ) | | | (1.47 | ) | | | (0.26 | ) | | | (0.44 | ) | | | (0.61 | ) |
| | | | | | |
Net asset value, end of period | | $ | 8.79 | | | $ | 8.35 | | | $ | 9.98 | | | $ | 9.27 | | | $ | 9.19 | | | $ | 7.67 | |
| | | | | | |
Total Return(b) | | | 5.27 | % | | | (6.57 | )% | | | 23.93 | % | | | 3.73 | % | | | 25.61 | % | | | (8.72 | )% |
| | | | | | |
Net assets, end of period (in 000’s) | | $ | 242,546 | | | $ | 238,371 | | | $ | 307,721 | | | $ | 299,564 | | | $ | 306,058 | | | $ | 282,891 | |
| | | | | | |
Ratio of net expenses to average net assets | | | 0.93 | %(c) | | | 0.93 | % | | | 0.92 | % | | | 0.94 | % | | | 0.98 | % | | | 0.96 | % |
| | | | | | |
Ratio of total expenses to average net assets | | | 1.04 | %(c) | | | 1.05 | % | | | 1.04 | % | | | 1.06 | % | | | 1.08 | % | | | 1.06 | % |
| | | | | | |
Ratio of net investment income to average net assets | | | 1.13 | %(c) | | | 1.15 | % | | | 0.84 | % | | | 1.21 | % | | | 1.21 | % | | | 1.07 | % |
| | | | | | |
Portfolio turnover rate(d) | | | 37 | % | | | 46 | % | | | 54 | % | | | 58 | % | | | 58 | % | | | 125 | % |
| (a) | Calculated based on the average shares outstanding methodology. |
| (b) | Assumes investment at the NAV at the beginning of the period, reinvestment of all dividends and distributions, a complete redemption of the investment at the NAV at the end of the period and no sales or redemption charges (if any). Total returns would be reduced if a sales or redemption charge was taken into account. Returns do not reflect the impact of taxes to shareholders relating to Fund distributions or the redemption of Fund shares. Total returns for periods less than one full year are not annualized. |
| (d) | The Fund’s portfolio turnover rate is calculated in accordance with regulatory requirements, without regard to transactions involving short term investments and certain derivatives. If such transactions were included, the Fund’s portfolio turnover rate may be higher. |
| | |
| The accompanying notes are an integral part of these financial statements. | | 53 |
GOLDMAN SACHS VARIABLE INSURANCE TRUST MID CAP GROWTH FUND
Financial Highlights (continued)
Selected Data for a Share Outstanding Throughout Each Period
| | | | | | | | | | | | | | | | | | | | | | | | |
| | | Goldman Sachs Mid Cap Growth Fund | |
| | | Institutional Shares | |
| | | Six Months Ended
June 30, 2023
(Unaudited) | | | Year Ended December 31,(a) | |
| | | 2022 | | | 2021 | | | 2020 | | | 2019 | | | 2018 | |
| | | | | | | | | | | | | | | | | | | | | | | | |
| Per Share Data | | | | | | | | | | | | | | | | | | |
| | | | | | |
Net asset value, beginning of period | | $ | 9.32 | | | $ | 13.05 | | | $ | 13.93 | | | $ | 11.50 | | | $ | 10.51 | | | $ | 31.13 | |
| | | | | | |
Net investment loss(b) | | | — | (c) | | | (0.02 | ) | | | (0.07 | ) | | | (0.04 | ) | | | (0.01 | ) | | | (0.02 | ) |
| | | | | | |
Net realized and unrealized gain (loss) | | | 1.16 | | | | (3.38 | ) | | | 1.71 | | | | 5.06 | | | | 3.59 | | | | (1.30 | ) |
| | | | | | |
Total from investment operations | | | 1.16 | | | | (3.40 | ) | | | 1.64 | | | | 5.02 | | | | 3.58 | | | | (1.32 | ) |
| | | | | | |
Distributions to shareholders from net realized gains | | | — | | | | (0.33 | ) | | | (2.52 | ) | | | (2.59 | ) | | | (2.59 | ) | | | (19.30 | ) |
| | | | | | |
Net asset value, end of period | | $ | 10.48 | | | $ | 9.32 | | | $ | 13.05 | | | $ | 13.93 | | | $ | 11.50 | | | $ | 10.51 | |
| | | | | | |
Total Return(d) | | | 12.45 | % | | | (26.20 | )% | | | 11.65 | % | | | 44.33 | % | | | 34.35 | % | | | (4.17 | )% |
| | | | | | |
Net assets, end of period (in 000’s) | | $ | 1,353 | | | $ | 1,132 | | | $ | 483 | | | $ | 151 | | | $ | 94 | | | $ | 59 | |
| | | | | | |
Ratio of net expenses to average net assets | | | 0.83 | %(e) | | | 0.82 | % | | | 0.83 | % | | | 0.85 | % | | | 0.88 | % | | | 0.85 | % |
| | | | | | |
Ratio of total expenses to average net assets | | | 1.20 | %(e) | | | 1.20 | % | | | 1.33 | % | | | 1.23 | % | | | 1.26 | % | | | 1.20 | % |
| | | | | | |
Ratio of net investment loss to average net assets | | | (0.03 | )%(e) | | | (0.16 | )% | | | (0.47 | )% | | | (0.34 | )% | | | (0.12 | )% | | | (0.08 | )% |
| | | | | | |
Portfolio turnover rate(f) | | | 29 | % | | | 59 | % | | | 50 | % | | | 71 | % | | | 75 | % | | | 59 | % |
| (a) | All per share amounts representing data prior to May 17, 2019 have been adjusted to reflect a 4 to 1 reverse stock split which occurred on that date. |
| (b) | Calculated based on the average shares outstanding methodology. |
| (c) | Amount is less than $0.005 per share. |
| (d) | Assumes investment at the NAV at the beginning of the period, reinvestment of all dividends and distributions, a complete redemption of the investment at the NAV at the end of the period and no sales or redemption charges (if any). Total returns would be reduced if a sales or redemption charge was taken into account. Returns do not reflect the impact of taxes to shareholders relating to Fund distributions or the redemption of Fund shares. Total returns for periods less than one full year are not annualized. |
| (f) | The Fund’s portfolio turnover rate is calculated in accordance with regulatory requirements, without regard to transactions involving short term investments and certain derivatives. If such transactions were included, the Fund’s portfolio turnover rate may be higher. |
| | |
| 54 | | The accompanying notes are an integral part of these financial statements. |
GOLDMAN SACHS VARIABLE INSURANCE TRUST MID CAP GROWTH FUND
Financial Highlights (continued)
Selected Data for a Share Outstanding Throughout Each Period
| | | | | | | | | | | | | | | | | | | | | | | | |
| | | Goldman Sachs Mid Cap Growth Fund | |
| | | Service Shares | |
| | | Six Months Ended
June 30, 2023
(Unaudited) | | | Year Ended December 31,(a) | |
| | | 2022 | | | 2021 | | | 2020 | | | 2019 | | | 2018 | |
| | | | | | | | | | | | | | | | | | | | | | | | |
| Per Share Data | | | | | | | | | | | | | | | | | | |
| | | | | | |
Net asset value, beginning of period | | $ | 8.68 | | | $ | 12.20 | | | $ | 13.19 | | | $ | 11.00 | | | $ | 10.15 | | | $ | 30.80 | |
| | | | | | |
Net investment loss(b) | | | (0.01 | ) | | | (0.03 | ) | | | (0.09 | ) | | | (0.06 | ) | | | (0.02 | ) | | | (0.07 | ) |
| | | | | | |
Net realized and unrealized gain (loss) | | | 1.08 | | | | (3.16 | ) | | | 1.62 | | | | 4.84 | | | | 3.46 | | | | (1.28 | ) |
| | | | | | |
Total from investment operations | | | 1.07 | | | | (3.19 | ) | | | 1.53 | | | | 4.78 | | | | 3.44 | | | | (1.35 | ) |
| | | | | | |
Distributions to shareholders from net realized gains | | | — | | | | (0.33 | ) | | | (2.52 | ) | | | (2.59 | ) | | | (2.59 | ) | | | (19.30 | ) |
| | | | | | |
Net asset value, end of period | | $ | 9.75 | | | $ | 8.68 | | | $ | 12.20 | | | $ | 13.19 | | | $ | 11.00 | | | $ | 10.15 | |
| | | | | | |
Total Return(c) | | | 12.33 | % | | | (26.30 | )% | | | 11.48 | % | | | 44.16 | % | | | 34.06 | % | | | (4.34 | )% |
| | | | | | |
Net assets, end of period (in 000’s) | | $ | 60,469 | | | $ | 51,286 | | | $ | 76,986 | | | $ | 82,134 | | | $ | 73,406 | | | $ | 59,910 | |
| | | | | | |
Ratio of net expenses to average net assets | | | 0.98 | %(d) | | | 0.98 | % | | | 0.99 | % | | | 1.01 | % | | | 1.04 | % | | | 1.01 | % |
| | | | | | |
Ratio of total expenses to average net assets | | | 1.45 | %(d) | | | 1.51 | % | | | 1.43 | % | | | 1.48 | % | | | 1.51 | % | | | 1.44 | % |
| | | | | | |
Ratio of net investment loss to average net assets | | | (0.18 | )%(d) | | | (0.36 | )% | | | (0.62 | )% | | | (0.50 | )% | | | (0.28 | )% | | | (0.24 | )% |
| | | | | | |
Portfolio turnover rate(e) | | | 29 | % | | | 59 | % | | | 50 | % | | | 71 | % | | | 75 | % | | | 59 | % |
| (a) | All per share amounts representing data prior to May 17, 2019 have been adjusted to reflect a 4 to 1 reverse stock split which occurred on that date. |
| (b) | Calculated based on the average shares outstanding methodology. |
| (c) | Assumes investment at the NAV at the beginning of the period, reinvestment of all dividends and distributions, a complete redemption of the investment at the NAV at the end of the period and no sales or redemption charges (if any). Total returns would be reduced if a sales or redemption charge was taken into account. Returns do not reflect the impact of taxes to shareholders relating to Fund distributions or the redemption of Fund shares. Total returns for periods less than one full year are not annualized. |
| (e) | The Fund’s portfolio turnover rate is calculated in accordance with regulatory requirements, without regard to transactions involving short term investments and certain derivatives. If such transactions were included, the Fund’s portfolio turnover rate may be higher. |
| | |
| The accompanying notes are an integral part of these financial statements. | | 55 |
GOLDMAN SACHS VARIABLE INSURANCE TRUST MID CAP VALUE FUND
Financial Highlights (continued)
Selected Data for a Share Outstanding Throughout Each Period
| | | | | | | | | | | | | | | | | | | | | | | | |
| | | Goldman Sachs Mid Cap Value Fund | |
| | | Institutional Shares | |
| | | Six Months Ended
June 30, 2023
(Unaudited) | | | Year Ended December 31, | |
| | | 2022 | | | 2021 | | | 2020 | | | 2019 | | | 2018 | |
| | | | | | | | | | | | | | | | | | | | | | | | |
| Per Share Data | | | | | | | | | | | | | | | | | | |
| | | | | | |
Net asset value, beginning of period | | $ | 14.89 | | | $ | 19.53 | | | $ | 17.23 | | | $ | 16.22 | | | $ | 12.89 | | | $ | 16.93 | |
| | | | | | |
Net investment income(a) | | | 0.07 | | | | 0.16 | | | | 0.09 | | | | 0.10 | | | | 0.13 | | | | 0.13 | |
| | | | | | |
Net realized and unrealized gain (loss) | | | 0.73 | | | | (1.98 | ) | | | 5.20 | | | | 1.26 | | | | 3.93 | | | | (1.86 | ) |
| | | | | | |
Total from investment operations | | | 0.80 | | | | (1.82 | ) | | | 5.29 | | | | 1.36 | | | | 4.06 | | | | (1.73 | ) |
| | | | | | |
Distributions to shareholders from net investment income | | | — | | | | (0.13 | ) | | | (0.10 | ) | | | (0.10 | ) | | | (0.13 | ) | | | (0.23 | ) |
| | | | | | |
Distributions to shareholders from net realized gains | | | — | | | | (2.69 | ) | | | (2.89 | ) | | | (0.25 | ) | | | (0.60 | ) | | | (2.08 | ) |
| | | | | | |
Total distributions | | | — | | | | (2.82 | ) | | | (2.99 | ) | | | (0.35 | ) | | | (0.73 | ) | | | (2.31 | ) |
| | | | | | |
Net asset value, end of period | | $ | 15.69 | | | $ | 14.89 | | | $ | 19.53 | | | $ | 17.23 | | | $ | 16.22 | | | $ | 12.89 | |
| | | | | | |
Total Return(b) | | | 5.37 | % | | | (9.99 | )% | | | 30.95 | % | | | 8.38 | % | | | 31.53 | % | | | (10.46 | )% |
| | | | | | |
Net assets, end of period (in 000’s) | | $ | 318,084 | | | $ | 311,440 | | | $ | 383,315 | | | $ | 327,376 | | | $ | 335,229 | | | $ | 300,056 | |
| | | | | | |
Ratio of net expenses to average net assets | | | 0.84 | %(c) | | | 0.83 | % | | | 0.83 | % | | | 0.84 | % | | | 0.87 | % | | | 0.84 | % |
| | | | | | |
Ratio of total expenses to average net assets | | | 0.84 | %(c) | | | 0.85 | % | | | 0.85 | % | | | 0.90 | % | | | 0.90 | % | | | 0.86 | % |
| | | | | | |
Ratio of net investment income to average net assets | | | 0.97 | %(c) | | | 0.89 | % | | | 0.46 | % | | | 0.68 | % | | | 0.85 | % | | | 0.75 | % |
| | | | | | |
Portfolio turnover rate(d) | | | 48 | % | | | 75 | % | | | 63 | % | | | 111 | % | | | 89 | % | | | 109 | % |
| (a) | Calculated based on the average shares outstanding methodology. |
| (b) | Assumes investment at the NAV at the beginning of the period, reinvestment of all dividends and distributions, a complete redemption of the investment at the NAV at the end of the period and no sales or redemption charges (if any). Total returns would be reduced if a sales or redemption charge was taken into account. Returns do not reflect the impact of taxes to shareholders relating to Fund distributions or the redemption of Fund shares. Total returns for periods less than one full year are not annualized. |
| (d) | The Fund’s portfolio turnover rate is calculated in accordance with regulatory requirements, without regard to transactions involving short term investments and certain derivatives. If such transactions were included, the Fund’s portfolio turnover rate may be higher. |
| | |
| 56 | | The accompanying notes are an integral part of these financial statements. |
GOLDMAN SACHS VARIABLE INSURANCE TRUST MID CAP VALUE FUND
Financial Highlights (continued)
Selected Data for a Share Outstanding Throughout Each Period
| | | | | | | | | | | | | | | | | | | | | | | | |
| | | Goldman Sachs Mid Cap Value Fund | |
| | | Service Shares | |
| | | Six Months Ended
June 30, 2023
(Unaudited) | | | Year Ended December 31, | |
| | | 2022 | | | 2021 | | | 2020 | | | 2019 | | | 2018 | |
| | | | | | | | | | | | | | | | | | | | | | | | |
| Per Share Data | | | | | | | | | | | | | | | | | | |
| | | | | | |
Net asset value, beginning of period | | $ | 15.07 | | | $ | 19.73 | | | $ | 17.39 | | | $ | 16.37 | | | $ | 13.01 | | | $ | 16.95 | |
| | | | | | |
Net investment income(a) | | | 0.06 | | | | 0.10 | | | | 0.04 | | | | 0.06 | | | | 0.10 | | | | 0.07 | |
| | | | | | |
Net realized and unrealized gain (loss) | | | 0.73 | | | | (1.99 | ) | | | 5.24 | | | | 1.28 | | | | 3.95 | | | | (1.84 | ) |
| | | | | | |
Total from investment operations | | | 0.79 | | | | (1.89 | ) | | | 5.28 | | | | 1.34 | | | | 4.05 | | | | (1.77 | ) |
| | | | | | |
Distributions to shareholders from net investment income | | | — | | | | (0.08 | ) | | | (0.05 | ) | | | (0.07 | ) | | | (0.09 | ) | | | (0.09 | ) |
| | | | | | |
Distributions to shareholders from net realized gains | | | — | | | | (2.69 | ) | | | (2.89 | ) | | | (0.25 | ) | | | (0.60 | ) | | | (2.08 | ) |
| | | | | | |
Total distributions | | | — | | | | (2.77 | ) | | | (2.94 | ) | | | (0.32 | ) | | | (0.69 | ) | | | (2.17 | ) |
| | | | | | |
Net asset value, end of period | | $ | 15.86 | | | $ | 15.07 | | | $ | 19.73 | | | $ | 17.39 | | | $ | 16.37 | | | $ | 13.01 | |
| | | | | | |
Total Return(b) | | | 5.24 | % | | | (10.23 | )% | | | 30.57 | % | | | 8.17 | % | | | 31.17 | % | | | (10.70 | )% |
| | | | | | |
Net assets, end of period (in 000’s) | | $ | 116,193 | | | $ | 89,460 | | | $ | 169,283 | | | $ | 158,909 | | | $ | 174,896 | | | $ | 76,835 | |
| | | | | | |
Ratio of net expenses to average net assets | | | 1.08 | %(c) | | | 1.08 | % | | | 1.08 | % | | | 1.09 | % | | | 1.12 | % | | | 1.09 | % |
| | | | | | |
Ratio of total expenses to average net assets | | | 1.09 | %(c) | | | 1.10 | % | | | 1.10 | % | | | 1.14 | % | | | 1.16 | % | | | 1.11 | % |
| | | | | | |
Ratio of net investment income to average net assets | | | 0.80 | %(c) | | | 0.56 | % | | | 0.21 | % | | | 0.39 | % | | | 0.66 | % | | | 0.42 | % |
| | | | | | |
Portfolio turnover rate(d) | | | 48 | % | | | 75 | % | | | 63 | % | | | 111 | % | | | 89 | % | | | 109 | % |
| (a) | Calculated based on the average shares outstanding methodology. |
| (b) | Assumes investment at the NAV at the beginning of the period, reinvestment of all dividends and distributions, a complete redemption of the investment at the NAV at the end of the period and no sales or redemption charges (if any). Total returns would be reduced if a sales or redemption charge was taken into account. Returns do not reflect the impact of taxes to shareholders relating to Fund distributions or the redemption of Fund shares. Total returns for periods less than one full year are not annualized. |
| (d) | The Fund’s portfolio turnover rate is calculated in accordance with regulatory requirements, without regard to transactions involving short term investments and certain derivatives. If such transactions were included, the Fund’s portfolio turnover rate may be higher. |
| | |
| The accompanying notes are an integral part of these financial statements. | | 57 |
GOLDMAN SACHS VARIABLE INSURANCE TRUST SMALL CAP EQUITY INSIGHTS FUND
Financial Highlights (continued)
Selected Data for a Share Outstanding Throughout Each Period
| | | | | | | | | | | | | | | | | | | | | | | | |
| | | Goldman Sachs Small Cap Equity Insights Fund | |
| | | Institutional Shares | |
| | | Six Months Ended
June 30, 2023
(Unaudited) | | | Year Ended December 31, | |
| | | 2022 | | | 2021 | | | 2020 | | | 2019 | | | 2018 | |
| | | | | | | | | | | | | | | | | | | | | | | | |
| Per Share Data | | | | | | | | | | | | | | | | | | |
| | | | | | |
Net asset value, beginning of period | | $ | 10.40 | | | $ | 13.08 | | | $ | 13.51 | | | $ | 12.62 | | | $ | 10.37 | | | $ | 13.66 | |
| | | | | | |
Net investment income(a) | | | 0.06 | (b) | | | 0.07 | (c) | | | 0.05 | (d) | | | 0.05 | | | | 0.06 | | | | 0.07 | (e) |
| | | | | | |
Net realized and unrealized gain (loss) | | | 1.04 | | | | (2.59 | ) | | | 3.17 | | | | 1.03 | | | | 2.51 | | | | (1.21 | ) |
| | | | | | |
Total from investment operations | | | 1.10 | | | | (2.52 | ) | | | 3.22 | | | | 1.08 | | | | 2.57 | | | | (1.14 | ) |
| | | | | | |
Distributions to shareholders from net investment income | | | — | | | | (0.04 | ) | | | (0.08 | ) | | | (0.03 | ) | | | (0.06 | ) | | | (0.07 | ) |
| | | | | | |
Distributions to shareholders from net realized gains | | | — | | | | (0.12 | ) | | | (3.57 | ) | | | (0.16 | ) | | | (0.26 | ) | | | (2.08 | ) |
| | | | | | |
Total distributions | | | — | | | | (0.16 | ) | | | (3.65 | ) | | | (0.19 | ) | | | (0.32 | ) | | | (2.15 | ) |
| | | | | | |
Net asset value, end of period | | $ | 11.50 | | | $ | 10.40 | | | $ | 13.08 | | | $ | 13.51 | | | $ | 12.62 | | | $ | 10.37 | |
| | | | | | |
Total Return(f) | | | 10.58 | % | | | (19.38 | )% | | | 23.79 | % | | | 8.56 | % | | | 24.84 | % | | | (8.62 | )% |
| | | | | | |
Net assets, end of period (in 000’s) | | $ | 94,692 | | | $ | 87,877 | | | $ | 108,716 | | | $ | 84,887 | | | $ | 79,791 | | | $ | 68,951 | |
| | | | | | |
Ratio of net expenses to average net assets | | | 0.81 | %(g) | | | 0.81 | % | | | 0.81 | % | | | 0.81 | % | | | 0.86 | % | | | 0.81 | % |
| | | | | | |
Ratio of total expenses to average net assets | | | 0.88 | %(g) | | | 0.95 | % | | | 0.93 | % | | | 1.08 | % | | | 1.05 | % | | | 0.98 | % |
| | | | | | |
Ratio of net investment income to average net assets | | | 1.12 | %(b)(g) | | | 0.65 | %(c) | | | 0.34 | %(d) | | | 0.46 | % | | | 0.51 | % | | | 0.46 | %(e) |
| | | | | | |
Portfolio turnover rate(h) | | | 78 | % | | | 163 | % | | | 172 | % | | | 147 | % | | | 125 | % | | | 116 | % |
| (a) | Calculated based on the average shares outstanding methodology. |
| (b) | Reflects income recognized from special dividends which amounted to $0.03 per share and 0.26% of average net assets. |
| (c) | Reflects income recognized from special dividends which amounted to $0.02 per share and 0.21% of average net assets. |
| (d) | Reflects income recognized from special dividends which amounted to $0.03 per share and 0.22% of average net assets. |
| (e) | Reflects income recognized from special dividends which amounted to $0.02 per share and 0.17% of average net assets. |
| (f) | Assumes investment at the NAV at the beginning of the period, reinvestment of all dividends and distributions, a complete redemption of the investment at the NAV at the end of the period and no sales or redemption charges (if any). Total returns would be reduced if a sales or redemption charge was taken into account. Returns do not reflect the impact of taxes to shareholders relating to Fund distributions or the redemption of Fund shares. Total returns for periods less than one full year are not annualized. |
| (h) | The Fund’s portfolio turnover rate is calculated in accordance with regulatory requirements, without regard to transactions involving short term investments and certain derivatives. If such transactions were included, the Fund’s portfolio turnover rate may be higher. |
| | |
| 58 | | The accompanying notes are an integral part of these financial statements. |
GOLDMAN SACHS VARIABLE INSURANCE TRUST SMALL CAP EQUITY INSIGHTS FUND
Financial Highlights (continued)
Selected Data for a Share Outstanding Throughout Each Period
| | | | | | | | | | | | | | | | | | | | | | | | |
| | | Goldman Sachs Small Cap Equity Insights Fund | |
| | | Service Shares | |
| | | Six Months Ended
June 30, 2023
(Unaudited) | | | Year Ended December 31, | |
| | | 2022 | | | 2021 | | | 2020 | | | 2019 | | | 2018 | |
| | | | | | | | | | | | | | | | | | | | | | | | |
| Per Share Data | | | | | | | | | | | | | | | | | | |
| | | | | | |
Net asset value, beginning of period | | $ | 10.27 | | | $ | 12.93 | | | $ | 13.39 | | | $ | 12.51 | | | $ | 10.28 | | | $ | 13.55 | |
| | | | | | |
Net investment income(a) | | | 0.05 | (b) | | | 0.05 | (c) | | | 0.01 | (d) | | | 0.02 | | | | 0.03 | | | | 0.03 | (e) |
| | | | | | |
Net realized and unrealized gain (loss) | | | 1.03 | | | | (2.58 | ) | | | 3.14 | | | | 1.02 | | | | 2.49 | | | | (1.19 | ) |
| | | | | | |
Total from investment operations | | | 1.08 | | | | (2.53 | ) | | | 3.15 | | | | 1.04 | | | | 2.52 | | | | (1.16 | ) |
| | | | | | |
Distributions to shareholders from net investment income | | | — | | | | (0.01 | ) | | | (0.04 | ) | | | — | | | | (0.03 | ) | | | (0.03 | ) |
| | | | | | |
Distributions to shareholders from net realized gains | | | — | | | | (0.12 | ) | | | (3.57 | ) | | | (0.16 | ) | | | (0.26 | ) | | | (2.08 | ) |
| | | | | | |
Total distributions | | | — | | | | (0.13 | ) | | | (3.61 | ) | | | (0.16 | ) | | | (0.29 | ) | | | (2.11 | ) |
| | | | | | |
Net asset value, end of period | | $ | 11.35 | | | $ | 10.27 | | | $ | 12.93 | | | $ | 13.39 | | | $ | 12.51 | | | $ | 10.28 | |
| | | | | | |
Total Return(f) | | | 10.52 | % | | | (19.64 | )% | | | 23.50 | % | | | 8.34 | % | | | 24.53 | % | | | (8.82 | )% |
| | | | | | |
Net assets, end of period (in 000’s) | | $ | 25,414 | | | $ | 21,617 | | | $ | 22,114 | | | $ | 17,239 | | | $ | 15,742 | | | $ | 16,537 | |
| | | | | | |
Ratio of net expenses to average net assets | | | 1.06 | %(g) | | | 1.06 | % | | | 1.06 | % | | | 1.06 | % | | | 1.10 | % | | | 1.06 | % |
| | | | | | |
Ratio of total expenses to average net assets | | | 1.13 | %(g) | | | 1.20 | % | | | 1.18 | % | | | 1.33 | % | | | 1.30 | % | | | 1.23 | % |
| | | | | | |
Ratio of net investment income to average net assets | | | 0.87 | %(b)(g) | | | 0.43 | %(c) | | | 0.09 | %(d) | | | 0.22 | % | | | 0.27 | % | | | 0.19 | %(e) |
| | | | | | |
Portfolio turnover rate(h) | | | 78 | % | | | 163 | % | | | 172 | % | | | 147 | % | | | 125 | % | | | 116 | % |
| (a) | Calculated based on the average shares outstanding methodology. |
| (b) | Reflects income recognized from special dividends which amounted to $0.03 per share and 0.26% of average net assets. |
| (c) | Reflects income recognized from special dividends which amounted to $0.02 per share and 0.21% of average net assets. |
| (d) | Reflects income recognized from special dividends which amounted to $0.03 per share and 0.22% of average net assets. |
| (e) | Reflects income recognized from special dividends which amounted to $0.02 per share and 0.17% of average net assets. |
| (f) | Assumes investment at the NAV at the beginning of the period, reinvestment of all dividends and distributions, a complete redemption of the investment at the NAV at the end of the period and no sales or redemption charges (if any). Total returns would be reduced if a sales or redemption charge was taken into account. Returns do not reflect the impact of taxes to shareholders relating to Fund distributions or the redemption of Fund shares. Total returns for periods less than one full year are not annualized. |
| (h) | The Fund’s portfolio turnover rate is calculated in accordance with regulatory requirements, without regard to transactions involving short term investments and certain derivatives. If such transactions were included, the Fund’s portfolio turnover rate may be higher. |
| | |
| The accompanying notes are an integral part of these financial statements. | | 59 |
GOLDMAN SACHS VARIABLE INSURANCE TRUST STRATEGIC GROWTH FUND
Financial Highlights (continued)
Selected Data for a Share Outstanding Throughout Each Period
| | | | | | | | | | | | | | | | | | | | | | | | |
| | | Goldman Sachs Strategic Growth Fund | |
| | | Institutional Shares | |
| | | Six Months Ended
June 30, 2023
(Unaudited) | | | Year Ended December 31, | |
| | | 2022 | | | 2021 | | | 2020 | | | 2019 | | | 2018 | |
| | | | | | | | | | | | | | | | | | | | | | | | |
| Per Share Data | | | | | | | | | | | | | | | | | | |
| | | | | | |
Net asset value, beginning of period | | $ | 9.20 | | | $ | 16.63 | | | $ | 15.43 | | | $ | 11.90 | | | $ | 9.78 | | | $ | 19.73 | |
| | | | | | |
Net investment income (loss)(a) | | | — | (b) | | | (0.01 | ) | | | (0.05 | ) | | | — | (b) | | | 0.03 | | | | 0.06 | |
| | | | | | |
Net realized and unrealized gain (loss) | | | 2.77 | | | | (5.24 | ) | | | 3.46 | | | | 4.79 | | | | 3.43 | | | | (0.18 | ) |
| | | | | | |
Total from investment operations | | | 2.77 | | | | (5.25 | ) | | | 3.41 | | | | 4.79 | | | | 3.46 | | | | (0.12 | ) |
| | | | | | |
Distributions to shareholders from net investment income | | | — | | | | — | | | | — | | | | (0.01 | ) | | | (0.04 | ) | | | (0.10 | ) |
| | | | | | |
Distributions to shareholders from net realized gains | | | — | | | | (2.18 | ) | | | (2.21 | ) | | | (1.25 | ) | | | (1.30 | ) | | | (9.73 | ) |
| | | | | | |
Total distributions | | | — | | | | (2.18 | ) | | | (2.21 | ) | | | (1.26 | ) | | | (1.34 | ) | | | (9.83 | ) |
| | | | | | |
Net asset value, end of period | | $ | 11.97 | | | $ | 9.20 | | | $ | 16.63 | | | $ | 15.43 | | | $ | 11.90 | | | $ | 9.78 | |
| | | | | | |
Total Return(c) | | | 30.11 | % | | | (32.52 | )% | | | 21.93 | % | | | 40.37 | % | | | 35.53 | % | | | (1.04 | )% |
| | | | | | |
Net assets, end of period (in 000’s) | | $ | 153,423 | | | $ | 122,077 | | | $ | 187,144 | | | $ | 167,930 | | | $ | 129,686 | | | $ | 102,199 | |
| | | | | | |
Ratio of net expenses to average net assets | | | 0.74 | %(d) | | | 0.74 | % | | | 0.73 | % | | | 0.74 | % | | | 0.77 | % | | | 0.74 | % |
| | | | | | |
Ratio of total expenses to average net assets | | | 0.79 | %(d) | | | 0.82 | % | | | 0.79 | % | | | 0.81 | % | | | 0.85 | % | | | 0.82 | % |
| | | | | | |
Ratio of net investment income (loss) to average net assets | | | (0.02 | )%(d) | | | (0.11 | )% | | | (0.27 | )% | | | (0.01 | )% | | | 0.29 | % | | | 0.30 | % |
| | | | | | |
Portfolio turnover rate(e) | | | 29 | % | | | 29 | % | | | 20 | % | | | 45 | % | | | 44 | % | | | 41 | % |
| (a) | Calculated based on the average shares outstanding methodology. |
| (b) | Amount is less than $0.005 per share. |
| (c) | Assumes investment at the NAV at the beginning of the period, reinvestment of all dividends and distributions, a complete redemption of the investment at the NAV at the end of the period and no sales or redemption charges (if any). Total returns would be reduced if a sales or redemption charge was taken into account. Returns do not reflect the impact of taxes to shareholders relating to Fund distributions or the redemption of Fund shares. Total returns for periods less than one full year are not annualized. |
| (e) | The Fund’s portfolio turnover rate is calculated in accordance with regulatory requirements, without regard to transactions involving short term investments and certain derivatives. If such transactions were included, the Fund’s portfolio turnover rate may be higher. |
| | |
| 60 | | The accompanying notes are an integral part of these financial statements. |
GOLDMAN SACHS VARIABLE INSURANCE TRUST STRATEGIC GROWTH FUND
Financial Highlights (continued)
Selected Data for a Share Outstanding Throughout Each Period
| | | | | | | | | | | | | | | | | | | | | | | | |
| | | Goldman Sachs Strategic Growth Fund | |
| | | Service Shares | |
| | | Six Months Ended
June 30, 2023
(Unaudited) | | | Year Ended December 31, | |
| | | 2022 | | | 2021 | | | 2020 | | | 2019 | | | 2018 | |
| | | | | | | | | | | | | | | | | | | | | | | | |
| Per Share Data | | | | | | | | | | | | | | | | | | |
| | | | | | |
Net asset value, beginning of period | | $ | 9.12 | | | $ | 16.55 | | | $ | 15.41 | | | $ | 11.91 | | | $ | 9.78 | | | $ | 19.68 | |
| | | | | | |
Net investment income (loss)(a) | | | (0.01 | ) | | | (0.05 | ) | | | (0.09 | ) | | | (0.03 | ) | | | 0.01 | | | | 0.01 | |
| | | | | | |
Net realized and unrealized gain (loss) | | | 2.74 | | | | (5.20 | ) | | | 3.44 | | | | 4.78 | | | | 3.43 | | | | (0.18 | ) |
| | | | | | |
Total from investment operations | | | 2.73 | | | | (5.25 | ) | | | 3.35 | | | | 4.75 | | | | 3.44 | | | | (0.17 | ) |
| | | | | | |
Distributions to shareholders from net investment income | | | — | | | | — | | | | — | | | | — | | | | (0.01 | ) | | | — | |
| | | | | | |
Distributions to shareholders from net realized gains | | | — | | | | (2.18 | ) | | | (2.21 | ) | | | (1.25 | ) | | | (1.30 | ) | | | (9.73 | ) |
| | | | | | |
Total distributions | | | — | | | | (2.18 | ) | | | (2.21 | ) | | | (1.25 | ) | | | (1.31 | ) | | | (9.73 | ) |
| | | | | | |
Net asset value, end of period | | $ | 11.85 | | | $ | 9.12 | | | $ | 16.55 | | | $ | 15.41 | | | $ | 11.91 | | | $ | 9.78 | |
| | | | | | |
Total Return(b) | | | 29.93 | % | | | (32.68 | )% | | | 21.56 | % | | | 39.98 | % | | | 35.32 | % | | | (1.32 | )% |
| | | | | | |
Net assets, end of period (in 000’s) | | $ | 207,324 | | | $ | 115,205 | | | $ | 262,782 | | | $ | 257,714 | | | $ | 241,375 | | | $ | 139,414 | |
| | | | | | |
Ratio of net expenses to average net assets | | | 0.99 | %(c) | | | 0.99 | % | | | 0.98 | % | | | 0.99 | % | | | 1.02 | % | | | 0.99 | % |
| | | | | | |
Ratio of total expenses to average net assets | | | 1.04 | %(c) | | | 1.07 | % | | | 1.04 | % | | | 1.06 | % | | | 1.10 | % | | | 1.07 | % |
| | | | | | |
Ratio of net investment income (loss) to average net assets | | | (0.26 | )%(c) | | | (0.38 | )% | | | (0.52 | )% | | | (0.24 | )% | | | 0.04 | % | | | 0.04 | % |
| | | | | | |
Portfolio turnover rate(d) | | | 29 | % | | | 29 | % | | | 20 | % | | | 45 | % | | | 44 | % | | | 41 | % |
| (a) | Calculated based on the average shares outstanding methodology. |
| (b) | Assumes investment at the NAV at the beginning of the period, reinvestment of all dividends and distributions, a complete redemption of the investment at the NAV at the end of the period and no sales or redemption charges (if any). Total returns would be reduced if a sales or redemption charge was taken into account. Returns do not reflect the impact of taxes to shareholders relating to Fund distributions or the redemption of Fund shares. Total returns for periods less than one full year are not annualized. |
| (d) | The Fund’s portfolio turnover rate is calculated in accordance with regulatory requirements, without regard to transactions involving short term investments and certain derivatives. If such transactions were included, the Fund’s portfolio turnover rate may be higher. |
| | |
| The accompanying notes are an integral part of these financial statements. | | 61 |
GOLDMAN SACHS VARIABLE INSURANCE TRUST U.S. EQUITY INSIGHTS FUND
Financial Highlights (continued)
Selected Data for a Share Outstanding Throughout Each Period
| | | | | | | | | | | | | | | | | | | | | | | | |
| | | Goldman Sachs U.S. Equity Insights Fund | |
| | | Institutional Shares | |
| | | Six Months Ended
June 30, 2023
(Unaudited) | | | Year Ended December 31, | |
| | | 2022 | | | 2021 | | | 2020 | | | 2019 | | | 2018 | |
| | | | | | | | | | | | | | | | | | | | | | | | |
| Per Share Data | | | | | | | | | | | | | | | | | | |
| | | | | | |
Net asset value, beginning of period | | $ | 15.88 | | | $ | 20.06 | | | $ | 20.08 | | | $ | 17.93 | | | $ | 15.03 | | | $ | 19.41 | |
| | | | | | |
Net investment income(a) | | | 0.08 | | | | 0.15 | | | | 0.18 | | | | 0.15 | | | | 0.21 | | | | 0.22 | |
| | | | | | |
Net realized and unrealized gain (loss) | | | 2.21 | | | | (4.10 | ) | | | 5.61 | | | | 2.98 | | | | 3.57 | | | | (1.38 | ) |
| | | | | | |
Total from investment operations | | | 2.29 | | | | (3.95 | ) | | | 5.79 | | | | 3.13 | | | | 3.78 | | | | (1.16 | ) |
| | | | | | |
Distributions to shareholders from net investment income | | | — | | | | (0.14 | ) | | | (0.19 | ) | | | (0.16 | ) | | | (0.23 | ) | | | (0.25 | ) |
| | | | | | |
Distributions to shareholders from net realized gains | | | — | | | | (0.09 | ) | | | (5.62 | ) | | | (0.82 | ) | | | (0.65 | ) | | | (2.97 | ) |
| | | | | | |
Total distributions | | | — | | | | (0.23 | ) | | | (5.81 | ) | | | (0.98 | ) | | | (0.88 | ) | | | (3.22 | ) |
| | | | | | |
Net asset value, end of period | | $ | 18.17 | | | $ | 15.88 | | | $ | 20.06 | | | $ | 20.08 | | | $ | 17.93 | | | $ | 15.03 | |
| | | | | | |
Total Return(b) | | | 14.42 | % | | | (19.74 | )% | | | 29.41 | % | | | 17.49 | % | | | 25.21 | % | | | (6.19 | )% |
| | | | | | |
Net assets, end of period (in 000’s) | | $ | 272,588 | | | $ | 242,239 | | | $ | 317,468 | | | $ | 267,592 | | | $ | 256,930 | | | $ | 235,553 | |
| | | | | | |
Ratio of net expenses to average net assets | | | 0.56 | %(c) | | | 0.56 | % | | | 0.55 | % | | | 0.56 | % | | | 0.58 | % | | | 0.58 | % |
| | | | | | |
Ratio of total expenses to average net assets | | | 0.70 | %(c) | | | 0.72 | % | | | 0.71 | % | | | 0.75 | % | | | 0.76 | % | | | 0.73 | % |
| | | | | | |
Ratio of net investment income to average net assets | | | 0.94 | %(c) | | | 0.86 | % | | | 0.81 | % | | | 0.85 | % | | | 1.24 | % | | | 1.12 | % |
| | | | | | |
Portfolio turnover rate(d) | | | 100 | % | | | 203 | % | | | 206 | % | | | 203 | % | | | 187 | % | | | 160 | % |
| (a) | Calculated based on the average shares outstanding methodology. |
| (b) | Assumes investment at the NAV at the beginning of the period, reinvestment of all dividends and distributions, a complete redemption of the investment at the NAV at the end of the period and no sales or redemption charges (if any). Total returns would be reduced if a sales or redemption charge was taken into account. Returns do not reflect the impact of taxes to shareholders relating to Fund distributions or the redemption of Fund shares. Total returns for periods less than one full year are not annualized. |
| (d) | The Fund’s portfolio turnover rate is calculated in accordance with regulatory requirements, without regard to transactions involving short term investments and certain derivatives. If such transactions were included, the Fund’s portfolio turnover rate may be higher. |
| | |
| 62 | | The accompanying notes are an integral part of these financial statements. |
GOLDMAN SACHS VARIABLE INSURANCE TRUST U.S. EQUITY INSIGHTS FUND
Financial Highlights (continued)
Selected Data for a Share Outstanding Throughout Each Period
| | | | | | | | | | | | | | | | | | | | | | | | |
| | | Goldman Sachs U.S. Equity Insights Fund | |
| | | Service Shares | |
| | | Six Months Ended
June 30, 2023
(Unaudited) | | | Year Ended December 31, | |
| | | 2022 | | | 2021 | | | 2020 | | | 2019 | | | 2018 | |
| | | | | | | | | | | | | | | | | | | | | | | | |
| Per Share Data | | | | | | | | | | | | | | | | | | |
| | | | | | |
Net asset value, beginning of period | | $ | 16.02 | | | $ | 20.23 | | | $ | 20.21 | | | $ | 18.04 | | | $ | 15.12 | | | $ | 19.48 | |
| | | | | | |
Net investment income(a) | | | 0.06 | | | | 0.11 | | | | 0.14 | | | | 0.12 | | | | 0.18 | | | | 0.18 | |
| | | | | | |
Net realized and unrealized gain (loss) | | | 2.23 | | | | (4.13 | ) | | | 5.64 | | | | 2.99 | | | | 3.58 | | | | (1.37 | ) |
| | | | | | |
Total from investment operations | | | 2.29 | | | | (4.02 | ) | | | 5.78 | | | | 3.11 | | | | 3.76 | | | | (1.19 | ) |
| | | | | | |
Distributions to shareholders from net investment income | | | — | | | | (0.10 | ) | | | (0.14 | ) | | | (0.12 | ) | | | (0.19 | ) | | | (0.20 | ) |
| | | | | | |
Distributions to shareholders from net realized gains | | | — | | | | (0.09 | ) | | | (5.62 | ) | | | (0.82 | ) | | | (0.65 | ) | | | (2.97 | ) |
| | | | | | |
Total distributions | | | — | | | | (0.19 | ) | | | (5.76 | ) | | | (0.94 | ) | | | (0.84 | ) | | | (3.17 | ) |
| | | | | | |
Net asset value, end of period | | $ | 18.31 | | | $ | 16.02 | | | $ | 20.23 | | | $ | 20.21 | | | $ | 18.04 | | | $ | 15.12 | |
| | | | | | |
Total Return(b) | | | 14.29 | % | | | (19.90 | )% | | | 29.11 | % | | | 17.27 | % | | | 24.93 | % | | | (6.36 | )% |
| | | | | | |
Net assets, end of period (in 000’s) | | $ | 43,938 | | | $ | 41,870 | | | $ | 61,849 | | | $ | 54,149 | | | $ | 55,201 | | | $ | 53,208 | |
| | | | | | |
Ratio of net expenses to average net assets | | | 0.77 | %(c) | | | 0.77 | % | | | 0.77 | % | | | 0.77 | % | | | 0.79 | % | | | 0.79 | % |
| | | | | | |
Ratio of total expenses to average net assets | | | 0.95 | %(c) | | | 0.97 | % | | | 0.93 | % | | | 1.00 | % | | | 1.01 | % | | | 0.97 | % |
| | | | | | |
Ratio of net investment income to average net assets | | | 0.72 | %(c) | | | 0.64 | % | | | 0.60 | % | | | 0.63 | % | | | 1.03 | % | | | 0.88 | % |
| | | | | | |
Portfolio turnover rate(d) | | | 100 | % | | | 203 | % | | | 206 | % | | | 203 | % | | | 187 | % | | | 160 | % |
| (a) | Calculated based on the average shares outstanding methodology. |
| (b) | Assumes investment at the NAV at the beginning of the period, reinvestment of all dividends and distributions, a complete redemption of the investment at the NAV at the end of the period and no sales or redemption charges (if any). Total returns would be reduced if a sales or redemption charge was taken into account. Returns do not reflect the impact of taxes to shareholders relating to Fund distributions or the redemption of Fund shares. Total returns for periods less than one full year are not annualized. |
| (d) | The Fund’s portfolio turnover rate is calculated in accordance with regulatory requirements, without regard to transactions involving short term investments and certain derivatives. If such transactions were included, the Fund’s portfolio turnover rate may be higher. |
| | |
| The accompanying notes are an integral part of these financial statements. | | 63 |
GOLDMAN SACHS VARIABLE INSURANCE TRUST EQUITY FUNDS
Notes to Financial Statements
June 30, 2023 (Unaudited)
1. ORGANIZATION
Goldman Sachs Variable Insurance Trust (the “Trust” or “VIT”) is a Delaware statutory trust registered under the Investment Company Act of 1940, as amended (the “Act”), as an open-end management investment company. The following table lists those series of the Trust that are included in this report (collectively, the “Funds” or individually a “Fund”), along with their corresponding share classes and respective diversification status under the Act:
| | | | | | |
| Fund | | Share Classes Offered | | | | Diversified/ Non-diversified |
International Equity Insights | | Institutional and Service | | | | Diversified |
Large Cap Value | | Institutional and Service | | | | Diversified |
Mid Cap Growth | | Institutional and Service | | | | Diversified |
Mid Cap Value | | Institutional and Service | | | | Diversified |
Small Cap Equity Insights | | Institutional and Service | | | | Diversified |
Strategic Growth | | Institutional and Service | | | | Non-Diversified |
U.S. Equity Insights | | Institutional and Service | | | | Diversified |
Shares of the Trust are offered to separate accounts of participating life insurance companies for the purpose of funding variable annuity contracts and variable life insurance policies.
Goldman Sachs Asset Management, L.P. (“GSAM” or the “Investment Adviser”), an affiliate of Goldman Sachs & Co. LLC (“Goldman Sachs”), serves as investment adviser to the Funds pursuant to management agreements (the “Agreements”) with the Trust.
2. SIGNIFICANT ACCOUNTING POLICES
The financial statements have been prepared in accordance with accounting principles generally accepted in the United States of America (“GAAP”) and require management to make estimates and assumptions that may affect the reported amounts and disclosures. Actual results may differ from those estimates and assumptions. Each Fund is an investment company under GAAP and follows the accounting and reporting guidance applicable to investment companies.
A. Investment Valuation — The Funds’ valuation policy is to value investments at fair value.
B. Investment Income and Investments — Investment income includes interest income, dividend income, and securities lending income, if any. Interest income is accrued daily and adjusted for amortization of premiums and accretion of discounts. Dividend income is recognized on ex-dividend date or, for certain foreign securities, as soon as such information is obtained subsequent to the ex-dividend date. Non-cash dividends, if any, are recorded at the fair market value of the securities received. Investment transactions are reflected on trade date. Realized gains and losses are calculated using identified cost. Investment transactions are recorded on the following business day for daily net asset value (“NAV”) calculations. Investment income is recorded net of any foreign withholding taxes, less any amounts reclaimable. The Funds may file withholding tax reclaims in certain jurisdictions to recover a portion of amounts previously withheld. Any foreign capital gains tax is accrued daily based upon net unrealized gains, and is payable upon sale of such investments. Distributions received from the Funds’ investments in United States (“U.S.”) real estate investment trusts (“REITs”) may be characterized as ordinary income, net capital gain and/or a return of capital. A return of capital is recorded by the Funds as a reduction to the cost basis of the REIT.
For derivative contracts, unrealized gains and losses are recorded daily and become realized gains and losses upon disposition or termination of the contract.
C. Class Allocations and Expenses — Investment income, realized and unrealized gain (loss), if any, and non-class specific expenses of each Fund are allocated daily based upon the proportion of net assets of each class. Non-class specific expenses
GOLDMAN SACHS VARIABLE INSURANCE TRUST EQUITY FUNDS
2. SIGNIFICANT ACCOUNTING POLICES (continued)
directly incurred by a Fund are charged to that Fund, while such expenses incurred by the Trust are allocated across the applicable Funds on a straight-line and/or pro-rata basis depending upon the nature of the expenses. Class specific expenses, where applicable, are borne by the respective share classes and include Distribution and Service and Transfer Agency fees.
D. Federal Taxes and Distributions to Shareholders — It is each Fund’s policy to comply with the requirements of the Internal Revenue Code of 1986, as amended (the “Code”), applicable to regulated investment companies and to distribute each year substantially all of its investment company taxable income and capital gains to its shareholders. Accordingly, each Fund is not required to make any provisions for the payment of federal income tax. Distributions to shareholders are recorded on the ex-dividend date. Income and capital gains distributions, if any, are declared and paid at least annually.
Net capital losses, if any, are carried forward to future fiscal years and may be used to the extent allowed by the Code to offset any future capital gains. Losses that are carried forward will retain their character as either short-term or long-term capital losses. Utilization of capital loss carryforwards will reduce the requirement of future capital gains distributions.
The characterization of distributions to shareholders for financial reporting purposes is determined in accordance with federal income tax rules, which may differ from GAAP. The source of each Fund’s distributions may be shown in the accompanying financial statements as either from distributable earnings or capital. Certain components of the Funds’ net assets on the Statements of Assets and Liabilities reflect permanent GAAP/tax differences based on the appropriate tax character.
E. Foreign Currency Translation — The accounting records and reporting currency of a Fund are maintained in U.S. dollars. Assets and liabilities denominated in foreign currencies are translated into U.S. dollars using the current exchange rates at the close of each business day. The effect of changes in foreign currency exchange rates on investments is included within net realized and unrealized gain (loss) on investments. Changes in the value of other assets and liabilities as a result of fluctuations in foreign exchange rates are included in the Statements of Operations within net change in unrealized gain (loss) on foreign currency translation. Transactions denominated in foreign currencies are translated into U.S. dollars on the date the transaction occurred, the effects of which are included within net realized gain (loss) on foreign currency transactions.
3. INVESTMENTS AND FAIR VALUE MEASUREMENTS
U.S. GAAP defines the fair value of a financial instrument as the amount that would be received to sell an asset or paid to transfer a liability in an orderly transaction between market participants at the measurement date (i.e., the exit price); the Funds’ policy is to use the market approach. GAAP establishes a fair value hierarchy that prioritizes the inputs to valuation techniques used to measure fair value. The hierarchy gives the highest priority to unadjusted quoted prices in active markets for identical assets or liabilities (Level 1 measurements) and the lowest priority to unobservable inputs (Level 3 measurements). The level in the fair value hierarchy within which the fair value measurement in its entirety falls shall be determined based on the lowest level input that is significant to the fair value measurement in its entirety. The levels used for classifying investments are not necessarily an indication of the risk associated with investing in these investments. The three levels of the fair value hierarchy are described below:
Level 1 — Unadjusted quoted prices in active markets that are accessible at the measurement date for identical, unrestricted assets or liabilities;
Level 2 — Quoted prices in markets that are not active or financial instruments for which significant inputs are observable (including, but not limited to, quoted prices for similar investments, interest rates, foreign exchange rates, volatility and credit spreads), either directly or indirectly;
Level 3 — Prices or valuations that require significant unobservable inputs (including GSAM’s assumptions in determining fair value measurement).
The Board of Trustees (“Trustees”) has approved Valuation Procedures that govern the valuation of the portfolio investments held by the Funds, including investments for which market quotations are not readily available. With respect to the Funds’ investments that do not have readily available market quotations, the Trustees have designated the Adviser as the valuation designee to perform
GOLDMAN SACHS VARIABLE INSURANCE TRUST EQUITY FUNDS
Notes to Financial Statements (continued)
June 30, 2023 (Unaudited)
3. INVESTMENTS AND FAIR VALUE MEASUREMENTS (continued)
fair valuations pursuant to Rule 2a-5 under the Investment Company Act of 1940 (the “Valuation Designee”). GSAM has day-to-day responsibility for implementing and maintaining internal controls and procedures related to the valuation of the Funds’ investments. To assess the continuing appropriateness of pricing sources and methodologies, GSAM regularly performs price verification procedures and issues challenges as necessary to third party pricing vendors or brokers, and any differences are reviewed in accordance with the Valuation Procedures.
A. Level 1 and Level 2 Fair Value Investments — The valuation techniques and significant inputs used in determining the fair values for investments classified as Level 1 and Level 2 are as follows:
Equity Securities — Equity securities traded on a U.S. securities exchange or the NASDAQ system, or those located on certain foreign exchanges, including but not limited to the Americas, are valued daily at their last sale price or official closing price on the principal exchange or system on which they are traded. If there is no sale or official closing price or such price is believed by GSAM to not represent fair value, equity securities will be valued at the valid closing bid price for long positions and at the valid closing ask price for short positions (i.e. where there is sufficient volume, during normal exchange trading hours). If no valid bid/ask price is available, the equity security will be valued pursuant to the Valuation Procedures and consistent with applicable regulatory guidance. To the extent these investments are actively traded, they are classified as Level 1 of the fair value hierarchy, otherwise they are generally classified as Level 2. Certain equity securities containing unique attributes may be classified as Level 2.
Unlisted equity securities for which market quotations are available are valued at the last sale price on the valuation date, or if no sale occurs, at the last bid price for long positions or the last ask price for short positions, and are generally classified as Level 2. Securities traded on certain foreign securities exchanges are valued daily at fair value determined by an independent fair value service (if available) under the Valuation Procedures and consistent with applicable regulatory guidance. The independent fair value service takes into account multiple factors including, but not limited to, movements in the securities markets, certain depositary receipts, futures contracts and foreign currency exchange rates that have occurred subsequent to the close of the foreign securities exchange. These investments are generally classified as Level 2 of the fair value hierarchy.
Money Market Funds — Investments in the Goldman Sachs Financial Square Government Fund (“Underlying Money Market Fund”) are valued at the NAV per share of the Institutional Share class on the day of valuation. These investments are generally classified as Level 1 of the fair value hierarchy. For information regarding the Underlying Money Market Fund’s accounting policies and investment holdings, please see the Underlying Money Market Fund’s shareholder report.
Derivative Contracts — A derivative is an instrument whose value is derived from underlying assets, indices, reference rates or a combination of these factors. A Fund enters into derivative transactions to hedge against changes in interest rates, securities prices, and/or currency exchange rates, to increase total return, or to gain access to certain markets or attain exposure to other underliers. For financial reporting purposes, cash collateral that has been pledged to cover obligations of a Fund and cash collateral received, if any, is reported separately on the Statements of Assets and Liabilities as either due to broker/receivable for collateral on certain derivative contracts. Non-cash collateral pledged by a Fund, if any, is noted in the Schedules of Investments.
Exchange-traded derivatives, including futures and options contracts, are generally valued at the last sale or settlement price on the exchange where they are principally traded. Exchange-traded options without settlement prices are generally valued at the midpoint of the bid and ask prices on the exchange where they are principally traded (or, in the absence of two-way trading, at the last bid price for long positions and the last ask price for short positions). Exchange-traded derivatives typically fall within Level 1 of the fair value hierarchy. Over-the-counter (“OTC”) and centrally cleared derivatives are valued using market transactions and other market evidence, including market-based inputs to models, calibration to market-clearing transactions, broker or dealer quotations, or other alternative pricing sources. Where models are used, the selection of a particular model to value OTC and centrally cleared derivatives depends upon the contractual terms of, and specific risks inherent in, the instrument, as well as the availability of pricing information in the market. Valuation models require a variety of inputs, including contractual terms, market prices, yield curves, credit curves, measures of volatility, voluntary and involuntary prepayment rates, loss severity rates and correlations of such inputs. For OTC and centrally cleared derivatives that trade in liquid markets, model inputs can generally be
GOLDMAN SACHS VARIABLE INSURANCE TRUST EQUITY FUNDS
3. INVESTMENTS AND FAIR VALUE MEASUREMENTS (continued)
verified and model selection does not involve significant management judgment. OTC and centrally cleared derivatives are classified within Level 2 of the fair value hierarchy when significant inputs are corroborated by market evidence.
i. Futures Contracts — Futures contracts are contracts to buy or sell a standardized quantity of a specified commodity or security. Upon entering into a futures contract, a Fund deposits cash or securities in an account on behalf of the broker in an amount sufficient to meet the initial margin requirement. Subsequent payments are made or received by a Fund equal to the daily change in the contract value and are recorded as variation margin receivable or payable with a corresponding offset to unrealized gains or losses.
B. Level 3 Fair Value Investments — To the extent that significant inputs to valuation models and other alternative pricing sources are unobservable, or if quotations are not readily available, or if GSAM believes that such quotations do not accurately reflect fair value, the fair value of a Fund’s investments may be determined under the Valuation Procedures. GSAM, consistent with its procedures and applicable regulatory guidance, may make an adjustment to the most recent valuation prices of either domestic or foreign securities in light of significant events to reflect what it believes to be the fair value of the securities at the time of determining a Fund’s NAV. To the extent investments are valued using single source broker quotations obtained directly from the broker or passed through from third party pricing vendors, such investments are classified as Level 3 investments.
C. Fair Value Hierarchy — The following is a summary of the Funds’ investments and derivatives classified in the fair value hierarchy as of June 30, 2023:
| | | | | | | | | | | | |
|
| INTERNATIONAL EQUITY INSIGHTS FUND | |
| Investment Type | | Level 1 | | | Level 2 | | | Level 3 | |
| | | |
| Assets | | | | | | | | | | | | |
| Common Stock and/or Other Equity Investments(a) | |
Asia | | $ | 697,502 | | | $ | 28,563,093 | | | $ | — | |
Europe | | | 2,643,308 | | | | 56,354,106 | | | | — | |
North America | | | 1,070,661 | | | | 7,527,380 | | | | — | |
Oceania | | | — | | | | 8,075,741 | | | | — | |
| | | |
| Total | | $ | 4,411,471 | | | $ | 100,520,320 | | | $ | — | |
| | | |
| Derivative Type | | | | | | | | | |
| | | |
| Assets(b) | | | | | | | | | | | | |
| Futures Contracts | | $ | 12,543 | | | $ | — | | | $ | — | |
| | | |
| Total | | $ | 12,543 | | | $ | — | | | $ | — | |
| | | |
| Derivative Type | | | | | | | | | |
| | | |
| Liabilities(b) | | | | | | | | | | | | |
| Futures Contracts | | $ | (721 | ) | | $ | — | | | $ | — | |
| | | |
| Total | | $ | (721 | ) | | $ | — | | | $ | — | |
| (a) | Amounts are disclosed by continent to highlight the impact of time zone differences between local market close and the calculation of NAV. Security valuations are based on the principal exchange or system on which they are traded, which may differ from country of domicile noted in table. The Fund utilizes fair value model prices provided by an independent third party fair value service for certain international equity securities resulting in a Level 2 classification. |
| (b) | Amount shown represents unrealized gain (loss) at period end. |
GOLDMAN SACHS VARIABLE INSURANCE TRUST EQUITY FUNDS
Notes to Financial Statements (continued)
June 30, 2023 (Unaudited)
3. INVESTMENTS AND FAIR VALUE MEASUREMENTS (continued)
| | | | | | | | | | | | |
|
| LARGE CAP VALUE FUND | |
| Investment Type | | Level 1 | | | Level 2 | | | Level 3 | |
| | | |
| Assets | | | | | | | | | | | | |
| Common Stock and/or Other Equity Investments(a) | |
Europe | | $ | 4,934,322 | | | $ | — | | | $ | — | |
North America | | | 379,709,012 | | | | — | | | | — | |
| Investment Company | | | 855,090 | | | | — | | | | — | |
| | | |
| Total | | $ | 385,498,424 | | | $ | — | | | $ | — | |
|
| MID CAP GROWTH FUND | |
| Investment Type | | Level 1 | | | Level 2 | | | Level 3 | |
| | | |
| Assets | | | | | | | | | | | | |
| Common Stock and/or Other Equity Investments(a) | |
Europe | | $ | 164,466 | | | $ | — | | | $ | — | |
North America | | | 58,709,291 | | | | — | | | | — | |
| Investment Company | | | 2,933,066 | | | | — | | | | — | |
| | | |
| Total | | $ | 61,806,823 | | | $ | — | | | $ | — | |
|
| MID CAP VALUE FUND | |
| Investment Type | | Level 1 | | | Level 2 | | | Level 3 | |
| | | |
| Assets | | | | | | | | | | | | |
| Common Stock and/or Other Equity Investments(a) | |
Europe | | $ | 6,385,271 | | | $ | — | | | $ | — | |
North America | | | 420,654,189 | | | | — | | | | — | |
| Investment Company | | | 8,997,935 | | | | — | | | | — | |
| | | |
| Total | | $ | 436,037,395 | | | $ | — | | | $ | — | |
|
| SMALL CAP EQUITY INSIGHTS FUND | |
| Investment Type | | Level 1 | | | Level 2 | | | Level 3 | |
| | | |
| Assets | | | | | | | | | | | | |
| Common Stock and/or Other Equity Investments(a) | |
Africa | | $ | 640,207 | | | $ | — | | | $ | — | |
Asia | | | 850,486 | | | | — | | | | — | |
Europe | | | 1,609,576 | | | | — | | | | — | |
North America | | | 113,776,159 | | | | — | | | | — | |
South America | | | 243,437 | | | | — | | | | — | |
Investment Company | | | 1,176,220 | | | | — | | | | — | |
| Securities Lending Reinvestment Vehicle | | | 912,449 | | | | — | | | | — | |
| | | |
| Total | | $ | 119,208,534 | | | $ | — | | | $ | — | |
| | | |
| Derivative Type | | | | | | | | | |
| | | |
| Assets(b) | | | | | | | | | | | | |
| Futures Contracts | | $ | 17,300 | | | $ | — | | | $ | — | |
| | | |
| Total | | $ | 17,300 | | | $ | — | | | $ | — | |
| (a) | Amounts are disclosed by continent to highlight the impact of time zone differences between local market close and the calculation of NAV. Security valuations are based on the principal exchange or system on which they are traded, which may differ from country of domicile noted in table. |
| (b) | Amount shown represents unrealized gain (loss) at period end. |
GOLDMAN SACHS VARIABLE INSURANCE TRUST EQUITY FUNDS
3. INVESTMENTS AND FAIR VALUE MEASUREMENTS (continued)
| | | | | | | | | | | | |
|
| STRATEGIC GROWTH FUND | |
| Investment Type | | Level 1 | | | Level 2 | | | Level 3 | |
| | | |
| Assets | | | | | | | | | | | | |
| Common Stock and/or Other Equity Investments(a) | |
Europe | | $ | 5,637,119 | | | $ | — | | | $ | — | |
North America | | | 352,106,815 | | | | — | | | | — | |
| | | |
| Total | | $ | 357,743,934 | | | $ | — | | | $ | — | |
|
| U.S. EQUITY INSIGHTS FUND | |
| Investment Type | | Level 1 | | | Level 2 | | | Level 3 | |
| | | |
| Assets | | | | | | | | | | | | |
| Common Stock and/or Other Equity Investments(a) | |
Asia | | $ | 1,127,992 | | | $ | — | | | $ | — | |
North America | | | 308,054,315 | | | | — | | | | — | |
South America | | | 1,343,336 | | | | — | | | | — | |
| Investment Company | | | 1,788,518 | | | | — | | | | — | |
| | | |
| Total | | $ | 312,314,161 | | | $ | — | | | $ | — | |
| | | |
| Derivative Type | | | | | | | | | |
| | | |
| Assets(b) | | | | | | | | | | | | |
| Futures Contracts | | $ | 110,495 | | | $ | — | | | $ | — | |
| | | |
| Total | | $ | 110,495 | | | $ | — | | | $ | — | |
| (a) | Amounts are disclosed by continent to highlight the impact of time zone differences between local market close and the calculation of NAV. Security valuations are based on the principal exchange or system on which they are traded, which may differ from country of domicile noted in table. |
| (b) | Amount shown represents unrealized gain (loss) at period end. |
For further information regarding security characteristics, see the Schedules of Investments.
4. INVESTMENTS IN DERIVATIVES
The following table sets forth, by certain risk types, the gross value of derivative contracts (not considered to be hedging instruments for accounting disclosure purposes) as of June 30, 2023. These instruments were used as part of the Funds’ investment strategies and to obtain and/or manage exposure related to the risks below. The values in the tables below exclude the effects of cash collateral received or posted pursuant to these derivative contracts, and therefore are not representative of the Funds’ net exposure.
| | | | | | | | | | | | | | |
| Fund | | Risk | | Statements of Assets and Liabilities | | Assets(a) | | | Statements of Assets and Liabilities | | Liabilities(a) | |
| International Equity Insights | | Equity | | Variation margin on futures contracts | | $ | 12,543 | | | Variation margin on futures contracts | | $ | (721 | ) |
| Small Cap Equity Insights | | Equity | | Variation margin on futures contracts | | | 17,300 | | | — | | | — | |
| U.S. Equity Insights | | Equity | | Variation margin on futures contracts | | | 110,495 | | | — | | | — | |
| (a) | Includes unrealized gain (loss) on futures contracts described in the Additional Investment Information sections of the Schedules of Investments. Only the variation margin as of June 30, 2023 is reported within the Statements of Assets and Liabilities. |
GOLDMAN SACHS VARIABLE INSURANCE TRUST EQUITY FUNDS
Notes to Financial Statements (continued)
June 30, 2023 (Unaudited)
4. INVESTMENTS IN DERIVATIVES (continued)
The following tables set forth, by certain risk types, the Funds’ gains (losses) related to these derivatives and their indicative volumes for the six months ended June 30, 2023. These gains (losses) should be considered in the context that these derivative contracts may have been executed to create investment opportunities and/or economically hedge certain investments, and accordingly, certain gains (losses) on such derivative contracts may offset certain (losses) gains attributable to investments. These gains (losses) are included in “Net realized gain (loss)” or “Net change in unrealized gain (loss)” on the Statements of Operations:
International Equity Insights
| | | | | | | | |
| Risk | | Statement of Operations | | Net
Realized
Gain (Loss) | | Net Change in
Unrealized
Gain (Loss) | |
| | | |
| Equity | | Net realized gain (loss) from futures contracts/Net change in unrealized gain (loss) on futures contracts | | $121,206 | | $ | 36,654 | |
Small Cap Equity Insights
| | | | | | | | |
| Risk | | Statement of Operations | | Net
Realized
Gain (Loss) | | Net Change in
Unrealized
Gain (Loss) | |
| | | |
| Equity | | Net realized gain (loss) from futures contracts/Net change in unrealized gain (loss) on futures contracts | | $42,883 | | $ | 58,053 | |
U.S. Equity Insights
| | | | | | | | |
| Risk | | Statement of Operations | | Net
Realized
Gain (Loss) | | Net Change in
Unrealized
Gain (Loss) | |
| | | |
| Equity | | Net realized gain (loss) from futures contracts/Net change in unrealized gain (loss) on futures contracts | | $262,832 | | $ | 126,673 | |
For the six months ended June 30, 2023, the average number of futures contracts for certain Funds were as follows:
| | | | |
| | | Average Number
of Contracts(1) | |
| Fund | | Futures
Contracts | |
| International Equity Insights | | | 16 | |
| Small Cap Equity Insights | | | 20 | |
| U.S. Equity Insights | | | 9 | |
| (1) | Amounts disclosed represent average number of contracts for futures contracts, based on absolute values, which is indicative of volume of this derivative type, for the months that the Fund held such derivatives during the six months ended June 30, 2023. |
5. AGREEMENTS AND AFFILIATED TRANSACTIONS
A. Management Agreements — Under the Agreements, GSAM manages the Funds, subject to the general supervision of the Trustees.
As compensation for the services rendered pursuant to the Agreements, the assumption of the expenses related thereto and administration of the Funds’ business affairs, including providing facilities, GSAM is entitled to a management fee, accrued daily and paid monthly, equal to an annual percentage rate of each Fund’s average daily net assets.
GOLDMAN SACHS VARIABLE INSURANCE TRUST EQUITY FUNDS
5. AGREEMENTS AND AFFILIATED TRANSACTIONS (continued)
For the six months ended June 30, 2023, contractual and effective net management fees with GSAM were at the following rates:
| | | | | | | | | | | | | | | | | | | | | | | | | | | | |
| | | Contractual Management Rate | | | Effective
Rate | | | Effective Net
Management
Rate^ | |
| Fund | | First
$1 billion | | | Next
$1 billion | | | Next
$3 billion | | | Next
$3 billion | | | Over
$8 billion | |
| International Equity Insights | | | 0.81 | % | | | 0.73 | % | | | 0.69 | % | | | 0.68 | % | | | 0.67 | % | | | 0.81 | % | | | 0.79 | %* |
| Large Cap Value | | | 0.72 | | | | 0.65 | | | | 0.62 | | | | 0.60 | | | | 0.59 | | | | 0.72 | | | | 0.68 | * |
| Mid Cap Growth | | | 0.87 | | | | 0.87 | | | | 0.78 | | | | 0.74 | | | | 0.73 | | | | 0.87 | | | | 0.81 | * |
| Mid Cap Value | | | 0.77 | | | | 0.77 | | | | 0.69 | | | | 0.66 | | | | 0.65 | | | | 0.77 | | | | 0.77 | |
| Small Cap Equity Insights | | | 0.70 | | | | 0.70 | | | | 0.63 | | | | 0.60 | | | | 0.59 | | | | 0.70 | | | | 0.70 | |
| Strategic Growth | | | 0.71 | | | | 0.64 | | | | 0.61 | | | | 0.59 | | | | 0.58 | | | | 0.71 | | | | 0.71 | |
| U.S. Equity Insights | | | 0.62 | | | | 0.59 | | | | 0.56 | | | | 0.55 | | | | 0.54 | | | | 0.62 | | | | 0.54 | * |
| ^ | Effective Net Management Rate includes the impact of management fee waivers of affiliated Underlying Funds, if any. The Effective Net Management Rate may not correlate to the Contractual Management Rate as a result of management fee waivers that may be in effect from time to time. |
| * | GSAM agreed to waive a portion of its management fee in order to achieve an effective net management rate as defined in the Funds’ most recent prospectus. This waiver will remain in effect through at least April 28, 2024, and prior to such date GSAM may not terminate the arrangement without approval of the Trustees. |
The International Equity Insights, Large Cap Value, Mid Cap Growth, Mid Cap Value, Small Cap Equity Insights, Strategic Growth and U.S. Equity Insights Funds invest in Institutional Shares of the Goldman Sachs Financial Square Government Fund, which is an affiliated Underlying Fund. GSAM has agreed to waive a portion of its management fee payable by the Funds in an amount equal to the management fee it earns as an investment adviser to the affiliated Underlying Fund in which the Funds invest, except those management fees it earns from the Funds’ investments of cash collateral received in connection with securities lending transactions in the Goldman Sachs Financial Square Government Fund. For the six months ended June 30, 2023, with respect to the Funds’ investments in an affiliated Underlying Fund GSAM waived $2,083, $1,751, $4,262, $812, and $3,065 of the Large Cap Value, Mid Cap Growth, Mid Cap Value, Small Cap Equity Insights and Strategic Growth Funds’ management fees, respectively.
B. Distribution and/or Service (12b-1) Plans — The Trust, on behalf of Service Shares of each Fund, has adopted a Distribution and Service Plan subject to Rule 12b-1 under the Act. Under the Distribution and Service Plan, Goldman Sachs, which serves as distributor (the “Distributor”), is entitled to a fee accrued daily and paid monthly for distribution services and personal and account maintenance services, which may then be paid by Goldman Sachs to authorized dealers, equal to, on an annual basis, 0.25% of the Funds’ average daily net assets attributable to Service Shares. For the six months ended June 30, 2023 for the U.S. Equity Insights Fund, Goldman Sachs agreed to waive distribution and services fees so as not to exceed an annual rate of 0.21% of average daily net assets of the Fund. For the six months ended June 30, 2023 for the Mid Cap Growth Fund, Goldman Sachs agreed to waive distribution and services fees so as not to exceed an annual rate of 0.15% of average daily net assets of the Fund. These distribution and service fee waivers will remain in place through at least April 28, 2024, and prior to such date Goldman Sachs may not terminate the arrangement without the approval of the Trustees.
C. Transfer Agency Agreement — Goldman Sachs also serves as the transfer agent of the Funds for a fee pursuant to the Transfer Agency Agreement. The fees charged for such transfer agency services are accrued daily and paid monthly at an annual rate of 0.02% of the average daily net assets of Institutional and Service Shares. Goldman Sachs has agreed to waive its transfer agency fee attributable to the Service Shares of the Large Cap Value Fund. This arrangement will remain in place through at least April 28, 2024, and prior to such date Goldman Sachs may not terminate the arrangement without approval of the Board of Trustees.
GOLDMAN SACHS VARIABLE INSURANCE TRUST EQUITY FUNDS
Notes to Financial Statements (continued)
June 30, 2023 (Unaudited)
5. AGREEMENTS AND AFFILIATED TRANSACTIONS (continued)
D. Other Expense Agreements and Affiliated Transactions — GSAM has agreed to reduce or limit certain “Other Expenses” of the Funds (excluding acquired fund fees and expenses, transfer agency fees and expenses, service fees and shareholder administration fees (as applicable), taxes, interest, brokerage fees, expenses of shareholder meetings, litigation and indemnification, and extraordinary expenses) to the extent such expenses exceed, on an annual basis, a percentage rate of the average daily net assets of each Fund. Such Other Expense reimbursements, if any, are accrued daily and paid monthly. In addition, the Funds are not obligated to reimburse GSAM for prior fiscal year expense reimbursements, if any. The Other Expense limitations as an annual percentage rate of average daily net assets for the International Equity Insights, Large Cap Value, Mid Cap Growth, Mid Cap Value, Small Cap Equity Insights, Strategic Growth and U.S. Equity Insights Funds are 0.004%, 0.004%, 0.004%, 0.054%, 0.094%, 0.014% and 0.004%, respectively. These Other Expense limitations will remain in place through at least April 28, 2024, and prior to such date GSAM may not terminate the arrangements without the approval of the Trustees. In addition, the Funds have entered into certain offset arrangements with the custodian and the transfer agent, which may result in a reduction of the Funds’ expenses and are received irrespective of the application of the “Other Expense” limitations described above.
For the six months ended June 30, 2023, these expense reductions, including any fee waivers and Other Expense reimbursements, were as follows:
| | | | | | | | | | | | | | | | | | | | |
| Fund | | Management
Fee Waiver | | | Distribution and
Service Fee Waiver | | | Transfer Agency
Waiver/Credits | | | Other Expense
Reimbursement | | | Total Expense
Reductions | |
| International Equity Insights | | $ | 10,275 | | | $ | — | | | $ | — | | | $ | 107,825 | | | $ | 118,100 | |
| Large Cap Value | | | 77,563 | | | | — | | | | 23,604 | | | | 83,719 | | | | 184,886 | |
| Mid Cap Growth | | | 18,943 | | | | 28,054 | | | | — | | | | 86,817 | | | | 133,814 | |
| Mid Cap Value | | | 4,262 | | | | — | | | | — | | | | 8,572 | | | | 12,834 | |
| Small Cap Equity Insights | | | 812 | | | | — | | | | — | | | | 37,171 | | | | 37,983 | |
| Strategic Growth | | | 3,065 | | | | — | | | | — | | | | 64,674 | | | | 67,739 | |
| U.S. Equity Insights | | | 117,273 | | | | 8,402 | | | | — | | | | 82,748 | | | | 208,423 | |
E. Line of Credit Facility — As of June 30, 2023, the Funds participated in a $1,110,000,000 committed, unsecured revolving line of credit facility (the “facility”) together with other funds of the Trust and certain registered investment companies having management agreements with GSAM or its affiliates. This facility is to be used for temporary emergency purposes, or to allow for an orderly liquidation of securities to meet redemption requests. The interest rate on borrowings is based on the federal funds rate. The facility also requires a fee to be paid by the Funds based on the amount of the commitment that has not been utilized. For the six months ended June 30, 2023, the Funds did not have any borrowings under the facility. Prior to April 19, 2023, the facility was $1,250,000,000.
F. Other Transactions with Affiliates — For the six months ended June 30, 2023, Goldman Sachs earned $602, $215 and $2,022 in brokerage commissions from portfolio transactions, including futures transactions executed with Goldman Sachs as the Futures Commission Merchant, on behalf of the Large Cap Value, Mid Cap Growth and Strategic Growth Funds, respectively.
GOLDMAN SACHS VARIABLE INSURANCE TRUST EQUITY FUNDS
5. AGREEMENTS AND AFFILIATED TRANSACTIONS (continued)
The following table provides information about the Funds’ investment in the Goldman Sachs Financial Square Government Fund as of and for the six months ended June 30, 2023:
| | | | | | | | | | | | | | | | | | | | | | | | |
| Fund | | Beginning
Value as of
December 31, 2022 | | | Purchases
at Cost | | | Proceeds
from Sales | | | Ending
Value as of
June 30, 2023 | | | Shares as of
June 30, 2023 | | | Dividend
Income | |
| International Equity Insights | | $ | — | | | $ | 3,203,269 | | | $ | (3,203,269 | ) | | $ | — | | | | — | | | $ | 1,263 | |
| Large Cap Value | | | 394,821 | | | | 20,734,948 | | | | (20,274,679 | ) | | | 855,090 | | | | 855,090 | | | | 62,030 | |
| Mid Cap Growth | | | 2,865,404 | | | | 12,256,514 | | | | (12,188,852 | ) | | | 2,933,066 | | | | 2,933,066 | | | | 50,993 | |
| Mid Cap Value | | | 2,407,505 | | | | 102,279,942 | | | | (95,689,512 | ) | | | 8,997,935 | | | | 8,997,935 | | | | 118,330 | |
| Small Cap Equity Insights | | | 852,072 | | | | 6,798,612 | | | | (6,474,464 | ) | | | 1,176,220 | | | | 1,176,220 | | | | 23,428 | |
| Strategic Growth | | | 2,849,066 | | | | 65,472,738 | | | | (68,321,804 | ) | | | — | | | | — | | | | 83,720 | |
| U.S. Equity Insights | | | — | | | | 7,451,244 | | | | (5,662,726 | ) | | | 1,788,518 | | | | 1,788,518 | | | | 19,552 | |
6. PORTFOLIO SECURITIES TRANSACTIONS
The cost of purchases and proceeds from sales and maturities of long-term securities for the six months ended June 30, 2023, were as follows:
| | | | | | | | | | | | | | | | | | | | | | | | |
| Fund | | | | | | | | | | | | | | Purchases | | | Sales and
Maturities | |
| International Equity Insights | | | | | | | | | | | | | | | | | | $ | 86,549,125 | | | $ | 82,789,323 | |
| Large Cap Value | | | | | | | | | | | | | | | | | | | 139,730,564 | | | | 152,812,976 | |
| Mid Cap Growth | | | | | | | | | | | | | | | | | | | 18,880,764 | | | | 16,248,655 | |
| Mid Cap Value | | | | | | | | | | | | | | | | | | | 207,296,290 | | | | 196,301,926 | |
| Small Cap Equity Insights | | | | | | | | | | | | | | | | | | | 88,245,967 | | | | 89,183,075 | |
| Strategic Growth | | | | | | | | | | | | | | | | | | | 131,415,194 | | | | 86,849,079 | |
| U.S. Equity Insights | | | | | | | | | | | | | | | | | | | 293,807,436 | | | | 304,188,650 | |
7. SECURITIES LENDING
The Large Cap Value, Mid Cap Growth, Mid Cap Value and Strategic Growth Funds may lend their securities through a securities lending agent, the Bank of New York Mellon (“BNYM”), to certain qualified borrowers. Pursuant to exemptive relief granted by the Securities and Exchange Commission (“SEC”) and the terms and conditions contained therein, the International Equity Insights, Small Cap Equity Insights and U. S. Equity Insights Funds may lend their securities through a securities lending agent, Goldman Sachs Agency Lending (“GSAL”), a wholly-owned subsidiary of Goldman Sachs, to certain qualified borrowers including Goldman Sachs and affiliates. In accordance with the Funds’ securities lending procedures, the Funds receive cash collateral at least equal to the market value of the securities on loan. The market value of the loaned securities is determined at the close of business of the Funds, at their last sale price or official closing price on the principal exchange or system on which they are traded, and any
GOLDMAN SACHS VARIABLE INSURANCE TRUST EQUITY FUNDS
Notes to Financial Statements (continued)
June 30, 2023 (Unaudited)
7. SECURITIES LENDING (continued)
additional required collateral is delivered to the Funds on the next business day. As with other extensions of credit, the Funds may experience delay in the recovery of their securities or incur a loss should the borrower of the securities breach its agreement with the Funds or become insolvent at a time when the collateral is insufficient to cover the cost of repurchasing securities on loan. Dividend income received from securities on loan may not be subject to withholding taxes and therefore withholding taxes paid may differ from the amounts listed in the Statements of Operations. Loans of securities are terminable at any time and as such 1) the remaining contractual maturities of the outstanding securities lending transactions are considered to be overnight and continuous and 2) the borrower, after notice, is required to return borrowed securities within the standard time period for settlement of securities transactions.
The International Equity Insights, Large Cap Value, Mid Cap Growth, Mid Cap Value, Small Cap Equity Insights, Strategic Growth and U.S. Equity Insights Funds invest the cash collateral received in connection with securities lending transactions in the Goldman Sachs Financial Square Government Fund (“Government Money Market Fund”), an affiliated series of the Goldman Sachs Trust. The Government Money Market Fund is registered under the Act as an open end investment company, is subject to Rule 2a-7 under the Act, and is managed by GSAM, for which GSAM may receive a management fee of up to 0.16% on an annualized basis of the average daily net assets of the Government Money Market Fund.
In the event of a default by a borrower with respect to any loan, GSAL will, and BNYM may, exercise any and all remedies provided under the applicable borrower agreement to make the Funds whole. These remedies include purchasing replacement securities by applying the collateral held from the defaulting broker against the purchase cost of the replacement securities. If GSAL or BNYM are unable to purchase replacement securities, GSAL and/or BNYM will indemnify the Funds by paying the Funds an amount equal to the market value of the securities loaned minus the value of cash collateral received from the borrower for the loan, subject to an exclusion for any shortfalls resulting from a loss of value in such cash collateral due to reinvestment risk. The Funds’ master netting agreements with certain borrowers provide the right, in the event of a default (including bankruptcy or insolvency), for the non-defaulting party to liquidate the collateral and calculate net exposure to the defaulting party or request additional collateral. However, in the event of a default by a borrower, a resolution authority could determine that such rights are not enforceable due to the restrictions or prohibitions against the right of set-off that may be imposed in accordance with a particular jurisdiction’s bankruptcy or insolvency laws. The Funds’ loaned securities were all subject to enforceable Securities Lending Agreements and the value of the collateral was at least equal to the value of the cash received. The amounts of the Funds’ overnight and continuous agreements, which represent the gross amounts of recognized liabilities for securities lending transactions outstanding as of June 30, 2023, are disclosed as “Payable upon return of securities loaned” on the Statements of Assets and Liabilities, where applicable.
Each of the Funds, GSAL and BNYM received compensation relating to the lending of the Funds’ securities. The amounts earned, if any, by the Funds’ for the six months ended June 30, 2023, are reported under Investment Income on the Statements of Operations.
The table below details securities lending activity with affiliates of Goldman Sachs:
| | | | | | | | | | | | |
| | | For the six months ended June 30, 2023 | | | Amounts payable to
Goldman Sachs Upon
Return of Securities Loaned
as of June 30, 2023 | |
| Fund | | Earnings of GSAL Relating
to Securities Loaned | | | Amounts Received by
the Funds from Lending
to Goldman Sachs | |
| International Equity Insights | | $ | 1,204 | | | $ | — | | | $ | — | |
| Small Cap Equity Insights | | | 649 | | | | 412 | | | | 289,424 | |
| U.S. Equity Insights | | | 7 | | | | — | | | | — | |
GOLDMAN SACHS VARIABLE INSURANCE TRUST EQUITY FUNDS
7. SECURITIES LENDING (continued)
The following table provides information about the Funds’ investment in the Government Money Market Fund for the six months ended June 30, 2023:
| | | | | | | | | | | | | | | | |
| Fund | | Beginning
Value as of
December 31, 2022 | | | Purchases
at Cost | | | Proceeds
from Sales | | | Ending Value as of
June 30, 2023 | |
| International Equity Insights | | $ | 166,392 | | | $ | 5,539,882 | | | $ | (5,706,274 | ) | | $ | — | |
| Mid Cap Growth | | | — | | | | 47,908 | | | | (47,908 | ) | | | — | |
| Mid Cap Value | | | — | | | | 233,900 | | | | (233,900 | ) | | | — | |
| Small Cap Equity Insights | | | 1,025,843 | | | | 3,943,205 | | | | (4,056,599 | ) | | | 912,449 | |
| U.S. Equity Insights | | | — | | | | 614,000 | | | | (614,000 | ) | | | — | |
8. TAX INFORMATION
As of the Funds’ most recent fiscal year end, December 31, 2022, the Funds’ capital loss carryforwards and certain timing differences, on a tax-basis were as follows:
| | | | | | | | | | | | | | | | |
| | | International Equity Insights | | | Large Cap Value | | | Mid Cap Growth | | | Mid Cap Value | |
| Capital loss carryforwards | | | | | | | | | | | | | | | | |
Perpetual short-term | | $ | (11,394,712 | ) | | $ | — | | | $ | (184,177 | ) | | $ | — | |
| Total capital loss carryforwards | | $ | (11,394,712 | ) | | $ | — | | | $ | (184,177 | ) | | $ | — | |
| Timing differences (Real Estate Investment Trusts, late year ordinary loss deferral, post October loss deferral, and straddle loss deferrals) | | $ | (181,062 | ) | | $ | 54,783 | | | $ | (102,750 | ) | | $ | (861,362 | ) |
| | | | |
| | | | | | Small Cap Equity Insights | | | Strategic Growth | | | U.S. Equity Insights | |
| Capital loss carryforwards | | | | | | | | | | | | | | | | |
Perpetual short-term | | | | | | $ | (11,118,251 | ) | | $ | — | | | $ | (10,171,033 | ) |
| Total capital loss carryforwards | | | | | | $ | (11,118,251 | ) | | $ | — | | | $ | (10,171,033 | ) |
| Timing differences (Real Estate Investment Trusts, late year ordinary loss deferral, post October loss deferral, and straddle loss deferrals) | | | | | | $ | (2,297,849 | ) | | $ | (532,698 | ) | | $ | 4,606 | |
GOLDMAN SACHS VARIABLE INSURANCE TRUST EQUITY FUNDS
Notes to Financial Statements (continued)
June 30, 2023 (Unaudited)
8. TAX INFORMATION (continued)
As of June 30, 2023, the Funds’ aggregate security unrealized gains and losses based on cost for U.S. federal income tax purposes were as follows:
| | | | | | | | | | | | | | | | |
| | | International Equity Insights | | | Large Cap Value | | | Mid Cap Growth | | | Mid Cap Value | |
| Tax cost | | $ | 96,090,668 | | | $ | 336,019,877 | | | $ | 50,714,077 | | | $ | 374,330,992 | |
Gross unrealized gain | | | 10,983,781 | | | | 66,925,056 | | | | 12,441,047 | | | | 70,324,828 | |
| Gross unrealized loss | | | (2,142,658 | ) | | | (17,446,509 | ) | | | (1,348,301 | ) | | | (8,618,425 | ) |
| Net unrealized gain (loss) | | $ | 8,841,123 | | | $ | 49,478,547 | | | $ | 11,092,746 | | | $ | 61,706,403 | |
| | | | |
| | | | | | Small Cap Equity Insights | | | Strategic Growth | | | U.S. Equity Insights | |
| Tax cost | | | | | | $ | 110,922,752 | | | $ | 186,185,144 | | | $ | 247,854,075 | |
Gross unrealized gain | | | | | | | 14,138,068 | | | | 174,770,453 | | | | 68,701,975 | |
| Gross unrealized loss | | | | | | | (5,852,286 | ) | | | (3,211,663 | ) | | | (4,241,889 | ) |
| Net unrealized gain (loss) | | | | | | $ | 8,285,782 | | | $ | 171,558,790 | | | $ | 64,460,086 | |
The difference between GAAP-basis and tax-basis unrealized gains (losses) is attributable primarily to wash sales, net mark to market gains (losses) on regulated futures and foreign currency contracts, and differences in the tax treatment of real estate investment trust investments and passive foreign investment company investments.
GSAM has reviewed the Funds’ tax positions for all open tax years (the current and prior three years, as applicable) and has concluded that no provision for income tax is required in the Funds’ financial statements. Such open tax years remain subject to examination and adjustment by tax authorities.
9. OTHER RISKS
The Funds’ risks include, but are not limited to, the following:
Derivatives Risk — The Funds’ use of derivatives and other similar instruments (collectively referred to in this paragraph as “derivatives”) may result in loss, including due to adverse market movements. Derivatives, which may pose risks in addition to and greater than those associated with investing directly in securities, currencies or other assets and instruments, may increase market exposure and be illiquid or less liquid, volatile, difficult to price and leveraged so that small changes in the value of the underlying assets or instruments may produce disproportionate losses to the Funds. Certain derivatives are also subject to counterparty risk, which is the risk that the other party in the transaction will not, or lacks the capacity or authority to, fulfill its contractual obligations, liquidity risk, which includes the risk that the Funds will not be able to exit the derivative when it is advantageous to do so, and risks arising from margin requirements, which include the risk that the Funds will be required to pay additional margin or set aside additional collateral to maintain open derivative positions. The use of derivatives is a highly specialized activity that involves investment techniques and risks different from those associated with investments in more traditional securities and instruments. Losses from derivatives can also result from a lack of correlation between changes in the value of derivative instruments and the portfolio assets (if any) being hedged.
Foreign and Emerging Countries Risk — Investing in foreign markets may involve special risks and considerations not typically associated with investing in the U.S. Foreign securities may be subject to risk of loss because of more or less foreign government regulation; less public information; less stringent investor protections; less stringent accounting, corporate governance, financial reporting and disclosure standards; and less economic, political and social stability in the countries in which a Fund invests. The imposition of sanctions, exchange controls (including repatriation restrictions), confiscation of assets and property, trade restrictions (including tariffs) and other government restrictions by the U.S. or other governments, or from problems in
GOLDMAN SACHS VARIABLE INSURANCE TRUST EQUITY FUNDS
9. OTHER RISKS (continued)
registration, settlement or custody, may also result in losses. The type and severity of sanctions and other similar measures, including counter sanctions and other retaliatory actions, that may be imposed could vary broadly in scope, and their impact is impossible to predict. For example, the imposition of sanctions and other similar measures could, among other things, cause a decline in the value and/or liquidity of securities issued by the sanctioned country or companies located in or economically tied to the sanctioned country and increase market volatility and disruption in the sanctioned country and throughout the world. Sanctions and other similar measures could limit or prevent a Fund from buying and selling securities (in the sanctioned country and other markets), significantly delay or prevent the settlement of securities transactions, and significantly impact a Fund’s liquidity and performance. Foreign risk also involves the risk of negative foreign currency exchange rate fluctuations, which may cause the value of securities denominated in such foreign currency (or other instruments through which a Fund has exposure to foreign currencies) to decline in value. Currency exchange rates may fluctuate significantly over short periods of time. To the extent that a Fund also invests in securities of issuers located in, or economically tied to, emerging markets, these risks may be more pronounced.
Foreign Custody Risk — A Fund invests in foreign securities, and as such the Fund may hold such securities and cash with foreign banks, agents, and securities depositories appointed by the Fund’s custodian (each a “Foreign Custodian”). Some foreign custodians may be recently organized or new to the foreign custody business. In some countries, Foreign Custodians may be subject to little or no regulatory oversight over, or independent evaluation of, their operations. Further, the laws of certain countries may place limitations on a Fund’s ability to recover its assets if a Foreign Custodian enters bankruptcy. Investments in emerging markets may be subject to even greater custody risks than investments in more developed markets. Custody services in emerging market countries are very often undeveloped and may be considerably less well regulated than in more developed countries, and thus may not afford the same level of investor protection as would apply in developed countries.
Investments in Other Investment Companies Risk — As a shareholder of another investment company, a Fund will indirectly bear its proportionate share of any net management fees and other expenses paid by such other investment companies, in addition to the fees and expenses regularly borne by the Fund.
Large Shareholder Transactions Risk — A Fund may experience adverse effects when certain large shareholders, such as other funds, institutional investors (including those trading by use of non-discretionary mathematical formulas), financial intermediaries (who may make investment decisions on behalf of underlying clients and/or include a Fund in their investment model), individuals, accounts and Goldman Sachs affiliates, purchase or redeem large amounts of shares of a Fund. Such large shareholder redemptions, which may occur rapidly or unexpectedly, may cause a Fund to sell portfolio securities at times when it would not otherwise do so, which may negatively impact a Fund’s NAV and liquidity. These transactions may also accelerate the realization of taxable income to shareholders if such sales of investments resulted in gains, and may also increase transaction costs. In addition, a large redemption could result in a Fund’s current expenses being allocated over a smaller asset base, leading to an increase in the Fund’s expense ratio. Similarly, large Fund share purchases may adversely affect a Fund’s performance to the extent that the Fund is delayed in investing new cash or otherwise maintains a larger cash position than it ordinarily would.
Liquidity Risk — A Fund may make investments that are illiquid or that may become less liquid in response to market developments or adverse investor perceptions. Illiquid investments may be more difficult to value. Liquidity risk may also refer to the risk that a Fund will not be able to pay redemption proceeds within the allowable time period or without significant dilution to remaining investors’ interests because of unusual market conditions, declining prices of the securities sold, an unusually high volume of redemption requests, or other reasons. To meet redemption requests, a Fund may be forced to sell investments at an unfavorable time and/or under unfavorable conditions. If a Fund is forced to sell securities at an unfavorable time and/or under unfavorable conditions, such sales may adversely affect the Fund’s NAV and dilute remaining investors’ interests. Liquidity risk may be the result of, among other things, the reduced number and capacity of traditional market participants to make a market in fixed income securities or the lack of an active market. The potential for liquidity risk may be magnified by a rising interest rate environment or other circumstances where investor redemptions from fixed income funds may be higher than normal, potentially causing increased supply in the market due to selling activity. These risks may be more pronounced in connection with a Fund’s investments in securities of issuers located in emerging market countries. Redemptions by large shareholders may have a negative impact on a Fund’s liquidity.
GOLDMAN SACHS VARIABLE INSURANCE TRUST EQUITY FUNDS
Notes to Financial Statements (continued)
June 30, 2023 (Unaudited)
9. OTHER RISKS (continued)
Market and Credit Risks — In the normal course of business, a Fund trades financial instruments and enters into financial transactions where risk of potential loss exists due to changes in the market (market risk). The value of the securities in which a Fund invests may go up or down in response to the prospects of individual companies, particular sectors or governments and/or general economic conditions throughout the world due to increasingly interconnected global economies and financial markets. Events such as war, military conflict, acts of terrorism, social unrest, natural disasters, recessions, inflation, rapid interest rate changes, supply chain disruptions, sanctions, the spread of infectious illness or other public health threats could also significantly impact a Fund and its investments. Additionally, a Fund may also be exposed to credit risk in the event that an issuer or guarantor fails to perform or that an institution or entity with which the Fund has unsettled or open transactions defaults.
Non-Diversification Risk — The Strategic Growth Fund is non-diversified, meaning that it is permitted to invest a larger percentage of its assets in one or more issuers or in fewer issuers than diversified mutual funds. Thus, the Fund may be more susceptible to adverse developments affecting any single issuer held in its portfolio, and may be more susceptible to greater losses because of these developments.
10. INDEMNIFICATIONS
Under the Trust’s organizational documents, its Trustees, officers, employees and agents are indemnified, to the extent permitted by the Act and state law, against certain liabilities that may arise out of performance of their duties to the Funds. Additionally, in the course of business, the Funds enter into contracts that contain a variety of indemnification clauses. The Funds’ maximum exposure under these arrangements is unknown, as this would involve future claims that may be made against the Funds that have not yet occurred. However, GSAM believes the risk of loss under these arrangements to be remote.
11. SUBSEQUENT EVENTS
Subsequent events after the Statements of Assets and Liabilities date have been evaluated, and GSAM has concluded that there is no impact requiring adjustment or disclosure in the financial statements.
GOLDMAN SACHS VARIABLE INSURANCE TRUST EQUITY FUNDS
12. SUMMARY OF SHARE TRANSACTIONS
Share activity is as follows:
| | | | | | | | | | | | | | | | |
| | | International Equity Insights Fund | |
| | | For the Six Months Ended
June 30, 2023 (Unaudited) | | | For the Fiscal Year Ended
December 31, 2022 | |
| | | Shares | | | Dollars | | | Shares | | | Dollars | |
| Institutional Shares | | | | | | | | | | | | | | | | |
| Shares sold | | | 543,207 | | | $ | 4,413,316 | | | | 1,306,039 | | | $ | 10,885,092 | |
| Reinvestment of distributions | | | — | | | | — | | | | 253,079 | | | | 1,971,488 | |
| Shares redeemed | | | (331,569 | ) | | | (2,727,727 | ) | | | (733,445 | ) | | | (5,861,784 | ) |
| | | | 211,638 | | | | 1,685,589 | | | | 825,673 | | | | 6,994,796 | |
| Service Shares | | | | | | | | | | | | | | | | |
| Shares sold | | | 511,694 | | | | 4,151,788 | | | | 522,850 | | | | 4,549,789 | |
| Reinvestment of distributions | | | — | | | | — | | | | 134,038 | | | | 1,049,519 | |
| Shares redeemed | | | (497,001 | ) | | | (4,112,344 | ) | | | (1,042,479 | ) | | | (8,911,581 | ) |
| | | | 14,693 | | | | 39,444 | | | | (385,591 | ) | | | (3,312,273 | ) |
| | | | |
| NET INCREASE | | | 226,331 | | | $ | 1,725,033 | | | | 440,082 | | | $ | 3,682,523 | |
| | | | | | | | | | | | | | | | |
| | | Large Cap Value Fund | |
| | | For the Six Months Ended
June 30, 2023 (Unaudited) | | | For the Fiscal Year Ended
December 31, 2022 | |
| | | Shares | | | Dollars | | | Shares | | | Dollars | |
| Institutional Shares | | | | | | | | | | | | | | | | |
| Shares sold | | | 353,433 | | | $ | 2,964,339 | | | | 950,934 | | | $ | 8,789,990 | |
| Reinvestment of distributions | | | — | | | | — | | | | 1,876,236 | | | | 16,379,536 | |
| Shares redeemed | | | (1,496,826 | ) | | | (12,693,989 | ) | | | (3,426,119 | ) | | | (32,079,665 | ) |
| | | | (1,143,393 | ) | | | (9,729,650 | ) | | | (598,949 | ) | | | (6,910,139 | ) |
| Service Shares | | | | | | | | | | | | | | | | |
| Shares sold | | | 885,474 | | | $ | 7,493,026 | | | | 996,820 | | | | 9,307,435 | |
| Reinvestment of distributions | | | — | | | | — | | | | 3,046,274 | | | | 26,593,971 | |
| Shares redeemed | | | (1,846,743 | ) | | | (15,568,264 | ) | | | (6,321,557 | ) | | | (58,612,498 | ) |
| | | | (961,269 | ) | | | (8,075,238 | ) | | | (2,278,463 | ) | | | (22,711,092 | ) |
| | | | |
| NET DECREASE | | | (2,104,662 | ) | | $ | (17,804,888 | ) | | | (2,877,412 | ) | | $ | (29,621,231 | ) |
GOLDMAN SACHS VARIABLE INSURANCE TRUST EQUITY FUNDS
Notes to Financial Statements (continued)
June 30, 2023 (Unaudited)
12. SUMMARY OF SHARE TRANSACTIONS (continued)
| | | | | | | | | | | | | | | | |
| | | Mid Cap Growth Fund | |
| | | For the Six Months Ended
June 30, 2023 (Unaudited) | | | For the Fiscal Year Ended
December 31, 2022 | |
| | | Shares | | | Dollars | | | Shares | | | Dollars | |
| Institutional Shares | | | | | | | | | | | | | | | | |
| Shares sold | | | 7,629 | | | $ | 75,000 | | | | 82,652 | | | $ | 879,904 | |
| Reinvestment of distributions | | | — | | | | — | | | | 3,921 | | | | 39,168 | |
| Shares redeemed | | | — | | | | — | | | | (2,047 | ) | | | (19,226 | ) |
| | | | 7,629 | | | | 75,000 | | | | 84,526 | | | | 899,846 | |
| Service Shares | | | | | | | | | | | | | | | | |
| Shares sold | | | 859,671 | | | $ | 7,911,572 | | | | 689,640 | | | | 6,396,245 | |
| Reinvestment of distributions | | | — | | | | — | | | | 204,787 | | | | 1,904,522 | |
| Shares redeemed | | | (566,421 | ) | | | (5,126,093 | ) | | | (1,294,096 | ) | | | (12,861,876 | ) |
| | | | 293,250 | | | | 2,785,479 | | | | (399,669 | ) | | | (4,561,109 | ) |
| | | | |
| NET INCREASE (DECREASE) | | | 300,879 | | | $ | 2,860,479 | | | | (315,143 | ) | | $ | (3,661,263 | ) |
| | | | | | | | | | | | | | | | |
| | | Mid Cap Value Fund | |
| | | For the Six Months Ended
June 30, 2023 (Unaudited) | | | For the Fiscal Year Ended
December 31, 2022 | |
| | | Shares | | | Dollars | | | Shares | | | Dollars | |
| Institutional Shares | | | | | | | | | | | | | | | | |
| Shares sold | | | 482,484 | | | $ | 7,273,887 | | | | 644,665 | | | $ | 11,319,610 | |
| Reinvestment of distributions | | | — | | | | — | | | | 3,213,607 | | | | 50,260,811 | |
| Shares redeemed | | | (1,126,448 | ) | | | (17,048,061 | ) | | | (2,565,377 | ) | | | (45,341,378 | ) |
| | | | (643,964 | ) | | | (9,774,174 | ) | | | 1,292,895 | | | | 16,239,043 | |
| Service Shares | | | | | | | | | | | | | | | | |
| Shares sold | | | 6,438,479 | | | $ | 100,009,215 | | | | 4,528,288 | | | | 81,887,182 | |
| Reinvestment of distributions | | | — | | | | — | | | | 959,682 | | | | 15,201,358 | |
| Shares redeemed | | | (5,048,319 | ) | | | (74,449,338 | ) | | | (8,132,136 | ) | | | (140,363,135 | ) |
| | | | 1,390,160 | | | | 25,559,877 | | | | (2,644,166 | ) | | | (43,274,595 | ) |
| | | | |
| NET INCREASE (DECREASE) | | | 746,196 | | | $ | 15,785,703 | | | | (1,351,271 | ) | | $ | (27,035,552 | ) |
GOLDMAN SACHS VARIABLE INSURANCE TRUST EQUITY FUNDS
12. SUMMARY OF SHARE TRANSACTIONS (continued)
| | | | | | | | | | | | | | | | |
| | | Small Cap Equity Insights Fund | |
| | | For the Six Months Ended
June 30, 2023 (Unaudited) | | | For the Fiscal Year Ended
December 31, 2022 | |
| | | Shares | | | Dollars | | | Shares | | | Dollars | |
| Institutional Shares | | | | | | | | | | | | | | | | |
| Shares sold | | | 410,764 | | | $ | 4,479,679 | | | | 1,292,071 | | | $ | 14,688,216 | |
| Reinvestment of distributions | | | — | | | | — | | | | 116,516 | | | | 1,287,501 | |
| Shares redeemed | | | (631,924 | ) | | | (6,893,631 | ) | | | (1,264,967 | ) | | | (14,195,917 | ) |
| | | | (221,160 | ) | | | (2,413,952 | ) | | | 143,620 | | | | 1,779,800 | |
| Service Shares | | | | | | | | | | | | | | | | |
| Shares sold | | | 219,491 | | | $ | 2,366,740 | | | | 623,675 | | | | 6,800,371 | |
| Reinvestment of distributions | | | — | | | | — | | | | 24,431 | | | | 266,792 | |
| Shares redeemed | | | (85,082 | ) | | | (920,895 | ) | | | (253,528 | ) | | �� | (2,768,698 | ) |
| | | | 134,409 | | | | 1,445,845 | | | | 394,578 | | | | 4,298,465 | |
| | | | |
| NET INCREASE (DECREASE) | | | (86,751 | ) | | $ | (968,107 | ) | | | 538,198 | | | $ | 6,078,265 | |
| | | | | | | | | | | | | | | | |
| | | Strategic Growth Fund | |
| | | For the Six Months Ended
June 30, 2023 (Unaudited) | | | For the Fiscal Year Ended
December 31, 2022 | |
| | | Shares | | | Dollars | | | Shares | | | Dollars | |
| Institutional Shares | | | | | | | | | | | | | | | | |
| Shares sold | | | 376,567 | | | $ | 3,982,655 | | | | 650,339 | | | $ | 8,099,060 | |
| Reinvestment of distributions | | | — | | | | — | | | | 2,405,496 | | | | 23,862,524 | |
| Shares redeemed | | | (831,784 | ) | | | (8,784,719 | ) | | | (1,036,439 | ) | | | (12,855,382 | ) |
| | | | (455,217 | ) | | | (4,802,064 | ) | | | 2,019,396 | | | | 19,106,202 | |
| Service Shares | | | | | | | | | | | | | | | | |
| Shares sold | | | 7,967,427 | | | $ | 81,195,059 | | | | 1,076,390 | | | | 12,762,705 | |
| Reinvestment of distributions | | | — | | | | — | | | | 2,294,192 | | | | 22,574,843 | |
| Shares redeemed | | | (3,110,127 | ) | | | (31,539,578 | ) | | | (6,611,696 | ) | | | (94,253,137 | ) |
| | | | 4,857,300 | | | | 49,655,481 | | | | (3,241,114 | ) | | | (58,915,589 | ) |
| | | | |
| NET INCREASE (DECREASE) | | | 4,402,083 | | | $ | 44,853,417 | | | | (1,221,718 | ) | | $ | (39,809,387 | ) |
GOLDMAN SACHS VARIABLE INSURANCE TRUST EQUITY FUNDS
Notes to Financial Statements (continued)
June 30, 2023 (Unaudited)
12. SUMMARY OF SHARE TRANSACTIONS (continued)
| | | | | | | | | | | | | | | | |
| | | U.S. Equity Insights Fund | |
| | | For the Six Months Ended
June 30, 2023 (Unaudited) | | | For the Fiscal Year Ended
December 31, 2022 | |
| | | Shares | | | Dollars | | | Shares | | | Dollars | |
| Institutional Shares | | | | | | | | | | | | | | | | |
| Shares sold | | | 731,552 | | | $ | 12,232,041 | | | | 1,049,282 | | | $ | 18,219,119 | |
| Reinvestment of distributions | | | — | | | | — | | | | 210,737 | | | | 3,548,809 | |
| Shares redeemed | | | (984,996 | ) | | | (16,591,766 | ) | | | (1,826,212 | ) | | | (31,436,133 | ) |
| | | | (253,444 | ) | | | (4,359,725 | ) | | | (566,193 | ) | | | (9,668,205 | ) |
| Service Shares | | | | | | | | | | | | | | | | |
| Shares sold | | | 23,596 | | | $ | 399,644 | | | | 78,305 | | | | 1,349,171 | |
| Reinvestment of distributions | | | — | | | | — | | | | 30,015 | | | | 509,957 | |
| Shares redeemed | | | (237,915 | ) | | | (4,014,691 | ) | | | (550,922 | ) | | | (9,529,595 | ) |
| | | | (214,319 | ) | | | (3,615,047 | ) | | | (442,602 | ) | | | (7,670,467 | ) |
| | | | |
| NET DECREASE | | | (467,763 | ) | | $ | (7,974,772 | ) | | | (1,008,795 | ) | | $ | (17,338,672 | ) |
GOLDMAN SACHS VARIABLE INSURANCE TRUST EQUITY FUNDS
Statement Regarding Basis for Approval of Management Agreement (Unaudited)
Background
The Goldman Sachs Mid Cap Growth Fund, Goldman Sachs International Equity Insights Fund, Goldman Sachs Mid Cap Value Fund, Goldman Sachs Large Cap Value Fund, Goldman Sachs Small Cap Equity Insights Fund, Goldman Sachs Strategic Growth Fund, and Goldman Sachs U.S. Equity Insights Fund (the “Funds”) are investment portfolios of Goldman Sachs Variable Insurance Trust (the “Trust”). The Board of Trustees oversees the management of the Trust and reviews the investment performance and expenses of the Funds at regularly scheduled meetings held throughout the year. In addition, the Board of Trustees determines annually whether to approve the continuance of the Trust’s investment management agreement (the “Management Agreement”) with Goldman Sachs Asset Management, L.P. (the “Investment Adviser”) on behalf of the Funds.
The Management Agreement was most recently approved for continuation until June 30, 2024 by the Board of Trustees, including those Trustees who are not parties to the Management Agreement or “interested persons” (as defined in the Investment Company Act of 1940, as amended) of any party thereto (the “Independent Trustees”), at a meeting held on June 13-14, 2023 (the “Annual Meeting”).
The review process undertaken by the Trustees spans the course of the year and culminates with the Annual Meeting. To assist the Trustees in their deliberations, the Trustees have established a Contract Review Committee (the “Committee”), comprised of the Independent Trustees. The Committee held two meetings over the course of the year since the Management Agreement was last approved. At those Committee meetings, regularly scheduled Board or other committee meetings, and/or the Annual Meeting, matters relevant to the renewal of the Management Agreement were considered by the Board, or the Independent Trustees, as applicable. With respect to each Fund, such matters included:
| | (a) | | the nature and quality of the advisory, administrative, and other services provided to the Fund by the Investment Adviser and its affiliates, including information about: |
| | (i) | | the structure, staff, and capabilities of the Investment Adviser and its portfolio management teams; |
| | (ii) | | the groups within the Investment Adviser and its affiliates that support the portfolio management teams or provide other types of necessary services, including fund services groups (e.g., accounting and financial reporting, tax, shareholder services, and operations); controls and risk management groups (e.g., legal, compliance, valuation oversight, credit risk management, internal audit, compliance testing, market risk analysis, finance, and central funding); sales and distribution support groups, and others (e.g., information technology and training); |
| | (iii) | | trends in employee headcount; |
| | (iv) | | the Investment Adviser’s financial resources and ability to hire and retain talented personnel and strengthen its operations; and |
| | (v) | | the parent company’s support of the Investment Adviser and its mutual fund business, as expressed by the firm’s senior management; |
| | (b) | | information on the investment performance of the Fund, including comparisons to the performance of similar mutual funds, as provided by a third-party mutual fund data provider engaged as part of the contract review process (the “Outside Data Provider”), a benchmark performance index, and in the case of the Mid Cap Growth Fund, Mid Cap Value Fund, Small Cap Equity Insights Fund, Strategic Growth Fund, and U.S. Equity Insights Fund, a composite of accounts with comparable investment strategies managed by the Investment Adviser; and information on general investment outlooks in the markets in which the Fund invests; |
| | (c) | | information provided by the Investment Adviser indicating the Investment Adviser’s views on whether the Fund’s peer group and/or benchmark index had high, medium, or low relevance given the Fund’s particular investment strategy; |
| | (d) | | the terms of the Management Agreement and other agreements with affiliated service providers entered into by the Trust on behalf of the Fund; |
| | (e) | | fee and expense information for the Fund, including: |
| | (i) | | the relative management fee and expense levels of the Fund as compared to those of comparable funds managed by other advisers, as provided by the Outside Data Provider; |
| | (ii) | | the Fund’s expense trends over time; and |
| | (iii) | | to the extent the Investment Adviser manages other types of accounts (such as bank collective trusts, private wealth management accounts, institutional separate accounts, sub-advised mutual funds, and non-U.S. funds) having investment objectives and policies similar to those of the Fund, comparative information on the advisory fees charged and services provided to those accounts by the Investment Adviser; |
| | (f) | | with respect to the extensive investment performance and expense comparison data provided by the Outside Data Provider, its processes in producing that data for the Fund; |
GOLDMAN SACHS VARIABLE INSURANCE TRUST EQUITY FUNDS
Statement Regarding Basis for Approval of Management Agreement (Unaudited) (continued)
| | (g) | | the undertakings of the Investment Adviser and its affiliates to implement fee waivers and/or expense limitations; |
| | (h) | | information relating to the profitability of the Management Agreement and the transfer agency and distribution and service arrangements of the Fund to the Investment Adviser and its affiliates; |
| | (i) | | whether the Fund’s existing management fee schedule adequately addressed any economies of scale; |
| | (j) | | a summary of the “fall-out” benefits derived by the Investment Adviser and its affiliates from their relationships with the Fund, including the fees received by the Investment Adviser’s affiliates from the Fund for transfer agency, securities lending (in the case of the International Equity Insights Fund, Small Cap Equity Insights Fund, and U.S. Equity Insights Fund), portfolio trading, distribution and other services; |
| | (k) | | a summary of potential benefits derived by the Fund as a result of its relationship with the Investment Adviser; |
| | (l) | | information regarding commissions paid by the Fund and broker oversight, an update on the Investment Adviser’s soft dollars practices (in the case of the Mid Cap Growth Fund, Mid Cap Value Fund, Large Cap Value Fund, and Strategic Growth Fund), other information regarding portfolio trading, and how the Investment Adviser carries out its duty to seek best execution; |
| | (m) | | the manner in which portfolio manager compensation is determined; and the number and types of accounts managed by the portfolio managers; |
| | (n) | | the nature and quality of the services provided to the Fund by its unaffiliated service providers, and the Investment Adviser’s general oversight and evaluation (including reports on due diligence) of those service providers as part of the administrative services provided under the Management Agreement; and |
| | (o) | | the Investment Adviser’s processes and policies addressing various types of potential conflicts of interest; its approach to risk management; the annual review of the effectiveness of the Fund’s compliance program; and periodic compliance reports. |
The Trustees also received an overview of the Funds’ distribution arrangements. They received information regarding the Funds’ assets, share purchase and redemption activity, and payment of distribution and service fees. Information was also provided to the Trustees relating to revenue sharing payments made by and services provided by the Investment Adviser and its affiliates to intermediaries that promote the sale, distribution, and/or servicing of Fund shares. The Independent Trustees also discussed the broad range of other investment choices that are available to Fund investors, including the availability of comparable funds managed by other advisers.
The presentations made at the Board and Committee meetings and at the Annual Meeting encompassed the Funds and other mutual funds for which the Board of Trustees has responsibility. In evaluating the Management Agreement at the Annual Meeting, the Trustees relied upon their knowledge, resulting from their meetings and other interactions throughout the year, of the Investment Adviser and its affiliates, their services, and the Funds. In conjunction with these meetings, the Trustees received written materials and oral presentations on the topics covered, and the Investment Adviser addressed the questions and concerns of the Trustees, including concerns regarding the investment performance of certain of the funds they oversee. The Independent Trustees were advised by their independent legal counsel regarding their responsibilities and other regulatory requirements related to the approval and continuation of mutual fund investment management agreements under applicable law. In addition, the Investment Adviser and its affiliates provided the Independent Trustees with a written response to a formal request for information sent on behalf of the Independent Trustees by their independent legal counsel. During the course of their deliberations, the Independent Trustees met in executive sessions with their independent legal counsel, without representatives of the Investment Adviser or its affiliates present.
Nature, Extent, and Quality of the Services Provided Under the Management Agreement
As part of their review, the Trustees considered the nature, extent, and quality of the services provided to the Funds by the Investment Adviser. In this regard, the Trustees considered both the investment advisory services and non-advisory services that are provided by the Investment Adviser and its affiliates. The Trustees noted the transition in the leadership and changes in personnel of various of the Investment Adviser’s portfolio management teams that had occurred in recent periods, and the ongoing recruitment efforts aimed at bringing high quality investment talent to the Investment Adviser. They also noted the Investment Adviser’s commitment to maintaining high quality systems and expending substantial resources to respond to ongoing changes to the market, regulatory and control environment in which the Funds and their service providers operate, including developments associated with the COVID-19 pandemic, geopolitical events, and economic sanctions, as well as the efforts of the Investment Adviser and its affiliates to combat cyber security risks. The Trustees also considered information regarding the Investment Adviser’s business continuity planning and remote operations capabilities. The Trustees concluded that the Investment Adviser continued to commit substantial financial and operational resources to the Funds and expressed confidence that the Investment
GOLDMAN SACHS VARIABLE INSURANCE TRUST EQUITY FUNDS
Statement Regarding Basis for Approval of Management Agreement (Unaudited) (continued)
Adviser would continue to do so in the future. The Trustees also recognized that the Investment Adviser had made significant commitments to address regulatory compliance requirements applicable to the Funds and the Investment Adviser and its affiliates.
Investment Performance
The Trustees also considered the investment performance of the Funds. In this regard, they compared the investment performance of each Fund to its peers using rankings and ratings compiled by the Outside Data Provider as of December 31, 2022, and updated performance information prepared by the Investment Adviser using the peer group identified by the Outside Data Provider as of March 31, 2023. The information on each Fund’s investment performance was provided for the one-, three-, five-, and ten-year periods ending on the applicable dates, to the extent that each Fund had been in existence for those periods. The Trustees also reviewed each Fund’s investment performance relative to its performance benchmark. As part of this review, they considered the investment performance trends of the Funds over time, and reviewed the investment performance of each Fund in light of its investment objective and policies and market conditions. The Trustees also received information comparing the performance of the Mid Cap Growth Fund, Mid Cap Value Fund, Small Cap Equity Insights Fund, Strategic Growth Fund, and U.S. Equity Insights Fund to that of composites of accounts with comparable investment strategies managed by the Investment Adviser.
In addition, the Trustees considered materials prepared and presentations made by the Investment Adviser’s senior management and portfolio management personnel in which Fund performance was assessed. The Trustees also considered the Investment Adviser’s periodic reports with respect to the Funds’ risk profiles, and how the Investment Adviser’s approach to risk monitoring and management influences portfolio management. In the case of International Equity Insights Fund, Small Cap Equity Insights Fund, and U.S. Equity Insights Fund, they noted the efforts of the Funds’ portfolio management team to continue to enhance the investment models used in managing the Funds.
The Trustees noted that the Mid Cap Growth Fund’s Institutional Shares had placed in the top half of the Fund’s peer group for the one-, five-, and ten-year periods, and in the third quartile for the three-year period, and had outperformed the Fund’s benchmark index for the one-year period and underperformed for the three- and five-year periods ended March 31, 2023. They observed that the International Equity Insights Fund’s Institutional Shares had placed in the top half of the Fund’s peer group for the one- and three-year periods, and in the third quartile for the five- and ten-year periods, and had outperformed the Fund’s benchmark index for the three-year period and underperformed for the one-, five-, and ten-year periods ended March 31, 2023. The Trustees noted that the Mid Cap Value Fund’s Institutional Shares had placed in the top half of the Fund’s peer group for the three- and five-year periods, and in the third quartile for the one- and ten-year periods, and had outperformed the Fund’s benchmark index for the one-, three-, and five-year periods and underperformed for the ten-year period ended March 31, 2023. They considered that the Large Cap Value Fund’s Institutional Shares had placed in the top half of the Fund’s peer group for the five-year period, in the third quartile for the one- and three-year periods, and in the fourth quartile for the ten-year period, and had outperformed the Fund’s benchmark index for the one- and five-year periods and underperformed for the three- and ten-year periods ended March 31, 2023. The Trustees observed that the Small Cap Equity Insights Fund’s Institutional Shares had placed in the top half of the Fund’s peer group for the ten-year period, and in the third quartile for the one-, three-, and five-year periods, and had outperformed the Fund’s benchmark index for the one-, three-, five-, and ten-year periods ended March 31, 2023. They considered that the Strategic Growth Fund’s Institutional Shares had placed in the top half of the Fund’s peer group for the three-, five-, and ten-year periods, and in the third quartile for the one-year period, and had underperformed the Fund’s benchmark index for the one-, three-, five-, and ten-year periods ended March 31, 2023. The Trustees observed that the U.S. Equity Insights Fund’s Institutional Shares had placed in the top half of the Fund’s peer group for the ten-year period, in the third quartile for the three-year period, and in the fourth quartile for the one- and five-year periods, and had underperformed the Fund’s benchmark index for the one-, three-, five-, and ten-year periods ended March 31, 2023.
Costs of Services Provided and Competitive Information
The Trustees considered the contractual terms of the Management Agreement and the fee rates payable by each Fund thereunder. In this regard, the Trustees considered information on the services rendered by the Investment Adviser to the Funds, which included both advisory and administrative services that were directed to the needs and operations of the Funds as registered mutual funds.
In particular, the Trustees reviewed analyses prepared by the Outside Data Provider regarding the expense rankings of the Funds. The analyses provided a comparison of each Fund’s management fee and breakpoints to those of a relevant peer group and category universe; an expense analysis which compared each Fund’s overall net and gross expenses to a peer group and a category universe; and data comparing each Fund’s net expenses to the peer and category medians. The analyses also compared each Fund’s
GOLDMAN SACHS VARIABLE INSURANCE TRUST EQUITY FUNDS
Statement Regarding Basis for Approval of Management Agreement (Unaudited) (continued)
other expenses and fee waivers/reimbursements to those of the peer group and category medians. The Trustees concluded that the comparisons provided by the Outside Data Provider were useful in evaluating the reasonableness of the management fees and total expenses paid by the Funds.
In addition, the Trustees considered the Investment Adviser’s undertakings to implement fee waivers and/or expense limitations. The Trustees also noted that certain changes were being made to existing fee waiver or expense limitation arrangements of the International Equity Insights Fund and Strategic Growth Fund that would have the effect of decreasing total Fund expenses, with such changes taking effect in connection with the Fund’s next annual registration statement update. They also considered, to the extent that the Investment Adviser manages other types of accounts having investment objectives and policies similar to those of the Funds, comparative fee information for services provided by the Investment Adviser to those accounts, and information that indicated that services provided to the Funds differed in various significant respects from the services provided to other types of accounts which, in many cases, operated under less stringent legal and regulatory structures, required fewer services from the Investment Adviser to a smaller number of client contact points, and were less time-intensive.
In addition, the Trustees noted that shareholders are able to redeem their shares at any time if shareholders believe that the Fund fees and expenses are too high or if they are dissatisfied with the performance of the Fund.
Profitability
The Trustees reviewed each Fund’s contribution to the Investment Adviser’s revenues and pre-tax profit margins. In this regard the Trustees noted that they had received, among other things, profitability analyses and summaries, revenue and expense schedules by Fund and by function (i.e., investment management, transfer agency and distribution and service), and information on the Investment Adviser’s expense allocation methodology. They observed that the profitability and expense figures are substantially similar to those used by the Investment Adviser for many internal purposes, including compensation decisions among various business groups, and are thus subject to a vigorous internal debate about how certain revenue and expenses should be allocated. The Trustees also noted that the internal audit group within the Goldman Sachs organization periodically audits the expense allocation methodology and that the internal audit group was satisfied with the reasonableness, consistency, and accuracy of the Investment Adviser’s expense allocation methodology. Profitability data for each Fund was provided for 2022 and 2021, and the Trustees considered this information in relation to the Investment Adviser’s overall profitability.
Economies of Scale
The Trustees considered the information that had been provided regarding whether there have been economies of scale with respect to the management of the Funds. The Trustees also considered the breakpoints in the fee rate payable under the Management Agreement for each of the Funds at the following annual percentage rates of the average daily net assets of the Funds:
| | | | | | | | | | | | | | | | |
| | | International Equity
Insights Fund | | | Large Cap
Value Fund | | | Strategic
Growth Fund | | | U.S. Equity
Insights Fund | |
| | | | |
| First $1 billion | | | 0.81 | % | | | 0.72 | % | | | 0.71 | % | | | 0.62 | % |
| | | | |
| Next $1 billion | | | 0.73 | | | | 0.65 | | | | 0.64 | | | | 0.59 | |
| | | | |
| Next $3 billion | | | 0.69 | | | | 0.62 | | | | 0.61 | | | | 0.56 | |
| | | | |
| Next $3 billion | | | 0.68 | | | | 0.60 | | | | 0.59 | | | | 0.55 | |
| | | | |
| Over $8 billion | | | 0.67 | | | | 0.59 | | | | 0.58 | | | | 0.54 | |
| | | | | | | | | | | | |
| | | Mid Cap
Growth Fund | | | Mid Cap
Value Fund | | | Small Cap Equity
Insights Fund | |
| | | |
| First $2 billion | | | 0.87 | % | | | 0.77 | % | | | 0.70 | % |
| | | |
| Next $3 billion | | | 0.78 | | | | 0.69 | | | | 0.63 | |
| | | |
| Next $3 billion | | | 0.74 | | | | 0.66 | | | | 0.60 | |
| | | |
| Over $8 billion | | | 0.73 | | | | 0.65 | | | | 0.59 | |
The Trustees noted that the breakpoints were designed to share potential economies of scale, if any, with the Funds and their shareholders as assets under management reach those asset levels. The Trustees considered the amounts of assets in the Funds; the Funds’ recent share purchase and redemption activity; the information provided by the Investment Adviser relating to the costs of
GOLDMAN SACHS VARIABLE INSURANCE TRUST EQUITY FUNDS
Statement Regarding Basis for Approval of Management Agreement (Unaudited) (continued)
the services provided by the Investment Adviser and its affiliates and their realized profits; information comparing fee rates charged by the Investment Adviser with fee rates charged to other funds in the peer groups; and the Investment Adviser’s undertakings to waive a portion of its management fee (with respect to the Mid Cap Growth Fund, International Equity Insights Fund, Large Cap Value Fund, and U.S. Equity Insights Fund) and to limit certain expenses of the Funds that exceed specified levels as well as Goldman Sachs & Co. LLC’s (“Goldman Sachs”) undertaking to waive a portion of the Distribution and Service fees paid by Mid Cap Growth Fund and U.S. Equity Insights Fund. Upon reviewing these matters at the Annual Meeting, the Trustees concluded that the fee breakpoints represented a means of assuring that benefits of scalability, if any, would be passed along to shareholders at the specified asset levels. They also noted that the Investment Adviser had passed along savings to shareholders of the Mid Cap Growth Fund and Mid Cap Value Fund, which had asset levels above at least the first breakpoint during the prior fiscal year.
Other Benefits to the Investment Adviser and Its Affiliates
The Trustees also considered the other benefits derived by the Investment Adviser and its affiliates from their relationships with the Funds as stated above, including: (a) transfer agency fees received by Goldman Sachs; (b) brokerage and futures commissions earned by Goldman Sachs for executing securities and futures transactions on behalf of the Funds; (c) research received by the Investment Adviser from broker-dealers in exchange for executing certain transactions on behalf of the Mid Cap Growth Fund, Mid Cap Value Fund, Large Cap Value Fund, and Strategic Growth Fund; (d) trading efficiencies resulting from aggregation of orders of the Funds with those for other funds or accounts managed by the Investment Adviser; (e) fees earned by Goldman Sachs Agency Lending (“GSAL”), an affiliate of the Investment Adviser, as securities lending agent for the International Equity Insights Fund, Small Cap Equity Insights Fund, and U.S. Equity Insights Fund and fees earned by the Investment Adviser for managing the fund in which the Funds’ securities lending cash collateral of the Mid Cap Growth Fund, Mid Cap Value Fund, Large Cap Value Fund, and Strategic Growth Fund is invested; (f) the Investment Adviser’s ability to leverage the infrastructure designed to service the Funds on behalf of its other clients; (g) the Investment Adviser’s ability to cross-market other products and services to Fund shareholders; (h) Goldman Sachs’ retention of certain fees as Fund Distributor; (i) the Investment Adviser’s ability to negotiate better pricing with custodians on behalf of its other clients, as a result of the relationship with the Funds; (j) the investment of cash and cash collateral in money market funds managed by the Investment Adviser that will result in increased assets under management for those money market funds; (k) the investment in exchange-traded funds (“ETFs”) managed by the Investment Adviser that will result in increased assets under management for those ETFs and may facilitate the development of the Investment Adviser’s ETF advisory business; and (l) the possibility that the working relationship between the Investment Adviser and the Funds’ third-party service providers may cause those service providers to be more likely to do business with other areas of Goldman Sachs. In the course of considering the foregoing, the Independent Trustees requested and received further information quantifying certain of these fall-out benefits.
Other Benefits to the Funds and Their Shareholders
The Trustees also noted that the Funds receive certain other potential benefits as a result of their relationship with the Investment Adviser, including: (a) trading efficiencies resulting from aggregation of orders of the Funds with those of other funds or accounts managed by the Investment Adviser; (b) enhanced servicing from vendors due to the volume of business generated by the Investment Adviser and its affiliates; (c) enhanced servicing from broker-dealers due to the volume of business generated by the Investment Adviser and its affiliates; (d) the Investment Adviser’s ability to negotiate favorable terms with derivatives counterparties on behalf of the Funds as a result of the size and reputation of the Goldman Sachs organization; (e) the advantages received from the Investment Adviser’s knowledge and experience gained from managing other accounts and products; (f) the Investment Adviser’s ability to hire and retain qualified personnel to provide services to the Funds because of the reputation of the Goldman Sachs organization; (g) the Funds’ access, through the Investment Adviser, to certain firm-wide resources (e.g., proprietary risk management systems and databases), subject to certain restrictions; (h) the ability of the International Equity Insights Fund, Small Cap Equity Insights Fund, and U.S. Equity Insights Fund to participate in the securities lending program administered by GSAL, as measured by the revenue received by the Funds in connection with the program; and (i) the Funds’ access to certain affiliated distribution channels. In addition, the Trustees noted the competitive nature of the mutual fund marketplace, and considered that many of the Funds’ shareholders invested in the Funds in part because of the Funds’ relationship with the Investment Adviser and that those shareholders have a general expectation that the relationship will continue.
Conclusion
In connection with their consideration of the Management Agreement, the Trustees gave weight to each of the factors described above, but did not identify any particular factor as controlling their decision. After deliberation and consideration of all of
GOLDMAN SACHS VARIABLE INSURANCE TRUST EQUITY FUNDS
Statement Regarding Basis for Approval of Management Agreement (Unaudited) (continued)
the information provided, including the factors described above, the Trustees concluded, in the exercise of their business judgment, that the management fees paid by each of the Funds were reasonable in light of the services provided to it by the Investment Adviser, the Investment Adviser’s costs and each Fund’s current and reasonably foreseeable asset levels. The Trustees unanimously concluded that the Investment Adviser’s continued management likely would benefit each Fund and its shareholders and that the Management Agreement should be approved and continued with respect to each Fund until June 30, 2024.
GOLDMAN SACHS VARIABLE INSURANCE TRUST EQUITY FUNDS
Liquidity Risk Management Program (Unaudited)
Each Fund has adopted and implemented a liquidity risk management program (the “Program”) in accordance with Rule 22e-4 under the 1940 Act. The Program seeks to assess and manage each Fund’s liquidity risk, i.e., the risk that a Fund is unable to satisfy redemption requests without significantly diluting remaining investors’ interests in the Fund. The Board of Trustees of the Trust has designated GSAM, each Fund’s investment adviser, to administer the Program. Certain aspects of the Program rely on third parties to perform certain functions, including the provision of market data and application of models.
The Program is comprised of various components designed to support the assessment and/or management of liquidity risk, including: (1) the periodic assessment (no less frequently than annually) of certain factors that influence a Fund’s liquidity risk; (2) the periodic classification (no less frequently than monthly) of a Fund’s investments into one of four liquidity categories that reflect an estimate of their liquidity under current market conditions; (3) a 15% limit on the acquisition of “illiquid investments” (as defined under Rule 22e-4); (4) for a Fund that does not invest primarily in “highly liquid investments” (as defined under Rule 22e-4), the determination of a minimum percentage of the Fund’s assets that will generally be invested in highly liquid investments (a “Highly Liquid Investment Minimum”); and (5) periodic reporting to the Board of Trustees.
At a meeting of the Board of Trustees on February 14-15, 2023, GSAM provided a written report to the Board addressing the operation, and the adequacy and effectiveness of the implementation, of the Program, including, as applicable, the operation of any Highly Liquid Investment Minimum and any material changes to the Program, for the period from January 1, 2022 through December 31, 2022 (the “Reporting Period”). Among other things, the annual report discussed: (1) the results of stress tests designed to assess liquidity under a hypothetical stressed scenario involving elevated redemptions; (2) an assessment of the methodologies used to classify investments into one of four liquidity categories; (3) the impact of local holidays in non-U.S. jurisdictions; and (4) the impact of geopolitical, market and economic developments and events on liquidity and liquidity risk. The report concluded that the Program continues to be reasonably designed to assess and manage liquidity risk and was adequately and effectively implemented during the Reporting Period.
There can be no assurance that the Program will achieve its objectives under all circumstances in the future. Please refer to your Fund’s prospectus for more information regarding the Fund’s exposure to liquidity risk and other risks to which it may be subject.
GOLDMAN SACHS VARIABLE INSURANCE TRUST EQUITY FUNDS
| | |
| Fund Expenses — Six Month Period Ended June 30, 2023 (Unaudited) | | |
As a shareholder of Institutional or Service Shares of the Funds, you incur ongoing costs, including management fees, distribution and/or service (12b-1) fees (with respect to Service Shares) and other Fund expenses. This example is intended to help you understand your ongoing costs (in dollars) of investing in the Institutional Shares and Service Shares of the Funds and to compare these costs with the ongoing costs of investing in other mutual funds.
The example is based on an investment of $1,000 invested at the beginning of the period and held for the entire period from January 1, 2023 through June 30, 2023, which represents a period of 181 days of a 365 day year.
Actual Expenses — The first line under each share class in the table below provides information about actual account values and actual expenses. You may use the informationinthis line, together with the amount you invested, to estimate the expenses that you paid over the period. Simply divide your account value by $1,000 (for example, an $8,600 account value divided by $1,000=8.6), then multiply the result by the number in the first line under the heading entitled “Expenses Paid” to estimate the expenses you paid on your account during this period.
Hypothetical Example for Comparison Purposes — The second line under each share class in the table below provides information about hypothetical account values and hypothetical expenses based on the Funds’ actual net expense ratio and an assumed rate of return of 5% per year before expenses, which is not the Funds’ actual return. The hypothetical account values and expenses may not be used to estimate the actual ending account balance or expenses you paid for the period. You may use this information to compare the ongoing costs of investing in the Funds and other funds. To do so, compare this 5% hypothetical example with the 5% hypothetical examples that appear in the shareholder reports of the other funds.
Please note that the expenses shown in the table are meant to highlight your ongoing costs only. As a shareholder of the Funds you do not incur any transaction costs, such as sales charges, redemption fees, or exchange fees, but shareholders of other funds may incur such costs. The second line of the table is useful in comparing ongoing costs only and will not help you determine the relative total costs of owning different funds whose shareholders may incur transaction costs.
| | | | | | | | | | | | | | | | | | | | | | | | | | | | | | | | | | | | | | | | | | | | | | | | |
| | | International Equity Insights Fund | | | Large Cap Value Fund | | | Mid Cap Growth Fund | | | Mid Cap Value Fund | |
| Share Class | | Beginning
Account
Value
1/1/23 | | | Ending
Account
Value
6/30/23 | | | Expenses
Paid for the
6 months
ended
6/30/23* | | | Beginning
Account
Value
1/1/23 | | | Ending
Account
Value
6/30/23 | | | Expenses
Paid for the
6 months
ended
6/30/23* | | | Beginning
Account
Value
1/1/23 | | | Ending
Account
Value
6/30/23 | | | Expenses
Paid for the
6 months
ended
6/30/23* | | | Beginning
Account
Value
1/1/23 | | | Ending
Account
Value
6/30/23 | | | Expenses
Paid for the
6 months
ended
6/30/23* | |
| Institutional | | | | | | | | | | | | | | | | | | | | | | | | | | | | | | | | | | | | | | | | | | | | | | | | |
| | | | | | | | | | | | | |
Actual | | $ | 1,000.00 | | | $ | 1,120.10 | | | $ | 4.28 | | | $ | 1,000.00 | | | $ | 1,053.96 | | | $ | 3.58 | | | $ | 1,000.00 | | | $ | 1,124.46 | | | $ | 4.36 | | | $ | 1,000.00 | | | $ | 1,053.73 | | | $ | 4.25 | |
Hypothetical 5% return | | | 1,000.00 | | | | 1,020.76 | + | | | 4.08 | | | | 1,000.00 | | | | 1,021.31 | + | | | 3.52 | | | | 1,000.00 | | | | 1,020.69 | + | | | 4.15 | | | | 1,000.00 | | | | 1,020.65 | + | | | 4.19 | |
| Service | | | | | | | | | | | | | | | | | | | | | | | | | | | | | | | | | | | | | | | | | | | | | | | | |
| | | | | | | | | | | | | |
Actual | | | 1,000.00 | | | | 1,118.18 | | | | 5.59 | | | | 1,000.00 | | | | 1,052.70 | | | | 4.75 | | | | 1,000.00 | | | | 1,123.27 | | | | 5.15 | | | | 1,000.00 | | | | 1,052.42 | | | | 5.51 | |
Hypothetical 5% return | | | 1,000.00 | | | | 1,019.52 | + | | | 5.33 | | | | 1,000.00 | | | | 1,020.17 | + | | | 4.67 | | | | 1,000.00 | | | | 1,019.95 | + | | | 4.90 | | | | 1,000.00 | | | | 1,019.42 | + | | | 5.42 | |
| | + | Hypothetical expenses are based on each Fund’s actual annualized net expense ratios and an assumed rate of return of 5% per year before expenses. | |
| | * | Expenses are calculated using each Fund’s annualized net expense ratio for each class, which represents the ongoing expenses as a percentage of net assets for the six months ended June 30, 2023. Expenses are calculated by multiplying the annualized net expense ratio by the average account value for the period; then multiplying the result by the number of days in the most recent fiscal half year; and then dividing that result by the number of days in the fiscal year. The annualized net expense ratios for the period were as follows: | |
| | | | | | |
| | |
Fund | | Institutional
Shares | | Service
Shares | |
International Equity Insights Fund | | 0.81% | | | 1.06 | % |
Large Cap Value Fund | | 0.70 | | | 0.93 | |
Mid Cap Growth Fund | | 0.83 | | | 0.98 | |
Mid Cap Value Fund | | 0.84 | | | 1.08 | |
90
GOLDMAN SACHS VARIABLE INSURANCE TRUST EQUITY FUNDS
| | |
| Fund Expenses — Six Month Period Ended June 30, 2023 (Unaudited) (continued) | | |
As a shareholder of Institutional or Service Shares of the Funds, you incur ongoing costs, including management fees, distribution and/or service (12b-1) fees (with respect to Service and Advisor Shares) and other Fund expenses. This example is intended to help you understand your ongoing costs (in dollars) of investing in the Institutional Shares and Service Shares of the Funds and to compare these costs with the ongoing costs of investing in other mutual funds.
The example is based on an investment of $1,000 invested at the beginning of the period and held for the entire period from January 1, 2023 through June 30, 2023, which represents a period of 181 days of a 365 day year.
Actual Expenses — The first line under each share class in the table below provides information about actual account values and actual expenses. You may use the information in this line, together with the amount you invested, to estimate the expenses that you paid over the period. Simply divide your account value by $1,000 (for example, an $8,600 account value divided by $1,000=8.6), then multiply the result by the number in the first line under the heading entitled “Expenses Paid” to estimate the expenses you paid on your account during this period.
Hypothetical Example for Comparison Purposes — The second line under each share class in the table below provides information about hypothetical account values and hypothetical expenses based on the Funds’ actual net expense ratio and an assumed rate of return of 5% per year before expenses, which is not the Funds’ actual return. The hypothetical account values and expenses may not be used to estimate the actual ending account balance or expenses you paid for the period. You may use this information to compare the ongoing costs of investing in the Funds and other funds. To do so, compare this 5% hypothetical example with the 5% hypothetical examples that appear in the shareholder reports of the other funds.
Please note that the expenses shown in the table are meant to highlight your ongoing costs only. As a shareholder of the Funds you do not incur any transaction costs, such as sales charges, redemption fees, or exchange fees, but shareholders of other funds may incur such costs. The second line of the table is useful in comparing ongoing costs only and will not help you determine the relative total costs of owning different funds whose shareholders may incur transaction costs.
| | | | | | | | | | | | | | | | | | | | | | | | | | | | | | | | | | | | |
| | | Small Cap Equity Insights Fund | | | Strategic Growth Fund | | | U.S. Equity Insights Fund | |
| Share Class | | Beginning
Account
Value
1/1/23 | | | Ending
Account
Value
6/30/23 | | | Expenses
Paid for the
6 months
ended
6/30/23* | | | Beginning
Account
Value
1/1/23 | | | Ending
Account
Value
6/30/23 | | | Expenses
Paid for the
6 months
ended
6/30/23* | | | Beginning
Account
Value
1/1/23 | | | Ending
Account
Value
6/30/23 | | | Expenses
Paid for the
6 months
ended
6/30/23* | |
| Institutional | | | | | | | | | | | | | | | | | | | | | | | | | | | | | | | | | | | | |
| | | | | | | | | | |
Actual | | $ | 1,000.00 | | | $ | 1,105.77 | | | $ | 4.24 | | | $ | 1,000.00 | | | $ | 1,301.09 | | | $ | 4.23 | | | $ | 1,000.00 | | | $ | 1,144.21 | | | $ | 3.00 | |
Hypothetical 5% return | | | 1,000.00 | | | | 1,020.77 | + | | | 4.07 | | | | 1,000.00 | | | | 1,021.12 | + | | | 3.72 | | | | 1,000.00 | | | | 1,022.00 | + | | | 2.83 | |
| Service | | | | | | | | | | | | | | | | | | | | | | | | | | | | | | | | | | | | |
| | | | | | | | | | |
Actual | | | 1,000.00 | | | | 1,105.16 | | | | 5.54 | | | | 1,000.00 | | | | 1,299.34 | | | | 5.66 | | | | 1,000.00 | | | | 1,142.95 | | | | 4.11 | |
Hypothetical 5% return | | | 1,000.00 | | | | 1,019.53 | + | | | 5.32 | | | | 1,000.00 | | | | 1,019.88 | + | | | 4.97 | | | | 1,000.00 | | | | 1,020.96 | + | | | 3.88 | |
| | + | Hypothetical expenses are based on each Fund’s actual annualized net expense ratios and an assumed rate of return of 5% per year before expenses. | |
| | * | Expenses are calculated using each Fund’s annualized net expense ratio for each class, which represents the ongoing expenses as a percentage of net assets for the six months ended June 30, 2023. Expenses are calculated by multiplying the annualized net expense ratio by the average account value for the period; then multiplying the result by the number of days in the most recent fiscal half year; and then dividing that result by the number of days in the fiscal year. The annualized net expense ratios for the period were as follows: | |
| | | | | | |
| | |
Fund | | Institutional
Shares | | Service
Shares | |
Small Cap Equity Insights Fund | | 0.81% | | | 1.06 | % |
Strategic Growth Fund | | 0.74 | | | 0.99 | |
U.S. Equity Insights Fund | | 0.56 | | | 0.77 | |
91
| | |
| TRUSTEES | | OFFICERS |
Gregory G. Weaver, Chair | | James A. McNamara, President |
Dwight L. Bush | | Joseph F. DiMaria, Principal Financial Officer, Principal Accounting Officer and Treasurer Caroline L. Kraus, Secretary |
Kathryn A. Cassidy |
John G. Chou |
Joaquin Delgado |
Eileen H. Dowling |
James A. McNamara | | |
Paul C. Wirth | | |
GOLDMAN SACHS & CO. LLC
Distributor and Transfer Agent
GOLDMAN SACHS ASSET MANAGEMENT, L.P.
Investment Adviser
200 West Street, New York,
New York 10282
Visit our web site at www.GSAMFUNDS.com to obtain the most recent month-end returns.
The reports concerning the Funds included in this shareholder report may contain certain forward-looking statements about the factors that may affect the performance of the Funds in the future. These statements are based on Funds management’s predictions and expectations concerning certain future events and their expected impact on the Funds, such as performance of the economy as a whole and of specific industry sectors, changes in the levels of interest rates, the impact of developing world events, and other factors that may influence the future performance of the Funds. Management believes these forward-looking statements to be reasonable, although they are inherently uncertain and difficult to predict. Actual events may cause adjustments in portfolio management strategies from those currently expected to be employed.
A description of the policies and procedures that the Funds uses to determine how to vote proxies relating to portfolio securities and information regarding how the Funds voted proxies relating to portfolio securities for the 12-month period ended June 30 is available (i) without charge, upon request by calling 1-800-621-2550; and (ii) on the Securities and Exchange Commission (“SEC”) web site at http://www.sec.gov.
The Funds will file portfolio holdings information for each month in a fiscal quarter within 60 days after the end of the relevant fiscal quarter on Form N-PORT. Portfolio holdings information for the third month of each fiscal quarter will be made available on the SEC’s web site at http://www.sec.gov. Portfolio holdings information may be obtained upon request and without charge by calling 1-800-526-7384 (for Retail Shareholders) or 1-800-621-2550 (for Institutional Shareholders).
Views and opinions expressed are for informational purposes only and do not constitute a recommendation by GSAM to buy, sell, or hold any security. Views and opinions are current as of the date of this presentation and may be subject to change, they should not be construed as investment advice.
Goldman Sachs & Co. LLC (“Goldman Sachs”) does not provide legal, tax or accounting advice. Any statement contained in this communication (including any attachments) concerning U.S. tax matters was not intended or written to be used, and cannot be used, for the purpose of avoiding penalties under the Internal Revenue Code, and was written to support the promotion or marketing of transactions or matters addressed. Clients of Goldman Sachs should obtain their own independent tax advice based on their particular circumstances.
The website links provided are for your convenience only and are not an endorsement or recommendation by GSAM of any of these websites or the products or services offered. GSAM is not responsible for the accuracy and validity of the content of these websites.
Funds holdings and allocations shown are as of June 30, 2023 and may not be representative of future investments. Funds holdings should not be relied on in making investment decisions and should not be construed as research or investment advice regarding particular securities. Current and future holdings are subject to risk.
References to indices, benchmarks or other measures of relative market performance over a specified period of time are provided for your information only and do not imply that the portfolio will achieve similar results. The index composition may not reflect the manner in which a portfolio is constructed. While an adviser seeks to design a portfolio which reflects appropriate risk and return features, portfolio characteristics may deviate from those of the benchmark.
The Global Industry Classification Standard (“GICS”) was developed by and is the exclusive property and a service mark of Morgan Stanley Capital International Inc. (“MSCI”) and Standard & Poor’s, a division of The McGraw-Hill Companies, Inc. (“S&P”) and is licensed for use by Goldman Sachs. Neither MSCI, S&P nor any other party involved in making or compiling the GICS or any GICS classifications makes any express or implied warranties or representations with respect to such standard or classification (or the results to be obtained by the use thereof), and all such parties hereby expressly disclaim all warranties of originality, accuracy, completeness, merchantability or fitness for a particular purpose with respect to any of such standard or classification. Without limiting any of the foregoing, in no event shall MSCI, S&P, any of their affiliates or any third party involved in making or compiling the GICS or any GICS classifications have any liability for any direct, indirect, special, punitive, consequential or any other damages (including lost profits) even if notified of the possibility of such damages.
The portfolio risk management process includes an effort to monitor and manage risk, but does not imply low risk.
Shares of the Goldman Sachs VIT Funds are offered to separate accounts of participating life insurance companies for the purpose of funding variable annuity contracts and variable life insurance policies. Shares of the Funds are not offered directly to the general public. The variable annuity contracts and variable life insurance policies are described in the separate prospectuses issued by participating insurance companies. You should refer to those prospectuses for information about surrender charges, mortality and expense risk fees and other charges that may be assessed by participating insurance companies under the variable annuity contracts or variable life insurance policies. Such fees or charges, if any, may affect the return you may realize with respect to your investments. Ask your representative for more complete information. Please consider a Fund’s objectives, risks and charges and expenses, and read the prospectus carefully before investing. The prospectus contains this and other information about the Funds.
This material is not authorized for distribution to prospective investors unless preceded or accompanied by a current prospectus or summary prospectus, if applicable. Investors should consider the Funds’ objective, risks, and charges and expenses, and read the summary prospectus, if available, and/or the prospectus carefully before investing or sending money. The summary prospectus, if available, and the prospectus contain this and other information about the Funds and may be obtained from your authorized dealer or from Goldman Sachs & Co. LLC by calling 1-800-621-2550.
This report is prepared for the general information of contract owners and is not an offer of shares of the Goldman Sachs Variable Insurance Trust Funds.
© 2023 Goldman Sachs. All rights reserved.
VITEQTYSAR-23/330600-OTU-08/2023
Goldman
Sachs Variable Insurance Trust
Goldman Sachs Buffered S&P 500 Fund — Jan/Jul
Goldman Sachs Buffered S&P 500 Fund — Mar/Sep
Goldman Sachs Buffered S&P 500 Fund — May/Nov
Semi-Annual Report
June 30, 2023

Goldman Sachs Variable Insurance Trust
| ∎ | | Goldman Sachs Buffered S&P 500 Fund — Jan/Jul |
| ∎ | | Goldman Sachs Buffered S&P 500 Fund — Mar/Sep |
| ∎ | | Goldman Sachs Buffered S&P 500 Fund — May/Nov |
| | | | |
| | | |
| NOT FDIC-INSURED | | May Lose Value | | No Bank Guarantee |
MARKET REVIEW
Goldman Sachs Variable Insurance Trust – Goldman Sachs Buffered S&P 500 Funds
The following are highlights both of key factors affecting the U.S. equity markets and of any key changes made to the Goldman Sachs VIT — Goldman Sachs Buffered S&P 500 Funds (the “Funds”) during the six months ended June 30, 2023 (the “Reporting Period”). Attribution highlights are provided for those Funds that materially outperformed or underperformed their respective benchmark during the Reporting Period. A fuller review will appear in the Funds’ annual shareholder report covering the 12 months ended December 31, 2023.
Market and Economic Review
U.S. Equities
| • | | Overall, U.S. equities rallied during the Reporting Period following poor performance in 2022. The Standard & Poor’s 500® Index (the “S&P 500 Index”) ended the Reporting Period with a return of 16.89%, its best first-half showing since 2019 and second best since 1998. The Russell 3000® Index generated a return of 16.17%. |
| • | | The U.S. equity market’s strength was predominantly driven throughout the Reporting Period by disinflation momentum, an upswing in soft economic landing expectations and consumer resilience. (A soft landing, in economics, is a cyclical slowdown in economic growth that avoids recession.) |
| • | | During the first quarter of 2023, the S&P 500 Index returned 7.53%, marking its second straight quarterly gain. |
| | • | | Following a stellar start to the calendar year, February 2023 proved to be a setback for the disinflation path after nonfarm payrolls data illustrated the largest job growth in six months, and the U.S. unemployment rate fell to a 53-year low, in turn pushing market forecasts for the U.S. Federal Reserve’s (“Fed”) terminal rate upward. (The terminal federal funds rate is the ultimate interest rate level the Fed sets as its target for a cycle of rate hikes or cuts.) |
| | • | | The January 2023 Producer Price Index (“PPI”) and core Personal Consumption Expenditure (“PCE”) Index saw their largest monthly increases since mid-2022, illustrating that more work was needed to combat inflation. |
| | • | | The bearish case was further supported by a disappointing fourth quarter 2022 corporate earnings season, as margins came under pressure by persistently high input costs and weaker demand. (Bearish refers to an expected downward movement in the prices of securities.) |
| | • | | Consensus forecasts for the Fed’s interest rate path took a dovish turn in March 2023 due to an abrupt banking crisis that escalated the risk of raising interest rates. Economic data in March also contributed to the dovish sentiment, as February 2023 PPI, PCE and personal income growth data were cooler than expected. (Dovish suggests lower interest rates; opposite of hawkish.) |
| | • | | On the geopolitical front, the most constructive takeaways came from China’s accelerated economic re-opening following its unanticipated zero-COVID policy pivot toward the end of 2022 as well as Europe’s warmer than anticipated weather that helped avoid an energy crisis. |
| • | | During the second quarter of 2023, the S&P 500 Index returned 8.74%, marking its third consecutive quarterly gain. |
| | • | | In addition to those factors that drove strong performance throughout the Reporting Period, second quarter results were boosted by a better than consensus expected first quarter 2023 corporate earnings season and persistent enthusiasm around artificial intelligence (“AI”), including the possibility for a boom in AI-related chipmakers. |
| | • | | In turn, growth stocks significantly outperformed their value counterparts, as mega-cap technology stocks accounted for a vast majority of the S&P 500 Index’s rally in the quarter. |
| | • | | First quarter 2023 corporate earnings metrics, although supported by a lower bar, were well above their one-year averages due to a combination of ongoing pricing power, supply-chain normalization, cost-cutting initiatives and margin expansion. |
| | • | | Disinflation progress was highlighted by a cooler than consensus expected May 2023 Consumer Price Index reading, as the inflation rate fell to 4.0%, the lowest level in more than two years, on the back of lower energy |
MARKET REVIEW
| | prices. The May PPI and headline PCE Index data also came in below consensus market forecasts. Furthermore, transitory inflation pressures, such as supply-chain disruptions, continued to fade throughout the quarter. |
| | • | | The soft landing narrative continued to take form with a still-tight labor market and robust housing market helping to counteract the possibility of a recession. |
| | • | | Despite the S&P 500 Index’s strong second calendar quarter, there were numerous bearish takeaways. |
| | • | | These primarily surrounded the implacable higher-for-longer messaging from the Fed. Although the June Fed meeting left the federal funds rate unchanged, Fed Chair Powell made a hawkish statement that the Fed is open to additional rate hikes before year end. |
| | • | | Concentrated market leadership was another concern for investors that raised doubts about the sustainability of the U.S. equity market rally. |
| | • | | On the geopolitical front, a slower than consensus expected economic recovery in China presented an additional setback for the market. |
| • | | During the Reporting Period overall, all segments of the U.S. equity markets gained ground, but large-cap stocks were strongest, followed by mid-cap stocks and then small-cap stocks. In a reversal from 2022, growth stocks meaningfully outperformed value stocks on a relative basis across the capitalization spectrum during the Reporting Period. |
| • | | Eight of the 11 sectors of the S&P 500 Index gained during the Reporting Period. In another reversal from 2022, the best performing sectors by far within the S&P 500 Index during the Reporting Period were information technology, communication services and consumer discretionary. The weakest performing sectors during the Reporting Period were utilities, energy and health care. |
Fund Changes and Highlights
Each Fund seeks to achieve a total return, for a specified Outcome Period (as described below), that tracks the S&P 500 Price Return Index (the “Underlying Index”) up to a “cap” while providing a downside “buffer” against losses over the Outcome Period.
Goldman Sachs Buffered S&P 500 Fund — Jan/Jul
| • | | The Fund underperformed its primary benchmark, the S&P 500® Total Return Index (net, USD, unhedged), during the Reporting Period. |
| | • | | Such underperformance was primarily driven by the limited upside participation in the U.S. equity market rally due to the Fund’s targeted outcome strategy. |
| | • | | The Fund seeks to provide equity exposure up to a Cap, implemented via short call positions, with a Buffer from downside risk. |
| | • | | The Cap represents the maximum percentage return a Fund can achieve for the duration of an Outcome Period. The Buffer provides downside protection against approximately the first 5% of losses of the S&P 500 Price Return Index over each Outcome Period, before the deduction of Fund fees and expenses. |
| | • | | If the value of the S&P 500 Price Return Index increases over an Outcome Period, the Fund seeks to provide investment returns that track the performance of the S&P 500 Price Return Index up to the Cap for the Outcome Period. If the value of the S&P 500 Price Return Index increases in excess of the Cap during an Outcome Period, the Fund, and therefore its investors, will not fully participate in those excess gains. |
| | • | | During the Reporting Period, the S&P 500 Price Return Index delivered strong performance that exceeded the Cap, leading to reduced upside participation of the Fund. |
| • | | As described in the Fund’s prospectus, the Fund’s performance is subject to a Cap that represents the maximum percentage return the Fund can achieve for the duration of a six-month Outcome Period. The Fund also seeks to provide a downside Buffer against certain losses over an Outcome Period. |
MARKET REVIEW
| | • | | The Fund’s initial Outcome Period commenced on January 1, 2023 and ended on June 30, 2023. The Fund’s Cap is based on the cost of providing the Buffer and will differ from one Outcome Period to the next. |
| | • | | The Cap and Buffer for the Fund for the initial Outcome Period are listed in the tables below. The tables below show the Cap and Buffer before and after Fund Fees and Expenses for each share class. The Cap and Buffer were further reduced by any brokerage commissions, trading fees, taxes and non-routine or extraordinary expenses incurred by the Fund. |
| | | | |
Share Class | | Cap (before Fund Fees and
Expenses) | | Cap (after Fund Fees and
Expenses)* |
| Institutional Shares | | 7.95% | | 7.60% |
| Service Shares | | 7.95% | | 7.47% |
| | | | |
Share Class | | Buffer (before Fund Fees and
Expenses) | | Buffer (after Fund Fees and
Expenses)* |
| Institutional Shares | | 5.00% | | 4.65% |
| Service Shares | | 5.00% | | 4.52% |
| * | Fund Fees and Expenses are derived from the "Annual Fund Operating Expenses" tables included in the Fund’s Prospectus dated October 5, 2022. Actual Fund Fees and Expenses may differ over the next Outcome Period. |
| | • | | The Fund’s next Outcome Period commenced on July 1, 2023 and will end on December 31, 2023. The Fund’s Cap is based on the cost of providing the Buffer and will differ from one Outcome Period to the next. |
| | • | | The Cap and Buffer for the Fund for the next Outcome Period are listed in the tables below. The Fund’s returns will be further reduced by any brokerage commissions, trading fees, taxes and non-routine or extraordinary expenses incurred by the Fund. |
| | | | |
Share Class | | Cap (before Fund Fees and
Expenses) | | Cap (after Fund Fees and
Expenses)* |
| Institutional Shares | | 2.87% | | 2.52% |
| Service Shares | | 2.87% | | 2.39% |
| | | | |
Share Class | | Buffer (before Fund Fees and
Expenses) | | Buffer (after Fund Fees and
Expenses)* |
| Institutional Shares | | 5.00% | | 4.65% |
| Service Shares | | 5.00% | | 4.52% |
| * | Fund Fees and Expenses are derived from the “Annual Fund Operating Expenses” tables included in the Fund’s Prospectus dated April 28, 2023. Actual Fund Fees and Expenses may differ over the next Outcome Period. |
Goldman Sachs Buffered S&P 500 Fund — Mar/Sep
| • | | The Fund underperformed its primary benchmark, the S&P 500® Total Return Index (net, USD, unhedged), during the Reporting Period. |
| | • | | Such underperformance was primarily driven by the limited upside participation in the U.S. equity market rally due to the Fund’s targeted outcome strategy. |
| | • | | The Fund seeks to provide equity exposure up to a Cap, implemented via short call positions, with a Buffer from downside risk. |
| | • | | The Cap represents the maximum percentage return a Fund can achieve for the duration of an Outcome Period. The Buffer provides downside protection against approximately the first 5% of losses of the S&P 500 Price Return Index over each Outcome Period, before the deduction of Fund fees and expenses. |
| | • | | If the value of the S&P 500 Price Return Index increases over an Outcome Period, the Fund seeks to provide investment returns that track the performance of the S&P 500 Price Return Index up to the Cap for the |
MARKET REVIEW
| | Outcome Period. If the value of the S&P 500 Price Return Index increases in excess of the Cap during an Outcome Period, the Fund, and therefore its investors, will not fully participate in those excess gains. |
| | • | | During the Reporting Period, the S&P 500 Price Return Index delivered strong performance that exceeded the Cap, leading to reduced upside participation of the Fund. |
| • | | As described in the Fund’s prospectus, the Fund’s performance is subject to a Cap that represents the maximum percentage return the Fund can achieve for the duration of a six-month Outcome Period. The Fund also seeks to provide a downside Buffer against certain losses over an Outcome Period. |
| | • | | The Fund’s current Outcome Period commenced on March 1, 2023 and will end on August 31, 2023. The Fund’s Cap is based on the cost of providing the Buffer and will differ from one Outcome Period to the next. |
| | • | | The Cap and Buffer for the Fund for the current Outcome Period are listed in the tables below. The Fund’s returns will be further reduced by any brokerage commissions, trading fees, taxes and non-routine or extraordinary expenses incurred by the Fund. |
| | | | |
Share Class | | Cap (before Fund Fees and
Expenses) | | Cap (after Fund Fees and Expenses)* |
| Institutional Shares | | 5.50% | | 5.15% |
| Service Shares | | 5.50% | | 5.03% |
| | | | |
Share Class | | Buffer (before Fund Fees and
Expenses) | | Buffer (after Fund Fees and
Expenses)* |
| Institutional Shares | | 5.00% | | 4.65% |
| Service Shares | | 5.00% | | 4.53% |
| * | Fund Fees and Expenses are derived from the “Annual Fund Operating Expenses” tables included in the Fund’s Prospectus dated October 5, 2022. Actual Fund Fees and Expenses may differ over the next Outcome Period. |
Goldman Sachs Buffered S&P 500 Fund — May/Nov
| • | | The Fund underperformed its primary benchmark, the S&P 500® Total Return Index (net, USD, unhedged), during the Reporting Period. |
| | • | | Such underperformance was primarily driven by the limited upside participation in the U.S. equity market rally due to the Fund’s targeted outcome strategy. |
| | • | | The Fund seeks to provide equity exposure up to a Cap, implemented via short call positions, with a Buffer from downside risk. |
| | • | | The Cap represents the maximum percentage return a Fund can achieve for the duration of an Outcome Period. The Buffer provides downside protection against approximately the first 5% of losses of the S&P 500 Price Return Index over each Outcome Period, before the deduction of Fund fees and expenses. |
| | • | | If the value of the S&P 500 Price Return Index increases over an Outcome Period, the Fund seeks to provide investment returns that track the performance of the S&P 500 Price Return Index up to the Cap for the Outcome Period. If the value of the S&P 500 Price Return Index increases in excess of the Cap during an Outcome Period, the Fund, and therefore its investors, will not fully participate in those excess gains. |
| | • | | During the Reporting Period, the S&P 500 Price Return Index delivered strong performance that exceeded the Cap, leading to reduced upside participation of the Fund. |
| • | | As described in the Fund’s prospectus, the Fund’s performance is subject to a Cap that represents the maximum percentage return the Fund can achieve for the duration of a six-month Outcome Period. The Fund also seeks to provide a downside Buffer against certain losses over an Outcome Period. |
MARKET REVIEW
| | • | | The Fund’s current Outcome Period commenced on May 1, 2023 and will end on October 31, 2023. The Fund’s Cap is based on the cost of providing the Buffer and will differ from one Outcome Period to the next. |
| | • | | The Cap and Buffer for the Fund for the current Outcome Period are listed in the tables below. The Fund’s returns will be further reduced by any brokerage commissions, trading fees, taxes and non-routine or extraordinary expenses incurred by the Fund. |
| | | | |
Share Class | | Cap (before Fund Fees and
Expenses) | | Cap (after Fund Fees and Expenses)* |
| Institutional Shares | | 4.70% | | 4.35% |
| Service Shares | | 4.70% | | 4.23% |
| | | | |
Share Class | | Buffer (before Fund Fees and
Expenses) | | Buffer (after Fund Fees and
Expenses)* |
| Institutional Shares | | 5.00% | | 4.65% |
| Service Shares | | 5.00% | | 4.52% |
| * | Fund Fees and Expenses are derived from the “Annual Fund Operating Expenses” tables included in the Fund’s Prospectus dated April 28, 2023. Actual Fund Fees and Expenses may differ over the next Outcome Period. |
FUND BASICS
Goldman Sachs Buffered S&P 500 Fund — Jan/Jul
as of June 30, 2023
PERFORMANCE REVIEW
| | | | | | | | |
| | |
| January 1, 2023 – June 30, 2023 | | Fund Total Return
(based on NAV)1 | | | S&P 500
(Net Total Return,
Unhedged, USD)2 | |
| Institutional | | | 9.60 | % | | | 16.60 | % |
| Service | | | 9.60 | | | | 16.60 | |
| 1 | The net asset value (“NAV”) represents the net assets of the class of the Fund (ex-dividend) divided by the total number of shares of the class outstanding. The Fund’s performance assumes the reinvestment of dividends and other distributions. The Fund’s performance does not reflect the deduction of any applicable sales charges. |
| 2 | The S&P 500® Index is the Standard & Poor’s composite index of 500 stocks, an unmanaged index of common stock prices. The figures for the index do not include any deduction for fees, expenses or taxes. It is not possible to invest directly in an unmanaged index. |
The returns set forth in the table above represent past performance. Past performance does not guarantee future results. The Fund’s investment return and principal value will fluctuate so that an investor’s shares, when redeemed, may be worth more or less than their original cost. Current performance may be lower or higher than the performance quoted above. Please visit our web site at www.GSAMFUNDS.com to obtain the most recent month-end returns. Performance reflects applicable fee waivers and/or expense limitations in effect during the periods shown. In their absence, performance would be reduced. Returns do not reflect the deduction of taxes that a shareholder would pay on Fund distributions or the redemption of Fund shares.
FUND BASICS
FUND COMPOSITION3
Percentage of Net Assets
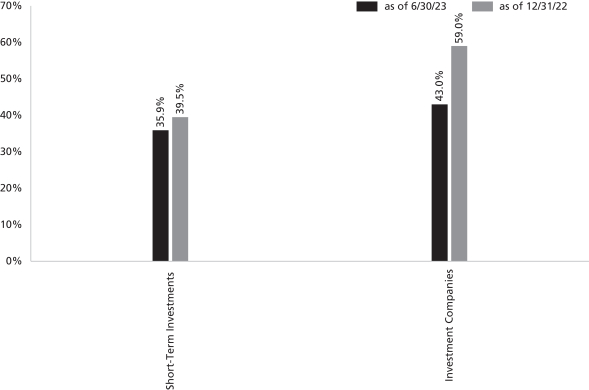
| 3 | The percentage shown for each investment category reflects the value of investments in that category as a percentage of net assets. Figures in the above graph may not sum to 100% due to the exclusion of other assets and liabilities. The graph depicts the Fund’s investments but may not represent the Fund’s market exposure due to the exclusion of certain derivatives, if any, as listed in the Additional Investment Information section of the Schedule of Investments. |
For more information about your Fund, please refer to www.GSAMFUNDS.com. There, you can learn more about your Fund’s investment strategies, holdings, and performance.
FUND BASICS
Goldman Sachs Buffered S&P 500 Fund — Mar/Sep
as of June 30, 2023
PERFORMANCE REVIEW
| | | | | | | | |
| | |
| February 28, 2023 – June 30, 2023 | | Fund Total Return
(based on NAV)1 | | | S&P 500
(Net Total Return,
Unhedged, USD)2 | |
| Institutional | | | 6.30 | % | | | 12.54 | % |
| Service | | | 6.20 | | | | 12.54 | |
| 1 | The net asset value (“NAV”) represents the net assets of the class of the Fund (ex-dividend) divided by the total number of shares of the class outstanding. The Fund’s performance assumes the reinvestment of dividends and other distributions. The Fund’s performance does not reflect the deduction of any applicable sales charges. |
| 2 | The S&P 500® Index is the Standard & Poor’s composite index of 500 stocks, an unmanaged index of common stock prices. The figures for the index do not include any deduction for fees, expenses or taxes. It is not possible to invest directly in an unmanaged index. |
The returns set forth in the table above represent past performance. Past performance does not guarantee future results. The Fund’s investment return and principal value will fluctuate so that an investor’s shares, when redeemed, may be worth more or less than their original cost. Current performance may be lower or higher than the performance quoted above. Please visit our web site at www.GSAMFUNDS.com to obtain the most recent month-end returns. Performance reflects applicable fee waivers and/or expense limitations in effect during the periods shown. In their absence, performance would be reduced. Returns do not reflect the deduction of taxes that a shareholder would pay on Fund distributions or the redemption of Fund shares.
FUND BASICS
FUND COMPOSITION3
Percentage of Net Assets

| 3 | The percentage shown for each investment category reflects the value of investments in that category as a percentage of net assets. Figures in the graph may not sum to 100% due to the exclusion of other assets and liabilities. The graph depicts the Fund’s investments but does not represent the Fund’s market exposure due to the exclusion of certain derivatives as listed in the Additional Investment Information section of the Schedule of Investments. |
For more information about your Portfolio, please refer to www.GSAMFUNDS.com. There, you can learn more about your Portfolio’s investment strategies, holdings, and performance.
FUND BASICS
Goldman Sachs Buffered S&P 500 Fund — May/Nov
as of June 30, 2023
PERFORMANCE REVIEW
| | | | | | | | |
| | |
| April 28, 2023 – June 30, 2023 | | Fund Total Return
(based on NAV)1 | | | S&P 500
(Net Total Return,
Unhedged, USD)2 | |
| Institutional | | | 3.60 | % | | | 6.97 | % |
| Service | | | 3.60 | | | | 6.97 | |
| 1 | The net asset value (“NAV”) represents the net assets of the class of the Fund (ex-dividend) divided by the total number of shares of the class outstanding. The Fund’s performance assumes the reinvestment of dividends and other distributions. The Fund’s performance does not reflect the deduction of any applicable sales charges. |
| 2 | The S&P 500® Index is the Standard & Poor’s composite index of 500 stocks, an unmanaged index of common stock prices. The figures for the index do not include any deduction for fees, expenses or taxes. It is not possible to invest directly in an unmanaged index. |
The returns set forth in the table above represent past performance. Past performance does not guarantee future results. The Fund’s investment return and principal value will fluctuate so that an investor’s shares, when redeemed, may be worth more or less than their original cost. Current performance may be lower or higher than the performance quoted above. Please visit our web site at www.GSAMFUNDS.com to obtain the most recent month-end returns. Performance reflects applicable fee waivers and/or expense limitations in effect during the periods shown. In their absence, performance would be reduced. Returns do not reflect the deduction of taxes that a shareholder would pay on Fund distributions or the redemption of Fund shares.
FUND BASICS
FUND COMPOSITION3
Percentage of Net Assets
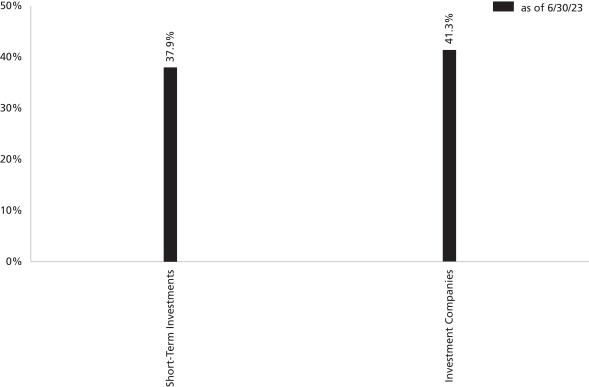
| 3 | The percentage shown for each investment category reflects the value of investments in that category as a percentage of net assets. Figures in the graph may not sum to 100% due to the exclusion of other assets and liabilities. The graph depicts the Fund’s investments but does not represent the Fund’s market exposure due to the exclusion of certain derivatives as listed in the Additional Investment Information section of the Schedule of Investments. |
For more information about your Portfolio, please refer to www.GSAMFUNDS.com. There, you can learn more about your Portfolio’s investment strategies, holdings, and performance.
GOLDMAN SACHS BUFFERED S&P 500 FUND — JAN/JUL
Schedule of Investments
June 30, 2023 (Unaudited)
| | | | | | |
| Shares | | Distribution
Rate | | Value | |
|
| Investment Companies(a) – 43.0% | |
Goldman Sachs Financial Square Government Fund — Institutional Class | |
| 308,354 | | 5.022% | | $ | 308,354 | |
Goldman Sachs Financial Square Treasury Instruments Fund — Institutional Class | |
| 511,416 | | 4.997 | | | 511,416 | |
Goldman Sachs Financial Square Treasury Obligations Fund — Institutional Class | |
| 511,694 | | 5.000 | | | 511,694 | |
Goldman Sachs Financial Square Treasury Solutions Fund — Institutional Class | |
| 511,709 | | 4.993 | | | 511,709 | |
Goldman Sachs Variable Insurance Trust Government Money Market Fund — Institutional Class | |
| 511,663 | | 5.021 | | | 511,663 | |
| |
| TOTAL INVESTMENT COMPANIES | |
| (Cost $2,354,836) | | $ | 2,354,836 | |
| |
Principal
Amount | | | Interest
Rate | | | Maturity
Date | | | Value | |
|
| Short-term Investments(b) – 35.9% | |
| | FHLB | |
| $ | 500,000 | | | | 0.000 | % | | | 08/09/23 | | | $ | 496,935 | |
| | United States Treasury Bill | |
| | 1,500,000 | | | | 0.000 | | | | 11/16/23 | | | | 1,470,647 | |
| | |
| | TOTAL SHORT-TERM INVESTMENTS | |
| | (Cost $1,968,075) | | | $ | 1,967,582 | |
| | |
| | TOTAL INVESTMENTS – 78.9% | |
| | (Cost $4,322,911) | | | $ | 4,322,418 | |
| | |
| OTHER ASSETS IN EXCESS OF
LIABILITIES – 21.1% |
| | | 1,157,808 | |
| | |
| | NET ASSETS – 100.0% | | | $ | 5,480,226 | |
| | |
| | |
| The percentage shown for each investment category reflects the value of investments in that category as a percentage of net assets. |
| |
| (a) | | Represents an affiliated issuer. |
| |
| (b) | | Issued with a zero coupon. Income is recognized through the accretion of discount. |
| | |
| |
| Investment Abbreviation: |
| FHLB | | —Federal Home Loan Bank |
ADDITIONAL INVESTMENT INFORMATION
PURCHASED AND WRITTEN OPTIONS CONTRACTS — At June 30, 2023, the Fund had the following purchased and written options:
| | | | | | | | | | | | | | | | | | | | | | | | | | |
| Description | | Exercise
Price | | | Expiration
Date | | Number of
Contracts | | | Notional
Amount | | | Market
Value | | | Premiums
Paid (Received)
by Fund | | | Unrealized
Appreciation/
(Depreciation) | |
| |
Purchased option contracts | | | | | |
| |
Calls | | | | | |
| | | | | | | |
S&P 500 Index | | $ | 4,450.380 | | | 12/29/2023 | | | 12 | | | $ | 5,340,456 | | | $ | 267,048 | | | $ | 267,048 | | | $ | — | |
| |
Written option contracts | | | | | |
| |
Calls | | | | | |
| | | | | | | |
S&P 500 Index | | | 4,578.110 | | | 12/29/2023 | | | (12 | ) | | | (5,493,732 | ) | | | (170,868 | ) | | | (170,868 | ) | | | — | |
| |
Puts | | | | | |
| | | | | | | |
S&P 500 Index | | | 4,227.860 | | | 12/29/2023 | | | (12 | ) | | | (5,073,432 | ) | | | (96,108 | ) | | | (96,108 | ) | | | — | |
| | | | | |
| Total written option contracts | | | (24 | ) | | $ | (10,567,164 | ) | | $ | (266,976 | ) | | $ | (266,976 | ) | | $ | — | |
| | | | | | | |
| TOTAL | | | | | | | | | (12 | ) | | $ | (5,226,708 | ) | | $ | 72 | | | $ | 72 | | | $ | — | |
| | |
| 12 | | The accompanying notes are an integral part of these financial statements. |
GOLDMAN SACHS BUFFERED S&P 500 FUND — MAR/SEP
Schedule of Investments
June 30, 2023 (Unaudited)
| | | | | | |
| Shares | | Distribution
Rate | | Value | |
|
| Investment Companies(a) – 46.0% | |
Goldman Sachs Financial Square Government Fund — Institutional Class | |
| 411,353 | | 5.022% | | $ | 411,353 | |
Goldman Sachs Financial Square Treasury Instruments Fund — Institutional Class | |
| 507,840 | | 4.997 | | | 507,840 | |
Goldman Sachs Financial Square Treasury Obligations Fund — Institutional Class | |
| 508,035 | | 5.000 | | | 508,035 | |
Goldman Sachs Financial Square Treasury Solutions Fund — Institutional Class | |
| 508,047 | | 4.993 | | | 508,047 | |
Goldman Sachs Variable Insurance Trust Government Money Market Fund — Institutional Class | |
| 508,035 | | 5.021 | | | 508,035 | |
| |
| TOTAL INVESTMENT COMPANIES | |
| (Cost $2,443,310) | | $ | 2,443,310 | |
| |
| | | | | | | | | | | | |
Principal
Amount | | | Interest
Rate | | Maturity
Date | | | Value | |
|
| Short-term Investments(b) – 37.1% | |
| | FHLB | |
| $ | 500,000 | | | 0.000% | | | 08/30/23 | | | $ | 496,085 | |
| | United States Treasury Bill | |
| | 1,500,000 | | | 0.000 | | | 11/02/23 | | | | 1,473,569 | |
| | |
| | TOTAL SHORT-TERM INVESTMENTS | |
| | (Cost $1,970,554) | | | $ | 1,969,654 | |
| | |
| | TOTAL INVESTMENTS – 83.1% | |
| | (Cost $4,413,864) | | | $ | 4,412,964 | |
| | |
| OTHER ASSETS IN EXCESS OF
LIABILITIES – 16.9% |
| | | 901,186 | |
| | |
| | NET ASSETS – 100.0% | | | $ | 5,314,150 | |
| | |
| | |
| The percentage shown for each investment category reflects the value of investments in that category as a percentage of net assets. |
| |
| (a) | | Represents an affiliated issuer. |
| |
| (b) | | Issued with a zero coupon. Income is recognized through the accretion of discount. |
| | |
| |
| Investment Abbreviation: |
| FHLB | | —Federal Home Loan Bank |
ADDITIONAL INVESTMENT INFORMATION
PURCHASED AND WRITTEN OPTIONS CONTRACTS — At June 30, 2023, the Fund had the following purchased and written options:
| | | | | | | | | | | | | | | | | | | | | | | | | | |
| Description | | Exercise
Price | | | Expiration
Date | | Number of
Contracts | | | Notional
Amount | | | Market
Value | | | Premiums
Paid (Received)
by Fund | | | Unrealized
Appreciation/
(Depreciation) | |
| |
Purchased option contracts | | | | | |
| |
Calls | | | | | |
| | | | | | | |
S&P 500 Index | | $ | 3,970.150 | | | 08/31/2023 | | | 13 | | | $ | 5,161,195 | | | $ | 673,220 | | | $ | 330,317 | | | $ | 342,903 | |
| |
Written option contracts | | | | | |
| |
Calls | | | | | |
| | | | | | | |
S&P 500 Index | | $ | 4,188.510 | | | 08/31/2023 | | | (13 | ) | | | (5,445,063 | ) | | | (407,817 | ) | | | (175,487 | ) | | | (232,330 | ) |
| |
Puts | | | | | |
| | | | | | | |
S&P 500 Index | | $ | 3,771.640 | | | 08/31/2023 | | | (13 | ) | | | (4,903,132 | ) | | | (8,229 | ) | | | (154,830 | ) | | | 146,601 | |
| | | | | |
| Total written option contracts | | | (26 | ) | | $ | (10,348,195 | ) | | $ | (416,046 | ) | | $ | (330,317 | ) | | $ | (85,729 | ) |
| | | | | | | |
| TOTAL | | | | | | | | | (13 | ) | | $ | (5,187,000 | ) | | $ | 257,174 | | | $ | — | | | $ | 257,174 | |
| | |
| The accompanying notes are an integral part of these financial statements. | | 13 |
GOLDMAN SACHS BUFFERED S&P 500 FUND — MAY/NOV
Schedule of Investments
June 30, 2023 (Unaudited)
| | | | | | |
| Shares | | Distribution
Rate | | Value | |
|
| Investment Companies(a) – 41.3% | |
Goldman Sachs Financial Square Government Fund — Institutional Class | |
| 138,613 | | 5.022% | | $ | 138,613 | |
Goldman Sachs Financial Square Treasury Instruments Fund — Institutional Class | |
| 500,000 | | 4.997 | | | 500,000 | |
Goldman Sachs Financial Square Treasury Obligations Fund — Institutional Class | |
| 504,013 | | 5.000 | | | 504,013 | |
Goldman Sachs Financial Square Treasury Solutions Fund —Institutional Class | |
| 500,000 | | 4.993 | | | 500,000 | |
Goldman Sachs Variable Insurance Trust Government Money Market Fund — Institutional Class | |
| 500,000 | | 5.021 | | | 500,000 | |
| |
| TOTAL INVESTMENT COMPANIES | |
| (Cost $2,142,626) | | $ | 2,142,626 | |
| |
| | | | | | | | | | | | | | |
Principal
Amount | | | Interest
Rate | | | Maturity
Date | | | Value | |
|
| Short-term Investments(b) – 37.9% | |
| | FHLB | | | | | | | | | |
| $ | 500,000 | | | | 0.000 | % | | | 08/25/23 | | | $ | 495,713 | |
| | United States Treasury Bill | |
| | 1,500,000 | | | | 0.000 | | | | 11/16/23 | | | | 1,470,647 | |
| | |
| | TOTAL SHORT-TERM INVESTMENTS | |
| | (Cost $1,966,879) | | | $ | 1,966,360 | |
| | |
| | TOTAL INVESTMENTS – 79.3% | |
| | (Cost $4,109,505) | | | $ | 4,108,986 | |
| | |
| OTHER ASSETS IN EXCESS OF
LIABILITIES – 20.7% |
| | | 1,072,939 | |
| | |
| | NET ASSETS – 100.0% | | | $ | 5,181,925 | |
| | |
| | |
| The percentage shown for each investment category reflects the value of investments in that category as a percentage of net assets. |
| |
| (a) | | Represents an affiliated issuer. |
| |
| (b) | | Issued with a zero coupon. Income is recognized through the accretion of discount. |
| | |
| |
| Investment Abbreviation: |
| FHLB | | —Federal Home Loan Bank |
ADDITIONAL INVESTMENT INFORMATION
PURCHASED AND WRITTEN OPTIONS CONTRACTS — At June 30, 2023, the Fund had the following purchased and written options:
| | | | | | | | | | | | | | | | | | | | | | | | | | |
| Description | | Exercise
Price | | | Expiration
Date | | Number of
Contracts | | | Notional
Amount | | | Market
Value | | | Premiums
Paid (Received)
by Fund | | | Unrealized
Appreciation/
(Depreciation) | |
| |
Purchased option contracts | | | | | |
| |
Calls | | | | | |
| | | | | | | |
S&P 500 Index | | $ | 4,169.480 | | | 10/31/2023 | | | 12 | | | $ | 5,003,376 | | | $ | 465,360 | | | $ | 303,504 | | | $ | 161,856 | |
| |
Written option contracts | | | | | |
| |
Calls | | | | | |
| | | | | | | |
S&P 500 Index | | $ | 4,365.460 | | | 10/31/2023 | | | (12 | ) | | | (5,238,552 | ) | | | (273,134 | ) | | | (161,052 | ) | | | (112,082 | ) |
| |
Puts | | | | | |
| | | | | | | |
S&P 500 Index | | $ | 3,961.010 | | | 10/31/2023 | | | (12 | ) | | | (4,753,212 | ) | | | (36,918 | ) | | | (142,452 | ) | | | 105,534 | |
| | | | | |
| Total written option contracts | | | (24 | ) | | $ | (9,991,764 | ) | | $ | (310,052 | ) | | $ | (303,504 | ) | | $ | (6,548 | ) |
| | | | | | | |
| TOTAL | | | | | | | | | (12 | ) | | $ | (4,988,388 | ) | | $ | 155,308 | | | $ | — | | | $ | 155,308 | |
| | |
| 14 | | The accompanying notes are an integral part of these financial statements. |
GOLDMAN SACHS VIT BUFFERED S&P 500 FUNDS
Statements of Assets and Liabilities
June 30, 2023 (Unaudited)
| | | | | | | | | | | | |
| | | Buffered S&P 500
Fund — Jan/Jul | | | Buffered S&P 500
Fund — Mar/Sep | | | Buffered S&P 500
Fund — May/Nov | |
| | | | | | | | | | | | |
| Assets: | | | | |
Investments, at value (cost $1,968,075, $1,970,554 and $1,966,879, respectively) | | $ | 1,967,582 | | | $ | 1,969,654 | | | $ | 1,966,360 | |
Investments of affiliated issuers, at value (cost $2,354,836, $2,443,310 and $2,142,626, respectively) | | | 2,354,836 | | | | 2,443,310 | | | | 2,142,626 | |
Purchased options contracts, at value (premium paid $267,048, $330,317 and $303,504, respectively) | | | 267,048 | | | | 673,220 | | | | 465,360 | |
Cash | | | 92,865 | | | | 90,657 | | | | 76,885 | |
Receivables: | |
Investments sold | | | 794,144 | | | | — | | | | — | |
Collateral on options contracts(a) | | | 604,551 | | | | 513,055 | | | | 786,369 | |
Investments sold on an extended-settlement basis | | | 266,976 | | | | — | | | | — | |
Deferred offering costs | | | 63,025 | | | | 47,102 | | | | 53,781 | |
Reimbursement from investment adviser | | | 15,748 | | | | 15,821 | | | | 14,975 | |
Dividends and Interest | | | 12,149 | | | | 9,977 | | | | 14,324 | |
Other assets | | | 291 | | | | 13 | | | | — | |
| | | |
| Total assets | | | 6,439,215 | | | | 5,762,809 | | | | 5,520,680 | |
| | | | | | | | | | | | |
| | | | | | | | | | | | |
| Liabilities: | | | | |
Written option contracts, at value (premium received $266,976, $330,317 and $303,504, respectively) | | | 266,976 | | | | 416,046 | | | | 310,052 | |
Payables: | |
Investments purchased | | | 406,960 | | | | 9,909 | | | | 2,477 | |
Investments purchased on an extended — settlement basis | | | 267,048 | | | | — | | | | — | |
Offering expense | | | — | | | | — | | | | 8,888 | |
Management fees | | | 1,912 | | | | 1,827 | | | | 1,833 | |
Distribution and Service fees and Transfer Agency fees | | | 90 | | | | 87 | | | | 98 | |
Accrued expenses | | | 16,003 | | | | 20,790 | | | | 15,407 | |
| | | |
| Total liabilities | | | 958,989 | | | | 448,659 | | | | 338,755 | |
| | | | | | | | | | | | |
| | | | | | | | | | | | |
| Net Assets: | |
Paid-in capital | | | 4,999,998 | | | | 5,000,000 | | | | 5,000,000 | |
Total distributable earnings | | | 480,228 | | | | 314,150 | | | | 181,925 | |
| | | |
| NET ASSETS | | $ | 5,480,226 | | | $ | 5,314,150 | | | $ | 5,181,925 | |
Net Assets: | |
Institutional | | $ | 5,425,425 | | | $ | 5,261,009 | | | $ | 5,130,106 | |
Service | | | 54,801 | | | | 53,141 | | | | 51,819 | |
| | | |
Total Net Assets | | $ | 5,480,226 | | | $ | 5,314,150 | | | $ | 5,181,925 | |
Shares Outstanding $0.001 par value (unlimited number of shares authorized): | | | | | | | | | | | | |
Institutional | | | 495,000 | | | | 495,000 | | | | 495,000 | |
Service | | | 5,000 | | | | 5,000 | | | | 5,000 | |
Net asset value, offering and redemption price per share: | | | | | | | | | | | | |
Institutional | | | $10.96 | | | | $10.63 | | | | $10.36 | |
Service | | | 10.96 | | | | 10.62 | | | | 10.36 | |
(a) Segregated for initial margin requirements and/or collateral on options.
| | |
| The accompanying notes are an integral part of these financial statements. | | 15 |
GOLDMAN SACHS VIT BUFFERED S&P 500 FUNDS
Statements of Operations
For the Six Months Ended June 30, 2023 (Unaudited)
| | | | | | | | | | | | |
| | | Buffered S&P 500
Fund — Jan/Jul | | | Buffered S&P 500
Fund — Mar/Sep(a) | | | Buffered S&P 500
Fund —May/Nov(b) | |
| | | | | | | | | | | | |
| Investment income: | | | |
Dividends — affiliated issuers | | $ | 56,305 | | | $ | 36,977 | | | $ | 16,522 | |
Interest | | | 43,174 | | | | 32,403 | | | | 16,220 | |
| | | |
| Total investment income | | | 99,479 | | | | 69,380 | | | | 32,742 | |
| | | | | | | | | | | | |
| | | | | | | | | | | | |
| Expenses: | | | |
Amortization of offering costs | | | 32,232 | | | | 21,726 | | | | 11,219 | |
Professional fees | | | 27,912 | | | | 18,814 | | | | 9,715 | |
Custody, accounting and administrative services | | | 15,168 | | | | 10,213 | | | | 5,271 | |
Management fees | | | 13,069 | | | | 8,585 | | | | 4,230 | |
Trustee fees | | | 7,838 | | | | 7,255 | | | | 929 | |
Printing and mailing costs | | | 7,439 | | | | 5,014 | | | | 2,589 | |
Transfer Agency fees(a) | | | 523 | | | | 344 | | | | 175 | |
Distribution and/or Service (12b-1) fees | | | 65 | | | | 43 | | | | 22 | |
Registration fees | | | 24 | | | | 8 | | | | — | |
Organization costs | | | — | | | | 12,000 | | | | 12,000 | |
Other | | | 4,132 | | | | 2,752 | | | | 1,454 | |
| | | |
| Total expenses | | | 108,402 | | | | 86,754 | | | | 47,604 | |
| | | |
Less — expense reductions | | | (91,636 | ) | | | (75,926 | ) | | | (41,998 | ) |
| | | |
| Net expenses | | | 16,766 | | | | 10,828 | | | | 5,606 | |
| | | |
| NET INVESTMENT INCOME | | | 82,713 | | | | 58,552 | | | | 27,136 | |
| | | | | | | | | | | | |
| | | | | | | | | | | | |
| Realized and unrealized gain (loss) from transactions: | | | |
Net realized gain (loss) from: | |
Investments — unaffiliated issuers | | | (71 | ) | | | (676 | ) | | | — | |
Purchased options | | | 429,754 | | | | — | | | | — | |
Written options | | | (33,020 | ) | | | — | | | | — | |
Net change in unrealized gain (loss) on: | |
Investments — unaffiliated issuers | | | (540 | ) | | | (900 | ) | | | (519 | ) |
Purchased options | | | 3,221 | | | | 342,903 | | | | 161,856 | |
Written options | | | (6,135 | ) | | | (85,729 | ) | | | (6,548 | ) |
| | | |
| Net realized and unrealized gain | | | 393,209 | | | | 255,598 | | | | 154,789 | |
| | | |
| NET INCREASE IN NET ASSETS RESULTING FROM OPERATIONS | | $ | 475,922 | | | $ | 314,150 | | | $ | 181,925 | |
(a) Commenced operations on February 28, 2023.
(b) Commenced operations on April 28, 2023.
(c) Class specific Transfer Agency fees were as follows:
| | | | | | | | |
| | | Transfer Agency Fees | |
| | | Institutional | | | Service Class | |
Buffered S&P 500 Fund — Jan/Jul | | $ | 518 | | | $ | 5 | |
Buffered S&P 500 Fund — Mar/Sep | | | 340 | | | | 4 | |
Buffered S&P 500 Fund — May/Nov | | | 173 | | | | 2 | |
| | |
| 16 | | The accompanying notes are an integral part of these financial statements. |
GOLDMAN SACHS VIT BUFFERED S&P 500 FUNDS
Statements of Changes in Net Assets
| | | | | | | | | | | | |
| | | Buffered S&P 500 Fund — Jan/Jul | | | Buffered S&P 500
Fund — Mar/Sep(b) | |
| | | For the
Six Months Ended
June 30, 2023
(Unaudited) | | | For the
Period Ended
December 31,
2022(a) | | | For the
Period Ended
June 30, 2023
(Unaudited) | |
| | | | | | | | | | | | |
| From operations: | | | | | | | | | |
Net investment income | | $ | 82,713 | | | $ | 1,343 | | | $ | 58,552 | |
Net realized gain (loss) | | | 396,663 | | | | — | | | | (676 | ) |
Net change in unrealized gain (loss) | | | (3,454 | ) | | | 2,961 | | | | 256,274 | |
| | | |
| Net increase in net assets resulting from operations | | | 475,922 | | | | 4,304 | | | | 314,150 | |
| | | | | | | | | | | | |
| | | | | | | | | | | | |
| From share transactions: | | | | | | | | | |
Proceeds from sales of shares | | | — | | | | 5,000,000 | | | | 5,000,020 | |
Cost of shares redeemed | | | — | | | | — | | | | (20 | ) |
| | | |
| Net increase in net assets resulting from share transactions | | | — | | | | 5,000,000 | | | | 5,000,000 | |
| | | |
| TOTAL INCREASE | | | 475,922 | | | | 5,004,304 | | | | 5,314,150 | |
| | | | | | | | | | | | |
| | | | | | | | | | | | |
| Net assets: | | | | | | | | | |
| | | |
Beginning of period | | | 5,004,304 | | | | — | | | | — | |
| | | |
End of period | | $ | 5,480,226 | | | $ | 5,004,304 | | | $ | 5,314,150 | |
(a) Commenced operations on December 30, 2022.
(b) Commenced operations on February 28, 2023.
| | |
| The accompanying notes are an integral part of these financial statements. | | 17 |
GOLDMAN SACHS VIT BUFFERED S&P 500 FUNDS
Statements of Changes in Net Assets (continued)
| | | | |
| | | Buffered S&P 500
Fund — May/Nov(a) | |
| | | For the
Period Ended
June 30, 2023
(Unaudited) | |
| | | | |
| From operations: | | | |
Net investment income | | $ | 27,136 | |
Net realized gain | | | — | |
Net unrealized gain | | | 154,789 | |
| |
| Net increase in net assets resulting from operations | | | 181,925 | |
| | | | |
| | | | |
| From share transactions: | | | |
Proceeds from sales of shares | | | 5,000,020 | |
Cost of shares redeemed | | | (20 | ) |
| |
| Net increase in net assets resulting from share transactions | | | 5,000,000 | |
| |
| TOTAL INCREASE | | | 5,181,925 | |
| | | | |
| | | | |
| Net assets: | | | |
| |
Beginning of period | | | — | |
| |
End of period | | $ | 5,181,925 | |
(a) Commenced operations on April 28, 2023.
| | |
| 18 | | The accompanying notes are an integral part of these financial statements. |
GOLDMAN SACHS BUFFERED S&P 500 FUND — JAN/JUL
Financial Highlights
Selected Share Data for a Share Outstanding Throughout each Period
| | | | | | | | |
| | | Goldman Sachs Buffered S&P 500
Fund — Jan/Jul | |
| | Institutional Shares | |
| | | Six Months Ended June 30, 2023
(Unaudited) | | | Period Ended December 31, 2022(a) | |
| | | | | | | | |
| Per Share Data | |
| | |
Net asset value, beginning of period | | $ | 10.00 | | | $ | 10.00 | |
| | |
Net investment income(b)(c) | | | 0.17 | | | | 0.00 | (d) |
| | |
Net realized and unrealized gain (loss) | | | 0.79 | | | | 0.00 | (d) |
| | |
Total from investment operations | | | 0.96 | | | | — | |
| | |
Net asset value, end of period | | $ | 10.96 | | | $ | 10.00 | |
| | |
Total return(e) | | | 9.60 | % | | | — | % |
| | |
Net assets, end of period (in 000s) | | $ | 5,425 | | | $ | 4,954 | |
| | |
Ratio of net expenses to average net assets(f)(g) | | | 0.64 | % | | | 0.54 | % |
| | |
Ratio of total expenses to average net assets(f)(g) | | | 3.52 | % | | | 66.87 | % |
| | |
Ratio of net investment income to average net assets(c)(g) | | | 3.16 | % | | | 4.90 | % |
| | |
Portfolio turnover rate(h) | | | — | % | | | — | % |
| (a) | Commenced operations on December 30, 2022. |
| (b) | Calculated based on the average shares outstanding methodology. |
| (c) | Recognition of net investment income by the Fund is affected by the timing of declaration of dividends by the Underlying Funds in which the Fund invests. |
| (d) | Amount is less than $0.005 per share. |
| (e) | Assumes investment at the NAV at the beginning of the period, reinvestment of all dividends and distributions, a complete redemption of the investment at the NAV at the end of the period and no sales or redemption charges (if any). Total returns would be reduced if a sales or redemption charge was taken into account. Returns do not reflect the impact of taxes to shareholders relating to Fund distributions or the redemption of Fund shares. Total returns for periods less than one full year are not annualized. |
| (f) | Expense ratios exclude the expenses of the Underlying Funds in which the Fund invests. |
| (h) | There were no long-term transactions for the period ended June 30, 2023. |
| | |
| The accompanying notes are an integral part of these financial statements. | | 19 |
GOLDMAN SACHS BUFFERED S&P 500 FUND — JAN/JUL
Financial Highlights (continued)
Selected Share Data for a Share Outstanding Throughout each Period
| | | | | | | | |
| | | Goldman Sachs Buffered S&P 500
Fund — Jan/Jul | |
| | | Service Shares | |
| | | Six Months Ended June 30, 2023
(Unaudited) | | | Period Ended December 31, 2022(a) | |
| | | | | | | | |
| Per Share Data | |
| | |
Net asset value, beginning of period | | $ | 10.00 | | | $ | 10.00 | |
| | |
Net investment income(b)(c) | | | 0.17 | | | | 0.00 | (d) |
| | |
Net realized and unrealized gain (loss) | | | 0.79 | | | | 0.00 | (d) |
| | |
Total from investment operations | | | 0.96 | | | | — | |
| | |
Net asset value, end of period | | $ | 10.96 | | | $ | 10.00 | |
| | |
Total return(e) | | | 9.60 | % | | | — | % |
| | |
Net assets, end of period (in 000s) | | $ | 55 | | | $ | 50 | |
| | |
Ratio of net expenses to average net assets(f)(g) | | | 0.64 | % | | | 0.79 | % |
| | |
Ratio of total expenses to average net assets(f)(g) | | | 3.77 | % | | | 67.12 | % |
| | |
Ratio of net investment income to average net assets(c)(g) | | | 3.16 | % | | | 4.65 | % |
| | |
Portfolio turnover rate(h) | | | — | % | | | — | % |
| (a) | Commenced operations on December 30, 2022. |
| (b) | Calculated based on the average shares outstanding methodology. |
| (c) | Recognition of net investment income by the Fund is affected by the timing of declaration of dividends by the Underlying Funds in which the Fund invests. |
| (d) | Amount is less than $0.005 per share. |
| (e) | Assumes investment at the NAV at the beginning of the period, reinvestment of all dividends and distributions, a complete redemption of the investment at the NAV at the end of the period and no sales or redemption charges (if any). Total returns would be reduced if a sales or redemption charge was taken into account. Returns do not reflect the impact of taxes to shareholders relating to Fund distributions or the redemption of Fund shares. Total returns for periods less than one full year are not annualized. |
| (f) | Expense ratios exclude the expenses of the Underlying Funds in which the Fund invests. |
| (h) | There were no long-term transactions for the period ended June 30, 2023. |
| | |
| 20 | | The accompanying notes are an integral part of these financial statements. |
GOLDMAN SACHS BUFFERED S&P 500 FUND — MAR/SEP
Financial Highlights (continued)
Selected Share Data for a Share Outstanding Throughout the Period
| | | | |
| | | Goldman Sachs Buffered S&P 500
Fund — Mar/Sep | |
| | | Institutional Shares | |
| | | Period Ended
June 30, 2023
(Unaudited)(a) | |
| | | | |
| Per Share Data | |
| |
Net asset value, beginning of period | | $ | 10.00 | |
| |
Net investment income(b)(c) | | | 0.12 | |
| |
Net realized and unrealized gain | | | 0.51 | |
| |
Total from investment operations | | | 0.63 | |
| |
Net asset value, end of period | | $ | 10.63 | |
| |
Total return(d) | | | 6.30 | % |
| |
Net assets, end of period (in 000s) | | $ | 5,261 | |
| |
Ratio of net expenses to average net assets(e)(f) | | | 0.63 | % |
| |
Ratio of total expenses to average net assets(e)(f) | | | 4.03 | % |
| |
Ratio of net investment income to average net assets(c)(f) | | | 3.41 | % |
| |
Portfolio turnover rate(g) | | | — | % |
| (a) | Commenced operations on February 28, 2023. |
| (b) | Calculated based on the average shares outstanding methodology. |
| (c) | Recognition of net investment income by the Fund is affected by the timing of declaration of dividends by the Underlying Funds in which the Fund invests. |
| (d) | Assumes investment at the NAV at the beginning of the year, reinvestment of all dividends and distributions, a complete redemption of the investment at the NAV at the end of the year and no sales or redemption charges (if any). Total returns would be reduced if a sales or redemption charge was taken into account. Returns do not reflect the impact of taxes to shareholders relating to Fund distributions or the redemption of Fund shares. Total returns for periods less than one full year are not annualized. |
| (e) | Expense ratios exclude the expenses of the Underlying Funds in which the Fund invests. |
| (g) | There were no long-term transactions for the period ended June 30, 2023. |
| | |
| The accompanying notes are an integral part of these financial statements. | | 21 |
GOLDMAN SACHS BUFFERED S&P 500 FUND — MAR/SEP
Financial Highlights (continued)
Selected Share Data for a Share Outstanding Throughout the Period
| | | | |
| | | Goldman Sachs Buffered S&P 500
Fund — Mar/Sep | |
| | | Service Shares | |
| | | Period Ended
June 30, 2023
(Unaudited)(a) | |
| | | | |
| Per Share Data | |
| |
Net asset value, beginning of period | | $ | 10.00 | |
| |
Net investment income(b)(c) | | | 0.12 | |
| |
Net realized and unrealized gain | | | 0.50 | |
| |
Total from investment operations | | | 0.62 | |
| |
Net asset value, end of period | | $ | 10.62 | |
| |
Total return(d) | | | 6.20 | % |
| |
Net assets, end of period (in 000s) | | $ | 53 | |
| |
Ratio of net expenses to average net assets(e)(f) | | | 0.63 | % |
| |
Ratio of total expenses to average net assets(e)(f) | | | 4.28 | % |
| |
Ratio of net investment income to average net assets(c)(f) | | | 3.41 | % |
| |
Portfolio turnover rate(g) | | | — | % |
| (a) | Commenced operations on February 28, 2023. |
| (b) | Calculated based on the average shares outstanding methodology. |
| (c) | Recognition of net investment income by the Fund is affected by the timing of declaration of dividends by the Underlying Funds in which the Fund invests. |
| (d) | Assumes investment at the NAV at the beginning of the year, reinvestment of all dividends and distributions, a complete redemption of the investment at the NAV at the end of the year and no sales or redemption charges (if any). Total returns would be reduced if a sales or redemption charge was taken into account. Returns do not reflect the impact of taxes to shareholders relating to Fund distributions or the redemption of Fund shares. Total returns for periods less than one full year are not annualized. |
| (e) | Expense ratios exclude the expenses of the Underlying Funds in which the Fund invests. |
| (g) | There were no long-term transactions for the period ended June 30, 2023. |
| | |
| 22 | | The accompanying notes are an integral part of these financial statements. |
GOLDMAN SACHS BUFFERED S&P 500 FUND — MAY/NOV
Financial Highlights (continued)
Selected Share Data for a Share Outstanding Throughout the Period
| | | | |
| | | Goldman Sachs Buffered S&P 500
Fund — May/Nov | |
| | | Institutional Shares | |
| | | Period Ended
June 30, 2023
(Unaudited)(a) | |
| | | | |
| Per Share Data | |
| |
Net asset value, beginning of period | | $ | 10.00 | |
| |
Net investment income(b)(c) | | | 0.05 | |
| |
Net realized and unrealized gain | | | 0.31 | |
| |
Total from investment operations | | | 0.36 | |
| |
Net asset value, end of period | | $ | 10.36 | |
| |
Total return(d) | | | 3.60 | % |
| |
Net assets, end of period (in 000s) | | $ | 5,130 | |
| |
Ratio of net expenses to average net assets(e)(f) | | | 0.66 | % |
| |
Ratio of total expenses to average net assets(e)(f) | | | 3.47 | % |
| |
Ratio of net investment income to average net assets(c)(f) | | | 3.21 | % |
| |
Portfolio turnover rate(g) | | | — | % |
| (a) | Commenced operations on April 28, 2023. |
| (b) | Calculated based on the average shares outstanding methodology. |
| (c) | Recognition of net investment income by the Fund is affected by the timing of declaration of dividends by the Underlying Funds in which the Fund invests. |
| (d) | Assumes investment at the NAV at the beginning of the year, reinvestment of all dividends and distributions, a complete redemption of the investment at the NAV at the end of the year and no sales or redemption charges (if any). Total returns would be reduced if a sales or redemption charge was taken into account. Returns do not reflect the impact of taxes to shareholders relating to Fund distributions or the redemption of Fund shares. Total returns for periods less than one full year are not annualized. |
| (e) | Expense ratios exclude the expenses of the Underlying Funds in which the Fund invests. |
| (g) | There were no long-term transactions for the period ended June 30, 2023. |
| | |
| The accompanying notes are an integral part of these financial statements. | | 23 |
GOLDMAN SACHS BUFFERED S&P 500 FUND — MAY/NOV
Financial Highlights (continued)
Selected Share Data for a Share Outstanding Throughout the Period
| | | | |
| | | Goldman Sachs Buffered S&P 500
Fund — May/Nov | |
| | | Service Shares | |
| | | Period Ended
June 30, 2023
(Unaudited)(a) | |
| | | | |
| Per Share Data | |
| |
Net asset value, beginning of period | | $ | 10.00 | |
| |
Net investment income(b)(c) | | | 0.05 | |
| |
Net realized and unrealized gain | | | 0.31 | |
| |
Total from investment operations | | | 0.36 | |
| |
Net asset value, end of period | | $ | 10.36 | |
| |
Total return(d) | | | 3.60 | % |
| |
Net assets, end of period (in 000s) | | $ | 52 | |
| |
Ratio of net expenses to average net assets(e)(f) | | | 0.66 | % |
| |
Ratio of total expenses to average net assets(e)(f) | | | 3.73 | % |
| |
Ratio of net investment income to average net assets(c)(f) | | | 3.21 | % |
| |
Portfolio turnover rate(g) | | | — | % |
| (a) | Commenced operations on April 28, 2023. |
| (b) | Calculated based on the average shares outstanding methodology. |
| (c) | Recognition of net investment income by the Fund is affected by the timing of declaration of dividends by the Underlying Funds in which the Fund invests. |
| (d) | Assumes investment at the NAV at the beginning of the year, reinvestment of all dividends and distributions, a complete redemption of the investment at the NAV at the end of the year and no sales or redemption charges (if any). Total returns would be reduced if a sales or redemption charge was taken into account. Returns do not reflect the impact of taxes to shareholders relating to Fund distributions or the redemption of Fund shares. Total returns for periods less than one full year are not annualized. |
| (e) | Expense ratios exclude the expenses of the Underlying Funds in which the Fund invests. |
| (g) | There were no long-term transactions for the period ended June 30, 2023. |
| | |
| 24 | | The accompanying notes are an integral part of these financial statements. |
GOLDMAN SACHS VIT BUFFERED S&P 500 FUNDS
Notes to Financial Statements
June 30, 2023 (Unaudited)
1. ORGANIZATION
Goldman Sachs Variable Insurance Trust (the “Trust” or “VIT”) is a Delaware statutory trust registered under the Investment Company Act of 1940, as amended (the “Act”), as an open-end management investment company. The following table lists those series of the Trust that are included in this report (collectively, the “Funds” or individually a “Fund”), along with their corresponding share classes and respective diversification status under the Act:
| | | | | | | | |
| Fund | | Share Classes Offered | | | Diversified/
Non-diversified | |
| Buffered S&P 500 Fund — Jan/Jul | | | Institutional and Service | | | | Non-diversified | |
| Buffered S&P 500 Fund — Mar/Sep | | | Institutional and Service | | | | Non-diversified | |
| Buffered S&P 500 Fund — May/Nov | | | Institutional and Service | | | | Non-diversified | |
Shares of the Trust are offered to a separate account of participating life insurance companies for the purpose of funding variable annuity contracts and variable life insurance policies.
The Funds seek to achieve a total return for a specified Outcome Period that tracks the S&P 500 Price Return Index (the “Underlying Index”) up to a “cap” while providing a downside “buffer” against losses over a six-month Outcome Period. After the conclusion of an Outcome Period, another six-month Outcome Period will begin. In order to implement the buffer and cap, the Fund will primarily invest in FLexible EXchange® Options (“FLEX Options”) and over-the counter (“OTC”) and listed options that reference the Underlying Index (together with FLEX Options, “S&P 500 Options”). FLEX Options are customized exchange-traded option contracts available through the Chicago Board Option Exchange. Through FLEX Options, the Fund could customize key contract terms such as exercise prices and expiration dates.
Goldman Sachs Asset Management, L.P. (“GSAM”), an affiliate of Goldman Sachs & Co. LLC (“Goldman Sachs”), serves as investment adviser to the Funds pursuant to a management agreement (the “Agreement”) with the Trust.
2. SIGNIFICANT ACCOUNTING POLICIES
The financial statements have been prepared in accordance with accounting principles generally accepted in the United States of America (“GAAP”) and require management to make estimates and assumptions that may affect the reported amounts and disclosures. Actual results may differ from those estimates and assumptions. Each Fund is an investment company under GAAP and follows the accounting and reporting guidance applicable to investment companies.
A. Investment Valuation — The Funds’ valuation policy is to value investments at fair value.
B. Investment Income and Investments — Investment income includes interest income, dividend income and securities
lending income, if any. Interest income is accrued daily and adjusted for amortization of premiums and accretion of discounts. Dividend income is recognized on ex-dividend date or, for certain foreign securities, as soon as such information is obtained subsequent to the ex-dividend date. Non-cash dividends, if any, are recorded at the fair market value of the securities received. Investment transactions are reflected on trade date. Realized gains and losses are calculated using identified cost. Investment transactions are recorded on the following business day for daily net asset value (“NAV”) calculations. For derivative contracts, unrealized gains and losses are recorded daily and become realized gains and losses upon disposition or termination of the contract.
C. Class Allocations and Expenses — Investment income, realized and unrealized gain (loss), if any, and non-class specific expenses of each Fund are allocated daily based upon the proportion of net assets of each class. Non-class specific expenses directly incurred by a Fund are charged to that Fund, while such expenses incurred by the Trust are allocated across the applicable Funds on a straightline and/or pro-rata basis depending upon the nature of the expenses. Class specific expenses, where applicable, are borne by the respective share classes and include Distribution and Service and Transfer Agency fees.
GOLDMAN SACHS VIT BUFFERED S&P 500 FUNDS
Notes to Financial Statements (continued)
June 30, 2023 (Unaudited)
2. SIGNIFICANT ACCOUNTING POLICIES (continued)
D. Offering and Organization Costs — Offering costs paid in connection with the initial offering of shares of each Fund are being amortized on a straight-line basis over 12 months from the date of commencement of operations for the applicable Fund. Organization costs paid in connection with the organization of each Fund were expensed on the first day of operations for the applicable Fund.
E. Federal Taxes and Distributions to Shareholders — It is each Fund’s policy to comply with the requirements of the Internal Revenue Code of 1986, as amended (the “Code”), applicable to regulated investment companies and to distribute each year substantially all of its investment company taxable income and capital gains to its shareholders. Accordingly, each Fund is not required to make any provisions for the payment of federal income tax. Distributions to shareholders are recorded on the ex-dividend date. Income and capital gains distributions, if any, are declared and paid according to the following schedule:
| | | | |
| Fund | | Income Distributions Declared/Paid | | Capital Gains Distributions Declared/Paid |
Buffered S&P 500 Fund — Jan/Jul | | Annually | | Annually |
Buffered S&P 500 Fund — Mar/Sep | | Annually | | Annually |
Buffered S&P 500 Fund — May/Nov | | Annually | | Annually |
Net capital losses, if any, are carried forward to future fiscal years and may be used to the extent allowed by the Code to offset any future capital gains. Losses that are carried forward will retain their character as either short-term or long-term capital losses. Utilization of capital loss carryforwards will reduce the requirement of future capital gains distributions.
The characterization of distributions to shareholders for financial reporting purposes is determined in accordance with federal income tax rules, which may differ from GAAP. The source of each Fund’s distributions may be shown in the accompanying financial statements as either from distributable earnings or capital. Certain components of the Funds’ net assets on the Statements of Assets and Liabilities reflect permanent GAAP/tax differences based on the appropriate tax character.
3. INVESTMENTS AND FAIR VALUE MEASUREMENTS
U.S. GAAP defines the fair value of a financial instrument as the amount that would be received to sell an asset or paid to transfer a liability in an orderly transaction between market participants at the measurement date (i.e., the exit price); the Funds’ policy is to use the market approach. GAAP establishes a fair value hierarchy that prioritizes the inputs to valuation techniques used to measure fair value. The hierarchy gives the highest priority to unadjusted quoted prices in active markets for identical assets or liabilities (Level 1 measurements) and the lowest priority to unobservable inputs (Level 3 measurements). The Level in the fair value hierarchy within which the fair value measurement in its entirety falls shall be determined based on the lowest Level input that is significant to the fair value measurement in its entirety. The levels used for classifying investments are not necessarily an indication of the risk associated with investing in these investments. The three levels of the fair value hierarchy are described below:
Level 1 — Unadjusted quoted prices in active markets that are accessible at the measurement date for identical, unrestricted assets or liabilities;
Level 2 — Quoted prices in markets that are not active or financial instruments for which significant inputs are observable (including, but not limited to, quoted prices for similar investments, interest rates, foreign exchange rates, volatility and credit spreads), either directly or indirectly;
Level 3 — Prices or valuations that require significant unobservable inputs (including GSAM’s assumptions in determining fair value measurement).
The Board of Trustees (“Trustees”) has approved Valuation Procedures that govern the valuation of the portfolio investments held by the Funds, including investments for which market quotations are not readily available. With respect to the Funds’ investments that do not have readily available market quotations, the Trustees have designated the Adviser as the valuation designee to perform
GOLDMAN SACHS VIT BUFFERED S&P 500 FUNDS
3. INVESTMENTS AND FAIR VALUE MEASUREMENTS (continued)
fair valuations pursuant to Rule 2a-5 under the Investment Company Act of 1940 (the “Valuation Designee”). GSAM has day-to-day responsibility for implementing and maintaining internal controls and procedures related to the valuation of the Funds’ investments. To assess the continuing appropriateness of pricing sources and methodologies, GSAM regularly performs price verification procedures and issues challenges as necessary to third party pricing vendors or brokers, and any differences are reviewed in accordance with the Valuation Procedures.
A. Level 1 and Level 2 Fair Value Investments — The valuation techniques and significant inputs used in determining the fair values for investments classified as Level 1 and Level 2 are as follows:
Debt Securities — Debt securities for which market quotations are readily available are valued daily on the basis of quotations supplied by dealers or an independent pricing service. The pricing services may use valuation models or matrix pricing, which consider: (i) yield or price with respect to bonds that are considered comparable in characteristics such as rating, interest rate and maturity date or (ii) quotations from securities dealers to determine current value. With the exception of treasury securities of G7 countries, which are generally classified as Level 1, these investments are generally classified as Level 2 of the fair value hierarchy.
Equity Securities — Equity securities traded on a United States (“U.S.”) securities exchange or the NASDAQ system, or those located on certain foreign exchanges, including but not limited to the Americas, are valued daily at their last sale price or official closing price on the principal exchange or system on which they are traded. If there is no sale or official closing price or such price is believed by GSAM to not represent fair value, equity securities will be valued at the valid closing bid price for long positions and at the valid closing ask price for short positions (i.e. where there is sufficient volume, during normal exchange trading hours). If no valid bid/ask price is available, the equity security will be valued pursuant to the Valuation Procedures and consistent with applicable regulatory guidance. To the extent these investments are actively traded, they are classified as Level 1 of the fair value hierarchy, otherwise they are generally classified as Level 2. Certain equity securities containing unique attributes may be classified as Level 2. Unlisted equity securities for which market quotations are available are valued at the last sale price on the valuation date, or if no sale occurs, at the last bid price for long positions or the last ask price for short positions, and are generally classified as Level 2.
Money Market Funds — Investments in the Goldman Sachs Financial Square Government Fund, Goldman Sachs Financial Square Treasury Instruments Fund, Goldman Sachs Financial Square Treasury Obligations Fund, Goldman Sachs VIT Government Money Market Fund and Goldman Sachs Financial Square Treasury Solutions Fund (“Underlying Money Market Funds”) are valued at the NAV per share of the Institutional Share class on the day of valuation. These investments are generally classified as Level 1 of the fair value hierarchy. For information regarding the Underlying Money Market Funds’ accounting policies and investment holdings, please see the Underlying Money Market Funds’ shareholder report.
Derivative Contracts — A derivative is an instrument whose value is derived from underlying assets, indices, reference rates or a combination of these factors. A Fund enters into derivative transactions to hedge against changes in interest rates, securities prices, and/or currency exchange rates, to increase total return, or to gain access to certain markets or attain exposure to other underliers. For financial reporting purposes, cash collateral that has been pledged to cover obligations of a Fund and cash collateral received, if any, is reported separately on the Statements of Assets and Liabilities as either due to broker/receivable for collateral on certain derivative contracts. Non-cash collateral pledged by a Fund, if any, is noted in the Schedules of Investments.
Exchange-traded derivatives, including futures and options contracts, are generally valued at the last sale or settlement price on the exchange where they are principally traded. Exchange-traded options without settlement prices are generally valued at the midpoint of the bid and ask prices on the exchange where they are principally traded (or, in the absence of two-way trading, at the last bid price for long positions and the last ask price for short positions). Exchange-traded derivatives typically fall within Level 1 of the fair value hierarchy. Over-the-counter (“OTC”) and centrally cleared derivatives are valued using market transactions and other market evidence, including market-based inputs to models, calibration to market-clearing transactions, broker or dealer quotations, or other alternative pricing sources. Where models are used, the selection of a particular model to value OTC and
GOLDMAN SACHS VIT BUFFERED S&P 500 FUNDS
Notes to Financial Statements (continued)
June 30, 2023 (Unaudited)
3. INVESTMENTS AND FAIR VALUE MEASUREMENTS (continued)
centrally cleared derivatives depends upon the contractual terms of, and specific risks inherent in, the instrument, as well as the availability of pricing information in the market. Valuation models require a variety of inputs, including contractual terms, market prices, yield curves, credit curves, measures of volatility, voluntary and involuntary prepayment rates, loss severity rates and correlations of such inputs. For OTC and centrally cleared derivatives that trade in liquid markets, model inputs can generally be verified and model selection does not involve significant management judgment. OTC and centrally cleared derivatives are classified within Level 2 of the fair value hierarchy when significant inputs are corroborated by market evidence.
i. Options— When a Fund writes call or put options, an amount equal to the premium received is recorded as a liability and is subsequently marked-to-market to reflect the current value of the option written. Swaptions are options on swap contracts.
Upon the purchase of a call option or a put option by a Fund, the premium paid is recorded as an investment and subsequently marked-to-market to reflect the current value of the option. Certain options may be purchased with premiums to be determined on a future date. The premiums for these options are based upon implied volatility parameters at specified terms.
B. Level 3 Fair Value Investments — To the extent that significant inputs to valuation models and other alternative pricing sources are unobservable, or if quotations are not readily available, or if GSAM believes that such quotations do not accurately reflect fair value, the fair value of a Fund’s investments may be determined under the Valuation Procedures. GSAM, consistent with its procedures and applicable regulatory guidance, may make an adjustment to the most recent valuation prices of either domestic or foreign securities in light of significant events to reflect what it believes to be the fair value of the securities at the time of determining a Fund’s NAV. To the extent investments are valued using single source broker quotations obtained directly from the broker or passed through from third party pricing vendors, such investments are classified as Level 3 investments.
C. Fair Value Hierarchy — The following is a summary of the Funds’ investments and derivatives classified in the fair value hierarchy as of June 30, 2023:
| | | | | | | | | | | | |
| | | |
| BUFFERED S&P 500 Fund — Jan/Jul | | | | | | | | | |
| Investment Type | | Level 1 | | | Level 2 | | | Level 3 | |
| | | |
| Assets | | | | | | | | | | | | |
| Investment Companies | | $ | 2,354,836 | | | $ | — | | | $ | — | |
| Short-Term Investments | | | 1,967,582 | | | | — | | | | — | |
| | | |
| Total | | $ | 4,322,418 | | | $ | — | | | $ | — | |
| | | |
| Derivative Type | | | | | | | | | |
| | | |
| Assets | | | | | | | | | | | | |
| Purchased Option Contracts | | $ | — | | | $ | 267,048 | | | $ | — | |
| | | |
| Liabilities | | | | | | | | | | | | |
| Written Option Contracts | | $ | — | | | $ | (266,976 | ) | | $ | — | |
| | | |
| BUFFERED S&P 500 Fund — Mar/Sep | | | | | | | | | |
| Investment Type | | Level 1 | | | Level 2 | | | Level 3 | |
| | | |
| Assets | | | | | | | | | | | | |
| Investment Companies | | $ | 2,443,310 | | | $ | — | | | $ | — | |
| Short-Term Investments | | | 1,969,654 | | | | — | | | | — | |
| | | |
| Total | | $ | 4,412,964 | | | $ | — | | | $ | — | |
GOLDMAN SACHS VIT BUFFERED S&P 500 FUNDS
3. INVESTMENTS AND FAIR VALUE MEASUREMENTS (continued)
| | | | | | | | | | | | |
| | | |
| BUFFERED S&P 500 Fund — Mar/Sep (continued) | | | | | | | | | |
| | | |
| Derivative Type | | Level 1 | | | Level 2 | | | Level 3 | |
| | | |
| Assets | | | | | | | | | | | | |
| Purchased Option Contracts | | $ | — | | | $ | 673,220 | | | $ | — | |
| | | |
| Liabilities | | | | | | | | | | | | |
| Written Option Contracts | | $ | — | | | $ | (416,046 | ) | | $ | — | |
| | | |
| BUFFERED S&P 500 Fund — May/Nov | | | | | | | | | |
| Investment Type | | Level 1 | | | Level 2 | | | Level 3 | |
| | | |
| Assets | | | | | | | | | | | | |
| Investment Companies | | $ | 2,142,626 | | | $ | — | | | $ | — | |
| Short-Term Investments | | | 1,966,360 | | | | — | | | | — | |
| | | |
| Total | | $ | 4,108,986 | | | $ | — | | | $ | — | |
| | | |
| Derivative Type | | | | | | | | | |
| | | |
| Assets | | | | | | | | | | | | |
| Purchased Option Contracts | | $ | — | | | $ | 465,360 | | | $ | — | |
| | | |
| Liabilities | | | | | | | | | | | | |
| Written Option Contracts | | $ | — | | | $ | (310,052 | ) | | $ | — | |
For further information regarding security characteristics, see the Schedules of Investments.
4. INVESTMENTS IN DERIVATIVES
The following tables set forth, by certain risk types, the gross value of derivative contracts (not considered to be hedging instruments for accounting disclosure purposes) as of June 30, 2023. These instruments were used as part of the Funds’ investment strategies and to obtain and/or manage exposure related to the risks below. The values in the tables below exclude the effects of cash collateral received or posted pursuant to these derivative contracts, and therefore are not representative of the Funds’ net exposure.
BUFFERED S&P 500 Fund — Jan/Jul
| | | | | | | | | | | | | | | | | | |
| Risk | | | Statement of Assets and Liabilities | | | Assets | | | Statement of Assets and Liabilities | | | Liabilities | |
| | Equity | | | | Purchased options contracts, at value | | | $ | 267,048 | | | | Written options contracts, at value | | | $ | (266,976 | ) |
BUFFERED S&P 500 Fund — Mar/Sep
| | | | | | | | | | | | | | | | | | |
| Risk | | | Statement of Assets and Liabilities | | | Assets | | | Statement of Assets and Liabilities | | | Liabilities | |
| | Equity | | | | Purchased options contracts, at value | | | $ | 673,220 | | | | Written options contracts, at value | | | $ | (416,046 | ) |
BUFFERED S&P 500 Fund — May/Nov
| | | | | | | | | | | | | | | | | | |
| Risk | | | Statement of Assets and Liabilities | | | Assets | | | Statement of Assets and Liabilities | | | Liabilities | |
| | Equity | | | | Purchased options contracts, at value | | | $ | 465,360 | | | | Written options contracts, at value | | | $ | (310,052 | ) |
GOLDMAN SACHS VIT BUFFERED S&P 500 FUNDS
Notes to Financial Statements (continued)
June 30, 2023 (Unaudited)
4. INVESTMENTS IN DERIVATIVES (continued)
The following tables set forth, by certain risk types, the Funds’ gains (losses) related to these derivatives and their indicative volumes for the six months ended June 30, 2023. These gains (losses) should be considered in the context that these derivative contracts may have been executed to create investment opportunities and/or economically hedge certain investments, and accordingly, certain gains (losses) on such derivative contracts may offset certain (losses) gains attributable to investments. These gains (losses) are included in “Net realized gain (loss)” or “Net change in unrealized gain (loss)” on the Statements of Operations:
BUFFERED S&P 500 Fund — Jan/Jul
| | | | | | | | | | |
| Risk | | Statement of Operations | | Net Realized
Gain (Loss) | | | Net Change in
Unrealized
Gain (Loss) | |
| | | |
| Equity | | Net realized gain (loss) from purchased options and written options/Net change in unrealized gain on purchased options and written options | | $ | 396,734 | | | $ | (2,914 | ) |
BUFFERED S&P 500 Fund — Mar/Sep
| | | | | | | | | | |
| Risk | | Statement of Operations | | Net Realized
Gain (Loss) | | | Net Change in
Unrealized
Gain (Loss) | |
| | | |
| Equity | | Net realized gain (loss) from purchased options and written options/Net change in unrealized gain on purchased options and written options | | $ | — | | | $ | 257,174 | |
BUFFERED S&P 500 Fund — May/Nov
| | | | | | | | | | |
| Risk | | Statement of Operations | | Net Realized
Gain (Loss) | | | Net Change in
Unrealized
Gain (Loss) | |
| | | |
| Equity | | Net realized gain (loss) from purchased options and written options/Net change in unrealized gain on purchased options and written options | | $ | — | | | $ | 155,308 | |
For the six months ended June 30, 2023, the relevant values for each derivative type was as follows:
| | | | | | | | |
| | | Average Number of Contracts,
Shares/Units(a) | |
| Fund | | Purchased Options | | | Written options | |
| Buffered S&P 500 Fund — Jan/Jul | | | 1,283 | | | | 2,567 | |
| Buffered S&P 500 Fund — Mar/Sep | | | 1,300 | | | | 2,600 | |
| Buffered S&P 500 Fund — May/Nov | | | 1,200 | | | | 2,400 | |
| (a) | Amounts disclosed represent average number of contracts for shares/units outstanding for purchased options and written options, based on absolute values, which is indicative of volume for this derivative type, for the months that the Fund held such derivatives during the period ended June 30, 2023. |
5. AGREEMENTS AND AFFILIATED TRANSACTIONS
A. Management Agreement — Under the Agreement, GSAM manages the Funds subject to the general supervision of the Trustees.
As compensation for the services rendered pursuant to the Agreement, the assumption of the expenses related thereto and administration of the Funds’ business affairs, including providing facilities, GSAM is entitled to a management fee, accrued daily and paid monthly, equal to an annual percentage rate of each Fund’s average daily net assets.
GOLDMAN SACHS VIT BUFFERED S&P 500 FUNDS
5. AGREEMENTS AND AFFILIATED TRANSACTIONS (continued)
For the six months ended June 30, 2023, contractual and effective net management fees with GSAM were at the following rates:
| | | | | | | | | | | | | | | | | | | | | | | | | | | | |
| | | Contractual Management Rate | | | Effective
Rate | | | Effective Net
Management
Rate^ | |
| Fund | | First
$1 billion | | | Next
$1 billion | | | Next
$3 billion | | | Next
$3 billion | | | Over
$8 billion | |
| Buffered S&P 500 Fund — Jan/Jul | | | 0.50 | % | | | 0.45 | % | | | 0.43 | % | | | 0.42 | % | | | 0.41 | % | | | 0.50 | % | | | 0.44 | % |
| Buffered S&P 500 Fund — Mar/Sep | | | 0.50 | | | | 0.45 | | | | 0.43 | | | | 0.42 | | | | 0.41 | | | | 0.50 | | | | 0.42 | |
| Buffered S&P 500 Fund — May/Nov | | | 0.50 | | | | 0.45 | | | | 0.43 | | | | 0.42 | | | | 0.41 | | | | 0.50 | | | | 0.43 | |
| ^ | The Effective Net Management Rate includes the impact of management fee waivers of affiliated underlying funds, if any. The Effective Net Management Rate may not correlate to the Contractual Management Rate as a result of management fee waivers that may be in effect from time to time. |
The Funds invest in Institutional Shares of the Goldman Sachs Financial Square Government Fund, Goldman Sachs Financial Square Treasury Instruments Fund, Goldman Sachs Financial Square Treasury Obligations Fund, Goldman Sachs VIT Money Market Fund and Goldman Sachs Financial Square Treasury Solutions Fund, which are affiliated Underlying Money Market Funds. GSAM has agreed to waive a portion of its management fee payable by the Funds in an amount equal to the management fee it earns as an investment adviser to the affiliated Underlying Money Market Funds in which the Funds invest, except those management fees it earns from the Funds’ investment of cash collateral received in connection with securities lending transactions in the Government Money Market Fund. For the six months ended June 30, 2023 management fee waived by GSAM for each Fund was as follows:
| | | | |
| Fund Name | | Management Fee Waived | |
| Buffered S&P 500 Fund — Jan/Jul | | $ | 1,634 | |
| Buffered S&P 500 Fund — Mar/Sep | | | 1,338 | |
| Buffered S&P 500 Fund — May/Nov | | | 480 | |
B. Distribution and/or Service (12b-1) Plans — The Trust, on behalf of the Service Shares of each Fund, has adopted a Distribution and Service Plan subject to Rule 12b-1 under the Act (the “Plan”). Under the Plan, Goldman Sachs, which serves as distributor (the “Distributor”), is entitled to a fee accrued daily and paid monthly, for distribution services and personal and account maintenance services, which may then be paid by Goldman Sachs to authorized dealers, equal to, on an annual basis, 0.25% of the Funds’ average daily net assets attributable to Service Shares. Goldman Sachs has agreed to a voluntary temporary fee waiver equal to 0.25% of the Service Fees on the Service Shares of the Funds. Such voluntary waiver may be discontinued or modified at any time without notice.
C. Transfer Agency Agreement — Goldman Sachs also serves as the transfer agent of the Funds for a fee pursuant to the Transfer Agency Agreement. The fees charged for such transfer agency services are accrued daily and paid monthly at an annual rate of 0.02% of the average daily net assets of Institutional and Service Shares.
D. Other Expense Agreements and Affiliated Transactions — GSAM has agreed to reduce or limit certain “Other Expenses” of the Funds (excluding acquired fund fees and expenses, transfer agency fees and expenses, taxes, interest, brokerage fees, expenses of shareholder meetings, litigation and indemnification, and extraordinary expenses) to the extent such expenses exceed, on an annual basis, a percentage rate of the average daily net assets of each Fund. Such Other Expense reimbursements, if any, are accrued daily and paid monthly. In addition, the Funds are not obligated to reimburse GSAM for prior fiscal year expense reimbursements, if any. The Other Expense limitations as an annual percentage rate of average daily net assets for the Buffered S&P 500 Fund — Jan/Jul, Buffered S&P 500 Fund — Mar/Sep and Buffered S&P 500 Fund — May/Nov are 0.184%, 0.184%, and
GOLDMAN SACHS VIT BUFFERED S&P 500 FUNDS
Notes to Financial Statements (continued)
June 30, 2023 (Unaudited)
5. AGREEMENTS AND AFFILIATED TRANSACTIONS (continued)
0.184%, respectively. These Other Expense limitations will remain in place through at least April 28, 2024, and prior to such date GSAM may not terminate the arrangements without the approval of the Trustees. In addition, the Funds have entered into certain offset arrangements with the transfer agent, which may result in a reduction of the Funds’ expenses and are received irrespective of the application of the “Other Expense” limitations described above.
For the six months ended June 30, 2023, these expense reductions, including any fee waivers and Other Expense reimbursements, were as follows:
| | | | | | | | | | | | | | | | |
| Fund | | Management
Fee Waiver | | | Distribution and
Service Fee Waiver | | | Other Expense
Reimbursements | | | Total Expense
Reductions | |
| Buffered S&P 500 Fund — Jan/Jul | | $ | 1,634 | | | $ | 65 | | | $ | 89,937 | | | $ | 91,636 | |
| Buffered S&P 500 Fund — Mar/Sep | | | 1,338 | | | | 43 | | | | 74,545 | | | | 75,926 | |
| Buffered S&P 500 Fund — May/Nov | | | 480 | | | | 22 | | | | 41,496 | | | | 41,998 | |
E. Line of Credit Facility — As of June 30, 2023, the Funds participated in a $1,110,000,000 committed, unsecured revolving line of credit facility (the “facility”) together with other funds of the Trust and certain registered investment companies having management agreements with GSAM or its affiliates. This facility is to be used for temporary emergency purposes, or to allow for an orderly liquidation of securities to meet redemption requests. The interest rate on borrowings is based on the federal funds rate. The facility also requires a fee to be paid by the Funds based on the amount of the commitment that has not been utilized. For the six months ended June 30, 2023, the Funds did not have any borrowings under the facility. Prior to April 19, 2023, the facility was $1,250,000,000.
F. Other Transactions with Affiliates — The Funds invest primarily in Institutional Shares of the Underlying Money Market Funds. These Underlying Money Market Funds are considered to be affiliated with the Funds. The tables below show the transactions in and earnings from investments in these Underlying Money Market Funds for the six months ended June 30, 2023:
Buffered S&P 500 Fund — Jan/Jul
| | | | | | | | | | | | | | | | | | | | | | | | |
| Underlying Fund | | Beginning Value as of December 31,
2022 | | | Purchases at Cost | | | Proceeds from Sales | | | Ending Value as of June 30,
2023 | | | Shares as of
June 30,
2023 | | | Dividend Income | |
Goldman Sachs Financial Square Government Fund — Institutional Class | | $ | 949,142 | | | $ | 1,894,014 | | | $ | (2,534,802 | ) | | $ | 308,354 | | | | 308,354 | | | $ | 4,153 | |
Goldman Sachs Financial Square Treasury Instruments Fund — Institutional Class | | | 500,109 | | | | 11,307 | | | | — | | | | 511,416 | | | | 511,416 | | | | 13,532 | |
Goldman Sachs Financial Square Treasury Obligations Fund — Institutional Class | | | 500,114 | | | | 11,580 | | | | — | | | | 511,694 | | | | 511,694 | | | | 12,365 | |
Goldman Sachs Financial Square Treasury Solutions Fund — Institutional Class | | | 500,114 | | | | 11,595 | | | | — | | | | 511,709 | | | | 511,709 | | | | 14,305 | |
Goldman Sachs Variable Insurance Trust Government Money Market Fund — Institutional Shares | | | 500,114 | | | | 11,663 | | | | — | | | | 511,663 | | | | 511,663 | | | | 11,950 | |
| | | | | | |
| Total | | $ | 2,949,479 | | | $ | 1,940,159 | | | $ | (2,534,802 | ) | | $ | 2,354,836 | | | | | | | $ | 56,305 | |
GOLDMAN SACHS VIT BUFFERED S&P 500 FUNDS
5. AGREEMENTS AND AFFILIATED TRANSACTIONS (continued)
Buffered S&P 500 Fund — Mar/Sep
| | | | | | | | | | | | | | | | | | | | | | | | |
| Underlying Fund | | Beginning Value as of February 28, 2023 | | | Purchases at Cost | | | Proceeds from Sales | | | Ending Value as of June 30,
2023 | | | Shares as of June 30,
2023 | | | Dividend Income | |
Goldman Sachs Financial Square Government Fund — Institutional Shares | | $ | — | | | $ | 735,810 | | | $ | (324,457 | ) | | $ | 411,353 | | | | 411,353 | | | $ | 3,487 | |
Goldman Sachs Financial Square Treasury Instruments Fund — Institutional Shares | | | — | | | | 507,840 | | | | — | | | | 507,840 | | | | 507,840 | | | | 8,142 | |
Goldman Sachs Financial Square Treasury Obligations Fund — Institutional Shares | | | — | | | | 508,035 | | | | — | | | | 508,035 | | | | 508,035 | | | | 8,276 | |
Goldman Sachs Financial Square Treasury Solutions Fund — Institutional Shares | | | — | | | | 508,047 | | | | — | | | | 508,047 | | | | 508,047 | | | | 8,922 | |
Goldman Sachs Variable Insurance Trust Government Money Market Fund — Institutional Shares | | | | | | | 508,035 | | | | — | | | | 508,035 | | | | 508,035 | | | | 8,150 | |
| | | | | | |
| Total | | $ | — | | | $ | 2,767,767 | | | $ | (324,457 | ) | | $ | 2,443,310 | | | | | | | $ | 36,977 | |
Buffered S&P 500 Fund — May/Nov
| | | | | | | | | | | | | | | | | | | | | | | | |
| Underlying Fund | | Beginning Value as of April 28, 2023 | | | Purchases at Cost | | | Proceeds from Sales | | | Ending Value as of June 30,
2023 | | | Shares as of June 30,
2023 | | | Dividend Income | |
Goldman Sachs Financial Square Government Fund — Institutional Shares | | $ | — | | | $ | 469,611 | | | $ | (330,998 | ) | | $ | 138,613 | | | | 138,613 | | | $ | 611 | |
Goldman Sachs Financial Square Funds — Treasury Instruments Fund | | | — | | | | 500,000 | | | | — | | | | 500,000 | | | | 500,000 | | | | 4,350 | |
Goldman Sachs Financial Square Treasury Obligations Fund — Institutional Shares | | | — | | | | 504,013 | | | | — | | | | 504,013 | | | | 504,013 | | | | 4,090 | |
Goldman Sachs Financial Square Treasury Solutions Fund — Institutional Shares | | | — | | | | 500,000 | | | | — | | | | 500,000 | | | | 500,000 | | | | 3,749 | |
Goldman Sachs Variable Insurance Trust Government Money Market Fund — Institutional Shares | | | — | | | | 500,000 | | | | — | | | | 500,000 | | | | 500,000 | | | | 3,722 | |
| | | | | | |
| Total | | $ | — | | | $ | 2,473,624 | | | $ | (330,998 | ) | | $ | 2,142,626 | | | | | | | $ | 16,522 | |
6. PORTFOLIO SECURITIES TRANSACTIONS
For the six months ended June 30, 2023, there were no purchases and proceeds from sales and maturities of long-term securities for the Buffered S&P 500 Fund — Jan/Jul, Buffered S&P 500 Fund — Mar/Sep and Buffered S&P 500 Fund — May/Nov.
GOLDMAN SACHS VIT BUFFERED S&P 500 FUNDS
Notes to Financial Statements (continued)
June 30, 2023 (Unaudited)
7. TAX INFORMATION
As of June 30, 2023, the Funds aggregate security unrealized gains and losses based on cost for U.S. federal income tax purposes were as follows:
| | | | | | | | | | | | |
| | | Buffered S&P 500
Fund — Jan/Jul | | | Buffered S&P 500
Fund — Mar/Sep | | | Buffered S&P 500
Fund — May/Nov | |
| Tax Cost | | $ | 4,592,873 | | | $ | 4,744,181 | | | $ | 4,413,009 | |
Gross unrealized gain | | | — | | | | — | | | | — | |
| Gross unrealized loss | | | (270,455 | ) | | | (331,217 | ) | | | (304,023 | ) |
| Net unrealized losses | | $ | (270,455 | ) | | $ | (331,217 | ) | | $ | (304,023 | ) |
The difference between GAAP-basis and tax basis unrealized gains (losses) is attributable primarily to net mark to market gains/(losses) on regulated options contracts.
GSAM has reviewed the Fund’s tax positions for the open tax year (the current year, as applicable) and has concluded that no provision for income tax is required in the Fund’s financial statements. Such open tax years remain subject to examination and adjustment by tax authorities.
8. OTHER RISKS
The Funds’ risks include, but are not limited to, the following:
Buffered Loss Risk — The Funds seek to provide a downside Buffer against losses of the Underlying Index over a specified Outcome Period and will implement the Buffer by primarily investing in S&P 500 Options. There can be no guarantee that the Funds will be successful in their strategy to provide buffered protection against losses if the value of the Underlying Index decreases over an Outcome Period. A shareholder may lose their entire investment. Each Fund’s strategy seeks to deliver returns that match the Underlying Index (up to the Cap before Fund fees and expenses), while limiting downside losses, if shares are bought on the day on which the Fund enters into the S&P Options and held until those S&P Options expire at the end of the Outcome Period. In the event an investor purchases shares after the date on which the S&P 500 Options were entered into or sells shares prior to the expiration of the S&P Options, the Buffer that a Fund seeks to provide may not be fully available. The Funds do not provide principal protection and an investor may experience significant losses on their investment, including the loss of their entire investment. The Buffer is not guaranteed and may not be achieved.
Capped Upside Return Risk — Each Fund’s strategy seeks to provide returns only up to the Cap over an Outcome Period before Fund fees and expenses. In the event that the value of the Underlying Index increases in excess of the Cap during an Outcome Period, a Fund will not participate in those gains beyond the Cap. In the event an investor purchases shares after the commencement of an Outcome Period and a Fund has risen in value to a level near the Cap for that Outcome Period, there will likely be little or no ability for that investor to experience investment gains for the remainder of that Outcome Period. A new Cap is established on or before the first day of each Outcome Period and is dependent on prevailing market conditions. Accordingly, the Cap may increase or decrease from one Outcome Period to the next. The Cap is based on the market costs associated with a series of S&P Options (or other derivatives) that are purchased and sold in order to seek to obtain the relevant market exposure and the Buffer. The market conditions and other factors that influence the Cap can include, but are not limited to, interest rate levels, the volatility of the Underlying Index, and relationship of put and calls on the underlying S&P 500 Options. Depending on those factors, it is possible that the Cap will limit a Fund’s returns during an Outcome Period to a level substantially less than an investor might expect from another comparable equity product that does not employ a Cap and Buffer.
Derivatives Risk — The Funds’ use of derivatives, including FLEX Options, and other similar instruments (collectively referred to in this paragraph as “derivatives”) may result in loss, including due to adverse market movements. Derivatives, which may pose risks in addition to and greater than those associated with investing directly in securities, currencies or other assets and instruments,
GOLDMAN SACHS VIT BUFFERED S&P 500 FUNDS
8. OTHER RISKS (continued)
may increase market exposure and be illiquid or less liquid, volatile, difficult to price and leveraged so that small changes in the value of the underlying assets or instruments may produce disproportionate losses to the Funds. Certain derivatives are also subject to counterparty risk, which is the risk that the other party in the transaction will not, or lacks the capacity or authority to, fulfill its contractual obligations, liquidity risk, which includes the risk that the Funds will not be able to exit the derivative when it is advantageous to do so, and risks arising from margin requirements, which include the risk that the Funds will be required to pay additional margin or set aside additional collateral to maintain open derivative positions. The use of derivatives is a highly specialized activity that involves investment techniques and risks different from those associated with investments in more traditional securities and instruments. Losses from derivatives can also result from a lack of correlation between changes in the value of derivative instruments and the portfolio assets (if any) being hedged.
FLEX Options Risk — The Funds utilize FLEX Options guaranteed for settlement by the Options Clearing Corporation (the “OCC”), and bears the risk that the OCC will be unable or unwilling to perform its obligations under the FLEX Options contracts, which is a form of counterparty risk. Additionally, FLEX Options may be less liquid than certain other securities, such as standardized options. In a less liquid market, a Fund may have difficulty closing out certain FLEX Options positions at desired times and prices (and may have to pay a premium or accept a discounted price). The Funds may experience substantial downside from certain FLEX Option positions, and FLEX Option positions may expire worthless. The value of the FLEX Options will be affected by, among other things, changes in the value of the Underlying Index, changes in interest rates, changes in the actual and implied volatility of the Underlying Index and the remaining time until the FLEX Options expire. The value of FLEX Options does not increase or decrease at the same rate as the level of the Underlying Index (although they generally move in the same direction).
Interest Rate Risk — When interest rates increase, fixed income securities or instruments held by the Funds will generally decline in value. Long-term fixed income securities or instruments will normally have more price volatility because of this risk than short-term fixed income securities or instruments. A wide variety of market factors can cause interest rates to rise, including central bank monetary policy, rising inflation and changes in general economic conditions. Changing interest rates may have unpredictable effects on the markets, may result in heightened market volatility and may detract from a Fund’s performance. In addition, changes in monetary policy may exacerbate the risks associated with changing interest rates. Funds with longer average portfolio durations will generally be more sensitive to changes in interest rates than funds with a shorter average portfolio duration. Fluctuations in interest rates may also affect the liquidity of fixed income securities and instruments held by the Funds. A sudden or unpredictable increase in interest rates may cause volatility in the market and may decrease the liquidity of the Funds’ investments, which would make it harder for the Funds to sell their investments at an advantageous time.
Investments in Other Investment Companies Risk — As a shareholder of another investment company, a Fund will indirectly bear its proportionate share of any net management fees and other expenses paid by such other investment companies, in addition to the fees and expenses regularly borne by the Fund.
Large Shareholder Transactions Risk — A Fund may experience adverse effects when certain large shareholders, such as other funds, institutional investors (including those trading by use of non-discretionary mathematical formulas), financial intermediaries (who may make investment decisions on behalf of underlying clients and/or include a Fund in their investment model), individuals, accounts and Goldman Sachs affiliates, purchase or redeem large amounts of shares of a Fund. Such large shareholder redemptions, which may occur rapidly or unexpectedly, may cause a Fund to sell portfolio securities at times when it would not otherwise do so, which may negatively impact a Fund’s NAV and liquidity. These transactions may also accelerate the realization of taxable income to shareholders if such sales of investments resulted in gains, and may also increase transaction costs. In addition, a large redemption could result in a Fund’s current expenses being allocated over a smaller asset base, leading to an increase in the Fund’s expense ratio. Similarly, large Fund share purchases may adversely affect a Fund’s performance to the extent that the Fund is delayed in investing new cash or otherwise maintains a larger cash position than it ordinarily would.
Market and Credit Risks — In the normal course of business, a Fund trades financial instruments and enters into financial transactions where risk of potential loss exists due to changes in the market (market risk). The value of the securities in which a Fund invests may go up or down in response to the prospects of individual companies, particular sectors or governments and/or
GOLDMAN SACHS VIT BUFFERED S&P 500 FUNDS
Notes to Financial Statements (continued)
June 30, 2023 (Unaudited)
8. OTHER RISKS (continued)
general economic conditions throughout the world due to increasingly interconnected global economies and financial markets. Events such as war, military conflict acts of terrorism, social unrest, natural disasters, recessions, inflation, rapid interest rate changes, supply chain disruptions, sanctions, the spread of infectious illness or other public health threats could also significantly impact the Funds and their investments. Additionally, the Funds may also be exposed to credit risk in the event that an issuer or guarantor fails to perform or that an institution or entity with which the Funds have unsettled or open transactions defaults.
Non-Diversification Risk — The Funds are non-diversified, meaning that they are permitted to invest a larger percentage of their assets in one or more issuers or in fewer issuers than diversified mutual funds. Thus, the Funds may be more susceptible to adverse developments affecting any single issuer held in their portfolios, and may be more susceptible to greater losses because of these developments.
9. INDEMNIFICATIONS
Under the Trust’s organizational documents, its Trustees, officers, employees and agents are indemnified, to the extent permitted by the Act and state law, against certain liabilities that may arise out of performance of their duties to the Funds. Additionally, in the course of business, the Funds enter into contracts that contain a variety of indemnification clauses. The Funds maximum exposure under these arrangements is unknown, as this would involve future claims that may be made against the Funds that have not yet occurred. However, GSAM believes the risk of loss under these arrangements to be remote.
10. SUBSEQUENT EVENTS
Subsequent events after the Statements of Assets and Liabilities date have been evaluated, and GSAM has concluded that there is no impact requiring adjustment or disclosure in the financial statements.
11. SUMMARY OF SHARE TRANSACTIONS
Share activity is as follows:
| | | | | | | | | | | | | | | | |
| | | Goldman Sachs Buffered S&P 500 Fund —
Jan/Jul | |
| | | For the
Six Months Ended
June 30, 2023
(Unaudited) | | | For the
Period Ended
December 31, 2022(a) | |
| | | Shares | | | Dollars | | | Shares | | | Dollars | |
| Institutional Shares | | | | | | | | | | | | | | | | |
| Shares sold | | | — | | | $ | — | | | | 495,000 | | | $ | 4,950,000 | |
| | | | — | | | | — | | | | 495,000 | | | | 4,950,000 | |
| Service Shares | | | | | | | | | | | | | | | | |
| Shares sold | | | — | | | | — | | | | 5,000 | | | | 50,000 | |
| | | | — | | | | — | | | | 5,000 | | | | 50,000 | |
| | | | |
| NET INCREASE | | | — | | | $ | — | | | | 500,000 | | | $ | 5,000,000 | |
| (a) | Commenced operations on December 30, 2022. |
GOLDMAN SACHS VIT BUFFERED S&P 500 FUNDS
11. SUMMARY OF SHARE TRANSACTIONS (continued)
| | | | | | | | |
| | | Goldman Sachs Buffered
S&P 500 Fund — Mar/Sep | |
| | | For the Period Ended
June 30, 2023
(Unaudited)(a) | |
| | | Shares | | | Dollars | |
| Institutional Shares | | | | | | | | |
Shares sold | | | 495,001 | | | $ | 4,950,010 | |
| Shares redeemed | | | (1 | ) | | | (10 | ) |
| | | | 495,000 | | | | 4,950,000 | |
| Service Shares | | | | | | | | |
Shares sold | | | 5,001 | | | | 50,010 | |
| Shares redeemed | | | (1 | ) | | | (10 | ) |
| | | | 5,000 | | | | 50,000 | |
| | |
| NET INCREASE | | | 500,000 | | | $ | 5,000,000 | |
| (a) | Commenced operations on February 28, 2023. |
| | | | | | | | |
| | | Goldman Sachs Buffered
S&P 500 Fund — May/Nov | |
| | | For the Period Ended
June 30, 2023
(Unaudited)(a) | |
| | | Shares | | | Dollars | |
| Institutional Shares | | | | | | | | |
Shares sold | | | 495,001 | | | $ | 4,950,010 | |
| Shares redeemed | | �� | (1 | ) | | | (10 | ) |
| | | | 495,000 | | | | 4,950,000 | |
| Service Shares | | | | | | | | |
Shares sold | | | 5,001 | | | | 50,010 | |
| Shares redeemed | | | (1 | ) | | | (10 | ) |
| | | | 5,000 | | | | 50,000 | |
| | |
| NET INCREASE | | | 500,000 | | | $ | 5,000,000 | |
| (a) | Commenced operations on April 28, 2023 |
GOLDMAN SACHS VIT BUFFERED S&P 500 FUNDS
| | |
| Fund Expenses — Six Months Period Ended June 30, 2023 (Unaudited) | | |
As a shareholder of Institutional or Service Shares of a Fund, you incur ongoing costs, including management fees, distribution and/or service (12b-1) fees (with respect to Service) and other Fund expenses. This example is intended to help you understand your ongoing costs (in dollars) of investing in the Institutional Shares and Service Shares of a Fund and to compare these costs with the ongoing costs of investing in other mutual funds.
The Example is intended to help you understand your ongoing costs (in dollars) of investing in of Institutional or Service Shares of a Fund and to compare these costs with the ongoing costs of investing in other mutual funds. The Example is based on an investment of $1,000 invested at the beginning of the period and held for the entire period from January 1, 2023 through June 30, 2023, which represents a period of 181 days of a 365 day year.
Actual Expenses — The first line under each share class in the table below provides information about actual account values and actual expenses. You may use the information in this line, together with the amount you invested, to estimate the expenses that you paid over the period. Simply divide your account value by $1,000 (for example, an $8,600 account value divided by $1,000=8.6), then multiply the result by the number in the first line under the heading entitled “Expenses Paid” to estimate the expenses you paid on your account during this period.
Hypothetical Example for Comparison Purposes — The second line under each share class in the table below provides information about hypothetical account values and hypothetical expenses based on the Funds’ actual net expense ratios and an assumed rate of return of 5% per year before expenses, which is not the Funds’ actual return. The hypothetical account values and expenses may not be used to estimate the actual ending account balance or expenses you paid for the period. You may use this information to compare the ongoing costs of investing in the Funds and other funds. To do so, compare this 5% hypothetical example with the 5% hypothetical examples that appear in the shareholder reports of the other funds.
Please note that the expenses shown in the table are meant to highlight your ongoing costs only and do not reflect any transactional costs, such as sales charges, redemption fees, or exchange fees and do not include expenses of Underlying Funds in which the Funds invest. Therefore, the second line of the table is useful in comparing ongoing costs only and will not help you determine the relative total costs of owning different funds. In addition, if these transactional costs were included, your costs would have been higher.
| | | | | | | | | | | | | | | | | | | | | | | | | | | | | | | | | | | | |
| | | Buffered S&P 500 Fund — Jan/Jul | | | Buffered S&P 500 Fund — Mar/Sep | | | Buffered S&P 500 Fund — May/Nov | |
| Share Class | | Beginning
Account
Value
1/1/23 | | | Ending
Account
Value
6/30/23 | | | Expenses
Paid for the
6 months
ended
6/30/23* | | | Beginning
Account
Value
1/1/23 | | | Ending
Account
Value
6/30/23 | | | Expenses
Paid for the
6 months
ended
6/30/23* | | | Beginning
Account
Value
1/1/23 | | | Ending
Account
Value
6/30/23 | | | Expenses
Paid for the
6 months
ended
6/30/23* | |
| | | | | | | | | | |
Institutional | | | | | | | | | | | | | | | | | | | | | | | | | | | | | | | | | | | | |
| | | | | | | | | | |
Actual | | | 1,000.00 | | | $ | 1,000.00 | | | $ | 3.17 | | | | 1,000.00 | | | $ | 1,063.00 | | | $ | 2.17 | | | | 1,000.00 | | | $ | 1,000.00 | | | $ | 1.10 | |
Hypothetical 5% return | | | 1,000.00 | | | | 1,021.62 | + | | | 3.21 | | | | 1,000.00 | | | | 1,014.61 | + | | | 2.12 | | | | 1,000.00 | | | | 1,005.08 | + | | | 3.28 | |
| | | | | | | | | | |
Service | | | | | | | | | | | | | | | | | | | | | | | | | | | | | | | | | | | | |
| | | | | | | | | | |
Actual | | | 1,000.00 | | | $ | 1,000.00 | | | $ | 3.17 | | | | 1,000.00 | | | | 1,062.00 | | | $ | 2.17 | | | | 1,000.00 | | | | 1,000.00 | | | | 1.10 | |
Hypothetical 5% return | | | 1,000.00 | | | | 1,021.62 | + | | | 3.21 | | | | 1,000.00 | | | | 1.014.61 | + | | | 2.12 | | | | 1,000.00 | | | | 1,005.08 | + | | | 3.28 | |
| | * | Expenses for each share class are calculated using each Fund’s annualized net expense ratio for each class, which represents the ongoing expenses as a percentage of net assets for the six months ended June 30, 2023. Expenses are calculated by multiplying the annualized net expense ratio by the average account value for the period; then multiplying the result by the number of days in the most recent fiscal half year; and then dividing that result by the number of days in the fiscal year. The annualized net expense ratios for the period were as follows: | |
| | | | | | | | |
| | |
| Fund | | Institutional | | | Service | |
Buffered S&P 500 Fund — Jan/Jul | | | 0.64 | | | | 0.64 | |
Buffered S&P 500 Fund — Mar/Sep | | | 0.63 | | | | 0.63 | |
| Buffered S&P 500 Fund — May/Nov | | | 0.66 | | | | 0.66 | |
| | + | Hypothetical expenses are based on each Fund’s actual annualized net expense ratios and an assumed rate of return of 5% per year before expenses. | |
38
GOLDMAN SACHS VIT BUFFERED S&P 500 FUNDS
Statement Regarding Basis for Initial Approval of Management Agreement for the Goldman Sachs Buffered S&P 500 Fund – Mar/Sep and Goldman Sachs Buffered S&P 500 Fund – May/Nov (Unaudited)
Background
The Goldman Sachs Buffered S&P 500 Fund – Mar/Sep and Goldman Sachs Buffered S&P 500 Fund – May/Nov (the “Funds”) are newly-organized investment portfolios of Goldman Sachs Variable Insurance Trust (the “Trust”) that commenced investment operations on February 28, 2023 and April 28, 2023, respectively. At a meeting held on June 14-15, 2022 (the “Meeting”) in connection with the Funds’ organization, the Board of Trustees, including all of the Trustees present who are not parties to the Funds’ investment management agreement (the “Management Agreement”) or “interested persons” (as defined in the Investment Company Act of 1940, as amended) of any party thereto (the “Independent Trustees”) approved the Management Agreement with Goldman Sachs Asset Management, L.P. (the “Investment Adviser”).
At the Meeting, the Trustees reviewed the Management Agreement, including information regarding the terms of the Management Agreement; the nature, extent and quality of the Investment Adviser’s anticipated services; the fees and expenses to be paid by each Fund; a comparison of each Fund’s proposed management fee and anticipated expenses with those paid by other similar mutual funds; the Investment Adviser’s proposal to limit certain expenses of the Funds that exceed a specified level; and potential benefits to be derived by the Investment Adviser and its affiliates from their relationships with the Funds. Various information was also provided at a prior meeting at which the Funds were discussed.
In connection with the Meeting, the Trustees received written materials and oral presentations on the topics covered. The Independent Trustees were advised by their independent legal counsel regarding their responsibilities under applicable law. In evaluating the Management Agreement at the Meeting, the Trustees relied upon information included in a presentation made by the Investment Adviser at the Meeting and information received at prior meetings of the Trustees, as well as on their knowledge of the Investment Adviser resulting from their meetings and other interactions over time.
Nature, Extent, and Quality of the Services to be Provided under the Management Agreement
As part of their review, the Trustees considered the nature, extent, and quality of the services to be provided by the Investment Adviser. In this regard, the Trustees considered both the investment advisory services and non-advisory services that would be provided to each Fund by the Investment Adviser and its affiliates. The Trustees also considered information about each Fund’s structure, investment objective, strategies, and other characteristics. The Trustees considered the experience and capabilities of the investment team and noted that the Funds’ portfolio managers were currently managing other series of the Trust. The Trustees concluded that the Investment Adviser would be able to commit substantial financial and other resources to the Funds. In this regard, the Trustees noted that, although the Funds were new (and therefore had no performance data to evaluate), the Investment Adviser’s management of the Funds likely would benefit the Funds and their shareholders.
Costs of Services to Be Provided and Profitability
The Trustees considered the contractual terms of the Management Agreement and the fee rates to be payable by each Fund thereunder. In this regard, the Trustees considered information on the services to be rendered by the Investment Adviser to the Funds, which included both advisory and administrative services that were directed to the needs and operations of the Funds as registered mutual funds.
In particular, the Trustees reviewed information on the proposed management fees and each Fund’s projected total operating expense ratios (both gross and net of expense limitations), and those were compared to similar information for comparable mutual funds advised by other, unaffiliated investment management firms, as well as the peer group and category medians. The comparisons of each Fund’s fee rates and total operating expense ratios were prepared by a third-party provider of mutual fund data. The Trustees believed that this information was useful in evaluating the reasonableness of the management fees and total expenses expected to be paid by each Fund.
The Trustees considered the Investment Adviser’s undertaking to limit certain expenses of the Funds that exceed a specified level. In addition, the Trustees recognized that there was not yet profitability data to evaluate for the Funds, but considered the Investment Adviser’s representations that (i) such data would be provided after the Funds commenced operations, and (ii) the Funds were not expected to be profitable to the Investment Adviser and its affiliates initially.
The Trustees noted the competitive nature of the fund marketplace, and that many of the Funds’ shareholders would be investing in the Funds in part because of the Funds’ relationship with the Investment Adviser. They also noted that shareholders would be able to redeem their shares if they believe that the Funds’ fees and expenses are too high or if they are dissatisfied with the performance of the Funds.
GOLDMAN SACHS VIT BUFFERED S&P 500 FUNDS
Statement Regarding Basis for Initial Approval of Management Agreement for the Goldman Sachs Buffered S&P 500 Fund – Mar/Sep and Goldman Sachs Buffered S&P 500 Fund – May/Nov (Unaudited) (continued)
Economies of Scale
The Trustees considered the proposed breakpoints in the fee rates payable under the Management Agreement at the following annual percentage rates of the average daily net assets of each Fund:
| | | | |
Average Daily
Net Assets | | Management Fee
Annual Rate | |
| |
| First $1 billion | | | 0.50 | % |
| |
| Next $1 billion | | | 0.45 | % |
| |
| Next $3 billion | | | 0.43 | % |
| |
| Next $3 billion | | | 0.42 | % |
| |
| Over $8 billion | | | 0.41 | % |
The Trustees noted that the breakpoints were meant to share potential economies of scale, if any, with each Fund and its shareholders as assets under management reach those asset levels. The Trustees considered each Fund’s projected asset levels and information comparing fee rates charged by the Investment Adviser with fee rates charged to other funds in the peer group, as well as the Investment Adviser’s undertaking to limit certain expenses of the Funds that exceed a specified level. Upon reviewing these matters, the Trustees concluded that the fee breakpoints represented a means of assuring that benefits of scalability, if any, would be passed along to shareholders at the specified asset levels.
Other Benefits to the Investment Adviser and Its Affiliates
The Trustees also considered the other benefits expected to be derived by the Investment Adviser and its affiliates from their relationship with the Funds, including: (a) transfer agency fees received by Goldman Sachs & Co. LLC (“Goldman Sachs”); (b) futures commissions earned by Goldman Sachs for executing futures transactions on behalf of the Funds; (c) trading efficiencies resulting from aggregation of orders of the Funds with those for other funds or accounts managed by the Investment Adviser; (d) the Investment Adviser’s ability to leverage the infrastructure designed to service the Funds on behalf of its other clients; (e) the Investment Adviser’s ability to cross-market other products and services to Fund shareholders; (f) Goldman Sachs’ retention of certain fees as Fund Distributor; (g) the Investment Adviser’s ability to negotiate better pricing with custodians on behalf of its other clients, as a result of the relationship with the Funds; (h) the investment by the Funds of cash and cash collateral in money market funds managed by the Investment Adviser that will result in increased assets under management for those money market funds; (i) the investment in exchange-traded funds (“ETFs”) managed by the Investment Adviser that will result in increased assets under management for those ETFs and may facilitate the development of the Investment Adviser’s ETF advisory business; and (j) the possibility that the working relationship between the Investment Adviser and the Funds’ third-party service providers may cause those service providers to be open to doing business with other areas of Goldman Sachs.
Conclusion
In connection with their consideration of the Management Agreement for the Funds at the Meeting, the Trustees gave weight to various factors, but did not identify any particular factor as controlling their decision. After deliberation and consideration of the information provided, including the factors described above, the Trustees concluded, in the exercise of their business judgment, that the management fee that would be payable by each Fund was reasonable in light of the services to be provided to it by the Investment Adviser, the Investment Adviser’s anticipated costs and each Fund’s reasonably anticipated asset levels. The Trustees unanimously concluded that the Investment Adviser’s management likely would benefit each Fund and its shareholders and that the Management Agreement should be approved with respect to each Fund.
GOLDMAN SACHS VIT BUFFERED S&P 500 FUNDS
Statement Regarding Basis for Approval of Management Agreement (Unaudited)
Background
The Goldman Sachs Buffered S&P 500 Fund — Jan/Jul, Goldman Sachs Buffered S&P 500 Fund — Mar/Sep and Goldman Sachs Buffered S&P 500 Fund — May/Nov (the “Funds”) are investment portfolios of Goldman Sachs Variable Insurance Trust (the “Trust”). The Board of Trustees oversees the management of the Trust and reviews the investment performance and expenses of the Funds at regularly scheduled meetings held throughout the year. In addition, the Board of Trustees determines annually whether to approve the continuance of the Trust’s investment management agreement (the “Management Agreement”) with Goldman Sachs Asset Management, L.P. (the “Investment Adviser”) on behalf of the Funds.
The Management Agreement was most recently approved for continuation until June 30, 2024 by the Board of Trustees, including those Trustees who are not parties to the Management Agreement or “interested persons” (as defined in the Investment Company Act of 1940, as amended) of any party thereto (the “Independent Trustees”), at a meeting held on June 13-14, 2023 (the “Annual Meeting”).
The review process undertaken by the Trustees spans the course of the year and culminates with the Annual Meeting. To assist the Trustees in their deliberations, the Trustees have established a Contract Review Committee (the “Committee”), comprised of the Independent Trustees. The Committee held two meetings over the course of the year since the Management Agreement was last approved. At those Committee meetings, regularly scheduled Board or other committee meetings, and/or the Annual Meeting, matters relevant to the renewal of the Management Agreement were considered by the Board, or the Independent Trustees, as applicable. With respect to each Fund, such matters included:
| | (a) | | the nature and quality of the advisory, administrative, and other services provided to the Fund by the Investment Adviser and its affiliates, including information about: |
| | (i) | | the structure, staff, and capabilities of the Investment Adviser and its portfolio management teams; |
| | (ii) | | the groups within the Investment Adviser and its affiliates that support the portfolio management teams or provide other types of necessary services, including fund services groups (e.g., accounting and financial reporting, tax, shareholder services, and operations); controls and risk management groups (e.g., legal, compliance, valuation oversight, credit risk management, internal audit, compliance testing, market risk analysis, finance, and central funding); sales and distribution support groups, and others (e.g., information technology and training); |
| | (iii) | | trends in employee headcount; |
| | (iv) | | the Investment Adviser’s financial resources and ability to hire and retain talented personnel and strengthen its operations; and |
| | (v) | | the parent company’s support of the Investment Adviser and its mutual fund business, as expressed by the firm’s senior management; |
| | (b) | | information on general investment outlooks in the markets in which the Fund invests; |
| | (c) | | the terms of the Management Agreement and other agreements with affiliated service providers entered into by the Trust on behalf of the Fund; |
| | (d) | | fee and expense information for the Fund, including: |
| | (i) | | the relative management fee and expense levels of the Fund as compared to those of comparable funds managed by other advisers, as provided by the Outside Data Provider; and |
| | (ii) | | to the extent the Investment Adviser manages other types of accounts (such as bank collective trusts, private wealth management accounts, institutional separate accounts, sub-advised mutual funds, and non-U.S. funds) having investment objectives and policies similar to those of the Fund, comparative information on the advisory fees charged and services provided to those accounts by the Investment Adviser; |
| | (e) | | with respect to the expense comparison data provided by the Outside Data Provider, its processes in producing that data for the Fund; |
| | (f) | | the undertakings of the Investment Adviser and its affiliates to implement fee waivers and/or expense limitations; |
| | (g) | | whether the Fund’s existing management fee schedule adequately addressed any economies of scale; |
| | (h) | | a summary of the “fall-out” benefits derived by the Investment Adviser and its affiliates from their relationships with the Fund, including the fees received by the Investment Adviser’s affiliates from the Fund for transfer agency, distribution and other services; |
| | (i) | | a summary of potential benefits derived by the Fund as a result of its relationship with the Investment Adviser; |
| | (j) | | information regarding portfolio trading and how the Investment Adviser carries out its duty to seek best execution; |
| | (k) | | the manner in which portfolio manager compensation is determined; and the number and types of accounts managed by the portfolio managers; |
GOLDMAN SACHS VIT BUFFERED S&P 500 FUNDS
Statement Regarding Basis for Approval of Management Agreement (Unaudited) (continued)
| | (l) | | the nature and quality of the services provided to the Fund by its unaffiliated service providers, and the Investment Adviser’s general oversight and evaluation (including reports on due diligence) of those service providers as part of the administrative services provided under the Management Agreement; and |
| | (m) | | the Investment Adviser’s processes and policies addressing various types of potential conflicts of interest; its approach to risk management; the annual review of the effectiveness of the Fund’s compliance program; and periodic compliance reports. |
The Trustees also received an overview of the Funds’ distribution arrangements. They received information regarding the Funds’ assets, share purchase and redemption activity, and payment of distribution fees. Information was also provided to the Trustees relating to revenue sharing payments made by and services provided by the Investment Adviser and its affiliates to intermediaries that promote the sale, distribution, and/or servicing of Fund shares. The Independent Trustees also discussed the broad range of other investment choices that are available to Fund investors, including the availability of comparable funds managed by other advisers.
The presentations made at the Board and Committee meetings and at the Annual Meeting encompassed the Funds and other mutual funds for which the Board of Trustees has responsibility. In evaluating the Management Agreement at the Annual Meeting, the Trustees relied upon their knowledge, resulting from their meetings and other interactions throughout the year, of the Investment Adviser and its affiliates, their services, and the Funds. In conjunction with these meetings, the Trustees received written materials and oral presentations on the topics covered, and the Investment Adviser addressed the questions and concerns of the Trustees, including concerns regarding the investment performance of certain of the funds they oversee. The Independent Trustees were advised by their independent legal counsel regarding their responsibilities and other regulatory requirements related to the approval and continuation of mutual fund investment management agreements under applicable law. In addition, the Investment Adviser and its affiliates provided the Independent Trustees with a written response to a formal request for information sent on behalf of the Independent Trustees by their independent legal counsel. During the course of their deliberations, the Independent Trustees met in executive sessions with their independent legal counsel, without representatives of the Investment Adviser or its affiliates present.
Nature, Extent, and Quality of the Services Provided Under the Management Agreement
As part of their review, the Trustees considered the nature, extent, and quality of the services provided to the Funds by the Investment Adviser. In this regard, the Trustees considered both the investment advisory services and non-advisory services that are provided by the Investment Adviser and its affiliates. The Trustees noted the transition in the leadership and changes in personnel of various of the Investment Adviser’s portfolio management teams that had occurred in recent periods, and the ongoing recruitment efforts aimed at bringing high quality investment talent to the Investment Adviser. They also noted the Investment Adviser’s commitment to maintaining high quality systems and expending substantial resources to respond to ongoing changes to the market, regulatory and control environment in which the Funds and their service providers operate, including developments associated with the COVID-19 pandemic, geopolitical events, and economic sanctions, as well as the efforts of the Investment Adviser and its affiliates to combat cyber security risks. The Trustees also considered information regarding the Investment Adviser’s business continuity planning and remote operations capabilities. The Trustees concluded that the Investment Adviser continued to commit substantial financial and operational resources to the Funds and expressed confidence that the Investment Adviser would continue to do so in the future. The Trustees also recognized that the Investment Adviser had made significant commitments to address regulatory compliance requirements applicable to the Funds and the Investment Adviser and its affiliates. The Trustees noted that the Goldman Sachs Buffered S&P 500 Fund — Jan/Jul had launched on December 30, 2022, the Goldman Sachs Buffered S&P 500 Fund — Mar/Sep had launched on February 28, 2023, and the Goldman Sachs Buffered S&P 500 Fund — May/Nov had launched on April 28, 2023, and each Fund did not yet have a meaningful performance history.
Costs of Services Provided and Competitive Information
The Trustees considered the contractual terms of the Management Agreement and the fee rates payable by each Fund thereunder. In this regard, the Trustees considered information on the services rendered by the Investment Adviser to the Funds, which included both advisory and administrative services that were directed to the needs and operations of the Funds as registered mutual funds.
In particular, the Trustees reviewed analyses prepared by the Outside Data Provider regarding the expense rankings of the Funds. The analyses provided a comparison of each Fund’s management fee and breakpoints to those of a relevant peer group and category universe; an expense analysis which compared each Fund’s overall net and gross expenses to a peer group and a category universe; and data comparing each Fund’s net expenses to the peer and category medians. The analyses also compared each Fund’s
GOLDMAN SACHS VIT BUFFERED S&P 500 FUNDS
Statement Regarding Basis for Approval of Management Agreement (Unaudited) (continued)
other expenses and fee waivers/reimbursements to those of the peer group and category medians. The Trustees concluded that the comparisons provided by the Outside Data Provider were useful in evaluating the reasonableness of the management fees and total expenses paid by the Funds.
In addition, the Trustees considered the Investment Adviser’s undertakings to implement fee waivers and/or expense limitations. They also considered, to the extent that the Investment Adviser manages other types of accounts having investment objectives and policies similar to those of the Funds, comparative fee information for services provided by the Investment Adviser to those accounts, and information that indicated that services provided to the Funds differed in various significant respects from the services provided to other types of accounts which, in many cases, operated under less stringent legal and regulatory structures, required fewer services from the Investment Adviser to a smaller number of client contact points, and were less time-intensive.
In addition, the Trustees noted that shareholders are able to redeem their shares at any time if shareholders believe that the Fund fees and expenses are too high or if they are dissatisfied with the performance of the Fund.
Profitability
The Trustees noted that the Goldman Sachs Buffered S&P 500 Fund — Jan/Jul had launched on December 30, 2022, the Goldman Sachs Buffered S&P 500 Fund — Mar/Sep had launched on February 28, 2023, and the Goldman Sachs Buffered S&P 500 Fund — May/Nov had launched on April 28, 2023, and each Fund did not yet have a meaningful performance history.
Economies of Scale
The Trustees considered the information that had been provided regarding whether there have been economies of scale with respect to the management of the Funds. The Trustees also considered the breakpoints in the fee rate payable under the Management Agreement for each of the Funds at the following annual percentage rates of the average daily net assets of the Funds:
| | | | | | | | | | | | |
| | | Goldman Sachs Buffered
S&P 500 Fund — Jan/Jul | | | Goldman Sachs Buffered
S&P 500 Fund — Mar/Sep | | | Goldman Sachs Buffered
S&P 500 Fund — May/Nov | |
| | | |
| First $1 billion | | | 0.50 | % | | | 0.50 | % | | | 0.50 | % |
| | | |
| Next $1 billion | | | 0.45 | | | | 0.45 | | | | 0.45 | |
| | | |
| Next $3 billion | | | 0.43 | | | | 0.43 | | | | 0.43 | |
| | | |
| Next $3 billion | | | 0.42 | | | | 0.42 | | | | 0.42 | |
| | | |
| Over $8 billion | | | 0.41 | | | | 0.41 | | | | 0.41 | |
The Trustees noted that the breakpoints were designed to share potential economies of scale, if any, with the Funds and their shareholders as assets under management reach those asset levels. The Trustees considered the amounts of assets in the Funds; the Funds’ recent share purchase and redemption activity; the information provided by the Investment Adviser relating to the costs of the services provided by the Investment Adviser and its affiliates and their realized profits; information comparing fee rates charged by the Investment Adviser with fee rates charged to other funds in the peer groups; and the Investment Adviser’s undertaking to limit certain expenses of the Funds that exceed specified levels. Upon reviewing these matters at the Annual Meeting, the Trustees concluded that the fee breakpoints represented a means of assuring that benefits of scalability, if any, would be passed along to shareholders at the specified asset levels.
Other Benefits to the Investment Adviser and Its Affiliates
The Trustees also considered the other benefits derived by the Investment Adviser and its affiliates from their relationships with the Funds as stated above, including: (a) transfer agency fees received by Goldman Sachs & Co. LLC (“Goldman Sachs”); (b) trading efficiencies resulting from aggregation of orders of the Funds with those for other funds or accounts managed by the Investment Adviser; (c) the Investment Adviser’s ability to leverage the infrastructure designed to service the Funds on behalf of its other clients; (d) the Investment Adviser’s ability to cross-market other products and services to Fund shareholders; (e) Goldman Sachs’ retention of certain fees as Fund Distributor; (f) the Investment Adviser’s ability to negotiate better pricing with custodians on behalf of its other clients, as a result of the relationship with the Funds; (g) the investment of cash and cash collateral in money market funds managed by the Investment Adviser that will result in increased assets under management for those money market funds; (h) the investment in exchange-traded funds (“ETFs”) managed by the Investment Adviser that will result in increased assets under management for those ETFs and may facilitate the development of the Investment Adviser’s ETF advisory business; and (i) the possibility that the working relationship between the Investment Adviser and the Funds’ third-party service providers may cause those service providers to be more likely to do business with other areas of Goldman Sachs. In the course of considering the foregoing, the Independent Trustees requested and received further information quantifying certain of these fall-out benefits.
GOLDMAN SACHS VIT BUFFERED S&P 500 FUNDS
Statement Regarding Basis for Approval of Management Agreement (Unaudited) (continued)
Other Benefits to the Funds and Their Shareholders
The Trustees also noted that the Funds receive certain other potential benefits as a result of their relationship with the Investment Adviser, including: (a) trading efficiencies resulting from aggregation of orders of the Funds with those of other funds or accounts managed by the Investment Adviser; (b) enhanced servicing from vendors due to the volume of business generated by the Investment Adviser and its affiliates; (c) enhanced servicing from broker-dealers due to the volume of business generated by the Investment Adviser and its affiliates; (d) the Investment Adviser’s ability to negotiate favorable terms with derivatives counterparties on behalf of the Funds as a result of the size and reputation of the Goldman Sachs organization; (e) the advantages received from the Investment Adviser’s knowledge and experience gained from managing other accounts and products; (f) the Investment Adviser’s ability to hire and retain qualified personnel to provide services to the Funds because of the reputation of the Goldman Sachs organization; (g) the Funds’ access, through the Investment Adviser, to certain firm-wide resources (e.g., proprietary risk management systems and databases), subject to certain restrictions; and (h) the Funds’ access to certain affiliated distribution channels. In addition, the Trustees noted the competitive nature of the mutual fund marketplace, and considered that many of the Funds’ shareholders invested in the Funds in part because of the Funds’ relationship with the Investment Adviser and that those shareholders have a general expectation that the relationship will continue.
Conclusion
In connection with their consideration of the Management Agreement, the Trustees gave weight to each of the factors described above, but did not identify any particular factor as controlling their decision. After deliberation and consideration of all of the information provided, including the factors described above, the Trustees concluded, in the exercise of their business judgment, that the management fees paid by each of the Funds were reasonable in light of the services provided to it by the Investment Adviser, the Investment Adviser’s costs and each Fund’s current and reasonably foreseeable asset levels. The Trustees unanimously concluded that the Investment Adviser’s continued management likely would benefit each Fund and its shareholders and that the Management Agreement should be approved and continued with respect to each Fund until June 30, 2024.
| | |
| TRUSTEES | | OFFICERS |
| Gregory G. Weaver, Chair | | James A. McNamara, President |
| Dwight L. Bush | | Joseph F. DiMaria, Principal Financial Officer, Principal Accounting Officer and Treasurer Caroline L. Kraus, Secretary |
| Kathryn A. Cassidy |
| John G. Chou |
Joaquin Delgado |
| Eileen H. Dowling | | |
| James A. McNamara | | |
| Paul C. Wirth | | |
GOLDMAN SACHS & CO. LLC
Distributor and Transfer Agent
GOLDMAN SACHS ASSET MANAGEMENT, L.P.
Investment Adviser
200 West Street, New York,
New York 10282
Visit our web site at www.GSAMFUNDS.com to obtain the most recent month-end returns.
The reports concerning the Fund included in this shareholder report may contain certain forward-looking statements about the factors that may affect the performance of the Fund in the future. These statements are based on Fund management’s predictions and expectations concerning certain future events and their expected impact on the Fund, such as performance of the economy as a whole and of specific industry sectors, changes in the levels of interest rates, the impact of developing world events, and other factors that may influence the future performance of the Fund. Management believes these forward-looking statements to be reasonable, although they are inherently uncertain and difficult to predict. Actual events may cause adjustments in portfolio management strategies from those currently expected to be employed.
A description of the policies and procedures that the Fund uses to determine how to vote proxies relating to portfolio securities and information regarding how the Fund voted proxies relating to portfolio securities for the 12-month period ended June 30 is available (i) without charge, upon request by calling 1-800-621-2550; and (ii) on the Securities and Exchange Commission (“SEC”) web site at http://www.sec.gov.
The Fund will file portfolio holdings information for each month in a fiscal quarter within 60 days after the end of the relevant fiscal quarter on Form N-PORT. Portfolio holdings information for the third month of each fiscal quarter will be made available on the SEC’s web site at http://www.sec.gov. Portfolio holdings information may be obtained upon request and without charge by calling 1-800-526-7384 (for Retail Shareholders) or 1-800-621-2550 (for Institutional Shareholders).
Views and opinions expressed are for informational purposes only and do not constitute a recommendation by GSAM to buy, sell, or hold any security. Views and opinions are current as of the date of this presentation and may be subject to change, they should not be construed as investment advice.
Goldman Sachs & Co. LLC (“Goldman Sachs”) does not provide legal, tax or accounting advice. Any statement contained in this communication (including any attachments) concerning U.S. tax matters was not intended or written to be used, and cannot be used, for the purpose of avoiding penalties under the Internal Revenue Code, and was written to support the promotion or marketing of transactions or matters addressed. Clients of Goldman Sachs should obtain their own independent tax advice based on their particular circumstances.
The website links provided are for your convenience only and are not an endorsement or recommendation by GSAM of any of these websites or the products or services offered. GSAM is not responsible for the accuracy and validity of the content of these websites.
Fund holdings and allocations shown are as of June 30, 2023 and may not be representative of future investments. Fund holdings should not be relied on in making investment decisions and should not be construed as research or investment advice regarding particular securities. Current and future holdings are subject to risk.
References to indices, benchmarks or other measures of relative market performance over a specified period of time are provided for your information only and do not imply that the portfolio will achieve similar results. The index composition may not reflect the manner in which a portfolio is constructed. While an adviser seeks to design a portfolio which reflects appropriate risk and return features, portfolio characteristics may deviate from those of the benchmark.
The Global Industry Classification Standard (“GICS”) was developed by and is the exclusive property and a service mark of Morgan Stanley Capital International Inc. (“MSCI”) and Standard & Poor’s, a division of The McGraw-Hill Companies, Inc. (“S&P”) and is licensed for use by Goldman Sachs. Neither MSCI, S&P nor any other party involved in making or compiling the GICS or any GICS classifications makes any express or implied warranties or representations with respect to such standard or classification (or the results to be obtained by the use thereof), and all such parties hereby expressly disclaim all warranties of originality, accuracy, completeness, merchantability or fitness for a particular purpose with respect to any of such standard or classification. Without limiting any of the foregoing, in no event shall MSCI, S&P, any of their affiliates or any third party involved in making or compiling the GICS or any GICS classifications have any liability for any direct, indirect, special, punitive, consequential or any other damages (including lost profits) even if notified of the possibility of such damages.
The portfolio risk management process includes an effort to monitor and manage risk, but does not imply low risk.
Shares of the Goldman Sachs VIT Funds are offered to separate accounts of participating life insurance companies for the purpose of funding variable annuity contracts and variable life insurance policies. Shares of the Funds are not offered directly to the general public. The variable annuity contracts and variable life insurance policies are described in the separate prospectuses issued by participating insurance companies. You should refer to those prospectuses for information about surrender charges, mortality and expense risk fees and other charges that may be assessed by participating insurance companies under the variable annuity contracts or variable life insurance policies. Such fees or charges, if any, may affect the return you may realize with respect to your investments. Ask your representative for more complete information. Please consider a Fund’s objectives, risks and charges and expenses, and read the prospectus carefully before investing. The prospectus contains this and other information about the Funds.
This material is not authorized for distribution to prospective investors unless preceded or accompanied by a current prospectus or summary prospectus, if applicable. Investors should consider the Funds’ objective, risks, and charges and expenses, and read the summary prospectus, if available, and/or the prospectus carefully before investing or sending money. The summary prospectus, if available, and the prospectus contain this and other information about the Funds and may be obtained from your authorized dealer or from Goldman Sachs & Co. LLC by calling 1-800-621-2550.
This report is prepared for the general information of contract owners and is not an offer of shares of the Goldman Sachs Variable Insurance Trust.
© 2023 Goldman Sachs. All rights reserved.
VITBSP500SAR-23 330601-OTU-1851787
| | (a) | | As of the end of the period covered by this report, the registrant has adopted a code of ethics that applies to the registrant’s principal executive officer, principal financial officer, principal accounting officer or controller, or persons performing similar functions, regardless of whether these individuals are employed by the registrant or a third party (the “Code of Ethics”). |
| | (c) | | During the period covered by this report, no amendments were made to the provisions of the Code of Ethics. |
| | (d) | | During the period covered by this report, the registrant did not grant any waivers, including an implicit waiver, from any provision of the Code of Ethics. |
| | (f) | | A copy of the Code of Ethics is available as provided in Item 13(a)(1) of this report. |
| ITEM 3. | AUDIT COMMITTEE FINANCIAL EXPERT. |
| | The registrant’s board of trustees has determined that the registrant has at least one “audit committee financial expert” (as defined in Item 3 of Form N-CSR) serving on its audit committee. Kathryn A. Cassidy is the “audit committee financial expert” and is “independent” (as each term is defined in Item 3 of Form N-CSR). |
| ITEM 4. | PRINCIPAL ACCOUNTANT FEES AND SERVICES. |
| | The information required by this Item is only required in an annual report on this Form N-CSR. |
| ITEM 5. | AUDIT COMMITTEE OF LISTED REGISTRANTS. |
Not applicable.
| ITEM 6. | SCHEDULE OF INVESTMENTS. |
Schedule of Investments is included as part of the Reports to Shareholders filed under Item 1.
| ITEM 7. | DISCLOSURE OF PROXY VOTING POLICIES AND PROCEDURES FOR CLOSED-END MANAGEMENT INVESTMENT COMPANIES. |
Not applicable.
| ITEM 8. | PORTFOLIO MANAGERS OF CLOSED-END MANAGEMENT INVESTMENT COMPANIES. |
Not applicable.
| ITEM 9. | PURCHASES OF EQUITY SECURITIES BY CLOSED-END MANAGEMENT INVESTMENT COMPANY AND AFFILIATED PURCHASERS. |
Not applicable.
| ITEM 10. | SUBMISSION OF MATTERS TO A VOTE OF SECURITY HOLDERS. |
There have been no material changes to the procedures by which shareholders may recommend nominees to the registrant’s board of trustees.
| ITEM 11. | CONTROLS AND PROCEDURES. |
| | (a) | | The registrant’s principal executive and principal financial officers or persons performing similar functions have concluded that the registrant’s disclosure controls and procedures (as defined in Rule 30a-3(c) under the Investment Company Act of 1940, as amended (the “1940 Act”)) are effective as of a date within 90 days of the filing date of this report that includes the disclosure required by this paragraph, based on the evaluation of these controls and procedures required by Rule 30a-3(b) under the 1940 Act and 15d-15(b) under the Securities Exchange Act of 1934, as amended. |
| | (b) | | There were no changes in the registrant’s internal control over financial reporting (as defined in Rule 30a-3(d) under the 1940 Act) that occurred during the period covered by this report that have materially affected, or are reasonably likely to materially affect, the registrant’s internal control over financial reporting. |
| ITEM 12. | DISCLOSURE OF SECURITIES LENDING ACTIVITIES FOR CLOSED-END MANAGEMENT INVESTMENT COMPANIES. |
Not applicable.
SIGNATURES
Pursuant to the requirements of the Securities Exchange Act of 1934 and the Investment Company Act of 1940, the registrant has duly caused this report to be signed on its behalf by the undersigned, thereunto duly authorized.
Goldman Sachs Variable Insurance Trust
| | |
/s/ James A. McNamara |
By: James A. McNamara |
President/Chief Executive Officer of |
Goldman Sachs Variable Insurance Trust |
|
Date: August 25, 2023 |
Pursuant to the requirements of the Securities Exchange Act of 1934 and the Investment Company Act of 1940, the report has been signed below by the following persons on behalf of the registrant and in the capacities and on the dates indicated.
| | |
/s/ James A. McNamara |
By: James A. McNamara |
President/Chief Executive Officer of |
Goldman Sachs Variable Insurance Trust |
|
Date: August 25, 2023 |
|
/s/ Joseph F. DiMaria |
By: Joseph F. DiMaria |
Principal Financial Officer of |
Goldman Sachs Variable Insurance Trust |
|
Date: August 25, 2023 |