Exhibit 99.(a)(5)(ZZ)
e•on
2006 Nine Months Results
Analyst & Investor Conference Call
November 8, 2006
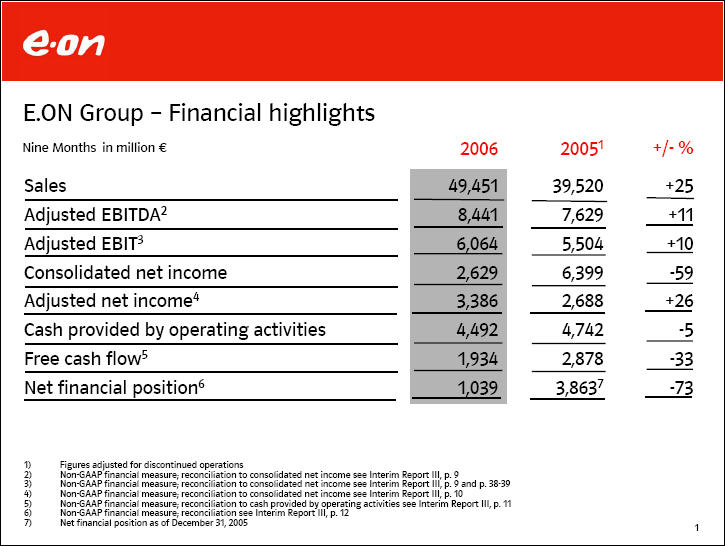
E.ON Group - Financial highlights Nine Months in million € 2006 20051 +/- % Sales 49,451 39,520 +25 Adjusted EBITDA2 8,441 7,629 +11
Adjusted EBIT3 6,064 5,504 +10 Consolidated net income 2,629 6,399 -59 Adjusted net income4 3,386 2,688 +26 Cash provided by operating activities 4,492 4,742 -5 Free cash flow5 1,934 2,878 -33 Net financial position6 1,039 3,863-7 -73 1)Figures adjusted for iscontinued operations 2)Non-GAAP financial measure; reconciliation to consolidated net income see Interim Report III, p. 9 3)Non-GAAP financial measure; reconciliation to consolidated net income see Interim Report III, p. 9 and p. 38-39 4)Non-GAAP financial measure; reconciliation to consolidated net income see Interim Report III, p. 10 5)Non-GAAP financial measure; reconciliation to cash provided by operating activities see Interim Report III, p. 11 6)Non-GAAP financial measure; reconciliation see Interim Report III, p. 12
7)Net financial position as of December 31, 2005
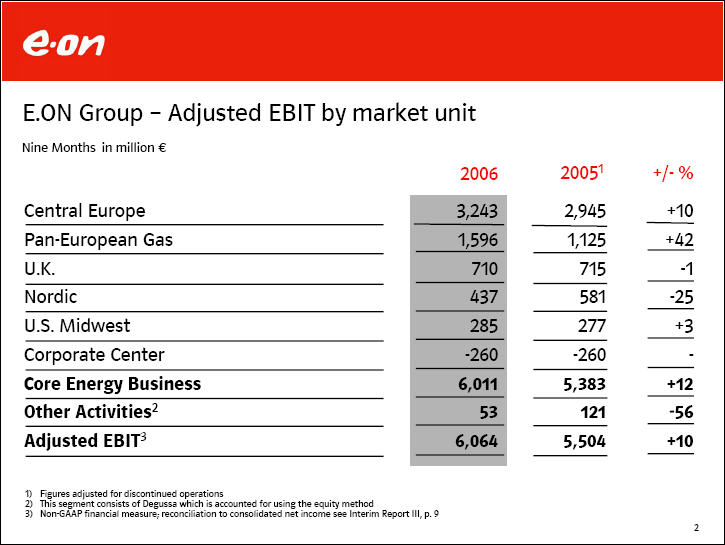
E.ON Group - Adjusted EBIT by market unit Nine Months in million € 2006 20051 +/- % Central Europe 3,243 2,945 +10 Pan-European Gas 1,596 1,125 +42 U.K. 710 715 -1 Nordic 437 581 -25 U.S. Midwest 285 277 +3 Corporate Center -260 -260 Core Energy Business 6,011 5,383 +12 Other Activities 2 53 121 -56 Adjusted EBIT3 6,064 5,504 +10 1)Figures adjusted for discontinued operations
2)This segment consists of Degussa which is accounted for using the equity method 3)Non-GAAP financial measure; reconciliation to consolidated net income see Interim Report III, p. 9

Adjusted EBIT by business unit (1) Nine Months in million € 2006 20051 +/-% Central Europe Central Europe West Power 2,643 2,568 +3 Central Europe West Gas 257 218 +18 Central Europe East 243 172 +41 Other/Consolidation 100 -13
Adjusted EBIT-2 3,243 2,945 +10 1)Figures adjusted for discontinued operations 2)Non-GAAP financial measure; reconciliation to consolidated net income see Interim Report III, p. 9
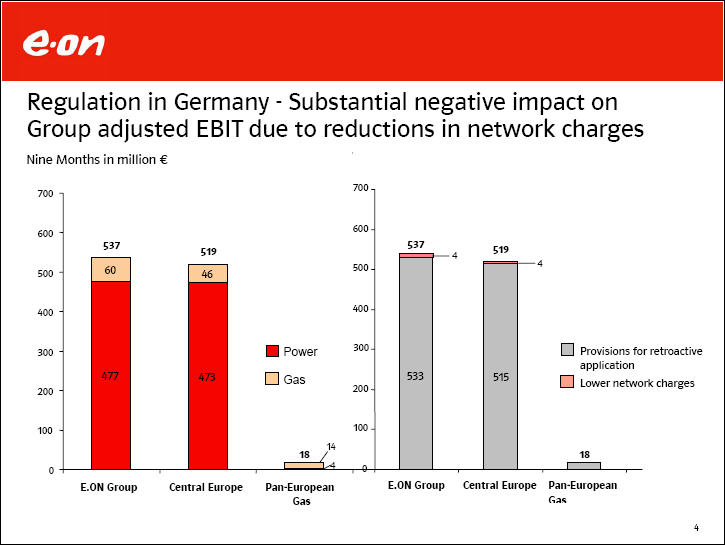
Regulation in Germany - Substantial negative impact on Group adjusted EBIT due to reductions in network charges Nine Months in million €
700 700 600 - 600 537 537 519 519 4 4 500 60 46 500 400 400 300 • Power 300 q Provisions for retroactive application 477 473 q Gas 533 515 q Lower network charges 200 200 100 100 0 18 14 4 0 18 E.ON Group Central Europe Pan-European Gas E.ON Group Central Europe Pan-European Gas

Adjusted EBIT by business unit (2) Nine Months in million € Pan-European Gas Up-/Midstream 2006 1,222 20051 712 +/-% +72
Downstream participations 367 405 -9 Other/Consolidation 7 8 -13 Adjusted EBIT2 1,596 1,125 +42 U.K.
Regulated business 347 327 +6 Non-regulated business 443 393 +13 Other/Consolidation -80 -5 Adjusted EBIT2 710 715 -1
1) Figures adjusted for discontinued operations 2) Non-GAAP financial measure; reconciliation to consolidated net income see Interim Report III, p.9

Adjusted EBIT by business unit (3) Nine Months in million € 2006 2005 +/-% Nordic Regulated business 163 189 -14 Non-regulated business 291 392 -26 Other/Consolidation -17 Adjusted EBIT1 437 581 -25 U.S. Midwest Regulated business 283 269 +5 Non-regulated business/ Other 2 8 -75 Adjusted EBIT1 285 277 +3 1) Non-GAAP financial measure; reconciliation to consolidated net income see Interim Report III, p. 9
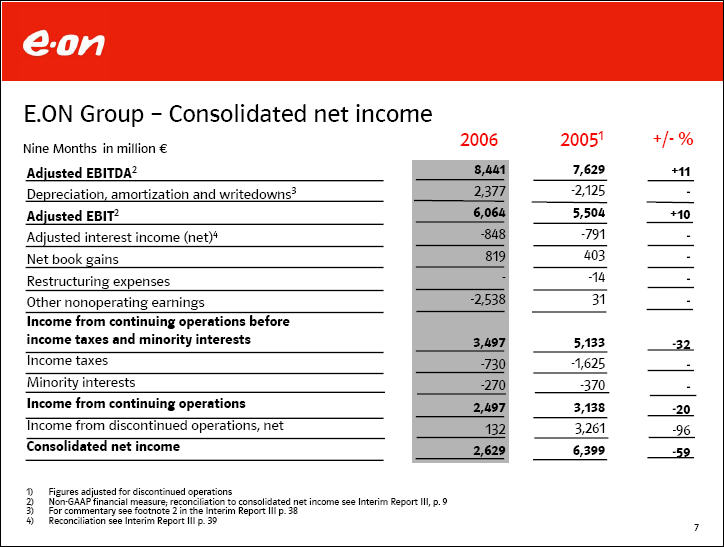
E.ON Group - Consolidated net income 2006 20051 +/- % Nine Months in million € Adjusted EBITDA2 8,441 7,629 +11 Depreciation, amortization and writedowns3 2,377 -2,125 Adjusted EBIT2 6,064 5,504 +10 Adjusted interest income (net)4 -848 -791 Net book gains 819 403 Restructuring expenses -14 Other nonoperating earnings -2,538 31 Income from continuing operations before income taxes and minority interests 3,497 5,133 -32 Income taxes -730 -1,625 Minority interests -270 -370 Income from continuing operations 2,497 3,138 -20 Income from discontinued operations, net 132 3,261 -96 Consolidated net income 2,629 6,399 -59 1) Figures adjusted for discontinued operations 2)Non-GAAP financial measure; reconciliation to consolidated net income see Interim Report III, p. 9 3) For commentary see footnote 2 in the Interim Report III p. 38 4) Reconciliation see Interim Report III p.39

Regulation-induced impairments on gas distribution activities Nine Months in million € 600 - 547 500 € 227m on own networks and € 24m on other shareholdings 400 359 Other shareholdings at Pan-European Gas 296 300 251 108 Thuga shareholdings in municipal distribution network operators 200 251 100 188 188 0 E.ON Group Central Europe Pan-European Gas EBIT-effective Non-operating

E.ON Group - Adjusted net income Nine Months in million € 2006 2005 +/-% Consolidated net income 2,629 6,399 -59 ,,Non-operating income" after related income taxes and minority interests 889 -450 Income from discontinued operations, net 32 -3,261Adjusted net income1 3,386 2,688 +26 1) Non-GAAP financial measure

E.ON Group - Cash provided by operating activities by market unit Nine Months in million € 2006 20051 +/- Central Europe 2,484 2,516 -32 Pan-European Gas 291 1,266 -975 U.K. 493 -55 +548 Nordic 554 490 +64 U.S. Midwest 367 226 +141 Corporate Center 303 299 +4
Cash provided by operating activities 4,492 4,742 -250 Investments in intangible assets and property, plant and equipment 2,558 1,864 +694
Free cash flow2 1,934 2,878 -944 1)Figures adjusted for discontinued operations 1) Non-GAAP financial measure; reconciliation to cash provided by operating activities see Interim Report III, p. 11

E.ON Group - Development of net financial position1
Nine Months in billion € +3.9 -4,8 1 0.4 1,0 -3.4 +3.6 +4.5 2.6 -0.6
Net financial position as of Dec. 31, 2005 Dividends Investments 2) Funding CTA Consolidations Cash provided by operating activities
Divestments2)/ Deconsolidations Others Net financial position as of Sep. 30, 2006
1)Non-GAAP financial measure; reconciliation see Interim Report III, p.12
2)Investments in / divestments of intangible and fixed assets and participations
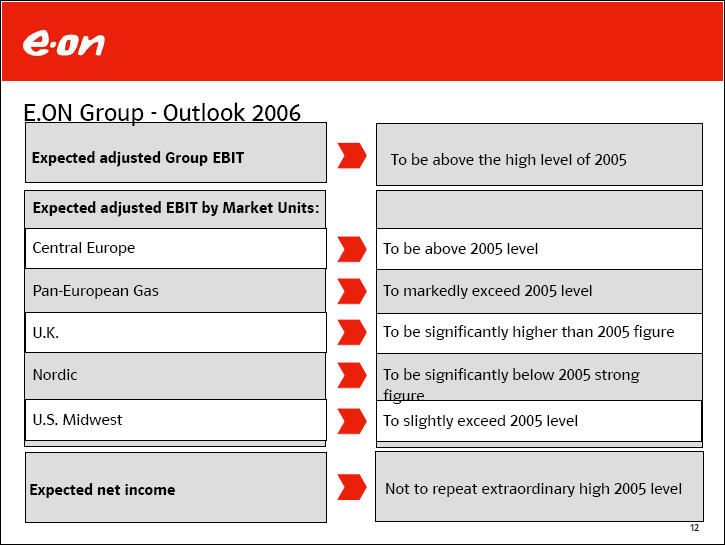
E.ON Group - Outlook 2006 Expected adjusted Group EBIT To be above the high level of 2005 Expected adjusted EBIT by Market Units: Central Europe To be above 2005 level Pan-European Gas To markedly exceed 2005 Level U.K. To be significantly higher than 2005 figure Nordic To be significantly below 2005 strong figure U.S. Midwest To slightly exceed 2005 level Expected net income Not to repeat extraordinary high 2005 level
Back-up Charts

Development of electricity prices in selected markets EEX, UK, Nord Pool, French and US Forward prices Cal 2007 Key drivers UK forward prices appear to be driven mainly by the UK natural gas prices. Nordic forward prices appear to be driven mainly by the hydrological situation, fuel and CO2 prices. Mainland European forward prices appear to be driven by coal, gas and CO2 prices. US forward prices appear to be driven by US gas prices. 1.9.05 1.12.05 1.3.06 1.6.06 1.9.06 01.09 16.09 Legend UK Cal 07 Base Load (EUR/MWh) French Cal 07 Base Load (EUR/MWh) EEX Cal 07 Base Load (EUR/MWh) Nord Pool Cal 07 Base Load (EUR/MWh) US Cal 07 Base Load (EUR/MWh)
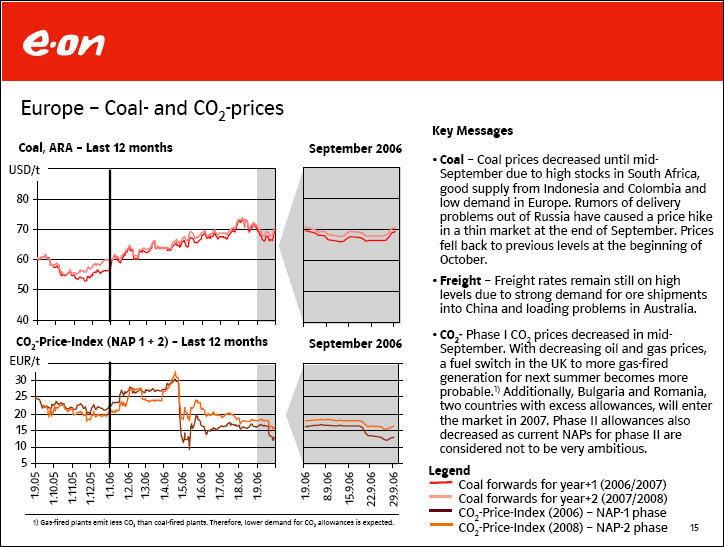
Europe - Coal- and C02-prices Coal, ARA - Last 12 months September 2006 USD/t 80 70 60 50 40 Co2-Price-Index (NAP 1 + 2) - Last 12 months September 2006 EUR/t 30 25 20 15 10 5 1.9.05 1.01.05 1.11.05 1.12.05 1.1.06 1.2.06 1.3.06 1.4.06 1.5.06 1.6.06 1.7.06 1.8.06 1.9.06 1.9.06 8.9.06 15.9.06 22.9.06 29.9.06 1) Gas-fired plants emit less CO2 than coal-fired plants. Therefore, lower demand for CO2 allowances is expected. Key Messages Coal - Coal prices decreased until mid-September due to high stocks in South Africa, good supply from Indonesia and Colombia and low demand in Europe. Rumors of delivery problems out of Russia have caused a price hike in a thin market at the end of September. Prices fell back to previous levels at the beginning of October. Freight - Freight rates remain still on high levels due to strong demand for ore shipments into China and loading problems in Australia. C02- Phase I CO2 prices decreased in mid-September. With decreasing oil and gas prices, a fuel switch in the UK to more gas-fired generation for next summer becomes more probable') Additionally, Bulgaria and Romania, two countries with excess allowances, will enter the market in 2007. Phase II allowances also decreased as current NAPs for phase II are considered not to be very ambitious. Legend Coal forwards for year+1(2006/2007) Coal forwards for year+2 (2007/2008) - C02 Price-Index (2006) - NAP-1 phase C02 Price-Index (2008) - NAP-2 phase
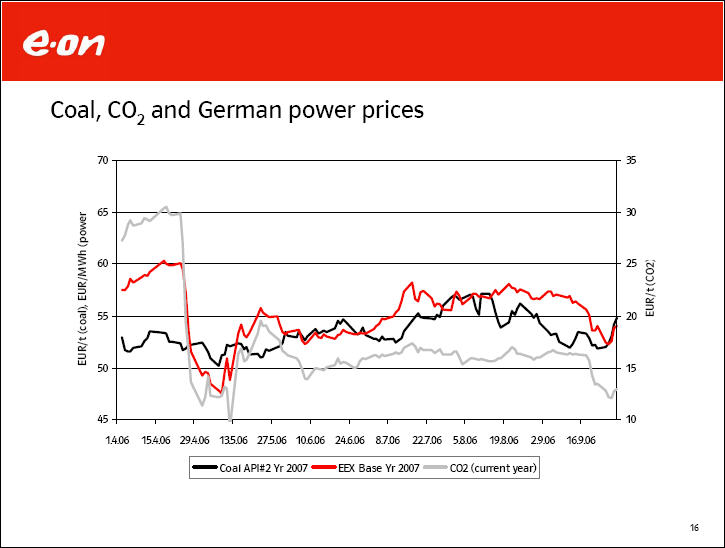
Coal, CO2 and German power prices
70 65 60 55 50 45 35 30 25 20 15 10 1.4.06 15.4.06 29.4.06 13.5.06 27.5.06 10.6.06 24.6.06 8.7.06 22.7.06 5.8.06 19.8.06 2.9.06 16.9.06
Coal API#2 Yr 2007 EEX Base Yr 2007 CO2 (current year)
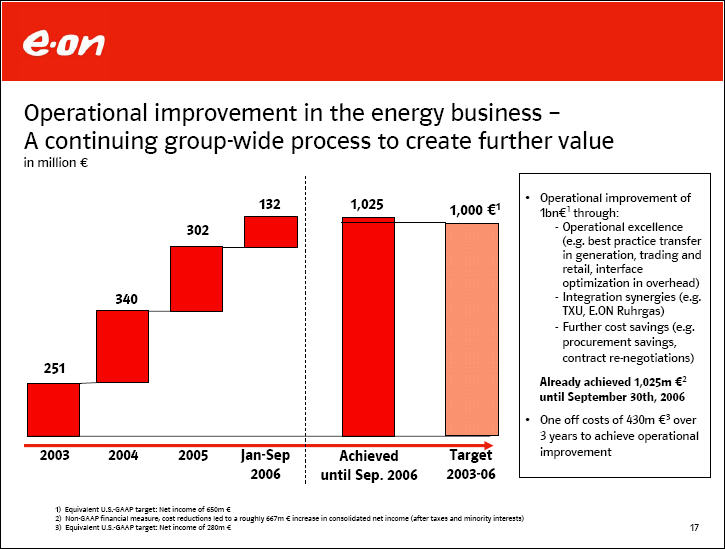
Operational improvement in the energy business - A continuing group-wide process to create further value in million € 132 251 302 340 1,025 1,000 €~ Operational improvement of 1bn€1 through:- Operational excellence (e.g. best practice transfer in generation, trading and retail, interface optimization in overhead) - Integration synergies (e.g. TXU, E.ON Ruhrgas) - Further cost savings (e.g. procurement savings, contract re-negotiations) Already achieved 1,025m €2 until September 30th, 2006 • One off costs of 430m €3 over 3 years to achieve operational improvement 2003 2004 2005 Jan-Sep 2006 Achieved until Sep. 2006 Target 2003-06 1)Equivalent U.S.-GAAP target: Net income of 650m € 2)Non-GAAP financial measure; cost reductions led to a roughly 667m € increase in consolidated net income (after taxes and minority interests) 3) Equivalent U.S.-GAAP target: Net income of 280m €

E.ON Group - "Non-operating income" Nine Months in million € 2006 Net book gains 819 Securities 351 Degussa 376 Other 92 Restructuring expenses 0 Other non-operating income -2,538 Mark-to-market valuation of derivatives -1,954 Regulation-induced impairments on gas assets -359 Other -225 "Non-operating income" -1,719

E.ON Group - Discontinued operations Nine Months in million € 2006 2005 Book gains Other earnings Total Book gains Other earnings Total E.ON Finland 11 0 11 E.ON Finland 0 16 16 WKE 0 95 95 WKE 0 -2 -2 Viterra 26 0 26 Viterra 2,450 157 2,607 Ruhrgas Industries 0 0 0 Ruhrgas Industries 613 21 634 Other' 0 0 0 Other' 10 -4 6 Results from discontinued operations Results from discontinued operations 37 95 132 3,073 188 3,261 1) "Other" relates to post-sale gains and losses in connection with the disposal of subsidiaries in prior years (2005: VAW aluminium)

E.ON Group - Split of gross external debt1 as of September 30, 2006, in billion € Central Europe PanEuropean Gas U.K. Nordic U.S. Midwest Corporate Center E.ON Group Bonds 0,0 0,0 0,4 0,6 0,8 7,3 9,1 Commercial Paper 0,0 0,0 0,0 0,3 0,0 0,9 1,2 Bank Loans / others 1,3 0,6 0,2 0,5 0,0 0,1 2,7 Gross External Debt 1 1,3 0,6 0,6 1,4 0,8 8,3 13,0 Split by Market Unit Central Europe 10% PanEuropen Gas 5% UK 5% Nordic 11% U.S. Midwest 6% Corporate Center 64% Split by Maturity 2006 27% 2007 7% 2009 4% 2010 4% 2011-2016 36% After 2016 22% Split by Currency 2 EUR 45% GBP 28% USD 15% SEK 12% 1)Non-GAAP financial measure; gross external debt equals financial liabilities to banks and third parties, see Interim Report III, p.12 2)Before hedging

E.ON's Ratings compared to its peer group As of October 26, 2006 Moody's (Aa3/p-1" review for possible downgrade") On February 22, 2006, Moody's has placed its Aa3 credit rating of E.ON AG on review for a possible downgrade, following the announcement by E.ON that it has made an offer to acquire 100% of the shares in Endesa SA. "Moody's says that, if the acquisition were to be successful, the most likely outcome would be an E.ON AG rating that is a weakly positioned at A2." On September 28, 2006, Moody's decided to extend its review for downgrade to E.ON's short-term P-1 rating. Standard & Poor's (AA-/ A-1+, creditwatch negative") On February 21, 2006, Standard & Poor's has placed its AA-/ A-1+ credit rating of E.ON AG on creditwatch with negative implications, following the announcement by E.ON that it has made an offer to acquire 100% of the shares in Endesa SA. "Based on current information and statements by the company, the ratings are unlikely to be lowered by more than two notches, however." positive positive = outlook, negative = negative outlook, rev. down. review for possible downgrade, watch neg. = creditwatch negative Standard & Poor's Moody's EdF AA- negative Aal stable GdF AA- watch neg. Aal rev. down E.ON AA- watch neg. Aa3 rev. down Enel A+ negative Aa3 stable Scottish & Southern A+ stable Al stable RWE A+ negative Al stable Endesa A watch neg. A3 negative Vattenfall A- stable A2 stable Scottish Power A- stable Baal stable
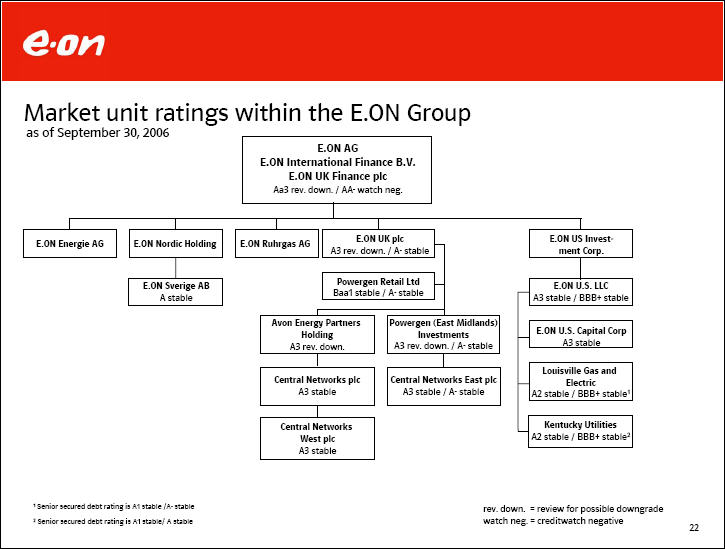
Market unit ratings within the E.ON Group as of September 30, 2006 E.ON AG E.ON International Finance B.V. E.ON UK Finance plc Aa3 rev. down. / AA- watch neg. E.ON Energie AG E.ON Nordic Holding E.ON Ruhrgas AG E.ON UK plc A3 rev. down. / A- stable E.ON US Investment Corp. E.ON Sverige AB A Stable Powergen Retail Ltd Baal stable / A- stable E.ON U.S. LLC A3 stable / BBB+ stable Avon Energy Partners Holding A3 rev. down. Powergen (East Midlands) Investments A3 rev. down. / A- stable E.ON U.S. Capital Corp A3 stable Central Networks plc A3 stable Central Networks East plc A3 stable / A- stable Louisville Gas and Electric A2 stable / BBB+ stable1 Central Networks West plc A3 stable Kentucky Utilities A2 stable / BBB+ stable2 Louisville Gas and Electric 1A2 stable / BBB+ stable Kentucky Utilities A2 stable / BBB+ stable2 Senior secured debt rating is Al stable /A- stable rev. down. = review for possible downgrade 2 Senior secured debt rating is Al stable/ A stable watch neg. = creditwatch negative

This statement does not constitute an invitation to sell or an offer to buy any securities or a solicitation of any vote or approval. Endesa investors and security holders are urged to read the prospectus and U.S. tender offer statement from E.ON regarding the proposed tender offer for Endesa when they become available, because they will contain important information. The prospectus and certain complementary documentation will be filed in Spain with the Spanish Comisión Nacional del Mercado de Valores (the "CNMV"). Likewise, a U.S. tender offer statement will be filed in the United States with the U.S. Securities and Exchange Commission (the "SEC"). Investors and security holders may obtain a free copy of the prospectus (when it is available) and its complementary documentation from E.ON, Endesa, the four Spanish Stock Exchanges, and Santander Investment Bolsa SV SA or Santander Investment SA, Corredores de Bolsa. The prospectus will also be available on the websites of the CNMV (www.cnmv.es) and E.ON (www.eon.com). Likewise, investors and security holders may obtain a free copy of the U.S. tender offer statement (when it is available) and other documents filed by E.ON with the SEC on the SEC's web site at www.sec.gov. The U.S. tender offer statement and these other documents may also be obtained for free from E.ON, when they become available, by directing a request to E.ON AG, External Communications, Tel.: 0211- 45 79 - 4 53. This presentation may contain forward-looking statements. Various known and unknown risks, uncertainties and other factors could lead to material differences between the actual future results, financial situation, development or performance of E.ON and Endesa and the estimates given here. These factors include the inability to obtain necessary regulatory approvals or to obtain them on acceptable terms; the inability to integrate successfully Endesa within the E.ON Group or to realize synergies from such integration; costs related to the acquisition of Endesa; the economic environment of the industries in which E.ON and Endesa operate; and other risk factors discussed in E.ON's public reports filed with the Frankfurt Stock Exchange and with the SEC (including E.ON's Interim Report III on Form 20-F) and in Endesa's public reports filed with the CNMV and with the SEC (including Endesa's Interim Report III on Form 20-F). E.ON assumes no liability whatsoever to update these forward-looking statements or to conform them to future events or developments. E.ON prepares its consolidated financial statements in accordance with generally accepted accounting principles in the United States ("U.S. GAAP"). This presentation may contain references to certain financial measures (including forward looking measures) that are not calculated in accordance with U.S. GAAP and are therefore considered "non-GAAP financial measures" within the meaning of the U.S. federal securities laws. E.ON presents a reconciliation of these non-GAAP financial measures to the most comparable U.S. GAAP measure or target, either in this presentation, in its Interim Report III, or on its website at www.eon.com. Management believes that the non-GAAP financial measures used by E.ON, when considered in conjunction with (but not in lieu of) other measures that are computed in U.S. GAAP, enhance an understanding of E.ON's results of operations. A number of these non-GAAP financial measures are also commonly used by securities analysts, credit rating agencies, and investors to evaluate and compare the periodic and future operating performance and value of E.ON and other companies with which E.ON competes. These non-GAAP financial measures should not be considered in isolation as a measure of E.ON's profitability or liquidity, and should be considered in addition to, rather than as a substitute for, net income, cash flow provided by operating activities, and the other income or cash flow data prepared in accordance with U.S. GAAP. The non-GAAP financial measures used by E.ON may differ from, and not be comparable to, similarly titled measures used by other companies.