FORM 6-K
SECURITIES AND EXCHANGE COMMISSION
Washington, D.C. 20549
Report of Foreign Issuer
Pursuant to Rule 13a-16 or 15d-16 of
the Securities Exchange Act of 1934
For the month of June, 2006
Commission File Number: 333-07654
ENDESA, S.A.
(Translation of Registrant's Name into English)
Ribera del Loira, 60
28042 Madrid, Spain
(Address of principal executive office)
Indicate by check mark whether the registrant files or will file
annual reports under cover of Form 20-F or Form 40-F:
Indicate by check mark if the registrant is submitting the Form 6-K
in paper as permitted by Regulation S-T Rule 101(b)(1):
Indicate by check mark if the registrant is submitting the Form 6-K
in paper as permitted by Regulation S-T Rule 101(b)(7):
Indicate by check mark whether by furnishing the information
contained in this Form, the Registrant is also thereby furnishing the information to the Commission
pursuant to Rule 12g3-2(b) under the Securities Exchange Act of 1934:
If “Yes” is marked, indicate below the file number assigned to the registrant
in connection with Rule 12g3-2(b): N/A
|
June 2006 Carbon and electricity markets, National Allocation Plans General Management for Spain and Portugal |
|
Contents 1. The Carbon and Electricity markets 2. Activity of ENDESA in the Carbon market 3. Balance of the first year of application of the 2005-2007 NAP in Spain and Europe 4. .and Phase II |
|
Contents 1. The Carbon and Electricity markets 2. Activity of ENDESA in the Carbon market 3. Balance of the first year of application of the 2005-2007 NAP in Spain and Europe 4. . and Phase II |
|
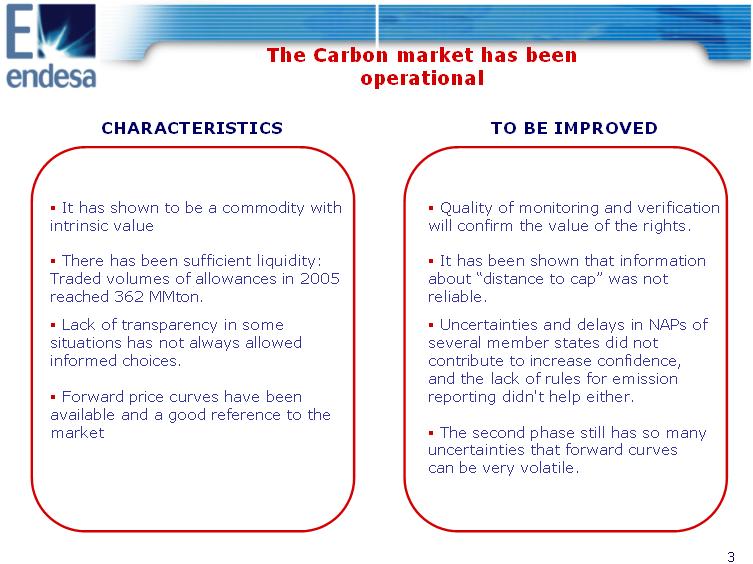
The Carbon market has been operational CHARACTERISTICS TO BE IMPROVED It has shown to be a commodity with intrinsic value There has been sufficient liquidity: Traded volumes of allowances in 2005 reached 362 MMton. Lack of transparency in some situations has not always allowed informed choices. Forward price curves have been available and a good reference to the market Quality of monitoring and verification will confirm the value of the rights. It has been shown that information about "distance to cap" was not reliable. Uncertainties and delays in NAPs of several member states did not contribute to increase confidence, and the lack of rules for emission reporting didn't help either. The second phase still has so many uncertainties that forward curves can be very volatile. |
|
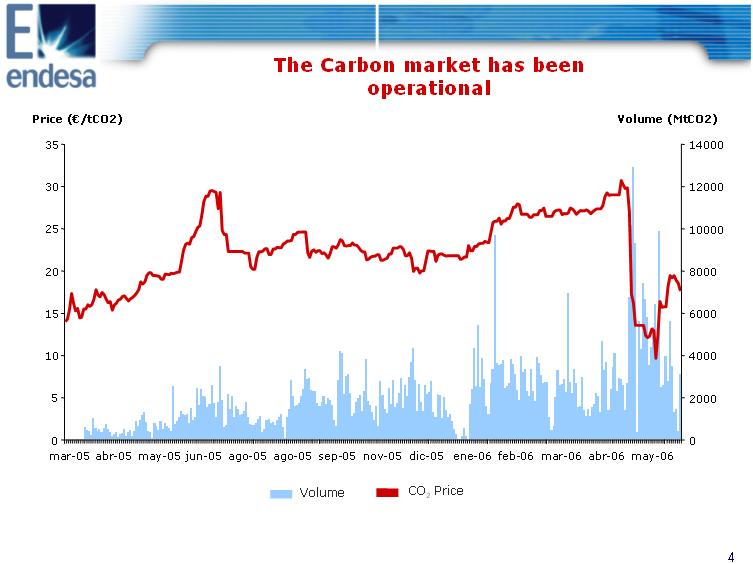
The Carbon market has been operational Price ((euro)/tCO2) Volume (MtCO2) 35 30 25 20 15 10 5 0 mar-05 abr-05 may-05 jun-05 ago-05 ago-05 sep-05 nov-05 dic-05 ene-06 feb-06 mar-06 abr-06 may-06 CO2 Price Volume 14000 12000 10000 8000 6000 4000 2000 0 |
|
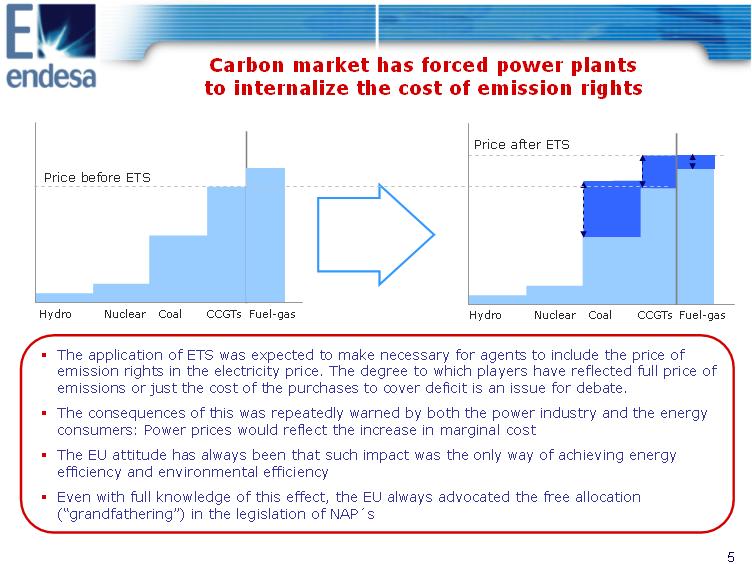
Carbon market has forced power plants to internalize the cost of emission rights Price after ETS Price before ETS Hydro Nuclear Coal CCGTs Fuel-gas Hydro Nuclear Coal CCGTs Fuel-gas o The application of ETS was expected to make necessary for agents to include the price of emission rights in the electricity price. The degree to which players have reflected full price of emissions or just the cost of the purchases to cover deficit is an issue for debate. o The consequences of this was repeatedly warned by both the power industry and the energy consumers: Power prices would reflect the increase in marginal cost o The EU attitude has always been that such impact was the only way of achieving energy efficiency and environmental efficiency o Even with full knowledge of this effect, the EU always advocated the free allocation ("grandfathering") in the legislation of NAP<180>s |
|
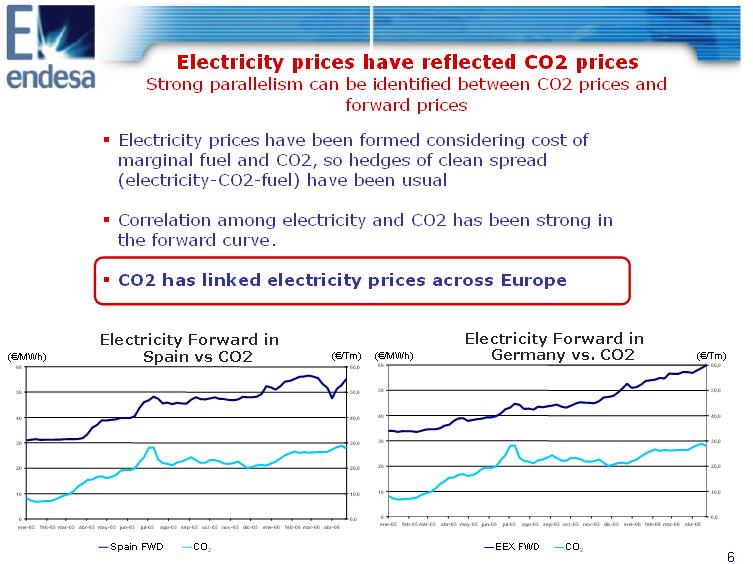
Electricity prices have reflected CO2 prices Strong parallelism can be identified between CO2 prices and forward prices o Electricity prices have been formed considering cost of marginal fuel and CO2, so hedges of clean spread (electricity-CO2-fuel) have been usual o Correlation among electricity and CO2 has been strong in the forward curve. o CO2 has linked electricity prices across Europe Electricity Forward in Electricity Forward in Spain vs CO2 ((euro)/Tm) ((euro)/MWh) Germany vs. CO2 ((euro)/Tm) 60 60,0 ((euro)/MWh) 60 60,0 50,0 50 50,0 50 40,0 40 40,0 40 30,0 30 30,0 30 20,0 20 20,0 20 10,0 10 10,0 10 0,0 0 0,0 0 ene-05 feb-05 mar-05 abr-05 may-05 jun-05 jul-05 ago-05 sep-05 oct-05 nov-05 dic-05 ene-06 feb-06 mar-06 abr-06 ene-05 feb-05 mar-05 abr-05 may-05 jun-05 jul-05 ago-05 sep-05 oct-05 nov-05 dic-05 ene-06 feb-06 mar-06 abr-06 CO2 CO2 Spain FWD EEX FWD 6 |
|
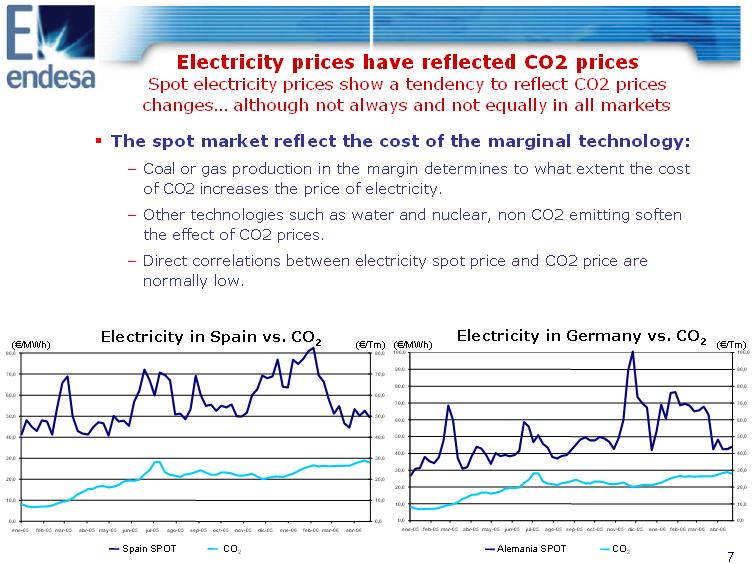
Electricity prices have reflected CO2 prices Spot electricity prices show a tendency to reflect CO2 prices changes. although not always and not equally in all markets o The spot market reflect the cost of the marginal technology: - Coal or gas production in the margin determines to what extent the cost of CO2 increases the price of electricity. - Other technologies such as water and nuclear, non CO2 emitting soften the effect of CO2 prices. - Direct correlations between electricity spot price and CO2 price are normally low. Electricity in Spain vs. CO2 ((euro)/Tm) ((euro)/MWh) Electricity in Germany vs. CO2 ((euro)/Tm) 80,0 100,0 100,0 90,0 90,0 70,0 80,0 80,0 60,0 70,0 70,0 50,0 60,0 60,0 50,0 40,0 50,0 40,0 40,0 30,0 30,0 30,0 20,0 20,0 20,0 10,0 10,0 10,0 0,0 0,0 0,0 ((euro)/MWh) 80,0 70,0 60,0 50,0 40,0 30,0 20,0 10,0 0,0 ene-05 feb-05 mar-05 abr-05 may-05 jun-05 jul-05 ago-05 sep-05 oct-05 nov-05 dic-05 ene-06 feb-06 mar-06 abr-06 ene-05 feb-05 mar-05 abr-05 may-05 jun-05 jul-05 ago-05 sep-05 oct-05 nov-05 dic-05 ene-06 feb-06 mar-06 abr-06 CO2 Alemania SPOT CO2 Spain SPOT |
|
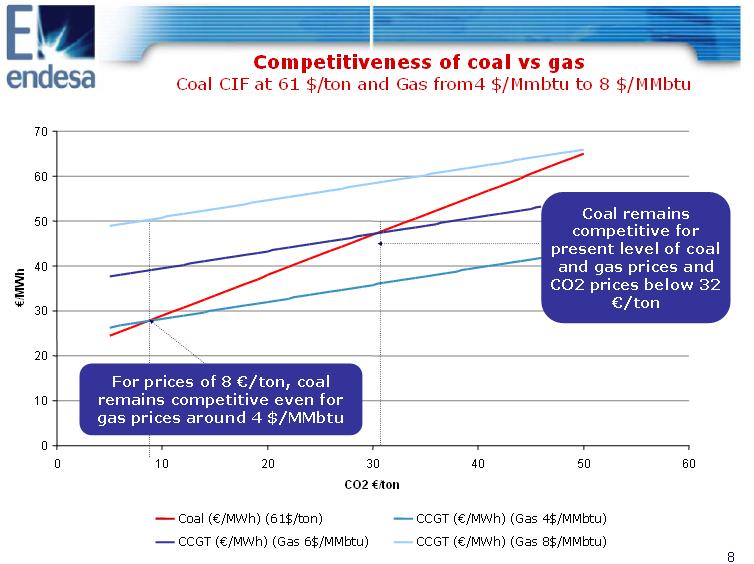
Competitiveness of coal vs gas Coal CIF at 61 $/ton and Gas from4 $/Mmbtu to 8 $/MMbtu 0 10 20 30 40 50 60 70 0 10 20 30 40 50 60 (euro)/MWh Coal remains competitive for present level of coal and gas prices and CO2 prices below 32 (euro)/ton For prices of 8 (euro)/ton, coal remains competitive even for gas prices around 4 $/MMbtu CO2 (euro)/ton Coal ((euro)/MWh) (61$/ton) CCGT ((euro)/MWh) (Gas 4$/MMbtu) CCGT ((euro)/MWh) (Gas 6$/MMbtu) CCGT ((euro)/MWh) (Gas 8$/MMbtu) |
|
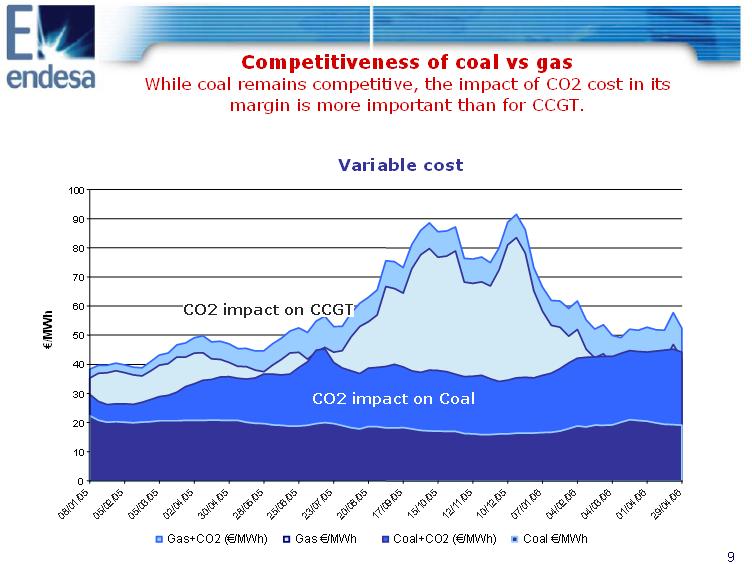
While coal remains competitive, the impact of CO2 cost in its margin is more important than for CCGT. Competitiveness of coal vs gas Variable cost 0 10 20 30 40 50 60 70 80 90 100 (euro)/MWh CO2 impact on Coal CO2 impact on CCGT Gas+CO2 ((euro)/MWh) Gas (euro)/MWh Coal+CO2 ((euro)/MWh) Coal (euro)/MWh |
|
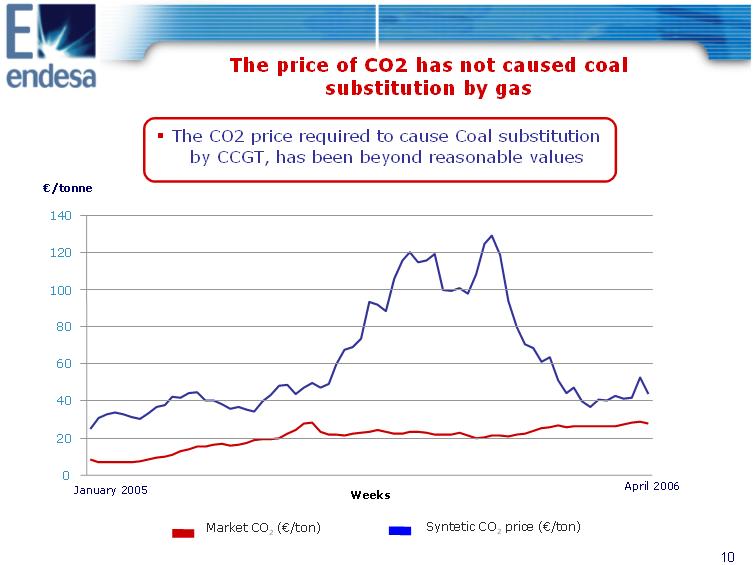
The price of CO2 has not caused coal substitution by gas o The CO2 price required to cause Coal substitution by CCGT, has been beyond reasonable values (euro)/tonne 140 20 40 60 80 100 120 0 January 2005 Weeks April 2006 Market CO2 ((euro)/ton) Syntetic CO2 price ((euro)/ton) |
|
Contents 1. The Carbon and Electricity markets 2. Activity of ENDESA in the Carbon market 3. Balance of the first year of application of the 2005-2007 NAP in Spain and Europe 4. and Phase II |
|
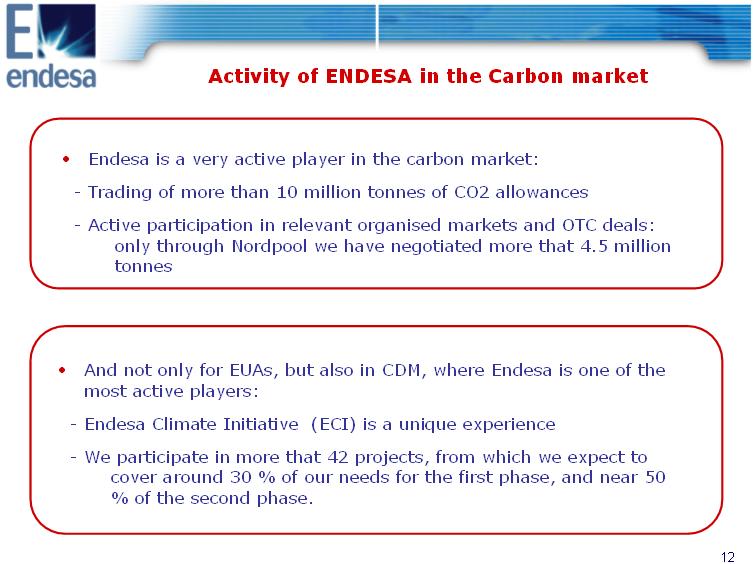
Activity of ENDESA in the Carbon market o Endesa is a very active player in the carbon market: -Trading of more than 10 million tonnes of CO2 allowances -Active participation in relevant organised markets and OTC deals: only through Nordpool we have negotiated more that 4.5 million tonnes o And not only for EUAs, but also in CDM, where Endesa is one of the most active players: -Endesa Climate Initiative (ECI) is a unique experience -We participate in more that 42 projects, from which we expect to cover around 30 % of our needs for the first phase, and near 50 % of the second phase. |
|
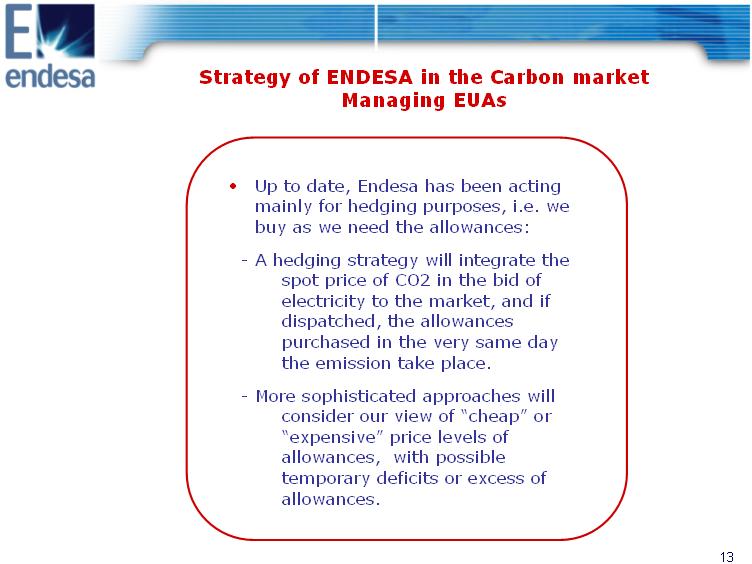
Strategy of ENDESA in the Carbon market Managing EUAs o Up to date, Endesa has been acting mainly for hedging purposes, i.e. we buy as we need the allowances: -A hedging strategy will integrate the spot price of CO2 in the bid of electricity to the market, and if dispatched, the allowances purchased in the very same day the emission take place. -More sophisticated approaches will consider our view of "cheap" or "expensive" price levels of allowances, with possible temporary deficits or excess of allowances. |
|
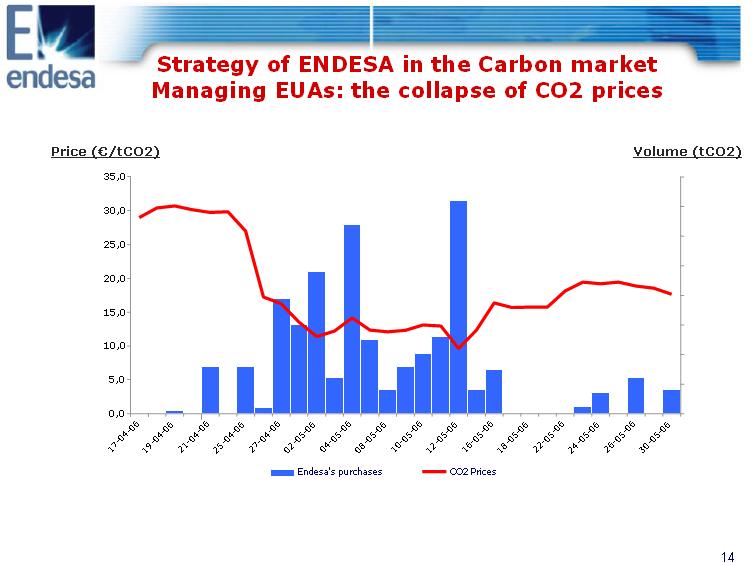
Managing EUAs: the collapse of CO2 prices Strategy of ENDESA in the Carbon market Price ((euro)/tCO2) Volume (tCO2) 35,0 30,0 25,0 20,0 15,0 10,0 5,0 0, 17-04-06 19-04-06 21-04-06 25-04-06 27-04-06 02-05-06 04-05-06 08-05-06 10-05-06 12-05-06 16-05-06 18-05-06 22-05-06 24-05-06 26-05-06 30-05-06 0 Endesa's purchases CO2 Prices |
|
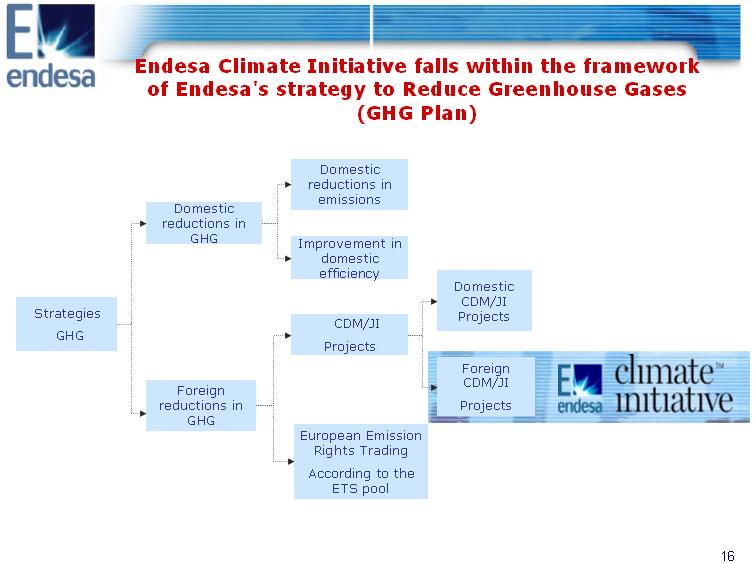
Endesa Climate Initiative falls within the framework of Endesa's strategy to Reduce Greenhouse Gases (GHG Plan) Strategies GHG Domestic reductions in GHG CDM/JI Projects European Emission Rights Trading According to the ETS pool Foreign reductions in GHG Improvement in domestic efficiency Domestic reductions in emissions Foreign CDM/JI Projects Domestic CDM/JI Projects |
|
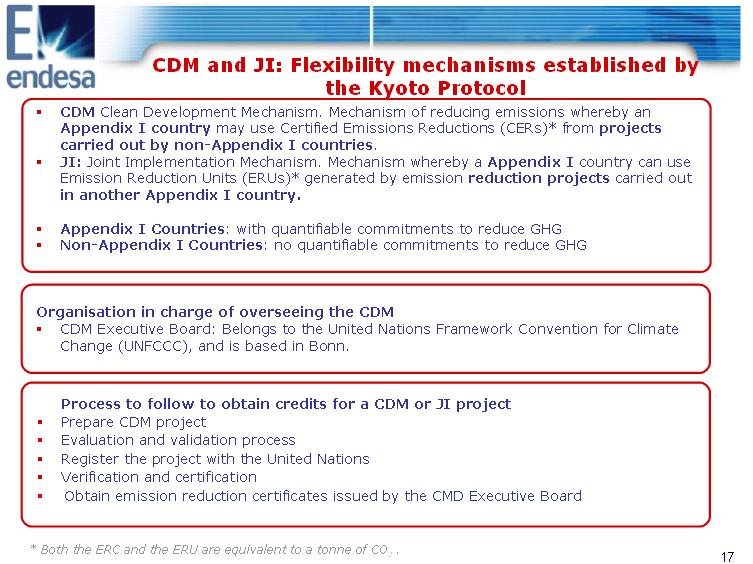
CDM and JI: Flexibility mechanisms established by CDM Clean Development Mechanism. Mechanism of reducing emissions whereby an Appendix I country may use Certified Emissions Reductions (CERs)* from projects carried out by non-Appendix I countries. JI: Joint Implementation Mechanism. Mechanism whereby a Appendix I country can use Emission Reduction Units (ERUs)* generated by emission reduction projects carried out in another Appendix I country. Appendix I Countries: with quantifiable commitments to reduce GHG Non-Appendix I Countries: no quantifiable commitments to reduce GHG Organisation in charge of overseeing the CDM CDM Executive Board: Belongs to the United Nations Framework Convention for Climate Change (UNFCCC), and is based in Bonn. Process to follow to obtain credits for a CDM or JI project Prepare CDM project Evaluation and validation process Register the project with the United Nations Verification and certification Obtain emission reduction certificates issued by the CMD Executive Board the Kyoto Protocol * Both the ERC and the ERU are equivalent to a tonne of CO2 . |
|
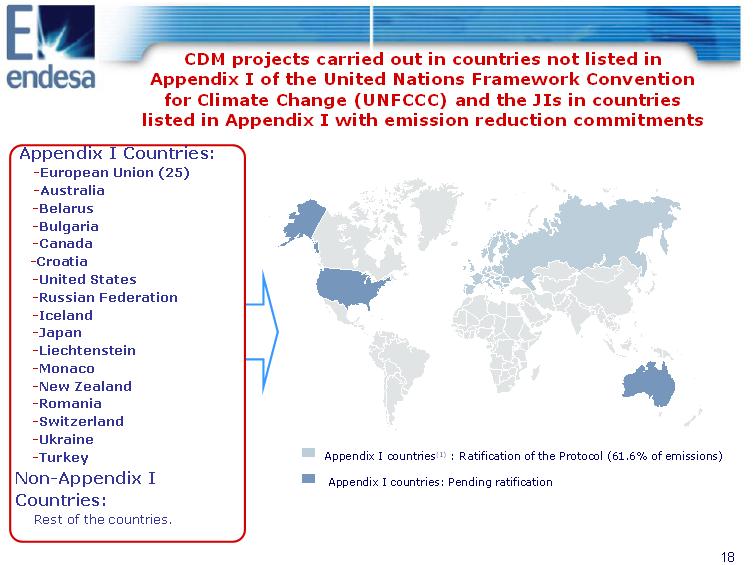
18 Appendix I countries(1) : Ratification of the Protocol (61.6% of emissions) Appendix I countries: Pending ratification Appendix I Countries: -European Union (25) -Australia -Belarus -Bulgaria -Canada -Croatia -United States -Russian Federation -Iceland -Japan -Liechtenstein -Monaco -New Zealand -Romania -Switzerland -Ukraine -Turkey Non-Appendix I Countries: Rest of the countries. CDM projects carried out in countries not listed in Appendix I of the United Nations Framework Convention for Climate Change (UNFCCC) and the JIs in countries listed in Appendix I with emission reduction commitments |
|
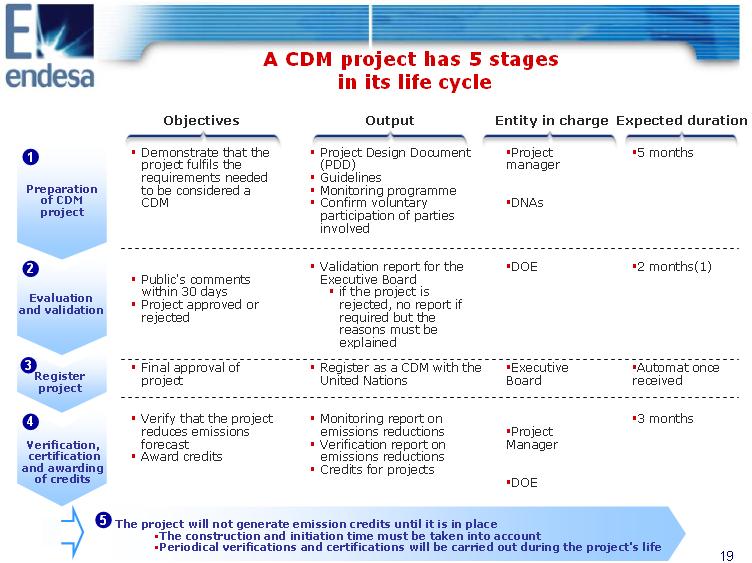
in its life cycle A CDM project has 5 stages Objectives Output Entity in charge Expected duration 1 2 3 Demonstrate that the project fulfils the requirements needed to be considered a CDM Public's comments within 30 days Project approved or rejected Final approval of project Verify that the project reduces emissions forecast Award credits Project Design Document (PDD) Guidelines Monitoring programme Confirm voluntary participation of parties involved Validation report for the Executive Board if the project is rejected, no report if required but the reasons must be explained Register as a CDM with the United Nations Monitoring report on emissions reductions Verification report on emissions reductions Credits for projects Project manager DNAs DOE Executive Board Project Manager DOE 4 The project will not generate emission credits until it is in place The construction and initiation time must be taken into account Periodical verifications and certifications will be carried out during the project's life 5 months 2 months(1) Automat once received 3 months 5 Preparation of CDM project Evaluation and validation Register project Verification, certification and awarding of credits |
|
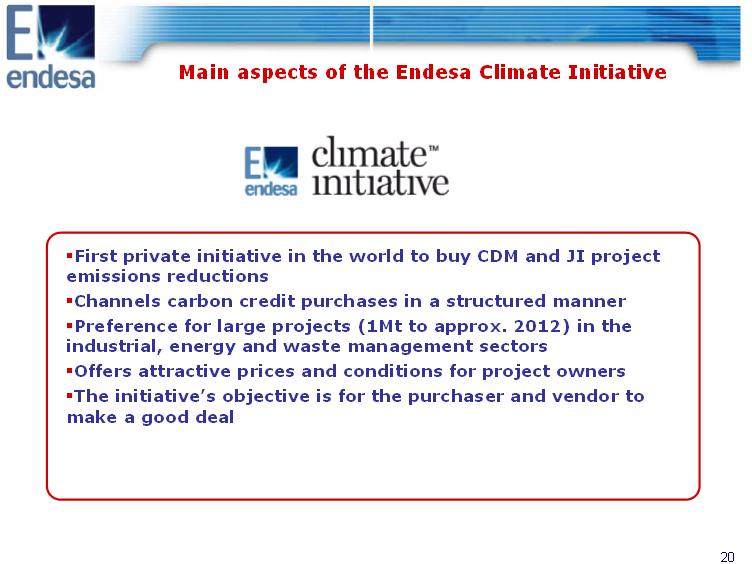
Main aspects of the Endesa Climate Initiative First private initiative in the world to buy CDM and JI project emissions reductions Channels carbon credit purchases in a structured manner Preference for large projects (1Mt to approx. 2012) in the industrial, energy and waste management sectors Offers attractive prices and conditions for project owners The initiative's objective is for the purchaser and vendor to make a good deal |
|
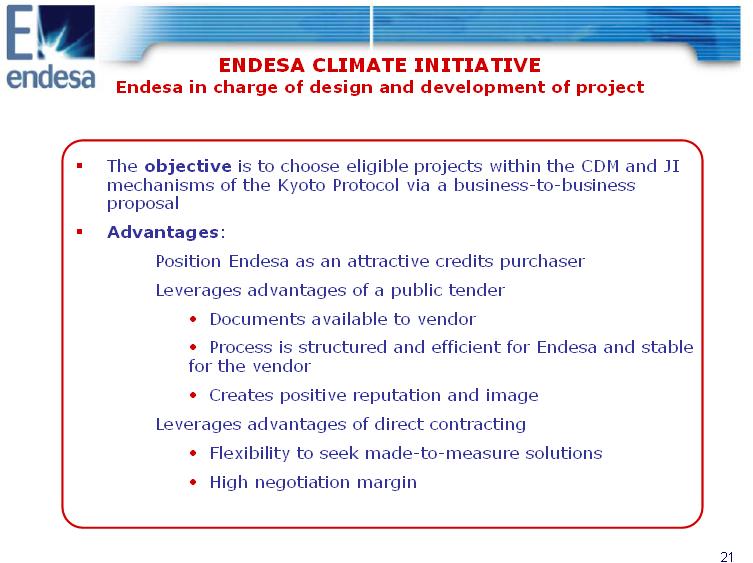
ENDESA CLIMATE INITIATIVE Endesa in charge of design and development of project The objective is to choose eligible projects within the CDM and JI mechanisms of the Kyoto Protocol via a business-to-business proposal Advantages: Position Endesa as an attractive credits purchaser Leverages advantages of a public tender o Documents available to vendor o Process is structured and efficient for Endesa and stable for the vendor o Creates positive reputation and image Leverages advantages of direct contracting o Flexibility to seek made-to-measure solutions o High negotiation margin |
|
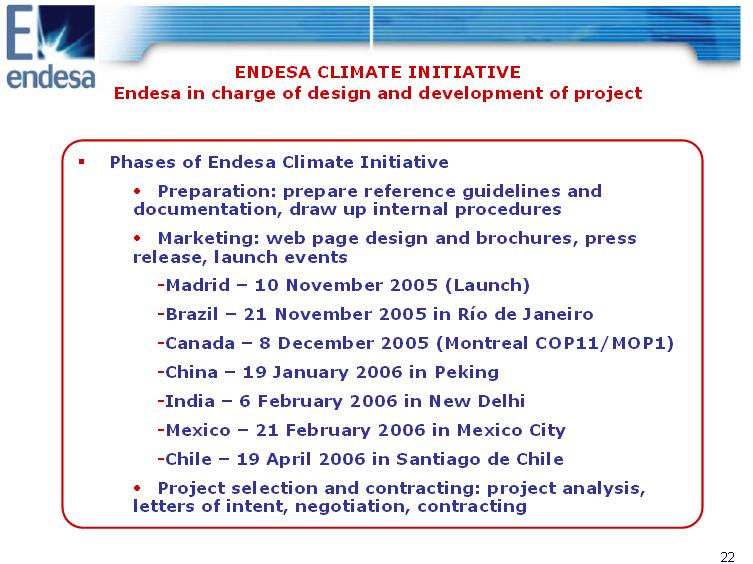
ENDESA CLIMATE INITIATIVE Endesa in charge of design and development of project Phases of Endesa Climate Initiative o Preparation: prepare reference guidelines and documentation, draw up internal procedures o Marketing: web page design and brochures, press release, launch events -Madrid - 10 November 2005 (Launch) -Brazil - 21 November 2005 in Rio de Janeiro -Canada - 8 December 2005 (Montreal COP11/MOP1) -China - 19 January 2006 in Peking -India - 6 February 2006 in New Delhi -Mexico - 21 February 2006 in Mexico City -Chile - 19 April 2006 in Santiago de Chile o Project selection and contracting: project analysis, letters of intent, negotiation, contracting |
|
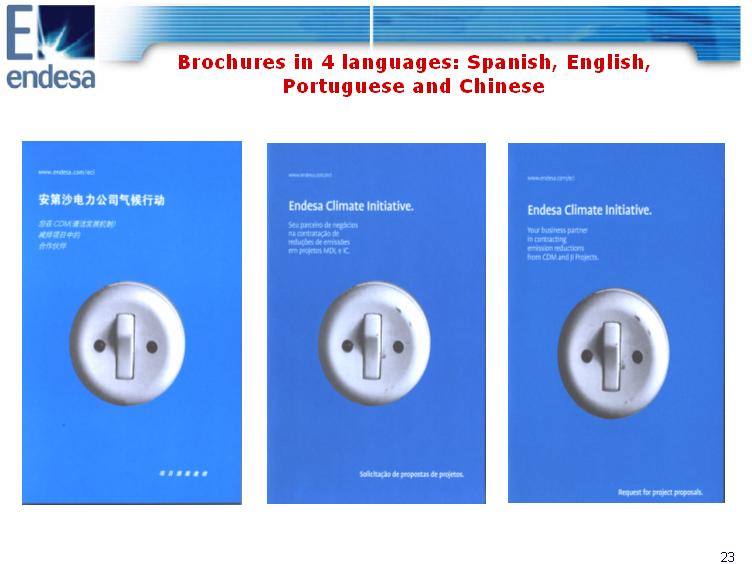
Brochures in 4 languages: Spanish, English, Portuguese and Chinese |
|
CDM and JI Project Portfolio Projects with Emission Reduction Purchase Agreement (ERPA) contract signed Projects with Letter of Intent (LOI) and agreed price, in process of due diligence and preparation of ERPA contract Rest of Project Portfolio Projects being negotiated o 62.7 Mt CO2e o Average Price (euro)7.30/t CO2e o 20.5 Mt CO2e o Average Price (euro)7.25/t CO2e o 65.2 Mt CO2e o 95.7 Mt CO2e |
|
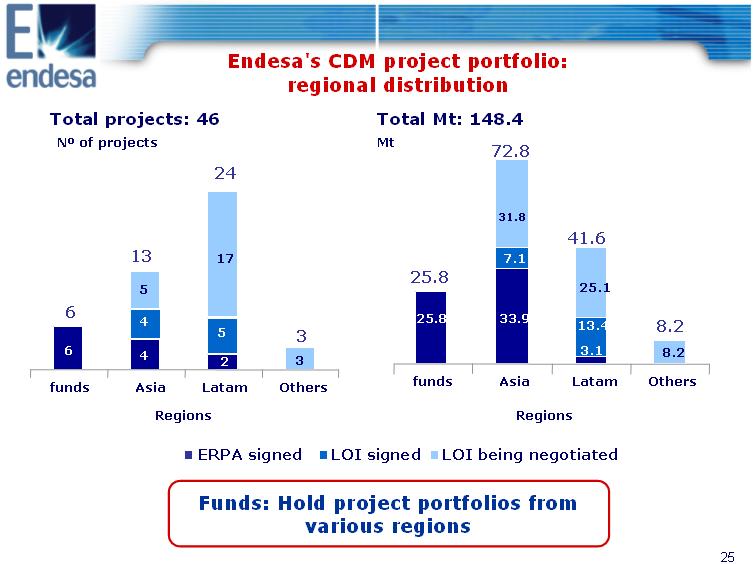
Endesa's CDM project portfolio: regional distribution Total projects: 46 Total Mt: 148.4 N(0) of projects Mt 72.8 24 17 41.6 13 25.8 6 445 52 36 25.8 8.2 3 31.8 7.1 33.9 25.1 13.4 3.1 8.2 funds Asia Latam Others funds Asia Latam Others Regions Regions ERPA signed LOI signed LOI being negotiated Funds: Hold project portfolios from various regions |
|
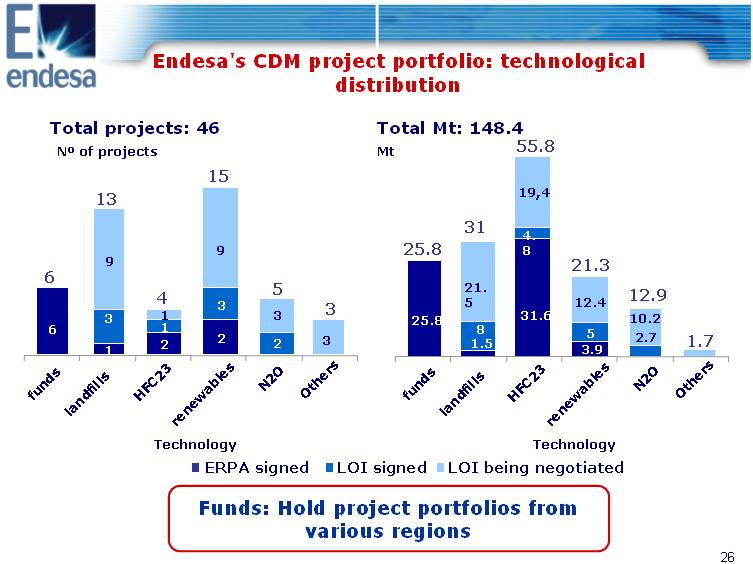
Endesa's CDM project portfolio: technological distribution Total projects: 46 Total Mt: 148.4 N(0) of projects Mt 55.8 4. 9 8 9 3 31.6 3 31 25.8 1 6 8 5 12 223 1.5 3.9 nds ndfills HFC23 ables N2O Others nds ndfills HFC23 ables N2O Others 21. 5 19,4 12.4 10.2 2.7 1.7 31 25.8 21.3 12.9 6 13 15 4 5 3 Technology Technology ERPA signed LOI signed LOI being negotiated Funds: Hold project portfolios from various regions |
|
Contents 1. The Carbon and Electricity markets 2. Activity of ENDESA in the Carbon market 3. Balance of the first year of application of the 2005-2007 NAP in Spain and Europe 4. . and Phase II |
|
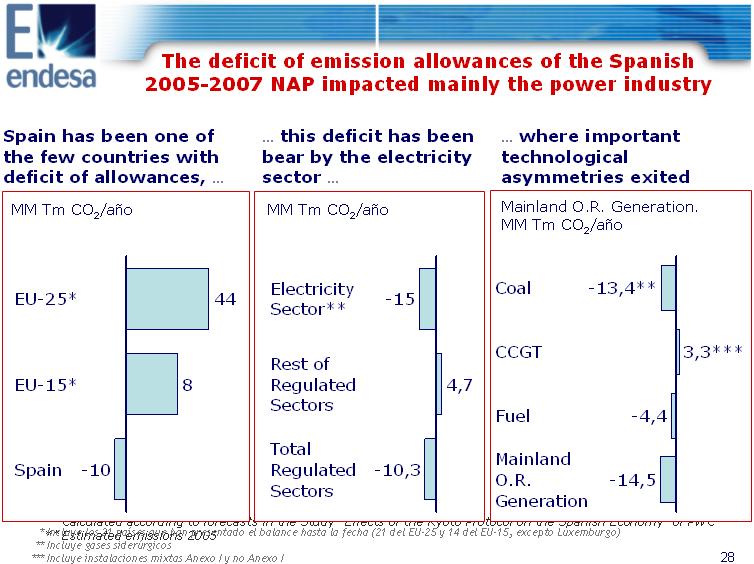
The deficit of emission allowances of the Spanish 2005-2007 NAP impacted mainly the power industry Spain has been one of . this deficit has been . where important the few countries with bear by the electricity technological deficit of allowances, . sector . asymmetries exited MM Tm CO2/ano 8 44EU-25* EU-15* -10Spain Calculated according to forecasts in the Study "Effects of the Kyoto Protocol on the Spanish Economy" of PWC MM Tm CO2/ano -15Electricity Sector** 4,7 Rest of Regulated Sectors -10,3 Total Regulated Sectors -13,4**Coal 3,3***CCGT -4,4Fuel -14,5 Mainland O.R. Generation Mainland O.R. Generation. MM Tm CO2/ano ** Estimated emissions 2005 * Incluye los 21 paises que han presentado el balance hasta la fecha (21 del EU-25 y 14 del EU-15, excepto Luxemburgo) ** Incluye gases siderurgicos *** Incluye instalaciones mixtas Anexo I y no Anexo I |
|
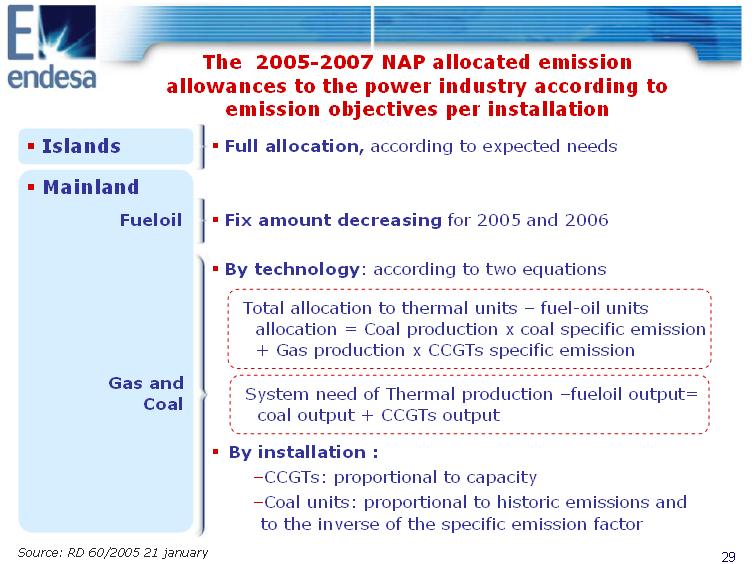
The 2005-2007 NAP allocated emission allowances to the power industry according to emission objectives per installation Islands o Full allocation, according to expected needs o Fix amount decreasing for 2005 and 2006 o By technology: according to two equations Source: RD 60/2005 21 january Mainland Fueloil Gas and Coal Total allocation to thermal units - fuel-oil units allocation = Coal production x coal specific emission + Gas production x CCGTs specific emission System need of Thermal production -fueloil output= coal output + CCGTs output o By installation : -CCGTs: proportional to capacity -Coal units: proportional to historic emissions and to the inverse of the specific emission factor |
|
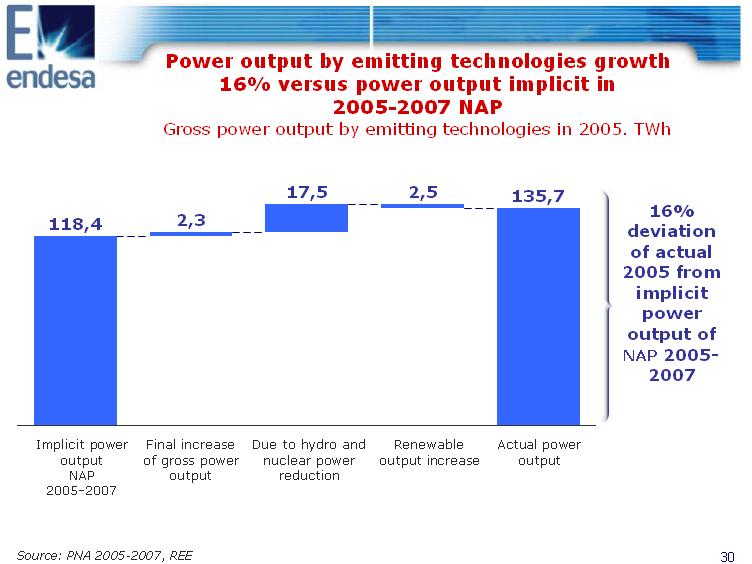
Power output by emitting technologies growth 16% versus power output implicit in 2005-2007 NAP Gross power output by emitting technologies in 2005. TWh 118,4 2,3 17,5 2,5 135,7 16% deviation of actual 2005 from implicit power output of NAP 20052007 Implicit power Final increase Due to hydro and Renewable Actual power output of gross power nuclear power output increase output NAP output reduction 2005-2007 Source: PNA 2005-2007, REE |
|
Total emissions in 2005 has been well above allocation of 2005-2007 NAP Mainland power sector emissions. Mton CO2. 2005 5,6 95,8 11,5 78,7 Allocation NAP Large output by Generation mix Total 2005-2007 emitting differences between emission technologies actual 2005 mix and implicit NAP mix Source: PNA 2005-07, Endesa |
|
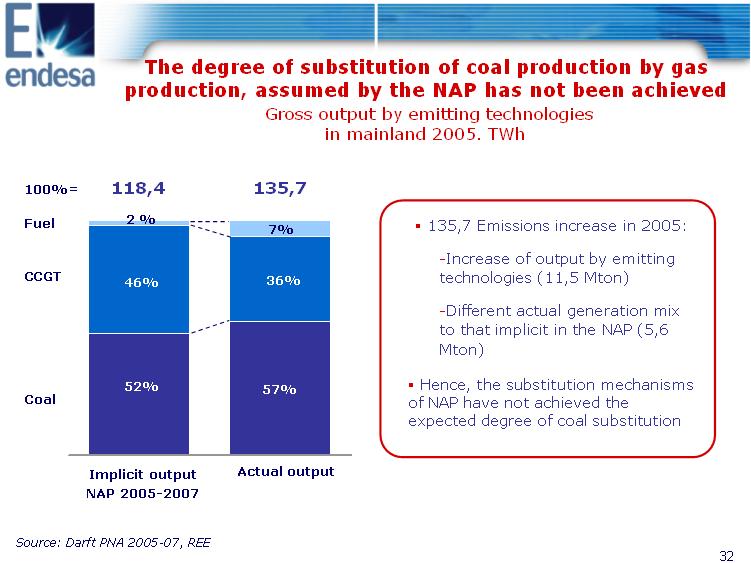
The degree of substitution of coal production by gas production, assumed by the NAP has not been achieved Gross output by emitting technologies in mainland 2005. TWh 100%= 118,4 135,7 Fuel 46% 52% 2 % 57% 36% 7% o 135,7 Emissions increase in 2005: -Increase of output by emitting CCGT technologies (11,5 Mton) -Different actual generation mix to that implicit in the NAP (5,6 Mton) o Hence, the substitution mechanisms Coal of NAP have not achieved the expected degree of coal substitution Implicit output Actual output NAP 2005-2007 Source: Darft PNA 2005-07, REE |
|
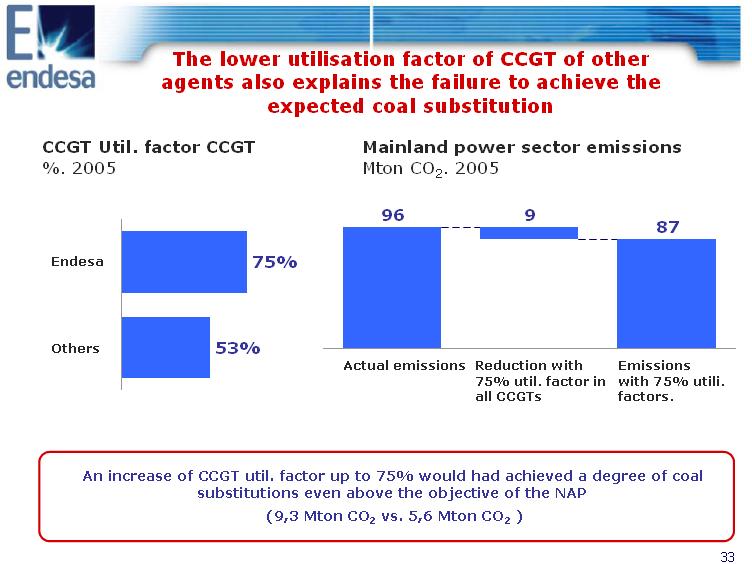
The lower utilisation factor of CCGT of other agents also explains the failure to achieve the expected coal substitution CCGT Util. factor CCGT Mainland power sector emissions %. 2005 Mton CO2. 2005 96 9 87 Endesa 75% Others 53% Actual emissions Reduction with Emissions 75% util. factor in with 75% utili. all CCGTs factors. An increase of CCGT util. factor up to 75% would had achieved a degree of coal substitutions even above the objective of the NAP (9,3 Mton CO2 vs. 5,6 Mton CO2 ) |
|
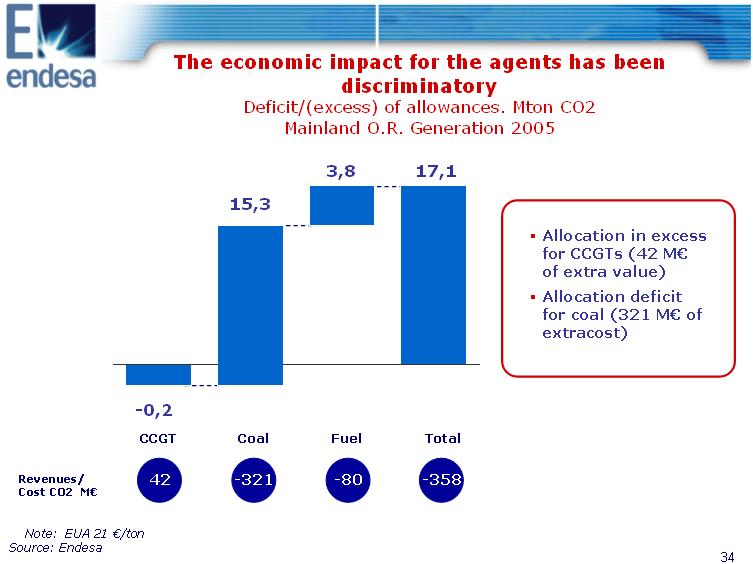
The economic impact for the agents has been discriminatory Deficit/(excess) of allowances. Mton CO2 Mainland O.R. Generation 2005 3,8 17,1 15,3 o Allocation in excess for CCGTs (42 M(euro) of extra value) o Allocation deficit for coal (321 M(euro) of extracost) -0,2 CCGT Coal Fuel Total Revenues/ Cost CO2 M(euro) 42 -321 -80 -358 Note: EUA 21 (euro)/ton Source: Endesa |
|
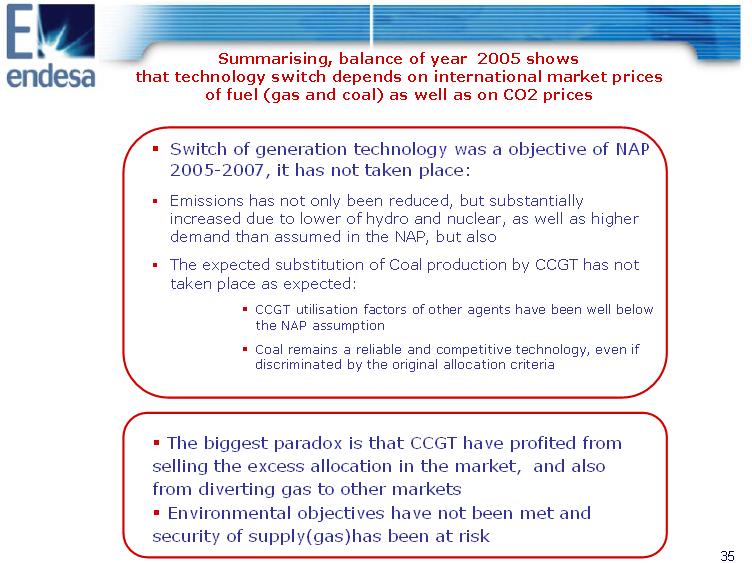
Summarising, balance of year 2005 shows that technology switch depends on international market prices of fuel (gas and coal) as well as on CO2 prices Switch of generation technology was a objective of NAP 2005-2007, it has not taken place: Emissions has not only been reduced, but substantially increased due to lower of hydro and nuclear, as well as higher demand than assumed in the NAP, but also The expected substitution of Coal production by CCGT has not taken place as expected: CCGT utilisation factors of other agents have been well below the NAP assumption Coal remains a reliable and competitive technology, even if discriminated by the original allocation criteria 35 The biggest paradox is that CCGT have profited from selling the excess allocation in the market, and also from diverting gas to other markets Environmental objectives have not been met and security of supply(gas)has been at risk |
|
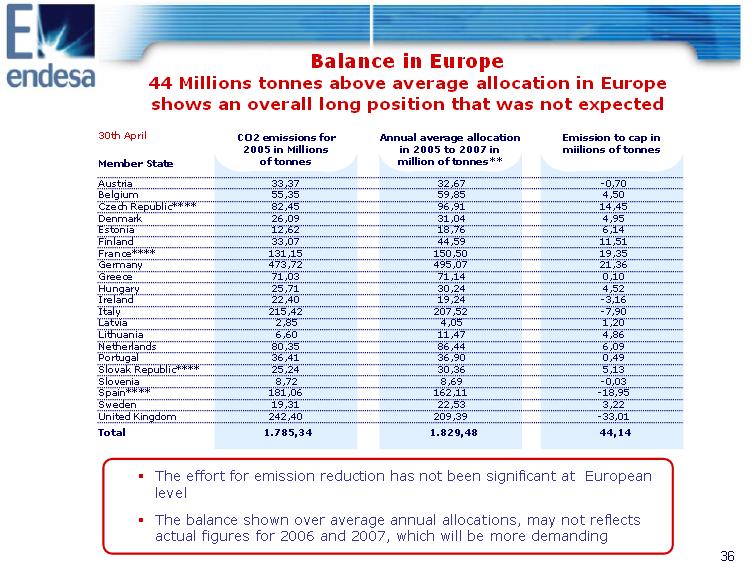
Balance in Europe44 Millions tonnes above average allocation in Europe shows an overall long position that was not expected 30th April Member State CO2 emissions for 2005 in Millions of tonnes Annual average allocation in 2005 to 2007 in million of tonnes** Emission to cap in miilions of tonnes Austria 33,37 32,67 -0,70 Belgium 55,35 59,85 4,50 Czech Republic**** 82,45 96,91 14,45 Denmark 26,09 31,04 4,95 Estonia 12,62 18,76 6,14 Finland 33,07 44,59 11,51 France**** 131,15 150,50 19,35 Germany 473,72 495,07 21,36 Greece 71,03 71,14 0,10 Hungary 25,71 30,24 4,52 Ireland 22,40 19,24 -3,16 Italy 215,42 207,52 -7,90 Latvia 2,85 4,05 1,20 Lithuania 6,60 11,47 4,86 Netherlands 80,35 86,44 6,09 Portugal 36,41 36,90 0,49 Slovak Republic**** 25,24 30,36 5,13 Slovenia 8,72 8,69 -0,03 Spain**** 181,06 162,11 -18,95 Sweden 19,31 22,53 3,22 United Kingdom 242,40 209,39 -33,01 Total 1.785,34 1.829,48 44,14 The effort for emission reduction has not been significant at European level The balance shown over average annual allocations, may not reflects actual figures for 2006 and 2007, which will be more demanding |
|
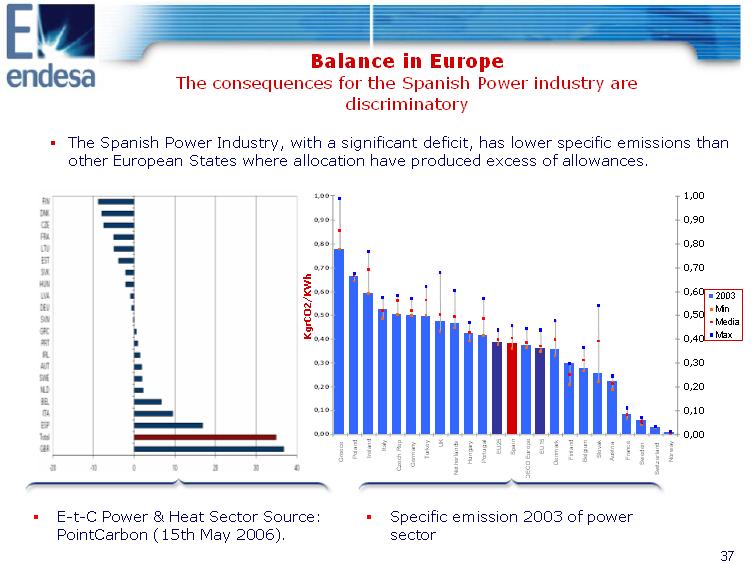
Balance in Europe The consequences for the Spanish Power industry are discriminatory o The Spanish Power Industry, with a significant deficit, has lower specific emissions than other European States where allocation have produced excess of allowances. 1,00 1,00 0,90 0,90 0,80 0,80 0,70 0,70 KgrCO2/KWh 0,60 0,50 0,40 0,30 0,20 0,10 0,00 0,60 0,50 0,40 0,30 0,20 0,10 0,00 2003 Min Media Max GreecePolandIrelandItalyCzech RepGermanyTurkeyUKNetherlandsHungaryPortugalEU25SpainOECD EuropeEU15DenmarkFinlandBelgium SlovakAustriaFranceSwedenSwitzerland Norway o E-t-C Power & Heat Sector Source: o Specific emission 2003 of power PointCarbon (15th May 2006). sector 37 |
|
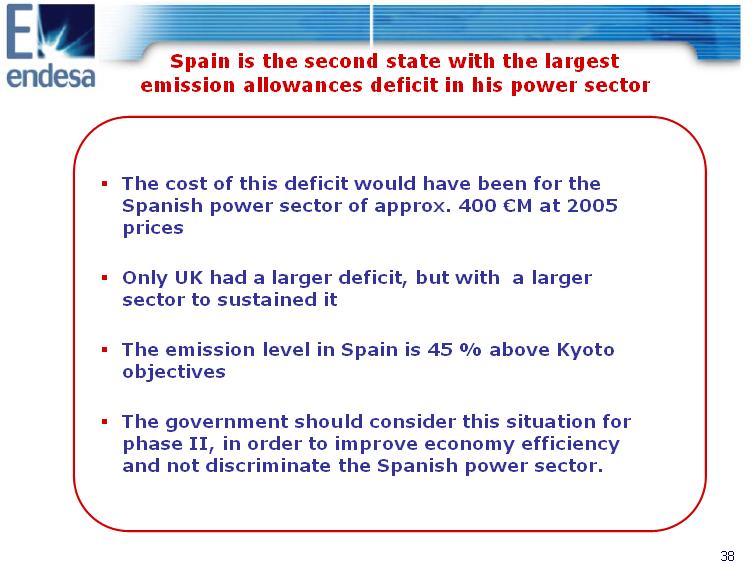
Spain is the second state with the largest emission allowances deficit in his power sector o The cost of this deficit would have been for the Spanish power sector of approx. 400 (euro)M at 2005 prices o Only UK had a larger deficit, but with a larger sector to sustained it o The emission level in Spain is 45 % above Kyoto objectives o The government should consider this situation for phase II, in order to improve economy efficiency and not discriminate the Spanish power sector. |
|
Contents 1. The Carbon and Electricity markets 1. Activity of ENDESA in the Carbon market 3. Balance of the first year of application of the 2005-2007 NAP in Spain and Europe 2. and Phase II |
|
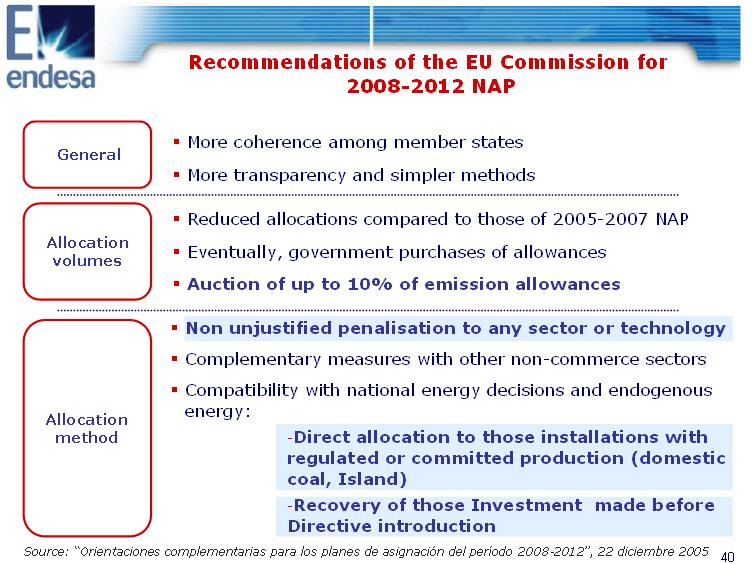
2008-2012 NAP Recommendations of the EU Commission for o More coherence among member states General o More transparency and simpler methods o Reduced allocations compared to those of 2005-2007 NAP Allocation o Eventually, government purchases of allowances volumes o Auction of up to 10% of emission allowances o Complementary measures with other non-commerce sectors o Compatibility with national energy decisions and endogenous Allocation energy: method Non unjustified penalisation to any sector or technology -Direct allocation to those installations with regulated or committed production (domestic coal, Island) -Recovery of those Investment made before Directive introduction Source: "Orientaciones complementarias para los planes de asignacion del periodo 2008-2012", 22 diciembre 2005 |
|
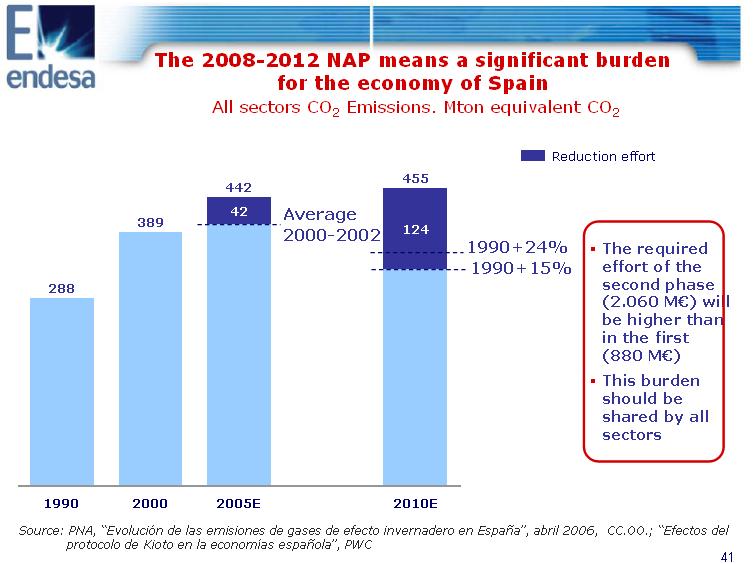
The 2008-2012 NAP means a significant burden for the economy of Spain All sectors CO2 Emissions. Mton equivalent CO2 Reduction effort 455 442 1990+24% o The required 1990+15% effort of the second phase 42 Average 389 2000-2002 124 288 (2.060 M(euro)) will be higher than in the first (880 M(euro)) o This burden should be shared by all sectors 1990 2000 2005E 2010E Source: PNA, "Evolucion de las emisiones de gases de efecto invernadero en Espana", abril 2006, CC.OO.; "Efectos del protocolo de Kioto en la economias espanola", PWC |
|
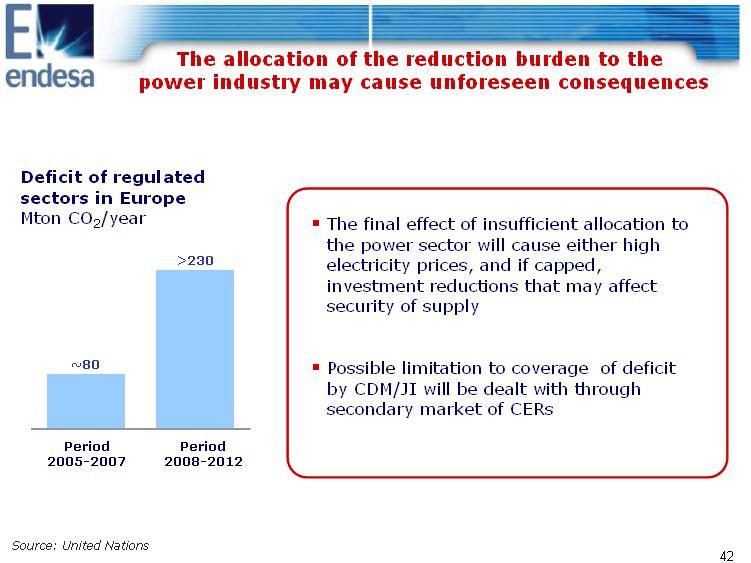
The allocation of the reduction burden to thepower industry may cause unforeseen consequences Deficit of regulated sectors in Europe Mton CO2/year o The final effect of insufficient allocation to the power sector will cause either high ~80Period 2005-2007 Period 2008-2012>230 electricity prices, and if capped, investment reductions that may affect security of supply o Possible limitation to coverage of deficit by CDM/JI will be dealt with through secondary market of CERs Source: United Nations |
|
Lessons learned from the National Allocation Plan for the second period 2008-2012 The electricity price and the NAP In order to provide the right price signal to new investment and to consumers, electricity price should internalise CO2 market price. Provisionally and until the additive tariff is established, it could be considered a mechanism for the mitigation of the impact on the tariff of electricity price increases due to CO2: Discount in the revenues of the generation that does not need to buy allowances, of the value of the internalisation of CO2 in the electricity price . This mechanism preserve the environmental efficiency pursued by emissions trading. This mechanism does not discriminate technologies, while other mechanisms such as return of the value of NAP allocation discriminates coal production. |
|
Lessons learned from the National Allocation Plan for the second period 2008-2012 NAP criteria for free allocation: Technologyswitching must take place as a result of the combined effect of the markets: electricity, fuel, CO2 and cost of investment. Otherwise the cost to reduce emissions for Society could result larger than the actual environmental cost: Free allocation is not a signal to incentive new investment: these should be done based on their market value, with the environmental cost internalised, according to ETS. Return of investment done previously to the ETS application should not be reduced due to emissions trading: Sufficient free allocation during the installation useful life. Sufficientfree allocation for coal production in order to avoid discrimination occurred during the first period and in order to ensure its contribution to security of supply. Need to guarantee non-discriminatory treatment among CO2 sectors in Spain. Allowance surplus for industrial sectors must be avoided, since a power sector allowance deficit will have a higher impact on electricity prices and negatively affect competition in these industrial sectors. |
|
Disclaimer This presentation contains certain "forward-looking statements" regarding anticipated financial and operating results and statistics and other future events. These statements are not guarantees of future performance and are subject to material risks, uncertainties, changes and other factors which may be beyond Endesa's control or may be difficult to predict. The principal assumptions underlying these forecasts and targets relate to economic, market and regulatory environment. In addition to other factors described under "Risk Factors" in our annual report on Form 20-F for the most recent fiscal year and in the Documento Registro de Acciones presently in force registered with the Comision Nacional de Valores, the following important factors could cause actual financial and operating results and statistics to differ materially from those expressed in our forward-looking statements: Materially adverse changes in economic or industry conditions generally or in our markets; the effect of existing regulations and regulatory changes; tariff reductions; the impact of any fluctuations in interest rates; the impact of fluctuations in exchange rates; the impact of more stringent regulations and the inherent environmental risks relating to our business operations; any delays inor failure to obtain necessary regulatory, antitrust and other approvals, or any conditions imposed in connection with such approvals; opposition or actions of partners, competitors and political or ethnic groups; adverse changes in the political and regulatory environment; adverse weather conditions; natural disasters, accidents or other unforeseen eventsNo assurance can be given that the forward-looking statements in this document will be realized. Except as may be required by applicable law, neither Endesa nor any of its affiliates intends to update these forward-looking statements. For all of these forward-looking statements, we claim the protection of the safe harbor for forward-looking statements contained in the Private Securities Litigation Reform Act of 1995. |
|
June 2006 Carbon and electricity markets, National Allocation Plans General Management for Spain and Portugal |
SIGNATURES
Pursuant to the requirements of the Securities Exchange Act of 1934, the registrant has duly caused this report to be signed on its behalf by the undersigned, thereunto duly authorized.
| | | |
| | ENDESA, S.A. |
|
|
|
| Dated: June 8th , 2006 | By: | /s/ Álvaro Pérez de Lema |
| |
Name: Álvaro Pérez de Lema |
| | Title: Manager of North America Investor Relations |