FORM 6-K
SECURITIES AND EXCHANGE COMMISSION
Washington, D.C. 20549
Report of Foreign Issuer
Pursuant to Rule 13a-16 or 15d-16 of
the Securities Exchange Act of 1934
For the month of July, 2006
Commission File Number: 333-07654
ENDESA, S.A.
(Translation of Registrant's Name into English)
Ribera del Loira, 60
28042 Madrid, Spain
(Address of principal executive office)
Indicate by check mark whether the registrant files or will file
annual reports under cover of Form 20-F or Form 40-F:
Indicate by check mark if the registrant is submitting the Form 6-K
in paper as permitted by Regulation S-T Rule 101(b)(1):
Indicate by check mark if the registrant is submitting the Form 6-K
in paper as permitted by Regulation S-T Rule 101(b)(7):
Indicate by check mark whether by furnishing the information
contained in this Form, the Registrant is also thereby furnishing the information to the Commission
pursuant to Rule 12g3-2(b) under the Securities Exchange Act of 1934:
If “Yes” is marked, indicate below the file number assigned to the registrant
in connection with Rule 12g3-2(b): N/A
|
25 July 2004 1H 2006 results Endesa's greater value |
|
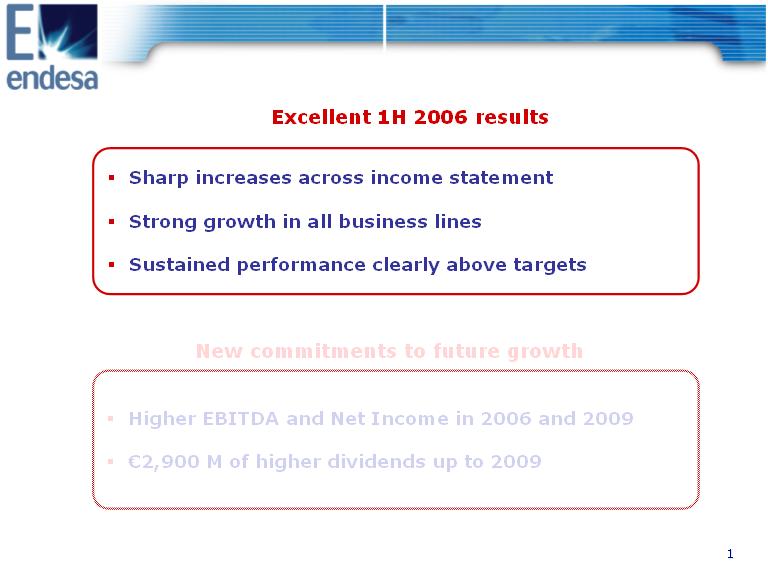
Excellent 1H 2006 results o Sharp increases across income statement o Strong growth in all business lines o Sustained performance clearly above targets New commitments to future growth o Higher EBITDA and Net Income in 2006 and 2009 o (euro)2,900 M of higher dividends up to 2009 |
|
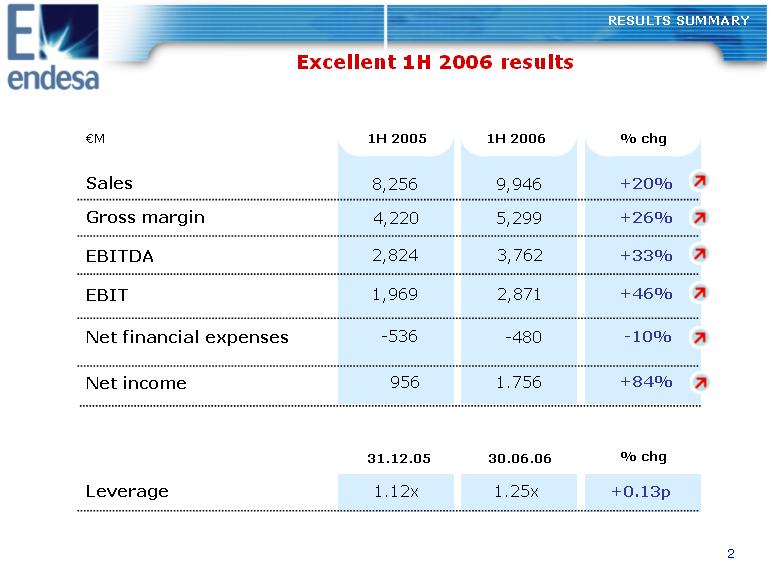
Excellent 1H 2006 results 1H 2005 1H 2006 % chg 2,824 1,969 -536 8,256 4,220 +33% +46% -10% +20% +26% 3,762 2,871 -480 9,946 5,299 Sales Gross margin EBITDA EBIT Net financial expenses (euro)M Net income 956 1.756 +84% RESULTS SUMMARY 31.12.05 30.06.06 % chg Leverage 1.12x +0.13p1.25x |
|
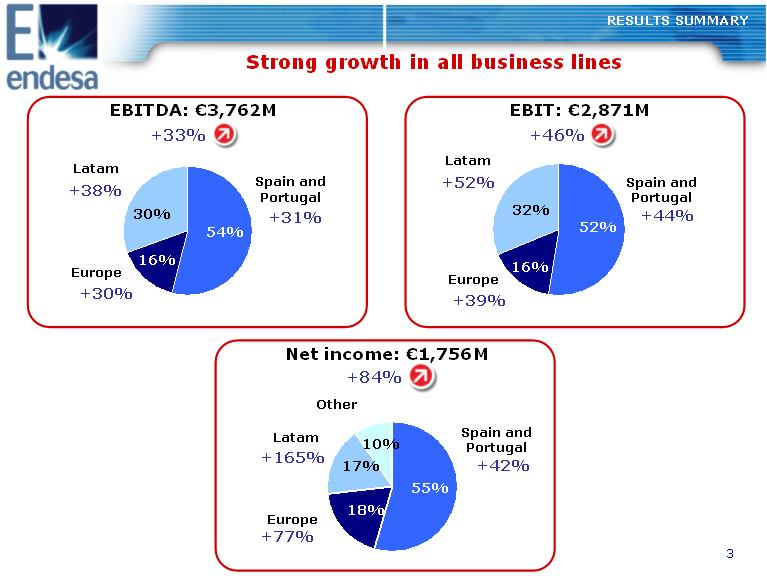
Strong growth in all business lines RESULTS SUMMARY EBITDA: (euro)3,762M Spain and Portugal Latam Europe +33% +38% +30% +31% 54% 16% 30% EBIT: (euro)2,871M +46% Europe +39% 16% Latam +52% 32% Spain and Portugal +44% 52% 33Net income: (euro)1,756M +84% Spain and Portugal +42% 55% Europe +77% 18% Latam +165% 17% Other 10% |
|
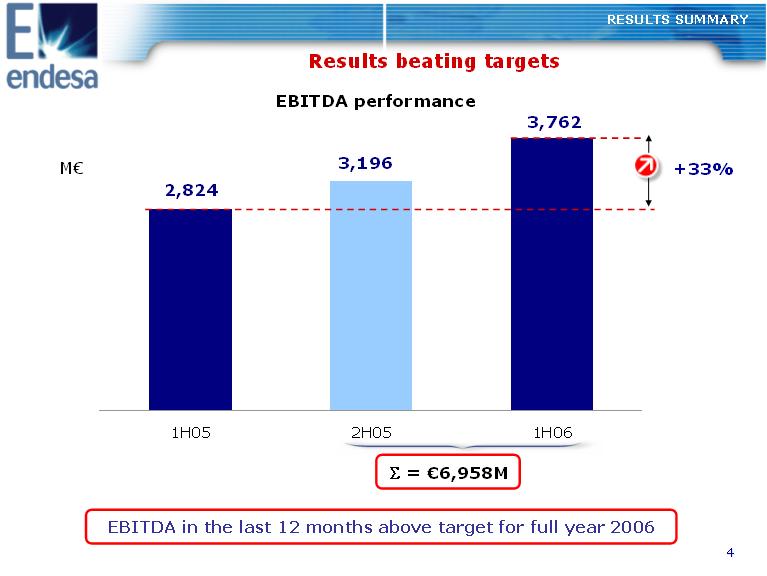
Results beating targets RESULTS SUMMARY EBITDA performance 3,762 3,196 2,824 M(euro) +33% 1H05 2H05 1H06 S= (euro)6,958M EBITDA in the last 12 months above target for full year 2006 |
|
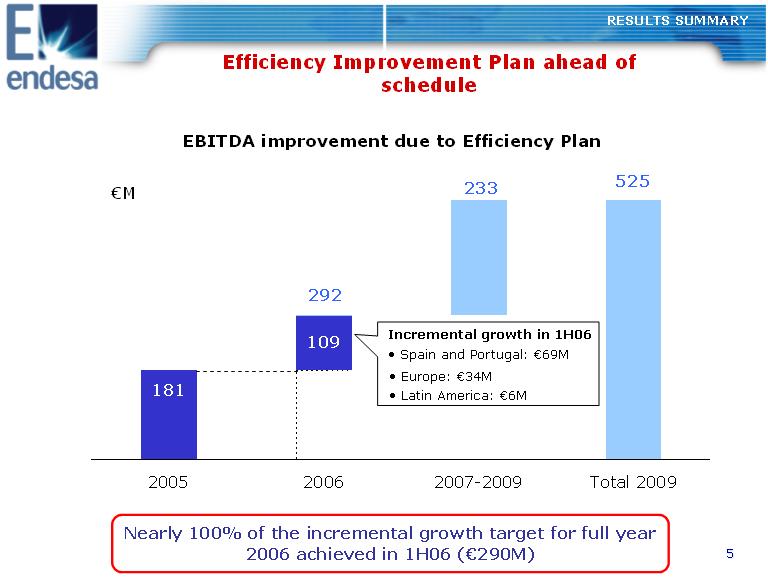
Efficiency Improvement Plan ahead of schedule RESULTS SUMMARY EBITDA improvement due to Efficiency Plan (euro)M 233 525 109 292 2005 2006 2007-2009 Total 2009 Incremental growth in 1H06 o Europe: (euro)34M o Latin America: (euro)6M o Spain and Portugal: (euro)69M 181 55Nearly 100% of the incremental growth target for full year 2006 achieved in 1H06 ((euro)290M) |
|
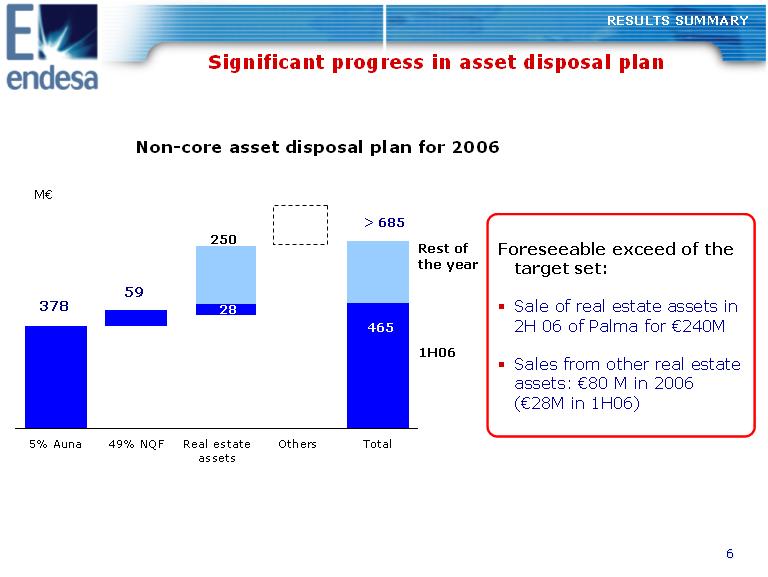
Significant progress in asset disposal plan RESULTS SUMMARY Non-core asset disposal plan for 2006 M(euro) 250 59 378 28 > 685 465 Rest of Foreseeable exceed of the the year target set: o Sale of real estate assets in 2H 06 of Palma for (euro)240M 1H06 o Sales from other real estate assets: (euro)80 M in 2006 ((euro)28M in 1H06) 5% Auna 49% NQF Real estate Others Total assets |
|
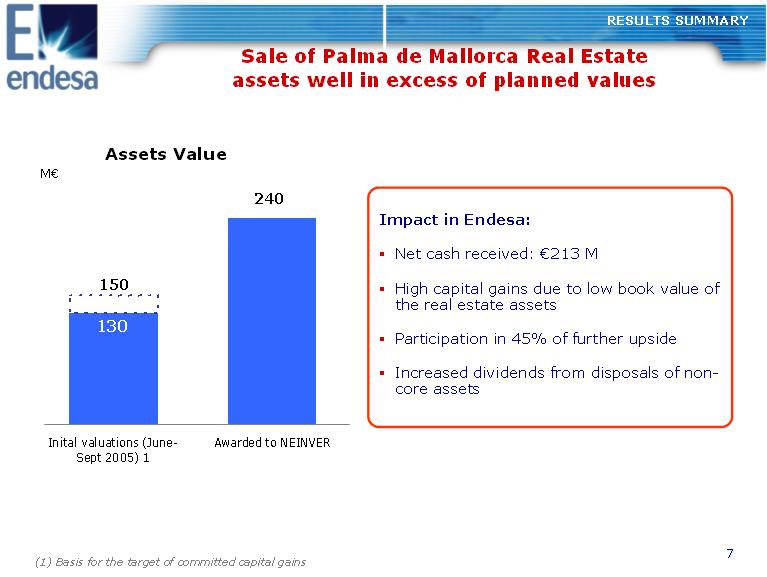
RESULTS SUMMARY Sale of Palma de Mallorca Real Estate assets well in excess of planned values Assets Value M(euro) 240 130 150 Impact in Endesa: o Net cash received: (euro)213 M o High capital gains due to low book value of the real estate assets o Participation in 45% of further upside o Increased dividends from disposals of non- core assets Inital valuations (June-Awarded to NEINVER Sept 2005) 1 (1) Basis for the target of committed capital gains |
|
Spain and Portugal 1H 2006 results |
|
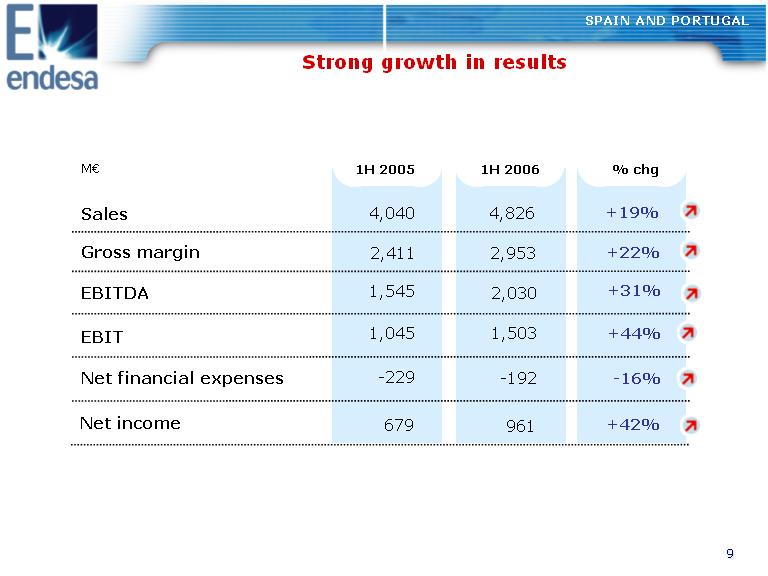
SPAIN AND PORTUGAL Strong growth in results Sales Gross margin EBITDA EBIT Net financial expenses M(euro) 1H 2005 1H 2006 % chg 1,545 1,045 -229 4,040 2,411 +31% +44% -16% +19% +22% 2,030 1,503 -192 4,826 2,953 Net income 679 +42%961 |
|
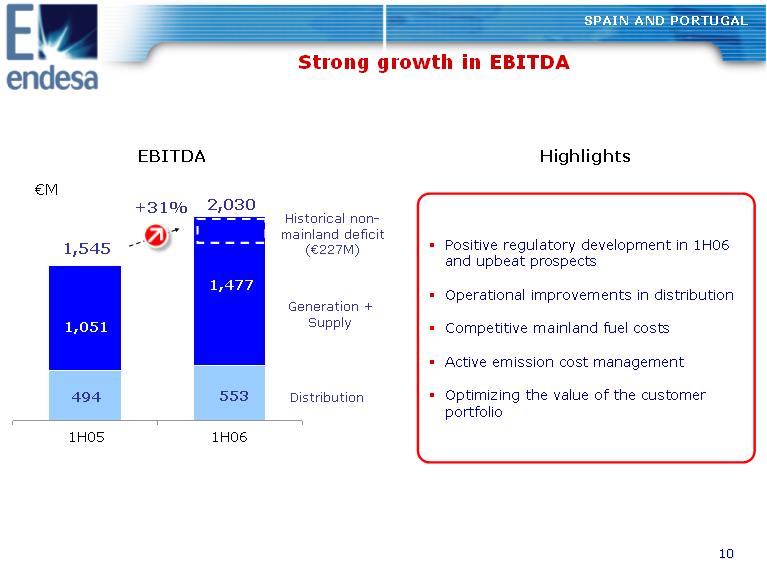
SPAIN AND PORTUGAL Strong growth in EBITDA EBITDA (euro)M +31% 2,030 Historical non- mainland deficit ((euro)227M) Generation + Supply Distribution 1H05 1H06 1,545 494 1,477 1,051 553 Highlights Positive regulatory development in 1H06 and upbeat prospects Operational improvements in distribution Competitive mainland fuel costs Active emission cost management Optimizing the value of the customer portfolio |
|
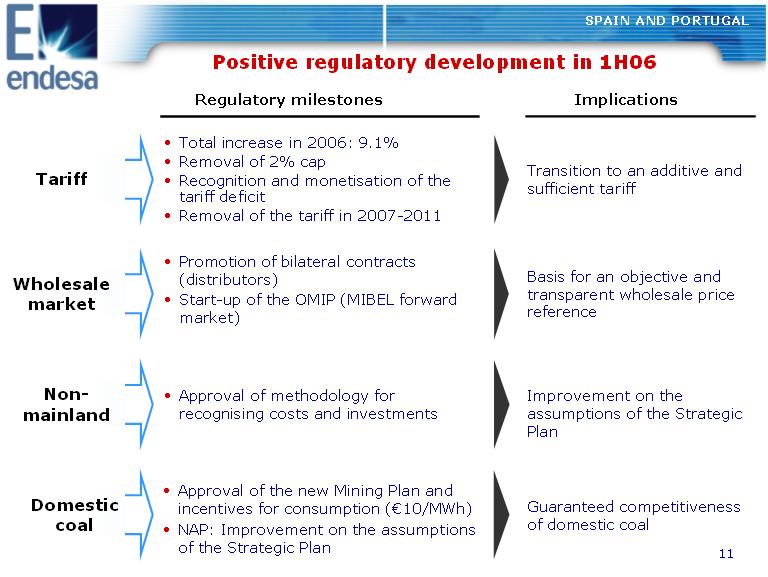
Positive regulatory development in 1H06 SPAIN AND PORTUGAL Regulatory milestones Implications Tariff Wholesale market Non- mainland o Total increase in 2006: 9.1% o Removal of 2% cap o Recognition and monetisation of the tariff deficit o Removal of the tariff in 2007-2011 o Promotion of bilateral contracts (distributors) o Start-up of the OMIP (MIBEL forward market) o Approval of methodology for recognising costs and investments Transition to an additive and sufficient tariff Basis for an objective and transparent wholesale price reference Improvement on the assumptions of the Strategic Plan o Approval of the new Mining Plan and Guaranteed competitiveness Domesictincentives for consumption ((euro)10/MWh) coal of domestic coal o NAP: Improvement on the assumptions of the Strategic Plan |
|
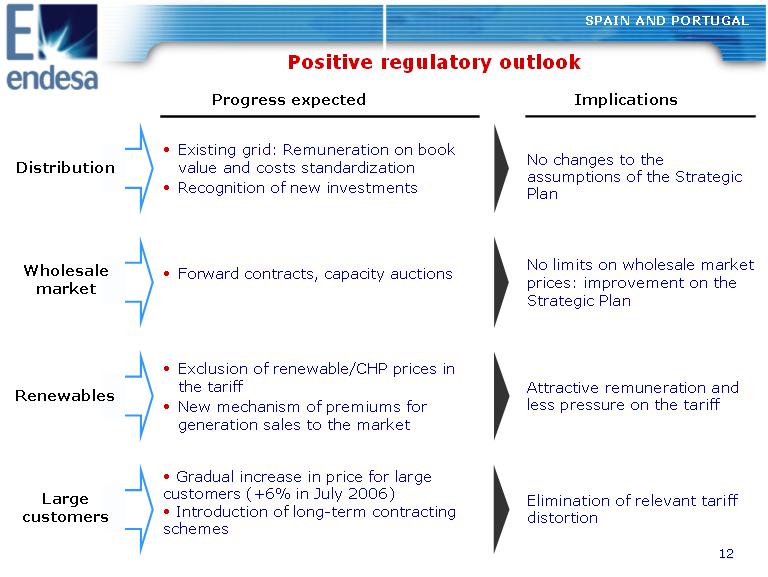
Positive regulatory outlook SPAIN AND PORTUGAL Progress expected Implications Distribution Wholesale market Renewables Large customers o Existing grid: Remuneration on book value and costs standardization o Recognition of new investments o Forward contracts, capacity auctions o Exclusion of renewable/CHP prices in the tariff o New mechanism of premiums for generation sales to the market o Gradual increase in price for large customers (+6% in July 2006) o Introduction of long-term contracting schemes No changes to the assumptions of the Strategic Plan No limits on wholesale market prices: improvement on the Strategic Plan Attractive remuneration and less pressure on the tariff Elimination of relevant tariff distortion |
|
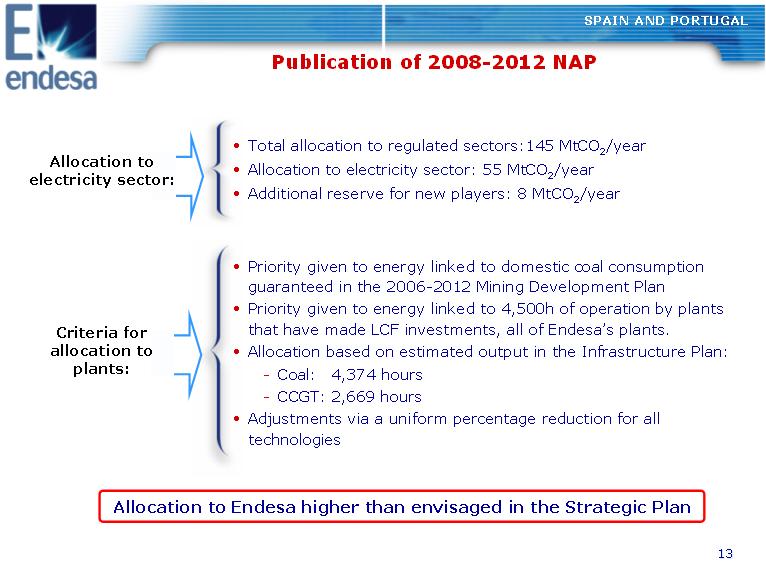
Publication of 2008-2012 NAP SPAIN AND PORTUGAL o Total allocation to regulated sectors:145 MtCO2/year Allocation to electricity sector: o Allocation to electricity sector: 55 MtCO2/year o Additional reserve for new players: 8 MtCO2/year Criteria for allocation to plants: o Priority given to energy linked to domestic coal consumption guaranteed in the 2006-2012 Mining Development Plan o Priority given to energy linked to 4,500h of operation by plants that have made LCF investments, all of Endesa's plants. o Allocation based on estimated output in the Infrastructure Plan: -Coal: 4,374 hours -CCGT: 2,669 hours o Adjustments via a uniform percentage reduction for all technologies Allocation to Endesa higher than envisaged in the Strategic Plan |
|
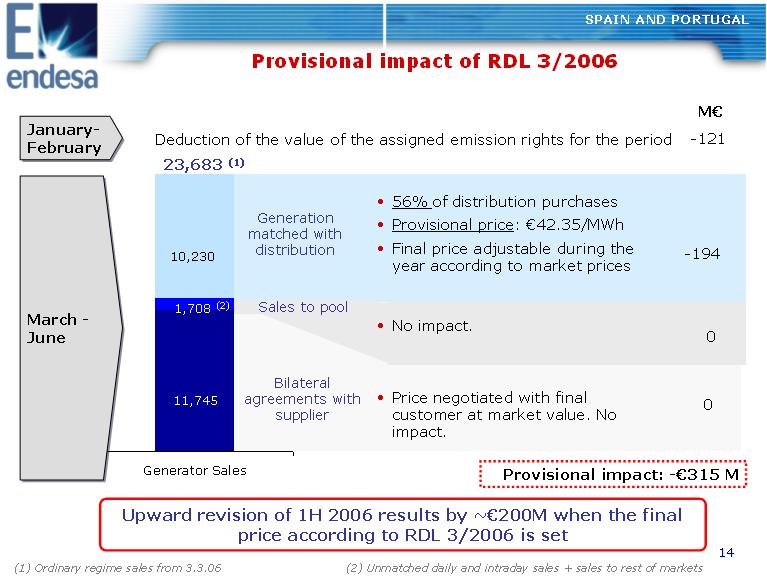
Provisional impact of RDL 3/2006 SPAIN AND PORTUGAL January- February M(euro) Deduction of the value of the assigned emission rights for the period -121 23,683 (1) Generation matched with distribution o 56% of distribution purchases o Provisional price: (euro)42.35/MWh o Final price adjustable during the year according to market prices o No impact. 10,230 March June -194 0 Sales to pool 11,745 Bilateral agreements with o Price negotiated with final 0supplier customer at market value. No impact. Generator Sales Provisional impact: -(euro)315 M (2) 1414Upward revision of 1H 2006 results by ~(euro)200M when the final price according to RDL 3/2006 is set (1) Ordinary regime sales from 3.3.06 (2) Unmatched daily and intraday sales + sales to rest of markets |
|
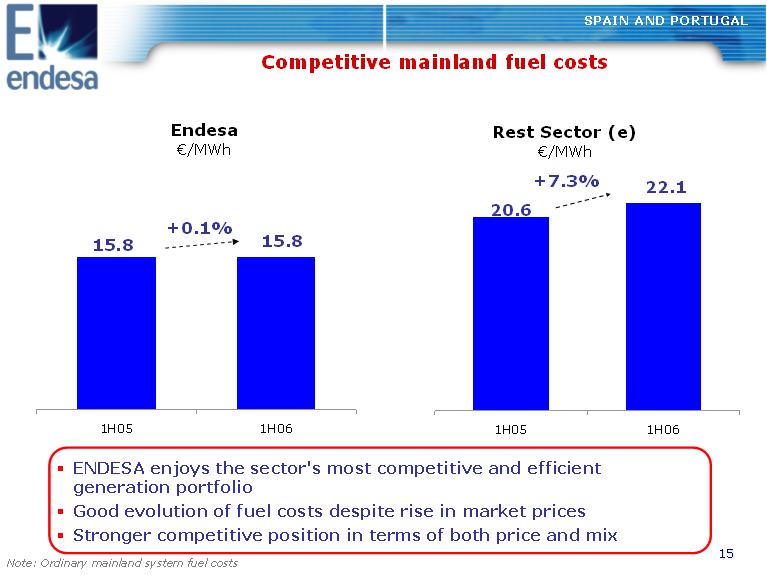
SPAIN AND PORTUGAL Competitive mainland fuel costs Endesa Rest Sector (e) (euro)/MWh (euro)/MWh 15.815.8 22.1 20.6 +0.1% +7.3% 1H05 1H06 1H05 1H06 o ENDESA enjoys the sector's most competitive and efficient generation portfolio o Good evolution of fuel costs despite rise in market prices o Stronger competitive position in terms of both price and mix Note: Ordinary mainland system fuel costs |
|
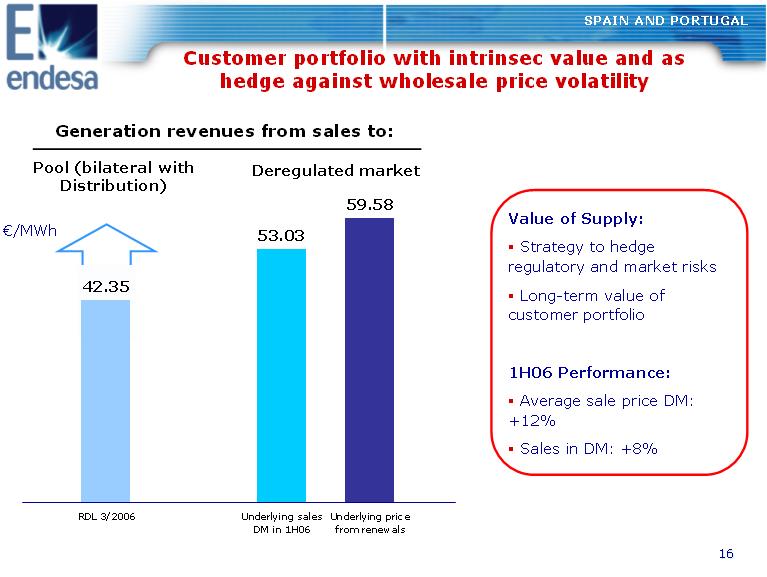
SPAIN AND PORTUGAL Customer portfolio with intrinsec value and as hedge against wholesale price volatility Generation revenues from sales to: Pool (bilateral with Deregulated market Distribution) 59.58 (euro)/MWh 53.03 42.35 Value of Supply: o Strategy to hedge regulatory and market risks o Long-term value of customer portfolio 1H06 Performance: o Average sale price DM: +12% o Sales in DM: +8% RDL 3/2006 Underlying sales Underlying price DM in 1H06 from renewals |
|
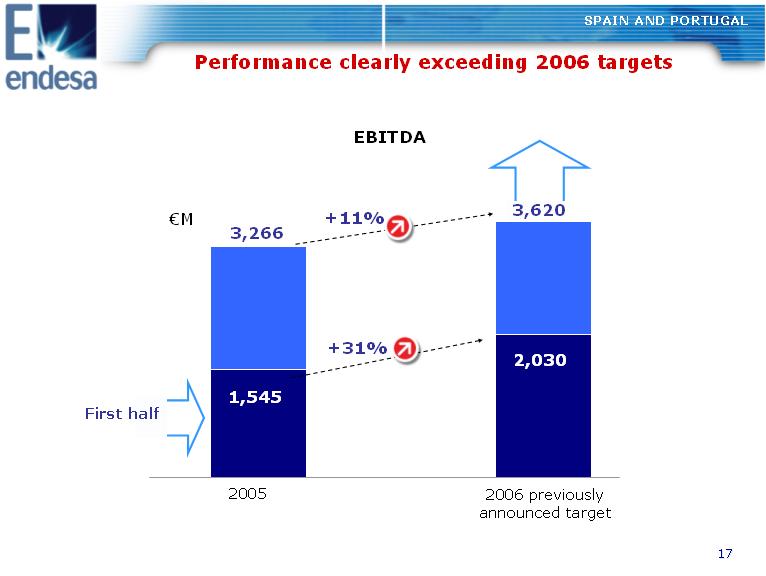
EBITDA SPAIN AND PORTUGAL First half Performance clearly exceeding 2006 targets (euro)M 3,266 3,620 1,545 2,030 +11% +31% 2005 2006 previously announced target |
|
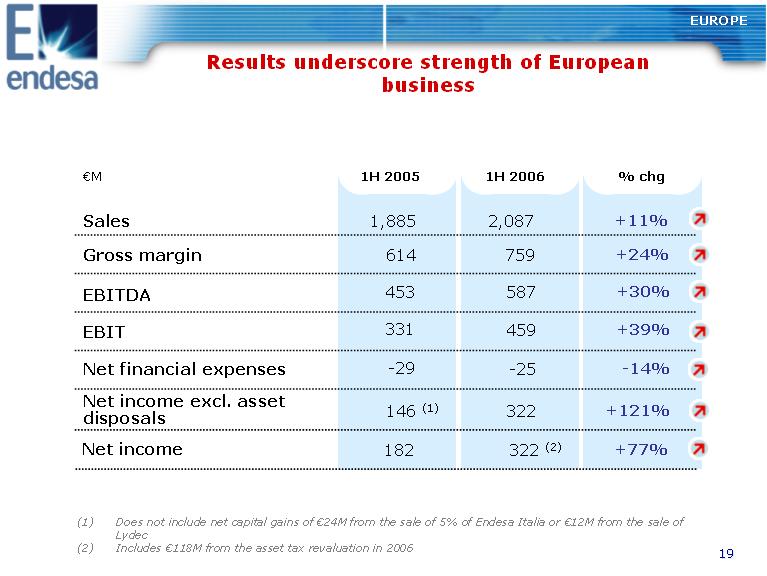
EUROPE Results underscore strength of European business 1H 2005 1H 2006 % chg 453 331 -29 1,885 614 +30% +39% -14% +11% +24% 587 459 -25 2,087 759 Sales Gross margin EBITDA EBIT Net financial expenses (euro)M 146 (1) +121%322Net income excl. asset disposals 182 +77%322 (2)Net income (1) Does not include net capital gains of (euro)24M from the sale of 5% of Endesa Italia or (euro)12M from the sale of Lydec (2) Includes (euro)118M from the asset tax revaluation in 2006 |
|
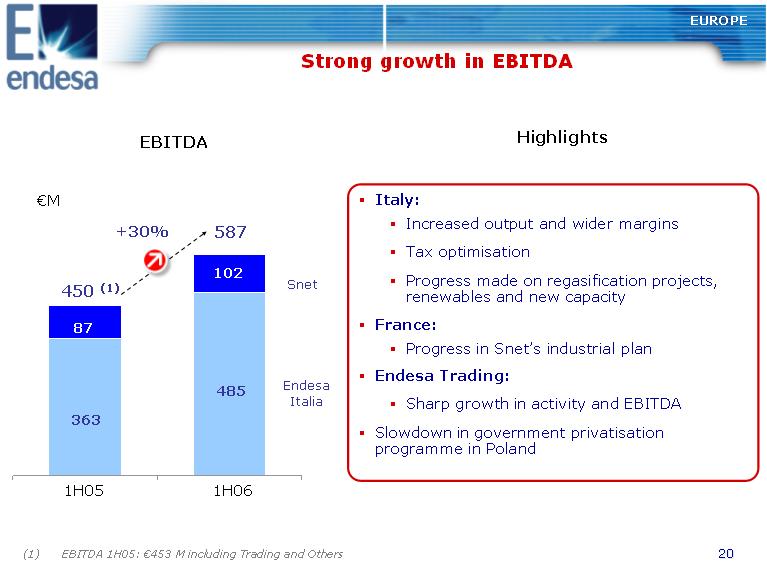
EUROPE Strong growth in EBITDA EBITDA (euro)M 450 (1) 587+30% 363 485 102 87 1H05 1H06 Snet Endesa Italia (1) EBITDA 1H05: (euro)453 M including Trading and Others Highlights Italy: Increasedoutput andwider margins Tax optimisation Progress made on regasification projects, renewables and new capacity France: Progress in Snet's industrial plan Endesa Trading: Sharp growth in activity and EBITDA Slowdown in government privatisation programme in Poland |
|
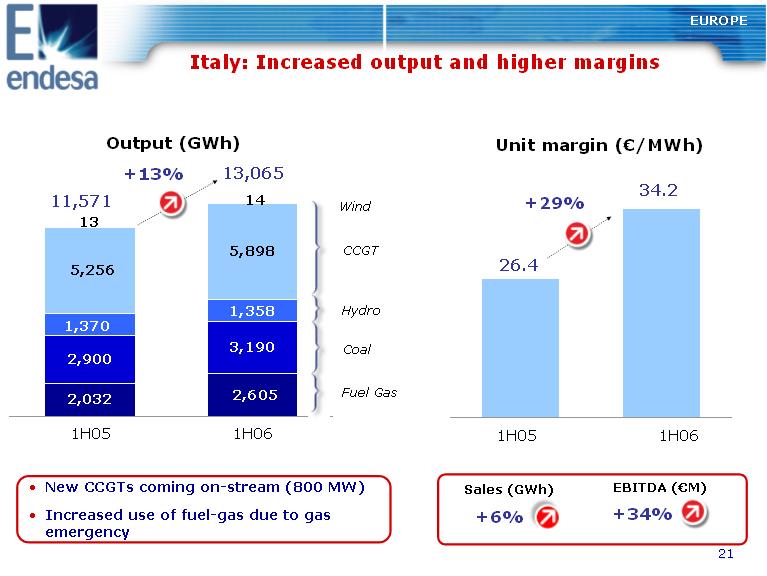
EUROPE Italy: Increased output and higher margins Output (GWh) Unit margin ((euro)/MWh) +13% 13,065 34.2 11,571 5,898 14 Wind +29% 13 5,256 CCGT 26.4 2,6052,032 3,190 2,900 1,370 1,358 Hydro Coal Fuel Gas 1H05 1H06 1H05 1H06 o New CCGTs coming on-stream (800 MW) Sales (GWh) EBITDA ((euro)M) o Increased use of fuel-gas due to gas +6% +34% emergency |
|
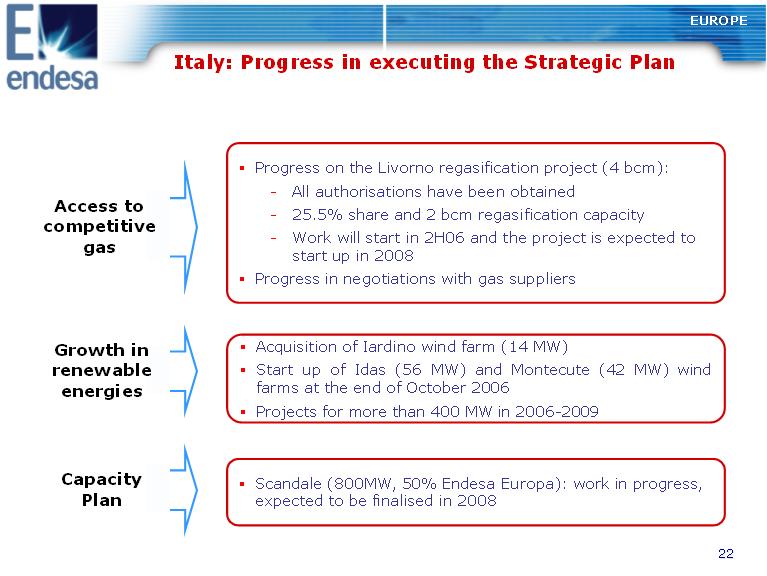
EUROPE Italy: Progress in executing the Strategic Plan Access to competitivegas Growth in renewable energies Capacity Plan o Progress on the Livorno regasification project (4 bcm): -All authorisations have been obtained -25.5% share and 2 bcm regasification capacity -Work will start in 2H06 and the project is expected to start up in 2008 o Progress in negotiations with gas suppliers o Acquisition of Iardino wind farm (14 MW) o Start up of Idas (56 MW) and Montecute (42 MW) wind farms at the end of October 2006 o Projects for more than 400 MW in 2006-2009 o Scandale (800MW, 50% Endesa Europa): work in progress, expected to be finalised in 2008 |
|
EUROPE France: Increased output and margins Snet sales (GWh) +23% 9,857 8,044 5,396 5,606 4,251 2,648 Output Purchases 1H05 1H06 o Significant developments on the supply side: -Auchan (400 GWh in 2006) -SNCF (6,600 GWh in 2007-2011) o Significant progress in executing Industrial Plan 8,044 1H061H05 EdF Contract Forward and Daily market Supply Poland 41% 33% 35% 22% 10% 18% 29% 12% Destination of Snet sales (GWh) +23% 9,857 Unit Margin: 20 (euro)/MWh New contracts at 26(euro)/MWh EBITDA ((euro)M) +17% |
|
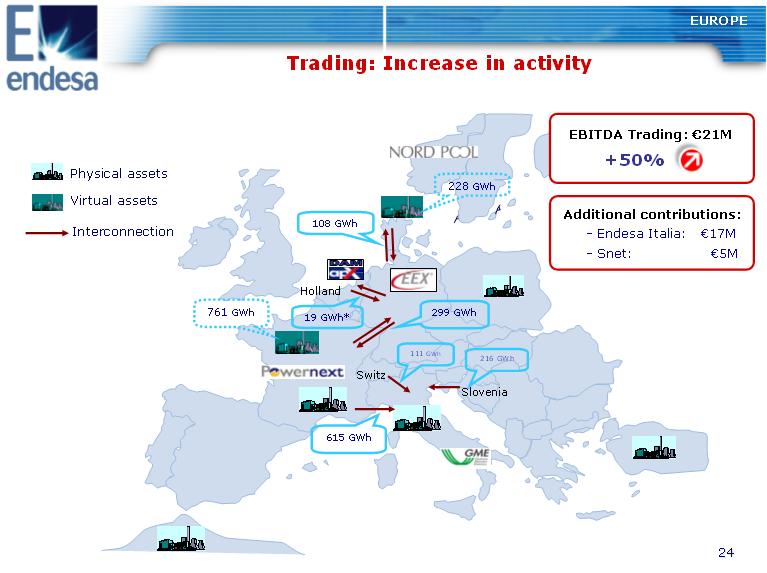
2424Physical assets Virtual assets Interconnection Switz Slovenia 228 GWh 615 GWh 761 GWh 108 GWh 111 GWh 216 GWh 299 GWh19 GWh* Holland EUROPE Trading: Increase in activity EBITDA Trading: (euro)21M Additional contributions: -Endesa Italia: (euro)17M -Snet: (euro)5M +50% |
|
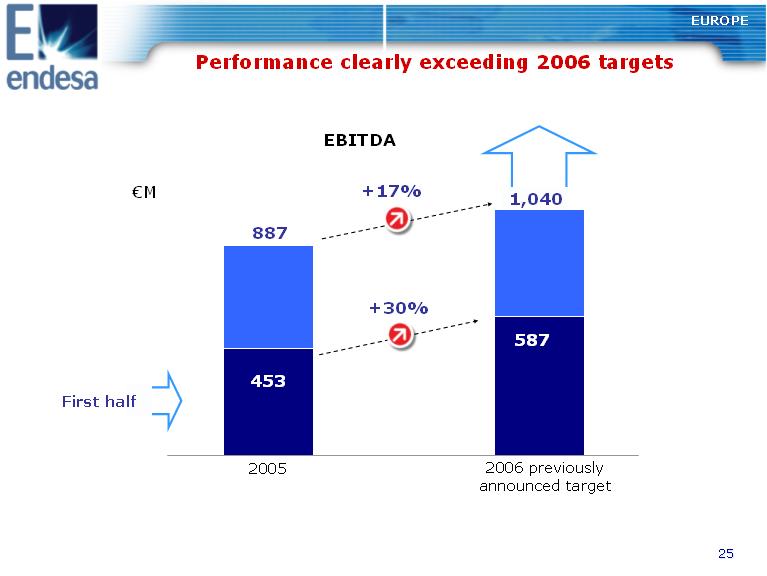
EUROPE Performance clearly exceeding 2006 targets EBITDA (euro)M +17% 887 453 +30% First half 1,040 587 2005 2006 previously announced target |
|
Latin America 1H 2006 results |
|
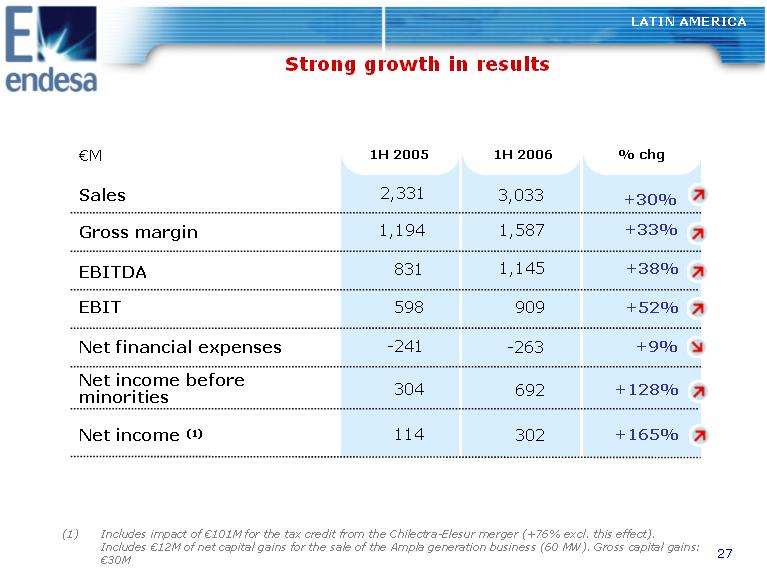
LATIN AMERICA Strong growth in results 1H 2005 1H 2006 % chg(euro)M Sales Gross margin EBITDA EBIT Net financial expenses Net income before minorities Net income (1) 831 598 114 -241 2,331 1,194 +38% +52% +165% +9% +30% +33% 1,145 909 302 -263 3,033 1,587 304 +128%692 (1) Includes impact of (euro)101M for the tax credit from the Chilectra-Elesur merger (+76% excl. this effect). Includes (euro)12M of net capital gains for the sale of the Ampla generation business (60 MW). Gross capital gains: (euro)30M |
|
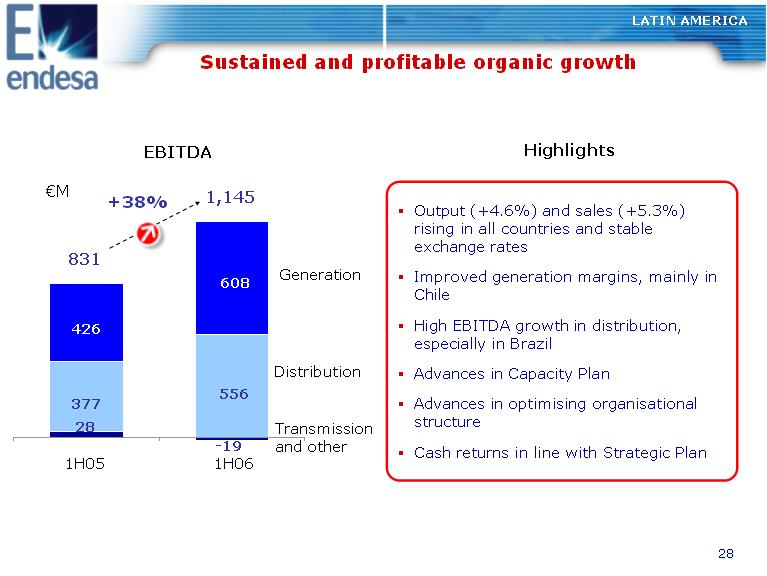
LATIN AMERICA Sustained and profitable organic growth EBITDA (euro)M +38% 1,145 -19 and other 1H05 1H06 831 377 608 556 426 28 Distribution Transmission Generation Highlights Output (+4.6%) and sales (+5.3%) rising in all countries and stable exchange rates Improved generation margins, mainly in Chile High EBITDA growth in distribution, especially in Brazil Advances in Capacity Plan Advances in optimising organisational structure Cash returns in line with Strategic Plan |
|
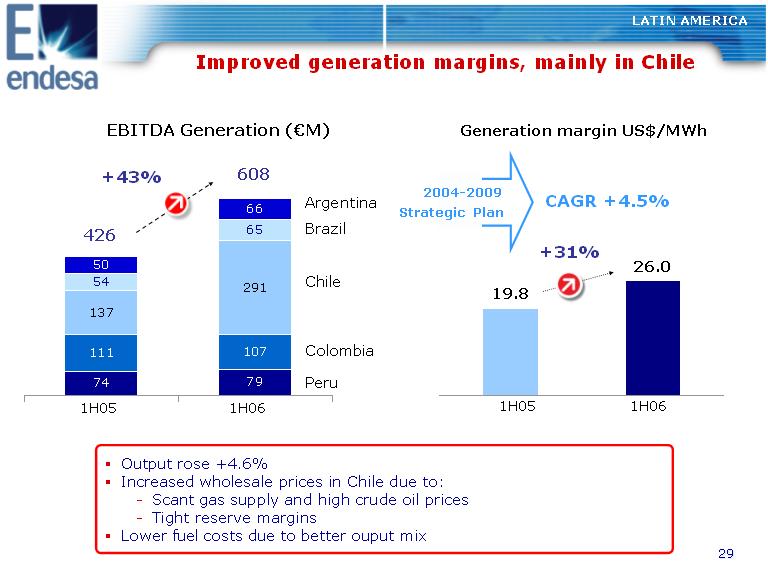
LATIN AMERICA Improved generation margins, mainly in Chile EBITDA Generation ((euro)M) Generation margin US$/MWh +43% 608 Argentina Strategic 2004-2009Plan CAGR +4.5% Brazil 426 74 79 111 107 137 29154 Colombia Peru 65 50 66Chile +31% 26.0 19.8 1H05 1H06 1H05 1H06 o Output rose +4.6% o Increased wholesale prices in Chile due to: -Scant gas supply and high crude oil prices -Tight reserve margins o Lower fuel costs due to better ouput mix |
|
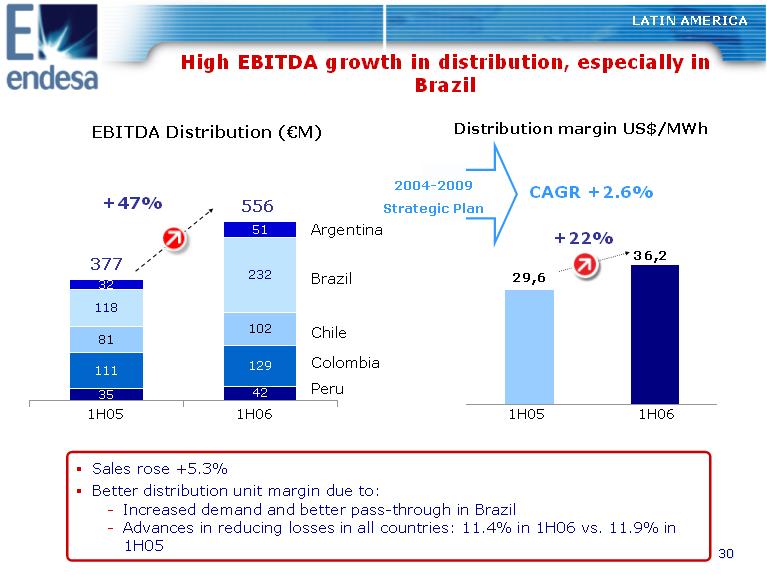
High EBITDA growth in distribution, especially in Brazil LATIN AMERICA EBITDA Distribution ((euro)M) Distribution margin US$/MWh 35 42 111 129 81 102 118 23232 51 Argentina Brazil Chile Colombia Peru +47% 377 556 36,2 29,6 +22% CAGR +2.6%2004-2009 Strategic Plan 1H05 1H06 1H05 1H06 o Sales rose +5.3% o Better distribution unit margin due to: -Increased demand and better pass-through in Brazil -Advances in reducing losses in all countries: 11.4% in 1H06 vs. 11.9% in 1H05 |
|
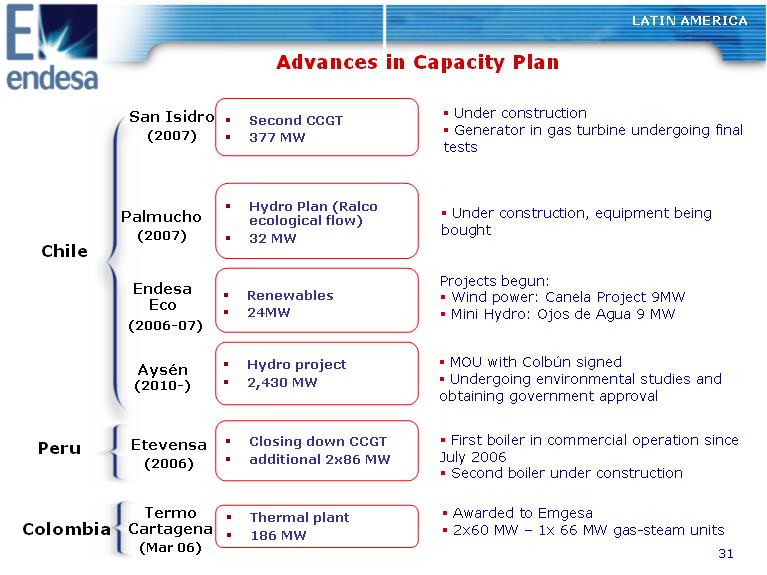
Under construction Generatorin gas turbine undergoing final tests Advances in Capacity Plan Palmucho (2007) Etevensa (2006) San Isidro (2007) Second CCGT 377 MW Aysen (2010-) Endesa Eco (2006-07) LATIN AMERICA Chile Peru o Hydro Plan (Ralco ecological flow) 32 MW Renewables 24MW Hydro project 2,430 MW Closing down CCGT additional 2x86 MW Thermal plant 186 MW o Under construction, equipment being bought Projects begun: o Wind power: Canela Project 9MW o Mini Hydro: Ojos de Agua 9 MW o MOU with Colbun signed o Undergoing environmental studies and obtaining government approval o First boiler in commercial operation since July 2006 o Second boiler under construction o Awarded to Emgesa o 2x60 MW - 1x 66 MW gas-steam units Colombia Cartagena o (Mar 06) |
|
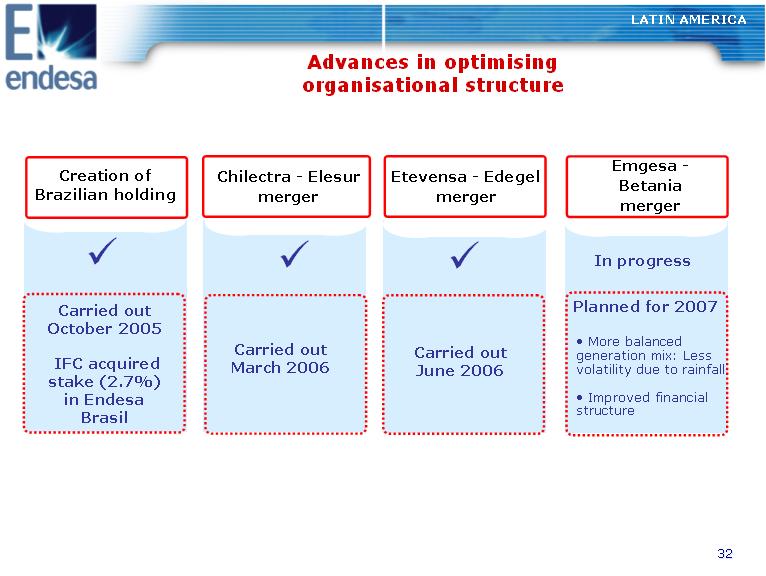
LATIN AMERICA Advances in optimising organisational structure Etevensa -Edegel merger Carried out June 2006 Creation of Brazilian holding Carried out October 2005 IFC acquired stake (2.7%) in Endesa Brasil Chilectra -Elesur merger Carried out March 2006 Emgesa - Betania merger In progress Planned for 2007 o More balanced generation mix: Less volatility due to rainfall o Improved financial structure |
|
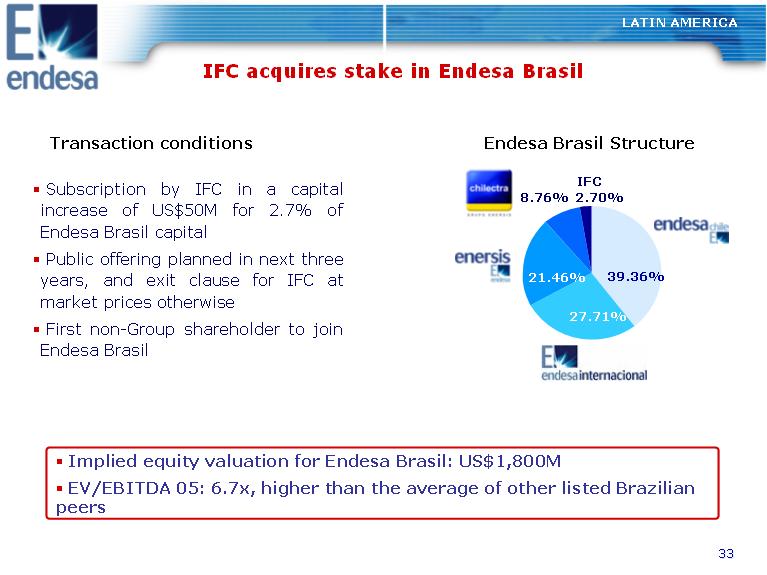
IFC acquires stake in Endesa Brasil LATIN AMERICA Transaction conditions Endesa Brasil Structure o Subscription by IFC in a capital increase of US$50M for 2.7% of Endesa Brasil capital o Public offering planned in next three years, and exit clause for IFC at market prices otherwise o First non-Group shareholder to join Endesa Brasil o Implied equity valuation for Endesa Brasil: US$1,800M o EV/EBITDA 05: 6.7x, higher than the average of other listed Brazilian peers 39.36% 27.71% 21.46% 8.76% 2.70% IFC |
|
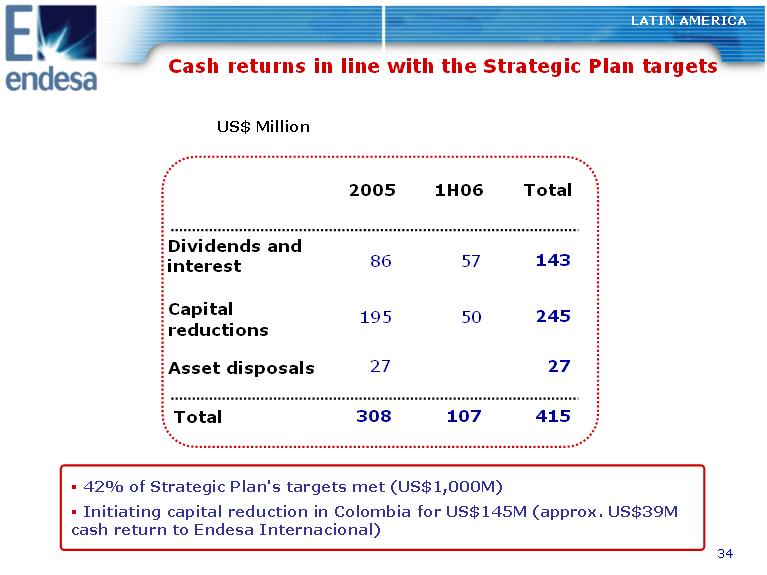
LATIN AMERICA Cash returns in line with the Strategic Plan targets US$ Million 2005 1H06 Total Dividends and interest 86 57 143 Capital 195 50 245 reductions Asset disposals 27 27 Total 308 107 415 o 42% of Strategic Plan's targets met (US$1,000M) o Initiating capital reduction in Colombia for US$145M (approx. US$39M cash return to Endesa Internacional) |
|
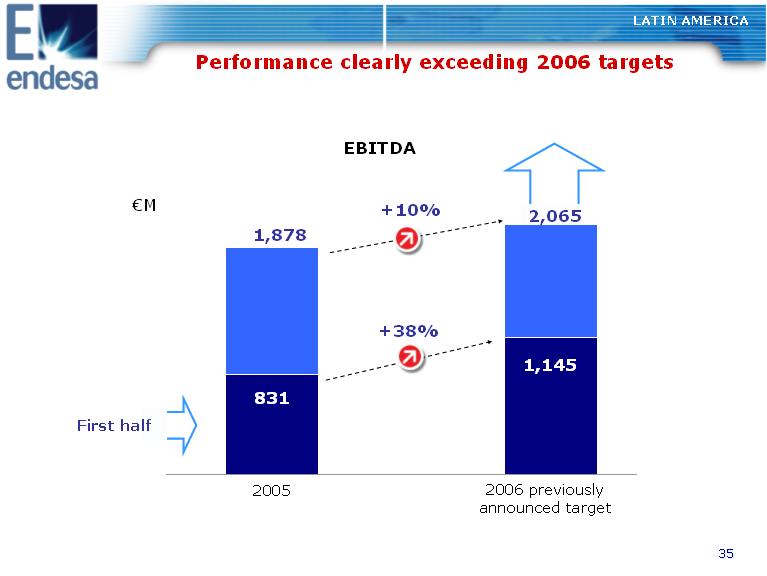
LATIN AMERICA Performance clearly exceeding 2006 targets EBITDA (euro)M +10% 1,878 2,065 1,145 +38% First half 831 2005 2006 previously announced target |
|
Financial analysis 1H 2006 results |
|
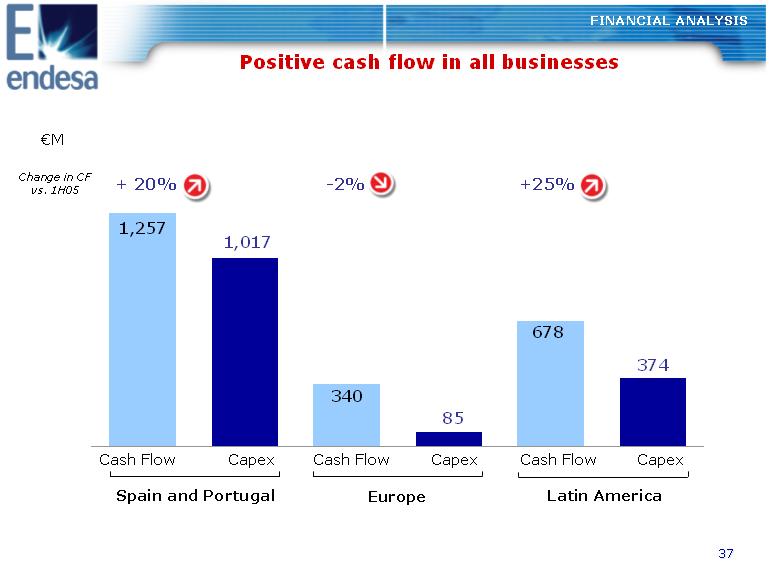
FINANCIAL ANALYSIS Positive cash flow in all businesses (euro)M Change in CF + 20% -2% +25% vs. 1H05 678 340 1,257 374 85 1,017 Cash Flow Capex Cash Flow Capex Cash Flow Capex Spain and Portugal Europe Latin America |
|
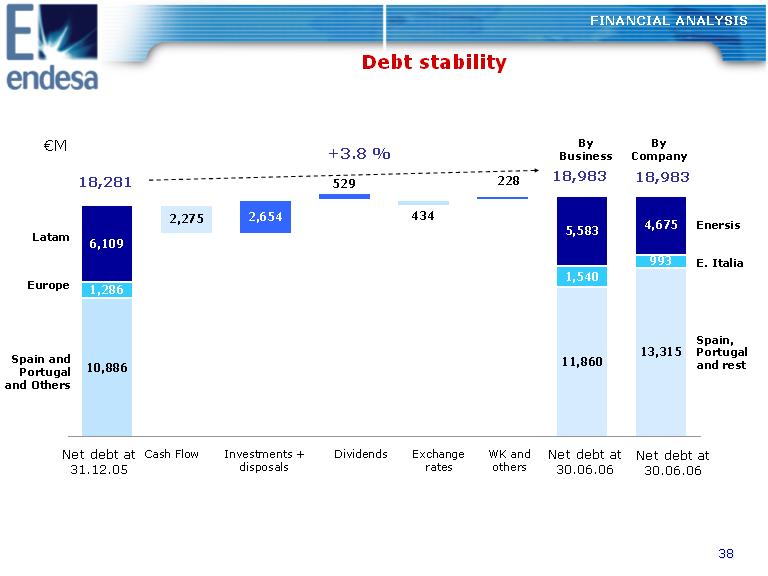
Debt stability FINANCIAL ANALYSIS (euro)M By By+3.8 % Business Company 22852918,281 18,983 18,983 1,286 6,109 434 2,275 2,654 1,540 5,583 Enersis Latam 993 4,675 E. Italia Europe Spain, Portugal Spain and and rest Portugal and Others 10,886 11,860 13,315 Net debt at Cash Flow Investments + Dividends Exchange WK and Net debt at Net debt at 31.12.05 disposals rates others 30.06.06 30.06.06 |
|
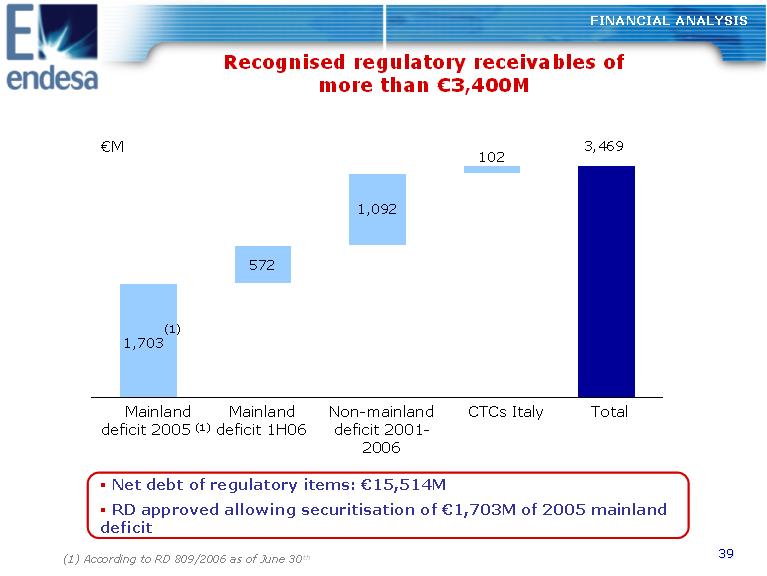
Recognised regulatory receivables of more than (euro)3,400M FINANCIAL ANALYSIS (euro)M 3,469 102 1,092 572 1,703 (1) Mainland Mainland Non-mainland CTCs Italy Total deficit 2005 (1) deficit 1H06 deficit 2001- 2006 o Net debt of regulatory items: (euro)15,514M o RD approved allowing securitisation of (euro)1,703M of 2005 mainland deficit (1) According to RD 809/2006 as of June 30th |
|
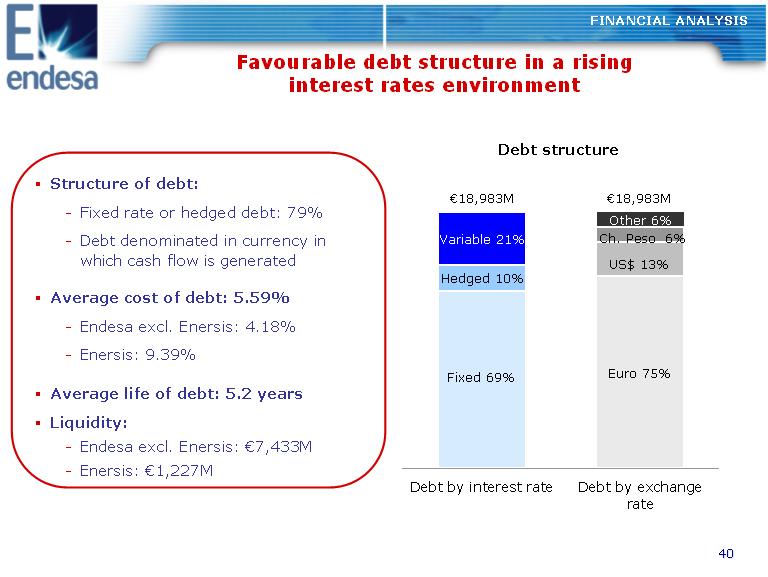
FINANCIAL ANALYSIS Favourable debt structure in a rising interest rates environment Debt structure o Structure of debt: (euro)18,983M (euro)18,983M -Fixed rate or hedged debt: 79% -Debt denominated in currency in which cash flow is generated Variable 21% US$ 13% Ch. Peso 6% Other 6% o Average cost of debt: 5.59% -Endesa excl. Enersis: 4.18% -Enersis: 9.39% o Average life of debt: 5.2 years o Liquidity: -Endesa excl. Enersis: (euro)7,433M -Enersis: (euro)1,227M Debt by interest rate Debt by exchange rate Fixed 69% Euro 75% Hedged 10% |
|
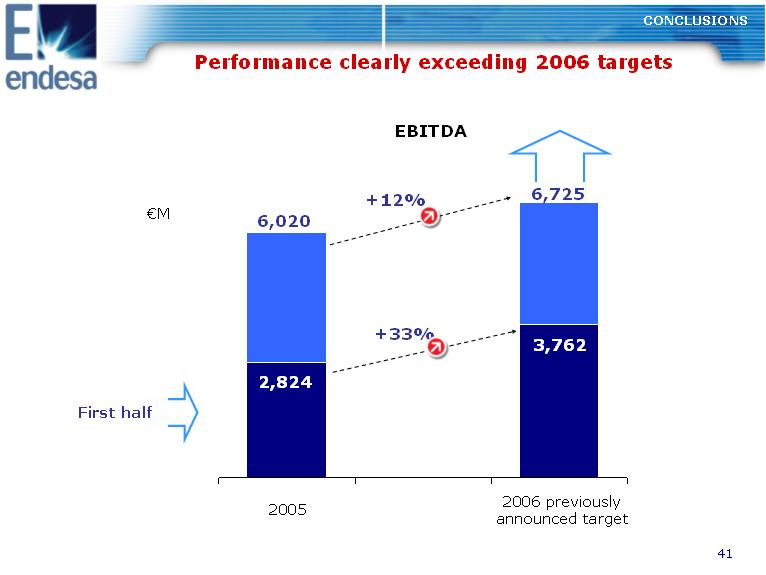
CONCLUSIONS Performance clearly exceeding 2006 targets EBITDA +12% (euro)M 6,020 +33% 6,725 3,762 2,824 First half 2006 previously 2005 announced target |
|
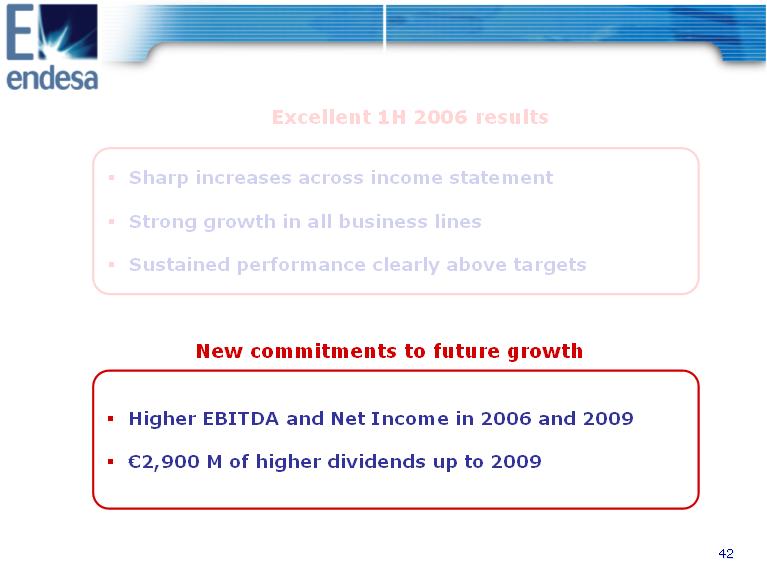
Excellent 1H 2006 results o Sharp increases across income statement o Strong growth in all business lines o Sustained performance clearly above targets New commitments to future growth o Higher EBITDA and Net Income in 2006 and 2009 o (euro)2,900 M of higher dividends up to 2009 |
|
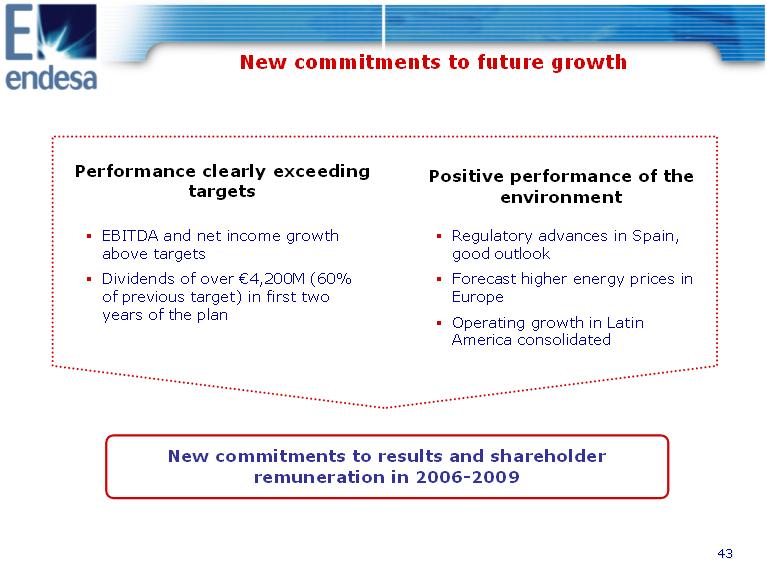
New commitments to future growth Performance clearly exceeding targets o EBITDA and net income growth above targets o Dividends of over (euro)4,200M (60% of previous target) in first two years of the plan Positive performance of the environment o Regulatory advances in Spain, good outlook o Forecast higher energy prices in Europe o Operating growth in Latin America consolidated New commitments to results and shareholder remuneration in 2006-2009 |
|
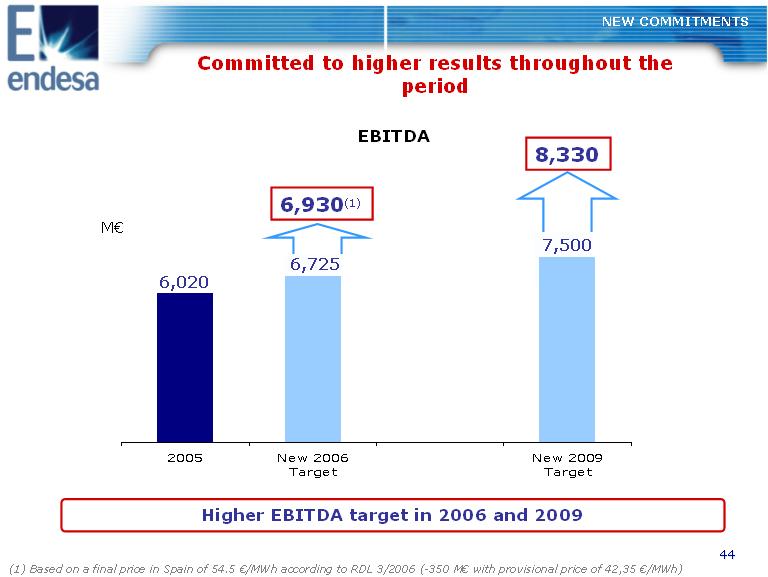
NEW COMMITMENTS Committed to higher results throughout the period EBITDA 8,330 6,930(1) 6,020 6,725 M(euro) 7,500 2005 New 2006 New 2009 Target Target Higher EBITDA target in 2006 and 2009 (1) Based on a final price in Spain of 54.5 (euro)/MWh according to RDL 3/2006 (-350 M(euro) with provisional price of 42,35 (euro)/MWh) |
|
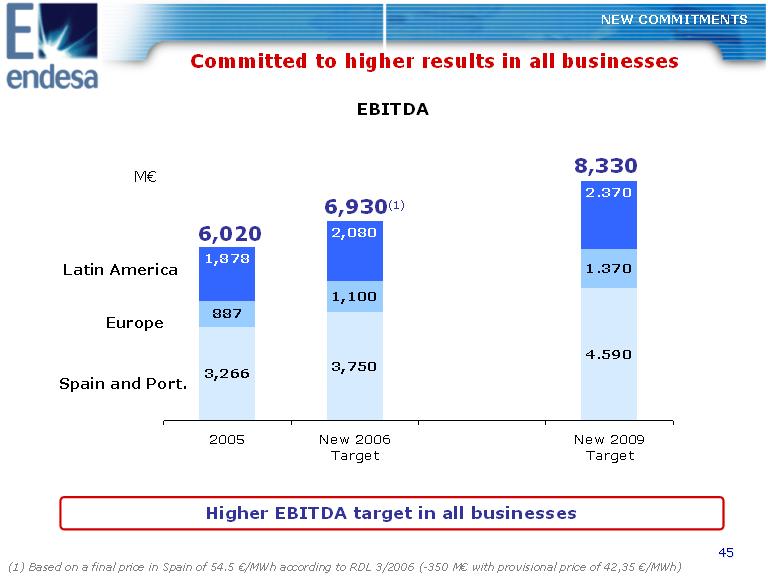
NEW COMMITMENTS Committed to higher results in all businesses EBITDA 8,330 M(euro) 6,930(1) 6,020 4.590 887 1.370 3,266 3,750 1,100 2.370 Latin America Europe Spain and Port. 2,080 1,878 2005 New 2006 New 2009 Target Target Higher EBITDA target in all businesses (1) Based on a final price in Spain of 54.5 (euro)/MWh according to RDL 3/2006 (-350 M(euro) with provisional price of 42,35 (euro)/MWh) |
|
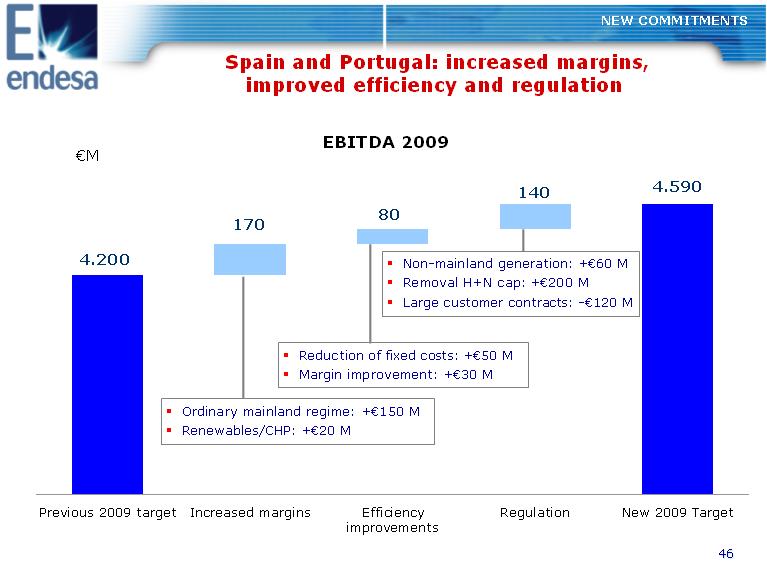
Spain and Portugal: increased margins, improved efficiency and regulation NEW COMMITMENTS EBITDA 2009 (euro)M 140 4.590 170 80 4.200 Ordinary mainland regime: +(euro)150 M Renewables/CHP: +(euro)20 M Reduction of fixed costs: +(euro)50 M Margin improvement: +(euro)30 M Non-mainland generation: +(euro)60 M Removal H+N cap: +(euro)200 M Large customer contracts: -(euro)120 M Previous 2009 target Increased margins Efficiency Regulation New 2009 Target improvements |
|
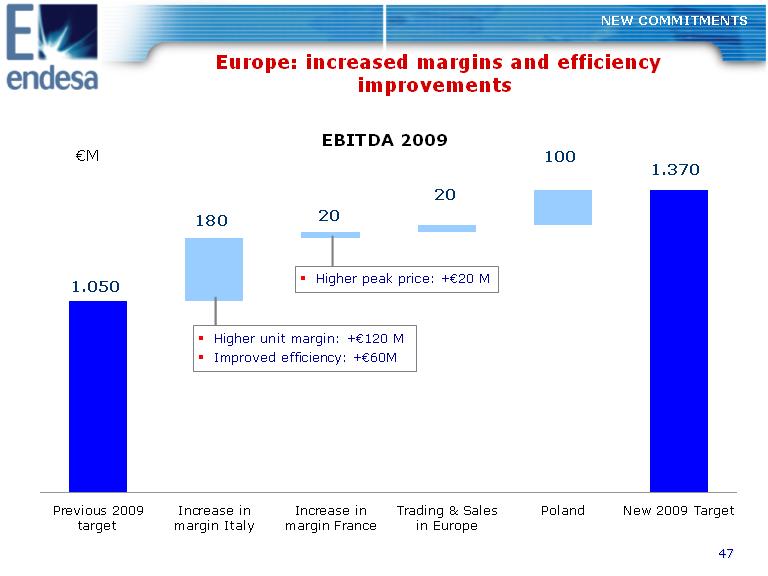
Europe: increased margins and efficiency improvements NEW COMMITMENTS EBITDA 2009 (euro)M 100 1.370 1.050 20 20180 Higher unit margin: +(euro)120 M Improved efficiency: +(euro)60M Higher peak price: +(euro)20 M Previous 2009 Increase in Increase in Trading & Sales Poland New 2009 Target target margin Italy margin France in Europe |
|
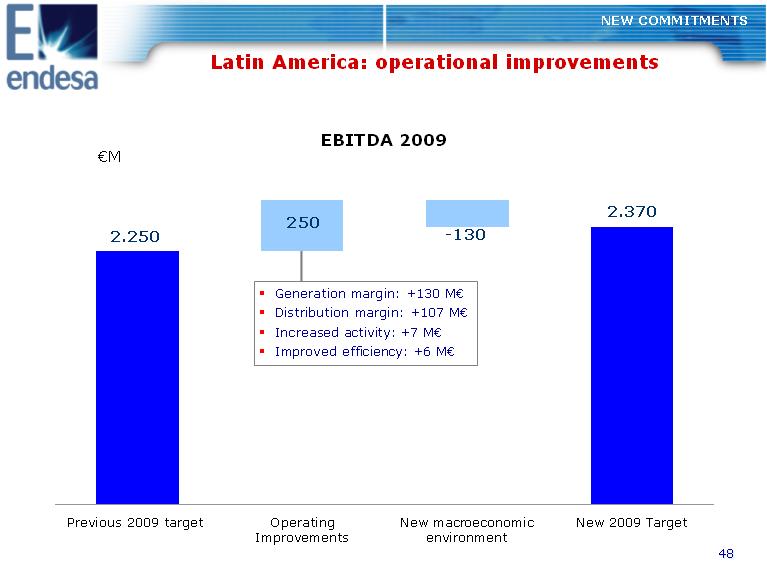
Latin America: operational improvements NEW COMMITMENTS EBITDA 2009 (euro)M 2.250 2.370 -130 250 Generation margin: +130 M(euro) Distribution margin: +107 M(euro) Increased activity: +7 M(euro) Improved efficiency: +6 M(euro) Previous 2009 target Operating New macroeconomic New 2009 Target Improvements environment |
|
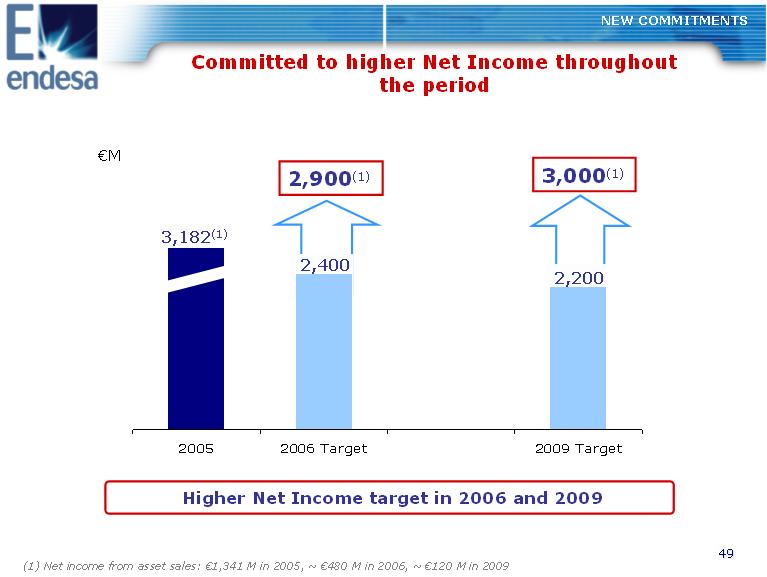
Committed to higher Net Income throughout the period NEW COMMITMENTS 2,900(1) 3,182(1) 2,400 2,200 3,000(1) (euro)M 2005 2006 Target 2009 Target Higher Net Income target in 2006 and 2009 (1) Net income from asset sales: (euro)1,341 M in 2005, ~ (euro)480 M in 2006, ~ (euro)120 M in 2009 |
|
Dividend from ordinary activities CAGR > 12% Dividends from disposals 100% pay-out of capital gains ~(euro)7,600M in dividends from ordinary activities in 20052009 ~(euro)2,300M in capital gains from disposal of non-core assets + Committed to higher dividends throughout the period NEW COMMITMENTS Additional dividend of (euro)2,900M in application of current dividend policy Note: Dividend policy to be reviewed at General Shareholders' Meeting Dividends paid in 2006 (euro)2,541M: (euro)1,200M from ordinary activities and (euro)1,341M from disposal of non-core assets |
|
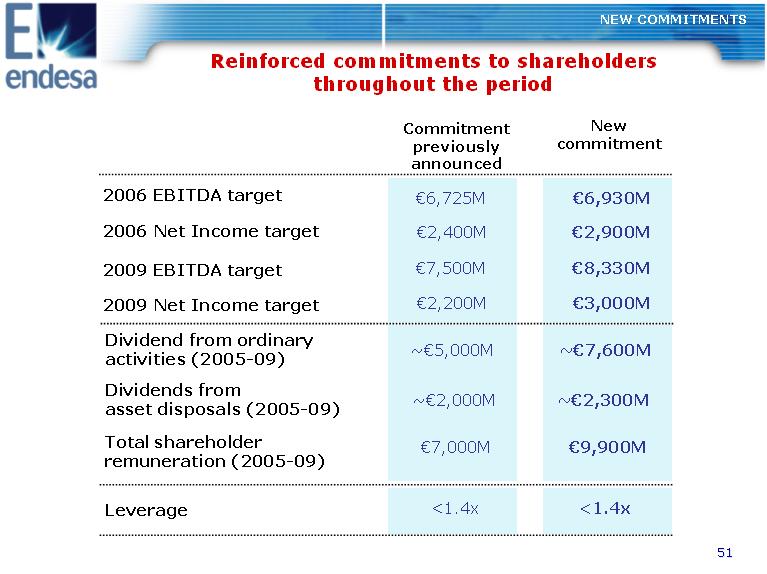
Reinforced commitments to shareholders throughout the period NEW COMMITMENTS Commitment New previously commitment announced 2006 EBITDA target (euro)6,725M (euro)6,930M 2006 Net Income target (euro)2,400M (euro)2,900M 2009 EBITDA target (euro)7,500M (euro)8,330M 2009 Net Income target (euro)2,200M (euro)3,000M Dividend from ordinary activities (2005-09) ~(euro)5,000M ~(euro)7,600M Dividends from asset disposals (2005-09) ~(euro)2,000M ~(euro)2,300M Total shareholder remuneration (2005-09) (euro)7,000M (euro)9,900M Leverage <1.4x <1.4x |
|
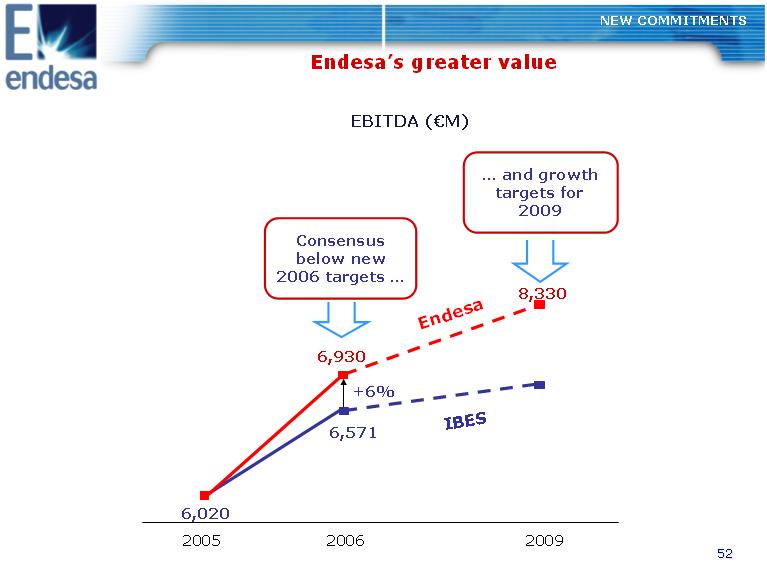
Endesa's greater value NEW COMMITMENTS EBITDA ((euro)M) Consensus below new 2006 targets . .and growth targets for 2009 8,330 6,930 6,571 Endesa IBES +6% 6,020 2005 2006 2009 |
|
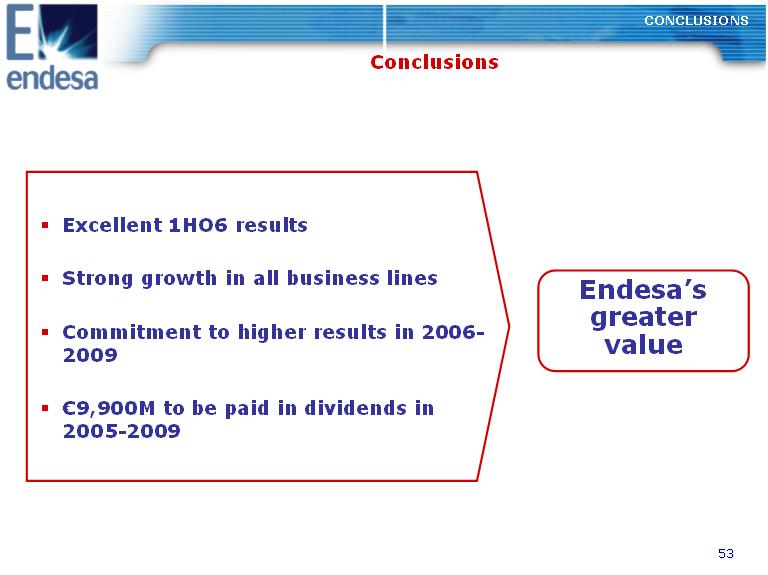
Conclusions CONCLUSIONS o Excellent 1HO6 results o Strong growth in all business lines Endesa's o Commitment to higher results in 2006-greater value 2009 o (euro)9,900M to be paid in dividends in 2005-2009 |
|
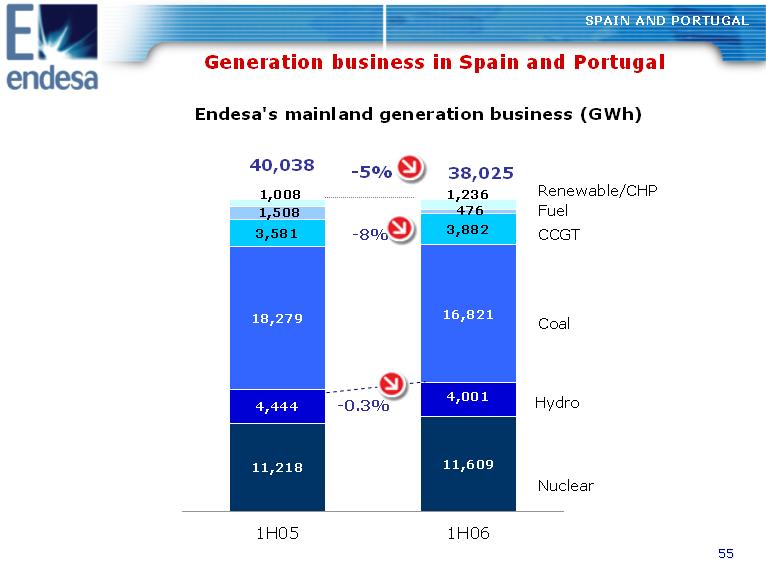
Generation business in Spain and Portugal SPAIN AND PORTUGAL Endesa's mainland generation business (GWh) 11,60911,218 4,0014,444 16,82118,279 3,8823,581 4761,508 1,008 1,236 Nuclear Hydro CCGT Coal Renewable/CHP Fuel -0.3% -8% 38,02540,038 -5% 1H05 1H06 |
|
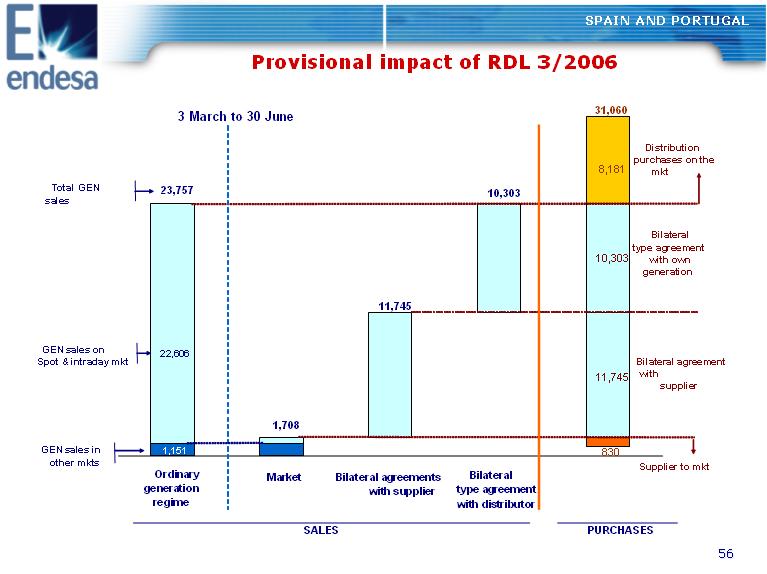
SPAIN AND PORTUGAL Provisional impact of RDL 3/2006 PURCHASESSALES 22,60611,74510,30323,757 1,708 10,303 11,745 Distribution purchases on the with own with mkt Supplier to mkt 830Ordinary generation regime Market Bilateral agreements Bilateral with supplier type agreement with distributor Bilateral type agreement generation Bilateral agreement supplier 3 March to 30 June 8,181 31,060 Total GEN sales GEN sales on Spot & intraday mkt GEN sales in other mkts 1,151 |
|
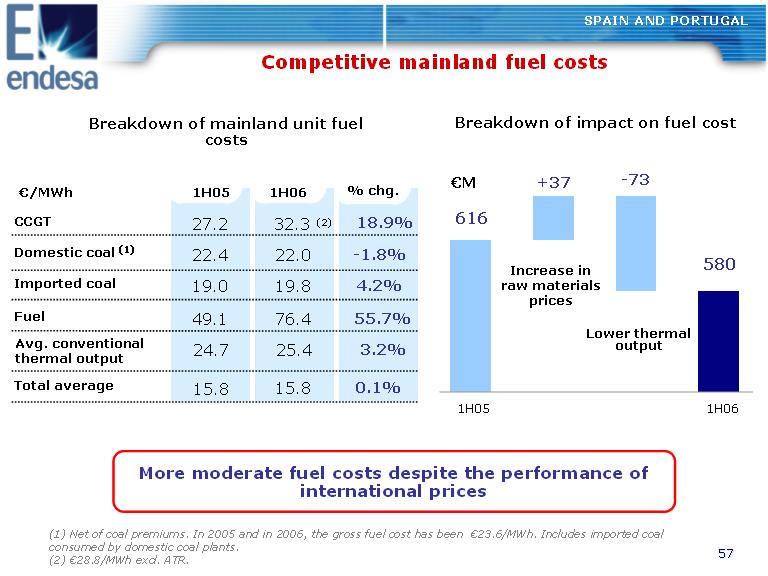
SPAIN AND PORTUGAL Competitive mainland fuel costs Breakdown of mainland unit fuel Breakdown of impact on fuel cost costs 1H05 1H06 27.2 32.3 (2) 18.9% 22.4 22.0 -1.8% 19.0 19.8 4.2% 49.1 76.4 55.7% % chg. 15.8 0.1%15.8 24.7 25.4 3.2% (euro)M +37 -73 (euro)/MWh 616 CCGT Domestic coal (1) 580 Increase in Imported coal raw materials prices Fuel Lower thermal Avg. conventional output thermal output Total average 1H05 1H06 More moderate fuel costs despite the performance of international prices (1) Net of coal premiums. In 2005 and in 2006, the gross fuel cost has been (euro)23.6/MWh. Includes imported coal consumed by domestic coal plants. (2) (euro)28.8/MWh excl. ATR. |
|
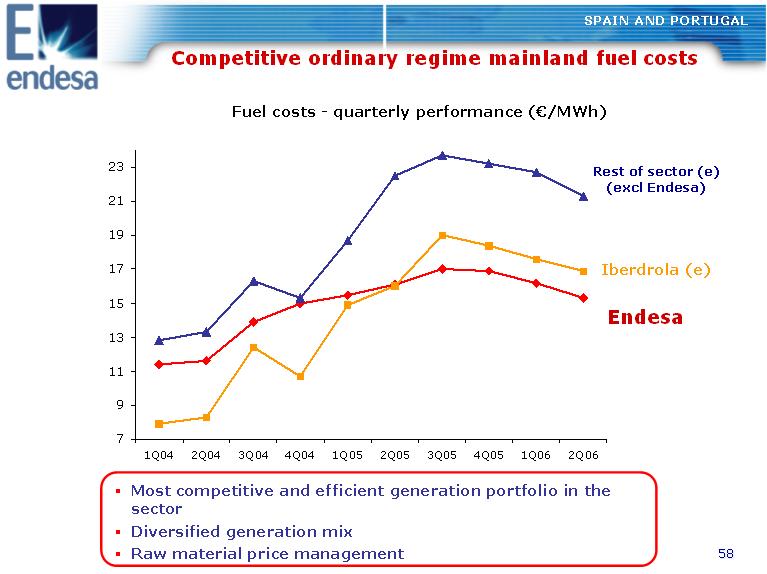
SPAIN AND PORTUGAL Competitive ordinary regime mainland fuel costs Fuel costs -quarterly performance ((euro)/MWh) 23 21 19 17 15 13 11 9 7 Rest of sector (e) (excl Endesa) Iberdrola (e) Endesa 1Q04 2Q04 3Q04 4Q04 1Q05 2Q05 3Q05 4Q05 1Q06 2Q06 o Most competitive and efficient generation portfolio in the sector o Diversified generation mix o Raw material price management |
|
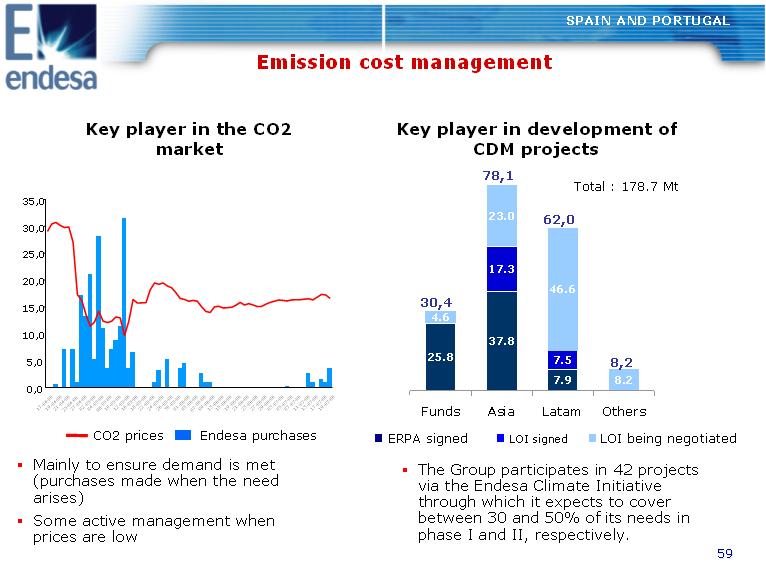
Emission cost management SPAIN AND PORTUGAL Key player in the CO2 Key player in development of market CDM projects 78,1 35,0 25.8 37.8 7.9 17.3 7.5 4.6 23.0 46.6 8.2 Funds Asia Latam Others 30,4 62,0 8,2 Total : 178.7 Mt 30,0 25,0 20,0 15,0 10,0 5,0 0,0 CO2 prices Endesa purchases LOI signed ERPA signed LOI being negotiated o Mainly to ensure demand is met o The Group participates in 42 projects(purchases made when the need via the Endesa Climate Initiative arises) through which it expects to cover o Some active management when between 30 and 50% of its needs in prices are low phase I and II, respectively. |
|
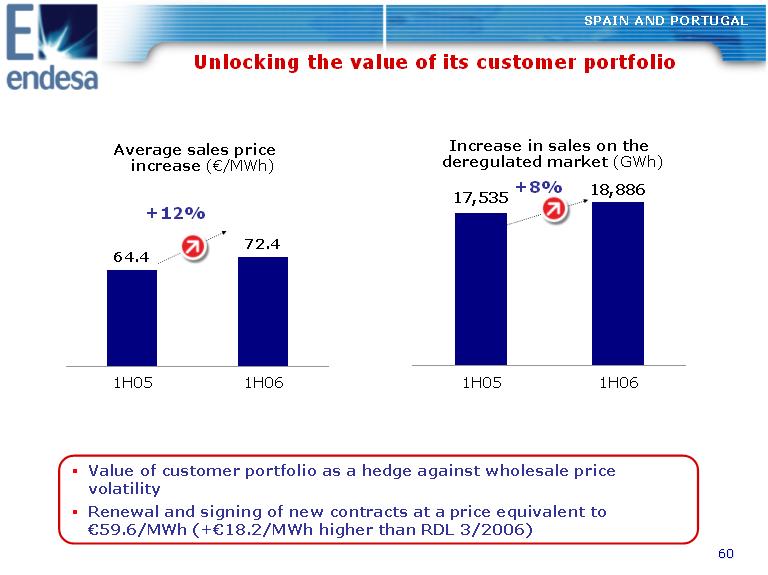
SPAIN AND PORTUGAL Unlocking the value of its customer portfolio Average sales price Increase in sales on the increase ((euro)/MWh) deregulated market (GWh) 18,88617,535 72.4 64.4 +12% +8% 1H05 1H06 1H05 1H06 o Value of customer portfolio as a hedge against wholesale price volatility o Renewal and signing of new contracts at a price equivalent to (euro)59.6/MWh (+(euro)18.2/MWh higher than RDL 3/2006) |
|
Underlying wholesale power prices SPAIN AND PORTUGAL Generation revenues from sales to: Pool (bilateral with Deregulated market Distribution) (euro)/MWh 51.0 33.8 44.5 RDL 3/2006 Underlying price Renewals from sales in the liberalized market o The difference in prices between the energy sold under the RDL 3/2006 and the average underlying price of energy sold to the liberalized market is 10.7 (euro)/MWh o The average underlying price of renewals in 1S06 is 6.5 (euro)/MWh greater |
|
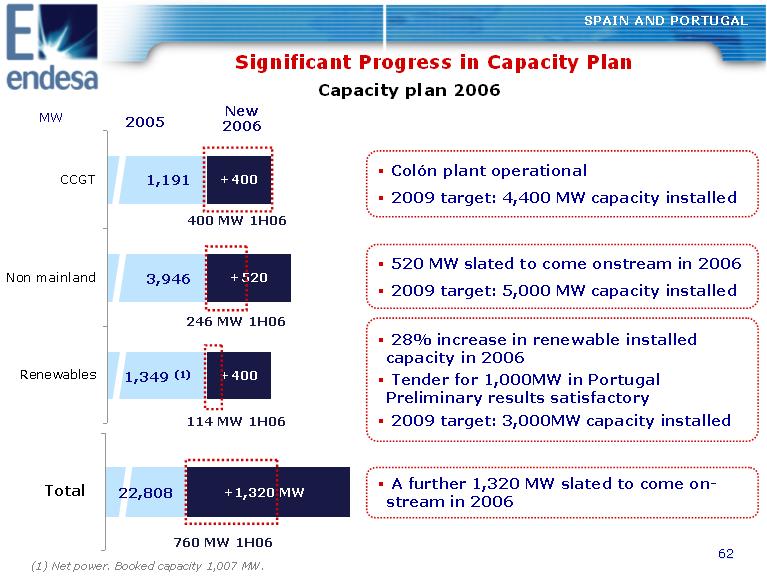
SPAIN AND PORTUGAL Significant Progress in Capacity Plan Capacity plan 2006 MW New 2005 2006 CCGT 1,191 3,946 1,349 (1) +400 400 MW 1H06 Non mainland +520 246 MW 1H06 Renewables +400 114 MW 1H06 Total 22,808 +1,320 MW 760 MW 1H06 A further 1,320 MW slated to come on- stream in 2006 28% increase in renewable installed capacity in 2006 Tender for 1,000MW in Portugal Preliminary results satisfactory 2009 target: 3,000MW capacity installed 520 MW slated to come onstream in 2006 2009 target: 5,000 MW capacity installed Colon plant operational 2009 target: 4,400 MW capacity installed (1) Net power. Booked capacity 1,007 MW. |
|
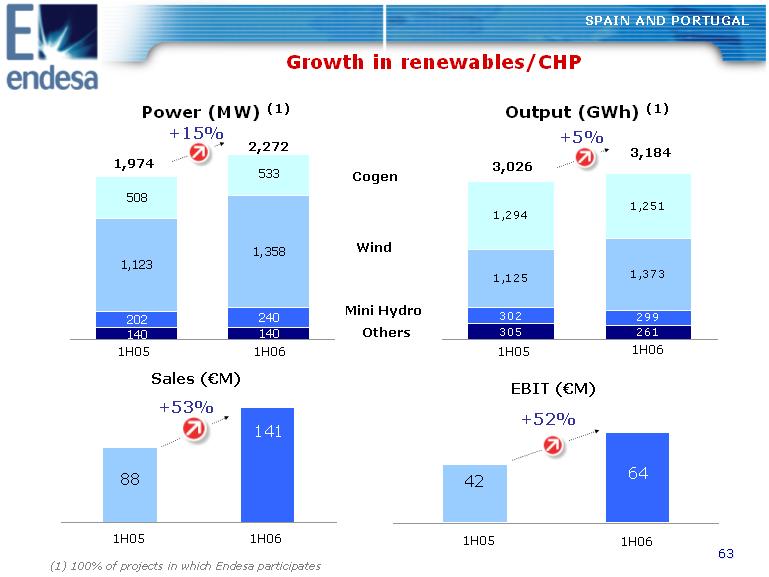
Growth in renewables/CHP SPAIN AND PORTUGAL Power (MW) (1) Output (GWh) (1) +15% +5% 2,272 533 1,358 3,1841,974 3,026 508 1,123 Cogen Wind 140 202 240 140 Mini Hydro Others 1,125 1,373 1,294 1,251 261 302 299 305 1H05 1H06 1H05 1H06 Sales ((euro)M) EBIT ((euro)M) +52% +53% 88 141 42 64 1H05 1H06 1H05 1H06 (1) 100% of projects in which Endesa participates |
|
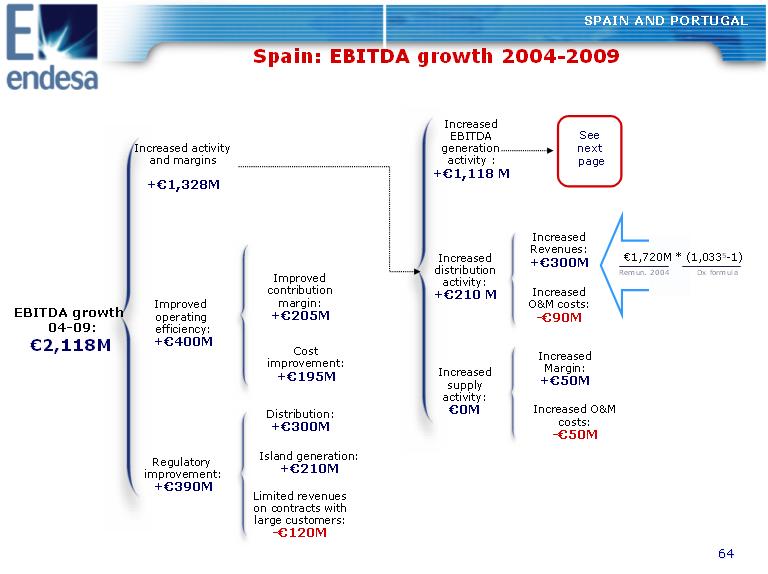
SPAIN AND PORTUGAL Spain: EBITDA growth 2004-2009 Improved Increased activity and margins +(euro)1,328M EBITDA growth operating04-09: efficiency: (euro)2,118M +(euro)400M Distribution: +(euro)300M Cost improvement: +(euro)195M Improved contribution margin: +(euro)205M Island generation: +(euro)210M Increased EBITDA generation activity : +(euro)1,118 M Increased distribution activity: +(euro)210 M Increased supply activity: (euro)0M See next page Increased Revenues: +(euro)300M Increased O&M costs: -(euro)90M Increased Margin: +(euro)50M Increased O&M costs: -(euro)50M (euro)1,720M * (1,0335-1) Remun. 2004 Dx formula Regulatory improvement: +(euro)390M Limited revenues on contracts with large customers: -(euro)120M |
|
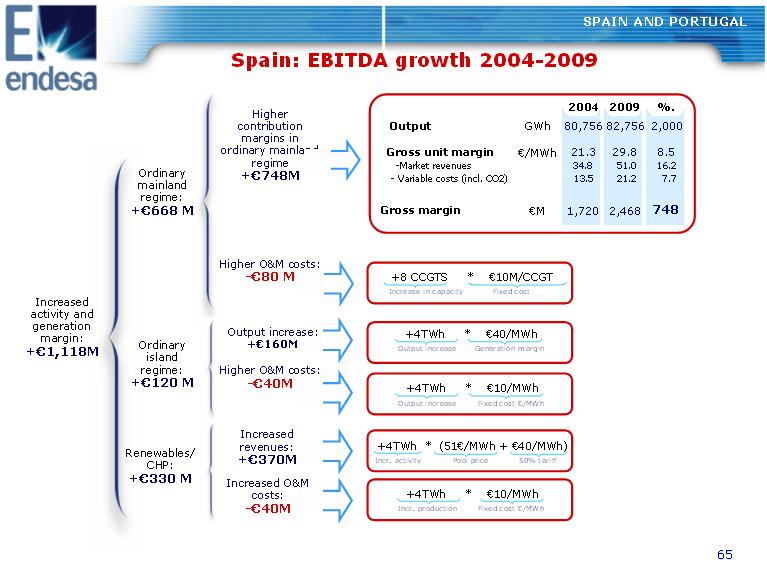
Ordinary mainland regime: Higher contribution margins in ordinary mainland regime +(euro)748M SPAIN AND PORTUGAL Spain: EBITDA growth 2004-2009 2004 2009 %. Output GWh 80,756 82,756 2,000 Gross unit margin (euro)/MWh 21.3 29.8 8.5 -Market revenues 34.8 51.0 16.2 -Variable costs (incl. CO2) 13.5 21.2 7.7 Gross margin (euro)M 1,720 2,468 748 +8 CCGTS * (euro)10M/CCGT Increase in capacity Fixed cost +4TWh * (euro)40/MWh Output increase Generation margin +4TWh * (euro)10/MWh Output increase Fixed cost (euro)/MWh +4TWh * (51(euro)/MWh (euro)40/MWh)+ Incr. activity Pool price 50% tariff +4TWh * (euro)10/MWh Incr. production Fixed cost (euro)/MWh +(euro)160M +(euro)1,118M Ordinary island regime: Higher O&M costs: +(euro)120 M -(euro)40M Increased Renewables/ revenues: +(euro)370M CHP: +(euro)330 M Increased O&M costs: -(euro)40M Increased activity and generation margin: Higher O&M costs: -(euro)80 M Output increase: |
|
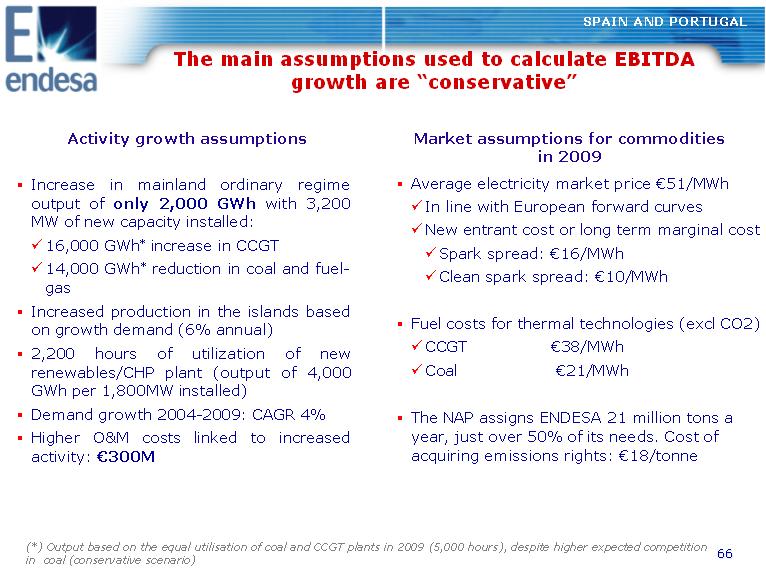
SPAIN AND PORTUGAL The main assumptions used to calculate EBITDA growth are "conservative" Activity growth assumptions o Increase in mainland ordinary regime output of only 2,000 GWh with 3,200 MW of new capacity installed: 16,000 GWh* increase in CCGT 14,000 GWh* reduction in coal and fuel- gas o Increased production in the islands based on growth demand (6% annual) o 2,200 hours of utilization of new renewables/CHP plant (output of 4,000 GWh per 1,800MW installed) o Demand growth 2004-2009: CAGR 4% o Higher O&M costs linked to increased activity: (euro)300M Market assumptions for commodities in 2009 o Average electricity market price (euro)51/MWh In line with European forward curves New entrant cost or long term marginal cost Spark spread: (euro)16/MWh Clean spark spread: (euro)10/MWh o Fuel costs for thermal technologies (excl CO2) CCGT (euro)38/MWh Coal (euro)21/MWh o The NAP assigns ENDESA 21 million tons a year, just over 50% of its needs. Cost of acquiring emissions rights: (euro)18/tonne (*) Output based on the equal utilisation of coal and CCGT plants in 2009 (5,000 hours), despite higher expected competition in coal (conservative scenario) |
|
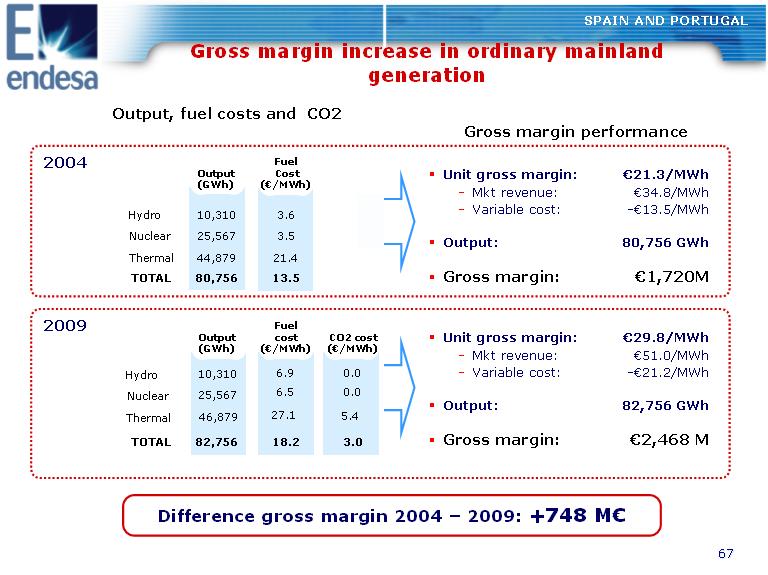
SPAIN AND PORTUGAL Gross margin increase in ordinary mainland generation Output, fuel costs and CO2 Gross margin performance 2004 Unit gross margin: (euro)21.3/MWh -Mkt revenue: (euro)34.8/MWh -Variable cost: -(euro)13.5/MWh Output: 80,756 GWh Gross margin: (euro)1,720M Output Fuel Cost (GWh) ((euro)/MWh) Hydro 10,310 3.6 Nuclear 25,567 3.5 Thermal 44,879 21.4 TOTAL 80,756 13.5 2009 Unit gross margin: (euro)29.8/MWh -Mkt revenue: (euro)51.0/MWh -Variable cost: -(euro)21.2/MWh Output: 82,756 GWh Gross margin: (euro)2,468 M Output Fuel cost CO2 cost (GWh) ((euro)/MWh) ((euro)/MWh) 6.9 0.0 6.5 0.0 TOTAL 82,756 18.2 3.0 Difference gross margin 2004 - 2009: +748 M(euro) Hydro Nuclear Thermal 10,310 25,567 46,879 27.1 5.4 |
|
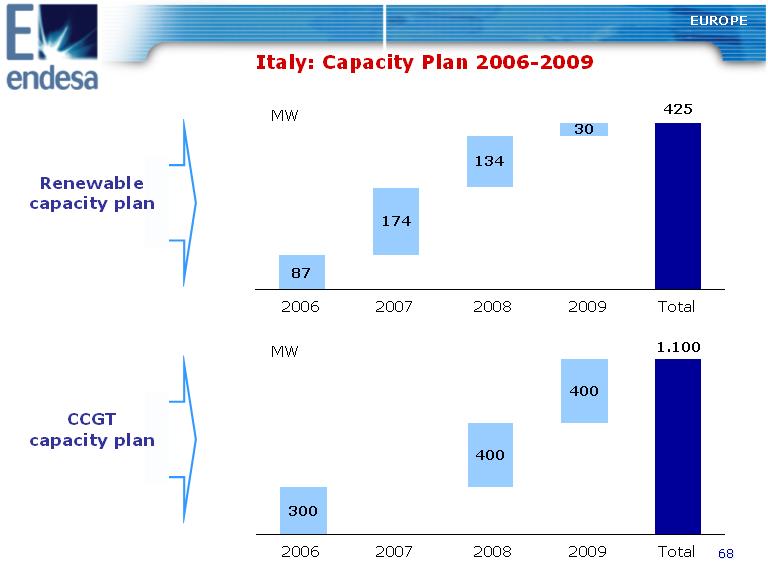
EUROPE Italy: Capacity Plan 2006-2009 MW 425 174 134 30 87 Renewable capacity plan 2006 2007 2008 2009 Total MW 1.100 400 400 300 CCGT capacity plan 2006 2007 2008 2009 Total |
|
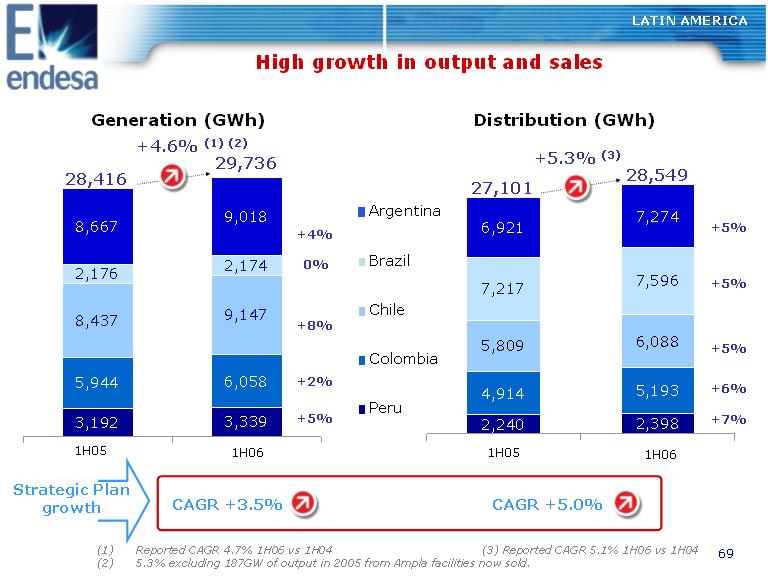
High growth in output and sales LATIN AMERICA Generation (GWh) Distribution (GWh) +4.6% (1) (2) 29,736 +5.3% (3) 9,018 28,549 28,416 8,667 27,101 7,274 Argentina 4,914 5,193 5,809 6,088 7,217 7,596 6,921 +5% +4% 3,192 3,339 5,944 6,058 8,437 9,147 2,176 2,174 Brazil 0% +5% Chile +8% +5% Colombia +2% +6% Peru +5% +7% 2,240 2,398 1H05 1H06 1H05 1H06 Strategic Plan growth CAGR +3.5% CAGR +5.0% (1) Reported CAGR 4.7% 1H06 vs 1H04 (3) Reported CAGR 5.1% 1H06 vs 1H04 (2) 5.3% excluding 187GW of output in 2005 from Ampla facilities now sold. |
|
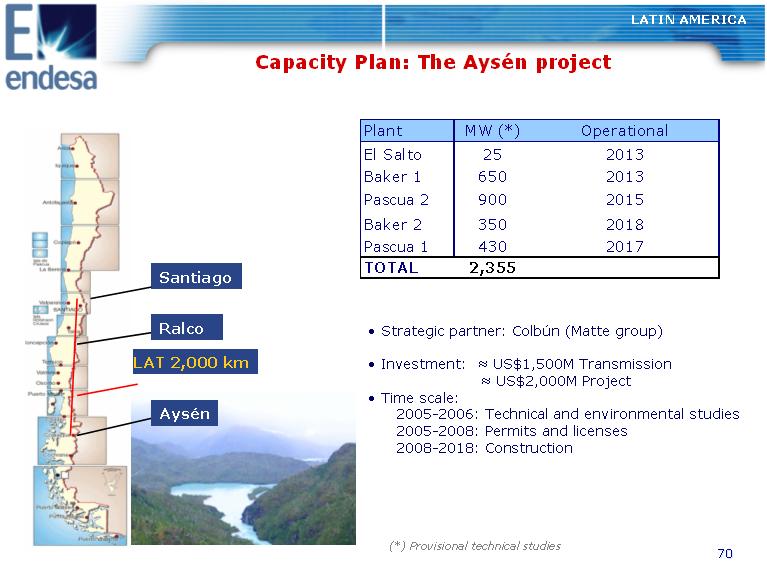
LATIN AMERICA Capacity Plan: The Aysen project LAT 2,000 km Santiago Ralco Aysen Plant MW (*) Operational El Salto 25 2013 Baker 1 650 2013 Pascua 2 900 2015 Baker 2 350 2018 Pascua 1 430 2017 TOTAL 2,355 o Strategic partner: Colbun (Matte group) o Investment: ~ US$1,500M Transmission ~ US$2,000M Project o Time scale: 2005-2006: Technical and environmental studies 2005-2008: Permits and licenses 2008-2018: Construction (*) Provisional technical studies |
|
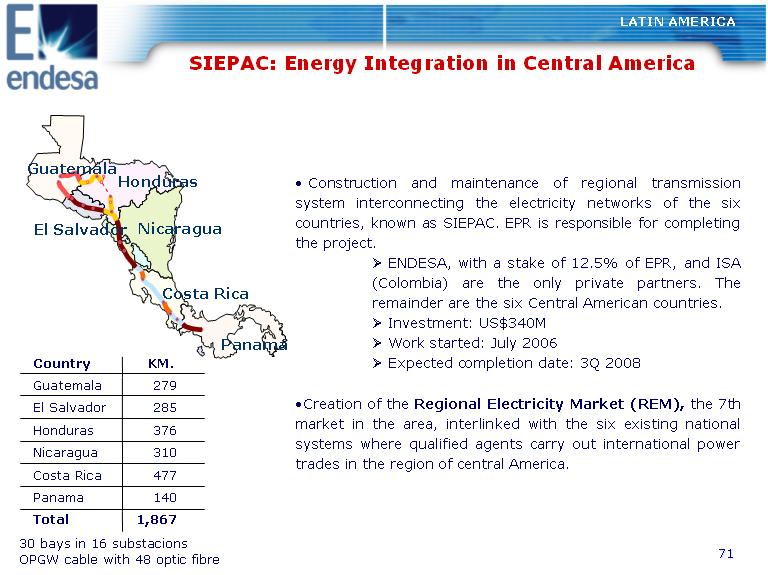
SIEPAC: Energy Integration in Central America LATIN AMERICA Guatemala Honduras NicaraguaEl Salvador Costa Rica Panama o Construction and maintenance of regional transmission system interconnecting the electricity networks of the six countries, known as SIEPAC. EPR is responsible for completing the project. o ENDESA, with a stake of 12.5% of EPR, and ISA (Colombia) are the only private partners. The remainder are the six Central American countries. o Investment: US$340M o Work started: July 2006 o Expected completion date: 3Q 2008 Country Guatemala 279 El Salvador 285 oCreation of the Regional Electricity Market (REM), the 7th Honduras 376 market in the area, interlinked with the six existing national Nicaragua Costa Rica 310 477 systems where qualified agents carry out international power trades in the region of central America. Panama 140 KM. Total 1,867 30 bays in 16 substacions OPGW cable with 48 optic fibre |
|
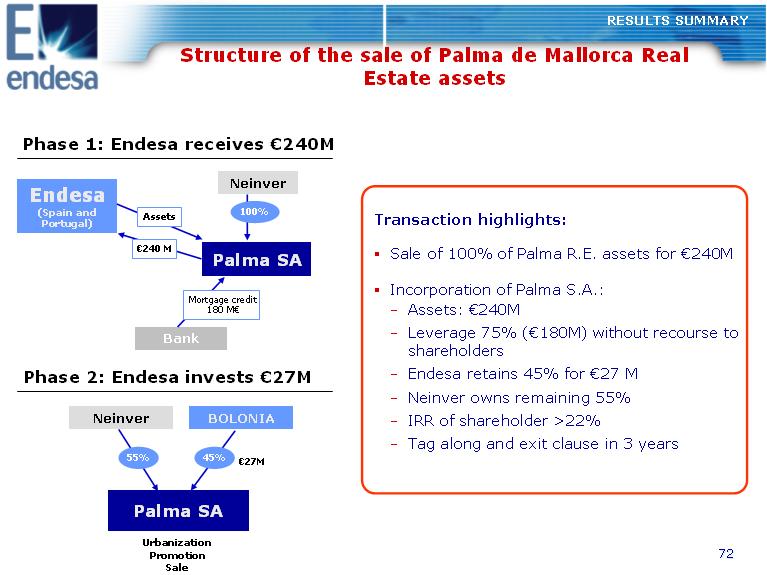
RESULTS SUMMARY Structure of the sale of Palma de Mallorca Real Estate assets Phase 1: Endesa receives (euro)240M Endesa (Spain and Portugal) Palma SA Neinver 100%Assets (euro)240 M Bank Mortgage credit 180 M(euro) Phase 2: Endesa invests (euro)27M Neinver 55% 45% Palma SA BOLONIA (euro)27M Transaction highlights: o Sale of 100% of Palma R.E. assets for (euro)240M o Incorporation of Palma S.A.: -Assets: (euro)240M -Leverage 75% ((euro)180M) without recourse to shareholders -Endesa retains 45% for (euro)27 M -Neinver owns remaining 55% -IRR of shareholder >22% -Tag along and exit clause in 3 years Urbanization Promotion Sale |
|
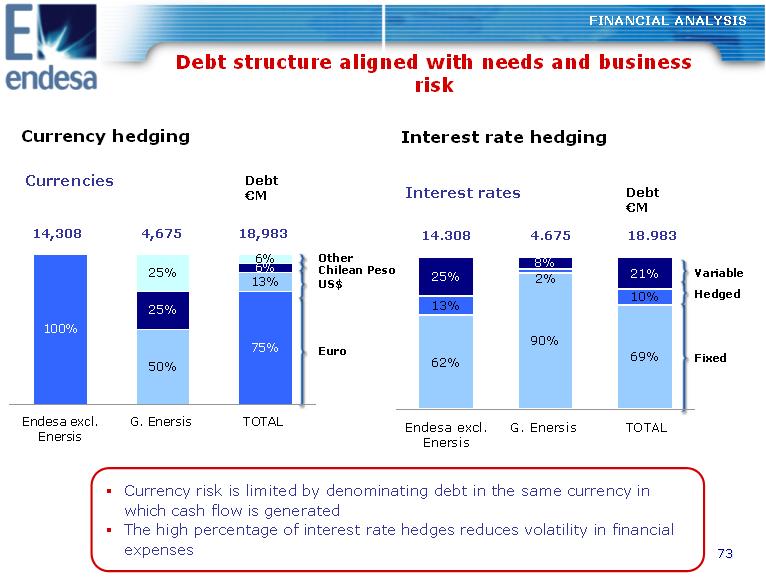
FINANCIAL ANALYSIS Debt structure aligned with needs and business risk Currency hedging Interest rate hedging Currencies Debt (euro)M Interest rates Debt (euro)M 14,308 4,675 18,983 14.308 4.675 18.983 100% 75% 50% 13% 25% 6%25% 6% Euro US$ Chilean Peso Other 62% 90% 69% 13% 10% 25% 8% 21%2% Fixed Hedged Variable Endesa excl. G. Enersis TOTAL Endesa excl. G. Enersis TOTALEnersis Enersis 7373 Currency risk is limited by denominating debt in the same currency in which cash flow is generated The high percentage of interest rate hedges reduces volatility in financial expenses |
|
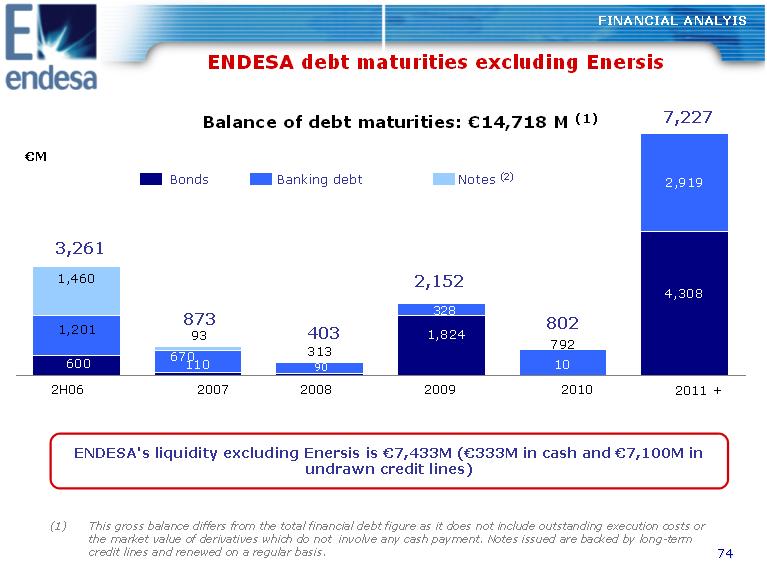
FINANCIAL ANALYIS ENDESA debt maturities excluding Enersis Balance of debt maturities: (euro)14,718 M (1) 7,227 (euro)M Bonds Banking debt Notes (2) 3,261 1,201 1,460 2,152 873 1,824 328 802 93 403 110670 10 792 313 600 4,308 2,919 90 2H06 2007 2008 2009 2010 2011 + ENDESA's liquidity excluding Enersis is (euro)7,433M ((euro)333M in cash and (euro)7,100M in undrawn credit lines) (1) This gross balance differs from the total financial debt figure as it does not include outstanding execution costs or the market value of derivatives which do not involve any cash payment. Notes issued are backed by long-term credit lines and renewed on a regular basis. |
|
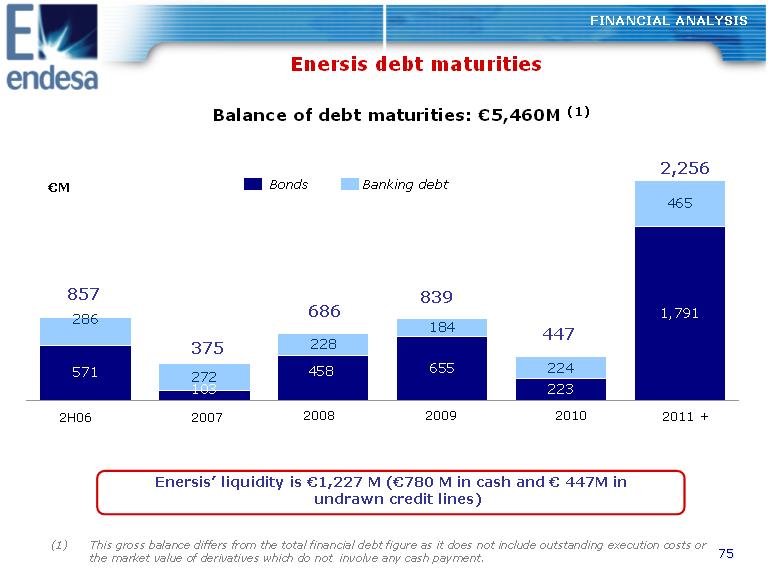
FINANCIAL ANALYSIS Enersis debt maturities Balance of debt maturities: (euro)5,460M (1) 2,256 Bonds Banking debt (euro)M 857 839 686 571 286 447 375 228 655 184 465 1,791 272 458 103 223 224 2H06 2007 2008 2009 2010 2011 + Enersis' liquidity is (euro)1,227 M ((euro)780 M in cash and (euro) 447M in undrawn credit lines) (1) This gross balance differs from the total financial debt figure as it does not include outstanding execution costs or the market value of derivatives which do not involve any cash payment. |
|
Important information Investors are urged to read Endesa's Solicitation/Recommendation Statement on Schedule 14D-9 when it is filed with the U.S. Securities and Exchange Commission (the "SEC"), as it will contain important information. The Solicitation/Recommendation Statement and other public filings made from time to time by Endesa with the SEC are available without charge from the SEC's website at www.sec.gov and at Endesa's principal executive offices in Madrid, Spain. This presentation contains certain "forward-looking statements" regarding anticipated financial and operating results and statistics and other future events. These statements are not guarantees of future performance and are subject to material risks, uncertainties, changes and other factors which may be beyond Endesa's control or may be difficult to predict. Forward-looking statements include, but are not limited to, information regarding: estimated future earnings; anticipated increases in wind and CCGTs generation and market share; expected increases in demand for gas and gas sourcing; management strategy and goals; estimated cost reductions; tariffs and pricing structure; estimated capital expenditures and other investments; expected asset disposals; estimated increases in capacity and output and changes in capacity mix; repowering of capacity and macroeconomic conditions. For example, the EBITDA and dividends targets for 2004 to 2009 included in this presentation are forward- looking statements and are based on certain assumptions which may or may not prove correct. The principal assumptions underlying these forecasts and targets relate to regulatory environment, exchange rates, disposals, increases in ouput and installed capacity in the various markets where Endesa operates, increases in demand in these markets, allocation of ouput among different technologies increased costs associated with higher activity levels not exceeding certain levels, the market price of electricity not falling below certain levels, the cost of CCGT and the availability and cost of gas, fuel, coal and emission rights necessary to operate our business at desired levels. The following important factors, in addition to those discussed elsewhere in this presentation, could cause actual financial and operating results and statistics to differ materially from those expressed in our forward-looking statements: Economic and Industry Conditions: materially adverse changes in economic or industry conditions generally or in our markets; the effect of existing regulations and regulatory changes; tariff reductions; the impact of any fluctuations in interest rates; the impact of fluctuations in exchange rates; natural disasters; the impact of more stringent environmental regulations and the inherent environmental risks relating to our business operations; the potential liabilities relating to our nuclear facilities. Transaction or Commercial Factors: any delays in or failure to obtain necessary regulatory, antitrust and other approvals for our proposed acquisitions or asset disposals, or any conditions imposed in connection with such approvals; our ability to integrate acquired businesses successfully; the challenges inherent in diverting management's focus and resources from other strategic opportunities and from operational matters during the process of integrating acquired businesses; the outcome of any negotiations with partners and governments. Any delays in or failure to obtain necessary regulatory approvals, including environmental to construct new facilities, repowering or enhancement of existing facilities; shortages or changes in the price of equipment, materials or labor; opposition of political and ethnic groups; adverse changes in the political and regulatory environment in the countries where we and our related companies operate; adverse weather conditions, which may delay the completion of power plants or substations, or natural disasters, accidents or other unforeseen events; and the inability to obtain financing at rates that are satisfactory to us. Political/Governmental Factors: political conditions in Latin America; changes in Spanish, European and foreign laws, regulations and taxes. Operating Factors: technical difficulties; changes in operating conditions and costs; the ability to implement cost reduction plans; the ability to maintain a stable supply of coal, fuel and gas and the impact of fluctuations on fuel and gas prices; acquisitions or restructurings; the ability to implement an international and diversification strategy successfully. Competitive Factors: the actions of competitors; changes in competition and pricing environments; the entry of new competitors in our markets. Further information about the reasons why actual results and developments may differ materially from the expectations disclosed or implied by our forward-looking statements can be found under "Risk Factors" in our annual report on Form 20-F for the year ended December 31, 2005. No assurance can be given that the forward-looking statements in this document will be realized. Except as may be required by applicable law, neither Endesa nor any of its affiliates intends to update these forward-looking statements. |
|
1H 2006 results Endesa's greater value 25 July 2006 |
SIGNATURES
Pursuant to the requirements of the Securities Exchange Act of 1934, the registrant has duly caused this report to be signed on its behalf by the undersigned, thereunto duly authorized.
| | ENDESA, S.A. |
| | |
| Dated: July 25, 2006 | By: /s/ Álvaro Pérez de Lema |
| | Name: Álvaro Pérez de Lema |
| | Title: Manager of North America Investor Relations |