FORM 6-K
SECURITIES AND EXCHANGE COMMISSION
Washington, D.C. 20549
Report of Foreign Issuer
Pursuant to Rule 13a-16 or 15d-16 of
the Securities Exchange Act of 1934
For the month of June, 2007
Commission File Number: 333-07654
ENDESA, S.A.
(Translation of Registrant's Name into English)
Ribera del Loira, 60
28042 Madrid, Spain
(Address of principal executive office)
Indicate by check mark whether the registrant files or will file
annual reports under cover of Form 20-F or Form 40-F:
| Form 20-F | X | Form 40-F |
Indicate by check mark if the registrant is submitting the Form 6-K
in paper as permitted by Regulation S-T Rule 101(b)(1):
| Yes | No | X |
Indicate by check mark if the registrant is submitting the Form 6-K
in paper as permitted by Regulation S-T Rule 101(b)(7):
| Yes | No | X |
Indicate by check mark whether by furnishing the information
contained in this Form, the Registrant is also thereby furnishing the information to the Commission
pursuant to Rule 12g3-2(b) under the Securities Exchange Act of 1934:
| Yes | No | X |
If “Yes” is marked, indicate below the file number assigned to the registrant
in connection with Rule 12g3-2(b): N/A

Excellent 2006 results Excellent 2006 results 1 Endesa: a global energy company Endesa: a global energy company 2 r bids Takeover bids 3
Excellent 2006 results Excellent 2006 results 1
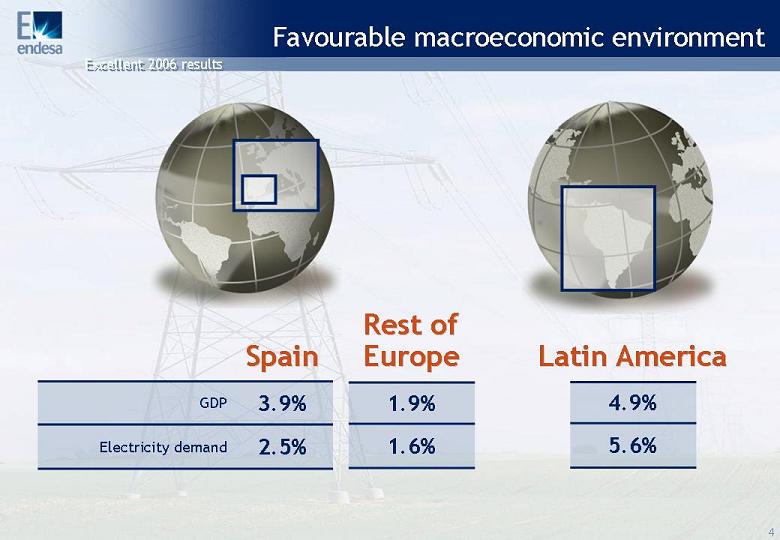
Favourable macroeconomic environment Favourable macroeconomic environment Spain Spain Latin America Latin America 2.5% Electricity demand 3.9% GDP 5.6% 4.9% Rest of Rest of Europe Europe 1.6% 1.9%
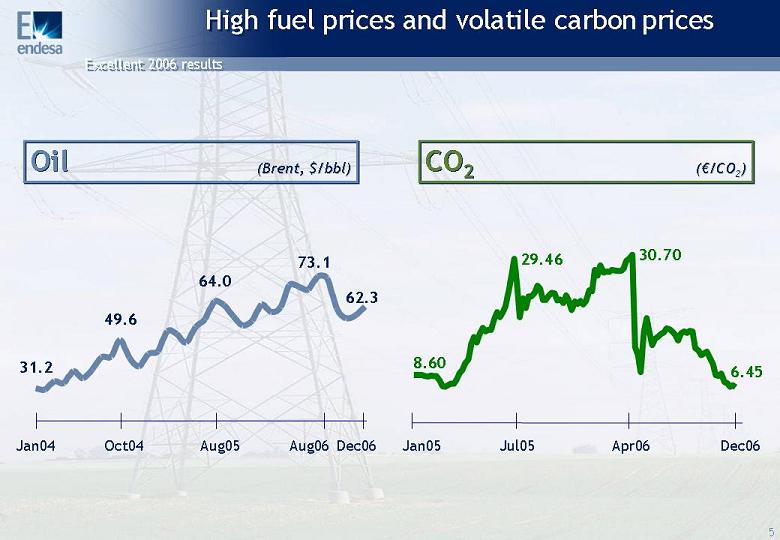
High fuel prices and volatile carbon prices High fuel prices and volatile carbon prices Oil Oil (Brent, $/bbl) (Brent, $/bbl) CO2 CO2 (€/CO /CO2) 73.1 31.2 49.6 64.0 Jan04 Aug05 Dec06 Oct04 Aug06 62.3 6.45 30.70 29.46 8.60 Jan05 Dec06 Jul05 Apr06
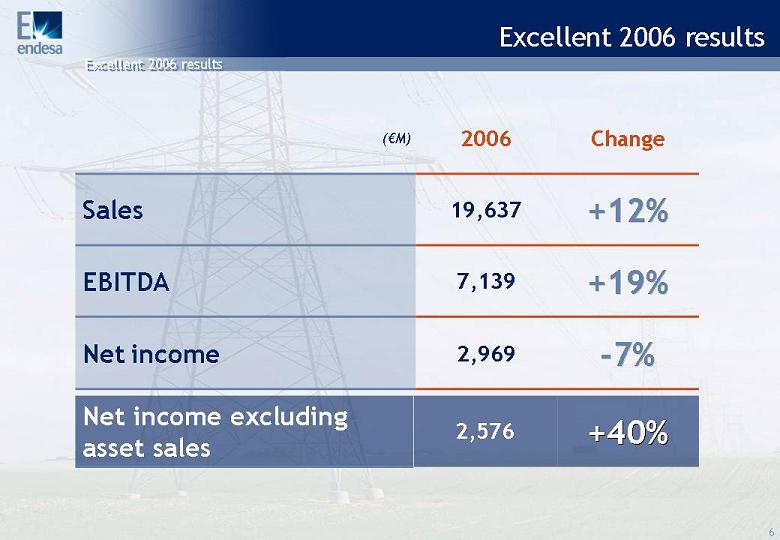
Excellent 2006 results (€M) Change 2006 12% +12% 19,637 Sales % +19% 7,139 EBITDA Net income -7% 7% 2,969 Net income excluding asset sales % +40% 2,576
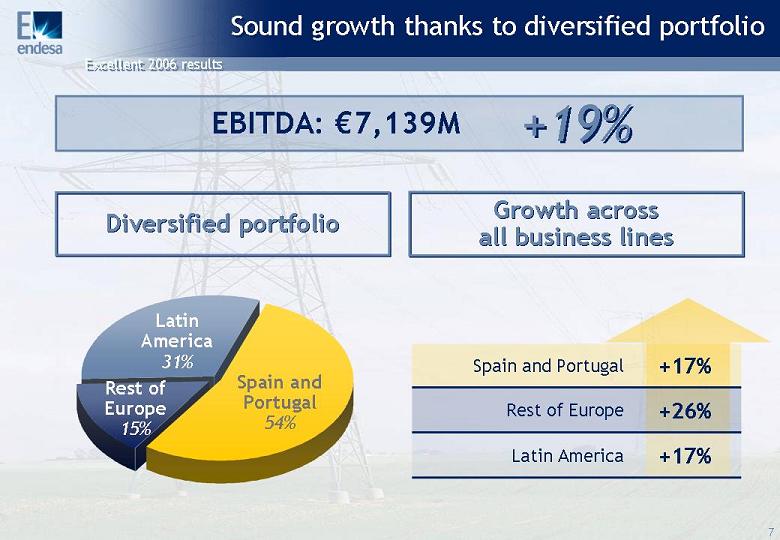
Sound growth thanks to diversified portfolio Sound growth thanks to diversified portfolio Diversified portfolio Diversified portfolio EBITDA: €7,139M Spain and Portugal 54% Rest of Europe 15% Latin America 31% Growth across all business lines Growth across all business lines +17% Spain and Portugal +26% Rest of Europe +17% Latin America +19%
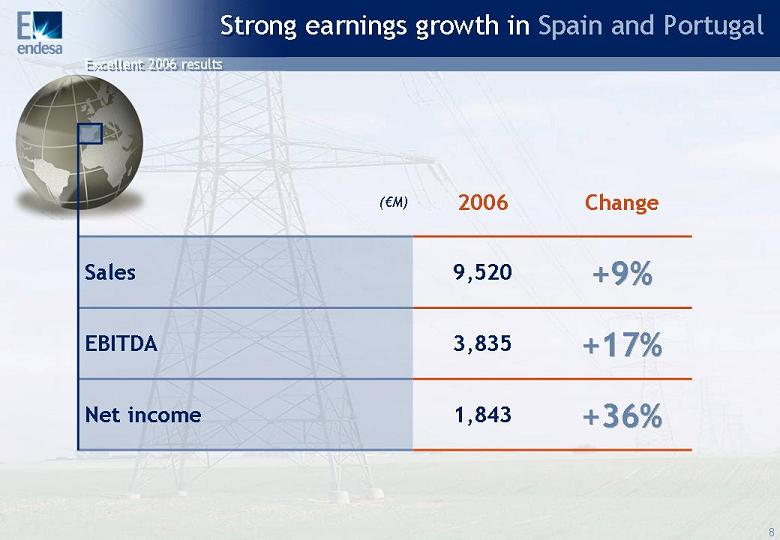
Strong earnings growth in Spain and Portugal Strong earnings growth in Spain and Portugal +9% +9% 9,520 Sales Change 2006 (€M) +17% +17% 3,835 EBITDA +36% +36% 1,843 Net income
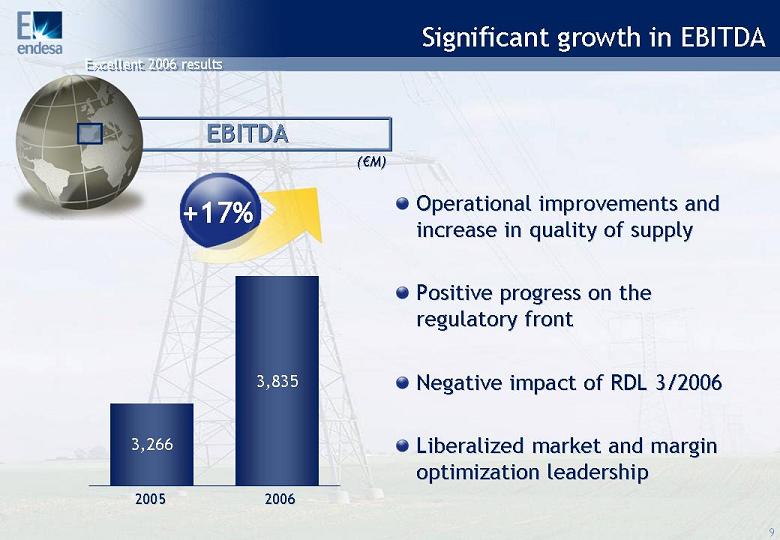
Significant growth in EBITDA Significant growth in EBITDA EBITDA EBITDA (€M) M) Operational improvements and Operational improvements and increase in quality of supply increase in quality of supply Positive Positive progress progress on on the the regulatory regulatory front front Negative impact of RDL 3/2006 Negative impact of RDL 3/2006 Liberalized Liberalized market market and and margin margin optimization optimization leadership leadership +17% 2005 2005 2006 2006 3,266 3,835
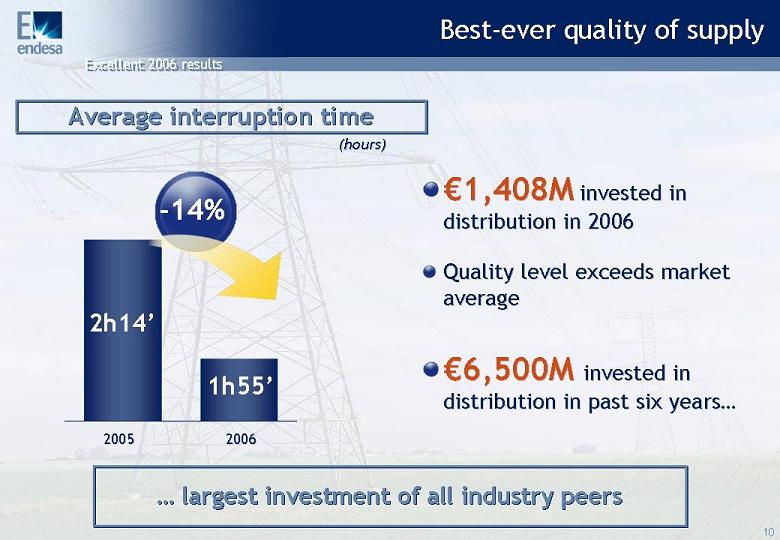
Best-ever quality of supply Best-ever quality of supply Average interruption time Average interruption time (hours) (hours) -14% 2h14’ 1h55’ €1,408M 1,408M invested in invested in distribution in 2006 distribution in 2006 Quality level exceeds market Quality level exceeds market average average €6,500M 6,500M invested in invested in distribution in past six years distribution in past six years… … largest investment of all industry peers
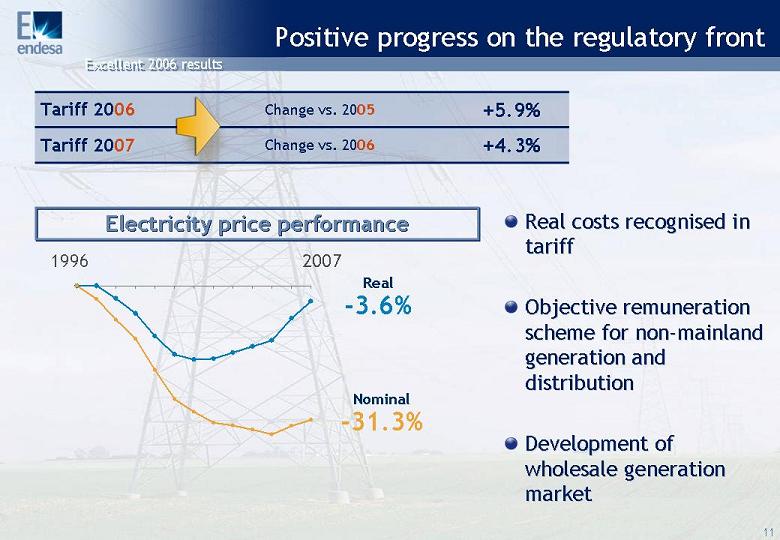
Positive progress on the regulatory front Real costs Real costs recognised recognised in in tariff tariff Objective remuneration Objective remuneration scheme for non scheme for non-mainland mainland generation and generation and distribution distribution Development of Development of wholesale generation wholesale generation market market Change vs. 2006 Change vs. 2005 +4.3% Tariff 2007 +5.9% Tariff 2006 Electricity price performance Electricity price performance Real -3.6% Nominal -31.3% 1996 2007
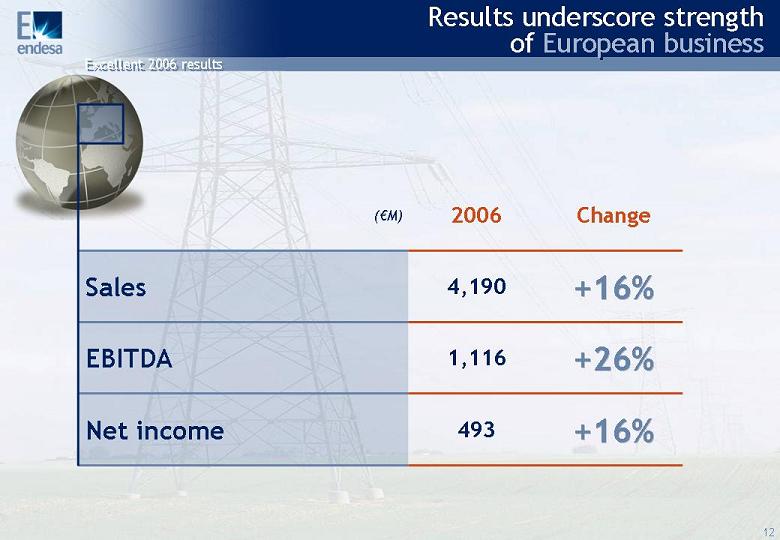
Results underscore strength of European business +16% +16% 4,190 Sales Change 2006 (€M) +26% +26% 1,116 EBITDA +16% +16% 493 Net income
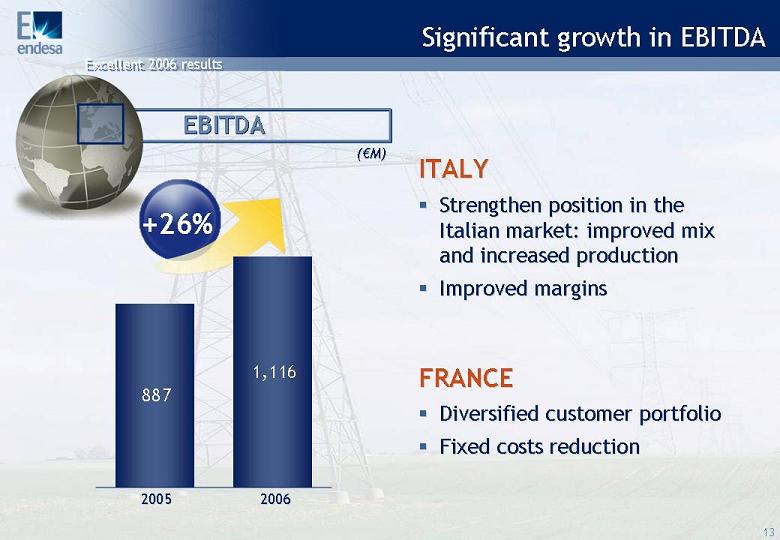
Significant growth in EBITDA Significant growth in EBITDA EBITDA EBITDA (€M) M) +26% ITALY ITALY ���� Strengthen position in the Strengthen position in the Italian Italian market: market: improved improved mix mix and and increased increased production production ���� Improved margins Improved margins FRANCE FRANCE ���� Diversified customer portfolio Diversified customer portfolio ���� Fixed Fixed costs costs reduction reduction 887 1,116
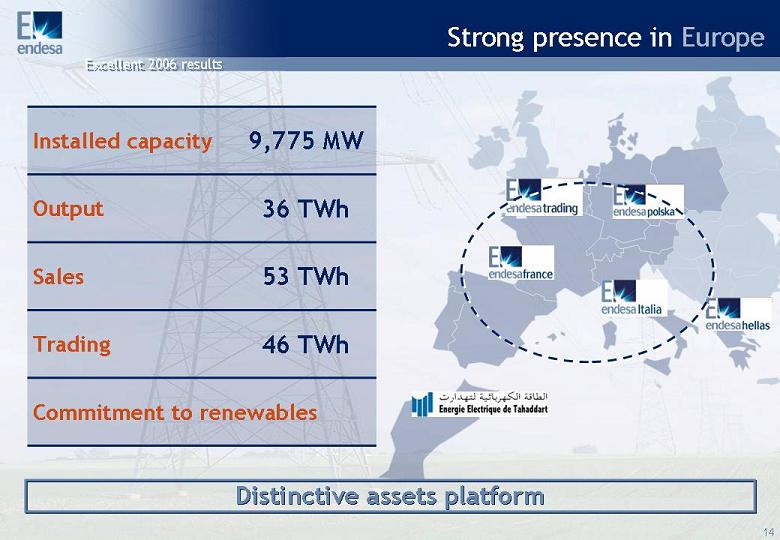
Strong presence in Europe Strong presence in Europe 36 TWh Output 46 TWh Trading 53 TWh Sales Commitment to renewables 9,775 MW Installed capacity Distinctive assets platform Distinctive assets platform
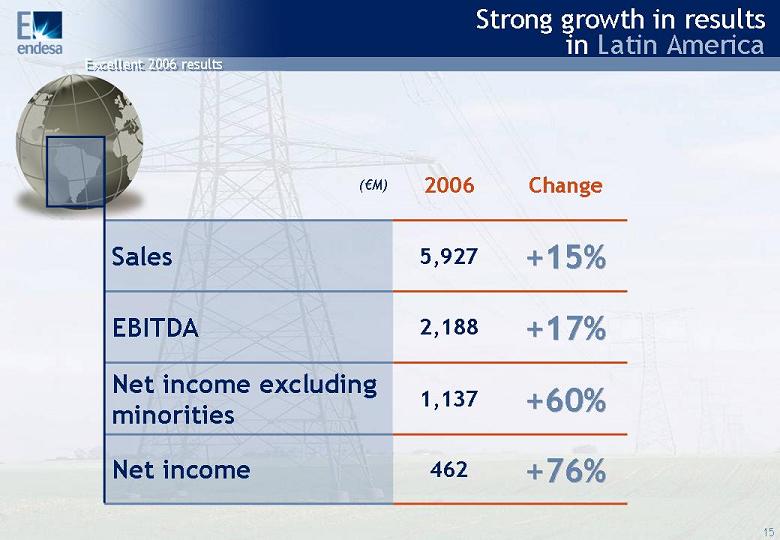
Change 2006 (€M) Strong growth in results in Latin America Strong 5% +15% 5,927 Sales +17% +17% 2,188 EBITDA Net income excluding minorities 0% +60% 1,137 Net income 6% +76% 462
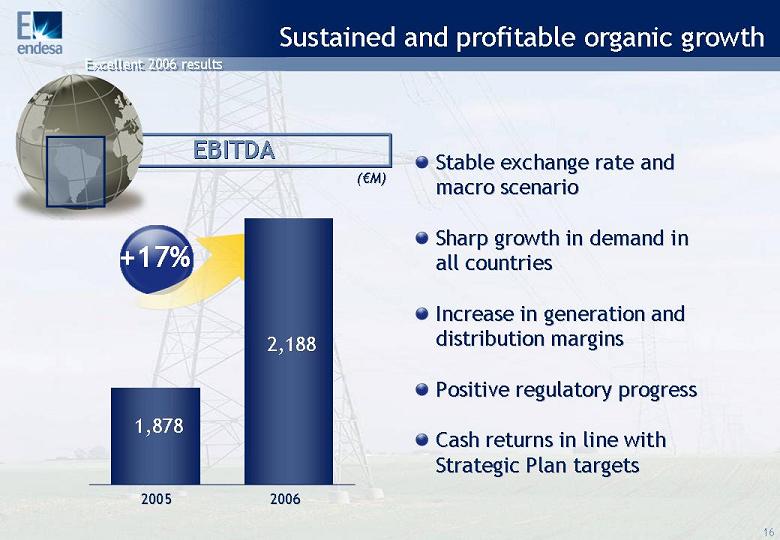
Sustained and profitable organic growth Sustained and profitable organic growth EBITDA EBITDA (€M) M) Stable Stable exchange exchange rate rate and and macro macro scenario scenario Sharp growth in demand in Sharp growth in demand in all all countries countries Increase Increase in generation and in generation and distribution margins distribution margins Positive regulatory Positive regulatory progress progress Cash returns in line with Cash returns in line with Strategic Strategic
Plan targets Plan targets 2005 2005 2006 2006 +17% 2,188 1,878
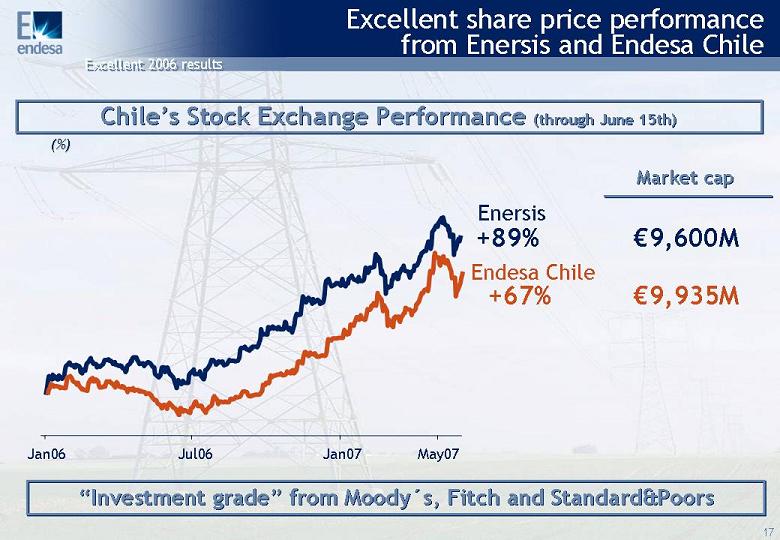
Excellent share price performance from Enersis and Endesa Chile Chile’s Stock Exchange Performance (through
June 15th) Chile’s Stock Exchange Performance (through June 15th) (%) (%) Enersis +89% +67% Endesa Chile Market cap Market cap €9,600M €9,935M
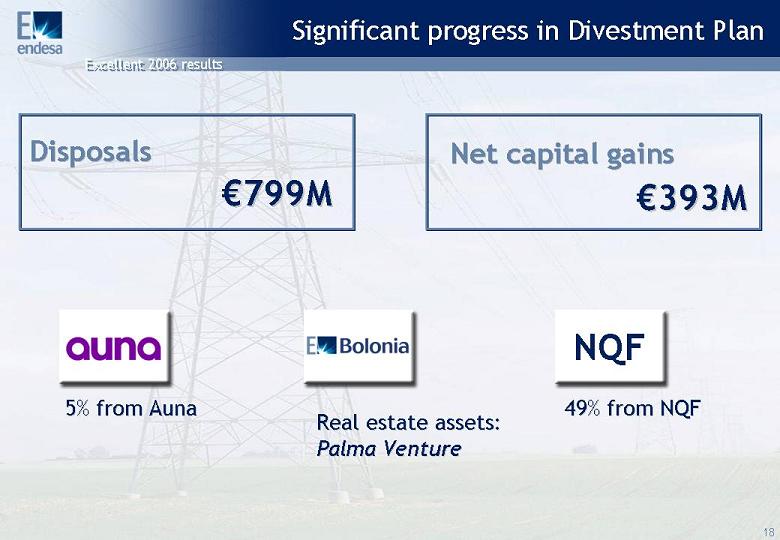
Significant progress in Divestment Plan Significant progress in Divestment Plan 5% from Auna 5% from Auna 49% from NQF 49% from NQF Real estate assets: Real estate assets: Palma Palma Venture Venture NQF Disposals Disposals €799M 799M Net capital Net capital gains gains €393M 393M
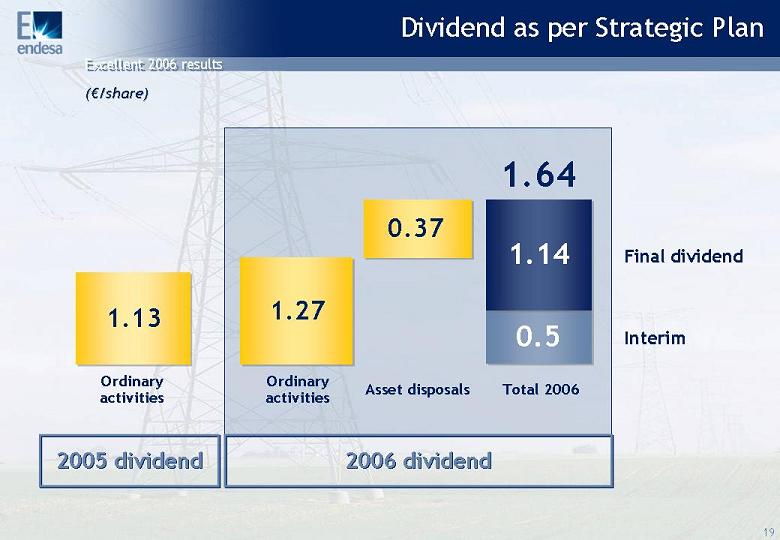
Dividend as per Strategic Plan (€/share) /share) 1.27 Ordinary activiti
es 0.37 Asset disposals 2006 dividend 2006 dividend Interim Final dividend Total 2006 1.14 0.5 1.64 1.13 2005 dividend 2005 dividend Ordinary activities
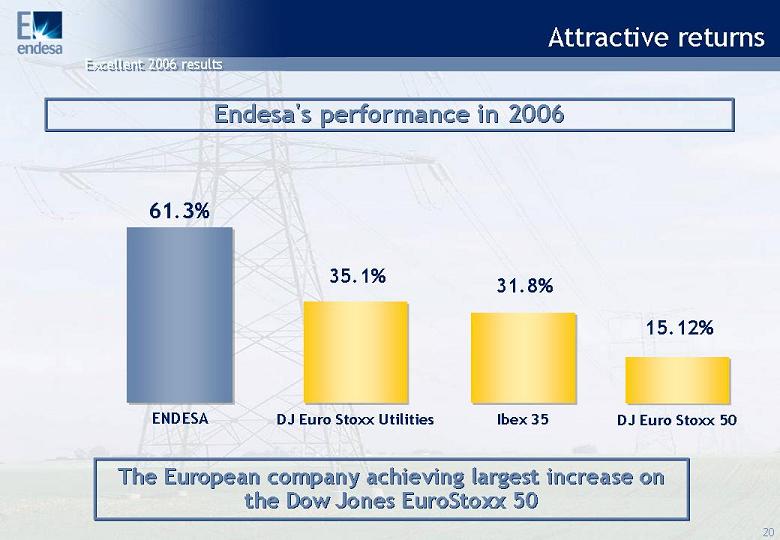
Attractive returns ENDESA 61.3% Endesa's performance in 2006 Endesa's performance in 2006 The European company achieving largest increase on the Dow Jones EuroStoxx 50 The European company achieving largest increase on the Dow Jones EuroStoxx 50 35.1% DJ Euro Stoxx Utilities 31.8% Ibex 35 15.12% DJ Euro Stoxx 50
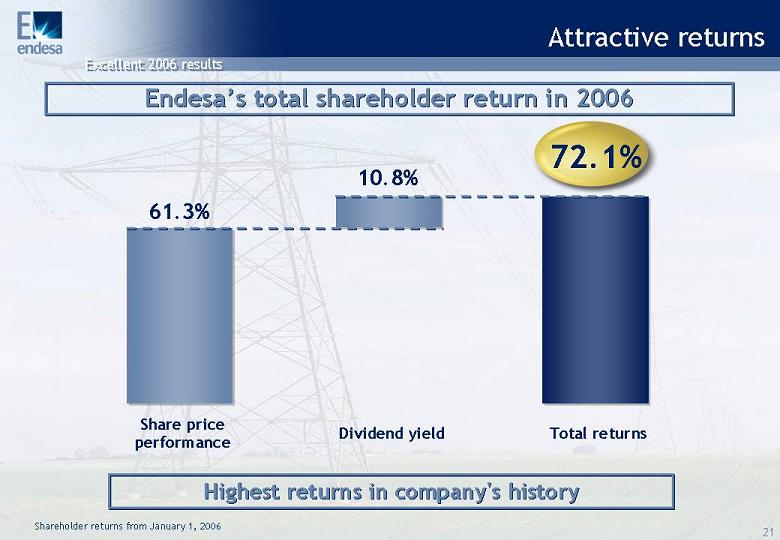
Attractive returns Attractive returns Endesa’s total shareholder return in 2006 Endesa’s total shareholder return in 2006 Share price performance 61.3% Dividend yield 10.8% Total returns 72.1% Shareholder returns from January 1, 2006 Highest returns in company's history Highest returns in company's history
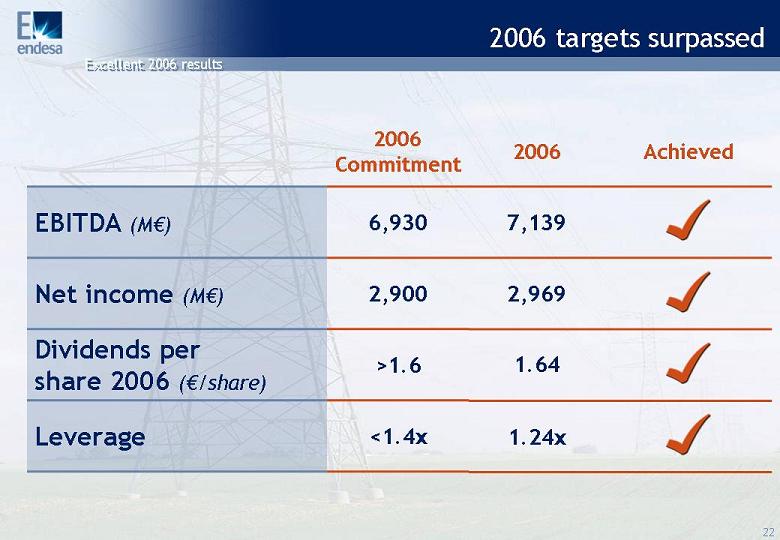
2006 targets surpassed 2006 2006 Commitment Achieved 2006 EBITDA (M€) 6,930 7,139 Net income (M€) 2,900 2,969 Dividend
s per share 2006 (€/share)>1.6 1.64 Leverage <1.4x 1.24x
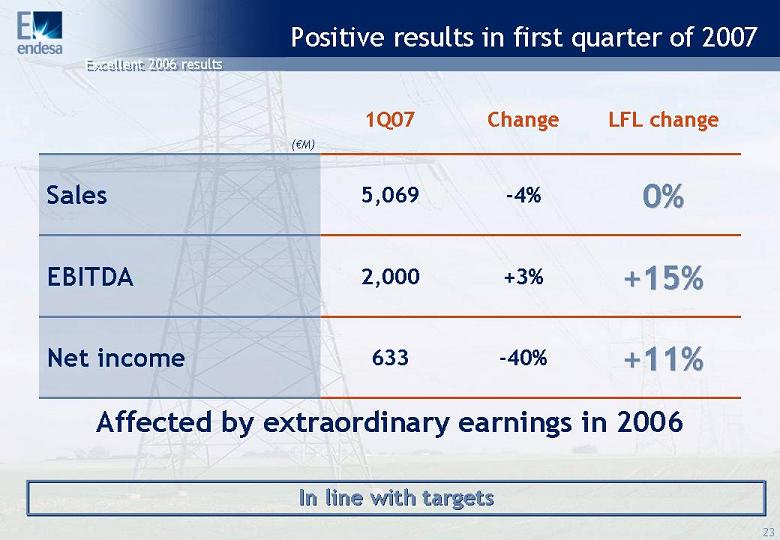
Positive results in first quarter of 2007 Positive results in first quarter of 2007 0% 0% -4% 5,069 Sales LFL change Change 1Q07 (€M) In line with targets In line with targets Affected by extraordinary earnings in 2006 +15% +15% +3% 2,000 EBITDA +11% +11% -40% 633 Net income
Endesa: a global energy company Endesa: a global energy company 2
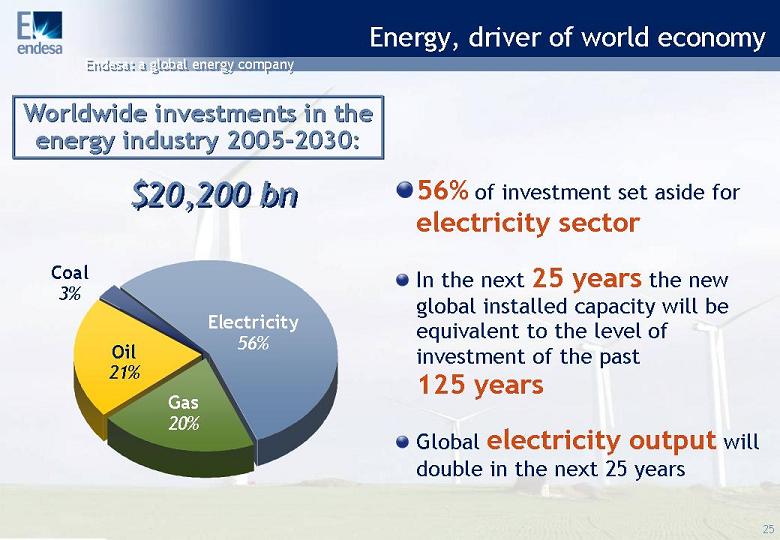
Energy, driver of world economy Energy, driver of world economy 56% of investment set aside for electricity sector In the next 25 years the new global installed capacity will be equivalent to the level of investment of the past 125 years Global electricity output will double in the next 25 years Worldwide investments in the energy industry 2005-2030: Worldwide investments in the $20,200 bn
Coal 3% Oil 21% Electricity 56% Gas 20%
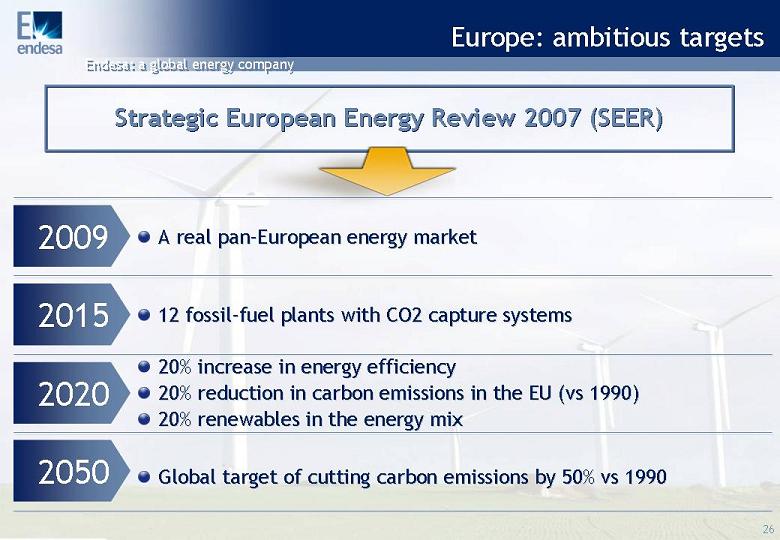
Europe: ambitious targets Europe: ambitious targets 12 fossil 12 fossil-fuel plants with CO2 capture systems fuel plants with CO2 capture systems Global target of cutting Global target of cutting carbon carbon emissions by 50% vs 1990 emissions by 50% vs 1990 A real pan A real pan-European energy market European energy market Strategic European Energy Review 2007 (SEER) Strategic European Energy Review 2007 (SEER) 2009 2015 2020 2050 20% increase in energy efficiency 20% reduction in 20% reduction in carbon carbon emissions in the EU (vs 1990) emissions in the EU (vs 1990) 20% 20% renewables renewables in the energy in the energy mix
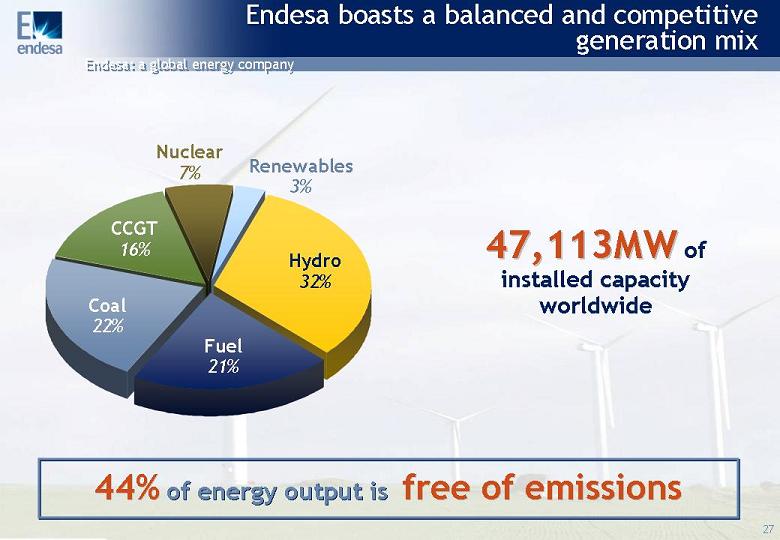
Endesa boasts a balanced and competitive generation mix 44% of energy output is free of emissions 44% 44% of energy output is free of emissions f
ree of emissions Coal 22% Fuel 21% Hydro 32% Nuclear 7% Renewables 3% CCGT 16% 47,113MW 47,113MW of installed capacity worldwide
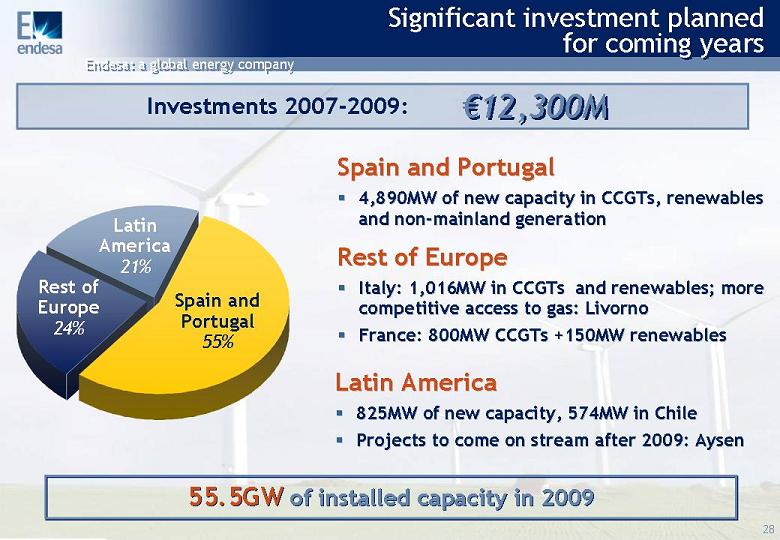
Significant investment planned for coming years Latin Latin America America ���� 825MW of new capacity, 574MW in Chile 825MW of new capacity, 574MW in Chile ���� Projects to come on stream after 2009: Aysen Projects to come on stream after 2009: Aysen Latin America 21% Rest of Europe 24% Spain and Portugal 55% Rest of Europe Rest of Europe ���� Italy: 1,016MW in Italy: 1,016MW in CCGTs CCGTs and and renewables; more renewables; more competitive access to gas: Livorno competitive access to gas: Livorno ���� France: 800MW France: 800MW CCGTs CCGTs +150MW renewables +150MW renewables Spain and Portugal Spain and Portugal ���� 4,890MW of new 4,890MW of new capacity capacity in in CCGTs CCGTs, renewables renewables and and non non-mainland mainland generation generation 55.5GW of installed capacity in 2009 55.5GW of installed capacity in 2009 Investments 2007-2009: €12,300M €12,300M
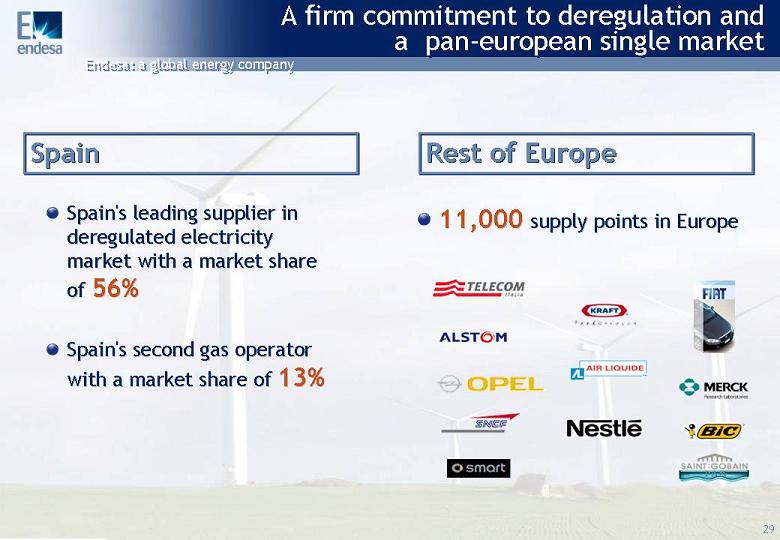
A firm commitment to deregulation and a pan-european single market Spain Spain Rest of Europe Rest of Europe Spain's leading supplier in Spain's leading supplier in deregulated electricity deregulated electricity market with a market share market with a market share of of 56% 56% Spain's second gas operator Spain's second gas operator with a market share with a market share of of 13% 13% 11,00
0 11,000 supply supply points points in Europe in Europe
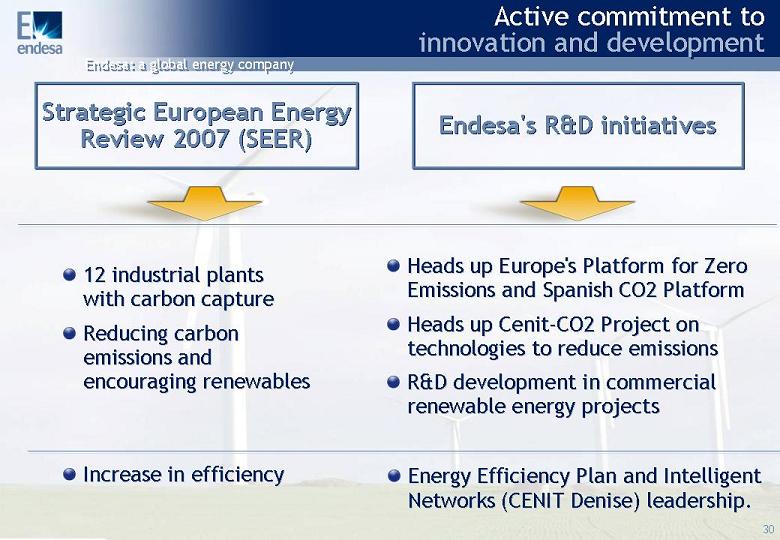
Active commitment to innovation and development 12 industrial plants 12 industrial plants with with carbon carbon capture capture Reducing Reducing carbon carbon emissions and emissions and encouraging renewables encouraging renewables Strategic European Energy Review 2007 (SEER) Strategic European Energy Review 2007 (SEER) Heads up Europe's Platform for Zero Heads up Europe's Platform for Zero Emissions and Spanish CO2 Platform Emissions and Spanish CO2 Platform Heads up Cenit Heads up Cenit-CO2 Project on CO2 Project on technologies to reduce emissions technologies to reduce emissions R&D development in commercial R&D development in commercial renewable energy projects renewable energy projects Increase in efficiency Increase in efficiency Energy Energy Efficiency Efficiency Plan and Plan and Intelligent Intelligent Networks (CENIT Networks (CENIT Denise Denise) leadership leadership. Endesa's R&D initiatives
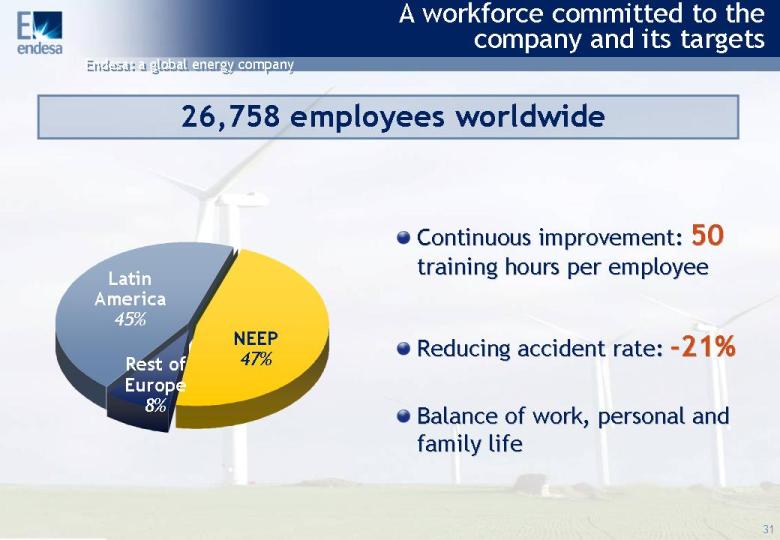
A workforce committed to the company and its targets 26,758 employees worldwide Continuous Continuous improvement improvement: 50 50 training training hours hours per per employee employee Reducing Reducing accident accident rate rate: -21% 21% Balance Balance of of work work, personal , personal and and family family life life NEEP 47% Rest of Europe 8% Latin America 45% Others 0%
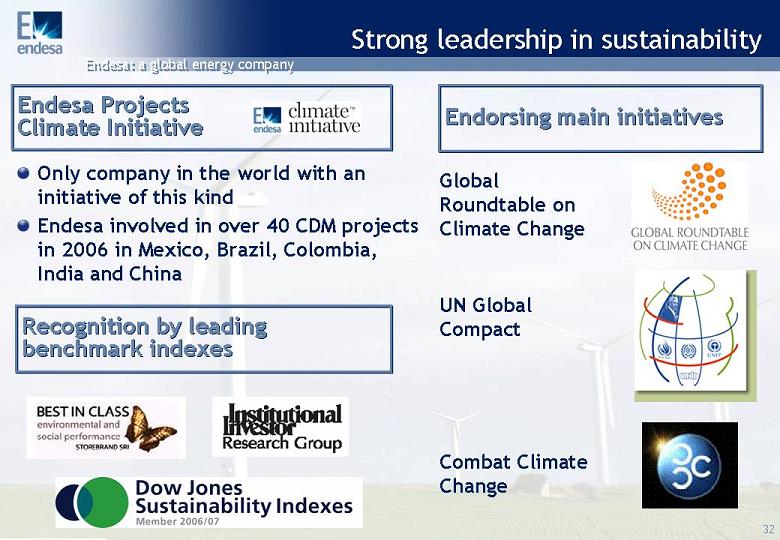
Strong leadership in sustainability Only company in the world with an initiative of this kind Endesa involved in over 40 CDM projects in 2006 in Mexico, Brazil, Colombia, India and China Endesa Projects Climate Initiative Endesa Projects Climate Initiative UN Global Compact Endorsing main initiatives Endorsing main initiatives Combat Climate Change Recognition by leading benchmark indexes Recognition by leading benchmark indexes Global Roundtable on Climate Change
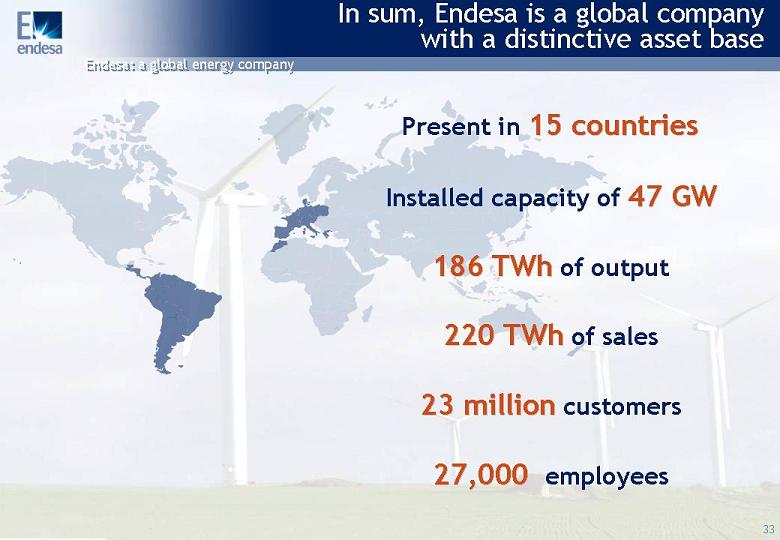
In sum, Endesa is a global company with a distinctive asset base Present in 15 countries 15 countries Installed capacity of 47 GW 47
GW 186 TWh 186 TWh of output 220 TWh 220 TWh of sales 23 million 23 million customers 27,000 27,000 employees
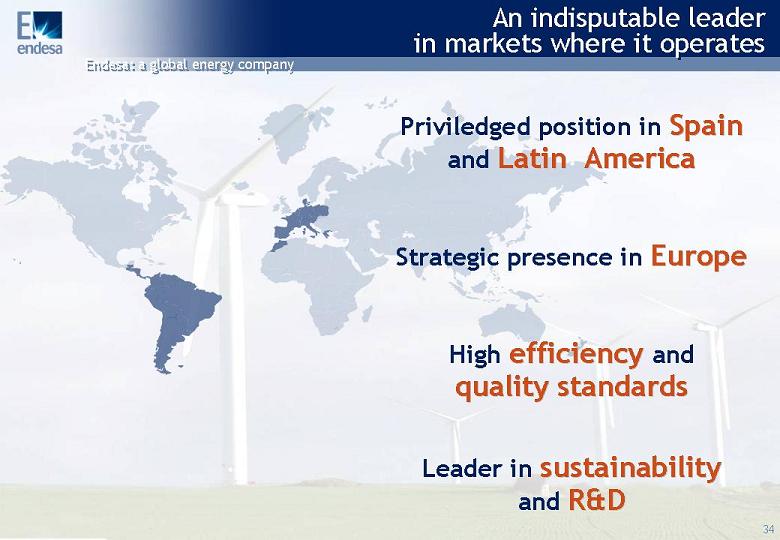
An indisputable leader in markets where it operates Priviledged position in Spain Spain and Latin Latin America America Stra
tegic presence in Europe Europe Leader in sustainability sustainability and R&D R&D High efficiency efficiency and quality quality standards standards
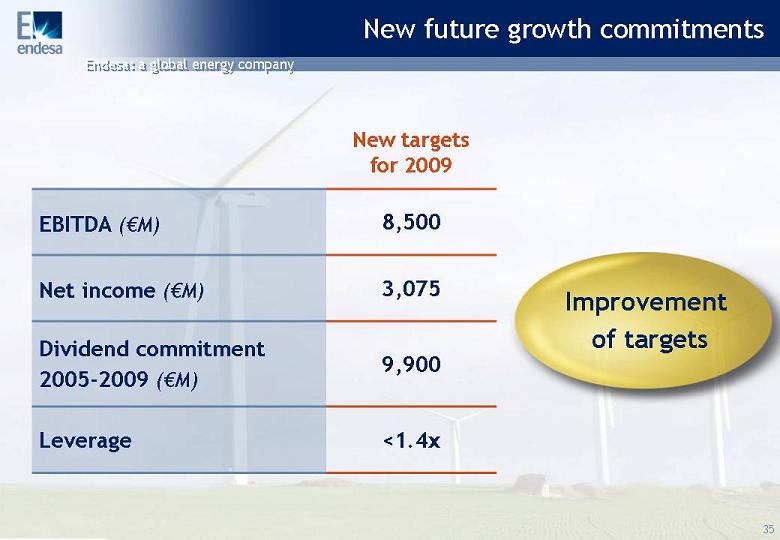
New future growth commitments New targets for 2009 EBITDA (€M) 8,500 Net income (€M) 3,075 Dividend commitment 2005-2009 (€M) 9,900 Leverage <1.4x Improvement of targ
ets
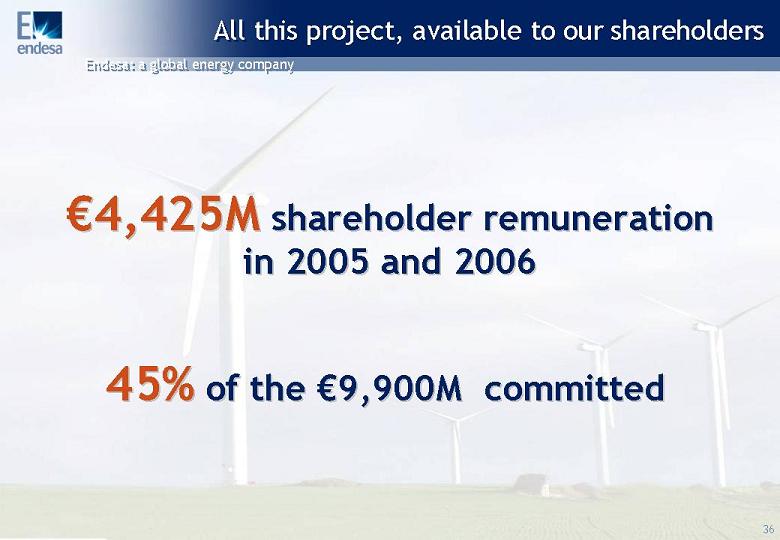
All this project, available to our shareholders €4,425M 4,425M shareholder remuneration shareholder remuneration in 2005 and 2006 in 2005 and 2006 45% 45%
of the of the €9,900M committed 9,900M committed
Takeover bids Takeover bids 3
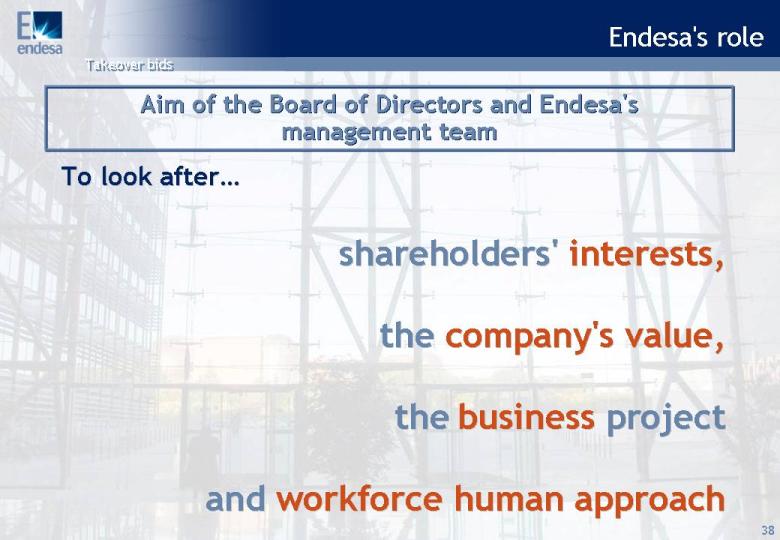
Endesa's role Endesa's role Aim of the Board of Directors and Endesa's management team Aim of the Board of Directors and Endesa's management team To To look look after after… shareholders' shareholders' interests, interests, the the company's value, company's value, the the business business project and and workforce human approach
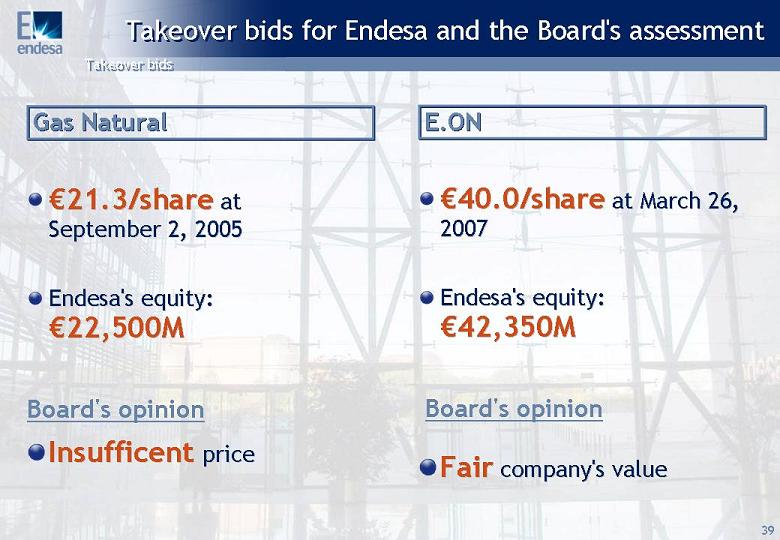
Takeover bids for Endesa and the Board's assessment Takeover bids for Endesa and the Board's assessment Gas Natural Gas Natural €21.3/share 21.3/share at at September September 2, 2005 2, 2005 Endesa's Endesa's equity equity: €22,500M 22,500M Insufficent Insufficent price price E.ON E.ON €40.0/ 40.0/share share at at March March 26, 26, 2007 2007 Endesa's Endesa's equity equity: €42,350M 42,350M
Fair Fair company's company's value value Board's opinion Board's opinion
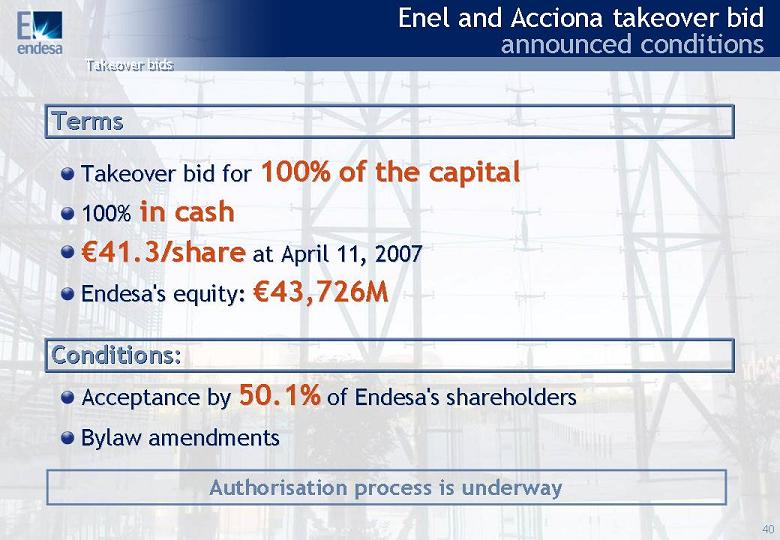
Enel and Acciona takeover bid announced conditions Terms Terms Takeover Takeover bid bid for for 100% of the capital 100% of the capital 100% 100% in cash in cash €41.3/share 41.3/share at at April April 11, 2007 11, 2007 Endesa's Endesa's equity equity: €43,726M 43,726M Conditions: Conditions: Acceptance by Acceptance by 50.1% 50.1% of Endesa's shareholders of Endesa's shareholders Bylaw am
endments Bylaw amendments Authorisation process is underway
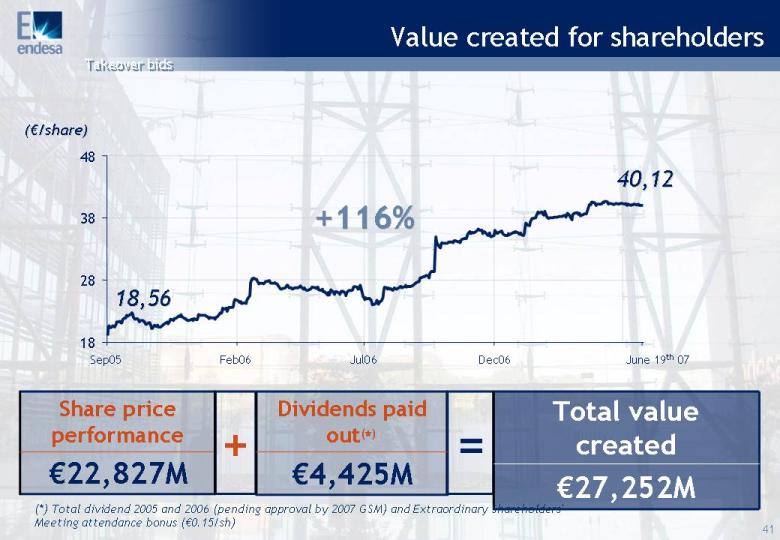
Value created for shareholders €22,827M Share price performance (€/share) /share) 18 28 38 48 Sep05 Feb06 Jul06 Dec06 June 19th 07 18,56 18,56 40,12 40,12 +116% +116% + = €4,425M Dividends paid out(*) €27,252M Total value created (*) Total dividend 2005 and 2006 (pending approval by 2007 GSM) and Extraordinary Shareholders' Meeting attendance bonus (€0.15/sh)
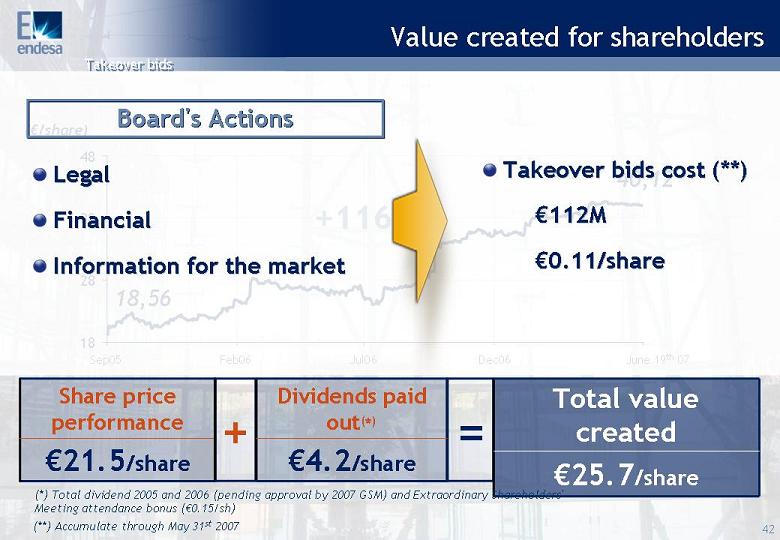
Value created for shareholders Value created for shareholders €21.5/share Share price performance + = €4.2/share Dividends paid out(*) €25.7/share Total value created (*) Total dividend 2005 and 2006 (pending approval by 2007 GSM) and Extraordinary Shareholders' Meeting attendance bonus (€0.15/sh) Board's Actions Board's Actions Legal Legal Financial Financial Information for the market Information for the market Takeover Takeo
ver bids bids cost cost (**) (**) €112M 112M €0.11/ 0.11/share
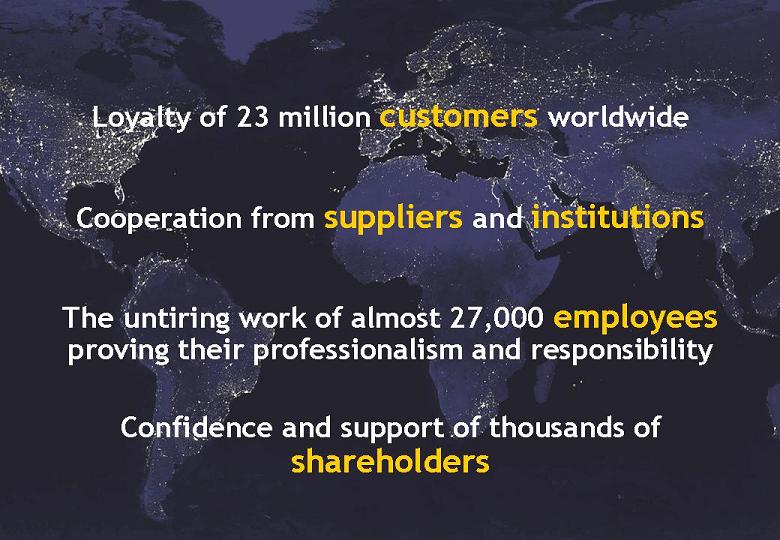
Loyalty of 23 million customers worldwide Cooperation from suppliers and institutions The u
ntiring work of almost 27,000 employees proving their professionalism and responsibility Confidence and support of thousands of shareholders
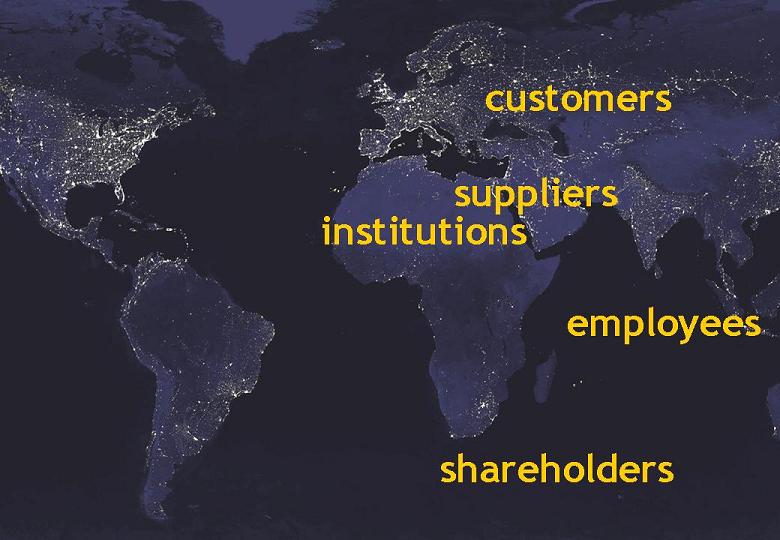
employees proving their professionalism and responsibility shareholders customers suppliers institutions employees
SIGNATURES
Pursuant to the requirements of the Securities Exchange Act of 1934, the registrant has duly caused this report to be signed on its behalf by the undersigned, thereunto duly authorized.
| ENDESA, S.A. | |
| Dated: June 21, 2007 | By: /s/ Álvaro Pérez de Lema |
| Name: Álvaro Pérez de Lema | |
| Title: Manager of North America Investor Relations |