UNITED STATES
SECURITIES AND EXCHANGE COMMISSION
Washington, D.C. 20549
FORM N-CSR
CERTIFIED SHAREHOLDER REPORT OF REGISTERED MANAGEMENT INVESTMENT COMPANIES
Investment Company Act file number 811-08397
THE MARSICO INVESTMENT FUND
(Exact name of registrant as specified in charter)
1200 17th Street, Suite 1600
Denver, CO 80202
(Address of principal executive offices) (Zip code)
Christopher J. Marsico
The Marsico Investment Fund
1200 17th Street, Suite 1600
Denver, CO 80202
(Name and address of agent for service)
Copies to:
Sander M. Bieber, Esq.
Dechert LLP
1775 I Street, N.W.
Washington, D.C. 20006
Registrant’s telephone number, including area code: (303)454-5600
Date of fiscal year end: September 30
Date of reporting period: September 30, 2006
Item 1 – Reports to Stockholders.


OCTOBER 2006
DEAR SHAREHOLDER:
Enclosed is your fiscal year 2006 annual report for the
Marsico Investment Fund that encompasses the one-year
period from October 1, 2005 - September 30, 2006.
Equities around the world shrugged off a number of
challenges - including higher energy prices, concerns
regarding interest rates and inflation, and geopolitical
tensions - and posted solid overall gains during the reporting
period. The most widely-recognized US benchmark equity
indexes were well into positive territory, with gains in the
neighborhood of 10% being common. International equities,
once again, were “the story,” generating nearly twice the
return of their US counterparts in dollar terms.
This report is intended to provide a retrospective for the
Funds’ investment results for fiscal year 2006 by discussing
the main factors that impacted performance -- sector
positioning, industry allocations, and stock selection -- as
compared to the Funds’ benchmark indexes. Certain sector
or industry classifications used in this discussion may be
broader than those used elsewhere in this annual report. For
our updated thoughts regarding the market environment and
our overall investment outlook, please refer to the Funds’ most
recent quarterly shareholder update that is available on the
Funds’ Website at www.marsicofunds.com.
2
TABLE OF CONTENTS
Investment Review for Focus Fund and Growth Fund | 4 |
MARSICO FOCUS FUND | |
Fund Overview | 8 |
Schedule of Investments | 9 |
Statement of Assets and Liabilities | 11 |
Statement of Operations | 11 |
Statements of Changes in Net Assets | 12 |
Financial Highlights | 13 |
MARSICO GROWTH FUND | |
Fund Overview | 14 |
Schedule of Investments | 15 |
Statement of Assets and Liabilities | 17 |
Statement of Operations | 17 |
Statements of Changes in Net Assets | 18 |
Financial Highlights | 19 |
MARSICO 21ST CENTURY FUND | |
Investment Review for 21st Century Fund | 20 |
Fund Overview | 22 |
Schedule of Investments | 23 |
Statement of Assets and Liabilities | 25 |
Statement of Operations | 25 |
Statements of Changes in Net Assets | 26 |
Financial Highlights | 27 |
MARSICO INTERNATIONAL OPPORTUNITIES FUND | |
Investment Review for International Opportunities Fund | 28 |
Fund Overview | 31 |
Schedule of Investments | 32 |
Statement of Assets and Liabilities | 34 |
Statement of Operations | 34 |
Statements of Changes in Net Assets | 35 |
Financial Highlights | 36 |
NOTES TO FINANCIAL STATEMENTS | 37 |
REPORT OF INDEPENDENT REGISTERED | |
PUBLIC ACCOUNTING FIRM | 43 |
EXPENSE EXAMPLE | 44 |
OTHER INFORMATION | 45 |
TRUSTEE AND OFFICER INFORMATION | 46 |
3
MARSICO FOCUS FUND & MARSICO GROWTH FUND
INVESTMENT REVIEW BY TOM MARSICO (UNAUDITED)
The Focus Fund and Growth Fund underperformed their primary benchmark Index for the one-year period ended September 30, 2006, with total returns of 4.24% and 2.87%, respectively. For comparative purposes, the S&P 500 Index -- which we consider to be the Funds’ primary equity benchmark Index -- had a total return of 10.79% for the one-year period ended September 30, 2006. The Funds reached 8-3/4 years of operating history as of the end of September. Please see the Funds’ Overviews for more detailed information about each Fund’s longer-term performance for various periods ended September 30, 2006.
The performance data for the Funds quoted here represent past performance, and past performance is not a guarantee of future results. Investment return and principal value of an investment will fluctuate so that an investor’s shares, when redeemed, may be worth more or less than their original cost. Current performance may be lower or higher than the performance information quoted. To obtain performance information current to the most recent month-end, please call 888-860-8686 or visit www.marsicofunds.com.(1)
In assessing the Funds’ performance over the past year, it is interesting to “decompose” the S&P 500 Index’s return. More than half of the Index’s gain for the entire reporting period was attributable to its performance in the last three months of the fiscal year, when it rose by nearly 6%. Equities seemed to be buoyed by the Federal Reserve Board’s decisions (first, at a meeting of the Federal Open Market Committee in August, then once again in September) to cease raising interest rates at least temporarily. In addition, lower long-term bond yields, tamer inflation data, substantial declines in energy and commodity prices, and strong corporate profit reports seemed to further bolster stock prices.
During the Funds’ fiscal year, there were several interesting aspects of the US and international equity markets:
| • | In the US large capitalization equity arena, a now all-too-familiar scenario for growth investors unfolded: it was yet another period in which “value” stocks outperformed “growth” stocks by a substantial margin. The Russell 1000 Value Index, which is intended to provide a representation of the performance of major companies whose stocks trade at relatively low valuations, had a total one-year return of 14.62%. The Russell 1000 Growth Index, which is intended to be a proxy for the performance of large capitalization growth-oriented companies, had a total one-year return of 6.04%. Much of the differential between the two investment styles was attributable to the substantially higher weighting of financial companies represented in the value index (which were among the best-performing areas of the equity markets), and the substantially higher weighting of technology companies in the growth index (which had relatively subdued returns). |
| • | Stocks of small and medium capitalization companies, which have dominated larger capitalization companies performance-wise for years, modestly trailed their large cap brethren for the one-year period ended September 30, 2006. Some of this performance differential was attributable to a substantial retracement of smaller cap valuations that occurred in the second and third calendar quarters of 2006. The Russell Mid-Cap Index, which is intended to provide a representation for the performance of medium-sized companies, had a total return of 9.57% during the reporting period. The Russell 2000 Index, a proxy for the performance of small-sized companies, gained 9.92%. |
| • | Non-US stocks, despite a significant sell-off in mid-2006, again were “the place to be” for the overall reporting period. The MSCI EAFE Index had a total 12-month return of (US$) 19.16% - nearly doubling the return of the S&P 500 Index. |
At the economic sector level, gains were widespread. While all 10 Global Industry Classification Standard industry sectors (“GICS”) that comprise the S&P 500 Index had positive returns, considerable changes in market leadership took place during the reporting period. Energy, which had soared by 48% in the fiscal year ended September 30, 2005, was the lowest-performing sector in the S&P 500 Index for the one-year period ended September 30, 2006, eking out a gain of about 3.5%. The top-performing sectors included Telecommunications Services (+26%), Financials (+21%), Materials (+18%) and
4
Industrials (+12%). In addition to Energy, areas such as Information Technology (+3%), Utilities (+5%), and Health Care (+8%) also lagged the S&P 500 Index’s return.
At an industry group level, the top-performing areas included Real Estate (+28%), Diversified Financials (+26%), Banks (+21%), Transportation (+16%), and Consumer Services (+16%). Six other groups had gains in excess of 10%. Few industries were substantially “in the red” last year, with one exception: Semiconductors & Semiconductor Equipment, which sank -7%. Certain industries edged lower, including Consumer Durables & Apparel (-2%) (largely due to weakness in homebuilding-related company stock prices), and Health Care Equipment & Services (-0.4%).
Turning to the factors underlying the performance of the Focus Fund and the Growth Fund, as you know, these Funds often invest in similar growth companies. Their performance may differ at times, however, for a number of reasons. Among other factors, the Focus Fund is a non-diversified mutual fund that may invest in a more concentrated portfolio and may hold the securities of fewer issuers than the Growth Fund. As a result, the Focus Fund may hold some stocks that are different from those held by the Growth Fund, and may be more exposed to individual stock volatility than the Growth Fund or other mutual funds that invest in a larger number of securities. As discussed below, the two Funds experienced relatively similar performance during the annual reporting period.
You should keep in mind that our views on all investments discussed in this report are subject to change at any time and references to specific securities, industries, and sectors discussed in this report are not recommendations to purchase or sell the securities, and that the Funds may not necessarily hold these securities today. Please see the accompanying Schedule of Investments for the percentage of each Fund’s portfolio represented by the securities or industries mentioned in this report.
The following is a synopsis of each Fund’s investment results for the fiscal year:
FOCUS FUND
The Focus Fund’s underperformance for the one-year period ended September 30, 2006 (as compared to the S&P 500 Index), can be attributed to several factors:
| • | Stock selection and positioning in the Health Care sector: More than half of the Fund’s performance shortfall during the fiscal year was attributable to individual stock selection and industry weightings within the Health Care sector. In Health Care Equipment & Services, the Fund’s holdings had an aggregate return of -12% during the reporting period, with UnitedHealth Group, Inc. (-12%), Zimmer Holdings (-17% prior to being sold), and Medtronic (-9% prior to being sold) representing the primary performance “culprits.” An overweighted posture in this industry group which, as noted above, was one of the few areas to be in negative territory return-wise, also adversely impacted performance. With regard to the Pharmaceutical, Biotechnology & Life Sciences industry, the Fund’s stock selection also was off the mark. The Fund’s holdings had a collective return of -7% during the reporting period, while the S&P 500 Index’s industry group return, which was led primarily by the performance of suddenly resurgent big pharmaceutical companies, was +12%. In particular, Genentech – one of the Fund’s largest individual holdings throughout the fiscal year – edged lower by -2%, and Amgen declined -11% prior to being sold. |
| • | Stock selection in the Retailing industry: Home improvement retailers Lowe’s Cos. (-13%) and The Home Depot, Inc. (-13% prior to being sold) weakened considerably, as concerns grew regarding the potential for a pronounced slowdown in the housing industry and concomitant worries about the outlook for consumer discretionary spending. |
| • | Stock selection in the Energy sector: Halliburton (-21% prior to being sold) and Exxon Mobil (-11% prior to being sold) were among the Fund’s weaker-performing individual holdings during the reporting period. |
| • | Stock selection in the Technology Hardware & Equipment industry: QUALCOMM, Inc., a provider of digital wireless telecommunications products and services, fell -17% prior to being sold. |
5
MARSICO FOCUS FUND & MARSICO GROWTH FUND
| • | An underweighted posture in Banks: This industry group in the Fund’s benchmark Index rose 21% during the reporting period, and was among the best-performing areas of the stock market. The Fund absorbed a fairly significant opportunity cost by being underweighted in the industry. |
| • | Stock selection in the Consumer Durables & Apparel industry: The price of Lennar Corp. Class A shares skidded -23% during the reporting period as the Homebuilding industry showed signs of softening and concerns grew regarding the outlook for interest rates and consumer spending. |
On the “plus” side of the performance balance sheet, there were a few significant positive contributors to the Fund’s performance:
The Fund’s positions in the Diversified Financials industry group had a collective return of 33% during the fiscal year ended September 30, 2006, led by Goldman Sachs Group (+40%), UBS AG (+47%), and Lehman Brothers Holdings (+15%).
Other areas that performed well were holdings in Technology Software & Services, Consumer Services, and Transportation industries. Google rose 26%, prior to being sold. Hotel/casino operators generally performed well, including Wynn Resorts, Ltd. (+51%) and Las Vegas Sands Corp. (+37%). A position in Apple Computer, which gained 16% prior to being sold, also was a material “positive.”
GROWTH FUND
The Growth Fund shared many of the Focus Fund’s performance characteristics for the one-year period ended September 30, 2006. Positioning and individual stock selection in areas such as Health Care, Consumer Durables & Apparel, Retailing, Energy, and Technology Hardware & Equipment were significant detractors from performance. These factors are discussed below in more detail:
| • | Health Care: As in the case of the Focus Fund, stock selection and positioning in the Health Care sector, which has been a major area of emphasis for the Growth Fund for an extended period of time, were significant “negatives” for the Growth Fund’s performance in the fiscal year. In Health Care Equipment & Services, the Fund’s holdings had a collective return of -9% during the reporting period. These positions included UnitedHealth Group, Inc. (-12%), Medtronic, Inc. (-12% prior to being sold), and Zimmer Holdings (-9% prior to being sold). The Fund’s overweighted posture in this industry also adversely impacted performance, as it was among the weaker-performing groups in the benchmark Index. In the Pharmaceuticals, Biotechnology & Life Sciences industry, one of the strongest-performing areas of the S&P 500 Index during the fiscal year, the Fund’s investment results were impacted primarily by tepid performance from Genentech, which was a major position throughout the reporting period. Genentech’s stock price declined about -2%. That result compared quite unfavorably to the benchmark Index’s industry group return, which was +12%. |
| • | Consumer Durables & Apparel: Within this industry group, the Fund’s homebuilding positions were particularly weak during the reporting period, falling by -35% in aggregate. Based on their price deterioration during the fiscal year, homebuilding stocks, in retrospect, appeared to have discounted a “hard landing” for the industry. The Fund’s holdings in this area included KB Home (-39%), Toll Brothers (-49% prior to being sold), Lennar Corp. Class A (-23%), and MDC Corp. (-19% prior to being sold). |
| • | Retailing: Echoing the performance of homebuilders mentioned above, home improvement retailers Lowe’s Cos. (-13%) and The Home Depot, Inc. (-14% prior to being sold) were weak performers for the Fund. |
| • | Energy: Stock selection within this sector detracted materially from the Fund’s performance. Specific individual holdings that impacted performance included Peabody Energy Corporation (-31%), whose principal activity is coal mining, Halliburton (-16%), an oil equipment and services provider, and Exxon Mobil Corporation (-11% prior to being sold). |
6
| • | Technology Hardware & Equipment: QUALCOMM, Inc., a provider of digital wireless telecommunications products and services, declined -17% prior to being sold. |
On the positive side of the performance ledger, there were several areas of strength for the Fund during the reporting period, including:
| • | Diversified Financials: The Fund’s positions in this industry group gained 34%, led by UBS AG (+47%), Lehman Brothers Holdings (+28%), Goldman Sachs Group (+40%), and Chicago Mercantile Exchange Holdings, the world’s largest electronic trading platform (+30% prior to being sold). |
| • | Technology Software & Services: Google rose 26% prior to being sold. |
| • | Consumer Services: Hotel/casino operators performed well overall including Wynn Resorts, Ltd. (+51%) and Las Vegas Sands Corp. (+37%). |
| • | Transportation: The Fund’s transportation-related holdings rose 25% in aggregate during the reporting period. More specifically, FedEx Corp. (+25%), Burlington Northern Santa Fe (+24%), and Union Pacific Corp. (+25%) had solid gains during the reporting period. |
| • | Capital Goods: The Fund’s holdings in this industry gained 19%, collectively, during the fiscal year. These included aerospace/defense companies Lockheed Martin (+43%) and General Dynamics (+22%), as well as Caterpillar, Inc. (+14%). |
FISCAL YEAR-END INVESTMENT POSTURE
As of September 30, 2006, the Focus and Growth Fund’s primary economic sector allocations were in Consumer Discretionary, Financials, Industrials, and Health Care.
Sincerely,
THOMAS F. MARSICO
PORTFOLIO MANAGER
| (1) | Total returns are based on net change in NAV assuming reinvestment of distributions. A redemption fee of 2% may be imposed on redemptions or exchanges of Fund shares owned for 30 days or less. Please see the prospectus for more information. |
7
MARSICO FOCUS FUND
FUND OVERVIEW SEPTEMBER 30, 2006
The Focus Fund invests primarily in the common stocks of large companies, normally a core position of 20–30 common stocks that are selected for their long-term growth potential.
PERFORMANCE COMPARISON
| One Year | Five Year Average Annual | Average Annual Since Inception |
| (10/1/05 – 9/30/06) | (10/1/01 – 9/30/06) | (12/31/97 – 9/30/06) |
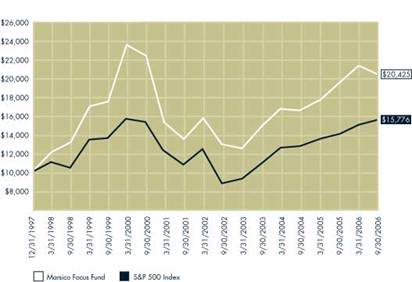
Marsico Focus Fund | 4.24% | 8.26% | 8.51% |
S&P 500 Index | 10.79% | 6.96% | 5.35% |
GROWTH OF $10,000(1)
| | Focus | | S&P 500 |
| | | | |
31-Dec-97 | | 10,000 | | 10,000 |
31-Mar-98 | | 12,310 | | 11,395 |
30-Sep-98 | | 12,360 | | 10,600 |
31-Mar-99 | | 17,030 | | 13,498 |
30-Sep-99 | | 17,430 | | 13,548 |
31-Mar-00 | | 23,542 | | 15,920 |
30-Sep-00 | | 22,210 | | 15,347 |
31-Mar-01 | | 15,692 | | 12,469 |
30-Sep-01 | | 13,733 | | 11,262 |
31-Mar-02 | | 15,956 | | 12,500 |
30-Sep-02 | | 13,115 | | 8,955 |
31-Mar-03 | | 12,711 | | 9,404 |
30-Sep-03 | | 15,148 | | 11,140 |
31-Mar-04 | | 16,866 | | 12,708 |
30-Sep-04 | | 16,652 | | 12,685 |
31-Mar-05 | | 17,854 | | 13,558 |
30-Sep-05 | | 19,594 | | 14,239 |
31-Mar-06 | | 21,335 | | 15,148 |
NET ASSETS | |
9/30/06 | $4,616,454,662 |
NET ASSET VALUE | |
Net Asset Value Per Share | $18.19 |
TOP FIVE HOLDINGS
UnitedHealth Group, Inc. | 7.81 | % |
Genentech, Inc. | 5.49 | |
The Goldman Sachs | | |
Group, Inc. | 5.25 | |
UBS AG | 4.91 | |
Burlington Northern | | |
Santa Fe Corporation | 4.36 | |
SECTOR ALLOCATION(2)
Consumer Cyclical | 22.99 | % |
Consumer Non-Cyclical | 22.72 | |
Financials | 21.45 | |
Industrials | 15.61 | |
Communications | 8.92 | |
Technology | 4.79 | |
Energy | 3.52 | |
The performance data quoted here represent past performance, and past performance is not a guarantee of future results. Investment return and principal value of an investment will fluctuate so that an investor’s shares, when redeemed, may be worth more or less than their original cost. Current performance may be lower or higher than the performance information quoted. To obtain performance information current to the most recent month-end, please call 888-860-8686 or visit www.marsicofunds.com. A redemption fee may be imposed on redemptions or exchanges of Fund shares held for 30 days or less.
The performance included in the table and graph does not reflect the deduction of taxes on Fund distributions or the redemption of Fund shares.
| (1) | This chart assumes an initial investment of $10,000 made on December 31, 1997 (inception). Total returns are based on net change in NAV, assuming reinvestment of distributions. |
| (2) | Sector weightings represent the percentage of the Fund’s equity investments in certain general sectors. These sectors may include more than one industry. The Fund’s portfolio composition is subject to change at any time. |
8
SCHEDULE OF INVESTMENTS SEPTEMBER 30, 2006
| Number | | Percent |
| of | | of Net |
| Shares | Value | Assets |
COMMON STOCKS
Aerospace/Defense | | | | |
Lockheed Martin Corporation | 1,603,360 | $137,985,162 | 2.99 | % |
Aerospace/Defense - | | | | |
Equipment | | | | |
United Technologies | | | | |
Corporation | 633,821 | 40,152,560 | 0.87 | |
Automotive - Cars/Light Trucks | | | | |
Toyota Motor | | | | |
Corporation ADR | 1,482,751 | 161,471,584 | 3.50 | |
Beverages - Non-Alcoholic | | | | |
PepsiCo, Inc. | 1,051,721 | 68,635,312 | 1.49 | |
Building - | | | | |
Residential/Commercial | | | | |
Lennar Corporation - Cl. A | 1,646,640 | 74,510,460 | 1.61 | |
Cable TV | | | | |
Comcast Corporation - Cl. A* | 5,010,175 | 184,624,949 | 4.00 | |
Casino Hotels | | | | |
Las Vegas Sands Corp.* | 1,780,479 | 121,695,740 | 2.63 | |
MGM MIRAGE* | 3,023,668 | 119,404,649 | 2.59 | |
Wynn Resorts Ltd.* | 1,633,932 | 111,123,715 | 2.41 | |
| | 352,224,104 | 7.63 | |
Cosmetics & Toiletries | | | | |
The Procter & | | | | |
Gamble Company | 3,156,641 | 195,648,609 | 4.24 | |
Electronic Components - | | | | |
Semiconductors | | | | |
Advanced Micro Devices, Inc.* | 2,578,679 | 64,080,173 | 1.39 | |
Texas Instruments, Inc. | 4,175,698 | 138,841,959 | 3.01 | |
| | 202,922,132 | 4.40 | |
Finance - Investment | | | | |
Banker/Broker | | | | |
The Goldman Sachs | | | | |
Group, Inc. | 1,432,175 | 242,281,045 | 5.25 | |
Lehman Brothers Holdings, Inc. | 2,081,690 | 153,753,623 | 3.33 | |
UBS AG | 3,826,172 | 226,930,261 | 4.91 | |
| | 622,964,929 | 13.49 | |
Finance - Multi-line Insurance | | | | |
Genworth | | | | |
Financial, Inc. - Cl. A | 3,164,698 | 110,796,077 | 2.40 | |
Hotels & Motels | | | | |
Four Seasons Hotels, Inc. | 825,883 | 52,732,630 | 1.14 | |
| Number | | Percent |
| of | | of Net |
| Shares | Value | Assets |
COMMON STOCKS continued
Machinery - | | | | |
Construction/Mining | | | | |
Caterpillar, Inc. | 1,401,498 | $92,218,568 | 2.00 | % |
Medical - Biomedical/Genetic | | | | |
Genentech, Inc.* | 3,063,682 | 253,366,502 | 5.49 | |
Genzyme Corporation* | 1,263,750 | 85,265,213 | 1.85 | |
| | 338,631,715 | 7.34 | |
Medical - HMO | | | | |
UnitedHealth Group, Inc. | 7,325,111 | 360,395,461 | 7.81 | |
Networking Products | | | | |
Cisco Systems, Inc.* | 4,982,400 | 114,595,200 | 2.48 | |
Oil - Field Services | | | | |
Schlumberger Ltd. | 2,405,594 | 149,218,996 | 3.23 | |
REITs - Warehouse/Industrial | | | | |
ProLogis | 663,586 | 37,864,217 | 0.82 | |
Retail - Building Products | | | | |
Lowe’s Companies, Inc. | 4,838,453 | 135,766,991 | 2.94 | |
Retail - Discount | | | | |
Target Corporation | 1,540,220 | 85,097,155 | 1.84 | |
Retail - Restaurants | | | | |
Starbucks Corporation* | 3,315,280 | 112,885,284 | 2.44 | |
Super-Regional Banks - U.S. | | | | |
Wells Fargo & Company | 3,806,954 | 137,735,596 | 2.98 | |
Transportation - Rail | | | | |
Burlington Northern | | | | |
Santa Fe Corporation | 2,738,545 | 201,118,745 | 4.36 | |
Transportation - Services | | | | |
FedEx Corporation | 1,753,268 | 190,545,166 | 4.13 | |
Wireless Equipment | | | | |
Motorola, Inc. | 3,166,705 | 79,167,625 | 1.71 | |
Total Common Stocks | | | | |
(cost $3,355,381,274) | | 4,239,909,227 | 91.84 | |
See notes to financial statements.
9
MARSICO FOCUS FUND
SCHEDULE OF INVESTMENTS SEPTEMBER 30, 2006
| Number | | Percent |
| of | | of Net |
| Shares | Value | Assets |
SHORT-TERM INVESTMENTS
SSgA Prime Money | | | | |
Market Fund, 5.17% | 208,003,440 | 208,003,440 | 4.51 | |
SSgA Money | | | | |
Market Fund, 4.99% | 184,860,064 | 184,860,064 | 4.00 | |
Federal Home Loan | | | | |
Bank Discount Notes, | | | | |
4.40%, 10/2/06 | 43,500,000 | 43,494,683 | 0.94 | |
Total Short-Term Investments | | | | |
(cost $436,358,187) | | 436,358,187 | 9.45 | |
Total Investments | | | | |
(cost $3,791,739,461) | | 4,676,267,414 | 101.29 | |
Liabilities Less Cash | | | | |
and Other Assets | | (59,812,752) | (1.29 | ) |
NET ASSETS | | $4,616,454,662 | 100.00 | % |
See notes to financial statements.
10
STATEMENT OF ASSETS AND LIABILITIES
SEPTEMBER 30, 2006
(Amounts in thousands)
ASSETS | | |
Investments, at value (cost $3,791,739) | $4,676,267 | |
Receivable for capital stock sold | 3,717 | |
Interest and dividends receivable | 4,234 | |
Prepaid expenses and other assets | 886 | |
Total Assets | 4,685,104 | |
LIABILITIES | | |
Payable for investments purchased | 60,457 | |
Payable for capital stock redeemed | 3,238 | |
Accrued investment advisory fee | 3,031 | |
Accrued distribution fee | 341 | |
Accrued trustees’ fees | 910 | |
Accrued expenses and other liabilities | 672 | |
Total Liabilities | 68,649 | |
NET ASSETS | $4,616,455 | |
NET ASSETS CONSIST OF | | |
Paid-in-capital | $3,672,423 | |
Accumulated net investment loss | (802 | ) |
Accumulated net realized gain on investments | | |
and foreign currency transactions | 60,151 | |
Net unrealized appreciation on investments | 884,683 | |
NET ASSETS | $4,616,455 | |
SHARES OUTSTANDING, $0.001 par value | | |
(Unlimited shares authorized) | 253,787 | |
NET ASSET VALUE, REDEMPTION PRICE, AND OFFERING PRICE PER SHARE (NET ASSETS/SHARES OUTSTANDING)* | $18.19 | |
STATEMENT OF OPERATIONS
FOR THE YEAR ENDED SEPTEMBER 30, 2006
(Amounts in thousands)
INVESTMENT INCOME
Interest | $14,908 | |
Dividends (net of $835 of non-reclaimable | | |
foreign withholding taxes) | 31,922 | |
Total Investment Income | 46,830 | |
EXPENSES | | |
Investment advisory fees | 35,163 | |
Distribution fees | 10,721 | |
Transfer agent fees and expenses | 4,419 | |
Printing and postage expenses | 916 | |
Custody and fund accounting fees | 504 | |
Fund administration fees | 362 | |
Federal and state registration fees | 300 | |
Professional fees | 278 | |
Trustees’ fees and expenses | 225 | |
Miscellaneous | 218 | |
Total expenses | 53,106 | |
Less expenses paid indirectly | (666 | ) |
Net Expenses | 52,440 | |
NET INVESTMENT LOSS | (5,610 | ) |
REALIZED AND UNREALIZED GAIN | | |
Net realized gain on investments | 241,639 | |
Net realized loss on foreign | | |
currency transactions | — | (1) |
Change in unrealized appreciation/ | | |
depreciation on investments and | | |
foreign currency translations | (83,235 | ) |
Net Gain on Investments | 158,404 | |
NET INCREASE IN NET ASSETS | | |
RESULTING FROM OPERATIONS | $152,794 | |
See notes to financial statements.
11
MARSICO FOCUS FUND
STATEMENTS OF CHANGES IN NET ASSETS
| Year | Year |
| Ended | Ended |
| 9/30/06 | 9/30/05 |
(Amounts in thousands)
OPERATIONS
Net investment loss | $(5,610 | ) | $(6,052 | ) |
Net realized gain on investments | 241,639 | | 116,499 | |
Net realized gain on options written | — | | 1,524 | |
Net realized gain (loss) on foreign currency transactions | — | (1) | 1,037 | |
Change in unrealized appreciation/depreciation | | | | |
on investments and foreign currency translations | (83,235 | ) | 418,080 | |
Net increase in net assets resulting from operations | 152,794 | | 531,088 | |
CAPITAL SHARE TRANSACTIONS | | | | |
Proceeds from sale of shares | 1,548,292 | | 978,811 | |
Redemption fees | 64 | | 29 | |
Redemption of shares | (824,886 | ) | (665,059 | ) |
Net increase from capital share transactions | 723,470 | | 313,781 | |
TOTAL INCREASE IN NET ASSETS | 876,264 | | 844,869 | |
NET ASSETS | | | | |
Beginning of period | 3,740,191 | | 2,895,322 | |
End of period | $4,616,455 | | $3,740,191 | |
Accumulated net investment loss | (802 | ) | (700 | ) |
TRANSACTIONS IN SHARES | | | | |
Shares sold | 85,019 | | 60,431 | |
Shares redeemed | (45,617 | ) | (41,224 | ) |
Net increase | 39,402 | | 19,207 | |
See notes to financial statements.
12
FINANCIAL HIGHLIGHTS
| Year | Year | Year | Year | Year |
For a Fund Share Outstanding | Ended | Ended | Ended | Ended | Ended |
Throughout the Period. | 9/30/06 | 9/30/05 | 9/30/04 | 9/30/03 | 9/30/02 |
NET ASSET VALUE, BEGINNING OF PERIOD | $17.45 | | $14.83 | | $13.49 | | $11.68 | | $12.27 | | |
INCOME FROM INVESTMENT OPERATIONS | | | | | | | | | | | |
Net investment loss | (0.02 | ) | (0.03 | ) | (0.05 | ) | (0.03 | ) | (0.08 | ) | |
Net realized and unrealized gains | | | | | | | | | | | |
(losses) on investments | 0.76 | | 2.65 | | 1.39 | | 1.84 | | (0.47 | ) | |
Total from investment operations | 0.74 | | 2.62 | | 1.34 | | 1.81 | | (0.55 | ) | |
DISTRIBUTIONS & OTHER | | | | | | | | | | | |
Net realized gains | — | | — | | — | | — | | — | | |
Tax return of capital | — | | — | | — | | — | | (0.04 | ) | |
Redemption fees [See Note 2(i)] | — | (1) | — | (1) | — | (1) | — | | — | | |
Total distributions & other | — | | — | | — | | — | | (0.04 | ) | |
NET ASSET VALUE, END OF PERIOD | $18.19 | | $17.45 | | $14.83 | | $13.49 | | $11.68 | | |
TOTAL RETURN | 4.24% | | 17.67% | | 9.93% | | 15.50% | | (4.50)% | | |
SUPPLEMENTAL DATA AND RATIOS | | | | | | | | | | | |
Net assets, end of period (000s) | $4,616,455 | | $3,740,191 | | $2,895,322 | | $2,282,113 | | $1,274,068 | | |
Ratio of expenses to average net assets, | | | | | | | | | | | |
before expenses paid indirectly | 1.24% | | 1.25% | | 1.30% | | 1.34% | | 1.35% | | |
Ratio of net investment loss to average net | | | | | | | | | | | |
assets, net of expenses paid indirectly | (0.13)% | | (0.18)% | | (0.36)% | | (0.54)% | | (0.64)% | | |
Ratio of net investment loss to average net | | | | | | | | | | | |
assets, before expenses paid indirectly | (0.15)% | | (0.21)% | | (0.40)% | | (0.59)% | | (0.68)% | | |
Portfolio turnover rate | 80% | | 84% | | 84% | | 90% | | 117% | | |
| | | | | | | | | | | | |
See notes to financial statements.
13
MARSICO GROWTH FUND
FUND OVERVIEW SEPTEMBER 30, 2006
The Growth Fund invests primarily in the common stocks of large companies that are selected for their long-term growth potential. The Growth Fund will normally hold a core position of between 35 and 50 common stocks.
PERFORMANCE COMPARISON
| One Year | Five Year Average Annual | Average Annual Since Inception |
| (10/1/05 – 9/30/06) | (10/1/01 – 9/30/06) | (12/31/97 – 9/30/06) |
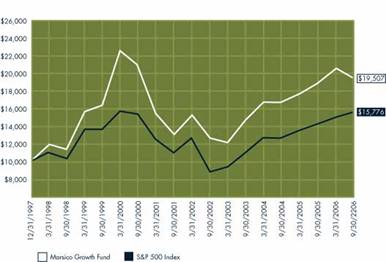
Marsico Growth Fund | 2.87% | 7.95% | 7.94% |
S&P 500 Index | 10.79% | 6.96% | 5.35% |
GROWTH OF $10,000(1)
| | Growth | | S&P 500 |
| | | | |
| | | | |
31-Dec-97 | | 10,000 | | 10,000 |
31-Mar-98 | | 11,960 | | 11,395 |
30-Sep-98 | | 11,540 | | 10,600 |
31-Mar-99 | | 15,710 | | 13,498 |
30-Sep-99 | | 16,290 | | 13,548 |
31-Mar-00 | | 22,607 | | 15,920 |
30-Sep-00 | | 20,938 | | 15,347 |
31-Mar-01 | | 15,495 | | 12,469 |
30-Sep-01 | | 13,307 | | 11,262 |
31-Mar-02 | | 15,304 | | 12,500 |
30-Sep-02 | | 12,452 | | 8,955 |
31-Mar-03 | | 12,159 | | 9,404 |
30-Sep-03 | | 14,769 | | 11,140 |
31-Mar-04 | | 16,614 | | 12,708 |
30-Sep-04 | | 16,719 | | 12,685 |
31-Mar-05 | | 17,714 | | 13,558 |
30-Sep-05 | | 18,962 | | 14,239 |
31-Mar-06 | | 20,419 | | 15,148 |
30-Sep-06 | | 19,507 | | 15,776 |
NET ASSETS | |
9/30/06 | $2,550,640,917 |
NET ASSET VALUE | |
Net Asset Value Per Share | $18.61 |
TOP FIVE HOLDINGS
UnitedHealth Group, Inc. | 6.49 | % |
The Goldman Sachs | | |
Group, Inc. | 5.37 | |
Genentech, Inc. | 5.06 | |
UBS AG | 4.54 | |
The Procter & Gamble | | |
Company | 4.35 | |
SECTOR ALLOCATION(2)
Consumer Non-Cyclical | 26.71 | % |
Financials | 20.09 | |
Industrials | 19.86 | |
Consumer Cyclical | 19.65 | |
Communications | 8.59 | |
Energy | 3.36 | |
Technology | 1.30 | |
Basic Materials | 0.44 | |
The performance data quoted here represent past performance, and past performance is not a guarantee of future results. Investment return and principal value of an investment will fluctuate so that an investor’s shares, when redeemed, may be worth more or less than their original cost. Current performance may be lower or higher than the performance information quoted. To obtain performance information current to the most recent month-end, please call 888-860-8686 or visit www.marsicofunds.com. A redemption fee may be imposed on redemptions or exchanges of Fund shares owned for 30 days or less.
The performance included in the table and graph does not reflect the deduction of taxes on Fund distributions or the redemption of Fund shares.
| (1) | This chart assumes an initial investment of $10,000 made on December 31, 1997 (inception). Total returns are based on net change in NAV, assuming reinvestment of distributions. |
| (2) | Sector weightings represent the percentage of the Fund’s equity investments in certain general sectors. These sectors may include more than one industry. The Fund’s portfolio composition is subject to change at any time. |
14
SCHEDULE OF INVESTMENTS SEPTEMBER 30, 2006
| Number | | Percent |
| of | | of Net |
| Shares | Value | Assets |
COMMON STOCKS
Aerospace/Defense | | | | |
General Dynamics Corporation | 1,095,705 | $78,529,177 | 3.08 | % |
Lockheed Martin Corporation | 896,229 | 77,129,468 | 3.02 | |
| | 155,658,645 | 6.10 | |
Aerospace/Defense - Equipment | | | | |
United Technologies | | | | |
Corporation | 670,120 | 42,452,102 | 1.66 | |
Agricultural Chemicals | | | | |
Monsanto Company | 1,032,673 | 48,545,958 | 1.90 | |
Agricultural Operations | | | | |
Archer Daniels | | | | |
Midland Company | 1,018,169 | 38,568,242 | 1.51 | |
Automotive - Cars/Light Trucks | | | | |
Toyota Motor | | | | |
Corporation ADR | 443,860 | 48,336,354 | 1.90 | |
Beverages - Non-Alcoholic | | | | |
PepsiCo, Inc. | 188,086 | 12,274,492 | 0.48 | |
Brewery | | | | |
Heineken N.V. ADR | 1,031,746 | 23,575,396 | 0.92 | |
Building - | | | | |
Residential/Commercial | | | | |
KB Home | 536,089 | 23,480,698 | 0.92 | |
Lennar Corporation - Cl. A | 478,490 | 21,651,673 | 0.85 | |
| | 45,132,371 | 1.77 | |
Cable TV | | | | |
Comcast Corporation - Cl. A* | 2,834,281 | 104,443,255 | 4.09 | |
Casino Hotels | | | | |
Las Vegas Sands Corp.* | 683,162 | 46,694,123 | 1.83 | |
MGM MIRAGE* | 1,243,503 | 49,105,933 | 1.93 | |
Station Casinos, Inc. | 322,311 | 18,639,245 | 0.73 | |
Wynn Resorts Ltd.* | 791,390 | 53,822,434 | 2.11 | |
| | 168,261,735 | 6.60 | |
Cellular Telecommunications | | | | |
America Movil S.A. | | | | |
de C.V. ADR | 941,379 | 37,062,091 | 1.45 | |
Coal | | | | |
Peabody Energy | | | | |
Corporation | 631,477 | 23,225,724 | 0.91 | |
Cosmetics & Toiletries | | | | |
The Procter & Gamble | | | | |
Company | 1,788,616 | 110,858,420 | 4.35 | |
| Number | | Percent |
| of | | of Net |
| Shares | Value | Assets |
COMMON STOCKS continued
Electronic Components - | | | | |
Semiconductors | | | | |
Texas Instruments, Inc. | 946,537 | $31,472,355 | 1.23 | % |
Finance - Investment | | | | |
Banker/Broker | | | | |
The Goldman Sachs Group, Inc. | 809,912 | 137,012,813 | 5.37 | |
Lehman Brothers Holdings, Inc. | 1,154,756 | 85,290,278 | 3.35 | |
UBS AG | 1,954,042 | 115,894,231 | 4.54 | |
| | 338,197,322 | 13.26 | |
Finance - Multi-line Insurance | | | | |
Genworth Financial, | | | | |
Inc. - Cl. A | 579,292 | 20,281,013 | 0.80 | |
Hotels & Motels | | | | |
Four Seasons Hotels, Inc. | 336,417 | 21,480,226 | 0.84 | |
Industrial Gases | | | | |
Air Products and | | | | |
Chemicals, Inc. | 61,359 | 4,072,397 | 0.16 | |
Praxair, Inc. | 111,579 | 6,601,013 | 0.26 | |
| | 10,673,410 | 0.42 | |
Machinery - | | | | |
Construction/Mining | | | | |
Caterpillar, Inc. | 728,611 | 47,942,604 | 1.88 | |
Medical - Biomedical/Genetic | | | | |
Genentech, Inc.* | 1,561,111 | 129,103,880 | 5.06 | |
Genzyme Corporation* | 521,223 | 35,166,916 | 1.38 | |
| | 164,270,796 | 6.44 | |
Medical - Drugs | | | | |
Abbott Laboratories | 672,041 | 32,634,311 | 1.28 | |
Medical - HMO | | | | |
UnitedHealth Group, Inc. | 3,364,267 | 165,521,936 | 6.49 | |
Medical Labs & Testing Services | | | | |
Quest Diagnostics, Inc. | 221,339 | 13,537,093 | 0.53 | |
Networking Products | | | | |
Cisco Systems, Inc.* | 1,674,035 | 38,502,805 | 1.51 | |
Oil - Field Services | | | | |
Halliburton Company | 280,256 | 7,973,283 | 0.31 | |
Schlumberger Ltd. | 811,460 | 50,334,864 | 1.98 | |
| | 58,308,147 | 2.29 | |
Property/Casualty Insurance | | | | |
The Progressive Corporation | 825,200 | 20,250,408 | 0.79 | |
See notes to financial statements.
15
MARSICO GROWTH FUND
SCHEDULE OF INVESTMENTS SEPTEMBER 30, 2006
| Number | | Percent |
| of | | of Net |
| Shares | Value | Assets |
COMMON STOCKS continued
Real Estate | | | | |
Management/Services | | | | |
CB Richard Ellis | | | | |
Group, Inc. - Cl. A* | 135,319 | $3,328,847 | 0.13 | % |
Real Estate | | | | |
Operating/Development | | | | |
The St. Joe Company | 317,602 | 17,426,822 | 0.68 | |
REITs - Mortgage | | | | |
KKR Financial Corporation | 451,399 | 11,077,331 | 0.44 | |
Retail - Building Products | | | | |
Lowe’s Companies, Inc. | 2,237,315 | 62,779,059 | 2.46 | |
Retail - Discount | | | | |
Target Corporation | 669,498 | 36,989,765 | 1.45 | |
Retail - Drug Stores | | | | |
Walgreen Co. | 143,434 | 6,367,035 | 0.25 | |
Retail - Restaurants | | | | |
Starbucks Corporation* | 1,140,379 | 38,829,905 | 1.52 | |
Yum! Brands, Inc. | 930,820 | 48,449,181 | 1.90 | |
| | 87,279,086 | 3.42 | |
Super-Regional Banks - U.S. | | | | |
Wells Fargo & Company | 2,118,888 | 76,661,368 | 3.01 | |
Therapeutics | | | | |
Amylin Pharmaceuticals, Inc.* | 866,156 | 38,171,495 | 1.50 | |
Transportation - Rail | | | | |
Burlington Northern | | | | |
Santa Fe Corporation | 1,301,365 | 95,572,246 | 3.75 | |
Union Pacific Corporation | 639,856 | 56,307,328 | 2.21 | |
| | 151,879,574 | 5.96 | |
Transportation - Services | | | | |
FedEx Corporation | 771,300 | 83,824,884 | 3.29 | |
Wireless Equipment | | | | |
Motorola, Inc. | 1,136,582 | 28,414,550 | 1.11 | |
Total Common Stocks | | | | |
(cost $1,990,157,181) | | 2,425,667,027 | 95.10 | |
| Number | | Percent |
| of | | of Net |
| Shares | Value | Assets |
SHORT-TERM INVESTMENTS | | | | |
SSgA Prime Money | | | | |
Market Fund, 5.17% | 91,581,697 | $91,581,697 | 3.59 | % |
SSgA Money Market | | | | |
Fund, 4.99% | 1 | 1 | 0.00 | |
Total Short-Term Investments | | | | |
(cost $91,581,698) | | 91,581,698 | 3.59 | |
Total Investments | | | | |
(cost $2,081,738,879) | | 2,517,248,725 | 98.69 | |
Cash and Other | | | | |
Assets Less Liabilities | | 33,392,192 | 1.31 | |
NET ASSETS | | $2,550,640,917 | 100.00 | % |
See notes to financial statements.
16
STATEMENT OF ASSETS AND LIABILITIES
SEPTEMBER 30, 2006
(Amounts in thousands)
ASSETS
Investments, at value (cost $2,081,739) | $2,517,249 | |
Receivable for investments sold | 33,737 | |
Receivable for capital stock sold | 2,692 | |
Interest and dividends receivable | 1,645 | |
Prepaid expenses and other assets | 471 | |
Total Assets | 2,555,794 | |
LIABILITIES | | |
Payable for capital stock redeemed | 2,056 | |
Accrued investment advisory fee | 1,754 | |
Accrued distribution fee | 349 | |
Accrued trustees’ fees | 470 | |
Accrued expenses and other liabilities | 524 | |
Total Liabilities | 5,153 | |
NET ASSETS | $2,550,641 | |
NET ASSETS CONSIST OF | | |
Paid-in-capital | $2,142,105 | |
Accumulated net investment loss | (416 | ) |
Accumulated net realized loss on investments | | |
and foreign currency transactions | (26,634 | ) |
Net unrealized appreciation on investments | | |
and foreign currency translations | 435,586 | |
NET ASSETS | $2,550,641 | |
SHARES OUTSTANDING, $0.001 par value | | |
(Unlimited shares authorized) | 137,057 | |
NET ASSET VALUE, REDEMPTION PRICE, | | |
AND OFFERING PRICE PER SHARE | | |
(NET ASSETS/SHARES OUTSTANDING)* | $18.61 | |
STATEMENT OF OPERATIONS
FOR THE YEAR ENDED SEPTEMBER 30, 2006
(Amounts in thousands)
INVESTMENT INCOME | | |
Interest | $4,411 | |
Dividends (net of $332 of non-reclaimable | | |
foreign withholding taxes) | 19,007 | |
Total Investment Income | 23,418 | |
EXPENSES | | |
Investment advisory fees | 20,132 | |
Distribution fees | 5,921 | |
Transfer agent fees and expenses | 2,107 | |
Printing and postage expenses | 454 | |
Custody and fund accounting fees | 318 | |
Fund administration fees | 266 | |
Federal and state registration fees | 222 | |
Professional fees | 161 | |
Trustees’ fees and expenses | 121 | |
Miscellaneous | 119 | |
Total expenses | 29,821 | |
Less expenses paid indirectly | (253 | ) |
Net Expenses | 29,568 | |
NET INVESTMENT LOSS | (6,150 | ) |
REALIZED AND UNREALIZED GAIN | | |
Net realized gain on investments | 93,450 | |
Net realized loss on foreign | | |
currency transactions | — | (1) |
Change in unrealized appreciation/ | | |
depreciation on investments and | | |
foreign currency translations | (30,092 | ) |
Net Gain on Investments | 63,358 | |
NET INCREASE IN NET ASSETS | | |
RESULTING FROM OPERATIONS | $57,208 | |
See notes to financial statements.
17
MARSICO GROWTH FUND
STATEMENTS OF CHANGES IN NET ASSETS
| Year | Year |
| Ended | Ended |
| 9/30/06 | 9/30/05 |
(Amounts in thousands) | | | | |
OPERATIONS | | | | |
Net investment loss | $(6,150 | ) | $(2,427 | ) |
Net realized gain on investments | 93,450 | | 13,226 | |
Net realized gain on options written | — | | 42 | |
Net realized gain (loss) on foreign currency transactions | — | (1) | 1,037 | |
Change in unrealized appreciation/depreciation | | | | |
on investments and foreign currency translations | (30,092 | ) | 201,230 | |
Net increase in net assets resulting from operations | 57,208 | | 213,108 | |
CAPITAL SHARE TRANSACTIONS | | | | |
Proceeds from sale of shares | 959,936 | | 834,350 | |
Redemption fees | 71 | | 85 | |
Redemption of shares | (592,242 | ) | (285,300 | ) |
Net increase from capital share transactions | 367,765 | | 549,135 | |
TOTAL INCREASE IN NET ASSETS | 424,973 | | 762,243 | |
NET ASSETS | | | | |
Beginning of period | 2,125,668 | | 1,363,425 | |
End of period | $2,550,641 | | $2,125,668 | |
Accumulated net investment loss | (416 | ) | (338 | ) |
TRANSACTIONS IN SHARES | | | | |
Shares sold | 51,358 | | 48,520 | |
Shares redeemed | (31,795 | ) | (16,522 | ) |
Net increase | 19,563 | | 31,998 | |
See notes to financial statements.
18
FINANCIAL HIGHLIGHTS | |
| Year | Year | Year | Year | Year |
For a Fund Share Outstanding | Ended | Ended | Ended | Ended | Ended |
Throughout the Period. | 9/30/06 | 9/30/05 | 9/30/04 | 9/30/03 | 9/30/02 |
| $18.09 | | $15.95 | | $14.09 | | $11.88 | | $12.71 | |
INCOME FROM INVESTMENT OPERATIONS | | | | | | | | | | |
Net investment loss | (0.04) | (0.02) | (0.04) | (0.07) | (0.04) |
Net realized and unrealized gains | | | | | | | | | | |
(losses) on investments | 0.56 | | 2.16 | | 1.90 | | 2.28 | | (0.77) |
Total from investment operations | 0.52 | | 2.14 | | 1.86 | | 2.21 | | (0.81) |
DISTRIBUTIONS & OTHER | | | | | | | | | | |
Net realized gains | — | | — | | — | | — | | — | |
Tax return of capital | — | | — | | — | | — | | (0.02) |
Redemption fees [See Note 2(i)] | — | (1) | — | (1) | — | (1) | — | (1) | — | |
Total distributions & other | — | | — | | — | | — | | (0.02) |
NET ASSET VALUE, END OF PERIOD | $18.61 | | $18.09 | | $15.95 | | $14.09 | | $11.88 | |
TOTAL RETURN | 2.87% | | 13.42% | | 13.20% | | 18.60% | | (6.42)% | |
SUPPLEMENTAL DATA AND RATIOS | | | | | | | | | | |
Net assets, end of period (000s) | $2,550,641 | | $2,125,668 | | $1,363,425 | | $789,220 | | $641,974 | |
Ratio of expenses to average net assets, | | | | | | | | | | |
before expenses paid indirectly | 1.26% | | 1.26% | | 1.30% | | 1.38% | | 1.37% | |
Ratio of net investment loss to average net | | | | | | | | | | |
assets, net of expenses paid indirectly | (0.26)% | | (0.14)% | | (0.34)% | | (0.62)% | | (0.49)% | |
Ratio of net investment loss to average net | | | | | | | | | | |
assets, before expenses paid indirectly | (0.27)% | | (0.16)% | | (0.38)% | | (0.67)% | | (0.52)% | |
Portfolio turnover rate | 59% | | 73% | | 73% | | 91% | | 111% | |
| | | | | | | | | | | | | | |
See notes to financial statements.
19
MARSICO 21ST CENTURY FUND
INVESTMENT REVIEW BY CORY GILCHRIST (UNAUDITED)
The 21st Century Fund outperformed its primary benchmark Index, as well as certain other pertinent indices, for the one-year period ended September 30, 2006. The 21st Century Fund had a total return of 15.10%. For comparative purposes, the S&P 500 Index (which we consider to be the Fund’s primary benchmark Index), the Russell 3000 Index (a proxy for the performance of all publicly-traded US stocks, including smaller capitalization companies), and the NASDAQ Composite Index (which is comprised primarily of technology-related companies) had total returns of 10.79%, 10.22%, and 5.84%, respectively, for the one-year period ended September 30, 2006. Please see the Fund Overview for more detailed information about the Fund’s longer-term performance for various periods ended September 30, 2006.
The performance data for the Fund quoted here represent past performance, and past performance is not a guarantee of future results. Investment return and principal value of an investment will fluctuate so that an investor’s shares, when redeemed, may be worth more or less than their original cost. Current performance may be lower or higher than the performance information quoted. To obtain performance information current to the most recent month-end, please call 888-860-8686 or visit www.marsicofunds.com.(1)
You should keep in mind that our views on all investments discussed in this report are subject to change at any time and references to specific securities, industries, and sectors discussed in this report are not recommendations to purchase or sell the securities, and that the Fund may not necessarily hold these securities today. Please see the accompanying Schedule of Investments for the percentage of the Fund’s portfolio represented by the securities or industries mentioned in this report.
The primary areas that contributed to the Fund’s outperformance for the fiscal year ended September 30, 2006 included:
| • | Consumer Services: The Fund’s positions in this industry group rose 28% in aggregate during the reporting period, led by hotel/casino operators Las Vegas Sands Corp. (+108%) and Wynn Resorts, Ltd. (+51%). |
| • | Diversified Financials: This area buoyed the Fund’s performance considerably, as the Fund’s holdings in the industry group had a collective gain of 46%. These positions included UBS AG (+44%), Chicago Mercantile Exchange Holdings (+30% prior to being sold), Jefferies Group (+33%), Investors Financial Services (+35% prior to being sold), and Banco Ita´u Holding Financiera SA, a Brazil-based provider of banking-related services, including investment banking, consumer credit, foreign exchange, securities brokerage, investment fund management, and insurance (+16%). |
| • | Industrials: Performance was helped by a variety of holdings in the Industrials sector. Transportation-related positions had an aggregate return of 23% during the reporting period, led by railroad operator Burlington Northern Santa Fe (+24%), and Expeditors International of Washington, a global logistic services company operating in airfreight, ocean freight, and customs brokerage and import services (+30% prior to being sold). FedEx Corporation was another strong-performing holding, rising 17% prior to being sold. The Fund’s holdings in the Capital Goods industry also had solid overall gains, including Caterpillar, Inc. (+25% prior to being sold), General Dynamics Corp. (+23%), and Joy Global, Inc., a mining equipment manufacturer (+26% prior to being sold). The Fund further benefited from its generally overweighted posture in the Transportation and Capital Goods industries. These groups were among the best-performing areas in the benchmark S&P 500 Index, posting gains of 16% and 12%, respectively, in the Index during the fiscal year. |
| • | Technology Software & Services: A position in Google, Inc. rose 26% prior to being sold. |
| • | Retailing: In an overall difficult operating environment for many retailers, the Fund’s positions performed very well, generating an aggregate return of 25% during the one-year period ended September 30, 2006. In particular, Nordstrom, Inc., an apparel retailer, rose 21%, and Gymboree, an apparel retailer focused on children and women, gained 34%. |
Other factors that had a material positive impact on performance included Media-related holdings (e.g., Cablevision Systems), and an underweighted posture, on average, in the Energy sector, which had the lowest sector-level return in the S&P 500 Index for the one-year fiscal period ended September 30, 2006.
20
There were a few areas of “softness” for the Fund during the fiscal year, including:
| • | Real Estate: The Fund’s stock selection in this industry was, plainly speaking, off-target. The Fund’s real estate-related positions, which were a significant area of investment emphasis during the reporting period, essentially “marked time,” with a collective return of -0.2%. Meanwhile, the benchmark Index’s industry group, which was largely comprised by strong-performing real estate investment trusts, gained 28%. Clearly, there was plenty of blame to go around with regard to the Fund’s holdings in this industry. The most significant detractors included The St. Joe Company, a Florida-based land developer (-11%), Government Properties Trust, Inc., a self-administered real estate investment trust (-3%), and CB Richard Ellis Group, a real estate holding and development company (+13%) (although the latter position did have a solid absolute return, it still trailed the benchmark Index’s industry gain by a considerable margin). |
| • | Health Care Equipment & Services: The Fund’s holdings in this industry were a major “blemish” on performance, with a collective return of -26% during the reporting period. The primary “problem stocks” for the Fund included managed health care providers Aetna US Healthcare (-21% prior to being sold) and UnitedHealth Group, Inc. (-12%). Foxhollow Technologies, Inc., a medical device company focused on the treatment of peripheral artery disease, fell -23% prior to being sold. |
| • | Homebuilders: Weakness abounded in homebuilders’ stock prices during the fiscal year. The Fund’s position in luxury homebuilder Toll Brothers (-32% prior to being sold), had a material negative impact on performance. |
| • | Banks: Performance for the fiscal year was hurt in two dimensions with respect to the Fund’s banking-related positions. First, the Fund’s stock selection, in general, left something to be desired. The Fund’s industry holdings had a collective return of -11% during the reporting period, which was far behind the benchmark Index’s industry return of 21%. In particular, positions that impacted performance included ICICI Bank, Ltd., an Indian commercial bank (-10% prior to being sold) and UCBH Holdings, Inc., a regional commercial bank focused on providing a variety of financial services to the Chinese community, among others in California (-6% prior to being sold). In addition, the Fund’s decision to maintain, on average, an underweighted posture (as compared to the S&P 500 Index) in the Banking industry created an opportunity cost for the Fund, as the group was among the top-performing areas of the Index. |
| • | Technology Hardware & Equipment: A position in QUALCOMM, Inc. (-24% prior to being sold) negatively impacted performance. |
The Fund has tended to have a relatively high portfolio turnover level because of its investment style. Although the Fund may hold core positions for some time, it may change its portfolio composition quickly to take advantage of new opportunities, or to address issues affecting particular holdings.
FISCAL YEAR-END INVESTMENT POSTURE
As of September 30, 2006, the Fund’s holdings primarily emphasized four economic sectors: Financials, Consumer Discretionary, Health Care, and Industrials. The Fund had little or no investment in Energy, Materials, Telecommunications Services, and Utilities.
Sincerely,
CORYDON J. GILCHRIST, CFA
PORTFOLIO MANAGER
| (1) | Total returns are based on net change in NAV assuming reinvestment of distributions. For the period prior to March 31, 2004, the performance returns for the 21st Century Fund reflect a fee waiver in effect; in the absence of such a waiver, the returns would have been reduced. For the period beginning April 2004 through January 2005, performance returns for the 21st Century Fund would have been higher but for the reimbursement of fees waived previously. A redemption fee of 2% may be imposed on redemptions or exchanges of Fund shares owned for 30 days or less. Please see the prospectus for more information. |
21
MARSICO 21ST CENTURY FUND
FUND OVERVIEW SEPTEMBER 30, 2006
The 21st Century Fund invests primarily in common stocks that are selected for their long-term growth potential. The Fund may invest in companies of any size, and will normally hold a core position of between 35 and 50 common stocks.
PERFORMANCE COMPARISON
| One Year | Five Year Average Annual | Average Annual Since Inception |
| (10/1/05–9/30/06) | (10/1/01–9/30/06) | (2/1/00 –9/30/06) |
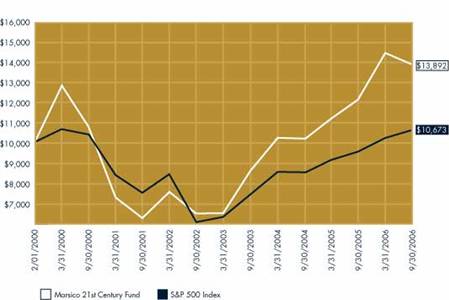
Marsico 21st Century Fund | 15.10% | 17.28%(1) | 5.06%(1) |
S&P 500 Index | 10.79% | 6.96% | 0.98% |
GROWTH OF $10,000(1)(2)
| | 21st | | |
| | Century | | S&P 500 |
| | | | |
| | | | |
31-Mar-00 | | 12,810 | | 10,770 |
30-Sep-00 | | 10,860 | | 10,383 |
31-Mar-01 | | 7,290 | | 8,436 |
30-Sep-01 | | 6,260 | | 7,619 |
31-Mar-02 | | 7,520 | | 8,456 |
30-Sep-02 | | 6,540 | | 6,058 |
31-Mar-03 | | 6,540 | | 6,362 |
30-Sep-03 | | 8,740 | | 7,536 |
31-Mar-04 | | 10,260 | | 8,597 |
30-Sep-04 | | 10,200 | | 8,582 |
31-Mar-05 | | 11,190 | | 9,172 |
30-Sep-05 | | 12,070 | | 9,633 |
31-Mar-06 | | 14,412 | | 10,248 |
30-Sep-06 | | 13,892 | | 10,673 |
NET ASSETS | |
9/30/06 | $871,458,871 |
NET ASSET VALUE | |
Net Asset Value Per Share | $13.89 |
TOP FIVE HOLDINGS
UnitedHeath Group, Inc. | 4.91 | % |
UBS AG | 4.59 | |
Station Casinos, Inc. | 4.54 | |
Amylin Pharmaceuticals, Inc. | 4.31 | |
Cisco Systems, Inc. | 3.84 | |
SECTOR ALLOCATION(3)
Financials | 31.70 | % |
Consumer Non-Cyclical | 22.97 | |
Consumer Cyclical | 17.32 | |
Industrials | 15.09 | |
Communications | 9.77 | |
Technology | 3.15 | |
The performance data quoted here represent past performance, and past performance is not a guarantee of future results. Investment return and principal value of an investment will fluctuate so that an investor’s shares, when redeemed, may be worth more or less than their original cost. Current performance may be lower or higher than the performance information quoted. To obtain performance information current to the most recent month-end, please call 888-860-8686 or visit www.marsicofunds.com. A redemption fee may be imposed on redemptions or exchanges of Fund shares owned for 30 days or less.
The performance included in the table and graph does not reflect the deduction of taxes on Fund distributions or the redemption of Fund shares.
| (1) | The performance returns for the 21st Century Fund (for the period prior to March 31, 2004) reflect a fee waiver in effect; in the absence of such a waiver, the returns would be reduced. For the period beginning April 2004 through January 2005, performance returns for the 21st Century Fund would be higher but for the reimbursement of fees waived previously. |
| (2) | This chart assumes an initial investment of $10,000 made on February 1, 2000 (inception). Total returns are based on net change in NAV, assuming reinvestment of distributions. |
| (3) | Sector weightings represent the percentage of the Fund’s equity investments in certain general sectors. These sectors may include more than one industry. The Fund’s portfolio composition is subject to change at any time. |
22
SCHEDULE OF INVESTMENTS SEPTEMBER 30, 2006
| Number | | Percent |
| of | | of Net |
| Shares | Value | Assets |
COMMON STOCKS
Aerospace/Defense | | | | | |
General Dynamics | | | | | |
Corporation | 371,754 | $26,643,609 | | 3.06 | % |
Aerospace/Defense - Equipment | | | | | |
DRS Technologies, Inc. | 495,911 | 21,656,433 | | 2.49 | |
United Technologies | | | | | |
Corporation | 397,780 | 25,199,363 | | 2.89 | |
| | 46,855,796 | | 5.38 | |
Apparel Manufacturers | | | | | |
The Gymboree Corporation | 196,599 | 8,292,546 | | 0.95 | |
True Religion Apparel, Inc.* | 240,567 | 5,078,369 | | 0.58 | |
| | 13,370,915 | | 1.53 | |
Brewery | | | | | |
Heineken Holding N.V. | 661,717 | 26,003,421 | | 2.98 | |
Cable TV | | | | | |
Cablevision Systems | | | | | |
Corporation - Cl. A* | 969,515 | 22,017,686 | | 2.53 | |
Comcast Corporation - Cl. A* | 510,885 | 18,826,112 | | 2.16 | |
| | 40,843,798 | | 4.69 | |
Casino Hotels | | | | | |
Las Vegas Sands Corp.* | 446,434 | 30,513,764 | | 3.50 | |
Station Casinos, Inc. | 683,443 | 39,523,509 | | 4.54 | |
Wynn Resorts Ltd.* | 411,790 | 28,005,838 | | 3.21 | |
| | 98,043,111 | | 11.25 | |
Commercial Banks - Non-US | | | | | |
Banco Ita´u Holding | | | | | |
Financeria S.A. ADR | 581,960 | 17,458,800 | | 2.00 | |
China Merchants Bank* | 358,500 | 505,263 | | 0.06 | |
Erste Bank der oesterreichischen | | | | | |
Sparkassen AG | 188,707 | 11,749,141 | | 1.35 | |
| | 29,713,204 | | 3.41 | |
Cosmetics & Toiletries | | | | | |
Bare Escentuals, Inc.* | 181,336 | 4,923,272 | | 0.56 | |
Electronic Components - | | | | | |
Semiconductors | | | | | |
Texas Instruments, Inc. | 769,223 | 25,576,665 | | 2.93 | |
| Number | | Percent |
| of | | of Net |
| Shares | Value | Assets |
COMMON STOCKS continued
Finance - Investment | | | | | |
Banker/Broker | | | | | |
Evercore Partners, Inc.* | 87,743 | $2,526,998 | | 0.29 | % |
The Goldman Sachs Group, Inc. | 149,236 | 25,246,254 | | 2.90 | |
Jefferies Group, Inc. | 537,031 | 15,305,384 | | 1.75 | |
UBS AG | 668,309 | 39,977,219 | | 4.59 | |
| | 83,055,855 | | 9.53 | |
Finance - Multi-line Insurance | | | | | |
Genworth Financial, | | | | | |
Inc. - Cl. A | 612,001 | 21,426,155 | | 2.46 | |
Food - Confectionery | | | | | |
The Hershey Company | 241,454 | 12,905,716 | | 1.48 | |
Internet Infrastructure Software | | | | | |
Akamai Technologies, Inc.* | 99,646 | 4,981,304 | | 0.57 | |
Investment Management/ | | | | | |
Advisory Services | | | | | |
Franklin Resources, Inc. | 110,516 | 11,687,067 | | 1.34 | |
Medical - Biomedical/Genetic | | | | | |
Diversa Corporation* | 482,579 | 3,870,284 | | 0.44 | |
Genentech, Inc.* | 205,063 | 16,958,710 | | 1.95 | |
Genzyme Corporation* | 381,859 | 25,764,027 | | 2.96 | |
| | 46,593,021 | | 5.35 | |
Medical - Drugs | | | | | |
Roche Holding AG | 90,989 | 15,731,794 | | 1.81 | |
Medical - HMO | | | | | |
UnitedHealth Group, Inc. | 868,925 | 42,751,110 | | 4.91 | |
Miscellaneous Manufacturing | | | | | |
American Railcar | | | | | |
Industries, Inc. | 353,734 | 10,297,197 | | 1.18 | |
Networking Products | | | | | |
Cisco Systems, Inc.* | 1,455,303 | 33,471,969 | | 3.84 | |
Real Estate | | | | | |
Management/Services | | | | | |
CB Richard Ellis Group, | | | | | |
Inc. - Cl. A* | 491,288 | 12,085,685 | | 1.39 | |
Real Estate | | | | | |
Operating/Development | | | | | |
The St. Joe Company | 535,846 | 29,401,870 | | 3.37 | |
See notes to financial statements.
23
MARSICO 21ST CENTURY FUND
SCHEDULE OF INVESTMENTS SEPTEMBER 30, 2006
| Number | | Percent |
| of | | of Net |
| Shares | Value | Assets |
COMMON STOCKS continued
REITs - Mortgage | | | | | |
Crystal River Capital, | | | | | |
Inc. 144A † | 240,411 | $5,335,585 | | 0.61 | % |
KKR Financial Corporation | 806,719 | 19,796,884 | | 2.27 | |
Redwood Trust, Inc. | 107,842 | 5,432,001 | | 0.62 | |
| | 30,564,470 | | 3.50 | |
REITs - Office Property | | | | | |
Government Properties | | | | | |
Trust, Inc. | 445,914 | 4,022,144 | | 0.46 | |
REITs - Warehouse/Industrial | | | | | |
ProLogis | 196,460 | 11,210,008 | | 1.29 | |
Retail - Apparel/Shoe | | | | | |
Nordstrom, Inc. | 690,213 | 29,196,010 | | 3.35 | |
Super-Regional Banks - U.S. | | | | | |
Wells Fargo & Company | 669,406 | 24,219,109 | | 2.78 | |
Therapeutics | | | | | |
Amylin Pharmaceuticals, Inc.* | 852,008 | 37,547,993 | | 4.31 | |
Transportation - Rail | | | | | |
Burlington Northern | | | | | |
Santa Fe Corporation | 390,956 | 28,711,809 | | 3.30 | |
Genesee & Wyoming, | | | | | |
Inc. - Cl. A* | 429,165 | 9,965,211 | | 1.14 | |
| | 38,677,020 | | 4.44 | |
Total Common Stocks | | | | | |
(cost $730,048,957) | | 811,799,288 | | 93.15 | |
| Number | | Percent |
| of | | of Net |
| Shares | Value | Assets |
SHORT-TERM INVESTMENTS | | | | | |
SSgA Prime Money | | | | | |
Market Fund, 5.17% | 39,042,828 | $39,042,828 | | 4.48 | % |
SSgA Money Market | | | | | |
Fund, 4.99% | 28,471,481 | 28,471,481 | | 3.27 | |
Total Short-Term Investments | | | | | |
(cost $67,514,309) | | 67,514,309 | | 7.75 | |
Total Investments | | | | | |
(cost $797,563,266) | | 879,313,597 | | 100.90 | |
Liabilities Less Cash | | | | | |
and Other Assets | | (7,854,726 | ) | (0.90 | ) |
NET ASSETS | | $871,458,871 | | 100.00 | % |
| † | Security valued at fair value as determined in good faith by Marsico Capital Management, LLC, investment adviser to the Fund, in accordance with procedures established by, and under the general supervision of, the Fund’s Board of Trustees. The security was purchased on March 9, 2005 for $6,010,275 and is considered to be restricted and illiquid due to resale restrictions. At September 30, 2006, the value of the Fund’s restricted and illiquid securities was 0.61% of net assets. |
See notes to financial statements.
24
STATEMENT OF ASSETS AND LIABILITIES
SEPTEMBER 30, 2006
(Amounts in thousands)
ASSETS | | |
Investments, at value (cost $797,563) | $879,314 | |
Receivable for capital stock sold | 5,557 | |
Interest and dividends receivable | 679 | |
Prepaid expenses and other assets | 259 | |
Total Assets | 885,809 | |
LIABILITIES | | |
Payable for investments purchased | 12,668 | |
Payable for capital stock redeemed | 360 | |
Accrued investment advisory fee | 573 | |
Accrued distribution fee | 325 | |
Accrued trustees’ fees | 293 | |
Accrued expenses and other liabilities | 131 | |
Total Liabilities | 14,350 | |
NET ASSETS | $871,459 | |
NET ASSETS CONSIST OF | | |
Paid-in-capital | $793,154 | |
Accumulated net investment gain | 352 | |
Accumulated net realized loss on investments | | |
and foreign currency transactions | (3,861 | ) |
Net unrealized appreciation on investments | 81,814 | |
NET ASSETS | $871,459 | |
SHARES OUTSTANDING, $0.001 par value | | |
(Unlimited shares authorized) | 62,730 | |
NET ASSET VALUE, REDEMPTION PRICE, | | |
AND OFFERING PRICE PER SHARE | | |
(NET ASSETS/SHARES OUTSTANDING)* | $13.89 | |
STATEMENT OF OPERATIONS
FOR THE YEAR ENDED SEPTEMBER 30, 2006
(Amounts in thousands)
INVESTMENT INCOME | | |
Interest | $2,732 | |
Dividends (net of $124 of non-reclaimable | | |
foreign withholding taxes) | 5,924 | |
Total Investment Income | 8,656 | |
EXPENSES | | |
Investment advisory fees | 4,802 | |
Distribution fees | 1,412 | |
Transfer agent fees and expenses | 645 | |
Fund administration fees | 167 | |
Custody and fund accounting fees | 155 | |
Federal and state registration fees | 124 | |
Printing and postage expenses | 111 | |
Trustees’ fees and expenses | 46 | |
Professional fees | 36 | |
Miscellaneous | 28 | |
Total expenses | 7,526 | |
Less expenses paid indirectly | (1 | ) |
Net Expenses | 7,525 | |
NET INVESTMENT INCOME | 1,131 | |
REALIZED AND UNREALIZED GAIN | | |
Net realized gain on investments | 32,726 | |
Net realized loss on foreign | | |
currency transactions | (215 | ) |
Change in unrealized appreciation/ | | |
depreciation on investments and | | |
foreign currency translations | 26,623 | |
Net Gain on Investments | 59,134 | |
NET INCREASE IN NET ASSETS | | |
RESULTING FROM OPERATIONS | $60,265 | |
See notes to financial statements.
25
MARSICO 21ST CENTURY FUND
STATEMENTS OF CHANGES IN NET ASSETS
| Year | Year |
| Ended | Ended |
| 9/30/06 | 9/30/05 |
(Amounts in thousands)
OPERATIONS
Net investment income (loss) | $1,131 | | $(662 | ) | |
Net realized gain on investments | 32,726 | | 14,704 | | |
Net realized gain (loss) on foreign currency transactions | (215 | ) | 405 | | |
Change in unrealized appreciation/depreciation | | | | | |
on investments and foreign currency translations | 26,623 | | 30,495 | | |
Net increase in net assets resulting from operations | 60,265 | | 44,942 | | |
DISTRIBUTIONS | | | | | |
Net investment income | (67 | ) | — | | |
Total distributions | (67 | ) | — | | |
CAPITAL SHARE TRANSACTIONS | | | | | |
Proceeds from sale of shares | 586,063 | | 269,623 | | |
Proceeds from reinvestment of distributions | 64 | | — | | |
Redemption fees | 138 | | 35 | | |
Redemption of shares | (154,332 | ) | (151,500 | ) | |
Net increase from capital share transactions | 431,933 | | 118,158 | | |
TOTAL INCREASE IN NET ASSETS | 492,131 | | 163,100 | | |
NET ASSETS | | | | | |
Beginning of period | 379,328 | | 216,228 | | |
End of period | $871,459 | | $379,328 | | |
Accumulated net investment gain (loss) | 352 | | (135 | ) | |
TRANSACTIONS IN SHARES | | | | | |
Shares sold | 42,721 | | 23,590 | | |
Shares issued in reinvestment of distributions | 5 | | — | | |
Shares redeemed | (11,411 | ) | (13,372 | ) | |
| | | | | |
Net increase | 31,315 | | 10,218 | | |
See notes to financial statements.
26
FINANCIAL HIGHLIGHTS
| Year | Year | Year | Year | Year |
For a Fund Share Outstanding | Ended | Ended | Ended | Ended | Ended |
Throughout the Period. | 9/30/06 | 9/30/05 | 9/30/04 | 9/30/03 | 9/30/02 |
NET ASSET VALUE, BEGINNING OF PERIOD | $12.07 | | $10.20 | | $8.74 | | $6.54 | | $6.26 | | |
INCOME FROM INVESTMENT OPERATIONS | | | | | | | | | | | |
Net investment gain (loss) | 0.02 | | (0.01 | ) | (0.04 | ) | (0.04 | ) | (0.08 | ) | |
Net realized and unrealized | | | | | | | | | | | |
gains on investments | 1.80 | | 1.88 | | 1.50 | | 2.23 | | 0.36 | | |
Total from investment operations | 1.82 | | 1.87 | | 1.46 | | 2.19 | | 0.28 | | |
DISTRIBUTIONS & OTHER | | | | | | | | | | | |
Net investment income | — | (1) | — | | — | | — | | — | | |
Increase from payment by service provider | — | | — | | — | | 0.01 | | — | | |
Redemption fees [See Note 2(i)] | — | (1) | — | (1) | — | (1) | — | | — | | |
Total distributions & other | — | | — | | — | | 0.01 | | — | | |
NET ASSET VALUE, END OF PERIOD | $13.89 | | $12.07 | | $10.20 | | $8.74 | | $6.54 | | |
TOTAL RETURN | 15.10% | | 18.33% | | 16.70% | | 33.64% | | 4.47% | | |
SUPPLEMENTAL DATA AND RATIOS | | | | | | | | | | | |
Net assets, end of period (000s) | $871,459 | | $379,328 | | $216,228 | | $104,038 | | $56,021 | | |
Ratio of expenses to average net assets, less | | | | | | | | | | | |
waivers and before expenses paid indirectly, plus | | | | | | | | | | | |
reimbursements of previously waived expenses | 1.33% | | 1.39% | | 1.50% | | 1.55% | (3) | 1.50% | | |
Ratio of net investment gain (loss) to average net assets, | | | | | | | | | | | |
net of waivers, expenses paid indirectly and | | | | | | | | | | | |
reimbursements of previously waived expenses | 0.20% | | (0.19)% | | (0.48)% | | (1.05)% | | (0.89)% | | |
Ratio of expenses to average net assets, before | | | | | | | | | | | |
waivers, expenses paid indirectly and | | | | | | | | | | | |
reimbursements of previously waived expenses | 1.33% | | 1.36% | | 1.44% | | 1.65% | | 1.60% | | |
Ratio of net investment gain (loss) to average net assets, | | | | | | | | | | | |
before waivers, expenses paid indirectly and | | | | | | | | | | | |
reimbursements of previously waived expenses | 0.20% | | (0.22)% | | (0.42)% | | (1.15)% | | (0.99)% | | |
Portfolio turnover rate(2) | 136% | | 175% | | 191% | | 236% | | 388% | | |
| | | | | | | | | | | | |
| (2) | Portfolio turnover is greater than most funds due to the investment style of the Fund. |
| (3) | See Note 3 for information regarding the voluntary fee waiver. |
See notes to financial statements.
27
MARSICO INTERNATIONAL OPPORTUNITIES FUND
INVESTMENT REVIEW BY JIM GENDELMAN (UNAUDITED)
The International Opportunities Fund outperformed its primary benchmark Index with a (US$) total return of 22.46% for the one-year period ended September 30, 2006. For comparative purposes, the MSCI EAFE Index (“EAFE Index”), which we consider to be the Fund’s primary benchmark Index, had a total one-year (US$) return of 19.16% for the same time period. Please see the Fund Overview for more detailed information about the Fund’s longer-term performance for various periods ended September 30, 2006.
The performance data for the Fund quoted here represent past performance, and past performance is not a guarantee of future results. Investment return and principal value of an investment will fluctuate so that an investor’s shares, when redeemed, may be worth more or less than their original cost. Current performance may be lower or higher than the performance information quoted. To obtain performance information current to the most recent month-end, please call 888-860-8686 or visit www.marsicofunds.com.(1)
International equity performance in developed markets was, once again, solid during the fiscal year ended September 30, 2006. Japan, although experiencing some weakness during the second half of the reporting period, rose 13%. Australia gained 14%. Europe, which comprised more than half of the EAFE Index as of September 30, 2006, was strong across the board, as highlighted below:
| % of EAFE Index | Price Return |
Country | 9/30/06 | 9/30/05-9/30/06 |
| | |
United Kingdom | 24% | 19% |
France | 10% | 22% |
Switzerland | 7% | 28% |
Germany | 7% | 25% |
Spain | 4% | 27% |
Italy | 4% | 19% |
Within the EAFE Index, economic sector strength abounded. Eight sectors posted gains of 15% or more, led by Utilities (+33%), Financials (+27%), Materials (+24%), and Consumer Staples (+22%). Energy, which edged lower by -0.1%, was the only sector to be in negative territory. A similar story of widespread strength unfolded at the industry level. With the exception of Energy-related industry groups, there were no negative returns within the benchmark Index, and gains of 20% or more were commonplace. The top-performing areas included: Diversified Financials (+32%), Real Estate (+31%), Household & Personal Products (+31%), and Insurance (+29%).
Currency fluctuations were quite significant throughout the fiscal year. The US dollar, which had strengthened considerably during calendar year 2005, especially during the fourth quarter of that year (which was part of the Fund’s 2006 fiscal year), experienced a significant valuation retracement compared to some world currencies in the first half of calendar year 2006 before stabilizing. For the reporting period as a whole, the dollar weakened, as demonstrated by the EAFE Index’s total 12-month return of (US$) 19.16% and comparing it to the EAFE “local” return of 16.54%. For dollar-based investors, currency “translation” had a positive performance impact of about 2.6 percentage points.
You should keep in mind that our views on all investments discussed in this report are subject to change at any time and references to specific securities, industries, and sectors discussed in this report are not recommendations to purchase or sell the securities, and that the Fund may not necessarily hold these securities today. Please see the accompanying Schedule of Investments for the percentage of the Fund’s portfolio represented by the securities or industries mentioned in this report.
Several of the key performance “drivers” for the International Opportunities Fund during the reporting period included:
| • | Telecommunications Services: America Movil SA, a Mexico-headquartered provider of mobile communications services in Latin America, gained 54%. |
| • | Consumer Discretionary: The Fund’s holdings in this sector gained 28% in aggregate. More specifically, a variety of positions encompassing several industries within the sector buoyed performance. These included Automobiles & Components (e.g., Continental AG, Toyota Motor Corp.), Consumer Services (e.g., |
28
Shangri-La Asia Ltd., Enterprise Inns plc), and Retailing (e.g., Carphone Warehouse plc, Yamada Denki Co., Ltd.).
| • | Capital Goods: Vallourec SA, a France-based manufacturer of carbon steel and alloy tubes, surged 117%. ABB Limited, a Switzerland-based provider of power and automation technologies, gained 23%. |
| • | Real Estate: The Fund had positions in three real estate management and development companies – Sumitomo Realty & Development (Japan), Capitaland (Singapore), and LeoPalace 21 Corporation (Japan) – that posted robust gains during the reporting period. Sumitomo Realty & Development increased 99%, Capitaland gained 77%, and LeoPalace 21 rose 35% prior to being sold. |
| • | Energy: Although energy-related stock performance on the whole was relatively subdued (as measured by the EAFE Index’s fiscal year sector return), we were fortunate to experience good results in several of our Energy holdings. These included Brazilian-based oil company Petroleo Brasileiro (+23% prior to being sold) and Acergy S.A. (formerly Stolt Offshore S.A.), a British offshore engineering and construction contractor for the oil and gas industry (which gained 47%). These gains more than offset weakness in British Petroleum (sometimes referred to as “BP”), which declined -13%, at least part of which seemed attributable to a significant supply disruption in Prudhoe Bay, Alaska. An underweighted posture, on average, in the sector also benefited the Fund’s performance since – as mentioned above – Energy was the sole sector in the Fund’s benchmark Index that did not have a positive return in the reporting period. |
| • | Pharmaceuticals & Biotechnology: Several of the Fund’s holdings in this industry group generated strong returns. These include Roche Holdings AG (+25%), CSL Limited (+39%), an Australian-headquartered biotechnology company, and Chugai Pharmaceutical Co., Ltd. (+13% prior to being sold), a Tokyo-based drug company focused on prescription medicines for central nervous, cardiovascular, respiratory, gastrointestinal and metabolic systems. |
There were some interesting performance-related aspects in the Financials sector. The Fund’s financial-related positions, overall, posted a very strong return of 29% in aggregate. That performance was highlighted, as noted above, by major gains in several of the Fund’s real estate-related holdings. Remarkably, however, in relation to the EAFE Index’s sector and industry performance, the Fund’s financial holdings were somewhat mixed performance-wise. The Fund’s positions in Banks and Diversified Financials rose 14% and 29%, respectively, during the reporting period. In most periods, those would be considered stellar results. However, the benchmark Index’s industry returns were even better: +25% in Banks and +32% in Diversified Financials. As a result, while the Fund experienced significant gains in many of its financial-related investments, in several cases those results were outpaced by the benchmark Index. As of September 30, 2006, over 30% of the EAFE Index was comprised of financial companies, so the sector’s performance had a significant influence on the overall Index return during the fiscal year.
Country allocation, on balance, contributed positively to the Fund’s investment results. That was primarily due to the fact that the Fund had investments in several “emerging market” countries – including Brazil, Mexico, and India – that performed well. In addition, an underweighted posture in Japan and an overweighted posture in Switzerland (as compared to the EAFE Index) aided performance. All that said, we should note that country weightings typically are a residual of the Fund’s “bottom-up” stock selection process.
There were several areas that did negatively impact investment results:
| • | Food & Staples Retailing: Seiyu, a Japan-based food retailer, skidded -29%. |
| • | Technology Hardware & Equipment: Ericsson, the Stockholm-headquartered supplier of systems and services for mobile and fixed line communications and network operators, had an adverse impact on the Fund’s performance, declining -6%. |
29
MARSICO INTERNATIONAL OPPORTUNITIES FUND
| • | Consumer Durables & Apparel: The Fund’s positions in two Japanese-headquartered companies hurt performance in relation to the Fund’s benchmark Index. Sega Sammy Holdings, a manufacturer of amusement and game machines, declined -9%. Misawa Homes Holdings, a homebuilder, edged lower by -1% prior to being sold. |
For the complete fiscal year ended September 30, 2006, fluctuations in currency exchange rates did not have a material impact on the Fund’s return. At times during the fiscal year, however, currency was a significant factor. In the fourth quarter of 2005, for example, the Fund had a significant number of US dollar-related positions, which included some holdings that trade in dollars or were denominated in a currency that tends to correlate highly with the US dollar (e.g., the Mexican peso). As the dollar strengthened in relation to other major world currencies, the Fund’s performance was positively impacted. Later in the fiscal year, however, the dollar tended to weaken, which had a marginal adverse impact for the Fund’s
dollar-related positions.
The International Opportunities Fund has tended to have a relatively high portfolio turnover level due to its investment style. Although the Fund may hold core positions for some time, it may change its portfolio composition quickly to take advantage of new opportunities, or to address issues affecting particular holdings.
FISCAL YEAR-END INVESTMENT POSTURE
As of September 30, 2006, the Fund’s holdings, in terms of economic sector distribution, were allocated primarily to Financials, Consumer Discretionary, Consumer Staples, Industrials, and Materials. The Fund’s largest country-level allocations were in Switzerland, Japan, United Kingdom and France.
Sincerely,
JAMES G. GENDELMAN
PORTFOLIO MANAGER
(1) | Total returns are based on net change in NAV assuming reinvestment of distributions. For the period prior to September 30, 2004, the performance returns for the International Opportunities Fund reflect a fee waiver in effect; in the absence of such a waiver, the returns would have been reduced. For the period beginning October 1, 2004 through December 2005, performance returns for the International Opportunities Fund would have been higher but for the reimbursement of fees waived previously. A redemption fee of 2% may be imposed on redemptions or exchanges of Fund shares owned for 30 days or less. Please see the prospectus for more information. |
The MSCI EAFE Index tracks the stocks of about 1,000 companies in Europe, Australasia, and the Far East (together referred to as “EAFE”). You cannot invest directly in an index. Foreign investments present additional risks due to currency fluctuations, economic and political factors, lower liquidity, government regulations, differences in securities regulations and accounting standards, possible changes in taxation, limited public information and other factors.
30
FUND OVERVIEW SEPTEMBER 30, 2006
The International Opportunities Fund invests primarily in common stocks of foreign companies that are selected for their long-term growth potential. The Fund may invest in companies of any size throughout the world. It normally invests in the securities of issuers that are economically tied to one or more foreign countries, and expects to be invested in various issuers or securities that together have ties to at least four different foreign countries. Some issuers or securities in the Fund’s portfolio may be based in or economically tied to the United States. The Fund will normally hold a core position of between 35 and 50 common stocks.
PERFORMANCE COMPARISON
| One Year | Five Year Average Annual | Average Annual Since Inception |
| (10/1/05–9/30/06) | (10/1/01–9/30/06) | (6/30/00–9/30/06) |
Marsico International Opportunities Fund | 22.46%(1) | 18.64%(1) | 8.32%(1) |
Morgan Stanley Capital International EAFE Index | 19.16% | 14.26% | 4.02% |
GROWTH OF $10,000(1)(2)
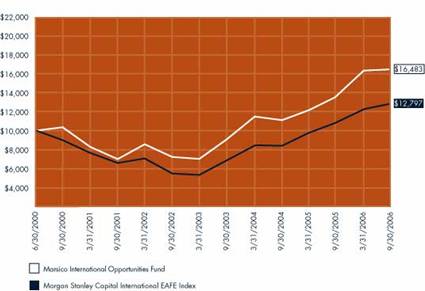
| | Int’l | | MS |
| | Opportunities | | EAFE |
| | | | |
30-Jun-00 | | | | |
31-Mar-00 | | | | |
30-Sep-00 | | 10,360 | | 9,193 |
31-Mar-01 | | 8,283 | | 7,720 |
30-Sep-01 | | 7,011 | | 6,570 |
31-Mar-02 | | 8,542 | | 7,064 |
30-Sep-02 | | 7,248 | | 5,550 |
31-Mar-03 | | 7,040 | | 5,422 |
30-Sep-03 | | 9,101 | | 6,993 |
31-Mar-04 | | 11,493 | | 8,542 |
30-Sep-04 | | 11,006 | | 8,537 |
31-Mar-05 | | 12,072 | | 9,829 |
30-Sep-05 | | 13,460 | | 10,739 |
31-Mar-06 | | 16,295 | | 12,228 |
NET ASSETS | |
9/30/06 | $571,683,895 |
NET ASSET VALUE | |
Net Asset Value Per Share | $15.81 |
TOP FIVE HOLDINGS
UBS AG | 4.31 | % |
Roche Holding AG | 4.15 | |
Syngenta AG | 3.92 | |
Continental AG | 3.43 | |
BAE Systems plc | 3.22 | |
SECTOR ALLOCATION(3)
Financials | 27.30 | % |
Consumer Non-Cyclical | 17.28 | |
Industrials | 16.47 | |
Consumer Cyclical | 15.27 | |
Communications | 6.97 | |
Basic Materials | 6.72 | |
Energy | 3.44 | |
Utilities | 3.33 | |
Diversified | 2.52 | |
Technology | 0.70 | |
The performance included in the table and graph do not reflect the deduction of taxes on Fund distributions or the redemption of Fund shares.
The performance data quoted here represent past performance, and past performance is not a guarantee of future results. Investment return and principal value of an investment will fluctuate so that an investor’s shares, when redeemed, may be worth more or less than their original cost. Current performance may be lower or higher than the performance information quoted. To obtain performance information current to the most recent month-end, please call 888-860-8686 or visit www.marsicofunds.com. A redemption fee may be imposed on redemptions or exchanges of Fund shares owned for 30 days or less.
| (1) | The performance returns for the International Opportunities Fund (for the period prior to September 30, 2004) reflect a fee waiver in effect; in the absence of such a waiver, the returns would be reduced. For the period beginning October 1, 2004 through December 2005, performance returns for the International Opportunities Fund would be higher but for the reimbursement of fees waived previously. |
| (2) | This chart assumes an initial investment of $10,000 made on June 30, 2000 (inception). Total returns are based on net change in NAV, assuming reinvestment of distributions. |
| (3) | Sector weightings represent the percentage of the Fund’s equity investments in certain general sectors. These sectors may include more than one industry. The Fund’s portfolio composition is subject to change at any time. |
The Morgan Stanley Capital International EAFE Index tracks the stocks of about 1,000 companies in Europe, Australasia, and the Far East (EAFE). You cannot invest directly in an index.
31
MARSICO INTERNATIONAL OPPORTUNITIES FUND
SCHEDULE OF INVESTMENTS SEPTEMBER 30, 2006
| Number | | Percent |
| of | | of Net |
| Shares | Value | Assets |
COMMON STOCKS
Advertising Services | | | | |
JC Decaux S.A. | 204,419 | $5,529,027 | 0.97 | % |
Aerospace/Defense | | | | |
BAE Systems plc | 2,486,132 | 18,398,535 | 3.22 | |
Agricultural Chemicals | | | | |
Syngenta AG | 148,446 | 22,389,472 | 3.92 | |
Automotive - Cars/Light Trucks | | | | |
Toyota Motor Corporation | 215,800 | 11,728,559 | 2.05 | |
Beverages - Wine/Spirits | | | | |
Diageo PLC | 942,592 | 16,651,480 | 2.91 | |
Building Products - | | | | |
Air & Heating | | | | |
Daikin Industries Ltd. | 137,973 | 4,088,089 | 0.72 | |
Building Products - | | | | |
Cement/Aggregates | | | | |
Cemex S.A. de C.V. ADR | 417,947 | 12,571,846 | 2.20 | |
Cellular Telecommunications | | | | |
America Movil S.A. | | | | |
de C.V. ADR | 397,082 | 15,633,118 | 2.73 | |
Chemicals - Specialty | | | | |
Lonza Group AG | 211,144 | 14,622,792 | 2.56 | |
Commercial Banks - Non-US | | | | |
Banca Intesa S.p.A. | 1,319,250 | 8,682,226 | 1.52 | |
Erste Bank der | | | | |
oesterreichischen | | | | |
Sparkassen AG | 89,883 | 5,596,232 | 0.98 | |
ICICI Bank Ltd. Spon. ADR | 189,654 | 5,824,274 | 1.02 | |
Mitsui Trust Holdings, Inc. | 650,000 | 7,395,556 | 1.29 | |
Sanpaolo Imi S.p.A. | 396,485 | 8,371,005 | 1.46 | |
Unibanco Holdings S.A. ADR | 118,227 | 8,748,798 | 1.53 | |
| | 44,618,091 | 7.80 | |
Distribution/Wholesale | | | | |
Esprit Holdings, Ltd. | 1,462,500 | 13,262,773 | 2.32 | |
Diversified Operations | | | | |
LVMH Moet Hennessy | | | | |
Louis Vuitton SA | 134,954 | 13,904,192 | 2.43 | |
Electronic Components – | | | | |
Miscellaneous | | | | |
Nippon Electric | | | | |
Glass Co., Ltd. | 415,000 | 9,151,958 | 1.60 | |
| | | | |
| of | | of Net |
| Shares | Value | Assets |
COMMON STOCKS continued | | | | |
Electronic Components - | | | | |
Semiconductors | | | | |
Samsung Electronics | | | | |
Co., Ltd. | 24,470 | $17,171,022 | 3.00 | % |
Electronic Measuring | | | | |
Instruments | | | | |
Advantest Corporation | 65,400 | 3,244,394 | 0.57 | |
Engineering/R&D Services | | | | |
ABB Ltd. | 730,848 | 9,614,499 | 1.68 | |
Finance - Credit Card | | | | |
Credit Saison Co., Ltd. | 239,100 | 10,080,152 | 1.76 | |
Finance - Investment | | | | |
Banker/Broker | | | | |
Macquarie Bank, Ltd. | 97,982 | 5,049,746 | 0.88 | |
Nomura Holdings, Inc. | 184,900 | 3,255,805 | 0.57 | |
UBS AG | 411,343 | 24,605,907 | 4.31 | |
| | 32,911,458 | 5.76 | |
Finance - Multi-line Insurance | | | | |
ING Groep N.V. | 192,308 | 8,459,375 | 1.48 | |
Finance - Other Services | | | | |
Man Group PLC | 1,387,978 | 11,642,541 | 2.04 | |
Food - Miscellaneous/Diversified | | | | |
Nestle S.A. | 43,489 | 15,163,504 | 2.65 | |
Food - Retail | | | | |
Tesco PLC | 1,589,054 | 10,710,958 | 1.87 | |
Hotels & Motels | | | | |
Shangri-La Asia Ltd. | 3,915,003 | 8,643,445 | 1.51 | |
Import/Export | | | | |
Marubeni Corporation | 1,856,000 | 9,238,756 | 1.62 | |
Leisure & Recreation Products | | | | |
Sega Sammy Holdings, Inc. | 340,952 | 10,968,191 | 1.92 | |
Medical - Drugs | | | | |
CSL Ltd. | 149,869 | 6,035,007 | 1.06 | |
Roche Holding AG | 137,264 | 23,732,638 | 4.15 | |
| | 29,767,645 | 5.21 | |
Money Center Banks | | | | |
DBS Group Holdings Ltd. | 1,192,000 | 14,409,822 | 2.52 | |
Mortgage Banks | | | | |
Hypo Real Estate | | | | |
Holding AG | 164,177 | 10,242,690 | 1.79 | |
Oil - Field Services | | | | |
Acergy S.A.* | 464,265 | 7,931,472 | 1.39 | |
See notes to financial statements.
SCHEDULE OF INVESTMENTS SEPTEMBER 30, 2006
| Number | | Percent |
| of | | of Net |
| Shares | Value | Assets |
COMMON STOCKS continued
Oil Companies - | | | | |
Exploration & Production | | | | |
CNOOC Ltd. ADR | 66,759 | $5,560,357 | 0.97 | % |
Oil Companies - Integrated | | | | |
BP PLC | 497,389 | 5,420,088 | 0.95 | |
Real Estate | | | | |
Operating/Development | | | | |
Capitaland Ltd. | 1,794,000 | 5,704,203 | 1.00 | |
Gafisa S/A* | 254,391 | 3,281,823 | 0.57 | |
Sumitomo Realty & | | | | |
Development Co., Ltd. | 308,000 | 9,047,703 | 1.58 | |
| | 18,033,729 | 3.15 | |
Retail - Consumer Electronics | | | | |
The Carphone Warehouse | | | | |
Group PLC | 1,037,119 | 5,966,335 | 1.04 | |
Yamada Denki Company Ltd. | 85,000 | 8,519,789 | 1.49 | |
| | 14,486,124 | 2.53 | |
Retail - Drug Stores | | | | |
Shoppers Drug Mart | | | | |
Corporation | 256,855 | 10,492,507 | 1.84 | |
Retail - Miscellaneous/Diversified | | | | |
The Seiyu Ltd.* | 1,301,000 | 2,158,696 | 0.38 | |
Rubber - Tires | | | | |
Continental AG | 169,093 | 19,606,427 | 3.43 | |
Semiconductors | | | | |
Components/Integrated Circuits | | | | |
Taiwan Semiconductor | | | | |
Manufacturing Co., Ltd. | 403,067 | 3,869,443 | 0.68 | |
Soap & Cleaning Preparations | | | | |
Reckitt Benckiser PLC | 299,718 | 12,424,463 | 2.17 | |
Steel Pipe & Tube | | | | |
Vallourec S.A. | 46,300 | 10,796,906 | 1.89 | |
Transportation - Rail | | | | |
Canadian National | | | | |
Railway Co. | 136,129 | 5,709,250 | 1.00 | |
Water | | | | |
Veolia Environment | 304,067 | 18,357,101 | 3.21 | |
Wireless Equipment | | | | |
Ericsson (LM) Tel-SP ADR | 327,486 | 11,281,893 | 1.97 | |
Total Common Stocks | | | | |
(cost $466,318,810) | | 550,946,840 | 96.37 | |
| Number | | Percent |
| of | | of Net |
| Shares | Value | Assets |
SSgA Prime Money | | | | |
Market Fund, 5.17% | 15,353,638 | $15,353,638 | 2.69 | |
SSgA Money Market | | | | |
Fund, 4.99% | 1 | 1 | 0.00 | |
Total Short-Term Investments | | | | |
(cost $15,353,639) | | 15,353,639 | 2.69 | |
Total Investments | | | | |
(cost $481,672,449) | | 566,300,479 | 99.06 | |
Cash and Other | | | | |
Assets Less Liabilities | | 5,383,416 | 0.94 | |
NET ASSETS | | $571,683,895 | 100.00 | % |
| SUMMARY OF INVESTMENTS BY COUNTRY |
| | Percent |
| | of |
| Market | Investment |
Country | Value | Securities |
Australia | $11,084,752 | 2.0 | % |
Austria | 5,596,232 | 1.0 | |
Brazil | 12,030,621 | 2.1 | |
Canada | 16,201,757 | 2.9 | |
France | 48,587,226 | 8.6 | |
Germany | 29,849,118 | 5.3 | |
Hong Kong | 27,466,575 | 4.8 | |
India | 5,824,274 | 1.0 | |
Italy | 17,053,231 | 3.0 | |
Japan | 88,877,647 | 15.7 | |
Mexico | 28,204,964 | 5.0 | |
Netherlands | 8,459,375 | 1.5 | |
Singapore | 20,114,025 | 3.6 | |
South Korea | 17,171,022 | 3.0 | |
Sweden | 11,281,893 | 2.0 | |
Switzerland | 110,128,812 | 19.4 | |
Taiwan | 3,869,443 | 0.7 | |
United Kingdom | 89,145,873 | 15.7 | |
United States(1) | 15,353,639 | 2.7 | |
Total | $566,300,479 | 100.0 | % |
| (1) | Includes short-term securities. |
See notes to financial statements.
33
MARSICO INTERNATIONAL OPPORTUNITIES FUND
STATEMENT OF ASSETS AND LIABILITIES
SEPTEMBER 30, 2006
(Amounts in thousands)
ASSETS
Investments, at value (cost $481,672) | $566,300 |
Cash | 16 |
Receivable for investments sold | 5,003 |
Receivable for capital stock sold | 880 |
Interest and dividends receivable | 1,165 |
Prepaid expenses and other assets | 206 |
Total Assets | 573,570 |
LIABILITIES | |
Payable for investments purchased | 664 |
Payable for capital stock redeemed | 294 |
Accrued investment advisory fee | 393 |
Accrued distribution fee | 155 |
Accrued trustees’ fees | 237 |
Accrued expenses and other liabilities | 143 |
Total Liabilities | 1,886 |
NET ASSETS | $571,684 |
NET ASSETS CONSIST OF | |
Paid-in-capital | $467,635 |
Accumulated net investment income | 891 |
Accumulated net realized gain on investments | |
and foreign currency transactions | 18,470 |
Net unrealized appreciation on investments | 84,688 |
NET ASSETS | $571,684 |
SHARES OUTSTANDING, $0.001 par value | |
(Unlimited shares authorized) | 36,170 |
NET ASSET VALUE, REDEMPTION PRICE, | |
AND OFFERING PRICE PER SHARE | |
(NET ASSETS/SHARES OUTSTANDING)* | $15.81 |
STATEMENT OF OPERATIONS
FOR THE YEAR ENDED SEPTEMBER 30, 2006
(Amounts in thousands)
INVESTMENT INCOME
Interest | $805 | |
Dividends (net of $564 of non-reclaimable | | |
foreign withholding taxes) | 6,642 | |
Total Investment Income | 7,447 | |
EXPENSES | | |
Investment advisory fees | 3,586 | |
Distribution fees | 1,055 | |
Transfer agent fees and expenses | 455 | |
Custody and fund accounting fees | 416 | |
Fund administration fees | 177 | |
Federal and state registration fees | 101 | |
Printing and postage expenses | 82 | |
Trustees’ fees and expenses | 41 | |
Professional fees | 29 | |
Miscellaneous | 17 | |
Total expenses | 5,959 | |
Recovery of previously waived expenses | 101 | |
Less expenses paid indirectly | (1 | ) |
Net Expenses | 6,059 | |
NET INVESTMENT INCOME | 1,388 | |
REALIZED AND UNREALIZED GAIN | | |
Net realized gain on investments | 22,905 | |
Net realized loss on foreign | | |
currency transactions | (832 | ) |
Change in unrealized appreciation/ | | |
depreciation on investments and | | |
foreign currency translations | 43,922 | |
Net Gain on Investments | 65,995 | |
NET INCREASE IN NET ASSETS | | |
RESULTING FROM OPERATIONS | $67,383 | |
See notes to financial statements.
34
STATEMENTS OF CHANGES IN NET ASSETS
| Year | Year |
| Ended | Ended |
| 9/30/06 | 9/30/05 |
(Amounts in thousands)
OPERATIONS
Net investment income | $1,388 | | $2,216 | |
Net realized gain on investments | 22,905 | | 4,461 | |
Net realized loss on foreign currency transactions | (832 | ) | (1,206 | ) |
Change in unrealized appreciation/depreciation | | | | |
on investments and foreign currency translations | 43,922 | | 30,413 | |
Net increase in net assets resulting from operations | 67,383 | | 35,884 | |
DISTRIBUTIONS | | | | |
Net investment income | (2,078 | ) | — | |
Total distributions | (2,078 | ) | — | |
CAPITAL SHARE TRANSACTIONS | | | | |
Proceeds from sale of shares | 349,169 | | 165,245 | |
Proceeds from reinvestment of distributions | 1,980 | | — | |
Redemption fees | 73 | | 11 | |
Redemption of shares | (107,365 | ) | (44,780 | ) |
Net increase from capital share transactions | 243,857 | | 120,476 | |
TOTAL INCREASE IN NET ASSETS | 309,162 | | 156,360 | |
NET ASSETS | | | | |
Beginning of period | 262,522 | | 106,162 | |
End of period | $571,684 | | $262,522 | |
Accumulated net investment income | 891 | | 1,824 | |
TRANSACTIONS IN SHARES | | | | |
Shares sold | 23,164 | | 14,012 | |
Shares issued in reinvestment of distributions | 141 | | — | |
Shares redeemed | (7,322 | ) | (3,810 | ) |
Net increase | 15,983 | | 10,202 | |
35
See notes to financial statements.
FINANCIAL HIGHLIGHTS
| Year | Year | Year | Year | Year |
For a Fund Share Outstanding | Ended | Ended | Ended | Ended | Ended |
Throughout the Period. | 9/30/06 | 9/30/05 | 9/30/04 | 9/30/03 | 9/30/02 |
NET ASSET VALUE, BEGINNING OF PERIOD | $13.00 | | $10.63 | | $8.80 | | $7.00 | | $6.78 | |
INCOME FROM INVESTMENT OPERATIONS | | | | | | | | | | |
Net investment income (loss) | 0.04 | | 0.12 | | 0.04 | | 0.02 | | (0.02 | ) |
Net realized and unrealized | | | | | | | | | | |
gains on investments | 2.87 | | 2.25 | | 1.79 | | 1.78 | | 0.19 | |
Total from investment operations | 2.91 | | 2.37 | | 1.83 | | 1.80 | | 0.17 | |
DISTRIBUTIONS & OTHER | | | | | | | | | | |
Net investment income | (0.10 | ) | — | | — | | — | | (0.01 | ) |
Net realized gains | — | | — | | — | | — | | — | |
Redemption fees [See Note 2(i)] | — | (1) | — | (1) | — | (1) | — | (1) | 0.05 | |
Payment by affiliate | — | | — | | — | | — | | 0.01 | |
Total distributions & other | (0.10 | ) | — | | — | | — | | 0.05 | |
NET ASSET VALUE, END OF PERIOD | $15.81 | | $13.00 | | $10.63 | | $8.80 | | $7.00 | |
TOTAL RETURN | 22.46% | | 22.30% | | 20.80% | | 25.71% | | 3.37% | |
SUPPLEMENTAL DATA AND RATIOS | | | | | | | | | | |
Net assets, end of period (000s) | $571,684 | | $262,522 | | $106,162 | | $28,409 | | $20,632 | |
Ratio of expenses to average net assets, | | | | | | | | | | |
less waivers and before expenses paid | | | | | | | | | | |
indirectly, plus reimbursements of previously | | | | | | | | | | |
waived expenses | 1.44% | | 1.60% | | 1.60% | | 1.68% | (3) | 1.60% | |
Ratio of net investment income (loss) to | | | | | | | | | | |
average net assets, net of waivers, expenses | | | | | | | | | | |
paid indirectly and reimbursements of | | | | | | | | | | |
previously waived expenses | 0.33% | | 1.19% | | 0.07% | | 0.18% | | (0.25)% | |
Ratio of expenses to average net assets, | | | | | | | | | | |
before waivers, expenses paid indirectly and | | | | | | | | | | |
reimbursements of previously waived expenses | 1.41% | | 1.49% | | 1.68% | | 2.31% | | 2.07% | |
Ratio of net investment income (loss) to average | | | | | | | | | | |
net assets, before waivers, expenses paid | | | | | | | | | | |
indirectly and reimbursements of previously | | | | | | | | | | |
waived expenses | 0.36% | | 1.30% | | 0.00% | | (0.45)% | | (0.73)% | |
Portfolio turnover rate(2) | 101% | | 156% | | 105% | | 211% | | 192% | |
| | | | | | | | | | | |
| (2) | Portfolio turnover is greater than most funds due to the investment style of the Fund. |
| (3) | See Note 3 for information regarding the voluntary fee waiver. |
See notes to financial statements.
36
MARSICO FUNDS
NOTES TO FINANCIAL STATEMENTS SEPTEMBER 30, 2006
The Marsico Investment Fund (the “Trust”) was organized on October 1, 1997, as a Delaware Statutory Trust and is registered under the Investment Company Act of 1940 (the “1940 Act”) as an open-end management investment company. The Focus Fund, the Growth Fund, the 21st Century Fund and the International Opportunities Fund (collectively, the “Funds”) are separate investment portfolios of the Trust. The Focus Fund is a non-diversified fund and the Growth Fund, the 21st Century Fund and the International Opportunities Fund are diversified funds. The Focus and Growth Funds commenced operations on December 31, 1997, the 21st Century Fund commenced operations on February 1, 2000 and the International Opportunities Fund commenced operations on June 30, 2000. Affiliates of the Adviser hold approximately 5% of the International Opportunities Fund as of September 30, 2006.
2. | Significant Accounting Policies |
The following is a summary of significant accounting policies consistently followed by the Funds in the preparation of their financial statements. These policies are in conformity with generally accepted accounting principles (“GAAP”) for investment companies. The presentation of financial statements in conformity with GAAP requires management to make estimates and assumptions that affect the reported amounts of assets and liabilities at the date of the financial statements and the reported amounts of income and expenses during the reporting period. Actual results could differ from those estimates. Certain prior year information has been reformatted to conform to the current year presentation.
| (a) | Investment Valuation—A security traded on a recognized stock exchange is valued at the last sale price prior to the closing of the principal exchange on which the security is traded. Securities traded on NASDAQ generally will be valued at the NASDAQ Official Closing Price. If no sale is reported on the valuation date, the most current bid price will generally be used. All other securities for which over-the-counter market quotations are readily available are valued at the last sale price. Debt securities that will mature in more than 60 days are generally valued at their bid prices furnished by a pricing service. Debt securities that will mature in 60 days or less are valued at amortized cost, if it approximates market value. Any securities for which market quotations are not readily available are valued at their fair value as determined in good faith by the Adviser in accordance with procedures established by, and under the general supervision of, the Funds’ Board of Trustees. The Funds may use pricing services to assist in determining market value. The Board of Trustees has authorized the use of a pricing service to assist the Funds in valuing certain equity securities listed or traded on foreign security exchanges in the Funds’ portfolios in certain circumstances where there is a significant change in the value of related U.S.-traded securities, as represented by the S&P 500 Index. |
| (b) | Expenses—The Funds are charged for those expenses that are directly attributable to each Fund, such as advisory and custodial fees. Expenses that are not directly attributable to a Fund are typically allocated among the Funds in proportion to their respective net assets. The Funds’ expenses may be reduced by voluntary advisory fee waivers, brokerage credits and uninvested cash balances earning interest or credits. Such credits are included in Waiver of Expenses and Expenses Paid Indirectly in the Statement of Operations. |
Brokerage commissions were paid to unaffiliated brokers which reduced certain transfer agent fees and expenses in the amount of $655,915 and $247,067 for the Focus Fund and Growth Fund, respectively, for the year ended September 30, 2006. Also, the Funds received credits on certain custody account balances which reduced certain transfer agent fees and expenses in the amount of $10,439, $5,766, $1,375 and $1,027 for the Focus Fund, Growth Fund, 21st Century Fund and International Opportunities Fund, respectively, for the year ended September 30, 2006. Brokerage commission credits and custody account earnings credits are included in Expenses Paid Indirectly on the Statements of Operations.
37
MARSICO FUNDS
NOTES TO FINANCIAL STATEMENTS SEPTEMBER 30, 2006 (continued)
| (c) | Federal Income Taxes—Each Fund intends to comply with the requirements of the Internal Revenue Code necessary to qualify as a regulated investment company and to make the requisite distributions of income to its shareholders which will be sufficient to relieve it from all or substantially all federal and state income and excise taxes. Certain Funds may utilize earnings and profits on redemption of shares as part of the dividends paid deduction. |
| (d) | Distributions to Shareholders—Dividends from net investment income and net realized capital gains, if any, will be declared and paid at least annually. Distributions to shareholders are recorded on the ex-dividend date. Each Fund may periodically make reclassifications among certain of its capital accounts as a result of the timing and characterization of certain income and capital gains determined in accordance with federal tax regulations, which may differ from GAAP. These reclassifications are due to differing treatment for items such as deferral of wash sales, foreign currency transactions, deferred trustees compensation, net operating losses and post-October capital losses. |
| (e) | Foreign Currency Translation—The accounting records of the Funds are maintained in U.S. dollars. Values of securities denominated in foreign currencies are translated into U.S. dollars at 4:00 p.m. ET. Amounts related to the purchase and sale of foreign securities and investment income are translated at the rates of exchange prevailing on the respective dates of such transactions. |
Reported realized gains on foreign currency transactions arise from sales of portfolio securities, forward currency contracts, currency gains or losses realized between the trade and settlement dates on securities transactions, the difference between the amounts of dividends, interest, and foreign withholding taxes recorded on the Funds’ books, and the U.S. dollar equivalent of the amounts actually received or paid.
The Funds do not isolate that portion of the results of operations resulting from changes in foreign exchange rates on investments from the fluctuations arising from changes in market prices of securities held at fiscal year-end. Net unrealized appreciation or depreciation on investments and foreign currency translations arise from changes in the value of assets and liabilities, including investments in securities at fiscal year-end, resulting from changes in the exchange rates and changes in market prices of securities held.
| (f) | Forward Currency Contracts and Futures Contracts—The Funds may enter into forward currency contracts to reduce their exposure to changes in foreign currency exchange rates on their foreign holdings and to lock in the U.S. dollar cost of firm purchase and sale commitments for securities denominated in foreign currencies. A forward currency contract is a commitment to purchase or sell a foreign currency at a future date at a negotiated forward rate. The gain or loss arising from the difference between the U.S. dollar cost of the original contract and the value of the foreign currency in U.S. dollars upon closing of such contract is included in net realized gain or loss from foreign currency transactions. |
Forward currency contracts held by the Funds are fully collateralized by other securities. If held by the Funds, such collateral would be in the possession of the Funds’ custodian. The collateral would be evaluated daily to ensure its market value equals or exceeds the current market value of the corresponding forward currency contracts.
Futures contracts are marked to market daily and the resultant variation margin is recorded as an unrealized gain or loss. When a contract is closed, a realized gain or loss is recorded equal to the difference between the opening and closing value of the contract. Generally, open forward and futures contracts are marked to market (i.e., treated as realized and subject to distribution) for federal income tax purposes at fiscal year-end.
Foreign-denominated assets and forward currency contracts may involve more risks than domestic transactions, including currency risk, political and economic risk, regulatory risk and market risk. Risks may arise from the potential inability of a
38
counterparty to meet the terms of a contract and from unanticipated movements in the value of foreign currencies relative to the U.S. dollar.
The Funds may enter into “futures contracts” and “options” on securities, financial indexes and foreign currencies, forward contracts, and interest rate swaps and swap-related products. The Funds intend to use such derivative instruments primarily to hedge or protect from adverse movements in securities prices, currency rates or interest rates. The use of futures contracts and options may involve risks such as the possibility of illiquid markets or imperfect correlation between the value of the contracts and the underlying securities, or that the counterparty will fail to perform its obligations. There were no outstanding futures, options, or forward currency contracts open as of September 30, 2006.
| (g) | Options Contracts—The Funds may purchase and write (sell) put and call options on foreign and domestic stock indices, foreign currencies and U.S. and foreign securities that are traded on U.S. and foreign securities exchanges and over-the-counter markets. These transactions are for hedging purposes or for the purpose of earning additional income. In addition, the Funds may enter into such transactions for cross-hedging purposes. |
The risk associated with purchasing an option is that the Fund pays a premium whether or not the option is exercised. Additionally, the Fund bears the risk of loss of premium and change in market value should the counterparty not perform under the contract. Put and call options purchased are accounted for in the same manner as portfolio securities. The cost of securities acquired through the exercise of call options is increased by premiums paid. The proceeds from securities sold through the exercise of put options are decreased by the premiums paid.
When the Fund writes an option, the premium received by the Fund is recorded as a liability and is subsequently adjusted to the current market value of the option written. Premiums received from writing options that expire are recorded by the Fund on the expiration date as realized gains from option transactions. The difference between the premium and the amount paid on effecting a closing purchase transaction, including brokerage commissions, is also treated as a realized gain, or if the premium is less than the amount paid for the closing purchase transaction, as a realized loss. If a call option is exercised, the premium is added to the proceeds from the sale of the underlying security or currency in determining whether the Fund has realized a gain or loss. If a put option is exercised, the premium reduces the cost basis of the security or currency purchased by the Fund. In writing an option, the Fund bears the market risk of an unfavorable change in the price of the security or currency underlying the written option. Exercise of an option written by the Fund could result in the Fund selling or buying a security or currency at a price different from the current market value.
| (h) | Trustees’ Compensation—Effective February 1, 2000, the Board of Trustees adopted the Marsico Investment Fund Deferred Fee Plan, amended and restated as of December 30, 2005 (the “Deferred Fee Plan”), which allows the independent Trustees to defer the receipt of all or a portion of the Trustees’ fees payable. The Trustees are deemed to be notionally invested in the Funds until distribution in accordance with the Deferred Fee Plan. Included in the net unrealized appreciation on investments on the Statement of Assets and Liabilities is the unrealized appreciation of $154,214, $76,338, $62,619 and $60,663 related to the mark-to-market of the shares of the Deferred Fee Plan for the Focus Fund, Growth Fund, 21st Century Fund and International Opportunities Fund, respectively. |
| (i) | Redemption Fee—For shares purchased on or after January 30, 2004, a 2.00% redemption fee is retained by the Funds to offset transaction costs and other expenses associated with short-term investing. The fee is imposed on certain redemptions or exchanges of shares held 30 days or less from their purchase date. Prior to January 30, 2004, a 2.00% redemption fee was imposed on redemptions or exchanges of shares of the International |
39
MARSICO FUNDS
NOTES TO FINANCIAL STATEMENTS SEPTEMBER 30, 2006 (continued)
Opportunities Fund held three months or less from their purchase date. Redemption fees are recorded by the Funds as a reduction of shares redeemed and as a credit to paid-in-capital. For the year ended September 30, 2006, the Focus Fund, Growth Fund, 21st Century Fund and International Opportunities Fund received $63,834, $70,718, $137,655 and $73,253, respectively, in redemption fees.
| (j) | Other—Investment transactions are accounted for on a trade date basis. Each Fund determines the gain or loss realized from the investment transactions by comparing the original cost of the security lot sold with the net sale proceeds. Dividend income is recognized on the ex-dividend date. Certain dividends from foreign securities will be recorded as soon as the Trust is informed of the dividend if such information is obtained subsequent to the ex-dividend date. Interest income is recognized on an accrual basis. |
| (k) | Indemnifications—In the normal course of business, the Funds enter into contracts that contain provisions indemnifying other parties against specified potential liabilities. Each Fund’s maximum exposure under these arrangements is unknown as this would involve future claims that may be made against the Fund that have not yet occurred. However, based on experience, the Funds expect the risk of loss to be remote. |
3. | Investment Advisory Agreement and Transactions With Affiliates |
The Funds have an agreement with Marsico Capital Management, LLC (the “Adviser”) to furnish investment advisory services to the Funds. Under the terms of this agreement, the Adviser is compensated for managing the Focus Fund and the Growth Fund at the rate of 0.85% per year of average daily net assets up to $3 billion in each Fund, and 0.75% per year of average daily net assets exceeding $3 billion in each Fund; and at a rate of 0.85% of the average daily net assets of the 21st Century Fund and the International Opportunities Fund. Prior to November 11, 2004, the Adviser was compensated for managing the Focus Fund and the Growth Fund at a rate of 0.85% of average daily net assets of each Fund. The Adviser has voluntarily agreed to limit the total expenses of each Fund (excluding interest, taxes, brokerage and extraordinary expenses) to an annual rate of 1.60% of the Focus and International Opportunities Funds’ average daily net assets and 1.50% of the Growth and 21st Century Funds’ average daily net assets until December 31, 2007. This fee waiver is voluntary and may be terminated at any time.
The voluntary waiver of expenses for the year ended September 30, 2003 excludes as an extraordinary item the unrealized appreciation of $30,090 and $17,937, respectively, for the 21st Century Fund and International Opportunities Fund related to the mark-to-market of the shares of the Deferred Fee Plan. As a result, the unrealized appreciation is retained by the Funds in accordance with the Deferred Fee Plan. For periods subsequent to September 30, 2003, unrealized appreciation/depreciation of Fund shares in the Deferred Fee Plan will be subject to the Funds’ expense reimbursement agreement with the Adviser.
The Adviser is entitled to reimbursement from a Fund of any fees waived pursuant to this arrangement if such reimbursements do not cause a Fund to exceed existing expense limitations and the reimbursement is made within three years after the year in which the Adviser incurred the expense. For the year ended September 30, 2006, the Adviser recovered previously waived fees of $101,347 in the International Opportunities Fund.
Banc of America Securities is an affiliate of the Adviser and may be designated as an introductory broker on certain Fund transactions. For the year ended September 30, 2006, none of the Funds paid brokerage commissions to Banc of America Securities.
4. | Service and Distribution Plan |
The Funds have adopted a Service and Distribution Plan (the “Plan”) pursuant to Rule 12b-1 under the 1940 Act. The Plan authorizes payments by the Funds in connection with the distribution of their shares at an annual rate, as determined from time to time by the Board of Trustees, of up to 0.25% of a Fund’s average daily net assets.
40
5. | Investment Transactions |
The aggregate purchases and sales of securities, excluding short-term investments, for the Funds for the year ended September 30, 2006, were as follows:
| | | 21st | International |
| Focus | Growth | Century | Opportunities |
(Amounts in thousands) | Fund | Fund | Fund | Fund |
Purchases | $3,552,616 | $1,676,285 | $1,085,203 | $641,871 |
Sales | $3,161,547 | $1,344,014 | $710,327 | $413,216 |
There were no purchases or sales of U.S. government securities.
6. | Federal Income Tax Information |
At September 30, 2006, gross unrealized appreciation and depreciation of investments, based on cost for federal income tax purposes, were as follows:
| | | 21st | International |
| Focus | Growth | Century | Opportunities |
(Amounts in thousands) | Fund | Fund | Fund | Fund |
Cost of investments | $3,817,354 | | $2,083,269 | | $801,290 | | $485,259 | |
Gross unrealized appreciation | 897,471 | | 473,363 | | 91,243 | | 85,982 | |
Gross unrealized depreciation | (38,558 | ) | (39,383 | ) | (13,219 | ) | (4,941 | ) |
Net unrealized appreciation | | | | | | | | |
on investments | $858,913 | | $433,980 | | $78,024 | | $81,041 | |
The difference between cost amounts for financial statement and federal income tax purposes is due primarily to wash sale loss deferrals and foreign currency transactions.
The Focus, Growth, and International Opportunities Funds had realized currency losses (in thousands) from transactions between November 1, 2005 and September 30, 2006 of $0, $0 and $260, respectively. Post-October currency losses and capital losses are treated as arising in the Fund’s next fiscal year.
At September 30, 2006, the Growth and 21st Century Funds had accumulated capital loss carryforwards (in thousands) of $25,104 and $134, with $0 and $134 expiring in 2010 and $25,104 and $0 expiring in 2011, respectively. To the extent that a fund may realize future net capital gains, those gains will be offset by any of its unused capital loss carryforward.
The Focus, Growth, 21st Century and International Opportunities Funds utilized (in thousands) $173,667, $93,760, $36,323 and $1,519, respectively, of its capital loss carryforwards during the year ended September 30, 2006.
41
MARSICO FUNDS
NOTES TO FINANCIAL STATEMENTS SEPTEMBER 30, 2006 (continued)
As of September 30, 2006, the components of accumulated earnings (deficit) on a tax basis were as follows:
| | | 21st | International |
| Focus | Growth | Century | Opportunities |
(Amounts in thousands) | Fund | Fund | Fund | Fund |
Undistributed ordinary income (deficit) | $(647 | ) | $(340 | ) | $416 | | $8,677 | |
Undistributed long-term capital gains | 85,766 | | — | | — | | 14,331 | |
Tax accumulated earnings (deficit) | 85,119 | | (340 | ) | 416 | | 23,008 | |
Accumulated capital and other losses | — | | (25,104 | ) | (134 | ) | — | |
Unrealized appreciation on investments | 858,913 | | 433,980 | | 78,024 | | 81,041 | |
Total accumulated earnings | $944,032 | | $408,536 | | $78,306 | | $104,049 | |
Undistributed ordinary income (deficit) consists of net investment income, short-term capital gains and timing differences related to post-October currency losses and deferred Trustees’ compensation.
The 21st Century and International Opportunities Funds distributed to shareholders (in thousands) ordinary income of $67 and $2,078, respectively, for the fiscal year ended September 30, 2006. No distributions were made for the fiscal year ended September 30, 2005.
New Accounting Pronouncements
In July 2006, the Financial Accounting Standards Board issued Interpretation No. 48, “Accounting for Uncertainty in Income Taxes - an Interpretation of FASB Statement No. 109” (the “Interpretation”). The Interpretation establishes for all entities, including pass-through entities such as the Funds, a minimum threshold for financial statement recognition of the benefit of positions taken in filing tax returns (including whether an entity is taxable in a particular jurisdiction), and requires certain expanded tax disclosures. The Interpretation is effective for fiscal years beginning after December 15, 2006, and is to be applied to all open tax years as of the date of effectiveness. Management has recently begun to evaluate the application of the Interpretation to the Funds, and is not in a position at this time to estimate the significance of its impact, if any, on the Funds’ financial statements.
In September 2006, the Financial Accounting Standards Board issued Statement of Financial Accounting Standards No. 157, “Fair Value Measurements.” The Statement defines fair value, establishes a framework for measuring fair value in generally accepted accounting principles (GAAP), and expands disclosures about fair value measurements. The Statement establishes a fair value hierarchy that distinguishes between (1) market participant assumptions developed based on market data obtained from sources independent of the reporting entity (observable inputs) and (2) the reporting entity’s own assumptions about market participant assumptions developed based on the best information available in the circumstances (unobservable inputs). The Statement is effective for financial statements issued for fiscal years beginning after November 15, 2007, and is to be applied prospectively as of the beginning of the fiscal year in which this Statement is initially applied. Management has recently begun to evaluate the application of the Statement to the Funds, and is not in a position at this time to evaluate the significance of its impact, if any, on the Funds’ financial statements.
42
REPORT OF INDEPENDENT REGISTERED PUBLIC ACCOUNTING FIRM
To the Board of Trustees and Shareholders of The Marsico Investment Fund
In our opinion, the accompanying statement of assets and liabilities, including the schedule of investments, and the related statements of operations and of changes in net assets and the financial highlights present fairly, in all material respects, the financial position of the Marsico Focus Fund, the Marsico Growth Fund, the Marsico 21st Century Fund and the Marsico International Opportunities Fund (constituting The Marsico Investment Fund, hereafter referred to as the “Trust”) at September 30, 2006, the results of their operations for the year then ended, the changes in its net assets for each of the two years in the period then ended and the financial highlights for each of the five years in the period then ended, in conformity with accounting principles generally accepted in the United States of America. These financial statements and financial highlights (hereafter referred to as “financial statements”) are the responsibility of the Trust’s management; our responsibility is to express an opinion on these financial statements based on our audits. We conducted our audits of these financial statements in accordance with the standards of the Public Company Accounting Oversight Board (United States). Those standards require that we plan and perform the audit to obtain reasonable assurance about whether the financial statements are free of material misstatement. An audit includes examining, on a test basis, evidence supporting the amounts and disclosures in the financial statements, assessing the accounting principles used and significant estimates made by management, and evaluating the overall financial statement presentation. We believe that our audits, which included confirmation of securities at September 30, 2006 by correspondence with the custodian and brokers and the application of alternative procedures where securities purchased had not been received, provide a reasonable basis for the opinion expressed above.

PricewaterhouseCoopers LLP
Denver, Colorado
November 6, 2006
43
MARSICO FUNDS
EXPENSE EXAMPLE FOR THE SIX MONTHS ENDED SEPTEMBER 30, 2006 (UNAUDITED)
As a shareholder of the Marsico Funds (the “Funds”), you incur two types of costs: (1) transaction costs, including redemption fees on certain redemptions; and (2) ongoing costs, including management fees; distribution (12b-1) fees, and other Fund expenses. This Example is intended to help you understand your ongoing costs (in dollars) of investing in the Funds and to compare these costs with the ongoing costs of investing in other mutual funds.
The Example is based on an investment of $1,000 invested at the beginning of the period and held for the entire period from April 1, 2006 to September 30, 2006 (the “period”).
Actual Expenses
The first line of the table below provides information about actual account values and actual expenses. You may use the information in this line, together with the amount you invested, to estimate the expenses you paid over the period. Simply divide your account value by $1,000 (for example, an $8,600 account value divided by $1,000 equals 8.6), then multiply the result by the number in the first line under the heading entitled “Expenses Paid During the Period” to estimate the expenses you paid on your account during the period.
Hypothetical Example for Comparison Purposes
The second line of the table below provides information about hypothetical account values and hypothetical expenses based on the Funds’ actual expense ratios and an assumed rate of return of 5% per year before expenses, which is not the actual return of any of the Funds. The hypothetical account values and expenses may not be used to estimate the actual ending account balance or expenses you paid for the period. You may use this information to compare the ongoing costs of investing in the Funds and other funds. To do so, compare this 5% hypothetical example with the 5% hypothetical examples that appear in the shareholder reports of other funds.
Please note that the expenses shown in the table are meant to highlight your ongoing costs only and do not reflect any transactional costs, such as redemption fees. Therefore, the second line of the table is useful in comparing the ongoing costs only, and will not help you determine the relative total costs of owning different funds. In addition, if these transactional costs were included, your costs could have been higher.
Expenses Paid During the Period
| | FOCUS FUND | |
| Beginning | Ending | Expenses paid for the |
| account value | account value | six-month period ended |
| April 1, 2006 | September 30, 2006 | September 30, 2006(1) |
Actual Example | $1,000.00 | $957.40 | $6.11 |
Hypothetical Example, | | | |
assuming a 5% return before expenses | $1,000.00 | $1,018.76 | $6.30 |
| | GROWTH FUND | |
| Beginning | Ending | Expenses paid for the |
| account value | account value | six-month period ended |
| April 1, 2006 | September 30, 2006 | September 30, 2006(1) |
Actual Example | $1,000.00 | $955.30 | $6.17 |
Hypothetical Example, | | | |
assuming a 5% return before expenses | $1,000.00 | $1,018.69 | $6.37 |
| | | |
44
Expenses Paid During the Period (continued)
| | 21st CENTURY FUND | |
| Beginning | Ending | Expenses paid for the |
| account value | account value | six-month period ended |
| April 1, 2006 | September 30, 2006 | September 30, 2006(1) |
Actual Example | $1,000.00 | $963.90 | $6.50 |
Hypothetical Example, | | | |
assuming a 5% return before expenses | $1,000.00 | $1,018.38 | $6.68 |
| INTERNATIONAL OPPORTUNITIES FUND |
| Beginning | Ending | Expenses paid for the |
| account value | account value | six-month period ended |
| April 1, 2006 | September 30, 2006 | September 30, 2006(1) |
Actual Example | $1,000.00 | $1,011.50 | $7.25 |
Hypothetical Example, | | | |
assuming a 5% return before expenses | $1,000.00 | $1,017.79 | $7.27 |
OTHER INFORMATION (UNAUDITED)
Proxy Voting Guidelines
The Funds exercise the voting rights associated with the securities held by the Funds under the proxy voting policy of the Funds. A description of those policies and procedures of the Funds and a record of the Funds’ proxy votes for the one-year period ended June 30, 2006 are available without charge, upon request, by calling 888-860-8686. It is also available on the Securities and Exchange Commission’s Website at www.sec.gov.
Quarterly Filing of Portfolio Holdings
The Funds will file their complete schedule of investments with the SEC for the first and third quarters of each fiscal year on Form N-Q. The Funds’ Form N-Q will be available (i) on the SEC’s Website at www.sec.gov; (ii) at the SEC’s Public Reference Room; and (iii) by calling 800-SEC-0330.
Other Tax Information
Corporate Dividends Received Deduction
For the fiscal year ended September 30, 2006, 100% and 0% of dividends paid from net investment income, qualifies for the dividends received deduction available to corporate shareholders of the Marsico 21st Century and International Opportunities Funds, respectively.
Qualified Dividend Income
Pursuant to Section 854 of the Internal Revenue Code of 1986, the 21st Century Fund designates $526 (in thousands) and the International Opportunities Fund designates $6,368 (in thousands) as qualified dividend income for the fiscal year ended September 30, 2006.
Foreign Taxes Paid
Pursuant to the foreign tax credit election under Section 853 of the Internal Revenue Code of 1986, the International Opportunities Fund designates $1,196 (in thousands) of income derived from foreign sources and $565 (in thousands) of foreign taxes paid, for the fiscal year ended September 30, 2006.
| (1) | Expenses are equal to the Funds’ annualized expense ratios (1.25% for the Focus Fund, 1.26% for the Growth Fund, 1.32% for the 21st Century Fund and 1.44% for the International Opportunities Fund), multiplied by the average account value over the period, multiplied by 183/365 (to reflect the six month period). |
45
MARSICO FUNDS
TRUSTEE AND OFFICER INFORMATION INDEPENDENT TRUSTEES
| | Term of Office(1) | | Number of Portfolios | |
| Position(s) Held | and Length of | Principal Occupation(s) | in Fund Complex | Other Directorships |
Name, Address and Age | with the Trust | Time Served | During Past 5 Years | Overseen by Trustee | Held by Trustee |
Jay S. Goodgold | Trustee | Since February 2006 | Private investor (July 2003 - present); | 4 | None |
1200 17th Street | | | Managing Director, Goldman, | | |
Suite 1600 | | | Sachs & Co. (August 1978 - | | |
Denver, CO 80202 | | | June 2003). | | |
DOB: 1954 | | | | | |
Elizabeth Hoffman | Trustee | Since February 2006 | President Emerita and Professor of | 4 | None |
1200 17th Street | | | Economics and Public Affairs, | | |
Suite 1600 | | | University of Colorado (August | | |
Denver, CO 80202 | | | 2005 - present); President, University | | |
DOB: 1946 | | | of Colorado (September 2000 - | | |
| | | July 2005). | | |
Walter A. Koelbel, Jr. | Trustee | Since December 1997 | President, and other positions, | 4 | None |
1200 17th Street | | | Koelbel and Company (full service | | |
Suite 1600 | | | real estate, development, investment, | | |
Denver, CO 80202 | | | and management company) | | |
DOB: 1952 | | | (more than five years). | | |
Christopher E. Kubasik | Trustee | Since February 2006 | Chief Financial Officer, Lockheed | 4 | None |
1200 17th Street | | | Martin Corp. (February 2001 - present). | | |
Suite 1600 | | | | | |
Denver, CO 80202 | | | | | |
DOB: 1961 | | | | | |
Michael D. Rierson | Trustee | Since November 1998 | Vice President and Vice Chancellor | 4 | None |
1200 17th Street | | | for University Advancement at the | | |
Suite 1600 | | | University of Houston and UH | | |
Denver, CO 80202 | | | System, respectively. (November | | |
DOB: 1952 | | | 2005 - present); President and Vice | | |
| | | President, University of South Florida | | |
| | | Foundation and University of South | | |
| | | Florida (May 2001 - September 2005). | | |
Joseph T. Willett | Trustee | Since November 2002 | Private investor (2002 - present); | 4 | None |
1200 17th Street | | | Chief Operating Officer, Merrill Lynch | | |
Suite 1600 | | | Europe (1998 - 2002). | | |
Denver, CO 80202 | | | | | |
DOB: 1951 | | | | | |
| (1) | Each Trustee serves an indefinite term until the election of a successor. Each Officer serves an indefinite term, renewed annually, until the election of a successor. |
The Statement of Additional Information includes additional information about the Trustees and is available upon request, without charge, by calling 888-860-8686.
46
TRUSTEE AND OFFICER INFORMATION INTERESTED TRUSTEES AND OFFICERS
| | Term of Office(1) | | Number of Portfolios | |
| Position(s) Held | and Length of | Principal Occupation(s) | in Fund Complex | Other Directorships |
Name, Address and Age | with the Trust | Time Served | During Past 5 Years | Overseen by Trustee | Held by Trustee |
Thomas F. Marsico(2)(3) | Trustee, President | Since December 1997 | Chief Executive Officer, Marsico | 4 | None |
1200 17th Street | and Chief | | Capital Management, LLC | | |
Suite 1600 | Executive Officer | | (more than five years). | | |
Denver, CO 80202 | | | | | |
DOB: 1955 | | | | | |
J. Jeffrey Riggs(2) | Trustee | Since December 1997 | President, Essex Financial Group, | 4 | None |
1200 17th Street | | | Inc. (commercial mortgage bank) | | |
Suite 1600 | | | (more than five years); Principal, | | |
Denver, CO 80202 DOB: 1953 | | | Baron Properties, LLC (more than five years). | | |
Christopher J. Marsico(3) | Vice President | Since September 2002 | President, Marsico Capital | N/A | N/A |
1200 17th Street | and Treasurer | | Management, LLC (June 2002 - | | |
Suite 1600 Denver, CO 80202 | | | present); Chief Operations Officer, Marsico Capital Management, LLC | | |
DOB: 1961 | | | (September 1997 - June 2002). | | |
Mary L. Watson | Vice President | Since September 2002 | Executive Vice President and | N/A | N/A |
1200 17th Street | and Secretary | | Chief Operations Officer, Marsico | | |
Suite 1600 | | | Capital Management, LLC (June 2002 | | |
Denver, CO 80202 | | | - present); Vice President of Client | | |
DOB: 1959 | | | Services, Marsico Capital | | |
| | | Management, LLC (September 1997 - | | |
| | | June 2002). | | |
David C. Price, CPA | Chief | Since August 2004 | Chief Compliance Officer, The | N/A | N/A |
1200 17th Street | Compliance | | Marsico Investment Fund, and | | |
Suite 1600 | Officer | | Director of Compliance, | | |
Denver, CO 80202 | | | Marsico Capital Management, LLC | | |
DOB: 1969 | | | (August 2004 - present); Senior | | |
| | | Compliance Officer, INVESCO | | |
| | | Institutional, N.A. (October 2003 - | | |
| | | July 2004); Assistant Vice President- | | |
| | | Compliance, Berger Financial | | |
| | | Group LLC and The Berger Funds | | |
| | | (March 2001 - May 2003). | | |
Sander M. Bieber | Assistant | Since December 1997 | Partner, Dechert, LLP (law firm) | | |
1775 I Street, N.W. | Secretary | | (more than five years). | N/A | N/A |
Washington, D.C. 20006 | | | | | |
DOB: 1950 | | | | | |
| (1) | Each Trustee serves an indefinite term until the election of a successor. Each Officer serves an indefinite term, renewed annually, until the election of a successor. |
| (2) | Mr. T. Marsico is considered an Interested Trustee of the Trust within the meaning of the Investment Company Act of 1940, as amended, because of his affiliation with Marsico Capital Management, LLC. The Trust treats Mr. Riggs as an Interested Trustee due to a business relationship with Mr. T. Marsico whereby Mr. T. Marsico has invested personal assets in certain partnerships for which Mr. Riggs acts as principal. |
| (3) | Mr. T. Marsico and Mr. C. Marsico are brothers. |
The Statement of Additional Information includes additional information about the Trustees and is available upon request, without charge, by calling 888-860-8686.
47


Item 2 - Code of Ethics.
(a) The Registrant, as of the end of the period covered by this report, has adopted a code of ethics that applies to the Registrant’s principal executive officer, principal financial officer, principal accounting officer or controller, or persons performing similar functions, regardless of whether these individuals are employed by the Registrant or a third party. A copy of this code of ethics is attached hereto as Exhibit (a).
(c) There have been no amendments, during the period covered by this report, to a provision of the code of ethics that applies to the Registrant’s principal executive officer, principal financial officer, principal accounting officer or controller, or persons performing similar functions, regardless of whether these individuals are employed by the Registrant or a third party, and that relates to any element of the code of ethics description.
(d) The Registrant has not granted any waivers, including an implicit waiver, from a provision of the code of ethics that applies to the Registrant’s principal executive officer, principal financial officer, principal accounting officer or controller, or persons performing similar functions, regardless of whether these individuals are employed by the Registrant or a third party, that relates to one or more of the items set forth in paragraph (b) of this item’s instructions.
(e) Not applicable.
(f) | See attached Exhibit (a). |
Item 3 - Audit Committee Financial Expert.
(a)(1) The Registrant’s Board of Trustees has determined that the Registrant has at least one audit committee financial expert serving on its audit committee.
(a)(2) | Mr. Joseph T. Willett is the audit committee financial expert. Mr. Willett is “independent” under the applicable rules |
Item 4 - Principal Accountant Fees and Services.
In each of the fiscal years ended September 30, 2006 and September 30, 2005, the aggregate Audit Fees billed (or to be billed) by PricewaterhouseCoopers LLP (PwC) for professional services rendered for the audits of the financial statements, or services that are normally provided in connection with statutory and regulatory filings or engagements as well as reimbursable expenses are listed below.
(a) Audit Fees.
(b) Audit-Related Fees.
In each of the fiscal years ended September 30, 2006 and September 30, 2005, the aggregate Audit-Related Fees billed (or to be billed) by PwC for services rendered for assurance and related services to each fund that are reasonably related to the performance of the audit or review of the fund’s financial statements, but not reported as Audit Fees, are shown in the table below.
(c) Tax Fees.
In each of the fiscal years ended September 30, 2006 and September 30, 2005 the aggregate Tax Fees billed (or to be billed) by PwC for professional services rendered for tax compliance, tax advice, and tax planning are shown in the table below.
All of these fees were approved by the Trust’s Audit Committee as required pursuant to paragraph (c)(7)(ii) of Rule 2-01 of Regulation S-X.
Fees included in the Tax Fees category comprise all services performed by professional staff in the independent registered public accounting firm’s tax division except those services related to the audit. Typically, this category would include fees for tax compliance, tax planning, and tax advice. Tax compliance, tax advice, and tax planning services include preparation of original and amended tax returns, claims for refund and tax payment-planning services, assistance with tax audits and appeals, tax advice related to mergers and acquisitions and requests for rulings or technical advice from taxing authorities.
(d) All Other Fees.
In each of the fiscal years ended September 30, 2006 and September 30, 2005 the aggregate Other Fees billed (or to be billed) by PwC for all other non-audit services rendered are shown in the table below.
(e) (1) | Audit Committee Pre-Approval Policies and Procedures: |
Pursuant to the Trust’s Audit Committee Charter and Policies and Procedures (collectively, the “Procedures”), the Audit Committee has adopted pre-approval policies and procedures to govern the pre-approval of (i) all audit services and permissible non-audit services to be provided to the Trust by its independent accountant, and (ii) all permissible non-audit services to be provided by such independent accountant to the Trust’s investment adviser and to any entity controlling, controlled by or under common control with the investment adviser that provides on-going services to the Trust (collectively, any “Service Affiliates”) if the engagement directly relates to the Trust’s operations and financial reporting.
In accordance with the Procedures, the Committee is responsible for the engagement of the independent accountant to certify the Trust’s financial statements for each fiscal year. With respect to the pre-approval of non-audit services provided to the Trust and its Service Affiliates, the Procedures provide that the Committee may pre-approve such services on a project-by-project basis as they arise. The Procedures also permit the Committee to delegate authority to the Audit Committee Chairman (the “Designated Member”) to pre-approve any proposed non-audit services that have not been previously approved by the Committee, subject to certain conditions. Any action by the Designated Member in approving a requested non-audit service shall be presented to the Audit Committee not later than at its next scheduled meeting. If the Designated Member does not approve the independent auditor’s provision of a requested non-audit service, the matter may be presented to the full Committee for its consideration and action.
(e)(2) | Services approved pursuant to paragraph (c)(7)(i)(C) of Rule 2-01 of Regulation S-X: |
100% of these fees were approved by the Trust’s Audit Committee as required pursuant to paragraph (c)(7)(ii) of Rule 2-01 of Regulation S-X.
(f) According to PwC for the fiscal year ended September 30, 2006, the percentage of hours spent on the audit the Marsico Funds’ financial statements for the most recent fiscal year that were attributed to work performed by persons who are not full-time, permanent employees of PwC is as follows:
Work performed by persons who are not full-time | 0% |
(g) In each of the fiscal years ended September 30, 2006 and September 30, 2005, the aggregate fees billed (or to be billed) by PwC relating to non-audit services that were rendered to the Trust, to its investment adviser, and to any entity controlling, controlled by, or under common control with the investment adviser and that provides ongoing services to the Trust are shown in the table below.
(h) All non-audit services of the specified type (services that were provided by PwC to the investment adviser and to any entity controlling, controlled by, or under common control with the investment adviser and that provides ongoing services to the Trust) were pre-approved.
Item 5 – Audit Committee of Listed Registrants.
Item 6 – Schedule of Investments.
The schedule of investments in securities of unaffiliated issuers is included as part of the report to shareholders filed under Item 1.
Item 7 – Disclosure of Proxy Voting Policies and Procedures for Closed-End Management Investment Companies.
Item 8 – Portfolio Managers of Closed-End Management Investment Companies.
Item 9 – Purchases of Equity Securities by Closed-End Management Investment Company and Affiliated Purchasers.
Item 10 – Submission of Matters to a Vote of Security Holders.
Item 11 – Controls and Procedures.
(a) The registrant’s principal executive officer and principal financial officer have concluded that the registrant’s disclosure controls and procedures (as defined in Rule 30a-3(c) under the Investment Company Act of 1940, as amended) are effective based on their evaluation of these disclosure controls and procedures within 90 days of the filing date of this report on Form N-CSR.
(b) There were no significant changes in the registrant’s internal control over financial reporting (as defined in Rule 30a-3(d) under the Investment Company Act of 1940, as amended) that occurred during the second fiscal half-year covered by this report that has materially affected, or is reasonably likely to materially affect, the registrant’s internal control over financial reporting.
Item 12 – Exhibits.
(a)(1) Code of Ethics - Filed as an attachment to this filing (Exhibit (a)).
(a)(2) Certification for each principal executive and principal financial officer of the registrant as required by Rule 30a-2(a) under the Act (17 CFR 270.30a-2(a)) (Exhibits (b) and (c)).
(a) (3) Any written solicitation to purchase securities under Rule 23c-1 under the Investment Company Act of 1940, as amended, that was sent or given during the period covered by the report by or on behalf of the registrant to 10 or more persons.
(b) Certifications required by Rule 30a-2(b) under the Act (17 CFR 270.30a-2(b)), Rule 13a-14(b) or Rule 15d-14(b) under the Exchange Act (17 CFR 240.13a-14(b) or 240.15d-14(b)), and Section 1350 of Chapter 63 of Title 18 of the United States Code (18 U.S.C. 1350) – Filed as an attachment to this filing (Exhibits (d) and (e)).
SIGNATURES
Pursuant to the requirements of the Securities Exchange Act of 1934 and the Investment Company Act of 1940, the registrant has duly caused this report to be signed on its behalf by the undersigned, thereunto duly authorized.
The Marsico Investment Fund
By: | /s/ Thomas F. Marsico |
| Thomas F. Marsico |
| President |
| |
Date: | December 7, 2006 |
Pursuant to the requirements of the Securities Exchange Act of 1934 and the Investment Company Act of 1940, this report has been signed below by the following persons on behalf of the registrant and in the capacities and on the dates indicated.
By: | /s/ Thomas F. Marsico |
| Thomas F. Marsico |
| President |
| |
Date: | December 7, 2006 |
By: | /s/ Christopher J. Marsico |
| Christopher J. Marsico |
| Vice President and Treasurer |
| |
Date: | December 7, 2006 |