UNITED STATES
SECURITIES AND EXCHANGE COMMISSION
Washington, D.C. 20549
FORM N-CSR
CERTIFIED SHAREHOLDER REPORT OF REGISTERED MANAGEMENT INVESTMENT COMPANIES
Investment Company Act file number 811-08397
THE MARSICO INVESTMENT FUND
(Exact name of registrant as specified in charter)
1200 17th Street, Suite 1600
Denver, CO 80202
(Address of principal executive offices) (Zip code)
Christopher J. Marsico
The Marsico Investment Fund
1200 17th Street, Suite 1600
Denver, CO 80202
(Name and address of agent for service)
Copies to:
Sander M. Bieber, Esq.
Dechert LLP
1775 I Street, N.W.
Washington, D.C. 20006
Registrant's telephone number, including area code: (303)454-5600
Date of fiscal year end: September 30
Date of reporting period: September 30, 2008
Item 1 - Reports to Stockholders.
OCTOBER 2008
DEAR SHAREHOLDER:
Enclosed is your annual report for The Marsico Investment Fund, encompassing the one-year fiscal period from October 1, 2007 to September 30, 2008.
The purpose of this report is to provide a retrospective for the Marsico Funds’ one-year investment results by discussing what we believe were the main areas that impacted performance - including the macroeconomic environment, sector and industry positioning, and individual stock selection - as compared to the Funds’ performance benchmark indexes. Certain sector or industry classifications used in the discussion and review portions of the annual report may be broader or narrower than those used in Key Fund Statistics, Fund Overviews, Schedules of Investments, or elsewhere in this report. For our updated commentary regarding the market environment and the Funds’ overall investment postures, please refer to the Funds’ most recent quarterly shareholder update, which is available on the Funds’ website at www.marsicofunds.com.
We also wanted to remind you that on December 14, 2007, the transaction to purchase the Funds’ investment adviser, Marsico Capital Management, LLC, from Bank of America closed successfully, after Marsico Fund shareholders approved the required new investment advisory contract earlier in 2007. Marsico Capital Management is now an independent, employee-owned firm. Marsico Capital Management continues to provide the same investment advisory services to the Funds that it did prior to the transaction.
The one-year fiscal period ended September 30, 2008 was an exceedingly challenging period of time for equity markets. The severity of market events and poor equity market performance of the past 12 months - and continuing during October 2008 - has been very unsettling. A seemingly endless number of events unfolded over the course of the year, rocking financial markets worldwide. Numerous policy responses by US and foreign governments and central banks around the world have been recently announced to help address the financial market crisis. We anticipate more stimulus measures are forthcoming. While it may take some time for these initiatives to have their intended effect, we want to assure you that we are doing our best to position the Funds to weather these trying times and be poised to benefit when an equity market recovery takes place.
We would like to express gratitude to our shareholders for their support and for including the Marsico Funds in their investment program.
TABLE OF CONTENTS
| KEY FUND STATISTICS | 4 |
| | |
| MARKET ENVIRONMENT | 7 |
| | |
MARSICO FOCUS FUND | |
| Investment Review | 9 |
| Fund Overview | 12 |
| Schedule of Investments | 13 |
| Financial Statements | 14-16 |
MARSICO GROWTH FUND | |
| Investment Review | 9 |
| Fund Overview | 17 |
| Schedule of Investments | 18 |
| Financial Statements | 20-22 |
MARSICO 21st CENTURY FUND | |
| Investment Review | 23 |
| Fund Overview | 25 |
| Schedule of Investments | 26 |
| Financial Statements | 28-30 |
MARSICO INTERNATIONAL OPPORTUNITIES FUND | |
| Investment Review | 31 |
| Fund Overview | 33 |
| Schedule of Investments | 34 |
| Financial Statements | 36-38 |
MARSICO FLEXIBLE CAPITAL FUND | |
| Investment Review | 39 |
| Fund Overview | 41 |
| Schedule of Investments | 42 |
| Financial Statements | 43-45 |
MARSICO GLOBAL FUND | |
| Investment Review | 46 |
| Fund Overview | 48 |
| Schedule of Investments | 49 |
| Financial Statements | 51-53 |
| | |
| NOTES TO FINANCIAL STATEMENTS | 54 |
| | |
| REPORT OF INDEPENDENT REGISTERED PUBLIC ACCOUNTING FIRM | 62 |
| | |
| EXPENSE EXAMPLE | 63 |
| | |
| OTHER INFORMATION | 65 |
| | |
| TRUSTEE AND OFFICER INFORMATION | 66 |
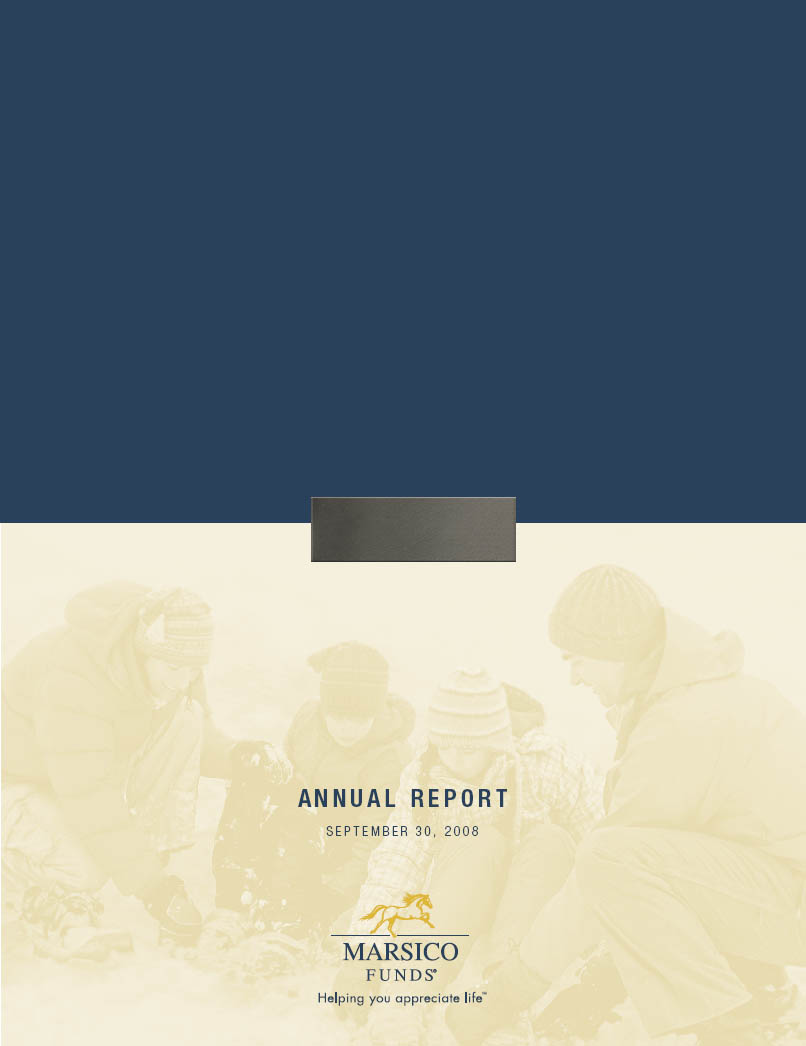
KEY FUND STATISTICS (UNAUDITED)
For additional disclosures about the Marsico Funds, please see page 6. The performance data quoted here represent past performance, and past performance is not a guarantee of future results. Investment return and principal value of an investment will fluctuate so that an investor’s shares, when redeemed, may be worth more or less than their original cost.
Current performance may be lower or higher than the performance information quoted. To obtain performance information current to the most recent month-end, please call 888.860.8686 or visit www.marsicofunds.com. A redemption fee may be imposed on redemptions or exchanges of Fund shares held for 30 days or less.
KEY FUND STATISTICS (UNAUDITED)
| * | The Total Annual Operating Expenses and Net Expenses are reflective of the information disclosed in the Funds’ Prospectus dated February 1, 2008. The information may differ from the expense ratios disclosed in this report. |
| † | The Adviser has entered into a written expense limitation agreement under which it has agreed to limit the total expenses of the Flexible Capital Fund and Global Fund (excluding interest, taxes, acquired fund fees and expenses, litigation, brokerage and extraordinary expenses) to an annual rate of 0.75% of each Fund’s average net assets until December 31, 2008. This fee waiver may be terminated at any time after December 31, 2008. The Adviser may recoup any waived amount from a Fund pursuant to this arrangement if such reimbursement does not cause the Fund to exceed existing expense limitations and the reimbursement is made within three years after the year in which the Adviser incurred the expense. Prior to June 1, 2007, the Adviser’s expense limitation agreement relating to the Flexible Capital Fund limited total expenses to an annual rate of 1.60% of average net assets. As a result, the Net Expenses exceed 0.75% for the Flexible Capital Fund. |
(1) | The performance data quoted here represent past performance, and past performance is not a guarantee of future results. Investment return and principal value of an investment will fluctuate so that an investor’s shares, when redeemed, may be worth more or less than their original cost. Current performance may be lower or higher than the performance information quoted. To obtain performance information current to the most recent month-end, please call 888-860-8686 or visit www.marsicofunds.com. A redemption fee may be imposed on redemptions or exchanges of Fund shares held for 30 days or less. |
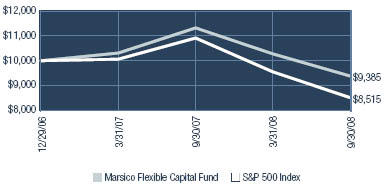
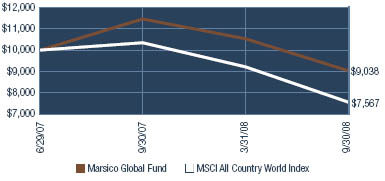
For the Flexible Capital Fund and the Global Fund, initial public offerings (“IPOs”) made a significant positive contribution to the Funds’ recent performance. There can be no assurance that similar contributions from IPOs will continue in the future.
The performance included in the table and graph does not reflect the deduction of taxes on Fund distributions or the redemption of Fund shares.
The performance returns for the 21st Century Fund (for the period prior to March 31, 2004), the International Opportunities Fund (for the period prior to September 30, 2004), the Flexible Capital Fund (for the periods ended September 30, 2008), and the Global Fund (for the periods ended September 30, 2008) reflect a fee waiver in effect; in the absence of such a waiver, the returns would be reduced. For the period beginning April 2004 through January 2005, performance returns for the 21st Century Fund would be higher but for the reimbursement of fees waived previously. For the period beginning October 2004 through December 2005, performance returns for the International Opportunities Fund would be higher but for the reimbursement of fees waived previously.
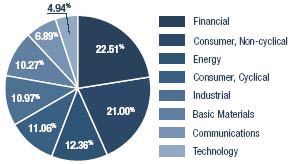
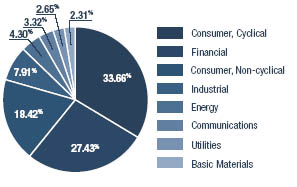
(2) | Sector weightings represent the percentage of the respective Fund’s investments (excluding cash equivalents) in certain general sectors. These sectors may include more than one industry. The Fund’s portfolio composition is subject to change at any time. |
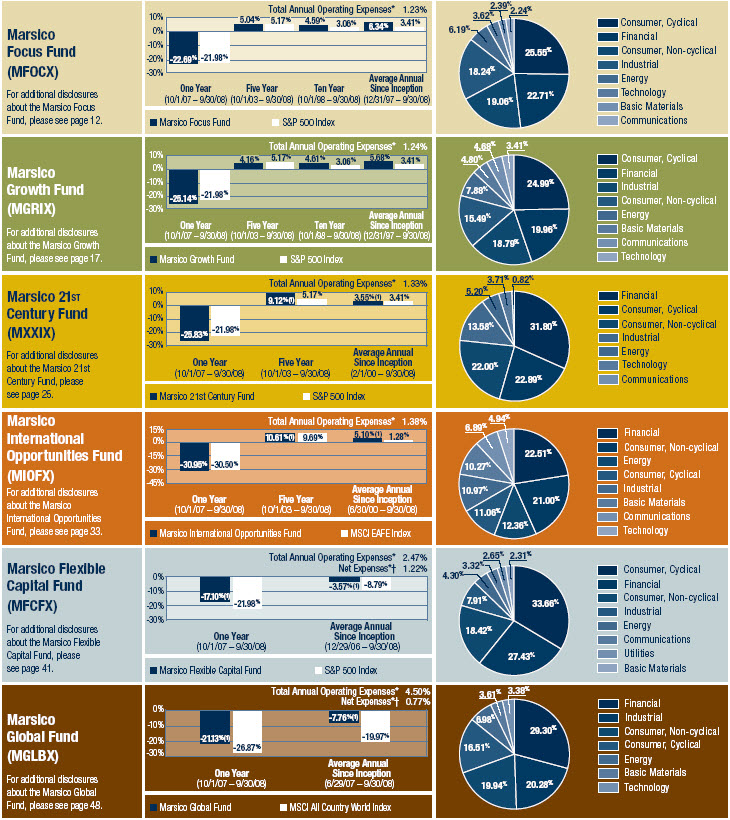
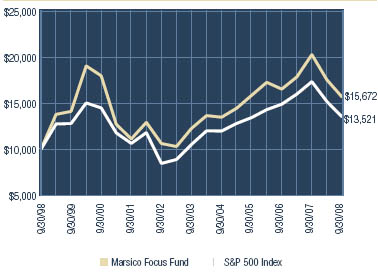
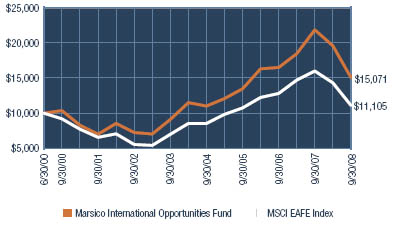
(3) | This chart assumes an initial investment of $10,000 made on September 30,1998 for the Focus Fund and Growth Fund and on the inception date of the other Funds. Total returns are based on net change in NAV, assuming reinvestment of distributions. |
Inception dates are as follows:
Marsico Focus Fund: December 31, 1997
Marsico Growth Fund: December 31, 1997
Marsico 21st Century Fund: February 1, 2000
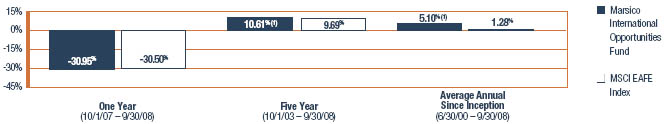
Marsico International Opportunities Fund: June 30, 2000
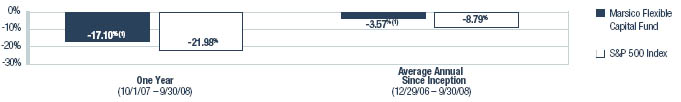
Marsico Flexible Capital Fund: December 29, 2006
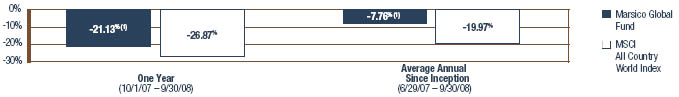
Marsico Global Fund: June 29, 2007
OCTOBER 2008
MARKET ENVIRONMENT: OCTOBER 2007 - SEPTEMBER 2008 (UNAUDITED)
Equities were buffeted throughout the 12-month period ended September 30, 2008 by concerns regarding decelerating US and global economic growth, credit market turmoil, liquidity shortages, bank and financial institution failures, volatile commodity prices, weakening US employment, and softening consumer discretionary spending. Losses were widespread. Many well-known broad-market global indices posted double-digit negative results, as shown below:
| | Universe of | 12-Month |
Index Name | Equities Represented | Total Return |
US | | |
| S&P 500 | US large- | |
| | capitalization equities | -21.98% |
| | | |
| Russell 3000 | US publicly-traded | |
| | equities of all sizes | -21.52% |
| | | |
| Russell 2000 | US small- | |
| | capitalization equities | -14.48% |
| | | |
| Russell Mid-Cap | US medium- | |
| | capitalization equities | -22.36% |
| | Universe of | 12-Month |
Index Name | Equities Represented | Total Return |
INTERNATIONAL | | |
| MSCI EAFE | Equities in developed | |
| (US$) | international equity markets, | |
| | including Japan, Western | |
| | Europe, and Australasia | -30.50% |
| | | |
| MSCI Emerging | Equities in developing | |
| Markets (US$) | international equity markets, | |
| | including China, India, | |
| | Eastern Europe, and | |
| | Latin America | -33.20% |
| | | |
| MSCI ACWI | Equities in the global | |
| (US$) | developed and | |
| | emerging markets | -26.87% |
US LARGE-CAPITALIZATION EQUITIES
US large-cap stocks moved lower during the one-year period ended September 30, 2008. Nine of the 10 S&P 500 Index economic sectors, as defined under the Global Industry Classification Standard (“GICS”), were in negative territory. Financials (-39%), Telecommunication Services (-33%), Industrials (-25%), Information Technology (-23%), Consumer Discretionary (-22%), and Materials (-21%) were the weakest-performing sectors. Utilities (-14%), Energy (-14%), and Health Care (-12%) also experienced sharp declines. Consumer Staples - generally considered to be one of the more “defensive” sectors of the Index - was the sole sector to eke out a positive return of just 0.72%.
At an industry level, Financials-related industries were among the poorest-performing groups, including Banks (-47%), Insurance (-44%), Diversified Financials (-37%), and Real Estate (-15%). There were many other notable industry laggards including Automobiles & Components (-41%), Semiconductor & Semiconductor Equipment (-34%), Capital Goods (-30%), Media (-25%), Retailing (-22%), and Commercial & Professional Services (-21%). Only three industries posted modest, positive returns: Household & Personal Products (+3%), Food & Staples Retailing (+1%), and Transportation (+0.50%). Food, Beverage, and Tobacco was down a modest amount (-0.27%). Remaining industries generally experienced losses of between -11% and -20%.
US ALL-CAPITALIZATION EQUITIES
The performance of the broad US equity market, as measured by the Russell 3000 Index which encompasses companies of all sizes, was poor for the one-year period ended September 30, 2008. Weakness in the Russell 3000 Index was widespread and sector-level performance was negative across the board. Financials (-34%) and Telecommunication Services (-34%) were the weakest performing sectors and, similar to the S&P 500 Index, Consumer Staples (-0.73%) was the strongest performing area. The small-capitalization area of the US equity market was comparatively stronger than large- and mid-capitalization equities. This result was striking because small-capitalization equities are generally thought not to perform as well as large-capitalization equities during times of weakening economic conditions. Small-capitalization equities were buoyed to some extent by stronger performance in the Utilities, Energy, and Financials sectors than their respective large-capitalization peers.
OCTOBER 2008
MARKET ENVIRONMENT: OCTOBER 2007 - SEPTEMBER 2008 (UNAUDITED) (continued)
INTERNATIONAL EQUITIES
International equities posted dismal results for the one-year period ended September 30, 2008, underperforming their US equity counterparts by a significant margin. There was seemingly “no place to hide.” Sharp declines were experienced across market capitalizations and geographic regions as concerns mounted regarding a slowing global growth outlook and credit crisis. The negative returns experienced in broad-based foreign equity markets was a stark reversal compared to the strong returns experienced in the 12-month period ended September 30, 2007.
There was tremendous volatility in currency movements versus the US dollar during the period. Overall, US-based investors in international equities did not get the benefit of a significant currency “lift” during the 12-month period, as certain currencies including the euro and the pound declined against the dollar.
From a GICS economic sector perspective (using the MSCI EAFE Index as a reference point), performance weakness was widespread. All 10 GICS sectors in the MSCI EAFE Index had negative returns, the weakest being Materials (-38%), Information Technology (-37%), Financials (-37%), Industrials (-35%), and Consumer Discretionary (-33%). Health Care was the best-performing foreign equity sector with a return of -13%. All other sectors were down between -16% and -25%.
At an industry level, weakness was broad-based. Every GICS industry group in the MSCI EAFE Index had a double-digit negative return. The most significant laggards were Diversified Financials (-49%), Semiconductor & Semiconductor Equipment (-47%), Technology Hardware & Equipment (-42%), and Retailing (-42%).
The MSCI EAFE Index’s largest country-level constituents had unfavorable results for the period. The United Kingdom and Japan, which together comprise nearly 44% of the Index, posted returns of -31% and -27%, respectively. Emerging markets tumbled as falling commodity and natural resource prices took their toll. As noted above, the MSCI Emerging Markets Index plummeted more than -33% for the 12 months ended September 30, 2008.
THE MARSICO INVESTMENT TEAM
MARSICO FOCUS FUND & MARSICO GROWTH FUND
INVESTMENT REVIEW BY TOM MARSICO (UNAUDITED)
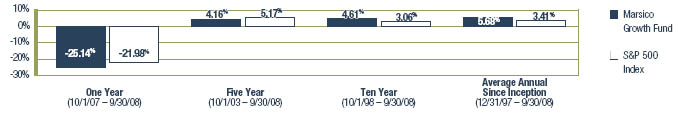
The Focus Fund and the Growth Fund underperformed their primary benchmark index for the one-year fiscal period ended September 30, 2008, generating total returns of -22.69% and -25.14%, respectively. For comparative purposes, the S&P 500 Index - which we consider to be the Funds’ primary benchmark index - had a total return of -21.98% for the period ended September 30, 2008. Please see the Funds’ Overviews for more detailed information about each Fund’s longer-term performance for various periods ended September 30, 2008.
The performance data for the Funds quoted here represent past performance, and past performance is not a guarantee of future results. Investment return and principal value of an investment will fluctuate so that an investor’s shares, when redeemed, may be worth more or less than their original cost. Current performance may be lower or higher than the performance information quoted. To obtain performance information current to the most recent month-end, please call 888-860-8686 or visit www.marsicofunds.com.1
This review highlights Fund performance over a one-year fiscal period. Shareholders should keep in mind that the Funds are intended for long-term investors who hold their shares for substantially longer periods of time. You should also keep in mind that our views on all investments discussed in this report are subject to change at any time. References to specific securities, industries, and sectors discussed in this report are not recommendations to buy or sell such securities or related investments, and the Funds may not necessarily hold these securities or investments today. Please see the accompanying Schedules of Investments for the percentage of each Fund’s portfolio represented by the securities mentioned in this report.
As you know, the Focus Fund and Growth Fund often invest in similar growth companies. Their performance may differ at times, however, because of a variety of factors. Among other factors, the Focus Fund is a non-diversified mutual fund that may invest in a more concentrated portfolio and may hold the securities of fewer issuers than the Growth Fund. As a result, the Focus Fund may hold some securities that are different from those held by the Growth Fund, and may be more exposed to individual stock volatility than the Growth Fund or other mutual funds that invest in a larger number of securities.
FOCUS FUND
There were a number of factors that contributed to the Focus Fund’s underperformance for the one-year period ended September 30, 2008 (as compared with the S&P 500 Index):
| ● | Consumer Discretionary: The Fund’s hotel/casino operator holdings declined sharply, including Las Vegas Sands Corp. (-73%), Wynn Resorts Ltd. (-46%), and MGM MIRAGE (-41% prior to being sold from the Fund). Media position Comcast Corporation - Cl. A. declined -27% and was sold from the Fund. |
| ● | Health Care: The Fund’s holdings in the Health Care sector had a collective loss of -17% during the reporting period. Pharmaceutical company Merck & Co., Inc. (-34%) and health care services provider UnitedHealth Group, Inc. (-38%) detracted significantly from performance. Both were sold from the Fund during the period. The Fund was further hurt by having less exposure to the Health Care sector than the benchmark index, as Health Care was a comparatively strong-performing sector of the S&P 500 Index with a return of -12%. |
| ● | Information Technology: Certain Information Technology positions had disappointing results for the reporting period. Apple, Inc. (-47%), Google, Inc. - Cl. A (-24%), MasterCard, Inc. - Cl. A (-11%), Microsoft Corporation (-21%), and Intel Corporation (-23%) each had a material, negative effect on the Fund’s fiscal year performance. (Google, Microsoft, and Intel were sold prior to September 30, 2008.) |
MARSICO FOCUS FUND & MARSICO GROWTH FUND
| ● | Consumer Staples: The Fund had little exposure to Consumer Staples during the 12-month period. The Fund would have benefitted by having more exposure to the sector, as Consumer Staples was the sole sector of the S&P 500 Index to post a positive return. The Fund’s underweighted posture, therefore, imposed a significant “opportunity cost” on performance relative to the benchmark. Additionally, the Fund’s return was impaired by its position in retail pharmacy CVS Caremark Corporation (-15%). |
| ● | Telecommunication Services: The Fund’s holdings in China-based wireless telecommunications company China Mobile Ltd. Spon. ADR and major telecommunications company AT&T, Inc. suffered losses of -35% and -24%, respectively. AT&T was not held in the Fund as of September 30, 2008. |
Certain individual positions in various sectors struggled during the period. Financials holding The Goldman Sachs Group, Inc. (-39%) and Energy position Schlumberger Ltd. (-24%) had a material, negative effect on performance.
There were a few areas of strength for the Focus Fund during the annual period:
| ● | Financials: While the Fund’s Financials holdings posted a collective loss of -14% during the reporting period, this return was significantly better than the S&P 500 Index’s sector return of -39%. Banking positions Wells Fargo & Company (+18%), U.S. Bancorp (+24%), and diversified financials company Bank of America Corporation (+49%) experienced solid gains during the period while they were held by the Fund. |
| ● | Industrials: A number of the Fund’s Industrials holdings fared well, including railroad operators Union Pacific Corporation (+27%) and Norfolk Southern Corporation (+27%). |
The Fund’s Energy and Materials holdings, in aggregate, had better returns than the S&P 500 Index Energy and Materials sectors. Brazil-based energy company Petroleo Brasileiro S.A. ADR (+19%) and agricultural materials company Monsanto Company (+16%) helped buoy the Fund’s return. Certain individual positions in other sectors also performed well. Restaurant company McDonald’s Corporation (+19%), financial transactions processor Visa, Inc. - Cl. A (+40%, purchased as an Initial Public Offering), and biotechnology company Genentech, Inc. (+14%) were among the Fund’s strongest performing holdings.
During the period, the Fund reduced its exposure to the Consumer Discretionary, Energy, and Information Technology sectors while increasing its exposure to Industrials and Financials. The Fund’s cash position increased, particularly during the later portion of the 12-month period. As of period-end cash and cash equivalents represented approximately 9% of the Fund’s total net assets. This positioning provided a limited measure of protection in the volatile market and helped preserve capital to some extent.
GROWTH FUND
The Growth Fund shared many of the Focus Fund’s performance attributes for the 12-month period ended September 30, 2008, including:
| ● | Health Care: The Fund’s holdings in the Health Care sector dropped -24%, significantly trailing the S&P 500 Index sector return of -12%. UnitedHealth Group, Inc. (-38%), Merck & Co., Inc. (-34%), and Amylin Pharmaceuticals, Inc. (-59%) each had a material, negative effect on performance results and were sold during the period. The Fund was further penalized by having less exposure to this relatively strong performing sector than its benchmark index. |
| ● | Consumer Staples: Similar to the Focus Fund, the Growth Fund was hurt by having less exposure, on average, to the strong-performing Consumer Staples sector than the benchmark index. The Fund also held a few positions that sagged during the period. Netherlands-based brewery company Heineken N.V. ADR and retail pharmacy CVS Caremark Corporation declined -38% and -15%, respectively. |
| ● | Consumer Discretionary: The Fund was adversely affected by hotel/casino operator positions. These positions included Las Vegas Sands Corp. (-73%), MGM MIRAGE (-72% prior to being sold), and Wynn Resorts Ltd. (-46%). Media company Comcast Corporation - Cl. A (-26% prior to being sold) also disappointed. |
| ● | Information Technology: Apple, Inc. (-48%), Google, Inc. - Cl. A (-24%), Microsoft Corporation (-23%), and Intel Corporation (-23%) were among the Fund’s weakest performing individual positions. Google, Microsoft, and Intel were sold during the reporting period. |
Like the Focus Fund, certain of the Growth Fund’s individual positions struggled during the period. Financials holding The Goldman Sachs Group, Inc. (-41%), energy company Schlumberger Ltd. (-25%), and telecommunications companies China Mobile Ltd. Spon. ADR (-39%) and AT&T, Inc. (-31% prior to being sold) had disappointing performance results.
The following factors aided the Fund’s fiscal year performance:
| ● | Financials: Like the Focus Fund, the Growth Fund’s Financials holdings fared substantially better than the S&P 500 Index’s sector return of -39%. The Fund’s best performing Financials positions included Wells Fargo & Company (+11%), U.S. Bancorp (+23%), and Bank of America Corporation (+7%). |
| ● | Industrials: Railroad operators Union Pacific Corporation (+28%) and Norfolk Southern Corporation (+27%) and aerospace/defense company Lockheed Martin Corporation (+3%) were solid performers. |
| ● | Materials: The Fund’s Materials holdings posted a collective loss of -4%. While the performance was negative, the Fund’s stock selection was significantly better than the benchmark index sector which experienced a loss of -21%. The Fund’s positions in this sector were led by agricultural materials company Monsanto Company (+16%). |
There were several individual holdings in various sectors that posted strong returns, including: McDonald’s Corporation (+19%), Petrohawk Energy Corporation (+127% prior to being sold), biotechnology company Genentech, Inc. (+14%), and MasterCard, Inc. - Cl. A (+20%).
The Fund increased its exposure to the Financials and Industrials sectors during the 12-month period, while reducing exposure to Consumer Discretionary, Health Care, Telecommunication Services and Information Technology sectors. As of period-end cash and cash equivalents represented approximately 5% of the Fund’s total net assets.
FISCAL PERIOD-END INVESTMENT POSTURE
As of September 30, 2008 the Focus Fund’s and Growth Fund’s primary sector allocations were in Financials, Consumer Discretionary, Industrials, and Information Technology. The Funds had little or no exposure to Utilities.
Sincerely,
THOMAS F. MARSICO
PORTFOLIO MANAGER
(1) | Total returns are based on net change in net asset value assuming reinvestment of distributions. A redemption fee of 2% may be imposed on redemptions or exchanges of Fund shares owned for 30 days or less. Please see the Prospectus for more information. |
MARSICO FOCUS FUND
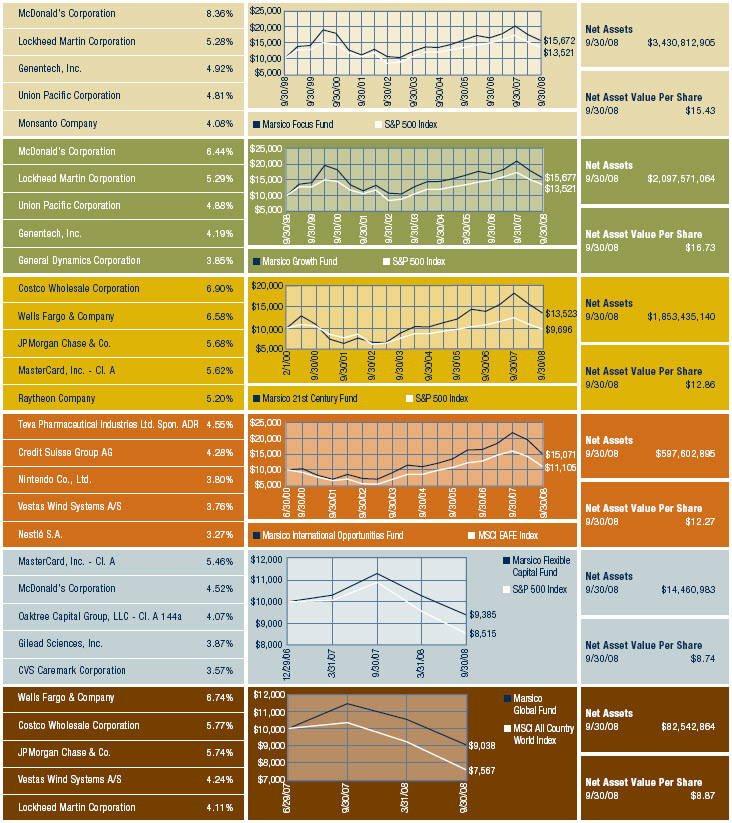
FUND OVERVIEW September 30, 2008 (Unaudited)
The Focus Fund invests primarily in the common stocks of large companies, normally a core position of 20-30 common stocks that are selected for their long-term growth potential.
PERFORMANCE COMPARISON
| | | | |
TOTAL ANNUAL OPERATING EXPENSES* | | 1.23 | % |
| | | | |
NET ASSETS | | | |
| | | | |
| 9/30/08 | | | $3,430,812,905 | |
| | | | | |
NET ASSET VALUE | | | | |
| | | | | |
| Net Asset Value Per Share | | | $15.43 | |
| | | | | |
TOP FIVE HOLDINGS | | | | |
| | | | | |
| McDonald’s Corporation | | | 8.36 | % |
| Lockheed Martin Corporation | | | 5.28 | |
| Genentech, Inc. | | | 4.92 | |
| Union Pacific Corporation | | | 4.81 | |
| Monsanto Company | | | 4.08 | |
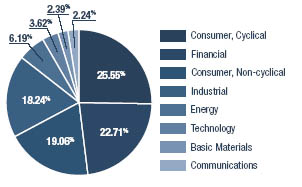
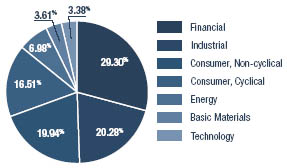
SECTOR ALLOCATION(2)
| * | The Total Annual Operating Expenses are reflective of the information disclosed in the Funds’ Prospectus dated February 1, 2008 and may differ from the expense ratios disclosed in this report. |
The performance data quoted here represent past performance, and past performance is not a guarantee of future results. Investment return and principal value of an investment will fluctuate so that an investor’s shares, when redeemed, may be worth more or less than their original cost. Current performance may be lower or higher than the performance information quoted. To obtain performance information current to the most recent month-end, please call 888-860-8686 or visit www.marsicofunds.com. A redemption fee may be imposed on redemptions or exchanges of Fund shares held for 30 days or less.
The performance included in the table and graph does not reflect the deduction of taxes on Fund distributions or the redemption of Fund shares.
(1) | This chart assumes an initial investment of $10,000 made on September 30, 1998. Total returns are based on net change in NAV, assuming reinvestment of distributions. |
(2) | Sector weightings represent the percentage of the Fund’s investments (excluding cash equivalents) in certain general sectors. These sectors may include more than one industry. The Fund’s portfolio composition is subject to change at any time. |
SCHEDULE OF INVESTMENTS September 30, 2008 |
| | | Number of Shares | | Value | | Percent of Net Assets | |
COMMON STOCKS | | | | | | | |
| | | | | | | | |
Aerospace/Defense | | | | | | | |
| General Dynamics Corporation | | | 1,612,124 | | | $118,684,569 | | | 3.46 | % |
| Lockheed Martin Corporation | | | 1,653,143 | | | 181,300,193 | | | 5.28 | |
| | | | | | | 299,984,762 | | | 8.74 | |
Agricultural Chemicals | | | | | | | | | | |
| Monsanto Company | | | 1,413,426 | | | 139,900,905 | | | 4.08 | |
| | | | | | | | | | | |
Casino Hotels | | | | | | | | | | |
| Las Vegas Sands Corp.* | | | 1,919,644 | | | 69,318,345 | | | 2.02 | |
| Wynn Resorts Ltd. | | | 1,467,410 | | | 119,799,352 | | | 3.49 | |
| | | | | | | 189,117,697 | | | 5.51 | |
Cellular Telecommunications | | | | | | | | | | |
| China Mobile Ltd. Spon. ADR | | | 704,748 | | | 35,293,780 | | | 1.03 | |
| | | | | | | | | | | |
Commercial Banks - Non-U.S. | | | | | | | | | | |
| Industrial and Commercial | | | | | | | | | | |
| Bank of China Ltd. - Cl. H | | | 201,520,100 | | | 121,797,676 | | | 3.55 | |
| | | | | | | | | | | |
Commercial Services - Finance | | | | | | | | | | |
| MasterCard, Inc. - Cl. A | | | 602,774 | | | 106,889,913 | | | 3.12 | |
| Visa, Inc. - Cl. A | | | 2,081,075 | | | 127,757,194 | | | 3.72 | |
| | | | | | | 234,647,107 | | | 6.84 | |
Computers | | | | | | | | | | |
| Apple, Inc.* | | | 940,234 | | | 106,866,996 | | | 3.12 | |
| | | | | | | |
Finance - Investment Banker/Broker | | | | | | |
| The Goldman Sachs Group, Inc. | | | 1,062,649 | | | 136,019,072 | | | 3.96 | |
| JPMorgan Chase & Co. | | | 1,613,639 | | | 75,356,941 | | | 2.20 | |
| | | | | | | 211,376,013 | | | 6.16 | |
Industrial Gases | | | | | | | | | | |
| Air Products and Chemicals, Inc. | | | 1,027,076 | | | 70,344,435 | | | 2.05 | |
| | | | | | | | | | | |
Medical - Biomedical/Genetic | | | | | | | | | | |
| Genentech, Inc.* | | | 1,904,717 | | | 168,910,304 | | | 4.92 | |
| Gilead Sciences, Inc.* | | | 404,689 | | | 18,445,725 | | | 0.54 | |
| | | | | | | 187,356,029 | | | 5.46 | |
Oil - Field Services | | | | | | | | | | |
| Schlumberger Ltd. | | | 697,696 | | | 54,483,081 | | | 1.59 | |
| | | | | | | | | | | |
Oil & Gas Drilling | | | | | | | | | | |
| Transocean, Inc. | | | 569,437 | | | 62,546,960 | | | 1.82 | |
| | | | | | | | | | | |
Oil Companies - Integrated | | | | | | | | | | |
| Petroleo Brasileiro S.A. ADR | | | 1,492,529 | | | 65,596,650 | | | 1.91 | |
| | | | | | | | | | | |
Retail - Building Products | | | | | | | | | | |
| Lowe’s Companies, Inc. | | | 4,335,365 | | | 102,704,797 | | | 2.99 | |
| | | | | | | | | | | |
Retail - Discount | | | | | | | | | | |
| Target Corporation | | | 687,603 | | | 33,726,927 | | | 0.98 | |
| Wal-Mart Stores, Inc. | | | 145,706 | | | 8,726,332 | | | 0.26 | |
| | | | | | | 42,453,259 | | | 1.24 | |
Retail - Drug Store | | | | | | | |
| CVS Caremark Corporation | | | 3,935,624 | | | 132,473,104 | | | 3.86 | |
| | | | | | | | | | | |
Retail - Restaurants | | | | | | | | | | |
| McDonald’s Corporation | | | 4,645,368 | | | 286,619,206 | | | 8.36 | |
| | | | | | | | | | | |
Super-Regional Banks - U.S. | | | | | | | | | | |
| Bank of America Corporation | | | 3,166,351 | | | 110,822,285 | | | 3.23 | |
| U.S. Bancorp | | | 2,883,792 | | | 103,874,188 | | | 3.03 | |
| Wells Fargo & Company | | | 3,245,547 | | | 121,805,379 | | | 3.55 | |
| | | | | | | 336,501,852 | | | 9.81 | |
Transportation - Rail | | | | | | | | | | |
| Norfolk Southern Corporation | | | 1,098,254 | | | 72,715,397 | | | 2.12 | |
| Union Pacific Corporation | | | 2,319,715 | | | 165,070,919 | | | 4.81 | |
| | | | | | | 237,786,316 | | | 6.93 | |
Wireless Equipment | | | | | | | | | | |
| QUALCOMM, Inc. | | | 712,330 | | | 30,608,820 | | | 0.89 | |
| | | | | | | | | | | |
TOTAL COMMON STOCKS | | | | | | | | | | |
(Cost $2,588,628,563) | | | | | | 2,948,459,445 | | | 85.94 | |
| | | | | | | |
SHORT-TERM INVESTMENTS | | | | | | |
| | | | | | | | | | | |
| Federal Home Loan | | | | | | | | | | |
| Bank Discount Note, | | | | | | | | | | |
| 0.10%, 10/01/2008 | | | 14,200,000 | | | 14,200,000 | | | 0.41 | |
| SSgA Money Market | | | | | | | | | | |
| Fund, 2.22% | | | 114,562,089 | | | 114,562,089 | | | 3.34 | |
| SSgA Prime | | | | | | | | | | |
| Money Market Fund, 2.41% | | | 147,294,114 | | | 147,294,114 | | | 4.29 | |
| SSgA U.S. Government | | | | | | | | | | |
| Money Market Fund, 1.79% | | | 1 | | | 1 | | | 0.00 | |
| SSgA U.S. Treasury | | | | | | | | | | |
| Money Market Fund, 0.20% | | | 32,816,723 | | | 32,816,723 | | | 0.96 | |
| | | | | | | |
TOTAL SHORT-TERM INVESTMENTS | | | | | | |
(Cost $308,872,927) | | | | | | 308,872,927 | | | 9.00 | |
| | | | | | | | | | | |
TOTAL INVESTMENTS | | | | | | | | | | |
(Cost $2,897,501,490) | | | | | | 3,257,332,372 | | | 94.94 | |
| | | | | | | | | | | |
| Other Assets Less Liabilities | | | | | | 173,480,533 | | | 5.06 | |
| | | | | | | | | | | |
NET ASSETS | | | | | | $3,430,812,905 | | | 100.00 | % |
See notes to financial statements.
MARSICO FOCUS FUND
STATEMENT OF ASSETS AND LIABILITIES | |
| September 30, 2008 | | | |
| | | | |
| (Amounts in thousands) | | | |
| | | | |
ASSETS | | | |
| Investments, at value (cost $2,897,501) | | | $3,257,332 | |
| Receivable for investments sold | | | 186,937 | |
| Receivable for capital stock sold | | | 3,531 | |
| Interest and dividends receivable | | | 3,964 | |
| Prepaid expenses and other assets | | | 754 | |
Total Assets | | | 3,452,518 | |
| | | | | |
LIABILITIES | | | | |
| Payable for investments purchased | | | 8,588 | |
| Payable for capital stock redeemed | | | 8,275 | |
| Accrued investment advisory fee | | | 2,499 | |
| Accrued distribution fee | | | 624 | |
| Accrued trustees’ fees | | | 620 | |
| Accrued transfer agent fees and expenses | | | 567 | |
| Accrued expenses and other liabilities | | | 532 | |
Total Liabilities | | | 21,705 | |
NET ASSETS | | | $3,430,813 | |
| | | | | |
NET ASSETS CONSIST OF | | | | |
| Paid-in-capital | | | $3,118,487 | |
| Accumulated net investment income | | | 15,432 | |
| Accumulated net realized loss on investments and foreign currency transactions | | | (62,922 | ) |
| Net unrealized appreciation on investments and foreign currency translations | | | 359,816 | |
NET ASSETS | | | $3,430,813 | |
| | | | | |
SHARES OUTSTANDING, $0.001 par value | | | | |
| (Unlimited shares authorized) | | | 222,327 | |
| | | | | |
NET ASSET VALUE, REDEMPTION PRICE, AND OFFERING PRICE PER SHARE (NET ASSETS/SHARES OUTSTANDING)* | | | $15.43 | |
STATEMENT OF OPERATIONS | | | |
| FOR THE YEAR ENDED September 30, 2008 | | | |
| | | | |
| (Amounts in thousands) | | | |
| | | | |
INVESTMENT INCOME | | | |
| Interest | | | $6,811 | |
| Dividends (net of $243 of non-reclaimable | | | | |
| foreign withholding taxes) | | | 63,918 | |
Total Investment Income | | | 70,729 | |
| | | | | |
EXPENSES | | | | |
| Investment advisory fees | | | 35,696 | |
| Distribution fees | | | 10,898 | |
| Transfer agent fees and expenses | | | 3,859 | |
| Printing and postage expenses | | | 766 | |
| Custody and fund accounting fees | | | 628 | |
| Fund administration fees | | | 365 | |
| Miscellaneous | | | 201 | |
| Professional fees | | | 191 | |
| Federal and state registration fees | | | 116 | |
| Trustees’ fees and expenses | | | (70 | )(1) |
Total Expenses | | | 52,650 | |
| Less expenses paid indirectly | | | (5 | ) |
Net Expenses | | | 52,645 | |
NET INVESTMENT INCOME | | | 18,084 | |
| | | | | |
REALIZED AND UNREALIZED GAIN/LOSS | | | | |
| Net realized gain on investments | | | 42,492 | |
| Net realized gain on foreign currency transactions | | | 1,701 | |
| Change in unrealized appreciation/depreciation on investments and foreign currency translations | | | (1,147,336 | ) |
Net Loss on Investments | | | (1,103,143 | ) |
| | | | | |
NET DECREASE IN NET ASSETS RESULTING FROM OPERATIONS | | | $(1,085,059 | ) |
(1) | Includes $183,361 for trustees’ fees and expenses and $(253,550) for the unrealized depreciation related to the mark to market of the shares in the Deferred Fee Plan during the year ended September 30, 2008. |
See notes to financial statements.
STATEMENTS OF CHANGES IN NET ASSETS | | | | | |
| (Amounts in thousands) | | Year Ended 9/30/08 | | Year Ended 9/30/07 | |
OPERATIONS | | | | | |
| Net investment income (loss) | | | $18,084 | | | $(9,832 | ) |
| Net realized gain on investments | | | 42,492 | | | 370,444 | |
| Net realized gain on foreign currency transactions | | | 1,701 | | | 52 | |
| Change in unrealized appreciation/depreciation on investments and foreign currency translations | | | (1,147,336 | ) | | 622,469 | |
Net increase (decrease) in net assets resulting from operations | | | (1,085,059 | ) | | 983,133 | |
| | | | | | | | |
DISTRIBUTIONS | | | | | | | |
| Net investment income | | | — | | | (5,110 | ) |
| Net realized gains | | | (416,043 | ) | | (118,228 | ) |
Total distributions | | | (416,043 | ) | | (123,338 | ) |
| | | | | | | | |
CAPITAL SHARE TRANSACTIONS | | | | | | | |
| Proceeds from sale of shares | | | 1,108,792 | | | 1,232,491 | |
| Proceeds from reinvestment of distributions | | | 407,742 | | | 120,538 | |
| Redemption fees | | | 51 | | | 41 | |
| Redemption of shares | | | (1,636,332 | ) | | (1,777,658 | ) |
Net decrease from capital share transactions | | | (119,747 | ) | | (424,588 | ) |
TOTAL INCREASE (DECREASE) IN NET ASSETS | | | (1,620,849 | ) | | 435,207 | |
| | | | | | | | |
NET ASSETS | | | | | | | |
| Beginning of Period | | | 5,051,662 | | | 4,616,455 | |
END OF PERIOD | | | $3,430,813 | | | $5,051,662 | |
| Accumulated net investment income (loss) | | | 15,432 | | | (940 | ) |
| | | | | | | | |
TRANSACTIONS IN SHARES | | | | | | | |
| Shares sold | | | 59,309 | | | 62,930 | |
| Shares issued in reinvestment of distributions | | | 20,326 | | | 6,311 | |
| Shares redeemed | | | (89,520 | ) | | (90,816 | ) |
NET DECREASE | | | (9,885 | ) | | (21,575 | ) |
See notes to financial statements.
MARSICO FOCUS FUND
FINANCIAL HIGHLIGHTS | | | | | | | | | | | |
For a Fund Share Outstanding Throughout the Period | | Year Ended 9/30/08 | | Year Ended 9/30/07 | | Year Ended 9/30/06 | | Year Ended 9/30/05 | | Year Ended 9/30/04 | |
| | | | | | | | | | | | |
NET ASSET VALUE, BEGINNING OF PERIOD | | | $21.75 | | | $18.19 | | | $17.45 | | | $14.83 | | | $13.49 | |
| | | | | | | | | | | | | | | | | |
INCOME FROM INVESTMENT OPERATIONS | | | | | | | | | | | | | | | | |
| Net investment income (loss) | | | 0.08 | | | (0.04 | ) | | (0.02 | ) | | (0.03 | ) | | (0.05 | ) |
| Net realized and unrealized | | | | | | | | | | | | | | | | |
| gains (losses) on investments | | | (4.60 | ) | | 4.09 | | | 0.76 | | | 2.65 | | | 1.39 | |
Total from investment operations | | | (4.52 | ) | | 4.05 | | | 0.74 | | | 2.62 | | | 1.34 | |
| | | | | | | | | | | | | | | | | |
DISTRIBUTIONS & OTHER | | | | | | | | | | | | | | | | |
| Net investment income | | | — | | | (0.02 | ) | | — | | | — | | | — | |
| Net realized gains | | | (1.80 | ) | | (0.47 | ) | | — | | | — | | | — | |
| Redemption fees [See Note 2(i)] | | | — | (1) | | — | (1) | | — | (1) | | — | (1) | | — | (1) |
Total distributions & other | | | (1.80 | ) | | (0.49 | ) | | — | | | — | | | — | |
NET ASSET VALUE, END OF PERIOD | | | $15.43 | | | $21.75 | | | $18.19 | | | $17.45 | | | $14.83 | |
| | | | | | | | | | | | | | | | | |
TOTAL RETURN | | | (22.69 | )% | | 22.65 | % | | 4.24 | % | | 17.67 | % | | 9.93 | % |
| | | | | | | | | | | | | | | | | |
SUPPLEMENTAL DATA AND RATIOS | | | | | | | | | | | | | | | | |
| Net assets, end of period (000s) | | | $3,430,813 | | | $5,051,662 | | | $4,616,455 | | | $3,740,191 | | | $2,895,322 | |
| Ratio of expenses to average net assets before expenses paid indirectly | | | 1.21 | % | | 1.23 | % | | 1.24 | % | | 1.25 | % | | 1.30 | % |
| Ratio of net investment income (loss) to average net assets, net expenses paid indirectly | | | 0.41 | % | | (0.20 | )% | | (0.13 | )% | | (0.18 | )% | | (0.36 | )% |
| Ratio of net investment income (loss) to average net assets, before expenses paid indirectly | | | 0.41 | % | | (0.21 | )% | | (0.15 | )% | | (0.21 | )% | | (0.40 | )% |
| Portfolio turnover rate | | | 78 | % | | 69 | % | | 80 | % | | 84 | % | | 84 | % |
See notes to financial statements.
MARSICO GROWTH FUND
FUND OVERVIEW September 30, 2008 (Unaudited)
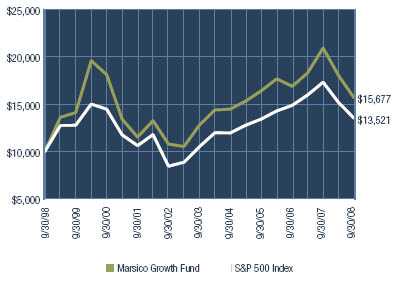
The Growth Fund invests primarily in the common stocks of large companies that are selected for their long-term growth potential. The Growth Fund will normally hold a core position of between 35 and 50 common stocks.
| | | | |
TOTAL ANNUAL OPERATING EXPENSES* | | 1.24 | % |
| | | | |
NET ASSETS | | | |
| | | | |
| 9/30/08 | | | $2,097,571,064 | |
| | | | | |
NET ASSET VALUE | | | | |
| | | | | |
| Net Asset Value Per | | | $16.73 | |
| | | | | |
TOP FIVE HOLDINGS | | | | |
| | | | | |
| McDonald’s Corporation | | | 6.44 | % |
| Lockheed Martin Corporation | | | 5.29 | |
| Union Pacific Corporation | | | 4.88 | |
| Genentech, Inc. | | | 4.19 | |
| General Dynamics Corporation | | | 3.85 | |
SECTOR ALLOCATION(2)
| * | The Total Annual Operating Expenses are reflective of the information disclosed in the Funds’ Prospectus dated February 1, 2008 and may differ from the expense ratios disclosed in this report. |
The performance data quoted here represent past performance, and past performance is not a guarantee of future results. Investment return and principal value of an investment will fluctuate so that an investor’s shares, when redeemed, may be worth more or less than their original cost. Current performance may be lower or higher than the performance information quoted. To obtain performance information current to the most recent month-end, please call 888-860-8686 or visit www.marsicofunds.com. A redemption fee may be imposed on redemptions or exchanges of Fund shares owned for 30 days or less.
The performance included in the table and graph does not reflect the deduction of taxes on Fund distributions or the redemption of Fund shares.
(1) | This chart assumes an initial investment of $10,000 made on September 30, 1998. Total returns are based on net change in NAV, assuming reinvestment of distributions. |
(2) | Sector weightings represent the percentage of the Fund’s investments (excluding cash equivalents) in certain general sectors. These sectors may include more than one industry. The Fund’s portfolio composition is subject to change at any time. |
MARSICO GROWTH FUND
SCHEDULE OF INVESTMENTS September 30, 2008 | |
| | | Number of Shares | | Value | | Percent of Net Assets | |
COMMON STOCKS | | | | | | | |
| | | | | | | | |
Aerospace/Defense | | | | | | | |
| General Dynamics Corporation | | | 1,095,705 | | | $80,665,802 | | | 3.85 | % |
| Lockheed Martin Corporation | | | 1,011,922 | | | 110,977,486 | | | 5.29 | |
| | | | | | | 191,643,288 | | | 9.14 | |
Agricultural Chemicals | | | | | | | | | | |
| Monsanto Company | | | 793,512 | | | 78,541,818 | | | 3.74 | |
| Potash Corporation | | | | | | | | | | |
| of Saskatchewan, Inc. | | | 187,809 | | | 24,792,666 | | | 1.18 | |
| | | | | | | 103,334,484 | | | 4.92 | |
Athletic Footwear | | | | | | | | | | |
| NIKE, Inc. - Cl. B | | | 391,854 | | | 26,215,033 | | | 1.25 | |
| | | | | | | | | | | |
Brewery | | | | | | | | | | |
| Heineken N.V. ADR | | | 1,166,355 | | | 23,198,801 | | | 1.11 | |
| | | | | | | | | | | |
Casino Hotels | | | | | | | | | | |
| Las Vegas Sands Corp.* | | | 683,777 | | | 24,691,187 | | | 1.18 | |
| Wynn Resorts Ltd. | | | 753,897 | | | 61,548,151 | | | 2.93 | |
| | | | | | | 86,239,338 | | | 4.11 | |
Cellular Telecommunications | | | | | | | | | | |
| América Móvil, S.A.B. | | | | | | | | | | |
| de C.V. ADR Ser. L | | | 459,490 | | | 21,301,956 | | | 1.01 | |
| China Mobile Ltd. | | | 2,156,500 | | | 21,603,113 | | | 1.03 | |
| | | | | | | 42,905,069 | | | 2.04 | |
Commercial Banks - Non-U.S. | | | | | | | | | | |
| Industrial and Commercial | | | | | | | | | | |
| Bank of China Ltd. - Cl. H | | | 112,478,000 | | | 67,981,104 | | | 3.24 | |
| | | | | | | | | | | |
Commercial Services - Finance | | | | | | | | | | |
| MasterCard, Inc. - Cl. A | | | 375,748 | | | 66,631,393 | | | 3.18 | |
| Visa, Inc. - Cl. A | | | 687,169 | | | 42,185,305 | | | 2.01 | |
| | | | | | | 108,816,698 | | | 5.19 | |
Computers | | | | | | | | | | |
| Apple, Inc.* | | | 577,639 | | | 65,654,449 | | | 3.13 | |
| | | | | | | | | | | |
Energy - Alternate Sources | | | | | | | | | | |
| Vestas Wind Systems A/S* | | | 186,603 | | | 16,287,613 | | | 0.78 | |
| | | | | | | |
Finance - Investment Banker/Broker | | | | | | |
| The Goldman Sachs Group, Inc. | | | 531,493 | | | 68,031,104 | | | 3.24 | |
| JPMorgan Chase & Co. | | | 997,510 | | | 46,583,717 | | | 2.22 | |
| Morgan Stanley | | | 510,460 | | | 11,740,580 | | | 0.56 | |
| | | | | | | 126,355,401 | | | 6.02 | |
Industrial Gases | | | | | | | | | | |
| Air Products and Chemicals, Inc. | | | 306,946 | | | 21,022,731 | | | 1.00 | |
| Praxair, Inc. | | | 648,988 | | | 46,558,399 | | | 2.22 | |
| | | | | | | 67,581,130 | | | 3.22 | |
Medical - Biomedical/Genetic | | | | | | | | | | |
| Genentech, Inc.* | | | 990,110 | | | 87,802,955 | | | 4.19 | |
| | | | | | | | | | | |
Metal Processors & Fabricators | | | | | | | |
| Precision Castparts Corp. | | | 110,106 | | | 8,674,151 | | | 0.41 | |
| | | | | | | | | | | |
Oil - Field Services | | | | | | | | | | |
| Schlumberger Ltd. | | | 428,635 | | | 33,472,107 | | | 1.60 | |
| | | | | | | | | | | |
Oil & Gas Drilling | | | | | | | | | | |
| Transocean, Inc. | | | 349,837 | | | 38,426,096 | | | 1.83 | |
| | | | | | | | | | | |
Oil Companies - Integrated | | | | | | | | | | |
| Hess Corporation | | | 70,514 | | | 5,787,789 | | | 0.28 | |
| Petroleo Brasileiro S.A. ADR | | | 932,415 | | | 40,979,639 | | | 1.95 | |
| | | | | | | 46,767,428 | | | 2.23 | |
Oil Field Machinery & Equipment | | | | | | | | | | |
| Cameron International Corporation* | | | 438,643 | | | 16,905,301 | | | 0.81 | |
| | | | | | | | | | | |
Retail - Building Products | | | | | | | | | | |
| Lowe’s Companies, Inc. | | | 2,257,311 | | | 53,475,698 | | | 2.55 | |
| | | | | | | | | | | |
Retail - Discount | | | | | | | | | | |
| Costco Wholesale Corporation | | | 663,017 | | | 43,049,694 | | | 2.05 | |
| Target Corporation | | | 428,062 | | | 20,996,441 | | | 1.00 | |
| | | | | | | 64,046,135 | | | 3.05 | |
Retail - Drug Store | | | | | | | | | | |
| CVS Caremark Corporation | | | 1,652,163 | | | 55,611,807 | | | 2.65 | |
| | | | | | | | | | | |
Retail - Restaurants | | | | | | | | | | |
| McDonald’s Corporation | | | 2,188,577 | | | 135,035,201 | | | 6.44 | |
| YUM! Brands, Inc. | | | 1,861,640 | | | 60,708,080 | | | 2.89 | |
| | | | | | | 195,743,281 | | | 9.33 | |
Super-Regional Banks - U.S. | | | | | | | | | | |
| Bank of America Corporation | | | 1,945,270 | | | 68,084,450 | | | 3.25 | |
| U.S. Bancorp | | | 1,312,298 | | | 47,268,974 | | | 2.25 | |
| Wells Fargo & Company | | | 1,993,926 | | | 74,832,043 | | | 3.57 | |
| | | | | | | 190,185,467 | | | 9.07 | |
Transportation - Rail | | | | | | | | | | |
| CSX Corporation | | | 221,728 | | | 12,099,697 | | | 0.58 | |
| Norfolk Southern Corporation | | | 712,186 | | | 47,153,835 | | | 2.25 | |
| Union Pacific Corporation | | | 1,439,424 | | | 102,429,412 | | | 4.88 | |
| | | | | | | 161,682,944 | | | 7.71 | |
Wireless Equipment | | | | | | | | | | |
| QUALCOMM, Inc. | | | 1,097,772 | | | 47,171,263 | | | 2.25 | |
| | | | | | | | | | | |
TOTAL COMMON STOCKS | | | | | | | | | | |
(Cost $1,614,892,106) | | | | | | 1,926,177,041 | | | 91.83 | |
See notes to financial statements.
SCHEDULE OF INVESTMENTS September 30, 2008 | |
| | | Number of Shares | | Value | | Percent of Net Assets | |
SHORT-TERM INVESTMENTS | | | | | |
| SSgA Money Market | | | | | | | |
| Fund, 2.22% | | | 1 | | | $1 | | | 0.00 | % |
| SSgA Prime | | | | | | | | | | |
| Money Market Fund, 2.41% | | | 66,958,779 | | | 66,958,779 | | | 3.19 | |
| SSgA U.S. Government | | | | | | | | | | |
| Money Market Fund, 1.79% | | | 20,040,120 | | | 20,040,120 | | | 0.96 | |
| SSgA U.S. Treasury | | | | | | | | | | |
| Money Market Fund, 0.20% | | | 20,040,119 | | | 20,040,119 | | | 0.95 | |
| | | | | | | |
TOTAL SHORT-TERM INVESTMENTS | | | | | | |
(Cost $107,039,019) | | | | | | 107,039,019 | | | 5.10 | |
| | | | | | | | | | | |
TOTAL INVESTMENTS | | | | | | | | | | |
(Cost $1,721,931,125) | | | | | | 2,033,216,060 | | | 96.93 | |
| | | | | | | | | | | |
| Other Assets Less Liabilities | | | | | | 64,355,004 | | | 3.07 | |
| | | | | | | | | | | |
NET ASSETS | | | | | | $2,097,571,064 | | | 100.00 | % |
See notes to financial statements.
MARSICO GROWTH FUND
STATEMENT OF ASSETS AND LIABILITIES | |
| September 30, 2008 | | | |
| (Amounts in thousands) | | | |
| | | | |
ASSETS | | | |
| Investments, at value (cost $1,721,931) | | | $2,033,216 | |
| Foreign currency (cost $403) | | | 403 | |
| Receivable for investments sold | | | 88,451 | |
| Receivable for capital stock sold | | | 2,057 | |
| Interest and dividends receivable | | | 1,622 | |
| Prepaid expenses and other assets | | | 396 | |
Total Assets | | | 2,126,145 | |
| | | | | |
LIABILITIES | | | | |
| Payable for investments purchased | | | 20,630 | |
| Payable for capital stock redeemed | | | 4,919 | |
| Accrued investment advisory fee | | | 1,584 | |
| Accrued distribution fee | | | 466 | |
| Accrued trustees’ fees | | | 326 | |
| Accrued transfer agent fees and expenses | | | 279 | |
| Accrued expenses and other liabilities | | | 370 | |
Total Liabilities | | | 28,574 | |
| | | | | |
NET ASSETS | | | $2,097,571 | |
| | | | | |
NET ASSETS CONSIST OF | | | | |
| Paid-in-capital | | | $1,934,363 | |
| Accumulated net investment income | | | 8,790 | |
| Accumulated net realized loss on investments and foreign currency transactions | | | (156,871 | ) |
| Net unrealized appreciation on investments and foreign currency translations | | | 311,289 | |
NET ASSETS | | | $2,097,571 | |
| | | | | |
SHARES OUTSTANDING, $0.001 par value | | | | |
| (Unlimited shares authorized) | | | 125,396 | |
| | | | | |
NET ASSET VALUE, REDEMPTION PRICE, AND OFFERING PRICE PER SHARE (NET ASSETS/SHARES OUTSTANDING)* | | | $16.73 | |
STATEMENT OF OPERATIONS | | | |
| FOR THE YEAR ENDED September 30, 2008 | | | |
| (Amounts in thousands) | | | |
| | | | |
INVESTMENT INCOME | | | |
| Interest | | | $2,782 | |
| Dividends (net of $157 of non-reclaimable | | | | |
| foreign withholding taxes) | | | 41,177 | |
Total Investment Income | | | 43,959 | |
| | | | | |
EXPENSES | | | | |
| Investment advisory fees | | | 23,751 | |
| Distribution fees | | | 6,985 | |
| Transfer agent fees and expenses | | | 2,387 | |
| Custody and fund accounting fees | | | 476 | |
| Printing and postage expenses | | | 405 | |
| Fund administration fees | | | 287 | |
| Professional fees | | | 125 | |
| Miscellaneous | | | 121 | |
| Federal and state registration fees | | | 93 | |
| Trustees’ fees and expenses | | | (1 | )(1) |
Total Expenses | | | 34,629 | |
| Less expenses paid indirectly | | | (3 | ) |
Net Expenses | | | 34,626 | |
| | | | | |
NET INVESTMENT INCOME | | | 9,333 | |
| | | | | |
REALIZED AND UNREALIZED GAIN/LOSS | | | | |
| Net realized loss on investments | | | (150,107 | ) |
| Net realized loss on foreign currency transactions | | | (1,278 | ) |
| Change in unrealized appreciation/depreciation on investments and foreign currency translations | | | (616,090 | ) |
Net Loss on Investments | | | (767,475 | ) |
| | | | | |
NET DECREASE IN NET ASSETS RESULTING FROM OPERATIONS | | | $(758,142 | ) |
| (1) | Includes $119,919 for trustees’ fees and expenses and $(120,248) for the unrealized depreciation related to the mark to market of the shares in the Deferred Fee Plan during the year ended September 30, 2008. |
See notes to financial statements.
STATEMENTS OF CHANGES IN NET ASSETS | | | | | |
| (Amounts in thousands) | | Year Ended 9/30/08 | | Year Ended 9/30/07 | |
| | | | | | |
OPERATIONS | | | | | |
| Net investment income (loss) | | | $9,333 | | | $(6,991 | ) |
| Net realized gain (loss) on investments | | | (150,107 | ) | | 118,821 | |
| Net realized gain (loss) on foreign currency transactions | | | (1,278 | ) | | 21 | |
| Change in unrealized appreciation/depreciation | | | | | | | |
| on investments and foreign currency translations | | | (616,090 | ) | | 491,793 | |
Net increase (decrease) in net assets resulting from operations | | | (758,142 | ) | | 603,644 | |
| | | | | | | | |
DISTRIBUTIONS | | | | | | | |
| Net realized gains | | | (97,785 | ) | | — | |
Total distributions | | | (97,785 | ) | | — | |
| | | | | | | | |
CAPITAL SHARE TRANSACTIONS | | | | | | | |
| Proceeds from sale of shares | | | 694,634 | | | 699,062 | |
| Proceeds from reinvestment of distributions | | | 92,101 | | | — | |
| Redemption fees | | | 125 | | | 41 | |
| Redemption of shares | | | (921,266 | ) | | (765,484 | ) |
Net decrease from capital share transactions | | | (134,406 | ) | | (66,381 | ) |
| | | | | | | | |
TOTAL INCREASE (DECREASE) IN NET ASSETS | | | (990,333 | ) | | 537,263 | |
| | | | | | | | |
NET ASSETS | | | | | | | |
| Beginning of period | | | 3,087,904 | | | 2,550,641 | |
| | | | | | | | |
END OF PERIOD | | | $2,097,571 | | | $3,087,904 | |
| Accumulated net investment income (loss) | | | 8,790 | | | (506 | ) |
| | | | | | | | |
TRANSACTIONS IN SHARES | | | | | | | |
| Shares sold | | | 33,382 | | | 33,881 | |
| Shares issued in reinvestment of distributions | | | 4,123 | | | — | |
| Shares redeemed | | | (45,970 | ) | | (37,077 | ) |
| | | | | | | | |
NET DECREASE | | | (8,465 | ) | | (3,196 | ) |
See notes to financial statements.
MARSICO GROWTH FUND
FINANCIAL HIGHLIGHTS | | | | | | | | | | | |
For a Fund Share Outstanding Throughout the Period | | Year Ended 9/30/08 | | Year Ended 9/30/07 | | Year Ended 9/30/06 | | Year Ended 9/30/05 | | Year Ended 9/30/04 | |
| | | | | | | | | | | | |
NET ASSET VALUE, BEGINNING OF PERIOD | | | $23.07 | | | $18.61 | | | $18.09 | | | $15.95 | | | $14.09 | |
| | | | | | | | | | | | | | | | | |
INCOME FROM INVESTMENT OPERATIONS | | | | | | | | | | | | | | | | |
| Net investment income (loss) | | | 0.07 | | | (0.05 | ) | | (0.04 | ) | | (0.02 | ) | | (0.04 | ) |
| Net realized and unrealized | | | | | | | | | | | | | | | | |
| gains (losses) on investments | | | (5.69 | ) | | 4.51 | | | 0.56 | | | 2.16 | | | 1.90 | |
Total from investment operations | | | (5.62 | ) | | 4.46 | | | 0.52 | | | 2.14 | | | 1.86 | |
| | | | | | | | | | | | | | | | | |
DISTRIBUTIONS & OTHER | | | | | | | | | | | | | | | | |
| Net realized gains | | | (0.72 | ) | | — | | | — | | | — | | | — | |
| Redemption fees [See Note 2(i)] | | | — | (1) | | — | (1) | | — | (1) | | — | (1) | | — | (1) |
Total distributions & other | | | (0.72 | ) | | — | | | — | | | — | | | — | |
| | | | | | | | | | | | | | | | | |
NET ASSET VALUE, END OF PERIOD | | | $16.73 | | | $23.07 | | | $18.61 | | | $18.09 | | | $15.95 | |
| | | | | | | | | | | | | | | | | |
TOTAL RETURN | | | (25.14 | )% | | 23.97 | % | | 2.87 | % | | 13.42 | % | | 13.20 | % |
| | | | | | | | | | | | | | | | | |
SUPPLEMENTAL DATA AND RATIOS | | | | | | | | | | | | | | | | |
| Net assets, end of period (000s) | | | $2,097,571 | | | $3,087,904 | | | $2,550,641 | | | $2,125,668 | | | $1,363,425 | |
| Ratio of expenses to average net assets, before expenses paid indirectly | | | 1.24 | % | | 1.24 | % | | 1.26 | % | | 1.26 | % | | 1.30 | % |
| Ratio of net investment income (loss) to average net assets, net of expenses paid indirectly | | | 0.33 | % | | (0.25 | )% | | (0.26 | )% | | (0.14 | )% | | (0.34 | )% |
| Ratio of net investment income (loss) to average net assets, before expenses paid indirectly | | | 0.33 | % | | (0.25 | )% | | (0.27 | )% | | (0.16 | )% | | (0.38 | )% |
| Portfolio turnover rate | | | 72 | % | | 53 | % | | 59 | % | | 73 | % | | 73 | % |
See notes to financial statements.
MARSICO 21ST CENTURY FUND
INVESTMENT REVIEW BY CORY GILCHRIST (UNAUDITED)
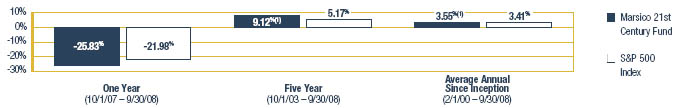
The 21st Century Fund posted a total return of -25.83% for the 12-month fiscal period ended September 30, 2008. The return lagged the S&P 500 Index, which we consider to be the Fund’s primary benchmark index, which had a total return of -21.98%. For comparative purposes, the Russell 3000 Index, a proxy for the performance of all publicly-traded US equity securities including smaller capitalization companies (which may be a useful representation of the Fund’s ability to invest across the entire market capitalization spectrum), had a total return of -21.52%. Please see the Fund Overview for more detailed information about the Fund’s longer-term performance for various time periods ended September 30, 2008.
The performance data for the Fund quoted here represent past performance, and past performance is not a guarantee of future results. Investment return and principal value of an investment will fluctuate so that an investor’s shares, when redeemed, may be worth more or less than their original cost. Current performance may be lower or higher than the performance information quoted. To obtain performance information current to the most recent month-end, please call 888-860-8686 or visit www.marsicofunds.com.1
This review highlights Fund performance over a one-year fiscal period. Shareholders should keep in mind that the Funds are intended for long-term investors who hold their shares for substantially longer periods of time. You should also keep in mind that our views on all investments discussed in this report are subject to change at any time. References to specific securities, industries, and sectors discussed in this report are not recommendations to buy or sell such securities or related investments, and the Fund may not necessarily hold these securities or investments today. Please see the accompanying Schedule of Investments for the percentage of the Fund’s portfolio represented by the securities mentioned in this report.
Several primary factors adversely impacted the 21st Century Fund’s investment results:
| ● | Consumer Discretionary: Many of the Fund’s holdings in the Consumer Discretionary sector declined sharply, apparently beset by worries about the potential for a significant slowdown in global economic growth and a deteriorating outlook for US consumer discretionary spending. Hotel/casino operators and retailing positions were the main culprits. These positions included Las Vegas Sands Corp. (-73%), Starwood Hotels & Resorts Worldwide, Inc. (-41% prior to being sold), Saks, Inc. (-46%), Wynn Resorts Ltd. (-46%), Vail Resorts, Inc. (-44%), and MGM MIRAGE (-31% prior to being sold). |
| ● | Health Care: The Fund’s Health Care positions declined -35%, in aggregate, for the reporting period. This performance result significantly lagged performance of the benchmark index sector, which posted a return of -12%. The Fund’s positions in Amylin Pharmaceuticals, Inc. (-60%) and UnitedHealth Group, Inc. (-38% prior to being sold) materially detracted from performance results. The Fund had few investments in the sector during the period. This investment posture presented an “opportunity cost” for the Fund, as the sector fared better than many other areas of the benchmark index. |
| ● | Industrials: Several of the Fund’s Industrials positions struggled, including energy services company The Shaw Group, Inc. (-56%) and defense company Raytheon Company (-15%). |
The Fund’s investments in the Financials sector posted mixed results. Washington Mutual, Inc. and KKR Financial Holdings LLC posted losses of -81% and -28%, respectively, prior to being sold from the Fund. These losses were offset, in part, by solid gains experienced by Wells Fargo & Company (+10%), U.S. Bancorp (+44%), JPMorgan Chase & Co. (+13%), and real estate company The St. Joe Company (+19%) during the period while they were held by the Fund. The Fund’s Financials positions posted a collective return of -15%, significantly outpacing the benchmark index sector return of -39%.
Other areas of strength for the Fund included individual holdings in various sectors such as MasterCard, Inc. - Cl. A (+21%), discount retailer Costco Wholesale Corporation (+7%), live music company Live Nation, Inc. (+57%), and Brazil-based energy company Petroleo Brasileiro S.A. ADR (+26%). Throughout the period, the Fund had little exposure to the Telecommunications sector. This proved to be a sound decision, as this sector within the S&P 500 Index posted a loss of -33%.
MARSICO 21ST CENTURY FUND
The Fund held an average of 10% in cash and cash equivalents during the 12-month period. The elevated cash level provided a measure of down-side protection. As of September 30, 2008, cash and cash equivalents represented more than 7% of the Fund’s net assets.
During the period, the Fund increased its exposure to Financials and Industrials sectors and reduced its weighting in the Consumer Discretionary, Energy, and Information Technology sectors.
The 21st Century Fund has tended to have a relatively high portfolio turnover level because of its investment style. Although the Fund may hold core positions for some time, it may change its portfolio composition quickly to take advantage of new opportunities, or to address issues affecting particular holdings.
FISCAL PERIOD-END INVESTMENT POSTURE
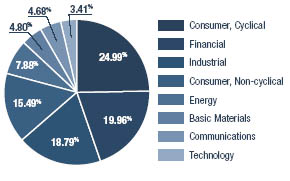
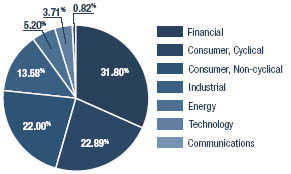
As of September 30, 2008, the Fund’s primary economic sector allocations were in the following areas: Financials, Industrials, Consumer Discretionary, and Information Technology. The Fund had little or no exposure to the Telecommunication Services and Utilities sectors.
Sincerely,
CORYDON J. GILCHRIST, CFA
PORTFOLIO MANAGER
| (1) | Total returns are based on net change in net asset value assuming reinvestment of distributions. For the period prior to March 31, 2004, the performance returns for the 21st Century Fund reflect a fee waiver in effect; in the absence of such a waiver, the returns would have been reduced.For the period beginning April 2004 through January 2005, performance returns for the Fund would have been higher but for the reimbursement of fees waived previously. A redemption fee of 2% may be imposed on redemptions or exchanges of Fund shares owned for 30 days or less. Please see the Prospectus for more information. |
FUND OVERVIEW September 30, 2008 (Unaudited)
The 21st Century Fund invests primarily in common stocks that are selected for their long-term growth potential. The Fund may invest in companies of any size, and will normally hold a core position of between 35 and 50 common stocks.
PERFORMANCE COMPARISON
| | | | |
| TOTAL ANNUAL OPERATING EXPENSES* | | 1.33 | % |
| | | | |
| NET ASSETS | | | |
| | | $1,856,435,140 | |
| 9/30/2008 | | | |
| | | | |
NET ASSET VALUE | | | |
| | | | |
| Net Asset Value Per Share | | | $12.86 | |
| | | | | |
TOP FIVE HOLDINGS | | | | |
| | | | | |
| Costco Wholesale Corporation | | | 6.90 | % |
| Wells Fargo Company | | | 6.58 | |
| JPMorgan Chase & Co. | | | 5.68 | |
| MasterCard, Inc. - Cl. A | | | 5.62 | |
| Raytheon Company | | | 5.20 | |
| * | The Total Annual Operating Expenses are reflective of the information disclosed in the Funds’ Prospectus dated February 1, 2008 and may differ from the expense ratios disclosed in this report. |
The performance data quoted here represent past performance, and past performance is not a guarantee of future results. Investment return and principal value of an investment will fluctuate so that an investor’s shares, when redeemed, may be worth more or less than their original cost. Current performance may be lower or higher than the performance information quoted. To obtain performance information current to the most recent month-end, please call 888-860-8686 or visit www. marsicofunds.com. A redemption fee may be imposed on redemptions or exchanges of Fund shares owned for 30 days or less.
The performance included in the table and graph does not reflect the deduction of taxes on Fund distributions or the redemption of Fund shares.
(1) | The performance returns for the 21st Century Fund (for the period prior to March 31, 2004) reflect a fee waiver in effect; in the absence of such a waiver, the returns would be reduced. For the period beginning April 2004 through January 2005, performance returns for the 21st Century Fund would be higher but for the reimbursement of fees waived previously. |
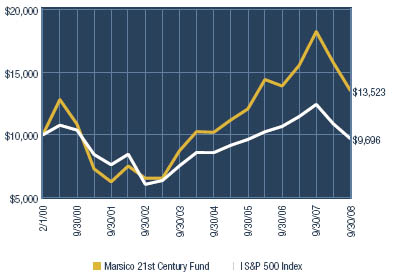
(2) | This chart assumes an initial investment of $10,000 made on February 1, 2000 (inception). Total returns are based on net change in NAV, assuming reinvestment of distributions. |
(3) | Sector weightings represent the percentage of the Fund’s investments (excluding cash equivalents) in certain general sectors. These sectors may include more than one industry. The Fund’s portfolio composition is subject to change at any time. |
MARSICO 21ST CENTURY FUND
SCHEDULE OF INVESTMENTS September 30, 2008 | |
| | | Number | | | | Percent | |
| | | of | | | | of Net | |
| | | Shares | | Value | | Assets | |
COMMON STOCKS | | | | | | | |
| | | | | | | | |
Aerospace/Defense | | | | | | | |
| Raytheon Company | | | 1,799,473 | | | $96,289,800 | | | 5.20 | % |
| | | | | | | | | | | |
Agricultural Chemicals | | | | | | | | | | |
| Monsanto Company | | | 563,647 | | | 55,789,780 | | | 3.01 | |
| | | | | | | | | | | |
Airlines | | | | | | | | | | |
| Ryanair Holdings PLC Spon. ADR* | | | 138,667 | | | 3,110,301 | | | 0.17 | |
| | | | | | | | | | | |
Brewery | | | | | | | | | | |
| Heineken Holding N.V. | | | 1,344,152 | | | 52,769,746 | | | 2.85 | |
| | | | | | | | | | | |
Casino Hotels | | | | | | | | | | |
| Las Vegas Sands Corp.* | | | 1,446,143 | | | 52,220,224 | | | 2.82 | |
| Wynn Resorts Ltd. | | | 544,438 | | | 44,447,918 | | | 2.40 | |
| | | | | | | 96,668,142 | | | 5.22 | |
Commercial Banks - U.S. | | | | | | | | | | |
| City National Corporation | | | 460,401 | | | 24,999,774 | | | 1.35 | |
| Regions Financial Corporation | | | 415,144 | | | 3,985,382 | | | 0.21 | |
| | | | | | | 28,985,156 | | | 1.56 | |
Commercial Services | | | | | | | | | | |
| Live Nation, Inc.* | | | 1,607,982 | | | 26,161,867 | | | 1.41 | |
| | | | | | | | | | | |
Commercial Services - Finance | | | | | | | | | | |
| MasterCard, Inc. - Cl. A | | | 586,918 | | | 104,078,169 | | | 5.62 | |
| Visa, Inc. - Cl. A | | | 758,110 | | | 46,540,373 | | | 2.51 | |
| | | | | | | 150,618,542 | | | 8.13 | |
Computers | | | | | | | | | | |
| Apple, Inc.* | | | 396,524 | | | 45,068,918 | | | 2.43 | |
| | | | | | | | | | | |
E-Commerce/Products | | | | | | | | | | |
| Blue Nile, Inc.* | | | 298,764 | | | 12,808,013 | | | 0.69 | |
| | | | | | | | | | | |
Energy - Alternate Sources | | | | | | | | | | |
| Vestas Wind Systems A/S* | | | 765,489 | | | 66,815,583 | | | 3.60 | |
| | | | | | | | | | | |
Engineering/R&D Services | | | | | | | | | | |
| AECOM Technology Corporation* | | | 967,328 | | | 23,641,496 | | | 1.28 | |
| The Shaw Group, Inc.* | | | 964,408 | | | 29,636,258 | | | 1.60 | |
| | | | | | | 53,277,754 | | | 2.88 | |
Finance - Investment Banker/Broker | | | | | | |
| Duff & Phelps Corporation - Cl. A* | | | 835,929 | | | 17,579,587 | | | 0.95 | |
| The Goldman Sachs Group, Inc. | | | 182,381 | | | 23,344,768 | | | 1.26 | |
| Jefferies Group, Inc. | | | 1,622,982 | | | 36,354,797 | | | 1.96 | |
| JPMorgan Chase & Co. | | | 2,254,495 | | | 105,284,916 | | | 5.68 | |
| | | | | | | 182,564,068 | | | 9.85 | |
Investment Management/Advisory Services | | | | | | |
| Oaktree Capital Group, LLC - | | | | | | | | | | |
| Cl. A 144a | | | 1,711,000 | | | 47,480,250 | | | 2.56 | |
| | | | | | | | | | | |
Medical - Biomedical/Genetic | | | | | | | |
| Amylin Pharmaceuticals, Inc.* | | | 1,081,871 | | | 21,875,432 | | | 1.18 | |
| Gilead Sciences, Inc.* | | | 398,336 | | | 18,156,155 | | | 0.98 | |
| | | | | | | 40,031,587 | | | 2.16 | |
Medical Information Systems | | | | | | | | | | |
| athenahealth, Inc.* | | | 384,541 | | | 12,793,679 | | | 0.69 | |
| | | | | | | | | | | |
Medical Instruments | | | | | | | | | | |
| Intuitive Surgical, Inc.* | | | 71,368 | | | 17,198,261 | | | 0.93 | |
| | | | | | | | | | | |
Oil Companies - Integrated | | | | | | | | | | |
| Petroleo Brasileiro S.A. ADR | | | 321,162 | | | 14,115,070 | | | 0.76 | |
| | | | | | | | | | | |
Power Conversion/Supply Equipment | | | | | | |
| Energy Conversion Devices, Inc.* | | | 210,086 | | | 12,237,510 | | | 0.66 | |
| | | | | | | | | | | |
Real Estate Operating/Development | | | | | | |
| The St. Joe Company* | | | 1,058,488 | | | 41,376,296 | | | 2.23 | |
| | | | | | | | | | | |
Resorts/Theme Parks | | | | | | | | | | |
| Vail Resorts, Inc.* | | | 904,219 | | | 31,602,454 | | | 1.71 | |
| | | | | | | | | | | |
Retail - Apparel/Shoes | | | | | | | | | | |
| J. Crew Group, Inc.* | | | 379,398 | | | 10,839,401 | | | 0.58 | |
| | | | | | | | | | | |
Retail - Building Products | | | | | | | | | | |
| The Home Depot, Inc. | | | 1,793,230 | | | 46,426,725 | | | 2.50 | |
| | | | | | | | | | | |
Retail - Discount | | | | | | | | | | |
| Costco Wholesale Corporation | | | 1,968,929 | | | 127,842,560 | | | 6.90 | |
| | | | | | | | | | | |
Retail - Major Department Store | | | | | | | | | | |
| Saks, Inc.* | | | 3,587,711 | | | 33,186,327 | | | 1.79 | |
| | | | | | | | | | | |
Retail - Restaurants | | | | | | | | | | |
| Chipotle Mexican Grill, Inc.* | | | 121,180 | | | 6,724,278 | | | 0.36 | |
| | | | | | | | | | | |
Savings & Loans/Thrifts | | | | | | | | | | |
| People’s United Financial, Inc. | | | 1,520,507 | | | 29,269,760 | | | 1.58 | |
| | | | | | | | | | | |
Super-Regional Banks - U.S. | | | | | | | | | | |
| U.S. Bancorp | | | 1,211,071 | | | 43,622,777 | | | 2.35 | |
| Wells Fargo & Company | | | 3,249,880 | | | 121,967,996 | | | 6.58 | |
| | | | | | | 165,590,773 | | | 8.93 | |
Transportation - Rail | | | | | | | | | | |
| America Latina Logistica S.A. | | | 1,002,892 | | | 6,851,435 | | | 0.37 | |
| Canadian National Railway Company | | | 894,771 | | | 42,796,897 | | | 2.31 | |
| | | | | | | 49,648,332 | | | 2.68 | |
TOTAL COMMON STOCKS | | | | | | | | | | |
(Cost $1,609,667,288) | | | | | | 1,557,290,933 | | | 84.02 | |
See notes to financial statements.
SCHEDULE OF INVESTMENTS September 30, 2008 | |
| | | Number | | | | Percent | |
| | of | | | | of Net | |
| | Shares | | Value | | Assets | |
SHORT-TERM INVESTMENTS | | | | | |
| SSgA Money Market Fund, | | | | | | | |
| 2.22% | | | 1,939,924 | | | $1,939,924 | | | 0.11 | % |
| SSgA Prime | | | | | | | | | | |
| Money Market Fund, 2.41% | | | 79,777,897 | | | 79,777,897 | | | 4.30 | |
| SSgA U.S. Government | | | | | | | | | | |
| Money Market Fund, 1.79% | | | 17,728,422 | | | 17,728,422 | | | 0.96 | |
| SSgA U.S. Treasury | | | | | | | | | | |
| Money Market Fund, 0.20% | | | 35,456,843 | | | 35,456,843 | | | 1.91 | |
| | | | | | | | | | | |
TOTAL SHORT-TERM INVESTMENTS | | | | | | |
(Cost $134,903,086) | | | | | | 134,903,086 | | | 7.28 | |
| | | | | | | | | | | |
TOTAL INVESTMENTS | | | | | | | | | | |
(Cost $1,744,570,374) | | | | | | 1,692,194,019 | | | 91.30 | |
| | | | | | | | | | | |
| Other Assets Less Liabilities | | | | | | 161,241,121 | | | 8.70 | |
| | | | | | | | | | | |
NET ASSETS | | | | | | $1,853,435,140 | | | 100.00 | % |
See notes to financial statements.
MARSICO 21ST CENTURY FUND
STATEMENT OF ASSETS AND LIABILITIES | |
| September 30, 2008 | | | |
| (Amounts in thousands) | | | |
| | | | |
ASSETS | | | |
| Investments, at value (cost $1,744,570) | | | $1,692,194 | |
| Receivable for investments sold | | | 166,335 | |
| Receivable for capital stock sold | | | 1,474 | |
| Interest and dividends receivable | | | 1,597 | |
| Prepaid expenses and other assets | | | 393 | |
Total Assets | | | 1,861,993 | |
| | | | | |
LIABILITIES | | | | |
| Payable for investments purchased | | | 34 | |
| Payable for capital stock redeemed | | | 5,366 | |
| Accrued investment advisory fee | | | 1,416 | |
| Accrued distribution fee | | | 787 | |
| Accrued trustees’ fees | | | 307 | |
| Accrued transfer agent fees and expenses | | | 334 | |
| Accrued expenses and other liabilities | | | 314 | |
Total Liabilities | | | 8,558 | |
| | | | | |
NET ASSETS | | | $1,853,435 | |
| | | | | |
NET ASSETS CONSIST OF | | | | |
| Paid-in-capital | | | $2,165,940 | |
| Accumulated net investment income | | | 570 | |
| Accumulated net realized loss on investments and | | | | |
| foreign currency transactions | | | (260,695 | ) |
| Net unrealized depreciation on investments | | | | |
| and foreign currency translations | | | (52,380 | ) |
NET ASSETS | | | $1,853,435 | |
| | | | | |
SHARES OUTSTANDING, $0.001 par value | | | | |
| (Unlimited shares authorized) | | | 144,136 | |
| | | | | |
NET ASSET VALUE, REDEMPTION PRICE, | | | | |
AND OFFERING PRICE PER SHARE | | | | |
(NET ASSETS/SHARES OUTSTANDING)* | | | $12.86 | |
STATEMENT OF OPERATIONS | | | |
| FOR THE YEAR ENDED September 30, 2008 | | | |
| (Amounts in thousands) | | | |
| | | | |
INVESTMENT INCOME | | | |
| Interest | | | $7,577 | |
| Dividends (net of $480 of non-reclaimable | | | | |
| foreign withholding taxes) | | | 25,833 | |
Total Investment Income | | | 33,410 | |
| | | | | |
EXPENSES | | | | |
| Investment advisory fees | | | 20,814 | |
| Distribution fees | | | 6,122 | |
| Transfer agent fees and expenses | | | 3,039 | |
| Custody and fund accounting fees | | | 511 | |
| Printing and postage expenses | | | 477 | |
| Fund administration fees | | | 270 | |
| Miscellaneous | | | 133 | |
| Professional fees | | | 113 | |
| Federal and state registration fees | | | 109 | |
| Trustees’ fees and expenses | | | (5 | )(1) |
Total Expenses | | | 31,583 | |
| | | | | |
| Less expenses paid indirectly | | | (3 | ) |
Net Expenses | | | 31,580 | |
| | | | | |
NET INVESTMENT INCOME | | | 1,830 | |
| | | | | |
REALIZED AND UNREALIZED GAIN | | | | |
| Net realized loss on investments | | | (260,968 | ) |
| Net realized gain on foreign currency transactions | | | 13,996 | |
| Change in unrealized appreciation/depreciation on | | | | |
| investments and foreign currency translations | | | (465,584 | ) |
Net Loss on Investments | | | (712,556 | ) |
| | | | | |
NET DECREASE IN NET ASSETS | | | | |
RESULTING FROM OPERATIONS | | | $(710,726 | ) |
| (1) | Includes $109,658 for trustees’ fees and expenses and $(114,185) for the unrealized depreciation related to the mark to market of the shares in the Deferred Fee Plan during the year ended September 30, 2008. |
See notes to financial statements.
STATEMENTS OF CHANGES IN NET ASSETS | | | | | |
| | | Year | | Year | |
| | Ended | | Ended | |
| (Amounts in thousands) | | 9/30/08 | | 9/30/07 | |
| | | | | | |
OPERATIONS | | | | | |
| Net investment income | | | $1,830 | | | $7,337 | |
| Net realized gain (loss) on investments | | | (260,968 | ) | | 98,375 | |
| Net realized gain on foreign currency transactions | | | 13,996 | | | 2,932 | |
| Change in unrealized appreciation/depreciation | | | | | | | |
| on investments and foreign currency translations | | | (465,584 | ) | | 331,390 | |
Net increase (decrease) in net assets resulting from operations | | | (710,726 | ) | | 440,034 | |
| | | | | | | | |
DISTRIBUTIONS | | | | | | | |
| Net investment income | | | — | | | (10,724 | ) |
| Net realized gains | | | (109,030 | ) | | — | |
Total distributions | | | (109,030 | ) | | (10,724 | ) |
| | | | | | | | |
CAPITAL SHARE TRANSACTIONS | | | | | | | |
| Proceeds from sale of shares | | | 1,038,877 | | | 1,550,625 | |
| Proceeds from reinvestment of distributions | | | 105,830 | | | 10,081 | |
| Redemption fees | | | 172 | | | 121 | |
| Redemption of shares | | | (938,814 | ) | | (394,470 | ) |
Net increase from capital share transactions | | | 206,065 | | | 1,166,357 | |
| | | | | | | | |
TOTAL INCREASE (DECREASE) IN NET ASSETS | | | (613,691 | ) | | 1,595,667 | |
| | | | | | | | |
NET ASSETS | | | | | | | |
| Beginning of period | | | 2,467,126 | | | 871,459 | |
END OF PERIOD | | | $1,853,435 | | | $2,467,126 | |
| Accumulated net investment income (loss) | | | 570 | | | (618 | ) |
| | | | | | | | |
TRANSACTIONS IN SHARES | | | | | | | |
| Shares sold | | | 63,308 | | | 97,600 | |
| Shares issued in reinvestment of distributions | | | 6,051 | | | 663 | |
| Shares redeemed | | | (61,724 | ) | | (24,492 | ) |
| | | | | | | | |
NET INCREASE | | | 7,635 | | | 73,771 | |
See notes to financial statements.
MARSICO 21ST CENTURY FUND
FINANCIAL HIGHLIGHTS | | | | | | | | | | | |
| | | Year | | Year | | Year | | Year | | Year | |
| For a Fund Share Outstanding | | Ended | | Ended | | Ended | | Ended | | Ended | |
| Throughout the Period | | 9/30/08 | | 9/30/07 | | 9/30/06 | | 9/30/05 | | 9/30/04 | |
| | | | | | | | | | | | |
NET ASSET VALUE, BEGINNING OF PERIOD | | | $18.07 | | | $13.89 | | | $12.07 | | | $10.20 | | | $8.74 | |
| | | | | | | | | | | | | | | | | |
INCOME FROM INVESTMENT OPERATIONS | | | | | | | | | | | | | | | | |
| Net investment income (loss) | | | 0.01 | | | 0.05 | | | 0.02 | | | (0.01 | ) | | (0.04 | ) |
| Net realized and unrealized | | | | | | | | | | | | | | | | |
| gains (losses) on investments | | | (4.48 | ) | | 4.26 | | | 1.80 | | | 1.88 | | | 1.50 | |
Total from investment operations | | | (4.47 | ) | | 4.31 | | | 1.82 | | | 1.87 | | | 1.46 | |
| | | | | | | | | | | | | | | | | |
DISTRIBUTIONS & OTHER | | | | | | | | | | | | | | | | |
| Net investment income | | | — | | | (0.13 | ) | | — | | | — | | | — | |
| Net realized gains | | | (0.74 | ) | | — | (1) | | — | | | — | | | — | |
| Redemption fees [See Note 2(i)] | | | — | (1) | | — | (1) | | — | (1) | | — | (1) | | — | (1) |
Total distributions & other | | | (0.74 | ) | | (0.13 | ) | | — | | | — | | | — | |
NET ASSET VALUE, END OF PERIOD | | | $12.86 | | | $18.07 | | | $13.89 | | | $12.07 | | | $10.20 | |
| | | | | | | | | | | | | | | | | |
TOTAL RETURN | | | (25.83 | )% | | 31.25 | % | | 15.10 | % | | 18.33 | % | | 16.70 | % |
| | | | | | | | | | | | | | | | | |
SUPPLEMENTAL DATA AND RATIOS | | | | | | | | | | | | | | | | |
| Net assets, end of period (000s) | | | $1,853,435 | | | $2,467,126 | | | $871,459 | | | $379,328 | | | $216,228 | |
| Ratio of expenses to average net assets, | | | | | | | | | | | | | | | | |
| less waivers and before expenses paid | | | | | | | | | | | | | | | | |
| indirectly, plus reimbursements of | | | | | | | | | | | | | | | | |
| previously waived expenses | | | 1.29 | % | | 1.31 | % | | 1.33 | % | | 1.39 | % | | 1.50 | % |
| Ratio of net investment income (loss) to | | | | | | | | | | | | | | | | |
| average net assets, net of waivers, | | | | | | | | | | | | | | | | |
| reimbursements of previously waived | | | | | | | | | | | | | | | | |
| expenses and expenses paid indirectly | | | 0.07 | % | | 0.43 | % | | 0.20 | % | | (0.19 | )% | | (0.48 | )% |
| Ratio of expenses to average net assets, | | | | | | | | | | | | | | | | |
| before waivers, reimbursements of | | | | | | | | | | | | | | | | |
| previously waived expenses and | | | | | | | | | | | | | | | | |
| expenses paid indirectly | | | 1.29 | % | | 1.31 | % | | 1.33 | % | | 1.36 | % | | 1.44 | % |
| Ratio of net investment income (loss) to | | | | | | | | | | | | | | | | |
| average net assets, before waivers, | | | | | | | | | | | | | | | | |
| reimbursements of previously waived | | | | | | | | | | | | | | | | |
| expenses and expenses paid indirectly | | | 0.07 | % | | 0.43 | % | | 0.20 | % | | (0.22 | )% | | (0.42 | )% |
Portfolio turnover rate(2) | | | 143 | % | | 105 | % | | 136 | % | | 175 | % | | 191 | % |
| (2) | Portfolio turnover is greater than most funds due to the investment style of the Fund. |
See notes to financial statements.
MARSICO INTERNATIONAL OPPORTUNITIES FUND
INVESTMENT REVIEW BY JIM GENDELMAN (UNAUDITED)
International equities - like their US equity counterparts - struggled during the fiscal year ended September 30, 2008. The Marsico International Opportunities Fund posted a total return of (US$) -30.95% for the period. The Fund’s return slightly lagged the MSCI EAFE Index, which we consider to be the Fund’s primary benchmark index and which had a total return of (US$) -30.50%. Please see the Fund Overview for more detailed information about the Fund’s longer-term performance for various time periods ended September 30, 2008.
The performance data for the Fund quoted here represent past performance, and past performance is not a guarantee of future results. Investment return and principal value of an investment will fluctuate so that an investor’s shares, when redeemed, may be worth more or less than their original cost. Current performance may be lower or higher than the performance information quoted. To obtain performance information current to the most recent month-end, please call 888-860-8686 or visit www.marsicofunds.com.(1)
This review highlights Fund performance over a one-year fiscal period. Shareholders should keep in mind that the Funds are intended for long-term investors who hold their shares for substantially longer periods of time. You should also keep in mind that our views on all investments discussed in this report are subject to change at any time. References to specific securities, industries, and sectors discussed in this report are not recommendations to buy or sell such securities or related investments, and the Fund may not necessarily hold these securities or investments today. Please see the accompanying Schedule of Investments for the percentage of the Fund’s portfolio represented by the securities mentioned in this report.
The following factors contributed to the Fund’s modest performance shortfall compared to its benchmark index during the 12-month period ended September 30, 2008:
| ● | Consumer Discretionary: The Fund’s performance results were hampered by both stock selection and positioning in the Consumer Discretionary sector. Though the Fund reduced its exposure to the sector later in the reporting period, on average, the Fund had more exposure to the Consumer Discretionary sector than its benchmark index. This positioning hurt performance as consumer-related equities were seemingly beset by worries regarding the potential impact of a global economic slowdown. A number of the Fund’s holdings in the sector posted sharp declines, including hotel/casino operator Las Vegas Sands Corp. (-73%), Hong Kong-headquartered apparel company Esprit Holdings, Ltd. (-60%), media company British Sky Broadcasting Group PLC (-44% prior to being sold), and hotel operators Accor S.A. (-38%) and Shangri-La Asia Ltd. (-60% prior to being sold). |
| ● | Utilities: Stock selection in the Utilities sector was among the leading detractors from the Fund’s annual performance. Veolia Environnement, a France-based water and waste treatment company, and Electricite de France S.A. dropped -49% and -19%, respectively. Both were sold from the Fund. |
| ● | Industrials: Industrials-related positions in the Fund posted an aggregate loss of -35%. Denmark-headquartered manufacturer of wind turbines Vestas Wind Systems A/S declined -20%. Japan-based distribution company Marubeni Corporation skidded -51%, while French power company ALSTOM S.A. sagged -26%. |
Certain individual positions in various sectors fell significantly in value, including Nintendo Co. Ltd. (-19%), India-based ICICI Bank Ltd. Spon. ADR (-55%), Netherlands-headquartered beverage company Heineken N.V. (-38%), and German industrial gas and engineering company Linde AG (-28%).
There were several bright spots in the Fund’s performance. Brazil-based energy company Petroleo Brasileiro S.A. ADR gained 19%. Stock selection in the Health Care sector was strong, led by Swiss biotechnology company Lonza Group AG (+16%). Through stock selection, the Fund was able to achieve better returns in the hard-hit Materials and Information Technology sectors than its benchmark index.
MARSICO INTERNATIONAL OPPORTUNITIES FUND
The Fund had cash and cash equivalents positions of approximately 6%, on average during the 12-month period. Given the volatility and overall decline in international equity prices, the Fund’s cash weighting had a modest positive impact on performance as compared to the fully-invested MSCI EAFE Index. The Fund further achieved some benefit from dollar strengthening through its dollar-based holdings (including cash equivalents) and its tendency to be underweighted in countries whose “home currency” depreciated substantially vs. the dollar, including the euro and the pound.
The International Opportunities Fund has tended to have a relatively high portfolio turnover level because of its investment style. Although the Fund may hold core positions for some time, it may change its portfolio composition quickly to take advantage of new opportunities, or to address issues affecting particular holdings.
FISCAL PERIOD-END INVESTMENT POSTURE
As of September 30, 2008, the Fund’s primary economic sector allocations included Financials, Health Care, Industrials, and Information Technology. In terms of country allocations, the Fund’s most significant weightings at period-end were Switzerland, the United Kingdom, France, Japan, and Brazil. The Fund held several positions domiciled in emerging markets including Brazil, Israel, Taiwan, Mexico, Hong Kong/China, South Africa, and India. Such emerging markets exposure represented approximately 23% of the Fund’s net assets as of September 30, 2008. As mentioned in previous shareholder reports, country-level weightings generally should be considered a residual of the Fund’s stock selection process rather than a major, proactive facet of its investment strategy.
Sincerely,
JAMES G. GENDELMAN
PORTFOLIO MANAGER
| (1) | Total returns are based on net change in net asset value assuming reinvestment of distributions. For the period prior to September 30, 2004, the performance returns for the International Opportunities Fund reflect a fee waiver in effect; in the absence of such a waiver, the returns would have been reduced. For the period beginning October 2004 through December 2005, performance returns for the International Opportunities Fund would have been higher but for the reimbursement of fees waived previously. A redemption fee of 2% may be imposed on redemptions or exchanges of Fund shares owned for 30 days or less. Please see the Prospectus for more information. |
FUND OVERVIEW September 30, 2008 (Unaudited)
The International Opportunities Fund invests primarily in common stocks of foreign companies that are selected for their long-term growth potential. The Fund may invest in companies of any size throughout the world. It normally invests in the securities of issuers that are -30% economically tied to one or more foreign countries, and expects to be invested in various issuers or securities that together have ties to at least four different foreign countries. Some issuers or securities in the Fund’s portfolio may be based in or economically tied to the United States. The Fund may hold an unlimited number of common stocks.
PERFORMANCE COMPARISON
| | | | |
| TOTAL ANNUAL OPERATING EXPENSES* | | 1.38 | % |
| | | | |
NET ASSETS | | | |
| | | | |
| 9/30/08 | | | $597,602,895 | |
| | | | | |
NET ASSET VALUE | | | | |
| | | | | |
| Net Asset Value Per Share | | | $12.27 | |
| | | | | |
TOP FIVE HOLDINGS | | | | |
| | | | | |
| Teva Pharmaceutical Industries Ltd. Spon. ADR | | | 4.55 | % |
| Credit Suisse Group AG | | | 4.28 | |
| Nintendo Co., Ltd. | | | 3.80 | |
| Vestas Wind Systems A/S | | | 3.76 | |
| Nestlé S.A. | | | 3.27 | |
SECTOR ALLOCATION(3)
| * | The Total Annual Operating Expenses and Net Expenses are reflective of the information disclosed in the Funds’ Prospectus dated February 1, 2008 and may differ from the expense ratios disclosed in this report. |
The performance data quoted here represent past performance, and past performance is not a guarantee of future results. Investment return and principal value of an investment will fluctuate so that an investor’s shares, when redeemed, may be worth more or less than their original cost. Current performance may be lower or higher than the performance information quoted. To obtain performance information current to the most recent month-end, please call 888-860-8686 or visit www.marsicofunds.com. A redemption fee may be imposed on redemptions or exchanges of Fund shares owned for 30 days or less.
The performance included in the table and graph do not reflect the deduction of taxes on Fund distributions or the redemption of Fund shares.
(1) | The performance returns for the International Opportunities Fund (for the period prior to September 30, 2004) reflect a fee waiver in effect; in the absence of such a waiver, the returns would be reduced. For the period beginning October 2004 through December 2005, performance returns for the International Opportunities Fund would be higher but for the reimbursement of fees waived previously. |
(2) | This chart assumes an initial investment of $10,000 made on June 30, 2000 (inception). Total returns are based on net change in NAV, assuming reinvestment of distributions. |
(3) | Sector weightings represent the percentage of the Fund’s investments (excluding cash equivalents) in certain general sectors. These sectors may include more than one industry. The Fund’s portfolio composition is subject to change at any time. |
The Morgan Stanley Capital International (MSCI) EAFE Index tracks the stocks of about 1,000 companies in Europe, Australasia, and the Far East (EAFE). You cannot invest directly in an index.
MARSICO INTERNATIONAL OPPORTUNITIES FUND
SCHEDULE OF INVESTMENTS September 30, 2008 | |
| | | Number | | | | Percent | |
| | of | | | | of Net | |
| | Shares | | Value | | Assets | |
COMMON STOCKS | | | | | | | |
| | | | | | | | |
Advertising Services | | | | | | | |
| JC Decaux S.A. | | | 197,162 | | | $4,317,455 | | | 0.72 | % |
| | | | | | | | | | | |
Agricultural Chemicals | | | | | | | | | | |
| Potash Corporation of | | | | | | | | | | |
| Saskatchewan, Inc. | | | 93,658 | | | 12,363,793 | | | 2.07 | |
| | | | | | | | | | | |
Apparel Manufacturers | | | | | | | | | | |
| Esprit Holdings, Ltd. | | | 915,500 | | | 5,674,788 | | | 0.95 | |
| | | | | | | | | | | |
Brewery | | | | | | | | | | |
| Heineken N.V. | | | 316,231 | | | 12,705,315 | | | 2.13 | |
| | | | | | | | | | | |
Building - Residential/Commercial | | | | | | | | | | |
| Gafisa S.A. | | | 567,281 | | | 7,184,546 | | | 1.20 | |
| | | | | | | | | | | |
Building Products - Air/Heating | | | | | | | | | | |
| Daikin Industries, Ltd. | | | 209,773 | | | 7,075,228 | | | 1.18 | |
| | | | | | | | | | | |
Building Products - Cement/Aggregates | | | | | | |
| CEMEX, S.A.B. de C.V. Spon. ADR* | | | 343,776 | | | 5,919,823 | | | 0.99 | |
| | | | | | | | | | | |
Casino Hotels | | | | | | | | | | |
| Las Vegas Sands Corp.* | | | 184,763 | | | 6,671,792 | | | 1.12 | |
| | | | | | | | | | | |
Cellular Telecommunications | | | | | | | | | | |
| América Móvil, | | | | | | | | | | |
| S.A.B. de C.V. ADR Ser. L | | | 216,199 | | | 10,022,986 | | | 1.68 | |
| MTN Group Ltd. | | | 482,582 | | | 6,809,461 | | | 1.14 | |
| | | | | | | 16,832,447 | | | 2.82 | |
Chemicals - Diversified | | | | | | | | | | |
| Johnson Matthey PLC | | | 67,483 | | | 1,641,679 | | | 0.27 | |
| | | | | | | | | | | |
Chemicals - Specialty | | | | | | | | | | |
| Lonza Group AG | | | 144,976 | | | 18,190,301 | | | 3.04 | |
| | | | | | | | | | | |
Commercial Banks - Non-U.S. | | | | | | | | | | |
| BNP Paribas | | | 78,565 | | | 7,499,619 | | | 1.25 | |
| Deutsche Bank AG | | | 125,003 | | | 8,942,340 | | | 1.50 | |
| HSBC Holdings PLC | | | 805,388 | | | 13,029,779 | | | 2.18 | |
| ICICI Bank Ltd. Spon. ADR | | | 282,055 | | | 6,633,934 | | | 1.11 | |
| Julius Baer Holding Ltd. | | | 239,783 | | | 11,924,508 | | | 2.00 | |
| Mizuho Financial Group, Inc. | | | 2,006 | | | 8,772,532 | | | 1.47 | |
| Unibanco - Uniao de Bancos | | | | | | | | | | |
| Brasileiros S.A. GDR | | | 96,076 | | | 9,695,990 | | | 1.62 | |
| | | | | | | 66,498,702 | | | 11.13 | |
Computers | | | | | | | | | | |
| Research In Motion, Ltd.* | | | 137,496 | | | 9,390,977 | | | 1.57 | |
| | | | | | | | | | | |
Electric Components - Miscellaneous | | | | | | |
| Hon Hai Precision Industry Co., Ltd. | | | 2,481,550 | | | 8,888,153 | | | 1.49 | |
| | | | | | | | | | | |
Energy - Alternate Sources | | | | | | | | | | |
| Vestas Wind Systems A/S* | | | 257,482 | | | 22,474,275 | | | 3.76 | |
| | | | | | | | | | | |
Engineering/R&D Services | | | | | | | |
| ABB Ltd.* | | | 627,859 | | | 12,166,913 | | | 2.04 | |
| | | | | | | | | | | |
Finance - Investment Banker/Broker | | | | | | |
| Credit Suisse Group AG | | | 547,231 | | | 25,556,756 | | | 4.28 | |
| Daiwa Securities Group, Inc. | | | 1,065,000 | | | 7,757,178 | | | 1.30 | |
| UBS AG* | | | 378,198 | | | 6,464,323 | | | 1.08 | |
| | | | | | | 39,778,257 | | | 6.66 | |
Food - Miscellaneous/Diversified | | | | | | | | | | |
| Nestlé S.A. | | | 452,696 | | | 19,564,391 | | | 3.27 | |
| | | | | | | | | | | |
Food - Retail | | | | | | | | | | |
| Tesco PLC | | | 2,111,358 | | | 14,684,463 | | | 2.46 | |
| | | | | | | | | | | |
Hotels & Motels | | | | | | | | | | |
| Accor S.A. | | | 166,241 | | | 8,878,354 | | | 1.49 | |
| | | | | | | | | | | |
Import/Export | | | | | | | | | | |
| Marubeni Corporation | | | 1,968,000 | | | 8,920,913 | | | 1.49 | |
| | | | | | | | | | | |
Industrial Gases | | | | | | | | | | |
| Linde AG | | | 173,083 | | | 18,482,789 | | | 3.09 | |
| | | | | | | | | | | |
Machinery - General Industrial | | | | | | | | | | |
| ALSTOM S.A. | | | 168,138 | | | 12,763,250 | | | 2.14 | |
| | | | | | | | | | | |
Medical - Biomedical/Genetic | | | | | | | | | | |
| CSL Ltd. | | | 553,786 | | | 16,776,886 | | | 2.81 | |
| | | | | | | | | | | |
Medical - Drugs | | | | | | | | | | |
| Actelion Ltd.* | | | 132,294 | | | 6,816,912 | | | 1.14 | |
| | | | | | | | | | | |
Medical - Generic Drugs | | | | | | | | | | |
| Teva Pharmaceutical Industries Ltd. | | | | | | | | | | |
| Spon. ADR | | | 594,409 | | | 27,217,988 | | | 4.55 | |
| | | | | | | | | | | |
Metal - Diversified | | | | | | | | | | |
| Rio Tinto PLC | | | 81,486 | | | 5,114,004 | | | 0.86 | |
| | | | | | | | | | | |
Multi-Line Insurance | | | | | | | | | | |
| AXA | | | 488,052 | | | 15,976,074 | | | 2.67 | |
| | | | | | | | | | | |
Oil Companies - Exploration & Production | | | | | | |
| CNOOC Ltd. | | | 5,362,800 | | | 6,024,548 | | | 1.01 | |
| | | | | | | | | | | |
Oil Companies - Integrated | | | | | | | | | | |
| BG Group PLC | | | 719,373 | | | 13,046,586 | | | 2.18 | |
| Petroleo Brasileiro S.A. ADR | | | 437,533 | | | 19,229,575 | | | 3.22 | |
| | | | | | | 32,276,161 | | | 5.40 | |
Optical Supplies | | | | | | | | | | |
| Alcon, Inc. | | | 38,200 | | | 6,169,682 | | | 1.03 | |
| | | | | | | | | | | |
Power Conversion/Supply Equipment | | | | | | |
| Gamesa Corporación Tecnológica S.A. | | | 283,654 | | | 9,718,543 | | | 1.63 | |
| See notes to financial statements. | | | | | | | | | | |
SCHEDULE OF INVESTMENTS September 30, 2008 | |
| | | | | Number | | | | Percent | |
| | | | of | | | | of Net | |
| | | | Shares | | Value | | Assets | |
| COMMON STOCKS CONTINUED | | | | | | | |
| Seismic Data Collection | | | | | | | | | |
| CGG - Veritas* | | | | | | 199,516 | | | $6,330,472 | | | 1.06 | % |
| | | | | | | | | | | | | | |
Semiconductor Component - Integrated Circuitry | | | | | | | | |
| Taiwan Semiconductor | | | | | | | | | | | | | |
| Manufacturing Co., Ltd. Spon. ADR | | | | | | 1,861,742 | | | 17,444,522 | | | 2.92 | |
| | | | | | | | | | | | | | |
Soap & Cleaning Preparations | | | | | | | | | | | | | |
| Reckitt Benckiser Group PLC | | | | | | 209,124 | | | 10,139,352 | | | 1.70 | |
| | | | | | | | | | | | | | |
Toys | | | | | | | | | | | | | |
| Nintendo Co., Ltd. | | | | | | 53,600 | | | 22,735,712 | | | 3.80 | |
| | | | | | | | | | | | | | |
Transportation - Rail | | | | | | | | | | | | | |
| America Latina Logistica S.A. | | | | | | 447,261 | | | 3,055,543 | | | 0.51 | |
| | | | | | | | | | | | | | |
Wireless Equipment | | | | | | | | | | | | | |
| Rogers Communications, Inc. - Cl. B | | | | | | 502,159 | | | 16,288,023 | | | 2.72 | |
| | | | | | | | | | | | | | |
TOTAL COMMON STOCKS | | | | | | | | | | | | | |
(Cost $581,284,999) | | | | | | | | | 543,153,026 | | | 90.89 | |
| | | | | | |
SHORT-TERM INVESTMENTS | | | | | |
| SSgA U.S. Government | | | | | | | |
| Money Market Fund, 1.79% | | | 7,561,722 | | | $7,561,722 | | | 1.27 | % |
| SSgA U.S. Treasury | | | | | | | | | | |
| Money Market Fund, 0.20% | | | 25,844,062 | | | 25,844,062 | | | 4.32 | |
| | | | | | | | | | | |
TOTAL SHORT-TERM INVESTMENTS | | | | | | |
(Cost $33,405,784) | | | | | | 33,405,784 | | | 5.59 | |
| | | | | | | | | | | |
TOTAL INVESTMENTS | | | | | | | | | | |
(Cost $614,690,783) | | | | | | 576,558,810 | | | 96.48 | |
| | | | | | | | | | | |
| Other Assets Less Liabilities | | | | | | 21,044,085 | | | 3.52 | |
NET ASSETS | | | | | | $597,602,895 | | | 100.00 | % |
| | |
SUMMARY OF INVESTMENTS BY COUNTRY | |
| | | | | Percent of | |
| | | | Investment | |
Country | | Market Value | | Securities | |
| Australia | | | $16,776,886 | | | 2.91 | % |
| Brazil | | | 39,165,654 | | | 6.79 | |
| Canada | | | 38,042,793 | | | 6.60 | |
| Denmark | | | 22,474,275 | | | 3.90 | |
| France | | | 55,765,224 | | | 9.67 | |
| Germany | | | 27,425,129 | | | 4.76 | |
| Hong Kong | | | 11,699,336 | | | 2.03 | |
| India | | | 6,633,934 | | | 1.15 | |
| Israel | | | 27,217,988 | | | 4.72 | |
| Japan | | | 55,261,563 | | | 9.58 | |
| Mexico | | | 15,942,809 | | | 2.77 | |
| Netherlands | | | 12,705,315 | | | 2.20 | |
| South Africa | | | 6,809,461 | | | 1.18 | |
| Spain | | | 9,718,543 | | | 1.69 | |
| Switzerland | | | 106,853,786 | | | 18.53 | |
| Taiwan | | | 26,332,675 | | | 4.57 | |
| United Kingdom | | | 57,655,863 | | | 10.00 | |
United States(1) | | | 40,077,576 | | | 6.95 | |
Total | | | $576,558,810 | | | 100.00 | % |
| * | Non-income producing. | | | |
(1) | Includes short-term securities. | | | |
| | | | | |
| | See notes to financial statements. | | | |
MARSICO INTERNATIONAL OPPORTUNITIES FUND
STATEMENT OF ASSETS AND LIABILITIES | |
| September 30, 2008 | | | |
| (Amounts in thousands) | | | |
| | | | |
ASSETS | | | |
| Investments, at value (cost $614,691) | | | $576,559 | |
| Foreign currency (cost $1,262) | | | 1,233 | |
| Receivable for investments sold | | | 22,814 | |
| Receivable for capital stock sold | | | 2,057 | |
| Interest and dividends receivable | | | 2,090 | |
| Prepaid expenses and other assets | | | 264 | |
Total Assets | | | 605,017 | |
| | | | | |
LIABILITIES | | | | |
| Payable for investments purchased | | | 5,071 | |
| Payable for capital stock redeemed | | | 1,222 | |
| Accrued investment advisory fee | | | 459 | |
| Accrued trustees’ fees | | | 212 | |
| Accrued distribution fee | | | 190 | |
| Accrued transfer agent fees and expenses | | | 114 | |
| Accrued expenses and other liabilities | | | 146 | |
Total Liabilities | | | 7,414 | |
NET ASSETS | | | $597,603 | |
| | | | | |
NET ASSETS CONSIST OF | | | | |
| Paid-in-capital | | | $693,223 | |
| Accumulated net investment income | | | 5,708 | |
| Accumulated net realized loss on investments and | | | | |
| foreign currency transactions | | | (63,137 | ) |
| Net unrealized depreciation on investments | | | | |
| and foreign currency translations | | | (38,191 | ) |
NET ASSETS | | | $597,603 | |
| | | | | |
SHARES OUTSTANDING, $0.001 par value | | | | |
| (Unlimited shares authorized) | | | 48,707 | |
| | | | �� | |
NET ASSET VALUE, REDEMPTION PRICE, | | | | |
AND OFFERING PRICE PER SHARE | | | | |
(NET ASSETS/SHARES OUTSTANDING)* | | | $12.27 | |
STATEMENT OF OPERATIONS | | | |
| FOR THE YEAR ENDED September 30, 2008 | | | |
| (Amounts in thousands) | | | |
| | | | |
INVESTMENT INCOME | | | |
| Interest | | | $1,062 | |
| Dividends (net of $1,484 of non-reclaimable | | | | |
| foreign withholding taxes) | | | 17,690 | |
Total Investment Income | | | 18,752 | |
| | | | | |
EXPENSES | | | | |
| Investment advisory fees | | | 6,800 | |
| Distribution fees | | | 2,000 | |
| Transfer agent fees and expenses | | | 881 | |
| Custody and fund accounting fees | | | 676 | |
| Fund administration fees | | | 213 | |
| Printing and postage expenses | | | 156 | |
| Federal and state registration fees | | | 56 | |
| Miscellaneous | | | 38 | |
| Professional fees | | | 35 | |
| Trustees’ fees and expenses | | | (84 | )(1) |
Total Expenses | | | 10,771 | |
| | | | | |
| Less expenses paid indirectly | | | (1 | ) |
Net Expenses | | | 10,770 | |
| | | | | |
NET INVESTMENT INCOME | | | 7,982 | |
| | | | | |
REALIZED AND UNREALIZED GAIN/LOSS | | | | |
| Net realized loss on investments | | | (82,082 | ) |
| Net realized gain on foreign currency transactions | | | 28,951 | |
| Change in unrealized appreciation/depreciation on | | | | |
| investments and foreign currency translations | | | (230,787 | ) |
Net Loss on Investments | | | (283,918 | ) |
| | | | | |
NET DECREASE IN NET ASSETS | | | | |
RESULTING FROM OPERATIONS | | | $(275,936 | ) |
* Not in thousands.
| (1) | Includes $34,369 for trustees’ fees and expenses and $(118,400) for the unrealized depreciation related to the mark to market of the shares in the Deferred Fee Plan during the year ended September 30, 2008. |
See notes to financial statements.
STATEMENTS OF CHANGES IN NET ASSETS | | | | | |
| | | Year | | Year | |
| | Ended | | Ended | |
| (Amounts in thousands) | | 9/30/08 | | 9/30/07 | |
OPERATIONS | | | | | |
| | | | | | |
| Net investment income | | | $7,982 | | | $6,431 | |
| Net realized gain (loss) on investments | | | (82,082 | ) | | 67,964 | |
| Net realized gain on foreign currency transactions | | | 28,951 | | | 15,833 | |
| Change in unrealized appreciation/depreciation | | | | | | | |
| on investments and foreign currency translations | | | (230,787 | ) | | 107,907 | |
Net increase (decrease) in net assets resulting from operations | | | (275,936 | ) | | 198,135 | |
| | | | | | | | |
DISTRIBUTIONS | | | | | | | |
| Net investment income | | | (7,301 | ) | | (1,290 | ) |
| Net realized gains | | | (88,835 | ) | | (24,442 | ) |
Total distributions | | | (96,136 | ) | | (25,732 | ) |
| | | | | | | | |
CAPITAL SHARE TRANSACTIONS | | | | | | | |
| Proceeds from sale of shares | | | 357,381 | | | 261,388 | |
| Proceeds from reinvestment of distributions | | | 92,902 | | | 24,671 | |
| Redemption fees | | | 96 | | | 40 | |
| Redemption of shares | | | (302,777 | ) | | (208,113 | ) |
Net increase from capital share transactions | | | 147,602 | | | 77,986 | |
| | | | | | | | |
TOTAL INCREASE (DECREASE) IN NET ASSETS | | | (224,470 | ) | | 250,389 | |
| | | | | | | | |
NET ASSETS | | | | | | | |
| Beginning of period | | | 822,073 | | | 571,684 | |
| | | | | | | | |
END OF PERIOD | | | $597,603 | | | $822,073 | |
| Accumulated net investment income | | | 5,708 | | | 5,703 | |
| | | | | | | | |
TRANSACTIONS IN SHARES | | | | | | | |
| Shares sold | | | 21,256 | | | 15,189 | |
| Shares issued in reinvestment of distributions | | | 5,225 | | | 1,495 | |
| Shares redeemed | | | (18,683 | ) | | (11,945 | ) |
NET INCREASE | | | 7,798 | | | 4,739 | |
See notes to financial statements.
MARSICO INTERNATIONAL OPPORTUNITIES FUND
FINANCIAL HIGHLIGHTS | | | | | | | | | | | |
| For a Fund Share Outstanding | | Year | | Year | | Year | | Year | | Year | |
| Throughout the Period | | Ended | | Ended | | Ended | | Ended | | Ended | |
| | 9/30/08 | | 9/30/07 | | 9/30/06 | | 9/30/05 | | 9/30/04 | |
| | | | | | | | | | | | |
NET ASSET VALUE, BEGINNING OF PERIOD | | | $20.10 | | | $15.81 | | | $13.00 | | | $10.63 | | | $8.80 | |
| | | | | | | | | | | | | | | | | |
INCOME FROM INVESTMENT OPERATIONS | | | | | | | | | | | | | | | | |
| Net investment income | | | 0.16 | | | 0.16 | | | 0.04 | | | 0.12 | | | 0.04 | |
| Net realized and unrealized | | | | | | | | | | | | | | | | |
| gains (losses) on investments | | | (5.66 | ) | | 4.81 | | | 2.87 | | | 2.25 | | | 1.79 | |
Total from investment operations | | | (5.50 | ) | | 4.97 | | | 2.91 | | | 2.37 | | | 1.83 | |
| | | | | | | | | | | | | | | | | |
DISTRIBUTIONS & OTHER | | | | | | | | | | | | | | | | |
| Net investment income | | | (0.18 | ) | | (0.03 | ) | | (0.10 | ) | | — | | | — | |
| Net realized gains | | | (2.15 | ) | | (0.65 | ) | | — | | | — | | | — | |
| Redemption fees [See Note 2(i)] | | | — | (1) | | — | (1) | | — | (1) | | — | (1) | | — | (1) |
Total distributions & other | | | (2.33 | ) | | (0.68 | ) | | (0.10 | ) | | — | | | — | |
NET ASSET VALUE, END OF PERIOD | | | $12.27 | | | $20.10 | | | $15.81 | | | $13.00 | | | $10.63 | |
| | | | | | | | | | | | | | | | | |
TOTAL RETURN | | | (30.95 | )% | | 32.42 | % | | 22.46 | % | | 22.30 | % | | 20.80 | % |
| | | | | | | | | | | | | | | | | |
SUPPLEMENTAL DATA AND RATIOS | | | | | | | | | | | | | | | | |
| Net assets, end of period (000s) | | | $597,603 | | | $822,073 | | | $571,684 | | | $262,522 | | | $106,162 | |
| Ratio of expenses to average net assets, | | | | | | | | | | | | | | | | |
| less waivers and before expenses | | | | | | | | | | | | | | | | |
| paid indirectly, plus reimbursements of | | | | | | | | | | | | | | | | |
| previously waived expenses | | | 1.35 | % | | 1.37 | % | | 1.44 | % | | 1.60 | % | | 1.60 | % |
| Ratio of net investment income (loss) | | | | | | | | | | | | | | | | |
| to average net assets, net of waivers, | | | | | | | | | | | | | | | | |
| reimbursements of previously waived | | | | | | | | | | | | | | | | |
| expenses and expenses paid indirectly | | | 1.00 | % | | 0.92 | % | | 0.33 | % | | 1.19 | % | | 0.07 | % |
| Ratio of expenses to average net assets, | | | | | | | | | | | | | | | | |
| before waivers, reimbursements of | | | | | | | | | | | | | | | | |
| previously waived expenses and | | | | | | | | | | | | | | | | |
| expenses paid indirectly | | | 1.35 | % | | 1.37 | % | | 1.41 | % | | 1.49 | % | | 1.68 | % |
| Ratio of net investment income (loss) to | | | | | | | | | | | | | | | | |
| average net assets, before waivers, | | | | | | | | | | | | | | | | |
| reimbursements of previously waived | | | | | | | | | | | | | | | | |
| expenses and expenses paid indirectly | | | 1.00 | % | | 0.92 | % | | 0.36 | % | | 1.30 | % | | 0.00 | % |
Portfolio turnover rate(2) | | | 115 | % | | 125 | % | | 101 | % | | 156 | % | | 105 | % |
| (2) | Portfolio turnover is greater than most funds due to the investment style of the Fund. |
See notes to financial statements.
MARSICO FLEXIBLE CAPITAL FUND
INVESTMENT REVIEW BY DOUG RAO (UNAUDITED)
The Flexible Capital Fund posted a return of -17.10% for the twelve-month period ended September 30, 2008, and outperformed the S&P 500 Index, which we consider to be the Fund’s primary benchmark index and which had a total return of -21.98% over the same time period. Please see the Fund Overview for more detailed information about the Fund’s performance for various time periods ended September 30, 2008.
The performance data for the Fund quoted here represent past performance, and past performance is not a guarantee of future results. Investment return and principal value of an investment will fluctuate so that an investor’s shares, when redeemed, may be worth more or less than their original cost. Current performance may be lower or higher than the performance information quoted. To obtain performance information current to the most recent month-end, please call 888-860-8686 or visit www.marsicofunds.com.(1)
This review highlights Fund performance over a one-year fiscal period. Shareholders should keep in mind that the Funds are intended for long-term investors who hold their shares for substantially longer periods of time. You should also keep in mind that our views on all investments discussed in this report are subject to change at any time. References to specific securities, industries, and sectors discussed in this report are not recommendations to buy or sell such securities or related investments, and the Fund may not necessarily hold these securities or investments today. Please see the accompanying Schedule of Investments for the percentage of the Fund’s portfolio represented by the securities mentioned in this report.
During the 12-month period ended September 30, 2008, the Fund’s performance was aided by the following factors:
| ● | Information Technology: Credit- and debit-card transaction processor MasterCard, Inc. - Cl. A (+20%) appreciated sharply and had a material, positive effect on performance. |
| ● | Energy: The Fund’s positions in Petrohawk Energy Corporation (+85%) and Wellstream Holdings PLC (+12%) posted strong results and were sold. |
| ● | Telecommunications: The Fund benefitted from having little exposure, on average, to the weak performing Telecommunications sector. Its position in wireless provider China Mobile Ltd. Spon. ADR gained 5% before being sold from the Fund. |
● Select Holdings: A number of individual positions in various sectors materially enhanced performance, including U.S. Bancorp (+22%), McDonald’s Corporation (+19%), Duff & Phelps Corporation - Cl. A (+16%), and JPMorgan Chase & Co. (+17%).
The Fund had an average of approximately 12% in cash or cash equivalent positions during the 12-month period. This defensive posture helped the Fund’s performance, providing a measure of capital protection in a challenging equity market.
The main weaknesses for the Fund, in terms of investment performance, included:
| ● | Health Care: The Fund’s performance was hurt by both stock selection and an underweighted posture in the Health Care sector as compared to the benchmark index. The Health Care sector fared better than many of the benchmark index sectors and the Fund would have benefitted from having more exposure to the sector. The Fund was further hurt by its position in WellPoint, Inc., a health care service provider position, which skidded -44% prior to being sold from the Fund. |
| ● | Consumer Staples: Several of the Fund’s Consumer Staples positions posted double-digit losses for the period they were held, including Heineken N.V. (-34% prior to being sold), Cosan S/A Industria e Comercio (-12% prior to being sold), and CVS Caremark Corporation (-14%). |
MARSICO FLEXIBLE CAPITAL FUND
| ● | Consumer Discretionary: A number of the Fund’s Consumer Discretionary positions experienced significant price declines, including marketing communications company MDC Partners, Inc. - Cl. A (-34%), German auto components company Continental AG (-40%), casino operator Las Vegas Sands Corp. (-39%), and retailer Saks, Inc. (-39%). MDC Partners, Continental, and Las Vegas Sands were not held in the Fund as of September 30, 2008. |
| ● | Financials: The Financials sector was among the weakest performing sectors of the benchmark index. The Fund’s overweighted allocation to the sector, therefore, had a negative effect on performance relative to the benchmark index. |
The Flexible Capital Fund over its short history has tended to have a relatively high portfolio turnover level. This is attributable to the Fund’s investment style, the change in its investment goal and strategies during 2007, and its relatively small base of assets under management. Although the Fund may hold core positions for some time, it may change its portfolio composition quickly to take advantage of new opportunities, or to address issues affecting particular holdings.
FISCAL PERIOD-END INVESTMENT POSTURE
As of September 30, 2008, the Fund’s primary economic sector allocations included Consumer Discretionary, Financials, Consumer Staples, and Industrials.
Sincerely,
A. DOUGLAS RAO
PORTFOLIO MANAGER
(1) | Total returns are based on net change in net asset value assuming reinvestment of distributions. The performance returns for the Flexible Capital Fund reflect a fee waiver in effect; in the absence of such a waiver, the returns would have been reduced. A redemption fee of 2% may be imposed on redemptions or exchanges of Fund shares owned for 30 days or less. Please see the Prospectus for more information. |
FUND OVERVIEW September 30, 2008 (Unaudited)
The Flexible Capital Fund invests primarily in equity securities and other investments that are selected primarily for their long-term growth potential. The Fund may invest in issuers of any size throughout the world, and will normally hold a core position of between 20 and 50 securities or other investments.
PERFORMANCE COMPARISON
| | | | | |
TOTAL ANNUAL OPERATING EXPENSES* | | | 2.47 | % |
| | | | | |
NET EXPENSES*† | | | 1.22 | % |
| | | | | |
NET ASSETS | | | | |
| | | | | |
| 9/30/08 | | | $14,460,983 | |
| | | | | |
NET ASSET VALUE | | | | |
| | | | | |
| Net Asset Value Per Share | | | $8.74 | |
| | | | | |
TOP FIVE HOLDINGS | | | | |
| | | | | |
| MasterCard, Inc. - Cl. A | | | 5.46 | % |
| McDonald’s Corporation | | | 4.52 | |
| Oaktree Capital Group, LLC - Cl. A 144a | | | 4.07 | |
| Gilead Sciences, Inc. | | | 3.87 | |
| CVS Caremark Corporation | | | 3.57 | |
| * | The Total Annual Operating Expenses and Net Expenses are reflective of the information disclosed in the Funds’ Prospectus dated February 1, 2008 and may differ from the expense ratios disclosed in this report. |
| † | The Adviser has entered into a written expense limitation agreement under which it has agreed to limit the total expenses of the Fund (excluding interest, taxes, acquired fund fees and expenses, litigation, brokerage and extraordinary expenses) to an annual rate of 0.75% of the Flexible Capital Fund’s average net assets until December 31, 2008. This fee waiver may be terminated at any time after December 31, 2008. The Adviser may recoup any waived amount from a Fund pursuant to this arrangement if such reimbursement does not cause the Fund to exceed existing expense limitations and the reimbursement is made within three years after the year in which the Adviser incurred the expense. Prior to June 1, 2007, the Adviser’s expense limitation agreement relating to the Fund limited total expenses to an annual rate of 1.60% of average net assets. As a result, the Net Expenses exceed 0.75% for the Flexible Capital Fund. |
The performance data quoted here represent past performance, and past performance is not a guarantee of future results. Investment return and principal value of an investment will fluctuate so that an investor’s shares, when redeemed, may be worth more or less than their original cost. Current performance may be lower or higher than the performance information quoted. To obtain performance information current to the most recent month-end, please call 888-860-8686 or visit www.marsicofunds.com. A redemption fee may be imposed on redemptions or exchanges of Fund shares owned for 30 days or less.
Initial public offerings (“IPOs”) made a significant positive contribution to the Fund’s recent performance. There can be no assurance that similar contributions from IPOs will continue in the future.
The performance included in the table and graph does not reflect the deduction of taxes on Fund distributions or the redemption of Fund shares.
(1) | The performance returns for the Flexible Capital Fund reflect a fee waiver in effect; in the absence of such a waiver, the returns would be reduced. |
(2) | This chart assumes an initial investment of $10,000 made on December 29, 2006 (inception). Total returns are based on change in NAV, assuming reinvestment of distributions. |
(3) | Sector weightings represent the percentage of the Fund’s investments (excluding cash equivalents) in certain general sectors. These sectors may include more than one industry. The Fund’s portfolio composition is subject to change at any time. |
MARSICO FLEXIBLE CAPITAL FUND
SCHEDULE OF INVESTMENTS September 30, 2008 | |
| | | Number | | | | Percent | |
| | of | | | | of Net | |
| | Shares | | Value | | Assets | |
COMMON STOCKS | | | | | | | |
| | | | | | | | |
Agricultural Chemicals | | | | | | | |
| Monsanto Company | | | 2,746 | | | $271,799 | | | 1.88 | % |
| Potash Corporation of | | | | | | | | | | |
| Saskatchewan, Inc. | | | 251 | | | 33,135 | | | 0.23 | |
| Syngenta AG Spon. ADR | | | 5,500 | | | 232,760 | | | 1.61 | |
| | | | | | | 537,694 | | | 3.72 | |
Commercial Banks - Non-U.S. | | | | | | | | | | |
| Industrial and Commercial | | | | | | | | | | |
| Bank of China Ltd. - Cl. H | | | 708,000 | | | 427,911 | | | 2.96 | |
| | | | | | | | | | | |
Commercial Services | | | | | | | | | | |
| Live Nation, Inc.* | | | 30,486 | | | 496,007 | | | 3.43 | |
| | | | | | | | | | | |
Commercial Services - Finance | | | | | | | | | | |
| MasterCard, Inc. - Cl. A | | | 4,456 | | | 790,182 | | | 5.46 | |
| | | | | | | | | | | |
Electric - Integrated | | | | | | | | | | |
| Exelon Corporation | | | 4,867 | | | 304,772 | | | 2.11 | |
| | | | | | | | | | | |
Energy - Alternate Sources | | | | | | | | | | |
| Vestas Wind Systems A/S* | | | 2,838 | | | 247,714 | | | 1.71 | |
| | | | | | | | | | | |
Engineering/R&D Services | | | | | | | | | | |
| AECOM Technology Corporation* | | | 6,947 | | | 169,785 | | | 1.17 | |
| | | | | | | | | | | |
Fiduciary Banks | | | | | | | | | | |
| The Bank of New York | | | | | | | | | | |
| Mellon Corp. | | | 3,074 | | | 100,151 | | | 0.69 | |
| | | | | | | | | | | |
Finance - Investment Banker/Broker | | | | | | | | | | |
| Credit Suisse Group AG | | | 3,557 | | | 166,119 | | | 1.15 | |
| Duff & Phelps Corporation - Cl. A* | | | 8,671 | | | 182,351 | | | 1.26 | |
| JPMorgan Chase & Co. | | | 8,639 | | | 403,441 | | | 2.79 | |
| | | | | | | 751,911 | | | 5.20 | |
Investment Management/Advisory Services | | | | | | |
| Oaktree Capital Group, LLC - Cl. A 144a | | | 21,200 | | | 588,300 | | | 4.07 | |
| | | | | | | | | | | |
Medical - Biomedical/Genetic | | | | | | | | | | |
| Gilead Sciences, Inc.* | | | 12,287 | | | 560,041 | | | 3.87 | |
| | | | | | | | | | | |
Oil Field Machinery & Equipment | | | | | | | | | | |
| National Oilwell Varco, Inc.* | | | 4,911 | | | 246,680 | | | 1.71 | |
| | | | | | | | | | | |
Power Conversion/Supply Equipment | | | | | | | | | | |
| Energy Conversion Devices, Inc.* | | | 2,881 | | | 167,818 | | | 1.16 | |
| | | | | | | | | | | |
Retail - Apparel/Shoes | | | | | | | | | | |
| J. Crew Group, Inc.* | | | 12,645 | | | 361,268 | | | 2.50 | |
| | | | | | | | | | | |
Retail - Auto Parts | | | | | | | | | | |
| Advance Auto Parts, Inc. | | | 4,266 | | | 169,190 | | | 1.17 | |
| | | | | | | | | | | |
Retail - Building Products | | | | | | | | | | |
| Lowe’s Companies, Inc. | | | 21,716 | | | 514,452 | | | 3.56 | |
| | | | | | | | | | | |
Retail - Discount | | | | | | | |
| BJ’s Wholesale Club, Inc.* | | | 10,760 | | | 418,134 | | | 2.89 | |
| Costco Wholesale Corporation | | | 6,088 | | | 395,294 | | | 2.73 | |
| | | | | | | 813,428 | | | 5.62 | |
Retail - Drug Store | | | | | | | | | | |
| CVS Caremark Corporation | | | 15,333 | | | 516,109 | | | 3.57 | |
| | | | | | | | | | | |
Retail - Major Department Store | | | | | | | | | | |
| Saks, Inc.* | | | 17,067 | | | 157,870 | | | 1.09 | |
| | | | | | | | | | | |
Retail - Office Supplies | | | | | | | | | | |
| Staples, Inc. | | | 7,878 | | | 177,255 | | | 1.23 | |
| | | | | | | | | | | |
Retail - Restaurants | | | | | | | | | | |
| Burger King Holdings, Inc. | | | 20,650 | | | 507,164 | | | 3.51 | |
| McDonald’s Corporation | | | 10,593 | | | 653,588 | | | 4.52 | |
| | | | | | | 1,160,752 | | | 8.03 | |
Savings & Loans/Thrifts | | | | | | | | | | |
| Meta Financial Group, Inc. | | | 29,055 | | | 493,935 | | | 3.42 | |
| | | | | | | | | | | |
Super-Regional Banks - U.S. | | | | | | | | | | |
| Bank of America Corporation | | | 10,531 | | | 368,585 | | | 2.55 | |
| U.S. Bancorp | | | 11,738 | | | 422,803 | | | 2.92 | |
| | | | | | | 791,388 | | | 5.47 | |
Transportation - Rail | | | | | | | | | | |
| America Latina Logistica S.A. | | | 28,544 | | | 195,003 | | | 1.35 | |
| Norfolk Southern Corporation | | | 5,692 | | | 376,867 | | | 2.60 | |
| | | | | | | 571,870 | | | 3.95 | |
Wireless Equipment | | | | | | | | | | |
| QUALCOMM, Inc. | | | 8,868 | | | 381,058 | | | 2.64 | |
| | | | | | | | | | | |
TOTAL COMMON STOCKS | | | | | | | | | | |
(Cost $11,386,821) | | | | | | 11,497,541 | | | 79.51 | |
| | | | | | | | | | | |
SHORT-TERM INVESTMENTS | | | | | | |
| SSgA Money Market Fund, | | | | | | | | | | |
| 2.22% | | | 1 | | | 1 | | | 0.00 | |
| SSgA Prime | | | | | | | | | | |
| Money Market Fund, 2.41% | | | 1 | | | 1 | | | 0.00 | |
| SSgA U.S. Government | | | | | | | | | | |
| Money Market Fund, 1.79% | | | 1 | | | 1 | | | 0.00 | |
| SSgA U.S. Treasury | | | | | | | | | | |
| Money Market Fund, 0.20% | | | 446,963 | | | 446,963 | | | 3.09 | |
| | | | | | | | | | | |
TOTAL SHORT-TERM INVESTMENTS | | | | | | | | | | |
(Cost $446,966) | | | | | | 446,966 | | | 3.09 | |
| | | | | | | | | | | |
TOTAL INVESTMENTS | | | | | | | | | | |
(Cost $11,833,787) | | | | | | 11,944,507 | | | 82.60 | |
| | | | | | | | | | | |
| Other Assets Less Liabilities | | | | | | 2,516,476 | | | 17.40 | |
| | | | | | | | | | | |
NET ASSETS | | | | | | $14,460,983 | | | 100.00 | % |
| See notes to financial statements. | | | | | | | | | | |
STATEMENT OF ASSETS AND LIABILITIES | |
| September 30, 2008 | | | |
| (Amounts in thousands) | | | |
| | | | |
ASSETS | | | |
| Investments, at value (cost $11,834) | | | $11,945 | |
| Receivable for investments sold | | | 2,648 | |
| Receivable for capital stock sold | | | 3 | |
| Interest and dividends receivable | | | 15 | |
| Prepaid expenses and other assets | | | 195 | |
Total Assets | | | 14,806 | |
| | | | | |
LIABILITIES | | | | |
| Payable for investments purchased | | | 85 | |
| Payable for capital stock redeemed | | | 6 | |
| Accrued investment advisory fee | | | 41 | |
| Accrued distribution fee | | | 12 | |
| Accrued trustees’ fees | | | 185 | |
| Accrued transfer agent fees and expenses | | | 4 | |
| Accrued expenses and other liabilities | | | 12 | |
Total Liabilities | | | 345 | |
| | | | | |
NET ASSETS | | | $14,461 | |
| | | | | |
NET ASSETS CONSIST OF | | | | |
| Paid-in-capital | | | $17,001 | |
| Accumulated net investment income | | | 129 | |
| Accumulated net realized loss on investments and | | | | |
| foreign currency transactions | | | (2,739 | ) |
| Net unrealized depreciation on investments | | | | |
| and foreign currency translations | | | 70 | |
| | | | | |
NET ASSETS | | | $14,461 | |
| | | | | |
SHARES OUTSTANDING, $0.001 par value | | | | |
| (Unlimited shares authorized) | | | 1,654 | |
| | | | | |
NET ASSET VALUE, REDEMPTION PRICE, | | | | |
AND OFFERING PRICE PER SHARE | | | | |
(NET ASSETS/SHARES OUTSTANDING)* | | | $8.74 | |
STATEMENT OF OPERATIONS | | | |
| FOR THE YEAR ENDED September 30, 2008 | | | |
| (Amounts in thousands) | | | |
| | | | |
INVESTMENT INCOME | | | |
| Interest | | | $63 | |
| Dividends (net of $5 of non-reclaimable | | | | |
| foreign withholding taxes) | | | 311 | |
Total Investment Income | | | 374 | |
| | | | | |
EXPENSES | | | | |
| Investment advisory fees | | | 168 | |
| Custody and fund accounting fees | | | 73 | |
| Distribution fees | | | 49 | |
| Fund administration fees | | | 47 | |
| Transfer agent fees and expenses | | | 34 | |
| Miscellaneous | | | 17 | |
| Trustees’ fees and expenses | | | (50 | )(1) |
Total Expenses | | | 338 | |
| | | | | |
| Less waiver of expenses and expenses paid indirectly | | | (190 | ) |
Net Expenses | | | 148 | |
| | | | | |
NET INVESTMENT INCOME | | | 226 | |
| | | | | |
REALIZED AND UNREALIZED GAIN/LOSS | | | | |
| Net realized loss on investments | | | (2,633 | ) |
| Net realized gain on foreign currency transactions | | | 477 | |
| Change in unrealized appreciation/depreciation on | | | | |
| investments and foreign currency translations | | | (1,764 | ) |
Net Loss on Investments | | | (3,920 | ) |
| | | | | |
NET DECREASE IN NET ASSETS | | | | |
RESULTING FROM OPERATIONS | | | $(3,694 | ) |
| (1) | Includes $867 for trustees’ fees and expenses and ($50,786) for the unrealized depreciation related to the mark to market of the shares in the Deferred Fee Plan during the year ended September 30, 2008. |
See notes to financial statements.
MARSICO FLEXIBLE CAPITAL FUND
STATEMENTS OF CHANGES IN NET ASSETS | | | | | |
| | | Year Ended | | 12/29/06* | |
| (Amounts in thousands) | | 9/30/08 | | to 9/30/07 | |
| | | | | | |
OPERATIONS | | | | | |
| Net investment income | | | $226 | | | $474 | |
| Net realized loss on investments | | | (2,633 | ) | | (125 | ) |
| Net realized gain on foreign currency transactions | | | 477 | | | 337 | |
| Change in unrealized appreciation/depreciation | | | | | | | |
| on investments and foreign currency translations | | | (1,764 | ) | | 1,833 | |
Net increase (decrease) in net assets resulting from operations | | | (3,694 | ) | | 2,519 | |
| | | | | | | | |
DISTRIBUTIONS | | | | | | | |
| Net investment income | | | (633 | ) | | — | |
| Net realized gains | | | (805 | ) | | — | |
Total distributions | | | (1,438 | ) | | — | |
| | | | | | | | |
CAPITAL SHARE TRANSACTIONS | | | | | | | |
| Proceeds from sale of shares | | | 6,769 | | | 32,595 | |
| Proceeds from reinvestment of distributions | | | 1,420 | | | — | |
| Redemption fees | | | 5 | | | 2 | |
| Redemption of shares | | | (13,342 | ) | | (10,375 | ) |
Net increase (decrease) from capital share transactions | | | (5,148 | ) | | 22,222 | |
| | | | | | | | |
TOTAL INCREASE (DECREASE) IN NET ASSETS | | | (10,280 | ) | | 24,741 | |
| | | | | | | | |
NET ASSETS | | | | | | | |
| Beginning of period | | | 24,741 | | | — | |
END OF PERIOD | | | $14,461 | | | $24,741 | |
| Accumulated net investment income | | | 129 | | | 456 | |
| | | | | | | | |
TRANSACTIONS IN SHARES | | | | | | | |
| Shares sold | | | 633 | | | 3,184 | |
| Shares issued in reinvestment of distributions | | | 133 | | | — | |
| Shares redeemed | | | (1,297 | ) | | (999 | ) |
NET INCREASE (DECREASE) | | | (531 | ) | | 2,185 | |
| * | Commencement of operations. |
See notes to financial statements.
FINANCIAL HIGHLIGHTS | | | | | |
| For a Fund Share Outstanding | | Year | | 12/29/06* | |
| Throughout the Period | | Ended | | to | |
| | 9/30/08 | | 9/30/07 | |
| | | | | | |
NET ASSET VALUE, BEGINNING OF PERIOD | | | $11.32 | | | $10.00 | |
| | | | | | | | |
INCOME FROM INVESTMENT OPERATIONS | | | | | | | |
| Net investment income | | | 0.14 | | | 0.22 | |
| Net realized and unrealized gains | | | | | | | |
| (losses) on investments | | | (1.93 | ) | | 1.10 | |
Total from investment operations | | | (1.79 | ) | | 1.32 | |
| | | | | | | | |
DISTRIBUTIONS & OTHER | | | | | | | |
| Net investment income | | | (0.35 | ) | | — | |
| Net realized gains | | | (0.44 | ) | | — | |
| Redemption fees [See Note 2(i)] | | | — | (1) | | — | (1) |
Total distributions & other | | | (0.79 | ) | | — | |
NET ASSET VALUE, END OF PERIOD | | | $8.74 | | | $11.32 | |
| | | | | | | | |
TOTAL RETURN | | | (17.10 | )% | | 13.20 | %(3) |
| | | | | | | | |
SUPPLEMENTAL DATA AND RATIOS | | | | | | | |
| Net assets, end of period (000s) | | | $14,461 | | | $24,741 | |
| Ratio of expenses to average net assets, | | | | | | | |
| less waivers and before expenses paid indirectly | | | 0.75 | % | | 1.22% | (2) |
| Ratio of net investment income to average net | | | | | | | |
| assets, net of waivers, and expenses paid indirectly | | | 1.15 | % | | 2.62% | (2) |
| Ratio of expenses to average net assets, | | | | | | | |
| before waivers, and expenses paid indirectly | | | 1.71 | % | | 2.47% | (2) |
| Ratio of net investment income to average net | | | | | | | |
| assets, before waivers, and expenses paid indirectly | | | 0.19 | % | | 1.37% | (2) |
Portfolio turnover rate (4) | | | 207 | % | | 237% | (3) |
| * | Commencement of operations. |
| (3) | Not annualized for the period December 29, 2006 to September 30, 2007. |
| (4) | Portfolio turnover is greater than most funds due to the investment style of the Fund. |
See notes to financial statements.
MARSICO GLOBAL FUND
INVESTMENT REVIEW BY CORY GILCHRIST, TOM MARSICO AND JIM GENDELMAN (UNAUDITED)
The Marsico Global Fund posted a total return of -21.13% for the 12-month period ended September 30, 2008, and outperformed the MSCI All Country World Index (MSCI ACWI Index), which we consider to be the Fund’s primary benchmark index and which had a total return of -26.87%. The MSCI ACWI Index measures equity market performance in the global developed and emerging markets. Please see the Fund Overview for more detailed information about the Fund’s performance for the periods ended September 30, 2008.
The performance data for the Fund quoted here represent past performance, and past performance is not a guarantee of future results. Investment return and principal value of an investment will fluctuate so that an investor’s shares, when redeemed, may be worth more or less than their original cost. Current performance may be lower or higher than the performance information quoted. To obtain performance information current to the most recent month-end, please call 888-860-8686 or visit www.marsicofunds.com.(1)
This review highlights Fund performance over a one-year fiscal period. Shareholders should keep in mind that the Funds are intended for long-term investors who hold their shares for substantially longer periods of time. You should also keep in mind that our views on all investments discussed in this report are subject to change at any time. References to specific securities, industries, and sectors discussed in this report are not recommendations to buy or sell such securities or related investments, and the Fund may not necessarily hold these securities or investments today. Please see the accompanying Schedule of Investments for the percentage of the Fund’s portfolio represented by the securities mentioned in this report.
The following areas bolstered the performance results of the Fund:
| ● | Financials: For much of the early portion of the reporting period, the Fund had less exposure to the Financials sector than the MSCI ACWI Index. This aided performance relative to the benchmark, as the benchmark index sector posted a return of -36%. The Fund increased its weighting in Financials positions in the later half of the reporting period and a number of the Fund’s holdings in the sector performed well. Wells Fargo & Company (+33%), JPMorgan Chase & Co. (+21%), and U.S. Bancorp (+38%) were among the Fund’s strongest-performing individual positions during the period while they were held by the Fund. |
| ● | Materials: The Fund also benefitted from having little exposure to the Materials sector as the sector plunged -34% in the benchmark index. Stock selection for the Fund was stronger than the index, garnering a sector return of -16%. The Fund’s position in agricultural products company Monsanto Company (+19%) helped to partially offset losses experienced by other holdings in the sector. |
| ● | Industrials: Certain of the Fund’s Industrials holdings experienced solid gains, including China-based solar electric products manufacturer and developer Suntech Power Holdings Co. Ltd. (+66% prior to being sold), Japan-headquartered Hitachi Construction Machinery Co. Ltd. (+38% prior to being sold), and Canadian National Railway Company (+6%). |
Several other individual securities in various sectors had a substantially positive effect on the Fund’s performance. These included MasterCard, Inc. - Cl. A (+19%), McDonald’s Corporation (+19%), and Brazil-headquartered energy company Petroleo Brasileiro S.A. ADR (+29%).
On average, the Fund had more exposure to securities economically tied to the US than did the MSCI ACWI Index during the 12-month period, and at times had invested less than 40% of its net assets in foreign securities (as may occur when the adviser deems foreign market conditions not to be favorable), and dipped below a 30% weighting in foreign securities at period end. This positioning presented a significant currency “tailwind” to the Fund, as the US dollar appreciated relative to many other world currencies such as the euro and the pound. As compared to the benchmark index, the Fund generally had less exposure to companies whose securities are priced in euros and the pound; therefore a smaller portion of the Fund was hurt by the euro’s and pound’s valuation losses relative to the dollar.
Though the Fund outperformed the MSCI ACWI Index for the 12-month period, there were several weak points in the Fund’s performance:
| ● | Consumer Discretionary: The Fund’s Consumer Discretionary-related positions were a significant area of weakness, dropping -41% in aggregate. Much of the loss stemmed from the Fund’s investments in hotel/resort operators. Las Vegas Sands Corp. and Starwood Hotels & Resorts Worldwide, Inc. plunged -65% and -47%, respectively, prior to being sold from the Fund. The Fund was further negatively affected by having an overweighted posture on average in the weak performing sector. The Fund pared back its exposure to Consumer Discretionary-related investments in the later portion of the reporting period. |
| ● | Consumer Staples: Several of the Fund’s Consumer Staples positions struggled, including beverage company Heineken Holding N.V. (-31%) and Brazil-based sugarcane ethanol producer Cosan S/A Industria e Comercio (-48% prior to being sold). |
While certain of the Fund’s Industrials positions performed well as noted above, others had a material, negative effect on performance. These holdings included fossil and nuclear power engineering company The Shaw Group, Inc. (-45%), Brazilian railroad operator America Latina Logistica S.A. (-54%), Switzerland-headquartered power products company ABB Ltd. (-45%), and Dutch wind turbine manufacturer Vestas Wind Systems A/S (-23%). An overweighted posture in Industrials hindered performance results, as the sector was among the weaker-performing areas of the benchmark index.
The Fund’s performance was also impeded by having an average overweight position in the weak performing Information Technology sector while maintaining an underweighted position in the comparatively strong performing Health Care sector.
During the fiscal year ended September 30, 2008, the Fund had 14% of its net assets, on average, in cash and cash equivalents. This defensive posture helped to preserve capital in a volatile market environment. We anticipate that the Fund’s cash level may decline going forward as we add selectively to existing holdings and identify new investment opportunities.
The Global Fund over its short history has tended to have a fairly high portfolio turnover level. This is attributable to the Fund’s investment style and its growing base of assets under management. Although the Fund may hold core positions for some time, it may change its portfolio composition quickly to take advantage of new opportunities, or to address issues affecting particular holdings.
FISCAL PERIOD-END INVESTMENT POSTURE
As of September 30, 2008, the Fund’s primary economic sector allocations were in the following areas: Financials, Industrials, Consumer Staples, and Information Technology. Cash and cash equivalents represented approximately 8% of the Fund’s net assets. The Fund’s most significant country allocations were the US (including the Fund’s cash position), Switzerland, Denmark, Canada and the Netherlands.
Sincerely,
CORYDON J. GILCHRIST, CFA
THOMAS F. MARSICO
JAMES G. GENDELMAN
PORTFOLIO MANAGERS
(1) | Total returns are based on net change in net asset value assuming reinvestment of distributions. The performance returns for the Global Fund reflect a fee waiver in effect; in the absence of such a waiver, the returns would have been reduced. A redemption fee of 2% may be imposed on redemptions or exchanges of Fund shares owned for 30 days or less. Please see the Prospectus for more information. |
FUND OVERVIEW September 30, 2008 (Unaudited) | |
The Global Fund invests primarily in common stocks that are selected for their long-term growth potential. The Fund invests in the securities of companies of any size that are economically tied to any countries or markets throughout the world, including the securities of companies economically tied to emerging markets. Under normal market conditions, the Fund will invest significantly (generally, at least 40% of its net assets) in the securities of issuers organized or located outside the U.S. or doing business outside the U.S. (unless market conditions are not deemed favorable by the Adviser, in which case the Fund generally will invest at least 30% of its assets in such foreign securities). The Fund will invest its assets in various regions and countries, including the U.S., that encompass not less than three different countries overall. The Fund may hold an unlimited number of common stocks.
PERFORMANCE COMPARISON
| | | | | |
TOTAL ANNUAL OPERATING EXPENSES* | | | 4.50 | % |
| | | | | |
NET EXPENSES*† | | | 0.77 | % |
| | | | | |
NET ASSETS | | | | |
| | | | | |
| 9/30/08 | | | $82,542,864 | |
| | | | | |
NET ASSET VALUE | | | | |
| | | | | |
| Net Asset Value Per Share | | | $8.87 | |
| | | | | |
TOP FIVE HOLDINGS | | | | |
| | | | | |
| Wells Fargo & Company | | | 6.74 | % |
| Costco Wholesale Corporation | | | 5.77 | |
| JPMorgan Chase & Co. | | | 5.74 | |
| Vestas Wind Systems A/S | | | 4.24 | |
| Lockheed Martin Corporation | | | 4.11 | |
SECTOR ALLOCATION(3)
| * | The Total Annual Operating Expenses and Net Expenses are reflective of the information disclosed in the Funds’ Prospectus dated February 1, 2008 and may differ from the expense ratios disclosed in this report. |
| † | The Adviser has entered into a written expense limitation agreement under which it has agreed to limit the total expenses of the Fund (excluding interest, taxes, acquired fund fees and expenses, litigation, brokerage and extraordinary expenses) to an annual rate of 0.75% of the Global Fund’s average net assets until December 31, 2008. This fee waiver may be terminated at any time after December 31, 2008. The Adviser may recoup any waived amount from a Fund pursuant to this arrangement if such reimbursement does not cause the Fund to exceed existing expense limitations and the reimbursement is made within three years after the year in which the Adviser incurred the expense. |
The performance data quoted here represent past performance, and past performance is not a guarantee of future results. Investment return and principal value of an investment will fluctuate so that an investor’s shares, when redeemed, may be worth more or less than their original cost. Current performance may be lower or higher than the performance information quoted. To obtain performance information current to the most recent month-end, please call 888-860-8686 or visit www.marsicofunds.com. A redemption fee may be imposed on redemptions or exchanges of Fund shares held for 30 days or less.
Initial public offerings (“IPOs”) made a significant positive contribution to the Fund’s recent performance. There can be no assurance that similar contributions from IPOs will continue in the future.
The performance included in the table and graph does not reflect the deduction of taxes on Fund distributions or the redemption of Fund shares.
(1) | The performance returns for the Global Fund reflect a fee waiver in effect; in the absence of such a waiver, the returns would be reduced. |
(2) | This chart assumes an initial investment of $10,000 made on June 29, 2007 (inception). Total returns are based on change in NAV, assuming reinvestment of distributions. |
| Sector weightings represent the percentage of the Fund’s equity investments in certain general sectors. These sectors may include more than one industry. The Fund’s portfolio composition is subject to change at any time. |
The MSCI ACWI (All Country World Index) Index is a free float-adjusted market capitalization index that is designed to measure equity market performance in the global developed and emerging markets. You cannot invest directly in an index.
SCHEDULE OF INVESTMENTS September 30, 2008 | |
| | | Number | | | | Percent | |
| | of | | | | of Net | |
| | Shares | | Value | | Assets | |
COMMON STOCKS | | | | | | | |
| | | | | | | | |
Aerospace/Defense | | | | | | | |
| Lockheed Martin Corporation | | | 30,888 | | | $3,387,487 | | | 4.11 | % |
| Raytheon Company | | | 41,692 | | | 2,230,939 | | | 2.70 | |
| | | | | | | 5,618,426 | | | 6.81 | |
Agricultural Chemicals | | | | | | | | | | |
| Monsanto Company | | | 25,705 | | | 2,544,281 | | | 3.08 | |
| | | | | | | | | | | |
Airlines | | | | | | | | | | |
| Ryanair Holdings PLC Spon. ADR* | | | 37,800 | | | 847,854 | | | 1.03 | |
| | | | | | | | | | | |
Brewery | | | | | | | | | | |
| Heineken Holding N.V. | | | 74,103 | | | 2,909,192 | | | 3.52 | |
| | | | | | | | | | | |
Chemicals - Specialty | | | | | | | | | | |
| Lonza Group AG | | | 14,616 | | | 1,833,886 | | | 2.22 | |
| | | | | | | | | | | |
Commercial Banks - Non-U.S. | | | | | | | | | | |
| Industrial and Commercial | | | | | | | | | | |
| Bank of China - Cl. H | | | 961,000 | | | 580,823 | | | 0.70 | |
| | | | | | | | | | | |
Commercial Services | | | | | | | | | | |
| Live Nation, Inc.* | | | 64,301 | | | 1,046,177 | | | 1.27 | |
| | | | | | | | | | | |
Commercial Services - Finance | | | | | | | | | | |
| MasterCard, Inc. - Cl. A | | | 13,013 | | | 2,307,595 | | | 2.80 | |
| Visa, Inc. - Cl. A | | | 35,907 | | | 2,204,331 | | | 2.67 | |
| | | | | | | 4,511,926 | | | 5.47 | |
Computers | | | | | | | | | | |
| Apple, Inc.* | | | 20,195 | | | 2,295,364 | | | 2.78 | |
| | | | | | | | | | | |
Distribution/Wholesale | | | | | | | | | | |
| Li & Fung Ltd. | | | 546,000 | | | 1,336,087 | | | 1.62 | |
| | | | | | | | | | | |
Energy - Alternate Sources | | | | | | | | | | |
| Vestas Wind Systems A/S* | | | 40,143 | | | 3,503,875 | | | 4.24 | |
| | | | | | | | | | | |
Engineering/R&D Services | | | | | | | | | | |
| ABB Ltd.* | | | 60,793 | | | 1,178,072 | | | 1.43 | |
| AECOM Technology Corporation* | | | 42,421 | | | 1,036,769 | | | 1.26 | |
| The Shaw Group, Inc.* | | | 52,221 | | | 1,604,751 | | | 1.94 | |
| | | | | | | 3,819,592 | | | 4.63 | |
Finance - Investment Banker/Broker | | | | | | | | | | |
| Credit Suisse Group AG | | | 60,445 | | | 2,822,899 | | | 3.42 | |
| The Goldman Sachs Group, Inc. | | | 9,906 | | | 1,267,968 | | | 1.54 | |
| JPMorgan Chase & Co. | | | 101,453 | | | 4,737,855 | | | 5.74 | |
| | | | | | | 8,828,722 | | | 10.70 | |
Food - Retail | | | | | | | | | | |
| Tesco PLC | | | 104,202 | | | 724,723 | | | 0.88 | |
| | | | | | | | | | | |
Hotels & Motels | | | | | | | | | | |
| Mandarin Oriental International Ltd. | | | 665,000 | | | 1,030,692 | | | 1.25 | |
| | | | | | | | | | | |
Industrial Gases | | | | | | | | | | |
| Praxair, Inc. | | | 8,622 | | | 618,542 | | | 0.75 | |
| | | | | | | | | | | |
Medical - Biomedical/Genetic | | | | | | | |
| Gilead Sciences, Inc.* | | | 22,381 | | | 1,020,126 | | | 1.23 | |
| | | | | | | | | | | |
Medical Instruments | | | | | | | | | | |
| Intuitive Surgical, Inc.* | | | 3,204 | | | 772,100 | | | 0.93 | |
| | | | | | | | | | | |
Oil Companies - Integrated | | | | | | | | | | |
| Petroleo Brasileiro S.A. ADR | | | 27,990 | | | 1,230,161 | | | 1.49 | |
| | | | | | | | | | | |
Power Conversion/Supply Equipment | | | | | | | | | | |
| Energy Conversion Devices, Inc.* | | | 15,271 | | | 889,536 | | | 1.08 | |
| | | | | | | | | | | |
Real Estate Operating/Development | | | | | | | | | | |
| Brookfield Asset | | | | | | | | | | |
| Management, Inc. - Cl. A | | | 47,988 | | | 1,316,791 | | | 1.59 | |
| | | | | | | | | | | |
Retail - Building Products | | | | | | | | | | |
| The Home Depot, Inc. | | | 64,928 | | | 1,680,986 | | | 2.04 | |
| | | | | | | | | | | |
Retail - Discount | | | | | | | | | | |
| Costco Wholesale Corporation | | | 73,344 | | | 4,762,226 | | | 5.77 | |
| | | | | | | | | | | |
Retail - Restaurants | | | | | | | | | | |
| McDonald’s Corporation | | | 24,995 | | | 1,542,192 | | | 1.87 | |
| | | | | | | | | | | |
Super-Regional Banks - U.S. | | | | | | | | | | |
| Bank of America Corporation | | | 48,416 | | | 1,694,560 | | | 2.05 | |
| U.S. Bancorp | | | 52,496 | | | 1,890,906 | | | 2.29 | |
| Wells Fargo & Company | | | 148,263 | | | 5,564,310 | | | 6.74 | |
| | | | | | | 9,149,776 | | | 11.08 | |
Transportation - Rail | | | | | | | | | | |
| America Latina Logistica S.A. | | | 145,462 | | | 993,750 | | | 1.20 | |
| Canadian National Railway Company | | | 39,961 | | | 1,911,335 | | | 2.32 | |
| | | | | | | 2,905,085 | | | 3.52 | |
Transportation - Services | | | | | | | | | | |
| Kuehne + Nagel International AG | | | 7,880 | | | 525,774 | | | 0.64 | |
| | | | | | | | | | | |
TOTAL COMMON STOCKS | | | | | | | | | | |
(Cost $73,204,827) | | | | | | 67,844,915 | | | 82.19 | |
See notes to financial statements.
MARSICO GLOBAL FUND
SCHEDULE OF INVESTMENTS September 30, 2008 | |
| | | Number | | | | Percent | |
| | of | | | | of Net | |
| | Shares | | Value | | Assets | |
SHORT-TERM INVESTMENTS | | | | | |
| SSgA Prime Money Market Funds, | | | | | | | |
| 2.41% | | | 1 | | | $1 | | | 0.00 | % |
| SSgA U.S. Government | | | | | | | | | | |
| Money Market Fund, 1.79% | | | 3,113,692 | | | 3,113,692 | | | 3.77 | |
| SSgA U.S. Treasury | | | | | | | | | | |
| Money Market Fund, 0.20% | | | 3,573,440 | | | 3,573,440 | | | 4.33 | |
| | | | | | | | | | | |
TOTAL SHORT-TERM INVESTMENTS | | | | | | | | | | |
(Cost $6,687,133) | | | | | | 6,687,133 | | | 8.10 | |
| | | | | | | | | | | |
TOTAL INVESTMENTS | | | | | | | | | | |
(Cost $79,891,960) | | | | | | 74,532,048 | | | 90.29 | |
| | | | | | | | | | | |
| Other Assets Less Liabilities | | | | | | 8,010,816 | | | 9.71 | |
| | | | | | | | | | | |
NET ASSETS | | | | | | $82,542,864 | | | 100.00 | % |
| | |
SUMMARY OF INVESTMENTS BY COUNTRY | |
| | | | | Percent of | |
| | | | Investment | |
Country | | Market Value | | Securities | |
| Brazil | | | $2,223,911 | | | 2.98 | % |
| Canada | | | 3,228,126 | | | 4.33 | |
| China | | | 580,823 | | | 0.78 | |
| Denmark | | | 3,503,875 | | | 4.70 | |
| Hong Kong | | | 2,366,779 | | | 3.18 | |
| Ireland | | | 847,854 | | | 1.14 | |
| Netherlands | | | 2,909,192 | | | 3.90 | |
| Switzerland | | | 6,360,631 | | | 8.54 | |
| United Kingdom | | | 724,723 | | | 0.97 | |
United States(1) | | | 51,786,134 | | | 69.48 | |
Total | | | $74,532,048 | | | 100.00 | % |
| (1) | Includes short-term securities. |
See notes to financial statements.
STATEMENT OF ASSETS AND LIABILITIES | |
| September 30, 2008 | | | |
| (Amounts in thousands) | | | |
| | | | |
ASSETS | | | |
| Investments, at value (cost $79,892) | | | $74,532 | |
| Receivable for investments sold | | | 8,380 | |
| Receivable for capital stock sold | | | 164 | |
| Interest and dividends receivable | | | 89 | |
| Prepaid expenses and other assets | | | 80 | |
Total Assets | | | 83,245 | |
| | | | | |
LIABILITIES | | | | |
| Payable for capital stock redeemed | | | 527 | |
| Accrued investment advisory fee | | | 32 | |
| Accrued distribution fee | | | 45 | |
| Accrued trustees’ fees | | | 58 | |
| Accrued transfer agent fees and expenses | | | 13 | |
| Accrued expenses and other liabilities | | | 27 | |
Total Liabilities | | | 702 | |
| | | | | |
NET ASSETS | | | $82,543 | |
| | | | | |
NET ASSETS CONSIST OF | | | | |
| Paid-in-capital | | | $102,969 | |
| Accumulated net investment income | | | 584 | |
| Accumulated net realized loss on investments and | | | | |
| foreign currency transactions | | | (15,637 | ) |
| Net unrealized depreciation on investments | | | | |
| and foreign currency translations | | | (5,373 | ) |
NET ASSETS | | | $82,543 | |
| | | | | |
SHARES OUTSTANDING, $0.001 par value | | | | |
| (Unlimited shares authorized) | | | 9,302 | |
| | | | | |
NET ASSET VALUE, REDEMPTION PRICE, | | | | |
AND OFFERING PRICE PER SHARE | | | | |
(NET ASSETS/SHARES OUTSTANDING)* | | | $8.87 | |
STATEMENT OF OPERATIONS | | | |
| FOR THE YEAR ENDED September 30, 2008 | | | |
| (Amounts in thousands) | | | |
| | | | |
INVESTMENT INCOME | | | |
| Interest | | | $295 | |
| Dividends (net of $52 of non-reclaimable | | | | |
| foreign withholding taxes) | | | 1,005 | |
Total Investment Income | | | 1,300 | |
| | | | | |
EXPENSES | | | | |
| Investment advisory fees | | | 678 | |
| Distribution fees | | | 200 | |
| Custody and fund accounting fees | | | 107 | |
| Transfer agent fees and expenses | | | 92 | |
| Fund administration fees | | | 86 | |
| Miscellaneous | | | 38 | |
| Trustees’ fees and expenses | | | (11 | )(1) |
Total Expenses | | | 1,190 | |
| Less waiver of expenses and expenses paid indirectly | | | (591 | ) |
Net Expenses | | | 599 | |
| | | | | |
NET INVESTMENT INCOME | | | 701 | |
| | | | | |
REALIZED AND UNREALIZED GAIN/LOSS | | | | |
| Net realized loss on investments | | | (15,861 | ) |
| Net realized gain on foreign currency transactions | | | 686 | |
| Change in unrealized appreciation/depreciation on | | | | |
| investments and foreign currency translations | | | (8,458 | ) |
Net Loss on Investments | | | (23,633 | ) |
| | | | | |
NET DECREASE IN NET ASSETS | | | | |
RESULTING FROM OPERATIONS | | | $(22,932 | ) |
| (1) | Includes $3,215 for trustees’ fees and expenses, and $(13,763) for the unrealized depreciation related to the mark to market of the shares in the Deferred Fee Plan during the year ended September 30, 2008. |
See notes to financial statements.
STATEMENTS OF CHANGES IN NET ASSETS | | | | | |
| | | Year Ended | | 6/29/07* | |
| (Amounts in thousands) | | 9/30/08 | | to 9/30/07 | |
| | | | | | |
OPERATIONS | | | | | |
| Net investment income | | | $701 | | | $57 | |
| Net realized gain (loss) on investments | | | (15,861 | ) | | 350 | |
| Net realized gain (loss) on foreign currency transactions | | | 686 | | | (50 | ) |
| Change in unrealized appreciation/depreciation | | | | | | | |
| on investments and foreign currency translations | | | (8,458 | ) | | 3,084 | |
Net increase (decrease) in net assets resulting from operations | | | (22,932 | ) | | 3,441 | |
| | | | | | | | |
DISTRIBUTIONS | | | | | | | |
| Net investment income | | | (236 | ) | | — | |
| Net realized gains | | | (763 | ) | | — | |
Total distributions | | | (999 | ) | | — | |
| | | | | | | | |
CAPITAL SHARE TRANSACTIONS | | | | | | | |
| Proceeds from sale of shares | | | 115,046 | | | 29,091 | |
| Proceeds from reinvestment of distributions | | | 987 | | | — | |
| Redemption fees | | | 33 | | | 5 | |
| Redemption of shares | | | (41,069 | ) | | (1,060 | ) |
Net increase from capital share transactions | | | 74,997 | | | 28,036 | |
TOTAL INCREASE IN NET ASSETS | | | 51,066 | | | 31,477 | |
| | | | | | | | |
NET ASSETS | | | | | | | |
| Beginning of period | | | 31,477 | | | — | |
| | | | | | | | |
END OF PERIOD | | | $82,543 | | | $31,477 | |
| Accumulated net investment income | | | 584 | | | 132 | |
| | | | | | | | |
TRANSACTIONS IN SHARES | | | | | | | |
| Shares sold | | | 10,358 | | | 2,851 | |
| Shares issued in reinvestment of distributions | | | 84 | | | — | |
| Shares redeemed | | | (3,888 | ) | | (103 | ) |
| | | | | | | | |
NET INCREASE | | | 6,554 | | | 2,748 | |
| * | Commencement of operations. |
See notes to financial statements.
FINANCIAL HIGHLIGHTS | | | | | |
| For a Fund Share Outstanding | | Year | | 6/29/07* | |
| Throughout the Period | | Ended | | to | |
| | 9/30/08 | | 9/30/07 | |
| | | | | | |
NET ASSET VALUE, BEGINNING OF PERIOD | | | $11.46 | | | $10.00 | |
| | | | | | | | |
INCOME FROM INVESTMENT OPERATIONS | | | | | | | |
| Net investment income | | | 0.08 | | | 0.02 | |
| Net realized and unrealized gains | | | | | | | |
| (losses) on investment | | | (2.46 | ) | | 1.44 | |
Total from investment operations | | | (2.38 | ) | | 1.46 | |
| | | | | | | | |
DISTRIBUTIONS & OTHER | | | | | | | |
| Net investment income | | | (0.05 | ) | | — | |
| Net realized gains | | | (0.17 | ) | | — | |
| Redemption fees [See Note 2(i)] | | | 0.01 | | | — | (1) |
Total distributions & other | | | (0.21 | ) | | — | |
NET ASSET VALUE, END OF PERIOD | | | $8.87 | | | $11.46 | |
| | | | | | | | |
TOTAL RETURN | | | (21.13 | )% | | 14.60% | (3) |
| | | | | | | | |
SUPPLEMENTAL DATA AND RATIOS | | | | | | | |
| Net assets, end of period (000s) | | | $82,543 | | | $31,477 | |
| Ratio of expenses to average net assets, less | | | | | | | |
| waivers and before expenses paid indirectly | | | 0.75 | % | | 0.75% | (2) |
| Ratio of net investment income to average net | | | | | | | |
| assets, net of waivers, and expenses paid indirectly | | | 0.88 | % | | 1.06% | (2) |
| Ratio of expenses to average net assets, before | | | | | | | |
| waivers, and expenses paid indirectly | | | 1.49 | % | | 4.48% | (2) |
| Ratio of net investment income (loss) to average net | | | | | | | |
| assets, before waivers, and expenses paid indirectly | | | 0.14 | % | | (2.67% | )(2) |
Portfolio turnover rate(4) | | | 201 | % | | 56% | (3) |
| * | Commencement of operations. |
| (3) | Not annualized for the period June 29, 2007 to September 30, 2007. |
| (4) | Portfolio turnover is greater than most funds due to the investment style of the Fund. |
See notes to financial statements.
MARSICO FUNDS
NOTES TO FINANCIAL STATEMENTS September 30, 2008
| | The Marsico Investment Fund (the “Trust”) was organized on October 1, 1997, as a Delaware Statutory Trust and is registered under the Investment Company Act of 1940 (the “1940 Act”) as an open-end management investment company. The Focus Fund, the Growth Fund, the 21st Century Fund, the International Opportunities Fund, the Flexible Capital Fund, and the Global Fund (collectively, the “Funds”) are separate investment portfolios of the Trust. The Focus Fund and the Flexible Capital Fund are non-diversified funds and the Growth Fund, the 21st Century Fund, the International Opportunities Fund, and the Global Fund are diversified funds. The Focus and Growth Funds commenced operations on December 31, 1997, the 21st Century Fund commenced operations on February 1, 2000, the International Opportunities Fund commenced operations on June 30, 2000, the Flexible Capital Fund commenced operations on December 29, 2006, and the Global Fund commenced operations on June 29, 2007. Affiliates of the Adviser hold approximately 43% of the Flexible Capital Fund as of September 30, 2008. |
2. | Significant Accounting Policies |
| | The following is a summary of significant accounting policies consistently followed by the Funds in the preparation of their financial statements. These policies are in conformity with Generally Accepted Accounting Principles (“GAAP”) for investment companies. The presentation of financial statements in conformity with GAAP requires management to make estimates and assumptions that affect the reported amounts of assets and liabilities at the date of the financial statements and the reported amounts of income and expenses during the reporting period. Actual results could differ from those estimates. |
| | (a) | Investment Valuation—A security traded on a recognized stock exchange is valued at the last sale price prior to the closing of the principal exchange on which the security is traded. Securities traded on NASDAQ generally will be valued at the NASDAQ Official Closing Price. If no sale is reported on the valuation date, the most current bid price will generally be used. Other securities for which over-the-counter market quotations are readily available are generally valued at the last sale price. Debt securities that will mature in more than 60 days are generally valued at their bid prices furnished by a pricing service. Debt securities that will mature in 60 days or less are valued at amortized cost, if it approximates market value. Any securities for which market quotations are not readily available are valued at their fair value as determined in good faith by the Adviser in accordance with procedures established by, and under the general supervision of, the Funds’ Board of Trustees. The Funds may use pricing services to assist in determining market value. The Board of Trustees has authorized the use of a pricing service to assist the Funds in valuing certain equity securities listed or traded on foreign security exchanges in the Funds’ portfolios in certain circumstances where there is a significant change in the value of related U.S.- traded securities, as represented by the S&P 500 Index. |
| | (b) | Expenses—The Funds are charged for those expenses that are directly attributable to each Fund, such as advisory and custodial fees. Expenses that are not directly attributable to a Fund are typically allocated among the Funds in proportion to their respective net assets and in some cases allocated based on other factors. The Funds’ expenses may be reduced by voluntary advisory fee waivers, brokerage credits and uninvested cash balances earning interest or credits. Such credits are included in Waiver of Expenses and Expenses Paid Indirectly in the Statement of Operations. |
| | | The Funds received credits on certain bank account balances which reduced certain transfer agent fees and expenses in the amount of $5,155, $3,304, $2,896, $946, $23, and $94 for the Focus Fund, Growth Fund, 21st Century Fund, International Opportunities Fund, Flexible Capital Fund, and Global Fund respectively, for the year ended September 30, 2008. Account earnings credits are included in Expenses Paid Indirectly on the Statements of Operations. |
| | (c) | Federal Income Taxes—Each Fund intends to comply with the requirements of the Internal Revenue Code necessary to qualify as a regulated investment company and to make the requisite distributions of income to its shareholders which will be sufficient to relieve it from all or substantially all federal and state income taxes. Certain funds may utilize earnings and profits on redemption of shares as part of the dividends paid deduction. |
| | (d) | Distributions to Shareholders—Dividends from net investment income and net realized capital gains, if any, will be declared and paid at least annually. Distributions to shareholders are recorded on the ex-dividend date. Each Fund may periodically make reclassifications among certain of its capital accounts as a result of the timing and characterization of certain income and capital gains distributions determined in accordance with federal tax regulations, which may differ from GAAP. These reclassifications are due to differing treatment for items such as foreign currency transactions, net investment losses and investments in partnerships and REITs. |
| | (e) | Foreign Currency Translation—The accounting records of the Funds are maintained in U.S. dollars. Values of securities denominated in foreign currencies are translated into U.S. dollars at 4:00 p.m. ET. Amounts related to the purchase and sale of foreign securities and investment income are translated at the rates of exchange prevailing on the respective dates of such transactions. |
| | | Reported realized gains on foreign currency transactions arise from sales of portfolio securities, forward currency contracts, currency gains or losses realized between the trade and settlement dates on securities transactions, the difference between the amounts of dividends, interest, and foreign withholding taxes recorded on the Funds’ books, and the U.S. dollar equivalent of the amounts actually received or paid. |
| | | The Funds do not isolate that portion of the results of operations resulting from changes in foreign exchange rates on investments from the fluctuations arising from changes in market prices of securities held at fiscal year-end. Net unrealized appreciation or depreciation on investments and foreign currency translations arise from changes in the value of assets and liabilities, including investments in securities at fiscal year-end, resulting from changes in the exchange rates and changes in market prices of securities held. |
| | (f) | Forward Currency Contracts and Futures Contracts—The Funds may enter into forward currency contracts to reduce their exposure to changes in foreign currency exchange rates on their foreign holdings and to lock in the U.S. dollar cost of firm purchase and sale commitments for securities denominated in foreign currencies. A forward currency contract is a commitment to purchase or sell a foreign currency at a future date at a negotiated forward rate. The gain or loss arising from the difference between the U.S. dollar cost of the original contract and the value of the foreign currency in U.S. dollars upon closing of such contract is included in net realized gain or loss from foreign currency transactions. |
| | | Forward currency contracts held by the Funds are fully collateralized by other securities. If held by the Funds, such collateral would be in the possession of the Funds’ custodian. The collateral would be evaluated daily to ensure its market value equals or exceeds the current market value of the corresponding forward currency contracts. |
| | | Futures contracts are marked to market daily and the resultant variation margin is recorded as an unrealized gain or loss. When a contract is closed, a realized gain or loss is recorded equal to the difference between the opening and closing value of the contract. Generally, open forward and futures contracts are marked to market (i.e., treated as realized and subject to distribution) for federal income tax purposes at fiscal year-end. |
NOTES TO FINANCIAL STATEMENTS September 30, 2008 (continued)
| | | Foreign-denominated assets and forward currency contracts may involve more risks than domestic transactions, including currency risk, political and economic risk, regulatory risk and market risk. Risks may arise from the potential inability of a counterparty to meet the terms of a contract and from unanticipated movements in the value of foreign currencies relative to the U.S. dollar. |
| | | The Funds may enter into futures contracts and options on securities, financial indexes, foreign currencies, forward contracts, interest rate swaps and swap-related products. The Funds intend to use such derivative instruments primarily to hedge or protect from adverse movements in securities prices, currency rates or interest rates. The use of futures contracts and options may involve risks such as the possibility of illiquid markets or imperfect correlation between the value of the contracts and the underlying securities, or that the counterparty will fail to perform its obligations. There were no futures, forward currency contracts, or swap-related products open as of September 30, 2008. |
| | (g) | Options Contracts—The Funds may purchase and write (sell) put and call options on foreign and domestic stock indices, foreign currencies and U.S. and foreign securities that are traded on U.S. and foreign securities exchanges and over-the-counter markets. These transactions are for hedging purposes or for the purpose of earning additional income. In addition, the Funds may enter into such transactions for cross-hedging purposes. |
| | | The risk associated with purchasing an option is that the Fund pays a premium whether or not the option is exercised. Additionally, the Fund bears the risk of loss of premium and change in market value should the counterparty not perform under the contract. Put and call options purchased are accounted for in the same manner as portfolio securities. The cost of securities acquired through the exercise of call options is increased by premiums paid. The proceeds from securities sold through the exercise of put options are decreased by the premiums paid. |
| | | When the Fund writes an option, the premium received by the Fund is recorded as a liability and is subsequently adjusted to the current market value of the option written. Premiums received from writing options that expire are recorded by the Fund on the expiration date as realized gains from option transactions. The difference between the premium and the amount paid on effecting a closing purchase transaction, including brokerage commissions, is also treated as a realized gain, or if the premium is less than the amount paid for the closing purchase transaction, as a realized loss. If a call option is exercised, the premium is added to the proceeds from the sale of the underlying security or currency in determining whether the Fund has realized a gain or loss. If a put option is exercised, the premium reduces the cost basis of the security or currency purchased by the Fund. In writing an option, the Fund bears the market risk of an unfavorable change in the price of the security or currency underlying the written option. Exercise of an option written by the Fund could result in the Fund selling or buying a security or currency at a price different from the current market value. There were no options open as of September 30, 2008. |
| | (h) | Trustees’ Deferred Fee Plan— Effective February 1, 2000, the Board of Trustees adopted the Marsico Investment Fund Deferred Fee Plan (the “Deferred Fee Plan”), amended and restated as of December 30, 2005, which allows the Trustees to defer the receipt of all or a portion of their compensation received from the Funds. Any deferred fees are credited to accounts established on behalf of the Trustees into the Funds as directed by each Trustee. The amounts credited to these accounts increase or decrease in accordance with the performance of the Funds selected by the Trustees. The market value of the deferred account balances as of September 30, 2008 is shown on the Statement of Assets and Liabilities as part of an asset account, “Prepaid expenses and other assets,” and a liability account, “Accrued trustees’ fees.” Additionally, the fluctuation of the account balances due to the Funds performance is recorded by the Funds as unrealized appreciation/(depreciation) which is shown as part of “Net unrealized appreciation on investments and foreign currency translations” on the Statement of Assets and Liabilities and |
| | | as compensation expense which is shown as part of the expense account “Trustees’ fees and expenses” on the Statement of Operations. Fees earned and deferred by the Trustees for the year ended September 30, 2008 are also included in “Trustees’ fees and expenses” on the Statement of Operations. Amounts credited to the Deferred Fee Plan will be deferred until distributed in accordance with the Deferred Fee Plan. |
| | (i) | Redemption Fee—A 2.00% redemption fee is retained by the Funds to offset transaction costs and other expenses associated with short-term investing. The fee is imposed on certain redemptions or exchanges of shares held 30 days or less from their purchase date. Redemption fees are recorded by the Funds as a reduction of shares redeemed and as a credit to paid-in-capital. For the year ended September 30, 2008, the Focus Fund, Growth Fund, 21st Century Fund, International Opportunities Fund, Flexible Capital Fund and Global Fund received $50,828, $125,386, $171,690, $96,266, $5,010 and $32,715, respectively, in redemption fees. |
| | (j) | Other—Investment transactions are accounted for on a trade date basis. Each Fund determines the gain or loss realized from the investment transactions by comparing the original cost of the security lot sold with the net sale proceeds. Dividend income is recognized on the ex-dividend date. Certain dividends from foreign securities will be recorded as soon as the Trust is informed of the dividend if such information is obtained subsequent to the ex-dividend date. Interest income is recognized on an accrual basis. |
| | | During the year ended September 30, 2008, a broker reimbursed $5,919 to the Flexible Capital Fund and $57,680 to the Global Fund for losses due to a processing error. These reimbursements did not have an impact on the total return of these Funds. |
| | (k) | Indemnifications—In the normal course of business, the Funds enter into contracts that contain provisions indemnifying other parties against specified potential liabilities. Each Fund’s maximum exposure under these arrangements is unknown as this would involve future claims that may be made against the Fund that have not yet occurred. However, based on experience, the Funds expect the risk of loss to be remote. |
3. | Investment Advisory Agreement and Transactions With Affiliates |
| | Each Fund has an agreement with Marsico Capital Management, LLC (the “Adviser”) to furnish investment advisory services to the Funds. Under the terms of these agreements, the Adviser is compensated for managing the Focus Fund and the Growth Fund at the rate of 0.85% per year of average daily net assets up to $3 billion in each Fund, and 0.75% per year of average daily net assets exceeding $3 billion in each Fund; and at a rate of 0.85% of the average daily net assets of the 21st Century Fund, the International Opportunities Fund, the Flexible Capital Fund, and the Global Fund. The Adviser has voluntarily agreed to limit the total expenses of each Fund (excluding interest, taxes, acquired fund fees and expenses, litigation, brokerage and extraordinary expenses) to an annual rate of 1.60% of the Focus and International Opportunities Funds’ average net assets, 1.50% of the Growth and the 21st Century Funds’ average net assets, and 0.75% of the Flexible Capital and Global Funds’ average net assets until December 31, 2008. This fee waiver is voluntary and may be terminated or modified at any time. Prior to June 1, 2007, the Adviser’s voluntary limitation agreement relating to the Flexible Capital Fund limited total expenses of the Flexible Capital Fund (excluding interest, taxes, acquired fund fees and expenses, litigation, brokerage and extraordinary expenses) to an annual rate of 1.60% of the Flexible Capital Fund’s average net assets. Unrealized appreciation/depreciation of Fund shares held in the Deferred Fee Plan is subject to the Funds’ expense reimbursement agreement with the Adviser. |
| | The Adviser is entitled to reimbursement from a Fund of any fees waived pursuant to this arrangement if such reimbursements do not cause a Fund to exceed existing expense limitations and the reimbursement is made within three years after the year in which the |
NOTES TO FINANCIAL STATEMENTS September 30, 2008 (continued)
| | Adviser incurred the expense. As of September 30, 2008, reimbursements that may potentially be made by the Flexible Capital Fund and the Global Fund to the Adviser are $427,898 and $798,988, respectively, which expire between 2010 and 2011. |
| | On December 14, 2007, Thomas F. Marsico, the founder and CEO of the Adviser, and a company controlled by him, completed a buy back of ownership of the Adviser from Bank of America Corporation. Prior to this date, the Adviser had been a wholly-owned subsidiary of the Bank of America Corporation since 2001. Shareholders of the Funds approved new investment advisory and management agreements that also took effect on this date. These agreements were identical in all material respects to the agreements previously in place, and the change in control did not change in any significant way the services provided to the Funds. |
| | During the period October 1, 2007 through December 14, 2007, while the Adviser was a wholly-owned subsidiary of Bank of America Corporation, the Funds paid no brokerage commissions to Banc of America Securities, its then-affiliated broker-dealer. |
4. | Service and Distribution Plan |
| | The Funds have adopted a Service and Distribution Plan (the “Plan”) pursuant to Rule 12b-1 under the 1940 Act. The Plan authorizes payments by the Funds in connection with the distribution of their shares at an annual rate, as determined from time to time by the Board of Trustees, of up to 0.25% of a Fund’s average daily net assets. |
5. | Investment Transactions |
| | The aggregate purchases and sales of securities, excluding short-term investments, for the Funds for the year ended September 30, 2008, were as follows: |
| (Amounts in thousands) | | Focus Fund | | Growth Fund | | 21st Century Fund | | International Opportunities Fund | | Flexible Capital Fund | | Global Fund | |
| Purchases | | | $3,237,292 | | | $1,960,906 | | | $3,202,852 | | | $924,016 | | | $35,920 | | | $202,244 | |
| Sales | | | $4,108,012 | | | $2,244,531 | | | $3,159,941 | | | $869,421 | | | $42,149 | | | $137,713 | |
| | There were no purchases or sales of U.S. government securities, excluding short-term investments. |
6. | Transactions with Affiliated Companies |
| | KKR Financial Holdings LLC is deemed to be an affiliated company of the 21st Century Fund for the year ended September 30, 2008. An affiliated company is a company in which a fund has ownership of at least 5% of the outstanding voting securities during the period. The 21st Century Fund conducted the following transactions during the year ended September 30, 2008 in the shares of affiliated companies as so defined: |
| | | Market Value | | Purchases | | Sales | | Realized | | Dividend | | Market Value | |
| 21st Century Fund | | at 9/30/07 | | Shares | | $ Cost | | Shares | | $ Cost | | Gain/(Loss) | | Income | | at 9/30/08 | |
| KKR Financial Holdings LLC | | | $100,270,592 | | | 376,016 | | | $4,455,790 | | | 6,326,793 | | | $90,146,979 | | | $(12,940,420 | ) | | $5,900,777 | | | $ —* | |
| | | | | | | | | | | | | | | | | | | | | | | | | | |
| * Company was not held at September 30, 2008. | | | | | | | | | | | | | | | | | | |
7. | Federal Income Tax Information |
| | The Focus Fund, Growth Fund, 21st Century Fund and International Opportunities Fund adopted the provisions of Financial Accounting Standards Board Interpretation No. 48 (“FIN 48”), Accounting for Uncertainty in Income Taxes, on October 1, 2007. The Flexible Capital Fund and Global Fund adopted FIN 48 at their respective inception dates. FIN 48 requires an evaluation of tax positions taken (or expected to be taken) in the course of preparing a Fund’s tax returns to determine whether these positions meet a “more-likely-than-not” standard that based on the technical merits have a more than fifty percent likelihood of being sustained by a taxing authority upon examination. A tax position that meets the “more-likely-than-not” recognition threshold is measured to determine the amount of benefit to recognize in the financial statements. The Funds recognize interest and penalties, if any, related to unrecognized tax benefits as income tax expense in the Statement of Operations. |
| | FIN 48 requires management of the Funds to analyze all open tax years, fiscal years 2005-2007 as defined by IRS statute of limitations for all major jurisdictions, including federal tax authorities and certain state tax authorities. As of and during the year ended September 30, 2008, the Funds did not have a liability for any unrecognized tax benefits. The Funds have no examination in progress and are not aware of any tax positions for which it is reasonably possible that the total amounts of unrecognized tax benefits will significantly change in the next twelve months. |
| | At September 30, 2008 gross unrealized appreciation and depreciation of investments, based on cost for federal income tax purposes were as follows: |
| (Amounts in thousands) | | Focus Fund | | Growth Fund | | 21st Century Fund | | International Opportunities Fund | | Flexible Capital Fund | | Global Fund | |
| Cost of investments | | | $2,919,600 | | | $1,741,554 | | | $1,798,112 | | | $627,185 | | | $12,304 | | | $81,719 | |
| Gross Unrealized | | | | | | | | | | | | | | | | | | | |
| Appreciation | | | $542,448 | | | $422,207 | | | $130,743 | | | $45,986 | | | $590 | | | $3,038 | |
| Gross Unrealized | | | | | | | | | | | | | | | | | | | |
| Depreciation | | | (204,716 | ) | | (130,545 | ) | | (236,661 | ) | | (96,641 | ) | | (949 | ) | | (10,225 | ) |
| Net Unrealized | | | | | | | | | | | | | | | | | | | |
| Appreciation | | | | | | | | | | | | | | | | | | | |
| (Depreciation) | | | | | | | | | | | | | | | | | | | |
| on investments | | | $337,732 | | | $291,662 | | | $(105,918 | ) | | $(50,655 | ) | | $(359 | ) | | $(7,187 | ) |
| | The difference between cost amounts for financial statement and federal income tax purposes is due primarily to wash sale loss deferrals. |
| | The Focus, Growth, 21st Century, International Opportunities and Global Funds had realized currency losses (in thousands) from transactions between November 1, 2007 and September 30, 2008 of $686, $32, $337, $608 and $33 respectively. Post-October currency losses are treated as arising in the fund’s next fiscal year. |
| | The Focus, Growth, 21st Century, International Opportunities, Flexible Capital and Global Funds had realized capital losses (in thousands) from transactions between November 1, 2007 and September 30, 2008 of $43,626, $137,882, $205,993, $50,643, $2,269 and $13,809 respectively. Post-October capital losses are treated as arising in the Fund’s next fiscal year. |
NOTES TO FINANCIAL STATEMENTS September 30, 2008 (continued)
| | As of September 30, 2008 the components of accumulated earnings (deficit) on a tax basis were as follows: |
| (Amounts in thousands) | | Focus Fund | | Growth Fund | | 21st Century Fund | | International Opportunities Fund | | Flexible Capital Fund | | Global Fund | |
| Undistributed ordinary | | | | | | | | | | | | | |
| income (deficit) | | | $18,542 | | | $9,459 | | | $903 | | | $6,286 | | | $88 | | | $604 | |
| Undistributed long-term | | | | | | | | | | | | | | | | | | | |
| capital gains | | | 364 | | | — | | | — | | | — | | | — | | | — | |
| Tax accumulated earnings | | | 18,906 | | | 9,459 | | | 903 | | | 6,286 | | | 88 | | | 604 | |
| Accumulated Capital and | | | | | | | | | | | | | | | | | | | |
| Other Losses | | | (44,312 | ) | | (137,913 | ) | | (207,490 | ) | | (51,251 | ) | | (2,269 | ) | | (13,843 | ) |
| Unrealized appreciation | | | | | | | | | | | | | | | | | | | |
| (depreciation) on | | | | | | | | | | | | | | | | | | | |
| investments | | | 337,732 | | | 291,662 | | | (105,918 | ) | | (50,655 | ) | | (359 | ) | | (7,187 | ) |
Total accumulated | | | | | | | | | | | | | | | | | | | |
earnings (deficit) | | | $312,326 | | | $163,208 | | | $(312,505 | ) | | $(95,620 | ) | | $(2,540 | ) | | $(20,426 | ) |
Undistributed ordinary income (deficit) consists of net investment income, short-term capital gains and timing differences related to post-October currency losses and deferred Trustees’ compensation.
The Focus, 21st Century, International Opportunities, Flexible Capital and Global Funds distributed to shareholders (in thousands) ordinary income of $43,537, $85,691, $42,800, $1,395 and $998 respectively, during the fiscal year ended September 30, 2008. The Focus, Growth, 21st Century, International Opportunities, Flexible Capital and Global Funds distributed to shareholders (in thousands) long term capital gains of $372,506, $97,785, $23,339, $53,336, $43 and $1 respectively, during the fiscal year ended September 30, 2008.
The Focus, 21st Century and International Opportunities Funds distributed to shareholders (in thousands) ordinary income of $5,110, $10,724 and $9,321 respectively, during the fiscal year ended September 30, 2007. The Focus and International Opportunities Funds distributed to shareholders (in thousands) long term capital gains of $118,229 and $16,411 respectively, during the fiscal year ended September 30, 2007.
The tax character of dividends paid may differ from that shown in the Statements of Changes in Net Assets due to short-term gains being treated as ordinary income for tax purposes.
New Accounting Pronouncements
In September 2006, the Financial Accounting Standards Board issued Statement of Financial Accounting Standards No. 157, “Fair Value Measurements.” The Statement defines fair value, establishes a framework for measuring fair value in generally accepted accounting principles (GAAP), and expands disclosures about fair value measurements. The Statement establishes a fair value hierarchy that distinguishes between (1) market participant assumptions developed based on market data obtained from sources independent of the reporting entity (observable inputs) and (2) the reporting entity’s own assumptions about market participant assumptions developed based on the best information available in the circumstances (unobservable inputs). The Statement is effective for financial statements issued for fiscal years beginning after November 15, 2007, and is to be applied prospectively as of the beginning of the fiscal year in which this Statement is initially applied; the Statement will be effective for the Funds beginning October 1, 2008. As of September 30, 2008, management does not believe the adoption of the Statement will impact the amounts reported in the financial statements, however, additional disclosures may be required about the inputs used to develop the measurements and the effect of certain of the measurements reported on the statement of changes in net assets for a fiscal period.
In March 2008, the FASB issued Statement of Financial Accounting Standards No. 161, “Disclosures about Derivative Instruments and Hedging Activities.” The Statement is effective for fiscal years and interim periods beginning after November 15, 2008 and may require enhanced disclosures about the Funds’ derivative and hedging activities. Management is currently evaluating the impact the adoption of the Statement may have on the Funds’ financial statement disclosures.
REPORT OF INDEPENDENT REGISTERED PUBLIC ACCOUNTING FIRM
To the Board of Trustees and Shareholders of The Marsico Investment Fund
In our opinion, the accompanying statements of assets and liabilities, including the schedules of investments, and the related statements of operations and of changes in net assets and the financial highlights present fairly, in all material respects, the financial position of the Marsico Focus Fund, the Marsico Growth Fund, the Marsico 21st Century Fund, the Marsico International Opportunities Fund, the Marsico Flexible Capital Fund and the Marsico Global Fund (constituting The Marsico Investment Fund, hereafter referred to as the “Trust”) at September 30, 2008, the results of each of their operations for the year then ended, and the changes in each of their net assets and their financial highlights for each of the periods indicated, in conformity with accounting principles generally accepted in the United States of America. These financial statements and financial highlights (hereafter referred to as “financial statements”) are the responsibility of the Trust’s management; our responsibility is to express an opinion on these financial statements based on our audits. We conducted our audits of these financial statements in accordance with the standards of the Public Company Accounting Oversight Board (United States). Those standards require that we plan and perform the audit to obtain reasonable assurance about whether the financial statements are free of material misstatement. An audit includes examining, on a test basis, evidence supporting the amounts and disclosures in the financial statements, assessing the accounting principles used and significant estimates made by management, and evaluating the overall financial statement presentation. We believe that our audits, which included confirmation of securities at September 30, 2008 by correspondence with the custodian and brokers and the application of alternative procedures where securities purchased had not been received, provide a reasonable basis for the opinion expressed above.

PricewaterhouseCoopers LLP
Denver, Colorado
November 6, 2008
EXPENSE EXAMPLE For the six months ended September 30, 2008 (Unaudited)
As a shareholder of the Marsico Funds (the “Funds”), you incur two types of costs: (1) transaction costs, including redemption fees on certain redemptions; and (2) ongoing costs, including management fees; distribution (12b-1) fees, and other Fund expenses. This Example is intended to help you understand your ongoing costs (in dollars) of investing in the Funds and to compare these costs with the ongoing costs of investing in other mutual funds.
The Example is based on an investment of $1,000 invested at the beginning of the period and held for the entire period from April 1, 2008 to September 30, 2008 (the “period”).
Actual Expenses
The first line of the table below provides information about actual account values and actual expenses. You may use the information in this line, together with the amount you invested, to estimate the expenses you paid over the period. Simply divide your account value by $1,000 (for example, an $8,600 account value divided by $1,000 equals 8.6), then multiply the result by the number in the first line under the heading entitled “Expenses Paid During the Period” to estimate the expenses you paid on your account during the period.
Hypothetical Example for Comparison Purposes
The second line of the table below provides information about hypothetical account values and hypothetical expenses based on the Funds’ actual expense ratios and an assumed rate of return of 5% per year before expenses, which is not the actual return of any of the Funds. The hypothetical account values and expenses may not be used to estimate the actual ending account balance or expenses you paid for the period. You may use this information to compare the ongoing costs of investing in the Funds and other funds. To do so, compare this 5% hypothetical example with the 5% hypothetical examples that appear in the shareholder reports of other funds.
Please note that the expenses shown in the table are meant to highlight your ongoing costs only and do not reflect any transactional costs, such as redemption fees. Therefore, the second line of the table is useful in comparing the ongoing costs only, and will not help you determine the relative total costs of owning different funds. In addition, if these transactional costs were included, your costs could have been higher.
Expenses Paid During the Period | | | | | | | |
| | | | | FOCUS FUND | | | |
| | | Beginning account value April 1, 2008 | | Ending account value September 30, 2008 | | Expenses paid for the six-month period ended September 30, 2008(1) | |
| Actual Example | | | $1,000.00 | | | $894.60 | | | $5.67 | |
Hypothetical Example, assuming a 5% return before expenses | | | $1,000.00 | | | $1,019.02 | | | $6.04 | |
| | | | | GROWTH FUND | | | |
| | | Beginning account value April 1, 2008 | | Ending account value September 30, 2008 | | Expenses paid for the six-month period ended September 30, 2008(1) | |
| Actual Example | | | $1,000.00 | | | $870.00 | | | $5.73 | |
Hypothetical Example, assuming a 5% return before expenses | | | $1,000.00 | | | $1,018.87 | | | $6.19 | |
| (1) | Expenses are equal to the Funds’ annualized expense ratios (1.196% for the Focus Fund, 1.226% for the Growth Fund, 1.299% for the 21st Century Fund, 1.337% for the International Opportunities Fund, 0.752% for the Flexible Capital Fund, and 0.750% for the Global Fund), multiplied by the average account value over the period, multiplied by 183/366 (to reflect the six month period). |
EXPENSE EXAMPLE For the six months ended September 30, 2008 (Unaudited) (continued)
| | | | | 21st CENTURY FUND | | | |
| | | Beginning account value April 1, 2008 | | Ending account value September 30, 2008 | | Expenses paid for the six-month period ended September 30, 2008(1) | |
| Actual Example | | | $1,000.00 | | | $859.10 | | | $6.04 | |
Hypothetical Example, assuming a 5% return before expenses | | | $1,000.00 | | | $1,018.51 | | | $6.56 | |
| | | INTERNATIONAL OPPORTUNITIES FUND | |
| | | Beginning account value April 1, 2008 | | Ending account value September 30, 2008 | | Expenses paid for the six-month period ended September 30, 2008(1) | |
| Actual Example | | | $1,000.00 | | | $771.50 | | | $5.92 | |
Hypothetical Example, assuming a 5% return before expenses | | | $1,000.00 | | | $1,018.32 | | | $6.74 | |
| | | FLEXIBLE CAPITAL FUND | |
| | | Beginning account value April 1, 2008 | | Ending account value September 30, 2008 | | Expenses paid for the six-month period ended September 30, 2008(1) | |
| Actual Example | | | $1,000.00 | | | $913.30 | | | $3.59 | |
Hypothetical Example, assuming a 5% return before expenses | | | $1,000.00 | | | $1,021.24 | | | $3.80 | |
| | | GLOBAL FUND | |
| | | Beginning account value April 1, 2008 | | Ending account value September 30, 2008 | | Expenses paid for the six-month period ended September 30, 2008(1) | |
| Actual Example | | | $1,000.00 | | | $859.80 | | | $3.49 | |
Hypothetical Example, assuming a 5% return before expenses | | | $1,000.00 | | | $1,021.25 | | | $3.79 | |
| (1) | Expenses are equal to the Funds’ annualized expense ratios (1.196% for the Focus Fund, 1.226% for the Growth Fund, 1.299% for the 21st Century Fund, 1.337% for the International Opportunities Fund, 0.752% for the Flexible Capital Fund, and 0.750% for the Global Fund), multiplied by the average account value over the period, multiplied by 183/366 (to reflect the six month period). |
OTHER INFORMATION (Unaudited)
Proxy Voting Guidelines
The Funds exercise the voting rights associated with the securities held by the Funds under the proxy voting policy of the Funds. A description of those policies and procedures of the Funds and a record of the Funds’ proxy votes for the one-year period ended June 30, 2008 are available without charge, upon request, by calling 888-860-8686. It is also available on the Securities and Exchange Commission’s website at www.sec.gov.
Quarterly Filing of Portfolio Holdings
The Funds will file their complete schedule of investments with the SEC for the first and third quarters of each fiscal year on Form N-Q. The Funds’ Form N-Q will be available (i) on the SEC’s Website at www.sec.gov; (ii) at the SEC’s Public Reference Room; and (iii) by calling 800-SEC-0330.
Other Tax Information
Corporate Dividends Received Deduction
For the fiscal year ended September 30, 2008, 100%,13%, 0%, 11% and 5% of the dividends paid from net investment income qualifies for the dividends received deduction available to corporate shareholders of the Marsico Focus, 21st Century, International Opportunities, Flexible Capital and Global Funds, respectively.
Qualified Dividend Income
Pursuant to Section 854 of the Internal revenue Code of 1986, the Focus, 21st Century, International Opportunities, Flexible Capital and Global Funds designate income dividends (in thousands) of $43,538, $17,330, $16,051, $324 and $74 respectively, as qualified dividend income paid during the fiscal year ended September 30, 2008.
Foreign Taxes Paid
Pursuant to the foreign tax credit election under Section 853 of the Internal revenue Code of 1986, the International Opportunities Fund designates (in thousands) $19,175 of income derived from foreign sources and $1,484 of foreign taxes paid, for the year ended September 30, 2008.
Of the ordinary income (including short-term capital gain) distributions made by the International Opportunities Fund during the year ended September 30, 2008, the proportionate share of income derived from foreign sources and foreign taxes paid attributable to one share of stock are $0.4294 and $0.0303, respectively.
Long Term Capital Gains Designation
Pursuant to IRC 852(b)(3) of the Internal Revenue Code, the Focus, Growth, 21st Century, International Opportunities, Flexible Capital and Global Funds hereby designate (in thousands) $372,506, $97,785, $23,339, $53,336, $43 and $1 respectively, as long-term capital gains distributed during the year ended September 30, 2008, or if subsequently determined to be different, the net capital gain of such year.
TRUSTEE AND OFFICER INFORMATION INDEPENDENT TRUSTEES
| Name, Address and Age | Position(s) Held with the Trust | Term of Office(1) and Length of Time Served | Principal Occupation(s) During Past 5 Years | Number of Portfolios in Fund Complex Overseen by Trustee | Other Directorships Held by Trustee |
Jay S. Goodgold 1200 17th Street Suite 1600 Denver, CO 80202 DOB: 1954 | Trustee | Since February 2006 | Private investor (July 2003 - present); Managing Director, Goldman, Sachs & Co. (August 1978 - June 2003). | 6 | None |
| | | | | | |
Elizabeth Hoffman 1200 17th Street Suite 1600 Denver, CO 80202 DOB: 1946 | Trustee | Since February 2006 | Executive Vice President and Provost, Iowa State University (January 2007 - present); President Emerita and Professor of Economics and Public Affairs, University of Colorado (August 2005 - December 2006); President, University of Colorado (September 2000 - July 2005). | 6 | Viral Genetics, Inc. |
| | | | | | |
Walter A. Koelbel, Jr. 1200 17th Street Suite 1600 Denver, CO 80202 DOB: 1952 | Trustee | Since December 1997 | President, and other positions, Koelbel and Company (full service real estate, development, investment, and management company) (more than five years). | 6 | None |
| | | | | | |
Christopher E. Kubasik 1200 17th Street Suite 1600 Denver, CO 80202 DOB: 1961 | Trustee | Since February 2006 | Executive Vice President, Electronic Systems Business Area, Lockheed Martin Corp. (September 2007 - present); Chief Financial Officer, Lockheed Martin Corp. (February 2001 - September 2007). | 6 | None |
| | | | | | |
Michael D. Rierson 1200 17th Street Suite 1600 Denver, CO 80202 DOB: 1952 | Trustee | Since November 1998 | Vice President and Vice Chancellor for University Advancement at the University of Houston and UH System, respectively (November 2005 - present); President and Vice President, University of South Florida Foundation and University of South Florida (May 2001 - September 2005). | 6 | None |
| | | | | | |
Joseph T. Willett 1200 17th Street Suite 1600 Denver, CO 80202 DOB: 1951 | Trustee | Since November 2002 | Private investor (2002 - present); Chief Operating Officer, Merrill Lynch Europe (1998 - 2002). | 6 | None |
| (1) | Each Trustee serves an indefinite term until the election of a successor. Each Officer serves an indefinite term, renewed annually, until the election of a successor. |
The Statement of Additional Information includes additional information about the Trustees and is available upon request, without charge, by calling 888-860-8686.
TRUSTEE AND OFFICER INFORMATION INTERESTED TRUSTEES AND OFFICERS
| Name, Address and Age | Position(s) Held with the Trust | Term of Office(1) and Length of Time Served | Principal Occupation(s) During Past 5 Years | Number of Portfolios in Fund Complex Overseen by Trustee | Other Directorships Held by Trustee |
Thomas F. Marsico(2) 1200 17th Street Suite 1600 Denver, CO 80202 DOB: 1955 | Trustee, President and Chief Executive Officer | Since December 1997 | Chief Executive Officer, Marsico Capital Management, LLC (more than five years). | 6 | None |
| | | | | | |
Christopher J. Marsico(2) 1200 17th Street Suite 1600 Denver, CO 80202 DOB: 1961 | Trustee, Vice President and Treasurer | Trustee (since August 2007); Vice President and Treasurer (since September 2002) | President, Marsico Capital Management, LLC (more than five years). | 6 | None |
| | | | | | |
Neil L. Gloude, CPA 1200 17th Street Suite 1600 Denver, CO 80202 DOB: 1961 | Vice President and Secretary | Since May 2008 | Executive Vice President and Chief Financial Officer, Marsico Capital Management, LLC (September 2007 - present); Partner, PricewaterhouseCoopers LLP (public accounting firm) (January 1999 - August 2007). | N/A | N/A |
| | | | | | |
David C. Price, CPA 1200 17th Street Suite 1600 Denver, CO 80202 DOB: 1969 | Chief Compliance Officer | Since August 2004 | Chief Compliance Officer, The Marsico Investment Fund, and Director of Compliance, Marsico Capital Management, LLC (August 2004 - present); Senior Compliance Officer, INVESCO Institutional, N.A. (October 2003 - July 2004); Assistant Vice President- Compliance, Berger Financial Group LLC and The Berger Funds (March 2001 - May 2003). | N/A | N/A |
| | | | | | |
Sander M. Bieber 1775 I Street, N.W. Washington, D.C. 20006 DOB: 1950 | Assistant Secretary | Since December 1997 | Partner, Dechert, LLP (law firm) (more than five years). | N/A | N/A |
| (1) | Each Trustee serves an indefinite term until the election of a successor. Each Officer serves an indefinite term, renewed annually, until the election of a successor. |
| (2) | Mr. Thomas Marsico and Mr. Christopher Marsico are considered Interested Trustees of the Trust because of their affiliation with Marsico Capital Management, LLC, the investment adviser to the Funds. Mr. Thomas Marsico and Mr. Christopher Marsico are brothers. |
The Statement of Additional Information includes additional information about the Trustees and is available upon request, without charge, by calling 888-860-8686.
Item 2 - Code of Ethics.
(a) The Registrant, as of the end of the period covered by this report, has adopted a code of ethics that applies to the Registrant’s principal executive officer, principal financial officer, principal accounting officer or controller, or persons performing similar functions, regardless of whether these individuals are employed by the Registrant or a third party. A copy of this code of ethics is attached hereto as Exhibit (a).
(b) Not used.
(c) There were no substantive amendments, during the period covered by this report, to a provision of the code of ethics that applies to the Registrant’s principal executive officer, principal financial officer, principal accounting officer or controller, or persons performing similar functions, regardless of whether these individuals are employed by the Registrant or a third party, and that relates to any element of the code of ethics description.
(d) The Registrant has not granted any waivers, including an implicit waiver, from a provision of the code of ethics that applies to the Registrant’s principal executive officer, principal financial officer, principal accounting officer or controller, or persons performing similar functions, regardless of whether these individuals are employed by the Registrant or a third party, that relates to one or more of the items set forth in paragraph (b) of this item’s instructions.
(e) Not applicable.
(f) See attached Exhibit (a).
Item 3 - Audit Committee Financial Expert.
(a)(1) The Registrant’s Board of Trustees has determined that the Registrant has at least one audit committee financial expert serving on its audit committee.
(a)(2) Mr. Joseph T. Willett is the audit committee financial expert. Mr. Willett is “independent” under the applicable rules.
Item 4 - Principal Accountant Fees and Services.
In each of the fiscal years ended September 30, 2008 and September 30, 2007, the aggregate Audit Fees billed (or to be billed) by PricewaterhouseCoopers LLP (PwC) for professional services rendered to the Registrant for the audits of the financial statements, or services that are normally provided in connection with statutory and regulatory filings or engagements as well as reimbursable expenses are listed below.
(a) Audit Fees.
(b) Audit-Related Fees.
In each of the fiscal years ended September 30, 2008 and September 30, 2007, the aggregate Audit-Related Fees billed (or to be billed) by PwC for services rendered to the Registrant for assurance and related services to each fund that are reasonably related to the performance of the audit or review of the fund's financial statements, but not reported as Audit Fees, are shown in the table below.
(c) Tax Fees.
In each of the fiscal years ended September 30, 2008 and September 30, 2007 the aggregate Tax Fees billed (or to be billed) by PwC for professional services rendered to the Registrant for tax compliance, tax advice, and tax planning are shown in the table below.
All of these fees were approved by the Trust’s Audit Committee as required pursuant to paragraph (c)(7)(ii) of Rule 2-01 of Regulation S-X.
Fees included in the Tax Fees category comprise all services performed by professional staff in the independent registered public accounting firm's tax division except those services related to the audit. Typically, this category would include fees for tax compliance, tax planning, and tax advice. Tax compliance, tax advice, and tax planning services include preparation of original and amended tax returns, claims for refund and tax payment-planning services, assistance with tax audits and appeals, tax advice related to mergers and acquisitions and requests for rulings or technical advice from taxing authorities.
(d) All Other Fees.
In each of the fiscal years ended September 30, 2008 and September 30, 2007 the aggregate Other Fees billed (or to be billed) by PwC for all other non-audit services rendered to the Registrant are shown in the table below.
(e) (1) Audit Committee Pre-Approval Policies and Procedures:
Pursuant to the Trust’s Audit Committee Charter and Policies and Procedures (collectively, the “Procedures”), the Audit Committee has adopted pre-approval policies and procedures to govern the pre-approval of (i) all audit services and permissible non-audit services to be provided to the Trust by its independent accountant, and (ii) all permissible non-audit services to be provided by such independent accountant to the Trust’s investment adviser and to any entity controlling, controlled by or under common control with the investment adviser that provides on-going services to the Trust (collectively, any “Service Affiliates”) if the engagement directly relates to the Trust’s operations and financial reporting.
In accordance with the Procedures, the Committee is responsible for the engagement of the independent accountant to certify the Trust’s financial statements for each fiscal year. With respect to the pre-approval of non-audit services provided to the Trust and its Service Affiliates, the Procedures provide that the Committee may pre-approve such services on a project-by-project basis as they arise. The Procedures also permit the Committee to delegate authority to the Audit Committee Chairman (the “Designated Member”) to pre-approve any proposed non-audit services that have not been previously approved by the Committee, subject to certain conditions. Any action by the Designated Member in approving a requested non-audit service shall be presented to the Audit Committee not later than at its next scheduled meeting. If the Designated Member does not approve the independent auditor’s provision of a requested non-audit service, the matter may be presented to the full Committee for its consideration and action.
| (e)(2) | Services approved pursuant to paragraph (c)(7)(i)(C) of Rule 2-01 of Regulation S-X: |
100% of these fees were approved by the Trust’s Audit Committee as required pursuant to paragraph (c)(7)(ii) of Rule 2-01 of Regulation S-X.
(f) According to PwC for the fiscal year ended September 30, 2008, the percentage of hours spent on the audit of the Marsico Funds’ financial statements for the most recent fiscal year that were attributed to work performed by persons who are not full-time, permanent employees of PwC is as follows:
| PwC | 2008 |
| Work performed by persons who are not full-time | 0% |
(g) In each of the fiscal years ended September 30, 2008 and September 30, 2007, the aggregate fees billed (or to be billed) by PwC relating to non-audit services that were rendered to the Trust, to its investment adviser, and to any entity controlling, controlled by, or under common control with the investment adviser and that provides ongoing services to the Trust are shown in the table below.
For the fiscal year ended September 30, 2008, there were no non-audit services provided by PwC to the Trust, its investment adviser, or to any entity controlling, controlled by, or under common control with the investment adviser. Fees in the amount of $277,000 have been billed by PwC for audit-related services provided to the investment adviser of the Trust.
(h) All non-audit services of the specified type (services that were provided by PwC to the investment adviser and to any entity controlling, controlled by, or under common control with the investment adviser and that provides ongoing services to the Trust) were pre-approved.
Item 5 - Audit Committee of Listed Registrants.
Not applicable.
Item 6 - Schedule of Investments.
The schedule of investments in securities of unaffiliated issuers is included as part of the report to shareholders filed under Item 1.
Item 7 - Disclosure of Proxy Voting Policies and Procedures for Closed-End Management Investment Companies.
Not applicable.
Item 8 - Portfolio Managers of Closed-End Management Investment Companies.
Not applicable.
Item 9 - Purchases of Equity Securities by Closed-End Management Investment Company and Affiliated Purchasers.
Not applicable.
Item 10 - Submission of Matters to a Vote of Security Holders.
Not applicable.
Item 11 - Controls and Procedures.
(a) The registrant's principal executive officer and principal financial officer have concluded that the registrant's disclosure controls and procedures (as defined in Rule 30a-3(c) under the Investment Company Act of 1940, as amended) are effective based on their evaluation of these disclosure controls and procedures within 90 days of the filing date of this report on Form N-CSR.
(b) There were no significant changes in the registrant's internal control over financial reporting (as defined in Rule 30a-3(d) under the Investment Company Act of 1940, as amended) that occurred during the second fiscal half-year covered by this report that has materially affected, or is reasonably likely to materially affect, the registrant’s internal control over financial reporting.
Item 12 - Exhibits.
(a)(1) Code of Ethics - Filed as an attachment to this filing.
(a)(2) Certification for each principal executive and principal financial officer of the registrant as required by Rule 30a-2(a) under the Act (17 CFR 270.30a-2(a)). Filed as an attachment to this filing.
(a)(3) Any written solicitation to purchase securities under Rule 23c-1 under the Investment Company Act of 1940, as amended, that was sent or given during the period covered by the report by or on behalf of the registrant to 10 or more persons.
Not applicable.
(b) Certifications required by Rule 30a-2(b) under the Act (17 CFR 270.30a-2(b)), Rule 13a-14(b) or Rule 15d-14(b) under the Exchange Act (17 CFR 240.13a-14(b) or 240.15d-14(b)), and Section 1350 of Chapter 63 of Title 18 of the United States Code (18 U.S.C. 1350) - Filed as an attachment to this filing.
SIGNATURES
Pursuant to the requirements of the Securities Exchange Act of 1934 and the Investment Company Act of 1940, the registrant has duly caused this report to be signed on its behalf by the undersigned, thereunto duly authorized.
The Marsico Investment Fund
By: /s/ Thomas F. Marsico
Thomas F. Marsico
President
Date: December 5, 2008
Pursuant to the requirements of the Securities Exchange Act of 1934 and the Investment Company Act of 1940, this report has been signed below by the following persons on behalf of the registrant and in the capacities and on the dates indicated.
By: /s/ Thomas F. Marsico
Thomas F. Marsico
President
Date: December 5, 2008
By: /s/ Christopher J. Marsico
Christopher J. Marsico
Vice President and Treasurer
Date: December 5, 2008