UNITED STATES
SECURITIES AND EXCHANGE COMMISSION
Washington, D.C. 20549
FORM N-CSR
CERTIFIED SHAREHOLDER REPORT OF REGISTERED MANAGEMENT INVESTMENT COMPANIES
Investment Company Act file number 811-08397
THE MARSICO INVESTMENT FUND
(Exact name of registrant as specified in charter)
1200 17th Street, Suite 1600
(Address of principal executive offices) (Zip code)
Christopher J. Marsico
The Marsico Investment Fund
1200 17th Street, Suite 1600
(Name and address of agent for service)
Copies to:
Sander M. Bieber, Esq.
Dechert LLP
1775 I Street, N.W.
Washington, D.C. 20006
Registrant's telephone number, including area code: (303)454-5600
Date of fiscal year end: September 30
Date of reporting period: September 30, 2010
Item 1 – Reports to Stockholders.
ANNUAL REPORT
SEPTEMBER 30, 2010
| | Commitment to your financial goals can help you devote more time to what truly matters in life. |
OCTOBER 2010
DEAR SHAREHOLDER:
Enclosed is your annual report for The Marsico Investment Fund, encompassing the one-year fiscal period from October 1, 2009 to September 30, 2010.
The purpose of this report is to provide a retrospective for the Marsico Funds’ one-year investment results by discussing what we believe were the main areas that impacted performance – including the macroeconomic environment, sector and industry positioning, and individual stock selection – as compared to the Funds’ performance benchmark indices. For updated information regarding the market environment and the Funds’ overall investment postures and performance, please refer to the Funds’ most recent monthly fact sheets and quarterly investment updates, which are available under the name of each Fund on the Funds’ website at www.marsicofunds.com.
NOTE REGARDING ADDITIONS TO THE MARSICO INVESTMENT TEAM
Effective November 1, 2010, we are pleased to welcome Coralie Witter as a third member of the team co-managing the Focus Fund and the Growth Fund, along with Tom Marsico and Doug Rao. Coralie has been a senior analyst at Marsico Capital Management since 2004, and brings a variety of strengths to our team, including more than thirteen years of experience in the financial services industry, most of which involved equity research. We look forward to her contributions in helping to co-manage these Funds.
In another development also effective November 1, 2010, we are pleased to welcome Munish Malhotra as a co-manager of the International Opportunities Fund along with Jim Gendelman. Munish has been a senior analyst at Marsico Capital Management since 2003, and brings a variety of strengths to the Fund, including more than ten years of experience in the financial services industry. We look forward to his contributions in assisting in the co-management of the Fund.
TABLE OF CONTENTS
| KEY FUND STATISTICS | 4 |
| | |
| MARKET ENVIRONMENT | 7 |
| | |
| MARSICO FOCUS FUND | |
| Investment Review | 9 |
| Fund Overview | 12 |
| Schedule of Investments | 13 |
| | |
| MARSICO GROWTH FUND | |
| Investment Review | 9 |
| Fund Overview | 14 |
| Schedule of Investments | 15 |
| | |
MARSICO 21st CENTURY FUND | |
| Investment Review | 16 |
| Fund Overview | 18 |
| Schedule of Investments | 19 |
| | |
| MARSICO INTERNATIONAL | |
| OPPORTUNITIES FUND | |
| Investment Review | 21 |
| Fund Overview | 23 |
| Schedule of Investments | 24 |
| | |
| MARSICO FLEXIBLE CAPITAL FUND | |
| Investment Review | 26 |
| Fund Overview | 28 |
| Schedule of Investments | 29 |
| | |
| MARSICO GLOBAL FUND | |
| Investment Review | 31 |
| Fund Overview | 33 |
| Schedule of Investments | 34 |
| | |
| FINANCIAL STATEMENTS | 36 |
| NOTES TO FINANCIAL STATEMENTS | 46 |
| REPORT OF INDEPENDENT REGISTERED | |
| PUBLIC ACCOUNTING FIRM | 54 |
| EXPENSE EXAMPLE | 55 |
| OTHER INFORMATION | 56 |
| TRUSTEE AND OFFICER INFORMATION | 57 |
| KEY FUND STATISTICS (UNAUDITED) |
Marsico Focus Fund MFOCX | Marsico Growth Fund MGRIX | Marsico 21st Century Fund MXXIX |
| | | |
| For additional disclosures, please see page 12. | For additional disclosures, please see page 14. | For additional disclosures, please see page 18. |
| | | |
PERFORMANCE COMPARISON(1) | PERFORMANCE COMPARISON(1) | PERFORMANCE COMPARISON(1) |
| | | |
| | |
| | | |
TOTAL ANNUAL OPERATING EXPENSES* 1.32% | TOTAL ANNUAL OPERATING EXPENSES* 1.31% | TOTAL ANNUAL OPERATING EXPENSES* 1.38% |
| | | |
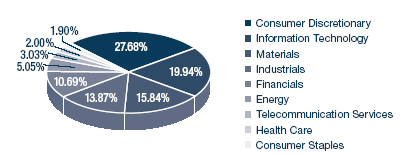
SECTOR ALLOCATION(2) | SECTOR ALLOCATION(2) | SECTOR ALLOCATION(2) |
| | | |
| | |
| | | |
| TOP FIVE HOLDINGS | TOP FIVE HOLDINGS | TOP FIVE HOLDINGS |
| | | |
| 6.79% | APPLE, INC. | 6.96% | WELLS FARGO & COMPANY | 5.78% |
| 6.06% | | 4.91% | THE PNC FINANCIAL SERVICES GROUP, INC. | 4.81% |
| BAIDU, INC. SPON. ADR | 5.31% | | 4.66% | INTUITIVE SURGICAL, INC. | 4.44% |
| UNION PACIFIC CORPORATION | 5.13% | UNION PACIFIC CORPORATION | 4.41% | | 4.33% |
| MCDONALD'S CORPORATION | 4.96% | AMAZON.COM, INC. | 4.27% | CSX CORPORATION | 4.03% |
| | | | | | |
For additional disclosures about the Marsico Funds, please see page 6. The performance data quoted here represent past performance, and past performance is not a guarantee of future results. Investment return and principal value of an investment will fluctuate so that an investor’s shares, when redeemed, may be worth more or less than their original cost.
| KEY FUND STATISTICS (UNAUDITED) |
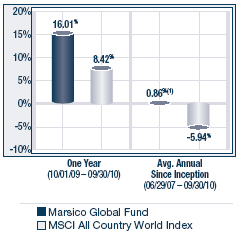
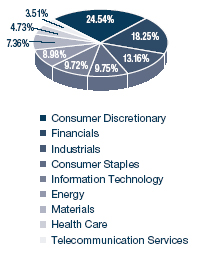
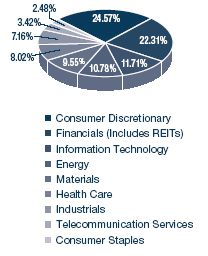
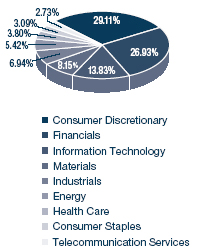
Marsico International Opportunities Fund MIOFX | Marsico Flexible Capital Fund MFCFX | Marsico Global Fund MGLBX |
| For additional disclosures, please see page 23. | For additional disclosures, please see page 28. | For additional disclosures, please see page 33. |
| | | |
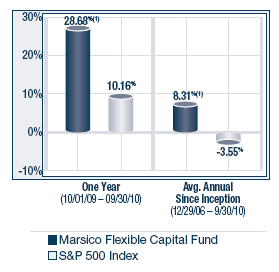
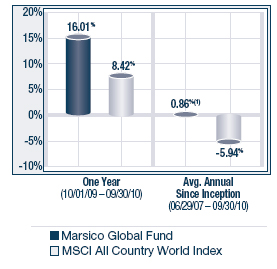
PERFORMANCE COMPARISON(1) | PERFORMANCE COMPARISON(1) | PERFORMANCE COMPARISON(1) |
| | | |
| | |
| | | |
TOTAL ANNUAL OPERATING EXPENSES* 1.50% | TOTAL ANNUAL OPERATING EXPENSES* 2.86% NET EXPENSES*† 0.77% | TOTAL ANNUAL OPERATING EXPENSES* 1.60% |
| | | |
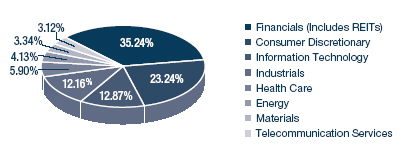
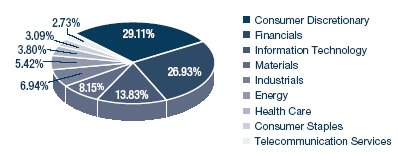
SECTOR ALLOCATION(2) | SECTOR ALLOCATION(2) | SECTOR ALLOCATION(2) |
| | | |
| | |
| | | |
| TOP FIVE HOLDINGS | TOP FIVE HOLDINGS | TOP FIVE HOLDINGS |
| | | |
OGX PETRÓLEO E GÁS PARTICIPAÇÕES S.A. | 3.88% | COUNTRYWIDE CAPITAL V, CAPITAL SECURITIES, 7.000%. | 4.09% | INDUSTRIA DE DISENO TEXTILE S.A. (INDITEX) | 4.88% |
| 3.29% | ANHANGUERA EDUCACIONAL PARTICIPACOES S.A. | 3.57% | | 4.72% |
INDUSTRIA DE DISENO TEXTILE S.A. (INDITEX) | 3.03% | | 2.94% | COMPAGNIE FINANCIÈRE RICHEMONT SA | 3.87% |
TEVA PHARMACEUTICAL INDUSTRIES LTD. SPON. ADR | 3.02% | | 2.88% | OGX PETRÓLEO E GÁS PARTICIPAÇÕES S.A. | 3.85% |
BANCO BILBAO VIZCAYA ARGENTARIA S.A. | 3.02% | SENSATA TECHNOLOGIES HOLDING N.V. | 2.79% | | 3.80% |
Current performance may be lower or higher than the performance information quoted. To obtain performance information current to the most recent month-end, please call 888-860-8686 or visit www.marsicofunds.com. A redemption fee may be imposed on redemptions or exchanges of Fund shares held for 30 days or less.
KEY FUND STATISTICS (UNAUDITED)
| * | The Total Annual Operating Expenses and Net Expenses are reflective of the information disclosed in the Funds’ Prospectus dated February 1, 2010.Operating The information may differ from the expense ratios disclosed in this report. |
| † | Marsico Capital Management, LLC (the “Adviser”) has entered into a written expense limitation agreement under which it has agreed to limit the total expenses (excluding interest, taxes, acquired fund fees and expenses, litigation, brokerage and extraordinary expenses) to an annual rate of 0.75% of the Flexible Capital Fund’s average net assets until January 31, 2011. This fee waiver may be terminated at any time after January 31, 2011. The Adviser may recoup, unless it otherwise elects, any waived amount from a Fund pursuant to this arrangement if such reimbursement does not cause the Fund to exceed existing expense limitations and the reimbursement is made within three years after the year in which the Adviser incurred the expense. |
| (1) | The performance data quoted here represent past performance, and past performance is not a guarantee of future results. Investment return and principal value of an investment will fluctuate so that an investor’s shares, when redeemed, may be worth more or less than their original cost. Current performance may be lower or higher than the performance information quoted. To obtain performance information current to the most recent month-end, please call 888-860-8686 or visit www.marsicofunds.com. A redemption fee may be imposed on redemptions or exchanges of Fund shares held for 30 days or less. |
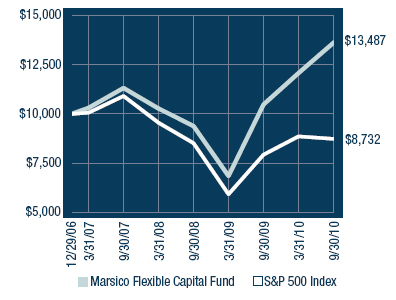
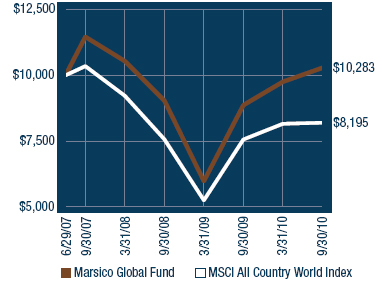
For the Flexible Capital Fund and the Global Fund, initial public offerings (“IPOs”) made a significant positive contribution to the Fund’s recent performance. There can be no assurance that similar contributions from IPOs will continue in the future.
The performance included in the chart does not reflect the deduction of taxes on Fund distributions or the redemption of Fund shares.
All indices are unmanaged and investors cannot invest directly in an index.
The performance returns for the 21st Century Fund (for the period prior to March 31, 2004), the International Opportunities Fund (for the period prior to September 30, 2004), the Flexible Capital Fund (for the periods ended September 30, 2010), and the Global Fund (for the period prior to December 31, 2008 and from April through May 2009) reflect a fee waiver in effect; in the absence of such a waiver, the returns would be reduced. The performance returns for the 21st Century Fund (for the period beginning April 2004 through January 2005), the International Opportunities Fund (for the period beginning October 2004 through December 2005) and the Global Fund (for the one-month period June 2009) would have been higher but for the reimbursement of fees waived previously.
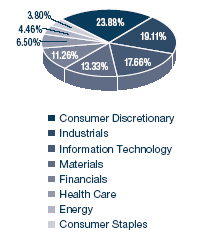
| (2) | Sector weightings represent the percentage of the respective Fund’s investments (excluding cash equivalents) in certain general sectors. These sectors may include more than one industry. The Fund’s portfolio composition is subject to change at any time. |
MARKET ENVIRONMENT
MARKET ENVIRONMENT: OCTOBER 2009 – SEPTEMBER 2010 (UNAUDITED)
Broad equity market indices posted positive returns for the one-year fiscal period ended September 30, 2010. International emerging markets registered the strongest gains. US equities also experienced double-digit positive returns. Developed international markets, however, posted anemic results:
| | Universe of | 12-Month |
Index Name(1) | Equities Represented | Total Return |
US | | |
| S&P 500 | US large-capitalization equities | +10.16% |
| | | |
| Russell 3000 | US publicly-traded equities of all sizes | +10.96% |
| | | |
| Russell 2000 | US small-capitalization equities | +13.35% |
| | | |
| Russell Mid-Cap | US medium-capitalization equities | +17.54% |
| | | |
| | Universe of | 12-Month |
Index Name(1) | Equities Represented | Total Return |
INTERNATIONAL | |
| MSCI EAFE (US$) | Equities in developed international | |
| | equity markets, including Japan, | |
| | Western Europe, and Australasia | +3.27% |
| | | |
| MSCI Emerging | Equities in developing international | |
| Markets (US$) | equity markets, including China, India, | |
| | Eastern Europe, and Latin America | +20.22% |
| | | |
| MSCI ACWI (US$) | Equities in the global developed | |
| | and emerging markets | +8.42% |
US LARGE-CAPITALIZATION EQUITIES
US stock performance see-sawed during the 12-month period. Large-capitalization US equities generally rose during the first six months of the reporting period, headed lower in May and June 2010, sharply increased in July, suffered steep declines in August, and then recovered in September.
US equities struggled in the latter half of the reporting period as the ever-shifting sands of the economic outlook suggested a US economic slowdown was potentially underway, employment and housing data remained disappointing in general, consumer and business confidence ebbed, and concerns about policy-making (including tax-related legislation) in Washington rattled investors. During September 2010, however, various macroeconomic data points either improved or stabilized to some extent and the Federal Reserve Board signaled it was open-minded about the possibility of implementing a further phase of quantitative easing. Those developments rekindled enthusiasm for stocks and sent prices sharply higher during the month. For the entire 12-month period, the S&P 500 Index rose by +10.16%.
Nine of the 10 S&P 500 Index economic sectors, as defined under the Global Industry Classification Standard (“GICS”)(2) , were in positive territory during the period. Consumer Discretionary (+24%), Industrials (+20%), and Telecommunication Services (+19%) were the strongest-performing sectors. Consumer Staples, Utilities, Information Technology, and Materials each registered returns of more than +10%. Health Care (+8%) and Energy (+5%) also experienced gains. Financials was the sole sector to post a negative return and declined - -3%.
At an industry level, Financials-related industries were among the weakest-performing groups, including Diversified Financials (-12%) and Banks (-2%). An exception was Real Estate which soared +35%. Other leading industry groups were comprised of consumer-related industries such as Automobiles & Components (+40%), Transportation (+31%), Consumer Services (+24%), Retailing (+23%), Consumer Durables & Apparel (+22%), and Media (+22%).
US ALL-CAPITALIZATION EQUITIES
Performance of the broad US equity market, as measured by the Russell 3000 Index which encompasses publicly-traded companies of all sizes, was strong for the fiscal year period.
All 10 GICS sectors of the Russell 3000 Index posted positive returns. Similar to its large-capitalization counterparts, Consumer Discretionary was the strongest-performing sector of the Russell 3000 Index with a return of +24%. Financials was the weakest-performing sector and eked out a return of +0.1%. Energy (+5%) and Health Care (+9%) also posted modest gains. The remaining six sectors of the Index each rose between +12% and +19%. The mid- and small-capitalization area of the US equity market was comparatively stronger than large-capitalization equities. Smaller-capitalization equities are generally thought to lead the market during the early stages of a market recovery.
MARKET ENVIRONMENT
INTERNATIONAL EQUITIES
Developed market international equities, as measured by the MSCI EAFE Index, posted a 12-month return of +3.27%. Emerging markets, meanwhile, managed to achieve very strong equity returns. The MSCI Emerging Markets Index gained +20.22% during the period.
International equities were buffeted by a muddled global growth outlook. Although a global growth recovery seemed on balance to be gaining further traction during the period, there were signs that it was becoming increasingly asynchronous in contrast with the highly correlated market downturn in 2008 and the first part of the recovery in early- to mid-2009. Several countries (e.g., China, India and Australia) took steps to temper inflationary pressures by reining in strong economic growth. Meanwhile, however, other countries, particularly in the European Union, grappled with massive government deficits and deteriorating economic growth prospects.
At a sector level, the MSCI EAFE Index was led by Consumer Staples (+17%), Consumer Discretionary (+13%), Materials (+13%), and Industrials (+11%). Telecommunication Services, Health Care, and Information Technology each registered small gains. Three sectors finished the period in negative territory: Financials (-7%), Utilities (-7%), and Energy (-2%).
The MSCI EAFE Index’s largest country-level constituents, the United Kingdom and Japan, which together comprise approximately 41% of the Index, posted returns of +11% and +0.2%, respectively.
There was significant volatility in currency movements during the period, as demonstrated by the Japanese yen and the euro. The Japanese yen strengthened in the period versus the US dollar. The euro, however, slipped in value versus many other major currencies including the US dollar as the European Union struggled due to concerns of rising government deficits and debt levels of some of its member countries, including Greece, Spain, and Portugal.
Currency translation for US-based international equity investors had an overall small, positive effect. The MSCI EAFE Index’s return measured in local currency terms was +2.55% versus the slightly higher +3.27% return in US dollar terms. The 0.72% difference between the two measures demonstrated the US dollar’s modest weakness.
THE MARSICO INVESTMENT TEAM
| All indices are unmanaged and investors cannot invest directly in an index. |
| The Global Industry Classification Standard (“GICS”) was developed by and is the exclusive property and service mark of MSCI, Inc. (“MSCI”) and Standard & Poor’s (“S&P”) and is licensed for use by Marsico Capital Management, LLC (“MCM”). Neither MSCI, S&P, nor MCM or any third party involved in compiling GICS makes any express or implied warranties or representations with respect to such standard or classification (or the results from use thereof), and all such parties hereby expressly disclaim all warranties of originality, accuracy, completeness, merchantability and fitness for a particular purpose with respect to any of such standard or classification. MSCI, S&P, MCM, and any of their affiliates or third parties involved in compiling GICS shall not have any liability for any direct, indirect, special, punitive, consequential or any other damages (including lost profits) even if notified of the possibility of such damages. |
FOCUS FUND & GROWTH FUND
INVESTMENT REVIEW BY TOM MARSICO AND DOUG RAO (UNAUDITED)
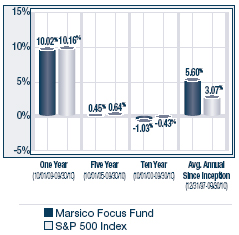
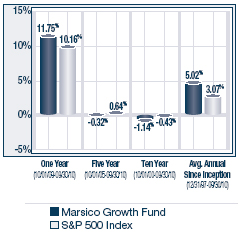
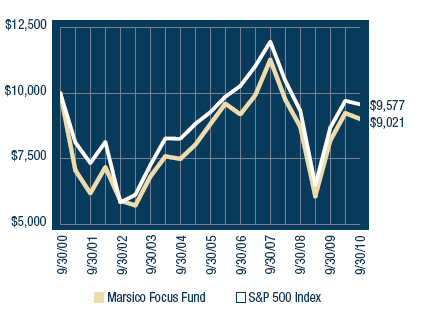
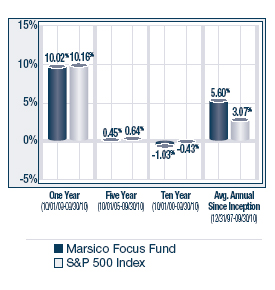
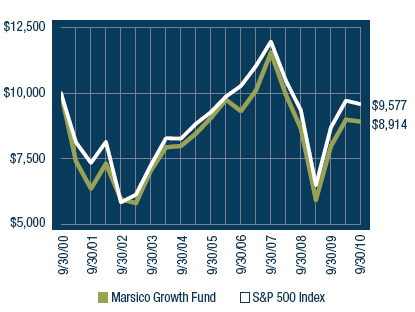
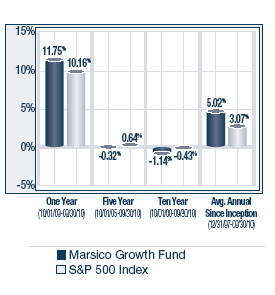
The Marsico Focus Fund and the Marsico Growth Fund posted returns of +10.02% and +11.75%, respectively, for the one-year fiscal period ended September 30, 2010. For comparative purposes, the S&P 500 Index, which we consider to be the Funds’ primary benchmark, had a total return of +10.16%. Please see the Funds’ Overviews for more detailed information about each Fund’s longer-term performance for various time periods ended September 30, 2010.
The performance data for the Funds quoted here represent past performance, and past performance is not a guarantee of future results. Investment return and principal value of an investment will fluctuate so that an investor’s shares, when redeemed, may be worth more or less than their original cost. Current performance may be lower or higher than the performance information quoted. To obtain performance information current to the most recent month-end, please call 888-860-8686 or visit www.marsicofunds.com. (1)
This review highlights Fund performance over a one-year fiscal period. Shareholders should keep in mind that the Funds are intended for long-term investors who hold their shares for substantially longer periods of time. You should also keep in mind that our views on all investments discussed in this report are subject to change at any time. References to specific securities, industries, and sectors discussed in this report are not recommendations to buy or sell such securities or related investments, and the Funds may not necessarily hold these securities or investments today. Please see the accompanying Schedules of Investments for the percentage of each Fund’s portfolio represented by the securities mentioned in this report as of the end of the reporting period.
The Focus Fund and the Growth Fund often invest in similar growth companies. Their performance may differ at times, however, because of a variety of factors. Among other reasons, the Focus Fund is a non-diversified mutual fund that may invest in a more concentrated portfolio and may hold the securities of fewer issuers than the Growth Fund. As a result, the Focus Fund may hold some securities that are different from those held in the Growth Fund and may be more exposed to individual stock volatility than the Growth Fund or other mutual funds that invest in a larger number of securities.
FOCUS FUND
The Focus Fund’s 12-month performance was in-line with the return of its primary benchmark, the S&P 500 Index.
There were some significant areas of strength for the Fund. The Fund’s stock selection in the Information Technology and Consumer Discretionary sectors was strong. Information Technology positions were led by Baidu, Inc. Spon. ADR, a China-based website search engine, which soared +164%, and Apple, Inc., which rose +53%. In the Consumer Discretionary sector, online retailers priceline.com, Inc. (+60%) and Amazon.com, Inc. (+13%) posted solid gains as did restaurant operator McDonald’s Corporation (+35%). In addition, one of the Fund’s Industrials positions, railroad operator Union Pacific Corporation, posted a return of +42%.
The Focus Fund’s performance was primarily hurt by stock selection in the Energy sector and by stock selection and an overweight posture in the Banks industry.
Several of the Fund’s Energy positions posted disappointing stock price returns. Transocean Ltd. and Southwestern Energy Company dropped -16% and -23%, respectively, prior to being sold from the Fund. The Fund trimmed its position in Transocean during the first half of the reporting period and sold its remaining stake in Transocean shortly after the late-April 2010 oil spill in the Gulf of Mexico.
FOCUS FUND & GROWTH FUND
The Fund’s performance was hurt by maintaining an overweighted allocation to the Banks industry during the period, as Banks were a weak-performing industry group of the S&P 500 Index with a return of -2%. Stock selection within Financials also had an adverse effect on performance. Bank positions Wells Fargo & Company (-10%) and The PNC Financial Services Group, Inc. (-22%) each posted double-digit negative returns. Diversified Financials company The Goldman Sachs Group, Inc. sagged -21% and was a material detractor from performance.
Certain of the Fund’s Health Care and Materials positions struggled, including biopharmaceutical company Gilead Sciences, Inc. (-12%) and agricultural materials and chemicals company Monsanto Company (-2%). The Fund sold its position in Gilead Sciences during the reporting period. Though many of the Fund’s technology-related positions posted strong gains, the Fund was hurt by its position in wireless communications company QUALCOMM, Inc., which slid -14% prior to being sold from the Fund.
The Fund reduced its exposure to the Financials, Information Technology, Energy, and Health Care sectors during the period, while increasing its allocations to the Consumer Discretionary, Industrials, and Materials sectors.
GROWTH FUND
The Growth Fund, which outperformed its primary benchmark, the S&P 500 Index, shared many of the Focus Fund’s performance characteristics for the 12-month period ended September 30, 2010, plus several others. In particular, the Fund benefitted from strong stock selection in the Information Technology and Consumer Discretionary sectors.
Similar to the Focus Fund, the Growth Fund’s positions in the Information Technology sector performed well, posting an aggregate return of +29%. Leading Fund holdings included Chinese Internet search company Baidu, Inc. Spon. ADR (+165%) and Apple, Inc. (+53%).
The Fund was also aided by stock selection in the Consumer Discretionary sector. The Consumer Discretionary sector was the strongest-performing area of the S&P 500 Index with a return of +24%. As a result, the Growth Fund’s performance was bolstered by having an average of nearly double the allocation to the Consumer Discretionary sector reflected in its benchmark index. Online retailers priceline.com, Inc. (+58%), Amazon.com, Inc. (+80%), restaurant operator McDonald’s Corporation (+35%), sporting goods company NIKE, Inc. – Cl. B (+26%), and media company The DIRECTV Group, Inc. – Cl. A (+51%) each had a meaningful, positive effect on the Fund’s performance.
Other leading Fund holdings included wireless communications tower company American Tower Corporation – Cl. A (+41%) and Materials positions PPG Industries, Inc. (+29%) and BHP Billiton PLC ADR (+19%).
Several factors hurt the Fund’s performance results. Like the Focus Fund, a number of the Growth Fund’s Financials sector holdings had disappointing investment results. Wells Fargo & Company (-10%), The Goldman Sachs Group, Inc. (-21%) and The PNC Financial Services Group, Inc. (-4%) were significant performance laggards. In the Energy sector, Transocean Ltd. slid -16% prior to being sold from the Fund.
Similar to the Focus Fund, the Growth Fund’s performance was hurt by its position in wireless communications company QUALCOMM, Inc., which slid -13% prior to being sold from the Fund.
Throughout the reporting period, the Fund had little exposure to investments in the Consumer Staples sector. This positioning detracted from the Fund’s performance, as Consumer Staples was among the stronger-performing sectors of the S&P 500 Index.
FOCUS FUND & GROWTH FUND
During the period, the Fund increased its exposure to the Consumer Discretionary, Industrials, and Materials sectors while it reduced its exposure to the Financials, Information Technology, Energy, and Health Care sectors.
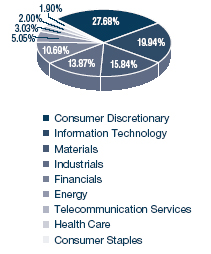
Fiscal Period-End Investment Posture
As of September 30, 2010, the Focus Fund’s and the Growth Fund’s primary sector allocations included Consumer Discretionary, Information Technology, Materials, Industrials, and Financials. The Funds had little or no exposure to Utilities and Telecommunication Services.
Sincerely,
THOMAS F. MARSICO
PORTFOLIO MANAGER
A. DOUGLAS RAO
PORTFOLIO MANAGER
| Total returns are based on net change in net asset value assuming reinvestment of distributions. A redemption fee of 2% may be imposed on redemptions or exchanges of Fund shares owned for 30 days or less. Please see the Prospectus for more information. |
September 30, 2010 (Unaudited)
The Focus Fund invests primarily in the common stocks of large companies, normally a core position of 20–30 common stocks that are selected for their long-term growth potential.
| TOTAL ANNUAL OPERATING EXPENSES* | 1.32% | NET ASSETS | $1,451,877,247 | NET ASSET VALUE PER SHARE | $15.79 |
| | |
GROWTH OF $10,000(1) | PERFORMANCE COMPARISON |
| | |
| |
| | |
SECTOR ALLOCATION(2) | TOP FIVE HOLDINGS |
| | | |
| | |
| |
| |
UNION PACIFIC CORPORATION | |
| |
| | | |
| * | The Total Annual Operating expenses are reflective of the information disclosed in the Funds’ prospectus dated February 1, 2010 and may differ from the expense ratio disclosed in this report. |
The performance data quoted here represent past performance, and past performance is not a guarantee of future results. Investment return and principal value of an investment will fluctuate so that an investor’s shares, when redeemed, may be worth more or less than their original cost. Current performance may be lower or higher than the performance information quoted. To obtain performance information current to the most recent month-end, please call 888-860-8686 or visit www.marsicofunds.com. A redemption fee may be imposed on redemptions or exchanges of Fund shares held for 30 days or less.
The performance included in the chart and graph does not reflect the deduction of taxes on Fund distributions or the redemption of Fund shares.
All indices are unmanaged and investors cannot invest directly in an index.
| (1) | This chart assumes an initial investment of $10,000 made on September 30, 2000. Total returns are based on net change in NAV, assuming reinvestment of distributions. |
| (2) | Sector weightings represent the percentage of the Fund’s investments (excluding cash equivalents) in certain general sectors. These sectors may include more than one industry. The Fund’s portfolio composition is subject to change at any time. |
SCHEDULE OF INVESTMENTS
MARSICO FOCUS FUND
SCHEDULE OF INVESTMENTS
September 30, 2010
| | | Number | | | | | | Percent | |
| | | of | | | | | | of Net | |
| | | Shares | | | Value | | | Assets | |
| COMMON STOCKS | | | | | | | | | |
| | | | | | | | | | |
| Aerospace & Defense | | | | | | | | | |
| General Dynamics Corporation | | | 413,716 | | | $ | 25,985,502 | | | | 1.79 | % |
| Goodrich Corporation | | | 813,802 | | | | 60,001,621 | | | | 4.13 | |
| | | | | | | | 85,987,123 | | | | 5.92 | |
| | | | | | | | | | | | | |
| Air Freight & Logistics | | | | | | | | | | | | |
| FedEx Corporation | | | 258,083 | | | | 22,066,097 | | | | 1.52 | |
| | | | | | | | | | | | | |
| Application Software | | | | | | | | | | | | |
| salesforce.com, inc.* | | | 185,263 | | | | 20,712,403 | | | | 1.43 | |
| | | | | | | | | | | | | |
| Cable & Satellite | | | | | | | | | | | | |
| The DIRECTV Group, Inc. - Cl. A* | | | 591,519 | | | | 24,624,936 | | | | 1.69 | |
| | | | | | | | | | | | | |
| Casinos & Gaming | | | | | | | | | | | | |
| Wynn Resorts Ltd. | | | 344,643 | | | | 29,904,673 | | | | 2.06 | |
| | | | | | | | | | | | | |
| Communications Equipment | | | | | | | | | |
| Cisco Systems, Inc.* | | | 1,698,669 | | | | 37,200,851 | | | | 2.56 | |
| | | | | | | | | | | | | |
| Computer Hardware | | | | | | | | | | | | |
| Apple, Inc.* | | | 347,620 | | | | 98,637,175 | | | | 6.79 | |
| | | | | | |
| Construction & Farm Machinery & Heavy Trucks | | | | | |
| Cummins, Inc. | | | 218,218 | | | | 19,766,186 | | | | 1.36 | |
| | | | | | | | | | | | | |
| Department Stores | | | | | | | | | | | | |
| Nordstrom, Inc. | | | 801,488 | | | | 29,815,354 | | | | 2.05 | |
| | | | | | | | | | | | | |
| Diversified Banks | | | | | | | | | | | | |
| ICICI Bank Ltd. Spon. ADR | | | 361,816 | | | | 18,036,528 | | | | 1.24 | |
| U.S. Bancorp | | | 2,106,218 | | | | 45,536,433 | | | | 3.14 | |
| Wells Fargo & Company | | | 1,532,237 | | | | 38,505,116 | | | | 2.65 | |
| | | | | | | | 102,078,077 | | | | 7.03 | |
| | | | | | | | | | | | | |
| Diversified Chemicals | | | | | | | | | | | | |
| The Dow Chemical Company | | | 3,202,826 | | | | 87,949,602 | | | | 6.06 | |
| | | | | | | | | | | | | |
| Diversified Metals & Mining | | | | | | | | | |
| BHP Billiton PLC ADR | | | 920,270 | | | | 58,823,658 | | | | 4.05 | |
| | | | | | | | | | | | | |
| Fertilizers & Agricultural Chemicals | | | | | | | | | |
| Monsanto Company | | | 898,565 | | | | 43,068,221 | | | | 2.97 | |
| | | | | | | | | | | | | |
| Footwear | | | | | | | | | | | | |
| NIKE, Inc. - Cl. B | | | 421,646 | | | | 33,790,710 | | | | 2.33 | |
| | | | | | | | | | | | | |
| Health Care Equipment | | | | | | | | | | | | |
| Intuitive Surgical, Inc.* | | | 146,795 | | | | 41,651,613 | | | | 2.87 | |
| | | | | | | | | | | | | |
| Industrial Machinery | | | | | | | | | | | | |
| Eaton Corporation | | | 846,949 | | | | 69,864,823 | | | | 4.81 | |
| | | | | | | | | | | | | |
| Internet Retail | | | | | | | | | | | | |
| Amazon.com, Inc.* | | | 431,219 | | | | 67,727,256 | | | | 4.66 | |
| priceline.com, Inc.* | | | 153,722 | | | | 53,547,522 | | | | 3.69 | |
| | | | | | | | 121,274,778 | | | | 8.35 | |
| Internet Software & Services | | | | | | | |
| Baidu, Inc. Spon. ADR* | | | 750,944 | | | | 77,061,873 | | | | 5.31 | |
| | | | | | | | | | | | | |
| Investment Banking & Brokerage | | | | | | | | | |
| The Goldman Sachs Group, Inc. | | | 283,963 | | | | 41,055,371 | | | | 2.83 | |
| | | | | | | | | | | | | |
| Movies & Entertainment | | | | | | | | | | | | |
| The Walt Disney Company | | | 864,666 | | | | 28,629,091 | | | | 1.97 | |
| | | | | | | | | | | | | |
| Oil & Gas Exploration & Production | | | | | |
| Anadarko Petroleum Corporation | | | 709,650 | | | | 40,485,532 | | | | 2.79 | |
| EOG Resources, Inc. | | | 248,104 | | | | 23,066,229 | | | | 1.59 | |
| | | | | | | | 63,551,761 | | | | 4.38 | |
| | | | | | | | | | | | | |
| Packaged Foods & Meats | | | | | | | | | | | | |
| Mead Johnson Nutrition Company | | | 951,458 | | | | 54,147,475 | | | | 3.73 | |
| | | | | | | | | | | | | |
| Pharmaceuticals | | | | | | | | | | | | |
| Merck & Co., Inc. | | | 1,383,401 | | | | 50,922,991 | | | | 3.51 | |
| | | | | | | | | | | | | |
| Railroads | | | | | | | | | | | | |
| Union Pacific Corporation | | | 910,139 | | | | 74,449,370 | | | | 5.13 | |
| | | | | | | | | | | | | |
| Regional Banks | | | | | | | | | | | | |
| The PNC Financial Services Group, Inc. | | | 330,406 | | | | 17,151,376 | | | | 1.18 | |
| | | | | | | | | | | | | |
| Restaurants | | | | | | | | | | | | |
| McDonald’s Corporation | | | 966,444 | | | | 72,009,742 | | | | 4.96 | |
| | | | | | | | | | | | | |
| Systems Software | | | | | | | | | | | | |
| Oracle Corporation | | | 664,907 | | | | 17,852,753 | | | | 1.23 | |
| | | | | | | | | | | | | |
| TOTAL COMMON STOCKS | | | | | | | | | | | | |
| (Cost $1,102,876,127) | | | | | | | 1,424,048,083 | | | | 98.08 | |
| | | | | | | | | | | | | |
| SHORT-TERM INVESTMENTS | | | | | | | | | |
| State Street Institutional | | | | | | | | | | | | |
U.S. Government | | | | | | | | | | | | |
| Money Market, 0.106% | | | 21,778,758 | | | | 21,778,758 | | | | 1.50 | |
| | | | | | |
| TOTAL SHORT-TERM INVESTMENTS | | | | | |
| (Cost $21,778,758) | | | | | | | 21,778,758 | | | | 1.50 | |
| | | | | | | | | | | | | |
| TOTAL INVESTMENTS | | | | | | | | | | | | |
| (Cost $1,124,654,885) | | | | | | | 1,445,826,841 | | | | 99.58 | |
| | | | | | | | | | | | | |
| Cash and Other Assets, Less Liabilities | | | | | | | 6,050,406 | | | | 0.42 | |
| | | | | | | | | | | | | |
| NET ASSETS | | | | | | $ | 1,451,877,247 | | | | 100.00 | % |
See notes to financial statements.
September 30, 2010 (Unaudited)
The Growth Fund invests primarily in the common stocks of large companies that are selected for their long-term growth potential. The Growth Fund will normally hold a core position of between 35 and 50 common stocks.
| TOTAL ANNUAL OPERATING EXPENSES* | 1.31% | NET ASSETS | $883,052,538 | NET ASSET VALUE PER SHARE | $17.04 |
| | |
GROWTH OF $10,000(1) | PERFORMANCE COMPARISON |
| | |
| |
| | |
SECTOR ALLOCATION(2) | TOP FIVE HOLDINGS |
| | | |
| | |
| |
| |
UNION PACIFIC CORPORATION | |
| |
| | | |
| * | The Total Annual Operating expenses are reflective of the information disclosed in the Funds’ prospectus dated February 1, 2010 and may differ from the expense ratio disclosed in this report. |
The performance data quoted here represent past performance, and past performance is not a guarantee of future results. Investment return and principal value of an investment will fluctuate so that an investor’s shares, when redeemed, may be worth more or less than their original cost. Current performance may be lower or higher than the performance information quoted. To obtain performance information current to the most recent month end, please call 888-860-8686 or visit www.marsicofunds.com. A redemption fee may be imposed on redemptions or exchanges of Fund shares held for 30 days or less.
The performance included in the chart and graph does not reflect the deduction of taxes on Fund distributions or the redemption of Fund shares.
All indices are unmanaged and investors cannot invest directly in an index.
| This chart assumes an initial investment of $10,000 made on September 30, 2000. total returns are based on net change in NAV, assuming reinvestment of distributions. |
| Sector weightings represent the percentage of the Fund’s investments (excluding cash equivalents) in certain general sectors. these sectors may include more than one industry. the Fund’s portfolio composition is subject to change at any time. |
SCHEDULE OF INVESTMENTS
MARSICO GROWTH FUND
SCHEDULE OF INVESTMENTS
September 30, 2010
| | | Number | | | | | | Percent | |
| | | of | | | | | | of Net | |
| | | Shares | | | Value | | | Assets | |
| COMMON STOCKS | | | | | | | | | |
| Aerospace & Defense | | | | | | | | | |
| General Dynamics Corporation | | | 379,614 | | | $ | 23,843,556 | | | | 2.70 | % |
| Precision Castparts Corp. | | | 54,609 | | | | 6,954,456 | | | | 0.79 | |
| | | | | | | | 30,798,012 | | | | 3.49 | |
| | | | | | | | | | | | | |
| Air Freight & Logistics | | | | | | | | | | | | |
| FedEx Corporation | | | 144,053 | | | | 12,316,532 | | | | 1.40 | |
| | | | | | | | | | | | | |
| Apparel Retail | | | | | | | | | | | | |
| The TJX Companies, Inc. | | | 365,534 | | | | 16,313,782 | | | | 1.85 | |
| | | | | | | | | | | | | |
| Application Software | | | | | | | | | | | | |
| salesforce.com, inc.* | | | 120,148 | | | | 13,432,546 | | | | 1.52 | |
| | | | | | | | | | | | | |
| Cable & Satellite | | | | | | | | | | | | |
| The DIRECTV Group, Inc. - Cl. A* | | | 322,010 | | | | 13,405,276 | | | | 1.52 | |
| | | | | | | | | | | | | |
| Casinos & Gaming | | | | | | | | | | | | |
| Wynn Resorts Ltd. | | | 170,517 | | | | 14,795,760 | | | | 1.68 | |
| | | | | | | | | | | | | |
| Communications Equipment | | | | | | | | | |
| Cisco Systems, Inc.* | | | 994,892 | | | | 21,788,135 | | | | 2.47 | |
| | | | | | | | | | | | | |
| Computer Hardware | | | | | | | | | | | | |
| Apple, Inc.* | | | 216,520 | | | | 61,437,550 | | | | 6.96 | |
| | | | | | | | | | | | | |
| Computer Storage & Peripherals | | | | | | | | | |
| EMC Corporation* | | | 455,560 | | | | 9,252,424 | | | | 1.05 | |
| | | | | | | | | | | | | |
| Construction & Farm Machinery & Heavy Trucks | | | | | |
| Cummins, Inc. | | | 122,061 | | | | 11,056,285 | | | | 1.25 | |
| | | | | | | | | | | | | |
| Department Stores | | | | | | | | | | | | |
| Nordstrom, Inc. | | | 317,532 | | | | 11,812,190 | | | | 1.34 | |
| | | | | | | | | | | | | |
| Diversified Banks | | | | | | | | | | | | |
| U.S. Bancorp | | | 1,144,296 | | | | 24,739,679 | | | | 2.80 | |
| Wells Fargo & Company | | | 933,759 | | | | 23,465,364 | | | | 2.66 | |
| | | | | | | | 48,205,043 | | | | 5.46 | |
| | | | | | | | | | | | | |
| Diversified Chemicals | | | | | | | | | | | | |
| PPG Industries, Inc. | | | 313,045 | | | | 22,789,676 | | | | 2.58 | |
| The Dow Chemical Company | | | 1,202,244 | | | | 33,013,620 | | | | 3.74 | |
| | | | | | | | 55,803,296 | | | | 6.32 | |
| | | | | | | | | | | | | |
| Diversified Metals & Mining | | | | | | | | | |
| BHP Billiton PLC ADR | | | 477,244 | | | | 30,505,436 | | | | 3.45 | |
| | | | | | | | | | | | | |
| Fertilizers & Agricultural Chemicals | | | | | | | | | |
| Monsanto Company | | | 530,719 | | | | 25,437,362 | | | | 2.88 | |
| | | | | | | | | | | | | |
| Footwear | | | | | | | | | | | | |
| NIKE, Inc. - Cl. B | | | 429,052 | | | | 34,384,227 | | | | 3.89 | |
| | | | | | | | | | | | | |
| Household Appliances | | | | | | | | | | | | |
| Whirlpool Corporation | | | 64,478 | | | | 5,220,139 | | | | 0.59 | |
| | | | | | | | | | | | | |
| Industrial Gases | | | | | | | | | | | | |
| Praxair, Inc. | | | 291,751 | | | | 26,333,445 | | | | 2.98 | |
| | | | | | | | | | | | | |
| Industrial Machinery | | | | | | | | | | | | |
| Danaher Corporation | | | 460,256 | | | | 18,690,996 | | | | 2.12 | |
| Eaton Corporation | | | 110,226 | | | | 9,092,543 | | | | 1.03 | |
| | | | | | | | 27,783,539 | | | | 3.15 | |
| | | | | | | | | | | | | |
| Internet Retail | | | | | | | | | | | | |
| Amazon.com, Inc.* | | | 240,109 | | | | 37,711,520 | | | | 4.27 | |
| priceline.com, Inc.* | | | 60,166 | | | | 20,958,224 | | | | 2.37 | |
| | | | | | | | 58,669,744 | | | | 6.64 | |
| Internet Software & Services | | | | | | | |
| Baidu, Inc. Spon. ADR* | | | 422,057 | | | | 43,311,489 | | | | 4.91 | |
| | | | | | | | | | | | | |
| Investment Banking & Brokerage | | | | | | | | | |
| The Goldman Sachs Group, Inc. | | | 106,550 | | | | 15,404,999 | | | | 1.74 | |
| | | | | | | | | | | | | |
| Movies & Entertainment | | | | | | | | | | | | |
| The Walt Disney Company | | | 547,745 | | | | 18,135,837 | | | | 2.05 | |
| | | | | | | | | | | | | |
| Oil & Gas Exploration & Production | | | | | | | | | |
| Anadarko Petroleum Corporation | | | 445,887 | | | | 25,437,853 | | | | 2.88 | |
| EOG Resources, Inc. | | | 200,344 | | | | 18,625,982 | | | | 2.11 | |
| | | | | | | | 44,063,835 | | | | 4.99 | |
| | | | | | | | | | | | | |
| Packaged Foods & Meats | | | | | | | | | | | | |
| Mead Johnson Nutrition Company | | | 138,080 | | | | 7,858,133 | | | | 0.89 | |
| | | | | | | | | | | | | |
| Personal Products | | | | | | | | | | | | |
| The Estee Lauder Companies, Inc. - Cl. A | | | 138,012 | | | | 8,726,499 | | | | 0.99 | |
| | | | | | | | | | | | | |
| Pharmaceuticals | | | | | | | | | | | | |
| Merck & Co., Inc. | | | 472,526 | | | | 17,393,682 | | | | 1.97 | |
| | | | | | | | | | | | | |
| Railroads | | | | | | | | | | | | |
| Union Pacific Corporation | | | 476,572 | | | | 38,983,590 | | | | 4.41 | |
| | | | | | | | | | | | | |
| Regional Banks | | | | | | | | | | | | |
| The PNC Financial Services Group, Inc. | | | 391,757 | | | | 20,336,106 | | | | 2.30 | |
| | | | | | | | | | | | | |
| Restaurants | | | | | | | | | | | | |
| McDonald’s Corporation | | | 552,834 | | | | 41,191,661 | | | | 4.66 | |
| YUM! Brands, Inc. | | | 284,865 | | | | 13,120,882 | | | | 1.49 | |
| | | | | | | | 54,312,543 | | | | 6.15 | |
| | | | | | | | | | | | | |
| Semiconductors | | | | | | | | | | | | |
| Broadcom Corporation - Cl. A | | | 233,218 | | | | 8,253,585 | | | | 0.93 | |
| | | | | | | | | | | | | |
| Specialty Stores | | | | | | | | | | | | |
| Tiffany & Co. | | | 303,437 | | | | 14,258,505 | | | | 1.62 | |
| | | | | | | | | | | | | |
| Systems Software | | | | | | | | | | | | |
| Oracle Corporation | | | 611,223 | | | | 16,411,338 | | | | 1.86 | |
| | | | | | | | | | | | | |
| Wireless Telecommunication Services | | | | | |
| American Tower Corporation - Cl. A* | | | 374,452 | | | | 19,194,410 | | | | 2.17 | |
| Crown Castle International Corp.* | | | 164,195 | | | | 7,249,209 | | | | 0.82 | |
| | | | | | | | 26,443,619 | | | | 2.99 | |
| | | | | | | | | | | | | |
| TOTAL COMMON STOCKS | | | | | | | | | | | | |
| (Cost $646,855,542) | | | | | | | 862,644,483 | | | | 97.69 | |
| | | | | | | | | | | | | |
| PREFERRED STOCKS | | | | | | | | | | | | |
| Diversified Banks | | | | | | | | | | | | |
| Wells Fargo & Company, | | | | | | | | | | | | |
Series J Pref., 8.000% | | | 337,000 | | | | 9,210,210 | | | | 1.04 | |
| | | | | | | | | | | | | |
| TOTAL PREFERRED STOCKS | | | | | | | | | |
| (Cost $5,954,706) | | | | | | | 9,210,210 | | | | 1.04 | |
| | | | | | | | | | | | | |
| SHORT-TERM INVESTMENTS | | | | | | | | | |
| State Street Institutional Treasury | | | | | | | | | | | | |
| Money Market Fund, 0.026% | | | 23,055,742 | | | | 23,055,742 | | | | 2.61 | |
| | | | | | | | | | | | | |
| TOTAL SHORT-TERM INVESTMENTS | | | | | | | | | |
| (Cost $23,055,742) | | | | | | | 23,055,742 | | | | 2.61 | |
| | | | | | | | | | | | | |
| TOTAL INVESTMENTS | | | | | | | | | | | | |
| (Cost $675,865,990) | | | | | | | 894,910,435 | | | | 101.34 | |
| | | | | | | | | | | | | |
| Liabilities, Less Cash and Other Assets | | | | | | | (11,857,897 | ) | | | (1.34 | ) |
| | | | | | | | | | | | | |
| NET ASSETS | | | | | | $ | 883,052,538 | | | | 100.00 | % |
See notes to financial statements.
21st CENTURY FUND
INVESTMENT REVIEW BY CORY GILCHRIST (UNAUDITED)
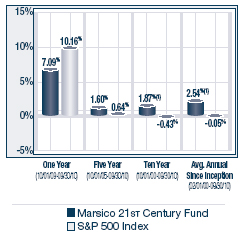
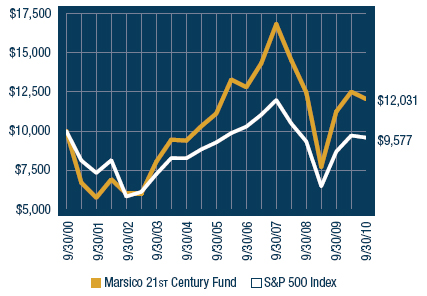
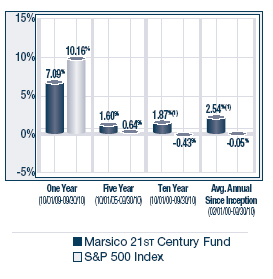
The 21st Century Fund posted a return of +7.09% for the one-year fiscal period ended September 30, 2010. The Fund’s return underperformed the S&P 500 Index, which we consider to be the Fund’s primary benchmark index and which had a total return of +10.16% over the same time period. For comparative purposes, the Russell 3000 Index, a proxy for the performance of all publicly-traded US equity securities including smaller capitalization companies (which may be a useful representation of the Fund’s ability to invest across the entire market capitalization spectrum), had a total return of +10.96%. Please see the Fund Overview for more detailed information about the Fund’s longer-term performance for various time periods ended September 30, 2010.
The performance data for the Fund quoted here represent past performance, and past performance is not a guarantee of future results. Investment return and principal value of an investment will fluctuate so that an investor’s shares, when redeemed, may be worth more or less than their original cost. Current performance may be lower or higher than the performance information quoted. To obtain performance information current to the most recent month-end, please call 888-860-8686 or visit www.marsicofunds.com.(1)
This review highlights Fund performance over a one-year fiscal period. Shareholders should keep in mind that the Fund is intended for long-term investors who hold their shares for substantially longer periods of time. You should also keep in mind that our views on all investments discussed in this report are subject to change at any time. References to specific securities, industries, and sectors discussed in this report are not recommendations to buy or sell such securities or related investments, and the Fund may not necessarily hold these securities or investments today. Please see the accompanying Schedule of Investments for the percentage of the Fund’s portfolio represented by the securities mentioned in this report as of the end of the reporting period.
While the Fund posted a positive return for the 12-month period, its return lagged that of its benchmark index. The primary factor responsible for the Fund’s underperformance was the Fund’s investments in the Financials sector.
Financial services companies, beset by US financial reform initiatives and the lingering effects of the credit crisis, were under stress for much of the fiscal year. Financials was the sole sector of the S&P 500 Index to register a negative return, slipping -3% for the 12-month period. On average, the Fund had more than twice the level of exposure to the Financials sector reflected in its benchmark index. A number of the Fund’s Financials holdings experienced sizable price declines, including Wells Fargo & Company (-10%), Jefferies Group, Inc. (-16%), State Street Corporation (-28%), and First Horizon National Corporation (-16%). The Fund’s Financials holdings reflect a combination of top-down views we held during the year, including: expectations of a credit recovery in the US; improving consumer discretionary spending, especially among the top 20% of wage earners; and a healing US banking system. The financial services holdings in the Fund also reflect a variety of positive company fundamentals such as: strong balance sheets, highly-accretive acquisitions beginning to bear fruit, expanded geographical footprints, market share growth opportunity as a result of diminished competition, and attractive equity valuations that do not appear to “price in” the future earnings power of many of these franchises.
Additional areas of weakness for the Fund included stock selection in the Industrials, Health Care, and Energy sectors. In the Industrials sector, wind turbine energy company Vestas Wind Systems A/S (-23%) dropped sharply prior to being sold from the Fund. Several of the Fund’s biotechnology holdings posted disappointing returns, including Gilead Sciences, Inc. (-11%) and Celgene Corporation (-7%). Both positions were sold prior to September 30, 2010. In the Energy sector, natural gas company Range Resources Corporation slid -24% prior to being sold from the Fund.
There were several areas of strength for the Fund. The Fund’s stock selection in the Information Technology and Telecommunication Services sectors was generally strong. Information Technology holdings were led by OpenTable, Inc. (+124%), Apple, Inc. (+52%), and Akamai Technologies, Inc. (+29% prior to being sold). In the Telecommunication Services sector, cellular communications tower company Crown Castle International Corp. (+40%) appreciated sharply. Crown Castle and Apple were among the Fund’s largest individual holdings and, as such, they each had a significant positive impact on performance.
The Consumer Discretionary sector was the strongest-performing area of the S&P 500 Index with a return of +24%. As a result, the Fund’s performance was aided by having an average of more than twice the allocation to the Consumer Discretionary sector reflected in its benchmark index. Positions in Ford Motor Company common stock and Ford Motor Company convertible bond (4.250% 11/15/2016) soared +88% and +59%, respectively, prior to being sold. (The Fund purchased the Ford Motor convertible bond at its initial public offering.)
During the one-year fiscal period, the Fund increased its allocation to the Consumer Discretionary and Industrials sectors while decreasing its weighting in the Information Technology and Energy sectors.
The 21st Century Fund has tended to have a relatively high portfolio turnover level because of its investment style. Although the Fund may hold core positions for some time, it may change its portfolio composition quickly to take advantage of new opportunities or to address issues affecting particular holdings.
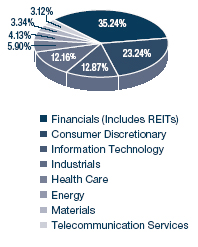
Fiscal Period-End Investment Posture
As of September 30, 2010, the Fund’s primary economic sector allocations were in the following areas: Financials, Consumer Discretionary, Information Technology, and Industrials. The Fund had little or no exposure to the Utilities and Consumer Staples sectors.
Sincerely,
CORYDON J. GILCHRIST, CFA
PORTFOLIO MANAGER
| Total returns are based on net change in net asset value assuming reinvestment of distributions. For the period prior to March 31, 2004, the performance returns for the 21st Century Fund reflect a fee waiver in effect; in the absence of such a waiver, the returns would have been reduced. For the period beginning April 2004 through January 2005, performance returns for the Fund would have been higher but for the reimbursement of fees waived previously. A redemption fee of 2% may be imposed on redemptions or exchanges of Fund shares owned for 30 days or less. Please see the Prospectus for more information. |
21ST CENTURY FUND OVERVIEW |
September 30, 2010 (Unaudited)
The 21st Century Fund invests primarily in common stocks that are selected for their long-term growth potential. The Fund may invest in companies of any size, and will normally hold a core position of between 35 and 50 common stocks.
| TOTAL ANNUAL OPERATING EXPENSES* | 1.38% | NET ASSETS | | NET ASSET VALUE PER SHARE | $12.38 |
| | |
GROWTH OF $10,000(1)(2) | PERFORMANCE COMPARISON |
| | |
| |
| | |
SECTOR ALLOCATION(3) | TOP FIVE HOLDINGS |
| | | |
| | |
THE PNC FINANCIAL SERVICES GROUP, INC. | |
| |
| |
| |
| | | |
| * | The Total Annual Operating expenses are reflective of the information disclosed in the Funds’ prospectus dated February 1, 2010 and may differ from the expense ratio disclosed in this report. |
The performance data quoted here represent past performance, and past performance is not a guarantee of future results. Investment return and principal value of an investment will fluctuate so that an investor’s shares, when redeemed, may be worth more or less than their original cost. Current performance may be lower or higher than the performance information quoted. To obtain performance information current to the most recent month end, please call 888-860-8686 or visit www.marsicofunds.com. A redemption fee may be imposed on redemptions or exchanges of Fund shares held for 30 days or less.
The performance included in the chart and graph does not reflect the deduction of taxes on Fund distributions or the redemption of Fund shares.
All indices are unmanaged and investors cannot invest directly in an index.
| (1) | The performance returns for the 21st Century Fund (for the period prior to march 31, 2004) reflect a fee waiver in effect; in the absence of such a waiver, the returns would be reduced. For the period beginning April 2004 through January 2005, performance returns for the 21st Century Fund would be higher but for the reimbursement of fees waived previously. |
| (2) | This chart assumes an initial investment of $10,000 made on September 30, 2000. Total returns are based on net change in NAV, assuming reinvestment of distributions. |
| (3) | Sector weightings represent the percentage of the Fund’s investments (excluding cash equivalents) in certain general sectors. These sectors may include more than one industry. The Fund’s portfolio composition is subject to change at any time. |
SCHEDULE OF INVESTMENTS
MARSICO 21st CENTURY FUND
SCHEDULE OF INVESTMENTS
September 30, 2010
| | | Number | | | | | | Percent | |
| | | of | | | | | | of Net | |
| | | Shares | | | Value | | | Assets | |
| COMMON STOCKS | | | | | | | | | |
| Aerospace & Defense | | | | | | | | | |
| Honeywell International, Inc. | | | 482,628 | | | $ | 21,206,675 | | | | 2.80 | % |
| Precision Castparts Corp. | | | 170,932 | | | | 21,768,190 | | | | 2.87 | |
| | | | | | | | 42,974,865 | | | | 5.67 | |
| | | | | | | | | | | | | |
| Apparel Retail | | | | | | | | | | | | |
| J. Crew Group, Inc.* | | | 115,403 | | | | 3,879,849 | | | | 0.51 | |
| rue21, inc.* | | | 222,658 | | | | 5,746,803 | | | | 0.76 | |
| | | | | | | | 9,626,652 | | | | 1.27 | |
| | | | | | | | | | | | | |
| Application Software | | | | | | | | | | | | |
| ANSYS, Inc.* | | | 337,651 | | | | 14,265,755 | | | | 1.88 | |
| Informatica Corporation* | | | 277,574 | | | | 10,661,617 | | | | 1.41 | |
| Nuance Communications, Inc.* | | | 828,060 | | | | 12,950,858 | | | | 1.71 | |
| salesforce.com, inc.* | | | 160,403 | | | | 17,933,056 | | | | 2.37 | |
| | | | | | | | 55,811,286 | | | | 7.37 | |
| | | | | | | | | | | | | |
| Asset Management & Custody Banks | | | | | | | | | |
| State Street Corporation | | | 501,000 | | | | 18,867,660 | | | | 2.49 | |
| | | | | | | | | | | | | |
| Broadcasting | | | | | | | | | | | | |
| CBS Corporation - Cl. B | | | 1,210,828 | | | | 19,203,732 | | | | 2.54 | |
| | | | | | | | | | | | | |
| Casinos & Gaming | | | | | | | | | | | | |
| Wynn Resorts Ltd. | | | 84,815 | | | | 7,359,398 | | | | 0.97 | |
| | | | | | | | | | | | | |
| Coal & Consumable Fuels | | | | | | | | | | | | |
| Amyris, Inc.* | | | 135,508 | | | | 2,337,513 | | | | 0.31 | |
| | | | | | | | | | | | | |
| Computer Hardware | | | | | | | | | | | | |
| Apple, Inc.* | | | 115,574 | | | | 32,794,122 | | | | 4.33 | |
| | | | | | | | | | | | | |
| Diversified Banks | | | | | | | | | | | | |
| Wells Fargo & Company | | | 1,743,359 | | | | 43,810,612 | | | | 5.78 | |
| | | | | | | | | | | | | |
| Diversified Support Services | | | | | | | | | |
| Ritchie Bros. Auctioneers, Inc. | | | 201,822 | | | | 4,191,843 | | | | 0.55 | |
| | | | | | | | | | | | | |
| Electrical Components & Equipment | | | | | | | | | |
| Sensata Technologies Holding N.V.* | | | 609,600 | | | | 12,045,696 | | | | 1.59 | |
| | | | | | | | | | | | | |
| Fertilizers & Agricultural Chemicals | | | | | | | | | |
| Monsanto Company | | | 514,106 | | | | 24,641,101 | | | | 3.25 | |
| | | | | | | | | | | | | |
| Health Care Equipment | | | | | | | | | | | | |
| Intuitive Surgical, Inc.* | | | 118,529 | | | | 33,631,418 | | | | 4.44 | |
| | | | | | | | | | | | | |
| Health Care Services | | | | | | | | | | | | |
| Emergency Medical Services | | | | | | | | | | | | |
Corporation - Cl. A* | | | 186,003 | | | | 9,904,660 | | | | 1.31 | |
| | | | | | | | | | | | | |
| Homebuilding | | | | | | | | | | | | |
| PDG Realty S.A. Empreendimentos | | | | | | | | | | | | |
e Participações | | | 636,962 | | | | 7,585,570 | | | | 1.00 | |
| | | | | | | | | | | | | |
| Homefurnishing Retail | | | | | | | | | | | | |
| Williams-Sonoma, Inc. | | | 818,963 | | | | 25,961,127 | | | | 3.43 | |
| | | | | | | | | | | | | |
| Hotels, Resorts & Cruise Lines | | | | | | | | | |
| Starwood Hotels & Resorts | | | | | | | | | | | | |
Worldwide, Inc. | | | 481,635 | | | | 25,309,919 | | | | 3.34 | |
| Internet Retail | | | | | | | | | |
| Amazon.com, Inc.* | | | 161,042 | | | | 25,293,257 | | | | 3.34 | |
| | | | | | | | | | | | | |
| Internet Software & Services | | | | | | | | | |
| OpenTable, Inc.* | | | 94,619 | | | | 6,441,662 | | | | 0.85 | |
| | | | | | | | | | | | | |
| Investment Banking & Brokerage | | | | | | | | | |
| Jefferies Group, Inc. | | | 1,014,016 | | | | 23,008,023 | | | | 3.04 | |
| Lazard Ltd. - Cl. A | | | 467,800 | | | | 16,410,424 | | | | 2.17 | |
| | | | | | | | 39,418,447 | | | | 5.21 | |
| | | | | | | | | | | | | |
| Leisure Facilities | | | | | | | | | | | | |
| Vail Resorts, Inc.* | | | 477,816 | | | | 17,927,656 | | | | 2.37 | |
| | | | | | | | | | | | | |
| Movies & Entertainment | | | | | | | | | | | | |
| The Walt Disney Company | | | 895,308 | | | | 29,643,648 | | | | 3.91 | |
| | | | | | | | | | | | | |
| Oil & Gas Exploration & Production | | | | | | | | | |
| Anadarko Petroleum Corporation | | | 351,338 | | | | 20,043,833 | | | | 2.65 | |
| OGX Petróleo e Gás Participações S.A.* | | | 622,000 | | | | 8,105,851 | | | | 1.07 | |
| | | | | | | | 28,149,684 | | | | 3.72 | |
| | | | | | | | | | | | | |
| Railroads | | | | | | | | | | | | |
| CSX Corporation | | | 551,964 | | | | 30,534,648 | | | | 4.03 | |
| | | | | | | | | | | | | |
| Real Estate Operating Companies | | | | | | | | | |
| BR Malls Participacoes S.A. | | | 770,312 | | | | 6,437,477 | | | | 0.85 | |
| | | | | | | | | | | | | |
| Real Estate Services | | | | | | | | | | | | |
| Jones Lang LaSalle, Inc. | | | 241,534 | | | | 20,837,138 | | | | 2.75 | |
| | | | | | | | | | | | | |
| Regional Banks | | | | | | | | | | | | |
| City National Corporation | | | 296,966 | | | | 15,759,986 | | | | 2.08 | |
| Columbia Banking System, Inc. | | | 231,258 | | | | 4,544,220 | | | | 0.60 | |
| First Horizon National Corporation* | | | 1,921,860 | | | | 21,928,422 | | | | 2.89 | |
| First Midwest Bancorp, Inc. | | | 515,881 | | | | 5,948,108 | | | | 0.78 | |
| Fulton Financial Corporation | | | 282,131 | | | | 2,556,107 | | | | 0.34 | |
| Glacier Bancorp, Inc. | | | 398,029 | | | | 5,811,223 | | | | 0.77 | |
| Park Sterling Bank, Inc.* | | | 419,993 | | | | 2,540,958 | | | | 0.34 | |
| The PNC Financial Services Group, Inc. | | | 701,498 | | | | 36,414,761 | | | | 4.81 | |
| | | | | | | | 95,503,785 | | | | 12.61 | |
| | | | | | | | | | | | | |
| Restaurants | | | | | | | | | | | | |
| Chipotle Mexican Grill, Inc. - Cl. A* | | | 21,567 | | | | 3,709,524 | | | | 0.49 | |
| | | | | | | | | | | | | |
| Retail REITs | | | | | | | | | | | | |
| Colony Financial, Inc. | | | 157,543 | | | | 2,911,395 | | | | 0.39 | |
| Taubman Centers, Inc. | | | 127,732 | | | | 5,698,124 | | | | 0.75 | |
| | | | | | | | 8,609,519 | | | | 1.14 | |
| | | | | | | | | | | | | |
| Thrifts & Mortgage Finance | | | | | | | | | |
| First Niagara Financial Group, Inc. | | | 1,957,025 | | | | 22,799,341 | | | | 3.01 | |
| | | | | | | | | | | | | |
| Wireless Telecommunication Services | | | | | |
| Crown Castle International Corp.* | | | 521,995 | | | | 23,046,079 | | | | 3.04 | |
| | | | | | | | | | | | | |
| TOTAL COMMON STOCKS | | | | | | | | | | | | |
| (Cost $618,614,921) | | | | | | | 734,409,039 | | | | 96.96 | |
See notes to financial statements.
SCHEDULE OF INVESTMENTS
MARSICO 21st CENTURY FUND
SCHEDULE OF INVESTMENTS (continued)
September 30, 2010
| | | Number | | | | | | Percent | |
| | | of | | | | | | of Net | |
| | | Shares | | | Value | | | Assets | |
| WARRANTS | | | | | | | | | |
| Other Diversified Financial Services | | | | | | | |
| JPMorgan Chase & Co., | | | | | | | | | |
| Strike Price: $42.42, | | | | | | | | | |
| Expiration Date: October 28, 2018* | | | 338,399 | | | $ | 3,949,116 | | | | 0.52 | % |
| | | | | | | | | | | | | |
| TOTAL WARRANTS | | | | | | | | | | | | |
| (Cost $4,242,378) | | | | | | | 3,949,116 | | | | 0.52 | |
| | | | | | | | | | | | | |
| SHORT-TERM INVESTMENTS | | | | | | | | | |
| State Street Institutional Treasury | | | | | | | | | | | | |
Money Market Fund, 0.026% | | | 26,444,360 | | | | 26,444,360 | | | | 3.49 | |
| | | | | | | | | | | | | |
| TOTAL SHORT-TERM INVESTMENTS | | | | | | | | | |
| (Cost $26,444,360) | | | | | | | 26,444,360 | | | | 3.49 | |
| | | | | | | | | | | | | |
| TOTAL INVESTMENTS | | | | | | | | | | | | |
| (Cost $649,301,659) | | | | | | | 764,802,515 | | | | 100.97 | |
| | | | | | | | | | | | | |
| Liabilities, Less Cash and Other Assets | | | | (7,364,252 | ) | | | (0.97 | ) |
| | | | | | | | | | | | | |
| NET ASSETS | | | | | | $ | 757,438,263 | | | | 100.00 | % |
| | | | | | | | | | | | | |
See notes to financial statements.
INTERNATIONAL OPPORTUNITIES FUND
INVESTMENT REVIEW BY JIM GENDELMAN (UNAUDITED)
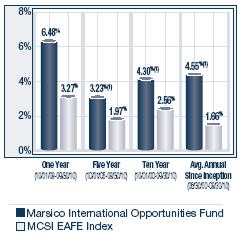
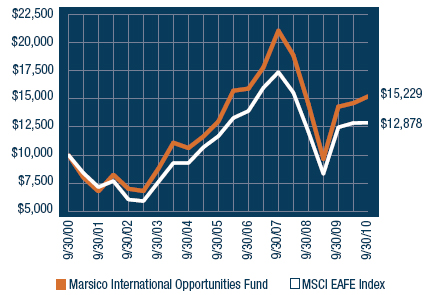
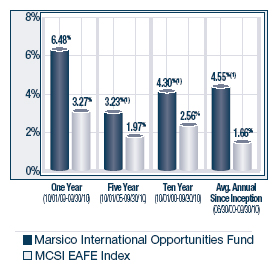
The Marsico International Opportunities Fund posted a total return of (US$) +6.48% for the one-year fiscal period ended September 30, 2010. The Fund’s return surpassed the MSCI EAFE Index, which we consider to be the Fund’s primary benchmark index and which had a total return of (US$) +3.27%. Please see the Fund Overview for more detailed information about the Fund’s longer-term performance for various time periods ended September 30, 2010.
The performance data for the Fund quoted here represent past performance, and past performance is not a guarantee of future results. Investment return and principal value of an investment will fluctuate so that an investor’s shares, when redeemed, may be worth more or less than their original cost. Current performance may be lower or higher than the performance information quoted. To obtain performance information current to the most recent month-end, please call 888-860-8686 or visit www.marsicofunds.com. (1)
This review highlights Fund performance over a one-year fiscal period. Shareholders should keep in mind that the Fund is intended for long-term investors who hold their shares for substantially longer periods of time. You should also keep in mind that our views on all investments discussed in this report are subject to change at any time. References to specific securities, industries, and sectors discussed in this report are not recommendations to buy or sell such securities or related investments, and the Fund may not necessarily hold these securities or investments today. Please see the accompanying Schedule of Investments for the percentage of the Fund’s portfolio represented by the securities mentioned in this report as of the end of the reporting period.
There were several factors that contributed to the Fund’s outperformance versus its benchmark index. Stock selection and an emphasis on the Consumer Discretionary sector aided the Fund’s performance. In aggregate, the Fund’s Consumer Discretionary positions rose +19% and significantly outperformed the MSCI EAFE Index Consumer Discretionary sector return of +13%. The Fund’s retailing and apparel holdings performed well, including fashion clothing manufacturer Industria de Diseno Textil S.A. (Inditex) (+26%), Swiss watch manufacturer Swatch Group AG (+39%), and Hong Kong-based manufacturer, exporter, and distributor of retail goods Li & Fung Ltd. (+25%). Brazilian real estate developer PDG Realty S.A. Empreendimentos e Participações (+52%) and China-based online travel company Ctrip.com International Ltd. ADR (+62%) also experienced strong stock price gains. Consumer Discretionary was among the strongest-performing sectors of the benchmark index and the Fund benefitted from having a significant portion of its net assets invested in the sector.
On average, the Fund had less exposure to the Energy and Utilities sectors than did its benchmark index. This investment posture aided the Fund as Energy and Utilities were among the weakest-performing sectors of the MSCI EAFE Index. One of the Fund’s holdings in the Energy sector had a material, positive impact on performance: Brazil-headquartered oil and natural gas exploration and production company OGX Petróleo e Gás Participações S.A. soared +69%.
Stock selection in the Information Technology sector also proved advantageous. Taiwan-based wireless handheld device company HTC Corporation (+82%), Chinese Internet search company Baidu, Inc. Spon. ADR (+120%), and Japan-headquartered semiconductor company Infineon Technologies AG (+23%) each garnered strong returns.
The Fund’s results in the Financials sector were generally strong. Financials was the weakest-performing sector of the MSCI EAFE Index with a return of -7% and the Fund did well by maintaining an underweighted allocation to the sector. Several of the Fund’s emerging markets-related investments in the sector posted strong returns, most notably India-based ICICI Bank Ltd. ADR (+31%) and Hong Kong-headquartered real estate company Hang Lung Properties Ltd. (+35%). Singapore-headquartered commercial property company CapitaLand Ltd. (+20%) was another leading holding. There were a few Financials holdings that struggled, however. Japanese bank Mizuho Financial Group, Inc. (-24%) and diversified financials company Credit Suisse Group AG (-20%) dropped sharply.
Although active currency management is not a central facet of the Fund’s investment process, currency fluctuations may at times affect its performance. For the period, currency fluctuations had a material, negative effect on results relative to the benchmark, even though some foreign currencies rose and the US dollar showed modest weakness during the period. Among other factors, the Fund had few investments in securities of companies traded in the Japan yen and Australian dollar. This detracted from the Fund’s return as the Japanese yen and Australian dollar appreciated substantially versus the US dollar and many other major world currencies.
INTERNATIONAL OPPORTUNITIES FUND
Stock selection in the Industrials and Health Care sectors did not keep pace with the performance results of their sector counterparts in the MSCI EAFE Index. In the Industrials sector, wind energy turbine manufacturers Gamesa Corporación Tecnológica S.A. and Vestas Wind Systems A/S declined -26% and -23%, respectively, prior to being sold. Alstom S.A., a power generation and rail infrastructure company, slid -28% prior to being sold from the Fund. In the Health Care sector, drug manufacturer Lonza Group AG (-35%) and healthcare products manufacturer Novartis AG (-14%) each posted double-digit declines prior to being sold from the Fund.
During the period, the Fund significantly increased its allocation to the Consumer Discretionary sector, while it reduced its exposure to the Financials sector.
The International Opportunities Fund has tended to have a relatively high portfolio turnover level because of its investment style. Although the Fund may hold core positions for some time, it may change its portfolio composition quickly to take advantage of new opportunities or to address issues affecting particular holdings.
Fiscal Period-End Investment Posture
In terms of country allocations, the Fund’s most significant weightings at period-end were the United Kingdom, Japan, Germany, China/Hong Kong, Brazil and France, although exposure to Japan and the United Kingdom represented significantly underweighted postures relative to the benchmark index. The Fund held several positions domiciled in emerging markets including China/Hong Kong, Brazil, India, South Africa, Taiwan, Argentina, and Indonesia. Such emerging markets exposure represented approximately 27% of the Fund’s net assets as of September 30, 2010. Country-level weightings generally should be considered a residual of the Fund’s stock selection process rather than a major, proactive facet of its investment strategy.
Sincerely,
JAMES G. GENDELMAN
PORTFOLIO MANAGER
| Total returns are based on net change in net asset value assuming reinvestment of distributions. For the period prior to September 30, 2004, the performance returns for the International Opportunities Fund reflect a fee waiver in effect; in the absence of such a waiver, the returns would have been reduced. For the period beginning October 2004 through December 2005, performance returns for the International Opportunities Fund would have been higher but for the reimbursement of fees waived previously. A redemption fee of 2% may be imposed on redemptions or exchanges of Fund shares owned for 30 days or less. Please see the Prospectus for more information. |
| INTERNATIONAL OPPORTUNITIES FUND OVERVIEW |
September 30, 2010 (Unaudited)
The International Opportunities Fund invests primarily in common stocks of foreign companies that are selected for their long-term growth potential. The Fund may invest in companies of any size throughout the world. It normally invests in the securities of issuers that are economically tied to one or more foreign countries, and expects to be invested in various issuers or securities that together have ties to at least four different foreign countries. Some issuers or securities in the Fund’s portfolio may be based in or economically tied to the United States. The Fund may hold an unlimited number of common stocks.
| TOTAL ANNUAL OPERATING EXPENSES* | 1.50% | NET ASSETS | | NET ASSET VALUE PER SHARE | $12.57 |
| | |
GROWTH OF $10,000(1)(2) | PERFORMANCE COMPARISON |
| | |
| |
| | |
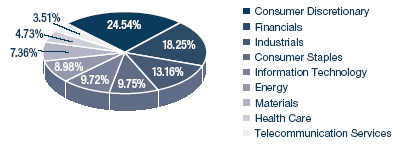
SECTOR ALLOCATION(3) | TOP FIVE HOLDINGS |
| | | |
| OGX PETRÓLEO E GÁS PARTICIPAÇÕES S.A. | |
| |
INDUSTRIA DE DISENO TEXTILE S.A. (INDITEX) | |
TEVA PHARMACEUTICAL INDUSTRIES LTD. SPON. ADR | |
BANCO BILBAO VIZCAYA ARGENTARIA S.A. | |
| | | |
| * | The total Annual Operating expenses are reflective of the information disclosed in the Funds’ prospectus dated February 1, 2010 and may differ from the expense ratio disclosed in this report. |
The performance data quoted here represent past performance, and past performance is not a guarantee of future results. Investment return and principal value of an investment will fluctuate so that an investor’s shares, when redeemed, may be worth more or less than their original cost. Current performance may be lower or higher than the performance information quoted. To obtain performance information current to the most recent month end, please call 888-860-8686 or visit www.marsicofunds.com. A redemption fee may be imposed on redemptions or exchanges of Fund shares held for 30 days or less.
The performance included in the chart and graph does not reflect the deduction of taxes on Fund distributions or the redemption of Fund shares.
All indices are unmanaged and investors cannot invest directly in an index.
| (1) | The performance returns for the International Opportunities Fund (for the period prior to September 30, 2004) reflect a fee waiver in effect; in the absence of such a waiver, the returns would be reduced. For the period beginning October 2004 through December 2005, performance returns for the International Opportunities Fund would be higher but for the reimbursement of fees waived previously. |
| (2) | This chart assumes an initial investment of $10,000 made on September 30, 2000. Total returns are based on net change in NAV, assuming reinvestment of distributions. |
| (3) | Sector weightings represent the percentage of the Fund’s investments (excluding cash equivalents) in certain general sectors. these sectors may include more than one industry. the Fund’s portfolio composition is subject to change at any time. |
The Morgan Stanley Capital International (MSCI) EAFE Index tracks the stocks of about 1,000 companies in Europe, Australasia, and the Far East (EAFE).
SCHEDULE OF INVESTMENTS
MARSICO INTERNATIONAL OPPORTUNITIES FUND
SCHEDULE OF INVESTMENTS
September 30, 2010
| | | Number | | | | | | Percent | |
| | | of | | | | | | of Net | |
| | | Shares | | | Value | | | Assets | |
| COMMON STOCKS | | | | | | | | | |
| | | | | | | | | | |
| Advertising | | | | | | | | | |
| Publicis Groupe S.A. | | | 113,172 | | | $ | 5,375,177 | | | | 1.50 | % |
| | | | | | | | | | | | | |
| Aerospace & Defense | | | | | | | | | | | | |
| Rolls-Royce Group PLC* | | | 389,620 | | | | 3,693,745 | | | | 1.03 | |
| | | | | | | | | | | | | |
| Apparel Retail | | | | | | | | | | | | |
| Industria de Diseno Textile S.A. (Inditex) | | | 136,782 | | | | 10,865,496 | | | | 3.03 | |
| | | | | | | | | | | | | |
| Apparel, Accessories & Luxury Goods | | | | | | | | |
| Adidas A.G. | | | 77,109 | | | | 4,773,448 | | | | 1.33 | |
| Swatch Group AG | | | 23,443 | | | | 8,819,902 | | | | 2.46 | |
| | | | | | | | 13,593,350 | | | | 3.79 | |
| | | | | | | | | | | | | |
| Application Software | | | | | | | | | | | | |
| Autonomy Corporation PLC* | | | 189,830 | | | | 5,406,435 | | | | 1.51 | |
| | | | | | | | | | | | | |
| Automobile Manufacturers | | | | | | | | | |
| Daimler A.G.* | | | 117,426 | | | | 7,437,365 | | | | 2.07 | |
| Honda Motor Co., Ltd. | | | 202,200 | | | | 7,176,792 | | | | 2.00 | |
| PT ASTRA International Tbk | | | 143,500 | | | | 911,647 | | | | 0.25 | |
| | | | | | | | 15,525,804 | | | | 4.32 | |
| | | | | | | | | | | | | |
| Brewers | | | | | | | | | | | | |
| Anheuser-Busch InBev N.V. | | | 95,072 | | | | 5,592,539 | | | | 1.56 | |
| | | | | | | | | | | | | |
| Building Products | | | | | | | | | | | | |
| ASSA ABLOY AB - Cl. B | | | 106,313 | | | | 2,681,346 | | | | 0.75 | |
| Daikin Industries, Ltd. | | | 94,873 | | | | 3,568,534 | | | | 0.99 | |
| | | | | | | | 6,249,880 | | | | 1.74 | |
| | | | | | | | | | | | | |
| Cable & Satellite | | | | | | | | | | | | |
| Naspers Ltd. - Cl. N | | | 41,781 | | | | 2,042,820 | | | | 0.57 | |
| | | | | | | | | | | | | |
| Communications Equipment | | | | | | | | | |
| HTC Corporation | | | 152,400 | | | | 3,458,592 | | | | 0.96 | |
| | | | | | | | | | | | | |
| Construction & Farm Machinery & Heavy Trucks | | | | | |
| Komatsu Ltd. | | | 232,500 | | | | 5,397,520 | | | | 1.50 | |
| | | | | | | | | | | | | |
| Consumer Electronics | | | | | | | | | | | | |
| Panasonic Corporation | | | 275,500 | | | | 3,732,517 | | | | 1.04 | |
| | | | | | | | | | | | | |
| Distillers & Vintners | | | | | | | | | | | | |
| Pernod-Ricard S.A. | | | 45,182 | | | | 3,772,656 | | | | 1.05 | |
| | | | | | | | | | | | | |
| Distributors | | | | | | | | | | | | |
| Li & Fung Ltd. | | | 2,092,000 | | | | 11,823,170 | | | | 3.29 | |
| | | | | | | | | | | | | |
| Diversified Banks | | | | | | | | | | | | |
| Banco Bilbao Vizcaya Argentaria S.A. | | | 802,008 | | | | 10,829,509 | | | | 3.02 | |
| Barclays PLC | | | 739,247 | | | | 3,479,203 | | | | 0.97 | |
| BNP Paribas | | | 51,786 | | | | 3,683,060 | | | | 1.02 | |
| HSBC Holdings PLC | | | 526,593 | | | | 5,335,599 | | | | 1.48 | |
| ICICI Bank Ltd. Spon. ADR | | | 199,336 | | | | 9,936,899 | | | | 2.77 | |
| Mizuho Financial Group, Inc. | | | 3,216,400 | | | | 4,700,537 | | | | 1.31 | |
| Standard Chartered PLC | | | 162,543 | | | | 4,662,485 | | | | 1.30 | |
| | | | | | | | 42,627,292 | | | | 11.87 | |
| | | | | | | | | | | | | |
| Diversified Capital Markets | | | | | | | | | |
| Credit Suisse Group AG | | | 82,209 | | | | 3,513,741 | | | | 0.98 | |
| Diversified Chemicals | | | | | | | | | |
| BASF S.E. | | | 171,602 | | | | 10,820,732 | | | | 3.01 | |
| | | | | | | | | | | | | |
| Diversified Metals & Mining | | | | | | | | | |
| Teck Resources Ltd. - Cl. B | | | 87,275 | | | | 3,589,735 | | | | 1.00 | |
| | | | | | | | | | | | | |
| Diversified Real Estate Activities | | | | | | | | | |
| CapitaLand Ltd. | | | 1,517,000 | | | | 4,683,309 | | | | 1.30 | |
| Hang Lung Properties Ltd. | | | 730,000 | | | | 3,551,751 | | | | 0.99 | |
| | | | | | | | 8,235,060 | | | | 2.29 | |
| | | | | | | | | | | | | |
| Electrical Components & Equipment | | | | | | | | | |
| Schneider Electric S.A. | | | 67,311 | | | | 8,534,760 | | | | 2.38 | |
| | | | | | | | | | | | | |
| Electronic Manufacturing Services | | | | | | | | | |
| Hon Hai Precision Industry Co., Ltd. | | | 221,059 | | | | 831,408 | | | | 0.23 | |
| | | | | | | | | | | | | |
| Food Retail | | | | | | | | | | | | |
| FamilyMart Co., Ltd. | | | 130,200 | | | | 4,668,047 | | | | 1.30 | |
| Tesco PLC | | | 823,422 | | | | 5,484,496 | | | | 1.53 | |
| | | | | | | | 10,152,543 | | | | 2.83 | |
| | | | | | | | | | | | | |
| Homebuilding | | | | | | | | | | | | |
| PDG Realty S.A. Empreendimentos | | | | | | | | | | | | |
e Participações | | | 684,700 | | | | 8,154,081 | | | | 2.27 | |
| | | | | | | | | | | | | |
| Hotels, Resorts & Cruise Lines | | | | | | | | | |
| Accor S.A. | | | 168,406 | | | | 6,149,288 | | | | 1.71 | |
| Ctrip.com International, Ltd. ADR* | | | 60,200 | | | | 2,874,550 | | | | 0.80 | |
| | | | | | | | 9,023,838 | | | | 2.51 | |
| | | | | | | | | | | | | |
| Household Products | | | | | | | | | | | | |
| Reckitt Benckiser Group PLC | | | 98,518 | | | | 5,418,213 | | | | 1.51 | |
| | | | | | | | | | | | | |
| Hypermarkets & Super Centers | | | | | | | | | |
| Metro AG | | | 55,053 | | | | 3,583,686 | | | | 1.00 | |
| | | | | | | | | | | | | |
| Industrial Conglomerates | | | | | | | | | | | | |
| Siemens A.G. | | | 84,518 | | | | 8,921,422 | | | | 2.49 | |
| | | | | | | | | | | | | |
| Internet Software & Services | | | | | | | | | |
| Alibaba.com Ltd.* | | | 888,000 | | | | 1,851,800 | | | | 0.52 | |
| Baidu, Inc. Spon. ADR* | | | 34,615 | | | | 3,552,191 | | | | 0.99 | |
| MercadoLibre, Inc.* | | | 50,400 | | | | 3,637,872 | | | | 1.01 | |
| Tencent Holdings Ltd. | | | 165,600 | | | | 3,617,701 | | | | 1.01 | |
| Yahoo Japan Corporation | | | 4,731 | | | | 1,634,428 | | | | 0.45 | |
| | | | | | | | 14,293,992 | | | | 3.98 | |
| | | | | | | | | | | | | |
| Life & Health Insurance | | | | | | | | | | | | |
| Ping An Insurance (Group) | | | | | | | | | | | | |
Company of China Ltd. - Cl. H | | | 482,000 | | | | 4,929,429 | | | | 1.37 | |
| | | | | | | | | | | | | |
| Office Electronics | | | | | | | | | | | | |
| Canon, Inc. | | | 168,100 | | | | 7,843,190 | | | | 2.19 | |
| | | | | | | | | | | | | |
| Oil & Gas Drilling | | | | | | | | | | | | |
| Seadrill Ltd. | | | 149,513 | | | | 4,319,267 | | | | 1.20 | |
| | | | | | | | | | | | | |
| Oil & Gas Equipment & Services | | | | | | | | | |
| Core Laboratories N.V. | | | 16,183 | | | | 1,424,751 | | | | 0.40 | |
| | See notes to financial statements. |
SCHEDULE OF INVESTMENTS
| | | Number | | | | | | Percent | |
| | | of | | | | | | of Net | |
| | | Shares/Units | | | Value | | | Assets | |
COMMON STOCKS (continued) | | | | | | | | | |
Oil & Gas Exploration & Production | | | | | | | |
CNOOC Ltd. | | | 1,859,800 | | | $ | 3,609,889 | | | | 1.00 | % |
| OGX Petróleo e Gás Participações S.A.* | | | 1,068,400 | | | | 13,923,298 | | | | 3.88 | |
Tullow Oil PLC | | | 399,874 | | | | 8,002,782 | | | | 2.23 | |
| | | | | | | | 25,535,969 | | | | 7.11 | |
| | | | | | | | | | | | | |
Packaged Foods & Meats | | | | | | | | | | | | |
Nestlé S.A. | | | 102,171 | | | | 5,443,089 | | | | 1.52 | |
| | | | | | | | | | | | | |
Pharmaceuticals | | | | | | | | | | | | |
Novo Nordisk A/S - Cl. B | | | 56,678 | | | | 5,624,463 | | | | 1.57 | |
Teva Pharmaceutical Industries | | | | | | | | | | | | |
Ltd. Spon. ADR | | | 205,592 | | | | 10,844,978 | | | | 3.02 | |
| | | | | | | | 16,469,441 | | | | 4.59 | |
| | | | | | | | | | | | | |
Railroads | | | | | | | | | | | | |
Canadian National Railway Company | | | 113,437 | | | | 7,262,237 | | | | 2.02 | |
| | | | | | | | | | | | | |
Real Estate Operating Companies | | | | | | | | | |
BR Malls Participacoes S.A. | | | 506,200 | | | | 4,230,300 | | | | 1.18 | |
| | | | | | | | | | | | | |
Restaurants | | | | | | | | | | | | |
Compass Group PLC | | | 422,016 | | | | 3,516,922 | | | | 0.98 | |
| | | | | | | | | | | | | |
Semiconductors | | | | | | | | | | | | |
Infineon Technologies AG* | | | 291,758 | | | | 2,020,913 | | | | 0.56 | |
| | | | | | | | | | | | | |
Specialty Chemicals | | | | | | | | | | | | |
Novozymes A/S - Cl. B | | | 24,925 | | | | 3,171,021 | | | | 0.88 | |
| | | | | | | | | | | | | |
Steel | | | | | | | | | | | | |
ThyssenKrupp AG | | | 141,015 | | | | 4,598,351 | | | | 1.28 | |
Vale SA Spon. ADR | | | 110,600 | | | | 3,458,462 | | | | 0.96 | |
| | | | | | | | 8,056,813 | | | | 2.24 | |
| | | | | | | | | | | | | |
Trading Companies & Distributors | | | | | | | | | |
Marubeni Corporation | | | 1,021,000 | | | | 5,772,784 | | | | 1.61 | |
| | | | | | | | | | | | | |
Wireless Telecommunication Services | | | | | |
Millicom International Cellular S.A. | | | 51,300 | | | | 4,922,235 | | | | 1.37 | |
MTN Group Ltd. | | | 402,949 | | | | 7,284,039 | | | | 2.03 | |
| | | | | | | | 12,206,274 | | | | 3.40 | |
| | | | | | | | | | | | | |
TOTAL COMMON STOCKS | | | | | | | | | | | | |
(Cost $271,118,597) | | | | | | | 346,432,604 | | | | 96.49 | |
| | | | | | | | | | | | | |
UNITS | | | | | | | | | | | | |
Education Services | | | | | | | | | | | | |
Anhanguera Educacional | | | | | | | | | | | | |
Participacoes S.A. | | | 102,500 | | | | 1,817,981 | | | | 0.51 | |
| | | | | | | | | | | | | |
TOTAL UNITS | | | | | | | | | | | | |
(Cost $1,813,238) | | | | | | | 1,817,981 | | | | 0.51 | |
| SHORT-TERM INVESTMENTS | | | | | | | |
| State Street Institutional Treasury | | | | | | | | | |
Money Market Fund, 0.026% | | | 151,178 | | | | 151,178 | | | | 0.04 | % |
| | | | | | | | | | | | | |
| TOTAL SHORT-TERM INVESTMENTS | | | | | | | | | |
| (Cost $151,178) | | | | | | | 151,178 | | | | 0.04 | |
| | | | | | | | | | | | | |
| TOTAL INVESTMENTS | | | | | | | | | | | | |
| (Cost $273,083,013) | | | | | | | 348,401,763 | | | | 97.04 | |
| | | | | | | | | | | | | |
| Cash and Other Assets, Less Liabilities | | | | 10,614,122 | | | | 2.96 | |
| | | | | | | | | | |
| NET ASSETS | | | | | | $ | 359,015,885 | | | | 100.00 | % |
SUMMARY OF INVESTMENTS BY COUNTRY
| Country | | Market Value | | | Percent of Investment Securities | |
| Argentina | | $ | 3,637,872 | | | | 1.04 | % |
| Belgium | | | 5,592,539 | | | | 1.61 | |
| Brazil | | | 31,584,122 | | | | 9.07 | |
| Canada | | | 10,851,972 | | | | 3.11 | |
| China/Hong Kong | | | 35,810,481 | | | | 10.28 | |
| Denmark | | | 8,795,484 | | | | 2.53 | |
| France | | | 27,514,941 | | | | 7.90 | |
| Germany | | | 42,155,917 | | | | 12.10 | |
| India | | | 9,936,899 | | | | 2.85 | |
| Indonesia | | | 911,647 | | | | 0.26 | |
| Israel | | | 10,844,978 | | | | 3.11 | |
| Japan | | | 44,494,349 | | | | 12.77 | |
| Luxembourg | | | 4,922,235 | | | | 1.41 | |
| Netherlands | | | 1,424,751 | | | | 0.41 | |
| Norway | | | 4,319,267 | | | | 1.24 | |
| Singapore | | | 4,683,309 | | | | 1.34 | |
| South Africa | | | 9,326,859 | | | | 2.68 | |
| Spain | | | 21,695,005 | | | | 6.23 | |
| Sweden | | | 2,681,346 | | | | 0.77 | |
| Switzerland | | | 17,776,732 | | | | 5.10 | |
| Taiwan | | | 4,290,000 | | | | 1.23 | |
| United Kingdom | | | 44,999,880 | | | | 12.92 | |
United States(1) | | | 151,178 | | | | 0.04 | |
| | | $ | 348,401,763 | | | | 100.00 | % |
| (1) | Includes short-term securities. |
| | See notes to financial statements. |
FLEXIBLE CAPITAL FUND
INVESTMENT REVIEW BY DOUG RAO (UNAUDITED)
The Flexible Capital Fund posted a total return of +28.68% for the one-year fiscal period ended September 30, 2010. That result significantly outpaced the return of the S&P 500 Index, which we consider to be the Fund’s primary benchmark index and which had a total return of +10.16%. Please see the Fund Overview for more detailed information about the Fund’s performance for various time periods ended September 30, 2010.
The performance data for the Fund quoted here represent past performance, and past performance is not a guarantee of future results. Investment return and principal value of an investment will fluctuate so that an investor’s shares, when redeemed, may be worth more or less than their original cost. Current performance may be lower or higher than the performance information quoted. To obtain performance information current to the most recent month-end, please call 888-860-8686 or visit www.marsicofunds.com.(1)
This review highlights Fund performance over a one-year fiscal period. Shareholders should keep in mind that the Fund is intended for long-term investors who hold their shares for substantially longer periods of time. You should also keep in mind that our views on all investments discussed in this report are subject to change at any time. References to specific securities, industries, and sectors discussed in this report are not recommendations to buy or sell such securities or related investments, and the Fund may not necessarily hold these securities or investments today. Please see the accompanying Schedule of Investments for the percentage of the Fund’s portfolio represented by the securities mentioned in this report as of the end of the reporting period.
The Fund’s strong 12-month return was attributable to investments in a variety of economic sectors, security types, and geographic regions. The Fund invests from time to time in initial public offerings (“IPOs”) of common stock or other equity or debt securities issued by a corporate issuer. Investments in IPOs made a significant, positive contribution to the Fund’s performance during the 12-month period ended September 30, 2010. There can be no assurance that similar contributions from IPOs will continue in the future.
The Fund’s Financials holdings posted an aggregate gain of +23%, while the S&P 500 Index’s Financials sector declined - -3%. The Fund’s investment process seeks to find attractive long-term investments and may invest in a variety of security types across a company’s capital structure. The Fund’s investment in Countrywide Capital V Capital Securities, 7.000% preferred stock appreciated +30%. A JPMorgan Chase & Co. warrant holding and a position in Citigroup, Inc. Tangible Dividend Enhanced Common Stock (T-DECS), a stock with both equity and fixed income characteristics, gained +15% and +35%, respectively, prior to being sold. Strong-performing common stock positions included insurance companies Primerica, Inc. (+60% prior to being sold) and Ping An Insurance (Group) Company of China Ltd. – Cl. H (+28%). The Fund established positions in Primerica and Ping An Insurance at each company’s respective IPO. The Fund also maintained investments in several real estate companies whose businesses benefitted from growth in emerging markets, including Hang Lung Properties Ltd. (+39%), BR Malls Participacoes S.A. (+43%), and Ascendas India Trust (+32%). US regional bank CVB Financial Corp. (+37% prior to being sold) was also a material contributor to performance.
A number of the Fund’s Consumer Discretionary-related holdings had notable investment results. Indian online travel reservations company MakeMyTrip Ltd. soared +163%. (The Fund participated in MakeMyTrip’s IPO.) Canada-headquartered athletic apparel company lululemon athletic, inc. (+96%), online movie rental company NetFlix, Inc. (+91%), and online travel reservations company priceline.com, Inc. (+76%) each had a significant, positive impact on performance.
The Fund’s stock selection in the Information Technology sector was a further area of strength. Chinese software and services companies Baidu Inc. Spon. ADR (+172%), Kingdee International Software Group Company Ltd. (+140% prior to being sold), and hiSoft Technology International Ltd. ADR (+144%) each posted impressive stock price gains. The Fund participated in hiSoft Technology International’s IPO.
FLEXIBLE CAPITAL FUND
Although a number of the Fund’s Financials positions performed well, several Financials positions posted negative returns, including U.S. Bancorp (-6%), The Goldman Sachs Group, Inc. (-18%), and Spain-headquartered Banco Bilbao Vizcaya Argentaria S.A. (-31% prior to being sold). The Fund’s performance was further penalized by having more exposure to the Financials sector than its benchmark index, as Financials was the sole sector of the S&P 500 Index to post a negative return.
Cash and cash equivalents averaged nearly 10% of the Fund’s net assets during the period. The Fund’s elevated cash was a “drag” on performance results during a period of generally stronger US equity returns. The Fund’s cash, including pending purchases, declined by September 30, 2010 to approximately 6% of the Fund’s net assets.
Other individual positions posting negative returns included energy company Hardy Oil & Gas PLC (-58%) and Chinese jewelry manufacturer Fuqi International Inc. (-37%). Both positions were sold from the Fund prior to September 30, 2010.
The Flexible Capital Fund has tended to have a relatively high portfolio turnover level. This is attributable in part to the Fund’s investment style. Although the Fund may hold core positions for some time, it may change its portfolio composition quickly to take advantage of new opportunities or to address issues affecting particular holdings.
During the 12-month period, the Fund significantly reduced its allocation to the Financials and Energy sectors, while increasing its allocations to the Industrials and Materials sectors.
Fiscal Period-End Investment Posture
As of September 30, 2010, the Fund’s primary economic sector allocations included Consumer Discretionary, Financials, Information Technology, and Energy. As of period-end, the Fund had more than 30% of its net assets invested in non-US companies. Approximately 20% of the Fund’s net assets were comprised of investments in emerging markets including Brazil and China/Hong Kong. Country-level weightings generally should be considered a residual of the Fund’s stock selection process rather than a major, proactive facet of its investment strategy.
Pending Expiration of Fund Expense Limitation Agreement
On January 31, 2011, an expense limitation agreement will expire under which Marsico Capital Management has been paying certain Fund expenses under the agreement that exceeded 0.75% of net assets on an annual basis through a fee waiver. This expense limitation level was set during the period when the Fund had a small asset base. As the Fund has grown substantially, Marsico Capital intends to propose a new expense limitation agreement with the Fund under which Marsico Capital will bear Fund expenses that exceed 1.60% of average net assets per year beginning February 1, 2011, in line with various other Marsico Funds. As a result, after February 1, 2011, the Fund may be obligated to pay Fund expenses up to 1.60% of average net assets per year if such a new agreement is approved.
Sincerely,
A. DOUGLAS RAO
PORTFOLIO MANAGER
| Total returns are based on net change in net asset value assuming reinvestment of distributions. The performance returns for the Flexible Capital Fund reflect a fee waiver in effect; in the absence of such a waiver, the returns would have been reduced. A redemption fee of 2% may be imposed on redemptions or exchanges of Fund shares owned for 30 days or less. Please see the Prospectus for more information. |
| FLEXIBLE CAPITAL FUND OVERVIEW |
September 30, 2010 (Unaudited)
The Flexible Capital Fund invests primarily in equity securities and other investments that are selected primarily for their long-term growth potential. The Fund may invest in issuers of any size throughout the world, and will normally hold a core position of between 20 and 50 securities or other investments.
| TOTAL ANNUAL OPERATING EXPENSES* | 2.86% | | | | |
NET EXPENSES*† | 0.77% | NET ASSETS | | NET ASSET VALUE PER SHARE | $11.97 |
| | |
GROWTH OF $10,000(1)(2) | PERFORMANCE COMPARISON |
| | |
| |
| | |
SECTOR ALLOCATION(3) | TOP FIVE HOLDINGS |
| | | |
| COUNTRYWIDE CAPITAL V, CAPITAL SECURITIES, 7.000% | |
ANHANGUERA EDUCACIONAL PARTICIPACOES S.A. | |
ODONTOPREV S.A. | |
| |
SENSATA TECHNOLOGIES HOLDING N.V. | |
| | | |
| * | The Total Annual Operating expenses and Net expenses are reflective of the information disclosed in the Funds’ prospectus dated February 1, 2010 and may differ from the expense ratios disclosed in this report. |
| † | The Adviser has entered into a written expense limitation agreement under which it has agreed to limit the total expenses of the Fund (excluding interest, taxes, acquired fund fees and expenses, litigation, brokerage and extraordinary expenses) to an annual rate of 0.75% of the Flexible Capital Fund’s average net assets until January 31, 2011. This fee waiver may be terminated at any time after January 31, 2011. The Adviser may recoup, unless it otherwise elects, any waived amount from the Fund pursuant to this arrangement if such reimbursement does not cause the Fund to exceed existing expense limitations and the reimbursement is made within three years after the year in which the Adviser incurred the expense. |
The performance data quoted here represent past performance, and past performance is not a guarantee of future results. Investment return and principal value of an investment will fluctuate so that an investor’s shares, when redeemed, may be worth more or less than their original cost. Current performance may be lower or higher than the performance information quoted. To obtain performance information current to the most recent month-end, please call 888-860-8686 or visit www.marsicofunds.com. A redemption fee may be imposed on redemptions or exchanges of Fund shares owned for 30 days or less.
Initial public offerings (“IPOs”) made a significant positive contribution to the Fund’s recent performance. there can be no assurance that similar contributions from IPOs will continue in the future.
The performance included in the chart and graph does not reflect the deduction of taxes on Fund distributions or the redemption of Fund shares.
All indices are unmanaged and investors cannot invest directly in an index.
| (1) | The performance returns for the Flexible Capital Fund reflect a fee waiver in effect; in the absence of such a waiver, the returns would be reduced. |
| (2) | This chart assumes an initial investment of $10,000 made on December 29, 2006 (inception). total returns are based on change in NAV, assuming reinvestment of distributions. |
| (3) | Sector weightings represent the percentage of the Fund’s investments (excluding cash equivalents) in certain general sectors. These sectors may include more than one industry. The Fund’s portfolio composition is subject to change at any time. |
SCHEDULE OF INVESTMENTS
MARSICO FLEXIBLE CAPITAL FUND
SCHEDULE OF INVESTMENTS
September 30, 2010
| | | Number | | | | | | Percent | |
| | | of | | | | | | of Net | |
| | | Shares | | | Value | | | Assets | |
| COMMON STOCKS | | | | | | | | | |
| | | | | | | | | | |
| Aerospace & Defense | | | | | | | | | |
| BE Aerospace, Inc.* | | | 31,798 | | | $ | 963,797 | | | | 0.73 | % |
| | | | | | | | | | | | | |
| Apparel Retail | | | | | | | | | | | | |
| Boshiwa International Holding Ltd.* | | | 55,668 | | | | 53,524 | | | | 0.04 | |
| rue21, inc.* | | | 109,842 | | | | 2,835,022 | | | | 2.14 | |
| The TJX Companies, Inc. | | | 69,354 | | | | 3,095,269 | | | | 2.34 | |
| | | | | | | | 5,983,815 | | | | 4.52 | |
| | | | | | | | | | | | | |
| Apparel, Accessories & Luxury Goods | | | | | | | | | |
| lululemon athletica, inc.* | | | 26,293 | | | | 1,175,823 | | | | 0.89 | |
| | | | | | | | | | | | | |
| Application Software | | | | | | | | | | | | |
| Informatica Corporation* | | | 99,188 | | | | 3,809,811 | | | | 2.88 | |
| Nuance Communications, Inc.* | | | 161,416 | | | | 2,524,546 | | | | 1.91 | |
| | | | | | | | 6,334,357 | | | | 4.79 | |
| | | | | | | | | | | | | |
| Auto Parts & Equipment | | | | | | | | | | | | |
| BorgWarner, Inc.* | | | 48,702 | | | | 2,562,699 | | | | 1.94 | |
| | | | | | | | | | | | | |
| Biotechnology | | | | | | | | | | | | |
| Ironwood Pharmaceuticals, Inc.* | | | 77,942 | | | | 793,450 | | | | 0.60 | |
| | | | | | | | | | | | | |
| Broadcasting | | | | | | | | | | | | |
| Discovery Communications, Inc. - Cl. A* | | | 33,686 | | | | 1,467,025 | | | | 1.11 | |
| | | | | | | | | | | | | |
| Cable & Satellite | | | | | | | | | | | | |
| The DIRECTV Group, Inc. - Cl. A* | | | 54,060 | | | | 2,250,518 | | | | 1.70 | |
| | | | | | | | | | | | | |
| Coal & Consumable Fuels | | | | | | | | | | | | |
| Amyris, Inc.* | | | 36,163 | | | | 623,812 | | | | 0.47 | |
| | | | | | | | | | | | | |
| Computer Hardware | | | | | | | | | | | | |
| Apple, Inc.* | | | 5,328 | | | | 1,511,820 | | | | 1.14 | |
| | | | | | | | | | | | | |
| Computer Storage & Peripherals | | | | | | | | | |
| Compellent Technologies, Inc.* | | | 42,069 | | | | 764,814 | | | | 0.58 | |
| | | | | | | | | | | | | |
| Construction Materials | | | | | | | | | | | | |
| Holcim Ltd.* | | | 20,819 | | | | 1,336,874 | | | | 1.01 | |
| | | | | | | | | | | | | |
| Data Processing & Outsourced Services | | | | | |
| hiSoft Technology International Ltd. ADR* | | | 59,416 | | | | 1,461,039 | | | | 1.10 | |
| | | | | | | | | | | | | |
| Department Stores | | | | | | | | | | | | |
| Nordstrom, Inc. | | | 67,110 | | | | 2,496,492 | | | | 1.89 | |
| | | | | | | | | | | | | |
| Diversified Banks | | | | | | | | | | | | |
| U.S. Bancorp | | | 143,092 | | | | 3,093,649 | | | | 2.34 | |
| Wells Fargo & Company | | | 63,836 | | | | 1,604,199 | | | | 1.21 | |
| | | | | | | | 4,697,848 | | | | 3.55 | |
| | | | | | | | | | | | | |
| Diversified Chemicals | | | | | | | | | �� | | | |
| PPG Industries, Inc. | | | 11,270 | | | | 820,456 | | | | 0.62 | |
| | | | | | | | | | | | | |
| Diversified Metals & Mining | | | | | | | | | |
| Freeport-McMoRan Copper & Gold, Inc. | | | 20,127 | | | | 1,718,645 | | | | 1.30 | |
| | | | | | | | | | | | | |
| Diversified Real Estate Activities | | | | | | | | | |
| Hang Lung Properties Ltd. | | | 537,000 | | | | 2,612,726 | | | | 1.97 | |
| Diversified Support Services | | | | | | | |
| Edenred* | | | 95,554 | | | | 1,892,736 | | | | 1.43 | |
| | | | | | | | | | | | | |
| Electrical Components & Equipment | | | | | | | | | |
| Sensata Technologies Holding N.V.* | | | 186,600 | | | | 3,687,216 | | | | 2.79 | |
| | | | | | | | | | | | | |
| Fertilizers & Agricultural Chemicals | | | | | | | | | |
| Monsanto Company | | | 74,737 | | | | 3,582,144 | | | | 2.71 | |
| | | | | | | | | | | | | |
| Health Care Equipment | | | | | | | | | | | | |
| Cardica, Inc.* | | | 92,067 | | | | 199,785 | | | | 0.15 | |
| | | | | | | | | | | | | |
| Industrial Machinery | | | | | | | | | | | | |
| Eaton Corporation | | | 28,159 | | | | 2,322,836 | | | | 1.75 | |
| | | | | | | | | | | | | |
| Internet Retail | | | | | | | | | | | | |
| MakeMyTrip Ltd.* | | | 53,424 | | | | 2,068,043 | | | | 1.56 | |
| NetFlix, Inc.* | | | 11,217 | | | | 1,818,949 | | | | 1.37 | |
| priceline.com, Inc.* | | | 4,851 | | | | 1,689,797 | | | | 1.28 | |
| | | | | | | | 5,576,789 | | | | 4.21 | |
| | | | | | | | | | | | | |
| Internet Software & Services | | | | | | | | | |
| Baidu, Inc. Spon. ADR* | | | 15,712 | | | | 1,612,365 | | | | 1.22 | |
| | | | | | | | | | | | | |
| Investment Banking & Brokerage | | | | | | | | | |
| KBW, Inc. | | | 94,258 | | | | 2,413,005 | | | | 1.82 | |
| Lazard Ltd. - Cl. A | | | 35,400 | | | | 1,241,832 | | | | 0.94 | |
| The Goldman Sachs Group, Inc. | | | 12,985 | | | | 1,877,371 | | | | 1.42 | |
| | | | | | | | 5,532,208 | | | | 4.18 | |
| | | | | | | | | | | | | |
| Life & Health Insurance | | | | | | | | | | | | |
| Ping An Insurance (Group) | | | | | | | | | | | | |
Company of China Ltd. - Cl. H | | | 312,000 | | | | 3,190,834 | | | | 2.41 | |
| | | | | | | | | | | | | |
| Managed Health Care | | | | | | | | | | | | |
| Odontoprev S.A. | | | 331,200 | | | | 3,893,362 | | | | 2.94 | |
| | | | | | | | | | | | | |
| Metal & Glass Containers | | | | | | | | | | | | |
| Owens-Illinois, Inc.* | | | 89,269 | | | | 2,504,888 | | | | 1.89 | |
| | | | | | | | | | | | | |
| Office REITs | | | | | | | | | | | | |
| Ascendas India Trust | | | 2,011,000 | | | | 1,529,161 | | | | 1.16 | |
| | | | | | | | | | | | | |
| Oil & Gas Drilling | | | | | | | | | | | | |
| Seadrill Ltd. | | | 98,100 | | | | 2,843,919 | | | | 2.15 | |
| | | | | | | | | | | | | |
| Oil & Gas Equipment & Services | | | | | | | | | |
| Core Laboratories N.V. | | | 20,936 | | | | 1,843,206 | | | | 1.39 | |
| | | | | | | | | | | | | |
| Oil & Gas Exploration & Production | | | | | | | | | |
| Anadarko Petroleum Corporation | | | 51,668 | | | | 2,947,659 | | | | 2.23 | |
| OGX Petróleo e Gás Participações S.A.* | | | 244,200 | | | | 3,182,394 | | | | 2.40 | |
| | | | | | | | 6,130,053 | | | | 4.63 | |
| | | | | | | | | | | | | |
| Packaged Foods & Meats | | | | | | | | | | | | |
| Mead Johnson Nutrition Company | | | 53,959 | | | | 3,070,807 | | | | 2.32 | |
| | | | | | | | | | | | | |
| Real Estate Operating Companies | | | | | | | | | |
| BR Malls Participacoes S.A. | | | 283,100 | | | | 2,365,859 | | | | 1.79 | |
| | | | | | | | | | | | | |
| Regional Banks | | | | | | | | | | | | |
| Columbia Banking System, Inc. | | | 38,614 | | | | 758,765 | | | | 0.57 | |
| | See notes to financial statements. |
SCHEDULE OF INVESTMENTS
MARSICO FLEXIBLE CAPITAL FUND
SCHEDULE OF INVESTMENTS (continued)
September 30, 2010
| | | Number | | | | | | Percent | |
| | | of Shares/ | | | | | | of Net | |
| | | Par Value | | | Value | | | Assets | |
COMMON STOCKS (continued) | | | | | | | | | |
| | | | | | | | | | |
| Specialty Chemicals | | | | | | | | | |
| Novozymes A/S - Cl. B | | | 14,697 | | | $ | 1,869,789 | | | | 1.41 | % |
| | | | | | | | | | | | | |
| Specialty Stores | | | | | | | | | | | | |
| L’Occitane International S.A.* | | | 462,000 | | | | 1,292,125 | | | | 0.98 | |
| | | | | | | | | | | | | |
| Systems Software | | | | | | | | | | | | |
| ChinaCache International | | | | | | | | | | | | |
Holdings Ltd. ADR*† | | | 72,210 | | | | 1,949,670 | | | | 1.47 | |
| Totvs S.A. | | | 11,300 | | | | 867,536 | | | | 0.66 | |
| | | | | | | | 2,817,206 | | | | 2.13 | |
| Wireless Telecommunication Services | | | | | |
| Crown Castle International Corp.* | | | 29,455 | | | | 1,300,438 | | | | 0.98 | |
| Sprint Nextel Corporation* | | | 143,355 | | | | 663,734 | | | | 0.50 | |
| | | | | | | | 1,964,172 | | | | 1.48 | |
| TOTAL COMMON STOCKS | | | | | | | | | | | | |
| (Cost $85,467,941) | | | | | | | 100,056,235 | | | | 75.60 | |
| | | | | | | | | | |
| CONVERTIBLE CORPORATE BONDS | | | | | | | | | |
| Oil & Gas Drilling | | | | | | | | | | | | |
Transocean, Ltd., | | | | | | | | | | | | |
1.500%, 12/15/37 | | | 2,000,000 | | | | 1,912,500 | | | | 1.45 | |
| | | | | | |
| TOTAL CONVERTIBLE CORPORATE BONDS | | | | | |
| (Cost $1,701,831) | | | | | | | 1,912,500 | | | | 1.45 | |
| | | | | | | | | | | | | |
| CORPORATE BONDS | | | | | | | | | | | | |
| General Merchandise Stores | | | | | | | | | |
| Dollar General Corporation, | | | | | | | | | | | | |
| 11.875%, 07/15/17 | | | 2,480,000 | | | | 2,901,600 | | | | 2.19 | |
| | | | | | | | | | | | | |
| Health Care Facilities | | | | | | | | | | | | |
| HCA, Inc., | | | | | | | | | | | | |
9.250%, 11/15/16 | | | 2,000,000 | | | | 2,165,000 | | | | 1.64 | |
9.625%, 11/15/16 | | | 2,658,000 | | | | 2,883,930 | | | | 2.18 | |
| | | | | | | | 5,048,930 | | | | 3.82 | |
| Investment Banking & Brokerage | | | | | | | | | |
| Schwab Capital Trust I, | | | | | | | | | | | | |
Trust Preferred Security, | | | | | | | | | | | | |
7.500%, 11/15/37 | | | 1,490,000 | | | | 1,526,833 | | | | 1.16 | |
| | | | | | |
| Wireless Telecommunication Services | | | | | |
| Crown Castle International Corp., | | | | | | | | | | | | |
9.000%, 01/15/15 | | | 2,055,000 | | | | 2,265,637 | | | | 1.71 | |
| | | | | | | | | | |
| TOTAL CORPORATE BONDS | | | | | | | | | |
| (Cost $11,345,084) | | | | | | | 11,743,000 | | | | 8.88 | |
| | | | | | | | | | | | | |
| PREFERRED STOCKS | | | | | | | | | | | | |
| Other Diversified Financial Services | | | | | | | | | |
| Countrywide Capital V, | | | | | | | | | | | | |
Capital Securities, 7.000% | | | 219,775 | | | | 5,413,058 | | | | 4.09 | |
| | | | | | | | | | |
| TOTAL PREFERRED STOCKS | | | | | | | | | |
| (Cost $4,673,523) | | | | | | | 5,413,058 | | | | 4.09 | |
| | | Number | | | | | | Percent | |
| | | of | | | | | | of Net | |
| | | Shares/Units | | | Value | | | Assets | |
| UNITS | | | | | | | | | |
| | | | | | | | | | |
| Education Services | | | | | | | | | |
| Anhanguera Educacional | | | | | | | | | |
| Participacoes S.A. | | | 266,600 | | | | 4,728,526 | | | | 3.57 | |
| | | | | | | | | | | | | |
| TOTAL UNITS | | | | | | | | | | | | |
| (Cost $4,314,741) | | | | | | | 4,728,526 | | | | 3.57 | |
| | | | | | | | | | |
| SHORT-TERM INVESTMENTS | | | | | | | | | |
| State Street Institutional Treasury | | | | | | | | | | | | |
| Money Market Fund, 0.026% | | | 17,725,943 | | | | 17,725,943 | | | | 13.39 | |
| | | | | | | | | | |
| TOTAL SHORT-TERM INVESTMENTS | | | | | | | | | |
| (Cost $17,725,943) | | | | | | | 17,725,943 | | | | 13.39 | |
| | | | | | | | | | | | | |
| TOTAL INVESTMENTS | | | | | | | | | | | | |
| (Cost $125,229,063) | | | | | | | 141,579,262 | | | | 106.98 | |
| | | | | | | | | | |
| Liabilities, Less Cash and Other Assets | | | | (9,234,701 | ) | | | (6.98 | ) |
| | | | | | | | | | | | | |
| NET ASSETS | | | | | | $ | 132,344,561 | | | | 100.00 | % |
SUMMARY OF INVESTMENTS BY COUNTRY
| Country | | Market Value | | | Percent of Investment Securities | |
| Brazil | | $ | 15,037,677 | | | | 10.62 | % |
| Canada | | | 1,175,823 | | | | 0.83 | |
| China/Hong Kong | | | 10,880,158 | | | | 7.69 | |
| Denmark | | | 1,869,789 | | | | 1.32 | |
| France | | | 1,892,736 | | | | 1.34 | |
| India | | | 3,597,204 | | | | 2.54 | |
| Luxembourg | | | 1,292,125 | | | | 0.91 | |
| Netherlands | | | 5,530,422 | | | | 3.91 | |
| Norway | | | 2,843,919 | | | | 2.01 | |
| Switzerland | | | 1,336,874 | | | | 0.94 | |
United States(1) | | | 96,122,535 | | | | 67.89 | |
| | | $ | 141,579,262 | | | | 100.00 | % |
| | | | | | | | | |
| (1) | Includes short-term securities. |
| † | The security is valued at its fair value as determined in good faith by the Adviser to the Fund, in accordance with procedures established by, and under the general supervision of the Fund’s Board of Trustees. |
| | See notes to financial statements. |
GLOBAL FUND
INVESTMENT REVIEW BY CORY GILCHRIST, TOM MARSICO AND JIM GENDELMAN (UNAUDITED)
The Marsico Global Fund posted a total return of +16.01% for the one-year fiscal period ended September 30, 2010. The Fund solidly outperformed the MSCI All Country World Index (MSCI ACWI Index), which we consider to be the Fund’s primary benchmark index and which had a total return of +8.42%. The MSCI ACWI Index measures equity market performance in the global developed and emerging markets. Please see the Fund Overview for more detailed information about the Fund’s performance for various time periods ended September 30, 2010.
The performance data for the Fund quoted here represent past performance, and past performance is not a guarantee of future results. Investment return and principal value of an investment will fluctuate so that an investor’s shares, when redeemed, may be worth more or less than their original cost. Current performance may be lower or higher than the performance information quoted. To obtain performance information current to the most recent month-end, please call 888-860-8686 or visit www.marsicofunds.com.(1)
This review highlights Fund performance over a one-year fiscal period. Shareholders should keep in mind that the Fund is intended for long-term investors who hold their shares for substantially longer periods of time. You should also keep in mind that our views on all investments discussed in this report are subject to change at any time. References to specific securities, industries, and sectors discussed in this report are not recommendations to buy or sell such securities or related investments, and the Fund may not necessarily hold these securities or investments today. Please see the accompanying Schedule of Investments for the percentage of the Fund’s portfolio represented by the securities mentioned in this report as of the end of the reporting period.
There were several factors that contributed to the Global Fund’s strong performance for the one-year period ended September 30, 2010 as compared with the MSCI ACWI Index.
The leading contributor to the Fund’s performance results was stock selection and an emphasis on the Consumer Discretionary sector. In the aggregate, the Fund’s Consumer Discretionary positions soared +34%. Apparel and retailing positions performed well, including Swiss luxury goods provider Compagnie Financière Richemont SA (+49%), fashion clothing manufacturer Industria de Diseno Textile S.A. (Inditex) +24%, Canada-headquartered athletic apparel company lululemon athletica, inc. (+97%), and Hong Kong-based manufacturer, exporter, and distributor of retail goods Li & Fung Ltd. (+41%). Restaurant operator Chipotle Mexican Grill, Inc. – Cl. A (+76%) was another leading holding in the sector. Consumer Discretionary was the strongest-performing sector of the benchmark index. As such, the Fund also benefitted from having a significant portion of its net assets invested in the sector.
A number of the Fund’s Information Technology-related positions posted sizable stock price gains. China-headquartered Internet search services company Baidu, Inc. Spon. ADR (+167%), Apple, Inc. (+53%), online restaurant reservations software company OpenTable, Inc. (+125%), Latin American e-commerce company MercadoLibre, Inc. (+51%), and technology services company hiSoft Technology International Ltd. ADR (+146%) were leading holdings. (The Fund purchased hiSoft Technology International at its initial public offering (“IPO.”))
Stock selection in the Financials sector was also a material contributor to the Fund’s return. Many of the Fund’s financials positions economically tied to emerging markets performed well. Real estate holdings BR Malls Participacoes S.A. (+43%), a Brazilian shopping mall management company, and Hong Kong-headquartered property management company Hang Lung Properties Ltd. (+35%), generated strong returns. Chinese insurance company Ping An Insurance (Group) Company of China Ltd. – Cl. H (+28%) rose following its initial public offering. Other strong-performing positions included India’s largest bank, ICICI Bank Ltd. Spon. ADR (+31%) and Brazil-based bank Itaú Unibanco Holding S.A. ADR (+14% prior to being sold from the Fund).
The Fund had few investments in the Energy sector. This positioning benefited the Fund, as Energy was among the weakest-performing sectors of the MSCI ACWI Index during the period. OGX Petróleo e Gás Participações S.A., a Brazil-based oil and natural gas exploration and production company, gained +73% and was a material positive contributor to the Fund’s performance.
There were a few areas of weakness for the Fund during the period. In the Health Care sector, Lonza Group AG (-27%) and Gilead Sciences, Inc. (-11%) traded down prior to being sold from the Fund. While stock selection in the Financials sector was generally strong, as discussed earlier, several US and European financials holdings posted double-digit negative returns during the period they were held by the Fund, including Wells Fargo & Company (-10%), United Kingdom-based HSBC Holdings PLC (-22% prior to being sold), Spain-headquartered Banco Bilbao Vizcaya Argentaria S.A. (-18% prior to being sold), JPMorgan Chase & Co. (-13% prior to being sold), State Street Corporation (-21%), and The Goldman Sachs Group, Inc. (-17% prior to being sold). Financial reform initiatives in the US and Europe were headwinds for many US and European financial companies and the Fund lightened its exposure to such companies during the period.
GLOBAL FUND
The Fund’s positioning in the Industrials sector was less than optimal in two respects. First, the Fund had relatively little exposure to the sector during the period. This represented an opportunity cost for the Fund as the Industrials sector fared better than many other sectors of the benchmark index during the 12-month period. Second, the Fund’s stock selection within the sector was disappointing. Denmark-based wind turbine energy company Vestas Wind Systems A/S skidded -23% and was sold from the Fund.
Although currency management is not a central facet of the Fund’s investment process, fluctuations in major world currencies can sometimes affect the Fund’s performance results. Though there was a significant amount of turbulence in currency movements during the period, the net effect on the Fund’s performance was overall neutral. For example, the Fund was negatively impacted by having little exposure to companies whose securities are tied to the stronger Japanese yen. Much of this negative impact, however, was offset by the Fund’s overweight to securities denominated in the Swiss franc, which was another strong-performing currency during the reporting period.
Over its relatively short history, the Global Fund has tended to have a fairly high portfolio turnover level. Although the Fund may hold core positions for some time, it may change its portfolio composition quickly to take advantage of new opportunities or to address issues affecting particular holdings.
The Fund invests from time to time in initial public offerings (“IPOs”) of common stock or other equity or debt securities issued by a corporate issuer. Investments in IPOs made a meaningful positive contribution to the Fund’s performance during the 12-month period ended September 30, 2010. There can be no assurance that similar contributions from IPOs will continue in the future.
Fiscal Period-End Investment Posture
As of September 30, 2010, the Fund’s primary economic sector allocations were in the following areas: Consumer Discretionary, Financials, Information Technology, Materials, and Industrials. The Fund’s most significant country allocations were the US, Switzerland, China/Hong Kong, Brazil and Spain. As of period-end, the Fund had approximately 27% of its net assets invested in companies domiciled in emerging markets including China/Hong Kong, Brazil, India and Argentina. These markets may be more volatile than markets in more developed countries. Country-level weightings generally should be considered a residual of the Fund’s stock selection process rather than a major, proactive facet of its investment strategy.
Sincerely,
CORYDON J. GILCHRIST, CFA
THOMAS F. MARSICO
JAMES G. GENDELMAN
PORTFOLIO MANAGERS
| Total returns are based on net change in net asset value assuming reinvestment of distributions. For the period prior to December 31, 2008 and from April through May 2009, the performance returns for the Global Fund reflect a fee waiver in effect; in the absence of such a waiver, the returns would have been reduced. For the one-month period of June 2009, performance returns for the Global Fund would have been higher but for the reimbursement of fees waived previously. A redemption fee of 2% may be imposed on redemptions or exchanges of Fund shares owned for 30 days or less. Please see the Prospectus for more information. |
September 30, 2010 (Unaudited)
The Global Fund invests primarily in common stocks that are selected for their long-term growth potential. The Fund invests in the securities of companies of any size that are economically tied to any countries or markets throughout the world, including the securities of companies economically tied to emerging markets. Under normal market conditions, the Fund will invest significantly (generally, at least 40% of its net assets) in the securities of issuers organized or located outside the U.S. or doing business outside the U.S. (unless market conditions are not deemed favorable by the Adviser, in which case the Fund generally will invest at least 30% of its assets in such foreign securities). The Fund will invest its assets in various regions and countries, including the U.S., that encompass not less than three different countries overall. The Fund may hold an unlimited number of common stocks.
| TOTAL ANNUAL OPERATING EXPENSES* | 1.60% | NET ASSETS | | NET ASSET VALUE PER SHARE | $9.90 |
| | |
GROWTH OF $10,000(1)(2) | PERFORMANCE COMPARISON |
| | |
| |
| | |
SECTOR ALLOCATION(3) | TOP FIVE HOLDINGS |
| | | |
| INDUSTRIA DE DISENO TEXTILE S.A. (INDITEX) | |
| |
COMPAGNIE FINANCIÈRE RICHEMONT SA | |
OGX PETRÓLEO E GÁS PARTICIPAÇÕES S.A. | |
| |
| | | |
| * | The Total Annual Operating expenses are reflective of the information disclosed in the Funds’ prospectus dated February 1, 2010 and may differ from the expense ratio disclosed in this report. |
The performance data quoted here represent past performance, and past performance is not a guarantee of future results. Investment return and principal value of an investment will fluctuate so that an investor’s shares, when redeemed, may be worth more or less than their original cost. Current performance may be lower or higher than the performance information quoted. To obtain performance information current to the most recent month-end, please call 888-860-8686 or visit www.marsicofunds.com. A redemption fee may be imposed on redemptions or exchanges of Fund shares held for 30 days or less.
Initial public offerings (“IPOs”) made a significant positive contribution to the Fund’s recent performance. There can be no assurance that similar contributions from IPOs will continue in the future.
The performance included in the chart and graph does not reflect the deduction of taxes on Fund distributions or the redemption of Fund shares.
All indices are unmanaged and investors cannot invest directly in an index.
| (1) | The performance returns for the Global Fund (for the period prior to December 31, 2008 and from April through may 2009) reflect a fee waiver in effect; in absence of such a waiver, the returns would be reduced. For the one-month period June 2009, performance returns for the Global Fund would have been higher but for reimbursement of fees waived previously. |
| (2) | This chart assumes an initial investment of $10,000 made on June 29, 2007 (inception). Total returns are based on change in NAV, assuming reinvestment of distributions. |
| (3) | Sector weightings represent the percentage of the Fund’s equity investments in certain general sectors. These sectors may include more than one industry. the Fund’s portfolio composition is subject to change at any time. |
The MSCI ACWI (All Country World Index) Index is a free float-adjusted market capitalization index that is designed to measure equity market performance in the global developed and emerging markets.
SCHEDULE OF INVESTMENTS
MARSICO GLOBAL FUND
SCHEDULE OF INVESTMENTS
September 30, 2010
| | | Number | | | | | | Percent | |
| | | of | | | | | | of Net | |
| | | Shares | | | Value | | | Assets | |
| COMMON STOCKS | | | | | | | | | |
| | | | | | | | | | |
| Aerospace & Defense | | | | | | | | | |
| Precision Castparts Corp. | | | 22,306 | | | $ | 2,840,669 | | | | 2.45 | % |
| | | | | | | | | | | | | |
| Apparel Retail | | | | | | | | | | | | |
| Boshiwa International Holding Ltd.* | | | 56,035 | | | | 53,877 | | | | 0.05 | |
| Industria de Diseno Textile S.A. (Inditex) | | | 71,348 | | | | 5,667,642 | | | | 4.88 | |
| rue21, inc.* | | | 30,632 | | | | 790,612 | | | | 0.68 | |
| | | | | | | | 6,512,131 | | | | 5.61 | |
| | | | | | | | | | | | | |
| Apparel, Accessories & Luxury Goods | | | | | | | | | |
| Compagnie Financière Richemont SA | | | 93,396 | | | | 4,496,580 | | | | 3.87 | |
| lululemon athletica, inc.* | | | 13,546 | | | | 605,777 | | | | 0.52 | |
| | | | | | | | 5,102,357 | | | | 4.39 | |
| | | | | | | | | | | | | |
| Application Software | | | | | | | | | | | | |
| ANSYS, Inc.* | | | 32,180 | | | | 1,359,605 | | | | 1.17 | |
| AutoNavi Holdings Ltd. ADR* | | | 19,500 | | | | 341,250 | | | | 0.29 | |
| Nuance Communications, Inc.* | | | 96,129 | | | | 1,503,458 | | | | 1.30 | |
| salesforce.com, inc.* | | | 20,935 | | | | 2,340,533 | | | | 2.02 | |
| | | | | | | | 5,544,846 | | | | 4.78 | |
| | | | | | | | | | | | | |
| Asset Management & Custody Banks | | | | | | | | | |
| Julius Baer Group Ltd. | | | 110,832 | | | | 4,034,459 | | | | 3.48 | |
| State Street Corporation | | | 67,940 | | | | 2,558,620 | | | | 2.20 | |
| | | | | | | | 6,593,079 | | | | 5.68 | |
| | | | | | | | | | | | | |
| Automobile Manufacturers | | | | | | | | | | | | |
| Bayerische Motoren Werke AG | | | 17,227 | | | | 1,208,054 | | | | 1.04 | |
| | | | | | | | | | | | | |
| Brewers | | | | | | | | | | | | |
| Anheuser-Busch InBev N.V. | | | 19,591 | | | | 1,152,426 | | | | 0.99 | |
| | | | | | | | | | | | | |
| Casinos & Gaming | | | | | | | | | | | | |
| Wynn Macau Ltd.* | | | 1,607,475 | | | | 2,784,493 | | | | 2.40 | |
| | | | | | | | | | | | | |
| Coal & Consumable Fuels | | | | | | | | | | | | |
| Amyris, Inc.* | | | 20,553 | | | | 354,539 | | | | 0.31 | |
| | | | | | | | | | | | | |
| Computer Hardware | | | | | | | | | | | | |
| Apple, Inc.* | | | 15,554 | | | | 4,413,447 | | | | 3.80 | |
| | | | | | | | | | | | | |
| Data Processing & Outsourced Services | | | | | |
| hiSoft Technology International Ltd. ADR* | | | 38,400 | | | | 944,256 | | | | 0.81 | |
| | | | | | | | | | | | | |
| Distributors | | | | | | | | | | | | |
| Li & Fung Ltd. | | | 762,000 | | | | 4,306,527 | | | | 3.71 | |
| | | | | | | | | | | | | |
| Diversified Banks | | | | | | | | | | | | |
| ICICI Bank Ltd. Spon. ADR | | | 51,148 | | | | 2,549,728 | | | | 2.20 | |
| Standard Chartered PLC | | | 29,100 | | | | 861,128 | | | | 0.74 | |
| Wells Fargo & Company | | | 218,103 | | | | 5,480,928 | | | | 4.72 | |
| | | | | | | | 8,891,784 | | | | 7.66 | |
| | | | | | | | | | | | | |
| Diversified Capital Markets | | | | | | | | | | | | |
| Credit Suisse Group AG | | | 58,550 | | | | 2,502,519 | | | | 2.16 | |
| | | | | | | | | | | | | |
| Diversified Metals & Mining | | | | | | | | | |
| BHP Billiton PLC | | | 94,842 | | | | 3,016,992 | | | | 2.60 | |
| Diversified Real Estate Activities | | | | | | | |
| Hang Lung Properties Ltd. | | | 451,000 | | | | 2,194,301 | | | | 1.89 | |
| | | | | | | | | | | | | |
| Diversified Support Services | | | | | | | | | |
| Ritchie Bros. Auctioneers, Inc. | | | 40,707 | | | | 845,484 | | | | 0.73 | |
| | | | | | | | | | | | | |
| Electrical Components & Equipment | | | | | | | | | |
| Sensata Technologies Holding N.V.* | | | 74,500 | | | | 1,472,120 | | | | 1.27 | |
| | | | | | | | | | | | | |
| Fertilizers & Agricultural Chemicals | | | | | | | | | |
| Monsanto Company | | | 66,574 | | | | 3,190,892 | | | | 2.75 | |
| | | | | | | | | | | | | |
| Health Care Equipment | | | | | | | | | | | | |
| Intuitive Surgical, Inc.* | | | 14,885 | | | | 4,223,470 | | | | 3.64 | |
| | | | | | | | | | | | | |
| Homebuilding | | | | | | | | | | | | |
| PDG Realty S.A. Empreendimentos | | | | | | | | | | | | |
e Participações | | | 122,100 | | | | 1,454,087 | | | | 1.25 | |
| | | | | | | | | | | | | |
| Hotels, Resorts & Cruise Lines | | | | | | | | | |
| Starwood Hotels & Resorts | | | | | | | | | | | | |
Worldwide, Inc. | | | 68,978 | | | | 3,624,794 | | | | 3.12 | |
| | | | | | | | | | | | | |
| Internet Retail | | | | | | | | | | | | |
| Amazon.com, Inc.* | | | 18,352 | | | | 2,882,365 | | | | 2.48 | |
| MakeMyTrip Ltd.* | | | 11,221 | | | | 434,365 | | | | 0.38 | |
| | | | | | | | 3,316,730 | | | | 2.86 | |
| | | | | | | | | | | | | |
| Internet Software & Services | | | | | | | | | |
| Baidu, Inc. Spon. ADR* | | | 7,940 | | | | 814,803 | | | | 0.70 | |
| MercadoLibre, Inc.* | | | 38,200 | | | | 2,757,276 | | | | 2.38 | |
| OpenTable, Inc.* | | | 13,165 | | | | 896,273 | | | | 0.77 | |
| | | | | | | | 4,468,352 | | | | 3.85 | |
| | | | | | | | | | | | | |
| Life & Health Insurance | | | | | | | | | | | | |
| Ping An Insurance (Group) | | | | | | | | | | | | |
Company of China Ltd. - Cl. H | | | 278,000 | | | | 2,843,115 | | | | 2.45 | |
| | | | | | | | | | | | | |
| Marine | | | | | | | | | | | | |
| Kuehne + Nagel International AG | | | 21,337 | | | | 2,562,220 | | | | 2.21 | |
| | | | | | | | | | | | | |
| Movies & Entertainment | | | | | | | | | | | | |
| The Walt Disney Company | | | 70,259 | | | | 2,326,275 | | | | 2.00 | |
| | | | | | | | | | | | | |
| Oil & Gas Exploration & Production | | | | | | | | | |
| Anadarko Petroleum Corporation | | | 20,919 | | | | 1,193,429 | | | | 1.03 | |
| OGX Petróleo e Gás Participações S.A.* | | | 343,400 | | | | 4,475,159 | | | | 3.85 | |
| | | | | | | | 5,668,588 | | | | 4.88 | |
| | | | | | | | | | | | | |
| Packaged Foods & Meats | | | | | | | | | | | | |
| Nestlé S.A. | | | 42,816 | | | | 2,280,993 | | | | 1.96 | |
| | | | | | | | | | | | | |
| Real Estate Operating Companies | | | | | | | | | |
| BR Malls Participacoes S.A. | | | 474,200 | | | | 3,962,877 | | | | 3.41 | |
| | | | | | | | | | | | | |
| Real Estate Services | | | | | | | | | | | | |
| IFM Investments Ltd. ADR* | | | 105,000 | | | | 630,000 | | | | 0.54 | |
See notes to financial statements.
| | | Number | | | | | | Percent | |
| | | of | | | | | | of Net | |
| | | Shares/Units | | | Value | | | Assets | |
COMMON STOCKS (continued) | | | | | | | | | |
| | | | | | | | | | |
| Regional Banks | | | | | | | | | |
| First Midwest Bancorp, Inc. | | | 78,864 | | | $ | 909,302 | | | | 0.78 | % |
| | | | | | | | | | | | | |
| Restaurants | | | | | | | | | | | | |
| Chipotle Mexican Grill, Inc. - Cl. A* | | | 3,301 | | | | 567,772 | | | | 0.49 | |
| | | | | | | | | | | | | |
| Specialized Finance | | | | | | | | | | | | |
| CME Group, Inc. | | | 5,408 | | | | 1,408,514 | | | | 1.21 | |
| | | | | | | | | | | | | |
| Specialty Chemicals | | | | | | | | | | | | |
| Novozymes A/S - Cl. B | | | 22,424 | | | | 2,852,837 | | | | 2.46 | |
| | | | | | | | | | | | | |
| Wireless Telecommunication Services | | | | | |
| Crown Castle International Corp.* | | | 68,717 | | | | 3,033,856 | | | | 2.61 | |
| | | | | | | | | | | | | |
| TOTAL COMMON STOCKS | | | | | | | | | | | | |
| (Cost $85,153,553) | | | | | | | 110,004,698 | | | | 94.75 | |
| | | | | | | | | | | | | |
| UNITS | | | | | | | | | | | | |
| | | | | | | | | | | | | |
| Education Services | | | | | | | | | | | | |
| Anhanguera Educacional | | | | | | | | | | | | |
Participacoes S.A. | | | 64,800 | | | | 1,149,319 | | | | 0.99 | |
| | | | | | | | | | | | | |
| TOTAL UNITS | | | | | | | | | | | | |
| (Cost $1,146,723) | | | | | | | 1,149,319 | | | | 0.99 | |
| | | | | | | | | | | | | |
| SHORT-TERM INVESTMENTS | | | | | | | | | |
| State Street Institutional Treasury | | | | | | | | | | | | |
Money Market Fund, 0.026% | | | 4,400,007 | | | | 4,400,007 | | | | 3.79 | |
| | | | | | | | | | | | | |
| TOTAL SHORT-TERM INVESTMENTS | | | | | | | | | |
| (Cost $4,400,007) | | | | | | | 4,400,007 | | | | 3.79 | |
| | | | | | | | | | | | | |
| TOTAL INVESTMENTS | | | | | | | | | | | | |
| (Cost $90,700,283) | | | | | | | 115,554,024 | | | | 99.53 | |
| | | | | | | | | | | | | |
| Cash and Other Assets, Less Liabilities | | | | | | | 547,338 | | | | 0.47 | |
| | | | | | | | | | | | | |
| NET ASSETS | | | | | | $ | 116,101,362 | | | | 100.00 | % |
SUMMARY OF INVESTMENTS BY COUNTRY
| | | | | | Percent of | |
| | | | | | Investment | |
| Country | | Market Value | | | Securities | |
| Argentina | | $ | 2,757,276 | | | | 2.38 | % |
| Australia | | | 3,016,992 | | | | 2.61 | |
| Belgium | | | 1,152,426 | | | | 1.00 | |
| Brazil | | | 11,041,442 | | | | 9.55 | |
| Canada | | | 1,451,261 | | | | 1.25 | |
| China/Hong Kong | | | 14,912,622 | | | | 12.93 | |
| Denmark | | | 2,852,837 | | | | 2.47 | |
| Germany | | | 1,208,054 | | | | 1.04 | |
| India | | | 2,984,093 | | | | 2.59 | |
| Netherlands | | | 1,472,120 | | | | 1.27 | |
| Spain | | | 5,667,642 | | | | 4.90 | |
| Switzerland | | | 15,876,771 | | | | 13.74 | |
| United Kingdom | | | 861,128 | | | | 0.74 | |
United States(1) | | | 50,299,360 | | | | 43.53 | |
| | | $ | 115,554,024 | | | | 100.00 | % |
| (1) | Includes short-term securities. |
| | See notes to financial statements. |
FINANCIAL STATEMENTS
STATEMENTS OF ASSETS AND LIABILITIES
September 30, 2010
| | | MARSICO | | | MARSICO | |
| | | FOCUS FUND | | | GROWTH FUND | |
| (Amounts in thousands) | | | | | | |
| | | | | | | |
| ASSETS | | | | | | |
| | | | | | | |
Investments, at value (cost $1,124,655, $675,866, $649,302, | | | | | | |
$273,083, $125,229 and $90,700, respectively) | | $ | 1,445,827 | | | $ | 894,910 | |
| Cash | | | — | | | | — | |
Receivable for investments sold | | | 8,753 | | | | 4,623 | |
Receivable for capital stock sold | | | 661 | | | | 186 | |
Interest and dividends receivable | | | 2,140 | | | | 821 | |
Due from adviser | | | — | | | | — | |
Prepaid expenses and other assets | | | 815 | | | | 428 | |
Total Assets | | | 1,458,196 | | | | 900,968 | |
| | | | | | | | | |
| LIABILITIES | | | | | | | | |
Payable for investments purchased | | | 940 | | | | 12,902 | |
Payable for capital stock redeemed | | | 2,238 | | | | 3,103 | |
Accrued investment advisory fee | | | 1,048 | | | | 608 | |
Accrued transfer agent fees and expenses | | | 201 | | | | 127 | |
Accrued trustees’ fees | | | 738 | | | | 385 | |
Accrued printing expenses | | | 289 | | | | 151 | |
Accrued distribution fee | | | 727 | | | | 559 | |
Due to custodian | | | — | | | | — | |
Accrued expenses and other liabilities | | | 138 | | | | 80 | |
Total Liabilities | | | 6,319 | | | | 17,915 | |
| | | | | | | | | |
| NET ASSETS | | $ | 1,451,877 | | | $ | 883,053 | |
| | | | | | | | | |
| NET ASSETS CONSIST OF | | | | | | | | |
Paid-in-capital | | $ | 1,425,483 | | | $ | 907,013 | |
Undistributed net investment income | | | | | | | | |
(accumulated net investment loss) | | | (1,147 | ) | | | (172 | ) |
Accumulated net realized loss on investments and | | | | | | | | |
foreign currency transactions | | | (293,655 | ) | | | (242,856 | ) |
Net unrealized appreciation on investments | | | | | | | | |
and foreign currency translations | | | 321,196 | | | | 219,068 | |
| NET ASSETS | | $ | 1,451,877 | | | $ | 883,053 | |
| | | | | | | | | |
| SHARES OUTSTANDING, $0.001 par value | | | 91,952 | | | | 51,826 | |
(Unlimited shares authorized) | | | | | | | | |
| | | | | | | | | |
| NET ASSET VALUE, REDEMPTION PRICE, | | | | | | | | |
| AND OFFERING PRICE PER SHARE | | | | | | | | |
| (NET ASSETS/SHARES OUTSTANDING)* | | $ | 15.79 | | | $ | 17.04 | |
| * | Not in thousands, based on unrounded net assets and shares outstanding. |
| | See notes to financial statements. |
FINANCIAL STATEMENTS
| | | | MARSICO | | | MARSICO | | | | |
| | MARSICO | | INTERNATIONAL | | | FLEXIBLE | | | MARSICO | |
| | 21st CENTURY FUND | | OPPORTUNITIES FUND | | | CAPITAL FUND | | | GLOBAL FUND | |
| | | | | | | | | | | | | | |
| | | | | | | | | | | | | | |
| | | | | | | | | | | | | | |
| | | | | | | | | | | | | | |
| | | | | | | | | | | | | | |
| $ | 764,803 | | $ | 348,402 | | | $ | 141,579 | | | $ | 115,554 | |
| | — | | | 29 | | | | — | | | | — | |
| | 15,374 | | | 21,500 | | | | — | | | | 1,216 | |
| | 137 | | | 455 | | | | 872 | | | | 18 | |
| | 134 | | | 873 | | | | 340 | | | | 142 | |
| | — | | | — | | | | 31 | | | | — | |
| | 473 | | | 367 | | | | 458 | | | | 296 | |
| | 780,921 | | | 371,626 | | | | 143,280 | | | | 117,226 | |
| | | | | | | | | | | | | | |
| | | | | | | | | | | | | | |
| | 21,124 | | | 5,816 | | | | 10,388 | | | | 599 | |
| | 726 | | | 1,123 | | | | 2 | | | | 25 | |
| | 532 | | | 271 | | | | — | | | | 79 | |
| | 118 | | | 78 | | | | 10 | | | | 23 | |
| | 440 | | | 342 | | | | 444 | | | | 283 | |
| | 126 | | | 62 | | | | 8 | | | | 17 | |
| | 315 | | | 168 | | | | 66 | | | | 73 | |
| | — | | | 4,667 | | | | — | | | | — | |
| | 102 | | | 83 | | | | 17 | | | | 26 | |
| | 23,483 | | | 12,610 | | | | 10,935 | | | | 1,125 | |
| | | | | | | | | | | | | | |
| $ | 757,438 | | $ | 359,016 | | | $ | 132,345 | | | $ | 116,101 | |
| | | | | | | | | | | | | | |
| | | | | | | | | | | | | | |
| $ | 1,349,648 | | $ | 485,945 | | | $ | 116,590 | | | $ | 118,597 | |
| | | | | | | | | | | | | | |
| | (395 | ) | | 726 | | | | 425 | | | | (855 | ) |
| | | | | | | | | | | | | | |
| | (707,333 | ) | | (202,988 | ) | | | (1,120 | ) | | | (26,548 | ) |
| | | | | | | | | | | | | | |
| | 115,518 | | | 75,333 | | | | 16,450 | | | | 24,907 | |
| $ | 757,438 | | $ | 359,016 | | | $ | 132,345 | | | $ | 116,101 | |
| | | | | | | | | | | | | | |
| | 61,188 | | | 28,572 | | | | 11,054 | | | | 11,728 | |
| | | | | | | | | | | | | | |
| | | | | | | | | | | | | | |
| | | | | | | | | | | | | | |
| | | | | | | | | | | | | | |
| $ | 12.38 | | $ | 12.57 | | | $ | 11.97 | | | $ | 9.90 | |
FINANCIAL STATEMENTS
STATEMENTS OF OPERATIONS
FOR THE YEAR ENDED September 30, 2010
| | | MARSICO | | | MARSICO | |
| (Amounts in thousands) | | FOCUS FUND | | | GROWTH FUND | |
| | | | | | | |
| INVESTMENT INCOME | | | | | | |
Dividends (net of $270, $136, $187, $886, $7, | | | | | | |
and $78 of non-reclaimable foreign withholding taxes) | | $ | 24,474 | | | $ | 13,804 | |
Interest | | | 37 | | | | 1 | |
Total Investment Income | | | 24,511 | | | | 13,805 | |
| | | | | | | | | |
| EXPENSES | | | | | | | | |
Investment advisory fees | | | 16,303 | | | | 8,563 | |
Distribution fees | | | 4,795 | | | | 2,519 | |
Transfer agent fees and expenses | | | 2,605 | | | | 1,285 | |
Printing and postage expenses | | | 617 | | | | 212 | |
Custody and fund accounting fees | | | 278 | | | | 204 | |
Trustees’ fees and expenses | | | 264 | (1) | | | 146 | (1) |
Fund administration fees | | | 244 | | | | 198 | |
Professional fees | | | 223 | | | | 120 | |
Miscellaneous | | | 191 | | | | 104 | |
Federal and state registration fees | | | 80 | | | | 57 | |
Total Expenses | | | 25,600 | | | | 13,408 | |
Less waiver of expenses and expenses paid indirectly | | | (2 | ) | | | (1 | ) |
Net Expenses | | | 25,598 | | | | 13,407 | |
| | | | | | | | | |
| NET INVESTMENT INCOME (LOSS) | | | (1,087 | ) | | | 398 | |
| | | | | | | | | |
| REALIZED AND UNREALIZED GAIN/LOSS | | | | | | | | |
Net realized gain on investments | | | 266,464 | | | | 150,487 | |
Net realized gain (loss) on foreign currency transactions | | | (34 | ) | | | (1 | ) |
Change in unrealized appreciation/depreciation on | | | | | | | | |
investments and foreign currency translations | | | (91,316 | ) | | | (31,263 | ) |
| | | | | | | | | |
Net Gain on Investments | | | 175,114 | | | | 119,223 | |
| | | | | | | | | |
| NET INCREASE IN NET ASSETS | | | | | | | | |
| RESULTING FROM OPERATIONS | | $ | 174,027 | | | $ | 119,621 | |
| Amounts include trustees’ fees and expenses and the mark to market unrealized appreciation (depreciation) during the period for shares held in the Trustees’ Deferred Plan, as more fully described in Note 2(g) in the Notes to Financial Statements. |
| | | Trustees’ | | | Unrealized | |
| | | Fees and | | | Appreciation | |
| | | Expenses* | | | (Depreciation)* | |
| Focus Fund | | $ | 205,402 | | | $ | 58,865 | |
| Growth Fund | | | 110,744 | | | | 35,275 | |
21st Century Fund | | | 89,938 | | | | 25,485 | |
| International Opportunities Fund | | | 47,611 | | | | 21,002 | |
| Flexible Capital Fund | | | 5,188 | | | | 80,230 | |
| Global Fund | | | 12,224 | | | | 35,315 | |
| | See notes to financial statements. |
FINANCIAL STATEMENTS
| | | | MARSICO | | | MARSICO | | | | |
| | MARSICO | | INTERNATIONAL | | | FLEXIBLE | | | MARSICO | |
| | 21st CENTURY FUND | | OPPORTUNITIES FUND | | | CAPITAL FUND | | | GLOBAL FUND | |
| | | | | | | | | | | | | | |
| | | | | | | | | | | | | | |
| | | | | | | | | | | | | | |
| $ | 6,397 | | $ | 7,573 | | | $ | 813 | | | $ | 1,064 | |
| | 72 | | | 2 | | | | 325 | | | | 1 | |
| | 6,469 | | | 7,575 | | | | 1,138 | | | | 1,065 | |
| | | | | | | | | | | | | | |
| | | | | | | | | | | | | | |
| | 7,165 | | | 3,513 | | | | 466 | | | | 931 | |
| | 2,108 | | | 1,033 | | | | 137 | | | | 274 | |
| | 1,318 | | | 680 | | | | 67 | | | | 136 | |
| | 218 | | | 117 | | | | 12 | | | | 23 | |
| | 214 | | | 576 | | | | 87 | | | | 131 | |
| | 115 | | | 69 | (1) | | | 85 | (1) | | | 48 | (1) |
| | 190 | | | 176 | | | | 63 | | | | 104 | |
| | 95 | | | 52 | | | | 6 | | | | 13 | |
| | 83 | | | 38 | | | | 7 | | | | 12 | |
| | 40 | | | 30 | | | | 19 | | | | 20 | |
| | 11,546 | | | 6,284 | | | | 949 | | | | 1,692 | |
| | (1) | | | — | | | | (538 | ) | | | — | |
| | 11,545 | | | 6,284 | | | | 411 | | | | 1,692 | |
| | | | | | | | | | | | | | |
| | (5,076) | | | 1,291 | | | | 727 | | | | (627 | ) |
| | | | | | | | | | | | | | |
| | | | | | | | | | | | | | |
| | 186,490 | | | 31,713 | | | | 4,987 | | | | 21,046 | |
| | 3,484 | | | 1,978 | | | | (180 | ) | | | 5 | |
| | | | | | | | | | | | | | |
| | (123,379) | | | (10,812 | ) | | | 10,612 | | | | (3,921 | ) |
| | | | | | | | | | | | | | |
| | 66,595 | | | 22,879 | | | | 15,419 | | | | 17,130 | |
| | | | | | | | | | | | | | |
| | | | | | | | | | | | | | |
| $ | 61,519 | | $ | 24,170 | | | $ | 16,146 | | | $ | 16,503 | |
FINANCIAL STATEMENTS
STATEMENTS OF CHANGES IN NET ASSETS
| | | MARSICO | | | MARSICO | |
| | | FOCUS FUND | | | GROWTH FUND | |
| | | | | | | | | | | | | |
| | | Year Ended | | | Year Ended | | | Year Ended | | | Year Ended | |
| (Amounts in thousands) | | 9/30/10 | | | 9/30/09 | | | 9/30/10 | | | 9/30/09 | |
| | | | | | | | | | | | | |
| OPERATIONS: | | | | | | | | | | | | |
Net investment income (loss) | | $ | (1,087 | ) | | $ | 5,951 | | | $ | 398 | | | $ | 5,112 | |
Net realized gain (loss) on investments | | | 266,464 | | | | (494,446 | ) | | | 150,487 | | | | (232,123 | ) |
Net realized loss on written option contracts | | | — | | | | (573 | ) | | | — | | | | (333 | ) |
Net realized gain (loss) on foreign currency transactions | | | (34 | ) | | | 265 | | | | (1 | ) | | | (3,386 | ) |
Change in unrealized appreciation/depreciation | | | | | | | | | | | | | | | | |
on investments and foreign currency translations | | | (91,316 | ) | | | 52,697 | | | | (31,263 | ) | | | (60,958 | ) |
| | | | | | | | | | | | | | | | | |
Net increase (decrease) in net assets resulting from operations | | | 174,027 | | | | (436,106 | ) | | | 119,621 | | | | (291,688 | ) |
| | | | | | | | | | | | | | | | | |
| DISTRIBUTIONS: | | | | | | | | | | | | | | | | |
Net investment income | | | (3,909 | ) | | | (18,239 | ) | | | (5,169 | ) | | | (9,299 | ) |
Tax return of capital | | | — | | | | — | | | | — | | | | — | |
Net realized gains | | | — | | | | (2,822 | ) | | | — | | | | (634 | ) |
| | | | | | | | | | | | | | | | | |
Total distributions | | | (3,909 | ) | | | (21,061 | ) | | | (5,169 | ) | | | (9,933 | ) |
| | | | | | | | | | | | | | | | | |
| CAPITAL SHARE TRANSACTIONS: | | | | | | | | | | | | | | | | |
Proceeds from sale of shares | | | 406,466 | | | | 588,756 | | | | 147,976 | | | | 283,460 | |
Proceeds from reinvestment of distributions | | | 3,863 | | | | 20,657 | | | | 5,054 | | | | 9,571 | |
Redemption fees | | | 12 | | | | 41 | | | | 91 | | | | 111 | |
Redemption of shares | | | (1,129,623 | ) | | | (1,582,059 | ) | | | (577,751 | ) | | | (895,861 | ) |
| | | | | | | | | | | | | | | | | |
Net increase (decrease) from capital share transactions | | | (719,282 | ) | | | (972,605 | ) | | | (424,630 | ) | | | (602,719 | ) |
| | | | | | | | | | | | | | | | | |
| TOTAL INCREASE (DECREASE) IN NET ASSETS | | | (549,164 | ) | | | (1,429,772 | ) | | | (310,178 | ) | | | (904,340 | ) |
| | | | | | | | | | | | | | | | | |
| NET ASSETS: | | | | | | | | | | | | | | | | |
Beginning of Period | | | 2,001,041 | | | | 3,430,813 | | | | 1,193,231 | | | | 2,097,571 | �� |
| | | | | | | | | | | | | | | | | |
End of Period | | $ | 1,451,877 | | | $ | 2,001,041 | | | $ | 883,053 | | | $ | 1,193,231 | |
| | | | | | | | | | | | | | | | | |
Undistributed net investment income | | | | | | | | | | | | | | | | |
(accumulated net investment loss) | | $ | (1,147 | ) | | $ | 2,892 | | | $ | (172 | ) | | $ | 4,597 | |
| | | | | | | | | | | | | | | | | |
| TRANSACTIONS IN SHARES: | | | | | | | | | | | | | | | | |
Shares sold | | | 26,472 | | | | 49,096 | | | | 9,009 | | | | 22,391 | |
Shares issued in reinvestment of distributions | | | 257 | | | | 1,808 | | | | 317 | | | | 782 | |
Shares redeemed | | | (73,945 | ) | | | (134,063 | ) | | | (35,384 | ) | | | (70,685 | ) |
| | | | | | | | | | | | | | | | | |
NET INCREASE (DECREASE) | | | (47,216 | ) | | | (83,159 | ) | | | (26,058 | ) | | | (47,512 | ) |
See notes to financial statements.
FINANCIAL STATEMENTS
| | | | | | | MARSICO | | | MARSICO | | | | | | | |
| | MARSICO | | | INTERNATIONAL | | | FLEXIBLE | | | MARSICO | |
| | 21st CENTURY FUND | | | OPPORTUNITIES FUND | | | CAPITAL FUND | | | GLOBAL FUND | |
| | | | | | | | | | | | | | | | | | | | | | | |
| | Year Ended | | Year Ended | | | Year Ended | | | Year Ended | | | Year Ended | | | Year Ended | | | Year Ended | | | Year Ended | |
| | 9/30/10 | | 9/30/09 | | | 9/30/10 | | | 9/30/09 | | | 9/30/10 | | | 9/30/09 | | | 9/30/10 | | | 9/30/09 | |
| | | | | | | | | | | | | | | | | | | | | | | |
| | | | | | | | | | | | | | | | | | | | | | | |
| $ | (5,076) | | $ | 632 | | | $ | 1,291 | | | $ | 2,129 | | | $ | 727 | | | $ | 201 | | | $ | (627 | ) | | $ | 447 | |
| | 186,490 | | | (631,997 | ) | | | 31,713 | | | | (145,120 | ) | | | 4,987 | | | | (2,351 | ) | | | 21,046 | | | | (29,833 | ) |
| | — | | | — | | | | — | | | | — | | | | — | | | | — | | | | — | | | | — | |
| | 3,484 | | | (6,258 | ) | | | 1,978 | | | | (28,332 | ) | | | (180 | ) | | | (87 | ) | | | 5 | | | | (2,001 | ) |
| | | | | | | | | | | | | | | | | | | | | | | | | | | | | | |
| | (123,379) | | | 291,278 | | | | (10,812 | ) | | | 124,337 | | | | 10,612 | | | | 5,768 | | | | (3,921 | ) | | | 34,202 | |
| | | | | | | | | | | | | | | | | | | | | | | | | | | | | | |
| | 61,519 | | | (346,345 | ) | | | 24,170 | | | | (46,986 | ) | | | 16,146 | | | | 3,531 | | | | 16,503 | | | | 2,815 | |
| | | | | | | | | | | | | | | | | | | | | | | | | | | | | | |
| | | | | | | | | | | | | | | | | | | | | | | | | | | | | | |
| | — | | | (2,148 | ) | | | (2,073 | ) | | | (6,419 | ) | | | (1,302 | ) | | | (116 | ) | | | (721 | ) | | | (734 | ) |
| | — | | | (2,082 | ) | | | — | | | | — | | | | — | | | | — | | | | — | | | | — | |
| | — | | | — | | | | — | | | | — | | | | — | | | | — | | | | — | | | | — | |
| | | | | | | | | | | | | | | | | | | | | | | | | | | | | | |
| | — | | | (4,230 | ) | | | (2,073 | ) | | | (6,419 | ) | | | (1,302 | ) | | | (116 | ) | | | (721 | ) | | | (734 | ) |
| | | | | | | | | | | | | | | | | | | | | | | | | | | | | | |
| | | | | | | | | | | | | | | | | | | | | | | | | | | | | | |
| | 78,025 | | | 192,918 | | | | 84,957 | | | | 120,047 | | | | 96,849 | | | | 16,961 | | | | 26,530 | | | | 82,507 | |
| | — | | | 4,133 | | | | 2,034 | | | | 6,241 | | | | 1,293 | | | | 114 | | | | 718 | | | | 728 | |
| | 10 | | | 86 | | | | 34 | | | | 43 | | | | 10 | | | | — | | | | 5 | | | | 7 | |
| | (303,792) | | | (778,321 | ) | | | (201,032 | ) | | | (219,603 | ) | | | (11,982 | ) | | | (3,620 | ) | | | (36,083 | ) | | | (58,717 | ) |
| | | | | | | | | | | | | | | | | | | | | | | | | | | | | | |
| | (225,757) | | | (581,184 | ) | | | (114,007 | ) | | | (93,272 | ) | | | 86,170 | | | | 13,455 | | | | (8,830 | ) | | | 24,525 | |
| | | | | | | | | | | | | | | | | | | | | | | | | | | | | | |
| | (164,238) | | | (931,759 | ) | | | (91,910 | ) | | | (146,677 | ) | | | 101,014 | | | | 16,870 | | | | 6,952 | | | | 26,606 | |
| | | | | | | | | | | | | | | | | | | | | | | | | | | | | | |
| | | | | | | | | | | | | | | | | | | | | | | | | | | | | | |
| | 921,676 | | | 1,853,435 | | | | 450,926 | | | | 597,603 | | | | 31,331 | | | | 14,461 | | | | 109,149 | | | | 82,543 | |
| | | | | | | | | | | | | | | | | | | | | | | | | | | | | | |
| $ | 757,438 | | $ | 921,676 | | | $ | 359,016 | | | $ | 450,926 | | | $ | 132,345 | | | $ | 31,331 | | | $ | 116,101 | | | $ | 109,149 | |
| | | | | | | | | | | | | | | | | | | | | | | | | | | | | | |
| | | | | | | | | | | | | | | | | | | | | | | | | | | | | | |
| $ | (395) | | $ | (520 | ) | | $ | 726 | | | $ | 1,392 | | | $ | 425 | | | $ | 242 | | | $ | (855 | ) | | $ | 323 | |
| | | | | | | | | | | | | | | | | | | | | | | | | | | | | | |
| | | | | | | | | | | | | | | | | | | | | | | | | | | | | | |
| | 6,323 | | | 20,568 | | | | 7,276 | | | | 13,281 | | | | 8,807 | | | | 2,102 | | | | 2,935 | | | | 12,114 | |
| | — | | | 455 | | | | 174 | | | | 754 | | | | 131 | | | | 17 | | | | 82 | | | | 114 | |
| | (24,890) | | | (85,404 | ) | | | (16,887 | ) | | | (24,733 | ) | | | (1,129 | ) | | | (528 | ) | | | (3,997 | ) | | | (8,822 | ) |
| | | | | | | | | | | | | | | | | | | | | | | | | | | | | | |
| | (18,567) | | | (64,381 | ) | | | (9,437 | ) | | | (10,698 | ) | | | 7,809 | | | | 1,591 | | | | (980 | ) | | | 3,406 | |
FINANCIAL STATEMENTS
FINANCIAL HIGHLIGHTS
| | | MARSICO | |
| | | FOCUS FUND | |
| | | Year | | | Year | | | Year | | | Year | | | Year | |
| For a Fund Share Outstanding | | Ended | | | Ended | | | Ended | | | Ended | | | Ended | |
| Throughout the Period | | 9/30/10 | | | 9/30/09 | | | 9/30/08 | | | 9/30/07 | | | 9/30/06 | |
| | | | | | | | | | | | | | | | |
| Net Asset Value, Beginning of Period | | $ | 14.38 | | | $ | 15.43 | | | $ | 21.75 | | | $ | 18.19 | | | $ | 17.45 | |
| | | | | | | | | | | | | | | | | | | | | |
| Income from Investment Operations: | | | | | | | | | | | | | | | | | | | | |
| Net investment income (loss) | | | (0.01 | ) | | | 0.04 | | | | 0.08 | | | | (0.04 | ) | | | (0.02 | ) |
| Net realized and unrealized gains (losses) on investments | | | 1.45 | | | | (0.99 | ) | | | (4.60 | ) | | | 4.09 | | | | 0.76 | |
| | | | | | | | | | | | | | | | | | | | | |
| Total from investment operations | | | 1.44 | | | | (0.95 | ) | | | (4.52 | ) | | | 4.05 | | | | 0.74 | |
| | | | | | | | | | | | | | | | | | | | | |
| Distributions & Other: | | | | | | | | | | | | | | | | | | | | |
| Net investment income | | | (0.03 | ) | | | (0.09 | ) | | | — | | | | (0.02 | ) | | | — | |
| Tax return of capital | | | — | | | | — | | | | — | | | | — | | | | — | |
| Net realized gains | | | — | | | | (0.01 | ) | | | (1.80 | ) | | | (0.47 | ) | | | — | |
| Redemption fees [See Note 2(h)] | | | — | (1) | | | — | (1) | | | — | (1) | | | — | (1) | | | — | (1) |
| | | | | | | | | | | | | | | | | | | | | |
| Total distributions and other | | | (0.03 | ) | | | (0.10 | ) | | | (1.80 | ) | | | (0.49 | ) | | | — | |
| | | | | | | | | | | | | | | | | | | | | |
| Net Asset Value, End of Period | | $ | 15.79 | | | $ | 14.38 | | | $ | 15.43 | | | $ | 21.75 | | | $ | 18.19 | |
| | | | | | | | | | | | | | | | | | | | | |
| Total Return | | | 10.02 | % | | | (5.98 | )% | | | (22.69 | )% | | | 22.65 | % | | | 4.24 | % |
| | | | | | | | | | | | | | | | | | | | | |
| Supplemental Data and Ratios: | | | | | | | | | | | | | | | | | | | | |
| | | | | | | | | | | | | | | | | | | | | |
| Net assets, end of Period (000s) | | $ | 1,451,877 | | | $ | 2,001,041 | | | $ | 3,430,813 | | | $ | 5,051,662 | | | $ | 4,616,455 | |
| | | | | | | | | | | | | | | | | | | | | |
| Ratio of expenses to average net assets, less | | | | | | | | | | | | | | | | | | | | |
| waivers and before expenses paid indirectly, plus | | | | | | | | | | | | | | | | | | | | |
| reimbursements of previously waived expenses | | | 1.33 | % | | | 1.31 | % | | | 1.21 | % | | | 1.23 | % | | | 1.24 | % |
| | | | | | | | | | | | | | | | | | | | | |
| Ratio of net investment income (loss) to average net | | | | | | | | | | | | | | | | | | | | |
| assets, net of waivers, reimbursements of previously | | | | | | | | | | | | | | | | | | | | |
| waived expenses and expenses paid indirectly | | | (0.06 | )% | | | 0.27 | % | | | 0.41 | % | | | (0.20 | )% | | | (0.13 | )% |
| | | | | | | | | | | | | | | | | | | | | |
| Ratio of expenses to average net assets, before | | | | | | | | | | | | | | | | | | | | |
| waivers, reimbursements of previously waived | | | | | | | | | | | | | | | | | | | | |
| expenses and expenses paid indirectly | | | 1.33 | % | | | 1.31 | % | | | 1.21 | % | | | 1.23 | % | | | 1.24 | % |
| | | | | | | | | | | | | | | | | | | | | |
| Ratio of net investment income (loss) to average net | | | | | | | | | | | | | | | | | | | | |
| assets, before waivers, reimbursements of previously | | | | | | | | | | | | | | | | | | | | |
| waived expenses and expenses paid indirectly | | | (0.06 | )% | | | 0.27 | % | | | 0.41 | % | | | (0.21 | )% | | | (0.15 | )% |
| | | | | | | | | | | | | | | | | | | | | |
| Portfolio turnover rate | | | 85 | % | | | 90 | % | | | 78 | % | | | 69 | % | | | 80 | % |
| Portfolio turnover is greater than most funds due to the investment style of the Fund. |
See notes to financial statements.
FINANCIAL STATEMENTS
| | MARSICO | | | | MARSICO | |
| | GROWTH FUND | | | | 21st CENTURY FUND | |
| | | | | | | | | | | | | | | | | | | | | | | | | | | | | | |
| | Year | | Year | | | Year | | | Year | | | Year | | | | Year | | | Year | | | Year | | | Year | | | Year | |
| | Ended | | Ended | | | Ended | | | Ended | | | Ended | | | | Ended | | | Ended | | | Ended | | | Ended | | | Ended | |
| | 9/30/10 | | 9/30/09 | | | 9/30/08 | | | 9/30/07 | | | 9/30/06 | | | | 9/30/10 | | | 9/30/09 | | | 9/30/08 | | | 9/30/07 | | | 9/30/06 | |
| | | | | | | | | | | | | | | | | | | | | | | | | | | | | | |
| $ | 15.32 | | $ | 16.73 | | | $ | 23.07 | | | $ | 18.61 | | | $ | 18.09 | | | | $ | 11.56 | | | $ | 12.86 | | | $ | 18.07 | | | $ | 13.89 | | | $ | 12.07 | |
| | | | | | | | | | | | | | | | | | | | | | | | | | | | | | | | | | | | | | | |
| | | | | | | | | | | | | | | | | | | | | | | | | | | | | | | | | | | | | | | |
| | 0.01 | | | 0.07 | | | | 0.07 | | | | (0.05 | ) | | | (0.04 | ) | | | | (0.08 | ) | | | — | (1) | | | 0.01 | | | | 0.05 | | | | 0.02 | |
| | 1.78 | | | (1.38 | ) | | | (5.69 | ) | | | 4.51 | | | | 0.56 | | | | | 0.90 | | | | (1.27 | ) | | | (4.48 | ) | | | 4.26 | | | | 1.80 | |
| | | | | | | | | | | | | | | | | | | | | | | | | | | | | | | | | | | | | | | |
| | 1.79 | | | (1.31 | ) | | | (5.62 | ) | | | 4.46 | | | | 0.52 | | | | | 0.82 | | | | (1.27 | ) | | | (4.47 | ) | | | 4.31 | | | | 1.82 | |
| | | | | | | | | | | | | | | | | | | | | | | | | | | | | | | | | | | | | | | |
| | | | | | | | | | | | | | | | | | | | | | | | | | | | | | | | | | | | | | | |
| | (0.07) | | | (0.09 | ) | | | — | | | | — | | | | — | | | | | — | | | | (0.01 | ) | | | — | | | | (0.13 | ) | | | — | (1) |
| | — | | | — | | | | — | | | | — | | | | — | | | | | — | | | | (0.02 | ) | | | — | | | | — | | | | — | |
| | — | | | (0.01 | ) | | | (0.72 | ) | | | — | | | | — | | | | | — | | | | — | | | | (0.74 | ) | | | — | (1) | | | — | |
| | — | (1) | | — | (1) | | | — | (1) | | | — | (1) | | | — | (1) | | | | — | (1) | | | — | (1) | | | — | (1) | | | — | (1) | | | — | (1) |
| | | | | | | | | | | | | | | | | | | | | | | | | | | | | | | | | | | | | | | |
| | (0.07) | | | (0.10 | ) | | | (0.72 | ) | | | — | | | | — | | | | | — | | | | (0.03 | ) | | | (0.74 | ) | | | (0.13 | ) | | | — | |
| | | | | | | | | | | | | | | | | | | | | | | | | | | | | | | | | | | | | | | |
| $ | 17.04 | | $ | 15.32 | | | $ | 16.73 | | | $ | 23.07 | | | $ | 18.61 | | | | $ | 12.38 | | | $ | 11.56 | | | $ | 12.86 | | | $ | 18.07 | | | $ | 13.89 | |
| | | | | | | | | | | | | | | | | | | | | | | | | | | | | | | | | | | | | | | |
| | 11.75% | | | (7.74 | )% | | | (25.14 | )% | | | 23.97 | % | | | 2.87 | % | | | | 7.09 | % | | | (9.79 | )% | | | (25.83 | )% | | | 31.25 | % | | | 15.10 | % |
| | | | | | | | | | | | | | | | | | | | | | | | | | | | | | | | | | | | | | | |
| | | | | | | | | | | | | | | | | | | | | | | | | | | | | | | | | | | | | | | |
| | | | | | | | | | | | | | | | | | | | | | | | | | | | | | | | | | | | | | | |
| $ | 883,053 | | $ | 1,193,231 | | | $ | 2,097,571 | | | $ | 3,087,904 | | | $ | 2,550,641 | | | | $ | 757,438 | | | $ | 921,676 | | | $ | 1,853,435 | | | $ | 2,467,126 | | | $ | 871,459 | |
| | | | | | | | | | | | | | | | | | | | | | | | | | | | | | | | | | | | | | | |
| | | | | | | | | | | | | | | | | | | | | | | | | | | | | | | | | | | | | | | |
| | | | | | | | | | | | | | | | | | | | | | | | | | | | | | | | | | | | | | | |
| | 1.33% | | | 1.30 | % | | | 1.24 | % | | | 1.24 | % | | | 1.26 | % | | | | 1.37 | % | | | 1.37 | % | | | 1.29 | % | | | 1.31 | % | | | 1.33 | % |
| | | | | | | | | | | | | | | | | | | | | | | | | | | | | | | | | | | | | | | |
| | | | | | | | | | | | | | | | | | | | | | | | | | | | | | | | | | | | | | | |
| | | | | | | | | | | | | | | | | | | | | | | | | | | | | | | | | | | | | | | |
| | 0.04% | | | 0.42 | % | | | 0.33 | % | | | (0.25 | )% | | | (0.26 | )% | | | | (0.60 | )% | | | 0.06 | % | | | 0.07 | % | | | 0.43 | % | | | 0.20 | % |
| | | | | | | | | | | | | | | | | | | | | | | | | | | | | | | | | | | | | | | |
| | | | | | | | | | | | | | | | | | | | | | | | | | | | | | | | | | | | | | | |
| | | | | | | | | | | | | | | | | | | | | | | | | | | | | | | | | | | | | | | |
| | 1.33% | | | 1.30 | % | | | 1.24 | % | | | 1.24 | % | | | 1.26 | % | | | | 1.37 | % | | | 1.37 | % | | | 1.29 | % | | | 1.31 | % | | | 1.33 | % |
| | | | | | | | | | | | | | | | | | | | | | | | | | | | | | | | | | | | | | | |
| | | | | | | | | | | | | | | | | | | | | | | | | | | | | | | | | | | | | | | |
| | | | | | | | | | | | | | | | | | | | | | | | | | | | | | | | | | | | | | | |
| | 0.04% | | | 0.41 | % | | | 0.33 | % | | | (0.25 | )% | | | (0.27 | )% | | | | (0.60 | )% | | | 0.06 | % | | | 0.07 | % | | | 0.43 | % | | | 0.20 | % |
| | | | | | | | | | | | | | | | | | | | | | | | | | | | | | | | | | | | | | | |
| | 67% | | | 77 | % | | | 72 | % | | | 53 | % | | | 59 | % | | | | 100 | %(2) | | | 135 | %(2) | | | 143 | %(2) | | | 105 | %(2) | | | 136 | %(2) |
FINANCIAL STATEMENTS
FINANCIAL HIGHLIGHTS
| | | MARSICO | |
| | | INTERNATIONAL OPPORTUNITIES FUND | |
| | | Year | | | Year | | | Year | | | Year | | | Year | |
| For a Fund Share Outstanding | | Ended | | | Ended | | | Ended | | | Ended | | | Ended | |
| Throughout the Period | | 9/30/10 | | | 9/30/09 | | | 9/30/08 | | | 9/30/07 | | | 9/30/06 | |
| | | | | | | | | | | | | | | | |
| Net Asset Value, Beginning of Period | | $ | 11.86 | | | $ | 12.27 | | | $ | 20.10 | | | $ | 15.81 | | | $ | 13.00 | |
| | | | | | | | | | | | | | | | | | | | | |
| Income from Investment Operations: | | | | | | | | | | | | | | | | | | | | |
Net investment income (loss) | | | 0.04 | | | | 0.06 | | | | 0.16 | | | | 0.16 | | | | 0.04 | |
Net realized and unrealized gains (losses) on investments | | | 0.72 | | | | (0.33 | ) | | | (5.66 | ) | | | 4.81 | | | | 2.87 | |
| | | | | | | | | | | | | | | | | | | | | |
Total from investment operations | | | 0.76 | | | | (0.27 | ) | | | (5.50 | ) | | | 4.97 | | | | 2.91 | |
| | | | | | | | | | | | | | | | | | | | | |
| Distributions & Other: | | | | | | | | | | | | | | | | | | | | |
Net investment income | | | (0.05 | ) | | | (0.14 | ) | | | (0.18 | ) | | | (0.03 | ) | | | (0.10 | ) |
Net realized gains | | | — | | | | — | | | | (2.15 | ) | | | (0.65 | ) | | | — | |
Redemption fees [See Note 2(h)] | | | — | (1) | | | — | (1) | | | — | (1) | | | — | (1) | | | — | (1) |
| | | | | | | | | | | | | | | | | | | | | |
Total distributions and other | | | (0.05 | ) | | | (0.14 | ) | | | (2.33 | ) | | | (0.68 | ) | | | (0.10 | ) |
| | | | | | | | | | | | | | | | | | | | | |
| Net Asset Value, End of Period | | $ | 12.57 | | | $ | 11.86 | | | $ | 12.27 | | | $ | 20.10 | | | $ | 15.81 | |
| | | | | | | | | | | | | | | | | | | | | |
| Total Return | | | 6.48 | % | | | (1.68 | )% | | | (30.95 | )% | | | 32.42 | % | | | 22.46 | % |
| | | | | | | | | | | | | | | | | | | | | |
| Supplemental Data and Ratios: | | | | | | | | | | | | | | | | | | | | |
| | | | | | | | | | | | | | | | | | | | | |
Net assets, end of Period (000s) | | $ | 359,016 | | | $ | 450,926 | | | $ | 597,603 | | | $ | 822,073 | | | $ | 571,684 | |
| | | | | | | | | | | | | | | | | | | | | |
Ratio of expenses to average net assets, less | | | | | | | | | | | | | | | | | | | | |
waivers and before expenses paid indirectly, plus | | | | | | | | | | | | | | | | | | | | |
reimbursements of previously waived expenses | | | 1.52 | % | | | 1.48 | % | | | 1.35 | % | | | 1.37 | % | | | 1.44 | % |
| | | | | | | | | | | | | | | | | | | | | |
Ratio of net investment income (loss) to average net | | | | | | | | | | | | | | | | | | | | |
assets, net of waivers, reimbursements of previously | | | | | | | | | | | | | | | | | | | | |
waived expenses and expenses paid indirectly | | | 0.31 | % | | | 0.54 | % | | | 1.00 | % | | | 0.92 | % | | | 0.33 | % |
| | | | | | | | | | | | | | | | | | | | | |
Ratio of expenses to average net assets, before | | | | | | | | | | | | | | | | | | | | |
waivers, reimbursements of previously waived | | | | | | | | | | | | | | | | | | | | |
expenses and expenses paid indirectly | | | 1.52 | % | | | 1.48 | % | | | 1.35 | % | | | 1.37 | % | | | 1.41 | % |
| | | | | | | | | | | | | | | | | | | | | |
Ratio of net investment income (loss) to average net | | | | | | | | | | | | | | | | | | | | |
assets, before waivers, reimbursements of previously | | | | | | | | | | | | | | | | | | | | |
waived expenses and expenses paid indirectly | | | 0.31 | % | | | 0.54 | % | | | 1.00 | % | | | 0.92 | % | | | 0.36 | % |
| | | | | | | | | | | | | | | | | | | | | |
Portfolio turnover rate | | | 134 | %(4) | | | 108 | %(4) | | | 115 | %(4) | | | 125 | %(4) | | | 101 | %(4) |
* Commencement of operations.
| Portfolio turnover is greater than most funds due to the investment style of the Fund. |
See notes to financial statements.
FINANCIAL STATEMENTS
| | MARSICO FLEXIBLE CAPITAL FUND | | | MARSICO GLOBAL FUND | |
| | | | | | | | | | | | | | | | | | | | | | | |
| | Year Ended 9/30/10 | | Year Ended 9/30/09 | | | Year Ended 9/30/08 | | | 12/29/2006* to 9/30/07 | | | Year Ended 9/30/10 | | | Year Ended 9/30/09 | | | Year Ended 9/30/08 | | | 6/29/2007* to 9/30/07 | |
| | | | | | | | | | | | | | | | | | | | | | | |
| $ | 9.65 | | $ | 8.74 | | | $ | 11.32 | | | | 10.00 | | | $ | 8.59 | | | $ | 8.87 | | | $ | 11.46 | | | | 10.00 | |
| | | | | | | | | | | | | | | | | | | | | | | | | | | | | | |
| | | | | | | | | | | | | | | | | | | | | | | | | | | | | | |
| | 0.27 | | | 0.06 | | | | 0.14 | | | | 0.22 | | | | (0.05 | ) | | | 0.04 | | | | 0.08 | | | | 0.02 | |
| | 2.42 | | | 0.93 | | | | (1.93 | ) | | | 1.10 | | | | 1.42 | | | | (0.24 | ) | | | (2.46 | ) | | | 1.44 | |
| | | | | | | | | | | | | | | | | | | | | | | | | | | | | | |
| | 2.69 | | | 0.99 | | | | (1.79 | ) | | | 1.32 | | | | 1.37 | | | | (0.20 | ) | | | (2.38 | ) | | | 1.46 | |
| | | | | | | | | | | | | | | | | | | | | | | | | | | | | | |
| | | | | | | | | | | | | | | | | | | | | | | | | | | | | | |
| | (0.37 | ) | | (0.08 | ) | | | (0.35 | ) | | | — | | | | (0.06 | ) | | | (0.08 | ) | | | (0.05 | ) | | | — | |
| | — | | | — | | | | (0.44 | ) | | | — | | | | — | | | | — | | | | (0.17 | ) | | | — | |
| | — | (1) | | — | (1) | | | — | (1) | | | — | (1) | | | — | (1) | | | — | (1) | | | 0.01 | | | | — | (1) |
| | | | | | | | | | | | | | | | | | | | | | | | | | | | | | |
| | (0.37 | ) | | (0.08 | ) | | | (0.79 | ) | | | — | | | | (0.06 | ) | | | (0.08 | ) | | | (0.21 | ) | | | — | |
| | | | | | | | | | | | | | | | | | | | | | | | | | | | | | |
| $ | 11.97 | | $ | 9.65 | | | $ | 8.74 | | | | 11.32 | | | $ | 9.90 $ | | | $ | 8.59 | | | $ | 8.87 | | | | 11.46 | |
| | | | | | | | | | | | | | | | | | | | | | | | | | | | | | |
| | 28.68 | % | | 11.68 | % | | | (17.10 | )% | | | 13.20 | %(2) | | | 16.01 | % | | | (1.93 | )% | | | (21.13 | )% | | | 14.60 | %(2) |
| | | | | | | | | | | | | | | | | | | | | | | | | | | | | | |
| | | | | | | | | | | | | | | | | | | | | | | | | | | | | | |
| | | | | | | | | | | | | | | | | | | | | | | | | | | | | | |
| $ | 132,345 | | $ | 31,331 | | | $ | 14,461 | | | | 24,741 | | | $ | 116,101 $ | | | $ | 109,149 | | | $ | 82,543 | | | | 31,477 | |
| | | | | | | | | | | | | | | | | | | | | | | | | | | | | | |
| | | | | | | | | | | | | | | | | | | | | | | | | | | | | | |
| | | | | | | | | | | | | | | | | | | | | | | | | | | | | | |
| | 0.75% | | | 0.75 | % | | | 0.75 | % | | | 1.22 | %(3) | | | 1.54 | % | | | 1.40 | % | | | 0.75 | % | | | 0.75 | %(3) |
| | | | | | | | | | | | | | | | | | | | | | | | | | | | | | |
| | | | | | | | | | | | | | | | | | | | | | | | | | | | | | |
| | | | | | | | | | | | | | | | | | | | | | | | | | | | | | |
| | 1.33% | | | 1.44 | % | | | 1.15 | % | | | 2.62 | %(3) | | | (0.57 | )% | | | 0.52 | % | | | 0.88 | % | | | 1.06 | %(3) |
| | | | | | | | | | | | | | | | | | | | | | | | | | | | | | |
| | | | | | | | | | | | | | | | | | | | | | | | | | | | | | |
| | | | | | | | | | | | | | | | | | | | | | | | | | | | | | |
| | 1.73% | | | 2.84 | % | | | 1.71 | % | | | 2.47 | %(3) | | | 1.54 | % | | | 1.58 | % | | | 1.49 | % | | | 4.48 | %(3) |
| | | | | | | | | | | | | | | | | | | | | | | | | | | | | | |
| | | | | | | | | | | | | | | | | | | | | | | | | | | | | | |
| | | | | | | | | | | | | | | | | | | | | | | | | | | | | | |
| | 0.35% | | | (0.65 | )% | | | 0.19 | % | | | 1.37 | %(3) | | | (0.57 | )% | | | 0.34 | % | | | 0.14 | % | | | (2.67 | )%(3) |
| | | | | | | | | | | | | | | | | | | | | | | | | | | | | | |
| | 146 | %(4) | | 259 | %(4) | | | 207 | %(4) | | | 237 | %(2)(4) | | | 125 | %(4) | | | 185 | %(4) | | | 201 | %(4) | | | 56 | %(2)(4) |
NOTES TO FINANCIAL STATEMENTS
NOTES TO FINANCIAL STATEMENTS September 30, 2010
The Marsico Investment Fund (the “Trust”) was organized on October 1, 1997, as a Delaware Statutory Trust and is registered under the Investment Company Act of 1940 (the “1940 Act”) as an open-end management investment company. The Focus Fund, Growth Fund, 21st Century Fund, International Opportunities Fund, Flexible Capital Fund, and Global Fund (collectively, the “Funds”) are separate investment portfolios of the Trust. The Focus Fund and the Flexible Capital Fund are non-diversified funds and the Growth Fund, the 21st Century Fund, the International Opportunities Fund, and the Global Fund are diversified funds. The Focus and Growth Funds commenced operations on December 31, 1997, the 21st Century Fund commenced operations on February 1, 2000, the International Opportunities Fund commenced operations on June 30, 2000, the Flexible Capital Fund commenced operations on December 29, 2006, and the Global Fund commenced operations on June 29, 2007. Affiliates of Marsico Capital Management, LLC (the “Adviser”) hold approximately 19% of the Flexible Capital Fund’s outstanding shares as of September 30, 2010.
| 2. | Significant Accounting Policies |
The following is a summary of significant accounting policies consistently followed by the Funds in the preparation of their financial statements. These policies are in conformity with Generally Accepted Accounting Principles (“GAAP”) for investment companies. The presentation of financial statements in conformity with GAAP requires management to make estimates and assumptions that affect the reported amounts of assets and liabilities at the date of the financial statements and the reported amounts of income and expenses during the reporting period. Actual results could differ from those estimates.
| | (a) | Investment Valuation—A security traded on a recognized stock exchange is valued at the last sale price prior to the closing of the principal exchange on which the security is traded. Securities traded on NASDAQ generally will be valued at the NASDAQ Official Closing Price. If no sale price is reported on the valuation date, the most current bid price will generally be used. Other securities for which over-the-counter market quotations are readily available are generally valued at the last sale price. Debt securities that will mature in more than 60 days are generally valued at their bid prices furnished by a pricing service approved by the Funds’ Board of Trustees and subject to review and determination of the appropriate price by the Adviser. Debt securities that will mature in 60 days or less are valued at amortized cost, if it approximates market value. Any securities for which market quotations are not readily available are valued at their fair value as determined in good faith by the Adviser in accordance with procedures established by, and under the general supervision of, the Funds’ Board of Trustees. The Funds may use pricing services to assist in determining market value. The Board of Trustees has authorized the use of a pricing service to assist the Funds in valuing certain equity securities listed or traded on foreign security exchanges in the Funds’ portfolios in certain circumstances where there is a significant change in the value of related U.S.- traded securities, as represented by, for example, the S&P 500 Index. |
“Fair Value Measurements and Disclosures” (the “Fair Value Statement”) defines fair value, establishes a framework for measuring fair value in GAAP, and expands disclosures about fair value measurements. Under the Fair Value Statement, various inputs are used in determining the value of the Funds’ investments.
These inputs are summarized into three broad levels and described below:
| | · | Level 1 – quoted prices in active markets for identical investments |
| | · | Level 2 – other significant observable inputs (including quoted prices for similar investments, interest rates, and evaluated quotations obtained from pricing services) |
| | · | Level 3 – significant unobservable inputs (including the Fund’s own assumptions in determining the fair value of investments). |
NOTES TO FINANCIAL STATEMENTS
The inputs or methodology used for valuing investments are not an indication of the risk associated with investing in those investments. The following is a summary of the fair values of the Funds’ investments in each category and economic sector as of September 30, 2010:
| Fund Investments by | | | | | | | | | | | | |
| Major Security Type | | Level 1 | | | Level 2* | | | Level 3 | | | Total | |
| Marsico Focus Fund | | | | | | | | | | | | |
| Common stocks | | | | | | | | | | | | |
Consumer Discretionary | | $ | 340,049,284 | | | $ | — | | | $ | — | | | $ | 340,049,284 | |
Consumer Staples | | | 54,147,475 | | | | — | | | | — | | | | 54,147,475 | |
Energy | | | 63,551,761 | | | | — | | | | — | | | | 63,551,761 | |
Financials | | | 160,284,824 | | | | — | | | | — | | | | 160,284,824 | |
Health Care | | | 92,574,604 | | | | — | | | | — | | | | 92,574,604 | |
Industrials | | | 272,133,599 | | | | — | | | | — | | | | 272,133,599 | |
Information Technology | | | 251,465,055 | | | | — | | | | — | | | | 251,465,055 | |
Materials | | | 189,841,481 | | | | — | | | | — | | | | 189,841,481 | |
| Short-term Investments | | | 21,778,758 | | | | — | | | | — | | | | 21,778,758 | |
| | | | | | | | | | | | | | | $ | 1,445,826,841 | |
| Marsico Growth Fund | | | | | | | | | | | | | | | | |
| Common stocks | | | | | | | | | | | | | | | | |
Consumer Discretionary | | | 241,308,003 | | | | — | | | | — | | | | 241,308,003 | |
Consumer Staples | | | 16,584,632 | | | | — | | | | — | | | | 16,584,632 | |
Energy | | | 44,063,835 | | | | — | | | | — | | | | 44,063,835 | |
Financials | | | 83,946,148 | | | | — | | | | — | | | | 83,946,148 | |
Health Care | | | 17,393,682 | | | | — | | | | — | | | | 17,393,682 | |
Industrials | | | 120,937,958 | | | | — | | | | — | | | | 120,937,958 | |
Information Technology | | | 173,887,067 | | | | — | | | | — | | | | 173,887,067 | |
Materials | | | 138,079,539 | | | | — | | | | — | | | | 138,079,539 | |
Telecommunication Services | | | 26,443,619 | | | | — | | | | — | | | | 26,443,619 | |
| Preferred Stocks | | | 9,210,210 | | | | — | | | | — | | | | 9,210,210 | |
| Short-term Investments | | | 23,055,742 | | | | — | | | | — | | | | 23,055,742 | |
| | | | | | | | | | | | | | | $ | 894,910,435 | |
Marsico 21st Century Fund | | | | | | | | | | | | | | | | |
| Common stocks | | | | | | | | | | | | | | | | |
Consumer Discretionary | | | 171,620,483 | | | | — | | | | — | | | | 171,620,483 | |
Energy | | | 30,487,197 | | | | — | | | | — | | | | 30,487,197 | |
Financials | | | 256,283,979 | | | | — | | | | — | | | | 256,283,979 | |
Health Care | | | 43,536,078 | | | | — | | | | — | | | | 43,536,078 | |
Industrials | | | 89,747,052 | | | | — | | | | — | | | | 89,747,052 | |
Information Technology | | | 95,047,070 | | | | — | | | | — | | | | 95,047,070 | |
Materials | | | 24,641,101 | | | | — | | | | — | | | | 24,641,101 | |
Telecommunication Services | | | 23,046,079 | | | | — | | | | — | | | | 23,046,079 | |
| Warrants | | | 3,949,116 | | | | — | | | | — | | | | 3,949,116 | |
| Short-term Investments | | | 26,444,360 | | | | — | | | | — | | | | 26,444,360 | |
| | | | | | | | | | | | | | | $ | 764,802,515 | |
| Marsico International Opportunities Fund | | | | | | | | | | | | | | | | |
| Common stocks | | | | | | | | | | | | | | | | |
Consumer Discretionary | | | 83,653,175 | | | | — | | | | — | | | | 83,653,175 | |
Consumer Staples | | | 33,962,726 | | | | — | | | | — | | | | 33,962,726 | |
Energy | | | 31,279,987 | | | | — | | | | — | | | | 31,279,987 | |
Financials | | | 63,535,822 | | | | — | | | | — | | | | 63,535,822 | |
Health Care | | | 16,469,441 | | | | — | | | | — | | | | 16,469,441 | |
Industrials | | | 45,832,348 | | | | — | | | | — | | | | 45,832,348 | |
Information Technology | | | 33,854,530 | | | | — | | | | — | | | | 33,854,530 | |
Materials | | | 25,638,301 | | | | — | | | | — | | | | 25,638,301 | |
Telecommunication Services | | | 12,206,274 | | | | — | | | | — | | | | 12,206,274 | |
| Units | | | 1,817,981 | | | | — | | | | — | | | | 1,817,981 | |
| Short-term Investments | | | 151,178 | | | | — | | | | — | | | | 151,178 | |
| | | | | | | | | | | | | | | $ | 348,401,763 | |
NOTES TO FINANCIAL STATEMENTS
NOTES TO FINANCIAL STATEMENTS September 30, 2010 (continued)
| Fund Investments by | | | | | | | | | | | | |
| Major Security Type | | Level 1 | | | Level 2* | | | Level 3 | | | Total | |
| Marsico Flexible Capital Fund | | | | | | | | | | | | |
| Common stocks | | | | | | | | | | | | |
Consumer Discretionary | | $ | 22,805,286 | | | $ | — | | | $ | — | | | $ | 22,805,286 | |
Consumer Staples | | | 3,070,807 | | | | — | | | | — | | | | 3,070,807 | |
Energy | | | 11,440,990 | | | | — | | | | — | | | | 11,440,990 | |
Financials | | | 20,687,401 | | | | — | | | | — | | | | 20,687,401 | |
Health Care | | | 4,886,597 | | | | — | | | | — | | | | 4,886,597 | |
Industrials | | | 8,866,585 | | | | — | | | | — | | | | 8,866,585 | |
Information Technology | | | 12,551,931 | | | | 1,949,670 | | | | — | | | | 14,501,601 | |
Materials | | | 11,832,796 | | | | — | | | | — | | | | 11,832,796 | |
Telecommunication Services | | | 1,964,172 | | | | — | | | | — | | | | 1,964,172 | |
| Convertible Corporate Bonds | | | — | | | | 1,912,500 | | | | — | | | | 1,912,500 | |
| Corporate Bonds | | | — | | | | 11,743,000 | | | | — | | | | 11,743,000 | |
| Preferred stocks | | | 5,413,058 | | | | — | | | | — | | | | 5,413,058 | |
| Units | | | 4,728,526 | | | | — | | | | — | | | | 4,728,526 | |
| Short-term Investments | | | 17,725,943 | | | | — | | | | — | | | | 17,725,943 | |
| | | | | | | | | | | | | | | $ | 141,579,262 | |
| Marsico Global Fund | | | | | | | | | | | | | | | | |
| Common stocks | | | | | | | | | | | | | | | | |
Consumer Discretionary | | | 31,203,220 | | | | — | | | | — | | | | 31,203,220 | |
Consumer Staples | | | 3,433,419 | | | | — | | | | — | | | | 3,433,419 | |
Energy | | | 6,023,127 | | | | — | | | | — | | | | 6,023,127 | |
Financials | | | 29,935,491 | | | | — | | | | — | | | | 29,935,491 | |
Health Care | | | 4,223,470 | | | | — | | | | — | | | | 4,223,470 | |
Industrials | | | 7,720,493 | | | | — | | | | — | | | | 7,720,493 | |
Information Technology | | | 15,370,901 | | | | — | | | | — | | | | 15,370,901 | |
Materials | | | 9,060,721 | | | | — | | | | — | | | | 9,060,721 | |
Telecommunication Services | | | 3,033,856 | | | | — | | | | — | | | | 3,033,856 | |
| Units | | | 1,149,319 | | | | — | | | | — | | | | 1,149,319 | |
| Short-term Investments | | | 4,400,007 | | | | — | | | | — | | | | 4,400,007 | |
| | | | | | | | | | | | | | | $ | 115,554,024 | |
| | * | In accordance with procedures established by, and under the general supervision of, the Funds’ Board of Trustees, certain equity securities purchased in initial public offerings were fair valued as of the applicable fiscal year-end and categorized as Level 2. Such securities are categorized as Level 2 until the securities commence active market trading and meet the necessary requirements to be categorized as Level 1. These securities represent the only significant transfers between each of the three levels. |
| | (b) | Expenses—The Funds are charged for those expenses that are directly attributable to each Fund, such as advisory and custodial fees. Expenses that are not directly attributable to a Fund are typically allocated among the Funds in proportion to their respective net assets and in some cases allocated based on other factors. The Funds’ expenses may be reduced by voluntary advisory fee waivers, brokerage credits and uninvested cash balances earning interest or credits. Such credits are included in “Less waiver of expenses and expenses paid indirectly” on the Statements of Operations. |
Brokerage commissions were paid to certain brokers which reduced certain transfer agent fees and expenses in the amount of $554 and $149 for the Focus Fund and Growth Fund, respectively, for the year ended September 30, 2010. The Funds also received earnings credits on certain cash account balances which reduced transfer agent fees and expenses in the amount of $1,448, $761, $637, $312, $41 and $83 for the Focus Fund, Growth Fund, 21st Century Fund, International Opportunities Fund, Flexible Capital Fund and Global Fund, respectively, for the year ended September 30, 2010. Brokerage commission credits and earnings credits are included in “Less waiver of expenses and expenses paid indirectly” on the Statements of Operations.
| | (c) | Federal Income Taxes—Each Fund intends to comply with the requirements of the Internal Revenue Code necessary to qualify as a regulated investment company and to make the requisite distributions of income to its shareholders which will be sufficient to relieve it from all or substantially all federal and state income taxes. Certain funds may utilize earnings and profits on redemption of shares as part of the dividends paid deduction. |
NOTES TO FINANCIAL STATEMENTS
| | (d) | Distributions to Shareholders—Dividends from net investment income and net realized capital gains, if any, will be declared and paid at least annually. Distributions to shareholders are recorded on the ex-dividend date. Each Fund may periodically make reclassifications among certain of its capital accounts as a result of the timing and characterization of certain income and capital gains distributions determined in accordance with federal tax regulations, which may differ from GAAP. These reclassifications are due to differing treatment for items such as foreign currency transactions, net investment losses and investments in partnerships and REITs. |
| | (e) | Foreign Currency Translation—The accounting records of the Funds are maintained in U.S. dollars. Values of securities denominated in foreign currencies are translated into U.S. dollars at 4:00 p.m. ET. Amounts related to the purchase and sale of foreign securities and investment income are translated at the rates of exchange prevailing on the respective dates of such transactions. |
Reported realized gains on foreign currency transactions arise from sales of portfolio securities, forward currency contracts, currency gains or losses realized between the trade and settlement dates on securities transactions, the difference between the amounts of dividends, interest, and foreign withholding taxes recorded on the Funds’ books, and the U.S. dollar equivalent of the amounts actually received or paid.
The Funds do not isolate that portion of the results of operations resulting from changes in foreign exchange rates on investments from the fluctuations arising from changes in market prices of securities held at fiscal year-end. Net unrealized appreciation or depreciation on investments and foreign currency translations arise from changes in the value of assets and liabilities, including investments in securities at fiscal year-end, resulting from changes in the exchange rates and changes in market prices of securities held.
| | (f) | Derivative Instruments — “Disclosure about Derivative Instruments and Hedging Activities” (the “Derivatives Statement”) requires enhanced disclosures about the Funds’ derivative and hedging activities, including how such activities are accounted for and their effects on the Funds’ financial position, performance and cash flows. |
The Funds may enter into futures contracts and options on securities, financial indexes and foreign currencies, options on futures, forward contracts, interest rate swaps, credit default swaps and swap-related products. The Funds intend to use such derivative instruments primarily to hedge or protect from adverse movements in securities prices, currency rates or interest rates. The use of futures contracts and options may involve risks such as the possibility of illiquid markets or imperfect correlation between the value of the contracts and the underlying securities, or that the counterparty will fail to perform its obligations. The Funds did not hold any derivative or hedging positions as of September 30, 2010 and there was no use of derivatives by the Funds during the year ended September 30, 2010. The limited use of derivatives by the Funds during the 2009 fiscal year was related to written equity put options and resulted in a net realized loss of $573,200 and $333,082 for the Focus Fund and Growth Fund, respectively, which is reflected on the Statements of Changes in Net Assets.
Options Contracts — The Funds may purchase and write (sell) put and call options on foreign and domestic stock indices, foreign currencies, and U.S. and foreign securities that are traded on a securities exchange or an over-the-counter market. These transactions are for hedging purposes or for the purpose of earning additional income. In addition, the Funds may enter into such transactions for cross-hedging purposes.
The risk associated with purchasing an option is that the Fund pays a premium whether or not the option is exercised. Additionally, the Fund bears the risk of loss of premium and change in market value should the counterparty not perform under the contract. Put and call options purchased are accounted for in the same manner as portfolio securities. The cost of securities acquired through the exercise of call options is increased by premiums paid. The proceeds from securities sold through the exercise of put options are decreased by the premiums paid.
NOTES TO FINANCIAL STATEMENTS
NOTES TO FINANCIAL STATEMENTS September 30, 2010 (continued)
When the Fund writes an option, the premium received by the Fund is recorded as a liability and is subsequently adjusted to the current market value of the option written. Premiums received from writing options that expire are recorded by the Fund on the expiration date as realized gains from option transactions. The difference between the premium and the amount paid on effecting a closing purchase transaction, including brokerage commissions, is also treated as a realized gain, or if the premium is less than the amount paid for the closing purchase transaction, as a realized loss. If a call option is exercised, the premium is added to the proceeds from the sale of the underlying security or currency in determining whether the Fund has realized a gain or loss. If a put option is exercised, the premium reduces the cost basis of the security or currency purchased by the Fund. In writing an option, the Fund bears the market risk of an unfavorable change in the price of the security or currency underlying the written option. Exercise of an option written by the Fund could result in the Fund selling or buying a security or currency at a price different from the current market value.
| | (g) | Trustees’ Deferred Fee Plan— Effective February 1, 2000, the Board of Trustees adopted the Marsico Investment Fund Deferred Fee Plan (the “Deferred Fee Plan”), amended and restated as of December 30, 2005, which allows the Trustees to defer the receipt of all or a portion of their compensation received from the Funds. Any deferred fees are credited to accounts established on behalf of the Trustees into the Funds as directed by each Trustee. The amounts credited to these accounts increase or decrease in accordance with the performance of the Funds selected by the Trustees. The market value of the deferred account balances as of September 30, 2010 is shown on the Statements of Assets and Liabilities as part of an asset account, “Prepaid expenses and other assets”, and a liability account, “Accrued trustees’ fees”. Additionally, the fluctuation of the account balances due to the Funds’ performance is recorded by the Funds as unrealized appreciation/(depreciation) which is shown as part of “Net unrealized appreciation on investments and foreign currency translations” on the Statements of Assets and Liabilities and as compensation expense which is shown as part of the expense account “Trustees’ fees and expenses” on the Statements of Operations. Fees earned and deferred by the Trustees for the year ended September 30, 2010 are also included in “Trustees’ fees and expenses” on the Statements of Operations. Amounts credited to the Deferred Fee Plan will be deferred until distributed in accordance with the Deferred Fee Plan. Unrealized appreciation/depreciation of Fund shares held in the Deferred Fee Plan is subject to the Funds’ expense reimbursement agreement with the Adviser. |
| | (h) | Redemption Fee—A 2.00% redemption fee is retained by the Funds to offset transaction costs and other expenses associated with short-term investing. The fee is imposed on certain redemptions or exchanges of shares held 30 days or less from their purchase date. Redemption fees are recorded by the Funds as a reduction of shares redeemed and as a credit to paid-in-capital. For the year ended September 30, 2010, the Focus Fund, Growth Fund, 21st Century Fund, International Opportunities Fund, Flexible Capital Fund, and Global Fund received $11,566, $90,996, $9,912, $34,491, $9,996 and $5,204, respectively, in redemption fees. |
| | (i) | Other—Investment transactions are accounted for on a trade date basis. Each Fund determines the gain or loss realized from the investment transactions by comparing the original cost of the security lot sold with the net sale proceeds. Dividend income is recognized on the ex-dividend date. Certain dividends from foreign securities will be recorded as soon as the Trust is informed of the dividend if such information is obtained subsequent to the ex-dividend date. Interest income is recognized on an accrual basis. |
| | (j) | Indemnifications—In the normal course of business, the Funds enter into contracts that contain provisions indemnifying other parties against specified potential liabilities. Each Fund’s maximum exposure under these arrangements is unknown as this would involve future claims that may be made against the Fund that have not yet occurred. However, based on experience, the Funds expect the risk of loss to be remote. |
NOTES TO FINANCIAL STATEMENTS
| 3. | Investment Advisory Agreement and Transactions With Affiliates |
Each Fund has an agreement with the Adviser to furnish investment advisory services to the Funds. Under the terms of these agreements, the Adviser is compensated for managing the Focus Fund and the Growth Fund at the rate of 0.85% per year of average daily net assets up to $3 billion in each Fund, and 0.75% per year of average daily net assets exceeding $3 billion in each Fund; and at a rate of 0.85% of the average daily net assets of the 21st Century Fund, the International Opportunities Fund, the Flexible Capital Fund, and the Global Fund. The Adviser has voluntarily agreed to limit the total expenses of each Fund (excluding interest, taxes, acquired fund fees and expenses, litigation, brokerage and extraordinary expenses) to an annual rate of 1.60% of the average net assets of the Focus Fund, the International Opportunities Fund and the Global Fund, 1.50% of the average net assets of the Growth Fund and the 21st Century Fund, and 0.75% of the average net assets of the Flexible Capital Fund until January 31, 2011. This expense limitation and fee waiver agreement is voluntary and may be terminated at any time after January 31, 2011. Prior to January 1, 2009, the Adviser’s voluntary expense limitation agreement relating to the Global Fund limited total expenses of the Global Fund (excluding interest, taxes, acquired fund fees and expenses, litigation, brokerage and extraordinary expenses) to an annual rate of 0.75% of the Global Fund’s average net assets.
The Adviser is entitled to reimbursement from a Fund of any fees waived pursuant to this arrangement if such reimbursements do not cause a Fund to exceed current expense limitations and the reimbursement is made within three years after the year in which the Adviser incurred the expense. As of September 30, 2010, the fees waived or expenses reimbursed related to the Flexible Capital Fund’s expense limitation of 0.75% of average net assets totaled $1,018,632. The Adviser has elected not to seek recoupment of this amount.
| 4. | Service and Distribution Plan |
The Funds have adopted a Service and Distribution Plan (the “Plan”) pursuant to Rule 12b-1 under the 1940 Act. The Plan authorizes payments by the Funds in connection with the distribution of their shares at an annual rate, as determined from time to time by the Board of Trustees, of up to 0.25% of a Fund’s average daily net assets. The Adviser may, out of its own resources and at its sole discretion, make certain payments on behalf of the Plan for expenses incurred by a Fund for distribution of Fund shares and related services.
| 5. | Investment Transactions |
The aggregate purchases and sales of securities, excluding short-term investments, for the Funds for the year ended September 30, 2010, were as follows:
| | | | | | | | | | | | | | | | | |
| | | | | | | | | 21st | | International | | | Flexible | | | | |
| | | Focus | | | Growth | | | Century | | Opportunities | | | Capital | | | Global | |
| (Amounts in thousands) | | Fund | | | Fund | | | Fund | | | Fund | | | Fund | | | Fund | |
| Purchases | | $ | 1,540,632 | | | $ | 649,393 | | | $ | 801,757 | | | $ | 522,361 | | | $ | 152,956 | | | $ | 130,790 | |
| Sales | | $ | 2,249,825 | | | $ | 1,048,760 | | | $ | 1,020,452 | | | $ | 628,451 | | | $ | 75,023 | | | $ | 142,604 | |
There were no purchases or sales of U.S. government securities, excluding short-term investments.
NOTES TO FINANCIAL STATEMENTS
NOTES TO FINANCIAL STATEMENTS September 30, 2010 (continued)
| 6. | Federal Income Tax Information |
Accounting for Uncertainty in Income Taxes (the “Income Tax Statement”) requires an evaluation of tax positions taken (or expected to be taken) in the course of preparing a Fund’s tax returns to determine whether these positions meet a “more-likely-than-not” standard that, based on the technical merits, have a more than fifty percent likelihood of being sustained by a taxing authority upon examination. A tax position that meets the “more-likely-than-not” recognition threshold is measured to determine the amount of benefit to recognize in the financial statements. The Funds recognize interest and penalties, if any, related to unrecognized tax benefits as income tax expense in the Statements of Operations.
The Income Tax Statement requires management of the Funds to analyze all open tax years, fiscal years 2007-2010 as defined by IRS statute of limitations for all major jurisdictions, including federal tax authorities and certain state tax authorities. As of and during the year ended September 30, 2010, the Funds did not have a liability for any unrecognized tax benefits. The Funds have no examinations in progress and are not aware of any tax positions for which it is reasonably possible that the total amounts of unrecognized tax benefits will significantly change in the next twelve months.
At September 30, 2010 gross unrealized appreciation and depreciation of investments, based on cost for federal income tax purposes were as follows:
| | | | | | | | | | | | | | | | | | | |
| | | | | | | | | 21st | | | International | | | Flexible | | | | |
| | | Focus | | | Growth | | | Century | | | Opportunities | | | Capital | | | Global | |
| (Amounts in thousands) | | Fund | | | Fund | | | Fund | | | Fund | | | Fund | | | Fund | |
| Cost of investments | | $ | 1,162,050 | | | $ | 689,972 | | | $ | 678,259 | | | $ | 288,372 | | | $ | 126,710 | | | $ | 95,243 | |
| Gross unrealized appreciation | | $ | 317,862 | | | $ | 219,728 | | | $ | 121,015 | | | $ | 68,234 | | | $ | 15,667 | | | $ | 22,581 | |
| Gross unrealized depreciation | | | (34,085 | ) | | | (14,790 | ) | | | (34,471 | ) | | | (8,204 | ) | | | (798 | ) | | | (2,270 | ) |
| Unrealized appreciation on | | | | | | | | | | | | | | | | | | | | | | | | |
foreign currency | | | — | | | | — | | | | — | | | | 12 | | | | — | | | | — | |
| Net unrealized appreciation | | | | | | | | | | | | | | | | | | | | | | | | |
(depreciation) on investments | | $ | 283,777 | | | $ | 204,938 | | | $ | 86,544 | | | $ | 60,042 | | | $ | 14,869 | | | $ | 20,311 | |
The difference between cost amounts for financial statement and federal income tax purposes is due primarily to wash sale loss deferrals and passive foreign investment companies (“PFICs”).
The International Opportunities Fund, Flexible Capital Fund and Global Fund had realized currency losses (in thousands) from transactions between November 1, 2009 and September 30, 2010 of $245, $3 and $56, respectively. Each Fund has elected to treat post-October currency losses as arising in the next fiscal year.
At September 30, 2010, the Focus Fund, Growth Fund, 21st Century Fund, International Opportunities Fund, Flexible Capital Fund and Global Fund had accumulated capital loss carryforwards (in thousands) of $256,260, $228,750, $678,426, $193,127, $595 and $23,833 which $92,393, $228,750, $287,847, $99,570, $595 and $17,393 expires in 2017, respectively, and $163,867, $0, $390,579, $93,557, $0 and $6,440 expires in 2018, respectively. To the extent that a fund may realize future net capital gains, those gains will be offset by any of its unused capital loss carryforward. Future capital loss carryover utilization in any given year may be subject to Internal Revenue Code limitations.
The Growth Fund and Flexible Capital Fund utilized (in thousands) $21,269 and $2,715, respectively, of its capital loss carryforwards, during the year ended September 30, 2010.
NOTES TO FINANCIAL STATEMENTS
As of September 30, 2010, the components of accumulated earnings (deficit) on a tax basis were as follows:
| | | | | | | | | 21st | | | International | | | Flexible | | | | |
| | | Focus | | | Growth | | | Century | | | Opportunities | | | Capital | | | Global | |
| (Amounts in thousands) | | Fund | | | Fund | | | Fund | | | Fund | | | Fund | | | Fund | |
| Undistributed ordinary | | | | | | | | | | | | | | | | | | |
| income | | $ | — | | | $ | 472 | | | $ | 37 | | | $ | 6,588 | | | $ | 1,489 | | | $ | 1,098 | |
| Undistributed Trustee’s | | | | | | | | | | | | | | | | | | | | | | | | |
| deferred compensation | | | (1,147 | ) | | | (644 | ) | | | (382 | ) | | | (189 | ) | | | (105 | ) | | | (70 | ) |
| Undistributed long-term | | | | | | | | | | | | | | | | | | | | | | | | |
| capital gains | | | — | | | | — | | | | — | | | | — | | | | — | | | | — | |
| Tax accumulated earnings | | | (1,147 | ) | | | (172 | ) | | | (345 | ) | | | 6,399 | | | | 1,384 | | | | 1,028 | |
| Accumulated Capital and | | | | | | | | | | | | | | | | | | | | | | | | |
| Other Losses | | | (256,260 | ) | | | (228,750 | ) | | | (678,426 | ) | | | (193,372 | ) | | | (598 | ) | | | (23,889 | ) |
| Unrealized appreciation (depreciation) | | | | | | | | | | | | | | | | | | | | | | | | |
| on investments and on foreign | | | | | | | | | | | | | | | | | | | | | | | | |
| currency translations | | | 283,777 | | | | 204,938 | | | | 86,544 | | | | 60,042 | | | | 14,869 | | | | 20,311 | |
| Trustees deferred compensation | | | | | | | | | | | | | | | | | | | | | | | | |
| mark to market | | | 24 | | | | 24 | | | | 17 | | | | 2 | | | | 100 | | | | 54 | |
| Total accumulated | | | | | | | | | | | | | | | | | | | | | | | | |
| earnings (deficit) | | $ | 26,394 | | | $ | (23,960 | ) | | $ | (592,210 | ) | | $ | (126,929 | ) | | $ | 15,755 | | | $ | (2,496 | ) |
Undistributed ordinary income (deficit) consists of net investment income and timing differences related to post-October currency losses, partnerships and PFICs.
The tax character of distributions paid during the fiscal years ended September 30, 2010 and 2009 were as follows:
| (Amounts in thousands) | | 2010 | | | 2009 | |
| | | | | | Tax | | | Long-Term | | | | | | Tax | | | Long-Term | |
| Fund | | | | | Return of Capital | | | Capital Gains | | | | | | Return of Capital | | | Capital Gains | |
| Focus Fund | | $ | 3,909 | | | $ | — | | | $ | — | | | $ | 20,688 | | | $ | — | | | $ | 373 | |
| Growth Fund | | | 5,169 | | | | — | | | | — | | | | 9,933 | | | | — | | | | — | |
| 21st Century Fund | | | — | | | | — | | | | — | | | | 2,148 | | | | 2,082 | | | | — | |
| International Opportunities Fund | | | 2,073 | | | | — | | | | — | | | | 6,419 | | | | — | | | | — | |
| Flexible Capital Fund | | | 1,302 | | | | — | | | | — | | | | 116 | | | | — | | | | — | |
| Global Fund | | | 721 | | | | — | | | | — | | | | 734 | | | | — | | | | — | |
The tax character of dividends paid may differ from that shown in the Statements of Changes in Net Assets due to short-term gains being treated as ordinary income for tax purposes.
Management has determined that there were no material events that would require disclosure in the Funds’ financial statements.
REPORT OF INDEPENDENT REGISTERED PUBLIC ACCOUNTING FIRM
REPORT OF INDEPENDENT REGISTERED PUBLIC ACCOUNTING FIRM
To the Board of Trustees and Shareholders of The Marsico Investment Fund
In our opinion, the accompanying statements of assets and liabilities, including the schedules of investments, and the related statements of operations and of changes in net assets and the financial highlights present fairly, in all material respects, the financial position of the Marsico Focus Fund, the Marsico Growth Fund, the Marsico 21st Century Fund, the Marsico International Opportunities Fund, the Marsico Flexible Capital Fund and the Marsico Global Fund (constituting The Marsico Investment Fund, hereafter referred to as the “Trust”) at September 30, 2010, the results of each of their operations for the year then ended, and the changes in each of their net assets for each of the two years in the period then ended and their financial highlights for each of the periods indicated, in conformity with accounting principles generally accepted in the United States of America. These financial statements and financial highlights (hereafter referred to as “financial statements”) are the responsibility of the Trust’s management; our responsibility is to express an opinion on these financial statements based on our audits. We conducted our audits of these financial statements in accordance with the standards of the Public Company Accounting Oversight Board (United States). Those standards require that we plan and perform the audit to obtain reasonable assurance about whether the financial statements are free of material misstatement. An audit includes examining, on a test basis, evidence supporting the amounts and disclosures in the financial statements, assessing the accounting principles used and significant estimates made by management, and evaluating the overall financial statement presentation. We believe that our audits, which included confirmation of securities at September 30, 2010 by correspondence with the custodian and the application of alternative procedures where securities purchased had not been received, provide a reasonable basis for the opinion expressed above.

PricewaterhouseCoopers LLP
Denver, Colorado
November 10, 2010
EXPENSE EXAMPLE
EXPENSE EXAMPLE For the six months ended September 30, 2010 (Unaudited)
As a shareholder of the Marsico Funds (the “Funds”), you incur two types of costs: (1) transaction costs, including redemption fees on certain redemptions; and (2) ongoing costs, including management fees, distribution (12b-1) fees, and other Fund expenses. This Example is intended to help you understand your ongoing costs (in dollars) of investing in the Funds and to compare these costs with the ongoing costs of investing in other mutual funds.
The Example is based on an investment of $1,000 invested at the beginning of the period and held for the entire period from April 1, 2010 to September 30, 2010 (the “period”).
Actual Expenses
The first line of the table below provides information about actual account values and actual expenses. You may use the information in this line, together with the amount you invested, to estimate the expenses you paid over the period. Simply divide your account value by $1,000 (for example, an $8,600 account value divided by $1,000 equals 8.6), then multiply the result by the number in the first line under the heading entitled “Expenses paid for the six-month period ended September 30, 2010” to estimate the expenses you paid on your account during the period.
Hypothetical Example for Comparison Purposes
The second line of the table below provides information about hypothetical account values and hypothetical expenses based on the Funds’ actual expense ratios and an assumed rate of return of 5% per year before expenses, which is not the actual return of any of the Funds. The hypothetical account values and expenses may not be used to estimate the actual ending account balance or expenses you paid for the period. You may use this information to compare the ongoing costs of investing in the Funds and other funds. To do so, compare this 5% hypothetical example with the 5% hypothetical examples that appear in the shareholder reports of other funds.
Please note that the expenses shown in the table are meant to highlight your ongoing costs only and do not reflect any transactional costs, such as redemption fees. Therefore, the second line of the table is useful in comparing the ongoing costs only, and will not help you determine the relative total costs of owning different funds. In addition, if these transactional costs were included, your costs could have been higher.
| Expenses Paid During the Period | | | | | | | | | |
| | | Beginning account value April 1, 2010 | | | Ending account valueSeptember 30, 2010 | | | Expenses paid for the six-month period endedSeptember 30, 2010(1) | |
| FOCUS FUND | | | | | | | | | |
Actual Example | | $ | 1,000.00 | | | $ | 975.90 | | | $ | 6.62 | |
Hypothetical Example, assuming a 5% return before expenses | | $ | 1,000.00 | | | $ | 1,018.29 | | | $ | 6.77 | |
| | | | | | | | | | | | | |
| GROWTH FUND | | | | | | | | | | | | |
Actual Example | | $ | 1,000.00 | | | $ | 991.90 | | | $ | 6.52 | |
Hypothetical Example, assuming a 5% return before expenses | | $ | 1,000.00 | | | $ | 1,018.46 | | | $ | 6.60 | |
| | | | | | | | | | | | | |
21st CENTURY FUND | | | | | | | | | | | | |
Actual Example | | $ | 1,000.00 | | | $ | 962.70 | | | $ | 6.63 | |
Hypothetical Example, assuming a 5% return before expenses | | $ | 1,000.00 | | | $ | 1,018.24 | | | $ | 6.82 | |
| | | | | | | | | | | | | |
| INTERNATIONAL OPPORTUNITIES FUND | | | | | | | | | | | | |
Actual Example | | $ | 1,000.00 | | | $ | 1,041.40 | | | $ | 7.90 | |
Hypothetical Example, assuming a 5% return before expenses | | $ | 1,000.00 | | | $ | 1,017.26 | | | $ | 7.80 | |
| | | | | | | | | | | | | |
| FLEXIBLE CAPITAL FUND | | | | | | | | | | | | |
Actual Example | | $ | 1,000.00 | | | $ | 1,116.60 | | | $ | 3.98 | |
Hypothetical Example, assuming a 5% return before expenses | | $ | 1,000.00 | | | $ | 1,021.24 | | | $ | 3.80 | |
| | | | | | | | | | | | | |
| GLOBAL FUND | | | | | | | | | | | | |
Actual Example | | $ | 1,000.00 | | | $ | 1,054.30 | | | $ | 8.15 | |
Hypothetical Example, assuming a 5% return before expenses | | $ | 1,000.00 | | | $ | 1,017.07 | | | $ | 8.00 | |
| Expenses are equal to the Funds’ annualized expense ratios (1.338% for the Focus Fund, 1.305% for the Growth Fund, 1.348% for the 21st Century Fund, 1.543% for the International Opportunities Fund, 0.750% for the Flexible Capital Fund, and 1.582% for the Global Fund), multiplied by the average account value over the period, multiplied by 183/365 (to reflect the six-month period). |
OTHER INFORMATION
OTHER INFORMATION (Unaudited)
Proxy Voting Guidelines
The Funds exercise the voting rights associated with the securities held by the Funds under the proxy voting policy of the Funds. A description of those policies and procedures of the Funds and a record of the Funds’ proxy votes for the one-year period ended June 30, 2010 are available without charge, upon request, by calling 888-860-8686. It is also available on the Securities and Exchange Commission’s website at www.sec.gov.
Quarterly Filing of Portfolio Holdings
The Funds will file their complete schedule of investments with the SEC for the first and third quarters of each fiscal year on Form N-Q. The Funds’ Form N-Q will be available (i) on the SEC’s Website at www.sec.gov; (ii) at the SEC’s Public Reference Room; and (iii) by calling 800-SEC-0330.
Other Tax Information
Corporate Dividends Received Deduction
For the fiscal year ended September 30, 2010, 100%, 100%, 0%, 0%, 19% and 78% of the dividends paid from net investment income qualifies for the dividends received deduction available to corporate shareholders of the Focus, Growth, 21st Century, International Opportunities, Flexible Capital and Global Funds, respectively.
Qualified Dividend Income
Pursuant to Section 854 of the Internal Revenue Code of 1986, the Focus, Growth, 21st Century, International Opportunities, Flexible Capital and Global Funds designate income dividends (in thousands) of $3,909, $5,169, $0, $2,073, $231 and $721, respectively, as qualified dividend income paid during the fiscal year ended September 30, 2010.
Foreign Taxes Paid
Pursuant to the foreign tax credit election under Section 853 of the Internal Revenue Code of 1986, the International Opportunities Fund designates (in thousands) $8,459 of income derived from foreign sources and $886 of foreign taxes paid, for the year ended September 30, 2010.
Of the ordinary income (including short-term capital gain) distributions made by the International Opportunities Fund during the year ended September 30, 2010, the proportionate share of income derived from foreign sources and foreign taxes paid attributable to one share of stock are $0.2961 and $0.031, respectively.
TRUSTEE AND OFFICER INFORMATION
TRUSTEE AND OFFICER INFORMATION INDEPENDENT TRUSTEES
| Name, Address and Age | Position(s) Held with the Trust | Term of Office(1) and Length of Time Served | Principal Occupation(s) During Past 5 Years | Number of Portfolios in Fund Complex Overseen by Trustee | Other Directorships Held by Trustee |
| | | | | | |
Jay S. Goodgold 1200 17th Street Suite 1600 Denver, CO 80202 DOB: 1954 | Trustee | Since February 2006 | Private investor (July 2003 -present); Managing Director, Goldman, Sachs & Co. (August 1978 - June 2003). | 6 | None |
| | | | | | |
Elizabeth Hoffman 1200 17th Street Suite 1600 Denver, CO 80202 DOB: 1946 | Trustee | Since February 2006 | Executive Vice President and Provost, Iowa State University (January 2007 – present); President Emerita and Professor of Economics and Public Affairs, University of Colorado (August 2005 – December 2006); President, University of Colorado (September 2000 – July 2005). | 6 | None |
| | | | | | |
Walter A. Koelbel, Jr. 1200 17th Street Suite 1600 Denver, CO 80202 DOB: 1952 | Trustee | Since December 1997 | President, and other positions, Koelbel and Company (full service real estate, development, investment, and management company) (more than five years). | 6 | None |
| | | | | | |
Michael D. Rierson 1200 17th Street Suite 1600 Denver, CO 80202 DOB: 1952 | Trustee | Since November 1998 | Vice President and Vice Chancellor for University Advancement at the University of Houston and UH System, respectively (November 2005 - present); President and Vice President, University of South Florida Foundation and University of South Florida (May 2001 - September 2005). | 6 | None |
| | | | | | |
Bruce E. Stangle 1200 17th Street Suite 1600 Denver, CO 80202 DOB: 1948 | Trustee | Since May 2010 | Chairman, Analysis Group, Inc. (economic consulting) (more than five years). | 6 | Director, Wellington Trust Company (Since 2001) |
| | | | | | |
Joseph T. Willett 1200 17th Street Suite 1600 Denver, CO 80202 DOB: 1951 | Trustee | Since November 2002 | Private investor (2002 - present); Chief Operating Officer, Merrill Lynch Europe (1998 - 2002). | 6 | None |
| Each Trustee serves an indefinite term until the election of a successor. Each Officer serves an indefinite term, renewed annually, until the election of a successor. |
| | The Statement of Additional Information includes additional information about the Trustees and is available upon request, without charge, by calling 888-860-8686 or visit www.marsicofunds.com. |
TRUSTEE AND OFFICER INFORMATION
TRUSTEE AND OFFICER INFORMATION INTERESTED TRUSTEES AND OFFICERS
| Name, Address and Age | Position(s) Held with the Trust | Term of Office(1) and Length of Time Served | Principal Occupation(s) During Past 5 Years | Number of Portfolios in Fund Complex Overseen by Trustee | Other Directorships Held by Trustee |
| | | | | | |
Thomas F. Marsico(2) 1200 17th Street Suite 1600 Denver, CO 80202 DOB: 1955 | Trustee, President and Chief Executive Officer | Since December 1997 | Chief Executive Officer, Marsico Capital Management, LLC (more than five years). | 6 | None |
| | | | | | |
Christopher J. Marsico(2) 1200 17th Street Suite 1600 Denver, CO 80202 DOB: 1961 | Trustee, Executive Vice President and Chief Operating Officer | Trustee (August 2007 – March 2010 and since May 2010); Vice President and Treasurer (September 2002 – May 2010); Executive Vice President and Chief Operating Officer (since May 2010) | President, Marsico Capital Management, LLC (more than five years). | 6 | None |
| | | | | | |
Neil L. Gloude, CPA 1200 17th Street Suite 1600 Denver, CO 80202 DOB: 1961 | Vice President, Secretary and Treasurer | Vice President and Secretary (Since May 2008); Treasurer (since May 2010) | Executive Vice President and Chief Financial Officer, Marsico Capital Management, LLC (September 2007 - present); Partner, PricewaterhouseCoopers LLP (public accounting firm) (January 1999 - August 2007). | N/A | N/A |
| | | | | | |
David C. Price, CPA 1200 17th Street Suite 1600 Denver, CO 80202 DOB: 1969 | Chief Compliance Officer | Since August 2004 | Chief Compliance Officer, The Marsico Investment Fund, and Director of Compliance, Marsico Capital Management, LLC (more than five years). | N/A | N/A |
| | | | | | |
Sander M. Bieber 1775 I Street, N.W. Washington, D.C. 20006 DOB: 1950 | Assistant Secretary | Since December 1997 | Partner, Dechert LLP (law firm) (more than five years). | N/A | N/A |
| Each Trustee serves an indefinite term until the election of a successor. Each Officer serves an indefinite term, renewed annually, until the election of a successor. |
| Mr. Thomas Marsico and Mr. Christopher Marsico are considered Interested Trustees of the Trust, within the meaning of the 1940 Act, because of their affiliation with Marsico Capital Management, LLC, the investment adviser to the Funds. Mr. Thomas Marsico and Mr. Christopher Marsico are brothers. |
| | The Statement of Additional Information includes additional information about the Trustees and is available upon request, without charge, by calling 888-860-8686 or visit www.marsicofunds.com. |
NOTES
The Marsico Investment Fund
UMB Distribution Services, LLC, Distributor
P.O. Box 3210, Milwaukee, WI 53201-3210
www.marsicofunds.com ● 888.860.8686
©2010 MARSICO CAPITAL MANAGEMENT, LLC
Not authorized for distribution unless preceded or accompanied by an effective Marsico Funds prospectus.
The ticker symbols on page one are fictitious and do not refer to existing securities.
Item 2 - Code of Ethics.
(a) The Registrant, as of the end of the period covered by this report, has adopted a code of ethics that applies to the Registrant’s principal executive officer, principal financial officer, principal accounting officer or controller, or persons performing similar functions, regardless of whether these individuals are employed by the Registrant or a third party. A copy of this code of ethics is attached hereto as Exhibit (a).
(b) Not used.
(c) There were no substantive amendments, during the period covered by this report, to a provision of the code of ethics that applies to the Registrant’s principal executive officer, principal financial officer, principal accounting officer or controller, or persons performing similar functions, regardless of whether these individuals are employed by the Registrant or a third party, and that relates to any element of the code of ethics description.
(d) The Registrant has not granted any waivers, including an implicit waiver, from a provision of the code of ethics that applies to the Registrant’s principal executive officer, principal financial officer, principal accounting officer or controller, or persons performing similar functions, regardless of whether these individuals are employed by the Registrant or a third party, that relates to one or more of the items set forth in paragraph (b) of this item’s instructions.
| (f) | See attached Exhibit (a). |
Item 3 - Audit Committee Financial Expert.
(a)(1) The Registrant’s Board of Trustees has determined that the Registrant has at least one audit committee financial expert serving on its audit committee.
(a)(2) Mr. Joseph T. Willett is the audit committee financial expert. Mr. Willett is “independent” under the applicable rules.
Item 4 - Principal Accountant Fees and Services.
In each of the fiscal years ended September 30, 2010 and September 30, 2009, the aggregate Audit Fees billed (or to be billed) by PricewaterhouseCoopers LLP (PwC) for professional services rendered for the audits of the financial statements, or services that are normally provided in connection with statutory and regulatory filings or engagements as well as reimbursable expenses are listed below.
(a) Audit Fees.
| | 2010 | 2009 |
| | $136,000 | $132,000 |
(b) Audit-Related Fees.
In each of the fiscal years ended September 30, 2010 and September 30, 2009, the aggregate Audit-Related Fees billed (or to be billed) by PwC for services rendered for assurance and related services to each fund that are reasonably related to the performance of the audit or review of the fund's financial statements, but not reported as Audit Fees, are shown in the table below.
(c) Tax Fees.
In each of the fiscal years ended September 30, 2010 and September 30, 2009 the aggregate Tax Fees billed (or to be billed) by PwC for professional services rendered for tax compliance, tax advice, and tax planning are shown in the table below.
All of these fees were approved by the Trust’s Audit Committee as required pursuant to paragraph (c)(7)(ii) of Rule 2-01 of Regulation S-X.
Fees included in the Tax Fees category comprise all services performed by professional staff in the independent registered public accounting firm's tax division except those services related to the audit. Typically, this category would include fees for tax compliance, tax planning, and tax advice. Tax compliance, tax advice, and tax planning services include preparation of original and amended tax returns, claims for refund and tax payment-planning services, assistance with tax audits and appeals, tax advice related to mergers and acquisitions and requests for rulings or technical advice from taxing authorities.
(d) All Other Fees.
In each of the fiscal years ended September 30, 2010 and September 30, 2009 the aggregate Other Fees billed (or to be billed) by PwC for all other non-audit services rendered are shown in the table below.
| (e) (1) | Audit Committee Pre-Approval Policies and Procedures: |
Pursuant to the Trust’s Audit Committee Charter and Policies and Procedures (collectively, the “Procedures”), the Audit Committee has adopted pre-approval policies and procedures to govern the pre-approval of (i) all audit services and permissible non-audit services to be provided to the Trust by its independent accountant, and (ii) all permissible non-audit services to be provided by such independent accountant to the Trust’s investment adviser and to any entity controlling, controlled by or under common control with the investment adviser that provides on-going services to the Trust (collectively, any “Service Affiliates”) if the engagement directly relates to the Trust’s operations and financial reporting.
In accordance with the Procedures, the Committee is responsible for the engagement of the independent accountant to certify the Trust’s financial statements for each fiscal year. With respect to the pre-approval of non-audit services provided to the Trust and its Service Affiliates, the Procedures provide that the Committee may pre-approve such services on a project-by-project basis as they arise. The Procedures also permit the Committee to delegate authority to the Audit Committee Chairman (the “Designated Member”) to pre-approve any proposed non-audit services that have not been previously approved by the Committee, subject to certain conditions. Any action by the Designated Member in approving a requested non-audit service shall be presented to the Audit Committee not later than at its next scheduled meeting. If the Designated Member does not approve the independent auditor’s provision of a requested non-audit service, the matter may be presented to the full Committee for its consideration and action.
| (e)(2) | Services approved pursuant to paragraph (c)(7)(i)(C) of Rule 2-01 of Regulation S-X: |
100% of these fees were approved by the Trust’s Audit Committee as required pursuant to paragraph (c)(7)(ii) of Rule 2-01 of Regulation S-X.
(f) According to PwC for the fiscal year ended September 30, 2010, the percentage of hours spent on the audit the Marsico Funds’ financial statements for the most recent fiscal year that were attributed to work performed by persons who are not full-time, permanent employees of PwC is as follows:
| PwC | 2010 |
| Work performed by persons who are not full-time | 0% |
(g) In each of the fiscal years ended September 30, 2010 and September 30, 2009, the aggregate fees billed (or to be billed) by PwC relating to non-audit services that were rendered to the Trust, to its investment adviser, and to any entity controlling, controlled by, or under common control with the investment adviser and that provides ongoing services to the Trust are shown in the table below.
For the fiscal years ended September 30, 2010 and September 30, 2009, there were no non-audit services provided by PwC to the Trust, its investment adviser, or to any entity controlling, controlled by, or under common control with the investment adviser. For the fiscal years ended 2010 and 2009, fees in the amount of $45,700 and $96,000 respectively, have been billed by PwC for audit-related services provided to the investment adviser of the Trust.
(h) All non-audit services of the specified type (services that were provided by PwC to the investment adviser and to any entity controlling, controlled by, or under common control with the investment adviser and that provides ongoing services to the Trust) were pre-approved.
Item 5 - Audit Committee of Listed Registrants.
Not applicable.
Item 6 - Schedule of Investments.
The schedule of investments in securities of unaffiliated issuers is included as part of the report to shareholders filed under Item 1.
Item 7 - Disclosure of Proxy Voting Policies and Procedures for Closed-End Management Investment Companies.
Not applicable.
Item 8 – Portfolio Managers of Closed-End Management Investment Companies.
Not applicable.
Item 9 – Purchases of Equity Securities by Closed-End Management Investment Company and Affiliated Purchasers.
Not applicable.
Item 10 – Submission of Matters to a Vote of Security Holders.
Not applicable.
Item 11 - Controls and Procedures.
(a) The registrant's principal executive officer and principal financial officer have concluded that the registrant's disclosure controls and procedures (as defined in Rule 30a-3(c) under the Investment Company Act of 1940, as amended) are effective based on their evaluation of these disclosure controls and procedures within 90 days of the filing date of this report on Form N-CSR.
(b) There were no significant changes in the registrant's internal control over financial reporting (as defined in Rule 30a-3(d) under the Investment Company Act of 1940, as amended) that occurred during the second fiscal half-year covered by this report that has materially affected, or is reasonably likely to materially affect, the registrant’s internal control over financial reporting.
Item 12 – Exhibits.
(a)(1) Code of Ethics - Filed as an attachment to this filing.
(a)(2) Certification for each principal executive and principal financial officer of the registrant as required by Rule 30a-2(a) under the Act (17 CFR 270.30a-2(a)). Filed as an attachment to this filing.
(a)(3) Any written solicitation to purchase securities under Rule 23c-1 under the Investment Company Act of 1940, as amended, that was sent or given during the period covered by the report by or on behalf of the registrant to 10 or more persons.
Not applicable.
(b) Certifications required by Rule 30a-2(b) under the Act (17 CFR 270.30a-2(b)), Rule 13a-14(b) or Rule 15d-14(b) under the Exchange Act (17 CFR 240.13a-14(b) or 240.15d-14(b)), and Section 1350 of Chapter 63 of Title 18 of the United States Code (18 U.S.C. 1350) – Filed as an attachment to this filing. Filed as an attachment to this filing.
SIGNATURES
Pursuant to the requirements of the Securities Exchange Act of 1934 and the Investment Company Act of 1940, the registrant has duly caused this report to be signed on its behalf by the undersigned, thereunto duly authorized.
The Marsico Investment Fund
By: /s/ Christopher J. Marsico
Christopher J. Marsico
Executive Vice President and Chief Operating Officer
Date: November 22, 2010
Pursuant to the requirements of the Securities Exchange Act of 1934 and the Investment Company Act of 1940, this report has been signed below by the following persons on behalf of the registrant and in the capacities and on the dates indicated.
By: /s/ Christopher J. Marsico
Christopher J. Marsico
Executive Vice President and Chief Operating Officer
Date: November 22, 2010
By: /s/ Neil L. Gloude
Neil L. Gloude
Vice President, Secretary and Treasurer
Date: November 22, 2010