|
ANNUAL REPORT |
SEPTEMBER 30, 2011 |
OCTOBER 2011
DEAR SHAREHOLDER: Enclosed is your annual report for The Marsico Investment Fund, encompassing the one-year fiscal period from October 1, 2010 to September 30, 2011. The purpose of this report is to provide a retrospective for the Marsico Funds’ one-year investment results by discussing what we believe were the main areas that impacted performance – including the macroeconomic environment, sector and industry positioning, and individual stock selection – as compared to the Funds’ performance benchmark indexes. For updated information regarding the market environment and the Funds’ overall investment postures and performance, please refer to the Funds’ most recent monthly fact sheets and quarterly investment updates, which are available under the name of each Fund on the Funds’ website at www.marsicofunds.com. NOTE REGARDING CHANGES TO THE MARSICO INVESTMENT TEAM Effective October 1, 2011, Cory Gilchrist, CFA, portfolio manager of the Marsico 21st Century Fund and co-manager of the Marsico Global Fund, left Marsico Capital Management, LLC to pursue personal and charitable interests. Brandon Geisler, senior research analyst at Marsico Capital Management, LLC, has been appointed portfolio manager of the Marsico 21st Century Fund. Brandon joined Marsico Capital in January 2006. He has nine years of experience in the financial services industry. Brandon spent four years with Goldman, Sachs & Co., where he was a Vice President in Equity Research covering the restaurant, retailing, and other consumer-related industry groups. At Marsico Capital, Brandon has remained actively involved in those areas, while broadening his research responsibilities to include the automobile, aerospace/defense, home improvement, and other industries. Tom Marsico and Jim Gendelman, who have served as co-portfolio managers for the Marsico Global Fund since its inception, will remain in those roles. |
TABLE OF CONTENTS |
| | | |
| | KEY FUND STATISTICS | 2 |
| | MARKET ENVIRONMENT | 5 |
| | | |
| | |
| | Investment Review | 8 |
| | Fund Overview | 11 |
| | Schedule of Investments | 12 |
| | | |
| | |
| | Investment Review | 8 |
| | Fund Overview | 13 |
| | Schedule of Investments | 14 |
| | | |
| | MARSICO 21st CENTURY FUND |
| | Investment Review | 16 |
| | Fund Overview | 18 |
| | Schedule of Investments | 19 |
| | | |
| | MARSICO INTERNATIONAL OPPORTUNITIES FUND |
| | Investment Review | 20 |
| | Fund Overview | 22 |
| | Schedule of Investments | 23 |
| | | |
| | MARSICO FLEXIBLE CAPITAL FUND |
| | Investment Review | 25 |
| | Fund Overview | 27 |
| | Schedule of Investments | 28 |
| | | |
| | |
| | Investment Review | 30 |
| | Fund Overview | 32 |
| | Schedule of Investments | 33 |
| | | |
| | MARSICO EMERGING MARKETS FUND |
| | Investment Review | 35 |
| | Fund Overview | 37 |
| | Schedule of Investments | 38 |
| | | |
| | FINANCIAL STATEMENTS | 40 |
| | NOTES TO FINANCIAL STATEMENTS | 50 |
| | REPORT OF INDEPENDENT REGISTERED PUBLIC ACCOUNTING FIRM | 59 |
| | EXPENSE EXAMPLE | 60 |
| | OTHER INFORMATION | 61 |
| | TRUSTEE AND OFFICER INFORMATION | 62 |
KEY FUND STATISTICS (UNAUDITED) |
Marsico Focus Fund | Marsico Growth Fund | Marsico 21st Century Fund |
| MFOCX | MGRIX | MXXIX |
| For additional disclosures, please see page 11. | For additional disclosures, please see page 13. | For additional disclosures, please see page 18. |
PERFORMANCE COMPARISON(1) | PERFORMANCE COMPARISON(1) | PERFORMANCE COMPARISON(1) |
| | |
TOTAL ANNUAL OPERATING EXPENSES* 1.34% | TOTAL ANNUAL OPERATING EXPENSES* 1.34% | TOTAL ANNUAL OPERATING EXPENSES* 1.38% |
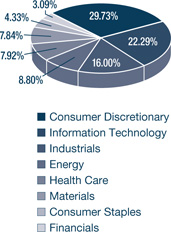
SECTOR ALLOCATION(2) | SECTOR ALLOCATION(2) | SECTOR ALLOCATION(2) |
| | |
| TOP FIVE HOLDINGS | TOP FIVE HOLDINGS | TOP FIVE HOLDINGS |
| APPLE, INC. | 6.41% | APPLE, INC. | 4.49% | WILLIAMS-SONOMA, INC. | 5.54% |
| BAIDU, INC. SPON. ADR | 4.37% | THE TJX COMPANIES, INC. | 4.24% | APPLE, INC. | 5.44% |
| PRICELINE.COM, INC. | 4.27% | AMAZON.COM, INC. | 3.34% | THE PNC FINANCIAL SERVICES GROUP, INC. | 5.33% |
| AMAZON.COM, INC. | 4.20% | PRICELINE.COM, INC. | 3.25% | ROSS STORES, INC. | 5.11% |
| MEAD JOHNSON NUTRITION COMPANY | 4.05% | VISA, INC. - CL. A | 3.18% | INTUITIVE SURGICAL, INC. | 4.50% |
For additional disclosures about the Marsico Funds, please see page 4. The performance data quoted here represent past performance, and past performance is not a guarantee of future results. Investment return and principal value of an investment will fluctuate so that an investor’s shares, when redeemed, may be worth more or less than their original cost.
KEY FUND STATISTICS (UNAUDITED) |
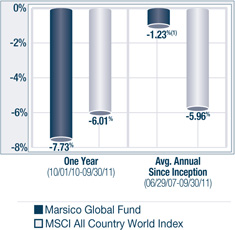
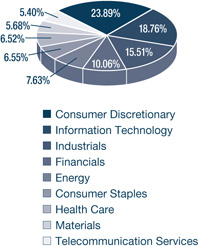
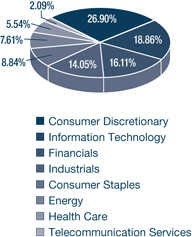
Marsico International Opportunities Fund | Marsico Flexible Capital Fund | Marsico Global Fund |
| MIOFX | MFCFX | MGLBX |
| For additional disclosures, please see page 22. | For additional disclosures, please see page 27. | For additional disclosures, please see page 32. |
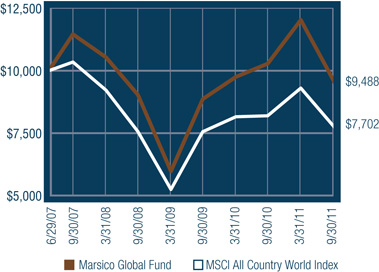
PERFORMANCE COMPARISON(1) | PERFORMANCE COMPARISON(1) | PERFORMANCE COMPARISON(1) |
| | |
TOTAL ANNUAL OPERATING EXPENSES* 1.54% | TOTAL ANNUAL OPERATING EXPENSES* 1.49% | TOTAL ANNUAL OPERATING EXPENSES* 1.56% |
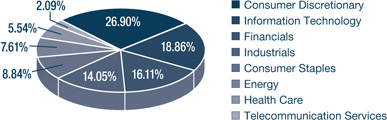
SECTOR ALLOCATION(2) | SECTOR ALLOCATION(2) | SECTOR ALLOCATION(2) |
| | |
| TOP FIVE HOLDINGS | TOP FIVE HOLDINGS | TOP FIVE HOLDINGS |
| ASML HOLDING N.V. | 3.08% | SENSATA TECHNOLOGIES HOLDING N.V. | 4.71% | INDUSTRIA DE DISENO TEXTILE S.A. (INDITEX) | 6.42% |
| TAIWAN SEMICONDUCTOR MANUFACTURING CO., LTD. SPON. ADR | 2.91% | TARGA RESOURCES CORPORATION | 4.24% | APPLE, INC. | 5.43% |
| ROCHE HOLDING AG | 2.86% | VISA, INC. - CL. A | 3.20% | THE PNC FINANCIAL SERVICES GROUP, INC. | 5.30% |
| CANADIAN NATIONAL RAILWAY COMPANY | 2.75% | AUTOZONE, INC. | 3.16% | BB&T CORPORATION | 4.38% |
| CHINA UNICOM HONG KONG LTD. | 2.74% | SOLARWINDS, INC. | 3.15% | COMPAGNIE FINANCIÈRE RICHEMONT SA | 4.09% |
Current performance may be lower or higher than the performance information quoted. To obtain performance information current to the most recent month-end, please call 888-860-8686 or visit www.marsicofunds.com. A redemption fee may be imposed on redemptions or exchanges of Fund shares held for 30 days or less.
KEY FUND STATISTICS (UNAUDITED) |
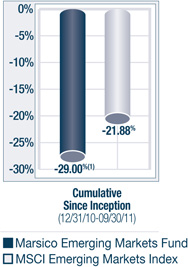
Marsico Emerging Markets Fund | |
| MERGX | |
| For additional disclosures, please see page 37. | |
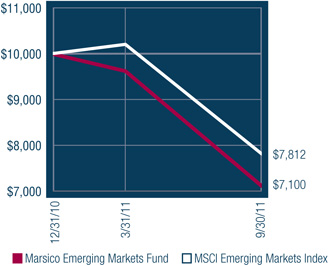
PERFORMANCE COMPARISON(1) | |
| |
TOTAL ANNUAL OPERATING EXPENSES* 3.36% NET EXPENSES*† 1.75% | |
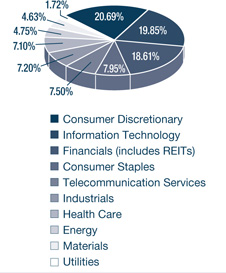
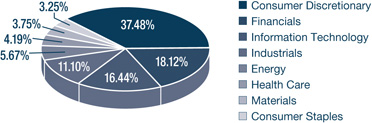
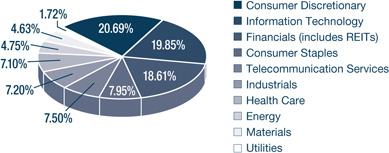
SECTOR ALLOCATION(2) | |
| |
| TOP FIVE HOLDINGS | |
| PHILIPPINE LONG DISTANCE TELEPHONE COMPANY SPON. ADR | 3.18% | |
| APPLE, INC. | 2.48% | |
| TAIWAN SEMICONDUCTOR MANUFACTURING CO., LTD. SPON. ADR | 2.42% | |
| HYUNDAI MOTOR COMPANY | 2.22% | |
| CELLTRION, INC. | 2.16% | |
ADDITIONAL DISCLOSURES ABOUT THE MARSICO FUNDS
| * | The Total Annual Operating Expenses and Net Expenses are reflective of the information disclosed in the Funds’ Prospectus dated February 1, 2011. The information may differ from the expense ratios disclosed in this report. |
| † | Marsico Capital Management, LLC (the “Adviser”) has entered into a written expense limitation agreement under which it has agreed to limit the total expenses (excluding interest, taxes, acquired fund fees and expenses, litigation, brokerage and extraordinary expenses) to an annual rate of 1.75% of the Emerging Markets Fund’s average net assets until January 31, 2012. This fee waiver may be terminated at any time after January 31, 2012. The Adviser may recoup any waived amount from a Fund pursuant to this arrangement if such reimbursement does not cause the Fund to exceed existing expense limitations and the reimbursement is made within three years after the year in which the Adviser incurred the expense. |
| (1) | The performance data quoted here represent past performance, and past performance is not a guarantee of future results. Investment return and principal value of an investment will fluctuate so that an investor’s shares, when redeemed, may be worth more or less than their original cost. Current performance may be lower or higher than the performance information quoted. To obtain performance information current to the most recent month-end, please call 888-860-8686 or visit www.marsicofunds.com. A redemption fee may be imposed on redemptions or exchanges of Fund shares held for 30 days or less. |
| | The performance included in the chart does not reflect the deduction of taxes on Fund distributions or the redemption of Fund shares. |
| | All indices are unmanaged and investors cannot invest directly in an index. |
| | The performance returns for the 21st Century Fund (for the period prior to March 31, 2004), the International Opportunities Fund (for the period prior to September 30, 2004), the Flexible Capital Fund (for the period prior to February 1, 2011), the Global Fund (for the period prior to January 1, 2009 and from April through May 2009), and the Emerging Markets Fund (for the periods ended September 30, 2011) reflect a fee waiver in effect; in the absence of such a waiver, the returns would be reduced. The performance returns for the 21st Century Fund (for the period beginning April 2004 through January 2005), the International Opportunities Fund (for the period beginning October 2004 through December 2005) and the Global Fund (for the one-month period June 2009) would have been higher but for the reimbursement of fees waived previously. |
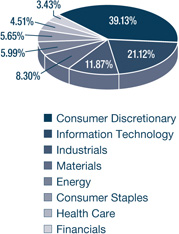
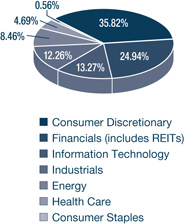
| (2) | Sector weightings represent the percentage of the respective Fund’s investments (excluding cash equivalents) in certain general sectors. These sectors may include more than one industry. The Fund’s portfolio composition is subject to change at any time. |
MARKET ENVIRONMENT: OCTOBER 2010 – SEPTEMBER 2011 (UNAUDITED)
The one-year period ended September 30, 2011 began in promising fashion but, over time, became a highly tempestuous period for stocks around the world. Equities were buoyed initially by a generally upbeat outlook for global economic growth, while in the US there were numerous signs that the economic recovery was beginning to broaden out and gain momentum. However, as time passed a variety of macro-related developments dampened growth expectations, such as political turmoil in the Middle East and North Africa, a major earthquake and tsunami in Japan, the Eurozone’s debt crisis and the absence of a strategic resolution, inflationary pressures in many emerging markets, controversy surrounding the US debt ceiling debate, a downgrade of the US government’s credit rating by Standard & Poor’s Corporation and increasing uncertainty about government policy. These developments weighed heavily on consumer and business confidence and put downward pressure on stock prices, particularly in the second half of the reporting period. Better-than-expected corporate profit reports served to buoy stocks periodically, but more often than not the relief was temporary in nature.
Economic outlooks around the world tended to weaken in synchronized fashion. The US economy ran into three major headwinds during the period: stubbornly-high unemployment, housing and construction industries still generally ensconced in the doldrums, and the absence of significant expansion in credit as a result of ongoing consumer and corporate de-leveraging. As the US economy sputtered, the Federal Reserve incrementally downgraded its investment outlook and undertook a variety of steps known as “quantitative easing” to further reduce interest rates from their already-low levels in the belief that lower rates would spur greater consumer discretionary spending and lending activity. President Obama introduced a series of proposals geared at promoting job growth. Questions remained, however, as to the potential effectiveness of the Federal Reserve’s monetary policy easing tactics and whether the Obama administration’s plan would be both meaningful and enactable in an increasingly truculent and divisive political environment. International markets struggled as well with contracting economic growth. Japan’s economy reeled in the aftermath of the March earthquake, tsunami and nuclear crisis. The Eurozone struggled to control its budget problems and sovereign debt crises, while its members with export-driven economies (e.g., Germany) weakened in concert with ebbing global demand. Many emerging markets – including China, India and Brazil – were challenged by higher inflation, which led central banks in those countries to undertake various policy-tightening measures geared at tempering economic growth.
As the economic skies darkened, investor response was swift and emphatic. Risk aversion skyrocketed and a massive “flight to safety” ensued. Individual stock correlations reached record heights, in some markets to levels not seen in 80 years, attesting to the widespread and indiscriminate selling of equities. Despite trading at generationally low absolute and relative valuations and offering earnings yields well in excess of fixed-income securities, stocks were eschewed by many investors and money flowed into areas considered to be safe havens such as US Treasury securities and the US dollar. Volatility in US stock prices reached almost unprecedented levels. As just one example, the Dow Jones Industrial Average Index had a four-day period during August in which it either moved up or down by at least 400 points.
Given that overall backdrop, the chart below is quite interesting. For the entire one-year period overall, some segments of the US equity market barely moved. The S&P 500 and Russell 3000 Indexes managed to eke out gains. Meanwhile international stocks, particularly those in emerging markets, suffered significant declines.
MARKET ENVIRONMENT
Index Name(1) | Universe of Equities Represented | One-Year Total Return |
| US | | |
| S&P 500 | US large–capitalization equities | +1.14% |
| Russell 3000 | US publicly-traded equities of all sizes | +0.55% |
| Russell 2000 | US small-capitalization equities | -3.53% |
| Russell Mid-Cap | US medium-capitalization equities | -0.88% |
Index Name(1) | Universe of Equities Represented | One-Year Total Return |
| INTERNATIONAL | |
| MSCI EAFE (US$) | Equities in developed international equity markets, including Japan, Western Europe, and Australasia | -9.36% | |
| MSCI Emerging Markets (US$) | Equities in developing international equity markets, including China, India, Eastern Europe, and Latin America | -16.15% | |
| MSCI ACWI (US$) | Equities in the global developed and emerging markets | -6.01% | |
US LARGE-CAPITALIZATION EQUITIES
US large-capitalization stocks (as measured by the S&P 500 Index) managed to eke out a positive return during the period. Performance was strong during the first six months of the reporting period, and then reversed course to slide sharply lower during the last half of the reporting period. Performance of the ten S&P 500 Index economic sectors, as defined under the Global Industry Classification Standard (“GICS”)(2), was mixed. Sectors generally considered to be defensive fared best, including Utilities (+12%), Consumer Staples (+10%), Energy (+8%) and Health Care (+6%). Consumer Discretionary (+6%), Telecommunication Services (+6%), and Information Technology (+4%) also registered positive returns. Financials was, by far, the weakest-performing sector with a return of -17%. Materials (-7%) and Industrials (-4%) also posted negative returns.
Industry group performance was led by several consumer-related industries. Food, Beverage & Tobacco (+12%), Consumer Services (+12%), Retailing (+9%), and Household & Personal Products (+9%) were among the strongest-performing industries. The weakest-performing industries were Diversified Financials (-26%), Automobiles & Components (-14%), Insurance (-13%) and Banks (-8%).
US ALL-CAPITALIZATION EQUITIES
Performance of the broad US equity market, as measured by the Russell 3000 Index which encompasses publicly-traded companies of all sizes, was essentially flat for the period. The mid-capitalization and small-capitalization areas of the US equity market were comparatively weaker than large-capitalization equities. Smaller-capitalization equities at times may underperform large-capitalization equities as investors’ risk appetite wanes.
Similar to the S&P 500 Index, the Russell 3000 Index’s performance was strong early in the period, followed by considerable weakness during the second half of the Funds’ fiscal year.
The Financials (-14%), Materials (-7%) and Industrials (-5%) sectors posted negative returns. In contrast, Utilities (+12%), Consumer Staples (+11%), Energy (+7%), and Health Care (+6%) performed well. Consumer Discretionary (+4%), Telecommunication Services (+4%), and Information Technology (+3%) posted more muted gains.
At an industry group-level, Food Beverage & Tobacco (+13%), Household & Personal Products (+10%), and Retailing (+10%) were among the best-performing groups. The weakest-performing industry groups were comprised of Diversified Financials (-24%), Automobiles & Components (-13%), Insurance (-12%) and Banks (-11%).
INTERNATIONAL EQUITIES
Developed market international equities lost ground for the one-year period ended September 30, 2011. Weakness was widespread. Eight of the ten GICS sectors in the MSCI EAFE Index posted negative returns. Financials (-20%), Materials (-12%), Utilities (-12%) and Industrials (-10%) experienced double-digit losses. Information Technology (-8%), Consumer Discretionary (-7%), Energy (-3%), and Telecommunication Services (-1%) also struggled. Only two sectors posted modest gains, as Health Care and Consumer Staples each rose (+3%).
Many GICS industry groups in the MSCI EAFE Index experienced weakness. The most significant losses among industries included: Diversified Financials (-25%), Banks (-23%), Consumer Durables & Apparel (-12%), and Real Estate (-12%). Food Beverage & Tobacco (+8%), Health Care Equipment & Services (+5%), Pharmaceuticals Biotechnology & Life Sciences (+3%), and Semiconductors & Semiconductor Equipment (+1%) were the only industry groups to post positive returns.
The MSCI EAFE Index’s largest country constituents, Japan and the United Kingdom, posted returns of +0.1% and -5.3%, respectively. Many other country-level constituents, however, posted double-digit negative returns. For example, France (-16%), Germany (-13%), and Spain (-18%) registered significant losses. Greece slid -52%, as concerns mounted regarding the country’s sovereign debt crisis.
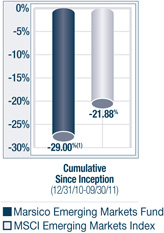
Emerging markets, meanwhile, significantly trailed their developed-market counterparts. Emerging market performance was weaker on fears of inflationary factors, concerns of a significant slow-down in China, and unrest in the Middle East. The MSCI Emerging Markets Index slid -16.15% for the one-year period.
It was a volatile period for currencies. Early in the period, for example, the US dollar lost ground compared to currencies such as the Japanese yen, Swiss franc and Australian dollar. During the final weeks of the reporting period, however, the US dollar strengthened as worries about the Eurozone debit crisis and slower global economic growth led investors into currencies with perceived safety including the US dollar.
THE MARSICO INVESTMENT TEAM
MARKET ENVIRONMENT
| (1) | All indices are unmanaged and investors cannot invest directly in an index. |
| (2) | The Global Industry Classification Standard (“GICS”) was developed by and is the exclusive property and service mark of MSCI Inc. (“MSCI”) and Standard & Poor’s (“S&P”) and is licensed for use by Marsico Capital Management, LLC (“MCM”). Neither MSCI, S&P, nor MCM or any third party involved in compiling GICS makes any express or implied warranties or representations with respect to such standard or classification (or the results from use thereof), and all such parties hereby expressly disclaim all warranties of originality, accuracy, completeness, merchantability and fitness for a particular purpose with respect to any such standard or classification. MSCI, S&P, MCM, and any of their affiliates or third parties involved in compiling GICS shall not have any liability for any direct, indirect, special, punitive, consequential or any other damages (including lost profits) even if notified of the possibility of such damages. |
INVESTMENT REVIEW BY TOM MARSICO, DOUG RAO AND CORALIE WITTER (UNAUDITED)
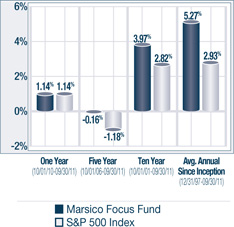
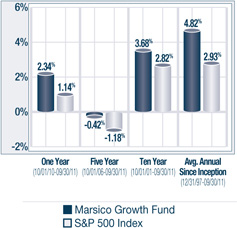
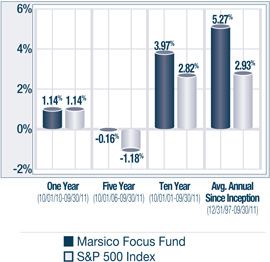
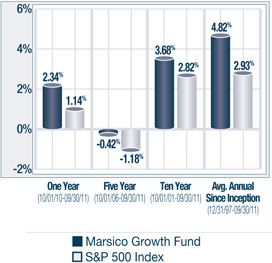
The Marsico Focus Fund generated a return of +1.14% for the one-year fiscal period. The Fund’s performance matched that of the S&P 500 Index, which also posted a total return of +1.14%. The Marsico Growth Fund outperformed the S&P 500 Index and posted a return of +2.34%. Please see the Funds’ Overviews for more detailed information about each Fund’s longer-term performance for various periods ended September 30, 2011.
The performance data for the Funds quoted here represent past performance, and past performance is not a guarantee of future results. Investment return and principal value of an investment will fluctuate so that an investor’s shares, when redeemed, may be worth more or less than their original cost. Current performance may be lower or higher than the performance information quoted. To obtain performance information current to the most recent month-end, please call 888-860-8686 or visit www.marsicofunds.com.(1)
This review highlights Fund performance over a one-year fiscal period. Shareholders should keep in mind that the Funds are intended for long-term investors who hold their shares for substantially longer periods of time. You should also keep in mind that our views on all investments discussed in this report are subject to change at any time. References to specific securities, industries, and sectors discussed in this report are not recommendations to buy or sell such securities or related investments, and the Funds may not necessarily hold these securities or investments today. Please see the accompanying Schedules of Investments for the percentage of each Fund’s portfolio represented by the securities mentioned in this report as of the end of the reporting period.
The Focus Fund is non-diversified and may hold fewer securities than a diversified fund. Holding fewer securities increases the risk that the value of the Fund could go down because of the poor performance of a single investment. Stocks and markets in which the Focus Fund and the Growth Fund invest may experience periods of turbulence and instability, and the general risk that domestic and global economies and stock markets may go through periods of decline and cyclical change.
The Focus Fund and the Growth Fund often invest in similar growth companies. Their performance may differ at times, however, because of a variety of factors. Among other factors, the Focus Fund is a non-diversified mutual fund that may invest in a more concentrated portfolio and may hold the securities of fewer issuers than the Growth Fund. As a result, the Focus Fund may hold some securities that are different from those held by the Growth Fund, and may be more exposed to individual stock volatility than the Growth Fund or other mutual funds that invest in a larger number of securities.
FOCUS FUND
The Marsico Focus Fund performed in-line with the S&P 500 Index for the one-year fiscal period ended September 30, 2011.
The Fund’s performance results were aided by stock selection and an overweight allocation to the Consumer Discretionary sector. Online retailers Amazon.com, Inc. and priceline.com, Inc. posted returns of +38% and +30%, respectively. Casino and resort operator Wynn Resorts Ltd. rose +44%. Coffeehouse company Starbucks Corporation gained +16%. Consumer Discretionary was one of the strongest-performing sectors of the S&P 500 Index during the one-year period and the Fund did well by having a significant portion of its net assets invested in the sector.
Several holdings in the Industrials, Information Technology, and Materials sectors also posted strong gains. Aerospace components manufacturer Goodrich Corporation soared +64%. The Fund’s Information Technology positions were led by Apple, Inc. (+35%) and financial transactions processor Visa, Inc. – Cl. A (+7%). A specific holding in the Materials sector, Monsanto Company (+28%), was another important contributor to performance.
Financials was the weakest-performing sector of the S&P 500 Index with a return of -17%. The Fund significantly reduced its allocation to Financials during the period, selling positions such as Citigroup, Inc. (-19% prior to being sold) and The Goldman Sachs Group, Inc. (-7% prior to being sold). The Fund’s limited investments in Financials significantly aided
performance during the latter stages of the period. The Fund’s reduced Financials holdings represented a change in our outlook for a number of the largest financial services institutions. From our perspective, the regulatory environment for this group has become considerably more complex. Ultimately, we think there could be a number of new or additional regulatory restrictions that may impact future profitability for some companies.
A primary area of weakness for the Fund was stock selection and positioning in the Energy sector. Oil and gas exploration and production companies Halliburton Company (-17%) and Occidental Petroleum Corporation (-20%) each posted significant stock price declines. The Fund’s performance was also hampered by having few investments in the Energy sector, as Energy was among the stronger-performing sectors of the S&P 500 Index.
Similarly, the Fund was hurt by having underweight allocations to the Health Care, Consumer Staples, and Utilities sectors. These sectors were also some of the strongest-performing sectors of the benchmark index.
Certain individual positions exerted a material drag on performance, including: Freeport-McMoRan Copper & Gold, Inc. (-40%), life sciences and chemical instruments company Agilent Technologies, Inc. (-34%), and Chinese Internet services company SINA Corporation (-28% prior to being sold).
During the period, the Fund reduced its exposure to the Financials, Materials, and Industrials sectors while increasing its allocations to the Information Technology, Consumer Discretionary, and Energy sectors.
GROWTH FUND
The Marsico Growth Fund shared several of the Focus Fund’s performance attributes for the one-year fiscal period ended September 30, 2011. Both Funds benefitted from having a significant percentage of their assets invested in the strong-performing Consumer Discretionary sector. The positive sector allocation effect was greater in the Growth Fund, as the Growth Fund had a larger percentage of its net assets in Consumer Discretionary-related investments, on average, than the Focus Fund. This positioning contributed to the Growth Fund’s outperformance as compared to the Focus Fund. Several of the Growth Fund’s Consumer Discretionary positions posted strong gains, including retailers The TJX Companies, Inc. (+26%), priceline.com, Inc. (+29%), Amazon.com, Inc. (+38%), and Tiffany & Co. (+31%). Wynn Resorts Ltd. (+45%) was another leading holding in the sector.
Also similar to the Focus Fund, the Growth Fund benefitted from maintaining an underweight posture to the beleaguered Financials sector.
Additional areas of strength for the Growth Fund were stock selection in the Materials and Consumer Staples sectors. Materials positions Monsanto Company (+28%) and BHP Billiton PLC ADR (+29% prior to being sold) each were meaningful contributors to performance. Leading Consumer Staples positions included cosmetic company The Estee Lauder Companies, Inc. – Cl. A (+40%) and Green Mountain Coffee Roasters, Inc. (+46%).
Like the Focus Fund, the Growth Fund’s performance was held back by having few investments in some of the strongest-performing sectors of the S&P 500 Index, such as Health Care, Energy, Utilities, and Consumer Staples. Stock selection within the Energy sector was also disappointing. Halliburton Company (-17%) and Occidental Petroleum Corporation (-26%) were material detractors from performance.
Other individual positions having a negative effect on performance included Information Technology holdings Youku.com, Inc. Spon. ADR (-58%) and Agilent Technologies, Inc. (-29%). Industrials holding Rockwell Automation, Inc. (-37%) and luxury goods provider Compagnie Financière Richemont SA ADR (-21%) also declined sharply.
During the period, the Fund reduced its exposure to the Financials, Materials, and Industrials sectors, while increasing exposure to the Consumer Discretionary and Consumer Staples sectors. During the period, the Fund sold its Telecommunication Services positions.
Fiscal Period-End Investment Posture
As of September 30, 2011, the Focus Fund’s and the Growth Fund’s primary sector allocations included Consumer Discretionary, Information Technology, and Industrials. The Funds had no investments in the Utilities or Telecommunication Services sectors.
Sincerely,
THOMAS F. MARSICO
A. DOUGLAS RAO
CORALIE T. WITTER, CFA
PORTFOLIO MANAGERS
| (1) | Total returns are based on net change in net asset value assuming reinvestment of distributions. A redemption fee of 2% may be imposed on redemptions or exchanges of Fund shares owned for 30 days or less. Please see the Prospectus for more information. |
September 30, 2011 (Unaudited)
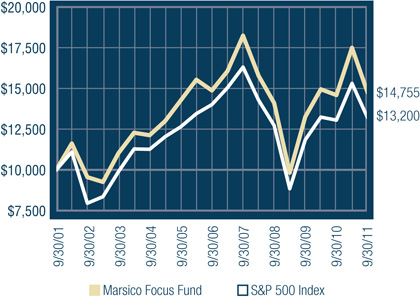
The Focus Fund invests primarily in the common stocks of large companies, normally a core position of 20–30 common stocks that are selected for their long-term growth potential.
| TOTAL ANNUAL OPERATING EXPENSES* 1.34% | NET ASSETS $936,382,267 | NET ASSET VALUE PER SHARE $15.97 |
GROWTH OF $10,000(1) | PERFORMANCE COMPARISON |
| |
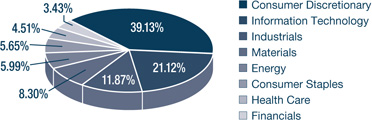
SECTOR ALLOCATION(2) | TOP FIVE HOLDINGS |
| | | | |
| | APPLE, INC. | 6.41% | |
| | BAIDU, INC. SPON. ADR | 4.37% | |
| | PRICELINE.COM, INC. | 4.27% | |
| | AMAZON.COM, INC. | 4.20% | |
| | MEAD JOHNSON NUTRITION COMPANY | 4.05% | |
| | | | |
| * | The Total Annual Operating Expenses are reflective of the information disclosed in the Funds’ Prospectus dated February 1, 2011 and may differ from the expense ratio disclosed in this report. |
| | The performance data quoted here represent past performance, and past performance is not a guarantee of future results. Investment return and principal value of an investment will fluctuate so that an investor’s shares, when redeemed, may be worth more or less than their original cost. Current performance may be lower or higher than the performance information quoted. To obtain performance information current to the most recent month-end, please call 888-860-8686 or visit www.marsicofunds.com. A redemption fee may be imposed on redemptions or exchanges of Fund shares held for 30 days or less. |
| | The performance included in the chart and graph does not reflect the deduction of taxes on Fund distributions or the redemption of Fund shares. |
| | All indices are unmanaged and investors cannot invest directly in an index. |
| (1) | This chart assumes an initial investment of $10,000 made on September 30, 2001. Total returns are based on net change in NAV, assuming reinvestment of distributions. |
| (2) | Sector weightings represent the percentage of the Fund’s investments (excluding cash equivalents) in certain general sectors. These sectors may include more than one industry. The Fund’s portfolio composition is subject to change at any time. |
MARSICO FOCUS FUND
SCHEDULE OF INVESTMENTS
September 30, 2011
| | | Number of Shares | | | Value | | | Percent of Net Assets | |
| COMMON STOCKS | | | | | | | | | |
| Aerospace & Defense | | | | | | | | | |
| Goodrich Corporation | | | 200,644 | | | $ | 24,213,718 | | | | 2.58 | % |
| Precision Castparts Corp. | | | 153,387 | | | | 23,845,543 | | | | 2.55 | |
| | | | | | | | 48,059,261 | | | | 5.13 | |
| Biotechnology | | | | | | | | | | | | |
| Biogen Idec Inc.* | | | 277,588 | | | | 25,857,322 | | | | 2.76 | |
| | | | | | | | | | | | | |
| Cable & Satellite | | | | | | | | | | | | |
| British Sky Broadcasting Group PLC | | | 1,399,519 | | | | 14,413,853 | | | | 1.54 | |
| | | | | | | | | | | | | |
| Casinos & Gaming | | | | | | | | | | | | |
| Wynn Resorts Ltd. | | | 323,307 | | | | 37,206,170 | | | | 3.97 | |
| | | | | | | | | | | | | |
| Computer Hardware | | | | | | | | | | | | |
| Apple, Inc.* | | | 157,501 | | | | 60,036,231 | | | | 6.41 | |
| | | | | | | | | | | | | |
| Construction & Farm Machinery & Heavy Trucks | | | | | |
| Cummins, Inc. | | | 284,010 | | | | 23,192,257 | | | | 2.48 | |
| | | | | | | | | | | | | |
| Consumer Finance | | | | | | | | | | | | |
| American Express Company | | | 603,419 | | | | 27,093,513 | | | | 2.89 | |
| | | | | | | | | | | | | |
| Data Processing & Outsourced Services | | | | | |
| Visa, Inc. - Cl. A | | | 406,985 | | | | 34,886,754 | | | | 3.73 | |
| | | | | | | | | | | | | |
| Diversified Chemicals | | | | | | | | | | | | |
| The Dow Chemical Company | | | 707,349 | | | | 15,887,059 | | | | 1.70 | |
| | | | | | | | | | | | | |
| Diversified Metals & Mining | | | | | | | | | |
| Freeport-McMoRan Copper & Gold, Inc. | | | 474,229 | | | | 14,440,273 | | | | 1.54 | |
| | | | | | | | | | | | | |
| Fertilizers & Agricultural Chemicals | | | | | | | | | |
| Monsanto Company | | | 489,568 | | | | 29,393,663 | | | | 3.14 | |
| | | | | | | | | | | | | |
| Footwear | | | | | | | | | | | | |
| NIKE, Inc. - Cl. B | | | 64,722 | | | | 5,534,378 | | | | 0.59 | |
| | | | | | | | | | | | | |
| General Merchandise Stores | | | | | | | | | |
| Dollar General Corporation* | | | 506,587 | | | | 19,128,725 | | | | 2.04 | |
| | | | | | | | | | | | | |
| Industrial Conglomerates | | | | | | | | | | | | |
| Danaher Corporation | | | 557,690 | | | | 23,389,519 | | | | 2.50 | |
| | | | | | | | | | | | | |
| Industrial Gases | | | | | | | | | | | | |
| Praxair, Inc. | | | 96,684 | | | | 9,038,020 | | | | 0.97 | |
| | | | | | | | | | | | | |
| Industrial Machinery | | | | | | | | | | | | |
| Eaton Corporation | | | 391,655 | | | | 13,903,752 | | | | 1.48 | |
| | | | | | | | | | | | | |
| Integrated Oil & Gas | | | | | | | | | | | | |
| Occidental Petroleum Corporation | | | 323,508 | | | | 23,130,822 | | | | 2.47 | |
| | | | | | | | | | | | | |
| Internet Retail | | | | | | | | | | | | |
| Amazon.com, Inc.* | | | 181,887 | | | | 39,329,426 | | | | 4.20 | |
| priceline.com, Inc.* | | | 89,001 | | | | 40,002,389 | | | | 4.27 | |
| | | | | | | | 79,331,815 | | | | 8.47 | |
COMMON STOCKS (continued) | | | | | | | | | |
| Internet Software & Services | | | | | | | | | |
| Baidu, Inc. Spon. ADR* | | | 382,749 | | | $ | 40,919,696 | | | | 4.37 | % |
| | | | | | | | | | | | | |
| IT Consulting & Other Services | | | | | | | | | |
| Accenture plc - Cl. A | | | 536,777 | | | | 28,277,412 | | | | 3.02 | |
| | | | | | | | | | | | | |
| Life Sciences Tools & Services | | | | | | | | | |
| Agilent Technologies, Inc.* | | | 288,350 | | | | 9,010,937 | | | | 0.96 | |
| | | | | | | | | | | | | |
| Movies & Entertainment | | | | | | | | | | | | |
| Time Warner, Inc. | | | 855,774 | | | | 25,647,547 | | | | 2.74 | |
| | | | | | | | | | | | | |
| Oil & Gas Equipment & Services | | | | | | | | | |
| Halliburton Company | | | 790,089 | | | | 24,113,516 | | | | 2.58 | |
| | | | | | | | | | | | | |
| Oil & Gas Exploration & Production | | | | | | | | | |
| Anadarko Petroleum Corporation | | | 215,295 | | | | 13,574,350 | | | | 1.45 | |
| | | | | | | | | | | | | |
| Oil & Gas Storage & Transportation | | | | | | | | | |
| Kinder Morgan, Inc. | | | 629,103 | | | | 16,287,477 | | | | 1.74 | |
| | | | | | | | | | | | | |
| Packaged Foods & Meats | | | | | | | | | | | | |
| Mead Johnson Nutrition Company | | | 551,639 | | | | 37,969,312 | | | | 4.05 | |
| | | | | | | | | | | | | |
| Pharmaceuticals | | | | | | | | | | | | |
| Allergan, Inc. | | | 392,983 | | | | 32,373,939 | | | | 3.46 | |
| Bristol-Myers Squibb Company | | | 68,741 | | | | 2,157,093 | | | | 0.23 | |
| | | | | | | | 34,531,032 | | | | 3.69 | |
| Railroads | | | | | | | | | | | | |
| Union Pacific Corporation | | | 388,340 | | | | 31,715,728 | | | | 3.39 | |
| | | | | | | | | | | | | |
| Restaurants | | | | | | | | | | | | |
| Chipotle Mexican Grill, Inc.* | | | 55,490 | | | | 16,810,696 | | | | 1.80 | |
| McDonald's Corporation | | | 280,911 | | | | 24,669,604 | | | | 2.63 | |
| Starbucks Corporation | | | 1,013,374 | | | | 37,788,716 | | | | 4.04 | |
| | | | | | | | 79,269,016 | | | | 8.47 | |
| Systems Software | | | | | | | | | | | | |
| Oracle Corporation | | | 1,085,919 | | | | 31,209,312 | | | | 3.33 | |
| | | | | | | | | | | | | |
| TOTAL COMMON STOCKS | | | | | | | | | | | | |
| (Cost $751,377,922) | | | | | | | 876,448,722 | | | | 93.60 | |
| | | | | | | | | | | | | |
| SHORT-TERM INVESTMENTS | | | | | | | | | |
| State Street Institutional U.S. Government Money Market Fund, 0.000% | | | 68,208,324 | | | | 68,208,324 | | | | 7.28 | |
| | | | | | | | | | | | | |
| TOTAL SHORT-TERM INVESTMENTS | | | | | | | | | |
| (Cost $68,208,324) | | | | | | | 68,208,324 | | | | 7.28 | |
| | | | | | | | | | | | | |
| TOTAL INVESTMENTS | | | | | | | | | | | | |
| (Cost $819,586,246) | | | | | | | 944,657,046 | | | | 100.88 | |
| | | | | | | | | | | | | |
| Liabilities, Less Cash and Other Assets | | | | | | | (8,274,779 | ) | | | (0.88 | ) |
| | | | | | | | | | | | | |
| NET ASSETS | | | | | | $ | 936,382,267 | | | | 100.00 | % |
| | See notes to financial statements. |
September 30, 2011 (Unaudited)
The Growth Fund invests primarily in the common stocks of large companies that are selected for their long-term growth potential. The Growth Fund will normally hold a core position of between 35 and 50 common stocks.
| TOTAL ANNUAL OPERATING EXPENSES* 1.34% | NET ASSETS $666,924,598 | NET ASSET VALUE PER SHARE $17.43 |
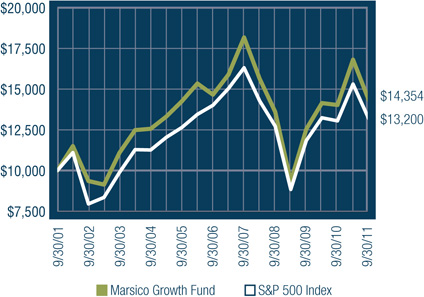
GROWTH OF $10,000(1) | PERFORMANCE COMPARISON |
| |
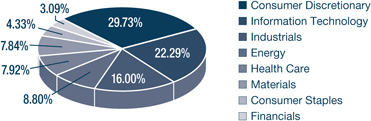
SECTOR ALLOCATION(2) | TOP FIVE HOLDINGS |
| | | | |
| | APPLE, INC. | 4.49% | |
| | THE TJX COMPANIES, INC. | 4.24% | |
| | AMAZON.COM, INC. | 3.34% | |
| | PRICELINE.COM, INC. | 3.25% | |
| | VISA, INC. - CL. A | 3.18% | |
| | | | |
GROWTH FUND OVERVIEW
| * | The Total Annual Operating Expenses are reflective of the information disclosed in the Funds’ Prospectus dated February 1, 2011 and may differ from the expense ratio disclosed in this report. |
| | The performance data quoted here represent past performance, and past performance is not a guarantee of future results. Investment return and principal value of an investment will fluctuate so that an investor’s shares, when redeemed, may be worth more or less than their original cost. Current performance may be lower or higher than the performance information quoted. To obtain performance information current to the most recent month-end, please call 888-860-8686 or visit www.marsicofunds.com. A redemption fee may be imposed on redemptions or exchanges of Fund shares held for 30 days or less. |
| | The performance included in the chart and graph does not reflect the deduction of taxes on Fund distributions or the redemption of Fund shares. |
| | All indices are unmanaged and investors cannot invest directly in an index. |
| (1) | This chart assumes an initial investment of $10,000 made on September 30, 2001. Total returns are based on net change in NAV, assuming reinvestment of distributions. |
| (2) | Sector weightings represent the percentage of the Fund’s investments (excluding cash equivalents) in certain general sectors. These sectors may include more than one industry. The Fund’s portfolio composition is subject to change at any time. |
MARSICO GROWTH FUND
SCHEDULE OF INVESTMENTS
September 30, 2011
| | | Number of Shares | | | Value | | | Percent of Net Assets | |
| COMMON STOCKS | | | | | | | | | |
| Aerospace & Defense | | | | | | | | | |
| Precision Castparts Corp. | | | 99,842 | | | $ | 15,521,437 | | | | 2.33 | % |
| | | | | | | | | | | | | |
| Apparel Retail | | | | | | | | | | | | |
| The TJX Companies, Inc. | | | 510,121 | | | | 28,296,412 | | | | 4.24 | |
| | | | | | | | | | | | | |
| Apparel, Accessories & Luxury Goods | | | | | |
| Coach, Inc. | | | 199,595 | | | | 10,345,009 | | | | 1.55 | |
| Compagnie Financière Richemont SA ADR | | | 3,690,557 | | | | 16,312,262 | | | | 2.45 | |
| | | | | | | | 26,657,271 | | | | 4.00 | |
| Application Software | | | | | | | | | | | | |
| salesforce.com, inc.* | | | 58,073 | | | | 6,636,582 | | | | 0.99 | |
| | | | | | | | | | | | | |
| Automotive Retail | | | | | | | | | | | | |
| AutoZone, Inc.* | | | 11,644 | | | | 3,716,649 | | | | 0.56 | |
| O'Reilly Automotive, Inc.* | | | 117,475 | | | | 7,827,359 | | | | 1.17 | |
| | | | | | | | 11,544,008 | | | | 1.73 | |
| Biotechnology | | | | | | | | | | | | |
| Biogen Idec Inc.* | | | 145,728 | | | | 13,574,563 | | | | 2.04 | |
| | | | | | | | | | | | | |
| Cable & Satellite | | | | | | | | | | | | |
| British Sky Broadcasting Group PLC | | | 630,516 | | | | 6,493,777 | | | | 0.97 | |
| | | | | | | | | | | | | |
| Casinos & Gaming | | | | | | | | | | | | |
| Wynn Resorts Ltd. | | | 143,661 | | | | 16,532,508 | | | | 2.48 | |
| | | | | | | | | | | | | |
| Computer Hardware | | | | | | | | | | | | |
| Apple, Inc.* | | | 78,599 | | | | 29,960,367 | | | | 4.49 | |
| | | | | | | | | | | | | |
| Construction & Farm Machinery & Heavy Trucks | | | | | |
| Cummins, Inc. | | | 105,939 | | | | 8,650,979 | | | | 1.30 | |
| | | | | | | | | | | | | |
| Data Processing & Outsourced Services | | | | | |
| Visa, Inc. - Cl. A | | | 247,710 | | | | 21,233,701 | | | | 3.18 | |
| | | | | | | | | | | | | |
| Distributors | | | | | | | | | | | | |
| Li & Fung Ltd. | | | 2,906,000 | | | | 4,870,905 | | | | 0.73 | |
| | | | | | | | | | | | | |
| Diversified Banks | | | | | | | | | | | | |
| U.S. Bancorp | | | 484,875 | | | | 11,413,957 | | | | 1.71 | |
| | | | | | | | | | | | | |
| Diversified Chemicals | | | | | | | | | | | | |
| PPG Industries, Inc. | | | 140,531 | | | | 9,929,920 | | | | 1.49 | |
| The Dow Chemical Company | | | 399,891 | | | | 8,981,552 | | | | 1.35 | |
| | | | | | | | 18,911,472 | | | | 2.84 | |
| Electrical Components & Equipment | | | | | |
| Rockwell Automation, Inc. | | | 99,232 | | | | 5,556,992 | | | | 0.83 | |
| | | | | | | | | | | | | |
| Fertilizers & Agricultural Chemicals | | | | | | | | | |
| Monsanto Company | | | 178,413 | | | | 10,711,917 | | | | 1.61 | |
| | | | | | | | | | | | | |
| Footwear | | | | | | | | | | | | |
| NIKE, Inc. - Cl. B | | | 246,001 | | | | 21,035,546 | | | | 3.15 | |
| | | | | | | | | | | | | |
COMMON STOCKS (continued) | | | | | | | | | |
| Industrial Conglomerates | | | | | | | | | | | | |
| Danaher Corporation | | | 309,508 | | | $ | 12,980,766 | | | | 1.95 | % |
| | | | | | | | | | | | | |
| Industrial Gases | | | | | | | | | | | | |
| Praxair, Inc. | | | 220,152 | | | | 20,579,809 | | | | 3.09 | |
| | | | | | | | | | | | | |
| Industrial Machinery | | | | | | | | | | | | |
| Eaton Corporation | | | 202,370 | | | | 7,184,135 | | | | 1.08 | |
| | | | | | | | | | | | | |
| Integrated Oil & Gas | | | | | | | | | | | | |
| Occidental Petroleum Corporation | | | 185,709 | | | | 13,278,193 | | | | 1.99 | |
| | | | | | | | | | | | | |
| Internet Retail | | | | | | | | | | | | |
| Amazon.com, Inc.* | | | 102,926 | | | | 22,255,689 | | | | 3.34 | |
| priceline.com, Inc.* | | | 48,241 | | | | 21,682,400 | | | | 3.25 | |
| | | | | | | | 43,938,089 | | | | 6.59 | |
| Internet Software & Services | | | | | | | | | |
| Baidu, Inc. Spon. ADR* | | | 188,823 | | | | 20,187,067 | | | | 3.02 | |
| Google, Inc. - Cl. A* | | | 13,210 | | | | 6,794,960 | | | | 1.02 | |
| Youku.com, Inc. Spon. ADR* | | | 195,206 | | | | 3,193,570 | | | | 0.48 | |
| | | | | | | | 30,175,597 | | | | 4.52 | |
| IT Consulting & Other Services | | | | | | | | | |
| Accenture plc - Cl. A | | | 140,790 | | | | 7,416,817 | | | | 1.11 | |
| | | | | | | | | | | | | |
| Life Sciences Tools & Services | | | | | | | | | |
| Agilent Technologies, Inc.* | | | 201,889 | | | | 6,309,031 | | | | 0.95 | |
| | | | | | | | | | | | | |
| Movies & Entertainment | | | | | | | | | | | | |
| Time Warner, Inc. | | | 484,828 | | | | 14,530,295 | | | | 2.18 | |
| | | | | | | | | | | | | |
| Oil & Gas Equipment & Services | | | | | | | | | |
| Halliburton Company | | | 500,710 | | | | 15,281,669 | | | | 2.29 | |
| National Oilwell Varco, Inc. | | | 109,581 | | | | 5,612,739 | | | | 0.84 | |
| | | | | | | | 20,894,408 | | | | 3.13 | |
| Oil & Gas Exploration & Production | | | | | | | | | |
| Continental Resources, Inc.* | | | 42,061 | | | | 2,034,491 | | | | 0.30 | |
| | | | | | | | | | | | | |
| Packaged Foods & Meats | | | | | | | | | | | | |
| Green Mountain Coffee Roasters, Inc.* | | | 106,360 | | | | 9,885,098 | | | | 1.48 | |
| Mead Johnson Nutrition Company | | | 156,606 | | | | 10,779,191 | | | | 1.62 | |
| | | | | | | | 20,664,289 | | | | 3.10 | |
| Personal Products | | | | | | | | | | | | |
| The Estee Lauder Companies, Inc. - Cl. A | | | 153,432 | | | | 13,477,467 | | | | 2.02 | |
| | | | | | | | | | | | | |
| Pharmaceuticals | | | | | | | | | | | | |
| Allergan, Inc. | | | 89,472 | | | | 7,370,703 | | | | 1.11 | |
| | | | | | | | | | | | | |
| Railroads | | | | | | | | | | | | |
| Union Pacific Corporation | | | 177,031 | | | | 14,458,122 | | | | 2.17 | |
| | | | | | | | | | | | | |
| Restaurants | | | | | | | | | | | | |
| McDonald's Corporation | | | 225,860 | | | | 19,835,025 | | | | 2.97 | |
| Starbucks Corporation | | | 512,266 | | | | 19,102,399 | | | | 2.86 | |
| YUM! Brands, Inc. | | | 299,107 | | | | 14,772,895 | | | | 2.22 | |
| | | | | | | | 53,710,319 | | | | 8.05 | |
| Specialized Consumer Services | | | | | | | | | |
| Sotheby's | | | 30,431 | | | | 838,983 | | | | 0.13 | |
| | See notes to financial statements. |
| | | Number of Shares/Units | | | Value | | | Percent of Net Assets | |
COMMON STOCKS (continued) | | | | | | | |
| Specialty Stores | | | | | | | | | |
| Tiffany & Co. | | | 132,858 | | | $ | 8,080,424 | | | | 1.21 | % |
| | | | | | | | | | | | | |
| Systems Software | | | | | | | | | | | | |
| Check Point Software Technologies Ltd.* | | | 127,653 | | | | 6,734,972 | | | | 1.01 | |
| Oracle Corporation | | | 539,592 | | | | 15,507,874 | | | | 2.32 | |
| Red Hat, Inc.* | | | 236,452 | | | | 9,992,462 | | | | 1.50 | |
| | | | | | | | 32,235,308 | | | | 4.83 | |
| TOTAL COMMON STOCKS | | | | | | | | | | | | |
| (Cost $491,261,439) | | | | | | | 587,759,640 | | | | 88.13 | |
| | | | | | | | | | | | | |
| PREFERRED STOCKS | | | | | | | | | | | | |
| Diversified Banks | | | | | | | | | | | | |
| Wells Fargo & Company, Series J Pref., 8.000% | | | 337,000 | | | | 9,294,460 | | | | 1.39 | |
| | | | | | | | | | | | | |
| TOTAL PREFERRED STOCKS | | | | | | | | | |
| (Cost $5,954,707) | | | | | | | 9,294,460 | | | | 1.39 | |
| | | | | | | | | | | | | |
| UNITS | | | | | | | | | | | | |
| Marine Ports & Services | | | | | | | | | | | | |
| Hutchison Port Holdings Trust - Cl. U | | | 11,140,000 | | | | 7,436,106 | | | | 1.12 | |
| | | | | | | | | | | | | |
| TOTAL UNITS | | | | | | | | | | | | |
| (Cost $11,195,875) | | | | | | | 7,436,106 | | | | 1.12 | |
| | | | | | | | | | | | | |
| SHORT-TERM INVESTMENTS | | | | | | | | | |
| State Street Institutional Treasury Money Market Fund, 0.000% | | | 64,093,556 | | | | 64,093,556 | | | | 9.61 | |
| | | | | | | | | | | | | |
| TOTAL SHORT-TERM INVESTMENTS | | | | | |
| (Cost $64,093,556) | | | | | | | 64,093,556 | | | | 9.61 | |
| | | | | | | | | | | | | |
| TOTAL INVESTMENTS | | | | | | | | | | | | |
| (Cost $572,505,577) | | | | | | | 668,583,762 | | | | 100.25 | |
| | | | | | | | | | | | | |
| Liabilities, Less Cash and Other Assets | | | | | | | (1,659,164 | ) | | | (0.25 | ) |
| | | | | | | | | | | | | |
| NET ASSETS | | | | | | $ | 666,924,598 | | | | 100.00 | % |
SCHEDULE OF INVESTMENTS
| | See notes to financial statements. |
INVESTMENT REVIEW BY BRANDON GEISLER (UNAUDITED)
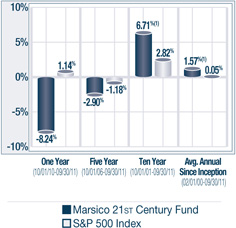
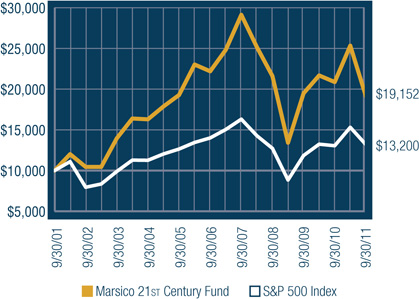
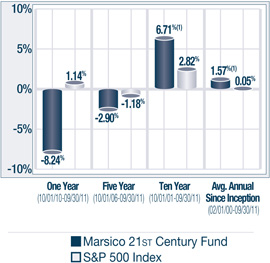
The Marsico 21st Century Fund posted a return of -8.24% for the one-year fiscal period ended September 30, 2011. The Fund’s performance significantly lagged the S&P 500 Index, which we consider to be the Fund’s primary benchmark index and which had a total return of +1.14% over the same time period. For comparative purposes, the Russell 3000 Index, a proxy for the performance of all publicly-traded US equity securities including smaller capitalization companies (which may be a useful representation of the Fund’s ability to invest across the entire market capitalization spectrum), had a total return of +0.55%. Please see the Fund Overview for more detailed information about the Fund’s longer-term performance for various time periods ended September 30, 2011.
The performance data for the Fund quoted here represent past performance, and past performance is not a guarantee of future results. Investment return and principal value of an investment will fluctuate so that an investor’s shares, when redeemed, may be worth more or less than their original cost. Current performance may be lower or higher than the performance information quoted. To obtain performance information current to the most recent month-end, please call 888-860-8686 or visit www.marsicofunds.com.(1)
This review highlights Fund performance over a one-year fiscal period. Shareholders should keep in mind that the Fund is intended for long-term investors who hold their shares for substantially longer periods of time. You should also keep in mind that our views on all investments discussed in this report are subject to change at any time. References to specific securities, industries, and sectors discussed in this report are not recommendations to buy or sell such securities or related investments, and the Fund may not necessarily hold these securities or investments today. Please see the accompanying Schedule of Investments for the percentage of the Fund’s portfolio represented by the securities mentioned in this report as of the end of the reporting period.
Stocks and markets in which the Fund invests may experience periods of turbulence and instability, and the general risk that domestic and global economies and stock markets may go through periods of decline and cyclical change.
There were several factors that contributed to the Fund’s performance shortfall. The Fund’s sector allocations (which are generally a by-product of the Fund’s stock selection process) detracted from annual performance. The Fund was unfavorably positioned from a sector weighting perspective as it had a higher allocation to the weakest-performing sector of the S&P 500 Index, Financials, while having less exposure to stronger-performing sectors, such as Energy, Consumer Staples, Information Technology, Utilities, and Health Care.
Stock selection in the Energy sector was weak. Oil and gas exploration and production companies OGX Petróleo e Gás Participações S.A. (-36% prior to being sold), Occidental Petroleum Corporation (-36%), and National Oilwell Varco, Inc. (-37%) each posted significant declines.
The Fund’s performance was also hurt by poor stock selection in Financials. For some time, the Fund held a significant percentage of its net assets in the Financials sector, with an emphasis on banking-related companies. The Fund’s positions in the Banks industry generally focused on what we believed to be the strongest companies with the best balance sheets, liquidity, and capital levels. During the period, however, stock selection in the industry detracted from results relative to the benchmark index. First Horizon National Corporation (-47%), First Niagara Financial Group, Inc. (-17%), BB&T Corporation (-23%), and City National Corporation (-28%) were material detractors from performance. Diversified financials holding Jefferies Group, Inc. (-44%) and real estate company Jones Lang LaSalle, Inc. (-40%) were additional detractors within the Financials sector. Our outlook for many large US financials shifted to some extent as we believe policy-makers want to regulate the largest banks and financial institutions more stringently. As a result, earnings visibility and outlooks have deteriorated for some banking and financial services companies.
Other individual positions having a material, negative impact on performance included auto manufacturer General Motors Company (-40%) and media company The Walt Disney Company (-4% prior to being sold). The Fund purchased General Motors at its initial public offering following the government’s rescue of the automaker.
There were several positive contributors to performance. The Fund’s Industrials positions were led by Precision Castparts Corp. (+22%), a manufacturer of components used in the aerospace industry, Sensata Technologies Holding N.V. (+34%), a Netherlands-based global industrial technology firm, and railroad services company CSX Corporation (+37% prior to being sold).
Several of the Fund’s Information Technology holdings also experienced sizeable stock price gains. Apple, Inc., maker of the iPhone and iPad, posted a return of +34%. As one of the Fund’s largest individual holdings, Apple had a significant positive effect on performance. Engineering software and services company ANSYS, Inc. (+16%) also performed well.
Agricultural products company Monsanto Company soared +44% prior to being sold from the Fund.
During the period, the Fund increased its exposure to the Consumer Discretionary and Energy sectors while reducing its exposure to the Financials sector. Also during the period, the Fund sold its holdings in the Telecommunication Services and Materials sectors.
Fiscal Period-End Investment Posture
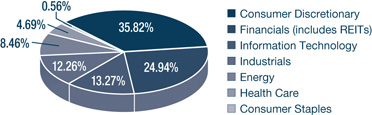
As of September 30, 2011, the Fund’s primary economic sector allocations were in the Consumer Discretionary, Financials, Information Technology, and Industrials sectors. As of period-end, the Fund had no investments in the Utilities, Telecommunication Services, and Materials sectors.
In closing, we would like to note that effective October 1, 2011, Cory Gilchrist left Marsico Capital Management, LLC to pursue personal and charitable interests, and Brandon Geisler, senior research analyst at Marsico Capital Management, LLC, was appointed portfolio manager of the Marsico 21st Century Fund. More information appears on the inside cover page of this report.
It has been a challenging year for the Fund. We are taking steps that we believe will improve the Fund’s performance. We plan to add more balance and breadth to the Fund. We may further reduce the Fund’s financials exposure, and intend to focus on investments with company and industry-specific growth drivers over macro-dependent growth catalysts. The investments we are considering are companies we think are capable of compounding their earnings growth even in a choppy economic environment. They span a variety of industries but share several common factors such as an established global footprint, high quality assets, strong balance sheets, solid top-line unit growth, and an ability to gain market share.
Sincerely,
BRANDON A. GEISLER
PORTFOLIO MANAGER
| (1) | Total returns are based on net change in net asset value assuming reinvestment of distributions. For the period prior to March 31, 2004, the performance returns for the 21st Century Fund reflect a fee waiver in effect; in the absence of such a waiver, the returns would have been reduced. For the period beginning April 2004 through January 2005, performance returns for the 21st Century Fund would have been higher but for the reimbursement of fees waived previously. A redemption fee of 2% may be imposed on redemptions or exchanges of Fund shares owned for 30 days or less. Please see the Prospectus for more information. |
21st CENTURY FUND OVERVIEW |
September 30, 2011 (Unaudited)
The 21st Century Fund invests primarily in common stocks that are selected for their long-term growth potential. The Fund may invest in companies of any size, and will normally hold a core position of between 35 and 50 common stocks.
| TOTAL ANNUAL OPERATING EXPENSES* 1.38% | NET ASSETS $495,482,108 | NET ASSET VALUE PER SHARE $11.36 |
GROWTH OF $10,000(1)(2) | PERFORMANCE COMPARISON |
| |
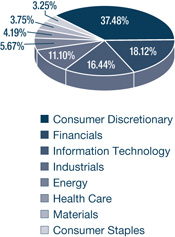
SECTOR ALLOCATION(3) | TOP FIVE HOLDINGS |
| | | | |
| | WILLIAMS-SONOMA, INC. | 5.54% | |
| | APPLE, INC. | 5.44% | |
| | THE PNC FINANCIAL SERVICES GROUP, INC. | 5.33% | |
| | ROSS STORES, INC. | 5.11% | |
| | INTUITIVE SURGICAL, INC. | 4.50% | |
| | | | |
| * | The Total Annual Operating Expenses are reflective of the information disclosed in the Funds’ Prospectus dated February 1, 2011 and may differ from the expense ratio disclosed in this report. |
| | The performance data quoted here represent past performance, and past performance is not a guarantee of future results. Investment return and principal value of an investment will fluctuate so that an investor’s shares, when redeemed, may be worth more or less than their original cost. Current performance may be lower or higher than the performance information quoted. To obtain performance information current to the most recent month-end, please call 888-860-8686 or visit www.marsicofunds.com. A redemption fee may be imposed on redemptions or exchanges of Fund shares held for 30 days or less. |
| | The performance included in the chart and graph does not reflect the deduction of taxes on Fund distributions or the redemption of Fund shares. |
| | All indices are unmanaged and investors cannot invest directly in an index. |
| (1) | The performance returns for the 21st Century Fund (for the period prior to March 31, 2004) reflect a fee waiver in effect; in the absence of such a waiver, the returns would be reduced. For the period beginning April 2004 through January 2005, performance returns for the 21st Century Fund would be higher but for the reimbursement of fees waived previously. |
| (2) | This chart assumes an initial investment of $10,000 made on September 30, 2001. Total returns are based on net change in NAV, assuming reinvestment of distributions. |
| (3) | Sector weightings represent the percentage of the Fund’s investments (excluding cash equivalents) in certain general sectors. These sectors may include more than one industry. The Fund’s portfolio composition is subject to change at any time. |
MARSICO 21st CENTURY FUND
SCHEDULE OF INVESTMENTS
September 30, 2011
| | | Number of Shares | | | Value | | | Percent of Net Assets | |
| COMMON STOCKS | | | | | | | | | |
| Aerospace & Defense | | | | | | | | | |
| Precision Castparts Corp. | | | 93,108 | | | $ | 14,474,570 | | | | 2.92 | % |
| | | | | | | | | | | | | |
| Air Freight & Logistics | | | | | | | | | | | | |
| Expeditors International of Washington, Inc. | | | 265,623 | | | | 10,771,013 | | | | 2.17 | |
| | | | | | | | | | | | | |
| Airport Services | | | | | | | | | | | | |
| Wesco Aircraft Holdings, Inc.* | | | 291,484 | | | | 3,185,920 | | | | 0.64 | |
| | | | | | | | | | | | | |
| Apparel Retail | | | | | | | | | | | | |
| Ross Stores, Inc. | | | 321,756 | | | | 25,318,980 | | | | 5.11 | |
| rue21, inc.* | | | 224,992 | | | | 5,105,068 | | | | 1.03 | |
| | | | | | | | 30,424,048 | | | | 6.14 | |
| Apparel, Accessories & Luxury Goods | | | | | |
| Ralph Lauren Corporation | | | 89,912 | | | | 11,661,586 | | | | 2.35 | |
| | | | | | | | | | | | | |
| Application Software | | | | | | | | | | | | |
| ANSYS, Inc.* | | | 230,277 | | | | 11,292,784 | | | | 2.28 | |
| Informatica Corporation* | | | 318,143 | | | | 13,027,956 | | | | 2.63 | |
| | | | | | | | 24,320,740 | | | | 4.91 | |
| Automobile Manufacturers | | | | | | | | | | | | |
| General Motors Company* | | | 441,760 | | | | 8,914,717 | | | | 1.80 | |
| Tesla Motors, Inc.* | | | 115,535 | | | | 2,817,898 | | | | 0.57 | |
| | | | | | | | 11,732,615 | | | | 2.37 | |
| Automotive Retail | | | | | | | | | | | | |
| CarMax, Inc.* | | | 315,451 | | | | 7,523,506 | | | | 1.52 | |
| | | | | | | | | | | | | |
| Casinos & Gaming | | | | | | | | | | | | |
| Wynn Resorts Ltd. | | | 128,165 | | | | 14,749,228 | | | | 2.98 | |
| | | | | | | | | | | | | |
| Coal & Consumable Fuels | | | | | | | | | | | | |
| Solazyme, Inc.* | | | 144,496 | | | | 1,388,607 | | | | 0.28 | |
| | | | | | | | | | | | | |
| Computer Hardware | | | | | | | | | | | | |
| Apple, Inc.* | | | 70,679 | | | | 26,941,421 | | | | 5.44 | |
| | | | | | | | | | | | | |
| Electrical Components & Equipment | | | | | | | | | |
| Roper Industries, Inc. | | | 129,335 | | | | 8,912,475 | | | | 1.80 | |
| Sensata Technologies Holding N.V.* | | | 689,082 | | | | 18,233,110 | | | | 3.68 | |
| | | | | | | | 27,145,585 | | | | 5.48 | |
| Health Care Equipment | | | | | | | | | | | | |
| Intuitive Surgical, Inc.* | | | 61,138 | | | | 22,271,351 | | | | 4.50 | |
| | | | | | | | | | | | | |
| Homefurnishing Retail | | | | | | | | | | | | |
| Williams-Sonoma, Inc. | | | 892,108 | | | | 27,468,005 | | | | 5.54 | |
| | | | | | | | | | | | | |
| Integrated Oil & Gas | | | | | | | | | | | | |
| Occidental Petroleum Corporation | | | 223,780 | | | | 16,000,270 | | | | 3.23 | |
| | | | | | | | | | | | | |
| Internet Retail | | | | | | | | | | | | |
| Amazon.com, Inc.* | | | 44,309 | | | | 9,580,935 | | | | 1.93 | |
| HomeAway, Inc.* | | | 101,996 | | | | 3,429,106 | | | | 0.69 | |
| priceline.com, Inc.* | | | 12,765 | | | | 5,737,357 | | | | 1.16 | |
| | | | | | | | 18,747,398 | | | | 3.78 | |
| Internet Software & Services | | | | | | | | | |
| Bankrate, Inc.* | | | 318,980 | | | | 4,851,686 | | | | 0.98 | |
| OpenTable, Inc.* | | | 73,011 | | | | 3,359,236 | | | | 0.68 | |
| | | | | | | | 8,210,922 | | | | 1.66 | |
| Investment Banking & Brokerage | | | | | | | | | |
| Jefferies Group, Inc. | | | 669,364 | | | | 8,306,807 | | | | 1.68 | |
| | | | | | | | | | | | | |
COMMON STOCKS (continued) | | | | | | | | | |
| Leisure Facilities | | | | | | | | | | | | |
| Vail Resorts, Inc. | | | 129,894 | | | $ | 4,908,694 | | | | 0.99 | % |
| | | | | | | | | | | | | |
| Oil & Gas Equipment & Services | | | | | | | | | |
| Halliburton Company | | | 273,720 | | | | 8,353,935 | | | | 1.69 | |
| National Oilwell Varco, Inc. | | | 227,788 | | | | 11,667,301 | | | | 2.35 | |
| | | | | | | | 20,021,236 | | | | 4.04 | |
| Oil & Gas Refining & Marketing | | | | | | | | | |
| Amyris, Inc.* | | | 135,508 | | | | 2,742,682 | | | | 0.55 | |
| | | | | | | | | | | | | |
| Packaged Foods & Meats | | | | | | | | | | | | |
| Green Mountain Coffee Roasters, Inc.* | | | 28,587 | | | | 2,656,876 | | | | 0.54 | |
| | | | | | | | | | | | | |
| Real Estate Services | | | | | | | | | | | | |
| Jones Lang LaSalle, Inc. | | | 72,853 | | | | 3,774,514 | | | | 0.76 | |
| | | | | | | | | | | | | |
| Regional Banks | | | | | | | | | | | | |
| BB&T Corporation | | | 845,585 | | | | 18,036,328 | | | | 3.64 | |
| City National Corporation | | | 275,958 | | | | 10,420,174 | | | | 2.10 | |
| Columbia Banking System, Inc. | | | 337,955 | | | | 4,839,516 | | | | 0.98 | |
| First Horizon National Corporation | | | 1,914,927 | | | | 11,412,965 | | | | 2.30 | |
| Fulton Financial Corporation | | | 1,341,271 | | | | 10,260,723 | | | | 2.07 | |
| Park Sterling Bank, Inc.* | | | 419,993 | | | | 1,436,376 | | | | 0.29 | |
| The PNC Financial Services Group, Inc. | | | 547,348 | | | | 26,376,700 | | | | 5.33 | |
| | | | | | | | 82,782,782 | | | | 16.71 | |
| Restaurants | | | | | | | | | | | | |
| Chipotle Mexican Grill, Inc.* | | | 17,864 | | | | 5,411,899 | | | | 1.09 | |
| Panera Bread Company - Cl. A* | | | 101,208 | | | | 10,519,559 | | | | 2.12 | |
| The Wendy's Company | | | 2,931,598 | | | | 13,456,035 | | | | 2.72 | |
| | | | | | | | 29,387,493 | | | | 5.93 | |
| Retail REITs | | | | | | | | | | | | |
| Colony Financial, Inc. | | | 221,851 | | | | 2,866,315 | | | | 0.58 | |
| | | | | | | | | | | | | |
| Specialty Stores | | | | | | | | | | | | |
| Ulta Salon, Cosmetics & Fragrance, Inc.* | | | 216,784 | | | | 13,490,468 | | | | 2.72 | |
| | | | | | | | | | | | | |
| Systems Software | | | | | | | | | | | | |
| Red Hat, Inc.* | | | 83,358 | | | | 3,522,709 | | | | 0.71 | |
| | | | | | | | | | | | | |
| Thrifts & Mortgage Finance | | | | | | | | | |
| First Niagara Financial Group, Inc. | | | 2,262,602 | | | | 20,702,808 | | | | 4.18 | |
| | | | | | | | | | | | | |
| Trucking | | | | | | | | | | | | |
| Zipcar, Inc.* | | | 145,657 | | | | 2,621,826 | | | | 0.53 | |
| | | | | | | | | | | | | |
| TOTAL COMMON STOCKS | | | | | | | | | | | | |
| (Cost $481,823,050) | | | | | | | 474,801,995 | | | | 95.83 | |
| | | | | | | | | | | | | |
| SHORT-TERM INVESTMENTS | | | | | | | | | |
| State Street Institutional Treasury Money Market Fund, 0.000% | | | 12,731,900 | | | | 12,731,900 | | | | 2.57 | |
| | | | | | | | | | | | | |
| TOTAL SHORT-TERM INVESTMENTS | | | | | | | | | |
| (Cost $12,731,900) | | | | | | | 12,731,900 | | | | 2.57 | |
| | | | | | | | | | | | | |
| TOTAL INVESTMENTS | | | | | | | | | | | | |
| (Cost $494,554,950) | | | | | | | 487,533,895 | | | | 98.40 | |
| | | | | | | | | | | | | |
| Cash and Other Assets, Less Liabilities | | | | | | | 7,948,213 | | | | 1.60 | |
| | | | | | | | | | | | | |
| NET ASSETS | | | | | | $ | 495,482,108 | | | | 100.00 | % |
| | See notes to financial statements. |
INTERNATIONAL OPPORTUNITIES FUND |
INVESTMENT REVIEW BY JIM GENDELMAN AND MUNISH MALHOTRA (UNAUDITED)
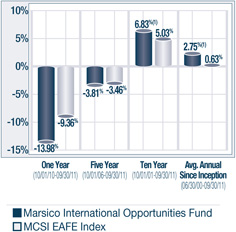
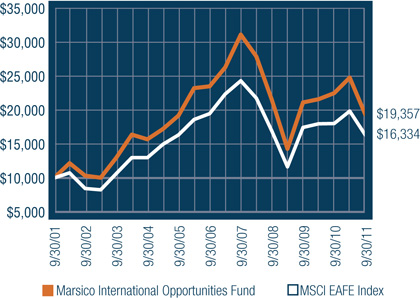
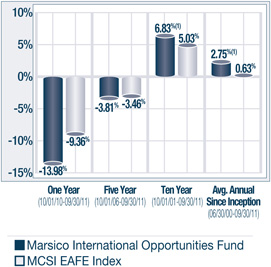
The Marsico International Opportunities Fund posted a total return of (US$) -13.98% for the one-year fiscal period ended September 30, 2011. The Fund’s return lagged that of the MSCI EAFE Index, which we consider to be the Fund’s primary benchmark index and which had a total return of (US$) -9.36%. Please see the Fund Overview for more detailed information about the Fund’s longer-term performance for various time periods ended September 30, 2011.
The performance data for the Fund quoted here represent past performance, and past performance is not a guarantee of future results. Investment return and principal value of an investment will fluctuate so that an investor’s shares, when redeemed, may be worth more or less than their original cost. Current performance may be lower or higher than the performance information quoted. To obtain performance information current to the most recent month-end, please call 888-860-8686 or visit www.marsicofunds.com.(1)
This review highlights Fund performance over a one-year fiscal period. Shareholders should keep in mind that the Fund is intended for long-term investors who hold their shares for substantially longer periods of time. You should also keep in mind that our views on all investments discussed in this report are subject to change at any time. References to specific securities, industries, and sectors discussed in this report are not recommendations to buy or sell such securities or related investments, and the Fund may not necessarily hold these securities or investments today. Please see the accompanying Schedule of Investments for the percentage of the Fund’s portfolio represented by the securities mentioned in this report as of the end of the reporting period.
Foreign investments present additional risks due to currency fluctuations, economic and political factors, lower liquidity, differences in securities regulations and accounting standards, possible changes in taxation, limited public information, and other factors.
There were several factors that detracted from the Fund’s performance results. Stock selection in the Energy, Consumer Discretionary, and Financials sectors was weak. In the Energy sector, Brazil-headquartered oil and gas exploration company OGX Petróleo e Gás Participações S.A. slid -52% and was the largest individual detractor to the Fund’s annual performance results. The Fund continued to maintain a position in OGX due to its impressive oil and natural gas reserves off the coast of Brazil. Several Consumer Discretionary positions posted significant declines, including Hong Kong-based manufacturer, exporter and distributor of retail goods Li & Fung Ltd. (-38%) and Canada-based motion picture technology company Imax Corporation (-59%). The Fund’s Financials holdings struggled. The Fund’s investment in Citigroup, Inc., which has a growing presence in emerging markets, slid -43% prior to being sold. Other Financials positions having a material, negative impact included Spain-based CaixaBank S.A. and London-headquartered Barclays PLC, and each was sold during the period. The Fund significantly reduced its exposure to European financial companies as concerns about financial problems intensified in the Eurozone.
Certain of the Fund’s holdings in the Software & Services industry group also struggled. Chinese Internet television company Youku.com, Inc. Spon. ADR and British enterprise software provider Autonomy Corporation PLC, each posted double-digit losses prior to being sold from the Fund.
The Fund’s sector allocations during the reporting period (which are generally a by-product of the Fund’s stock selection process) detracted from annual performance. The Fund was unfavorably positioned from a sector weighting perspective as it had few investments in the Health Care and Consumer Staples sectors, which were the best-performing sectors of the benchmark index.
Active currency management is not a central facet of the Fund’s investment process, but fluctuations in major world currencies can affect performance. On an overall basis, currency was an additional source of underperformance for the Fund during the fiscal year. For the period from early April through early August 2011, approximately one-half of the Fund’s Japanese yen-dominated holdings were hedged into US dollars. The hedge was initiated as a capital preservation strategy, based on our view that the yen was significantly overvalued relative to the dollar on a purchasing power parity basis. However, the yen continued to strengthen versus the US dollar and other major currencies and the hedge, therefore,
INTERNATIONAL OPPORTUNITIES FUND |
detracted from performance. We unwound the hedge after the August downgrade of the US government’s credit rating by Standard & Poor’s Corporation, as we felt that currencies such as the yen and the Swiss franc may continue to strengthen versus the US dollar and the Euro.
There were a few areas that positively affected performance. The Fund’s Industrials holdings posted a collective return of -1%. While the return was negative on an absolute basis, the Fund’s Industrials positions significantly outperformed the -10% return of the benchmark index Industrials sector. Railroad company Canadian National Railway Company (+5%) was the Fund’s leading holding in the sector.
Several of the Fund’s Germany-based positions posted relatively strong returns, most notably Materials companies ThyssenKrupp AG (+39% prior to being sold) and BASF S.E. (+1%). The Fund purchased ThyssenKrupp at its initial public offering and the company subsequently reported solid earnings with strong production volumes in their steel business. BASF benefitted from strength in its chemicals and plastics businesses.
Other individual holdings having a material positive impact on performance included the United Kingdom-based semiconductor company ARM Holdings PLC (+46%) and Japanese e-commerce company DeNA Co. Ltd. (+58%).
The Financials sector was the weakest-performing sector of the MSCI EAFE Index, and the Fund benefitted from having an underweight allocation to the sector as compared to the benchmark index.
The International Opportunities Fund has tended to have a relatively high portfolio turnover level because of its investment style. Although the Fund may hold core positions for some time, it may change its portfolio composition quickly to take advantage of new opportunities, or to address issues affecting particular holdings.
During the period, the Fund reduced its exposure to the Financials and Consumer Staples sectors, while increasing its allocation to the Information Technology and Industrials sectors.
Fiscal Period-End Investment Posture
As of September 30, 2011, the Fund’s primary economic sector allocations included Consumer Discretionary, Information Technology, Industrials, and Financials. The Fund had no exposure to the Utilities sector.
In terms of country allocations, the Fund’s most significant weightings at period-end were China/Hong Kong, the United Kingdom, Japan, and Switzerland, although exposure to the United Kingdom and Japan represented underweighted postures relative to the benchmark index. The Fund held several positions domiciled in emerging markets including China, Brazil, Taiwan, Argentina, India, Mexico, and Russia. Country-level weightings generally should be considered a residual of the Fund’s stock selection process rather than a major, proactive facet of its investment strategy.
Sincerely,
JAMES G. GENDELMAN
MUNISH MALHOTRA, CFA
PORTFOLIO MANAGERS
INTERNATIONAL OPPORTUNITIES FUND
| (1) | Total returns are based on net change in net asset value assuming reinvestment of distributions. For the period prior to September 30, 2004, the performance returns for the International Opportunities Fund reflect a fee waiver in effect; in the absence of such a waiver, the returns would have been reduced. For the period beginning October 2004 through December 2005, performance returns for the International Opportunities Fund would have been higher but for the reimbursement of fees waived previously. A redemption fee of 2% may be imposed on redemptions or exchanges of Fund shares owned for 30 days or less. Please see the Prospectus for more information. |
INTERNATIONAL OPPORTUNITIES FUND OVERVIEW |
September 30, 2011 (Unaudited)
The International Opportunities Fund invests primarily in common stocks of foreign companies that are selected for their long-term growth potential. The Fund may invest in companies of any size throughout the world. It normally invests in the securities of issuers that are economically tied to one or more foreign countries, and expects to be invested in various issuers or securities that together have ties to at least four different foreign countries. Some issuers or securities in the Fund’s portfolio may be based in or economically tied to the United States. The Fund may hold an unlimited number of common stocks.
| TOTAL ANNUAL OPERATING EXPENSES* 1.54% | NET ASSETS $153,855,233 | NET ASSET VALUE PER SHARE $10.61 |
GROWTH OF $10,000(1)(2) | PERFORMANCE COMPARISON |
| |
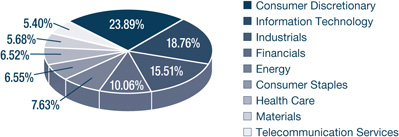
SECTOR ALLOCATION(3) | TOP FIVE HOLDINGS |
| | | | |
| | ASML HOLDING N.V. | 3.08% | |
| | TAIWAN SEMICONDUCTOR MANUFACTURING CO., LTD. SPON. ADR | 2.91% | |
| | ROCHE HOLDING AG | 2.86% | |
| | CANADIAN NATIONAL RAILWAY COMPANY | 2.75% | |
| | CHINA UNICOM HONG KONG LTD. | 2.74% | |
| | | | |
| * | The Total Annual Operating Expenses are reflective of the information disclosed in the Funds’ Prospectus dated February 1, 2011 and may differ from the expense ratio disclosed in this report. |
| | The performance data quoted here represent past performance, and past performance is not a guarantee of future results. Investment return and principal value of an investment will fluctuate so that an investor’s shares, when redeemed, may be worth more or less than their original cost. Current performance may be lower or higher than the performance information quoted. To obtain performance information current to the most recent month-end, please call 888-860-8686 or visit www.marsicofunds.com. A redemption fee may be imposed on redemptions or exchanges of Fund shares held for 30 days or less. |
| | The performance included in the chart and graph does not reflect the deduction of taxes on Fund distributions or the redemption of Fund shares. |
| | All indices are unmanaged and investors cannot invest directly in an index. |
| (1) | The performance returns for the International Opportunities Fund (for the period prior to September 30, 2004) reflect a fee waiver in effect; in the absence of such a waiver, the returns would be reduced. For the period beginning October 2004 through December 2005, performance returns for the International Opportunities Fund would be higher but for the reimbursement of fees waived previously. |
| (2) | This chart assumes an initial investment of $10,000 made on September 30, 2001. Total returns are based on net change in NAV, assuming reinvestment of distributions. |
| (3) | Sector weightings represent the percentage of the Fund’s investments (excluding cash equivalents) in certain general sectors. These sectors may include more than one industry. The Fund’s portfolio composition is subject to change at any time. |
| | The MSCI EAFE Index tracks the stocks of about 1,000 companies in Europe, Australasia, and the Far East (EAFE). |
MARSICO INTERNATIONAL OPPORTUNITIES FUND
SCHEDULE OF INVESTMENTS
September 30, 2011
| | | Number of Shares | | | Value | | | Percent of Net Assets | |
| COMMON STOCKS | | | | | | | | | |
| Advertising | | | | | | | | | |
| Publicis Groupe S.A. | | | 39,119 | | | $ | 1,632,687 | | | | 1.06 | % |
| | | | | | | | | | | | | |
| Aerospace & Defense | | | | | | | | | | | | |
| Rolls-Royce Group PLC* | | | 256,142 | | | | 2,354,649 | | | | 1.53 | |
| | | | | | | | | | | | | |
| Apparel Retail | | | | | | | | | | | | |
| Belle International Holdings Ltd. | | | 1,003,000 | | | | 1,734,250 | | | | 1.13 | |
| H&M Hennes & Mauritz AB - Cl. B | | | 49,093 | | | | 1,469,934 | | | | 0.95 | |
| Industria de Diseno Textile S.A. (Inditex) | | | 35,299 | | | | 3,013,308 | | | | 1.96 | |
| | | | | | | | 6,217,492 | | | | 4.04 | |
| Apparel, Accessories & Luxury Goods | | | | | |
| Adidas A.G. | | | 41,240 | | | | 2,509,699 | | | | 1.63 | |
| Prada S.p.A.* | | | 126,400 | | | | 532,388 | | | | 0.35 | |
| Swatch Group AG | | | 10,246 | | | | 3,371,181 | | | | 2.19 | |
| | | | | | | | 6,413,268 | | | | 4.17 | |
| Asset Management & Custody Banks | | | | | |
| Julius Baer Group Ltd.* | | | 111,382 | | | | 3,722,181 | | | | 2.42 | |
| | | | | | | | | | | | | |
| Automobile Manufacturers | | | | | | | | | | | | |
| Bayerische Motoren Werke AG | | | 39,851 | | | | 2,632,605 | | | | 1.71 | |
| Honda Motor Co., Ltd. | | | 53,700 | | | | 1,573,134 | | | | 1.02 | |
| | | | | | | | 4,205,739 | | | | 2.73 | |
| Brewers | | | | | | | | | | | | |
| Anheuser-Busch InBev N.V. | | | 73,223 | | | | 3,886,613 | | | | 2.53 | |
| | | | | | | | | | | | | |
| Cable & Satellite | | | | | | | | | | | | |
| British Sky Broadcasting Group PLC | | | 328,273 | | | | 3,380,932 | | | | 2.20 | |
| | | | | | | | | | | | | |
| Casinos & Gaming | | | | | | | | | | | | |
| Genting Singapore PLC* | | | 1,911,000 | | | | 2,218,939 | | | | 1.44 | |
| Wynn Resorts Ltd. | | | 19,667 | | | | 2,263,278 | | | | 1.47 | |
| | | | | | | | 4,482,217 | | | | 2.91 | |
| Computer & Electronics Retail | | | | | | | | | |
| Yamada-Denki Co., Ltd. | | | 23,800 | | | | 1,655,271 | | | | 1.08 | |
| | | | | | | | | | | | | |
| Construction & Farm Machinery & Heavy Trucks | | | | | |
| Komatsu Ltd. | | | 71,200 | | | | 1,535,076 | | | | 1.00 | |
| | | | | | | | | | | | | |
| Distillers & Vintners | | | | | | | | | | | | |
| Pernod-Ricard S.A. | | | 26,173 | | | | 2,049,153 | | | | 1.33 | |
| | | | | | | | | | | | | |
| Distributors | | | | | | | | | | | | |
| Li & Fung Ltd. | | | 1,834,000 | | | | 3,074,067 | | | | 2.00 | |
| | | | | | | | | | | | | |
| Diversified Banks | | | | | | | | | | | | |
| ICICI Bank Ltd. Spon. ADR | | | 54,679 | | | | 1,898,455 | | | | 1.23 | |
| Standard Chartered PLC | | | 171,991 | | | | 3,431,388 | | | | 2.23 | |
| | | | | | | | 5,329,843 | | | | 3.46 | |
| Diversified Chemicals | | | | | | | | | | | | |
| BASF S.E. | | | 27,807 | | | | 1,695,265 | | | | 1.10 | |
| | | | | | | | | | | | | |
| Diversified Metals & Mining | | | | | | | | | |
| Xstrata PLC | | | 165,171 | | | | 2,085,728 | | | | 1.36 | |
| | | | | | | | | | | | | |
COMMON STOCKS (continued) | | | | | | | | | |
| Diversified Real Estate Activities | | | | | | | | | |
| Hang Lung Properties Ltd. | | | 728,000 | | | $ | 2,189,178 | | | | 1.43 | % |
| Sumitomo Realty & Development Co., Ltd. | | | 93,000 | | | | 1,787,742 | | | | 1.16 | |
| | | | | | | | 3,976,920 | | | | 2.59 | |
| Education Services | | | | | | | | | | | | |
| Anhanguera Educacional Participacoes S.A. | | | 73,100 | | | | 940,843 | | | | 0.61 | |
| | | | | | | | | | | | | |
| Electrical Components & Equipment | | | | | | | | | |
| Schneider Electric S.A. | | | 75,802 | | | | 4,056,583 | | | | 2.64 | |
| Sensata Technologies Holding N.V.* | | | 113,116 | | | | 2,993,050 | | | | 1.94 | |
| | | | | | | | 7,049,633 | | | | 4.58 | |
| Electronic Components | | | | | | | | | | | | |
| HOYA CORPORATION | | | 76,800 | | | | 1,780,574 | | | | 1.16 | |
| | | | | | | | | | | | | |
| Fertilizers & Agricultural Chemicals | | | | | | | | | |
| Potash Corporation of Saskatchewan, Inc. | | | 71,960 | | | | 3,110,111 | | | | 2.02 | |
| | | | | | | | | | | | | |
| Hypermarkets & Super Centers | | | | | | | | | |
| Wal-Mart de Mexico S.A.B. de C.V. | | | 697,300 | | | | 1,598,891 | | | | 1.04 | |
| | | | | | | | | | | | | |
| Industrial Conglomerates | | | | | | | | | | | | |
| Siemens A.G. | | | 18,904 | | | | 1,700,800 | | | | 1.11 | |
| | | | | | | | | | | | | |
| Industrial Machinery | | | | | | | | | | | | |
| FANUC Corporation | | | 18,000 | | | | 2,479,426 | | | | 1.61 | |
| | | | | | | | | | | | | |
| Integrated Telecommunication Services | | | | | |
| China Unicom Hong Kong Ltd. | | | 2,074,000 | | | | 4,221,870 | | | | 2.74 | |
| | | | | | | | | | | | | |
| Internet Software & Services | | | | | | | | | |
| Baidu, Inc. Spon. ADR* | | | 32,552 | | | | 3,480,135 | | | | 2.26 | |
| DeNA Co., Ltd. | | | 31,400 | | | | 1,315,391 | | | | 0.85 | |
| MercadoLibre, Inc. | | | 35,364 | | | | 1,900,815 | | | | 1.24 | |
| SINA Corporation* | | | 20,228 | | | | 1,448,527 | | | | 0.94 | |
| Yandex N.V. - Cl. A* | | | 35,354 | | | | 721,575 | | | | 0.47 | |
| | | | | | | | 8,866,443 | | | | 5.76 | |
| IT Consulting & Other Services | | | | | | | | | |
| Accenture plc - Cl. A | | | 49,772 | | | | 2,621,989 | | | | 1.70 | |
| | | | | | | | | | | | | |
| Movies & Entertainment | | | | | | | | | | | | |
| Imax Corporation* | | | 58,506 | | | | 847,167 | | | | 0.55 | |
| | | | | | | | | | | | | |
| Office Electronics | | | | | | | | | | | | |
| Canon, Inc. | | | 55,600 | | | | 2,524,575 | | | | 1.64 | |
| | | | | | | | | | | | | |
| Oil & Gas Exploration & Production | | | | | | | | | |
| CNOOC Ltd. | | | 924,800 | | | | 1,482,405 | | | | 0.96 | |
| OGX Petróleo e Gás Participações S.A.* | | | 672,900 | | | | 4,115,596 | | | | 2.67 | |
| Pacific Rubiales Energy Corp. | | | 137,739 | | | | 2,918,032 | | | | 1.90 | |
| Tullow Oil PLC | | | 149,806 | | | | 3,029,693 | | | | 1.97 | |
| | | | | | | | 11,545,726 | | | | 7.50 | |
| Packaged Foods & Meats | | | | | | | | | | | | |
| Nestlé S.A. | | | 43,000 | | | | 2,367,265 | | | | 1.54 | |
| | See notes to financial statements. |
MARSICO INTERNATIONAL OPPORTUNITIES FUND
SCHEDULE OF INVESTMENTS (continued)
September 30, 2011
| | | Number of Shares | | | Value | | | Percent of Net Assets | |
COMMON STOCKS (continued) | | | | | | | | | |
| Pharmaceuticals | | | | | | | | | | | | |
| Novo Nordisk A/S - Cl. B | | | 25,675 | | | $ | 2,560,674 | | | | 1.67 | % |
| Roche Holding AG | | | 27,277 | | | | 4,405,564 | | | | 2.86 | |
| Shire PLC | | | 92,881 | | | | 2,896,454 | | | | 1.88 | |
| | | | | | | | 9,862,692 | | | | 6.41 | |
| Publishing | | | | | | | | | | | | |
| Reed Elsevier PLC | | | 224,916 | | | | 1,721,959 | | | | 1.12 | |
| | | | | | | | | | | | | |
| Railroads | | | | | | | | | | | | |
| Canadian National Railway Company | | | 63,491 | | | | 4,227,231 | | | | 2.75 | |
| | | | | | | | | | | | | |
| Real Estate Operating Companies | | | | | | | | | |
| BR Malls Participacoes S.A. | | | 214,100 | | | | 2,187,401 | | | | 1.42 | |
| | | | | | | | | | | | | |
| Research & Consulting Services | | | | | | | | | |
| Experian PLC | | | 233,436 | | | | 2,620,472 | | | | 1.70 | |
| | | | | | | | | | | | | |
| Restaurants | | | | | | | | | | | | |
| Arcos Dorados Holdings, Inc. - Cl. A | | | 67,415 | | | | 1,563,354 | | | | 1.02 | |
| | | | | | | | | | | | | |
| Semiconductor Equipment | | | | | | | | | | | | |
| ASML Holding N.V. | | | 137,168 | | | | 4,743,051 | | | | 3.08 | |
| | | | | | | | | | | | | |
| Semiconductors | | | | | | | | | | | | |
| ARM Holdings PLC | | | 266,799 | | | | 2,281,567 | | | | 1.48 | |
| Infineon Technologies AG | | | 147,001 | | | | 1,084,660 | | | | 0.71 | |
| Taiwan Semiconductor Manufacturing Co., Ltd. Spon. ADR | | | 391,890 | | | | 4,479,303 | | | | 2.91 | |
| | | | | | | | 7,845,530 | | | | 5.10 | |
| Specialty Chemicals | | | | | | | | | | | | |
| Novozymes A/S - Cl. B | | | 11,903 | | | | 1,692,349 | | | | 1.10 | |
| | | | | | | | | | | | | |
| Trading Companies & Distributors | | | | | | | | | |
| Marubeni Corporation | | | 268,000 | | | | 1,496,500 | | | | 0.97 | |
| | | | | | | | | | | | | |
| Wireless Telecommunication Services | | | | | |
| Millicom International Cellular S.A. | | | 39,856 | | | | 3,949,730 | | | | 2.57 | |
| | | | | | | | | | | | | |
| TOTAL COMMON STOCKS | | | | | | | | | | | | |
| (Cost $151,225,287) | | | | | | | 151,262,683 | | | | 98.31 | |
| | | | | | | | | | | | | |
| SHORT-TERM INVESTMENTS | | | | | | | | | |
| State Street Institutional Treasury Money Market Fund, 0.000%† | | | 4,384,064 | | | | 4,384,064 | | | | 2.85 | |
| | | | | | | | | | | | | |
| TOTAL SHORT-TERM INVESTMENTS | | | | | | | | | |
| (Cost $4,384,064) | | | | | | | 4,384,064 | | | | 2.85 | |
| | | | | | | | | | | | | |
| TOTAL INVESTMENTS | | | | | | | | | | | | |
| (Cost $155,609,351) | | | | | | | 155,646,747 | | | | 101.16 | |
| | | | | | | | | | | | | |
| Liabilities, Less Cash and Other Assets | | | | | | | (1,791,514 | ) | | | (1.16 | ) |
| | | | | | | | | | | | | |
| NET ASSETS | | | | | | $ | 153,855,233 | | | | 100.00 | % |
FORWARD FOREIGN CURRENCY CONTRACTS OUTSTANDING AT SEPTEMBER 30, 2011 | |
| | | | | | | | | | | | | |
| Counterparty: State Street Global Markets | |
| Japanese Yen (¥) | | | | | | | | | | | | |
| | | | | | | | | Unrealized Appreciation (Depreciation) | |
| | | | | | |
| October 11, 2011 | | ¥ | 1,381,981,832 | | | $ | 17,680,401 | | | $ | 17,919,265 | | | $ | 238,864 | |
| | | | | | | | | | | | | | | | 238,864 | |
| | | | | | | | | | | | | | | | | |
| October 11, 2011 | | $ | 17,107,398 | | | ¥ | 1,381,981,832 | | | $ | 17,919,265 | | | | (811,867 | ) |
| | | | | | | | | | | | | | | | (811,867 | ) |
| | | | | | | | | | | | | | | | | |
| Total | | | | | | | | | | | | | | $ | (573,003 | ) |
| SUMMARY OF INVESTMENTS BY COUNTRY | | | | |
| Country | | Market Value | | | Percent of Investment Securities | |
| Argentina | | $ | 3,464,169 | | | | 2.23 | % |
| Belgium | | | 3,886,613 | | | | 2.50 | |
| Brazil | | | 7,243,840 | | | | 4.65 | |
| Canada | | | 8,184,509 | | | | 5.26 | |
| China/Hong Kong | | | 17,630,432 | | | | 11.33 | |
| Colombia | | | 2,918,032 | | | | 1.87 | |
| Denmark | | | 4,253,023 | | | | 2.73 | |
| France | | | 7,738,423 | | | | 4.97 | |
| Germany | | | 9,623,029 | | | | 6.18 | |
| India | | | 1,898,455 | | | | 1.22 | |
| Ireland | | | 8,138,915 | | | | 5.23 | |
| Italy | | | 532,388 | | | | 0.34 | |
| Japan | | | 16,147,689 | | | | 10.37 | |
| Luxembourg | | | 3,949,730 | | | | 2.54 | |
| Mexico | | | 1,598,891 | | | | 1.03 | |
| Netherlands | | | 7,736,101 | | | | 4.97 | |
| Russia | | | 721,575 | | | | 0.46 | |
| Singapore | | | 2,218,939 | | | | 1.43 | |
| Spain | | | 3,013,308 | | | | 1.94 | |
| Sweden | | | 1,469,934 | | | | 0.94 | |
| Switzerland | | | 15,951,919 | | | | 10.25 | |
| Taiwan | | | 4,479,303 | | | | 2.88 | |
| United Kingdom | | | 16,200,188 | | | | 10.41 | |
United States(1) | | | 6,647,342 | | | | 4.27 | |
| | | $ | 155,646,747 | | | | 100.00 | % |
| (1) | Includes short-term securities. |
| † | A portion of the security is designated as collateral for the net unrealized depreciation amount related to the outstanding forward foreign currency contracts. |
| | See notes to financial statements. |
INVESTMENT REVIEW BY DOUG RAO (UNAUDITED)
The Marsico Flexible Capital Fund posted a total return of +1.59% for the one-year fiscal period ended September 30, 2011. The Fund outperformed the S&P 500 Index, which we consider to be the Fund’s primary benchmark index and which had a total return of +1.14%. Please see the Fund Overview for more detailed information about the Fund’s performance for various time periods ended September 30, 2011.
The performance data for the Fund quoted here represent past performance, and past performance is not a guarantee of future results. Investment return and principal value of an investment will fluctuate so that an investor’s shares, when redeemed, may be worth more or less than their original cost. Current performance may be lower or higher than the performance information quoted. To obtain performance information current to the most recent month-end, please call 888-860-8686 or visit www.marsicofunds.com.(1)
This review highlights Fund performance over a one-year fiscal period. Shareholders should keep in mind that the Fund is intended for long-term investors who hold their shares for substantially longer periods of time. You should also keep in mind that our views on all investments discussed in this report are subject to change at any time. References to specific securities, industries, and sectors discussed in this report are not recommendations to buy or sell such securities or related investments, and the Fund may not necessarily hold these securities or investments today. Please see the accompanying Schedule of Investments for the percentage of the Fund’s portfolio represented by the securities mentioned in this report as of the end of the reporting period.
Stocks and markets in which the Fund invests may experience periods of turbulence and instability, and the general risk that domestic and global economies and stock markets may go through periods of decline and cyclical change.
Stock selection in the Information Technology, Materials, Consumer Staples, and Health Care sectors contributed to the Fund’s outperformance as compared to the S&P 500 Index.
The Fund’s Information Technology holdings posted a collective return of +44%, while the S&P 500 Index Information Technology sector returned +4%. Three of the Fund’s China-based software and services holdings had a positive impact on the Fund’s performance. Internet service company ChinaCache International Holdings Ltd. ADR soared +94% prior to being sold. Online video hosting service company Youku.com, Inc. Spon. ADR (purchased by the Fund at its initial public offering) and online search company Baidu, Inc. Spon. ADR gained +15% and +5%, respectively. Financial transactions processor Visa, Inc. – Cl. A (+14%) and technology hardware manufacturer TOSHIBA Corporation (+34% prior to being sold) further aided performance.
The Fund held several positions in the Materials sector early in the reporting period that performed well. Agricultural products company Monsanto Company, mining company Freeport-McMoRan Copper & Gold, Inc., and materials firm BASF S.E. each posted double-digit gains prior to being sold. The Fund sold all its Materials positions prior to period-end, as we took steps geared toward reducing the Fund’s exposure to economically-sensitive companies. This proved to be beneficial, as the benchmark index’s Materials sector posted a significant decline during the second half of the reporting period.
Several stocks in the Consumer Staples sector proved advantageous. Green Mountain Coffee Roasters, Inc.’s stock price rose +47%, due in part to strong growth of its single cup coffee systems. Mead Johnson Nutrition Company (+23%) also registered a solid gain. Mead Johnson Nutrition benefitted from increased sales in regions such as Asia and Latin America. In the Health Care sector, Odontoprev S.A., Brazil’s largest provider of dental-care plans, posted a return of +33%. Industrials positions were led by Netherlands-based global industrial technology firm Sensata Technologies Holding N.V. (+37%).
There were a few areas that detracted from performance relative to the benchmark index. The Fund may hold elevated cash levels as a buying reserve or as a defensive measure in adverse market conditions. Cash and cash equivalents averaged more than 10% of the Fund’s net assets during the one-year period. The Fund’s elevated cash tempered performance results at times during certain periods of generally stronger US equity returns.
Stock selection in the Consumer Discretionary sector was also a source of underperformance in the period. Positions in Hong Kong-based export trading company Li & Fung Ltd. (-40%), China-based Phoenix Satellite Television Holdings Ltd. (-27% prior to being sold), and Chinese budget hotel chain Home Inns & Hotels Management, Inc. ADR (‑27%) were detractors.
Energy was an area of weakness for the Fund. The Energy sector was a relatively strong performing sector within the S&P 500 Index. The Fund had less exposure than the benchmark index to Energy, which hurt results. In addition, the Fund’s positions in Brazil-based oil and natural gas exploration company OGX Petróleo e Gás Participações S.A. (-30% before being sold from the Fund) and Halliburton Company (-24%) were material detractors from performance.
Early in the reporting period, the Fund had a significant portion of its net assets invested in the Financials sector as compared to the S&P 500 Index. This positioning hurt Fund performance because the Financials sector underperformed the overall return of the benchmark index. During the period, the Fund reduced its exposure to the Financials sector. Our outlook for many large US financials shifted to some extent as we believe policy-makers want to regulate the largest banks and financial institutions more stringently. As a result, earnings visibility and outlooks have deteriorated for some banking and financial services companies.
During the period, the Fund increased its allocations to the Information Technology, Consumer Staples, and Industrials sectors. The Fund sold its holdings in the Materials sector, and exposures to the Financials, Health Care, Energy, and Telecommunication Services sectors were reduced.
As part of the ongoing research process for the Fund, we look across companies’ entire capital structures to identify attractive investment opportunities. That has led the Fund to investments in several corporate bonds that we believe offer attractive yields.
The Flexible Capital Fund has tended to have a relatively high portfolio turnover level. This is attributable, in part, to the Fund’s investment style. Although the Fund may hold core positions for some time, it may change its portfolio composition quickly to take advantage of new opportunities, preserve capital or to address issues affecting particular holdings.
Fiscal Period-End Investment Posture
As of September 30, 2011, the Fund’s primary economic sector allocations included Consumer Discretionary, Information Technology, Financials, and Industrials. At period-end, the Fund had no exposure to the Utilities and Materials sectors.
Sincerely,
A. DOUGLAS RAO
PORTFOLIO MANAGER
| (1) | Total returns are based on net change in net asset value assuming reinvestment of distributions. For the period prior to February 1, 2011, the performance returns for the Flexible Capital Fund reflect a fee waiver in effect; in the absence of such a waiver, the returns would have been reduced. A redemption fee of 2% may be imposed on redemptions or exchanges of Fund shares owned for 30 days or less. Please see the Prospectus for more information. |
FLEXIBLE CAPITAL FUND OVERVIEW |
September 30, 2011 (Unaudited)
The Flexible Capital Fund invests primarily in equity securities and other investments that are selected primarily for their long-term growth potential. The Fund may invest in issuers of any size throughout the world, and will normally hold a core position of between 20 and 50 securities or other investments.
| TOTAL ANNUAL OPERATING EXPENSES* 1.49% | NET ASSETS $409,145,126 | NET ASSET VALUE PER SHARE $12.05 |
GROWTH OF $10,000(1)(2) | PERFORMANCE COMPARISON |
| |
SECTOR ALLOCATION(3) | TOP FIVE HOLDINGS |
| | | | |
| | SENSATA TECHNOLOGIES HOLDING N.V. | 4.71% | |
| | TARGA RESOURCES CORPORATION | 4.24% | |
| | VISA, INC. - CL. A | 3.20% | |
| | AUTOZONE, INC. | 3.16% | |
| | SOLARWINDS, INC. | 3.15% | |
| | | | |
| * | The Total Annual Operating Expenses are reflective of the information disclosed in the Funds’ Prospectus dated February 1, 2011 and may differ from the expense ratio disclosed in this report. |
| | The performance data quoted here represent past performance, and past performance is not a guarantee of future results. Investment return and principal value of an investment will fluctuate so that an investor’s shares, when redeemed, may be worth more or less than their original cost. Current performance may be lower or higher than the performance information quoted. To obtain performance information current to the most recent month-end, please call 888-860-8686 or visit www.marsicofunds.com. A redemption fee may be imposed on redemptions or exchanges of Fund shares owned for 30 days or less. |
| | The performance included in the chart and graph does not reflect the deduction of taxes on Fund distributions or the redemption of Fund shares. |
| | All indices are unmanaged and investors cannot invest directly in an index. |
| (1) | The performance returns for the Flexible Capital Fund (for the period prior to February 1, 2011) reflect a fee waiver in effect; in the absence of such a waiver, the returns would be reduced. |
| (2) | This chart assumes an initial investment of $10,000 made on December 29, 2006 (inception). Total returns are based on change in NAV, assuming reinvestment of distributions. |
| (3) | Sector weightings represent the percentage of the Fund’s investments (excluding cash equivalents) in certain general sectors. These sectors may include more than one industry. The Fund’s portfolio composition is subject to change at any time. |
MARSICO FLEXIBLE CAPITAL FUND
SCHEDULE OF INVESTMENTS
September 30, 2011
| | | Number of Shares | | | Value | | | Percent of Net Assets | |
| COMMON STOCKS | | | | | | | | | |
| Aerospace & Defense | | | | | | | | | |
| TransDigm, Inc.* | | | 63,404 | | | $ | 5,178,205 | | | | 1.27 | % |
| | | | | | | | | | | | | |
| Airport Services | | | | | | | | | | | | |
| Wesco Aircraft Holdings, Inc.* | | | 596,320 | | | | 6,517,778 | | | | 1.59 | |
| | | | | | | | | | | | | |
| Apparel Retail | | | | | | | | | | | | |
| The TJX Companies, Inc. | | | 225,403 | | | | 12,503,104 | | | | 3.06 | |
| Urban Outfitters, Inc.* | | | 181,727 | | | | 4,056,147 | | | | 0.99 | |
| | | | | | | | 16,559,251 | | | | 4.05 | |
| Apparel, Accessories & Luxury Goods | | | | | |
| Adidas A.G. | | | 148,267 | | | | 9,022,927 | | | | 2.21 | |
| Compagnie Financière Richemont SA | | | 85,848 | | | | 3,824,127 | | | | 0.93 | |
| PVH Corp. | | | 87,265 | | | | 5,082,313 | | | | 1.24 | |
| | | | | | | | 17,929,367 | | | | 4.38 | |
| Application Software | | | | | | | | | | | | |
| SolarWinds, Inc.* | | | 584,848 | | | | 12,878,353 | | | | 3.15 | |
| | | | | | | | | | | | | |
| Automobile Manufacturers | | | | | | | | | | | | |
| Tesla Motors, Inc.* | | | 117,221 | | | | 2,859,020 | | | | 0.70 | |
| | | | | | | | | | | | | |
| Automotive Retail | | | | | | | | | | | | |
| AutoZone, Inc.* | | | 40,512 | | | | 12,931,025 | | | | 3.16 | |
| | | | | | | | | | | | | |
| Cable & Satellite | | | | | | | | | | | | |
| British Sky Broadcasting Group PLC | | | 1,114,880 | | | | 11,482,314 | | | | 2.81 | |
| | | | | | | | | | | | | |
| Computer Hardware | | | | | | | | | | | | |
| Apple, Inc.* | | | 26,090 | | | | 9,944,986 | | | | 2.43 | |
| | | | | | | | | | | | | |
| Construction & Farm Machinery & Heavy Trucks | | | | | |
| Cummins, Inc. | | | 61,942 | | | | 5,058,184 | | | | 1.24 | |
| | | | | | | | | | | | | |
| Consumer Finance | | | | | | | | | | | | |
| Capital One Financial Corporation | | | 125,763 | | | | 4,983,988 | | | | 1.22 | |
| | | | | | | | | | | | | |
| Data Processing & Outsourced Services | | | | | |
| Visa, Inc. - Cl. A | | | 152,777 | | | | 13,096,044 | | | | 3.20 | |
| | | | | | | | | | | | | |
| Distributors | | | | | | | | | | | | |
| Li & Fung Ltd. | | | 5,155,000 | | | | 8,640,576 | | | | 2.11 | |
| | | | | | | | | | | | | |
| Diversified Banks | | | | | | | | | | | | |
| U.S. Bancorp | | | 442,640 | | | | 10,419,746 | | | | 2.55 | |
| | | | | | | | | | | | | |
| Education Services | | | | | | | | | | | | |
| Anhanguera Educacional Participacoes S.A. | | | 192,900 | | | | 2,482,744 | | | | 0.61 | |
| | | | | | | | | | | | | |
| Electrical Components & Equipment | | | | | | | | | |
| Sensata Technologies Holding N.V.* | | | 728,676 | | | | 19,280,767 | | | | 4.71 | |
| | | | | | | | | | | | | |
| Hotels, Resorts & Cruise Lines | | | | | | | | | |
| Home Inns & Hotels Management, Inc. ADR* | | | 200,265 | | | | 5,160,829 | | | | 1.26 | |
| | | | | | | | | | | | | |
COMMON STOCKS (continued) | | | | | | | | | |
| Hypermarkets & Super Centers | | | | | | | | | |
| PriceSmart, Inc. | | | 78,902 | | | $ | 4,917,173 | | | | 1.20 | % |
| | | | | | | | | | | | | |
| Industrial Conglomerates | | | | | | | | | | | | |
| Jardine Matheson Holdings Ltd. | | | 212,000 | | | | 9,636,080 | | | | 2.35 | |
| | | | | | | | | | | | | |
| Internet Retail | | | | | | | | | | | | |
| HomeAway, Inc.* | | | 122,004 | | | | 4,101,774 | | | | 1.00 | |
| | | | | | | | | | | | | |
| Internet Software & Services | | | | | | | | | |
| Baidu, Inc. Spon. ADR* | | | 63,048 | | | | 6,740,462 | | | | 1.65 | |
| Youku.com, Inc. Spon. ADR* | | | 133,778 | | | | 2,188,608 | | | | 0.53 | |
| | | | | | | | 8,929,070 | | | | 2.18 | |
| Investment Banking & Brokerage | | | | | | | | | |
| The Goldman Sachs Group, Inc. | | | 41,604 | | | | 3,933,658 | | | | 0.96 | |
| | | | | | | | | | | | | |
| IT Consulting & Other Services | | | | | | | | | |
| Accenture plc - Cl. A | | | 181,458 | | | | 9,559,207 | | | | 2.34 | |
| | | | | | | | | | | | | |
| Life & Health Insurance | | | | | | | | | | | | |
| AIA Group Ltd. | | | 1,115,800 | | | | 3,174,049 | | | | 0.78 | |
| | | | | | | | | | | | | |
| Managed Health Care | | | | | | | | | | | | |
| Odontoprev S.A. | | | 585,400 | | | | 8,652,182 | | | | 2.11 | |
| | | | | | | | | | | | | |
| Movies & Entertainment | | | | | | | | | | | | |
| Time Warner, Inc. | | | 291,595 | | | | 8,739,102 | | | | 2.14 | |
| | | | | | | | | | | | | |
| Oil & Gas Equipment & Services | | | | | | | | | |
| Halliburton Company | | | 255,667 | | | | 7,802,957 | | | | 1.91 | |
| | | | | | | | | | | | | |
| Oil & Gas Refining & Marketing | | | | | | | | | |
| Amyris, Inc.* | | | 91,653 | | | | 1,855,057 | | | | 0.45 | |
| | | | | | | | | | | | | |
| Oil & Gas Storage & Transportation | | | | | | | | | |
| Targa Resources Corporation | | | 583,597 | | | | 17,362,011 | | | | 4.24 | |
| | | | | | | | | | | | | |
| Packaged Foods & Meats | | | | | | | | | | | | |
| Green Mountain Coffee Roasters, Inc.* | | | 62,438 | | | | 5,802,988 | | | | 1.42 | |
| McCormick & Company, Inc. | | | 249,176 | | | | 11,501,964 | | | | 2.81 | |
| Mead Johnson Nutrition Company | | | 132,951 | | | | 9,151,017 | | | | 2.24 | |
| | | | | | | | 26,455,969 | | | | 6.47 | |
| Pharmaceuticals | | | | | | | | | | | | |
| Allergan, Inc. | | | 133,626 | | | | 11,008,110 | | | | 2.69 | |
| | | | | | | | | | | | | |
| Property & Casualty Insurance | | | | | | | | | |
| The Progressive Corporation | | | 707,408 | | | | 12,563,566 | | | | 3.07 | |
| | | | | | | | | | | | | |
| Semiconductors | | | | | | | | | | | | |
| Mellanox Technologies Ltd.* | | | 159,997 | | | | 4,995,106 | | | | 1.22 | |
| Taiwan Semiconductor Manufacturing Co., Ltd. Spon. ADR | | | 659,159 | | | | 7,534,188 | | | | 1.84 | |
| | | | | | | | 12,529,294 | | | | 3.06 | |
| Thrifts & Mortgage Finance | | | | | | | | | |
| First Niagara Financial Group, Inc. | | | 345,208 | | | | 3,158,653 | | | | 0.77 | |
| | | | | | | | | | | | | |
| TOTAL COMMON STOCKS | | | | | | | | | | | | |
| (Cost $317,945,521) | | | | | | | 319,781,089 | | | | 78.16 | |
| | See notes to financial statements. |
| | | Number of Shares/ Par Value | | | Value | | | Percent of Net Assets | |
| CORPORATE BONDS | | | | | | | | | |
| Aerospace & Defense | | | | | | | | | |
| TransDigm, Inc., 7.750%, 12/15/18 | | $ | 4,141,000 | | | $ | 4,213,468 | | | | 1.03 | % |
| | | | | | | | | | | | | |
| Real Estate Services | | | | | | | | | | | | |
| CB Richard Ellis Services, Inc., 11.625%, 6/15/17 | | | 5,613,000 | | | | 6,328,657 | | | | 1.54 | |
| | | | | | | | | | | | | |
| Restaurants | | | | | | | | | | | | |
| The Wendy's Company, 10.000%, 7/15/16 | | | 4,357,000 | | | | 4,585,742 | | | | 1.12 | |
| | | | | | | | | | | | | |
| Wireless Telecommunication Services | | | | | |
| Crown Castle International Corp., 7.125%, 11/1/19 | | | 7,193,000 | | | | 7,408,790 | | | | 1.81 | |
| | | | | | | | | | | | | |
| TOTAL CORPORATE BONDS | | | | | | | | | |
| (Cost $22,666,470) | | | | | | | 22,536,657 | | | | 5.50 | |
| | | | | | | | | | | | | |
| PREFERRED PURCHASED SECURITIES | | | | | |
| Diversified Banks | | | | | | | | | | | | |
| Wells Fargo Capital XV, 9.75% | | | 12,669,000 | | | | 12,599,321 | | | | 3.08 | |
| | | | | | | | | | | | | |
| TOTAL PREFERRED PURCHASED SECURITIES | | | | | |
| (Cost $13,178,154) | | | | | | | 12,599,321 | | | | 3.08 | |
| | | | | | | | | | | | | |
| SHORT-TERM INVESTMENTS | | | | | | | | | |
| State Street Institutional Treasury Money Market Fund, 0.000% | | | 51,456,797 | | | | 51,456,797 | | | | 12.58 | |
| | | | | | | | | | | | | |
| TOTAL SHORT-TERM INVESTMENTS | | | | | | | | | |
| (Cost $51,456,797) | | | | | | | 51,456,797 | | | | 12.58 | |
| | | | | | | | | | | | | |
| TOTAL INVESTMENTS | | | | | | | | | | | | |
| (Cost $405,246,942) | | | | | | | 406,373,864 | | | | 99.32 | |
| | | | | | | | | | | | | |
| Cash and Other Assets, Less Liabilities | | | | | | | 2,771,262 | | | | 0.68 | |
| | | | | | | | | | | | | |
| NET ASSETS | | | | | | $ | 409,145,126 | | | | 100.00 | % |
| SUMMARY OF INVESTMENTS BY COUNTRY | | | | |
| Country | | Market Value | | | Percent of Investment Securities | |
| Brazil | | $ | 11,134,926 | | | | 2.74 | % |
| China/Hong Kong | | | 35,540,604 | | | | 8.75 | |
| Germany | | | 9,022,927 | | | | 2.22 | |
| Ireland | | | 9,559,207 | | | | 2.35 | |
| Israel | | | 4,995,106 | | | | 1.23 | |
| Netherlands | | | 19,280,767 | | | | 4.74 | |
| Switzerland | | | 3,824,127 | | | | 0.94 | |
| Taiwan | | | 7,534,188 | | | | 1.85 | |
| United Kingdom | | | 11,482,314 | | | | 2.83 | |
United States(1) | | | 293,999,698 | | | | 72.35 | |
| | | $ | 406,373,864 | | | | 100.00 | % |
| (1) | Includes short-term securities. |
| | See notes to financial statements. |
INVESTMENT REVIEW BY TOM MARSICO AND JIM GENDELMAN (UNAUDITED)
The Marsico Global Fund posted a total return of -7.73% for the one-year fiscal period ended September 30, 2011. The Fund’s return underperformed that of the MSCI All Country World Index (“MSCI ACWI Index”), which we consider to be the Fund’s primary benchmark index and which had a total return of -6.01%. The MSCI ACWI Index measures equity market performance in the global developed and emerging markets. Please see the Fund Overview for more detailed information about the Fund’s performance for various time periods ended September 30, 2011.
The performance data for the Fund quoted here represent past performance, and past performance is not a guarantee of future results. Investment return and principal value of an investment will fluctuate so that an investor’s shares, when redeemed, may be worth more or less than their original cost. Current performance may be lower or higher than the performance information quoted. To obtain performance information current to the most recent month-end, please call 888-860-8686 or visit www.marsicofunds.com.(1)
This review highlights Fund performance over a one-year fiscal period. Shareholders should keep in mind that the Fund is intended for long-term investors who hold their shares for substantially longer periods of time. You should also keep in mind that our views on all investments discussed in this report are subject to change at any time. References to specific securities, industries, and sectors discussed in this report are not recommendations to buy or sell such securities or related investments, and the Fund may not necessarily hold these securities or investments today. Please see the accompanying Schedule of Investments for the percentage of the Fund’s portfolio represented by the securities mentioned in this report as of the end of the reporting period.
Foreign investments present additional risks due to currency fluctuations, economic and political factors, lower liquidity, differences in securities regulations and accounting standards, possible changes in taxation, limited public information, and other factors.
The Global Fund’s underperformance for the one-year period ended September 30, 2011 was largely attributable to stock selection and positioning in the Energy sector. The Fund’s allocation to the Energy sector was roughly half of its benchmark index’s sector weight. Energy was a relatively strong-performing sector of the benchmark index and the Fund was therefore penalized by having few investments in the sector. Moreover, the Fund’s holdings within the sector did not perform well. Brazilian oil and gas exploration and production company OGX Petróleo e Gás Participações S.A. slid -48% prior to being sold from the Fund. Baker Hughes, Inc., an oil field services provider, declined -41%.
From a sector allocation standpoint, the Fund was poorly positioned by having few investments in the strongest-performing sectors of the benchmark index, including Consumer Staples, Health Care, and Telecommunication Services.
Certain of the Fund’s Consumer Discretionary positions also had a material, negative impact on performance. The Fund purchased auto manufacturer General Motors Company at its initial public offering following the government’s rescue of the automaker. General Motors slid -36% before it was sold from the Fund. Hong Kong-based manufacturer, exporter and distributor of retail goods Li & Fung Ltd. (-38%) also posted a significant stock price decline.
Results in the Financials sector were mixed. Several of the Fund’s Financials positions posted solid gains, including Brazil real estate company BR Malls Participacoes S.A. (+24%). The Fund, however, was penalized by having an overweight allocation to the sector during the early portion of the reporting period, as Financials was a weak-performing area of the market.
On the plus side, the Fund benefitted from stock selection and an underweight allocation to the Materials sector. Agricultural products company Monsanto Company gained +43% prior to being sold from the Fund. Monsanto’s stock price benefitted, in part, from strong sales of its specialty seeds. Novozymes A/S – Cl. B, a Denmark-headquartered enzymes company whose products are used for bio-energy, agricultural, and other applications, rose +14%.
Stock selection in the Industrials sector was also strong. Netherlands-based global industrial technology company Sensata Technologies Holding N.V. (+35%) and aerospace components provider Precision Castparts Corp. (+22%) performed well.
Several individual holdings also performed well, including, Apple, Inc. (+34%), maker of the iPhone and iPad, and health care surgical systems manufacturer Intuitive Surgical, Inc. (+28%).
Active currency management is not a central facet of the Fund’s investment process, but fluctuations in major world currencies can affect performance. Currency had a modest, positive overall effect on performance during the period. In particular, the Fund benefitted from having a relatively significant portion of its assets invested in companies whose securities are traded in the Swiss franc, as the franc appreciated against the US dollar during the period. A portion of this benefit was offset by the Fund’s lack of investments in Japanese equities, as the yen was another strong-performing currency with significant representation in the benchmark index.
The Global Fund has tended to have a fairly high portfolio turnover level. This is mainly attributable to the Fund’s investment style. Although the Fund may hold core positions for some time, it may change its portfolio composition quickly to take advantage of new opportunities, or to address issues affecting particular holdings.
Fiscal Period-End Investment Posture
As of September 30, 2011, the Fund’s primary economic sector allocations were in the following areas: Consumer Discretionary, Financials, Information Technology, and Industrials. The Fund had no investments in Utilities and Telecommunication Services sectors.
The Fund’s most significant country allocations were the US, Switzerland, China/Hong Kong, and Spain. The Fund held several positions domiciled in emerging markets, including China, Argentina, Brazil, and India.
In closing, we also would like to note that effective October 1, 2011, Cory Gilchrist, CFA, co-manager of the Marsico Global Fund, left Marsico Capital Management, LLC to pursue personal and charitable interests. Tom Marsico and Jim Gendelman, who have served as co-portfolio managers for the Marsico Global Fund since its inception, will remain co-managers of the Fund.
Sincerely,
THOMAS F. MARSICO
JAMES G. GENDELMAN
PORTFOLIO MANAGERS
| (1) | Total returns are based on net change in net asset value assuming reinvestment of distributions. For the period prior to January 1, 2009, and from April through May 2009, the performance returns for the Global Fund reflect a fee waiver in effect; in the absence of such a waiver, the returns would have been reduced. For the one-month period of June 2009, performance returns for the Global Fund would have been higher but for the reimbursement of fees waived previously. A redemption fee of 2% may be imposed on redemptions or exchanges of Fund shares owned for 30 days or less. Please see the Prospectus for more information. |
September 30, 2011 (Unaudited)
The Global Fund invests primarily in common stocks that are selected for their long-term growth potential. The Fund invests in the securities of companies of any size that are economically tied to any countries or markets throughout the world, including the securities of companies economically tied to emerging markets. Under normal market conditions, the Fund will invest significantly (generally, at least 40% of its net assets) in the securities of issuers organized or located outside the US or doing business outside the US (unless market conditions are not deemed favorable by the Adviser, in which case the Fund generally will invest at least 30% of its assets in such foreign securities). The Fund will invest its assets in various regions and countries, including the US, that encompass not less than three different countries overall. The Fund may hold an unlimited number of common stocks.
| TOTAL ANNUAL OPERATING EXPENSES* 1.56% | NET ASSETS $108,021,126 | NET ASSET VALUE PER SHARE $9.06 |
GROWTH OF $10,000(1)(2) | PERFORMANCE COMPARISON |
| |
SECTOR ALLOCATION(3) | TOP FIVE HOLDINGS |
| | | | |
| | INDUSTRIA DE DISENO TEXTILE S.A. (INDITEX) | 6.42% | |
| | APPLE, INC. | 5.43% | |
| | THE PNC FINANCIAL SERVICES GROUP, INC. | 5.30% | |
| | BB&T CORPORATION | 4.38% | |
| | COMPAGNIE FINANCIÈRE RICHEMONT SA | 4.09% | |
| | | | |
| * | The Total Annual Operating Expenses are reflective of the information disclosed in the Funds’ Prospectus dated February 1, 2011 and may differ from the expense ratio disclosed in this report. |
| | The performance data quoted here represent past performance, and past performance is not a guarantee of future results. Investment return and principal value of an investment will fluctuate so that an investor’s shares, when redeemed, may be worth more or less than their original cost. Current performance may be lower or higher than the performance information quoted. To obtain performance information current to the most recent month-end, please call 888-860-8686 or visit www.marsicofunds.com. A redemption fee may be imposed on redemptions or exchanges of Fund shares held for 30 days or less. |
| | The performance included in the chart and graph does not reflect the deduction of taxes on Fund distributions or the redemption of Fund shares. |
| | All indices are unmanaged and investors cannot invest directly in an index. |
| (1) | The performance returns for the Global Fund (for the period prior to January 1, 2009 and from April through May 2009) reflect a fee waiver in effect; in absence of such a waiver, the returns would be reduced. For the one-month period June 2009, performance returns for the Global Fund would have been higher but for reimbursement of fees waived previously. |
| (2) | This chart assumes an initial investment of $10,000 made on June 29, 2007 (inception). Total returns are based on change in NAV, assuming reinvestment of distributions. |
| (3) | Sector weightings represent the percentage of the Fund’s investments (excluding cash equivalents) in certain general sectors. These sectors may include more than one industry. The Fund’s portfolio composition is subject to change at any time. |
| | The MSCI ACWI (All Country World Index) Index is a free float-adjusted market capitalization index that is designed to measure equity market performance in the global developed and emerging markets. |
MARSICO GLOBAL FUND
SCHEDULE OF INVESTMENTS
September 30, 2011
| | | Number of Shares | | | Value | | | Percent of Net Assets | |
| COMMON STOCKS | | | | | | | | | |
| Aerospace & Defense | | | | | | | | | |
| Precision Castparts Corp. | | | 19,800 | | | $ | 3,078,108 | | | | 2.85 | % |
| | | | | | | | | | | | | |
| Air Freight & Logistics | | | | | | | | | | | | |
| Expeditors International of Washington, Inc. | | | 46,098 | | | | 1,869,274 | | | | 1.73 | |
| | | | | | | | | | | | | |
| Apparel Retail | | | | | | | | | | | | |
| Industria de Diseno Textile S.A. (Inditex) | | | 81,219 | | | | 6,933,280 | | | | 6.42 | |
| rue21, inc.* | | | 37,951 | | | | 861,108 | | | | 0.80 | |
| | | | | | | | 7,794,388 | | | | 7.22 | |
| Apparel, Accessories & Luxury Goods | | | | | |
| Compagnie Financière Richemont SA | | | 99,071 | | | | 4,413,149 | | | | 4.09 | |
| lululemon athletica, inc.* | | | 31,300 | | | | 1,522,745 | | | | 1.41 | |
| Prada S.p.A.* | | | 563,000 | | | | 2,371,318 | | | | 2.19 | |
| | | | | | | | 8,307,212 | | | | 7.69 | |
| Application Software | | | | | | | | | | | | |
| ANSYS, Inc.* | | | 40,839 | | | | 2,002,744 | | | | 1.86 | |
| Informatica Corporation* | | | 70,203 | | | | 2,874,813 | | | | 2.66 | |
| | | | | | | | 4,877,557 | | | | 4.52 | |
| Asset Management & Custody Banks | | | | | |
| Julius Baer Group Ltd.* | | | 104,989 | | | | 3,508,539 | | | | 3.25 | |
| | | | | | | | | | | | | |
| Automobile Manufacturers | | | | | | | | | | | | |
| Bayerische Motoren Werke AG | | | 64,026 | | | | 4,229,634 | | | | 3.92 | |
| Tesla Motors, Inc.* | | | 29,691 | | | | 724,164 | | | | 0.67 | |
| | | | | | | | 4,953,798 | | | | 4.59 | |
| Casinos & Gaming | | | | | | | | | | | | |
| Wynn Macau Ltd. | | | 1,754,675 | | | | 4,127,382 | | | | 3.82 | |
| | | | | | | | | | | | | |
| Coal & Consumable Fuels | | | | | | | | | | | | |
| Solazyme, Inc.* | | | 26,546 | | | | 255,107 | | | | 0.24 | |
| | | | | | | | | | | | | |
| Computer Hardware | | | | | | | | | | | | |
| Apple, Inc.* | | | 15,383 | | | | 5,863,692 | | | | 5.43 | |
| | | | | | | | | | | | | |
| Distributors | | | | | | | | | | | | |
| Li & Fung Ltd. | | | 1,176,000 | | | | 1,971,158 | | | | 1.82 | |
| | | | | | | | | | | | | |
| Diversified Banks | | | | | | | | | | | | |
| Standard Chartered PLC | | | 81,333 | | | | 1,622,673 | | | | 1.50 | |
| | | | | | | | | | | | | |
| Electrical Components & Equipment | | | | | | | | | |
| Sensata Technologies Holding N.V.* | | | 121,951 | | | | 3,226,823 | | | | 2.99 | |
| | | | | | | | | | | | | |
| Health Care Equipment | | | | | | | | | | | | |
| Intuitive Surgical, Inc.* | | | 11,741 | | | | 4,277,011 | | | | 3.96 | |
| | | | | | | | | | | | | |
| Homefurnishing Retail | | | | | | | | | | | | |
| Williams-Sonoma, Inc. | | | 73,638 | | | | 2,267,314 | | | | 2.10 | |
| | | | | | | | | | | | | |
| Hotels, Resorts & Cruise Lines | | | | | | | | | |
| Starwood Hotels & Resorts Worldwide, Inc. | | | 52,737 | | | | 2,047,250 | | | | 1.89 | |
| | | | | | | | | | | | | |
COMMON STOCKS (continued) | | | | | | | | | |
| Hypermarkets & Super Centers | | | | | | | | | |
| PriceSmart, Inc. | | | 9,106 | | | $ | 567,486 | | | | 0.52 | % |
| | | | | | | | | | | | | |
| Integrated Oil & Gas | | | | | | | | | | | | |
| Occidental Petroleum Corporation | | | 35,334 | | | | 2,526,381 | | | | 2.34 | |
| | | | | | | | | | | | | |
| Internet Retail | | | | | | | | | | | | |
| Amazon.com, Inc.* | | | 14,156 | | | | 3,060,952 | | | | 2.83 | |
| HomeAway, Inc.* | | | 21,554 | | | | 724,645 | | | | 0.67 | |
| MakeMyTrip Ltd.* | | | 11,221 | | | | 247,760 | | | | 0.23 | |
| priceline.com, Inc.* | | | 3,694 | | | | 1,660,305 | | | | 1.54 | |
| | | | | | | | 5,693,662 | | | | 5.27 | |
| Internet Software & Services | | | | | | | | | |
| Baidu, Inc. Spon. ADR* | | | 17,869 | | | | 1,910,375 | | | | 1.77 | |
| Bankrate, Inc.* | | | 60,131 | | | | 914,593 | | | | 0.85 | |
| MercadoLibre, Inc. | | | 43,452 | | | | 2,335,545 | | | | 2.16 | |
| OpenTable, Inc.* | | | 11,346 | | | | 522,029 | | | | 0.48 | |
| Youku.com, Inc. Spon. ADR* | | | 23,411 | | | | 383,004 | | | | 0.35 | |
| | | | | | | | 6,065,546 | | | | 5.61 | |
| Investment Banking & Brokerage | | | | | | | | | |
| Jefferies Group, Inc. | | | 64,523 | | | | 800,730 | | | | 0.74 | |
| | | | | | | | | | | | | |
| Marine | | | | | | | | | | | | |
| Kuehne + Nagel International AG | | | 28,278 | | | | 3,173,722 | | | | 2.94 | |
| | | | | | | | | | | | | |
| Oil & Gas Equipment & Services | | | | | | | | | |
| Baker Hughes, Inc. | | | 54,091 | | | | 2,496,841 | | | | 2.31 | |
| | | | | | | | | | | | | |
| Oil & Gas Refining & Marketing | | | | | | | | | |
| Amyris, Inc.* | | | 25,390 | | | | 513,894 | | | | 0.48 | |
| | | | | | | | | | | | | |
| Packaged Foods & Meats | | | | | | | | | | | | |
| Nestlé S.A. | | | 50,069 | | | | 2,756,433 | | | | 2.55 | |
| | | | | | | | | | | | | |
| Real Estate Operating Companies | | | | | | | | | |
| BR Malls Participacoes S.A. | | | 209,400 | | | | 2,139,383 | | | | 1.98 | |
| | | | | | | | | | | | | |
| Regional Banks | | | | | | | | | | | | |
| BB&T Corporation | | | 221,783 | | | | 4,730,632 | | | | 4.38 | |
| The PNC Financial Services Group, Inc. | | | 118,801 | | | | 5,725,020 | | | | 5.30 | |
| | | | | | | | 10,455,652 | | | | 9.68 | |
| Restaurants | | | | | | | | | | | | |
| Chipotle Mexican Grill, Inc.* | | | 3,812 | | | | 1,154,845 | | | | 1.07 | |
| | | | | | | | | | | | | |
| Specialty Chemicals | | | | | | | | | | | | |
| Novozymes A/S - Cl. B | | | 26,977 | | | | 3,835,546 | | | | 3.55 | |
| | | | | | | | | | | | | |
| TOTAL COMMON STOCKS | | | | | | | | | | | | |
| (Cost $94,977,116) | | | | | | | 102,227,407 | | | | 94.64 | |
| | See notes to financial statements. |
MARSICO GLOBAL FUND
SCHEDULE OF INVESTMENTS (continued)
September 30, 2011
| | | Number of Shares | | | Value | | | Percent of Net Assets | |
| SHORT-TERM INVESTMENTS | | | | | | | | | |
| State Street Institutional Treasury Money Market Fund, 0.000% | | | 6,245,901 | | | $ | 6,245,901 | | | | 5.78 | % |
| | | | | | | | | | | | | |
| TOTAL SHORT-TERM INVESTMENTS | | | | | | | | | |
| (Cost $6,245,901) | | | | | | | 6,245,901 | | | | 5.78 | |
| | | | | | | | | | | | | |
| TOTAL INVESTMENTS | | | | | | | | | | | | |
| (Cost $101,223,017) | | | | | | | 108,473,308 | | | | 100.42 | |
| | | | | | | | | | | | | |
| Liabilities, Less Cash and Other Assets | | | | | | | (452,182 | ) | | | (0.42 | ) |
| | | | | | | | | | | | | |
| NET ASSETS | | | | | | $ | 108,021,126 | | | | 100.00 | % |
| SUMMARY OF INVESTMENTS BY COUNTRY | | | | |
| Country | | Market Value | | | Percent of Investment Securities | |
| Argentina | | $ | 2,335,545 | | | | 2.15 | % |
| Brazil | | | 2,139,383 | | | | 1.97 | |
| Canada | | | 1,522,745 | | | | 1.40 | |
| China/Hong Kong | | | 8,391,919 | | | | 7.74 | |
| Denmark | | | 3,835,546 | | | | 3.54 | |
| Germany | | | 4,229,634 | | | | 3.90 | |
| India | | | 247,760 | | | | 0.23 | |
| Italy | | | 2,371,318 | | | | 2.19 | |
| Netherlands | | | 3,226,823 | | | | 2.97 | |
| Spain | | | 6,933,280 | | | | 6.39 | |
| Switzerland | | | 13,851,843 | | | | 12.77 | |
| United Kingdom | | | 1,622,673 | | | | 1.50 | |
United States(1) | | | 57,764,839 | | | | 53.25 | |
| | | $ | 108,473,308 | | | | 100.00 | % |
| (1) | Includes short-term securities. |
| | See notes to financial statements. |
INVESTMENT REVIEW BY MUNISH MALHOTRA, JOSH RUBIN AND CHARLIE WILSON (UNAUDITED)
The Marsico Emerging Markets Fund began operations on December 31, 2010, three months after the beginning of the fiscal year on October 1, 2010. As a reminder, the Fund seeks long-term growth of capital by investing primarily in issuers economically tied to emerging markets that are selected for their long-term growth potential.
The Fund posted a total return of (US$) -29.00% for the period from December 31, 2010 (inception) through September 30, 2011. For comparative purposes over the same nine-month period, the MSCI Emerging Markets Index, which we consider to be the Fund’s primary benchmark index, had a total return of (US$) -21.88%. Please see the Fund Overview for more detailed information about the Fund’s performance for the nine-month period ended September 30, 2011.
The performance data for the Fund quoted here represent past performance, and past performance is not a guarantee of future results. Investment return and principal value of an investment will fluctuate so that an investor’s shares, when redeemed, may be worth more or less than their original cost. Current performance may be lower or higher than the performance information quoted. To obtain performance information current to the most recent month-end, please call 888-860-8686 or visit www.marsicofunds.com.(1)
This review highlights Fund performance over a nine-month period. Shareholders should keep in mind that the Fund is intended for long-term investors who hold their shares for substantially longer periods of time. You should also keep in mind that our views on all investments discussed in this report are subject to change at any time. References to specific securities, industries, and sectors discussed in this report are not recommendations to buy or sell such securities or related investments, and the Fund may not necessarily hold these securities or investments today. Please see the accompanying Schedule of Investments for the percentage of the Fund’s portfolio represented by the securities mentioned in this report as of the end of the reporting period.
Foreign investments present additional risks due to currency fluctuations, economic and political factors, lower liquidity, differences in securities regulations and accounting standards, possible changes in taxation, limited public information, and other factors. These risks may be greater in less-developed emerging markets.
The first nine months of calendar year 2011 presented a very difficult market environment for emerging market equities. Questions regarding the health and growth of developed markets including the Europe and US (important end-users of many emerging markets’ goods and services) dampened emerging markets performance. Early in the period, many emerging markets faced inflationary pressures in their local markets and some began to raise interest rates, which added further headwinds to equity performance. As global economic headwinds mounted, asset classes perceived to be higher in risk, including emerging markets, lost ground as investors sought safe havens.
The Fund’s performance shortfall versus its benchmark index was primarily attributable to stock selection in the Consumer Discretionary sector. Anhanguera Educacional Participacoes S.A., a Brazil-based higher education company (-50%), South African media company Naspers Ltd. - Cl. N (-28%), and Chinese budget hotel chain Home Inns & Hotels Management, Inc. ADR (-37%) each had a material, negative impact on performance.
Energy holdings, particularly oil and natural gas producers, also posted disappointing returns. Brazil-headquartered OGX Petróleo e Gás Participações S.A.’s stock price dropped -49% prior to being sold from the Fund. Pacific Rubiales Energy Corp., a Canada-headquartered company with principal operations in Columbia, slid -39%. At period end, the Fund continued to maintain a position in Pacific Rubiales as we believed the company had strong volume growth opportunities, was poised to generate significant free cash flow, and found the stock to be attractively valued as compared to many other oil companies.
Stock selection in the Consumer Staples and Materials sectors also detracted from results. In the Consumer Staples sector, Asian Citrus Holdings Ltd., an agricultural producer of oranges and other fruit juice products, posted a double-digit decline prior to being sold from the Fund. Materials companies’ stock prices struggled as concerns regarding a slower global growth environment put downward pressure on prices. Mining, transport, and water company Antofagasta PLC (-30%) and coal mining company PT Borneo Lumbung Energi & Metal Tbk (-50%) were poor-performing Materials holdings.
The Fund had few investments in the Telecommunication Services sector. This investment posture hurt the Fund’s performance, as Telecommunication Services was the best-performing sector of the benchmark index.
We believe that emerging markets offer compelling investment opportunities for long-term growth of capital. In January of 2011, however, political unrest in the Middle East and North Africa raised concerns for us regarding the potential ripple effects of political instability in the region. In an effort to preserve capital, the Fund sold many of its equity positions and assumed a temporary defensive position by raising the percentage of its net assets in cash and cash equivalents. We gradually began to redeploy the Fund’s cash position into equities as evidence mounted that political unrest remained relatively contained in certain areas and that powerful demand trends from emerging markets would persist. The Fund’s elevated cash position hurt performance as the Fund did not fully participate in the positive equity returns experienced by the benchmark index during the months of February and March.
Active currency management is not a central facet of the Fund’s investment process, but fluctuations in major world currencies can affect performance. The US dollar generally weakened as compared to many emerging market currencies during the early portion of the reporting period before strengthening late in the period. Therefore, the Fund’s elevated US dollar cash positions in early 2011 caused a negative currency effect. This negative effect was offset later in the reporting period, as the US dollar strengthened versus many emerging market currencies.
There were a few bright spots in the Fund’s performance. Several of the Fund’s Financials holdings posted positive returns, including Brazilian real estate company BR Malls Participacoes S.A (+7%) and PT Bank Rakya Indonesia Persero Tbk (+14%).
Another area of strength for the Fund was stock selection in the Information Technology sector. The Fund’s Information Technology holdings posted a collective return of -6%. While the sector’s performance was negative on an absolute basis, the return significantly surpassed the -21% return of the benchmark index’s Information Technology sector return. Chinese Internet technology company SINA Corporation (-5%) and Taiwan Semiconductor Manufacturing Co., Ltd. Spon. ADR (-8%) performed relatively well compared to the rest of the sector.
The Fund’s strongest-performing holding was Arcos Dorados Holdings, Inc. – Cl. A, a Latin American franchisee of McDonald’s restaurants. The Fund initiated an investment in the company at its initial public offering. The Fund sold its position in Arcos Dorados Holdings, Inc. – Cl. A several weeks later after its stock price rose more than +29%.
Several of the Fund’s sector allocations also proved beneficial. The Fund had an underweight allocation to some of the poorest-performing areas of the benchmark index, including Materials, Financials, and Industrials. The Fund also benefitted from having a significant overweight allocation to the relatively strong-performing Consumer Discretionary sector.
The Emerging Markets Fund may tend to have a relatively high portfolio turnover level because of its investment style. Although the Fund may hold core positions for some time, it may change its portfolio composition quickly to take advantage of new opportunities, or to address issues affecting particular holdings.
Fiscal Period-End Investment Posture
As of period-end, the Fund’s most significant sector allocations included Consumer Discretionary, Information Technology, and Financials. The Fund’s largest country weights were China/Hong Kong, Brazil, and South Korea.
Sincerely,
MUNISH MALHOTRA, CFA
JOSHUA N. RUBIN
CHARLES K. WILSON
PORTFOLIO MANAGERS
| (1) | Total returns are based on net change in net asset value assuming reinvestment of distributions. The performance returns for the Emerging Markets Fund reflect a fee waiver in effect; in the absence of such a waiver, the returns would have been reduced. A redemption fee of 2% may be imposed on redemptions or exchanges of Fund shares owned for 30 days or less. Please see the Prospectus for more information. |
EMERGING MARKETS FUND OVERVIEW |
September 30, 2011 (Unaudited)
The Emerging Markets Fund seeks long-term growth of capital through a diversified portfolio. The Fund invests primarily (no less than 80% of net assets) in common stocks and other securities of issuers economically tied to emerging markets. The Fund may invest in the securities of an unlimited number of issuers of any size around the world.
TOTAL ANNUAL OPERATING EXPENSES* NET EXPENSES*† | 3.36% 1.75% | NET ASSETS $4,635,522 | NET ASSET VALUE PER SHARE $7.10 |
GROWTH OF $10,000(1)(2) | PERFORMANCE COMPARISON |
| |
SECTOR ALLOCATION(3) | TOP FIVE HOLDINGS |
| | | | |
| | PHILIPPINE LONG DISTANCE TELEPHONE COMPANY SPON. ADR | 3.18% | |
| | APPLE, INC. | 2.48% | |
| | TAIWAN SEMICONDUCTOR MANUFACTURING CO., LTD. SPON. ADR | 2.42% | |
| | HYUNDAI MOTOR COMPANY | 2.22% | |
| | CELLTRION, INC. | 2.16% | |
| | | | |
EMERGING MARKETS FUND OVERVIEW
| * | The Total Annual Operating Expenses and Net Expenses are reflective of the information disclosed in the Funds’ Prospectus dated February 1, 2011 and may differ from the expense ratios disclosed in this report. |
| † | The Adviser has entered into a written expense limitation agreement under which it has agreed to limit the total expenses of the Fund (excluding interest, taxes, acquired fund fees and expenses, litigation, brokerage and extraordinary expenses) to an annual rate of 1.75% of the Emerging Markets Fund’s average net assets until January 31, 2012. This fee waiver may be terminated at any time after January 31, 2012. The Adviser may recoup any waived amount from the Fund pursuant to this arrangement if such reimbursement does not cause the Fund to exceed existing expense limitations and the reimbursement is made within three years after the year in which the Adviser incurred the expense. |
| | The performance data quoted here represent past performance, and past performance is not a guarantee of future results. Investment return and principal value of an investment will fluctuate so that an investor’s shares, when redeemed, may be worth more or less than their original cost. Current performance may be lower or higher than the performance information quoted. To obtain performance information current to the most recent month-end, please call 888-860-8686 or visit www.marsicofunds.com. A redemption fee may be imposed on redemptions or exchanges of Fund shares held for 30 days or less. |
| | The performance included in the chart and graph does not reflect the deduction of taxes on Fund distributions or the redemption of Fund shares. |
| | All indices are unmanaged and investors cannot invest directly in an index. |
| (1) | The performance returns for the Emerging Markets Fund reflect a fee waiver in effect; in absence of such a waiver, the returns would be reduced. |
| (2) | This chart assumes an initial investment of $10,000 made on December 31, 2010 (inception). Total returns are based on change in NAV, assuming reinvestment of distributions. |
| (3) | Sector weightings represent the percentage of the Fund’s investments (excluding cash equivalents) in certain general sectors. These sectors may include more than one industry. The Fund’s portfolio composition is subject to change at any time. |
| | The MSCI Emerging Markets Index is a free float-adjusted market capitalization index that is designed to measure equity market performance in the global emerging markets. |
MARSICO EMERGING MARKETS FUND
SCHEDULE OF INVESTMENTS
September 30, 2011
| | | Number of Shares | | | Value | | | Percent of Net Assets | |
| COMMON STOCKS | | | | | | | | | |
| Airport Services | | | | | | | | | |
| TAV Havalimanlari Holding A.S.* | | | 14,055 | | | $ | 55,441 | | | | 1.20 | % |
| | | | | | | | | | | | | |
| Apparel Retail | | | | | | | | | | | | |
| Belle International Holdings Ltd. | | | 35,000 | | | | 60,517 | | | | 1.31 | |
| | | | | | | | | | | | | |
| Automobile Manufacturers | | | | | | | | | | | | |
| Hyundai Motor Company | | | 590 | | | | 103,142 | | | | 2.22 | |
| | | | | | | | | | | | | |
| Brewers | | | | | | | | | | | | |
| San Miguel Corporation | | | 20,130 | | | | 53,133 | | | | 1.15 | |
| | | | | | | | | | | | | |
| Cable & Satellite | | | | | | | | | | | | |
| Naspers Ltd. - Cl. N | | | 2,240 | | | | 96,735 | | | | 2.09 | |
| | | | | | | | | | | | | |
| Casinos & Gaming | | | | | | | | | | | | |
| Genting Singapore PLC* | | | 42,000 | | | | 48,768 | | | | 1.05 | |
| Kangwon Land, Inc. | | | 2,130 | | | | 48,746 | | | | 1.05 | |
| MGM China Holdings Ltd.* | | | 36,400 | | | | 47,957 | | | | 1.03 | |
| Wynn Macau Ltd. | | | 22,000 | | | | 51,749 | | | | 1.12 | |
| | | | | | | | 197,220 | | | | 4.25 | |
| Commodity Chemicals | | | | | | | | | | | | |
| Petronas Chemicals Group Bhd | | | 28,300 | | | | 48,833 | | | | 1.05 | |
| | | | | | | | | | | | | |
| Communications Equipment | | | | | | | | | |
| HTC Corporation | | | 4,000 | | | | 87,828 | | | | 1.89 | |
| | | | | | | | | | | | | |
| Computer Hardware | | | | | | | | | | | | |
| Apple, Inc.* | | | 301 | | | | 114,735 | | | | 2.48 | |
| | | | | | | | | | | | | |
| Construction & Farm Machinery & Heavy Trucks | | | | | |
| Sany Heavy Equipment International Holdings Co., Ltd. | | | 59,000 | | | | 47,160 | | | | 1.02 | |
| | | | | | | | | | | | | |
| Department Stores | | | | | | | | | | | | |
| Golden Eagle Retail Group Ltd. | | | 28,000 | | | | 57,358 | | | | 1.24 | |
| | | | | | | | | | | | | |
| Diversified Banks | | | | | | | | | | | | |
| Credicorp Ltd. | | | 514 | | | | 47,391 | | | | 1.02 | |
| ICICI Bank Ltd. Spon. ADR | | | 2,728 | | | | 94,716 | | | | 2.04 | |
| Itaú Unibanco Holding S.A. - Preference - ADR | | | 6,247 | | | | 96,953 | | | | 2.09 | |
| PT Bank Rakyat Indonesia Persero Tbk | | | 150,500 | | | | 98,543 | | | | 2.13 | |
| Sberbank of Russia Spon. ADR* | | | 5,616 | | | | 48,298 | | | | 1.04 | |
| | | | | | | | 385,901 | | | | 8.32 | |
| Diversified Metals & Mining | | | | | | | | | |
| Antofagasta PLC | | | 3,144 | | | | 44,892 | | | | 0.97 | |
| PT Borneo Lumbung Energi & Metal Tbk* | | | 527,500 | | | | 52,634 | | | | 1.13 | |
| | | | | | | | 97,526 | | | | 2.10 | |
| Diversified Real Estate Activities | | | | | | | | | |
| Hang Lung Properties Ltd. | | | 32,000 | | | | 96,228 | | | | 2.08 | |
| | | | | | | | | | | | | |
| Diversified Support Services | | | | | | | | | |
| Multiplus S.A. | | | 3,300 | | | | 45,895 | | | | 0.99 | |
| | | | | | | | | | | | | |
COMMON STOCKS (continued) | | | | | | | | | |
| Drug Retail | | | | | | | | | | | | |
| Brazil Pharma S.A.* | | | 10,000 | | | $ | 74,458 | | | | 1.61 | % |
| | | | | | | | | | | | | |
| Education Services | | | | | | | | | | | | |
| Anhanguera Educacional Participacoes S.A. | | | 3,900 | | | | 50,195 | | | | 1.08 | |
| | | | | | | | | | | | | |
| Electric Utilities | | | | | | | | | | | | |
| Light S.A. | | | 5,400 | | | | 71,052 | | | | 1.53 | |
| | | | | | | | | | | | | |
| Fertilizers & Agricultural Chemicals | | | | | | | | | |
| Sociedad Quimica y Minera de Chile S.A. Spon. ADR | | | 943 | | | | 45,085 | | | | 0.97 | |
| | | | | | | | | | | | | |
| Food Retail | | | | | | | | | | | | |
| Magnit OJSC Spon. GDR - 144A | | | 2,683 | | | | 51,299 | | | | 1.11 | |
| X5 Retail Group N.V. - GDR - 144A* | | | 1,866 | | | | 51,688 | | | | 1.11 | |
| | | | | | | | 102,987 | | | | 2.22 | |
| Health Care Equipment | | | | | | | | | | | | |
| China Kanghui Holdings Spon. ADR* | | | 2,422 | | | | 47,229 | | | | 1.02 | |
| | | | | | | | | | | | | |
| Home Entertainment Software | | | | | | | | | |
| NCsoft Corporation | | | 353 | | | | 99,726 | | | | 2.15 | |
| | | | | | | | | | | | | |
| Homebuilding | | | | | | | | | | | | |
| PDG Realty S.A. Empreendimentos e Participações | | | 13,700 | | | | 44,665 | | | | 0.96 | |
| | | | | | | | | | | | | |
| Hotels, Resorts & Cruise Lines | | | | | | | | | |
| Hana Tour Service, Inc. | | | 1,209 | | | | 38,030 | | | | 0.82 | |
| Home Inns & Hotels Management, Inc. ADR* | | | 1,550 | | | | 39,943 | | | | 0.86 | |
| Shangri-La Asia Ltd. | | | 24,833 | | | | 47,416 | | | | 1.02 | |
| | | | | | | | 125,389 | | | | 2.70 | |
| Industrial Conglomerates | | | | | | | | | | | | |
| Alliance Global Group, Inc. | | | 238,700 | | | | 50,404 | | | | 1.09 | |
| | | | | | | | | | | | | |
| Industrial Machinery | | | | | | | | | | | | |
| Airtac International Group | | | 10,000 | | | | 56,480 | | | | 1.22 | |
| | | | | | | | | | | | | |
| Integrated Oil & Gas | | | | | | | | | | | | |
| YPF S.A. Spon. ADR | | | 1,415 | | | | 48,407 | | | | 1.04 | |
| | | | | | | | | | | | | |
| Integrated Telecommunication Services | | | | | |
| KT Corporation Spon. ADR | | | 4,895 | | | | 72,348 | | | | 1.56 | |
| | | | | | | | | | | | | |
| Internet Retail | | | | | | | | | | | | |
| MakeMyTrip Ltd.* | | | 4,477 | | | | 98,852 | | | | 2.13 | |
| | | | | | | | | | | | | |
| Internet Software & Services | | | | | | | | | |
| Baidu, Inc. Spon. ADR* | | | 819 | | | | 87,559 | | | | 1.89 | |
| MercadoLibre, Inc. | | | 1,663 | | | | 89,386 | | | | 1.93 | |
| SINA Corporation* | | | 1,223 | | | | 87,579 | | | | 1.89 | |
| Yandex N.V. - Cl. A* | | | 2,307 | | | | 47,086 | | | | 1.01 | |
| | | | | | | | 311,610 | | | | 6.72 | |
| Life Sciences Tools & Services | | | | | | | | | |
| WuXi PharmaTech (Cayman) Inc. ADR* | | | 4,049 | | | | 47,130 | | | | 1.02 | |
| | See notes to financial statements. |
| | | Number of Shares | | | Value | | | Percent of Net Assets | |
COMMON STOCKS (continued) | | | | | | | | | |
| Managed Health Care | | | | | | | | | | | | |
| Odontoprev S.A. | | | 6,700 | | | $ | 99,026 | | | | 2.14 | % |
| | | | | | | | | | | | | |
| Office REITs | | | | | | | | | | | | |
| Ascendas India Trust | | | 156,000 | | | | 91,538 | | | | 1.97 | |
| | | | | | | | | | | | | |
| Oil & Gas Exploration & Production | | | | | | | | | |
| NovaTek OAO - Spon. GDR - 144A | | | 463 | | | | 53,800 | | | | 1.16 | |
| Pacific Rubiales Energy Corp. | | | 4,452 | | | | 94,317 | | | | 2.04 | |
| | | | | | | | 148,117 | | | | 3.20 | |
| Packaged Foods & Meats | | | | | | | | | | | | |
| PT Indofood Sukses Makmur Tbk | | | 177,500 | | | | 98,531 | | | | 2.13 | |
| | | | | | | | | | | | | |
| Pharmaceuticals | | | | | | | | | | | | |
| Celltrion, Inc. | | | 2,731 | | | | 100,204 | | | | 2.16 | |
| | | | | | | | | | | | | |
| Real Estate Operating Companies | | | | | | | | | |
| BR Malls Participacoes S.A. | | | 9,600 | | | | 98,081 | | | | 2.12 | |
| Parque Arauco S.A. | | | 59,759 | | | | 97,875 | | | | 2.11 | |
| | | | | | | | 195,956 | | | | 4.23 | |
| Research & Consulting Services | | | | | | | | | |
| Qualicorp S.A.* | | | 5,700 | | | | 42,441 | | | | 0.92 | |
| | | | | | | | | | | | | |
| Restaurants | | | | | | | | | | | | |
| International Meal Company Holdings S.A.* | | | 3,400 | | | | 21,609 | | | | 0.47 | |
| | | | | | | | | | | | | |
| Semiconductors | | | | | | | | | | | | |
| Taiwan Semiconductor Manufacturing Co., Ltd. Spon. ADR | | | 9,825 | | | | 112,300 | | | | 2.42 | |
| | | | | | | | | | | | | |
| Systems Software | | | | | | | | | | | | |
| Totvs S.A. | | | 5,565 | | | | 94,711 | | | | 2.04 | |
| | | | | | | | | | | | | |
| Wireless Telecommunication Services | | | | | |
| MTN Group Ltd. | | | 5,570 | | | | 90,995 | | | | 1.96 | |
| Philippine Long Distance Telephone Company Spon. ADR | | | 2,970 | | | | 147,104 | | | | 3.18 | |
| | | | | | | | 238,099 | | | | 5.14 | |
| TOTAL COMMON STOCKS | | | | | | | | | | | | |
| (Cost $4,963,291) | | | | | | | 4,136,201 | | | | 89.23 | |
| | | | | | | | | | | | | |
| SHORT-TERM INVESTMENTS | | | | | | | | | |
| State Street Institutional Treasury Money Market Fund, 0.000% | | | 238,915 | | | | 238,915 | | | | 5.15 | |
| | | | | | | | | | | | | |
| TOTAL SHORT-TERM INVESTMENTS | | | | | | | | | |
| (Cost $238,915) | | | | | | | 238,915 | | | | 5.15 | |
| | | | | | | | | | | | | |
| TOTAL INVESTMENTS | | | | | | | | | | | | |
| (Cost $5,202,206) | | | | | | | 4,375,116 | | | | 94.38 | |
| | | | | | | | | | | | | |
| Cash and Other Assets, Less Liabilities | | | | | | | 260,406 | | | | 5.62 | |
| | | | | | | | | | | | | |
| NET ASSETS | | | | | | $ | 4,635,522 | | | | 100.00 | % |
| SUMMARY OF INVESTMENTS BY COUNTRY | | | | |
| Country | | Market Value | | | Percent of Investment Securities | |
| Argentina | | $ | 137,793 | | | | 3.15 | % |
| Brazil | | | 739,086 | | | | 16.89 | |
| Chile | | | 187,852 | | | | 4.29 | |
| China/Hong Kong | | | 774,305 | | | | 17.70 | |
| Colombia | | | 94,317 | | | | 2.16 | |
| India | | | 285,106 | | | | 6.52 | |
| Indonesia | | | 249,708 | | | | 5.71 | |
| Malaysia | | | 48,833 | | | | 1.12 | |
| Peru | | | 47,391 | | | | 1.08 | |
| Philippines | | | 250,641 | | | | 5.73 | |
| Russia | | | 252,171 | | | | 5.76 | |
| Singapore | | | 48,768 | | | | 1.12 | |
| South Africa | | | 187,730 | | | | 4.29 | |
| South Korea | | | 462,196 | | | | 10.56 | |
| Taiwan | | | 200,128 | | | | 4.57 | |
| Turkey | | | 55,441 | | | | 1.27 | |
United States(1) | | | 353,650 | | | | 8.08 | |
| | | $ | 4,375,116 | | | | 100.00 | % |
| (1) | Includes short-term securities. |
SCHEDULE OF INVESTMENTS
See notes to financial statements.
STATEMENTS OF ASSETS AND LIABILITIES
September 30, 2011
| (Amounts in thousands) | | MARSICO FOCUS FUND | | | MARSICO GROWTH FUND | |
| | | | | | | |
| ASSETS | | | | | | |
| Investments, at value (cost $819,586, $572,506, $494,555, $155,609, $405,247, $101,223, and $5,202, respectively) | | $ | 944,657 | | | $ | 668,584 | |
| Cash | | | — | | | | — | |
| Foreign currency (cost $0, $0, $0, $29, $0, $0, and $188, respectively) | | | — | | | | — | |
| Receivable for investments sold | | | 826 | | | | — | |
| Receivable for capital stock sold | | | 781 | | | | 159 | |
| Interest and dividends receivable | | | — | | | | 680 | |
| Unrealized appreciation on forward foreign currency contracts | | | — | | | | — | |
| Due from adviser | | | — | | | | — | |
| Prepaid expenses and other assets | | | 638 | | | | 417 | |
| Total Assets | | | 946,902 | | | | 669,840 | |
| | | | | | | | | |
| LIABILITIES | | | | | | | | |
| Payable for investments purchased | | | 7,195 | | | | — | |
| Payable for capital stock redeemed | | | 490 | | | | 909 | |
| Accrued investment advisory fee | | | 695 | | | | 486 | |
| Accrued transfer agent fees and expenses | | | 171 | | | | 119 | |
| Accrued trustees' fees | | | 600 | | | | 383 | |
| Accrued printing expenses | | | 78 | | | | 55 | |
| Accrued distribution fee | | | 1,158 | | | | 759 | |
| Accrued professional fees | | | 86 | | | | 61 | |
| Unrealized depreciation on forward foreign currency contracts | | | — | | | | — | |
| Due to custodian | | | — | | | | 105 | |
| Accrued expenses and other liabilities | | | 47 | | | | 38 | |
| Total Liabilities | | | 10,520 | | | | 2,915 | |
| | | | | | | | | |
| NET ASSETS | | $ | 936,382 | | | $ | 666,925 | |
| | | | | | | | | |
| NET ASSETS CONSIST OF | | | | | | | | |
| Paid-in-capital | | $ | 850,245 | | | $ | 636,463 | |
| Undistributed net investment income (accumulated net investment loss) | | | (1,177 | ) | | | (389 | ) |
| Accumulated net realized loss on investments, written option contracts, forward foreign currency contracts and foreign currency transactions | | | (37,791 | ) | | | (65,251 | ) |
| Net unrealized appreciation (depreciation) on investments, forward foreign currency contracts, and foreign currency translations | | | 125,105 | | | | 96,102 | |
| NET ASSETS | | $ | 936,382 | | | $ | 666,925 | |
| | | | | | | | | |
| SHARES OUTSTANDING, $0.001 par value (Unlimited shares authorized) | | | 58,631 | | | | 38,259 | |
| | | | | | | | | |
| NET ASSET VALUE, REDEMPTION PRICE, AND OFFERING PRICE PER SHARE (NET ASSETS/SHARES OUTSTANDING)* | | $ | 15.97 | | | $ | 17.43 | |
| * | Not in thousands, based on unrounded net assets and shares outstanding. |
| | See notes to financial statements. |
MARSICO 21st CENTURY FUND | | | MARSICO INTERNATIONAL OPPORTUNITIES FUND | | | MARSICO FLEXIBLE CAPITAL FUND | | | MARSICO GLOBAL FUND | | | MARSICO EMERGING MARKETS FUND | |
| | | | | | | | | | | | | | |
| | | | | | | | | | | | | | |
| $ | 487,534 | | | $ | 155,647 | | | $ | 406,374 | | | $ | 108,473 | | | $ | 4,375 | |
| | — | | | | 17 | | | | — | | | | — | | | | — | |
| | — | | | | 29 | | | | — | | | | — | | | | 180 | |
| | 9,040 | | | | — | | | | 16,707 | | | | 363 | | | | 437 | |
| | 28 | | | | 75 | | | | 219 | | | | 19 | | | | — | |
| | 321 | | | | 275 | | | | 857 | | | | 81 | | | | 4 | |
| | — | | | | 239 | | | | — | | | | — | | | | — | |
| | — | | | | — | | | | — | | | | — | | | | 23 | |
| | 406 | | | | 304 | | | | 607 | | | | 314 | | | | 54 | |
| | 497,329 | | | | 156,586 | | | | 424,764 | | | | 109,250 | | | | 5,073 | |
| | | | | | | | | | | | | | | | | | | |
| | | | | | | | | | | | | | | | | | | |
| | — | | | | 1,109 | | | | 13,021 | | | | 608 | | | | 363 | |
| | 398 | | | | 157 | | | | 1,349 | | | | 60 | | | | — | |
| | 378 | | | | 118 | | | | 309 | | | | 82 | | | | — | |
| | 112 | | | | 47 | | | | 89 | | | | 30 | | | | 3 | |
| | 381 | | | | 284 | | | | 546 | | | | 302 | | | | 48 | |
| | 47 | | | | 18 | | | | 30 | | | | 8 | | | | 1 | |
| | 421 | | | | 116 | | | | 210 | | | | 106 | | | | 1 | |
| | 51 | | | | 19 | | | | 33 | | | | 9 | | | | 1 | |
| | — | | | | 812 | | | | — | | | | — | | | | — | |
| | — | | | | — | | | | — | | | | — | | | | — | |
| | 59 | | | | 51 | | | | 32 | | | | 24 | | | | 20 | |
| | 1,847 | | | | 2,731 | | | | 15,619 | | | | 1,229 | | | | 437 | |
| | | | | | | | | | | | | | | | | | | |
| $ | 495,482 | | | $ | 153,855 | | | $ | 409,145 | | | $ | 108,021 | | | $ | 4,636 | |
| | | | | | | | | | | | | | | | | | | |
| | | | | | | | | | | | | | | | | | | |
| $ | 1,105,497 | | | $ | 295,735 | | | $ | 432,892 | | | $ | 118,250 | | | $ | 6,913 | |
| | (549 | ) | | | (1,314 | ) | | | 801 | | | | (128 | ) | | | 12 | |
| | (602,434 | ) | | | (139,990 | ) | | | (25,779 | ) | | | (17,385 | ) | | | (1,441 | ) |
| | (7,032 | ) | | | (576 | ) | | | 1,231 | | | | 7,284 | | | | (848 | ) |
| $ | 495,482 | | | $ | 153,855 | | | $ | 409,145 | | | $ | 108,021 | | | $ | 4,636 | |
| | | | | | | | | | | | | | | | | | | |
| | 43,604 | | | | 14,506 | | | | 33,961 | | | | 11,928 | | | | 653 | |
| | | | | | | | | | | | | | | | | | | |
| $ | 11.36 | | | $ | 10.61 | | | $ | 12.05 | | | $ | 9.06 | | | $ | 7.10 | |
STATEMENTS OF OPERATIONS
FOR THE YEAR ENDED September 30, 2011
| (Amounts in thousands) | | MARSICO FOCUS FUND | | | MARSICO GROWTH FUND | |
| | | | | | | |
| INVESTMENT INCOME | | | | | | |
| Dividends (net of $0, $24, $0, $412, $116, $75, and $6, respectively of non-reclaimable foreign withholding taxes) | | $ | 15,757 | | | $ | 11,894 | |
| Interest | | | 12 | | | | 2 | |
| Total Investment Income | | | 15,769 | | | | 11,896 | |
| | | | | | | | | |
| EXPENSES | | | | | | | | |
| Investment advisory fees | | | 10,446 | | | | 7,446 | |
| Distribution fees | | | 3,072 | | | | 2,190 | |
| Transfer agent fees and expenses | | | 1,562 | | | | 1,025 | |
| Custody and fund accounting fees | | | 210 | | | | 207 | |
| Fund administration fees | | | 209 | | | | 191 | |
| Professional fees | | | 209 | | | | 167 | |
| Printing and postage expenses | | | 200 | | | | 150 | |
| Trustees' fees and expenses | | | 185 | (2) | | | 132 | (2) |
| Miscellaneous | | | 152 | | | | 89 | |
| Federal and state registration fees | | | 62 | | | | 48 | |
| Total Expenses | | | 16,307 | | | | 11,645 | |
| Less waiver of expenses and expenses paid indirectly | | | (1 | ) | | | (1 | ) |
| Net Expenses | | | 16,306 | | | | 11,644 | |
| | | | | | | | | |
| NET INVESTMENT INCOME (LOSS) | | | (537 | ) | | | 252 | |
| | | | | | | | | |
| REALIZED AND UNREALIZED GAIN (LOSS) | | | | | | | | |
| Net realized gain (loss) on investments | | | 255,864 | | | | 177,608 | |
| Net realized gain on written option contracts | | | — | | | | — | |
| Net realized gain (loss) on foreign currency transactions and forward foreign currency contracts | | | 1 | | | | 2 | |
| Change in unrealized appreciation (depreciation) on investments and foreign currency translations | | | (196,092 | ) | | | (122,967 | ) |
| Change in unrealized appreciation (depreciation) on forward foreign currency contracts | | | — | | | | — | |
| | | | | | | | | |
| Net Gain (Loss) on Investments | | | 59,773 | | | | 54,643 | |
| | | | | | | | | |
| NET INCREASE (DECREASE) IN NET ASSETS RESULTING FROM OPERATIONS | | $ | 59,236 | | | $ | 54,895 | |
| (1) | The Marsico Emerging Markets Fund commenced operations on December 31, 2010. |
| (2) | Amounts include trustees’ fees and expenses and the mark to market unrealized appreciation (depreciation) during the period for shares held in the Trustees’ Deferred Plan, as more fully described in Note 2(g) in the Notes to Financial Statements. |
| | | Trustees’ Fees and Expenses* | | | Unrealized Appreciation (Depreciation)* | |
| Focus Fund | | $ | 143,993 | | | $ | 41,381 | |
| Growth Fund | | | 114,401 | | | | 17,435 | |
21st Century Fund | | | 93,902 | | | | (11,519 | ) |
| International Opportunities Fund | | | 38,161 | | | | (39,741 | ) |
| Flexible Capital Fund | | | 55,543 | | | | 9,224 | |
| Global Fund | | | 16,632 | | | | (17,162 | ) |
| Emerging Markets Fund | | | 1,090 | | | | (12,580 | ) |
| | See notes to financial statements. |
MARSICO 21st CENTURY FUND | | | MARSICO INTERNATIONAL OPPORTUNITIES FUND | | | MARSICO FLEXIBLE CAPITAL FUND | | | MARSICO GLOBAL FUND | | | MARSICO EMERGING MARKETS FUND(1) | |
| | | | | | | | | | | | | | |
| | | | | | | | | | | | | | |
| $ | 7,652 | | | $ | 3,694 | | | $ | 7,240 | | | $ | 1,324 | | | $ | 118 | |
| | 3 | | | | — | | | | 1,515 | | | | — | | | | — | |
| | 7,655 | | | | 3,694 | | | | 8,755 | | | | 1,324 | | | | 118 | |
| | | | | | | | | | | | | | | | | | | |
| | | | | | | | | | | | | | | | | | | |
| | 6,240 | | | | 2,353 | | | | 4,079 | | | | 1,106 | | | | 63 | |
| | 1,835 | | | | 692 | | | | 1,200 | | | | 326 | | | | 16 | |
| | 1,107 | | | | 482 | | | | 704 | | | | 172 | | | | 16 | |
| | 186 | | | | 439 | | | | 211 | | | | 133 | | | | 122 | |
| | 183 | | | | 163 | | | | 158 | | | | 112 | | | | 37 | |
| | 136 | | | | 55 | | | | 81 | | | | 24 | | | | 81 | |
| | 149 | | | | 61 | | | | 112 | | | | 20 | | | | 10 | |
| | 82 | (2) | | | (2 | )(2) | | | 65 | (2) | | | (1 | )(2) | | | (11 | )(2) |
| | 67 | | | | 42 | | | | 20 | | | | 14 | | | | 7 | |
| | 36 | | | | 29 | | | | 92 | | | | 19 | | | | 18 | |
| | 10,021 | | | | 4,314 | | | | 6,722 | | | | 1,925 | | | | 359 | |
| | (1 | ) | | | — | | | | (636 | ) | | | — | | | | (249 | ) |
| | 10,020 | | | | 4,314 | | | | 6,086 | | | | 1,925 | | | | 110 | |
| | | | | | | | | | | | | | | | | | | |
| | (2,365 | ) | | | (620 | ) | | | 2,669 | | | | (601 | ) | | | 8 | |
| | | | | | | | | | | | | | | | | | | |
| | | | | | | | | | | | | | | | | | | |
| | 103,526 | | | | 50,008 | | | | (24,643 | ) | | | 8,558 | | | | (1,378 | ) |
| | — | | | | — | | | | 394 | | | | — | | | | — | |
| | 1,073 | | | | 12,543 | | | | 263 | | | | 750 | | | | (79 | ) |
| | (122,551 | ) | | | (75,336 | ) | | | (15,219 | ) | | | (17,624 | ) | | | (848 | ) |
| | — | | | | (573 | ) | | | — | | | | — | | | | — | |
| | | | | | | | | | | | | | | | | | | |
| | (17,952 | ) | | | (13,358 | ) | | | (39,205 | ) | | | (8,316 | ) | | | (2,305 | ) |
| | | | | | | | | | | | | | | | | | | |
| $ | (20,317 | ) | | $ | (13,978 | ) | | $ | (36,536 | ) | | $ | (8,917 | ) | | $ | (2,297 | ) |
FINANCIAL STATEMENTS
STATEMENTS OF CHANGES IN NET ASSETS
| | | MARSICO FOCUS FUND | | | MARSICO GROWTH FUND | | | MARSICO 21st CENTURY FUND | |
| | | | | | | | | | | | | | | | | | | |
| (Amounts in thousands) | | Year Ended 9/30/11 | | | Year Ended 9/30/10 | | | Year Ended 9/30/11 | | | Year Ended 9/30/10 | | | Year Ended 9/30/11 | | | Year Ended 9/30/10 | |
| | | | | | | | | | | | | | | | | | | |
| OPERATIONS: | | | | | | | | | | | | | | | | | | |
| Net investment income (loss) | | $ | (537 | ) | | $ | (1,087 | ) | | $ | 252 | | | $ | 398 | | | $ | (2,365 | ) | | $ | (5,076 | ) |
| Net realized gain (loss) on investments | | | 255,864 | | | | 266,464 | | | | 177,608 | | | | 150,487 | | | | 103,526 | | | | 186,490 | |
| Net realized gain on written option contracts | | | — | | | | — | | | | — | | | | — | | | | — | | | | — | |
| Net realized gain (loss) on foreign currency transactions and forward foreign currency contracts | | | 1 | | | | (34 | ) | | | 2 | | | | (1 | ) | | | 1,073 | | | | 3,484 | |
| Change in unrealized appreciation (depreciation) on investments and foreign currency translations | | | (196,092 | ) | | | (91,316 | ) | | | (122,967 | ) | | | (31,263 | ) | | | (122,551 | ) | | | (123,379 | ) |
| Change in unrealized appreciation (depreciation) on forward foreign currency contracts | | | — | | | | — | | | | — | | | | — | | | | — | | | | — | |
| | | | | | | | | | | | | | | | | | | | | | | | | |
| Net increase (decrease) in net assets resulting from operations | | | 59,236 | | | | 174,027 | | | | 54,895 | | | | 119,621 | | | | (20,317 | ) | | | 61,519 | |
| | | | | | | | | | | | | | | | | | | | | | | | | |
| DISTRIBUTIONS: | | | | | | | | | | | | | | | | | | | | | | | | |
| Net investment income | | | — | | | | (3,909 | ) | | | (473 | ) | | | (5,169 | ) | | | — | | | | — | |
| Net realized gains | | | — | | | | — | | | | — | | | | — | | | | — | | | | — | |
| Total distributions | | | — | | | | (3,909 | ) | | | (473 | ) | | | (5,169 | ) | | | — | | | | — | |
| | | | | | | | | | | | | | | | | | | | | | | | | |
| CAPITAL SHARE TRANSACTIONS: | | | | | | | | | | | | | | | | | | | | | | | | |
| Proceeds from sale of shares | | | 189,852 | | | | 406,466 | | | | 259,237 | | | | 147,976 | | | | 75,136 | | | | 78,025 | |
| Proceeds from reinvestment of distributions | | | — | | | | 3,863 | | | | 459 | | | | 5,054 | | | | — | | | | — | |
| Redemption fees | | | 20 | | | | 12 | | | | 126 | | | | 91 | | | | 7 | | | | 10 | |
| Redemption of shares | | | (764,603 | ) | | | (1,129,623 | ) | | | (530,372 | ) | | | (577,751 | ) | | | (316,782 | ) | | | (303,792 | ) |
| | | | | | | | | | | | | | | | | | | | | | | | | |
| Net increase (decrease) from capital share transactions | | | (574,731 | ) | | | (719,282 | ) | | | (270,550 | ) | | | (424,630 | ) | | | (241,639 | ) | | | (225,757 | ) |
| | | | | | | | | | | | | | | | | | | | | | | | | |
| TOTAL INCREASE (DECREASE) IN NET ASSETS | | | (515,495 | ) | | | (549,164 | ) | | | (216,128 | ) | | | (310,178 | ) | | | (261,956 | ) | | | (164,238 | ) |
| | | | | | | | | | | | | | | | | | | | | | | | | |
| NET ASSETS: | | | | | | | | | | | | | | | | | | | | | | | | |
| Beginning of Period | | | 1,451,877 | | | | 2,001,041 | | | | 883,053 | | | | 1,193,231 | | | | 757,438 | | | | 921,676 | |
| | | | | | | | | | | | | | | | | | | | | | | | | |
| End of Period | | $ | 936,382 | | | $ | 1,451,877 | | | $ | 666,925 | | | $ | 883,053 | | | $ | 495,482 | | | $ | 757,438 | |
| | | | | | | | | | | | | | | | | | | | | | | | | |
| Undistributed net investment income (Accumulated net investment loss) | | $ | (1,177 | ) | | $ | (1,147 | ) | | $ | (389 | ) | | $ | (172 | ) | | $ | (549 | ) | | $ | (395 | ) |
| | | | | | | | | | | | | | | | | | | | | | | | | |
| TRANSACTIONS IN SHARES: | | | | | | | | | | | | | | | | | | | | | | | | |
| Shares sold | | | 10,628 | | | | 26,472 | | | | 13,436 | | | | 9,009 | | | | 5,255 | | | | 6,323 | |
| Shares issued in reinvestment of distributions | | | — | | | | 257 | | | | 24 | | | | 317 | | | | — | | | | — | |
| Shares redeemed | | | (43,949 | ) | | | (73,945 | ) | | | (27,027 | ) | | | (35,384 | ) | | | (22,839 | ) | | | (24,890 | ) |
| | | | | | | | | | | | | | | | | | | | | | | | | |
| NET INCREASE DECREASE) | | | (33,321 | ) | | | (47,216 | ) | | | (13,567 | ) | | | (26,058 | ) | | | (17,584 | ) | | | (18,567 | ) |
| (1) | Commencement of operations. |
| | See notes to financial statements. |
MARSICO INTERNATIONAL OPPORTUNITIES FUND | | | MARSICO FLEXIBLE CAPITAL FUND | | | MARSICO GLOBAL FUND | | | MARSICO EMERGING MARKETS FUND | |
| | | | | | | | | | | | | | | | | | | | |
Year Ended 9/30/11 | | | Year Ended 9/30/10 | | | Year Ended 9/30/11 | | | Year Ended 9/30/10 | | | Year Ended 9/30/11 | | | Year Ended 9/30/10 | | | 12/31/10(1) to 9/30/11 | |
| | | | | | | | | | | | | | | | | | | | |
| | | | | | | | | | | | | | | | | | | | |
| $ | (620 | ) | | $ | 1,291 | | | $ | 2,669 | | | $ | 727 | | | $ | (601 | ) | | $ | (627 | ) | | $ | 8 | |
| | 50,008 | | | | 31,713 | | | | (24,643 | ) | | | 4,987 | | | | 8,558 | | | | 21,046 | | | | (1,378 | ) |
| | — | | | | — | | | | 394 | | | | — | | | | — | | | | — | | | | — | |
| | 12,543 | | | | 1,978 | | | | 263 | | | | (180 | ) | | | 750 | | | | 5 | | | | (79 | ) |
| | (75,336 | ) | | | (10,812 | ) | | | (15,219 | ) | | | 10,612 | | | | (17,624 | ) | | | (3,921 | ) | | | (848 | ) |
| | (573 | ) | | | — | | | | — | | | | — | | | | — | | | | — | | | | — | |
| | | | | | | | | | | | | | | | | | | | | | | | | | | |
| | (13,978 | ) | | | 24,170 | | | | (36,536 | ) | | | 16,146 | | | | (8,917 | ) | | | 16,503 | | | | (2,297 | ) |
| | | | | | | | | | | | | | | | | | | | | | | | | | | |
| | | | | | | | | | | | | | | | | | | | | | | | | | | |
| | (6,560 | ) | | | (2,073 | ) | | | (2,289 | ) | | | (1,302 | ) | | | (1,099 | ) | | | (721 | ) | | | — | |
| | — | | | | — | | | | (677 | ) | | | — | | | | — | | | | — | | | | — | |
| | (6,560 | ) | | | (2,073 | ) | | | (2,966 | ) | | | (1,302 | ) | | | (1,099 | ) | | | (721 | ) | | | — | |
| | | | | | | | | | | | | | | | | | | | | | | | | | | |
| | | | | | | | | | | | | | | | | | | | | | | | | | | |
| | 52,453 | | | | 84,957 | | | | 681,461 | | | | 96,849 | | | | 45,443 | | | | 26,530 | | | | 11,380 | |
| | 6,365 | | | | 2,034 | | | | 2,776 | | | | 1,293 | | | | 1,044 | | | | 718 | | | | — | |
| | 16 | | | | 34 | | | | 100 | | | | 10 | | | | 11 | | | | 5 | | | | — | |
| | (243,457 | ) | | | (201,032 | ) | | | (368,035 | ) | | | (11,982 | ) | | | (44,562 | ) | | | (36,083 | ) | | | (4,447 | ) |
| | | | | | | | | | | | | | | | | | | | | | | | | | | |
| | (184,623 | ) | | | (114,007 | ) | | | 316,302 | | | | 86,170 | | | | 1,936 | | | | (8,830 | ) | | | 6,933 | |
| | | | | | | | | | | | | | | | | | | | | | | | | | | |
| | (205,161 | ) | | | (91,910 | ) | | | 276,800 | | | | 101,014 | | | | (8,080 | ) | | | 6,952 | | | | 4,636 | |
| | | | | | | | | | | | | | | | | | | | | | | | | | | |
| | | | | | | | | | | | | | | | | | | | | | | | | | | |
| | 359,016 | | | | 450,926 | | | | 132,345 | | | | 31,331 | | | | 116,101 | | | | 109,149 | | | | — | |
| | | | | | | | | | | | | | | | | | | | | | | | | | | |
| $ | 153,855 | | | $ | 359,016 | | | $ | 409,145 | | | $ | 132,345 | | | $ | 108,021 | | | $ | 116,101 | | | $ | 4,636 | |
| | | | | | | | | | | | | | | | | | | | | | | | | | | |
| $ | (1,314 | ) | | $ | 726 | | | $ | 801 | | | $ | 425 | | | $ | (128 | ) | | $ | (855 | ) | | $ | 12 | |
| | | | | | | | | | | | | | | | | | | | | | | | | | | |
| | | | | | | | | | | | | | | | | | | | | | | | | | | |
| | 3,983 | | | | 7,276 | | | | 50,035 | | | | 8,807 | | | | 4,175 | | | | 2,935 | | | | 1,148 | |
| | 488 | | | | 174 | | | | 207 | | | | 131 | | | | 96 | | | | 82 | | | | — | |
| | (18,537 | ) | | | (16,887 | ) | | | (27,335 | ) | | | (1,129 | ) | | | (4,071 | ) | | | (3,997 | ) | | | (495 | ) |
| | | | | | | | | | | | | | | | | | | | | | | | | | | |
| | (14,066 | ) | | | (9,437 | ) | | | 22,907 | | | | 7,809 | | | | 200 | | | | (980 | ) | | | 653 | |
| | | MARSICO FOCUS FUND | |
For a Fund Share Outstanding Throughout the Period | | Year Ended 9/30/11 | | | Year Ended 9/30/10 | | | Year Ended 9/30/09 | | | Year Ended 9/30/08 | | | Year Ended 9/30/07 | |
| | | | | | | | | | | | | | | | |
| Net Asset Value, Beginning of Period | | $ | 15.79 | | | $ | 14.38 | | | $ | 15.43 | | | $ | 21.75 | | | $ | 18.19 | |
| | | | | | | | | | | | | | | | | | | | | |
| | | | | | | | | | | | | | | | | | | | | |
| Income from Investment Operations: | | | | | | | | | | | | | | | | | | | | |
| Net investment income (loss) | | | (0.02 | ) | | | (0.01 | ) | | | 0.04 | | | | 0.08 | | | | (0.04 | ) |
| Net realized and unrealized gains (losses) on investments | | | 0.20 | | | | 1.45 | | | | (0.99 | ) | | | (4.60 | ) | | | 4.09 | |
| | | | | | | | | | | | | | | | | | | | | |
| Total from investment operations | | | 0.18 | | | | 1.44 | | | | (0.95 | ) | | | (4.52 | ) | | | 4.05 | |
| | | | | | | | | | | | | | | | | | | | | |
| Distributions & Other: | | | | | | | | | | | | | | | | | | | | |
| Net investment income | | | — | | | | (0.03 | ) | | | (0.09 | ) | | | — | | | | (0.02 | ) |
| Tax return of capital | | | — | | | | — | | | | — | | | | — | | | | — | |
| Net realized gains | | | — | | | | — | | | | (0.01 | ) | | | (1.80 | ) | | | (0.47 | ) |
| Redemption fees [See Note 2(h)] | | | — | (1) | | | — | (1) | | | — | (1) | | | — | (1) | | | — | (1) |
| | | | | | | | | | | | | | | | | | | | | |
| Total distributions and other | | | — | | | | (0.03 | ) | | | (0.10 | ) | | | (1.80 | ) | | | (0.49 | ) |
| | | | | | | | | | | | | | | | | | | | | |
| Net Asset Value, End of Period | | $ | 15.97 | | | $ | 15.79 | | | $ | 14.38 | | | $ | 15.43 | | | $ | 21.75 | |
| | | | | | | | | | | | | | | | | | | | | |
| | | | | | | | | | | | | | | | | | | | | |
| Total Return | | | 1.14% | | | | 10.02% | | | | (5.98)% | | | | (22.69)% | | | | 22.65% | |
| | | | | | | | | | | | | | | | | | | | | |
| | | | | | | | | | | | | | | | | | | | | |
| Supplemental Data and Ratios: | | | | | | | | | | | | | | | | | | | | |
| | | | | | | | | | | | | | | | | | | | | |
| Net assets, end of Period (000s) | | $ | 936,382 | | | $ | 1,451,877 | | | $ | 2,001,041 | | | $ | 3,430,813 | | | $ | 5,051,662 | |
| | | | | | | | | | | | | | | | | | | | | |
| Ratio of expenses to average net assets, less waivers and before expenses paid indirectly, plus reimbursements of previously waived expenses | | | 1.33% | | | | 1.33% | | | | 1.31% | | | | 1.21% | | | | 1.23% | |
| | | | | | | | | | | | | | | | | | | | | |
| Ratio of net investment income (loss) to average net assets, net of waivers, reimbursements of previously waived expenses and expenses paid indirectly | | | (0.04)% | | | | (0.06)% | | | | 0.27% | | | | 0.41% | | | | (0.20)% | |
| | | | | | | | | | | | | | | | | | | | | |
| Ratio of expenses to average net assets, before waivers, reimbursements of previously waived expenses and expenses paid indirectly | | | 1.33% | | | | 1.33% | | | | 1.31% | | | | 1.21% | | | | 1.23% | |
| | | | | | | | | | | | | | | | | | | | | |
| Ratio of net investment income (loss) to average net assets, before waivers, reimbursements of previously waived expenses and expenses paid indirectly | | | (0.04)% | | | | (0.06)% | | | | 0.27% | | | | 0.41% | | | | (0.21)% | |
| | | | | | | | | | | | | | | | | | | | | |
| Portfolio turnover rate | | | 82% | | | | 85% | | | | 90% | | | | 78% | | | | 69% | |
| (2) | Portfolio turnover is greater than most funds due to the investment style of the Fund. |
| | See notes to financial statements. |
MARSICO GROWTH FUND | | | MARSICO 21st CENTURY FUND | |
Year Ended 9/30/11 | | | Year Ended 9/30/10 | | | Year Ended 9/30/09 | | | Year Ended 9/30/08 | | | Year Ended 9/30/07 | | | Year Ended 9/30/11 | | | Year Ended 9/30/10 | | | Year Ended 9/30/09 | | | Year Ended 9/30/08 | | | Year Ended 9/30/07 | |
| | | | | | | | | | | | | | | | | | | | | | | | | | | | | |
| $ | 17.04 | | | $ | 15.32 | | | $ | 16.73 | | | $ | 23.07 | | | $ | 18.61 | | | $ | 12.38 | | | $ | 11.56 | | | $ | 12.86 | | | $ | 18.07 | | | $ | 13.89 | |
| | | | | | | | | | | | | | | | | | | | | | | | | | | | | | | | | | | | | | | |
| | | | | | | | | | | | | | | | | | | | | | | | | | | | | | | | | | | | | | | |
| | | | | | | | | | | | | | | | | | | | | | | | | | | | | | | | | | | | | | | |
| | — | (1) | | | 0.01 | | | | 0.07 | | | | 0.07 | | | | (0.05 | ) | | | (0.06 | ) | | | (0.08 | ) | | | — | (1) | | | 0.01 | | | | 0.05 | |
| | 0.40 | | | | 1.78 | | | | (1.38 | ) | | | (5.69 | ) | | | 4.51 | | | | (0.96 | ) | | | 0.90 | | | | (1.27 | ) | | | (4.48 | ) | | | 4.26 | |
| | | | | | | | | | | | | | | | | | | | | | | | | | | | | | | | | | | | | | | |
| | 0.40 | | | | 1.79 | | | | (1.31 | ) | | | (5.62 | ) | | | 4.46 | | | | (1.02 | ) | | | 0.82 | | | | (1.27 | ) | | | (4.47 | ) | | | 4.31 | |
| | | | | | | | | | | | | | | | | | | | | | | | | | | | | | | | | | | | | | | |
| | | | | | | | | | | | | | | | | | | | | | | | | | | | | | | | | | | | | | | |
| | (0.01 | ) | | | (0.07 | ) | | | (0.09 | ) | | | — | | | | — | | | | — | | | | — | | | | (0.01 | ) | | | — | | | | (0.13 | ) |
| | — | | | | — | | | | — | | | | — | | | | — | | | | — | | | | — | | | | (0.02 | ) | | | — | | | | — | |
| | — | | | | — | | | | (0.01 | ) | | | (0.72 | ) | | | — | | | | — | | | | — | | | | — | | | | (0.74 | ) | | | — | (1) |
| | — | (1) | | | — | (1) | | | — | (1) | | | — | (1) | | | — | (1) | | | — | (1) | | | — | (1) | | | — | (1) | | | — | (1) | | | — | (1) |
| | | | | | | | | | | | | | | | | | | | | | | | | | | | | | | | | | | | | | | |
| | (0.01 | ) | | | (0.07 | ) | | | (0.10 | ) | | | (0.72 | ) | | | — | | | | — | | | | — | | | | (0.03 | ) | | | (0.74 | ) | | | (0.13 | ) |
| | | | | | | | | | | | | | | | | | | | | | | | | | | | | | | | | | | | | | | |
| $ | 17.43 | | | $ | 17.04 | | | $ | 15.32 | | | $ | 16.73 | | | $ | 23.07 | | | $ | 11.36 | | | $ | 12.38 | | | $ | 11.56 | | | $ | 12.86 | | | $ | 18.07 | |
| | | | | | | | | | | | | | | | | | | | | | | | | | | | | | | | | | | | | | | |
| | | | | | | | | | | | | | | | | | | | | | | | | | | | | | | | | | | | | | | |
| | 2.34% | | | | 11.75% | | | | (7.74)% | | | | (25.14)% | | | | 23.97% | | | | (8.24)% | | | | 7.09% | | | | (9.79)% | | | | (25.83)% | | | | 31.25% | |
| | | | | | | | | | | | | | | | | | | | | | | | | | | | | | | | | | | | | | | |
| | | | | | | | | | | | | | | | | | | | | | | | | | | | | | | | | | | | | | | |
| | | | | | | | | | | | | | | | | | | | | | | | | | | | | | | | | | | | | | | |
| | | | | | | | | | | | | | | | | | | | | | | | | | | | | | | | | | | | | | | |
| $ | 666,925 | | | $ | 883,053 | | | $ | 1,193,231 | | | $ | 2,097,571 | | | $ | 3,087,904 | | | $ | 495,482 | | | $ | 757,438 | | | $ | 921,676 | | | $ | 1,853,435 | | | $ | 2,467,126 | |
| | | | | | | | | | | | | | | | | | | | | | | | | | | | | | | | | | | | | | | |
| | 1.33% | | | | 1.33% | | | | 1.30% | | | | 1.24% | | | | 1.24% | | | | 1.37% | | | | 1.37% | | | | 1.37% | | | | 1.29% | | | | 1.31% | |
| | | | | | | | | | | | | | | | | | | | | | | | | | | | | | | | | | | | | | | |
| | 0.03% | | | | 0.04% | | | | 0.42% | | | | 0.33% | | | | (0.25)% | | | | (0.32)% | | | | (0.60)% | | | | 0.06% | | | | 0.07% | | | | 0.43% | |
| | | | | | | | | | | | | | | | | | | | | | | | | | | | | | | | | | | | | | | |
| | 1.33% | | | | 1.33% | | | | 1.30% | | | | 1.24% | | | | 1.24% | | | | 1.37% | | | | 1.37% | | | | 1.37% | | | | 1.29% | | | | 1.31% | |
| | | | | | | | | | | | | | | | | | | | | | | | | | | | | | | | | | | | | | | |
| | 0.03% | | | | 0.04% | | | | 0.41% | | | | 0.33% | | | | (0.25)% | | | | (0.32)% | | | | (0.60)% | | | | 0.06% | | | | 0.07% | | | | 0.43% | |
| | | | | | | | | | | | | | | | | | | | | | | | | | | | | | | | | | | | | | | |
| | 67% | | | | 67% | | | | 77% | | | | 72% | | | | 53% | | | | 86% | (2) | | | 100% | (2) | | | 135% | (2) | | | 143% | (2) | | | 105% | (2) |
FINANCIAL HIGHLIGHTS
| | | MARSICO INTERNATIONAL OPPORTUNITIES FUND | |
For a Fund Share Outstanding Throughout the Period | | Year Ended 9/30/11 | | | Year Ended 9/30/10 | | | Year Ended 9/30/09 | | | Year Ended 9/30/08 | | | Year Ended 9/30/07 | |
| | | | | | | | | | | | | | | | |
| Net Asset Value, Beginning of Period | | $ | 12.57 | | | $ | 11.86 | | | $ | 12.27 | | | $ | 20.10 | | | $ | 15.81 | |
| | | | | | | | | | | | | | | | | | | | | |
| | | | | | | | | | | | | | | | | | | | | |
| Income from Investment Operations: | | | | | | | | | | | | | | | | | | | | |
| Net investment income (loss) | | | (0.22 | ) | | | 0.04 | | | | 0.06 | | | | 0.16 | | | | 0.16 | |
| Net realized and unrealized gains (losses) on investments | | | (1.49 | ) | | | 0.72 | | | | (0.33 | ) | | | (5.66 | ) | | | 4.81 | |
| | | | | | | | | | | | | | | | | | | | | |
| Total from investment operations | | | (1.71 | ) | | | 0.76 | | | | (0.27 | ) | | | (5.50 | ) | | | 4.97 | |
| | | | | | | | | | | | | | | | | | | | | |
| Distributions & Other: | | | | | | | | | | | | | | | | | | | | |
| Net investment income | | | (0.25 | ) | | | (0.05 | ) | | | (0.14 | ) | | | (0.18 | ) | | | (0.03 | ) |
| Net realized gains | | | — | | | | — | | | | — | | | | (2.15 | ) | | | (0.65 | ) |
| Redemption fees [See Note 2(h)] | | | — | (1) | | | — | (1) | | | — | (1) | | | — | (1) | | | — | (1) |
| | | | | | | | | | | | | | | | | | | | | |
| Total distributions and other | | | (0.25 | ) | | | (0.05 | ) | | | (0.14 | ) | | | (2.33 | ) | | | (0.68 | ) |
| | | | | | | | | | | | | | | | | | | | | |
| Net Asset Value, End of Period | | $ | 10.61 | | | $ | 12.57 | | | $ | 11.86 | | | $ | 12.27 | | | $ | 20.10 | |
| | | | | | | | | | | | | | | | | | | | | |
| | | | | | | | | | | | | | | | | | | | | |
| Total Return | | | (13.98)% | | | | 6.48% | | | | (1.68)% | | | | (30.95)% | | | | 32.42% | |
| | | | | | | | | | | | | | | | | | | | | |
| | | | | | | | | | | | | | | | | | | | | |
| Supplemental Data and Ratios: | | | | | | | | | | | | | | | | | | | | |
| | | | | | | | | | | | | | | | | | | | | |
| Net assets, end of Period (000s) | | $ | 153,855 | | | $ | 359,016 | | | $ | 450,926 | | | $ | 597,603 | | | $ | 822,073 | |
| | | | | | | | | | | | | | | | | | | | | |
| Ratio of expenses to average net assets, less waivers and before expenses paid indirectly, plus reimbursements of previously waived expenses | | | 1.56% | | | | 1.52% | | | | 1.48% | | | | 1.35% | | | | 1.37% | |
| | | | | | | | | | | | | | | | | | | | | |
| Ratio of net investment income (loss) to average net assets, net of waivers, reimbursements of previously waived expenses and expenses paid indirectly | | | (0.22)% | | | | 0.31% | | | | 0.54% | | | | 1.00% | | | | 0.92% | |
| | | | | | | | | | | | | | | | | | | | | |
| Ratio of expenses to average net assets, before waivers, reimbursements of previously waived expenses and expenses paid indirectly | | | 1.56% | | | | 1.52% | | | | 1.48% | | | | 1.35% | | | | 1.37% | |
| | | | | | | | | | | | | | | | | | | | | |
| Ratio of net investment income (loss) to average net assets, before waivers, reimbursements of previously waived expenses and expenses paid indirectly | | | (0.22)% | | | | 0.31% | | | | 0.54% | | | | 1.00% | | | | 0.92% | |
| | | | | | | | | | | | | | | | | | | | | |
| Portfolio turnover rate | | | 103% | (4) | | | 134% | (4) | | | 108% | (4) | | | 115% | (4) | | | 125% | (4) |
| * | Commencement of operations. |
| (4) | Portfolio turnover is greater than most funds due to the investment style of the Fund. |
| | See notes to financial statements. |
MARSICO FLEXIBLE CAPITAL FUND | | | MARSICO GLOBAL FUND | | | MARSICO EMERGING MARKETS FUND | |
Year Ended 9/30/11 | | | Year Ended 9/30/10 | | | Year Ended 9/30/09 | | | Year Ended 9/30/08 | | | 12/29/06* to 9/30/07 | | | Year Ended 9/30/11 | | | Year Ended 9/30/10 | | | Year Ended 9/30/09 | | | Year Ended 9/30/08 | | | 6/29/07* to 9/30/07 | | | 12/31/10* to 9/30/11 | |
| | | | | | | | | | | | | | | | | | | | | | | | | | | | | | | | |
| $ | 11.97 | | | $ | 9.65 | | | $ | 8.74 | | | $ | 11.32 | | | $ | 10.00 | | | $ | 9.90 | | | $ | 8.59 | | | $ | 8.87 | | | $ | 11.46 | | | $ | 10.00 | | | $ | 10.00 | |
| | | | | | | | | | | | | | | | | | | | | | | | | | | | | | | | | | | | | | | | | | | |
| | | | | | | | | | | | | | | | | | | | | | | | | | | | | | | | | | | | | | | | | | | |
| | | | | | | | | | | | | | | | | | | | | | | | | | | | | | | | | | | | | | | | | | | |
| | 0.08 | | | | 0.27 | | | | 0.06 | | | | 0.14 | | | | 0.22 | | | | (0.05 | ) | | | (0.05 | ) | | | 0.04 | | | | 0.08 | | | | 0.02 | | | | 0.01 | |
| | 0.12 | | | | 2.42 | | | | 0.93 | | | | (1.93 | ) | | | 1.10 | | | | (0.70 | ) | | | 1.42 | | | | (0.24 | ) | | | (2.46 | ) | | | 1.44 | | | | (2.91 | ) |
| | | | | | | | | | | | | | | | | | | | | | | | | | | | | | | | | | | | | | | | | | | |
| | 0.20 | | | | 2.69 | | | | 0.99 | | | | (1.79 | ) | | | 1.32 | | | | (0.75 | ) | | | 1.37 | | | | (0.20 | ) | | | (2.38 | ) | | | 1.46 | | | | (2.90 | ) |
| | | | | | | | | | | | | | | | | | | | | | | | | | | | | | | | | | | | | | | | | | | |
| | | | | | | | | | | | | | | | | | | | | | | | | | | | | | | | | | | | | | | | | | | |
| | (0.09 | ) | | | (0.37 | ) | | | (0.08 | ) | | | (0.35 | ) | | | — | | | | (0.09 | ) | | | (0.06 | ) | | | (0.08 | ) | | | (0.05 | ) | | | — | | | | — | |
| | (0.03 | ) | | | — | | | | — | | | | (0.44 | ) | | | — | | | | — | | | | — | | | | — | | | | (0.17 | ) | | | — | | | | — | |
| | — | (1) | | | — | (1) | | | — | (1) | | | — | (1) | | | — | (1) | | | — | (1) | | | — | (1) | | | — | (1) | | | 0.01 | | | | — | (1) | | | — | (1) |
| | | | | | | | | | | | | | | | | | | | | | | | | | | | | | | | | | | | | | | | | | | |
| | (0.12 | ) | | | (0.37 | ) | | | (0.08 | ) | | | (0.79 | ) | | | — | | | | (0.09 | ) | | | (0.06 | ) | | | (0.08 | ) | | | (0.21 | ) | | | — | | | | — | |
| | | | | | | | | | | | | | | | | | | | | | | | | | | | | | | | | | | | | | | | | | | |
| $ | 12.05 | | | $ | 11.97 | | | $ | 9.65 | | | $ | 8.74 | | | $ | 11.32 | | | $ | 9.06 | | | $ | 9.90 | | | $ | 8.59 | | | $ | 8.87 | | | $ | 11.46 | | | $ | 7.10 | |
| | | | | | | | | | | | | | | | | | | | | | | | | | | | | | | | | | | | | | | | | | | |
| | | | | | | | | | | | | | | | | | | | | | | | | | | | | | | | | | | | | | | | | | | |
| | 1.59% | | | | 28.68% | | | | 11.68% | | | | (17.10)% | | | | 13.20% | (2) | | | (7.73)% | | | | 16.01% | | | | (1.93)% | | | | (21.13)% | | | | 14.60% | (2) | | | (29.00)% | (2) |
| | | | | | | | | | | | | | | | | | | | | | | | | | | | | | | | | | | | | | | | | | | |
| | | | | | | | | | | | | | | | | | | | | | | | | | | | | | | | | | | | | | | | | | | |
| | | | | | | | | | | | | | | | | | | | | | | | | | | | | | | | | | | | | | | | | | | |
| | | | | | | | | | | | | | | | | | | | | | | | | | | | | | | | | | | | | | | | | | | |
| $ | 409,145 | | | $ | 132,345 | | | $ | 31,331 | | | $ | 14,461 | | | $ | 24,741 | | | $ | 108,021 | | | $ | 116,101 | | | $ | 109,149 | | | $ | 82,543 | | | $ | 31,477 | | | $ | 4,636 | |
| | | | | | | | | | | | | | | | | | | | | | | | | | | | | | | | | | | | | | | | | | | |
| | 1.27% | | | | 0.75% | | | | 0.75% | | | | 0.75% | | | | 1.22% | (3) | | | 1.48% | | | | 1.54% | | | | 1.40% | | | | 0.75% | | | | 0.75% | (3) | | | 1.75% | (3) |
| | | | | | | | | | | | | | | | | | | | | | | | | | | | | | | | | | | | | | | | | | | |
| | 0.55% | | | | 1.33% | | | | 1.44% | | | | 1.15% | | | | 2.62% | (3) | | | (0.46)% | | | | (0.57)% | | | | 0.52% | | | | 0.88% | | | | 1.06% | (3) | | | 0.12% | (3) |
| | | | | | | | | | | | | | | | | | | | | | | | | | | | | | | | | | | | | | | | | | | |
| | 1.40% | | | | 1.73% | | | | 2.84% | | | | 1.71% | | | | 2.47% | (3) | | | 1.48% | | | | 1.54% | | | | 1.58% | | | | 1.49% | | | | 4.48% | (3) | | | 5.73% | (3) |
| | | | | | | | | | | | | | | | | | | | | | | | | | | | | | | | | | | | | | | | | | | |
| | 0.42% | | | | 0.35% | | | | (0.65)% | | | | 0.19% | | | | 1.37% | (3) | | | (0.46)% | | | | (0.57)% | | | | 0.34% | | | | 0.14% | | | | (2.67)% | (3) | | | (3.86)% | (3) |
| | | | | | | | | | | | | | | | | | | | | | | | | | | | | | | | | | | | | | | | | | | |
| | 231% | (4) | | | 146% | (4) | | | 259% | (4) | | | 207% | (4) | | | 237% | (2) (4) | | | 93% | (4) | | | 125% | (4) | | | 185% | (4) | | | 201% | (4) | | | 56% | (2) (4) | | | 389% | (2) (4) |
NOTES TO FINANCIAL STATEMENTS |
NOTES TO FINANCIAL STATEMENTS September 30, 2011
The Marsico Investment Fund (the “Trust”) was organized on October 1, 1997, as a Delaware Statutory Trust and is registered under the Investment Company Act of 1940 (the “1940 Act”) as an open-end management investment company. The Focus Fund, Growth Fund, 21st Century Fund, International Opportunities Fund, Flexible Capital Fund, Global Fund, and Emerging Markets Fund (collectively, the “Funds”) are separate investment portfolios of the Trust. The Focus Fund is a non-diversified fund and the Growth Fund, the 21st Century Fund, the International Opportunities Fund, the Flexible Capital Fund, the Global Fund, and the Emerging Markets Fund are diversified funds. The Focus and Growth Funds commenced operations on December 31, 1997, the 21st Century Fund commenced operations on February 1, 2000, the International Opportunities Fund commenced operations on June 30, 2000, the Flexible Capital Fund commenced operations on December 29, 2006, the Global Fund commenced operations on June 29, 2007, and the Emerging Markets Fund commenced operations on December 31, 2010. Affiliates of Marsico Capital Management, LLC (the “Adviser”) hold approximately 6%, 8%, and 82% of the Flexible Capital Fund’s, Global Fund’s, and Emerging Markets Fund’s outstanding shares, respectively, as of September 30, 2011.
| 2. | Significant Accounting Policies |
The following is a summary of significant accounting policies consistently followed by the Funds in the preparation of their financial statements. These policies are in conformity with Generally Accepted Accounting Principles (“GAAP”) for investment companies. The presentation of financial statements in conformity with GAAP requires management to make estimates and assumptions that affect the reported amounts of assets and liabilities at the date of the financial statements and the reported amounts of income and expenses during the reporting period. Actual results could differ from those estimates.
| | (a) | Investment Valuation — A security traded on a recognized stock exchange is generally valued at the last sale price prior to the closing of the principal exchange on which the security is traded. Securities traded on NASDAQ generally will be valued at the NASDAQ Official Closing Price. If no sale price is reported on the valuation date, the most current bid price will generally be used, with the exception of short option positions which will generally utilize the most current ask price. Other securities for which over-the-counter market quotations are readily available are generally valued at the last sale price. Debt securities that will mature in more than 60 days are generally valued at their bid prices furnished by a pricing service approved by the Funds’ Board of Trustees and subject to review and determination of the appropriate price by the Adviser. Debt securities that will mature in 60 days or less are valued at amortized cost, if it approximates market value. Any securities for which market quotations are not readily available are valued at their fair value as determined in good faith by the Adviser in accordance with procedures established by, and under the general supervision of, the Funds’ Board of Trustees. The Funds may use pricing services to assist in determining market value. The Board of Trustees has authorized the use of a pricing service to assist the Funds in valuing certain equity securities listed or traded on foreign security exchanges in the Funds’ portfolios in certain circumstances where there is a significant change in the value of related US-traded securities, as represented by, for example, the S&P 500 Index. |
“Fair Value Measurements and Disclosures” (the “Fair Value Statement”) defines fair value, establishes a framework for measuring fair value in GAAP, and expands disclosures about fair value measurements. Under the Fair Value Statement, various inputs are used in determining the value of the Funds’ investments.
These inputs are summarized into three broad levels and described below:
| | • | Level 1 – quoted prices in active markets for identical investments |
| | • | Level 2 – other significant observable inputs (including quoted prices for similar investments, interest rates, and evaluated quotations obtained from pricing services) |
| | • | Level 3 – significant unobservable inputs (including the Fund’s own assumptions in determining the fair value of investments). |
The inputs or methodology used for valuing investments are not an indication of the risk associated with investing in those investments. Changes in valuation techniques may result in transfers between the levels during the reporting period. The Funds recognize transfers between the levels as of the beginning and end of the reporting period. In accordance with procedures established by, and under the general supervision of, the Funds’ Board of Trustees, certain equity securities listed or traded
NOTES TO FINANCIAL STATEMENTS |
on foreign security exchanges in the Funds’ portfolios had a fair valuation adjustment factor applied to their equity prices as of the applicable fiscal year-end and were categorized as Level 2. Application of fair valuation adjustment factors was not deemed necessary at the beginning of the reporting period and as such equity securities listed or traded on foreign security exchanges were categorized as Level 1. These securities represent the only significant transfers between each of the three levels. The following is a summary of the fair values of the Funds’ investments in each category and economic sector as of September 30, 2011:
Fund Investments by Major Security Type | | | | | | | | | | | | |
| Marsico Focus Fund | | | | | | | | | | | | |
| Assets | | | | | | | | | | | | |
| Common Stocks | | | | | | | | | | | | |
| Consumer Discretionary | | $ | 246,117,651 | | | $ | 14,413,853 | | | $ | — | | | $ | 260,531,504 | |
| Consumer Staples | | | 37,969,312 | | | | — | | | | — | | | | 37,969,312 | |
| Energy | | | 77,106,165 | | | | — | | | | — | | | | 77,106,165 | |
| Financials | | | 27,093,513 | | | | — | | | | — | | | | 27,093,513 | |
| Health Care | | | 69,399,291 | | | | — | | | | — | | | | 69,399,291 | |
| Industrials | | | 140,260,517 | | | | — | | | | — | | | | 140,260,517 | |
| Information Technology | | | 195,329,405 | | | | — | | | | — | | | | 195,329,405 | |
| Materials | | | 68,759,015 | | | | — | | | | — | | | | 68,759,015 | |
| Short-term Investments | | | 68,208,324 | | | | — | | | | — | | | | 68,208,324 | |
| | | | | | | | | | | | | | | $ | 944,657,046 | |
| Marsico Growth Fund | | | | | | | | | | | | | | | | |
| Assets | | | | | | | | | | | | | | | | |
| Common Stocks | | | | | | | | | | | | | | | | |
| Consumer Discretionary | | | 225,163,855 | | | | 11,364,682 | | | | — | | | | 236,528,537 | |
| Consumer Staples | | | 34,141,756 | | | | — | | | | — | | | | 34,141,756 | |
| Energy | | | 36,207,092 | | | | — | | | | — | | | | 36,207,092 | |
| Financials | | | 11,413,957 | | | | — | | | | — | | | | 11,413,957 | |
| Health Care | | | 27,254,297 | | | | — | | | | — | | | | 27,254,297 | |
| Industrials | | | 64,352,431 | | | | — | | | | — | | | | 64,352,431 | |
| Information Technology | | | 127,658,372 | | | | — | | | | — | | | | 127,658,372 | |
| Materials | | | 50,203,198 | | | | — | | | | — | | | | 50,203,198 | |
| Preferred Stocks | | | 9,294,460 | | | | — | | | | — | | | | 9,294,460 | |
| Units | | | — | | | | 7,436,106 | | | | — | | | | 7,436,106 | |
| Short-term Investments | | | 64,093,556 | | | | — | | | | — | | | | 64,093,556 | |
| | | | | | | | | | | | | | | $ | 668,583,762 | |
Marsico 21st Century Fund | | | | | | | | | | | | | | | | |
| Assets | | | | | | | | | | | | | | | | |
| Common Stocks | | | | | | | | | | | | | | | | |
| Consumer Discretionary | | | 170,093,041 | | | | — | | | | — | | | | 170,093,041 | |
| Consumer Staples | | | 2,656,876 | | | | — | | | | — | | | | 2,656,876 | |
| Energy | | | 40,152,795 | | | | — | | | | — | | | | 40,152,795 | |
| Financials | | | 118,433,226 | | | | — | | | | — | | | | 118,433,226 | |
| Health Care | | | 22,271,351 | | | | — | | | | — | | | | 22,271,351 | |
| Industrials | | | 58,198,914 | | | | — | | | | — | | | | 58,198,914 | |
| Information Technology | | | 62,995,792 | | | | — | | | | — | | | | 62,995,792 | |
| Short-term Investments | | | 12,731,900 | | | | — | | | | — | | | | 12,731,900 | |
| | | | | | | | | | | | | | | $ | 487,533,895 | |
| Marsico International Opportunities Fund | | | | | | | | | | | | | | | | |
| Assets | | | | | | | | | | | | | | | | |
| Common Stocks | | | | | | | | | | | | | | | | |
| Consumer Discretionary | | | 6,147,030 | | | | 29,987,966 | | | | — | | | | 36,134,996 | |
| Consumer Staples | | | 1,598,891 | | | | 8,303,031 | | | | — | | | | 9,901,922 | |
| Energy | | | 7,033,628 | | | | 4,512,098 | | | | — | | | | 11,545,726 | |
| Financials | | | 4,085,856 | | | | 11,130,489 | | | | — | | | | 15,216,345 | |
| Health Care | | | — | | | | 9,862,692 | | | | — | | | | 9,862,692 | |
| Industrials | | | 7,220,281 | | | | 16,243,506 | | | | — | | | | 23,463,787 | |
| Information Technology | | | 14,652,344 | | | | 13,729,818 | | | | — | | | | 28,382,162 | |
| Materials | | | 3,110,111 | | | | 5,473,342 | | | | — | | | | 8,583,453 | |
| Telecommunication Services | | | 3,949,730 | | | | 4,221,870 | | | | — | | | | 8,171,600 | |
| Short-term Investments | | | 4,384,064 | | | | — | | | | — | | | | 4,384,064 | |
| | | | | | | | | | | | | | | $ | 155,646,747 | |
| | | | | | | | | | | | | | | | | |
| Other financial instruments* | | | — | | | | (573,003 | ) | | | — | | | | (573,003 | ) |
NOTES TO FINANCIAL STATEMENTS |
NOTES TO FINANCIAL STATEMENTS September 30, 2011 (continued)
Fund Investments by Major Security Type | | | | | | | | | | | | |
| Marsico Flexible Capital Fund | | | | | | | | | | | | |
| Assets | | | | | | | | | | | | |
| Common Stocks | | | | | | | | | | | | |
| Consumer Discretionary | | $ | 57,916,058 | | | $ | 32,969,944 | | | $ | — | | | $ | 90,886,002 | |
| Consumer Staples | | | 31,373,142 | | | | — | | | | — | | | | 31,373,142 | |
| Energy | | | 27,020,025 | | | | — | | | | — | | | | 27,020,025 | |
| Financials | | | 35,059,611 | | | | 3,174,049 | | | | — | | | | 38,233,660 | |
| Health Care | | | 19,660,292 | | | | — | | | | — | | | | 19,660,292 | |
| Industrials | | | 36,034,934 | | | | 9,636,080 | | | | — | | | | 45,671,014 | |
| Information Technology | | | 66,936,954 | | | | — | | | | — | | | | 66,936,954 | |
| Corporate Bonds | | | — | | | | 22,536,657 | | | | — | | | | 22,536,657 | |
| Preferred Purchased Securities | | | — | | | | 12,599,321 | | | | — | | | | 12,599,321 | |
| Short-term Investments | | | 51,456,797 | | | | — | | | | — | | | | 51,456,797 | |
| | | | | | | | | | | | | | | $ | 406,373,864 | |
| Marsico Global Fund | | | | | | | | | | | | | | | | |
| Assets | | | | | | | | | | | | | | | | |
| Common Stocks | | | | | | | | | | | | | | | | |
| Consumer Discretionary | | | 16,642,406 | | | | 21,674,603 | | | | — | | | | 38,317,009 | |
| Consumer Staples | | | 567,486 | | | | 2,756,433 | | | | — | | | | 3,323,919 | |
| Energy | | | 5,792,223 | | | | — | | | | — | | | | 5,792,223 | |
| Financials | | | 13,395,765 | | | | 5,131,212 | | | | — | | | | 18,526,977 | |
| Health Care | | | 4,277,011 | | | | — | | | | — | | | | 4,277,011 | |
| Industrials | | | 8,174,205 | | | | 3,173,722 | | | | — | | | | 11,347,927 | |
| Information Technology | | | 16,806,795 | | | | — | | | | — | | | | 16,806,795 | |
| Materials | | | — | | | | 3,835,546 | | | | — | | | | 3,835,546 | |
| Short-term Investments | | | 6,245,901 | | | | — | | | | — | | | | 6,245,901 | |
| | | | | | | | | | | | | | | $ | 108,473,308 | |
| Marsico Emerging Markets Fund | | | | | | �� | | | | | | | | | | |
| Assets | | | | | | | | | | | | | | | | |
| Common Stocks | | | | | | | | | | | | | |
| Consumer Discretionary | | | 303,221 | | | | 552,461 | | | | — | | | | 855,682 | |
| Consumer Staples | | | 177,445 | | | | 151,664 | | | | — | | | | 329,109 | |
| Energy | | | 196,524 | | | | — | | | | — | | | | 196,524 | |
| Financials | | | 483,314 | | | | 286,309 | | | | — | | | | 769,623 | |
| Health Care | | | 193,385 | | | | 100,204 | | | | — | | | | 293,589 | |
| Industrials | | | 88,336 | | | | 209,485 | | | | — | | | | 297,821 | |
| Information Technology | | | 633,356 | | | | 187,554 | | | | — | | | | 820,910 | |
| Materials | | | 45,085 | | | | 146,359 | | | | — | | | | 191,444 | |
| Telecommunication Services | | | 219,452 | | | | 90,995 | | | | — | | | | 310,447 | |
| Utilities | | | 71,052 | | | | — | | | | — | | | | 71,052 | |
| Short-term Investments | | | 238,915 | | | | — | | | | — | | | | 238,915 | |
| | | | | | | | | | | | | | | $ | 4,375,116 | |
| | * | Other financial instruments includes forward foreign currency contracts which are valued at unrealized appreciation (depreciation) on the investment. |
| | (b) | Expenses — The Funds are charged for those expenses that are directly attributable to each Fund, such as advisory and custodial fees. Expenses that are not directly attributable to a Fund are typically allocated among the Funds in proportion to their respective net assets and in some cases allocated based on other factors. The Funds’ expenses may be reduced by voluntary advisory fee waivers, brokerage credits and uninvested cash balances earning interest or credits. Such credits are included in “Less waiver of expenses and expenses paid indirectly” on the Statements of Operations. |
Brokerage commissions were paid to certain brokers which reduced certain transfer agent fees and expenses in the amount of $92 and $122 for the Focus Fund and Growth Fund, respectively, for the year ended September 30, 2011. The Funds also received earnings credits on certain cash account balances which reduced transfer agent fees and expenses in the amount of $1,005, $716, $600, $226, $392, $106, and $5 for the Focus Fund, Growth Fund, 21st Century Fund, International Opportunities Fund, Flexible Capital Fund, Global Fund, and Emerging Markets Fund, respectively, for the year ended September 30, 2011. Brokerage commission credits and earnings credits are included in “Less waiver of expenses and expenses paid indirectly” on the Statements of Operations.
NOTES TO FINANCIAL STATEMENTS |
| | (c) | Federal Income Taxes — Each Fund intends to comply with the requirements of the Internal Revenue Code necessary to qualify as a regulated investment company and to make the requisite distributions of income to its shareholders which will be sufficient to relieve it from all or substantially all federal and state income taxes. Certain funds may utilize earnings and profits on redemption of shares as part of the dividends paid deduction. |
| | (d) | Distributions to Shareholders — Dividends from net investment income and net realized capital gains, if any, will be declared and paid at least annually. Distributions to shareholders are recorded on the ex-dividend date. Each Fund may periodically make reclassifications among certain of its capital accounts as a result of the timing and characterization of certain income and capital gains distributions determined in accordance with federal tax regulations, which may differ from GAAP. These reclassifications are due to differing treatment for items such as foreign currency transactions, passive foreign investment companies (“PFICs”), net investment losses and investments in partnerships. |
| | (e) | Foreign Currency Translation — The accounting records of the Funds are maintained in US dollars. Values of securities denominated in foreign currencies are translated into US dollars at 4:00 p.m. ET. Amounts related to the purchase and sale of foreign securities and investment income are translated at the rates of exchange prevailing on the respective dates of such transactions. |
Reported realized gains on foreign currency transactions arise from sales of portfolio securities, forward foreign currency contracts, currency gains or losses realized between the trade and settlement dates on securities transactions, the difference between the amounts of dividends, interest, and foreign withholding taxes recorded on the Funds’ books, and the US dollar equivalent of the amounts actually received or paid.
The Funds do not isolate that portion of the results of operations resulting from changes in foreign exchange rates on investments from the fluctuations arising from changes in market prices of securities held at fiscal year-end. Net unrealized appreciation or depreciation on investments and foreign currency translations arise from changes in the value of assets and liabilities, including investments in securities at fiscal year-end, resulting from changes in the exchange rates and changes in market prices of securities held. Transactions in foreign-denominated assets may involve greater risks than domestic transactions, including currency risk, political and economic risk, regulatory risk and market risk.
| | (f) | Derivative Instruments — “Disclosure about Derivative Instruments and Hedging Activities” (the “Derivatives Statement”) requires enhanced disclosures about the Funds’ derivative and hedging activities, including how such activities are accounted for and their effects on the Funds’ financial position, performance and cash flows. |
The Funds may enter into futures contracts and options on securities, financial indexes, and foreign currencies, options on futures, forward foreign currency contracts, interest rate swaps, credit default swaps, and swap-related products. The Funds intend to use such derivative instruments primarily to hedge or protect from adverse movements in securities prices, currency rates or interest rates. The use of futures contracts, options, and forward foreign currency contracts may involve risks such as the possibility of illiquid markets or imperfect correlation between the value of the contracts and the underlying securities, or that the counterparty will fail to perform its obligations. The limited use of derivative instruments by the Funds during the year ended September 30, 2011 was related to the use of forward foreign currency contracts in the International Opportunities Fund and purchased index and written equity exchange-traded options for the Flexible Capital Fund, each of which did not have a significant impact on each Fund’s respective performance during the reporting period. Information concerning the outstanding forward foreign currency contracts held by the International Opportunities Fund as of September 30, 2011 is included on the Schedule of Investments as supplemental information. There were no outstanding option contracts held by the Flexible Capital Fund as of September 30, 2011. The following tables provide information about the fair value and location of derivatives on the Statements of Assets and Liabilities and the effects on the Statements of Operations for the International Opportunities Fund and Flexible Capital Fund, as appropriate.
The fair value of derivative instruments by primary risk category as of September 30, 2011 (amounts in thousands):
| | | | | | |
| Derivatives Not Accounted for as Hedging Instruments | Statements of Assets and Liabilities Location | | | | Statements of Assets and Liabilities Location | | | |
International Opportunities Fund | Forward Foreign Currency Contracts | Unrealized Appreciation on Forward Foreign Currency Contracts | | $ | 239 | | Unrealized Depreciation on Forward Foreign Currency Contracts | | $ | 812 | |
| | Total | | | $ | 239 | | | | $ | 812 | |
NOTES TO FINANCIAL STATEMENTS |
NOTES TO FINANCIAL STATEMENTS September 30, 2011 (continued)
NOTES TO FINANCIAL STATEMENTS
The effects of derivative instruments on the Statements of Operations for the period October 1, 2010 through September 30, 2011 (amounts in thousands):
| | | | Amount of Realized Gain (Loss) on Derivatives | |
| Derivatives Not Accounted for as Hedging Instruments | | | | | | | | Forward Foreign Currency Contracts | | | | |
| International Opportunities Fund | Forward Foreign Currency Contracts | | | N/A | | | | N/A | | | $ | (1,102 | ) | | $ | (1,102 | ) |
| | Total | | | N/A | | | | N/A | | | $ | (1,102 | ) | | $ | (1,102 | ) |
| | | | | | | | | | | | | | | | | | |
| Flexible Capital Fund | Equity/Index contracts | | $ | (1,177 | ) | | $ | 394 | | | | N/A | | | $ | (783 | ) |
| | Total | | $ | (1,177 | ) | | $ | 394 | | | | N/A | | | $ | (783 | ) |
| | | | Change in Unrealized Appreciation (Depreciation) on Derivatives | |
| Derivatives Not Accounted for as Hedging Instruments | | Forward Foreign Currency Contracts | |
| International Opportunities Fund | Forward Foreign Currency Contracts | | $ | (573 | ) |
| | Total | | $ | (573 | ) |
Forward Foreign Currency Contracts — A forward currency contract is a commitment to purchase or sell foreign currency at a specified price on a future date. The Funds may enter into a forward foreign currency contract in order to hedge against foreign currency fluctuations, such as when a Fund elects to reduce exposure to changes in foreign currency exchange rates on foreign portfolio holdings denominated in or exposed to foreign currencies, or in preparation of purchasing securities in a particular market as well as other investment purposes.
The market value of a forward foreign currency contract fluctuates with changes in currency exchange rates. Outstanding forward foreign currency contracts are valued daily at current market rates and the resulting change in market value is recorded as unrealized appreciation or depreciation. When a forward foreign currency contract is settled, the Fund records a realized gain or loss equal to the difference between the value at the time the forward foreign currency contract was opened and the value at the time it was settled.
The Funds are subject to foreign currency exchange risk in the normal course of pursuing their investment objectives. Forward foreign currency contracts may involve market risk in excess of the unrealized gain or loss reflected on the Statements of Assets and Liabilities. In addition, the Funds could be exposed to a credit risk if the counterparties are unable or unwilling to meet the terms of the contracts or if the value of the foreign currency changes unfavorably. In connection with these contracts, the Funds typically segregate cash and/or other securities as collateral in a sufficient value equal to the aggregate amount of the Funds’ commitments under the forward foreign currency contracts; such collateral would be in the possession of the Funds’ custodian, if applicable.
Options Contracts — The Funds may purchase and write (sell) put and call options on foreign and domestic stock indices, foreign currencies, and US and foreign securities that are traded on a securities exchange or an over-the-counter market. These transactions are for hedging purposes or for the purpose of earning additional income. In addition, the Funds may enter into such transactions for cross-hedging purposes. There is minimal counterparty credit risk involved in entering into option contracts since they are exchange-traded instruments and the exchange’s clearinghouse, as counterparty to all exchange-traded options, guarantees the options against default.
The risk associated with purchasing an option is that the Fund pays a premium whether or not the option is exercised. Additionally, the Fund bears the risk of loss of premium and change in market value should the counterparty not perform under the contract. Put and call options purchased are accounted for in the same manner as portfolio securities. The cost of securities acquired through the exercise of call options is increased by premiums paid. The proceeds from securities sold through the exercise of put options are decreased by the premiums paid.
NOTES TO FINANCIAL STATEMENTS |
When the Fund writes an option, the premium received by the Fund is recorded as a liability and is subsequently adjusted to the current market value of the option written. Premiums received from writing options that expire are recorded by the Fund on the expiration date as realized gains from option transactions. The difference between the premium and the amount paid on effecting a closing purchase transaction, including brokerage commissions, is also treated as a realized gain, or if the premium is less than the amount paid for the closing purchase transaction, as a realized loss. If a call option is exercised, the premium is added to the proceeds from the sale of the underlying security or currency in determining whether the Fund has realized a gain or loss. If a put option is exercised, the premium reduces the cost basis of the security or currency purchased by the Fund. In writing an option, the Fund bears the market risk of an unfavorable change in the price of the security or currency underlying the written option. Exercise of an option written by the Fund could result in the Fund selling or buying a security or currency at a price different from the current market value.
Transactions in written options for the year ended September 30, 2011 were as follows:
| | | Marsico Flexible Capital Fund | |
| | | | | | | |
| Options Outstanding at September 30, 2010 | | | — | | | $ | — | |
| Options Written | | | 11,783 | | | | 644,347 | |
| Options Closed | | | (3,472 | ) | | | (273,823 | ) |
| Options Exercised | | | — | | | | — | |
| Options Expired | | | (8,311 | ) | | | (370,524 | ) |
| Options Outstanding at September 30, 2011 | | | — | | | $ | — | |
| | (g) | Trustees’ Deferred Fee Plan — Effective February 1, 2000, the Board of Trustees adopted the Marsico Investment Fund Deferred Fee Plan (the “Deferred Fee Plan”), amended and restated as of December 30, 2005, which allows the Trustees to defer the receipt of all or a portion of their compensation received from the Funds. Any deferred fees are credited to accounts established on behalf of the Trustees into the Funds as directed by each Trustee. The amounts credited to these accounts increase or decrease in accordance with the performance of the Funds selected by the Trustees. The market value of the deferred account balances as of September 30, 2011 is shown on the Statements of Assets and Liabilities as part of an asset account, “Prepaid expenses and other assets”, and a liability account, “Accrued trustees’ fees”. Additionally, the fluctuation of the account balances due to the Funds’ performance is recorded by the Funds as unrealized appreciation/(depreciation) which is shown as part of “Net unrealized appreciation (depreciation) on investments, forward foreign currency contracts, and foreign currency translations” on the Statements of Assets and Liabilities and as compensation expense which is shown as part of the expense account “Trustees’ fees and expenses” on the Statements of Operations. Fees earned and deferred by the Trustees for the year ended September 30, 2011 are also included in “Trustees’ fees and expenses” on the Statements of Operations. Amounts credited to the Deferred Fee Plan will be deferred until distributed in accordance with the Deferred Fee Plan. Unrealized appreciation/depreciation of Fund shares held in the Deferred Fee Plan is subject to the Funds’ expense reimbursement agreement with the Adviser. |
| | (h) | Redemption Fee — A 2.00% redemption fee is retained by the Funds to offset transaction costs and other expenses associated with short-term investing. The fee is imposed on certain redemptions or exchanges of shares held 30 days or less from their purchase date. Redemption fees are recorded by the Funds as a reduction of shares redeemed and as a credit to paid-in-capital. For the year ended September 30, 2011, the Focus Fund, Growth Fund, 21st Century Fund, International Opportunities Fund, Flexible Capital Fund, Global Fund, and Emerging Markets Fund received $19,950, $126,365, $7,106, $15,543, $99,684, $10,601, and $30, respectively, in redemption fees. |
| | (i) | Other — Investment transactions are accounted for on a trade date basis. Each Fund determines the gain or loss realized from the investment transactions by comparing the original cost of the security lot sold with the net sale proceeds. Dividend income is recognized on the ex-dividend date. Certain dividends from foreign securities will be recorded as soon as the Trust is informed of the dividend if such information is obtained subsequent to the ex-dividend date. Interest income is recognized on an accrual basis. |
| | (j) | Indemnifications — In the normal course of business, the Funds enter into contracts that contain provisions indemnifying other parties against specified potential liabilities. Each Fund’s maximum exposure under these arrangements is unknown as this would involve future claims that may be made against the Fund that have not yet occurred. However, based on experience, the Funds expect the risk of loss to be remote. |
NOTES TO FINANCIAL STATEMENTS |
NOTES TO FINANCIAL STATEMENTS September 30, 2011 (continued)
| 3. | Investment Advisory Agreement and Transactions With Affiliates |
Each Fund has an agreement with the Adviser to furnish investment advisory services to the Funds. Under the terms of these agreements, the Adviser is compensated for managing the Focus Fund and the Growth Fund at the rate of 0.85% per year of average daily net assets up to $3 billion in each Fund, and 0.75% per year of average daily net assets exceeding $3 billion in each Fund; and at a rate of 0.85% of the average daily net assets of the 21st Century Fund, the International Opportunities Fund, the Flexible Capital Fund, and the Global Fund; and at a rate of 1.00% of the average net assets of the Emerging Markets Fund. The Adviser has voluntarily agreed to limit the total expenses of each Fund (excluding interest, taxes, acquired fund fees and expenses, litigation, brokerage, and extraordinary expenses) to an annual rate of 1.75% of the average net assets of the Emerging Markets Fund, 1.60% of the average net assets of the Focus Fund, the International Opportunities Fund, the Flexible Capital Fund, and the Global Fund, and 1.50% of the average net assets of the Growth Fund and the 21st Century Fund until January 31, 2012. Prior to February 1, 2011, the Adviser’s voluntary expense limitation agreement relating to the Flexible Capital Fund limited total expenses of the Flexible Capital Fund (excluding interest, taxes, acquired fund fees and expenses, litigation, brokerage, and extraordinary expenses) to an annual rate of 0.75% of the Flexible Capital Fund’s average net assets.
The Adviser is entitled to reimbursement from a Fund of any fees waived pursuant to this arrangement if such reimbursements do not cause a Fund to exceed current expense limitations and the reimbursement is made within three years after the year in which the Adviser incurred the expense. The potential reimbursement of fees waived or expenses reimbursed related to the Flexible Capital Fund’s expense limitation of 0.75% of average net assets totaled approximately $1,465,000 as of September 30, 2011. The Adviser has elected not to seek recoupment of this amount. As of September 30, 2011, reimbursements that may potentially be made by the Emerging Markets Fund to the Adviser are $249,467, which expire in 2014.
Certain officers of the Trust are also officers of the Adviser. The Funds pay a portion of the Chief Compliance Officer’s total compensation costs which is shown as part of the expense account “Professional fees” on the Statements of Operations. No other officers of the Trust received compensation from the Funds.
| 4. | Service and Distribution Plan |
The Funds have adopted a Service and Distribution Plan (the “Plan”) pursuant to Rule 12b-1 under the 1940 Act. The Plan authorizes payments by the Funds in connection with the distribution of their shares at an annual rate, as determined from time to time by the Board of Trustees, of up to 0.25% of a Fund’s average daily net assets. The Adviser may, out of its own resources and at its sole discretion, make certain payments on behalf of the Plan for expenses incurred by a Fund for distribution of Fund shares and related services.
| 5. | Investment Transactions |
The aggregate purchases and sales of securities, excluding short-term investments, for the Funds for the year ended September 30, 2011, were as follows:
| | | | | | | | | | | International Opportunities Fund | | | | | | | | | | |
| Purchases | | $ | 963,441 | | | $ | 571,379 | | | $ | 601,316 | | | $ | 278,900 | | | $ | 1,249,866 | | | $ | 115,529 | | | $ | 29,972 | |
| Sales | | $ | 1,569,937 | | | $ | 893,269 | | | $ | 847,691 | | | $ | 464,451 | | | $ | 980,556 | | | $ | 116,312 | | | $ | 23,691 | |
There were no purchases or sales of US government securities, excluding short-term investments.
| 6. | Federal Income Tax Information |
Accounting for Uncertainty in Income Taxes (the “Income Tax Statement”) requires an evaluation of tax positions taken (or expected to be taken) in the course of preparing a Fund’s tax returns to determine whether these positions meet a “more-likely-than-not” standard that, based on the technical merits, have a more than fifty percent likelihood of being sustained by a taxing authority upon examination. A tax position that meets the “more-likely-than-not” recognition threshold is measured to determine the amount of benefit to recognize in the financial statements. The Funds recognize interest and penalties, if any, related to unrecognized tax benefits as income tax expense in the Statements of Operations.
NOTES TO FINANCIAL STATEMENTS |
The Income Tax Statement requires management of the Funds to analyze all open tax years, fiscal years 2008-2011 as defined by IRS statute of limitations for all major jurisdictions, including federal tax authorities and certain state tax authorities. As of and during the fiscal year ended September 30, 2011, the Funds did not have a liability for any unrecognized tax benefits. The Funds have no examinations in progress and are not aware of any tax positions for which it is reasonably possible that the total amounts of unrecognized tax benefits will significantly change in the next twelve months.
At September 30, 2011 gross unrealized appreciation and depreciation of investments, based on cost for federal income tax purposes were as follows:
| | | | | | | | | | | International Opportunities Fund | | | | | | | | | | |
| Cost of Investments | | $ | 837,150 | | | $ | 582,950 | | | $ | 499,168 | | | $ | 156,935 | | | $ | 414,935 | | | $ | 102,068 | | | $ | 5,439 | |
| | | | | | | | | | | | | | | | | | | | | | | | | | | | | |
| Gross Unrealized Appreciation | | $ | 170,972 | | | $ | 137,058 | | | $ | 63,979 | | | $ | 14,389 | | | $ | 17,875 | | | $ | 16,877 | | | $ | 15 | |
| Gross Unrealized Depreciation | | | (63,465 | ) | | | (51,424 | ) | | | (75,613 | ) | | | (15,677 | ) | | | (26,436 | ) | | | (10,472 | ) | | | (1,079 | ) |
| Unrealized Depreciation on Forward Foreign Currency Contracts and Foreign Currency | | | — | | | | — | | | | — | | | | (573 | ) | | | — | | | | — | | | | (8 | ) |
| | | | | | | | | | | | | | | | | | | | | | | | | | | | | |
| Net Unrealized Appreciation (Depreciation) on Investments | | $ | 107,507 | | | $ | 85,634 | | | $ | (11,634 | ) | | $ | (1,861 | ) | | $ | (8,561 | ) | | $ | 6,405 | | | $ | (1,072 | ) |
The difference between cost amounts for financial statement and federal income tax purposes is due primarily to wash sale loss deferrals and PFICs.
The Flexible Capital Fund had realized capital losses (in thousands) from transactions between November 1, 2010 and September 30, 2011 of $16,092. The Flexible Capital Fund has elected to treat post-October capital losses as arising in the next fiscal year.
The Focus Fund, Growth Fund, 21st Century Fund, International Opportunities Fund, Flexible Capital Fund, and Global Fund had realized currency losses (in thousands) from transactions between November 1, 2010 and September 30, 2011 of $0, $0, $131, $1,710, $150, and $52 respectively. Each Fund has elected to treat post-October currency losses as arising in the next fiscal year.
At September 30, 2011, the Funds had accumulated capital loss carryforwards (in thousands) as follows:
| | | | | | | | | | | International Opportunities Fund | | | | | | | | | | |
| For Losses Expiring September 30, | | | | | | | | | | | | | | | | | | | | | |
| 2017 | | $ | — | | | $ | 54,807 | | | $ | 207,284 | | | $ | 45,122 | | | $ | — | | | $ | 10,100 | | | $ | — | |
| 2018 | | | 20,227 | | | | — | | | | 390,537 | | | | 93,558 | | | | — | | | | 6,440 | | | | — | |
| Not Subject to Expiration | | | — | | | | — | | | | — | | | | — | | | | — | | | | — | | | | 1,204 | |
| | | $ | 20,227 | | | $ | 54,807 | | | $ | 597,821 | | | $ | 138,680 | | | $ | — | | | $ | 16,540 | | | $ | 1,204 | |
To the extent that a Fund may realize future net capital gains, those gains will be offset by any of its unused capital loss carryforward. Future capital loss carryover utilization in any given year may be subject to Internal Revenue Code limitations.
Under the recently enacted Regulated Investment Company Modernization Act of 2010 (the “Act”), the Funds will be permitted to carryforward capital losses incurred in taxable years beginning after December 22, 2010 for an unlimited period. However, any losses incurred during those future taxable years will be required to be utilized prior to the losses incurred in pre-enactment taxable years. As a result of this ordering rule, pre-enactment capital loss carryforwards may be more likely to expire unused. Additionally, post-enactment capital losses that are carried forward will retain their character as either short-term or long-term capital losses rather than being considered all short-term as under previous law.
The Focus Fund, Growth Fund, 21st Century Fund, International Opportunities Fund, Flexible Capital Fund, and Global Fund utilized (in thousands) $236,033, $173,943, $80,563, $54,448, $595, and $7,293, respectively, of its capital loss carryforwards, during the year ended September 30, 2011.
NOTES TO FINANCIAL STATEMENTS |
NOTES TO FINANCIAL STATEMENTSNOTES TO FINANCIAL STATEMENTS September 30, 2011 (continued)
As of September 30, 2011, the components of accumulated earnings (deficit) on a tax basis were as follows:
| | | | | | | | | | | International Opportunities Fund | | | | | | | | | | |
| Undistributed Ordinary Income (Deficit) | | $ | — | | | $ | 289 | | | $ | — | | | $ | 573 | | | $ | 1,097 | | | $ | (11 | ) | | $ | — | |
| Undistributed Trustees’ Deferred Compensation | | | (1,177 | ) | | | (678 | ) | | | (418 | ) | | | (162 | ) | | | (145 | ) | | | (65 | ) | | | 12 | |
| Undistributed Long-Term Capital Gains | | | — | | | | — | | | | — | | | | — | | | | — | | | | — | | | | — | |
| Tax Accumulated Earnings (Deficit) | | | (1,177 | ) | | | (389 | ) | | | (418 | ) | | | 411 | | | | 952 | | | | (76 | ) | | | 12 | |
| Accumulated Capital and Other Losses | | | (20,227 | ) | | | (54,807 | ) | | | (597,952 | ) | | | (140,390 | ) | | | (16,242 | ) | | | (16,592 | ) | | | (1,204 | ) |
| Unrealized Appreciation (Depreciation) on Investments and on Foreign Currency Translations | | | 107,507 | | | | 85,634 | | | | (11,634 | ) | | | (1,861 | ) | | | (8,561 | ) | | | 6,405 | | | | (1,072 | ) |
| Trustees Deferred Compensation Mark to Market | | | 34 | | | | 24 | | | | (11 | ) | | | (40 | ) | | | 104 | | | | 34 | | | | (13 | ) |
| Total Accumulated Earnings (Deficit) | | $ | 86,137 | | | $ | 30,462 | | | $ | (610,015 | ) | | $ | (141,880 | ) | | $ | (23,747 | ) | | $ | (10,229 | ) | | $ | (2,277 | ) |
Undistributed ordinary income (deficit) consists of net investment income and timing differences related to post-October currency losses, PFICs, and forward foreign currency contracts.
The tax character of distributions paid during the fiscal years ended September 30, 2011 and 2010 were as follows:
| (Amounts in thousands) | | | | | | |
| | | | | | | | | | | | |
| Focus Fund | | $ | — | | | $ | — | | | $ | 3,909 | | | $ | — | |
| Growth Fund | | | 473 | | | | — | | | | 5,169 | | | | — | |
21st Century Fund | | | — | | | | — | | | | — | | | | — | |
| International Opportunities Fund | | | 6,560 | | | | — | | | | 2,073 | | | | — | |
| Flexible Capital Fund | | | 2,489 | | | | 477 | | | | 1,302 | | | | — | |
| Global Fund | | | 1,099 | | | | — | | | | 721 | | | | — | |
| Emerging Markets Fund | | | — | | | | — | | | | — | | | | — | |
The tax character of dividends paid may differ from that shown in the Statements of Changes in Net Assets due to short-term gains being treated as ordinary income for tax purposes.
Except for matters previously disclosed, management of the Adviser has determined that there were no material events that would require disclosure in the Funds’ financial statements.
| 8. | New Accounting Pronouncements |
In May 2011, the Financial Accounting Standards Board (“FASB”) issued Accounting Standards Update (“ASU”) No. 2011-04 “Amendments to Achieve Common Fair Value Measurement and Disclosure Requirements in GAAP and the International Financial Reporting Standards (“IFRSs”)”. ASU No. 2011-04 amends FASB Accounting Standards Codification Topic 820, Fair Value Measurement and Disclosures, to establish common requirements for measurement of and disclosure about fair value between GAAP and IFRSs. Additionally, ASU No. 2011-04 will require reporting entities to disclose certain information for fair value measurements categorized within Level 3 of the fair value hierarchy such as quantitative information about the unobservable inputs used in the fair value measurement, the valuation processes used by the reporting entity and a narrative description of the sensitivity of the fair value measurement to changes in unobservable inputs and the interrelationships between those unobservable inputs. ASU No. 2011-04 will further require reporting entities to make disclosures about amounts and reasons for transfers into and out of Level 1 and Level 2 fair value measurements. ASU No. 2011-04 is effective for fiscal years beginning after December 15, 2011 and for interim periods within those fiscal years. The Adviser is currently evaluating the impact the adoption of these amendments may have on the Funds’ financial statement disclosures.
REPORT OF INDEPENDENT REGISTERED PUBLIC ACCOUNTING FIRM |
REPORT OF INDEPENDENT REGISTERED PUBLIC ACCOUNTING FIRM
To the Board of Trustees and Shareholders of The Marsico Investment Fund
In our opinion, the accompanying statements of assets and liabilities, including the schedules of investments, and the related statements of operations and of changes in net assets and the financial highlights present fairly, in all material respects, the financial position of Marsico Focus Fund, Marsico Growth Fund, Marsico 21st Century Fund, Marsico International Opportunities Fund, Marsico Flexible Capital Fund, Marsico Global Fund, and Marsico Emerging Markets Fund (seven of the funds constituting The Marsico Investment Fund, hereafter referred to as the “Funds”) at September 30, 2011 and the results of each of their operations, the changes in each of their net assets, and their financial highlights for each of the periods presented, in conformity with accounting principles generally accepted in the United States of America. These financial statements and financial highlights (hereafter referred to as “financial statements”) are the responsibility of the Funds’ management; our responsibility is to express an opinion on these financial statements based on our audits. We conducted our audits of these financial statements in accordance with the standards of the Public Company Accounting Oversight Board (United States). Those standards require that we plan and perform the audit to obtain reasonable assurance about whether the financial statements are free of material misstatement. An audit includes examining, on a test basis, evidence supporting the amounts and disclosures in the financial statements, assessing the accounting principles used and significant estimates made by management, and evaluating the overall financial statement presentation. We believe that our audits, which included confirmation of securities at September 30, 2011 by correspondence with the custodian and brokers, provide a reasonable basis for our opinion.

PricewaterhouseCoopers LLP
Denver, Colorado
November 8, 2011
EXPENSE EXAMPLE For the six-months ended September 30, 2011 (Unaudited)
As a shareholder of the Marsico Funds (the “Funds”), you incur two types of costs: (1) transaction costs, including redemption fees on certain redemptions; and (2) ongoing costs, including management fees, distribution (12b-1) fees, and other Fund expenses. This Example is intended to help you understand your ongoing costs (in dollars) of investing in the Funds and to compare these costs with the ongoing costs of investing in other mutual funds.
The Example is based on an investment of $1,000 invested at the beginning of the period and held for the entire period from April 1, 2011 to September 30, 2011 (the “period”).
The first line of the table below provides information about actual account values and actual expenses. You may use the information in this line, together with the amount you invested, to estimate the expenses you paid over the period. Simply divide your account value by $1,000 (for example, an $8,600 account value divided by $1,000 equals 8.6), then multiply the result by the number in the first line under the heading entitled “Expenses paid for the six-month period ended September 30, 2011” to estimate the expenses you paid on your account during the period.
| Hypothetical Example for Comparison Purposes |
The second line of the table below provides information about hypothetical account values and hypothetical expenses based on the Funds’ actual expense ratios and an assumed rate of return of 5% per year before expenses, which is not the actual return of any of the Funds. The hypothetical account values and expenses may not be used to estimate the actual ending account balance or expenses you paid for the period. You may use this information to compare the ongoing costs of investing in the Funds and other funds. To do so, compare this 5% hypothetical example with the 5% hypothetical examples that appear in the shareholder reports of other funds.
Please note that the expenses shown in the table are meant to highlight your ongoing costs only and do not reflect any transactional costs, such as redemption fees. Therefore, the second line of the table is useful in comparing the ongoing costs only, and will not help you determine the relative total costs of owning different funds. In addition, if these transactional costs were included, your costs could have been higher.
| Expenses Paid During the Period | Beginning account value April 1, 2011 | Ending account value September 30, 2011 | Expenses paid for the six-month period ended September 30, 2011(1) |
| FOCUS FUND | | | | |
| Actual Example | $1,000.00 | $843.20 | | $5.94 |
| Hypothetical Example, assuming a 5% return before expenses | $1,000.00 | $1,018.56 | | $6.50 |
| | | | | |
| GROWTH FUND | | | | |
| Actual Example | $1,000.00 | $854.00 | | $6.09 |
| Hypothetical Example, assuming a 5% return before expenses | $1,000.00 | $1,018.43 | | $6.63 |
| | | | | |
21st CENTURY FUND | | | | |
| Actual Example | $1,000.00 | $755.80 | | $5.88 |
| Hypothetical Example, assuming a 5% return before expenses | $1,000.00 | $1,018.31 | | $6.75 |
| | | | | |
| INTERNATIONAL OPPORTUNITIES FUND | | | | |
| Actual Example | $1,000.00 | $780.70 | | $6.84 |
| Hypothetical Example, assuming a 5% return before expenses | $1,000.00 | $1,017.32 | | $7.74 |
| | | | | |
| FLEXIBLE CAPITAL FUND | | | | |
| Actual Example | $1,000.00 | $837.40 | | $6.34 |
| Hypothetical Example, assuming a 5% return before expenses | $1,000.00 | $1,018.10 | | $6.97 |
| | | | | |
| GLOBAL FUND | | | | |
| Actual Example | $1,000.00 | $788.50 | | $6.23 |
| Hypothetical Example, assuming a 5% return before expenses | $1,000.00 | $1,018.04 | | $7.03 |
| | | | | |
| EMERGING MARKETS FUND | | | | |
| Actual Example | $1,000.00 | $738.00 | | $7.63 |
| Hypothetical Example, assuming a 5% return before expenses | $1,000.00 | $1,016.23 | | $8.85 |
| (1) | Expenses are equal to the Funds’ annualized expense ratios (1.285% for the Focus Fund, 1.311% for the Growth Fund, 1.335% for the 21st Century Fund, 1.531% for the International Opportunities Fund, 1.377% for the Flexible Capital Fund, 1.389% for the Global Fund, and 1.750% for the Emerging Markets Fund), multiplied by the average account value over the period, multiplied by 183/365 (to reflect the six-month period). |
OTHER INFORMATION (Unaudited) |
The Funds exercise the voting rights associated with the securities held by the Funds under the proxy voting policy of the Funds. A description of those policies and procedures of the Funds and a record of the Funds’ proxy votes for the one-year period ended June 30, 2011 are available without charge, upon request, by calling 888-860-8686. It is also available on the Securities and Exchange Commission’s website at www.sec.gov.
| Quarterly Filing of Portfolio Holdings |
The Funds will file their complete schedule of investments with the SEC for the first and third quarters of each fiscal year on Form N-Q. The Funds’ Form N-Q will be available (i) on the SEC’s Website at www.sec.gov; (ii) at the SEC’s Public Reference Room; and (iii) by calling 800-SEC-0330.
| Corporate Dividends Received Deduction |
For the fiscal year ended September 30, 2011, 0%, 100%, 0%, 0%, 61%, 32%, and 0% of the dividends paid from net investment income qualifies for the dividends received deduction available to corporate shareholders of the Focus Fund, Growth Fund, 21st Century Fund, International Opportunities Fund, Flexible Capital Fund, Global Fund, and Emerging Markets Fund, respectively.
| Qualified Dividend Income |
Pursuant to Section 854 of the Internal Revenue Code of 1986, the Focus Fund, Growth Fund, 21st Century Fund, International Opportunities Fund, Flexible Capital Fund, Global Fund, and Emerging Markets Fund designate income dividends (in thousands) of $0, $473, $0, $5,944, $953, $776, and $0, respectively, as qualified dividend income paid during the fiscal year ended September 30, 2011.
Pursuant to the foreign tax credit election under Section 853 of the Internal Revenue Code of 1986, the International Opportunities Fund and Emerging Markets Fund, respectively designate (in thousands) $4,088 and $125 of income derived from foreign sources and $390 and $9 of foreign taxes paid, for the year ended September 30, 2011.
Of the ordinary income (including short-term capital gain) distributions made during the year ended September 30, 2011, the proportionate share of income derived from foreign sources and foreign taxes paid attributable to one share of stock are:
| | | |
| International Opportunities Fund | $0.2818 | $0.0269 |
| Emerging Markets Fund | $0.1920 | $0.0130 |
As of January 1, 2012, federal law requires that mutual fund companies must maintain and report a shareholder’s cost basis by tax lot, gain/loss information, and holding period of “covered” security sales to the Internal Revenue Service (“IRS”) on Form 1099. Covered securities, that are mutual fund shares, are shares acquired on or after January 1, 2012. A fund is not responsible for maintaining and reporting share information if such shares are not deemed “covered”.
The new tax regulations require that the Funds elect a default tax identification methodology in order to perform the required reporting. As a result, the Funds have chosen the first-in-first-out (“FIFO”) method as the default tax lot identification method for its shareholders. This is the method the Funds will use to determine which specific shares are deemed to be sold when a shareholder’s entire position is not sold in a single transaction and is the method in which “covered” share sales will be reported on a shareholder’s Form 1099.
However, at the time of purchase or upon the sale of “covered” shares, shareholders may choose a different tax lot identification method. Shareholders should consult a tax advisor with regard to their personal circumstances as the Funds and their service providers do not provide tax advice.
TRUSTEE AND OFFICER INFORMATION |
TRUSTEE AND OFFICER INFORMATION INDEPENDENT TRUSTEES
| Position(s) Held with the Trust | Term of Office(1) and Length of Time Served | Principal Occupation(s) During Past 5 Years | Number of Portfolios in Fund Complex Overseen by Trustee | Other Directorships Held by Trustee |
Jay S. Goodgold 1200 17th Street Suite 1600 Denver, CO 80202 DOB: 1954 | Trustee | Since February 2006; Lead Independent Trustee (since November 2010) | Private investor (July 2003 - present); Managing Director, Goldman, Sachs & Co. (August 1978 - June 2003). | 7 | None |
Elizabeth Hoffman 1200 17th Street Suite 1600 Denver, CO 80202 DOB: 1946 | Trustee | Since February 2006 | Executive Vice President and Provost, Iowa State University (January 2007 - present); President Emerita and Professor of Economics and Public Affairs, University of Colorado (August 2005 - December 2006); President, University of Colorado (September 2000 - July 2005). | 7 | None |
Walter A. Koelbel, Jr. 1200 17th Street Suite 1600 Denver, CO 80202 DOB: 1952 | Trustee | Since December 1997 | President, and other positions, Koelbel and Company (full service real estate, development, investment, and management company) (more than five years). | 7 | None |
Michael D. Rierson 1200 17th Street Suite 1600 Denver, CO 80202 DOB: 1952 | Trustee | Since November 1998 | Senior Vice President for Development, Colonial Williamsburg Foundation (January 2011 - present); Vice President and Vice Chancellor for University Advancement at the University of Houston and UH System, respectively (November 2005 - December 2010); President and Vice President, University of South Florida Foundation and University of South Florida (May 2001 - September 2005). | 7 | None |
Bruce E. Stangle 1200 17th Street Suite 1600 Denver, CO 80202 DOB: 1948 | Trustee | Since May 2010 | Chairman, Analysis Group, Inc. (economic consulting) (more than five years). | 7 | Director, Wellington Trust Company (Since 2001) |
Joseph T. Willett 1200 17th Street Suite 1600 Denver, CO 80202 DOB: 1951 | Trustee | Since November 2002 | Private investor (2002 - present); Chief Operating Officer, Merrill Lynch Europe (1998 - 2002). | 7 | None |
| (1) | Each Trustee serves an indefinite term until the election of a successor. Each Officer serves an indefinite term, renewed annually, until the election of a successor. |
The Statement of Additional Information includes additional information about the Trustees and is available upon request, without charge, by calling 888-860-8686 or visit www.marsicofunds.com.
TRUSTEE AND OFFICER INFORMATION |
TRUSTEE AND OFFICER INFORMATION INDEPENDENT TRUSTEES
| Position(s) Held with the Trust | Term of Office(1) and Length of Time Served | Principal Occupation(s) During Past 5 Years | Number of Portfolios in Fund Complex Overseen by Trustee | Other Directorships Held by Trustee |
Thomas F. Marsico(2) 1200 17th Street Suite 1600 Denver, CO 80202 DOB: 1955 | Trustee, President and Chief Executive Officer | Since December 1997 | Chief Executive Officer, Marsico Capital Management, LLC (more than five years). | 7 | None |
Christopher J. Marsico(2) 1200 17th Street Suite 1600 Denver, CO 80202 DOB: 1961 | Trustee, Executive Vice President and Chief Operating Officer | Trustee (August 2007 – March 2010 and since May 2010); Vice President and Treasurer (September 2002 – May 2010); Executive Vice President and Chief Operating Officer (since May 2010) | President, Marsico Capital Management, LLC (more than five years). | 7 | None |
Neil L. Gloude, CPA 1200 17th Street Suite 1600 Denver, CO 80202 DOB: 1961 | Vice President, Secretary and Treasurer | Vice President and Secretary (Since May 2008); Treasurer (since May 2010) | Executive Vice President, Chief Financial Officer and Treasurer, Marsico Capital Management, LLC (September 2007 - present); Partner, PricewaterhouseCoopers LLP (public accounting firm) (January 1999 - August 2007). | N/A | N/A |
David C. Price, CPA 1200 17th Street Suite 1600 Denver, CO 80202 DOB: 1969 | Chief Compliance Officer | Since August 2004 | Chief Compliance Officer, The Marsico Investment Fund, and Director of Compliance, Marsico Capital Management, LLC (more than five years). | N/A | N/A |
Sander M. Bieber 1775 I Street, N.W. Washington, D.C. 20006 DOB: 1950 | Assistant Secretary | Since December 1997 | Partner, Dechert LLP (law firm) (more than five years). | N/A | N/A |
TRUSTEE AND OFFICER INFORMATION
| (1) | Each Trustee serves an indefinite term until the election of a successor. Each Officer serves an indefinite term, renewed annually, until the election of a successor. |
| (2) | Mr. Thomas Marsico and Mr. Christopher Marsico are considered Interested Trustees of the Trust, within the meaning of the 1940 Act, because of their affiliation with Marsico Capital Management, LLC, the investment adviser to the Funds. Mr. Thomas Marsico and Mr. Christopher Marsico are brothers. |
| | The Statement of Additional Information includes additional information about the Trustees and is available upon request, without charge, by calling 888-860-8686 or visit www.marsicofunds.com. |
NOTES
The Marsico Investment Fund UMB Distribution Services, LLC, Distributor P.O. Box 3210, Milwaukee, WI 53201-3210 www.marsicofunds.com • 888.860.8686 ©2011 MARSICO CAPITAL MANAGEMENT, LLC Not authorized for distribution unless preceded or accompanied by an effective Marsico Funds prospectus. |
Item 2 - Code of Ethics.
| (a) | The Registrant, as of the end of the period covered by this report, has adopted a code of ethics that applies to the Registrant’s principal executive officer, principal financial officer, principal accounting officer or controller, or persons performing similar functions, regardless of whether these individuals are employed by the Registrant or a third party. A copy of this code of ethics is attached hereto as Exhibit (a). |
| (c) | There were no amendments, during the period covered by this report, to a provision of the code of ethics that applies to the Registrant’s principal executive officer, principal financial officer, principal accounting officer or controller, or persons performing similar functions, regardless of whether these individuals are employed by the Registrant or a third party, and that relates to any element of the code of ethics description. |
| (d) | The Registrant has not granted any waivers, including an implicit waiver, from a provision of the code of ethics that applies to the Registrant’s principal executive officer, principal financial officer, principal accounting officer or controller, or persons performing similar functions, regardless of whether these individuals are employed by the Registrant or a third party, that relates to one or more of the items set forth in paragraph (b) of this item’s instructions. |
| (f) | See attached Exhibit (a). |
Item 3 - Audit Committee Financial Expert.
| (a)(1) | The Registrant’s Board of Trustees has determined that the Registrant has at least one audit committee financial expert serving on its audit committee. |
| (a)(2) | Mr. Joseph T. Willett is the audit committee financial expert. Mr. Willett is “independent” under the applicable rules. |
Item 4 - Principal Accountant Fees and Services.
In each of the fiscal years ended September 30, 2011 and September 30, 2010, the aggregate Audit Fees billed (or to be billed) by PricewaterhouseCoopers LLP (PwC) for professional services rendered for the audits of the financial statements, or services that are normally provided in connection with statutory and regulatory filings or engagements as well as reimbursable expenses are listed below.
In each of the fiscal years ended September 30, 2011 and September 30, 2010, the aggregate Audit-Related Fees billed (or to be billed) by PwC for services rendered for assurance and related services to each fund that are reasonably related to the performance of the audit or review of the fund's financial statements, but not reported as Audit Fees, are shown in the table below.
In each of the fiscal years ended September 30, 2011 and September 30, 2010 the aggregate Tax Fees billed (or to be billed) by PwC for professional services rendered for tax compliance, tax advice, and tax planning are shown in the table below.
All of these fees were approved by the Trust’s Audit Committee as required pursuant to paragraph (c)(7)(ii) of Rule 2-01 of Regulation S-X.
Fees included in the Tax Fees category comprise all services performed by professional staff in the independent registered public accounting firm's tax division except those services related to the audit. Typically, this category would include fees for tax compliance, tax planning, and tax advice. Tax compliance, tax advice, and tax planning services include preparation of original and amended tax returns, claims for refund and tax payment-planning services, assistance with tax audits and appeals, tax advice related to mergers and acquisitions and requests for rulings or technical advice from taxing authorities.
In each of the fiscal years ended September 30, 2011 and September 30, 2010 the aggregate Other Fees billed (or to be billed) by PwC for all other non-audit services rendered are shown in the table below.
| (e) (1) | Audit Committee Pre-Approval Policies and Procedures: |
Pursuant to the Trust’s Audit Committee Charter and Policies and Procedures (collectively, the “Procedures”), the Audit Committee has adopted pre-approval policies and procedures to govern the pre-approval of (i) all audit services and permissible non-audit services to be provided to the Trust by its independent accountant, and (ii) all permissible non-audit services to be provided by such independent accountant to the Trust’s investment adviser and to any entity controlling, controlled by or under common control with the investment adviser that provides on-going services to the Trust (collectively, any “Service Affiliates”) if the engagement directly relates to the Trust’s operations and financial reporting.
In accordance with the Procedures, the Committee is responsible for the engagement of the independent accountant to certify the Trust’s financial statements for each fiscal year. With respect to the pre-approval of non-audit services provided to the Trust and its Service Affiliates, the Procedures provide that the Committee may pre-approve such services on a project-by-project basis as they arise. The Procedures also permit the Committee to delegate authority to the Audit Committee Chairman (the “Designated Member”) to pre-approve any proposed non-audit services that have not been previously approved by the Committee, subject to certain conditions. Any action by the Designated Member in approving a requested non-audit service shall be presented to the Audit Committee not later than at its next scheduled meeting. If the Designated Member does not approve the independent auditor’s provision of a requested non-audit service, the matter may be presented to the full Committee for its consideration and action.
| (e)(2) | Services approved pursuant to paragraph (c)(7)(i)(C) of Rule 2-01 of Regulation S-X: |
100% of these fees were approved by the Trust’s Audit Committee as required pursuant to paragraph (c)(7)(ii) of Rule 2-01 of Regulation S-X.
| (f) | According to PwC for the fiscal year ended September 30, 2011, the percentage of hours spent on the audit of the Marsico Funds’ financial statements for the most recent fiscal year that were attributed to work performed by persons who are not full-time, permanent employees of PwC is as follows: |
| PwC | 2011 |
| Work performed by persons who are not full-time | 0% |
| (g) | In each of the fiscal years ended September 30, 2011 and September 30, 2010, the aggregate fees billed (or to be billed) by PwC relating to non-audit services that were rendered to the Trust, to its investment adviser, and to any entity controlling, controlled by, or under common control with the investment adviser and that provides ongoing services to the Trust are shown in the table below. |
For the fiscal years ended September 30, 2011 and September 30, 2010, there were no non-audit services provided by PwC to the Trust, its investment adviser, or to any entity controlling, controlled by, or under common control with the investment adviser. For the fiscal years ended 2011 and 2010, fees in the amount of $0 and $30,250 respectively, have been billed by PwC for audit-related services provided to the investment adviser of the Trust.
| (h) | All non-audit services of the specified type (services that were provided by PwC to the investment adviser and to any entity controlling, controlled by, or under common control with the investment adviser and that provides ongoing services to the Trust) were pre-approved. |
Item 5 - Audit Committee of Listed Registrants.
Not applicable.
Item 6 - Schedule of Investments.
The schedule of investments in securities of unaffiliated issuers is included as part of the report to shareholders filed under Item 1.
| Item 7 - Disclosure of Proxy Voting Policies and Procedures for Closed-End Management Investment Companies. |
Not applicable.
Item 8 – Portfolio Managers of Closed-End Management Investment Companies.
Not applicable.
Item 9 – Purchases of Equity Securities by Closed-End Management Investment Company and Affiliated Purchasers.
Not applicable.
Item 10 – Submission of Matters to a Vote of Security Holders.
Not applicable.
Item 11 - Controls and Procedures.
| (a) | The registrant's principal executive officer and principal financial officer have concluded that the registrant's disclosure controls and procedures (as defined in Rule 30a-3(c) under the Investment Company Act of 1940, as amended) are effective based on their evaluation of these disclosure controls and procedures within 90 days of the filing date of this report on Form N-CSR. |
| (b) | There were no significant changes in the registrant's internal control over financial reporting (as defined in Rule 30a-3(d) under the Investment Company Act of 1940, as amended) that occurred during the second fiscal half-year covered by this report that has materially affected, or is reasonably likely to materially affect, the registrant’s internal control over financial reporting. |
Item 12 – Exhibits.
| (a)(1) | Code of Ethics - Filed as an attachment to this filing. |
| (a)(2) | Certification for each principal executive and principal financial officer of the registrant as required by Rule 30a-2(a) under the Act (17 CFR 270.30a-2(a)). Filed as an attachment to this filing. |
| (a)(3) | Any written solicitation to purchase securities under Rule 23c-1 under the Investment Company Act of 1940, as amended, that was sent or given during the period covered by the report by or on behalf of the registrant to 10 or more persons. |
Not applicable.
| (b) | Certifications required by Rule 30a-2(b) under the Act (17 CFR 270.30a-2(b)), Rule 13a-14(b) or Rule 15d-14(b) under the Exchange Act (17 CFR 240.13a-14(b) or 240.15d-14(b)), and Section 1350 of Chapter 63 of Title 18 of the United States Code (18 U.S.C. 1350) – Filed as an attachment to this filing. Filed as an attachment to this filing. |
SIGNATURES
Pursuant to the requirements of the Securities Exchange Act of 1934 and the Investment Company Act of 1940, the registrant has duly caused this report to be signed on its behalf by the undersigned, thereunto duly authorized.
The Marsico Investment Fund
| By: | /s/ Christopher J. Marsico |
| | Christopher J. Marsico |
| | Executive Vice President and Chief Operating Officer |
| | |
| Date: | November 29, 2011 |
Pursuant to the requirements of the Securities Exchange Act of 1934 and the Investment Company Act of 1940, this report has been signed below by the following persons on behalf of the registrant and in the capacities and on the dates indicated.
| By: | /s/ Christopher J. Marsico |
| | Christopher J. Marsico |
| | Executive Vice President and Chief Operating Officer |
| | |
| Date: | November 29, 2011 |
| | |
| | |
| By: | /s/ Neil L. Gloude |
| | Neil L. Gloude |
| | Vice President, Secretary and Treasurer |
| | |
| Date: | November 29, 2011 |