UNITED STATES
SECURITIES AND EXCHANGE COMMISSION
Washington, D.C. 20549
FORM N-CSR
CERTIFIED SHAREHOLDER REPORT OF
REGISTERED MANAGEMENT INVESTMENT COMPANIES
Investment Company Act file number 811-08397
THE MARSICO INVESTMENT FUND
(Exact name of registrant as specified in charter)
1200 17th Street, Suite 1600
(Address of principal executive offices)(Zip code)
Christopher J. Marsico
The Marsico Investment Fund
1200 17th Street, Suite 1600
(Name and address of agent for service)
Copies to:
Sander M. Bieber, Esq.
Dechert LLP
1775 I Street, N.W.
Washington, D.C. 20006
Registrant's telephone number, including area code: (303)454-5600
Date of fiscal year end: September 30
Date of reporting period: September 30, 2014
Item 1 – Reports to Stockholders.
DEAR SHAREHOLDER:
Enclosed is your annual report for The Marsico Investment Fund, encompassing the fiscal year from October 1, 2013 to September 30, 2014.
The purpose of this report is to provide a review of the Marsico Funds’ one-year investment results by discussing what we believe were the main areas that impacted performance – including the macroeconomic environment, sector and industry positioning, and individual stock selection – as compared to the Funds’ performance benchmark indexes. For updated information regarding the market environment and the Funds’ overall investment postures and performance, please refer to the Funds’ most recent monthly fact sheets and quarterly investment updates, which are available in the Investor Resources section of the Funds’ website at www.marsicofunds.com.(1)
NOTE REGARDING CHANGES TO THE MARSICO INVESTMENT TEAM
Effective August 22, 2014, Thomas F. Marsico, previously co-manager of the Marsico Global Fund, assumed sole portfolio manager responsibility for the Marsico Global Fund. Effective on the same date, Munish Malhotra, CFA, previously co-manager of the Marsico International Opportunities Fund, assumed sole portfolio manager responsibility for the Marsico International Opportunities Fund. On and after that date, James G. Gendelman no longer served as co-manager of either Fund.
| (1) | The references to the Marsico Funds website (www.marsicofunds.com) included throughout this annual report do not incorporate the website’s contents into this report. |
| | KEY FUND STATISTICS | 2 | |
| | MARKET ENVIRONMENT | 5 | |
| | | | |
| | |
| | Investment Review | 6 | |
| | Fund Overview | 9 | |
| | Schedule of Investments | 10 | |
| | | | |
| | |
| | Investment Review | 6 | |
| | Fund Overview | 11 | |
| | Schedule of Investments | 12 | |
| | | | |
| | MARSICO 21st CENTURY FUND |
| | Investment Review | 14 | |
| | Fund Overview | 16 | |
| | Schedule of Investments | 17 | |
| | | | |
| | MARSICO INTERNATIONAL OPPORTUNITIES FUND |
| | Investment Review | 19 | |
| | Fund Overview | 21 | |
| | Schedule of Investments | 22 | |
| | | | |
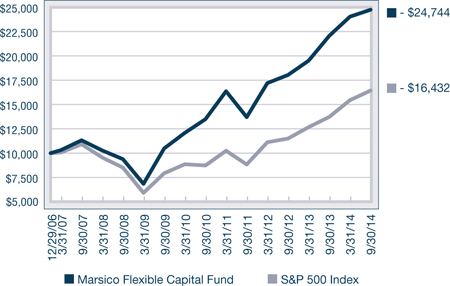
| | MARSICO FLEXIBLE CAPITAL FUND |
| | Investment Review | 24 | |
| | Fund Overview | 26 | |
| | Schedule of Investments | 27 | |
| | | | |
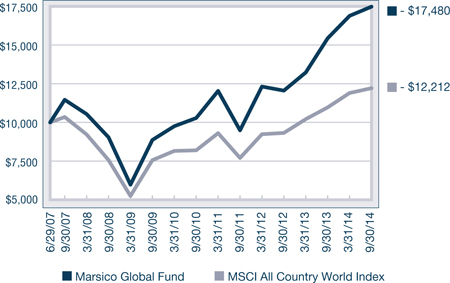
| | |
| | Investment Review | 29 | |
| | Fund Overview | 31 | |
| | Schedule of Investments | 32 | |
| | | | |
| | FINANCIAL STATEMENTS | 34 | |
| | NOTES TO FINANCIAL STATEMENTS | 44 | |
| | REPORT OF INDEPENDENT REGISTERED PUBLIC ACCOUNTING FIRM | 52 | |
| | EXPENSE EXAMPLE | 53 | |
| | OTHER INFORMATION | 54 | |
| | TRUSTEE AND OFFICER INFORMATION | 55 | |
KEY FUND STATISTICS (UNAUDITED) |
Marsico Focus Fund | Marsico Growth Fund | Marsico 21st Century Fund |
| | MFOCX | | | MGRIX | | | MXXIX | |
| For additional disclosures, please see page 9. | For additional disclosures, please see page 11. | For additional disclosures, please see page 16. |
PERFORMANCE COMPARISON(1) | PERFORMANCE COMPARISON(1) | PERFORMANCE COMPARISON(1) |
 |  |  |
TOTAL ANNUAL OPERATING EXPENSES* 1.36% | TOTAL ANNUAL OPERATING EXPENSES* 1.37% | TOTAL ANNUAL OPERATING EXPENSES* 1.46% |
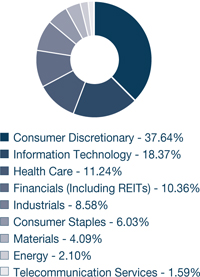
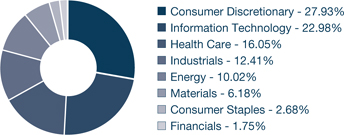
SECTOR ALLOCATION(2) | SECTOR ALLOCATION(2) | SECTOR ALLOCATION(2) |
 |  |  |
| TOP FIVE HOLDINGS | TOP FIVE HOLDINGS | TOP FIVE HOLDINGS |
| 8.50% | | 6.63% | | 5.21% |
| 6.15% | FACEBOOK, INC. - CL. A | 5.15% | | 4.89% |
| 5.42% | CANADIAN PACIFIC RAILWAY LTD. | 4.75% | | 3.59% |
CANADIAN PACIFIC RAILWAY LTD. | 5.25% | UNION PACIFIC CORPORATION | 4.06% | SCHLUMBERGER LTD. | 3.58% |
ALIBABA GROUP HOLDING LTD. SPON. ADR | 4.15% | STARWOOD HOTELS & RESORTS WORLDWIDE, INC. | 3.88% | | 3.29% |
For additional disclosures about the Marsico Funds, please see page 4. The performance data quoted here represent past performance, and past performance is not a guarantee of future results. Investment return and principal value of an investment will fluctuate so that an investor’s shares, when redeemed, may be worth more or less than their original cost.
KEY FUND STATISTICS (UNAUDITED) |
Marsico International Opportunities Fund | Marsico Flexible Capital Fund | Marsico Global Fund |
| | MIOFX | | | MFCFX | | | MGLBX | |
| For additional disclosures, please see page 21. | For additional disclosures, please see page 26. | For additional disclosures, please see page 31. |
PERFORMANCE COMPARISON(1) | PERFORMANCE COMPARISON(1) | PERFORMANCE COMPARISON(1) |
 |  |  |
TOTAL ANNUAL OPERATING EXPENSES* 1.74% NET EXPENSES*† 1.60% | TOTAL ANNUAL OPERATING EXPENSES* 1.47% | TOTAL ANNUAL OPERATING EXPENSES* 1.86% NET EXPENSES*† 1.60% |
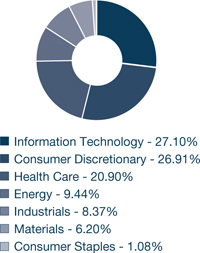
SECTOR ALLOCATION(2) | SECTOR ALLOCATION(2) | SECTOR ALLOCATION(2) |
 |  |  |
| TOP FIVE HOLDINGS | TOP FIVE HOLDINGS | TOP FIVE HOLDINGS |
LIBERTY GLOBAL PLC - SERIES C | 4.62% | | 4.46% | | 6.86% |
CANADIAN PACIFIC RAILWAY LTD. | 4.49% | | 4.23% | CANADIAN PACIFIC RAILWAY LTD. | 5.50% |
| 4.32% | | 4.04% | | 5.20% |
| 4.00% | UNION PACIFIC CORPORATION | 4.04% | | 4.40% |
| 3.56% | | 3.77% | | 4.20% |
Current performance may be lower or higher than the performance information quoted. To obtain performance information current to the most recent month-end, please call 888-860-8686 or visit www.marsicofunds.com.
KEY FUND STATISTICS (UNAUDITED) |
ADDITIONAL DISCLOSURES ABOUT THE MARSICO FUNDS
| * | The Total Annual Operating Expenses and Net Expenses are reflective of the information disclosed in the Funds’ Prospectus dated January 31, 2014. The information may differ from the expense ratios disclosed in this report. |
| † | Marsico Capital Management, LLC (the “Adviser”) has entered into a written expense limitation and fee waiver agreement under which it has agreed to limit the total expenses of each of the International Opportunities Fund and the Global Fund (excluding interest, taxes, acquired fund fees and expenses, litigation, brokerage and extraordinary expenses) to an annual rate of 1.60% of each Fund’s average net assets until January 31, 2015. This expense limitation and fee waiver agreement may be terminated by the Adviser at any time after January 31, 2015, upon 15 days prior notice to the Fund and its administrator. The Adviser may recoup from a Fund fees previously waived or expenses previously reimbursed by the Adviser with respect to that Fund pursuant to this agreement (or a previous expense limitation agreement) if such reimbursement does not cause the Fund to exceed the expense limitation currently in effect and the reimbursement is made within three years after the year in which the Adviser waived the fee or reimbursed the expense. |
| (1) | The performance data quoted here represent past performance, and past performance is not a guarantee of future results. Investment return and principal value of an investment will fluctuate so that an investor’s shares, when redeemed, may be worth more or less than their original cost. Current performance may be lower or higher than the performance information quoted. To obtain performance information current to the most recent month-end, please call 888-860-8686 or visit www.marsicofunds.com. |
The performance included in the chart does not reflect the deduction of taxes on Fund distributions or the redemption of Fund shares.
All indices are unmanaged and investors cannot invest directly in an index.
The performance returns for the 21st Century Fund (for the period prior to March 31, 2004), the International Opportunities Fund (for the period prior to September 30, 2004 and from October 2011 through December 2013), the Flexible Capital Fund (for the period prior to February 1, 2011), and the Global Fund (for the period prior to January 1, 2009, from April 2009 through May 2009 and from January 2012 through September 2014) reflect a fee waiver in effect; in the absence of such a waiver, the returns would be reduced. The performance returns for the 21st Century Fund (for the period from April 2004 through January 2005), the International Opportunities Fund (for the period from October 2004 through December 2005 and from January 2014 through September 2014), and the Global Fund (for the one-month period June 2009) would have been higher but for the reimbursement of fees waived previously.
| (2) | Sector weightings represent the percentage of the respective Fund’s investments (excluding cash equivalents) in certain general sectors. These sectors may include more than one industry. The Fund’s portfolio composition is subject to change at any time. |
MARKET ENVIRONMENT: OCTOBER 2013 – SEPTEMBER 2014 (UNAUDITED)
Global equity markets advanced to post positive returns for the one-year fiscal period that ended September 30, 2014. The rise in stock prices occurred even as investors grappled with concerns about US Federal Reserve (“Fed”) policy, slower growth in emerging markets and many developed markets, rising equity valuations, mixed US economic data and geopolitical tensions in Ukraine, sectarian violence in Iraq, and protests in Hong Kong.
Despite a string of weak job gains at the end of 2013 and a difficult winter, which were temporarily reflected in weak retail sales, construction activity and the housing market, the US economy expanded at a slow, but respectable pace during the year overall. Large capitalization US equities, as measured by the S&P 500 Index, significantly outperformed small capitalization stocks, as measured by the Russell 2000 Index. Equities of smaller capitalization stocks were under pressure during the period on concerns that valuations were stretched and that smaller companies, due to borrowing needs, may be more vulnerable to a rising interest rate environment.
International developed equity markets, as measured by the MSCI EAFE Index, posted a return that, while positive, lagged many US equity indices. Economic data in Europe and Japan was generally weak. European growth numbers remained soft as the region continued to struggle with high unemployment levels and near zero inflation. Japan’s economy, meanwhile, slowed after a large sales tax took effect in spring. China and Brazil, major players in the emerging markets, also exhibited evidence of slowdowns. Brazil showed signs of strain as inflation and consumer debt levels increased. China’s economic slowdown continued as industrial output declined and property markets slumped.
Index Name(1) | Universe of Equities Represented | One-Year Total Return |
| US | | |
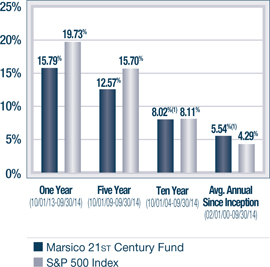
| S&P 500 | US large-capitalization equities | +19.73% |
| Russell 3000 | US publicly-traded equities of all sizes | +17.76% |
| Russell 2000 | US small-capitalization equities | +3.93% |
| Russell Mid-Cap | US medium-capitalization equities | +15.83% |
Index Name(1) | Universe of Equities Represented | One-Year Total Return |
| INTERNATIONAL | |
| MSCI EAFE (US$) | Equities in developed international equity markets, including Japan, Western Europe, and Australasia | +4.25% |
| MSCI Emerging Markets (US$) | Equities in developing international equity markets, including China, India, Eastern Europe, and Latin America | +4.30% |
| MSCI ACWI (US$) | Equities in the global developed and emerging markets | +11.32% |
The one-year fiscal period ended September 30, 2014 was a volatile period for many currencies. During the period, the US dollar appreciated, reflecting better than expected news in the US, and dimming prospects in Europe and the developing world as well as other geopolitical concerns. Emerging market currencies generally sold off due to economic instability and the potential effect of the Fed’s tapering of monetary stimulus to limit flows available to emerging economies. The Japanese yen weakened as Japanese policymakers continued initiatives to end Japan’s deflation. The stronger US dollar was a mixed blessing that generally pushed oil and other commodity prices down, benefitted US consumers and manufacturers, and penalized resource producers, US exporters, and US investors in foreign markets.
THE MARSICO INVESTMENT TEAM
| (1) | All indices are unmanaged and investors cannot invest directly in an index. |
INVESTMENT REVIEW BY TOM MARSICO AND CORALIE WITTER (UNAUDITED)
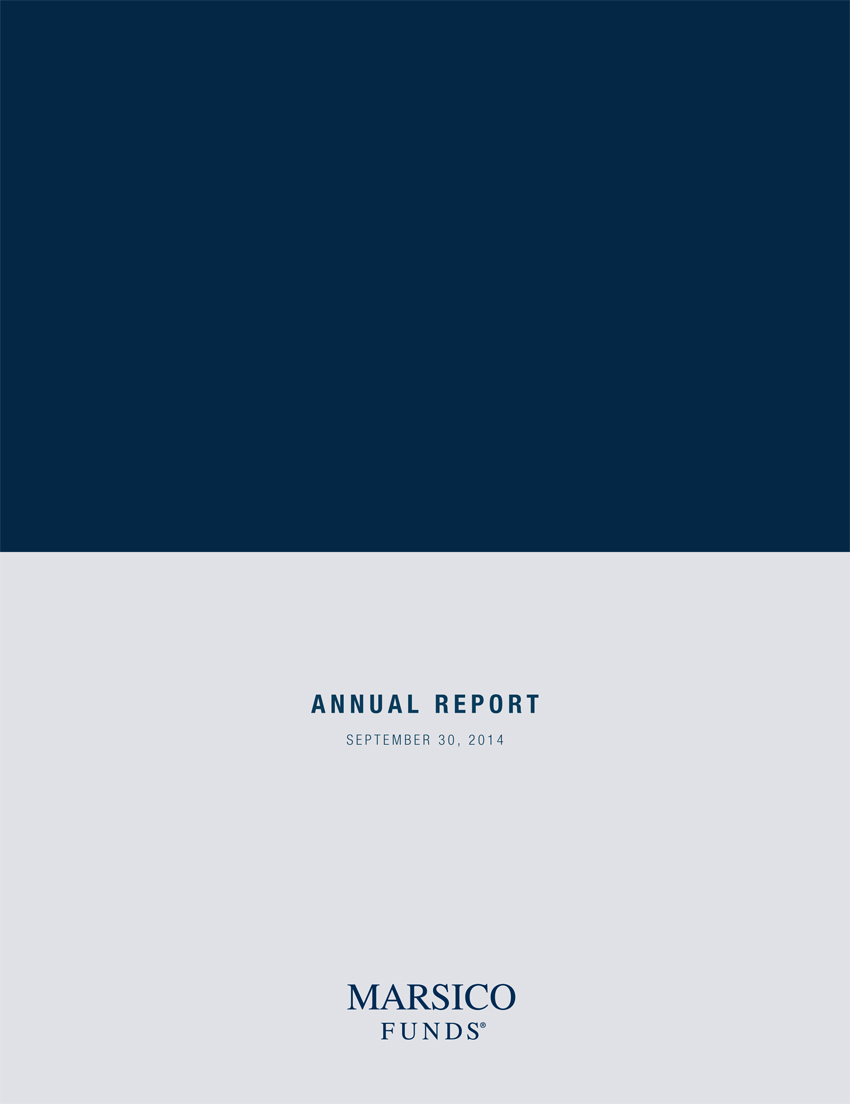
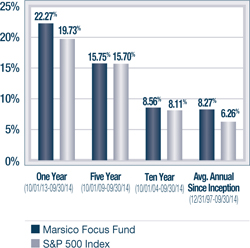
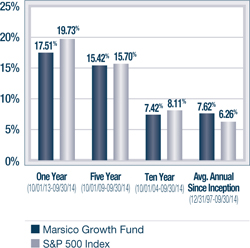
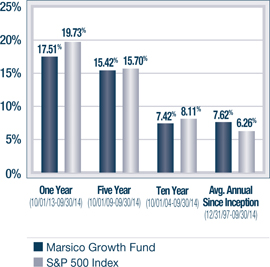
The Marsico Focus Fund and the Marsico Growth Fund posted total returns of +22.27% and +17.51%, respectively, for the one-year fiscal period ended September 30, 2014. For comparative purposes, the S&P 500 Index had a total return of +19.73% over that same time period. Please see the Funds’ Overviews immediately following this commentary for more detailed information about each Fund’s longer-term performance for various periods ended September 30, 2014.
The performance data for the Funds quoted here represent past performance, and past performance is not a guarantee of future results. Investment return and principal value of an investment will fluctuate so that an investor’s shares, when redeemed, may be worth more or less than their original cost. Current performance may be lower or higher than the performance information quoted. To obtain performance information current to the most recent month-end, please call 888-860-8686 or visit www.marsicofunds.com.(1)
This review highlights Fund performance over a one-year fiscal period. Shareholders should keep in mind that the Funds are intended for long-term investors who hold their shares for substantially longer periods of time. You should also keep in mind that our views on all investments discussed in this report are subject to change at any time. References to specific securities, industries, and sectors discussed in this report are not recommendations to buy or sell such securities or related investments, and the Funds may not necessarily hold these securities or investments today. Please see the accompanying Schedules of Investments for the percentage of each Fund’s portfolio represented by the securities mentioned in this report as of the end of the reporting period.
The Focus Fund is non-diversified and may hold fewer securities than a diversified fund because it is permitted to invest a greater percentage of its assets in a smaller number of securities. Holding fewer securities increases the risk that the value of the Fund could go down because of the poor performance of a single investment. The Funds are subject to broad risks associated with investing in equity securities markets generally, including the risks that the securities and markets in which they invest may experience volatility and instability, that domestic and global economies and markets may undergo periods of cyclical change and decline, that investors may at times avoid investments in equity securities, and that investments may not perform as anticipated. Please see the Prospectus for more information.
The Focus Fund and the Growth Fund often invest in similar growth companies. Their performance may differ, however, because of a variety of factors. Among other factors, the Focus Fund is a non-diversified mutual fund that may invest in a more concentrated portfolio and may hold the securities of fewer issuers than the Growth Fund, which is a diversified Fund. As a result, the Focus Fund may hold some securities that are different from those held by the Growth Fund, and the Focus Fund may be more exposed to individual stock volatility than the Growth Fund or other mutual funds that invest in a relatively larger number of securities.
FOCUS FUND
The Marsico Focus Fund’s outperformance versus the S&P 500 Index for the one-year fiscal period ended September 30, 2014 was primarily attributable to stock selection and an overweight allocation to the Health Care sector, as defined in the Global Industry Classification Standard (“GICS”)(2). The Fund maintained significant investments in the Health Care sector given the paradigm shift that we saw taking place within the biotechnology industry. Positions in the Pharmaceuticals, Biotechnology & Life Sciences industry, such as Gilead Sciences, Inc. (+69%), Biogen Idec Inc. (+38%), and Pacira Pharmaceuticals, Inc. (+46%) were major contributors to performance. All three companies offer what we believe are innovative products with large markets, and currently appear to have compelling new product pipelines. Health Care was one of the strongest performing sectors of the S&P 500 Index during the reporting period and the Fund benefitted from having an overweight allocation to the sector.
Canadian Pacific Railway Ltd. (+68%) was the Fund’s leading holding within the Industrials sector. Despite a challenging period of harsh winter weather, the railroad continued to improve its operations and cut costs.
Stock selection in the Consumer Discretionary sector was mixed. Media holding The Walt Disney Company (+40%) and hospitality company Starwood Hotels & Resorts Worldwide, Inc. (+32%) generated strong returns. Several other holdings in the sector struggled, however. Coffee company Starbucks Corporation (-2%) experienced stock price pressure as global coffee prices rose. Athletic apparel retailer lululemon athletica, inc. (-17% prior to being sold), like many other retailers, was hurt by exceptionally harsh winter weather in a number of its core markets. Further, the company faced several challenges including supply chain issues and a change in CEO. While lululemon has a strong brand and compelling opportunities to expand into new markets, we felt it prudent to exit the position and monitor the company for evidence of its success in managing its supply chain more effectively and its new CEO’s ability to execute. The Fund sold its position in discount retailer The TJX Companies, Inc. (-8% prior to being sold) as we became concerned about the competitive retail environment. From a sector allocation standpoint, the Fund’s performance was hampered by maintaining a significant overweight allocation to the Consumer Discretionary sector, as it was a weak-performing sector of the benchmark index.
The Fund’s Information Technology holdings also posted mixed performance results. Social media company Facebook, Inc. – Cl. A soared +57% and Internet services company Google, Inc. – Cl. A rose +35%. Both companies have gained market share as advertising dollars migrate from traditional media to online. The Fund purchased Alibaba Group Holding Ltd. Spon. ADR on its September 19, 2014 initial public offering and subsequently added modestly to the position. As of September 30, Alibaba had posted a return of +30%. Alibaba is China’s largest ecommerce company. We see Alibaba as an ecosystem that aims to remove friction from the flow of commerce globally. Alibaba’s business is multi-faceted, with elements related to Internet services, online advertising, electronic commerce, payment processing, and logistics.
While several Fund holdings within the Information Technology sector posted strong gains, others generated weak performance results. Cloud-based customer relationship manager services company salesforce.com, inc. declined -6% prior to being sold from the Fund. ASML Holding N.V., a leading Dutch semiconductor equipment provider of advanced lithography systems used in chip manufacturing, posted a return of just +0.7%. ASML’s stock price weakened after announcing a delay in introducing its new extreme ultraviolet technology tools used in chip manufacturing. The Fund re-established a position in Apple, Inc. (+3%) late in the reporting period. While Apple posted a modest, positive return, its performance did not keep pace with the overall return of the benchmark index.
The Fund’s Financials holdings posted a collective return of +10% during the period. While positive, the return lagged the +19% gain of the S&P 500 Index Financials sector. Fund positions in Citigroup, Inc. (+0.8%) and American International Group, Inc. (+0.6%) posted returns that were essentially flat prior to the sale of both securities from the Fund.
During the reporting period, the Fund reduced its exposure to the Financials, Industrials, and Consumer Discretionary sectors while increasing its allocations to the Information Technology, Energy, and Health Care sectors.
GROWTH FUND
Although the Marsico Growth Fund generated a strong positive return, it underperformed the S&P 500 Index for the one-year fiscal period ended September 30, 2014.
Stock selection and an overweight allocation to the Consumer Discretionary sector detracted from performance results. Athletic apparel retailer lululemon athletica, inc. (-36% prior to being sold) was the largest individual detractor from performance during the period. As compared to the Focus Fund, the Growth Fund held its position in lululemon longer, and the Growth Fund’s performance was negatively impacted as the company’s stock price posted further declines before being sold. Discount retailer The TJX Companies, Inc. (-7% prior to being sold) and media holding CBS Corporation – Cl. B (-2%) also posted weak returns. From a sector allocation standpoint, the Growth Fund’s performance was hampered by maintaining a significant overweight allocation to the Consumer Discretionary sector, as it was a weak-performing sector of the benchmark index.
Similar to the Focus Fund, the Growth Fund’s stock selection in the Information Technology sector posted mixed results. Social networking position LinkedIn Corporation – Cl. A (-40%) declined sharply after the company lowered its growth forecast. The Fund maintained an investment in the company as we believe LinkedIn is an innovative social media platform poised to grow user engagement and better monetize its content going forward. Apple, Inc. (+3%) and semiconductor company ASML Holding N.V. (+7%) posted modest positive returns that trailed the performance of the benchmark index. A portion of the negative stock selection effect was offset by strong performance of other Fund technology holdings, including Facebook, Inc. – Cl. A (+57%) and Google, Inc. – Cl. A (+35%). Like the Focus Fund, the Growth Fund purchased Alibaba Group Holding Ltd. Spon. ADR at the company’s IPO and subsequently added slightly to the position. Alibaba’s return to the Fund was +30% as of period end.
Also like the Focus Fund, the Growth Fund’s stock selection in the Financials sector was weak. Citigroup, Inc. (-0.2%) and American International Group, Inc. (-0.3%) posted modest negative returns prior to being sold from the Fund.
FOCUS FUND & GROWTH FUND
The Growth Fund’s Materials holdings posted a collective return of +16% during the period. While positive, the return lagged the +20% gain of the S&P 500 Index Materials sector. Agricultural materials holding Monsanto Company (+9%) produced a positive return, but was the primary detractor within the sector.
There were several areas of strength for the Fund during the period. The Fund’s Health Care positions, particularly Gilead Sciences, Inc. (+70%) and Biogen Idec Inc. (+38%) aided performance. Gilead’s newly launched hepatitis C therapy, Sovaldi, experienced strong sales during the period. Biogen’s stock price rose on strong performance of its new Multiple Sclerosis treatment, Tecfidera.
Within the Industrials sector, the Fund’s railroad operator positions in Canadian Pacific Railway Ltd. (+69%) and Union Pacific Corporation (+42%) were material contributors to performance.
The Fund’s stock selection and positioning in the Consumer Staples sector further aided performance. The Fund benefitted from having few investments in Consumer Staples, as it was a weaker-performing sector of the benchmark index. The Fund further benefitted from stock selection within that sector. Keurig Green Mountain, Inc. soared +71% during the period. The company’s stock price rose sharply on the company’s announcement of a partnership with Coca-Cola.
From a sector allocation standpoint, during the fiscal period, the Fund increased its exposure to the Energy, Information Technology, Health Care, and Consumer Staples sectors while reducing its exposure to Financials, Industrials, Consumer Discretionary, and Materials.
Fiscal Period-End Investment Posture
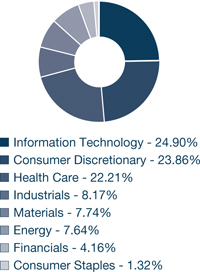
As of September 30, 2014, the Focus Fund’s and the Growth Fund’s largest sector allocations included Consumer Discretionary, Information Technology, Health Care, Industrials, Energy, and Materials. The Funds had no exposure to the Utilities or Telecommunication Services sectors.
Sincerely,
THOMAS F. MARSICO
CORALIE T. WITTER, CFA
PORTFOLIO MANAGERS
| (1) | Total returns are based on net change in net asset value assuming reinvestment of distributions. Please see the Prospectus for more information. |
| (2) | Regarding GICS data cited throughout this report, the Global Industry Classification Standard (“GICS”) was developed by and is the exclusive property and service mark of MSCI Inc. (“MSCI”) and Standard & Poor’s (“S&P”) and is licensed for use by Marsico Capital Management, LLC (the “Adviser”). Neither MSCI, S&P, nor the Adviser or any third party involved in compiling GICS makes any express or implied warranties or representations with respect to such standard or classification (or the results from use thereof), and all such parties hereby expressly disclaim all warranties of originality, accuracy, completeness, merchantability and fitness for a particular purpose with respect to any such standard or classification. MSCI, S&P, the Adviser, and any of their affiliates or third parties involved in compiling GICS shall not have any liability for any direct, indirect, special, punitive, consequential or any other damages (including lost profits) even if notified of the possibility of such damages. |
September 30, 2014 (Unaudited)
The Focus Fund invests primarily in the common stocks of large companies that are selected for their long-term growth potential. The Fund will normally hold a core position of between 20 and 35 common stocks.
| TOTAL ANNUAL OPERATING EXPENSES* 1.36% | NET ASSETS $933,054,313 | NET ASSET VALUE PER SHARE $22.41 |
GROWTH OF $10,000(1) | PERFORMANCE COMPARISON |
|  |
SECTOR ALLOCATION(2) | TOP FIVE HOLDINGS |
 | | |
| GILEAD SCIENCES, INC. | 8.50% |
| FACEBOOK, INC. - CL. A | 6.15% |
| BIOGEN IDEC INC. | 5.42% |
| CANADIAN PACIFIC RAILWAY LTD. | 5.25% |
| ALIBABA GROUP HOLDING LTD. SPON. ADR | 4.15% |
| * | The Total Annual Operating Expenses are reflective of the information disclosed in the Funds’ Prospectus dated January 31, 2014 and may differ from the expense ratio disclosed in this report. |
The performance data quoted here represent past performance, and past performance is not a guarantee of future results. Investment return and principal value of an investment will fluctuate so that an investor’s shares, when redeemed, may be worth more or less than their original cost. Current performance may be lower or higher than the performance information quoted. To obtain performance information current to the most recent month-end, please call 888-860-8686 or visit www.marsicofunds.com.
The performance included in the chart and graph does not reflect the deduction of taxes on Fund distributions or the redemption of Fund shares.
All indices are unmanaged and investors cannot invest directly in an index.
| (1) | This chart assumes an initial investment of $10,000 made on September 30, 2004. Total returns are based on net change in NAV, assuming reinvestment of distributions. |
| (2) | Sector weightings represent the percentage of the Fund’s investments (excluding cash equivalents) in certain general sectors. These sectors may include more than one industry. The Fund’s portfolio composition is subject to change at any time. |
MARSICO FOCUS FUND
SCHEDULE OF INVESTMENTS
September 30, 2014
| | | Number of Shares | | | Value | | | Percent of Net Assets | |
| COMMON STOCKS | | | | | | | | | |
| Aerospace & Defense | | | | | | | | | |
| General Dynamics Corporation | | | 187,024 | | | $ | 23,768,880 | | | | 2.55 | % |
| | | | | | | | | | | | | |
| Automobile Manufacturers | | | | | | | | | | | | |
| Tesla Motors, Inc.* | | | 90,693 | | | | 22,009,377 | | | | 2.36 | |
| | | | | | | | | | | | | |
| Biotechnology | | | | | | | | | | | | |
| Biogen Idec Inc.* | | | 152,797 | | | | 50,546,775 | | | | 5.42 | |
| Celgene Corporation* | | | 206,849 | | | | 19,605,148 | | | | 2.10 | |
| Gilead Sciences, Inc.* | | | 745,008 | | | | 79,306,102 | | | | 8.50 | |
| | | | | | | | 149,458,025 | | | | 16.02 | |
| Cable & Satellite | | | | | | | | | | | | |
| Comcast Corporation - Cl. A | | | 662,186 | | | | 35,612,363 | | | | 3.82 | |
| | | | | | | | | | | | | |
| Casinos & Gaming | | | | | | | | | | | | |
| Wynn Resorts Ltd. | | | 177,601 | | | | 33,225,595 | | | | 3.56 | |
| | | | | | | | | | | | | |
| Consumer Finance | | | | | | | | | | | | |
| American Express Company | | | 195,575 | | | | 17,120,636 | | | | 1.83 | |
| | | | | | | | | | | | | |
| Data Processing & Outsourced Services | | | | | |
| Visa, Inc. - Cl. A | | | 175,854 | | | | 37,521,968 | | | | 4.02 | |
| | | | | | | | | | | | | |
| Fertilizers & Agricultural Chemicals | | | | | | | | | |
| Monsanto Company | | | 316,420 | | | | 35,600,414 | | | | 3.81 | |
| | | | | | | | | | | | | |
| Footwear | | | | | | | | | | | | |
| NIKE, Inc. - Cl. B | | | 228,106 | | | | 20,347,055 | | | | 2.18 | |
| | | | | | | | | | | | | |
| Health Care Facilities | | | | | | | | | | | | |
| HCA Holdings, Inc.* | | | 408,888 | | | | 28,834,782 | | | | 3.09 | |
| | | | | | | | | | | | | |
| Hotels, Resorts & Cruise Lines | | | | | | | | | |
| Starwood Hotels & Resorts Worldwide, Inc. | | | 433,830 | | | | 36,098,994 | | | | 3.87 | |
| | | | | | | | | | | | | |
| Internet Software & Services | | | | | | | | | |
| Alibaba Group Holding Ltd. Spon. ADR* | | | 435,180 | | | | 38,665,743 | | | | 4.15 | |
| Facebook, Inc. - Cl. A* | | | 726,283 | | | | 57,405,408 | | | | 6.15 | |
| Google, Inc. - Cl. A* | | | 48,200 | | | | 28,361,362 | | | | 3.04 | |
| LinkedIn Corporation - Cl. A* | | | 21,129 | | | | 4,390,395 | | | | 0.47 | |
| | | | | | | | 128,822,908 | | | | 13.81 | |
| Investment Banking & Brokerage | | | | | | | | | |
| The Charles Schwab Corporation | | | 679,523 | | | | 19,971,181 | | | | 2.14 | |
| | | | | | | | | | | | | |
| Movies & Entertainment | | | | | | | | | | | | |
| The Walt Disney Company | | | 429,830 | | | | 38,267,765 | | | | 4.10 | |
| | | | | | | | | | | | | |
| Oil & Gas Equipment & Services | | | | | | | | | |
| Halliburton Company | | | 254,510 | | | | 16,418,440 | | | | 1.76 | |
| Schlumberger Ltd. | | | 297,815 | | | | 30,284,808 | | | | 3.24 | |
| | | | | | | | 46,703,248 | | | | 5.00 | |
COMMON STOCKS (continued) | | | | | | | | | |
| Oil & Gas Exploration & Production | | | | | | | | | |
| Continental Resources, Inc.* | | | 320,150 | | | $ | 21,283,572 | | | | 2.28 | % |
| | | | | | | | | | | | | |
| Packaged Foods & Meats | | | | | | | | | | | | |
| Keurig Green Mountain, Inc. | | | 90,138 | | | | 11,729,658 | | | | 1.26 | |
| | | | | | | | | | | | | |
| Pharmaceuticals | | | | | | | | | | | | |
| Pacira Pharmaceuticals, Inc.* | | | 200,969 | | | | 19,477,916 | | | | 2.09 | |
| | | | | | | | | | | | | |
| Railroads | | | | | | | | | | | | |
| Canadian Pacific Railway Ltd. | | | 235,973 | | | | 48,957,318 | | | | 5.25 | |
| | | | | | | | | | | | | |
| Restaurants | | | | | | | | | | | | |
| Starbucks Corporation | | | 356,287 | | | | 26,885,417 | | | | 2.88 | |
| | | | | | | | | | | | | |
| Semiconductor Equipment | | | | | | | | | | | | |
| ASML Holding N.V. | | | 206,645 | | | | 20,420,659 | | | | 2.19 | |
| | | | | | | | | | | | | |
| Specialty Chemicals | | | | | | | | | | | | |
| The Sherwin-Williams Company | | | 152,043 | | | | 33,295,897 | | | | 3.57 | |
| | | | | | | | | | | | | |
| Technology Hardware, Storage & Peripherals | | | | | |
| Apple, Inc. | | | 346,776 | | | | 34,937,682 | | | | 3.74 | |
| | | | | | | | | | | | | |
| TOTAL COMMON STOCKS | | | | | | | | | | | | |
| (Cost $602,803,342) | | | | | | | 890,351,310 | | | | 95.42 | |
| | | | | | | | | | | | | |
| SHORT-TERM INVESTMENTS | | | | | | | | | |
| State Street Institutional U.S. Government Money Market Fund, 0.000% | | | 44,200,875 | | | | 44,200,875 | | | | 4.74 | |
| | | | | | | | | | | | | |
| TOTAL SHORT-TERM INVESTMENTS | | | | | | | | | |
| (Cost $44,200,875) | | | | | | | 44,200,875 | | | | 4.74 | |
| | | | | | | | | | | | | |
| TOTAL INVESTMENTS | | | | | | | | | | | | |
| (Cost $647,004,217) | | | | | | | 934,552,185 | | | | 100.16 | |
| | | | | | | | | | | | | |
| Liabilities, Less Cash and Other Assets | | | | | | | (1,497,872 | ) | | | (0.16 | ) |
| | | | | | | | | | | | | |
| NET ASSETS | | | | | | $ | 933,054,313 | | | | 100.00 | % |
See notes to financial statements.
September 30, 2014 (Unaudited)
The Growth Fund invests primarily in the common stocks of large companies that are selected for their long-term growth potential. The Growth Fund will normally hold a core position of between 35 and 50 common stocks.
| TOTAL ANNUAL OPERATING EXPENSES* 1.37% | NET ASSETS $562,653,045 | NET ASSET VALUE PER SHARE $23.63 |
GROWTH OF $10,000(1) | PERFORMANCE COMPARISON |
|  |
SECTOR ALLOCATION(2) | TOP FIVE HOLDINGS |
 | | |
| GILEAD SCIENCES, INC. | 6.63% |
| FACEBOOK, INC. - CL. A | 5.15% |
| CANADIAN PACIFIC RAILWAY LTD. | 4.75% |
| UNION PACIFIC CORPORATION | 4.06% |
| STARWOOD HOTELS & RESORTS WORLDWIDE, INC. | 3.88% |
GROWTH FUND OVERVIEW
| * | The Total Annual Operating Expenses are reflective of the information disclosed in the Funds’ Prospectus dated January 31, 2014 and may differ from the expense ratio disclosed in this report. |
The performance data quoted here represent past performance, and past performance is not a guarantee of future results. Investment return and principal value of an investment will fluctuate so that an investor’s shares, when redeemed, may be worth more or less than their original cost. Current performance may be lower or higher than the performance information quoted. To obtain performance information current to the most recent month-end, please call 888-860-8686 or visit www.marsicofunds.com.
The performance included in the chart and graph does not reflect the deduction of taxes on Fund distributions or the redemption of Fund shares.
All indices are unmanaged and investors cannot invest directly in an index.
| (1) | This chart assumes an initial investment of $10,000 made on September 30, 2004. Total returns are based on net change in NAV, assuming reinvestment of distributions. |
| (2) | Sector weightings represent the percentage of the Fund’s investments (excluding cash equivalents) in certain general sectors. These sectors may include more than one industry. The Fund’s portfolio composition is subject to change at any time. |
MARSICO GROWTH FUND
SCHEDULE OF INVESTMENTS
September 30, 2014
| | | Number of Shares | | | Value | | | Percent of Net Assets | |
| COMMON STOCKS | | | | | | | | | |
| Aerospace & Defense | | | | | | | | | |
| General Dynamics Corporation | | | 118,615 | | | $ | 15,074,780 | | | | 2.68 | % |
| | | | | | | | | | | | | |
| Airlines | | | | | | | | | | | | |
| Delta Air Lines, Inc. | | | 71,722 | | | | 2,592,750 | | | | 0.46 | |
| | | | | | | | | | | | | |
| Auto Parts & Equipment | | | | | | | | | | | | |
| Delphi Automotive PLC | | | 84,483 | | | | 5,182,187 | | | | 0.92 | |
| | | | | | | | | | | | | |
| Automobile Manufacturers | | | | | | | | | | | | |
| Tesla Motors, Inc.* | | | 56,067 | | | | 13,606,340 | | | | 2.42 | |
| | | | | | | | | | | | | |
| Biotechnology | | | | | | | | | | | | |
| Biogen Idec Inc.* | | | 54,734 | | | | 18,106,555 | | | | 3.22 | |
| Celgene Corporation* | | | 122,322 | | | | 11,593,679 | | | | 2.06 | |
| Gilead Sciences, Inc.* | | | 350,638 | | | | 37,325,415 | | | | 6.63 | |
| | | | | | | | 67,025,649 | | | | 11.91 | |
| Broadcasting | | | | | | | | | | | | |
| CBS Corporation - Cl. B | | | 330,625 | | | | 17,688,437 | | | | 3.14 | |
| | | | | | | | | | | | | |
| Cable & Satellite | | | | | | | | | | | | |
| Comcast Corporation - Cl. A | | | 314,486 | | | | 16,913,057 | | | | 3.01 | |
| | | | | | | | | | | | | |
| Casinos & Gaming | | | | | | | | | | | | |
| Wynn Resorts Ltd. | | | 99,152 | | | | 18,549,356 | | | | 3.30 | |
| | | | | | | | | | | | | |
| Data Processing & Outsourced Services | | | | | |
| FleetCor Technologies, Inc.* | | | 40,251 | | | | 5,720,472 | | | | 1.02 | |
| Visa, Inc. - Cl. A | | | 85,166 | | | | 18,171,869 | | | | 3.23 | |
| | | | | | | | 23,892,341 | | | | 4.25 | |
| Drug Retail | | | | | | | | | | | | |
| CVS Caremark Corporation | | | 110,540 | | | | 8,797,879 | | | | 1.56 | |
| | | | | | | | | | | | | |
| Fertilizers & Agricultural Chemicals | | | | | | | | | |
| Monsanto Company | | | 150,021 | | | | 16,878,863 | | | | 3.00 | |
| | | | | | | | | | | | | |
| Footwear | | | | | | | | | | | | |
| NIKE, Inc. - Cl. B | | | 140,894 | | | | 12,567,745 | | | | 2.23 | |
| | | | | | | | | | | | | |
| Health Care Facilities | | | | | | | | | | | | |
| HCA Holdings, Inc.* | | | 211,290 | | | | 14,900,171 | | | | 2.65 | |
| | | | | | | | | | | | | |
| Hotels, Resorts & Cruise Lines | | | | | | | | | |
| Starwood Hotels & Resorts Worldwide, Inc. | | | 262,096 | | | | 21,809,008 | | | | 3.88 | |
| | | | | | | | | | | | | |
| Internet Retail | | | | | | | | | | | | |
| The Priceline Group, Inc.* | | | 10,939 | | | | 12,673,707 | | | | 2.25 | |
| | | | | | | | | | | | | |
COMMON STOCKS (continued) | | | | | | | | | |
| Internet Software & Services | | | | | | | | | |
| Alibaba Group Holding Ltd. Spon. ADR* | | | 187,701 | | | $ | 16,677,234 | | | | 2.96 | % |
| Facebook, Inc. - Cl. A* | | | 366,201 | | | | 28,944,527 | | | | 5.15 | |
| Google, Inc. - Cl. A* | | | 25,941 | | | | 15,263,944 | | | | 2.71 | |
| Google, Inc. - Cl. C* | | | 9,213 | | | | 5,319,217 | | | | 0.95 | |
| LinkedIn Corporation - Cl. A* | | | 13,052 | | | | 2,712,075 | | | | 0.48 | |
| | | | | | | | 68,916,997 | | | | 12.25 | |
| Investment Banking & Brokerage | | | | | | | | | |
| The Charles Schwab Corporation | | | 322,208 | | | | 9,469,693 | | | | 1.68 | |
| | | | | | | | | | | | | |
| Movies & Entertainment | | | | | | | | | | | | |
| The Walt Disney Company | | | 217,708 | | | | 19,382,543 | | | | 3.44 | |
| | | | | | | | | | | | | |
| Oil & Gas Equipment & Services | | | | | | | | | |
| Halliburton Company | | | 195,051 | | | | 12,582,740 | | | | 2.24 | |
| Schlumberger Ltd. | | | 206,580 | | | | 21,007,120 | | | | 3.73 | |
| | | | | | | | 33,589,860 | | | | 5.97 | |
| Oil & Gas Exploration & Production | | | | | | | | | |
| Antero Resources Corporation* | | | 161,286 | | | | 8,852,989 | | | | 1.57 | |
| Continental Resources, Inc.* | | | 109,806 | | | | 7,299,903 | | | | 1.30 | |
| EOG Resources, Inc. | | | 24,670 | | | | 2,442,823 | | | | 0.43 | |
| Pioneer Natural Resources Company | | | 10,693 | | | | 2,106,200 | | | | 0.38 | |
| | | | | | | | 20,701,915 | | | | 3.68 | |
| Packaged Foods & Meats | | | | | | | | | | | | |
| Keurig Green Mountain, Inc. | | | 43,759 | | | | 5,694,359 | | | | 1.01 | |
| | | | | | | | | | | | | |
| Pharmaceuticals | | | | | | | | | | | | |
| Pacira Pharmaceuticals, Inc.* | | | 51,526 | | | | 4,993,900 | | | | 0.89 | |
| | | | | | | | | | | | | |
| Railroads | | | | | | | | | | | | |
| Canadian Pacific Railway Ltd. | | | 128,813 | | | | 26,724,833 | | | | 4.75 | |
| Union Pacific Corporation | | | 210,724 | | | | 22,846,696 | | | | 4.06 | |
| | | | | | | | 49,571,529 | | | | 8.81 | |
| Restaurants | | | | | | | | | | | | |
| Starbucks Corporation | | | 171,234 | | | | 12,921,318 | | | | 2.30 | |
| | | | | | | | | | | | | |
| Semiconductor Equipment | | | | | | | | | | | | |
| ASML Holding N.V. | | | 119,045 | | | | 11,764,027 | | | | 2.09 | |
| | | | | | | | | | | | | |
| Specialty Chemicals | | | | | | | | | | | | |
| The Sherwin-Williams Company | | | 75,901 | | | | 16,621,560 | | | | 2.95 | |
| | | | | | | | | | | | | |
| Technology Hardware, Storage & Peripherals | | | | | |
| Apple, Inc. | | | 197,765 | | | | 19,924,824 | | | | 3.54 | |
| | | | | | | | | | | | | |
| TOTAL COMMON STOCKS | | | | | | | | | | | | |
| (Cost $371,088,208) | | | | | | | 541,704,795 | | | | 96.27 | |
See notes to financial statements.
| | | | Number of Shares | | | | Value | | | | Percent of Net Assets | |
| SHORT-TERM INVESTMENTS | | | | | | | | | |
| State Street Institutional Treasury Money Market Fund, 0.000% | | | 20,568,469 | | | $ | 20,568,469 | | | | 3.66 | % |
| | | | | | | | | | | | | |
| TOTAL SHORT-TERM INVESTMENTS | | | | | | | | | |
| (Cost $20,568,469) | | | | | | | 20,568,469 | | | | 3.66 | |
| | | | | | | | | | | | | |
| TOTAL INVESTMENTS | | | | | | | | | | | | |
| (Cost $391,656,677) | | | | | | | 562,273,264 | | | | 99.93 | |
| | | | | | | | | | | | | |
| Cash and Other Assets, Less Liabilities | | | | | | | 379,781 | | | | 0.07 | |
| | | | | | | | | | | | | |
| NET ASSETS | | | | | | $ | 562,653,045 | | | | 100.00 | % |
See notes to financial statements.
INVESTMENT REVIEW BY BRANDON GEISLER (UNAUDITED)
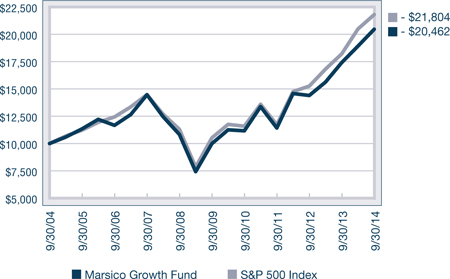
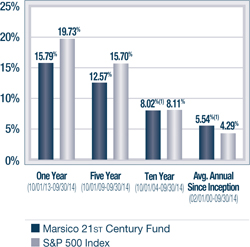
The Marsico 21st Century Fund posted a return of +15.79% for the one-year fiscal period ended September 30, 2014. While the Fund registered a solid gain, it underperformed the S&P 500 Index, which we consider to be the Fund’s primary benchmark index and which had a total return of +19.73% over the same time period. The Russell 3000 Index, a proxy for the performance of all publicly-traded US equity securities including smaller capitalization companies (which may be a useful comparison in light of the Fund’s ability to invest across the entire market capitalization spectrum), had a total return of +17.76% for the fiscal period. Please see the Fund Overview immediately following this commentary for more detailed information about the Fund’s longer-term performance for various time periods ended September 30, 2014.
The performance data for the Fund quoted here represent past performance, and past performance is not a guarantee of future results. Investment return and principal value of an investment will fluctuate so that an investor’s shares, when redeemed, may be worth more or less than their original cost. Current performance may be lower or higher than the performance information quoted. To obtain performance information current to the most recent month-end, please call 888-860-8686 or visit www.marsicofunds.com.(1)
This review highlights Fund performance over a one-year fiscal period. Shareholders should keep in mind that the Fund is intended for long-term investors who hold their shares for substantially longer periods of time. You should also keep in mind that our views on all investments discussed in this report are subject to change at any time. References to specific securities, industries, and sectors discussed in this report are not recommendations to buy or sell such securities or related investments, and the Fund may not necessarily hold these securities or investments today. Please see the accompanying Schedule of Investments for the percentage of the Fund’s portfolio represented by the securities mentioned in this report as of the end of the reporting period.
The Fund is subject to broad risks associated with investing in equity securities markets generally, including the risks that the securities and markets in which it invests may experience volatility and instability, that domestic and global economies and markets may undergo periods of cyclical change and decline, that investors may at times avoid investments in equity securities, and that investments may not perform as anticipated. Please see the Prospectus for more information.
Stock selection in a few sectors and variations from certain benchmark sector weightings detracted from the Fund’s performance for the one-year fiscal period ended September 30, 2014.
Consumer Discretionary was a relatively weak-performing sector of the benchmark S&P 500 Index with a return of +12%, and Fund performance was hampered by having more than 22% of the Fund’s net assets, on average, invested in the sector. The Fund’s holdings within the sector gained +0.9% and significantly underperformed the benchmark index sector return. Lululemon athletica, inc., an athletic apparel company, for example, faced several challenges during the period, including a change in its CEO. The stock declined -34% prior to being sold from the Fund. Retailing companies generally struggled during the period as extremely harsh winter weather led to fewer shoppers visiting stores. Fund positions LKQ Corporation, an auto parts retailer (-21%), Ulta Salon, Cosmetics & Fragrance, Inc. (-26% prior to being sold) and Lumber Liquidators Holdings, Inc. (-46% prior to being sold) each were material detractors from Fund performance.
Stock selection in the Industrials sector detracted from performance. DigitalGlobe, Inc., a provider of commercial earth imagery services, posted a return of ‑29% prior to being sold. Information services company Verisk Analytics, Inc. – Cl. A (-4% prior to being sold) also had a negative impact on performance results. Railroad operator Genessee & Wyoming, Inc. – Cl. A rose +2%; while positive, the company’s stock price return did not keep pace with the overall benchmark index return.
Several of the Fund’s Financials and Materials holdings struggled. Real estate company Realogy Holdings Corp. (-41% prior to being sold) and First Republic Bank (-0.8%) were weak-performing Financials positions. Within the Materials sector, agricultural products provider Monsanto Company posted a return of +9% which, though positive, significantly trailed the +20% return of the S&P 500 Index Materials sector return.
Stock selection in the Information Technology sector yielded mixed results. Social networking company holding LinkedIn Corporation – Cl. A (-13%) and semiconductor equipment companies ARM Holdings PLC (-1% prior to being sold) and ASML Holding N.V. (+3%) each detracted from performance as compared to the S&P 500 Index. Meanwhile, several of the Fund’s Internet services holdings performed well. Social media company Facebook, Inc. – Cl. A (+58%), European payment processor Wirecard A.G. (+35% prior to being sold), and Internet search and advertising company Google, Inc. – Cl. A (+35%) were among the Fund’s best performing positions. The Fund purchased shares of China’s biggest online commerce company, Alibaba Group Holding Ltd. Spon. ADR, at its IPO and later added to the position. The company’s return to the Fund was +31% as of September 30, 2014.
Stock selection within the Health Care sector was beneficial to performance. Biotechnology companies Gilead Sciences, Inc. (+71%), Biogen Idec Inc. (+38%) and Incyte Corporation Ltd. (+36% prior to being sold) each registered significant stock price gains.
The Fund’s Consumer Staples holdings also performed well. Beverage companies Keurig Green Mountain, Inc. (+74%) and Constellation Brands, Inc. – Cl. A (+52%) were among the Fund’s strongest-performing holdings.
Other individual holdings that performed well included media company The Walt Disney Company (+39%) and casino operator Wynn Resorts Ltd. (+24%).
During the reporting period, the Fund increased its investments in the Information Technology, Telecommunication Services, Energy, and Health Care sectors and trimmed its exposure to the Consumer Discretionary, Industrials, and Materials sectors.
Fiscal Period-End Investment Posture
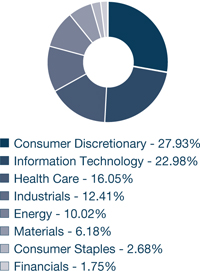
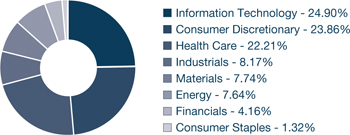
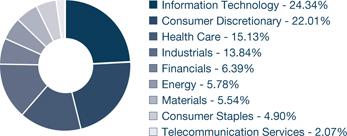
As of September 30, 2014, the Fund’s primary economic sector allocations included Information Technology, Consumer Discretionary, Health Care, and Industrials. The Fund had no investments in the Utilities sector.
Sincerely,
BRANDON A. GEISLER
PORTFOLIO MANAGER
21st CENTURY FUND
| (1) | Total returns are based on net change in net asset value assuming reinvestment of distributions. For the period prior to March 31, 2004, the performance returns for the 21st Century Fund reflect a fee waiver in effect; in the absence of such a waiver, the returns would have been reduced. For the period from April 2004 through January 2005, performance returns for the 21st Century Fund would have been higher but for the reimbursement of fees waived previously. Please see the Prospectus for more information. |
21ST CENTURY FUND OVERVIEW |
September 30, 2014 (Unaudited)
The 21st Century Fund invests primarily in common stocks that are selected for their long-term growth potential. The Fund may invest in companies of any size, and will normally hold a core position of between 35 and 60 common stocks.
| TOTAL ANNUAL OPERATING EXPENSES* 1.46% | NET ASSETS $316,293,021 | NET ASSET VALUE PER SHARE $20.90 |
GROWTH OF $10,000(1)(2) | PERFORMANCE COMPARISON |
|  |
SECTOR ALLOCATION(3) | TOP FIVE HOLDINGS |
 | | |
| FACEBOOK, INC. - CL. A | 5.21% |
| GILEAD SCIENCES, INC. | 4.89% |
| BIOGEN IDEC INC. | 3.59% |
| SCHLUMBERGER LTD. | 3.58% |
| THE WALT DISNEY COMPANY | 3.29% |
| * | The Total Annual Operating Expenses are reflective of the information disclosed in the Funds’ Prospectus dated January 31, 2014 and may differ from the expense ratio disclosed in this report. |
The performance data quoted here represent past performance, and past performance is not a guarantee of future results. Investment return and principal value of an investment will fluctuate so that an investor’s shares, when redeemed, may be worth more or less than their original cost. Current performance may be lower or higher than the performance information quoted. To obtain performance information current to the most recent month-end, please call 888-860-8686 or visit www.marsicofunds.com.
The performance included in the chart and graph does not reflect the deduction of taxes on Fund distributions or the redemption of Fund shares.
All indices are unmanaged and investors cannot invest directly in an index.
| (1) | The performance returns for the 21st Century Fund (for the period prior to March 31, 2004) reflect a fee waiver in effect; in the absence of such a waiver, the returns would be reduced. For the period from April 2004 through January 2005, performance returns for the 21st Century Fund would be higher but for the reimbursement of fees waived previously. |
| (2) | This chart assumes an initial investment of $10,000 made on September 30, 2004. Total returns are based on net change in NAV, assuming reinvestment of distributions. |
| (3) | Sector weightings represent the percentage of the Fund’s investments (excluding cash equivalents) in certain general sectors. These sectors may include more than one industry. The Fund’s portfolio composition is subject to change at any time. |
MARSICO 21st CENTURY FUND
SCHEDULE OF INVESTMENTS
September 30, 2014
| | | Number of Shares | | | Value | | | Percent of Net Assets | |
| COMMON STOCKS | | | | | | | | | |
| Aerospace & Defense | | | | | | | | | |
| BE Aerospace, Inc.* | | | 67,398 | | | $ | 5,657,388 | | | | 1.79 | % |
| General Dynamics Corporation | | | 66,486 | | | | 8,449,706 | | | | 2.67 | |
| | | | | | | | 14,107,094 | | | | 4.46 | |
| Airlines | | | | | | | | | | | | |
| Delta Air Lines, Inc. | | | 89,417 | | | | 3,232,424 | | | | 1.02 | |
| | | | | | | | | | | | | |
| Apparel, Accessories & Luxury Goods | | | | | |
| Under Armour, Inc. - Cl. A* | | | 23,199 | | | | 1,603,051 | | | | 0.51 | |
| | | | | | | | | | | | | |
| Application Software | | | | | | | | | | | | |
| Mobileye N.V.* | | | 29,029 | | | | 1,555,664 | | | | 0.49 | |
| salesforce.com, inc.* | | | 110,821 | | | | 6,375,532 | | | | 2.02 | |
| Workday, Inc. - Cl. A* | | | 29,864 | | | | 2,463,780 | | | | 0.78 | |
| | | | | | | | 10,394,976 | | | | 3.29 | |
| Automobile Manufacturers | | | | | | | | | | | | |
| Tesla Motors, Inc.* | | | 13,168 | | | | 3,195,610 | | | | 1.01 | |
| | | | | | | | | | | | | |
| Biotechnology | | | | | | | | | | | | |
| Alexion Pharmaceuticals, Inc.* | | | 27,032 | | | | 4,482,446 | | | | 1.42 | |
| Alkermes PLC* | | | 79,249 | | | | 3,397,405 | | | | 1.07 | |
| Biogen Idec Inc.* | | | 34,343 | | | | 11,361,008 | | | | 3.59 | |
| Gilead Sciences, Inc.* | | | 145,298 | | | | 15,466,972 | | | | 4.89 | |
| | | | | | | | 34,707,831 | | | | 10.97 | |
| Cable & Satellite | | | | | | | | | | | | |
| Comcast Corporation - Cl. A | | | 94,639 | | | | 5,089,685 | | | | 1.61 | |
| | | | | | | | | | | | | |
| Casinos & Gaming | | | | | | | | | | | | |
| Wynn Resorts Ltd. | | | 47,023 | | | | 8,797,063 | | | | 2.78 | |
| | | | | | | | | | | | | |
| Data Processing & Outsourced Services | | | | | |
| FleetCor Technologies, Inc.* | | | 52,084 | | | | 7,402,178 | | | | 2.34 | |
| MasterCard, Inc. - Cl. A | | | 92,893 | | | | 6,866,651 | | | | 2.17 | |
| | | | | | | | 14,268,829 | | | | 4.51 | |
| Distillers & Vintners | | | | | | | | | | | | |
| Constellation Brands, Inc. - Cl. A* | | | 107,637 | | | | 9,381,641 | | | | 2.97 | |
| | | | | | | | | | | | | |
| Distributors | | | | | | | | | | | | |
| LKQ Corporation* | | | 181,055 | | | | 4,814,252 | | | | 1.52 | |
| | | | | | | | | | | | | |
| Fertilizers & Agricultural Chemicals | | | | | | | | | |
| Monsanto Company | | | 70,415 | | | | 7,922,392 | | | | 2.50 | |
| | | | | | | | | | | | | |
| Footwear | | | | | | | | | | | | |
| Deckers Outdoor Corporation* | | | 28,621 | | | | 2,781,389 | | | | 0.88 | |
| | | | | | | | | | | | | |
| Health Care Services | | | | | | | | | | | | |
| Envision Healthcare Holdings, Inc.* | | | 186,603 | | | | 6,471,392 | | | | 2.05 | |
| | | | | | | | | | | | | |
| Hotels, Resorts & Cruise Lines | | | | | | | | | |
| Hilton Worldwide Holdings, Inc.* | | | 259,795 | | | | 6,398,751 | | | | 2.02 | |
| | | | | | | | | | | | | |
COMMON STOCKS (continued) | | | | | |
| Human Resource & Employment Services | | | | | |
| Robert Half International, Inc. | | | 97,423 | | | $ | 4,773,727 | | | | 1.51 | % |
| | | | | | | | | | | | | |
| Internet Retail | | | | | | | | | | | | |
| TripAdvisor, Inc.* | | | 70,923 | | | | 6,483,781 | | | | 2.05 | |
| | | | | | | | | | | | | |
| Internet Software & Services | | | | | | | | | |
| Alibaba Group Holding Ltd. Spon. ADR* | | | 91,525 | | | | 8,131,996 | | | | 2.57 | |
| CoStar Group, Inc.* | | | 14,127 | | | | 2,197,313 | | | | 0.69 | |
| Facebook, Inc. - Cl. A* | | | 208,277 | | | | 16,462,214 | | | | 5.21 | |
| Google, Inc. - Cl. A* | | | 10,229 | | | | 6,018,846 | | | | 1.90 | |
| Google, Inc. - Cl. C* | | | 2,844 | | | | 1,642,012 | | | | 0.52 | |
| LinkedIn Corporation - Cl. A* | | | 42,021 | | | | 8,731,544 | | | | 2.76 | |
| | | | | | | | 43,183,925 | | | | 13.65 | |
| Investment Banking & Brokerage | | | | | | | | | |
| Morgan Stanley | | | 213,388 | | | | 7,376,823 | | | | 2.33 | |
| The Charles Schwab Corporation | | | 182,131 | | | | 5,352,830 | | | | 1.69 | |
| | | | | | | | 12,729,653 | | | | 4.02 | |
| Movies & Entertainment | | | | | | | | | | | | |
| The Walt Disney Company | | | 116,741 | | | | 10,393,451 | | | | 3.29 | |
| Time Warner, Inc. | | | 105,344 | | | | 7,922,922 | | | | 2.50 | |
| | | | | | | | 18,316,373 | | | | 5.79 | |
| Oil & Gas Equipment & Services | | | | | | | | | |
| Schlumberger Ltd. | | | 111,232 | | | | 11,311,182 | | | | 3.58 | |
| | | | | | | | | | | | | |
| Oil & Gas Exploration & Production | | | | | | | | | |
| Antero Resources Corporation* | | | 116,000 | | | | 6,367,240 | | | | 2.01 | |
| | | | | | | | | | | | | |
| Packaged Foods & Meats | | | | | | | | | | | | |
| Keurig Green Mountain, Inc. | | | 43,015 | | | | 5,597,542 | | | | 1.77 | |
| | | | | | | | | | | | | |
| Pharmaceuticals | | | | | | | | | | | | |
| Salix Pharmaceuticals Ltd.* | | | 32,596 | | | | 5,092,799 | | | | 1.61 | |
| | | | | | | | | | | | | |
| Railroads | | | | | | | | | | | | |
| Genesee & Wyoming, Inc. - Cl. A* | | | 95,219 | | | | 9,075,323 | | | | 2.87 | |
| | | | | | | | | | | | | |
| Regional Banks | | | | | | | | | | | | |
| City National Corporation | | | 44,806 | | | | 3,390,470 | | | | 1.07 | |
| First Republic Bank | | | 69,133 | | | | 3,413,788 | | | | 1.08 | |
| | | | | | | | 6,804,258 | | | | 2.15 | |
| Research & Consulting Services | | | | | | | | | |
| IHS, Inc. - Cl. A* | | | 50,800 | | | | 6,359,652 | | | | 2.01 | |
| | | | | | | | | | | | | |
| Restaurants | | | | | | | | | | | | |
| Domino's Pizza, Inc. | | | 68,596 | | | | 5,279,148 | | | | 1.67 | |
| Dunkin' Brands Group, Inc. | | | 66,740 | | | | 2,991,287 | | | | 0.95 | |
| | | | | | | | 8,270,435 | | | | 2.62 | |
| Semiconductor Equipment | | | | | | | | | | | | |
| ASML Holding N.V. | | | 82,489 | | | | 8,151,563 | | | | 2.58 | |
See notes to financial statements.
MARSICO 21st CENTURY FUND
SCHEDULE OF INVESTMENTS (continued)
September 30, 2014
| | | | Number of Shares | | | | Value | | | | Percent of Net Assets | |
COMMON STOCKS (continued) | | | | | | | | | |
| Specialty Chemicals | | | | | | | | | | | | |
| The Sherwin-Williams Company | | | 41,260 | | | $ | 9,035,527 | | | | 2.86 | % |
| | | | | | | | | | | | | |
| Trading Companies & Distributors | | | | | | | | | |
| Fastenal Company | | | 106,326 | | | | 4,774,037 | | | | 1.51 | |
| | | | | | | | | | | | | |
| Wireless Telecommunication Services | | | | | |
| SBA Communications Corporation - Cl. A* | | | 57,113 | | | | 6,333,832 | | | | 2.00 | |
| | | | | | | | | | | | | |
| TOTAL COMMON STOCKS | | | | | | | | | | | | |
| (Cost $221,174,130) | | | | | | | 305,827,229 | | | | 96.69 | |
| | | | | | | | | | | | | |
| SHORT-TERM INVESTMENTS | | | | | | | | | |
| State Street Institutional Treasury Money Market Fund, 0.000% | | | 15,097,485 | | | | 15,097,485 | | | | 4.77 | |
| | | | | | | | | | | | | |
| TOTAL SHORT-TERM INVESTMENTS | | | | | | | | | |
| (Cost $15,097,485) | | | | | | | 15,097,485 | | | | 4.77 | |
| | | | | | | | | | | | | |
| TOTAL INVESTMENTS | | | | | | | | | | | | |
| (Cost $236,271,615) | | | | | | | 320,924,714 | | | | 101.46 | |
| | | | | | | | | | | | | |
| Liabilities, Less Cash and Other Assets | | | | | | | (4,631,693 | ) | | | (1.46 | ) |
| | | | | | | | | | | | | |
| NET ASSETS | | | | | | $ | 316,293,021 | | | | 100.00 | % |
SCHEDULE OF INVESTMENTS
See notes to financial statements.
INTERNATIONAL OPPORTUNITIES FUND |
INVESTMENT REVIEW BY MUNISH MALHOTRA (UNAUDITED)
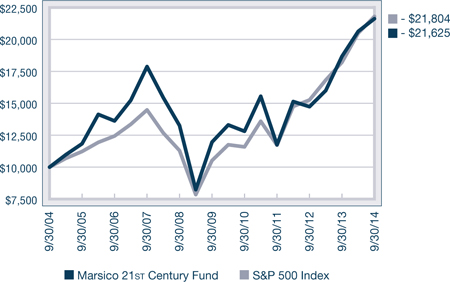
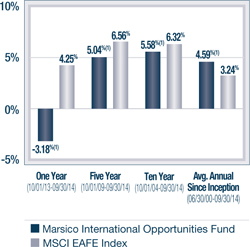
The Marsico International Opportunities Fund posted a total return of (US$) -3.18% for the one-year fiscal period ended September 30, 2014. The Fund underperformed the MSCI EAFE Index, which we consider to be the Fund’s benchmark index and which had a total return of (US$) +4.25%. Please see the Fund Overview immediately following this commentary for more detailed information about the Fund’s longer-term performance for various time periods ended September 30, 2014.
The performance data for the Fund quoted here represent past performance, and past performance is not a guarantee of future results. Investment return and principal value of an investment will fluctuate so that an investor’s shares, when redeemed, may be worth more or less than their original cost. Current performance may be lower or higher than the performance information quoted. To obtain performance information current to the most recent month-end, please call 888-860-8686 or visit www.marsicofunds.com.(1)
This review highlights Fund performance over a one-year fiscal period. Shareholders should keep in mind that the Fund is intended for long-term investors who hold their shares for substantially longer periods of time. You should also keep in mind that our views on all investments discussed in this report are subject to change at any time. References to specific securities, industries, and sectors discussed in this report are not recommendations to buy or sell such securities or related investments, and the Fund may not necessarily hold these securities or investments today. Please see the accompanying Schedule of Investments for the percentage of the Fund’s portfolio represented by the securities mentioned in this report as of the end of the reporting period.
Foreign investments present additional risks due to currency fluctuations, economic and political factors, lower liquidity, differences in securities regulations and accounting standards, possible changes in taxation, limited public information, and other factors. In addition, the Fund is subject to broad risks associated with investing in equity securities markets generally, including the risks that the securities and markets in which it invests may experience volatility and instability, that domestic and global economies and markets may undergo periods of cyclical change and decline, that investors may at times avoid investments in equity securities, and that investments may not perform as anticipated. Please see the Prospectus for more information.
Stock selection and an overweight allocation to the Consumer Discretionary sector, a weak-performing sector of the benchmark MSCI EAFE Index, detracted from Fund performance. Athletic apparel companies lululemon athletica, inc. and Adidas A.G. declined -36% and -24%, respectively, prior to the sale of both securities from the Fund. Several other Consumer Discretionary positions posted significant stock price declines, including casino operator Sands China Ltd.
(-23% prior to being sold) and Japanese online retailer Start Today Company Ltd. (-22%).
Within the Consumer Staples sector, French alcoholic beverage company Remy Cointreau S.A. (-26%) and Jeronimo Martins SGPS, S.A., a leading food distributor in Poland and Portugal (-25%), were primary detractors. Both positions were sold during the period.
The Fund’s performance was also adversely affected by stock selection in the Information Technology and Financials sectors. Several of the Fund’s Internet services investments posted negative returns. European data center provider Telecity Group PLC (-25% prior to being sold) and Latin American ecommerce company MercadoLibre, Inc. (-29% prior to being sold) each had a material, negative effect on performance. Semiconductor equipment company ARM Holdings PLC (-6%) was another detractor within the sector. Primary detractors in the Financials sector were Brazilian real estate company BR Malls Participacoes S.A. (-28% prior to being sold) and Italian asset management company Azimut Holding S.p.A. (-26%).
Certain individual Fund holdings had a material, positive effect on performance. Railroad operator Canadian Pacific Railway Ltd. gained +69% as the company continued to improve its operations and cut costs. Biotechnology company Gilead Sciences, Inc. rose +41%, aided by strong sales of Sovaldi, its new treatment for hepatitis C. Indian multinational automotive company Tata Motors Ltd. ADR (+67%) and global Internet services and media provider Naspers Ltd. – Cl. N (+38% prior to being sold) were other leading Fund holdings that produced strong returns. Chinese Internet services companies Baidu, Inc. Spon. ADR (+39%) and Alibaba Group Holding Ltd. Spon. ADR (+32%) were positive contributors to performance. The Fund purchased Alibaba at the company’s IPO and later added to the position.
INTERNATIONAL OPPORTUNITIES FUND |
INTERNATIONAL OPPORTUNITIES FUND
Although active currency management is not a central facet of the Fund’s investment process, fluctuations in major world currencies can at times affect the Fund’s performance. During the period, the net effect of currency moves was positive for the Fund. The Fund did well as compared to the benchmark index by having greater exposure to securities denominated in the US dollar, which strengthened versus most major world currencies. Additionally, the Fund’s results were positively affected by having very little exposure to the Japanese yen, which weakened during the period.
From a sector allocation perspective, the Fund benefitted as compared to its benchmark index by having overweight allocations to the strong-performing Information Technology and Health Care sectors, while being underweight the weak-performing Materials sector.
During the period, the Fund increased its allocations to the Health Care, Information Technology, and Industrials sectors. The Fund reduced its allocations to the Consumer Discretionary, Consumer Staples, Financials, and Materials sectors.
The International Opportunities Fund experienced elevated portfolio turnover during the period, which primarily related to the Fund’s changing its portfolio composition to reinvest in other positions that we believe may have more upside potential and to take advantage of new opportunities. Portfolio turnover increases transaction-related expenses and could reduce Fund returns.
As noted earlier in this report, effective August 22, 2014, Munish Malhotra, CFA, previously co-manager of the Marsico International Opportunities Fund, assumed sole portfolio manager responsibility for the Fund. Effective the same date, former co-manager James G. Gendelman no longer served as co-manager of the Fund.
Fiscal Period-End Investment Posture
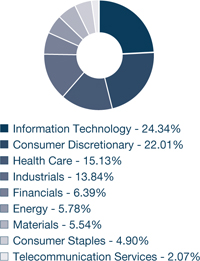
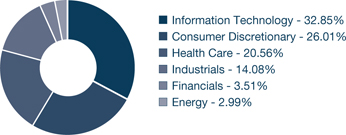
As of September 30, 2014, the Fund’s primary economic sector allocations included Information Technology, Consumer Discretionary, Health Care, and Industrials. The Fund had no exposure to the Consumer Staples, Utilities, Telecommunication Services, and Materials sectors at period-end.
In terms of country allocations, the Fund’s most significant weightings at period-end, excluding short-term investments, were China/Hong Kong, the United Kingdom, the United States, Germany, and the Netherlands. The Fund’s United States holdings primarily comprised multi-national companies. Country-level weightings generally should be considered a residual of the Fund’s stock selection process rather than a major, proactive facet of its investment strategy.
Sincerely,
MUNISH MALHOTRA, CFA
PORTFOLIO MANAGER
| (1) | Total returns are based on net change in net asset value assuming reinvestment of distributions. For the period prior to September 30, 2004 and from October 2011 through December 2013, the performance returns for the International Opportunities Fund reflect a fee waiver in effect; in the absence of such a waiver, the returns would have been reduced. For the period from October 2004 through December 2005 and from January 2014 through September 2014, performance returns for the International Opportunities Fund would have been higher but for the reimbursement of fees waived previously. Please see the Prospectus for more information. |
INTERNATIONAL OPPORTUNITIES FUND OVERVIEW |
September 30, 2014 (Unaudited)
The International Opportunities Fund invests primarily in common stocks of foreign companies that are selected for their long-term growth potential. The Fund may invest in an unlimited number of companies of any size throughout the world. It normally invests in the securities of issuers that are economically tied to one or more foreign countries, and expects to be invested in various issuers or securities that together have ties to at least four different foreign countries. Some issuers or securities in the Fund’s portfolio may be based in or economically tied to the United States or to emerging markets.
TOTAL ANNUAL OPERATING EXPENSES * NET EXPENSES*† | 1.74% 1.60% | NET ASSETS $175,983,641 | NET ASSET VALUE PER SHARE $14.72 |
GROWTH OF $10,000(1)(2) | PERFORMANCE COMPARISON |
|  |
SECTOR ALLOCATION(3) | TOP FIVE HOLDINGS |
 | | |
| LIBERTY GLOBAL PLC - SERIES C | 4.62% |
| CANADIAN PACIFIC RAILWAY LTD. | 4.49% |
| ASML HOLDING N.V. | 4.32% |
| ROCHE HOLDING AG | 4.00% |
| GILEAD SCIENCES, INC. | 3.56% |
INTERNATIONAL OPPORTUNITIES FUND OVERVIEW
| * | The Total Annual Operating Expenses and Net Expenses are reflective of the information disclosed in the Funds’ Prospectus dated January 31, 2014 and may differ from the expense ratios disclosed in this report. |
| † | Marsico Capital Management, LLC (the “Adviser”) has entered into a written expense limitation and fee waiver agreement under which it has agreed to limit the total expenses of the International Opportunities Fund (excluding interest, taxes, acquired fund fees and expenses, litigation, brokerage and extraordinary expenses) to an annual rate of 1.60% of the Fund’s average net assets until January 31, 2015. This expense limitation and fee waiver agreement may be terminated by the Adviser at any time after January 31, 2015, upon 15 days prior notice to the Fund and its administrator. The Adviser may recoup from the Fund fees previously waived or expenses previously reimbursed by the Adviser with respect to the Fund pursuant to this agreement (or a previous expense limitation agreement) if such reimbursement does not cause the Fund to exceed the expense limitation currently in effect and the reimbursement is made within three years after the year in which the Adviser waived the fee or reimbursed the expense. |
The performance data quoted here represent past performance, and past performance is not a guarantee of future results. Investment return and principal value of an investment will fluctuate so that an investor’s shares, when redeemed, may be worth more or less than their original cost. Current performance may be lower or higher than the performance information quoted. To obtain performance information current to the most recent month-end, please call 888-860-8686 or visit www.marsicofunds.com.
The performance included in the chart and graph does not reflect the deduction of taxes on Fund distributions or the redemption of Fund shares.
All indices are unmanaged and investors cannot invest directly in an index.
| (1) | The performance returns for the International Opportunities Fund (for the period prior to September 30, 2004 and from October 2011 through December 2013) reflect a fee waiver in effect; in the absence of such a waiver, the returns would be reduced. For the period from October 2004 through December 2005 and from January 2014 through September 2014, performance returns for the International Opportunities Fund would be higher but for the reimbursement of fees waived previously. |
| (2) | This chart assumes an initial investment of $10,000 made on September 30, 2004. Total returns are based on net change in NAV, assuming reinvestment of distributions. |
| (3) | Sector weightings represent the percentage of the Fund’s investments (excluding cash equivalents) in certain general sectors. These sectors may include more than one industry. The Fund’s portfolio composition is subject to change at any time. |
The MSCI EAFE Index tracks the stocks of about 1,000 companies in Europe, Australasia, and the Far East (EAFE).
\\
MARSICO INTERNATIONAL OPPORTUNITIES FUND
SCHEDULE OF INVESTMENTS
September 30, 2014
| | | Number of Shares | | | Value | | | Percent of Net Assets | |
| COMMON STOCKS | | | | | | | | | |
| Aerospace & Defense | | | | | | | | | |
| Safran S.A. | | | 94,347 | | | $ | 6,122,699 | | | | 3.48 | % |
| | | | | | | | | | | | | |
| Airlines | | | | | | | | | | | | |
| Copa Holdings S.A. - Cl. A | | | 13,343 | | | | 1,431,570 | | | | 0.81 | |
| | | | | | | | | | | | | |
| Apparel Retail | | | | | | | | | | | | |
| Zalando S.E.* | | | 33,257 | | | | 903,113 | | | | 0.51 | |
| | | | | | | | | | | | | |
| Application Software | | | | | | | | | | | | |
| Mobileye N.V.* | | | 15,332 | | | | 821,642 | | | | 0.47 | |
| | | | | | | | | | | | | |
| Asset Management & Custody Banks | | | | | |
| Azimut Holding S.p.A. | | | 117,932 | | | | 2,983,550 | | | | 1.70 | |
| Hargreaves Lansdown PLC | | | 148,438 | | | | 2,274,051 | | | | 1.29 | |
| | | | | | | | 5,257,601 | | | | 2.99 | |
| Automobile Manufacturers | | | | | | | | | | | | |
| Bayerische Motoren Werke AG | | | 38,004 | | | | 4,081,043 | | | | 2.32 | |
| Tata Motors Ltd. ADR | | | 65,875 | | | | 2,879,396 | | | | 1.64 | |
| | | | | | | | 6,960,439 | | | | 3.96 | |
| Biotechnology | | | | | | | | | | | | |
| Alkermes PLC* | | | 54,194 | | | | 2,323,297 | | | | 1.32 | |
| Gilead Sciences, Inc.* | | | 58,898 | | | | 6,269,692 | | | | 3.56 | |
| | | | | | | | 8,592,989 | | | | 4.88 | |
| Cable & Satellite | | | | | | | | | | | | |
| Liberty Global PLC - Series C* | | | 198,158 | | | | 8,127,450 | | | | 4.62 | |
| | | | | | | | | | | | | |
| Casinos & Gaming | | | | | | | | | | | | |
| MGM China Holdings Ltd. | | | 1,328,400 | | | | 3,806,500 | | | | 2.16 | |
| | | | | | | | | | | | | |
| Data Processing & Outsourced Services | | | | | |
| Cielo S.A. | | | 153,600 | | | | 2,510,061 | | | | 1.43 | |
| MasterCard, Inc. - Cl. A | | | 82,285 | | | | 6,082,507 | | | | 3.46 | |
| QIWI PLC Spon. ADR | | | 44,627 | | | | 1,409,767 | | | | 0.80 | |
| Wirecard A.G. | | | 86,493 | | | | 3,195,963 | | | | 1.81 | |
| | | | | | | | 13,198,298 | | | | 7.50 | |
| Electronic Equipment & Instruments | | | | | | | | | |
| Keyence Corporation | | | 10,700 | | | | 4,650,244 | | | | 2.64 | |
| | | | | | | | | | | | | |
| General Merchandise Stores | | | | | | | | | |
| Dollarama, Inc. | | | 36,926 | | | | 3,132,256 | | | | 1.78 | |
| | | | | | | | | | | | | |
| Industrial Machinery | | | | | | | | | | | | |
| FANUC Corporation | | | 14,700 | | | | 2,655,181 | | | | 1.51 | |
| The Weir Group PLC | | | 72,753 | | | | 2,950,947 | | | | 1.68 | |
| | | | | | | | 5,606,128 | | | | 3.19 | |
COMMON STOCKS (continued) | | | | | | | | | |
| Internet Retail | | | | | | | | | | | | |
| Ctrip.com International, Ltd. ADR* | | | 49,806 | | | $ | 2,826,989 | | | | 1.61 | % |
| Start Today Company Ltd. | | | 73,400 | | | | 1,597,500 | | | | 0.91 | |
| The Priceline Group, Inc.* | | | 3,892 | | | | 4,509,193 | | | | 2.56 | |
| Vipshop Holdings Ltd. Spon. ADR* | | | 7,645 | | | | 1,444,981 | | | | 0.82 | |
| | | | | | | | 10,378,663 | | | | 5.90 | |
| Internet Software & Services | | | | | | | | | |
| Alibaba Group Holding Ltd. Spon. ADR* | | | 68,233 | | | | 6,062,502 | | | | 3.44 | |
| Baidu, Inc. Spon. ADR* | | | 21,580 | | | | 4,709,403 | | | | 2.68 | |
| Tencent Holdings Ltd. | | | 279,600 | | | | 4,151,771 | | | | 2.36 | |
| | | | | | | | 14,923,676 | | | | 8.48 | |
| Oil & Gas Equipment & Services | | | | | | | | | |
| Schlumberger Ltd. | | | 43,930 | | | | 4,467,242 | | | | 2.54 | |
| | | | | | | | | | | | | |
| Pharmaceuticals | | | | | | | | | | | | |
| Novartis AG | | | 50,653 | | | | 4,783,040 | | | | 2.72 | |
| Ono Pharmaceutical Company Ltd. | | | 26,500 | | | | 2,353,408 | | | | 1.34 | |
| Perrigo Company | | | 21,253 | | | | 3,191,988 | | | | 1.81 | |
| Roche Holding AG | | | 23,733 | | | | 7,037,616 | | | | 4.00 | |
| UCB S.A. | | | 52,861 | | | | 4,799,148 | | | | 2.73 | |
| | | | | | | | 22,165,200 | | | | 12.60 | |
| Railroads | | | | | | | | | | | | |
| Canadian Pacific Railway Ltd. | | | 38,103 | | | | 7,907,746 | | | | 4.49 | |
| | | | | | | | | | | | | |
| Restaurants | | | | | | | | | | | | |
| Domino's Pizza Group PLC | | | 520,498 | | | | 4,792,815 | | | | 2.72 | |
| | | | | | | | | | | | | |
| Semiconductor Equipment | | | | | | | | | | | | |
| ASML Holding N.V. | | | 76,420 | | | | 7,607,889 | | | | 4.32 | |
| | | | | | | | | | | | | |
| Semiconductors | | | | | | | | | | | | |
| ARM Holdings PLC | | | 305,996 | | | | 4,494,353 | | | | 2.55 | |
| Infineon Technologies AG | | | 413,126 | | | | 4,275,099 | | | | 2.43 | |
| | | | | | | | 8,769,452 | | | | 4.98 | |
| TOTAL COMMON STOCKS | | | | | | | | | | | | |
| (Cost $137,582,635) | | | | | | | 149,623,612 | | | | 85.02 | |
| | | | | | | | | | | | | |
| SHORT-TERM INVESTMENTS | | | | | | | | | |
| State Street Institutional Treasury Money Market Fund, 0.000% | | | 6,770,237 | | | | 6,770,237 | | | | 3.85 | |
| | | | | | | | | | | | | |
| TOTAL SHORT-TERM INVESTMENTS | | | | | | | | | |
| (Cost $6,770,237) | | | | | | | 6,770,237 | | | | 3.85 | |
| | | | | | | | | | | | | |
| TOTAL INVESTMENTS | | | | | | | | | | | | |
| (Cost $144,352,872) | | | | | | | 156,393,849 | | | | 88.87 | |
| | | | | | | | | | | | | |
| Cash and Other Assets, Less Liabilities | | | | | | | 19,589,792 | | | | 11.13 | |
| | | | | | | | | | | | | |
| NET ASSETS | | | | | | $ | 175,983,641 | | | | 100.00 | % |
See notes to financial statements.
| SUMMARY OF INVESTMENTS BY COUNTRY | |
| Country | | Market Value | | | Percent of Investment Securities | |
| Belgium | | $ | 4,799,148 | | | | 3.07 | % |
| Brazil | | | 2,510,061 | | | | 1.60 | |
| Canada | | | 11,040,002 | | | | 7.06 | |
| China/Hong Kong | | | 23,002,146 | | | | 14.71 | |
| France | | | 6,122,699 | | | | 3.91 | |
| Germany | | | 12,455,218 | | | | 7.96 | |
| India | | | 2,879,396 | | | | 1.84 | |
| Ireland | | | 2,323,297 | | | | 1.49 | |
| Israel | | | 821,642 | | | | 0.52 | |
| Italy | | | 2,983,550 | | | | 1.91 | |
| Japan | | | 11,256,333 | | | | 7.20 | |
| Netherlands | | | 12,075,131 | | | | 7.72 | |
| Panama | | | 1,431,570 | | | | 0.92 | |
| Russia | | | 1,409,767 | | | | 0.90 | |
| Switzerland | | | 11,820,656 | | | | 7.56 | |
| United Kingdom | | | 22,639,616 | | | | 14.48 | |
United States(1) | | | 26,823,617 | | | | 17.15 | |
| | | $ | 156,393,849 | | | | 100.00 | % |
| (1) | Includes short-term securities. |
See notes to financial statements.
FLEXIBLE CAPITAL FUND
INVESTMENT REVIEW BY MUNISH MALHOTRA AND JORDON LAYCOB (UNAUDITED)
The Marsico Flexible Capital Fund posted a total return of +12.15% for the one-year fiscal period ended September 30, 2014. While the Fund produced a significant absolute return, it underperformed the S&P 500 Index, which we consider to be the Fund’s benchmark index and which had a total return of +19.73%. Please see the Fund Overview immediately following this commentary for more detailed information about the Fund’s performance for various time periods ended September 30, 2014.
The performance data for the Fund quoted here represent past performance, and past performance is not a guarantee of future results. Investment return and principal value of an investment will fluctuate so that an investor’s shares, when redeemed, may be worth more or less than their original cost. Current performance may be lower or higher than the performance information quoted. To obtain performance information current to the most recent month-end, please call 888-860-8686 or visit www.marsicofunds.com.(1)
This review highlights Fund performance over a one-year fiscal period. Shareholders should keep in mind that the Fund is intended for long-term investors who hold their shares for substantially longer periods of time. You should also keep in mind that our views on all investments discussed in this report are subject to change at any time. References to specific securities, industries, and sectors discussed in this report are not recommendations to buy or sell such securities or related investments, and the Fund may not necessarily hold these securities or investments today. Please see the accompanying Schedule of Investments for the percentage of the Fund’s portfolio represented by the securities mentioned in this report as of the end of the reporting period.
The Fund is subject to broad risks associated with investing in equity securities markets generally, including the risks that the securities and markets in which it invests may experience volatility and instability, that domestic and global economies and markets may undergo periods of cyclical change and decline, that investors may at times avoid investments in equity securities, and that investments may not perform as anticipated. Please see the Prospectus for more information.
Throughout the period, the Fund’s exposure to the Consumer Discretionary sector was more than twice that of its benchmark, the S&P 500 Index. This positioning detracted from relative performance, as Consumer Discretionary was a weak-performing sector of the benchmark index. Lululemon athletica, inc. (-36%), an athletic apparel company, faced several challenges during the period, including quality control and a change in its CEO. Media conglomerate SFX Entertainment, Inc. slid -40%. The Fund’s equity position in casino operator Pinnacle Entertainment, Inc. (-12%) also posted a negative return. Japanese eyewear retailer Jin Company Ltd. declined -39%. The shares of each of these companies were sold from the Fund prior to period-end. (The Fund continued to hold a corporate bond position in Pinnacle Entertainment at period end.)
Stock selection in the Financials sector detracted from performance. First Republic Bank (-7%) and UBS A.G. (-17%) each posted negative returns prior to being sold.
A few Industrials holdings were material detractors from performance. Latin American airline Copa Holdings S.A. – Cl. A (-25%) and Louis XIII Holdings Ltd., a developer of a high-end casino and hotel in Macau, China (-61%), were the Fund’s primary detractors within the sector.
The Fund’s Information Technology and Materials holdings also failed to keep pace with the returns of the pertinent benchmark index sectors. Semiconductor equipment holdings Infineon Technologies AG (-16%) and ASML Holding N.V. (+2%) were laggards. Within the Materials sector, agricultural products provider Monsanto Company gained +9%, which, though a positive return, underperformed the +20% return of the S&P 500 Index Materials sector and, therefore, detracted from performance relative to the Fund’s benchmark index.
Other holdings that detracted from Fund performance included surgical imaging technology company Novadaq Technologies, Inc. (-39% prior to being sold), and French alcoholic beverage company Remy Cointreau S.A. (-28% prior to being sold).
Stock selection in the Health Care sector was generally strong. Biotechnology holdings Gilead Sciences, Inc. (+70%), Pacira Pharmaceuticals, Inc. (+86%), and Biogen Idec Inc. (+38%) posted sizeable stock price gains.
Holdings within the Consumer Staples sector contributed some top performers for the period. Beverage companies Keurig Green Mountain, Inc. (+78%) and Constellation Brands, Inc. – Cl. A (+52%) aided Fund performance.
An underweight allocation to the weaker-performing Energy sector also helped results in comparison to benchmark performance.
Select Fund holdings in the Information Technology sector had a material, positive effect on performance. The Fund purchased shares of China’s biggest online commerce company, Alibaba Group Holding Ltd. Spon. ADR, at its IPO and subsequently added slightly to the position. Alibaba’s return to the Fund was +31% as of September 30, 2014. In addition, Facebook, Inc. – Cl. A (+56%) and Google, Inc. – Cl. A (+33%) were other leading holdings. Also, the Fund invested selectively in a number of newly public companies coming to market, and these investments on a net basis had a modest positive impact on the Fund’s total return for the year.
During the period, the Fund reduced its allocations to the Consumer Staples, Materials, Industrials, and Financials sectors. The Fund’s allocations to the Information Technology, Consumer Discretionary, Energy, and Health Care sectors increased. The Fund also held several investments in fixed-income securities that we believed to offer equity-like return potential. The Fund’s fixed-income holdings did not substantially affect performance during the period.
The Flexible Capital Fund experienced slightly elevated portfolio turnover during the period, which primarily related to the Fund’s changing its portfolio composition to reinvest in other positions that we believe may have more upside potential and to take advantage of new opportunities. Portfolio turnover increases transaction-related expenses and could reduce Fund returns.
Fiscal Period-End Investment Posture
As of period-end, the Fund’s primary economic sector allocations included Consumer Discretionary, Information Technology, Health Care, Financials, and Industrials. At period-end, the Fund had no exposure to the Utilities sector.
Sincerely,
MUNISH MALHOTRA, CFA
JORDON S. LAYCOB
PORTFOLIO MANAGERS
FLEXIBLE CAPITAL FUND
| (1) | Total returns are based on net change in net asset value assuming reinvestment of distributions. For the period prior to February 1, 2011, the performance returns for the Flexible Capital Fund reflect a fee waiver in effect; in the absence of such a waiver, the returns would have been reduced. Please see the Prospectus for more information. |
FLEXIBLE CAPITAL FUND OVERVIEW |
September 30, 2014 (Unaudited)
The Flexible Capital Fund invests primarily in equity securities and other investments that are selected primarily for their long-term growth potential. The Fund may invest in issuers of any size throughout the world, and will normally hold a core position of between 20 and 50 securities or other investments.
| TOTAL ANNUAL OPERATING EXPENSES* 1.47% | NET ASSETS $806,448,440 | NET ASSET VALUE PER SHARE $18.39 |
GROWTH OF $10,000(1)(2) | PERFORMANCE COMPARISON |
| 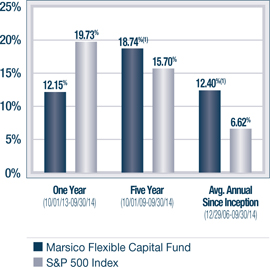 |
SECTOR ALLOCATION(3) | TOP FIVE HOLDINGS |
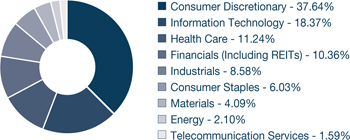 | | |
| GILEAD SCIENCES, INC. | 4.46% |
| WYNN RESORTS LTD. | 4.23% |
| FACEBOOK, INC. - CL. A | 4.04% |
| UNION PACIFIC CORPORATION | 4.04% |
| BIOGEN IDEC INC. | 3.77% |
| * | The Total Annual Operating Expenses are reflective of the information disclosed in the Funds’ Prospectus dated January 31, 2014 and may differ from the expense ratio disclosed in this report. |
The performance data quoted here represent past performance, and past performance is not a guarantee of future results. Investment return and principal value of an investment will fluctuate so that an investor’s shares, when redeemed, may be worth more or less than their original cost. Current performance may be lower or higher than the performance information quoted. To obtain performance information current to the most recent month-end, please call 888-860-8686 or visit www.marsicofunds.com.
The performance included in the chart and graph does not reflect the deduction of taxes on Fund distributions or the redemption of Fund shares.
All indices are unmanaged and investors cannot invest directly in an index.
| (1) | The performance returns for the Flexible Capital Fund (for the period prior to February 1, 2011) reflect a fee waiver in effect; in the absence of such a waiver, the returns would be reduced. |
| (2) | This chart assumes an initial investment of $10,000 made on December 29, 2006 (inception). Total returns are based on change in NAV, assuming reinvestment of distributions. |
| (3) | Sector weightings represent the percentage of the Fund’s investments (excluding cash equivalents) in certain general sectors. These sectors may include more than one industry. The Fund’s portfolio composition is subject to change at any time. |
MARSICO FLEXIBLE CAPITAL FUND
SCHEDULE OF INVESTMENTS
September 30, 2014
| | | Number of Shares | | | Value | | | Percent of Net Assets | |
| COMMON STOCKS | | | | | | | | | |
| Aerospace & Defense | | | | | | | | | |
| Safran S.A. | | | 251,858 | | | $ | 16,344,459 | | | | 2.03 | % |
| | | | | | | | | | | | | |
| Airlines | | | | | | | | | | | | |
| Copa Holdings S.A. - Cl. A | | | 78,711 | | | | 8,444,903 | | | | 1.05 | |
| | | | | | | | | | | | | |
| Automotive Retail | | | | | | | | | | | | |
| AutoZone, Inc.* | | | 32,091 | | | | 16,355,499 | | | | 2.03 | |
| | | | | | | | | | | | | |
| Biotechnology | | | | | | | | | | | | |
| Biogen Idec Inc.* | | | 91,928 | | | | 30,410,702 | | | | 3.77 | |
| Gilead Sciences, Inc.* | | | 337,685 | | | | 35,946,568 | | | | 4.46 | |
| | | | | | | | 66,357,270 | | | | 8.23 | |
| Broadcasting | | | | | | | | | | | | |
| CBS Corporation - Cl. B | | | 423,820 | | | | 22,674,370 | | | | 2.81 | |
| | | | | | | | | | | | | |
| Cable & Satellite | | | | | | | | | | | | |
| Liberty Global PLC - Series C* | | | 725,227 | | | | 29,745,185 | | | | 3.69 | |
| | | | | | | | | | | | | |
| Casinos & Gaming | | | | | | | | | | | | |
| Wynn Resorts Ltd. | | | 182,502 | | | | 34,142,474 | | | | 4.23 | |
| | | | | | | | | | | | | |
| Construction & Engineering | | | | | | | | | |
| Louis XIII Holdings Ltd.* | | | 7,804,000 | | | | 3,939,764 | | | | 0.49 | |
| | | | | | | | | | | | | |
| Data Processing & Outsourced Services | | | | | |
| Visa, Inc. - Cl. A | | | 121,153 | | | | 25,850,416 | | | | 3.20 | |
| | | | | | | | | | | | | |
| Department Stores | | | | | | | | | | | | |
| Macy's, Inc. | | | 410,675 | | | | 23,893,072 | | | | 2.96 | |
| | | | | | | | | | | | | |
| Distillers & Vintners | | | | | | | | | | | | |
| Constellation Brands, Inc. - Cl. A* | | | 340,718 | | | | 29,696,981 | | | | 3.68 | |
| | | | | | | | | | | | | |
| Diversified Banks | | | | | | | | | | | | |
| Citigroup, Inc. | | | 468,216 | | | | 24,262,953 | | | | 3.01 | |
| Grupo Financiero Santander Mexico S.A.B. de C.V. Series B ADR | | | 886,413 | | | | 11,993,168 | | | | 1.49 | |
| | | | | | | | 36,256,121 | | | | 4.50 | |
| Fertilizers & Agricultural Chemicals | | | | | | | | | |
| Monsanto Company | | | 228,329 | | | | 25,689,296 | | | | 3.18 | |
| | | | | | | | | | | | | |
| Health Care Services | | | | | | | | | | | | |
| Envision Healthcare Holdings, Inc.* | | | 347,728 | | | | 12,059,207 | | | | 1.49 | |
| | | | | | | | | | | | | |
| Home Improvement Retail | | | | | | | | | | | | |
| Lowe's Companies, Inc. | | | 509,829 | | | | 26,980,151 | | | | 3.35 | |
| | | | | | | | | | | | | |
| Hotels, Resorts & Cruise Lines | | | | | | | | | |
| Hilton Worldwide Holdings, Inc.* | | | 1,119,840 | | | | 27,581,659 | | | | 3.42 | |
| | | | | | | | | | | | | |
COMMON STOCKS (continued) | | | | | | | | | |
| Internet Retail | | | | | | | | | | | | |
| The Priceline Group, Inc.* | | | 14,126 | | | $ | 16,366,101 | | | | 2.03 | % |
| | | | | | | | | | | | | |
| Internet Software & Services | | | | | | | | | |
| Alibaba Group Holding Ltd. Spon. ADR* | | | 206,570 | | | | 18,353,745 | | | | 2.28 | |
| Facebook, Inc. - Cl. A* | | | 412,650 | | | | 32,615,856 | | | | 4.04 | |
| Google, Inc. - Cl. A* | | | 41,615 | | | | 24,486,682 | | | | 3.04 | |
| | | | | | | | 75,456,283 | | | | 9.36 | |
| Leisure Facilities | | | | | | | | | | | | |
| ClubCorp Holdings, Inc. | | | 901,554 | �� | | | 17,877,816 | | | | 2.22 | |
| | | | | | | | | | | | | |
| Mortgage REITs | | | | | | | | | | | | |
| Starwood Property Trust, Inc. | | | 729,633 | | | | 16,022,741 | | | | 1.99 | |
| | | | | | | | | | | | | |
| Movies & Entertainment | | | | | | | | | | | | |
| The Walt Disney Company | | | 274,619 | | | | 24,449,330 | | | | 3.03 | |
| | | | | | | | | | | | | |
| Oil & Gas Equipment & Services | | | | | | | | | |
| Halliburton Company | | | 248,889 | | | | 16,055,829 | | | | 1.99 | |
| | | | | | | | | | | | | |
| Packaged Foods & Meats | | | | | | | | | | | | |
| Keurig Green Mountain, Inc. | | | 125,992 | | | | 16,395,339 | | | | 2.03 | |
| | | | | | | | | | | | | |
| Pharmaceuticals | | | | | | | | | | | | |
| Pacira Pharmaceuticals, Inc.* | | | 77,934 | | | | 7,553,363 | | | | 0.94 | |
| | | | | | | | | | | | | |
| Publishing | | | | | | | | | | | | |
| Tribune Media Company - Cl. A* | | | 174,138 | | | | 11,458,280 | | | | 1.42 | |
| | | | | | | | | | | | | |
| Railroads | | | | | | | | | | | | |
| Union Pacific Corporation | | | 300,714 | | | | 32,603,412 | | | | 4.04 | |
| | | | | | | | | | | | | |
| Restaurants | | | | | | | | | | | | |
| Burger King Worldwide, Inc. | | | 266,475 | | | | 7,903,648 | | | | 0.98 | |
| Domino's Pizza Group PLC | | | 1,963,598 | | | | 18,081,072 | | | | 2.24 | |
| | | | | | | | 25,984,720 | | | | 3.22 | |
| Semiconductor Equipment | | | | | | | | | | | | |
| ASML Holding N.V. | | | 257,242 | | | | 25,420,654 | | | | 3.15 | |
| | | | | | | | | | | | | |
| Semiconductors | | | | | | | | | | | | |
| Infineon Technologies AG | | | 1,330,438 | | | | 13,767,602 | | | | 1.71 | |
| | | | | | | | | | | | | |
| TOTAL COMMON STOCKS | | | | | | | | | | | | |
| (Cost $565,106,316) | | | | | | | 705,422,297 | | | | 87.47 | |
SCHEDULE OF INVESTMENTS
See notes to financial statements.
MARSICO FLEXIBLE CAPITAL FUND
SCHEDULE OF INVESTMENTS (continued)
September 30, 2014
| | | Par Value | | | Value | | | Percent of Net Assets | |
| CORPORATE BONDS | | | | | | | | | |
| Cable & Satellite | | | | | | | | | |
DISH DBS Corp., 6.625%, 10/1/14 | | $ | 4,099,000 | | | $ | 4,099,000 | | | | 0.51 | % |
| | | | | | | | | | | | | |
| Casinos & Gaming | | | | | | | | | | | | |
Pinnacle Entertainment, Inc., 7.500%, 4/15/21 | | | 6,000,000 | | | | 6,240,000 | | | | 0.78 | |
| | | | | | | | | | | | | |
| Metal & Glass Containers | | | | | | | | | | | | |
Ball Corp., 4.000%, 11/15/23 | | | 6,000,000 | | | | 5,580,000 | | | | 0.69 | |
| | | | | | | | | | | | | |
| Real Estate Development | | | | | | | | | | | | |
The Howard Hughes Corporation, 6.875%, 10/1/21 | | | 4,000,000 | | | | 4,130,000 | | | | 0.51 | |
| | | | | | | | | | | | | |
| Trading Companies & Distributors | | | | | | | | | |
United Rentals North America, Inc., 8.375%, 9/15/20 | | | 4,000,000 | | | | 4,300,000 | | | | 0.53 | |
| | | | | | | | | | | | | |
| Wireless Telecommunication Services | | | | | |
T-Mobile USA, Inc., 6.464%, 4/28/19 | | | 4,000,000 | | | | 4,155,000 | | | | 0.52 | |
| | | | | | | | | | | | | |
| TOTAL CORPORATE BONDS | | | | | | | | | |
| (Cost $29,025,527) | | | | | | | 28,504,000 | | | | 3.54 | |
| | | | | | | | | | | | | |
| INTERNATIONAL BONDS | | | | | | | | | | | | |
| Alternative Carriers | | | | | | | | | | | | |
Ziggo Bond Co. 144A, 8.000%, 5/15/18 | | € | 6,086,000 | | | | 7,994,402 | | | | 0.99 | |
| | | | | | | | | | | | | |
| TOTAL INTERNATIONAL BONDS | | | | | | | | | |
| (Cost $7,848,462) | | | | | | | 7,994,402 | | | | 0.99 | |
| | | Number of Shares | | | Value | | | Percent of Net Assets | |
| PREFERRED STOCKS | | | | | | | | | |
| Diversified Banks | | | | | | | | | |
Wells Fargo & Company, Series N, 5.200% | | | 192,673 | | | $ | 4,383,311 | | | | 0.54 | % |
| | | | | | | | | | | | | |
| Mortgage REITs | | | | | | | | | | | | |
NorthStar Realty Finance Corp., Series E, 8.750% | | | 160,301 | | | | 4,044,394 | | | | 0.50 | |
| | | | | | | | | | | | | |
| Regional Banks | | | | | | | | | | | | |
BB&T Corporation, Series D, 5.850% | | | 173,848 | | | | 4,201,906 | | | | 0.52 | |
First Niagara Financial Group, Inc., Series B, 8.625% | | | 205,728 | | | | 5,822,103 | | | | 0.72 | |
Regions Financial Corporation, Series A, 6.375% | | | 179,141 | | | | 4,387,163 | | | | 0.55 | |
| | | | | | | | 14,411,172 | | | | 1.79 | |
| TOTAL PREFERRED STOCKS | | | | | | | | | |
| (Cost $22,284,617) | | | | | | | 22,838,877 | | | | 2.83 | |
| | | | | | | | | | | | | |
| SHORT-TERM INVESTMENTS | | | | | | | | | |
| State Street Institutional Treasury Money Market Fund, 0.000% | | | 22,645,596 | | | | 22,645,596 | | | | 2.81 | |
| | | | | | | | | | | | | |
| TOTAL SHORT-TERM INVESTMENTS | | | | | | | | | |
| (Cost $22,645,596) | | | | | | | 22,645,596 | | | | 2.81 | |
| | | | | | | | | | | | | |
| TOTAL INVESTMENTS | | | | | | | | | | | | |
| (Cost $646,910,518) | | | | | | | 787,405,172 | | | | 97.64 | |
| | | | | | | | | | | | | |
| Cash and Other Assets, Less Liabilities | | | | | | | 19,043,268 | | | | 2.36 | |
| | | | | | | | | | | | | |
| NET ASSETS | | | | | | $ | 806,448,440 | | | | 100.00 | % |
See notes to financial statements.
INVESTMENT REVIEW BY TOM MARSICO (UNAUDITED)
The Marsico Global Fund posted a total return of (US$) +13.23% for the one-year fiscal period ended September 30, 2014. The Fund outperformed the MSCI All Country World Index (“MSCI ACWI Index”), which we consider to be the Fund’s benchmark index and which had a total return of (US$) +11.32%. The MSCI ACWI Index measures equity market performance in the global developed and emerging markets. Please see the Fund Overview immediately following this commentary for more detailed information about the Fund’s performance for various time periods ended September 30, 2014.
The performance data for the Fund quoted here represent past performance, and past performance is not a guarantee of future results. Investment return and principal value of an investment will fluctuate so that an investor’s shares, when redeemed, may be worth more or less than their original cost. Current performance may be lower or higher than the performance information quoted. To obtain performance information current to the most recent month-end, please call 888-860-8686 or visit www.marsicofunds.com.(1)
This review highlights Fund performance over a one-year fiscal period. Shareholders should keep in mind that the Fund is intended for long-term investors who hold their shares for substantially longer periods of time. You should also keep in mind that our views on all investments discussed in this report are subject to change at any time. References to specific securities, industries, and sectors discussed in this report are not recommendations to buy or sell such securities or related investments, and the Fund may not necessarily hold these securities or investments today. Please see the accompanying Schedule of Investments for the percentage of the Fund’s portfolio represented by the securities mentioned in this report as of the end of the reporting period.
Foreign investments present additional risks due to currency fluctuations, economic and political factors, lower liquidity, differences in securities regulations and accounting standards, possible changes in taxation, limited public information, and other factors. In addition, the Fund is subject to broad risks associated with investing in equity securities markets generally, including the risks that the securities and markets in which it invests may experience volatility and instability, that domestic and global economies and markets may undergo periods of cyclical change and decline, that investors may at times avoid investments in equity securities, and that investments may not perform as anticipated. Please see the Prospectus for more information.
The Global Fund’s outperformance versus the MSCI ACWI Index was partially attributable to stock selection in the Industrials sector. Railroad operator Canadian Pacific Railway Ltd. (+66%) and aerospace and defense companies Lockheed Martin Corporation (+22% prior to being sold) and General Dynamics Corporation (+19%) were material, positive contributors to Fund performance.
Stock selection in the Health Care sector was strong. The Fund maintained significant investments in the sector given the paradigm shift that we saw taking place within the biotechnology industry. Positions in the Pharmaceuticals, Biotechnology & Life Sciences industry, such as Gilead Sciences, Inc. (+69%), Biogen Idec Inc. (+38%), and Pacira Pharmaceuticals, Inc. (+101%) were major contributors to performance. All three companies offer what we believe are innovative products with large markets, and currently appear to have compelling new product pipelines.
The +18% collective return of the Fund’s holdings in the Materials sector significantly outperformed the +2% return of the benchmark index Materials sector. Paint provider The Sherwin-Williams Company (+23%) was the strongest-performing Fund holding within the sector.
Performance in the Information Technology sector was mixed, and the aggregate return of the Fund’s holdings within the sector (+17%) lagged the +23% return of the respective benchmark index sector. Several of the Fund’s Internet services holdings performed well, including Facebook, Inc. – Cl. A (+48%) and Google, Inc. – Cl. A (+35%). The Fund purchased shares of China’s biggest online commerce company, Alibaba Group Holding Ltd. Spon. ADR, at its IPO and later added to the position. Alibaba’s return to the Fund was +30% as of September 30, 2014. The strong performance of these holdings, however, was offset by negative results from Latin American ecommerce holding MercadoLibre, Inc. (-21% prior to being sold), cloud software provider salesforce.com, inc. (-9% prior to being sold), and Chinese online gaming company Tencent Holdings Ltd. (-21%).
Other leading individual holdings that delivered positive performance included restaurant operator Potbelly Corporation (+122% prior to being sold) and Indian multinational automotive company Tata Motors Ltd. ADR (+65%). The Fund purchased Potbelly during the company’s initial public offering, and the stock was sold from the Fund several weeks later when it met our price target. Although Potbelly appreciated sharply, its contribution was muted by its relatively small position size in the Fund.
GLOBAL FUND
From a sector allocation standpoint, the Fund benefitted from having underweight allocations to the weak-performing Financials and Consumer Staples sectors, while maintaining overweight allocations to the strong-performing Health Care and Information Technology sectors. In addition, the Fund invested selectively in a number of newly public companies coming to market, and these investments on a net basis had a modest positive impact on the Fund’s total return for the year.
Stock selection and an overweight allocation to the weak-performing Consumer Discretionary sector detracted from performance. Luxury goods companies Hermes International (-16%) and Brunello Cucinelli SpA (-13% prior to being sold) posted negative returns. Harsh winter weather negatively impacted a number of retail companies. Athletic apparel company lululemon athletica, inc. (-16% prior to being sold), discount retailer The TJX Companies, Inc. (-8% prior to being sold) and auto parts retailer LKQ Corporation (-24%) were additional detractors from performance.
Stock selection in the Consumer Staples and Financials sectors held back Fund performance. Warehouse club operator PriceSmart, Inc. (-12% prior to being sold) was the primary detractor within the Consumer Staples sector. Financials holdings Citigroup, Inc. (+0.6%) and Industrial and Commercial Bank of China Ltd.– Cl. H (-4%) posted weak results prior to the sale of both securities from the Fund.
Although active currency management is not a central facet of the Fund’s investment process, fluctuations in major world currencies can at times affect the Fund’s performance. During the period, the net effect of currency moves was positive for the Fund, in part because a larger proportion of its securities compared to the benchmark was denominated in the US dollar, which strengthened as compared to many other major world currencies. The Fund’s performance was also helped by having no exposure to companies whose securities are denominated in the Japanese yen, which weakened during the period.
During the period, the Fund increased its allocations to the Information Technology, Energy, Health Care, and Materials sectors. The Fund reduced its allocations to the Consumer Discretionary, Industrials, Financials, Consumer Staples, and Telecommunication Services sectors.
The Global Fund experienced elevated portfolio turnover during the period, which primarily related to the Fund’s changing its portfolio composition to reinvest in other positions that we believe may have more upside potential and to take advantage of new opportunities. Portfolio turnover increases transaction-related expenses and could reduce Fund returns.
As noted earlier in this report, effective August 22, 2014, Tom Marsico, previously co-manager of the Marsico Global Fund, assumed sole portfolio manager responsibility for the Fund. Effective the same date, former co-manager James G. Gendelman no longer served as co-manager of the Fund.
Fiscal Period-End Investment Posture
As of September 30, 2014, the Fund’s primary economic sector allocations were Information Technology, Consumer Discretionary, Health Care, and Energy. The Fund had no investments in the Financials, Telecommunication Services, or Utilities sectors. The Fund’s most significant country allocations were the United States, China/Hong Kong, the Netherlands, the United Kingdom, and Switzerland. Country-level weightings generally should be considered a residual of the Fund’s stock selection process rather than a major, proactive facet of its investment strategy.
Sincerely,
THOMAS F. MARSICO
PORTFOLIO MANAGER
| (1) | Total returns are based on net change in net asset value assuming reinvestment of distributions. For the period prior to January 1, 2009, from April 2009 through May 2009, and from January 2012 through September 2014, the performance returns for the Global Fund reflect a fee waiver in effect; in the absence of such a waiver, the returns would have been reduced. For the one-month period of June 2009, performance returns for the Global Fund would have been higher but for the reimbursement of fees waived previously. Please see the Prospectus for more information. |
September 30, 2014 (Unaudited)
The Global Fund invests primarily in the common stocks of US and foreign companies that are selected for their long-term growth potential. The Fund may invest in the securities of companies of any size that are economically tied to any countries or markets throughout the world, including the securities of companies economically tied to emerging markets. Under normal market conditions, the Fund will invest significantly (generally, at least 40% of its net assets) in the securities of issuers organized or located outside the US or doing business outside the US (unless market conditions are not deemed favorable by the Adviser, in which case the Fund generally will invest at least 30% of its assets in such foreign securities). The Fund will invest its assets in various regions and countries, including the US, that encompass not less than three different countries overall. The Fund may hold an unlimited number of common stocks.
TOTAL ANNUAL OPERATING EXPENSES* NET EXPENSES*† | 1.86% 1.60% | NET ASSETS $73,475,168 | NET ASSET VALUE PER SHARE $14.45 |
GROWTH OF $10,000(1)(2) | PERFORMANCE COMPARISON |
| 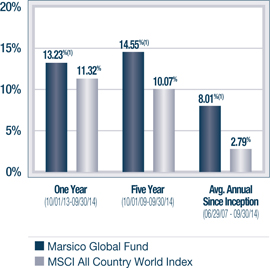 |
SECTOR ALLOCATION(3) | TOP FIVE HOLDINGS |
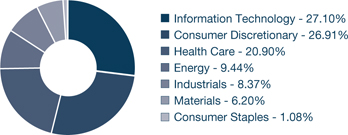 | | |
| GILEAD SCIENCES, INC. | 6.86% |
| CANADIAN PACIFIC RAILWAY LTD. | 5.50% |
| FACEBOOK, INC. - CL. A | 5.20% |
| ASML HOLDING N.V. | 4.40% |
| NOVARTIS AG | 4.20% |
| * | The Total Annual Operating Expenses and Net Expenses are reflective of the information disclosed in the Funds’ Prospectus dated January 31, 2014 and may differ from the expense ratios disclosed in this report. |
| † | Marsico Capital Management, LLC (the “Adviser”) has entered into a written expense limitation and fee waiver agreement under which it has agreed to limit the total expenses of the Global Fund (excluding interest, taxes, acquired fund fees and expenses, litigation, brokerage and extraordinary expenses) to an annual rate of 1.60% of the Fund’s average net assets until January 31, 2015. This expense limitation and fee waiver agreement may be terminated by the Adviser at any time after January 31, 2015, upon 15 days prior notice to the Fund and its administrator. The Adviser may recoup from the Fund fees previously waived or expenses previously reimbursed by the Adviser with respect to the Fund pursuant to this agreement (or a previous expense limitation agreement) if such reimbursement does not cause the Fund to exceed the expense limitation currently in effect and the reimbursement is made within three years after the year in which the Adviser waived the fee or reimbursed the expense. |
The performance data quoted here represent past performance, and past performance is not a guarantee of future results. Investment return and principal value of an investment will fluctuate so that an investor’s shares, when redeemed, may be worth more or less than their original cost. Current performance may be lower or higher than the performance information quoted. To obtain performance information current to the most recent month-end, please call 888-860-8686 or visit www.marsicofunds.com.
The performance included in the chart and graph does not reflect the deduction of taxes on Fund distributions or the redemption of Fund shares.
All indices are unmanaged and investors cannot invest directly in an index.
| (1) | The performance returns for the Global Fund (for the period prior to January 1, 2009, from April 2009 through May 2009 and from January 2012 through September 2014) reflect a fee waiver in effect; in absence of such a waiver, the returns would be reduced. For the one-month period June 2009, performance returns for the Global Fund would have been higher but for reimbursement of fees waived previously. |
| (2) | This chart assumes an initial investment of $10,000 made on June 29, 2007 (inception). Total returns are based on change in NAV, assuming reinvestment of distributions. |
| (3) | Sector weightings represent the percentage of the Fund’s investments (excluding cash equivalents) in certain general sectors. These sectors may include more than one industry. The Fund’s portfolio composition is subject to change at any time. |
The MSCI ACWI (All Country World Index) Index is a free float-adjusted market capitalization index that is designed to measure equity market performance in the global developed and emerging markets.
MARSICO GLOBAL FUND
SCHEDULE OF INVESTMENTS
September 30, 2014
| | | Number of Shares | | | Value | | | Percent of Net Assets | |
| COMMON STOCKS | | | | | | | | | |
| Aerospace & Defense | | | | | | | | | |
| General Dynamics Corporation | | | 16,099 | | | $ | 2,046,022 | | | | 2.78 | % |
| | | | | | | | | | | | | |
| Apparel Retail | | | | | | | | | | | | |
| Zalando S.E.* | | | 15,964 | | | | 433,512 | | | | 0.59 | |
| | | | | | | | | | | | | |
| Apparel, Accessories & Luxury Goods | | | | | |
| Hermes International | | | 4,660 | | | | 1,393,467 | | | | 1.90 | |
| | | | | | | | | | | | | |
| Application Software | | | | | | | | | | | | |
| Mobileye N.V.* | | | 7,338 | | | | 393,243 | | | | 0.54 | |
| | | | | | | | | | | | | |
| Automobile Manufacturers | | | | | | | | | | | | |
| Bayerische Motoren Werke AG | | | 12,237 | | | | 1,314,065 | | | | 1.79 | |
| Tata Motors Ltd. ADR | | | 48,857 | | | | 2,135,539 | | | | 2.90 | |
| Tesla Motors, Inc.* | | | 6,721 | | | | 1,631,052 | | | | 2.22 | |
| | | | | | | | 5,080,656 | | | | 6.91 | |
| Biotechnology | | | | | | | | | | | | |
| Biogen Idec Inc.* | | | 7,052 | | | | 2,332,872 | | | | 3.18 | |
| Gilead Sciences, Inc.* | | | 47,351 | | | | 5,040,514 | | | | 6.86 | |
| | | | | | | | 7,373,386 | | | | 10.04 | |
| Cable & Satellite | | | | | | | | | | | | |
| Liberty Global PLC - Series C* | | | 45,297 | | | | 1,857,856 | | | | 2.53 | |
| | | | | | | | | | | | | |
| Casinos & Gaming | | | | | | | | | | | | |
| Wynn Macau Ltd. | | | 539,200 | | | | 1,715,196 | | | | 2.33 | |
| | | | | | | | | | | | | |
| Data Processing & Outsourced Services | | | | | |
| Visa, Inc. - Cl. A | | | 9,191 | | | | 1,961,084 | | | | 2.67 | |
| | | | | | | | | | | | | |
| Distributors | | | | | | | | | | | | |
| LKQ Corporation* | | | 13,424 | | | | 356,944 | | | | 0.49 | |
| | | | | | | | | | | | | |
| Fertilizers & Agricultural Chemicals | | | | | | | | | |
| Monsanto Company | | | 20,070 | | | | 2,258,076 | | | | 3.07 | |
| | | | | | | | | | | | | |
| Footwear | | | | | | | | | | | | |
| NIKE, Inc. - Cl. B | | | 18,253 | | | | 1,628,168 | | | | 2.22 | |
| | | | | | | | | | | | | |
| Hotels, Resorts & Cruise Lines | | | | | | | | | |
| Starwood Hotels & Resorts Worldwide, Inc. | | | 28,566 | | | | 2,376,977 | | | | 3.23 | |
| | | | | | | | | | | | | |
| Internet Software & Services | | | | | | | | | |
| Alibaba Group Holding Ltd. Spon. ADR* | | | 24,360 | | | | 2,164,386 | | | | 2.94 | |
| Facebook, Inc. - Cl. A* | | | 48,314 | | | | 3,818,739 | | | | 5.20 | |
| Google, Inc. - Cl. A* | | | 2,406 | | | | 1,415,715 | | | | 1.93 | |
| Google, Inc. - Cl. C* | | | 1,938 | | | | 1,118,924 | | | | 1.52 | |
| LinkedIn Corporation - Cl. A* | | | 1,717 | | | | 356,775 | | | | 0.48 | |
| Tencent Holdings Ltd. | | | 144,800 | | | | 2,150,130 | | | | 2.93 | |
| | | | | | | | 11,024,669 | | | | 15.00 | |
| Movies & Entertainment | | | | | | | | | | | | |
| The Walt Disney Company | | | 21,955 | | | | 1,954,654 | | | | 2.66 | |
| | | | | | | | | | | | | |
COMMON STOCKS (continued) | | | | | | | | | |
| Oil & Gas Equipment & Services | | | | | | | | | |
| Halliburton Company | | | 24,163 | | | $ | 1,558,755 | | | | 2.12 | % |
| Schlumberger Ltd. | | | 21,655 | | | | 2,202,097 | | | | 3.00 | |
| | | | | | | | 3,760,852 | | | | 5.12 | |
| Oil & Gas Exploration & Production | | | | | | | | | |
| Antero Resources Corporation* | | | 18,637 | | | | 1,022,985 | | | | 1.39 | |
| Continental Resources, Inc.* | | | 31,371 | | | | 2,085,544 | | | | 2.84 | |
| | | | | | | | 3,108,529 | | | | 4.23 | |
| Packaged Foods & Meats | | | | | | | | | | | | |
| Keurig Green Mountain, Inc. | | | 6,073 | | | | 790,279 | | | | 1.08 | |
| | | | | | | | | | | | | |
| Pharmaceuticals | | | | | | | | | | | | |
| Novartis AG | | | 32,658 | | | | 3,083,816 | | | | 4.20 | |
| Pacira Pharmaceuticals, Inc.* | | | 13,931 | | | | 1,350,192 | | | | 1.84 | |
| Roche Holding AG | | | 6,657 | | | | 1,974,020 | | | | 2.68 | |
| UCB S.A. | | | 15,680 | | | | 1,423,557 | | | | 1.94 | |
| | | | | | | | 7,831,585 | | | | 10.66 | |
| Railroads | | | | | | | | | | | | |
| Canadian Pacific Railway Ltd. | | | 19,482 | | | | 4,043,217 | | | | 5.50 | |
| | | | | | | | | | | | | |
| Restaurants | | | | | | | | | | | | |
| Domino's Pizza Group PLC | | | 259,303 | | | | 2,387,697 | | | | 3.25 | |
| | | | | | | | | | | | | |
| Semiconductor Equipment | | | | | | | | | | | | |
| ASML Holding N.V. | | | 32,693 | | | | 3,230,722 | | | | 4.40 | |
| | | | | | | | | | | | | |
| Semiconductors | | | | | | | | | | | | |
| ARM Holdings PLC | | | 68,741 | | | | 1,009,642 | | | | 1.37 | |
| | | | | | | | | | | | | |
| Specialty Chemicals | | | | | | | | | | | | |
| The Sherwin-Williams Company | | | 10,287 | | | | 2,252,750 | | | | 3.07 | |
| | | | | | | | | | | | | |
| Technology Hardware, Storage & Peripherals | | | | | |
| Apple, Inc. | | | 24,754 | | | | 2,493,965 | | | | 3.39 | |
| | | | | | | | | | | | | |
| TOTAL COMMON STOCKS | | | | | | | | | | | | |
| (Cost $60,106,892) | | | | | | | 72,763,148 | | | | 99.03 | |
| | | | | | | | | | | | | |
| SHORT-TERM INVESTMENTS | | | | | | | | | |
| State Street Institutional Treasury Money Market Fund, 0.000% | | | 1,557,995 | | | | 1,557,995 | | | | 2.12 | |
| | | | | | | | | | | | | |
| TOTAL SHORT-TERM INVESTMENTS | | | | | | | | | |
| (Cost $1,557,995) | | | | | | | 1,557,995 | | | | 2.12 | |
| | | | | | | | | | | | | |
| TOTAL INVESTMENTS | | | | | | | | | | | | |
| (Cost $61,664,887) | | | | | | | 74,321,143 | | | | 101.15 | |
| | | | | | | | | | | | | |
| Liabilities, Less Cash and Other Assets | | | | | | | (845,975 | ) | | | (1.15 | ) |
| | | | | | | | | | | | | |
| NET ASSETS | | | | | | $ | 73,475,168 | | | | 100.00 | % |
See notes to financial statements.
| SUMMARY OF INVESTMENTS BY COUNTRY | |
| Country | | Market Value | | | Percent of Investment Securities | |
| Belgium | | $ | 1,423,557 | | | | 1.92 | % |
| Canada | | | 4,043,217 | | | | 5.44 | |
| China/Hong Kong | | | 6,029,712 | | | | 8.11 | |
| France | | | 1,393,467 | | | | 1.88 | |
| Germany | | | 1,747,577 | | | | 2.35 | |
| India | | | 2,135,539 | | | | 2.87 | |
| Israel | | | 393,243 | | | | 0.53 | |
| Netherlands | | | 5,432,819 | | | | 7.31 | |
| Switzerland | | | 5,057,836 | | | | 6.80 | |
| United Kingdom | | | 5,255,195 | | | | 7.07 | |
United States(1) | | | 41,408,981 | | | | 55.72 | |
| | | $ | 74,321,143 | | | | 100.00 | % |
| (1) | Includes short-term securities. |
SCHEDULE OF INVESTMENTS
See notes to financial statements.
STATEMENTS OF ASSETS AND LIABILITIES
September 30, 2014
| (Amounts in thousands) | | MARSICO FOCUS FUND | | | MARSICO GROWTH FUND | |
| | | | | | | |
| ASSETS | | | | | | |
Investments, at value (cost $647,004, $391,657, $236,272, $144,353, $646,911, and $61,665, respectively) | | $ | 934,552 | | | $ | 562,273 | |
| Foreign currency (cost $0, $0, $0, $41, $0, and $0, respectively) | | | — | | | | — | |
| Receivable for investments sold | | | 8,919 | | | | 5,651 | |
| Receivable for capital stock sold | | | 641 | | | | 28 | |
| Interest and dividends receivable | | | 418 | | | | 418 | |
| Prepaid expenses and other assets | | | 1,450 | | | | 955 | |
| Total Assets | | | 945,980 | | | | 569,325 | |
| | | | | | | | | |
| LIABILITIES | | | | | | | | |
| Payable for investments purchased | | | 7,448 | | | | 3,452 | |
| Payable for capital stock redeemed | | | 289 | | | | 179 | |
| Payable to investment adviser | | | 655 | | | | 402 | |
| Accrued trustees' fees | | | 1,428 | | | | 935 | |
| Accrued distribution fee | | | 2,827 | | | | 1,515 | |
| Accrued professional fees | | | 60 | | | | 40 | |
| Accrued transfer agent fees and expenses | | | 117 | | | | 77 | |
| Accrued printing expenses | | | 57 | | | | 38 | |
| Accrued expenses and other liabilities | | | 45 | | | | 34 | |
| Total Liabilities | | | 12,926 | | | | 6,672 | |
| | | | | | | | | |
| NET ASSETS | | $ | 933,054 | | | $ | 562,653 | |
| | | | | | | | | |
| NET ASSETS CONSIST OF | | | | | | | | |
| Paid-in-capital | | $ | 528,080 | | | $ | 331,087 | |
| Accumulated net investment loss | | | (4,903 | ) | | | (2,669 | ) |
Accumulated net realized gain (loss) on investments and foreign currency transactions | | | 121,756 | | | | 63,266 | |
Net unrealized appreciation on investments and foreign currency translations | | | 288,121 | | | | 170,969 | |
| NET ASSETS | | $ | 933,054 | | | $ | 562,653 | |
| | | | | | | | | |
| SHARES OUTSTANDING, $0.001 par value | | | | | | | | |
| (Unlimited shares authorized) | | | 41,644 | | | | 23,806 | |
| | | | | | | | | |
NET ASSET VALUE, REDEMPTION PRICE, AND OFFERING PRICE PER SHARE (NET ASSETS/SHARES OUTSTANDING)* | | $ | 22.41 | | | $ | 23.63 | |
| * | Not in thousands, based on unrounded net assets and shares outstanding. |
See notes to financial statements.
MARSICO 21st CENTURY FUND | | | MARSICO INTERNATIONAL OPPORTUNITIES FUND | | | MARSICO FLEXIBLE CAPITAL FUND | | | MARSICO GLOBAL FUND | |
| | | | | | | | | | | |
| $ | 320,925 | | | $ | 156,394 | | | $ | 787,405 | | | $ | 74,321 | |
| | — | | | | 41 | | | | — | | | | — | |
| | 3,657 | | | | 24,747 | | | | 28,746 | | | | — | |
| | 27 | | | | 84 | | | | 202 | | | | 24 | |
| | 61 | | | | 294 | | | | 1,674 | | | | 85 | |
| | 775 | | | | 345 | | | | 1,265 | | | | 485 | |
| | 325,445 | | | | 181,905 | | | | 819,292 | | | | 74,915 | |
| | | | | | | | | | | | | | | |
| | | | | | | | | | | | | | | |
| | 6,910 | | | | 4,960 | | | | 8,604 | | | | 684 | |
| | 379 | | | | 132 | | | | 1,727 | | | | 42 | |
| | 225 | | | | 144 | | | | 580 | | | | 62 | |
| | 764 | | | | 332 | | | | 1,234 | | | | 469 | |
| | 745 | | | | 269 | | | | 425 | | | | 144 | |
| | 22 | | | | 12 | | | | 62 | | | | 5 | |
| | 47 | | | | 25 | | | | 119 | | | | 11 | |
| | 21 | | | | 11 | | | | 59 | | | | 4 | |
| | 39 | | | | 36 | | | | 34 | | | | 19 | |
| | 9,152 | | | | 5,921 | | | | 12,844 | | | | 1,440 | |
| | | | | | | | | | | | | | | |
| $ | 316,293 | | | $ | 175,984 | | | $ | 806,448 | | | $ | 73,475 | |
| | | | | | | | | | | | | | | |
| | | | | | | | | | | | | | | |
| $ | 697,594 | | | $ | 275,360 | | | $ | 609,646 | | | $ | 52,726 | |
| | (3,011 | ) | | | (799 | ) | | | (2,440 | ) | | | (511 | ) |
| | (463,228 | ) | | | (110,660 | ) | | | 58,241 | | | | 8,378 | |
| | 84,938 | | | | 12,083 | | | | 141,001 | | | | 12,882 | |
| $ | 316,293 | | | $ | 175,984 | | | $ | 806,448 | | | $ | 73,475 | |
| | | | | | | | | | | | | | | |
| | | | | | | | | | | | | | | |
| | 15,135 | | | | 11,956 | | | | 43,854 | | | | 5,083 | |
| | | | | | | | | | | | | | | |
| $ | 20.90 | | | $ | 14.72 | | | $ | 18.39 | | | $ | 14.45 | |
STATEMENTS OF CHANGES IN NET ASSETS
| | | MARSICO FOCUS FUND | | | MARSICO GROWTH FUND | |
| | | | | | | | | | | | | |
| (Amounts in thousands) | | Year Ended 9/30/14 | | | Year Ended 9/30/13 | | | Year Ended 9/30/14 | | | Year Ended 9/30/13 | |
| | | | | | | | | | | | | |
| OPERATIONS: | | | | | | | | | | | | |
| Net investment income (loss) | | $ | (3,071 | ) | | $ | (888 | ) | | $ | (1,962 | ) | | $ | 70 | |
| Net realized gain on investments | | | 133,166 | | | | 178,279 | | | | 75,176 | | | | 151,295 | |
| Net realized gain (loss) on foreign currency transactions | | | 2,085 | | | | 608 | | | | 281 | | | | 298 | |
| Change in unrealized appreciation (depreciation) on investments and foreign currency translations | | | 46,251 | | | | (12,255 | ) | | | 19,061 | | | | (36,212 | ) |
| | | | | | | | | | | | | | | | | |
| Net increase (decrease) in net assets resulting from operations | | | 178,431 | | | | 165,744 | | | | 92,556 | | | | 115,451 | |
| | | | | | | | | | | | | | | | | |
| DISTRIBUTIONS: | | | | | | | | | | | | | | | | |
| Net investment income | | | — | | | | (1,177 | ) | | | (1,356 | ) | | | (1,219 | ) |
| Net realized gains | | | (133,035 | ) | | | (101,796 | ) | | | (117,682 | ) | | | (34,354 | ) |
| | | | | | | | | | | | | | | | | |
| Total distributions | | | (133,035 | ) | | | (102,973 | ) | | | (119,038 | ) | | | (35,573 | ) |
| | | | | | | | | | | | | | | | | |
| CAPITAL SHARE TRANSACTIONS: | | | | | | | | | | | | | | | | |
| Proceeds from sales of shares | | | 79,841 | | | | 95,434 | | | | 83,402 | | | | 55,964 | |
| Proceeds from reinvestment of distributions | | | 120,542 | | | | 100,815 | | | | 112,618 | | | | 34,546 | |
| Redemption fees | | | 2 | | | | 11 | | | | 2 | | | | 9 | |
| Redemption of shares | | | (167,435 | ) | | | (370,333 | ) | | | (171,653 | ) | | | (283,024 | ) |
| | | | | | | | | | | | | | | | | |
| Net increase (decrease) from capital share transactions | | | 32,950 | | | | (174,073 | ) | | | 24,369 | | | | (192,505 | ) |
| | | | | | | | | | | | | | | | | |
| TOTAL INCREASE (DECREASE) IN NET ASSETS | | | 78,346 | | | | (111,302 | ) | | | (2,113 | ) | | | (112,627 | ) |
| | | | | | | | | | | | | | | | | |
| NET ASSETS: | | | | | | | | | | | | | | | | |
| Beginning of Period | | | 854,708 | | | | 966,010 | | | | 564,766 | | | | 677,393 | |
| | | | | | | | | | | | | | | | | |
| End of Period | | $ | 933,054 | | | $ | 854,708 | | | $ | 562,653 | | | $ | 564,766 | |
| | | | | | | | | | | | | | | | | |
Undistributed net investment income (Accumulated net investment loss) | | $ | (4,903 | ) | | $ | (2,174 | ) | | $ | (2,669 | ) | | $ | (890 | ) |
| | | | | | | | | | | | | | | | | |
| TRANSACTIONS IN SHARES: | | | | | | | | | | | | | | | | |
| Shares sold | | | 3,721 | | | | 4,907 | | | | 3,612 | | | | 2,486 | |
| Shares issued in reinvestment of distributions | | | 5,988 | | | | 5,817 | | | | 5,173 | | | | 1,705 | |
| Shares redeemed | | | (7,882 | ) | | | (19,169 | ) | | | (7,546 | ) | | | (12,469 | ) |
| | | | | | | | | | | | | | | | | |
| NET INCREASE (DECREASE) | | | 1,827 | | | | (8,445 | ) | | | 1,239 | | | | (8,278 | ) |
See notes to financial statements.
MARSICO 21st CENTURY FUND | | | MARSICO INTERNATIONAL OPPORTUNITIES FUND | | | MARSICO FLEXIBLE CAPITAL FUND | | | MARSICO GLOBAL FUND | |
| | | | | | | | | | | | | | | | | | | | | | | |
Year Ended 9/30/14 | | | Year Ended 9/30/13 | | | Year Ended 9/30/14 | | | Year Ended 9/30/13 | | | Year Ended 9/30/14 | | | Year Ended 9/30/13 | | | Year Ended 9/30/14 | | | Year Ended 9/30/13 | |
| | | | | | | | | | | | | | | | | | | | | | | |
| | | | | | | | | | | | | | | | | | | | | | | |
| $ | (2,856 | ) | | $ | (1,019 | ) | | $ | (923 | ) | | $ | 736 | | | $ | (1,860 | ) | | $ | 1,056 | | | $ | (307 | ) | | $ | (32 | ) |
| | 47,655 | | | | 76,783 | | | | 3,145 | | | | 26,474 | | | | 78,629 | | | | 107,689 | | | | 9,758 | | | | 14,236 | |
| | 89 | | | | 6 | | | | (1,232 | ) | | | (1,652 | ) | | | 646 | | | | (969 | ) | | | 427 | | | | 96 | |
| | 2,092 | | | | (5,269 | ) | | | (8,497 | ) | | | (1,499 | ) | | | 20,204 | | | | 28,858 | | | | (1,297 | ) | | | (767 | ) |
| | | | | | | | | | | | | | | | | | | | | | | | | | | | | | | |
| | 46,980 | | | | 70,501 | | | | (7,507 | ) | | | 24,059 | | | | 97,619 | | | | 136,634 | | | | 8,581 | | | | 13,533 | |
| | | | | | | | | | | | | | | | | | | | | | | | | | | | | | | |
| | | | | | | | | | | | | | | | | | | | | | | | | | | | | | | |
| | — | | | | — | | | | (742 | ) | | | — | | | | — | | | | (3,473 | ) | | | — | | | | — | |
| | — | | | | — | | | | — | | | | — | | | | (89,103 | ) | | | (29,533 | ) | | | (9,278 | ) | | | — | |
| | | | | | | | | | | | | | | | | | | | | | | | | | | | | | | |
| | — | | | | — | | | | (742 | ) | | | — | | | | (89,103 | ) | | | (33,006 | ) | | | (9,278 | ) | | | — | |
| | | | | | | | | | | | | | | | | | | | | | | | | | | | | | | |
| | | | | | | | | | | | | | | | | | | | | | | | | | | | | | | |
| | 12,600 | | | | 9,472 | | | | 101,347 | | | | 8,254 | | | | 249,527 | | | | 368,214 | | | | 27,301 | | | | 6,067 | |
| | — | | | | — | | | | 694 | | | | — | | | | 74,212 | | | | 29,608 | | | | 7,242 | | | | — | |
| | 1 | | | | 2 | | | | 3 | | | | 1 | | | | 30 | | | | 52 | | | | 2 | | | | — | |
| | (55,503 | ) | | | (122,305 | ) | | | (37,333 | ) | | | (47,013 | ) | | | (331,572 | ) | | | (286,060 | ) | | | (21,756 | ) | | | (12,412 | ) |
| | | | | | | | | | | | | | | | | | | | | | | | | | | | | | | |
| | (42,902 | ) | | | (112,831 | ) | | | 64,711 | | | | (38,758 | ) | | | (7,803 | ) | | | 111,814 | | | | 12,789 | | | | (6,345 | ) |
| | | | | | | | | | | | | | | | | | | | | | | | | | | | | | | |
| | 4,078 | | | | (42,330 | ) | | | 56,462 | | | | (14,699 | ) | | | 713 | | | | 215,442 | | | | 12,092 | | | | 7,188 | |
| | | | | | | | | | | | | | | | | | | | | | | | | | | | | | | |
| | | | | | | | | | | | | | | | | | | | | | | | | | | | | | | |
| | 312,215 | | | | 354,545 | | | | 119,522 | | | | 134,221 | | | | 805,735 | | | | 590,293 | | | | 61,383 | | | | 54,195 | |
| | | | | | | | | | | | | | | | | | | | | | | | | | | | | | | |
| $ | 316,293 | | | $ | 312,215 | | | $ | 175,984 | | | $ | 119,522 | | | $ | 806,448 | | | $ | 805,735 | | | $ | 73,475 | | | $ | 61,383 | |
| | | | | | | | | | | | | | | | | | | | | | | | | | | | | | | |
| $ | (3,011 | ) | | $ | (2,307 | ) | | $ | (799 | ) | | $ | 443 | | | $ | (2,440 | ) | | $ | (651 | ) | | $ | (511 | ) | | $ | (272 | ) |
| | | | | | | | | | | | | | | | | | | | | | | | | | | | | | | |
| | | | | | | | | | | | | | | | | | | | | | | | | | | | | | | |
| | 632 | | | | 607 | | | | 6,558 | | | | 598 | | | | 13,675 | | | | 22,747 | | | | 1,924 | | | | 461 | |
| | — | | | | — | | | | 45 | | | | — | | | | 4,188 | | | | 1,998 | | | | 518 | | | | — | |
| | (2,792 | ) | | | (8,209 | ) | | | (2,461 | ) | | | (3,520 | ) | | | (18,246 | ) | | | (17,885 | ) | | | (1,524 | ) | | | (1,006 | ) |
| | | | | | | | | | | | | | | | | | | | | | | | | | | | | | | |
| | (2,160 | ) | | | (7,602 | ) | | | 4,142 | | | | (2,922 | ) | | | (383 | ) | | | 6,860 | | | | 918 | | | | (545 | ) |
FINANCIAL HIGHLIGHTS
| | | MARSICO FOCUS FUND | |
| | | | |
For a Fund Share Outstanding Throughout the Period | | Year Ended 9/30/14 | | | Year Ended 9/30/13 | | | Year Ended 9/30/12 | | | Year Ended 9/30/11 | | | Year Ended 9/30/10 | |
| | | | | | | | | | | | | | | | |
| Net Asset Value, Beginning of Period | | $ | 21.47 | | | $ | 20.02 | | | $ | 15.97 | | | $ | 15.79 | | | $ | 14.38 | |
| | | | | | | | | | | | | | | | | | | | | |
| | | | | | | | | | | | | | | | | | | | | |
| Income from Investment Operations: | | | | | | | | | | | | | | | | | | | | |
| Net investment income (loss) | | | (0.07 | ) | | | (0.03 | ) | | | 0.02 | | | | (0.02 | ) | | | (0.01 | ) |
| Net realized and unrealized gains (losses) on investments | | | 4.46 | | | | 3.84 | | | | 4.03 | | | | 0.20 | | | | 1.45 | |
| | | | | | | | | | | | | | | | | | | | | |
| Total from investment operations | | | 4.39 | | | | 3.81 | | | | 4.05 | | | | 0.18 | | | | 1.44 | |
| | | | | | | | | | | | | | | | | | | | | |
| Distributions & Other: | | | | | | | | | | | | | | | | | | | | |
| Net investment income | | | — | | | | (0.03 | ) | | | — | | | | — | | | | (0.03 | ) |
| Net realized gains | | | (3.45 | ) | | | (2.33 | ) | | | — | | | | — | | | | — | |
| Redemption fees [See Note 2(h)] | | | — | (1) | | | — | (1) | | | — | (1) | | | — | (1) | | | — | (1) |
| | | | | | | | | | | | | | | | | | | | | |
| Total distributions and other | | | (3.45 | ) | | | (2.36 | ) | | | — | | | | — | | | | (0.03 | ) |
| | | | | | | | | | | | | | | | | | | | | |
| Net Asset Value, End of Period | | $ | 22.41 | | | $ | 21.47 | | | $ | 20.02 | | | $ | 15.97 | | | $ | 15.79 | |
| | | | | | | | | | | | | | | | | | | | | |
| | | | | | | | | | | | | | | | | | | | | |
| Total Return | | | 22.27 | % | | | 21.86 | % | | | 25.36 | % | | | 1.14 | % | | | 10.02 | % |
| | | | | | | | | | | | | | | | | | | | | |
| | | | | | | | | | | | | | | | | | | | | |
| Supplemental Data and Ratios: | | | | | | | | | | | | | | | | | | | | |
| | | | | | | | | | | | | | | | | | | | | |
| Net assets, end of Period (000s) | | $ | 933,054 | | | $ | 854,708 | | | $ | 966,010 | | | $ | 936,382 | | | $ | 1,451,877 | |
| | | | | | | | | | | | | | | | | | | | | |
| Ratio of expenses to average net assets, less waivers and before expenses paid indirectly, plus reimbursements of previously waived expenses | | | 1.34 | % | | | 1.35 | % | | | 1.34 | % | | | 1.33 | % | | | 1.33 | % |
| | | | | | | | | | | | | | | | | | | | | |
| Ratio of net investment income (loss) to average net assets, net of waivers, reimbursements of previously waived expenses and expenses paid indirectly | | | (0.35 | )% | | | (0.10 | )% | | | 0.09 | % | | | (0.04 | )% | | | (0.06 | )% |
| | | | | | | | | | | | | | | | | | | | | |
| Ratio of expenses to average net assets, before waivers, reimbursements of previously waived expenses and expenses paid indirectly | | | 1.34 | % | | | 1.35 | % | | | 1.34 | % | | | 1.33 | % | | | 1.33 | % |
| | | | | | | | | | | | | | | | | | | | | |
| Ratio of net investment income (loss) to average net assets, before waivers, reimbursements of previously waived expenses and expenses paid indirectly | | | (0.35 | )% | | | (0.10 | )% | | | 0.09 | % | | | (0.04 | )% | | | (0.06 | )% |
| | | | | | | | | | | | | | | | | | | | | |
| Portfolio turnover rate | | | 71 | % | | | 92 | % | | | 66 | % | | | 82 | % | | | 85 | % |
See notes to financial statements.
MARSICO GROWTH FUND | | | MARSICO 21st CENTURY FUND | |
| | | | | |
Year Ended 9/30/14 | | | Year Ended 9/30/13 | | | Year Ended 9/30/12 | | | Year Ended 9/30/11 | | | Year Ended 9/30/10 | | | Year Ended 9/30/14 | | | Year Ended 9/30/13 | | | Year Ended 9/30/12 | | | Year Ended 9/30/11 | | | Year Ended 9/30/10 | |
| | | | | | | | | | | | | | | | | | | | | | | | | | | | | |
| $ | 25.03 | | | $ | 21.96 | | | $ | 17.43 | | | $ | 17.04 | | | $ | 15.32 | | | $ | 18.05 | | | $ | 14.24 | | | $ | 11.36 | | | $ | 12.38 | | | $ | 11.56 | |
| | | | | | | | | | | | | | | | | | | | | | | | | | | | | | | | | | | | | | | |
| | | | | | | | | | | | | | | | | | | | | | | | | | | | | | | | | | | | | | | |
| | | | | | | | | | | | | | | | | | | | | | | | | | | | | | | | | | | | | | | |
| | (0.08 | ) | | | — | (1) | | | 0.03 | | | | — | (1) | | | 0.01 | | | | (0.21 | ) | | | (0.09 | ) | | | (0.06 | ) | | | (0.06 | ) | | | (0.08 | ) |
| | 4.01 | | | | 4.30 | | | | 4.51 | | | | 0.40 | | | | 1.78 | | | | 3.06 | | | | 3.90 | | | | 2.94 | | | | (0.96 | ) | | | 0.90 | |
| | | | | | | | | | | | | | | | | | | | | | | | | | | | | | | | | | | | | | | |
| | 3.93 | | | | 4.30 | | | | 4.54 | | | | 0.40 | | | | 1.79 | | | | 2.85 | | | | 3.81 | | | | 2.88 | | | | (1.02 | ) | | | 0.82 | |
| | | | | | | | | | | | | | | | | | | | | | | | | | | | | | | | | | | | | | | |
| | | | | | | | | | | | | | | | | | | | | | | | | | | | | | | | | | | | | | | |
| | (0.06 | ) | | | (0.04 | ) | | | (0.01 | ) | | | (0.01 | ) | | | (0.07 | ) | | | — | | | | — | | | | — | | | | — | | | | — | |
| | (5.27 | ) | | | (1.19 | ) | | | — | | | | — | | | | — | | | | — | | | | — | | | | — | | | | — | | | | — | |
| | — | (1) | | | — | (1) | | | — | (1) | | | — | (1) | | | — | (1) | | | — | (1) | | | — | (1) | | | — | (1) | | | — | (1) | | | — | (1) |
| | | | | | | | | | | | | | | | | | | | | | | | | | | | | | | | | | | | | | | |
| | (5.33 | ) | | | (1.23 | ) | | | (0.01 | ) | | | (0.01 | ) | | | (0.07 | ) | | | — | | | | — | | | | — | | | | — | | | | — | |
| | | | | | | | | | | | | | | | | | | | | | | | | | | | | | | | | | | | | | | |
| $ | 23.63 | | | $ | 25.03 | | | $ | 21.96 | | | $ | 17.43 | | | $ | 17.04 | | | $ | 20.90 | | | $ | 18.05 | | | $ | 14.24 | | | $ | 11.36 | | | $ | 12.38 | |
| | | | | | | | | | | | | | | | | | | | | | | | | | | | | | | | | | | | | | | |
| | | | | | | | | | | | | | | | | | | | | | | | | | | | | | | | | | | | | | | |
| | 17.51 | % | | | 20.92 | % | | | 26.04 | % | | | 2.34 | % | | | 11.75 | % | | | 15.79 | % | | | 26.76 | % | | | 25.35 | % | | | (8.24 | )% | | | 7.09 | % |
| | | | | | | | | | | | | | | | | | | | | | | | | | | | | | | | | | | | | | | |
| | | | | | | | | | | | | | | | | | | | | | | | | | | | | | | | | | | | | | | |
| | | | | | | | | | | | | | | | | | | | | | | | | | | | | | | | | | | | | | | |
| | | | | | | | | | | | | | | | | | | | | | | | | | | | | | | | | | | | | | | |
| $ | 562,653 | | | $ | 564,766 | | | $ | 677,393 | | | $ | 666,925 | | | $ | 883,053 | | | $ | 316,293 | | | $ | 312,215 | | | $ | 354,545 | | | $ | 495,482 | | | $ | 757,438 | |
| | | | | | | | | | | | | | | | | | | | | | | | | | | | | | | | | | | | | | | |
| | 1.37 | % | | | 1.37 | % | | | 1.35 | % | | | 1.33 | % | | | 1.33 | % | | | 1.42 | % | | | 1.45 | % | | | 1.41 | % | | | 1.37 | % | | | 1.37 | % |
| | | | | | | | | | | | | | | | | | | | | | | | | | | | | | | | | | | | | | | |
| | (0.34 | )% | | | 0.01 | % | | | 0.15 | % | | | 0.03 | % | | | 0.04 | % | | | (0.88 | )% | | | (0.33 | )% | | | (0.31 | )% | | | (0.32 | )% | | | (0.60 | )% |
| | | | | | | | | | | | | | | | | | | | | | | | | | | | | | | | | | | | | | | |
| | 80 | % | | | 114 | % | | | 65 | % | | | 67 | % | | | 67 | % | | | 83 | % | | | 102 | % | | | 63 | % | | | 86 | % | | | 100 | % |
FINANCIAL STATEMENTS
FINANCIAL HIGHLIGHTS
| | | MARSICO INTERNATIONAL OPPORTUNITIES FUND | |
| | | | |
For a Fund Share Outstanding Throughout the Period | | Year Ended 9/30/14 | | | Year Ended 9/30/13 | | | Year Ended 9/30/12 | | | Year Ended 9/30/11 | | | Year Ended 9/30/10 | |
| | | | | | | | | | | | | | | | |
| Net Asset Value, Beginning of Period | | $ | 15.30 | | | $ | 12.50 | | | $ | 10.61 | | | $ | 12.57 | | | $ | 11.86 | |
| | | | | | | | | | | | | | | | | | | | | |
| | | | | | | | | | | | | | | | | | | | | |
| Income from Investment Operations: | | | | | | | | | | | | | | | | | | | | |
| Net investment income (loss) | | | (0.06 | ) | | | 0.09 | | | | 0.01 | | | | (0.22 | ) | | | 0.04 | |
| Net realized and unrealized gains (losses) on investments | | | (0.42 | ) | | | 2.71 | | | | 1.88 | | | | (1.49 | ) | | | 0.72 | |
| | | | | | | | | | | | | | | | | | | | | |
| Total from investment operations | | | (0.48 | ) | | | 2.80 | | | | 1.89 | | | | (1.71 | ) | | | 0.76 | |
| | | | | | | | | | | | | | | | | | | | | |
| Distributions & Other: | | | | | | | | | | | | | | | | | | | | |
| Net investment income | | | (0.10 | ) | | | — | | | | — | | | | (0.25 | ) | | | (0.05 | ) |
| Net realized gains | | | — | | | | — | | | | — | | | | — | | | | — | |
| Redemption fees [See Note 2(h)] | | | — | (1) | | | — | (1) | | | — | (1) | | | — | (1) | | | — | (1) |
| | | | | | | | | | | | | | | | | | | | | |
| Total distributions and other | | | (0.10 | ) | | | — | | | | — | | | | (0.25 | ) | | | (0.05 | ) |
| | | | | | | | | | | | | | | | | | | | | |
| Net Asset Value, End of Period | | $ | 14.72 | | | $ | 15.30 | | | $ | 12.50 | | | $ | 10.61 | | | $ | 12.57 | |
| | | | | | | | | | | | | | | | | | | | | |
| | | | | | | | | | | | | | | | | | | | | |
| Total Return | | | (3.18 | )% | | | 22.40 | % | | | 17.81 | % | | | (13.98 | )% | | | 6.48 | % |
| | | | | | | | | | | | | | | | | | | | | |
| | | | | | | | | | | | | | | | | | | | | |
| Supplemental Data and Ratios: | | | | | | | | | | | | | | | | | | | | |
| | | | | | | | | | | | | | | | | | | | | |
| Net assets, end of Period (000s) | | $ | 175,984 | | | $ | 119,522 | | | $ | 134,221 | | | $ | 153,855 | | | $ | 359,016 | |
| | | | | | | | | | | | | | | | | | | | | |
| Ratio of expenses to average net assets, less waivers and before expenses paid indirectly, plus reimbursements of previously waived expenses | | | 1.60 | % | | | 1.60 | % | | | 1.60 | % | | | 1.56 | % | | | 1.52 | % |
| | | | | | | | | | | | | | | | | | | | | |
| Ratio of net investment income (loss) to average net assets, net of waivers, reimbursements of previously waived expenses and expenses paid indirectly | | | (0.55 | )% | | | 0.61 | % | | | 0.29 | % | | | (0.22 | )% | | | 0.31 | % |
| | | | | | | | | | | | | | | | | | | | | |
| Ratio of expenses to average net assets, before waivers, reimbursements of previously waived expenses and expenses paid indirectly | | | 1.52 | % | | | 1.74 | % | | | 1.65 | % | | | 1.56 | % | | | 1.52 | % |
| | | | | | | | | | | | | | | | | | | | | |
| Ratio of net investment income (loss) to average net assets, before waivers, reimbursements of previously waived expenses and expenses paid indirectly | | | (0.47 | )% | | | 0.47 | % | | | 0.24 | % | | | (0.22 | )% | | | 0.31 | % |
| | | | | | | | | | | | | | | | | | | | | |
| Portfolio turnover rate | | | 178 | % | | | 121 | % | | | 66 | % | | | 103 | % | | | 134 | % |
See notes to financial statements.
MARSICO FLEXIBLE CAPITAL FUND | | | MARSICO GLOBAL FUND | |
| | | | | |
Year Ended 9/30/14 | | | Year Ended 9/30/13 | | | Year Ended 9/30/12 | | | Year Ended 9/30/11 | | | Year Ended 9/30/10 | | | Year Ended 9/30/14 | | | Year Ended 9/30/13 | | | Year Ended 9/30/12 | | | Year Ended 9/30/11 | | | Year Ended 9/30/10 | |
| | | | | | | | | | | | | | | | | | | | | | | | | | | | | |
| $ | 18.21 | | | $ | 15.79 | | | $ | 12.05 | | | $ | 11.97 | | | $ | 9.65 | | | $ | 14.74 | | | $ | 11.51 | | | $ | 9.06 | | | $ | 9.90 | | | $ | 8.59 | |
| | | | | | | | | | | | | | | | | | | | | | | | | | | | | | | | | | | | | | | |
| | | | | | | | | | | | | | | | | | | | | | | | | | | | | | | | | | | | | | | |
| | | | | | | | | | | | | | | | | | | | | | | | | | | | | | | | | | | | | | | |
| | (0.04 | ) | | | 0.04 | | | | 0.03 | | | | 0.08 | | | | 0.27 | | | | (0.05 | ) | | | (0.02 | ) | | | (0.07 | ) | | | (0.05 | ) | | | (0.05 | ) |
| | 2.18 | | | | 3.28 | | | | 3.77 | | | | 0.12 | | | | 2.42 | | | | 1.93 | | | | 3.25 | | | | 2.52 | | | | (0.70 | ) | | | 1.42 | |
| | | | | | | | | | | | | | | | | | | | | | | | | | | | | | | | | | | | | | | |
| | 2.14 | | | | 3.32 | | | | 3.80 | | | | 0.20 | | | | 2.69 | | | | 1.88 | | | | 3.23 | | | | 2.45 | | | | (0.75 | ) | | | 1.37 | |
| | | | | | | | | | | | | | | | | | | | | | | | | | | | | | | | | | | | | | | |
| | | | | | | | | | | | | | | | | | | | | | | | | | | | | | | | | | | | | | | |
| | — | | | | (0.09 | ) | | | (0.06 | ) | | | (0.09 | ) | | | (0.37 | ) | | | — | | | | — | | | | — | | | | (0.09 | ) | | | (0.06 | ) |
| | (1.96 | ) | | | (0.81 | ) | | | — | | | | (0.03 | ) | | | — | | | | (2.17 | ) | | | — | | | | — | | | | — | | | | — | |
| | — | (1) | | | — | (1) | | | — | (1) | | | — | (1) | | | — | (1) | | | — | (1) | | | — | (1) | | | — | (1) | | | — | (1) | | | — | (1) |
| | | | | | | | | | | | | | | | | | | | | | | | | | | | | | | | | | | | | | | |
| | (1.96 | ) | | | (0.90 | ) | | | (0.06 | ) | | | (0.12 | ) | | | (0.37 | ) | | | (2.17 | ) | | | — | | | | — | | | | (0.09 | ) | | | (0.06 | ) |
| | | | | | | | | | | | | | | | | | | | | | | | | | | | | | | | | | | | | | | |
| $ | 18.39 | | | $ | 18.21 | | | $ | 15.79 | | | $ | 12.05 | | | $ | 11.97 | | | $ | 14.45 | | | $ | 14.74 | | | $ | 11.51 | | | $ | 9.06 | | | $ | 9.90 | |
| | | | | | | | | | | | | | | | | | | | | | | | | | | | | | | | | | | | | | | |
| | | | | | | | | | | | | | | | | | | | | | | | | | | | | | | | | | | | | | | |
| | 12.15 | % | | | 22.34 | % | | | 31.63 | % | | | 1.59 | % | | | 28.68 | % | | | 13.23 | % | | | 28.06 | % | | | 27.04 | % | | | (7.73 | )% | | | 16.01 | % |
| | | | | | | | | | | | | | | | | | | | | | | | | | | | | | | | | | | | | | | |
| | | | | | | | | | | | | | | | | | | | | | | | | | | | | | | | | | | | | | | |
| | | | | | | | | | | | | | | | | | | | | | | | | | | | | | | | | | | | | | | |
| | | | | | | | | | | | | | | | | | | | | | | | | | | | | | | | | | | | | | | |
| $ | 806,448 | | | $ | 805,735 | | | $ | 590,293 | | | $ | 409,145 | | | $ | 132,345 | | | $ | 73,475 | | | $ | 61,383 | | | $ | 54,195 | | | $ | 108,021 | | | $ | 116,101 | |
| | | | | | | | | | | | | | | | | | | | | | | | | | | | | | | | | | | | | | | |
| | 1.38 | % | | | 1.41 | % | | | 1.43 | % | | | 1.27 | % | | | 0.75 | % | | | 1.60 | % | | | 1.60 | % | | | 1.60 | % | | | 1.48 | % | | | 1.54 | % |
| | | | | | | | | | | | | | | | | | | | | | | | | | | | | | | | | | | | | | | |
| | (0.21 | )% | | | 0.16 | % | | | 0.17 | % | | | 0.55 | % | | | 1.33 | % | | | (0.42 | )% | | | (0.06 | )% | | | (0.32 | )% | | | (0.46 | )% | | | (0.57 | )% |
| | | | | | | | | | | | | | | | | | | | | | | | | | | | | | | | | | | | | | | |
| | 1.38 | % | | | 1.41 | % | | | 1.43 | % | | | 1.40 | % | | | 1.73 | % | | | 1.66 | % | | | 1.86 | % | | | 1.70 | % | | | 1.48 | % | | | 1.54 | % |
| | | | | | | | | | | | | | | | | | | | | | | | | | | | | | | | | | | | | | | |
| | (0.21 | )% | | | 0.16 | % | | | 0.17 | % | | | 0.42 | % | | | 0.35 | % | | | (0.48 | )% | | | (0.32 | )% | | | (0.42 | )% | | | (0.46 | )% | | | (0.57 | )% |
| | | | | | | | | | | | | | | | | | | | | | | | | | | | | | | | | | | | | | | |
| | 118 | % | | | 145 | % | | | 121 | % | | | 231 | % | | | 146 | % | | | 129 | % | | | 134 | % | | | 95 | % | | | 93 | % | | | 125 | % |
NOTES TO FINANCIAL STATEMENTS |
NOTES TO FINANCIAL STATEMENTS September 30, 2014
The Marsico Investment Fund (the “Trust”) was organized on October 1, 1997, as a Delaware statutory trust and is registered under the Investment Company Act of 1940 (the “1940 Act”) as an open-end management investment company. The Focus Fund, Growth Fund, 21st Century Fund, International Opportunities Fund, Flexible Capital Fund, and Global Fund (collectively, the “Funds”) are separate investment portfolios of the Trust. The Focus Fund is a non-diversified fund and the Growth Fund, the 21st Century Fund, the International Opportunities Fund, the Flexible Capital Fund, and the Global Fund are diversified funds. The Focus Fund and Growth Fund commenced operations on December 31, 1997, the 21st Century Fund commenced operations on February 1, 2000, the International Opportunities Fund commenced operations on June 30, 2000, the Flexible Capital Fund commenced operations on December 29, 2006, and the Global Fund commenced operations on June 29, 2007. Trustees and officers of the Trust and employees of Marsico Capital Management, LLC (the “Adviser”) own approximately 8% and 18% of the Focus Fund’s and Global Fund’s outstanding shares, respectively, as of September 30, 2014.
| 2. | Significant Accounting Policies |
The following is a summary of significant accounting policies consistently followed by the Funds in the preparation of their financial statements. These policies are in conformity with Generally Accepted Accounting Principles (“GAAP”) in the United States of America for investment companies. The presentation of financial statements in conformity with GAAP requires management to make estimates and assumptions that affect the reported amounts and disclosures of assets and liabilities at the date of the financial statements and the reported amounts and disclosures of income and expenses during the reporting period. Actual results could differ from those estimates.
| | (a) | Investment Valuation — A security traded on a recognized stock exchange is generally valued at the last sale price prior to the closing of the principal exchange on which the security is traded. Securities traded on NASDAQ generally will be valued at the NASDAQ Official Closing Price. If no sale price is reported on the valuation date, the most current bid price will generally be used, with the exception of short option positions which will generally utilize the most current ask price. Other securities for which over-the-counter market quotations are readily available are generally valued at the last sale price. Debt securities that will mature in more than 60 days are generally valued at their bid prices furnished by a pricing service approved by the Funds’ Board of Trustees and subject to review pursuant to procedures established by, and under the general supervision of, the Funds’ Board of Trustees. Debt securities that will mature in 60 days or less are valued at amortized cost, if it approximates market value. Any securities for which market quotations are not readily available are valued at their fair value as determined in good faith by the Adviser in accordance with procedures established by, and under the general supervision of, the Funds’ Board of Trustees. The Funds may use pricing services to assist in determining market value. The Board of Trustees has authorized the use of a pricing service to assist the Funds in valuing certain equity securities listed or traded on foreign security exchanges in the Funds’ portfolios in certain circumstances where there is a significant change in the value of related US-traded securities, as represented by, for example, the S&P 500 Index. |
“Fair Value Measurements and Disclosures” (the “Fair Value Statement”) defines fair value, establishes a framework for measuring fair value in GAAP, and expands disclosures about fair value measurements. Under the Fair Value Statement, various inputs are used in determining the value of the Funds’ investments.
These inputs are summarized into three broad levels and described below:
| | • | Level 1 – quoted prices in active markets for identical investments |
| | • | Level 2 – other significant observable inputs (including quoted prices for similar investments, interest rates, and evaluated quotations obtained from pricing services) |
| | • | Level 3 – significant unobservable inputs (including the Fund’s own assumptions in determining the fair value of investments). |
NOTES TO FINANCIAL STATEMENTS |
The inputs or methodology used for valuing investments are not an indication of the risk associated with investing in those investments. Changes in valuation techniques may result in transfers between the levels during the reporting period. The Funds recognize transfers between the levels as of the end of each reporting period. There were no transfers between each of the three levels during the reporting period. The following is a summary of the fair values of the Funds’ investments in each category and economic sector as of September 30, 2014:
Fund Investments by Major Security Type | | | | | | | | | | | | |
| Marsico Focus Fund | | | | | | | | | | | | |
| Assets | | | | | | | | | | | | |
| Common Stocks | | | | | | | | | | | | |
| Consumer Discretionary | | $ | 212,446,566 | | | $ | — | | | $ | — | | | $ | 212,446,566 | |
| Consumer Staples | | | 11,729,658 | | | | — | | | | — | | | | 11,729,658 | |
| Energy | | | 67,986,820 | | | | — | | | | — | | | | 67,986,820 | |
| Financials | | | 37,091,817 | | | | — | | | | — | | | | 37,091,817 | |
| Health Care | | | 197,770,723 | | | | — | | | | — | | | | 197,770,723 | |
| Industrials | | | 72,726,198 | | | | — | | | | — | | | | 72,726,198 | |
| Information Technology | | | 221,703,217 | | | | — | | | | — | | | | 221,703,217 | |
| Materials | | | 68,896,311 | | | | — | | | | — | | | | 68,896,311 | |
| Short-term Investments | | | 44,200,875 | | | | — | | | | — | | | | 44,200,875 | |
| | | | | | | | | | | | | | | $ | 934,552,185 | |
| Marsico Growth Fund | | | | | | | | | | | | | | | | |
| Assets | | | | | | | | | | | | | | | | |
| Common Stocks | | | | | | | | | | | | | | | | |
| Consumer Discretionary | | $ | 151,293,698 | | | $ | — | | | $ | — | | | $ | 151,293,698 | |
| Consumer Staples | | | 14,492,238 | | | | — | | | | — | | | | 14,492,238 | |
| Energy | | | 54,291,775 | | | | — | | | | — | | | | 54,291,775 | |
| Financials | | | 9,469,693 | | | | — | | | | — | | | | 9,469,693 | |
| Health Care | | | 86,919,720 | | | | — | | | | — | | | | 86,919,720 | |
| Industrials | | | 67,239,059 | | | | — | | | | — | | | | 67,239,059 | |
| Information Technology | | | 124,498,189 | | | | — | | | | — | | | | 124,498,189 | |
| Materials | | | 33,500,423 | | | | — | | | | — | | | | 33,500,423 | |
| Short-term Investments | | | 20,568,469 | | | | — | | | | — | | | | 20,568,469 | |
| | | | | | | | | | | | | | | $ | 562,273,264 | |
Marsico 21st Century Fund | | | | | | | | | | | | | | | | |
| Assets | | | | | | | | | | | | | | | | |
| Common Stocks | | | | | | | | | | | | | | | | |
| Consumer Discretionary | | $ | 67,306,054 | | | $ | — | | | $ | — | | | $ | 67,306,054 | |
| Consumer Staples | | | 14,979,183 | | | | — | | | | — | | | | 14,979,183 | |
| Energy | | | 17,678,422 | | | | — | | | | — | | | | 17,678,422 | |
| Financials | | | 19,533,911 | | | | — | | | | — | | | | 19,533,911 | |
| Health Care | | | 46,272,022 | | | | — | | | | — | | | | 46,272,022 | |
| Industrials | | | 42,322,257 | | | | — | | | | — | | | | 42,322,257 | |
| Information Technology | | | 74,443,629 | | | | — | | | | — | | | | 74,443,629 | |
| Materials | | | 16,957,919 | | | | — | | | | — | | | | 16,957,919 | |
| Telecommunication Services | | | 6,333,832 | | | | — | | | | — | | | | 6,333,832 | |
| Short-term Investments | | | 15,097,485 | | | | — | | | | — | | | | 15,097,485 | |
| | | | | | | | | | | | | | | $ | 320,924,714 | |
| Marsico International Opportunities Fund | | | | | | | | | | | | | | | | |
| Assets | | | | | | | | | | | | | | | | |
| Common Stocks | | | | | | | | | | | | | | | | |
| Consumer Discretionary | | $ | 38,922,878 | | | $ | — | | | $ | — | | | $ | 38,922,878 | |
| Energy | | | 4,467,242 | | | | — | | | | — | | | | 4,467,242 | |
| Financials | | | 5,257,601 | | | | — | | | | — | | | | 5,257,601 | |
| Health Care | | | 30,758,189 | | | | — | | | | — | | | | 30,758,189 | |
| Industrials | | | 21,068,143 | | | | — | | | | — | | | | 21,068,143 | |
| Information Technology | | | 49,149,559 | | | | — | | | | — | | | | 49,149,559 | |
| Short-term Investments | | | 6,770,237 | | | | — | | | | — | | | | 6,770,237 | |
| | | | | | | | | | | | | | | $ | 156,393,849 | |
NOTES TO FINANCIAL STATEMENTS |
NOTES TO FINANCIAL STATEMENTS September 30, 2014 (continued)
Fund Investments by Major Security Type | | | | | | | | | | | | |
| Marsico Flexible Capital Fund | | | | | | | | | | | | |
| Assets | | | | | | | | | | | | |
| Common Stocks | | | | | | | | | | | | |
| Consumer Discretionary | | $ | 277,508,657 | | | $ | — | | | $ | — | | | $ | 277,508,657 | |
| Consumer Staples | | | 46,092,320 | | | | — | | | | — | | | | 46,092,320 | |
| Energy | | | 16,055,829 | | | | — | | | | — | | | | 16,055,829 | |
| Financials | | | 52,278,862 | | | | — | | | | — | | | | 52,278,862 | |
| Health Care | | | 85,969,840 | | | | — | | | | — | | | | 85,969,840 | |
| Industrials | | | 61,332,538 | | | | — | | | | — | | | | 61,332,538 | |
| Information Technology | | | 140,494,955 | | | | — | | | | — | | | | 140,494,955 | |
| Materials | | | 25,689,296 | | | | — | | | | — | | | | 25,689,296 | |
| Corporate Bonds | | | — | | | | 28,504,000 | | | | — | | | | 28,504,000 | |
| International Bonds | | | — | | | | 7,994,402 | | | | — | | | | 7,994,402 | |
| Preferred Stocks | | | 22,838,877 | | | | — | | | | — | | | | 22,838,877 | |
| Short-term Investments | | | 22,645,596 | | | | — | | | | — | | | | 22,645,596 | |
| | | | | | | | | | | | | | | $ | 787,405,172 | |
| Marsico Global Fund | | | | | | | | | | | | | | | | |
| Assets | | | | | | | | | | | | | | | | |
| Common Stocks | | | | | | | | | | | | | | | | |
| Consumer Discretionary | | $ | 19,578,370 | | | $ | — | | | $ | — | | | $ | 19,578,370 | |
| Consumer Staples | | | 790,279 | | | | — | | | | — | | | | 790,279 | |
| Energy | | | 6,869,381 | | | | — | | | | — | | | | 6,869,381 | |
| Health Care | | | 15,204,971 | | | | — | | | | — | | | | 15,204,971 | |
| Industrials | | | 6,089,239 | | | | — | | | | — | | | | 6,089,239 | |
| Information Technology | | | 19,720,082 | | | | — | | | | — | | | | 19,720,082 | |
| Materials | | | 4,510,826 | | | | — | | | | — | | | | 4,510,826 | |
| Short-term Investments | | | 1,557,995 | | | | — | | | | — | | | | 1,557,995 | |
| | | | | | | | | | | | | | | $ | 74,321,143 | |
| | (b) | Expenses — The Funds are charged for those expenses that are directly attributable to each Fund, such as advisory and custodial fees. Expenses that are not directly attributable to a Fund are typically allocated among the Funds in proportion to their respective net assets and are in some cases allocated based on other factors. The Funds’ expenses may be reduced by advisory fee waivers, brokerage credits and uninvested cash balances earning interest or credits. Such credits are included in “Less waiver of expenses and expenses paid indirectly” on the Statements of Operations. |
Brokerage commissions may be paid to certain brokers which reduce transfer agent fees and expenses. For the year ended September 30, 2014 the Funds received no such brokerage commission credits. The Funds received earnings credits on certain cash account balances which reduced transfer agent fees and expenses in the amount of $433, $289, $160, $73, $431, and $34 for the Focus Fund, Growth Fund, 21st Century Fund, International Opportunities Fund, Flexible Capital Fund, and Global Fund, respectively, for the year ended September 30, 2014. Brokerage commission credits and earnings credits (if any) are included in “Less waiver of expenses and expenses paid indirectly” on the Statements of Operations.
| | (c) | Federal Income Taxes — Each Fund intends to comply with the requirements of the Internal Revenue Code of 1986, as amended, (the “Internal Revenue Code”) necessary to continue to qualify as a regulated investment company and to make the requisite distributions of income to its shareholders which will be sufficient to relieve it from all or substantially all federal and state income taxes. Certain Funds may utilize earnings and profits on redemption of shares as part of the dividends paid deduction. |
| | (d) | Distributions to Shareholders — Dividends from net investment income and net realized capital gains, if any, will be declared and paid at least annually. Distributions to shareholders are recorded on the ex-dividend date. Each Fund may periodically make reclassifications among certain of its capital accounts as a result of the timing and characterization of certain income and capital gains distributions determined in accordance with federal tax regulations, which may differ from GAAP. These reclassifications are due to differing treatment for items such as foreign currency transactions, passive foreign investment companies (“PFICs”) and net investment losses. |
The Funds at times may invest in real estate investment trusts (“REITs”). REITs generally pay dividends to their investors based upon cash available from their operations and this amount may differ significantly from the REITs’ actual earnings and profits (“E&P”) determined for income tax purposes. It is common for these dividends to exceed the REITs’ taxable E&P, resulting in the excess portion of such dividends eventually being designated as a return of capital. Determination of the tax character of dividends made by REITs is typically performed by the REIT several months subsequent to the payment of the dividend. Therefore, due to timing issues, the Funds may be in a position of being required to calculate and pay required distribution amounts to their shareholders based on the best information available from the REITs, which may be prior to the final determination of the REITs’ taxable E&P, and it is possible that a portion of the Funds’ distribution amounts could include a return of capital to shareholders for federal income tax purposes.
NOTES TO FINANCIAL STATEMENTS |
| | (e) | Foreign Currency Translation — The accounting records of the Funds are maintained in US dollars. For valuation purposes, values of securities denominated in foreign currencies are translated into US dollars at 4:00 p.m. Eastern Time. Amounts related to the purchase and sale of foreign securities and investment income are translated at the rates of exchange prevailing on the respective dates of such transactions. |
Reported realized gains and losses on foreign currency transactions arise from sales of portfolio securities, forward foreign currency contracts, currency gains or losses realized between the trade and settlement dates on securities transactions, and the difference between the amounts of dividends, interest, and foreign withholding taxes recorded on the Funds’ books and the US dollar equivalent of the amounts actually received or paid.
The Funds do not isolate that portion of the results of operations resulting from changes in foreign exchange rates on investments from the fluctuations arising from changes in market prices of securities held at the end of the reporting period. Net unrealized appreciation or depreciation on investments and foreign currency translations arises from changes in the value of assets and liabilities, including investments in securities at the end of the reporting period, resulting from changes in the exchange rates and changes in market prices of securities held. Transactions in foreign-denominated assets may involve greater risks than domestic transactions, including currency risk, political and economic risk, regulatory risk and market risk.
| | (f) | Derivative Instruments — “Disclosure about Derivative Instruments and Hedging Activities” (the “Derivatives Statement”) requires enhanced disclosures about the Funds’ derivative and hedging activities, including how such activities are accounted for and their effects on the Funds’ financial position, performance and cash flows. |
In January 2013, the Financial Accounting Standards Board (“FASB”) issued Accounting Standards Update (“ASU”) No. 2013-01 “Clarifying the Scope of Disclosures about Offsetting Assets and Liabilities”. This update gives additional clarification to the FASB’s ASU No. 2011-11 “Disclosures about Offsetting Assets and Liabilities”. The amendments in these ASUs require an entity to disclose information about offsetting and related arrangements to enable users of its financial statements to understand the effect of those arrangements on its financial position. The Funds adopted these ASUs in fiscal year 2014. The guidance requires retrospective application for all comparative periods presented. The adoption of these ASUs did not have a material effect on the Funds’ financial statements as of September 30, 2014.
The Funds are not intended as vehicles for investing substantially in derivative instruments, and may hold derivative instruments only infrequently. The Funds enter into derivative instruments in order to increase exposure to certain investments, asset classes, or markets, or for hedging purposes to hedge against adverse movements in securities prices, currency rates or interest rates. The Funds can hold various types of derivative instruments such as futures contracts and options on securities, financial indexes, and foreign currencies, options on futures, forward foreign currency contracts, interest rate swaps, credit default swaps, and swap-related products. The use of derivative instruments may involve risks such as the possibility of illiquid markets or imperfect correlation between the value of the derivative instruments and the underlying securities, or that the counterparty will fail to perform its obligations. There were no outstanding derivative instruments held by the Funds as of September 30, 2014 nor did the Funds utilize derivative instruments during the year ended September 30, 2014.
Forward Foreign Currency Contracts — A forward currency contract is a commitment to purchase or sell foreign currency at a specified price on a future date. A Fund may enter into a forward foreign currency contract in order to hedge against foreign currency fluctuations, such as when the Fund elects to reduce exposure to changes in foreign currency exchange rates on foreign portfolio holdings denominated in or exposed to foreign currencies, or in preparation for purchasing securities in a particular market, or for other investment purposes.
The market value of a forward foreign currency contract fluctuates with changes in currency exchange rates. Outstanding forward foreign currency contracts are valued daily at current market rates and the resulting change in market value is recorded as unrealized appreciation or depreciation. When a forward foreign currency contract is settled, the Fund records a realized gain or loss equal to the difference between the value at the time the forward foreign currency contract was opened and the value at the time it was settled.
NOTES TO FINANCIAL STATEMENTS |
NOTES TO FINANCIAL STATEMENTS September 30, 2014 (continued)
The Funds are subject to foreign currency exchange risk in the normal course of pursuing their investment objectives. Forward foreign currency contracts may involve market risk in excess of the unrealized gain or loss reflected on the Statements of Assets and Liabilities. In addition, the Funds could be exposed to a credit risk if the counterparties are unable or unwilling to meet the terms of the contracts or if the value of the foreign currency changes unfavorably. In connection with these contracts, the Funds typically segregate cash and/or other securities as collateral in a sufficient value equal to the aggregate amount of the Funds’ commitments under the forward foreign currency contracts; such collateral would be in the possession of the Funds’ custodian, if applicable.
Options Contracts — The Funds may purchase or write (sell) put and call options on foreign and domestic stock indices, foreign currencies, and US and foreign securities that are traded on a securities exchange or an over-the-counter market. These transactions are generally for hedging purposes or for the purpose of earning additional income. In addition, the Funds may enter into such transactions for cross-hedging purposes. There is generally limited counterparty credit risk involved when entering into exchange-traded option contracts because the exchange’s clearinghouse acts as counterparty to all options traded on such exchange.
In purchasing an option, a Fund pays a premium whether or not the option is exercised. Additionally, the Fund bears the risk of loss of premium and change in market value should the counterparty not perform under the contract. Put and call options purchased are accounted for in the same manner as portfolio securities. The cost of securities acquired through the exercise of call options is increased by premiums paid. The proceeds from securities sold through the exercise of put options are decreased by the premiums paid.
When a Fund writes an option, the premium received by the Fund is recorded as a liability and is subsequently adjusted to the current market value of the option written. Premiums received from writing options that expire are recorded by the Fund on the expiration date as realized gains from option transactions. The difference between the premium and the amount paid on effecting a closing purchase transaction, including brokerage commissions, is also treated as a realized gain, or if the premium is less than the amount paid for the closing purchase transaction, as a realized loss. If a call option is exercised, the premium is added to the proceeds from the sale of the underlying security or currency in determining whether the Fund has realized a gain or loss. If a put option is exercised, the premium reduces the cost basis of the security or currency purchased by the Fund. In writing an option, the Fund bears the market risk of an unfavorable change in the price of the security or currency underlying the written option. Exercise of an option written by the Fund could result in the Fund selling or buying a security or currency at a price different from the current market value.
| | (g) | Trustees’ Deferred Fee Plan — Effective February 1, 2000, the Board of Trustees adopted the Marsico Investment Fund Deferred Fee Plan (the “Deferred Fee Plan”), amended and restated as of December 30, 2005, which allows the Trustees to defer the receipt of all or a portion of their compensation received from the Funds. Any deferred fees are credited to accounts established on behalf of the Trustees into the Funds as directed by each Trustee. The amounts credited to these accounts increase or decrease in accordance with the performance of the Funds selected by the Trustees. The market value of the deferred account balances as of September 30, 2014 is shown on the Statements of Assets and Liabilities as part of an asset account, “Prepaid expenses and other assets”, and a liability account, “Accrued trustees’ fees”. Additionally, the fluctuation of the account balances due to the Funds’ performance is recorded by the Funds as unrealized appreciation (depreciation), which is shown as part of “Net unrealized appreciation on investments and foreign currency translations” on the Statements of Assets and Liabilities, and as compensation expense, which is shown as part of the expense account “Trustees’ fees and expenses” on the Statements of Operations. Fees earned and deferred by the Trustees for the year ended September 30, 2014 are also included in “Trustees’ fees and expenses” on the Statements of Operations. Amounts contributed to the Deferred Fee Plan will be deferred until distributed in accordance with the Deferred Fee Plan. Unrealized appreciation (depreciation) of Fund shares held in the Deferred Fee Plan is subject to the Funds’ expense reimbursement agreement with the Adviser. |
| | (h) | Redemption Fee — Effective January 31, 2014, the Funds’ Board of Trustees approved the elimination of redemption fees from Fund share transactions placed on and after January 31, 2014. Prior to January 31, 2014, a 2.00% redemption fee was retained by the Funds to offset transaction costs and other expenses associated with short-term investing. The fee was imposed on certain redemptions or exchanges of shares held 30 days or less from their purchase date. Redemption fees were recorded by the Funds as a reduction of shares redeemed and as a credit to paid-in-capital. For the period October 1, 2013 through January 30, 2014, the Focus Fund, Growth Fund, 21st Century Fund, International Opportunities Fund, Flexible Capital Fund, and Global Fund received $1,691, $1,538, $696, $3,378, $30,499, and $1,528, respectively, in redemption fees. |
NOTES TO FINANCIAL STATEMENTS |
| | (i) | Other — Investment transactions are accounted for on a trade date basis. Each Fund determines the gain or loss realized from the investment transactions by comparing the original cost of the security lot sold with the net sale proceeds. Dividend income is recognized on the ex-dividend date. Certain dividends from foreign securities are recorded when the Trust is informed of the dividend if such information is obtained subsequent to the ex-dividend date. Interest income is recognized on an accrual basis and includes amortization of premiums and accretion of discounts. |
| | (j) | Indemnifications — In the normal course of business, the Funds enter into contracts that contain provisions indemnifying other parties against specified potential liabilities. Each Fund’s maximum exposure under these arrangements is unknown as this would involve future claims that may be made against the Fund that have not yet occurred. However, based on experience, the Funds expect the risk of loss to be remote. |
| 3. | Investment Advisory Agreement and Transactions With Affiliates |
Each Fund has an agreement with the Adviser to furnish investment advisory services to the Funds. Under the terms of these agreements, the Adviser is compensated for managing the Focus Fund and the Growth Fund at the rate of 0.85% per year of average daily net assets up to $3 billion in each Fund, and 0.75% per year of average daily net assets exceeding $3 billion in each Fund; and at a rate of 0.85% of the average daily net assets of the 21st Century Fund, the International Opportunities Fund, the Flexible Capital Fund, and the Global Fund. The Adviser has entered into a written expense limitation and fee waiver agreement under which it has agreed to limit the total expenses of each Fund (excluding interest, taxes, acquired fund fees and expenses, litigation, brokerage, and extraordinary expenses) to an annual rate of 1.60% of the average net assets of the Focus Fund, the International Opportunities Fund, the Flexible Capital Fund, and the Global Fund, and 1.50% of the average net assets of the Growth Fund and the 21st Century Fund until January 31, 2015.
The Adviser is entitled to reimbursement from a Fund of any amounts waived pursuant to this arrangement (or a previous expense limitation agreement) if such reimbursement does not cause a Fund to exceed the expense limitation currently in effect and the reimbursement is made within three years after the year in which the Adviser waived the fee or reimbursed the expense. Under this arrangement during the year ended September 30, 2014, the Adviser received $137,989 of reimbursement from the International Opportunities Fund for previously waived fees or reimbursed expenses. The reimbursement amount is reflected in “Recovery of previously waived expenses” on the Statements of Operations. As of September 30, 2014, reimbursements that may potentially be made by the International Opportunities Fund and Global Fund to the Adviser are $100,918 and $256,516, respectively, which expire between 2015 and 2017.
Certain officers of the Trust are also officers of the Adviser. The Funds pay a portion of the Chief Compliance Officer’s total compensation costs which is shown as part of the expense account “Professional fees” on the Statements of Operations. No other officers of the Trust affiliated with the Adviser received compensation from the Funds during the year ended September 30, 2014.
| 4. | Distribution and Service Plan |
The Funds have adopted a Distribution and Service Plan (the “Plan”) pursuant to Rule 12b-1 under the 1940 Act. The Plan authorizes payments by the Funds in connection with the distribution of their shares at an annual rate, as determined from time to time by the Board of Trustees, of up to 0.25% of a Fund’s average daily net assets. The Adviser may, out of its own resources and at its sole discretion, make certain payments on behalf of the Plan for expenses incurred by a Fund for distribution of Fund shares and related services.
| 5. | Investment Transactions |
The aggregate purchases and sales of securities, excluding short-term investments, for the Funds for the year ended September 30, 2014, were as follows:
| | | | | | | | | | | International Opportunities Fund | | | | | | | |
| Purchases | | $ | 622,207 | | | $ | 452,141 | | | $ | 263,517 | | | $ | 316,568 | | | $ | 981,784 | | | $ | 94,956 | |
| Sales | | $ | 770,288 | | | $ | 561,354 | | | $ | 314,860 | | | $ | 277,864 | | | $ | 1,093,927 | | | $ | 92,463 | |
There were no purchases or sales of US government securities, excluding short-term investments.
NOTES TO FINANCIAL STATEMENTS |
NOTES TO FINANCIAL STATEMENTS September 30, 2014 (continued)
| 6. | Federal Income Tax Information |
“Accounting for Uncertainty in Income Taxes” (the “Income Tax Statement”) requires an evaluation of tax positions taken (or expected to be taken) in the course of preparing a Fund’s tax returns to determine whether these positions meet a “more-likely-than-not” standard that, based on the technical merits, have a more than fifty percent likelihood of being sustained by a taxing authority upon examination. A tax position that meets the “more-likely-than-not” recognition threshold is measured to determine the amount of benefit to recognize in the financial statements. The Funds recognize interest and penalties, if any, related to unrecognized tax benefits as income tax expense in the Statements of Operations.
The Income Tax Statement requires management of the Funds to analyze all open tax years, fiscal years 2011-2014 as defined by IRS statute of limitations for all major jurisdictions, including federal tax authorities and certain state tax authorities. As of and during the year ended September 30, 2014, the Funds did not have a liability for any unrecognized tax benefits. The Funds have no examinations in progress and are not aware of any tax positions for which it is reasonably possible that the total amounts of unrecognized tax benefits will significantly change in the next twelve months.
At September 30, 2014, gross unrealized appreciation and depreciation of investments, based on cost for federal income tax purposes, were as follows:
| | | | | | | | | | | International Opportunities Fund | | | | | | | |
| Cost of Investments | | $ | 649,327 | | | $ | 392,018 | | | $ | 238,620 | | | $ | 146,384 | | | $ | 648,313 | | | $ | 61,696 | |
| | | | | | | | | | | | | | | | | | | | | | | | | |
| Gross Unrealized Appreciation | | $ | 285,857 | | | $ | 172,723 | | | $ | 84,362 | | | $ | 14,532 | | | $ | 153,358 | | | $ | 13,546 | |
| Gross Unrealized Depreciation | | | (632 | ) | | | (2,468 | ) | | | (2,057 | ) | | | (4,522 | ) | | | (14,266 | ) | | | (921 | ) |
| | | | | | | | | | | | | | | | | | | | | | | | | |
| Net Unrealized Appreciation on investments | | $ | 285,225 | | | $ | 170,255 | | | $ | 82,305 | | | $ | 10,010 | | | $ | 139,092 | | | $ | 12,625 | |
The difference between cost amounts for financial statement and federal income tax purposes is due primarily to wash sale loss deferrals.
At September 30, 2014, the Funds had accumulated capital loss carryforwards (in thousands) as follows:
| | | | | | | | | | | International Opportunities Fund | | | | | | | |
For Losses Expiring September 30, | | | | | | | | | | | | | | | | | | |
| 2017 | | $ | — | | | $ | — | | | $ | 70,343 | | | $ | 8,585 | | | $ | — | | | $ | — | |
| 2018 | | | — | | | | — | | | | 390,537 | | | | 93,558 | | | | — | | | | — | |
| Not Subject to Expiration | | | — | | | | — | | | | — | | | | — | | | | — | | | | — | |
| | | $ | — | | | $ | — | | | $ | 460,880 | | | $ | 102,143 | | | $ | — | | | $ | — | |
To the extent that a Fund may realize future net capital gains, those gains will be offset by any of its unused capital loss carryforward. Future capital loss carryover utilization in any given year may be subject to Internal Revenue Code limitations.
Under the Regulated Investment Company Modernization Act of 2010, the Funds are permitted to carryforward capital losses incurred in taxable years beginning after December 22, 2010 for an unlimited period. However, any losses incurred during those future taxable years will be required to be utilized prior to the losses incurred in pre-enactment taxable years. As a result of this ordering rule, pre-enactment capital loss carryforwards may be more likely to expire unused. Additionally, post-enactment capital losses that are carried forward will retain their character as either short-term or long-term capital losses rather than being considered all short-term as under previous law.
As of September 30, 2014, the Focus Fund, Growth Fund, 21st Century Fund, International Opportunities Fund, Flexible Capital Fund, and Global Fund, respectively, had (in thousands) $3,004, $1,526, $2,212, $498, $1,649 and $164 of qualified late-year losses, which are deferred until fiscal year 2015 for tax purposes. Net late-year losses incurred after December 31st, and within the taxable year, are deemed to arise on the first day of the Fund’s next taxable year.
NOTES TO FINANCIAL STATEMENTS |
The International Opportunities Fund had realized capital losses (in thousands) from transactions between November 1, 2013 and September 30, 2014 of $6,487. The International Opportunities Fund has elected to treat post-October capital losses as arising in the next fiscal year.
The 21st Century Fund and International Opportunities Fund utilized (in thousands) $48,208 and $10,287, respectively, of its capital loss carryforwards, during the year ended September 30, 2014.
As of September 30, 2014, the components of accumulated earnings (deficit) on a tax basis were as follows:
| | | | | | | | | | | International Opportunities Fund | | | | | | | |
| Undistributed Ordinary Income | | $ | 17,275 | | | $ | 11,034 | | | $ | — | | | $ | — | | | $ | 11,183 | | | $ | 1,487 | |
| Undistributed Trustees’ Deferred Compensation | | | (1,899 | ) | | | (1,143 | ) | | | (798 | ) | | | (291 | ) | | | (786 | ) | | | (347 | ) |
| Undistributed Long-Term Capital Gains | | | 106,804 | | | | 52,593 | | | | — | | | | — | | | | 48,460 | | | | 6,922 | |
| Tax Accumulated Earnings (Deficit) | | | 122,180 | | | | 62,484 | | | | (798 | ) | | | (291 | ) | | | 58,857 | | | | 8,062 | |
| Accumulated Capital and Other Losses | | | (3,004 | ) | | | (1,526 | ) | | | (463,092 | ) | | | (109,128 | ) | | | (1,649 | ) | | | (164 | ) |
| Unrealized Appreciation on Investments and on Foreign Currency Translations | | | 285,225 | | | | 170,255 | | | | 82,305 | | | | 9,993 | | | | 139,055 | | | | 12,622 | |
| Trustees Deferred Compensation Mark to Market | | | 573 | | | | 353 | | | | 284 | | | | 50 | | | | 539 | | | | 229 | |
| Total Accumulated Earnings (Deficit) | | $ | 404,974 | | | $ | 231,566 | | | $ | (381,301 | ) | | $ | (99,376 | ) | | $ | 196,802 | | | $ | 20,749 | |
Undistributed ordinary income (deficit) consists of net investment income and timing differences related to qualified late-year losses.
The tax character of distributions paid during the fiscal years ended September 30, 2014 and 2013 were as follows:
| (Amounts in thousands) | | | | | | |
| | | | | | | | | | | | |
| Focus Fund | | $ | 13,021 | | | $ | 120,014 | | | $ | 1,177 | | | $ | 101,796 | |
| Growth Fund | | | 24,630 | | | | 94,408 | | | | 5,395 | | | | 30,178 | |
21st Century Fund | | | — | | | | — | | | | — | | | | — | |
| International Opportunities Fund | | | 742 | | | | — | | | | — | | | | — | |
| Flexible Capital Fund | | | 44,547 | | | | 44,556 | | | | 10,360 | | | | 22,646 | |
| Global Fund | | | 216 | | | | 9,062 | | | | — | | | | — | |
The tax character of dividends paid may differ from that shown in the Statements of Changes in Net Assets due to short-term gains being treated as ordinary income for tax purposes.
Subsequent to September 30, 2014, the Marsico International Opportunities Fund’s net assets and shares outstanding were reduced by approximately 40% due to redemption activity placed in the ordinary course of business. Management of the Adviser has determined that there were no other material subsequent events that would require disclosure in the Funds’ financial statements.
| 8. | New Accounting Pronouncements |
In June 2014, FASB issued ASU No. 2014-11 Repurchase-to-Maturity Transactions, Repurchase Financings, and Disclosures. The amendments in this ASU require an entity to modify accounting for repurchase-to-maturity transactions and repurchase financing arrangements, as well as to modify required disclosures for repurchase agreements, securities lending transactions, and repurchase-to-maturity transactions that are accounted for as secured borrowings. The guidance is effective for fiscal years beginning on or after December 15, 2014, and for interim periods within those fiscal years. Management is currently evaluating the impact these changes may have on the Funds’ financial statements.
REPORT OF INDEPENDENT REGISTERED PUBLIC ACCOUNTING FIRM |
REPORT OF INDEPENDENT REGISTERED PUBLIC ACCOUNTING FIRM
To the Board of Trustees and Shareholders of The Marsico Investment Fund
In our opinion, the accompanying statements of assets and liabilities, including the schedules of investments, and the related statements of operations and of changes in net assets and the financial highlights present fairly, in all material respects, the financial position of Marsico Focus Fund, Marsico Growth Fund, Marsico 21st Century Fund, Marsico International Opportunities Fund, Marsico Flexible Capital Fund, and Marsico Global Fund (the six funds constituting The Marsico Investment Fund, hereafter referred to as the “Funds”) at September 30, 2014, the results of each of their operations for the year then ended, the changes in each of their net assets for each of the two years in the period then ended and the financial highlights for each of the five years in the period then ended, in conformity with accounting principles generally accepted in the United States of America. These financial statements and financial highlights (hereafter referred to as “financial statements”) are the responsibility of the Funds’ management. Our responsibility is to express an opinion on these financial statements based on our audits. We conducted our audits of these financial statements in accordance with the standards of the Public Company Accounting Oversight Board (United States). Those standards require that we plan and perform the audit to obtain reasonable assurance about whether the financial statements are free of material misstatement. An audit includes examining, on a test basis, evidence supporting the amounts and disclosures in the financial statements, assessing the accounting principles used and significant estimates made by management, and evaluating the overall financial statement presentation. We believe that our audits, which included confirmation of securities at September 30, 2014 by correspondence with the custodian and brokers, provide a reasonable basis for our opinion.

Denver, Colorado
November 12, 2014
EXPENSE EXAMPLE For the six-month period ended September 30, 2014 (Unaudited)
As a shareholder of the Marsico Funds (the “Funds”), you incur two types of costs: (1) transaction costs, including redemption fees (if any), and (2) ongoing costs, including management fees, distribution (12b-1) fees, and other Fund expenses. This Example is intended to help you understand your ongoing costs (in dollars) of investing in the Funds and to compare these costs with the ongoing costs of investing in other mutual funds.
The Example is based on an investment of $1,000 invested at the beginning of the period and held for the entire period from April 1, 2014 to September 30, 2014 (the “period”).
The first line of the table below provides information about actual account values and actual expenses. You may use the information in this line, together with the amount you invested, to estimate the expenses you paid over the period. Simply divide your account value by $1,000 (for example, an $8,600 account value divided by $1,000 equals 8.6), then multiply the result by the number in the first line under the heading entitled “Expenses paid for the six-month period ended September 30, 2014” to estimate the expenses you paid on your account during the period.
Hypothetical Example for Comparison Purposes
The second line of the table below provides information about hypothetical account values and hypothetical expenses based on the Funds’ actual expense ratios and an assumed rate of return of 5% per year before expenses, which is not the actual return of any of the Funds. The hypothetical account values and expenses may not be used to estimate the actual ending account balance or expenses you paid for the period. You may use this information to compare the ongoing costs of investing in the Funds and other funds. To do so, compare this 5% hypothetical example with the 5% hypothetical examples that appear in the shareholder reports of other funds.
Please note that the expenses shown in the table are meant to highlight your ongoing costs only and do not reflect any transactional costs such as redemption fees (if any). Therefore, the second line of the table is useful in comparing the ongoing costs only, and will not help you determine the relative total costs of owning different funds. In addition, if these transactional costs (if any) were included, your costs could have been higher.
| Expenses Paid During the Period | | Beginning account value April 1, 2014 | | | Ending account value September 30, 2014 | | | Expenses paid for the six-month period ended September 30, 2014(1) | |
| FOCUS FUND | | | | | | | | | |
| Actual Example | | $ | 1,000.00 | | | $ | 1,110.00 | | | $ | 7.09 | |
| Hypothetical Example, assuming a 5% return before expenses | | $ | 1,000.00 | | | $ | 1,018.28 | | | $ | 6.78 | |
| | | | | | | | | | | | | |
| GROWTH FUND | | | | | | | | | | | | |
| Actual Example | | $ | 1,000.00 | | | $ | 1,081.50 | | | $ | 7.13 | |
| Hypothetical Example, assuming a 5% return before expenses | | $ | 1,000.00 | | | $ | 1,018.15 | | | $ | 6.91 | |
| | | | | | | | | | | | | |
21st CENTURY FUND | | | | | | | | | | | | |
| Actual Example | | $ | 1,000.00 | | | $ | 1,048.10 | | | $ | 7.28 | |
| Hypothetical Example, assuming a 5% return before expenses | | $ | 1,000.00 | | | $ | 1,017.89 | | | $ | 7.17 | |
| | | | | | | | | | | | | |
| INTERNATIONAL OPPORTUNITIES FUND | | | | | | | | | | | | |
| Actual Example | | $ | 1,000.00 | | | $ | 976.10 | | | $ | 7.94 | |
| Hypothetical Example, assuming a 5% return before expenses | | $ | 1,000.00 | | | $ | 1,016.97 | | | $ | 8.10 | |
| | | | | | | | | | | | | |
| FLEXIBLE CAPITAL FUND | | | | | | | | | | | | |
| Actual Example | | $ | 1,000.00 | | | $ | 1,029.70 | | | $ | 7.08 | |
| Hypothetical Example, assuming a 5% return before expenses | | $ | 1,000.00 | | | $ | 1,018.03 | | | $ | 7.04 | |
| | | | | | | | | | | | | |
| GLOBAL FUND | | | | | | | | | | | | |
| Actual Example | | $ | 1,000.00 | | | $ | 1,035.10 | | | $ | 8.17 | |
| Hypothetical Example, assuming a 5% return before expenses | | $ | 1,000.00 | | | $ | 1,016.97 | | | $ | 8.10 | |
| (1) | Expenses are equal to the Funds’ annualized expense ratios (1.34% for the Focus Fund, 1.37% for the Growth Fund, 1.42% for the 21st Century Fund, 1.60% for the International Opportunities Fund, 1.39% for the Flexible Capital Fund, and 1.60% for the Global Fund), multiplied by the average account value over the period, multiplied by 183/365 (to reflect the six-month period). |
OTHER INFORMATION (Unaudited)
The Funds exercise the voting rights associated with the securities held by the Funds under the proxy voting policy of the Funds. A description of those policies and procedures of the Funds and a record of the Funds’ proxy votes for the one-year period ended June 30, 2014 are available without charge, upon request, by calling 888-860-8686. It is also available on the Securities and Exchange Commission’s (SEC) website at www.sec.gov.
Quarterly Filing of Portfolio Holdings
The Funds will file their complete schedule of investments with the SEC for the first and third quarters of each fiscal year on Form N‑Q. The Funds’ Form N‑Q will be available (i) on the SEC’s website at www.sec.gov; (ii) at the SEC’s Public Reference Room; and (iii) by calling 800-SEC-0330.
Other Tax Information
Corporate Dividends Received Deduction
For the fiscal year ended September 30, 2014, 71.54%, 21.30%, 0%, 2.95%, 11.93% and 100.00% of the dividends paid from net investment income qualifies for the dividends received deduction available to corporate shareholders of the Focus Fund, Growth Fund, 21st Century Fund, International Opportunities Fund, Flexible Capital Fund, and Global Fund, respectively.
Qualified Dividend Income
Pursuant to Section 854 of the Internal Revenue Code of 1986, the Focus Fund, Growth Fund, 21st Century Fund, International Opportunities Fund, Flexible Capital Fund, and Global Fund designate income dividends (in thousands) of $10,888, $6,517, $0, $742, $6,128 and $216, respectively, as qualified dividend income paid during the fiscal year ended September 30, 2014.
Foreign Taxes Paid
Pursuant to the foreign tax credit election under Section 853 of the Internal Revenue Code of 1986, as amended, the International Opportunities Fund designates (in thousands) $1,910 of income derived from foreign sources and $143 of foreign taxes paid, for the year ended September 30, 2014.
Of the ordinary income (including short-term capital gain) distributions made during the year ended September 30, 2014, the proportionate share of income derived from foreign sources and foreign taxes paid attributable to one share of stock are:
| | | | | | | |
| International Opportunities Fund | | $ | 0.1598 | | | $ | 0.0120 | |
Long Term Capital Gains Designation
For the fiscal year ended September 30, 2014, the Focus Fund, Growth Fund, Flexible Capital Fund and Global Fund designate (in thousands) $125,483, $97,175, $49,411 and $10,052, respectively, as long-term capital gain dividends for the purpose of the dividends paid deduction. These amounts include earnings and profits distributed to shareholders on the redemption of shares. For income tax purposes, the Funds may utilize earnings and profits distributed to shareholders on the redemption of shares as part of the dividends paid deduction.
Cost Basis Information
Effective January 1, 2012, federal law required mutual fund companies to maintain and report a shareholder’s cost basis by tax lot, gain/loss information, and holding period of “covered” security sales to the Internal Revenue Service (“IRS”) on Form 1099. Covered securities that are mutual fund shares are shares acquired on or after January 1, 2012. A fund is not responsible for maintaining and reporting share information if such shares are not deemed “covered”.
Additionally, if a shareholder has not selected a tax lot identification method for their account, these tax regulations require the Funds to elect a default tax identification methodology in order to perform the required reporting. As a result, the Funds have chosen the first-in-first-out (“FIFO”) method as the default tax lot identification method for those shareholders that had not previously selected a tax lot identification method for their account. FIFO is the method, unless otherwise specified by the shareholder, that the Funds utilize to determine which specific shares are deemed to be sold when a shareholder’s entire position is not sold in a single transaction and is the method in which “covered” share sales are reported on a shareholder’s Form 1099.
However, at the time of purchase or upon the sale of “covered” shares, shareholders may choose a different tax lot identification method other than FIFO. Shareholders should consult a tax advisor with regard to their personal circumstances as the Funds and their service providers do not provide tax advice.
TRUSTEE AND OFFICER INFORMATION |
TRUSTEE AND OFFICER INFORMATION INDEPENDENT TRUSTEES
| Position(s) Held with the Trust | Term of Office(1) and Length of Time Served | Principal Occupation(s) During Past 5 Years | Number of Portfolios in Fund Complex Overseen by Trustee | Other Directorships Held by Trustee |
Jay S. Goodgold 1200 17th Street Suite 1600 Denver, CO 80202 DOB: 1954 | Trustee | Since February 2006; Lead Independent Trustee (since November 2010) | Private investor (July 2003 - present); Managing Director, Goldman, Sachs & Co. (August 1978 - June 2003). | 6 | None |
Elizabeth Hoffman 1200 17th Street Suite 1600 Denver, CO 80202 DOB: 1946 | Trustee | Since February 2006 | Professor of Economics (January 2007 - present) and Executive Vice President and Provost (January 2007 - July 2012), Iowa State University; President Emerita, University of Colorado (August 2005 - present). | 6 | None |
Walter A. Koelbel, Jr. 1200 17th Street Suite 1600 Denver, CO 80202 DOB: 1952 | Trustee | Since December 1997 | President, and other positions, Koelbel and Company (full service real estate, development, investment, and management company) (more than five years). | 6 | None |
Michael D. Rierson 1200 17th Street Suite 1600 Denver, CO 80202 DOB: 1952 | Trustee | Since November 1998 | Senior Vice President for Development, Colonial Williamsburg Foundation (January 2011 - present); Vice President and Vice Chancellor for University Advancement at the University of Houston and UH System, respectively (November 2005 - December 2010). | 6 | None |
Bruce E. Stangle 1200 17th Street Suite 1600 Denver, CO 80202 DOB: 1948 | Trustee | Since May 2010 | Chairman, Analysis Group, Inc. (economic consulting) (more than five years). | 6 | Director, Wellington Trust Company (Since 2001) |
Joseph T. Willett 1200 17th Street Suite 1600 Denver, CO 80202 DOB: 1951 | Trustee | Since November 2002 | Private investor (2002 - present); Chief Operating Officer, Merrill Lynch Europe (1998 - 2002). | 6 | None |
| (1) | Each Trustee serves an indefinite term until the election of a successor. Each Officer serves an indefinite term, renewed annually, until the election of a successor. |
The Statement of Additional Information includes additional information about the Trustees and is available upon request, without charge, by calling 888-860-8686 or visit www.marsicofunds.com.
TRUSTEE AND OFFICER INFORMATION
TRUSTEE AND OFFICER INFORMATION |
TRUSTEE AND OFFICER INFORMATION INTERESTED TRUSTEES AND OFFICERS
| Position(s) Held with the Trust | Term of Office(1) and Length of Time Served | Principal Occupation(s) During Past 5 Years | Number of Portfolios in Fund Complex Overseen by Trustee | Other Directorships Held by Trustee |
Thomas F. Marsico(2) 1200 17th Street Suite 1600 Denver, CO 80202 DOB: 1955 | Trustee, President and Chief Executive Officer | Since December 1997 | Chief Executive Officer, Marsico Capital Management, LLC (more than five years). | 6 | None |
Christopher J. Marsico(2) 1200 17th Street Suite 1600 Denver, CO 80202 DOB: 1961 | Trustee, Executive Vice President and Chief Operating Officer | Trustee (August 2007 – March 2010 and since May 2010); Vice President and Treasurer (September 2002 – May 2010); Executive Vice President and Chief Operating Officer (since May 2010) | President, Marsico Capital Management, LLC (more than five years). | 6 | None |
Neil L. Gloude, CPA 1200 17th Street Suite 1600 Denver, CO 80202 DOB: 1961 | Vice President, Secretary and Treasurer | Vice President and Secretary (Since May 2008); Treasurer (since May 2010) | Executive Vice President, Chief Financial Officer and Treasurer, Marsico Capital Management, LLC (more than five years). | N/A | N/A |
David C. Price, CPA 1200 17th Street Suite 1600 Denver, CO 80202 DOB: 1969 | Chief Compliance Officer | Since August 2004 | Chief Compliance Officer, The Marsico Investment Fund, and Director of Compliance, Marsico Capital Management, LLC (more than five years). | N/A | N/A |
Sander M. Bieber 1900 K Street, NW Washington, D.C. 20006 DOB: 1950 | Assistant Secretary | Since December 1997 | Partner, Dechert LLP (law firm) (more than five years). | N/A | N/A |
| (1) | Each Trustee serves an indefinite term until the election of a successor. Each Officer serves an indefinite term, renewed annually, until the election of a successor. |
| (2) | Mr. Thomas Marsico and Mr. Christopher Marsico are considered Interested Trustees of the Trust, within the meaning of the 1940 Act, because of their affiliation with Marsico Capital Management, LLC, the investment adviser to the Funds. Mr. Thomas Marsico and Mr. Christopher Marsico are brothers. |
The Statement of Additional Information includes additional information about the Trustees and is available upon request, without charge, by calling 888-860-8686 or visit www.marsicofunds.com.