UNITED STATES
SECURITIES AND EXCHANGE COMMISSION
Washington, D.C. 20549
FORM N-CSR
CERTIFIED SHAREHOLDER REPORT OF REGISTERED
MANAGEMENT INVESTMENT COMPANIES
Investment Company Act file number 811-08397
THE MARSICO INVESTMENT FUND
(Exact name of registrant as specified in charter)
1200 17th Street, Suite 1600
Denver, CO 80202
(Address of principal executive offices)(Zip code)
Christopher J. Marsico
The Marsico Investment Fund
1200 17th Street, Suite 1600
Denver, CO 80202
(Name and address of agent for service)
Copies to:
Anthony H. Zacharski
Dechert LLP
90 State House Square
Hartford, CT 06103
Registrant's telephone number, including area code: (303)454-5600
Date of fiscal year end: September 30
Date of reporting period: September 30, 2015
Item 1 – Reports to Stockholders.
DEAR SHAREHOLDER:
Enclosed is your annual report for The Marsico Investment Fund, encompassing the fiscal year from October 1, 2014 to September 30, 2015.
The purpose of this report is to provide a review of the Marsico Funds’ one-year investment results by discussing what we believe were the main areas that impacted performance – including the macroeconomic environment, sector and industry positioning, and individual stock selection – as compared to the Funds’ performance benchmark indexes. For updated information regarding the market environment and the Funds’ overall investment postures and performance, please refer to the Funds’ most recent monthly fact sheets and quarterly investment updates, which are available in the Investor Resources section of the Funds’ website at www.marsicofunds.com.(1)
NOTE REGARDING CHANGE TO THE MARSICO GROWTH FUND TEAM
The Marsico Growth Fund is co-managed by a team of managers. Effective October 6, 2015, Kevin Boone is no longer a member of the team that co-manages the Marsico Growth Fund. Thomas F. Marsico and Coralie T. Witter, CFA, continue to be jointly and primarily responsible for day-to-day management of the Fund.
(1) | The references to the Marsico Funds website (www.marsicofunds.com) included throughout this annual report do not incorporate the website’s contents into this report. |
| | KEY FUND STATISTICS | 2 | |
| | MARKET ENVIRONMENT | 5 | |
| | | | |
| | MARSICO FOCUS FUND |
| | Investment Review | 6 | |
| | Fund Overview | 9 | |
| | Schedule of Investments | 10 | |
| | | | |
| | MARSICO GROWTH FUND |
| | Investment Review | 11 | |
| | Fund Overview | 13 | |
| | Schedule of Investments | 14 | |
| | | | |
| | MARSICO 21st CENTURY FUND |
| | Investment Review | 16 | |
| | Fund Overview | 18 | |
| | Schedule of Investments | 19 | |
| | | | |
| | MARSICO INTERNATIONAL OPPORTUNITIES FUND |
| | Investment Review | 21 | |
| | Fund Overview | 23 | |
| | Schedule of Investments | 24 | |
| | | | |
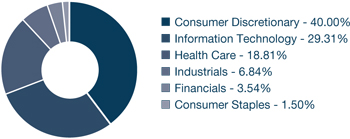
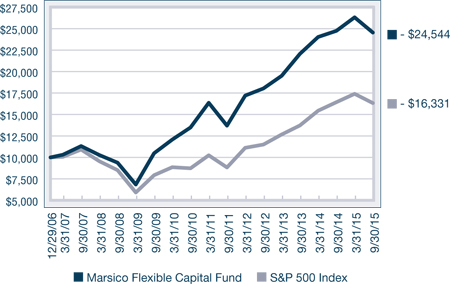
| | MARSICO FLEXIBLE CAPITAL FUND |
| | Investment Review | 26 | |
| | Fund Overview | 28 | |
| | Schedule of Investments | 29 | |
| | | | |
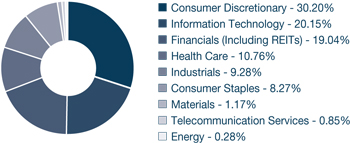
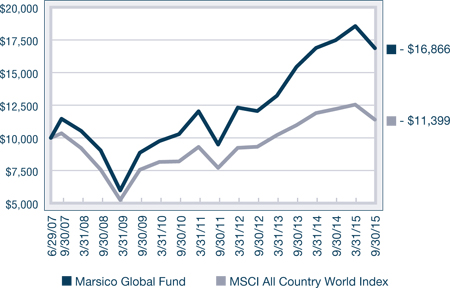
| | MARSICO GLOBAL FUND |
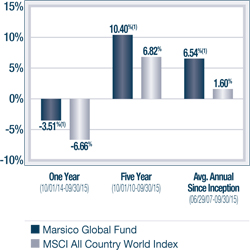
| | Investment Review | 31 | |
| | Fund Overview | 33 | |
| | Schedule of Investments | 34 | |
| | | | |
| | FINANCIAL STATEMENTS | 36 | |
| | NOTES TO FINANCIAL STATEMENTS | 46 | |
| | REPORT OF INDEPENDENT REGISTERED PUBLIC ACCOUNTING FIRM | 55 | |
| | EXPENSE EXAMPLE | 56 | |
| | OTHER INFORMATION | 57 | |
| | TRUSTEE AND OFFICER INFORMATION | 58 | |
| | | | |
1
KEY FUND STATISTICS (UNAUDITED) |
Marsico Focus Fund | Marsico Growth Fund | Marsico 21st Century
Fund |
| | MFOCX | | | MGRIX | | | MXXIX | |
For additional disclosures, please see page 9. | For additional disclosures, please see page 13. | For additional disclosures, please see page 18. |
PERFORMANCE COMPARISON(1) | PERFORMANCE COMPARISON(1) | PERFORMANCE COMPARISON(1) |
| | |
TOTAL ANNUAL OPERATING EXPENSES* 1.34% | TOTAL ANNUAL OPERATING EXPENSES* 1.37% | TOTAL ANNUAL OPERATING EXPENSES* 1.43% |
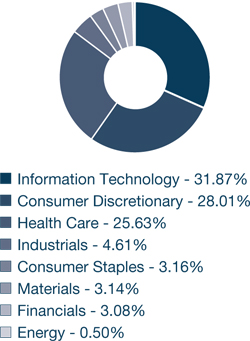
SECTOR ALLOCATION(2) | SECTOR ALLOCATION(2) | SECTOR ALLOCATION(2) |
| | |
TOP FIVE HOLDINGS | TOP FIVE HOLDINGS | TOP FIVE HOLDINGS |
Facebook, Inc. - Cl. A | 8.15% | Facebook, Inc. - Cl. A | 6.12% | Facebook, Inc. - Cl. A | 5.91% |
NIKE, Inc. - Cl. B | 5.76% | Google, Inc. - Cl. A | 5.07% | MasterCard, Inc. - Cl. A | 3.96% |
Visa, Inc. - Cl. A | 5.74% | NIKE, Inc. - Cl. B | 4.39% | Constellation Brands, Inc. - Cl. A | 3.63% |
Google, Inc. - Cl. A | 5.20% | The Walt Disney Company | 4.24% | Norwegian Cruise Line Holdings Ltd. | 3.63% |
The Walt Disney Company | 5.00% | Starbucks Corporation | 3.98% | Electronic Arts, Inc. | 3.16% |
For additional disclosures about the Marsico Funds, please see page 4. The performance data quoted here represent past performance, and past performance is not a guarantee of future results. Investment return and principal value of an investment will fluctuate so that an investor’s shares, when redeemed, may be worth more or less than their original cost.
2
KEY FUND STATISTICS (UNAUDITED) |
Marsico International
Opportunities Fund | Marsico Flexible Capital
Fund | Marsico Global Fund |
| | MIOFX | | | MFCFX | | | MGLBX | |
For additional disclosures, please see page 23. | For additional disclosures, please see page 28. | For additional disclosures, please see page 33. |
PERFORMANCE COMPARISON(1) | PERFORMANCE COMPARISON(1) | PERFORMANCE COMPARISON(1) |
| | |
TOTAL ANNUAL OPERATING EXPENSES* 1.69% NET EXPENSES*†1.60% | TOTAL ANNUAL OPERATING EXPENSES* 1.39% | TOTAL ANNUAL OPERATING EXPENSES* 1.66% NET EXPENSES*†1.60% |
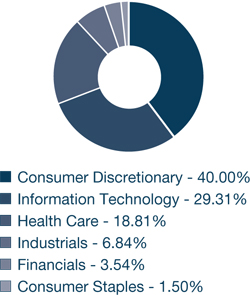
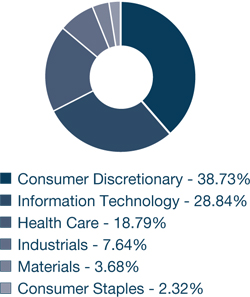
SECTOR ALLOCATION(2) | SECTOR ALLOCATION(2) | SECTOR ALLOCATION(2) |
| | |
TOP FIVE HOLDINGS | TOP FIVE HOLDINGS | TOP FIVE HOLDINGS |
Liberty Global PLC -
Series C | 4.84% | Constellation Brands, Inc. - Cl. A | 5.22% | Facebook, Inc. - Cl. A | 5.15% |
Endo International PLC | 4.21% | The Home Depot, Inc. | 5.20% | Novartis AG | 4.91% |
MasterCard, Inc. - Cl. A | 4.18% | Facebook, Inc. - Cl. A | 4.89% | Domino's Pizza Group PLC | 4.21% |
The Priceline Group, Inc. | 4.06% | Visa, Inc. - Cl. A | 4.85% | Ryanair Holdings PLC Spon. ADR | 4.17% |
Facebook, Inc. - Cl. A | 3.96% | The Walt Disney Company | 4.45% | NIKE, Inc. - Cl. B | 4.06% |
Current performance may be lower or higher than the performance information quoted. To obtain performance information current to the most recent month-end, please call 888-860-8686 or visit www.marsicofunds.com.
3
KEY FUND STATISTICS (UNAUDITED) |
ADDITIONAL DISCLOSURES ABOUT THE MARSICO FUNDS
* | The Total Annual Operating Expenses and Net Expenses are reflective of the information disclosed in the Funds’ Prospectus dated January 30, 2015. The information may differ from the expense ratios disclosed in this report. |
† | Marsico Capital Management, LLC (the “Adviser”) has entered into a written expense limitation and fee waiver agreement under which it has agreed to limit the total expenses of each of the International Opportunities Fund and the Global Fund (excluding interest, taxes, acquired fund fees and expenses, litigation, brokerage and extraordinary expenses) to an annual rate of 1.60% of each Fund’s average net assets until January 31, 2016. This expense limitation and fee waiver agreement may be terminated by the Adviser at any time after January 31, 2016, upon 15 days prior notice to the Fund and its administrator. The Adviser may recoup from a Fund fees previously waived or expenses previously reimbursed by the Adviser with respect to that Fund pursuant to this agreement (or a previous expenses limitation agreement) if: (1) such recoupment by the Adviser does not cause the Fund, at the time of recoupment, to exceed the lesser of (a) the expense limitation in effect at the time the relevant amount was waived and/or reimbursed, or (b) the expense limitation in effect at the time of the proposed recoupment, and (2) the recoupment is made within three fiscal years after the end of the fiscal year in which the amount was waived or reimbursed. |
(1) | The performance data quoted here represent past performance, and past performance is not a guarantee of future results. Investment return and principal value of an investment will fluctuate so that an investor’s shares, when redeemed, may be worth more or less than their original cost. Current performance may be lower or higher than the performance information quoted. To obtain performance information current to the most recent month-end, please call 888-860-8686 or visit www.marsicofunds.com. |
The performance included in the chart does not reflect the deduction of taxes on Fund distributions or the redemption of Fund shares.
All indices are unmanaged and investors cannot invest directly in an index.
Periodically, certain fees and expenses have been waived or reimbursed by the Adviser for the 21st Century Fund, the International Opportunities Fund, the Flexible Capital Fund and the Global Fund. In the absence of such a waiver, the performance returns reflected would have been reduced. In accordance with the expense limitation and fee waiver agreement, the Adviser may recoup fees and expenses previously waived or reimbursed under certain parameters. Periodically, the Adviser has recouped such fees or expenses from the 21st Century Fund, the International Opportunities Fund, and the Global Fund resulting in a lower performance return.
(2) | Sector weightings represent the percentage of the respective Fund’s investments (excluding cash equivalents) in certain general sectors. These sectors may include more than one industry. The Fund’s portfolio composition is subject to change at any time. |
4
MARKET ENVIRONMENT: OCTOBER 2014 – SEPTEMBER 2015 (UNAUDITED)
Global equity markets registered varying results for the one-year fiscal period ended September 30, 2015, ranging from modest losses overall in the US to substantial losses in emerging markets. US markets treaded water for much of the period as foreign stocks weakened, but both domestic and international stocks swooned late in the period on fears that global economic growth would falter. In August, a sharp downturn in Chinese equity market performance and an unexpected devaluation of China’s currency stoked fears of a prolonged slow-down in the Chinese economy. In addition, market participants focused on the effects of potential US interest rate hikes. Increased anxieties about geopolitical conflicts also contributed to the sell-off in the equity markets.
The center of concern during much of the reporting period was China. In the immediate aftermath of the 2007-09 “Great Recession,” China embarked upon massive government-supported infrastructure and real estate investment. China’s economic rebound was officially declared “strong” by the Chinese government, and a sharp rebound for globally priced industrial commodities and trade with China gave apparent legitimacy to claims of a solid recovery. As China pulled back from stimulus programs and an export-focused economy, however, raw industrial commodity prices retreated and shipments to Asia began to slow. While China has been slowing for some time, the recent sharp retrenchment in global risk assets reflected concerns about potential acceleration of the slowdown, despite upbeat official Chinese GDP reports.
The slowdown in China and US dollar strength led to weakness in the US manufacturing industry and created a headwind for multi-national businesses. Commodity prices fell and the equity returns of many commodity-oriented economies such as Brazil, Russia and China were hard hit, as evidenced by the dismal performance of the MSCI BRIC Index.
As illustrated in the table below, US equities posted returns that were better than the returns of many international equity markets. In the US, oil price weakness and falling prices of imported goods combined to keep the US inflation rate at essentially zero. Zero inflation and faltering activity abroad seemed to trump Federal Reserve Board insistence that rates would be raised this year. US consumer confidence perked up during the period, aided by lower prices at the gas pump and relatively strong housing markets. The US also saw improvement in the labor market as unemployment rates reached their lowest level in seven years. Given the strong US economic backdrop as compared to foreign economies, small, domestically-focused US companies were in favor. As depicted in the table below, small-capitalization US equities outperformed large capitalization stocks for the one-year fiscal period ended September 30, 2015.
Index Name(1) | Universe of
Equities Represented | One-Year Total Return |
US | | |
S&P 500 | US large-capitalization equities | -0.61% |
Russell 3000 | US publicly-traded equities of all sizes | -0.49% |
Russell 2000 | US small-capitalization equities | +1.25% |
Russell Mid-Cap | US medium-capitalization equities | -0.25% |
Index Name(1) | Universe of
Equities Represented | One-Year Total Return |
INTERNATIONAL | |
MSCI EAFE (US$) | Equities in developed international equity markets, including Japan, Western Europe, and Australasia | -8.66% |
MSCI Emerging Markets (US$) | Equities in developing international equity markets, including China, India, Eastern Europe, and Latin America | -19.28% |
MSCI ACWI (US$) | Equities in the global developed and emerging markets | -6.66% |
During the one-year fiscal period ended September 30, 2015, the US dollar generally appreciated against other currencies, reflecting the relative strength of the US economy. The US dollar’s rise dampened US inflationary pressures by making US exports less competitive overseas and lowering the cost of imported goods. Most emerging market currencies sold off sharply due to economic instability, the potential effects of further slowing in China, and higher interest rates that may come in the US. The devaluation of the Chinese yuan brought China’s currency to a four-year low versus the US dollar. Developed market currencies also trended lower. The Japanese yen weakened as Japanese policymakers continued initiatives to end Japan’s deflation, and the euro sank to a 12-year low versus the dollar before recovering a portion of its losses. The Australian dollar and Canadian dollar also weakened versus the US dollar as the price of commodities and crude oil declined.
THE MARSICO INVESTMENT TEAM
(1) | All indices are unmanaged and investors cannot invest directly in an index. |
5
INVESTMENT REVIEW BY TOM MARSICO AND CORALIE WITTER (UNAUDITED)
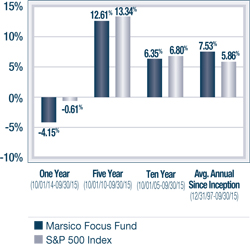
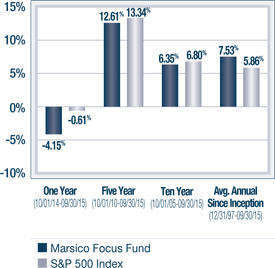
The Marsico Focus Fund posted a total return of -4.15% for the one-year fiscal period ended September 30, 2015. For comparative purposes, the S&P 500 Index, which is the Fund’s benchmark index, had a total return of -0.61% over that same time period. Please see the Fund Overview immediately following this commentary for more detailed information about the Fund’s longer-term performance for various periods ended September 30, 2015.
The performance data for the Fund quoted here represent past performance, and past performance is not a guarantee of future results. Investment return and principal value of an investment will fluctuate so that an investor’s shares, when redeemed, may be worth more or less than their original cost. Current performance may be lower or higher than the performance information quoted. To obtain performance information current to the most recent month-end, please call 888-860-8686 or visit www.marsicofunds.com.(1)
This review highlights Fund performance over a one-year fiscal period. Shareholders should keep in mind that the Fund is intended for long-term investors who hold their shares for substantially longer periods of time. You should also keep in mind that our current views and beliefs regarding all investments discussed in this report are subject to change at any time. References to specific securities, industries, and sectors discussed in this report are not recommendations to buy or sell such securities or related investments, and the Fund may not necessarily hold these securities or investments today. Please see the accompanying Schedules of Investments for the percentage of the Fund’s portfolio represented by the securities mentioned in this report as of the end of the reporting period.
The Focus Fund is non-diversified and may hold fewer securities than a diversified fund because it is permitted to invest a greater percentage of its assets in a smaller number of securities. Holding fewer securities increases the risk that the value of the Fund could go down because of the poor performance of a single investment. The Fund is subject to broad risks associated with investing in equity securities markets generally, including the risks that the securities and markets in which they invest may experience volatility and instability, that domestic and global economies and markets may undergo periods of cyclical change and decline, that investors may at times avoid investments in equity securities, and that investments may not perform as anticipated. Please see the Prospectus for more information.
The Focus Fund and the Growth Fund often invest in similar growth companies. Their performance may differ, however, because of a variety of factors. Among other factors, the Focus Fund is a non-diversified mutual fund that may hold the securities of fewer issuers than the Growth Fund, which is a diversified Fund. As a result, the Focus Fund may hold some securities that are different from those held by the Growth Fund, and the Focus Fund may be more exposed to individual stock volatility than the Growth Fund or other mutual funds that invest in a relatively larger number of securities.
The Marsico Focus Fund’s performance shortfall versus the S&P 500 Index for the one-year fiscal period ended September 30, 2015 was primarily attributable to investments in certain stocks in the Health Care and Industrials sectors, as defined in the Global Industry Classification Standard (“GICS”)(2).
A few stocks in the Pharmaceuticals Biotechnology & Life Sciences industry group detracted from performance. Pacira Pharmaceuticals, Inc. a manufacturer of non-opioid post-surgical pain anesthetics, declined -56% after the company suspended its previous 2015 revenue guidance for its Exparel product. As of the end of the fiscal year, we continued to maintain a position in Pacira, as we believe the company’s therapies to be best-in-class with long-term growth opportunities. Gilead Sciences, Inc. was a long-time holding in the Fund and added significant value to the Fund’s performance over the full period it was held. During the fiscal period of this report, Gilead Sciences experienced growing competitive pricing pressures for hepatitis C treatments, and its stock price dipped -2% prior to being sold from the Fund. Another long-time biotechnology holding, Biogen Idec Inc., slid -5% during the period. The company significantly cut its 2015 guidance on slower sales of its blockbuster multiple sclerosis drug, Tecfidera. We chose to sell Gilead Sciences and Biogen in favor of other investments with better growth visibility.
Canadian Pacific Railway Ltd. (-34% prior to being sold), like other railroad companies, faced headwinds of lower oil prices and lower volumes as fewer carloads of commodities such as coal are being transported. Though we believe Canadian Pacific to be among the best managed and operated railroad companies with significant pricing power, we chose to sell the position, as we believe low energy prices will remain a headwind for the company for some time.
6
Certain Consumer Discretionary positions struggled. Casino operator Wynn Resorts Ltd., a position that had contributed positively to the Fund’s performance for more than 10 years, posted a return of -31% during the reporting period, and was sold from the Fund. The Fund benefitted from the timing of the sale as Wynn Resorts continued to decline substantially after the Fund’s final sale through the end of the fiscal period. Wynn Resorts’ stock price weakened during a period of weaker Chinese economic data and the Chinese government’s anti-corruption campaign, which tended to restrain gaming activity in Macau. The Chinese government’s policies may hamper growth in Macau for some time, and it is difficult – if not impossible – to predict the timing of government policy changes. Accordingly, we chose to exit the position in favor of other investments with better growth visibility. Electric vehicle manufacturer Tesla Motors, Inc. fell in conjunction with the decline in crude oil prices, as concerns rose that lower gas prices may reduce demand for fuel efficient cars. Tesla Motors posted a return of -20% prior to being sold from the Fund.
Chinese ecommerce company Alibaba Group Holding Ltd. Spon. ADR (-43%) was a detractor within the Information Technology sector. The marketplace has been closely monitoring Alibaba’s ability to monetize sales made on mobile devices, as the company currently makes less on mobile device-based sales than on PC-based sales. Recent data suggests improvement in monetization trends, and we continue to have confidence in the long-term growth opportunities for Alibaba. Online social networking platform LinkedIn Corporation – Cl. A (-10% prior to being sold) and Internet services company Google, Inc. – Cl. A (-17%) were other weak performing holdings within the Information Technology sector.
Within the Financials sector, American Express Company’s stock price dropped -10% after the company announced that its exclusivity and co-branded card agreement with Costco Wholesale will end. We sold the position from the Fund.
The Fund sold most of its Energy-related positions prior to period-end. The Fund’s Energy holdings held earlier in the period, such as Continental Resources Corp. (-17% prior to being sold) and Halliburton Company (-19% prior to being sold) posted negative returns and detracted from performance.
There were several areas of strength for the Fund’s performance. From a sector allocation standpoint, the Fund benefitted relative to the benchmark index from selling most of its Energy holdings during the period, and from having significant overweight allocations to the Consumer Discretionary and Health Care sectors, as both were strong performing sectors of the benchmark index.
Although several Fund holdings within the Consumer Discretionary and Health Care sectors posted negative returns, other holdings within the sectors generated superior performance results relative to the Fund’s benchmark. Coffee purveyor Starbucks Corporation soared +53% as the company reported strong sales and continued its roll-out of a mobile order and pay platform in its stores. Athletic apparel company NIKE, Inc. – Cl. B gained +39% after the company reported continued acceleration of sales in a number of its markets. We believe Nike’s future product sales growth may be further bolstered by the 2016 Brazil Olympics, as Nike will be the official footwear and apparel supplier for US Olympic athletes. Media holding The Walt Disney Company (+17%) experienced strong revenue growth in its studio and consumer products businesses, driven in part by the continued success of its animated film, “Frozen.” Health care services provider United Health Group, Inc. (+24%) demonstrated strength in its business following the passage of the Affordable Care Act.
Leading individual holdings included financial transaction processor Visa, Inc. – Cl. A (+31%) and Facebook, Inc. – Cl. A (+14%). Visa managed to deliver solid performance despite a tumultuous global macroeconomic environment. Facebook’s business grew as more advertising continued to shift to online venues from traditional media such as print advertisements.
The Fund also benefitted relative to its benchmark from effective stock selection in the Materials sector. Agricultural materials provider Monsanto Company (+6% prior to being sold) and paint manufacturer The Sherwin-Williams Company (+3%) each generated positive returns.
During the reporting period, the Fund reduced its exposure to the Energy, Industrials and Materials sectors while increasing its allocations to the Information Technology, Health Care, Consumer Discretionary and Consumer Staples sectors.
7
Fiscal Period-End Investment Posture
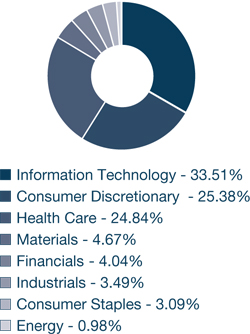
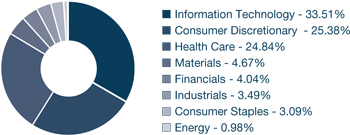
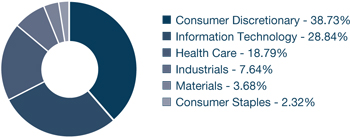
As of September 30, 2015, the Fund’s largest sector allocations included Information Technology, Consumer Discretionary, Health Care and Materials. The Fund had no exposure to the Utilities or Telecommunication Services sectors.
Sincerely,
THOMAS F. MARSICO
CORALIE T. WITTER, CFA
PORTFOLIO MANAGERS
(1) | Total returns are based on net change in net asset value assuming reinvestment of distributions. Please see the Prospectus for more information. |
(2) | Regarding GICS data cited throughout this report, the Global Industry Classification Standard (“GICS”) was developed by and is the exclusive property and service mark of MSCI Inc. (“MSCI”) and Standard & Poor’s (“S&P”) and is licensed for use by Marsico Capital Management, LLC (the “Adviser”). Neither MSCI, S&P, nor the Adviser or any third party involved in compiling GICS makes any express or implied warranties or representations with respect to such standard or classification (or the results from use thereof), and all such parties hereby expressly disclaim all warranties of originality, accuracy, completeness, merchantability and fitness for a particular purpose with respect to any such standard or classification. MSCI, S&P, the Adviser, and any of their affiliates or third parties involved in compiling GICS shall not have any liability for any direct, indirect, special, punitive, consequential or any other damages (including lost profits) even if notified of the possibility of such damages. |
8
September 30, 2015 (Unaudited)
The Focus Fund invests primarily in the common stocks of large companies that are selected for their long-term growth potential. The Fund will normally hold a core position of between 20 and 35 common stocks.
TOTAL ANNUAL OPERATING EXPENSES* 1.34% | NET ASSETS $788,850,513 | NET ASSET VALUE PER SHARE $18.83 |
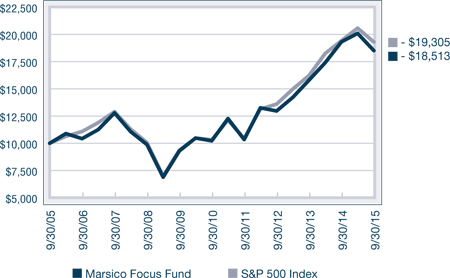
GROWTH OF $10,000(1) | PERFORMANCE COMPARISON |
| |
SECTOR ALLOCATION(2) | TOP FIVE HOLDINGS |
| | | | |
| | Facebook, Inc. - Cl. A | 8.15% | |
| | NIKE, Inc. - Cl. B | 5.76% | |
| | Visa, Inc. - Cl. A | 5.74% | |
| | Google, Inc. - Cl. A | 5.20% | |
| | The Walt Disney Company | 5.00% | |
| | | | |
* | The Total Annual Operating Expenses are reflective of the information disclosed in the Funds’ Prospectus dated January 30, 2015 and may differ from the expense ratio disclosed in this report. |
The performance data quoted here represent past performance, and past performance is not a guarantee of future results. Investment return and principal value of an investment will fluctuate so that an investor’s shares, when redeemed, may be worth more or less than their original cost. Current performance may be lower or higher than the performance information quoted. To obtain performance information current to the most recent month-end, please call 888-860-8686 or visit www.marsicofunds.com.
The performance included in the chart and graph does not reflect the deduction of taxes on Fund distributions or the redemption of Fund shares.
All indices are unmanaged and investors cannot invest directly in an index.
(1) | This chart assumes an initial investment of $10,000 made on September 30, 2005. Total returns are based on net change in NAV, assuming reinvestment of distributions. |
(2) | Sector weightings represent the percentage of the Fund’s investments (excluding cash equivalents) in certain general sectors. These sectors may include more than one industry. The Fund’s portfolio composition is subject to change at any time. |
9
MARSICO FOCUS FUND
SCHEDULE OF INVESTMENTS
September 30, 2015
| | | Number
of
Shares | | | Value | | | Percent
of Net
Assets | |
COMMON STOCKS | | | | | | | | | |
Aerospace & Defense | | | | | | | | | |
The Boeing Company | | | 206,731 | | | $ | 27,071,424 | | | | 3.43 | % |
| | | | | �� | | | | | | | | |
Application Software | | | | | | | | | | | | |
salesforce.com, inc.* | | | 427,341 | | | | 29,670,286 | | | | 3.76 | |
| | | | | | | | | | | | | |
Biotechnology | | | | | | | | | | | | |
Celgene Corporation* | | | 164,783 | | | | 17,824,577 | | | | 2.26 | |
Regeneron Pharmaceuticals, Inc.* | | | 17,402 | | | | 8,094,366 | | | | 1.03 | |
Vertex Pharmaceuticals, Inc.* | | | 193,460 | | | | 20,146,925 | | | | 2.55 | |
| | | | | | | | 46,065,868 | | | | 5.84 | |
Data Processing & Outsourced Services | | | | | |
Visa, Inc. - Cl. A | | | 649,746 | | | | 45,261,306 | | | | 5.74 | |
| | | | | | | | | | | | | |
Drug Retail | | | | | | | | | | | | |
CVS Health Corporation | | | 248,115 | | | | 23,938,135 | | | | 3.03 | |
| | | | | | | | | | | | | |
Footwear | | | | | | | | | | | | |
NIKE, Inc. - Cl. B | | | 369,313 | | | | 45,414,420 | | | | 5.76 | |
| | | | | | | | | | | | | |
General Merchandise Stores | | | | | | | | | |
Dollar Tree, Inc.* | | | 412,301 | | | | 27,483,985 | | | | 3.48 | |
| | | | | | | | | | | | | |
Health Care Facilities | | | | | | | | | | | | |
HCA Holdings, Inc.* | | | 420,666 | | | | 32,542,722 | | | | 4.13 | |
| | | | | | | | | | | | | |
Home Entertainment Software | | | | | | | | | |
Electronic Arts, Inc.* | | | 417,726 | | | | 28,300,936 | | | | 3.59 | |
| | | | | | | | | | | | | |
Internet Retail | | | | | | | | | | | | |
Amazon.com, Inc.* | | | 32,652 | | | | 16,714,232 | | | | 2.12 | |
| | | | | | | | | | | | | |
Internet Software & Services | | | | | |
Alibaba Group Holding Ltd. Spon. ADR* | | | 335,568 | | | | 19,788,445 | | | | 2.51 | |
Facebook, Inc. - Cl. A* | | | 715,727 | | | | 64,343,857 | | | | 8.15 | |
Google, Inc. - Cl. A* | | | 64,255 | | | | 41,018,465 | | | | 5.20 | |
| | | | | | | | 125,150,767 | | | | 15.86 | |
Investment Banking & Brokerage | | | | | |
The Charles Schwab Corporation | | | 1,096,477 | | | | 31,315,383 | | | | 3.97 | |
| | | | | | | | | | | | | |
Life Sciences Tools & Services | | | | | |
Illumina, Inc.* | | | 110,647 | | | | 19,453,956 | | | | 2.47 | |
| | | | | | | | | | | | | |
Managed Health Care | | | | | | | | | | | | |
UnitedHealth Group, Inc. | | | 293,621 | | | | 34,062,972 | | | | 4.32 | |
| | | | | | | | | | | | | |
Movies & Entertainment | | | | | | | | | | | | |
The Walt Disney Company | | | 386,349 | | | | 39,484,868 | | | | 5.00 | |
| | | | | | | | | | | | | |
Oil & Gas Equipment & Services | | | | | |
Schlumberger Ltd. | | | 110,667 | | | | 7,632,703 | | | | 0.97 | |
COMMON STOCKS (continued) | | | | | |
Pharmaceuticals | | | | | | | | | | | | |
Allergan PLC* | | | 85,694 | | | $ | 23,292,486 | | | | 2.96 | % |
Novartis AG | | | 280,877 | | | | 25,815,922 | | | | 3.27 | |
Pacira Pharmaceuticals, Inc.* | | | 278,768 | | | | 11,457,365 | | | | 1.45 | |
| | | | | | | | 60,565,773 | | | | 7.68 | |
Restaurants | | | | | | | | | | | | |
Chipotle Mexican Grill, Inc.* | | | 42,069 | | | | 30,300,197 | | | | 3.84 | |
Starbucks Corporation | | | 658,092 | | | | 37,405,949 | | | | 4.74 | |
| | | | | | | | 67,706,146 | | | | 8.58 | |
Specialty Chemicals | | | | | | | | | | | | |
The Sherwin-Williams Company | | | 162,647 | | | | 36,234,499 | | | | 4.59 | |
| | | | | | | | | | | | | |
Technology Hardware, Storage & Peripherals | | | | | |
Apple, Inc. | | | 285,441 | | | | 31,484,142 | | | | 3.99 | |
| | | | | | | | | | | | | |
TOTAL COMMON STOCKS | | | | | | | | | |
(Cost $675,268,791) | | | | | | | 775,554,523 | | | | 98.31 | |
| | | | | | | | | | | | | |
SHORT-TERM INVESTMENTS | | | | | |
State Street Institutional U.S. Government Money Market Fund, 0.000% | | | 9,931,496 | | | | 9,931,496 | | | | 1.26 | |
| | | | | | | | | | | | | |
TOTAL SHORT-TERM INVESTMENTS | | | | | |
(Cost $9,931,496) | | | | | | | 9,931,496 | | | | 1.26 | |
| | | | | | | | | | | | | |
TOTAL INVESTMENTS | | | | | | | | | |
(Cost $685,200,287) | | | | | | | 785,486,019 | | | | 99.57 | |
| | | | | | | | | | | | | |
Cash and Other Assets, Less Liabilities | | | | 3,364,494 | | | | 0.43 | |
| | | | | | | | | | | | | |
NET ASSETS | | | | | | $ | 788,850,513 | | | | 100.00 | % |
| See notes to financial statements. |
10
INVESTMENT REVIEW BY TOM MARSICO AND CORALIE WITTER (UNAUDITED)
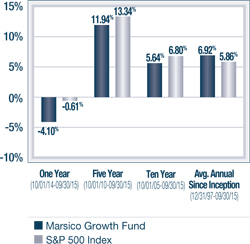
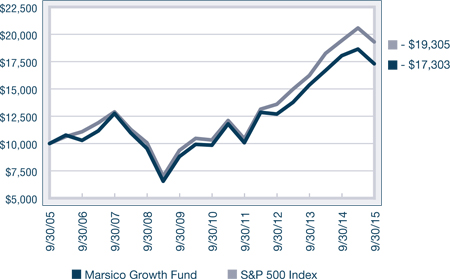
For the one-year fiscal period ended September 30, 2015, the Marsico Growth Fund posted a total return of -4.10%. For comparative purposes, the S&P 500 Index, which is the Fund’s benchmark index, had a total return of -0.61% over the same period. Please see the Fund Overview for more detailed information about the Fund’s longer-term performance for various periods ended September 30, 2015.
The performance data for the Fund quoted here represent past performance, and past performance is not a guarantee of future results. Investment return and principal value of an investment will fluctuate so that an investor’s shares, when redeemed, may be worth more or less than their original cost. Current performance may be lower or higher than the performance information quoted. To obtain performance information current to the most recent month-end, please call 888-860-8686 or visit www.marsicofunds.com.(1)
This review highlights Fund performance over a one-year fiscal period. Shareholders should keep in mind that the Fund is intended for long-term investors who hold their shares for substantially longer periods of time. You should also keep in mind that our current views and beliefs regarding all investments discussed in this report are subject to change at any time. References to specific securities, industries, and sectors discussed in this report are not recommendations to buy or sell such securities or related investments, and the Fund may not necessarily hold these securities or investments today. Please see the accompanying Schedules of Investments for the percentage of the Fund’s portfolio represented by the securities mentioned in this report as of the end of the reporting period.
The Fund is subject to broad risks associated with investing in equity securities markets generally, including the risks that the securities and markets in which it invests may experience volatility and instability, that domestic and global economies and markets may undergo periods of cyclical change and decline, that investors may at times avoid investments in equity securities, and that investments may not perform as anticipated. Please see the Prospectus for more information.
The Focus Fund and the Growth Fund often invest in similar growth companies. Their performance may differ, however, because of a variety of factors. Among other factors, the Focus Fund is a non-diversified mutual fund that may hold the securities of fewer issuers than the Growth Fund, which is a diversified Fund. As a result, the Focus Fund may hold some securities that are different from those held by the Growth Fund, and the Focus Fund may be more exposed to individual stock volatility than the Growth Fund or other mutual funds that invest in a relatively larger number of securities.
A number of the Growth Fund’s Health Care holdings, particularly in the Pharmaceuticals, Biotechnology & Life Sciences industry group, detracted from its performance relative to the S&P 500 Index during the one-year fiscal period. Pacira Pharmaceuticals, Inc., a manufacturer of non-opioid post-surgical pain anesthetics, declined -57% after the company suspended its previous 2015 revenue guidance for its Exparel product. As of the end of the fiscal year, we continued to maintain a position in Pacira, as we believe the company’s therapies to be best-in-class with long-term growth opportunities. Gilead Sciences, Inc., was a long-time holding in the Fund and added significant value to the Fund’s performance over the full period it was held. During the fiscal period of this report, Gilead Sciences experienced growing competitive pricing pressures for the hepatitis C treatment market, and its stock price dipped -2% prior to being sold from the Fund. Vertex Pharmaceuticals, Inc., a manufacturer of therapies for the treatment of cystic fibrosis patients, posted a return of -17% during the period.
In the Industrials sector, the Fund’s positions in railroad operators Canadian Pacific Railway, Ltd. (-34% prior to being sold) and Union Pacific Corporation (-9% prior to being sold) faced headwinds of lower oil prices and lower volumes as fewer carloads of commodities such as coal are being transported. We chose to sell both positions, as we believe low energy prices will remain a headwind for the companies for some time.
Casino operator Wynn Resorts Ltd., a Consumer Discretionary position that had contributed positively to the Fund’s performance for more than 10 years, posted a return of -30% during the reporting period and was sold from the Fund. The Fund benefitted from the timing of the sale as Wynn Resorts continued to decline substantially after the Fund’s final sale through the end of the fiscal period. Wynn Resorts’ stock price weakened during a period of weaker Chinese economic data and the Chinese government’s anti-corruption campaign, which tended to restrain gaming activity in Macau. The Chinese government’s policies may hamper growth in Macau for some time, and it is difficult – if not impossible – to predict the timing of government policy changes. Accordingly, we chose to exit the position in favor of other investments with better growth visibility.
11
Chinese ecommerce company Alibaba Group Holding Ltd. Spon. ADR (-44%) was a detractor within the Information Technology sector. Alibaba’s stock struggled on worries that slower macroeconomic growth in China could lead to fewer online retail sales. Some market participants question Alibaba’s ability to transition from focusing on sales made via desktop computers to monetizing sales made on mobile devices. We believe Alibaba will be successful in capitalizing on monetization trends, and we continue to have confidence in the company’s long-term growth opportunities. Online social networking platform LinkedIn Corporation – Cl. A (-9% prior to being sold) and Internet services company Google, Inc. – Cl. A (-18%) were other weak performing holdings within the Information Technology sector.
The Fund sold most of its Energy-related positions prior to period-end. A few of the Fund’s Energy holdings held earlier in the period, such as Antero Resources Corporation (-33% prior to being sold) and Halliburton Company (-19% prior to being sold) posted negative returns and detracted from performance. The Fund benefitted from the timing of the sale of Antero Resources Corp. as Antero continued to decline substantially after the Fund’s final sale through the end of the fiscal period.
There were several areas of strength for the Fund’s performance. From a sector allocation standpoint, the Fund benefitted relative to the benchmark index from selling most of its Energy holdings during the period and by having a significant overweight allocation to the Health Care sector, which was among the stronger-performing areas of the benchmark index.
Although several Fund holdings within the Consumer Discretionary and Health Care sectors posted negative returns, other holdings within the sectors generated superior performance results relative to the Fund’s benchmark. Coffee purveyor Starbucks Corporation soared +53% as the company reported strong sales and continued its roll-out of a mobile order and pay platform in its stores. Athletic apparel company NIKE, Inc. – Cl. B gained +39% after the company reported continued acceleration of sales in a number of its markets. We believe Nike’s future product sales growth may be further bolstered by the 2016 Brazil Olympics, as Nike will be the official footwear and apparel supplier for US Olympic athletes. Media holding The Walt Disney Company (+17%) experienced strong revenue growth in its studio and consumer products businesses, driven in part by the continued success of its animated film, “Frozen.” Health care services provider United Health Group, Inc. (+24%) demonstrated strength in its business following the passage of the Affordable Care Act.
Like the Focus Fund, leading individual holdings for the Growth Fund included financial transaction processor Visa, Inc. – Cl. A (+31%) and Facebook, Inc. – Cl. A (+14%). Financial transaction processor, Visa, managed to deliver solid performance despite a tumultuous global macroeconomic environment. Facebook’s business grew as more advertising continued to shift to online venues from traditional media such as print advertisements. Electronic game developer and distributor Electronic Arts, Inc. rose +20% after reporting strong revenue growth from sales and downloads of its video games.
The Fund also benefitted relative to its benchmark from effective stock selection in the Materials sector. Agricultural materials provider Monsanto Company (+6% prior to being sold) and paint manufacturer The Sherwin-Williams Company (+3%) each generated positive returns.
During the reporting period, the Fund increased its allocations to the Health Care and Information Technology sectors. The Fund reduced its holdings in the Energy, Industrials and Materials sectors.
Fiscal Period-End Investment Posture
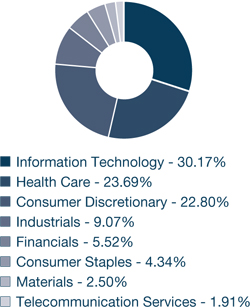
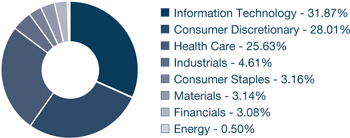
As of September 30, 2015, the Fund’s largest sector allocations included Information Technology, Consumer Discretionary, Health Care and Industrials. The Fund had no exposure to the Utilities or Telecommunication Services sectors.
As noted earlier in this report, effective October 6, 2015, Kevin Boone is no longer a member of the team that co-manages the Marsico Growth Fund. We continue to be jointly and primarily responsible for day-to-day management of the Fund.
Sincerely,
THOMAS F. MARSICO
CORALIE T. WITTER, CFA
PORTFOLIO MANAGERS
(1) | Total returns are based on net change in net asset value assuming reinvestment of distributions. Please see the Prospectus for more information. |
12
September 30, 2015 (Unaudited)
The Growth Fund invests primarily in the common stocks of large companies that are selected for their long-term growth potential. The Growth Fund will normally hold a core position of between 35 and 50 common stocks.
TOTAL ANNUAL OPERATING EXPENSES* 1.37% | NET ASSETS $410,441,505 | NET ASSET VALUE PER SHARE $20.11 |
GROWTH OF $10,000(1) | PERFORMANCE COMPARISON |
| |
SECTOR ALLOCATION(2) | TOP FIVE HOLDINGS |
| | | | |
| | Facebook, Inc. - Cl. A | 6.12% | |
| | Google, Inc. - Cl. A | 5.07% | |
| | NIKE, Inc. - Cl. B | 4.39% | |
| | The Walt Disney Company | 4.24% | |
| | Starbucks Corporation | 3.98% | |
| | | | |
* | The Total Annual Operating Expenses are reflective of the information disclosed in the Funds’ Prospectus dated January 30, 2015 and may differ from the expense ratio disclosed in this report. |
| The performance data quoted here represent past performance, and past performance is not a guarantee of future results. Investment return and principal value of an investment will fluctuate so that an investor’s shares, when redeemed, may be worth more or less than their original cost. Current performance may be lower or higher than the performance information quoted. To obtain performance information current to the most recent month-end, please call 888-860-8686 or visit www.marsicofunds.com. |
| The performance included in the chart and graph does not reflect the deduction of taxes on Fund distributions or the redemption of Fund shares. |
| All indices are unmanaged and investors cannot invest directly in an index. |
(1) | This chart assumes an initial investment of $10,000 made on September 30, 2005. Total returns are based on net change in NAV, assuming reinvestment of distributions. |
(2) | Sector weightings represent the percentage of the Fund’s investments (excluding cash equivalents) in certain general sectors. These sectors may include more than one industry. The Fund’s portfolio composition is subject to change at any time. |
13
MARSICO GROWTH FUND
SCHEDULE OF INVESTMENTS
September 30, 2015
| | | Number
of
Shares | | | Value | | | Percent
of Net
Assets | |
COMMON STOCKS | | | | | | | | | |
Aerospace & Defense | | | | | | | | | |
The Boeing Company | | | 100,382 | | | $ | 13,145,023 | | | | 3.20 | % |
| | | | | | | | | | | | | |
Airlines | | | | | | | | | | | | |
Delta Air Lines, Inc. | | | 114,551 | | | | 5,139,903 | | | | 1.25 | |
| | | | | | | | | | | | | |
Application Software | | | | | | | | | | | | |
salesforce.com, inc.* | | | 195,821 | | | | 13,595,852 | | | | 3.31 | |
| | | | | | | | | | | | | |
Automobile Manufacturers | | | | | |
Tesla Motors, Inc.* | | | 25,160 | | | | 6,249,744 | | | | 1.52 | |
| | | | | | | | | | | | | |
Biotechnology | | | | | | | | | | | | |
Celgene Corporation* | | | 99,318 | | | | 10,743,228 | | | | 2.62 | |
Incyte Corporation* | | | 49,576 | | | | 5,469,720 | | | | 1.33 | |
Regeneron Pharmaceuticals, Inc.* | | | 12,002 | | | | 5,582,610 | | | | 1.36 | |
Vertex Pharmaceuticals, Inc.* | | | 112,907 | | | | 11,758,135 | | | | 2.87 | |
| | | | | | | | 33,553,693 | | | | 8.18 | |
Communications Equipment | | | | | |
Palo Alto Networks, Inc.* | | | 39,969 | | | | 6,874,668 | | | | 1.68 | |
| | | | | | | | | | | | | |
Data Processing & Outsourced Services | | | | | |
FleetCor Technologies, Inc.* | | | 43,674 | | | | 6,010,416 | | | | 1.47 | |
Visa, Inc. - Cl. A | | | 203,363 | | | | 14,166,266 | | | | 3.45 | |
| | | | | | | | 20,176,682 | | | | 4.92 | |
Drug Retail | | | | | | | | | | | | |
CVS Health Corporation | | | 129,983 | | | | 12,540,760 | | | | 3.06 | |
| | | | | | | | | | | | | |
Footwear | | | | | | | | | | | | |
NIKE, Inc. - Cl. B | | | 146,599 | | | | 18,027,279 | | | | 4.39 | |
| | | | | | | | | | | | | |
General Merchandise Stores | | | | | |
Dollar Tree, Inc.* | | | 178,160 | | | | 11,876,146 | | | | 2.89 | |
| | | | | | | | | | | | | |
Health Care Facilities | | | | | | | | | | | | |
HCA Holdings, Inc.* | | | 153,462 | | | | 11,871,820 | | | | 2.89 | |
| | | | | | | | | | | | | |
Home Entertainment Software | | | | | |
Electronic Arts, Inc.* | | | 186,843 | | | | 12,658,613 | | | | 3.08 | |
| | | | | | | | | | | | | |
Hotels, Resorts & Cruise Lines | | | | | |
Royal Caribbean Cruises Ltd. | | | 68,279 | | | | 6,082,976 | | | | 1.48 | |
| | | | | | | | | | | | | |
Internet Retail | | | | | | | | | | | | |
Amazon.com, Inc.* | | | 17,126 | | | | 8,766,628 | | | | 2.14 | |
The Priceline Group, Inc.* | | | 7,447 | | | | 9,210,897 | | | | 2.24 | |
| | | | | | | | 17,977,525 | | | | 4.38 | |
| | | | | | | | | | | | | |
COMMON STOCKS (continued) | | | | | |
Internet Software & Services | | | | | |
Alibaba Group Holding Ltd. Spon. ADR* | | | 139,686 | | | $ | 8,237,284 | | | | 2.00 | % |
Facebook, Inc. - Cl. A* | | | 279,299 | | | | 25,108,980 | | | | 6.12 | |
Google, Inc. - Cl. A* | | | 32,593 | | | | 20,806,393 | | | | 5.07 | |
| | | | | | | | 54,152,657 | | | | 13.19 | |
Investment Banking & Brokerage | | | | | |
The Charles Schwab Corporation | | | 428,116 | | | | 12,226,993 | | | | 2.98 | |
| | | | | | | | | | | | | |
Life Sciences Tools & Services | | | | | |
Illumina, Inc.* | | | 57,539 | | | | 10,116,507 | | | | 2.47 | |
| | | | | | | | | | | | | |
Managed Health Care | | | | | | | | | | | | |
UnitedHealth Group, Inc. | | | 128,895 | | | | 14,953,109 | | | | 3.64 | |
| | | | | | | | | | | | | |
Movies & Entertainment | | | | | | | | | | | | |
The Walt Disney Company | | | 170,314 | | | | 17,406,091 | | | | 4.24 | |
| | | | | | | | | | | | | |
Oil & Gas Equipment & Services | | | | | |
Schlumberger Ltd. | | | 28,964 | | | | 1,997,647 | | | | 0.49 | |
| | | | | | | | | | | | | |
Pharmaceuticals | | | | | | | | | | | | |
Allergan PLC* | | | 47,116 | | | | 12,806,600 | | | | 3.12 | |
Eli Lilly & Company | | | 71,928 | | | | 6,019,654 | | | | 1.47 | |
Pacira Pharmaceuticals, Inc.* | | | 112,802 | | | | 4,636,162 | | | | 1.13 | |
Zoetis, Inc. | | | 188,169 | | | | 7,748,800 | | | | 1.89 | |
| | | | | | | | 31,211,216 | | | | 7.61 | |
Restaurants | | | | | | | | | | | | |
Chipotle Mexican Grill, Inc.* | | | 16,828 | | | | 12,120,367 | | | | 2.95 | |
Starbucks Corporation | | | 287,371 | | | | 16,334,168 | | | | 3.98 | |
| | | | | | | | 28,454,535 | | | | 6.93 | |
Semiconductors | | | | | | | | | | | | |
NXP Semiconductors N.V.* | | | 52,950 | | | | 4,610,356 | | | | 1.12 | |
| | | | | | | | | | | | | |
Specialty Chemicals | | | | | | | | | | | | |
The Sherwin-Williams Company | | | 55,906 | | | | 12,454,739 | | | | 3.04 | |
| | | | | | | | | | | | | |
Specialty Stores | | | | | | | | | | | | |
Signet Jewelers Ltd. | | | 37,181 | | | | 5,061,450 | | | | 1.23 | |
| | | | | | | | | | | | | |
Technology Hardware, Storage & Peripherals | | | | | |
Apple, Inc. | | | 130,598 | | | | 14,404,959 | | | | 3.51 | |
| | | | | | | | | | | | | |
TOTAL COMMON STOCKS | | | | | | | | | | | | |
(Cost $355,509,257) | | | | | | | 396,820,943 | | | | 96.68 | |
See notes to financial statements.
14
| | | Number
of
Shares | | | Value | | | Percent
of Net
Assets | |
SHORT-TERM INVESTMENTS | | | | |
State Street Institutional Treasury Money Market Fund, 0.000% | | | 13,528,740 | | | $ | 13,528,740 | | | | 3.30 | % |
| | | | | | | | | | | | | |
TOTAL SHORT-TERM INVESTMENTS | | | | | |
(Cost $13,528,740) | | | | | | | 13,528,740 | | | | 3.30 | |
| | | | | | | | | | | | | |
TOTAL INVESTMENTS | | | | | | | | | | | | |
(Cost $369,037,997) | | | | | | | 410,349,683 | | | | 99.98 | |
| | | | | | | | | | | | | |
Cash and Other Assets, Less Liabilities | | | | | | | 91,822 | | | | 0.02 | |
| | | | | | | | | | | | | |
NET ASSETS | | | | | | $ | 410,441,505 | | | | 100.00 | % |
| See notes to financial statements. |
15
INVESTMENT REVIEW BY BRANDON GEISLER (UNAUDITED)
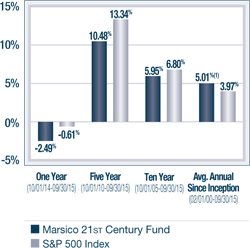
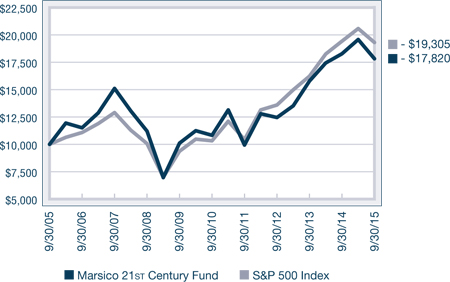
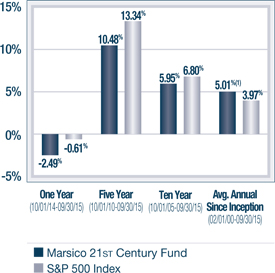
The Marsico 21st Century Fund posted a total return of -2.49% for the one-year fiscal period ended September 30, 2015. For comparative purposes, the S&P 500 Index, which is the Fund’s primary benchmark index, had a total return of -0.61% over the same time period. The Russell 3000 Index, a proxy for the performance of all publicly-traded US equity securities including smaller capitalization companies (which may be a useful comparison in light of the Fund’s ability to invest across the entire market capitalization spectrum), had a total return of -0.49% for the fiscal period. Please see the Fund Overview immediately following this commentary for more detailed information about the Fund’s longer-term performance for various time periods ended September 30, 2015.
The performance data for the Fund quoted here represent past performance, and past performance is not a guarantee of future results. Investment return and principal value of an investment will fluctuate so that an investor’s shares, when redeemed, may be worth more or less than their original cost. Current performance may be lower or higher than the performance information quoted. To obtain performance information current to the most recent month-end, please call 888-860-8686 or visit www.marsicofunds.com.(1)
This review highlights Fund performance over a one-year fiscal period. Shareholders should keep in mind that the Fund is intended for long-term investors who hold their shares for substantially longer periods of time. You should also keep in mind that our current views and beliefs regarding all investments discussed in this report are subject to change at any time. References to specific securities, industries, and sectors discussed in this report are not recommendations to buy or sell such securities or related investments, and the Fund may not necessarily hold these securities or investments today. Please see the accompanying Schedule of Investments for the percentage of the Fund’s portfolio represented by the securities mentioned in this report as of the end of the reporting period.
The Fund is subject to broad risks associated with investing in equity securities markets generally, including the risks that the securities and markets in which it invests may experience volatility and instability, that domestic and global economies and markets may undergo periods of cyclical change and decline, that investors may at times avoid investments in equity securities, and that investments may not perform as anticipated. Please see the Prospectus for more information.
Several weak-performing stocks in the Consumer Discretionary, Health Care and Industrials sectors were the primary detractors from the 21st Century Fund’s performance compared to its benchmark during the period. One of the larger positive contributors to the Fund’s performance over the past 10 years, casino operator Wynn Resorts Ltd., declined -30% during the reporting period prior to being sold. The Fund benefitted from the timing of the sale as Wynn Resorts continued to decline substantially after the Fund’s final sale through the end of the fiscal period. Wynn Resorts’ stock price struggled during a period of weaker Chinese economic data and the Chinese government’s anti-corruption campaign, which tended to restrain gaming activity in Macau. Online travel reservations company TripAdvisor, Inc. also posted a negative return (-23% during the period) and was sold. TripAdvisor’s stock price struggled after the company reported weaker than expected click-based ad revenue.
Health Care holdings Salix Pharmaceuticals Ltd. (-43% prior to being sold), Concordia Healthcare Corporation (-47%) and Gilead Sciences, Inc. (-7% prior to being sold) each posted negative returns during the period. The Fund sold Salix after the company announced inventory issues for several of its key products. Gilead Sciences was a long-time holding in the Fund, and added significant value to the Fund’s performance over the full period it was held. During the past year, Gilead Sciences experienced growing competitive pricing pressures for the hepatitis C treatment market, and was sold from the Fund. In the final weeks of the reporting period, comments by US presidential candidates led to greater concerns that legislative changes could lead to drug price controls and hamper profitability for drug manufacturers, and related attention to drug pricing contributed to a sell-off in many pharmaceutical and biotechnology company stocks. Concordia Healthcare, a biopharmaceutical company with headquarters in Canada, was among the stocks impacted.
Sharply lower energy prices negatively affected several of the Fund’s Industrials holdings such as railroad operators Genesee & Wyoming, Inc. – Cl. A (-38%) and Canadian Pacific Railway, Ltd. (-27%). BE Aerospace, Inc. (-28%), a manufacturer of interior cabin products for aircraft, also experienced challenges as weaker global oil prices temporarily slowed demand for new aircraft and aircraft components despite beneficial energy cost reductions.
The Fund also sold all of its holdings in the Energy sector prior to period-end given the lower energy prices. The Fund’s Energy holdings held early in the period posted negative returns and detracted from performance.
16
Chinese ecommerce company Alibaba Group Holding Ltd. Spon. ADR returned -16% prior to being sold from the Fund. Alibaba’s stock struggled on worries that slower macroeconomic growth in China could lead to fewer online retail sales.
Superior stock selection in the Information Technology sector and favorable sector allocation effects were primary factors contributing positively to the Fund’s performance. Video game company Electronic Arts, Inc. (+54%), social media company Facebook, Inc. – Cl. A (+13%) and cloud computing company salesforce.com, inc. (+21%) each had a material, positive impact on performance.
Select holdings in the Consumer Staples, Materials and Financials sectors also generated strong returns. Constellation Brands, Inc. – Cl. A soared +44% after the company reported strong beer sales that exceeded market expectations. Agricultural materials provider Monsanto Company (+5% prior to being sold) and paint manufacturer The Sherwin-Williams Company (+2%) each generated positive returns. First Republic Bank (+29%) performed well as the company reported strong loan and deposit growth.
While several Fund holdings within the Consumer Discretionary and Health Care sectors posted negative returns, other holdings within the sectors performed well. Leading Consumer Discretionary holdings included Norwegian Cruise Line Holdings Ltd. (+23%), Domino’s Pizza, Inc. (+43%) and The Walt Disney Company (+17%). Health Care holding, DexCom, Inc., a manufacturer of systems for diabetes management, rose +99%.
The Fund’s overall sector allocation effect was positive relative to the benchmark index. The Fund did well by having an underweight allocation to the Energy sector and by selling its few Energy holdings prior to period-end. The Fund also benefitted relative to the benchmark index from having an overweight allocation to the Consumer Discretionary sector, which was the strongest-performing sector of the benchmark index during the period.
During the reporting period, the Fund sold its Energy holdings, as noted earlier, and reduced its allocations to the Industrials and Materials sectors. The Fund increased its allocation to the Health Care and Information Technology sectors.
Fiscal Period-End Investment Posture
As of September 30, 2015, the Fund’s primary economic sector allocations included Information Technology, Health Care, Consumer Discretionary and Industrials. The Fund had no investments in the Energy and Utilities sectors.
Sincerely,
BRANDON A. GEISLER
PORTFOLIO MANAGER
(1) | Total returns are based on net change in net asset value assuming reinvestment of distributions. Periodically, certain fees and expenses have been waived or reimbursed by the Adviser for the 21st Century Fund. In the absence of such a waiver, the performance returns reflected would have been reduced. In accordance with the expense limitation and fee waiver agreement, the Adviser may recoup fees and expenses previously waived or reimbursed under certain parameters. Periodically, the Adviser has recouped such fees or expenses from the 21st Century Fund resulting in a lower performance return. Please see the Prospectus for more information. |
17
21st CENTURY FUND OVERVIEW |
September 30, 2015 (Unaudited)
The 21st Century Fund invests primarily in common stocks that are selected for their long-term growth potential. The Fund may invest in companies of any size, and will normally hold a core position of between 35 and 60 common stocks.
TOTAL ANNUAL OPERATING EXPENSES* 1.43% | NET ASSETS $268,383,830 | NET ASSET VALUE PER SHARE $20.38 |
GROWTH OF $10,000(1)(2) | PERFORMANCE COMPARISON |
| |
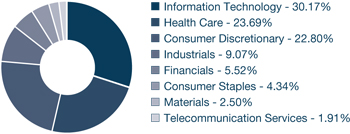
SECTOR ALLOCATION(3) | TOP FIVE HOLDINGS |
| | | | |
| | Facebook, Inc. - Cl. A | 5.91% | |
| | MasterCard, Inc. - Cl. A | 3.96% | |
| | Constellation Brands, Inc. - Cl. A | 3.63% | |
| | Norwegian Cruise Line Holdings Ltd. | 3.63% | |
| | Electronic Arts, Inc. | 3.16% | |
| | | | |
* | The Total Annual Operating Expenses are reflective of the information disclosed in the Funds’ Prospectus dated January 30, 2015 and may differ from the expense ratio disclosed in this report. |
The performance data quoted here represent past performance, and past performance is not a guarantee of future results. Investment return and principal value of an investment will fluctuate so that an investor’s shares, when redeemed, may be worth more or less than their original cost. Current performance may be lower or higher than the performance information quoted. To obtain performance information current to the most recent month-end, please call 888-860-8686 or visit www.marsicofunds.com.
The performance included in the chart and graph does not reflect the deduction of taxes on Fund distributions or the redemption of Fund shares.
All indices are unmanaged and investors cannot invest directly in an index.
(1) | Periodically, certain fees and expenses have been waived or reimbursed by the Adviser for the 21st Century Fund. In the absence of such a waiver, the performance returns reflected would have been reduced. In accordance with the expense limitation and fee waiver agreement, the Adviser may recoup fees and expenses previously waived or reimbursed under certain parameters. Periodically, the Adviser has recouped such fees or expenses from the 21st Century Fund resulting in a lower performance return. |
(2) | This chart assumes an initial investment of $10,000 made on September 30, 2005. Total returns are based on net change in NAV, assuming reinvestment of distributions. |
(3) | Sector weightings represent the percentage of the Fund’s investments (excluding cash equivalents) in certain general sectors. These sectors may include more than one industry. The Fund’s portfolio composition is subject to change at any time. |
19
MARSICO 21st CENTURY FUND
SCHEDULE OF INVESTMENTS
September 30, 2015
| | | Number
of
Shares | | | Value | | | Percent
of Net
Assets | |
COMMON STOCKS | | | | | | | | | |
Aerospace & Defense | | | | | | | | | |
BE Aerospace, Inc. | | | 91,649 | | | $ | 4,023,391 | | | | 1.50 | % |
The Boeing Company | | | 58,402 | | | | 7,647,742 | | | | 2.85 | |
| | | | | | | | 11,671,133 | | | | 4.35 | |
Airlines | | | | | | | | | | | | |
Delta Air Lines, Inc. | | | 59,247 | | | | 2,658,413 | | | | 0.99 | |
| | | | | | | | | | | | | |
Application Software | | | | | | | | | | | | |
Mobileye N.V.* | | | 45,593 | | | | 2,073,569 | | | | 0.77 | |
salesforce.com, inc.* | | | 114,104 | | | | 7,922,241 | | | | 2.95 | |
| | | | | | | | 9,995,810 | | | | 3.72 | |
Automobile Manufacturers | | | | | | | | | | | | |
Tesla Motors, Inc.* | | | 19,767 | | | | 4,910,123 | | | | 1.83 | |
| | | | | | | | | | | | | |
Automotive Retail | | | | | | | | | | | | |
O'Reilly Automotive, Inc.* | | | 17,779 | | | | 4,444,750 | | | | 1.66 | |
| | | | | | | | | | | | | |
Biotechnology | | | | | | | | | | | | |
Alexion Pharmaceuticals, Inc.* | | | 20,350 | | | | 3,182,536 | | | | 1.19 | |
Alkermes PLC* | | | 99,739 | | | | 5,851,687 | | | | 2.18 | |
Isis Pharmaceuticals, Inc.* | | | 27,865 | | | | 1,126,303 | | | | 0.42 | |
Juno Therapeutics, Inc.* | | | 28,456 | | | | 1,157,875 | | | | 0.43 | |
NATERA, Inc.* | | | 65,936 | | | | 715,406 | | | | 0.27 | |
Regeneron Pharmaceuticals, Inc.* | | | 11,561 | | | | 5,377,484 | | | | 2.00 | |
| | | | | | | | 17,411,291 | | | | 6.49 | |
Communications Equipment | | | | | |
Palo Alto Networks, Inc.* | | | 25,333 | | | | 4,357,276 | | | | 1.62 | |
| | | | | | | | | | | | | |
Construction Materials | | | | | | | | | | | | |
Vulcan Materials Company | | | 22,640 | | | | 2,019,488 | | | | 0.75 | |
| | | | | | | | | | | | | |
Data Processing & Outsourced Services | | | | | |
FleetCor Technologies, Inc.* | | | 40,009 | | | | 5,506,039 | | | | 2.05 | |
MasterCard, Inc. - Cl. A | | | 117,852 | | | | 10,620,822 | | | | 3.96 | |
| | | | | | | | 16,126,861 | | | | 6.01 | |
Distillers & Vintners | | | | | | | | | | | | |
Constellation Brands, Inc. - Cl. A | | | 77,746 | | | | 9,734,577 | | | | 3.63 | |
| | | | | | | | | | | | | |
Diversified Support Services | | | | | |
Healthcare Services Group, Inc. | | | 85,588 | | | | 2,884,315 | | | | 1.07 | |
| | | | | | | | | | | | | |
General Merchandise Stores | | | | | |
Burlington Stores, Inc.* | | | 93,211 | | | | 4,757,489 | | | | 1.77 | |
| | | | | | | | | | | | | |
Health Care Equipment | | | | | | | | | | | | |
ConforMIS, Inc.* | | | 55,348 | | | | 999,585 | | | | 0.37 | |
DexCom, Inc.* | | | 70,014 | | | | 6,011,402 | | | | 2.24 | |
Intuitive Surgical, Inc.* | | | 7,215 | | | | 3,315,870 | | | | 1.24 | |
| | | | | | | | 10,326,857 | | | | 3.85 | |
Health Care Facilities | | | | | | | | | | | | |
Acadia Healthcare Company, Inc.* | | | 65,496 | | | | 4,340,420 | | | | 1.62 | |
| | | | | | | | | | | | | |
COMMON STOCKS (continued) | | | | | |
Health Care Services | | | | | | | | | | | | |
Envision Healthcare Holdings, Inc.* | | | 97,968 | | | $ | 3,604,243 | | | | 1.34 | % |
| | | | | | | | | | | | | |
Home Entertainment Software | | | | | |
Electronic Arts, Inc.* | | | 125,066 | | | | 8,473,221 | | | | 3.16 | |
| | | | | | | | | | | | | |
Hotels, Resorts & Cruise Lines | | | | | |
Norwegian Cruise Line Holdings Ltd.* | | | 169,843 | | | | 9,732,004 | | | | 3.63 | |
| | | | | | | | | | | | | |
Internet Retail | | | | | | | | | | | | |
Amazon.com, Inc.* | | | 14,372 | | | | 7,356,883 | | | | 2.74 | |
Ctrip.com International, Ltd. ADR* | | | 42,284 | | | | 2,671,503 | | | | 1.00 | |
NetFlix, Inc.* | | | 27,135 | | | | 2,801,960 | | | | 1.04 | |
Yoox SpA* | | | 68,680 | | | | 2,067,806 | | | | 0.77 | |
| | | | | | | | 14,898,152 | | | | 5.55 | |
Internet Software & Services | | | | | |
CoStar Group, Inc.* | | | 23,846 | | | | 4,126,789 | | | | 1.54 | |
Envestnet, Inc.* | | | 18,464 | | | | 553,366 | | | | 0.21 | |
Facebook, Inc. - Cl. A* | | | 176,535 | | | | 15,870,497 | | | | 5.91 | |
LinkedIn Corporation - Cl. A* | | | 16,226 | | | | 3,085,049 | | | | 1.15 | |
| | | | | | | | 23,635,701 | | | | 8.81 | |
Investment Banking & Brokerage | | | | | |
The Charles Schwab Corporation | | | 230,969 | | | | 6,596,475 | | | | 2.46 | |
| | | | | | | | | | | | | |
Life Sciences Tools & Services | | | | | |
Illumina, Inc.* | | | 30,456 | | | | 5,354,774 | | | | 2.00 | |
| | | | | | | | | | | | | |
Movies & Entertainment | | | | | | | | | | | | |
Imax Corporation* | | | 88,002 | | | | 2,973,587 | | | | 1.11 | |
The Walt Disney Company | | | 79,218 | | | | 8,096,080 | | | | 3.01 | |
| | | | | | | | 11,069,667 | | | | 4.12 | |
Packaged Foods & Meats | | | | | | | | | | | | |
Blue Buffalo Pet Products, Inc.* | | | 55,386 | | | | 991,963 | | | | 0.37 | |
| | | | | | | | | | | | | |
Pharmaceuticals | | | | | | | | | | | | |
Allergan PLC* | | | 27,841 | | | | 7,567,462 | | | | 2.82 | |
Concordia Healthcare Corporation | | | 54,565 | | | | 2,328,161 | | | | 0.87 | |
Endo International PLC* | | | 110,634 | | | | 7,664,724 | | | | 2.85 | |
| | | | | | | | 17,560,347 | | | | 6.54 | |
Railroads | | | | | | | | | | | | |
Canadian Pacific Railway Ltd. | | | 26,875 | | | | 3,858,444 | | | | 1.44 | |
Genesee & Wyoming, Inc. - Cl. A* | | | 22,906 | | | | 1,353,286 | | | | 0.50 | |
| | | | | | | | 5,211,730 | | | | 1.94 | |
Regional Banks | | | | | | | | | | | | |
First Republic Bank | | | 112,291 | | | | 7,048,506 | | | | 2.63 | |
| | | | | | | | | | | | | |
Restaurants | | | | | | | | | | | | |
Domino's Pizza, Inc. | | | 60,997 | | | | 6,582,186 | | | | 2.45 | |
| | | | | | | | | | | | | |
Semiconductors | | | | | | | | | | | | |
ARM Holdings PLC | | | 190,851 | | | | 2,741,997 | | | | 1.02 | |
NXP Semiconductors N.V.* | | | 89,383 | | | | 7,782,578 | | | | 2.90 | |
| | | | | | | | 10,524,575 | | | | 3.92 | |
See notes to financial statements.
19
MARSICO 21st CENTURY FUND
SCHEDULE OF INVESTMENTS (continued)
September 30, 2015
| | | Number
of
Shares | | | Value | | | Percent
of Net
Assets | |
COMMON STOCKS (continued) | |
Specialty Chemicals | | | | | | | | | |
The Sherwin-Williams Company | | | 18,748 | | | $ | 4,176,679 | | | | 1.56 | % |
| | | | | | | | | | | | | |
Systems Software | | | | | | | | | | | | |
Tableau Software, Inc. - Cl. A* | | | 19,121 | | | | 1,525,473 | | | | 0.57 | |
| | | | | | | | | | | | | |
Wireless Telecommunication Services | | | | | |
SBA Communications Corporation - Cl. A* | | | 45,185 | | | | 4,732,677 | | | | 1.76 | |
| | | | | | | | | | | | | |
TOTAL COMMON STOCKS | | | | | | | | | |
(Cost $211,741,171) | | | | | | | 247,357,176 | | | | 92.17 | |
| | | | | | | | | | | | | |
SHORT-TERM INVESTMENTS | | | | | |
State Street Institutional Treasury Money Market Fund, 0.000% | | | 21,204,689 | | | | 21,204,689 | | | | 7.90 | |
| | | | | | | | | | | | | |
TOTAL SHORT-TERM INVESTMENTS | | | | | |
(Cost $21,204,689) | | | | | | | 21,204,689 | | | | 7.90 | |
| | | | | | | | | | | | | |
TOTAL INVESTMENTS | | | | | | | | | | | | |
(Cost $232,945,860) | | | | | | | 268,561,865 | | | | 100.07 | |
| | | | | | | | | | | | | |
Liabilities, Less Cash and Other Assets | | | | | | | (178,035 | ) | | | (0.07 | ) |
| | | | | | | | | | | | | |
NET ASSETS | | | | | | $ | 268,383,830 | | | | 100.00 | % |
See notes to financial statements.
20
INTERNATIONAL OPPORTUNITIES FUND |
INVESTMENT REVIEW BY MUNISH MALHOTRA (UNAUDITED)
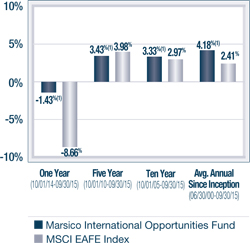
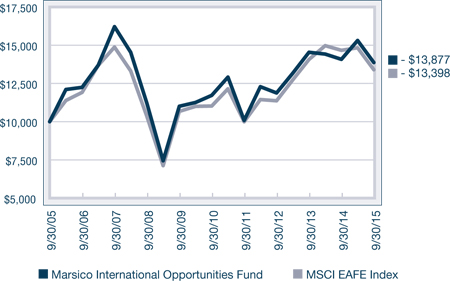
The Marsico International Opportunities Fund posted a total return of (US$) -1.43% for the one-year fiscal period ended September 30, 2015. For comparative purposes, the MSCI EAFE Index, which is the Fund’s benchmark index, had a total return of (US$) -8.66%. Please see the Fund Overview immediately following this commentary for more detailed information about the Fund’s longer-term performance for various time periods ended September 30, 2015.
The performance data for the Fund quoted here represent past performance, and past performance is not a guarantee of future results. Investment return and principal value of an investment will fluctuate so that an investor’s shares, when redeemed, may be worth more or less than their original cost. Current performance may be lower or higher than the performance information quoted. To obtain performance information current to the most recent month-end, please call 888-860-8686 or visit www.marsicofunds.com.(1)
This review highlights Fund performance over a one-year fiscal period. Shareholders should keep in mind that the Fund is intended for long-term investors who hold their shares for substantially longer periods of time. You should also keep in mind that our current views and beliefs regarding all investments discussed in this report are subject to change at any time. References to specific securities, industries, and sectors discussed in this report are not recommendations to buy or sell such securities or related investments, and the Fund may not necessarily hold these securities or investments today. Please see the accompanying Schedule of Investments for the percentage of the Fund’s portfolio represented by the securities mentioned in this report as of the end of the reporting period.
Foreign investments present additional risks due to currency fluctuations, economic and political factors, lower liquidity, differences in securities regulations and accounting standards, possible changes in taxation, limited public information, and other factors. In addition, the Fund is subject to broad risks associated with investing in equity securities markets generally, including the risks that the securities and markets in which it invests may experience volatility and instability, that domestic and global economies and markets may undergo periods of cyclical change and decline, that investors may at times avoid investments in equity securities, and that investments may not perform as anticipated. Please see the Prospectus for more information.
Superior stock selection and an overweight allocation to the Information Technology sector were significant contributors to the International Opportunities Fund’s substantial outperformance compared to its benchmark during the period. Leading Information Technology holdings in the Fund included financial transaction processor MasterCard Inc. – Cl. A (+22%), Chinese Internet services company Tencent Holdings Ltd. (+12%), United Kingdom’s online auto classified advertising service Auto Trader Group PLC (+47%), social media platform Facebook, Inc. – Cl. A (+10%) and global financial technology services company Wirecard A.G. (+24% prior to being sold). Information Technology was a relatively strong performing area of the benchmark index, and the Fund was aided by having a significant portion of its net assets invested in the sector.
Similarly, the Fund benefitted relative to the benchmark index from good stock selection and an overweight to the Consumer Discretionary sector. United Kingdom-based pizza master-franchise company Domino’s Pizza Group PLC soared +50% on strong system sales growth in the UK market. The Fund also held a position in related company Domino’s Pizza Enterprises Ltd., which holds master franchise rights for the pizza brand in markets including Australia, New Zealand, France, Belgium, the Netherlands and Japan. Domino’s Pizza Enterprises gained +15% during the period it was held in the Fund, buoyed by strong results in its European market. Norwegian Cruise Line Holdings Ltd. (+30%), Japanese retailer Start Today Company Ltd. (+42%) and media company Liberty Global PLC – Series C (+3%) were other positive contributors in the sector.
Other individual Fund holdings having a material, positive impact on performance included Ryanair Holdings PLC Spon. ADR (+27%) and Hargreaves Lansdown PLC (+23%). European discount airline Ryanair Holdings reported strong profits and operating performance during the period. Hargreaves Lansdown’s platform, Vantage, is the United Kingdom’s largest investment and fund supermarket.
The Fund sold its sole holding in the Energy sector during the period. This aided Fund performance relative to the benchmark index, as Energy was the weakest-performing sector of the MSCI EAFE Index.
21
INTERNATIONAL OPPORTUNITIES FUND |
Although active currency management is not a central facet of the Fund’s investment process, fluctuations in major world currencies can at times affect the Fund’s performance. During the period, the net effect of currency moves was positive for the Fund. The Fund did well as compared to the benchmark index by having greater exposure to securities denominated in the US dollar, which strengthened versus most major world currencies. Additionally, the Fund’s results were positively affected by having an underweight allocation to the euro and the Australian dollar, which weakened during the period. A portion of this positive effect was offset by the Fund’s holdings in securities denominated in the Canadian dollar. The Canadian dollar, like currencies of many commodity-rich countries, weakened during the period. Canadian securities are not constituents of the benchmark index.
A number of weaker stocks in the Health Care sector were the primary detractors from Fund performance relative to its benchmark during the period. In the final weeks of the reporting period, comments by US presidential candidates led to greater concerns that legislative changes could lead to drug price controls and hamper profitability for drug manufacturers, and related attention to drug pricing contributed to a sell-off in many pharmaceutical and biotechnology company stocks. Concordia Healthcare Corporation (-44%), a biopharmaceutical company with headquarters in Canada, was among the stocks impacted. UCB S.A., a Belgium headquartered manufacturer of treatment for central nervous system disorders, declined -16% and was sold from the Fund. Novadaq Technologies, Inc., a developer of imaging technologies for surgical procedures, posted a return of -30% prior to being sold from the Fund.
From a sector allocation perspective, the Fund’s performance was held back by having very few investments in the strongest-performing sector of the benchmark index, Consumer Staples.
During the period, the Fund significantly increased its allocation to the Consumer Discretionary sector. The Fund reduced its allocations to the Industrials and Energy sectors.
The International Opportunities Fund experienced elevated portfolio turnover during the period, which primarily related to the Fund’s changing its portfolio composition to reinvest in other positions that we believe may have more upside potential and to take advantage of new opportunities. Portfolio turnover increases transaction-related expenses and could reduce Fund returns.
Fiscal Period-End Investment Posture
As of September 30, 2015, the Fund’s primary economic sector allocations included Consumer Discretionary, Information Technology, Health Care and Industrials. The Fund had no exposure to the Utilities, Telecommunication Services, Energy and Materials sectors at period-end.
In terms of country allocations, the Fund’s most significant weightings at period-end, excluding short-term investments, were the United States, the United Kingdom, China/Hong Kong, Canada, France and Australia. The Fund’s United States holdings primarily comprised multi-national companies. Country-level weightings generally should be considered a residual of the Fund’s stock selection process rather than a major, proactive facet of its investment strategy.
Sincerely,
MUNISH MALHOTRA, CFA
PORTFOLIO MANAGER
(1) | Total returns are based on net change in net asset value assuming reinvestment of distributions. Periodically, certain fees and expenses have been waived or reimbursed by the Adviser for the International Opportunities Fund. In the absence of such a waiver, the performance returns reflected would have been reduced. In accordance with the expense limitation and fee waiver agreement, the Adviser may recoup fees and expenses previously waived or reimbursed under certain parameters. Periodically, the Adviser has recouped such fees or expenses from the International Opportunities Fund resulting in a lower performance return. Please see the Prospectus for more information. |
22
INTERNATIONAL OPPORTUNITIES FUND OVERVIEW |
September 30, 2015 (Unaudited)
The International Opportunities Fund invests primarily in common stocks of foreign companies that are selected for their long-term growth potential, including foreign securities, whether traded in the US (including as American Depositary Receipts) or in foreign markets or both. The Fund may invest in an unlimited number of companies of any size throughout the world. It normally invests in the securities of issuers that are economically tied to one or more foreign countries, and expects to be invested in various issuers or securities that together have ties to at least four different foreign countries. Some issuers or securities in the Fund’s portfolio may be based in or economically tied to the United States or to emerging markets.
TOTAL ANNUAL OPERATING EXPENSES* NET EXPENSES*† | 1.69% 1.60% | NET ASSETS $89,140,675 | NET ASSET VALUE PER SHARE $14.51 |
GROWTH OF $10,000(1)(2) | PERFORMANCE COMPARISON |
| |
SECTOR ALLOCATION(3) | TOP FIVE HOLDINGS |
| | | | |
| | Liberty Global PLC - Series C | 4.84% | |
| | Endo International PLC | 4.21% | |
| | MasterCard, Inc. - Cl. A | 4.18% | |
| | The Priceline Group, Inc. | 4.06% | |
| | Facebook, Inc. - Cl. A | 3.96% | |
| | | | |
* | The Total Annual Operating Expenses and Net Expenses are reflective of the information disclosed in the Funds’ Prospectus dated January 30, 2015 and may differ from the expense ratios disclosed in this report. |
† | Marsico Capital Management, LLC (the “Adviser”) has entered into a written expense limitation and fee waiver agreement under which it has agreed to limit the total expenses of the International Opportunities Fund (excluding interest, taxes, acquired fund fees and expenses, litigation, brokerage and extraordinary expenses) to an annual rate of 1.60% of the Fund’s average net assets until January 31, 2016. This expense limitation and fee waiver agreement may be terminated by the Adviser at any time after January 31, 2016, upon 15 days prior notice to the Fund and its administrator. The Adviser may recoup from the Fund fees previously waived or expenses previously reimbursed by the Adviser with respect to the Fund pursuant to this agreement (or a previous expense limitation agreement) if: (1) such recoupment by the Adviser does not cause the Fund, at the time of recoupment, to exceed the lesser of (a) the expense limitation in effect at the time the relevant amount was waived and/or reimbursed, or (b) the expense limitation in effect at the time of the proposed recoupment, and (2) the recoupment is made within three fiscal years after the end of the fiscal year in which the amount was waived or reimbursed. |
The performance data quoted here represent past performance, and past performance is not a guarantee of future results. Investment return and principal value of an investment will fluctuate so that an investor’s shares, when redeemed, may be worth more or less than their original cost. Current performance may be lower or higher than the performance information quoted. To obtain performance information current to the most recent month-end, please call 888-860-8686 or visit www.marsicofunds.com.
The performance included in the chart and graph does not reflect the deduction of taxes on Fund distributions or the redemption of Fund shares.
All indices are unmanaged and investors cannot invest directly in an index.
(1) | Periodically, certain fees and expenses have been waived or reimbursed by the Adviser for the International Opportunities Fund. In the absence of such a waiver, the performance returns reflected would have been reduced. In accordance with the expense limitation and fee waiver agreement, the Adviser may recoup fees and expenses previously waived or reimbursed under certain parameters. Periodically, the Adviser has recouped such fees or expenses from the International Opportunities Fund resulting in a lower performance return. |
(2) | This chart assumes an initial investment of $10,000 made on September 30, 2005. Total returns are based on net change in NAV, assuming reinvestment of distributions. |
(3) | Sector weightings represent the percentage of the Fund’s investments (excluding cash equivalents) in certain general sectors. These sectors may include more than one industry. The Fund’s portfolio composition is subject to change at any time. |
The MSCI EAFE Index tracks the stocks of about 1,000 companies in Europe, Australasia, and the Far East (EAFE).
23
MARSICO INTERNATIONAL OPPORTUNITIES FUND
SCHEDULE OF INVESTMENTS
September 30, 2015
| | | Number
of
Shares | | | Value | | | Percent
of Net
Assets | |
COMMON STOCKS | | | | | | | | | |
Advertising | | | | | | | | | |
JC Decaux S.A. | | | 77,707 | | | $ | 2,824,723 | | | | 3.17 | % |
REA Group Ltd. | | | 83,451 | | | | 2,613,283 | | | | 2.93 | |
| | | | | | | | 5,438,006 | | | | 6.10 | |
Aerospace & Defense | | | | | | | | | | | | |
Safran S.A. | | | 24,903 | | | | 1,872,496 | | | | 2.10 | |
| | | | | | | | | | | | | |
Airlines | | | | | | | | | | | | |
Ryanair Holdings PLC Spon. ADR | | | 40,040 | | | | 3,135,132 | | | | 3.52 | |
| | | | | | | | | | | | | |
Application Software | | | | | | | | | | | | |
Constellation Software, Inc. | | | 2,219 | | | | 930,084 | | | | 1.04 | |
| | | | | | | | | | | | | |
Asset Management & Custody Banks | | | | | |
Hargreaves Lansdown PLC | | | 169,057 | | | | 3,091,768 | | | | 3.47 | |
| | | | | | | | | | | | | |
Biotechnology | | | | | | | | | | | | |
Alkermes PLC* | | | 32,644 | | | | 1,915,224 | | | | 2.15 | |
| | | | | | | | | | | | | |
Cable & Satellite | | | | | | | | | | | | |
Liberty Global PLC - Series C* | | | 105,251 | | | | 4,317,396 | | | | 4.84 | |
| | | | | | | | | | | | | |
Data Processing & Outsourced Services | | | | | |
MasterCard, Inc. - Cl. A | | | 41,313 | | | | 3,723,128 | | | | 4.18 | |
| | | | | | | | | | | | | |
Distillers & Vintners | | | | | | | | | | | | |
Remy Cointreau S.A. | | | 19,858 | | | | 1,305,020 | | | | 1.46 | |
| | | | | | | | | | | | | |
Home Entertainment Software | | | | | |
Nintendo Co., Ltd. | | | 9,600 | | | | 1,618,096 | | | | 1.81 | |
| | | | | | | | | | | | | |
Hotels, Resorts & Cruise Lines | | | | | |
Norwegian Cruise Line Holdings Ltd.* | | | 56,941 | | | | 3,262,719 | | | | 3.66 | |
| | | | | | | | | | | | | |
Internet Retail | | | | | | | | | | | | |
Ctrip.com International, Ltd. ADR* | | | 29,568 | | | | 1,868,106 | | | | 2.09 | |
MakeMyTrip Ltd.* | | | 65,201 | | | | 896,514 | | | | 1.01 | |
Start Today Company Ltd. | | | 64,300 | | | | 2,128,345 | | | | 2.39 | |
The Priceline Group, Inc.* | | | 2,923 | | | | 3,615,342 | | | | 4.06 | |
Vipshop Holdings Ltd. Spon. ADR* | | | 105,734 | | | | 1,776,331 | | | | 1.99 | |
Yoox SpA* | | | 65,566 | | | | 1,974,050 | | | | 2.21 | |
| | | | | | | | 12,258,688 | | | | 13.75 | |
Internet Software & Services | | | | | |
Alibaba Group Holding Ltd. Spon. ADR* | | | 30,045 | | | | 1,771,753 | | | | 1.99 | |
Auto Trader Group PLC* | | | 361,916 | | | | 1,862,052 | | | | 2.09 | |
Facebook, Inc. - Cl. A* | | | 39,261 | | | | 3,529,564 | | | | 3.96 | |
Tencent Holdings Ltd. | | | 170,400 | | | | 2,876,806 | | | | 3.22 | |
| | | | | | | | 10,040,175 | | | | 11.26 | |
Movies & Entertainment | | | | | | | | | | | | |
Eros International PLC* | | | 30,045 | | | | 816,924 | | | | 0.92 | |
Imax Corporation* | | | 44,185 | | | | 1,493,011 | | | | 1.67 | |
| | | | | | | | 2,309,935 | | | | 2.59 | |
COMMON STOCKS (continued) | | | | | |
Pharmaceuticals | | | | | | | | | | | | |
Concordia Healthcare Corporation | | | 65,513 | | | $ | 2,795,287 | | | | 3.14 | % |
Endo International PLC* | | | 54,182 | | | | 3,753,729 | | | | 4.21 | |
GW Pharmaceuticals PLC ADR* | | | 4,822 | | | | 440,586 | | | | 0.50 | |
Novartis AG | | | 30,573 | | | | 2,810,021 | | | | 3.15 | |
Novo Nordisk A/S - Cl. B | | | 50,559 | | | | 2,728,394 | | | | 3.06 | |
Valeant Pharmaceuticals International, Inc.* | | | 11,156 | | | | 1,991,277 | | | | 2.23 | |
| | | | | | | | 14,519,294 | | | | 16.29 | |
Publishing | | | | | | | | | | | | |
Rightmove PLC | | | 26,214 | | | | 1,449,814 | | | | 1.63 | |
| | | | | | | | | | | | | |
Railroads | | | | | | | | | | | | |
Canadian Pacific Railway Ltd. | | | 6,761 | | | | 970,402 | | | | 1.09 | |
| | | | | | | | | | | | | |
Restaurants | | | | | | | | | | | | |
Domino's Pizza Enterprises Ltd. | | | 104,532 | | | | 2,973,200 | | | | 3.34 | |
Domino's Pizza Group PLC | | | 218,169 | | | | 2,935,567 | | | | 3.29 | |
| | | | | | | | 5,908,767 | | | | 6.63 | |
Semiconductor Equipment | | | | | | | | | |
ASML Holding N.V. | | | 10,426 | | | | 916,475 | | | | 1.03 | |
| | | | | | | | | | | | | |
Semiconductors | | | | | | | | | | | | |
ARM Holdings PLC | | | 194,167 | | | | 2,789,639 | | | | 3.13 | |
NXP Semiconductors N.V.* | | | 31,804 | | | | 2,769,174 | | | | 3.11 | |
| | | | | | | | 5,558,813 | | | | 6.24 | |
Systems Software | | | | | | | | | | | | |
Check Point Software Technologies Ltd.* | | | 35,490 | | | | 2,815,422 | | | | 3.16 | |
| | | | | | | | | | | | | |
TOTAL COMMON STOCKS | | | | | | | | | |
(Cost $82,829,112) | | | | | | | 87,356,854 | | | | 98.00 | |
| | | | | | | | | | | | | |
SHORT-TERM INVESTMENTS | | | | | |
State Street Institutional Treasury Money Market Fund, 0.000% | | | 3,338,114 | | | | 3,338,114 | | | | 3.74 | |
| | | | | | | | | | | | | |
TOTAL SHORT-TERM INVESTMENTS | | | | | |
(Cost $3,338,114) | | | | | | | 3,338,114 | | | | 3.74 | |
| | | | | | | | | | | | | |
TOTAL INVESTMENTS | | | | | | | | | | | | |
(Cost $86,167,226) | | | | | | | 90,694,968 | | | | 101.74 | |
| | | | | | | | | | | | | |
Liabilities, Less Cash and Other Assets | | | | (1,554,293 | ) | | | (1.74 | ) |
| | | | | | | | | | | | | |
NET ASSETS | | | | | | $ | 89,140,675 | | | | 100.00 | % |
See notes to financial statements.
24
SUMMARY OF INVESTMENTS BY COUNTRY | |
Country | | Market Value | | | Percent of
Investment
Securities | |
Australia | | $ | 5,586,483 | | | | 6.16 | % |
Canada | | | 8,180,061 | | | | 9.02 | |
China/Hong Kong | | | 8,292,996 | | | | 9.14 | |
Denmark | | | 2,728,394 | | | | 3.01 | |
France | | | 6,002,239 | | | | 6.62 | |
India | | | 1,713,438 | | | | 1.89 | |
Ireland | | | 5,050,356 | | | | 5.57 | |
Israel | | | 2,815,422 | | | | 3.10 | |
Italy | | | 1,974,050 | | | | 2.18 | |
Japan | | | 3,746,441 | | | | 4.13 | |
Netherlands | | | 3,685,649 | | | | 4.06 | |
Switzerland | | | 2,810,021 | | | | 3.10 | |
United Kingdom | | | 16,886,822 | | | | 18.62 | |
United States(1) | | | 21,222,596 | | | | 23.40 | |
| | | $ | 90,694,968 | | | | 100.00 | % |
(1) | Includes short-term securities. |
See notes to financial statements.
25
INVESTMENT REVIEW BY MUNISH MALHOTRA AND JORDON LAYCOB (UNAUDITED)
The Marsico Flexible Capital Fund posted a total return of -0.81% for the one-year fiscal period ended September 30, 2015. For comparative purposes, the S&P 500 Index, which is the Fund’s benchmark index, had a total return of -0.61%. Please see the Fund Overview immediately following this commentary for more detailed information about the Fund’s performance for various time periods ended September 30, 2015.
The performance data for the Fund quoted here represent past performance, and past performance is not a guarantee of future results. Investment return and principal value of an investment will fluctuate so that an investor’s shares, when redeemed, may be worth more or less than their original cost. Current performance may be lower or higher than the performance information quoted. To obtain performance information current to the most recent month-end, please call 888-860-8686 or visit www.marsicofunds.com.(1)
This review highlights Fund performance over a one-year fiscal period. Shareholders should keep in mind that the Fund is intended for long-term investors who hold their shares for substantially longer periods of time. You should also keep in mind that our current views and beliefs regarding all investments discussed in this report are subject to change at any time. References to specific securities, industries, and sectors discussed in this report are not recommendations to buy or sell such securities or related investments, and the Fund may not necessarily hold these securities or investments today. Please see the accompanying Schedule of Investments for the percentage of the Fund’s portfolio represented by the securities mentioned in this report as of the end of the reporting period.
The Fund is subject to broad risks associated with investing in equity securities markets generally, including the risks that the securities and markets in which it invests may experience volatility and instability, that domestic and global economies and markets may undergo periods of cyclical change and decline, that investors may at times avoid investments in equity securities, and that investments may not perform as anticipated. Please see the Prospectus for more information.
Throughout the period, the Flexible Capital Fund’s exposure to the Consumer Discretionary sector was more than twice that of its benchmark, the S&P 500 Index. This positioning aided the Fund’s relative performance, as Consumer Discretionary was the strongest-performing sector of the benchmark index. Certain holdings within the sector performed well. United Kingdom-based pizza master-franchise company Domino’s Pizza Group PLC soared +49% on strong system sales growth in the UK market. Retailer Lowe’s Companies, Inc. (+30% prior to being sold) benefitted from a strong home improvement market and efforts to improve its retail merchandising. ClubCorp Holdings, Inc. an owner and operator of private golf and country clubs, rose +11%.
Stock selection in the Consumer Staples sector was strong. Constellation Brands, Inc. – Cl. A soared +44% after the company reported strong beer sales that exceeded market expectations. Keurig Green Mountain, Inc. (+13% prior to being sold) was sold on stock price appreciation after the company benefitted from several key growth catalysts.
Within the Financials sector, options and futures exchange CME Group, Inc. (+20%) generated a strong return as the company reported strong market data and information services revenues.
The Fund had very few investments in the Energy sector during the period. This aided Fund performance relative to the benchmark index, as Energy was the weakest-performing sector of the S&P 500 Index.
There were a few areas of weakness for the Fund during the period. Casino operator Wynn Resorts Ltd. posted a decline of -43% during the period prior to being sold. The Fund benefitted from the timing of the sale as Wynn Resorts continued to decline substantially after the Fund’s final sale through the end of the fiscal period. Wynn Resorts’ stock price struggled during a period of weaker Chinese economic data and the Chinese government’s anti-corruption campaign, which tended to restrain gaming activity in Macau. Louis XIII Holdings Ltd., a construction and engineering company in the process of developing a high-end casino in Macau, also posted a decline of -43%.
Several stocks in the Pharmaceuticals Biotechnology & Life Sciences industry group detracted from performance. Pacira Pharmaceuticals, Inc., a manufacturer of non-opioid post-surgical pain anesthetics, posted a return of -39% during the period it was held by the Fund. Pacira’s stock price slumped after the company suspended its previous 2015 revenue guidance for its Exparel product. As of the end of the fiscal year, we continued to maintain a position in Pacira, as we believe the company’s therapies to be best-in-class with long-term growth opportunities. Gilead Sciences, Inc. experienced
26
growing competitive pricing pressures for the hepatitis C treatment market, and its stock price dipped -2% prior to being sold from the Fund. Biogen Idec Inc., meanwhile, slid -5% during the period prior to being sold. The company significantly cut its 2015 guidance on slower sales of its blockbuster multiple sclerosis drug, Tecfidera.
Canadian Pacific Railway Ltd. (-31% prior to being sold), like other railroad companies, faced headwinds of lower oil prices and lower volumes as fewer carloads of commodities such as coal are being transported. Though we believe Canadian Pacific to be among the best managed and operated railroad companies with significant pricing power, we chose to sell the position, as we believe low energy prices will remain a headwind for the company for some time.
The Fund has the opportunity to invest across various asset classes and may adjust its asset allocations with changing conditions in the market. During the reporting period, the Fund focused its investments in US equities as we believed the economic backdrop, valuations and growth opportunities in the US markets were most supportive of returns. During the period, the Fund reduced its allocations to the Consumer Discretionary, Materials, Health Care and Energy sectors. The Fund’s allocations to the Financials and Consumer Staples sectors increased.
Debt markets generally did not offer attractive investment opportunities for the Fund during the fiscal year period. The debt markets were characterized by tight spreads, high issuance, below average default rates and an expected higher interest rate cycle. The Fund had a modest allocation to fixed income, primarily investing in short-term, callable bonds that generate yield and may provide stability during periods of movements in US Treasury rates. In general, however, we found equities to be more attractive than fixed income during the period.
At the end of the reporting period, the Fund’s cash and short-term equivalents position rose and represented more than 10% of the Fund’s net assets. This position is intended to provide a limited measure of down-side protection as we anticipate a choppy market environment given the uncertain timing of US interest rate increases and market concerns about a potential hard landing in China. While the Fund’s cash and short-term investments position represents a modestly defensive posture, it is intended to be used opportunistically in the event that any further dislocation in the global markets may provide investment opportunities for purchases of stocks or debt securities.
Fiscal Period-End Investment Posture
As of period-end, the Fund’s primary economic sector allocations included Consumer Discretionary, Information Technology, Financials, Health Care and Industrials. At period-end, the Fund had no exposure to the Utilities sector.
Sincerely,
MUNISH MALHOTRA, CFA
JORDON S. LAYCOB
PORTFOLIO MANAGERS
(1) | Total returns are based on net change in net asset value assuming reinvestment of distributions. Periodically, certain fees and expenses have been waived or reimbursed by the Adviser for the Flexible Capital Fund. In the absence of such a waiver, the performance returns reflected would have been reduced. In accordance with the expense limitation and fee waiver agreement, the Adviser may recoup fees and expenses previously waived or reimbursed under certain parameters. Please see the Prospectus for more information. |
27
FLEXIBLE CAPITAL FUND OVERVIEW |
September 30, 2015 (Unaudited)
The Flexible Capital Fund invests primarily in equity securities and other investments that are selected primarily for their long-term growth potential. The Fund may invest in issuers of any size throughout the world, and will normally hold a core position of between 20 and 50 securities or other investments.
TOTAL ANNUAL OPERATING EXPENSES* 1.39% | NET ASSETS $549,212,560 | NET ASSET VALUE PER SHARE $16.59 |
GROWTH OF $10,000(1)(2) | PERFORMANCE COMPARISON |
| |
SECTOR ALLOCATION(3) | TOP FIVE HOLDINGS |
| | | | |
| | Constellation Brands, Inc. - Cl. A | 5.22% | |
| | The Home Depot, Inc. | 5.20% | |
| | Facebook, Inc. - Cl. A | 4.89% | |
| | Visa, Inc. - Cl. A | 4.85% | |
| | The Walt Disney Company | 4.45% | |
| | | | |
* | The Total Annual Operating Expenses are reflective of the information disclosed in the Funds’ Prospectus dated January 30, 2015 and may differ from the expense ratio disclosed in this report. |
The performance data quoted here represent past performance, and past performance is not a guarantee of future results. Investment return and principal value of an investment will fluctuate so that an investor’s shares, when redeemed, may be worth more or less than their original cost. Current performance may be lower or higher than the performance information quoted. To obtain performance information current to the most recent month-end, please call 888-860-8686 or visit www.marsicofunds.com.
The performance included in the chart and graph does not reflect the deduction of taxes on Fund distributions or the redemption of Fund shares.
All indices are unmanaged and investors cannot invest directly in an index.
(1) | Periodically, certain fees and expenses have been waived or reimbursed by the Adviser for the Flexible Capital Fund. In the absence of such a waiver, the performance returns reflected would have been reduced. In accordance with the expense limitation and fee waiver agreement, the Adviser may recoup fees and expenses previously waived or reimbursed under certain parameters. |
(2) | This chart assumes an initial investment of $10,000 made on December 29, 2006 (inception). Total returns are based on change in NAV, assuming reinvestment of distributions. |
(3) | Sector weightings represent the percentage of the Fund’s investments (excluding cash equivalents) in certain general sectors. These sectors may include more than one industry. The Fund’s portfolio composition is subject to change at any time. |
MARSICO FLEXIBLE CAPITAL FUND
SCHEDULE OF INVESTMENTS
September 30, 2015
| | | Number
of
Shares | | | Value | | | Percent
of Net
Assets | |
COMMON STOCKS | | | | | | | | | |
Aerospace & Defense | | | | | | | | | |
BAE Systems PLC | | | 2,514,521 | | | $ | 17,044,913 | | | | 3.10 | % |
| | | | | | | | | | | | | |
Automotive Retail | | | | | | | | | | | | |
O'Reilly Automotive, Inc.* | | | 59,020 | | | | 14,755,000 | | | | 2.69 | |
| | | | | | | | | | | | | |
Brewers | | | | | | | | | | | | |
Molson Coors Brewing Company - Cl. B | | | 131,769 | | | | 10,939,462 | | | | 1.99 | |
| | | | | | | | | | | | | |
Cable & Satellite | | | | | | | | | | | | |
Liberty Global PLC - Series C* | | | 408,123 | | | | 16,741,205 | | | | 3.05 | |
| | | | | | | | | | | | | |
Construction & Engineering | | | | | |
Louis XIII Holdings Ltd.* | | | 11,376,000 | | | | 3,108,888 | | | | 0.57 | |
| | | | | | | | | | | | | |
Data Processing & Outsourced Services | | | | | |
Visa, Inc. - Cl. A | | | 382,374 | | | | 26,636,173 | | | | 4.85 | |
| | | | | | | | | | | | | |
Distillers & Vintners | | | | | | | | | | | | |
Constellation Brands, Inc. - Cl. A | | | 229,134 | | | | 28,689,868 | | | | 5.22 | |
| | | | | | | | | | | | | |
Diversified Banks | | | | | | | | | | | | |
Citigroup, Inc. | | | 387,341 | | | | 19,215,987 | | | | 3.50 | |
| | | | | | | | | | | | | |
Health Care Equipment | | | | | | | | | | | | |
ConforMIS, Inc.* | | | 219,233 | | | | 3,959,348 | | | | 0.72 | |
| | | | | | | | | | | | | |
Health Care Services | | | | | | | | | | | | |
Envision Healthcare Holdings, Inc.* | | | 460,535 | | | | 16,943,083 | | | | 3.08 | |
| | | | | | | | | | | | | |
Home Improvement Retail | | | | | | | | | | | | |
The Home Depot, Inc. | | | 247,197 | | | | 28,548,782 | | | | 5.20 | |
| | | | | | | | | | | | | |
Hotels, Resorts & Cruise Lines | | | | | |
Marriott International, Inc. - Cl. A | | | 165,806 | | | | 11,307,969 | | | | 2.06 | |
| | | | | | | | | | | | | |
Internet Software & Services | | | | | |
Alibaba Group Holding Ltd. Spon. ADR* | | | 163,057 | | | | 9,615,471 | | | | 1.75 | |
Facebook, Inc. - Cl. A* | | | 298,808 | | | | 26,862,839 | | | | 4.89 | |
Google, Inc. - Cl. A* | | | 18,082 | | | | 11,543,007 | | | | 2.10 | |
| | | | | | | | 48,021,317 | | | | 8.74 | |
Leisure Facilities | | | | | | | | | | | | |
ClubCorp Holdings, Inc. | | | 1,015,139 | | | | 21,784,883 | | | | 3.97 | |
| | | | | | | | | | | | | |
Mortgage REITs | | | | | | | | | | | | |
Starwood Property Trust, Inc. | | | 863,213 | | | | 17,713,131 | | | | 3.23 | |
| | | | | | | | | | | | | |
Movies & Entertainment | | | | | | | | | | | | |
The Walt Disney Company | | | 239,134 | | | | 24,439,495 | | | | 4.45 | |
| | | | | | | | | | | | | |
Pharmaceuticals | | | | | | | | | |
Eli Lilly & Company | | | 169,056 | | | $ | 14,148,297 | | | | 2.58 | % |
Novartis AG | | | 141,738 | | | | 13,027,400 | | | | 2.37 | |
Pacira Pharmaceuticals, Inc.* | | | 84,442 | | | | 3,470,566 | | | | 0.63 | |
| | | | | | | | 30,646,263 | | | | 5.58 | |
Research & Consulting Services | | | | | |
Nielsen Holdings N.V. | | | 416,918 | | | | 18,540,344 | | | | 3.38 | |
| | | | | | | | | | | | | |
Restaurants | | | | | | | | | | | | |
Domino's Pizza Group PLC | | | 1,547,692 | | | | 20,824,929 | | | | 3.79 | |
| | | | | | | | | | | | | |
Specialized Finance | | | | | | | | | | | | |
CME Group, Inc. | | | 147,418 | | | | 13,671,545 | | | | 2.49 | |
| | | | | | | | | | | | | |
Specialized REITs | | | | | | | | | | | | |
Crown Castle International Corp. | | | 211,201 | | | | 16,657,423 | | | | 3.03 | |
| | | | | | | | | | | | | |
Technology Hardware, Storage & Peripherals | | | | | |
Apple, Inc. | | | 164,853 | | | | 18,183,286 | | | | 3.31 | |
| | | | | | | | | | | | | |
TOTAL COMMON STOCKS | | | | | | | | | |
(Cost $368,753,773) | | | | | | | 428,373,294 | | | | 78.00 | |
| | | | | | | | | | | | | |
CORPORATE BONDS | | | | | | | | | | | | |
Casinos & Gaming | | | | | | | | | | | | |
Pinnacle Entertainment, Inc., 7.500%, 4/15/21 | | $ | 6,000,000 | | | | 6,255,000 | | | | 1.14 | |
| | | | | | | | | | | | | |
Metal & Glass Containers | | | | | | | | | | | | |
Ball Corp.,
4.000%, 11/15/23 | | | 6,000,000 | | | | 5,610,000 | | | | 1.02 | |
| | | | | | | | | | | | | |
Oil & Gas Exploration & Production | | | | | |
Antero Resources Corporation, 5.625%, 6/1/23 | | | 1,500,000 | | | | 1,316,250 | | | | 0.24 | |
| | | | | | | | | | | | | |
Real Estate Development | | | | | | | | | | | | |
The Howard Hughes Corporation, 6.875%, 10/1/21 | | | 4,000,000 | | | | 4,063,600 | | | | 0.74 | |
| | | | | | | | | | | | | |
Research & Consulting Services | | | | | |
IHS, Inc.,
5.000%, 11/1/22 | | | 6,000,000 | | | | 5,767,500 | | | | 1.05 | |
| | | | | | | | | | | | | |
Semiconductors | | | | | | | | | | | | |
Micron Technology, Inc., 5.500%, 2/1/25 | | | 4,000,000 | | | | 3,670,000 | | | | 0.67 | |
| | | | | | | | | | | | | |
Wireless Telecommunication Services | | | | | |
T-Mobile USA, Inc.,
6.464%, 4/28/19 | | | 4,000,000 | | | | 4,070,000 | | | | 0.74 | |
| | | | | | | | | | | | | |
TOTAL CORPORATE BONDS | | | | | |
(Cost $31,979,689) | | | | | | | 30,752,350 | | | | 5.60 | |
See notes to financial statements.
29
MARSICO FLEXIBLE CAPITAL FUND
SCHEDULE OF INVESTMENTS (continued)
September 30, 2015
| | | Number
of
Shares | | | Value | | | Percent
of Net
Assets | |
PREFERRED STOCKS | | | | | | | | | |
Diversified Banks | | | | | | | | | |
Wells Fargo & Company, Series N, 5.200% | | | 172,538 | | | $ | 4,178,870 | | | | 0.76 | % |
| | | | | | | | | | | | | |
Mortgage REITs | | | | | | | | | | | | |
NorthStar Realty Finance Corp.,
Series E, 8.750% | | | 143,529 | | | | 3,477,708 | | | | 0.63 | |
| | | | | | | | | | | | | |
Regional Banks | | | | | | | | | | | | |
BB&T Corporation,
Series D, 5.850% | | | 150,181 | | | | 3,807,088 | | | | 0.69 | |
First Niagara Financial Group, Inc.,
Series B, 8.625% | | | 168,558 | | | | 4,468,473 | | | | 0.82 | |
Regions Financial Corporation, Series A, 6.375% | | | 154,966 | | | | 3,942,335 | | | | 0.72 | |
| | | | | | | | 12,217,896 | | | | 2.23 | |
TOTAL PREFERRED STOCKS | | | | | |
(Cost $19,290,972) | | | | | | | 19,874,474 | | | | 3.62 | |
| | | | | | | | | | | | | |
SHORT-TERM INVESTMENTS | | | | | |
State Street Institutional Treasury Money Market Fund, 0.000% | | | 59,217,980 | | | | 59,217,980 | | | | 10.78 | |
| | | | | | | | | | | | | |
TOTAL SHORT-TERM INVESTMENTS | | | | | |
(Cost $59,217,980) | | | | | | | 59,217,980 | | | | 10.78 | |
| | | | | | | | | | | | | |
TOTAL INVESTMENTS | | | | | | | | | | | | |
(Cost $479,242,414) | | | | | | | 538,218,098 | | | | 98.00 | |
| | | | | | | | | | | | | |
Cash and Other Assets, Less Liabilities | | | | 10,994,462 | | | | 2.00 | |
| | | | | | | | | | | | | |
NET ASSETS | | | | | | $ | 549,212,560 | | | | 100.00 | % |
See notes to financial statements.
30
INVESTMENT REVIEW BY TOM MARSICO (UNAUDITED)
The Marsico Global Fund posted a total return of (US$) -3.51% for the one-year fiscal period ended September 30, 2015. For comparative purposes, the MSCI All Country World Index (“MSCI ACWI Index”), which is the Fund’s benchmark index, had a total return of (US$) -6.66%. The MSCI ACWI Index measures equity market performance in the global developed and emerging markets. Please see the Fund Overview immediately following this commentary for more detailed information about the Fund’s performance for various time periods ended September 30, 2015.
The performance data for the Fund quoted here represent past performance, and past performance is not a guarantee of future results. Investment return and principal value of an investment will fluctuate so that an investor’s shares, when redeemed, may be worth more or less than their original cost. Current performance may be lower or higher than the performance information quoted. To obtain performance information current to the most recent month-end, please call 888-860-8686 or visit www.marsicofunds.com.(1)
This review highlights Fund performance over a one-year fiscal period. Shareholders should keep in mind that the Fund is intended for long-term investors who hold their shares for substantially longer periods of time. You should also keep in mind that our current views and beliefs regarding all investments discussed in this report are subject to change at any time. References to specific securities, industries, and sectors discussed in this report are not recommendations to buy or sell such securities or related investments, and the Fund may not necessarily hold these securities or investments today. Please see the accompanying Schedule of Investments for the percentage of the Fund’s portfolio represented by the securities mentioned in this report as of the end of the reporting period.
Foreign investments present additional risks due to currency fluctuations, economic and political factors, lower liquidity, differences in securities regulations and accounting standards, possible changes in taxation, limited public information, and other factors. In addition, the Fund is subject to broad risks associated with investing in equity securities markets generally, including the risks that the securities and markets in which it invests may experience volatility and instability, that domestic and global economies and markets may undergo periods of cyclical change and decline, that investors may at times avoid investments in equity securities, and that investments may not perform as anticipated. Please see the Prospectus for more information.
Favorable sector allocations contributed to the Global Fund’s outperformance versus the MSCI ACWI Index during the period. The Fund was well-positioned in having a significant portion of its net assets invested in the Consumer Discretionary sector, the strongest-performing sector of the benchmark index. An underweight allocation to the weakest-performing sector of the benchmark index, Energy, also aided performance.
Stock selection in the Consumer Discretionary sector was strong. United Kingdom-based pizza master-franchise company Domino’s Pizza Group PLC soared +49% on strong system sales growth in the UK market. Athletic apparel company NIKE, Inc. – Cl. B gained +39% after the company reported continued acceleration of sales in a number of its markets. Norwegian Cruise Line Holdings Ltd. (+13%), The Walt Disney Company (+17%) and luxury retailer Hermes International (+25%) were other leading holdings within the sector.
Several of the Fund’s Information Technology positions generated sizeable stock price gains. Financial transaction processor, Visa, Inc. – Cl. A (+31%), managed to deliver solid performance despite a tumultuous global macroeconomic environment. Social media company, Facebook, Inc. – Cl. A (+13%) saw its business grow as more advertising continued to shift to online venues from traditional media such as print advertisements. United Kingdom’s online auto classified advertising service Auto Trader Group PLC soared +48%.
Stock selection in the Industrials sector was also strong. France-headquartered aircraft engine and component manufacturer Safran, S.A. gained +17% during the period. Safran’s stock price rose after it reported better than expected results from its aftermarket propulsion business segment. European discount airline Ryanair Holdings PLC Spon. ADR (+10%) reported strong profits and operating performance during the period.
While the collective return of the Fund’s holdings in the Materials sector was negative (-8%), the Fund’s holdings significantly outperformed the -24% return of the benchmark index Materials sector. Paint provider The Sherwin-Williams Company (+3%) was the strongest-performing Fund holding within the sector.
Although active currency management is not a central facet of the Fund’s investment process, fluctuations in major world currencies can at times affect the Fund’s performance. During the period, the net effect of currency moves was positive for the Fund, in part because a larger proportion of its securities compared to the benchmark was denominated in the US
31
dollar, which strengthened as compared to many other major world currencies. The Fund’s euro-denominated investments posted an aggregate currency return that, while negative, fared slightly better than that of the index’s euro-denominated constituents. The Fund’s performance was also helped by having no significant exposure to companies whose securities are denominated in the currencies of most commodity-heavy economies, such as the Brazilian real and Australian dollar, which weakened during the period.
The Fund sold all of its Energy holdings prior to period-end. The Fund’s Energy holdings held early in the period posted negative returns and detracted from performance.
Several of the Fund’s Health Care holdings, particularly in the Pharmaceuticals Biotechnology & Life Sciences industry group, detracted from performance. Comments by US presidential candidates led to greater concerns that legislative changes could lead to drug price controls and hamper profitability for drug manufacturers, and related attention to drug pricing contributed to a sell-off in the industry group. Pacira Pharmaceuticals, Inc., a manufacturer of non-opioid post-surgical pain anesthetics, declined -58% after the company suspended its previous 2015 revenue guidance for its Exparel product. As of the end of the fiscal year, we continued to maintain a position in Pacira, as we believe the company’s therapies to be best-in-class with long-term growth opportunities. Gilead Sciences, Inc. experienced growing competitive pricing pressures for the hepatitis C treatment market and its stock price dipped -2% prior to being sold from the Fund. Illumina, Inc., a company that delivers affordable genomic sequencing solutions for use in medical and pharmaceutical research, slid -25%.
Chinese ecommerce company Alibaba Group Holding Ltd. Spon. ADR (-45%) was a detractor within the Information Technology sector. The marketplace has been closely monitoring Alibaba’s ability to monetize sales made on mobile devices, as the company currently makes less on mobile device-based sales than on PC-based sales. Recent data suggests improvement in monetization trends, and we continue to have confidence in the long-term growth opportunities for Alibaba.
In the Industrials sector, the Fund’s position in railroad operator Canadian Pacific Railway Ltd. (-25% prior to being sold) faced headwinds of lower oil prices and lower volumes as fewer carloads of commodities such as coal are being transported. We chose to sell the position, as we believe low energy prices will remain a headwind for the company for some time.
During the period, the Fund significantly increased its allocations to the Consumer Discretionary sector. The Fund sold its Energy holdings and reduced its allocation to the Health Care and Materials sectors.
The Global Fund experienced elevated portfolio turnover during the period, which primarily related to the Fund’s changing its portfolio composition to reinvest in other positions that we believe may have more upside potential and to take advantage of new opportunities. Portfolio turnover increases transaction-related expenses and could reduce Fund returns.
Fiscal Period-End Investment Posture
As of September 30, 2015, the Fund’s primary economic sector allocations were Consumer Discretionary, Information Technology and Health Care. The Fund had no investments in the Financials, Energy, Telecommunication Services or Utilities sectors. The Fund’s most significant country allocations were the United States, the United Kingdom, France, China/Hong Kong and Switzerland. Country-level weightings generally should be considered a residual of the Fund’s stock selection process rather than a major, proactive facet of its investment strategy.
Sincerely,
THOMAS F. MARSICO
PORTFOLIO MANAGER
(1) | Total returns are based on net change in net asset value assuming reinvestment of distributions. Periodically, certain fees and expenses have been waived or reimbursed by the Adviser for the Global Fund. In the absence of such a waiver, the performance returns reflected would have been reduced. In accordance with the expense limitation and fee waiver agreement, the Adviser may recoup fees and expenses previously waived or reimbursed under certain parameters. Periodically, the Adviser has recouped such fees or expenses from the Global Fund resulting in a lower performance return. Please see the Prospectus for more information. |
32
September 30, 2015 (Unaudited)
The Global Fund invests primarily in the common stocks of US and foreign companies that are selected for their long-term growth potential. The Fund may invest in the securities of companies of any size that are economically tied to any countries or markets throughout the world, including the securities of companies economically tied to emerging markets. Under normal market conditions, the Fund will invest significantly (generally, at least 40% of its net assets) in the securities of issuers organized or located outside the US or doing business outside the US (unless market conditions are not deemed favorable by the Adviser, in which case the Fund generally will invest at least 30% of its assets in such foreign securities). The Fund will invest its assets in various regions and countries, including the US, that encompass not less than three different countries overall. The Fund may hold an unlimited number of common stocks.
TOTAL ANNUAL OPERATING EXPENSES* NET EXPENSES*† | 1.66% 1.60% | NET ASSETS $66,612,146 | NET ASSET VALUE PER SHARE $12.37 |
GROWTH OF $10,000(1)(2) | PERFORMANCE COMPARISON |
| |
SECTOR ALLOCATION(3) | TOP FIVE HOLDINGS |
| | | | |
| | Facebook, Inc. - Cl. A | 5.15% | |
| | Novartis AG | 4.91% | |
| | Domino's Pizza Group PLC | 4.21% | |
| | Ryanair Holdings PLC Spon. ADR | 4.17% | |
| | NIKE, Inc. - Cl. B | 4.06% | |
| | | | |
* | The Total Annual Operating Expenses and Net Expenses are reflective of the information disclosed in the Funds’ Prospectus dated January 30, 2015 and may differ from the expense ratios disclosed in this report. |
† | Marsico Capital Management, LLC (the “Adviser”) has entered into a written expense limitation and fee waiver agreement under which it has agreed to limit the total expenses of the Global Fund (excluding interest, taxes, acquired fund fees and expenses, litigation, brokerage and extraordinary expenses) to an annual rate of 1.60% of the Fund’s average net assets until January 31, 2016. This expense limitation and fee waiver agreement may be terminated by the Adviser at any time after January 31, 2016, upon 15 days prior notice to the Fund and its administrator. The Adviser may recoup from the Fund fees previously waived or expenses previously reimbursed by the Adviser with respect to the Fund pursuant to this agreement (or a previous expense limitation agreement) if: (1) such recoupment by the Adviser does not cause the Fund, at the time of recoupment, to exceed the lesser of (a) the expense limitation in effect at the time the relevant amount was waived and/or reimbursed, or (b) the expense limitation in effect at the time of the proposed recoupment, and (2) the recoupment is made within three fiscal years after the end of the fiscal year in which the amount was waived or reimbursed. |
The performance data quoted here represent past performance, and past performance is not a guarantee of future results. Investment return and principal value of an investment will fluctuate so that an investor’s shares, when redeemed, may be worth more or less than their original cost. Current performance may be lower or higher than the performance information quoted. To obtain performance information current to the most recent month-end, please call 888-860-8686 or visit www.marsicofunds.com.
The performance included in the chart and graph does not reflect the deduction of taxes on Fund distributions or the redemption of Fund shares.
All indices are unmanaged and investors cannot invest directly in an index.
(1) | Periodically, certain fees and expenses have been waived or reimbursed by the Adviser for the Global Fund. In the absence of such a waiver, the performance returns reflected would have been reduced. In accordance with the expense limitation and fee waiver agreement, the Adviser may recoup fees and expenses previously waived or reimbursed under certain parameters. Periodically, the Adviser has recouped such fees or expenses from the Global Fund resulting in a lower performance return. |
(2) | This chart assumes an initial investment of $10,000 made on June 29, 2007 (inception). Total returns are based on change in NAV, assuming reinvestment of distributions. |
(3) | Sector weightings represent the percentage of the Fund’s investments (excluding cash equivalents) in certain general sectors. These sectors may include more than one industry. The Fund’s portfolio composition is subject to change at any time. |
The MSCI ACWI (All Country World Index) Index is a free float-adjusted market capitalization index that is designed to measure equity market performance in the global developed and emerging markets.
33
MARSICO GLOBAL FUND
SCHEDULE OF INVESTMENTS
September 30, 2015
| | | Number
of
Shares | | | Value | | | Percent
of Net
Assets | |
COMMON STOCKS | | | | | | | | | |
Advertising | | | | | | | | | |
JC Decaux S.A. | | | 41,379 | | | $ | 1,504,166 | | | | 2.26 | % |
| | | | | | | | | | | | | |
Aerospace & Defense | | | | | | | | | | | | |
Safran S.A. | | | 26,420 | | | | 1,986,562 | | | | 2.98 | |
| | | | | | | | | | | | | |
Airlines | | | | | | | | | | | | |
Ryanair Holdings PLC Spon. ADR | | | 35,466 | | | | 2,776,988 | | | | 4.17 | |
| | | | | | | | | | | | | |
Apparel, Accessories & Luxury Goods | | | | | |
Hermes International | | | 3,237 | | | | 1,178,309 | | | | 1.77 | |
| | | | | | | | | | | | | |
Biotechnology | | | | | | | | | | | | |
Nivalis Therapeutics, Inc.* | | | 62,021 | | | | 804,412 | | | | 1.21 | |
Vertex Pharmaceuticals, Inc.* | | | 9,480 | | | | 987,247 | | | | 1.48 | |
| | | | | | | | 1,791,659 | | | | 2.69 | |
Cable & Satellite | | | | | | | | | | | | |
Liberty Global PLC - Series C* | | | 45,742 | | | | 1,876,337 | | | | 2.82 | |
| | | | | | | | | | | | | |
Communications Equipment | | | | | |
Palo Alto Networks, Inc.* | | | 5,819 | | | | 1,000,868 | | | | 1.50 | |
| | | | | | | | | | | | | |
Data Processing & Outsourced Services | | | | | |
Visa, Inc. - Cl. A | | | 31,888 | | | | 2,221,318 | | | | 3.33 | |
| | | | | | | | | | | | | |
Drug Retail | | | | | | | | | | | | |
CVS Health Corporation | | | 14,974 | | | | 1,444,691 | | | | 2.17 | |
| | | | | | | | | | | | | |
Footwear | | | | | | | | | | | | |
NIKE, Inc. - Cl. B | | | 22,000 | | | | 2,705,340 | | | | 4.06 | |
| | | | | | | | | | | | | |
General Merchandise Stores | | | | | | | | | |
Dollar Tree, Inc.* | | | 18,498 | | | | 1,233,077 | | | | 1.85 | |
| | | | | | | | | | | | | |
Health Care Facilities | | | | | | | | | | | | |
HCA Holdings, Inc.* | | | 13,836 | | | | 1,070,353 | | | | 1.61 | |
| | | | | | | | | | | | | |
Home Entertainment Software | | | | | | | | | |
Electronic Arts, Inc.* | | | 25,332 | | | | 1,716,243 | | | | 2.58 | |
| | | | | | | | | | | | | |
Hotels, Resorts & Cruise Lines | | | | | |
Norwegian Cruise Line Holdings Ltd.* | | | 41,407 | | | | 2,372,621 | | | | 3.56 | |
| | | | | | | | | | | | | |
Internet Retail | | | | | | | | | | | | |
Ctrip.com International, Ltd. ADR* | | | 15,265 | | | | 964,443 | | | | 1.45 | |
NetFlix, Inc.* | | | 9,743 | | | | 1,006,062 | | | | 1.51 | |
The Priceline Group, Inc.* | | | 887 | | | | 1,097,095 | | | | 1.64 | |
| | | | | | | | 3,067,600 | | | | 4.60 | |
COMMON STOCKS (continued) | |
Internet Software & Services | | | | | |
Alibaba Group Holding Ltd. Spon. ADR* | | | 22,202 | | | $ | 1,309,252 | | | | 1.97 | % |
Auto Trader Group PLC* | | | 183,214 | | | | 942,633 | | | | 1.42 | |
Facebook, Inc. - Cl. A* | | | 38,179 | | | | 3,432,292 | | | | 5.15 | |
Google, Inc. - Cl. A* | | | 4,216 | | | | 2,691,368 | | | | 4.04 | |
Tencent Holdings Ltd. | | | 60,500 | | | | 1,021,401 | | | | 1.53 | |
| | | | | | | | 9,396,946 | | | | 14.11 | |
Life Sciences Tools & Services | | | | | |
Illumina, Inc.* | | | 5,693 | | | | 1,000,943 | | | | 1.50 | |
| | | | | | | | | | | | | |
Managed Health Care | | | | | | | | | | | | |
UnitedHealth Group, Inc. | | | 17,519 | | | | 2,032,379 | | | | 3.05 | |
| | | | | | | | | | | | | |
Movies & Entertainment | | | | | | | | | | | | |
Imax Corporation* | | | 39,300 | | | | 1,327,947 | | | | 1.99 | |
The Walt Disney Company | | | 21,955 | | | | 2,243,801 | | | | 3.37 | |
| | | | | | | | 3,571,748 | | | | 5.36 | |
Pharmaceuticals | | | | | | | | | | | | |
Novartis AG | | | 35,584 | | | | 3,270,591 | | | | 4.91 | |
Novo Nordisk A/S - Cl. B | | | 31,682 | | | | 1,709,705 | | | | 2.57 | |
Pacira Pharmaceuticals, Inc.* | | | 20,157 | | | | 828,453 | | | | 1.24 | |
| | | | | | | | 5,808,749 | | | | 8.72 | |
Restaurants | | | | | | | | | | | | |
Chipotle Mexican Grill, Inc.* | | | 2,337 | | | | 1,683,224 | | | | 2.53 | |
Domino's Pizza Enterprises Ltd. | | | 74,918 | | | | 2,130,890 | | | | 3.20 | |
Domino's Pizza Group PLC | | | 208,417 | | | | 2,804,350 | | | | 4.21 | |
| | | | | | | | 6,618,464 | | | | 9.94 | |
Semiconductors | | | | | | | | | | | | |
NXP Semiconductors N.V.* | | | 12,394 | | | | 1,079,146 | | | | 1.62 | |
| | | | | | | | | | | | | |
Specialty Chemicals | | | | | | | | | | | | |
The Sherwin-Williams Company | | | 10,287 | | | | 2,291,738 | | | | 3.44 | |
| | | | | | | | | | | | | |
Technology Hardware, Storage & Peripherals | | | | | |
Apple, Inc. | | | 23,125 | | | | 2,550,687 | | | | 3.83 | |
| | | | | | | | | | | | | |
TOTAL COMMON STOCKS | | | | | | | | | |
(Cost $58,149,831) | | | | | | | 62,296,932 | | | | 93.52 | |
| | | | | | | | | | | | | |
SHORT-TERM INVESTMENTS | | | | | |
State Street Institutional Treasury Money Market Fund, 0.000% | | | 1,296,190 | | | | 1,296,190 | | | | 1.95 | |
| | | | | | | | | | | | | |
TOTAL SHORT-TERM INVESTMENTS | | | | | |
(Cost $1,296,190) | | | | | | | 1,296,190 | | | | 1.95 | |
| | | | | | | | | | | | | |
TOTAL INVESTMENTS | | | | | | | | | | | | |
(Cost $59,446,021) | | | | | | | 63,593,122 | | | | 95.47 | |
| | | | | | | | | | | | | |
Cash and Other Assets, Less Liabilities | | | | | | | 3,019,024 | | | | 4.53 | |
| | | | | | | | | | | | | |
NET ASSETS | | | | | | $ | 66,612,146 | | | | 100.00 | % |
See notes to financial statements.
34
SUMMARY OF INVESTMENTS BY COUNTRY | |
Country | | Market Value | | | Percent of
Investment
Securities | |
Australia | | $ | 2,130,890 | | | | 3.35 | % |
Canada | | | 1,327,947 | | | | 2.09 | |
China/Hong Kong | | | 3,295,096 | | | | 5.18 | |
Denmark | | | 1,709,705 | | | | 2.69 | |
France | | | 4,669,037 | | | | 7.34 | |
Ireland | | | 2,776,988 | | | | 4.37 | |
Netherlands | | | 1,079,146 | | | | 1.70 | |
Switzerland | | | 3,270,591 | | | | 5.14 | |
United Kingdom | | | 5,623,320 | | | | 8.84 | |
United States(1) | | | 37,710,402 | | | | 59.30 | |
| | | $ | 63,593,122 | | | | 100.00 | % |
(1) | Includes short-term securities. |
See notes to financial statements.
35
STATEMENTS OF ASSETS AND LIABILITIES
September 30, 2015
(Amounts in thousands) | | MARSICO
FOCUS FUND | | | MARSICO
GROWTH FUND | |
| | | | | | | |
ASSETS | | | | | | |
Investments, at value (cost $685,200, $369,038, $232,946, $86,167, $479,242, and $59,446, respectively) | | $ | 785,486 | | | $ | 410,350 | |
Foreign currency (cost $0, $0, $0, $66, $0, and $0, respectively) | | | — | | | | — | |
Receivable for investments sold | | | 15,210 | | | | 3,981 | |
Receivable for capital stock sold | | | 44 | | | | 9 | |
Interest and dividends receivable | | | 268 | | | | 142 | |
Prepaid expenses and other assets | | | 1,487 | | | | 993 | |
Total Assets | | | 802,495 | | | | 415,475 | |
| | | | | | | | | |
LIABILITIES | | | | | | | | |
Payable for investments purchased | | | 7,563 | | | | 1,844 | |
Payable for capital stock redeemed | | | 354 | | | | 108 | |
Payable to investment adviser | | | 572 | | | | 299 | |
Accrued trustees' fees | | | 1,468 | | | | 980 | |
Accrued distribution fee | | | 3,399 | | | | 1,625 | |
Accrued professional fees | | | 78 | | | | 42 | |
Accrued transfer agent fees and expenses | | | 110 | | | | 68 | |
Accrued printing expenses | | | 38 | | | | 22 | |
Accrued expenses and other liabilities | | | 62 | | | | 45 | |
Total Liabilities | | | 13,644 | | | | 5,033 | |
| | | | | | | | | |
NET ASSETS | | $ | 788,851 | | | $ | 410,442 | |
| | | | | | | | | |
NET ASSETS CONSIST OF | | | | | | | | |
Paid-in-capital | | $ | 537,148 | | | $ | 261,097 | |
Undistributed net investment income
(accumulated net investment loss) | | | (5,458 | ) | | | (3,463 | ) |
Accumulated net realized gain (loss) on investments
and foreign currency transactions | | | 156,404 | | | | 111,211 | |
Net unrealized appreciation on investments
and foreign currency translations | | | 100,757 | | | | 41,597 | |
NET ASSETS | | $ | 788,851 | | | $ | 410,442 | |
| | | | | | | | | |
SHARES OUTSTANDING, $0.001 par value | | | | | | | | |
(Unlimited shares authorized) | | | 41,890 | | | | 20,406 | |
| | | | | | | | | |
NET ASSET VALUE, REDEMPTION PRICE, AND OFFERING PRICE PER SHARE (NET ASSETS/SHARES OUTSTANDING)* | | $ | 18.83 | | | $ | 20.11 | |
* | Not in thousands, based on unrounded net assets and shares outstanding. |
See notes to financial statements.
36
MARSICO
21st CENTURY FUND | | | MARSICO
INTERNATIONAL
OPPORTUNITIES
FUND | | | MARSICO
FLEXIBLE
CAPITAL FUND | | | MARSICO
GLOBAL FUND | |
| | | | | | | | | | |
| | | | | | | | | | |
$ | 268,562 | | | $ | 90,695 | | | $ | 538,218 | | | $ | 63,593 | |
| | — | | | | 66 | | | | — | | | | — | |
| | 2,778 | | | | 1,501 | | | | 18,156 | | | | 3,337 | |
| | 6 | | | | 12 | | | | 23 | | | | 2 | |
| | 15 | | | | 99 | | | | 1,439 | | | | 43 | |
| | 691 | | | | 328 | | | | 1,286 | | | | 458 | |
| | 272,052 | | | | 92,701 | | | | 559,122 | | | | 67,433 | |
| | | | | | | | | | | | | | | |
| | | | | | | | | | | | | | | |
| | 1,622 | | | | 2,772 | | | | 7,072 | | | | — | |
| | 190 | | | | 46 | | | | 625 | | | | 74 | |
| | 196 | | | | 118 | | | | 394 | | | | 91 | |
| | 682 | | | | 317 | | | | 1,265 | | | | 448 | |
| | 848 | | | | 235 | | | | 317 | | | | 161 | |
| | 26 | | | | 9 | | | | 58 | | | | 6 | |
| | 46 | | | | 20 | | | | 103 | | | | 13 | |
| | 13 | | | | 4 | | | | 30 | | | | 3 | |
| | 45 | | | | 39 | | | | 45 | | | | 25 | |
| | 3,668 | | | | 3,560 | | | | 9,909 | | | | 821 | |
| | | | | | | | | | | | | | | |
$ | 268,384 | | | $ | 89,141 | | | $ | 549,213 | | | $ | 66,612 | |
| | | | | | | | | | | | | | | |
| | | | | | | | | | | | | | | |
$ | 651,769 | | | $ | 189,078 | | | $ | 427,642 | | | $ | 56,605 | |
| | (2,755 | ) | | | (825 | ) | | | 1,273 | | | | (754 | ) |
| | (416,478 | ) | | | (103,665 | ) | | | 60,837 | | | | 6,444 | |
| | 35,848 | | | | 4,553 | | | | 59,461 | | | | 4,317 | |
$ | 268,384 | | | $ | 89,141 | | | $ | 549,213 | | | $ | 66,612 | |
| | | | | | | | | | | | | | | |
| | | | | | | | | | | | | | | |
| | 13,167 | | | | 6,145 | | | | 33,095 | | | | 5,385 | |
| | | | | | | | | | | | | | | |
$ | 20.38 | | | $ | 14.51 | | | $ | 16.59 | | | $ | 12.37 | |
37
STATEMENTS OF OPERATIONS
FOR THE YEAR ENDED September 30, 2015
(Amounts in thousands) | | MARSICO
FOCUS FUND | | | MARSICO
GROWTH FUND | |
| | | | | | | |
INVESTMENT INCOME | | | | | | |
Dividends (net of $135, $24, $11, $37, $132, and $33, respectively, of non-reclaimable foreign withholding taxes) | | $ | 7,902 | | | $ | 4,218 | |
Interest | | | — | | | | — | |
Total Investment Income | | | 7,902 | | | | 4,218 | |
| | | | | | | | | |
EXPENSES | | | | | | | | |
Investment advisory fees | | | 7,787 | | | | 4,346 | |
Distribution fees | | | 2,290 | | | | 1,278 | |
Transfer agent fees and expenses | | | 959 | | | | 619 | |
Professional fees | | | 284 | | | | 157 | |
Fund administration fees | | | 193 | | | | 161 | |
Custody and fund accounting fees | | | 174 | | | | 145 | |
Printing and postage expenses | | | 105 | | | | 60 | |
Miscellaneous | | | 91 | | | | 56 | |
Trustees' fees and expenses | | | 62 | (1) | | | 21 | (1) |
Federal and state registration fees | | | 48 | | | | 34 | |
Total Expenses | | | 11,993 | | | | 6,877 | |
Recoupment of previously waived expenses | | | — | | | | — | |
Less waiver of expenses and expenses paid indirectly | | | — | | | | — | |
Net Expenses | | | 11,993 | | | | 6,877 | |
| | | | | | | | | |
NET INVESTMENT INCOME (LOSS) | | | (4,091 | ) | | | (2,659 | ) |
| | | | | | | | | |
REALIZED AND UNREALIZED GAIN (LOSS) | | | | | | | | |
Net realized gain on investments | | | 163,514 | | | | 119,260 | |
Net realized loss on foreign currency transactions | | | (32 | ) | | | (301 | ) |
Change in unrealized appreciation (depreciation) on investments and foreign currency translations | | | (187,364 | ) | | | (129,372 | ) |
| | | | | | | | | |
Net Gain (Loss) on Investments | | | (23,882 | ) | | | (10,413 | ) |
| | | | | | | | | |
NET INCREASE (DECREASE) IN NET ASSETS RESULTING FROM OPERATIONS | | $ | (27,973 | ) | | $ | (13,072 | ) |
(1) | Amounts include trustees’ fees and expenses and the mark to market unrealized depreciation during the period for shares held in the Trustees’ Deferred Fee Plan, as more fully described in Note 2(g) in the Notes to Financial Statements. |
| | | Trustees’
Fees and
Expenses* | | | Unrealized
Depreciation* | |
Focus Fund | | $ | 162,068 | | | $ | (100,480 | ) |
Growth Fund | | | 88,874 | | | | (67,627 | ) |
21st Century Fund | | | 52,801 | | | | (38,723 | ) |
International Opportunities Fund | | | 16,278 | | | | (16,714 | ) |
Flexible Capital Fund | | | 121,098 | | | | (31,833 | ) |
Global Fund | | | 12,318 | | | | (27,652 | ) |
See notes to financial statements.
38
MARSICO
21st CENTURY FUND | | | MARSICO
INTERNATIONAL
OPPORTUNITIES
FUND | | | MARSICO
FLEXIBLE
CAPITAL FUND | | | MARSICO
GLOBAL FUND | |
| | | | | | | | | | |
| | | | | | | | | | |
$ | 1,867 | | | $ | 789 | | | $ | 11,825 | | | $ | 583 | |
| | — | | | | — | | | | 1,501 | | | | — | |
| | 1,867 | | | | 789 | | | | 13,326 | | | | 583 | |
| | | | | | | | | | | | | | | |
| | | | | | | | | | | | | | | |
| | 2,626 | | | | 902 | | | | 5,946 | | | | 617 | |
| | 772 | | | | 265 | | | | 1,749 | | | | 181 | |
| | 418 | | | | 179 | | | | 1,000 | | | | 107 | |
| | 92 | | | | 30 | | | | 214 | | | | 22 | |
| | 141 | | | | 103 | | | | 180 | | | | 81 | |
| | 108 | | | | 184 | | | | 178 | | | | 80 | |
| | 44 | | | | 21 | | | | 100 | | | | 9 | |
| | 30 | | | | 20 | | | | 87 | | | | 12 | |
| | 14 | (1) | | | — | (1) | | | 89 | (1) | | | (15 | )(1) |
| | 23 | | | | 26 | | | | 56 | | | | 25 | |
| | 4,268 | | | | 1,730 | | | | 9,599 | | | | 1,119 | |
| | — | | | | — | | | | — | | | | 42 | |
| | — | | | | (32 | ) | | | — | | | | — | |
| | 4,268 | | | | 1,698 | | | | 9,599 | | | | 1,161 | |
| | | | | | | | | | | | | | | |
| | (2,401 | ) | | | (909 | ) | | | 3,727 | | | | (578 | ) |
| | | | | | | | | | | | | | | |
| | | | | | | | | | | | | | | |
| | 47,026 | | | | 14,886 | | | | 89,386 | | | | 7,722 | |
| | (280 | ) | | | (7,949 | ) | | | (3,742 | ) | | | (1,071 | ) |
| | (49,090 | ) | | | (7,530 | ) | | | (81,540 | ) | | | (8,565 | ) |
| | | | | | | | | | | | | | | |
| | (2,344 | ) | | | (593 | ) | | | 4,104 | | | | (1,914 | ) |
| | | | | | | | | | | | | | | |
$ | (4,745 | ) | | $ | (1,502 | ) | | $ | 7,831 | | | $ | (2,492 | ) |
39
STATEMENTS OF CHANGES IN NET ASSETS
| | | MARSICO
FOCUS FUND | | | MARSICO
GROWTH FUND | |
| | | | | | | | | | | | | |
(Amounts in thousands) | | Year
Ended
9/30/15 | | | Year
Ended
9/30/14 | | | Year
Ended
9/30/15 | | | Year
Ended
9/30/14 | |
| | | | | | | | | | | | | |
OPERATIONS: | | | | | | | | | | | | |
Net investment income (loss) | | $ | (4,091 | ) | | $ | (3,071 | ) | | $ | (2,659 | ) | | $ | (1,962 | ) |
Net realized gain on investments | | | 163,514 | | | | 133,166 | | | | 119,260 | | | | 75,176 | |
Net realized gain (loss) on foreign currency transactions | | | (32 | ) | | | 2,085 | | | | (301 | ) | | | 281 | |
Change in unrealized appreciation (depreciation) on investments and foreign currency translations | | | (187,364 | ) | | | 46,251 | | | | (129,372 | ) | | | 19,061 | |
| | | | | | | | | | | | | | | | | |
Net increase (decrease) in net assets resulting from operations | | | (27,973 | ) | | | 178,431 | | | | (13,072 | ) | | | 92,556 | |
| | | | | | | | | | | | | | | | | |
DISTRIBUTIONS: | | | | | | | | | | | | | | | | |
Net investment income | | | — | | | | — | | | | — | | | | (1,356 | ) |
Net realized gains | | | (124,082 | ) | | | (133,035 | ) | | | (63,630 | ) | | | (117,682 | ) |
| | | | | | | | | | | | | | | | | |
Total distributions | | | (124,082 | ) | | | (133,035 | ) | | | (63,630 | ) | | | (119,038 | ) |
| | | | | | | | | | | | | | | | | |
CAPITAL SHARE TRANSACTIONS: | | | | | | | | | | | | | | | | |
Proceeds from sales of shares | | | 129,352 | | | | 79,841 | | | | 29,300 | | | | 83,402 | |
Proceeds from reinvestment of distributions | | | 113,800 | | | | 120,542 | | | | 61,081 | | | | 112,618 | |
Redemption fees | | | — | | | | 2 | | | | — | | | | 2 | |
Redemption of shares | | | (235,300 | ) | | | (167,435 | ) | | | (165,890 | ) | | | (171,653 | ) |
| | | | | | | | | | | | | | | | | |
Net increase (decrease) from capital share transactions | | | 7,852 | | | | 32,950 | | | | (75,509 | ) | | | 24,369 | |
| | | | | | | | | | | | | | | | | |
TOTAL INCREASE (DECREASE) IN NET ASSETS | | | (144,203 | ) | | | 78,346 | | | | (152,211 | ) | | | (2,113 | ) |
| | | | | | | | | | | | | | | | | |
NET ASSETS: | | | | | | | | | | | | | | | | |
Beginning of Period | | | 933,054 | | | | 854,708 | | | | 562,653 | | | | 564,766 | |
| | | | | | | | | | | | | | | | | |
End of Period | | $ | 788,851 | | | $ | 933,054 | | | $ | 410,442 | | | $ | 562,653 | |
| | | | | | | | | | | | | | | | | |
Undistributed net investment income
(Accumulated net investment loss) | | $ | (5,458 | ) | | $ | (4,903 | ) | | $ | (3,463 | ) | | $ | (2,669 | ) |
| | | | | | | | | | | | | | | | | |
TRANSACTIONS IN SHARES: | | | | | | | | | | | | | | | | |
Shares sold | | | 6,050 | | | | 3,721 | | | | 1,329 | | | | 3,612 | |
Shares issued in reinvestment of distributions | | | 5,600 | | | | 5,988 | | | | 2,823 | | | | 5,173 | |
Shares redeemed | | | (11,404 | ) | | | (7,882 | ) | | | (7,552 | ) | | | (7,546 | ) |
| | | | | | | | | | | | | | | | | |
NET INCREASE (DECREASE) | | | 246 | | | | 1,827 | | | | (3,400 | ) | | | 1,239 | |
See notes to financial statements.
40
MARSICO
21st CENTURY FUND | | | MARSICO
INTERNATIONAL
OPPORTUNITIES FUND | | | MARSICO
FLEXIBLE
CAPITAL FUND | | | MARSICO
GLOBAL FUND | |
| | | | | | | | | | | | | | | | | | | | | | |
Year
Ended
9/30/15 | | | Year
Ended
9/30/14 | | | Year
Ended
9/30/15 | | | Year
Ended
9/30/14 | | | Year
Ended
9/30/15 | | | Year
Ended
9/30/14 | | | Year
Ended
9/30/15 | | | Year
Ended
9/30/14 | |
| | | | | | | | | | | | | | | | | | | | | | |
| | | | | | | | | | | | | | | | | | | | | | |
$ | (2,401 | ) | | $ | (2,856 | ) | | $ | (909 | ) | | $ | (923 | ) | | $ | 3,727 | | | $ | (1,860 | ) | | $ | (578 | ) | | $ | (307 | ) |
| | 47,026 | | | | 47,655 | | | | 14,886 | | | | 3,145 | | | | 89,386 | | | | 78,629 | | | | 7,722 | | | | 9,758 | |
| | (280 | ) | | | 89 | | | | (7,949 | ) | | | (1,232 | ) | | | (3,742 | ) | | | 646 | | | | (1,071 | ) | | | 427 | |
| | (49,090 | ) | | | 2,092 | | | | (7,530 | ) | | | (8,497 | ) | | | (81,540 | ) | | | 20,204 | | | | (8,565 | ) | | | (1,297 | ) |
| | | | | | | | | | | | | | | | | | | | | | | | | | | | | | | |
| | (4,745 | ) | | | 46,980 | | | | (1,502 | ) | | | (7,507 | ) | | | 7,831 | | | | 97,619 | | | | (2,492 | ) | | | 8,581 | |
| | | | | | | | | | | | | | | | | | | | | | | | | | | | | | | |
| | | | | | | | | | | | | | | | | | | | | | | | | | | | | | | |
| | — | | | | — | | | | — | | | | (742 | ) | | | — | | | | — | | | | — | | | | — | |
| | — | | | | — | | | | — | | | | — | | | | (72,202 | ) | | | (89,103 | ) | | | (8,410 | ) | | | (9,278 | ) |
| | | | | | | | | | | | | | | | | | | | | | | | | | | | | | | |
| | — | | | | — | | | | — | | | | (742 | ) | | | (72,202 | ) | | | (89,103 | ) | | | (8,410 | ) | | | (9,278 | ) |
| | | | | | | | | | | | | | | | | | | | | | | | | | | | | | | |
| | | | | | | | | | | | | | | | | | | | | | | | | | | | | | | |
| | 6,269 | | | | 12,600 | | | | 28,781 | | | | 101,347 | | | | 64,926 | | | | 249,527 | | | | 17,368 | | | | 27,301 | |
| | — | | | | — | | | | — | | | | 694 | | | | 61,280 | | | | 74,212 | | | | 6,836 | | | | 7,242 | |
| | — | | | | 1 | | | | — | | | | 3 | | | | — | | | | 30 | | | | — | | | | 2 | |
| | (49,433 | ) | | | (55,503 | ) | | | (114,122 | ) | | | (37,333 | ) | | | (319,070 | ) | | | (331,572 | ) | | | (20,165 | ) | | | (21,756 | ) |
| | | | | | | | | | | | | | | | | | | | | | | | | | | | | | | |
| | (43,164 | ) | | | (42,902 | ) | | | (85,341 | ) | | | 64,711 | | | | (192,864 | ) | | | (7,803 | ) | | | 4,039 | | | | 12,789 | |
| | | | | | | | | | | | | | | | | | | | | | | | | | | | | | | |
| | (47,909 | ) | | | 4,078 | | | | (86,843 | ) | | | 56,462 | | | | (257,235 | ) | | | 713 | | | | (6,863 | ) | | | 12,092 | |
| | | | | | | | | | | | | | | | | | | | | | | | | | | | | | | |
| | | | | | | | | | | | | | | | | | | | | | | | | | | | | | | |
| | 316,293 | | | | 312,215 | | | | 175,984 | | | | 119,522 | | | | 806,448 | | | | 805,735 | | | | 73,475 | | | | 61,383 | |
| | | | | | | | | | | | | | | | | | | | | | | | | | | | | | | |
$ | 268,384 | | | $ | 316,293 | | | $ | 89,141 | | | $ | 175,984 | | | $ | 549,213 | | | $ | 806,448 | | | $ | 66,612 | | | $ | 73,475 | |
| | | | | | | | | | | | | | | | | | | | | | | | | | | | | | | |
$ | (2,755 | ) | | $ | (3,011 | ) | | $ | (825 | ) | | $ | (799 | ) | | $ | 1,273 | | | $ | (2,440 | ) | | $ | (754 | ) | | $ | (511 | ) |
| | | | | | | | | | | | | | | | | | | | | | | | | | | | | | | |
| | | | | | | | | | | | | | | | | | | | | | | | | | | | | | | |
| | 287 | | | | 632 | | | | 1,852 | | | | 6,558 | | | | 3,624 | | | | 13,675 | | | | 1,264 | | | | 1,924 | |
| | — | | | | — | | | | — | | | | 45 | | | | 3,496 | | | | 4,188 | | | | 523 | | | | 518 | |
| | (2,255 | ) | | | (2,792 | ) | | | (7,663 | ) | | | (2,461 | ) | | | (17,879 | ) | | | (18,246 | ) | | | (1,485 | ) | | | (1,524 | ) |
| | | | | | | | | | | | | | | | | | | | | | | | | | | | | | | |
| | (1,968 | ) | | | (2,160 | ) | | | (5,811 | ) | | | 4,142 | | | | (10,759 | ) | | | (383 | ) | | | 302 | | | | 918 | |
41
FINANCIAL HIGHLIGHTS
| | | MARSICO FOCUS FUND | |
| | | | |
For a Fund Share Outstanding Throughout the Period | | Year
Ended
9/30/15 | | | Year
Ended
9/30/14 | | | Year
Ended
9/30/13 | | | Year
Ended
9/30/12 | | | Year
Ended
9/30/11 | |
| | | | | | | | | | | | | | | | |
Net Asset Value, Beginning of Period | | $ | 22.41 | | | $ | 21.47 | | | $ | 20.02 | | | $ | 15.97 | | | $ | 15.79 | |
| | | | | | | | | | | | | | | | | | | | | |
| | | | | | | | | | | | | | | | | | | | | |
Income from Investment Operations: | | | | | | | | | | | | | | | | | | | | |
Net investment income (loss) | | | (0.10 | ) | | | (0.07 | ) | | | (0.03 | ) | | | 0.02 | | | | (0.02 | ) |
Net realized and unrealized gains (losses) on investments | | | (0.62 | ) | | | 4.46 | | | | 3.84 | | | | 4.03 | | | | 0.20 | |
| | | | | | | | | | | | | | | | | | | | | |
Total from investment operations | | | (0.72 | ) | | | 4.39 | | | | 3.81 | | | | 4.05 | | | | 0.18 | |
| | | | | | | | | | | | | | | | | | | | | |
Distributions & Other: | | | | | | | | | | | | | | | | | | | | |
Net investment income | | | — | | | | — | | | | (0.03 | ) | | | — | | | | — | |
Net realized gains | | | (2.86 | ) | | | (3.45 | ) | | | (2.33 | ) | | | — | | | | — | |
Redemption fees [See Note 2(h)] | | | — | | | | — | (1) | | | — | (1) | | | — | (1) | | | — | (1) |
| | | | | | | | | | | | | | | | | | | | | |
Total distributions and other | | | (2.86 | ) | | | (3.45 | ) | | | (2.36 | ) | | | — | | | | — | |
| | | | | | | | | | | | | | | | | | | | | |
Net Asset Value, End of Period | | $ | 18.83 | | | $ | 22.41 | | | $ | 21.47 | | | $ | 20.02 | | | $ | 15.97 | |
| | | | | | | | | | | | | | | | | | | | | |
| | | | | | | | | | | | | | | | | | | | | |
Total Return | | | (4.15 | )% | | | 22.27 | % | | | 21.86 | % | | | 25.36 | % | | | 1.14 | % |
| | | | | | | | | | | | | | | | | | | | | |
| | | | | | | | | | | | | | | | | | | | | |
Supplemental Data and Ratios: | | | | | | | | | | | | | | | | | | | | |
| | | | | | | | | | | | | | | | | | | | | |
Net assets, end of Period (000s) | | $ | 788,851 | | | $ | 933,054 | | | $ | 854,708 | | | $ | 966,010 | | | $ | 936,382 | |
| | | | | | | | | | | | | | | | | | | | | |
Ratio of expenses to average net assets, less waivers and before expenses paid indirectly, plus recoupment of previously waived expenses | | | 1.31 | % | | | 1.34 | % | | | 1.35 | % | | | 1.34 | % | | | 1.33 | % |
| | | | | | | | | | | | | | | | | | | | | |
Ratio of net investment income (loss) to average net assets, net of waivers, recoupment of previously waived expenses and expenses paid indirectly | | | (0.45 | )% | | | (0.35 | )% | | | (0.10 | )% | | | 0.09 | % | | | (0.04 | )% |
| | | | | | | | | | | | | | | | | | | | | |
Ratio of expenses to average net assets, before waivers, recoupment of previously waived expenses and expenses paid indirectly | | | 1.31 | % | | | 1.34 | % | | | 1.35 | % | | | 1.34 | % | | | 1.33 | % |
| | | | | | | | | | | | | | | | | | | | | |
Ratio of net investment income (loss) to average net assets, before waivers, recoupment of previously waived expenses and expenses paid indirectly | | | (0.45 | )% | | | (0.35 | )% | | | (0.10 | )% | | | 0.09 | % | | | (0.04 | )% |
| | | | | | | | | | | | | | | | | | | | | |
Portfolio turnover rate | | | 68 | % | | | 71 | % | | | 92 | % | | | 66 | % | | | 82 | % |
See notes to financial statements.
42
FINANCIAL STATEMENTS
MARSICO
GROWTH FUND | | | MARSICO
21st CENTURY FUND | |
| | | | | |
Year
Ended
9/30/15 | | | Year
Ended
9/30/14 | | | Year
Ended
9/30/13 | | | Year
Ended
9/30/12 | | | Year
Ended
9/30/11 | | | Year
Ended
9/30/15 | | | Year
Ended
9/30/14 | | | Year
Ended
9/30/13 | | | Year
Ended
9/30/12 | | | Year
Ended
9/30/11 | |
| | | | | | | | | | | | | | | | | | | | | | | | | | | | |
$ | 23.63 | | | $ | 25.03 | | | $ | 21.96 | | | $ | 17.43 | | | $ | 17.04 | | | $ | 20.90 | | | $ | 18.05 | | | $ | 14.24 | | | $ | 11.36 | | | $ | 12.38 | |
| | | | | | | | | | | | | | | | | | | | | | | | | | | | | | | | | | | | | | | |
| | | | | | | | | | | | | | | | | | | | | | | | | | | | | | | | | | | | | | | |
| | | | | | | | | | | | | | | | | | | | | | | | | | | | | | | | | | | | | | | |
| | (0.15 | ) | | | (0.08 | ) | | | — | (1) | | | 0.03 | | | | — | (1) | | | (0.21 | ) | | | (0.21 | ) | | | (0.09 | ) | | | (0.06 | ) | | | (0.06 | ) |
| | (0.62 | ) | | | 4.01 | | | | 4.30 | | | | 4.51 | | | | 0.40 | | | | (0.31 | ) | | | 3.06 | | | | 3.90 | | | | 2.94 | | | | (0.96 | ) |
| | | | | | | | | | | | | | | | | | | | | | | | | | | | | | | | | | | | | | | |
| | (0.77 | ) | | | 3.93 | | | | 4.30 | | | | 4.54 | | | | 0.40 | | | | (0.52 | ) | | | 2.85 | | | | 3.81 | | | | 2.88 | | | | (1.02 | ) |
| | | | | | | | | | | | | | | | | | | | | | | | | | | | | | | | | | | | | | | |
| | | | | | | | | | | | | | | | | | | | | | | | | | | | | | | | | | | | | | | |
| | — | | | | (0.06 | ) | | | (0.04 | ) | | | (0.01 | ) | | | (0.01 | ) | | | — | | | | — | | | | — | | | | — | | | | — | |
| | (2.75 | ) | | | (5.27 | ) | | | (1.19 | ) | | | — | | | | — | | | | — | | | | — | | | | — | | | | — | | | | — | |
| | — | | | | — | (1) | | | — | (1) | | | — | (1) | | | — | (1) | | | — | | | | — | (1) | | | — | (1) | | | — | (1) | | | — | (1) |
| | | | | | | | | | | | | | | | | | | | | | | | | | | | | | | | | | | | | | | |
| | (2.75 | ) | | | (5.33 | ) | | | (1.23 | ) | | | (0.01 | ) | | | (0.01 | ) | | | — | | | | — | | | | — | | | | — | | | | — | |
| | | | | | | | | | | | | | | | | | | | | | | | | | | | | | | | | | | | | | | |
$ | 20.11 | | | $ | 23.63 | | | $ | 25.03 | | | $ | 21.96 | | | $ | 17.43 | | | $ | 20.38 | | | $ | 20.90 | | | $ | 18.05 | | | $ | 14.24 | | | $ | 11.36 | |
| | | | | | | | | | | | | | | | | | | | | | | | | | | | | | | | | | | | | | | |
| | | | | | | | | | | | | | | | | | | | | | | | | | | | | | | | | | | | | | | |
| | (4.10 | )% | | | 17.51 | % | | | 20.92 | % | | | 26.04 | % | | | 2.34 | % | | | (2.49 | )% | | | 15.79 | % | | | 26.76 | % | | | 25.35 | % | | | (8.24 | )% |
| | | | | | | | | | | | | | | | | | | | | | | | | | | | | | | | | | | | | | | |
| | | | | | | | | | | | | | | | | | | | | | | | | | | | | | | | | | | | | | | |
| | | | | | | | | | | | | | | | | | | | | | | | | | | | | | | | | | | | | | | |
| | | | | | | | | | | | | | | | | | | | | | | | | | | | | | | | | | | | | | | |
$ | 410,442 | | | $ | 562,653 | | | $ | 564,766 | | | $ | 677,393 | | | $ | 666,925 | | | $ | 268,384 | | | $ | 316,293 | | | $ | 312,215 | | | $ | 354,545 | | | $ | 495,482 | |
| | | | | | | | | | | | | | | | | | | | | | | | | | | | | | | | | | | | | | | |
| | 1.35 | % | | | 1.37 | % | | | 1.37 | % | | | 1.35 | % | | | 1.33 | % | | | 1.38 | % | | | 1.42 | % | | | 1.45 | % | | | 1.41 | % | | | 1.37 | % |
| | | | | | | | | | | | | | | | | | | | | | | | | | | | | | | | | | | | | | | |
| | (0.52 | )% | | | (0.34 | )% | | | 0.01 | % | | | 0.15 | % | | | 0.03 | % | | | (0.78 | )% | | | (0.88 | )% | | | (0.33 | )% | | | (0.31 | )% | | | (0.32 | )% |
| | | | | | | | | | | | | | | | | | | | | | | | | | | | | | | | | | | | | | | |
| | 81 | % | | | 80 | % | | | 114 | % | | | 65 | % | | | 67 | % | | | 94 | % | | | 83 | % | | | 102 | % | | | 63 | % | | | 86 | % |
43
FINANCIAL HIGHLIGHTS
| | | MARSICO
INTERNATIONAL OPPORTUNITIES FUND | |
| | | | |
For a Fund Share Outstanding Throughout the Period | | Year
Ended
9/30/15 | | | Year
Ended
9/30/14 | | | Year
Ended
9/30/13 | | | Year
Ended
9/30/12 | | | Year
Ended
9/30/11 | |
| | | | | | | | | | | | | | | | |
Net Asset Value, Beginning of Period | | $ | 14.72 | | | $ | 15.30 | | | $ | 12.50 | | | $ | 10.61 | | | $ | 12.57 | |
| | | | | | | | | | | | | | | | | | | | | |
| | | | | | | | | | | | | | | | | | | | | |
Income from Investment Operations: | | | | | | | | | | | | | | | | | | | | |
Net investment income (loss) | | | (0.21 | ) | | | (0.06 | ) | | | 0.09 | | | | 0.01 | | | | (0.22 | ) |
Net realized and unrealized gains (losses) on investments | | | — | (1) | | | (0.42 | ) | | | 2.71 | | | | 1.88 | | | | (1.49 | ) |
| | | | | | | | | | | | | | | | | | | | | |
Total from investment operations | | | (0.21 | ) | | | (0.48 | ) | | | 2.80 | | | | 1.89 | | | | (1.71 | ) |
| | | | | | | | | | | | | | | | | | | | | |
Distributions & Other: | | | | | | | | | | | | | | | | | | | | |
Net investment income | | | — | | | | (0.10 | ) | | | — | | | | — | | | | (0.25 | ) |
Net realized gains | | | — | | | | — | | | | — | | | | — | | | | — | |
Redemption fees [See Note 2(h)] | | | — | | | | — | (1) | | | — | (1) | | | — | (1) | | | — | (1) |
| | | | | | | | | | | | | | | | | | | | | |
Total distributions and other | | | — | | | | (0.10 | ) | | | — | | | | — | | | | (0.25 | ) |
| | | | | | | | | | | | | | | | | | | | | |
Net Asset Value, End of Period | | $ | 14.51 | | | $ | 14.72 | | | $ | 15.30 | | | $ | 12.50 | | | $ | 10.61 | |
| | | | | | | | | | | | | | | | | | | | | |
| | | | | | | | | | | | | | | | | | | | | |
Total Return | | | (1.43 | )% | | | (3.18 | )% | | | 22.40 | % | | | 17.81 | % | | | (13.98 | )% |
| | | | | | | | | | | | | | | | | | | | | |
| | | | | | | | | | | | | | | | | | | | | |
Supplemental Data and Ratios: | | | | | | | | | | | | | | | | | | | | |
| | | | | | | | | | | | | | | | | | | | | |
Net assets, end of Period (000s) | | $ | 89,141 | | | $ | 175,984 | | | $ | 119,522 | | | $ | 134,221 | | | $ | 153,855 | |
| | | | | | | | | | | | | | | | | | | | | |
Ratio of expenses to average net assets, less waivers and before expenses paid indirectly, plus recoupment of previously waived expenses | | | 1.60 | % | | | 1.60 | % | | | 1.60 | % | | | 1.60 | % | | | 1.56 | % |
| | | | | | | | | | | | | | | | | | | | | |
Ratio of net investment income (loss) to average net assets, net of waivers, recoupment of previously waived expenses and expenses paid indirectly | | | (0.86 | )% | | | (0.55 | )% | | | 0.61 | % | | | 0.29 | % | | | (0.22 | )% |
| | | | | | | | | | | | | | | | | | | | | |
Ratio of expenses to average net assets, before waivers, recoupment of previously waived expenses and expenses paid indirectly | | | 1.63 | % | | | 1.52 | % | | | 1.74 | % | | | 1.65 | % | | | 1.56 | % |
| | | | | | | | | | | | | | | | | | | | | |
Ratio of net investment income (loss) to average net assets, before waivers, recoupment of previously waived expenses and expenses paid indirectly | | | (0.89 | )% | | | (0.47 | )% | | | 0.47 | % | | | 0.24 | % | | | (0.22 | )% |
| | | | | | | | | | | | | | | | | | | | | |
Portfolio turnover rate | | | 217 | % | | | 178 | % | | | 121 | % | | | 66 | % | | | 103 | % |
See notes to financial statements.
44
FINANCIAL STATEMENTS
MARSICO
FLEXIBLE CAPITAL FUND | | | MARSICO
GLOBAL FUND | |
| | | | |
Year
Ended
9/30/15 | | | Year
Ended
9/30/14 | | | Year
Ended
9/30/13 | | | Year
Ended
9/30/12 | | | Year
Ended
9/30/11 | | | Year
Ended
9/30/15 | | | Year
Ended
9/30/14 | | | Year
Ended
9/30/13 | | | Year
Ended
9/30/12 | | | Year
Ended
9/30/11 | |
| | | | | | | | | | | | | | | | | | | | | | | | | | | | |
$ | 18.39 | | | $ | 18.21 | | | $ | 15.79 | | | $ | 12.05 | | | $ | 11.97 | | | $ | 14.45 | | | $ | 14.74 | | | $ | 11.51 | | | $ | 9.06 | | | $ | 9.90 | |
| | | | | | | | | | | | | | | | | | | | | | | | | | | | | | | | | | | | | | | |
| | | | | | | | | | | | | | | �� | | | | | | | | | | | | | | | | | | | | | | | | |
| | | | | | | | | | | | | | | | | | | | | | | | | | | | | | | | | | | | | | | |
| | 0.09 | | | | (0.04 | ) | | | 0.04 | | | | 0.03 | | | | 0.08 | | | | (0.10 | ) | | | (0.05 | ) | | | (0.02 | ) | | | (0.07 | ) | | | (0.05 | ) |
| | (0.15 | ) | | | 2.18 | | | | 3.28 | | | | 3.77 | | | | 0.12 | | | | (0.32 | ) | | | 1.93 | | | | 3.25 | | | | 2.52 | | | | (0.70 | ) |
| | | | | | | | | | | | | | | | | | | | | | | | | | | | | | | | | | | | | | | |
| | (0.06 | ) | | | 2.14 | | | | 3.32 | | | | 3.80 | | | | 0.20 | | | | (0.42 | ) | | | 1.88 | | | | 3.23 | | | | 2.45 | | | | (0.75 | ) |
| | | | | | | | | | | | | | | | | | | | | | | | | | | | | | | | | | | | | | | |
| | | | | | | | | | | | | | | | | | | | | | | | | | | | | | | | | | | | | | | |
| | — | | | | — | | | | (0.09 | ) | | | (0.06 | ) | | | (0.09 | ) | | | — | | | | — | | | | — | | | | — | | | | (0.09 | ) |
| | (1.74 | ) | | | (1.96 | ) | | | (0.81 | ) | | | — | | | | (0.03 | ) | | | (1.66 | ) | | | (2.17 | ) | | | — | | | | — | | | | — | |
| | — | | | | — | (1) | | | — | (1) | | | — | (1) | | | — | (1) | | | — | | | | — | (1) | | | — | (1) | | | — | (1) | | | — | (1) |
| | | | | | | | | | | | | | | | | | | | | | | | | | | | | | | | | | | | | | | |
| | (1.74 | ) | | | (1.96 | ) | | | (0.90 | ) | | | (0.06 | ) | | | (0.12 | ) | | | (1.66 | ) | | | (2.17 | ) | | | — | | | | — | | | | (0.09 | ) |
| | | | | | | | | | | | | | | | | | | | | | | | | | | | | | | | | | | | | | | |
$ | 16.59 | | | $ | 18.39 | | | $ | 18.21 | | | $ | 15.79 | | | $ | 12.05 | | | $ | 12.37 | | | $ | 14.45 | | | $ | 14.74 | | | $ | 11.51 | | | $ | 9.06 | |
| | | | | | | | | | | | | | | | | | | | | | | | | | | | | | | | | | | | | | | |
| | | | | | | | | | | | | | | | | | | | | | | | | | | | | | | | | | | | | | | |
| | (0.81 | )% | | | 12.15 | % | | | 22.34 | % | | | 31.63 | % | | | 1.59 | % | | | (3.51 | )% | | | 13.23 | % | | | 28.06 | % | | | 27.04 | % | | | (7.73 | )% |
| | | | | | | | | | | | | | | | | | | | | | | | | | | | | | | | | | | | | | | |
| | | | | | | | | | | | | | | | | | | | | | | | | | | | | | | | | | | | | | | |
| | | | | | | | | | | | | | | | | | | | | | | | | | | | | | | | | | | | | | | |
| | | | | | | | | | | | | | | | | | | | | | | | | | | | | | | | | | | | | | | |
$ | 549,213 | | | $ | 806,448 | | | $ | 805,735 | | | $ | 590,293 | | | $ | 409,145 | | | $ | 66,612 | | | $ | 73,475 | | | $ | 61,383 | | | $ | 54,195 | | | $ | 108,021 | |
| | | | | | | | | | | | | | | | | | | | | | | | | | | | | | | | | | | | | | | |
| | 1.37 | % | | | 1.38 | % | | | 1.41 | % | | | 1.43 | % | | | 1.27 | % | | | 1.60 | % | | | 1.60 | % | | | 1.60 | % | | | 1.60 | % | | | 1.48 | % |
| | | | | | | | | | | | | | | | | | | | | | | | | | | | | | | | | | | | | | | |
| | 0.53 | % | | | (0.21 | )% | | | 0.16 | % | | | 0.17 | % | | | 0.55 | % | | | (0.80 | )% | | | (0.42 | )% | | | (0.06 | )% | | | (0.32 | )% | | | (0.46 | )% |
| | | | | | | | | | | | | | | | | | | | | | | | | | | | | | | | | | | | | | | |
| | 1.37 | % | | | 1.38 | % | | | 1.41 | % | | | 1.43 | % | | | 1.40 | % | | | 1.54 | % | | | 1.66 | % | | | 1.86 | % | | | 1.70 | % | | | 1.48 | % |
| | | | | | | | | | | | | | | | | | | | | | | | | | | | | | | | | | | | | | | |
| | 0.53 | % | | | (0.21 | )% | | | 0.16 | % | | | 0.17 | % | | | 0.42 | % | | | (0.74 | )% | | | (0.48 | )% | | | (0.32 | )% | | | (0.42 | )% | | | (0.46 | )% |
| | | | | | | | | | | | | | | | | | | | | | | | | | | | | | | | | | | | | | | |
| | 69 | % | | | 118 | % | | | 145 | % | | | 121 | % | | | 231 | % | | | 110 | % | | | 129 | % | | | 134 | % | | | 95 | % | | | 93 | % |
45
NOTES TO FINANCIAL STATEMENTS |
NOTES TO FINANCIAL STATEMENTS September 30, 2015
The Marsico Investment Fund (the “Trust”) was organized on October 1, 1997, as a Delaware statutory trust and is registered under the Investment Company Act of 1940 (the “1940 Act”) as an open-end management investment company. The Focus Fund, Growth Fund, 21st Century Fund, International Opportunities Fund, Flexible Capital Fund, and Global Fund (collectively, the “Funds”) are separate investment portfolios of the Trust. The Focus Fund is a non-diversified fund and the Growth Fund, the 21st Century Fund, the International Opportunities Fund, the Flexible Capital Fund, and the Global Fund are diversified funds. The Focus Fund and Growth Fund commenced operations on December 31, 1997, the 21st Century Fund commenced operations on February 1, 2000, the International Opportunities Fund commenced operations on June 30, 2000, the Flexible Capital Fund commenced operations on December 29, 2006, and the Global Fund commenced operations on June 29, 2007. Trustees and officers of the Trust and employees of Marsico Capital Management, LLC (the “Adviser”) own approximately 8%, 6%, 5%, and 17% of the Focus Fund’s, International Opportunities Fund’s, Flexible Capital Fund’s, and Global Fund’s outstanding shares, respectively, as of September 30, 2015.
2. | Significant Accounting Policies |
The Funds qualify as investment companies under Accounting Standards Update No. 2013-08, Accounting Standard Codification Topic 946, Financial Services — Investment Companies (“ASC 946”). The following is a summary of significant accounting policies consistently followed by the Funds in the preparation of their financial statements. These policies are in conformity with Generally Accepted Accounting Principles (“GAAP”) in the United States of America for investment companies and follow the accounting guidance provided in ASC 946. The presentation of financial statements in conformity with GAAP requires management to make estimates and assumptions that affect the reported amounts and disclosures of assets and liabilities at the date of the financial statements and the reported amounts and disclosures of income and expenses during the reporting period. Actual results could differ from those estimates.
| | (a) | Investment Valuation — A security traded on a recognized stock exchange is generally valued at the last sale price prior to the closing of the principal exchange on which the security is traded. Securities traded on NASDAQ generally will be valued at the NASDAQ Official Closing Price. If no sale price is reported on the valuation date, the most current bid price will generally be used, with the exception of short option positions which will generally utilize the most current ask price. Other securities for which over-the-counter market quotations are readily available are generally valued at the last sale price. Debt securities that will mature in more than 60 days are generally valued at their bid prices furnished by a pricing service approved by the Funds’ Board of Trustees and subject to review pursuant to procedures established by, and under the general supervision of, the Funds’ Board of Trustees. Debt securities that will mature in 60 days or less are valued at amortized cost, if it approximates market value. Any securities for which market quotations are not readily available are valued at their fair value as determined in good faith by the Adviser in accordance with procedures established by, and under the general supervision of, the Funds’ Board of Trustees. The Funds may use pricing services to assist in determining market value. The Board of Trustees has authorized the use of a pricing service to assist the Funds in valuing certain equity securities listed or traded on foreign security exchanges in the Funds’ portfolios in certain circumstances where there is a significant change in the value of related US-traded securities, as represented by, for example, the S&P 500 Index. |
“Fair Value Measurements and Disclosures” (the “Fair Value Statement”) defines fair value, establishes a framework for measuring fair value in GAAP, and expands disclosures about fair value measurements. Under the Fair Value Statement, various inputs are used in determining the value of the Funds’ investments.
These inputs are summarized into three broad levels and described below:
| | ● | Level 1 – quoted prices in active markets for identical investments |
| | ● | Level 2 – other significant observable inputs (including quoted prices for similar investments, interest rates, and evaluated quotations obtained from pricing services) |
| | ● | Level 3 – significant unobservable inputs (including the Fund’s assumptions that market participants would use in determining the fair value of investments) |
46
NOTES TO FINANCIAL STATEMENTS |
The inputs or methodology used for valuing investments are not an indication of the risk associated with investing in those investments. Changes in valuation techniques may result in transfers between the levels during the reporting period. The Funds recognize transfers between the levels as of the end of each reporting period and consider securities that are purchased during the reporting period as not having transferred between levels as of the end of the reporting period. In accordance with procedures established by, and under the general supervision of, the Funds’ Board of Trustees, certain equity securities listed or traded on foreign security exchanges in the Funds’ portfolios had a fair valuation adjustment factor applied to their equity prices as of the applicable fiscal year-end and were categorized as Level 2. Application of fair valuation adjustment factors was not deemed necessary at the beginning of the reporting period and, as such, equity securities listed or traded on foreign security exchanges were categorized as Level 1. These securities represent the only significant transfers between each of the three levels. As of September 30, 2015, the market value of these security transfers from Level 1 to Level 2 were (in thousands) $19,421, $23,934 and $8,275 for the International Opportunities Fund, Flexible Capital Fund and Global Fund, respectively. The following is a summary of the fair values of the Funds’ investments in each category and economic sector as of September 30, 2015:
Fund Investments by
Major Security Type | | Level 1 | | | Level 2 | | | Level 3 | | | Total | |
Marsico Focus Fund | | | | | | | | | | | | |
Assets | | | | | | | | | | | | |
Common Stocks | | | | | | | | | | | | |
Consumer Discretionary | | $ | 196,803,651 | | | $ | — | | | $ | — | | | $ | 196,803,651 | |
Consumer Staples | | | 23,938,135 | | | | — | | | | — | | | | 23,938,135 | |
Energy | | | 7,632,703 | | | | — | | | | — | | | | 7,632,703 | |
Financials | | | 31,315,383 | | | | — | | | | — | | | | 31,315,383 | |
Health Care | | | 166,875,369 | | | | 25,815,922 | | | | — | | | | 192,691,291 | |
Industrials | | | 27,071,424 | | | | — | | | | — | | | | 27,071,424 | |
Information Technology | | | 259,867,437 | | | | — | | | | — | | | | 259,867,437 | |
Materials | | | 36,234,499 | | | | — | | | | — | | | | 36,234,499 | |
Short-term Investments | | | 9,931,496 | | | | — | | | | — | | | | 9,931,496 | |
| | | | | | | | | | | | | | | $ | 785,486,019 | |
Marsico Growth Fund | | | | | | | | | | | | | | | | |
Assets | | | | | | | | | | | | | | | | |
Common Stocks | | | | | | | | | | | | | | | | |
Consumer Discretionary | | $ | 111,135,746 | | | $ | — | | | $ | — | | | $ | 111,135,746 | |
Consumer Staples | | | 12,540,760 | | | | — | | | | — | | | | 12,540,760 | |
Energy | | | 1,997,647 | | | | — | | | | — | | | | 1,997,647 | |
Financials | | | 12,226,993 | | | | — | | | | — | | | | 12,226,993 | |
Health Care | | | 101,706,345 | | | | — | | | | — | | | | 101,706,345 | |
Industrials | | | 18,284,926 | | | | — | | | | — | | | | 18,284,926 | |
Information Technology | | | 126,473,787 | | | | — | | | | — | | | | 126,473,787 | |
Materials | | | 12,454,739 | | | | — | | | | — | | | | 12,454,739 | |
Short-term Investments | | | 13,528,740 | | | | — | | | | — | | | | 13,528,740 | |
| | | | | | | | | | | | | | | $ | 410,349,683 | |
Marsico 21st Century Fund | | | | | | | | | | | | | | | | |
Assets | | | | | | | | | | | | | | | | |
Common Stocks | | | | | | | | | | | | | | | | |
Consumer Discretionary | | $ | 54,326,565 | | | $ | 2,067,806 | | | $ | — | | | $ | 56,394,371 | |
Consumer Staples | | | 10,726,540 | | | | — | | | | — | | | | 10,726,540 | |
Financials | | | 13,644,981 | | | | — | | | | — | | | | 13,644,981 | |
Health Care | | | 58,597,932 | | | | — | | | | — | | | | 58,597,932 | |
Industrials | | | 22,425,591 | | | | — | | | | — | | | | 22,425,591 | |
Information Technology | | | 71,896,920 | | | | 2,741,997 | | | | — | | | | 74,638,917 | |
Materials | | | 6,196,167 | | | | — | | | | — | | | | 6,196,167 | |
Telecommunication Services | | | 4,732,677 | | | | — | | | | — | | | | 4,732,677 | |
Short-term Investments | | | 21,204,689 | | | | — | | | | — | | | | 21,204,689 | |
| | | | | | | | | | | | | | | $ | 268,561,865 | |
Marsico International Opportunities Fund | | | | | | | | | | | | | | | | |
Assets | | | | | | | | | | | | | | | | |
Common Stocks | | | | | | | | | | | | | | | | |
Consumer Discretionary | | $ | 18,046,343 | | | $ | 16,898,982 | | | $ | — | | | $ | 34,945,325 | |
Consumer Staples | | | — | | | | 1,305,020 | | | | — | | | | 1,305,020 | |
Financials | | | — | | | | 3,091,768 | | | | — | | | | 3,091,768 | |
Health Care | | | 10,896,103 | | | | 5,538,415 | | | | — | | | | 16,434,518 | |
Industrials | | | 4,105,534 | | | | 1,872,496 | | | | — | | | | 5,978,030 | |
Information Technology | | | 15,539,125 | | | | 10,063,068 | | | | — | | | | 25,602,193 | |
Short-term Investments | | | 3,338,114 | | | | — | | | | — | | | | 3,338,114 | |
| | | | | | | | | | | | | | | $ | 90,694,968 | |
47
NOTES TO FINANCIAL STATEMENTS |
NOTES TO FINANCIAL STATEMENTS September 30, 2015 (continued)
Fund Investments by
Major Security Type | | Level 1 | | | Level 2 | | | Level 3 | | | Total | |
Marsico Flexible Capital Fund | | | | | | | | | | | | |
Assets | | | | | | | | | | | | |
Common Stocks | | | | | | | | | | | | |
Consumer Discretionary | | $ | 117,577,334 | | | $ | 20,824,929 | | | $ | — | | | $ | 138,402,263 | |
Consumer Staples | | | 39,629,330 | | | | — | | | | — | | | | 39,629,330 | |
Financials | | | 67,258,086 | | | | — | | | | — | | | | 67,258,086 | |
Health Care | | | 38,521,294 | | | | 13,027,400 | | | | — | | | | 51,548,694 | |
Industrials | | | 18,540,344 | | | | 20,153,801 | | | | — | | | | 38,694,145 | |
Information Technology | | | 92,840,776 | | | | — | | | | — | | | | 92,840,776 | |
Corporate Bonds | | | — | | | | 30,752,350 | | | | — | | | | 30,752,350 | |
Preferred Stocks | | | 19,874,474 | | | | — | | | | — | | | | 19,874,474 | |
Short-term Investments | | | 59,217,980 | | | | — | | | | — | | | | 59,217,980 | |
| | | | | | | | | | | | | | | $ | 538,218,098 | |
Marsico Global Fund | | | | | | | | | | | | | | | | |
Assets | | | | | | | | | | | | | | | | |
Common Stocks | | | | | | | | | | | | | | | | |
Consumer Discretionary | | $ | 16,509,947 | | | $ | 7,617,715 | | | $ | — | | | $ | 24,127,662 | |
Consumer Staples | | | 1,444,691 | | | | — | | | | — | | | | 1,444,691 | |
Health Care | | | 6,723,787 | | | | 4,980,296 | | | | — | | | | 11,704,083 | |
Industrials | | | 2,776,988 | | | | 1,986,562 | | | | — | | | | 4,763,550 | |
Information Technology | | | 16,001,174 | | | | 1,964,034 | | | | — | | | | 17,965,208 | |
Materials | | | 2,291,738 | | | | — | | | | — | | | | 2,291,738 | |
Short-term Investments | | | 1,296,190 | | | | — | | | | — | | | | 1,296,190 | |
| | | | | | | | | | | | | | | $ | 63,593,122 | |
| | (b) | Expenses — The Funds are charged for those expenses that are directly attributable to each Fund, such as advisory and custodial fees. Expenses that are not directly attributable to a Fund are typically allocated among the Funds in proportion to their respective net assets and are in some cases allocated based on other factors. The Funds’ expenses may be reduced by advisory fee waivers, brokerage credits and uninvested cash balances earning interest or credits. Such credits are included in “Less waiver of expenses and expenses paid indirectly” on the Statements of Operations. |
Brokerage commissions may be paid to certain brokers which reduce transfer agent fees and expenses. For the year ended September 30, 2015, the Funds received no such brokerage commission credits. The Funds received earnings credits on certain cash account balances which reduced transfer agent fees and expenses in the amount of $397, $222, $134, $46, $303, and $31 for the Focus Fund, Growth Fund, 21st Century Fund, International Opportunities Fund, Flexible Capital Fund, and Global Fund, respectively, for the year ended September 30, 2015. Brokerage commission credits and earnings credits (if any) are included in “Less waiver of expenses and expenses paid indirectly” on the Statements of Operations.
| | (c) | Federal Income Taxes — Each Fund intends to comply with the requirements of the Internal Revenue Code of 1986, as amended, (the “Internal Revenue Code”) necessary to continue to qualify as a regulated investment company and to make the requisite distributions of income to its shareholders which will be sufficient to relieve it from all or substantially all federal and state income taxes. Certain Funds may utilize earnings and profits on redemption of shares as part of the dividends paid deduction. |
| | (d) | Distributions to Shareholders — Dividends from net investment income and net realized capital gains, if any, will be declared and paid at least annually. Distributions to shareholders are recorded on the ex-dividend date. Each Fund may periodically make reclassifications among certain of its capital accounts as a result of the timing and characterization of certain income and capital gains distributions determined in accordance with federal tax regulations, which may differ from GAAP. These reclassifications are due to differing treatment for items such as foreign currency transactions, passive foreign investment companies (“PFICs”) and net investment losses. |
The Funds at times may invest in real estate investment trusts (“REITs”). REITs generally pay dividends to their investors based upon cash available from their operations and this amount may differ significantly from the REITs’ actual earnings and profits (“E&P”) determined for income tax purposes. It is common for these dividends to exceed the REITs’ taxable E&P, resulting in the excess portion of such dividends eventually being designated as a return of capital. Determination of the tax character of dividends made by REITs is typically performed by the REIT several months subsequent to the payment of the dividend. Therefore, due to timing issues, the Funds may be in a position of being required to calculate and pay required distribution amounts to their shareholders based on the best information available from the REITs, which may be prior to the final determination of the REITs’
48
NOTES TO FINANCIAL STATEMENTS |
taxable E&P, and it is possible that a portion of the Funds’ distribution amounts could include a return of capital to shareholders for federal income tax purposes.
| | (e) | Foreign Currency Translation — The accounting records of the Funds are maintained in US dollars. For valuation purposes, values of securities denominated in foreign currencies are translated into US dollars at 4:00 p.m. Eastern Time. Amounts related to the purchase and sale of foreign securities and investment income are translated at the rates of exchange prevailing on the respective dates of such transactions. |
Reported realized gains and losses on foreign currency transactions arise from sales of portfolio securities, forward foreign currency contracts, currency gains or losses realized between the trade and settlement dates on securities transactions, and the difference between the amounts of dividends, interest, and foreign withholding taxes recorded on the Funds’ books and the US dollar equivalent of the amounts actually received or paid.
The Funds do not isolate that portion of the results of operations resulting from changes in foreign exchange rates on investments from the fluctuations arising from changes in market prices of securities held at the end of the reporting period. Net unrealized appreciation or depreciation on investments and foreign currency translations arises from changes in the value of assets and liabilities, including investments in securities at the end of the reporting period, resulting from changes in the exchange rates and changes in market prices of securities held. Transactions in foreign-denominated assets may involve greater risks than domestic transactions, including currency risk, political and economic risk, regulatory risk and market risk.
| | (f) | Derivative Instruments — “Disclosure about Derivative Instruments and Hedging Activities” (the “Derivatives Statement”) requires enhanced disclosures about the Funds’ derivative and hedging activities, including how such activities are accounted for and their effects on the Funds’ financial position, performance and cash flows. |
The Funds are not intended as vehicles for investing substantially in derivative instruments, and may hold derivative instruments only infrequently. The Funds enter into derivative instruments in order to increase exposure to certain investments, asset classes, or markets, or for hedging purposes to hedge against adverse movements in securities prices, currency rates or interest rates. The Funds can hold various types of derivative instruments such as futures contracts and options on securities, financial indexes, and foreign currencies, options on futures, forward foreign currency contracts, interest rate swaps, credit default swaps, and swap-related products. The use of derivative instruments may involve risks such as the possibility of illiquid markets or imperfect correlation between the value of the derivative instruments and the underlying securities, or that the counterparty will fail to perform its obligations. There were no outstanding derivative instruments held by the Funds as of September 30, 2015 nor did the Funds utilize derivative instruments during the year ended September 30, 2015.
Forward Foreign Currency Contracts — A forward currency contract is a commitment to purchase or sell foreign currency at a specified price on a future date. A Fund may enter into a forward foreign currency contract in order to hedge against foreign currency fluctuations, such as when the Fund elects to reduce exposure to changes in foreign currency exchange rates on foreign portfolio holdings denominated in or exposed to foreign currencies, or in preparation for purchasing securities in a particular market, or for other investment purposes.
The market value of a forward foreign currency contract fluctuates with changes in currency exchange rates. Outstanding forward foreign currency contracts are valued daily at current market rates and the resulting change in market value is recorded as unrealized appreciation or depreciation. When a forward foreign currency contract is settled, the Fund records a realized gain or loss equal to the difference between the value at the time the forward foreign currency contract was opened and the value at the time it was settled.
The Funds are subject to foreign currency exchange risk in the normal course of pursuing their investment objectives. Forward foreign currency contracts may involve market risk in excess of the unrealized gain or loss reflected on the Statements of Assets and Liabilities. In addition, the Funds could be exposed to a credit risk if the counterparties are unable or unwilling to meet the terms of the contracts or if the value of the foreign currency changes unfavorably. In connection with these contracts, the Funds typically segregate cash and/or other securities as collateral in a sufficient value equal to the aggregate amount of the Funds’ commitments under the forward foreign currency contracts; such collateral would be in the possession of the Funds’ custodian, if applicable.
49
NOTES TO FINANCIAL STATEMENTS |
NOTES TO FINANCIAL STATEMENTS September 30, 2015 (continued)
Options Contracts — The Funds may purchase or write (sell) put and call options on foreign and domestic stock indices, foreign currencies, and US and foreign securities that are traded on a securities exchange or an over-the-counter market. These transactions are generally for hedging purposes or for the purpose of earning additional income. In addition, the Funds may enter into such transactions for cross-hedging purposes. There is generally limited counterparty credit risk involved when entering into exchange-traded option contracts because the exchange’s clearinghouse acts as counterparty to all options traded on such exchange.
In purchasing an option, a Fund pays a premium whether or not the option is exercised. Additionally, the Fund bears the risk of loss of premium and change in market value should the counterparty not perform under the contract. Put and call options purchased are accounted for in the same manner as portfolio securities. The cost of securities acquired through the exercise of call options is increased by premiums paid. The proceeds from securities sold through the exercise of put options are decreased by the premiums paid.
When a Fund writes an option, the premium received by the Fund is recorded as a liability and is subsequently adjusted to the current market value of the option written. Premiums received from writing options that expire are recorded by the Fund on the expiration date as realized gains from option transactions. The difference between the premium and the amount paid on effecting a closing purchase transaction, including brokerage commissions, is also treated as a realized gain, or if the premium is less than the amount paid for the closing purchase transaction, as a realized loss. If a call option is exercised, the premium is added to the proceeds from the sale of the underlying security or currency in determining whether the Fund has realized a gain or loss. If a put option is exercised, the premium reduces the cost basis of the security or currency purchased by the Fund. In writing an option, the Fund bears the market risk of an unfavorable change in the price of the security or currency underlying the written option. Exercise of an option written by the Fund could result in the Fund selling or buying a security or currency at a price different from the current market value.
| | (g) | Trustees’ Deferred Fee Plan — Effective February 1, 2000, the Board of Trustees adopted the Marsico Investment Fund Deferred Fee Plan (the “Deferred Fee Plan”), amended and restated as of December 30, 2005, which allows the Trustees to defer the receipt of all or a portion of their compensation received from the Funds. Any deferred fees are credited to accounts established on behalf of the Trustees into the Funds as directed by each Trustee. The amounts credited to these accounts increase or decrease in accordance with the performance of the Funds selected by the Trustees. The market value of the deferred account balances as of September 30, 2015 is shown on the Statements of Assets and Liabilities as part of an asset account, “Prepaid expenses and other assets”, and a liability account, “Accrued trustees’ fees”. Additionally, the fluctuation of the account balances due to the Funds’ performance is recorded by the Funds as unrealized appreciation (depreciation), which is shown as part of “Net unrealized appreciation on investments and foreign currency translations” on the Statements of Assets and Liabilities, and as compensation expense, which is shown as part of the expense account “Trustees’ fees and expenses” on the Statements of Operations. Fees earned and deferred by the Trustees for the year ended September 30, 2015 are also included in “Trustees’ fees and expenses” on the Statements of Operations. Amounts contributed to the Deferred Fee Plan will be deferred until distributed in accordance with the Deferred Fee Plan. Unrealized appreciation (depreciation) of Fund shares held in the Deferred Fee Plan is subject to the Funds’ expense reimbursement agreement with the Adviser. |
| | (h) | Redemption Fee — Effective January 31, 2014, the Funds’ Board of Trustees approved the elimination of redemption fees from Fund share transactions placed on and after January 31, 2014. Prior to January 31, 2014, a 2.00% redemption fee was retained by the Funds to offset transaction costs and other expenses associated with short-term investing. The fee was imposed on certain redemptions or exchanges of shares held 30 days or less from their purchase date. Redemption fees were recorded by the Funds as a reduction of shares redeemed and as a credit to paid-in-capital. |
| | (i) | Other — Investment transactions are accounted for on a trade date basis. Each Fund determines the gain or loss realized from the investment transactions by comparing the original cost of the security lot sold with the net sale proceeds. Dividend income is recognized on the ex-dividend date. Certain dividends from foreign securities are recorded when the Funds are informed of the dividend if such information is obtained subsequent to the ex-dividend date. Interest income is recognized on an accrual basis and includes amortization of premiums and accretion of discounts. |
50
NOTES TO FINANCIAL STATEMENTS |
| | (j) | Indemnifications — In the normal course of business, the Funds enter into contracts that contain provisions indemnifying other parties against specified potential liabilities. Each Fund’s maximum exposure under these arrangements is unknown as this would involve future claims that may be made against the Fund that have not yet occurred. However, based on experience, the Funds expect the risk of loss in connection with these potential indemnification obligations to be remote. There can be no assurance that material liabilities related to such obligations will not arise in the future, which may adversely impact a Fund. |
3. | Investment Advisory Agreement and Transactions With Affiliates |
Each Fund has an agreement with the Adviser to furnish investment advisory services to the Funds. Under the terms of these agreements, the Adviser is compensated for managing the Focus Fund and the Growth Fund at the rate of 0.85% per year of average daily net assets up to $3 billion in each Fund, and 0.75% per year of average daily net assets exceeding $3 billion in each Fund; and at a rate of 0.85% of the average daily net assets of the 21st Century Fund, the International Opportunities Fund, the Flexible Capital Fund, and the Global Fund. The Adviser has entered into a written expense limitation and fee waiver agreement under which it has agreed to limit the total expenses of each Fund (excluding interest, taxes, acquired fund fees and expenses, litigation, brokerage, and extraordinary expenses) to an annual rate of 1.60% of the average net assets of the Focus Fund, the International Opportunities Fund, the Flexible Capital Fund, and the Global Fund, and 1.50% of the average net assets of the Growth Fund and the 21st Century Fund until January 31, 2016. This expense limitation and fee waiver agreement may be terminated by the Adviser at any time after January 31, 2016, upon 15 days prior notice to the Fund and its administrator.
The Adviser may recoup from a Fund fees previously waived or expenses previously reimbursed by the Adviser with respect to that Fund pursuant to this agreement (or a previous expenses limitation agreement) if: (1) such recoupment by the Adviser does not cause the Fund, at the time of recoupment, to exceed the lesser of (a) the expense limitation in effect at the time the relevant amount was waived and/or reimbursed, or (b) the expense limitation in effect at the time of the proposed recoupment, and (2) the recoupment is made within three fiscal years after the end of the fiscal year in which the amount was waived or reimbursed. Under this arrangement during the year ended September 30, 2015, the Adviser received $42,127 of reimbursement from the Global Fund for previously waived or reimbursed expenses. The reimbursement amount is reflected in “Recoupment of previously waived expenses” on the Statements of Operations. As of September 30, 2015, recoupment amounts (in thousands) that may potentially be made by the International Opportunities Fund and Global Fund to the Adviser are as follows:
Year of Expiration | | International
Opportunities Fund | | | Global Fund | |
2016 | | $ | 101 | | | $ | 140 | |
2017 | | | — | | | | 47 | |
2018 | | | 32 | | | | — | |
| | | $ | 133 | | | $ | 187 | |
Certain officers of the Trust are also officers of the Adviser. The Funds pay a portion of the Chief Compliance Officer’s total compensation costs which is shown as part of the expense account “Professional fees” on the Statements of Operations. No other officers of the Trust affiliated with the Adviser received compensation from the Funds during the year ended September 30, 2015.
4. | Distribution and Service Plan |
The Funds have adopted a Distribution and Service Plan (the “Plan”) pursuant to Rule 12b-1 under the 1940 Act. The Plan authorizes payments by the Funds in connection with the distribution of their shares at an annual rate, as determined from time to time by the Board of Trustees, of up to 0.25% of a Fund’s average daily net assets. The Adviser may, out of its own resources and at its sole discretion, make certain payments on behalf of the Plan for expenses incurred by a Fund for distribution of Fund shares and related services.
51
NOTES TO FINANCIAL STATEMENTS |
NOTES TO FINANCIAL STATEMENTS September 30, 2015 (continued)
5. | Investment Transactions |
The aggregate purchases and sales of securities, excluding short-term investments, for the Funds for the year ended September 30, 2015, were as follows:
(Amounts in thousands) | | Focus
Fund | | | Growth
Fund | | | 21st
Century
Fund | | | International
Opportunities
Fund | | | Flexible
Capital
Fund | | | Global
Fund | |
Purchases | | $ | 602,480 | | | $ | 402,724 | | | $ | 278,577 | | | $ | 228,840 | | | $ | 455,513 | | | $ | 76,714 | |
Sales | | $ | 692,530 | | | $ | 536,522 | | | $ | 334,760 | | | $ | 290,637 | | | $ | 744,897 | | | $ | 85,317 | |
There were no purchases or sales of US government securities, excluding short-term investments.
6. | Federal Income Tax Information |
“Accounting for Uncertainty in Income Taxes” (the “Income Tax Statement”) requires an evaluation of tax positions taken (or expected to be taken) in the course of preparing a Fund’s tax returns to determine whether these positions meet a “more-likely-than-not” standard that, based on the technical merits, have a more than fifty percent likelihood of being sustained by a taxing authority upon examination. A tax position that meets the “more-likely-than-not” recognition threshold is measured to determine the amount of benefit to recognize in the financial statements. The Funds recognize interest and penalties, if any, related to unrecognized tax benefits as income tax expense in the Statements of Operations.
The Income Tax Statement requires management of the Funds to analyze all open tax years, fiscal years 2012-2015 as defined by Internal Revenue Service (“IRS”) statute of limitations for all major jurisdictions, including federal tax authorities and certain state tax authorities. As of and during the year ended September 30, 2015, the Funds did not have any liabilities for any unrecognized tax benefits. The Funds have no examinations in progress and are not aware of any tax positions for which it is reasonably possible that the total amounts of unrecognized tax benefits will significantly change in the next twelve months.
At September 30, 2015 gross unrealized appreciation and depreciation of investments, based on cost for federal income tax purposes were as follows:
(Amounts in thousands) | | Focus
Fund | | | Growth
Fund | | | 21st
Century
Fund | | | International
Opportunities
Fund | | | Flexible
Capital
Fund | | | Global
Fund | |
Cost of Investments | | $ | 686,501 | | | $ | 369,194 | | | $ | 233,583 | | | $ | 88,269 | | | $ | 479,727 | | | $ | 59,838 | |
| | | | | | | | | | | | | | | | | | | | | | | | | |
Gross Unrealized Appreciation | | $ | 140,911 | | | $ | 64,003 | | | $ | 47,976 | | | $ | 8,111 | | | $ | 80,506 | | | $ | 7,252 | |
Gross Unrealized Depreciation | | | (41,926 | ) | | | (22,847 | ) | | | (12,997 | ) | | | (5,685 | ) | | | (22,015 | ) | | | (3,497 | ) |
| | | | | | | | | | | | | | | | | | | | | | | | | |
Net Unrealized Appreciation on Investments | | $ | 98,985 | | | $ | 41,156 | | | $ | 34,979 | | | $ | 2,426 | | | $ | 58,491 | | | $ | 3,755 | |
The difference between cost amounts for financial statement and federal income tax purposes is due primarily to wash sale loss deferrals.
At September 30, 2015, for federal income tax purposes, the Funds had accumulated capital loss carryforwards as follows:
(Amounts in thousands) | | Focus
Fund | | | Growth
Fund | | | 21st
Century
Fund | | | International
Opportunities
Fund | | | Flexible
Capital
Fund | | | Global
Fund | |
For losses expiring September 30, | | | | | | | | | | | | | | | | | | |
2017 | | $ | — | | | $ | — | | | $ | 25,304 | | | $ | 8,008 | | | $ | — | | | $ | — | |
2018 | | | — | | | | — | | | | 390,537 | | | | 93,558 | | | | — | | | | — | |
Not Subject to Expiration | | | — | | | | — | | | | — | | | | — | | | | — | | | | — | |
| | | $ | — | | | $ | — | | | $ | 415,841 | | | $ | 101,566 | | | $ | — | | | $ | — | |
52
NOTES TO FINANCIAL STATEMENTS |
To the extent that a Fund may realize future net capital gains, those gains will be offset by any of its unused capital loss carryforward. Future capital loss carryforward utilization in any given year may be subject to Internal Revenue Code limitations.
The Funds are permitted to carryforward capital losses incurred in taxable years beginning after December 22, 2010 for an unlimited period, and such capital losses will retain their character as either short-term or long-term capital losses. Capital losses incurred by the Funds in taxable years beginning before December 23, 2010 may only be carried forward eight taxable years as short-term capital losses.
As of September 30, 2015, the Focus Fund, Growth Fund, 21st Century Fund, International Opportunities Fund, Flexible Capital Fund, and Global Fund, respectively, had (in thousands) $3,606, $2,357, $1,978, $541, $0 and $431 of qualified late-year losses, which are deferred until fiscal year 2016 for tax purposes. Net late-year losses incurred after December 31st, and within the taxable year, are deemed to arise on the first day of the Fund’s next taxable year.
The 21st Century Fund and International Opportunities Fund utilized (in thousands) $45,039 and $577, respectively, of its capital loss carryforwards, during the year ended September 30, 2015.
As of September 30, 2015, the components of accumulated earnings (deficit) on a tax basis were as follows:
(Amounts in thousands) | | Focus
Fund | | | Growth
Fund | | | 21st
Century
Fund | | | International
Opportunities
Fund | | | Flexible
Capital
Fund | | | Global
Fund | |
Undistributed Ordinary Income | | $ | — | | | $ | — | | | $ | — | | | $ | — | | | $ | 2,070 | | | $ | — | |
Undistributed Trustees' Deferred Compensation | | | (1,852 | ) | | | (1,106 | ) | | | (777 | ) | | | (281 | ) | | | (797 | ) | | | (323 | ) |
Undistributed Long-Term Capital Gains | | | 157,704 | | | | 111,367 | | | | — | | | | — | | | | 61,322 | | | | 6,835 | |
Tax Accumulated Earnings (Deficit) | | | 155,852 | | | | 110,261 | | | | (777 | ) | | | (281 | ) | | | 62,595 | | | | 6,512 | |
Accumulated Capital and Other Losses | | | (3,606 | ) | | | (2,357 | ) | | | (417,819 | ) | | | (102,107 | ) | | | — | | | | (431 | ) |
Net Unrealized Appreciation on Investments and Foreign Currency Translations | | | 98,985 | | | | 41,156 | | | | 34,979 | | | | 2,418 | | | | 58,473 | | | | 3,752 | |
Trustees' Deferred Compensation Mark-to-Market | | | 472 | | | | 285 | | | | 232 | | | | 33 | | | | 503 | | | | 174 | |
Total Accumulated Earnings (Deficit) | | $ | 251,703 | | | $ | 149,345 | | | $ | (383,385 | ) | | $ | (99,937 | ) | | $ | 121,571 | | | $ | 10,007 | |
Undistributed ordinary income consists of net investment income and timing differences related to qualified late-year losses.
The tax character of distributions paid during the fiscal years ended September 30, 2015 and 2014 was as follows:
| | | 2015 | | | 2014 | |
(Amounts in thousands) | | Ordinary Income | | | Long-Term Capital Gains | | | Ordinary Income | | | Long-Term Capital Gains | |
Focus Fund | | $ | 17,276 | | | $ | 106,806 | | | $ | 13,021 | | | $ | 120,014 | |
Growth Fund | | | 11,035 | | | | 52,595 | | | | 24,630 | | | | 94,408 | |
21st Century Fund | | | — | | | | — | | | | — | | | | — | |
International Opportunities Fund | | | — | | | | — | | | | 742 | | | | — | |
Flexible Capital Fund | | | 11,186 | | | | 61,016 | | | | 44,547 | | | | 44,556 | |
Global Fund | | | 1,487 | | | | 6,923 | | | | 216 | | | | 9,062 | |
The tax character of dividends paid may differ from that shown in the Statements of Changes in Net Assets due to short-term gains being treated as ordinary income for tax purposes.
53
NOTES TO FINANCIAL STATEMENTS |
NOTES TO FINANCIAL STATEMENTS September 30, 2015 (continued)
On November 18, 2015, the Board of Trustees approved amendments to the existing Investment Advisory and Management Agreements between each of the Funds and the Adviser. These amendments will reduce the amount of compensation paid to the Adviser by each of the Funds. Effective December 1, 2015, the new fee structure for each of the Funds will be as follows:
Annual Rate of Average Daily Net Assets | | Asset Threshold |
0.80% | | First $250 million |
0.75% | | Next $250 million |
0.70% | | Next $250 million |
0.65% | | In excess of $750 million |
Management of the Adviser has determined that there were no other material subsequent events that would require disclosure in the Funds’ financial statements.
8. | New Accounting Pronouncements |
In June 2014, the Financial Accounting Standards Board issued ASU No. 2014-11 “Repurchase-to-Maturity Transactions, Repurchase Financings, and Disclosures”. The amendments in this ASU require an entity to modify accounting for repurchase-to-maturity transactions and repurchase financing arrangements, as well as to modify required disclosures for repurchase agreements, securities lending transactions, and repurchase-to-maturity transactions that are accounted for as secured borrowings. The guidance is effective for fiscal years beginning on or after December 15, 2014, and for interim periods within those fiscal years. Management is currently evaluating the impact these changes may have on the Funds’ financial statements.
54
NOTES TO FINANCIAL STATEMENTS |
REPORT OF INDEPENDENT REGISTERED PUBLIC ACCOUNTING FIRM
To the Board of Trustees and Shareholders of The Marsico Investment Fund
In our opinion, the accompanying statements of assets and liabilities, including the schedules of investments, and the related statements of operations and of changes in net assets and the financial highlights present fairly, in all material respects, the financial position of Marsico Focus Fund, Marsico Growth Fund, Marsico 21st Century Fund, Marsico International Opportunities Fund, Marsico Flexible Capital Fund, and Marsico Global Fund (the six funds constituting The Marsico Investment Fund, hereafter referred to as the “Funds”) at September 30, 2015, the results of each of their operations for the year then ended, the changes in each of their net assets for each of the two years in the period then ended and the financial highlights for each of the five years in the period then ended, in conformity with accounting principles generally accepted in the United States of America. These financial statements and financial highlights (hereafter referred to as “financial statements”) are the responsibility of the Funds’ management. Our responsibility is to express an opinion on these financial statements based on our audits. We conducted our audits of these financial statements in accordance with the standards of the Public Company Accounting Oversight Board (United States). Those standards require that we plan and perform the audit to obtain reasonable assurance about whether the financial statements are free of material misstatement. An audit includes examining, on a test basis, evidence supporting the amounts and disclosures in the financial statements, assessing the accounting principles used and significant estimates made by management, and evaluating the overall financial statement presentation. We believe that our audits, which included confirmation of securities at September 30, 2015 by correspondence with the custodian and brokers, provide a reasonable basis for our opinion.

Denver, Colorado
November 18, 2015
55
EXPENSE EXAMPLE For the six-month period ended September 30, 2015 (Unaudited)
As a shareholder of the Marsico Funds (the “Funds”), you incur two types of costs: (1) transaction costs, including redemption fees (if any), and (2) ongoing costs, including management fees, distribution (12b-1) fees, and other Fund expenses. This Example is intended to help you understand your ongoing costs (in dollars) of investing in the Funds and to compare these costs with the ongoing costs of investing in other mutual funds.
The Example is based on an investment of $1,000 invested at the beginning of the period and held for the entire period from April 1, 2015 to September 30, 2015 (the “period”).
Actual Expenses
The first line of the table below provides information about actual account values and actual expenses. You may use the information in this line, together with the amount you invested, to estimate the expenses you paid over the period. Simply divide your account value by $1,000 (for example, an $8,600 account value divided by $1,000 equals 8.6), then multiply the result by the number in the first line under the heading entitled “Expenses paid for the six-month period ended September 30, 2015” to estimate the expenses you paid on your account during the period.
Hypothetical Example for Comparison Purposes
The second line of the table below provides information about hypothetical account values and hypothetical expenses based on the Funds’ actual expense ratios and an assumed rate of return of 5% per year before expenses, which is not the actual return of any of the Funds. The hypothetical account values and expenses may not be used to estimate the actual ending account balance or expenses you paid for the period. You may use this information to compare the ongoing costs of investing in the Funds and other funds. To do so, compare this 5% hypothetical example with the 5% hypothetical examples that appear in the shareholder reports of other funds.
Please note that the expenses shown in the table are meant to highlight your ongoing costs only and do not reflect any transactional costs such as redemption fees (if any). Therefore, the second line of the table is useful in comparing the ongoing costs only, and will not help you determine the relative total costs of owning different funds. In addition, if these transactional costs (if any) were included, your costs could have been higher.
Expenses Paid During the Period | Beginning
account value
April 1, 2015 | Ending
account value
September 30, 2015 | Expenses paid for the
six-month period ended
September 30, 2015(1) |
FOCUS FUND | | | |
Actual Example | $ 1,000.00 | $ 921.20 | $ 6.18 |
Hypothetical Example, assuming a 5% return before expenses | $ 1,000.00 | $ 1,018.57 | $ 6.50 |
| | | | |
GROWTH FUND | | | |
Actual Example | $ 1,000.00 | $ 928.00 | $ 6.36 |
Hypothetical Example, assuming a 5% return before expenses | $ 1,000.00 | $ 1,018.40 | $ 6.66 |
| | | | |
21st CENTURY FUND | | | |
Actual Example | $ 1,000.00 | $ 910.20 | $ 6.39 |
Hypothetical Example, assuming a 5% return before expenses | $ 1,000.00 | $ 1,018.29 | $ 6.75 |
| | | | |
INTERNATIONAL OPPORTUNITIES FUND | | | |
Actual Example | $ 1,000.00 | $ 906.30 | $ 7.65 |
Hypothetical Example, assuming a 5% return before expenses | $ 1,000.00 | $ 1,016.98 | $ 8.09 |
| | | | |
FLEXIBLE CAPITAL FUND | | | |
Actual Example | $ 1,000.00 | $ 932.50 | $ 6.52 |
Hypothetical Example, assuming a 5% return before expenses | $ 1,000.00 | $ 1,018.26 | $ 6.81 |
| | | | |
GLOBAL FUND | | | |
Actual Example | $ 1,000.00 | $ 908.90 | $ 7.66 |
Hypothetical Example, assuming a 5% return before expenses | $ 1,000.00 | $ 1,016.98 | $ 8.09 |
(1) | Expenses are equal to the Funds’ annualized expense ratios (1.28% for the Focus Fund, 1.32% for the Growth Fund, 1.33% for the 21st Century Fund, 1.60% for the International Opportunities Fund, 1.35% for the Flexible Capital Fund, and 1.60% for the Global Fund), multiplied by the average account value over the period, multiplied by 183/365 (to reflect the six-month period). |
56
OTHER INFORMATION (Unaudited)
Proxy Voting Guidelines
The Funds exercise the voting rights associated with the securities held by the Funds under the proxy voting policy of the Funds. A description of those policies and procedures of the Funds and a record of the Funds’ proxy votes for the one-year period ended June 30, 2015 are available without charge, upon request, by calling 888-860-8686. It is also available on the Securities and Exchange Commission’s (SEC) website at www.sec.gov.
Quarterly Filing of Portfolio Holdings
The Funds will file their complete schedule of investments with the SEC for the first and third quarters of each fiscal year on Form N-Q. The Funds’ Form N-Q will be available (i) on the SEC’s website at www.sec.gov; (ii) at the SEC’s Public Reference Room; and (iii) by calling 800-SEC-0330.
Other Tax Information
Corporate Dividends Received Deduction
For the fiscal year ended September 30, 2015, 44.71%, 40.13%, 0%, 19.78%, 57.27% and 19.78% of the dividends paid from net investment income qualified for the dividends received deduction available to corporate shareholders of the Focus Fund, Growth Fund, 21st Century Fund, International Opportunities Fund, Flexible Capital Fund, and Global Fund, respectively.
Qualified Dividend Income
Pursuant to Section 854 of the Internal Revenue Code, the Focus Fund, Growth Fund, 21st Century Fund, International Opportunities Fund, Flexible Capital Fund, and Global Fund designated income dividends (in thousands) of $8,910, $6,005, $0, $0, $7,564 and $788, respectively, as qualified dividend income paid during the fiscal year ended September 30, 2015.
Foreign Taxes Paid
Pursuant to the foreign tax credit election under Section 853 of the Internal Revenue Code, the International Opportunities Fund designated (in thousands) $798 of income derived from foreign sources and $36 of foreign taxes paid, for the year ended September 30, 2015.
Of the ordinary income (including short-term capital gain) distributions made during the year ended September 30, 2015, the proportionate share of income derived from foreign sources and foreign taxes paid attributable to one share of stock are:
| | Foreign Source Income | Foreign Taxes Paid |
International Opportunities Fund | $0.1299 | $0.0059 |
Long Term Capital Gains Designation
For the fiscal year ended September 30, 2015, the Focus Fund, Growth Fund, Flexible Capital Fund and Global Fund designated (in thousands) $111,592, $59,981, $71,911 and $7,093, respectively, as long-term capital gain dividends for the purpose of the dividends paid deduction. These amounts include earnings and profits distributed to shareholders on the redemption of shares. For income tax purposes, the Funds may utilize earnings and profits distributed to shareholders on the redemption of shares as part of the dividends paid deduction.
Cost Basis Information
Federal law requires mutual fund companies to maintain a shareholder’s cost basis by tax lot and report gain/loss information and holding periods for sales of mutual fund shares that are “covered” securities to the IRS and to shareholders on Form 1099. Mutual fund shares, such as shares of the Funds, acquired on or after January 1, 2012 are covered securities. The Funds are not responsible for maintaining and reporting share information for their shares that are not deemed “covered.”
The tax regulations require that the Funds elect a default tax identification methodology in order to perform the required reporting. The Funds have chosen the first-in-first-out (“FIFO”) method as the default tax lot identification method for its shareholders. This is the method the Funds will use to determine which specific shares are deemed to be sold when a shareholder’s entire position is not sold in a single transaction and is the method in which “covered” share sales will be reported on a shareholder’s Form 1099.
However, at the time of purchase or upon the sale of “covered” shares, shareholders may generally choose a different tax lot identification method. Shareholders should consult a tax advisor with regard to their personal circumstances as the Funds and their service providers do not provide tax advice.
57
TRUSTEE AND OFFICER INFORMATION |
TRUSTEE AND OFFICER INFORMATION INDEPENDENT TRUSTEES
Name, Address and Age | Position(s) Held
with the Trust | Term of Office(1)
and Length of
Time Served | Principal Occupation(s)
During Past 5 Years | Number of Portfolios
in Fund Complex
Overseen by Trustee | Other Directorships
Held by Trustee |
Jay S. Goodgold
1200 17th Street
Suite 1600
Denver, CO 80202
DOB: 1954 | Trustee; Lead Independent Trustee | Trustee (since
February 2006);
Lead Independent Trustee (since November 2010) | Private investor (July 2003 - present);
Managing Director, Goldman, Sachs & Co.
(August 1978 - June 2003). | 6 | None |
Elizabeth Hoffman
1200 17th Street
Suite 1600
Denver, CO 80202
DOB: 1946 | Trustee | Since February 2006 | Professor of Economics (January 2007 - present) and Executive Vice President and Provost (January 2007 - July 2012), Iowa State University; President Emerita, University of Colorado (August 2005 - present). | 6 | None |
Walter A. Koelbel, Jr.
1200 17th Street
Suite 1600
Denver, CO 80202
DOB: 1952 | Trustee | Since December 1997 | President, and other positions, Koelbel
and Company (full service real estate,
development, investment, and management
company) (more than five years). | 6 | None |
Michael D. Rierson
1200 17th Street
Suite 1600
Denver, CO 80202
DOB: 1952 | Trustee | Since November 1998 | President, The Rierson Group (marketing and consulting firm serving non-profit organizations) (June 2015 - present); Senior Vice President for Development, Colonial Williamsburg Foundation (January 2011 - June 2015); Vice President and Vice Chancellor for University Advancement at the University of Houston and UH System, respectively (November 2005 - December 2010). | 6 | None |
Bruce E. Stangle
1200 17th Street
Suite 1600
Denver, CO 80202
DOB: 1948 | Trustee | Since May 2010 | Chairman, Analysis Group, Inc. (economic
consulting) (more than five years). | 6 | Director, Wellington Trust Company, NA (since 2001). |
Joseph T. Willett
1200 17th Street
Suite 1600
Denver, CO 80202
DOB: 1951 | Trustee | Since November 2002 | Private investor (2002 - present); Chief
Operating Officer, Merrill Lynch Europe
(1998 - 2002). | 6 | None |
(1) | Each Trustee serves an indefinite term until the election of a successor. Each Officer serves an indefinite term, renewed annually, until the election of a successor. |
The Statement of Additional Information includes additional information about the Trustees and is available upon request, without charge, by calling 888-860-8686 or visiting www.marsicofunds.com.
58
TRUSTEE AND OFFICER INFORMATION |
TRUSTEE AND OFFICER INFORMATION INTERESTED TRUSTEES* AND OFFICERS
Name, Address and Age | Position(s) Held
with the Trust | Term of Office(1)
and Length of
Time Served | Principal Occupation(s)
During Past 5 Years | Number of Portfolios
in Fund Complex
Overseen by Trustee | Other Directorships
Held by Trustee |
Thomas F. Marsico(2)
1200 17th Street
Suite 1600
Denver, CO 80202
DOB: 1955 | Trustee, President, Chief Executive Officer and Chief Investment Officer | Since December 1997 | Chief Executive Officer,
Marsico Capital Management, LLC
(more than five years). | 6 | None |
Christopher J. Marsico(2) 1200 17th Street
Suite 1600
Denver, CO 80202
DOB: 1961 | Trustee, Executive
Vice President and
Chief Operating Officer | Trustee (August 2007 - March 2010 and since May 2010); Vice President and Treasurer (September 2002 - May 2010); Executive Vice President and Chief Operating Officer
(since May 2010) | President,
Marsico Capital Management, LLC
(more than five years). | 6 | None |
Neil L. Gloude, CPA
1200 17th Street
Suite 1600
Denver, CO 80202
DOB: 1961 | Vice President, Secretary and Treasurer | Vice President and Secretary
(since May 2008);
Treasurer (since May 2010) | Executive Vice President, Chief
Financial Officer and Treasurer, Marsico Capital Management, LLC
(more than five years). | N/A | N/A |
David C. Price, CPA
1200 17th Street
Suite 1600
Denver, CO 80202
DOB: 1969 | Chief Compliance Officer | Since August 2004 | Chief Compliance Officer,
The Marsico Investment Fund, and
Director of Compliance,
Marsico Capital Management, LLC
(more than five years). | N/A | N/A |
Thomas M. J. Kerwin
1200 17th Street
Suite 1600
Denver, CO 80202
DOB: 1955 | Chief Legal Officer | Since August 2003 | Executive Vice President and General Counsel, Marsico Capital Management, LLC (more than five years). | N/A | N/A |
* | Trustees who are “interested persons” of the Funds, as defined in the 1940 Act. |
(1) | Each Trustee serves an indefinite term until the election of a successor. Each Officer serves an indefinite term, renewed annually, until the election of a successor. |
(2) | Mr. Thomas Marsico and Mr. Christopher Marsico are considered Interested Trustees of the Trust because of their affiliation with Marsico Capital Management, LLC, the Adviser to the Funds. Mr. Thomas Marsico and Mr. Christopher Marsico are brothers. |
The Statement of Additional Information includes additional information about the Trustees and is available upon request, without charge, by calling 888-860-8686 or visiting www.marsicofunds.com.
59
NOTES
60
Item 2 - Code of Ethics.
| (a) | The Registrant, as of the end of the period covered by this report, has adopted a code of ethics that applies to the Registrant’s principal executive officer, principal financial officer, principal accounting officer or controller, or persons performing similar functions, regardless of whether these individuals are employed by the Registrant or a third party. A copy of this code of ethics is attached hereto as Exhibit (a). |
| (c) | There were no amendments, during the period covered by this report, to a provision of the code of ethics that applies to the Registrant’s principal executive officer, principal financial officer, principal accounting officer or controller, or persons performing similar functions, regardless of whether these individuals are employed by the Registrant or a third party, and that relates to any element of the code of ethics description. |
| (d) | The Registrant has not granted any waivers, including an implicit waiver, from a provision of the code of ethics that applies to the Registrant’s principal executive officer, principal financial officer, principal accounting officer or controller, or persons performing similar functions, regardless of whether these individuals are employed by the Registrant or a third party, that relates to one or more of the items set forth in paragraph (b) of this item’s instructions. |
| (f) | See attached Exhibit (a). |
Item 3 - Audit Committee Financial Expert.
| (a)(1) | The Registrant’s Board of Trustees has determined that the Registrant has at least one audit committee financial expert serving on its audit committee. |
| (a)(2) | Mr. Joseph T. Willett is the audit committee financial expert. Mr. Willett is “independent” under the applicable rules. |
Item 4 - Principal Accountant Fees and Services.
In each of the fiscal years ended September 30, 2015 and September 30, 2014, the aggregate Audit Fees billed (or to be billed) by PricewaterhouseCoopers LLP (PwC) for professional services rendered for the audits of the financial statements, or services that are normally provided in connection with statutory and regulatory filings or engagements as well as reimbursable expenses are listed below.
(a) Audit Fees.
(b) Audit-Related Fees.
In each of the fiscal years ended September 30, 2015 and September 30, 2014, the aggregate Audit-Related Fees billed (or to be billed) by PwC for services rendered for assurance and related services to each fund that are reasonably related to the performance of the audit or review of each fund's financial statements, but not reported as Audit Fees, are shown in the table below.
Audit-related fees noted in 2015 and 2014 are for non-recurring work performed by PwC related to the Funds’ distributions to shareholders.
(c) Tax Fees.
In each of the fiscal years ended September 30, 2015 and September 30, 2014 the aggregate Tax Fees billed (or to be billed) by PwC for professional services rendered for tax compliance, tax advice, and tax planning are shown in the table below.
All of these fees were approved by the Trust’s Audit Committee as required pursuant to paragraph (c)(7)(ii) of Rule 2-01 of Regulation S-X.
Fees included in the Tax Fees category comprise all services performed by professional staff in the independent registered public accounting firm's tax division except those services related to the audit. Typically, this category would include fees for tax compliance, tax planning, and tax advice. Tax compliance, tax advice, and tax planning services include preparation of original and amended tax returns, claims for refund and tax payment-planning services, assistance with tax audits and appeals, tax advice related to mergers and acquisitions and requests for rulings or technical advice from taxing authorities.
(d) All Other Fees.
In each of the fiscal years ended September 30, 2015 and September 30, 2014 the aggregate Other Fees billed (or to be billed) by PwC for all other non-audit services rendered are shown in the table below.
| (e)(1) | Audit Committee Pre-Approval Policies and Procedures: |
Pursuant to the Trust’s Audit Committee Charter and Policies and Procedures (collectively, the “Procedures”), the Audit Committee has adopted pre-approval policies and procedures to govern the pre-approval of (i) all audit services and permissible non-audit services to be provided to the Trust by its independent accountant, and (ii) all permissible non-audit services to be provided by such independent accountant to the Trust’s investment adviser and to any entity controlling, controlled by or under common control with the investment adviser that provides on-going services to the Trust (collectively, any “Service Affiliates”) if the engagement directly relates to the Trust’s operations and financial reporting.
In accordance with the Procedures, the Committee is responsible for the engagement of the independent accountant to certify the Trust’s financial statements for each fiscal year. With respect to the pre-approval of non-audit services provided to the Trust and its Service Affiliates, the Procedures provide that the Committee may pre-approve such services on a project-by-project basis as they arise. The Procedures also permit the Committee to delegate authority to the Audit Committee Chairman (the “Designated Member”) to pre-approve any proposed non-audit services that have not been previously approved by the Committee, subject to certain conditions. Any action by the Designated Member in approving a requested non-audit service shall be presented to the Audit Committee not later than at its next scheduled meeting. If the Designated Member does not approve the independent auditor’s provision of a requested non-audit service, the matter may be presented to the full Committee for its consideration and action.
| (e)(2) | Services approved pursuant to paragraph (c)(7)(i)(C) of Rule 2-01 of Regulation S-X: |
100% of these fees were approved by the Trust’s Audit Committee as required pursuant to paragraph (c)(7)(ii) of Rule 2-01 of Regulation S-X.
| (f) | According to PwC for the fiscal year ended September 30, 2015, the percentage of hours spent on the audit of the Marsico Funds’ financial statements for the most recent fiscal year that were attributed to work performed by persons who are not full-time, permanent employees of PwC is as follows: |
| PwC | 2015 |
| Work performed by persons who are not full-time | 0% |
| (g) | In each of the fiscal years ended September 30, 2015 and September 30, 2014, the aggregate fees billed (or to be billed) by PwC relating to non-audit services that were rendered to the Trust, to its investment adviser, and to any entity controlling, controlled by, or under common control with the investment adviser and that provides ongoing services to the Trust are shown in the table below. |
Item 5 – Audit Committee of Listed Registrants.
Not applicable.
Item 6 – Schedule of Investments.
The schedule of investments in securities of unaffiliated issuers is included as part of the report to shareholders filed under Item 1.
Item 7 – Disclosure of Proxy Voting Policies and Procedures for Closed-End Management Investment Companies.
Not applicable.
Item 8 – Portfolio Managers of Closed-End Management Investment Companies.
Not applicable.
Item 9 – Purchases of Equity Securities by Closed-End Management Investment Company and Affiliated Purchasers.
Not applicable.
Item 10 – Submission of Matters to a Vote of Security Holders.
Not applicable.
Item 11 – Controls and Procedures.
| (a) | The registrant's principal executive officer and principal financial officer have concluded that the registrant's disclosure controls and procedures (as defined in Rule 30a-3(c) under the Investment Company Act of 1940, as amended) are effective based on their evaluation of these disclosure controls and procedures within 90 days of the filing date of this report on Form N-CSR. |
| (b) | There were no significant changes in the registrant's internal control over financial reporting (as defined in Rule 30a-3(d) under the Investment Company Act of 1940, as amended) that occurred during the second fiscal half-year covered by this report that has materially affected, or is reasonably likely to materially affect, the registrant’s internal control over financial reporting. |
Item 12 – Exhibits.
| (a)(1) | Code of Ethics - Filed as an attachment to this filing. |
| (a)(2) | Certification for each principal executive and principal financial officer of the registrant as required by Rule 30a-2(a) under the Act (17 CFR 270.30a-2(a)). Filed as an attachment to this filing. |
| (a)(3) | Any written solicitation to purchase securities under Rule 23c-1 under the Investment Company Act of 1940, as amended, that was sent or given during the period covered by the report by or on behalf of the registrant to 10 or more persons. |
Not applicable.
| (b) | Certifications required by Rule 30a-2(b) under the Act (17 CFR 270.30a-2(b)), Rule 13a-14(b) or Rule 15d-14(b) under the Exchange Act (17 CFR 240.13a-14(b) or 240.15d-14(b)), and Section 1350 of Chapter 63 of Title 18 of the United States Code (18 U.S.C. 1350). Filed as an attachment to this filing. |
SIGNATURES
Pursuant to the requirements of the Securities Exchange Act of 1934 and the Investment Company Act of 1940, the registrant has duly caused this report to be signed on its behalf by the undersigned, thereunto duly authorized.
The Marsico Investment Fund
| By: | /s/ Christopher J. Marsico | |
| | Christopher J. Marsico | |
| | Executive Vice President and Chief Operating Officer | |
| | | |
| Date: | December 4, 2015 | |
| | | |
| Pursuant to the requirements of the Securities Exchange Act of 1934 and the Investment Company Act of 1940, this report has been signed below by the following persons on behalf of the registrant and in the capacities and on the dates indicated. |
| | | |
| By: | /s/ Christopher J. Marsico | |
| | Christopher J. Marsico | |
| | Executive Vice President and Chief Operating Officer | |
| | | |
| Date: | December 4, 2015 | |
| | | |
| By: | /s/ Neil L. Gloude | |
| | Neil L. Gloude | |
| | Vice President, Secretary and Treasurer | |
| | | |
| Date: | December 4, 2015 | |