UNITED STATES
SECURITIES AND EXCHANGE COMMISSION
Washington, D.C. 20549
FORM N-CSR
CERTIFIED SHAREHOLDER REPORT OF REGISTERED
MANAGEMENT INVESTMENT COMPANIES
Investment Company Act file number 811-08397
THE MARSICO INVESTMENT FUND
(Exact name of registrant as specified in charter)
1200 17th Street, Suite 1600
Denver, CO 80202
(Address of principal executive offices)(Zip code)
Christopher J. Marsico
The Marsico Investment Fund
1200 17th Street, Suite 1600
Denver, CO 80202
(Name and address of agent for service)
Copies to:
Anthony H. Zacharski
Dechert LLP
90 State House Square
Hartford, CT 06103
Registrant's telephone number, including area code: (303)454-5600
Date of fiscal year end: September 30
Date of reporting period: September 30, 2016
Item 1 – Reports to Stockholders.
DEAR SHAREHOLDER:
Enclosed is your annual report for The Marsico Investment Fund, encompassing the one-year fiscal period from October 1, 2015 to September 30, 2016.
The purpose of this report is to provide a review of the Marsico Funds’ one-year investment results by discussing what we believe were the main areas that impacted performance – including the macroeconomic environment, sector and industry positioning, and individual stock selection – as compared to the Funds’ performance benchmark indexes. For updated information regarding the market environment and the Funds’ overall investment postures and performance, please refer to the Funds’ most recent monthly fact sheets and quarterly investment updates, which are available in the Investor Resources section of the Funds’ website at marsicofunds.com.(1)
(1) | The references to the Marsico Funds website (marsicofunds.com) included throughout this annual report do not incorporate the website’s contents into this report. |
| | KEY FUND STATISTICS | 2 | |
| | MARKET ENVIRONMENT | 5 | |
| | | | |
| | MARSICO FOCUS FUND |
| | Investment Review | 6 | |
| | Fund Overview | 9 | |
| | Schedule of Investments | 10 | |
| | | | |
| | MARSICO GROWTH FUND |
| | Investment Review | 11 | |
| | Fund Overview | 14 | |
| | Schedule of Investments | 15 | |
| | | | |
| | MARSICO 21st CENTURY FUND |
| | Investment Review | 17 | |
| | Fund Overview | 19 | |
| | Schedule of Investments | 20 | |
| | | | |
| | MARSICO INTERNATIONAL OPPORTUNITIES FUND |
| | Investment Review | 22 | |
| | Fund Overview | 24 | |
| | Schedule of Investments | 25 | |
| | | | |
| | MARSICO FLEXIBLE CAPITAL FUND |
| | Investment Review | 27 | |
| | Fund Overview | 29 | |
| | Schedule of Investments | 30 | |
| | | | |
| | MARSICO GLOBAL FUND |
| | Investment Review | 32 | |
| | Fund Overview | 35 | |
| | Schedule of Investments | 36 | |
| | | | |
| | FINANCIAL STATEMENTS | 38 | |
| | NOTES TO FINANCIAL STATEMENTS | 48 | |
| | REPORT OF INDEPENDENT REGISTERED PUBLIC ACCOUNTING FIRM | 56 | |
| | EXPENSE EXAMPLE | 57 | |
| | OTHER INFORMATION | 58 | |
| | TRUSTEE AND OFFICER INFORMATION | 59 | |
1
KEY FUND STATISTICS (UNAUDITED) |
Marsico Focus Fund | Marsico Growth Fund | Marsico 21st Century
Fund |
| | MFOCX | | | MGRIX | | | MXXIX | |
For additional disclosures, please see page 9. | For additional disclosures, please see page 14. | For additional disclosures, please see page 19. |
PERFORMANCE COMPARISON(1) | PERFORMANCE COMPARISON(1) | PERFORMANCE COMPARISON(1) |
| 
| 
|
TOTAL ANNUAL OPERATING EXPENSES* 1.19% | TOTAL ANNUAL OPERATING EXPENSES* 1.27% | TOTAL ANNUAL OPERATING EXPENSES* 1.33% |
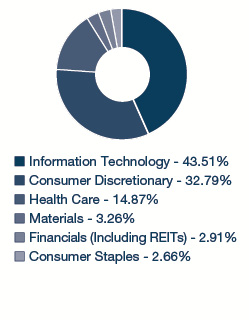
SECTOR ALLOCATION(2) | SECTOR ALLOCATION(2) | SECTOR ALLOCATION(2) |
 | 
| 
|
TOP FIVE HOLDINGS | TOP FIVE HOLDINGS | TOP FIVE HOLDINGS |
| ALIBABA GROUP HOLDING LTD. SPON. ADR | 8.29% | FACEBOOK, INC. - CL. A | 5.25% | CONSTELLATION BRANDS, INC. - CL. A | 4.22% |
| FACEBOOK, INC. - CL. A | 8.07% | AMAZON.COM, INC. | 5.05% | DOMINO’S PIZZA, INC. | 4.00% |
| AMAZON.COM, INC. | 6.33% | ALIBABA GROUP HOLDING LTD. SPON. ADR | 4.51% | FACEBOOK, INC. - CL. A | 4.00% |
| VISA, INC. - CL. A | 6.32% | VISA, INC. - CL. A | 4.20% | AMAZON.COM, INC. | 3.93% |
| ELECTRONIC ARTS, INC. | 6.03% | THE HOME DEPOT, INC. | 3.67% | MASTERCARD, INC. - CL. A | 3.75% |
For additional disclosures about the Marsico Funds, please see page 4. The performance data quoted here represent past performance, and past performance is not a guarantee of future results. Investment return and principal value of an investment will fluctuate so that an investor’s shares, when redeemed, may be worth more or less than their original cost.
2
KEY FUND STATISTICS (UNAUDITED) |
Marsico International
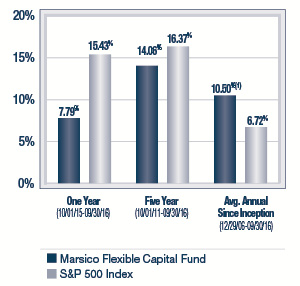
Opportunities Fund | Marsico Flexible Capital
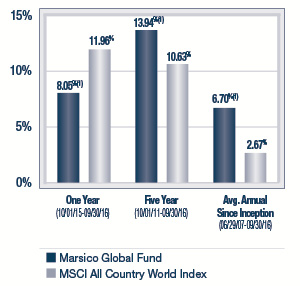
Fund | Marsico Global Fund |
| | MIOFX | | | MFCFX | | | MGLBX | |
For additional disclosures, please see page 24. | For additional disclosures, please see page 29. | For additional disclosures, please see page 35. |
PERFORMANCE COMPARISON(1) | PERFORMANCE COMPARISON(1) | PERFORMANCE COMPARISON(1) |
 | 
| 
|
TOTAL ANNUAL OPERATING EXPENSES* 1.58% NET EXPENSES*† 1.60% | TOTAL ANNUAL OPERATING EXPENSES* 1.27% | TOTAL ANNUAL OPERATING EXPENSES* 1.49% NET EXPENSES*† 1.60% |
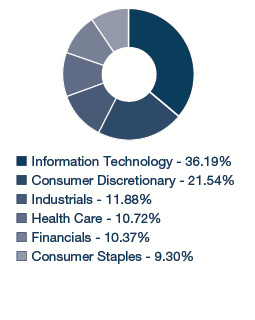
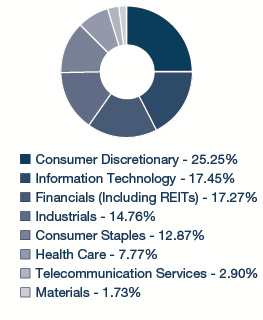
SECTOR ALLOCATION(2) | SECTOR ALLOCATION(2) | SECTOR ALLOCATION(2) |
| 
| 
|
TOP FIVE HOLDINGS | TOP FIVE HOLDINGS | TOP FIVE HOLDINGS |
| TENCENT HOLDINGS LTD. | 5.41% | CONSTELLATION BRANDS, INC. - CL. A | 6.36% | TENCENT HOLDINGS LTD. | 6.40% |
| ASML HOLDING N.V. | 5.12% | CROWN CASTLE INTERNATIONAL CORP. | 4.82% | ALIBABA GROUP HOLDING LTD. SPON. ADR | 5.77% |
| ELEMENT FINANCIAL CORPORATION | 4.42% | VISA, INC. - CL. A | 4.58% | FACEBOOK, INC. - CL. A | 5.25% |
| FACEBOOK, INC. - CL. A | 4.08% | THE HOME DEPOT, INC. | 4.48% | AMAZON.COM, INC. | 4.47% |
| WIRECARD A.G. | 4.06% | NIELSEN HOLDINGS PLC | 4.25% | DOMINO’S PIZZA ENTERPRISES LTD. | 3.74% |
Current performance may be lower or higher than the performance information quoted. To obtain performance information current to the most recent month-end, please call 888-860-8686 or visit marsicofunds.com.
3
KEY FUND STATISTICS (UNAUDITED) |
ADDITIONAL DISCLOSURES ABOUT THE MARSICO FUNDS
* | The Total Annual Operating Expenses and Net Expenses are reflective of the information disclosed in the Funds’ Prospectus dated January 29, 2016. The information may differ from the expense ratios disclosed in this report. |
† | Marsico Capital Management, LLC (the “Adviser”) has entered into a written expense limitation and fee waiver agreement under which it has agreed to limit the total expenses of each of the International Opportunities Fund and the Global Fund (excluding interest, taxes, acquired fund fees and expenses, litigation, brokerage and extraordinary expenses) to an annual rate of 1.60% of each Fund’s average net assets until January 31, 2017. This expense limitation and fee waiver agreement may be terminated by the Adviser at any time after January 31, 2017, upon 15 days prior notice to the Fund and its administrator. The Adviser may recoup from a Fund fees previously waived or expenses previously reimbursed by the Adviser with respect to that Fund pursuant to this agreement (or a previous expenses limitation agreement) if: (1) such recoupment by the Adviser does not cause the Fund, at the time of recoupment, to exceed the lesser of (a) the expense limitation in effect at the time the relevant amount was waived and/or reimbursed, or (b) the expense limitation in effect at the time of the proposed recoupment, and (2) the recoupment is made within three fiscal years after the end of the fiscal year in which the amount was waived or reimbursed. |
(1) | The performance data quoted here represent past performance, and past performance is not a guarantee of future results. Investment return and principal value of an investment will fluctuate so that an investor’s shares, when redeemed, may be worth more or less than their original cost. Current performance may be lower or higher than the performance information quoted. To obtain performance information current to the most recent month-end, please call 888-860-8686 or visit marsicofunds.com. |
| The performance included in the chart does not reflect the deduction of taxes on Fund distributions or the redemption of Fund shares. |
| All indices are unmanaged and investors cannot invest directly in an index. |
| Periodically, certain fees and expenses have been waived or reimbursed by the Adviser for the 21st Century Fund, the International Opportunities Fund, the Flexible Capital Fund and the Global Fund. In the absence of such a waiver or reimbursement, the performance returns reflected would have been reduced. In accordance with the expense limitation and fee waiver agreement, the Adviser may recoup fees and expenses previously waived or reimbursed under certain parameters. Periodically, the Adviser has recouped such fees or expenses from the 21st Century Fund, the International Opportunities Fund, and the Global Fund, resulting in a lower performance return. |
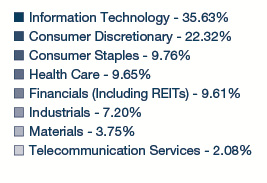
(2) | Sector weightings represent the percentage of the respective Fund’s investments (excluding cash equivalents) in certain general sectors. These sectors may include more than one industry. For the year ended September 30, 2016, the Financials sector includes real estate investment trusts. The Fund’s portfolio composition is subject to change at any time. |
4
MARKET ENVIRONMENT: OCTOBER 2015 – SEPTEMBER 2016 (UNAUDITED)
After a sharp decline in early 2016, global equity markets generally recorded positive performances for the one-year fiscal period ended September 30, 2016, with a few notable exceptions. Gains were healthy in the US, the UK, Germany, and in many emerging markets. Modest losses were recorded in other European markets, with larger losses in Japan. Chinese shares, although highly volatile, ended the period nearly flat.
Similarly, most commodity prices moved sideways during the one-year fiscal period, trading in relatively tight trading ranges at prices well below those of a few years ago. For example, oil prices were up only $3 per barrel over the prior one-year period ended September 30, 2015, with West Texas Intermediate crude ending the September 30, 2016 period trading at approximately $48 per barrel, or roughly half the price in place for much of 2014.
Regarding the decline in early 2016, after mounting decent rallies through year-end 2015, most of the world’s equity markets swooned during the first two months of 2016, in part as a reaction to the mid-December decision by the US Federal Reserve Board to begin raising interest rates. By early spring, Fed officials signaled newfound restraint, and ratcheted down their predictions of how fast rates would rise. Share prices globally rebounded, in part because of the Fed’s about-face, as well as easing by other central banks and signs of life in some emerging markets. As of period-end, there have been no Fed moves to tighten since late 2015. The general failure of wages and inflation to rebound, the slow pace for real GDP growth, and the surprising return of previously unemployed laborers to the US workforce all appear to have slowed Fed plans to tighten.
During the remainder of the one-year fiscal period ended September 30, 2016, three distinct storylines emerged. US and emerging economy shares continued to climb, as intermittent growth emerged and it appeared less likely that the Fed would raise short-term interest rates. In Japan, shares were saddled with an unwanted surge in the yen after the Bank of Japan expanded its stimulus program, and the Nikkei Index ended the period down sharply. Finally, in late June, the British surprised the world by voting to leave the European Union. This ushered in a violent sell-off for the British pound. The plunge for the pound compounded worries for Continental Europe regarding the impact of a “Brexit.”
With the exception of the pound and the yen, currency markets experienced relatively low volatility during the period. The dollar was little changed versus the euro, and declined versus a broad basket of currencies during the one-year period.
Throughout the developed world, inflation remained largely subdued. With global growth tepid and inflation quiescent, sovereign bond yields fell meaningfully. Domestically, the US 10-year Treasury bond yield fell to 1.37% in the summer of 2016 before rising to 1.60% at period end. In the rest of the developed world the declines were even more dramatic. Incredibly, 5-year sovereign yields ended the period in negative territory in Japan, Switzerland, the Netherlands, Sweden, Germany and France.
The performance of global markets during the period is depicted below. US markets posted strong gains for the one-year period. Large capitalization US equities mirrored small capitalization stocks, as companies of all sizes mostly rose in unison. Emerging market equities outperformed as their currencies strengthened slightly relative to the US dollar, easing import costs for those countries. Developed international markets posted the weakest returns, dragged down by factors such as the Japanese market’s reaction to Bank of Japan stimulus.
Index Name(1) | Universe of
Equities Represented | One-Year
Total Return (as of September 30, 2016) |
US | | |
S&P 500 | US large-capitalization equities | +15.43% |
Russell 3000 | US publicly-traded equities of all sizes | +14.96% |
Russell 2000 | US small-capitalization equities | +15.47% |
Russell Mid-Cap Growth | US medium-capitalization
equities | +11.24% |
Index Name(1) | Universe of
Equities Represented | One-Year
Total Return (as of September 30, 2016) |
INTERNATIONAL | |
MSCI EAFE (US$) | Equities in developed international equity markets, including Japan, Western Europe, and Australasia | +6.52% |
MSCI Emerging Markets (US$) | Equities in developing international equity markets, including China, India, Eastern Europe, and Latin America | +16.78% |
MSCI ACWI (US$) | Equities in the global developed and emerging markets | +11.96% |
THE MARSICO INVESTMENT TEAM
(1) | All indices are unmanaged and investors cannot invest directly in an index. |
5
INVESTMENT REVIEW BY TOM MARSICO AND CORALIE WITTER (UNAUDITED)
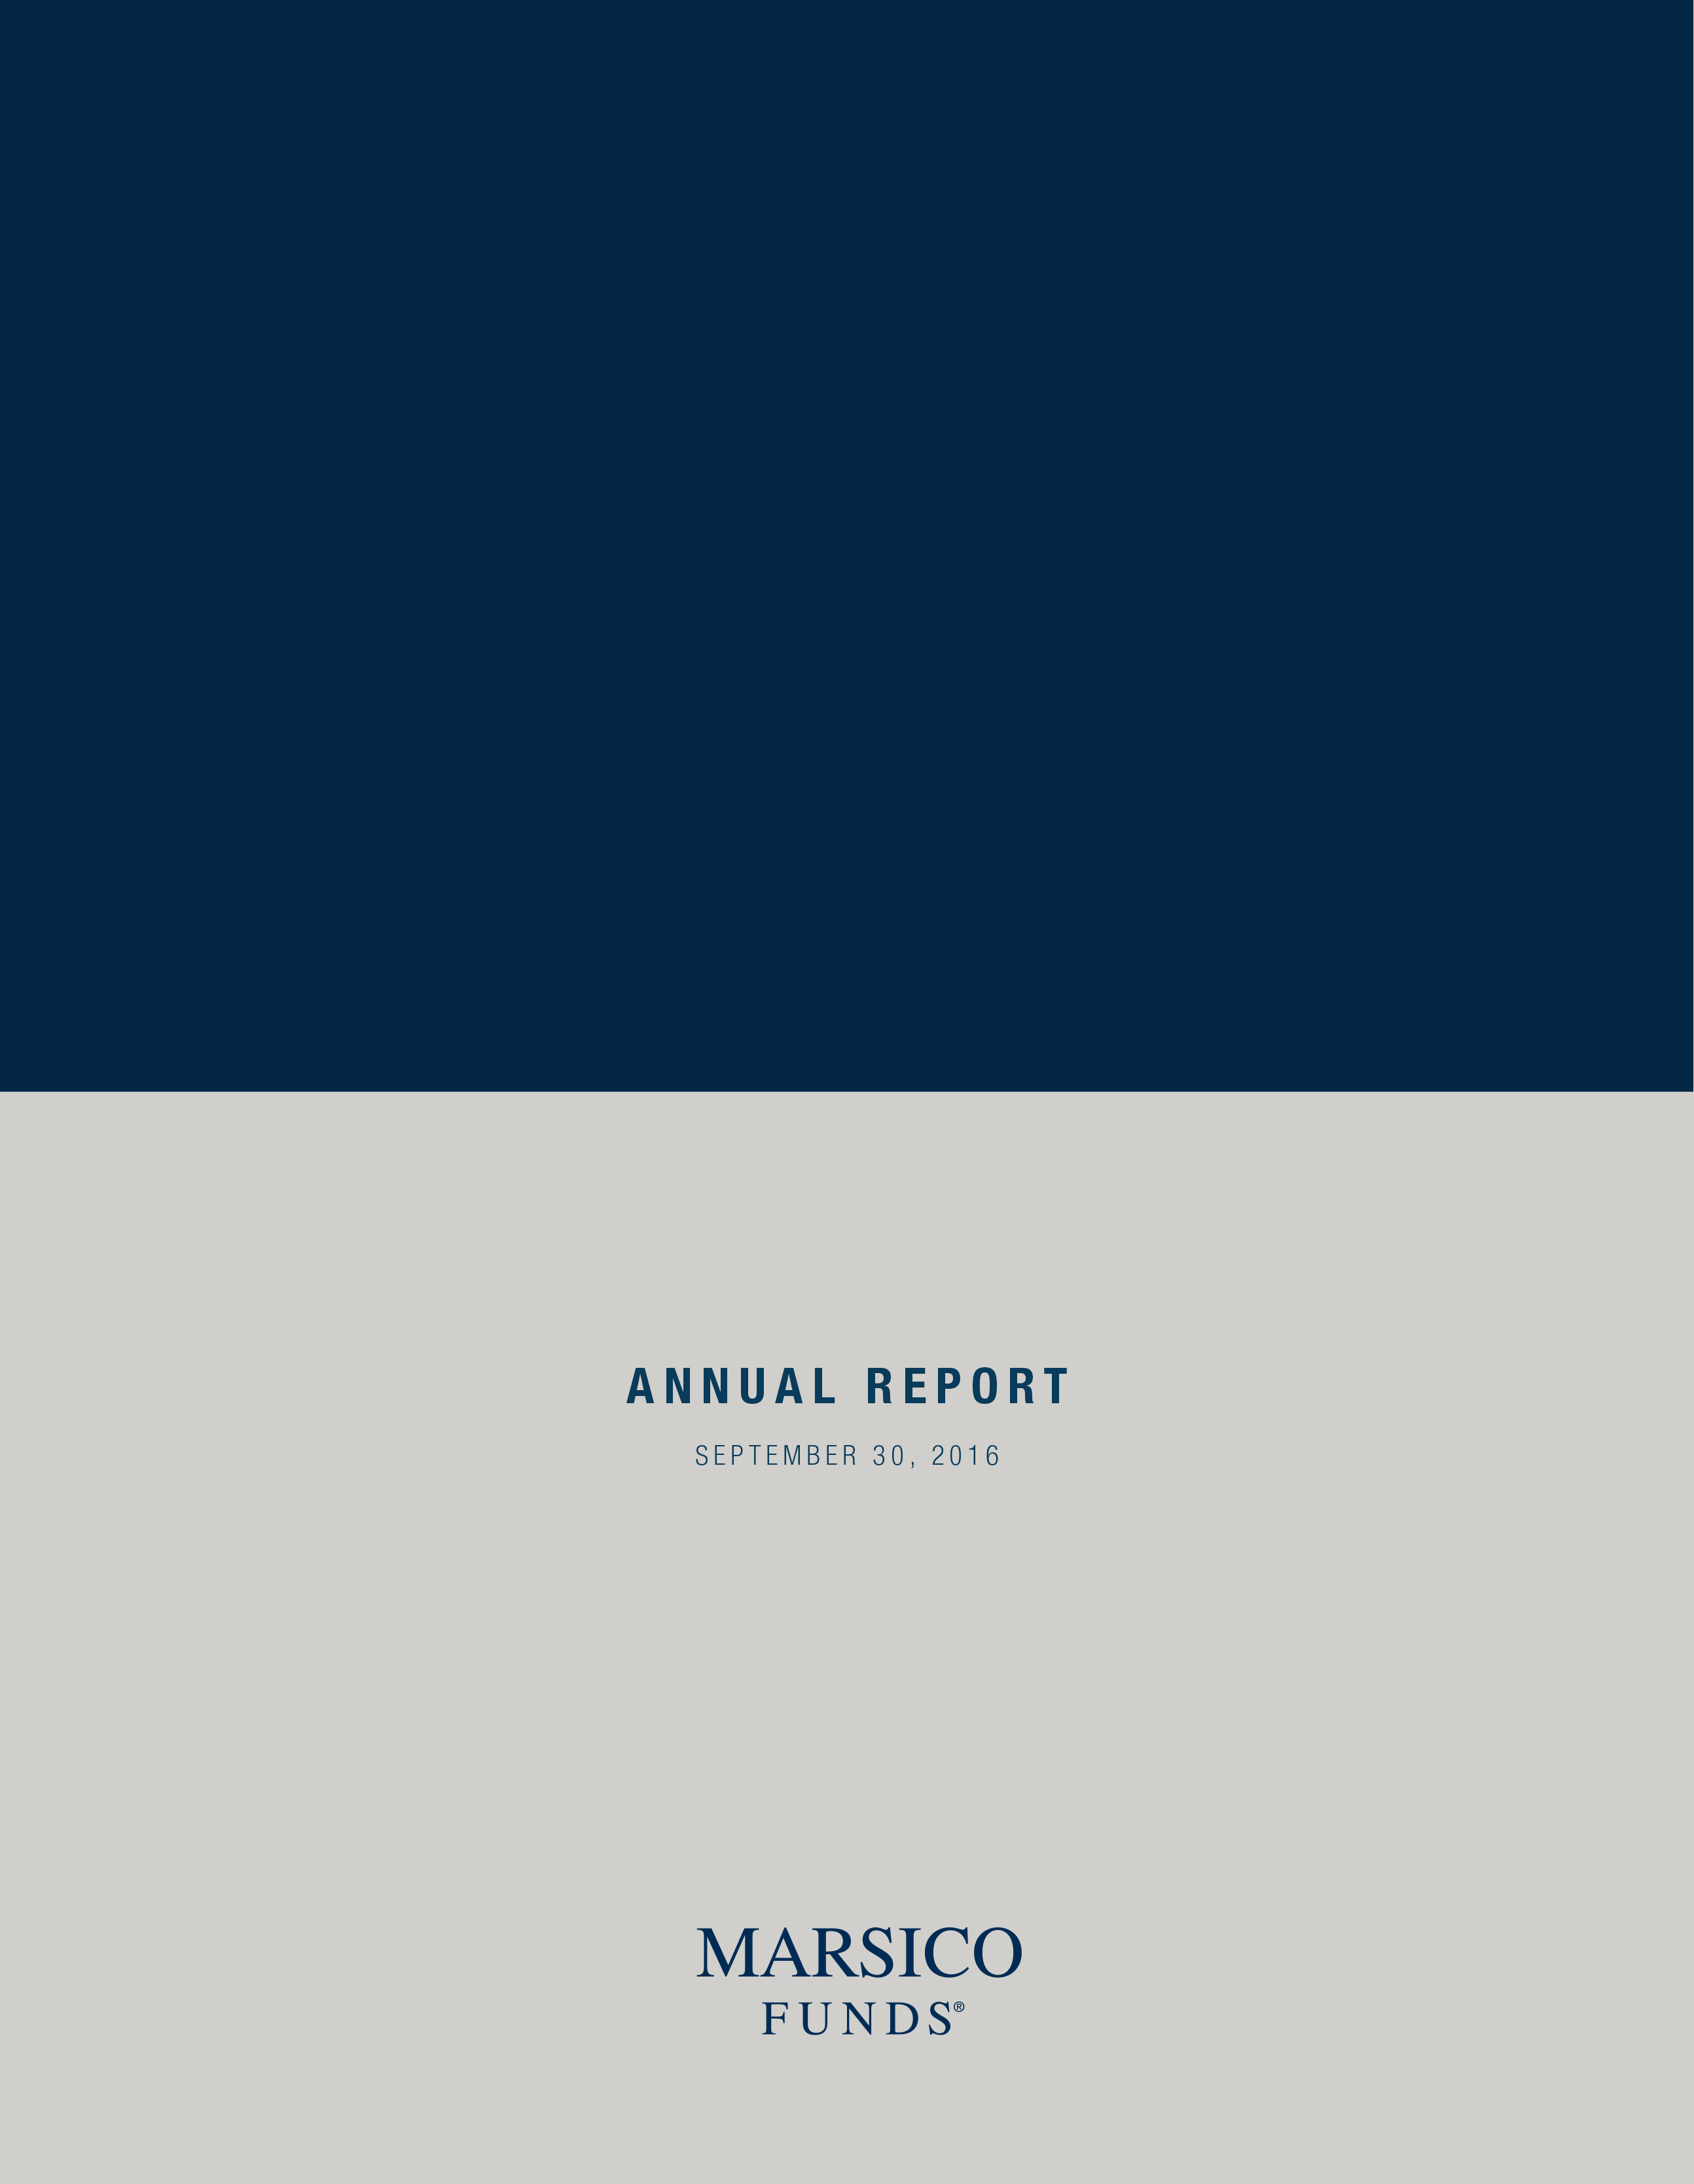
The Marsico Focus Fund posted a total return of +5.75% for the one-year fiscal period ended September 30, 2016. While the Fund posted a positive return, the Fund’s relative performance lagged its benchmark index, the S&P 500 Index, which had a total return of +15.43% over the same time period. Please see the Fund’s Overview for more detailed information about the Fund’s longer-term performance for various time periods ended September 30, 2016.
The performance data for the Fund quoted here represent past performance, and past performance is not a guarantee of future results. Investment return and principal value of an investment will fluctuate so that an investor’s shares, when redeemed, may be worth more or less than their original cost. Current performance may be lower or higher than the performance information quoted. To obtain performance information current to the most recent month-end, please call 888-860-8686 or visit marsicofunds.com. (1)
This review highlights Fund performance over a one-year fiscal period. Shareholders should keep in mind that the Fund is intended for long-term investors who hold their shares for substantially longer periods of time. You should also keep in mind that our current views and beliefs regarding all investments discussed in this report are subject to change at any time. References to specific securities, industries, and sectors discussed in this report are not recommendations to buy or sell such securities or related investments, and the Fund may not necessarily hold these securities or investments today. Please see the accompanying Schedule of Investments for the percentage of the Fund’s portfolio represented by the securities mentioned in this report as of the end of the reporting period.
The Focus Fund is non-diversified and may hold fewer securities than a diversified fund because it is permitted to invest a greater percentage of its assets in a smaller number of securities. Holding fewer securities increases the risk that the value of the Fund could go down because of the poor performance of a single investment or may be more volatile than its benchmark. The Fund is subject to broad risks associated with investing in equity securities markets generally, including the risks that the securities and markets in which it invests may experience volatility and instability, that domestic and global economies and markets may undergo periods of cyclical change and decline, that investors may at times avoid investments in equity securities, and that investments may not perform as anticipated. Please see the Prospectus for more information.
The Fund is not managed to track the benchmark index, and may hold a substantially overweight or underweight position in a sector, industry, or security compared to its weight in the benchmark. For informational purposes, the discussion below may compare the benchmark weight or performance of a sector or industry to the investment approach of the Fund.
The Focus Fund’s performance shortfall during the one-year ended September 30, 2016, as compared to the S&P 500 Index, was primarily attributable to certain Fund holdings in the Health Care, Consumer Discretionary, and Consumer Staples sectors, as defined in the Global Industry Classification Standard (“GICS”)(2).
Stock prices of many Health Care companies were under pressure during the reporting period. Hospital operators slumped during late 2015 on worries that an increasing number of uninsured patients will be unable to pay their bills as fewer states expand Medicaid and more patients drop insurance because of unaffordable premiums. The Fund’s position in health care facility operator HCA Holdings, Inc. slid -16% prior to being sold during the period.
Certain of the Fund’s holdings within the Pharmaceutical, Biotechnology & Life Sciences industry posted negative returns. A specific holding, Pacira Pharmaceuticals, Inc., a manufacturer of a non-opioid post-surgical pain anesthetic, Exparel, declined by -18% prior to being sold from the Fund. Pacira’s stock price was pressured by uncertainty surrounding its application for FDA approval for expanded use of Exparel to provide post-surgical pain relief. Although Pacira received a label expansion for Exparel in late 2015, the company has struggled to reaccelerate sales. Regeneron Pharmaceuticals, Inc. and Novartis AG declined -20% and -19%, respectively, during the period prior to being sold from the Fund. We chose to sell Regeneron because the US government is stepping up efforts to control Medicare Part B costs, an area where Regeneron has more exposure than many of its peers. We sold Novartis after a disappointing launch of the company’s new heart failure drug and operational challenges in its eye care division. Genome sequencing company Illumina, Inc. (-21% during the period prior to being sold) preannounced lower-than-expected revenues and cut its guidance due in part to disappointing sales in Europe and Asia.
6
Several of the Fund’s Consumer Discretionary holdings struggled during the period, including Chipotle Mexican Grill, Inc. and NIKE, Inc. – Cl. B. Restaurant operator Chipotle (-42%) posted a negative return during the period after it was discovered that foodborne illnesses, including norovirus and E. coli outbreaks, were linked to Chipotle restaurants in several states. The Fund maintained a position in the company as the company is taking important measures to improve the safety of its food supply chain, and a resolution of food safety issues should lead to improvement in the number of customer visits and contribute to strong same store sales growth. Additionally, the company launched a loyalty rewards program during the period, which should incentivize customers to return to the stores. Athletic apparel company NIKE, meanwhile, posted a return of -13% during the period. Although the company’s growth rates slowed slightly as competitors Adidas and Under Armour, Inc. took market share, we still like the long-term growth potential of NIKE, which we believe remains the clear leader in the space. Consumer Discretionary was a weaker-performing sector of the S&P 500 Index, and the Fund’s performance was held back by having an overweight allocation to the sector as compared to the benchmark index.
In the Consumer Staples sector, shares of grocer The Kroger Company, the nation’s largest supermarket chain by sales, slumped -19% as the company cut its full-year sales and earnings forecast due to declining food prices. An excess supply of food products, together with reduced global demand, have placed the US on track to post the largest decline in food prices in more than 50 years. Given the outlook, we elected to sell the position during the period.
We sold one of the Fund’s few holdings in the Financials sector, The Charles Schwab Corporation (-14% during the portion of the reporting period it was held), following the outcome of the “Brexit” vote, as we believe a persistent headwind of lower interest rates for a longer period will prove challenging for the stock.
From a sector allocation perspective, the Fund’s performance was impaired by having no exposure to the Telecommunication Services and Utilities sectors – two of the stronger-performing sectors of the S&P 500 Index during the period. In the continued uncertain macroeconomic environment, dividend paying stocks perceived by the market to offer safety, such as Utilities and Telecommunications, were rewarded. We believed valuations for many companies in both sectors were high, and we found more compelling investment opportunities in other sectors. In addition, Fund performance lagged as a result of having little exposure to the strong-performing Energy sector.
The picture was brighter in other areas. The Fund’s holdings in the Information Technology sector performed strongly, led by holdings in the Software & Services industry. For some time, the Fund has maintained investments in companies making innovative use of technology to create better retail and advertising business models. Alibaba Group Holding Ltd. Spon. ADR, China’s leading ecommerce company, staged a stock price gain of +79% during the period. Alibaba’s stock rose after sales on China’s “Singles Day,” a holiday popular among young unmarried adults in China, were stronger than expected. Positions in social media company Facebook, Inc. – Cl. A and internet services company Alphabet, Inc. – Cl. A also were among the Fund’s best performing holdings, and posted gains of +43% and +26%, respectively, during the reporting period. Facebook’s results continued to exceed market expectations, led by strong advertising revenue and monthly active user growth rates, a result of the company’s embracing a shift towards mobile phone usage. Early in the period, Google reorganized its business under a new holding company called Alphabet. The restructuring separated the companies’ reporting of proven moneymaking Internet business units from innovative “moonshot” businesses such as self-driving cars, smart home technology, and life sciences. The reorganization was welcomed by many investors, and Alphabet’s shares were buoyed by strong revenue growth, particularly from continued strength in mobile search.
Video game software company Electronic Arts, Inc.’s stock price rose +26% during the period. We believe the firm’s profitability should continue to improve as new video game consoles make it more convenient for players to download video games online, rather than purchasing physical copies of game software.
In the Consumer Discretionary sector, shares of online retailer Amazon.com, Inc. soared +62% during the period, thanks to a major contribution from its fast-growing and profitable cloud computing business Amazon Web Services. By expanding into cloud computing and other areas such as digital media, the company is complementing its core retail business. Amazon posted its fifth-straight profitable quarter.
The Fund’s sole holding in the Materials sector, The Sherwin-Williams Company (+26%), was another individual holding having a significant, positive impact on Fund performance. Sherwin-Williams has benefitted from lower raw materials costs and continued strength in the housing market.
7
From a sector allocation perspective, the Fund was aided relative to its benchmark index by having an overweight allocation to the strong-performing Information Technology sector, while being underweight the weak-performing Financials sector.
During the reporting period, the Fund sold its positions in the Industrials and Energy sectors and reduced its exposure to the Health Care, Financials, and Materials sectors. The Fund increased its allocations to the Consumer Discretionary and Information Technology sectors.
Fiscal Period-End Investment Posture
As of September 30, 2016, the Fund’s largest sector allocations included Information Technology, Consumer Discretionary, and Health Care. As of that date, the Fund had no exposure to the Energy, Industrials, Utilities, or Telecommunication Services sectors.
Sincerely,
THOMAS F. MARSICO
CORALIE T. WITTER, CFA
PORTFOLIO MANAGERS
(1) | Total returns are based on net change in net asset value assuming reinvestment of distributions. Please see the Prospectus for more information. |
(2) | Regarding GICS data cited throughout this report, the Global Industry Classification Standard (“GICS”) was developed by and is the exclusive property and service mark of MSCI Inc. (“MSCI”) and Standard & Poor’s (“S&P”) and is licensed for use by Marsico Capital Management, LLC (the “Adviser”). Neither MSCI, S&P, nor the Adviser or any third party involved in compiling GICS makes any express or implied warranties or representations with respect to such standard or classification (or the results from use thereof), and all such parties hereby expressly disclaim all warranties of originality, accuracy, completeness, merchantability and fitness for a particular purpose with respect to any such standard or classification. MSCI, S&P, the Adviser, and any of their affiliates or third parties involved in compiling GICS shall not have any liability for any direct, indirect, special, punitive, consequential or any other damages (including lost profits) even if notified of the possibility of such damages. |
8
September 30, 2016 (Unaudited)
The Focus Fund invests primarily in the common stocks of large companies that are selected for their long-term growth potential. The Fund will normally hold a core position of between 20 and 35 common stocks.
TOTAL ANNUAL OPERATING EXPENSES* 1.19% | NET ASSETS $613,870,293 | NET ASSET VALUE PER SHARE $15.96 |
GROWTH OF $10,000(1) | PERFORMANCE COMPARISON |
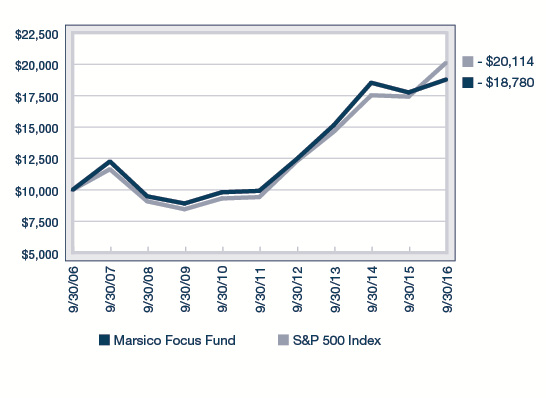
| 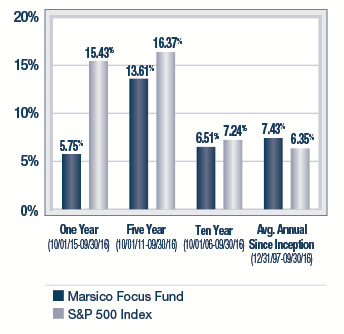
|
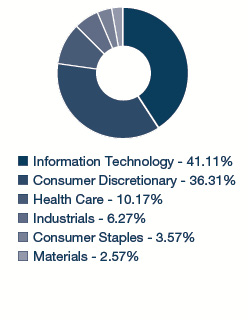
SECTOR ALLOCATION(2) | TOP FIVE HOLDINGS |
| | | | |
| | Alibaba Group Holding Ltd. Spon. ADR | 8.29% | |
| | Facebook, Inc. - Cl. A | 8.07% | |
| | Amazon.com, Inc. | 6.33% | |
| | Visa, Inc. - Cl. A | 6.32% | |
| | Electronic Arts, Inc. | 6.03% | |
| | | | |
* | The Total Annual Operating Expenses are reflective of the information disclosed in the Funds’ Prospectus dated January 29, 2016 and may differ from the expense ratio disclosed in this report. |
| The performance data quoted here represent past performance, and past performance is not a guarantee of future results. Investment return and principal value of an investment will fluctuate so that an investor’s shares, when redeemed, may be worth more or less than their original cost. Current performance may be lower or higher than the performance information quoted. To obtain performance information current to the most recent month-end, please call 888-860-8686 or visit marsicofunds.com. |
| The performance included in the chart and graph does not reflect the deduction of taxes on Fund distributions or the redemption of Fund shares. |
| All indices are unmanaged and investors cannot invest directly in an index. |
(1) | This chart assumes an initial investment of $10,000 made on September 30, 2006. Total returns are based on net change in NAV, assuming reinvestment of distributions. |
(2) | Sector weightings represent the percentage of the Fund’s investments (excluding cash equivalents) in certain general sectors. These sectors may include more than one industry. For the year ended September 30, 2016, the Financials sector includes real estate investment trusts. The Fund’s portfolio composition is subject to change at any time. |
9
MARSICO FOCUS FUND
SCHEDULE OF INVESTMENTS
September 30, 2016
| | | Number
of
Shares | | | Value | | | Percent
of Net
Assets | |
COMMON STOCKS | | | | | | | | | |
Application Software | | | | | | | | | |
salesforce.com, inc.* | | | 517,874 | | | $ | 36,939,952 | | | | 6.02 | % |
| | | | | | | | | | | | | |
Biotechnology | | | | | | | | | | | | |
Celgene Corporation* | | | 131,784 | | | | 13,775,382 | | | | 2.24 | |
| | | | | | | | | | | | | |
Data Processing & Outsourced Services | |
Visa, Inc. - Cl. A | | | 469,025 | | | | 38,788,367 | | | | 6.32 | |
| | | | | | | | | | | | | |
Footwear | | | | | | | | | | | | |
NIKE, Inc. - Cl. B | | | 464,523 | | | | 24,457,136 | | | | 3.99 | |
| | | | | | | | | | | | | |
General Merchandise Stores | |
Dollar Tree, Inc.* | | | 254,311 | | | | 20,072,767 | | | | 3.27 | |
| | | | | | | | | | | | | |
Home Entertainment Software | |
Activision Blizzard, Inc. | | | 235,799 | | | | 10,445,896 | | | | 1.70 | |
Electronic Arts, Inc.* | | | 433,488 | | | | 37,019,875 | | | | 6.03 | |
| | | | | | | | 47,465,771 | | | | 7.73 | |
Home Improvement Retail | |
The Home Depot, Inc. | | | 170,255 | | | | 21,908,413 | | | | 3.57 | |
| | | | | | | | | | | | | |
Internet & Direct Marketing Retail | |
Amazon.com, Inc.* | | | 46,447 | | | | 38,890,538 | | | | 6.33 | |
The Priceline Group, Inc.* | | | 18,339 | | | | 26,985,655 | | | | 4.40 | |
| | | | | | | | 65,876,193 | | | | 10.73 | |
Internet Software & Services | |
Alibaba Group Holding Ltd. Spon. ADR* | | | 481,247 | | | | 50,911,120 | | | | 8.29 | |
Alphabet, Inc. - Cl. A* | | | 27,745 | | | | 22,308,645 | | | | 3.64 | |
Facebook, Inc. - Cl. A* | | | 386,279 | | | | 49,548,007 | | | | 8.07 | |
| | | | | | | | 122,767,772 | | | | 20.00 | |
IT Consulting & Other Services | |
Accenture PLC - Cl. A | | | 131,527 | | | | 16,068,654 | | | | 2.62 | |
| | | | | | | | | | | | | |
Managed Health Care | | | | | | | | | | | | |
UnitedHealth Group, Inc. | | | 243,514 | | | | 34,091,960 | | | | 5.55 | |
| | | | | | | | | | | | | |
Packaged Foods & Meats | | | | | | | | | | | | |
The Kraft Heinz Company | | | 178,986 | | | | 16,021,037 | | | | 2.61 | |
| | | | | | | | | | | | | |
Pharmaceuticals | | | | | | | | | | | | |
Allergan PLC* | | | 88,030 | | | | 20,274,189 | | | | 3.30 | |
Zoetis, Inc. | | | 412,034 | | | | 21,429,889 | | | | 3.49 | |
| | | | | | | | 41,704,078 | | | | 6.79 | |
Restaurants | | | | | | | | | | | | |
Chipotle Mexican Grill, Inc.* | | | 75,844 | | | | 32,119,934 | | | | 5.23 | |
Domino's Pizza Enterprises Ltd. | | | 143,876 | | | | 7,743,320 | | | | 1.26 | |
Starbucks Corporation | | | 467,604 | | | | 25,316,081 | | | | 4.13 | |
| | | | | | | | 65,179,335 | | | | 10.62 | |
COMMON STOCKS (continued) | |
Specialized REITs | | | | | | | | | | | | |
Crown Castle International Corp. | | | 185,730 | | | $ | 17,497,623 | | | | 2.85 | % |
| | | | | | | | | | | | | |
Specialty Chemicals | | | | | | | | | | | | |
The Sherwin-Williams Company | | | 71,075 | | | | 19,663,609 | | | | 3.20 | |
| | | | | | | | | | | | | |
TOTAL COMMON STOCKS | |
(Cost $456,101,765) | | | | | | | 602,278,049 | | | | 98.11 | |
| | | | | | | | | | | | | |
SHORT-TERM INVESTMENTS | |
State Street Institutional U.S. Government Money Market Fund, 0.000% | | | 20,180,224 | | | | 20,180,224 | | | | 3.29 | |
| | | | | | | | | | | | | |
TOTAL SHORT-TERM INVESTMENTS | |
(Cost $20,180,224) | | | | | | | 20,180,224 | | | | 3.29 | |
| | | | | | | | | | | | | |
TOTAL INVESTMENTS | |
(Cost $476,281,989) | | | | | | | 622,458,273 | | | | 101.40 | |
| | | | | | | | | | | | | |
Liabilities, Less Cash and Other Assets | | | | | | | (8,587,980 | ) | | | (1.40 | ) |
| | | | | | | | | | | | | |
NET ASSETS | | | | | | $ | 613,870,293 | | | | 100.00 | % |
| See notes to financial statements. |
10
INVESTMENT REVIEW BY TOM MARSICO AND CORALIE WITTER (UNAUDITED)
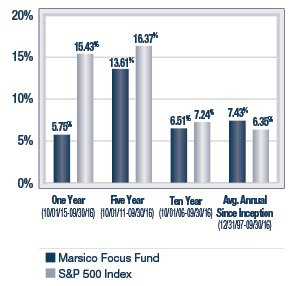
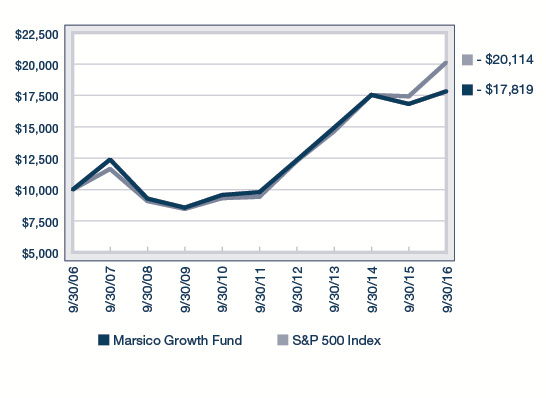
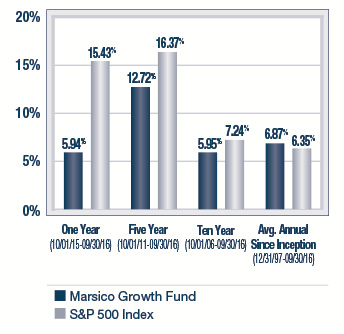
The Marsico Growth Fund posted a total return of +5.94% for the one-year fiscal period ended September 30, 2016. The Fund underperformed the S&P 500 Index, the Fund’s benchmark index, which had a total return of +15.43% over the same time period. Please see the Fund’s Overview for more detailed information about the Fund’s longer-term performance for various time periods ended September 30, 2016.
The performance data for the Fund quoted here represent past performance, and past performance is not a guarantee of future results. Investment return and principal value of an investment will fluctuate so that an investor’s shares, when redeemed, may be worth more or less than their original cost. Current performance may be lower or higher than the performance information quoted. To obtain performance information current to the most recent month-end, please call 888-860-8686 or visit marsicofunds.com. (1)
This review highlights Fund performance over a one-year fiscal period. Shareholders should keep in mind that the Fund is intended for long-term investors who hold their shares for substantially longer periods of time. You should also keep in mind that our current views and beliefs regarding all investments discussed in this report are subject to change at any time. References to specific securities, industries, and sectors discussed in this report are not recommendations to buy or sell such securities or related investments, and the Fund may not necessarily hold these securities or investments today. Please see the accompanying Schedule of Investments for the percentage of the Fund’s portfolio represented by the securities mentioned in this report as of the end of the reporting period.
The Fund is subject to broad risks associated with investing in equity securities markets generally, including the risks that the securities and markets in which it invests may experience volatility and instability, that domestic and global economies and markets may undergo periods of cyclical change and decline, that investors may at times avoid investments in equity securities, and that investments may not perform as anticipated. Please see the Prospectus for more information.
The Fund is not managed to track the benchmark index, and may hold a substantially overweight or underweight position in a sector, industry, or security compared to its weight in the benchmark. For informational purposes, the discussion below may compare the benchmark weight or performance of a sector or industry to the investment approach of the Fund.
Much of the Growth Fund’s underperformance during the one-year ended September 30, 2016, as compared to the S&P 500 Index, was attributable to certain holdings in the Consumer Discretionary, Health Care and Consumer Staples sectors.
Several of the Growth Fund’s Consumer Discretionary holdings struggled during the period, including Chipotle Mexican Grill, Inc. and NIKE, Inc. – Cl. B. Restaurant operator Chipotle (-44% prior to being sold) posted a negative return during the period after it was discovered that foodborne illnesses, including norovirus and E. coli outbreaks, were linked to Chipotle restaurants in several states. Athletic apparel company NIKE, meanwhile, posted a return of -14% during the period, trailing the return of the Fund’s benchmark index. Although the company’s growth rates slowed slightly as competitors Adidas and Under Armour, Inc. took market share, we still like the long-term growth potential of NIKE, which we believe remains the clear leader in the space.
Also within the Consumer Discretionary sector, Tesla Motors, Inc. (-40% prior to being sold) was a holding that detracted from Fund performance. Tesla’s stock price was subject to heightened volatility due to lofty production targets and the timing of new vehicle deliveries. In general, Consumer Discretionary was a weaker-performing sector of the S&P 500 Index and the Fund’s performance was held back by having an overweight allocation to the sector as compared to the benchmark index.
Stock prices of many Health Care companies were under pressure during the reporting period. Hospital operators slumped during late 2015 on worries that an increasing number of uninsured patients will be unable to pay their bills as fewer states expand Medicaid and more patients drop insurance because of unaffordable premiums. The Fund’s position in health care facility operator HCA Holdings, Inc. slid -16% prior to being sold during the period.
Several of the Fund’s Health Care holdings within the Pharmaceuticals, Biotechnology & Life Sciences industry posted negative returns. Illumina, Inc. and Regeneron Pharmaceuticals, Inc. declined -21% and -20%, respectively, during the period prior to being sold from the Fund. Genome sequencing company Illumina preannounced lower-than-expected revenues and cut its guidance due in part to disappointing sales in Europe and Asia. We chose to sell Regeneron because the US government is stepping up efforts to control Medicare Part B costs, an area where Regeneron has more exposure than many of its peers.
11
In the Consumer Staples sector, shares of grocer The Kroger Company, the nation’s largest supermarket chain by sales, slumped -23% as the company cut its full-year sales and earnings forecast due to declining food prices. An excess supply of food products, together with reduced global demand, have placed the US on track to post the largest decline in food prices in more than 50 years. Given the outlook, we elected to sell the position during the period.
We sold one of the Fund’s few holdings in the Financials sector, The Charles Schwab Corporation (-14% during the portion of the reporting period it was held), following the outcome of the “Brexit” vote, as we believe a persistent headwind of lower interest rates for a longer period will prove challenging for the stock.
From a sector allocation perspective, the Fund’s performance also was impaired by having no exposure to the Telecommunication Services and Utilities sectors – the two strongest-performing sectors of the S&P 500 Index. In the uncertain macroeconomic environment, dividend paying stocks perceived by the market to offer safety, such as Utilities and Telecommunications, were rewarded. We believed valuations for many companies in both sectors were high, and we found more compelling investment opportunities in other sectors.
The Fund’s Information Technology holdings posted mixed results. Two of the Fund’s holdings within the sector posted weaker returns. Cybersecurity provider Palo Alto Networks, Inc. slipped -27% prior to being sold on market concerns about slower spending by corporate enterprise customers. salesforce.com, inc., although posting a slightly positive return, lagged the benchmark index. This likely was due to market chatter about potential acquisitions in which the proposed strategic fit appeared questionable. The Fund continues to hold a position in the stock.
On the brighter side, several of the Fund’s Software & Services holdings posted strong returns. The Growth Fund maintained investments in companies making innovative use of technology to create better retail and advertising business models. Alibaba Group Holding Ltd. Spon. ADR, China’s leading ecommerce company, staged a stock price gain of +79% during the period. Alibaba’s stock rose after sales on China’s “Singles Day,” a holiday popular among young unmarried adults in China, were stronger than expected. A position in social media company Facebook, Inc. – Cl. A was among the Fund’s best performing holdings, and posted a gain of +43% during the reporting period. Facebook’s results continued to exceed market expectations, led by strong advertising revenue and monthly active user growth rates, a result of the company’s embracing a shift towards mobile phone usage. Early in the period, Alphabet, Inc. Cl. - A. (+26%), formerly Google, Inc., reorganized its business under a new holding company called Alphabet. The restructuring separated the companies’ reporting of proven moneymaking Internet business units from innovative “moonshot” businesses such as self-driving cars, smart home technology, and life sciences. The reorganization was welcomed by many investors, and Alphabet’s shares were buoyed by strong revenue growth, particularly from continued strength in mobile search.
Video game software company Electronic Arts, Inc.’s stock price rose +27% during the period. We believe the firm’s profitability should continue to improve as new video game consoles make it more convenient for players to download video games online, rather than purchasing physical copies of game software.
In the Consumer Discretionary sector, shares of online retailer Amazon.com, Inc. soared +63% during the period, thanks to a major contribution from its fast-growing and profitable cloud computing business Amazon Web Services. By expanding into cloud computing and other areas such as digital media, the company is complementing its core retail business. Amazon posted its fifth-straight profitable quarter.
One of the Fund’s few holdings in the Materials sector, The Sherwin-Williams Company (+26%), was another individual holding having a material, positive impact on Fund performance. Sherwin-Williams has benefitted from lower raw materials costs and continued strength in the housing market.
From a sector allocation perspective, the Fund benefitted relative to its benchmark index by having an overweight allocation to the strong-performing Information Technology sector, while being underweight the weak-performing Financials sector.
During the reporting period, the Fund sold its sole position in the Energy sector and reduced its exposure to the Health Care and Consumer Discretionary sectors. The Fund increased its allocations to the Financials, Industrials, and Information Technology sectors.
12
Fiscal Period-End Investment Posture
As of September 30, 2016, the Fund’s largest sector allocations included Information Technology, Consumer Discretionary, and Health Care. As of that date, the Fund had no exposure to the Energy, Utilities, or Telecommunication Services sectors.
Sincerely,
THOMAS F. MARSICO
CORALIE T. WITTER, CFA
PORTFOLIO MANAGERS
(1) | Total returns are based on net change in net asset value assuming reinvestment of distributions. Please see the Prospectus for more information. |
13
September 30, 2016 (Unaudited)
The Growth Fund invests primarily in the common stocks of large companies that are selected for their long-term growth potential. The Growth Fund will normally hold a core position of between 35 and 50 common stocks.
TOTAL ANNUAL OPERATING EXPENSES* 1.27% | NET ASSETS $288,212,959 | NET ASSET VALUE PER SHARE $15.54 |
GROWTH OF $10,000(1) | PERFORMANCE COMPARISON |
| 
|
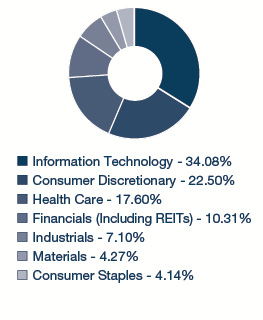
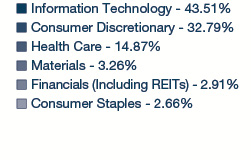
SECTOR ALLOCATION(2) | TOP FIVE HOLDINGS |
| | | | |
| | Facebook, Inc. - Cl. A | 5.25% | |
| | Amazon.com, Inc. | 5.05% | |
| | Alibaba Group Holding Ltd. Spon. ADR | 4.51% | |
| | Visa, Inc. - Cl. A | 4.20% | |
| | The Home Depot, Inc. | 3.67% | |
| | | | |
* | The Total Annual Operating Expenses are reflective of the information disclosed in the Funds’ Prospectus dated January 29, 2016 and may differ from the expense ratio disclosed in this report. |
| The performance data quoted here represent past performance, and past performance is not a guarantee of future results. Investment return and principal value of an investment will fluctuate so that an investor’s shares, when redeemed, may be worth more or less than their original cost. Current performance may be lower or higher than the performance information quoted. To obtain performance information current to the most recent month-end, please call 888-860-8686 or visit marsicofunds.com. |
| The performance included in the chart and graph does not reflect the deduction of taxes on Fund distributions or the redemption of Fund shares. |
| All indices are unmanaged and investors cannot invest directly in an index. |
(1) | This chart assumes an initial investment of $10,000 made on September 30, 2006. Total returns are based on net change in NAV, assuming reinvestment of distributions. |
(2) | Sector weightings represent the percentage of the Fund’s investments (excluding cash equivalents) in certain general sectors. These sectors may include more than one industry. For the year ended September 30, 2016, the Financials sector includes real estate investment trusts. The Fund’s portfolio composition is subject to change at any time. |
14
MARSICO GROWTH FUND
SCHEDULE OF INVESTMENTS
September 30, 2016
| | | Number
of
Shares | | | Value | | | Percent
of Net
Assets | |
COMMON STOCKS | | | | | | | | | |
Aerospace & Defense | | | | | | | | | |
Lockheed Martin Corporation | | | 30,332 | | | $ | 7,271,187 | | | | 2.52 | % |
Raytheon Company | | | 20,937 | | | | 2,850,154 | | | | 0.99 | |
| | | | | | | | 10,121,341 | | | | 3.51 | |
Application Software | | | | | | | | | | | | |
Adobe Systems, Inc.* | | | 72,717 | | | | 7,892,703 | | | | 2.74 | |
salesforce.com, inc.* | | | 111,249 | | | | 7,935,391 | | | | 2.75 | |
| | | | | | | | 15,828,094 | | | | 5.49 | |
Automotive Retail | | | | | | | | | | | | |
O'Reilly Automotive, Inc.* | | | 19,232 | | | | 5,387,076 | | | | 1.87 | |
| | | | | | | | | | | | | |
Biotechnology | | | | | | | | | | | | |
Amgen, Inc. | | | 51,709 | | | | 8,625,578 | | | | 2.99 | |
Celgene Corporation* | | | 45,615 | | | | 4,768,136 | | | | 1.66 | |
| | | | | | | | 13,393,714 | | | | 4.65 | |
Construction Materials | | | | | | | | | | | | |
Vulcan Materials Company | | | 25,384 | | | | 2,886,922 | | | | 1.00 | |
| | | | | | | | | | | | | |
Data Processing & Outsourced Services | |
FleetCor Technologies, Inc.* | | | 43,674 | | | | 7,587,484 | | | | 2.63 | |
Visa, Inc. - Cl. A | | | 146,116 | | | | 12,083,793 | | | | 4.20 | |
| | | | | | | | 19,671,277 | | | | 6.83 | |
Footwear | | | | | | | | | | | | |
NIKE, Inc. - Cl. B | | | 163,396 | | | | 8,602,799 | | | | 2.99 | |
| | | | | | | | | | | | | |
General Merchandise Stores | |
Dollar Tree, Inc.* | | | 81,278 | | | | 6,415,273 | | | | 2.23 | |
| | | | | | | | | | | | | |
Health Care Equipment | |
Edwards Lifesciences Corporation* | | | 24,419 | | | | 2,943,955 | | | | 1.02 | |
| | | | | | | | | | | | | |
Health Care Services | |
Laboratory Corporation of America Holdings* | | | 46,035 | | | | 6,328,892 | | | | 2.20 | |
| | | | | | | | | | | | | |
Home Entertainment Software | |
Electronic Arts, Inc.* | | | 108,664 | | | | 9,279,906 | | | | 3.22 | |
| | | | | | | | | | | | | |
Home Improvement Retail | |
The Home Depot, Inc. | | | 82,282 | | | | 10,588,048 | | | | 3.67 | |
| | | | | | | | | | | | | |
Hotel & Resort REITs | |
MGM Growth Properties LLC - Cl. A | | | 151,872 | | | | 3,959,303 | | | | 1.37 | |
| | | | | | | | | | | | | |
Housewares & Specialties | |
Newell Brands, Inc. | | | 56,249 | | | | 2,962,072 | | | | 1.03 | |
| | | | | | | | | | | | | |
Internet & Direct Marketing Retail | |
Amazon.com, Inc.* | | | 17,369 | | | | 14,543,237 | | | | 5.05 | |
The Priceline Group, Inc.* | | | 4,175 | | | | 6,143,471 | | | | 2.13 | |
| | | | | | | | 20,686,708 | | | | 7.18 | |
COMMON STOCKS (Continued) | | | | | |
Internet Software & Services | |
Alibaba Group Holding Ltd. Spon. ADR* | | | 122,935 | | | $ | 13,005,294 | | | | 4.51 | % |
Alphabet, Inc. - Cl. A* | | | 11,223 | | | | 9,023,965 | | | | 3.13 | |
Facebook, Inc. - Cl. A* | | | 117,910 | | | | 15,124,316 | | | | 5.25 | |
| | | | | | | | 37,153,575 | | | | 12.89 | |
| | | | | | | | | | | | | |
IT Consulting & Other Services | |
Accenture PLC - Cl. A | | | 77,215 | | | | 9,433,357 | | | | 3.27 | |
| | | | | | | | | | | | | |
Managed Health Care | | | | | | | | | | | | |
UnitedHealth Group, Inc. | | | 73,622 | | | | 10,307,080 | | | | 3.58 | |
| | | | | | | | | | | | | |
Multi-Sector Holdings | | | | | | | | | | | | |
Berkshire Hathaway, Inc. - Cl. B* | | | 65,900 | | | | 9,520,573 | | | | 3.30 | |
| | | | | | | | | | | | | |
Packaged Foods & Meats | | | | | | | | | | | | |
The Kraft Heinz Company | | | 81,879 | | | | 7,328,989 | | | | 2.55 | |
TreeHouse Foods, Inc.* | | | 43,062 | | | | 3,754,576 | | | | 1.30 | |
| | | | | | | | 11,083,565 | | | | 3.85 | |
Pharmaceuticals | | | | | | | | | | | | |
Allergan PLC* | | | 22,091 | | | | 5,087,778 | | | | 1.76 | |
Zoetis, Inc. | | | 175,422 | | | | 9,123,698 | | | | 3.17 | |
| | | | | | | | 14,211,476 | | | | 4.93 | |
Regional Banks | | | | | | | | | | | | |
First Republic Bank | | | 57,608 | | | | 4,442,153 | | | | 1.54 | |
| | | | | | | | | | | | | |
Research & Consulting Services | |
Nielsen Holdings PLC | | | 166,398 | | | | 8,913,941 | | | | 3.09 | |
| | | | | | | | | | | | | |
Restaurants | | | | | | | | | | | | |
Starbucks Corporation | | | 105,053 | | | | 5,687,569 | | | | 1.97 | |
| | | | | | | | | | | | | |
Specialized Finance | | | | | | | | | | | | |
IntercontinentalExchange, Inc. | | | 10,280 | | | | 2,769,021 | | | | 0.96 | |
| | | | | | | | | | | | | |
Specialized REITs | | | | | | | | | | | | |
Crown Castle International Corp. | | | 73,716 | | | | 6,944,784 | | | | 2.41 | |
| | | | | | | | | | | | | |
Specialty Chemicals | | | | | | | | | | | | |
The Sherwin-Williams Company | | | 30,964 | | | | 8,566,500 | | | | 2.97 | |
| | | | | | | | | | | | | |
TOTAL COMMON STOCKS | | | | | | | | | | | | |
(Cost $206,907,235) | | | | | | | 268,088,974 | | | | 93.02 | |
| See notes to financial statements. |
15
MARSICO GROWTH FUND
SCHEDULE OF INVESTMENTS (continued)
September 30, 2016
| | | Number
of
Shares | | | Value | | | Percent
of Net
Assets | |
SHORT-TERM INVESTMENTS | |
State Street Institutional Treasury Money Market Fund, 0.000% | | | 24,529,643 | | | $ | 24,529,643 | | | | 8.51 | % |
| | | | | | | | | | | | | |
TOTAL SHORT-TERM INVESTMENTS | |
(Cost $24,529,643) | | | | | | | 24,529,643 | | | | 8.51 | |
| | | | | | | | | | | | | |
TOTAL INVESTMENTS | | | | | | | | | | | | |
(Cost $231,436,878) | | | | | | | 292,618,617 | | | | 101.53 | |
| | | | | | | | | | | | | |
Liabilities, Less Cash and Other Assets | | | | | | | (4,405,658 | ) | | | (1.53 | ) |
| | | | | | | | | | | | | |
NET ASSETS | | | | | | $ | 288,212,959 | | | | 100.00 | % |
| See notes to financial statements. |
16
INVESTMENT REVIEW BY BRANDON GEISLER (UNAUDITED)
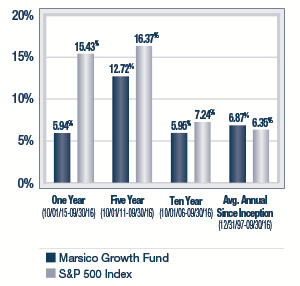
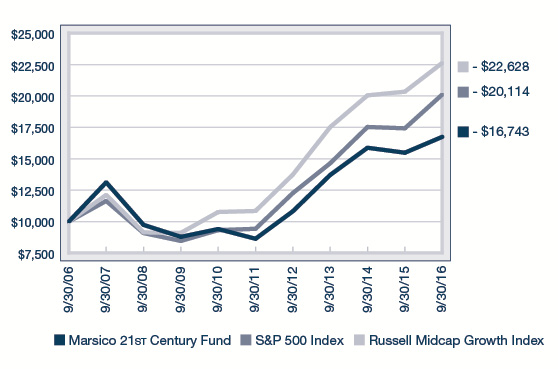
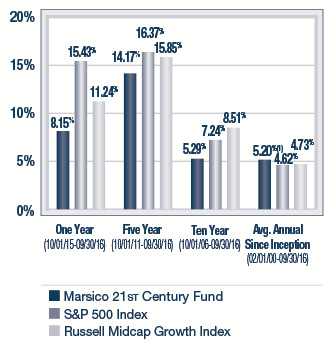
The Marsico 21st Century Fund posted a total return of +8.15% for the one-year fiscal period ended September 30, 2016. The Fund underperformed the S&P 500 Index, the Fund’s primary benchmark index, which had a total return of +15.43% over the same time period. The Russell Midcap Growth Index, a proxy for the performance of medium-capitalization US equity securities (which may be a useful comparison in light of the Fund’s current medium-capitalization positioning), had a total return of +11.24%. Please see the Fund’s Overview for more detailed information about the Fund’s longer-term performance for various time periods ended September 30, 2016.
The performance data for the Fund quoted here represent past performance, and past performance is not a guarantee of future results. Investment return and principal value of an investment will fluctuate so that an investor’s shares, when redeemed, may be worth more or less than their original cost. Current performance may be lower or higher than the performance information quoted. To obtain performance information current to the most recent month-end, please call 888-860-8686 or visit marsicofunds.com. (1)
This review highlights Fund performance over a one-year fiscal period. Shareholders should keep in mind that the Fund is intended for long-term investors who hold their shares for substantially longer periods of time. You should also keep in mind that our current views and beliefs regarding all investments discussed in this report are subject to change at any time. References to specific securities, industries, and sectors discussed in this report are not recommendations to buy or sell such securities or related investments, and the Fund may not necessarily hold these securities or investments today. Please see the accompanying Schedule of Investments for the percentage of the Fund’s portfolio represented by the securities mentioned in this report as of the end of the reporting period.
The Fund is subject to broad risks associated with investing in equity securities markets generally, including the risks that the securities and markets in which it invests may experience volatility and instability, that domestic and global economies and markets may undergo periods of cyclical change and decline, that investors may at times avoid investments in equity securities, and that investments may not perform as anticipated. Please see the Prospectus for more information.
The Fund is not managed to track the benchmark index, and may hold a substantially overweight or underweight position in a sector, industry, or security compared to its weight in the benchmark. For informational purposes, the discussion below may compare the benchmark weight or performance of a sector or industry to the investment approach of the Fund.
The 21st Century Fund’s underperformance as compared to the S&P 500 Index for the one-year period ended September 30, 2016 was primarily attributable to certain holdings in the Health Care, Information Technology, and Industrials sectors.
Health Care services provider Acadia Healthcare Company, Inc. posted a return of -25% during the period. Though the company has relatively little Medicare exposure, Acadia’s stock price slumped in tandem with many of its industry peers on worries about government reimbursement for health facilities and services.
Several of the Fund’s holdings in the Pharmaceuticals, Biotechnology & Life Sciences industry group also posted negative returns. Alkermes PLC, an Ireland-based specialty pharmaceutical company, slid -30% during the period. Regeneron Pharmaceuticals, Inc. and Alexion Pharmaceuticals, Inc. declined -24% and -21%, respectively. We sold the Fund’s holding in Regeneron because the US government is stepping up efforts to control Medicare Part B costs, an area where Regeneron has more exposure than many of its peers. The Fund added modestly to its position in shares of Alexion, a developer of treatments for rare diseases, at what we consider to be attractive stock prices. Among the products in Alexion’s pipeline is Soliris, a breakthrough drug for treatment of a rare, life-threatening blood disorder.
A few of the Fund’s Information Technology holdings posted negative returns and had an adverse effect on Fund performance. NXP Semiconductors N.V. (-22% prior to being sold) posted a negative return on concerns about weaker demand for semiconductors and rising inventory levels. salesforce.com, inc., although posting a slightly positive return, lagged the benchmark index. This likely was due to market chatter about potential acquisitions in which the proposed strategic fit appeared questionable. The Fund continues to maintain a position in the stock.
The Fund’s cash position was slightly elevated at times, particularly during the early portions of the reporting period. Much of the period was characterized by volatility in the markets. The Fund’s cash levels were reduced during the period as we sought to pick entry points in which to redeploy cash into securities at what we believed to be attractive prices. Nevertheless, in a generally rising equity market, the Fund’s cash positions were a drag on performance when measured over the full one-year period.
17
Within the Consumer Discretionary sector, Tesla Motors, Inc. (-18%) was a holding that detracted from Fund performance. Tesla’s stock price was subject to heightened volatility due to lofty production targets and the timing of new vehicle deliveries. Another of the Fund’s Consumer Discretionary holdings, cruise line operator Norwegian Cruise Line Holdings Ltd., posted a return of -34% during the period, and was an additional detractor from performance.
On the brighter side, Fund holdings in the Consumer Discretionary sector performed well. Clothing retailer Burlington Stores, Inc. soared +59%. Pizza delivery company Domino’s Pizza, Inc. gained +42% as the company reported strong same store sales growth. Central to our investment thesis is Domino’s use of technology to enable customers to place their orders more efficiently, and other technology enhancements designed to prepare and deliver pizzas more quickly. Online retailer Amazon.com, Inc. soared +63% during the period, thanks to a major contribution from its fast-growing and profitable cloud computing business Amazon Web Services. By expanding into cloud computing and other areas such as digital media, the company is complementing its core retail business. Amazon posted its fifth-straight profitable quarter.
A position in social media company Facebook, Inc. – Cl. A was among the Fund’s best performing holdings and posted a gain of +43% during the reporting period. Facebook’s results continued to exceed market expectations, led by strong advertising revenue and monthly active user growth rates, a result of the company’s embracing a shift towards mobile phone usage.
A select Financials holding, First Republic Bank, rose +24% during the period on the back of strong loan growth and continued expansion of its geographical reach and product lineup. As big banks struggle, we believe that First Republic, which focuses on affluent clients in Silicon Valley, may continue to grow.
In the Health Care sector, Intuitive Surgical, Inc. gained +58% during the period as it launched a next-generation surgical robot which allowed the company to enter the general surgery market, leading to revenue and earnings-per-share acceleration.
The Fund benefitted from having a significant portion of its assets invested in the strong-performing Information Technology sector. The Fund also did well by having underweight exposure to the Financials sector, the weakest-performing sector of the benchmark index.
The Fund invests across the market capitalization spectrum in companies of any size. Over the reporting period, the Fund has increased exposure to medium-capitalization companies, as we believe these companies have compelling growth opportunities that may not be recognized by the larger market. However, the Fund continues to hold stocks in what we considered to be high quality large-sized companies that we believe continue to offer strong long-term growth potential.
During the reporting period, the Fund significantly reduced its exposure to the Health Care sector. The Fund increased investment in the Information Technology, Consumer Staples, and Financials sectors.
Fiscal Period-End Investment Posture
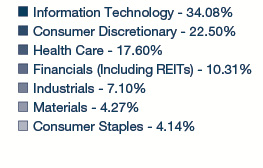
As of September 30, 2016, the Fund’s primary economic sector allocations included Information Technology, Consumer Discretionary, Consumer Staples, Health Care, and Financials. The Fund had no investments in the Energy or Utilities sectors.
Sincerely,
BRANDON A. GEISLER
PORTFOLIO MANAGER
(1) | Total returns are based on net change in net asset value assuming reinvestment of distributions. Periodically, certain fees and expenses have been waived or reimbursed by the Adviser for the 21st Century Fund. In the absence of such a waiver or reimbursement, the performance returns reflected would have been reduced. In accordance with the expense limitation and fee waiver agreement, the Adviser may recoup fees and expenses previously waived or reimbursed under certain parameters. Periodically, the Adviser has recouped such fees or expenses from the 21st Century Fund, resulting in a lower performance return. Please see the Prospectus for more information. |
18
21st CENTURY FUND OVERVIEW |
September 30, 2016 (Unaudited)
The 21st Century Fund invests primarily in common stocks that are selected for their long-term growth potential. The Fund may invest in companies of any size. The portions of Fund assets invested in large-capitalization, medium-capitalization, or small-capitalization companies will vary based on market conditions, depending on the portfolio manager’s judgment as to how to achieve the Fund’s investment objective. Under current market conditions the portfolio manager expects to invest substantially in medium-capitalization companies. The Fund will normally hold a core position of between 35 and 60 common stocks.
TOTAL ANNUAL OPERATING EXPENSES* 1.33% | NET ASSETS $234,779,718 | NET ASSET VALUE PER SHARE $22.04 |
GROWTH OF $10,000(1)(2) | PERFORMANCE COMPARISON |
| 
|
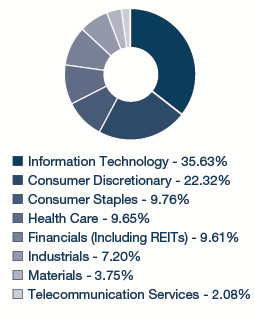
SECTOR ALLOCATION(3) | TOP FIVE HOLDINGS |
| | | | |
| | Constellation Brands, Inc. - Cl. A | 4.22% | |
| | Domino’s Pizza, Inc. | 4.00% | |
| | Facebook, Inc. - Cl. A | 4.00% | |
| | Amazon.com, Inc. | 3.93% | |
| | MasterCard, Inc. - Cl. A | 3.75% | |
| | | | |
* | The Total Annual Operating Expenses are reflective of the information disclosed in the Funds’ Prospectus dated January 29, 2016 and may differ from the expense ratio disclosed in this report. |
| The performance data quoted here represent past performance, and past performance is not a guarantee of future results. Investment return and principal value of an investment will fluctuate so that an investor’s shares, when redeemed, may be worth more or less than their original cost. Current performance may be lower or higher than the performance information quoted. To obtain performance information current to the most recent month-end, please call 888-860-8686 or visit marsicofunds.com. |
| The performance included in the chart and graph does not reflect the deduction of taxes on Fund distributions or the redemption of Fund shares. |
| All indices are unmanaged and investors cannot invest directly in an index. |
(1) | Periodically, certain fees and expenses have been waived or reimbursed by the Adviser for the 21st Century Fund. In the absence of such a waiver or reimbursement, the performance returns reflected would have been reduced. In accordance with the expense limitation and fee waiver agreement, the Adviser may recoup fees and expenses previously waived or reimbursed under certain parameters. Periodically, the Adviser has recouped such fees or expenses from the 21st Century Fund, resulting in a lower performance return. |
(2) | This chart assumes an initial investment of $10,000 made on September 30, 2006. Total returns are based on net change in NAV, assuming reinvestment of distributions. |
(3) | Sector weightings represent the percentage of the Fund’s investments (excluding cash equivalents) in certain general sectors. These sectors may include more than one industry. For the year ended September 30, 2016, the Financials sector includes real estate investment trusts. The Fund’s portfolio composition is subject to change at any time. |
| Effective July 15, 2016, the Russell Midcap Growth Index was added as a supplemental benchmark index. The Russell Midcap Growth Index is an index composed of mid-capitalization US equities that exhibit growth characteristics. |
19
MARSICO 21st CENTURY FUND
SCHEDULE OF INVESTMENTS
September 30, 2016
| | | Number
of
Shares | | | Value | | | Percent
of Net
Assets | |
COMMON STOCKS | | | | | | | | | |
Aerospace & Defense | | | | | | | | | |
BE Aerospace, Inc. | | | 91,649 | | | $ | 4,734,587 | | | | 2.02 | % |
| | | | | | | | | | | | | |
Apparel Retail | |
Burlington Stores, Inc.* | | | 102,129 | | | | 8,274,492 | | | | 3.52 | |
| | | | | | | | | | | | | |
Application Software | | | | | | | | | | | | |
Adobe Systems, Inc.* | | | 46,275 | | | | 5,022,689 | | | | 2.14 | |
Atlassian Corporation PLC - Cl. A* | | | 29,829 | | | | 893,975 | | | | 0.38 | |
Blackbaud, Inc. | | | 60,856 | | | | 4,037,187 | | | | 1.72 | |
Mobileye N.V.* | | | 64,247 | | | | 2,734,995 | | | | 1.17 | |
salesforce.com, inc.* | | | 118,554 | | | | 8,456,457 | | | | 3.60 | |
The Descartes Systems Group, Inc.* | | | 107,200 | | | | 2,306,685 | | | | 0.98 | |
| | | | | | | | 23,451,988 | | | | 9.99 | |
Automobile Manufacturers | |
Tesla Motors, Inc.* | | | 10,041 | | | | 2,048,665 | | | | 0.87 | |
| | | | | | | | | | | | | |
Automotive Retail | | | | | | | | | | | | |
O'Reilly Automotive, Inc.* | | | 21,576 | | | | 6,043,653 | | | | 2.57 | |
| | | | | | | | | | | | | |
Biotechnology | | | | | | | | | | | | |
Alexion Pharmaceuticals, Inc.* | | | 20,877 | | | | 2,558,267 | | | | 1.09 | |
Alkermes PLC* | | | 37,126 | | | | 1,746,036 | | | | 0.74 | |
| | | | | | | | 4,304,303 | | | | 1.83 | |
Communications Equipment | |
Palo Alto Networks, Inc.* | | | 29,960 | | | | 4,773,527 | | | | 2.03 | |
| | | | | | | | | | | | | |
Construction Materials | | | | | | | | | | | | |
Vulcan Materials Company | | | 40,483 | | | | 4,604,132 | | | | 1.96 | |
| | | | | | | | | | | | | |
Data Processing & Outsourced Services | |
Broadridge Financial Solutions, Inc. | | | 55,281 | | | | 3,747,499 | | | | 1.60 | |
FleetCor Technologies, Inc.* | | | 35,943 | | | | 6,244,377 | | | | 2.66 | |
MasterCard, Inc. - Cl. A | | | 86,574 | | | | 8,810,636 | | | | 3.75 | |
Paysafe Group PLC* | | | 557,718 | | | | 3,224,794 | | | | 1.37 | |
Vantiv, Inc. - Cl. A* | | | 55,837 | | | | 3,141,948 | | | | 1.34 | |
| | | | | | | | 25,169,254 | | | | 10.72 | |
Distillers & Vintners | | | | | | | | | | | | |
Constellation Brands, Inc. - Cl. A | | | 59,452 | | | | 9,898,163 | | | | 4.22 | |
| | | | | | | | | | | | | |
Distributors | |
LKQ Corporation* | | | 56,336 | | | | 1,997,675 | | | | 0.85 | |
| | | | | | | | | | | | | |
Diversified Support Services | |
Healthcare Services Group, Inc. | | | 135,549 | | | | 5,365,029 | | | | 2.28 | |
| | | | | | | | | | | | | |
Environmental & Facilities Services | |
Stericycle, Inc.* | | | 13,938 | | | | 1,116,991 | | | | 0.47 | |
| | | | | | | | | | | | | |
Food Retail | |
Whole Foods Market, Inc. | | | 17,871 | | | | 506,643 | | | | 0.22 | |
| | |
| | | | | | | | | | | | | |
| | | | | | | | | | | | | |
COMMON STOCKS (Continued) | | | | | |
Health Care Equipment | |
Dexcom, Inc.* | | | 39,256 | | | $ | 3,441,181 | | | | 1.47 | % |
Intuitive Surgical, Inc.* | | | 10,079 | | | | 7,305,562 | | | | 3.11 | |
Teleflex, Inc. | | | 21,130 | | | | 3,550,896 | | | | 1.51 | |
| | | | | | | | 14,297,639 | | | | 6.09 | |
Health Care Facilities | | | | | | | | | | | | |
Acadia Healthcare Company, Inc.* | | | 78,555 | | | | 3,892,400 | | | | 1.66 | |
| | | | | | | | | | | | | |
Home Entertainment Software | |
Activision Blizzard, Inc. | | | 58,832 | | | | 2,606,258 | | | | 1.11 | |
Electronic Arts, Inc.* | | | 79,725 | | | | 6,808,515 | | | | 2.90 | |
| | | | | | | | 9,414,773 | | | | 4.01 | |
Hotels, Resorts & Cruise Lines | |
Norwegian Cruise Line Holdings Ltd.* | | | 119,748 | | | | 4,514,500 | | | | 1.92 | |
| | | | | | | | | | | | | |
Integrated Telecommunication Services | |
SBA Communications Corporation - Cl. A* | | | 43,307 | | | | 4,857,313 | | | | 2.07 | |
| | | | | | | | | | | | | |
Internet & Direct Marketing Retail | |
Amazon.com, Inc.* | | | 11,009 | | | | 9,217,946 | | | | 3.93 | |
Ctrip.com International, Ltd. ADR* | | | 111,376 | | | | 5,186,780 | | | | 2.21 | |
NetFlix, Inc.* | | | 24,814 | | | | 2,445,420 | | | | 1.04 | |
| | | | | | | | 16,850,146 | | | | 7.18 | |
Internet Software & Services | |
CoStar Group, Inc.* | | | 35,500 | | | | 7,686,815 | | | | 3.27 | |
Facebook, Inc. - Cl. A* | | | 73,262 | | | | 9,397,317 | | | | 4.00 | |
Scout24 A.G.* | | | 61,007 | | | | 2,055,965 | | | | 0.88 | |
| | | | | | | | 19,140,097 | | | | 8.15 | |
Investment Banking & Brokerage | |
The Charles Schwab Corporation | | | 174,000 | | | | 5,493,180 | | | | 2.34 | |
| | | | | | | | | | | | | |
IT Consulting & Other Services | |
Gartner, Inc.* | | | 12,966 | | | | 1,146,843 | | | | 0.49 | |
| | | | | | | | | | | | | |
Packaged Foods & Meats | | | | | | | | | | | | |
Blue Buffalo Pet Products, Inc.* | | | 70,623 | | | | 1,678,002 | | | | 0.72 | |
TreeHouse Foods, Inc.* | | | 75,430 | | | | 6,576,742 | | | | 2.80 | |
| | | | | | | | 8,254,744 | | | | 3.52 | |
Railroads | | | | | | | | | | | | |
Genesee & Wyoming, Inc. - Cl. A* | | | 22,906 | | | | 1,579,369 | | | | 0.67 | |
| | | | | | | | | | | | | |
Regional Banks | | | | | | | | | | | | |
First Republic Bank | | | 107,613 | | | | 8,298,038 | | | | 3.53 | |
Signature Bank* | | | 10,000 | | | | 1,184,500 | | | | 0.51 | |
| | | | | | | | 9,482,538 | | | | 4.04 | |
Research & Consulting Services | |
Verisk Analytics, Inc. - Cl. A* | | | 49,049 | | | | 3,986,703 | | | | 1.70 | |
| | | | | | | | | | | | | |
Restaurants | | | | | | | | | | | | |
Domino's Pizza, Inc. | | | 61,900 | | | | 9,399,515 | | | | 4.00 | |
| | | | | | | | | | | | | |
Soft Drinks | | | | | | | | | | | | |
Monster Beverage Corporation* | | | 27,965 | | | | 4,105,542 | | | | 1.75 | |
| See notes to financial statements. |
20
| | | Number
of
Shares | | | Value | | | Percent
of Net
Assets | |
COMMON STOCKS (Continued) | | | | |
Specialized Finance | | | | | | | | | |
Element Financial Corporation | | | 221,106 | | | $ | 2,767,301 | | | | 1.18 | % |
| | | | | | | | | | | | | |
Specialized REITs | | | | | | | | | | | | |
Crown Castle International Corp. | | | 49,545 | | | | 4,667,634 | | | | 1.99 | |
| | | | | | | | | | | | | |
Specialty Chemicals | | | | | | | | | | | | |
The Sherwin-Williams Company | | | 15,007 | | | | 4,151,837 | | | | 1.77 | |
| | | | | | | | | | | | | |
Specialty Stores | | | | | | | | | | | | |
Ulta Salon Cosmetics & Fragrance, Inc.* | | | 12,311 | | | | 2,929,772 | | | | 1.25 | |
| | | | | | | | | | | | | |
TOTAL COMMON STOCKS | | | | | | | | | | | | |
(Cost $174,256,344) | | | | | | | 233,220,948 | | | | 99.33 | |
| | | | | | | | | | | | | |
SHORT-TERM INVESTMENTS | |
State Street Institutional Treasury Money Market Fund, 0.000% | | | 2,884,890 | | | | 2,884,890 | | | | 1.23 | |
| | | | | | | | | | | | | |
TOTAL SHORT-TERM INVESTMENTS | |
(Cost $2,884,890) | | | | | | | 2,884,890 | | | | 1.23 | |
| | | | | | | | | | | | | |
TOTAL INVESTMENTS | | | | | | | | | | | | |
(Cost $177,141,234) | | | | | | | 236,105,838 | | | | 100.56 | |
| | | | | | | | | | | | | |
Liabilities, Less Cash and Other Assets | | | | | | | (1,326,120 | ) | | | (0.56 | ) |
| | | | | | | | | | | | | |
NET ASSETS | | | | | | $ | 234,779,718 | | | | 100.00 | % |
| See notes to financial statements. |
21
INTERNATIONAL OPPORTUNITIES FUND |
INVESTMENT REVIEW BY MUNISH MALHOTRA (UNAUDITED)
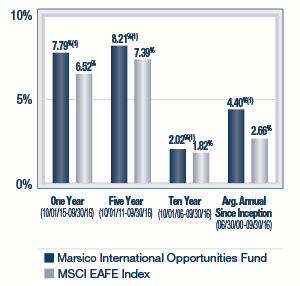
The Marsico International Opportunities Fund posted a total return of (US$) +7.79% for the one-year fiscal period ended September 30, 2016. The Fund outperformed the MSCI EAFE Index, the Fund’s benchmark index, which had a total return of (US$) +6.52% over the same time period. Please see the Fund’s Overview for more detailed information about the Fund’s longer-term performance for various time periods ended September 30, 2016.
The performance data for the Fund quoted here represent past performance, and past performance is not a guarantee of future results. Investment return and principal value of an investment will fluctuate so that an investor’s shares, when redeemed, may be worth more or less than their original cost. Current performance may be lower or higher than the performance information quoted. To obtain performance information current to the most recent month-end, please call 888-860-8686 or visit marsicofunds.com. (1)
This review highlights Fund performance over a one-year fiscal period. Shareholders should keep in mind that the Fund is intended for long-term investors who hold their shares for substantially longer periods of time. You should also keep in mind that our current views and beliefs regarding all investments discussed in this report are subject to change at any time. References to specific securities, industries, and sectors discussed in this report are not recommendations to buy or sell such securities or related investments, and the Fund may not necessarily hold these securities or investments today. Please see the accompanying Schedule of Investments for the percentage of the Fund’s portfolio represented by the securities mentioned in this report as of the end of the reporting period.
Foreign investments present additional risks due to currency fluctuations, economic and political factors, lower liquidity, differences in securities regulations and accounting standards, possible changes in taxation, limited public information, and other factors. In addition, the Fund is subject to broad risks associated with investing in equity securities markets generally, including the risks that the securities and markets in which it invests may experience volatility and instability, that domestic and global economies and markets may undergo periods of cyclical change and decline, that investors may at times avoid investments in equity securities, and that investments may not perform as anticipated. Please see the Prospectus for more information.
The Fund is not managed to track the benchmark index, and may hold a substantially overweight or underweight position in a sector, industry, or security compared to its weight in the benchmark. For informational purposes, the discussion below may compare the benchmark weight or performance of a sector or industry to the investment approach of the Fund.
The International Opportunities Fund’s outperformance during the one-year period ended September 30, 2016, as compared to the MSCI EAFE Index, was primarily attributable to certain outperforming stocks we selected in the Consumer Discretionary sector.
Several of the Fund’s positions in the Retailing and Consumer Services industries were significant, positive contributors to performance. Chinese online travel reservations company Ctrip.com International, Ltd. ADR soared +47%. Ctrip’s business has benefitted from a growing middle class in China that is increasing tourist travel. Canadian discount retailer Dollarama, Inc. gained +49% as the company reported strong same-store sales growth, benefiting from value conscious spending by consumers. Pizza delivery is a growing franchise business in Australia, where Domino’s Pizza Enterprises Ltd. (+92%) operates. Central to our investment thesis is Domino’s use of technology to enable customers to place their orders more efficiently, and other innovative enhancements designed to prepare and deliver pizzas more quickly. Japanese ecommerce fashion retailer Start Today Company Ltd. rose +54%. The company has made improvements to its smartphone app and is rolling out new discount promotions to help drive sales.
Media holding REA Group Ltd. gained +42%. REA’s Australian online real estate advertising service has seen improving revenue as its user base continues to grow.
The stocks we selected in the Information Technology sector exhibited strong performance, led by holdings in the Software & Services industry. Chinese Internet services company Tencent Holdings Ltd. gained +64% as the company generated strong revenue growth from its mobile gaming business. The company also is beginning to generate successful returns from its payments and cloud computing products. Social media company Facebook, Inc. – Cl. A gained +40%. Facebook’s results continued to exceed market expectations, led by strong advertising revenue and monthly active user growth rates, a result of the company’s embracing a shift towards mobile phone usage. The Fund’s overweight allocation to the Information Technology sector further benefitted performance, as Information Technology was among the stronger-performing sectors of the MSCI EAFE Index.
Financials was the weakest-performing sector of the benchmark index, posting a return of -4%. Maintaining a significant underweight allocation to the sector, relative to the benchmark index, therefore benefitted the Fund. Our selection of stocks within the sector also contributed to the Fund’s outperformance relative to the benchmark index, as the Fund’s Financials holdings posted a return of +12%, in aggregate, during the reporting period.
22
INTERNATIONAL OPPORTUNITIES FUND |
There were a few areas of negative performance during the reporting period. In particular, several of the Fund’s holdings within the Pharmaceutical, Biotechnology & Life Sciences industry posted negative returns. Negative effects of political rhetoric surrounding drug pricing were factors contributing to stock price declines for many pharmaceutical and biotechnology companies. We believe that political pressures will continue, and we therefore reduced the Fund’s investments in the industry, selling specialty pharmaceutical and biotechnology holdings including Concordia Healthcare Corporation (-52%), Endo International PLC (-19%), Alkermes PLC (-27%), Novo Nordisk A/S – Cl. B (-9%), and UCB S.A. (-14%).
One of the Fund’s Consumer Discretionary holdings, cruise line operator Norwegian Cruise Line Holdings Ltd., posted a return of -31% during the period prior to being sold, and was an additional detractor from performance.
Consumer Discretionary was one of the weaker-performing sectors of the benchmark index, and Fund performance lagged as a result of maintaining an overweight stance in the sector. On the other hand, Consumer Staples was one of the stronger-performing sectors of the benchmark index, and the Fund’s return was held back by having few investments in the sector.
The Fund had no investments in the Energy sector during the period. This positioning held back performance to a degree on a relative basis, as the sector was among the stronger-performing areas of the benchmark index.
Although active currency management is not a central facet of the Fund’s investment process, fluctuations in major world currencies can at times affect the Fund’s performance. During the period, the net effect of currency moves was modestly negative for the Fund. In particular, the Fund’s results were negatively affected by having an underweight allocation, as compared to the MSCI EAFE Index, to investments denominated in the Japanese yen, which strengthened relative to the US dollar during the period.
There were a few shifts in the Fund’s sector allocations during the period. The Fund reduced its allocations to the Health Care and Consumer Discretionary sectors and increased its allocations to the Information Technology, Consumer Staples, Industrials, and Financials sectors.
The International Opportunities Fund experienced elevated portfolio turnover during the period, which primarily related to the Fund’s changing its portfolio composition to reinvest in other positions that we believe may have more upside potential, and to take advantage of new opportunities. Increased portfolio turnover increases transaction-related expenses, which could reduce Fund returns.
Fiscal Period-End Investment Posture
As of September 30, 2016, the Fund’s primary economic sector allocations included Information Technology, Consumer Discretionary, Industrials, Health Care, and Financials. The Fund had no exposure to the Energy, Utilities, Telecommunication Services, and Materials sectors.
In terms of country allocations, the Fund’s most significant weightings at period-end, excluding short-term investments, were the United States, China/Hong Kong, Canada, Japan, Germany, and the United Kingdom. The Fund’s United States holdings primarily comprised multi-national companies. Country-level weightings generally should be considered a residual of the Fund’s stock selection process rather than a major, proactive facet of its investment strategy.
Sincerely,
MUNISH MALHOTRA, CFA
PORTFOLIO MANAGER
(1) | Total returns are based on net change in net asset value assuming reinvestment of distributions. Periodically, certain fees and expenses have been waived or reimbursed by the Adviser for the International Opportunities Fund. In the absence of such a waiver or reimbursement, the performance returns reflected would have been reduced. In accordance with the expense limitation and fee waiver agreement, the Adviser may recoup fees and expenses previously waived or reimbursed under certain parameters. Periodically, the Adviser has recouped such fees or expenses from the International Opportunities Fund, resulting in a lower performance return. Please see the Prospectus for more information. |
23
INTERNATIONAL OPPORTUNITIES FUND OVERVIEW |
September 30, 2016 (Unaudited)
The International Opportunities Fund invests primarily (no less than 65% of its total assets) in common stocks of foreign companies that are selected for their long-term growth potential, including foreign securities, whether traded in the US (including as American Depositary Receipts) or in foreign markets or both. The Fund may invest in an unlimited number of companies of any size throughout the world. It normally invests in the securities of issuers that are economically tied to one or more foreign countries, and expects to be invested in various issuers or securities that together have ties to at least four different foreign countries. Some issuers or securities in the Fund’s portfolio may be economically tied to the US or to emerging markets.
TOTAL ANNUAL OPERATING EXPENSES* 1.58% NET EXPENSES*† 1.60% | NET ASSETS $62,833,318 | NET ASSET VALUE PER SHARE $15.64 |
GROWTH OF $10,000(1)(2) | PERFORMANCE COMPARISON |
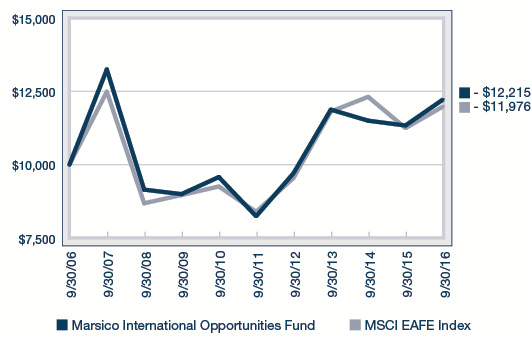
| 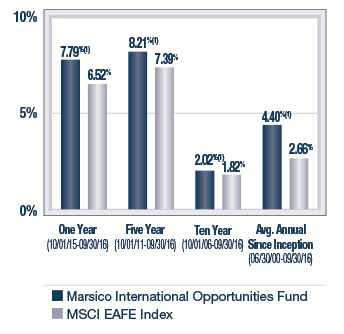
|
SECTOR ALLOCATION(3) | TOP FIVE HOLDINGS |
 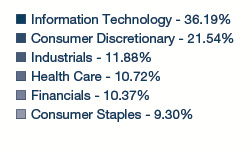
| | | | |
| | Tencent Holdings Ltd. | 5.41% | |
| | ASML Holding N.V. | 5.12% | |
| | Element Financial Corporation | 4.42% | |
| | Facebook, Inc. - Cl. A | 4.08% | |
| | Wirecard A.G. | 4.06% | |
| | | | |
* | The Total Annual Operating Expenses and Net Expenses are reflective of the information disclosed in the Funds’ Prospectus dated January 29, 2016 and may differ from the expense ratios disclosed in this report. |
† | Marsico Capital Management, LLC (the “Adviser”) has entered into a written expense limitation and fee waiver agreement under which it has agreed to limit the total expenses of the International Opportunities Fund (excluding interest, taxes, acquired fund fees and expenses, litigation, brokerage and extraordinary expenses) to an annual rate of 1.60% of the Fund’s average net assets until January 31, 2017. This expense limitation and fee waiver agreement may be terminated by the Adviser at any time after January 31, 2017, upon 15 days prior notice to the Fund and its administrator. The Adviser may recoup from the Fund fees previously waived or expenses previously reimbursed by the Adviser with respect to the Fund pursuant to this agreement (or a previous expense limitation agreement) if: (1) such recoupment by the Adviser does not cause the Fund, at the time of recoupment, to exceed the lesser of (a) the expense limitation in effect at the time the relevant amount was waived and/or reimbursed, or (b) the expense limitation in effect at the time of the proposed recoupment, and (2) the recoupment is made within three fiscal years after the end of the fiscal year in which the amount was waived or reimbursed. |
| The performance data quoted here represent past performance, and past performance is not a guarantee of future results. Investment return and principal value of an investment will fluctuate so that an investor’s shares, when redeemed, may be worth more or less than their original cost. Current performance may be lower or higher than the performance information quoted. To obtain performance information current to the most recent month-end, please call 888-860-8686 or visit marsicofunds.com. |
| The performance included in the chart and graph does not reflect the deduction of taxes on Fund distributions or the redemption of Fund shares. |
| All indices are unmanaged and investors cannot invest directly in an index. |
(1) | Periodically, certain fees and expenses have been waived or reimbursed by the Adviser for the International Opportunities Fund. In the absence of such a waiver or reimbursement, the performance returns reflected would have been reduced. In accordance with the expense limitation and fee waiver agreement, the Adviser may recoup fees and expenses previously waived or reimbursed under certain parameters. Periodically, the Adviser has recouped such fees or expenses from the International Opportunities Fund, resulting in a lower performance return. |
(2) | This chart assumes an initial investment of $10,000 made on September 30, 2006. Total returns are based on net change in NAV, assuming reinvestment of distributions. |
(3) | Sector weightings represent the percentage of the Fund’s investments (excluding cash equivalents) in certain general sectors. These sectors may include more than one industry. The Fund’s portfolio composition is subject to change at any time. |
| The MSCI EAFE Index tracks the stocks of about 1,000 companies in Europe, Australasia, and the Far East (EAFE). |
24
MARSICO INTERNATIONAL OPPORTUNITIES FUND
SCHEDULE OF INVESTMENTS
September 30, 2016
| | | Number
of
Shares | | | Value | | | Percent
of Net
Assets | |
COMMON STOCKS | | | | | | | | | |
Advertising | | | | | | | | | |
REA Group Ltd. | | | 36,141 | | | $ | 1,561,436 | | | | 2.48 | % |
| | | | | | | | | | | | | |
Airlines | | | | | | | | | | | | |
Ryanair Holdings PLC Spon. ADR | | | 24,950 | | | | 1,871,999 | | | | 2.98 | |
| | | | | | | | | | | | | |
Airport Services | |
Aena S.A. | | | 12,898 | | | | 1,902,400 | | | | 3.03 | |
| | | | | | | | | | | | | |
Application Software | | | | | | | | | | | | |
Constellation Software, Inc. | | | 4,145 | | | | 1,868,544 | | | | 2.97 | |
Mobileye N.V.* | | | 12,614 | | | | 536,978 | | | | 0.86 | |
| | | | | | | | 2,405,522 | | | | 3.83 | |
Biotechnology | |
Shire PLC | | | 27,803 | | | | 1,801,121 | | | | 2.87 | |
| | | | | | | | | | | | | |
Brewers | | | | | | | | | | | | |
Anheuser-Busch InBev N.V. | | | 9,828 | | | | 1,287,296 | | | | 2.05 | |
| | | | | | | | | | | | | |
Data Processing & Outsourced Services | |
MasterCard, Inc. - Cl. A | | | 12,873 | | | | 1,310,085 | | | | 2.08 | |
Paysafe Group PLC* | | | 209,747 | | | | 1,212,783 | | | | 1.93 | |
Wirecard A.G. | | | 49,043 | | | | 2,548,025 | | | | 4.06 | |
| | | | | | | | 5,070,893 | | | | 8.07 | |
Diversified Banks | | | | | | | | | | | | |
HDFC Bank Ltd. ADR | | | 33,724 | | | | 2,424,418 | | | | 3.86 | |
| | | | | | | | | | | | | |
Drug Retail | |
Kusuri No Aoki Company Ltd. | | | 31,100 | | | | 1,579,459 | | | | 2.51 | |
| | | | | | | | | | | | | |
General Merchandise Stores | |
Dollarama, Inc. | | | 24,194 | | | | 1,888,937 | | | | 3.01 | |
| | | | | | | | | | | | | |
Health Care Equipment | | | | | | | | | | | | |
Medtronic PLC | | | 28,073 | | | | 2,425,507 | | | | 3.86 | |
Sartorius A.G., Preference Shares | | | 15,443 | | | | 1,285,131 | | | | 2.04 | |
| | | | | | | | 3,710,638 | | | | 5.90 | |
Household Products | |
Reckitt Benckiser Group PLC | | | 18,432 | | | | 1,735,654 | | | | 2.76 | |
| | | | | | | | | | | | | |
Internet & Direct Marketing Retail | |
Ctrip.com International, Ltd. ADR* | | | 42,401 | | | | 1,974,615 | | | | 3.14 | |
Start Today Company Ltd. | | | 74,300 | | | | 1,267,581 | | | | 2.02 | |
Yoox Net-A-Porter Group SpA* | | | 44,789 | | | | 1,386,645 | | | | 2.21 | |
| | | | | | | | 4,628,841 | | | | 7.37 | |
Internet Software & Services | |
Alibaba Group Holding Ltd. Spon. ADR* | | | 23,580 | | | | 2,494,528 | | | | 3.97 | |
Facebook, Inc. - Cl. A* | | | 19,964 | | | | 2,560,782 | | | | 4.08 | |
MercadoLibre, Inc. | | | 3,602 | | | | 666,262 | | | | 1.06 | |
Scout24 A.G.* | | | 38,963 | | | | 1,313,072 | | | | 2.09 | |
Tencent Holdings Ltd. | | | 123,800 | | | | 3,399,696 | | | | 5.41 | |
| | | | | | | | 10,434,340 | | | | 16.61 | |
COMMON STOCKS (Continued) | | | | | | | | | |
IT Consulting & Other Services | | | | | |
InterXion Holding N.V.* | | | 42,144 | | | $ | 1,526,456 | | | | 2.43 | % |
| | | | | | | | | | | | | |
Life & Health Insurance | | | | | |
AIA Group Ltd. | | | 194,600 | | | | 1,293,336 | | | | 2.06 | |
| | | | | | | | | | | | | |
Personal Products | | | | | |
LG Household & Health Care Ltd. | | | 1,405 | | | | 1,218,300 | | | | 1.94 | |
| | | | | | | | | | | | | |
Pharmaceuticals | | | | | |
Allergan PLC* | | | 5,223 | | | | 1,202,909 | | | | 1.91 | |
| | | | | | | | | | | | | |
Publishing | | | | | | | | | | | | |
Next Company Ltd. | | | 195,900 | | | | 1,589,919 | | | | 2.53 | |
| | | | | | | | | | | | | |
Research & Consulting Services | |
Nielsen Holdings PLC | | | 33,227 | | | | 1,779,970 | | | | 2.83 | |
| | | | | | | | | | | | | |
Restaurants | | | | | | | | | | | | |
Domino's Pizza Enterprises Ltd. | | | 34,619 | | | | 1,863,174 | | | | 2.96 | |
Domino's Pizza Group PLC | | | 403,122 | | | | 1,951,561 | | | | 3.11 | |
| | | | | | | | 3,814,735 | | | | 6.07 | |
Semiconductor Equipment | |
ASML Holding N.V. | | | 29,330 | | | | 3,218,674 | | | | 5.12 | |
| | | | | | | | | | | | | |
Specialized Finance | | | | | | | | | | | | |
Element Financial Corporation | | | 221,934 | | | | 2,777,664 | | | | 4.42 | |
| | | | | | | | | | | | | |
Trading Companies & Distributors | |
MISUMI Group, Inc. | | | 101,500 | | | | 1,885,765 | | | | 3.00 | |
| | | | | | | | | | | | | |
TOTAL COMMON STOCKS | | | | | | | | | | | | |
(Cost $52,286,745) | | | | | | | 62,610,682 | | | | 99.64 | |
| | | | | | | | | | | | | |
SHORT-TERM INVESTMENTS | |
State Street Institutional Treasury Money Market Fund, 0.000% | | | 161,267 | | | | 161,267 | | | | 0.26 | |
| | | | | | | | | | | | | |
TOTAL SHORT-TERM INVESTMENTS | |
(Cost $161,267) | | | | | | | 161,267 | | | | 0.26 | |
| | | | | | | | | | | | | |
TOTAL INVESTMENTS | | | | | | | | | | | | |
(Cost $52,448,012) | | | | | | | 62,771,949 | | | | 99.90 | |
| | | | | | | | | | | | | |
Cash and Other Assets, Less Liabilities | | | | | | | 61,369 | | | | 0.10 | |
| | | | | | | | | | | | | |
NET ASSETS | | | | | | $ | 62,833,318 | | | | 100.00 | % |
| See notes to financial statements. |
25
MARSICO INTERNATIONAL OPPORTUNITIES FUND
SCHEDULE OF INVESTMENTS (continued)
September 30, 2016
SUMMARY OF INVESTMENTS BY COUNTRY | |
Country | | Market Value | | | Percent of
Investment
Securities | |
Argentina | | $ | 666,262 | | | | 1.06 | % |
Australia | | | 3,424,610 | | | | 5.46 | |
Belgium | | | 1,287,296 | | | | 2.05 | |
Canada | | | 6,535,145 | | | | 10.41 | |
China/Hong Kong | | | 9,162,175 | | | | 14.60 | |
Germany | | | 5,146,228 | | | | 8.20 | |
India | | | 2,424,418 | | | | 3.86 | |
Ireland | | | 3,673,120 | | | | 5.85 | |
Israel | | | 536,978 | | | | 0.85 | |
Italy | | | 1,386,645 | | | | 2.21 | |
Japan | | | 6,322,724 | | | | 10.07 | |
Netherlands | | | 4,745,130 | | | | 7.56 | |
South Korea | | | 1,218,300 | | | | 1.94 | |
Spain | | | 1,902,400 | | | | 3.03 | |
United Kingdom | | | 4,899,998 | | | | 7.81 | |
United States(1) | | | 9,440,520 | | | | 15.04 | |
| | | $ | 62,771,949 | | | | 100.00 | % |
(1) | Includes short-term securities. |
| See notes to financial statements. |
26
INVESTMENT REVIEW BY MUNISH MALHOTRA AND JORDON LAYCOB (UNAUDITED)
The Marsico Flexible Capital Fund posted a total return of +7.79% for the one-year fiscal period ended September 30, 2016. The Fund underperformed the S&P 500 Index, the Fund’s benchmark index, which had a total return of +15.43% over the same time period. Please see the Fund’s Overview for more detailed information about the Fund’s longer-term performance for various time periods ended September 30, 2016.
The performance data for the Fund quoted here represent past performance, and past performance is not a guarantee of future results. Investment return and principal value of an investment will fluctuate so that an investor’s shares, when redeemed, may be worth more or less than their original cost. Current performance may be lower or higher than the performance information quoted. To obtain performance information current to the most recent month-end, please call 888-860-8686 or visit marsicofunds.com. (1)
This review highlights Fund performance over a one-year fiscal period. Shareholders should keep in mind that the Fund is intended for long-term investors who hold their shares for substantially longer periods of time. You should also keep in mind that our current views and beliefs regarding all investments discussed in this report are subject to change at any time. References to specific securities, industries, and sectors discussed in this report are not recommendations to buy or sell such securities or related investments, and the Fund may not necessarily hold these securities or investments today. Please see the accompanying Schedule of Investments for the percentage of the Fund’s portfolio represented by the securities mentioned in this report as of the end of the reporting period.
The Fund is subject to broad risks associated with investing in equity securities markets generally, including the risks that the securities and markets in which it invests may experience volatility and instability, that domestic and global economies and markets may undergo periods of cyclical change and decline, that investors may at times avoid investments in equity securities, and that investments may not perform as anticipated. Please see the Prospectus for more information.
The Fund is not managed to track the benchmark index, and may hold a substantially overweight or underweight position in a sector, industry, or security compared to its weight in the benchmark. For informational purposes, the discussion below may compare the benchmark weight or performance of a sector or industry to the investment approach of the Fund.
The Flexible Capital Fund’s underperformance versus the S&P 500 Index was largely attributable to certain holdings in the Consumer Discretionary and Health Care sectors.
Consumer Discretionary position ClubCorp Holdings, Inc., the largest owner and operator of private golf and country clubs in the US, posted a return of -31%. The company’s stock declined on concerns that weak oil prices would negatively affect the company’s Texas clubs. We believed these fears to be overblown and maintained the position. Media position Liberty Global PLC – Series C (-23% prior to being sold) was another holding in the Consumer Discretionary sector that had a negative impact on Fund performance. London-headquartered Liberty Global is the largest cable TV provider in Europe. Uncertainty regarding the European Union’s economy and consumer spending for pay TV weighed on the company’s stock price.
Two of the Fund’s holdings in the Pharmaceuticals, Biotechnology & Life Sciences industry posted negative returns. Eli Lilly & Company declined -5% prior to being sold. In early 2016, the company issued more conservative profit and revenue guidance due, in part, to foreign-exchange headwinds. We sold Novartis AG (-17% during the period prior to being sold) after a disappointing launch of the company’s new heart failure drug and operational challenges in its eye care division.
Another of the Fund’s Health Care positions, Envision Healthcare Holdings, Inc., a provider of outsourced medical services, dropped -29% prior to being sold. Envision’s stock was under pressure as the company reported higher than anticipated turnover within its contract physician staffing segment.
From a sector allocation perspective, the Fund’s performance was impaired by having an overweight posture to the Consumer Discretionary sector – one of the weaker-performing sectors of the S&P 500 Index.
On the brighter side, the Fund’s holdings in the Consumer Staples sector contributed positively to the Fund’s performance for the one-year period ended September 30, 2016. Constellation Brands, Inc. – Cl. A posted a return of +34% on continued growth in the company’s beer segment, which includes the Corona and Modelo brands. Molson Coors Brewing Company – Cl. B also performed well, gaining +35% during the period.
27
Other strong performing individual Fund holdings included social media company Facebook, Inc. – Cl. A (+43%) and commercial services firm Nielsen Holdings PLC (+23%). Facebook’s results continued to exceed market expectations, led by strong advertising revenue and monthly active user growth rates, a result of the company’s embracing a shift towards mobile phone usage. Nielsen’s leadership position in media and retail measurement remains strong, and the company is gaining traction with its new unified rating for content shown across media including TV, desktops and mobile devices.
The Fund has a flexible mandate, and its allocations to equities, fixed income, preferred securities and cash may change over time. The Fund’s cash position was slightly elevated at times, particularly during the early portions of the reporting period. Much of the reporting period was characterized by volatility in the markets. The Fund’s cash levels were reduced during the period as we sought to pick entry points in which to redeploy cash into securities at what we believed to be attractive prices. Nevertheless, in a generally rising equity market, the Fund’s cash positions were a drag on performance when measured over the full one-year period.
During the period, the Fund sought to generate more income and increased its holdings in fixed-income and preferred stock securities. In aggregate, these holdings posted a positive return, but modestly trailed the overall return of the S&P 500 Index. The Fund increased its holdings in the Consumer Staples and Industrials sectors. The Fund trimmed its allocations to the Health Care and Consumer Discretionary sectors.
Fiscal Period-End Investment Posture
As of period-end, the Fund’s primary economic sector allocations included Consumer Discretionary, Information Technology, Financials, Industrials, and Consumer Staples. At period-end, the Fund had no exposure to the Energy and Utilities sectors.
Sincerely,
MUNISH MALHOTRA, CFA
JORDON S. LAYCOB
PORTFOLIO MANAGERS
(1) | Total returns are based on net change in net asset value assuming reinvestment of distributions. Periodically, certain fees and expenses have been waived or reimbursed by the Adviser for the Flexible Capital Fund. In the absence of such a waiver or reimbursement, the performance returns reflected would have been reduced. In accordance with the expense limitation and fee waiver agreement, the Adviser may recoup fees and expenses previously waived or reimbursed under certain parameters. Please see the Prospectus for more information. |
28
FLEXIBLE CAPITAL FUND OVERVIEW |
September 30, 2016 (Unaudited)
The Flexible Capital Fund invests primarily in equity securities and other investments that are selected primarily for their long-term growth potential. The Fund may invest in issuers of any size throughout the world, and will normally hold a core position of between 20 and 50 securities or other investments.
TOTAL ANNUAL OPERATING EXPENSES* 1.27% | NET ASSETS $353,090,511 | NET ASSET VALUE PER SHARE $15.55 |
GROWTH OF $10,000(1)(2) | PERFORMANCE COMPARISON |
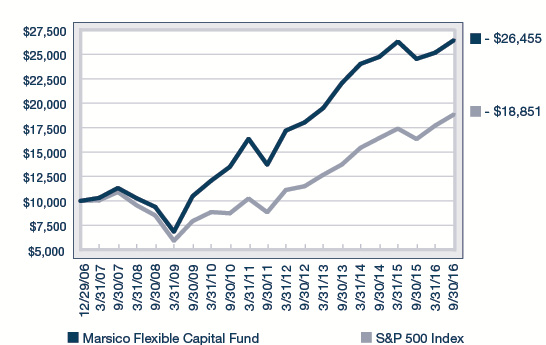
| 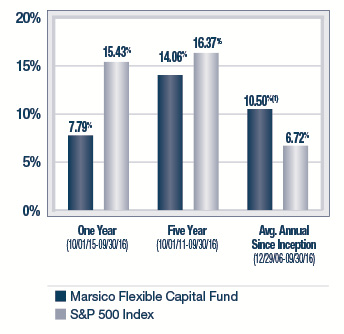
|
SECTOR ALLOCATION(3) | TOP FIVE HOLDINGS |
 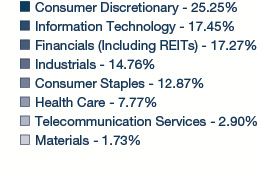
| | | | |
| | Constellation Brands, Inc. - Cl. A | 6.36% | |
| | Crown Castle International Corp. | 4.82% | |
| | Visa, Inc. - Cl. A | 4.58% | |
| | The Home Depot, Inc. | 4.48% | |
| | Nielsen Holdings PLC | 4.25% | |
| | | | |
* | The Total Annual Operating Expenses are reflective of the information disclosed in the Funds’ Prospectus dated January 29, 2016 and may differ from the expense ratio disclosed in this report. |
| The performance data quoted here represent past performance, and past performance is not a guarantee of future results. Investment return and principal value of an investment will fluctuate so that an investor’s shares, when redeemed, may be worth more or less than their original cost. Current performance may be lower or higher than the performance information quoted. To obtain performance information current to the most recent month-end, please call 888-860-8686 or visit marsicofunds.com. |
| The performance included in the chart and graph does not reflect the deduction of taxes on Fund distributions or the redemption of Fund shares. |
| All indices are unmanaged and investors cannot invest directly in an index. |
(1) | Periodically, certain fees and expenses have been waived or reimbursed by the Adviser for the Flexible Capital Fund. In the absence of such a waiver or reimbursement, the performance returns reflected would have been reduced. In accordance with the expense limitation and fee waiver agreement, the Adviser may recoup fees and expenses previously waived or reimbursed under certain parameters. |
(2) | This chart assumes an initial investment of $10,000 made on December 29, 2006 (inception). Total returns are based on change in NAV, assuming reinvestment of distributions. |
(3) | Sector weightings represent the percentage of the Fund’s investments (excluding cash equivalents) in certain general sectors. These sectors may include more than one industry. For the year ended September 30, 2016, the Financials sector includes real estate investment trusts. The Fund’s portfolio composition is subject to change at any time. |
29
MARSICO FLEXIBLE CAPITAL FUND
SCHEDULE OF INVESTMENTS
September 30, 2016
| | | Number
of
Shares | | | Value | | | Percent
of Net
Assets | |
COMMON STOCKS | | | | | | | | | |
Aerospace & Defense | | | | | | | | | |
BAE Systems PLC | | | 1,782,204 | | | $ | 12,104,414 | | | | 3.43 | % |
Lockheed Martin Corporation | | | 45,288 | | | | 10,856,439 | | | | 3.07 | |
| | | | | | | | 22,960,853 | | | | 6.50 | |
Airport Services | | | | | | | | | | | | |
Macquarie Infrastructure Corporation | | | 88,696 | | | | 7,383,055 | | | | 2.09 | |
| | | | | | | | | | | | | |
Automotive Retail | | | | | | | | | | | | |
O'Reilly Automotive, Inc.* | | | 39,010 | | | | 10,927,091 | | | | 3.09 | |
| | | | | | | | | | | | | |
Biotechnology | | | | | | | | | | | | |
Amgen, Inc. | | | 63,258 | | | | 10,552,067 | | | | 2.99 | |
| | | | | | | | | | | | | |
Brewers | | | | | | | | | | | | |
Molson Coors Brewing Company - Cl. B | | | 122,529 | | | | 13,453,684 | | | | 3.81 | |
| | | | | | | | | | | | | |
Casinos & Gaming | | | | | | | | | | | | |
Red Rock Resorts, Inc. - Cl. A | | | 194,103 | | | | 4,578,890 | | | | 1.30 | |
| | | | | | | | | | | | | |
Communications Equipment | | | | | |
Cisco Systems, Inc. | | | 442,587 | | | | 14,038,860 | | | | 3.98 | |
| | | | | | | | | | | | | |
Data Processing & Outsourced Services | |
Visa, Inc. - Cl. A | | | 195,544 | | | | 16,171,489 | | | | 4.58 | |
| | | | | | | | | | | | | |
Distillers & Vintners | | | | | | | | | | | | |
Constellation Brands, Inc. - Cl. A | | | 134,885 | | | | 22,457,004 | | | | 6.36 | |
| | | | | | | | | | | | | |
Home Improvement Retail | | | | | | | | | | | | |
The Home Depot, Inc. | | | 122,997 | | | | 15,827,254 | | | | 4.48 | |
| | | | | | | | | | | | | |
Integrated Telecommunication Services | |
AT&T, Inc. | | | 149,187 | | | | 6,058,484 | | | | 1.72 | |
| | | | | | | | | | | | | |
Internet Software & Services | |
Alphabet, Inc. - Cl. A* | | | 10,416 | | | | 8,375,089 | | | | 2.37 | |
Facebook, Inc. - Cl. A* | | | 97,411 | | | | 12,494,909 | | | | 3.54 | |
| | | | | | | | 20,869,998 | | | | 5.91 | |
Leisure Facilities | | | | | | | | | | | | |
ClubCorp Holdings, Inc. | | | 803,381 | | | | 11,624,923 | | | | 3.29 | |
Six Flags Entertainment Corporation | | | 155,899 | | | | 8,357,745 | | | | 2.37 | |
| | | | | | | | 19,982,668 | | | | 5.66 | |
Mortgage REITs | | | | | | | | | | | | |
Starwood Property Trust, Inc. | | | 582,649 | | | | 13,121,255 | | | | 3.72 | |
| | | | | | | | | | | | | |
Packaged Foods & Meats | | | | | | | | | | | | |
TreeHouse Foods, Inc.* | | | 105,250 | | | | 9,176,747 | | | | 2.60 | |
| | | | | | | | | | | | | |
Pharmaceuticals | | | | | | | | | | | | |
Johnson & Johnson | | | 88,206 | | | | 10,419,775 | | | | 2.95 | |
| | | | | | | | | | | | | |
Research & Consulting Services | |
Nielsen Holdings PLC | | | 280,215 | | | | 15,011,117 | | | | 4.25 | |
| | | | | | | | | | | | | |
| | | Number
of Shares/
Par Value | | | Value | | | Percent
of Net
Assets | |
COMMON STOCKS (Continued) | |
Restaurants | |
Domino's Pizza Group PLC | | | 2,313,460 | | | $ | 11,199,733 | | | | 3.17 | % |
| | | | | | | | | | | | | |
Specialized Finance | | | | | | | | | | | | |
CME Group, Inc. | | | 88,993 | | | | 9,301,548 | | | | 2.63 | |
| | | | | | | | | | | | | |
Specialized REITs | | | | | | | | | | | | |
Crown Castle International Corp. | | | 180,461 | | | | 17,001,231 | | | | 4.82 | |
| | | | | | | | | | | | | |
Technology Hardware, Storage & Peripherals | |
Apple, Inc. | | | 88,813 | | | | 10,040,310 | | | | 2.84 | |
| | | | | | | | | | | | | |
TOTAL COMMON STOCKS | | | | | | | | | | | | |
(Cost $221,447,115) | | | | | | | 280,533,113 | | | | 79.45 | |
| | | | | | | | | | | | | |
CONVERTIBLE PREFERRED STOCKS | | | | | |
Pharmaceuticals | | | | | | | | | | | | |
Allergan PLC, Series A, 5.500% | | | 7,595 | | | | 6,240,280 | | | | 1.77 | |
| | | | | | | | | | | | | |
TOTAL CONVERTIBLE PREFERRED STOCKS | | | | | |
(Cost $6,214,165) | | | | | | | 6,240,280 | | | | 1.77 | |
| | | | | | | | | | | | | |
CORPORATE BONDS | | | | | | | | | | | | |
Advertising | | | | | | | | | | | | |
MDC Partners, Inc. 144A, 6.500%, 5/1/24† | | $ | 2,500,000 | | | | 2,312,500 | | | | 0.66 | |
| | | | | | | | | | | | | |
Casinos & Gaming | | | | | | | | | | | | |
MGM Resorts International, 6.625%, 12/15/21 | | | 5,000,000 | | | | 5,625,000 | | | | 1.59 | |
| | | | | | | | | | | | | |
General Merchandise Stores | | | | | |
Dollar Tree, Inc., 5.750%, 3/1/23 | | | 6,000,000 | | | | 6,457,500 | | | | 1.83 | |
| | | | | | | | | | | | | |
Leisure Facilities | | | | | | | | | | | | |
ClubCorp Club Operations, Inc. 144A, 8.250%, 12/15/23† | | | 5,000,000 | | | | 5,375,000 | | | | 1.52 | |
| | | | | | | | | | | | | |
Metal & Glass Containers | | | | | | | | | | | | |
Ball Corp., 4.000%, 11/15/23 | | | 6,000,000 | | | | 6,045,000 | | | | 1.71 | |
| | | | | | | | | | | | | |
Real Estate Development | | | | | | | | | | | | |
The Howard Hughes Corporation 144A, 6.875%, 10/1/21† | | | 4,000,000 | | | | 4,205,000 | | | | 1.19 | |
| | | | | | | | | | | | | |
Research & Consulting Services | | | | | |
IHS Markit Ltd. 144A, 5.000%, 11/1/22† | | | 6,000,000 | | | | 6,348,600 | | | | 1.80 | |
| | | | | | | | | | | | | |
Restaurants | | | | | |
Yum! Brands, Inc., 6.875%, 11/15/37 | | | 6,000,000 | | | | 6,150,000 | | | | 1.74 | |
† | These securities have been determined to be liquid under guidelines established by the Board of Trustees. At September 30, 2016, the total value of the Fund’s 144A securities was 5.17% of net assets. |
| See notes to financial statements. |
30
| | | Par Value/Number
of Shares | | | Value | | | Percent
of Net
Assets | |
CORPORATE BONDS (Continued) | |
Wireless Telecommunication Services | |
T-Mobile USA, Inc., 6.464%, 4/28/19 | | $ | 4,000,000 | | | $ | 4,075,000 | | | | 1.16 | % |
| | | | | | | | | | | | | |
TOTAL CORPORATE BONDS | |
(Cost $44,385,960) | | | | | | $ | 46,593,600 | | | | 13.20 | % |
| | | | | | | | | | | | | |
PREFERRED STOCKS | | | | | | | | | | | | |
Diversified Banks | | | | | | | | | | | | |
JPMorgan Chase & Co., Series BB, 6.150% | | | 135,072 | | | | 3,668,556 | | | | 1.04 | |
Wells Fargo & Company, Series N, 5.200% | | | 172,538 | | | | 4,356,584 | | | | 1.23 | |
| | | | | | | | 8,025,140 | | | | 2.27 | |
Investment Banking & Brokerage | |
The Charles Schwab Corporation, Series C, 6.000% | | | 100,212 | | | | 2,758,836 | | | | 0.78 | |
| | | | | | | | | | | | | |
Regional Banks | | | | | | | | | | | | |
KeyCorp, Series C, 8.625% | | | 115,217 | | | | 3,009,468 | | | | 0.85 | |
Regions Financial Corporation, Series A, 6.375% | | | 117,906 | | | | 3,053,766 | | | | 0.87 | |
| | | | | | | | 6,063,234 | | | | 1.72 | |
TOTAL PREFERRED STOCKS | |
(Cost $15,836,645) | | | | | | | 16,847,210 | | | | 4.77 | |
| | | | | | | | | | | | | |
TOTAL INVESTMENTS | | | | | | | | | | | | |
(Cost $287,883,885) | | | | | | | 350,214,203 | | | | 99.19 | |
| | | | | | | | | | | | | |
Cash and Other Assets, Less Liabilities | | | | | | | 2,876,308 | | | | 0.81 | |
| | | | | | | | | | | | | |
NET ASSETS | | | | | | $ | 353,090,511 | | | | 100.00 | % |
| See notes to financial statements. |
31
INVESTMENT REVIEW BY TOM MARSICO (UNAUDITED)
The Marsico Global Fund posted a total return of (US$) +8.05% for the one-year fiscal period ended September 30, 2016. The Fund underperformed the MSCI All Country World Index (“MSCI ACWI Index”), the Fund’s benchmark index, which had a total return of (US$) +11.96% over the same time period. The MSCI ACWI Index measures equity market performance in the global developed and emerging markets. Please see the Fund’s Overview for more detailed information about the Fund’s longer-term performance for various time periods ended September 30, 2016.
The performance data for the Fund quoted here represent past performance, and past performance is not a guarantee of future results. Investment return and principal value of an investment will fluctuate so that an investor’s shares, when redeemed, may be worth more or less than their original cost. Current performance may be lower or higher than the performance information quoted. To obtain performance information current to the most recent month-end, please call 888-860-8686 or visit marsicofunds.com. (1)
This review highlights Fund performance over a one-year fiscal period. Shareholders should keep in mind that the Fund is intended for long-term investors who hold their shares for substantially longer periods of time. You should also keep in mind that our current views and beliefs regarding all investments discussed in this report are subject to change at any time. References to specific securities, industries, and sectors discussed in this report are not recommendations to buy or sell such securities or related investments, and the Fund may not necessarily hold these securities or investments today. Please see the accompanying Schedule of Investments for the percentage of the Fund’s portfolio represented by the securities mentioned in this report as of the end of the reporting period.
Foreign investments present additional risks due to currency fluctuations, economic and political factors, lower liquidity, differences in securities regulations and accounting standards, possible changes in taxation, limited public information, and other factors. In addition, the Fund is subject to broad risks associated with investing in equity securities markets generally, including the risks that the securities and markets in which it invests may experience volatility and instability, that domestic and global economies and markets may undergo periods of cyclical change and decline, that investors may at times avoid investments in equity securities, and that investments may not perform as anticipated. Please see the Prospectus for more information.
The Fund is not managed to track the benchmark index, and may hold a substantially overweight or underweight position in a sector, industry, or security compared to its weight in the benchmark. For informational purposes, the discussion below may compare the benchmark weight or performance of a sector or industry to the investment approach of the Fund.
The Global Fund’s underperformance versus the MSCI ACWI Index was partially attributable to certain holdings in the Health Care sector.
Stock prices of many Health Care companies were under pressure during the reporting period. DexCom, Inc., a developer of continuous glucose monitoring systems for people with diabetes, returned -26% during the period prior to being sold.
Certain of the Fund’s holdings within the Pharmaceutical, Biotechnology & Life Sciences industry posted negative returns. Nivalis Therapeutics, Inc., a drug company developing treatments for cystic fibrosis, returned -63% during the period and was sold from the Fund. Regeneron Pharmaceuticals, Inc. and Novartis AG declined -31% and -22%, respectively, during the period prior to being sold. We chose to sell Regeneron because the US government is stepping up efforts to control Medicare Part B costs, an area where Regeneron has more exposure than many of its peers. We sold Novartis after a disappointing launch of the company’s new heart failure drug and operational challenges in its eye care division. Genome sequencing company Illumina, Inc. (-21% during the period prior to being sold) preannounced lower-than-expected revenues and cut its guidance due in part to disappointing sales in Europe and Asia.
32
In the Consumer Discretionary sector restaurant operator Chipotle Mexican Grill, Inc. (-42%) posted a negative return during the period after it was discovered that foodborne illnesses, including norovirus and E. coli outbreaks, were linked to Chipotle restaurants in several states. The Fund maintained a position in the company as the company is taking important measures to improve the safety of its food supply chain, and a resolution of food safety issues should lead to improvement in the number of customer visits and contribute to strong same-store sales growth. Additionally, the company launched a loyalty rewards program during the period, which should incentivize customers to return to the stores.
Another of the Fund’s Consumer Discretionary holdings, cruise line operator Norwegian Cruise Line Holdings Ltd., posted a return of -32% during the period prior to being sold, and was an additional detractor from performance.
A select Information Technology holding detracted from performance. Activision Blizzard, Inc. posted a return of -30% and was sold after the company reported quarterly results that were weaker than expected and lowered its 2016 guidance.
The Fund’s performance was held back by having an underweight allocation to one of the strongest-performing sectors of the MSCI ACWI Index, Consumer Staples, as well as an overweight allocation to the weak-performing Consumer Discretionary sector.
On the brighter side, a portion of this negative effect was offset by the Fund’s lack of exposure to Financials, the weakest-performing sector of the benchmark index. An overweight allocation to the relatively strong Information Technology sector also aided performance.
Regarding positive contributors, many of the Fund’s Consumer Discretionary holdings performed well. Domino’s Pizza Enterprises Ltd. soared +93% on strong pizza sales in its Australian market. Central to our investment thesis is Domino’s use of technology to enable customers to place their orders more efficiently, and other innovative enhancements designed to prepare and deliver pizzas more quickly. Canadian discount retailer Dollarama, Inc. gained +46% as the company reported strong same store sales growth, benefiting from value-conscious spending by consumers. The Fund reestablished a position in casino operator Wynn Macau Ltd. during the period and the stock rose +31% during the period it was held by the Fund. We exited the position after the Wynn Palace opening failed to meet our expectations.
The Materials sector was strong and the Fund’s sole holding in the sector, The Sherwin-Williams Company, gained +26%. Sherwin-Williams has benefitted from lower raw materials costs and continued strength in the housing market.
Information Technology holdings Facebook, Inc. – Cl. A and Alibaba Group Holding Ltd. Spon. ADR each had a material, positive effect on performance. Alibaba, China’s leading ecommerce company, staged a stock price gain of +75% during the period. Alibaba’s stock rose after sales on China’s “Singles Day,” a holiday popular among young unmarried adults in China, were stronger than expected. Facebook’s results (+42%) continued to exceed market expectations, led by strong advertising revenue and monthly active user growth rates, a result of the company’s embracing a shift towards mobile phone usage.
Although active currency management is not a central facet of the Fund’s investment process, fluctuations in major world currencies can at times affect the Fund’s performance. During the period, the net effect of currency moves was negative for the Fund. In particular, the Fund’s results were adversely impacted by having an underweight allocation, as compared to the MSCI ACWI Index, to investments denominated in the Japanese yen, which strengthened during the period. The Fund’s overweight allocation to stocks denominated in the relatively weaker British pound sterling also modestly detracted from results.
During the period, the Fund increased its allocations to the Information Technology and Consumer Staples sectors. The Fund reduced its positions in the Health Care, Consumer Discretionary and Industrials sectors.
33
Fiscal Period-End Investment Posture
As of September 30, 2016, the Fund’s primary economic sector allocations were Information Technology, Consumer Discretionary, and Health Care. The Fund had no investments in the Financials, Energy, Telecommunication Services, or Utilities sectors. The Fund’s most significant country allocations were the United States, China/Hong Kong, Australia and Canada. Country-level weightings generally should be considered a residual of the Fund’s stock selection process rather than a major, proactive facet of its investment strategy.
Sincerely,
THOMAS F. MARSICO
PORTFOLIO MANAGER
(1) | Total returns are based on net change in net asset value assuming reinvestment of distributions. Periodically, certain fees and expenses have been waived or reimbursed by the Adviser for the Global Fund. In the absence of such a waiver or reimbursement, the performance returns reflected would have been reduced. In accordance with the expense limitation and fee waiver agreement, the Adviser may recoup fees and expenses previously waived or reimbursed under certain parameters. Periodically, the Adviser has recouped such fees or expenses from the Global Fund, resulting in a lower performance return. Please see the Prospectus for more information. |
34
September 30, 2016 (Unaudited)
The Global Fund invests primarily in the common stocks of US and foreign companies that are selected for their long-term growth potential. The Fund may invest in the securities of companies of any size that are economically tied to any countries or markets throughout the world, including the securities of companies economically tied to emerging markets. Under normal market conditions, the Fund will invest significantly (generally, at least 40% of its net assets) in the securities of issuers organized or located outside the US or doing business outside the US or other foreign securities (unless market conditions are not deemed favorable by the Adviser, in which case the Fund generally will invest at least 30% of its assets in such foreign securities). The Fund will invest its assets in various regions and countries, including the US, that encompass not less than three different countries overall. The Fund may hold an unlimited number of common stocks.
TOTAL ANNUAL OPERATING EXPENSES* 1.49% NET EXPENSES*† 1.60% | NET ASSETS $44,272,803 | NET ASSET VALUE PER SHARE $12.03 |
GROWTH OF $10,000(1)(2) | PERFORMANCE COMPARISON |
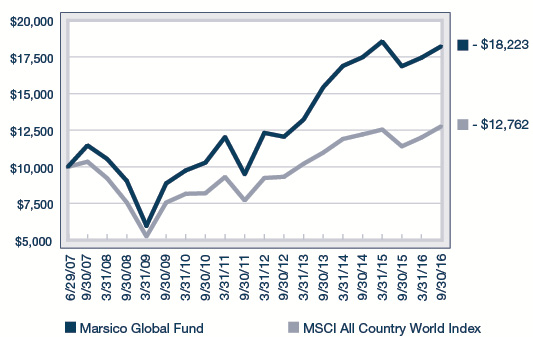
| 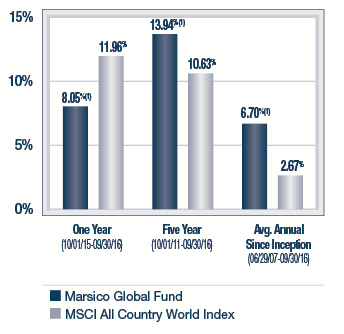
|
SECTOR ALLOCATION(3) | TOP FIVE HOLDINGS |
 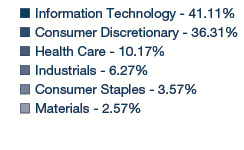
| | | | |
| | Tencent Holdings Ltd. | 6.40% | |
| | Alibaba Group Holding Ltd. Spon. ADR | 5.77% | |
| | Facebook, Inc. - Cl. A | 5.25% | |
| | Amazon.com, Inc. | 4.47% | |
| | Domino’s Pizza Enterprises Ltd. | 3.74% | |
| | | | |
* | The Total Annual Operating Expenses and Net Expenses are reflective of the information disclosed in the Funds’ Prospectus dated January 29, 2016 and may differ from the expense ratios disclosed in this report. |
† | Marsico Capital Management, LLC (the “Adviser”) has entered into a written expense limitation and fee waiver agreement under which it has agreed to limit the total expenses of the Global Fund (excluding interest, taxes, acquired fund fees and expenses, litigation, brokerage and extraordinary expenses) to an annual rate of 1.60% of the Fund’s average net assets until January 31, 2017. This expense limitation and fee waiver agreement may be terminated by the Adviser at any time after January 31, 2017, upon 15 days prior notice to the Fund and its administrator. The Adviser may recoup from the Fund fees previously waived or expenses previously reimbursed by the Adviser with respect to the Fund pursuant to this agreement (or a previous expense limitation agreement) if: (1) such recoupment by the Adviser does not cause the Fund, at the time of recoupment, to exceed the lesser of (a) the expense limitation in effect at the time the relevant amount was waived and/or reimbursed, or (b) the expense limitation in effect at the time of the proposed recoupment, and (2) the recoupment is made within three fiscal years after the end of the fiscal year in which the amount was waived or reimbursed. |
| The performance data quoted here represent past performance, and past performance is not a guarantee of future results. Investment return and principal value of an investment will fluctuate so that an investor’s shares, when redeemed, may be worth more or less than their original cost. Current performance may be lower or higher than the performance information quoted. To obtain performance information current to the most recent month-end, please call 888-860-8686 or visit marsicofunds.com. |
| The performance included in the chart and graph does not reflect the deduction of taxes on Fund distributions or the redemption of Fund shares. |
| All indices are unmanaged and investors cannot invest directly in an index. |
(1) | Periodically, certain fees and expenses have been waived or reimbursed by the Adviser for the Global Fund. In the absence of such a waiver or reimbursement, the performance returns reflected would have been reduced. In accordance with the expense limitation and fee waiver agreement, the Adviser may recoup fees and expenses previously waived or reimbursed under certain parameters. Periodically, the Adviser has recouped such fees or expenses from the Global Fund, resulting in a lower performance return. |
(2) | This chart assumes an initial investment of $10,000 made on June 29, 2007 (inception). Total returns are based on change in NAV, assuming reinvestment of distributions. |
(3) | Sector weightings represent the percentage of the Fund’s investments (excluding cash equivalents) in certain general sectors. These sectors may include more than one industry. The Fund’s portfolio composition is subject to change at any time. |
| The MSCI ACWI (All Country World Index) Index is a free float-adjusted market capitalization index that is designed to measure equity market performance in the global developed and emerging markets. |
35
MARSICO GLOBAL FUND
SCHEDULE OF INVESTMENTS
September 30, 2016
| | | Number
of
Shares | | | Value | | | Percent
of Net
Assets | |
COMMON STOCKS | | | | | | | | | |
Advertising | | | | | | | | | |
REA Group Ltd. | | | 9,180 | | | $ | 396,613 | | | | 0.90 | % |
| | | | | | | | | | | | | |
Airlines | | | | | | | | | | | | |
Ryanair Holdings PLC Spon. ADR | | | 17,617 | | | | 1,321,804 | | | | 2.99 | |
| | | | | | | | | | | | | |
Apparel, Accessories & Luxury Goods | |
Hermes International | | | 3,213 | | | | 1,307,477 | | | | 2.95 | |
| | | | | | | | | | | | | |
Application Software | | | | | | | | | | | | |
salesforce.com, inc.* | | | 22,264 | | | | 1,588,091 | | | | 3.59 | |
| | | | | | | | | | | | | |
Automotive Retail | | | | | | | | | | | | |
O'Reilly Automotive, Inc.* | | | 5,164 | | | | 1,446,488 | | | | 3.27 | |
| | | | | | | | | | | | | |
Biotechnology | | | | | | | | | | | | |
Amgen, Inc. | | | 7,787 | | | | 1,298,949 | | | | 2.93 | |
| | | | | | | | | | | | | |
Brewers | | | | | | | | | | | | |
Anheuser-Busch InBev N.V. | | | 11,221 | | | | 1,469,755 | | | | 3.32 | |
| | | | | | | | | | | | | |
Data Processing & Outsourced Services | |
Visa, Inc. - Cl. A | | | 16,985 | | | | 1,404,659 | | | | 3.17 | |
| | | | | | | | | | | | | |
Footwear | | | | | | | | | | | | |
NIKE, Inc. - Cl. B | | | 21,906 | | | | 1,153,351 | | | | 2.61 | |
| | | | | | | | | | | | | |
General Merchandise Stores | |
Dollarama, Inc. | | | 20,805 | | | | 1,624,343 | | | | 3.67 | |
| | | | | | | | | | | | | |
Health Care Equipment | | | | | | | | | | | | |
Intuitive Surgical, Inc.* | | | 2,102 | | | | 1,523,593 | | | | 3.44 | |
| | | | | | | | | | | | | |
Home Entertainment Software | |
Electronic Arts, Inc.* | | | 17,441 | | | | 1,489,461 | | | | 3.36 | |
| | | | | | | | | | | | | |
Home Improvement Retail | | | | | | | | | | | | |
The Home Depot, Inc. | | | 11,127 | | | | 1,431,822 | | | | 3.23 | |
| | | | | | | | | | | | | |
Internet & Direct Marketing Retail | |
Amazon.com, Inc.* | | | 2,365 | | | | 1,980,238 | | | | 4.47 | |
Ctrip.com International, Ltd. ADR* | | | 28,914 | | | | 1,346,525 | | | | 3.04 | |
| | | | | | | | 3,326,763 | | | | 7.51 | |
Internet Software & Services | |
Alibaba Group Holding Ltd. Spon. ADR* | | | 24,162 | | | | 2,556,098 | | | | 5.77 | |
Alphabet, Inc. - Cl. A* | | | 1,967 | | | | 1,581,586 | | | | 3.57 | |
Facebook, Inc. - Cl. A* | | | 18,133 | | | | 2,325,920 | | | | 5.25 | |
Tencent Holdings Ltd. | | | 103,100 | | | | 2,831,249 | | | | 6.40 | |
| | | | | | | | 9,294,853 | | | | 20.99 | |
IT Consulting & Other Services | | | | | |
Accenture PLC - Cl. A | | | 7,970 | | | | 973,695 | | | | 2.20 | |
| | | | | | | | | | | | | |
Managed Health Care | | | | | | | | | | | | |
UnitedHealth Group, Inc. | | | 9,730 | | | | 1,362,200 | | | | 3.08 | |
| | | | | | | | | | | | | |
COMMON STOCKS (Continued) | |
Research & Consulting Services | |
Nielsen Holdings PLC | | | 23,455 | | | $ | 1,256,484 | | | | 2.84 | % |
| | | | | | | | | | | | | |
Restaurants | | | | | | | | | | | | |
Chipotle Mexican Grill, Inc.* | | | 2,847 | | | | 1,205,705 | | | | 2.73 | |
Domino's Pizza Enterprises Ltd. | | | 30,764 | | | | 1,655,700 | | | | 3.74 | |
Domino's Pizza Group PLC | | | 287,462 | | | | 1,391,637 | | | | 3.14 | |
| | | | | | | | 4,253,042 | | | | 9.61 | |
Semiconductor Equipment | | | | | | | | | | | | |
ASML Holding N.V. | | | 10,374 | | | | 1,138,443 | | | | 2.57 | |
| | | | | | | | | | | | | |
Semiconductors | | | | | | | | | | | | |
NVIDIA Corporation | | | 15,028 | | | | 1,029,719 | | | | 2.33 | |
| | | | | | | | | | | | | |
Specialty Chemicals | | | | | | | | | | | | |
The Sherwin-Williams Company | | | 3,825 | | | | 1,058,224 | | | | 2.39 | |
| | | | | | | | | | | | | |
TOTAL COMMON STOCKS | | | | | |
(Cost $32,364,605) | | | | | | | 41,149,829 | | | | 92.95 | |
| | | | | | | | | | | | | |
SHORT-TERM INVESTMENTS | |
State Street Institutional Treasury Money Market Fund, 0.000% | | | 3,729,600 | | | | 3,729,600 | | | | 8.42 | |
| | | | | | | | | | | | | |
TOTAL SHORT-TERM INVESTMENTS | | | | | |
(Cost $3,729,600) | | | | | | | 3,729,600 | | | | 8.42 | |
| | | | | | | | | | | | | |
TOTAL INVESTMENTS | | | | | |
(Cost $36,094,205) | | | | | | | 44,879,429 | | | | 101.37 | |
| | | | | | | | | | | | | |
Liabilities, Less Cash and Other Assets | | | | | | | (606,626 | ) | | | (1.37 | ) |
| | | | | | | | | | | | | |
NET ASSETS | | | | | | $ | 44,272,803 | | | | 100.00 | % |
| See notes to financial statements. |
36
SUMMARY OF INVESTMENTS BY COUNTRY | |
Country | | Market Value | | | Percent of
Investment
Securities | |
Australia | | $ | 2,052,313 | | | | 4.57 | % |
Belgium | | | 1,469,755 | | | | 3.27 | |
Canada | | | 1,624,343 | | | | 3.62 | |
China/Hong Kong | | | 6,733,872 | | | | 15.01 | |
France | | | 1,307,477 | | | | 2.91 | |
Ireland | | | 1,321,804 | | | | 2.95 | |
Netherlands | | | 1,138,443 | | | | 2.54 | |
United Kingdom | | | 1,391,637 | | | | 3.10 | |
United States(1) | | | 27,839,785 | | | | 62.03 | |
| | | $ | 44,879,429 | | | | 100.00 | % |
(1) | Includes short-term securities. |
| See notes to financial statements. |
37
STATEMENTS OF ASSETS AND LIABILITIES
September 30, 2016
(Amounts in thousands) | | MARSICO
FOCUS FUND | | | MARSICO
GROWTH FUND | |
| | | | | | | |
ASSETS | | | | | | |
Investments, at value (cost $476,282, $231,437, $177,141, $52,448, $287,884, and $36,094, respectively) | | $ | 622,458 | | | $ | 292,619 | |
Receivable for investments sold | | | — | | | | 768 | |
Receivable for capital stock sold | | | 52 | | | | 3 | |
Interest and dividends receivable | | | 391 | | | | 146 | |
Prepaid expenses and other assets | | | 2,403 | | | | 954 | |
Total Assets | | | 625,304 | | | | 294,490 | |
| | | | | | | | | |
LIABILITIES | | | | | | | | |
Payable for investments purchased | | | — | | | | 2,911 | |
Payable for capital stock redeemed | | | 4,605 | | | | 411 | |
Due to custodian | | | — | | | | — | |
Payable to investment adviser | | | 389 | | | | 188 | |
Accrued trustees' fees | | | 2,390 | | | | 943 | |
Accrued distribution fee | | | 3,804 | | | | 1,692 | |
Accrued professional fees | | | 80 | | | | 39 | |
Accrued transfer agent fees and expenses | | | 84 | | | | 43 | |
Accrued printing expenses | | | 31 | | | | 15 | |
Accrued expenses and other liabilities | | | 51 | | | | 35 | |
Total Liabilities | | | 11,434 | | | | 6,277 | |
| | | | | | | | | |
NET ASSETS | | $ | 613,870 | | | $ | 288,213 | |
| | | | | | | | | |
NET ASSETS CONSIST OF | | | | | | | | |
Paid-in-capital | | $ | 473,742 | | | $ | 227,313 | |
Undistributed net investment income (accumulated net investment loss) | | | (5,164 | ) | | | (2,709 | ) |
Accumulated net realized gain (loss) on investments and foreign currency transactions | | | (1,464 | ) | | | 2,120 | |
Net unrealized appreciation on investments and foreign currency translations | | | 146,756 | | | | 61,489 | |
NET ASSETS | | $ | 613,870 | | | $ | 288,213 | |
| | | | | | | | | |
SHARES OUTSTANDING, $0.001 par value | | | | | | | | |
(Unlimited shares authorized) | | | 38,474 | | | | 18,550 | |
| | | | | | | | | |
NET ASSET VALUE, REDEMPTION PRICE, AND OFFERING PRICE PER SHARE (NET ASSETS/SHARES OUTSTANDING)* | | $ | 15.96 | | | $ | 15.54 | |
* | Not in thousands, based on unrounded net assets and shares outstanding. |
| See notes to financial statements. |
38
MARSICO
21st CENTURY FUND | | | MARSICO
INTERNATIONAL
OPPORTUNITIES
FUND | | | MARSICO
FLEXIBLE
CAPITAL FUND | | | MARSICO
GLOBAL FUND | |
| | | | | | | | | | | |
| | | | | | | | | | | |
$ | 236,106 | | | $ | 62,772 | | | $ | 350,214 | | | $ | 44,879 | |
| | 754 | | | | 638 | | | | 2,869 | | | | — | |
| | 10 | | | | 6 | | | | 66 | | | | — | |
| | 25 | | | | 113 | | | | 1,319 | | | | 34 | |
| | 348 | | | | 168 | | | | 1,611 | | | | 108 | |
| | 237,243 | | | | 63,697 | | | | 356,079 | | | | 45,021 | |
| | | | | | | | | | | | | | | |
| | | | | | | | | | | | | | | |
| | 682 | | | | 359 | | | | — | | | | 396 | |
| | 225 | | | | 6 | | | | 556 | | | | 10 | |
| | — | | | | — | | | | 164 | | | | — | |
| | 154 | | | | 37 | | | | 232 | | | | 26 | |
| | 341 | | | | 157 | | | | 1,600 | | | | 99 | |
| | 944 | | | | 240 | | | | 260 | | | | 169 | |
| | 29 | | | | 8 | | | | 52 | | | | 6 | |
| | 36 | | | | 15 | | | | 65 | | | | 9 | |
| | 11 | | | | 3 | | | | 21 | | | | 3 | |
| | 41 | | | | 39 | | | | 38 | | | | 30 | |
| | 2,463 | | | | 864 | | | | 2,988 | | | | 748 | |
| | | | | | | | | | | | | | | |
$ | 234,780 | | | $ | 62,833 | | | $ | 353,091 | | | $ | 44,273 | |
| | | | | | | | | | | | | | | |
| | | | | | | | | | | | | | | |
$ | 596,390 | | | $ | 156,120 | | | $ | 267,059 | | | $ | 36,721 | |
| | (2,729 | ) | | | (464 | ) | | | 2,348 | | | | (532 | ) |
| | (417,993 | ) | | | (103,177 | ) | | | 20,756 | | | | (750 | ) |
| | 59,112 | | | | 10,354 | | | | 62,928 | | | | 8,834 | |
$ | 234,780 | | | $ | 62,833 | | | $ | 353,091 | | | $ | 44,273 | |
| | | | | | | | | | | | | | | |
| | | | | | | | | | | | | | | |
| | 10,654 | | | | 4,017 | | | | 22,704 | | | | 3,681 | |
| | | | | | | | | | | | | | | |
$ | 22.04 | | | $ | 15.64 | | | $ | 15.55 | | | $ | 12.03 | |
39
STATEMENTS OF OPERATIONS
FOR THE YEAR ENDED September 30, 2016
(Amounts in thousands) | | MARSICO
FOCUS FUND | | | MARSICO
GROWTH FUND | |
| | | | | | | |
INVESTMENT INCOME | | | | | | |
Dividends (net of $77, $12, $3, $31, $0, and $16, respectively of non-reclaimable foreign withholding taxes) | | $ | 4,674 | | | $ | 2,595 | |
Interest | | | — | | | | — | |
Total Investment Income | | | 4,674 | | | | 2,595 | |
| | | | | | | | | |
EXPENSES | | | | | | | | |
Investment advisory fees | | | 5,483 | | | | 2,751 | |
Distribution fees | | | 1,772 | | | | 858 | |
Transfer agent fees and expenses | | | 759 | | | | 403 | |
Professional fees | | | 322 | | | | 158 | |
Trustees' fees and expenses | | | 278 | (1) | | | 157 | (1) |
Fund administration fees | | | 181 | | | | 144 | |
Custody and fund accounting fees | | | 149 | | | | 95 | |
Printing and postage expenses | | | 92 | | | | 48 | |
Miscellaneous | | | 86 | | | | 46 | |
Federal and state registration fees | | | 39 | | | | 33 | |
Total Expenses | | | 9,161 | | | | 4,693 | |
Less waiver of expenses and expenses paid indirectly | | | (1 | ) | | | — | |
Net Expenses | | | 9,160 | | | | 4,693 | |
| | | | | | | | | |
NET INVESTMENT INCOME (LOSS) | | | (4,486 | ) | | | (2,098 | ) |
| | | | | | | | | |
REALIZED AND UNREALIZED GAIN (LOSS) | | | | | | | | |
Net realized gain (loss) on investments | | | (119 | ) | | | 2,049 | |
Net realized loss on foreign currency transactions | | | (292 | ) | | | — | |
Change in unrealized appreciation (depreciation) on investments and foreign currency translations | | | 45,999 | | | | 19,892 | |
| | | | | | | | | |
Net Gain on Investments | | | 45,588 | | | | 21,941 | |
| | | | | | | | | |
NET INCREASE IN NET ASSETS RESULTING FROM OPERATIONS | | $ | 41,102 | | | $ | 19,843 | |
(1) | Amounts include trustees’ fees and expenses and the mark to market unrealized appreciation during the period for shares held in the Trustees’ Deferred Fee Plan, as more fully described in Note 2(g) in the Notes to Financial Statements. |
| | | Trustees’
Fees and
Expenses* | | | Unrealized
Appreciation* | |
Focus Fund | | $ | 171,991 | | | $ | 106,442 | |
Growth Fund | | | 83,484 | | | | 73,533 | |
21st Century Fund | | | 60,163 | | | | 53,890 | |
International Opportunities Fund | | | 17,160 | | | | 31,131 | |
Flexible Capital Fund | | | 111,994 | | | | 114,213 | |
Global Fund | | | 14,323 | | | | 34,153 | |
| See notes to financial statements. |
40
MARSICO
21st CENTURY FUND | | | MARSICO
INTERNATIONAL
OPPORTUNITIES
FUND | | | MARSICO
FLEXIBLE
CAPITAL FUND | | | MARSICO
GLOBAL FUND | |
| | | | | | | | | | | |
| | | | | | | | | | | |
$ | 1,020 | | | $ | 629 | | | $ | 9,334 | | | $ | 570 | |
| | — | | | | — | | | | 2,915 | | | | — | |
| | 1,020 | | | | 629 | | | | 12,249 | | | | 570 | |
| | | | | | | | | | | | | | | |
| | | | | | | | | | | | | | | |
| | 2,043 | | | | 572 | | | | 3,693 | | | | 461 | |
| | 631 | | | | 177 | | | | 1,165 | | | | 143 | |
| | 342 | | | | 128 | | | | 671 | | | | 88 | |
| | 112 | | | | 32 | | | | 212 | | | | 27 | |
| | 114 | (1) | | | 48 | (1) | | | 226 | (1) | | | 48 | (1) |
| | 135 | | | | 95 | | | | 157 | | | | 75 | |
| | 93 | | | | 152 | | | | 127 | | | | 82 | |
| | 43 | | | | 17 | | | | 78 | | | | 9 | |
| | 30 | | | | 16 | | | | 70 | | | | 12 | |
| | 24 | | | | 21 | | | | 38 | | | | 19 | |
| | 3,567 | | | | 1,258 | | | | 6,437 | | | | 964 | |
| | — | | | | (128 | ) | | | — | | | | (53 | ) |
| | 3,567 | | | | 1,130 | | | | 6,437 | | | | 911 | |
| | | | | | | | | | | | | | | |
| | (2,547 | ) | | | (501 | ) | | | 5,812 | | | | (341 | ) |
| | | | | | | | | | | | | | | |
| | | | | | | | | | | | | | | |
| | (1,442 | ) | | | 1,451 | | | | 28,781 | | | | 627 | |
| | (201 | ) | | | (982 | ) | | | (2,492 | ) | | | (979 | ) |
| | 23,264 | | | | 5,801 | | | | 3,467 | | | | 4,517 | |
| | | | | | | | | | | | | | | |
| | 21,621 | | | | 6,270 | | | | 29,756 | | | | 4,165 | |
| | | | | | | | | | | | | | | |
$ | 19,074 | | | $ | 5,769 | | | $ | 35,568 | | | $ | 3,824 | |
41
STATEMENTS OF CHANGES IN NET ASSETS
| | | MARSICO
FOCUS FUND | | | MARSICO
GROWTH FUND | |
| | | | | | | | | | | | | |
(Amounts in thousands) | | Year
Ended
9/30/16 | | | Year
Ended
9/30/15 | | | Year
Ended
9/30/16 | | | Year
Ended
9/30/15 | |
| | | | | | | | | | | | | |
OPERATIONS: | | | | | | | | | | | | |
Net investment income (loss) | | $ | (4,486 | ) | | $ | (4,091 | ) | | $ | (2,098 | ) | | $ | (2,659 | ) |
Net realized gain (loss) on investments | | | (119 | ) | | | 163,514 | | | | 2,049 | | | | 119,260 | |
Net realized loss on foreign currency transactions | | | (292 | ) | | | (32 | ) | | | — | | | | (301 | ) |
Change in unrealized appreciation (depreciation) on investments and foreign currency translations | | | 45,999 | | | | (187,364 | ) | | | 19,892 | | | | (129,372 | ) |
| | | | | | | | | | | | | | | | | |
Net increase (decrease) in net assets resulting from operations | | | 41,102 | | | | (27,973 | ) | | | 19,843 | | | | (13,072 | ) |
| | | | | | | | | | | | | | | | | |
DISTRIBUTIONS: | | | | | | | | | | | | | | | | |
Net investment income | | | — | | | | — | | | | — | | | | — | |
Net realized gains | | | (157,703 | ) | | | (124,082 | ) | | | (111,369 | ) | | | (63,630 | ) |
| | | | | | | | | | | | | | | | | |
Total distributions | | | (157,703 | ) | | | (124,082 | ) | | | (111,369 | ) | | | (63,630 | ) |
| | | | | | | | | | | | | | | | | |
CAPITAL SHARE TRANSACTIONS: | | | | | | | | | | | | | | | | |
Proceeds from sales of shares | | | 30,902 | | | | 129,352 | | | | 16,765 | | | | 29,300 | |
Proceeds from reinvestment of distributions | | | 147,665 | | | | 113,800 | | | | 106,035 | | | | 61,081 | |
Redemption of shares | | | (236,947 | ) | | | (235,300 | ) | | | (153,503 | ) | | | (165,890 | ) |
| | | | | | | | | | | | | | | | | |
Net increase (decrease) from capital share transactions | | | (58,380 | ) | | | 7,852 | | | | (30,703 | ) | | | (75,509 | ) |
| | | | | | | | | | | | | | | | | |
TOTAL DECREASE IN NET ASSETS | | | (174,981 | ) | | | (144,203 | ) | | | (122,229 | ) | | | (152,211 | ) |
| | | | | | | | | | | | | | | | | |
NET ASSETS: | | | | | | | | | | | | | | | | |
Beginning of Period | | | 788,851 | | | | 933,054 | | | | 410,442 | | | | 562,653 | |
| | | | | | | | | | | | | | | | | |
End of Period | | $ | 613,870 | | | $ | 788,851 | | | $ | 288,213 | | | $ | 410,442 | |
| | | | | | | | | | | | | | | | | |
Undistributed net investment income
(Accumulated net investment loss) | | $ | (5,164 | ) | | $ | (5,458 | ) | | $ | (2,709 | ) | | $ | (3,463 | ) |
| | | | | | | | | | | | | | | | | |
TRANSACTIONS IN SHARES: | | | | | | | | | | | | | | | | |
Shares sold | | | 1,894 | | | | 6,050 | | | | 1,038 | | | | 1,329 | |
Shares issued in reinvestment of distributions | | | 9,166 | | | | 5,600 | | | | 6,814 | | | | 2,823 | |
Shares redeemed | | | (14,476 | ) | | | (11,404 | ) | | | (9,708 | ) | | | (7,552 | ) |
| | | | | | | | | | | | | | | | | |
NET INCREASE (DECREASE) | | | (3,416 | ) | | | 246 | | | | (1,856 | ) | | | (3,400 | ) |
| See notes to financial statements. |
42
MARSICO
21st CENTURY FUND | | | MARSICO
INTERNATIONAL
OPPORTUNITIES FUND | | | MARSICO
FLEXIBLE
CAPITAL FUND | | | MARSICO
GLOBAL FUND | |
| | | | | | | | | | | | | | | | | | | | | | | |
Year
Ended
9/30/16 | | | Year
Ended
9/30/15 | | | Year
Ended
9/30/16 | | | Year
Ended
9/30/15 | | | Year
Ended
9/30/16 | | | Year
Ended
9/30/15 | | | Year
Ended
9/30/16 | | | Year
Ended
9/30/15 | |
| | | | | | | | | | | | | | | | | | | | | | | |
| | | | | | | | | | | | | | | | | | | | | | | |
$ | (2,547 | ) | | $ | (2,401 | ) | | $ | (501 | ) | | $ | (909 | ) | | $ | 5,812 | | | $ | 3,727 | | | $ | (341 | ) | | $ | (578 | ) |
| | (1,442 | ) | | | 47,026 | | | | 1,451 | | | | 14,886 | | | | 28,781 | | | | 89,386 | | | | 627 | | | | 7,722 | |
| | (201 | ) | | | (280 | ) | | | (982 | ) | | | (7,949 | ) | | | (2,492 | ) | | | (3,742 | ) | | | (979 | ) | | | (1,071 | ) |
| | 23,264 | | | | (49,090 | ) | | | 5,801 | | | | (7,530 | ) | | | 3,467 | | | | (81,540 | ) | | | 4,517 | | | | (8,565 | ) |
| | | | | | | | | | | | | | | | | | | | | | | | | | | | | | | |
| | 19,074 | | | | (4,745 | ) | | | 5,769 | | | | (1,502 | ) | | | 35,568 | | | | 7,831 | | | | 3,824 | | | | (2,492 | ) |
| | | | | | | | | | | | | | | | | | | | | | | | | | | | | | | |
| | | | | | | | | | | | | | | | | | | | | | | | | | | | | | | |
| | — | | | | — | | | | — | | | | — | | | | (3,373 | ) | | | — | | | | — | | | | — | |
| | — | | | | — | | | | — | | | | — | | | | (64,551 | ) | | | (72,202 | ) | | | (6,835 | ) | | | (8,410 | ) |
| | | | | | | | | | | | | | | | | | | | | | | | | | | | | | | |
| | — | | | | — | | | | — | | | | — | | | | (67,924 | ) | | | (72,202 | ) | | | (6,835 | ) | | | (8,410 | ) |
| | | | | | | | | | | | | | | | | | | | | | | | | | | | | | | |
| | | | | | | | | | | | | | | | | | | | | | | | | | | | | | | |
| | 3,888 | | | | 6,269 | | | | 2,573 | | | | 28,781 | | | | 74,732 | | | | 64,926 | | | | 6,817 | | | | 17,368 | |
| | — | | | | — | | | | — | | | | — | | | | 57,636 | | | | 61,280 | | | | 5,566 | | | | 6,836 | |
| | (56,566 | ) | | | (49,433 | ) | | | (34,650 | ) | | | (114,122 | ) | | | (296,134 | ) | | | (319,070 | ) | | | (31,711 | ) | | | (20,165 | ) |
| | | | | | | | | | | | | | | | | | | | | | | | | | | | | | | |
| | (52,678 | ) | | | (43,164 | ) | | | (32,077 | ) | | | (85,341 | ) | | | (163,766 | ) | | | (192,864 | ) | | | (19,328 | ) | | | 4,039 | |
| | | | | | | | | | | | | | | | | | | | | | | | | | | | | | | |
| | (33,604 | ) | | | (47,909 | ) | | | (26,308 | ) | | | (86,843 | ) | | | (196,122 | ) | | | (257,235 | ) | | | (22,339 | ) | | | (6,863 | ) |
| | | | | | | | | | | | | | | | | | | | | | | | | | | | | | | |
| | | | | | | | | | | | | | | | | | | | | | | | | | | | | | | |
| | 268,384 | | | | 316,293 | | | | 89,141 | | | | 175,984 | | | | 549,213 | | | | 806,448 | | | | 66,612 | | | | 73,475 | |
| | | | | | | | | | | | | | | | | | | | | | | | | | | | | | | |
$ | 234,780 | | | $ | 268,384 | | | $ | 62,833 | | | $ | 89,141 | | | $ | 353,091 | | | $ | 549,213 | | | $ | 44,273 | | | $ | 66,612 | |
| | | | | | | | | | | | | | | | | | | | | | | | | | | | | | | |
$ | (2,729 | ) | | $ | (2,755 | ) | | $ | (464 | ) | | $ | (825 | ) | | $ | 2,348 | | | $ | 1,273 | | | $ | (532 | ) | | $ | (754 | ) |
| | | | | | | | | | | | | | | | | | | | | | | | | | | | | | | |
| | | | | | | | | | | | | | | | | | | | | | | | | | | | | | | |
| | 180 | | | | 287 | | | | 164 | | | | 1,852 | | | | 5,059 | | | | 3,624 | | | | 572 | | | | 1,264 | |
| | — | | | | — | | | | — | | | | — | | | | 3,850 | | | | 3,496 | | | | 467 | | | | 523 | |
| | (2,693 | ) | | | (2,255 | ) | | | (2,292 | ) | | | (7,663 | ) | | | (19,300 | ) | | | (17,879 | ) | | | (2,743 | ) | | | (1,485 | ) |
| | | | | | | | | | | | | | | | | | | | | | | | | | | | | | | |
| | (2,513 | ) | | | (1,968 | ) | | | (2,128 | ) | | | (5,811 | ) | | | (10,391 | ) | | | (10,759 | ) | | | (1,704 | ) | | | 302 | |
43
FINANCIAL HIGHLIGHTS
| | | MARSICO FOCUS FUND |
For a Fund Share Outstanding Throughout the Period | | Year
Ended
9/30/16 | | | Year
Ended
9/30/15 | | | Year
Ended
9/30/14 | | | Year
Ended
9/30/13 | | | | Year
Ended
9/30/12 | |
| | | | | | | | | | | | | | | | | |
Net Asset Value, Beginning of Period | | $ | 18.83 | | | $ | 22.41 | | | $ | 21.47 | | | $ | 20.02 | | | $ | 15.97 | |
| | | | | | | | | | | | | | | | | | | | | |
| | | | | | | | | | | | | | | | | | | | | |
Income from Investment Operations: | | | | | | | | | | | | | | | | | | | | |
Net investment income (loss) | | | (0.13 | ) | | | (0.10 | ) | | | (0.07 | ) | | | (0.03 | ) | | | 0.02 | |
Net realized and unrealized gains (losses) on investments | | | 1.25 | | | | (0.62 | ) | | | 4.46 | | | | 3.84 | | | | 4.03 | |
| | | | | | | | | | | | | | | | | | | | | |
Total from investment operations | | | 1.12 | | | | (0.72 | ) | | | 4.39 | | | | 3.81 | | | | 4.05 | |
| | | | | | | | | | | | | | | | | | | | | |
Distributions & Other: | | | | | | | | | | | | | | | | | | | | |
Net investment income | | | — | | | | — | | | | — | | | | (0.03 | ) | | | — | |
Net realized gains | | | (3.99 | ) | | | (2.86 | ) | | | (3.45 | ) | | | (2.33 | ) | | | — | |
Redemption fees [See Note 2(h)] | | | — | | | | — | | | | — | (1) | | | — | (1) | | | — | (1) |
| | | | | | | | | | | | | | | | | | | | | |
Total distributions and other | | | (3.99 | ) | | | (2.86 | ) | | | (3.45 | ) | | | (2.36 | ) | | | — | |
| | | | | | | | | | | | | | | | | | | | | |
Net Asset Value, End of Period | | $ | 15.96 | | | $ | 18.83 | | | $ | 22.41 | | | $ | 21.47 | | | $ | 20.02 | |
| | | | | | | | | | | | | | | | | | | | | |
| | | | | | | | | | | | | | | | | | | | | |
Total Return | | | 5.75 | % | | | (4.15 | )% | | | 22.27 | % | | | 21.86 | % | | | 25.36 | % |
| | | | | | | | | | | | | | | | | | | | | |
| | | | | | | | | | | | | | | | | | | | | |
Supplemental Data and Ratios: | | | | | | | | | | | | | | | | | | | | |
| | | | | | | | | | | | | | | | | | | | | |
Net assets, end of period (000s) | | $ | 613,870 | | | $ | 788,851 | | | $ | 933,054 | | | $ | 854,708 | | | $ | 966,010 | |
| | | | | | | | | | | | | | | | | | | | | |
Ratio of expenses to average net assets, less waivers and before expenses paid indirectly, plus recoupment of previously waived fees or expenses paid | | | 1.29 | % | | | 1.31 | % | | | 1.34 | % | | | 1.35 | % | | | 1.34 | % |
| | | | | | | | | | | | | | | | | | | | | |
Ratio of net investment income (loss) to average net assets, net of waivers, recoupment of previously waived fees or expenses paid and expenses paid indirectly | | | (0.63 | )% | | | (0.45 | )% | | | (0.35 | )% | | | (0.10 | )% | | | 0.09 | % |
| | | | | | | | | | | | | | | | | | | | | |
Ratio of expenses to average net assets, before waivers, recoupment of previously waived fees or expenses paid and expenses paid indirectly | | | 1.29 | % | | | 1.31 | % | | | 1.34 | % | | | 1.35 | % | | | 1.34 | % |
| | | | | | | | | | | | | | | | | | | | | |
Ratio of net investment income (loss) to average net assets, before waivers, recoupment of previously waived fees or expenses paid and expenses paid indirectly | | | (0.63 | )% | | | (0.45 | )% | | | (0.35 | )% | | | (0.10 | )% | | | 0.09 | % |
| | | | | | | | | | | | | | | | | | | | | |
Portfolio turnover rate | | | 45 | % | | | 68 | % | | | 71 | % | | | 92 | % | | | 66 | % |
| See notes to financial statements. |
44
MARSICO
GROWTH FUND | | | MARSICO
21st CENTURY FUND | |
Year
Ended
9/30/16 | | | Year
Ended
9/30/15 | | | Year
Ended
9/30/14 | | | Year
Ended
9/30/13 | | | Year
Ended
9/30/12 | | | Year
Ended
9/30/16 | | | Year
Ended
9/30/15 | | | Year
Ended
9/30/14 | | | Year
Ended
9/30/13 | | | Year
Ended
9/30/12 | |
| | | | | | | | | | | | | | | | | | | | | | | | | | | | | |
$ | 20.11 | | | $ | 23.63 | | | $ | 25.03 | | | $ | 21.96 | | | $ | 17.43 | | | $ | 20.38 | | | $ | 20.90 | | | $ | 18.05 | | | $ | 14.24 | | | $ | 11.36 | |
| | | | | | | | | | | | | | | | | | | | | | | | | | | | | | | | | | | | | | | |
| | | | | | | | | | | | | | | | | | | | | | | | | | | | | | | | | | | | | | | |
| | | | | | | | | | | | | | | | | | | | | | | | | | | | | | | | | | | | | | | |
| | (0.13 | ) | | | (0.15 | ) | | | (0.08 | ) | | | — | (1) | | | 0.03 | | | | (0.29 | ) | | | (0.21 | ) | | | (0.21 | ) | | | (0.09 | ) | | | (0.06 | ) |
| | 1.33 | | | | (0.62 | ) | | | 4.01 | | | | 4.30 | | | | 4.51 | | | | 1.95 | | | | (0.31 | ) | | | 3.06 | | | | 3.90 | | | | 2.94 | |
| | | | | | | | | | | | | | | | | | | | | | | | | | | | | | | | | | | | | | | |
| | 1.20 | | | | (0.77 | ) | | | 3.93 | | | | 4.30 | | | | 4.54 | | | | 1.66 | | | | (0.52 | ) | | | 2.85 | | | | 3.81 | | | | 2.88 | |
| | | | | | | | | | | | | | | | | | | | | | | | | | | | | | | | | | | | | | | |
| | | | | | | | | | | | | | | | | | | | | | | | | | | | | | | | | | | | | | | |
| | — | | | | — | | | | (0.06 | ) | | | (0.04 | ) | | | (0.01 | ) | | | — | | | | — | | | | — | | | | — | | | | — | |
| | (5.77 | ) | | | (2.75 | ) | | | (5.27 | ) | | | (1.19 | ) | | | — | | | | — | | | | — | | | | — | | | | — | | | | — | |
| | — | | | | — | | | | — | (1) | | | — | (1) | | | — | (1) | | | — | | | | — | | | | — | (1) | | | — | (1) | | | — | (1) |
| | | | | | | | | | | | | | | | | | | | | | | | | | | | | | | | | | | | | | | |
| | (5.77 | ) | | | (2.75 | ) | | | (5.33 | ) | | | (1.23 | ) | | | (0.01 | ) | | | — | | | | — | | | | — | | | | — | | | | — | |
| | | | | | | | | | | | | | | | | | | | | | | | | | | | | | | | | | | | | | | |
$ | 15.54 | | | $ | 20.11 | | | $ | 23.63 | | | $ | 25.03 | | | $ | 21.96 | | | $ | 22.04 | | | $ | 20.38 | | | $ | 20.90 | | | $ | 18.05 | | | $ | 14.24 | |
| | | | | | | | | | | | | | | | | | | | | | | | | | | | | | | | | | | | | | | |
| | | | | | | | | | | | | | | | | | | | | | | | | | | | | | | | | | | | | | | |
| | 5.94 | % | | | (4.10 | )% | | | 17.51 | % | | | 20.92 | % | | | 26.04 | % | | | 8.15 | % | | | (2.49 | )% | | | 15.79 | % | | | 26.76 | % | | | 25.35 | % |
| | | | | | | | | | | | | | | | | | | | | | | | | | | | | | | | | | | | | | | |
| | | | | | | | | | | | | | | | | | | | | | | | | | | | | | | | | | | | | | | |
| | | | | | | | | | | | | | | | | | | | | | | | | | | | | | | | | | | | | | | |
| | | | | | | | | | | | | | | | | | | | | | | | | | | | | | | | | | | | | | | |
$ | 288,213 | | | $ | 410,442 | | | $ | 562,653 | | | $ | 564,766 | | | $ | 677,393 | | | $ | 234,780 | | | $ | 268,384 | | | $ | 316,293 | | | $ | 312,215 | | | $ | 354,545 | |
| | | | | | | | | | | | | | | | | | | | | | | | | | | | | | | | | | | | | | | |
| | 1.37 | % | | | 1.35 | % | | | 1.37 | % | | | 1.37 | % | | | 1.35 | % | | | 1.41 | % | | | 1.38 | % | | | 1.42 | % | | | 1.45 | % | | | 1.41 | % |
| | | | | | | | | | | | | | | | | | | | | | | | | | | | | | | | | | | | | | | |
| | (0.61 | )% | | | (0.52 | )% | | | (0.34 | )% | | | 0.01 | % | | | 0.15 | % | | | (1.01 | )% | | | (0.78 | )% | | | (0.88 | )% | | | (0.33 | )% | | | (0.31 | )% |
| | | | | | | | | | | | | | | | | | | | | | | | | | | | | | | | | | | | | | | |
| | 52 | % | | | 81 | % | | | 80 | % | | | 114 | % | | | 65 | % | | | 44 | % | | | 94 | % | | | 83 | % | | | 102 | % | | | 63 | % |
45
FINANCIAL HIGHLIGHTS
| | | MARSICO
INTERNATIONAL OPPORTUNITIES FUND | |
For a Fund Share Outstanding Throughout the Period | | Year
Ended
9/30/16 | | | Year
Ended
9/30/15 | | | Year
Ended
9/30/14 | | | Year
Ended
9/30/13 | | | Year
Ended
9/30/12 | |
| | | | | | | | | | | | | | | | |
Net Asset Value, Beginning of Period | | $ | 14.51 | | | $ | 14.72 | | | $ | 15.30 | | | $ | 12.50 | | | $ | 10.61 | |
| | | | | | | | | | | | | | | | | | | | | |
| | | | | | | | | | | | | | | | | | | | | |
Income from Investment Operations: | | | | | | | | | | | | | | | | | | | | |
Net investment income (loss) | | | (0.20 | ) | | | (0.21 | ) | | | (0.06 | ) | | | 0.09 | | | | 0.01 | |
Net realized and unrealized gains (losses) on investments | | | 1.33 | | | | — | (1) | | | (0.42 | ) | | | 2.71 | | | | 1.88 | |
| | | | | | | | | | | | | | | | | | | | | |
Total from investment operations | | | 1.13 | | | | (0.21 | ) | | | (0.48 | ) | | | 2.80 | | | | 1.89 | |
| | | | | | | | | | | | | | | | | | | | | |
Distributions & Other: | | | | | | | | | | | | | | | | | | | | |
Net investment income | | | — | | | | — | | | | (0.10 | ) | | | — | | | | — | |
Net realized gains | | | — | | | | — | | | | — | | | | — | | | | — | |
Redemption fees [See Note 2(h)] | | | — | | | | — | | | | — | (1) | | | — | (1) | | | — | (1) |
| | | | | | | | | | | | | | | | | | | | | |
Total distributions and other | | | — | | | | — | | | | (0.10 | ) | | | — | | | | — | |
| | | | | | | | | | | | | | | | | | | | | |
Net Asset Value, End of Period | | $ | 15.64 | | | $ | 14.51 | | | $ | 14.72 | | | $ | 15.30 | | | $ | 12.50 | |
| | | | | | | | | | | | | | | | | | | | | |
| | | | | | | | | | | | | | | | | | | | | |
Total Return | | | 7.79 | % | | | (1.43 | )% | | | (3.18 | )% | | | 22.40 | % | | | 17.81 | % |
| | | | | | | | | | | | | | | | | | | | | |
| | | | | | | | | | | | | | | | | | | | | |
Supplemental Data and Ratios: | | | | | | | | | | | | | | | | | | | | |
| | | | | | | | | | | | | | | | | | | | | |
Net assets, end of period (000s) | | $ | 62,833 | | | $ | 89,141 | | | $ | 175,984 | | | $ | 119,522 | | | $ | 134,221 | |
| | | | | | | | | | | | | | | | | | | | | |
Ratio of expenses to average net assets, less waivers and before expenses paid indirectly, plus recoupment of previously waived fees or expenses paid | | | 1.60 | % | | | 1.60 | % | | | 1.60 | % | | | 1.60 | % | | | 1.60 | % |
| | | | | | | | | | | | | | | | | | | | | |
Ratio of net investment income (loss) to average net assets, net of waivers, recoupment of previously waived fees or expenses paid and expenses paid indirectly | | | (0.71 | )% | | | (0.86 | )% | | | (0.55 | )% | | | 0.61 | % | | | 0.29 | % |
| | | | | | | | | | | | | | | | | | | | | |
Ratio of expenses to average net assets, before waivers, recoupment of previously waived fees or expenses paid and expenses paid indirectly | | | 1.78 | % | | | 1.63 | % | | | 1.52 | % | | | 1.74 | % | | | 1.65 | % |
| | | | | | | | | | | | | | | | | | | | | |
Ratio of net investment income (loss) to average net assets, before waivers, recoupment of previously waived fees or expenses paid and expenses paid indirectly | | | (0.89 | )% | | | (0.89 | )% | | | (0.47 | )% | | | 0.47 | % | | | 0.24 | % |
| | | | | | | | | | | | | | | | | | | | | |
Portfolio turnover rate | | | 223 | % | | | 217 | % | | | 178 | % | | | 121 | % | | | 66 | % |
| See notes to financial statements. |
46
MARSICO
FLEXIBLE CAPITAL FUND | | | MARSICO
GLOBAL FUND | |
Year
Ended
9/30/16 | | | Year
Ended
9/30/15 | | | Year
Ended
9/30/14 | | | Year
Ended
9/30/13 | | | Year
Ended
9/30/12 | | | Year
Ended
9/30/16 | | | Year
Ended
9/30/15 | | | Year
Ended
9/30/14 | | | Year
Ended
9/30/13 | | | Year
Ended
9/30/12 | |
| | | | | | | | | | | | | | | | | | | | | | | | | | | | | |
$ | 16.59 | | | $ | 18.39 | | | $ | 18.21 | | | $ | 15.79 | | | $ | 12.05 | | | $ | 12.37 | | | $ | 14.45 | | | $ | 14.74 | | | $ | 11.51 | | | $ | 9.06 | |
| | | | | | | | | | | | | | | | | | | | | | | | | | | | | | | | | | | | | | | |
| | | | | | | | | | | | | | | | | | | | | | | | | | | | | | | | | | | | | | | |
| | | | | | | | | | | | | | | | | | | | | | | | | | | | | | | | | | | | | | | |
| | 0.24 | | | | 0.09 | | | | (0.04 | ) | | | 0.04 | | | | 0.03 | | | | (0.16 | ) | | | (0.10 | ) | | | (0.05 | ) | | | (0.02 | ) | | | (0.07 | ) |
| | 0.96 | | | | (0.15 | ) | | | 2.18 | | | | 3.28 | | | | 3.77 | | | | 1.14 | | | | (0.32 | ) | | | 1.93 | | | | 3.25 | | | | 2.52 | |
| | | | | | | | | | | | | | | | | | | | | | | | | | | | | | | | | | | | | | | |
| | 1.20 | | | | (0.06 | ) | | | 2.14 | | | | 3.32 | | | | 3.80 | | | | 0.98 | | | | (0.42 | ) | | | 1.88 | | | | 3.23 | | | | 2.45 | |
| | | | | | | | | | | | | | | | | | | | | | | | | | | | | | | | | | | | | | | |
| | | | | | | | | | | | | | | | | | | | | | | | | | | | | | | | | | | | | | | |
| | (0.11 | ) | | | — | | | | — | | | | (0.09 | ) | | | (0.06 | ) | | | — | | | | — | | | | — | | | | — | | | | — | |
| | (2.13 | ) | | | (1.74 | ) | | | (1.96 | ) | | | (0.81 | ) | | | — | | | | (1.32 | ) | | | (1.66 | ) | | | (2.17 | ) | | | — | | | | — | |
| | — | | | | — | | | | — | (1) | | | — | (1) | | | — | (1) | | | — | | | | — | | | | — | (1) | | | — | (1) | | | — | (1) |
| | | | | | | | | | | | | | | | | | | | | | | | | | | | | | | | | | | | | | | |
| | (2.24 | ) | | | (1.74 | ) | | | (1.96 | ) | | | (0.90 | ) | | | (0.06 | ) | | | (1.32 | ) | | | (1.66 | ) | | | (2.17 | ) | | | — | | | | — | |
| | | | | | | | | | | | | | | | | | | | | | | | | | | | | | | | | | | | | | | |
$ | 15.55 | | | $ | 16.59 | | | $ | 18.39 | | | $ | 18.21 | | | $ | 15.79 | | | $ | 12.03 | | | $ | 12.37 | | | $ | 14.45 | | | $ | 14.74 | | | $ | 11.51 | |
| | | | | | | | | | | | | | | | | | | | | | | | | | | | | | | | | | | | | | | |
| | | | | | | | | | | | | | | | | | | | | | | | | | | | | | | | | | | | | | | |
| | 7.79 | % | | | (0.81 | )% | | | 12.15 | % | | | 22.34 | % | | | 31.63 | % | | | 8.05 | % | | | (3.51 | )% | | | 13.23 | % | | | 28.06 | % | | | 27.04 | % |
| | | | | | | | | | | | | | | | | | | | | | | | | | | | | | | | | | | | | | | |
| | | | | | | | | | | | | | | | | | | | | | | | | | | | | | | | | | | | | | | |
| | | | | | | | | | | | | | | | | | | | | | | | | | | | | | | | | | | | | | | |
| | | | | | | | | | | | | | | | | | | | | | | | | | | | | | | | | | | | | | | |
$ | 353,091 | | | $ | 549,213 | | | $ | 806,448 | | | $ | 805,735 | | | $ | 590,293 | | | $ | 44,273 | | | $ | 66,612 | | | $ | 73,475 | | | $ | 61,383 | | | $ | 54,195 | |
| | | | | | | | | | | | | | | | | | | | | | | | | | | | | | | | | | | | | | | |
| | 1.38 | % | | | 1.37 | % | | | 1.38 | % | | | 1.41 | % | | | 1.43 | % | | | 1.60 | % | | | 1.60 | % | | | 1.60 | % | | | 1.60 | % | | | 1.60 | % |
| | | | | | | | | | | | | | | | | | | | | | | | | | | | | | | | | | | | | | | |
| | 1.25 | % | | | 0.53 | % | | | (0.21 | )% | | | 0.16 | % | | | 0.17 | % | | | (0.60 | )% | | | (0.80 | )% | | | (0.42 | )% | | | (0.06 | )% | | | (0.32 | )% |
| | | | | | | | | | | | | | | | | | | | | | | | | | | | | | | | | | | | | | | |
| | 1.38 | % | | | 1.37 | % | | | 1.38 | % | | | 1.41 | % | | | 1.43 | % | | | 1.69 | % | | | 1.54 | % | | | 1.66 | % | | | 1.86 | % | | | 1.70 | % |
| | | | | | | | | | | | | | | | | | | | | | | | | | | | | | | | | | | | | | | |
| | 1.25 | % | | | 0.53 | % | | | (0.21 | )% | | | 0.16 | % | | | 0.17 | % | | | (0.69 | )% | | | (0.74 | )% | | | (0.48 | )% | | | (0.32 | )% | | | (0.42 | )% |
| | | | | | | | | | | | | | | | | | | | | | | | | | | | | | | | | | | | | | | |
| | 35 | % | | | 69 | % | | | 118 | % | | | 145 | % | | | 121 | % | | | 82 | % | | | 110 | % | | | 129 | % | | | 134 | % | | | 95 | % |
47
NOTES TO FINANCIAL STATEMENTS |
NOTES TO FINANCIAL STATEMENTS September 30, 2016
The Marsico Investment Fund (the “Trust”) was organized on October 1, 1997, as a Delaware statutory trust and is registered under the Investment Company Act of 1940 (the “1940 Act”) as an open-end management investment company. The Focus Fund, Growth Fund, 21st Century Fund, International Opportunities Fund, Flexible Capital Fund, and Global Fund (collectively, the “Funds”) are separate investment portfolios of the Trust. The Focus Fund is a non-diversified fund and the Growth Fund, the 21st Century Fund, the International Opportunities Fund, the Flexible Capital Fund, and the Global Fund are diversified funds. The Focus Fund and Growth Fund commenced operations on December 31, 1997, the 21st Century Fund commenced operations on February 1, 2000, the International Opportunities Fund commenced operations on June 30, 2000, the Flexible Capital Fund commenced operations on December 29, 2006, and the Global Fund commenced operations on June 29, 2007. Trustees and officers of the Trust and employees of Marsico Capital Management, LLC (the “Adviser”) own approximately 5% and 15% of the International Opportunities Fund’s and Global Fund’s outstanding shares, respectively, as of September 30, 2016.
2. | Significant Accounting Policies |
The Funds qualify as investment companies under Accounting Standards Update No. 2013-08, Accounting Standard Codification Topic 946, Financial Services — Investment Companies (“ASC 946”). The following is a summary of significant accounting policies consistently followed by the Funds in the preparation of their financial statements. These policies are in conformity with Generally Accepted Accounting Principles (“GAAP”) in the United States of America for investment companies and follow the accounting guidance provided in ASC 946. The presentation of financial statements in conformity with GAAP requires management to make estimates and assumptions that affect the reported amounts and disclosures of assets and liabilities at the date of the financial statements and the reported amounts and disclosures of income and expenses during the reporting period. Actual results could differ from those estimates.
| | (a) | Investment Valuation — A security traded on a recognized stock exchange is generally valued at the last sale price prior to the closing of the principal exchange on which the security is traded. Securities traded on NASDAQ generally will be valued at the NASDAQ Official Closing Price. If no sale price is reported on the valuation date, the most current bid price will generally be used, with the exception of short option positions which will generally utilize the most current ask price. Other securities for which over-the-counter market quotations are readily available are generally valued at the last sale price. Debt securities that will mature in more than 60 days are generally valued at their bid prices furnished by a pricing service approved by the Funds’ Board of Trustees and subject to review pursuant to procedures established by, and under the general supervision of, the Board of Trustees. Debt securities that will mature in 60 days or less are valued at amortized cost, if it approximates market value. Any securities for which market quotations are not readily available are valued at their fair value as determined in good faith by the Adviser in accordance with procedures established by, and under the general supervision of, the Funds’ Board of Trustees. The Funds may use pricing services to assist in determining market value. The Board of Trustees has authorized the use of a pricing service to assist the Funds in valuing certain equity securities listed or traded on foreign security exchanges in the Funds’ portfolios in certain circumstances where there is a significant change in the value of related US-traded securities, as represented by, for example, the S&P 500 Index. |
“Fair Value Measurements and Disclosures” (the “Fair Value Statement”) defines fair value, establishes a framework for measuring fair value in GAAP, and expands disclosures about fair value measurements. Under the Fair Value Statement, various inputs are used in determining the value of the Funds’ investments.
These inputs are summarized into three broad levels and described below:
| | ● | Level 1 – quoted prices in active markets for identical investments |
| | ● | Level 2 – other significant observable inputs (including quoted prices for similar investments, interest rates, and evaluated quotations obtained from pricing services) |
| | ● | Level 3 – significant unobservable inputs (including the Fund’s assumptions that market participants would use in determining the fair value of investments) |
48
NOTES TO FINANCIAL STATEMENTS |
The inputs or methodology used for valuing investments are not an indication of the risk associated with investing in those investments. Changes in valuation techniques may result in transfers between the levels during the reporting period. The Funds recognize transfers between the levels as of the end of each reporting period and consider securities that are purchased during the reporting period as not having transferred between levels as of the end of the reporting period. In accordance with procedures established by, and under the general supervision of, the Funds’ Board of Trustees, certain equity securities listed or traded on foreign security exchanges in the Funds’ portfolios had a fair valuation adjustment factor applied to their equity prices as of the applicable prior fiscal year-end and were categorized as Level 2. Application of fair valuation adjustment factors was not deemed necessary at the end of the reporting period and, as such, equity securities listed or traded on foreign security exchanges were categorized as Level 1. These securities represent the only significant transfers between each of the three levels. As of September 30, 2016, the market value of these security transfers from Level 2 to Level 1 were (in thousands) $14,649, $23,304 and $7,186 for the International Opportunities Fund, Flexible Capital Fund and Global Fund, respectively. The following is a summary of the fair values of the Funds’ investments in each category and economic sector as of September 30, 2016:
Fund Investments by Major Security Type | | Level 1 | | | Level 2 | | | Level 3 | | | Total | |
Marsico Focus Fund | | | | | | | | | | | | |
Assets | | | | | | | | | | | | |
Common Stocks | | | | | | | | | | | | |
Consumer Discretionary | | $ | 197,493,844 | | | $ | — | | | $ | — | | | $ | 197,493,844 | |
Consumer Staples | | | 16,021,037 | | | | — | | | | — | | | | 16,021,037 | |
Financials | | | 17,497,623 | | | | — | | | | — | | | | 17,497,623 | |
Health Care | | | 89,571,420 | | | | — | | | | — | | | | 89,571,420 | |
Information Technology | | | 262,030,516 | | | | — | | | | — | | | | 262,030,516 | |
Materials | | | 19,663,609 | | | | — | | | | — | | | | 19,663,609 | |
Short-term Investments | | | 20,180,224 | | | | — | | | | — | | | | 20,180,224 | |
| | | | | | | | | | | | | | | $ | 622,458,273 | |
Marsico Growth Fund | | | | | | | | | | | | | | | | |
Assets | | | | | | | | | | | | | | | | |
Common Stocks | | | | | | | | | | | | | | | | |
Consumer Discretionary | | $ | 60,329,545 | | | $ | — | | | $ | — | | | $ | 60,329,545 | |
Consumer Staples | | | 11,083,565 | | | | — | | | | — | | | | 11,083,565 | |
Financials | | | 27,635,834 | | | | — | | | | — | | | | 27,635,834 | |
Health Care | | | 47,185,117 | | | | — | | | | — | | | | 47,185,117 | |
Industrials | | | 19,035,282 | | | | — | | | | — | | | | 19,035,282 | |
Information Technology | | | 91,366,209 | | | | — | | | | — | | | | 91,366,209 | |
Materials | | | 11,453,422 | | | | — | | | | — | | | | 11,453,422 | |
Short-term Investments | | | 24,529,643 | | | | — | | | | — | | | | 24,529,643 | |
| | | | | | | | | | | | | | | $ | 292,618,617 | |
Marsico 21st Century Fund | | | | | | | | | | | | | | | | |
Assets | | | | | | | | | | | | | | | | |
Common Stocks | | | | | | | | | | | | | | | | |
Consumer Discretionary | | $ | 52,058,418 | | | $ | — | | | $ | — | | | $ | 52,058,418 | |
Consumer Staples | | | 22,765,092 | | | | — | | | | — | | | | 22,765,092 | |
Financials | | | 22,410,653 | | | | — | | | | — | | | | 22,410,653 | |
Health Care | | | 22,494,342 | | | | — | | | | — | | | | 22,494,342 | |
Industrials | | | 16,782,679 | | | | — | | | | — | | | | 16,782,679 | |
Information Technology | | | 83,096,482 | | | | — | | | | — | | | | 83,096,482 | |
Materials | | | 8,755,969 | | | | — | | | | — | | | | 8,755,969 | |
Telecommunication Services | | | 4,857,313 | | | | — | | | | — | | | | 4,857,313 | |
Short-term Investments | | | 2,884,890 | | | | — | | | | — | | | | 2,884,890 | |
| | | | | | | | | | | | | | | $ | 236,105,838 | |
Marsico International Opportunities Fund | | | | | | | | | | | | | | | | |
Assets | | | | | | | | | | | | | | | | |
Common Stocks | | | | | | | | | | | | | | | | |
Consumer Discretionary | | $ | 13,483,868 | | | $ | — | | | $ | — | | | $ | 13,483,868 | |
Consumer Staples | | | 5,820,709 | | | | — | | | | — | | | | 5,820,709 | |
Financials | | | 6,495,418 | | | | — | | | | — | | | | 6,495,418 | |
Health Care | | | 6,714,668 | | | | — | | | | — | | | | 6,714,668 | |
Industrials | | | 7,440,134 | | | | — | | | | — | | | | 7,440,134 | |
Information Technology | | | 22,655,885 | | | | — | | | | — | | | | 22,655,885 | |
Short-term Investments | | | 161,267 | | | | — | | | | — | | | | 161,267 | |
| | | | | | | | | | | | | | | $ | 62,771,949 | |
49
NOTES TO FINANCIAL STATEMENTS |
NOTES TO FINANCIAL STATEMENTS September 30, 2016 (continued)
Fund Investments by Major Security Type | | Level 1 | | | Level 2 | | | Level 3 | | | Total | |
Marsico Flexible Capital Fund | | | | | | | | | | | | |
Assets | | | | | | | | | | | | |
Common Stocks | | | | | | | | | | | | |
Consumer Discretionary | | $ | 62,515,636 | | | $ | — | | | $ | — | | | $ | 62,515,636 | |
Consumer Staples | | | 45,087,435 | | | | — | | | | — | | | | 45,087,435 | |
Financials | | | 39,424,034 | | | | — | | | | — | | | | 39,424,034 | |
Health Care | | | 20,971,842 | | | | — | | | | — | | | | 20,971,842 | |
Industrials | | | 45,355,025 | | | | — | | | | — | | | | 45,355,025 | |
Information Technology | | | 61,120,657 | | | | — | | | | — | | | | 61,120,657 | |
Telecommunication Services | | | 6,058,484 | | | | — | | | | — | | | | 6,058,484 | |
Convertible Preferred Stocks | | | 6,240,280 | | | | — | | | | — | | | | 6,240,280 | |
Corporate Bonds | | | — | | | | 46,593,600 | | | | — | | | | 46,593,600 | |
Preferred Stocks | | | 16,847,210 | | | | — | | | | — | | | | 16,847,210 | |
| | | | | | | | | | | | | | | $ | 350,214,203 | |
Marsico Global Fund | | | | | | | | | | | | | | | | |
Assets | | | | | | | | | | | | | | | | |
Common Stocks | | | | | | | | | | | | | | | | |
Consumer Discretionary | | $ | 14,939,899 | | | $ | — | | | $ | — | | | $ | 14,939,899 | |
Consumer Staples | | | 1,469,755 | | | | — | | | | — | | | | 1,469,755 | |
Health Care | | | 4,184,742 | | | | — | | | | — | | | | 4,184,742 | |
Industrials | | | 2,578,288 | | | | — | | | | — | | | | 2,578,288 | |
Information Technology | | | 16,918,921 | | | | — | | | | — | | | | 16,918,921 | |
Materials | | | 1,058,224 | | | | — | | | | — | | | | 1,058,224 | |
Short-term Investments | | | 3,729,600 | | | | — | | | | — | | | | 3,729,600 | |
| | | | | | | | | | | | | | | $ | 44,879,429 | |
| | (b) | Expenses — The Funds are charged for those expenses that are directly attributable to each Fund, such as advisory and custodial fees. Expenses that are not directly attributable to a Fund are typically allocated among the Funds in proportion to their respective net assets and are in some cases allocated based on other factors. The Funds’ expenses may be reduced by advisory fee waivers, brokerage credits and uninvested cash balances earning interest or credits. Such credits are included in “Less waiver of expenses and expenses paid indirectly” on the Statements of Operations. |
Brokerage commissions may be paid to certain brokers which reduce transfer agent fees and expenses. For the year ended September 30, 2016, the Funds received no such brokerage commission credits. The Funds received earnings credits on certain cash account balances which reduced transfer agent fees and expenses in the amount of $734, $356, $261, $73, $483 and $59 for the Focus Fund, Growth Fund, 21st Century Fund, International Opportunities Fund, Flexible Capital Fund, and Global Fund, respectively, for the year ended September 30, 2016. Brokerage commission credits and earnings credits (if any) are included in “Less waiver of expenses and expenses paid indirectly” on the Statements of Operations.
| | (c) | Federal Income Taxes — Each Fund intends to comply with the requirements of the Internal Revenue Code of 1986, as amended (the “Internal Revenue Code”), necessary to continue to qualify as a regulated investment company and to make the requisite distributions of income to its shareholders which will be sufficient to relieve it from all or substantially all federal and state income taxes. Certain Funds may utilize earnings and profits on redemption of shares as part of the dividends paid deduction. |
| | (d) | Distributions to Shareholders — Dividends from net investment income and net realized capital gains, if any, will be declared and paid at least annually. Distributions to shareholders are recorded on the ex-dividend date. Each Fund may periodically make reclassifications among certain of its capital accounts as a result of the timing and characterization of certain income and capital gains distributions determined in accordance with federal tax regulations, which may differ from GAAP. These reclassifications are due to differing treatment for items such as foreign currency transactions, passive foreign investment companies and net investment losses. |
The Funds at times may invest in real estate investment trusts (“REITs”). REITs generally pay dividends to their investors based upon cash available from their operations and this amount may differ significantly from the REITs’ actual earnings and profits (“E&P”) determined for income tax purposes. It is common for these dividends to exceed the REITs’ taxable E&P, resulting in the excess portion of such dividends eventually being designated as a return of capital. Determination of the tax character of dividends made by REITs is typically performed by the REIT several months subsequent to the payment of the dividend. Therefore, due to timing issues, the Funds may be in a position of being required to calculate and pay required distribution amounts to their
50
NOTES TO FINANCIAL STATEMENTS |
shareholders based on the best information available from the REITs, which may be prior to the final determination of the REITs’ taxable E&P, and it is possible that a portion of the Funds’ distribution amounts could include a return of capital to shareholders for federal income tax purposes.
| | (e) | Foreign Currency Translation — The accounting records of the Funds are maintained in US dollars. For valuation purposes, values of securities denominated in foreign currencies are translated into US dollars at 4:00 p.m. Eastern Time. Amounts related to the purchase and sale of foreign securities and investment income are translated at the rates of exchange prevailing on the respective dates of such transactions. |
Reported realized gains and losses on foreign currency transactions arise from sales of portfolio securities, forward foreign currency contracts, currency gains or losses realized between the trade and settlement dates on securities transactions, and the difference between the amounts of dividends, interest, and foreign withholding taxes recorded on the Funds’ books and the US dollar equivalent of the amounts actually received or paid.
The Funds do not isolate that portion of the results of operations resulting from changes in foreign exchange rates on investments from the fluctuations arising from changes in market prices of securities held at the end of the reporting period. Net unrealized appreciation or depreciation on investments and foreign currency translations arises from changes in the value of assets and liabilities, including investments in securities at the end of the reporting period, resulting from changes in the exchange rates and changes in market prices of securities held. Transactions in foreign-denominated assets may involve greater risks than domestic transactions, including currency risk, political and economic risk, regulatory risk and market risk.
| | (f) | Derivative Instruments — “Disclosure about Derivative Instruments and Hedging Activities” (the “Derivatives Statement”) requires enhanced disclosures about the Funds’ derivative and hedging activities, including how such activities are accounted for and their effects on the Funds’ financial position, performance and cash flows. |
The Funds are not intended as vehicles for investing substantially in derivative instruments, and may hold derivative instruments only infrequently. The Funds enter into derivative instruments in order to increase exposure to certain investments, asset classes, or markets, or for hedging purposes to hedge against adverse movements in securities prices, currency rates or interest rates. The Funds can hold various types of derivative instruments such as futures contracts and options on securities, financial indexes, and foreign currencies, options on futures, forward foreign currency contracts, interest rate swaps, credit default swaps, and swap-related products. The use of derivative instruments may involve risks such as the possibility of illiquid markets or imperfect correlation between the value of the derivative instruments and the underlying securities, or that the counterparty will fail to perform its obligations. There were no outstanding derivative instruments held by the Funds as of September 30, 2016 nor did the Funds utilize derivative instruments during the year ended September 30, 2016.
Forward Foreign Currency Contracts — A forward currency contract is a commitment to purchase or sell foreign currency at a specified price on a future date. A Fund may enter into a forward foreign currency contract in order to hedge against foreign currency fluctuations, such as when the Fund elects to reduce exposure to changes in foreign currency exchange rates on foreign portfolio holdings denominated in or exposed to foreign currencies, or in preparation for purchasing securities in a particular market, or for other investment purposes.
The market value of a forward foreign currency contract fluctuates with changes in currency exchange rates. Outstanding forward foreign currency contracts are valued daily at current market rates and the resulting change in market value is recorded as unrealized appreciation or depreciation. When a forward foreign currency contract is settled, the Fund records a realized gain or loss equal to the difference between the value at the time the forward foreign currency contract was opened and the value at the time it was settled.
The Funds are subject to foreign currency exchange risk in the normal course of pursuing their investment objectives. Forward foreign currency contracts may involve market risk in excess of the unrealized gain or loss reflected on the Statements of Assets and Liabilities. In addition, the Funds could be exposed to a credit risk if the counterparties are unable or unwilling to meet the terms of the contracts or if the value of the foreign currency changes unfavorably. In connection with these contracts, the Funds typically segregate cash and/or other securities as collateral in a sufficient value equal to the aggregate amount of the Funds’ commitments under the forward foreign currency contracts; such collateral would be in the possession of the Funds’ custodian, if applicable.
51
NOTES TO FINANCIAL STATEMENTS |
NOTES TO FINANCIAL STATEMENTS September 30, 2016 (continued)
Options Contracts — The Funds may purchase or write (sell) put and call options on foreign and domestic stock indices, foreign currencies, and US and foreign securities that are traded on a securities exchange or an over-the-counter market. These transactions are generally for hedging purposes or for the purpose of earning additional income. In addition, the Funds may enter into such transactions for cross-hedging purposes. There is generally limited counterparty credit risk involved when entering into exchange-traded option contracts because the exchange’s clearinghouse acts as counterparty to all options traded on such exchange.
In purchasing an option, a Fund pays a premium whether or not the option is exercised. Additionally, the Fund bears the risk of loss of premium and change in market value should the counterparty not perform under the contract. Put and call options purchased are accounted for in the same manner as portfolio securities. The cost of securities acquired through the exercise of call options is increased by premiums paid. The proceeds from securities sold through the exercise of put options are decreased by the premiums paid.
When a Fund writes an option, the premium received by the Fund is recorded as a liability and is subsequently adjusted to the current market value of the option written. Premiums received from writing options that expire are recorded by the Fund on the expiration date as realized gains from option transactions. The difference between the premium and the amount paid on effecting a closing purchase transaction, including brokerage commissions, is also treated as a realized gain, or if the premium is less than the amount paid for the closing purchase transaction, as a realized loss. If a call option is exercised, the premium is added to the proceeds from the sale of the underlying security or currency in determining whether the Fund has realized a gain or loss. If a put option is exercised, the premium reduces the cost basis of the security or currency purchased by the Fund. In writing an option, the Fund bears the market risk of an unfavorable change in the price of the security or currency underlying the written option. Exercise of an option written by the Fund could result in the Fund selling or buying a security or currency at a price different from the current market value.
| | (g) | Trustees’ Deferred Fee Plan — Effective February 1, 2000, the Board of Trustees adopted the Marsico Investment Fund Deferred Fee Plan (the “Deferred Fee Plan”), amended and restated as of December 30, 2005, which allows the Trustees to defer the receipt of all or a portion of their compensation received from the Funds. Any deferred fees are credited to accounts established on behalf of the Trustees into the Funds as directed by each Trustee. The amounts credited to these accounts increase or decrease in accordance with the performance of the Funds selected by the Trustees. The market value of the deferred account balances as of September 30, 2016 is shown on the Statements of Assets and Liabilities as part of an asset account, “Prepaid expenses and other assets”, and a liability account, “Accrued trustees’ fees”. Additionally, the fluctuation of the account balances due to the Funds’ performance is recorded by the Funds as unrealized appreciation (depreciation), which is shown as part of “Net unrealized appreciation on investments and foreign currency translations” on the Statements of Assets and Liabilities, and as compensation expense, which is shown as part of the expense account “Trustees’ fees and expenses” on the Statements of Operations. Fees earned and deferred by the Trustees for the year ended September 30, 2016 are also included in “Trustees’ fees and expenses” on the Statements of Operations. Amounts contributed to the Deferred Fee Plan will be deferred until distributed in accordance with the Deferred Fee Plan. Unrealized appreciation (depreciation) of Fund shares held in the Deferred Fee Plan is subject to the Funds’ expense reimbursement agreement with the Adviser. |
| | (h) | Redemption Fee — Effective January 31, 2014, the Funds’ Board of Trustees approved the elimination of redemption fees from Fund share transactions placed on and after January 31, 2014. Prior to January 31, 2014, a 2.00% redemption fee was retained by the Funds to offset transaction costs and other expenses associated with short-term investing. The fee was imposed on certain redemptions or exchanges of shares held 30 days or less from their purchase date. Redemption fees were recorded by the Funds as a reduction of shares redeemed and as a credit to paid-in-capital. |
| | (i) | Other — Investment transactions are accounted for on a trade date basis. Each Fund determines the gain or loss realized from the investment transactions by comparing the original cost of the security lot sold with the net sale proceeds. Dividend income is recognized on the ex-dividend date. Certain dividends from foreign securities are recorded when the Funds are informed of the dividend if such information is obtained subsequent to the ex-dividend date. Interest income is recognized on an accrual basis and includes amortization of premiums and accretion of discounts. |
During the year ended September 30, 2016, the custodian reimbursed the Funds, including interest, for billing processing errors. The custodian paid (in thousands) $32, $31, $35, $116, $8, and $11 to the Focus Fund, Growth Fund, 21st Century Fund, International Opportunities Fund, Flexible Capital Fund, and Global Fund, respectively. These amounts are included in Paid-in-capital and Capital Share Transactions for each of the Funds. The amounts did not have a significant effect on each of the Fund’s total return.
52
NOTES TO FINANCIAL STATEMENTS |
| | (j) | Indemnifications — In the normal course of business, the Funds enter into contracts that contain provisions indemnifying other parties against specified potential liabilities. Each Fund’s maximum exposure under these arrangements is unknown as this would involve future claims that may be made against the Fund that have not yet occurred. However, based on experience, the Funds expect the risk of loss in connection with these potential indemnification obligations to be remote. There can be no assurance that material liabilities related to such obligations will not arise in the future, which may adversely impact a Fund. |
3. | Investment Advisory Agreement and Transactions With Affiliates |
Each Fund has an agreement with the Adviser to furnish investment advisory services to the Funds. Prior to December 1, 2015, the Adviser was compensated for managing the Focus Fund and the Growth Fund at the rate of 0.85% per year of average daily net assets up to $3 billion in each Fund, and 0.75% per year of average daily net assets exceeding $3 billion in each Fund; and at a rate of 0.85% of the average daily net assets of the 21st Century Fund, the International Opportunities Fund, the Flexible Capital Fund, and the Global Fund. As of December 1, 2015, each Fund pays the Adviser a fee calculated using the following, lower rates:
Annual Rate of Average Daily Net Assets | Asset Threshold |
0.80% | First $250 million |
0.75% | Next $250 million |
0.70% | Next $250 million |
0.65% | In excess of $750 million |
The Adviser has entered into a written expense limitation and fee waiver agreement under which it has agreed to limit the total expenses of each Fund (excluding interest, taxes, acquired fund fees and expenses, litigation, brokerage, and extraordinary expenses) to an annual rate of 1.60% of the average net assets of the Focus Fund, the International Opportunities Fund, the Flexible Capital Fund, and the Global Fund, and 1.50% of the average net assets of the Growth Fund and the 21st Century Fund until January 31, 2017. This expense limitation and fee waiver agreement may be terminated by the Adviser at any time after January 31, 2017, upon 15 days prior notice to the Fund and its administrator.
The Adviser may recoup from a Fund fees previously waived or expenses previously reimbursed by the Adviser with respect to that Fund pursuant to this agreement (or a previous expense limitation agreement) if: (1) such recoupment by the Adviser does not cause the Fund, at the time of recoupment, to exceed the lesser of (a) the expense limitation in effect at the time the relevant amount was waived and/or reimbursed, or (b) the expense limitation in effect at the time of the proposed recoupment, and (2) the recoupment is made within three fiscal years after the end of the fiscal year in which the amount was waived or reimbursed. As of September 30, 2016, recoupment amounts (in thousands) that may potentially be made by the International Opportunities Fund and Global Fund to the Adviser are as follows:
Year of Expiration | | International
Opportunities Fund | | | Global Fund | |
2017 | | $ | — | | | $ | 47 | |
2018 | | | 32 | | | | — | |
2019 | | | 128 | | | | 53 | |
| | | $ | 160 | | | $ | 100 | |
Certain officers of the Trust are also officers of the Adviser. The Funds pay a portion of the Chief Compliance Officer’s total compensation costs which is shown as part of the expense account “Professional fees” on the Statements of Operations. No other officers of the Trust received compensation from the Funds during the year ended September 30, 2016.
4. | Distribution and Service Plan |
The Funds have adopted a Distribution and Service Plan (the “Plan”) pursuant to Rule 12b-1 under the 1940 Act. The Plan authorizes payments by the Funds in connection with the distribution of their shares at an annual rate, as determined from time to time by the Board of Trustees, of up to 0.25% of a Fund’s average daily net assets. The Adviser may, out of its own resources (which may include legitimate profits from providing advisory services to the Funds or other clients) and at its sole discretion, make certain payments on behalf of the Plan for expenses incurred by a Fund for distribution of Fund shares and related services.
53
| NOTES TO FINANCIAL STATEMENTS |
NOTES TO FINANCIAL STATEMENTS September 30, 2016 (continued)
5. | Investment Transactions |
The aggregate purchases and sales of securities, excluding short-term investments, for the Funds for the year ended September 30, 2016, were as follows:
(Amounts in thousands) | | Focus
Fund | | | Growth
Fund | | | 21st
Century
Fund | | | International
Opportunities
Fund | | | Flexible
Capital
Fund | | | Global
Fund | |
Purchases | | $ | 316,591 | | | $ | 175,793 | | | $ | 106,909 | | | $ | 157,185 | | | $ | 156,167 | | | $ | 46,159 | |
Sales | | $ | 534,587 | | | $ | 326,333 | | | $ | 142,738 | | | $ | 188,221 | | | $ | 314,539 | | | $ | 71,585 | |
There were no purchases or sales of US government securities, excluding short-term investments.
6. | Federal Income Tax Information |
“Accounting for Uncertainty in Income Taxes” (the “Income Tax Statement”) requires an evaluation of tax positions taken (or expected to be taken) in the course of preparing a Fund’s tax returns to determine whether these positions meet a “more-likely-than-not” standard that, based on the technical merits, have a more than fifty percent likelihood of being sustained by a taxing authority upon examination. A tax position that meets the “more-likely-than-not” recognition threshold is measured to determine the amount of benefit to recognize in the financial statements. The Funds recognize interest and penalties, if any, related to unrecognized tax benefits as income tax expense in the Statements of Operations.
The Income Tax Statement requires management of the Funds to analyze all open tax years, fiscal years 2013-2016 as defined by Internal Revenue Service (“IRS”) statute of limitations for all major jurisdictions, including federal tax authorities and certain state tax authorities. As of and during the year ended September 30, 2016, the Funds did not have any liabilities for any unrecognized tax benefits. The Funds have no examinations in progress and are not aware of any tax positions for which it is reasonably possible that the total amounts of unrecognized tax benefits will significantly change in the next twelve months.
At September 30, 2016, gross unrealized appreciation and depreciation of investments, based on cost for federal income tax purposes were as follows:
(Amounts in thousands) | | Focus
Fund | | | Growth
Fund | | | 21st
Century
Fund | | | International
Opportunities
Fund | | | Flexible
Capital
Fund | | | Global
Fund | |
Cost of Investments | | $ | 476,757 | | | $ | 231,452 | | | $ | 177,299 | | | $ | 53,248 | | | $ | 288,529 | | | $ | 36,428 | |
| | | | | | | | | | | | | | | | | | | | | | | | | |
Gross Unrealized Appreciation | | $ | 158,919 | | | $ | 61,524 | | | $ | 64,276 | | | $ | 9,760 | | | $ | 65,162 | | | $ | 8,910 | |
Gross Unrealized Depreciation | | | (13,218 | ) | | | (357 | ) | | | (5,469 | ) | | | (236 | ) | | | (3,477 | ) | | | (459 | ) |
| | | | | | | | | | | | | | | | | | | | | | | | | |
Net Unrealized Appreciation on Investments | | $ | 145,701 | | | $ | 61,167 | | | $ | 58,807 | | | $ | 9,524 | | | $ | 61,685 | | | $ | 8,451 | |
The difference between cost amounts for financial statement and federal income tax purposes is due primarily to wash sale loss deferrals.
At September 30, 2016, for federal income tax purposes, the Funds had accumulated capital loss carryforwards as follows:
(Amounts in thousands) | | Focus
Fund | | | Growth
Fund | | | 21st
Century
Fund | | | International
Opportunities
Fund | | | Flexible
Capital
Fund | | | Global
Fund | |
For losses expiring September 30, | | | | | | | | | | | | | | | | | | |
2017 | | $ | — | | | $ | — | | | $ | 25,304 | | | $ | 8,008 | | | $ | — | | | $ | — | |
2018 | | | — | | | | — | | | | 390,537 | | | | 93,558 | | | | — | | | | — | |
Not Subject to Expiration | | | 988 | | | | — | | | | 1,995 | | | | 811 | | | | — | | | | 416 | |
| | | $ | 988 | | | $ | — | | | $ | 417,836 | | | $ | 102,377 | | | $ | — | | | $ | 416 | |
To the extent that a Fund may realize future net capital gains, those gains will be offset by any of its unused capital loss carryforward. Future capital loss carryover utilization in any given year may be subject to Internal Revenue Code limitations.
54
NOTES TO FINANCIAL STATEMENTS |
The Funds are permitted to carryforward capital losses incurred in taxable years beginning after December 22, 2010 for an unlimited period, and such capital losses will retain their character as either short-term or long-term capital losses. Capital losses incurred by the Funds in taxable years beginning before December 23, 2010 may only be carried forward eight taxable years as short-term capital losses.
As of September 30, 2016, the Focus Fund, Growth Fund, 21st Century Fund, International Opportunities Fund, Flexible Capital Fund, and Global Fund, respectively, had (in thousands) $3,193, $1,522, $1,893, $151, $0 and $173 of qualified late-year losses, which are deferred until fiscal year 2017 for tax purposes. Net late-year losses incurred after December 31st, and within the taxable year, are deemed to arise on the first day of the Fund’s next taxable year.
As of September 30, 2016, the components of accumulated earnings (deficit) on a tax basis were as follows:
(Amounts in thousands) | | Focus
Fund | | | Growth
Fund | | | 21st
Century
Fund | | | International
Opportunities
Fund | | | Flexible
Capital
Fund | | | Global
Fund | |
Undistributed Ordinary Income | | $ | — | | | $ | — | | | $ | — | | | $ | — | | | $ | 3,268 | | | $ | — | |
Undistributed Trustees' Deferred Compensation | | | (1,971 | ) | | | (1,187 | ) | | | (835 | ) | | | (313 | ) | | | (920 | ) | | | (359 | ) |
Undistributed Long-Term Capital Gains | | | — | | | | 2,135 | | | | — | | | | — | | | | 21,402 | | | | — | |
Tax Accumulated Earnings (Deficit) | | | (1,971 | ) | | | 948 | | | | (835 | ) | | | (313 | ) | | | 23,750 | | | | (359 | ) |
Accumulated Capital and Other Losses | | | (4,181 | ) | | | (1,522 | ) | | | (419,729 | ) | | | (102,528 | ) | | | — | | | | (589 | ) |
Unrealized Appreciation on Investments and on Foreign Currency Translations | | | 145,701 | | | | 61,167 | | | | 58,807 | | | | 9,516 | | | | 61,669 | | | | 8,451 | |
Trustees' Deferred Compensation Mark-to-Market | | | 579 | | | | 307 | | | | 147 | | | | 38 | | | | 613 | | | | 49 | |
Total Accumulated Earnings (Deficit) | | $ | 140,128 | | | $ | 60,900 | | | $ | (361,610 | ) | | $ | (93,287 | ) | | $ | 86,032 | | | $ | 7,552 | |
Undistributed ordinary income consists of net investment income and timing differences related to qualified late-year losses.
The tax character of distributions paid during the fiscal years ended September 30, 2016 and 2015 was as follows:
| | | 2016 | | | 2015 | |
| (Amounts in thousands) | | Ordinary Income | | | Long-Term Capital Gains | | | Ordinary Income | | | Long-Term Capital Gains | |
| Focus Fund | | $ | — | | | $ | 157,703 | | | $ | 17,276 | | | $ | 106,806 | |
| Growth Fund | | | — | | | | 111,369 | | | | 11,035 | | | | 52,595 | |
21st Century Fund | | | — | | | | — | | | | — | | | | — | |
| International Opportunities Fund | | | — | | | | — | | | | — | | | | — | |
| Flexible Capital Fund | | | 3,373 | | | | 64,551 | | | | 11,186 | | | | 61,016 | |
| Global Fund | | | — | | | | 6,835 | | | | 1,487 | | | | 6,923 | |
The tax character of dividends paid may differ from that shown in the Statements of Changes in Net Assets due to short-term gains being treated as ordinary income for tax purposes.
Management of the Adviser has determined that there were no material subsequent events that would require disclosure in the Funds’ financial statements.
55
REPORT OF INDEPENDENT REGISTERED PUBLIC ACCOUNTING FIRM |
REPORT OF INDEPENDENT REGISTERED PUBLIC ACCOUNTING FIRM
To the Board of Trustees and Shareholders of The Marsico Investment Fund
In our opinion, the accompanying statements of assets and liabilities, including the schedules of investments, and the related statements of operations and of changes in net assets and the financial highlights present fairly, in all material respects, the financial position of Marsico Focus Fund, Marsico Growth Fund, Marsico 21st Century Fund, Marsico International Opportunities Fund, Marsico Flexible Capital Fund, and Marsico Global Fund (the six funds constituting The Marsico Investment Fund, hereafter referred to as the “Funds”) at September 30, 2016, the results of each of their operations for the year then ended, the changes in each of their net assets for each of the two years in the period then ended and the financial highlights for each of the five years in the period then ended, in conformity with accounting principles generally accepted in the United States of America. These financial statements and financial highlights (hereafter referred to as “financial statements”) are the responsibility of the Funds’ management. Our responsibility is to express an opinion on these financial statements based on our audits. We conducted our audits of these financial statements in accordance with the standards of the Public Company Accounting Oversight Board (United States). Those standards require that we plan and perform the audit to obtain reasonable assurance about whether the financial statements are free of material misstatement. An audit includes examining, on a test basis, evidence supporting the amounts and disclosures in the financial statements, assessing the accounting principles used and significant estimates made by management, and evaluating the overall financial statement presentation. We believe that our audits, which included confirmation of securities at September 30, 2016 by correspondence with the custodian and brokers, provide a reasonable basis for our opinion.

Denver, Colorado
November 16, 2016
56
EXPENSE EXAMPLE For the six-month period ended September 30, 2016 (Unaudited)
As a shareholder of the Marsico Funds (the “Funds”), you incur two types of costs: (1) transaction costs, including redemption fees (if any), and (2) ongoing costs, including management fees, distribution (12b-1) fees, and other Fund expenses. This Example is intended to help you understand your ongoing costs (in dollars) of investing in the Funds and to compare these costs with the ongoing costs of investing in other mutual funds.
The Example is based on an investment of $1,000 invested at the beginning of the period and held for the entire period from April 1, 2016 to September 30, 2016 (the “period”).
Actual Expenses
The first line of the table below provides information about actual account values and actual expenses. You may use the information in this line, together with the amount you invested, to estimate the expenses you paid over the period. Simply divide your account value by $1,000 (for example, an $8,600 account value divided by $1,000 equals 8.6), then multiply the result by the number in the first line under the heading entitled “Expenses paid for the six-month period ended September 30, 2016” to estimate the expenses you paid on your account during the period.
Hypothetical Example for Comparison Purposes
The second line of the table below provides information about hypothetical account values and hypothetical expenses based on the Funds’ actual expense ratios and an assumed rate of return of 5% per year before expenses, which is not the actual return of any of the Funds. The hypothetical account values and expenses may not be used to estimate the actual ending account balance or expenses you paid for the period. You may use this information to compare the ongoing costs of investing in the Funds and other funds. To do so, compare this 5% hypothetical example with the 5% hypothetical examples that appear in the shareholder reports of other funds.
Please note that the expenses shown in the table are meant to highlight your ongoing costs only and do not reflect any transactional costs such as redemption fees (if any). Therefore, the second line of the table is useful in comparing the ongoing costs only, and will not help you determine the relative total costs of owning different funds. In addition, if these transactional costs (if any) were included, your costs could have been higher.
Expenses Paid During the Period | Beginning
account value
April 1, 2016 | Ending
account value
September 30, 2016 | Expenses paid for the
six-month period ended
September 30, 2016(1) |
FOCUS FUND | | | |
Actual Example | $ 1,000.00 | $ 1,031.70 | $ 6.46 |
Hypothetical Example, assuming a 5% return before expenses | $ 1,000.00 | $ 1,018.64 | $ 6.42 |
| | | | |
GROWTH FUND | | | |
Actual Example | $ 1,000.00 | $ 1,044.40 | $ 6.88 |
Hypothetical Example, assuming a 5% return before expenses | $ 1,000.00 | $ 1,018.27 | $ 6.79 |
| | | | |
21st CENTURY FUND | | | |
Actual Example | $ 1,000.00 | $ 1,068.90 | $ 7.19 |
Hypothetical Example, assuming a 5% return before expenses | $ 1,000.00 | $ 1,018.05 | $ 7.01 |
| | | | |
INTERNATIONAL OPPORTUNITIES FUND | | | |
Actual Example | $ 1,000.00 | $ 1,051.10 | $ 8.20 |
Hypothetical Example, assuming a 5% return before expenses | $ 1,000.00 | $ 1,017.00 | $ 8.07 |
| | | | |
FLEXIBLE CAPITAL FUND | | | |
Actual Example | $ 1,000.00 | $ 1,050.70 | $ 7.04 |
Hypothetical Example, assuming a 5% return before expenses | $ 1,000.00 | $ 1,018.14 | $ 6.92 |
| | | | |
GLOBAL FUND | | | |
Actual Example | $ 1,000.00 | $ 1,044.30 | $ 8.18 |
Hypothetical Example, assuming a 5% return before expenses | $ 1,000.00 | $ 1,017.00 | $ 8.07 |
(1) | Expenses are equal to the Funds’ annualized expense ratios (1.27% for the Focus Fund, 1.35% for the Growth Fund, 1.39% for the 21st Century Fund, 1.60% for the International Opportunities Fund, 1.37% for the Flexible Capital Fund, and 1.60% for the Global Fund), multiplied by the average account value over the period, multiplied by 183/366 (to reflect the six-month period). |
57
OTHER INFORMATION (Unaudited)
Proxy Voting Guidelines
The Funds exercise the voting rights associated with the securities held by the Funds under the proxy voting policy of the Funds. A description of those policies and procedures of the Funds and a record of the Funds’ proxy votes for the one-year period ended June 30, 2016 are available without charge, upon request, by calling 888-860-8686. It is also available on the Securities and Exchange Commission’s (SEC) website at www.sec.gov.
Quarterly Filing of Portfolio Holdings
The Funds will file their complete schedule of investments with the SEC for the first and third quarters of each fiscal year on Form N-Q. The Funds’ Form N-Q will be available (i) on the SEC’s website at www.sec.gov; (ii) at the SEC’s Public Reference Room; and (iii) by calling 800-SEC-0330.
Other Tax Information
Corporate Dividends Received Deduction
For the fiscal year ended September 30, 2016, 0%, 0%, 0%, 0%, 100% and 0% of the dividends paid from net investment income qualified for the dividends received deduction available to corporate shareholders of the Focus Fund, Growth Fund, 21st Century Fund, International Opportunities Fund, Flexible Capital Fund, and Global Fund, respectively.
Qualified Dividend Income
Pursuant to Section 854 of the Internal Revenue Code, the Focus Fund, Growth Fund, 21st Century Fund, International Opportunties Fund, Flexible Capital Fund, and Global Fund designate income dividends (in thousands) of $0, $0, $0, $0, $3,373 and $0, respectively, as qualified dividend income paid during the fiscal year ended September 30, 2016.
Foreign Taxes Paid
Pursuant to the foreign tax credit election under Section 853 of the Internal Revenue Code, the International Opportunities Fund designated (in thousands) $641 of income derived from foreign sources and $24 of foreign taxes paid, for the year ended September 30, 2016.
Of the ordinary income (including short-term capital gain) distributions made during the year ended September 30, 2016, the proportionate share of income derived from foreign sources and foreign taxes paid attributable to one share of stock are:
| | Foreign Source Income | Foreign Taxes Paid |
International Opportunities Fund | $0.1597 | $0.0060 |
Long Term Capital Gains Designation
For the fiscal year ended September 30, 2016, the Focus Fund, Growth Fund, Flexible Capital Fund, and Global Fund designated (in thousands) $157,703, $111,369, $67,689 and $6,835, respectively, as a 20% rate gain distribution for the purpose of the dividends paid deduction. These amounts include earnings and profits distributed to shareholders on the redemption of shares. For income tax purposes, the Funds may utilize earnings and profits distributed to shareholders on the redemption of shares as part of the dividends paid deduction.
Cost Basis Information
Federal law requires mutual fund companies to maintain a shareholder’s cost basis by tax lot and report gain/loss information and holding periods for sales of mutual fund shares that are “covered” securities to the IRS and to shareholders on Form 1099. Mutual fund shares, such as shares of the Funds, acquired on or after January 1, 2012 are covered securities. The Funds are not responsible for maintaining and reporting share information for their shares that are not deemed “covered.”
The tax regulations require that the Funds elect a default tax identification methodology in order to perform the required reporting. The Funds have chosen the first-in-first-out (“FIFO”) method as the default tax lot identification method for its shareholders. This is the method the Funds will use to determine which specific shares are deemed to be sold when a shareholder’s entire position is not sold in a single transaction and is the method in which “covered” share sales will be reported on a shareholder’s Form 1099.
However, at the time of purchase or upon the sale of “covered” shares, shareholders may generally choose a different tax lot identification method. Shareholders should consult a tax advisor with regard to their personal circumstances as the Funds and their service providers do not provide tax advice.
58
TRUSTEE AND OFFICER INFORMATION |
TRUSTEE AND OFFICER INFORMATION INDEPENDENT TRUSTEES
Name, Address and Age | Position(s) Held
with the Trust | Term of Office(1)
and Length of
Time Served | Principal Occupation(s)
During Past 5 Years | Number of Portfolios
in Fund Complex
Overseen by Trustee | Other Directorships
Held by Trustee |
Jay S. Goodgold
1200 17th Street
Suite 1600
Denver, CO 80202
DOB: 1954 | Trustee; Lead Independent Trustee | Trustee (since
February 2006);
Lead Independent Trustee (since November 2010) | Private investor (July 2003 - present);
Managing Director, Goldman, Sachs & Co. (August 1978 - June 2003). | 6 | None |
Elizabeth Hoffman
1200 17th Street
Suite 1600
Denver, CO 80202
DOB: 1946 | Trustee | Since February 2006 | Professor of Economics (January 2007 - present) and Executive Vice President and Provost (January 2007 - July 2012), Iowa State University; President Emerita, University of Colorado (August 2005 - present). | 6 | None |
Walter A. Koelbel, Jr.
1200 17th Street
Suite 1600
Denver, CO 80202
DOB: 1952 | Trustee | Since December 1997 | President, and other positions, Koelbel
and Company (full service real estate,
development, investment, and management company) (more than five years). | 6 | None |
Michael D. Rierson
1200 17th Street
Suite 1600
Denver, CO 80202
DOB: 1952 | Trustee | Since November 1998 | President, The Rierson Group (marketing and consulting firm serving non-profit organizations) (June 2015 - present); Senior Vice President for Development, Colonial Williamsburg Foundation (January 2011 - June 2015). | 6 | None |
Bruce E. Stangle
1200 17th Street
Suite 1600
Denver, CO 80202
DOB: 1948 | Trustee | Since May 2010 | Chairman, Analysis Group, Inc. (economic consulting) (more than five years). | 6 | Director, Wellington Trust Company, NA (since 2001). |
Joseph T. Willett
1200 17th Street
Suite 1600
Denver, CO 80202
DOB: 1951 | Trustee | Since November 2002 | Private investor (2002 - present); Chief
Operating Officer, Merrill Lynch Europe (1998 - 2002). | 6 | None |
(1) | Each Trustee serves an indefinite term until the election of a successor or until reaching the mandatory retirement age for non-interested Trustees as established by the Trustees and set forth in the Trust’s Statement of Independent Trustee Retirement Policy, or until his or her resignation, death or removal. Each Officer serves an indefinite term, renewed annually, until the election of a successor (or until their resignation or removal). |
| The Statement of Additional Information includes additional information about the Trustees and is available upon request, without charge, by calling 888-860-8686 or visiting marsicofunds.com. |
59
TRUSTEE AND OFFICER INFORMATION |
TRUSTEE AND OFFICER INFORMATION INTERESTED TRUSTEES* AND OFFICERS
Name, Address and Age | Position(s) Held
with the Trust | Term of Office(1)
and Length of
Time Served | Principal Occupation(s)
During Past 5 Years | Number of Portfolios
in Fund Complex
Overseen by Trustee | Other Directorships
Held by Trustee |
Thomas F. Marsico(2)
1200 17th Street
Suite 1600
Denver, CO 80202
DOB: 1955 | Trustee, President, Chief Executive Officer and Chief Investment Officer | Since December 1997 | Chief Executive Officer,
Marsico Capital Management, LLC
(more than five years). | 6 | None |
Christopher J. Marsico(2) 1200 17th Street
Suite 1600
Denver, CO 80202
DOB: 1961 | Trustee, Executive
Vice President and
Chief Operating Officer | Trustee (August 2007 - March 2010 and since May 2010); Vice President and Treasurer (September 2002 - May 2010); Executive Vice President and Chief Operating Officer
(since May 2010) | President,
Marsico Capital Management, LLC
(more than five years). | 6 | None |
Neil L. Gloude, CPA
1200 17th Street
Suite 1600
Denver, CO 80202
DOB: 1961 | Vice President, Secretary and Treasurer | Vice President and Secretary
(since May 2008);
Treasurer (since May 2010) | Executive Vice President, Chief
Financial Officer and Treasurer, Marsico Capital Management, LLC
(more than five years). | N/A | N/A |
Steven Carlson
1200 17th Street
Suite 1600
Denver, CO 80202
DOB: 1964 | Chief Compliance Officer | Since July 2016 | Executive Vice President and Chief Compliance Officer,
Marsico Capital Management, LLC
(more than five years). | N/A | N/A |
Thomas M. J. Kerwin
1200 17th Street
Suite 1600
Denver, CO 80202
DOB: 1955 | Chief Legal Officer | Since August 2003 | Executive Vice President and General Counsel, Marsico Capital Management, LLC (more than five years). | N/A | N/A |
* | Trustees who are “interested persons” of the Funds, as defined in the 1940 Act. |
(1) | Each Trustee serves an indefinite term until the election of a successor or until reaching the mandatory retirement age for non-interested Trustees as established by the Trustees and set forth in the Trust’s Statement of Independent Trustee Retirement Policy, or until his or her resignation, death or removal. Each Officer serves an indefinite term, renewed annually, until the election of a successor (or until their resignation or removal). |
(2) | Mr. Thomas Marsico and Mr. Christopher Marsico are considered Interested Trustees of the Trust because of their affiliation with Marsico Capital Management, LLC, the Adviser to the Funds. Mr. Thomas Marsico and Mr. Christopher Marsico are brothers. |
| The Statement of Additional Information includes additional information about the Trustees and is available upon request, without charge, by calling 888-860-8686 or visiting marsicofunds.com. |
60
Item 2 - Code of Ethics.
(a) The Registrant, as of the end of the period covered by this report, has adopted a code of ethics that applies to the Registrant’s principal executive officer, principal financial officer, principal accounting officer or controller, or persons performing similar functions, regardless of whether these individuals are employed by the Registrant or a third party. A copy of this code of ethics is attached hereto as Exhibit (a).
(b) Not used.
(c) There were no amendments, during the period covered by this report, to a provision of the code of ethics that applies to the Registrant’s principal executive officer, principal financial officer, principal accounting officer or controller, or persons performing similar functions, regardless of whether these individuals are employed by the Registrant or a third party, and that relates to any element of the code of ethics description.
(d) The Registrant has not granted any waivers, including an implicit waiver, from a provision of the code of ethics that applies to the Registrant’s principal executive officer, principal financial officer, principal accounting officer or controller, or persons performing similar functions, regardless of whether these individuals are employed by the Registrant or a third party, that relates to one or more of the items set forth in paragraph (b) of this item’s instructions.
(e) Not applicable.
(f) See attached Exhibit (a).
Item 3 - Audit Committee Financial Expert.
(a)(1) The Registrant’s Board of Trustees has determined that the Registrant has at least one audit committee financial expert serving on its audit committee.
(a)(2) Mr. Joseph T. Willett is the audit committee financial expert. Mr. Willett is “independent” under the applicable rules.
Item 4 - Principal Accountant Fees and Services.
In each of the fiscal years ended September 30, 2016 and September 30, 2015, the aggregate Audit Fees billed (or to be billed) by PricewaterhouseCoopers LLP (PwC) for professional services rendered for the audits of the financial statements, or services that are normally provided in connection with statutory and regulatory filings or engagements as well as reimbursable expenses are listed below.
(a) Audit Fees.
(b) Audit-Related Fees.
In each of the fiscal years ended September 30, 2016 and September 30, 2015, the aggregate Audit-Related Fees billed (or to be billed) by PwC for services rendered for assurance and related services to each fund that are reasonably related to the performance of the audit or review of each fund's financial statements, but not reported as Audit Fees, are shown in the table below.
Audit-related fees noted in 2016 and 2015 are for non-recurring work performed by PwC related to the Funds’ distributions to shareholders.
(c) Tax Fees.
In each of the fiscal years ended September 30, 2016 and September 30, 2015 the aggregate Tax Fees billed (or to be billed) by PwC for professional services rendered for tax compliance, tax advice, and tax planning are shown in the table below.
All of these fees were approved by the Trust’s Audit Committee as required pursuant to paragraph (c)(7)(ii) of Rule 2-01 of Regulation S-X.
Fees included in the Tax Fees category comprise all services performed by professional staff in the independent registered public accounting firm's tax division except those services related to the audit. Typically, this category would include fees for tax compliance, tax planning, and tax advice. Tax compliance, tax advice, and tax planning services include preparation of original and amended tax returns, claims for refund and tax payment-planning services, assistance with tax audits and appeals, tax advice related to mergers and acquisitions and requests for rulings or technical advice from taxing authorities.
(d) All Other Fees.
In each of the fiscal years ended September 30, 2016 and September 30, 2015 the aggregate Other Fees billed (or to be billed) by PwC for all other non-audit services rendered are shown in the table below.
(e) (1) Audit Committee Pre-Approval Policies and Procedures:
Pursuant to the Trust’s Audit Committee Charter and Policies and Procedures (collectively, the “Procedures”), the Audit Committee has adopted pre-approval policies and procedures to govern the pre-approval of (i) all audit services and permissible non-audit services to be provided to the Trust by its independent accountant, and (ii) all permissible non-audit services to be provided by such independent accountant to the Trust’s investment adviser and to any entity controlling, controlled by or under common control with the investment adviser that provides on-going services to the Trust (collectively, any “Service Affiliates”) if the engagement directly relates to the Trust’s operations and financial reporting.
In accordance with the Procedures, the Committee is responsible for the engagement of the independent accountant to certify the Trust’s financial statements for each fiscal year. With respect to the pre-approval of non-audit services provided to the Trust and its Service Affiliates, the Procedures provide that the Committee may pre-approve such services on a project-by-project basis as they arise. The Procedures also permit the Committee to delegate authority to the Audit Committee Chairman (the “Designated Member”) to pre-approve any proposed non-audit services that have not been previously approved by the Committee, subject to certain conditions. Any action by the Designated Member in approving a requested non-audit service shall be presented to the Audit Committee not later than at its next scheduled meeting. If the Designated Member does not approve the independent auditor’s provision of a requested non-audit service, the matter may be presented to the full Committee for its consideration and action.
(e)(2) Services approved pursuant to paragraph (c)(7)(i)(C) of Rule 2-01 of Regulation S-X:
100% of these fees were approved by the Trust’s Audit Committee as required pursuant to paragraph (c)(7)(ii) of Rule 2-01 of Regulation S-X.
(f) According to PwC for the fiscal year ended September 30, 2016, the percentage of hours spent on the audit of the Marsico Funds’ financial statements for the most recent fiscal year that were attributed to work performed by persons who are not full-time, permanent employees of PwC is as follows:
| PwC | 2016 |
| Work performed by persons who are not full-time | 0% |
(g) In each of the fiscal years ended September 30, 2016 and September 30, 2015, the aggregate fees billed (or to be billed) by PwC relating to non-audit services that were rendered to the Trust, to its investment adviser, and to any entity controlling, controlled by, or under common control with the investment adviser and that provides ongoing services to the Trust are shown in the table below.
(h) Not applicable.
Item 5 - Audit Committee of Listed Registrants.
Not applicable.
Item 6 - Schedule of Investments.
The schedule of investments in securities of unaffiliated issuers is included as part of the report to shareholders filed under Item 1.
Item 7 - Disclosure of Proxy Voting Policies and Procedures for Closed-End Management Investment Companies.
Not applicable.
Item 8 – Portfolio Managers of Closed-End Management Investment Companies.
Not applicable.
Item 9 – Purchases of Equity Securities by Closed-End Management Investment Company and Affiliated Purchasers.
Not applicable.
Item 10 – Submission of Matters to a Vote of Security Holders.
Not applicable.
Item 11 - Controls and Procedures.
(a) The registrant's principal executive officer and principal financial officer have concluded that the registrant's disclosure controls and procedures (as defined in Rule 30a-3(c) under the Investment Company Act of 1940, as amended) are effective based on their evaluation of these disclosure controls and procedures within 90 days of the filing date of this report on Form N-CSR.
(b) There were no significant changes in the registrant's internal control over financial reporting (as defined in Rule 30a-3(d) under the Investment Company Act of 1940, as amended) that occurred during the second fiscal half-year covered by this report that has materially affected, or is reasonably likely to materially affect, the registrant’s internal control over financial reporting.
Item 12 – Exhibits.
(a)(1) Code of Ethics - Filed as an attachment to this filing.
(a)(2) Certification for each principal executive and principal financial officer of the registrant as required by Rule 30a-2(a) under the Act (17 CFR 270.30a-2(a)). Filed as an attachment to this filing.
(a)(3) Any written solicitation to purchase securities under Rule 23c-1 under the Investment Company Act of 1940, as amended, that was sent or given during the period covered by the report by or on behalf of the registrant to 10 or more persons.
Not applicable.
(b) Certifications required by Rule 30a-2(b) under the Act (17 CFR 270.30a-2(b)), Rule 13a-14(b) or Rule 15d-14(b) under the Exchange Act (17 CFR 240.13a-14(b) or 240.15d-14(b)), and Section 1350 of Chapter 63 of Title 18 of the United States Code (18 U.S.C. 1350). Filed as an attachment to this filing.
SIGNATURES
Pursuant to the requirements of the Securities Exchange Act of 1934 and the Investment Company Act of 1940, the registrant has duly caused this report to be signed on its behalf by the undersigned, thereunto duly authorized.
The Marsico Investment Fund
| By: | /s/Christopher J. Marsico | |
| | Christopher J. Marsico | |
| | Executive Vice President and Chief Operating Officer |
| | | |
| Date: | December 7, 2016 | |
Pursuant to the requirements of the Securities Exchange Act of 1934 and the Investment Company Act of 1940, this report has been signed below by the following persons on behalf of the registrant and in the capacities and on the dates indicated.
| By: | /s/Christopher J. Marsico | |
| | Christopher J. Marsico | |
| | Executive Vice President and Chief Operating Officer |
| | | |
| Date: | December 7, 2016 | |
| | | |
| By: | /s/ Neil L. Gloude | |
| | Neil L. Gloude | |
| | Vice President, Secretary and Treasurer | |
| | | |
| Date: | December 7, 2016 | |