UNITED STATES
SECURITIES AND EXCHANGE COMMISSION
WASHINGTON, D.C. 20549
FORM N-CSR
CERTIFIED SHAREHOLDER REPORT OF REGISTERED
MANAGEMENT INVESTMENT COMPANIES
Investment Company Act File Number: 811-08397
THE MARSICO INVESTMENT FUND
(Exact Name of Registrant as Specified in Charter)
1200 17th Street, Suite 1600
Denver, CO 80202
(Address of Principal Executive Offices) (Zip Code)
The Corporation Trust Company
The Marsico Investment Fund
Corporation Trust Center 1209 Orange Street
Wilmington, Delaware 19802
(Name and address of Agent for Service of Process)
Copies to:
Anthony H. Zacharski
Dechert LLP
90 State House Square
Hartford, CT 06103
Registrant's Telephone Number, including Area Code: 1-888-860-8686
Date of fiscal year end: September 30
Date of Reporting Period: September 30, 2018
| Item 1. | Reports to Stockholders |
DEAR SHAREHOLDER:
Enclosed is your annual report for each portfolio of The Marsico Investment Fund (the “Marsico Funds”), encompassing the one-year fiscal period from October 1, 2017 to September 30, 2018.
The purpose of this report is to provide a review of the Marsico Funds’ one-year investment results by discussing what we believe were the main areas that impacted performance – including the macroeconomic environment, sector and industry positioning, and individual stock selection – as compared to the Funds’ performance benchmark indexes.
For updated information regarding the market environment and each Fund’s overall investment positioning and performance, please refer to the Funds’ most recent monthly fact sheets and quarterly investment updates, which are available in the Investor Resources section of the Funds’ website at marsicofunds.com.(1)
Notes: After the close of business on August 3, 2018, the former Flexible Capital Fund was reorganized through a merger with and into the Global Fund. Effective September 1, 2018, Brandon A. Geisler and Robert G. Susman became co-managers of the Global Fund with Thomas F. Marsico.
| (1) | The references to the Marsico Funds website (marsicofunds.com) included throughout this annual report do not incorporate the website’s contents into this report. |
| | KEY FUND STATISTICS | 2 | |
| | MARKET ENVIRONMENT | 5 | |
| | | | |
| | MARSICO FOCUS FUND |
| | Investment Review | 7 | |
| | Fund Overview | 10 | |
| | Schedule of Investments | 11 | |
| | | | |
| | MARSICO GROWTH FUND |
| | Investment Review | 12 | |
| | Fund Overview | 14 | |
| | Schedule of Investments | 15 | |
| | | | |
| | MARSICO 21st CENTURY FUND |
| | Investment Review | 17 | |
| | Fund Overview | 19 | |
| | Schedule of Investments | 20 | |
| | | | |
| | MARSICO INTERNATIONAL OPPORTUNITIES FUND |
| | Investment Review | 22 | |
| | Fund Overview | 24 | |
| | Schedule of Investments | 25 | |
| | | | |
| | MARSICO GLOBAL FUND |
| | Investment Review | 27 | |
| | Fund Overview | 29 | |
| | Schedule of Investments | 30 | |
| | | | |
| | FINANCIAL STATEMENTS | 32 | |
| | NOTES TO FINANCIAL STATEMENTS | 42 | |
| | REPORT OF INDEPENDENT REGISTERED PUBLIC ACCOUNTING FIRM | 50 | |
| | EXPENSE EXAMPLE | 51 | |
| | OTHER INFORMATION | 53 | |
| | TRUSTEE AND OFFICER INFORMATION | 54 | |
1
| KEY FUND STATISTICS (UNAUDITED) |
Marsico Focus Fund | Marsico Growth Fund | Marsico 21st Century
Fund |
| | MFOCX | | | MGRIX | | | MXXIX | |
For additional disclosures, please see page 10. | For additional disclosures, please see page 14. | For additional disclosures, please see page 19. |
PERFORMANCE COMPARISON(1) | PERFORMANCE COMPARISON(1) | PERFORMANCE COMPARISON(1) |
| 
|  |
TOTAL ANNUAL OPERATING EXPENSES* 1.13% | TOTAL ANNUAL OPERATING EXPENSES* 1.17% | TOTAL ANNUAL OPERATING EXPENSES* 1.16% |
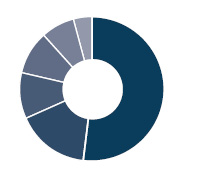
SECTOR ALLOCATION(2) | SECTOR ALLOCATION(2) | SECTOR ALLOCATION(2) |

| 
| 
|
TOP FIVE HOLDINGS | TOP FIVE HOLDINGS | TOP FIVE HOLDINGS |
| | | |
| | Amazon.com, Inc. | 7.23% | | | Amazon.com, Inc. | 6.21% | | | Take-Two Interactive Software, Inc. | 3.21% | |
| | Visa, Inc. - Cl. A | 6.23% | | | Alphabet, Inc. - Cl. A | 5.41% | | | Intuitive Surgical, Inc. | 3.08% | |
| | Alphabet, Inc. - Cl. A | 5.90% | | | Visa, Inc. - Cl. A | 4.55% | | | Worldpay, Inc. - Cl. A | 3.02% | |
| | UnitedHealth Group, Inc. | 5.54% | | | Apple, Inc. | 4.30% | | | CoStar Group, Inc. | 3.00% | |
| | Apple, Inc. | 5.19% | | | salesforce.com, inc. | 3.87% | | | Burlington Stores, Inc. | 2.98% | |
| | | | | | |
For additional disclosures about the Marsico Funds, please see page 4. The performance data quoted here represent past performance, and past performance is not a guarantee of future results. Investment return and principal value of an investment will fluctuate so that an investor’s shares, when redeemed, may be worth more or less than their original cost.
2
| KEY FUND STATISTICS (UNAUDITED) |
Marsico International
Opportunities Fund | Marsico Global Fund |
| | MIOFX | | | MGLBX | |
For additional disclosures, please see page 24. | For additional disclosures, please see page 29. |
PERFORMANCE COMPARISON(1) | PERFORMANCE COMPARISON(1) |
 | 
|
TOTAL ANNUAL OPERATING EXPENSES* 1.79% NET EXPENSES*† 1.50% | TOTAL ANNUAL OPERATING EXPENSES* 1.80% NET EXPENSES*† 1.45% |
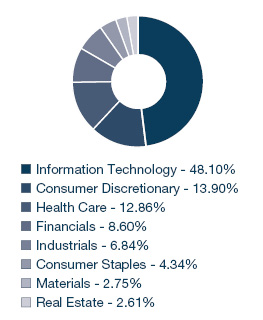
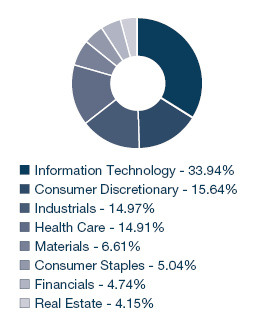
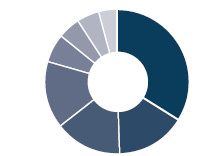
SECTOR ALLOCATION(2) | SECTOR ALLOCATION(2) |
 | 
|
TOP FIVE HOLDINGS | TOP FIVE HOLDINGS |
| | | | | | | | |
| | InterXion Holding N.V. | 4.04% | | | Amazon.com, Inc. | 6.03% | |
| | Alibaba Group Holding Ltd. Spon. ADR | 3.86% | | | Alphabet, Inc. - Cl. A | 4.94% | |
| | Worldpay, Inc. - Cl. A | 3.43% | | | Alibaba Group Holding Ltd. Spon. ADR | 4.60% | |
| | ASML Holding N.V. | 3.34% | | | Apple, Inc. | 4.50% | |
| | Wirecard A.G. | 3.32% | | | NVIDIA Corporation | 4.45% | |
| | | | | | | | |
Current performance may be lower or higher than the performance information quoted. To obtain performance information current to the most recent month-end, please call 888-860-8686 or visit marsicofunds.com.
3
| KEY FUND STATISTICS (UNAUDITED) |
ADDITIONAL DISCLOSURES ABOUT THE MARSICO FUNDS
* | The Total Annual Operating Expenses and Net Expenses are reflective of the information disclosed in the Funds’ Prospectus dated January 31, 2018, as supplemented. The information may differ from the expense ratios disclosed in this report. |
† | Marsico Capital Management, LLC (the “Adviser”) has entered into a written expense limitation and fee waiver agreement under which it has agreed to limit the total expenses of each Fund (excluding taxes, interest, acquired fund fees and expenses, litigation, extraordinary expenses, brokerage and other transaction expenses relating to the purchase or sale of portfolio investments) to an annual rate of 1.50% of the average net assets of the International Opportunities Fund until January 31, 2019 and 1.45% of the average net assets of the Global Fund until September 30, 2019. This expense limitation and fee waiver agreement may be terminated by the Adviser at any time after January 31, 2019 or September 30, 2019, as applicable, upon 15 days prior notice to the Fund and its administrator. The Adviser may recoup from a Fund fees previously waived or expenses previously reimbursed by the Adviser with respect to that Fund pursuant to this agreement (or a previous expense limitation agreement) if: (1) such recoupment by the Adviser does not cause the Fund, at the time of recoupment, to exceed the lesser of (a) the expense limitation in effect at the time the relevant amount was waived and/or reimbursed, or (b) the expense limitation in effect at the time of the proposed recoupment, and (2) the recoupment is made within three years after the fiscal year end date as of which the amount to be waived or reimbursed was determined and the waiver or reimbursement occurred. |
(1) | The performance data quoted here represent past performance, and past performance is not a guarantee of future results. Investment return and principal value of an investment will fluctuate so that an investor’s shares, when redeemed, may be worth more or less than their original cost. Current performance may be lower or higher than the performance information quoted. To obtain performance information current to the most recent month-end, please call 888-860-8686 or visit marsicofunds.com. |
| The performance included in the chart does not reflect the deduction of taxes on Fund distributions or the redemption of Fund shares. |
| All indices are unmanaged and investors cannot invest directly in an index. |
Periodically, certain fees and expenses have been waived or reimbursed by the Adviser for the 21st Century Fund, the International Opportunities Fund, and the Global Fund. In the absence of such a waiver or reimbursement, the performance returns reflected would have been reduced. In accordance with the expense limitation and fee waiver agreement, the Adviser may recoup fees and expenses previously waived or reimbursed under certain parameters. Periodically, the Adviser has recouped such fees or expenses from the 21st Century Fund, the International Opportunities Fund, and the Global Fund, resulting in a lower performance return.
(2) | Sector weightings represent the percentage of the respective Fund’s investments (excluding cash equivalents) in certain general sectors. These sectors may include more than one industry. The Fund’s portfolio composition is subject to change at any time. |
4
MARKET ENVIRONMENT: OCTOBER 2017 – SEPTEMBER 2018 (UNAUDITED)
US equity markets advanced powerfully amid widespread evidence of strong US economic momentum during the Marsico Funds’ fiscal year ended September 30, 2018. However, share prices struggled in much of the rest of the world.
Since this year’s outset, a primary question confronting US investors has been: would US economic policy measures such as the large corporate tax cut, regulatory easing, trade renegotiations, and substantial increases in government spending generate acceleration or deceleration for US economic growth? In the latter part of the fiscal year, a wide range of economic data confirmed that the US economy had shifted into a higher gear. In response to this stronger momentum, stocks moved sharply higher even as US interest rates jumped. In contrast, paltry gains for growth in Europe and growing anxieties about Italy’s finances weighed on European shares. Emerging market shares weakened as rising US interest rates and a strong US dollar took their toll, while China shares declined amid concerns about slowing internal growth and a bilateral trade war developing with the US.
Evidence of a meaningful acceleration for the US economy was on full display near the end of the reporting period. Non-farm payroll job gains averaged 190,000 per month over the last three months, despite hurricane-related weakness in September, which puts 2018 average monthly job gains at 209,000. These rapid gains for employment took the US unemployment rate down to 3.7%, a level last seen in the late 1960s. Real consumer spending appears to have risen at a 3.5% annualized pace in the most recent quarter. Factoring in strong government spending, including the ramping up of defense outlays reflected in real GDP growth, the most recent quarter is currently estimated to have run at about a 4% annualized economic growth rate.
Strong US employment momentum did lift the pace for hourly wage increases, with the annualized pace for wage gains, quarter over quarter, coming in at 3.4% for the most recent quarter. Both headline and core inflation hovered around 2%, showing no signs of any meaningful acceleration. That said, worries about another bout of deflationary pressures, a genuine concern in prior years, don’t seem to be relevant at this point.
Recognition that stronger real growth is now in place is understandably being met by a noticeable climb for US interest rates across the maturity spectrum. Federal Reserve officials have signaled that this strong growth validates the Fed’s plan to normalize the level of short-term interest rates. The yield on the US 2-year Treasury note through the first week of October is up by 37 basis points relative to its June 2018 level. This rise, however, has not flattened the yield curve, as the 10-year Treasury note yield also rose by 37 basis points during that period.
In emerging markets, in contrast, risk assets remain under pressure. The commitment to raise rates in the US, reaffirmed by Chair Powell during his Jackson Hole speech, and clear evidence of a rising rate regime taking hold in the US, along with a strong US dollar, has kept these markets on the defensive for much of this year. The long-term impact of trade renegotiations remains unclear. Temporary increases in US tariffs appear to have had a negative impact on some foreign markets, but may have spurred revised agreements with Mexico and Canada and talks with the European Union that may cut both foreign and US tariffs with some trading partners. The possibility of resolving deeper divisions with China remains uncertain.
There now appears to be no question: economic policy measures such as tax cuts, regulatory easing, and spending increases acted as catalysts for an acceleration of US growth, as after-tax profits for US corporations leapt, while taxes paid plunged, compliments of the tax cut. Hopes of an extension of strong corporate profit growth into future quarters now may be required to continue to propel the market forward.
5
The performance of global markets during the one-year fiscal period ended September 30, 2018 is depicted below. US markets posted strong gains for the period. Large capitalization US equities outperformed small capitalization stocks, yet both segments lagged medium-capitalization stocks during the period. Emerging market equities struggled as their currencies weakened relative to the US dollar. Developed international markets posted narrowly positive returns.
Index Name(1) | Universe of
Equities Represented | One-Year
Total Return (as of
September 30, 2018) |
US | | |
S&P 500 | US large-capitalization equities | +17.91% |
Russell 3000 | US publicly-traded equities of all sizes | +17.58% |
Russell 2000 | US small-capitalization equities | +15.24% |
Russell Mid-Cap Growth | US medium-capitalization equities | +21.10% |
Index Name(1) | Universe of
Equities Represented | One-Year
Total Return (as of
September 30, 2018) |
INTERNATIONAL | |
MSCI EAFE (US$) | Equities in developed international equity markets, including Japan, Western Europe, and Australasia | +2.74% |
MSCI Emerging Markets (US$) | Equities in developing international equity markets, including China, India, Eastern Europe, and Latin America | -0.81% |
MSCI ACWI (US$) | Equities in the global developed and emerging markets | +9.77% |
Sincerely,
THE MARSICO INVESTMENT TEAM
(1) | All indices are unmanaged and investors cannot invest directly in an index. |
6
INVESTMENT REVIEW BY TOM MARSICO (UNAUDITED)
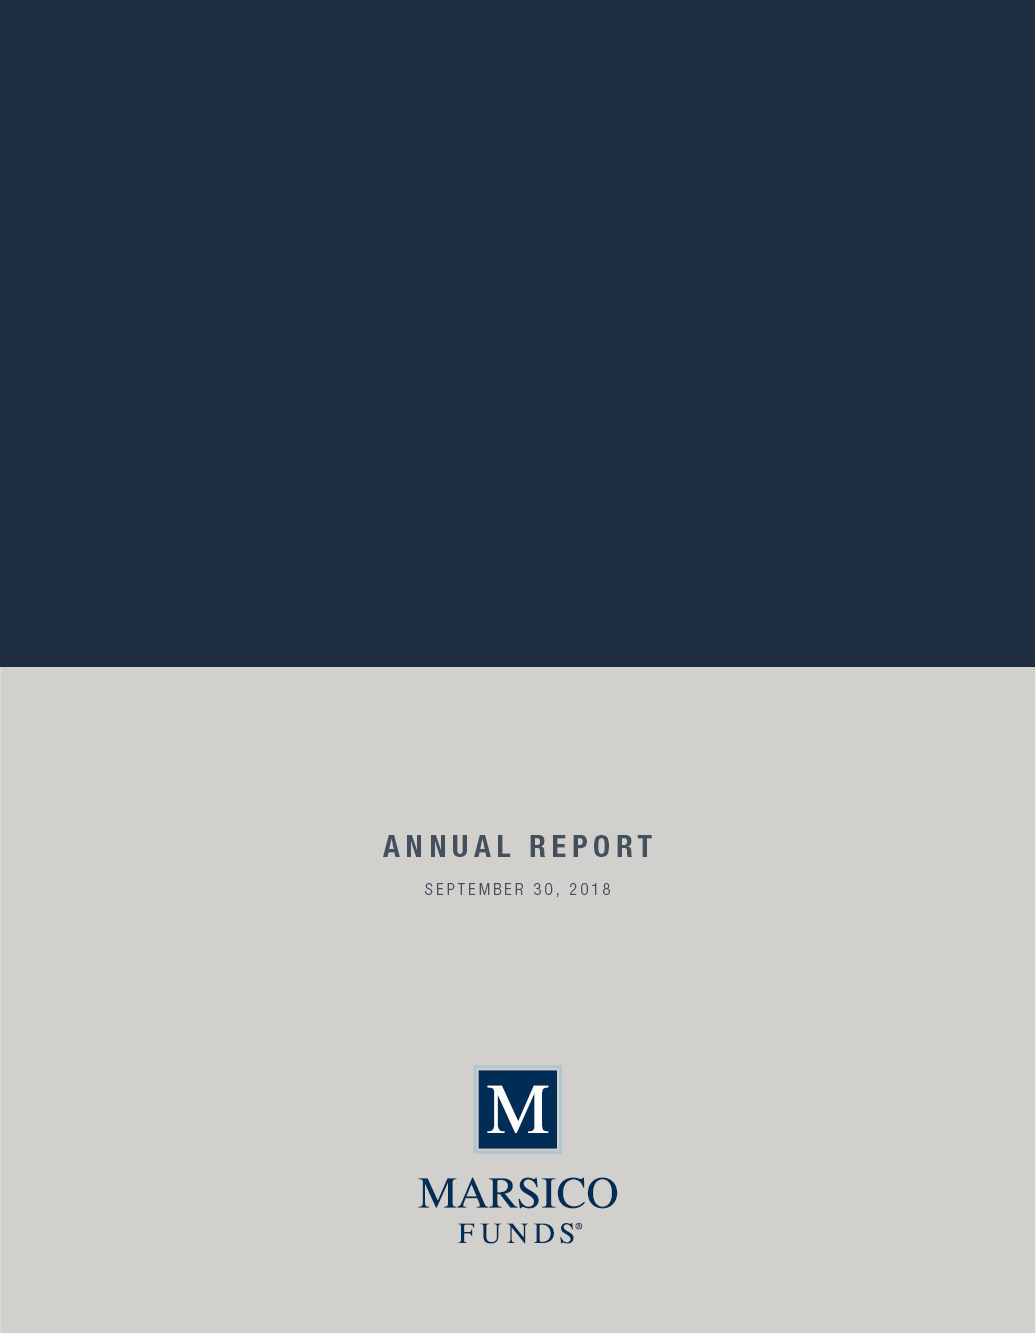
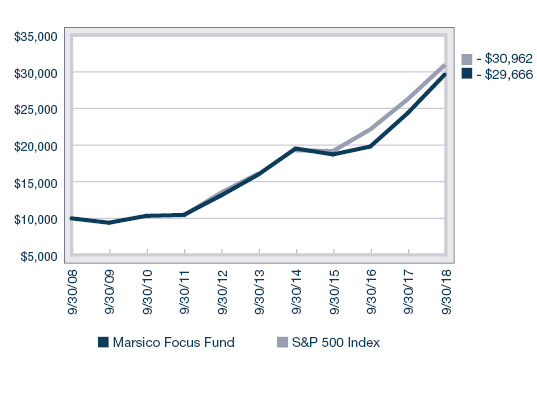
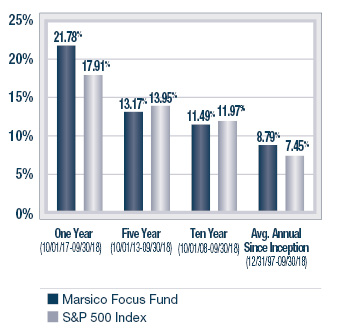
The Marsico Focus Fund posted a total return of +21.78% for the one-year fiscal period ended September 30, 2018. The Fund substantially outperformed its benchmark index, the S&P 500 Index, which had a total return of +17.91% over the same time period. Please see the Fund’s Overview for more detailed information about the Fund’s longer-term performance for various time periods ended September 30, 2018.
The performance data for the Fund quoted here represent past performance, and past performance is not a guarantee of future results. Investment return and principal value of an investment will fluctuate so that an investor’s shares, when redeemed, may be worth more or less than their original cost. Current performance may be lower or higher than the performance information quoted. To obtain performance information current to the most recent month-end, please call 888-860-8686 or visit marsicofunds.com.(1)
This review highlights Fund performance over a one-year fiscal period. Shareholders should keep in mind that the Fund is intended for long-term investors who hold their shares for substantially longer periods of time. You should also keep in mind that our current views and beliefs regarding all investments discussed in this report are subject to change at any time. References to specific securities, industries, and sectors discussed in this report are not recommendations to buy or sell such securities or related investments, and the Fund may not necessarily hold these securities or investments today. Please see the accompanying Schedule of Investments for the percentage of the Fund’s portfolio represented by the securities mentioned in this report as of the end of the reporting period.
The Focus Fund is non-diversified and may hold fewer securities than a diversified fund because it is permitted to invest a greater percentage of its assets in a smaller number of securities. Holding fewer securities increases the risk that the value of the Fund could go down because of the poor performance of a single investment or may be more volatile than its benchmark. The Fund is subject to broad risks associated with investing in equity securities markets generally, including the risks that the securities and markets in which it invests may experience volatility and instability, that domestic and global economies and markets may undergo periods of cyclical change and decline, that investors may at times avoid investments in equity securities, and that investments may not perform as anticipated. Please see the Prospectus for more information.
The Fund is not managed to track the benchmark index, and may hold a substantially overweight or underweight position in a sector, industry, or security compared to its weight in the benchmark. The Fund may be subject to risks associated with a particular sector or other area in which it is overweight, including the risk that the stocks of companies within one area could simultaneously decline in price because of an event that affects the entire area. For informational purposes, the discussion below may compare the benchmark weight or performance of a sector or industry to the investment approach of the Fund.
The Focus Fund’s outperformance during the one-year period ended September 30, 2018, as compared to the S&P 500 Index, was primarily attributable to certain Fund holdings in the Consumer Discretionary and the Information Technology sectors, as defined in the Global Industry Classification Standard (“GICS”)(2).
Stock prices of two Consumer Discretionary companies held by the Fund performed very strongly during the reporting period. Streaming content provider Netflix, Inc. returned +107%. The company has continued to penetrate the growing market for streaming content and, in our opinion, is adopting the right strategy in building content as rapidly as possible. Over the past year, Netflix began increasing subscription prices as well, hence improving already high operating margins. The current management team, headed by Reed Hastings and Ted Sarandos, has been extremely successful in securing great talent and high-quality content, and we believe it has the right strategy for continued success.
Online e-commerce platform Amazon.com, Inc. was also a strong positive contributor during the period, returning +108%, and was the largest positive contributor during the period to the Fund’s total return. Amazon continues to benefit from consumers’ growing preference to shop online, and has been adding new features to its Prime membership offering, leading to substantial growth. Advertising and cloud computing remain large opportunities for the company.
Several of the Fund’s Information Technology holdings also rose substantially during the period, including salesforce.com, inc. (+70%) and semiconductor company NVIDIA Corporation (+56%).
Customer relationship software maker salesforce.com (also referred to as “CRM”) was a strong performer during the period as the pace of new business acquisition continues to accelerate. This resulted in better growth than expected across the primary metrics we track during the company’s fiscal fourth quarter. Deferred revenue, unbilled revenue, calculated bookings and total backlog all grew 30%+ year over year, illustrating the strength of the demand environment and CRM’s dominant position in facilitating digital transformation for businesses. CRM’s total backlog of booked business now sits at an estimated $20.3 billion, which we believe should help CRM potentially achieve compounded growth of 20%+ over the next four years and a doubling of the company’s revenue.
7
NVIDIA has become “the” platform for parallel processing (running various calculations at the same time rather than in sequential order) due to its leadership in artificial intelligence and graphics-related hardware and software, as well as its proprietary CUDA computing platform and programming model. CUDA was developed 12 years ago by NVIDIA, and has become the standard platform for artificial intelligence in datacenters. Because of this strength of the company, as well as the company’s superior hardware, the company’s datacenter sales have generated revenues that surprised to the upside this year. In addition, the company’s core gaming business continues to produce better than expected results, and the business should continue to do well with a refresh of its graphics card line for the first time in over two years. New graphics card products just went on sale in late September, and are sold out in most retail channels.
The Fund initiated several new positions during the period. We invested in Intuitive Surgical, Inc. (+20%), the industry leader in the transformation of open surgical procedures to minimally invasive surgery, because we believe in its long-term growth prospects. The company focuses on the miniaturization of surgical instruments that can perform operations via a small incision and laparoscope. Using a surgical console and robotic instrumentation the company is quickly transitioning invasive open surgeries to minimally invasive procedures. This transition has a substantial benefit on the reduction of post-surgical complications and recovery time, and lowers costs for the healthcare system overall.
The Fund also purchased shares of The Boeing Company (+5%) as production rate increases and a shift to larger 787 aircraft are expected to result in sustainable revenue growth and operating margin expansion. In addition, the launch of the 777X aircraft in the next 18 months is expected to substantially bolster the operations of the company, and we believe the company’s emerging aircraft services business will drive further growth.
From a sector allocation perspective, the Fund’s performance was boosted by having a substantial overweight exposure to the Information Technology sector – the strongest-performing sector of the S&P 500 Index during the period – as compared to its benchmark index. When put in historical context, we don’t believe valuations for the Information Technology sector are unreasonably stretched at these levels, especially when considered through the lens of future earnings growth rates, and a pullback in the sector that occurred after the reporting period. We also continue to believe in the management teams and long-term business models of many of these innovative companies. In addition, Fund performance was aided by an underweight stance in the weak-performing Consumer Staples sector.
The Fund’s performance when compared to its benchmark index was held back by its investment selections in the Health Care sector. In particular, Celgene Corporation (-33% prior to being sold), didn’t perform as we anticipated. Celgene halted a drug trial on one product and struggled with another lead product for psoriatic arthritis, which caused us to sell the position.
Additionally, certain positions in the Information Technology sector such as Tencent Holdings Ltd. (-22%) and Applied Materials, Inc. (“AMAT”) (-23% prior to being sold) were weak during the period and held back Fund performance when compared to its benchmark. We sold AMAT, which provides machines used in the production of memory chips, because deteriorating industry fundamentals for the major global producers of memory chips have caused them to defer spending on new machines from AMAT. While we believe the reduced spending cycle will be relatively short in duration compared to prior down-cycles in memory chip spending because of the increased consolidation of the industry, it is difficult to know how much worse the spending environment could get before it improves. Long-term, there will be substantially more memory chips needed for applications from servers to phones to autos, but shorter-term it appears there is more supply than demand.
From a sector allocation perspective, the Fund was held back slightly relative to its benchmark index by having a 2% average cash weight during the period. The Fund occasionally may hold more cash than usual as a temporary defensive measure, or as a strategic measure enabling it to take rapid advantage of opportunities to buy stocks at favorable prices.
During the reporting period, the Fund reduced its exposure to the Consumer Discretionary and Health Care sectors and eliminated its exposure to the Consumer Staples sector. The Fund increased its allocations to the Financials, Industrials and Information Technology sectors. The Fund had limited exposure to the Real Estate and Energy sectors intra-period but liquidated the positions held within the sectors prior to period end. There was no significant change to the Fund’s allocation to the Materials sector.
8
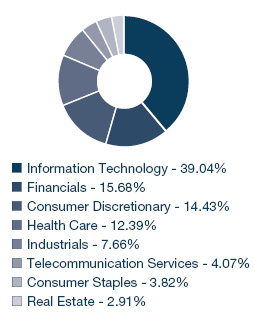
Fiscal Period-End Investment Posture
As of September 30, 2018, the Fund’s largest sector allocations included Information Technology, Health Care and Financials. As of that date, the Fund had no exposure to the Consumer Staples, Energy, Real Estate, Telecommunication Services or Utilities sectors.
Sincerely,
THOMAS F. MARSICO
PORTFOLIO MANAGER
(1) | Total returns are based on net change in net asset value assuming reinvestment of distributions. Please see the Prospectus for more information. |
(2) | Regarding GICS data cited throughout this report, the Global Industry Classification Standard (“GICS”) was developed by and is the exclusive property and service mark of MSCI Inc. (“MSCI”) and Standard & Poor’s (“S&P”) and is licensed for use by Marsico Capital Management, LLC (the “Adviser”). Neither MSCI, S&P, nor the Adviser or any third party involved in compiling GICS makes any express or implied warranties or representations with respect to such standard or classification (or the results from use thereof), and all such parties hereby expressly disclaim all warranties of originality, accuracy, completeness, merchantability and fitness for a particular purpose with respect to any such standard or classification. MSCI, S&P, the Adviser, and any of their affiliates or third parties involved in compiling GICS shall not have any liability for any direct, indirect, special, punitive, consequential or any other damages (including lost profits) even if notified of the possibility of such damages. |
9
September 30, 2018 (Unaudited)
The Focus Fund is a non-diversified portfolio and invests primarily in the common stocks of large companies that are selected for their long-term growth potential. The Fund will normally hold a core position of between 20 and 35 common stocks.
TOTAL ANNUAL OPERATING EXPENSES* 1.13% | NET ASSETS $606,014,236 | NET ASSET VALUE PER SHARE $20.17 |
GROWTH OF $10,000(1) | PERFORMANCE COMPARISON |
| 
|
SECTOR ALLOCATION(2) | TOP FIVE HOLDINGS |
| | | | |
| | Amazon.com, Inc. | 7.23% | |
| | Visa, Inc. - Cl. A | 6.23% | |
| | Alphabet, Inc. - Cl. A | 5.90% | |
| | UnitedHealth Group, Inc. | 5.54% | |
| | Apple, Inc. | 5.19% | |
| | | | |
* | The Total Annual Operating Expenses are reflective of the information disclosed in the Funds’ Prospectus dated January 31, 2018, as supplemented, and may differ from the expense ratio disclosed in this report. |
| The performance data quoted here represent past performance, and past performance is not a guarantee of future results. Investment return and principal value of an investment will fluctuate so that an investor’s shares, when redeemed, may be worth more or less than their original cost. Current performance may be lower or higher than the performance information quoted. To obtain performance information current to the most recent month-end, please call 888-860-8686 or visit marsicofunds.com. |
| The performance included in the chart and graph does not reflect the deduction of taxes on Fund distributions or the redemption of Fund shares. |
| All indices are unmanaged and investors cannot invest directly in an index. |
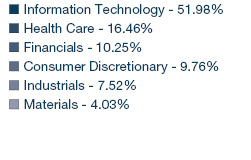
(1) | This chart assumes an initial investment of $10,000 made on September 30, 2008. Total returns are based on net change in NAV, assuming reinvestment of distributions. |
(2) | Sector weightings represent the percentage of the Fund’s investments (excluding cash equivalents) in certain general sectors. These sectors may include more than one industry. The Fund’s portfolio composition is subject to change at any time. |
10
MARSICO FOCUS FUND
SCHEDULE OF INVESTMENTS
September 30, 2018
| | | Number
of
Shares | | | Value | | | Percent
of Net
Assets | |
COMMON STOCKS | | | | | | | | | | | | |
Aerospace & Defense | | | | | | | | | | | | |
Lockheed Martin Corporation | | | 57,426 | | | $ | 19,867,099 | | | | 3.28% | |
The Boeing Company | | | 65,759 | | | | 24,455,772 | | | | 4.03 | |
| | | | | | | | 44,322,871 | | | | 7.31 | |
Application Software | | | | | | | | | | | | |
Adobe Systems, Inc.* | | | 67,612 | | | | 18,251,860 | | | | 3.01 | |
salesforce.com, inc.* | | | 195,774 | | | | 31,133,939 | | | | 5.14 | |
| | | | | | | | 49,385,799 | | | | 8.15 | |
Biotechnology | | | | | | | | | | | | |
Biogen Inc.* | | | 44,427 | | | | 15,696,503 | | | | 2.59 | |
| | | | | | | | | | | | | |
Data Processing & Outsourced Services | | | | | | | | |
PayPal Holdings, Inc.* | | | 354,504 | | | | 31,139,632 | | | | 5.14 | |
Visa, Inc. - Cl. A | | | 251,702 | | | | 37,777,953 | | | | 6.23 | |
| | | | | | | | 68,917,585 | | | | 11.37 | |
Diversified Banks | | | | | | | | | | | | |
JPMorgan Chase & Co. | | | 156,967 | | | | 17,712,156 | | | | 2.92 | |
| | | | | | | | | | | | | |
Financial Exchanges & Data | | | | | | | | | | | | |
Intercontinental Exchange, Inc. | | | 122,874 | | | | 9,202,034 | | | | 1.52 | |
S&P Global, Inc. | | | 109,532 | | | | 21,401,457 | | | | 3.53 | |
| | | | | | | | 30,603,491 | | | | 5.05 | |
Health Care Equipment | | | | | | | | | | | | |
Intuitive Surgical, Inc.* | | | 42,125 | | | | 24,179,750 | | | | 3.99 | |
| | | | | | | | | | | | | |
Home Entertainment Software | | | | | | | | | | | | |
Activision Blizzard, Inc. | | | 242,471 | | | | 20,171,162 | | | | 3.33 | |
| | | | | | | | | | | | | |
Internet & Direct Marketing Retail | | | | | | | | | | | | |
Amazon.com, Inc.* | | | 21,871 | | | | 43,807,613 | | | | 7.23 | |
Netflix, Inc.* | | | 36,564 | | | | 13,679,689 | | | | 2.26 | |
| | | | | | | | 57,487,302 | | | | 9.49 | |
Internet Software & Services | | | | | | | | | | | | |
Alibaba Group Holding Ltd. Spon. ADR* | | | 185,105 | | | | 30,497,900 | | | | 5.03 | |
Alphabet, Inc. - Cl. A* | | | 29,592 | | | | 35,719,911 | | | | 5.90 | |
Facebook, Inc. - Cl. A* | | | 146,643 | | | | 24,116,908 | | | | 3.98 | |
Tencent Holdings Ltd. | | | 380,700 | | | | 15,717,519 | | | | 2.59 | |
| | | | | | | | 106,052,238 | | | | 17.50 | |
Managed Health Care | | | | | | | | | | | | |
Anthem, Inc. | | | 86,087 | | | | 23,592,142 | | | | 3.89 | |
UnitedHealth Group, Inc. | | | 126,112 | | | | 33,550,837 | | | | 5.54 | |
| | | | | | | | 57,142,979 | | | | 9.43 | |
Regional Banks | | | | | | | | | | | | |
First Republic Bank | | | 125,735 | | | | 12,070,560 | | | | 1.99 | |
| | | | | | | | | | | | | |
Semiconductors | | | | | | | | | | | | |
NVIDIA Corporation | | | 108,184 | | | | 30,401,868 | | | | 5.02 | |
| | | | | | | | | | | | | |
Specialty Chemicals | | | | | | | | | | | | |
The Sherwin-Williams Company | | | 52,220 | | | | 23,771,066 | | | | 3.92 | |
| | | | | | | | | | | | | |
Technology Hardware, Storage & Peripherals | | | | | | | | |
Apple, Inc. | | | 139,221 | | | | 31,427,749 | | | | 5.19% | |
| | | | | | | | | | | | | |
TOTAL COMMON STOCKS | | | | | | | | | | | | |
(Cost $360,623,776) | | | | | | | 589,343,079 | | | | 97.25 | |
| | | | | | | | | | | | | |
SHORT-TERM INVESTMENTS | | | | | | | | |
State Street Institutional U.S. Government Money Market Fund, 0.017% | | | 17,562,307 | | | | 17,562,307 | | | | 2.90 | |
| | | | | | | | | | | | | |
TOTAL SHORT-TERM INVESTMENTS | | | | | | | | |
(Cost $17,562,307) | | | | | | | 17,562,307 | | | | 2.90 | |
| | | | | | | | | | | | | |
TOTAL INVESTMENTS | | | | | | | | | | | | |
(Cost $378,186,083) | | | | | | | 606,905,386 | | | | 100.15 | |
| | | | | | | | | | | | | |
Liabilities, Less Cash and Other Assets | | | | | | | (891,150 | ) | | | (0.15) | |
| | | | | | | | | | | | | |
NET ASSETS | | | | | | $ | 606,014,236 | | | | 100.00% | |
| See notes to financial statements. |
11
INVESTMENT REVIEW BY TOM MARSICO (UNAUDITED)
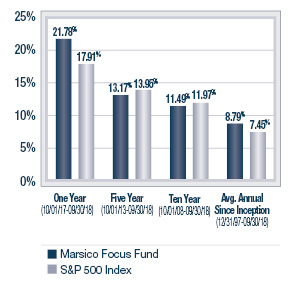
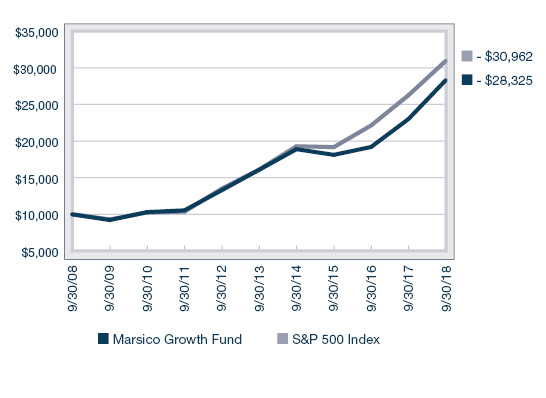
The Marsico Growth Fund posted a total return of +23.10% for the one-year fiscal period ended September 30, 2018. The Fund substantially outperformed the S&P 500 Index, the Fund’s benchmark index, which had a total return of +17.91% over the same time period. Please see the Fund’s Overview for more detailed information about the Fund’s longer-term performance for various time periods ended September 30, 2018.
The performance data for the Fund quoted here represent past performance, and past performance is not a guarantee of future results. Investment return and principal value of an investment will fluctuate so that an investor’s shares, when redeemed, may be worth more or less than their original cost. Current performance may be lower or higher than the performance information quoted. To obtain performance information current to the most recent month-end, please call 888-860-8686 or visit marsicofunds.com.(1)
This review highlights Fund performance over a one-year fiscal period. Shareholders should keep in mind that the Fund is intended for long-term investors who hold their shares for substantially longer periods of time. You should also keep in mind that our current views and beliefs regarding all investments discussed in this report are subject to change at any time. References to specific securities, industries, and sectors discussed in this report are not recommendations to buy or sell such securities or related investments, and the Fund may not necessarily hold these securities or investments today. Please see the accompanying Schedule of Investments for the percentage of the Fund’s portfolio represented by the securities mentioned in this report as of the end of the reporting period.
The Fund is subject to broad risks associated with investing in equity securities markets generally, including the risks that the securities and markets in which it invests may experience volatility and instability, that domestic and global economies and markets may undergo periods of cyclical change and decline, that investors may at times avoid investments in equity securities, and that investments may not perform as anticipated. Please see the Prospectus for more information.
The Fund is not managed to track the benchmark index, and may hold a substantially overweight or underweight position in a sector, industry, or security compared to its weight in the benchmark. The Fund may be subject to risks associated with a particular sector or other area in which it is overweight, including the risk that the stocks of companies within one area could simultaneously decline in price because of an event that affects the entire area. For informational purposes, the discussion below may compare the benchmark weight or performance of a sector or industry to the investment approach of the Fund.
The Growth Fund’s outperformance during the one-year period ended September 30, 2018, as compared to the S&P 500 Index, was primarily attributable to certain Fund holdings in the Consumer Discretionary and the Information Technology sectors.
Stock prices of two Consumer Discretionary companies held by the Fund performed very strongly during the reporting period. Streaming content provider Netflix, Inc. returned +106% and was a large positive contributor during the period. The company has continued to penetrate the growing market for streaming content and, in our opinion, is adopting the right strategy in building content as rapidly as possible. Over the past year, Netflix has begun increasing subscription prices as well, hence improving already high operating margins. The current management team, headed by Reed Hastings and Ted Sarandos, has been extremely successful in securing great talent and high-quality content, and we believe it has the right strategy for continued success.
Online e-commerce platform Amazon.com, Inc. was also a strong positive contributor during the period, returning +108%. Amazon continues to benefit from consumers’ growing preference to shop online, and has been adding new features to its Prime membership offering, leading to substantial growth. Advertising and cloud computing remain large opportunities for the company.
Several of the Fund’s Information Technology holdings also rose substantially during the period, including computer software company Adobe Systems, Inc. (+81%), which was a top positive contributor. Adobe has executed well recently, and has witnessed a positive inflection in new subscribers to its software, which we believe reflects a trend of increasing corporate budgets allocated to improving business software.
Customer relationship software maker salesforce.com, inc. (also referred to as “CRM”) was a strong performer during the period (+70%) as the pace of new business acquisition continues to accelerate. This resulted in better growth than expected across the primary metrics we track during the company’s fiscal fourth quarter. Deferred revenue, unbilled revenue, calculated bookings and total backlog all grew 30%+ year over year, illustrating the strength of the demand environment and CRM’s dominant position in facilitating digital transformation for businesses. CRM’s total backlog of booked business now sits at an estimated $20.3 billion, which we believe should help CRM potentially achieve compounded growth of 20%+ over the next 4 years and a doubling of the company’s revenue.
The Fund initiated several new positions during the period. We invested in Intuitive Surgical, Inc. (+20%), the industry leader in the transformation of open surgical procedures to minimally invasive surgery, because we believe in its long-term growth prospects. The company focuses on the miniaturization of surgical instruments that can perform operations via a small incision and laparoscope. Using a surgical console and robotic instrumentation the company is quickly transitioning invasive open surgeries to minimally invasive procedures. This transition has a substantial benefit on the reduction of post-surgical complications and recovery time, and lowers costs for the healthcare system overall.
12
From a portfolio positioning standpoint, JPMorgan Chase & Co. (+12%) (“JPM”) was added to the Growth Fund during the period to modestly alter exposure to the Financials sector with a high-quality bank that we expect should continue to compound its earnings. It represents a blue-chip company that appears to offer significant growth potential over the medium to long-term period. First, JPM is an earnings growth and capital return story among large financials, as it continues to take market share across its business units and is starting to level off on its regulatory spending, thereby allowing for more profit to be returned to shareholders. We expect EPS (earnings-per-share) growth in double digits over the next several years. Second, JPM is highly rate-sensitive in benefiting from the spread between short-term interest it pays to depositors and higher long-term interest rates it receives from loan borrowers. While the Federal Reserve raised short-term interest rates several times in 2018, long-term rates also generally rose, and JPM is positioned to be a natural beneficiary. Finally, JPM has a high corporate tax rate, and is a strong beneficiary of tax reforms which have lowered that rate for 2018.
From a sector allocation perspective, the Fund’s performance was boosted by having a substantial overweight exposure to the Information Technology sector – the strongest-performing sector of the S&P 500 Index during the period – as compared to its benchmark index. When put in historical context, we don’t believe valuations for the Information Technology sector are unreasonably stretched at these levels, especially when considered through the lens of future earnings growth rates, and a pullback in the sector that occurred after the reporting period. We also continue to believe in the management teams and long-term business models of many of these innovative companies. In addition, Fund performance was aided by an underweight allocation to the weak-performing Consumer Staples sector.
Several positions in the Health Care sector didn’t perform as we anticipated, hindered performance and were sold during the period. Celgene Corporation (-33% prior to being sold) was one such position. Celgene halted a drug trial on one product and struggled with another lead product for psoriatic arthritis, which caused us to sell the position.
Additionally, certain positions in the Information Technology sector such as Alibaba Group Holding Ltd. Spon. ADR (-5%) and Applied Materials, Inc. (“AMAT”)(-23% prior to being sold) were weak during the period and held back Fund performance when compared to its benchmark. We maintained our position in Alibaba because, in our view, the fundamentals of Alibaba remain as strong as ever with impressive top-line growth and operating margin profile. Likewise, the company operates one of the strongest business models and possesses a powerful competitive moat. However, the stock was impacted during the period as it felt the impact of the developing trade war between the US and China.
We sold AMAT, which provides machines used in the production of memory chips, because deteriorating industry fundamentals for the major global producers of memory chips have caused them to defer spending on new machines from AMAT. While we believe the reduced spending cycle will be relatively short in duration compared to prior down-cycles in memory chip spending because of the increased consolidation of the industry, it is difficult to know how much worse the spending environment could get before it improves. Long-term, there will be substantially more memory chips needed for applications from servers to phones to autos, but shorter-term it appears there is more supply than demand.
From a sector allocation perspective, the Fund was held back slightly relative to its benchmark index by having a 4% average cash weight during the period. The Fund occasionally may hold more cash than usual as a temporary defensive measure, or as a strategic measure enabling it to take rapid advantage of opportunities to buy stocks at favorable prices.
During the reporting period, the Fund reduced its exposure to the Health Care and Real Estate sectors. The Fund increased its allocations to the Information Technology, Consumer Discretionary, and Industrials sectors. There were no significant changes to the Fund’s allocations to the Materials, Financials and Consumer Staples sectors.
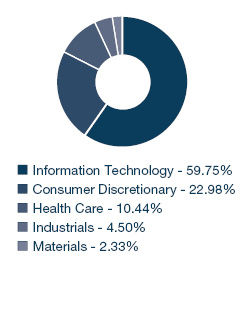
Fiscal Period-End Investment Posture
As of September 30, 2018, the Fund’s largest sector allocations included Information Technology, Consumer Discretionary and Health Care. As of that date, the Fund had no exposure to the Energy, Telecommunication Services or Utilities sectors.
Sincerely,
THOMAS F. MARSICO
PORTFOLIO MANAGER
(1) | Total returns are based on net change in net asset value assuming reinvestment of distributions. Please see the Prospectus for more information. |
13
September 30, 2018 (Unaudited)
The Growth Fund is a diversified portfolio and invests primarily in the common stocks of large companies that are selected for their long-term growth potential. The Growth Fund will normally hold a core position of between 35 and 50 common stocks.
TOTAL ANNUAL OPERATING EXPENSES* 1.17% | NET ASSETS $298,939,797 | NET ASSET VALUE PER SHARE $20.69 |
GROWTH OF $10,000(1) | PERFORMANCE COMPARISON |
| 
|
SECTOR ALLOCATION(2) | TOP FIVE HOLDINGS |
| | | | |
| | Amazon.com, Inc. | 6.21% | |
| | Alphabet, Inc. - Cl. A | 5.41% | |
| | Visa, Inc. - Cl. A | 4.55% | |
| | Apple, Inc. | 4.30% | |
| | salesforce.com, inc. | 3.87% | |
| | | | |
* | The Total Annual Operating Expenses are reflective of the information disclosed in the Funds’ Prospectus dated January 31, 2018, as supplemented, and may differ from the expense ratio disclosed in this report. |
| The performance data quoted here represent past performance, and past performance is not a guarantee of future results. Investment return and principal value of an investment will fluctuate so that an investor’s shares, when redeemed, may be worth more or less than their original cost. Current performance may be lower or higher than the performance information quoted. To obtain performance information current to the most recent month-end, please call 888-860-8686 or visit marsicofunds.com. |
| The performance included in the chart and graph does not reflect the deduction of taxes on Fund distributions or the redemption of Fund shares. |
| All indices are unmanaged and investors cannot invest directly in an index. |
(1) | This chart assumes an initial investment of $10,000 made on September 30, 2008. Total returns are based on net change in NAV, assuming reinvestment of distributions. |
(2) | Sector weightings represent the percentage of the Fund’s investments (excluding cash equivalents) in certain general sectors. These sectors may include more than one industry. The Fund’s portfolio composition is subject to change at any time. |
14
MARSICO GROWTH FUND
SCHEDULE OF INVESTMENTS
September 30, 2018
| | | Number
of
Shares | | | Value | | | Percent
of Net
Assets | |
COMMON STOCKS | | | | | | | | | | | | |
Aerospace & Defense | | | | | | | | | | | | |
Lockheed Martin Corporation | | | 25,976 | | | $ | 8,986,657 | | | | 3.01% | |
Raytheon Company | | | 31,428 | | | | 6,494,910 | | | | 2.17 | |
The Boeing Company | | | 12,213 | | | | 4,542,015 | | | | 1.52 | |
| | | | | | | | 20,023,582 | | | | 6.70 | |
Application Software | | | | | | | | | | | | |
Adobe Systems, Inc.* | | | 33,487 | | | | 9,039,816 | | | | 3.02 | |
salesforce.com, inc.* | | | 72,722 | | | | 11,564,980 | | | | 3.87 | |
The Ultimate Software Group, Inc.* | | | 14,080 | | | | 4,536,435 | | | | 1.52 | |
| | | | | | | | 25,141,231 | | | | 8.41 | |
Biotechnology | | | | | | | | | | | | |
Biogen Inc.* | | | 17,556 | | | | 6,202,710 | | | | 2.07 | |
G1 Therapeutics, Inc.* | | | 68,948 | | | | 3,605,291 | | | | 1.21 | |
| | | | | | | | 9,808,001 | | | | 3.28 | |
Data Processing & Outsourced Services | | | | |
PayPal Holdings, Inc.* | | | 106,064 | | | | 9,316,662 | | | | 3.12 | |
Visa, Inc. - Cl. A | | | 90,543 | | | | 13,589,599 | | | | 4.55 | |
Worldpay, Inc. - Cl. A* | | | 61,456 | | | | 6,223,649 | | | | 2.08 | |
| | | | | | | | 29,129,910 | | | | 9.75 | |
Distillers & Vintners | | | | | | | | | | | | |
Constellation Brands, Inc. - Cl. A | | | 33,546 | | | | 7,233,189 | | | | 2.42 | |
| | | | | | | | | | | | | |
Diversified Banks | | | | | | | | | | | | |
JPMorgan Chase & Co. | | | 59,311 | | | | 6,692,653 | | | | 2.24 | |
| | | | | | | | | | | | | |
Financial Exchanges & Data | | | | | | | | |
Intercontinental Exchange, Inc. | | | 57,579 | | | | 4,312,092 | | | | 1.44 | |
S&P Global, Inc. | | | 20,970 | | | | 4,097,328 | | | | 1.37 | |
| | | | | | | | 8,409,420 | | | | 2.81 | |
Health Care Equipment | | | | | | | | | | | | |
Intuitive Surgical, Inc.* | | | 6,123 | | | | 3,514,602 | | | | 1.18 | |
| | | | | | | | | | | | | |
Home Entertainment Software | | | | | | | | |
Activision Blizzard, Inc. | | | 55,459 | | | | 4,613,634 | | | | 1.54 | |
Take-Two Interactive Software, Inc.* | | | 30,982 | | | | 4,275,206 | | | | 1.43 | |
| | | | | | | | 8,888,840 | | | | 2.97 | |
Internet & Direct Marketing Retail | | | | | | | | |
Amazon.com, Inc.* | | | 9,266 | | | | 18,559,798 | | | | 6.21 | |
Netflix, Inc.* | | | 18,116 | | | | 6,777,739 | | | | 2.27 | |
| | | | | | | | 25,337,537 | | | | 8.48 | |
Internet Software & Services | | | | | | | | |
Alibaba Group Holding Ltd. Spon. ADR* | | | 64,153 | | | | 10,569,848 | | | | 3.54 | |
Alphabet, Inc. - Cl. A* | | | 13,403 | | | | 16,178,493 | | | | 5.41 | |
Facebook, Inc. - Cl. A* | | | 54,198 | | | | 8,913,403 | | | | 2.98 | |
Tencent Holdings Ltd. | | | 200,800 | | | | 8,290,197 | | | | 2.77 | |
| | | | | | | | 43,951,941 | | | | 14.70 | |
Managed Health Care | | | | | | | | | | | | |
Anthem, Inc. | | | 23,056 | | | | 6,318,497 | | | | 2.11% | |
UnitedHealth Group, Inc. | | | 35,115 | | | | 9,341,994 | | | | 3.13 | |
| | | | | | | | 15,660,491 | | | | 5.24 | |
Movies & Entertainment | | | | | | | | | | | | |
The Walt Disney Company | | | 38,693 | | | | 4,524,759 | | | | 1.51 | |
| | | | | | | | | | | | | |
Multi-Sector Holdings | | | | | | | | | | | | |
Berkshire Hathaway, Inc. - Cl. B* | | | 24,751 | | | | 5,299,437 | | | | 1.77 | |
| | | | | | | | | | | | | |
Pharmaceuticals | | | | | | | | | | | | |
Zoetis, Inc. | | | 94,413 | | | | 8,644,454 | | | | 2.89 | |
| | | | | | | | | | | | | |
Regional Banks | | | | | | | | | | | | |
First Republic Bank | | | 49,589 | | | | 4,760,544 | | | | 1.59 | |
| | | | | | | | | | | | | |
Restaurants | | | | | | | | | | | | |
McDonald's Corporation | | | 33,167 | | | | 5,548,508 | | | | 1.86 | |
| | | | | | | | | | | | | |
Semiconductors | | | | | | | | | | | | |
NVIDIA Corporation | | | 41,027 | | | | 11,529,408 | | | | 3.86 | |
| | | | | | | | | | | | | |
Soft Drinks | | | | | | | | | | | | |
Monster Beverage Corporation* | | | 94,033 | | | | 5,480,243 | | | | 1.83 | |
| | | | | | | | | | | | | |
Specialized REITs | | | | | | | | | | | | |
Crown Castle International Corp. | | | 68,703 | | | | 7,648,705 | | | | 2.56 | |
| | | | | | | | | | | | | |
Specialty Chemicals | | | | | | | | | | | | |
The Sherwin-Williams Company | | | 17,682 | | | | 8,049,023 | | | | 2.69 | |
| | | | | | | | | | | | | |
Specialty Stores | | | | | | | | | | | | |
Ulta Beauty, Inc.* | | | 18,735 | | | | 5,285,518 | | | | 1.77 | |
| | | | | | | | | | | | | |
Systems Software | | | | | | | | | | | | |
Microsoft Corporation | | | 81,265 | | | | 9,294,278 | | | | 3.11 | |
| | | | | | | | | | | | | |
Technology Hardware, Storage & Peripherals | | | | |
Apple, Inc. | | | 56,960 | | | | 12,858,150 | | | | 4.30 | |
| | | | | | | | | | | | | |
TOTAL COMMON STOCKS | | | | | | | | | | | | |
(Cost $181,130,817) | | | | | | | 292,714,424 | | | | 97.92 | |
| See notes to financial statements. |
15
MARSICO GROWTH FUND
SCHEDULE OF INVESTMENTS (continued)
September 30, 2018
| | | Number
of
Shares | | | Value | | | Percent
of Net
Assets | |
SHORT-TERM INVESTMENTS | | | | | | | | |
State Street Institutional Treasury Money Market Fund, 0.016% | | | 7,446,926 | | | $ | 7,446,926 | | | | 2.49% | |
| | | | | | | | | | | | | |
TOTAL SHORT-TERM INVESTMENTS | | | | | | | | |
(Cost $7,446,926) | | | | | | | 7,446,926 | | | | 2.49 | |
| | | | | | | | | | | | | |
TOTAL INVESTMENTS | | | | | | | | | | | | |
(Cost $188,577,743) | | | | | | | 300,161,350 | | | | 100.41 | |
| | | | | | | | | | | | | |
Liabilities, Less Cash and Other Assets | | | | | | | (1,221,553 | ) | | | (0.41) | |
| | | | | | | | | | | | | |
NET ASSETS | | | | | | $ | 298,939,797 | | | | 100.00% | |
| See notes to financial statements. |
16
INVESTMENT REVIEW BY BRANDON GEISLER (UNAUDITED)
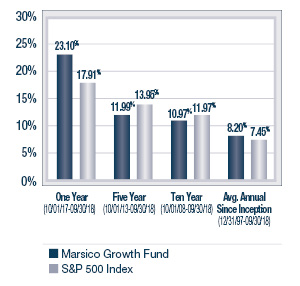
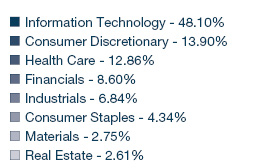
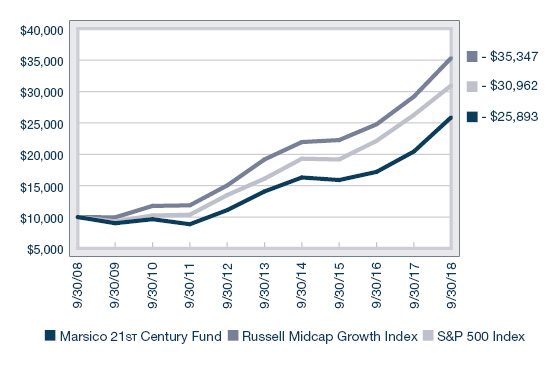
The Marsico 21st Century Fund posted a total return of +26.69% for the one-year fiscal period ended September 30, 2018. The Fund substantially outperformed both the Russell Midcap Growth Index, the Fund’s primary benchmark effective January 31, 2018, which had a total return of +21.10% during the one-year fiscal period, and the S&P 500 Index, which had a total return of +17.91% over the same time period. Prior to January 31, 2018, the S&P 500 Index was the Fund’s primary benchmark index. Please see the Fund’s Overview for more detailed information about the Fund’s longer-term performance for various time periods ended September 30, 2018.
The performance data for the Fund quoted here represent past performance, and past performance is not a guarantee of future results. Investment return and principal value of an investment will fluctuate so that an investor’s shares, when redeemed, may be worth more or less than their original cost. Current performance may be lower or higher than the performance information quoted. To obtain performance information current to the most recent month-end, please call 888-860-8686 or visit marsicofunds.com.(1)
This review highlights Fund performance over a one-year fiscal period. Shareholders should keep in mind that the Fund is intended for long-term investors who hold their shares for substantially longer periods of time. You should also keep in mind that our current views and beliefs regarding all investments discussed in this report are subject to change at any time. References to specific securities, industries, and sectors discussed in this report are not recommendations to buy or sell such securities or related investments, and the Fund may not necessarily hold these securities or investments today. Please see the accompanying Schedule of Investments for the percentage of the Fund’s portfolio represented by the securities mentioned in this report as of the end of the reporting period.
The Fund is subject to broad risks associated with investing in equity securities markets generally, including the risks that the securities and markets in which it invests may experience volatility and instability, that domestic and global economies and markets may undergo periods of cyclical change and decline, that investors may at times avoid investments in equity securities, and that investments may not perform as anticipated. Please see the Prospectus for more information.
The Fund is not managed to track the benchmark index, and may hold a substantially overweight or underweight position in a sector, industry, or security compared to its weight in the benchmark. The Fund may be subject to risks associated with a particular sector or other area in which it is overweight, including the risk that the stocks of companies within one area could simultaneously decline in price because of an event that affects the entire area. For informational purposes, the discussion below may compare the benchmark weight or performance of a sector or industry to the investment approach of the Fund.
The 21st Century Fund’s outperformance during the one-year period ended September 30, 2018 as compared to its current benchmark, the Russell Midcap Growth Index, was primarily attributable to certain holdings in the Consumer Discretionary and the Information Technology sectors.
Stock prices of several Consumer Discretionary companies performed very strongly during the reporting period, primarily in the Retailing industry group. One Consumer Discretionary company, streaming content provider Netflix, Inc. returned +127%, prior to being sold, and was a large positive contributor during the period. The company has continued to penetrate the growing market for streaming content and, in our opinion, is adopting the right strategy in building content as rapidly as possible. Over the past year, Netflix has begun increasing subscription prices as well, hence improving already high operating margins. However, given the strong performance of the stock, we sold the position in favor of other names with more near term catalysts.
Several of the Fund’s Information Technology holdings also rose substantially during the period, including customer relationship software maker salesforce.com, inc. (+70% prior to being sold) (also referred to as “CRM”) as the pace of new business acquisition continues to accelerate. This resulted in better growth than expected across the primary metrics we track during the company’s fiscal fourth quarter. Deferred revenue, unbilled revenue, calculated bookings and total backlog all grew 30%+ year over year, illustrating the strength of the demand environment and CRM’s dominant position in facilitating digital transformation for businesses. CRM’s total backlog of booked business now sits at an estimated $20.3 billion, which we believe should help CRM potentially achieve compounded growth of 20%+ over the next four years and a doubling of the company’s revenue.
A long-term holding in the Health Care sector, Intuitive Surgical, Inc. (+65%), performed well. The company is the industry leader in the transformation of open surgical procedures to minimally invasive surgery, and we believe in its long-term growth prospects. Intuitive Surgical focuses on the miniaturization of surgical instruments that can perform operations via a small incision and laparoscope. Using a surgical console and robotic instrumentation the company is quickly transitioning invasive open surgeries to minimally invasive procedures. This transition has a substantial benefit on the reduction of post-surgical complications and recovery time, and lowers costs for the healthcare system overall.
17
From a sector allocation perspective, the Fund’s performance was boosted by having no exposure to the Energy sector. We continue to believe the supply/demand dynamics for commodities such as oil don’t support higher prices, especially given the trend we have witnessed in China over the last several years, as the country transitions to a consumer-led economy and away from a construction and infrastructure focus.
In the Consumer Discretionary sector, Chinese travel and hotel booking firm Ctrip.com International, Ltd. ADR (-25% prior to being sold) underperformed over the period due to a change in Chinese regulations that restricted the sale of premium add-on features along with airline tickets. This change in regulation impacted the entire Chinese online travel agency industry as well as the broader airline industry, and we exited the position. First Republic Bank (-8%), operating in the Financials sector, was weak during the period. First Republic trades at a higher price/earnings multiple than its peers, is less rate sensitive than other banks, and may benefit less from tax reform than some competitors. Still, we continue to like First Republic as a mid-size consumer bank that may achieve long-term growth through exceptional customer service, including in prospering technology-focused markets. For example, First Republic may attract desirable clients from larger banks by initially offering mortgage banking relationships, and then cross-selling wealth management and other services.
From a sector allocation perspective, the Fund was held back relative to its benchmark, the Russell Midcap Growth Index, by maintaining a 7% average cash weight during the period. The Fund occasionally may hold more cash than usual as a temporary defensive measure, or as a strategic measure enabling it to take rapid advantage of opportunities to buy stocks at favorable prices. Its performance also was impaired by having an underweight allocation to the Information Technology sector, the strongest-performing sector in the benchmark during the period, and an overweight allocation to both the Materials and Financials sectors, which were lower performing sectors in the benchmark.
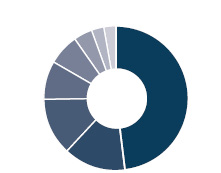
During the reporting period, the Fund reduced its exposure to the Financials, Consumer Staples, Consumer Discretionary and Real Estate sectors and increased its allocation to the Industrials, Health Care and Information Technology sectors. There was no significant change to the Fund’s allocation to the Materials sector.
Fiscal Period-End Investment Posture
As of September 30, 2018, the Fund’s primary economic sector allocations included Information Technology, Consumer Discretionary, Industrials and Health Care. The Fund had no investments in the Energy, Telecommunication Services or Utilities sectors.
Sincerely,
BRANDON A. GEISLER
PORTFOLIO MANAGER
(1) | Total returns are based on net change in net asset value assuming reinvestment of distributions. Periodically, certain fees and expenses have been waived or reimbursed by the Adviser for the 21st Century Fund. In the absence of such a waiver or reimbursement, the performance returns reflected would have been reduced. In accordance with the expense limitation and fee waiver agreement, the Adviser may recoup fees and expenses previously waived or reimbursed under certain parameters. Periodically, the Adviser has recouped such fees or expenses from the 21st Century Fund, resulting in a lower performance return. Please see the Prospectus for more information. |
18
| 21st CENTURY FUND OVERVIEW |
September 30, 2018 (Unaudited)
The 21st Century Fund is a diversified portfolio and invests primarily in common stocks that are selected for their long-term growth potential. The Fund may invest in companies of any size. The portions of Fund assets invested in large-capitalization, medium-capitalization, or small-capitalization companies will vary based on market conditions, depending on the portfolio manager’s judgment as to how to achieve the Fund’s investment objective. Under current market conditions the portfolio manager expects to invest substantially in medium-capitalization companies. The Fund will normally hold a core position of between 35 and 60 common stocks.
TOTAL ANNUAL OPERATING EXPENSES* 1.16% | NET ASSETS $272,866,847 | NET ASSET VALUE PER SHARE $33.18 |
GROWTH OF $10,000(2) | PERFORMANCE COMPARISON |
| 
|
SECTOR ALLOCATION(3) | TOP FIVE HOLDINGS |
| | | | |
| | Take-Two Interactive Software, Inc. | 3.21% | |
| | Intuitive Surgical, Inc. | 3.08% | |
| | Worldpay, Inc. - Cl. A | 3.02% | |
| | CoStar Group, Inc. | 3.00% | |
| | Burlington Stores, Inc. | 2.98% | |
| | | | |
* | The Total Annual Operating Expenses are reflective of the information disclosed in the Funds’ Prospectus dated January 31, 2018, as supplemented, and may differ from the expense ratio disclosed in this report. |
| The performance data quoted here represent past performance, and past performance is not a guarantee of future results. Investment return and principal value of an investment will fluctuate so that an investor’s shares, when redeemed, may be worth more or less than their original cost. Current performance may be lower or higher than the performance information quoted. To obtain performance information current to the most recent month-end, please call 888-860-8686 or visit marsicofunds.com. |
| The performance included in the chart and graph does not reflect the deduction of taxes on Fund distributions or the redemption of Fund shares. |
| All indices are unmanaged and investors cannot invest directly in an index. |
| Effective January 31, 2018, the Russell Midcap Growth Index was made the primary benchmark index and the S&P 500 Index was made a supplemental benchmark index of the Fund because under current market conditions the Fund is invested substantially in medium-capitalization securities. The Russell Midcap Growth Index (the “Underlying Index”) measures the performance of the mid-capitalization growth sector of the US equity market, and is composed of mid-capitalization US equities that exhibit growth characteristics. It is a subset of the Russell Midcap® Index, which measures the performance of the mid-capitalization sector of the US equity market. The Underlying Index measures the performance of equity securities of Russell Midcap Index issuers with higher price-to-book ratios and higher forecasted growth. |
(1) | Periodically, certain fees and expenses have been waived or reimbursed by the Adviser for the 21st Century Fund. In the absence of such a waiver or reimbursement, the performance returns reflected would have been reduced. In accordance with the expense limitation and fee waiver agreement, the Adviser may recoup fees and expenses previously waived or reimbursed under certain parameters. Periodically, the Adviser has recouped such fees or expenses from the 21st Century Fund, resulting in a lower performance return. |
(2) | This chart assumes an initial investment of $10,000 made on September 30, 2008. Total returns are based on net change in NAV, assuming reinvestment of distributions. |
(3) | Sector weightings represent the percentage of the Fund’s investments (excluding cash equivalents) in certain general sectors. These sectors may include more than one industry. The Fund’s portfolio composition is subject to change at any time. |
19
MARSICO 21st CENTURY FUND
SCHEDULE OF INVESTMENTS
September 30, 2018
| | | Number
of
Shares | | | Value | | | Percent
of Net
Assets | |
COMMON STOCKS | | | | | | | | | | | | |
Aerospace & Defense | | | | | | | | | | | | |
HEICO Corporation | | | 29,301 | | | $ | 2,713,566 | | | | 0.99% | |
| | | | | | | | | | | | | |
Apparel Retail | | | | | | | | | | | | |
Burlington Stores, Inc.* | | | 49,893 | | | | 8,128,568 | | | | 2.98 | |
| | | | | | | | | | | | | |
Apparel, Accessories & Luxury Goods | | | | |
Under Armour, Inc. - Cl. A* | | | 63,698 | | | | 1,351,672 | | | | 0.50 | |
| | | | | | | | | | | | | |
Application Software | | | | | | | | | | | | |
Atlassian Corporation PLC - Cl. A* | | | 28,633 | | | | 2,752,777 | | | | 1.01 | |
Constellation Software, Inc. | | | 5,549 | | | | 4,080,694 | | | | 1.49 | |
Guidewire Software, Inc.* | | | 60,461 | | | | 6,107,165 | | | | 2.24 | |
PTC, Inc.* | | | 71,905 | | | | 7,635,592 | | | | 2.80 | |
RealPage, Inc.* | | | 20,833 | | | | 1,372,895 | | | | 0.50 | |
The Descartes Systems Group, Inc.* | | | 120,500 | | | | 4,087,102 | | | | 1.50 | |
The Ultimate Software Group, Inc.* | | | 14,840 | | | | 4,781,299 | | | | 1.75 | |
| | | | | | | | 30,817,524 | | | | 11.29 | |
Automotive Retail | | | | | | | | | | | | |
O'Reilly Automotive, Inc.* | | | 16,990 | | | | 5,900,967 | | | | 2.16 | |
| | | | | | | | | | | | | |
Biotechnology | | | | | | | | | | | | |
Alkermes PLC* | | | 59,843 | | | | 2,539,737 | | | | 0.93 | |
Exact Sciences Corporation* | | | 24,717 | | | | 1,950,666 | | | | 0.72 | |
| | | | | | | | 4,490,403 | | | | 1.65 | |
Building Products | | | | | | | | | | | | |
A.O. Smith Corporation | | | 63,549 | | | | 3,391,610 | | | | 1.24 | |
| | | | | | | | | | | | | |
Construction Materials | | | | | | | | | | | | |
Vulcan Materials Company | | | 40,483 | | | | 4,501,710 | | | | 1.65 | |
| | | | | | | | | | | | | |
Data Processing & Outsourced Services | | | | |
Broadridge Financial Solutions, Inc. | | | 50,174 | | | | 6,620,459 | | | | 2.43 | |
FleetCor Technologies, Inc.* | | | 24,639 | | | | 5,613,750 | | | | 2.06 | |
Mastercard, Inc. - Cl. A | | | 30,709 | | | | 6,836,131 | | | | 2.50 | |
Worldpay, Inc. - Cl. A* | | | 81,286 | | | | 8,231,833 | | | | 3.02 | |
| | | | | | | | 27,302,173 | | | | 10.01 | |
Distillers & Vintners | | | | | | | | | | | | |
Constellation Brands, Inc. - Cl. A | | | 33,287 | | | | 7,177,343 | | | | 2.63 | |
| | | | | | | | | | | | | |
Diversified Support Services | | | | |
Healthcare Services Group, Inc. | | | 116,282 | | | | 4,723,375 | | | | 1.73 | |
| | | | | | | | | | | | | |
Electrical Components & Equipment | | | | |
AMETEK, Inc. | | | 70,010 | | | | 5,539,191 | | | | 2.03 | |
| | | | | | | | | | | | | |
Electronic Equipment & Instruments | | | | |
Cognex Corporation | | | 63,217 | | | | 3,528,773 | | | | 1.30 | |
Novanta, Inc.* | | | 44,786 | | | | 3,063,362 | | | | 1.12 | |
| | | | | | | | 6,592,135 | | | | 2.42 | |
General Merchandise Stores | | | | |
Ollie's Bargain Outlet Holdings, Inc.* | | | 61,401 | | | | 5,900,636 | | | | 2.16 | |
| | | | | | | | | | | | | |
Health Care Equipment | | | | | | | | | | | | |
ABIOMED, Inc.* | | | 3,565 | | | | 1,603,359 | | | | 0.59% | |
IDEXX Laboratories, Inc.* | | | 18,011 | | | | 4,496,626 | | | | 1.65 | |
Intuitive Surgical, Inc.* | | | 14,642 | | | | 8,404,508 | | | | 3.08 | |
LivaNova PLC* | | | 27,191 | | | | 3,370,868 | | | | 1.24 | |
Teleflex, Inc. | | | 25,486 | | | | 6,781,570 | | | | 2.48 | |
| | | | | | | | 24,656,931 | | | | 9.04 | |
Health Care Supplies | | | | | | | | | | | | |
The Cooper Companies, Inc. | | | 14,849 | | | | 4,115,400 | | | | 1.51 | |
| | | | | | | | | | | | | |
Heavy Electrical Equipment | | | | | | | | |
Bloom Energy Corporation - CI.A* | | | 28,984 | | | | 987,775 | | | | 0.36 | |
| | | | | | | | | | | | | |
Home Entertainment Software | | | | | | | | |
Take-Two Interactive Software, Inc.* | | | 63,428 | | | | 8,752,430 | | | | 3.21 | |
| | | | | | | | | | | | | |
Hotels, Resorts & Cruise Lines | | | | | | | | |
Norwegian Cruise Line Holdings Ltd.* | | | 87,410 | | | | 5,019,956 | | | | 1.84 | |
| | | | | | | | | | | | | |
Industrial Machinery | | | | | | | | | | | | |
RBC Bearings, Inc.* | | | 13,862 | | | | 2,084,290 | | | | 0.76 | |
| | | | | | | | | | | | | |
IT Consulting & Other Services | | | | | | | | |
Gartner, Inc.* | | | 49,162 | | | | 7,792,177 | | | | 2.86 | |
| | | | | | | | | | | | | |
Leisure Facilities | | | | | | | | | | | | |
Vail Resorts, Inc. | | | 12,341 | | | | 3,386,617 | | | | 1.24 | |
| | | | | | | | | | | | | |
Metal & Glass Containers | | | | | | | | | | | | |
Ball Corporation | | | 91,829 | | | | 4,039,558 | | | | 1.48 | |
| | | | | | | | | | | | | |
Pharmaceuticals | | | | | | | | | | | | |
Elanco Animal Health, Inc.* | | | 21,000 | | | | 732,690 | | | | 0.27 | |
GW Pharmaceuticals PLC ADR* | | | 19,446 | | | | 3,359,102 | | | | 1.23 | |
| | | | | | | | 4,091,792 | | | | 1.50 | |
Railroads | | | | | | | | | | | | |
Genesee & Wyoming, Inc. - Cl. A* | | | 35,533 | | | | 3,233,148 | | | | 1.18 | |
| | | | | | | | | | | | | |
Real Estate Services | | | | | | | | | | | | |
FirstService Corporation | | | 40,800 | | | | 3,447,144 | | | | 1.26 | |
| | | | | | | | | | | | | |
Regional Banks | | | | | | | | | | | | |
First Republic Bank | | | 76,842 | | | | 7,376,832 | | | | 2.70 | |
Signature Bank | | | 39,099 | | | | 4,490,129 | | | | 1.65 | |
| | | | | | | | 11,866,961 | | | | 4.35 | |
Research & Consulting Services | | | | | | | | |
CoStar Group, Inc.* | | | 19,455 | | | | 8,187,442 | | | | 3.00 | |
Verisk Analytics, Inc.* | | | 55,173 | | | | 6,651,105 | | | | 2.44 | |
| | | | | | | | 14,838,547 | | | | 5.44 | |
Restaurants | | | | | | | | | | | | |
Domino's Pizza, Inc. | | | 16,364 | | | | 4,824,107 | | | | 1.77 | |
| See notes to financial statements. |
20
| | | Number
of
Shares | | | Value | | | Percent
of Net
Assets | |
COMMON STOCKS (continued) | | | | | | | | |
Semiconductor Equipment | | | | | | | | | | | | |
Lam Research Corporation | | | 24,851 | | | $ | 3,769,897 | | | | 1.38% | |
| | | | | | | | | | | | | |
Soft Drinks | | | | | | | | | | | | |
Monster Beverage Corporation* | | | 93,368 | | | | 5,441,487 | | | | 1.99 | |
| | | | | | | | | | | | | |
Specialized Consumer Services | | | | | | | | |
ServiceMaster Global Holdings, Inc.* | | | 75,229 | | | | 4,666,455 | | | | 1.71 | |
| | | | | | | | | | | | | |
Specialized REITs | | | | | | | | | | | | |
SBA Communications Corporation - Cl. A* | | | 43,307 | | | | 6,956,403 | | | | 2.55 | |
| | | | | | | | | | | | | |
Specialty Chemicals | | | | | | | | | | | | |
The Sherwin-Williams Company | | | 15,007 | | | | 6,831,336 | | | | 2.50 | |
| | | | | | | | | | | | | |
Steel | | | | | | | | | | | | |
Steel Dynamics, Inc. | | | 26,557 | | | | 1,200,111 | | | | 0.44 | |
| | | | | | | | | | | | | |
TOTAL COMMON STOCKS | | | | | | | | | | | | |
(Cost $200,032,780) | | | | | | | 250,533,395 | | | | 91.81 | |
| | | | | | | | | | | | | |
SHORT-TERM INVESTMENTS | | | | | | | | |
State Street Institutional Treasury Money Market Fund, 0.016% | | | 25,430,477 | | | | 25,430,477 | | | | 9.32% | |
| | | | | | | | | | | | | |
TOTAL SHORT-TERM INVESTMENTS | | | | | | | | |
(Cost $25,430,477) | | | | | | | 25,430,477 | | | | 9.32 | |
| | | | | | | | | | | | | |
TOTAL INVESTMENTS | | | | | | | | | | | | |
(Cost $225,463,257) | | | | | | | 275,963,872 | | | | 101.13 | |
| | | | | | | | | | | | | |
Liabilities, Less Cash and Other Assets | | | | | | | (3,097,025 | ) | | | (1.13) | |
| | | | | | | | | | | | | |
NET ASSETS | | | | | | $ | 272,866,847 | | | | 100.00% | |
| See notes to financial statements. |
21
| INTERNATIONAL OPPORTUNITIES FUND |
INVESTMENT REVIEW BY TOM MARSICO AND ROB SUSMAN (UNAUDITED)
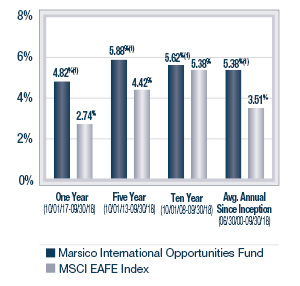
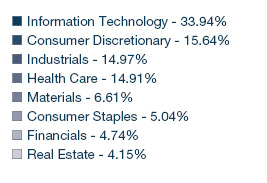
The Marsico International Opportunities Fund posted a total return of (US$) +4.82% for the one-year fiscal period ended September 30, 2018. The Fund outperformed the MSCI EAFE Index, the Fund’s benchmark index, which had a total return of (US$) +2.74% over the same time period. Please see the Fund’s Overview for more detailed information about the Fund’s longer-term performance for various time periods ended September 30, 2018.
The performance data for the Fund quoted here represent past performance, and past performance is not a guarantee of future results. Investment return and principal value of an investment will fluctuate so that an investor’s shares, when redeemed, may be worth more or less than their original cost. Current performance may be lower or higher than the performance information quoted. To obtain performance information current to the most recent month-end, please call 888-860-8686 or visit marsicofunds.com.(1)
This review highlights Fund performance over a one-year fiscal period. Shareholders should keep in mind that the Fund is intended for long-term investors who hold their shares for substantially longer periods of time. You should also keep in mind that our current views and beliefs regarding all investments discussed in this report are subject to change at any time. References to specific securities, industries, and sectors discussed in this report are not recommendations to buy or sell such securities or related investments, and the Fund may not necessarily hold these securities or investments today. Please see the accompanying Schedule of Investments for the percentage of the Fund’s portfolio represented by the securities mentioned in this report as of the end of the reporting period.
Foreign investments present additional risks due to currency fluctuations, economic and political factors, lower liquidity, differences in securities regulations and accounting standards, possible changes in taxation, limited public information, and other factors. In addition, the Fund is subject to broad risks associated with investing in equity securities markets generally, including the risks that the securities and markets in which it invests may experience volatility and instability, that domestic and global economies and markets may undergo periods of cyclical change and decline, that investors may at times avoid investments in equity securities, and that investments may not perform as anticipated. Please see the Prospectus for more information.
The Fund is not managed to track the benchmark index, and may hold a substantially overweight or underweight position in a sector, industry, or security compared to its weight in the benchmark. The Fund may be subject to risks associated with a particular sector or other area in which it is overweight, including the risk that the stocks of companies within one area could simultaneously decline in price because of an event that affects the entire area. For informational purposes, the discussion below may compare the benchmark weight or performance of a sector or industry to the investment approach of the Fund.
The International Opportunities Fund’s outperformance during the one-year period ended September 30, 2018 as compared to the MSCI EAFE Index was primarily attributable to strong stock selection in the Information Technology and the Financials sectors.
Several of the Fund’s positions in the Information Technology sector contributed positively to performance. Global payments company Wirecard A.G. (+138%) posted strong returns. Wirecard benefits as cash payments give way to electronic payments around the world, e-commerce grows, and Wirecard assists in processing these transactions. Wirecard has been consistently winning global accounts and taking market share from legacy competitors, and continues to grow revenues by +20% annually.
Also in the Software & Services industry group, European data center provider InterXion Holding N.V. (+32%) continues to produce consistent quarterly results. As more enterprises move to a hybrid cloud structure, InterXion is seeing increased demand for its colocation and interconnect data center offerings. This trend is in early innings as Europe appears to be about two years behind the US in these areas, and we expect continued revenue growth and operating margin expansion as diverse business enterprises, content providers and Telecommunication Services companies will require more data center space as data usage grows.
Global payments company Worldpay, Inc. - Cl. A (+44%) performed strongly over the last 12 months. The merger of Vantiv and Worldpay (together renamed Worldpay) created a global payments powerhouse that saw improving cost and revenue synergies from the merger as the year went on, as well as acceleration in the underlying volume trends driving both businesses. The merger moved Worldpay into the high growth world of e-commerce payment processing/acquiring, which improved growth rates and aided sentiment about the stock. In addition, Wall Street earnings estimates for 2019 appear to be moving up.
In terms of sector allocation as compared to its benchmark index, the Fund was rewarded for a substantial overweight stance in the Information Technology sector, a positive performing sector in the benchmark during the period, and for having an underweight stance in the Financials sector, the weakest performing sector during the period.
The Fund’s position in Bayer A.G., a select Health Care holding, fell during the period. Bayer A.G. (-32%), has been impacted by the pending acquisition of Monsanto as a result of weaker results in Bayer’s internal crop protection portfolio. In addition, the US District Court for the Northern District of California ruled that Bayer was liable for $289 million in damages as Roundup
22
| INTERNATIONAL OPPORTUNITIES FUND |
was potentially responsible for an individual applicant’s cancer. As a result of this ruling, Bayer will face additional cases, but will appeal the California ruling as the Environmental Protection Agency (EPA) does not consider the active ingredient in Roundup to be a carcinogen.
In the Consumer Discretionary sector there were several positions that were down during the period. They included Ctrip.com International, Ltd. ADR (-29%) and MGM China Holdings Ltd. (-34%). Chinese travel and hotel booking firm Ctrip underperformed over the period due to a change in Chinese regulations that restricted the sale of premium add-on features along with airline tickets. This change in regulation impacted the entire Chinese online travel agency industry as well as the broader airline industry. As the largest player in Chinese transportation and hotel booking, Ctrip appears best equipped to adjust to the regulatory changes and take market share.
MGM China Holdings struggled with a sell-off in the last few months of the fiscal year. We own MGM China to capitalize on two factors: 1) the growth in Chinese mainland travel to Macau, and 2) MGM’s recent opening of a second casino on Cotai, which should ramp up earnings into 2019. While broad traffic trends have held up fine, the MGM Cotai casino increased earnings slower than expected, which impacted the stock in the middle of the year. We expect the ramp up to continue on a normal course in 2019. More importantly, as concerns about a slowing Chinese economy and a developing trade war between the US and China mounted after the summer, shares of many Macau-related names traded down. We believe the company’s growth prospects remain intact and it will ride out a choppy macro environment. Over the long-term we see potentially significant upside in the name.
From a sector allocation perspective, the Fund was penalized for maintaining an underweight stance in the Energy sector, the strongest performing sector in the MSCI EAFE Index during the period.
Although active currency management is not a central facet of the Fund’s investment process, fluctuations in major world currencies can at times affect the Fund’s performance. During the period, the net effect of currency moves was positive for the Fund.
There were a few shifts in the Fund’s sector allocations during the period. The Fund reduced its allocations to the Consumer Discretionary, Consumer Staples, and Industrials sectors and increased its allocations to the Financials, Telecommunication Services and Real Estate sectors. The Fund had limited exposure to the Energy sector intra-period but liquidated the position held within the sector prior to period end. There were no significant changes to the Fund’s allocations to the Information Technology and Health Care sectors.
Fiscal Period-End Investment Posture
As of September 30, 2018, the Fund’s primary economic sector allocations included Information Technology, Financials, Consumer Discretionary and Health Care. The Fund had no exposure to the Energy, Materials or Utilities sectors.
In terms of country allocations, the Fund’s most significant weightings at period-end, excluding short-term investments, were in Germany, the Netherlands, the United Kingdom, Japan, China/Hong Kong and France. Country-level weightings generally should be considered a residual of the Fund’s stock selection process rather than a major, proactive facet of its investment strategy.
Sincerely,
THOMAS F. MARSICO
ROBERT G. SUSMAN, CFA
PORTFOLIO MANAGERS
(1) | Total returns are based on net change in net asset value assuming reinvestment of distributions. Periodically, certain fees and expenses have been waived or reimbursed by the Adviser for the International Opportunities Fund. In the absence of such a waiver or reimbursement, the performance returns reflected would have been reduced. In accordance with the expense limitation and fee waiver agreement, the Adviser may recoup fees and expenses previously waived or reimbursed under certain parameters. Periodically, the Adviser has recouped such fees or expenses from the International Opportunities Fund, resulting in a lower performance return. Please see the Prospectus for more information. |
23
| INTERNATIONAL OPPORTUNITIES FUND OVERVIEW |
September 30, 2018 (Unaudited)
The International Opportunities Fund is a diversified portfolio and invests primarily (no less than 65% of its total assets) in common stocks of foreign companies that are selected for their long-term growth potential, including foreign securities, whether traded in the US (including as American Depositary Receipts) or in foreign markets or both. The Fund may invest in an unlimited number of companies of any size throughout the world. It normally invests in the securities of issuers that are economically tied to one or more foreign countries, and expects to be invested in various issuers or securities that together have ties to at least four different foreign countries. The Fund may invest in securities of companies economically tied to emerging markets. Some issuers or securities in the Fund’s portfolio may be economically tied to the US.
TOTAL ANNUAL OPERATING EXPENSES* 1.79% NET EXPENSES*† 1.50% | NET ASSETS $62,152,087 | NET ASSET VALUE PER SHARE $20.23 |
GROWTH OF $10,000(1)(2) | PERFORMANCE COMPARISON |
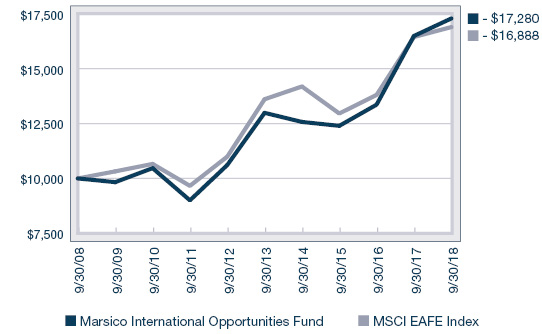
| 
|
SECTOR ALLOCATION(3) | TOP FIVE HOLDINGS |
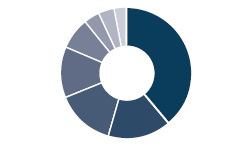 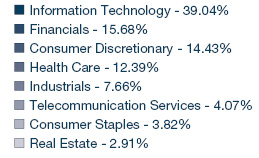
| | | | |
| | InterXion Holding N.V. | 4.04% | |
| | Alibaba Group Holding Ltd. Spon. ADR | 3.86% | |
| | Worldpay, Inc. - Cl. A | 3.43% | |
| | ASML Holding N.V. | 3.34% | |
| | Wirecard A.G. | 3.32% | |
| | | | |
* | The Total Annual Operating Expenses and Net Expenses are reflective of the information disclosed in the Funds’ Prospectus dated January 31, 2018, as supplemented, and may differ from the expense ratios disclosed in this report. |
| | |
† | Marsico Capital Management, LLC (the “Adviser”) has entered into a written expense limitation and fee waiver agreement under which it has agreed to limit the total expenses of the International Opportunities Fund (excluding taxes, interest, acquired fund fees and expenses, litigation, extraordinary expenses, brokerage and other transaction expenses relating to the purchase or sale of portfolio investments) to an annual rate of 1.50% of the Fund’s average net assets until January 31, 2019. This expense limitation and fee waiver agreement may be terminated by the Adviser at any time after January 31, 2019 upon 15 days prior notice to the Fund and its administrator. The Adviser may recoup from the Fund fees previously waived or expenses previously reimbursed by the Adviser with respect to that Fund pursuant to this agreement (or a previous expense limitation agreement) if: (1) such recoupment by the Adviser does not cause the Fund, at the time of recoupment, to exceed the lesser of (a) the expense limitation in effect at the time the relevant amount was waived and/or reimbursed, or (b) the expense limitation in effect at the time of the proposed recoupment, and (2) the recoupment is made within three years after the fiscal year end date as of which the amount to be waived or reimbursed was determined and the waiver or reimbursement occurred. |
| | |
| The performance data quoted here represent past performance, and past performance is not a guarantee of future results. Investment return and principal value of an investment will fluctuate so that an investor’s shares, when redeemed, may be worth more or less than their original cost. Current performance may be lower or higher than the performance information quoted. To obtain performance information current to the most recent month-end, please call 888-860-8686 or visit marsicofunds.com. |
| | |
| The performance included in the chart and graph does not reflect the deduction of taxes on Fund distributions or the redemption of Fund shares. |
| | |
| All indices are unmanaged and investors cannot invest directly in an index. |
| | |
| The MSCI EAFE Index tracks the stocks of about 1,000 companies in Europe, Australasia, and the Far East (EAFE). |
| | |
(1) | Periodically, certain fees and expenses have been waived or reimbursed by the Adviser for the International Opportunities Fund. In the absence of such a waiver or reimbursement, the performance returns reflected would have been reduced. In accordance with the expense limitation and fee waiver agreement, the Adviser may recoup fees and expenses previously waived or reimbursed under certain parameters. Periodically, the Adviser has recouped such fees or expenses from the International Opportunities Fund, resulting in a lower performance return. |
| | |
(2) | This chart assumes an initial investment of $10,000 made on September 30, 2008. Total returns are based on net change in NAV, assuming reinvestment of distributions. |
| | |
(3) | Sector weightings represent the percentage of the Fund’s investments (excluding cash equivalents) in certain general sectors. These sectors may include more than one industry. The Fund’s portfolio composition is subject to change at any time. |
24
MARSICO INTERNATIONAL OPPORTUNITIES FUND
SCHEDULE OF INVESTMENTS
September 30, 2018
| | | Number
of
Shares | | | Value | | | Percent
of Net
Assets | |
COMMON STOCKS | | | | | | | | | | | | |
Aerospace & Defense | | | | | | | | | | | | |
Airbus SE | | | 5,030 | | | $ | 631,780 | | | | 1.02% | |
| | | | | | | | | | | | | |
Airlines | | | | | | | | | | | | |
Ryanair Holdings PLC Spon. ADR* | | | 16,579 | | | | 1,592,247 | | | | 2.56 | |
| | | | | | | | | | | | | |
Application Software | | | | | | | | | | | | |
Constellation Software, Inc. | | | 1,678 | | | | 1,233,989 | | | | 1.99 | |
SAP S.E. | | | 11,119 | | | | 1,368,430 | | | | 2.20 | |
| | | | | | | | 2,602,419 | | | | 4.19 | |
Asset Management & Custody Banks | | | | |
Hargreaves Lansdown PLC | | | 37,969 | | | | 1,106,075 | | | | 1.78 | |
Julius Baer Group Ltd. | | | 38,198 | | | | 1,911,457 | | | | 3.08 | |
| | | | | | | | 3,017,532 | | | | 4.86 | |
Brewers | | | | | | | | | | | | |
Anheuser-Busch InBev S.A./N.V. | | | 15,685 | | | | 1,369,837 | | | | 2.20 | |
| | | | | | | | | | | | | |
Casinos & Gaming | | | | | | | | | | | | |
MGM China Holdings Ltd. | | | 584,000 | | | | 925,048 | | | | 1.49 | |
| | | | | | | | | | | | | |
Data Processing & Outsourced Services | | | | |
Pagseguro Digital Ltd. - Cl. A* | | | 10,061 | | | | 278,388 | | | | 0.45 | |
Wirecard A.G. | | | 9,526 | | | | 2,064,933 | | | | 3.32 | |
Worldpay, Inc. - Cl. A* | | | 21,033 | | | | 2,130,012 | | | | 3.43 | |
| | | | | | | | 4,473,333 | | | | 7.20 | |
Diversified Banks | | | | | | | | | | | | |
BAWAG Group A.G. | | | 13,839 | | | | 642,711 | | | | 1.04 | |
HDFC Bank Ltd. ADR | | | 11,355 | | | | 1,068,506 | | | | 1.72 | |
ING Groep N.V. | | | 50,912 | | | | 661,102 | | | | 1.06 | |
Sumitomo Mitsui Financial Group, Inc. | | | 26,700 | | | | 1,077,682 | | | | 1.73 | |
UniCredit SpA | | | 54,136 | | | | 814,847 | | | | 1.31 | |
| | | | | | | | 4,264,848 | | | | 6.86 | |
Financial Exchanges & Data | | | | |
Bolsa Mexicana de Valores S.A.B. de C.V. | | | 240,926 | | | | 492,949 | | | | 0.79 | |
Deutsche Boerse A.G. | | | 13,619 | | | | 1,824,745 | | | | 2.94 | |
| | | | | | | | 2,317,694 | | | | 3.73 | |
General Merchandise Stores | | | | | | | | |
B&M European Value Retail S.A. | | | 244,900 | | | | 1,234,676 | | | | 1.99 | |
Dollarama, Inc. | | | 42,248 | | | | 1,330,911 | | | | 2.14 | |
| | | | | | | | 2,565,587 | | | | 4.13 | |
Health Care Equipment | | | | | | | | | | | | |
Koninklijke Philips N.V. | | | 41,084 | | | | 1,871,533 | | | | 3.01 | |
| | | | | | | | | | | | | |
Home Entertainment Software | | | | | | | | |
Nintendo Co., Ltd. | | | 3,500 | | | | 1,277,152 | | | | 2.06 | |
Ubisoft Entertainment S.A.* | | | 12,620 | | | | 1,368,833 | | | | 2.20 | |
| | | | | | | | 2,645,985 | | | | 4.26 | |
Household Products | | | | | | | | | | | | |
Reckitt Benckiser Group PLC | | | 10,561 | | | | 965,767 | | | | 1.55 | |
| | | | | | | | | | | | | |
Industrial Machinery | | | | | | | | |
FANUC Corporation | | | 5,900 | | | | 1,112,287 | | | | 1.79% | |
MISUMI Group, Inc. | | | 52,300 | | | | 1,353,301 | | | | 2.18 | |
| | | | | | | | 2,465,588 | | | | 3.97 | |
| | | | | | | | | | | | | |
Integrated Telecommunication Services | | | | |
Cellnex Telecom SA | | | 31,615 | | | | 830,671 | | | | 1.34 | |
Orange S.A. | | | 50,360 | | | | 803,092 | | | | 1.29 | |
| | | | | | | | 1,633,763 | | | | 2.63 | |
Internet & Direct Marketing Retail | | | | | | | | |
ASOS PLC* | | | 8,965 | | | | 673,289 | | | | 1.08 | |
Ctrip.com International, Ltd. ADR* | | | 23,309 | | | | 866,395 | | | | 1.40 | |
MakeMyTrip Ltd.* | | | 23,860 | | | | 654,957 | | | | 1.05 | |
Start Today Company Ltd. | | | 18,700 | | | | 566,168 | | | | 0.91 | |
| | | | | | | | 2,760,809 | | | | 4.44 | |
Internet Software & Services | | | | | | | | |
58.com, Inc. ADR* | | | 4,504 | | | | 331,494 | | | | 0.54 | |
Alibaba Group Holding Ltd. Spon. ADR* | | | 14,568 | | | | 2,400,224 | | | | 3.86 | |
Facebook, Inc. - Cl. A* | | | 7,830 | | | | 1,287,722 | | | | 2.07 | |
Just Eat PLC* | | | 94,061 | | | | 821,659 | | | | 1.32 | |
Scout24 A.G. | | | 33,123 | | | | 1,544,452 | | | | 2.49 | |
Tencent Holdings Ltd. | | | 44,600 | | | | 1,841,349 | | | | 2.96 | |
| | | | | | | | 8,226,900 | | | | 13.24 | |
IT Consulting & Other Services | | | | | | | | |
Altran Technologies S.A. | | | 109,509 | | | | 949,777 | | | | 1.53 | |
InterXion Holding N.V.* | | | 37,351 | | | | 2,513,722 | | | | 4.04 | |
| | | | | | | | 3,463,499 | | | | 5.57 | |
Life Sciences Tools & Services | | | | | | | | |
Eurofins Scientific S.E. | | | 3,159 | | | | 1,793,534 | | | | 2.89 | |
QIAGEN N.V.* | | | 24,767 | | | | 938,174 | | | | 1.51 | |
| | | | | | | | 2,731,708 | | | | 4.40 | |
Pharmaceuticals | | | | | | | | | | | | |
Bayer A.G. | | | 13,768 | | | | 1,223,039 | | | | 1.97 | |
Dechra Pharmaceuticals PLC | | | 41,366 | | | | 1,174,300 | | | | 1.89 | |
GW Pharmaceuticals PLC ADR* | | | 3,364 | | | | 581,097 | | | | 0.93 | |
| | | | | | | | 2,978,436 | | | | 4.79 | |
Publishing | | | | | | | | | | | | |
Lifull Company Ltd. | | | 57,600 | | | | 319,380 | | | | 0.51 | |
| | | | | | | | | | | | | |
Real Estate Operating Companies | | | | | | | | |
Aroundtown S.A. | | | 200,669 | | | | 1,784,679 | | | | 2.87 | |
| | | | | | | | | | | | | |
Restaurants | | | | | | | | | | | | |
Domino's Pizza Enterprises Ltd. | | | 32,959 | | | | 1,267,459 | | | | 2.04 | |
Domino's Pizza Group PLC | | | 273,164 | | | | 994,781 | | | | 1.60 | |
| | | | | | | | 2,262,240 | | | | 3.64 | |
Semiconductor Equipment | | | | | | | | | | | | |
Applied Materials, Inc. | | | 10,551 | | | | 407,796 | | | | 0.65 | |
ASML Holding N.V. | | | 11,107 | | | | 2,074,932 | | | | 3.34 | |
| | | | | | | | 2,482,728 | | | | 3.99 | |
| See notes to financial statements. |
25
MARSICO INTERNATIONAL OPPORTUNITIES FUND
SCHEDULE OF INVESTMENTS (continued)
September 30, 2018
| | | Number
of
Shares | | | Value | | | Percent
of Net
Assets | |
COMMON STOCKS (continued) | | | | | | | | |
Wireless Telecommunication Services | | | | |
SoftBank Group Corporation | | | 8,500 | | | $ | 858,080 | | | | 1.38% | |
| | | | | | | | | | | | | |
TOTAL COMMON STOCKS | | | | | | | | | | | | |
(Cost $50,746,220) | | | | | | | 61,211,420 | | | | 98.49 | |
| | | | | | | | | | | | | |
SHORT-TERM INVESTMENTS | | | | | | | | |
State Street Institutional Treasury Money Market Fund, 0.016% | | | 721,850 | | | | 721,850 | | | | 1.16 | |
| | | | | | | | | | | | | |
TOTAL SHORT-TERM INVESTMENTS | | | | | | | | |
(Cost $721,850) | | | | | | | 721,850 | | | | 1.16 | |
| | | | | | | | | | | | | |
TOTAL INVESTMENTS | | | | | | | | |
(Cost $51,468,070) | | | | | | | 61,933,270 | | | | 99.65 | |
| | | | | | | | | | | | | |
Cash and Other Assets, Less Liabilities | | | | | | | 218,817 | | | | 0.35 | |
| | | | | | | | | | | | | |
NET ASSETS | | | | | | $ | 62,152,087 | | | | 100.00% | |
SUMMARY OF INVESTMENTS BY COUNTRY |
| |
Country | | Market Value | | | Percent of
Investment
Securities | |
Australia | | $ | 1,267,459 | | | | 2.05 | % |
Austria | | | 642,711 | | | | 1.04 | |
Belgium | | | 1,369,837 | | | | 2.21 | |
Brazil | | | 278,388 | | | | 0.45 | |
Canada | | | 2,564,900 | | | | 4.14 | |
China/Hong Kong | | | 6,364,510 | | | | 10.28 | |
France | | | 5,547,016 | | | | 8.96 | |
Germany | | | 9,810,278 | | | | 15.84 | |
India | | | 1,723,463 | | | | 2.78 | |
Ireland | | | 1,592,247 | | | | 2.57 | |
Italy | | | 814,847 | | | | 1.31 | |
Japan | | | 6,564,050 | | | | 10.60 | |
Mexico | | | 492,949 | | | | 0.80 | |
Netherlands | | | 8,059,463 | | | | 13.01 | |
Spain | | | 830,671 | | | | 1.34 | |
Switzerland | | | 1,911,457 | | | | 3.09 | |
United Kingdom | | | 7,551,644 | | | | 12.19 | |
United States(1) | | | 4,547,380 | | | | 7.34 | |
| | | $ | 61,933,270 | | | | 100.00 | % |
(1) | Includes short-term securities. |
| See notes to financial statements. |
26
INVESTMENT REVIEW BY TOM MARSICO, BRANDON GEISLER, AND ROB SUSMAN (UNAUDITED)
The Marsico Global Fund posted a total return of (US$) +23.94% for the one-year fiscal period ended September 30, 2018. The Fund substantially outperformed the MSCI All Country World Index (“MSCI ACWI Index”), the Fund’s benchmark index, which had a total return of (US$) +9.77% over the same time period. Please see the Fund’s Overview for more detailed information about the Fund’s longer-term performance for various time periods ended September 30, 2018.
The performance data for the Fund quoted here represent past performance, and past performance is not a guarantee of future results. Investment return and principal value of an investment will fluctuate so that an investor’s shares, when redeemed, may be worth more or less than their original cost. Current performance may be lower or higher than the performance information quoted. To obtain performance information current to the most recent month-end, please call 888-860-8686 or visit marsicofunds.com.(1)
This review highlights Fund performance over a one-year fiscal period. Shareholders should keep in mind that the Fund is intended for long-term investors who hold their shares for substantially longer periods of time. You should also keep in mind that our current views and beliefs regarding all investments discussed in this report are subject to change at any time. References to specific securities, industries, and sectors discussed in this report are not recommendations to buy or sell such securities or related investments, and the Fund may not necessarily hold these securities or investments today. Please see the accompanying Schedule of Investments for the percentage of the Fund’s portfolio represented by the securities mentioned in this report as of the end of the reporting period.
Foreign investments present additional risks due to currency fluctuations, economic and political factors, lower liquidity, differences in securities regulations and accounting standards, possible changes in taxation, limited public information, and other factors. In addition, the Fund is subject to broad risks associated with investing in equity securities markets generally, including the risks that the securities and markets in which it invests may experience volatility and instability, that domestic and global economies and markets may undergo periods of cyclical change and decline, that investors may at times avoid investments in equity securities, and that investments may not perform as anticipated. Please see the Prospectus for more information.
The Fund is not managed to track the benchmark index, and may hold a substantially overweight or underweight position in a sector, industry, or security compared to its weight in the benchmark. The Fund may be subject to risks associated with a particular sector or other area in which it is overweight, including the risk that the stocks of companies within one area could simultaneously decline in price because of an event that affects the entire area. For informational purposes, the discussion below may compare the benchmark weight or performance of a sector or industry to the investment approach of the Fund.
The Global Fund’s strong outperformance during the one-year period ended September 30, 2018 versus the MSCI ACWI Index was primarily attributable to stock selection in the Consumer Discretionary and the Information Technology sectors.
Stock prices of several Consumer Discretionary companies performed very strongly during the reporting period. Streaming content provider Netflix, Inc. returned +107%. The company has continued to penetrate the growing market for streaming content and, in our opinion, is adopting the right strategy in building content as rapidly as possible. Over the past year, Netflix has begun increasing subscription prices as well, hence improving already high operating margins. The current management team, headed by Reed Hastings and Ted Sarandos, has been extremely successful in securing great talent and high-quality content, and we believe it has the right strategy for continued success.
Online e-commerce platform Amazon.com, Inc. was also a strong positive contributor during the period, returning +107%. Amazon continues to benefit from consumers’ growing preference to shop online, and has been adding new features to its Prime membership offering, leading to substantial growth. Advertising and cloud computing remain large opportunities for the company.
The Fund’s holdings in the Information Technology sector, in aggregate, also beat the return of the MSCI ACWI Index and boosted returns. Global payments company Wirecard A.G. (+137%) posted strong returns during the period. Wirecard benefits as cash payments give way to electronic payments around the world, e-commerce grows, and Wirecard assists in processing these transactions. Wirecard has been consistently winning global accounts and taking share from legacy competitors, and continues to grow revenues by +20% annually.
The Fund’s performance also was aided by having overweight allocations, as compared to its benchmark index, to two of the strongest-performing sectors of the MSCI ACWI Index, Information Technology and Consumer Discretionary. In addition, the Fund’s returns were assisted by underweight allocations in the Financials and Consumer Staples sectors, which were weaker performing sectors during the period. In fact, the Fund liquidated its positions in the Financials and Consumer Staples Sectors during the period as the majority of the limited positions fell during the period and dampened performance.
A position in the Health Care sector didn’t perform as we anticipated and was sold during the period. Celgene Corporation (-33% prior to being sold) halted a drug trial on one product and struggled with another lead product for psoriatic arthritis, which caused us to sell the position.
27
Despite the long-term opportunity that Snap Inc. – Cl. A (-27% prior to being sold) may present, following a disappointing recent quarter, we questioned management’s ability to execute a redesign of the company’s signature app, creating near term uncertainty in user engagement and monetization of the platform. Given the concentrated nature of the Fund, we thought it was prudent to sell the position.
In the Consumer Discretionary sector, Chinese travel and hotel booking firm Ctrip.com International, Ltd. ADR (-24% prior to being sold), underperformed over the period due to a change in Chinese regulations restricting the sale of premium add-on features along with airline tickets. This change in regulation impacted the entire Chinese online travel agency industry as well as the broader airline industry, and we exited the position.
The Fund’s performance was slightly inhibited by having an underweight allocation to the strong-performing Energy sector of the MSCI ACWI Index. Additionally, the Fund was slightly held back relative to its benchmark index by maintaining a 4% average cash weight during the period. The Fund occasionally may hold more cash than usual as a temporary defensive measure, or as a strategic measure enabling it to take rapid advantage of opportunities to buy stocks at favorable prices.
Although active currency management is not a central facet of the Fund’s investment process, fluctuations in major world currencies can at times affect the Fund’s performance. During the period, the net effect of currency moves had a positive effect on Fund performance.
During the period, the Fund increased its allocations to the Information Technology, Consumer Discretionary and Industrials sectors. The Fund reduced its position in the Health Care sector and liquidated its positions in the Consumer Staples and Financials sectors. The Fund had limited exposure to the Real Estate and Energy sectors intra-period but liquidated the positions held within the sectors prior to period end. There was no significant change to the Fund’s allocation to the Materials sector.
Fiscal Period-End Investment Posture
As of September 30, 2018, the Fund’s primary economic sector allocations were Information Technology, Consumer Discretionary, and Health Care. The Fund had no investments in the Consumer Staples, Financials, Energy, Real Estate, Telecommunication Services or Utilities sectors.
The Fund’s most significant country allocations were in the United States, France, China/Hong Kong, Australia, Sweden and the Netherlands. Country-level weightings generally should be considered a residual of the Fund’s stock selection process rather than a major, proactive facet of its investment strategy.
Other Developments
After the close of business on August 3, 2018, the former Flexible Capital Fund was reorganized through a merger with and into the Global Fund. Effective September 1, 2018, Brandon A. Geisler and Robert G. Susman became co-managers of the Global Fund with Thomas F. Marsico.
Sincerely,
THOMAS F. MARSICO
BRANDON A. GEISLER
ROBERT G. SUSMAN, CFA
PORTFOLIO MANAGERS
(1) | Total returns are based on net change in net asset value assuming reinvestment of distributions. Periodically, certain fees and expenses have been waived or reimbursed by the Adviser for the Global Fund. In the absence of such a waiver or reimbursement, the performance returns reflected would have been reduced. In accordance with the expense limitation and fee waiver agreement, the Adviser may recoup fees and expenses previously waived or reimbursed under certain parameters. Periodically, the Adviser has recouped such fees or expenses from the Global Fund, resulting in a lower performance return. Please see the Prospectus for more information. |
28
September 30, 2018 (Unaudited)
The Global Fund is a diversified portfolio and invests primarily in the common stocks of US and foreign companies that are selected for their long-term growth potential. The Fund may invest in an unlimited number of companies of any size that are economically tied to any countries or markets throughout the world, including securities of companies economically tied to emerging markets. Under normal market conditions, the Fund will invest significantly (generally, at least 40% of its net assets) in the securities of issuers organized or located outside the US or doing business outside the US or other foreign securities (unless market conditions are not deemed favorable by the Adviser, in which case the Fund generally will invest at least 30% of its assets in such foreign securities). The Fund will invest its assets in various regions and countries, including the US, that encompass not less than three different countries overall.
TOTAL ANNUAL OPERATING EXPENSES* 1.80% NET EXPENSES*† 1.45% | NET ASSETS $286,513,664 | NET ASSET VALUE PER SHARE $17.16 |
GROWTH OF $10,000(1)(2) | PERFORMANCE COMPARISON |
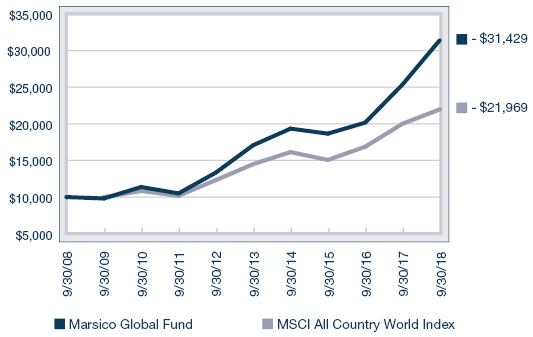
| 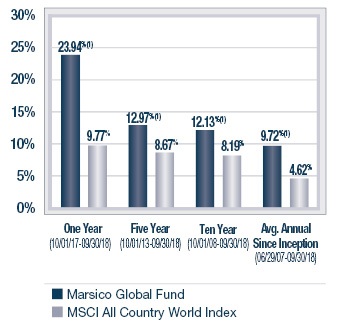 |
SECTOR ALLOCATION(3) | TOP FIVE HOLDINGS |
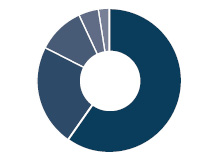 
| | | | |
| | Amazon.com, Inc. | 6.03% | |
| | Alphabet, Inc. - Cl. A | 4.94% | |
| | Alibaba Group Holding Ltd. Spon. ADR | 4.60% | |
| | Apple, Inc. | 4.50% | |
| | NVIDIA Corporation | 4.45% | |
| | | | |
* | The Total Annual Operating Expenses and Net Expenses are reflective of the information disclosed in the Funds’ Prospectus dated January 31, 2018, as supplemented, and may differ from the expense ratios disclosed in this report. |
| | |
† | Marsico Capital Management, LLC (the “Adviser”) has entered into a written expense limitation and fee waiver agreement under which it has agreed to limit the total expenses of the Global Fund (excluding taxes, interest, acquired fund fees and expenses, litigation, extraordinary expenses, brokerage and other transaction expenses relating to the purchase or sale of portfolio investments) to an annual rate of 1.45% of the Fund’s average net assets until September 30, 2019. This expense limitation and fee waiver agreement may be terminated by the Adviser at any time after September 30, 2019 upon 15 days prior notice to the Fund and its administrator. The Adviser may recoup from the Fund fees previously waived or expenses previously reimbursed by the Adviser with respect to that Fund pursuant to this agreement (or a previous expense limitation agreement) if: (1) such recoupment by the Adviser does not cause the Fund, at the time of recoupment, to exceed the lesser of (a) the expense limitation in effect at the time the relevant amount was waived and/or reimbursed, or (b) the expense limitation in effect at the time of the proposed recoupment, and (2) the recoupment is made within three years after the fiscal year end date as of which the amount to be waived or reimbursed was determined and the waiver or reimbursement occurred. |
| | |
| The performance data quoted here represent past performance, and past performance is not a guarantee of future results. Investment return and principal value of an investment will fluctuate so that an investor’s shares, when redeemed, may be worth more or less than their original cost. Current performance may be lower or higher than the performance information quoted. To obtain performance information current to the most recent month-end, please call 888-860-8686 or visit marsicofunds.com. |
| | |
| The performance included in the chart and graph does not reflect the deduction of taxes on Fund distributions or the redemption of Fund shares. |
| | |
| All indices are unmanaged and investors cannot invest directly in an index. |
| | |
| The MSCI ACWI (All Country World Index) Index is a free float-adjusted market capitalization index that is designed to measure equity market performance in the global developed and emerging markets. |
| | |
(1) | Periodically, certain fees and expenses have been waived or reimbursed by the Adviser for the Global Fund. In the absence of such a waiver or reimbursement, the performance returns reflected would have been reduced. In accordance with the expense limitation and fee waiver agreement, the Adviser may recoup fees and expenses previously waived or reimbursed under certain parameters. Periodically, the Adviser has recouped such fees or expenses from the Global Fund, resulting in a lower performance return. |
| | |
(2) | This chart assumes an initial investment of $10,000 made on September 30, 2008. Total returns are based on change in NAV, assuming reinvestment of distributions. |
| | |
(3) | Sector weightings represent the percentage of the Fund’s investments (excluding cash equivalents) in certain general sectors. These sectors may include more than one industry. The Fund’s portfolio composition is subject to change at any time. |
29
MARSICO GLOBAL FUND
SCHEDULE OF INVESTMENTS
September 30, 2018
| | | Number
of
Shares | | | Value | | | Percent
of Net
Assets | |
COMMON STOCKS | | | | | | | | | | | | |
Aerospace & Defense | | | | | | | | | | | | |
Airbus SE | | | 69,415 | | | $ | 8,718,693 | | | | 3.04% | |
| | | | | | | | | | | | | |
Airlines | | | | | | | | | | | | |
Ryanair Holdings PLC Spon. ADR* | | | 42,962 | | | | 4,126,071 | | | | 1.44 | |
| | | | | | | | | | | | | |
Apparel Retail | | | | | | | | | | | | |
Industria de Diseno Textil S.A. | | | 302,282 | | | | 9,163,687 | | | | 3.20 | |
| | | | | | | | | | | | | |
Apparel, Accessories & Luxury Goods | | | | |
Hermes International | | | 17,798 | | | | 11,791,093 | | | | 4.12 | |
lululemon athletica, inc.* | | | 43,992 | | | | 7,148,260 | | | | 2.49 | |
| | | | | | | | 18,939,353 | | | | 6.61 | |
Application Software | | | | | | | | | | | | |
Atlassian Corporation PLC - Cl. A* | | | 77,968 | | | | 7,495,843 | | | | 2.62 | |
salesforce.com, inc.* | | | 59,918 | | | | 9,528,760 | | | | 3.32 | |
| | | | | | | | 17,024,603 | | | | 5.94 | |
Biotechnology | | | | | | | | | | | | |
G1 Therapeutics, Inc.* | | | 66,404 | | | | 3,472,265 | | | | 1.21 | |
| | | | | | | | | | | | | |
Communications Equipment | | | | |
Telefonaktiebolaget LM Ericsson B Shares | | | 986,234 | | | | 8,753,307 | | | | 3.06 | |
| | | | | | | | | | | | | |
Data Processing & Outsourced Services | | | | |
Visa, Inc. - Cl. A | | | 60,407 | | | | 9,066,487 | | | | 3.16 | |
Wirecard A.G. | | | 42,258 | | | | 9,160,187 | | | | 3.20 | |
| | | | | | | | 18,226,674 | | | | 6.36 | |
Health Care Equipment | | | | | | | | | | | | |
Intuitive Surgical, Inc.* | | | 19,836 | | | | 11,385,864 | | | | 3.97 | |
| | | | | | | | | | | | | |
Home Entertainment Software | | | | | | | | |
Activision Blizzard, Inc. | | | 61,412 | | | | 5,108,864 | | | | 1.79 | |
Nintendo Co., Ltd. | | | 15,000 | | | | 5,473,508 | | | | 1.91 | |
Ubisoft Entertainment S.A.* | | | 82,207 | | | | 8,916,610 | | | | 3.11 | |
| | | | | | | | 19,498,982 | | | | 6.81 | |
Internet & Direct Marketing Retail | | | | | | | | |
Amazon.com, Inc.* | | | 8,631 | | | | 17,287,893 | | | | 6.03 | |
Netflix, Inc.* | | | 17,157 | | | | 6,418,948 | | | | 2.24 | |
| | | | | | | | 23,706,841 | | | | 8.27 | |
Internet Software & Services | | | | | | | | |
Alibaba Group Holding Ltd. Spon. ADR* | | | 79,910 | | | | 13,165,972 | | | | 4.60 | |
Alphabet, Inc. - Cl. A* | | | 11,733 | | | | 14,162,670 | | | | 4.94 | |
Facebook, Inc. - Cl. A* | | | 65,999 | | | | 10,854,195 | | | | 3.79 | |
Match Group, Inc.* | | | 129,576 | | | | 7,503,746 | | | | 2.62 | |
Spotify Technology S.A.* | | | 27,597 | | | | 4,990,365 | | | | 1.74 | |
Tencent Holdings Ltd. | | | 245,900 | | | | 10,152,188 | | | | 3.54 | |
| | | | | | | | 60,829,136 | | | | 21.23 | |
IT Consulting & Other Services | | | | | | | | |
InterXion Holding N.V.* | | | 124,720 | | | | 8,393,656 | | | | 2.93 | |
| | | | | | | | | | | | | |
Managed Health Care | | | | | | | | | | | | |
UnitedHealth Group, Inc. | | | 35,048 | | | | 9,324,170 | | | | 3.26% | |
| | | | | | | | | | | | | |
Pharmaceuticals | | | | | | | | | | | | |
GW Pharmaceuticals PLC ADR* | | | 32,723 | | | | 5,652,571 | | | | 1.97 | |
| | | | | | | | | | | | | |
Restaurants | | | | | | | | | | | | |
Domino's Pizza Enterprises Ltd. | | | 224,224 | | | | 8,622,672 | | | | 3.01 | |
Domino's Pizza, Inc. | | | 17,668 | | | | 5,208,527 | | | | 1.82 | |
| | | | | | | | 13,831,199 | | | | 4.83 | |
Semiconductor Equipment | | | | | | | | |
ASML Holding N.V. | | | 16,194 | | | | 3,025,250 | | | | 1.06 | |
| | | | | | | | | | | | | |
Semiconductors | | | | | | | | | | | | |
NVIDIA Corporation | | | 45,397 | | | | 12,757,465 | | | | 4.45 | |
| | | | | | | | | | | | | |
Specialty Chemicals | | | | | | | | | | | | |
The Sherwin-Williams Company | | | 14,605 | | | | 6,648,342 | | | | 2.32 | |
| | | | | | | | | | | | | |
Systems Software | | | | | | | | | | | | |
Microsoft Corporation | | | 81,058 | | | | 9,270,604 | | | | 3.24 | |
| | | | | | | | | | | | | |
Technology Hardware, Storage & Peripherals | | | | |
Apple, Inc. | | | 57,148 | | | | 12,900,590 | | | | 4.50 | |
| | | | | | | | | | | | | |
TOTAL COMMON STOCKS | | | | | | | | | | | | |
(Cost $222,586,179) | | | | | | | 285,649,323 | | | | 99.70 | |
| | | | | | | | | | | | | |
SHORT-TERM INVESTMENTS | | | | | | | | |
State Street Institutional Treasury Money Market Fund, 0.016% | | | 1,575,330 | | | | 1,575,330 | | | | 0.55 | |
| | | | | | | | | | | | | |
TOTAL SHORT-TERM INVESTMENTS | | | | | | | | |
(Cost $1,575,330) | | | | | | | 1,575,330 | | | | 0.55 | |
| | | | | | | | | | | | | |
TOTAL INVESTMENTS | | | | | | | | | | | | |
(Cost $224,161,509) | | | | | | | 287,224,653 | | | | 100.25 | |
| | | | | | | | | | | | | |
Liabilities, Less Cash and Other Assets | | | | | | | (710,989 | ) | | | (0.25) | |
| | | | | | | | | | | | | |
NET ASSETS | | | | | | $ | 286,513,664 | | | | 100.00% | |
| See notes to financial statements. |
30
SUMMARY OF INVESTMENTS BY COUNTRY |
Country | | Market Value | | | Percent of
Investment
Securities | |
Australia | | $ | 16,118,515 | | | | 5.61 | % |
China/Hong Kong | | | 23,318,160 | | | | 8.12 | |
France | | | 29,426,396 | | | | 10.25 | |
Germany | | | 9,160,187 | | | | 3.19 | |
Ireland | | | 4,126,071 | | | | 1.44 | |
Japan | | | 5,473,508 | | | | 1.90 | |
Netherlands | | | 11,418,906 | | | | 3.98 | |
Spain | | | 9,163,687 | | | | 3.19 | |
Sweden | | | 13,743,672 | | | | 4.78 | |
United Kingdom | | | 5,652,571 | | | | 1.97 | |
United States(1) | | | 159,622,980 | | | | 55.57 | |
| | | $ | 287,224,653 | | | | 100.00 | % |
(1) | Includes short-term securities. |
| See notes to financial statements. |
31
STATEMENTS OF ASSETS AND LIABILITIES
September 30, 2018
(Amounts in thousands) | | MARSICO
FOCUS FUND | | | MARSICO
GROWTH FUND | | |
| | | | | | | | | | |
ASSETS | | | | | | | | | |
Investments, at value (cost $378,186, $188,578, $225,463, $51,468, and $224,162, respectively) | | $ | 606,905 | | | $ | 300,161 | | |
Receivable for investments sold | | | 2,882 | | | | 383 | | |
Receivable for capital stock sold | | | 17 | | | | 4 | | |
Dividends receivable | | | 233 | | | | 13 | | |
Prepaid expenses and other assets | | | 3,386 | | | | 1,215 | | |
Total Assets | | | 613,423 | | | | 301,776 | | |
| | | | | | | | | | |
LIABILITIES | | | | | | | | | |
Payable for investments purchased | | | — | | | | — | | |
Payable for capital stock redeemed | | | 186 | | | | 76 | | |
Payable to investment adviser | | | 379 | | | | 194 | | |
Accrued trustees' fees | | | 3,363 | | | | 1,197 | | |
Accrued distribution fee | | | 3,254 | | | | 1,241 | | |
Accrued professional fees | | | 105 | | | | 51 | | |
Accrued transfer agent fees and expenses | | | 29 | | | | 16 | | |
Accrued printing expenses | | | 26 | | | | 13 | | |
Accrued custody and fund accounting fees | | | 21 | | | | 16 | | |
Accrued expenses and other liabilities | | | 46 | | | | 32 | | |
Total Liabilities | | | 7,409 | | | | 2,836 | | |
| | | | | | | | | | |
NET ASSETS | | $ | 606,014 | | | $ | 298,940 | | |
| | | | | | | | | | |
NET ASSETS CONSIST OF | | | | | | | | | |
Paid-in-capital | | $ | 329,228 | | | $ | 159,622 | | |
Total distributable earnings | | | 276,786 | | | | 139,318 | | |
NET ASSETS | | $ | 606,014 | | | $ | 298,940 | | |
| | | | | | | | | | |
SHARES OUTSTANDING, $0.001 par value | | | | | | | | | |
(Unlimited shares authorized) | | | 30,040 | | | | 14,450 | | |
| | | | | | | | | | |
NET ASSET VALUE, REDEMPTION PRICE, AND OFFERING PRICE PER SHARE (NET ASSETS/SHARES OUTSTANDING)* | | $ | 20.17 | | | $ | 20.69 | | |
* | Not in thousands, based on unrounded net assets and shares outstanding. |
| See notes to financial statements. |
32
| | MARSICO
21st CENTURY FUND | | | MARSICO
INTERNATIONAL
OPPORTUNITIES
FUND | | | MARSICO
GLOBAL FUND | |
| | | | | | | | | | | | |
| | | | | | | | | | | | |
| | $ | 275,964 | | | $ | 61,933 | | | $ | 287,225 | |
| | | 6,659 | | | | 541 | | | | 2,644 | |
| | | 15 | | | | 1 | | | | 159 | |
| | | 58 | | | | 108 | | | | 29 | |
| | | 378 | | | | 216 | | | | 2,015 | |
| | | 283,074 | | | | 62,799 | | | | 292,072 | |
| | | | | | | | | | | | |
| | | | | | | | | | | | |
| | | 9,109 | | | | 184 | | | | 2,813 | |
| | | 14 | | | | 20 | | | | 230 | |
| | | 178 | | | | 47 | | | | 196 | |
| | | 364 | | | | 202 | | | | 1,989 | |
| | | 420 | | | | 132 | | | | 160 | |
| | | 46 | | | | 14 | | | | 48 | |
| | | 14 | | | | 6 | | | | 54 | |
| | | 11 | | | | 3 | | | | 11 | |
| | | 14 | | | | 13 | | | | 24 | |
| | | 37 | | | | 26 | | | | 33 | |
| | | 10,207 | | | | 647 | | | | 5,558 | |
| | | | | | | | | | | | |
| | $ | 272,867 | | | $ | 62,152 | | | $ | 286,514 | |
| | | | | | | | | | | | |
| | | | | | | | | | | | |
| | $ | 224,338 | | | $ | 52,671 | | | $ | 223,576 | |
| | | 48,529 | | | | 9,481 | | | | 62,938 | |
| | $ | 272,867 | | | $ | 62,152 | | | $ | 286,514 | |
| | | | | | | | | | | | |
| | | | | | | | | | | | |
| | | 8,225 | | | | 3,072 | | | | 16,694 | |
| | | | | | | | | | | | |
| | $ | 33.18 | | | $ | 20.23 | | | $ | 17.16 | |
33
STATEMENTS OF OPERATIONS
FOR THE YEAR ENDED September 30, 2018
(Amounts in thousands) | | MARSICO
FOCUS FUND | | | MARSICO
GROWTH FUND | |
| | | | | | | | | |
INVESTMENT INCOME | | | | | | | | |
Dividends (net of $35, $15, $2, $88, and $24, respectively, of non-reclaimable foreign withholding taxes) | | $ | 4,241 | | | $ | 2,253 | |
Total Investment Income | | | 4,241 | | | | 2,253 | |
| | | | | | | | | |
EXPENSES | | | | | | | | |
Investment advisory fees | | | 4,457 | | | | 2,255 | |
Distribution fees | | | 810 | | | | 391 | |
Trustees' fees and expenses | | | 767 | (1) | | | 304 | (1) |
Professional fees | | | 317 | | | | 154 | |
Transfer agent fees and expenses | | | 196 | | | | 104 | |
Fund administration fees | | | 168 | | | | 138 | |
Custody and fund accounting fees | | | 128 | | | | 92 | |
Miscellaneous | | | 84 | | | | 41 | |
Printing and postage expenses | | | 74 | | | | 37 | |
Federal and state registration fees | | | 32 | | | | 33 | |
Total Expenses | | | 7,033 | | | | 3,549 | |
Less waiver of expenses and expenses paid indirectly | | | (1 | ) | | | — | |
Net Expenses | | | 7,032 | | | | 3,549 | |
| | | | | | | | | |
NET INVESTMENT LOSS | | | (2,791 | ) | | | (1,296 | ) |
| | | | | | | | | |
REALIZED AND UNREALIZED GAIN (LOSS) | | | | | | | | |
Net realized gain on investments | | | 53,497 | | | | 30,322 | |
Net realized gain (loss) on foreign currency transactions | | | 431 | | | | 279 | |
Change in unrealized appreciation (depreciation) on investments, foreign currency translations and non-interested trustees’ deferred compensation | | | 62,949 | | | | 28,796 | |
| | | | | | | | | |
Net Gain on Investments | | | 116,877 | | | | 59,397 | |
| | | | | | | | | |
NET INCREASE IN NET ASSETS RESULTING FROM OPERATIONS | | $ | 114,086 | | | $ | 58,101 | |
(1) | Amounts include Trustees’ fees and expenses and the mark to market unrealized appreciation during the period for shares held in the Non-Interested Trustees’ Deferred Fee Plan, as more fully described in Note 2(g) in the Notes to Financial Statements. |
| | | Trustees’
Fees and
Expenses* | | | Unrealized
Appreciation* | |
Focus Fund | | $ | 130,868 | | | $ | 636,235 | |
Growth Fund | | | 63,525 | | | | 240,935 | |
21st Century Fund | | | 56,109 | | | | 80,005 | |
International Opportunities Fund | | | 15,842 | | | | 12,398 | |
Global Fund | | | 18,752 | | | | 103,001 | |
| See notes to financial statements. |
34
| | MARSICO
21st CENTURY FUND | | | MARSICO
INTERNATIONAL
OPPORTUNITIES
FUND | | | MARSICO
GLOBAL FUND | |
| | | | | | | | | | | | |
| | | | | | | | | | | | |
| | $ | 1,196 | | | $ | 804 | | | $ | 553 | |
| | | 1,196 | | | | 804 | | | | 553 | |
| | | | | | | | | | | | |
| | | | | | | | | | | | |
| | | 2,021 | | | | 544 | | | | 721 | |
| | | 349 | | | | 170 | | | | 225 | |
| | | 136 | (1) | | | 28 | (1) | | | 122 | (1) |
| | | 136 | | | | 45 | | | | 45 | |
| | | 90 | | | | 41 | | | | 87 | |
| | | 135 | | | | 105 | | | | 92 | |
| | | 90 | | | | 101 | | | | 96 | |
| | | 36 | | | | 10 | | | | 10 | |
| | | 37 | | | | 13 | | | | 16 | |
| | | 24 | | | | 20 | | | | 23 | |
| | | 3,054 | | | | 1,077 | | | | 1,437 | |
| | | — | | | | (46 | ) | | | (99 | ) |
| | | 3,054 | | | | 1,031 | | | | 1,338 | |
| | | | | | | | | | | | |
| | | (1,858 | ) | | | (227 | ) | | | (785 | ) |
| | | | | | | | | | | | |
| | | | | | | | | | | | |
| | | 76,404 | | | | 6,541 | | | | 3,415 | |
| | | 151 | | | | 288 | | | | (22 | ) |
| | | (15,070 | ) | | | (3,447 | ) | | | 16,268 | |
| | | | | | | | | | | | |
| | | 61,485 | | | | 3,382 | | | | 19,661 | |
| | | | | | | | | | | | |
| | $ | 59,627 | | | $ | 3,155 | | | $ | 18,876 | |
35
STATEMENTS OF CHANGES IN NET ASSETS
| | | MARSICO
FOCUS FUND | | | MARSICO
GROWTH FUND | |
| | | | | | | | | | | | | | | | | |
(Amounts in thousands) | | Year
Ended
9/30/18 | | | Year
Ended
9/30/17 | | | Year
Ended
9/30/18 | | | Year
Ended
9/30/17 | |
| | | | | | | | | | | | | | | | | |
OPERATIONS: | | | | | | | | | | | | | | | | |
Net investment loss | | $ | (2,791 | ) | | $ | (3,378 | ) | | $ | (1,296 | ) | | $ | (1,396 | ) |
Net realized gain on investments | | | 53,497 | | | | 91,438 | | | | 30,322 | | | | 25,336 | |
Net realized gain (loss) on foreign currency transactions | | | 431 | | | | 222 | | | | 279 | | | | — | |
Change in unrealized appreciation (depreciation) on investments, foreign currency translations and non-interested trustees’ deferred compensation | | | 62,949 | | | | 20,700 | | | | 28,796 | | | | 21,972 | |
| | | | | | | | | | | | | | | | | |
Net increase in net assets resulting from operations | | | 114,086 | | | | 108,982 | | | | 58,101 | | | | 45,912 | |
| | | | | | | | | | | | | | | | | |
DISTRIBUTIONS: | | | | | | | | | | | | | | | | |
Distributions (1) | | | (87,734 | ) | | | | | | | (25,153 | ) | | | | |
| | | | | | | | | | | | | | | | | |
Net realized gains (1) | | | | | | | — | | | | | | | | (2,136 | ) |
Total distributions | | | | | | | — | | | | | | | | (2,136 | ) |
| | | | | | | | | | | | | | | | | |
CAPITAL SHARE TRANSACTIONS: | | | | | | | | | | | | | | | | |
Proceeds from sales of shares | | | 42,040 | | | | 30,112 | | | | 40,238 | | | | 14,269 | |
Proceeds from reinvestment of distributions | | | 85,196 | | | | — | | | | 24,655 | | | | 2,048 | |
Value of assets acquired in exchange for shares (2) | | | — | | | | — | | | | — | | | | — | |
Redemption of shares | | | (107,231 | ) | | | (193,307 | ) | | | (65,823 | ) | | | (81,384 | ) |
| | | | | | | | | | | | | | | | | |
Net increase (decrease) from capital share transactions | | | 20,005 | | | | (163,195 | ) | | | (930 | ) | | | (65,067 | ) |
| | | | | | | | | | | | | | | | | |
TOTAL INCREASE (DECREASE) IN NET ASSETS | | | 46,357 | | | | (54,213 | ) | | | 32,018 | | | | (21,291 | ) |
| | | | | | | | | | | | | | | | | |
NET ASSETS: | | | | | | | | | | | | | | | | |
Beginning of Period | | | 559,657 | | | | 613,870 | | | | 266,922 | | | | 288,213 | |
| | | | | | | | | | | | | | | | | |
End of Period (3) | | $ | 606,014 | | | $ | 559,657 | | | $ | 298,940 | | | $ | 266,922 | |
| | | | | | | | | | | | | | | | | |
TRANSACTIONS IN SHARES: | | | | | | | | | | | | | | | | |
Shares sold | | | 2,178 | | | | 1,762 | | | | 2,083 | | | | 864 | |
Shares issued in reinvestment of distributions | | | 4,953 | | | | — | | | | 1,391 | | | | 137 | |
Shares issued for acquisition (2) | | | — | | | | — | | | | — | | | | — | |
Shares redeemed | | | (5,608 | ) | | | (11,719 | ) | | | (3,475 | ) | | | (5,100 | ) |
| | | | | | | | | | | | | | | | | |
NET INCREASE (DECREASE) | | | 1,523 | | | | (9,957 | ) | | | (1 | ) | | | (4,099 | ) |
(1) | Distributions are presented separately by year in accordance with the SEC Rule for Disclosure Update and Simplification. The SEC eliminated the requirement to disclose the distribution amounts by type in 2018. |
(2) | Amounts relate to the reorganization of the Flexible Capital Fund with and into the Global Fund. Please refer to Note 4 for additional information. |
(3) | Net Assets - End of Period includes Accumulated net investment loss of $(4,373), $(2,262), $(2,457), $(553) and $(574) in 2017, for the Focus Fund, Growth Fund, 21st Century Fund, International Opportunities Fund, and Global Fund, respectively. The SEC eliminated the requirement to disclose undistributed net investment income (accumulated net investment loss) amounts as a separate line item in 2018. |
| See notes to financial statements. |
36
| | MARSICO
21st CENTURY FUND | | | MARSICO
INTERNATIONAL
OPPORTUNITIES FUND | | | MARSICO
GLOBAL FUND | |
| | | | | | | | | | | | | | | | | | | | | | | | |
| | Year
Ended
9/30/18 | | | Year
Ended
9/30/17 | | | Year
Ended
9/30/18 | | | Year
Ended
9/30/17 | | | Year
Ended
9/30/18 | | | Year
Ended
9/30/17 | |
| | | | | | | | | | | | | | | | | | | | | | | | |
| | | | | | | | | | | | | | | | | | | | | | | | |
| | $ | (1,858 | ) | | $ | (2,178 | ) | | $ | (227 | ) | | $ | (444 | ) | | $ | (785 | ) | | $ | (316 | ) |
| | | 76,404 | | | | 34,718 | | | | 6,541 | | | | 9,143 | | | | 3,415 | | | | 4,701 | |
| | | 151 | | | | (353 | ) | | | 288 | | | | (402 | ) | | | (22 | ) | | | 36 | |
| | | (15,070 | ) | | | 6,689 | | | | (3,447 | ) | | | 3,642 | | | | 16,268 | | | | 4,001 | |
| | | | | | | | | | | | | | | | | | | | | | | | |
| | | 59,627 | | | | 38,876 | | | | 3,155 | | | | 11,939 | | | | 18,876 | | | | 8,422 | |
| | | | | | | | | | | | | | | | | | | | | | | | |
| | | | | | | | | | | | | | | | | | | | | | | | |
| | | — | | | | | | | | — | | | | | | | | (4,068 | ) | | | | |
| | | | | | | | | | | | | | | | | | | | | | | | |
| | | | | | | — | | | | | | | | — | | | | | | | | — | |
| | | | | | | — | | | | | | | | — | | | | | | | | — | |
| | | | | | | | | | | | | | | | | | | | | | | | |
| | | | | | | | | | | | | | | | | | | | | | | | |
| | | 5,584 | | | | 6,114 | | | | 8,760 | | | | 3,027 | | | | 26,439 | | | | 3,764 | |
| | | — | | | | — | | | | — | | | | — | | | | 3,948 | | | | — | |
| | | — | | | | — | | | | — | | | | — | | | | 218,657 | | | | — | |
| | | (26,666 | ) | | | (45,448 | ) | | | (13,552 | ) | | | (14,010 | ) | | | (21,831 | ) | | | (11,966 | ) |
| | | | | | | | | | | | | | | | | | | | | | | | |
| | | (21,082 | ) | | | (39,334 | ) | | | (4,792 | ) | | | (10,983 | ) | | | 227,213 | | | | (8,202 | ) |
| | | | | | | | | | | | | | | | | | | | | | | | |
| | | 38,545 | | | | (458 | ) | | | (1,637 | ) | | | 956 | | | | 242,021 | | | | 220 | |
| | | | | | | | | | | | | | | | | | | | | | | | |
| | | | | | | | | | | | | | | | | | | | | | | | |
| | | 234,322 | | | | 234,780 | | | | 63,789 | | | | 62,833 | | | | 44,493 | | | | 44,273 | |
| | | | | | | | | | | | | | | | | | | | | | | | |
| | $ | 272,867 | | | $ | 234,322 | | | $ | 62,152 | | | $ | 63,789 | | | $ | 286,514 | | | $ | 44,493 | |
| | | | | | | | | | | | | | | | | | | | | | | | |
| | | | | | | | | | | | | | | | | | | | | | | | |
| | | 185 | | | | 256 | | | | 422 | | | | 181 | | | | 1,619 | | | | 267 | |
| | | — | | | | — | | | | — | | | | — | | | | 274 | | | | — | |
| | | — | | | | — | | | | — | | | | — | | | | 13,188 | | | | — | |
| | | (907 | ) | | | (1,963 | ) | | | (655 | ) | | | (893 | ) | | | (1,328 | ) | | | (1,007 | ) |
| | | | | | | | | | | | | | | | | | | | | | | | |
| | | (722 | ) | | | (1,707 | ) | | | (233 | ) | | | (712 | ) | | | 13,753 | | | | (740 | ) |
37
FINANCIAL HIGHLIGHTS
| | | MARSICO
FOCUS FUND | |
For a Fund Share Outstanding
Throughout the Period | | | Year
Ended
9/30/18 | | | | Year
Ended
9/30/17 | | | | Year
Ended
9/30/16 | | | | Year
Ended
9/30/15 | | | | Year
Ended
9/30/14 | |
| | | | | | | | | | | | | | | | | | | | | |
| Net Asset Value, Beginning of Period | | $ | 19.63 | | | $ | 15.96 | | | $ | 18.83 | | | $ | 22.41 | | | $ | 21.47 | |
| | | | | | | | | | | | | | | | | | | | | |
| | | | | | | | | | | | | | | | | | | | | |
| Income from Investment Operations: | | | | | | | | | | | | | | | | | | | | |
| Net investment loss | | | (0.09 | ) | | | (0.17 | ) | | | (0.13 | ) | | | (0.10 | ) | | | (0.07 | ) |
| Net realized and unrealized gains (losses) on investments | | | 3.82 | | | | 3.84 | | | | 1.25 | | | | (0.62 | ) | | | 4.46 | |
| | | | | | | | | | | | | | | | | | | | | |
| Total from investment operations | | | 3.73 | | | | 3.67 | | | | 1.12 | | | | (0.72 | ) | | | 4.39 | |
| | | | | | | | | | | | | | | | | | | | | |
| Distributions & Other: | | | | | | | | | | | | | | | | | | | | |
| Net investment income | | | — | | | | — | | | | — | | | | — | | | | — | |
| Net realized gains | | | (3.19 | ) | | | — | | | | (3.99 | ) | | | (2.86 | ) | | | (3.45 | ) |
| | | | | | | | | | | | | | | | | | | | | |
| Total distributions and other | | | (3.19 | ) | | | — | | | | (3.99 | ) | | | (2.86 | ) | | | (3.45 | ) |
| | | | | | | | | | | | | | | | | | | | | |
| Net Asset Value, End of Period | | $ | 20.17 | | | $ | 19.63 | | | $ | 15.96 | | | $ | 18.83 | | | $ | 22.41 | |
| | | | | | | | | | | | | | | | | | | | | |
| | | | | | | | | | | | | | | | | | | | | |
| Total Return | | | 21.78 | % | | | 22.99 | % | | | 5.75 | % | | | (4.15 | )% | | | 22.27 | % |
| | | | | | | | | | | | | | | | | | | | | |
| | | | | | | | | | | | | | | | | | | | | |
| Supplemental Data and Ratios: | | | | | | | | | | | | | | | | | | | | |
| | | | | | | | | | | | | | | | | | | | | |
| Net assets, end of period (000s) | | $ | 606,014 | | | $ | 559,657 | | | $ | 613,870 | | | $ | 788,851 | | | $ | 933,054 | |
| | | | | | | | | | | | | | | | | | | | | |
| Ratio of expenses to average net assets, less waivers and before expenses paid indirectly, plus recoupment of previously waived fees or expenses paid | | | 1.21 | % | | | 1.37 | % | | | 1.29 | % | | | 1.31 | % | | | 1.34 | % |
| | | | | | | | | | | | | | | | | | | | | |
| Ratio of net investment loss to average net assets, net of waivers, recoupment of previously waived fees or expenses paid and expenses paid indirectly | | | (0.48 | )% | | | (0.62 | )% | | | (0.63 | )% | | | (0.45 | )% | | | (0.35 | )% |
| | | | | | | | | | | | | | | | | | | | | |
| Ratio of expenses to average net assets, before waivers, recoupment of previously waived fees or expenses paid and expenses paid indirectly | | | 1.21 | % | | | 1.37 | % | | | 1.29 | % | | | 1.31 | % | | | 1.34 | % |
| | | | | | | | | | | | | | | | | | | | | |
| Ratio of net investment loss to average net assets, before waivers, recoupment of previously waived fees or expenses paid and expenses paid indirectly | | | (0.48 | )% | | | (0.62 | )% | | | (0.63 | )% | | | (0.45 | )% | | | (0.35 | )% |
| | | | | | | | | | | | | | | | | | | | | |
| Portfolio turnover rate | | | 53 | % | | | 67 | % | | | 45 | % | | | 68 | % | | | 71 | % |
| See notes to financial statements. |
38
MARSICO
GROWTH FUND | | | MARSICO
21st CENTURY FUND | |
Year
Ended
9/30/18 | | | Year
Ended
9/30/17 | | | Year
Ended
9/30/16 | | | Year
Ended
9/30/15 | | | Year
Ended
9/30/14 | | | Year
Ended
9/30/18 | | | Year
Ended
9/30/17 | | | Year
Ended
9/30/16 | | | Year
Ended
9/30/15 | | | Year
Ended
9/30/14 | |
| | | | | | | | | | | | | | | | | | | | | | | | | | | | | |
| $ | 18.47 | | | $ | 15.54 | | | $ | 20.11 | | | $ | 23.63 | | | $ | 25.03 | | | $ | 26.19 | | | $ | 22.04 | | | $ | 20.38 | | | $ | 20.90 | | | $ | 18.05 | |
| | | | | | | | | | | | | | | | | | | | | | | | | | | | | | | | | | | | | | | |
| | | | | | | | | | | | | | | | | | | | | | | | | | | | | | | | | | | | | | | |
| | | | | | | | | | | | | | | | | | | | | | | | | | | | | | | | | | | | | | | |
| | (0.09 | ) | | | (0.14 | ) | | | (0.13 | ) | | | (0.15 | ) | | | (0.08 | ) | | | (0.25 | ) | | | (0.29 | ) | | | (0.29 | ) | | | (0.21 | ) | | | (0.21 | ) |
| | 4.06 | | | | 3.19 | | | | 1.33 | | | | (0.62 | ) | | | 4.01 | | | | 7.24 | | | | 4.44 | | | | 1.95 | | | | (0.31 | ) | | | 3.06 | |
| | | | | | | | | | | | | | | | | | | | | | | | | | | | | | | | | | | | | | | |
| | 3.97 | | | | 3.05 | | | | 1.20 | | | | (0.77 | ) | | | 3.93 | | | | 6.99 | | | | 4.15 | | | | 1.66 | | | | (0.52 | ) | | | 2.85 | |
| | | | | | | | | | | | | | | | | | | | | | | | | | | | | | | | | | | | | | | |
| | | | | | | | | | | | | | | | | | | | | | | | | | | | | | | | | | | | | | | |
| | — | | | | — | | | | — | | | | — | | | | (0.06 | ) | | | — | | | | — | | | | — | | | | — | | | | — | |
| | (1.75 | ) | | | (0.12 | ) | | | (5.77 | ) | | | (2.75 | ) | | | (5.27 | ) | | | — | | | | — | | | | — | | | | — | | | | — | |
| | | | | | | | | | | | | | | | | | | | | | | | | | | | | | | | | | | | | | | |
| | (1.75 | ) | | | (0.12 | ) | | | (5.77 | ) | | | (2.75 | ) | | | (5.33 | ) | | | — | | | | — | | | | — | | | | — | | | | — | |
| | | | | | | | | | | | | | | | | | | | | | | | | | | | | | | | | | | | | | | |
| $ | 20.69 | | | $ | 18.47 | | | $ | 15.54 | | | $ | 20.11 | | | $ | 23.63 | | | $ | 33.18 | | | $ | 26.19 | | | $ | 22.04 | | | $ | 20.38 | | | $ | 20.90 | |
| | | | | | | | | | | | | | | | | | | | | | | | | | | | | | | | | | | | | | | |
| | | | | | | | | | | | | | | | | | | | | | | | | | | | | | | | | | | | | | | |
| | 23.10 | % | | | 19.85 | % | | | 5.94 | % | | | (4.10 | )% | | | 17.51 | % | | | 26.69 | % | | | 18.83 | % | | | 8.15 | % | | | (2.49 | )% | | | 15.79 | % |
| | | | | | | | | | | | | | | | | | | | | | | | | | | | | | | | | | | | | | | |
| | | | | | | | | | | | | | | | | | | | | | | | | | | | | | | | | | | | | | | |
| | | | | | | | | | | | | | | | | | | | | | | | | | | | | | | | | | | | | | | |
| | | | | | | | | | | | | | | | | | | | | | | | | | | | | | | | | | | | | | | |
| $ | 298,940 | | | $ | 266,922 | | | $ | 288,213 | | | $ | 410,442 | | | $ | 562,653 | | | $ | 272,867 | | | $ | 234,322 | | | $ | 234,780 | | | $ | 268,384 | | | $ | 316,293 | |
| | | | | | | | | | | | | | | | | | | | | | | | | | | | | | | | | | | | | | | |
| | 1.25 | % | | | 1.42 | % | | | 1.37 | % | | | 1.35 | % | | | 1.37 | % | | | 1.21 | % | | | 1.40 | % | | | 1.41 | % | | | 1.38 | % | | | 1.42 | % |
| | | | | | | | | | | | | | | | | | | | | | | | | | | | | | | | | | | | | | | |
| | (0.46 | )% | | | (0.53 | )% | | | (0.61 | )% | | | (0.52 | )% | | | (0.34 | )% | | | (0.74 | )% | | | (0.96 | )% | | | (1.01 | )% | | | (0.78 | )% | | | (0.88 | )% |
| | | | | | | | | | | | | | | | | | | | | | | | | | | | | | | | | | | | | | | |
| | 40 | % | | | 50 | % | | | 52 | % | | | 81 | % | | | 80 | % | | | 90 | % | | | 28 | % | | | 44 | % | | | 94 | % | | | 83 | % |
39
FINANCIAL HIGHLIGHTS
| | | MARSICO
INTERNATIONAL OPPORTUNITIES FUND | |
For a Fund Share Outstanding
Throughout the Period | | | Year
Ended
9/30/18 | | | | Year
Ended
9/30/17 | | | | Year
Ended
9/30/16 | | | | Year
Ended
9/30/15 | | | | Year
Ended
9/30/14 | |
| | | | | | | | | | | | | | | | | | | | | |
| Net Asset Value, Beginning of Period | | $ | 19.30 | | | $ | 15.64 | | | $ | 14.51 | | | $ | 14.72 | | | $ | 15.30 | |
| | | | | | | | | | | | | | | | | | | | | |
| | | | | | | | | | | | | | | | | | | | | |
| Income from Investment Operations: | | | | | | | | | | | | | | | | | | | | |
| Net investment income (loss) | | | (0.09 | ) | | | (0.16 | ) | | | (0.20 | ) | | | (0.21 | ) | | | (0.06 | ) |
| Net realized and unrealized gains (losses) on investments | | | 1.02 | | | | 3.82 | | | | 1.33 | | | | — | (1) | | | (0.42 | ) |
| | | | | | | | | | | | | | | | | | | | | |
| Total from investment operations | | | 0.93 | | | | 3.66 | | | | 1.13 | | | | (0.21 | ) | | | (0.48 | ) |
| | | | | | | | | | | | | | | | | | | | | |
| Distributions & Other: | | | | | | | | | | | | | | | | | | | | |
| Net investment income | | | — | | | | — | | | | — | | | | — | | | | (0.10 | ) |
| Net realized gains | | | — | | | | — | | | | — | | | | — | | | | — | |
| | | | | | | | | | | | | | | | | | | | | |
| Total distributions and other | | | — | | | | — | | | | — | | | | — | | | | (0.10 | ) |
| | | | | | | | | | | | | | | | | | | | | |
| Net Asset Value, End of Period | | $ | 20.23 | | | $ | 19.30 | | | $ | 15.64 | | | $ | 14.51 | | | $ | 14.72 | |
| | | | | | | | | | | | | | | | | | | | | |
| | | | | | | | | | | | | | | | | | | | | |
| Total Return | | | 4.82 | % | | | 23.40 | % | | | 7.79 | % | | | (1.43 | )% | | | (3.18 | )% |
| | | | | | | | | | | | | | | | | | | | | |
| | | | | | | | | | | | | | | | | | | | | |
| Supplemental Data and Ratios: | | | | | | | | | | | | | | | | | | | | |
| | | | | | | | | | | | | | | | | | | | | |
| Net assets, end of period (000s) | | $ | 62,152 | | | $ | 63,789 | | | $ | 62,833 | | | $ | 89,141 | | | $ | 175,984 | |
| | | | | | | | | | | | | | | | | | | | | |
| Ratio of expenses to average net assets, less waivers and before expenses paid indirectly, plus recoupment of previously waived fees or expenses paid | | | 1.52 | %(3) | | | 1.60 | % | | | 1.60 | % | | | 1.60 | % | | | 1.60 | % |
| | | | | | | | | | | | | | | | | | | | | |
| Ratio of net investment loss to average net assets, net of waivers, recoupment of previously waived fees or expenses paid and expenses paid indirectly | | | (0.33 | )% | | | (0.77 | )% | | | (0.71 | )% | | | (0.86 | )% | | | (0.55 | )% |
| | | | | | | | | | | | | | | | | | | | | |
| Ratio of expenses to average net assets, before waivers, recoupment of previously waived fees or expenses paid and expenses paid indirectly | | | 1.59 | % | | | 1.79 | % | | | 1.78 | % | | | 1.63 | % | | | 1.52 | % |
| | | | | | | | | | | | | | | | | | | | | |
| Ratio of net investment loss to average net assets, before waivers, recoupment of previously waived fees or expenses paid and expenses paid indirectly | | | (0.40 | )% | | | (0.96 | )% | | | (0.89 | )% | | | (0.89 | )% | | | (0.47 | )% |
| | | | | | | | | | | | | | | | | | | | | |
| Portfolio turnover rate | | | 33 | % | | | 108 | % | | | 223 | % | | | 217 | % | | | 178 | % |
(2) | The per share amount shown does not correlate with the amount reflected on the Global Fund’s Statement of Operations due to the shares outstanding significantly increasing late in the fiscal year as a result of the reorganization of the Flexible Capital Fund with and into the Global Fund. Please refer to Note 4 for additional information related to the reorganization. |
(3) | During the fiscal year, the Adviser agreed to reduce the expense limitation cap for the Fund. Please refer to Note 3 for information concerning the timing and modifications made to the written expense limitation and fee waiver agreement. |
| See notes to financial statements. |
40
| | MARSICO
GLOBAL FUND | |
| | | Year
Ended
9/30/18 | | | | Year
Ended
9/30/17 | | | | Year
Ended
9/30/16 | | | | Year
Ended
9/30/15 | | | | Year
Ended
9/30/14 | |
| | | | | | | | | | | | | | | | | | | | |
| $ | | 15.13 | | $ | 12.03 | | $ | 12.37 | | $ | 14.45 | | $ | 14.74 |
| | | | | | | | | | | | | | | | | | | | |
| | | | | | | | | | | | | | | | | | | | |
| | | | | | | | | | | | | | | | | | | | |
| | | 0.11 | (2) | | | (0.14 | ) | | | (0.16 | ) | | | (0.10 | ) | | | (0.05 | ) |
| | | 3.26 | | | | 3.24 | | | | 1.14 | | | | (0.32 | ) | | | 1.93 | |
| | | | | | | | | | | | | | | | | | | | |
| | | 3.37 | | | | 3.10 | | | | 0.98 | | | | (0.42 | ) | | | 1.88 | |
| | | | | | | | | | | | | | | | | | | | |
| | | | | | | | | | | | | | | | | | | | |
| | | — | | | | — | | | | — | | | | — | | | | — | |
| | | (1.34 | ) | | | — | | | | (1.32 | ) | | | (1.66 | ) | | | (2.17 | ) |
| | | | | | | | | | | | | | | | | | | | |
| | | (1.34 | ) | | | — | | | | (1.32 | ) | | | (1.66 | ) | | | (2.17 | ) |
| | | | | | | | | | | | | | | | | | | | |
| | $ | 17.16 | | | $ | 15.13 | | | $ | 12.03 | | | $ | 12.37 | | | $ | 14.45 | |
| | | | | | | | | | | | | | | | | | | | |
| | | | | | | | | | | | | | | | | | | | |
| | | 23.94 | % | | | 25.77 | % | | | 8.05 | % | | | (3.51 | )% | | | 13.23 | % |
| | | | | | | | | | | | | | | | | | | | |
| | | | | | | | | | | | | | | | | | | | |
| | | | | | | | | | | | | | | | | | | | |
| | | | | | | | | | | | | | | | | | | | |
| | $ | 286,514 | | | $ | 44,493 | | | $ | 44,273 | | | $ | 66,612 | | | $ | 73,475 | |
| | | | | | | | | | | | | | | | | | | | |
| | | 1.48 | %(3) | | | 1.60 | % | | | 1.60 | % | | | 1.60 | % | | | 1.60 | % |
| | | | | | | | | | | | | | | | | | | | |
| | | (0.87 | )% | | | (0.82 | )% | | | (0.60 | )% | | | (0.80 | )% | | | (0.42 | )% |
| | | | | | | | | | | | | | | | | | | | |
| | | 1.59 | % | | | 1.80 | % | | | 1.69 | % | | | 1.54 | % | | | 1.66 | % |
| | | | | | | | | | | | | | | | | | | | |
| | | (0.98 | )% | | | (1.02 | )% | | | (0.69 | )% | | | (0.74 | )% | | | (0.48 | )% |
| | | | | | | | | | | | | | | | | | | | |
| | | 89 | % | | | 79 | % | | | 82 | % | | | 110 | % | | | 129 | % |
41
| NOTES TO FINANCIAL STATEMENTS |
NOTES TO FINANCIAL STATEMENTS September 30, 2018
The Marsico Investment Fund (the “Trust”) was organized on October 1, 1997, as a Delaware statutory trust and is registered under the Investment Company Act of 1940 (the “1940 Act”) as an open-end management investment company. The Focus Fund, Growth Fund, 21st Century Fund, International Opportunities Fund, and Global Fund (collectively, the “Funds”) are separate investment portfolios of the Trust. The Focus Fund is a non-diversified fund and the Growth Fund, the 21st Century Fund, the International Opportunities Fund, and the Global Fund are diversified funds. The Focus Fund and Growth Fund commenced operations on December 31, 1997, the 21st Century Fund commenced operations on February 1, 2000, the International Opportunities Fund commenced operations on June 30, 2000, and the Global Fund commenced operations on June 29, 2007. Trustees and officers of the Trust and employees of Marsico Capital Management, LLC (the “Adviser”) own approximately 5%, 5%, and 8% of the Focus Fund’s, International Opportunities Fund’s, and Global Fund’s outstanding shares, respectively, as of September 30, 2018.
2. | Significant Accounting Policies |
The Funds qualify as investment companies under Accounting Standards Update No. 2013-08, Accounting Standard Codification Topic 946, Financial Services — Investment Companies (“ASC 946”). The following is a summary of significant accounting policies consistently followed by the Funds in the preparation of their financial statements. These policies are in conformity with Generally Accepted Accounting Principles (“GAAP”) in the United States of America for investment companies and follow the accounting guidance provided in ASC 946. The presentation of financial statements in conformity with GAAP requires management to make estimates and assumptions that affect the reported amounts and disclosures of assets and liabilities at the date of the financial statements and the reported amounts and disclosures of income and expenses during the reporting period. Actual results could differ from those estimates.
| | (a) | Investment Valuation — A security traded on a recognized stock exchange is generally valued at the last sale price prior to the closing of the principal exchange on which the security is traded. Securities traded on NASDAQ generally will be valued at the NASDAQ Official Closing Price. If no sale price is reported on the valuation date, the most current bid price will generally be used, with the exception of short option positions which will generally utilize the most current ask price. Other securities for which over-the-counter market quotations are readily available are generally valued at the last sale price. Debt securities that will mature in more than 60 days are generally valued at their bid prices furnished by a pricing service approved by the Funds’ Board of Trustees and subject to review pursuant to procedures established by, and under the general supervision of, the Board of Trustees. Debt securities that will mature in 60 days or less are valued at amortized cost, if it approximates market value. Any securities for which market quotations are not readily available are valued at their fair value as determined in good faith by the Adviser in accordance with procedures established by, and under the general supervision of, the Funds’ Board of Trustees. The Funds may use pricing services to assist in determining market value. The Board of Trustees has authorized the use of a pricing service to assist the Funds in valuing certain equity securities listed or traded on foreign security exchanges in the Funds’ portfolios in certain circumstances where there is a significant change in the value of related US-traded securities, as represented by, for example, the S&P 500 Index. |
“Fair Value Measurements and Disclosures” (the “Fair Value Statement”) defines fair value, establishes a framework for measuring fair value in GAAP, and expands disclosures about fair value measurements. Under the Fair Value Statement, various inputs are used in determining the value of the Funds’ investments.
These inputs are summarized into three broad levels and described below:
| | ● | Level 1 – quoted prices in active markets for identical investments |
| | ● | Level 2 – other significant observable inputs (including quoted prices for similar investments, interest rates, and evaluated quotations obtained from pricing services) |
| | ● | Level 3 – significant unobservable inputs (including the Fund’s assumptions that market participants would use in determining the fair value of investments) |
42
| NOTES TO FINANCIAL STATEMENTS |
The inputs or methodology used for valuing investments are not an indication of the risk associated with investing in those investments. Changes in valuation techniques may result in transfers between the levels during the reporting period. There were no transfers into or out of Level 3 during the reporting period. The following is a summary of the fair values of the Funds’ investments in each category and economic sector as of September 30, 2018:
Fund Investments by
Major Security Type | | Level 1 | | | Level 2 | | | Level 3 | | | Total | |
Marsico Focus Fund | | | | | | | | | | | | | | | | |
Assets | | | | | | | | | | | | | | | | |
Common Stocks | | | | | | | | | | | | | | | | |
Consumer Discretionary | | $ | 57,487,302 | | | $ | — | | | $ | — | | | $ | 57,487,302 | |
Financials | | | 60,386,207 | | | | — | | | | — | | | | 60,386,207 | |
Health Care | | | 97,019,232 | | | | — | | | | — | | | | 97,019,232 | |
Industrials | | | 44,322,871 | | | | — | | | | — | | | | 44,322,871 | |
Information Technology | | | 306,356,401 | | | | — | | | | — | | | | 306,356,401 | |
Materials | | | 23,771,066 | | | | — | | | | — | | | | 23,771,066 | |
Short-term Investments | | | 17,562,307 | | | | — | | | | — | | | | 17,562,307 | |
| | | | | | | | | | | | | | | $ | 606,905,386 | |
Marsico Growth Fund | | | | | | | | | | | | | | | | |
Assets | | | | | | | | | | | | | | | | |
Common Stocks | | | | | | | | | | | | | | | | |
Consumer Discretionary | | $ | 40,696,322 | | | $ | — | | | $ | — | | | $ | 40,696,322 | |
Consumer Staples | | | 12,713,432 | | | | — | | | | — | | | | 12,713,432 | |
Financials | | | 25,162,054 | | | | — | | | | — | | | | 25,162,054 | |
Health Care | | | 37,627,548 | | | | — | | | | — | | | | 37,627,548 | |
Industrials | | | 20,023,582 | | | | — | | | | — | | | | 20,023,582 | |
Information Technology | | | 140,793,758 | | | | — | | | | — | | | | 140,793,758 | |
Materials | | | 8,049,023 | | | | — | | | | — | | | | 8,049,023 | |
Real Estate | | | 7,648,705 | | | | — | | | | — | | | | 7,648,705 | |
Short-term Investments | | | 7,446,926 | | | | — | | | | — | | | | 7,446,926 | |
| | | | | | | | | | | | | | | $ | 300,161,350 | |
Marsico 21st Century Fund | | | | | | | | | | | | | | | | |
Assets | | | | | | | | | | | | | | | | |
Common Stocks | | | | | | | | | | | | | | | | |
Consumer Discretionary | | $ | 39,178,978 | | | $ | — | | | $ | — | | | $ | 39,178,978 | |
Consumer Staples | | | 12,618,830 | | | | — | | | | — | | | | 12,618,830 | |
Financials | | | 11,866,961 | | | | — | | | | — | | | | 11,866,961 | |
Health Care | | | 37,354,526 | | | | — | | | | — | | | | 37,354,526 | |
Industrials | | | 37,511,502 | | | | — | | | | — | | | | 37,511,502 | |
Information Technology | | | 85,026,336 | | | | — | | | | — | | | | 85,026,336 | |
Materials | | | 16,572,715 | | | | — | | | | — | | | | 16,572,715 | |
Real Estate | | | 10,403,547 | | | | — | | | | — | | | | 10,403,547 | |
Short-term Investments | | | 25,430,477 | | | | — | | | | — | | | | 25,430,477 | |
| | | | | | | | | | | | | | | $ | 275,963,872 | |
Marsico International Opportunities Fund | | | | | | | | | | | | | | | | |
Assets | | | | | | | | | | | | | | | | |
Common Stocks | | | | | | | | | | | | | | | | |
Consumer Discretionary | | $ | 8,833,064 | | | $ | — | | | $ | — | | | $ | 8,833,064 | |
Consumer Staples | | | 2,335,604 | | | | — | | | | — | | | | 2,335,604 | |
Financials | | | 9,600,074 | | | | — | | | | — | | | | 9,600,074 | |
Health Care | | | 7,581,677 | | | | — | | | | — | | | | 7,581,677 | |
Industrials | | | 4,689,615 | | | | — | | | | — | | | | 4,689,615 | |
Information Technology | | | 23,894,864 | | | | — | | | | — | | | | 23,894,864 | |
Real Estate | | | 1,784,679 | | | | — | | | | — | | | | 1,784,679 | |
Telecommunication Services | | | 2,491,843 | | | | — | | | | — | | | | 2,491,843 | |
Short-term Investments | | | 721,850 | | | | — | | | | — | | | | 721,850 | |
| | | | | | | | | | | | | | | $ | 61,933,270 | |
43
| NOTES TO FINANCIAL STATEMENTS |
NOTES TO FINANCIAL STATEMENTS September 30, 2018 (continued)
Fund Investments by
Major Security Type | | Level 1 | | | Level 2 | | | Level 3 | | | Total | |
Marsico Global Fund | | | | | | | | | | | | | | | | |
Assets | | | | | | | | | | | | | | | | |
Common Stocks | | | | | | | | | | | | | | | | |
Consumer Discretionary | | $ | 65,641,080 | | | $ | — | | | $ | — | | | $ | 65,641,080 | |
Health Care | | | 29,834,870 | | | | — | | | | — | | | | 29,834,870 | |
Industrials | | | 12,844,764 | | | | — | | | | — | | | | 12,844,764 | |
Information Technology | | | 170,680,267 | | | | — | | | | — | | | | 170,680,267 | |
Materials | | | 6,648,342 | | | | — | | | | — | | | | 6,648,342 | |
Short-term Investments | | | 1,575,330 | | | | — | | | | — | | | | 1,575,330 | |
| | | | | | | | | | | | | | | $ | 287,224,653 | |
| | (b) | Expenses — The Funds are charged for those expenses that are directly attributable to each Fund, such as advisory and custodial fees. Expenses that are not directly attributable to a Fund are typically allocated among the Funds in proportion to their respective net assets and are in some cases allocated based on other factors. The Funds’ expenses may be reduced by advisory fee waivers, brokerage credits and uninvested cash balances earning interest or credits. Such credits are included in “Less waiver of expenses and expenses paid indirectly” on the Statements of Operations. |
Brokerage commissions may be paid to certain brokers which reduce transfer agent fees and expenses. For the year ended September 30, 2018, the Funds received no such brokerage commission credits. The Funds received earnings credits on certain cash account balances which reduced transfer agent fees and expenses by $1 (in thousands) for the Focus Fund, and by less than $1 (in thousands) for each of the Growth Fund, 21st Century Fund, International Opportunities Fund, and Global Fund for the year ended September 30, 2018. Brokerage commission credits and earnings credits (if any) are included in “Less waiver of expenses and expenses paid indirectly” on the Statements of Operations.
| | (c) | Federal Income Taxes — Each Fund intends to comply with the requirements of the Internal Revenue Code of 1986, as amended (the “Internal Revenue Code”), necessary to continue to qualify as a regulated investment company and to make the requisite distributions of income to its shareholders which will be sufficient to relieve it from all or substantially all federal and state income taxes. Certain Funds may utilize earnings and profits on redemption of shares as part of the dividends paid deduction. |
| | (d) | Distributions to Shareholders — Dividends from net investment income and net realized capital gains, if any, will be declared and paid at least annually. Distributions to shareholders are recorded on the ex-dividend date. Each Fund may periodically make reclassifications among certain of its capital accounts as a result of the timing and characterization of certain income and capital gains distributions determined in accordance with federal tax regulations, which may differ from GAAP. These reclassifications are due to differing treatment for items such as foreign currency transactions, passive foreign investment companies and net investment losses. |
The Funds at times may invest in real estate investment trusts (“REITs”). REITs generally pay dividends to their investors based upon cash available from their operations and this amount may differ significantly from the REITs’ actual earnings and profits (“E&P”) determined for income tax purposes. It is common for these dividends to exceed the REITs’ taxable E&P, resulting in the excess portion of such dividends eventually being designated as a return of capital. Determination of the tax character of dividends made by REITs is typically performed by the REIT several months subsequent to the payment of the dividend. Therefore, due to timing issues, the Funds may be in a position of being required to calculate and pay required distribution amounts to their shareholders based on the best information available from the REITs, which may be prior to the final determination of the REITs’ taxable E&P, and it is possible that a portion of the Funds’ distribution amounts could include a return of capital to shareholders for federal income tax purposes.
| | (e) | Foreign Currency Translation — The accounting records of the Funds are maintained in US dollars. For valuation purposes, values of securities denominated in foreign currencies are translated into US dollars at 4:00 p.m. Eastern Time. Amounts related to the purchase and sale of foreign securities and investment income are translated at the rates of exchange prevailing on the respective dates of such transactions. |
Reported realized gains and losses on foreign currency transactions arise from sales of portfolio securities, forward foreign currency contracts, currency gains or losses realized between the trade and settlement dates on securities transactions, and the difference between the amounts of dividends, interest, and foreign withholding taxes recorded on the Funds’ books and the US dollar equivalent of the amounts actually received or paid.
The Funds do not isolate that portion of the results of operations resulting from changes in foreign exchange rates on investments from the fluctuations arising from changes in market prices of securities held at the end of the reporting period. Net unrealized appreciation or depreciation on investments and foreign currency translations arises from changes in the value of assets and liabilities, including investments in securities at the end of the reporting period, resulting from changes in the exchange rates and changes in market prices of securities held. Transactions in foreign-denominated assets may involve greater risks than domestic transactions, including currency risk, political and economic risk, regulatory risk and market risk.
44
| NOTES TO FINANCIAL STATEMENTS |
| | (f) | Derivative Instruments — “Disclosure about Derivative Instruments and Hedging Activities” (the “Derivatives Statement”) requires enhanced disclosures about the Funds’ derivative and hedging activities, including how such activities are accounted for and their effects on the Funds’ financial position, performance and cash flows. |
The Funds are not intended as vehicles for investing substantially in derivative instruments, and may hold derivative instruments only infrequently. The Funds enter into derivative instruments in order to increase exposure to certain investments, asset classes, or markets, or for hedging purposes to hedge against adverse movements in securities prices, currency rates or interest rates. The Funds can hold various types of derivative instruments such as futures contracts and options on securities, financial indexes, and foreign currencies, options on futures, forward foreign currency contracts, interest rate swaps, credit default swaps, and swap-related products. The use of derivative instruments may involve risks such as the possibility of illiquid markets or imperfect correlation between the value of the derivative instruments and the underlying securities, or that the counterparty will fail to perform its obligations. There were no outstanding derivative instruments held by the Funds as of September 30, 2018 nor did the Funds utilize derivative instruments during the year ended September 30, 2018.
| | (g) | Non-Interested Trustees’ Deferred Fee Plan — Effective February 1, 2000, the Board of Trustees adopted the Marsico Investment Fund Deferred Fee Plan (the “Deferred Fee Plan”), amended and restated as of December 30, 2005, which allows the Trustees who are not “interested persons” of the Funds, as defined in the 1940 Act (“non-interested Trustees”), to defer the receipt of all or a portion of their compensation received from the Funds. Any deferred fees are credited to accounts established on behalf of the non-interested Trustees into the Funds as directed by each non-interested Trustee. The amounts credited to these accounts increase or decrease in accordance with the performance of the Funds selected by the non-interested Trustees. The market value of the deferred account balances as of September 30, 2018 is shown on the Statements of Assets and Liabilities as part of an asset account, “Prepaid expenses and other assets”, and a liability account, “Accrued trustees’ fees”. Additionally, the fluctuation of the account balances due to the Funds’ performance is recorded by the Funds as unrealized appreciation (depreciation), which is shown as part of “Total distributable earnings (loss)” on the Statements of Assets and Liabilities, and as compensation expense, which is shown as part of the expense account “Trustees’ fees and expenses” on the Statements of Operations. Fees earned and deferred by the non-interested Trustees for the year ended September 30, 2018 are also included in “Trustees’ fees and expenses” on the Statements of Operations. Amounts contributed to the Deferred Fee Plan will be deferred until distributed in accordance with the Deferred Fee Plan. Unrealized appreciation (depreciation) of Fund shares held in the Deferred Fee Plan is subject to the Funds’ expense reimbursement agreement with the Adviser. |
| | (h) | Other — Investment transactions are accounted for on a trade date basis. Each Fund determines the gain or loss realized from the investment transactions by comparing the original cost of the security lot sold with the net sale proceeds. Dividend income is recognized on the ex-dividend date. Certain dividends from foreign securities are recorded when the Funds are informed of the dividend if such information is obtained subsequent to the ex-dividend date. Interest income is recognized on an accrual basis and includes amortization of premiums and accretion of discounts. |
| | (i) | Indemnifications — In the normal course of business, the Funds enter into contracts that contain provisions indemnifying other parties against specified potential liabilities. Each Fund’s maximum exposure under these arrangements is unknown as this would involve future claims that may be made against the Fund that have not yet occurred. However, based on experience, the Funds expect the risk of loss in connection with these potential indemnification obligations to be remote. There can be no assurance that material liabilities related to such obligations will not arise in the future, which may adversely impact a Fund. |
3. | Investment Advisory Agreement and Transactions With Affiliates |
Each Fund has an agreement with the Adviser to furnish investment advisory services to the Funds. Each Fund pays the Adviser a fee calculated using the following rates:
Annual Rate of Average Daily Net Assets | Asset Threshold |
0.80% | First $250 million |
0.75% | Next $250 million |
0.70% | Next $250 million |
0.65% | In excess of $750 million |
The Adviser has entered into a written expense limitation and fee waiver agreement under which it has agreed to limit the total expenses of each Fund (other than the Global Fund) (excluding taxes, interest, acquired fund fees and expenses, litigation, extraordinary expenses, brokerage and other transaction expenses relating to the purchase or sale of portfolio investments) to an annual rate of 1.50% of the average net assets of the International Opportunities Fund, and 1.45% of the average net assets of the Focus Fund, the Growth Fund, and the 21st Century Fund, until January 31, 2019. This expense limitation and fee waiver agreement may be terminated by the Adviser at any time after January 31, 2019, upon 15 days prior notice to the Fund and its administrator. These annual expense limitation rates were effective December 1, 2017. Prior to December 1, 2017, the Adviser had agreed to limit the total expenses of each Fund (other than the Global Fund) (with certain exclusions) to an annual rate of 1.60% of the average net assets of the Focus Fund, and the International Opportunities Fund and 1.50% of the average net assets of the Growth Fund and the 21st Century Fund.
45
| NOTES TO FINANCIAL STATEMENTS |
NOTES TO FINANCIAL STATEMENTS September 30, 2018 (continued)
The Adviser has entered into a written expense limitation and fee waiver agreement under which it has agreed to limit the total expenses of the Global Fund (excluding taxes, interest, acquired fund fees and expenses, litigation, extraordinary expenses, brokerage and other transaction expenses relating to the purchase or sale of portfolio investments) to an annual rate of 1.45% of the average net assets until September 30, 2019. This agreement became effective August 4, 2018 upon consummation of the reorganization of the Flexible Capital Fund with and into the Global Fund, which is discussed further below. For the period from December 1, 2017 through August 3, 2018, the Adviser had agreed to limit the total expenses of the Global Fund (with certain exclusions) to an annual rate of 1.50% of the average net assets of the Global Fund. Prior to December 1, 2017, the Adviser had agreed to limit the total expenses of the Global Fund (with certain exclusions) to an annual rate of 1.60% of the average net assets of the Global Fund.
The Adviser may recoup from a Fund fees previously waived or expenses previously reimbursed by the Adviser with respect to that Fund pursuant to these agreements (or a previous expense limitation agreement) if: (1) such recoupment by the Adviser does not cause the Fund, at the time of recoupment, to exceed the lesser of (a) the expense limitation in effect at the time the relevant amount was waived and/or reimbursed, or (b) the expense limitation in effect at the time of the proposed recoupment, and (2) the recoupment is made within three years after the fiscal year end date as of which the amount to be waived or reimbursed was determined and the waiver or reimbursement occurred. As of September 30, 2018, recoupment amounts (in thousands) that may potentially be made by the International Opportunities Fund and Global Fund to the Adviser are as follows:
Year of Expiration | | International
Opportunities Fund | | | Global Fund | |
2019 | | $ | 128 | | | $ | 53 | |
2020 | | | 106 | | | | 76 | |
2021 | | | 46 | | | | 99 | |
| | | $ | 280 | | | $ | 228 | |
Certain officers of the Trust are also officers of the Adviser. The Funds pay a portion of the Chief Compliance Officer’s total compensation costs which is shown as part of the expense account “Professional fees” on the Statements of Operations. No other officers of the Trust received compensation from the Funds during the year ended September 30, 2018.
On May 9, 2018, the Board of Trustees of the Trust unanimously approved an agreement and plan of reorganization that provided for the merger of the Flexible Capital Fund with and into the Global Fund. Based on the nature of the transaction, a shareholder vote was not required. After close of business on August 3, 2018, the Global Fund acquired all of the net assets of the Flexible Capital Fund in exchange for shares of the Global Fund. The purpose of the transaction was, in part, to combine two funds managed by the same portfolio manager with comparable investment objectives and strategies. The merger was deemed to be a tax-free reorganization for federal income tax purposes. The table below provides certain information for the impacted Funds on the merger date.
| Immediately Prior to Merger | | Immediately Subsequent to Merger | |
| (Amounts in thousands) | | Fund
Net Assets | | | Fund Shares Outstanding | | | Net Unrealized Appreciation on Investments, Foreign Currency Translations and Non-Interested Trustees’ Deferred Compensation | | | Fund
Net Assets | | | Fund Shares Outstanding | |
| Flexible Capital Fund | | $ | 218,657 | | | | 17,732 | | | $ | 35,003 | | | $ | — | | | | — | |
| Global Fund | | $ | 64,881 | | | | 3,914 | | | $ | 19,221 | | | $ | 283,538 | | | | 17,102 | |
46
| NOTES TO FINANCIAL STATEMENTS |
The following represents the pro forma results of operations (in thousands) for the year ended September 30, 2018 assuming the merger had been completed on October 1, 2017 (beginning of the fiscal year) and the annual written expense limitation and fee waiver agreement of 1.45% of average net assets was in effect for the entire fiscal year. The presentation of pro forma financial statement information requires management to make estimates and assumptions that affect this information. Actual results could differ from those estimates and the pro forma financial information does not purport to be indicative of the financial position or results of operations that may occur in the future.
| Net investment loss | | $ | (279 | ) |
| Net realized gain on investments | | $ | 46,329 | |
| Net realized loss on foreign currency transactions | | $ | (1,187 | ) |
| Change in unrealized appreciation (depreciation) on investments, foreign currency translations and non-interested trustees’ deferred compensation | | $ | (95 | ) |
| Net increase in net assets resulting from operations | | $ | 44,768 | |
The combined investment portfolios have been managed as a single portfolio since the merger was completed on August 3, 2018. Thus, it is not practicable to separate the amounts of revenue and earnings of the Flexible Capital Fund that have been included in the Global Fund’s Statement of Operations since the merger on August 3, 2018.
5. | Distribution and Service Plan |
The Funds have adopted a Distribution and Service Plan (the “Plan”) pursuant to Rule 12b-1 under the 1940 Act. The Plan authorizes payments by the Funds in connection with the distribution of their shares at an annual rate, as determined from time to time by the Board of Trustees, of 0.25% of a Fund’s average daily net assets.
Payments may be made by the Funds under the Plan for the purpose of financing any activity primarily intended to result in the sale of shares of the Funds, as determined by the Board of Trustees, as well as for account maintenance and personal services to shareholders and any other non-distribution-related services. The Adviser may, out of its own resources (which may include legitimate profits from providing advisory services to the Funds or other clients) and at its sole discretion, make certain payments on behalf of the Funds or the Plan for expenses incurred by a Fund for distribution of Fund shares and related services or for administrative or other expenses incurred by the Fund.
The Plan was amended effective December 1, 2017 to reflect non-material changes which were intended to clarify that while the maximum 12b-1 Fee rate remains limited to 0.25% per annum of each Fund’s average daily net assets, one or more Funds may be charged a lower rate from time to time upon approval by the Board of Trustees, and the rate may vary by Fund. The Plan, as amended, also clarifies that previously accrued amounts of the 12b-1 Fee for each Fund may be used by that Fund to pay any current or previously accrued expenses of the Fund authorized by the amended Plan, including non-distribution expenses, authorized by the Plan.
Effective June 1, 2018, pursuant to the amended Plan, the Board of Trustees determined to cause the Focus Fund, Growth Fund, and 21st Century Fund to accrue 12b-1 Fees at a rate of 0.00% per annum of the average daily net assets of each Fund, until such time as the Board authorizes a different rate (not exceeding 0.25% per annum). For the period from December 1, 2017 through May 31, 2018, pursuant to the amended Plan, the Board of Trustees caused the Focus Fund, Growth Fund, and 21st Century Fund to accrue 12b-1 Fees at a rate of 0.20% per annum of the average daily net assets of each Fund. Prior to December 1, 2017, the Focus Fund, Growth Fund, and 21st Century Fund accrued 12b-1 Fees at a rate of 0.25% per annum of average daily net assets of each Fund. The International Opportunities Fund and Global Fund continue to accrue 12b-1 Fees at the rate of 0.25% per annum of the average daily net assets of each Fund until such time as the Board authorizes a different rate.
6. | Investment Transactions |
The aggregate purchases and sales of securities, excluding short-term investments, for the Funds for the year ended September 30, 2018, were as follows:
(Amounts in thousands) | | Focus
Fund | | | Growth
Fund | | | 21st
Century
Fund | | | International
Opportunities
Fund | | | Global
Fund | |
Purchases | | $ | 301,123 | | | $ | 107,728 | | | $ | 211,901 | | | $ | 21,881 | | | $ | 86,318 | |
Sales | | $ | 358,899 | | | $ | 137,038 | | | $ | 240,553 | | | $ | 26,308 | | | $ | 76,975 | |
There were no purchases or sales of US government securities, excluding short-term investments.
47
| NOTES TO FINANCIAL STATEMENTS |
NOTES TO FINANCIAL STATEMENTS September 30, 2018 (continued)
7. | Federal Income Tax Information |
“Accounting for Uncertainty in Income Taxes” (the “Income Tax Statement”) requires an evaluation of tax positions taken (or expected to be taken) in the course of preparing a Fund’s tax returns to determine whether these positions meet a “more-likely-than-not” standard that, based on the technical merits, have a more than fifty percent likelihood of being sustained by a taxing authority upon examination. A tax position that meets the “more-likely-than-not” recognition threshold is measured to determine the amount of benefit to recognize in the financial statements. The Funds recognize interest and penalties, if any, related to unrecognized tax benefits as income tax expense in the Statements of Operations.
The Income Tax Statement requires management of the Funds to analyze all open tax years, consisting of fiscal years 2015-2018 as defined by Internal Revenue Service (“IRS”) statute of limitations for all major jurisdictions, including federal tax authorities and certain state tax authorities. As of and during the year ended September 30, 2018, the Funds did not have any liabilities for any unrecognized tax benefits. The Funds have no examinations in progress and are not aware of any tax positions for which it is reasonably possible that the total amounts of unrecognized tax benefits will significantly change in the next twelve months.
At September 30, 2018, gross unrealized appreciation and depreciation of investments, based on cost for federal income tax purposes, were as follows:
(Amounts in thousands) | | Focus
Fund | | | Growth
Fund | | | 21st
Century
Fund | | | International
Opportunities
Fund | | | Global
Fund | |
Cost of Investments | | $ | 379,116 | | | $ | 188,595 | | | $ | 225,479 | | | $ | 52,192 | | | $ | 225,652 | |
| | | | | | | | | | | | | | | | | | | | | |
Gross Unrealized Appreciation | | $ | 235,454 | | | $ | 112,740 | | | $ | 54,992 | | | $ | 12,669 | | | $ | 68,929 | |
Gross Unrealized Depreciation | | | (7,665 | ) | | | (1,174 | ) | | | (4,507 | ) | | | (2,928 | ) | | | (7,356 | ) |
| | | | | | | | | | | | | | | | | | | | | |
Net Unrealized Appreciation on Investments | | $ | 227,789 | | | $ | 111,566 | | | $ | 50,485 | | | $ | 9,741 | | | $ | 61,573 | |
The difference between cost amounts for financial statement and federal income tax purposes is due primarily to wash sale loss deferrals.
During the year ended September 30, 2018, the 21st Century Fund and International Opportunities Fund utilized capital loss carryforwards of (in thousands) $76,449 and $6,504, respectively. As of September 30, 2018, the remaining accumulated capital loss carryforwards of (in thousands) $307,179 and $87,054, respectively, for the 21st Century Fund and International Opportunities Fund expired unused. These unused balances have been reclassified to paid-in-capital for tax purposes.
As of September 30, 2018, the Focus Fund, Growth Fund, 21st Century Fund, International Opportunities Fund, and Global Fund, respectively, had (in thousands) $1,283, $740, $1,247, $0 and $520 of qualified late-year losses, which are deferred until fiscal year 2019 for tax purposes. Net late-year losses that are deferred are deemed to arise on the first day of the Fund’s next taxable year.
As of September 30, 2018, the components of accumulated earnings on a tax basis were as follows:
(Amounts in thousands) | | Focus
Fund | | | Growth
Fund | | | 21st
Century
Fund | | | International
Opportunities
Fund | | | Global
Fund | |
Undistributed Ordinary Income | | $ | 201 | | | $ | 1,227 | | | $ | — | | | $ | — | | | $ | — | |
Undistributed Trustees' Deferred Compensation | | | (3,052 | ) | | | (1,560 | ) | | | (940 | ) | | | (344 | ) | | | (1,695 | ) |
Undistributed Long-Term Capital Gains | | | 51,423 | | | | 28,123 | | | | — | | | | — | | | | 2,535 | |
Tax Accumulated Earnings (Deficit) | | | 48,572 | | | | 27,790 | | | | (940 | ) | | | (344 | ) | | | 840 | |
Accumulated Capital and Other Losses | | | (1,283 | ) | | | (740 | ) | | | (1,247 | ) | | | — | | | | (520 | ) |
Net Unrealized Appreciation on Investments and on Foreign Currency Translations | | | 227,789 | | | | 111,566 | | | | 50,485 | | | | 9,741 | | | | 61,573 | |
Trustees' Deferred Compensation Mark-to-Market | | | 1,686 | | | | 674 | | | | 231 | | | | 84 | | | | 1,042 | |
Total Accumulated Earnings | | $ | 276,764 | | | $ | 139,290 | | | $ | 48,529 | | | $ | 9,481 | | | $ | 62,935 | |
Undistributed ordinary income consists of net investment income and timing differences related to qualified late-year losses.
48
| NOTES TO FINANCIAL STATEMENTS |
The tax character of distributions paid during the fiscal years ended September 30, 2018 and 2017 was as follows:
| | | 2018 | | | 2017 | |
(Amounts in thousands) | | Ordinary Income | | | Long-Term Capital Gains | | | Ordinary Income | | | Long-Term Capital Gains | |
Focus Fund | | $ | — | | | $ | 87,734 | | | $ | — | | | $ | — | |
Growth Fund | | | — | | | | 25,153 | | | | — | | | | 2,136 | |
21st Century Fund | | | — | | | | — | | | | — | | | | — | |
International Opportunities Fund | | | — | | | | — | | | | — | | | | — | |
Global Fund | | | 361 | | | | 3,707 | | | | — | | | | — | |
The tax character of dividends paid for 2017 may differ from that shown in the Statements of Changes in Net Assets due to short-term gains being treated as ordinary income for tax purposes.
Management of the Adviser has determined that there were no material subsequent events that would require disclosure in the Funds’ financial statements.
| 9. | New Accounting Pronouncements |
The FASB issued Accounting Standards Update No. 2017-08, Receivables – Nonrefundable Fees and Other Costs (Subtopic 310-20), Premium Amortization on Purchased Callable Debt Securities (“ASU 2017-08”) to amend the amortization period for certain purchased callable debt securities held at a premium. The guidance requires certain premiums on callable debt securities to be amortized to the earliest call date. The amortization period for callable debt securities purchased at a discount will not be impacted. The guidance is effective for fiscal years beginning after December 15, 2018, and interim periods within those fiscal years, with early adoption permitted. Management is currently evaluating the impact these changes may have on the Funds’ financial statements.
The FASB issued Accounting Standards Update No. 2018-13, Fair Value Measurement (Topic 820), Disclosure Framework – Changes to the Disclosure Requirements for Fair Value Measurement (“ASU 2018-13”), which includes amendments intended to improve the effectiveness of disclosures in the notes to financial statements, add disclosure requirements regarding the range and weighted average of significant unobservable inputs used to develop Level 3 fair value measurements, and provide clarifications to the narrative description of measurement uncertainty disclosures. ASU 2018-13 is effective for interim and annual periods beginning after December 15, 2019. However, ASU 2018-13 allowed for immediate adoption of those provisions that eliminated certain disclosure items while delaying the adoption of the remaining provisions within ASU 2018-13 until the effective date. Management elected to early adopt only those provisions related to the elimination of certain disclosures, and is currently evaluating the impact that ASU 2018-13 will have on the Funds’ financial statements and related disclosures for the remaining provisions.
49
| REPORT OF INDEPENDENT REGISTERED PUBLIC ACCOUNTING FIRM |
REPORT OF INDEPENDENT REGISTERED PUBLIC ACCOUNTING FIRM
To the Board of Trustees of The Marsico Investment Fund and Shareholders of Marsico Focus Fund, Marsico Growth Fund, Marsico 21st Century Fund, Marsico International Opportunities Fund and Marsico Global Fund
Opinions on the Financial Statements
We have audited the accompanying statements of assets and liabilities, including the schedules of investments, of Marsico Focus Fund, Marsico Growth Fund, Marsico 21st Century Fund, Marsico International Opportunities Fund and Marsico Global Fund (constituting The Marsico Investment Fund, hereafter collectively referred to as the “Funds”) as of September 30, 2018, the related statements of operations for the year ended September 30, 2018, the statements of changes in net assets for each of the two years in the period ended September 30, 2018, including the related notes, and the financial highlights for each of the five years in the period ended September 30, 2018 (collectively referred to as the “financial statements”). In our opinion, the financial statements present fairly, in all material respects, the financial position of each of the Funds as of September 30, 2018, the results of each of their operations for the year then ended, the changes in each of their net assets for each of the two years in the period ended September 30, 2018 and each of the financial highlights for each of the five years in the period ended September 30, 2018 in conformity with accounting principles generally accepted in the United States of America.
Basis for Opinions
These financial statements are the responsibility of the Funds’ management. Our responsibility is to express an opinion on the Funds’ financial statements based on our audits. We are a public accounting firm registered with the Public Company Accounting Oversight Board (United States) (“PCAOB”) and are required to be independent with respect to the Funds in accordance with the U.S. federal securities laws and the applicable rules and regulations of the Securities and Exchange Commission and the PCAOB.
We conducted our audits of these financial statements in accordance with the standards of the PCAOB. Those standards require that we plan and perform the audit to obtain reasonable assurance about whether the financial statements are free of material misstatement, whether due to error or fraud.
Our audits included performing procedures to assess the risks of material misstatement of the financial statements, whether due to error or fraud, and performing procedures that respond to those risks. Such procedures included examining, on a test basis, evidence regarding the amounts and disclosures in the financial statements. Our audits also included evaluating the accounting principles used and significant estimates made by management, as well as evaluating the overall presentation of the financial statements. Our procedures included confirmation of securities owned as of September 30, 2018 by correspondence with the custodian and brokers; when replies were not received from brokers, we performed other auditing procedures. We believe that our audits provide a reasonable basis for our opinions.

Denver, Colorado
November 14, 2018
We have served as the auditor of one or more investment companies in The Marsico Investment Fund since 1997.
50
EXPENSE EXAMPLE For the six-month period ended September 30, 2018 (Unaudited)
As a shareholder of the Marsico Funds (the “Funds”), you incur two types of costs: (1) transaction costs, including redemption fees (if any), and (2) ongoing costs, including management fees, distribution (12b-1) fees, and other Fund expenses. This Example is intended to help you understand your ongoing costs (in dollars) of investing in the Funds and to compare these costs with the ongoing costs of investing in other mutual funds.
The Example is based on an investment of $1,000 invested at the beginning of the period and held for the entire period from April 1, 2018 to September 30, 2018 (the “period”).
Actual Expenses
The first line of the table below provides information about actual account values and actual expenses. You may use the information in this line, together with the amount you invested, to estimate the expenses you paid over the period. Simply divide your account value by $1,000 (for example, an $8,600 account value divided by $1,000 equals 8.6), then multiply the result by the number in the first line under the heading entitled “Expenses paid for the six-month period ended September 30, 2018” to estimate the expenses you paid on your account during the period.
Hypothetical Example for Comparison Purposes
The second line of the table below provides information about hypothetical account values and hypothetical expenses based on the Funds’ actual expense ratios and an assumed rate of return of 5% per year before expenses, which is not the actual return of any of the Funds. The hypothetical account values and expenses may not be used to estimate the actual ending account balance or expenses you paid for the period. You may use this information to compare the ongoing costs of investing in the Funds and other funds. To do so, compare this 5% hypothetical example with the 5% hypothetical examples that appear in the shareholder reports of other funds.
Please note that the expenses shown in the table are meant to highlight your ongoing costs only and do not reflect any transactional costs such as redemption fees (if any). Therefore, the second line of the table is useful in comparing the ongoing costs only, and will not help you determine the relative total costs of owning different funds. In addition, if these transactional costs (if any) were included, your costs could have been higher.
| | Annualized
expense ratio | Beginning
account value
April 1, 2018 | Ending
account value
September 30, 2018 | Expenses paid for the
six-month period ended
September 30, 2018 |
FOCUS FUND | | | | |
Actual Example | 1.14%(1) | $ 1,000.00 | $ 1,108.90 | $ 6.03(1)(2) |
Hypothetical Example, assuming a 5% return before expenses | | $ 1,000.00 | $ 1,019.28 | $ 5.77(1)(2) |
| (1) | If the reduction in the 12b-1 fee accrual rate discussed in Note 5 had been in effect for the entire six-month period, the restated annualized expense ratio would have been 1.08% and the expenses paid in the actual and hypothetical examples above would have been $5.69 and $5.45, respectively. |
| (2) | Expenses are equal to the Fund’s annualized expense ratio multiplied by the average account value over the period, multiplied by 183/365 (to reflect the six-month period). |
GROWTH FUND | | | | |
Actual Example | 1.17%(1) | $ 1,000.00 | $ 1,107.00 | $ 6.17(1)(2) |
Hypothetical Example, assuming a 5% return before expenses | | $ 1,000.00 | $ 1,019.14 | $ 5.92(1)(2) |
| (1) | If the reduction in the 12b-1 fee accrual rate discussed in Note 5 had been in effect for the entire six-month period, the restated annualized expense ratio would have been 1.11% and the expenses paid in the actual and hypothetical examples above would have been $5.84 and $5.60, respectively. |
| (2) | Expenses are equal to the Fund’s annualized expense ratio multiplied by the average account value over the period, multiplied by 183/365 (to reflect the six-month period). |
51
EXPENSE EXAMPLE For the six-month period ended September 30, 2018 (Unaudited) (continued)
| | Annualized
expense ratio | Beginning
account value
April 1, 2018 | Ending
account value
September 30, 2018 | Expenses paid for the
six-month period ended
September 30, 2018 |
21st CENTURY FUND | | | | |
Actual Example | 1.13%(1) | $ 1,000.00 | $ 1,135.50 | $ 6.06(1)(2) |
Hypothetical Example, assuming a 5% return before expenses | | $ 1,000.00 | $ 1,019.32 | $ 5.73(1)(2) |
| (1) | If the reduction in the 12b-1 fee accrual rate discussed in Note 5 had been in effect for the entire six-month period, the restated annualized expense ratio would have been 1.06% and the expenses paid in the actual and hypothetical examples above would have been $5.69 and $5.38, respectively. |
| (2) | Expenses are equal to the Fund’s annualized expense ratio multiplied by the average account value over the period, multiplied by 183/365 (to reflect the six-month period). |
INTERNATIONAL OPPORTUNITIES FUND | | | | |
Actual Example | 1.50% | $ 1,000.00 | $ 967.50 | $ 7.40(1) |
Hypothetical Example, assuming a 5% return before expenses | | $ 1,000.00 | $ 1,017.48 | $ 7.59(1) |
| (1) | Expenses are equal to the Fund’s annualized expense ratio multiplied by the average account value over the period, multiplied by 183/365 (to reflect the six-month period). |
GLOBAL FUND | | | | |
Actual Example | 1.47%(1) | $ 1,000.00 | $ 1,115.70 | $ 7.77(1)(2) |
Hypothetical Example, assuming a 5% return before expenses | | $ 1,000.00 | $ 1,017.65 | $ 7.41(1)(2) |
| (1) | If the reduction in the expense limitation cap discussed in Note 3 had been in effect for the entire six-month period, the restated annualized expense ratio would have been 1.45% and the expenses paid in the actual and hypothetical examples above would have been $7.69 and $7.33, respectively. |
| (2) | Expenses are equal to the Fund’s annualized expense ratio multiplied by the average account value over the period, multiplied by 183/365 (to reflect the six-month period). |
52
OTHER INFORMATION (Unaudited)
Proxy Voting Guidelines
The Funds exercise the voting rights associated with the securities held by the Funds under the proxy voting policy of the Funds. A description of those policies and procedures of the Funds and a record of the Funds’ proxy votes for the one-year period ended June 30, 2018 are available without charge, upon request, by calling 888-860-8686. It is also available on the Securities and Exchange Commission’s (SEC) website at www.sec.gov.
Quarterly Filing of Portfolio Holdings
The Funds will file their complete schedule of investments with the SEC for the first and third quarters of each fiscal year on Form N-Q. The Funds’ Form N-Q will be available (i) on the SEC’s website at www.sec.gov; (ii) at the SEC’s Public Reference Room; and (iii) by calling 800-SEC-0330.
Other Tax Information
Corporate Dividends Received Deduction
For the fiscal year ended September 30, 2018, 0%, 0%, 0%, 0% and 29% of the dividends paid from net investment income qualified for the dividends received deduction available to corporate shareholders of the Focus Fund, Growth Fund, 21st Century Fund, International Opportunities Fund, and Global Fund, respectively.
Qualified Dividend Income
Pursuant to Section 854 of the Internal Revenue Code, the Focus Fund, Growth Fund, 21st Century Fund, International Opportunities Fund, and Global Fund designate income dividends (in thousands) of $0, $0, $0, $0 and $310, respectively, as qualified dividend income paid during the fiscal year ended September 30, 2018.
Foreign Taxes Paid
Pursuant to the foreign tax credit election under Section 853 of the Internal Revenue Code, the International Opportunities Fund designated (in thousands) $855 of income derived from foreign sources and $84 of foreign taxes paid, for the year ended September 30, 2018.
Of the ordinary income (including short-term capital gain) distributions made during the year ended September 30, 2018, the proportionate share of income derived from foreign sources and foreign taxes paid attributable to one share of stock are:
| | | Foreign Source Income | | | Foreign Taxes Paid | |
International Opportunities Fund | | $ | 0.2784 | | | $ | 0.0274 | |
Long Term Capital Gains Designation
For the fiscal year ended September 30, 2018, the Focus Fund, Growth Fund, and Global Fund designated (in thousands) $87,734, $25,153 and $3,707, respectively, as a 20% rate gain distribution for the purpose of the dividends paid deduction. For income tax purposes, the Funds may utilize earnings and profits distributed to shareholders on the redemption of shares as part of the dividends paid deduction.
Cost Basis Information
Federal law requires mutual fund companies to maintain a shareholder’s cost basis by tax lot and report gain/loss information and holding periods for sales of mutual fund shares that are “covered” securities to the IRS and to shareholders on Form 1099. Mutual fund shares, such as shares of the Funds, acquired on or after January 1, 2012 are covered securities. The Funds are not responsible for maintaining and reporting share information for their shares that are not deemed “covered.”
The tax regulations require that the Funds elect a default tax identification methodology in order to perform the required reporting. The Funds have chosen the first-in-first-out (“FIFO”) method as the default tax lot identification method for its shareholders. This is the method the Funds will use to determine which specific shares are deemed to be sold when a shareholder’s entire position is not sold in a single transaction and is the method in which “covered” share sales will be reported on a shareholder’s Form 1099.
However, at the time of purchase or upon the sale of “covered” shares, shareholders may generally choose a different tax lot identification method. Shareholders should consult a tax advisor with regard to their personal circumstances as the Funds and their service providers do not provide tax advice.
53
| TRUSTEE AND OFFICER INFORMATION |
TRUSTEE AND OFFICER INFORMATION INDEPENDENT TRUSTEES
Name, Address and Age | Position(s) Held
with the Trust | Term of Office(1)
and Length of
Time Served | Principal Occupation(s)
During Past 5 Years | Number of Portfolios
in Fund Complex
Overseen by Trustee | Other Directorships
Held by Trustee |
Jay S. Goodgold
1200 17th Street
Suite 1600
Denver, CO 80202
DOB: 1954 | Trustee; Lead Independent Trustee | Trustee (since
February 2006);
Lead Independent Trustee (since November 2010) | Private investor (July 2003 - present);
Managing Director, Goldman, Sachs & Co.
(August 1978 - June 2003). | 5 | None |
Elizabeth Hoffman
1200 17th Street
Suite 1600
Denver, CO 80202
DOB: 1946 | Trustee | Since February 2006 | Professor of Economics (January 2007 - present) and Executive Vice President and Provost (January 2007 - July 2012), Iowa State University; President Emerita, University of Colorado (August 2005 - present). | 5 | None |
Michael D. Rierson
1200 17th Street
Suite 1600
Denver, CO 80202
DOB: 1952 | Trustee | Since November 1998 | President, The Rierson Group (marketing and consulting firm serving non-profit organizations) (June 2015 - present); Senior Vice President for Development, Colonial Williamsburg Foundation (January 2011 - June 2015). | 5 | None |
Joseph T. Willett
1200 17th Street
Suite 1600
Denver, CO 80202
DOB: 1951 | Trustee | Since November 2002 | Private investor (2002 - present); Chief
Operating Officer, Merrill Lynch Europe
(1998 - 2002). | 5 | None |
(1) | Each Trustee serves an indefinite term until the election of a successor or until reaching the mandatory retirement age for non-interested Trustees as established by the Trustees and set forth in the Trust’s Statement of Independent Trustee Retirement Policy, or until his or her resignation, death or removal. Each Officer serves an indefinite term, renewed annually, until the election of a successor (or until their resignation or removal). |
| The Statement of Additional Information includes additional information about the Trustees and is available upon request, without charge, by calling 888-860-8686 or visiting marsicofunds.com. |
54
| TRUSTEE AND OFFICER INFORMATION |
TRUSTEE AND OFFICER INFORMATION INTERESTED TRUSTEES* AND OFFICERS
Name, Address and Age | Position(s) Held
with the Trust | Term of Office(1)
and Length of
Time Served | Principal Occupation(s)
During Past 5 Years | Number of Portfolios
in Fund Complex
Overseen by Trustee | Other Directorships
Held by Trustee |
Thomas F. Marsico(2)
1200 17th Street
Suite 1600
Denver, CO 80202
DOB: 1955 | Trustee, President, Chief Executive Officer and Chief Investment Officer | Since December 1997 | Chief Executive Officer,
Marsico Capital Management, LLC
(more than five years). | 5 | None |
Christopher J. Marsico(2) 1200 17th Street
Suite 1600
Denver, CO 80202
DOB: 1961 | Trustee, Executive
Vice President and
Chief Operating Officer | Trustee (August 2007 - March 2010 and since May 2010); Vice President and Treasurer (September 2002 - May 2010); Executive Vice President and Chief Operating Officer
(since May 2010) | President,
Marsico Capital Management, LLC
(more than five years). | 5 | None |
Neil L. Gloude, CPA
1200 17th Street
Suite 1600
Denver, CO 80202
DOB: 1961 | Vice President, Secretary and Treasurer | Vice President and Secretary
(since May 2008);
Treasurer (since May 2010) | Executive Vice President, Chief
Financial Officer and Treasurer, Marsico Capital Management, LLC
(more than five years). | N/A | N/A |
Steven R. Carlson
1200 17th Street
Suite 1600
Denver, CO 80202
DOB: 1964 | Chief Compliance Officer | Since July 2016 | Executive Vice President and Chief Compliance Officer,
Marsico Capital Management, LLC
(more than five years). | N/A | N/A |
Thomas M. J. Kerwin
1200 17th Street
Suite 1600
Denver, CO 80202
DOB: 1955 | Chief Legal Officer | Since August 2003 | Executive Vice President and General Counsel, Marsico Capital Management, LLC (more than five years). | N/A | N/A |
* | Trustees who are “interested persons” of the Funds, as defined in the 1940 Act. |
(1) | Each Trustee serves an indefinite term until the election of a successor or until reaching the mandatory retirement age for non-interested Trustees as established by the Trustees and set forth in the Trust’s Statement of Independent Trustee Retirement Policy, or until his or her resignation, death or removal. Each Officer serves an indefinite term, renewed annually, until the election of a successor (or until their resignation or removal). |
(2) | Mr. Thomas Marsico and Mr. Christopher Marsico are considered Interested Trustees of the Trust because of their affiliation with Marsico Capital Management, LLC, the Adviser to the Funds. Mr. Thomas Marsico and Mr. Christopher Marsico are brothers. |
| The Statement of Additional Information includes additional information about the Trustees and is available upon request, without charge, by calling 888-860-8686 or visiting marsicofunds.com. |
55
NOTES
56
(a) The Registrant, as of the end of the period covered by this report, has adopted a code of ethics that applies to the Registrant’s principal executive officer, principal financial officer, principal accounting officer or controller, or persons performing similar functions, regardless of whether these individuals are employed by the Registrant or a third party. A copy of this code of ethics is attached hereto as Exhibit (a).
(b) Not used.
(c) There were no amendments, during the period covered by this report, to a provision of the code of ethics that applies to the Registrant’s principal executive officer, principal financial officer, principal accounting officer or controller, or persons performing similar functions, regardless of whether these individuals are employed by the Registrant or a third party, and that relates to any element of the code of ethics description.
(d) The Registrant has not granted any waivers, including an implicit waiver, from a provision of the code of ethics that applies to the Registrant’s principal executive officer, principal financial officer, principal accounting officer or controller, or persons performing similar functions, regardless of whether these individuals are employed by the Registrant or a third party, that relates to one or more of the items set forth in paragraph (b) of this item’s instructions.
(e) Not applicable.
(f) See attached Exhibit (a).
| Item 3. | Audit Committee Financial Expert |
(a)(1) The Registrant’s Board of Trustees has determined that the Registrant has at least one audit committee financial expert serving on its audit committee.
(a)(2) Mr. Joseph T. Willett is the audit committee financial expert. Mr. Willett is “independent” under the applicable rules.
| Item 4. | Principal Accountant Fees and Services |
In each of the fiscal years ended September 30, 2018 and September 30, 2017, the aggregate Audit Fees billed (or to be billed) by PricewaterhouseCoopers LLP (PwC) for professional services rendered for the audits of the financial statements, or services that are normally provided in connection with statutory and regulatory filings or engagements as well as reimbursable expenses are listed below.
(a) Audit Fees.
| 1 | Inclusive of $17,000 in fees for fund merger related services which were paid for by the investment adviser. |
(b) Audit-Related Fees.
In each of the fiscal years ended September 30, 2018 and September 30, 2017, the aggregate Audit-Related Fees billed (or to be billed) by PwC for services rendered for assurance and related services to each fund that are reasonably related to the performance of the audit or review of each fund's financial statements, but not reported as Audit Fees, are shown in the table below.
Audit-related fees noted in 2017 are for non-recurring work performed by PwC related to the Funds’ distributions to shareholders.
(c) Tax Fees.
In each of the fiscal years ended September 30, 2018 and September 30, 2017 the aggregate Tax Fees billed (or to be billed) by PwC for professional services rendered for tax compliance, tax advice, and tax planning are shown in the table below.
All of these fees were approved by the Trust’s Audit Committee as required pursuant to paragraph (c)(7)(ii) of Rule 2-01 of Regulation S-X.
Fees included in the Tax Fees category comprise all services performed by professional staff in the independent registered public accounting firm's tax division except those services related to the audit. Typically, this category would include fees for tax compliance, tax planning, and tax advice. Tax compliance, tax advice, and tax planning services include preparation of original and amended tax returns, claims for refund and tax payment-planning services, assistance with tax audits and appeals, tax advice related to mergers and acquisitions and requests for rulings or technical advice from taxing authorities.
(d) All Other Fees.
In each of the fiscal years ended September 30, 2018 and September 30, 2017 the aggregate Other Fees billed (or to be billed) by PwC for all other non-audit services rendered are shown in the table below.
(e) (1) Audit Committee Pre-Approval Policies and Procedures:
Pursuant to the Trust’s Audit Committee Charter and Policies and Procedures (collectively, the “Procedures”), the Audit Committee has adopted pre-approval policies and procedures to govern the pre-approval of (i) all audit services and permissible non-audit services to be provided to the Trust by its independent accountant, and (ii) all permissible non-audit services to be provided by such independent accountant to the Trust’s investment adviser and to any entity controlling, controlled by or under common control with the investment adviser that provides on-going services to the Trust (collectively, any “Service Affiliates”) if the engagement directly relates to the Trust’s operations and financial reporting.
| 2 | Fees for fund merger related services which were paid for by the investment adviser. |
| 3 | Inclusive of $3,200 in fees for fund merger related services which were paid for by the investment adviser. |
In accordance with the Procedures, the Committee is responsible for the engagement of the independent accountant to certify the Trust’s financial statements for each fiscal year. With respect to the pre-approval of non-audit services provided to the Trust and its Service Affiliates, the Procedures provide that the Committee may pre-approve such services on a project-by-project basis as they arise. The Procedures also permit the Committee to delegate authority to the Audit Committee Chairman (the “Designated Member”) to pre-approve any proposed non-audit services that have not been previously approved by the Committee, subject to certain conditions. Any action by the Designated Member in approving a requested non-audit service shall be presented to the Audit Committee not later than at its next scheduled meeting. If the Designated Member does not approve the independent auditor’s provision of a requested non-audit service, the matter may be presented to the full Committee for its consideration and action.
(e)(2) Services approved pursuant to paragraph (c)(7)(i)(C) of Rule 2-01 of Regulation S-X:
100% of these fees were approved by the Trust’s Audit Committee as required pursuant to paragraph
(c)(7)(ii) of Rule 2-01 of Regulation S-X.
(f) According to PwC for the fiscal year ended September 30, 2018, the percentage of hours spent on the audit of the Marsico Funds’ financial statements for the most recent fiscal year that were attributed to work performed by persons who are not full-time, permanent employees of PwC is as follows:
| PwC | 2018 |
| Work performed by persons who are not full-time | 0% |
(g) In each of the fiscal years ended September 30, 2018 and September 30, 2017, the aggregate fees billed (or to be billed) by PwC relating to non-audit services that were rendered to the Trust, to its investment adviser, and to any entity controlling, controlled by, or under common control with the investment adviser and that provides ongoing services to the Trust are shown in the table below.
(h) Not applicable.
| Item 5. | Audit Committee of Listed Registrants |
Not applicable.
| Item 6. | Schedule of Investments |
The schedule of investments in securities of unaffiliated issuers is included as part of the report to shareholders filed under Item 1.
| Item 7. | Disclosure of Proxy Voting Policies and Procedures for Closed-End Management Investment Companies |
Not applicable.
| Item 8. | Portfolio Managers of Closed-End Management Investment Companies |
Not applicable.
| Item 9. | Purchases of Equity Securities by Closed-End Management Investment Company and Affiliated |
Purchasers
Not applicable.
| Item 10. | Submission of Matters to a Vote of Security Holders |
Not applicable.
| Item 11. | Controls and Procedures. |
(a) The registrant's principal executive officer and principal financial officer have concluded that the registrant's disclosure controls and procedures (as defined in Rule 30a-3(c) under the Investment Company Act of 1940, as amended) are effective based on their evaluation of these disclosure controls and procedures within 90 days of the filing date of this report on Form N-CSR.
(b) There were no changes in the registrant's internal control over financial reporting (as defined in Rule 30a-3(d) under the Investment Company Act of 1940, as amended) that occurred during the last fiscal quarter of the period covered by this report that have materially affected, or are reasonably likely to materially affect, the registrant's internal control over financial reporting.
| Item 12. | Disclosure of Securities Lending Activities for Closed-End Management Investment Companies. |
Not applicable.
(a)(1) Code of Ethics - Filed as an attachment to this filing.
(a)(2) Certification for each principal executive and principal financial officer of the registrant as required by Rule 30a-2(a) under the Act (17 CFR 270.30a-2(a)). Filed as an attachment to this filing.
(a)(3) Any written solicitation to purchase securities under Rule 23c-1 under the Investment Company Act of 1940, as amended, that was sent or given during the period covered by the report by or on behalf of the registrant to 10 or more persons.
Not applicable.
(a)(4) Change in the registrant’s independent public accountant.
Not applicable.
(b) Certifications required by Rule 30a-2(b) under the Act (17 CFR 270.30a-2(b)), Rule 13a-14(b) or Rule 15d-14(b) under the Exchange Act (17 CFR 240.13a-14(b) or 240.15d-14(b)), and Section 1350 of Chapter 63 of Title 18 of the United States Code (18 U.S.C. 1350). Filed as an attachment to this filing.
SIGNATURES
Pursuant to the requirements of the Securities Exchange Act of 1934 and the Investment Company Act of 1940, the registrant has duly caused this report to be signed on its behalf by the undersigned, thereunto duly authorized.
The Marsico Investment Fund
| By: | /s/ Christopher J. Marsico | |
| | Christopher J. Marsico, | |
| | Trustee, Executive Vice President and Chief Operating Officer (Principal Executive Officer) | |
| | | |
| Date: | December 6, 2018 | |
| | | |
| Pursuant to the requirements of the Securities Exchange Act of 1934 and the Investment Company Act of 1940, this report has been signed below by the following persons on behalf of the registrant and in the capacities and on the dates indicated. |
| | | |
| By: | /s/ Christopher J. Marsico | |
| | Christopher J. Marsico, | |
| | Trustee, Executive Vice President and Chief Operating Officer (Principal Executive Officer) | |
| | | |
| Date: | December 6, 2018 | |
| | | |
| By: | /s/ Neil L. Gloude | |
| | Neil L. Gloude, | |
| | Vice President, Secretary and Treasurer (Principal Financial Officer) | |
| | | |
| Date: | December 6, 2018 | |