UNITED STATES
SECURITIES AND EXCHANGE COMMISSION
WASHINGTON, D.C. 20549
FORM N-CSR
CERTIFIED SHAREHOLDER REPORT OF REGISTERED
MANAGEMENT INVESTMENT COMPANIES
Investment Company Act File Number: 811-08397
THE MARSICO INVESTMENT FUND
(Exact Name of Registrant as Specified in Charter)
1200 17th Street, Suite 1700
Denver, CO 80202
(Address of Principal Executive Offices) (Zip Code)
The Corporation Trust Company
The Marsico Investment Fund
Corporation Trust Center 1209 Orange Street
Wilmington, Delaware 19802
(Name and address of Agent for Service of Process)
Copies to:
Anthony H. Zacharski
Dechert LLP
90 State House Square
Hartford, CT 06103
Registrant's Telephone Number, including Area Code: 1-888-860-8686
Date of fiscal year end: September 30
Date of Reporting Period: September 30, 2019
| Item 1. | Reports to Stockholders |
DEAR SHAREHOLDER:
Enclosed is your annual report for each portfolio of The Marsico Investment Fund (the “Marsico Funds”), encompassing the one-year fiscal period from October 1, 2018 to September 30, 2019.
The purpose of this report is to provide a review of the Marsico Funds’ one-year investment results by discussing what we believe were the main areas that impacted performance – including the macroeconomic environment, sector and industry positioning, and individual stock selection – as compared to the Funds’ performance benchmark indices.
For updated information regarding the market environment and each Fund’s overall investment positioning and performance, please refer to the Funds’ most recent monthly fact sheets and quarterly investment updates, which are available in the Investor Resources section of the Funds’ website atmarsicofunds.com.(1)
Note: Effective February 28, 2019, Brandon A. Geisler became co-manager of the Marsico Focus Fund and Marsico Growth Fund with Thomas F. Marsico.
(1) | The references to the Marsico Funds website (marsicofunds.com) included throughout this annual report do not incorporate the website’s contents into this report. |
| | | |
KEY FUND STATISTICS | 2 |
MARKET ENVIRONMENT | 5 |
MARSICO FOCUS FUND |
Investment Review | 7 |
Fund Overview | 10 |
Schedule of Investments | 11 |
MARSICO GROWTH FUND |
Investment Review | 12 |
Fund Overview | 14 |
Schedule of Investments | 15 |
MARSICO 21st CENTURY FUND |
Investment Review | 16 |
Fund Overview | 18 |
Schedule of Investments | 19 |
MARSICO INTERNATIONAL OPPORTUNITIES FUND |
Investment Review | 21 |
Fund Overview | 24 |
Schedule of Investments | 25 |
MARSICO GLOBAL FUND |
Investment Review | 27 |
Fund Overview | 30 |
Schedule of Investments | 31 |
FINANCIAL STATEMENTS | 32 |
NOTES TO FINANCIAL STATEMENTS | 42 |
REPORT OF INDEPENDENT REGISTERED PUBLIC ACCOUNTING FIRM | 50 |
EXPENSE EXAMPLE | 51 |
OTHER INFORMATION | 52 |
TRUSTEE AND OFFICER INFORMATION | 53 |
1
KEY FUND STATISTICS (UNAUDITED) |
Marsico Focus Fund | Marsico Growth Fund | Marsico
21st Century
Fund |
| | MFOCX | | | MGRIX | | | MXXIX | |
For additional disclosures, please see page 10. | For additional disclosures, please see page 14. | For additional disclosures, please see page 18. |
PERFORMANCE COMPARISON(1) | PERFORMANCE COMPARISON(1) | PERFORMANCE COMPARISON(1) |
Average Annualized Returns | Average Annualized Returns | Average Annualized Returns |
| 
| 
|
TOTAL ANNUAL OPERATING EXPENSES*1.14% | TOTAL ANNUAL OPERATING EXPENSES*1.44% | TOTAL ANNUAL OPERATING EXPENSES*1.42% |
SECTOR ALLOCATION(2) | SECTOR ALLOCATION(2) | SECTOR ALLOCATION(2) |
| 
| 
|
TOP FIVE HOLDINGS | TOP FIVE HOLDINGS | TOP FIVE HOLDINGS |
| | | |
| | Visa, Inc. - Cl. A | 8.06% | | | Apple, Inc. | 6.41% | | | CoStar Group, Inc. | 3.14% |
| | Microsoft Corporation | 6.31% | | | Visa, Inc. - Cl. A | 6.00% | | | Fidelity National Information Services, Inc. | 3.11% |
| | Amazon.com, Inc. | 6.08% | | | Microsoft Corporation | 5.74% | | | Burlington Stores, Inc. | 2.96% |
| | PayPal Holdings, Inc. | 5.99% | | | Amazon.com, Inc. | 5.33% | | | Teleflex, Inc. | 2.87% |
| | Facebook, Inc. - Cl. A | 5.74% | | | Facebook, Inc. - Cl. A | 4.41% | | | AMETEK, Inc. | 2.81% |
| | | | | | | | | | | |
For additional disclosures about the Marsico Funds, please see page 4. The performance data quoted here represent past performance, and past performance is not a guarantee of future results. Investment return and principal value of an investment will fluctuate so that an investor’s shares, when redeemed, may be worth more or less than their original cost.
2
KEY FUND STATISTICS (UNAUDITED) |
Marsico International
Opportunities Fund | Marsico Global Fund |
| | MIOFX | | | MGLBX | |
For additional disclosures, please see page 24. | For additional disclosures, please see page 30. |
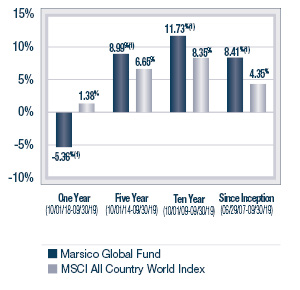
PERFORMANCE COMPARISON(1) | PERFORMANCE COMPARISON(1) |
Average Annualized Returns | Average Annualized Returns |
| 
|
TOTAL ANNUAL OPERATING EXPENSES*1.65% NET EXPENSES*†1.50% | TOTAL ANNUAL OPERATING EXPENSES*1.65% NET EXPENSES*†1.45% |
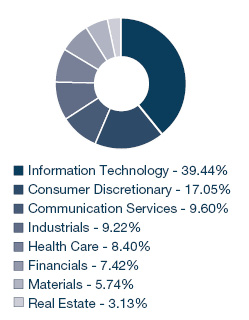
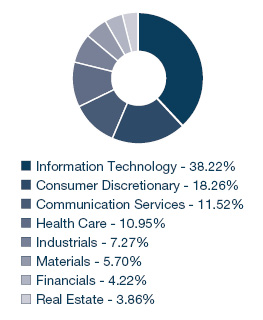
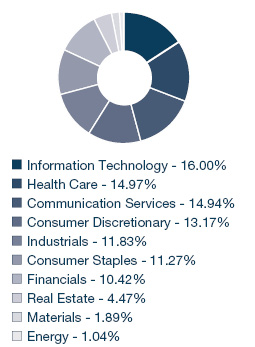
SECTOR ALLOCATION(2) | SECTOR ALLOCATION(2) |
| 
|
TOP FIVE HOLDINGS | TOP FIVE HOLDINGS |
| | | | | | | | |
| | Aroundtown S.A. | 4.24% | | | Microsoft Corporation | 5.39% | |
| | Koninklijke Philips N.V. | 3.93% | | | InterXion Holding N.V. | 5.30% | |
| | Alibaba Group Holding Ltd. Spon. ADR | 3.89% | | | Amazon.com, Inc. | 4.89% | |
| | Nestlé S.A. | 3.16% | | | Facebook, Inc. - Cl. A | 4.59% | |
| | Tencent Holdings Ltd. | 3.12% | | | Visa, Inc. - Cl. A | 4.51% | |
| | | | | | | | |
Current performance may be lower or higher than the performance information quoted. To obtain performance information current to the most recent month-end, please call888-860-8686or visitmarsicofunds.com.
3
KEY FUND STATISTICS (UNAUDITED) |
ADDITIONAL DISCLOSURES ABOUT THE MARSICO FUNDS
* | The Total Annual Operating Expenses and Net Expenses are reflective of the information disclosed in the Funds’ Prospectus dated February 1, 2019, as supplemented. The information may differ from the expense ratios disclosed in this report. |
† | Marsico Capital Management, LLC (the “Adviser”) has entered into a written expense limitation and fee waiver agreement under which it has agreed to limit the total expenses of each Fund (excluding taxes, interest, acquired fund fees and expenses, litigation, extraordinary expenses, brokerage and other transaction expenses relating to the purchase or sale of portfolio investments) to an annual rate of 1.50% of the average net assets of the International Opportunities Fund and 1.45% of the average net assets of the Global Fund until January 31, 2020. This expense limitation and fee waiver agreement may be terminated by the Adviser at any time after January 31, 2020, upon 15 days prior notice to the Fund and its administrator. The Adviser may recoup from a Fund fees previously waived or expenses previously reimbursed by the Adviser with respect to that Fund pursuant to this agreement (or a previous expense limitation agreement) if: (1) such recoupment by the Adviser does not cause the Fund, at the time of recoupment, to exceed the lesser of (a) the expense limitation in effect at the time the relevant amount was waived and/or reimbursed, or (b) the expense limitation in effect at the time of the proposed recoupment, and (2) the recoupment is made within three years after the fiscal year end date as of which the amount to be waived or reimbursed was determined and the waiver or reimbursement occurred. |
(1) | The performance data quoted here represent past performance, and past performance is not a guarantee of future results. Investment return and principal value of an investment will fluctuate so that an investor’s shares, when redeemed, may be worth more or less than their original cost. Current performance may be lower or higher than the performance information quoted. To obtain performance information current to the most recent month-end, please call 888-860-8686 or visitmarsicofunds.com. |
| The performance included in the chart does not reflect the deduction of taxes on Fund distributions or the redemption of Fund shares. |
| All indices are unmanaged and investors cannot invest directly in an index. |
Periodically, certain fees and expenses have been waived or reimbursed by the Adviser for the21st Century Fund, the International Opportunities Fund, and the Global Fund. In the absence of such a waiver or reimbursement, the performance returns reflected would have been reduced. In accordance with the expense limitation and fee waiver agreement, the Adviser may recoup fees and expenses previously waived or reimbursed under certain parameters. Periodically, the Adviser has recouped such fees or expenses from the21st Century Fund, the International Opportunities Fund, and the Global Fund, resulting in a lower performance return.
(2) | Sector weightings represent the percentage of the respective Fund’s investments (excluding cash equivalents) in certain general sectors. These sectors may include more than one industry. The Fund’s portfolio composition is subject to change at any time. |
4
MARKET ENVIRONMENT: OCTOBER 2018 – SEPTEMBER 2019 (UNAUDITED)
Amid a constant stream of volatility-inducing headlines, equity markets remained resilient and posted positive gains for the one-year period ended September 30, 2019. The combination of a more accommodative interest rate policy, continued progress in US trade talks with China, and impressive employment figures led to improved sentiment and near-record highs for many of the indices.
Stocks struggled in the beginning of the period, however, as investors became anxious over a litany of issues. At the forefront was the impact of potential additional Federal Reserve (the “Fed”) rate increases as telegraphed by Fed Chairman Powell in October of 2018 during his now infamous “rates are far from neutral” speech. Thankfully, the Federal Reserve reversed course in July of 2019 and announced a 25 basis point cut of the Federal Funds rate, marking just the fifth time in the past 25 years that the central bank switched from raising to lowering rates, and the first time since the credit crisis of 2008. Notably, Chairman Powell also said the Fed will act as appropriate to sustain US economic expansion as it evaluates future data. The Fed followed this cut with another in September, although the second was anticipated due to the slowing economic conditions witnessed as a result of the US/China trade war.
Moving to China, President Trump shocked markets on August 1 by announcing an additional 10% tariff on an additional $300 billion of goods and products coming into the US from China, supplementing the $250 billion of goods already being tariffed at 25%. The Chinese responded by putting a halt to purchases of US agricultural products and letting the Yuan tumble to its weakest level in more than a decade, prompting President Trump’s administration to label China a “currency manipulator.” These events led to sharp drops in the Dow Jones Industrials Average and the S&P 500 Index. However, both sides finally agreed to a high-level meeting in October, giving anxious markets some optimism about a path towards a resolution.
Oil prices were also volatile during the period. After dropping 38% in the fourth quarter of 2018, prices rose slowly throughout the year, only to skyrocket in September as markets reacted to a coordinated drone attack on numerous Saudi Aramco oil facilities. Fear of supply shocks and further attacks caused prices to jump 12% in a single day.
Trade uncertainties and slowing growth concerns supported a consistent decline in global government bond yields. As of period-end, the 10-year US Treasury yield dropped to 1.68% as the volatility experienced in the equity markets caused investors to flock to safety in spite of the historically low returns presented by bond assets. That said, US government debt yields remain relatively attractive at these levels compared to negative-yielding instruments issued by many European countries and Japan.
On the economic and employment front, data points indicated signs of slowing momentum. US nonfarm payrolls increased by 166,000, 168,000 and 136,000 in July, August and September, respectively. Job growth has averaged approximately 161,000 jobs per month through September 2019, compared to the 216,000 average monthly job gain for calendar year 2018. Also contributing to growth fears was September’s reading of manufacturing data from the Institute for Supply Management (ISM), which posted its lowest reading in ten years.
Outside the US, some negative sentiment continued to be driven by US/China trade and technology disputes, as well as unresolved trade issues between the US and the European Union. Ongoing sharp political divisions in the United Kingdom (“UK”) and Europe about the UK’s efforts to withdraw from the European Union (Brexit) added to uncertainties facing businesses and investors. Also, continuing demonstrations in Hong Kong may have harmed its reputation as a stable and secure financial center and an attractive environment for foreign investment. And as mentioned above, the attack on Saudi Arabia’s oil facilities shocked oil markets and raised troubling geopolitical and economic concerns.
5
The performance of global markets during the one-year fiscal period ended September 30, 2019 is depicted below. After all of the volatility, most US indices posted positive returns while global indices trailed significantly. Large capitalization US equities outperformed US small capitalization stocks, yet both segments lagged US medium-capitalization stocks during the period. Emerging market equities underperformed compared to developed international markets as both posted negative returns.
Index Name(1) | Universe of
Equities Represented | One-Year
Total Return (as of
September 30, 2019) |
US | | |
S&P 500 | US large-capitalization equities | +4.25% |
Russell 3000 | US publicly-traded equities of all sizes | +2.92% |
Russell 2000 | US small-capitalization equities | -8.89% |
Russell Mid-Cap Growth | US medium-capitalization equities | +5.20% |
Index Name(1) | Universe of
Equities Represented | One-Year
Total Return (as of
September 30, 2019) |
INTERNATIONAL | |
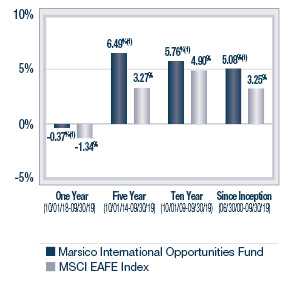
MSCI EAFE (US$) | Equities in developed international equity markets, including Japan, Western Europe, and Australasia | -1.34% |
MSCI Emerging Markets (US$) | Equities in developing international equity markets, including China, India, Eastern Europe, and Latin America | -2.02% |
MSCI ACWI (US$) | Equities in the global developed and emerging markets | +1.38% |
Sincerely,
THE MARSICO INVESTMENT TEAM
(1) | All indices are unmanaged and investors cannot invest directly in an index. |
6
Investment Review BY TOM MARSICO AND BRANDON GEISLER (UNAUDITED)
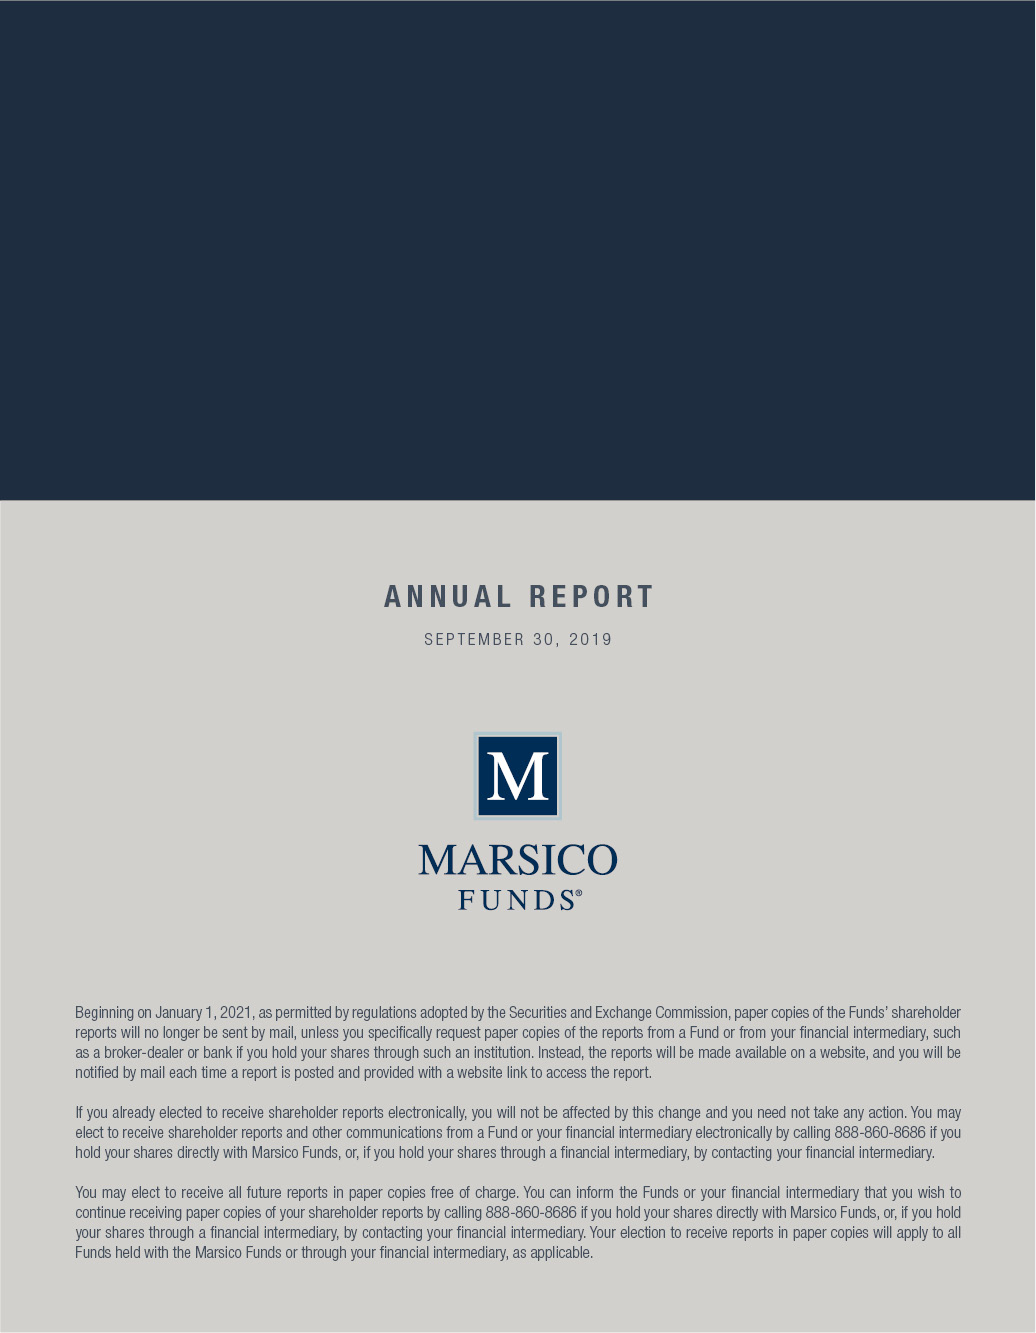
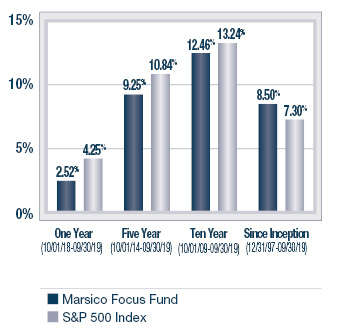
The Marsico Focus Fund posted a total return of +2.52% for the one-year fiscal period ended September 30, 2019. The Fund underperformed its benchmark index, the S&P 500 Index, which had a total return of +4.25% over the same time period. Please see the Fund’s Overview for more detailed information about the Fund’s longer-term performance for various time periods ended September 30, 2019.
The performance data for the Fund quoted here represent past performance, and past performance is not a guarantee of future results. Investment return and principal value of an investment will fluctuate so that an investor’s shares, when redeemed, may be worth more or less than their original cost. Current performance may be lower or higher than the performance information quoted. To obtain performance information current to the most recent month-end, please call 888-860-8686 or visitmarsicofunds.com.(1)
This review highlights Fund performance over a one-year fiscal period. Shareholders should keep in mind that the Fund is intended for long-term investors who hold their shares for substantially longer periods of time. You should also keep in mind that our current views and beliefs regarding all investments discussed in this report are subject to change at any time. References to specific securities, industries, and sectors discussed in this report are not recommendations to buy or sell such securities or related investments, and the Fund may not necessarily hold these securities or investments today. Please see the accompanying Schedule of Investments for the percentage of the Fund’s portfolio represented by the securities mentioned in this report as of the end of the reporting period.
The Focus Fund is non-diversified and may hold fewer securities than a diversified fund because it is permitted to invest a greater percentage of its assets in a smaller number of securities. Holding fewer securities increases the risk that the value of the Fund could go down because of the poor performance of a single investment or may be more volatile than its benchmark. The Fund is subject to broad risks associated with investing in equity securities markets generally, including the risks that the securities and markets in which it invests may experience volatility and instability, that domestic and global economies and markets may undergo periods of cyclical change and decline, that investors may at times avoid investments in equity securities, and that investments may not perform as anticipated. Please see the Prospectus for more information.
The Fund is not managed to track its benchmark index, and may hold a substantially overweight or underweight position in a sector, industry, or security compared to its weight in the benchmark. The Fund may be subject to risks associated with a particular sector or other area in which it is overweight, including the risk that the stocks of companies within one area could simultaneously decline in price because of an event that affects the entire area. For informational purposes, the discussion below may compare the benchmark weight or performance of a sector or industry to the investment approach of the Fund.
The Focus Fund’s underperformance during the one-year period ended September 30, 2019, as compared to the S&P 500 Index, was primarily attributable to certain Fund holdings in the Consumer Discretionary, Information Technology and Communication Services sectors, as defined in the Global Industry Classification Standard (“GICS”)(2). From a sector allocation perspective, the Fund was held back relative to its benchmark index by having limited or no exposure to the strong-performing Utilities, Real Estate (the Fund’s sole investment in this sector was added late in the period), and Consumer Staples sectors. As volatility increased during the period and bond yields dropped, investors sought the defensive characteristics and yield of stocks in these sectors.
In the Information Technology sector, semiconductor company NVIDIA Corporation (“NVDA”) (-24%) underperformed because of three primary negative factors, all of which we view as transitory and appear to be dissipating. First, the company underestimated how many of its graphics cards were going into the hands of cryptocurrency miners, as these cards were sold through traditional gaming channels. Cryptocurrency prices crashed throughout 2018, which led to less demand for NVDA’s graphics cards from cryptocurrency processors, and now NVDA’s gaming sales appear to be almost entirely tied to underlying demand from gamers (we view this as a positive, as we believe gamers are more predictable). Second, the new PC game slate has been weak for the past year, but the line-up looks substantially better over the next six months with the new Call of Duty: Modern Warfare, the upcoming launch of the highly anticipated Cyberpunk 2077, and the introduction of Minecraft with much improved graphics enabled by NVDA’s proprietary ray-tracing technology. The last factor that led to weakness over the last year was weaker demand for NVDA’s Datacenter products from cloud service providers (Amazon Web Services, Microsoft Azure, Google Cloud), but our research indicates these cloud service providers are now reaching full capacity utilization and they will need to start spending again on datacenters to support their businesses.
Communication Services holding Activision Blizzard, Inc. returned -23% during the period prior to being sold. The stock underperformed due to increased competition and a slowdown in sales of its key video games. The rise of Fortnite, a free-to-play multiplayer game, has led to a large portion of consumer time spent gaming to be shifted away from traditional titles.
7
The Fund’s performance was assisted by certain strong-performing stocks held in the Financials, Materials and Information Technology sectors.
The top individual contributor over the past twelve months was e-commerce payment facilitator PayPal Holdings, Inc. (+18%). The company continues to benefit from the continued rise of mobile commerce, and consumers’ behavioral trend away from cash toward electronic payments. PayPal is one of the most dominant online checkout tools, with approximately 200 million users, including users of its dominant peer-to-peer cash transfer app Venmo, which is growing at a rate of 80% per year and remains largely unmonetized.
Another top contributor over the past 12 months was S&P Global, Inc. (“SPGI”) (+27%), which provides company ratings, benchmarks, and securities market data worldwide, due to a combination of company-specific and macro news positively affecting its long-term business. The company reported very strong earnings at the end of July, and follow-through confidence from the strong results drove the stock higher in August. As a high-quality growth stock, SPGI also benefitted from investor rotation into “bond proxy” stocks in the face of equity market volatility, slowing economic growth and lower interest rates. Further, SPGI’s long term outlook improved as its China subsidiary continued to rate new Chinese corporate bonds in August, after rating the first domestic Chinese company bond in July. China’s debt market is roughly the same size as the United States debt market, and has the potential to be a substantial revenue growth driver for SPGI over the next decade.
Also contributing to positive performance was The Sherwin-Williams Company (+22%). The stock outperformed during the period as the company reported a strong earnings report driven by better-than-expected results from its Paint Store Group. In addition, Sherwin-Williams’ Paint division experienced strong results due to its enactment of price increases that have begun to offset the rising raw material costs that impacted the company’s profitability last year.
In the Real Estate sector, we added Crown Castle International Corp. (“CCI”) (+4%), a leading shared communications infrastructure company in the United States, with businesses which include operating cell towers and providing fiber to support small cells. We added it to the Fund for a variety of reasons. We like its record of consistent cash flow growth, and believe trends will improve on the macro tower side as the demand for data grows and carriers begin rolling out early 5G solutions. We also like the company’s small cell and fiber investments, and believe they will pay long term dividends and help differentiate CCI from other pure-play macro tower companies. Small cells will be increasingly important for 5G rollout in urban areas, and CCI is developing early expertise in the permitting process. In addition, the company trades at a discount to its tower peers and, similar to SPGI, is a defensive growth name in a market with slowing economic growth trends.
From a sector allocation perspective, the Fund’s performance was boosted relative to the benchmark index by having no exposure to the Energy sector and by an overweight stance in the Information Technology sector.
During the reporting period, the Fund reduced its exposure to the Health Care sector given recent political rhetoric surrounding health care policy including proposals to enact “Medicare for All” and a single-payer health care system. The ability to enact these types of programs remains challenging for legislators given the nature of election cycles, and we have seen prior periods during which the sector has underperformed and multiples have been pressured relating to such cycles. Investors prefer clarity in the Health Care space, and the fear of government legislation and uncertainty surrounding election cycles can act as serious headwinds causing stocks in the sector to pause.
The Fund also reduced exposure to the Communication Services and Financials sectors, and increased its allocations to the Information Technology, Consumer Discretionary, Real Estate, Materials, and Industrials sectors. The Fund had limited exposure to the Consumer Staples sector intra-period but liquidated its position within the sector prior to period end. Please note that GICS sectors were reconstituted on October 1, 2018, and that the beginning sector values for the Fund have been recalculated in accordance with the reconstitution for purposes of this paragraph.(3)
Fiscal Period-End Investment Posture
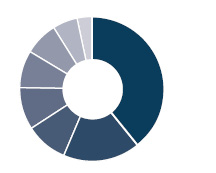
As of September 30, 2019, the Fund’s largest sector allocations included Information Technology, Consumer Discretionary, and Communication Services. As of that date, the Fund had no exposure to the Consumer Staples, Energy, or Utilities sectors.
8
Other Developments
Effective February 28, 2019, Brandon A. Geisler became co-manager of the Focus Fund with Thomas F. Marsico.
Sincerely,
THOMAS F. MARSICO
BRANDON A. GEISLER
PORTFOLIO MANAGERS
(1) | Total returns are based on net change in net asset value assuming reinvestment of distributions. Please see the Prospectus for more information. |
(2) | Regarding GICS data cited throughout this report, the Global Industry Classification Standard was developed by and is the exclusive property and service mark of MSCI Inc. (“MSCI”) and Standard & Poor’s (“S&P”) and is licensed for use by Marsico Capital Management, LLC (the “Adviser”). Neither MSCI, S&P, nor the Adviser or any third party involved in compiling GICS makes any express or implied warranties or representations with respect to such standard or classification (or the results from use thereof), and all such parties hereby expressly disclaim all warranties of originality, accuracy, completeness, merchantability and fitness for a particular purpose with respect to any such standard or classification. MSCI, S&P, the Adviser, and any of their affiliates or third parties involved in compiling GICS shall not have any liability for any direct, indirect, special, punitive, consequential or any other damages (including lost profits) even if notified of the possibility of such damages. |
(3) | Through September 30, 2018, the Funds reported certain investments as having been classified within the Information Technology, Consumer Discretionary or Telecommunication Services sectors. Effective October 1, 2018, GICS reconstituted those sectors by reclassifying certain stocks formerly included in them into other sectors based on their business characteristics. For example, investments in telecommunication services companies (previously included in the Telecommunication Services sector) as well as certain companies that offer content through various media platforms (previously included in the Information Technology or Consumer Discretionary sectors) are now reported in the broadened GICS Communication Services sector. Additionally, certain e-commerce companies (previously included in the Information Technology sector) are now reported in the Consumer Discretionary sector. References to investment sector exposure included throughout this annual report reflect the impact of these changes. |
9
September 30, 2019 (Unaudited)
The Focus Fund is a non-diversified portfolio and invests primarily in the common stocks of large companies that are selected for their long-term growth potential. The Fund will normally hold a core position of between 20 and 35 common stocks.
TOTAL ANNUAL OPERATING EXPENSES* 1.14% | NET ASSETS $554,645,484 | NET ASSET VALUE PER SHARE $18.59 |
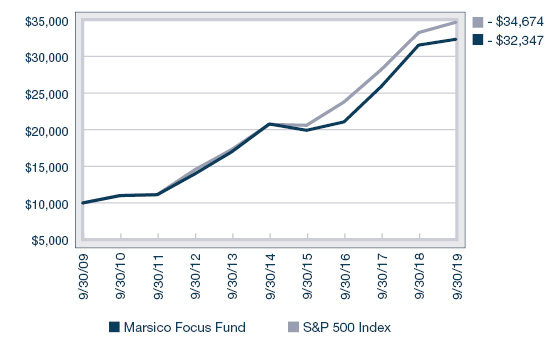
GROWTH OF $10,000(1) | PERFORMANCE COMPARISON |
| | Average Annualized Returns |
| 
|
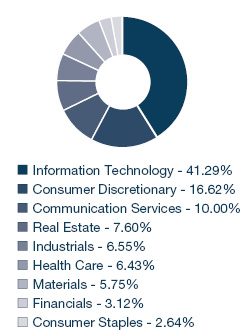
SECTOR ALLOCATION(2) | TOP FIVE HOLDINGS |
| | | | |
| | Visa, Inc. - Cl. A | 8.06% | |
| | Microsoft Corporation | 6.31% | |
| | Amazon.com, Inc. | 6.08% | |
| | PayPal Holdings, Inc. | 5.99% | |
| | Facebook, Inc. - Cl. A | 5.74% | |
| | | | |
* | The Total Annual Operating Expenses are reflective of the information disclosed in the Funds’ Prospectus dated February 1, 2019, as supplemented, and may differ from the expense ratio disclosed in this report. |
| The performance data quoted here represent past performance, and past performance is not a guarantee of future results. Investment return and principal value of an investment will fluctuate so that an investor’s shares, when redeemed, may be worth more or less than their original cost. Current performance may be lower or higher than the performance information quoted. To obtain performance information current to the most recent month-end, please call 888-860-8686 or visitmarsicofunds.com. |
| The performance included in the chart and graph does not reflect the deduction of taxes on Fund distributions or the redemption of Fund shares. |
| All indices are unmanaged and investors cannot invest directly in an index. |
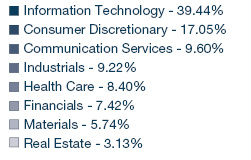
(1) | This chart assumes an initial investment of $10,000 made on September 30, 2009. Total returns are based on net change in NAV, assuming reinvestment of distributions. |
(2) | Sector weightings represent the percentage of the Fund’s investments (excluding cash equivalents) in certain general sectors. These sectors may include more than one industry. The Fund’s portfolio composition is subject to change at any time. |
10
MARSICO FOCUS FUND
SCHEDULE OF INVESTMENTS
September 30, 2019
| | | Number
of
Shares | | | Value | | | Percent
of Net
Assets | |
COMMON STOCKS | | | | | | | | | | | | |
Aerospace & Defense | | | | | | | | | | | | |
Lockheed Martin Corporation | | | 59,296 | | | $ | 23,128,998 | | | | 4.17 | % |
The Boeing Company | | | 67,900 | | | | 25,833,913 | | | | 4.66 | |
| | | | | | | 48,962,911 | | | | 8.83 | |
Application Software | | | | | | | | | | | | |
Adobe, Inc.* | | | 69,814 | | | | 19,286,117 | | | | 3.48 | |
salesforce.com, inc.* | | | 202,149 | | | | 30,006,998 | | | | 5.41 | |
| | | | | | | 49,293,115 | | | | 8.89 | |
Data Processing & Outsourced Services | | | | |
PayPal Holdings, Inc.* | | | 321,030 | | | | 33,255,498 | | | | 5.99 | |
Visa, Inc. - Cl. A | | | 259,898 | | | | 44,705,055 | | | | 8.06 | |
| | | | | | | 77,960,553 | | | | 14.05 | |
Financial Exchanges & Data | | | | | | | | |
Intercontinental Exchange, Inc. | | | 126,875 | | | | 11,706,756 | | | | 2.11 | |
S&P Global, Inc. | | | 113,099 | | | | 27,706,993 | | | | 5.00 | |
| | | | | | | 39,413,749 | | | | 7.11 | |
Footwear | | | | | | | | | | | | |
NIKE, Inc. - Cl. B | | | 123,424 | | | | 11,591,982 | | | | 2.09 | |
| | | | | | | | | | | | | |
Health Care Equipment | | | | | | | | | | | | |
Danaher Corporation | | | 120,203 | | | | 17,360,919 | | | | 3.13 | |
Intuitive Surgical, Inc.* | | | 24,981 | | | | 13,487,992 | | | | 2.43 | |
| | | | | | | 30,848,911 | | | | 5.56 | |
Hotels, Resorts & Cruise Lines | | | | | | | | |
Marriott International, Inc. - Cl. A | | | 134,108 | | | | 16,679,012 | | | | 3.01 | |
| | | | | | | | | | | | | |
Interactive Media & Services | | | | | | | | |
Alphabet, Inc. - Cl. A* | | | 15,665 | | | | 19,129,158 | | | | 3.45 | |
Facebook, Inc. - Cl. A* | | | 178,944 | | | | 31,866,348 | | | | 5.74 | |
| | | | | | | 50,995,506 | | | | 9.19 | |
Internet & Direct Marketing Retail | | | | | | | | |
Alibaba Group Holding Ltd. Spon. ADR* | | | 52,855 | | | | 8,838,941 | | | | 1.60 | |
Amazon.com, Inc.* | | | 19,436 | | | | 33,739,147 | | | | 6.08 | |
| | | | | | | 42,578,088 | | | | 7.68 | |
Managed Health Care | | | | | | | | | | | | |
UnitedHealth Group, Inc. | | | 63,516 | | | | 13,803,297 | | | | 2.49 | |
| | | | | | | | | | | | | |
Restaurants | | | | | | | | | | | | |
McDonald’s Corporation | | | 92,001 | | | | 19,753,535 | | | | 3.56 | |
| | | | | | | | | | | | | |
Semiconductors | | | | | | | | | | | | |
NVIDIA Corporation | | | 96,794 | | | | 16,848,931 | | | | 3.04 | |
| | | | | | | | | | | | | |
Specialized REITs | | | | | | | | | | | | |
Crown Castle International Corp. | | | 119,765 | | | | 16,648,533 | | | | 3.00 | |
| | | | | | | | | | | | | |
Specialty Chemicals | | | | | | | | | | | | |
The Sherwin-Williams Company | | | 55,469 | | | | 30,500,739 | | | | 5.50 | |
| | | | | | | | | | | | | |
Systems Software | | | | | | | | | | | | |
Microsoft Corporation | | | 251,948 | | | | 35,028,330 | | | | 6.31 | |
| | | | | | | | | | | | | |
Technology Hardware, Storage & Peripherals | | | | |
Apple, Inc. | | | 135,941 | | | | 30,446,706 | | | | 5.49 | % |
| | | | | | | | | | | | | |
TOTAL COMMON STOCKS | | | | | | | | | | | | |
(Cost $334,384,268) | | | | | | | 531,353,898 | | | | 95.80 | |
| | | | | | | | | | | | |
SHORT-TERM INVESTMENTS | | | | | | | | |
State Street Institutional U.S. Government Money Market Fund, 0.005% | | | 16,364,619 | | | | 16,364,619 | | | | 2.95 | |
| | | | | | | | | | | | | |
TOTAL SHORT-TERM INVESTMENTS | | | | | | | | |
(Cost $16,364,619) | | | | | | | 16,364,619 | | | | 2.95 | |
| | | | | | | | | | | | | |
TOTAL INVESTMENTS | | | | | | | | | | | | |
(Cost $350,748,887) | | | | | | | 547,718,517 | | | | 98.75 | |
| | | | | | | | | | | | | |
Cash and Other Assets, Less Liabilities | | | | | | | 6,926,967 | | | | 1.25 | |
| | | | | | | | | | | | | |
NET ASSETS | | | | | | $ | 554,645,484 | | | | 100.00 | % |
| See notes to financial statements. |
11
Investment Review BY TOM MARSICO AND BRANDON GEISLER (UNAUDITED)
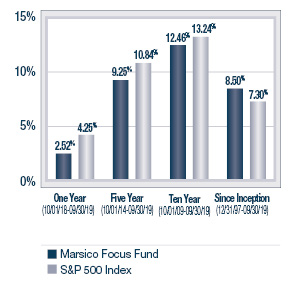
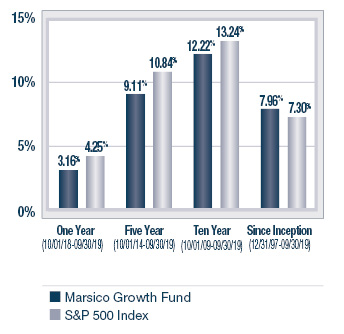
The Marsico Growth Fund posted a total return of +3.16% for the one-year fiscal period ended September 30, 2019. The Fund underperformed the S&P 500 Index, the Fund’s benchmark index, which had a total return of +4.25% over the same time period. Please see the Fund’s Overview for more detailed information about the Fund’s longer-term performance for various time periods ended September 30, 2019.
The performance data for the Fund quoted here represent past performance, and past performance is not a guarantee of future results. Investment return and principal value of an investment will fluctuate so that an investor’s shares, when redeemed, may be worth more or less than their original cost. Current performance may be lower or higher than the performance information quoted. To obtain performance information current to the most recent month-end, please call 888-860-8686 or visitmarsicofunds.com.(1)
This review highlights Fund performance over a one-year fiscal period. Shareholders should keep in mind that the Fund is intended for long-term investors who hold their shares for substantially longer periods of time. You should also keep in mind that our current views and beliefs regarding all investments discussed in this report are subject to change at any time. References to specific securities, industries, and sectors discussed in this report are not recommendations to buy or sell such securities or related investments, and the Fund may not necessarily hold these securities or investments today. Please see the accompanying Schedule of Investments for the percentage of the Fund’s portfolio represented by the securities mentioned in this report as of the end of the reporting period.
The Fund is subject to broad risks associated with investing in equity securities markets generally, including the risks that the securities and markets in which it invests may experience volatility and instability, that domestic and global economies and markets may undergo periods of cyclical change and decline, that investors may at times avoid investments in equity securities, and that investments may not perform as anticipated. Please see the Prospectus for more information.
The Fund is not managed to track its benchmark index, and may hold a substantially overweight or underweight position in a sector, industry, or security compared to its weight in the benchmark. The Fund may be subject to risks associated with a particular sector or other area in which it is overweight, including the risk that the stocks of companies within one area could simultaneously decline in price because of an event that affects the entire area. For informational purposes, the discussion below may compare the benchmark weight or performance of a sector or industry to the investment approach of the Fund.
The Growth Fund’s underperformance during the one-year period ended September 30, 2019, as compared to the S&P 500 Index, was in part attributable to certain Fund holdings in the Health Care, Consumer Staples, and Consumer Discretionary sectors as defined in the Global Industry Classification Standard (“GICS”). From a sector allocation perspective, the Fund was held back relative to its benchmark index by having no exposure to the strong-performing Utilities sector and an underweight stance in the Consumer Staples sector. As volatility increased during the period and bond yields dropped, investors sought the defensive characteristics and yield of stocks in these sectors.
The largest detractor from performance was Health Care holding G1 Therapeutics, Inc. (-65% prior to being sold) as the regulatory pathway for the company’s lead oncology molecule, trilaciclib, remains uncertain. With positive outcomes from three early stage trials in lung cancer and breast cancer, trilaciclib initially appeared likely to receive expedited approval from regulatory authorities. Although trilaciclib did show a reduction in the harmful side effects of chemotherapy, the company may be required to perform additional clinical work prior to approval.
Constellation Brands, Inc. – Cl. A, a material detractor from Fund performance during the period, returned -23% and was sold. We decided to further reduce our exposure to Consumer Staples by liquidating the Fund’s other investment held in the sector (Monster Beverage Corporation, -11% prior to being sold) and shift the Fund’s positioning toward other stocks where we see more opportunity.
On the positive side, the Fund’s performance was boosted relative to the benchmark index by select strong-performing stock holdings, by having no exposure to the weak-performing Energy sector, and by an overweight stance in the Information Technology sector.
In the Health Care sector, animal health company Zoetis, Inc. (+36%) performed very strongly during the reporting period. Zoetis is one of the leading manufacturers of animal health medications and vaccines and is benefitting from new product launches in the companion health space. After the company spun out from Pfizer, Zoetis remained focused on its core markets of livestock and companion animal health. The company livestock portfolio consists of medicines, vaccines and diagnostics for cattle, swine, poultry, fish, sheep and horses. The companion animal portfolio focuses on products that help extend and
12
improve the quality of life for pets. The company launched two innovations for companion animal health that help control skin itching and inflammation in dogs and flea and tick control for pets of all types. These products are more convenient for pet owners and tolerable for animals, and have increased revenue and earnings for the company.
A Software & Services holding that contributed to performance during the reporting period was Worldpay, Inc. – Cl. A (+33.31% prior to being acquired by Fidelity National Information Services, Inc. (“FIS”)). FIS is a core bank software company as well as a global payments processor, and both sides of the business have performed well. Underlying payment volume trends have been robust as Worldpay expands into e-commerce and integrated payment. Additionally, synergy expectations for the merger have proven to be conservative, as both top and bottom line synergies are coming in ahead of plan. We believe that both FIS and newly-acquired Worldpay find themselves in the sweet spot of two major global trends: the rise of electronic payments, and the rise of e-commerce.
Real Estate holding Crown Castle International Corp. rose +29% during the period and aided the Fund’s return. On a stock-specific level, the company benefitted from 5G cell tower growth globally, and benefitted from broader market trends as interest rates dropped and investors turned to yield-producing stocks in the Real Estate and Utilities sectors.
Last, we added Ball Corporation (-10%) to the Growth Fund late in the reporting period. As the leading global aluminum beverage can provider, Ball Corp. has benefitted greatly from the proliferation of beverage brands in the marketplace, providing a tailwind for the industry and producing exceptional volume growth for the past several quarters. We believe this growth can continue, if not accelerate, as beverage brands pivot their packaging to more sustainable and recyclable materials, such as aluminum. We think consumers’ growing awareness of the harmful effects plastics have on the environment will naturally shift consumption preferences away from plastic bottles in favor of aluminum cans, most notably in the still water category. This transition will take years to play out, but appears to present a sizable opportunity for investors in Ball Corp.
During the reporting period, the Fund reduced its exposure to the Communication Services, Financials, Consumer Staples and Health Care sectors. The Fund increased its allocations to the Information Technology, Consumer Discretionary, Materials, and Real Estate sectors. There was no significant change to the Fund’s allocation to the Industrials sector. Please note that GICS sectors were reconstituted on October 1, 2018, and that the beginning sector values for the Fund have been recalculated in accordance with the reconstitution for purposes of this paragraph.(2)
Fiscal Period-End Investment Posture
As of September 30, 2019, the Fund’s largest sector allocations included Information Technology, Consumer Discretionary, Communication Services, and Health Care. As of that date, the Fund had no exposure to the Consumer Staples, Energy, or Utilities sectors.
Other Developments
Effective February 28, 2019, Brandon A. Geisler became co-manager of the Growth Fund with Thomas F. Marsico.
Sincerely,
THOMAS F. MARSICO
BRANDON A. GEISLER
PORTFOLIO MANAGERS
(1) | Total returns are based on net change in net asset value assuming reinvestment of distributions. Please see the Prospectus for more information. |
(2) | Through September 30, 2018, the Funds reported certain investments as having been classified within the Information Technology, Consumer Discretionary or Telecommunication Services sectors. Effective October 1, 2018, GICS reconstituted those sectors by reclassifying certain stocks formerly included in them into other sectors based on their business characteristics. For example, investments in telecommunication services companies (previously included in the Telecommunication Services sector) as well as certain companies that offer content through various media platforms (previously included in the Information Technology or Consumer Discretionary sectors) are now reported in the broadened GICS Communication Services sector. Additionally, certain e-commerce companies (previously included in the Information Technology sector) are now reported in the Consumer Discretionary sector. References to investment sector exposure included throughout this annual report reflect the impact of these changes. |
13
September 30, 2019 (Unaudited)
The Growth Fund is a diversified portfolio and invests primarily in the common stocks of large companies that are selected for their long-term growth potential. The Growth Fund will normally hold a core position of between 35 and 50 common stocks.
TOTAL ANNUAL OPERATING EXPENSES* 1.44% | NET ASSETS $259,305,245 | NET ASSET VALUE PER SHARE $18.75 |
GROWTH OF $10,000(1) | PERFORMANCE COMPARISON |
| | Average Annualized Returns |
| 
|
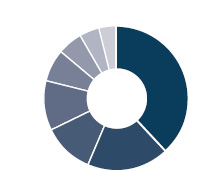
SECTOR ALLOCATION(2) | TOP FIVE HOLDINGS |
| | | | |
| | Apple, Inc. | 6.41% | |
| | Visa, Inc. - Cl. A | 6.00% | |
| | Microsoft Corporation | 5.74% | |
| | Amazon.com, Inc. | 5.33% | |
| | Facebook, Inc. - Cl. A | 4.41% | |
| | | | |
* | The Total Annual Operating Expenses are reflective of the information disclosed in the Funds’ Prospectus dated February 1, 2019, as supplemented, and may differ from the expense ratio disclosed in this report. |
| The performance data quoted here represent past performance, and past performance is not a guarantee of future results. Investment return and principal value of an investment will fluctuate so that an investor’s shares, when redeemed, may be worth more or less than their original cost. Current performance may be lower or higher than the performance information quoted. To obtain performance information current to the most recent month-end, please call 888-860-8686 or visitmarsicofunds.com. |
| The performance included in the chart and graph does not reflect the deduction of taxes on Fund distributions or the redemption of Fund shares. |
| All indices are unmanaged and investors cannot invest directly in an index. |
(1) | This chart assumes an initial investment of $10,000 made on September 30, 2009. Total returns are based on net change in NAV, assuming reinvestment of distributions. |
(2) | Sector weightings represent the percentage of the Fund’s investments (excluding cash equivalents) in certain general sectors. These sectors may include more than one industry. The Fund’s portfolio composition is subject to change at any time. |
14
MARSICO GROWTH FUND
SCHEDULE OF INVESTMENTS
September 30, 2019
| | | Number
of
Shares | | | Value | | | Percent
of Net
Assets | |
COMMON STOCKS | | | | | | | | | | | | |
Aerospace & Defense | | | | | | | | | | | | |
Lockheed Martin Corporation | | | 25,976 | | | $ | 10,132,198 | | | | 3.91 | % |
The Boeing Company | | | 20,606 | | | | 7,839,965 | | | | 3.02 | |
| | | | | | | 17,972,163 | | | | 6.93 | |
Apparel Retail | | | | | | | | | | | | |
The TJX Companies, Inc. | | | 125,723 | | | | 7,007,800 | | | | 2.70 | |
| | | | | | | | | | | | | |
Application Software | | | | | | | | | | | | |
Adobe, Inc.* | | | 33,487 | | | | 9,250,784 | | | | 3.57 | |
salesforce.com, inc.* | | | 72,722 | | | | 10,794,853 | | | | 4.16 | |
| | | | | | | 20,045,637 | | | | 7.73 | |
Data Processing & Outsourced Services | | | | |
Fidelity National Information Services, Inc. | | | 47,507 | | | | 6,307,029 | | | | 2.43 | |
PayPal Holdings, Inc.* | | | 106,064 | | | | 10,987,170 | | | | 4.24 | |
Visa, Inc. - Cl. A | | | 90,543 | | | | 15,574,301 | | | | 6.00 | |
| | | | | | | 32,868,500 | | | | 12.67 | |
Financial Exchanges & Data | | | | | | | | |
Intercontinental Exchange, Inc. | | | 57,579 | | | | 5,312,814 | | | | 2.05 | |
S&P Global, Inc. | | | 20,970 | | | | 5,137,231 | | | | 1.98 | |
| | | | | | | 10,450,045 | | | | 4.03 | |
Footwear | | | | | | | | | | | | |
NIKE, Inc. - Cl. B | | | 57,480 | | | | 5,398,522 | | | | 2.08 | |
| | | | | | | | | | | | | |
Health Care Equipment | | | | | | | | | | | | |
Danaher Corporation | | | 45,129 | | | | 6,517,981 | | | | 2.51 | |
Intuitive Surgical, Inc.* | | | 4,031 | | | | 2,176,458 | | | | 0.84 | |
ResMed, Inc. | | | 32,943 | | | | 4,450,929 | | | | 1.72 | |
| | | | | | | 13,145,368 | | | | 5.07 | |
Hotels, Resorts & Cruise Lines | | | | | | | | |
Marriott International, Inc. - Cl. A | | | 51,008 | | | | 6,343,865 | | | | 2.45 | |
| | | | | | | | | |
Interactive Home Entertainment | | | | | | | | |
Take-Two Interactive Software, Inc.* | | | 44,340 | | | | 5,557,576 | | | | 2.14 | |
| | | | | | | | | |
Interactive Media & Services | | | | | | | | |
Alphabet, Inc. - Cl. A* | | | 7,261 | | | | 8,866,698 | | | | 3.42 | |
Facebook, Inc. - Cl. A* | | | 64,171 | | | | 11,427,572 | | | | 4.41 | |
Snap, Inc. - Cl. A* | | | 167,813 | | | | 2,651,445 | | | | 1.02 | |
| | | | | | | 22,945,715 | | | | 8.85 | |
Internet & Direct Marketing Retail | | | | | | | | |
Alibaba Group Holding Ltd. Spon. ADR* | | | 16,402 | | | | 2,742,906 | | | | 1.06 | |
Amazon.com, Inc.* | | | 7,970 | | | | 13,835,203 | | | | 5.33 | |
| | | | | | | 16,578,109 | | | | 6.39 | |
Managed Health Care | | | | | | | | | | | | |
UnitedHealth Group, Inc. | | | 20,736 | | | | 4,506,347 | | | | 1.74 | |
| | | | | | | | | | | | | |
Metal & Glass Containers | | | | | | | | | | | | |
Ball Corporation | | | 50,179 | | | | 3,653,533 | | | | 1.41 | |
| | | | | | | | |
Pharmaceuticals | | | | | | | | | | | | |
Zoetis, Inc. | | | 75,708 | | | | 9,432,460 | | | | 3.64 | % |
| | | | | | | | | | | | | |
Restaurants | | | | | | | | | | | | |
McDonald’s Corporation | | | 33,167 | | | | 7,121,287 | | | | 2.75 | |
| | | | | | | | | | | | | |
Semiconductors | | | | | | | | | | | | |
NVIDIA Corporation | | | 36,211 | | | | 6,303,249 | | | | 2.43 | |
| | | | | | | | | | | | | |
Specialized Consumer Services | | | | | | | | |
ServiceMaster Global Holdings, Inc.* | | | 48,534 | | | | 2,713,051 | | | | 1.05 | |
| | | | | | | | | | | | | |
Specialized REITs | | | | | | | | | | | | |
Crown Castle International Corp. | | | 68,703 | | | | 9,550,404 | | | | 3.68 | |
| | | | | | | | | | | | | |
Specialty Chemicals | | | | | | | | | | | | |
The Sherwin-Williams Company | | | 18,996 | | | | 10,445,330 | | | | 4.03 | |
| | | | | | | | | | | | | |
Systems Software | | | | | | | | | | | | |
Microsoft Corporation | | | 107,107 | | | | 14,891,086 | | | | 5.74 | |
ServiceNow, Inc.* | | | 14,970 | | | | 3,800,135 | | | | 1.47 | |
| | | | | | | 18,691,221 | | | | 7.21 | |
Technology Hardware, Storage & Peripherals | | | | |
Apple, Inc. | | | 74,222 | | | | 16,623,501 | | | | 6.41 | |
| | | | | | | | | | | | | |
TOTAL COMMON STOCKS | | | | | | | | | | | | |
(Cost $154,668,437) | | | | | | | 247,353,683 | | | | 95.39 | |
| | | | | | | | | | | | | |
SHORT-TERM INVESTMENTS | | | | |
State Street Institutional Treasury Money Market Fund, 0.005% | | | 9,880,141 | | | | 9,880,141 | | | | 3.81 | |
| | | | | | | | | | | | | |
TOTAL SHORT-TERM INVESTMENTS | | | | | | | | |
(Cost $9,880,141) | | | | | | | 9,880,141 | | | | 3.81 | |
| | | | | | | | | | | | | |
TOTAL INVESTMENTS | | | | | | | | | | | | |
(Cost $164,548,578) | | | | | | | 257,233,824 | | | | 99.20 | |
| | | | | | | | | | | | | |
Cash and Other Assets, Less Liabilities | | | | | | | 2,071,421 | | | | 0.80 | |
| | | | | | | | | | | | | |
NET ASSETS | | | | | | $ | 259,305,245 | | | | 100.00 | % |
| See notes to financial statements. |
15
Investment Review BY BRANDON GEISLER (UNAUDITED)
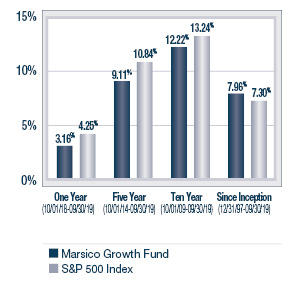
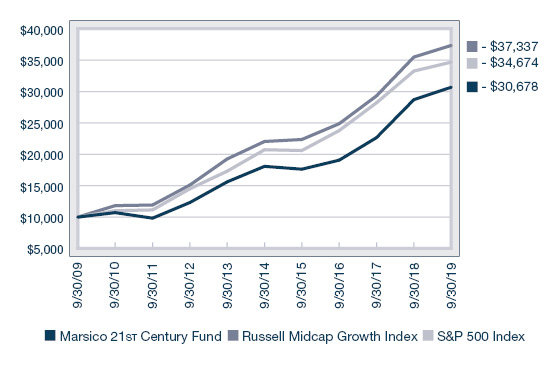
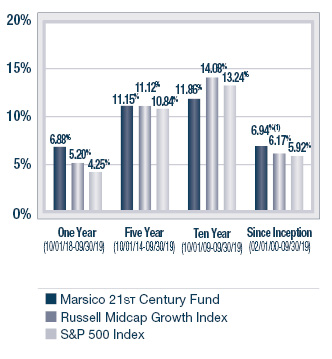
The Marsico 21stCentury Fund posted a total return of +6.88% for the one-year fiscal period ended September 30, 2019. The Fund outperformed the Russell Midcap Growth Index, the Fund’s primary benchmark, which had a total return of +5.20% during the one-year fiscal period. Please see the Fund’s Overview for more detailed information about the Fund’s longer-term performance for various time periods ended September 30, 2019.
The performance data for the Fund quoted here represent past performance, and past performance is not a guarantee of future results. Investment return and principal value of an investment will fluctuate so that an investor’s shares, when redeemed, may be worth more or less than their original cost. Current performance may be lower or higher than the performance information quoted. To obtain performance information current to the most recent month-end, please call 888-860-8686 or visitmarsicofunds.com.(1)
This review highlights Fund performance over a one-year fiscal period. Shareholders should keep in mind that the Fund is intended for long-term investors who hold their shares for substantially longer periods of time. You should also keep in mind that our current views and beliefs regarding all investments discussed in this report are subject to change at any time. References to specific securities, industries, and sectors discussed in this report are not recommendations to buy or sell such securities or related investments, and the Fund may not necessarily hold these securities or investments today. Please see the accompanying Schedule of Investments for the percentage of the Fund’s portfolio represented by the securities mentioned in this report as of the end of the reporting period.
The Fund is subject to broad risks associated with investing in equity securities markets generally, including the risks that the securities and markets in which it invests may experience volatility and instability, that domestic and global economies and markets may undergo periods of cyclical change and decline, that investors may at times avoid investments in equity securities, and that investments may not perform as anticipated. Please see the Prospectus for more information.
The Fund is not managed to track its benchmark index, and may hold a substantially overweight or underweight position in a sector, industry, or security compared to its weight in the benchmark. The Fund may be subject to risks associated with a particular sector or other area in which it is overweight, including the risk that the stocks of companies within one area could simultaneously decline in price because of an event that affects the entire area. For informational purposes, the discussion below may compare the benchmark weight or performance of a sector or industry to the investment approach of the Fund.
The 21st Century Fund’s outperformance during the one-year period ended September 30, 2019 as compared to its benchmark, the Russell Midcap Growth Index, was due in part to certain strong-performing stocks in the Information Technology, Materials and Industrials sectors as defined in the Global Industry Classification Standard (“GICS”). From a sector allocation perspective, the Fund’s performance was boosted by maintaining no exposure in the weak-performing Energy sector, as the sector posted a negative return for the period. In addition, the Fund benefitted from an overweight posture in the Real Estate sector, as it was the strongest sector in the benchmark index during the period. As volatility increased during the period and bond yields dropped, investors sought the defensive characteristics and yields of stocks in this sector.
A Software & Services holding that contributed to performance during the reporting period was Worldpay, Inc. – Cl. A (+33.88% prior to being acquired by Fidelity National Information Services, Inc. (“FIS”)). FIS is a core bank software company as well as a global payments processor, and both sides of the business have performed well. Underlying payment volume trends have been robust as Worldpay expands into e-commerce and integrated payment. Additionally, synergy expectations for the merger have proven to be conservative, as both top and bottom line synergies are coming in ahead of plan. We believe that both FIS and newly-acquired Worldpay find themselves in the sweet spot of two major global trends: the rise of electronic payments, and the rise of e-commerce.
Also on the positive side, in the Materials sector, aluminum can manufacturer Ball Corporation returned +67%, handily outperforming the Materials sector as well as the broader Russell Midcap Growth Index overall. As the leading global aluminum beverage can provider, Ball Corp. has benefitted greatly from the proliferation of beverage brands in the marketplace, providing a tailwind for the industry and producing exceptional volume growth for the past several quarters. We believe this growth can continue, if not accelerate, as beverage brands pivot their packaging to more sustainable and recyclable materials, such as aluminum. We think consumers’ growing awareness of the harmful effects plastics have on the environment will naturally shift consumption preferences away from plastic bottles in favor of aluminum cans, most notably in the still water category. This transition will take years to play out, but appears to present a sizable opportunity for investors in Ball Corp.
CoStar Group, Inc. was up +43% for the period due to continued strong organic sales within both its core suite of real estate data products as well as its online service at Apartments.com. This led to an inflection point in operating leverage trends and an improved outlook for the sustainability of its long-term growth trajectory.
16
A new addition during the period was Media & Entertainment company Snap, Inc. – Cl. A (+41%) as we feel the company is inflecting upwards and has begun to show positive signs of a turnaround in its business. Previously competitive pressure and lack of qualified management had hampered the ability of the company to realize its potential, which we view as significant. An overhaul of top management over the past 18 months has led to improved engagement, revenue, and profitability for the business, which we think is likely to lead to healthy performance of its shares.
From a sector allocation perspective, Fund performance was only marginally impaired by having an underweight allocation to the Financials sector, based on average weight for the period, as the sector return outmatched the overall benchmark index return over the same period.
On the negative side, in the Information Technology space, manufacturing-related software company PTC, Inc. (-36%) underperformed on investor concerns about a slowdown in US manufacturing and slower sales from markets like China, Russia and other parts of Asia.
We exited a position in Healthcare Services Group, Inc. (-42% prior to being sold), which provides basic housekeeping, maintenance, and food services to retirement facilities, because we believe the industry will continue to struggle with historically low occupancy rates and reimbursement cuts.
During the reporting period, the Fund reduced its exposure to the Consumer Staples, Materials, and Communication Services sectors and increased its allocation to the Information Technology and Industrials sectors. There were no significant changes to the Fund’s allocations to the Health Care, Real Estate, Consumer Discretionary, and Financials sectors. Please note that GICS sectors were reconstituted on October 1, 2018, and that the beginning sector values for the Fund have been recalculated in accordance with the reconstitution for purposes of this paragraph.(2)
Fiscal Period-End Investment Posture
As of September 30, 2019 the Fund’s primary economic sector allocations included Information Technology, Industrials, Health Care and Consumer Discretionary. The Fund had no investments in the Energy or Utilities sectors.
Sincerely,
BRANDON A. GEISLER
PORTFOLIO MANAGER
(1) | Total returns are based on net change in net asset value assuming reinvestment of distributions. Periodically, certain fees and expenses have been waived or reimbursed by the Adviser for the 21st Century Fund. In the absence of such a waiver or reimbursement, the performance returns reflected would have been reduced. In accordance with the expense limitation and fee waiver agreement, the Adviser may recoup fees and expenses previously waived or reimbursed under certain parameters. Periodically, the Adviser has recouped such fees or expenses from the 21st Century Fund, resulting in a lower performance return. Please see the Prospectus for more information. |
(2) | Through September 30, 2018, the Funds reported certain investments as having been classified within the Information Technology, Consumer Discretionary or Telecommunication Services sectors. Effective October 1, 2018, GICS reconstituted those sectors by reclassifying certain stocks formerly included in them into other sectors based on their business characteristics. For example, investments in telecommunication services companies (previously included in the Telecommunication Services sector) as well as certain companies that offer content through various media platforms (previously included in the Information Technology or Consumer Discretionary sectors) are now reported in the broadened GICS Communication Services sector. Additionally, certain e-commerce companies (previously included in the Information Technology sector) are now reported in the Consumer Discretionary sector. References to investment sector exposure included throughout this annual report reflect the impact of these changes. |
17
21stCENTURY Fund Overview |
September 30, 2019 (Unaudited)
The 21st Century Fund is a diversified portfolio and invests primarily in common stocks that are selected for their long-term growth potential. The Fund may invest in companies of any size. The portions of Fund assets invested in large-capitalization, medium-capitalization, or small-capitalization companies will vary based on market conditions, depending on the portfolio manager’s judgment as to how to achieve the Fund’s investment objective. Under current market conditions the portfolio manager expects to invest substantially in medium-capitalization companies. The Fund will normally hold a core position of between 35 and 60 common stocks.
TOTAL ANNUAL OPERATING EXPENSES* 1.42% | NET ASSETS $282,779,199 | NET ASSET VALUE PER SHARE $33.70 |
GROWTH OF $10,000(2) | PERFORMANCE COMPARISON |
| | Average Annualized Returns |
| 
|
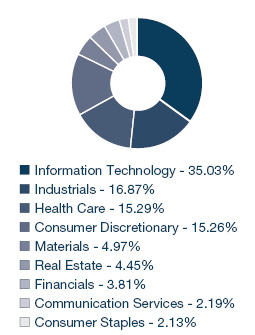
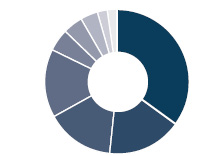
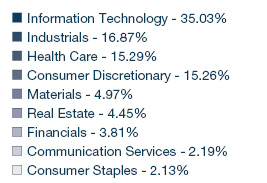
SECTOR ALLOCATION(3) | TOP FIVE HOLDINGS |
| | | | |
| | CoStar Group, Inc. | 3.14% | |
| | Fidelity National Information Services, Inc. | 3.11% | |
| | Burlington Stores, Inc. | 2.96% | |
| | Teleflex, Inc. | 2.87% | |
| | AMETEK, Inc. | 2.81% | |
| | | | |
* | The Total Annual Operating Expenses are reflective of the information disclosed in the Funds’ Prospectus dated February 1, 2019, as supplemented, and may differ from the expense ratio disclosed in this report. |
| The performance data quoted here represent past performance, and past performance is not a guarantee of future results. Investment return and principal value of an investment will fluctuate so that an investor’s shares, when redeemed, may be worth more or less than their original cost. Current performance may be lower or higher than the performance information quoted. To obtain performance information current to the most recent month-end, please call 888-860-8686 or visitmarsicofunds.com. |
| The performance included in the chart and graph does not reflect the deduction of taxes on Fund distributions or the redemption of Fund shares. |
| All indices are unmanaged and investors cannot invest directly in an index. |
| Effective January 31, 2018, the Russell Midcap Growth Index was made the primary benchmark index and the S&P 500 Index was made a supplemental benchmark index of the Fund because under current market conditions the Fund is invested substantially in medium-capitalization securities. The Russell Midcap Growth Index (the “Underlying Index”) measures the performance of the mid-capitalization growth sector of the US equity market, and is composed of mid-capitalization US equities that exhibit growth characteristics. It is a subset of the Russell Midcap® Index, which measures the performance of the mid-capitalization sector of the US equity market. The Underlying Index measures the performance of equity securities of Russell Midcap Index issuers with higher price-to-book ratios and higher forecasted growth. |
(1) | Periodically, certain fees and expenses have been waived or reimbursed by the Adviser for the21st Century Fund. In the absence of such a waiver or reimbursement, the performance returns reflected would have been reduced. In accordance with the expense limitation and fee waiver agreement, the Adviser may recoup fees and expenses previously waived or reimbursed under certain parameters. Periodically, the Adviser has recouped such fees or expenses from the21stCentury Fund, resulting in a lower performance return. |
(2) | This chart assumes an initial investment of $10,000 made on September 30, 2009. Total returns are based on net change in NAV, assuming reinvestment of distributions. |
(3) | Sector weightings represent the percentage of the Fund’s investments (excluding cash equivalents) in certain general sectors. These sectors may include more than one industry. The Fund’s portfolio composition is subject to change at any time. |
18
MARSICO 21st CENTURY FUND
SCHEDULE OF INVESTMENTS
September 30, 2019
| | | Number
of
Shares | | | Value | �� | | Percent
of Net
Assets | |
COMMON STOCKS | | | | | | | | | | | | |
Aerospace & Defense | | | | | | | | | | | | |
HEICO Corporation | | | 43,510 | | | $ | 5,433,529 | | | | 1.92 | % |
L3Harris Technologies, Inc. | | | 33,391 | | | | 6,966,698 | | | | 2.47 | |
| | | | | | | 12,400,227 | | | | 4.39 | |
Apparel Retail | | | | | | | | | | | | |
Burlington Stores, Inc.* | | | 41,876 | | | | 8,367,662 | | | | 2.96 | |
| | | | | | | | | | | | | |
Apparel, Accessories & Luxury Goods | | | | |
Under Armour, Inc. - Cl. A* | | | 123,367 | | | | 2,459,938 | | | | 0.87 | |
| | | | | | | | | | | | | |
Application Software | | | | | | | | | | | | |
Atlassian Corporation PLC - Cl. A* | | | 28,633 | | | | 3,591,724 | | | | 1.27 | |
Constellation Software, Inc. | | | 5,889 | | | | 5,881,444 | | | | 2.08 | |
Guidewire Software, Inc.* | | | 73,203 | | | | 7,714,132 | | | | 2.73 | |
PTC, Inc.* | | | 69,722 | | | | 4,753,646 | | | | 1.68 | |
RealPage, Inc.* | | | 101,697 | | | | 6,392,673 | | | | 2.26 | |
The Descartes Systems Group, Inc.* | | | 143,100 | | | | 5,776,494 | | | | 2.04 | |
| | | | | | | 34,110,113 | | | | 12.06 | |
Automotive Retail | | | | | | | | | | | | |
O’Reilly Automotive, Inc.* | | | 16,990 | | | | 6,770,685 | | | | 2.39 | |
| | | | | | | | | | | | | |
Biotechnology | | | | | | | | | | | | |
Exact Sciences Corporation* | | | 26,614 | | | | 2,405,107 | | | | 0.85 | |
| | | | | | | | | | | | | |
Building Products | | | | | | | | | | | | |
A.O. Smith Corporation | | | 102,151 | | | | 4,873,624 | | | | 1.72 | |
| | | | | | | | | | | | | |
Construction Materials | | | | | | | | | | | | |
Vulcan Materials Company | | | 45,671 | | | | 6,907,282 | | | | 2.44 | |
| | | | | | | | | | | | | |
Data Processing & Outsourced Services | | | | |
Broadridge Financial Solutions, Inc. | | | 39,343 | | | | 4,895,449 | | | | 1.73 | |
Fidelity National Information Services, Inc. | | | 66,150 | | | | 8,782,074 | | | | 3.11 | |
Square, Inc. - Cl. A* | | | 46,993 | | | | 2,911,216 | | | | 1.03 | |
WEX, Inc.* | | | 29,151 | | | | 5,890,543 | | | | 2.08 | |
| | | | | | | 22,479,282 | | | | 7.95 | |
Distillers & Vintners | | | | | | | | | | | | |
Constellation Brands, Inc. - Cl. A | | | 27,069 | | | | 5,610,862 | | | | 1.98 | |
| | | | | | | | | | | | | |
Electrical Components & Equipment | | | | | | | | |
AMETEK, Inc. | | | 86,491 | | | | 7,941,604 | | | | 2.81 | |
| | | | | | | | | | | | | |
Electronic Equipment & Instruments | | | | | | | | |
Cognex Corporation | | | 103,768 | | | | 5,098,122 | | | | 1.80 | |
Novanta, Inc.* | | | 54,344 | | | | 4,440,992 | | | | 1.57 | |
| | | | | | | 9,539,114 | | | | 3.37 | |
Financial Exchanges & Data | | | | | | | | |
MSCI, Inc. | | | 8,048 | | | | 1,752,452 | | | | 0.62 | |
| | | | | | | | | | | | | |
General Merchandise Stores | | | | |
Ollie’s Bargain Outlet Holdings, Inc.* | | | 58,776 | | | | 3,446,625 | | | | 1.22 | |
| | | | | | | | |
Health Care Equipment | | | | | | | | | | | | |
ABIOMED, Inc.* | | | 13,935 | | | | 2,478,897 | | | | 0.88 | % |
IDEXX Laboratories, Inc.* | | | 19,088 | | | | 5,190,600 | | | | 1.83 | |
Intuitive Surgical, Inc.* | | | 12,205 | | | | 6,589,846 | | | | 2.33 | |
LivaNova PLC* | | | 51,466 | | | | 3,797,676 | | | | 1.34 | |
Teleflex, Inc. | | | 23,854 | | | | 8,104,396 | | | | 2.87 | |
| | | | | | | 26,161,415 | | | | 9.25 | |
Health Care Supplies | | | | | | | | | | | | |
SmileDirectClub, Inc.* | | | 20,000 | | | | 277,600 | | | | 0.10 | |
The Cooper Companies, Inc. | | | 18,355 | | | | 5,451,435 | | | | 1.93 | |
| | | | | | | 5,729,035 | | | | 2.03 | |
Home Improvement Retail | | | | | | | | | | | | |
Floor & Decor Holdings, Inc. - Cl. A* | | | 48,648 | | | | 2,488,345 | | | | 0.88 | |
| | | | | | | | | | | | | |
Hotels, Resorts & Cruise Lines | | | | | | | | |
Norwegian Cruise Line Holdings Ltd.* | | | 71,572 | | | | 3,705,283 | | | | 1.31 | |
| | | | | | | | | | | | | |
Interactive Media & Services | | | | | | | | |
Snap, Inc. - Cl. A* | | | 364,443 | | | | 5,758,199 | | | | 2.04 | |
| | | | | | | | | | | | | |
Internet Services & Infrastructure | | | | | | | | |
Twilio, Inc. - Cl. A* | | | 21,108 | | | | 2,321,036 | | | | 0.82 | |
| | | | | | | | | | | | | |
IT Consulting & Other Services |
Gartner, Inc.* | | | 45,884 | | | | 6,560,953 | | | | 2.32 | |
InterXion Holding N.V.* | | | 46,743 | | | | 3,807,685 | | | | 1.35 | |
| | | | | | | 10,368,638 | | | | 3.67 | |
Leisure Facilities | | | | | | | | | | | | |
Vail Resorts, Inc. | | | 17,643 | | | | 4,014,841 | | | | 1.42 | |
| | | | | | | | | | | | | |
Metal & Glass Containers | | | | | | | | | | | | |
Ball Corporation | | | 84,843 | | | | 6,177,419 | | | | 2.19 | |
| | | | | | | | | | | | | |
Pharmaceuticals | | | | | | | | | | | | |
Elanco Animal Health, Inc.* | | | 122,242 | | | | 3,250,415 | | | | 1.15 | |
GW Pharmaceuticals PLC ADR* | | | 23,210 | | | | 2,669,846 | | | | 0.94 | |
| | | | | | | 5,920,261 | | | | 2.09 | |
Railroads | | | | | | | | | | | | |
Genesee & Wyoming, Inc. - Cl. A* | | | 37,657 | | | | 4,161,475 | | | | 1.47 | |
| | | | | | | | | | | | | |
Real Estate Services | | | | | | | | | | | | |
FirstService Corporation | | | 52,700 | | | | 5,403,058 | | | | 1.91 | |
| | | | | | | | | | | | | |
Regional Banks | | | | | | | | | | | | |
First Republic Bank | | | 51,040 | | | | 4,935,568 | | | | 1.75 | |
Signature Bank | | | 28,010 | | | | 3,339,352 | | | | 1.18 | |
| | | | | | | 8,274,920 | | | | 2.93 | |
Research & Consulting Services | | | | | | | | |
CoStar Group, Inc.* | | | 14,975 | | | | 8,883,170 | | | | 3.14 | |
Verisk Analytics, Inc. | | | 38,685 | | | | 6,117,646 | | | | 2.17 | |
| | | | | | | 15,000,816 | | | | 5.31 | |
Semiconductor Equipment | | | | | | | | | | | | |
Lam Research Corporation | | | 29,909 | | | | 6,912,269 | | | | 2.44 | |
| See notes to financial statements. |
19
MARSICO 21st CENTURY FUND
SCHEDULE OF INVESTMENTS (continued)
September 30, 2019
| | | Number
of
Shares | | | Value | | | Percent
of Net
Assets | |
COMMON STOCKS(continued) | | | | | | | | |
Semiconductors | | | | | | | | | | | | |
Microchip Technology, Inc. | | | 69,108 | | | $ | 6,420,824 | | | | 2.27 | % |
| | | | | | | | | | | | | |
Specialized Consumer Services | | | | | | | | |
frontdoor, Inc.* | | | 56,422 | | | | 2,740,417 | | | | 0.97 | |
ServiceMaster Global Holdings, Inc.* | | | 110,065 | | | | 6,152,633 | | | | 2.18 | |
| | | | | | | 8,893,050 | | | | 3.15 | |
Specialized REITs | | | | | | | | | | | | |
SBA Communications Corporation - Cl. A | | | 26,187 | | | | 6,314,995 | | | | 2.23 | |
| | | | | | | | | | | | | |
TOTAL COMMON STOCKS | | | | | | | | | | | | |
(Cost $205,274,137) | | | | | | | 263,090,456 | | | | 93.04 | |
| | | | | | | | | | | | | |
SHORT-TERM INVESTMENTS | | | | | | | | |
State Street Institutional Treasury Money Market Fund, 0.005% | | | 20,503,241 | | | | 20,503,241 | | | | 7.25 | |
| | | | | | | | | | | | | |
TOTAL SHORT-TERM INVESTMENTS | | | | | | | | |
(Cost $20,503,241) | | | | | | | 20,503,241 | | �� | | 7.25 | |
| | | | | | | | | | | | | |
TOTAL INVESTMENTS | | | | | | | | | | | | |
(Cost $225,777,378) | | | | | | | 283,593,697 | | | | 100.29 | |
| | | | | | | | | | | | | |
Liabilities, Less Cash and Other Assets | | | | | | | (814,498 | ) | | | (0.29 | ) |
| | | | | | | | | | | | | |
NET ASSETS | | | | | | $ | 282,779,199 | | | | 100.00 | % |
| See notes to financial statements. |
20
INTERNATIONAL OPPORTUNITIES FUND |
Investment Review BY TOM MARSICO AND ROB SUSMAN (UNAUDITED)
The Marsico International Opportunities Fund posted a total return of (US$) -0.37% for the one-year fiscal period ended September 30, 2019. The Fund outperformed the MSCI EAFE Index, the Fund’s benchmark index, which had a total return of (US$) -1.34% over the same time period. Please see the Fund’s Overview for more detailed information about the Fund’s longer-term performance for various time periods ended September 30, 2019.
The performance data for the Fund quoted here represent past performance, and past performance is not a guarantee of future results. Investment return and principal value of an investment will fluctuate so that an investor’s shares, when redeemed, may be worth more or less than their original cost. Current performance may be lower or higher than the performance information quoted. To obtain performance information current to the most recent month-end, please call 888-860-8686 or visitmarsicofunds.com.(1)
This review highlights Fund performance over a one-year fiscal period. Shareholders should keep in mind that the Fund is intended for long-term investors who hold their shares for substantially longer periods of time. You should also keep in mind that our current views and beliefs regarding all investments discussed in this report are subject to change at any time. References to specific securities, industries, and sectors discussed in this report are not recommendations to buy or sell such securities or related investments, and the Fund may not necessarily hold these securities or investments today. Please see the accompanying Schedule of Investments for the percentage of the Fund’s portfolio represented by the securities mentioned in this report as of the end of the reporting period.
Foreign investments present additional risks due to currency fluctuations, economic and political factors, lower liquidity, differences in securities regulations and accounting standards, possible changes in taxation, limited public information, and other factors. In addition, the Fund is subject to broad risks associated with investing in equity securities markets generally, including the risks that the securities and markets in which it invests may experience volatility and instability, that domestic and global economies and markets may undergo periods of cyclical change and decline, that investors may at times avoid investments in equity securities, and that investments may not perform as anticipated. Please see the Prospectus for more information.
The Fund is not managed to track its benchmark index, and may hold a substantially overweight or underweight position in a sector, industry, or security compared to its weight in the benchmark. The Fund may be subject to risks associated with a particular sector or other area in which it is overweight, including the risk that the stocks of companies within one area could simultaneously decline in price because of an event that affects the entire area. For informational purposes, the discussion below may compare the benchmark weight or performance of a sector or industry to the investment approach of the Fund.
The International Opportunities Fund’s outperformance during the one-year period ended September 30, 2019 as compared to the MSCI EAFE Index was due, in part, to certain strong-performing stocks in the Information Technology and Communication Services sectors as defined in the Global Industry Classification Standard (“GICS”). In terms of sector allocation as compared to its benchmark index, the Fund was rewarded for having minimal exposure to the Energy sector and an underweight stance in the Financials sector, two of the weakest performing sectors in the MSCI EAFE index during the period.
Several positions in the Fund performed positively during the period, including cellular tower company Cellnex Telecom SA (+60%). Cellnex is benefitting from a global re-rating in tower stocks given cell towers’ consistent cash flows, excitement about upcoming 5G deployments which will benefit these companies, and the defensive nature of the tower business in a souring global economy. Cellnex, in particular, has announced several large acquisitions in the last twelve months which we expect should prove to be highly accretive to earnings.
A Software & Services holding that contributed to performance during the reporting period was Worldpay, Inc. – Cl. A (+34.44% prior to being acquired by Fidelity National Information Services, Inc. (“FIS”)). FIS is a core bank software company as well as a global payments processor, and both sides of the business have performed well. Underlying payment volume trends have been robust as Worldpay expands into e-commerce and integrated payment. Additionally, synergy expectations for the merger have proven to be conservative, as both top and bottom line synergies are coming in ahead of plan. We believe that both FIS and newly-acquired Worldpay find themselves in the sweet spot of two major global trends: the rise of electronic payments, and the rise of e-commerce.
In the Semiconductors & Semiconductor Equipment industry group, Dutch lithography card maker ASML Holding N.V. (+32%) was a strong performer during the period. ASML has a dominant position in leading-edge photolithography tools used in the fabrication of semiconductors, which major chip makers and foundries (such as Intel, Samsung, and Global Foundries) must purchase to keep up with higher demand for CPUs and GPUs, as well as the constant need to increase transistor density to improve chip performance. We expect this trend will continue into 2020 and beyond, as chip makers must invest more in photolithography tools to improve processor performance while confronting the limitations of materials science and the need
21
INTERNATIONAL OPPORTUNITIES FUND |
to continue shrinking chip features down to scales measured in the dozens of atoms. ASML’s dominant position in leading-edge photolithography tools remains unchallenged, and we believe that its management continues to show excellent ability to manage a leading firm in a very complex, global industry.
From a sector allocation perspective, Fund performance was penalized for maintaining no exposure to the Utilities sector, the strongest performing sector in the MSCI EAFE Index during the period, and for maintaining an underweight stance to the Consumer Staples sector.
Several of the Fund’s positions in the Health Care sector detracted from performance including Eurofins Scientific S.E. (-21%). The company is a promising global manufacturer of products and services focused on laboratory safety and purity analysis important to the pharmaceutical, environmental, food, and consumer products industries. The company underperformed recently due to concerns that recent acquisitions may be dilutive to organic growth and may have increased debt leverage. However, the company reiterated its 2019 and 2020 guidance in August and reduced its leverage to their targeted goal of 3.5X.
In the Industrials sector, Irish low-cost airline Ryanair Holdings PLC Spon. ADR (-32%) underperformed due to weakness in European short-haul aviation demand relating to weakened economies in Germany, the UK, France, and Italy, as well as continued difficulties in negotiating labor agreements with pilots and cabin crews in its countries of operation. Ryanair is working with unions in all of its countries of operation for the first time in its history, which may facilitate labor predictability in the long term, but has required more time than expected to finalize collective labor agreements in the shorter-term. However, Ryanair has now completed the vast majority of labor deals. Ryanair also had to deal with excess industry capacity over the summer, which abated into the fall and is expected to continue to decrease into the winter, leading to improving fares.
Although active currency management is not a central facet of the Fund’s investment process, fluctuations in major world currencies can at times affect the Fund’s performance. During the period, the net effect of currency moves was slightly positive for the Fund, as the US dollar weakened modestly against some other currencies in which certain foreign stocks are priced.
There were a few shifts in the Fund’s sector allocations during the period. The Fund reduced its allocations to the Consumer Discretionary, Information Technology, Financials and Communication Services sectors and increased its allocations to the Consumer Staples, Industrials, Health Care, Materials, Real Estate, and Energy sectors. Please note that GICS sectors were reconstituted on October 1, 2018, and that the beginning sector values for the Fund have been recalculated in accordance with the reconstitution for purposes of this paragraph.(2)
22
INTERNATIONAL OPPORTUNITIES FUND |
Fiscal Period-End Investment Posture
As of September 30, 2019, the Fund’s primary economic sector allocations included Information Technology, Health Care, Communication Services, Consumer Discretionary, Industrials, Consumer Staples, and Financials. The Fund had no exposure to the Utilities sector.
In terms of country allocations, the Fund’s most significant weightings at period-end, excluding short-term investments, were in Japan, Germany, the United Kingdom, the Netherlands, Switzerland, China/Hong Kong, and France. Country-level weightings generally should be considered a residual of the Fund’s stock selection process rather than a major, proactive facet of its investment strategy.
Sincerely,
THOMAS F. MARSICO
ROBERT G. SUSMAN, CFA
PORTFOLIO MANAGERS
(1) | Total returns are based on net change in net asset value assuming reinvestment of distributions. Periodically, certain fees and expenses have been waived or reimbursed by the Adviser for the International Opportunities Fund. In the absence of such a waiver or reimbursement, the performance returns reflected would have been reduced. In accordance with the expense limitation and fee waiver agreement, the Adviser may recoup fees and expenses previously waived or reimbursed under certain parameters. Periodically, the Adviser has recouped such fees or expenses from the International Opportunities Fund, resulting in a lower performance return. Please see the Prospectus for more information. |
(2) | Through September 30, 2018, the Funds reported certain investments as having been classified within the Information Technology, Consumer Discretionary or Telecommunication Services sectors. Effective October 1, 2018, GICS reconstituted those sectors by reclassifying certain stocks formerly included in them into other sectors based on their business characteristics. For example, investments in telecommunication services companies (previously included in the Telecommunication Services sector) as well as certain companies that offer content through various media platforms (previously included in the Information Technology or Consumer Discretionary sectors) are now reported in the broadened GICS Communication Services sector. Additionally, certain e-commerce companies (previously included in the Information Technology sector) are now reported in the Consumer Discretionary sector. References to investment sector exposure included throughout this annual report reflect the impact of these changes. |
23
INTERNATIONAL OPPORTUNITIES Fund Overview |
September 30, 2019 (Unaudited)
The International Opportunities Fund is a diversified portfolio and invests primarily (generally, no less than 65% of its total assets) in common stocks of foreign companies that are selected for their long-term growth potential, including foreign securities, whether traded in the US (including as American Depositary Receipts) or in foreign markets or both. The Fund may invest in an unlimited number of companies of any size throughout the world. It normally invests in the securities of issuers that are economically tied to one or more foreign countries, and expects to be invested in various issuers or securities that together have ties to at least four different foreign countries. The Fund may invest in securities of companies economically tied to emerging markets. Some issuers or securities in the Fund’s portfolio may be economically tied to the US.
TOTAL ANNUAL OPERATING EXPENSES* 1.65% NET EXPENSES*† 1.50% | NET ASSETS $53,311,490 | NET ASSET VALUE PER SHARE $18.47 |
GROWTH OF $10,000(1)(2) | PERFORMANCE COMPARISON |
| | Average Annualized Returns |
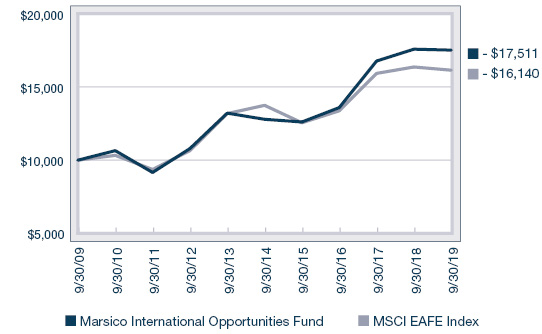
| 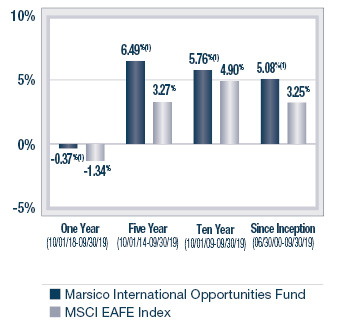
|
SECTOR ALLOCATION(3) | TOP FIVE HOLDINGS |
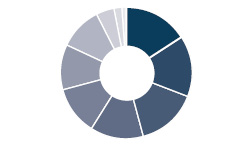 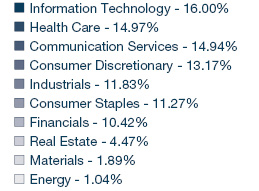
| | | | |
| | Aroundtown S.A. | 4.24% | |
| | Koninklijke Philips N.V. | 3.93% | |
| | Alibaba Group Holding Ltd. Spon. ADR | 3.89% | |
| | Nestlé S.A. | 3.16% | |
| | Tencent Holdings Ltd. | 3.12% | |
| | | | |
* | The Total Annual Operating Expenses and Net Expenses are reflective of the information disclosed in the Funds’ Prospectus dated February 1, 2019, as supplemented, and may differ from the expense ratios disclosed in this report. |
† | Marsico Capital Management, LLC (the “Adviser”) has entered into a written expense limitation and fee waiver agreement under which it has agreed to limit the total expenses of the International Opportunities Fund (excluding taxes, interest, acquired fund fees and expenses, litigation, extraordinary expenses, brokerage and other transaction expenses relating to the purchase or sale of portfolio investments) to an annual rate of 1.50% of the Fund’s average net assets until January 31, 2020. This expense limitation and fee waiver agreement may be terminated by the Adviser at any time after January 31, 2020 upon 15 days prior notice to the Fund and its administrator. The Adviser may recoup from the Fund fees previously waived or expenses previously reimbursed by the Adviser with respect to that Fund pursuant to this agreement (or a previous expense limitation agreement) if: (1) such recoupment by the Adviser does not cause the Fund, at the time of recoupment, to exceed the lesser of (a) the expense limitation in effect at the time the relevant amount was waived and/or reimbursed, or (b) the expense limitation in effect at the time of the proposed recoupment, and (2) the recoupment is made within three years after the fiscal year end date as of which the amount to be waived or reimbursed was determined and the waiver or reimbursement occurred. |
| The performance data quoted here represent past performance, and past performance is not a guarantee of future results. Investment return and principal value of an investment will fluctuate so that an investor’s shares, when redeemed, may be worth more or less than their original cost. Current performance may be lower or higher than the performance information quoted. To obtain performance information current to the most recent month-end, please call 888-860-8686 or visitmarsicofunds.com. |
| The performance included in the chart and graph does not reflect the deduction of taxes on Fund distributions or the redemption of Fund shares. |
| All indices are unmanaged and investors cannot invest directly in an index. |
| The MSCI EAFE Index tracks the stocks of about 1,000 companies in Europe, Australasia, and the Far East (EAFE). |
(1) | Periodically, certain fees and expenses have been waived or reimbursed by the Adviser for the International Opportunities Fund. In the absence of such a waiver or reimbursement, the performance returns reflected would have been reduced. In accordance with the expense limitation and fee waiver agreement, the Adviser may recoup fees and expenses previously waived or reimbursed under certain parameters. Periodically, the Adviser has recouped such fees or expenses from the International Opportunities Fund, resulting in a lower performance return. |
(2) | This chart assumes an initial investment of $10,000 made on September 30, 2009. Total returns are based on net change in NAV, assuming reinvestment of distributions. |
(3) | Sector weightings represent the percentage of the Fund’s investments (excluding cash equivalents) in certain general sectors. These sectors may include more than one industry. The Fund’s portfolio composition is subject to change at any time. |
24
MARSICO INTERNATIONAL OPPORTUNITIES FUND
SCHEDULE OF INVESTMENTS
September 30, 2019
| | | Number
of
Shares | | | Value | | | Percent
of Net
Assets | |
COMMON STOCKS | | | | | | | | | | | | |
Aerospace & Defense | | | | | | | | | | | | |
Airbus SE | | | 7,827 | | | $ | 1,016,900 | | | | 1.91 | % |
BAE Systems PLC | | | 100,922 | | | | 707,305 | | | | 1.32 | |
The Boeing Company | | | 1,117 | | | | 424,985 | | | | 0.80 | |
| | | | | | | 2,149,190 | | | | 4.03 | |
Airlines | | | | | | | | | | | | |
Ryanair Holdings PLC Spon. ADR* | | | 9,678 | | | | 642,426 | | | | 1.21 | |
| | | | | | | | | | | | | |
Apparel, Accessories & Luxury Goods | | | | |
adidas A.G. | | | 744 | | | | 231,640 | | | | 0.44 | |
LVMH Moet Hennessy Louis Vuitton S.E. | | | 1,158 | | | | 460,248 | | | | 0.86 | |
| | | | | | | 691,888 | | | | 1.30 | |
Application Software | | | | | | | | | | | | |
Constellation Software, Inc. | | | 288 | | | �� | 287,630 | | | | 0.54 | |
SAP S.E. | | | 11,660 | | | | 1,371,028 | | | | 2.57 | |
| | | | | | | 1,658,658 | | | | 3.11 | |
Asset Management & Custody Banks | | | | |
Hargreaves Lansdown PLC | | | 10,661 | | | | 272,520 | | | | 0.51 | |
Julius Baer Group Ltd. | | | 13,568 | | | | 601,149 | | | | 1.13 | |
| | | | | | | 873,669 | | | | 1.64 | |
Brewers | | | | | | | | | | | | |
Anheuser-Busch InBev S.A./N.V. | | | 13,753 | | | | 1,310,433 | | | | 2.46 | |
| | | | | | | | | |
Communications Equipment | | | | | | | | |
Telefonaktiebolaget LM Ericsson B Shares | | | 68,370 | | | | 546,318 | | | | 1.02 | |
| | | | | | | | | | | | | |
Consumer Electronics | | | | | | | | | | | | |
Sony Corporation | | | 12,200 | | | | 716,147 | | | | 1.34 | |
| | | | | |
Data Processing & Outsourced Services | | | | |
Fidelity National Information Services, Inc. | | | 6,498 | | | | 862,674 | | | | 1.62 | |
Pagseguro Digital Ltd. - Cl. A* | | | 6,118 | | | | 283,325 | | | | 0.53 | |
Wirecard A.G. | | | 4,826 | | | | 771,920 | | | | 1.45 | |
| | | | | | | 1,917,919 | | | | 3.60 | |
Distillers & Vintners | | | | | | | | | | | | |
Diageo PLC | | | 22,397 | | | | 917,849 | | | | 1.72 | |
Treasury Wine Estates Ltd. | | | 33,746 | | | | 422,966 | | | | 0.80 | |
| | | | | | | 1,340,815 | | | | 2.52 | |
Diversified Banks | | | | | | | | | | | | |
Banco Santander S.A. | | | 76,391 | | | | 311,110 | | | | 0.58 | |
BAWAG Group A.G. | | | 12,043 | | | | 474,121 | | | | 0.89 | |
HDFC Bank Ltd. ADR | | | 10,346 | | | | 590,239 | | | | 1.11 | |
Sumitomo Mitsui Financial Group, Inc. | | | 24,600 | | | | 840,666 | | | | 1.58 | |
| | | | | | | 2,216,136 | | | | 4.16 | |
Diversified Support Services | | | | | | | | |
ISS A/S | | | 15,818 | | | | 391,412 | | | | 0.73 | |
| | | | | | | | | |
Electrical Components & Equipment | | | | | | | | |
ABB Ltd. | | | 19,658 | | | | 386,247 | | | | 0.72 | |
| | | | | | | | | | | | | |
| Electronic Equipment & Instruments | | | | | | | | | | | | |
Keyence Corporation | | | 900 | | | | 556,855 | | | | 1.04 | % |
| | | | | | | | | |
Financial Exchanges & Data | | | | | | | | |
Deutsche Boerse A.G. | | | 6,693 | | | | 1,046,108 | | | | 1.96 | |
| | | | | | | | | |
General Merchandise Stores | | | | | | | | |
B&M European Value Retail S.A. | | | 172,299 | | | | 803,760 | | | | 1.51 | |
Dollarama, Inc. | | | 14,885 | | | | 532,887 | | | | 1.00 | |
| | | | | | | 1,336,647 | | | | 2.51 | |
Health Care Equipment | | | | | | | | | | | | |
Koninklijke Philips N.V. | | | 45,279 | | | | 2,097,454 | | | | 3.93 | |
Olympus Corporation | | | 11,300 | | | | 152,165 | | | | 0.29 | |
| | | | | | | 2,249,619 | | | | 4.22 | |
Health Care Supplies | | | | | | | | | | | | |
Alcon, Inc.* | | | 4,655 | | | | 271,450 | | | | 0.51 | |
| | | | | |
Human Resource & Employment Services | | | | |
Recruit Holdings Company Ltd. | | | 20,500 | | | | 623,010 | | | | 1.17 | |
| | | | | | | | | | | | | |
Industrial Conglomerates | | | | | | | | | | | | |
Siemens A.G. | | | 5,402 | | | | 578,487 | | | | 1.09 | |
| | | | | | | | | | | | | |
Industrial Gases | | | | | | | | | | | | |
Air Liquide S.A. | | | 2,129 | | | | 303,058 | | | | 0.57 | |
| | | | | | | | | | | | | |
Industrial Machinery | | | | | | | | | | | | |
FANUC Corporation | | | 1,600 | | | | 300,985 | | | | 0.56 | |
MISUMI Group, Inc. | | | 24,200 | | | | 569,162 | | | | 1.07 | |
| | | | | | | 870,147 | | | | 1.63 | |
Integrated Oil & Gas | | | | | | | | | | | | |
BP PLC | | | 82,950 | | | | 526,070 | | | | 0.99 | |
| | | | | |
Integrated Telecommunication Services | | | | |
Cellnex Telecom SA | | | 21,741 | | | | 898,102 | | | | 1.68 | |
Orange S.A. | | | 57,391 | | | | 900,455 | | | | 1.69 | |
| | | | | | | 1,798,557 | | | | 3.37 | |
Interactive Home Entertainment | | | | | | | | |
Nintendo Co., Ltd. | | | 2,300 | | | | 851,293 | | | | 1.60 | |
| | | | | | | | | |
Interactive Media & Services | | | | | | | | |
Facebook, Inc. - Cl. A* | | | 9,322 | | | | 1,660,062 | | | | 3.11 | |
Scout24 A.G. | | | 16,352 | | | | 932,136 | | | | 1.75 | |
Tencent Holdings Ltd. | | | 39,500 | | | | 1,664,123 | | | | 3.12 | |
| | | | | | | 4,256,321 | | | | 7.98 | |
Internet & Direct Marketing Retail | | | | | | | | |
Alibaba Group Holding Ltd. Spon. ADR* | | | 12,392 | | | | 2,072,314 | | | | 3.89 | |
MakeMyTrip Ltd.* | | | 15,248 | | | | 345,977 | | | | 0.65 | |
ZOZO, Inc. | | | 22,900 | | | | 527,786 | | | | 0.99 | |
| | | | | | | 2,946,077 | | | | 5.53 | |
IT Consulting & Other Services | | | | | | | | |
Gartner, Inc.* | | | 2,939 | | | | 420,247 | | | | 0.79 | |
InterXion Holding N.V.* | | | 19,045 | | | | 1,551,406 | | | | 2.91 | |
| | | | | | | 1,971,653 | | | | 3.70 | |
| See notes to financial statements. |
25
MARSICO INTERNATIONAL OPPORTUNITIES FUND
SCHEDULE OF INVESTMENTS (continued)
September 30, 2019
| | | Number
of
Shares | | | Value | | | Percent
of Net
Assets | |
COMMON STOCKS(continued) | | | | | | | | |
Life & Health Insurance | | | | | | | | | | | | |
AIA Group Ltd. | | | 42,600 | | | $ | 402,482 | | | | 0.75 | % |
| | | | | | | | | |
Life Sciences Tools & Services | | | | | | | | |
Eurofins Scientific S.E. | | | 1,268 | | | | 589,309 | | | | 1.11 | |
QIAGEN N.V.* | | | 12,154 | | | | 400,718 | | | | 0.75 | |
| | | | | | | 990,027 | | | | 1.86 | |
Movies & Entertainment | | | | | | | | | | | | |
Entertainment One Ltd. | | | 54,900 | | | | 382,063 | | | | 0.72 | |
| | | | | | | | | | | | | |
Multi-Line Insurance | | | | | | | | | | | | |
AXA S.A. | | | 28,882 | | | | 737,575 | | | | 1.38 | |
| | | | | | | | | | | | | |
Packaged Foods & Meats | | | | | | | | | | | | |
Nestlé S.A. | | | 15,514 | | | | 1,683,138 | | | | 3.16 | |
| | | | | | | | | | | | | |
Personal Products | | | | | | | | | | | | |
Kao Corporation | | | 3,400 | | | | 251,058 | | | | 0.47 | |
Unilever PLC | | | 18,661 | | | | 1,121,992 | | | | 2.11 | |
| | | | | | | 1,373,050 | | | | 2.58 | |
Pharmaceuticals | | | | | | | | | | | | |
AstraZeneca PLC | | | 5,614 | | | | 501,204 | | | | 0.94 | |
Dechra Pharmaceuticals PLC | | | 29,513 | | | | 1,004,443 | | | | 1.88 | |
Novartis AG | | | 12,263 | | | | 1,063,314 | | | | 2.00 | |
Roche Holding AG | | | 3,540 | | | | 1,030,202 | | | | 1.93 | |
Takeda Pharmaceutical Company Ltd. | | | 13,700 | | | | 467,542 | | | | 0.88 | |
| | | | | | | 4,066,705 | | | | 7.63 | |
Real Estate Operating Companies | | | | | | | | |
Aroundtown S.A. | | | 276,628 | | | | 2,262,537 | | | | 4.24 | |
| | | | | | | | | |
Research & Consulting Services | | | | | | | | |
Experian PLC | | | 10,864 | | | | 347,170 | | | | 0.65 | |
| | | | | | | | | | | | | |
Restaurants | | | | | | | | | | | | |
Domino’s Pizza Enterprises Ltd. | | | 21,623 | | | | 677,912 | | | | 1.27 | |
Domino’s Pizza Group PLC | | | 95,071 | | | | 297,964 | | | | 0.56 | |
| | | | | | | 975,876 | | | | 1.83 | |
Semiconductor Equipment | | | | | | | | | | | | |
ASML Holding N.V. | | | 4,096 | | | | 1,014,543 | | | | 1.90 | |
Tokyo Electron Ltd. | | | 2,300 | | | | 437,452 | | | | 0.82 | |
| | | | | | | 1,451,995 | | | | 2.72 | |
Specialty Chemicals | | | | | | | | | | | | |
Shin-Etsu Chemical Company Ltd. | | | 6,100 | | | | 652,171 | | | | 1.22 | |
| | | | | |
Wireless Telecommunication Services | | | | |
SoftBank Group Corporation | | | 7,000 | | | | 274,497 | | | | 0.51 | |
| | | | | | | | | | | | | |
TOTAL COMMON STOCKS | | | | | | | | | | | | |
(Cost $42,940,135) | | | | | | | 50,625,896 | | | | 94.96 | |
| | | | | | | | | |
SHORT-TERM INVESTMENTS | | | | | | | | |
State Street Institutional Treasury Money Market Fund, 0.005% | | | 2,719,130 | | | | 2,719,130 | | | | 5.10 | % |
| | | | | | | | | |
TOTAL SHORT-TERM INVESTMENTS | | | | | | | | |
(Cost $2,719,130) | | | | | | | 2,719,130 | | | | 5.10 | |
| | | | | | | | | | | | | |
TOTAL INVESTMENTS | | | | | | | | | | | | |
(Cost $45,659,265) | | | | | | | 53,345,026 | | | | 100.06 | |
| | | | | | | | | | | | | |
Liabilities, Less Cash and Other Assets | | | | | | | (33,536 | ) | | | (0.06 | ) |
| | | | | | | | | | | | | |
NET ASSETS | | | | | | $ | 53,311,490 | | | | 100.00 | % |
SUMMARY OF INVESTMENTS BY COUNTRY |
Country | | Market Value | | | Percent of
Investment
Securities | |
Australia | | $ | 1,100,878 | | | | 2.06 | % |
Austria | | | 474,121 | | | | 0.89 | |
Belgium | | | 1,310,433 | | | | 2.46 | |
Brazil | | | 283,325 | | | | 0.53 | |
Canada | | | 1,202,580 | | | | 2.25 | |
China/Hong Kong | | | 4,138,919 | | | | 7.76 | |
Denmark | | | 391,412 | | | | 0.73 | |
France | | | 4,007,545 | | | | 7.51 | |
Germany | | | 7,193,856 | | | | 13.49 | |
India | | | 936,216 | | | | 1.76 | |
Ireland | | | 642,426 | | | | 1.20 | |
Japan | | | 7,220,789 | | | | 13.54 | |
Netherlands | | | 5,064,121 | | | | 9.49 | |
Spain | | | 1,209,212 | | | | 2.27 | |
Sweden | | | 546,318 | | | | 1.02 | |
Switzerland | | | 5,035,500 | | | | 9.44 | |
United Kingdom | | | 6,500,277 | | | | 12.19 | |
United States(1) | | | 6,087,098 | | | | 11.41 | |
| | | $ | 53,345,026 | | | | 100.00 | % |
(1) | Includes short-term securities. |
| See notes to financial statements. |
26
Investment Review BY TOM MARSICO, BRANDON GEISLER, AND ROB SUSMAN (UNAUDITED)
The Marsico Global Fund posted a total return of (US$) -5.36% for the one-year fiscal period ended September 30, 2019. The Fund underperformed the MSCI All Country World Index (“MSCI ACWI Index”), the Fund’s benchmark index, which had a total return of (US$) +1.38% over the same time period. Please see the Fund’s Overview for more detailed information about the Fund’s longer-term performance for various time periods ended September 30, 2019.
The performance data for the Fund quoted here represent past performance, and past performance is not a guarantee of future results. Investment return and principal value of an investment will fluctuate so that an investor’s shares, when redeemed, may be worth more or less than their original cost. Current performance may be lower or higher than the performance information quoted. To obtain performance information current to the most recent month-end, please call 888-860-8686 or visitmarsicofunds.com.(1)
This review highlights Fund performance over a one-year fiscal period. Shareholders should keep in mind that the Fund is intended for long-term investors who hold their shares for substantially longer periods of time. You should also keep in mind that our current views and beliefs regarding all investments discussed in this report are subject to change at any time. References to specific securities, industries, and sectors discussed in this report are not recommendations to buy or sell such securities or related investments, and the Fund may not necessarily hold these securities or investments today. Please see the accompanying Schedule of Investments for the percentage of the Fund’s portfolio represented by the securities mentioned in this report as of the end of the reporting period.
Foreign investments present additional risks due to currency fluctuations, economic and political factors, lower liquidity, differences in securities regulations and accounting standards, possible changes in taxation, limited public information, and other factors. In addition, the Fund is subject to broad risks associated with investing in equity securities markets generally, including the risks that the securities and markets in which it invests may experience volatility and instability, that domestic and global economies and markets may undergo periods of cyclical change and decline, that investors may at times avoid investments in equity securities, and that investments may not perform as anticipated. Please see the Prospectus for more information.
The Fund is not managed to track its benchmark index, and may hold a substantially overweight or underweight position in a sector, industry, or security compared to its weight in the benchmark. The Fund may be subject to risks associated with a particular sector or other area in which it is overweight, including the risk that the stocks of companies within one area could simultaneously decline in price because of an event that affects the entire area. For informational purposes, the discussion below may compare the benchmark weight or performance of a sector or industry to the investment approach of the Fund.
The Global Fund’s underperformance during the one-year period ended September 30, 2019 versus the MSCI ACWI Index was due, in part, to certain weak-performing stocks in the Health Care, Information Technology, Consumer Discretionary, and Communication Services sectors as defined in the Global Industry Classification Standard (“GICS”). The Fund’s performance was also inhibited by having no allocation to the Utilities sector and an underweight stance to the Consumer Staples sector, which together were two of the stronger-performing sectors of the MSCI ACWI Index. As volatility increased during the period and bond yields dropped, investors sought the defensive characteristics and yields of stocks in these sectors.
A large detractor from performance was Health Care holding G1 Therapeutics, Inc. (-65% prior to being sold) as the regulatory pathway for the company’s lead oncology molecule, trilaciclib, remains uncertain. With positive outcomes from three early stage trials in lung cancer and breast cancer, trilaciclib initially appeared likely to receive expedited approval from regulatory authorities. Although trilaciclib did show a reduction in the harmful side effects of chemotherapy, the company may be required to perform additional clinical work prior to approval.
In the Information Technology sector, German payment processor Wirecard A.G. declined -31%. The stock underperformed largely due to a series of reports with factually-inaccurate information that accused the company of over-stating revenues. The UK’s Financial Times published a series of reports accusing Wirecard’s Asian operations of accounting irregularities, and suggested that Wirecard’s upper management was aware of the issues. A Singapore-based law firm found minor misstatements that amount to less than 1% of Wirecard’s revenues in each of the impacted years, 2016 and 2017, but found no evidence that management in Germany knew of the minor misstatements. Wirecard has since sued the Financial Times and the reporter who made the inaccurate claims without proper support, and the company has strengthened its internal compliance and audit controls. Wirecard is one of the most innovative payment companies in the world, and its Capital Markets Day in New York (attended by Marsico analysts) supports our thesis on the name.
From a sector allocation perspective, the Fund’s performance was aided relative to the benchmark index by having an overweight allocation in the Information Technology sector and no allocation to the Energy sector, which was the weakest performing sector during the period. The Fund also benefitted by maintaining a +4% average cash weight during the volatile twelve-month period. The Fund occasionally may hold more cash than usual as a temporary defensive measure, or as a strategic measure enabling it to take rapid advantage of opportunities to buy stocks at favorable prices.
27
A top positive contributor to the Fund’s one-year performance was InterXion Holding N.V., which returned +21%. The European data center company reported very strong and remarkably consistent quarterly results as the demand from large hyperscale cloud companies grows in Europe, following similar trends in the US. Additionally, as volatility picked up in European markets, investors prized InterXion’s defensive business model and multiyear guidance for continued revenue and earnings growth.
Dutch lithography company ASML Holding N.V. also performed well and returned +37% during the period. ASML has a dominant position in leading-edge photolithography tools used in the fabrication of semiconductors, which major chip makers and foundries (such as Intel, Samsung, and Global Foundries) must purchase to keep up with higher demand for CPUs and GPUs, as well as the constant need to increase transistor density to improve chip performance. We expect this trend will continue into 2020 and beyond, as chip makers must invest more in photolithography tools to improve processor performance while confronting the limitations of materials science and the need to continue shrinking chip features down to scales measured in the dozens of atoms. ASML’s dominant position in leading-edge photolithography tools remains unchallenged, and we believe that its management continues to show excellent ability to manage a leading company in a very complex, global industry.
Australian software company Atlassian Corporation PLC – Cl. A (+29%) has solidified its position as a leading software company focusing on collaboration, software development, and enterprise communication. Continuous product innovation and a growing partner community has allowed Atlassian to increase prices across its significant customer base this year. As a result, the company achieved revenue growth above 30%, margins expanded, and free cash flow growth inflected upwards, leading to strong performance for its shares.
Several new positions entered the portfolio during the one-year period, one of which was the Ball Corporation (-9%). As the leading global aluminum beverage can provider, Ball Corp. has benefitted greatly from the proliferation of beverage brands in the marketplace, providing a tailwind for the industry and producing exceptional volume growth for the past several quarters. We believe this growth can continue, if not accelerate, as beverage brands pivot their packaging to more sustainable and recyclable materials, such as aluminum. We think consumers’ growing awareness of the harmful effects plastics have on the environment will naturally shift consumption preferences away from plastic bottles in favor of aluminum cans, most notably in the still water category. This transition will take years to play out, but appears to present a sizable opportunity for investors in Ball Corp.
Although active currency management is not a central facet of the Fund’s investment process, fluctuations in major world currencies can at times affect the Fund’s performance. During the period, the net effect of currency moves had a slightly negative effect on Fund performance, as the US dollar appreciated modestly against some other currencies in which certain foreign stocks are priced.
During the period, the Fund increased its allocations to the Information Technology, Real Estate, Materials, Financials, Consumer Staples, and Industrials sectors. The Fund reduced its position in the Communication Services, Consumer Discretionary, and Health Care sectors. Please note that GICS sectors were reconstituted on October 1, 2018, and that the beginning sector values for the Fund have been recalculated in accordance with the reconstitution for purposes of this paragraph.(2)
28
Fiscal Period-End Investment Posture
As of September 30, 2019, the Fund’s primary economic sector allocations included Information Technology, Consumer Discretionary, and Communication Services. The Fund had no investments in the Energy or Utilities sectors.
The Fund’s most significant country allocation weightings at period-end, excluding short-term investments, were in the United States, the Netherlands, Germany, France, and China/Hong Kong. Country-level weightings generally should be considered a residual of the Fund’s stock selection process rather than a major, proactive facet of its investment strategy.
Sincerely,
THOMAS F. MARSICO
BRANDON A. GEISLER
ROBERT G. SUSMAN, CFA
PORTFOLIO MANAGERS
(1) | Total returns are based on net change in net asset value assuming reinvestment of distributions. Periodically, certain fees and expenses have been waived or reimbursed by the Adviser for the Global Fund. In the absence of such a waiver or reimbursement, the performance returns reflected would have been reduced. In accordance with the expense limitation and fee waiver agreement, the Adviser may recoup fees and expenses previously waived or reimbursed under certain parameters. Periodically, the Adviser has recouped such fees or expenses from the Global Fund, resulting in a lower performance return. Please see the Prospectus for more information. |
(2) | Through September 30, 2018, the Funds reported certain investments as having been classified within the Information Technology, Consumer Discretionary or Telecommunication Services sectors. Effective October 1, 2018, GICS reconstituted those sectors by reclassifying certain stocks formerly included in them into other sectors based on their business characteristics. For example, investments in telecommunication services companies (previously included in the Telecommunication Services sector) as well as certain companies that offer content through various media platforms (previously included in the Information Technology or Consumer Discretionary sectors) are now reported in the broadened GICS Communication Services sector. Additionally, certain e-commerce companies (previously included in the Information Technology sector) are now reported in the Consumer Discretionary sector. References to investment sector exposure included throughout this annual report reflect the impact of these changes. |
29
September 30, 2019 (Unaudited)
The Global Fund is a diversified portfolio and invests primarily in the common stocks of US and foreign companies that are selected for their long-term growth potential. The Fund may invest in an unlimited number of companies of any size that are economically tied to any countries or markets throughout the world, including securities of companies economically tied to emerging markets. Under normal market conditions, the Fund will invest significantly (generally, at least 40% of its net assets) in the securities of issuers organized or located outside the US or doing business outside the US or other foreign securities (unless market conditions are not deemed favorable by the Adviser, in which case the Fund generally will invest at least 30% of its assets in such foreign securities). The Fund will invest its assets in various regions and countries, including the US, that encompass not less than three different countries overall.
TOTAL ANNUAL OPERATING EXPENSES* 1.65% NET EXPENSES*† 1.45% | NET ASSETS $228,892,995 | NET ASSET VALUE PER SHARE $16.06 |
GROWTH OF $10,000(1)(2) | PERFORMANCE COMPARISON |
| | Average Annualized Returns |
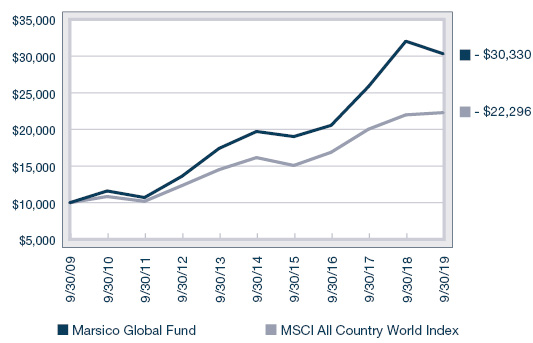
| 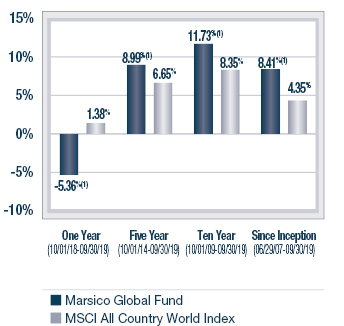
|
SECTOR ALLOCATION(3) | TOP FIVE HOLDINGS |
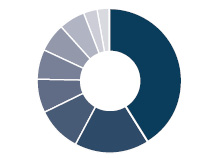 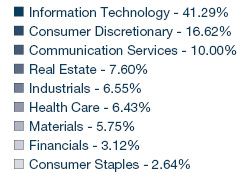
| | | | |
| | Microsoft Corporation | 5.39% | |
| | InterXion Holding N.V. | 5.30% | |
| | Amazon.com, Inc. | 4.89% | |
| | Facebook, Inc. - Cl. A | 4.59% | |
| | Visa, Inc. - Cl. A | 4.51% | |
| | | | |
* | The Total Annual Operating Expenses and Net Expenses are reflective of the information disclosed in the Funds’ Prospectus dated February 1, 2019, as supplemented, and may differ from the expense ratios disclosed in this report. |
† | Marsico Capital Management, LLC (the “Adviser”) has entered into a written expense limitation and fee waiver agreement under which it has agreed to limit the total expenses of the Global Fund (excluding taxes, interest, acquired fund fees and expenses, litigation, extraordinary expenses, brokerage and other transaction expenses relating to the purchase or sale of portfolio investments) to an annual rate of 1.45% of the Fund’s average net assets until January 31, 2020. This expense limitation and fee waiver agreement may be terminated by the Adviser at any time after January 31, 2020 upon 15 days prior notice to the Fund and its administrator. The Adviser may recoup from the Fund fees previously waived or expenses previously reimbursed by the Adviser with respect to that Fund pursuant to this agreement (or a previous expense limitation agreement) if: (1) such recoupment by the Adviser does not cause the Fund, at the time of recoupment, to exceed the lesser of (a) the expense limitation in effect at the time the relevant amount was waived and/or reimbursed, or (b) the expense limitation in effect at the time of the proposed recoupment, and (2) the recoupment is made within three years after the fiscal year end date as of which the amount to be waived or reimbursed was determined and the waiver or reimbursement occurred. |
| The performance data quoted here represent past performance, and past performance is not a guarantee of future results. Investment return and principal value of an investment will fluctuate so that an investor’s shares, when redeemed, may be worth more or less than their original cost. Current performance may be lower or higher than the performance information quoted. To obtain performance information current to the most recent month-end, please call 888-860-8686 or visitmarsicofunds.com. |
| The performance included in the chart and graph does not reflect the deduction of taxes on Fund distributions or the redemption of Fund shares. |
| All indices are unmanaged and investors cannot invest directly in an index. |
| The MSCI ACWI (All Country World Index) Index is a free float-adjusted market capitalization index that is designed to measure equity market performance in the global developed and emerging markets. |
(1) | Periodically, certain fees and expenses have been waived or reimbursed by the Adviser for the Global Fund. In the absence of such a waiver or reimbursement, the performance returns reflected would have been reduced. In accordance with the expense limitation and fee waiver agreement, the Adviser may recoup fees and expenses previously waived or reimbursed under certain parameters. Periodically, the Adviser has recouped such fees or expenses from the Global Fund, resulting in a lower performance return. |
(2) | This chart assumes an initial investment of $10,000 made on September 30, 2009. Total returns are based on change in NAV, assuming reinvestment of distributions. |
(3) | Sector weightings represent the percentage of the Fund’s investments (excluding cash equivalents) in certain general sectors. These sectors may include more than one industry. The Fund’s portfolio composition is subject to change at any time. |
30
MARSICO GLOBAL FUND
SCHEDULE OF INVESTMENTS
September 30, 2019
| | | Number
of
Shares | | | Value | | | Percent
of Net
Assets | |
COMMON STOCKS | | | | | | | | | | | | |
Aerospace & Defense | | | | | | | | | | | | |
Airbus SE | | | 73,217 | | | $ | 9,512,505 | | | | 4.16 | % |
Lockheed Martin Corporation | | | 12,513 | | | | 4,880,821 | | | | 2.13 | |
| | | | | | | 14,393,326 | | | | 6.29 | |
Apparel, Accessories & Luxury Goods | | | | |
Hermes International | | | 10,342 | | | | 7,146,617 | | | | 3.12 | |
| | | | | | | | | | | | | |
Application Software | | | | | | | | | | | | |
Atlassian Corporation PLC - Cl. A* | | | 26,520 | | | | 3,326,669 | | | | 1.45 | |
salesforce.com, inc.* | | | 52,842 | | | | 7,843,866 | | | | 3.43 | |
SAP S.E. | | | 63,509 | | | | 7,467,632 | | | | 3.26 | |
| | | | | | | 18,638,167 | | | | 8.14 | |
Brewers | | | | | | | | | | | | |
Anheuser-Busch InBev S.A./N.V. | | | 60,866 | | | | 5,799,523 | | | | 2.53 | |
| | | | | | | | | | | | | |
Communications Equipment | | | | | | | | |
Telefonaktiebolaget LM Ericsson B Shares | | | 436,709 | | | | 3,489,573 | | | | 1.53 | |
| | | | | | | | | | | | | |
Data Processing & Outsourced Services | | | | |
PayPal Holdings, Inc.* | | | 35,999 | | | | 3,729,136 | | | | 1.63 | |
Visa, Inc. - Cl. A | | | 59,986 | | | | 10,318,192 | | | | 4.51 | |
Wirecard A.G. | | | 62,814 | | | | 10,047,113 | | | | 4.39 | |
| | | | | | | 24,094,441 | | | | 10.53 | |
Financial Exchanges & Data | | | | | | | | |
S&P Global, Inc. | | | 27,995 | | | | 6,858,215 | | | | 3.00 | |
| | | | | | | | | | | | | |
General Merchandise Stores | | | | | | | | |
Ollie’s Bargain Outlet Holdings, Inc.* | | | 41,545 | | | | 2,436,199 | | | | 1.06 | |
| | | | | | | | | | | | | |
Health Care Equipment | | | | | | | | | | | | |
Intuitive Surgical, Inc.* | | | 8,988 | | | | 4,852,891 | | | | 2.12 | |
Koninklijke Philips N.V. | | | 152,075 | | | | 7,044,553 | | | | 3.08 | |
| | | | | | | 11,897,444 | | | | 5.20 | |
Hotels, Resorts & Cruise Lines | | | | | | | | |
Marriott International, Inc. - Cl. A | | | 28,613 | | | | 3,558,599 | | | | 1.56 | |
| | | | | | | | | | | | | |
Interactive Media & Services | | | | | | | | |
Facebook, Inc. - Cl. A* | | | 59,005 | | | | 10,507,611 | | | | 4.59 | |
Snap, Inc. - Cl. A* | | | 301,570 | | | | 4,764,806 | | | | 2.08 | |
Tencent Holdings Ltd. | | | 159,300 | | | | 6,711,262 | | | | 2.93 | |
| | | | | | | 21,983,679 | | | | 9.60 | |
Internet & Direct Marketing Retail | | | | | | | | |
Alibaba Group Holding Ltd. Spon. ADR* | | | 41,560 | | | | 6,950,079 | | | | 3.04 | |
Amazon.com, Inc.* | | | 6,447 | | | | 11,191,411 | | | | 4.89 | |
| | | | | | | 18,141,490 | | | | 7.93 | |
IT Consulting & Other Services | | | | | | | | |
InterXion Holding N.V.* | | | 149,009 | | | | 12,138,273 | | | | 5.30 | |
| | | | | | | | | | | | | |
Metal & Glass Containers | | | | | | | | | | | | |
Ball Corporation | | | 90,874 | | | | 6,616,536 | | | | 2.89 | |
| | | | | | | | | | | | | |
Pharmaceuticals | | | | | | | | | | | | |
GW Pharmaceuticals PLC ADR* | | | 19,405 | | | | 2,232,157 | | | | 0.98 | |
| | | | | | | | | | | | | |
Real Estate Operating Companies | | | | | | | | |
Aroundtown S.A. | | | 1,036,615 | | | | 8,478,461 | | | | 3.70 | % |
| | | | | | | | | | | | | |
Restaurants | | | | | | | | | | | | |
McDonald’s Corporation | | | 24,414 | | | | 5,241,930 | | | | 2.29 | |
| | | | | | | | | | | | | |
Semiconductor Equipment | | | | | | | | | | | | |
ASML Holding N.V. - NY Reg. Shs. | | | 35,957 | | | | 8,932,438 | | | | 3.90 | |
| | | | | | | | | | | | | |
Semiconductors | | | | | | | | | | | | |
NVIDIA Corporation | | | 30,147 | | | | 5,247,688 | | | | 2.29 | |
| | | | | | | | | | | | | |
Specialized REITs | | | | | | | | | | | | |
Crown Castle International Corp. | | | 59,167 | | | | 8,224,805 | | | | 3.59 | |
| | | | | | | | | | | | | |
Specialty Chemicals | | | | | | | | | | | | |
The Sherwin-Williams Company | | | 10,971 | | | | 6,032,624 | | | | 2.64 | |
| | | | | | | | | | | | | |
Systems Software | | | | | | | | | | | | |
Microsoft Corporation | | | 88,764 | | | | 12,340,859 | | | | 5.39 | |
| | | | | | | | | | | | | |
Technology Hardware, Storage & Peripherals | | | | |
Apple, Inc. | | | 26,241 | | | | 5,877,197 | | | | 2.57 | |
| | | | | | | | | | | | | |
TOTAL COMMON STOCKS | | | | | | | | | | | | |
(Cost $172,638,897) | | | | | | | 219,800,241 | | | | 96.03 | |
| | | | | | | | | | | | | |
SHORT-TERM INVESTMENTS | | | | | | | | |
State Street Institutional Treasury Money Market Fund, 0.005% | | | 9,206,275 | | | | 9,206,275 | | | | 4.02 | |
| | | | | | | | | | | | | |
TOTAL SHORT-TERM INVESTMENTS | | | | | | | | |
(Cost $9,206,275) | | | | | | | 9,206,275 | | | | 4.02 | |
| | | | | | | | | | | | | |
TOTAL INVESTMENTS | | | | | | | | | | | | |
(Cost $181,845,172) | | | | | | | 229,006,516 | | | | 100.05 | |
| | | | | | | | | | | | | |
Liabilities, Less Cash and Other Assets | | | | | | | (113,521 | ) | | | (0.05 | ) |
| | | | | | | | | | | | | |
NET ASSETS | | | | | | $ | 228,892,995 | | | | 100.00 | % |
SUMMARY OF INVESTMENTS BY COUNTRY |
Country | | Market Value | | | Percent of
Investment
Securities | |
Australia | | $ | 3,326,669 | | | | 1.45 | % |
Belgium | | | 5,799,523 | | | | 2.53 | |
China/Hong Kong | | | 13,661,341 | | | | 5.97 | |
France | | | 16,659,122 | | | | 7.28 | |
Germany | | | 25,993,206 | | | | 11.35 | |
Netherlands | | | 28,115,264 | | | | 12.28 | |
Sweden | | | 3,489,573 | | | | 1.52 | |
United Kingdom | | | 2,232,157 | | | | 0.97 | |
United States(1) | | | 129,729,661 | | | | 56.65 | |
| | | $ | 229,006,516 | | | | 100.00 | % |
(1) | Includes short-term securities. |
| See notes to financial statements. |
31
STATEMENTS OF ASSETS AND LIABILITIES
September 30, 2019
(Amounts in thousands) | | MARSICO
FOCUS FUND | | | MARSICO
GROWTH FUND | |
| | | | | | | | | |
ASSETS | | | | | | | | |
Investments, at value (cost $350,749, $164,549, $225,777, $45,659, and $181,845, respectively) | | $ | 547,719 | | | $ | 257,234 | |
Receivable for investments sold | | | 10,165 | | | | 3,359 | |
Receivable for capital stock sold | | | 11 | | | | 68 | |
Dividends receivable | | | 144 | | | | 26 | |
Prepaid expenses and other assets | | | 3,314 | | | | 1,190 | |
Total Assets | | | 561,353 | | | | 261,877 | |
| | | | | | | | | |
LIABILITIES | | | | | | | | |
Payable for investments purchased | | | — | | | | — | |
Payable for capital stock redeemed | | | 762 | | | | 63 | |
Payable to investment adviser | | | 356 | | | | 172 | |
Accrued trustees’ fees | | | 3,302 | | | | 1,179 | |
Accrued distribution fee | | | 2,095 | | | | 1,059 | |
Accrued professional fees | | | 67 | | | | 31 | |
Accrued transfer agent fees and expenses | | | 64 | | | | 32 | |
Accrued reporting, printing and postage expenses | | | 25 | | | | 12 | |
Accrued expenses and other liabilities | | | 37 | | | | 24 | |
Total Liabilities | | | 6,708 | | | | 2,572 | |
| | | | | | | | | |
NET ASSETS | | $ | 554,645 | | | $ | 259,305 | |
| | | | | | | | | |
NET ASSETS CONSIST OF | | | | | | | | |
Paid-in-capital | | $ | 316,836 | | | $ | 143,040 | |
Total distributable earnings | | | 237,809 | | | | 116,265 | |
NET ASSETS | | $ | 554,645 | | | $ | 259,305 | |
| | | | | | | | | |
SHARES OUTSTANDING, $0.001 par value | | | | | | | | |
(Unlimited shares authorized) | | | 29,843 | | | | 13,826 | |
| | | | | | | | | |
NET ASSET VALUE, REDEMPTION PRICE, AND OFFERING PRICE PER SHARE (NET ASSETS/SHARES OUTSTANDING)* | | $ | 18.59 | | | $ | 18.75 | |
* | Not in thousands, based on unrounded net assets and shares outstanding. |
| See notes to financial statements. |
32
MARSICO
21st CENTURY FUND | | | MARSICO
INTERNATIONAL
OPPORTUNITIES
FUND | | | MARSICO
GLOBAL FUND | |
| | | | | | | | | | | |
| | | | | | | | | | | |
| $ | 283,594 | | | $ | 53,345 | | | $ | 229,007 | |
| | — | | | | — | | | | 5,295 | |
| | 77 | | | | — | | | | 1 | |
| | 102 | | | | 135 | | | | 35 | |
| | 404 | | | | 214 | | | | 1,986 | |
| | 284,177 | | | | 53,694 | | | | 236,324 | |
| | | | | | | | | | | |
| | | | | | | | | | | |
| | 492 | | | | — | | | | 5,043 | |
| | 12 | | | | — | | | | 43 | |
| | 186 | | | | 25 | | | | 180 | |
| | 395 | | | | 201 | | | | 1,966 | |
| | 195 | | | | 116 | | | | 104 | |
| | 32 | | | | 8 | | | | 28 | |
| | 38 | | | | 11 | | | | 31 | |
| | 15 | | | | 3 | | | | 11 | |
| | 33 | | | | 19 | | | | 25 | |
| | 1,398 | | | | 383 | | | | 7,431 | |
| | | | | | | | | | | |
| $ | 282,779 | | | $ | 53,311 | | | $ | 228,893 | |
| | | | | | | | | | | |
| | | | | | | | | | | |
| $ | 218,229 | | | $ | 47,733 | | | $ | 184,843 | |
| | 64,550 | | | | 5,578 | | | | 44,050 | |
| $ | 282,779 | | | $ | 53,311 | | | $ | 228,893 | |
| | | | | | | | | | | |
| | | | | | | | | | | |
| | 8,390 | | | | 2,886 | | | | 14,255 | |
| | | | | | | | | | | |
| $ | 33.70 | | | $ | 18.47 | | | $ | 16.06 | |
33
STATEMENTS OF OPERATIONS
FOR THE YEAR ENDED September 30, 2019
(Amounts in thousands) | | MARSICO
FOCUS FUND | | | MARSICO
GROWTH FUND | |
| | | | | | | | | |
INVESTMENT INCOME | | | | | | | | |
Dividends (net of $0, $0, $24, $91, and $163, respectively, of non-reclaimable foreign withholding taxes) | | $ | 4,611 | | | $ | 2,248 | |
Total Investment Income | | | 4,611 | | | | 2,248 | |
| | | | | | | | | |
EXPENSES | | | | | | | | |
Investment advisory fees | | | 4,254 | | | | 2,063 | |
Distribution fees | | | — | | | | 434 | |
Transfer agent fees and expenses | | | 460 | | | | 221 | |
Professional fees | | | 293 | | | | 138 | |
Trustees’ fees and expenses | | | 190 | (1) | | | 95 | (1) |
Fund administration fees | | | 157 | | | | 128 | |
Custody and fund accounting fees | | | 116 | | | | 83 | |
Miscellaneous | | | 86 | | | | 42 | |
Reporting, printing, and postage expenses | | | 84 | | | | 47 | |
Federal and state registration fees | | | 36 | | | | 34 | |
Total Expenses | | | 5,676 | | | | 3,285 | |
Recoupment of previously waived expenses | | | — | | | | — | |
Less waiver of expenses and expenses paid indirectly | | | (1 | ) | | | — | |
Net Expenses | | | 5,675 | | | | 3,285 | |
| | | | | | | | | |
NET INVESTMENT INCOME (LOSS) | | | (1,064 | ) | | | (1,037 | ) |
| | | | | | | | | |
REALIZED AND UNREALIZED GAIN (LOSS) | | | | | | | | |
Net realized gain on investments | | | 44,005 | | | | 25,286 | |
Net realized gain (loss) on foreign currency transactions | | | 30 | | | | (41 | ) |
Change in unrealized appreciation (depreciation) on investments, foreign currency translations, and non-interested trustees’ deferred compensation | | | (31,757 | ) | | | (18,902 | ) |
| | | | | | | | | |
Net Gain (Loss) on Investments | | | 12,278 | | | | 6,343 | |
| | | | | | | | | |
NET INCREASE (DECREASE) IN NET ASSETS RESULTING FROM OPERATIONS | | $ | 11,214 | | | $ | 5,306 | |
(1) | Amounts include Trustees’ fees and expenses and the mark to market unrealized appreciation (depreciation) during the period for shares held in the Non-Interested Trustees’ Deferred Fee Plan, as more fully described in Note 2(g) in the Notes to Financial Statements. |
| | | Trustees’
Fees and
Expenses* | | | Unrealized
Appreciation
(Depreciation)* | |
Focus Fund | | $ | 157,592 | | | $ | 31,946 | |
Growth Fund | | | 73,756 | | | | 21,203 | |
21stCentury Fund | | | 74,965 | | | | 21,636 | |
International Opportunities Fund | | | 14,954 | | | | (2,172 | ) |
Global Fund | | | 69,008 | | | | (100,830 | ) |
| See notes to financial statements. |
34
MARSICO
21st CENTURY FUND | | | MARSICO
INTERNATIONAL
OPPORTUNITIES
FUND | | | MARSICO
GLOBAL FUND | |
| | | | | | | | | | | |
| | | | | | | | | | | |
| $ | 1,696 | | | $ | 891 | | | $ | 2,142 | |
| | 1,696 | | | | 891 | | | | 2,142 | |
| | | | | | | | | | | |
| | | | | | | | | | | |
| | 2,103 | | | | 434 | | | | 1,916 | |
| | 455 | | | | 135 | | | | 599 | |
| | 289 | | | | 78 | | | | 310 | |
| | 139 | | | | 32 | | | | 132 | |
| | 97 | (1) | | | 13 | (1) | | | (32 | )(1) |
| | 128 | | | | 66 | | | | 147 | |
| | 100 | | | | 122 | | | | 168 | |
| | 42 | | | | 11 | | | | 42 | |
| | 54 | | | | 24 | | | | 56 | |
| | 25 | | | | 21 | | | | 34 | |
| | 3,432 | | | | 936 | | | | 3,372 | |
| | — | | | | — | | | | 100 | |
| | — | | | | (123 | ) | | | — | |
| | 3,432 | | | | 813 | | | | 3,472 | |
| | | | | | | | | | | |
| | (1,736 | ) | | | 78 | | | | (1,330 | ) |
| | | | | | | | | | | |
| | | | | | | | | | | |
| | 11,833 | | | | 2,299 | | | | 2,142 | |
| | — | | | | (479 | ) | | | (2,347 | ) |
| | 7,337 | | | | (2,783 | ) | | | (16,018 | ) |
| | | | | | | | | | | |
| | 19,170 | | | | (963 | ) | | | (16,223 | ) |
| | | | | | | | | | | |
| $ | 17,434 | | | $ | (885 | ) | | $ | (17,553 | ) |
35
STATEMENTS OF CHANGES IN NET ASSETS
| | | MARSICO
FOCUS
FUND | | | MARSICO
GROWTH
FUND | |
| | | | | | | | | | | | | | | | | |
(Amounts in thousands) | | Year
Ended
9/30/19 | | | Year
Ended
9/30/18 | | | Year
Ended
9/30/19 | | | Year
Ended
9/30/18 | |
| | | | | | | | | | | | | | | | | |
OPERATIONS: | | | | | | | | | | | | | | | | |
Net investment income (loss) | | $ | (1,064 | ) | | $ | (2,791 | ) | | $ | (1,037 | ) | | $ | (1,296 | ) |
Net realized gain on investments | | | 44,005 | | | | 53,497 | | | | 25,286 | | | | 30,322 | |
Net realized gain (loss) on foreign currency transactions | | | 30 | | | | 431 | | | | (41 | ) | | | 279 | |
Change in unrealized appreciation (depreciation) on investments, foreign currency translations, and non-interested trustees’ deferred compensation | | | (31,757 | ) | | | 62,949 | | | | (18,902 | ) | | | 28,796 | |
| | | | | | | | | | | | | | | | | |
Net increase (decrease) in net assets resulting from operations | | | 11,214 | | | | 114,086 | | | | 5,306 | | | | 58,101 | |
| | | | | | | | | | | | | | | | | |
DISTRIBUTIONS: | | | (51,626 | ) | | | (87,734 | ) | | | (29,351 | ) | | | (25,153 | ) |
| | | | | | | | | | | | | | | | | |
CAPITAL SHARE TRANSACTIONS: | | | | | | | | | | | | | | | | |
Proceeds from sales of shares | | | 26,190 | | | | 42,040 | | | | 6,134 | | | | 40,238 | |
Proceeds from reinvestment of distributions | | | 49,333 | | | | 85,196 | | | | 28,064 | | | | 24,655 | |
Value of assets acquired in exchange for shares(1) | | | — | | | | — | | | | — | | | | — | |
Redemption of shares | | | (86,480 | ) | | | (107,231 | ) | | | (49,788 | ) | | | (65,823 | ) |
| | | | | | | | | | | | | | | | | |
Net increase (decrease) from capital share transactions | | | (10,957 | ) | | | 20,005 | | | | (15,590 | ) | | | (930 | ) |
| | | | | | | | | | | | | | | | | |
TOTAL INCREASE (DECREASE) IN NET ASSETS | | | (51,369 | ) | | | 46,357 | | | | (39,635 | ) | | | 32,018 | |
| | | | | | | | | | | | | | | | | |
NET ASSETS: | | | | | | | | | | | | | | | | |
Beginning of Period | | | 606,014 | | | | 559,657 | | | | 298,940 | | | | 266,922 | |
| | | | | | | | | | | | | | | | | |
End of Period | | $ | 554,645 | | | $ | 606,014 | | | $ | 259,305 | | | $ | 298,940 | |
| | | | | | | | | | | | | | | | | |
TRANSACTIONS IN SHARES: | | | | | | | | | | | | | | | | |
Shares sold | | | 1,522 | | | | 2,178 | | | | 343 | | | | 2,083 | |
Shares issued in reinvestment of distributions | | | 3,105 | | | | 4,953 | | | | 1,763 | | | | 1,391 | |
Shares issued for acquistion(1) | | | — | | | | — | | | | — | | | | — | |
Shares redeemed | | | (4,824 | ) | | | (5,608 | ) | | | (2,730 | ) | | | (3,475 | ) |
| | | | | | | | | | | | | | | | | |
NET INCREASE (DECREASE) | | | (197 | ) | | | 1,523 | | | | (624 | ) | | | (1 | ) |
(1) | Amounts relate to the reorganization of the Flexible Capital Fund with and into the Global Fund. Please refer to Note 4 for additional information. |
| See notes to financial statements. |
36
MARSICO
21st
CENTURY
FUND | | | MARSICO
INTERNATIONAL
OPPORTUNITIES FUND | | | MARSICO
GLOBAL
FUND | |
| | | | | | | | | | | | | | | | | | | | | | | |
Year
Ended
9/30/19 | | | Year
Ended
9/30/18 | | | Year
Ended
9/30/19 | | | Year
Ended
9/30/18 | | | Year
Ended
9/30/19 | | | Year
Ended
9/30/18 | |
| | | | | | | | | | | | | | | | | | | | | | | |
| | | | | | | | | | | | | | | | | | | | | | | |
| $ | (1,736 | ) | | $ | (1,858 | ) | | $ | 78 | | | $ | (227 | ) | | $ | (1,330 | ) | | $ | (785 | ) |
| | 11,833 | | | | 76,404 | | | | 2,299 | | | | 6,541 | | | | 2,142 | | | | 3,415 | |
| | — | | | | 151 | | | | (479 | ) | | | 288 | | | | (2,347 | ) | | | (22 | ) |
| | 7,337 | | | | (15,070 | ) | | | (2,783 | ) | | | (3,447 | ) | | | (16,018 | ) | | | 16,268 | |
| | | | | | | | | | | | | | | | | | | | | | | |
| | 17,434 | | | | 59,627 | | | | (885 | ) | | | 3,155 | | | | (17,553 | ) | | | 18,876 | |
| | | | | | | | | | | | | | | | | | | | | | | |
| | (11,665 | ) | | | — | | | | (4,245 | ) | | | — | | | | (2,537 | ) | | | (4,068 | ) |
| | | | | | | | | | | | | | | | | | | | | | | |
| | | | | | | | | | | | | | | | | | | | | | | |
| | 16,696 | | | | 5,584 | | | | 3,123 | | | | 8,760 | | | | 13,813 | | | | 26,439 | |
| | 11,079 | | | | — | | | | 4,007 | | | | — | | | | 2,299 | | | | 3,948 | |
| | — | | | | — | | | | — | | | | — | | | | — | | | | 218,657 | |
| | (23,632 | ) | | | (26,666 | ) | | | (10,841 | ) | | | (13,552 | ) | | | (53,643 | ) | | | (21,831 | ) |
| | | | | | | | | | | | | | | | | | | | | | | |
| | 4,143 | | | | (21,082 | ) | | | (3,711 | ) | | | (4,792 | ) | | | (37,531 | ) | | | 227,213 | |
| | | | | | | | | | | | | | | | | | | | | | | |
| | 9,912 | | | | 38,545 | | | | (8,841 | ) | | | (1,637 | ) | | | (57,621 | ) | | | 242,021 | |
| | | | | | | | | | | | | | | | | | | | | | | |
| | | | | | | | | | | | | | | | | | | | | | | |
| | 272,867 | | | | 234,322 | | | | 62,152 | | | | 63,789 | | | | 286,514 | | | | 44,493 | |
| | | | | | | | | | | | | | | | | | | | | | | |
| $ | 282,779 | | | $ | 272,867 | | | $ | 53,311 | | | $ | 62,152 | | | $ | 228,893 | | | $ | 286,514 | |
| | | | | | | | | | | | | | | | | | | | | | | |
| | | | | | | | | | | | | | | | | | | | | | | |
| | 516 | | | | 185 | | | | 173 | | | | 422 | | | | 897 | | | | 1,619 | |
| | 405 | | | | — | | | | 257 | | | | — | | | | 163 | | | | 274 | |
| | — | | | | — | | | | — | | | | — | | | | — | | | | 13,188 | |
| | (756 | ) | | | (907 | ) | | | (616 | ) | | | (655 | ) | | | (3,499 | ) | | | (1,328 | ) |
| | | | | | | | | | | | | | | | | | | | | | | |
| | 165 | | | | (722 | ) | | | (186 | ) | | | (233 | ) | | | (2,439 | ) | | | 13,753 | |
37
FINANCIAL HIGHLIGHTS
| | | | MARSICO FOCUS FUND | |
For a Fund Share Outstanding Throughout the Period | | | Year
Ended
9/30/19 | | | Year
Ended
9/30/18 | | | Year
Ended
9/30/17 | | | Year
Ended
9/30/16 | | | Year
Ended
9/30/15 | |
| | | | | | | | | | | | | | | | | | | | | | |
Net Asset Value, Beginning of Period | | | $ | 20.17 | | | $ | 19.63 | | | $ | 15.96 | | | $ | 18.83 | | | $ | 22.41 | |
| | | | | | | | | | | | | | | | | | | | | | |
| | | | | | | | | | | | | | | | | | | | | | |
Income from Investment Operations: | | | | | | | | | | | | | | | | | | | | | |
Net investment loss | | | | (0.04 | ) | | | (0.09 | ) | | | (0.17 | ) | | | (0.13 | ) | | | (0.10 | ) |
Net realized and unrealized gains (losses) on investments | | | | 0.25 | | | | 3.82 | | | | 3.84 | | | | 1.25 | | | | (0.62 | ) |
| | | | | | | | | | | | | | | | | | | | | | |
Total from investment operations | | | | 0.21 | | | | 3.73 | | | | 3.67 | | | | 1.12 | | | | (0.72 | ) |
| | | | | | | | | | | | | | | | | | | | | | |
Distributions & Other: | | | | | | | | | | | | | | | | | | | | | |
Net realized gains | | | | (1.79 | ) | | | (3.19 | ) | | | — | | | | (3.99 | ) | | | (2.86 | ) |
| | | | | | | | | | | | | | | | | | | | | | |
Total distributions and other | | | | (1.79 | ) | | | (3.19 | ) | | | — | | | | (3.99 | ) | | | (2.86 | ) |
| | | | | | | | | | | | | | | | | | | | | | |
Net Asset Value, End of Period | | | $ | 18.59 | | | $ | 20.17 | | | $ | 19.63 | | | $ | 15.96 | | | $ | 18.83 | |
| | | | | | | | | | | | | | | | | | | | | | |
| | | | | | | | | | | | | | | | | | | | | | |
Total Return | | | | 2.52 | % | | | 21.78 | % | | | 22.99 | % | | | 5.75 | % | | | (4.15 | )% |
| | | | | | | | | | | | | | | | | | | | | | |
| | | | | | | | | | | | | | | | | | | | | | |
Supplemental Data and Ratios: | | | | | | | | | | | | | | | | | | | | | |
| | | | | | | | | | | | | | | | | | | | | | |
Net assets, end of period (000s) | | | $ | 554,645 | | | $ | 606,014 | | | $ | 559,657 | | | $ | 613,870 | | | $ | 788,851 | |
| | | | | | | | | | | | | | | | | | | | | | |
Ratio of expenses to average net assets, less waivers and before expenses paid indirectly, plus recoupment of previously waived fees or expenses paid | | | | 1.02 | % | | | 1.21 | % | | | 1.37 | % | | | 1.29 | % | | | 1.31 | % |
| | | | | | | | | | | | | | | | | | | | | | |
Ratio of net investment loss to average net assets, net of waivers, recoupment of previously waived fees or expenses paid and expenses paid indirectly | | | | (0.19 | )% | | | (0.48 | )% | | | (0.62 | )% | | | (0.63 | )% | | | (0.45 | )% |
| | | | | | | | | | | | | | | | | | | | | | |
Ratio of expenses to average net assets, before waivers, recoupment of previously waived fees or expenses paid and expenses paid indirectly | | | | 1.02 | % | | | 1.21 | % | | | 1.37 | % | | | 1.29 | % | | | 1.31 | % |
| | | | | | | | | | | | | | | | | | | | | | |
Ratio of net investment loss to average net assets, before waivers, recoupment of previously waived fees or expenses paid and expenses paid indirectly | | | | (0.19 | )% | | | (0.48 | )% | | | (0.62 | )% | | | (0.63 | )% | | | (0.45 | )% |
| | | | | | | | | | | | | | | | | | | | | | |
Portfolio turnover rate | | | | 42 | % | | | 53 | % | | | 67 | % | | | 45 | % | | | 68 | % |
| See notes to financial statements. |
38
| | | MARSICO
GROWTH
FUND | | | | | MARSICO
21st
CENTURY FUND | | |
| | | Year
Ended
9/30/19 | | | Year
Ended
9/30/18 | | | Year
Ended
9/30/17 | | | Year
Ended
9/30/16 | | | Year
Ended
9/30/15 | | | | | Year
Ended
9/30/19 | | | Year
Ended
9/30/18 | | | Year
Ended
9/30/17 | | | Year
Ended
9/30/16 | | | Year
Ended
9/30/15 | | |
| | | | | | | | | | | | | | | | | | | | | | | | | | | | | | | | | | | | | | | | | | | | |
| | | $ | 20.69 | | | $ | 18.47 | | | $ | 15.54 | | | $ | 20.11 | | | $ | 23.63 | | | | | $ | 33.18 | | | $ | 26.19 | | | $ | 22.04 | | | $ | 20.38 | | | $ | 20.90 | | |
| | | | | | | | | | | | | | | | | | | | | | | | | | | | | | | | | | | | | | | | | | | | |
| | | | | | | | | | | | | | | | | | | | | | | | | | | | | | | | | | | | | | | | | | | | |
| | | | | | | | | | | | | | | | | | | | | | | | | | | | | | | | | | | | | | | | | | | | |
| | | | (0.08 | ) | | | (0.09 | ) | | | (0.14 | ) | | | (0.13 | ) | | | (0.15 | ) | | | | | (0.20 | ) | | | (0.25 | ) | | | (0.29 | ) | | | (0.29 | ) | | | (0.21 | ) | |
| | | | 0.34 | | | | 4.06 | | | | 3.19 | | | | 1.33 | | | | (0.62 | ) | | | | | 2.15 | | | | 7.24 | | | | 4.44 | | | | 1.95 | | | | (0.31 | ) | |
| | | | | | | | | | | | | | | | | | | | | | | | | | | | | | | | | | | | | | | | | | | | |
| | | | 0.26 | | | | 3.97 | | | | 3.05 | | | | 1.20 | | | | (0.77 | ) | | | | | 1.95 | | | | 6.99 | | | | 4.15 | | | | 1.66 | | | | (0.52 | ) | |
| | | | | | | | | | | | | | | | | | | | | | | | | | | | | | | | | | | | | | | | | | | | |
| | | | | | | | | | | | | | | | | | | | | | | | | | | | | | | | | | | | | | | | | | | | |
| | | | (2.20 | ) | | | (1.75 | ) | | | (0.12 | ) | | | (5.77 | ) | | | (2.75 | ) | | | | | (1.43 | ) | | | — | | | | — | | | | — | | | | — | | |
| | | | | | | | | | | | | | | | | | | | | | | | | | | | | | | | | | | | | | | | | | | | |
| | | | (2.20 | ) | | | (1.75 | ) | | | (0.12 | ) | | | (5.77 | ) | | | (2.75 | ) | | | | | (1.43 | ) | | | — | | | | — | | | | — | | | | — | | |
| | | | | | | | | | | | | | | | | | | | | | | | | | | | | | | | | | | | | | | | | | | | |
| | | $ | 18.75 | | | $ | 20.69 | | | $ | 18.47 | | | $ | 15.54 | | | $ | 20.11 | | | | | $ | 33.70 | | | $ | 33.18 | | | $ | 26.19 | | | $ | 22.04 | | | $ | 20.38 | | |
| | | | | | | | | | | | | | | | | | | | | | | | | | | | | | | | | | | | | | | | | | | | |
| | | | | | | | | | | | | | | | | | | | | | | | | | | | | | | | | | | | | | | | | | | | |
| | | | 3.16 | % | | | 23.10 | % | | | 19.85 | % | | | 5.94 | % | | | (4.10 | )% | | | | | 6.88 | % | | | 26.69 | % | | | 18.83 | % | | | 8.15 | % | | | (2.49 | )% | |
| | | | | | | | | | | | | | | | | | | | | | | | | | | | | | | | | | | | | | | | | | | | |
| | | | | | | | | | | | | | | | | | | | | | | | | | | | | | | | | | | | | | | | | | | | |
| | | | | | | | | | | | | | | | | | | | | | | | | | | | | | | | | | | | | | | | | | | | |
| | | | | | | | | | | | | | | | | | | | | | | | | | | | | | | | | | | | | | | | | | | | |
| | | $ | 259,305 | | | $ | 298,940 | | | $ | 266,922 | | | $ | 288,213 | | | $ | 410,442 | | | | | $ | 282,779 | | | $ | 272,867 | | | $ | 234,322 | | | $ | 234,780 | | | $ | 268,384 | | |
| | | | | | | | | | | | | | | | | | | | | | | | | | | | | | | | | | | | | | | | | | | | |
| | | | 1.27 | % | | | 1.25 | % | | | 1.42 | % | | | 1.37 | % | | | 1.35 | % | | | | | 1.30 | % | | | 1.21 | % | | | 1.40 | % | | | 1.41 | % | | | 1.38 | % | |
| | | | | | | | | | | | | | | | | | | | | | | | | | | | | | | | | | | | | | | | | | | | |
| | | | (0.40 | )% | | | (0.46 | )% | | | (0.53 | )% | | | (0.61 | )% | | | (0.52 | )% | | | | | (0.66 | )% | | | (0.74 | )% | | | (0.96 | )% | | | (1.01 | )% | | | (0.78 | )% | |
| | | | | | | | | | | | | | | | | | | | | | | | | | | | | | | | | | | | | | | | | | | | |
| | | | 39 | % | | | 40 | % | | | 50 | % | | | 52 | % | | | 81 | % | | | | | 34 | % | | | 90 | % | | | 28 | % | | | 44 | % | | | 94 | % | |
39
FINANCIAL HIGHLIGHTS
| | | | MARSICO
INTERNATIONAL OPPORTUNITIES FUND | |
For a Fund Share Outstanding Throughout the Period | | | Year
Ended
9/30/19 | | | Year
Ended
9/30/18 | | | Year
Ended
9/30/17 | | | Year
Ended
9/30/16 | | | Year
Ended
9/30/15 | |
| | | | | | | | | | | | | | | | | | | | | | |
Net Asset Value, Beginning of Period | | | $ | 20.23 | | | $ | 19.30 | | | $ | 15.64 | | | $ | 14.51 | | | $ | 14.72 | |
| | | | | | | | | | | | | | | | | | | | | | |
| | | | | | | | | | | | | | | | | | | | | | |
Income from Investment Operations: | | | | | | | | | | | | | | | | | | | | | |
Net investment income (loss) | | | | 0.01 | | | | (0.09 | ) | | | (0.16 | ) | | | (0.20 | ) | | | (0.21 | ) |
Net realized and unrealized gains (losses) on investments | | | | (0.35 | ) | | | 1.02 | | | | 3.82 | | | | 1.33 | | | | — | (1) |
| | | | | | | | | | | | | | | | | | | | | | |
Total from investment operations | | | | (0.34 | ) | | | 0.93 | | | | 3.66 | | | | 1.13 | | | | (0.21 | ) |
| | | | | | | | | | | | | | | | | | | | | | |
Distributions & Other: | | | | | | | | | | | | | | | | | | | | | |
Net realized gains | | | | (1.42 | ) | | | — | | | | — | | | | — | | | | — | |
| | | | | | | | | | | | | | | | | | | | | | |
Total distributions and other | | | | (1.42 | ) | | | — | | | | — | | | | — | | | | — | |
| | | | | | | | | | | | | | | | | | | | | | |
Net Asset Value, End of Period | | | $ | 18.47 | | | $ | 20.23 | | | $ | 19.30 | | | $ | 15.64 | | | $ | 14.51 | |
| | | | | | | | | | | | | | | | | | | | | | |
| | | | | | | | | | | | | | | | | | | | | | |
Total Return | | | | (0.37 | )% | | | 4.82 | % | | | 23.40 | % | | | 7.79 | % | | | (1.43 | )% |
| | | | | | | | | | | | | | | | | | | | | | |
| | | | | | | | | | | | | | | | | | | | | | |
Supplemental Data and Ratios: | | | | | | | | | | | | | | | | | | | | | |
| | | | | | | | | | | | | | | | | | | | | | |
Net assets, end of period (000s) | | | $ | 53,311 | | | $ | 62,152 | | | $ | 63,789 | | | $ | 62,833 | | | $ | 89,141 | |
| | | | | | | | | | | | | | | | | | | | | | |
Ratio of expenses to average net assets, less waivers and before expenses paid indirectly, plus recoupment of previously waived fees or expenses paid | | | | 1.50 | % | | | 1.52 | %(3) | | | 1.60 | % | | | 1.60 | % | | | 1.60 | % |
| | | | | | | | | | | | | | | | | | | | | | |
Ratio of net investment income (loss) to average net assets, net of waivers, recoupment of previously waived fees or expenses paid and expenses paid indirectly | | | | 0.14 | % | | | (0.33 | )% | | | (0.77 | )% | | | (0.71 | )% | | | (0.86 | )% |
| | | | | | | | | | | | | | | | | | | | | | |
Ratio of expenses to average net assets, before waivers, recoupment of previously waived fees or expenses paid and expenses paid indirectly | | | | 1.72 | % | | | 1.59 | % | | | 1.79 | % | | | 1.78 | % | | | 1.63 | % |
| | | | | | | | | | | | | | | | | | | | | | |
Ratio of net investment loss to average net assets, before waivers, recoupment of previously waived fees or expenses paid and expenses paid indirectly | | | | (0.08 | )% | | | (0.40 | )% | | | (0.96 | )% | | | (0.89 | )% | | | (0.89 | )% |
| | | | | | | | | | | | | | | | | | | | | | |
Portfolio turnover rate | | | | 57 | % | | | 33 | % | | | 108 | % | | | 223 | % | | | 217 | % |
(2) | The per share amount shown does not correlate with the amount reflected on the Global Fund’s Statement of Changes in Net Assets due to the shares outstanding significantly increasing late in the fiscal year as a result of the reorganization of the Flexible Capital Fund with and into the Global Fund. Please refer to Note 4 for additional information related to the reorganization. |
(3) | During the fiscal year, the Adviser agreed to reduce the expense limitation cap for the Fund. Please refer to Note 3 for information concerning the timing and modifications made to the written expense limitation and fee waiver agreement. |
| See notes to financial statements. |
40
| | MARSICO
GLOBAL
FUND | |
| | Year
Ended
9/30/19 | | | Year
Ended
9/30/18 | | | Year
Ended
9/30/17 | | | Year
Ended
9/30/16 | | | Year
Ended
9/30/15 | |
| | | | | | | | | | | | | | | | | | | | |
| | $ | 17.16 | | | $ | 15.13 | | | $ | 12.03 | | | $ | 12.37 | | | $ | 14.45 | |
| | | | | | | | | | | | | | | | | | | | |
| | | | | | | | | | | | | | | | | | | | |
| | | | | | | | | | | | | | | | | | | | |
| | | (0.12 | ) | | | 0.11 | (2) | | | (0.14 | ) | | | (0.16 | ) | | | (0.10 | ) |
| | | (0.82 | ) | | | 3.26 | | | | 3.24 | | | | 1.14 | | | | (0.32 | ) |
| | | | | | | | | | | | | | | | | | | | |
| | | (0.94 | ) | | | 3.37 | | | | 3.10 | | | | 0.98 | | | | (0.42 | ) |
| | | | | | | | | | | | | | | | | | | | |
| | | | | | | | | | | | | | | | | | | | |
| | | (0.16 | ) | | | (1.34 | ) | | | — | | | | (1.32 | ) | | | (1.66 | ) |
| | | | | | | | | | | | | | | | | | | | |
| | | (0.16 | ) | | | (1.34 | ) | | | — | | | | (1.32 | ) | | | (1.66 | ) |
| | | | | | | | | | | | | | | | | | | | |
| | $ | 16.06 | | | $ | 17.16 | | | $ | 15.13 | | | $ | 12.03 | | | $ | 12.37 | |
| | | | | | | | | | | | | | | | | | | | |
| | | | | | | | | | | | | | | | | | | | |
| | | (5.36 | )% | | | 23.94 | % | | | 25.77 | % | | | 8.05 | % | | | (3.51 | )% |
| | | | | | | | | | | | | | | | | | | | |
| | | | | | | | | | | | | | | | | | | | |
| | | | | | | | | | | | | | | | | | | | |
| | | | | | | | | | | | | | | | | | | | |
| | $ | 228,893 | | | $ | 286,514 | | | $ | 44,493 | | | $ | 44,273 | | | $ | 66,612 | |
| | | | | | | | | | | | | | | | | | | | |
| | | 1.45 | % | | | 1.48 | %(3) | | | 1.60 | % | | | 1.60 | % | | | 1.60 | % |
| | | | | | | | | | | | | | | | | | | | |
| | | (0.55 | )% | | | (0.87 | )% | | | (0.82 | )% | | | (0.60 | )% | | | (0.80 | )% |
| | | | | | | | | | | | | | | | | | | | |
| | | 1.41 | % | | | 1.59 | % | | | 1.80 | % | | | 1.69 | % | | | 1.54 | % |
| | | | | | | | | | | | | | | | | | | | |
| | | (0.51 | )% | | | (0.98 | )% | | | (1.02 | )% | | | (0.69 | )% | | | (0.74 | )% |
| | | | | | | | | | | | | | | | | | | | |
| | | 67 | % | | | 89 | % | | | 79 | % | | | 82 | % | | | 110 | % |
41
NOTES TO FINANCIAL STATEMENTS |
NOTES TO FINANCIAL STATEMENTSSeptember 30, 2019
The Marsico Investment Fund (the “Trust”) was organized on October 1, 1997, as a Delaware statutory trust and is registered under the Investment Company Act of 1940 (the “1940 Act”) as an open-end management investment company. The Focus Fund, Growth Fund, 21st Century Fund, International Opportunities Fund, and Global Fund (collectively, the “Funds”) are separate investment portfolios of the Trust. The Focus Fund is a non-diversified fund and the Growth Fund, the 21st Century Fund, the International Opportunities Fund, and the Global Fund are diversified funds. The Focus Fund and Growth Fund commenced operations on December 31, 1997, the 21st Century Fund commenced operations on February 1, 2000, the International Opportunities Fund commenced operations on June 30, 2000, and the Global Fund commenced operations on June 29, 2007. Trustees and officers of the Trust and employees of Marsico Capital Management, LLC (the “Adviser”) own approximately 6%, 5%, 6%, and 9% of the Focus Fund’s, Growth Fund’s, International Opportunities Fund’s, and Global Fund’s outstanding shares, respectively, as of September 30, 2019.
2. | Significant Accounting Policies |
The Funds qualify as investment companies under Accounting Standards Update No. 2013-08, Accounting Standard Codification Topic 946, Financial Services — Investment Companies (“ASC 946”). The following is a summary of significant accounting policies consistently followed by the Funds in the preparation of their financial statements. These policies are in conformity with Generally Accepted Accounting Principles (“GAAP”) in the United States of America for investment companies and follow the accounting guidance provided in ASC 946. The presentation of financial statements in conformity with GAAP requires management to make estimates and assumptions that affect the reported amounts and disclosures of assets and liabilities at the date of the financial statements and the reported amounts and disclosures of income and expenses during the reporting period. Actual results could differ from those estimates.
| | (a) | Investment Valuation — A security traded on a recognized stock exchange is generally valued at the last sale price prior to the closing of the principal exchange on which the security is traded. Securities traded on NASDAQ generally will be valued at the NASDAQ Official Closing Price. If no sale price is reported on the valuation date, the most current bid price will generally be used, with the exception of short option positions which will generally utilize the most current ask price. Other securities for which over-the-counter market quotations are readily available are generally valued at the last sale price. Debt securities that will mature in more than 60 days are generally valued at their bid prices furnished by a pricing service approved by the Funds’ Board of Trustees and subject to review pursuant to procedures established by, and under the general supervision of, the Board of Trustees. Debt securities that will mature in 60 days or less are valued at amortized cost, if it approximates market value. Any securities for which market quotations are not readily available are valued at their fair value as determined in good faith by the Adviser in accordance with procedures established by, and under the general supervision of, the Funds’ Board of Trustees. The Funds may use pricing services to assist in determining market value. The Board of Trustees has authorized the use of a pricing service to assist the Funds in valuing certain equity securities listed or traded on foreign security exchanges in the Funds’ portfolios in certain circumstances where there is a significant change in the value of related US-traded securities, as represented by, for example, the S&P 500 Index. |
“Fair Value Measurements and Disclosures” (the “Fair Value Statement”) defines fair value, establishes a framework for measuring fair value in GAAP, and expands disclosures about fair value measurements. Under the Fair Value Statement, various inputs are used in determining the value of the Funds’ investments.
These inputs are summarized into three broad levels and described below:
| | ● | Level 1 – quoted prices in active markets for identical investments |
| | ● | Level 2 – other significant observable inputs (including quoted prices for similar investments, interest rates, and evaluated quotations obtained from pricing services) |
| | ● | Level 3 – significant unobservable inputs (including the Fund’s assumptions that market participants would use in determining the fair value of investments) |
42
NOTES TO FINANCIAL STATEMENTS |
The inputs or methodology used for valuing investments are not an indication of the risk associated with investing in those investments. Changes in valuation techniques may result in transfers between the levels during the reporting period. There were no transfers into or out of Level 3 during the reporting period. The following is a summary of the fair values of the Funds’ investments in each category and economic sector as of September 30, 2019:
Fund Investments by
Major Security Type | | Level 1 | | | Level 2 | | | Level 3 | | | Total | |
Marsico Focus Fund | | | | | | | | | | | | | | | | |
Assets | | | | | | | | | | | | | | | | |
Common Stocks | | | | | | | | | | | | | | | | |
Communication Services | | $ | 50,995,506 | | | $ | — | | | $ | — | | | $ | 50,995,506 | |
Consumer Discretionary | | | 90,602,617 | | | | — | | | | — | | | | 90,602,617 | |
Financials | | | 39,413,749 | | | | — | | | | — | | | | 39,413,749 | |
Health Care | | | 44,652,208 | | | | — | | | | — | | | | 44,652,208 | |
Industrials | | | 48,962,911 | | | | — | | | | — | | | | 48,962,911 | |
Information Technology | | | 209,577,635 | | | | — | | | | — | | | | 209,577,635 | |
Materials | | | 30,500,739 | | | | — | | | | — | | | | 30,500,739 | |
Real Estate | | | 16,648,533 | | | | — | | | | — | | | | 16,648,533 | |
Short-term Investments | | | 16,364,619 | | | | — | | | | — | | | | 16,364,619 | |
| | | | | | | | | | | | | | | $ | 547,718,517 | |
Marsico Growth Fund | | | | | | | | | | | | | | | | |
Assets | | | | | | | | | | | | | | | | |
Common Stocks | | | | | | | | | | | | | | | | |
Communication Services | | $ | 28,503,291 | | | $ | — | | | $ | — | | | $ | 28,503,291 | |
Consumer Discretionary | | | 45,162,634 | | | | — | | | | — | | | | 45,162,634 | |
Financials | | | 10,450,045 | | | | — | | | | — | | | | 10,450,045 | |
Health Care | | | 27,084,175 | | | | — | | | | — | | | | 27,084,175 | |
Industrials | | | 17,972,163 | | | | — | | | | — | | | | 17,972,163 | |
Information Technology | | | 94,532,108 | | | | — | | | | — | | | | 94,532,108 | |
Materials | | | 14,098,863 | | | | — | | | | — | | | | 14,098,863 | |
Real Estate | | | 9,550,404 | | | | — | | | | — | | | | 9,550,404 | |
Short-term Investments | | | 9,880,141 | | | | — | | | | — | | | | 9,880,141 | |
| | | | | | | | | | | | | | | $ | 257,233,824 | |
Marsico 21st Century Fund | | | | | | | | | | | | | | | | |
Assets | | | | | | | | | | | | | | | | |
Common Stocks | | | | | | | | | | | | | | | | |
Communication Services | | $ | 5,758,199 | | | $ | — | | | $ | — | | | $ | 5,758,199 | |
Consumer Discretionary | | | 40,146,429 | | | | — | | | | — | | | | 40,146,429 | |
Consumer Staples | | | 5,610,862 | | | | — | | | | — | | | | 5,610,862 | |
Financials | | | 10,027,372 | | | | — | | | | — | | | | 10,027,372 | |
Health Care | | | 40,215,818 | | | | — | | | | — | | | | 40,215,818 | |
Industrials | | | 44,377,746 | | | | — | | | | — | | | | 44,377,746 | |
Information Technology | | | 92,151,276 | | | | — | | | | — | | | | 92,151,276 | |
Materials | | | 13,084,701 | | | | — | | | | — | | | | 13,084,701 | |
Real Estate | | | 11,718,053 | | | | — | | | | — | | | | 11,718,053 | |
Short-term Investments | | | 20,503,241 | | | | — | | | | — | | | | 20,503,241 | |
| | | | | | | | | | | | | | | $ | 283,593,697 | |
Marsico International Opportunities Fund | | | | | | | | | | | | | | | | |
Assets | | | | | | | | | | | | | | | | |
Common Stocks | | | | | | | | | | | | | | | | |
Communication Services | | $ | 7,562,731 | | | $ | — | | | $ | — | | | $ | 7,562,731 | |
Consumer Discretionary | | | 6,666,635 | | | | — | | | | — | | | | 6,666,635 | |
Consumer Staples | | | 5,707,436 | | | | — | | | | — | | | | 5,707,436 | |
Energy | | | 526,070 | | | | — | | | | — | | | | 526,070 | |
Financials | | | 5,275,970 | | | | — | | | | — | | | | 5,275,970 | |
Health Care | | | 7,577,801 | | | | — | | | | — | | | | 7,577,801 | |
Industrials | | | 5,988,089 | | | | — | | | | — | | | | 5,988,089 | |
Information Technology | | | 8,103,398 | | | | — | | | | — | | | | 8,103,398 | |
Materials | | | 955,229 | | | | — | | | | — | | | | 955,229 | |
Real Estate | | | 2,262,537 | | | | — | | | | — | | | | 2,262,537 | |
Short-term Investments | | | 2,719,130 | | | | — | | | | — | | | | 2,719,130 | |
| | | | | | | | | | | | | | | $ | 53,345,026 | |
43
NOTES TO FINANCIAL STATEMENTS |
NOTES TO FINANCIAL STATEMENTSSeptember 30, 2019 (continued)
Fund Investments by
Major Security Type | | Level 1 | | | Level 2 | | | Level 3 | | | Total | |
Marsico Global Fund | | | | | | | | | | | | | | | | |
Assets | | | | | | | | | | | | | | | | |
Common Stocks | | | | | | | | | | | | | | | | |
Communication Services | | $ | 21,983,679 | | | $ | — | | | $ | — | | | $ | 21,983,679 | |
Consumer Discretionary | | | 36,524,835 | | | | — | | | | — | | | | 36,524,835 | |
Consumer Staples | | | 5,799,523 | | | | — | | | | — | | | | 5,799,523 | |
Financials | | | 6,858,215 | | | | — | | | | — | | | | 6,858,215 | |
Health Care | | | 14,129,601 | | | | — | | | | — | | | | 14,129,601 | |
Industrials | | | 14,393,326 | | | | — | | | | — | | | | 14,393,326 | |
Information Technology | | | 90,758,636 | | | | — | | | | — | | | | 90,758,636 | |
Materials | | | 12,649,160 | | | | — | | | | — | | | | 12,649,160 | |
Real Estate | | | 16,703,266 | | | | — | | | | — | | | | 16,703,266 | |
Short-term Investments | | | 9,206,275 | | | | — | | | | — | | | | 9,206,275 | |
| | | | | | | | | | | | | | | $ | 229,006,516 | |
| | (b) | Expenses — The Funds are charged for those expenses that are directly attributable to each Fund, such as advisory and custodial fees. Expenses that are not directly attributable to a Fund are typically allocated among the Funds in proportion to their respective net assets and are in some cases allocated based on other factors. The Funds’ expenses may be reduced by advisory fee waivers, brokerage credits and uninvested cash balances earning interest or credits. Such credits are included in “Less waiver of expenses and expenses paid indirectly” on the Statements of Operations. |
Brokerage commissions may be paid to certain brokers which reduce transfer agent fees and expenses. For the year ended September 30, 2019, the Funds received no such brokerage commission credits. The Funds received earnings credits on certain cash account balances which reduced transfer agent fees and expenses by $1 (in thousands) for the Focus Fund, and by less than $1 (in thousands) for each of the Growth Fund, 21st Century Fund, International Opportunities Fund, and Global Fund for the year ended September 30, 2019. Brokerage commission credits and earnings credits (if any) are included in “Less waiver of expenses and expenses paid indirectly” on the Statements of Operations.
| | (c) | Federal Income Taxes — Each Fund intends to comply with the requirements of the Internal Revenue Code of 1986, as amended (the “Internal Revenue Code”), necessary to continue to qualify as a regulated investment company and to make the requisite distributions of income to its shareholders which will be sufficient to relieve it from all or substantially all federal and state income taxes. Certain Funds may utilize earnings and profits on redemption of shares as part of the dividends paid deduction. |
| | (d) | Distributions to Shareholders — Dividends from net investment income and net realized capital gains, if any, will be declared and paid at least annually. Distributions to shareholders are recorded on the ex-dividend date. Each Fund may periodically make reclassifications among certain of its capital accounts as a result of the timing and characterization of certain income and capital gains distributions determined in accordance with federal tax regulations, which may differ from GAAP. These reclassifications are due to differing treatment for items such as foreign currency transactions, passive foreign investment companies and net investment losses. |
The Funds at times may invest in real estate investment trusts (“REITs”). REITs generally pay dividends to their investors based upon cash available from their operations and this amount may differ significantly from the REITs’ actual earnings and profits (“E&P”) determined for income tax purposes. It is common for these dividends to exceed the REITs’ taxable E&P, resulting in the excess portion of such dividends eventually being designated as a return of capital. Determination of the tax character of dividends made by REITs is typically performed by the REIT several months subsequent to the payment of the dividend. Therefore, due to timing issues, the Funds may be in a position of being required to calculate and pay required distribution amounts to their shareholders based on the best information available from the REITs, which may be prior to the final determination of the REITs’ taxable E&P, and it is possible that a portion of the Funds’ distribution amounts could include a return of capital to shareholders for federal income tax purposes.
| | (e) | Foreign Currency Translation — The accounting records of the Funds are maintained in US dollars. For valuation purposes, values of securities denominated in foreign currencies are translated into US dollars at 4:00 p.m. Eastern Time. Amounts related to the purchase and sale of foreign securities and investment income are translated at the rates of exchange prevailing on the respective dates of such transactions. |
Reported realized gains and losses on foreign currency transactions arise from sales of portfolio securities, forward foreign currency contracts, currency gains or losses realized between the trade and settlement dates on securities transactions, and the difference between the amounts of dividends, interest, and foreign withholding taxes recorded on the Funds’ books and the US dollar equivalent of the amounts actually received or paid.
The Funds do not isolate that portion of the results of operations resulting from changes in foreign exchange rates on investments from the fluctuations arising from changes in market prices of securities held at the end of the reporting period. Net unrealized appreciation or depreciation on investments and foreign currency translations arises from changes in the value of assets and liabilities, including investments in securities at the end of the reporting period, resulting from changes in the exchange rates and changes in market prices of securities held.
44
NOTES TO FINANCIAL STATEMENTS |
Transactions in foreign-denominated assets may involve greater risks than domestic transactions, including currency risk, political and economic risk, regulatory risk and market risk.
| | (f) | Derivative Instruments — “Disclosure about Derivative Instruments and Hedging Activities” (the “Derivatives Statement”) requires enhanced disclosures about the Funds’ derivative and hedging activities, including how such activities are accounted for and their effects on the Funds’ financial position, performance and cash flows. |
The Funds are not intended as vehicles for investing substantially in derivative instruments, and may hold derivative instruments only infrequently. The Funds enter into derivative instruments in order to increase exposure to certain investments, asset classes, or markets, or for hedging purposes to hedge against adverse movements in securities prices, currency rates or interest rates. The Funds can hold various types of derivative instruments such as futures contracts and options on securities, financial indexes, and foreign currencies, options on futures, forward foreign currency contracts, interest rate swaps, credit default swaps, and swap-related products. The use of derivative instruments may involve risks such as the possibility of illiquid markets or imperfect correlation between the value of the derivative instruments and the underlying securities, or that the counterparty will fail to perform its obligations. There were no outstanding derivative instruments held by the Funds as of September 30, 2019 nor did the Funds utilize derivative instruments during the year ended September 30, 2019.
| | (g) | Non-Interested Trustees’ Deferred Fee Plan — Effective February 1, 2000, the Board of Trustees adopted the Marsico Investment Fund Deferred Fee Plan (the “Deferred Fee Plan”), amended and restated as of December 30, 2005, which allows the Trustees who are not “interested persons” of the Funds, as defined in the 1940 Act (“non-interested Trustees”), to defer the receipt of all or a portion of their compensation received from the Funds. Any deferred fees are credited to accounts established on behalf of the non-interested Trustees into the Funds as directed by each non-interested Trustee. The amounts credited to these accounts increase or decrease in accordance with the performance of the Funds selected by the non-interested Trustees. The market value of the deferred account balances as of September 30, 2019 is shown on the Statements of Assets and Liabilities as part of an asset account, “Prepaid expenses and other assets”, and a liability account, “Accrued trustees’ fees”. Additionally, the fluctuation of the account balances due to the Funds’ performance is recorded by the Funds as unrealized appreciation (depreciation), which is shown as part of “Total distributable earnings” on the Statements of Assets and Liabilities, and as compensation expense, which is shown as part of the expense account “Trustees’ fees and expenses” on the Statements of Operations. Fees earned and deferred by the non-interested Trustees for the year ended September 30, 2019 are also included in “Trustees’ fees and expenses” on the Statements of Operations. Amounts contributed to the Deferred Fee Plan will be deferred until distributed in accordance with the Deferred Fee Plan. Unrealized appreciation (depreciation) of Fund shares held in the Deferred Fee Plan is subject to the Funds’ expense reimbursement agreement with the Adviser. |
| | (h) | Other — Investment transactions are accounted for on a trade date basis. Each Fund determines the gain or loss realized from the investment transactions by comparing the original cost of the security lot sold with the net sale proceeds. Dividend income is recognized on the ex-dividend date. Certain dividends from foreign securities are recorded when the Funds are informed of the dividend if such information is obtained subsequent to the ex-dividend date. Interest income is recognized on an accrual basis and includes amortization of premiums and accretion of discounts. |
During the year ended September 30, 2019, the transfer agent reimbursed the Funds for billing processing errors. The transfer agent paid (in thousands) $14, $7, $6, $2, and $7 to the Focus Fund, Growth Fund,21st Century Fund, International Opportunities Fund, and Global Fund, respectively. These amounts are included in Paid-in-capital and Capital Share Transactions for each of the Funds. The amounts did not have a significant effect on each of the Fund’s total return.
| | (i) | Indemnifications — In the normal course of business, the Funds enter into contracts that contain provisions indemnifying other parties against specified potential liabilities. Each Fund’s maximum exposure under these arrangements is unknown as this would involve future claims that may be made against the Fund that have not yet occurred. However, based on experience, the Funds expect the risk of loss in connection with these potential indemnification obligations to be remote. There can be no assurance that material liabilities related to such obligations will not arise in the future, which may adversely impact a Fund. |
3. | Investment Advisory Agreement and Transactions With Affiliates |
Each Fund has an agreement with the Adviser to furnish investment advisory services to the Funds. Each Fund pays the Adviser a fee calculated using the following rates:
Annual Rate of Average Daily Net Assets | Asset Threshold |
0.80% | First $250 million |
0.75% | Next $250 million |
0.70% | Next $250 million |
0.65% | In excess of $750 million |
The Adviser has entered into a written expense limitation and fee waiver agreement under which it has agreed to limit the total expenses of each Fund (excluding taxes, interest, acquired fund fees and expenses, litigation, extraordinary expenses, brokerage and other transaction expenses relating
45
NOTES TO FINANCIAL STATEMENTS |
NOTES TO FINANCIAL STATEMENTSSeptember 30, 2019 (continued)
to the purchase or sale of portfolio investments) to an annual rate of 1.50% of the average net assets of the International Opportunities Fund, and 1.45% of the average net assets of the Focus Fund, the Growth Fund, the 21stCentury Fund, and the Global Fund until January 31, 2020. This expense limitation and fee waiver agreement may be terminated by the Adviser at any time after January 31, 2020, upon 15 days prior notice to the Fund and its administrator. These annual expense limitation rates were effective December 1, 2017 (other than the Global Fund). Prior to December 1, 2017, the Adviser had agreed to limit the total expenses of each Fund (other than the Global Fund) (with certain exclusions) to an annual rate of 1.60% of the average net assets of the Focus Fund and the International Opportunities Fund and 1.50% of the average net assets of the Growth Fund and the21st Century Fund.
The expense limitation agreement between the Adviser and the Global Fund, discussed above, became effective August 4, 2018 upon consummation of the reorganization of the Flexible Capital Fund with and into the Global Fund, which is discussed further below. For the period from December 1, 2017 through August 3, 2018, the Adviser had agreed to limit the total expenses of the Global Fund (with certain exclusions) to an annual rate of 1.50% of the average net assets of the Global Fund. Prior to December 1, 2017, the Adviser had agreed to limit the total expenses of the Global Fund (with certain exclusions) to an annual rate of 1.60% of the average net assets of the Global Fund.
The Adviser may recoup from a Fund fees previously waived or expenses previously reimbursed by the Adviser with respect to that Fund pursuant to these agreements (or a previous expense limitation agreement) if: (1) such recoupment by the Adviser does not cause the Fund, at the time of recoupment, to exceed the lesser of (a) the expense limitation in effect at the time the relevant amount was waived and/or reimbursed, or (b) the expense limitation in effect at the time of the proposed recoupment, and (2) the recoupment is made within three years after the fiscal year end date as of which the amount to be waived or reimbursed was determined and the waiver or reimbursement occurred. Under this arrangement during the year ended September 30, 2019, the Adviser received $100 (in thousands) of reimbursement from the Global Fund for previously waived or reimbursed expenses. The reimbursement amount is reflected in “Recoupment of previously waived expenses” on the Statements of Operations. As of September 30, 2019, recoupment amounts (in thousands) that may potentially be made by the International Opportunities Fund and Global Fund to the Adviser are as follows:
Year of Expiration | | International
Opportunities Fund | | | Global Fund | |
2020 | | $ | 106 | | | $ | 29 | |
2021 | | | 46 | | | | 99 | |
2022 | | | 123 | | | | — | |
| | | $ | 275 | | | $ | 128 | |
Certain officers of the Trust are also officers of the Adviser. The Funds pay a portion of the Chief Compliance Officer’s total compensation costs which is shown as part of the expense account “Professional fees” on the Statements of Operations. No other officers of the Trust received compensation from the Funds during the year ended September 30, 2019.
On May 9, 2018, the Board of Trustees of the Trust unanimously approved an agreement and plan of reorganization that provided for the reorganization of the Flexible Capital Fund with and into the Global Fund. Based on the nature of the transaction, a shareholder vote was not required. After close of business on August 3, 2018, the Global Fund acquired all of the net assets of the Flexible Capital Fund in exchange for shares of the Global Fund. The purpose of the transaction was, in part, to combine two funds managed by the same portfolio manager with comparable investment objectives and strategies. The reorganization was deemed to be a tax-free reorganization for federal income tax purposes. The table below provides certain information for the impacted Funds on the reorganization date.
Immediately Prior to Reorganization | | | Immediately Subsequent to Reorganization | |
(Amounts in thousands) | | Fund
Net Assets | | | Fund Shares
Outstanding | | | Net Unrealized
Appreciation on
Investments, Foreign
Currency Translations
and Non-Interested
Trustees’ Deferred
Compensation | | | | Fund
Net Assets | | | Fund Shares
Outstanding | |
Flexible Capital Fund | | $ | 218,657 | | | | 17,732 | | | $ | 35,003 | | | | $ | — | | | | — | |
Global Fund | | $ | 64,881 | | | | 3,914 | | | $ | 19,221 | | | | $ | 283,538 | | | | 17,102 | |
46
NOTES TO FINANCIAL STATEMENTS |
5. | Distribution and Service Plan |
The Funds have adopted a Distribution and Service Plan (the “Plan”) pursuant to Rule 12b-1 under the 1940 Act. The Plan authorizes payments by the Funds in connection with the distribution of their shares at an annual rate, as determined from time to time by the Board of Trustees, of 0.25% of a Fund’s average daily net assets.
Payments may be made by the Funds under the Plan for the purpose of financing any activity primarily intended to result in the sale of shares of the Funds, as determined by the Board of Trustees, as well as for account maintenance and personal services to shareholders and any other non-distribution-related services. The Adviser may, out of its own resources (which may include legitimate profits from providing advisory services to the Funds or other clients) and at its sole discretion, make certain payments on behalf of the Funds or the Plan for expenses incurred by a Fund for distribution of Fund shares and related services or for administrative or other expenses incurred by the Fund.
The Plan was amended effective December 1, 2017 to reflect non-material changes which were intended to clarify that while the maximum 12b-1 Fee rate remains limited to 0.25% per annum of each Fund’s average daily net assets, one or more Funds may be charged a lower rate from time to time upon approval by the Board of Trustees, and the rate may vary by Fund. The Plan, as amended, also clarifies that previously accrued amounts of the 12b-1 Fee for each Fund may be used by that Fund to pay any current or previously accrued expenses of the Fund authorized by the amended Plan, including non-distribution expenses, authorized by the Plan.
Pursuant to the amended Plan, the Board of Trustees has determined to cause each Fund to accrue 12b-1 Fees as described below.
Effective June 1, 2018, the Focus Fund suspended accrual of 12b-1 Fees until such time as the Board authorizes accruing 12b-1 Fees (at a rate not exceeding 0.25% per annum). The Focus Fund had previously accrued 12b-1 Fees at a rate of 0.20% per annum (for the period December 1, 2017 through May 31, 2018) and 0.25% per annum (for periods prior to December 1, 2017) of the average daily net assets of the Fund.
Effective February 1, 2019, the Growth Fund and 21st Century Fund began accruing 12b-1 Fees at a rate of 0.25% per annum of the average daily net assets of each Fund. The Growth Fund and 21stCentury Fund had previously suspended accrual of 12b-1 Fees (for the period June 1, 2018 through January 31, 2019), and had previously accrued 12b-1 Fees at a rate of 0.20% per annum (for the period December 1, 2017 through May 31, 2018) and 0.25% per annum (for periods prior to December 1, 2017) of the average daily net assets of each Fund.
The International Opportunities Fund and Global Fund continue to accrue 12b-1 Fees at a rate of 0.25% per annum of the average daily net assets of each Fund.
6. | Investment Transactions |
The aggregate purchases and sales of securities, excluding short-term investments, for the Funds for the year ended September 30, 2019, were as follows:
(Amounts in thousands) | | Focus
Fund | | | Growth
Fund | | | 21st
Century
Fund | | | International
Opportunities
Fund | | | Global
Fund | |
Purchases | | $ | 225,326 | | | $ | 97,090 | | | $ | 84,773 | | | $ | 29,104 | | | $ | 155,898 | |
Sales | | $ | 295,588 | | | $ | 148,689 | | | $ | 91,318 | | | $ | 38,734 | | | $ | 205,568 | |
There were no purchases or sales of US government securities, excluding short-term investments.
47
NOTES TO FINANCIAL STATEMENTS |
NOTES TO FINANCIAL STATEMENTSSeptember 30, 2019 (continued)
7. | Federal Income Tax Information |
“Accounting for Uncertainty in Income Taxes” (the “Income Tax Statement”) requires an evaluation of tax positions taken (or expected to be taken) in the course of preparing a Fund’s tax returns to determine whether these positions meet a “more-likely-than-not” standard that, based on the technical merits, have a more than fifty percent likelihood of being sustained by a taxing authority upon examination. A tax position that meets the “more-likely-than-not” recognition threshold is measured to determine the amount of benefit to recognize in the financial statements. The Funds recognize interest and penalties, if any, related to unrecognized tax benefits as income tax expense in the Statements of Operations.
The Income Tax Statement requires management of the Funds to analyze all open tax years, consisting of fiscal years 2016-2019 as defined by Internal Revenue Service (“IRS”) statute of limitations for all major jurisdictions, including federal tax authorities and certain state tax authorities. As of and during the year ended September 30, 2019, the Funds did not have any liabilities for any unrecognized tax benefits. The Funds have no examinations in progress and are not aware of any tax positions for which it is reasonably possible that the total amounts of unrecognized tax benefits will significantly change in the next twelve months.
At September 30, 2019, gross unrealized appreciation and depreciation of investments, based on cost for federal income tax purposes, were as follows:
(Amounts in thousands) | | Focus
Fund | | | Growth
Fund | | | 21st
Century
Fund | | | International
Opportunities
Fund | | | Global
Fund | |
Cost of Investments | | $ | 351,048 | | | $ | 164,481 | | | $ | 225,782 | | | $ | 46,070 | | | $ | 182,659 | |
| | | | | | | | | | | | | | | | | | | | | |
Gross Unrealized Appreciation | | $ | 197,223 | | | $ | 93,538 | | | $ | 65,764 | | | $ | 8,523 | | | $ | 50,156 | |
Gross Unrealized Depreciation | | | (552 | ) | | | (785 | ) | | | (7,952 | ) | | | (1,248 | ) | | | (3,808 | ) |
| | | | | | | | | | | | | | | | | | | | | |
Net Unrealized Appreciation on Investments | | $ | 196,671 | | | $ | 92,753 | | | $ | 57,812 | | | $ | 7,275 | | | $ | 46,348 | |
The difference between cost amounts for financial statement and federal income tax purposes is due primarily to wash sale loss deferrals.
As of September 30, 2019, the Focus Fund, Growth Fund, 21st Century Fund, International Opportunities Fund, and Global Fund, respectively, had (in thousands) $896, $949, $1,448, $0, and $628 of qualified late-year losses, which are deferred until fiscal year 2020 for tax purposes. Net late-year losses that are deferred are deemed to arise on the first day of the Fund’s next taxable year.
The International Opportunities Fund had realized capital losses (in thousands) from transactions between November 1, 2018 and September 30, 2019 of $1,441. The International Opportunities Fund has elected to treat post-October capital losses as arising in the next fiscal year.
As of September 30, 2019, the components of accumulated earnings on a tax basis were as follows:
(Amounts in thousands) | | Focus
Fund | | | Growth
Fund | | | 21st
Century
Fund | | | International
Opportunities
Fund | | | Global
Fund | |
Undistributed Ordinary Income | | $ | — | | | $ | — | | | $ | — | | | $ | — | | | $ | — | |
Undistributed Trustees’ Deferred Compensation | | | (3,062 | ) | | | (1,568 | ) | | | (951 | ) | | | (337 | ) | | | (1,612 | ) |
Undistributed Long-Term Capital Gains | | | 43,405 | | | | 25,235 | | | | 8,885 | | | | — | | | | — | |
Tax Accumulated Earnings (Deficit) | | | 40,343 | | | | 23,667 | | | | 7,934 | | | | (337 | ) | | | (1,612 | ) |
Accumulated Capital and Other Losses | | | (896 | ) | | | (949 | ) | | | (1,448 | ) | | | (1,441 | ) | | | (1,617 | ) |
Net Unrealized Appreciation on Investments and on Foreign Currency Translations | | | 196,671 | | | | 92,753 | | | | 57,812 | | | | 7,275 | | | | 46,348 | |
Trustees’ Deferred Compensation Mark-to-Market | | | 1,678 | | | | 670 | | | | 252 | | | | 81 | | | | 926 | |
Total Accumulated Earnings | | $ | 237,796 | | | $ | 116,141 | | | $ | 64,550 | | | $ | 5,578 | | | $ | 44,045 | |
Undistributed ordinary income consists of net investment income, passive foreign investment company (“PFICs”) and timing differences related to qualified late-year losses.
At September 30, 2019, for federal income tax purposes, the Funds had accumulated capital loss carryforwards as follows:
(Amounts in thousands) | | Focus
Fund | | | Growth
Fund | | | 21st
Century
Fund | | | International
Opportunities
Fund | | | Global
Fund | |
Not Subject to Expiration | | $ | — | | | $ | — | | | $ | — | | | $ | — | | | $ | 989 | |
| | | $ | — | | | $ | — | | | $ | — | | | $ | — | | | $ | 989 | |
48
NOTES TO FINANCIAL STATEMENTS |
To the extent that a Fund may realize future net capital gains, those gains will be offset by any of its unused capital loss carryforwards if and to the extent a Fund is able to under the Internal Revenue Code.
The tax character of distributions paid during the fiscal years ended September 30, 2019 and 2018 was as follows:
| | | 2019 | | | 2018 | |
(Amounts in thousands) | | Ordinary Income | | | Long-Term Capital Gains | | | Ordinary Income | | | Long-Term Capital Gains | |
Focus Fund | | $ | 202 | | | | 51,424 | | | $ | — | | | $ | 87,734 | |
Growth Fund | | | 1,218 | | | | 28,133 | | | | — | | | | 25,153 | |
21stCentury Fund | | | 10,934 | | | | 731 | | | | — | | | | — | |
International Opportunities Fund | | | — | | | | 4,245 | | | | — | | | | — | |
Global Fund | | | — | | | | 2,537 | | | | 361 | | | | 3,707 | |
The tax character of dividends paid may differ from that shown in the Financial Highlights due to short-term gains being treated as ordinary income for tax purposes.
8. New Accounting Pronouncements
The FASB issued Accounting Standards Update No. 2017-08, Receivables – Nonrefundable Fees and Other Costs (Subtopic 310-20), Premium Amortization on Purchased Callable Debt Securities (“ASU 2017-08”) to amend the amortization period for certain purchased callable debt securities held at a premium. The guidance requires certain premiums on callable debt securities to be amortized to the earliest call date. The amortization period for callable debt securities purchased at a discount will not be impacted. The guidance is effective for fiscal years beginning after December 15, 2018, and interim periods within those fiscal years, with early adoption permitted. Management does not believe there will be a significant impact on the Funds’ financial statements.
The FASB issued Accounting Standards Update No. 2018-13, Fair Value Measurement (Topic 820), Disclosure Framework – Changes to the Disclosure Requirements for Fair Value Measurement (“ASU 2018-13”), which includes amendments intended to improve the effectiveness of disclosures in the notes to financial statements, add disclosure requirements regarding the range and weighted average of significant unobservable inputs used to develop Level 3 fair value measurements, and provide clarifications to the narrative description of measurement uncertainty disclosures. ASU 2018-13 is effective for interim and annual periods beginning after December 15, 2019. However, ASU 2018-13 allowed for immediate adoption of those provisions that eliminated certain disclosure items while delaying the adoption of the remaining provisions within ASU 2018-13 until the effective date. Management elected to early adopt only those provisions related to the elimination of certain disclosures, and is currently evaluating the impact that ASU 2018-13 will have on the Funds’ financial statements and related disclosures for the remaining provisions.
Management of the Adviser has determined that there were no material subsequent events that would require disclosure in the Funds’ financial statements.
49
| REPORT OF INDEPENDENT REGISTERED PUBLIC ACCOUNTING FIRM |
REPORT OF INDEPENDENT REGISTERED PUBLIC ACCOUNTING FIRM
To the Board of Trustees of The Marsico Investment Fund and Shareholders of Marsico Focus Fund, Marsico Growth Fund, Marsico 21stCentury Fund, Marsico International Opportunities Fund and Marsico Global Fund
Opinions on the Financial Statements
We have audited the accompanying statements of assets and liabilities, including the schedules of investments, of Marsico Focus Fund, Marsico Growth Fund, Marsico 21stCentury Fund, Marsico International Opportunities Fund and Marsico Global Fund (constituting The Marsico Investment Fund, hereafter collectively referred to as the “Funds”) as of September 30, 2019, the related statements of operations for the year ended September 30, 2019, the statements of changes in net assets for each of the two years in the period ended September 30, 2019, including the related notes, and the financial highlights for each of the five years in the period ended September 30, 2019 (collectively referred to as the “financial statements”). In our opinion, the financial statements present fairly, in all material respects, the financial position of each of the Funds as of September 30, 2019, the results of each of their operations for the year then ended, the changes in each of their net assets for each of the two years in the period ended September 30, 2019 and each of the financial highlights for each of the five years in the period ended September 30, 2019 in conformity with accounting principles generally accepted in the United States of America.
Basis for Opinions
These financial statements are the responsibility of the Funds’ management. Our responsibility is to express an opinion on the Funds’ financial statements based on our audits. We are a public accounting firm registered with the Public Company Accounting Oversight Board (United States) (PCAOB) and are required to be independent with respect to the Funds in accordance with the U.S. federal securities laws and the applicable rules and regulations of the Securities and Exchange Commission and the PCAOB.
We conducted our audits of these financial statements in accordance with the standards of the PCAOB. Those standards require that we plan and perform the audit to obtain reasonable assurance about whether the financial statements are free of material misstatement, whether due to error or fraud.
Our audits included performing procedures to assess the risks of material misstatement of the financial statements, whether due to error or fraud, and performing procedures that respond to those risks. Such procedures included examining, on a test basis, evidence regarding the amounts and disclosures in the financial statements. Our audits also included evaluating the accounting principles used and significant estimates made by management, as well as evaluating the overall presentation of the financial statements. Our procedures included confirmation of securities owned as of September 30, 2019 by correspondence with the custodian and brokers; when replies were not received from brokers, we performed other auditing procedures. We believe that our audits provide a reasonable basis for our opinions.

Denver, Colorado
November 20, 2019
We have served as the auditor of one or more investment companies in The Marsico Investment Fund since 1997.
50
EXPENSE EXAMPLE For the six-month period ended September 30, 2019 (Unaudited)
As a shareholder of the Marsico Funds (the “Funds”), you incur two types of costs: (1) transaction costs, including redemption fees (if any), and (2) ongoing costs, including management fees, distribution (12b-1) fees, and other Fund expenses. This Example is intended to help you understand your ongoing costs (in dollars) of investing in the Funds and to compare these costs with the ongoing costs of investing in other mutual funds.
The Example is based on an investment of $1,000 invested at the beginning of the period and held for the entire period from April 1, 2019 to September 30, 2019 (the “period”).
Actual Expenses
The first line of the table below provides information about actual account values and actual expenses. You may use the information in this line, together with the amount you invested, to estimate the expenses you paid over the period. Simply divide your account value by $1,000 (for example, an $8,600 account value divided by $1,000 equals 8.6), then multiply the result by the number in the first line under the heading entitled “Expenses paid for the six-month period ended September 30, 2019” to estimate the expenses you paid on your account during the period.
Hypothetical Example for Comparison Purposes
The second line of the table below provides information about hypothetical account values and hypothetical expenses based on the Funds’ actual expense ratios and an assumed rate of return of 5% per year before expenses, which is not the actual return of any of the Funds. The hypothetical account values and expenses may not be used to estimate the actual ending account balance or expenses you paid for the period. You may use this information to compare the ongoing costs of investing in the Funds and other funds. To do so, compare this 5% hypothetical example with the 5% hypothetical examples that appear in the shareholder reports of other funds.
Please note that the expenses shown in the table are meant to highlight your ongoing costs only and do not reflect any transactional costs such as redemption fees (if any). Therefore, the second line of the table is useful in comparing the ongoing costs only, and will not help you determine the relative total costs of owning different funds. In addition, if these transactional costs (if any) were included, your costs could have been higher.
| | Annualized
expense ratio | Beginning
account value
April 1, 2019 | Ending
account value
September 30, 2019 | Expenses paid for the
six-month period ended
September 30, 2019(1) |
FOCUS FUND | | | | |
Actual Example | 1.06% | $ 1,000.00 | $ 1,040.30 | $ 5.43 |
Hypothetical Example, assuming a 5% return before expenses | | $ 1,000.00 | $ 1,019.68 | $ 5.38 |
| | | | | |
GROWTH FUND | | | | |
Actual Example | 1.37% | $ 1,000.00 | $ 1,048.70 | $ 7.06 |
Hypothetical Example, assuming a 5% return before expenses | | $ 1,000.00 | $ 1,018.11 | $ 6.95 |
| | | | | |
21stCENTURY FUND | | | | |
Actual Example | 1.39% | $ 1,000.00 | $ 1,066.10 | $ 7.21 |
Hypothetical Example, assuming a 5% return before expenses | | $ 1,000.00 | $ 1,018.02 | $ 7.04 |
| | | | | |
INTERNATIONAL OPPORTUNITIES FUND | | | | |
Actual Example | 1.50% | $ 1,000.00 | $ 1,053.00 | $ 7.71 |
Hypothetical Example, assuming a 5% return before expenses | | $ 1,000.00 | $ 1,017.48 | $ 7.58 |
| | | | | |
GLOBAL FUND | | | | |
Actual Example | 1.45% | $ 1,000.00 | $ 1,024.90 | $ 7.37 |
Hypothetical Example, assuming a 5% return before expenses | | $ 1,000.00 | $ 1,017.72 | $ 7.34 |
| | | | | |
| (1) | Expenses are equal to the Fund’s annualized expense ratio multiplied by the average account value over the period, multiplied by 183/365 (to reflect the six-month period). |
51
OTHER INFORMATION(Unaudited)
Proxy Voting Guidelines
The Funds exercise the voting rights associated with the securities held by the Funds under the proxy voting policy of the Funds. A description of those policies and procedures of the Funds and a record of the Funds’ proxy votes for the one-year period ended June 30, 2019 are available without charge, upon request, by calling 888-860-8686. It is also available on the Securities and Exchange Commission’s (SEC) website at www.sec.gov.
Quarterly Filing of Portfolio Holdings
The Funds will file their portfolio holdings information for each month in a fiscal quarter within 60 days after the end of the relevant fiscal quarter on Form N-PORT. Portfolio holdings information for the third month of each fiscal quarter will be made available immediately upon filing on the SEC’s website at www.sec.gov.
Other Tax Information
Corporate Dividends Received Deduction
For the fiscal year ended September 30, 2019, 100%, 100%, 2.47%, 0%, and 0% of the dividends paid from net investment income qualified for the dividends received deduction available to corporate shareholders of the Focus Fund, Growth Fund, 21stCentury Fund, International Opportunities Fund, and Global Fund, respectively.
Qualified Dividend Income
Pursuant to Section 854 of the Internal Revenue Code, the Focus Fund, Growth Fund, 21st Century Fund, International Opportunities Fund, and Global Fund designate income dividends (in thousands) of $202, $1,218, $270, $0, and $0, respectively, as qualified dividend income paid during the fiscal year ended September 30, 2019.
Foreign Taxes Paid
Pursuant to the foreign tax credit election under Section 853 of the Internal Revenue Code, the International Opportunities Fund designated (in thousands) $898 of income derived from foreign sources and $82 of foreign taxes paid, for the year ended September 30, 2019.
Of the ordinary income (including short-term capital gain) distributions made during the year ended September 30, 2019, the proportionate share of income derived from foreign sources and foreign taxes paid attributable to one share of stock are:
| | | Foreign Source Income | | | Foreign Taxes Paid | |
International Opportunities Fund | | $ | 0.3113 | | | $ | 0.0283 | |
Long Term Capital Gains Designation
For the fiscal year ended September 30, 2019, the Focus Fund, Growth Fund, 21st Century Fund, International Opportunities Fund, and Global Fund designated (in thousands) $51,424, $28,133, $731, $4,245, and $2,537, respectively, as a 20% rate gain distribution for the purpose of the dividends paid deduction. For income tax purposes, the Funds may utilize earnings and profits distributed to shareholders on the redemption of shares as part of the dividends paid deduction.
Cost Basis Information
Federal law requires mutual fund companies to maintain a shareholder’s cost basis by tax lot and report gain/loss information and holding periods for sales of mutual fund shares that are “covered” securities to the IRS and to shareholders on Form 1099. Mutual fund shares, such as shares of the Funds, acquired on or after January 1, 2012 are covered securities. The Funds are not responsible for maintaining and reporting share information for their shares that are not deemed “covered.”
The tax regulations require that the Funds elect a default tax identification methodology in order to perform the required reporting. The Funds have chosen the first-in-first-out (“FIFO”) method as the default tax lot identification method for its shareholders. This is the method the Funds will use to determine which specific shares are deemed to be sold when a shareholder’s entire position is not sold in a single transaction and is the method in which “covered” share sales will be reported on a shareholder’s Form 1099.
However, at the time of purchase or upon the sale of “covered” shares, shareholders may generally choose a different tax lot identification method. Shareholders should consult a tax advisor with regard to their personal circumstances as the Funds and their service providers do not provide tax advice.
52
| TRUSTEE AND OFFICER INFORMATION |
TRUSTEE AND OFFICER INFORMATION INDEPENDENT TRUSTEES
Name, Address and Age | Position(s) Held
with the Trust | Term of Office(1)
and Length of
Time Served | Principal Occupation(s)
During Past 5 Years | Number of Portfolios
in Fund Complex
Overseen by Trustee | Other Directorships
Held by Trustee |
Jay S. Goodgold
1200 17th Street
Suite 1700
Denver, CO 80202
DOB: 1954 | Trustee; Lead Independent Trustee | Trustee (since
February 2006);
Lead Independent Trustee (since November 2010) | Private investor (July 2003 - present);
Managing Director, Goldman, Sachs & Co.
(August 1978 - June 2003). | 5 | None |
Elizabeth Hoffman
1200 17th Street
Suite 1700
Denver, CO 80202
DOB: 1946 | Trustee | Since February 2006 | Professor of Economics (January 2007 - present) and Executive Vice President and Provost (January 2007 - July 2012), Iowa State University; President Emerita, University of Colorado (August 2005 - present). | 5 | None |
Michael D. Rierson
1200 17th Street
Suite 1700
Denver, CO 80202
DOB: 1952 | Trustee | Since November 1998 | President, The Rierson Group (marketing and consulting firm serving non-profit organizations) (June 2015 - present); Senior Vice President for Development, Colonial Williamsburg Foundation (January 2011 - June 2015). | 5 | None |
Joseph T. Willett
1200 17th Street
Suite 1700
Denver, CO 80202
DOB: 1951 | Trustee | Since November 2002 | Private investor (2002 - present); Chief
Operating Officer, Merrill Lynch Europe
(1998 - 2002). | 5 | None |
Matthew Flavin
1200 17th Street
Suite 1700
Denver, CO 80202
DOB: 1979 | Trustee | Since August
2019 | Chairman and Chief Executive Officer, Concord Energy Holdings (October 2015 - present); Senior Vice President, Energy Corporation of America (March 2012 - October 2015); National Security Council/Department of Defense Senior Executive Service (November 2008 - February 2012); United States Navy (August 2002 - July 2007). | 5 | None |
(1) | Each Trustee serves an indefinite term until the election of a successor or until reaching the mandatory retirement age for non-interested Trustees as established by the Trustees and set forth in the Trust’s Statement of Independent Trustee Retirement Policy, or until his or her resignation, death or removal. Each Officer serves an indefinite term, renewed annually, until the election of a successor (or until their resignation or removal). |
| The Statement of Additional Information includes additional information about the Trustees and is available upon request, without charge, by calling 888-860-8686 or visitingmarsicofunds.com. |
53
| TRUSTEE AND OFFICER INFORMATION |
TRUSTEE AND OFFICER INFORMATION INTERESTED TRUSTEES* AND OFFICERS
Name, Address and Age | Position(s) Held
with the Trust | Term of Office(1)
and Length of
Time Served | Principal Occupation(s)
During Past 5 Years | Number of Portfolios
in Fund Complex
Overseen by Trustee | Other Directorships
Held by Trustee |
Thomas F. Marsico(2)
1200 17th Street
Suite 1700
Denver, CO 80202
DOB: 1955 | Trustee, President, Chief Executive Officer and Chief Investment Officer | Since December 1997 | Chief Executive Officer,
Marsico Capital Management, LLC
(more than five years). | 5 | None |
Christopher J. Marsico(2)1200 17th Street
Suite 1700
Denver, CO 80202
DOB: 1961 | Trustee, Executive
Vice President and
Chief Operating Officer | Trustee (August 2007 - March 2010 and since May 2010); Vice President and Treasurer (September 2002 - May 2010); Executive Vice President and Chief Operating Officer
(since May 2010) | President,
Marsico Capital Management, LLC
(more than five years). | 5 | None |
Neil L. Gloude, CPA
1200 17th Street
Suite 1700
Denver, CO 80202
DOB: 1961 | Vice President, Secretary and Treasurer | Vice President and Secretary
(since May 2008);
Treasurer (since May 2010) | Executive Vice President, Chief
Financial Officer and Treasurer, Marsico Capital Management, LLC
(more than five years). | N/A | N/A |
Steven R. Carlson
1200 17th Street
Suite 1700
Denver, CO 80202
DOB: 1964 | Chief Compliance Officer | Since July 2016 | Executive Vice President and Chief Compliance Officer,
Marsico Capital Management, LLC
(more than five years). | N/A | N/A |
Thomas M. J. Kerwin
1200 17th Street
Suite 1700
Denver, CO 80202
DOB: 1955 | Chief Legal Officer | Since August 2003 | Executive Vice President and General Counsel, Marsico Capital Management, LLC (more than five years). | N/A | N/A |
* | Trustees who are “interested persons” of the Funds, as defined in the 1940 Act. |
(1) | Each Trustee serves an indefinite term until the election of a successor or until reaching the mandatory retirement age for non-interested Trustees as established by the Trustees and set forth in the Trust’s Statement of Independent Trustee Retirement Policy, or until his or her resignation, death or removal. Each Officer serves an indefinite term, renewed annually, until the election of a successor (or until their resignation or removal). |
(2) | Mr. Thomas Marsico and Mr. Christopher Marsico are considered Interested Trustees of the Trust because of their affiliation with Marsico Capital Management, LLC, the Adviser to the Funds. Mr. Thomas Marsico and Mr. Christopher Marsico are brothers. |
| The Statement of Additional Information includes additional information about the Trustees and is available upon request, without charge, by calling 888-860-8686 or visitingmarsicofunds.com. |
54
NOTES
55
NOTES
56

(a) The Registrant, as of the end of the period covered by this report, has adopted a code of ethics that applies to the Registrant’s principal executive officer, principal financial officer, principal accounting officer or controller, or persons performing similar functions, regardless of whether these individuals are employed by the Registrant or a third party. A copy of this code of ethics is attached hereto as Exhibit (a).
(b) Not used.
(c) There were no amendments, during the period covered by this report, to a provision of the code of ethics that applies to the Registrant’s principal executive officer, principal financial officer, principal accounting officer or controller, or persons performing similar functions, regardless of whether these individuals are employed by the Registrant or a third party, and that relates to any element of the code of ethics description.
(d) The Registrant has not granted any waivers, including an implicit waiver, from a provision of the code of ethics that applies to the Registrant’s principal executive officer, principal financial officer, principal accounting officer or controller, or persons performing similar functions, regardless of whether these individuals are employed by the Registrant or a third party, that relates to one or more of the items set forth in paragraph (b) of this item’s instructions.
(e) Not applicable.
(f) See attached Exhibit (a).
| Item 3. | Audit Committee Financial Expert |
(a)(1) The Registrant’s Board of Trustees has determined that the Registrant has at least one audit committee financial expert serving on its audit committee.
(a)(2) Mr. Joseph T. Willett is the audit committee financial expert. Mr. Willett is “independent” under the applicable rules.
| Item 4. | Principal Accountant Fees and Services |
In each of the fiscal years ended September 30, 2019 and September 30, 2018, the aggregate Audit Fees billed (or to be billed) by PricewaterhouseCoopers LLP (PwC) for professional services rendered for the audits of the financial statements, or services that are normally provided in connection with statutory and regulatory filings or engagements as well as reimbursable expenses are listed below.
(a) Audit Fees.
| | 2019 | 2018 |
| | $156,000 | $173,0001 |
| | 1 | Inclusive of $17,000 in fees for fund merger related services which were paid for by the investment adviser. |
(b) Audit-Related Fees.
In each of the fiscal years ended September 30, 2019 and September 30, 2018, the aggregate Audit-Related Fees billed (or to be billed) by PwC for services rendered for assurance and related services to each fund that are reasonably related to the performance of the audit or review of each fund's financial statements, but not reported as Audit Fees, are shown in the table below.
| | 2 | Fees for fund merger related services which were paid for by the investment adviser. |
(c) Tax Fees.
In each of the fiscal years ended September 30, 2019 and September 30, 2018 the aggregate Tax Fees billed (or to be billed) by PwC for professional services rendered for tax compliance, tax advice, and tax planning are shown in the table below.
| | 2019 | 2018 |
| | $51,000 | $54,2003 |
| | 3 | Inclusive of $3,200 in fees for fund merger related services which were paid for by the investment adviser. |
All of these fees were approved by the Trust’s Audit Committee as required pursuant to paragraph (c)(7)(ii) of Rule 2-01 of Regulation S-X.
Fees included in the Tax Fees category comprise all services performed by professional staff in the independent registered public accounting firm's tax division except those services related to the audit. Typically, this category would include fees for tax compliance, tax planning, and tax advice. Tax compliance, tax advice, and tax planning services include preparation of original and amended tax returns, claims for refund and tax payment-planning services, assistance with tax audits and appeals, tax advice related to mergers and acquisitions and requests for rulings or technical advice from taxing authorities.
(d) All Other Fees.
In each of the fiscal years ended September 30, 2019 and September 30, 2018 the aggregate Other Fees billed (or to be billed) by PwC for all other non-audit services rendered are shown in the table below.
(e) (1) Audit Committee Pre-Approval Policies and Procedures:
Pursuant to the Trust’s Audit Committee Charter and Policies and Procedures (collectively, the “Procedures”), the Audit Committee has adopted pre-approval policies and procedures to govern the pre-approval of (i) all audit services and permissible non-audit services to be provided to the Trust by its independent accountant, and (ii) all permissible non-audit services to be provided by such independent accountant to the Trust’s investment adviser and to any entity controlling, controlled by or under common control with the investment adviser that provides on-going services to the Trust (collectively, any “Service Affiliates”) if the engagement directly relates to the Trust’s operations and financial reporting.
In accordance with the Procedures, the Committee is responsible for the engagement of the independent accountant to certify the Trust’s financial statements for each fiscal year. With respect to the pre-approval of non-audit services provided to the Trust and its Service Affiliates, the Procedures provide that the Committee may pre-approve such services on a project-by-project basis as they arise. The Procedures also permit the Committee to delegate authority to the Audit Committee Chairman (the “Designated Member”) to pre-approve any proposed non-audit services that have not been previously approved by the Committee, subject to certain conditions. Any action by the Designated Member in approving a requested non-audit service shall be presented to the Audit Committee not later than at its next scheduled meeting. If the Designated Member does not approve the independent auditor’s provision of a requested non-audit service, the matter may be presented to the full Committee for its consideration and action.
(e)(2) Services approved pursuant to paragraph (c)(7)(i)(C) of Rule 2-01 of Regulation S-X:
100% of these fees were approved by the Trust’s Audit Committee as required pursuant to paragraph (c)(7)(ii) of Rule 2-01 of Regulation S-X.
(f) According to PwC for the fiscal year ended September 30, 2019, the percentage of hours spent on the audit of the Marsico Funds’ financial statements for the most recent fiscal year that were attributed to work performed by persons who are not full-time, permanent employees of PwC is as follows:
| PwC | 2019 |
| Work performed by persons who are not full-time | 0% |
(g) In each of the fiscal years ended September 30, 2019 and September 30, 2018, the aggregate fees billed (or to be billed) by PwC relating to non-audit services that were rendered to the Trust, to its investment adviser, and to any entity controlling, controlled by, or under common control with the investment adviser and that provides ongoing services to the Trust are shown in the table below.
Non-audit services noted in 2019 and 2018 are for an accounting guidance software license utilized and paid for by the investment adviser
(h) Not applicable.
| Item 5. | Audit Committee of Listed Registrants |
Not applicable.
| Item 6. | Schedule of Investments |
The schedule of investments in securities of unaffiliated issuers is included as part of the report to shareholders filed under Item 1.
| Item 7. | Disclosure of Proxy Voting Policies and Procedures for Closed-End Management Investment Companies |
Not applicable.
| Item 8. | Portfolio Managers of Closed-End Management Investment Companies |
Not applicable.
| Item 9. | Purchases of Equity Securities by Closed-End Management Investment Company and Affiliated Purchasers |
Not applicable.
| Item 10. | Submission of Matters to a Vote of Security Holders |
Not applicable.
| Item 11. | Controls and Procedures. |
(a) The registrant's principal executive officer and principal financial officer have concluded that the registrant's disclosure controls and procedures (as defined in Rule 30a-3(c) under the Investment Company Act of 1940, as amended) are effective based on their evaluation of these disclosure controls and procedures within 90 days of the filing date of this report on Form N-CSR.
(b) There were no changes in the registrant's internal control over financial reporting (as defined in Rule 30a-3(d) under the Investment Company Act of 1940, as amended) that occurred during the most recent fiscal half-year of the period covered by this report that have materially affected, or are reasonably likely to materially affect, the registrant's internal control over financial reporting.
| Item 12. | Disclosure of Securities Lending Activities for Closed-End Management Investment Companies. |
Not applicable.
(a)(1) Code of Ethics - Filed as an attachment to this filing.
(a)(2) Certification for each principal executive and principal financial officer of the registrant as required by Rule 30a-2(a) under the Act (17 CFR 270.30a-2(a)). Filed as an attachment to this filing.
(a)(3) Any written solicitation to purchase securities under Rule 23c-1 under the Investment Company Act of 1940, as amended, that was sent or given during the period covered by the report by or on behalf of the registrant to 10 or more persons.
Not applicable.
(a)(4) Change in the registrant’s independent public accountant.
Not applicable.
(b) Certifications required by Rule 30a-2(b) under the Act (17 CFR 270.30a-2(b)), Rule 13a-14(b) or Rule 15d-14(b) under the Exchange Act (17 CFR 240.13a-14(b) or 240.15d-14(b)), and Section 1350 of Chapter 63 of Title 18 of the United States Code (18 U.S.C. 1350). Filed as an attachment to this filing.
SIGNATURES
Pursuant to the requirements of the Securities Exchange Act of 1934 and the Investment Company Act of 1940, the registrant has duly caused this report to be signed on its behalf by the undersigned, thereunto duly authorized.
The Marsico Investment Fund
| By: | /s/ Christopher J. Marsico |
| Christopher J. Marsico, |
| Trustee, Executive Vice President and Chief Operating Officer |
| (Principal Executive Officer) |
| | |
| Date: | December 4, 2019 |
Pursuant to the requirements of the Securities Exchange Act of 1934 and the Investment Company Act of 1940, this report has been signed below by the following persons on behalf of the registrant and in the capacities and on the dates indicated.
| By: | /s/ Christopher J. Marsico |
| | Christopher J. Marsico, |
| | Trustee, Executive Vice President and Chief Operating Officer |
| | (Principal Executive Officer) |
| | |
| Date: | December 4, 2019 |
| | |
| By: | /s/ Neil L. Gloude |
| | Neil L. Gloude, |
| | Vice President, Secretary and Treasurer |
| | (Principal Financial Officer) |
| | |
| Date: | December 4, 2019 |