UNITED STATES
SECURITIES AND EXCHANGE COMMISSION
WASHINGTON, D.C. 20549
FORM N-CSR
CERTIFIED SHAREHOLDER REPORT OF REGISTERED
MANAGEMENT INVESTMENT COMPANIES
Investment Company Act File Number: 811-08397
THE MARSICO INVESTMENT FUND
(Exact Name of Registrant as Specified in Charter)
1200 17th Street, Suite 1700
Denver, CO 80202
(Address of Principal Executive Offices) (Zip Code)
The Corporation Trust Company
The Marsico Investment Fund
Corporation Trust Center 1209 Orange Street
Wilmington, Delaware 19802
(Name and address of Agent for Service of Process)
Copies to:
Anthony H. Zacharski
Dechert LLP
90 State House Square
Hartford, CT 06103
Registrant's Telephone Number, including Area Code: 1-888-860-8686
Date of fiscal year end: September 30
Date of Reporting Period: September 30, 2020
| Item 1. | Reports to Stockholders |
DEAR SHAREHOLDER:
Enclosed is your annual report for each portfolio of The Marsico Investment Fund (the “Marsico Funds”), encompassing the one-year fiscal period from October 1, 2019 to September 30, 2020.
The purpose of this report is to provide a review of the Marsico Funds’ one-year investment results by discussing what we believe were the main areas that impacted performance – including the macroeconomic environment, sector and industry positioning, and individual stock selection – as compared to the Funds’ performance benchmark indices.
For updated information regarding the market environment and each Fund’s overall investment positioning and performance, please refer to the Funds’ most recent monthly fact sheets and quarterly investment updates, which are available in the Investor Resources section of the Funds’ website at marsicofunds.com.(1)
As discussed in a previous report, in April 2020, the Marsico Funds issued a supplement to the Marsico Funds’ Prospectus discussing the potential risks that may impact the Marsico Funds due to the effects of the COVID-19 pandemic and similar global events on global economies and markets. You can visit the Investor Resources/Literature Library/Marsico Funds Prospectus section of the Marsico Funds website at marsicofunds.com to read the Prospectus supplement.
Note: Effective November 30, 2019, Peter C. Marsico became co-manager of the Marsico Growth Fund with Thomas F. Marsico and Brandon A. Geisler.
(1) | The references to the Marsico Funds website (marsicofunds.com) included throughout this annual report do not incorporate the website’s contents into this report. |
| | | |
KEY FUND STATISTICS | 2 |
MARKET ENVIRONMENT | 5 |
MARSICO FOCUS FUND | |
Investment Review | 7 |
Fund Overview | 10 |
Schedule of Investments | 11 |
MARSICO GROWTH FUND | |
Investment Review | 12 |
Fund Overview | 14 |
Schedule of Investments | 15 |
MARSICO 21st CENTURY FUND | |
Investment Review | 16 |
Fund Overview | 18 |
Schedule of Investments | 19 |
MARSICO INTERNATIONAL OPPORTUNITIES FUND |
Investment Review | 21 |
Fund Overview | 23 |
Schedule of Investments | 24 |
MARSICO GLOBAL FUND | |
Investment Review | 27 |
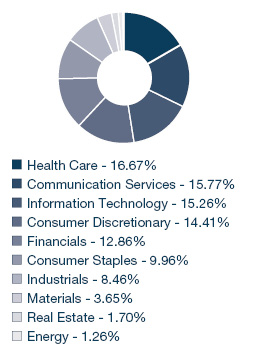
Fund Overview | 29 |
Schedule of Investments | 30 |
FINANCIAL STATEMENTS | 32 |
NOTES TO FINANCIAL STATEMENTS | 42 |
REPORT OF INDEPENDENT REGISTERED PUBLIC ACCOUNTING FIRM | 48 |
EXPENSE EXAMPLE | 49 |
REVIEW OF LIQUIDITY RISK MANAGEMENT PROGRAM | 50 |
OTHER INFORMATION | 51 |
TRUSTEE AND OFFICER INFORMATION | 52 |
1
KEY FUND STATISTICS (UNAUDITED) |
Marsico Focus Fund | Marsico Growth Fund | Marsico
21st Century
Fund |
| | MFOCX | | | MGRIX | | | MXXIX | |
For additional disclosures, please see page 10. | For additional disclosures, please see page 14. | For additional disclosures, please see page 18. |
PERFORMANCE COMPARISON(1) | PERFORMANCE COMPARISON(1) | PERFORMANCE COMPARISON(1) |
Average Annualized Returns | Average Annualized Returns | Average Annualized Returns |
| 
| 
|
TOTAL ANNUAL OPERATING EXPENSES* 1.04% | TOTAL ANNUAL OPERATING EXPENSES* 1.37% | TOTAL ANNUAL OPERATING EXPENSES* 1.40% |
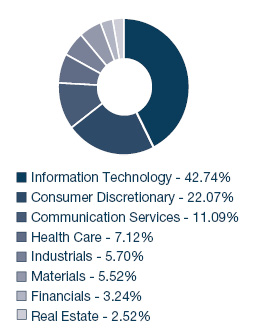
SECTOR ALLOCATION(3) | SECTOR ALLOCATION(3) | SECTOR ALLOCATION(3) |
| 
| 
|
TOP FIVE HOLDINGS | TOP FIVE HOLDINGS | TOP FIVE HOLDINGS |
| | | |
| | Amazon.com, Inc. | 7.53% | | | Amazon.com, Inc. | 7.81% | | | Snap, Inc. - Cl. A | 4.36% |
| | Apple, Inc. | 6.72% | | | Apple, Inc. | 7.00% | | | Square, Inc. - Cl. A | 3.49% |
| | Microsoft Corporation | 6.57% | | | Microsoft Corporation | 5.73% | | | CoStar Group, Inc. | 3.37% |
| | PayPal Holdings, Inc. | 6.19% | | | PayPal Holdings, Inc. | 4.14% | | | Cintas Corp. | 2.95% |
| | ServiceNow, Inc. | 4.80% | | | Adobe, Inc. | 4.00% | | | FirstService Corporation | 2.88% |
| | | | | | | | | | | |
For additional disclosures about the Marsico Funds, please see page 4. The performance data quoted here represent past performance, and past performance is not a guarantee of future results. Investment return and principal value of an investment will fluctuate so that an investor’s shares, when redeemed, may be worth more or less than their original cost.
2
KEY FUND STATISTICS (UNAUDITED) |
Marsico International
Opportunities Fund | Marsico Global Fund |
| | MIOFX | | | MGLBX | |
For additional disclosures, please see page 23. | For additional disclosures, please see page 29. |
PERFORMANCE COMPARISON(1) | PERFORMANCE COMPARISON(1) |
Average Annualized Returns | Average Annualized Returns |
| 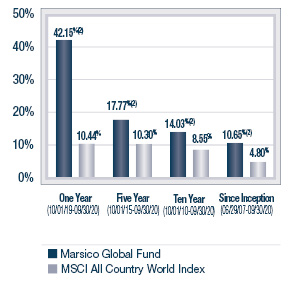
|
TOTAL ANNUAL OPERATING EXPENSES* 1.74% NET EXPENSES*† 1.51% | TOTAL ANNUAL OPERATING EXPENSES* 1.41% NET EXPENSES*† 1.45% |
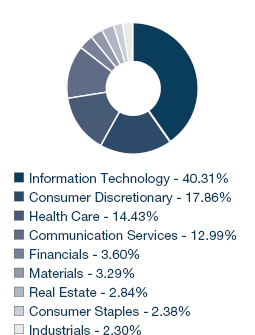
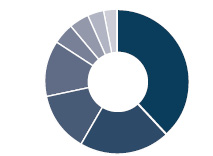
SECTOR ALLOCATION(3) | SECTOR ALLOCATION(3) |
| 
|
TOP FIVE HOLDINGS | TOP FIVE HOLDINGS |
| | | | | | | | |
| | Alibaba Group Holding Ltd. Spon. ADR | 5.69% | | | Amazon.com, Inc. | 6.44% | |
| | Tencent Holdings Ltd. | 3.95% | | | Alibaba Group Holding Ltd. Spon. ADR | 5.97% | |
| | Nestlé S.A. | 3.11% | | | Microsoft Corporation | 5.63% | |
| | SAP S.E. | 2.95% | | | Facebook, Inc. - Cl. A | 4.40% | |
| | Cellnex Telecom SA | 2.82% | | | Apple, Inc. | 4.26% | |
| | | | | | | | |
Current performance may be lower or higher than the performance information quoted. To obtain performance information current to the most recent month-end, please call 888-860-8686 or visit marsicofunds.com.
3
KEY FUND STATISTICS (UNAUDITED) |
ADDITIONAL DISCLOSURES ABOUT THE MARSICO FUNDS
* | The Total Annual Operating Expenses and Net Expenses are reflective of the information disclosed in the Funds’ Prospectus dated January 31, 2020, as supplemented. The information may differ from the expense ratios disclosed in this report. |
† | Marsico Capital Management, LLC (the “Adviser”) has entered into a written expense limitation and fee waiver agreement under which it has agreed to limit the total expenses of each Fund (excluding taxes, interest, acquired fund fees and expenses, litigation, extraordinary expenses, and brokerage and other transaction expenses relating to the purchase or sale of portfolio investments) to an annual rate of 1.50% of the average net assets of the International Opportunities Fund and 1.45% of the average net assets of the Global Fund until January 31, 2021. This expense limitation and fee waiver agreement may be terminated by the Adviser at any time after January 31, 2021, upon 15 days prior notice to the Fund and its administrator. The Adviser may recoup from a Fund fees previously waived or expenses previously reimbursed by the Adviser with respect to that Fund pursuant to this agreement (or a previous expense limitation agreement) if: (1) such recoupment by the Adviser does not cause the Fund, at the time of recoupment, to exceed the lesser of (a) the expense limitation in effect at the time the relevant amount was waived and/or reimbursed, or (b) the expense limitation in effect at the time of the proposed recoupment, and (2) the recoupment is made within three years after the fiscal year end date as of which the amount to be waived or reimbursed was determined and the waiver or reimbursement occurred. |
(1) | The performance data quoted here represent past performance, and past performance is not a guarantee of future results. Investment return and principal value of an investment will fluctuate so that an investor’s shares, when redeemed, may be worth more or less than their original cost. Current performance may be lower or higher than the performance information quoted. To obtain performance information current to the most recent month-end, please call 888-860-8686 or visit marsicofunds.com. |
| The performance included in the chart does not reflect the deduction of taxes on Fund distributions or the redemption of Fund shares. |
| All indices are unmanaged and investors cannot invest directly in an index. |
(2) | Periodically, certain fees and expenses have been waived or reimbursed by the Adviser for the Growth Fund, the 21st Century Fund, the International Opportunities Fund, and the Global Fund. In the absence of such a waiver or reimbursement, the performance returns reflected would have been reduced. In accordance with the expense limitation and fee waiver agreement, the Adviser may recoup fees and expenses previously waived or reimbursed under certain parameters. Periodically, the Adviser has recouped such fees or expenses from the 21st Century Fund, the International Opportunities Fund, and the Global Fund, resulting in a lower performance return. |
(3) | Sector weightings represent the percentage of the respective Fund’s investments (excluding cash equivalents) in certain general sectors. These sectors may include more than one industry. The Fund’s portfolio composition is subject to change at any time. |
4
MARKET ENVIRONMENT: OCTOBER 2019 – SEPTEMBER 2020 (UNAUDITED)
Although economic momentum and stock prices rose in late 2019, the appearance of a novel strain of coronavirus (COVID-19) in early 2020 led to a pandemic that caused equities to sell off dramatically. Further damage included plummeting oil prices and a historic drop in the yield on the US 10-year Treasury note, all in the span of a few weeks.
The US equity market finished 2019 with strong fourth-quarter performance, leading to the best annual gain in the S&P 500 Index since 2013. Prior to the pandemic, 2020 also began strongly as a US/China trade deal was signed and President Trump was ultimately acquitted of the charges for which he was impeached. As the first quarter of 2020 progressed, however, the COVID-19 outbreak spread from China to many other countries across the globe. Equities experienced significant losses, and volatility surged across most asset classes as governments of many countries imposed lockdowns, clamping down on economic activity in the name of containing the spread of the virus. In April, however, the US stock market rebounded, with the S&P 500 Index rising +12.82% and posting its best month since 1974. As states slowly began re-opening portions of their economies and some companies reported stronger-than-expected first quarter earnings, investors embraced risk assets, specifically focusing on high-quality, large-capitalization growth assets. Throughout the pandemic, certain of these companies have continued to thrive as consumer behaviors continue to shift in ways that further support their business lines such as e-commerce, cloud computing, mobile business, and other growth areas.
In the heart of the pandemic, the US Senate and House of Representatives passed the CARES Act, the largest single economic relief bill in the country’s history. The roughly $2 trillion plan included provisions for one-time payments to individuals, strengthened unemployment insurance, and provided loans and grants to small businesses to deter layoffs, offered student loan assistance, and earmarked other funds for corporations and public health facilities. In recent months, however, politicians have continued to jockey over a stalled additional COVID-19-related relief package, with the major sticking points being additional state funding and enhanced unemployment benefits. All in, the Democrats price tag is estimated to be in the $2.4 trillion range, whereas the Republicans are proposing a much smaller bill.
On the monetary side, Federal Reserve Board Chairman Powell stressed that the Federal Reserve remains committed to using its tools to do what it can for as long as it takes to ensure the economic recovery will be as strong as possible. He also reiterated that, despite the extent of the recovery thus far, the path ahead for the economy remains “highly uncertain.” Powell has repeatedly said that more fiscal support is needed, and that “the risks of overdoing it seem to be smaller,” although he hesitated to give specific policy prescriptions.
Regarding health care efforts to reduce COVID-19 concerns, antiviral drugs such as Gilead Science’s remdesivir have become more widely available and we continue to witness progress in the race for a vaccine. In late September, Johnson & Johnson (“J&J”) announced that it had begun phase three trial testing of its potential COVID-19 vaccine. J&J is the fourth drugmaker backed by the Trump administration’s vaccine program “Operation Warp Speed” to enter late-stage testing. The others are Moderna, Pfizer and AstraZeneca. This development coincides with President Trump’s speculation that the US could find a safe and effective vaccine this Fall and have enough vaccine doses to inoculate every American by April 2021, although some health care experts are skeptical that those goals can be met.
Looking more broadly, third quarter GDP is expected to show a sharp rebound from its annualized -31% second-quarter plunge, and housing has been a strong point as well, largely due to historically low interest rates. Commodities have been mixed during the one-year period ended September 30, while the US dollar has declined overall. After national employment statistics bounced back strongly in the second quarter, with the June jobs number reflecting an all-time record increase, employment gains began to slow recently. Although July and August each posted more than a million new payroll jobs, September job gains totaled 661,000, the smallest gain since May of this year, suggesting the US labor market has been losing a bit of traction, as noted by Federal Reserve Chairman Powell in recent testimony to the US Senate. This number reduced the unemployment rate to 7.9% as of period end, a drastic improvement since the crisis began, although still higher than the historical average.
5
The performance of global markets during the one-year fiscal period ended September 30, 2020 is depicted below. US markets posted strong gains for the period. Large capitalization US equities outperformed US small-capitalization stocks, yet both segments lagged medium-capitalization stocks during the period. Emerging market equities outperformed compared to developed international equity markets.
Index Name(1) | Universe of
Equities Represented | One-Year
Total Return (as of
September 30, 2020) |
US | | |
S&P 500 | US large-capitalization equities | +15.15% |
Russell 3000 | US publicly-traded equities of all sizes | +15.00% |
Russell 2000 | US small-capitalization equities | +0.39% |
Russell Mid-Cap Growth | US medium-capitalization equities | +23.23% |
Index Name(1) | Universe of
Equities Represented | One-Year
Total Return (as of
September 30, 2020) |
INTERNATIONAL | |
MSCI EAFE (US$) | Equities in developed international equity markets, including Japan, Western Europe, and Australasia | +0.49% |
MSCI Emerging Markets (US$) | Equities in developing international equity markets, including China, India, Eastern Europe, and Latin America | +10.54% |
MSCI ACWI (US$) | Equities in the global developed and emerging markets | +10.44% |
Sincerely,
THE MARSICO INVESTMENT TEAM
(1) | All indices are unmanaged and investors cannot invest directly in an index. |
6
Investment Review BY TOM MARSICO AND BRANDON GEISLER (UNAUDITED)
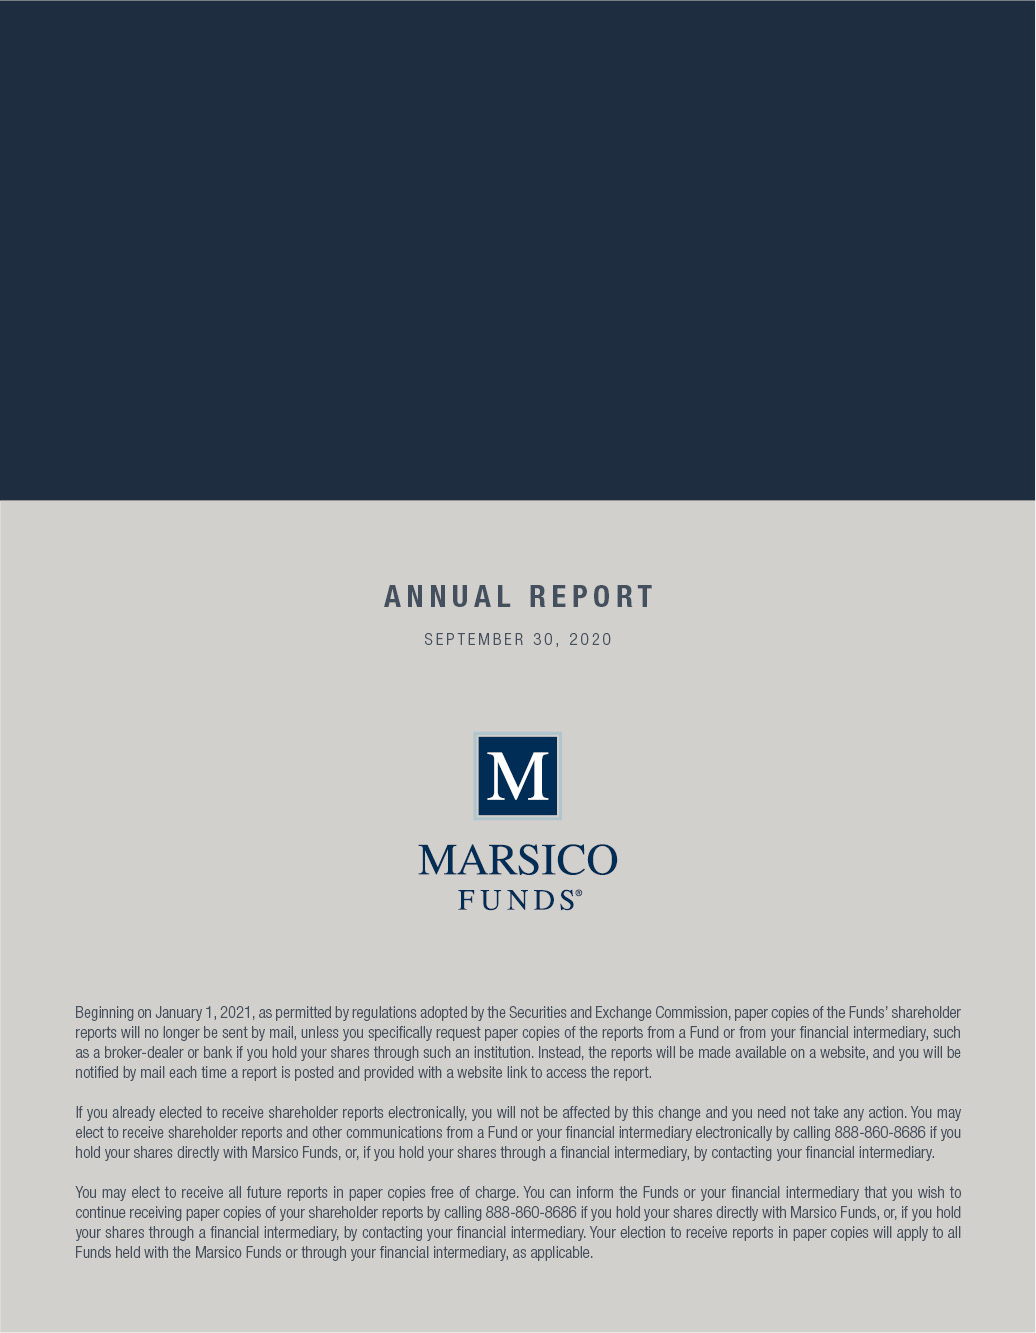
The Marsico Focus Fund posted a total return of +50.71% for the one-year fiscal period ended September 30, 2020. The Fund strongly outperformed its benchmark index, the S&P 500 Index, which had a total return of +15.15% over the same time period. Please see the Fund’s Overview for more detailed information about the Fund’s longer-term performance for various time periods ended September 30, 2020.
The performance data for the Fund quoted here represent past performance, and past performance is not a guarantee of future results. Investment return and principal value of an investment will fluctuate so that an investor’s shares, when redeemed, may be worth more or less than their original cost. Current performance may be lower or higher than the performance information quoted. To obtain performance information current to the most recent month-end, please call 888-860-8686 or visit marsicofunds.com.(1)
This review highlights Fund performance over a one-year fiscal period. Shareholders should keep in mind that the Fund is intended for long-term investors who hold their shares for substantially longer periods of time. You should also keep in mind that our current views and beliefs regarding all investments discussed in this report are subject to change at any time. References to specific securities, industries, and sectors discussed in this report are not recommendations to buy or sell such securities or related investments, and the Fund may not necessarily hold these securities or investments today. Please see the accompanying Schedule of Investments for the percentage of the Fund’s portfolio represented by the securities mentioned in this report as of the end of the reporting period.
The Focus Fund is non-diversified and may hold fewer securities than a diversified fund because it is permitted to invest a greater percentage of its assets in a smaller number of issuers. Holding securities of fewer issuers increases the risk that the value of the Fund could go down because of the poor performance of a single investment or may be more volatile than its benchmark. The Fund is subject to broad risks associated with investing in equity securities markets generally, including the risks that the securities and markets in which it invests may experience volatility and instability, that domestic and global economies and markets may undergo periods of cyclical change and decline, that investors may at times avoid investments in equity securities, and that investments may not perform as anticipated. Please see the Prospectus for more information.
The Fund is not managed to track its benchmark index, and may hold a substantially overweight or underweight position in a sector, industry, or security compared to its weight in the benchmark. The Fund may be subject to risks associated with a particular sector or other area in which it is overweight, including the risk that the stocks of companies within one area could simultaneously decline in price because of an event that affects the entire area. For informational purposes, the discussion below may compare the benchmark weight or performance of a sector or industry to the investment approach of the Fund.
The Focus Fund’s strong outperformance during the one-year period ended September 30, 2020, as compared to the S&P 500 Index, was primarily attributable to certain Fund holdings in the Information Technology, Consumer Discretionary and Financials sectors, as defined in the Global Industry Classification Standard (“GICS”)(2). From a sector allocation perspective, the Fund’s performance was boosted relative to its benchmark index by maintaining an overweight position in the strong-performing Information Technology sector, by having no investments in the weak-performing Energy sector, and by maintaining an underweight stance in the Financials sector.
In the Information Technology sector, semiconductor company NVIDIA Corporation (“NVIDIA”) (+213%) rose on the back of its launch of a new graphics processing chip used for both video gaming graphics cards and the company’s datacenter products. NVIDIA also made a successful acquisition earlier in the year of Mellanox Technologies, a supplier of computer networking products. Additionally, in mid-September, NVIDIA announced its intention to acquire ARM Holdings, a UK-based semiconductor and software design company that licenses intellectual property for producing processors that are complementary to NVIDIA’s current offerings.
Another Information Technology sector holding, PayPal Holdings, Inc. (“PayPal”), returned +90% during the period. As the pandemic took its toll on economic activity in general, e-commerce spending quickly recovered and actually surged ahead of its levels pre-COVID-19. PayPal is a primary beneficiary of this trend, as it provides a dominant “checkout feature” for e-commerce transactions. Additionally, the pandemic led to a surge of new customers who might not have previously used PayPal or any other e-commerce transaction platform.
Another top contributor over the period was electric car maker Tesla, Inc. (“Tesla”) (+260%), a stock we opportunistically purchased during the early days of the pandemic. The company’s continued strong execution in terms of production, delivery, and software updates for Tesla’s vehicles contributed to solid fundamentals for the company. Investor sentiment has been supportive of the stock due to the continued strong performance of the company and management, although excitement around what is to come for Tesla in the future may have led to a temporary run-up in its share price. Advance excitement around Tesla’s “Battery Day” presentation held in conjunction with its annual meeting created high expectations for the
7
stock, as the market was anticipating significant announcements around battery-related innovations for this core input and competitive differentiator for the company’s cars. We continue to be optimistic about the company over the longer term, and were pleased with the innovations announced at the company’s Battery Day presentation, particularly the massive reductions in battery costs that are expected to occur over the next 3-4 years.
We added other new positions during the period including Square, Inc. – Cl. A (“Square”) which returned +96% during the period as its “Cash App” for small businesses utilizing online transactions experienced huge growth. With the COVID-19 pandemic rolling through the world population, traditional small business, finance, and personal banking operations that formerly focused mainly on physical transactions have had to rapidly migrate toward a more digital presence. This is a significant positive for Square as it provides a multitude of these banking services through its mobile app. As a result, downloads, revenue, and gross profits for Square experienced outsized growth in 2020 to date, leading to strong stock performance. With this tailwind positively impacting Square’s business, we expect to see continued growth for the company, especially in contrast to traditional banking operations.
In the Communication Services sector, The Walt Disney Company (“Disney”) (-8%) was recently added to the Fund as the development of its direct to consumer strategy (led by Disney’s online streaming service, Disney+) has created a new driver of growth, somewhat offsetting the current operating obstacles at the company’s theme park and studio businesses due to COVID-19 restrictions. While we expect the theme park and studio businesses to fully recover over time, growth is likely to be sustained thereafter driven by the expansion of Disney+ and the introduction of new online streaming services outside of the US, as the company leverages recently acquired 21st Century Fox assets. In all, we believe Disney should come out stronger post-pandemic as the company takes advantage of the opportunity to cross-sell its services and products by leveraging the data it receives from these new streaming relationships worldwide.
From a sector allocation perspective, the Fund’s performance was held back relative to its benchmark index by having an underweight exposure to the strong-performing Health Care sector. In addition, certain stocks in the Industrials sector held by the Fund underperformed as discussed further below.
The Boeing Company (“Boeing”) stock dropped -32% prior to being sold as the spread of COVID-19 resulted in a drastic decrease in commercial airline travel demand. While airlines were generally in good financial health prior to the pandemic, the unprecedented drop in travel demand resulted in corresponding drops in airline revenues. It was our belief that, in the absence of revenue, airlines would delay or possibly cancel the delivery of new aircraft. This delay in aircraft deliveries has hurt Boeing’s revenues while production has consumed company cash, thereby threatening both Boeing’s financial balance sheet and its liquidity. Airlines have received some targeted government aid, and it is inconsistent with our investment philosophy to maintain a position in a business that is likely dependent on government assistance. Further, it remains unclear what the long-term demand for aircraft will be as travel remains reduced due to the remaining threat of COVID-19 and other potential pandemics.
Uber Technologies, Inc. (“UBER”) slid -47% and was sold as the spread of COVID-19 led to the global population reducing activities outside of their homes. Because UBER is highly reliant on consumer demand for transportation to work, the airport, or other commerce activities to drive revenue, the company’s business is understandably under pressure with continued uncertainty regarding when the world can return to normal activities.
During the reporting period, the Fund reduced exposure to the Financials, Industrials, and Health Care sectors, and increased its allocations to the Consumer Discretionary, Information Technology, and Communication Services sectors. There were no significant changes to the Fund’s allocations to the Materials and Real Estate sectors. The Fund maintained a 3% cash position on average, including a 2% cash position (as represented by the Fund’s short-term investments holding) at period-end.
8
Fiscal Period-End Investment Posture
As of September 30, 2020, the Fund’s largest sector allocations included Information Technology, Consumer Discretionary, and Communication Services. As of that date, the Fund had no investments in the Consumer Staples, Energy, or Utilities sectors.
Sincerely,
THOMAS F. MARSICO
BRANDON A. GEISLER
PORTFOLIO MANAGERS
(1) | Total returns are based on net change in net asset value assuming reinvestment of distributions. Please see the Prospectus for more information. |
(2) | Regarding GICS data cited throughout this report, the Global Industry Classification Standard was developed by and is the exclusive property and service mark of MSCI Inc. (“MSCI”) and Standard & Poor’s (“S&P”) and is licensed for use by Marsico Capital Management, LLC (the “Adviser”). Neither MSCI, S&P, nor the Adviser or any third party involved in compiling GICS makes any express or implied warranties or representations with respect to such standard or classification (or the results from use thereof), and all such parties hereby expressly disclaim all warranties of originality, accuracy, completeness, merchantability and fitness for a particular purpose with respect to any such standard or classification. MSCI, S&P, the Adviser, and any of their affiliates or third parties involved in compiling GICS shall not have any liability for any direct, indirect, special, punitive, consequential or any other damages (including lost profits) even if notified of the possibility of such damages. |
9
September 30, 2020 (Unaudited)
The Focus Fund is a non-diversified portfolio and invests primarily in the common stocks of large companies that are selected for their long-term growth potential. The Fund will normally hold a core position of between 20 and 35 common stocks.
TOTAL ANNUAL OPERATING EXPENSES* 1.04% | NET ASSETS $806,180,856 | NET ASSET VALUE PER SHARE $25.92 |
GROWTH OF $10,000(1)(2) | PERFORMANCE COMPARISON(1) |
| | Average Annualized Returns |

| 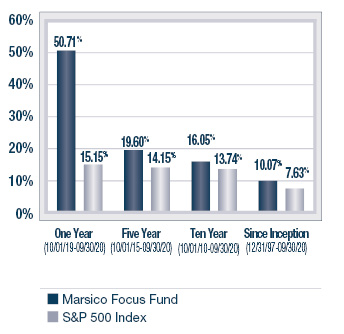
|
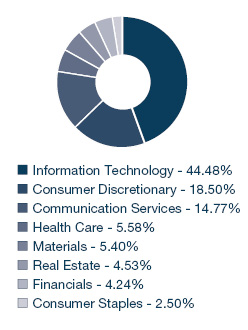
SECTOR ALLOCATION(3) | TOP FIVE HOLDINGS |
| | | | |
| | Amazon.com, Inc. | 7.53% | |
| | Apple, Inc. | 6.72% | |
| | Microsoft Corporation | 6.57% | |
| | PayPal Holdings, Inc. | 6.19% | |
| | ServiceNow, Inc. | 4.80% | |
| | | | |
* | The Total Annual Operating Expenses are reflective of the information disclosed in the Funds’ Prospectus dated January 31, 2020, as supplemented, and may differ from the expense ratio disclosed in this report. |
(1) | The performance data quoted here represent past performance, and past performance is not a guarantee of future results. Investment return and principal value of an investment will fluctuate so that an investor’s shares, when redeemed, may be worth more or less than their original cost. Current performance may be lower or higher than the performance information quoted. To obtain performance information current to the most recent month-end, please call 888-860-8686 or visit marsicofunds.com. |
| The performance included in the chart and graph does not reflect the deduction of taxes on Fund distributions or the redemption of Fund shares. |
| All indices are unmanaged and investors cannot invest directly in an index. |
(2) | This chart assumes an initial investment of $10,000 made on September 30, 2010. Total returns are based on net change in NAV, assuming reinvestment of distributions. |
(3) | Sector weightings represent the percentage of the Fund’s investments (excluding cash equivalents) in certain general sectors. These sectors may include more than one industry. The Fund’s portfolio composition is subject to change at any time. |
10
MARSICO FOCUS FUND
SCHEDULE OF INVESTMENTS
September 30, 2020
| | | Number
of
Shares | | | Value | | | Percent
of Net
Assets | |
COMMON STOCKS^ | | | | | | | | | | | | |
Aerospace & Defense | | | | | | | | | | | | |
Lockheed Martin Corporation | | | 59,296 | | | $ | 22,726,971 | | | | 2.82 | % |
| | | | | | | | | | | | | |
Air Freight & Logistics | | | | | | | | | | | | |
United Parcel Service, Inc. - Cl. B | | | 133,938 | | | | 22,318,089 | | | | 2.77 | |
| | | | | | | | | | | | | |
Apparel, Accessories & Luxury Goods | | | | |
lululemon athletica, inc.* | | | 52,632 | | | | 17,335,402 | | | | 2.15 | |
| | | | | | | | | | | | | |
Application Software | | | | | | | | | | | | |
Adobe, Inc.* | | | 69,814 | | | | 34,238,880 | | | | 4.25 | |
| | | | | | | | | | | | | |
Automobile Manufacturers | | | | | | | | | | | | |
Tesla, Inc.* | | | 33,761 | | | | 14,483,807 | | | | 1.80 | |
| | | | | | | | | | | | | |
Data Processing & Outsourced Services | | | | |
PayPal Holdings, Inc.* | | | 253,465 | | | | 49,940,209 | | | | 6.19 | |
Square, Inc. - Cl. A* | | | 136,447 | | | | 22,179,460 | | | | 2.75 | |
Visa, Inc. - Cl. A | | | 188,089 | | | | 37,612,157 | | | | 4.67 | |
| | | | | | | 109,731,826 | | | | 13.61 | |
Financial Exchanges & Data | | | | |
S&P Global, Inc. | | | 70,925 | | | | 25,575,555 | | | | 3.17 | |
| | | | | | | | | | | | | |
Footwear | | | | | | | | | | | | |
NIKE, Inc. - Cl. B | | | 180,748 | | | | 22,691,104 | | | | 2.81 | |
| | | | | | | | | | | | | |
Health Care Equipment | | | | | | | | | | | | |
Danaher Corporation | | | 120,203 | | | | 25,883,312 | | | | 3.21 | |
DexCom, Inc.* | | | 35,001 | | | | 14,428,462 | | | | 1.79 | |
Intuitive Surgical, Inc.* | | | 22,515 | | | | 15,975,293 | | | | 1.98 | |
| | | | | | | 56,287,067 | | | | 6.98 | |
Interactive Media & Services | | | | | | | | |
Alphabet, Inc. - Cl. A* | | | 22,894 | | | | 33,553,446 | | | | 4.16 | |
Facebook, Inc. - Cl. A* | | | 121,838 | | | | 31,909,372 | | | | 3.96 | |
| | | | | | | 65,462,818 | | | | 8.12 | |
Internet & Direct Marketing Retail | | | | |
Amazon.com, Inc.* | | | 19,268 | | | | 60,669,730 | | | | 7.53 | |
| | | | | | | | | | | | | |
Metal & Glass Containers | | | | | | | | | | | | |
Ball Corporation | | | 160,448 | | | | 13,336,438 | | | | 1.65 | |
| | | | | | | | | | | | | |
Movies & Entertainment | | | | | | | | | | | | |
The Walt Disney Company | | | 178,383 | | | | 22,133,763 | | | | 2.75 | |
| | | | | | | | | | | | | |
Restaurants | | | | | | | | | | | | |
Chipotle Mexican Grill, Inc.* | | | 15,789 | | | | 19,636,937 | | | | 2.44 | |
McDonald’s Corporation | | | 68,152 | | | | 14,958,682 | | | | 1.85 | |
Starbucks Corp. | | | 285,964 | | | | 24,570,027 | | | | 3.05 | |
| | | | | | | 59,165,646 | | | | 7.34 | |
Semiconductor Equipment | | | | | | | | | | | | |
Lam Research Corporation | | | 47,205 | | | | 15,660,259 | | | | 1.94 | % |
| | | | | | | | | | | | | |
Semiconductors | | | | | | | | | | | | |
NVIDIA Corporation | | | 59,664 | | | | 32,291,350 | | | | 4.00 | |
| | | | | | | | | | | | | |
Specialized REITs | | | | | | | | | | | | |
Crown Castle International Corp. | | | 119,765 | | | | 19,940,872 | | | | 2.47 | |
| | | | | | | | | | | | | |
Specialty Chemicals | | | | | | | | | | | | |
The Sherwin-Williams Company | | | 43,393 | | | | 30,233,639 | | | | 3.75 | |
| | | | | | | | | | | | | |
Systems Software | | | | | | | | | | | | |
Microsoft Corporation | | | 251,948 | | | | 52,992,223 | | | | 6.57 | |
ServiceNow, Inc.* | | | 79,691 | | | | 38,650,135 | | | | 4.80 | |
| | | | | | | 91,642,358 | | | | 11.37 | |
Technology Hardware, Storage & Peripherals | | | | |
Apple, Inc. | | | 467,544 | | | | 54,146,271 | | | | 6.72 | |
| | | | | | | | | | | | | |
TOTAL COMMON STOCKS | | | | | | | | | | | | |
(Cost $402,172,651) | | | | | | | 790,071,845 | | | | 98.00 | |
| | | | | | | | | | | | |
SHORT-TERM INVESTMENTS^ | | | | | | | | |
State Street Institutional Treasury Money Market Fund - Premier Class, 0.000% | | | 18,058,262 | | | | 18,058,262 | | | | 2.24 | |
| | | | | | | | | | | | | |
TOTAL SHORT-TERM INVESTMENTS | | | | | | | | |
(Cost $18,058,262) | | | | | | | 18,058,262 | | | | 2.24 | |
| | | | | | | | | | | | | |
TOTAL INVESTMENTS | | | | | | | | | | | | |
(Cost $420,230,913) | | | | | | | 808,130,107 | | | | 100.24 | |
| | | | | | | | | | | | | |
Liabilities, Less Cash and Other Assets | | | | | | | (1,949,251 | ) | | | (0.24 | ) |
| | | | | | | | | | | | | |
NET ASSETS | | | | | | $ | 806,180,856 | | | | 100.00 | % |
^ | As of September 30, 2020, all investments were classified as Level 1 with their corresponding fair valuation disclosed in the above Schedule of Investments. For more information on investment valuation and valuation inputs, refer to Note 2(a) in the Notes to Financial Statements. |
| See notes to financial statements. |
11
Investment Review BY TOM MARSICO, BRANDON GEISLER, AND PETER MARSICO (UNAUDITED)
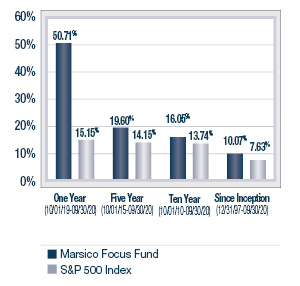
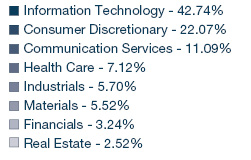
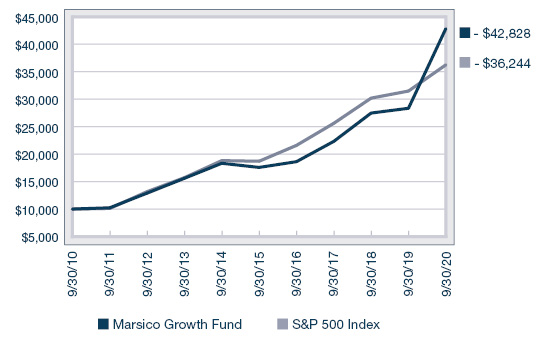
The Marsico Growth Fund posted a total return of +51.11% for the one-year fiscal period ended September 30, 2020. The Fund strongly outperformed the S&P 500 Index, the Fund’s benchmark index, which had a total return of +15.15% over the same time period. Please see the Fund’s Overview for more detailed information about the Fund’s longer-term performance for various time periods ended September 30, 2020.
The performance data for the Fund quoted here represent past performance, and past performance is not a guarantee of future results. Investment return and principal value of an investment will fluctuate so that an investor’s shares, when redeemed, may be worth more or less than their original cost. Current performance may be lower or higher than the performance information quoted. To obtain performance information current to the most recent month-end, please call 888-860-8686 or visit marsicofunds.com.(1)
This review highlights Fund performance over a one-year fiscal period. Shareholders should keep in mind that the Fund is intended for long-term investors who hold their shares for substantially longer periods of time. You should also keep in mind that our current views and beliefs regarding all investments discussed in this report are subject to change at any time. References to specific securities, industries, and sectors discussed in this report are not recommendations to buy or sell such securities or related investments, and the Fund may not necessarily hold these securities or investments today. Please see the accompanying Schedule of Investments for the percentage of the Fund’s portfolio represented by the securities mentioned in this report as of the end of the reporting period.
The Fund is subject to broad risks associated with investing in equity securities markets generally, including the risks that the securities and markets in which it invests may experience volatility and instability, that domestic and global economies and markets may undergo periods of cyclical change and decline, that investors may at times avoid investments in equity securities, and that investments may not perform as anticipated. Please see the Prospectus for more information.
The Fund is not managed to track its benchmark index, and may hold a substantially overweight or underweight position in a sector, industry, or security compared to its weight in the benchmark. The Fund may be subject to risks associated with a particular sector or other area in which it is overweight, including the risk that the stocks of companies within one area could simultaneously decline in price because of an event that affects the entire area. For informational purposes, the discussion below may compare the benchmark weight or performance of a sector or industry to the investment approach of the Fund.
The Growth Fund’s strong outperformance during the one-year period ended September 30, 2020, as compared to the S&P 500 Index, was in part attributable to certain Fund holdings in the Information Technology, Consumer Discretionary, and Communication Services sectors as defined in the Global Industry Classification Standard (“GICS”). From a sector allocation perspective, the Fund’s performance was boosted relative to its benchmark index by maintaining an overweight position in the strong-performing Information Technology sector, by having no investments in the weak-performing Energy sector, and by maintaining an underweight stance in the Financials sector.
In the Information Technology sector, semiconductor company NVIDIA Corporation (“NVIDIA”) (+190%) rose on the back of its launch of a new graphics processing chip used for both video gaming graphics cards and the company’s datacenter products. NVIDIA also made a successful acquisition earlier in the year of Mellanox Technologies, a supplier of computer networking products. Additionally, in mid-September, NVIDIA announced its intention to acquire ARM Holdings, a UK-based semiconductor and software design company that licenses intellectual property for producing processors that are complementary to NVIDIA’s current offerings.
Another top contributor over the period was electric car maker Tesla, Inc. (“Tesla”) (+272%), a stock we opportunistically purchased during the early days of the pandemic. The company’s continued strong execution in terms of production, delivery, and software updates for Tesla’s vehicles contributed to solid fundamentals for the company. Investor sentiment has been supportive of the stock due to the continued strong performance of the company and management, although excitement around what is to come for Tesla in the future may have led to a temporary run-up in its share price. Advance excitement around Tesla’s “Battery Day” presentation held in conjunction with its annual meeting created high expectations for the stock, as the market was anticipating significant announcements around battery-related innovations for this core input and competitive differentiator for the company’s cars. We continue to be optimistic about the company over the longer term, and were pleased with the innovations announced at the company’s Battery Day presentation, particularly the massive reductions in battery costs that are expected to occur over the next 3-4 years.
We added other new positions during the period including Square, Inc. – Cl. A (“Square”) which returned +113% during the period as its “Cash App” for small businesses utilizing online transactions experienced huge growth. With the COVID-19 pandemic rolling through the world population, traditional small business, finance, and personal banking operations that formerly focused mainly on physical transactions have had to rapidly migrate toward a more digital presence. This is a significant positive for Square as it provides a multitude of these banking services through its mobile app. As a result,
12
downloads, revenue, and gross profits for Square experienced outsized growth in 2020 to date, leading to strong stock performance. With this tailwind positively impacting Square’s business, we expect to see continued growth for the company, especially in contrast to traditional banking operations.
In the Communication Services sector, The Walt Disney Company (“Disney”) (+18%) was added to the Fund as the development of its direct to consumer strategy (led by Disney’s online streaming service, Disney+) has created a new driver of growth, somewhat offsetting the current operating obstacles at the company’s theme park and studio businesses due to COVID-19 restrictions. While we expect the theme park and studio businesses to fully recover over time, growth is likely to be sustained thereafter driven by the expansion of Disney+ and the introduction of new online streaming services outside of the US as the company leverages recently acquired 21st Century Fox assets. In all, we believe Disney should come out stronger post-pandemic as the company takes advantage of the opportunity to cross-sell its services and products by leveraging the data it receives from these new streaming relationships worldwide.
From a sector allocation perspective, the Fund’s performance was held back relative to the benchmark index by having underweight exposure to the strong-performing Health Care sector. Also, certain stocks held by the Fund underperformed. Two such examples are discussed further below.
The Boeing Company (“Boeing”) dropped -33% prior to being sold, as the spread of COVID-19 resulted in a drastic decrease in commercial airline travel demand. While airlines were generally in good financial health prior to the pandemic, the unprecedented drop in travel demand resulted in corresponding drops in airline revenues. It was our belief that, in the absence of revenue, airlines would delay or possibly cancel the delivery of new aircraft. This delay in aircraft deliveries has hurt Boeing’s revenues while production has consumed company cash, thereby threatening both Boeing’s financial balance sheet and its liquidity. Airlines have received some targeted government aid, and it is inconsistent with our investment philosophy to maintain a position in a business that is likely dependent on government assistance. Further, it remains unclear what the long-term demand for aircraft will be as travel remains reduced due to the remaining threat of COVID-19 and other potential pandemics.
Consumer Discretionary stock NIKE, Inc. – Cl. B (“Nike”) dropped -20% and was sold during the period as its exposure to traditional wholesale retail distribution impaired its revenue growth. As consumer traffic to physical locations has slowed in favor of digital commerce, we see Nike in a difficult spot as its e-commerce business is relatively nascent and too small to offset losses from physical store sales.
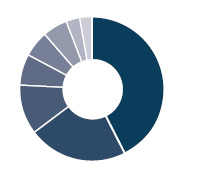
During the reporting period, the Fund reduced its exposure to the Industrials, Materials, and Real Estate sectors. The Fund increased its allocations to the Health Care, Consumer Staples, Information Technology, and Communication Services sectors. There were no significant changes to the Fund’s allocations to the Consumer Discretionary and Financials sectors. The Fund maintained a 3% cash position on average, including a 3% cash position (as represented by the Fund’s short-term investments holding) at period-end.
Fiscal Period-End Investment Posture
As of September 30, 2020, the Fund’s largest sector allocations included Information Technology, Consumer Discretionary, Health Care, and Communication Services. As of that date, the Fund had no investments in the Energy or Utilities sectors.
Other Developments
Effective November 30, 2019, Peter C. Marsico became co-manager of the Growth Fund with Thomas F. Marsico and Brandon A. Geisler.
Sincerely,
THOMAS F. MARSICO
BRANDON A. GEISLER
PETER C. MARSICO
PORTFOLIO MANAGERS
(1) | Total returns are based on net change in net asset value assuming reinvestment of distributions. Periodically, certain fees and expenses have been waived or reimbursed by the Adviser for the Growth Fund. In the absence of such a waiver or reimbursement, the performance returns reflected would have been reduced. In accordance with the expense limitation and fee waiver agreement, the Adviser may recoup fees and expenses previously waived or reimbursed under certain parameters. Please see the Prospectus for more information. |
13
September 30, 2020 (Unaudited)
The Growth Fund is a diversified portfolio and invests primarily in the common stocks of large companies that are selected for their long-term growth potential. The Growth Fund will normally hold a core position of up to 50 common stocks.
TOTAL ANNUAL OPERATING EXPENSES* 1.37% | NET ASSETS $410,592,480 | NET ASSET VALUE PER SHARE $25.66 |
GROWTH OF $10,000(1)(2)(3) | PERFORMANCE COMPARISON(1) |
| | Average Annualized Returns |
| 
|
SECTOR ALLOCATION(4) | TOP FIVE HOLDINGS |
| | | | |
| | Amazon.com, Inc. | 7.81% | |
| | Apple, Inc. | 7.00% | |
| | Microsoft Corporation | 5.73% | |
| | PayPal Holdings, Inc. | 4.14% | |
| | Adobe, Inc. | 4.00% | |
| | | | |
* | The Total Annual Operating Expenses are reflective of the information disclosed in the Funds’ Prospectus dated January 31, 2020, as supplemented, and may differ from the expense ratio disclosed in this report. |
(1) | The performance data quoted here represent past performance, and past performance is not a guarantee of future results. Investment return and principal value of an investment will fluctuate so that an investor’s shares, when redeemed, may be worth more or less than their original cost. Current performance may be lower or higher than the performance information quoted. To obtain performance information current to the most recent month-end, please call 888-860-8686 or visit marsicofunds.com. |
| The performance included in the chart and graph does not reflect the deduction of taxes on Fund distributions or the redemption of Fund shares. |
| All indices are unmanaged and investors cannot invest directly in an index. |
(2) | Periodically, certain fees and expenses have been waived or reimbursed by the Adviser for the Growth Fund. In the absence of such a waiver or reimbursement, the performance returns reflected would have been reduced. In accordance with the expense limitation and fee waiver agreement, the Adviser may recoup fees and expenses previously waived or reimbursed under certain parameters. |
(3) | This chart assumes an initial investment of $10,000 made on September 30, 2010. Total returns are based on net change in NAV, assuming reinvestment of distributions. |
(4) | Sector weightings represent the percentage of the Fund’s investments (excluding cash equivalents) in certain general sectors. These sectors may include more than one industry. The Fund’s portfolio composition is subject to change at any time. |
14
MARSICO GROWTH FUND
SCHEDULE OF INVESTMENTS
September 30, 2020
| | | Number
of
Shares | | | Value | | | Percent
of Net
Assets | |
COMMON STOCKS^ | | | | | | | | | | | | |
Apparel Retail | | | | | | | | | | | | |
Burlington Stores, Inc.* | | | 40,848 | | | $ | 8,418,364 | | | | 2.05 | % |
| | | | | | | | | | | | | |
Application Software | | | | | | | | | | | | |
Adobe, Inc.* | | | 33,487 | | | | 16,423,029 | | | | 4.00 | |
salesforce.com, inc.* | | | 36,490 | | | | 9,170,667 | | | | 2.23 | |
| | | | | | | 25,593,696 | | | | 6.23 | |
Automobile Manufacturers | | | | | | | | | | | | |
Tesla, Inc.* | | | 16,661 | | | | 7,147,736 | | | | 1.74 | |
| | | | | | | | | | | | | |
Data Processing & Outsourced Services |
Mastercard, Inc. - Cl. A | | | 47,188 | | | | 15,957,566 | | | | 3.88 | |
PayPal Holdings, Inc.* | | | 86,359 | | | | 17,015,314 | | | | 4.14 | |
Square, Inc. - Cl. A* | | | 96,181 | | | | 15,634,221 | | | | 3.81 | |
Visa, Inc. - Cl. A | | | 55,369 | | | | 11,072,139 | | | | 2.70 | |
| | | | | | | 59,679,240 | | | | 14.53 | |
Financial Exchanges & Data | | | | |
Moody’s Corp. | | | 17,693 | | | | 5,128,316 | | | | 1.25 | |
S&P Global, Inc. | | | 25,935 | | | | 9,352,161 | | | | 2.28 | |
| | | | | | | 14,480,477 | | | | 3.53 | |
Health Care Equipment | | | | | | | | | | | | |
Danaher Corporation | | | 45,129 | | | | 9,717,628 | | | | 2.36 | |
Edwards Lifesciences Corp.* | | | 126,475 | | | | 10,095,234 | | | | 2.46 | |
IDEXX Laboratories, Inc.* | | | 9,934 | | | | 3,905,155 | | | | 0.95 | |
Intuitive Surgical, Inc.* | | | 12,084 | | | | 8,574,081 | | | | 2.09 | |
| | | | | | | 32,292,098 | | | | 7.86 | |
Interactive Media & Services | | | | | | | | |
Alphabet, Inc. - Cl. A* | | | 8,732 | | | | 12,797,619 | | | | 3.11 | |
Facebook, Inc. - Cl. A* | | | 52,337 | | | | 13,707,060 | | | | 3.34 | |
Snap, Inc. - Cl. A* | | | 331,716 | | | | 8,661,105 | | | | 2.11 | |
| | | | | | | 35,165,784 | | | | 8.56 | |
Internet & Direct Marketing Retail | | | | | | | | |
Amazon.com, Inc.* | | | 10,185 | | | | 32,069,815 | | | | 7.81 | |
| | | | | | | | | | | | |
Life Sciences Tools & Services | | | | | | | | |
Mettler-Toledo International, Inc.* | | | 12,497 | | | | 12,068,978 | | | | 2.94 | |
| | | | | | | | | | | | | |
Movies & Entertainment | | | | | | | | | | | | |
Spotify Technology S.A.* | | | 23,589 | | | | 5,721,984 | | | | 1.39 | |
The Walt Disney Company | | | 92,139 | | | | 11,432,607 | | | | 2.79 | |
| | | | | | | 17,154,591 | | | | 4.18 | |
Personal Products | | | | | | | | | | | | |
The Estee Lauder Companies, Inc. – Cl. A | | | 43,996 | | | | 9,602,127 | | | | 2.34 | |
| | | | | | | | | | | | | |
Pharmaceuticals | | | | | | | | | | | | |
Zoetis, Inc. | | | 82,950 | | | | 13,717,441 | | | | 3.34 | |
| | | | | | | | | | | | | |
Research & Consulting Services | | | | | | | | |
CoStar Group, Inc.* | | | 5,308 | | | | 4,503,891 | | | | 1.10 | % |
| | | | | | | | | | | | | |
Restaurants | | | | | | | | | | | | |
Chipotle Mexican Grill, Inc.* | | | 9,822 | | | | 12,215,720 | | | | 2.98 | |
Starbucks Corp. | | | 140,613 | | | | 12,081,469 | | | | 2.94 | |
| | | | | | | 24,297,189 | | | | 5.92 | |
Semiconductors | | | | | | | | | | | | |
NVIDIA Corporation | | | 26,745 | | | | 14,474,929 | | | | 3.53 | |
| | | | | | | | | | | | | |
Specialized REITs | | | | | | | | | | | | |
Crown Castle International Corp. | | | 68,703 | | | | 11,439,050 | | | | 2.79 | |
| | | | | | | | | | | | | |
Specialty Chemicals | | | | | | | | | | | | |
The Sherwin-Williams Company | | | 18,996 | | | | 13,235,273 | | | | 3.22 | |
| | | | | | | | | | | | | |
Systems Software | | | | | | | | | | | | |
Microsoft Corporation | | | 111,892 | | | | 23,534,244 | | | | 5.73 | |
ServiceNow, Inc.* | | | 21,274 | | | | 10,317,890 | | | | 2.51 | |
| | | | | | | 33,852,134 | | | | 8.24 | |
Technology Hardware, Storage & Peripherals | | | | |
Apple, Inc. | | | 248,007 | | | | 28,721,691 | | | | 7.00 | |
| | | | | | | | | | | | | |
Trucking | | | | | | | | | | | | |
Uber Technologies, Inc.* | | | 129,768 | | | | 4,733,937 | | | | 1.15 | |
| | | | | | | | | | | | | |
TOTAL COMMON STOCKS | | | | | | | | | | | | |
(Cost $214,498,815) | | | | | | | 402,648,441 | | | | 98.06 | |
| | | | | | | | | | | | |
SHORT-TERM INVESTMENTS^ | | | | | | | | |
State Street Institutional Treasury Money Market Fund - Premier Class, 0.000% | | | 11,888,876 | | | | 11,888,876 | | | | 2.90 | |
| | | | | | | | | | | | | |
TOTAL SHORT-TERM INVESTMENTS | | | | | | | | |
(Cost $11,888,876) | | | | | | | 11,888,876 | | | | 2.90 | |
| | | | | | | | | | | | | |
TOTAL INVESTMENTS | | | | | | | | | | | | |
(Cost $226,387,691) | | | | | | | 414,537,317 | | | | 100.96 | |
| | | | | | | | | | | | | |
Liabilities, Less Cash and Other Assets | | | | | | | (3,944,837 | ) | | | (0.96 | ) |
| | | | | | | | | | | | | |
NET ASSETS | | | | | | $ | 410,592,480 | | | | 100.00 | % |
^ | As of September 30, 2020, all investments were classified as Level 1 with their corresponding fair valuation disclosed in the above Schedule of Investments. For more information on investment valuation and valuation inputs, refer to Note 2(a) in the Notes to Financial Statements. |
| See notes to financial statements. |
15
Investment Review BY BRANDON GEISLER (UNAUDITED)
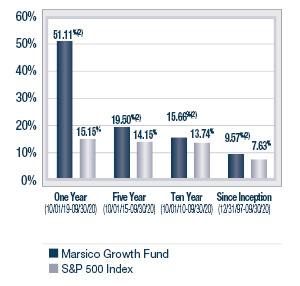
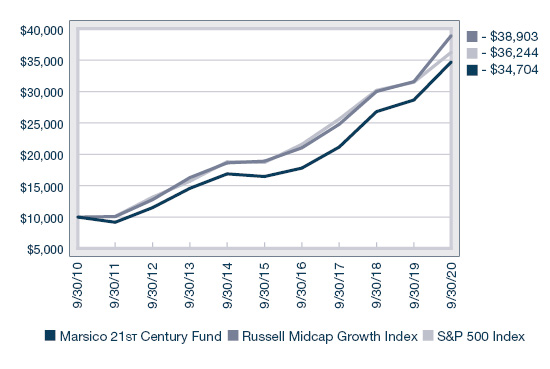
The Marsico 21st Century Fund posted a total return of +21.15% for the one-year fiscal period ended September 30, 2020. The Fund underperformed the Russell Midcap Growth Index, the Fund’s primary benchmark, which had a total return of +23.23% over the same time period. Please see the Fund’s Overview for more detailed information about the Fund’s longer-term performance for various time periods ended September 30, 2020.
The performance data for the Fund quoted here represent past performance, and past performance is not a guarantee of future results. Investment return and principal value of an investment will fluctuate so that an investor’s shares, when redeemed, may be worth more or less than their original cost. Current performance may be lower or higher than the performance information quoted. To obtain performance information current to the most recent month-end, please call 888-860-8686 or visit marsicofunds.com.(1)
This review highlights Fund performance over a one-year fiscal period. Shareholders should keep in mind that the Fund is intended for long-term investors who hold their shares for substantially longer periods of time. You should also keep in mind that our current views and beliefs regarding all investments discussed in this report are subject to change at any time. References to specific securities, industries, and sectors discussed in this report are not recommendations to buy or sell such securities or related investments, and the Fund may not necessarily hold these securities or investments today. Please see the accompanying Schedule of Investments for the percentage of the Fund’s portfolio represented by the securities mentioned in this report as of the end of the reporting period.
The Fund is subject to broad risks associated with investing in equity securities markets generally, including the risks that the securities and markets in which it invests may experience volatility and instability, that domestic and global economies and markets may undergo periods of cyclical change and decline, that investors may at times avoid investments in equity securities, and that investments may not perform as anticipated. Please see the Prospectus for more information.
The Fund is not managed to track its benchmark index, and may hold a substantially overweight or underweight position in a sector, industry, or security compared to its weight in the benchmark. The Fund may be subject to risks associated with a particular sector or other area in which it is overweight, including the risk that the stocks of companies within one area could simultaneously decline in price because of an event that affects the entire area. For informational purposes, the discussion below may compare the benchmark weight or performance of a sector or industry to the investment approach of the Fund.
The 21st Century Fund’s underperformance during the one-year period ended September 30, 2020 as compared to its benchmark, the Russell Midcap Growth Index, was due in part to certain stocks in various sectors. From a sector allocation perspective, Fund performance was marginally impaired by having an overweight allocation to the Materials sector, based on average weight for the period, as the sector return lagged the overall benchmark index return over the same period.
In the Consumer Discretionary space, residential and commercial service company ServiceMaster Global Holdings, Inc. (-37%) underperformed and was sold from the Fund after an aggressive termite swarm caused outsized claims liabilities in parts of Alabama.
In the Information Technology sector, software company WEX, Inc. (“WEX”) dropped -30% due to the continued weakness in oil prices. WEX does not face oil price risk directly, but provides payment processing and information management services to the commercial and government vehicle fleet industry, and the decline in oil prices has resulted in lower fees on payments as transaction amounts are smaller. Further, the transportation market served by WEX has been negatively impacted by COVID-19. We continue to believe WEX is a high-quality payments business and that it has a strong ability to navigate hard economic conditions.
Last, ride-hailing service Lyft, Inc. – Cl. A (“Lyft”) dropped -43% due to a sharp decline in ridership after COVID-19 guidelines and shelter-in-place orders resulted in a steep drop in trips to work, airports, bars, restaurants, and similar discrete trips. As Lyft is a booking platform for rides, revenue and profits of the company declined sharply as well. We maintained our position because we look favorably on the long-term outlook for the trend away from car ownership, and have seen evidence of accelerating Lyft sales as economies re-open.
On the positive side, the 21st Century Fund’s performance was boosted by maintaining no exposure to the weak-performing Energy sector, as the sector posted a -32% return for the period. In addition, the Fund benefitted slightly from an underweight posture in the Communication Services sector. Although we began the period with a 7% cash level (as represented by the Fund’s short-term investments), we opportunistically purchased stocks throughout the period, and ended September with less than 1% in cash (as represented by the Fund’s short-term investments holding).
16
Several stocks added to returns in the Fund, including Twilio, Inc. – Cl. A (“TWLO”), which rose +149% during the period. TWLO is a leading cloud communications platform that enables businesses and their customers to communicate more effectively in a mobile-first environment. As the customers of many companies have been forced to work from home as a result of the pandemic, companies have had to develop new ways to reach customers. This trend has led to accelerating adoption and growth of TWLO’s products and services by companies like Nike, Uber, and Netflix. The company announced projected revenue growth of over 30% for the next 4 years, leading to strong performance by the stock.
Also on the positive side in the Information Technology sector, Square, Inc. – Cl. A (“Square”) returned +161% during the period as its “Cash App” for small businesses utilizing online transactions experienced huge growth. With the COVID-19 pandemic rolling through the world population, traditional small business, finance, and personal banking operations that formerly focused mainly on physical transactions have had to rapidly migrate toward a more digital presence. This is a significant positive for Square as it provides a multitude of these banking services through its mobile app. As a result, downloads, revenue, and gross profits for Square experienced outsized growth in 2020 to date, leading to strong stock performance. With this tailwind positively impacting Square’s business, we expect to see continued growth for the company, especially in contrast to traditional banking operations.
Snap, Inc. – Cl. A (“Snap”) rose +67% during the period and added to Fund returns. Following a troubled IPO, an app redesign, and management turnover, Snap came out firing on all cylinders in 2020 as it left those problems behind. New leadership and innovation around its products for both users and advertisers has led to improved fundamentals and sentiment toward the stock. As a result, the stock has performed well due to increased engagement and revenue generation that has outpaced our expectations. We see this as only the beginning for the company, and believe that Snap may continue to drive substantial returns as global pandemic impacts recede.
A new addition during the period was Cintas Corp. (“Cintas”) (+63%) a supplier of company uniforms and cleaning and first aid products and services. We initiated a position in Cintas as we believed the market was focusing too heavily on the short-run closure of businesses and did not appreciate that Cintas would sell more first aid, cleaning, disinfectant, and sanitary supplies when businesses re-opened due to enhanced cleaning procedures. Additionally, we believed that more companies, particularly in the medical field, would utilize Cintas’s uniform cleaning services rather than have employees personally wash uniforms. As businesses have reopened, Cintas has seen an increase in sales due to increased volumes and more services purchased. We continue to believe Cintas can grow revenue and earnings above market expectations.
During the reporting period, the Fund eliminated its holding in the Consumer Staples sector, reduced its exposure to the Industrials, Materials, and Consumer Discretionary sectors, and increased its allocations to the Health Care, Information Technology, and Communication Services sectors. There were no significant changes to the Fund’s allocations to the Real Estate and Financials sectors.
Fiscal Period-End Investment Posture
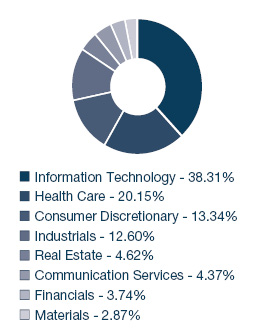
As of September 30, 2020, the Fund’s primary economic sector allocations included Information Technology, Health Care, Consumer Discretionary, and Industrials. At period end, the Fund had no investments in the Consumer Staples, Energy, or Utilities sectors.
Sincerely,
BRANDON A. GEISLER
PORTFOLIO MANAGER
(1) | Total returns are based on net change in net asset value assuming reinvestment of distributions. Periodically, certain fees and expenses have been waived or reimbursed by the Adviser for the 21st Century Fund. In the absence of such a waiver or reimbursement, the performance returns reflected would have been reduced. In accordance with the expense limitation and fee waiver agreement, the Adviser may recoup fees and expenses previously waived or reimbursed under certain parameters. Periodically, the Adviser has recouped such fees or expenses from the 21st Century Fund, resulting in a lower performance return. Please see the Prospectus for more information. |
17
21st CENTURY Fund Overview |
September 30, 2020 (Unaudited)
The 21st Century Fund is a diversified portfolio and invests primarily in common stocks that are selected for their long-term growth potential. The Fund may invest in companies of any size. The portions of Fund assets invested in large-capitalization, medium-capitalization, or small-capitalization companies will vary based on market conditions, depending on the portfolio manager’s judgment as to how to achieve the Fund’s investment objective. Under current market conditions the portfolio manager expects to invest substantially in medium-capitalization companies. The Fund will normally hold a core position of between 35 and 60 common stocks.
TOTAL ANNUAL OPERATING EXPENSES* 1.40% | NET ASSETS $291,976,169 | NET ASSET VALUE PER SHARE $39.52 |
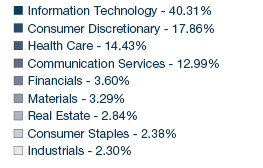
GROWTH OF $10,000(1)(3) | PERFORMANCE COMPARISON(1) |
| | Average Annualized Returns |
| 
|
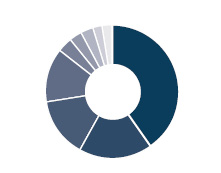
SECTOR ALLOCATION(4) | TOP FIVE HOLDINGS |
| | | | |
| | Snap, Inc. - Cl. A | 4.36% | |
| | Square, Inc. - Cl. A | 3.49% | |
| | CoStar Group, Inc. | 3.37% | |
| | Cintas Corp. | 2.95% | |
| | FirstService Corporation | 2.88% | |
| | | | |
* | The Total Annual Operating Expenses are reflective of the information disclosed in the Funds’ Prospectus dated January 31, 2020, as supplemented, and may differ from the expense ratio disclosed in this report. |
(1) | The performance data quoted here represent past performance, and past performance is not a guarantee of future results. Investment return and principal value of an investment will fluctuate so that an investor’s shares, when redeemed, may be worth more or less than their original cost. Current performance may be lower or higher than the performance information quoted. To obtain performance information current to the most recent month-end, please call 888-860-8686 or visit marsicofunds.com. |
| The performance included in the chart and graph does not reflect the deduction of taxes on Fund distributions or the redemption of Fund shares. |
| All indices are unmanaged and investors cannot invest directly in an index. |
| The Russell Midcap Growth Index (the “Underlying Index”) measures the performance of the mid-capitalization growth sector of the US equity market, and is composed of mid-capitalization US equities that exhibit growth characteristics. It is a subset of the Russell Midcap® Index, which measures the performance of the mid-capitalization sector of the US equity market. The Underlying Index measures the performance of equity securities of Russell Midcap Index issuers with higher price-to-book ratios and higher forecasted growth. |
(2) | Periodically, certain fees and expenses have been waived or reimbursed by the Adviser for the 21st Century Fund. In the absence of such a waiver or reimbursement, the performance returns reflected would have been reduced. In accordance with the expense limitation and fee waiver agreement, the Adviser may recoup fees and expenses previously waived or reimbursed under certain parameters. Periodically, the Adviser has recouped such fees or expenses from the 21st Century Fund, resulting in a lower performance return. |
(3) | This chart assumes an initial investment of $10,000 made on September 30, 2010. Total returns are based on net change in NAV, assuming reinvestment of distributions. |
(4) | Sector weightings represent the percentage of the Fund’s investments (excluding cash equivalents) in certain general sectors. These sectors may include more than one industry. The Fund’s portfolio composition is subject to change at any time. |
18
MARSICO 21st CENTURY FUND
SCHEDULE OF INVESTMENTS
September 30, 2020
| | | Number
of
Shares | | | Value | | | Percent
of Net
Assets | |
COMMON STOCKS^ | | | | | | | | | | | | |
Aerospace & Defense | | | | | | | | | | | | |
HEICO Corporation | | | 48,506 | | | $ | 5,076,638 | | | | 1.74 | % |
| | | | | | | | | | | | |
Apparel Retail | | | | | | | | | | | | |
Burlington Stores, Inc.* | | | 31,646 | | | | 6,521,924 | | | | 2.23 | |
| | | | | | | | | | | | | |
Apparel, Accessories & Luxury Goods | | | | |
lululemon athletica, inc.* | | | 11,268 | | | | 3,711,341 | | | | 1.27 | |
| | | | | | | | | | | | | |
Application Software | | | | | | | | | | | | |
Atlassian Corporation PLC - Cl. A* | | | 42,007 | | | | 7,636,453 | | | | 2.62 | |
Constellation Software, Inc. | | | 5,185 | | | | 5,761,617 | | | | 1.97 | |
Datadog, Inc. - Cl. A* | | | 8,109 | | | | 828,415 | | | | 0.28 | |
Guidewire Software, Inc.* | | | 51,859 | | | | 5,407,338 | | | | 1.85 | |
PTC, Inc.* | | | 62,052 | | | | 5,132,941 | | | | 1.76 | |
RealPage, Inc.* | | | 84,965 | | | | 4,897,383 | | | | 1.68 | |
The Descartes Systems Group, Inc.* | | | 143,100 | | | | 8,151,504 | | | | 2.79 | |
| | | | | | | 37,815,651 | | | | 12.95 | |
Biotechnology | | | | | | | | | | | | |
Exact Sciences Corporation* | | | 39,238 | | | | 4,000,314 | | | | 1.37 | |
Natera, Inc.* | | | 37,954 | | | | 2,741,797 | | | | 0.94 | |
| | | | | | | 6,742,111 | | | | 2.31 | |
Construction Materials | | | | | | | | | | | | |
Vulcan Materials Company | | | 17,340 | | | | 2,350,264 | | | | 0.80 | |
| | | | | | | | | | | | | |
Data Processing & Outsourced Services | | | | |
Fidelity National Information Services, Inc. | | | 39,181 | | | | 5,767,835 | | | | 1.97 | |
Global Payments, Inc. | | | 44,029 | | | | 7,818,670 | | | | 2.68 | |
Square, Inc. - Cl. A* | | | 62,616 | | | | 10,178,231 | | | | 3.49 | |
WEX, Inc.* | | | 35,248 | | | | 4,898,414 | | | | 1.68 | |
| | | | | | | 28,663,150 | | | | 9.82 | |
Diversified Support Services | | | | | | | | |
Cintas Corp. | | | 25,868 | | | | 8,609,646 | | | | 2.95 | |
| | | | | | | | | | | | | |
Education Services | | | | | | | | | | | | |
Bright Horizons Family Solutions, Inc.* | | | 44,346 | | | | 6,742,366 | | | | 2.31 | |
| | | | | | | | | | | | | |
Electrical Components & Equipment | | | | |
AMETEK, Inc. | | | 48,635 | | | | 4,834,319 | | | | 1.66 | |
| | | | | | | | | | | | | |
Electronic Components | | | | | | | | | | | | |
Amphenol Corp. - Cl. A | | | 56,395 | | | | 6,105,887 | | | | 2.09 | |
| | | | | | | | | | | | | |
Electronic Equipment & Instruments | | | | |
Cognex Corporation | | | 95,603 | | | | 6,223,755 | | | | 2.13 | |
Novanta, Inc.* | | | 42,470 | | | | 4,473,790 | | | | 1.53 | |
| | | | | | | 10,697,545 | | | | 3.66 | |
Financial Exchanges & Data | | | | |
MSCI, Inc. | | | 14,888 | | | | 5,311,741 | | | | 1.82 | |
| | | | | | | | | | | | | |
General Merchandise Stores | | | | |
Ollie’s Bargain Outlet Holdings, Inc.* | | | 54,113 | | | | 4,726,771 | | | | 1.62 | |
| | | | | | | | | | | | | |
Health Care Equipment | | | | | | | | | | | | |
DexCom, Inc.* | | | 13,176 | | | | 5,431,543 | | | | 1.86 | % |
IDEXX Laboratories, Inc.* | | | 17,270 | | | | 6,789,010 | | | | 2.33 | |
Insulet Corp.* | | | 21,643 | | | | 5,120,517 | | | | 1.75 | |
Intuitive Surgical, Inc.* | | | 8,073 | | | | 5,728,116 | | | | 1.96 | |
Teleflex, Inc. | | | 16,270 | | | | 5,538,633 | | | | 1.90 | |
| | | | | | | 28,607,819 | | | | 9.80 | |
Health Care Supplies | | | | | | | | | | | | |
The Cooper Companies, Inc. | | | 19,474 | | | | 6,565,075 | | | | 2.25 | |
| | | | | | | | | | | | | |
Health Care Technology | | | | | | | | | | | | |
GoodRx Holdings, Inc. - Cl. A* | | | 1,000 | | | | 55,600 | | | | 0.02 | |
Teladoc Health, Inc.* | | | 3,671 | | | | 804,830 | | | | 0.27 | |
| | | | | | | 860,430 | | | | 0.29 | |
Home Improvement Retail | | | | | | | | | | | | |
Floor & Decor Holdings, Inc. - Cl. A* | | | 48,648 | | | | 3,638,870 | | | | 1.25 | |
| | | | | | | | | | | | | |
Hotels, Resorts & Cruise Lines | | | | | | | | |
Hilton Worldwide Holdings, Inc. | | | 67,365 | | | | 5,747,582 | | | | 1.97 | |
| | | | | | | | | | | | | |
Interactive Media & Services | | | | | | | | |
Snap, Inc. - Cl. A* | | | 487,700 | | | | 12,733,847 | | | | 4.36 | |
| | | | | | | | | | | | | |
Internet Services & Infrastructure | | | | | | | | |
Okta, Inc.* | | | 7,187 | | | | 1,536,940 | | | | 0.53 | |
Twilio, Inc. - Cl. A* | | | 33,381 | | | | 8,248,111 | | | | 2.82 | |
| | | | | | | 9,785,051 | | | | 3.35 | |
Life Sciences Tools & Services | | | | | | | | |
Adaptive Biotechnologies Corporation* | | | 90,038 | | | | 4,378,548 | | | | 1.50 | |
Avantor, Inc.* | | | 183,513 | | | | 4,127,207 | | | | 1.41 | |
Mettler-Toledo International, Inc.* | | | 4,141 | | | | 3,999,171 | | | | 1.37 | |
Repligen Corp.* | | | 22,893 | | | | 3,377,633 | | | | 1.16 | |
| | | | | | | 15,882,559 | | | | 5.44 | |
Metal & Glass Containers | | | | | | | | | | | | |
Ball Corporation | | | 72,399 | | | | 6,017,805 | | | | 2.06 | |
| | | | | | | | | | | | | |
Real Estate Services | | | | | | | | | | | | |
FirstService Corporation | | | 63,800 | | | | 8,419,463 | | | | 2.88 | |
| | | | | | | | | | | | | |
Regional Banks | | | | | | | | | | | | |
First Republic Bank | | | 51,040 | | | | 5,566,422 | | | | 1.91 | |
| | | | | | | | | | | | | |
Research & Consulting Services | | | | |
CoStar Group, Inc.* | | | 11,601 | | | | 9,843,564 | | | | 3.37 | |
Verisk Analytics, Inc. | | | 22,774 | | | | 4,220,250 | | | | 1.45 | |
| | | | | | | 14,063,814 | | | | 4.82 | |
Restaurants | | | | | | | | | | | | |
Chipotle Mexican Grill, Inc.* | | | 4,457 | | | | 5,543,215 | | | | 1.90 | |
| | | | | | | | | | | | | |
Semiconductor Equipment | | | | | | | | | | | | |
Lam Research Corporation | | | 23,981 | | | | 7,955,697 | | | | 2.72 | |
19
MARSICO 21st CENTURY FUND
SCHEDULE OF INVESTMENTS (continued)
September 30, 2020
| | | Number
of
Shares | | | Value | | | Percent
of Net
Assets | |
COMMON STOCKS^ (continued) | | | | | | | | |
Semiconductors | | | | | | | | | | | | |
Marvell Technology Group Ltd. | | | 127,202 | | | $ | 5,049,919 | | | | 1.73 | % |
Microchip Technology, Inc. | | | 53,322 | | | | 5,479,369 | | | | 1.88 | |
| | | | | | | 10,529,288 | | | | 3.61 | |
Specialized Consumer Services | | | | | | | | |
frontdoor, Inc.* | | | 56,422 | | | | 2,195,380 | | | | 0.75 | |
| | | | | | | | | | | | |
Specialized REITs | | | | | | | | | | | | |
SBA Communications Corporation - Cl. A | | | 15,799 | | | | 5,031,666 | | | | 1.72 | |
| | | | | | | | | | | | | |
Trucking | | | | | | | | | | | | |
Lyft, Inc. - Cl. A* | | | 148,350 | | | | 4,087,043 | | | | 1.40 | |
| | | | | | | | | | | | | |
TOTAL COMMON STOCKS | | | | | | | | | | | | |
(Cost $186,376,137) | | | | | | | 291,140,380 | | | | 99.71 | |
| | | | | | | | | | | | |
SHORT-TERM INVESTMENTS^ | | | | | | | | |
State Street Institutional Treasury Money Market Fund - Premier Class, 0.000% | | | 1,549,961 | | | | 1,549,961 | | | | 0.53 | |
| | | | | | | | | | | | | |
TOTAL SHORT-TERM INVESTMENTS | | | | |
(Cost $1,549,961) | | | | | | | 1,549,961 | | | | 0.53 | |
| | | | | | | | | | | | | |
TOTAL INVESTMENTS | | | | | | | | | | | | |
(Cost $187,926,098) | | | | | | | 292,690,341 | | | | 100.24 | |
| | | | | | | | | | | | | |
Liabilities, Less Cash and Other Assets | | | | | | | (714,172 | ) | | | (0.24 | ) |
| | | | | | | | | | | | | |
NET ASSETS | | | | | | $ | 291,976,169 | | | | 100.00 | % |
^ | As of September 30, 2020, all investments were classified as Level 1 with their corresponding fair valuation disclosed in the above Schedule of Investments. For more information on investment valuation and valuation inputs, refer to Note 2(a) in the Notes to Financial Statements. |
| See notes to financial statements. |
20
INTERNATIONAL OPPORTUNITIES FUND |
Investment Review BY TOM MARSICO AND ROB SUSMAN (UNAUDITED)
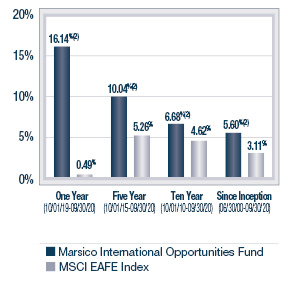
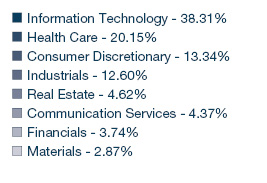
The Marsico International Opportunities Fund posted a total return of (US$) +16.14% for the one-year fiscal period ended September 30, 2020. The Fund strongly outperformed the MSCI EAFE Index, the Fund’s benchmark index, which had a total return of (US$) +0.49% over the same time period. Please see the Fund’s Overview for more detailed information about the Fund’s longer-term performance for various time periods ended September 30, 2020.
The performance data for the Fund quoted here represent past performance, and past performance is not a guarantee of future results. Investment return and principal value of an investment will fluctuate so that an investor’s shares, when redeemed, may be worth more or less than their original cost. Current performance may be lower or higher than the performance information quoted. To obtain performance information current to the most recent month-end, please call 888-860-8686 or visit marsicofunds.com.(1)
This review highlights Fund performance over a one-year fiscal period. Shareholders should keep in mind that the Fund is intended for long-term investors who hold their shares for substantially longer periods of time. You should also keep in mind that our current views and beliefs regarding all investments discussed in this report are subject to change at any time. References to specific securities, industries, and sectors discussed in this report are not recommendations to buy or sell such securities or related investments, and the Fund may not necessarily hold these securities or investments today. Please see the accompanying Schedule of Investments for the percentage of the Fund’s portfolio represented by the securities mentioned in this report as of the end of the reporting period.
Foreign investments present additional risks due to currency fluctuations, economic and political factors, lower liquidity, differences in securities regulations and accounting standards, possible changes in taxation, limited public information, and other factors. In addition, the Fund is subject to broad risks associated with investing in equity securities markets generally, including the risks that the securities and markets in which it invests may experience volatility and instability, that domestic and global economies and markets may undergo periods of cyclical change and decline, that investors may at times avoid investments in equity securities, and that investments may not perform as anticipated. Please see the Prospectus for more information.
The Fund is not managed to track its benchmark index, and may hold a substantially overweight or underweight position in a sector, industry, or security compared to its weight in the benchmark. The Fund may be subject to risks associated with a particular sector or other area in which it is overweight, including the risk that the stocks of companies within one area could simultaneously decline in price because of an event that affects the entire area. For informational purposes, the discussion below may compare the benchmark weight or performance of a sector or industry to the investment approach of the Fund.
The International Opportunities Fund’s outperformance during the one-year period ended September 30, 2020 as compared to the MSCI EAFE Index was due, in part, to certain strong-performing stocks in the Communication Services and Consumer Discretionary sectors as defined in the Global Industry Classification Standard (“GICS”). In addition, the Fund benefitted from an overweight posture and good stock selection in the Information Technology sector, the strongest-performing sector in the benchmark index during the period. The Fund also benefitted from having an underweight posture in both the Financial Services and Energy sectors, two of the weaker-performing sectors in the benchmark index.
Several positions in the Fund performed positively during the period, including cellular tower company Cellnex Telecom SA (“Cellnex”) (+65%), which is quickly acquiring cell-phone towers around Europe. In contrast to the US where numerous cell tower companies operate, in Europe Cellnex is largely alone and competes against potentially less efficient, big nationalized operators. Importantly, cell-tower stocks are viewed as defensive given the need for cell phones to work well in a pandemic, which positions Cellnex as an attractive stock to own during this challenging time.
Also contributing to the Fund’s performance was Chinese e-commerce company Alibaba Group Holding Ltd. Spon. ADR (“BABA”) (+77%). Alibaba’s investments in multiple business lines, including its retail presence, personalized recommendation feeds, and live-streaming services have improved the customer experience across its on-line marketplaces. As efficiencies continue to develop across various other segments such as Alibaba Cloud, earnings steadily improved throughout the second half of 2019, and appeared poised to continue to do so in 2020 prior to the COVID-19 pandemic. As we look out to the remainder of 2020 and beyond, we see BABA further distinguishing itself from peers in China as the go-to player for everyday and specialty e-commerce, as well as cloud, media, local delivery and financial services.
Also based in China, Tencent Holdings Ltd. (“Tencent”) (+56%) was a strong performer over the last year as video gaming, Tencent’s largest revenue source, has grown significantly while users have spent more time inside their homes as a result of the COVID-19 pandemic. We don’t see this as a one-time occurrence, but as a paradigm shift toward consumers spending more time and money on home-based activities instead of larger gatherings in event centers or malls. Tencent’s platform also is levered to the growth of cloud computing services. Much like Amazon and Microsoft, Tencent has a fast-growing cloud computing business model that is still in its early innings. Given that media consumption is migrating toward use of portable digital devices rather than devices in fixed locations, we believe that Tencent will benefit across its portfolio of assets.
21
INTERNATIONAL OPPORTUNITIES FUND |
From a sector allocation perspective, Fund performance was marginally penalized for maintaining an underweight stance to the Materials sector, one of the stronger-performing sectors in the MSCI EAFE Index during the period, and for maintaining an underweight stance to the Industrials sector.
In the Real Estate sector, Germany-based real estate company Aroundtown S.A. (“Aroundtown”) (-40%) performed well in 2019 and the first two months of 2020. Then, as concerns mounted about a growing recession and the question of when Europeans will travel again and stay at hotels, Aroundtown’s stock languished along with those of other commercial and hotel real estate operators. We have trimmed our position size significantly during this challenging time. That said, Aroundtown has very low leverage, a large portfolio of unencumbered real estate assets, and a strong balance sheet. As the COVID-19 pandemic wanes, we believe the stock will recover and Aroundtown’s management will use its balance sheet to opportunistically grow its portfolio.
Several of the Fund’s positions in the Industrials sector detracted from performance including Airbus SE (“Airbus”) (-59% prior to being sold). Airbus is one of the two largest commercial aircraft manufacturers in the world, and as such the company’s stock declined after the COVID-19 pandemic due to a severe drop in air travel. Due to this decline, airlines stopped taking delivery of aircraft, canceled future orders, and decreased plans for future fleet expansion.
Although active currency management is not a central facet of the International Opportunities Fund’s investment process, fluctuations in major world currencies can at times affect the Fund’s performance. During the period, the net effect of currency moves had a positive impact on Fund performance.
There were a few shifts in the Fund’s sector allocations during the period. The Fund reduced its allocations to the Industrials, Real Estate, and Consumer Staples sectors and increased its allocations to the Financials, Materials, Health Care, and Consumer Discretionary sectors. There were no significant changes to the Fund’s allocations to the Communication Services, Energy, and Information Technology sectors.
Fiscal Period-End Investment Posture
As of September 30, 2020, the Fund’s primary economic sector allocations included Health Care, Communication Services, Information Technology, Consumer Discretionary, Financials, and Consumer Staples. The Fund had no investments in the Utilities sector.
In terms of country allocations, the Fund’s most significant weightings at period-end, excluding short-term investments, were in Japan, the United Kingdom, Germany, China/Hong Kong, Switzerland, France, and the Netherlands. Country-level weightings generally should be considered a residual of the Fund’s stock selection process rather than a major, proactive facet of its investment strategy.
Sincerely,
THOMAS F. MARSICO
ROBERT G. SUSMAN, CFA
PORTFOLIO MANAGERS
(1) | Total returns are based on net change in net asset value assuming reinvestment of distributions. Periodically, certain fees and expenses have been waived or reimbursed by the Adviser for the International Opportunities Fund. In the absence of such a waiver or reimbursement, the performance returns reflected would have been reduced. In accordance with the expense limitation and fee waiver agreement, the Adviser may recoup fees and expenses previously waived or reimbursed under certain parameters. Periodically, the Adviser has recouped such fees or expenses from the International Opportunities Fund, resulting in a lower performance return. Please see the Prospectus for more information. |
22
INTERNATIONAL OPPORTUNITIES Fund Overview |
September 30, 2020 (Unaudited)
The International Opportunities Fund is a diversified portfolio and invests primarily in common stocks of foreign companies that are selected for their long-term growth potential, including foreign securities, whether traded in the US (including as American Depositary Receipts) or in foreign markets or both. The Fund may invest in an unlimited number of companies of any size throughout the world. It normally invests in the securities of issuers that are economically tied to one or more foreign countries, and expects to be invested in various issuers or securities that together have ties to at least four different foreign countries. The Fund may invest in securities of companies economically tied to emerging markets. Some issuers or securities in the Fund’s portfolio may be economically tied to the US.
TOTAL ANNUAL OPERATING EXPENSES* 1.74% NET EXPENSES*† 1.51% | NET ASSETS $55,024,221 | NET ASSET VALUE PER SHARE $20.57 |
GROWTH OF $10,000(1)(2)(3) | PERFORMANCE COMPARISON(1) |
| | Average Annualized Returns |
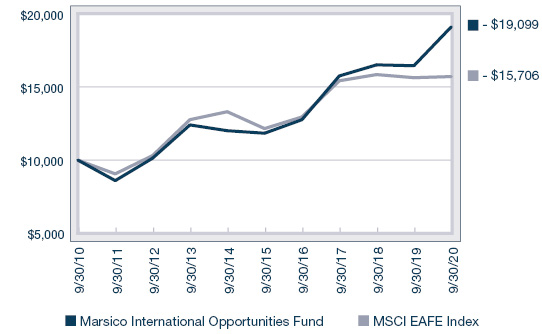
| 
|
SECTOR ALLOCATION(4) | TOP FIVE HOLDINGS |
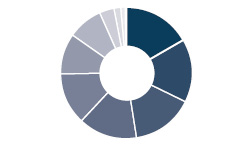 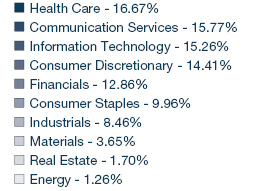
| | | | |
| | Alibaba Group Holding Ltd. Spon. ADR | 5.69% | |
| | Tencent Holdings Ltd. | 3.95% | |
| | Nestlé S.A. | 3.11% | |
| | SAP S.E. | 2.95% | |
| | Cellnex Telecom SA | 2.82% | |
| | | | |
* | The Total Annual Operating Expenses and Net Expenses are reflective of the information disclosed in the Funds’ Prospectus dated January 31, 2020, as supplemented, and may differ from the expense ratios disclosed in this report. |
† | Marsico Capital Management, LLC (the “Adviser”) has entered into a written expense limitation and fee waiver agreement under which it has agreed to limit the total expenses of the International Opportunities Fund (excluding taxes, interest, acquired fund fees and expenses, litigation, extraordinary expenses, and brokerage and other transaction expenses relating to the purchase or sale of portfolio investments) to an annual rate of 1.50% of the Fund’s average net assets until January 31, 2021. This expense limitation and fee waiver agreement may be terminated by the Adviser at any time after January 31, 2021 upon 15 days prior notice to the Fund and its administrator. The Adviser may recoup from the Fund fees previously waived or expenses previously reimbursed by the Adviser with respect to that Fund pursuant to this agreement (or a previous expense limitation agreement) if: (1) such recoupment by the Adviser does not cause the Fund, at the time of recoupment, to exceed the lesser of (a) the expense limitation in effect at the time the relevant amount was waived and/or reimbursed, or (b) the expense limitation in effect at the time of the proposed recoupment, and (2) the recoupment is made within three years after the fiscal year end date as of which the amount to be waived or reimbursed was determined and the waiver or reimbursement occurred. |
(1) | The performance data quoted here represent past performance, and past performance is not a guarantee of future results. Investment return and principal value of an investment will fluctuate so that an investor’s shares, when redeemed, may be worth more or less than their original cost. Current performance may be lower or higher than the performance information quoted. To obtain performance information current to the most recent month-end, please call 888-860-8686 or visit marsicofunds.com. |
| The performance included in the chart and graph does not reflect the deduction of taxes on Fund distributions or the redemption of Fund shares. |
| All indices are unmanaged and investors cannot invest directly in an index. |
| The MSCI EAFE Index tracks the stocks of about 1,000 companies in Europe, Australasia, and the Far East (EAFE). |
(2) | Periodically, certain fees and expenses have been waived or reimbursed by the Adviser for the International Opportunities Fund. In the absence of such a waiver or reimbursement, the performance returns reflected would have been reduced. In accordance with the expense limitation and fee waiver agreement, the Adviser may recoup fees and expenses previously waived or reimbursed under certain parameters. Periodically, the Adviser has recouped such fees or expenses from the International Opportunities Fund, resulting in a lower performance return. |
(3) | This chart assumes an initial investment of $10,000 made on September 30, 2010. Total returns are based on net change in NAV, assuming reinvestment of distributions. |
(4) | Sector weightings represent the percentage of the Fund’s investments (excluding cash equivalents) in certain general sectors. These sectors may include more than one industry. The Fund’s portfolio composition is subject to change at any time. |
23
MARSICO INTERNATIONAL OPPORTUNITIES FUND
SCHEDULE OF INVESTMENTS
September 30, 2020
| | | Number
of
Shares | | | Value | | | Percent
of Net
Assets | |
COMMON STOCKS^ | | | | | | | | | | | | |
Aerospace & Defense | | | | | | | | | | | | |
BAE Systems PLC | | | 80,681 | | | $ | 501,794 | | | | 0.91 | % |
Safran S.A.* | | | 3,320 | | | | 328,686 | | | | 0.60 | |
| | | | | | | 830,480 | | | | 1.51 | |
Apparel, Accessories & Luxury Goods | | | | |
adidas A.G.* | | | 1,652 | | | | 534,775 | | | | 0.97 | |
LVMH Moet Hennessy Louis Vuitton S.E. | | | 1,065 | | | | 498,714 | | | | 0.91 | |
| | | | | | | 1,033,489 | | | | 1.88 | |
Application Software | | | | | | | | | | | | |
Atlassian Corporation PLC - Cl. A* | | | 2,907 | | | | 528,464 | | | | 0.96 | |
Constellation Software, Inc. | | | 288 | | | | 320,028 | | | | 0.58 | |
SAP S.E. | | | 10,429 | | | | 1,623,320 | | | | 2.95 | |
The Descartes Systems Group, Inc.* | | | 6,800 | | | | 387,353 | | | | 0.71 | |
Xero Ltd.* | | | 5,957 | | | | 429,870 | | | | 0.78 | |
| | | | | | | 3,289,035 | | | | 5.98 | |
Asset Management & Custody Banks | | | | |
Julius Baer Group Ltd. | | | 12,810 | | | | 546,169 | | | | 0.99 | |
| | | | | | | | | | | | |
Biotechnology | | | | | | | | | | | | |
CSL Ltd. | | | 1,898 | | | | 390,160 | | | | 0.71 | |
| | | | | | | | | | | | | |
Casinos & Gaming | | | | | | | | | | | | |
Sands China, Ltd. | | | 65,600 | | | | 252,664 | | | | 0.46 | |
| | | | | | | | | | | | | |
Communications Equipment | | | | | | | | |
Telefonaktiebolaget LM Ericsson B Shares | | | 43,083 | | | | 472,786 | | | | 0.86 | |
| | | | | | | | | | | | | |
Consumer Electronics | | | | | | | | | | | | |
Sony Corporation | | | 12,800 | | | | 974,822 | | | | 1.77 | |
| | | | | | | | | | | | | |
Data Processing & Outsourced Services | | | | |
Mastercard, Inc. - Cl. A | | | 1,050 | | | | 355,078 | | | | 0.64 | |
Pagseguro Digital Ltd. - Cl. A* | | | 11,032 | | | | 416,017 | | | | 0.76 | |
PayPal Holdings, Inc.* | | | 1,356 | | | | 267,173 | | | | 0.49 | |
| | | | | | | 1,038,268 | | | | 1.89 | |
Distillers & Vintners | | | | | | | | | | | | |
Diageo PLC | | | 15,969 | | | | 546,048 | | | | 0.99 | |
Pernod Ricard S.A. | | | 2,799 | | | | 446,802 | | | | 0.81 | |
| | | | | | | 992,850 | | | | 1.80 | |
Diversified Banks | | | | | | | | | | | | |
BAWAG Group A.G.* | | | 9,866 | | | | 356,275 | | | | 0.65 | |
BNP Paribas S.A.* | | | 23,280 | | | | 845,451 | | | | 1.53 | |
HDFC Bank Ltd. ADR* | | | 7,605 | | | | 379,946 | | | | 0.69 | |
Sumitomo Mitsui Financial Group, Inc. | | | 17,700 | | | | 489,639 | | | | 0.89 | |
| | | | | | | 2,071,311 | | | | 3.76 | |
Drug Retail | | | | | | | | | | | | |
Zur Rose Group A.G.* | | | 887 | | | | 211,867 | | | | 0.38 | |
| | | | | | | | | | | | | |
Electronic Equipment & Instruments | | | | |
Keyence Corporation | | | 1,600 | | | | 743,071 | | | | 1.35 | |
| | | | | | | | | | | | | |
Financial Exchanges & Data | | | | | | | | |
Deutsche Boerse A.G. | | | 6,153 | | | | 1,080,670 | | | | 1.96 | % |
Hong Kong Exchanges & Clearing Ltd. | | | 4,900 | | | | 228,749 | | | | 0.42 | |
London Stock Exchange Group PLC | | | 2,783 | | | | 318,741 | | | | 0.58 | |
| | | | | | | 1,628,160 | | | | 2.96 | |
Food Retail | | | | | | | | | | | | |
Koninklijke Ahold Delhaize N.V. | | | 10,150 | | | | 300,484 | | | | 0.55 | |
| | | | | | | | | | | | | |
General Merchandise Stores | | | | |
B&M European Value Retail S.A. | | | 130,418 | | | | 832,505 | | | | 1.51 | |
Dollarama, Inc. | | | 11,269 | | | | 431,955 | | | | 0.79 | |
| | | | | | | 1,264,460 | | | | 2.30 | |
Health Care Equipment | | | | | | | | | | | | |
Koninklijke Philips N.V.* | | | 27,228 | | | | 1,283,323 | | | | 2.33 | |
Olympus Corporation | | | 30,100 | | | | 622,749 | | | | 1.13 | |
Straumann Holding A.G. | | | 269 | | | | 271,614 | | | | 0.50 | |
| | | | | | | 2,177,686 | | | | 3.96 | |
Health Care Supplies | | | | | | | | | | | | |
Alcon, Inc.* | | | 6,970 | | | | 395,778 | | | | 0.72 | |
| | | | | | | | | | | | | |
Heavy Electrical Equipment | | | | | | | | |
Siemens Energy A.G.* | | | 5,223 | | | | 140,845 | | | | 0.26 | |
| | | | | | | | | | | | | |
Human Resource & Employment Services | | | | |
Recruit Holdings Company Ltd. | | | 12,300 | | | | 485,166 | | | | 0.88 | |
| | | | | | | | | | | | | |
Industrial Conglomerates | | | | | | | | | | | | |
Siemens A.G. | | | 10,446 | | | | 1,321,251 | | | | 2.40 | |
| | | | | | | | | | | | | |
Industrial Gases | | | | | | | | | | | | |
Air Liquide S.A. | | | 3,042 | | | | 483,273 | | | | 0.88 | |
| | | | | | | | | | | | | |
Industrial Machinery | | | | | | | | | | | | |
MISUMI Group, Inc. | | | 20,500 | | | | 570,497 | | | | 1.04 | |
| | | | | | | | | | | | |
Integrated Oil & Gas | | | | | | | | | | | | |
TOTAL S.E. | | | 20,225 | | | | 692,414 | | | | 1.26 | |
| | | | | | | | | | | | | |
Integrated Telecommunication Services | | | | |
Cellnex Telecom SA | | | 25,469 | | | | 1,552,779 | | | | 2.82 | |
Infrastrutture Wireless Italiane SpA | | | 28,330 | | | | 313,554 | | | | 0.57 | |
| | | | | | | 1,866,333 | | | | 3.39 | |
Interactive Home Entertainment | | | | | | | | |
Nintendo Co., Ltd. | | | 1,600 | | | | 905,097 | | | | 1.64 | |
Sea Ltd. ADR* | | | 3,636 | | | | 560,089 | | | | 1.02 | |
| | | | | | | 1,465,186 | | | | 2.66 | |
Interactive Media & Services | | | | |
Adevinta ASA* | | | 23,770 | | | | 408,505 | | | | 0.74 | |
Facebook, Inc. - Cl. A* | | | 1,424 | | | | 372,946 | | | | 0.68 | |
REA Group Ltd. | | | 6,872 | | | | 541,280 | | | | 0.98 | |
Scout24 A.G. | | | 8,646 | | | | 755,206 | | | | 1.37 | |
Tencent Holdings Ltd. | | | 32,900 | | | | 2,171,386 | | | | 3.95 | |
Z Holdings Corporation | | | 83,000 | | | | 550,107 | | | | 1.00 | |
| | | | | | | 4,799,430 | | | | 8.72 | |
24
| | | Number
of
Shares | | | Value | | | Percent
of Net
Assets | |
COMMON STOCKS^ (continued) | | | | | | | | |
Internet & Direct Marketing Retail | | | | |
Alibaba Group Holding Ltd. Spon. ADR* | | | 10,659 | | | $ | 3,133,533 | | | | 5.69 | % |
boohoo Group PLC* | | | 90,704 | | | | 439,484 | | | | 0.80 | |
Trainline PLC* | | | 61,200 | | | | 286,659 | | | | 0.52 | |
| | | | | | | 3,859,676 | | | | 7.01 | |
Internet Services & Infrastructure | | | | | | | | |
Shopify, Inc. - Cl. A* | | | 305 | | | | 312,006 | | | | 0.57 | |
| | | | | | | | | | | | | |
Life & Health Insurance | | | | | | | | | | | | |
AIA Group Ltd. | | | 59,400 | | | | 581,733 | | | | 1.06 | |
| | | | | | | | | | | | | |
Movies & Entertainment | | | | | | | | | | | | |
Spotify Technology S.A.* | | | 2,134 | | | | 517,644 | | | | 0.94 | |
| | | | | | | | | | | | | |
Multi-Line Insurance | | | | | | | | | | | | |
AXA S.A. | | | 46,879 | | | | 867,100 | | | | 1.58 | |
| | | | | | | | | | | | | |
Packaged Foods & Meats | | | | | | | | | | | | |
Nestlé S.A. | | | 14,398 | | | | 1,709,220 | | | | 3.11 | |
| | | | | | | | | | | | | |
Personal Products | | | | | | | | | | | | |
L’Oreal S.A. | | | 1,030 | | | | 335,236 | | | | 0.61 | |
Unilever PLC | | | 22,004 | | | | 1,356,042 | | | | 2.46 | |
| | | | | | | 1,691,278 | | | | 3.07 | |
Pharmaceuticals | | | | | | | | | | | | |
AstraZeneca PLC | | | 4,779 | | | | 521,508 | | | | 0.95 | |
Bayer A.G. | | | 6,015 | | | | 375,957 | | | | 0.68 | |
Dechra Pharmaceuticals PLC | | | 18,855 | | | | 784,384 | | | | 1.43 | |
GW Pharmaceuticals PLC ADR* | | | 3,068 | | | | 298,670 | | | | 0.54 | |
Novartis AG | | | 16,308 | | | | 1,414,877 | | | | 2.57 | |
Novo Nordisk A/S - Cl. B | | | 7,229 | | | | 500,175 | | | | 0.91 | |
Roche Holding AG | | | 3,932 | | | | 1,345,388 | | | | 2.45 | |
Takeda Pharmaceutical Company Ltd. | | | 26,400 | | | | 937,198 | | | | 1.70 | |
| | | | | | | 6,178,157 | | | | 11.23 | |
Property & Casualty Insurance | | | | | | | | |
Tokio Marine Holdings, Inc. | | | 20,000 | | | | 872,327 | | | | 1.59 | |
| | | | | | | | | | | | | |
Real Estate Operating Companies | | | | |
Aroundtown S.A.* | | | 98,870 | | | | 497,297 | | | | 0.90 | |
| | | | | | | | | | | | | |
Real Estate Services | | | | | | | | | | | | |
FirstService Corporation | | | 3,300 | | | | 435,489 | | | | 0.79 | |
| | | | | | | | | | | | | |
Reinsurance | | | | | | | | | | | | |
Muenchener Rueckversicherungs-Gesellschaft AG | | | 1,896 | | | | 481,494 | | | | 0.87 | |
| | | | | | | | | | | | | |
Research & Consulting Services | | | | | | | | |
Experian PLC | | | 12,210 | | | | 460,051 | | | | 0.84 | |
RELX PLC | | | 18,410 | | | | 410,017 | | | | 0.74 | |
| | | | | | | 870,068 | | | | 1.58 | |
Restaurants | | | | | | | | | | | | |
Domino’s Pizza Enterprises Ltd. | | | 9,065 | | | | 514,360 | | | | 0.93 | % |
| | | | | | | | | | | | | |
Semiconductor Equipment | | | | | | | | | | | | |
ASML Holding N.V. | | | 2,994 | | | | 1,104,696 | | | | 2.01 | |
Tokyo Electron Ltd. | | | 2,200 | | | | 570,104 | | | | 1.03 | |
| | | | | | | 1,674,800 | | | | 3.04 | |
Semiconductors | | | | | | | | | | | | |
Taiwan Semiconductor Manufacturing Co., Ltd. Spon. ADR | | | 4,278 | | | | 346,817 | | | | 0.63 | |
| | | | | | | | | | | | | |
Soft Drinks | | | | | | | | | | | | |
Coca-Cola European Partners PLC | | | 14,307 | | | | 555,255 | | | | 1.01 | |
| | | | | | | | | | | | | |
Specialty Chemicals | | | | | | | | | | | | |
Akzo Nobel N.V. | | | 4,150 | | | | 420,491 | | | | 0.76 | |
Shin-Etsu Chemical Company Ltd. | | | 5,700 | | | | 739,625 | | | | 1.34 | |
Symrise A.G. | | | 2,568 | | | | 355,280 | | | | 0.65 | |
| | | | | | | 1,515,396 | | | | 2.75 | |
Technology Hardware, Storage & Peripherals | | | | |
Samsung Electronics Company Ltd. GDR 144A† | | | 385 | | | | 487,795 | | | | 0.89 | |
| | | | | | | | | | | | | |
Trucking | | | | | | | | | | | | |
Uber Technologies, Inc.* | | | 11,552 | | | | 421,417 | | | | 0.77 | |
| | | | | | | | | | | | | |
TOTAL COMMON STOCKS | | | | | | | | | | | | |
(Cost $40,639,952) | | | | | | | 54,827,264 | | | | 99.64 | |
| | | | | | | | | | | | |
SHORT-TERM INVESTMENTS^ | | | | | | | | |
State Street Institutional Treasury Money Market Fund - Premier Class, 0.000% | | | 305,210 | | | | 305,210 | | | | 0.56 | |
| | | | | | | | | | | | | |
TOTAL SHORT-TERM INVESTMENTS | | | | | | | | |
(Cost $305,210) | | | | | | | 305,210 | | | | 0.56 | |
| | | | | | | | | | | | | |
TOTAL INVESTMENTS | | | | | | | | | | | | |
(Cost $40,945,162) | | | | | | | 55,132,474 | | | | 100.20 | |
| | | | | | | | | | | | | |
Liabilities, Less Cash and Other Assets | | | | | | | (108,253 | ) | | | (0.20 | ) |
| | | | | | | | | | | | | |
NET ASSETS | | | | | | $ | 55,024,221 | | | | 100.00 | % |
25
MARSICO INTERNATIONAL OPPORTUNITIES FUND
SCHEDULE OF INVESTMENTS (continued)
September 30, 2020
SUMMARY OF INVESTMENTS BY COUNTRY |
Country | | Market Value | | | Percent of
Investment
Securities | |
Australia | | $ | 1,974,264 | | | | 3.58% | |
Austria | | | 356,275 | | | | 0.64 | |
Brazil | | | 416,017 | | | | 0.75 | |
Canada | | | 1,886,831 | | | | 3.42 | |
China/Hong Kong | | | 6,368,065 | | | | 11.55 | |
Denmark | | | 500,175 | | | | 0.91 | |
France | | | 4,497,676 | | | | 8.16 | |
Germany | | | 7,166,095 | | | | 13.00 | |
India | | | 379,946 | | | | 0.69 | |
Italy | | | 313,554 | | | | 0.57 | |
Japan | | | 8,460,402 | | | | 15.35 | |
Netherlands | | | 3,108,994 | | | | 5.64 | |
New Zealand | | | 429,870 | | | | 0.78 | |
Norway | | | 408,505 | | | | 0.74 | |
Singapore | | | 560,089 | | | | 1.02 | |
South Korea | | | 487,795 | | | | 0.88 | |
Spain | | | 1,552,779 | | | | 2.82 | |
Sweden | | | 990,430 | | | | 1.80 | |
Switzerland | | | 5,894,913 | | | | 10.69 | |
Taiwan | | | 346,817 | | | | 0.63 | |
United Kingdom | | | 7,311,158 | | | | 13.26 | |
United States(1) | | | 1,721,824 | | | | 3.12 | |
| | | $ | 55,132,474 | | | | 100.00% | |
(1) | Includes short-term securities. |
^ | As of September 30, 2020, all investments were classified as Level 1 with their corresponding fair valuation disclosed in the above Schedule of Investments. For more information on investment valuation and valuation inputs, refer to Note 2(a) in the Notes to Financial Statements. |
† | This security has been determined to be liquid under guidelines established by the Board of Trustees. At September 30, 2020, the total value of the Fund’s 144A securities was 0.89% of net assets. |
| See notes to financial statements. |
26
Investment Review BY TOM MARSICO, BRANDON GEISLER, AND ROB SUSMAN (UNAUDITED)
The Marsico Global Fund posted a total return of (US$) +42.15% for the one-year fiscal period ended September 30, 2020. The Fund strongly outperformed the MSCI All Country World Index (“MSCI ACWI Index”), the Fund’s benchmark index, which had a total return of (US$) +10.44% over the same time period. Please see the Fund’s Overview for more detailed information about the Fund’s longer-term performance for various time periods ended September 30, 2020.
The performance data for the Fund quoted here represent past performance, and past performance is not a guarantee of future results. Investment return and principal value of an investment will fluctuate so that an investor’s shares, when redeemed, may be worth more or less than their original cost. Current performance may be lower or higher than the performance information quoted. To obtain performance information current to the most recent month-end, please call 888-860-8686 or visit marsicofunds.com.(1)
This review highlights Fund performance over a one-year fiscal period. Shareholders should keep in mind that the Fund is intended for long-term investors who hold their shares for substantially longer periods of time. You should also keep in mind that our current views and beliefs regarding all investments discussed in this report are subject to change at any time. References to specific securities, industries, and sectors discussed in this report are not recommendations to buy or sell such securities or related investments, and the Fund may not necessarily hold these securities or investments today. Please see the accompanying Schedule of Investments for the percentage of the Fund’s portfolio represented by the securities mentioned in this report as of the end of the reporting period.
Foreign investments present additional risks due to currency fluctuations, economic and political factors, lower liquidity, differences in securities regulations and accounting standards, possible changes in taxation, limited public information, and other factors. In addition, the Fund is subject to broad risks associated with investing in equity securities markets generally, including the risks that the securities and markets in which it invests may experience volatility and instability, that domestic and global economies and markets may undergo periods of cyclical change and decline, that investors may at times avoid investments in equity securities, and that investments may not perform as anticipated. Please see the Prospectus for more information.
The Fund is not managed to track its benchmark index, and may hold a substantially overweight or underweight position in a sector, industry, or security compared to its weight in the benchmark. The Fund may be subject to risks associated with a particular sector or other area in which it is overweight, including the risk that the stocks of companies within one area could simultaneously decline in price because of an event that affects the entire area. For informational purposes, the discussion below may compare the benchmark weight or performance of a sector or industry to the investment approach of the Fund.
The Global Fund’s strong outperformance during the one-year period ended September 30, 2020 as compared to the MSCI ACWI Index was due, in part, to certain strong-performing stocks in the Information Technology, Consumer Discretionary, and Communication Services sectors as defined in the Global Industry Classification Standard (“GICS”). The Fund’s performance was also aided relative to the benchmark index by having an overweight allocation in the Information Technology sector, underweight allocation in the Financials sector, and no exposure to the Energy sector, which was the weakest-performing sector during the period.
In the Information Technology sector, semiconductor company NVIDIA Corporation (“NVIDIA”) (+207%) rose on the back of its launch of a new graphics processing chip used for both video gaming graphics cards and the company’s datacenter products. NVIDIA also made a successful acquisition earlier in the year of Mellanox Technologies, a supplier of computer networking products. Additionally, in mid-September, NVIDIA announced its intention to acquire ARM Holdings, a UK-based semiconductor and software design company that licenses intellectual property for producing processors that are complementary to NVIDIA’s current offerings.
Also contributing to the Fund’s outperformance was software company Twilio, Inc. – Cl. A (“TWLO”) (+124%). TWLO is a leading cloud communications platform that enables businesses and their customers to communicate more effectively in a mobile-first environment. As the customers of many companies have been forced to work from home as a result of the pandemic, companies have had to develop new ways to reach customers. This trend has led to accelerating adoption and growth of TWLO’s products and services by companies like Nike, Uber, and Netflix. The company announced projected revenue growth of over 30% for the next 4 years, leading to strong performance by the stock.
We added several new positions to the Global Fund during the one-year period including software company ServiceNow, Inc. (“ServiceNow”) (+102%). We believe ServiceNow is uniquely positioned to accelerate the work from home (”WFH”) movement as its tools provide an enterprise with the ability to better understand workflow across the different areas of its business (Finance, Human Resources, Sales, etc.). With a number of employees working from remote locations, enterprises often struggle to accurately gauge employee productivity and other workforce data. This is one of the areas in which ServiceNow may add significant value. We believe we are just in the beginning stages of a paradigm shift toward WFH, which should lead to significant revenue growth and high incremental margins for the company going forward.
27
The Fund’s performance was inhibited by an underweight stance relative to its benchmark in the strong-performing Health Care sector and an overweight stance in the Real Estate sector, which was one of the weaker-performing sectors during the year.
Specifically, Germany-based real estate company Aroundtown S.A. (“Aroundtown”) (-36% prior to being sold) performed well in 2019 and the first two months of 2020. Then, as concerns mounted about a growing recession and the question of when Europeans will travel again and stay at hotels, Aroundtown’s stock languished along with those of other commercial and hotel real estate operators, causing us to exit the position in the Global Fund.
In addition, Uber Technologies, Inc. (“UBER”) slid -55% during the period and was sold as the spread of COVID-19 led to the global population reducing activities outside of their homes. Because UBER is highly reliant on consumer demand for transportation to work, the airport, or other commerce activities to drive revenue, the company’s business is understandably under pressure with continued uncertainty regarding when the world can return to normal activities.
Although active currency management is not a central facet of the Global Fund’s investment process, fluctuations in major world currencies can at times affect the Fund’s performance. During the period, the net effect of currency moves had a positive impact on Fund performance.
During the period, the Fund increased its allocations to the Communication Services, Information Technology, Consumer Discretionary, and Financials sectors. The Fund eliminated its holdings in the Industrials sector and reduced its position in the Real Estate sector. There were no significant changes to the Fund’s allocations to the Consumer Staples, Materials, and Health Care sectors.
Fiscal Period-End Investment Posture
As of September 30, 2020, the Fund’s primary economic sector allocations included Information Technology, Consumer Discretionary, and Communication Services. The Fund had no investments in the Energy, Industrials, or Utilities sectors.
The Fund’s most significant country allocation weightings at period-end, excluding short-term investments, were in the United States, China/Hong Kong, Switzerland, Germany, France, and the Netherlands. Country-level weightings generally should be considered a residual of the Fund’s stock selection process rather than a major, proactive facet of its investment strategy.
Sincerely,
THOMAS F. MARSICO
BRANDON A. GEISLER
ROBERT G. SUSMAN, CFA
PORTFOLIO MANAGERS
(1) | Total returns are based on net change in net asset value assuming reinvestment of distributions. Periodically, certain fees and expenses have been waived or reimbursed by the Adviser for the Global Fund. In the absence of such a waiver or reimbursement, the performance returns reflected would have been reduced. In accordance with the expense limitation and fee waiver agreement, the Adviser may recoup fees and expenses previously waived or reimbursed under certain parameters. Periodically, the Adviser has recouped such fees or expenses from the Global Fund, resulting in a lower performance return. Please see the Prospectus for more information. |
28
September 30, 2020 (Unaudited)
The Global Fund is a diversified portfolio and invests primarily in the common stocks of US and foreign companies that are selected for their long-term growth potential. The Fund may invest in an unlimited number of companies of any size that are economically tied to any countries or markets throughout the world, including securities of companies economically tied to emerging markets. Under normal market conditions, the Fund will invest significantly (generally, at least 40% of its net assets) in the securities of issuers organized or located outside the US or doing business outside the US or other foreign securities (unless market conditions are not deemed favorable by the Adviser, in which case the Fund generally will invest at least 30% of its assets in such foreign securities). The Fund will invest its assets in various regions and countries, including the US, that encompass not less than three different countries overall.
TOTAL ANNUAL OPERATING EXPENSES* 1.41% NET EXPENSES*† 1.45% | NET ASSETS $285,033,117 | NET ASSET VALUE PER SHARE $22.83 |
GROWTH OF $10,000(1)(2)(3) | PERFORMANCE COMPARISON(1) |
| | Average Annualized Returns |
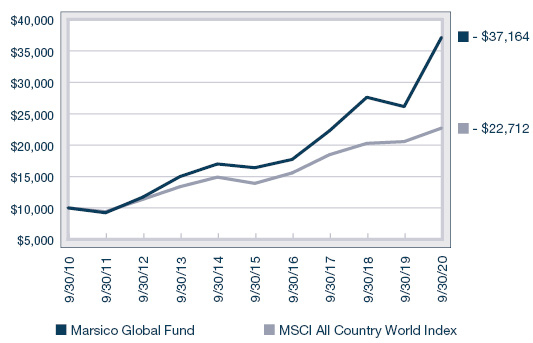
| 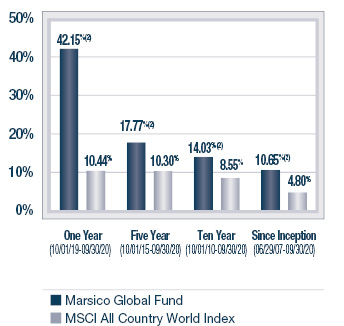
|
SECTOR ALLOCATION(4) | TOP FIVE HOLDINGS |
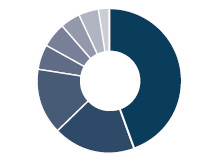 
| | | | |
| | Amazon.com, Inc. | 6.44% | |
| | Alibaba Group Holding Ltd. Spon. ADR | 5.97% | |
| | Microsoft Corporation | 5.63% | |
| | Facebook, Inc. - Cl. A | 4.40% | |
| | Apple, Inc. | 4.26% | |
| | | | |
* | The Total Annual Operating Expenses and Net Expenses are reflective of the information disclosed in the Funds’ Prospectus dated January 31, 2020, as supplemented, and may differ from the expense ratios disclosed in this report. |
† | Marsico Capital Management, LLC (the “Adviser”) has entered into a written expense limitation and fee waiver agreement under which it has agreed to limit the total expenses of the Global Fund (excluding taxes, interest, acquired fund fees and expenses, litigation, extraordinary expenses, and brokerage and other transaction expenses relating to the purchase or sale of portfolio investments) to an annual rate of 1.45% of the Fund’s average net assets until January 31, 2021. This expense limitation and fee waiver agreement may be terminated by the Adviser at any time after January 31, 2021 upon 15 days prior notice to the Fund and its administrator. The Adviser may recoup from the Fund fees previously waived or expenses previously reimbursed by the Adviser with respect to that Fund pursuant to this agreement (or a previous expense limitation agreement) if: (1) such recoupment by the Adviser does not cause the Fund, at the time of recoupment, to exceed the lesser of (a) the expense limitation in effect at the time the relevant amount was waived and/or reimbursed, or (b) the expense limitation in effect at the time of the proposed recoupment, and (2) the recoupment is made within three years after the fiscal year end date as of which the amount to be waived or reimbursed was determined and the waiver or reimbursement occurred. |
(1) | The performance data quoted here represent past performance, and past performance is not a guarantee of future results. Investment return and principal value of an investment will fluctuate so that an investor’s shares, when redeemed, may be worth more or less than their original cost. Current performance may be lower or higher than the performance information quoted. To obtain performance information current to the most recent month-end, please call 888-860-8686 or visit marsicofunds.com. |
| The performance included in the chart and graph does not reflect the deduction of taxes on Fund distributions or the redemption of Fund shares. |
| All indices are unmanaged and investors cannot invest directly in an index. |
| The MSCI ACWI (All Country World Index) Index is a free float-adjusted market capitalization index that is designed to measure equity market performance in the global developed and emerging markets. |
(2) | Periodically, certain fees and expenses have been waived or reimbursed by the Adviser for the Global Fund. In the absence of such a waiver or reimbursement, the performance returns reflected would have been reduced. In accordance with the expense limitation and fee waiver agreement, the Adviser may recoup fees and expenses previously waived or reimbursed under certain parameters. Periodically, the Adviser has recouped such fees or expenses from the Global Fund, resulting in a lower performance return. |
(3) | This chart assumes an initial investment of $10,000 made on September 30, 2010. Total returns are based on change in NAV, assuming reinvestment of distributions. |
(4) | Sector weightings represent the percentage of the Fund’s investments (excluding cash equivalents) in certain general sectors. These sectors may include more than one industry. The Fund’s portfolio composition is subject to change at any time. |
29
MARSICO GLOBAL FUND
SCHEDULE OF INVESTMENTS
September 30, 2020
| | | Number
of
Shares | | | Value | | | Percent
of Net
Assets | |
COMMON STOCKS^ | | | | | | | | | | | | |
Apparel, Accessories & Luxury Goods | | | | |
Hermes International | | | 8,813 | | | $ | 7,607,007 | | | | 2.67 | % |
lululemon athletica, inc.* | | | 27,734 | | | | 9,134,748 | | | | 3.20 | |
| | | | | | | 16,741,755 | | | | 5.87 | |
Application Software | | | | | | | | | | | | |
Atlassian Corporation PLC - Cl. A* | | | 26,520 | | | | 4,821,071 | | | | 1.69 | |
SAP S.E. | | | 35,639 | | | | 5,547,368 | | | | 1.95 | |
| | | | | | | 10,368,439 | | | | 3.64 | |
Data Processing & Outsourced Services | | | | |
Adyen N.V.* | | | 2,583 | | | | 4,762,218 | | | | 1.67 | |
PayPal Holdings, Inc.* | | | 46,660 | | | | 9,193,420 | | | | 3.23 | |
Square, Inc. - Cl. A* | | | 54,767 | | | | 8,902,376 | | | | 3.12 | |
Visa, Inc. - Cl. A | | | 54,241 | | | | 10,846,573 | | | | 3.80 | |
| | | | | | | 33,704,587 | | | | 11.82 | |
Financial Exchanges & Data | | | | | | | | |
Deutsche Boerse A.G. | | | 29,063 | | | | 5,104,421 | | | | 1.79 | |
S&P Global, Inc. | | | 18,937 | | | | 6,828,682 | | | | 2.40 | |
| | | | | | | 11,933,103 | | | | 4.19 | |
Integrated Telecommunication Services | | | | |
Cellnex Telecom SA | | | 127,901 | | | | 7,797,790 | | | | 2.74 | |
| | | | | | | | | | | | | |
Interactive Media & Services |
Facebook, Inc. - Cl. A* | | | 47,851 | | | | 12,532,177 | | | | 4.40 | |
Scout24 A.G. | | | 55,464 | | | | 4,844,642 | | | | 1.70 | |
Tencent Holdings Ltd. ADR | | | 142,852 | | | | 9,663,938 | | | | 3.39 | |
| | | | | | | 27,040,757 | | | | 9.49 | |
Internet & Direct Marketing Retail | | | | | | | | |
Alibaba Group Holding Ltd. Spon. ADR* | | | 57,888 | | | | 17,017,914 | | | | 5.97 | |
Amazon.com, Inc.* | | | 5,829 | | | | 18,353,947 | | | | 6.44 | |
| | | | | | | 35,371,861 | | | | 12.41 | |
Internet Services & Infrastructure | | | | |
Okta, Inc.* | | | 7,773 | | | | 1,662,256 | | | | 0.58 | |
Shopify, Inc. - Cl. A* | | | 7,744 | | | | 7,921,880 | | | | 2.78 | |
Twilio, Inc. - Cl. A* | | | 32,635 | | | | 8,063,782 | | | | 2.83 | |
| | | | | | | 17,647,918 | | | | 6.19 | |
Life Sciences Tools & Services | | | | | | | | |
Lonza Group AG | | | 9,117 | | | | 5,628,279 | | | | 1.97 | |
| | | | | | | | | | | | | |
Metal & Glass Containers | | | | | | | | | | | | |
Ball Corporation | | | 90,874 | | | | 7,553,447 | | | | 2.65 | |
| | | | | | | | | | | | | |
Movies & Entertainment | | | | | | | | | | | | |
Spotify Technology S.A.* | | | 27,910 | | | | 6,770,129 | | | | 2.38 | |
| | | | | | | | | | | | | |
Personal Products | | | | | | | | | | | | |
L’Oreal S.A. | | | 21,664 | | | | 7,051,026 | | | | 2.47 | |
| | | | | | | | | | | | | |
Pharmaceuticals | | | | | | | | | | | | |
Roche Holding AG | | | 29,459 | | | | 10,079,804 | | | | 3.54 | |
| | | | | | | | | | | | | |
Semiconductor Equipment | | | | | | | | | | | | |
ASML Holding N.V. - NY Reg. Shs. | | | 26,284 | | | | 9,705,893 | | | | 3.41 | |
| | | | | | | | | | | | | |
Semiconductors | | | | | | | | | | | | |
NVIDIA Corporation | | | 20,203 | | | | 10,934,268 | | | | 3.84 | % |
Taiwan Semiconductor Manufacturing Co., Ltd. Spon. ADR | | | 56,787 | | | | 4,603,722 | | | | 1.61 | |
| | | | | | | 15,537,990 | | | | 5.45 | |
Specialized REITs | | | | | | | | | | | | |
Crown Castle International Corp. | | | 44,159 | | | | 7,352,473 | | | | 2.58 | |
Digital Realty Trust, Inc. | | | 36,739 | | | | 5,391,816 | | | | 1.89 | |
| | | | | | | 12,744,289 | | | | 4.47 | |
Specialty Chemicals | | | | | | | | | | | | |
The Sherwin-Williams Company | | | 10,971 | | | | 7,643,934 | | | | 2.68 | |
| | | | | | | | | | | | | |
Systems Software | | | | | | | | | | | | |
Microsoft Corporation | | | 76,272 | | | | 16,042,290 | | | | 5.63 | |
ServiceNow, Inc.* | | | 20,862 | | | | 10,118,070 | | | | 3.55 | |
| | | | | | | 26,160,360 | | | | 9.18 | |
Technology Hardware, Storage & Peripherals | | | | |
Apple, Inc. | | | 104,964 | | | | 12,155,881 | | | | 4.26 | |
| | | | | | | | | | | | | |
TOTAL COMMON STOCKS | | | | | | | | | | | | |
(Cost $153,645,493) | | | | | | | 281,637,242 | | | | 98.81 | |
| | | | | | | | | | | | | |
SHORT-TERM INVESTMENTS^ | | | | | | | | |
State Street Institutional Treasury Money Market Fund - Premier Class, 0.000% | | | 3,853,834 | | | | 3,853,834 | | | | 1.35 | |
| | | | | | | | | | | | | |
TOTAL SHORT-TERM INVESTMENTS | | | | |
(Cost $3,853,834) | | | | | | | 3,853,834 | | | | 1.35 | |
| | | | | | | | | | | | | |
TOTAL INVESTMENTS | | | | | | | | | | | | |
(Cost $157,499,327) | | | | | | | 285,491,076 | | | | 100.16 | |
| | | | | | | | | | | | | |
Liabilities, Less Cash and Other Assets | | | | | | | (457,959 | ) | | | (0.16 | ) |
| | | | | | | | | | | | | |
NET ASSETS | | | | | | $ | 285,033,117 | | | | 100.00 | % |
30
SUMMARY OF INVESTMENTS BY COUNTRY |
Country | | Market Value | | | Percent of
Investment
Securities | |
Australia | | $ | 4,821,071 | | | | 1.69 | % |
Canada | | | 7,921,880 | | | | 2.78 | |
China/Hong Kong | | | 26,681,852 | | | | 9.35 | |
France | | | 14,658,033 | | | | 5.13 | |
Germany | | | 15,496,431 | | | | 5.43 | |
Netherlands | | | 14,468,111 | | | | 5.07 | |
Spain | | | 7,797,790 | | | | 2.73 | |
Sweden | | | 6,770,129 | | | | 2.37 | |
Switzerland | | | 15,708,083 | | | | 5.50 | |
Taiwan | | | 4,603,722 | | | | 1.61 | |
United States(1) | | | 166,563,974 | | | | 58.34 | |
| | | $ | 285,491,076 | | | | 100.00 | % |
(1) | Includes short-term securities. |
^ | As of September 30, 2020, all investments were classified as Level 1 with their corresponding fair valuation disclosed in the above Schedule of Investments. For more information on investment valuation and valuation inputs, refer to Note 2(a) in the Notes to Financial Statements. |
| See notes to financial statements. |
31
STATEMENTS OF ASSETS AND LIABILITIES
September 30, 2020
(Amounts in thousands) | | MARSICO
FOCUS FUND | | | MARSICO
GROWTH FUND | |
| | | | | | | | | |
ASSETS | | | | | | | | |
Investments, at value (cost $420,231, $226,388, $187,926, $40,945, and $157,499, respectively) | | $ | 808,130 | | | $ | 414,537 | |
Receivable for capital stock sold | | | 33 | | | | 90 | |
Dividends receivable | | | 128 | | | | 8 | |
Prepaid expenses and other assets | | | 4,681 | | | | 1,705 | |
Total Assets | | | 812,972 | | | | 416,340 | |
| | | | | | | | | |
LIABILITIES | | | | | | | | |
Payable for investments purchased | | | — | | | | 2,210 | |
Payable for capital stock redeemed | | | 233 | | | | 44 | |
Payable to investment adviser | | | 489 | | | | 379 | |
Accrued trustees’ fees | | | 4,660 | | | | 1,688 | |
Accrued distribution fee | | | 1,187 | | | | 1,307 | |
Accrued professional fees | | | 84 | | | | 41 | |
Accrued transfer agent fees and expenses | | | 76 | | | | 40 | |
Accrued reporting, printing and postage expenses | | | 22 | | | | 12 | |
Accrued expenses and other liabilities | | | 40 | | | | 27 | |
Total Liabilities | | | 6,791 | | | | 5,748 | |
| | | | | | | | | |
NET ASSETS | | $ | 806,181 | | | $ | 410,592 | |
| | | | | | | | | |
NET ASSETS CONSIST OF | | | | | | | | |
Paid-in-capital | | $ | 340,222 | | | $ | 186,428 | |
Total distributable earnings | | | 465,959 | | | | 224,164 | |
NET ASSETS | | $ | 806,181 | | | $ | 410,592 | |
| | | | | | | | | |
SHARES OUTSTANDING, $0.001 par value | | | | | | | | |
(Unlimited shares authorized) | | | 31,099 | | | | 15,999 | |
| | | | | | | | | |
NET ASSET VALUE, REDEMPTION PRICE, AND OFFERING PRICE PER SHARE (NET ASSETS/SHARES OUTSTANDING)* | | $ | 25.92 | | | $ | 25.66 | |
* | Not in thousands, based on unrounded net assets and shares outstanding. |
| See notes to financial statements. |
32
| | MARSICO
21st CENTURY FUND | | | MARSICO
INTERNATIONAL
OPPORTUNITIES
FUND | | | MARSICO
GLOBAL FUND | |
| | | | | | | | | | | | |
| | | | | | | | | | | | |
| | $ | 292,690 | | | $ | 55,132 | | | $ | 285,491 | |
| | | 2 | | | | 1 | | | | 40 | |
| | | 59 | | | | 196 | | | | 78 | |
| | | 481 | | | | 244 | | | | 2,791 | |
| | | 293,232 | | | | 55,573 | | | | 288,400 | |
| | | | | | | | | | | | |
| | | | | | | | | | | | |
| | | — | | | | 99 | | | | — | |
| | | 153 | | | | 5 | | | | 18 | |
| | | 187 | | | | 27 | | | | 293 | |
| | | 466 | | | | 232 | | | | 2,773 | |
| | | 335 | | | | 143 | | | | 178 | |
| | | 36 | | | | 9 | | | | 32 | |
| | | 36 | | | | 10 | | | | 36 | |
| | | 10 | | | | 3 | | | | 9 | |
| | | 33 | | | | 21 | | | | 28 | |
| | | 1,256 | | | | 549 | | | | 3,367 | |
| | | | | | | | | | | | |
| | $ | 291,976 | | | $ | 55,024 | | | $ | 285,033 | |
| | | | | | | | | | | | |
| | | | | | | | | | | | |
| | $ | 184,001 | | | $ | 42,245 | | | $ | 153,652 | |
| | | 107,975 | | | | 12,779 | | | | 131,381 | |
| | $ | 291,976 | | | $ | 55,024 | | | $ | 285,033 | |
| | | | | | | | | | | | |
| | | | | | | | | | | | |
| | | 7,387 | | | | 2,675 | | | | 12,485 | |
| | | | | | | | | | | | |
| | $ | 39.52 | | | $ | 20.57 | | | $ | 22.83 | |
33
STATEMENTS OF OPERATIONS
FOR THE YEAR ENDED September 30, 2020
(Amounts in thousands) | | MARSICO
FOCUS FUND | | | MARSICO
GROWTH FUND | |
| | | | | | | | | |
INVESTMENT INCOME | | | | | | | | |
Dividends (net of $0, $0, $9, $92, and $83, respectively, of non-reclaimable foreign withholding taxes) | | $ | 4,546 | | | $ | 1,819 | |
Total Investment Income | | | 4,546 | | | | 1,819 | |
| | | | | | | | | |
EXPENSES | | | | | | | | |
Investment advisory fees | | | 4,817 | | | | 2,419 | |
Distribution fees | | | — | | | | 765 | |
Trustees’ fees and expenses | | | 1,742 | (1) | | | 634 | (1) |
Transfer agent fees and expenses | | | 567 | | | | 287 | |
Professional fees | | | 293 | | | | 138 | |
Fund administration fees | | | 163 | | | | 131 | |
Custody and fund accounting fees | | | 118 | | | | 86 | |
Miscellaneous | | | 85 | | | | 43 | |
Reporting, printing, and postage expenses | | | 77 | | | | 43 | |
Federal and state registration fees | | | 34 | | | | 28 | |
Total Expenses | | | 7,896 | | | | 4,574 | |
Less waiver of expenses and expenses paid indirectly | | | (1 | ) | | | (139 | ) |
Net Expenses | | | 7,895 | | | | 4,435 | |
| | | | | | | | | |
NET INVESTMENT INCOME (LOSS) | | | (3,349 | ) | | | (2,616 | ) |
| | | | | | | | | |
REALIZED AND UNREALIZED GAIN (LOSS) | | | | | | | | |
Net realized gain on investments | | | 82,521 | | | | 39,875 | |
Net realized loss on foreign currency transactions | | | — | | | | — | |
Change in unrealized appreciation (depreciation) on investments, foreign currency translations, and non-interested trustees’ deferred compensation | | | 192,398 | | | | 96,000 | |
| | | | | | | | | |
Net Gain on Investments | | | 274,919 | | | | 135,875 | |
| | | | | | | | | |
NET INCREASE IN NET ASSETS RESULTING FROM OPERATIONS | | $ | 271,570 | | | $ | 133,259 | |
(1) | Amounts include Trustees’ fees and expenses and the mark to market unrealized appreciation during the period for shares held in the Non-Interested Trustees’ Deferred Fee Plan, as more fully described in Note 2(g) in the Notes to Financial Statements. |
| | | Trustees’
Fees and
Expenses* | | | Unrealized
Appreciation* | |
Focus Fund | | $ | 131,531 | | | $ | 1,610,299 | |
Growth Fund | | | 62,393 | | | | 571,350 | |
21st Century Fund | | | 60,263 | | | | 80,582 | |
International Opportunities Fund | | | 11,892 | | | | 32,102 | |
Global Fund | | | 50,532 | | | | 785,692 | |
| See notes to financial statements. |
34
| | MARSICO
21st CENTURY FUND | | | MARSICO
INTERNATIONAL
OPPORTUNITIES
FUND | | | MARSICO
GLOBAL FUND | |
| | | | | | | | | | | | |
| | | | | | | | | | | | |
| | $ | 1,168 | | | $ | 960 | | | $ | 1,474 | |
| | | 1,168 | | | | 960 | | | | 1,474 | |
| | | | | | | | | | | | |
| | | | | | | | | | | | |
| | | 2,149 | | | | 432 | | | | 1,937 | |
| | | 675 | | | | 135 | | | | 605 | |
| | | 141 | (1) | | | 44 | (1) | | | 836 | (1) |
| | | 332 | | | | 85 | | | | 322 | |
| | | 136 | | | | 34 | | | | 118 | |
| | | 127 | | | | 58 | | | | 147 | |
| | | 97 | | | | 136 | | | | 124 | |
| | | 43 | | | | 11 | | | | 36 | |
| | | 44 | | | | 22 | | | | 44 | |
| | | 28 | | | | 20 | | | | 28 | |
| | | 3,772 | | | | 977 | | | | 4,197 | |
| | | — | | | | (167 | ) | | | (686 | ) |
| | | 3,772 | | | | 810 | | | | 3,511 | |
| | | | | | | | | | | | |
| | | (2,604 | ) | | | 150 | | | | (2,037 | ) |
| | | | | | | | | | | | |
| | | | | | | | | | | | |
| | | 5,929 | | | | 1,457 | | | | 8,476 | |
| | | (34 | ) | | | (201 | ) | | | (1,591 | ) |
| | | 47,029 | | | | 6,540 | | | | 81,560 | |
| | | | | | | | | | | | |
| | | 52,924 | | | | 7,796 | | | | 88,445 | |
| | | | | | | | | | | | |
| | $ | 50,320 | | | $ | 7,946 | | | $ | 86,408 | |
35
STATEMENTS OF CHANGES IN NET ASSETS
| | | MARSICO
FOCUS
FUND | | | MARSICO
GROWTH
FUND | |
| | | | | | | | | | | | | | | | | |
(Amounts in thousands) | | Year
Ended
9/30/20 | | | Year
Ended
9/30/19 | | | Year
Ended
9/30/20 | | | Year
Ended
9/30/19 | |
| | | | | | | | | | | | | | | | | |
OPERATIONS: | | | | | | | | | | | | | | | | |
Net investment income (loss) | | $ | (3,349 | ) | | $ | (1,064 | ) | | $ | (2,616 | ) | | $ | (1,037 | ) |
Net realized gain on investments | | | 82,521 | | | | 44,005 | | | | 39,875 | | | | 25,286 | |
Net realized gain (loss) on foreign currency transactions | | | — | | | | 30 | | | | — | | | | (41 | ) |
Change in unrealized appreciation (depreciation) on investments, foreign currency translations, and non-interested trustees’ deferred compensation | | | 192,398 | | | | (31,757 | ) | | | 96,000 | | | | (18,902 | ) |
| | | | | | | | | | | | | | | | | |
Net increase (decrease) in net assets resulting from operations | | | 271,570 | | | | 11,214 | | | | 133,259 | | | | 5,306 | |
| | | | | | | | | | | | | | | | | |
DISTRIBUTIONS: | | | (43,408 | ) | | | (51,626 | ) | | | (25,236 | ) | | | (29,351 | ) |
| | | | | | | | | | | | | | | | | |
CAPITAL SHARE TRANSACTIONS: | | | | | | | | | | | | | | | | |
Proceeds from sales of shares | | | 73,471 | | | | 26,190 | | | | 68,169 | | | | 6,134 | |
Proceeds from reinvestment of distributions | | | 42,039 | | | | 49,333 | | | | 24,193 | | | | 28,064 | |
Redemption of shares | | | (92,136 | ) | | | (86,480 | ) | | | (49,098 | ) | | | (49,788 | ) |
| | | | | | | | | | | | | | | | | |
Net increase (decrease) from capital share transactions | | | 23,374 | | | | (10,957 | ) | | | 43,264 | | | | (15,590 | ) |
| | | | | | | | | | | | | | | | | |
TOTAL INCREASE (DECREASE) IN NET ASSETS | | | 251,536 | | | | (51,369 | ) | | | 151,287 | | | | (39,635 | ) |
| | | | | | | | | | | | | | | | | |
NET ASSETS: | | | | | | | | | | | | | | | | |
Beginning of Period | | | 554,645 | | | | 606,014 | | | | 259,305 | | | | 298,940 | |
| | | | | | | | | | | | | | | | | |
End of Period | | $ | 806,181 | | | $ | 554,645 | | | $ | 410,592 | | | $ | 259,305 | |
| | | | | | | | | | | | | | | | | |
TRANSACTIONS IN SHARES: | | | | | | | | | | | | | | | | |
Shares sold | | | 3,475 | | | | 1,522 | | | | 3,291 | | | | 343 | |
Shares issued in reinvestment of distributions | | | 2,280 | | | | 3,105 | | | | 1,345 | | | | 1,763 | |
Shares redeemed | | | (4,499 | ) | | | (4,824 | ) | | | (2,463 | ) | | | (2,730 | ) |
| | | | | | | | | | | | | | | | | |
NET INCREASE (DECREASE) | | | 1,256 | | | | (197 | ) | | | 2,173 | | | | (624 | ) |
| See notes to financial statements. |
36
MARSICO
21st
CENTURY
FUND | | | MARSICO
INTERNATIONAL
OPPORTUNITIES FUND | | | MARSICO
GLOBAL
FUND | |
| | | | | | | | | | | | | | | | | | | | | | | |
Year
Ended
9/30/20 | | | Year
Ended
9/30/19 | | | Year
Ended
9/30/20 | | | Year
Ended
9/30/19 | | | Year
Ended
9/30/20 | | | Year
Ended
9/30/19 | |
| | | | | | | | | | | | | | | | | | | | | | | |
| | | | | | | | | | | | | | | | | | | | | | | |
| $ | (2,604 | ) | | $ | (1,736 | ) | | $ | 150 | | | $ | 78 | | | $ | (2,037 | ) | | $ | (1,330 | ) |
| | 5,929 | | | | 11,833 | | | | 1,457 | | | | 2,299 | | | | 8,476 | | | | 2,142 | |
| | (34 | ) | | | — | | | | (201 | ) | | | (479 | ) | | | (1,591 | ) | | | (2,347 | ) |
| | 47,029 | | | | 7,337 | | | | 6,540 | | | | (2,783 | ) | | | 81,560 | | | | (16,018 | ) |
| | | | | | | | | | | | | | | | | | | | | | | |
| | 50,320 | | | | 17,434 | | | | 7,946 | | | | (885 | ) | | | 86,408 | | | | (17,553 | ) |
| | | | | | | | | | | | | | | | | | | | | | | |
| | (8,884 | ) | | | (11,665 | ) | | | (2,281 | ) | | | (4,245 | ) | | | — | | | | (2,537 | ) |
| | | | | | | | | | | | | | | | | | | | | | | |
| | | | | | | | | | | | | | | | | | | | | | | |
| | 5,247 | | | | 16,696 | | | | 5,356 | | | | 3,123 | | | | 15,187 | | | | 13,813 | |
| | 8,549 | | | | 11,079 | | | | 2,211 | | | | 4,007 | | | | — | | | | 2,299 | |
| | (46,035 | ) | | | (23,632 | ) | | | (11,519 | ) | | | (10,841 | ) | | | (45,455 | ) | | | (53,643 | ) |
| | | | | | | | | | | | | | | | | | | | | | | |
| | (32,239 | ) | | | 4,143 | | | | (3,952 | ) | | | (3,711 | ) | | | (30,268 | ) | | | (37,531 | ) |
| | | | | | | | | | | | | | | | | | | | | | | |
| | 9,197 | | | | 9,912 | | | | 1,713 | | | | (8,841 | ) | | | 56,140 | | | | (57,621 | ) |
| | | | | | | | | | | | | | | | | | | | | | | |
| | | | | | | | | | | | | | | | | | | | | | | |
| | 282,779 | | | | 272,867 | | | | 53,311 | | | | 62,152 | | | | 228,893 | | | | 286,514 | |
| | | | | | | | | | | | | | | | | | | | | | | |
| $ | 291,976 | | | $ | 282,779 | | | $ | 55,024 | | | $ | 53,311 | | | $ | 285,033 | | | $ | 228,893 | |
| | | | | | | | | | | | | | | | | | | | | | | |
| | | | | | | | | | | | | | | | | | | | | | | |
| | 157 | | | | 516 | | | | 283 | | | | 173 | | | | 789 | | | | 897 | |
| | 258 | | | | 405 | | | | 118 | | | | 257 | | | | — | | | | 163 | |
| | (1,418 | ) | | | (756 | ) | | | (612 | ) | | | (616 | ) | | | (2,559 | ) | | | (3,499 | ) |
| | | | | | | | | | | | | | | | | | | | | | | |
| | (1,003 | ) | | | 165 | | | | (211 | ) | | | (186 | ) | | | (1,770 | ) | | | (2,439 | ) |
37
FINANCIAL HIGHLIGHTS
| | | | MARSICO FOCUS FUND | |
For a Fund Share Outstanding Throughout the Period | | | Year
Ended
9/30/20 | | | Year
Ended
9/30/19 | | | Year
Ended
9/30/18 | | | Year
Ended
9/30/17 | | | Year
Ended
9/30/16 | |
| | | | | | | | | | | | | | | | | | | | | | |
Net Asset Value, Beginning of Period | | | $ | 18.59 | | | $ | 20.17 | | | $ | 19.63 | | | $ | 15.96 | | | $ | 18.83 | |
| | | | | | | | | | | | | | | | | | | | | | |
| | | | | | | | | | | | | | | | | | | | | | |
Income from Investment Operations: | | | | | | | | | | | | | | | | | | | | | |
Net investment loss | | | | (0.10 | ) | | | (0.04 | ) | | | (0.09 | ) | | | (0.17 | ) | | | (0.13 | ) |
Net realized and unrealized gains on investments | | | | 8.92 | | | | 0.25 | | | | 3.82 | | | | 3.84 | | | | 1.25 | |
| | | | | | | | | | | | | | | | | | | | | | |
Total from investment operations | | | | 8.82 | | | | 0.21 | | | | 3.73 | | | | 3.67 | | | | 1.12 | |
| | | | | | | | | | | | | | | | | | | | | | |
Distributions & Other: | | | | | | | | | | | | | | | | | | | | | |
Net realized gains | | | | (1.49 | ) | | | (1.79 | ) | | | (3.19 | ) | | | — | | | | (3.99 | ) |
| | | | | | | | | | | | | | | | | | | | | | |
Total distributions and other | | | | (1.49 | ) | | | (1.79 | ) | | | (3.19 | ) | | | — | | | | (3.99 | ) |
| | | | | | | | | | | | | | | | | | | | | | |
Net Asset Value, End of Period | | | $ | 25.92 | | | $ | 18.59 | | | $ | 20.17 | | | $ | 19.63 | | | $ | 15.96 | |
| | | | | | | | | | | | | | | | | | | | | | |
| | | | | | | | | | | | | | | | | | | | | | |
Total Return | | | | 50.71 | % | | | 2.52 | % | | | 21.78 | % | | | 22.99 | % | | | 5.75 | % |
| | | | | | | | | | | | | | | | | | | | | | |
| | | | | | | | | | | | | | | | | | | | | | |
Supplemental Data and Ratios: | | | | | | | | | | | | | | | | | | | | | |
| | | | | | | | | | | | | | | | | | | | | | |
Net assets, end of period (000s) | | | $ | 806,181 | | | $ | 554,645 | | | $ | 606,014 | | | $ | 559,657 | | | $ | 613,870 | |
| | | | | | | | | | | | | | | | | | | | | | |
Ratio of expenses to average net assets, less waivers and before expenses paid indirectly, plus recoupment of previously waived fees or expenses paid | | | | 1.24 | % | | | 1.02 | % | | | 1.21 | % | | | 1.37 | % | | | 1.29 | % |
| | | | | | | | | | | | | | | | | | | | | | |
Ratio of net investment loss to average net assets, net of waivers, recoupment of previously waived fees or expenses paid and expenses paid indirectly | | | | (0.53 | )% | | | (0.19 | )% | | | (0.48 | )% | | | (0.62 | )% | | | (0.63 | )% |
| | | | | | | | | | | | | | | | | | | | | | |
Ratio of expenses to average net assets, before waivers, recoupment of previously waived fees or expenses paid and expenses paid indirectly | | | | 1.24 | % | | | 1.02 | % | | | 1.21 | % | | | 1.37 | % | | | 1.29 | % |
| | | | | | | | | | | | | | | | | | | | | | |
Ratio of net investment loss to average net assets, before waivers, recoupment of previously waived fees or expenses paid and expenses paid indirectly | | | | (0.53 | )% | | | (0.19 | )% | | | (0.48 | )% | | | (0.62 | )% | | | (0.63 | )% |
| | | | | | | | | | | | | | | | | | | | | | |
Portfolio turnover rate | | | | 45 | % | | | 42 | % | | | 53 | % | | | 67 | % | | | 45 | % |
| See notes to financial statements. |
38
MARSICO
GROWTH
FUND | | | MARSICO
21st
CENTURY FUND | |
Year
Ended
9/30/20 | | | Year
Ended
9/30/19 | | | Year
Ended
9/30/18 | | | Year
Ended
9/30/17 | | | Year
Ended
9/30/16 | | | Year
Ended
9/30/20 | | | Year
Ended
9/30/19 | | | Year
Ended
9/30/18 | | | Year
Ended
9/30/17 | | | Year
Ended
9/30/16 | |
| | | | | | | | | | | | | | | | | | | | | | | | | | | | | |
| $ | 18.75 | | | $ | 20.69 | | | $ | 18.47 | | | $ | 15.54 | | | $ | 20.11 | | | $ | 33.70 | | | $ | 33.18 | | | $ | 26.19 | | | $ | 22.04 | | | $ | 20.38 | |
| | | | | | | | | | | | | | | | | | | | | | | | | | | | | | | | | | | | | | | |
| | | | | | | | | | | | | | | | | | | | | | | | | | | | | | | | | | | | | | | |
| | | | | | | | | | | | | | | | | | | | | | | | | | | | | | | | | | | | | | | |
| | (0.14 | ) | | | (0.08 | ) | | | (0.09 | ) | | | (0.14 | ) | | | (0.13 | ) | | | (0.39 | ) | | | (0.20 | ) | | | (0.25 | ) | | | (0.29 | ) | | | (0.29 | ) |
| | 8.92 | | | | 0.34 | | | | 4.06 | | | | 3.19 | | | | 1.33 | | | | 7.30 | | | | 2.15 | | | | 7.24 | | | | 4.44 | | | | 1.95 | |
| | | | | | | | | | | | | | | | | | | | | | | | | | | | | | | | | | | | | | | |
| | 8.78 | | | | 0.26 | | | | 3.97 | | | | 3.05 | | | | 1.20 | | | | 6.91 | | | | 1.95 | | | | 6.99 | | | | 4.15 | | | | 1.66 | |
| | | | | | | | | | | | | | | | | | | | | | | | | | | | | | | | | | | | | | | |
| | | | | | | | | | | | | | | | | | | | | | | | | | | | | | | | | | | | | | | |
| | (1.87 | ) | | | (2.20 | ) | | | (1.75 | ) | | | (0.12 | ) | | | (5.77 | ) | | | (1.09 | ) | | | (1.43 | ) | | | — | | | | — | | | | — | |
| | | | | | | | | | | | | | | | | | | | | | | | | | | | | | | | | | | | | | | |
| | (1.87 | ) | | | (2.20 | ) | | | (1.75 | ) | | | (0.12 | ) | | | (5.77 | ) | | | (1.09 | ) | | | (1.43 | ) | | | — | | | | — | | | | — | |
| | | | | | | | | | | | | | | | | | | | | | | | | | | | | | | | | | | | | | | |
| $ | 25.66 | | | $ | 18.75 | | | $ | 20.69 | | | $ | 18.47 | | | $ | 15.54 | | | $ | 39.52 | | | $ | 33.70 | | | $ | 33.18 | | | $ | 26.19 | | | $ | 22.04 | |
| | | | | | | | | | | | | | | | | | | | | | | | | | | | | | | | | | | | | | | |
| | | | | | | | | | | | | | | | | | | | | | | | | | | | | | | | | | | | | | | |
| | 51.11 | % | | | 3.16 | % | | | 23.10 | % | | | 19.85 | % | | | 5.94 | % | | | 21.15 | % | | | 6.88 | % | | | 26.69 | % | | | 18.83 | % | | | 8.15 | % |
| | | | | | | | | | | | | | | | | | | | | | | | | | | | | | | | | | | | | | | |
| | | | | | | | | | | | | | | | | | | | | | | | | | | | | | | | | | | | | | | |
| | | | | | | | | | | | | | | | | | | | | | | | | | | | | | | | | | | | | | | |
| | | | | | | | | | | | | | | | | | | | | | | | | | | | | | | | | | | | | | | |
| $ | 410,592 | | | $ | 259,305 | | | $ | 298,940 | | | $ | 266,922 | | | $ | 288,213 | | | $ | 291,976 | | | $ | 282,779 | | | $ | 272,867 | | | $ | 234,322 | | | $ | 234,780 | |
| | | | | | | | | | | | | | | | | | | | | | | | | | | | | | | | | | | | | | | |
| | 1.45 | % | | | 1.27 | % | | | 1.25 | % | | | 1.42 | % | | | 1.37 | % | | | 1.40 | % | | | 1.30 | % | | | 1.21 | % | | | 1.40 | % | | | 1.41 | % |
| | | | | | | | | | | | | | | | | | | | | | | | | | | | | | | | | | | | | | | |
| | (0.85 | )% | | | (0.40 | )% | | | (0.46 | )% | | | (0.53 | )% | | | (0.61 | )% | | | (0.96 | )% | | | (0.66 | )% | | | (0.74 | )% | | | (0.96 | )% | | | (1.01 | )% |
| | | | | | | | | | | | | | | | | | | | | | | | | | | | | | | | | | | | | | | |
| | 1.50 | % | | | 1.27 | % | | | 1.25 | % | | | 1.42 | % | | | 1.37 | % | | | 1.40 | % | | | 1.30 | % | | | 1.21 | % | | | 1.40 | % | | | 1.41 | % |
| | | | | | | | | | | | | | | | | | | | | | | | | | | | | | | | | | | | | | | |
| | (0.90 | )% | | | (0.40 | )% | | | (0.46 | )% | | | (0.53 | )% | | | (0.61 | )% | | | (0.96 | )% | | | (0.66 | )% | | | (0.74 | )% | | | (0.96 | )% | | | (1.01 | )% |
| | | | | | | | | | | | | | | | | | | | | | | | | | | | | | | | | | | | | | | |
| | 77 | % | | | 39 | % | | | 40 | % | | | 50 | % | | | 52 | % | | | 38 | % | | | 34 | % | | | 90 | % | | | 28 | % | | | 44 | % |
39
FINANCIAL HIGHLIGHTS
| | | | MARSICO
INTERNATIONAL OPPORTUNITIES FUND | | |
For a Fund Share Outstanding Throughout the Period | | | Year
Ended
9/30/20 | | | Year
Ended
9/30/19 | | | Year
Ended
9/30/18 | | | Year
Ended
9/30/17 | | | Year
Ended
9/30/16 | | |
| | | | | | | | | | | | | | | | | | | | | | | |
Net Asset Value, Beginning of Period | | | $ | 18.47 | | | $ | 20.23 | | | $ | 19.30 | | | $ | 15.64 | | | $ | 14.51 | | |
| | | | | | | | | | | | | | | | | | | | | | | |
| | | | | | | | | | | | | | | | | | | | | | | |
Income from Investment Operations: | | | | | | | | | | | | | | | | | | | | | | |
Net investment income (loss) | | | | 0.04 | | | | 0.01 | | | | (0.09 | ) | | | (0.16 | ) | | | (0.20 | ) | |
Net realized and unrealized gains (losses) on investments | | | | 2.87 | | | | (0.35 | ) | | | 1.02 | | | | 3.82 | | | | 1.33 | | |
| | | | | | | | | | | | | | | | | | | | | | | |
Total from investment operations | | | | 2.91 | | | | (0.34 | ) | | | 0.93 | | | | 3.66 | | | | 1.13 | | |
| | | | | | | | | | | | | | | | | | | | | | | |
Distributions & Other: | | | | | | | | | | | | | | | | | | | | | | |
Net investment income | | | | (0.07 | ) | | | — | | | | — | | | | — | | | | — | | |
Net realized gains | | | | (0.74 | ) | | | (1.42 | ) | | | — | | | | — | | | | — | | |
| | | | | | | | | | | | | | | | | | | | | | | |
Total distributions and other | | | | (0.81 | ) | | | (1.42 | ) | | | — | | | | — | | | | — | | |
| | | | | | | | | | | | | | | | | | | | | | | |
Net Asset Value, End of Period | | | $ | 20.57 | | | $ | 18.47 | | | $ | 20.23 | | | $ | 19.30 | | | $ | 15.64 | | |
| | | | | | | | | | | | | | | | | | | | | | | |
| | | | | | | | | | | | | | | | | | | | | | | |
Total Return | | | | 16.14 | % | | | (0.37 | )% | | | 4.82 | % | | | 23.40 | % | | | 7.79 | % | |
| | | | | | | | | | | | | | | | | | | | | | | |
| | | | | | | | | | | | | | | | | | | | | | | |
Supplemental Data and Ratios: | | | | | | | | | | | | | | | | | | | | | | |
| | | | | | | | | | | | | | | | | | | | | | | |
Net assets, end of period (000s) | | | $ | 55,024 | | | $ | 53,311 | | | $ | 62,152 | | | $ | 63,789 | | | $ | 62,833 | | |
| | | | | | | | | | | | | | | | | | | | | | | |
Ratio of expenses to average net assets, less waivers and before expenses paid indirectly, plus recoupment of previously waived fees or expenses paid | | | | 1.50 | % | | | 1.50 | % | | | 1.52 | % | | | 1.60 | % | | | 1.60 | % | |
| | | | | | | | | | | | | | | | | | | | | | | |
Ratio of net investment income (loss) to average net assets, net of waivers, recoupment of previously waived fees or expenses paid and expenses paid indirectly | | | | 0.28 | % | | | 0.14 | % | | | (0.33 | )% | | | (0.77 | )% | | | (0.71 | )% | |
| | | | | | | | | | | | | | | | | | | | | | | |
Ratio of expenses to average net assets, before waivers, recoupment of previously waived fees or expenses paid and expenses paid indirectly | | | | 1.81 | % | | | 1.72 | % | | | 1.59 | % | | | 1.79 | % | | | 1.78 | % | |
| | | | | | | | | | | | | | | | | | | | | | | |
Ratio of net investment loss to average net assets, before waivers, recoupment of previously waived fees or expenses paid and expenses paid indirectly | | | | (0.03 | )% | | | (0.08 | )% | | | (0.40 | )% | | | (0.96 | )% | | | (0.89 | )% | |
| | | | | | | | | | | | | | | | | | | | | | | |
Portfolio turnover rate | | | | 60 | % | | | 57 | % | | | 33 | % | | | 108 | % | | | 223 | % | |
| See notes to financial statements. |
40
| | MARSICO
GLOBAL
FUND | |
| | Year
Ended
9/30/20 | | | Year
Ended
9/30/19 | | | Year
Ended
9/30/18 | | | Year
Ended
9/30/17 | | | Year
Ended
9/30/16 | |
| | | | | | | | | | | | | | | | | | | | |
| | $ | 16.06 | | | $ | 17.16 | | | $ | 15.13 | | | $ | 12.03 | | | $ | 12.37 | |
| | | | | | | | | | | | | | | | | | | | |
| | | | | | | | | | | | | | | | | | | | |
| | | | | | | | | | | | | | | | | | | | |
| | | (0.19 | ) | | | (0.12 | ) | | | 0.11 | | | | (0.14 | ) | | | (0.16 | ) |
| | | 6.96 | | | | (0.82 | ) | | | 3.26 | | | | 3.24 | | | | 1.14 | |
| | | | | | | | | | | | | | | | | | | | |
| | | 6.77 | | | | (0.94 | ) | | | 3.37 | | | | 3.10 | | | | 0.98 | |
| | | | | | | | | | | | | | | | | | | | |
| | | | | | | | | | | | | | | | | | | | |
| | | — | | | | — | | | | — | | | | — | | | | — | |
| | | — | | | | (0.16 | ) | | | (1.34 | ) | | | — | | | | (1.32 | ) |
| | | | | | | | | | | | | | | | | | | | |
| | | — | | | | (0.16 | ) | | | (1.34 | ) | | | — | | | | (1.32 | ) |
| | | | | | | | | | | | | | | | | | | | |
| | $ | 22.83 | | | $ | 16.06 | | | $ | 17.16 | | | $ | 15.13 | | | $ | 12.03 | |
| | | | | | | | | | | | | | | | | | | | |
| | | | | | | | | | | | | | | | | | | | |
| | | 42.15 | % | | | (5.36 | )% | | | 23.94 | % | | | 25.77 | % | | | 8.05 | % |
| | | | | | | | | | | | | | | | | | | | |
| | | | | | | | | | | | | | | | | | | | |
| | | | | | | | | | | | | | | | | | | | |
| | | | | | | | | | | | | | | | | | | | |
| | $ | 285,033 | | | $ | 228,893 | | | $ | 286,514 | | | $ | 44,493 | | | $ | 44,273 | |
| | | | | | | | | | | | | | | | | | | | |
| | | 1.45 | % | | | 1.45 | % | | | 1.48 | % | | | 1.60 | % | | | 1.60 | % |
| | | | | | | | | | | | | | | | | | | | |
| | | (0.84 | )% | | | (0.55 | )% | | | (0.87 | )% | | | (0.82 | )% | | | (0.60 | )% |
| | | | | | | | | | | | | | | | | | | | |
| | | 1.73 | % | | | 1.41 | % | | | 1.59 | % | | | 1.80 | % | | | 1.69 | % |
| | | | | | | | | | | | | | | | | | | | |
| | | (1.12 | )% | | | (0.51 | )% | | | (0.98 | )% | | | (1.02 | )% | | | (0.69 | )% |
| | | | | | | | | | | | | | | | | | | | |
| | | 51 | % | | | 67 | % | | | 89 | % | | | 79 | % | | | 82 | % |
41
NOTES TO FINANCIAL STATEMENTS |
NOTES TO FINANCIAL STATEMENTS September 30, 2020
The Marsico Investment Fund (the “Trust”) was organized on October 1, 1997, as a Delaware statutory trust and is registered under the Investment Company Act of 1940 (the “1940 Act”) as an open-end management investment company. The Focus Fund, Growth Fund, 21st Century Fund, International Opportunities Fund, and Global Fund (collectively, the “Funds”) are separate investment portfolios of the Trust. The Focus Fund is a non-diversified fund and the Growth Fund, the 21st Century Fund, the International Opportunities Fund, and the Global Fund are diversified funds. The Focus Fund and Growth Fund commenced operations on December 31, 1997, the 21st Century Fund commenced operations on February 1, 2000, the International Opportunities Fund commenced operations on June 30, 2000, and the Global Fund commenced operations on June 29, 2007. Trustees and officers of the Trust and employees of Marsico Capital Management, LLC (the “Adviser”) own approximately 6%, 7%, and 11% of the Focus Fund’s, International Opportunities Fund’s, and Global Fund’s outstanding shares, respectively, as of September 30, 2020.
2. | Significant Accounting Policies |
The Funds qualify as investment companies under Accounting Standards Update No. 2013-08, Accounting Standard Codification Topic 946, Financial Services — Investment Companies (“ASC 946”). The following is a summary of significant accounting policies consistently followed by the Funds in the preparation of their financial statements. These policies are in conformity with Generally Accepted Accounting Principles (“GAAP”) in the United States of America for investment companies and follow the accounting guidance provided in ASC 946. The presentation of financial statements in conformity with GAAP requires management to make estimates and assumptions that affect the reported amounts and disclosures of assets and liabilities at the date of the financial statements and the reported amounts and disclosures of income and expenses during the reporting period. Actual results could differ from those estimates.
| | (a) | Investment Valuation — A security traded on a recognized stock exchange is generally valued at the last sale price prior to the closing of the principal exchange on which the security is traded. Securities traded on NASDAQ generally will be valued at the NASDAQ Official Closing Price. If no sale price is reported on the valuation date, the most current bid price will generally be used, with the exception of short option positions which will generally utilize the most current ask price. Other securities for which over-the-counter market quotations are readily available are generally valued at the last sale price. Debt securities that will mature in more than 60 days are generally valued at their bid prices furnished by a pricing service approved by the Funds’ Board of Trustees and subject to review pursuant to procedures established by, and under the general supervision of, the Board of Trustees. Debt securities that will mature in 60 days or less are valued at amortized cost, if it approximates market value. Any securities for which market quotations are not readily available are valued at their fair value as determined in good faith by the Adviser in accordance with procedures established by, and under the general supervision of, the Funds’ Board of Trustees. The Funds may use pricing services to assist in determining market value. The Board of Trustees has authorized the use of a pricing service to assist the Funds in valuing certain equity securities listed or traded on foreign security exchanges in the Funds’ portfolios in certain circumstances where there is a significant change in the value of related US-traded securities, as represented by, for example, the S&P 500 Index. |
“Fair Value Measurements and Disclosures” (the “Fair Value Statement”) defines fair value, establishes a framework for measuring fair value in GAAP, and expands disclosures about fair value measurements. Under the Fair Value Statement, various inputs are used in determining the value of the Funds’ investments.
These inputs are summarized into three broad levels and described below:
| | ● | Level 1 – quoted prices in active markets for identical investments |
| | ● | Level 2 – other significant observable inputs (including quoted prices for similar investments, interest rates, and evaluated quotations obtained from pricing services) |
| | ● | Level 3 – significant unobservable inputs (including the Fund’s assumptions that market participants would use in determining the fair value of investments) |
The inputs or methodology used for valuing investments are not an indication of the risk associated with investing in those investments. Changes in valuation techniques may result in transfers between the levels during the reporting period. There were no transfers into or out of Level 3 during the reporting period. As of September 30, 2020, each of the Fund’s investments were categorized as Level 1 securities. The fair values of the investments are reflected on each Fund’s Schedule of Investments by security type and economic industry.
| | (b) | Expenses — The Funds are charged for those expenses that are directly attributable to each Fund, such as advisory and custodial fees. Expenses that are not directly attributable to a Fund are typically allocated among the Funds in proportion to their respective net assets and are in some cases allocated based on other factors. The Funds’ expenses may be reduced by advisory fee waivers, brokerage credits and uninvested cash balances earning interest or credits. Such credits are included in “Less waiver of expenses and expenses paid indirectly” on the Statements of Operations. |
Brokerage commissions may be paid to certain brokers which reduce transfer agent fees and expenses. For the year ended September 30, 2020, the Funds received no such brokerage commission credits. The Funds received earnings credits on certain cash account balances which reduced transfer agent fees and expenses by $1 (in thousands) for the Focus Fund, and by less than $1 (in thousands) for each of the Growth
42
NOTES TO FINANCIAL STATEMENTS |
Fund, 21st Century Fund, International Opportunities Fund, and Global Fund for the year ended September 30, 2020. Brokerage commission credits and earnings credits (if any) are included in “Less waiver of expenses and expenses paid indirectly” on the Statements of Operations.
| | (c) | Federal Income Taxes — Each Fund intends to comply with the requirements of the Internal Revenue Code of 1986, as amended (the “Internal Revenue Code”), necessary to continue to qualify as a regulated investment company and to make the requisite distributions of income to its shareholders which will be sufficient to relieve it from all or substantially all federal and state income taxes. Certain Funds may utilize earnings and profits on redemption of shares as part of the dividends paid deduction. |
| | (d) | Distributions to Shareholders — Dividends from net investment income and net realized capital gains, if any, will be declared and paid at least annually. Distributions to shareholders are recorded on the ex-dividend date. Each Fund may periodically make reclassifications among certain of its capital accounts as a result of the timing and characterization of certain income and capital gains distributions determined in accordance with federal tax regulations, which may differ from GAAP. These reclassifications are due to differing treatment for items such as foreign currency transactions, passive foreign investment companies and net investment losses. |
The Funds at times may invest in real estate investment trusts (“REITs”). REITs generally pay dividends to their investors based upon cash available from their operations and this amount may differ significantly from the REITs’ actual earnings and profits (“E&P”) determined for income tax purposes. It is common for these dividends to exceed the REITs’ taxable E&P, resulting in the excess portion of such dividends eventually being designated as a return of capital. Determination of the tax character of dividends made by REITs is typically performed by the REIT several months subsequent to the payment of the dividend. Therefore, due to timing issues, the Funds may be in a position of being required to calculate and pay required distribution amounts to their shareholders based on the best information available from the REITs, which may be prior to the final determination of the REITs’ taxable E&P, and it is possible that a portion of the Funds’ distribution amounts could include a return of capital to shareholders for federal income tax purposes.
| | (e) | Foreign Currency Translation — The accounting records of the Funds are maintained in US dollars. For valuation purposes, values of securities denominated in foreign currencies are translated into US dollars at 4:00 p.m. Eastern Time. Amounts related to the purchase and sale of foreign securities and investment income are translated at the rates of exchange prevailing on the respective dates of such transactions. |
Reported realized gains and losses on foreign currency transactions arise from sales of portfolio securities, forward foreign currency contracts, currency gains or losses realized between the trade and settlement dates on securities transactions, and the difference between the amounts of dividends, interest, and foreign withholding taxes recorded on the Funds’ books and the US dollar equivalent of the amounts actually received or paid.
The Funds do not isolate that portion of the results of operations resulting from changes in foreign exchange rates on investments from the fluctuations arising from changes in market prices of securities held at the end of the reporting period. Net unrealized appreciation or depreciation on investments and foreign currency translations arises from changes in the value of assets and liabilities, including investments in securities at the end of the reporting period, resulting from changes in the exchange rates and changes in market prices of securities held.
Transactions in foreign-denominated assets may involve greater risks than domestic transactions, including currency risk, political and economic risk, regulatory risk and market risk.
| | (f) | Derivative Instruments — “Disclosure about Derivative Instruments and Hedging Activities” (the “Derivatives Statement”) requires enhanced disclosures about the Funds’ derivative and hedging activities, including how such activities are accounted for and their effects on the Funds’ financial position, performance and cash flows. |
The Funds are not intended as vehicles for investing substantially in derivative instruments, and may hold derivative instruments only infrequently. The Funds enter into derivative instruments in order to increase exposure to certain investments, asset classes, or markets, or for hedging purposes to hedge against adverse movements in securities prices, currency rates or interest rates. The Funds can hold various types of derivative instruments such as futures contracts and options on securities, financial indexes, and foreign currencies, options on futures, forward foreign currency contracts, interest rate swaps, credit default swaps, and swap-related products. The use of derivative instruments may involve risks such as the possibility of illiquid markets or imperfect correlation between the value of the derivative instruments and the underlying securities, or that the counterparty will fail to perform its obligations. There were no outstanding derivative instruments held by the Funds as of September 30, 2020 nor did the Funds utilize derivative instruments during the year ended September 30, 2020.
| | (g) | Non-Interested Trustees’ Deferred Fee Plan — Effective February 1, 2000, the Board of Trustees adopted the Marsico Investment Fund Deferred Fee Plan (the “Deferred Fee Plan”), amended and restated as of December 30, 2005, which allows the Trustees who are not “interested persons” of the Funds, as defined in the 1940 Act (“non-interested Trustees”), to defer the receipt of all or a portion of their compensation received from the Funds. Any deferred fees are credited to accounts established on behalf of the non-interested Trustees into the Funds as directed by each non-interested Trustee. The amounts credited to these accounts increase or decrease in accordance with the performance of the Funds selected by the non-interested Trustees. The market value of the deferred account balances as of September 30, 2020 is shown on the Statements of Assets and Liabilities as part of an asset account, “Prepaid expenses and other assets”, and a liability account, “Accrued trustees’ fees”. Additionally, the fluctuation of the account balances due to the Funds’ performance is recorded by the Funds as unrealized appreciation (depreciation), which is shown as part of “Total distributable earnings (deficit)” on the Statements of Assets and Liabilities, and as compensation expense, which is shown as part of the expense account “Trustees’ fees and expenses” on the Statements of Operations. Fees |
43
NOTES TO FINANCIAL STATEMENTS |
NOTES TO FINANCIAL STATEMENTS September 30, 2020 (continued)
earned and deferred by the non-interested Trustees for the year ended September 30, 2020 are also included in “Trustees’ fees and expenses” on the Statements of Operations. Amounts contributed to the Deferred Fee Plan will be deferred until distributed in accordance with the Deferred Fee Plan. Unrealized appreciation (depreciation) of Fund shares held in the Deferred Fee Plan is subject to the Funds’ expense reimbursement agreement with the Adviser.
| | (h) | Other — Investment transactions are accounted for on a trade date basis. Each Fund determines the gain or loss realized from the investment transactions by comparing the original cost of the security lot sold with the net sale proceeds. Dividend income is recognized on the ex-dividend date. Certain dividends from foreign securities are recorded when the Funds are informed of the dividend if such information is obtained subsequent to the ex-dividend date. Interest income is recognized on an accrual basis and includes amortization of premiums and accretion of discounts. |
| | (i) | Indemnifications — In the normal course of business, the Funds enter into contracts that contain provisions indemnifying other parties against specified potential liabilities. Each Fund’s maximum exposure under these arrangements is unknown as this would involve future claims that may be made against the Fund that have not yet occurred. However, based on experience, the Funds expect the risk of loss in connection with these potential indemnification obligations to be remote. There can be no assurance that material liabilities related to such obligations will not arise in the future, which may adversely impact a Fund. |
3. | Investment Advisory Agreement and Transactions With Affiliates |
Each Fund has an agreement with the Adviser to furnish investment advisory services to the Funds. Each Fund calculates and accrues the investment advisory fee daily based on the following rates (expressed as annual rates) and pays the Adviser monthly:
Annual Rate of Average Daily Net Assets | Asset Threshold |
0.80% | First $250 million |
0.75% | Next $250 million |
0.70% | Next $250 million |
0.65% | In excess of $750 million |
The Adviser has entered into a written expense limitation and fee waiver agreement under which it has agreed to limit the total expenses of each Fund (excluding taxes, interest, acquired fund fees and expenses, litigation, extraordinary expenses, and brokerage and other transaction expenses relating to the purchase or sale of portfolio investments) to an annual rate of 1.50% of the average net assets of the International Opportunities Fund, and 1.45% of the average net assets of the Focus Fund, the Growth Fund, the 21st Century Fund, and the Global Fund until January 31, 2021. This expense limitation and fee waiver agreement may be terminated by the Adviser at any time after January 31, 2021, upon 15 days prior notice to the Fund and its administrator.
The Adviser may recoup from a Fund fees previously waived or expenses previously reimbursed by the Adviser with respect to that Fund pursuant to these agreements (or a previous expense limitation agreement) if: (1) such recoupment by the Adviser does not cause the Fund, at the time of recoupment, to exceed the lesser of (a) the expense limitation in effect at the time the relevant amount was waived and/or reimbursed, or (b) the expense limitation in effect at the time of the proposed recoupment, and (2) the recoupment is made within three years after the fiscal year end date as of which the amount to be waived or reimbursed was determined and the waiver or reimbursement occurred. As of September 30, 2020, recoupment amounts (in thousands) that may potentially be made by the Growth Fund, International Opportunities Fund, and Global Fund to the Adviser are as follows:
Year of Expiration | | Growth Fund | | | International
Opportunities Fund | | | Global Fund | |
2021 | | $ | — | | | $ | 46 | | | $ | 99 | |
2022 | | | — | | | | 123 | | | | — | |
2023 | | | 139 | | | | 167 | | | | 686 | |
| | | $ | 139 | | | $ | 336 | | | $ | 785 | |
Certain officers of the Trust are also officers of the Adviser. The Funds pay a portion of the Chief Compliance Officer’s total compensation costs which is shown as part of the expense account “Professional fees” on the Statements of Operations. No other officers of the Trust received compensation from the Funds during the year ended September 30, 2020.
4. | Distribution and Service Plan |
The Funds have adopted a Distribution and Service Plan pursuant to Rule 12b-1 under the 1940 Act, and effective December 1, 2017, the Board of Trustees approved a Second Amended and Restated Distribution and Service Plan (the “Plan”). The Plan authorizes payments by the Funds in connection with the distribution of their shares at an annual rate, as determined from time to time by the Board of Trustees, of up to 0.25% of a Fund’s average daily net assets. The Plan, as amended, clarifies that while the maximum 12b-1 Fee rate remains limited to 0.25% per annum of each
44
NOTES TO FINANCIAL STATEMENTS |
Fund’s average daily net assets, one or more Funds may be charged a lower rate from time to time upon approval by the Board of Trustees, and the rate may vary by Fund. The Plan, as amended, also clarifies that previously accrued amounts of the 12b-1 Fee for each Fund may be used by that Fund to pay any current or previously accrued expenses of the Fund authorized by the amended Plan, including non-distribution expenses, authorized by the Plan.
Payments may be made by the Funds under the Plan for the purpose of financing any activity primarily intended to result in the sale of shares of the Funds, as determined by the Board of Trustees, as well as for account maintenance and personal services to shareholders and any other non-distribution-related services. The Adviser may, out of its own resources (which may include legitimate profits from providing advisory services to the Funds or other clients) and at its sole discretion, make certain payments on behalf of the Funds or the Plan for expenses incurred by a Fund for distribution of Fund shares and related services or for administrative or other expenses incurred by the Fund.
Pursuant to the amended Plan, the Board of Trustees determined to cause the Focus Fund to no longer accrue 12b-1 Fees effective on June 1, 2018 and continuing until such time as the Board authorizes a different rate (not exceeding 0.25% per annum). The Board also temporarily eliminated 12b-1 accruals for the Growth Fund and the 21st Century Fund for the period from June 1, 2018 to January 31, 2019. Effective February 1, 2019, the Growth Fund and the 21st Century Fund began accruing 12b-1 Fees at a rate of 0.25% per annum of the average daily net assets of each Fund, and continuing until such time as the Board authorizes a different rate. The International Opportunities Fund and Global Fund continue to accrue 12b-1 Fees at a rate of 0.25% per annum of the average daily net assets of each Fund.
5. | Investment Transactions |
The aggregate purchases and sales of securities, excluding short-term investments, for the Funds for the year ended September 30, 2020, were as follows:
(Amounts in thousands) | | Focus
Fund | | | Growth
Fund | | | 21st
Century
Fund | | | International
Opportunities
Fund | | | Global
Fund | |
Purchases | | $ | 283,104 | | | $ | 251,133 | | | $ | 99,068 | | | $ | 31,545 | | | $ | 122,674 | |
Sales | | $ | 297,682 | | | $ | 231,041 | | | $ | 123,832 | | | $ | 35,107 | | | $ | 148,513 | |
There were no purchases or sales of US government securities, excluding short-term investments.
The recent global outbreak of an infectious respiratory illness caused by a novel strain of coronavirus (“COVID-19”) has disrupted economic and financial markets, resulted in substantial market volatility and impacted the valuations of the Funds’ investments during the reporting period. The prolonged economic impact of COVID-19 remains uncertain. The operational and financial performance of the issuers of securities in which the Funds invest depends on future developments, including the duration and spread of the COVID-19 pandemic, and such uncertainty may in turn continue to impact the value of the Funds’ investments.
7. | Federal Income Tax Information |
“Accounting for Uncertainty in Income Taxes” (the “Income Tax Statement”) requires an evaluation of tax positions taken (or expected to be taken) in the course of preparing a Fund’s tax returns to determine whether these positions meet a “more-likely-than-not” standard that, based on the technical merits, have a more than fifty percent likelihood of being sustained by a taxing authority upon examination. A tax position that meets the “more-likely-than-not” recognition threshold is measured to determine the amount of benefit to recognize in the financial statements. The Funds recognize interest and penalties, if any, related to unrecognized tax benefits as income tax expense in the Statements of Operations.
The Income Tax Statement requires management of the Funds to analyze all open tax years, consisting of fiscal years 2017-2020 as defined by Internal Revenue Service (“IRS”) statute of limitations for all major jurisdictions, including federal tax authorities and certain state tax authorities. As of and during the year ended September 30, 2020, the Funds did not have any liabilities for any unrecognized tax benefits. The Funds have no examinations in progress and are not aware of any tax positions for which it is reasonably possible that the total amounts of unrecognized tax benefits will significantly change in the next twelve months.
45
NOTES TO FINANCIAL STATEMENTS |
NOTES TO FINANCIAL STATEMENTS September 30, 2020 (continued)
At September 30, 2020, gross unrealized appreciation and depreciation of investments, based on cost for federal income tax purposes, were as follows:
(Amounts in thousands) | | Focus
Fund | | | Growth
Fund | | | 21st
Century
Fund | | | International
Opportunities
Fund | | | Global
Fund | |
Cost of Investments | | $ | 420,533 | | | $ | 227,454 | | | $ | 187,927 | | | $ | 41,137 | | | $ | 157,822 | |
| | | | | | | | | | | | | | | | | | | | | |
Gross Unrealized Appreciation | | $ | 390,487 | | | $ | 188,427 | | | $ | 109,856 | | | $ | 15,322 | | | $ | 127,829 | |
Gross Unrealized Depreciation | | | (2,890 | ) | | | (1,344 | ) | | | (5,092 | ) | | | (1,327 | ) | | | (160 | ) |
| | | | | | | | | | | | | | | | | | | | | |
Net Unrealized Appreciation on Investments | | $ | 387,597 | | | $ | 187,083 | | | $ | 104,764 | | | $ | 13,995 | | | $ | 127,669 | |
The difference between cost amounts for financial statement and federal income tax purposes is due primarily to wash sale loss deferrals.
As of September 30, 2020, the Focus Fund, Growth Fund, 21st Century Fund, International Opportunities Fund, and Global Fund, respectively, had (in thousands) $0, $0, $2,012, $259, and $865 of qualified late-year losses, which are deferred until fiscal year 2021 for tax purposes. Net late-year losses that are deferred are deemed to arise on the first day of the Fund’s next taxable year.
The International Opportunities Fund had realized capital losses (in thousands) from transactions between November 1, 2019 and September 30, 2020 of $719. The International Opportunities Fund has elected to treat post-October capital losses as arising in the next fiscal year.
As of September 30, 2020, the components of accumulated earnings on a tax basis were as follows:
(Amounts in thousands) | | Focus
Fund | | | Growth
Fund | | | 21st
Century
Fund | | | International
Opportunities
Fund | | | Global
Fund | |
Undistributed Ordinary Income | | $ | 13,700 | | | $ | 11,532 | | | $ | — | | | $ | — | | | $ | — | |
Undistributed Trustees’ Deferred Compensation | | | (4,604 | ) | | | (2,094 | ) | | | (1,001 | ) | | | (357 | ) | | | (2,375 | ) |
Undistributed Long-Term Capital Gains | | | 66,119 | | | | 26,437 | | | | 5,891 | | | | — | | | | 5,296 | |
Tax Accumulated Earnings (Deficit) | | | 75,215 | | | | 35,875 | | | | 4,890 | | | | (357 | ) | | | 2,921 | |
Accumulated Capital and Other Losses | | | — | | | | — | | | | (2,012 | ) | | | (978 | ) | | | (865 | ) |
Net Unrealized Appreciation on Investments and on Foreign Currency Translations | | | 387,597 | | | | 187,083 | | | | 104,764 | | | | 13,995 | | | | 127,669 | |
Trustees’ Deferred Compensation Mark-to-Market | | | 3,147 | | | | 1,206 | | | | 333 | | | | 114 | | | | 1,653 | |
Total Accumulated Earnings | | $ | 465,959 | | | $ | 224,164 | | | $ | 107,975 | | | $ | 12,774 | | | $ | 131,378 | |
Undistributed ordinary income consists of net investment income, passive foreign investment company and timing differences related to qualified late-year losses.
During the year ended September 30, 2020, the Global Fund utilized capital loss carryforwards of (in thousands) $989.
The tax character of distributions paid during the fiscal years ended September 30, 2020 and 2019 was as follows:
| | | 2020 | | | 2019 | |
(Amounts in thousands) | | Ordinary Income | | | Long-Term Capital Gains | | | Ordinary Income | | | Long-Term Capital Gains | |
Focus Fund | | $ | — | | | $ | 43,408 | | | $ | 202 | | | $ | 51,424 | |
Growth Fund | | | — | | | | 25,236 | | | | 1,218 | | | | 28,133 | |
21st Century Fund | | | — | | | | 8,884 | | | | 10,934 | | | | 731 | |
International Opportunities Fund | | | 191 | | | | 2,090 | | | | — | | | | 4,245 | |
Global Fund | | | — | | | | — | | | | — | | | | 2,537 | |
The tax character of dividends paid may differ from that shown in the Financial Highlights due to short-term gains being treated as ordinary income for tax purposes.
8. New Accounting Pronouncements
The FASB issued Accounting Standards Update No. 2018-13, Fair Value Measurement (Topic 820), Disclosure Framework – Changes to the Disclosure Requirements for Fair Value Measurement (“ASU 2018-13”), which includes amendments intended to improve the effectiveness of disclosures in the notes to financial statements, add disclosure requirements regarding the range and weighted average of significant unobservable inputs used to develop Level 3 fair value measurements, and provide clarifications to the narrative description of measurement uncertainty disclosures. ASU 2018-13 is effective for interim and annual periods beginning after December 15, 2019. However, ASU 2018-13 allowed for
46
NOTES TO FINANCIAL STATEMENTS |
immediate adoption of those provisions that eliminated certain disclosure items while delaying the adoption of the remaining provisions within ASU 2018-13 until the effective date. Management elected to early adopt only those provisions related to the elimination of certain disclosures. Management does not believe there will be a significant impact on the Funds’ financial statements and related disclosures for the remaining provisions.
On November 18, 2020, the Board of Trustees approved the Adviser’s proposed written expense limitation and fee waiver agreement. This written expense limitation and fee waiver agreement will become effective February 1, 2021 after the current written expense limitation and fee waiver agreement between each of the Funds and the Adviser expires on January 31, 2021. Under this written expense limitation and fee waiver agreement, the Adviser has agreed to limit the total expenses of each Fund (excluding taxes, interest, acquired fund fees and expenses, litigation, extraordinary expenses, brokerage and other transaction expenses relating to the purchase or sale of portfolio investments) to the annual rates noted below based on the average net assets of each of the Funds until January 31, 2022. This expense limitation and fee waiver agreement may be terminated by the Adviser at any time after January 31, 2022, upon 15 days prior notice to the Funds and their administrator. The total expense limitation for each of the Funds will be as follows:
Fund | Total Expense Limitation
Effective Through January 31, 2021 | Total Expense Limitation
Effective February 1, 2021 |
Focus Fund | 1.45% | 1.45% |
Growth Fund | 1.45% | 1.45% |
21st Century Fund | 1.45% | 1.45% |
International Opportunities Fund | 1.50% | 1.50% |
Global Fund | 1.45% | 1.50% |
Additionally on November 18, 2020, the Board of Trustees determined to cause the Focus Fund to begin accruing 12b-1 Fees at a rate of 0.25% per annum of the Fund’s average daily net assets effective February 1, 2021. Future changes to this rate as well as the annual rates established for the other Funds may be approved by the Board of Trustees from time to time.
Management of the Adviser has determined that there were no other material subsequent events that would require disclosure in the Funds’ financial statements.
47
REPORT OF INDEPENDENT REGISTERED PUBLIC ACCOUNTING FIRM |
REPORT OF INDEPENDENT REGISTERED PUBLIC ACCOUNTING FIRM
To the Board of Trustees of The Marsico Investment Fund and Shareholders of Marsico Focus Fund, Marsico Growth Fund, Marsico 21st Century Fund, Marsico International Opportunities Fund and Marsico Global Fund
Opinions on the Financial Statements
We have audited the accompanying statements of assets and liabilities, including the schedules of investments, of Marsico Focus Fund, Marsico Growth Fund, Marsico 21st Century Fund, Marsico International Opportunities Fund and Marsico Global Fund (constituting The Marsico Investment Fund, hereafter collectively referred to as the “Funds”) as of September 30, 2020, the related statements of operations for the year ended September 30, 2020, the statements of changes in net assets for each of the two years in the period ended September 30, 2020, including the related notes, and the financial highlights for each of the five years in the period ended September 30, 2020 (collectively referred to as the “financial statements”). In our opinion, the financial statements present fairly, in all material respects, the financial position of each of the Funds as of September 30, 2020, the results of each of their operations for the year then ended, the changes in each of their net assets for each of the two years in the period ended September 30, 2020 and each of the financial highlights for each of the five years in the period ended September 30, 2020 in conformity with accounting principles generally accepted in the United States of America.
Basis for Opinions
These financial statements are the responsibility of the Funds’ management. Our responsibility is to express an opinion on the Funds’ financial statements based on our audits. We are a public accounting firm registered with the Public Company Accounting Oversight Board (United States) (PCAOB) and are required to be independent with respect to the Funds in accordance with the U.S. federal securities laws and the applicable rules and regulations of the Securities and Exchange Commission and the PCAOB.
We conducted our audits of these financial statements in accordance with the standards of the PCAOB. Those standards require that we plan and perform the audit to obtain reasonable assurance about whether the financial statements are free of material misstatement, whether due to error or fraud.
Our audits included performing procedures to assess the risks of material misstatement of the financial statements, whether due to error or fraud, and performing procedures that respond to those risks. Such procedures included examining, on a test basis, evidence regarding the amounts and disclosures in the financial statements. Our audits also included evaluating the accounting principles used and significant estimates made by management, as well as evaluating the overall presentation of the financial statements. Our procedures included confirmation of securities owned as of September 30, 2020 by correspondence with the custodian and brokers; when replies were not received from brokers, we performed other auditing procedures. We believe that our audits provide a reasonable basis for our opinions.

Denver, Colorado
November 18, 2020
We have served as the auditor of one or more investment companies in The Marsico Investment Fund since 1997.
48
EXPENSE EXAMPLE For the six-month period ended September 30, 2020 (Unaudited)
As a shareholder of the Marsico Funds (the “Funds”), you incur two types of costs: (1) transaction costs, including redemption fees (if any), and (2) ongoing costs, including management fees, distribution (12b-1) fees, and other Fund expenses. This Example is intended to help you understand your ongoing costs (in dollars) of investing in the Funds and to compare these costs with the ongoing costs of investing in other mutual funds.
The Example is based on an investment of $1,000 invested at the beginning of the period and held for the entire period from April 1, 2020 to September 30, 2020 (the “period”).
Actual Expenses
The first line of the table below provides information about actual account values and actual expenses. You may use the information in this line, together with the amount you invested, to estimate the expenses you paid over the period. Simply divide your account value by $1,000 (for example, an $8,600 account value divided by $1,000 equals 8.6), then multiply the result by the number in the first line under the heading entitled “Expenses paid for the six-month period ended September 30, 2020” to estimate the expenses you paid on your account during the period.
Hypothetical Example for Comparison Purposes
The second line of the table below provides information about hypothetical account values and hypothetical expenses based on the Funds’ actual expense ratios and an assumed rate of return of 5% per year before expenses, which is not the actual return of any of the Funds. The hypothetical account values and expenses may not be used to estimate the actual ending account balance or expenses you paid for the period. You may use this information to compare the ongoing costs of investing in the Funds and other funds. To do so, compare this 5% hypothetical example with the 5% hypothetical examples that appear in the shareholder reports of other funds.
Please note that the expenses shown in the table are meant to highlight your ongoing costs only and do not reflect any transactional costs such as redemption fees (if any). Therefore, the second line of the table is useful in comparing the ongoing costs only, and will not help you determine the relative total costs of owning different funds. In addition, if these transactional costs (if any) were included, your costs could have been higher.
| | Annualized
expense ratio | Beginning
account value
April 1, 2020 | Ending
account value
September 30, 2020 | Expenses paid for the
six-month period ended
September 30, 2020(1) |
FOCUS FUND | | | | |
Actual Example | 1.43% | $ 1,000.00 | $ 1,544.70 | $ 9.07 |
Hypothetical Example, assuming a 5% return before expenses | | $ 1,000.00 | $ 1,017.87 | $ 7.19 |
| | | | | |
GROWTH FUND | | | | |
Actual Example | 1.54% | $ 1,000.00 | $ 1,560.80 | $ 9.83 |
Hypothetical Example, assuming a 5% return before expenses | | $ 1,000.00 | $ 1,017.32 | $ 7.75 |
| | | | | |
21st CENTURY FUND | | | | |
Actual Example | 1.45% | $ 1,000.00 | $ 1,465.90 | $ 8.94 |
Hypothetical Example, assuming a 5% return before expenses | | $ 1,000.00 | $ 1,017.75 | $ 7.32 |
| | | | | |
INTERNATIONAL OPPORTUNITIES FUND | | | | |
Actual Example | 1.50% | $ 1,000.00 | $ 1,324.50 | $ 8.72 |
Hypothetical Example, assuming a 5% return before expenses | | $ 1,000.00 | $ 1,017.50 | $ 7.57 |
| | | | | |
GLOBAL FUND | | | | |
Actual Example | 1.45% | $ 1,000.00 | $ 1,494.10 | $ 9.04 |
Hypothetical Example, assuming a 5% return before expenses | | $ 1,000.00 | $ 1,017.75 | $ 7.32 |
| (1) | Expenses are equal to the Fund’s annualized expense ratio multiplied by the average account value over the period, multiplied by 183/366 (to reflect the six-month period). |
49
REVIEW OF LIQUIDITY RISK MANAGEMENT PROGRAM |
REVIEW OF LIQUIDITY RISK MANAGEMENT PROGRAM (Unaudited)
Pursuant to Rule 22e-4 under the Investment Company Act (“Rule 22e-4”), the Trust has adopted and implemented a Liquidity Risk Management Program (the “Program”) and Policy (the “Policy”) for the Funds. The Board designated Marsico Capital Management, LLC (or a committee of its employees representing various departments such as trading, compliance, legal, operations and research, and one or more officers of the Trust, as available) (the “Committee”) as the Program Administrator.
The Program and Policy are reasonably designed to assess and manage each Fund’s liquidity risk. For purposes of Rule 22e-4, “liquidity risk” is defined as the risk that a Fund could not meet requests to redeem shares issued by the Fund without significant dilution of remaining investors’ interests in the Fund. Components of the Program and Policy include: (i) assessing each Fund’s liquidity risk based on certain factors at least annually; (ii) classifying the liquidity of each Fund’s portfolio investments into one of four designated liquidity categories (Highly Liquid, Moderately Liquid, Less Liquid and Illiquid) that reflect an estimate of liquidity under current market conditions, and reviewing the classification at least monthly; (iii) confirming expectations in the Policy that the Funds do not need to set a requirement to hold a minimum amount of highly liquid investments (or Highly Liquid Investment Minimum (“HLIM”)) because each Fund primarily holds investments that are highly liquid and qualifies as a Primarily Highly Liquid Fund not subject to HLIM requirements; (iv) restricting the illiquid investments held by a Fund to no more than 15% of the Fund’s net assets and monitoring compliance with the limit; and (v) periodic reporting of liquidity information as required.
At a meeting held on May 13, 2020, the Board of Trustees reviewed the operation and effectiveness of the Program for the period beginning June 1, 2019, the date when the Program was required to be fully implemented (following the initial implementation of portions of the Program beginning December 1, 2018, and the Board’s formal approval of the Program on May 8, 2019) and ending March 31, 2020, or any later date for which relevant information was presented (the “period”). The Board had previously received interim updates on the implementation of the Program at each regularly scheduled quarterly meeting subsequent to the formal Program adoption. At the May 13, 2020 meeting, the Board reviewed a report and related information prepared by the Chief Compliance Officer on behalf of the Program Administrator and Committee regarding the operation of the Program and Policy, the adequacy and effectiveness of their implementation during the period, and other issues. The report included, among other things, a review of the Committee’s findings regarding: (A) the liquidity risk of each Fund; (B) the classification of the liquidity of each portfolio investment and review at least monthly; (C) confirmation that the HLIM is not applicable; (D) monitoring of the 15% restriction on illiquid investments held by a Fund; (E) periodic reporting of liquidity information as required; and other matters. Based upon the review, the Committee determined that the Program and Policy appeared to have operated well, and to have been implemented adequately and effectively to meet key Program requirements in facilitating the Funds’ compliance with Rule 22e-4 during the period.
50
OTHER INFORMATION (Unaudited)
Proxy Voting Guidelines
The Funds exercise the voting rights associated with the securities held by the Funds under the proxy voting policy of the Funds. A description of those policies and procedures of the Funds and a record of the Funds’ proxy votes for the one-year period ended June 30, 2020 are available without charge, upon request, by calling 888-860-8686. It is also available on the Securities and Exchange Commission’s (SEC) website at www.sec.gov.
Quarterly Filing of Portfolio Holdings
The Funds will file their portfolio holdings information for each month in a fiscal quarter within 60 days after the end of the relevant fiscal quarter on Form N-PORT. Portfolio holdings information for the third month of each fiscal quarter will be made available immediately upon filing on the SEC’s website at www.sec.gov.
Other Tax Information
Corporate Dividends Received Deduction
For the fiscal year ended September 30, 2020, 0%, 0%, 0%, 6.05%, and 0% of the dividends paid from net investment income qualified for the dividends received deduction available to corporate shareholders of the Focus Fund, Growth Fund, 21st Century Fund, International Opportunities Fund, and Global Fund, respectively.
Qualified Dividend Income
Pursuant to Section 854 of the Internal Revenue Code, the Focus Fund, Growth Fund, 21st Century Fund, International Opportunities Fund, and Global Fund designate income dividends (in thousands) of $0, $0, $0, $191, and $0, respectively, as qualified dividend income paid during the fiscal year ended September 30, 2020.
Foreign Taxes Paid
Pursuant to the foreign tax credit election under Section 853 of the Internal Revenue Code, the International Opportunities Fund designated (in thousands) $1,023 of income derived from foreign sources and $75 of foreign taxes paid, for the year ended September 30, 2020.
Of the ordinary income (including short-term capital gain) distributions made during the year ended September 30, 2020, the proportionate share of income derived from foreign sources and foreign taxes paid attributable to one share of stock are:
| | Foreign Source Income | Foreign Taxes Paid |
International Opportunities Fund | $0.3823 | $0.0281 |
Long Term Capital Gains Designation
For the fiscal year ended September 30, 2020, the Focus Fund, Growth Fund, 21st Century Fund, International Opportunities Fund, and Global Fund designated (in thousands) $43,408, $25,236, $8,884, $2,090, and $0, respectively, as a 20% rate gain distribution for the purpose of the dividends paid deduction. For income tax purposes, the Funds may utilize earnings and profits distributed to shareholders on the redemption of shares as part of the dividends paid deduction.
Cost Basis Information
Federal law requires mutual fund companies to maintain a shareholder’s cost basis by tax lot and report gain/loss information and holding periods for sales of mutual fund shares that are “covered” securities to the IRS and to shareholders on Form 1099. Mutual fund shares, such as shares of the Funds, acquired on or after January 1, 2012 are covered securities. The Funds are not responsible for maintaining and reporting share information for their shares that are not deemed “covered.”
The tax regulations require that the Funds elect a default tax identification methodology in order to perform the required reporting. The Funds have chosen the first-in-first-out method as the default tax lot identification method for its shareholders. This is the method the Funds will use to determine which specific shares are deemed to be sold when a shareholder’s entire position is not sold in a single transaction and is the method in which “covered” share sales will be reported on a shareholder’s Form 1099.
However, at the time of purchase or upon the sale of “covered” shares, shareholders may generally choose a different tax lot identification method. Shareholders should consult a tax advisor with regard to their personal circumstances as the Funds and their service providers do not provide tax advice.
51
TRUSTEE AND OFFICER INFORMATION |
TRUSTEE AND OFFICER INFORMATION INDEPENDENT TRUSTEES
Name, Address and Age | Position(s) Held
with the Trust | Term of Office(1)
and Length of
Time Served | Principal Occupation(s)
During Past 5 Years | Number of Portfolios
in Fund Complex
Overseen by Trustee | Other Directorships
Held by Trustee |
Jay S. Goodgold
1200 17th Street
Suite 1700
Denver, CO 80202
DOB: 1954 | Trustee; Lead Independent Trustee | Trustee (since
February 2006);
Lead Independent Trustee (since November 2010) | Private investor (July 2003 - present);
Managing Director, Goldman, Sachs & Co.
(August 1978 - June 2003). | 5 | None |
Michael D. Rierson
1200 17th Street
Suite 1700
Denver, CO 80202
DOB: 1952 | Trustee | Since November 1998 | Private investor (December 2019 - present); President, The Rierson Group (marketing and consulting firm serving non-profit organizations) (June 2015 - present); Senior Vice President for Development, Colonial Williamsburg Foundation (January 2011 - June 2015). | 5 | None |
Joseph T. Willett
1200 17th Street
Suite 1700
Denver, CO 80202
DOB: 1951 | Trustee | Since November 2002 | Private investor (2002 - present); Chief
Operating Officer, Merrill Lynch Europe
(1998 - 2002). | 5 | None |
Matthew C. Flavin
1200 17th Street
Suite 1700
Denver, CO 80202
DOB: 1979 | Trustee | Since August
2019 | Chairman and Chief Executive Officer, Concord Energy Holdings (October 2015 - present); Senior Vice President, Energy Corporation of America (March 2012 - October 2015); National Security Council/Department of Defense Senior Executive Service (November 2008 - February 2012); United States Navy (August 2002 - July 2007). | 5 | None |
(1) | Each Trustee serves an indefinite term until the election of a successor or until reaching the mandatory retirement age for non-interested Trustees as established by the Trustees and set forth in the Trust’s Statement of Independent Trustee Retirement Policy, or until his or her resignation, death or removal. Each Officer serves an indefinite term, renewed annually, until the election of a successor (or until their resignation or removal). |
| The Statement of Additional Information includes additional information about the Trustees and is available upon request, without charge, by calling 888-860-8686 or visiting marsicofunds.com. |
52
TRUSTEE AND OFFICER INFORMATION |
TRUSTEE AND OFFICER INFORMATION INTERESTED TRUSTEES* AND OFFICERS
Name, Address and Age | Position(s) Held
with the Trust | Term of Office(1)
and Length of
Time Served | Principal Occupation(s)
During Past 5 Years | Number of Portfolios
in Fund Complex
Overseen by Trustee | Other Directorships
Held by Trustee |
Thomas F. Marsico(2)
1200 17th Street
Suite 1700
Denver, CO 80202
DOB: 1955 | Trustee, President, Chief Executive Officer and Chief Investment Officer | Since December 1997 | Chief Executive Officer,
Marsico Capital Management, LLC
(more than five years). | 5 | None |
Christopher J. Marsico(2) 1200 17th Street
Suite 1700
Denver, CO 80202
DOB: 1961 | Trustee, Executive
Vice President and
Chief Operating Officer | Trustee (August 2007 - March 2010 and since May 2010); Vice President and Treasurer (September 2002 - May 2010); Executive Vice President and Chief Operating Officer
(since May 2010) | President,
Marsico Capital Management, LLC
(more than five years). | 5 | None |
Neil L. Gloude, CPA
1200 17th Street
Suite 1700
Denver, CO 80202
DOB: 1961 | Vice President, Secretary and Treasurer | Vice President and Secretary
(since May 2008);
Treasurer (since May 2010) | Executive Vice President, Chief
Financial Officer and Treasurer, Marsico Capital Management, LLC
(more than five years). | N/A | N/A |
Steven R. Carlson
1200 17th Street
Suite 1700
Denver, CO 80202
DOB: 1964 | Chief Compliance Officer | Since July 2016 | Executive Vice President and Chief Compliance Officer,
Marsico Capital Management, LLC
(more than five years). | N/A | N/A |
Thomas M. J. Kerwin
1200 17th Street
Suite 1700
Denver, CO 80202
DOB: 1955 | Chief Legal Officer | Since August 2003 | Executive Vice President and General Counsel, Marsico Capital Management, LLC (more than five years). | N/A | N/A |
* | Trustees who are “interested persons” of the Funds, as defined in the 1940 Act. |
(1) | Each Trustee serves an indefinite term until the election of a successor or until reaching the mandatory retirement age for non-interested Trustees as established by the Trustees and set forth in the Trust’s Statement of Independent Trustee Retirement Policy, or until his or her resignation, death or removal. Each Officer serves an indefinite term, renewed annually, until the election of a successor (or until their resignation or removal). |
(2) | Mr. Thomas Marsico and Mr. Christopher Marsico are considered Interested Trustees of the Trust because of their affiliation with Marsico Capital Management, LLC, the Adviser to the Funds. Mr. Thomas Marsico and Mr. Christopher Marsico are brothers. |
| The Statement of Additional Information includes additional information about the Trustees and is available upon request, without charge, by calling 888-860-8686 or visiting marsicofunds.com. |
53
NOTES
54
NOTES
55
NOTES
56
(a) The Registrant, as of the end of the period covered by this report, has adopted a code of ethics that applies to the Registrant’s principal executive officer, principal financial officer, principal accounting officer or controller, or persons performing similar functions, regardless of whether these individuals are employed by the Registrant or a third party. A copy of this code of ethics is attached hereto as Exhibit (a).
(b) Not used.
(c) There were no amendments, during the period covered by this report, to a provision of the code of ethics that applies to the Registrant’s principal executive officer, principal financial officer, principal accounting officer or controller, or persons performing similar functions, regardless of whether these individuals are employed by the Registrant or a third party, and that relates to any element of the code of ethics description.
(d) The Registrant has not granted any waivers, including an implicit waiver, from a provision of the code of ethics that applies to the Registrant’s principal executive officer, principal financial officer, principal accounting officer or controller, or persons performing similar functions, regardless of whether these individuals are employed by the Registrant or a third party, that relates to one or more of the items set forth in paragraph (b) of this item’s instructions.
(e) Not applicable.
(f) See attached Exhibit (a).
| Item 3. | Audit Committee Financial Expert |
(a)(1) The Registrant’s Board of Trustees has determined that the Registrant has at least one audit committee financial expert serving on its audit committee.
(a)(2) Mr. Joseph T. Willett is the audit committee financial expert. Mr. Willett is “independent” under the applicable rules.
| Item 4. | Principal Accountant Fees and Services |
In each of the fiscal years ended September 30, 2020 and September 30, 2019, the aggregate Audit Fees billed (or to be billed) by PricewaterhouseCoopers LLP (PwC) for professional services rendered for the audits of the financial statements, or services that are normally provided in connection with statutory and regulatory filings or engagements as well as reimbursable expenses are listed below.
(a) Audit Fees.
(b) Audit-Related Fees.
In each of the fiscal years ended September 30, 2020 and September 30, 2019, the aggregate Audit-Related Fees billed (or to be billed) by PwC for services rendered for assurance and related services to each fund that are reasonably related to the performance of the audit or review of each fund's financial statements, but not reported as Audit Fees, are shown in the table below.
(c) Tax Fees.
In each of the fiscal years ended September 30, 2020 and September 30, 2019 the aggregate Tax Fees billed (or to be billed) by PwC for professional services rendered for tax compliance, tax advice, and tax planning are shown in the table below.
All of these fees were approved by the Trust’s Audit Committee as required pursuant to paragraph (c)(7)(ii) of Rule 2-01 of Regulation S-X.
Fees included in the Tax Fees category comprise all services performed by professional staff in the independent registered public accounting firm's tax division except those services related to the audit. Typically, this category would include fees for tax compliance, tax planning, and tax advice. Tax compliance, tax advice, and tax planning services include preparation of original and amended tax returns, claims for refund and tax payment-planning services, assistance with tax audits and appeals, tax advice related to mergers and acquisitions and requests for rulings or technical advice from taxing authorities.
(d) All Other Fees.
In each of the fiscal years ended September 30, 2020 and September 30, 2019 the aggregate Other Fees billed (or to be billed) by PwC for all other non-audit services rendered are shown in the table below.
(e) (1) Audit Committee Pre-Approval Policies and Procedures:
Pursuant to the Trust’s Audit Committee Charter and Policies and Procedures (collectively, the “Procedures”), the Audit Committee has adopted pre-approval policies and procedures to govern the pre-approval of (i) all audit services and permissible non-audit services to be provided to the Trust by its independent accountant, and (ii) all permissible non-audit services to be provided by such independent accountant to the Trust’s investment adviser and to any entity controlling, controlled by or under common control with the investment adviser that provides on-going services to the Trust (collectively, any “Service Affiliates”) if the engagement directly relates to the Trust’s operations and financial reporting.
In accordance with the Procedures, the Committee is responsible for the engagement of the independent accountant to certify the Trust’s financial statements for each fiscal year. With respect to the pre-approval of non-audit services provided to the Trust and its Service Affiliates, the Procedures provide that the Committee may pre-approve such services on a project-by-project basis as they arise. The Procedures also permit the Committee to delegate authority to the Audit Committee Chairman (the “Designated Member”) to pre-approve any proposed non-audit services that have not been previously approved by the Committee, subject to certain conditions. Any action by the Designated Member in approving a requested non-audit service shall be presented to the Audit Committee not later than at its next scheduled meeting. If the Designated Member does not approve the independent auditor’s provision of a requested non-audit service, the matter may be presented to the full Committee for its consideration and action.
(e)(2) Services approved pursuant to paragraph (c)(7)(i)(C) of Rule 2-01 of Regulation S-X:
100% of these fees were approved by the Trust’s Audit Committee as required pursuant to paragraph (c)(7)(ii) of Rule 2-01 of Regulation S-X.
(f) According to PwC for the fiscal year ended September 30, 2020, the percentage of hours spent on the audit of the Marsico Funds’ financial statements for the most recent fiscal year that were attributed to work performed by persons who are not full-time, permanent employees of PwC is as follows:
| PwC | 2020 |
| Work performed by persons who are not full-time | 0% |
(g) In each of the fiscal years ended September 30, 2020 and September 30, 2019, the aggregate fees billed (or to be billed) by PwC relating to non-audit services that were rendered to the Trust, to its investment adviser, and to any entity controlling, controlled by, or under common control with the investment adviser and that provides ongoing services to the Trust are shown in the table below.
Non-audit services noted in 2020 and 2019 are for an accounting guidance software license utilized and paid for by the investment adviser
(h) Not applicable.
| Item 5. | Audit Committee of Listed Registrants |
Not applicable.
| Item 6. | Schedule of Investments |
The schedule of investments in securities of unaffiliated issuers is included as part of the report to shareholders filed under Item 1.
| Item 7. | Disclosure of Proxy Voting Policies and Procedures for Closed-End Management Investment Companies |
Not applicable.
| Item 8. | Portfolio Managers of Closed-End Management Investment Companies |
Not applicable.
| Item 9. | Purchases of Equity Securities by Closed-End Management Investment Company and Affiliated Purchasers |
Not applicable.
| Item 10. | Submission of Matters to a Vote of Security Holders |
Not applicable.
| Item 11. | Controls and Procedures. |
(a) The registrant's principal executive officer and principal financial officer have concluded that the registrant's disclosure controls and procedures (as defined in Rule 30a-3(c) under the Investment Company Act of 1940, as amended) are effective based on their evaluation of these disclosure controls and procedures within 90 days of the filing date of this report on Form N-CSR.
(b) There were no changes in the registrant's internal control over financial reporting (as defined in Rule 30a-3(d) under the Investment Company Act of 1940, as amended) that occurred during the most recent fiscal half-year of the period covered by this report that have materially affected, or are reasonably likely to materially affect, the registrant's internal control over financial reporting.
| Item 12. | Disclosure of Securities Lending Activities for Closed-End Management Investment Companies. |
Not applicable.
(a)(1) Code of Ethics - Filed as an attachment to this filing.
(a)(2) Certification for each principal executive and principal financial officer of the registrant as required by Rule 30a-2(a) under the Act (17 CFR 270.30a-2(a)). Filed as an attachment to this filing.
(a)(3) Any written solicitation to purchase securities under Rule 23c-1 under the Investment Company Act of 1940, as amended, that was sent or given during the period covered by the report by or on behalf of the registrant to 10 or more persons.
Not applicable.
(a)(4) Change in the registrant’s independent public accountant.
Not applicable.
(b) Certifications required by Rule 30a-2(b) under the Act (17 CFR 270.30a-2(b)), Rule 13a-14(b) or Rule 15d-14(b) under the Exchange Act (17 CFR 240.13a-14(b) or 240.15d-14(b)), and Section 1350 of Chapter 63 of Title 18 of the United States Code (18 U.S.C. 1350). Filed as an attachment to this filing.
SIGNATURES
Pursuant to the requirements of the Securities Exchange Act of 1934 and the Investment Company Act of 1940, the registrant has duly caused this report to be signed on its behalf by the undersigned, thereunto duly authorized.
The Marsico Investment Fund
| By: | /s/ Christopher J. Marsico |
| Christopher J. Marsico, |
| Trustee, Executive Vice President and Chief Operating Officer |
| (Principal Executive Officer) |
| | |
| Date: | December 3, 2020 |
Pursuant to the requirements of the Securities Exchange Act of 1934 and the Investment Company Act of 1940, this report has been signed below by the following persons on behalf of the registrant and in the capacities and on the dates indicated.
| By: | /s/ Christopher J. Marsico |
| Christopher J. Marsico, |
| Trustee, Executive Vice President and Chief Operating Officer |
| (Principal Executive Officer) |
| | |
| Date: | December 3, 2020 |
| | |
| By: | /s/ Neil L. Gloude |
| Neil L. Gloude, |
| Vice President, Secretary and Treasurer |
| (Principal Financial Officer) |
| | |
| Date: | December 3, 2020 |