Table of Contents
UNITED STATES
SECURITIES AND EXCHANGE COMMISSION
Washington, D.C. 20549
FORM N-CSR
CERTIFIED SHAREHOLDER REPORT OF REGISTERED
MANAGEMENT INVESTMENT COMPANIES
Investment Company Act file number: 811-08437
Undiscovered Managers Funds
(Exact name of registrant as specified in charter)
270 Park Avenue
New York, NY 10017
(Address of principal executive offices) (Zip code)
Frank J. Nasta
270 Park Avenue
New York, NY 10017
(Name and Address of Agent for Service)
Registrant’s telephone number, including area code: (800) 480-4111
Date of fiscal year end: August 31
Date of reporting period: September 1, 2015 through February 29, 2016
Form N-CSR is to be used by management investment companies to file reports with the Commission not later than 10 days after the transmission to stockholders of any report that is required to be transmitted to stockholders under Rule 30e-1 under the Investment Company Act of 1940 (17 CFR 270.30e-1). The Commission may use the information provided on Form N-CSR in its regulatory, disclosure review, inspection, and policymaking roles.
A registrant is required to disclose the information specified by Form N-CSR, and the Commission will make this information public. A registrant is not required to respond to the collection of information contained in Form N-CSR unless the Form displays a currently valid Office of Management and Budget (“OMB”) control number. Please direct comments concerning the accuracy of the information collection burden estimate and any suggestions for reducing the burden to Secretary, Securities and Exchange Commission, 450 Fifth Street, NW, Washington, DC 20549-0609. The OMB has reviewed this collection of information under the clearance requirements of 44 U.S.C. Section 3507.
Table of Contents
ITEM 1. REPORTS TO STOCKHOLDERS.
The following is a copy of the report transmitted to shareholders pursuant to Rule 30e-1 under the Investment Company Act of 1940 (17 CFR 270.30e-1).
Table of Contents
Semi-Annual Report
Undiscovered Managers Funds
February 29, 2016 (Unaudited)
Undiscovered Managers Behavioral Value Fund
JPMorgan Realty Income Fund

Table of Contents
| CEO’s Letter | 1 | |||
Fund Commentaries: | ||||
| 2 | ||||
| 5 | ||||
| Schedules of Portfolio Investments | 8 | |||
| Financial Statements | 14 | |||
| Financial Highlights | 20 | |||
| Notes to Financial Statements | 24 | |||
| Schedule of Shareholder Expenses | 30 | |||
Investments in a Fund are not deposits or obligations of, or guaranteed or endorsed by, any bank and are not insured or guaranteed by the FDIC, the Federal Reserve Board or any other government agency. You could lose money if you sell when a Fund’s share price is lower than when you invested.
Past performance is no guarantee of future performance. The general market views expressed in this report are opinions based on market and other conditions through the end of the reporting period and are subject to change without notice. These views are not intended to predict the future performance of a Fund or the securities markets. References to specific securities and their issuers are for illustrative purposes only and are not intended to be, and should not be interpreted as, recommendations to purchase or sell such securities. Such views are not meant as investment advice and may not be relied on as an indication of trading intent on behalf of any Fund.
Prospective investors should refer to the Funds’ prospectus for a discussion of the Funds’ investment objectives, strategies and risks. Call J.P. Morgan Funds Service Center at 1-800-480-4111 for a prospectus containing more complete information about a Fund, including management fees and other expenses. Please read it carefully before investing.
Table of Contents
March 16, 2016 (Unaudited)
Dear Shareholder,
The U.S. economy strengthened sufficiently in late 2015 for the U.S. Federal Reserve (the “Fed”) to raise interest rates in December for the first time in a decade but slowing growth elsewhere in the world proved to be an increasing drag on U.S. growth into 2016.
 |
While the outlook for the U.S. economy had dimmed somewhat by the end of February, job growth continued, core inflation remained stable and the risk of economic recession in the U.S. appeared low.” |
While gains in U.S. employment and consumer spending continued through the six months ended February 29, 2016, central banks in China, Japan and the European Union enacted extraordinary measures to stimulate economic growth and stabilize financial markets. In the face of slowing global growth and rising market volatility, the Fed declined to further raise interest rates at its mid-March 2016 meeting.
Throughout the past six months, oil and gas prices remained historically low amid global oversupply and slowing demand, and by the end of the reporting period prices were roughly two-thirds off their peak in 2014. In February, spot prices for crude oil dropped to levels not seen since 2004.
While low energy prices put more money into consumers’ pockets and helped reduce commercial transportation costs, deteriorating balance sheets of energy sector companies raised the threat of increasing defaults, particularly in the market for high yield bonds (also known as ‘junk bonds”). Also, energy companies sharply curtailed spending on new projects, which hurt the broader industrial sector that supplies pipeline, construction materials and machinery for oil exploration and production.
Along with low oil prices, the U.S. dollar’s strength relative to other currencies was an important factor over the past six months. Overseas central bank interventions have driven down the value of foreign currencies, particularly the euro and the yen, while the strength of the U.S. economy had made the dollar more attractive. This in turn hurt the overseas earnings
of U.S. companies. Among the companies that comprise the Standard & Poor’s 500 Index (S&P 500), an estimated aggregate of 35% to 40% of their earnings come from overseas and the loss of income was reflected in the final quarter of 2015, when aggregate per-share earnings of companies in the S&P 500 declined on a year-over-year basis for the third consecutive quarter. Notably, financial analysts accelerated the pace of downward revisions to their earnings estimates during the first two months of 2016.
Meanwhile, the broader U.S. economy continued along its low-growth trajectory for the past six months. Gross domestic product (GDP), which grew by 2.0% in the third quarter of 2015, increased by 1.4% in the final three months of 2015. With the addition of 230,000 new jobs in February, non-farm private sector employment extended its expansion to 72 consecutive months. During the six months ended February 29, 2016, the unemployment rate fell to 4.9% from 5.1%, though wage growth during the period barely outpaced the rate of inflation. Consumer spending, which accounts for two-thirds of U.S. economic activity, slowed to 0.1% growth in December and maintained that pace through January and February.
While the outlook for the U.S. economy had dimmed somewhat by the end of February, job growth continued, core inflation remained stable and the risk of economic recession in the U.S. appeared low. In this climate of low growth and heightened volatility in financial markets, investors may best be served by a patient, long term outlook and a fully diversified portfolio.
On behalf of everyone at J.P. Morgan Asset Management, thank you for your continued support. We look forward to managing your investment needs for years to come. Should you have any questions, please visit www.jpmorganfunds.com or contact the J.P. Morgan Funds Service Center at 1-800-480-4111.
Sincerely yours,

George C.W. Gatch
CEO, Global Funds Management, J.P. Morgan Asset Management
| FEBRUARY 29, 2016 | UNDISCOVERED MANAGERS FUNDS | 1 | ||||||
Table of Contents
Undiscovered Managers Behavioral Value Fund
FUND COMMENTARY
SIX MONTHS ENDED FEBRUARY 29, 2016 (Unaudited)
| REPORTING PERIOD RETURN: | ||||
| Fund (Institutional Class Shares)* | -2.66% | |||
| Russell 2000 Value Index | -6.73% | |||
| Net Assets as of 2/29/2016 (In Thousands) | $ | 3,724,701 | ||
INVESTMENT OBJECTIVE**
The Undiscovered Managers Behavioral Value Fund (the “Fund”) seeks to provide capital appreciation.
HOW DID THE MARKET PERFORM?
U.S. equity markets posted negative returns for the six months ended February 29, 2016. Following a global sell-off in equities in August, stock prices in the U.S. generally rebounded in October to turn in their best one-month performance since late 2011. Leading equity indexes mostly held their ground through November and largely weathered the U.S. Federal Reserve’s December 15 decision to lift interest rates.
The first week of January 2016 proved to be the worst week on record for U.S. equity prices. For the full month, the Standard & Poor’s 500 Index dropped 5.07% and the Dow Jones Industrial Average fell 5.50%. Selling was driven by worrisome data on China’s economy and expectations for slower economic growth globally. The continued weakness in commodities prices and the relative strength of the U.S. dollar added to investor concerns. These concerns appeared to ease somewhat in February, though leading equity indexes remained down for the six month reporting period.
In general, the energy, materials and industrials sectors underperformed the broader market during the six month reporting period, while the consumer discretionary, consumer staples and health care sectors outperformed the broader market. Over the reporting period, growth stocks generally outperformed value stocks and small cap stocks generally underperformed both mid cap and large cap stocks. For the six months ended February 29, 2016, the S&P 500 Index returned -0.92% and the Russell 2000 Value Index returned -6.73%.
WHAT WERE THE MAIN DRIVERS OF THE FUND’S PERFORMANCE?
For the six months ended February 29, 2016, the Fund’s Institutional Class Shares outperformed the Russell 2000 Value Index (the “Benchmark”). The Fund’s security selection in the utilities sector and its security selection and overweight position in the information technology sector were leading contributors to performance relative to the Benchmark. The Fund’s security selection in the financials sector and its overweight position in the industrials sector were leading detractors from relative performance.
Leading individual contributors to relative performance included the Fund’s overweight position in Piedmont Natural Gas Co. and its out-of-Benchmark positions in Sally Beauty Holdings Inc. and PBF Energy Inc. Shares of Piedmont Natural Gas, a distributor of natural gas, rose on news of a takeover offer from Duke Energy Corp. Shares of Sally Beauty Holdings, a retailer and distributor of beauty products, rose on better-than-expected earnings and revenue. Shares of PBF Energy, a petroleum refinery company, rose on better-than-expected earnings.
Leading individual detractors from relative performance included the Fund’s out-of-Benchmark position in Genworth Financial Inc. and Harsco Corp., and its overweight position in KLX Inc. Shares of Genworth Financial, a provider of life and mortgage insurance, fell after the company’s debt rating was downgraded following Genworth’s decision to suspend sales of life insurance and fixed annuity products. Shares of Harsco, a provider of industrial services and engineered products primarily for the mining and metals sector, fell on continued weakness in global commodities prices. Shares of KLX, a provider of hardware to the aerospace and energy sectors, fell on weaker-than-expected earnings.
HOW WAS THE FUND POSITIONED?
The Fund’s sub-adviser, Fuller & Thaler Asset Management Inc. (the “Sub-adviser”) looked for stocks that it believed were mispriced based on behavioral biases. The Sub-adviser generally utilizes a three-pronged approach that includes i) positive signals such as significant share purchases by company insiders or stock repurchase activity by the company; ii) evidence of overreaction due to behavioral factors that have resulted in an absolute or relative decline in valuation; and iii) analysis of the company fundamentals with regard to business model, valuation and credit risk.
As a result of this process, the Fund’s largest average overweight position versus the Benchmark was in the industrials sector, while its largest underweight position versus the Benchmark was in the financials sector.
| * | The return shown is based on net asset values calculated for shareholder transactions and may differ from the return shown in the financial highlights, which reflects adjustments made to the net asset values in accordance with accounting principles generally accepted in the United States of America. |
| ** | The adviser seeks to achieve the Fund’s objective. There can be no guarantee that it will be achieved. |
| 2 | UNDISCOVERED MANAGERS FUNDS | FEBRUARY 29, 2016 | ||||
Table of Contents
| TOP TEN EQUITY HOLDINGS OF THE PORTFOLIO* | ||||||||
| 1. | Investors Bancorp, Inc. | 4.6 | % | |||||
| 2. | Copart, Inc. | 2.6 | ||||||
| 3. | B/E Aerospace, Inc. | 2.5 | ||||||
| 4. | Commercial Metals Co. | 2.3 | ||||||
| 5. | White Mountains Insurance Group Ltd. | 2.2 | ||||||
| 6. | Actuant Corp., Class A | 2.2 | ||||||
| 7. | KLX, Inc. | 2.1 | ||||||
| 8. | First Niagara Financial Group, Inc. | 2.1 | ||||||
| 9. | ACI Worldwide, Inc. | 2.0 | ||||||
| 10. | Colony Financial, Inc., Class A | 1.9 | ||||||
PORTFOLIO COMPOSITION BY SECTOR* | ||||
| Financials | 30.8 | % | ||
| Industrials | 19.6 | |||
| Information Technology | 13.6 | |||
| Consumer Discretionary | 10.2 | |||
| Materials | 7.7 | |||
| Health Care | 4.1 | |||
| Energy | 3.9 | |||
| Utilities | 2.2 | |||
| Consumer Staples | 1.1 | |||
| Short-Term Investment | 6.8 | |||
| * | Percentages indicated are based on total investments as of February 29, 2016. The Fund’s portfolio composition is subject to change. |
| FEBRUARY 29, 2016 | UNDISCOVERED MANAGERS FUNDS | 3 | ||||||
Table of Contents
Undiscovered Managers Behavioral Value Fund
FUND COMMENTARY
SIX MONTHS ENDED FEBRUARY 29, 2016 (Unaudited) (continued)
AVERAGE ANNUAL TOTAL RETURNS AS OF FEBRUARY 29, 2016 | ||||||||||
| INCEPTION DATE OF CLASS | 6 MONTH* | 1 YEAR | 5 YEAR | 10 YEAR | ||||||||||||||
CLASS A SHARES | June 4, 2004 | |||||||||||||||||
With Sales Charge** | (7.97 | )% | (8.01 | )% | 9.11 | % | 6.73 | % | ||||||||||
Without Sales Charge | (2.87 | ) | (2.91 | ) | 10.30 | 7.31 | ||||||||||||
CLASS C SHARES | June 4, 2004 | |||||||||||||||||
With CDSC*** | (4.12 | ) | (4.39 | ) | 9.75 | 6.78 | ||||||||||||
Without CDSC | (3.12 | ) | (3.39 | ) | 9.75 | 6.78 | ||||||||||||
CLASS R2 SHARES | April 30, 2013 | (2.99 | ) | (3.17 | ) | 10.14 | 7.23 | |||||||||||
CLASS R6 SHARES | April 30, 2013 | (2.62 | ) | (2.43 | ) | 10.71 | 7.63 | |||||||||||
INSTITUTIONAL CLASS SHARES | December 28, 1998 | (2.66 | ) | (2.52 | ) | 10.65 | 7.60 | |||||||||||
SELECT CLASS SHARES | April 30, 2013 | (2.74 | ) | (2.67 | ) | 10.56 | 7.56 | |||||||||||
| * | Not annualized. |
| ** | Sales Charge for Class A Shares is 5.25% |
| *** | Assumes a 1% CDSC (contingent deferred sales charge) for the one year period and 0% CDSC thereafter. |
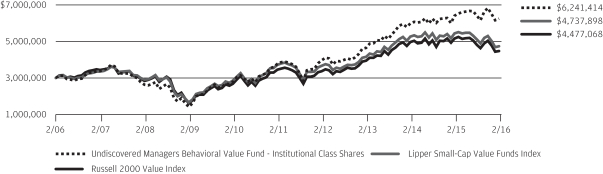
TEN YEAR PERFORMANCE (2/28/06 TO 2/29/16)
The performance quoted is past performance and is not a guarantee of future results. Mutual funds are subject to certain market risks. Investment returns and principal value of an investment will fluctuate so that an investor’s shares, when redeemed, may be worth more or less than their original cost. Current performance may be higher or lower than the performance data shown. For up-to-date month-end performance information please call 1-800-480-4111.
Returns for Class R6 and Select Class Shares prior to their inception date are based on the performance of Institutional Class Shares. The actual returns of Select Class Shares would have been lower than those shown because Select Class Shares have higher expenses than Institutional Class Shares. The actual returns of Class R6 Shares would have been different than those shown because Class R6 Shares have different expenses than Institutional Class Shares. Returns for Class R2 Shares prior to their inception date are based on the performance of Class A Shares. The actual returns of Class R2 Shares would have been lower than those shown because Class R2 Shares have higher expenses than Class A Shares.
The graph illustrates comparative performance for $3,000,000 invested in Institutional Class Shares of the Undiscovered Managers Behavioral Value Fund, the Russell 2000 Value Index and the Lipper Small-Cap Value Funds Index from February 28, 2006 to February 29, 2016. The performance of the Fund assumes reinvestment of all dividends and capital gain distributions, if any, and does not include a sales charge. The performance of the Russell 2000 Value Index does
not reflect the deduction of expenses or a sales charge associated with a mutual fund and has been adjusted to reflect reinvestment of all dividends and capital gain distributions of securities included in the benchmark, if applicable. The performance of the Lipper Small-Cap Value Funds Index includes expenses associated with a mutual fund, such as investment management fees. These expenses are not identical to the expenses incurred by the Fund. The Russell 2000 Value Index is an unmanaged index, which measures the performance of those Russell 2000 companies with lower price-to-book ratios and lower forecasted growth values. The Lipper Small-Cap Value Funds Index is an index based on total returns of certain mutual funds within the Fund’s designated category as determined by Lipper, Inc. Investors cannot invest directly in an index.
Institutional Class Shares have a $3,000,000 minimum initial investment.
Fund performance may reflect the waiver of the Fund’s fees and reimbursement of expenses for certain periods since the inception date. Without these waivers and reimbursements, performance would have been lower. Also, performance shown in this section does not reflect the deduction of taxes that a shareholder would pay on Fund distributions or redemption of Fund shares.
The returns shown are based on net asset values calculated for shareholder transactions and may differ from the returns shown in the financial highlights, which reflect adjustments made to the net asset values in accordance with accounting principles generally accepted in the United States of America.
| 4 | UNDISCOVERED MANAGERS FUNDS | FEBRUARY 29, 2016 | ||||
Table of Contents
FUND COMMENTARY
SIX MONTHS ENDED FEBRUARY 29, 2016 (Unaudited)
| REPORTING PERIOD RETURN: | ||||
| Fund (Institutional Class Shares)* | 3.70% | |||
| Morgan Stanley Capital International (“MSCI”) US REIT Index | 6.21% | |||
| Net Assets as of 2/29/2016 (In Thousands) | $ | 1,969,961 | ||
INVESTMENT OBJECTIVE**
The JPMorgan Realty Income Fund (the “Fund”) seeks to provide high total investment return through a combination of capital appreciation and current income.
HOW DID THE MARKET PERFORM?
U.S. equity markets overall posted negative returns for the six months ended February 29, 2016. Following a global sell-off in equities in August, stock prices in the U.S. generally rebounded in October to turn in their best one-month performance since late 2011. Leading equity indexes mostly held their ground through November and largely weathered the U.S. Federal Reserve’s December 15, 2015 decision to raise interest rates.
The first week of January 2016 proved to be the worst week on record for U.S. equity prices. For the full month, the Standard & Poor’s 500 Index dropped 5.07% and the Dow Jones Industrial Average fell 5.50%. Selling was driven by worrisome data on China’s economy and expectations for slower economic growth globally. The continued weakness in commodities prices and the relative strength of the U.S. dollar added to investor concerns. These concerns appeared to ease somewhat in February, though leading equity indexes remained down for the six month reporting period.
In general, prices for real estate investment trusts (REITs) also came under selling pressure as investors worried that weakening economic conditions outside the U.S. would hurt domestic growth and U.S. real estate prices. For the six months ended February 29, 2016, the S&P 500 Index returned -0.92% and the MSCI US REIT Index returned 6.21%.
WHAT WERE THE MAIN DRIVERS OF THE FUND’S PERFORMANCE?
For the six months ended February 29, 2016, the Fund’s Institutional Class Shares underperformed the MSCI U.S. REIT Index (the “Benchmark”). The Fund’s overall security selection in the lodging, health care and storage sector as well as the office sector and the residential sector was a leading detractor from
performance relative to the Benchmark. The Fund’s security selection in the retail sector made a positive contribution to relative performance, due to the Fund manager’s bias toward higher quality REIT securities.
Leading individual detractors from the Fund’s relative performance included its overweight positions in Pebblebrook Hotel Trust, LaSalle Hotel Properties and Diamondrock Hospitality Co. All three companies operate in the hospitality sector and their share prices declined amid investor concerns that a slowing U.S. economy would hurt hotel and lodging companies.
Leading individual contributors to the Fund’s relative performance included its overweight positions in Regency Centers Corp. and Kimco Realty Corp. and its underweight position in WP Glimcher Inc. All three companies operate in the retail sector, and shares of Regency Centers and Kimco Realty rose as investors bought what they considered to be undervalued shares. Shares of Glimcher fell due to its tenant exposure to Sears Holdings, which reported declining sales.
HOW WAS THE FUND POSITIONED?
The Fund’s portfolio managers used bottom-up fundamental research to construct, in their view, a portfolio of attractively valued real estate securities. They projected long-term cash flow for each portfolio holding and valued the holdings using a proprietary dividend discount model. During the reporting period, the portfolio managers used gains from the lodging and retail sectors to fund investments in the residential and industrial sectors and sought companies that they believed would benefit from economic recovery, especially malls and storage companies.
| * | The return shown is based on net asset values calculated for shareholder transactions and may differ from the return shown in the financial highlights, which reflects adjustments made to the net asset values in accordance with accounting principles generally accepted in the United States of America. |
| ** | The adviser seeks to achieve the Fund’s objective. There can be no guarantee that it will be achieved. |
| FEBRUARY 29, 2016 | UNDISCOVERED MANAGERS FUNDS | 5 | ||||||
Table of Contents
JPMorgan Realty Income Fund
FUND COMMENTARY
SIX MONTHS ENDED FEBRUARY 29, 2016 (Unaudited) (continued)
| TOP TEN EQUITY HOLDINGS OF THE PORTFOLIO* | ||||||||
| 1. | Simon Property Group, Inc. | 7.3 | % | |||||
| 2. | AvalonBay Communities, Inc. | 6.4 | ||||||
| 3. | Public Storage | 6.1 | ||||||
| 4. | Equinix, Inc. | 5.7 | ||||||
| 5. | Kimco Realty Corp. | 5.0 | ||||||
| 6. | Equity Residential | 4.6 | ||||||
| 7. | SL Green Realty Corp. | 4.3 | ||||||
| 8. | Vornado Realty Trust | 4.1 | ||||||
| 9. | HCP, Inc. | 4.0 | ||||||
| 10. | Macerich Co. (The) | 3.8 | ||||||
PORTFOLIO COMPOSITION BY SECTOR* | ||||
| Apartments | 17.7 | % | ||
| Regional Malls | 15.4 | |||
| Diversified | 13.1 | |||
| Office | 11.2 | |||
| Health Care | 10.8 | |||
| Storage | 8.1 | |||
| Shopping Centers | 7.7 | |||
| Hotels | 6.3 | |||
| Single Tenant | 4.7 | |||
| Industrial | 3.8 | |||
| Multifamily | 0.3 | |||
| Short-Term Investment | 0.9 | |||
| * | Percentages indicated are based on total investments as of February 29, 2016. The Fund’s portfolio composition is subject to change. |
| 6 | UNDISCOVERED MANAGERS FUNDS | FEBRUARY 29, 2016 | ||||
Table of Contents
AVERAGE ANNUAL TOTAL RETURNS AS OF FEBRUARY 29, 2016 | ||||||||
| INCEPTION DATE OF CLASS | 6 MONTH* | 1 YEAR | 5 YEAR | 10 YEAR | ||||||||||||||
CLASS A SHARES | June 4, 2004 | |||||||||||||||||
With Sales Charge** | (1.86 | )% | (10.44 | )% | 7.25 | % | 4.59 | % | ||||||||||
Without Sales Charge | 3.60 | (5.46 | ) | 8.42 | 5.15 | |||||||||||||
CLASS C SHARES | June 4, 2004 | |||||||||||||||||
With CDSC*** | 2.25 | (6.99 | ) | 7.86 | 4.62 | |||||||||||||
Without CDSC | 3.25 | (5.99 | ) | 7.86 | 4.62 | |||||||||||||
CLASS R5 SHARES | May 15, 2006 | 3.74 | (5.11 | ) | 8.89 | 5.63 | ||||||||||||
CLASS R6 SHARES | November 2, 2015 | 3.82 | (5.04 | ) | 8.90 | 5.64 | ||||||||||||
INSTITUTIONAL CLASS SHARES | January 1, 1998 | 3.70 | (5.19 | ) | 8.82 | 5.58 | ||||||||||||
| * | Not annualized. |
| ** | Sales Charge for Class A Shares is 5.25% |
| *** | Assumes a 1% CDSC (contingent deferred sales charge) for the one year period and 0% CDSC thereafter. |
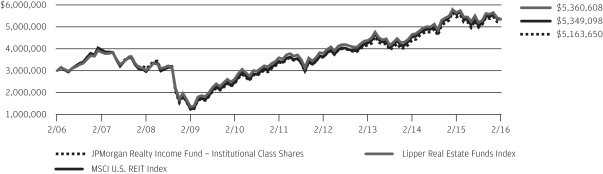
TEN YEAR PERFORMANCE (2/28/06 TO 2/29/16)
The performance quoted is past performance and is not a guarantee of future results. Mutual funds are subject to certain market risks. Investment returns and principal value of an investment will fluctuate so that an investor’s shares, when redeemed, may be worth more or less than their original cost. Current performance may be higher or lower than the performance data shown. For up-to-date month-end performance information please call 1-800-480-4111.
Returns for Class R5 Shares prior to its inception date are based on the performance of Institutional Class Shares. The actual returns of Class R5 Shares would have been different than those shown because Class R5 Shares have different expenses than Institutional Class Shares.
Returns for Class R6 Shares prior to its inception date are based on the performance of Class R5 Shares. The actual returns of R6 Shares would have been different than those shown because R6 Shares have different expenses than Class R5 Shares.
The graph illustrates comparative performance for $3,000,000 invested in Institutional Class Shares of the JPMorgan Realty Income Fund, the MSCI U.S. REIT Index and the Lipper Real Estate Funds Index from February 28, 2006 to February 29, 2016. The performance of the Fund assumes reinvestment of all dividends and capital gain distributions, if any, and does not include a sales charge. The performance of the MSCI U.S. REIT Index does not reflect the deduction of expenses or a sales charge associated with a mutual fund and has been adjusted to reflect reinvestment of all dividends and capital gain distributions of securities included in the benchmark, if applicable.
The performance of the Lipper Real Estate Funds Index includes expenses associated with a mutual fund, such as investment management fees. These expenses are not identical to the expenses incurred by the Fund. The MSCI U.S. REIT Index is a free float-adjusted market capitalization weighted index that is comprised of equity REITs that are included in the MSCI U.S. Investable Market 2500 Index, with the exception of specialty equity REITs that do not generate a majority of their revenue and income from real estate rental and leasing operations. The index represents approximately 85% of the U.S. REIT universe. The Lipper Real Estate Funds Index is an index based on total returns of certain mutual funds within the Fund’s designated category as determined by Lipper, Inc. Investors cannot invest directly in an index.
Institutional Class Shares have a $3,000,000 minimum initial investment.
Fund performance may reflect the waiver of the Fund’s fees and reimbursement of expenses for certain periods since the inception date. Without these waivers and reimbursements, performance would have been lower. Also, performance shown in this section does not reflect the deduction of taxes that a shareholder would pay on Fund distributions or redemption of Fund shares.
The returns shown are based on net asset values calculated for shareholder transactions and may differ from the returns shown in the financial highlights, which reflect adjustments made to the net asset values in accordance with accounting principles generally accepted in the United States of America.
| FEBRUARY 29, 2016 | UNDISCOVERED MANAGERS FUNDS | 7 | ||||||
Table of Contents
Undiscovered Managers Behavioral Value Fund
SCHEDULE OF PORTFOLIO INVESTMENTS
AS OF FEBRUARY 29, 2016 (Unaudited)
(Amounts in thousands)
| SHARES | SECURITY DESCRIPTION | VALUE($) | ||||||
| Common Stocks — 94.0% | |||||||
Consumer Discretionary — 10.3% | ||||||||
Diversified Consumer Services — 0.4% | ||||||||
| 681 | Sotheby’s | 15,484 | ||||||
|
| |||||||
Hotels, Restaurants & Leisure — 1.4% | ||||||||
| 610 | Brinker International, Inc. | 30,368 | ||||||
| 273 | Wyndham Worldwide Corp. | 19,856 | ||||||
|
| |||||||
| 50,224 | ||||||||
|
| |||||||
Household Durables — 1.3% | ||||||||
| 962 | Tupperware Brands Corp. | 48,059 | ||||||
|
| |||||||
Media — 1.2% | ||||||||
| 1,007 | John Wiley & Sons, Inc., Class A | 43,822 | ||||||
|
| |||||||
Specialty Retail — 4.6% | ||||||||
| 1,364 | American Eagle Outfitters, Inc. | 20,815 | ||||||
| 1,613 | GNC Holdings, Inc., Class A | 45,927 | ||||||
| 728 | Guess?, Inc. | 15,545 | ||||||
| 1,312 | Sally Beauty Holdings, Inc. (a) | 41,444 | ||||||
| 962 | Select Comfort Corp. (a) | 17,225 | ||||||
| 1,153 | Vitamin Shoppe, Inc. (a) | 31,805 | ||||||
|
| |||||||
| 172,761 | ||||||||
|
| |||||||
Textiles, Apparel & Luxury Goods — 1.4% | ||||||||
| 881 | Columbia Sportswear Co. | 52,435 | ||||||
|
| |||||||
Total Consumer Discretionary | 382,785 | |||||||
|
| |||||||
Consumer Staples — 1.1% | ||||||||
Household Products — 1.1% |
| |||||||
| 1,052 | Energizer Holdings, Inc. | 40,958 | ||||||
|
| |||||||
Energy — 3.9% | ||||||||
Energy Equipment & Services — 1.6% |
| |||||||
| 2,041 | Patterson-UTI Energy, Inc. | 31,719 | ||||||
| 2,845 | TETRA Technologies, Inc. (a) | 14,339 | ||||||
| 2,402 | Tidewater, Inc. | 13,811 | ||||||
|
| |||||||
| 59,869 | ||||||||
|
| |||||||
Oil, Gas & Consumable Fuels — 2.3% | ||||||||
| 1,659 | PBF Energy, Inc., Class A | 50,111 | ||||||
| 192 | Tesoro Corp. | 15,474 | ||||||
| 4,857 | WPX Energy, Inc. (a) | 19,962 | ||||||
|
| |||||||
| 85,547 | ||||||||
|
| |||||||
Total Energy | 145,416 | |||||||
|
| |||||||
Financials — 31.1% | ||||||||
Banks — 10.4% |
| |||||||
| 1,410 | Bancorp, Inc. (The) (a) | 6,728 | ||||||
| 3,658 | BBCN Bancorp, Inc. | 52,352 | ||||||
| 3,698 | First Horizon National Corp. | 44,450 | ||||||
| 8,366 | First Niagara Financial Group, Inc. | 77,302 | ||||||
| SHARES | SECURITY DESCRIPTION | VALUE($) | ||||||
Banks — continued |
| |||||||
| 15,081 | Investors Bancorp, Inc. | 170,714 | ||||||
| 991 | PrivateBancorp, Inc. | 34,054 | ||||||
|
| |||||||
| 385,600 | ||||||||
|
| |||||||
Capital Markets — 4.6% | ||||||||
| 5,416 | Apollo Investment Corp. | 27,730 | ||||||
| 1,318 | Artisan Partners Asset Management, Inc., Class A | 37,407 | ||||||
| 4,242 | Fifth Street Finance Corp. | 20,998 | ||||||
| 1,607 | Investment Technology Group, Inc. | 29,443 | ||||||
| 2,713 | Janus Capital Group, Inc. | 35,079 | ||||||
| 869 | Waddell & Reed Financial, Inc., Class A | 20,350 | ||||||
|
| |||||||
| 171,007 | ||||||||
|
| |||||||
Insurance — 4.6% | ||||||||
| 3,947 | CNO Financial Group, Inc. | 68,794 | ||||||
| 9,013 | Genworth Financial, Inc., Class A (a) | 19,107 | ||||||
| 110 | White Mountains Insurance Group Ltd. | 84,075 | ||||||
|
| |||||||
| 171,976 | ||||||||
|
| |||||||
Real Estate Investment Trusts (REITs) — 10.9% |
| |||||||
| 1,587 | AG Mortgage Investment Trust, Inc. | 19,565 | ||||||
| 2,735 | Apollo Commercial Real Estate Finance, Inc. | 42,263 | ||||||
| 2,386 | Chatham Lodging Trust | 47,857 | ||||||
| 4,337 | Colony Capital, Inc., Class A | 71,125 | ||||||
| 622 | Colony Starwood Homes | 13,655 | ||||||
| 5,667 | Franklin Street Properties Corp. | 53,898 | ||||||
| 2,335 | Hatteras Financial Corp. | 32,106 | ||||||
| 678 | Potlatch Corp. | 17,931 | ||||||
| 2,661 | Rayonier, Inc. | 58,092 | ||||||
| 544 | Ryman Hospitality Properties, Inc. | 26,061 | ||||||
| 1,322 | Starwood Property Trust, Inc. | 23,183 | ||||||
|
| |||||||
| 405,736 | ||||||||
|
| |||||||
Real Estate Management & Development — 0.6% |
| |||||||
| 668 | Alexander & Baldwin, Inc. | 22,404 | ||||||
|
| |||||||
Total Financials | 1,156,723 | |||||||
|
| |||||||
Health Care — 4.2% | ||||||||
Health Care Equipment & Supplies — 2.0% |
| |||||||
| 1,484 | Haemonetics Corp. (a) | 47,600 | ||||||
| 727 | Masimo Corp. (a) | 27,504 | ||||||
|
| |||||||
| 75,104 | ||||||||
|
| |||||||
Health Care Providers & Services — 0.6% | ||||||||
| 101 | Health Net, Inc. (a) | 6,278 | ||||||
| 588 | PharMerica Corp. (a) | 13,599 | ||||||
|
| |||||||
| 19,877 | ||||||||
|
| |||||||
SEE NOTES TO FINANCIAL STATEMENTS.
| 8 | UNDISCOVERED MANAGERS FUNDS | FEBRUARY 29, 2016 | ||||
Table of Contents
| SHARES | SECURITY DESCRIPTION | VALUE($) | ||||||
| Common Stocks — continued | |||||||
Health Care Technology — 1.6% | ||||||||
| 4,130 | Allscripts Healthcare Solutions, Inc. (a) | 51,710 | ||||||
| 145 | Computer Programs & Systems, Inc. | 8,233 | ||||||
|
| |||||||
| 59,943 | ||||||||
|
| |||||||
Total Health Care | 154,924 | |||||||
|
| |||||||
Industrials — 19.7% | ||||||||
Aerospace & Defense — 4.6% |
| |||||||
| 2,136 | B/E Aerospace, Inc. | 93,181 | ||||||
| 2,813 | KLX, Inc. (a) | 78,732 | ||||||
|
| |||||||
| 171,913 | ||||||||
|
| |||||||
Building Products — 0.7% | ||||||||
| 661 | Armstrong World Industries, Inc. (a) | 26,792 | ||||||
|
| |||||||
Commercial Services & Supplies — 5.0% | ||||||||
| 906 | Brink’s Co. (The) | 26,500 | ||||||
| 3,389 | Civeo Corp. (a) | 3,016 | ||||||
| 1,352 | Clean Harbors, Inc. (a) | 57,582 | ||||||
| 2,605 | Copart, Inc. (a) | 98,355 | ||||||
|
| |||||||
| 185,453 | ||||||||
|
| |||||||
Construction & Engineering — 0.5% | ||||||||
| 323 | Dycom Industries, Inc. (a) | 18,374 | ||||||
|
| |||||||
Machinery — 5.5% | ||||||||
| 3,583 | Actuant Corp., Class A | 83,874 | ||||||
| 3,175 | Harsco Corp. | 12,032 | ||||||
| 382 | Hyster-Yale Materials Handling, Inc. | 22,609 | ||||||
| 2,399 | Kennametal, Inc. | 48,288 | ||||||
| 1,745 | Terex Corp. | 39,043 | ||||||
|
| |||||||
| 205,846 | ||||||||
|
| |||||||
Marine — 1.6% | ||||||||
| 1,489 | Matson, Inc. | 59,707 | ||||||
|
| |||||||
Trading Companies & Distributors — 1.8% | ||||||||
| 824 | Applied Industrial Technologies, Inc. | 31,728 | ||||||
| 2,926 | MRC Global, Inc. (a) | 34,966 | ||||||
|
| |||||||
| 66,694 | ||||||||
|
| |||||||
Total Industrials | 734,779 | |||||||
|
| |||||||
Information Technology — 13.7% | ||||||||
Communications Equipment — 1.0% |
| |||||||
| 1,659 | ADTRAN, Inc. | 31,041 | ||||||
| 1,796 | Harmonic, Inc. (a) | 6,017 | ||||||
|
| |||||||
| 37,058 | ||||||||
|
| |||||||
Electronic Equipment, Instruments & Components — 2.7% |
| |||||||
| 1,477 | Dolby Laboratories, Inc., Class A | 58,342 | ||||||
| SHARES | SECURITY DESCRIPTION | VALUE($) | ||||||
Electronic Equipment, Instruments & Components — continued |
| |||||||
| 739 | MTS Systems Corp. | 40,592 | ||||||
|
| |||||||
| 98,934 | ||||||||
|
| |||||||
IT Services — 6.5% | ||||||||
| 860 | Broadridge Financial Solutions, Inc. | 48,248 | ||||||
| 941 | Cardtronics, Inc. (a) | 31,720 | ||||||
| 2,481 | Convergys Corp. | 63,971 | ||||||
| 3,713 | Everi Holdings, Inc. (a) | 10,917 | ||||||
| 750 | Global Payments, Inc. | 45,695 | ||||||
| 1,385 | Sykes Enterprises, Inc. (a) | 42,190 | ||||||
|
| |||||||
| 242,741 | ||||||||
|
| |||||||
Semiconductors & Semiconductor Equipment — 1.5% |
| |||||||
| 4,437 | Intersil Corp., Class A | 56,664 | ||||||
|
| |||||||
Software — 2.0% | ||||||||
| 4,036 | ACI Worldwide, Inc. (a) | 75,315 | ||||||
|
| |||||||
Total Information Technology | 510,712 | |||||||
|
| |||||||
Materials — 7.8% | ||||||||
Chemicals — 3.2% |
| |||||||
| 991 | Cabot Corp. | 44,121 | ||||||
| 946 | Celanese Corp., Series A | 57,088 | ||||||
| 1,016 | Koppers Holdings, Inc. (a) | 17,813 | ||||||
|
| |||||||
| 119,022 | ||||||||
|
| |||||||
Construction Materials — 0.9% | ||||||||
| 570 | Eagle Materials, Inc. | 34,409 | ||||||
|
| |||||||
Metals & Mining — 2.3% | ||||||||
| 5,911 | Commercial Metals Co. | 86,833 | ||||||
|
| |||||||
Paper & Forest Products — 1.4% | ||||||||
| 2,745 | PH Glatfelter Co. | 50,419 | ||||||
|
| |||||||
Total Materials | 290,683 | |||||||
|
| |||||||
Utilities — 2.2% | ||||||||
Electric Utilities — 1.8% |
| |||||||
| 1,680 | El Paso Electric Co. | 68,641 | ||||||
|
| |||||||
Gas Utilities — 0.4% | ||||||||
| 241 | Piedmont Natural Gas Co., Inc. | 14,325 | ||||||
|
| |||||||
Total Utilities | 82,966 | |||||||
|
| |||||||
Total Common Stocks | 3,499,946 | |||||||
|
| |||||||
SEE NOTES TO FINANCIAL STATEMENTS.
| FEBRUARY 29, 2016 | UNDISCOVERED MANAGERS FUNDS | 9 | ||||||
Table of Contents
Undiscovered Managers Behavioral Value Fund
SCHEDULE OF PORTFOLIO INVESTMENTS
AS OF FEBRUARY 29, 2016 (Unaudited) (continued)
(Amounts in thousands)
| SHARES | SECURITY DESCRIPTION | VALUE($) | ||||||
| Short-Term Investment — 6.8% | |||||||
Investment Company — 6.8% |
| |||||||
| 253,875 | JPMorgan Prime Money Market Fund, Institutional Class Shares, 0.350% (b) (l) | 253,875 | ||||||
|
| |||||||
Total Investments — 100.8% | 3,753,821 | |||||||
Liabilities in Excess of | (29,120 | ) | ||||||
|
| |||||||
NET ASSETS — 100.0% | $ | 3,724,701 | ||||||
|
| |||||||
Percentages indicated are based on net assets.
SEE NOTES TO FINANCIAL STATEMENTS.
| 10 | UNDISCOVERED MANAGERS FUNDS | FEBRUARY 29, 2016 | ||||
Table of Contents
JPMorgan Realty Income Fund
SCHEDULE OF PORTFOLIO INVESTMENTS
AS OF FEBRUARY 29, 2016 (Unaudited)
(Amounts in thousands)
| SHARES | SECURITY DESCRIPTION | VALUE($) | ||||||
| Common Stocks — 98.7% | |||||||
Apartments — 17.6% | ||||||||
| 243 | American Campus Communities, Inc. | 10,636 | ||||||
| 1,695 | Apartment Investment & Management Co., Class A | 62,058 | ||||||
| 732 | AvalonBay Communities, Inc. | 125,675 | ||||||
| 1,214 | Equity Residential | 90,436 | ||||||
| 277 | Essex Property Trust, Inc. | 57,913 | ||||||
|
| |||||||
| 346,718 | ||||||||
|
| |||||||
Diversified — 13.1% | ||||||||
| 1,859 | Duke Realty Corp. | 38,444 | ||||||
| 367 | Equinix, Inc. | 111,433 | ||||||
| 932 | Liberty Property Trust | 26,917 | ||||||
| 936 | Vornado Realty Trust | 80,820 | ||||||
|
| |||||||
| 257,614 | ||||||||
|
| |||||||
Health Care — 10.8% | ||||||||
| 2,641 | HCP, Inc. | 78,120 | ||||||
| 549 | National Health Investors, Inc. | 34,564 | ||||||
| 1,369 | Omega Healthcare Investors, Inc. | 43,886 | ||||||
| 916 | Senior Housing Properties Trust | 14,299 | ||||||
| 647 | Welltower, Inc. | 41,275 | ||||||
|
| |||||||
| 212,144 | ||||||||
|
| |||||||
Hotels — 6.3% | ||||||||
| 1,995 | DiamondRock Hospitality Co. | 17,755 | ||||||
| 2,038 | Host Hotels & Resorts, Inc. | 31,202 | ||||||
| 2,191 | LaSalle Hotel Properties | 53,356 | ||||||
| 633 | Pebblebrook Hotel Trust | 17,181 | ||||||
| 310 | Sunstone Hotel Investors, Inc. | 3,999 | ||||||
|
| |||||||
| 123,493 | ||||||||
|
| |||||||
Industrial — 3.8% | ||||||||
| 1,929 | Prologis, Inc. | 74,201 | ||||||
|
| |||||||
Multifamily — 0.3% | ||||||||
| 87 | Equity LifeStyle Properties, Inc. | 6,104 | ||||||
|
| |||||||
Office — 11.1% | ||||||||
| 529 | Boston Properties, Inc. | 60,396 | ||||||
| 367 | Douglas Emmett, Inc. | 9,848 | ||||||
| 769 | Hudson Pacific Properties, Inc. | 19,610 | ||||||
| 477 | Kilroy Realty Corp. | 25,905 | ||||||
| 917 | New York REIT, Inc. | 8,803 | ||||||
| 685 | Parkway Properties, Inc. | 9,177 | ||||||
| 965 | SL Green Realty Corp. | 85,051 | ||||||
|
| |||||||
| 218,790 | ||||||||
|
| |||||||
Regional Malls — 15.4% | ||||||||
| 2,561 | General Growth Properties, Inc. | 70,475 | ||||||
| 951 | Macerich Co. (The) | 75,170 | ||||||
| SHARES | SECURITY DESCRIPTION | VALUE($) | ||||||
Regional Malls — continued | ||||||||
| 774 | Pennsylvania Real Estate Investment Trust | 14,830 | ||||||
| 751 | Simon Property Group, Inc. | 142,429 | ||||||
|
| |||||||
| 302,904 | ||||||||
|
| |||||||
Shopping Centers — 7.6% | ||||||||
| 205 | Equity One, Inc. | 5,609 | ||||||
| 3,658 | Kimco Realty Corp. | 97,864 | ||||||
| 673 | Regency Centers Corp. | 47,493 | ||||||
|
| |||||||
| 150,966 | ||||||||
|
| |||||||
Single Tenant — 4.6% | ||||||||
| 814 | Realty Income Corp. | 47,631 | ||||||
| 4,126 | Spirit Realty Capital, Inc. | 44,108 | ||||||
|
| |||||||
| 91,739 | ||||||||
|
| |||||||
Storage — 8.1% | ||||||||
| 478 | Extra Space Storage, Inc. | 39,265 | ||||||
| 483 | Public Storage | 120,437 | ||||||
|
| |||||||
| 159,702 | ||||||||
|
| |||||||
Total Common Stocks | 1,944,375 | |||||||
|
| |||||||
| Short-Term Investment — 0.9% | |||||||
Investment Company — 0.9% | ||||||||
| 17,836 | JPMorgan Prime Money Market Fund, Institutional Class Shares, 0.350% (b) (l) | 17,836 | ||||||
|
| |||||||
Total Investments — 99.6% | 1,962,211 | |||||||
Other Assets in Excess of | 7,750 | |||||||
|
| |||||||
NET ASSETS — 100.0% | $ | 1,969,961 | ||||||
|
| |||||||
Percentages indicated are based on net assets.
SEE NOTES TO FINANCIAL STATEMENTS.
| FEBRUARY 29, 2016 | UNDISCOVERED MANAGERS FUNDS | 11 | ||||||
Table of Contents
Undiscovered Managers Funds
NOTES TO SCHEDULES OF PORTFOLIO INVESTMENTS
AS OF FEBRUARY 29, 2016 (Unaudited)
| (a) | — Non-income producing security. | |
| (b) | — Investment in affiliate. Money market fund is registered under the Investment Company Act of 1940, as amended, and advised by J.P. Morgan Investment Management Inc. |
| (l) | — The rate shown is the current yield as of February 29, 2016 |
SEE NOTES TO FINANCIAL STATEMENTS.
| 12 | UNDISCOVERED MANAGERS FUNDS | FEBRUARY 29, 2016 | ||||
Table of Contents
THIS PAGE IS INTENTIONALLY LEFT BLANK
| FEBRUARY 29, 2016 | UNDISCOVERED MANAGERS FUNDS | 13 | ||||||
Table of Contents
STATEMENTS OF ASSETS AND LIABILITIES
AS OF FEBRUARY 29, 2016 (Unaudited)
(Amounts in thousands, except per share amounts)
| Behavioral Value Fund | Realty Income Fund | |||||||
ASSETS: |
| |||||||
Investments in non-affiliates, at value | $ | 3,499,946 | $ | 1,944,375 | ||||
Investments in affiliates, at value | 253,875 | 17,836 | ||||||
|
|
|
| |||||
Total investment securities, at value | 3,753,821 | 1,962,211 | ||||||
Cash | — | 9 | ||||||
Due from custodian | — | 1,949 | ||||||
Receivables: | ||||||||
Investment securities sold | 13,419 | 941 | ||||||
Fund shares sold | 25,601 | 13,368 | ||||||
Dividends from non-affiliates | 1,753 | 1,328 | ||||||
Dividends from affiliates | 46 | 6 | ||||||
|
|
|
| |||||
Total Assets | 3,794,640 | 1,979,812 | ||||||
|
|
|
| |||||
LIABILITIES: | ||||||||
Payables: | ||||||||
Investment securities purchased | 64,260 | 3,397 | ||||||
Fund shares redeemed | 2,448 | 5,228 | ||||||
Accrued liabilities: | ||||||||
Investment advisory fees | 1,949 | 975 | ||||||
Administration fees | 154 | 17 | ||||||
Shareholder servicing fees | 250 | 37 | ||||||
Distribution fees | 315 | 41 | ||||||
Custodian and accounting fees | 26 | 23 | ||||||
Trustees’ and Chief Compliance Officer’s fees | 2 | — | ||||||
Other | 535 | 133 | ||||||
|
|
|
| |||||
Total Liabilities | 69,939 | 9,851 | ||||||
|
|
|
| |||||
Net Assets | $ | 3,724,701 | $ | 1,969,961 | ||||
|
|
|
| |||||
SEE NOTES TO FINANCIAL STATEMENTS.
| 14 | UNDISCOVERED MANAGERS FUNDS | FEBRUARY 29, 2016 | ||||
Table of Contents
| Behavioral Value Fund | Realty Income Fund | |||||||
NET ASSETS: |
| |||||||
Paid-in-Capital | $ | 3,817,199 | $ | 1,828,469 | ||||
Accumulated undistributed (distributions in excess of) net investment income | 3,224 | (118 | ) | |||||
Accumulated net realized gains (losses) | 79,690 | (67,954 | ) | |||||
Net unrealized appreciation (depreciation) | (175,412 | ) | 209,564 | |||||
|
|
|
| |||||
Total Net Assets | $ | 3,724,701 | $ | 1,969,961 | ||||
|
|
|
| |||||
Net Assets: | ||||||||
Class A | $ | 915,433 | $ | 171,061 | ||||
Class C | 239,709 | 8,401 | ||||||
Class R2 | 8,564 | — | ||||||
Class R5 | — | 25,986 | ||||||
Class R6 | 96,364 | 1,639,159 | ||||||
Institutional Class | 1,688,064 | 125,354 | ||||||
Select Class | 776,567 | — | ||||||
|
|
|
| |||||
Total | $ | 3,724,701 | $ | 1,969,961 | ||||
|
|
|
| |||||
Outstanding units of beneficial interest (shares) | ||||||||
($0.0001 par value; unlimited number of shares authorized): | ||||||||
Class A | 17,658 | 13,612 | ||||||
Class C | 4,881 | 686 | ||||||
Class R2 | 166 | — | ||||||
Class R5 | — | 2,038 | ||||||
Class R6 | 1,817 | 129,100 | ||||||
Institutional Class | 31,859 | 9,883 | ||||||
Select Class | 14,692 | — | ||||||
Net Asset Value (a): | ||||||||
Class A — Redemption price per share | $ | 51.84 | $ | 12.57 | ||||
Class C — Offering price per share (b) | 49.11 | 12.24 | ||||||
Class R2 — Offering and redemption price per share | 51.58 | — | ||||||
Class R5 — Offering and redemption price per share | — | 12.75 | ||||||
Class R6 — Offering and redemption price per share | 53.04 | 12.70 | ||||||
Institutional Class — Offering and redemption price per share | 52.99 | 12.68 | ||||||
Select Class — Offering and redemption price per share | 52.86 | — | ||||||
Class A maximum sales charge | 5.25 | % | 5.25 | % | ||||
Class A maximum public offering price per share | $ | 54.71 | $ | 13.27 | ||||
|
|
|
| |||||
Cost of investments in non-affiliates | $ | 3,675,358 | $ | 1,734,811 | ||||
Cost of investments in affiliates | 253,875 | 17,836 | ||||||
| (a) | Per share amounts may not recalculate due to rounding of net assets and/or shares outstanding. |
| (b) | Redemption price for Class C Shares varies based upon length of time the shares are held. |
SEE NOTES TO FINANCIAL STATEMENTS.
| FEBRUARY 29, 2016 | UNDISCOVERED MANAGERS FUNDS | 15 | ||||||
Table of Contents
STATEMENTS OF OPERATIONS
FOR THE SIX MONTHS ENDED FEBRUARY 29, 2016 (Unaudited)
(Amounts in thousands)
| Behavioral Value Fund | Realty Income Fund | |||||||
INVESTMENT INCOME: |
| |||||||
Dividend income from non-affiliates | $ | 36,030 | $ | 33,490 | ||||
Dividend income from affiliates | 95 | 19 | ||||||
|
|
|
| |||||
Total investment income | 36,125 | 33,509 | ||||||
|
|
|
| |||||
EXPENSES: | ||||||||
Investment advisory fees | 16,524 | 8,306 | ||||||
Administration fees | 1,289 | 907 | ||||||
Distribution fees: | ||||||||
Class A | 1,026 | 232 | ||||||
Class C | 807 | 35 | ||||||
Class R2 | 18 | — | ||||||
Shareholder servicing fees: | ||||||||
Class A | 1,026 | 232 | ||||||
Class C | 269 | 11 | ||||||
Class R2 | 9 | — | ||||||
Class R5 | — | 174 | ||||||
Institutional Class | 676 | 79 | ||||||
Select Class | 846 | — | ||||||
Custodian and accounting fees | 60 | 39 | ||||||
Interest expense to affiliates | — | — | (a) | |||||
Professional fees | 42 | 45 | ||||||
Trustees’ and Chief Compliance Officer’s fees | 13 | 8 | ||||||
Printing and mailing costs | 98 | 35 | ||||||
Registration and filing fees | 236 | 77 | ||||||
Transfer agent fees (See Note 2.C.) | 53 | 22 | ||||||
Sub-transfer agent fees (See Note 2.C.) | 1,212 | 174 | ||||||
Other | 35 | 24 | ||||||
|
|
|
| |||||
Total expenses | 24,239 | 10,400 | ||||||
|
|
|
| |||||
Less fees waived | (7,065 | ) | (2,128 | ) | ||||
Less expense reimbursements | — | (3 | ) | |||||
|
|
|
| |||||
Net expenses | 17,174 | 8,269 | ||||||
|
|
|
| |||||
Net investment income (loss) | 18,951 | 25,240 | ||||||
|
|
|
| |||||
REALIZED/UNREALIZED GAINS (LOSSES): | ||||||||
Net realized gain (loss) on transactions from investments in non-affiliates | 122,878 | (17,419 | ) | |||||
Change in net unrealized appreciation/depreciation on investments in non-affiliates | (244,561 | ) | 83,634 | |||||
|
|
|
| |||||
Net realized/unrealized gains (losses) | (121,683 | ) | 66,215 | |||||
|
|
|
| |||||
Change in net assets resulting from operations | $ | (102,732 | ) | $ | 91,455 | |||
|
|
|
| |||||
| (a) | Amount rounds to less than $1,000. |
SEE NOTES TO FINANCIAL STATEMENTS.
| 16 | UNDISCOVERED MANAGERS FUNDS | FEBRUARY 29, 2016 | ||||
Table of Contents
STATEMENTS OF CHANGES IN NET ASSETS
FOR THE PERIODS INDICATED
(Amounts in thousands)
| Behavioral Value Fund | Realty Income Fund | |||||||||||||||
| Six Months Ended February 29, 2016 (Unaudited) | Year Ended August 31, 2015 | Six Months Ended February 29, 2016 (Unaudited) | Year Ended August 31, 2015 | |||||||||||||
CHANGE IN NET ASSETS RESULTING FROM OPERATIONS: | ||||||||||||||||
Net investment income (loss) | $ | 18,951 | $ | 16,485 | $ | 25,240 | $ | 34,849 | ||||||||
Net realized gain (loss) | 122,878 | 59,226 | (17,419 | ) | 109,158 | |||||||||||
Change in net unrealized appreciation/depreciation | (244,561 | ) | (43,844 | ) | 83,634 | (122,196 | ) | |||||||||
|
|
|
|
|
|
|
| |||||||||
Change in net assets resulting from operations | (102,732 | ) | 31,867 | 91,455 | 21,811 | |||||||||||
|
|
|
|
|
|
|
| |||||||||
DISTRIBUTIONS TO SHAREHOLDERS: | ||||||||||||||||
Class A | ||||||||||||||||
From net investment income | (5,101 | ) | (3,398 | ) | (2,142 | ) | (2,310 | ) | ||||||||
From net realized gains | (24,776 | ) | (6,395 | ) | (9,943 | ) | (3,621 | ) | ||||||||
Class B (a) | ||||||||||||||||
From net investment income | — | — | — | (6 | ) | |||||||||||
From net realized gains | — | (7 | ) | — | (11 | ) | ||||||||||
Class C | ||||||||||||||||
From net investment income | (565 | ) | (574 | ) | (86 | ) | (105 | ) | ||||||||
From net realized gains | (6,871 | ) | (1,933 | ) | (521 | ) | (200 | ) | ||||||||
Class R2 | ||||||||||||||||
From net investment income | (45 | ) | (6 | ) | — | — | ||||||||||
From net realized gains | (231 | ) | (14 | ) | — | — | ||||||||||
Class R5 | ||||||||||||||||
From net investment income | — | — | (6,997 | ) | (27,688 | ) | ||||||||||
From net realized gains | — | — | (1,354 | ) | (36,925 | ) | ||||||||||
Class R6 (b) | ||||||||||||||||
From net investment income | (743 | ) | (203 | ) | (19,863 | ) | — | |||||||||
From net realized gains | (2,260 | ) | (258 | ) | (101,525 | ) | — | |||||||||
Institutional Class | ||||||||||||||||
From net investment income | (12,126 | ) | (6,933 | ) | (1,981 | ) | (3,954 | ) | ||||||||
From net realized gains | (38,389 | ) | (9,417 | ) | (7,198 | ) | (5,747 | ) | ||||||||
Select Class | ||||||||||||||||
From net investment income | (5,368 | ) | (3,602 | ) | — | — | ||||||||||
From net realized gains | (20,046 | ) | (5,050 | ) | — | — | ||||||||||
|
|
|
|
|
|
|
| |||||||||
Total distributions to shareholders | (116,521 | ) | (37,790 | ) | (151,610 | ) | (80,567 | ) | ||||||||
|
|
|
|
|
|
|
| |||||||||
CAPITAL TRANSACTIONS: | ||||||||||||||||
Change in net assets resulting from capital transactions | 1,268,967 | 1,400,880 | (179,193 | ) | 466,785 | |||||||||||
|
|
|
|
|
|
|
| |||||||||
NET ASSETS: | ||||||||||||||||
Change in net assets | 1,049,714 | 1,394,957 | (239,348 | ) | 408,029 | |||||||||||
Beginning of period | 2,674,987 | 1,280,030 | 2,209,309 | 1,801,280 | ||||||||||||
|
|
|
|
|
|
|
| |||||||||
End of period | $ | 3,724,701 | $ | 2,674,987 | $ | 1,969,961 | $ | 2,209,309 | ||||||||
|
|
|
|
|
|
|
| |||||||||
Accumulated undistributed (distributions in excess of) net investment income | $ | 3,224 | $ | 8,221 | $ | (118 | ) | $ | 5,711 | |||||||
|
|
|
|
|
|
|
| |||||||||
| (a) | All remaining Class B Shares converted to Class A Shares on June 19, 2015. |
| (b) | Commencement of offering of shares effective November 2, 2015 for Realty Income Fund. |
SEE NOTES TO FINANCIAL STATEMENTS.
| FEBRUARY 29, 2016 | UNDISCOVERED MANAGERS FUNDS | 17 | ||||||
Table of Contents
STATEMENTS OF CHANGES IN NET ASSETS
FOR THE PERIODS INDICATED (continued)
(Amounts in thousands)
| Behavioral Value Fund | Realty Income Fund | |||||||||||||||
| Six Months Ended February 29, 2016 (Unaudited) | Year Ended August 31, 2015 | Six Months Ended February 29, 2016 (Unaudited) | Year Ended August 31, 2015 | |||||||||||||
CAPITAL TRANSACTIONS: | ||||||||||||||||
Class A | ||||||||||||||||
Proceeds from shares issued | $ | 376,133 | $ | 468,554 | $ | 48,060 | $ | 100,080 | ||||||||
Distributions reinvested | 28,319 | 9,350 | 11,990 | 4,845 | ||||||||||||
Cost of shares redeemed | (125,838 | ) | (144,391 | ) | (54,952 | ) | (68,100 | ) | ||||||||
Conversion from Class B Shares | — | 304 | — | 292 | ||||||||||||
|
|
|
|
|
|
|
| |||||||||
Change in net assets resulting from Class A capital transactions | $ | 278,614 | $ | 333,817 | $ | 5,098 | $ | 37,117 | ||||||||
|
|
|
|
|
|
|
| |||||||||
Class B (a) | ||||||||||||||||
Proceeds from shares issued | $ | — | $ | 30 | $ | — | $ | 15 | ||||||||
Distributions reinvested | — | 7 | — | 17 | ||||||||||||
Cost of shares redeemed | — | (300 | ) | — | (235 | ) | ||||||||||
Conversion to Class A Shares | — | (304 | ) | — | (292 | ) | ||||||||||
|
|
|
|
|
|
|
| |||||||||
Change in net assets resulting from Class B capital transactions | $ | — | $ | (567 | ) | $ | — | $ | (495 | ) | ||||||
|
|
|
|
|
|
|
| |||||||||
Class C | ||||||||||||||||
Proceeds from shares issued | $ | 79,863 | $ | 96,143 | $ | 1,290 | $ | 5,377 | ||||||||
Distributions reinvested | 6,156 | 2,087 | 594 | 296 | ||||||||||||
Cost of shares redeemed | (15,520 | ) | (19,345 | ) | (2,302 | ) | (4,068 | ) | ||||||||
|
|
|
|
|
|
|
| |||||||||
Change in net assets resulting from Class C capital transactions | $ | 70,499 | $ | 78,885 | $ | (418 | ) | $ | 1,605 | |||||||
|
|
|
|
|
|
|
| |||||||||
Class R2 | ||||||||||||||||
Proceeds from shares issued | $ | 4,889 | $ | 4,766 | $ | — | $ | — | ||||||||
Distributions reinvested | 276 | 20 | — | — | ||||||||||||
Cost of shares redeemed | (869 | ) | (804 | ) | — | — | ||||||||||
|
|
|
|
|
|
|
| |||||||||
Change in net assets resulting from Class R2 capital transactions | $ | 4,296 | $ | 3,982 | $ | — | $ | — | ||||||||
|
|
|
|
|
|
|
| |||||||||
Class R5 | ||||||||||||||||
Proceeds from shares issued | $ | — | $ | — | $ | 136,200 | $ | 534,703 | ||||||||
Distributions reinvested | — | — | 8,276 | 64,553 | ||||||||||||
Cost of shares redeemed | — | — | (2,130,232 | ) | (104,075 | ) | ||||||||||
|
|
|
|
|
|
|
| |||||||||
Change in net assets resulting from Class R5 capital transactions | $ | — | $ | — | $ | (1,985,756 | ) | $ | 495,181 | |||||||
|
|
|
|
|
|
|
| |||||||||
Class R6 (b) | ||||||||||||||||
Proceeds from shares issued | $ | 50,842 | $ | 76,234 | $ | 2,178,779 | $ | — | ||||||||
Distributions reinvested | 2,995 | 461 | 121,388 | — | ||||||||||||
Cost of shares redeemed | (7,173 | ) | (39,759 | ) | (433,524 | ) | — | |||||||||
|
|
|
|
|
|
|
| |||||||||
Change in net assets resulting from Class R6 capital transactions | $ | 46,664 | $ | 36,936 | $ | 1,866,643 | $ | — | ||||||||
|
|
|
|
|
|
|
| |||||||||
Institutional Class | ||||||||||||||||
Proceeds from shares issued | $ | 773,526 | $ | 782,843 | $ | 9,514 | $ | 40,726 | ||||||||
Distributions reinvested | 25,245 | 7,148 | 4,397 | 5,537 | ||||||||||||
Cost of shares redeemed | (174,191 | ) | (152,170 | ) | (78,671 | ) | (112,886 | ) | ||||||||
|
|
|
|
|
|
|
| |||||||||
Change in net assets resulting from Institutional Class capital transactions | $ | 624,580 | $ | 637,821 | $ | (64,760 | ) | $ | (66,623 | ) | ||||||
|
|
|
|
|
|
|
| |||||||||
Select Class | ||||||||||||||||
Proceeds from shares issued | $ | 369,509 | $ | 420,446 | $ | — | $ | — | ||||||||
Distributions reinvested | 18,405 | 5,658 | — | — | ||||||||||||
Cost of shares redeemed | (143,600 | ) | (116,098 | ) | — | — | ||||||||||
|
|
|
|
|
|
|
| |||||||||
Change in net assets resulting from Select Class capital transactions | $ | 244,314 | $ | 310,006 | $ | — | $ | — | ||||||||
|
|
|
|
|
|
|
| |||||||||
Total change in net assets resulting from capital transactions | $ | 1,268,967 | $ | 1,400,880 | $ | (179,193 | ) | $ | 466,785 | |||||||
|
|
|
|
|
|
|
| |||||||||
| (a) | All remaining Class B Shares converted to Class A Shares on June 19, 2015. |
| (b) | Commencement of offering of shares effective November 2, 2015 for Realty Income Fund. |
SEE NOTES TO FINANCIAL STATEMENTS.
| 18 | UNDISCOVERED MANAGERS FUNDS | FEBRUARY 29, 2016 | ||||
Table of Contents
| Behavioral Value Fund | Realty Income Fund | |||||||||||||||
| Six Months Ended February 29, 2016 (Unaudited) | Year Ended August 31, 2015 | Six Months Ended February 29, 2016 (Unaudited) | Year Ended August 31, 2015 | |||||||||||||
SHARE TRANSACTIONS: | ||||||||||||||||
Class A | ||||||||||||||||
Issued | 6,926 | 8,425 | 3,618 | 7,202 | ||||||||||||
Reinvested | 526 | 176 | 927 | 356 | ||||||||||||
Redeemed | (2,384 | ) | (2,603 | ) | (4,232 | ) | (4,900 | ) | ||||||||
Conversion from Class B Shares | — | 5 | — | 21 | ||||||||||||
|
|
|
|
|
|
|
| |||||||||
Change in Class A Shares | 5,068 | 6,003 | 313 | 2,679 | ||||||||||||
|
|
|
|
|
|
|
| |||||||||
Class B (a) | ||||||||||||||||
Issued | — | 1 | — | 1 | ||||||||||||
Reinvested | — | — | (b) | — | 1 | |||||||||||
Redeemed | — | (6 | ) | — | (17 | ) | ||||||||||
Conversion to Class A Shares | — | (5 | ) | — | (22 | ) | ||||||||||
|
|
|
|
|
|
|
| |||||||||
Change in Class B Shares | — | (10 | ) | — | (37 | ) | ||||||||||
|
|
|
|
|
|
|
| |||||||||
Class C | ||||||||||||||||
Issued | 1,534 | 1,820 | 99 | 393 | ||||||||||||
Reinvested | 121 | 42 | 47 | 22 | ||||||||||||
Redeemed | (309 | ) | (367 | ) | (185 | ) | (301 | ) | ||||||||
|
|
|
|
|
|
|
| |||||||||
Change in Class C Shares | 1,346 | 1,495 | (39 | ) | 114 | |||||||||||
|
|
|
|
|
|
|
| |||||||||
Class R2 | ||||||||||||||||
Issued | 89 | 86 | — | — | ||||||||||||
Reinvested | 5 | — | (b) | — | — | |||||||||||
Redeemed | (16 | ) | (15 | ) | — | — | ||||||||||
|
|
|
|
|
|
|
| |||||||||
Change in Class R2 Shares | 78 | 71 | — | — | ||||||||||||
|
|
|
|
|
|
|
| |||||||||
Class R5 | ||||||||||||||||
Issued | — | — | 9,912 | 39,015 | ||||||||||||
Reinvested | — | — | 633 | 4,711 | ||||||||||||
Redeemed | — | — | (149,140 | ) | (7,245 | ) | ||||||||||
|
|
|
|
|
|
|
| |||||||||
Change in Class R5 Shares | — | — | (138,595 | ) | 36,481 | |||||||||||
|
|
|
|
|
|
|
| |||||||||
Class R6 (c) | ||||||||||||||||
Issued | 925 | 1,364 | 152,668 | — | ||||||||||||
Reinvested | 54 | 8 | 9,290 | — | ||||||||||||
Redeemed | (133 | ) | (670 | ) | (32,858 | ) | — | |||||||||
|
|
|
|
|
|
|
| |||||||||
Change in Class R6 Shares | 846 | 702 | 129,100 | — | ||||||||||||
|
|
|
|
|
|
|
| |||||||||
Institutional Class | ||||||||||||||||
Issued | 14,174 | 13,782 | 729 | 2,926 | ||||||||||||
Reinvested | 458 | 132 | 337 | 404 | ||||||||||||
Redeemed | (3,195 | ) | (2,701 | ) | (5,633 | ) | (8,215 | ) | ||||||||
|
|
|
|
|
|
|
| |||||||||
Change in Institutional Class Shares | 11,437 | 11,213 | (4,567 | ) | (4,885 | ) | ||||||||||
|
|
|
|
|
|
|
| |||||||||
Select Class | ||||||||||||||||
Issued | 6,768 | 7,445 | — | — | ||||||||||||
Reinvested | 335 | 104 | — | — | ||||||||||||
Redeemed | (2,689 | ) | (2,069 | ) | — | — | ||||||||||
|
|
|
|
|
|
|
| |||||||||
Change in Select Class Shares | 4,414 | 5,480 | — | — | ||||||||||||
|
|
|
|
|
|
|
| |||||||||
| (a) | All remaining Class B Shares converted to Class A Shares on June 19, 2015. |
| (b) | Amount rounds to less than 1,000 shares. |
| (c) | Commencement of offering of shares effective November 2, 2015 for Realty Income Fund. |
SEE NOTES TO FINANCIAL STATEMENTS.
| FEBRUARY 29, 2016 | UNDISCOVERED MANAGERS FUNDS | 19 | ||||||
Table of Contents
FOR THE PERIODS INDICATED
| Per share operating performance | |||||||||||||||||||||||||||
| Investment operations | Distributions | |||||||||||||||||||||||||||
| Net asset value, beginning of period | Net investment income (loss) (b) | Net realized and unrealized gains (losses) on investments | Total from investment operations | Net investment income | Net realized gain | Total distributions | ||||||||||||||||||||||
Behavioral Value Fund |
| |||||||||||||||||||||||||||
Class A |
| |||||||||||||||||||||||||||
Six Months Ended February 29, 2016 (Unaudited) | $ | 55.30 | $ | 0.27 | $ | (1.80 | ) | $ | (1.53 | ) | $ | (0.31 | ) | $ | (1.62 | ) | $ | (1.93 | ) | |||||||||
Year Ended August 31, 2015 | 55.38 | 0.37 | 0.81 | 1.18 | (0.43 | ) | (0.83 | ) | (1.26 | ) | ||||||||||||||||||
Year Ended August 31, 2014 | 45.93 | 0.53 | 9.13 | 9.66 | (0.21 | ) | — | (0.21 | ) | |||||||||||||||||||
Year Ended August 31, 2013 | 35.72 | 0.12 | (g) | 10.09 | 10.21 | — | — | — | ||||||||||||||||||||
Year Ended August 31, 2012 | 29.26 | (0.10 | ) | 6.58 | 6.48 | (0.02 | ) | — | (0.02 | ) | ||||||||||||||||||
Year Ended August 31, 2011 | 25.01 | 0.04 | 4.21 | 4.25 | — | — | — | |||||||||||||||||||||
Class C | ||||||||||||||||||||||||||||
Six Months Ended February 29, 2016 (Unaudited) | 52.43 | 0.13 | (1.71 | ) | (1.58 | ) | (0.12 | ) | (1.62 | ) | (1.74 | ) | ||||||||||||||||
Year Ended August 31, 2015 | 52.64 | 0.09 | 0.77 | 0.86 | (0.24 | ) | (0.83 | ) | (1.07 | ) | ||||||||||||||||||
Year Ended August 31, 2014 | 43.80 | 0.26 | 8.69 | 8.95 | (0.11 | ) | — | (0.11 | ) | |||||||||||||||||||
Year Ended August 31, 2013 | 34.23 | (0.08 | )(g) | 9.65 | 9.57 | — | — | — | ||||||||||||||||||||
Year Ended August 31, 2012 | 28.16 | (0.24 | ) | 6.31 | 6.07 | — | — | — | ||||||||||||||||||||
Year Ended August 31, 2011 | 24.19 | (0.10 | ) | 4.07 | 3.97 | — | — | — | ||||||||||||||||||||
Class R2 | ||||||||||||||||||||||||||||
Six Months Ended February 29, 2016 (Unaudited) | 55.09 | 0.20 | (1.78 | ) | (1.58 | ) | (0.31 | ) | (1.62 | ) | (1.93 | ) | ||||||||||||||||
Year Ended August 31, 2015 | 55.18 | 0.20 | 0.84 | 1.04 | (0.30 | ) | (0.83 | ) | (1.13 | ) | ||||||||||||||||||
Year Ended August 31, 2014 | 45.89 | 0.40 | 9.12 | 9.52 | (0.23 | ) | — | (0.23 | ) | |||||||||||||||||||
April 30, 2013 (h) through August 31, 2013 | 43.77 | 0.02 | (g) | 2.10 | 2.12 | — | — | — | ||||||||||||||||||||
Class R6 | ||||||||||||||||||||||||||||
Six Months Ended February 29, 2016 (Unaudited) | 56.59 | 0.40 | (1.82 | ) | (1.42 | ) | (0.51 | ) | (1.62 | ) | (2.13 | ) | ||||||||||||||||
Year Ended August 31, 2015 | 56.58 | 0.63 | 0.85 | 1.48 | (0.64 | ) | (0.83 | ) | (1.47 | ) | ||||||||||||||||||
Year Ended August 31, 2014 | 46.82 | 0.78 | 9.34 | 10.12 | (0.36 | ) | — | (0.36 | ) | |||||||||||||||||||
April 30, 2013 (h) through August 31, 2013 | 44.54 | 0.14 | (g) | 2.14 | 2.28 | — | — | — | ||||||||||||||||||||
Institutional Class | ||||||||||||||||||||||||||||
Six Months Ended February 29, 2016 (Unaudited) | 56.52 | 0.38 | (1.82 | ) | (1.44 | ) | (0.47 | ) | (1.62 | ) | (2.09 | ) | ||||||||||||||||
Year Ended August 31, 2015 | 56.52 | 0.60 | 0.83 | 1.43 | (0.60 | ) | (0.83 | ) | (1.43 | ) | ||||||||||||||||||
Year Ended August 31, 2014 | 46.80 | 0.74 | 9.32 | 10.06 | (0.34 | ) | — | (0.34 | ) | |||||||||||||||||||
Year Ended August 31, 2013 | 36.29 | 0.29 | (g) | 10.22 | 10.51 | — | — | — | ||||||||||||||||||||
Year Ended August 31, 2012 | 29.76 | (0.02 | ) | 6.67 | 6.65 | (0.12 | ) | — | (0.12 | ) | ||||||||||||||||||
Year Ended August 31, 2011 | 25.39 | 0.12 | 4.25 | 4.37 | — | — | — | |||||||||||||||||||||
Select Class | ||||||||||||||||||||||||||||
Six Months Ended February 29, 2016 (Unaudited) | 56.37 | 0.34 | (1.82 | ) | (1.48 | ) | (0.41 | ) | (1.62 | ) | (2.03 | ) | ||||||||||||||||
Year Ended August 31, 2015 | 56.41 | 0.52 | 0.82 | 1.34 | (0.55 | ) | (0.83 | ) | (1.38 | ) | ||||||||||||||||||
Year Ended August 31, 2014 | 46.78 | 0.68 | 9.29 | 9.97 | (0.34 | ) | — | (0.34 | ) | |||||||||||||||||||
April 30, 2013 (h) through August 31, 2013 | 44.54 | 0.09 | (g) | 2.15 | 2.24 | — | — | — | ||||||||||||||||||||
| (a) | Annualized for periods less than one year, unless otherwise noted. |
| (b) | Calculated based upon average shares outstanding. |
| (c) | Not annualized for periods less than one year. |
| (d) | Includes adjustments in accordance with accounting principles generally accepted in the United States of America and as such, the net asset values for financial reporting purposes and the returns based upon those net asset values may differ from the net asset values and returns for shareholder transactions. |
| (e) | Includes earnings credits and interest expense, if applicable, each of which is less than 0.01% unless otherwise noted. |
| (f) | Portfolio turnover is calculated by dividing the lesser of total purchases or sales of portfolio securities for the reporting period by the monthly average value of portfolio securities owned during the reporting period. Excluded from both the numerator and denominator are amounts relating to derivatives and securities whose maturities or expiration dates at the time of acquisition were one year or less. |
| (g) | Reflects a special dividend paid out during the period by several of the Fund’s holdings. Had the Fund not received the special dividends, the net investment income (loss) per share would have been $0.08, $(0.12), $(0.02), $0.10, $0.25 and $0.05 for Class A, Class C, Class R2, Class R6, Institutional Class and Select Class Shares, respectively, and the net investment income (loss) ratio would have been 0.19%, (0.29)%, (0.14)%, 0.61%, 0.55% and 0.29% for Class A, Class C, Class R2, Class R6, Institutional Class and Select Class Shares, respectively. |
| (h) | Commencement of offering of class of shares. |
SEE NOTES TO FINANCIAL STATEMENTS.
| 20 | UNDISCOVERED MANAGERS FUNDS | FEBRUARY 29, 2016 | ||||
Table of Contents
| Ratios/Supplemental data | |||||||||||||||||||||||||
| Ratios to average net assets (a) | ||||||||||||||||||||||||||
| Net asset value, end of period | Total return (excludes sales charge) (c)(d) | Net assets, end of period (000’s) | Net expenses (e) | Net investment income (loss) | Expenses without waivers, reimbursements and earnings credits | Portfolio turnover rate (c)(f) | ||||||||||||||||||||
| $ | 51.84 | (2.87 | )% | $ | 915,433 | 1.30 | % | 1.01 | % | 1.82 | % | 24 | % | |||||||||||||
| 55.30 | 2.23 | 696,222 | 1.29 | 0.66 | 1.86 | 36 | ||||||||||||||||||||
| 55.38 | 21.06 | 364,773 | 1.28 | 1.02 | 1.79 | 44 | ||||||||||||||||||||
| 45.93 | 28.58 | 201,017 | 1.35 | 0.28 | (g) | 1.89 | 58 | |||||||||||||||||||
| 35.72 | 22.17 | 18,601 | 1.59 | (0.30 | ) | 2.13 | 61 | |||||||||||||||||||
| 29.26 | 16.99 | 12,149 | 1.59 | 0.14 | 2.16 | 44 | ||||||||||||||||||||
| 49.11 | (3.12 | ) | 239,709 | 1.80 | 0.50 | 2.27 | 24 | |||||||||||||||||||
| 52.43 | 1.73 | 185,342 | 1.79 | 0.17 | 2.31 | 36 | ||||||||||||||||||||
| 52.64 | 20.46 | 107,383 | 1.78 | 0.52 | 2.29 | 44 | ||||||||||||||||||||
| 43.80 | 27.96 | 38,608 | 1.87 | (0.19 | )(g) | 2.40 | 58 | |||||||||||||||||||
| 34.23 | 21.56 | 8,474 | 2.09 | (0.75 | ) | 2.66 | 61 | |||||||||||||||||||
| 28.16 | 16.41 | 6,684 | 2.09 | (0.32 | ) | 2.67 | 44 | |||||||||||||||||||
| 51.58 | (2.99 | ) | 8,564 | 1.55 | 0.74 | 2.05 | 24 | |||||||||||||||||||
| 55.09 | 1.98 | 4,845 | 1.54 | 0.36 | 2.10 | 36 | ||||||||||||||||||||
| 55.18 | 20.77 | 942 | 1.54 | 0.74 | 2.05 | 44 | ||||||||||||||||||||
| 45.89 | 4.84 | 52 | 1.54 | 0.14 | (g) | 2.12 | 58 | |||||||||||||||||||
| 53.04 | (2.62 | ) | 96,364 | 0.80 | 1.48 | 1.17 | 24 | |||||||||||||||||||
| 56.59 | 2.73 | 54,931 | 0.79 | 1.10 | 1.19 | 36 | ||||||||||||||||||||
| 56.58 | 21.67 | 15,199 | 0.79 | 1.41 | 1.29 | 44 | ||||||||||||||||||||
| 46.82 | 5.12 | 53 | 0.79 | 0.89 | (g) | 1.37 | 58 | |||||||||||||||||||
| 52.99 | (2.66 | ) | 1,688,064 | 0.90 | 1.40 | 1.30 | 24 | |||||||||||||||||||
| 56.52 | 2.65 | 1,154,307 | 0.89 | 1.06 | 1.33 | 36 | ||||||||||||||||||||
| 56.52 | 21.54 | 520,539 | 0.89 | 1.37 | 1.39 | 44 | ||||||||||||||||||||
| 46.80 | 28.96 | 150,140 | 1.00 | 0.65 | (g) | 1.49 | 58 | |||||||||||||||||||
| 36.29 | 22.41 | 17,982 | 1.39 | (0.06 | ) | 1.76 | 61 | |||||||||||||||||||
| 29.76 | 17.21 | 12,079 | 1.39 | 0.39 | 1.77 | 44 | ||||||||||||||||||||
| 52.86 | (2.74 | ) | 776,567 | 1.05 | 1.26 | 1.49 | 24 | |||||||||||||||||||
| 56.37 | 2.49 | 579,340 | 1.04 | 0.91 | 1.54 | 36 | ||||||||||||||||||||
| 56.41 | 21.36 | 270,648 | 1.04 | 1.25 | 1.55 | 44 | ||||||||||||||||||||
| 46.78 | 5.03 | 2,775 | 1.03 | 0.57 | (g) | 1.67 | 58 | |||||||||||||||||||
SEE NOTES TO FINANCIAL STATEMENTS.
| FEBRUARY 29, 2016 | UNDISCOVERED MANAGERS FUNDS | 21 | ||||||
Table of Contents
FINANCIAL HIGHLIGHTS
FOR THE PERIODS INDICATED (continued)
| Per share operating performance | |||||||||||||||||||||||||||
| Investment operations | Distributions | |||||||||||||||||||||||||||
| Net asset value, beginning of period | Net investment income (loss) (b) | Net realized and unrealized gains (losses) on investments | Total from investment operations | Net investment income | Net realized gain | Total distributions | ||||||||||||||||||||||
Realty Income Fund | ||||||||||||||||||||||||||||
Class A | ||||||||||||||||||||||||||||
Six Months Ended February 29, 2016 (Unaudited) | $ | 12.95 | $ | 0.12 | (g) | $ | 0.36 | $ | 0.48 | $ | (0.14 | ) | $ | (0.72 | ) | $ | (0.86 | ) | ||||||||||
Year Ended August 31, 2015 | 13.28 | 0.18 | 0.03 | 0.21 | (0.20 | ) | (0.34 | ) | (0.54 | ) | ||||||||||||||||||
Year Ended August 31, 2014 | 11.26 | 0.15 | (g) | 2.37 | 2.52 | (0.19 | ) | (0.31 | ) | (0.50 | ) | |||||||||||||||||
Year Ended August 31, 2013 | 11.70 | 0.15 | (0.34 | ) | (0.19 | ) | (0.16 | ) | (0.09 | ) | (0.25 | ) | ||||||||||||||||
Year Ended August 31, 2012 | 9.95 | 0.11 | 1.83 | 1.94 | (0.12 | ) | (0.07 | ) | (0.19 | ) | ||||||||||||||||||
Year Ended August 31, 2011 | 8.47 | 0.09 | 1.57 | 1.66 | (0.18 | ) | — | (0.18 | ) | |||||||||||||||||||
Class C | ||||||||||||||||||||||||||||
Six Months Ended February 29, 2016 (Unaudited) | 12.64 | 0.09 | (g) | 0.34 | 0.43 | (0.11 | ) | (0.72 | ) | (0.83 | ) | |||||||||||||||||
Year Ended August 31, 2015 | 13.00 | 0.10 | 0.05 | 0.15 | (0.17 | ) | (0.34 | ) | (0.51 | ) | ||||||||||||||||||
Year Ended August 31, 2014 | 11.06 | 0.10 | (g) | 2.30 | 2.40 | (0.15 | ) | (0.31 | ) | (0.46 | ) | |||||||||||||||||
Year Ended August 31, 2013 | 11.50 | 0.09 | (0.32 | ) | (0.23 | ) | (0.12 | ) | (0.09 | ) | (0.21 | ) | ||||||||||||||||
Year Ended August 31, 2012 | 9.79 | 0.06 | 1.80 | 1.86 | (0.08 | ) | (0.07 | ) | (0.15 | ) | ||||||||||||||||||
Year Ended August 31, 2011 | 8.35 | 0.04 | 1.54 | 1.58 | (0.14 | ) | — | (0.14 | ) | |||||||||||||||||||
Class R5 | ||||||||||||||||||||||||||||
Six Months Ended February 29, 2016 (Unaudited) | 13.08 | 0.15 | (g) | 0.35 | 0.50 | (0.11 | ) | (0.72 | ) | (0.83 | ) | |||||||||||||||||
Year Ended August 31, 2015 | 13.38 | 0.24 | 0.04 | 0.28 | (0.24 | ) | (0.34 | ) | (0.58 | ) | ||||||||||||||||||
Year Ended August 31, 2014 | 11.32 | 0.21 | (g) | 2.37 | 2.58 | (0.21 | ) | (0.31 | ) | (0.52 | ) | |||||||||||||||||
Year Ended August 31, 2013 | 11.74 | 0.20 | (0.32 | ) | (0.12 | ) | (0.21 | ) | (0.09 | ) | (0.30 | ) | ||||||||||||||||
Year Ended August 31, 2012 | 9.97 | 0.16 | 1.84 | 2.00 | (0.16 | ) | (0.07 | ) | (0.23 | ) | ||||||||||||||||||
Year Ended August 31, 2011 | 8.48 | 0.14 | 1.57 | 1.71 | (0.22 | ) | — | (0.22 | ) | |||||||||||||||||||
Class R6 | ||||||||||||||||||||||||||||
November 2, 2015 (h) through February 29, 2016 (Unaudited) | 14.55 | 0.10 | (g) | (1.10 | )(i) | (1.00 | ) | (0.13 | ) | (0.72 | ) | (0.85 | ) | |||||||||||||||
Institutional Class | ||||||||||||||||||||||||||||
Six Months Ended February 29, 2016 (Unaudited) | 13.07 | 0.15 | (g) | 0.35 | 0.50 | (0.17 | ) | (0.72 | ) | (0.89 | ) | |||||||||||||||||
Year Ended August 31, 2015 | 13.37 | 0.24 | 0.03 | 0.27 | (0.23 | ) | (0.34 | ) | (0.57 | ) | ||||||||||||||||||
Year Ended August 31, 2014 | 11.31 | 0.22 | (g) | 2.36 | 2.58 | (0.21 | ) | (0.31 | ) | (0.52 | ) | |||||||||||||||||
Year Ended August 31, 2013 | 11.74 | 0.20 | (0.34 | ) | (0.14 | ) | (0.20 | ) | (0.09 | ) | (0.29 | ) | ||||||||||||||||
Year Ended August 31, 2012 | 9.97 | 0.16 | 1.84 | 2.00 | (0.16 | ) | (0.07 | ) | (0.23 | ) | ||||||||||||||||||
Year Ended August 31, 2011 | 8.48 | 0.13 | 1.57 | 1.70 | (0.21 | ) | — | (0.21 | ) | |||||||||||||||||||
| (a) | Annualized for periods less than one year, unless otherwise noted. |
| (b) | Calculated based upon average shares outstanding. |
| (c) | Not annualized for periods less than one year. |
| (d) | Includes adjustments in accordance with accounting principles generally accepted in the United States of America and as such, the net asset values for financial reporting purposes and the returns based upon those net asset values may differ from the net asset values and returns for shareholder transactions. |
| (e) | Includes earnings credits and interest expense, if applicable, each of which is less than 0.01% unless otherwise noted. |
| (f) | Portfolio turnover is calculated by dividing the lesser of total purchases or sales of portfolio securities for the reporting period by the monthly average value of portfolio securities owned during the reporting period. Excluded from both the numerator and denominator are amounts relating to derivatives and securities whose maturities or expiration dates at the time of acquisition were one year or less. |
| (g) | Net investment income (loss) may appear disproportionate among the classes due to the timing of recognition of income and changes in the relative size of the classes. |
| (h) | Commencement of offering of class of shares. |
| (i) | Calculation of the net realized and unrealized gains (losses) per share do not correlate with the Fund’s net realized and unrealized gains (losses) presented in the Statement of Operations due to the timing of capital transactions in relation to the fluctuating market values of the Fund’s investments. |
SEE NOTES TO FINANCIAL STATEMENTS.
| 22 | UNDISCOVERED MANAGERS FUNDS | FEBRUARY 29, 2016 | ||||
Table of Contents
| Ratios/Supplemental data | |||||||||||||||||||||||||
| Ratios to average net assets (a) | ||||||||||||||||||||||||||
| Net asset value, end of period | Total return (excludes sales charge) (c)(d) | Net assets, end of period (000’s) | Net expenses (e) | Net investment income (loss) | Expenses without waivers, reimbursements and earnings credits | Portfolio turnover rate (c)(f) | ||||||||||||||||||||
| $ | 12.57 | 3.60 | % | $ | 171,061 | 1.18 | % | $ | 1.82 | (g) | 1.53 | % | 63 | % | ||||||||||||
| 12.95 | 1.46 | 172,267 | 1.18 | 1.28 | 1.54 | 93 | ||||||||||||||||||||
| 13.28 | 23.30 | 141,044 | 1.18 | 1.24 | (g) | 1.39 | 105 | |||||||||||||||||||
| 11.26 | (1.67 | ) | 57,005 | 1.18 | 1.25 | 1.40 | 60 | |||||||||||||||||||
| 11.70 | 19.75 | 47,124 | 1.18 | 1.04 | 1.42 | 78 | ||||||||||||||||||||
| 9.95 | 19.67 | 26,485 | 1.18 | 0.94 | 1.44 | 141 | ||||||||||||||||||||
| 12.24 | 3.25 | 8,401 | 1.68 | 1.33 | (g) | 1.97 | 63 | |||||||||||||||||||
| 12.64 | 0.98 | 9,154 | 1.68 | 0.76 | 1.97 | 93 | ||||||||||||||||||||
| 13.00 | 22.64 | 7,941 | 1.68 | 0.83 | (g) | 1.90 | 105 | |||||||||||||||||||
| 11.06 | (2.08 | ) | 7,420 | 1.68 | 0.75 | 1.90 | 60 | |||||||||||||||||||
| 11.50 | 19.19 | 5,416 | 1.68 | 0.55 | 1.92 | 78 | ||||||||||||||||||||
| 9.79 | 19.00 | 3,924 | 1.68 | 0.44 | 1.94 | 141 | ||||||||||||||||||||
| 12.75 | 3.74 | 25,986 | 0.73 | 2.21 | (g) | 0.90 | 63 | |||||||||||||||||||
| 13.08 | 1.94 | 1,839,070 | 0.73 | 1.74 | 0.91 | 93 | ||||||||||||||||||||
| 13.38 | 23.83 | 1,393,335 | 0.73 | 1.69 | (g) | 0.94 | 105 | |||||||||||||||||||
| 11.32 | (1.15 | ) | 487,985 | 0.73 | 1.70 | 0.95 | 60 | |||||||||||||||||||
| 11.74 | 20.33 | 388,566 | 0.73 | 1.44 | 0.96 | 78 | ||||||||||||||||||||
| 9.97 | 20.21 | 96,854 | 0.73 | 1.45 | 1.00 | 141 | ||||||||||||||||||||
| 12.70 | (7.01 | ) | 1,639,159 | 0.68 | 2.42 | (g) | 0.86 | 63 | ||||||||||||||||||
| 12.68 | 3.70 | 125,354 | 0.78 | 2.20 | (g) | 0.98 | 63 | |||||||||||||||||||
| 13.07 | 1.89 | 188,818 | 0.78 | 1.71 | 0.97 | 93 | ||||||||||||||||||||
| 13.37 | 23.81 | 258,480 | 0.78 | 1.78 | (g) | 1.00 | 105 | |||||||||||||||||||
| 11.31 | (1.27 | ) | 447,799 | 0.78 | 1.65 | 1.00 | 60 | |||||||||||||||||||
| 11.74 | 20.28 | 318,175 | 0.78 | 1.47 | 1.02 | 78 | ||||||||||||||||||||
| 9.97 | 20.17 | 242,555 | 0.78 | 1.35 | 1.04 | 141 | ||||||||||||||||||||
SEE NOTES TO FINANCIAL STATEMENTS.
| FEBRUARY 29, 2016 | UNDISCOVERED MANAGERS FUNDS | 23 | ||||||
Table of Contents
AS OF FEBRUARY 29, 2016 (Unaudited)
1. Organization
Undiscovered Managers Funds (the “Trust”) was organized on September 29, 1997, as a Massachusetts business trust and is registered under the Investment Company Act of 1940, as amended (the “1940 Act”), as an open-end management investment company.
The following are 2 separate funds of the Trust (collectively, the “Funds”) covered by this report:
| Classes Offered | Diversified/Non-Diversified | |||
| Undiscovered Managers Behavioral Value Fund | Class A, Class C, Class R2, Class R6, Institutional Class and Select Class | Diversified | ||
| JPMorgan Realty Income Fund | Class A, Class C, Class R5, Class R6* and Institutional Class | Non-Diversified |
* Class R6 Shares commenced operations on November 2, 2015, for Realty Income Fund.
The investment objective of Behavioral Value Fund is capital appreciation.
The investment objective of Realty Income Fund is high total investment return through a combination of capital appreciation and current income.
Class A Shares generally provide for a front-end sales charge while Class C Shares provide for a contingent deferred sales charge (“CDSC”). No sales charges are assessed with respect to Class R2, Class R5, Class R6, Institutional Class and Select Class Shares. All classes of shares have equal rights as to earnings, assets and voting privileges, except that each class may bear different transfer agency, sub-transfer agency, distribution and shareholder servicing fees and each class has exclusive voting rights with respect to its distribution plan and shareholder servicing agreements. Certain Class A Shares, for which front-end sales charges have been waived, may be subject to a CDSC as described in the Funds’ prospectus.
On June 19, 2015, all remaining Class B Shares converted to Class A Shares of the same Fund. Prior to June 19, 2015, Class B Shares automatically converted to Class A Shares after eight years and provided for a CDSC.
2. Significant Accounting Policies
The following is a summary of significant accounting policies followed by the Funds in the preparation of their financial statements. The Funds are investment companies and, accordingly, follow the investment company accounting and reporting guidance of the Financial Accounting Standards Board Accounting Standards Codification Topic 946—Investment Companies, which is part of U.S. generally accepted accounting principles (“GAAP”). The preparation of financial statements in conformity with GAAP requires management to make estimates and assumptions that affect the reported amounts of assets and liabilities and disclosure of contingent assets and liabilities at the date of the financial statements and the reported amounts of increases and decreases in net assets from operations during the reporting period. Actual results could differ from those estimates.
A. Valuation of Investments — The valuation of investments is in accordance with GAAP and the Funds’ valuation policies set forth by and under the supervision and responsibility of the Board of Trustees (the “Board”), which established the following approach to valuation, as described more fully below: (i) investments for which market quotations are readily available shall be valued at such unadjusted quoted prices and (ii) all other investments for which market quotations are not readily available shall be valued at their fair value as determined in good faith by the Board.
JPMorgan Funds Management, Inc. (the “Administrator”) has established the J.P. Morgan Asset Management Americas Valuation Committee (“AVC”) to assist the Board with the oversight and monitoring of the valuation of the Funds’ investments. The Administrator implements the valuation policies of the Funds’ investments, as directed by the Board. The AVC oversees and carries out the policies for the valuation of investments held in the Funds. This includes monitoring the appropriateness of fair values based on results of ongoing valuation oversight, including but not limited to consideration of macro or security specific events, market events and pricing vendor and broker due diligence. The Administrator is responsible for discussing and assessing the potential impacts to the fair values on an ongoing basis, and at least on a quarterly basis with the AVC and the Board.
Equities and other exchange-traded instruments are valued at the last sale price or official market closing price on the primary exchange on which the instrument is traded before the net asset values (“NAV”) of the Funds are calculated on a valuation date.
Investments in open-end investment companies (the “Underlying Funds”) are valued at each Underlying Fund’s net asset value per share (“NAV”) as of the report date.
Valuations reflected in this report are as of the report date. As a result, changes in valuation due to market events and/or issuer related events after the report date and prior to issuance of the report are not reflected herein.
The various inputs that are used in determining the valuation of the Funds’ investments are summarized into the three broad levels listed below.
| • | Level 1 — Unadjusted inputs using quoted prices in active markets for identical investments. |
| • | Level 2 — Other significant observable inputs including, but not limited to, quoted prices for similar investments, inputs other than quoted prices that are observable for investments (such as interest rates, prepayment speeds, credit risk, etc.) or other market corroborated inputs. |
| • | Level 3 — Significant inputs based on the best information available in the circumstances, to the extent observable inputs are not available (including the Funds’ assumptions in determining the fair value of investments). |
| 24 | UNDISCOVERED MANAGERS FUNDS | FEBRUARY 29, 2016 | ||||
Table of Contents
A financial instrument’s level within the fair value hierarchy is based on the lowest level of any input, both individually and in the aggregate, that is significant to the fair value measurement. The inputs or methodology used for valuing instruments are not necessarily an indication of the risk associated with investing in those instruments.
The following tables represent each valuation input as presented on the Schedules of Portfolio Investments (“SOIs”) (amount in thousands):
Behavioral Value Fund
| Level 1 Quoted prices | Level 2 Other significant observable inputs | Level 3 Significant unobservable inputs | Total | |||||||||||||
Total Investments in Securities (a) | $ | 3,753,821 | $ | — | $ | — | $ | 3,753,821 | ||||||||
|
|
|
|
|
|
|
| |||||||||
Realty Income Fund
| Level 1 Quoted prices | Level 2 Other significant observable inputs | Level 3 Significant | Total | |||||||||||||
Total Investments in Securities (a) | $ | 1,962,211 | $ | — | $ | — | $ | 1,962,211 | ||||||||
|
|
|
|
|
|
|
| |||||||||
| (a) | All portfolio holdings designated as level 1 are disclosed individually on the SOIs. Please refer to the SOIs for industry specifics of portfolio holdings. |
There were no transfers among any levels during the six months ended February 29, 2016.
B. Security Transactions and Investment Income — Investment transactions are accounted for on the trade date (the date the order to buy or sell is executed). Securities gains and losses are calculated on a specifically identified cost basis. Dividend income net of foreign taxes withheld, if any, is recorded on the ex-dividend date or when a Fund first learns of the dividend.
To the extent such information is publicly available, the Funds record distributions received in excess of income earned from underlying investments as a reduction of cost of investments and/or realized gain. Such amounts are based on estimates if actual amounts are not available and actual amounts of income, realized gain and return of capital may differ from the estimated amounts. The Funds adjust the estimated amounts of the components of distributions (and consequently their net investment income) as necessary once the issuers provide information about the actual composition of the distributions.
C. Allocation of Income and Expenses — Expenses directly attributable to a fund are charged directly to that fund, while the expenses attributable to more than one fund of the Trust are allocated among the respective funds. In calculating the NAV of each class, investment income, realized and unrealized gains and losses and expenses, other than class specific expenses, are allocated daily to each class of shares based upon the proportion of net assets of each class at the beginning of each day.
Transfer agent and sub-transfer agent fees are class-specific expenses. The amount of the transfer agent and sub-transfer agent fees charged to each class of the Funds for the six months ended February 29, 2016 are as follows (amounts in thousands):
| Class A | Class C | Class R2 | Class R5 | Class R6 | Institutional Class | Select Class | Total | |||||||||||||||||||||||||
Behavioral Value Fund | ||||||||||||||||||||||||||||||||
Transfer agent fees | $ | 26 | $ | 6 | $ | 1 | n/a | $ | 2 | $ | 12 | $ | 6 | $ | 53 | |||||||||||||||||
Sub-transfer agent fees | 609 | 104 | 4 | n/a | n/a | 239 | 256 | 1,212 | ||||||||||||||||||||||||
Realty Income Fund | ||||||||||||||||||||||||||||||||
Transfer agent fees | 8 | 1 | n/a | $ | 5 | 5 | 3 | n/a | 22 | |||||||||||||||||||||||
Sub-transfer agent fees | 152 | 4 | n/a | 3 | n/a | 15 | n/a | 174 | ||||||||||||||||||||||||
D. Federal Income Taxes — Each Fund is treated as a separate taxable entity for Federal income tax purposes. Each Fund’s policy is to comply with the provisions of the Internal Revenue Code of 1986, as amended (the “Code”), applicable to regulated investment companies and to distribute to shareholders all of its distributable net investment income and net realized capital gains on investments. Accordingly, no provision for Federal income tax is necessary. Management has reviewed the Funds’ tax positions for all open tax years and has determined that as of February 29, 2016, no liability for income tax is required in the Funds’ financial statements for net unrecognized tax benefits. However, management’s conclusions may be subject to future review based on changes in, or the interpretation of, the accounting standards or tax laws and regulations. Each of the Funds’ Federal tax returns for the prior three fiscal years remain subject to examination by the Internal Revenue Service.
E. Distributions to Shareholders — For Behavioral Value Fund, distributions from net investment income are generally declared and paid annually. For Realty Income Fund, distributions from net investment income are generally declared and paid quarterly. Distributions are declared separately for each class. No class has preferential dividend rights; differences in per share rates are due to differences in separate class expenses. Net realized capital gains, if any, are distributed by each Fund at least annually. The amount of distributions from net investment income and net realized capital gains is determined in accordance with Federal income tax regulations, which may differ from GAAP. To the extent these “book/tax” differences are
| FEBRUARY 29, 2016 | UNDISCOVERED MANAGERS FUNDS | 25 | ||||||
Table of Contents
NOTES TO FINANCIAL STATEMENTS
AS OF FEBRUARY 29, 2016 (Unaudited) (continued)
permanent in nature (i.e., that they result from other than timing of recognition — “temporary differences”), such amounts are reclassified within the capital accounts based on their Federal tax-basis treatment.
3. Fees and Other Transactions with Affiliates
A. Investment Advisory Fee — Pursuant to the Investment Advisory Agreement, J.P. Morgan Investment Management Inc. (the “Adviser” or “JPMIM”), an indirect, wholly-owned subsidiary of JPMorgan Chase & Co. (“JPMorgan”), supervises the investments of each Fund and for such services is paid a fee. The fee is accrued daily and paid monthly based on each Fund’s respective average daily net assets. The annual rate for each Fund is as follows:
Behavioral Value Fund | 1.05 | % | ||
Realty Income Fund | 0.75 |
A Sub-advisory agreement exists between JPMIM and Fuller & Thaler Asset Management, Inc. for the Behavioral Value Fund. Under the terms of the Sub-Advisory agreement, JPMIM pays the sub-adviser a portion of fees received by JPMIM.
The Adviser waived Investment Advisory fees and/or reimbursed expenses as outlined in Note 3.F.
B. Administration Fee — Pursuant to an Administration Agreement, the Administrator, an indirect, wholly-owned subsidiary of JPMorgan, provides certain administration services to the Funds. In consideration of these services, the Administrator receives a fee accrued daily and paid monthly at an annual rate of 0.15% of the first $25 billion of the average daily net assets of all funds in the J.P. Morgan Funds Complex covered by the Administration Agreement (excluding certain funds of funds and money market funds) and 0.075% of the average daily net assets in excess of $25 billion of all such funds. For the six months ended February 29, 2016, the effective rate was 0.08% of each Fund’s average daily net assets, notwithstanding any fee waivers and/or expense reimbursements.
Effective April 1, 2016, the Administrator merged into JPMIM, and JPMIM became the Funds’ administrator under the Administration Agreement.
The Administrator waived Administration fees as outlined in Note 3.F.
JPMorgan Chase Bank, N.A. (“JPMCB”), a wholly-owned subsidiary of JPMorgan, serves as the Funds’ sub-administrator (the “Sub-administrator”). For its services as Sub-administrator, JPMCB receives a portion of the fees payable to the Administrator.
C. Distribution Fees — Pursuant to a Distribution Agreement, JPMorgan Distribution Services, Inc. (the “Distributor”), a wholly-owned subsidiary of JPMorgan, serves as the Trust’s exclusive underwriter and promotes and arranges for the sale of each Fund’s shares.
The Board has adopted a Distribution Plan (the “Distribution Plan”) for Class A, Class C and Class R2 Shares of the Funds, as applicable, in accordance with Rule 12b-1 under the 1940 Act. The Distribution Plan provides that each Fund shall pay distribution fees, including payments to the Distributor, at annual rates of the average daily net assets as shown in the table below:
| Class A | Class C | Class R2 | ||||||||||
Behavioral Value Fund | 0.25 | % | 0.75 | % | 0.50 | % | ||||||
Realty Income Fund | 0.25 | 0.75 | n/a | |||||||||
In addition, the Distributor is entitled to receive the front-end sales charges from purchases of Class A Shares and the CDSC from redemptions of Class C Shares and certain Class A Shares for which front-end sales charges have been waived. For the six months ended February 29, 2016, the Distributor retained the following (amounts in thousands):
| Front-End Sales Charge | CDSC | |||||||
Behavioral Value Fund | $ | 213 | $ | 1 | ||||
Realty Income Fund | 4 | — | (a) | |||||
| (a) | Amount rounds to less than $1,000. |
D. Shareholder Servicing Fees — The Trust, on behalf of the Funds, has entered into a Shareholder Servicing Agreement with the Distributor under which the Distributor provides certain support services to the shareholders. The Class R6 Shares do not participate in the Shareholder Servicing Agreement. For performing these services, the Distributor receives a fee that is accrued daily and paid monthly equal to a percentage of the average daily net assets as shown in the table below:
| Class A | Class C | Class R2 | Class R5 | Institutional Class | Select Class | |||||||||||||||||||
Behavioral Value Fund | 0.25 | % | 0.25 | % | 0.25 | % | n/a | 0.10 | % | 0.25 | % | |||||||||||||
Realty Income Fund | 0.25 | 0.25 | n/a | 0.05 | % | 0.10 | n/a | |||||||||||||||||
The Distributor has entered into shareholder services contracts with affiliated and unaffiliated financial intermediaries who provide shareholder services and other related services to their clients or customers who invest in the Funds under which the Distributor will pay all or a portion of such fees earned to financial intermediaries for performing such services.
The Distributor waived Shareholder Servicing fees as outlined in Note 3.F.
| 26 | UNDISCOVERED MANAGERS FUNDS | FEBRUARY 29, 2016 | ||||
Table of Contents
E. Custodian and Accounting Fees — JPMCB provides portfolio custody and accounting services to the Funds. For these services, the Funds pay JPMCB transaction and asset-based fees that vary according to the number of transactions and positions, plus out-of-pocket expenses. The amounts paid directly to JPMCB by the Funds for custody and accounting services are included in Custodian and accounting fees on the Statements of Operations. Payments to the custodian may be reduced by credits earned by each Fund, based on uninvested cash balances held by the custodian. Such earnings credits, if any, are presented separately on the Statements of Operations.
Interest expense paid to the custodian related to cash overdrafts, if any, is included in Interest expense to affiliates on the Statements of Operations.
F. Waivers and Reimbursements — The Adviser, Administrator and/or Distributor have contractually agreed to waive fees and/or reimburse the Funds to the extent that total annual operating expenses (excluding acquired fund fees and expenses other than certain money market fund fees as described below, dividend and interest expenses related to short sales, interest, taxes, expenses related to litigation and potential litigation and extraordinary expenses) exceed the percentages of the Funds’ respective average daily net assets as shown in the table below:
| Class A | Class C | Class R2 | Class R5 | Class R6 | Institutional Class | Select Class | ||||||||||||||||||||||
Behavioral Value Fund | 1.30 | % | 1.80 | % | 1.55 | % | n/a | 0.80 | % | 0.90 | % | 1.05 | % | |||||||||||||||
Realty Income Fund | 1.18 | 1.68 | n/a | 0.73 | % | 0.68 | 0.78 | n/a | ||||||||||||||||||||
The expense limitation agreement was in effect for the six months ended February 29, 2016 and is in place until at least December 30, 2016.
For the six months ended February 29, 2016, the Funds’ service providers waived fees and/or reimbursed expenses for each of the Funds as follows (amounts in thousands). None of these parties expect the Funds to repay any such waived fees and/or reimbursed expenses in future years.
| Contractual Waivers | ||||||||||||||||||||
| Investment Advisory | Administration | Shareholder Servicing | Total | Contractual Reimbursements | ||||||||||||||||
Behavioral Value Fund | $ | 5,373 | $ | 419 | $ | 1,180 | $ | 6,972 | $ | — | ||||||||||
Realty Income Fund | 1,153 | 769 | 183 | 2,105 | 3 | |||||||||||||||
Additionally, the Funds may invest in one or more money market funds advised by the Adviser or its affiliates (affiliated money market funds). Effective December 29, 2015, the Adviser, Administrator and/or Distributor, as shareholder servicing agent, have contractually agreed to waive fees and/or reimburse expenses in an amount sufficient to offset the respective net fees each collects from the affiliated money market fund on the Funds’ investment in such affiliated money market fund. Prior to December 29, 2015, a portion of the waiver was voluntary.
The amounts of waivers resulting from investments in these money market funds for the six months ended February 29, 2016 were as follows (amounts in thousands):
Behavioral Value Fund | $ | 93 | ||
Realty Income Fund | 23 |
G. Other — Certain officers of the Trust are affiliated with the Adviser, the Administrator and the Distributor. Such officers, with the exception of the Chief Compliance Officer, receive no compensation from the Funds for serving in their respective roles.
The Board appointed a Chief Compliance Officer to the Funds in accordance with Federal securities regulations. Each Fund, along with other affiliated funds, makes reimbursement payments, on a pro-rata basis, to the Administrator for a portion of the fees associated with the Office of the Chief Compliance Officer. Such fees are included in Trustees’ and Chief Compliance Officer’s fees on the Statements of Operations.
The Trust adopted a Trustee Deferred Compensation Plan (the “Plan”) which allows the Independent Trustees to defer the receipt of all or a portion of compensation related to performance of their duties as Trustees. The deferred fees are invested in various J.P. Morgan Funds until distribution in accordance with the Plan.
During the six months ended February 29, 2016, Realty Income Fund purchased securities from an underwriting syndicate in which the principal underwriter or members of the syndicate are affiliated with the Adviser.
The Funds may use related party broker-dealers. For the six months ended February 29, 2016, the Funds did not incur any brokerage commissions with broker-dealers affiliated with the Adviser.
The Securities and Exchange Commission (“SEC”) has granted an exemptive order permitting the Funds to engage in principal transactions with J.P. Morgan Securities, Inc., an affiliated broker, involving taxable money market instruments, subject to certain conditions.
| FEBRUARY 29, 2016 | UNDISCOVERED MANAGERS FUNDS | 27 | ||||||
Table of Contents
NOTES TO FINANCIAL STATEMENTS
AS OF FEBRUARY 29, 2016 (Unaudited) (continued)
4. Investment Transactions
During the six months ended February 29, 2016, purchases and sales of investments (excluding short-term investments) were as follows (amounts in thousands):
| Purchases (excluding U.S. Government) | Sales (excluding U.S. Government) | |||||||
Behavioral Value Fund | $ | 1,712,169 | $ | 736,533 | ||||
Realty Income Fund | 1,377,102 | 1,685,120 | ||||||
During the six months ended February 29, 2016, there were no purchases or sales of U.S. Government securities.
5. Federal Income Tax Matters
For Federal income tax purposes, the cost and unrealized appreciation (depreciation) in value of investment securities held at February 29, 2016 were as follows (amounts in thousands):
| Aggregate Cost | Gross Unrealized Appreciation | Gross Unrealized Depreciation | Net Unrealized Appreciation (Depreciation) | |||||||||||||
Behavioral Value Fund | $ | 3,929,233 | $ | 205,585 | $ | 380,997 | $ | (175,412 | ) | |||||||
Realty Income Fund | 1,752,647 | 275,556 | 65,992 | 209,564 | ||||||||||||
At August 31, 2015, the Funds did not have any net capital loss carryforwards.
6. Borrowings
The Funds rely upon an exemptive order granted by the SEC (the “Order”) permitting the establishment and operation of an Interfund Lending Facility (the “Facility”). The Facility allows the Funds to directly lend and borrow money to or from any other fund relying upon the Order at rates beneficial to both the borrowing and lending funds. Advances under the Facility are taken primarily for temporary or emergency purposes, including the meeting of redemption requests that otherwise might require the untimely disposition of securities, and are subject to each Fund’s borrowing restrictions. The Interfund loan rate is determined, as specified in the Order, by averaging the current repurchase agreement rate and the current bank loan rate. The Order was granted to JPMorgan Trust II and may be relied upon by the Funds because the Funds and the series of JPMorgan Trust II are all investment companies in the same “group of investment companies” (as defined in Section 12(d)(1)(G) of the 1940 Act).
In addition, the Trust and JPMCB have entered into a financing arrangement. Under this arrangement, JPMCB provides an unsecured, uncommitted credit facility in the aggregate amount of $100 million to certain of the J.P. Morgan Funds, including the Funds. Advances under the arrangement are taken primarily for temporary or emergency purposes, including the meeting of redemption requests that otherwise might require the untimely disposition of securities, and are subject to each Fund’s borrowing restrictions. Interest on borrowings is payable at a rate determined by JPMCB at the time of borrowing. This agreement has been extended until November 7, 2016.
The Funds had no borrowings outstanding from another fund or from the unsecured, uncommitted credit facility at February 29, 2016, Average borrowings from the Facility for, or at any time during the six months ended February 29, 2016, were as follows (amounts in thousands):
| Average Borrowings | Average Interest Rate Paid | Number of Days Outstanding | Interest Paid | |||||||||||||
Realty Income Fund | $ | 11,162 | 0.31 | % | 1 | $ | — | (a) | ||||||||
| (a) | Amount rounds to less than $1,000. |
7. Risks, Concentrations and Indemnifications
In the normal course of business, the Funds enter into contracts that contain a variety of representations which provide general indemnifications. Each Fund’s maximum exposure under these arrangements is unknown. The amount of exposure would depend on future claims that may be made against each Fund that have not yet occurred. However, based on experience, the Funds expect the risk of loss to be remote.
As of February 29, 2016, JPMorgan SmartRetirement Funds, which are affiliated funds of funds, own in the aggregate approximately 73.4% of the net assets of Realty Income Fund.
As of February 29, 2016, Behavioral Value Fund has a shareholder, which is an account maintained by a financial intermediary on behalf of its clients, that collectively own 17.1% of the Fund’s assets.
Significant shareholder transactions by these shareholders may impact the Funds’ performance.
| 28 | UNDISCOVERED MANAGERS FUNDS | FEBRUARY 29, 2016 | ||||
Table of Contents
Because the Funds may invest a significant portion of their assets in real estate investment trusts (“REITs”), the Funds may be subject to certain risks similar to those associated with direct investments in real estate. REITs may be affected by changes in the value of their underlying properties and by defaults by tenants. REITs depend generally on their ability to generate cash flow to make distributions to shareholders, and certain REITs have self-liquidation provisions by which mortgages held may be paid in full and distributions of capital returns may be made at any time.
The Funds may invest in companies with relatively small market capitalizations. Behavioral Value Fund will invest primarily in such companies. Investments in companies with relatively small market capitalizations may involve greater risk than is usually associated with stocks of larger companies. These securities may have limited marketability and may be subject to more abrupt or erratic movements in price than securities of companies with larger capitalizations.
| FEBRUARY 29, 2016 | UNDISCOVERED MANAGERS FUNDS | 29 | ||||||
Table of Contents
SCHEDULE OF SHAREHOLDER EXPENSES
(Unaudited)
Hypothetical $1,000 Investment
As a shareholder of the Funds, you incur two types of costs: (1) transaction costs, including sales charges (loads) on purchase payments and (2) ongoing costs, including investment advisory fees, administration fees, distribution fees and other Fund expenses. The examples below are intended to help you understand your ongoing costs (in dollars) of investing in the Funds and to compare these costs with the ongoing costs of investing in other mutual funds. The examples assume that you had a $1,000 investment in each Class at the beginning of the reporting period, September 1, 2015, and continued to hold your shares at the end of the reporting period, February 29, 2016.
Actual Expenses
For each Class of each Fund in the table below, the first line provides information about actual account values and actual expenses. You may use the information in this line, together with the amount you invested, to estimate the expenses that you paid over the period. Simply divide your account value by $1,000 (for example, an $8,600 account value divided by $1,000 = 8.6), then multiply the result by the number in the first line of each Class under the heading entitled “Expenses Paid During the Period” to estimate the expenses you paid on your account during this period.
Hypothetical Example for Comparison Purposes
The second line of each Class in the table below provides information about hypothetical account values and hypothetical expenses based on the Class’ actual expense ratio and an assumed rate of return of 5% per year before expenses, which is not the Class’ actual return. The hypothetical account values and expenses may not be used to estimate the actual ending account balance or expenses you paid for the period. You may use this information to compare the ongoing costs of investing in the Class of the Fund and other funds. To do so, compare this 5% hypothetical example with the 5% hypothetical examples that appear in the shareholder reports of the other funds. Please note that the expenses shown in the table are meant to highlight your ongoing costs only and do not reflect any transaction costs, such as sales charges (loads) or redemption fees. Therefore, the second line for each Class in the table is useful in comparing ongoing costs only, and will not help you determine the relative total costs of owning different funds. In addition, if these transaction costs were included, your costs would have been higher. The examples also assume all dividends and distributions have been reinvested.
| Beginning Account Value September 1, 2015 | Ending Account Value February 29, 2016 | Expenses Paid During the Period | Annualized Expense Ratio | |||||||||||||
Behavioral Value Fund | ||||||||||||||||
Class A | ||||||||||||||||
Actual* | $ | 1,000.00 | $ | 971.30 | $ | 6.37 | 1.30 | % | ||||||||
Hypothetical* | 1,000.00 | 1,018.40 | 6.52 | 1.30 | ||||||||||||
Class C | ||||||||||||||||
Actual* | 1,000.00 | 968.80 | 8.81 | 1.80 | ||||||||||||
Hypothetical* | 1,000.00 | 1,015.91 | 9.02 | 1.80 | ||||||||||||
Class R2 | ||||||||||||||||
Actual* | 1,000.00 | 970.10 | 7.59 | 1.55 | ||||||||||||
Hypothetical* | 1,000.00 | 1,017.16 | 7.77 | 1.55 | ||||||||||||
Class R6 | ||||||||||||||||
Actual* | 1,000.00 | 973.80 | 3.93 | 0.80 | ||||||||||||
Hypothetical* | 1,000.00 | 1,020.89 | 4.02 | 0.80 | ||||||||||||
Institutional Class | ||||||||||||||||
Actual* | 1,000.00 | 973.40 | 4.42 | 0.90 | ||||||||||||
Hypothetical* | 1,000.00 | 1,020.39 | 4.52 | 0.90 | ||||||||||||
Select Class | ||||||||||||||||
Actual* | 1,000.00 | 972.60 | 5.15 | �� | 1.05 | |||||||||||
Hypothetical* | 1,000.00 | 1,019.64 | 5.27 | 1.05 | ||||||||||||
Realty Income Fund | ||||||||||||||||
Class A | ||||||||||||||||
Actual* | 1,000.00 | 1,036.00 | 5.97 | 1.18 | ||||||||||||
Hypothetical* | 1,000.00 | 1,019.00 | 5.92 | 1.18 | ||||||||||||
Class C | ||||||||||||||||
Actual* | 1,000.00 | 1,032.50 | 8.49 | 1.68 | ||||||||||||
Hypothetical* | 1,000.00 | 1,016.51 | 8.42 | 1.68 | ||||||||||||
Class R5 | ||||||||||||||||
Actual* | 1,000.00 | 1,037.40 | 3.70 | 0.73 | ||||||||||||
Hypothetical* | 1,000.00 | 1,021.23 | 3.67 | 0.73 | ||||||||||||
| 30 | UNDISCOVERED MANAGERS FUNDS | FEBRUARY 29, 2016 | ||||
Table of Contents
| Beginning Account Value September 1, 2015 | Ending Account Value February 29, 2016 | Expenses Paid During the Period | Annualized Expense Ratio | |||||||||||||
Realty Income Fund (continued) | ||||||||||||||||
Class R6 | ||||||||||||||||
Actual** | $ | 1,000.00 | $ | 929.90 | $ | 2.13 | 0.68 | % | ||||||||
Hypothetical* | 1,000.00 | 1,021.48 | 3.42 | 0.68 | ||||||||||||
Institutional Class | ||||||||||||||||
Actual* | 1,000.00 | 1,037.00 | 3.95 | 0.78 | ||||||||||||
Hypothetical* | 1,000.00 | 1,020.98 | 3.92 | 0.78 | ||||||||||||
| * | Expenses are equal to each Class’ respective annualized expense ratio, multiplied by the average account value over the period, multiplied by 182/366 (to reflect the one-half year period). |
| ** | Expenses are equal to each Class’ respective annualized expense ratio, multiplied by the average account value over the period, multiplied by 119/366 (to reflect the actual period). Commencement of operations was November 2, 2015. |
| FEBRUARY 29, 2016 | UNDISCOVERED MANAGERS FUNDS | 31 | ||||||
Table of Contents
J.P. Morgan Funds are distributed by JPMorgan Distribution Services, Inc., which is an affiliate of JPMorgan Chase & Co. Affiliates of JPMorgan Chase & Co. receive fees for providing various services to the funds.
Contact JPMorgan Distribution Services, Inc. at 1-800-480-4111 for a fund prospectus. You can also visit us at www.jpmorganfunds.com. Investors should carefully consider the investment objectives and risk as well as charges and expenses of the mutual fund before investing. The prospectus contains this and other information about the mutual fund. Read the prospectus carefully before investing.
Investors may obtain information about the Securities Investor Protection Corporation (SIPC), including the SIPC brochure by visiting www.sipc.org or by calling SIPC at 202-371-8300.
Each Fund files a complete schedule of its fund holdings for the first and third quarters of its fiscal year with the SEC on Form N-Q. The Funds’ Forms N-Q are available on the SEC’s website at http://www.sec.gov and may be reviewed and copied at the SEC’s Public Reference Room in Washington, DC. Information on the operation of the SEC’s Public Reference Room may be obtained by calling 1-800-SEC-0330. Shareholders may request the Form N-Q without charge by calling 1-800-480-4111 or by visiting the J.P. Morgan Funds’ website at www.jpmorganfunds.com.
A description of each Fund’s policies and procedures with respect to the disclosure of each Fund’s holdings is available in the prospectus and Statement of Additional Information.
A copy of proxy policies and procedures is available without charge upon request by calling 1-800-480-4111 and on the Funds’ website at www.jpmorganfunds.com. A description of such policies and procedures is on the SEC’s website at www.sec.gov. The Trustees have delegated the authority to vote proxies for securities owned by the Funds to the Adviser. A copy of the Funds’ voting record for the most recent 12-month period ended June 30 is available on the SEC’s website at www.sec.gov or at the Funds’ website at www.jpmorganfunds.com no later than August 31 of each year. The Funds’ proxy voting record will include, among other things, a brief description of the matter voted on for each fund security, and will state how each vote was cast, for example, for or against the proposal.

Table of Contents

J.P. Morgan Asset Management is the marketing name for the asset management business of JPMorgan Chase & Co. Those businesses include, but are not limited to, J.P. Morgan Investment Management Inc., Security Capital Research & Management Incorporated and J.P. Morgan Alternative Asset Management, Inc.
| © JPMorgan Chase & Co., 2016. All rights reserved. February 2016. | SAN-UM-216 |
Table of Contents
ITEM 2. CODE OF ETHICS.
Disclose whether, as of the end of the period covered by the report, the registrant has adopted a code of ethics that applies to the registrant’s principal executive officer, principal financial officer, principal accounting officer or controller, or persons performing similar functions, regardless of whether these individuals are employed by the registrant or a third party. If the registrant has not adopted such a code of ethics, explain why it has not done so.
The registrant must briefly describe the nature of any amendment, during the period covered by the report, to a provision of its code of ethics that applies to the registrant’s principal executive officer, principal financial officer, principal accounting officer or controller, or persons performing similar functions, regardless of whether these individuals are employed by the registrant or a third party, and that relates to any element of the code of ethics definition enumerated in paragraph (b) of this Item. The registrant must file a copy of any such amendment as an exhibit pursuant to Item 12(a)(1), unless the registrant has elected to satisfy paragraph (f) of this Item by positing its code of ethics on its website pursuant to paragraph (f)(2) of this Item, or by undertaking to provide its code of ethics to any person without charge, upon request, pursuant to paragraph (f)(3) of this Item.
If the registrant has, during the period covered by the report, granted a waiver, including an implicit waiver, from a provision of the code of ethics that applies to the registrant’s principal executive officer, principal financial officer, principal accounting officer or controller, or persons performing similar functions, regardless of whether these individuals are employed by the registrant or third party, that relates to one or more items set forth in paragraph (b) of this Item, the registrant must briefly describe the nature of the waiver, the name of the person to whom the waiver was granted, and the date of the waiver.
Not applicable to a semi-annual report.
ITEM 3. AUDIT COMMITTEE FINANCIAL EXPERT.
(a) (1) Disclose that the registrant’s board of directors has determined that the registrant either:
(i) Has at least one audit committee financial expert serving on its audit committee; or
(ii) Does not have an audit committee financial expert serving on its audit committee.
(2) If the registrant provides the disclosure required by paragraph (a)(1)(i) of this Item, it must disclose the name of the audit committee financial expert and whether that person is “independent.” In order to be considered “independent” for purposes of this Item, a member of an audit committee may not, other than in his or her capacity as a member of the audit committee, the board of directors, or any other board committee:
(i) Accept directly or indirectly any consulting, advisory, or other compensatory fee from the issuer; or
(ii) Be an “interested person” of the investment company as defined in Section 2(a)(19) of the Act (15 U.S.C. 80a-2(a)(19)).
(3) If the registrant provides the disclosure required by paragraph (a)(1)(ii) of this Item, it must explain why it does not have an audit committee financial expert.
Not applicable to a semi-annual report.
Table of Contents
ITEM 4. PRINCIPAL ACCOUNTANT FEES AND SERVICES.
(a) Disclose, under the caption Audit Fees, the aggregate fees billed for each of the last two fiscal years for professional services rendered by the principal accountant for the audit of the registrant’s annual financial statements or services that are normally provided by the accountant in connection with statutory and regulatory filings or engagements for those fiscal years.
(b) Disclose, under the caption Audit-Related Fees, the aggregate fees billed in each of the last two fiscal years for assurance and related services by the principal accountant that are reasonably related to the performance of the audit of the registrant’s financial statements and are not reported under paragraph (a) of this Item. Registrants shall describe the nature of the services comprising the fees disclosed under this category.
(c) Disclose, under the caption Tax Fees, the aggregate fees billed in each of the last two fiscal years for professional services rendered by the principal accountant for tax compliance, tax advice, and tax planning. Registrants shall describe the nature of the services comprising the fees disclosed under this category.
(d) Disclose, under the caption All Other Fees, the aggregate fees billed in each of the last two fiscal years for products and services provided by the principal accountant, other than the services reported in paragraphs (a) through (c) of this Item. Registrants shall describe the nature of the services comprising the fees disclosed under this category.
(e) (1) Disclose the audit committee’s pre-approval policies and procedures described in paragraph (c)(7) of Rule 2-01 of Regulation S-X.
(2) Disclose the percentage of services described in each of paragraphs (b) through (d) of this Item that were approved by the audit committee pursuant to paragraph (c)(7)(i)(C) of Rule 2-01 of Regulation S-X.
(f) If greater than 50 percent, disclose the percentage of hours expended on the principal accountant’s engagement to audit the registrant’s financial statements for the most recent fiscal year that were attributed to work performed by persons other than the principal accountant’s full-time, permanent employees.
Not applicable - Less than 50%.
(g) Disclose the aggregate non-audit fees billed by the registrant’s accountant for services rendered to the registrant, and rendered to the registrant’s investment adviser (not including any sub-adviser whose role is primarily portfolio management and is subcontracted with or overseen by another investment adviser), and any entity controlling, controlled by, or under common control with the adviser that provides ongoing services to the registrant for each of the last two fiscal years of the registrant.
(h) Disclose whether the registrant’s audit committee of the board of directors has considered whether the provision of non-audit services that were rendered to the registrant’s investment adviser (not including any subadviser whose role is primarily portfolio management and is subcontracted with or overseen by another investment adviser), and any entity controlling, controlled by, or under common control with the investment adviser that provides ongoing services to the registrant that were not pre-approved pursuant to paragraph (c)(7)(ii) of Rule 2-01 of Regulation S-X is compatible with maintaining the principal accountant’s independence.
Not applicable to a semi-annual report.
ITEM 5. AUDIT COMMITTEE OF LISTED REGISTRANTS.
(a) If the registrant is a listed issuer as defined in Rule 10A-3 under the Exchange Act (17CFR 240.10A-3), state whether or not the registrant has a separately-designated standing audit committee established in accordance with Section 3(a)(58)(A) of the Exchange Act (15 U.S.C. 78c(a)(58)(A)). If the registrant has such a committee, however designated, identify each committee member. If the entire board of directors is acting as the registrant’s audit committee as specified in Section 3(a)(58)(B) of the Exchange Act (15 U.S.C. 78c(a)(58)(B)), so state.
(b) If applicable, provide the disclosure required by Rule 10A-3(d) under the Exchange Act (17CFR 240.10A-3(d)) regarding an exemption from the listing standards for all audit committees.
Not applicable to a semiannual report.
Table of Contents
ITEM 6. SCHEDULE OF INVESTMENTS.
File Schedule I – Investments in securities of unaffiliated issuers as of the close of the reporting period as set forth in Section 210.12-12 of Regulation S-X, unless the schedule is included as part of the report to shareholders filed under Item 1 of this Form.
Included in Item 1.
ITEM 7. DISCLOSURE OF PROXY VOTING POLICIES AND PROCEDURES FOR CLOSED-END MANAGEMENT INVESTMENT COMPANIES.
A closed-end management investment company that is filing an annual report on this Form N-CSR must, unless it invests exclusively in non-voting securities, describe the policies and procedures that it uses to determine how to vote proxies relating to portfolio securities, including the procedures that the company uses when a vote presents a conflict between the interests of its shareholders, on the one hand, and those of the company’s investment adviser; principal underwriter; or any affiliated person (as defined in Section 2(a)(3) of the Investment Company Act of 1940 (15 U.S.C. 80a-2(a)(3)) and the rules thereunder) of the company, its investment adviser, or its principal underwriter, on the other. Include any policies and procedures of the company’s investment adviser, or any other third party, that the company uses, or that are used on the company’s behalf, to determine how to vote proxies relating to portfolio securities.
Not applicable.
ITEM 8. PORTFOLIO MANAGERS OF CLOSED-END MANAGEMENT INVESTMENT COMPANIES.
Not applicable.
ITEM 9. PURCHASE OF EQUITY SECURITIES BY CLOSED-END MANAGEMENT INVESTMENT COMPANY AND AFFILIATED PURCHASERS.
(a) If the registrant is a closed-end management investment company, provide the information specified in paragraph (b) of this Item with respect to any purchase made by or on behalf of the registrant or any “affiliated purchaser,” as defined in Rule 10b-18(a)(3) under the Exchange Act (17 CFR 240.10b-18(a)(3)), of shares or other units of any class of the registrant’s equity securities that is registered by the registrant pursuant to Section 12 of the Exchange Act (15 U.S.C. 781).
Not applicable.
ITEM 10. SUBMISSION OF MATTERS TO A VOTE OF SECURITY HOLDERS.
Describe any material changes to the procedures by which shareholders may recommend nominees to the registrant’s board of directors, where those changes were implemented after the registrant last provided disclosure in response to the requirements of Item 7(d)(2)(ii)(G) of Schedule 14A (17 CFR 240.14a-101), or this Item.
No material changes to report.
ITEM 11. CONTROLS AND PROCEDURES.
(a) Disclose the conclusions of the registrant’s principal executive and principal financial officers, or persons performing similar functions, regarding the effectiveness of the registrant’s disclosure controls and procedures (as defined in Rule 30a-3(c) under the Act (17 CFR 270.30a-3(c))) as of a date within 90 days of the filing date of the report that includes the disclosure required by this paragraph, based on the evaluation of these controls and procedures required by Rule 30a-3(b) under the Act (17 CFR 270.30a-3(b)) and Rules 13a-15(b) or 15d-15(b) under the Exchange Act (17 CFR 240.13a-15(b) or 240.15d-15(b)).
The Registrant’s principal executive and principal financial officers have concluded, based on their evaluation of the Registrant’s disclosure controls and procedures as of a date within 90 days of the filing date of this report, that the Registrant’s disclosure controls and procedures are reasonably designed to ensure that information required to be disclosed by the Registrant on Form N-CSR is recorded, processed, summarized and reported within the required time
Table of Contents
periods and that information required to be disclosed by the Registrant in the reports that it files or submits on Form N-CSR is accumulated and communicated to the Registrant’s management, including its principal executive and principal financial officers, as appropriate to allow timely decisions regarding required disclosure.
(b) Disclose any change in the registrant’s internal control over financial reporting (as defined in Rule 30a-3(d) under the Act (17 CFR 270.30a-3(d)) that occurred during the registrant’s second fiscal quarter of the period covered by this report that has materially affected, or is reasonably likely to materially affect, the registrant’s internal control over financial reporting.
There were no changes in the Registrant’s internal control over financial reporting that occurred during the last fiscal quarter covered by this report that have materially affected, or are reasonably likely to materially affect, the Registrant’s internal control over financial reporting.
ITEM 12. EXHIBITS.
(a) File the exhibits listed below as part of this Form. Letter or number the exhibits in the sequence indicated.
(a)(1) Any code of ethics, or amendment thereto, that is the subject of the disclosure required by Item 2, to the extent that the registrant intends to satisfy the Item 2 requirements through filing of an exhibit.
Not applicable.
(a)(2) A separate certification for each principal executive officer and principal financial officer of the registrant as required by Rule 30a-2(a) under the Act (17 CFR 270.30a-2).
Certifications pursuant to Rule 30a-2(a) under the Investment Company Act of 1940 are attached hereto.
(a)(3) Any written solicitation to purchase securities under Rule 23c-1 under the Act (17 CFR 270.23c-1) sent or given during the period covered by the report by or on behalf of the registrant to 10 or more persons.
Not applicable.
(b) A separate or combined certification for each principal executive officer and principal officer of the registrant as required by Rule 30a-2(b) under the Act of 1940.
Certifications pursuant to Rule 30a-2(b) under the Investment Company Act of 1940 are attached hereto.
Table of Contents
SIGNATURES
Pursuant to the requirements of the Securities Exchange Act of 1934 and the Investment Company Act of 1940, the registrant has duly caused this report to be signed on its behalf by the undersigned, thereunto duly authorized.
Undiscovered Managers Funds
| By: | /s/ Robert L. Young | |
| Robert L. Young | ||
| President and Principal Executive Office | ||
| May 5, 2016 |
Pursuant to the requirements of the Securities Exchange Act of 1934 and the Investment Company Act of 1940, this report has been signed below by the following persons on behalf of the registrant and in the capacities and on the dates indicated.
| By: | /s/ Robert L. Young | |
| Robert L. Young | ||
| President and Principal Executive Officer | ||
| May 5, 2016 |
| By: | /s/ Laura M. Del Prato | |
| Laura M. Del Prato | ||
| Treasurer and Principal Financial Officer | ||
| May 5, 2016 |