Table of Contents
UNITED STATES
SECURITIES AND EXCHANGE COMMISSION
Washington, D.C. 20549
FORMN-CSR
CERTIFIED SHAREHOLDER REPORT OF REGISTERED
MANAGEMENT INVESTMENT COMPANIES
Investment Company Act file number:811-08437
Undiscovered Managers Funds
(Exact name of registrant as specified in charter)
277 Park Avenue
New York, NY 10172
(Address of principal executive offices) (Zip code)
Gregory S. Samuels
277 Park Avenue
New York, NY 10172
(Name and Address of Agent for Service)
Registrant’s telephone number, including area code: (800)480-4111
Date of fiscal year end: August 31
Date of reporting period: September 1, 2018 through February 28, 2019
FormN-CSR is to be used by management investment companies to file reports with the Commission not later than 10 days after the transmission to stockholders of any report that is required to be transmitted to stockholders under Rule30e-1 under the Investment Company Act of 1940 (17 CFR270.30e-1). The Commission may use the information provided on FormN-CSR in its regulatory, disclosure review, inspection, and policymaking roles.
A registrant is required to disclose the information specified by FormN-CSR, and the Commission will make this information public. A registrant is not required to respond to the collection of information contained in FormN-CSR unless the Form displays a currently valid Office of Management and Budget (“OMB”) control number. Please direct comments concerning the accuracy of the information collection burden estimate and any suggestions for reducing the burden to Secretary, Securities and Exchange Commission, 450 Fifth Street, NW, Washington, DC 20549-0609. The OMB has reviewed this collection of information under the clearance requirements of 44 U.S.C. Section 3507.
Table of Contents
ITEM 1. REPORTS TO STOCKHOLDERS.
The following is a copy of the report transmitted to shareholders pursuant to Rule30e-1 under the Investment Company Act of 1940 (17 CFR270.30e-1).
Table of Contents
Semi-Annual Report
Undiscovered Managers Funds
February 28, 2019 (Unaudited)
Undiscovered Managers Behavioral Value Fund
Beginning on January 1, 2021, as permitted by regulations adopted by the Securities and Exchange Commission, paper copies of the Fund’s annual and semi-annual shareholder reports will no longer be sent by mail, unless you specifically request paper copies of the reports. Instead, the reports will be made available on the Fund’s websitewww.jpmorganfunds.comand you will be notified by mail each time a report is posted and provided with a website to access the report. If you already elected to receive shareholder reports electronically, you will not be affected by this change and you need not take any action.
You may elect to receive shareholder reports and other communications from the Fund electronically anytime by contacting your financial intermediary (such as a broker dealer, bank, or retirement plan) or, if you are a direct investor, by going towww.jpmorganfunds.com/edelivery.
You may elect to receive paper copies of all future reports free of charge. Contact your financial intermediary or, if you invest directly with the Fund, email us atfunds.website.support@jpmorganfunds.comor call 1-800-480-4111. Your election to receive paper reports will apply to all funds held within your account(s).

Table of Contents
| CEO’s Letter | 1 | |||
| Fund Commentary | 2 | |||
| Schedule of Portfolio Investments | 5 | |||
| Financial Statements | 8 | |||
| Financial Highlights | 14 | |||
| Notes to Financial Statements | 16 | |||
| Schedule of Shareholder Expenses | 22 | |||
Investments in a Fund are not deposits or obligations of, or guaranteed or endorsed by, any bank and are not insured or guaranteed by the FDIC, the Federal Reserve Board or any other government agency. You could lose money if you sell when a Fund’s share price is lower than when you invested.
Past performance is no guarantee of future performance. The general market views expressed in this report are opinions based on market and other conditions through the end of the reporting period and are subject to change without notice. These views are not intended to predict the future performance of a Fund or the securities markets. References to specific securities and their issuers are for illustrative purposes only and are not intended to be, and should not be interpreted as, recommendations to purchase or sell such securities. Such views are not meant as investment advice and may not be relied on as an indication of trading intent on behalf of any Fund.
Prospective investors should refer to the Fund’s prospectuses for a discussion of the Fund’s investment objectives, strategies and risks. Call J.P. Morgan Funds Service Center at1-800-480-4111 for a prospectus containing more complete information about the Fund, including management fees and other expenses. Please read it carefully before investing.
Table of Contents
April 12, 2019 (Unaudited)
Dear Shareholders,
Even as the U.S. economy continued to outperform other leading economies, the pace of global expansion slowed through the six months ended February 28, 2019 and the U.S. Federal Reserve and other central banks responded with policies seeking to bolster flagging growth.
 |
“The U.S. economy is forecast by the International Monetary Fund to grow by about 2.3% in 2019, slower than the previous year but still positive and on track to achieve its longest period of economic expansion on record.” — George C.W. Gatch |
Equity and bond markets suffered an acutesell-off in the fourth quarter of 2018 amid investor expectations for rising interest rates, concerns about U.S.-China trade tensions and a budget stalemate that led to the temporary shutdown of large portions of the U.S. federal government. While financials markets rebounded somewhat in early 2019, the S&P 500 Index returned-3.04% for the six month reporting period, while the Bloomberg Barclays U.S. Aggregate Bond Index returned 1.99%.
Meanwhile, growth in U.S. gross domestic product (GDP) cooled from 3.4% in the third quarter of 2018 to 2.2% in the fourth quarter. The unemployment rate in the U.S. remained at historic lows, ranging between 4.0% and 3.7% for the reporting period. While corporate earnings and revenues generally outperformed analysts’ expectations for the third quarter of 2018, investors and economists expected that trend to recede due to slowing global demand and the fading effects of federal tax cuts enacted at the end of 2017.
Globally, manufacturing and export sectors slumped in the19-nation Eurozone, as well as in South Korean and Taiwan, amid softening demand from China and the impact of reciprocal trade tariffs between the U.S. and leading trading
partners. In response, the European Central Bank offered a new round oflow-cost loans to banks and indicated it would not raise interest rates through the end of 2019. China also moved to counter slowing domestic growth via tax cuts, infrastructure spending and increased bank lending.
Emerging market debt largely outperformed other asset classes during the reporting period. A decline in interest rates at the end of the reporting period and investor expectations for improvement in trade tensions generally bolstered both sovereign and corporate bonds in certain emerging markets.
The International Monetary Fund and the Organization for Economic Cooperation and Development (OECD) have forecast 3.3% growth in global GDP for 2019, but the OECD has also warned of weakening economic prospects in the 20 largest economies, particularly in China, Europe and the U.K. The organization has cited “vulnerabilities” from slowing trade and manufacturing, as well as acutegeo-political risks. The U.S. economy is forecast by the International Monetary Fund to grow by about 2.3% in 2019, slower than the previous year but still positive and on track to achieve its longest period of economic expansion on record.
We believe those investors who remain fully invested for the long term in a well-diversified portfolio may continue to benefit from extant market opportunities. We look forward to managing your investment needs for years to come. Should you have any questions, please visit www.jpmorganfunds.com or contact the J.P. Morgan Funds Service Center at1-800-480-4111.
Sincerely yours,

George C.W. Gatch
CEO, Global Funds Management
J.P. Morgan Asset Management
| FEBRUARY 28, 2019 | UNDISCOVERED MANAGERS FUNDS | 1 | ||||||
Table of Contents
Undiscovered Managers Behavioral Value Fund
SIX MONTHS ENDED FEBRUARY 28, 2019 (Unaudited)
REPORTING PERIOD RETURN: | ||||
| Fund (Class L Shares)* | (8.03)% | |||
| Russell 2000 Value Index | (8.59)% | |||
| Net Assets as of 2/28/2019 (In Thousands) | $5,518,677 | |||
INVESTMENT OBJECTIVE**
The Undiscovered Managers Behavioral Value Fund (the “Fund”) seeks to provide capital appreciation.
HOW DID THE MARKET PERFORM?
U.S. equity markets continued to outperform U.S. bond markets during the six month reporting period. Equity prices were generally supported by record corporate profits, low interest rates and the continued expansion of the U.S. economy. Conversely, investor expectations for accelerating inflation and future increases in interest rates weighed down prices for corporate debt and U.S. Treasury bonds for most of the reporting period.
Notably, investors sold off equity and bonds in the fourth quarter of 2018 amid concerns about U.S.-China trade tensions, slowing economic growth in China and Europe and a political impasse in Washington, D.C. that led to the partial shutdown of the federal government.
However, prices for both equity and bonds rebounded somewhat in the first two months of 2019. A budget agreementre-opened federal government operations in January and the U.S. Federal Reserve (the “Fed”) said it would take a “patient” approach toward future interest rate increases. At the same time, inflation remained below the Fed’s target level despite a tightening job market and emerging signs of wage growth in the U.S.
WHAT WERE THE MAIN DRIVERS OF THE FUND’S PERFORMANCE?
For the six months ended February 28, 2019, the Fund’s Class L Shares outperformed the Russell 2000 Value Index (the “Benchmark”). The Fund’s security selection in the industrials sector and its underweight position in the health care sector were leading contributors to performance relative to the Benchmark, while the Fund’s security selection in the real estate and financial sectors was a leading detractor from relative performance.
Leading individual contributors to relative performance included the Fund’s overweight positions in Crown Holdings Inc., Investors Bancorp Inc. and Brink’s Co. Shares of Crown Holdings, a maker of consumer product packaging not held in the Benchmark, rose after the company reported better-than-expected results for the fourth quarter of 2018. Shares of
Investors Bancorp, a bank holding company, rose after a news report that the company may put itself up for sale. Shares of Brink’s, a provider of security services not held in the Benchmark, rose after the company unveiled a $50 million share repurchase plan and reported a profit and an increase in revenue for the fourth quarter of 2018.
Leading individual detractors from relative performance included the Fund’s overweight positions in WPX Energy Inc., Cabot Corp. and Range Resources Inc. Shares of WPX Energy, an oil and natural gas producer not held in the Benchmark, fell along with the broader energy sector amid a decline in petroleum prices during the fourth quarter of 2018. Shares of Cabot, a specialty chemical and materials manufacturer not held in the Benchmark, fell after the company lowered its earnings forecast for its current fiscal year. Shares of Range Resources, a natural gas and petroleum producer not held in the Benchmark, fell sharply in the fourth quarter of 2018 amid investor concerns about natural gas prices.
HOW WAS THE FUND POSITIONED?
The Fund’ssub-adviser, Fuller & Thaler Asset Management Inc., looked for stocks that it believed were mispriced based on behavioral biases. Thesub-adviser generally utilizes a three-pronged approach that includes i) positive signals such as significant share purchases by company insiders or stock repurchase activity by the company; ii) evidence of market overreaction due to behavioral factors like loss aversion or stereotyping that has resulted in an absolute or relative decline in the valuation of certain securities; and iii) analysis of the company’s fundamentals with regard to business model, valuation and credit risk.
During the reporting period, the Fund’s largest overweight positions versus the Benchmark were in the industrials and materials sectors, while its largest underweight positions versus the Benchmark were in the utilities and communication services sectors.
| * | The return shown is based on net asset values calculated for shareholder transactions and may differ from the return shown in the financial highlights, which reflects adjustments made to the net asset values in accordance with accounting principles generally accepted in the United States of America. |
| ** | The adviser seeks to achieve the Fund’s objective. There can be no guarantee that it will be achieved. |
| 2 | UNDISCOVERED MANAGERS FUNDS | FEBRUARY 28, 2019 | ||||
Table of Contents
| TOP TEN EQUITY HOLDINGS OF THE PORTFOLIO* | ||||||||
| 1. | Investors Bancorp, Inc. | 3.9 | % | |||||
| 2. | First Horizon National Corp. | 3.6 | ||||||
| 3. | Crown Holdings, Inc. | 2.9 | ||||||
| 4. | KeyCorp | 2.4 | ||||||
| 5. | Brixmor Property Group, Inc. | 2.2 | ||||||
| 6. | CNO Financial Group, Inc. | 2.1 | ||||||
| 7. | Graphic Packaging Holding Co. | 2.0 | ||||||
| 8. | Celanese Corp. | 1.9 | ||||||
| 9. | Brink’s Co. (The) | 1.8 | ||||||
| 10. | Energizer Holdings, Inc. | 1.6 | ||||||
PORTFOLIO COMPOSITION BY SECTOR* | ||||
| Financials | 26.6 | % | ||
| Industrials | 17.1 | |||
| Materials | 12.0 | |||
| Real Estate | 9.1 | |||
| Information Technology | 7.6 | |||
| Consumer Discretionary | 7.3 | |||
| Energy | 4.5 | |||
| Consumer Staples | 1.9 | |||
| Health Care | 1.6 | |||
| Utilities | 1.5 | |||
| Communication Services | 0.5 | |||
| Short-Term Investments | 10.3 | |||
| * | Percentages indicated are based on total investments as of February 28, 2019. The Fund’s portfolio composition is subject to change. |
| FEBRUARY 28, 2019 | UNDISCOVERED MANAGERS FUNDS | 3 | ||||||
Table of Contents
Undiscovered Managers Behavioral Value Fund
FUND COMMENTARY
SIX MONTHS ENDED FEBRUARY 28, 2019 (Unaudited) (continued)
AVERAGE ANNUAL TOTAL RETURNSAS OF FEBRUARY 28, 2019 | ||||||||||||||||||
| INCEPTION DATE OF CLASS | 6 MONTH* | 1 YEAR | 5 YEAR | 10 YEAR | ||||||||||||||
CLASS A SHARES | June 4, 2004 | |||||||||||||||||
With Sales Charge** | (13.03 | )% | (2.48 | )% | 6.66 | % | 19.10 | % | ||||||||||
Without Sales Charge | (8.21 | ) | 2.92 | 7.82 | 19.75 | |||||||||||||
CLASS C SHARES | June 4, 2004 | |||||||||||||||||
With CDSC*** | (9.43 | ) | 1.42 | 7.28 | 19.16 | |||||||||||||
Without CDSC | (8.43 | ) | 2.42 | 7.28 | 19.16 | |||||||||||||
CLASS I SHARES | April 30, 2013 | (8.10 | ) | 3.18 | 8.09 | 20.03 | ||||||||||||
CLASS L SHARES | December 28, 1998 | (8.03 | ) | 3.34 | 8.25 | 20.14 | ||||||||||||
CLASS R2 SHARES | April 30, 2013 | (8.31 | ) | 2.68 | 7.55 | 19.58 | ||||||||||||
CLASS R3 SHARES | March 1, 2017 | (8.21 | ) | 2.92 | 7.82 | 19.75 | ||||||||||||
CLASS R4 SHARES | March 1, 2017 | (8.11 | ) | 3.18 | 8.08 | 20.03 | ||||||||||||
CLASS R5 SHARES | March 1, 2017 | (8.03 | ) | 3.33 | 8.25 | 20.13 | ||||||||||||
CLASS R6 SHARES | April 30, 2013 | (7.98 | ) | 3.45 | 8.36 | 20.21 | ||||||||||||
| * | Not annualized. |
| ** | Sales Charge for Class A Shares is 5.25%. |
| *** | Assumes a 1% CDSC (contingent deferred sales charge) for the 6 month and one year periods and 0% CDSC thereafter. |
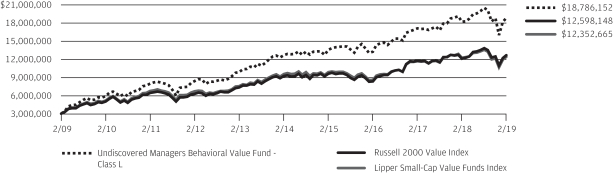
TEN YEAR PERFORMANCE(2/28/09 TO 2/28/19)
The performance quoted is past performance and is not a guarantee of future results. Mutual funds are subject to certain market risks. Investment returns and principal value of an investment will fluctuate so that an investor’s shares, when redeemed, may be worth more or less than their original cost. Current performance may be higher or lower than the performance data shown. Forup-to-datemonth-end performance information pleasecall 1-800-480-4111.
Returns for Class R6 and Class I Shares prior to their inception date are based on the performance of Class L Shares. The actual returns of Class I Shares would have been lower than those shown because Class I Shares have higher expenses than Class L Shares. The actual returns of Class R6 Shares would have been different than those shown because Class R6 Shares have different expenses than Class L Shares.
Returns for Class R2 Shares prior to their inception date are based on the performance of Class A Shares. The actual returns of Class R2 Shares would have been lower than those shown because Class R2 Shares have higher expenses than Class A Shares.
Returns for Class R3, Class R4 and Class R5 Shares prior to their inception dates are based on the performance of the Class A, Class I and Class L Shares, respectively. The actual returns for Class R3, Class R4 and Class R5 Shares would have been similar to those shown because Class R3, Class R4 and Class R5 Shares have similar expenses to Class A, Class I and Class L Shares, respectively.
The graph illustrates comparative performance for $3,000,000 invested in Class L Shares of the Undiscovered Managers Behavioral Value Fund, the
Russell 2000 Value Index and the LipperSmall-Cap Value Funds Index from February 28, 2009 to February 28, 2019. The performance of the Fund assumes reinvestment of all dividends and capital gain distributions, if any, and does not include a sales charge. The performance of the Russell 2000 Value Index does not reflect the deduction of expenses or a sales charge associated with a mutual fund and has been adjusted to reflect reinvestment of all dividends and capital gain distributions of securities included in the benchmark, if applicable. The performance of the LipperSmall-Cap Value Funds Index includes expenses associated with a mutual fund, such as investment management fees. These expenses are not identical to the expenses incurred by the Fund. The Russell 2000 Value Index is an unmanaged index, which measures the performance of those Russell 2000 companies with lowerprice-to-book ratios and lower forecasted growth values. The LipperSmall-Cap Value Funds Index is an index based on the total returns of certain mutual funds within the Fund’s designated category as determined by Lipper, Inc. Investors cannot invest directly in an index.
Class L Shares have a $3,000,000 minimum initial investment.
Fund performance may reflect the waiver of the Fund’s fees and reimbursement of expenses for certain periods since the inception date. Without these waivers and reimbursements, performance would have been lower. Also, performance shown in this section does not reflect the deduction of taxes that a shareholder would pay on Fund distributions or redemptions of Fund shares.
The returns shown are based on net asset values calculated for shareholder transactions and may differ from the returns shown in the financial highlights, which reflect adjustments made to the net asset values in accordance with accounting principles generally accepted in the United States of America.
| 4 | UNDISCOVERED MANAGERS FUNDS | FEBRUARY 28, 2019 | ||||
Table of Contents
Undiscovered Managers Behavioral Value Fund
SCHEDULE OF PORTFOLIO INVESTMENTS
AS OF FEBRUARY 28, 2019 (Unaudited)
| INVESTMENTS | SHARES (000) | VALUE ($000) | ||||||
Common Stocks — 89.1% |
| |||||||
Auto Components — 3.6% |
| |||||||
American Axle & Manufacturing Holdings, Inc.* | 1,477 | 23,785 | ||||||
Cooper-Standard Holdings, Inc.* | 768 | 46,150 | ||||||
Gentherm, Inc.* | 1,469 | 60,220 | ||||||
Tenneco, Inc., Class A | 2,052 | 71,016 | ||||||
|
| |||||||
| 201,171 | ||||||||
|
| |||||||
Banks — 18.8% | ||||||||
Bancorp, Inc. (The)* | 1,709 | 15,505 | ||||||
Brookline Bancorp, Inc. | 2,847 | 45,495 | ||||||
First Horizon National Corp. | 12,687 | 198,291 | ||||||
First Midwest Bancorp, Inc. | 3,230 | 74,769 | ||||||
FNB Corp. | 6,545 | 80,113 | ||||||
Hope Bancorp, Inc. | 5,913 | 86,218 | ||||||
Investors Bancorp, Inc. | 16,947 | 213,024 | ||||||
KeyCorp | 7,403 | 130,729 | ||||||
Simmons First National Corp., Class A | 971 | 26,055 | ||||||
TCF Financial Corp. | 2,529 | 57,922 | ||||||
Texas Capital Bancshares, Inc.* | 744 | 45,393 | ||||||
United Bankshares, Inc. | 1,698 | 65,191 | ||||||
|
| |||||||
| 1,038,705 | ||||||||
|
| |||||||
Building Products — 2.7% | ||||||||
Armstrong World Industries, Inc. | �� | 588 | 43,020 | |||||
Builders FirstSource, Inc.* | 3,158 | 43,996 | ||||||
JELD-WEN Holding, Inc.* | 3,054 | 61,714 | ||||||
|
| |||||||
| 148,730 | ||||||||
|
| |||||||
Capital Markets — 2.2% | ||||||||
Apollo Investment Corp. | 909 | 13,928 | ||||||
Artisan Partners Asset Management, Inc., Class A | 1,100 | 28,929 | ||||||
Janus Henderson Group plc (United Kingdom) | 2,273 | 55,698 | ||||||
Waddell & Reed Financial, Inc., Class A | 1,248 | 23,098 | ||||||
|
| |||||||
| 121,653 | ||||||||
|
| |||||||
Chemicals — 4.8% | ||||||||
Cabot Corp. | 1,715 | 80,415 | ||||||
Celanese Corp. | 993 | 101,612 | ||||||
Koppers Holdings, Inc.* | 1,514 | 37,220 | ||||||
Trinseo SA | 860 | 43,176 | ||||||
|
| |||||||
| 262,423 | ||||||||
|
| |||||||
Commercial Services & Supplies — 5.8% | ||||||||
Brink’s Co. (The) | 1,216 | 95,931 | ||||||
Civeo Corp.* | 2,134 | 5,549 | ||||||
Clean Harbors, Inc.* | 992 | 67,443 | ||||||
Copart, Inc.* | 369 | 21,674 | ||||||
Covanta Holding Corp. | 4,988 | 84,689 | ||||||
Herman Miller, Inc. | 1,234 | 45,249 | ||||||
|
| |||||||
| 320,535 | ||||||||
|
| |||||||
| INVESTMENTS | SHARES (000) | VALUE ($000) | ||||||
Communications Equipment — 1.4% |
| |||||||
ADTRAN, Inc. | 1,598 | 23,995 | ||||||
CommScope Holding Co., Inc.* | 2,230 | 51,970 | ||||||
|
| |||||||
| 75,965 | ||||||||
|
| |||||||
Construction & Engineering — 1.4% | ||||||||
Granite Construction, Inc. | 1,696 | 78,983 | ||||||
|
| |||||||
Construction Materials — 0.8% | ||||||||
Eagle Materials, Inc. | 544 | 41,554 | ||||||
|
| |||||||
Containers & Packaging — 4.9% | ||||||||
Crown Holdings, Inc.* | 2,948 | 160,023 | ||||||
Graphic Packaging Holding Co. | 9,134 | 111,257 | ||||||
|
| |||||||
| 271,280 | ||||||||
|
| |||||||
Diversified Consumer Services — 0.4% | ||||||||
Sotheby’s* | 549 | 24,079 | ||||||
|
| |||||||
Electric Utilities — 1.5% | ||||||||
El Paso Electric Co. | 1,219 | 65,563 | ||||||
Portland General Electric Co. | 347 | 17,423 | ||||||
|
| |||||||
| 82,986 | ||||||||
|
| |||||||
Electronic Equipment, Instruments & Components — 2.8% |
| |||||||
Avnet, Inc. | 695 | 30,219 | ||||||
Dolby Laboratories, Inc., Class A | 729 | 47,270 | ||||||
Flex Ltd.* | 2,039 | 21,492 | ||||||
MTS Systems Corp. | 1,028 | 54,770 | ||||||
|
| |||||||
| 153,751 | ||||||||
|
| |||||||
Energy Equipment & Services — 2.6% | ||||||||
KLX Energy Services Holdings, Inc.* | 922 | 24,297 | ||||||
Patterson-UTI Energy, Inc. | 5,946 | 78,844 | ||||||
TETRA Technologies, Inc.* | 5,757 | 13,758 | ||||||
US Silica Holdings, Inc. | 1,908 | 28,432 | ||||||
|
| |||||||
| 145,331 | ||||||||
|
| |||||||
Equity Real Estate Investment Trusts (REITs) — 9.0% |
| |||||||
Alexander & Baldwin, Inc.* | 1,253 | 28,720 | ||||||
Brixmor Property Group, Inc. | 6,859 | 119,766 | ||||||
Chatham Lodging Trust | 2,349 | 46,926 | ||||||
Colony Capital, Inc. | 14,328 | 79,661 | ||||||
Franklin Street Properties Corp. | 5,629 | 40,755 | ||||||
Kite Realty Group Trust | 1,776 | 27,957 | ||||||
Pebblebrook Hotel Trust | 548 | 17,545 | ||||||
PotlatchDeltic Corp. | 524 | 18,863 | ||||||
Rayonier, Inc. | 1,913 | 56,376 | ||||||
Retail Properties of America, Inc., Class A | 2,081 | 25,927 | ||||||
Ryman Hospitality Properties, Inc. | 427 | 34,621 | ||||||
|
| |||||||
| 497,117 | ||||||||
|
| |||||||
SEE NOTES TO FINANCIAL STATEMENTS.
| FEBRUARY 28, 2019 | UNDISCOVERED MANAGERS FUNDS | 5 | ||||||
Table of Contents
Undiscovered Managers Behavioral Value Fund
SCHEDULE OF PORTFOLIO INVESTMENTS
AS OF FEBRUARY 28, 2019 (Unaudited) (continued)
| INVESTMENTS | SHARES (000) | VALUE ($000) | ||||||
Common Stocks — continued |
| |||||||
Food & Staples Retailing — 0.3% |
| |||||||
Sprouts Farmers Market, Inc.* | 747 | 17,421 | ||||||
|
| |||||||
Health Care Technology — 0.9% | ||||||||
Allscripts Healthcare Solutions, Inc.* | 4,439 | 47,583 | ||||||
|
| |||||||
Hotels, Restaurants & Leisure — 0.2% | ||||||||
Bloomin’ Brands, Inc. | 492 | 10,177 | ||||||
|
| |||||||
Household Durables — 1.2% | ||||||||
TRI Pointe Group, Inc.* | 2,188 | 27,565 | ||||||
Tupperware Brands Corp. | 1,212 | 36,493 | ||||||
|
| |||||||
| 64,058 | ||||||||
|
| |||||||
Household Products — 1.6% | ||||||||
Energizer Holdings, Inc. | 1,940 | 88,995 | ||||||
|
| |||||||
Insurance — 5.0% | ||||||||
Assured Guaranty Ltd. | 824 | 34,394 | ||||||
CNO Financial Group, Inc. | 6,740 | 114,790 | ||||||
National General Holdings Corp. | 2,501 | 64,559 | ||||||
White Mountains Insurance Group Ltd. | 64 | 60,384 | ||||||
|
| |||||||
| 274,127 | ||||||||
|
| |||||||
IT Services — 1.3% | ||||||||
Cardtronics plc, Class A* | 921 | 27,170 | ||||||
Sykes Enterprises, Inc.* | 1,583 | 46,830 | ||||||
|
| |||||||
| 74,000 | ||||||||
|
| |||||||
Machinery — 3.6% | ||||||||
Actuant Corp., Class A | 991 | 24,236 | ||||||
Harsco Corp.* | 1,134 | 25,384 | ||||||
Hyster-Yale Materials Handling, Inc. | 436 | 29,483 | ||||||
Kennametal, Inc. | 2,012 | 75,837 | ||||||
Terex Corp. | 1,346 | 45,204 | ||||||
|
| |||||||
| 200,144 | ||||||||
|
| |||||||
Marine — 1.2% | ||||||||
Matson, Inc. | 1,852 | 66,864 | ||||||
|
| |||||||
Media — 0.5% | ||||||||
John Wiley & Sons, Inc., Class A | 544 | 28,233 | ||||||
|
| |||||||
Metals & Mining — 1.0% | ||||||||
Commercial Metals Co. | 3,213 | 53,183 | ||||||
|
| |||||||
Mortgage Real Estate Investment Trusts (REITs) — 0.4% |
| |||||||
AG Mortgage Investment Trust, Inc. | 1,237 | 21,991 | ||||||
|
| |||||||
Oil, Gas & Consumable Fuels — 1.9% | ||||||||
PBF Energy, Inc., Class A | 333 | 10,348 | ||||||
Range Resources Corp. | 3,396 | 36,340 | ||||||
WPX Energy, Inc.* | 4,640 | 57,254 | ||||||
|
| |||||||
| 103,942 | ||||||||
|
| |||||||
| INVESTMENTS | SHARES (000) | VALUE ($000) | ||||||
Paper & Forest Products — 0.5% |
| |||||||
PH Glatfelter Co. | 1,994 | 26,819 | ||||||
|
| |||||||
Pharmaceuticals — 0.8% | ||||||||
Prestige Consumer Healthcare, Inc.* | 1,420 | 41,553 | ||||||
|
| |||||||
Software — 1.1% | ||||||||
ACI Worldwide, Inc.* | 534 | 17,010 | ||||||
Verint Systems, Inc.* | 784 | 41,732 | ||||||
|
| |||||||
| 58,742 | ||||||||
|
| |||||||
Specialty Retail — 1.0% | ||||||||
DSW, Inc., Class A | 1,854 | 54,903 | ||||||
|
| |||||||
Technology Hardware, Storage & Peripherals — 0.9% |
| |||||||
NCR Corp.* | 1,851 | 51,857 | ||||||
|
| |||||||
Textiles, Apparel & Luxury Goods — 0.8% | ||||||||
Columbia Sportswear Co. | 428 | 44,101 | ||||||
|
| |||||||
Trading Companies & Distributors — 2.2% | ||||||||
Applied Industrial Technologies, Inc. | 407 | 23,666 | ||||||
Beacon Roofing Supply, Inc.* | 1,451 | 52,646 | ||||||
MRC Global, Inc.* | 2,840 | 47,879 | ||||||
|
| |||||||
| 124,191 | ||||||||
|
| |||||||
Total Common Stocks | 4,917,147 | |||||||
|
| |||||||
Short-Term Investments — 10.2% | ||||||||
Investment Companies — 10.2% | ||||||||
JPMorgan U.S. Government Money Market Fund Class Institutional Shares, 2.33% (a)(b) | 563,665 | 563,665 | ||||||
|
| |||||||
Total Investments — 99.3% | 5,480,812 | |||||||
Other Assets Less Liabilities — 0.7% | 37,865 | |||||||
|
| |||||||
Net Assets — 100.0% | 5,518,677 | |||||||
|
| |||||||
Percentages indicated are based on net assets.
| (a) | Investment in affiliate. Fund is registered under the Investment Company Act of 1940, as amended, and advised by J.P. Morgan Investment Management Inc. | |
| (b) | The rate shown is the current yield as of February 28, 2019. | |
| * | Non-income producing security. |
SEE NOTES TO FINANCIAL STATEMENTS.
| 6 | UNDISCOVERED MANAGERS FUNDS | FEBRUARY 28, 2019 | ||||
Table of Contents
THIS PAGE IS INTENTIONALLY LEFT BLANK
| FEBRUARY 28, 2019 | UNDISCOVERED MANAGERS FUNDS | 7 | ||||||
Table of Contents
STATEMENT OF ASSETS AND LIABILITIES
AS OF FEBRUARY 28, 2019 (Unaudited)
(Amounts in thousands, except per share amounts)
| Undiscovered Managers Behavioral Value Fund | ||||
ASSETS: | ||||
Investments in non-affiliates, at value | $ | 4,917,147 | ||
Investments in affiliates, at value | 563,665 | |||
Cash | 752 | |||
Receivables: | ||||
Investment securities sold | 51,742 | |||
Fund shares sold | 9,551 | |||
Dividends from non-affiliates | 3,456 | |||
Dividends from affiliates | 534 | |||
|
| |||
Total Assets | 5,546,847 | |||
|
| |||
LIABILITIES: | ||||
Payables: | ||||
Investment securities purchased | 17,285 | |||
Fund shares redeemed | 6,439 | |||
Accrued liabilities: | ||||
Investment advisory fees | 2,933 | |||
Administration fees | 296 | |||
Distribution fees | 243 | |||
Service fees | 529 | |||
Custodian and accounting fees | 43 | |||
Other | 402 | |||
|
| |||
Total Liabilities | 28,170 | |||
|
| |||
Net Assets | $ | 5,518,677 | ||
|
| |||
SEE NOTES TO FINANCIAL STATEMENTS.
| 8 | UNDISCOVERED MANAGERS FUNDS | FEBRUARY 28, 2019 | ||||
Table of Contents
Undiscovered | ||||
NET ASSETS: | ||||
Paid-in-Capital | $ | 4,886,743 | ||
Total distributable earnings (loss) (a) | 631,934 | |||
|
| |||
Total Net Assets | $ | 5,518,677 | ||
|
| |||
Net Assets: | ||||
Class A | $ | 669,892 | ||
Class C | 181,222 | |||
Class I | 958,378 | |||
Class L | 2,692,582 | |||
Class R2 | 18,821 | |||
Class R3 | 3,737 | |||
Class R4 | 2,723 | |||
Class R5 | 12,320 | |||
Class R6 | 979,002 | |||
|
| |||
Total | $ | 5,518,677 | ||
|
| |||
Outstanding units of beneficial interest (shares) | ||||
($0.0001 par value; unlimited number of shares authorized): | ||||
Class A | 10,907 | |||
Class C | 3,148 | |||
Class I | 15,260 | |||
Class L | 42,748 | |||
Class R2 | 309 | |||
Class R3 | 61 | |||
Class R4 | 43 | |||
Class R5 | 196 | |||
Class R6 | 15,521 | |||
Net Asset Value (b): | ||||
Class A — Redemption price per share | $ | 61.42 | ||
Class C — Offering price per share (c) | 57.57 | |||
Class I — Offering and redemption price per share | 62.80 | |||
Class L — Offering and redemption price per share | 62.99 | |||
Class R2 — Offering and redemption price per share | 60.82 | |||
Class R3 — Offering and redemption price per share | 60.93 | |||
Class R4 — Offering and redemption price per share | 62.65 | |||
Class R5 — Offering and redemption price per share | 62.93 | |||
Class R6 — Offering and redemption price per share | 63.08 | |||
Class A maximum sales charge | 5.25 | % | ||
Class A maximum public offering price per share | $ | 64.82 | ||
|
| |||
Cost of investments in non-affiliates | $ | 4,328,066 | ||
Cost of investments in affiliates | 563,665 | |||
| (a) | Total distributable earnings have been aggregated to conform to the current presentation requirements for the adoption of the Securities and Exchange Commission’s Disclosure Update and Simplification Rule. See Note 9. |
| (b) | Per share amounts may not recalculate due to rounding of net assets and/or shares outstanding. |
| (c) | Redemption price for Class C Shares varies based upon length of time the shares are held. |
SEE NOTES TO FINANCIAL STATEMENTS.
| FEBRUARY 28, 2019 | UNDISCOVERED MANAGERS FUNDS | 9 | ||||||
Table of Contents
STATEMENT OF OPERATIONS
FOR THE SIX MONTHS ENDED FEBRUARY 28, 2019 (Unaudited)
(Amounts in thousands)
Undiscovered | ||||
INVESTMENT INCOME: | ||||
Interest income from affiliates | $ | — | (a) | |
Dividend income from non-affiliates | 44,520 | |||
Dividend income from affiliates | 947 | |||
Non-cash dividend income from non-affiliates | 18,739 | |||
|
| |||
Total investment income | 64,206 | |||
|
| |||
EXPENSES: | ||||
Investment advisory fees | 21,461 | |||
Administration fees | 2,270 | |||
Distribution fees: | ||||
Class A | 920 | |||
Class C | 728 | |||
Class R2 | 47 | |||
Class R3 | 3 | |||
Service fees: | ||||
Class A | 920 | |||
Class C | 243 | |||
Class I | 1,285 | |||
Class L | 1,447 | |||
Class R2 | 23 | |||
Class R3 | 3 | |||
Class R4 | 3 | |||
Class R5 | 3 | |||
Custodian and accounting fees | 91 | |||
Interest expense to affiliates | 35 | |||
Professional fees | 67 | |||
Trustees’ and Chief Compliance Officer’s fees | 24 | |||
Printing and mailing costs | 171 | |||
Registration and filing fees | 84 | |||
Transfer agency fees (See Note 2.E.) | 113 | |||
Other | 55 | |||
|
| |||
Total expenses | 29,996 | |||
|
| |||
Less fees waived | (1,478 | ) | ||
Less expense reimbursements | (11 | ) | ||
|
| |||
Net expenses | 28,507 | |||
|
| |||
Net investment income (loss) | 35,699 | |||
|
| |||
REALIZED/UNREALIZED GAINS (LOSSES): | ||||
Net realized gain (loss) on transactions from investments in non-affiliates | 254,628 | |||
Change in net unrealized appreciation/depreciation on investments in non-affiliates | (912,132 | ) | ||
|
| |||
Net realized/unrealized gains (losses) | (657,504 | ) | ||
|
| |||
Change in net assets resulting from operations | $ | (621,805 | ) | |
|
| |||
| (a) | Amount rounds to less than one thousand. |
SEE NOTES TO FINANCIAL STATEMENTS.
| 10 | UNDISCOVERED MANAGERS FUNDS | FEBRUARY 28, 2019 | ||||
Table of Contents
STATEMENT OF CHANGES IN NET ASSETS
FOR THE PERIODS INDICATED
(Amounts in thousands)
| Undiscovered Mangers Behavioral Value Fund | ||||||||
| Six Months Ended February 28, 2019 (Unaudited) | Year Ended August 31, 2018 | |||||||
CHANGE IN NET ASSETS RESULTING FROM OPERATIONS: | ||||||||
Net investment income (loss) | $ | 35,699 | $ | 70,344 | ||||
Net realized gain (loss) | 254,628 | 378,564 | ||||||
Change in net unrealized appreciation/depreciation | (912,132 | ) | 762,683 | |||||
|
|
|
| |||||
Change in net assets resulting from operations | (621,805 | ) | 1,211,591 | |||||
|
|
|
| |||||
DISTRIBUTIONS TO SHAREHOLDERS:(a) | ||||||||
Class A | (68,178 | ) | (39,985 | ) | ||||
Class C | (18,025 | ) | (9,775 | ) | ||||
Class I | (97,054 | ) | (55,287 | ) | ||||
Class L | (271,656 | ) | (143,892 | ) | ||||
Class R2 | (1,669 | ) | (757 | ) | ||||
Class R3 | (246 | ) | (17 | ) | ||||
Class R4 | (239 | ) | (80 | ) | ||||
Class R5 | (414 | ) | (27 | ) | ||||
Class R6 | (84,249 | ) | (26,870 | ) | ||||
|
|
|
| |||||
Total distributions to shareholders | (541,730 | ) | (276,690 | ) | ||||
|
|
|
| |||||
CAPITAL TRANSACTIONS: | ||||||||
Change in net assets resulting from capital transactions | (6,734 | ) | 95,767 | |||||
|
|
|
| |||||
NET ASSETS: | ||||||||
Change in net assets | (1,170,269 | ) | 1,030,668 | |||||
Beginning of period | 6,688,946 | 5,658,278 | ||||||
|
|
|
| |||||
End of period | $ | 5,518,677 | $ | 6,688,946 | ||||
|
|
|
| |||||
| (a) | The prior period distributions have been reclassified to conform to current period presentation for the adoption of the Securities and Exchange Commission’s Disclosure Update and Simplification Rule. See Note 9. Prior period balances were as follows: |
Class A | ||||
From net investment income | $(6,330) | |||
From net realized gains | (33,655) | |||
Class C | ||||
From net investment income | (486) | |||
From net realized gains | (9,289) | |||
Class I | ||||
From net investment income | (11,790) | |||
From net realized gains | (43,497) | |||
Class L | ||||
From net investment income | (34,176) | |||
From net realized gains | (109,716) | |||
Class R2 | ||||
From net investment income | (91) | |||
From net realized gains | (666) | |||
Class R3 | ||||
From net investment income | (4) | |||
From net realized gains | (13) | |||
Class R4 | ||||
From net investment income | (19) | |||
From net realized gains | (61) | |||
Class R5 | ||||
From net investment income | (7) | |||
From net realized gains | (20) | |||
Class R6 | ||||
From net investment income | (6,860) | |||
From net realized gains | (20,010) |
SEE NOTES TO FINANCIAL STATEMENTS.
| FEBRUARY 28, 2019 | UNDISCOVERED MANAGERS FUNDS | 11 | ||||||
Table of Contents
STATEMENT OF CHANGES IN NET ASSETS
FOR THE PERIODS INDICATED (continued)
(Amounts in thousands)
| Undiscovered Mangers Behavioral Value Fund | ||||||||
| Six Months Ended February 28, 2019 (Unaudited) | Year Ended August 31, 2018 | |||||||
CAPITAL TRANSACTIONS: | ||||||||
Class A | ||||||||
Proceeds from shares issued | $ | 59,375 | $ | 130,102 | ||||
Distributions reinvested | 62,468 | 36,742 | ||||||
Cost of shares redeemed | (187,597 | ) | (323,160 | ) | ||||
|
|
|
| |||||
Change in net assets resulting from Class A capital transactions | $ | (65,754 | ) | $ | (156,316 | ) | ||
|
|
|
| |||||
Class C | ||||||||
Proceeds from shares issued | $ | 5,943 | $ | 8,502 | ||||
Distributions reinvested | 15,827 | 8,473 | ||||||
Cost of shares redeemed | (33,552 | ) | (66,644 | ) | ||||
|
|
|
| |||||
Change in net assets resulting from Class C capital transactions | $ | (11,782 | ) | $ | (49,669 | ) | ||
|
|
|
| |||||
Class I | ||||||||
Proceeds from shares issued | $ | 117,784 | $ | 168,614 | ||||
Distributions reinvested | 80,056 | 45,229 | ||||||
Cost of shares redeemed | (246,124 | ) | (320,398 | ) | ||||
|
|
|
| |||||
Change in net assets resulting from Class I capital transactions | $ | (48,284 | ) | $ | (106,555 | ) | ||
|
|
|
| |||||
Class L | ||||||||
Proceeds from shares issued | $ | 373,697 | $ | 730,404 | ||||
Distributions reinvested | 171,396 | 89,324 | ||||||
Cost of shares redeemed | (835,747 | ) | (588,407 | ) | ||||
|
|
|
| |||||
Change in net assets resulting from Class L capital transactions | $ | (290,654 | ) | $ | 231,321 | |||
|
|
|
| |||||
Class R2 | ||||||||
Proceeds from shares issued | $ | 2,570 | $ | 6,207 | ||||
Distributions reinvested | 1,669 | 757 | ||||||
Cost of shares redeemed | (2,567 | ) | (6,899 | ) | ||||
|
|
|
| |||||
Change in net assets resulting from Class R2 capital transactions | $ | 1,672 | $ | 65 | ||||
|
|
|
| |||||
Class R3 | ||||||||
Proceeds from shares issued | $ | 2,654 | $ | 1,611 | ||||
Distributions reinvested | 246 | 17 | ||||||
Cost of shares redeemed | (546 | ) | (90 | ) | ||||
|
|
|
| |||||
Change in net assets resulting from Class R3 capital transactions | $ | 2,354 | $ | 1,538 | ||||
|
|
|
| |||||
Class R4 | ||||||||
Proceeds from shares issued | $ | 660 | $ | 837 | ||||
Distributions reinvested | 239 | 80 | ||||||
Cost of shares redeemed | (173 | ) | (348 | ) | ||||
|
|
|
| |||||
Change in net assets resulting from Class R4 capital transactions | $ | 726 | $ | 569 | ||||
|
|
|
| |||||
Class R5 | ||||||||
Proceeds from shares issued | $ | 9,085 | $ | 4,118 | ||||
Distributions reinvested | 299 | 27 | ||||||
Cost of shares redeemed | (1,632 | ) | (822 | ) | ||||
|
|
|
| |||||
Change in net assets resulting from Class R5 capital transactions | $ | 7,752 | $ | 3,323 | ||||
|
|
|
| |||||
Class R6 | ||||||||
Proceeds from shares issued | $ | 414,802 | $ | 269,269 | ||||
Distributions reinvested | 72,981 | 26,588 | ||||||
Cost of shares redeemed | (90,547 | ) | (124,366 | ) | ||||
|
|
|
| |||||
Change in net assets resulting from Class R6 capital transactions | $ | 397,236 | $ | 171,491 | ||||
|
|
|
| |||||
Total change in net assets resulting from capital transactions | $ | (6,734 | ) | $ | 95,767 | |||
|
|
|
| |||||
SEE NOTES TO FINANCIAL STATEMENTS.
| 12 | UNDISCOVERED MANAGERS FUNDS | FEBRUARY 28, 2019 | ||||
Table of Contents
| Undiscovered Mangers Behavioral Value Fund | ||||||||
| Six Months Ended February 28, 2019 (Unaudited) | Year Ended August 31, 2018 | |||||||
SHARE TRANSACTIONS: |
| |||||||
Class A |
| |||||||
Issued | 958 | 1,888 | ||||||
Reinvested | 1,100 | 542 | ||||||
Redeemed | (3,165 | ) | (4,685 | ) | ||||
|
|
|
| |||||
Change in Class A Shares | (1,107 | ) | (2,255 | ) | ||||
|
|
|
| |||||
Class C | ||||||||
Issued | 107 | 131 | ||||||
Reinvested | 297 | 133 | ||||||
Redeemed | (613 | ) | (1,033 | ) | ||||
|
|
|
| |||||
Change in Class C Shares | (209 | ) | (769 | ) | ||||
|
|
|
| |||||
Class I | ||||||||
Issued | 1,884 | 2,384 | ||||||
Reinvested | 1,379 | 652 | ||||||
Redeemed | (4,150 | ) | (4,530 | ) | ||||
|
|
|
| |||||
Change in Class I Shares | (887 | ) | (1,494 | ) | ||||
|
|
|
| |||||
Class L | ||||||||
Issued | 5,945 | 10,290 | ||||||
Reinvested | 2,944 | 1,282 | ||||||
Redeemed | (13,431 | ) | (8,366 | ) | ||||
|
|
|
| |||||
Change in Class L Shares | (4,542 | ) | 3,206 | |||||
|
|
|
| |||||
Class R2 | ||||||||
Issued | 40 | 90 | ||||||
Reinvested | 30 | 11 | ||||||
Redeemed | (43 | ) | (101 | ) | ||||
|
|
|
| |||||
Change in Class R2 Shares | 27 | — | (a) | |||||
|
|
|
| |||||
Class R3 | ||||||||
Issued | 41 | 23 | ||||||
Reinvested | 5 | — | (a) | |||||
Redeemed | (9 | ) | (1 | ) | ||||
|
|
|
| |||||
Change in Class R3 Shares | 37 | 22 | ||||||
|
|
|
| |||||
Class R4 | ||||||||
Issued | 9 | 13 | ||||||
Reinvested | 4 | 1 | ||||||
Redeemed | (3 | ) | (5 | ) | ||||
|
|
|
| |||||
Change in Class R4 Shares | 10 | 9 | ||||||
|
|
|
| |||||
Class R5 | ||||||||
Issued | 156 | 58 | ||||||
Reinvested | 5 | — | (a) | |||||
Redeemed | (24 | ) | (12 | ) | ||||
|
|
|
| |||||
Change in Class R5 Shares | 137 | 46 | ||||||
|
|
|
| |||||
Class R6 | ||||||||
Issued | 6,151 | 3,820 | ||||||
Reinvested | 1,252 | 381 | ||||||
Redeemed | (1,447 | ) | (1,754 | ) | ||||
|
|
|
| |||||
Change in Class R6 Shares | 5,956 | 2,447 | ||||||
|
|
|
| |||||
| (a) | Amount rounds to less than one thousand. |
SEE NOTES TO FINANCIAL STATEMENTS.
| FEBRUARY 28, 2019 | UNDISCOVERED MANAGERS FUNDS | 13 | ||||||
Table of Contents
FOR THE PERIODS INDICATED
| Per share operating performance | |||||||||||||||||||||||||||
| Investment operations | Distributions | |||||||||||||||||||||||||||
| Net asset value, beginning of period | Net investment income (loss) (b) | Net realized gains | Total from investment operations | Net investment income | Net realized gain | Total distributions | ||||||||||||||||||||||
Undiscovered Managers Behavioral Value Fund | ||||||||||||||||||||||||||||
Class A | ||||||||||||||||||||||||||||
Six Months Ended February 28, 2019 (Unaudited) | $ | 73.97 | $ | 0.30 | $ | (6.92 | ) | $ | (6.62 | ) | $ | (0.54 | ) | $ | (5.39 | ) | $ | (5.93 | ) | |||||||||
Year Ended August 31, 2018 | 63.57 | 0.59 | 12.77 | 13.36 | (0.46 | ) | (2.50 | ) | (2.96 | ) | ||||||||||||||||||
Year Ended August 31, 2017 | 60.15 | 0.32 | 4.95 | 5.27 | (0.40 | ) | (1.45 | ) | (1.85 | ) | ||||||||||||||||||
Year Ended August 31, 2016 | 55.30 | 0.49 | 6.29 | 6.78 | (0.31 | ) | (1.62 | ) | (1.93 | ) | ||||||||||||||||||
Year Ended August 31, 2015 | 55.38 | 0.37 | 0.81 | 1.18 | (0.43 | ) | (0.83 | ) | (1.26 | ) | ||||||||||||||||||
Year Ended August 31, 2014 | 45.93 | 0.53 | 9.13 | 9.66 | (0.21 | ) | — | (0.21 | ) | |||||||||||||||||||
Class C | ||||||||||||||||||||||||||||
Six Months Ended February 28, 2019 (Unaudited) | 69.55 | 0.14 | (6.49 | ) | (6.35 | ) | (0.24 | ) | (5.39 | ) | (5.63 | ) | ||||||||||||||||
Year Ended August 31, 2018 | 59.93 | 0.24 | 12.01 | 12.25 | (0.13 | ) | (2.50 | ) | (2.63 | ) | ||||||||||||||||||
Year Ended August 31, 2017 | 56.84 | 0.01 | 4.67 | 4.68 | (0.14 | ) | (1.45 | ) | (1.59 | ) | ||||||||||||||||||
Year Ended August 31, 2016 | 52.43 | 0.20 | 5.95 | 6.15 | (0.12 | ) | (1.62 | ) | (1.74 | ) | ||||||||||||||||||
Year Ended August 31, 2015 | 52.64 | 0.09 | 0.77 | 0.86 | (0.24 | ) | (0.83 | ) | (1.07 | ) | ||||||||||||||||||
Year Ended August 31, 2014 | 43.80 | 0.26 | 8.69 | 8.95 | (0.11 | ) | — | (0.11 | ) | |||||||||||||||||||
Class I | ||||||||||||||||||||||||||||
Six Months Ended February 28, 2019 (Unaudited) | 75.61 | 0.39 | (7.09 | ) | (6.70 | ) | (0.72 | ) | (5.39 | ) | (6.11 | ) | ||||||||||||||||
Year Ended August 31, 2018 | 64.95 | 0.78 | 13.04 | 13.82 | (0.66 | ) | (2.50 | ) | (3.16 | ) | ||||||||||||||||||
Year Ended August 31, 2017 | 61.41 | 0.50 | 5.04 | 5.54 | (0.55 | ) | (1.45 | ) | (2.00 | ) | ||||||||||||||||||
Year Ended August 31, 2016 | 56.37 | 0.64 | 6.43 | 7.07 | (0.41 | ) | (1.62 | ) | (2.03 | ) | ||||||||||||||||||
Year Ended August 31, 2015 | 56.41 | 0.52 | 0.82 | 1.34 | (0.55 | ) | (0.83 | ) | (1.38 | ) | ||||||||||||||||||
Year Ended August 31, 2014 | 46.78 | 0.68 | 9.29 | 9.97 | (0.34 | ) | — | (0.34 | ) | |||||||||||||||||||
Class L | ||||||||||||||||||||||||||||
Six Months Ended February 28, 2019 (Unaudited) | 75.89 | 0.44 | (7.12 | ) | (6.68 | ) | (0.83 | ) | (5.39 | ) | (6.22 | ) | ||||||||||||||||
Year Ended August 31, 2018 | 65.17 | 0.88 | 13.10 | 13.98 | (0.76 | ) | (2.50 | ) | (3.26 | ) | ||||||||||||||||||
Year Ended August 31, 2017 | 61.60 | 0.59 | 5.07 | 5.66 | (0.64 | ) | (1.45 | ) | (2.09 | ) | ||||||||||||||||||
Year Ended August 31, 2016 | 56.52 | 0.73 | 6.44 | 7.17 | (0.47 | ) | (1.62 | ) | (2.09 | ) | ||||||||||||||||||
Year Ended August 31, 2015 | 56.52 | 0.60 | 0.83 | 1.43 | (0.60 | ) | (0.83 | ) | (1.43 | ) | ||||||||||||||||||
Year Ended August 31, 2014 | 46.80 | 0.74 | 9.32 | 10.06 | (0.34 | ) | — | (0.34 | ) | |||||||||||||||||||
Class R2 | ||||||||||||||||||||||||||||
Six Months Ended February 28, 2019 (Unaudited) | 73.28 | 0.22 | (6.84 | ) | (6.62 | ) | (0.45 | ) | (5.39 | ) | (5.84 | ) | ||||||||||||||||
Year Ended August 31, 2018 | 63.05 | 0.42 | 12.65 | 13.07 | (0.34 | ) | (2.50 | ) | (2.84 | ) | ||||||||||||||||||
Year Ended August 31, 2017 | 59.78 | 0.17 | 4.90 | 5.07 | (0.35 | ) | (1.45 | ) | (1.80 | ) | ||||||||||||||||||
Year Ended August 31, 2016 | 55.09 | 0.34 | 6.28 | 6.62 | (0.31 | ) | (1.62 | ) | (1.93 | ) | ||||||||||||||||||
Year Ended August 31, 2015 | 55.18 | 0.20 | 0.84 | 1.04 | (0.30 | ) | (0.83 | ) | (1.13 | ) | ||||||||||||||||||
Year Ended August 31, 2014 | 45.89 | 0.40 | 9.12 | 9.52 | (0.23 | ) | — | (0.23 | ) | |||||||||||||||||||
Class R3 | ||||||||||||||||||||||||||||
Six Months Ended February 28, 2019 (Unaudited) | 73.69 | 0.26 | (6.89 | ) | (6.63 | ) | (0.74 | ) | (5.39 | ) | (6.13 | ) | ||||||||||||||||
Year Ended August 31, 2018 | 63.57 | 0.47 | 12.86 | 13.33 | (0.71 | ) | (2.50 | ) | (3.21 | ) | ||||||||||||||||||
March 1, 2017 (f) through August 31, 2017 | 64.80 | 0.13 | (1.36 | ) | (1.23 | ) | — | — | — | |||||||||||||||||||
Class R4 | ||||||||||||||||||||||||||||
Six Months Ended February 28, 2019 (Unaudited) | 75.50 | 0.37 | (7.07 | ) | (6.70 | ) | (0.76 | ) | (5.39 | ) | (6.15 | ) | ||||||||||||||||
Year Ended August 31, 2018 | 64.94 | 0.76 | 13.06 | 13.82 | (0.76 | ) | (2.50 | ) | (3.26 | ) | ||||||||||||||||||
March 1, 2017 (f) through August 31, 2017 | 66.12 | 0.15 | (1.33 | ) | (1.18 | ) | — | — | — | |||||||||||||||||||
Class R5 | ||||||||||||||||||||||||||||
Six Months Ended February 28, 2019 (Unaudited) | 75.88 | 0.32 | (7.02 | ) | (6.70 | ) | (0.86 | ) | (5.39 | ) | (6.25 | ) | ||||||||||||||||
Year Ended August 31, 2018 | 65.17 | 0.72 | 13.26 | 13.98 | (0.77 | ) | (2.50 | ) | (3.27 | ) | ||||||||||||||||||
March 1, 2017 (f) through August 31, 2017 | 66.30 | 0.29 | (1.42 | ) | (1.13 | ) | — | — | — | |||||||||||||||||||
Class R6 | ||||||||||||||||||||||||||||
Six Months Ended February 28, 2019 (Unaudited) | 76.05 | 0.44 | (7.12 | ) | (6.68 | ) | (0.90 | ) | (5.39 | ) | (6.29 | ) | ||||||||||||||||
Year Ended August 31, 2018 | 65.29 | 0.94 | 13.15 | 14.09 | (0.83 | ) | (2.50 | ) | (3.33 | ) | ||||||||||||||||||
Year Ended August 31, 2017 | 61.70 | 0.66 | 5.07 | 5.73 | (0.69 | ) | (1.45 | ) | (2.14 | ) | ||||||||||||||||||
Year Ended August 31, 2016 | 56.59 | 0.72 | 6.52 | 7.24 | (0.51 | ) | (1.62 | ) | (2.13 | ) | ||||||||||||||||||
Year Ended August 31, 2015 | 56.58 | 0.63 | 0.85 | 1.48 | (0.64 | ) | (0.83 | ) | (1.47 | ) | ||||||||||||||||||
Year Ended August 31, 2014 | 46.82 | 0.78 | 9.34 | 10.12 | (0.36 | ) | — | (0.36 | ) | |||||||||||||||||||
| (a) | Annualized for periods less than one year, unless otherwise noted. |
| (b) | Calculated based upon average shares outstanding. |
| (c) | Not annualized for periods less than one year. |
| (d) | Includes adjustments in accordance with accounting principles generally accepted in the United States of America and as such, the net asset values for financial reporting purposes and the returns based upon those net asset values may differ from the net asset values and returns for shareholder transactions. |
| (e) | Includes earnings credits and interest expense, if applicable, each of which is less than 0.005% unless otherwise noted. |
| (f) | Commencement of offering of class of shares. |
SEE NOTES TO FINANCIAL STATEMENTS.
| 14 | UNDISCOVERED MANAGERS FUNDS | FEBRUARY 28, 2019 | ||||
Table of Contents
| Ratios/Supplemental data | |||||||||||||||||||||||||
| Ratios to average net assets (a) | ||||||||||||||||||||||||||
| Net asset value, end of period | Total return (excludes sales charge) (c)(d) | Net assets, period (000’s) | Net expenses (e) | Net income | �� Expenses without waivers, reimbursements and earnings credits | Portfolio turnover rate (c) | ||||||||||||||||||||
| $ | 61.42 | (8.22 | )% | $ | 669,892 | 1.30 | % | 0.96 | % | 1.35 | % | 23 | % | |||||||||||||
| 73.97 | 21.46 | 888,695 | 1.29 | 0.86 | 1.35 | 29 | ||||||||||||||||||||
| 63.57 | 8.76 | 907,053 | 1.28 | 0.51 | 1.76 | 24 | ||||||||||||||||||||
| 60.15 | 12.70 | 1,146,043 | 1.29 | 0.88 | 1.83 | 44 | ||||||||||||||||||||
| 55.30 | 2.23 | 696,222 | 1.29 | 0.66 | 1.86 | 36 | ||||||||||||||||||||
| 55.38 | 21.06 | 364,773 | 1.28 | 1.02 | 1.79 | 44 | ||||||||||||||||||||
| 57.57 | (8.44 | ) | 181,222 | 1.80 | 0.46 | 1.86 | 23 | |||||||||||||||||||
| 69.55 | 20.85 | 233,455 | 1.79 | 0.37 | 1.85 | 29 | ||||||||||||||||||||
| 59.93 | 8.22 | 247,259 | 1.78 | 0.02 | 2.23 | 24 | ||||||||||||||||||||
| 56.84 | 12.13 | 300,255 | 1.79 | 0.38 | 2.28 | 44 | ||||||||||||||||||||
| 52.43 | 1.73 | 185,342 | 1.79 | 0.17 | 2.31 | 36 | ||||||||||||||||||||
| 52.64 | 20.46 | 107,383 | 1.78 | 0.52 | 2.29 | 44 | ||||||||||||||||||||
| 62.80 | (8.10 | ) | 958,378 | 1.05 | 1.20 | 1.10 | 23 | |||||||||||||||||||
| 75.61 | 21.75 | 1,220,927 | 1.04 | 1.11 | 1.10 | 29 | ||||||||||||||||||||
| 64.95 | 9.03 | 1,145,714 | 1.03 | 0.77 | 1.44 | 24 | ||||||||||||||||||||
| 61.41 | 12.99 | 1,095,710 | 1.04 | 1.13 | 1.49 | 44 | ||||||||||||||||||||
| 56.37 | 2.49 | 579,340 | 1.04 | 0.91 | 1.54 | 36 | ||||||||||||||||||||
| 56.41 | 21.36 | 270,648 | 1.04 | 1.25 | 1.55 | 44 | ||||||||||||||||||||
| 62.99 | (8.03 | ) | 2,692,582 | 0.90 | 1.36 | 0.95 | 23 | |||||||||||||||||||
| 75.89 | 21.95 | 3,589,067 | 0.90 | 1.24 | 0.95 | 29 | ||||||||||||||||||||
| 65.17 | 9.19 | 2,873,203 | 0.88 | 0.91 | 1.28 | 24 | ||||||||||||||||||||
| 61.60 | 13.16 | 2,230,948 | 0.89 | 1.28 | 1.31 | 44 | ||||||||||||||||||||
| 56.52 | 2.65 | 1,154,307 | 0.89 | 1.06 | 1.33 | 36 | ||||||||||||||||||||
| 56.52 | 21.54 | 520,539 | 0.89 | 1.37 | 1.39 | 44 | ||||||||||||||||||||
| 60.82 | (8.32 | ) | 18,821 | 1.55 | 0.69 | 1.63 | 23 | |||||||||||||||||||
| 73.28 | 21.16 | 20,684 | 1.54 | 0.61 | 1.63 | 29 | ||||||||||||||||||||
| 63.05 | 8.47 | 17,759 | 1.53 | 0.27 | 2.05 | 24 | ||||||||||||||||||||
| 59.78 | 12.43 | 12,822 | 1.54 | 0.61 | 2.10 | 44 | ||||||||||||||||||||
| 55.09 | 1.98 | 4,845 | 1.54 | 0.36 | 2.10 | 36 | ||||||||||||||||||||
| 55.18 | 20.77 | 942 | 1.54 | 0.74 | 2.05 | 44 | ||||||||||||||||||||
| 60.93 | (8.22 | ) | 3,737 | 1.30 | 0.84 | 1.37 | 23 | |||||||||||||||||||
| 73.69 | 21.45 | 1,784 | 1.30 | 0.67 | 1.38 | 29 | ||||||||||||||||||||
| 63.57 | (1.90 | ) | 133 | 1.29 | 0.40 | 1.66 | 24 | |||||||||||||||||||
| 62.65 | (8.11 | ) | 2,723 | 1.05 | 1.17 | 1.11 | 23 | |||||||||||||||||||
| 75.50 | 21.76 | 2,461 | 1.05 | 1.08 | 1.10 | 29 | ||||||||||||||||||||
| 64.94 | (1.78 | ) | 1,586 | 1.04 | 0.47 | 1.42 | 24 | |||||||||||||||||||
| 62.93 | (8.04 | ) | 12,320 | 0.90 | 1.00 | 0.95 | 23 | |||||||||||||||||||
| 75.88 | 21.95 | 4,521 | 0.90 | 1.00 | 1.02 | 29 | ||||||||||||||||||||
| 65.17 | (1.70 | ) | 821 | 0.89 | 0.88 | 1.26 | 24 | |||||||||||||||||||
| 63.08 | (7.99 | ) | 979,002 | 0.80 | 1.36 | 0.85 | 23 | |||||||||||||||||||
| 76.05 | 22.08 | 727,352 | 0.80 | 1.33 | 0.85 | 29 | ||||||||||||||||||||
| 65.29 | 9.29 | 464,750 | 0.78 | 1.01 | 1.16 | 24 | ||||||||||||||||||||
| 61.70 | 13.28 | 309,958 | 0.78 | 1.24 | 1.17 | 44 | ||||||||||||||||||||
| 56.59 | 2.73 | 54,931 | 0.79 | 1.10 | 1.19 | 36 | ||||||||||||||||||||
| 56.58 | 21.67 | 15,199 | 0.79 | 1.41 | 1.29 | 44 | ||||||||||||||||||||
SEE NOTES TO FINANCIAL STATEMENTS.
| FEBRUARY 28, 2019 | UNDISCOVERED MANAGERS FUNDS | 15 | ||||||
Table of Contents
AS OF FEBRUARY 28, 2019 (Unaudited)
1. Organization
Undiscovered Managers Funds (the “Trust”) was organized on September 29, 1997, as a Massachusetts business trust and is registered under the Investment Company Act of 1940, as amended (the “1940 Act”), as an open-end management investment company.
The following is a separate fund of the Trust (the “Fund”) covered by this report:
| Classes Offered | Diversified/ Non-Diversified | |||
| Undiscovered Managers Behavioral Value Fund | Class A, Class C, Class I, Class L, Class R2, Class R3, Class R4, Class R5 and Class R6 | Diversified |
All share classes for the Fund are publicly offered on a limited basis.
The investment objective of the Fund is capital appreciation.
Class A Shares generally provide for a front-end sales charge while Class C Shares provide for a contingent deferred sales charge (“CDSC”). No sales charges are assessed with respect to Class I, Class L, Class R2, Class R3, Class R4, Class R5 and Class R6 Shares. Certain Class A Shares, for which front-end sales charges have been waived, may be subject to a CDSC as described in the Fund’s prospectus. Beginning on November 14, 2017, Class C Shares automatically convert to Class A Shares after ten years. All classes of shares have equal rights as to earnings, assets and voting privileges, except that each class may bear different transfer agency, distribution and service fees and each class has exclusive voting rights with respect to its distribution plan and shareholder servicing agreements.
J.P. Morgan Investment Management Inc. (“JPMIM”), an indirect, wholly-owned subsidiary of JPMorgan Chase & Co. (“JPMorgan”), acts as Adviser (the “Adviser”) and Administrator (the “Administrator”) to the Fund.
2. Significant Accounting Policies
The following is a summary of significant accounting policies followed by the Fund in the preparation of their financial statements. The Fund is an investment company and, thus, follows the investment company accounting and reporting guidance of the Financial Accounting Standards Board Accounting Standards Codification Topic 946 — Investment Companies, which is part of U.S. generally accepted accounting principles (“GAAP”). The preparation of financial statements in conformity with GAAP requires management to make estimates and assumptions that affect the reported amounts of assets and liabilities and disclosure of contingent assets and liabilities at the date of the financial statements and the reported amounts of increases and decreases in net assets from operations during the reporting period. Actual results could differ from those estimates.
A. Valuation of Investments — The valuation of investments is in accordance with GAAP and the Fund’s valuation policies set forth by and under the supervision and responsibility of the Board of Trustees (the “Board”), which established the following approach to valuation, as described more fully below: (i) investments for which market quotations are readily available shall be valued at their market value and (ii) all other investments for which market quotations are not readily available shall be valued at their fair value as determined in good faith by the Board.
The Administrator has established the J.P. Morgan Asset Management Americas Valuation Committee (“AVC”) to assist the Board with the oversight and monitoring of the valuation of the Fund’s investments. The Administrator implements the valuation policies of the Fund’s investments, as directed by the Board. The AVC oversees and carries out the policies for the valuation of investments held in the Fund. This includes monitoring the appropriateness of fair values based on results of ongoing valuation oversight including, but not limited to, consideration of macro or security specific events, market events and pricing vendor and broker due diligence. The Administrator is responsible for discussing and assessing the potential impacts to the fair values on an ongoing basis, and at least on a quarterly basis with the AVC and the Board.
Equities and other exchange-traded instruments are valued at the last sale price or official market closing price on the primary exchange on which the instrument is traded before the net asset values (“NAV”) of the Fund is calculated on a valuation date.
Investments in open-end investment companies (the “Underlying Funds”) are valued at each Underlying Fund’s NAV per share as of the report date.
Valuations reflected in this report are as of the report date. As a result, changes in valuation due to market events and/or issuer related events after the report date and prior to issuance of the report are not reflected herein.
The various inputs that are used in determining the valuation of the Fund’s investments are summarized into the three broad levels listed below.
| • | Level 1 — Unadjusted inputs using quoted prices in active markets for identical investments. |
| • | Level 2 — Other significant observable inputs including, but not limited to, quoted prices for similar investments, inputs other than quoted prices that are observable for investments (such as interest rates, prepayment speeds, credit risk, etc.) or other market corroborated inputs. |
| • | Level 3 — Significant inputs based on the best information available in the circumstances, to the extent observable inputs are not available (including the Fund’s assumptions in determining the fair value of investments). |
A financial instrument’s level within the fair value hierarchy is based on the lowest level of any input, both individually and in the aggregate, that is significant to the fair value measurement. The inputs or methodology used for valuing instruments are not necessarily an indication of the risk associated with investing in those instruments.
| 16 | UNDISCOVERED MANAGERS FUNDS | FEBRUARY 28, 2019 | ||||
Table of Contents
The following table represents each valuation input as presented on the Schedule of Portfolio Investments (“SOI”) (amounts in thousands):
| Level 1 Quoted prices | Level 2 Other significant observable inputs | Level 3 Significant unobservable inputs | Total | |||||||||||||
Total Investments in Securities(a) | $ | 5,480,812 | $ | — | $ | — | $ | 5,480,812 | ||||||||
|
|
|
|
|
|
|
| |||||||||
| (a) | All portfolio holdings designated as level 1 are disclosed individually on the SOI. Please refer to the SOI for industry specifics of portfolio holdings. |
B. Securities Lending — Effective October 5, 2018, the Fund became authorized to engage in securities lending in order to generate additional income. The Fund is able to lend to approved borrowers. Citibank N.A. (“Citibank”) serves as lending agent for the Fund, pursuant to a Securities Lending Agency Agreement (the “Securities Lending Agency Agreement”). Securities loaned are collateralized by cash equal to at least 100% of the market value plus accrued interest on the securities lent, which is invested in an affiliated money market fund. The Fund retains loan fees and the interest on cash collateral investments but are required to pay the borrower a rebate for the use of cash collateral. In cases where the lent security is of high value to borrowers, there may be a negative rebate (i.e., a net payment from the borrower to the Fund). Upon termination of a loan, the Fund is required to return to the borrower an amount equal to the cash collateral, plus any rebate owed to the borrowers. The remaining maturities of the securities lending transactions are considered overnight and continuous. Loans are subject to termination by the Fund or the borrower at any time.
The net income earned on the securities lending (after payment of rebates and Citibank’s fee) is included on the Statement of Operations as Income from securities lending (net). The Fund also receives payments from the borrower during the period of the loan, equivalent to dividends and interest earned on the securities loaned, which are recorded as Dividend or Interest income, respectively, on the Statement of Operations.
Under the Securities Lending Agency Agreement, Citibank marks to market the loaned securities on a daily basis. In the event the cash received from the borrower is less than 102% of the value of the loaned securities (105% for loans of non-U.S. securities), Citibank requests additional cash from the borrower so as to maintain a collateralization level of at least 102% of the value of the loaned securities plus accrued interest (105% for loans of non-U.S. securities), subject to certainde minimis amounts.
The value of securities out on loan is recorded as an asset on the Statement of Assets and Liabilities. The value of the cash collateral received is recorded as a liability on the Statement of Assets and Liabilities and details of Collateral Investments are disclosed on the SOI.
The Fund bears the risk of loss associated with the Collateral Investments and is not entitled to additional collateral from the borrower to cover any such losses. To the extent that the value of the Collateral Investments declines below the amount owed to a borrower, the Fund’s may incur losses that exceed the amount it earned on lending the security. Upon termination of a loan, the Fund may use leverage (borrow money) to repay the borrower for cash collateral posted if the Adviser does not believe that it is prudent to sell the Collateral Investments to fund the payment of this liability. Securities lending activity is subject to master netting arrangements.
Securities lending also involves counterparty risks, including the risk that the loaned securities may not be returned in a timely manner or at all. Subject to certain conditions, Citibank has agreed to indemnify the Fund from losses resulting from a borrower’s failure to return a loaned security.
The Fund did not lend out any securities during the period October 5, 2018 through February 28, 2019.
C. Investment Transactions with Affiliates — The Fund invested in an Underlying Fund which is advised by the Adviser or its affiliates. An issuer which is under common control with the Fund may be considered an affiliate. For the purposes of the financial statements, the Fund assumes the issuer listed in the table below to be an affiliated issuer. The Underlying Fund’s distributions may be reinvested into the Underlying Fund. Reinvestment amounts are included in the purchase cost amounts in the table below. Amounts in the table below are in thousands.
| For the six months ended February 28, 2019 | ||||||||||||||||||||||||||||||||||||
| Security Description | Value at August 31, 2018 | Purchases at Cost | Proceeds from Sales | Net Realized Gain (Loss) | Change in Unrealized Appreciation/ (Depreciation) | Value at February 28, 2019 | Shares at February 28, 2019 | Dividend Income | Capital Gain Distributions | |||||||||||||||||||||||||||
JPMorgan U.S. Government Money Market Fund Class Institutional Shares, 2.33% (a)(b) | $ | 92,184 | $ | 1,036,061 | $ | 564,580 | $ | — | $ | — | $ | 563,665 | 563,665 | $ | 947 | $ | — | |||||||||||||||||||
|
|
|
|
|
|
|
|
|
|
|
|
|
|
|
| |||||||||||||||||||||
| (a) | Investment in affiliate. Fund is registered under the Investment Company Act of 1940, as amended, and advised by J.P. Morgan Investment Management Inc. |
| (b) | The rate shown is the current yield as of February 28, 2019. |
D. Security Transactions and Investment Income — Investment transactions are accounted for on the trade date (the date the order to buy or sell is executed). Securities gains and losses are calculated on a specifically identified cost basis. Dividend income, net of foreign taxes withheld, if any, is recorded on the ex-dividend date or when a fund first learns of the dividend.
| FEBRUARY 28, 2019 | UNDISCOVERED MANAGERS FUNDS | 17 | ||||||
Table of Contents
NOTES TO FINANCIAL STATEMENTS
AS OF FEBRUARY 28, 2019 (Unaudited) (continued)
To the extent such information is publicly available, the Fund records distributions received in excess of income earned from underlying investments as a reduction of cost of investments and/or realized gain. Such amounts are based on estimates if actual amounts are not available and actual amounts of income, realized gain and return of capital may differ from the estimated amounts. The Fund adjusts the estimated amounts of the components of distributions (and consequently their net investment income) as necessary once the issuers provide information about the actual composition of the distributions.
E. Allocation of Income and Expenses — Expenses directly attributable to a fund are charged directly to that fund, while the expenses attributable to more than one fund of the Trust are allocated among the respective funds. In calculating the NAV of each class, investment income, realized and unrealized gains and losses and expenses, other than class-specific expenses, are allocated daily to each class of shares based upon the proportion of net assets of each class at the beginning of each day.
Transfer agency fees are class-specific expenses. The amount of the transfer agency fees charged to each class of the Fund for the six months ended February 28, 2019 are as follows (amounts in thousands):
| Class A | Class C | Class I | Class L | Class R2 | Class R3 | Class R4 | Class R5 | Class R6 | Total | |||||||||||||||||||||||||||||||
Transfer agency fees | $ | 17 | $ | 5 | $ | 9 | $ | 66 | $ | 3 | $ | — | (a) | $ | — | (a) | $ | — | (a) | $ | 13 | $ | 113 | |||||||||||||||||
| (a) | Amount rounds to less than one thousand. |
F. Federal Income Taxes — The Fund is treated as a separate taxable entity for Federal income tax purposes. The Fund’s policy is to comply with the provisions of the Internal Revenue Code (the “Code”), applicable to regulated investment companies and to distribute to shareholders all of its distributable net investment income and net realized capital gains on investments. Accordingly, no provision for Federal income tax is necessary. Management has reviewed the Fund’s tax positions for all open tax years and has determined that as of February 28, 2019, no liability for income tax is required in the Fund’s financial statements for net unrecognized tax benefits. However, management’s conclusions may be subject to future review based on changes in, or the interpretation of, the accounting standards or tax laws and regulations. The Fund’s Federal tax returns for the prior three fiscal years remain subject to examination by the Internal Revenue Service.
G. Distributions to Shareholders — Distributions from net investment income, if any, are generally declared and paid annually and are declared separately for each class. No class has preferential dividend rights; differences in per share rates are due to differences in separate class expenses. Net realized capital gains, if any, are distributed by the Fund at least annually. The amount of distributions from net investment income and net realized capital gains is determined in accordance with Federal income tax regulations, which may differ from GAAP. To the extent these “book/tax” differences are permanent in nature (i.e., that they result from other than timing of recognition — “temporary differences”), such amounts are reclassified within the capital accounts based on their Federal tax-basis treatment.
3. Fees and Other Transactions with Affiliates
A. Investment Advisory Fee — Pursuant to an Investment Advisory Agreement, the Adviser supervises the investments of the Fund and for such services is paid a fee. The fee is accrued daily and paid monthly at an annual rate of 0.75% of the Fund’s average daily net assets.
A Sub-advisory Agreement exists between JPMIM and Fuller & Thaler Asset Management, Inc. for the Fund. Under the terms of the Sub-Advisory Agreement, JPMIM pays the sub-adviser a portion of fees received by JPMIM.
The Adviser waived Investment Advisory fees and/or reimbursed expenses as outlined in Note 3.F.
B. Administration Fee — Pursuant to an Administration Agreement, the Administrator provides certain administration services to the Fund. In consideration of these services, effective January 1, 2019, the Administrator receives a fee accrued daily and paid monthly at an annual rate of 0.075% of the first $10 billion of the Fund’s average daily net assets, plus 0.050% of the Fund’s average daily net assets between $10 billion and $20 billion, plus 0.025% of the Fund’s average daily net assets between $20 billion and $25 billion, plus 0.01% of the Fund’s respective average daily net assets in excess of $25 billion. Prior to January 1, 2019, the Administrator received a fee accrued daily and paid monthly at an annual rate of 0.15% of the first $25 billion of the average daily net assets of all funds in the J.P. Morgan Funds Complex covered by the Administration Agreement (excluding certain funds of funds and money market funds) and 0.075% of the average daily net assets in excess of $25 billion of all such funds. For the six months ended February 28, 2019, the effective annualized rate was 0.08% of the Fund’s average daily net assets, notwithstanding any fee waivers and/or expense reimbursements.
The Administrator waived Administration fees as outlined in Note 3.F.
JPMorgan Chase Bank, N.A. (“JPMCB”), a wholly-owned subsidiary of JPMorgan, serves as the Fund’s sub-administrator (the “Sub-administrator”). For its services as Sub-administrator, JPMCB receives a portion of the fees payable to the Administrator.
C. Distribution Fees — Pursuant to a Distribution Agreement, JPMorgan Distribution Services, Inc. (“JPMDS”), an indirect, wholly-owned subsidiary of JPMorgan, serves as the Trust’s principal underwriter and promotes and arranges for the sale of the Fund’s shares.
| 18 | UNDISCOVERED MANAGERS FUNDS | FEBRUARY 28, 2019 | ||||
Table of Contents
The Board has adopted a Distribution Plan (the “Distribution Plan”) for Class A, Class C, Class R2 and Class R3 Shares of the Fund, as applicable, in accordance with Rule 12b-1 under the 1940 Act. Class I, Class L, Class R4, Class R5 and Class R6 Shares do not charge a distribution fee. The Distribution Plan provides that the Fund shall pay distribution fees, including payments to JPMDS, at annual rates of the average daily net assets as shown in the table below:
| Class A | Class C | Class R2 | Class R3 | |||||||||||||
| 0.25 | % | 0.75 | % | 0.50 | % | 0.25 | % | |||||||||
In addition, JPMDS is entitled to receive the front-end sales charges from purchases of Class A Shares and the CDSC from redemptions of Class C Shares and certain Class A Shares for which front-end sales charges have been waived. For the six months ended February 28, 2019, JPMDS retained the following (amounts in thousands):
| Front-End Sales Charge | CDSC | |||||||
| $ | 9 | $ | — | (a) | ||||
| (a) | Amount rounds to less than one thousand. |
D. Service Fees — The Trust, on behalf of the Fund, has entered into a Shareholder Servicing Agreement with JPMDS under which JPMDS provides certain support services to the shareholders. For performing these services, JPMDS receives a fee, except for Class R6 Shares which do not charge a service fee, that is accrued daily and paid monthly equal to a percentage of the average daily net assets as shown in the table below:
| Class A | Class C | Class I | Class L | Class R2 | Class R3 | Class R4 | Class R5 | |||||||||||||||||||||||||
| 0.25 | % | 0.25 | % | 0.25 | % | 0.10 | % | 0.25 | % | 0.25 | % | 0.25 | % | 0.10 | % | |||||||||||||||||
JPMDS has entered into shareholder services contracts with affiliated and unaffiliated financial intermediaries who provide shareholder services and other related services to their clients or customers who invest in the Fund under which JPMDS will pay all or a portion of such fees earned to financial intermediaries for performing such services.
JPMDS waived service fees as outlined in Note 3.F.
E. Custodian and Accounting Fees — JPMCB provides portfolio custody and accounting services to the Fund. For performing these services, the Fund pays JPMCB transaction and asset-based fees that vary according to the number of transactions and positions, plus out-of-pocket expenses. The amounts paid directly to JPMCB by the Fund for custody and accounting services are included in Custodian and accounting fees on the Statement of Operations. Interest income earned on cash balances at the custodian, if any, is included in Interest income from affiliates on the Statement of Operations. Interest expense paid to the custodian related to cash overdrafts, if any, is included in Interest expense to affiliates on the Statement of Operations.
F. Waivers and Reimbursements — The Adviser, Administrator and/or JPMDS have contractually agreed to waive fees and/or reimburse the Fund to the extent that total annual operating expenses (excluding acquired fund fees and expenses other than certain money market fund fees as described below, dividend and interest expenses related to short sales, interest, taxes, expenses related to litigation and potential litigation, expenses related to trustee elections and extraordinary expenses) exceed the percentages of the Fund’s respective average daily net assets as shown in the table below:
| Class A | Class C | Class I | Class L | Class R2 | Class R3 | Class R4 | Class R5 | Class R6 | ||||||||||||||||||||||||||||
| 1.30 | % | 1.80 | % | 1.05 | % | 0.90 | % | 1.55 | % | 1.30 | % | 1.05 | % | 0.90 | % | 0.80 | % | |||||||||||||||||||
The expense limitation agreement was in effect for the six months ended February 28, 2019 and is in place until at least December 31, 2019.
For the six months ended February 28, 2019, the Fund’s service providers waived fees and/or reimbursed expenses for the Fund as follows (amounts in thousands). None of these parties expect the Fund to repay any such waived fees and/or reimbursed expenses in future years.
| Contractual Waivers | ||||||||||||||||||||
| Investment Advisory Fees | Administration Fees | Service Fees | Total | Contractual Reimbursements | ||||||||||||||||
| $ | 1,217 | $ | 129 | $ | 85 | $ | 1,431 | $ | 11 | |||||||||||
Additionally, the Fund may invest in one or more money market funds advised by the Adviser or its affiliates (affiliated money market funds). The Adviser, Administrator and/or JPMDS, as shareholder servicing agent, have contractually agreed to waive fees and/or reimburse expenses in an amount sufficient to offset the respective net fees each collects from the affiliated money market fund on the applicable Fund’s investment in such affiliated money market fund, except for investments of securities lending cash collateral.
The amount of waivers resulting from investments in these money market funds for the six months ended February 28, 2019 was approximately $47,000.
G. Other — Certain officers of the Trust are affiliated with the Adviser, the Administrator and JPMDS. Such officers, with the exception of the Chief Compliance Officer, receive no compensation from the Fund for serving in their respective roles.
| FEBRUARY 28, 2019 | UNDISCOVERED MANAGERS FUNDS | 19 | ||||||
Table of Contents
NOTES TO FINANCIAL STATEMENTS
AS OF FEBRUARY 28, 2019 (Unaudited) (continued)
The Board appointed a Chief Compliance Officer to the Fund in accordance with Federal securities regulations. The Fund, along with other affiliated funds, makes reimbursement payments, on a pro-rata basis, to the Administrator for a portion of the fees associated with the Office of the Chief Compliance Officer. Such fees are included in Trustees’ and Chief Compliance Officer’s fees on the Statement of Operations.
The Trust adopted a Trustee Deferred Compensation Plan (the “Plan”) which allows the Independent Trustees to defer the receipt of all or a portion of compensation related to performance of their duties as Trustees. The deferred fees are invested in various J.P. Morgan Funds until distribution in accordance with the Plan.
The Fund may use related party broker-dealers. For the six months ended February 28, 2019, the Fund did not incur any brokerage commissions with broker-dealers affiliated with the Adviser.
The Securities and Exchange Commission (“SEC”) has granted an exemptive order permitting the Fund to engage in principal transactions with J.P. Morgan Securities, Inc., an affiliated broker, involving taxable money market instruments, subject to certain conditions.
4. Investment Transactions
During the six months ended February 28, 2019, purchases and sales of investments (excluding short-term investments) were as follows (amounts in thousands):
| Purchases (excluding U.S. Government) | Sales (excluding U.S. Government) | |||||||
| $ | 1,316,663 | $ | 2,328,315 | |||||
During the six months ended February 28, 2019, there were no purchases or sales of U.S. Government securities.
5. Federal Income Tax Matters
For Federal income tax purposes, the estimated cost and unrealized appreciation (depreciation) in value of investments held at February 28, 2019 were as follows (amounts in thousands):
| Aggregate Cost | Gross Unrealized Appreciation | Gross Unrealized Depreciation | Net Unrealized Appreciation (Depreciation) | |||||||||||||
| $ | 4,891,731 | $ | 804,519 | $ | 215,438 | $ | 589,081 | |||||||||
6. Borrowings
The Fund relies upon an exemptive order granted by the SEC (the “Order”) permitting the establishment and operation of an Interfund Lending Facility (the “Facility”). The Facility allows the Fund to directly lend and borrow money to or from any other fund relying upon the Order at rates beneficial to both the borrowing and lending funds. Advances under the Facility are taken primarily for temporary or emergency purposes, including the meeting of redemption requests that otherwise might require the untimely disposition of securities, and are subject to the Fund’s borrowing restrictions. The Interfund loan rate is determined, as specified in the Order, by averaging the current repurchase agreement rate and the current bank loan rate. The Order was granted to JPMorgan Trust II and may be relied upon by the Fund because the Fund and the series of JPMorgan Trust II are all investment companies in the same “group of investment companies” (as defined in Section 12(d)(1)(G) of the 1940 Act).
The Trust and JPMCB have entered into a financing arrangement. Under this arrangement, JPMCB provides an unsecured, uncommitted credit facility in the aggregate amount of $100 million to certain of the J.P. Morgan Funds, including the Fund. Advances under the arrangement are taken primarily for temporary or emergency purposes, including the meeting of redemption requests that otherwise might require the untimely disposition of securities, and are subject to the Fund’s borrowing restrictions. Interest on borrowings is payable at a rate determined by JPMCB at the time of borrowing. This agreement has been extended until November 4, 2019.
The Fund had no borrowings outstanding from another fund or from the unsecured, uncommitted credit facility at February 28, 2019. Average borrowings from the Facility during the six months ended February 28, 2019, were as follows (amounts in thousands, except number of days outstanding):
| Average Borrowings | Average Interest Rate Paid | Number of Days Outstanding | Interest Paid | |||||||||||||
| $ | 22,502,307 | 3.01 | % | 18 | $ | 35 | ||||||||||
Interest expense paid as a result of borrowings from another fund or from the unsecured, uncommitted credit facility is included in Interest expense to affiliates on the Statement of Operations.
The Trust, along with certain other trusts (“Borrowers”), has entered into a joint syndicated senior unsecured revolving credit facility totaling $1.5 billion (“Credit Facility”) with various lenders and The Bank of New York Mellon, as administrative agent for the lenders. This Credit Facility provides a source of funds to the Borrowers for temporary and emergency purposes, including the meeting of redemption requests that otherwise might require the untimely disposition of securities. Under the terms of the Credit Facility, a borrowing fund must have a minimum of $25,000,000
| 20 | UNDISCOVERED MANAGERS FUNDS | FEBRUARY 28, 2019 | ||||
Table of Contents
in adjusted net asset value and not exceed certain adjusted net asset coverage ratios prior to and during the time in which any borrowings are outstanding. If a fund does not comply with the aforementioned requirements, the fund must remediate within three business days with respect to the $25,000,000 minimum adjusted net asset value or within one business day with respect to certain asset coverage ratios or the administrative agent at the request of, or with the consent of, the lenders may terminate the Credit Facility and declare any outstanding borrowings to be due and payable immediately.
Interest associated with any borrowing under the Credit Facility is charged to the borrowing fund at a rate of interest equal to 1.00% plus the greater of the federal funds effective rate or one month LIBOR. The annual commitment fee to maintain the Credit Facility is 0.15% and is incurred on the unused portion of the Credit Facility and is allocated to all participating funds pro rata based on their respective net assets. Effective August 14, 2018, this agreement has been amended and restated for a term of 364 days, unless extended.
The Fund did not utilize the Credit Facility during the six months ended February 28, 2019.
7. Risks, Concentrations and Indemnifications
In the normal course of business, the Fund enters into contracts that contain a variety of representations which provide general indemnifications. The Fund’s maximum exposure under these arrangements is unknown. The amount of exposure would depend on future claims that may be brought against the Fund. However, based on experience, the Fund expects the risk of loss to be remote.
As of February 28, 2019, the Fund had three individual shareholder and/or non-affiliated omnibus accounts, which owned 38.9% of the Fund’s outstanding shares.
Significant shareholder transactions by these shareholders may impact the Fund’s performance and liquidity.
Because the Fund may invest a significant portion of its assets in real estate investment trusts (“REITs”), the Fund may be subject to certain risks similar to those associated with direct investments in real estate. REITs may be affected by changes in the value of their underlying properties and by defaults by tenants. REITs depend generally on their ability to generate cash flow to make distributions to shareholders, and certain REITs have self-liquidation provisions by which mortgages held may be paid in full and distributions of capital returns may be made at any time.
The Fund may invest in companies with relatively small market capitalizations. The Fund will invest primarily in such companies. Investments in companies with relatively small market capitalizations may involve greater risk than is usually associated with stocks of larger companies. These securities may have limited marketability and may be subject to more abrupt or erratic movements in price than securities of companies with larger capitalizations.
8. New Accounting Pronouncements
In August 2018, the Financial Accounting Standard Board (“FASB”) issued Accounting Standard Update (“ASU”) 2018-13 (“ASU 2018-13”)Fair Value Measurement (Topic 820): Disclosure Framework — Changes to the Disclosure Requirements for Fair Value Measurement,which adds, removes, and modifies certain aspects of the fair value disclosure. ASU 2018-13 amendments are the result of a broader disclosure project, FASB Concepts StatementConceptual Framework for Financial Reporting — Chapter 8: Notes to Financial Statements, to improve the effectiveness of the fair value disclosure requirements. ASU 2018-13 is effective for the fiscal years, and interim periods within those fiscal years, beginning after December 15, 2019; early adoption is permitted. Management has evaluated the implications of these changes and the amendments are included in the financial statements, which had no effect on the Fund’s net assets or results of operation.
In August 2018, the SEC adopted their Disclosure Update and Simplification Rule (the “Rule”). The Rule is part of the SEC’s overall project to improve disclosure effectiveness by amending certain disclosure requirements that have become redundant, duplicative, overlapping, outdated, or superseded in light of other SEC disclosure requirements, U.S. GAAP, or changes in the information environment. The amendments are intended to facilitate the disclosure of information to investors and simplify compliance without significantly altering the total mix of information provided to investors. Management has evaluated the implications of these changes and the amendments are included in the financial statements, which had no effect on the Fund’s net assets or results of operation.
| FEBRUARY 28, 2019 | UNDISCOVERED MANAGERS FUNDS | 21 | ||||||
Table of Contents
SCHEDULE OF SHAREHOLDER EXPENSES
(Unaudited)
Hypothetical $1,000 Investment
As a shareholder of the Fund, you incur two types of costs: (1) transaction costs, including sales charges (loads) on purchase payments and (2) ongoing costs, including investment advisory fees, administration fees, distribution fees and other Fund expenses. The examples below are intended to help you understand your ongoing costs (in dollars) of investing in the Fund and to compare these ongoing costs with the ongoing costs of investing in other mutual funds. The examples assume that you had a $1,000 investment in each Class at the beginning of the reporting period, September 1, 2018, and continued to hold your shares at the end of the reporting period, February 28, 2019.
Actual Expenses
For each Class of the Fund in the table below, the first line provides information about actual account values and actual expenses. You may use the information in this line, together with the amount you invested, to estimate the expenses that you paid over the period. Simply divide your account value by $1,000 (for example, an $8,600 account value divided by $1,000 = 8.6), then multiply the result by the number in the first line of each Class under the heading entitled “Expenses Paid During the Period” to estimate the expenses you paid on your account during this period.
Hypothetical Example for Comparison Purposes
The second line of each Class in the table below provides information about hypothetical account values and hypothetical expenses based on the Class’ actual expense ratio and an assumed rate of return of 5% per year before expenses, which is not the Class’ actual return. The hypothetical account values and expenses may not be used to estimate the actual ending account balance or expenses you paid for the period. You may use this information to compare the ongoing costs of investing in the Class of the Fund and other funds. To do so, compare this 5% hypothetical example with the 5% hypothetical examples that appear in the shareholder reports of the other funds. Please note that the expenses shown in the table are meant to highlight your ongoing costs only and do not reflect any transaction costs, such as sales charges (loads) or redemption fees. Therefore, the second line for each Class in the table is useful in comparing ongoing costs only, and will not help you determine the relative total costs of owning different funds. In addition, if these transaction costs were included, your costs would have been higher. The examples also assume all dividends and distributions have been reinvested.
| Beginning Account Value September 1, 2018 | Ending Account Value February 28, 2019 | Expenses Paid During the Period* | Annualized Expense Ratio | |||||||||||||
Undiscovered Managers Behavioral Value Fund | ||||||||||||||||
Class A | ||||||||||||||||
Actual | $ | 1,000.00 | $ | 917.80 | $ | 6.18 | 1.30 | % | ||||||||
Hypothetical | 1,000.00 | 1,018.35 | 6.51 | 1.30 | ||||||||||||
Class C | ||||||||||||||||
Actual | 1,000.00 | 915.60 | 8.55 | 1.80 | ||||||||||||
Hypothetical | 1,000.00 | 1,015.87 | 9.00 | 1.80 | ||||||||||||
Class I | ||||||||||||||||
Actual | 1,000.00 | 919.00 | 5.00 | 1.05 | ||||||||||||
Hypothetical | 1,000.00 | 1,019.59 | 5.26 | 1.05 | ||||||||||||
Class L | ||||||||||||||||
Actual | 1,000.00 | 919.70 | 4.28 | 0.90 | ||||||||||||
Hypothetical | 1,000.00 | 1,020.33 | 4.51 | 0.90 | ||||||||||||
Class R2 | ||||||||||||||||
Actual | 1,000.00 | 916.80 | 7.37 | 1.55 | ||||||||||||
Hypothetical | 1,000.00 | 1,017.11 | 7.75 | 1.55 | ||||||||||||
Class R3 | ||||||||||||||||
Actual | 1,000.00 | 917.80 | 6.18 | 1.30 | ||||||||||||
Hypothetical | 1,000.00 | 1,018.35 | 6.51 | 1.30 | ||||||||||||
Class R4 | ||||||||||||||||
Actual | 1,000.00 | 918.90 | 5.00 | 1.05 | ||||||||||||
Hypothetical | 1,000.00 | 1,019.59 | 5.26 | 1.05 | ||||||||||||
Class R5 | ||||||||||||||||
Actual | 1,000.00 | 919.60 | 4.28 | 0.90 | ||||||||||||
Hypothetical | 1,000.00 | 1,020.33 | 4.51 | 0.90 | ||||||||||||
Class R6 | ||||||||||||||||
Actual | 1,000.00 | 920.10 | 3.81 | 0.80 | ||||||||||||
Hypothetical | 1,000.00 | 1,020.83 | 4.01 | 0.80 | ||||||||||||
| * | Expenses are equal to each Class’ respective annualized expense ratio, multiplied by the average account value over the period, multiplied by 181/365 (to reflect the one-half year period). |
| 22 | UNDISCOVERED MANAGERS FUNDS | FEBRUARY 28, 2019 | ||||
Table of Contents
J.P. Morgan Funds are distributed by JPMorgan Distribution Services, Inc., which is an affiliate of JPMorgan Chase & Co. Affiliates of JPMorgan Chase & Co. receive fees for providing various services to the funds.
Contact JPMorgan Distribution Services, Inc. at1-800-480-4111 for a fund prospectus. You can also visit us at www.jpmorganfunds.com. Investors should carefully consider the investment objectives and risk as well as charges and expenses of the mutual fund before investing. The prospectus contains this and other information about the mutual fund. Read the prospectus carefully before investing.
Investors may obtain information about the Securities Investor Protection Corporation (SIPC), including the SIPC brochure, by visiting www.sipc.org or by calling SIPC at202-371-8300.
The Fund files a complete schedule of its fund holdings for the first and third quarters of its fiscal year with the SEC onForm N-Q. The Fund’s FormsN-Q are available on the SEC’s website at http://www.sec.gov. Shareholders may request the FormN-Q without charge by calling1-800-480-4111 or by visiting the J.P. Morgan Funds’ website at www.jpmorganfunds.com.
A description of the Fund’s policies and procedures with respect to the disclosure of the Fund’s holdings is available in the prospectuses and Statement of Additional Information.
A copy of proxy policies and procedures is available without charge upon request by calling1-800-480-4111 and on the Fund’s website at www.jpmorganfunds.com. A description of such policies and procedures is on the SEC’s website at www.sec.gov. The Trustees have delegated the authority to vote proxies for securities owned by the Fund to the Adviser. A copy of the Fund’s voting record for the most recent12-month period ended June 30 is available on the SEC’s website at www.sec.gov or at the Fund’s website at www.jpmorganfunds.com no later than August 31 of each year. The Fund’s proxy voting record will include, among other things, a brief description of the matter voted on for each fund security, and will state how each vote was cast, for example, for or against the proposal.

Table of Contents

J.P. Morgan Asset Management is the marketing name for the asset management businesses of JPMorgan Chase & Co. Those businesses include, but are not limited to, J.P. Morgan Investment Management Inc., Security Capital Research & Management Incorporated and J.P. Morgan Alternative Asset Management, Inc.
| © JPMorgan Chase & Co., 2019. All rights reserved. February 2019. | SAN-UM-219 |
Table of Contents
ITEM 2. CODE OF ETHICS.
Disclose whether, as of the end of the period covered by the report, the registrant has adopted a code of ethics that applies to the registrant’s principal executive officer, principal financial officer, principal accounting officer or controller, or persons performing similar functions, regardless of whether these individuals are employed by the registrant or a third party. If the registrant has not adopted such a code of ethics, explain why it has not done so.
Table of Contents
The registrant must briefly describe the nature of any amendment, during the period covered by the report, to a provision of its code of ethics that applies to the registrant’s principal executive officer, principal financial officer, principal accounting officer or controller, or persons performing similar functions, regardless of whether these individuals are employed by the registrant or a third party, and that relates to any element of the code of ethics definition enumerated in paragraph (b) of this Item. The registrant must file a copy of any such amendment as an exhibit pursuant to Item 13(a)(1), unless the registrant has elected to satisfy paragraph (f) of this Item by positing its code of ethics on its website pursuant to paragraph (f)(2) of this Item, or by undertaking to provide its code of ethics to any person without charge, upon request, pursuant to paragraph (f)(3) of this Item.
If the registrant has, during the period covered by the report, granted a waiver, including an implicit waiver, from a provision of the code of ethics that applies to the registrant’s principal executive officer, principal financial officer, principal accounting officer or controller, or persons performing similar functions, regardless of whether these individuals are employed by the registrant or third party, that relates to one or more items set forth in paragraph (b) of this Item, the registrant must briefly describe the nature of the waiver, the name of the person to whom the waiver was granted, and the date of the waiver.
Not applicable to a semi-annual report.
ITEM 3. AUDIT COMMITTEE FINANCIAL EXPERT.
(a) (1) Disclose that the registrant’s board of directors has determined that the registrant either:
(i) Has at least one audit committee financial expert serving on its audit committee; or
(ii) Does not have an audit committee financial expert serving on its audit committee.
(2) If the registrant provides the disclosure required by paragraph (a)(1)(i) of this Item, it must disclose the name of the audit committee financial expert and whether that person is “independent.” In order to be considered “independent” for purposes of this Item, a member of an audit committee may not, other than in his or her capacity as a member of the audit committee, the board of directors, or any other board committee:
(i) Accept directly or indirectly any consulting, advisory, or other compensatory fee from the issuer; or
(ii) Be an “interested person” of the investment company as defined in Section 2(a)(19) of the Act (15 U.S.C.80a-2(a)(19)).
(3) If the registrant provides the disclosure required by paragraph (a)(1)(ii) of this Item, it must explain why it does not have an audit committee financial expert.
Not applicable to a semi-annual report.
Table of Contents
ITEM 4. PRINCIPAL ACCOUNTANT FEES AND SERVICES.
(a) Disclose, under the caption Audit Fees, the aggregate fees billed for each of the last two fiscal years for professional services rendered by the principal accountant for the audit of the registrant’s annual financial statements or services that are normally provided by the accountant in connection with statutory and regulatory filings or engagements for those fiscal years.
(b) Disclose, under the caption Audit-Related Fees, the aggregate fees billed in each of the last two fiscal years for assurance and related services by the principal accountant that are reasonably related to the performance of the audit of the registrant’s financial statements and are not reported under paragraph (a) of this Item. Registrants shall describe the nature of the services comprising the fees disclosed under this category.
(c) Disclose, under the caption Tax Fees, the aggregate fees billed in each of the last two fiscal years for professional services rendered by the principal accountant for tax compliance, tax advice, and tax planning. Registrants shall describe the nature of the services comprising the fees disclosed under this category.
(d) Disclose, under the caption All Other Fees, the aggregate fees billed in each of the last two fiscal years for products and services provided by the principal accountant, other than the services reported in paragraphs (a) through (c) of this Item. Registrants shall describe the nature of the services comprising the fees disclosed under this category.
(e) (1) Disclose the audit committee’spre-approval policies and procedures described in paragraph (c)(7) of Rule2-01 of RegulationS-X.
(2) Disclose the percentage of services described in each of paragraphs (b) through (d) of this Item that were approved by the audit committee pursuant to paragraph (c)(7)(i)(C) of Rule2-01 of RegulationS-X.
(f) If greater than 50 percent, disclose the percentage of hours expended on the principal accountant’s engagement to audit the registrant’s financial statements for the most recent fiscal year that were attributed to work performed by persons other than the principal accountant’s full-time, permanent employees.
(g) Disclose the aggregatenon-audit fees billed by the registrant’s accountant for services rendered to the registrant, and rendered to the registrant’s investment adviser (not including anysub-adviser whose role is primarily portfolio management and is subcontracted with or overseen by another investment adviser), and any entity controlling, controlled by, or under common control with the adviser that provides ongoing services to the registrant for each of the last two fiscal years of the registrant.
(h) Disclose whether the registrant’s audit committee of the board of directors has considered whether the provision ofnon-audit services that were rendered to the registrant’s investment adviser (not including any subadviser whose role is primarily portfolio management and is subcontracted with or overseen by another investment adviser), and any entity controlling, controlled by, or under common control with the investment adviser that provides ongoing services to the registrant that were notpre-approved pursuant to paragraph (c)(7)(ii) of Rule2-01 of RegulationS-X is compatible with maintaining the principal accountant’s independence.
Not applicable to a semi-annual report.
ITEM 5. AUDIT COMMITTEE OF LISTED REGISTRANTS.
(a) If the registrant is a listed issuer as defined in Rule10A-3 under the Exchange Act (17CFR240.10A-3), state whether or not the registrant has a separately-designated standing audit committee established in accordance with Section 3(a)(58)(A) of the Exchange Act (15 U.S.C. 78c(a)(58)(A)). If the registrant has such a committee, however designated, identify each committee member. If the entire board of directors is acting as the registrant’s audit committee as specified in Section 3(a)(58)(B) of the Exchange Act (15 U.S.C. 78c(a)(58)(B)), so state.
(b) If applicable, provide the disclosure required by Rule10A-3(d) under the Exchange Act (17CFR240.10A-3(d)) regarding an exemption from the listing standards for all audit committees.
Not applicable to a semi-annual report.
Table of Contents
ITEM 6. INVESTMENTS.
File Schedule I – Investments in securities of unaffiliated issuers as of the close of the reporting period as set forth inSection 210.12-12 of RegulationS-X, unless the schedule is included as part of the report to shareholders filed under Item 1 of this Form.
Included in Item 1.
ITEM 7. DISCLOSURE OF PROXY VOTING POLICIES AND PROCEDURES FORCLOSED-END MANAGEMENT INVESTMENT COMPANIES.
Not applicable.
ITEM 8. PORTFOLIO MANAGERS OFCLOSED-END MANAGEMENT INVESTMENT COMPANIES.
Not applicable.
ITEM 9. PURCHASE OF EQUITY SECURITIES BYCLOSED-END MANAGEMENT INVESTMENT COMPANY AND AFFILIATED PURCHASERS.
Not applicable.
ITEM 10. SUBMISSION OF MATTERS TO A VOTE OF SECURITY HOLDERS.
Describe any material changes to the procedures by which shareholders may recommend nominees to the registrant’s board of directors, where those changes were implemented after the registrant last provided disclosure in response to the requirements of Item 7(d)(2)(ii)(G) of Schedule 14A (17 CFR240.14a-101), or this Item.
No material changes to report.
ITEM 11. CONTROLS AND PROCEDURES.
(a) Disclose the conclusions of the registrant’s principal executive and principal financial officers, or persons performing similar functions, regarding the effectiveness of the registrant’s disclosure controls and procedures (as defined in Rule30a-3(c) under the Act (17 CFR270.30a-3(c))) as of a date within 90 days of the filing date of the report that includes the disclosure required by this paragraph, based on the evaluation of these controls and procedures required by Rule30a-3(b) under the Act (17 CFR270.30a-3(b)) and Rules13a-15(b) or15d-15(b) under the Exchange Act (17 CFR240.13a-15(b) or240.15d-15(b)).
The Registrant’s principal executive and principal financial officers have concluded, based on their evaluation of the Registrant’s disclosure controls and procedures as of a date within 90 days of the filing date of this report, that the Registrant’s disclosure controls and procedures are reasonably designed to ensure that information required to be disclosed by the Registrant on FormN-CSR is recorded, processed, summarized and reported within the required time periods and that information required to be disclosed by the Registrant in the reports that it files or submits on FormN-CSR is accumulated and communicated to the Registrant’s management, including its principal executive and principal financial officers, as appropriate to allow timely decisions regarding required disclosure.
(b) Disclose any change in the registrant’s internal control over financial reporting (as defined in Rule30a-3(d) under the Act (17 CFR270.30a-3(d)) that occurred during the registrant’s second fiscal quarter of the period covered by this report that has materially affected, or is reasonably likely to materially affect, the registrant’s internal control over financial reporting.
There were no changes in the Registrant’s internal control over financial reporting that occurred during the last fiscal quarter covered by this report that have materially affected, or are reasonably likely to materially affect, the Registrant’s internal control over financial reporting.
Table of Contents
ITEM 12. DISCLOSURE OF SECURITIES LENDING ACTIVITIES FORCLOSED-END MANAGEMENT INVESTMENT COMPANIES.
Not applicable.
ITEM 13. EXHIBITS.
| (a) | File the exhibits listed below as part of this Form. Letter or number the exhibits in the sequence indicated. |
(1) Any code of ethics, or amendment thereto, that is the subject of the disclosure required by Item 2, to the extent that the registrant intends to satisfy the Item 2 requirements through filing of an exhibit.
Not applicable.
(2) A separate certification for each principal executive officer and principal financial officer of the registrant as required by Rule30a-2(a) under the Act (17 CFR270.30a-2).
Certifications pursuant to Rule30a-2(a) under the Investment Company Act of 1940 are attached hereto.
(3) Any written solicitation to purchase securities under Rule23c-1 under the Act (17 CFR270.23c-1) sent or given during the period covered by the report by or on behalf of the registrant to 10 or more persons.
Not applicable.
| (b) | A separate or combined certification for each principal executive officer and principal officer of the registrant as required by Rule30a-2(b) under the Act of 1940. |
Certifications pursuant to Rule30a-2(b) under the Investment Company Act of 1940 are attached hereto.
Table of Contents
SIGNATURES
Pursuant to the requirements of the Securities Exchange Act of 1934 and the Investment Company Act of 1940, the registrant has duly caused this report to be signed on its behalf by the undersigned, thereunto duly authorized.
| Undiscovered Managers Funds | ||
| By: | /s/ Brian S. Shlissel | |
| Brian S. Shlissel | ||
| President and Principal Executive Officer | ||
| May 07, 2019 | ||
Pursuant to the requirements of the Securities Exchange Act of 1934 and the Investment Company Act of 1940, this report has been signed below by the following persons on behalf of the registrant and in the capacities and on the dates indicated.
| By: | /s/ Brian S. Shlissel | |
| Brian S. Shlissel | ||
| President and Principal Executive Officer | ||
| May 07, 2019 | ||
| By: | /s/ Timothy J. Clemens | |
| Timothy J. Clemens | ||
| Treasurer and Principal Financial Officer | ||
| May 07, 2019 | ||