UNITED STATES SECURITIES AND EXCHANGE COMMISSION
Washington, D.C. 20549
FORM N-CSR
CERTIFIED SHAREHOLDER REPORT OF REGISTERED MANAGEMENT
INVESTMENT COMPANIES
| Investment Company Act file number: | 811-08457 |
| |
| Exact name of registrant as specified in charter: | Delaware Group® Foundation Funds |
| |
| Address of principal executive offices: | 2005 Market Street |
| Philadelphia, PA 19103 |
| |
| Name and address of agent for service: | David F. Connor, Esq. |
| 2005 Market Street |
| Philadelphia, PA 19103 |
| |
| Registrant’s telephone number, including area code: | (800) 523-1918 |
| |
| Date of fiscal year end: | March 31 |
| |
| Date of reporting period: | March 31, 2017 |
Item 1. Reports to Stockholders
|
Delaware Foundation Funds® Delaware Foundation® Growth Allocation Fund Delaware Foundation Moderate Allocation Fund Delaware Foundation Conservative Allocation Fund Annual report March 31, 2017 Multi-asset mutual funds |
Carefully consider the Funds’ investment objectives, risk factors, charges, and expenses before investing. This and other information can be found in the Funds’ prospectus and their summary prospectuses, which may be obtained by visiting delawarefunds.com/literature or calling 800 523-1918. Investors should read the prospectus and the summary prospectus carefully before investing.
You can obtain shareholder reports and prospectuses online instead of in the mail. Visit delawarefunds.com/edelivery.

Table of contents
Delaware Management Holdings, Inc. and its subsidiaries (collectively known by the marketing name of Delaware Investments) are wholly owned subsidiaries of Macquarie Group Limited, a global provider of banking, financial, advisory, investment and funds management services.
Neither Delaware Investments nor its affiliates referred to in this document are authorized deposit-taking institutions for the purposes of the Banking Act 1959 (Commonwealth of Australia). The obligations of these entities do not represent deposits or other liabilities of Macquarie Bank Limited (MBL), a subsidiary of Macquarie Group Limited and an affiliate of Delaware Investments. MBL does not guarantee or otherwise provide assurance in respect of the obligations of these entities, unless noted otherwise. The Funds are governed by US laws and regulations.
Unless otherwise noted, views expressed herein are current as of March 31, 2017, and subject to change for events occurring after such date.
The Funds are not FDIC insured and are not guaranteed. It is possible to lose the principal amount invested.
Mutual fund advisory services provided by Delaware Management Company, a series of Delaware Management Business Trust, which is a registered investment advisor. Delaware Investments, a member of Macquarie Group, refers to Delaware Management Holdings, Inc. and its subsidiaries, including the Funds’ distributor, Delaware Distributors, L.P. Macquarie Group refers to Macquarie Group Limited and its subsidiaries and affiliates worldwide.
© 2017 Delaware Management Holdings, Inc.
All third-party marks cited are the property of their respective owners.
| | |
| Portfolio management review | | |
| |
| Delaware Foundation Funds® | | April 11, 2017 |
| (Unaudited) | | |
| | | | |
Performance preview (for the year ended March 31, 2017) | | | | |
| | |
Delaware Foundation® Growth Allocation Fund (Institutional Class shares) | | 1-year return | | +11.56% |
| | |
Delaware Foundation Growth Allocation Fund (Class A shares) | | 1-year return | | +11.25% |
| | |
S&P 500® Index (benchmark) | | 1-year return | | +17.17% |
| | |
Lipper Mixed-Asset Target Allocation Growth Funds Average | | 1-year return | | +11.16% |
Past performance does not guarantee future results.
For complete, annualized performance for Delaware Foundation Growth Allocation Fund, please see the table on page 4. Institutional Class shares are available without sales or asset-based distribution charges only to certain eligible accounts.
The performance of Class A shares excludes the applicable sales charge. Both Institutional Class shares and Class A shares reflect the reinvestment of all distributions.
The Lipper Mixed-Asset Target Allocation Growth Funds Average compares funds that, by portfolio practice, maintain a mix of between 60% and 80% equity securities, with the remainder invested in bonds, cash, and cash equivalents.
Please see page 6 for a description of the index. Index performance returns do not reflect any management fees, transaction costs, or expenses. Indices are unmanaged and one cannot invest directly in an index.
| | | | | | | | |
| | | |
Delaware Foundation Moderate Allocation Fund (Institutional Class shares) | | | 1-year return | | | | +9.70% | |
| | |
Delaware Foundation Moderate Allocation Fund (Class A shares) | | | 1-year return | | | | +9.45% | |
| | |
S&P 500 Index (benchmark) | | | 1-year return | | | | +17.17% | |
| | |
Bloomberg Barclays US Aggregate Index* (benchmark) | | | 1-year return | | | | +0.44% | |
| | |
Lipper Mixed-Asset Target Allocation Moderate Funds Average | | | 1-year return | | | | +9.86% | |
Past performance does not guarantee future results.
For complete, annualized performance for Delaware Foundation Moderate Allocation Fund, please see the table on page 7. Institutional Class shares are available without sales or asset-based distribution charges only to certain eligible accounts.
The performance of Class A shares excludes the applicable sales charge. Both Institutional Class shares and Class A shares reflect the reinvestment of all distributions.
The Lipper Mixed-Asset Target Allocation Moderate Funds Average compares funds that, by portfolio practice, maintain a mix of between 40% and 60% equity securities, with the remainder invested in bonds, cash, and cash equivalents.
Please see page 9 for a description of the indices. Index performance returns do not reflect any management fees, transaction costs, or expenses. Indices are unmanaged and one cannot invest directly in an index.
| | | | |
| | | |
Delaware Foundation Conservative Allocation Fund (Institutional Class shares) | | 1-year return | | +7.66% |
| | |
Delaware Foundation Conservative Allocation Fund (Class A shares) | | 1-year return | | +7.40% |
| | |
Bloomberg Barclays US Aggregate Index* (benchmark) | | 1-year return | | +0.44% |
| | |
Lipper Mixed-Asset Target Allocation Conservative Funds Average | | 1-year return | | +6.84% |
Past performance does not guarantee future results.
For complete, annualized performance for Delaware Foundation Conservative Allocation Fund, please see the table on page 10.
Institutional Class shares are available without sales or asset-based distribution charges only to certain eligible accounts.
The performance of Class A shares excludes the applicable sales charge. Both Institutional Class shares and Class A shares reflect the reinvestment of all distributions.
The Lipper Mixed-Asset Target Allocation Conservative Funds Average compares funds that, by portfolio practice, maintain a mix of between 20% and 40% equity securities, with the remainder invested in bonds, cash, and cash equivalents.
Please see page 12 for a description of the index. Index performance returns do not reflect any management fees, transaction costs, or expenses. Indices are unmanaged and one cannot invest directly in an index.
* Formerly known as the Barclays US Aggregate Index.
Portfolio management review
Delaware Foundation Funds®
Jackson Square Partners, LLC (JSP) is the sub-advisor to the Funds’ US large-cap growth sleeve. As sub-advisor, JSP is responsible for day-to-day management of its portion of the Funds’ assets. Although JSP serves as sub-advisor, the investment manager, Delaware Management Company, a series of Delaware Management Business Trust, has ultimate responsibility for all investment advisory services.
Overview
All three Delaware Foundation Funds posted a positive return for the 1-year period ended March 31, 2017. Delaware Foundation® Conservative Allocation Fund produced the lowest return, followed by Delaware Foundation Moderate Allocation Fund, with Delaware Foundation Growth Allocation Fund delivering the highest return over the period.
Delaware Foundation Growth Allocation Fund and Delaware Foundation Moderate Allocation Fund delivered lower returns than the S&P 500 Index, which we did not find surprising because both portfolios held fixed income securities, which generally underperformed equities for the 12-month period. Delaware Foundation Conservative Allocation Fund delivered returns that were above those of the Bloomberg Barclays US Aggregate Index, which we also did not find surprising because the Fund held equities, which generally outperformed fixed income securities over the period.
All three Delaware Foundation Funds tend to hold a higher weight in non-US securities than most other asset allocation funds; thus, when US markets are delivering higher total returns than non-US markets, and when the US dollar is appreciating relative to other currencies, these funds will tend to struggle. However, during the fiscal year ended March 31, 2017, Delaware Foundation Growth Allocation Fund and Delaware Foundation Conservative Allocation Fund delivered returns that were above the average returns of their respective Lipper peer groups, while Delaware Foundation Moderate Allocation Fund underperformed the average return of its Lipper peer group, as shown on page 1.
Economic backdrop
In the period from April 2016 to March 2017, the prices of risky assets around the world generally rose, though non-US investment grade fixed income securities generated small losses. In most developed countries, governments and central banks remained willing to provide some support for economic recovery, typically using a blend of fiscal and monetary measures. Over the course of the Funds’ fiscal year, investors apparently became less apprehensive about the near-term outlook for a number of major countries in Europe.
The currency markets experienced considerable fluctuations during the 12-month period. The trade-weighted US dollar appreciated by 6.1% over the period, and the trade-weighted Japanese yen rose by 4.2%. The trade-weighted euro depreciated by 0.5%, and the trade-weighted British pound fell by 9.2%, with much of the decline in the pound coming immediately after the outcome of the United Kingdom’s referendum on leaving the European Union. In general, a stronger currency means that imports look cheaper for US
consumers, but tends to impair the competitiveness of US exporters. The increase in the value of the dollar and the yen may worsen the competitive position of exporters in the United States and Japan relative to their counterparts in the euro zone and the UK.
The price of many commodities rose during the Funds’ fiscal year. Over the 12 months ended March 31, 2017, the spot price of West Texas Intermediate crude oil rose 32.0%, and the relatively energy-intensive S&P GSCI® index rose 20.0%. The Thomson Reuters/ CoreCommodity CRB Index, which has a lower weight in energy-linked commodities, gained 9.0% during the period, while the spot price of gold rose by 6.1%. (Source: Bloomberg.)
Portfolio positioning
The Funds’ strategic policy weights reflect a commitment to seeking diversification in terms of both geographies and asset classes. At the beginning of April 2016, all three Funds were positioned defensively relative to their strategic policy weights. In particular, the Asset Allocation Committee chose to keep the Funds at slightly below their strategic policy weights in developed-market equities. Conversely, the Funds began the year with small tactical positions in US real estate equities, which were viewed as offering an attractive balance between risk and reward given the uncertain outlook.
In broad terms, these active positions were maintained throughout the 12 months ended March 31, 2017. The Asset Allocation Committee chose to slightly reduce the overweight in US large-cap equities and to maintain the underweight in developed-market equities. The Committee also continued to hold the Funds’ small tactical position in US real estate equities and maintained a modest overweight in US small-cap equities.
As part of the oversight process for the Funds, the Asset Allocation Committee periodically analyzes the sources of the Funds’ active performance. Over the 12 months ended March 31, 2017, the active positioning of the Funds with respect to the strategic policy weights of different asset classes detracted from the active performance of Delaware Foundation Growth Allocation Fund, but contributed to the active performance of Delaware Foundation Moderate Allocation Fund and Delaware Foundation Conservative Allocation Fund relative to their hypothetical returns at the strategic policy weights.
The Asset Allocation Committee also periodically examines the contribution of derivatives to the Funds’ performance. Based on the available information, the combination of futures, options, swaps, and currency positions in the Funds had only a limited effect on performance during the 12 months ended March 31, 2017. The estimated effect from these instruments amounted to 1.28% for Delaware Foundation Growth Allocation Fund, 1.50% for Delaware
2
Foundation Moderate Allocation Fund, and 1.35% for Delaware Foundation Conservative Allocation Fund.
About Delaware Foundation Funds
As the Funds’ fiscal year came to a close, we continued to seek to deliver the benefits of diversification while aiming to actively manage risk. With these two precepts in mind, each Delaware Foundation Fund seeks to deliver returns that are derived from tactical asset
allocation decisions as well as from active management of individual asset classes and investment styles. The Funds are based on the assumption that investors should keep a global perspective when evaluating potential investment opportunities. We therefore continue to manage each Fund so that it includes investment possibilities around the globe.
| | |
| Performance summaries | | |
| |
| Delaware Foundation® Growth Allocation Fund | | March 31, 2017 |
| (Unaudited) | | |
The performance data quoted represent past performance; past performance does not guarantee future results. Investment return and principal value will fluctuate so your shares, when redeemed, may be worth more or less than their original cost. Please obtain the performance data current for the most recent month end by calling 800 523-1918 or visiting our website at delawarefunds.com/performance. Current performance may be lower or higher than the performance data quoted.
Fund and benchmark performance1,2
| | | | | | | | | | | | | | | | |
| | | Average annual total returns through March 31, 2017 | |
| | | | |
| | | 1 year | | | 5 years | | | 10 years | | | Lifetime | |
| | | | | | | | | | | | | | | | |
Class A (Est. Dec. 31, 1997) | | | | | | | | | | | | | | | | |
Excluding sales charge | | | +11.25% | | | | +6.82% | | | | +4.54% | | | | +4.83% | |
Including sales charge | | | +4.90% | | | | +5.56% | | | | +3.92% | | | | +4.51% | |
| | | | | | | | | | | | | | | | |
Class C (Est. Dec. 31, 1997) | | | | | | | | | | | | | | | | |
Excluding sales charge | | | +10.44% | | | | +6.02% | | | | +3.76% | | | | +4.06% | |
Including sales charge | | | +9.44% | | | | +6.02% | | | | +3.76% | | | | +4.06% | |
| | | | | | | | | | | | | | | | |
Class R (Est. June 2, 2003) | | | | | | | | | | | | | | | | |
Excluding sales charge | | | +11.08% | | | | +6.57% | | | | +4.29% | | | | +6.41% | |
Including sales charge | | | +11.08% | | | | +6.57% | | | | +4.29% | | | | +6.41% | |
| | | | | | | | | | | | | | | | |
Institutional Class (Est. Dec. 31, 1997) | | | | | | | | | | | | | | | | |
Excluding sales charge | | | +11.56% | | | | +7.11% | | | | +4.81% | | | | +5.10% | |
Including sales charge | | | +11.56% | | | | +7.11% | | | | +4.81% | | | | +5.10% | |
| | | | | | | | | | | | | | | | |
S&P 500 Index | | | +17.17% | | | | +13.30% | | | | +7.51% | | | | +6.71%* | |
*The benchmark lifetime return is for Institutional Class share comparison only and is calculated using the last business day in the month of the Fund’s Institutional Class inception date.
1Returns reflect the reinvestment of all distributions and are presented both with and without the applicable sales charges described below. Returns do not reflect the deduction of taxes the shareholder would pay on Fund distributions or redemptions of Fund shares.
Expense limitations were in effect for certain classes during some or all of the periods shown in the “Fund and benchmark performance” table. Expenses for each class are listed on the “Fund expense ratios” table on page 5. Performance would have been lower had expense limitations not been in effect.
Institutional Class shares are available without sales or asset-based distribution charges only to certain eligible accounts.
Class A shares are sold with a maximum front-end sales charge of 5.75%, and have an annual distribution and service fee of 0.25% of average daily net assets. Performance for Class A shares, excluding sales charges, assumes that no front-end sales charge applied.
Class C shares are sold with a contingent deferred sales charge of 1.00% if redeemed during the first 12 months. They are also subject to an annual distribution and service fee of 1.00% of average daily net assets. Performance for Class C shares, excluding sales charges, assumes either that contingent deferred sales charges did not apply or that the investment was not redeemed.
Class R shares are available only for certain retirement plan products. They are sold without a sales charge and have an annual distribution and service fee of 0.50% of average daily net assets.
This Fund is subject to the same risks as the underlying styles in which it invests.
Fixed income securities and bond funds can lose value, and investors can lose principal, as interest rates rise. They also may be affected by economic conditions that hinder an issuer’s ability to make interest and principal payments on its debt.
The Fund may also be subject to prepayment risk, the risk that the principal of a bond that is held by a portfolio will be prepaid prior to maturity, at the time when interest rates are lower than what the bond was paying. A portfolio may then have to reinvest that money at a lower interest rate.
High yielding, non-investment-grade bonds (junk bonds) involve higher risk than investment grade bonds.
International investments entail risks not ordinarily associated with US investments including fluctuation in currency values, differences in accounting principles, or economic or political instability in other nations. Investing in emerging markets can be riskier than investing in established foreign markets due to increased volatility and lower trading volume.
If and when the Fund invests in forward foreign currency contracts or uses other investments to hedge against currency risks, the Fund will be subject to special risks, including counterparty risk.
The Fund may invest in derivatives, which may involve additional expenses and are subject to risk, including the risk that an underlying security or securities index moves in the opposite direction from what the portfolio manager anticipated. A derivatives transaction depends upon the counterparties’ ability to fulfill their contractual obligations.
Risk controls and asset allocation models do not promise any level of performance or guarantee against loss of principal.
Narrowly focused investments may exhibit higher volatility than investments in multiple industry sectors.
REIT investments are subject to many of the risks associated with direct real estate ownership, including changes in economic conditions, credit risk, and interest rate fluctuations.
The Fund may experience portfolio turnover in excess of 100%, which could result in higher transaction costs and tax liability.
Interest payments on inflation-indexed debt securities will vary as the principal and/or interest is adjusted for inflation.
2 The Fund’s expense ratios, as described in the most recent prospectus, are disclosed in the following “Fund expense ratios” table. Delaware Management Company has agreed to reimburse certain expenses and/or waive certain fees in order to prevent total annual fund operating expenses (excluding any 12b-1 fees, acquired fund fees and expenses, taxes, interest, short sale and dividend interest expenses, brokerage fees, certain insurance costs, and nonroutine expenses or costs, including, but not limited to, those relating to reorganizations, litigation, conducting shareholder meetings, and liquidations (collectively, nonroutine expenses)) from exceeding 0.90% of the Fund’s average daily net assets during the period from April 1, 2016 through March 31, 2017.* Please see the most recent prospectus and any applicable supplement(s) for additional information on these fee waivers and/or reimbursements.
| | | | | | | | |
| Fund expense ratios | | Class A | | Class C | | Class R | | Institutional Class |
Total annual operating expenses (without fee waivers) | | 1.50% | | 2.25% | | 1.75% | | 1.25% |
Net expenses (including fee waivers, if any) | | 1.15% | | 1.90% | | 1.40% | | 0.90% |
Type of waiver | | Contractual | | Contractual | | Contractual | | Contractual |
*The aggregate contractual waiver period covering this report is from Jan. 29, 2015, through July 29, 2017.
Performance summaries
Delaware Foundation® Growth Allocation Fund
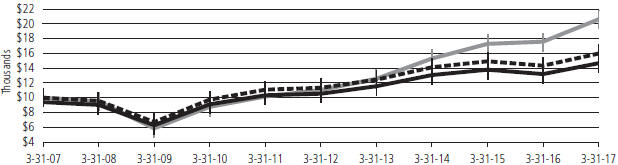
Performance of a $10,000 investment1
Average annual total returns from March 31, 2007, through March 31, 2017
| | | | | | |
| | | Starting value (March 31, 2007) | | | Ending value (March 31, 2017) |
 S&P 500 Index S&P 500 Index | | | $10,000 | | | $20,627 |
 Delaware Foundation® Growth Allocation Fund — Institutional Class shares Delaware Foundation® Growth Allocation Fund — Institutional Class shares | | | $10,000 | | | $15,991 |
 Delaware Foundation Growth Allocation Fund — Class A shares Delaware Foundation Growth Allocation Fund — Class A shares | | | $9,425 | | | $14,696 |
1 The “Performance of a $10,000 investment” graph assumes $10,000 invested in Institutional Class and Class A shares of the Fund on March 31, 2007, and includes the effect of a 5.75% front-end sales charge (for Class A shares) and the reinvestment of all distributions. The graph does not reflect the deduction of taxes the shareholders would pay on Fund distributions or redemptions of Fund shares. Expense limitations were in effect for some or all of the periods shown. Performance would have been lower had expense limitations not been in effect. Expenses are listed in the “Fund expense ratios” table on page 5. Please note additional details on pages 4 through 6.
The graph also assumes $10,000 invested in the S&P 500 Index as of March 31, 2007. The S&P 500 Index measures the performance of 500 mostly large-cap stocks weighted by market value, and is often used to represent performance of the US stock market.
Index performance returns do not reflect any management fees, transaction costs, or expenses. Indices are unmanaged and one cannot invest directly in an index. Past performance is not a guarantee of future results.
Performance of other Fund classes will vary due to different charges and expenses.
Stock symbols and CUSIP numbers
| | | | |
| | | Nasdaq symbols | | CUSIPs |
Class A | | DFGAX | | 245918883 |
Class C | | DFGCX | | 245918867 |
Class R | | DFGRX | | 245918826 |
Institutional Class | | DFGIX | | 245918859 |
6
| | |
| Performance summaries | | |
| |
| Delaware Foundation® Moderate Allocation Fund | | March 31, 2017 |
| (Unaudited) | | |
The performance data quoted represent past performance; past performance does not guarantee future results. Investment return and principal value will fluctuate so your shares, when redeemed, may be worth more or less than their original cost. Please obtain the performance data current for the most recent month end by calling 800 523-1918 or visiting our website at delawarefunds.com/performance. Current performance may be lower or higher than the performance data quoted.
Fund and benchmark performance1,2
| | | | | | | | | | | | | | | | |
| | | Average annual total returns through March 31, 2017 | |
| | | | |
| | | 1 year | | | 5 years | | | 10 years | | | Lifetime | |
| | | | | | | | | | | | | | | | |
Class A (Est. Dec. 31, 1997) | | | | | | | | | | | | | | | | |
Excluding sales charge | | | +9.45% | | | | +5.94% | | | | +5.02% | | | | +4.94% | |
Including sales charge | | | +3.15% | | | | +4.69% | | | | +4.40% | | | | +4.62% | |
| | | | | | | | | | | | | | | | |
Class C (Est. Dec. 31, 1997) | | | | | | | | | | | | | | | | |
Excluding sales charge | | | +8.62% | | | | +5.13% | | | | +4.22% | | | | +4.17% | |
Including sales charge | | | +7.62% | | | | +5.13% | | | | +4.22% | | | | +4.17% | |
| | | | | | | | | | | | | | | | |
Class R (Est. June 2, 2003) | | | | | | | | | | | | | | | | |
Excluding sales charge | | | +9.11% | | | | +5.63% | | | | +4.73% | | | | +6.06% | |
Including sales charge | | | +9.11% | | | | +5.63% | | | | +4.73% | | | | +6.06% | |
| | | | | | | | | | | | | | | | |
Institutional Class (Est. Dec. 31, 1997) | | | | | | | | | | | | | | | | |
Excluding sales charge | | | +9.70% | | | | +6.17% | | | | +5.26% | | | | +5.19% | |
Including sales charge | | | +9.70% | | | | +6.17% | | | | +5.26% | | | | +5.19% | |
| | | | | | | | | | | | | | | | |
S&P 500 Index | | | +17.17% | | | | +13.30% | | | | +7.51% | | | | +6.71%* | |
| | | | | | | | | | | | | | | | |
Bloomberg Barclays US Aggregate Index | | | +0.44% | | | | +2.34% | | | | +4.27% | | | | +5.04%* | |
*The benchmark lifetime return is for Institutional Class share comparison only and is calculated using the last business day in the month of the Fund’s Institutional Class inception date.
1Returns reflect the reinvestment of all distributions and are presented both with and without the applicable sales charges described below. Returns do not reflect the deduction of taxes the shareholder would pay on Fund distributions or redemptions of Fund shares.
Expense limitations were in effect for certain classes during some or all of the periods shown in the “Fund and benchmark performance” table. Expenses for each class are listed on the “Fund expense ratios” table on page 8. Performance would have been lower had expense limitations not been in effect.
Institutional Class shares are available without sales or asset-based distribution charges only to certain eligible accounts.
Class A shares are sold with a maximum front-end sales charge of 5.75%, and have an annual distribution and service fee of 0.25% of average daily net assets. The Board has adopted a formula for calculating 12b-1 plan fees for the Fund’s Class A shares. The Fund’s Class A shares are currently subject to a blended 12b-1 fee equal to the sum of: (i) 0.10% of average daily net assets representing shares acquired prior to June 1, 1992, and (ii) 0.25% of average daily net assets representing shares acquired on or after June 1, 1992. All Class A shares currently bear 12b-1 fees at the same rate, the blended rate, currently 0.25% of average daily net assets, based on the formula described above. This method of calculating Class A 12b-1 fees may be discontinued at the sole discretion of the Board. Performance for Class A shares, excluding sales charges, assumes that no front-end sales charge applied.
Class C shares are sold with a contingent deferred sales charge of 1.00% if redeemed during the first 12 months. They are also subject to an annual distribution and service fee of 1.00% of average daily net assets. Performance for Class C shares, excluding sales charges, assumes either that contingent deferred sales charges did not apply or that the investment was not redeemed.
Class R shares are available only for certain retirement plan products. They are sold without a sales charge and have an annual distribution and service fee of 0.50% of average daily net assets.
Performance summaries
Delaware Foundation® Moderate Allocation Fund
This Fund is subject to the same risks as the underlying styles in which it invests.
Fixed income securities and bond funds can lose value, and investors can lose principal, as interest rates rise. They also may be affected by economic conditions that hinder an issuer’s ability to make interest and principal payments on its debt.
The Fund may also be subject to prepayment risk, the risk that the principal of a bond that is held by a portfolio will be prepaid prior to maturity, at the time when interest rates are lower than what the bond was paying. A portfolio may then have to reinvest that money at a lower interest rate.
High yielding, non-investment-grade bonds (junk bonds) involve higher risk than investment grade bonds.
International investments entail risks not ordinarily associated with US investments including fluctuation in currency values, differences in accounting principles, or economic or political instability in other nations. Investing in emerging markets can be riskier than investing in established foreign markets due to increased volatility and lower trading volume.
If and when the Fund invests in forward foreign currency contracts or uses other investments to hedge against currency risks, the Fund will be subject to special risks, including counterparty risk.
The Fund may invest in derivatives, which may involve additional expenses and are subject to risk, including the risk that an underlying security or securities index moves in the opposite direction from what the portfolio manager anticipated. A derivatives transaction depends upon the counterparties’ ability to fulfill their contractual obligations.
Risk controls and asset allocation models do not promise any level of performance or guarantee against loss of principal.
Narrowly focused investments may exhibit higher volatility than investments in multiple industry sectors.
REIT investments are subject to many of the risks associated with direct real estate ownership, including changes in economic conditions, credit risk, and interest rate fluctuations.
The Fund may experience portfolio turnover in excess of 100%, which could result in higher transaction costs and tax liability.
Interest payments on inflation-indexed debt securities will vary as the principal and/or interest is adjusted for inflation.
2 The Fund’s expense ratios, as described in the most recent prospectus, are disclosed in the following “Fund expense ratios” table. Delaware Management Company has agreed to reimburse certain expenses and/or waive certain fees in order to prevent total annual fund operating expenses (excluding any 12b-1 fees, acquired fund fees and expenses, taxes, interest, short sale and dividend interest expenses, brokerage fees, certain insurance costs, and nonroutine expenses or costs, including, but not limited to, those relating to reorganizations, litigation, conducting shareholder meetings, and liquidations (collectively, nonroutine expenses)) from exceeding 0.90% of the Fund’s average daily net assets during the period from April 1, 2016 through March 31, 2017.* Please see the most recent prospectus and any applicable supplement(s) for additional information on these fee waivers and/or reimbursements.
| | | | | | | | |
| Fund expense ratios | | Class A | | Class C | | Class R | | Institutional Class |
Total annual operating expenses (without fee waivers) | | 1.17% | | 1.93% | | 1.43% | | 0.93% |
Net expenses (including fee waivers, if any) | | 1.14% | | 1.90% | | 1.40% | | 0.90% |
Type of waiver | | Contractual | | Contractual | | Contractual | | Contractual |
*The aggregate contractual waiver period covering this report is from Jan. 29, 2015 through July 29, 2017.
8
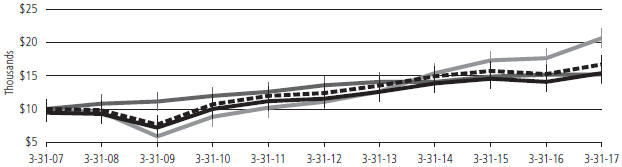
Performance of a $10,000 investment1
Average annual total returns from March 31, 2007, through March 31, 2017
| | | | | | |
| | | Starting value (March 31, 2007) | | | Ending value (March 31, 2017) |
| S&P 500 Index | | | $10,000 | | | $20,627 |
| Delaware Foundation Moderate Allocation Fund — Institutional Class shares | | | $10,000 | | | $16,693 |
| Delaware Foundation Moderate Allocation Fund — Class A shares | | | $9,425 | | | $15,381 |
| Bloomberg Barclays US Aggregate Index | | | $10,000 | | | $15,197 |
1The “Performance of a $10,000 investment” graph assumes $10,000 invested in Institutional Class and Class A shares of the Fund on March 31, 2007, and includes the effect of a 5.75% front-end sales charge (for Class A shares) and the reinvestment of all distributions. The graph does not reflect the deduction of taxes the shareholders would pay on Fund distributions or redemptions of Fund shares. Expense limitations were in effect for some or all of the periods shown. Performance would have been lower had expense limitations not been in effect. Expenses are listed in the “Fund expense ratios” table on page 8. Please note additional details on pages 7 through 9.
The graph also assumes $10,000 invested in the Bloomberg Barclays US Aggregate Index and the S&P 500 Index as of March 31, 2007.
The Bloomberg Barclays US Aggregate Index (formerly known as the Barclays US Aggregate Index) is a broad composite that tracks the investment grade domestic bond market.
The S&P 500 Index measures the performance of 500 mostly large-cap stocks weighted by market value, and is often used to represent performance of the US stock market.
Index performance returns do not reflect any management fees, transaction costs, or expenses. Indices are unmanaged and one cannot invest directly in an index. Past performance is not a guarantee of future results.
Performance of other Fund classes will vary due to different charges and expenses.
Stock symbols and CUSIP numbers
| | | | |
| | | Nasdaq symbols | | CUSIPs |
Class A | | DFBAX | | 245918503 |
Class C | | DFBCX | | 245918701 |
Class R | | DFBRX | | 245918834 |
Institutional Class | | DFFIX | | 245918800 |
| | |
| Performance summaries | | |
| |
| Delaware Foundation® Conservative Allocation Fund | | March 31, 2017 |
| (Unaudited) | | |
The performance data quoted represent past performance; past performance does not guarantee future results. Investment return and principal value will fluctuate so your shares, when redeemed, may be worth more or less than their original cost. Please obtain the performance data current for the most recent month end by calling 800 523-1918 or visiting our website at delawarefunds.com/performance. Current performance may be lower or higher than the performance data quoted.
Fund and benchmark performance1,2
| | | | | | | | | | | | | | | | |
| | | Average annual total returns through March 31, 2017 | |
| | | | |
| | | 1 year | | | 5 years | | | 10 years | | | Lifetime | |
| | | | | | | | | | | | | | | | |
Class A (Est. Dec. 31, 1997) | | | | | | | | | | | | | | | | |
Excluding sales charge | | | +7.40% | | | | +4.77% | | | | +5.09% | | | | +4.76% | |
Including sales charge | | | +1.27% | | | | +3.53% | | | | +4.47% | | | | +4.44% | |
| | | | | | | | | | | | | | | | |
Class C (Est. Dec. 31, 1997) | | | | | | | | | | | | | | | | |
Excluding sales charge | | | +6.60% | | | | +3.99% | | | | +4.31% | | | | +3.98% | |
Including sales charge | | | +5.60% | | | | +3.99% | | | | +4.31% | | | | +3.98% | |
| | | | | | | | | | | | | | | | |
Class R (Est. June 2, 2003) | | | | | | | | | | | | | | | | |
Excluding sales charge | | | +7.15% | | | | +4.51% | | | | +4.83% | | | | +5.50% | |
Including sales charge | | | +7.15% | | | | +4.51% | | | | +4.83% | | | | +5.50% | |
| | | | | | | | | | | | | | | | |
Institutional Class (Est. Dec. 31, 1997) | | | | | | | | | | | | | | | | |
Excluding sales charge | | | +7.66% | | | | +5.02% | | | | +5.35% | | | | +5.02% | |
Including sales charge | | | +7.66% | | | | +5.02% | | | | +5.35% | | | | +5.02% | |
| | | | | | | | | | | | | | | | |
Bloomberg Barclays US Aggregate Index | | | +0.44% | | | | +2.34% | | | | +4.27% | | | | +5.04%* | |
*The benchmark lifetime return is for Institutional Class share comparison only and is calculated using the last business day in the month of the Fund’s Institutional Class inception date.
1Returns reflect the reinvestment of all distributions and are presented both with and without the applicable sales charges described below. Returns do not reflect the deduction of taxes the shareholder would pay on Fund distributions or redemptions of Fund shares.
Expense limitations were in effect for certain classes during some or all of the periods shown in the “Fund and benchmark performance” table. Expenses for each class are listed on the “Fund expense ratios” table on page 11. Performance would have been lower had expense limitations not been in effect.
Institutional Class shares are available without sales or asset-based distribution charges only to certain eligible accounts.
Class A shares are sold with a maximum front-end sales charge of 5.75%, and have an annual distribution and service fee of 0.25% of average daily net assets. Performance for Class A shares, excluding sales charges, assumes that no front-end sales charge applied.
Class C shares are sold with a contingent deferred sales charge of 1.00% if redeemed during the first 12 months. They are also subject to an annual distribution and service fee of 1.00% of average daily net assets. Performance for Class C shares, excluding sales charges, assumes either that contingent deferred sales charges did not apply or that the investment was not redeemed.
Class R shares are available only for certain retirement plan products. They are sold without a sales charge and have an annual distribution and service fee of 0.50% of average daily net assets.
This Fund is subject to the same risks as the underlying styles in which it invests.
Fixed income securities and bond funds can lose value, and investors can lose principal, as interest rates rise. They also may be affected by economic conditions that hinder an issuer’s ability to make interest and principal payments on its debt.
The Fund may also be subject to prepayment risk, the risk that the principal of a bond that is held by a portfolio will be prepaid prior to maturity, at the time when interest rates are lower than what the bond was paying. A portfolio may then have to reinvest that money at a lower interest rate.
10
High yielding, non-investment-grade bonds (junk bonds) involve higher risk than investment grade bonds.
International investments entail risks not ordinarily associated with US investments including fluctuation in currency values, differences in accounting principles, or economic or political instability in other nations. Investing in emerging markets can be riskier than investing in established foreign markets due to increased volatility and lower trading volume.
If and when the Fund invests in forward foreign currency contracts or uses other investments to hedge against currency risks, the Fund will be subject to special risks, including counterparty risk.
The Fund may invest in derivatives, which may involve additional expenses and are subject to risk, including the risk that an underlying security or securities index moves in the opposite direction from what the portfolio manager anticipated. A derivatives transaction depends upon the counterparties’ ability to fulfill their contractual obligations.
Risk controls and asset allocation models do not promise any level of performance or guarantee against loss of principal.
Narrowly focused investments may exhibit higher volatility than investments in multiple industry sectors.
REIT investments are subject to many of the risks associated with direct real estate ownership, including changes in economic conditions, credit risk, and interest rate fluctuations.
The Fund may experience portfolio turnover in excess of 100%, which could result in higher transaction costs and tax liability.
Interest payments on inflation-indexed debt securities will vary as the principal and/or interest is adjusted for inflation.
2 The Fund’s expense ratios, as described in the most recent prospectus, are disclosed in the following “Fund expense ratios” table. Delaware Management Company has agreed to reimburse certain expenses and/or waive certain fees in order to prevent total annual fund operating expenses (excluding any 12b-1 fees, acquired fund fees and expenses, taxes, interest, short sale and dividend interest expenses, brokerage fees, certain insurance costs, and nonroutine expenses or costs, including, but not limited to, those relating to reorganizations, litigation, conducting shareholder meetings, and liquidations (collectively, nonroutine expenses)) from exceeding 0.90% of the Fund’s average daily net assets during the period from April 1, 2016 through March 31, 2017.* Please see the most recent prospectus and any applicable supplement(s) for additional information on these fee waivers and/or reimbursements.
| | | | | | | | |
| Fund expense ratios | | Class A | | Class C | | Class R | | Institutional Class |
Total annual operating expenses (without fee waivers) | | 1.36% | | 2.11% | | 1.61% | | 1.11% |
Net expenses (including fee waivers, if any) | | 1.15% | | 1.90% | | 1.40% | | 0.90% |
Type of waiver | | Contractual | | Contractual | | Contractual | | Contractual |
*The aggregate contractual waiver period covering this report is from Jan. 29, 2015 through July 29, 2017.
Performance summaries
Delaware Foundation® Conservative Allocation Fund
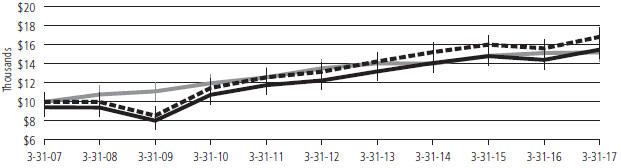
Performance of a $10,000 investment1
Average annual total returns from March 31, 2007, through March 31, 2017
| | | | | | |
| | | Starting value (March 31, 2007) | | | Ending value (March 31, 2017) |
| Delaware Foundation® Conservative Allocation Fund — Institutional Class shares | | | $10,000 | | | $16,840 |
| Delaware Foundation Conservative Allocation Fund — Class A shares | | | $9,425 | | | $15,481 |
| Bloomberg Barclays US Aggregate Index | | | $10,000 | | | $15,197 |
1The “Performance of a $10,000 investment” graph assumes $10,000 invested in Institutional Class and Class A shares of the Fund on March 31, 2007, and includes the effect of a 5.75% front-end sales charge (for Class A shares) and the reinvestment of all distributions. The graph does not reflect the deduction of taxes the shareholders would pay on Fund distributions or redemptions of Fund shares. Expense limitations were in effect for some or all of the periods shown. Performance would have been lower had expense limitations not been in effect. Expenses are listed in the “Fund expense ratios” table on page 11. Please note additional details on pages 10 through 12.
The graph also assumes $10,000 invested in the Bloomberg Barclays US Aggregate Index as of March 31, 2007. The Bloomberg Barclays US Aggregate Index (formerly known as the Barclays US Aggregate Index) is a broad composite that tracks the investment grade domestic bond market.
Index performance returns do not reflect any management fees, transaction costs, or expenses. Indices are unmanaged and one cannot invest directly in an index. Past performance is not a guarantee of future results.
Performance of other Fund classes will vary due to different charges and expenses.
Stock symbols and CUSIP numbers
| | | | |
| | | Nasdaq symbols | | CUSIPs |
Class A | | DFIAX | | 245918107 |
Class C | | DFICX | | 245918305 |
Class R | | DFIRX | | 245918818 |
Institutional Class | | DFIIX | | 245918404 |
12
This page intentionally left blank.
Disclosure of Fund expenses
For the six-month period from October 1, 2016 to March 31, 2017 (Unaudited)
As a shareholder of a Fund, you incur two types of costs: (1) transaction costs, including sales charges (loads) on purchase payments, reinvested dividends, or other distributions; redemption fees; and exchange fees; and (2) ongoing costs, including management fees; distribution and/or service (12b-1) fees; and other Fund expenses. These following examples are intended to help you understand your ongoing costs (in dollars) of investing in a Fund and to compare these costs with the ongoing costs of investing in other mutual funds.
The examples are based on an investment of $1,000 invested at the beginning of the period and held for the entire six-month period from Oct. 1, 2016 to March 31, 2017.
Actual Expenses
The first section of the tables shown, “Actual Fund return,” provides information about actual account values and actual expenses. You may use the information in this section of the table, together with the amount you invested, to estimate the expenses that you paid over the period. Simply divide your account value by $1,000 (for example, an $8,600 account value divided by $1,000 = 8.6), then multiply the result by the number in the first section under the heading entitled “Expenses Paid During Period” to estimate the expenses you paid on your account during this period.
Hypothetical Example for Comparison Purposes
The second section of the tables shown, “Hypothetical 5% return,” provides information about hypothetical account values and hypothetical expenses based on the Funds’ actual expense ratios and an assumed rate of return of 5% per year before expenses, which is not the Funds’ actual return. The hypothetical account values and expenses may not be used to estimate the actual ending account balance or expenses you paid for the period. You may use this information to compare the ongoing costs of investing in the Funds and other funds. To do so, compare this 5% hypothetical example with the 5% hypothetical examples that appear in the shareholder reports of the other funds.
Please note that the expenses shown in the tables are meant to highlight your ongoing costs only and do not reflect any transactional costs, such as sales charges (loads), redemption fees, or exchange fees. Therefore, the second section of each table is useful in comparing ongoing costs only, and will not help you determine the relative total costs of owning different funds. In addition, if these transactional costs were included, your costs would have been higher. The Funds’ expenses shown in the tables reflect fee waivers in effect. The expenses shown in each table assume reinvestment of all dividends and distributions.
Delaware Foundation® Growth Allocation Fund
Expense analysis of an investment of $1,000
| | | | | | | | | | | | | | | | |
| | | Beginning
Account
Value
10/1/16 | | | Ending
Account
Value
3/31/17 | | | Annualized Expense
Ratio | | | Expenses
Paid
During
Period
10/1/16 to
3/31/17* | |
| Actual Fund return† | | | | | |
Class A | | $ | 1,000.00 | | | $ | 1,046.60 | | | | 1.15% | | | | $5.87 | |
Class C | | | 1,000.00 | | | | 1,042.20 | | | | 1.90% | | | | 9.67 | |
Class R | | | 1,000.00 | | | | 1,046.10 | | | | 1.40% | | | | 7.14 | |
Institutional Class | | | 1,000.00 | | | | 1,048.20 | | | | 0.90% | | | | 4.60 | |
Hypothetical 5% return (5% return before expenses) | |
Class A | | $ | 1,000.00 | | | $ | 1,019.20 | | | | 1.15% | | | | $5.79 | |
Class C | | | 1,000.00 | | | | 1,015.46 | | | | 1.90% | | | | 9.55 | |
Class R | | | 1,000.00 | | | | 1,017.95 | | | | 1.40% | | | | 7.04 | |
Institutional Class | | | 1,000.00 | | | | 1,020.44 | | | | 0.90% | | | | 4.53 | |
Delaware Foundation Moderate Allocation Fund
Expense analysis of an investment of $1,000
| | | | | | | | | | | | | | | | |
| | | Beginning
Account
Value
10/1/16 | | | Ending
Account
Value
3/31/17 | | | Annualized
Expense
Ratio | | | Expenses
Paid
During
Period
10/1/16 to
3/31/17* | |
| Actual Fund return† | | | | | |
Class A | | $ | 1,000.00 | | | $ | 1,037.50 | | | | 1.14% | | | | $5.79 | |
Class C | | | 1,000.00 | | | | 1,032.60 | | | | 1.90% | | | | 9.63 | |
Class R | | | 1,000.00 | | | | 1,035.40 | | | | 1.40% | | | | 7.10 | |
Institutional Class | | | 1,000.00 | | | | 1,037.70 | | | | 0.90% | | | | 4.57 | |
Hypothetical 5% return (5% return before expenses) | |
Class A | | $ | 1,000.00 | | | $ | 1,019.25 | | | | 1.14% | | | | $5.74 | |
Class C | | | 1,000.00 | | | | 1,015.46 | | | | 1.90% | | | | 9.55 | |
Class R | | | 1,000.00 | | | | 1,017.95 | | | | 1.40% | | | | 7.04 | |
Institutional Class | | | 1,000.00 | | | | 1,020.44 | | | | 0.90% | | | | 4.53 | |
Delaware Foundation® Conservative Allocation Fund
Expense analysis of an investment of $1,000
| | | | | | | | | | | | | | | | |
| | | Beginning
Account
Value
10/1/16 | | | Ending
Account
Value
3/31/17 | | | Annualized
Expense
Ratio | | | Expenses
Paid
During
Period
10/1/16 to
3/31/17* | |
Actual Fund return† | |
Class A | | | $1,000.00 | | | | $1,027.20 | | | | 1.15% | | | | $5.81 | |
Class C | | | 1,000.00 | | | | 1,023.40 | | | | 1.90% | | | | 9.58 | |
Class R | | | 1,000.00 | | | | 1,026.00 | | | | 1.40% | | | | 7.07 | |
Institutional Class | | | 1,000.00 | | | | 1,028.40 | | | | 0.90% | | | | 4.55 | |
Hypothetical 5% return (5% return before expenses) | |
Class A | | | $1,000.00 | | | | $1,019.20 | | | | 1.15% | | | | $5.79 | |
Class C | | | 1,000.00 | | | | 1,015.46 | | | | 1.90% | | | | 9.55 | |
Class R | | | 1,000.00 | | | | 1,017.95 | | | | 1.40% | | | | 7.04 | |
Institutional Class | | | 1,000.00 | | | | 1,020.44 | | | | 0.90% | | | | 4.53 | |
*“Expenses Paid During Period” are equal to the relevant Fund’s annualized expense ratio, multiplied by the average account value over the period, multiplied by 182/365 (to reflect the one-half year period).
†Because actual returns reflect only the most recent six-month period, the returns shown may differ significantly from fiscal year returns.
Security type / sector allocations, top 10 equity
holdings and country allocations
Delaware Foundation® Growth Allocation Fund
As of March 31, 2017 (Unaudited)
Sector, country, and region designations may be different than the sector designations presented in other Fund materials. The sector designations may represent the investment manager’s internal sector classifications, which may result in the sector designations for one fund being different than another fund’s sector designations.
| | | | |
| Security type / sector | | Percentage
of net assets | |
Common Stock | | | 70.61% | |
U.S. Markets | | | 38.31% | |
Consumer Discretionary | | | 2.86% | |
Consumer Staples | | | 2.05% | |
Energy | | | 2.47% | |
Financials | | | 4.87% | |
Healthcare | | | 5.76% | |
Industrials | | | 3.85% | |
Information Technology | | | 7.43% | |
Materials | | | 1.15% | |
Real Estate | | | 6.30% | |
Telecommunication Services | | | 1.00% | |
Utilities | | | 0.57% | |
Developed Markets | | | 22.97% | |
Consumer Discretionary | | | 3.91% | |
Consumer Staples | | | 3.41% | |
Energy | | | 0.68% | |
Financials | | | 2.85% | |
Healthcare | | | 3.14% | |
Industrials | | | 4.70% | |
Information Technology | | | 1.55% | |
Materials | | | 1.36% | |
Real Estate | | | 0.18% | |
Telecommunication Services | | | 1.03% | |
Utilities | | | 0.16% | |
Emerging Markets | | | 9.33% | |
Consumer Discretionary | | | 0.77% | |
Consumer Staples | | | 1.28% | |
Energy | | | 1.39% | |
Financials | | | 1.19% | |
Healthcare | | | 0.06% | |
Industrials | | | 0.15% | |
Information Technology | | | 2.59% | |
Materials | | | 0.42% | |
Real Estate | | | 0.14% | |
Telecommunication Services | | | 1.34% | |
Utilities | | | 0.00% | |
Exchange-Traded Funds | | | 2.90% | |
Agency Collateralized Mortgage Obligations | | | 4.44% | |
Agency Commercial Mortgage-Backed Securities | | | 0.25% | |
| | | | |
| Security type / sector | | Percentage
of net assets | |
Agency Mortgage-Backed Securities | | | 4.01% | |
Collateralized Debt Obligations | | | 0.31% | |
Convertible Bond | | | 0.06% | |
Corporate Bonds | | | 11.08% | |
Banking | | | 1.84% | |
Basic Industry | | | 0.90% | |
Capital Goods | | | 0.43% | |
Consumer Cyclical | | | 0.77% | |
Consumer Non-Cyclical | | | 1.17% | |
Energy | | | 1.02% | |
Financials | | | 0.35% | |
Insurance | | | 0.62% | |
Media | | | 0.33% | |
Real Estate | | | 0.66% | |
Services | | | 0.11% | |
Technology | | | 0.39% | |
Telecommunications | | | 0.55% | |
Transportation | | | 0.38% | |
Utilities | | | 1.56% | |
Loan Agreements | | | 1.55% | |
Municipal Bonds | | | 0.21% | |
Non-Agency Asset-Backed Securities | | | 1.12% | |
Non-Agency Collateralized Mortgage Obligations | | | 0.06% | |
Non-Agency Commercial Mortgage-Backed Securities | | | 1.41% | |
Regional Bonds | | | 0.05% | |
Sovereign Bonds | | | 0.12% | |
Supranational Banks | | | 0.06% | |
U.S. Treasury Obligations | | | 1.28% | |
Preferred Stock | | | 0.12% | |
Rights | | | 0.01% | |
Short-Term Investments | | | 1.51% | |
Total Value of Securities | | | 101.16% | |
Liabilities Net of Receivables and Other Assets | | | (1.16%) | |
Total Net Assets | | | 100.00% | |
Holdings are for informational purposes only and are subject to change at any time. They are not a recommendation to buy, sell, or hold any security.
| | |
| Top 10 equity holdings | | Percentage
of net assets |
Reliance Industries GDR | | 0.65% |
Novartis | | 0.61% |
AT&T | | 0.59% |
Microsoft | | 0.56% |
Samsung Electronics | | 0.55% |
ITOCHU | | 0.55% |
Mitsubishi UFJ Financial Group | | 0.54% |
Sanofi | | 0.53% |
Vinci | | 0.52% |
Chevron | | 0.51% |
| *Country / market | | Percentage of net assets |
Developed Markets | | 24.63% |
Australia | | 1.13% |
Austria | | 0.06% |
Belgium | | 0.15% |
Canada | | 1.14% |
Cayman Islands | | 0.46% |
Denmark | | 0.48% |
Finland | | 0.11% |
France | | 3.59% |
Germany | | 1.61% |
Hong Kong | | 1.04% |
Ireland | | 0.21% |
Israel | | 0.51% |
Italy | | 0.35% |
Japan | | 5.79% |
Netherlands | | 1.48% |
| | |
| *Country / market | | Percentage
of net assets |
New Zealand | | 0.08% |
Norway | | 0.06% |
Portugal | | 0.07% |
Singapore | | 0.04% |
Spain | | 0.18% |
Sweden | | 0.92% |
Switzerland | | 1.81% |
United Kingdom | | 3.36% |
Emerging Markets | | 9.47% |
Argentina | | 0.16% |
Brazil | | 1.30% |
Chile | | 0.12% |
China | | 2.05% |
Colombia | | 0.03% |
Hungary | | 0.04% |
India | | 1.08% |
Indonesia | | 0.11% |
Malaysia | | 0.04% |
Mexico | | 0.91% |
Peru | | 0.05% |
Republic of Korea | | 1.67% |
Russia | | 0.74% |
South Africa | | 0.12% |
Taiwan | | 0.62% |
Thailand | | 0.20% |
Turkey | | 0.23% |
Supranational | | 0.06% |
U.S. Markets | | 65.49% |
Total | | 99.65% |
*Allocation includes all investments except for short-term investments.
Security type / sector allocations, top 10 equity holdings and country allocations
Delaware Foundation® Moderate Allocation Fund
As of March 31, 2017 (Unaudited)
Sector, country, and region designations may be different than the sector designations presented in other Fund materials. The sector designations may represent the investment manager’s internal sector classifications, which may result in the sector designations for one fund being different than another fund’s sector designations.
| | | | |
| Security type / sector | | Percentage
of net assets | |
Common Stock | | | 52.54% | |
U.S. Markets | | | 28.57% | |
Consumer Discretionary | | | 2.11% | |
Consumer Staples | | | 1.54% | |
Energy | | | 1.80% | |
Financials | | | 3.64% | |
Healthcare | | | 4.28% | |
Industrials | | | 2.88% | |
Information Technology | | | 5.50% | |
Materials | | | 0.86% | |
Real Estate | | | 4.79% | |
Telecommunication Services | | | 0.75% | |
Utilities | | | 0.42% | |
Developed Markets | | | 17.25% | |
Consumer Discretionary | | | 2.92% | |
Consumer Staples | | | 2.57% | |
Energy | | | 0.51% | |
Financials | | | 2.15% | |
Healthcare | | | 2.39% | |
Industrials | | | 3.52% | |
Information Technology | | | 1.15% | |
Materials | | | 1.03% | |
Real Estate | | | 0.13% | |
Telecommunication Services | | | 0.76% | |
Utilities | | | 0.12% | |
Emerging Markets | | | 6.72% | |
Consumer Discretionary | | | 0.54% | |
Consumer Staples | | | 0.92% | |
Energy | | | 0.97% | |
Financials | | | 0.85% | |
Healthcare | | | 0.04% | |
Industrials | | | 0.11% | |
Information Technology | | | 1.93% | |
Materials | | | 0.31% | |
Real Estate | | | 0.09% | |
Telecommunication Services | | | 0.96% | |
Exchange-Traded Funds | | | 2.38% | |
Agency Asset-Backed Securities | | | 0.02% | |
Agency Collateralized Mortgage Obligations | | | 7.22% | |
Agency Commercial Mortgage-Backed Securities | | | 0.41% | |
Agency Mortgage-Backed Securities | | | 6.45% | |
| | | | |
| Security type / sector | | Percentage
of net��assets | |
Collateralized Debt Obligations | | | 1.04% | |
Convertible Bond | | | 0.09% | |
Corporate Bonds | | | 22.17% | |
Banking | | | 5.15% | |
Basic Industry | | | 1.53% | |
Capital Goods | | | 0.98% | |
Consumer Cyclical | | | 1.41% | |
Consumer Non-Cyclical | | | 1.92% | |
Energy | | | 2.07% | |
Financials | | | 0.76% | |
Insurance | | | 0.77% | |
Media | | | 0.67% | |
Real Estate | | | 0.94% | |
Services | | | 0.14% | |
Technology | | | 0.66% | |
Telecommunications | | | 1.33% | |
Transportation | | | 0.68% | |
Utilities | | | 3.16% | |
Loan Agreements | | | 1.01% | |
Municipal Bonds | | | 0.36% | |
Non-Agency Asset-Backed Securities | | | 1.96% | |
Non-Agency Collateralized Mortgage Obligations | | | 0.46% | |
Non-Agency Commercial Mortgage-Backed Securities | | | 2.01% | |
Regional Bonds | | | 0.16% | |
Sovereign Bonds | | | 0.60% | |
Supranational Banks | | | 0.08% | |
U.S. Treasury Obligations | | | 0.65% | |
Preferred Stock | | | 0.36% | |
Rights | | | 0.01% | |
Short-Term Investments | | | 1.73% | |
Total Value of Securities | | | 101.71% | |
Liabilities Net of Receivables and Other Assets | | | (1.71%) | |
Total Net Assets | | | 100.00% | |
18
Holdings are for informational purposes only and are subject to change at any time. They are not a recommendation to buy, sell, or hold any security.
| | | | |
| Top 10 equity holdings | | Percentage
of net assets | |
Novartis | | | 0.47% | |
Reliance Industries GDR | | | 0.45% | |
AT&T | | | 0.44% | |
Equity Residential | | | 0.42% | |
ITOCHU | | | 0.42% | |
Microsoft | | | 0.41% | |
Samsung Electronics | | | 0.41% | |
Mitsubishi UFJ Financial Group | | | 0.40% | |
Sanofi | | | 0.40% | |
Vinci | | | 0.38% | |
| *Country / market | | Percentage
of net assets | |
Developed Markets | | | 23.27% | |
Australia | | | 1.10% | |
Austria | | | 0.05% | |
Belgium | | | 0.11% | |
Bermuda | | | 0.14% | |
Canada | | | 1.26% | |
Cayman Islands | | | 1.19% | |
Denmark | | | 0.36% | |
Finland | | | 0.08% | |
France | | | 2.79% | |
Germany | | | 1.28% | |
Guernsey | | | 0.12% | |
Hong Kong | | | 0.77% | |
Ireland | | | 0.35% | |
Israel | | | 0.39% | |
Italy | | | 0.34% | |
Japan | | | 4.34% | |
Jersey | | | 0.07% | |
Luxembourg | | | 0.12% | |
Netherlands | | | 2.17% | |
New Zealand | | | 0.09% | |
Norway | | | 0.04% | |
| | | | |
| *Country / market | | Percentage
of net assets | |
Portugal | | | 0.06% | |
Singapore | | | 0.03% | |
Spain | | | 0.14% | |
Sweden | | | 0.77% | |
Switzerland | | | 1.72% | |
United Kingdom | | | 3.39% | |
Emerging Markets | | | 8.77% | |
Argentina | | | 0.43% | |
Barbados | | | 0.08% | |
Brazil | | | 1.03% | |
Chile | | | 0.32% | |
China | | | 1.60% | |
Colombia | | | 0.11% | |
Costa Rica | | | 0.08% | |
Curacao | | | 0.04% | |
Hungary | | | 0.05% | |
India | | | 0.82% | |
Indonesia | | | 0.24% | |
Jamaica | | | 0.06% | |
Malaysia | | | 0.03% | |
Mexico | | | 0.87% | |
Morocco | | | 0.07% | |
Panama | | | 0.08% | |
Peru | | | 0.12% | |
Republic of Korea | | | 1.26% | |
Russia | | | 0.51% | |
Saudi Arabia | | | 0.07% | |
South Africa | | | 0.08% | |
Sri Lanka | | | 0.07% | |
Taiwan | | | 0.46% | |
Thailand | | | 0.13% | |
Turkey | | | 0.16% | |
Supranational | | | 0.08% | |
U.S. Markets | | | 67.86% | |
Total | | | 99.98% | |
*Allocation includes all investments except for short-term investments.
Security type / sector allocations, top 10 equity holdings and country allocations
Delaware Foundation® Conservative Allocation Fund
As of March 31, 2017 (Unaudited)
Sector, country, and region designations may be different than the sector designations presented in other Fund materials. The sector designations may represent the investment manager’s internal sector classifications, which may result in the sector designations for one fund being different than another fund’s sector designations.
| | | | |
| Security type / sector | | Percentage
of net assets | |
Common Stock | | | 35.97% | |
U.S. Markets | | | 19.20% | |
Consumer Discretionary | | | 1.42% | |
Consumer Staples | | | 1.02% | |
Energy | | | 1.24% | |
Financials | | | 2.48% | |
Healthcare | | | 2.87% | |
Industrials | | | 1.94% | |
Information Technology | | | 3.72% | |
Materials | | | 0.58% | |
Real Estate | | | 3.14% | |
Telecommunication Services | | | 0.50% | |
Utilities | | | 0.29% | |
Developed Markets | | | 11.88% | |
Consumer Discretionary | | | 2.04% | |
Consumer Staples | | | 1.77% | |
Energy | | | 0.34% | |
Financials | | | 1.45% | |
Healthcare | | | 1.66% | |
Industrials | | | 2.42% | |
Information Technology | | | 0.80% | |
Materials | | | 0.71% | |
Real Estate | | | 0.09% | |
Telecommunication Services | | | 0.52% | |
Utilities | | | 0.08% | |
Emerging Markets | | | 4.89% | |
Consumer Discretionary | | | 0.40% | |
Consumer Staples | | | 0.69% | |
Energy | | | 0.71% | |
Financials | | | 0.63% | |
Healthcare | | | 0.03% | |
Industrials | | | 0.08% | |
Information Technology | | | 1.36% | |
Materials | | | 0.22% | |
Real Estate | | | 0.07% | |
Telecommunication Services | | | 0.70% | |
Exchange-Traded Funds | | | 1.26% | |
Agency Collateralized Mortgage Obligations | | | 10.49% | |
Agency Commercial Mortgage-Backed Securities | | | 0.68% | |
Agency Mortgage-Backed Securities | | | 9.58% | |
Collateralized Debt Obligations | | | 1.79% | |
| | | | |
| Security type / sector | | Percentage
of net assets | |
Convertible Bond | | | 0.13% | |
Corporate Bonds | | | 30.07% | |
Banking | | | 5.97% | |
Basic Industry | | | 2.49% | |
Capital Goods | | | 1.16% | |
Consumer Cyclical | | | 1.85% | |
Consumer Non-Cyclical | | | 2.69% | |
Energy | | | 2.59% | |
Financials | | | 1.27% | |
Insurance | | | 1.01% | |
Media | | | 0.71% | |
Real Estate | | | 1.60% | |
Services | | | 0.23% | |
Technology | | | 0.73% | |
Telecommunications | | | 2.33% | |
Transportation | | | 0.74% | |
Utilities | | | 4.70% | |
Loan Agreements | | | 1.56% | |
Municipal Bonds | | | 0.47% | |
Non-Agency Asset-Backed Securities | | | 3.40% | |
Non-Agency Collateralized Mortgage Obligations | | | 1.35% | |
Non-Agency Commercial Mortgage-Backed Securities | | | 3.32% | |
Regional Bond | | | 0.07% | |
Sovereign Bonds | | | 0.36% | |
Supranational Banks | | | 0.15% | |
U.S. Treasury Obligations | | | 1.46% | |
Preferred Stock | | | 0.71% | |
Rights | | | 0.01% | |
Short-Term Investments | | | 0.64% | |
Total Value of Securities | | | 103.47% | |
Liabilities Net of Receivables and Other Assets | | | (3.47%) | |
Total Net Assets | | | 100.00% | |
20
Holdings are for informational purposes only and are subject to change at any time. They are not a recommendation to buy, sell, or hold any security.
| | |
| Top 10 equity holdings | | Percentage
of net assets |
Reliance Industries GDR | | 0.33% |
Novartis | | 0.32% |
AT&T | | 0.29% |
Samsung Electronics | | 0.29% |
Equity Residential | | 0.28% |
Microsoft | | 0.28% |
Mitsubishi UFJ Financial Group | | 0.27% |
Sanofi | | 0.27% |
Vinci | | 0.26% |
ITOCHU | | 0.26% |
| *Country / market | | Percentage of net assets |
Developed Markets | | 19.42% |
Australia | | 0.83% |
Austria | | 0.03% |
Belgium | | 0.08% |
Canada | | 1.37% |
Cayman Islands | | 1.95% |
Denmark | | 0.25% |
Finland | | 0.06% |
France | | 1.84% |
Germany | | 0.94% |
Guernsey | | 0.32% |
Hong Kong | | 0.54% |
Ireland | | 0.45% |
Israel | | 0.27% |
Italy | | 0.46% |
Japan | | 2.99% |
Jersey | | 0.25% |
Luxembourg | | 0.40% |
| | |
| *Country / market | | Percentage of net assets |
Netherlands | | 1.73% |
New Zealand | | 0.11% |
Norway | | 0.03% |
Portugal | | 0.09% |
Singapore | | 0.02% |
Spain | | 0.10% |
Sweden | | 0.47% |
Switzerland | | 1.22% |
United Kingdom | | 2.62% |
Emerging Markets | | 6.40% |
Argentina | | 0.15% |
Brazil | | 0.75% |
Chile | | 0.09% |
China | | 1.07% |
Colombia | | 0.03% |
Hungary | | 0.08% |
India | | 0.80% |
Indonesia | | 0.06% |
Jamaica | | 0.21% |
Malaysia | | 0.02% |
Mexico | | 0.97% |
Morocco | | 0.24% |
Peru | | 0.05% |
Republic of Korea | | 0.89% |
Russia | | 0.38% |
South Africa | | 0.07% |
Taiwan | | 0.33% |
Thailand | | 0.09% |
Turkey | | 0.12% |
Supranational | | 0.15% |
U.S. Markets | | 76.86% |
Total | | 102.83% |
*Allocation includes all investments except for short-term investments.
Schedules of investments
Delaware Foundation® Growth Allocation Fund
March 31, 2017
| | | | | | | | |
| | | Number of shares | | | Value (U.S. $) | |
| |
Common Stock – 70.61% | | | | | |
| |
U.S. Markets – 38.31% | | | | | |
Consumer Discretionary – 2.86% | | | | | |
Amazon.com † | | | 90 | | | $ | 79,789 | |
Aramark | | | 990 | | | | 36,501 | |
BorgWarner | | | 990 | | | | 41,372 | |
Cheesecake Factory | | | 530 | | | | 33,581 | |
Chuy’s Holdings † | | | 560 | | | | 16,688 | |
Cinemark Holdings | | | 1,090 | | | | 48,331 | |
Comcast Class A | | | 1,940 | | | | 72,925 | |
Del Frisco’s Restaurant Group † | | | 2,045 | | | | 36,912 | |
Dollar General | | | 987 | | | | 68,824 | |
Fiesta Restaurant Group † | | | 610 | | | | 14,762 | |
Five Below † | | | 815 | | | | 35,298 | |
Ford Motor | | | 3,720 | | | | 43,301 | |
Home Depot | | | 600 | | | | 88,098 | |
Jack in the Box | | | 550 | | | | 55,946 | |
Liberty Global Class A † | | | 736 | | | | 26,400 | |
Liberty Global Class C † | | | 2,762 | | | | 96,780 | |
Liberty Interactive Corp. QVC Group Class A † | | | 6,834 | | | | 136,817 | |
Lowe’s | | | 2,900 | | | | 238,409 | |
Malibu Boats Class A † | | | 1,900 | | | | 42,655 | |
National CineMedia | | | 1,960 | | | | 24,755 | |
Newell Brands | | | 1,356 | | | | 63,963 | |
NIKE Class B | | | 800 | | | | 44,584 | |
Shutterfly † | | | 665 | | | | 32,113 | |
Starbucks | | | 1,210 | | | | 70,652 | |
Steven Madden † | | | 1,377 | | | | 53,083 | |
Tenneco | | | 840 | | | | 52,433 | |
Tractor Supply | | | 490 | | | | 33,795 | |
TripAdvisor † | | | 2,150 | | | | 92,794 | |
Walt Disney | | | 1,200 | | | | 136,068 | |
| | | | | | | | |
| | | | | | | 1,817,629 | |
| | | | | | | | |
Consumer Staples – 2.05% | | | | | |
Archer-Daniels-Midland | | | 5,100 | | | | 234,804 | |
Casey’s General Stores | | | 340 | | | | 38,165 | |
CVS Health | | | 3,700 | | | | 290,450 | |
General Mills | | | 590 | | | | 34,816 | |
J&J Snack Foods | | | 317 | | | | 42,973 | |
Kimberly-Clark | | | 250 | | | | 32,907 | |
Kraft Heinz | | | 2,533 | | | | 230,022 | |
Mondelez International | | | 5,300 | | | | 228,324 | |
PepsiCo | | | 470 | | | | 52,574 | |
Pinnacle Foods | | | 600 | | | | 34,722 | |
Procter & Gamble | | | 360 | | | | 32,346 | |
Walgreens Boots Alliance | | | 573 | | | | 47,588 | |
| | | | | | | | |
| | | | | | | 1,299,691 | |
| | | | | | | | |
| | | | | | | | |
| | | Number of shares | | | Value (U.S. $) | |
| |
Common Stock (continued) | | | | | |
| |
U.S. Markets (continued) | | | | | |
Energy – 2.47% | | | | | |
Carrizo Oil & Gas † | | | 1,250 | | | $ | 35,825 | |
Chevron | | | 3,000 | | | | 322,110 | |
ConocoPhillips | | | 5,100 | | | | 254,337 | |
EOG Resources | | | 480 | | | | 46,824 | |
Halliburton | | | 5,550 | | | | 273,115 | |
Keane Group † | | | 615 | | | | 8,795 | |
Marathon Oil | | | 10,800 | | | | 170,640 | |
Occidental Petroleum | | | 4,140 | | | | 262,310 | |
PDC Energy † | | | 585 | | | | 36,475 | |
Pioneer Energy Services † | | | 1,740 | | | | 6,960 | |
Pioneer Natural Resources | | | 370 | | | | 68,905 | |
RSP Permian † | | | 885 | | | | 36,666 | |
SRC Energy † | | | 3,800 | | | | 32,072 | |
Superior Energy Services † | | | 1,120 | | | | 15,971 | |
| | | | | | | | |
| | | | | | | 1,571,005 | |
| | | | | | | | |
Financials – 4.87% | | | | | |
Aflac | | | 1,120 | | | | 81,110 | |
Allstate | | | 2,900 | | | | 236,321 | |
American Equity Investment Life Holding | | | 1,545 | | | | 36,508 | |
Bank of New York Mellon | | | 4,900 | | | | 231,427 | |
BB&T | | | 4,800 | | | | 214,560 | |
BlackRock | | | 180 | | | | 69,032 | |
Bryn Mawr Bank | | | 640 | | | | 25,280 | |
Capital One Financial | | | 700 | | | | 60,662 | |
Cardinal Financial | | | 1,310 | | | | 39,221 | |
Charles Schwab | | | 2,478 | | | | 101,127 | |
Citigroup | | | 1,590 | | | | 95,114 | |
City Holding | | | 781 | | | | 50,359 | |
CoBiz Financial | | | 1,705 | | | | 28,644 | |
East West Bancorp | | | 340 | | | | 17,547 | |
Essent Group † | | | 1,440 | | | | 52,085 | |
Evercore Partners Class A | | | 480 | | | | 37,392 | |
First Bancorp (North Carolina) | | | 615 | | | | 18,013 | |
Flushing Financial | | | 705 | | | | 18,943 | |
Great Western Bancorp | | | 1,200 | | | | 50,892 | |
Hope Bancorp | | | 2,275 | | | | 43,612 | |
Houlihan Lokey | | | 900 | | | | 31,005 | |
Independent Bank (Massachusetts) | | | 455 | | | | 29,575 | |
Infinity Property & Casualty | | | 390 | | | | 37,245 | |
Intercontinental Exchange | | | 3,154 | | | | 188,830 | |
Invesco | | | 1,830 | | | | 56,053 | |
JPMorgan Chase & Co. | | | 1,710 | | | | 150,206 | |
KeyCorp | | | 3,280 | | | | 58,318 | |
| | | | | | | | |
| | | Number of shares | | | Value (U.S. $) | |
| |
Common Stock (continued) | | | | | |
| |
U.S. Markets (continued) | | | | | |
Financials (continued) | | | | | | | | |
Marsh & McLennan | | | 3,200 | | | $ | 236,448 | |
MGIC Investment † | | | 7,215 | | | | 73,088 | |
Old National Bancorp | | | 2,920 | | | | 50,662 | |
Primerica | | | 715 | | | | 58,773 | |
Prosperity Bancshares | | | 765 | | | | 53,328 | |
Prudential Financial | | | 510 | | | | 54,407 | |
Raymond James Financial | | | 630 | | | | 48,044 | |
Reinsurance Group of America | | | 210 | | | | 26,666 | |
Selective Insurance Group | | | 1,055 | | | | 49,743 | |
State Street | | | 600 | | | | 47,766 | |
Sterling Bancorp | | | 2,555 | | | | 60,553 | |
Stifel Financial † | | | 825 | | | | 41,407 | |
Travelers | | | 340 | | | | 40,984 | |
Umpqua Holdings | | | 2,700 | | | | 47,898 | |
United Fire Group | | | 350 | | | | 14,970 | |
Validus Holdings | | | 540 | | | | 30,451 | |
Webster Financial | | | 1,050 | | | | 52,542 | |
WSFS Financial | | | 940 | | | | 43,193 | |
| | | | | | | | |
| | | | | | | 3,090,004 | |
| | | | | | | | |
Healthcare – 5.76% | | | | | |
Abbott Laboratories | | | 6,390 | | | | 283,780 | |
AbbVie | | | 440 | | | | 28,670 | |
Acorda Therapeutics † | | | 810 | | | | 17,010 | |
Air Methods † | | | 775 | | | | 33,325 | |
Alkermes † | | | 430 | | | | 25,155 | |
Allergan | | | 470 | | | | 112,292 | |
Biogen † | | | 486 | | | | 132,882 | |
Brookdale Senior Living † | | | 4,350 | | | | 58,421 | |
Cardinal Health | | | 2,900 | | | | 236,495 | |
Catalent † | | | 1,695 | | | | 48,002 | |
Celgene † | | | 2,258 | | | | 280,963 | |
Cigna | | | 450 | | | | 65,921 | |
CONMED | | | 1,010 | | | | 44,854 | |
CryoLife † | | | 1,767 | | | | 29,421 | |
DENTSPLY SIRONA | | | 1,592 | | | | 99,404 | |
Edwards Lifesciences † | | | 420 | | | | 39,509 | |
Eli Lilly & Co. | | | 600 | | | | 50,466 | |
Exact Sciences † | | | 860 | | | | 20,313 | |
Express Scripts Holding † | | | 4,140 | | | | 272,867 | |
Gilead Sciences | | | 710 | | | | 48,223 | |
HealthSouth | | | 800 | | | | 34,248 | |
Johnson & Johnson | | | 2,410 | | | | 300,165 | |
Ligand Pharmaceuticals Class B † | | | 465 | | | | 49,216 | |
Medicines † | | | 905 | | | | 44,255 | |
Merck & Co. | | | 4,670 | | | | 296,732 | |
| | | | | | | | |
| | | Number of shares | | | Value (U.S. $) | |
| |
Common Stock (continued) | | | | | |
| |
U.S. Markets (continued) | | | | | |
Healthcare (continued) | | | | | | | | |
Merit Medical Systems † | | | 1,508 | | | $ | 43,581 | |
Natera † | | | 770 | | | | 6,830 | |
Pfizer | | | 6,738 | | | | 230,507 | |
Prestige Brands Holdings † | | | 766 | | | | 42,559 | |
Quest Diagnostics | | | 2,400 | | | | 235,656 | |
Quidel † | | | 1,785 | | | | 40,412 | |
Quintiles IMS Holdings † | | | 1,497 | | | | 120,553 | |
Repligen † | | | 725 | | | | 25,520 | |
Retrophin † | | | 1,520 | | | | 28,059 | |
Spectrum Pharmaceuticals † | | | 3,135 | | | | 20,377 | |
TESARO † | | | 335 | | | | 51,546 | |
Thermo Fisher Scientific | | | 350 | | | | 53,760 | |
Vanda Pharmaceuticals † | | | 2,120 | | | | 29,680 | |
Vertex Pharmaceuticals † | | | 310 | | | | 33,899 | |
Wright Medical Group † | | | 1,250 | | | | 38,900 | |
| | | | | | | | |
| | | | | | | 3,654,428 | |
| | | | | | | | |
Industrials – 3.85% | | | | | |
AAON | | | 1,555 | | | | 54,969 | |
ABM Industries | | | 1,105 | | | | 48,178 | |
Applied Industrial Technologies | | | 780 | | | | 48,243 | |
Barnes Group | | | 1,230 | | | | 63,148 | |
Casella Waste Systems † | | | 642 | | | | 9,059 | |
Columbus McKinnon | | | 1,586 | | | | 39,365 | |
Continental Building Products † | | | 2,140 | | | | 52,430 | |
Eaton | | | 610 | | | | 45,232 | |
ESCO Technologies | | | 1,025 | | | | 59,553 | |
Esterline Technologies † | | | 225 | | | | 19,361 | |
Federal Signal | | | 1,575 | | | | 21,751 | |
FedEx | | | 567 | | | | 110,650 | |
General Electric | | | 4,100 | | | | 122,180 | |
Granite Construction | | | 985 | | | | 49,437 | |
Hawaiian Holdings † | | | 220 | | | | 10,219 | |
Honeywell International | | | 320 | | | | 39,958 | |
Kadant | | | 985 | | | | 58,460 | |
KeyW Holding † | | | 2,170 | | | | 20,485 | |
Kforce | | | 1,600 | | | | 38,000 | |
KLX † | | | 900 | | | | 40,230 | |
Lockheed Martin | | | 160 | | | | 42,816 | |
MYR Group † | | | 1,015 | | | | 41,615 | |
Nielsen Holdings | | | 2,881 | | | | 119,014 | |
Northrop Grumman | | | 1,000 | | | | 237,840 | |
On Assignment † | | | 1,105 | | | | 53,626 | |
Parker-Hannifin | | | 450 | | | | 72,144 | |
Raytheon | | | 1,500 | | | | 228,750 | |
Schedules of investments
Delaware Foundation® Growth Allocation Fund
| | | | | | | | |
| | | Number of shares | | | Value (U.S. $) | |
| |
Common Stock (continued) | | | | | |
| |
U.S. Markets (continued) | | | | | |
Industrials (continued) | | | | | | | | |
Rockwell Collins | | | 330 | | | $ | 32,063 | |
Southwest Airlines | | | 510 | | | | 27,418 | |
Swift Transportation † | | | 1,415 | | | | 29,064 | |
Tetra Tech | | | 1,095 | | | | 44,731 | |
TransUnion † | | | 780 | | | | 29,913 | |
TriNet Group † | | | 1,205 | | | | 34,825 | |
U.S. Ecology | | | 795 | | | | 37,246 | |
Union Pacific | | | 720 | | | | 76,262 | |
United Technologies | | | 600 | | | | 67,326 | |
WageWorks † | | | 536 | | | | 38,753 | |
Waste Management | | | 3,200 | | | | 233,344 | |
XPO Logistics † | | | 1,030 | | | | 49,327 | |
| | | | | | | | |
| | | | | | | 2,446,985 | |
| | | | | | | | |
Information Technology – 7.43% | | | | | |
Accenture Class A | | | 460 | | | | 55,145 | |
Adobe Systems † | | | 680 | | | | 88,488 | |
Alphabet Class A † | | | 350 | | | | 296,730 | |
Alphabet Class C † | | | 135 | | | | 111,991 | |
Analog Devices | | | 410 | | | | 33,599 | |
Anixter International † | | | 485 | | | | 38,461 | |
Apple | | | 1,110 | | | | 159,463 | |
Broadcom | | | 350 | | | | 76,636 | |
Brooks Automation | | | 1,415 | | | | 31,696 | |
CA | | | 7,274 | | | | 230,731 | |
Callidus Software † | | | 2,255 | | | | 48,144 | |
Cisco Systems | | | 8,270 | | | | 279,526 | |
Convergys | | | 1,825 | | | | 38,599 | |
eBay † | | | 4,880 | | | | 163,822 | |
Electronic Arts † | | | 1,447 | | | | 129,535 | |
ExlService Holdings † | | | 945 | | | | 44,755 | |
Facebook Class A † | | | 2,042 | | | | 290,066 | |
GrubHub † | | | 805 | | | | 26,476 | |
Guidewire Software † | | | 240 | | | | 13,519 | |
II-VI † | | | 660 | | | | 23,793 | |
Intel | | | 8,840 | | | | 318,859 | |
Intuit | | | 634 | | | | 73,538 | |
j2 Global | | | 740 | | | | 62,093 | |
MACOM Technology Solutions Holdings † | | | 845 | | | | 40,813 | |
Mastercard Class A | | | 1,517 | | | | 170,617 | |
Maxim Integrated Products | | | 880 | | | | 39,565 | |
MaxLinear Class A † | | | 1,700 | | | | 47,685 | |
Microsemi † | | | 1,175 | | | | 60,548 | |
Microsoft | | | 5,445 | | | | 358,608 | |
NETGEAR † | | | 675 | | | | 33,446 | |
Oracle | | | 5,300 | | | | 236,433 | |
| | | | | | | | |
| | | Number of shares | | | Value (U.S. $) | |
| |
Common Stock (continued) | | | | | |
| |
U.S. Markets (continued) | | | | | |
Information Technology (continued) | | | | | |
PayPal Holdings † | | | 4,823 | | | $ | 207,485 | |
Plantronics | | | 570 | | | | 30,843 | |
Proofpoint † | | | 700 | | | | 52,052 | |
Q2 Holdings † | | | 760 | | | | 26,486 | |
QUALCOMM | | | 1,859 | | | | 106,595 | |
salesforce.com † | | | 900 | | | | 74,241 | |
Semtech † | | | 1,515 | | | | 51,207 | |
Silicon Laboratories † | | | 445 | | | | 32,730 | |
SS&C Technologies Holdings | | | 980 | | | | 34,692 | |
Symantec | | | 4,002 | | | | 122,781 | |
Synaptics † | | | 630 | | | | 31,191 | |
Tyler Technologies † | | | 310 | | | | 47,914 | |
Visa Class A | | | 2,408 | | | | 213,999 | |
Yahoo † | | | 1,400 | | | | 64,974 | |
| | | | | | | | |
| | | | | | | 4,720,570 | |
| | | | | | | | |
Materials – 1.15% | | | | | |
Axalta Coating Systems † | | | 1,720 | | | | 55,384 | |
Balchem | | | 355 | | | | 29,259 | |
Boise Cascade † | | | 1,145 | | | | 30,571 | |
Chemtura † | | | 575 | | | | 19,205 | |
Eastman Chemical | | | 690 | | | | 55,752 | |
EI du Pont de Nemours & Co. | | | 2,900 | | | | 232,957 | |
Kaiser Aluminum | | | 475 | | | | 37,953 | |
Minerals Technologies | | | 830 | | | | 63,578 | |
Neenah Paper | | | 670 | | | | 50,049 | |
Quaker Chemical | | | 450 | | | | 59,247 | |
WestRock | | | 908 | | | | 47,243 | |
Worthington Industries | | | 1,060 | | | | 47,795 | |
| | | | | | | | |
| | | | | | | 728,993 | |
| | | | | | | | |
Real Estate – 6.30% | | | | | |
American Tower | | | 760 | | | | 92,370 | |
Apartment Investment & Management | | | 1,575 | | | | 69,851 | |
AvalonBay Communities | | | 350 | | | | 64,260 | |
Boston Properties | | | 600 | | | | 79,446 | |
Brandywine Realty Trust | | | 3,475 | | | | 56,399 | |
Cousins Properties | | | 4,225 | | | | 34,941 | |
Crown Castle International | | | 1,803 | | | | 170,293 | |
DCT Industrial Trust | | | 1,694 | | | | 81,515 | |
DDR | | | 3,075 | | | | 38,530 | |
Douglas Emmett | | | 1,825 | | | | 70,080 | |
EastGroup Properties | | | 600 | | | | 44,118 | |
Empire State Realty Trust | | | 750 | | | | 15,480 | |
EPR Properties | | | 1,070 | | | | 78,784 | |
Equinix | | | 230 | | | | 92,085 | |
Equity LifeStyle Properties | | | 1,175 | | | | 90,545 | |
| | | | | | | | |
| | | Number of shares | | | Value (U.S. $) | |
| |
Common Stock (continued) | | | | | |
| |
U.S. Markets (continued) | | | | | |
Real Estate (continued) | | | | | |
Equity Residential | | | 4,550 | | | $ | 283,101 | |
Essex Property Trust | | | 250 | | | | 57,883 | |
Extra Space Storage | | | 1,050 | | | | 78,109 | |
Federal Realty Investment Trust | | | 475 | | | | 63,413 | |
First Industrial Realty Trust | | | 4,395 | | | | 117,039 | |
First Potomac Realty Trust | | | 4,200 | | | | 43,176 | |
GGP | | | 2,400 | | | | 55,632 | |
Gramercy Property Trust | | | 1,858 | | | | 48,865 | |
Healthcare Realty Trust | | | 1,275 | | | | 41,437 | |
Healthcare Trust of America Class A | | | 2,237 | | | | 70,376 | |
Highwoods Properties | | | 1,375 | | | | 67,554 | |
Host Hotels & Resorts | | | 5,985 | | | | 111,680 | |
Kilroy Realty | | | 875 | | | | 63,070 | |
Kimco Realty | | | 2,350 | | | | 51,911 | |
Kite Realty Group Trust | | | 2,160 | | | | 46,440 | |
LaSalle Hotel Properties | | | 2,805 | | | | 81,205 | |
Lexington Realty Trust | | | 3,325 | | | | 33,183 | |
Liberty Property Trust | | | 1,550 | | | | 59,753 | |
Life Storage | | | 510 | | | | 41,881 | |
LTC Properties | | | 1,425 | | | | 68,257 | |
Macerich | | | 800 | | | | 51,520 | |
Mack-Cali Realty | | | 1,570 | | | | 42,296 | |
Mid-America Apartment Communities | | | 748 | | | | 76,102 | |
National Retail Properties | | | 2,805 | | | | 122,354 | |
Parkway | | | 540 | | | | 10,741 | |
Pebblebrook Hotel Trust | | | 2,665 | | | | 77,845 | |
Prologis | | | 1,375 | | | | 71,335 | |
PS Business Parks | | | 700 | | | | 80,332 | |
Public Storage | | | 450 | | | | 98,509 | |
Ramco-Gershenson Properties Trust | | | 6,090 | | | | 85,382 | |
Regency Centers | | | 2,007 | | | | 133,245 | |
RLJ Lodging Trust | | | 1,775 | | | | 41,730 | |
Sabra Health Care REIT | | | 1,825 | | | | 50,972 | |
Simon Property Group | | | 225 | | | | 38,707 | |
SL Green Realty | | | 525 | | | | 55,975 | |
Spirit Realty Capital | | | 4,675 | | | | 47,358 | |
Tanger Factory Outlet Centers | | | 1,575 | | | | 51,613 | |
Taubman Centers | | | 775 | | | | 51,166 | |
UDR | | | 1,775 | | | | 64,362 | |
Urban Edge Properties | | | 325 | | | | 8,548 | |
Ventas | | | 850 | | | | 55,284 | |
Vornado Realty Trust | | | 650 | | | | 65,202 | |
| | | | | | | | |
| | | Number of shares | | | Value (U.S. $) | |
| |
Common Stock (continued) | | | | | |
| |
U.S. Markets (continued) | | | | | |
Real Estate (continued) | | | | | | | | |
Welltower | | | 850 | | | $ | 60,197 | |
| | | | | | | | |
| | | | | | | 4,003,437 | |
| | | | | | | | |
Telecommunication Services – 1.00% | | | | | |
AT&T | | | 9,010 | | | | 374,365 | |
ATN International | | | 475 | | | | 33,449 | |
Verizon Communications | | | 4,700 | | | | 229,125 | |
| | | | | | | | |
| | | | | | | 636,939 | |
| | | | | | | | |
Utilities – 0.57% | | | | | |
Edison International | | | 2,900 | | | | 230,869 | |
NorthWestern | | | 860 | | | | 50,482 | |
South Jersey Industries | | | 1,020 | | | | 36,363 | |
Spire | | | 615 | | | | 41,513 | |
| | | | | | | | |
| | | | | | | 359,227 | |
| | | | | | | | |
Total U.S. Markets
(cost $15,463,031) | | | | | | | 24,328,908 | |
| | | | | | | | |
Developed Markets – 22.97%§ | | | | | |
Consumer Discretionary – 3.91% | | | | | |
Bandai Namco Holdings | | | 1,300 | | | | 38,884 | |
Bayerische Motoren Werke | | | 2,305 | | | | 210,267 | |
Cie Generale des Etablissements Michelin | | | 310 | | | | 37,651 | |
Denso | | | 1,300 | | | | 57,182 | |
Donaco International | | | 51,000 | | | | 15,391 | |
Hennes & Mauritz Class B | | | 1,450 | | | | 37,056 | |
Industria de Diseno Textil | | | 1,580 | | | | 55,690 | |
Kering | | | 704 | | | | 182,087 | |
LVMH Moet Hennessy Louis Vuitton | | | 370 | | | | 81,252 | |
Next | | | 485 | | | | 26,251 | |
Nitori Holdings | | | 1,542 | | | | 194,880 | |
Oriental Land | | | 700 | | | | 40,134 | |
Publicis Groupe | | | 1,205 | | | | 84,213 | |
RTL Group | | | 512 | | | | 41,238 | |
Sekisui Chemical | | | 3,100 | | | | 52,098 | |
Sodexo | | | 380 | | | | 44,694 | |
Stanley Electric | | | 1,600 | | | | 45,630 | |
Sumitomo Rubber Industries | | | 12,600 | | | | 214,697 | |
Techtronic Industries | | | 49,500 | | | | 200,318 | |
Toyota Motor | | | 4,886 | | | | 265,169 | |
USS | | | 2,200 | | | | 36,677 | |
Valeo | | | 2,206 | | | | 146,920 | |
Whitbread | | | 760 | | | | 37,688 | |
WPP | | | 2,600 | | | | 57,072 | |
Yue Yuen Industrial Holdings | | | 71,500 | | | | 281,069 | |
| | | | | | | | |
| | | | | | | 2,484,208 | |
| | | | | | | | |
Schedules of investments
Delaware Foundation® Growth Allocation Fund
| | | | | | | | |
| | | Number of shares | | | Value (U.S. $) | |
| |
Common Stock (continued) | | | | | |
| |
Developed Markets§ (continued) | | | | | |
Consumer Staples – 3.41% | | | | | |
Anheuser-Busch InBev | | | 455 | | | $ | 49,947 | |
Aryzta † | | | 4,085 | | | | 131,116 | |
Asahi Group Holdings | | | 1,000 | | | | 37,798 | |
British American Tobacco | | | 2,015 | | | | 133,803 | |
Carlsberg Class B | | | 2,105 | | | | 194,393 | |
Chocoladefabriken Lindt & Spruengli † | | | 9 | | | | 51,036 | |
Coca-Cola Amatil | | | 19,119 | | | | 158,047 | |
Coca-Cola European Partners | | | 1,215 | | | | 45,430 | |
Danone | | | 875 | | | | 59,517 | |
Diageo | | | 1,830 | | | | 52,356 | |
FamilyMart UNY Holdings | | | 600 | | | | 35,785 | |
Imperial Brands | | | 3,707 | | | | 179,603 | |
Japan Tobacco | | | 7,000 | | | | 227,486 | |
Jeronimo Martins | | | 2,450 | | | | 43,831 | |
Kao | | | 1,000 | | | | 54,828 | |
Koninklijke Ahold Delhaize | | | 2,485 | | | | 53,179 | |
L’Oreal | | | 440 | | | | 84,561 | |
Nestle | | | 2,535 | | | | 194,494 | |
Reckitt Benckiser Group | | | 445 | | | | 40,622 | |
Suntory Beverage & Food | | | 900 | | | | 37,914 | |
Svenska Cellulosa Class B | | | 1,130 | | | | 36,445 | |
Tate & Lyle | | | 3,700 | | | | 35,440 | |
Treasury Wine Estates | | | 3,600 | | | | 33,637 | |
Unilever | | | 960 | | | | 47,384 | |
Unilever CVA | | | 1,290 | | | | 64,088 | |
WH Group 144A # | | | 46,500 | | | | 40,089 | |
Woolworths | | | 2,100 | | | | 42,517 | |
| | | | | | | | |
| | | | | | | 2,165,346 | |
| | | | | | | | |
Energy – 0.68% | | | | | |
Amec Foster Wheeler | | | 5,550 | | | | 36,958 | |
Neste | | | 650 | | | | 25,351 | |
Origin Energy † | | | 6,500 | | | | 35,010 | |
Suncor Energy | | | 4,800 | | | | 147,373 | |
TOTAL | | | 3,726 | | | | 188,470 | |
| | | | | | | | |
| | | | | | | 433,162 | |
| | | | | | | | |
Financials – 2.85% | | | | | |
AIA Group | | | 13,200 | | | | 83,227 | |
AXA | | | 9,668 | | | | 250,162 | |
Banco Espirito Santo Class R =† | | | 105,000 | | | | 0 | |
Bank Leumi Le-Israel † | | | 10,950 | | | | 48,364 | |
Deutsche Bank † | | | 1,200 | | | | 20,675 | |
ING Groep | | | 14,766 | | | | 223,211 | |
Medibank Pvt | | | 16,200 | | | | 34,903 | |
| | | | | | | | |
| | | Number of shares | | | Value (U.S. $) | |
| |
Common Stock (continued) | | | | | |
| |
Developed Markets§ (continued) | | | | | |
Financials (continued) | | | | | |
Mitsubishi UFJ Financial Group | | | 54,114 | | | $ | 340,102 | |
Nordea Bank | | | 26,201 | | | | 299,126 | |
Prudential | | | 3,850 | | | | 81,327 | |
Sony Financial Holdings | | | 2,300 | | | | 36,959 | |
Standard Chartered † | | | 23,051 | | | | 220,359 | |
UniCredit | | | 11,287 | | | | 173,992 | |
| | | | | | | | |
| | | | | | | 1,812,407 | |
| | | | | | | | |
Healthcare – 3.14% | | | | | |
Actelion † | | | 205 | | | | 57,756 | |
Astellas Pharma | | | 4,600 | | | | 60,573 | |
Bayer | | | 625 | | | | 72,042 | |
Fresenius SE & Co. | | | 740 | | | | 59,468 | |
GlaxoSmithKline | | | 2,450 | | | | 50,940 | |
ICON † | | | 525 | | | | 41,853 | |
Indivior | | | 9,200 | | | | 37,127 | |
Lonza Group † | | | 220 | | | | 41,599 | |
Merck | | | 445 | | | | 50,701 | |
Miraca Holdings | | | 1,000 | | | | 45,989 | |
Novartis | | | 5,201 | | | | 386,057 | |
Novo Nordisk Class B | | | 1,100 | | | | 37,778 | |
Orion Class B | | | 870 | | | | 45,357 | |
Ramsay Health Care | | | 810 | | | | 43,251 | |
Roche Holding | | | 710 | | | | 181,319 | |
Sanofi | | | 3,711 | | | | 335,002 | |
Shire | | | 3,286 | | | | 191,895 | |
Smith & Nephew | | | 2,750 | | | | 41,897 | |
Sumitomo Dainippon Pharma | | | 2,500 | | | | 41,274 | |
Teva Pharmaceutical Industries ADR | | | 5,300 | | | | 170,077 | |
| | | | | | | | |
| | | | | | | 1,991,955 | |
| | | | | | | | |
Industrials – 4.70% | | | | | |
ABB | | | 2,220 | | | | 51,929 | |
ANDRITZ | | | 770 | | | | 38,513 | |
Aurizon Holdings | | | 10,200 | | | | 40,912 | |
Deutsche Lufthansa | | | 3,150 | | | | 51,078 | |
Deutsche Post | | | 8,059 | | | | 276,018 | |
East Japan Railway | | | 3,003 | | | | 261,485 | |
Elbit Systems | | | 300 | | | | 34,335 | |
Fraport Frankfurt Airport Services Worldwide | | | 720 | | | | 50,948 | |
Fuji Electric | | | 8,000 | | | | 47,498 | |
ITOCHU | | | 24,673 | | | | 350,160 | |
Japan Airlines | | | 1,400 | | | | 44,340 | |
JTEKT | | | 2,500 | | | | 38,826 | |
Koninklijke Philips | | | 9,486 | | | | 304,905 | |
| | | | | | | | |
| | | Number of shares | | | Value (U.S. $) | |
| |
Common Stock (continued) | | | | | |
| |
Developed Markets§ (continued) | | | | | |
Industrials (continued) | | | | | |
Legrand | | | 860 | | | $ | 51,854 | |
Leonardo † | | | 3,459 | | | | 49,041 | |
Meggitt | | | 25,896 | | | | 144,478 | |
MINEBEA MITSUMI | | | 12,800 | | | | 170,736 | |
Mitsubishi Electric | | | 3,000 | | | | 43,034 | |
Mitsubishi Heavy Industries | | | 11,000 | | | | 44,126 | |
Rexel | | | 5,413 | | | | 98,283 | |
Rolls-Royce Holdings † | | | 4,550 | | | | 42,983 | |
Safran | | | 610 | | | | 45,572 | |
Securitas Class B | | | 2,200 | | | | 34,372 | |
Singapore Airlines | | | 3,900 | | | | 28,075 | |
Teleperformance | | | 1,837 | | | | 198,421 | |
Vestas Wind Systems | | | 485 | | | | 39,434 | |
Vinci | | | 4,174 | | | | 330,845 | |
Wolters Kluwer | | | 950 | | | | 39,489 | |
Yamato Holdings | | | 1,600 | | | | 33,522 | |
| | | | | | | | |
| | | | | | | 2,985,212 | |
| | | | | | | | |
Information Technology – 1.55% | | | | | |
Amadeus IT Group | | | 1,210 | | | | 61,392 | |
ASM Pacific Technology | | | 4,300 | | | | 58,484 | |
ASML Holding (New York Shares) † | | | 437 | | | | 58,034 | |
Atos | | | 500 | | | | 61,848 | |
Brother Industries | | | 2,400 | | | | 50,121 | |
CGI Group Class A † | | | 3,646 | | | | 174,699 | |
Infineon Technologies | | | 2,300 | | | | 46,975 | |
InterXion Holding † | | | 750 | | | | 29,670 | |
Nice | | | 570 | | | | 38,299 | |
Omron | | | 1,300 | | | | 57,042 | |
Playtech | | | 15,871 | | | | 185,127 | |
SAP | | | 690 | | | | 67,706 | |
Seiko Epson | | | 2,600 | | | | 54,742 | |
Trend Micro | | | 900 | | | | 40,016 | |
| | | | | | | | |
| | | | | | | 984,155 | |
| | | | | | | | |
Materials – 1.36% | | | | | |
Alamos Gold | | | 9,480 | | | | 76,134 | |
Amcor | | | 3,550 | | | | 40,846 | |
Anglo American † | | | 2,900 | | | | 44,309 | |
Anglo American ADR † | | | 2,700 | | | | 20,547 | |
BHP Billiton | | | 2,500 | | | | 38,652 | |
Boral | | | 7,700 | | | | 34,356 | |
Chr Hansen Holding | | | 540 | | | | 34,660 | |
Covestro 144A # | | | 520 | | | | 40,030 | |
Daicel | | | 3,400 | | | | 40,954 | |
EMS-Chemie Holding | | | 95 | | | | 55,341 | |
Fletcher Building | | | 5,300 | | | | 30,911 | |
| | | | | | | | |
| | | Number of shares | | | Value (U.S. $) | |
| |
Common Stock (continued) | | | | | |
| |
Developed Markets§ (continued) | | | | | |
Materials (continued) | | | | | |
Johnson Matthey | | | 950 | | | $ | 36,660 | |
Kuraray | | | 2,900 | | | | 43,970 | |
Rio Tinto | | | 3,739 | | | | 150,352 | |
Shin-Etsu Chemical | | | 700 | | | | 60,638 | |
South32 | | | 18,800 | | | | 39,642 | |
Umicore | | | 740 | | | | 42,156 | |
Yamana Gold | | | 12,748 | | | | 35,181 | |
| | | | | | | | |
| | | | | | | 865,339 | |
| | | | | | | | |
Real Estate – 0.18% | | | | | |
Azrieli Group † | | | 580 | | | | 30,773 | |
Daito Trust Construction | | | 300 | | | | 41,215 | |
Westfield | | | 5,800 | | | | 39,349 | |
| | | | | | | | |
| | | | | | | 111,337 | |
| | | | | | | | |
Telecommunication Services – 1.03% | | | | | |
KDDI | | | 2,300 | | | | 60,366 | |
Nippon Telegraph & Telephone | | | 6,712 | | | | 286,494 | |
Tele2 Class B | | | 18,624 | | | | 177,809 | |
Telenor | | | 2,100 | | | | 34,950 | |
Telstra | | | 12,400 | | | | 44,147 | |
Vodafone Group | | | 17,900 | | | | 46,670 | |
| | | | | | | | |
| | | | | | | 650,436 | |
| | | | | | | | |
Utilities – 0.16% | | | | | |
National Grid | | | 4,377 | | | | 55,580 | |
Tokyo Gas | | | 10,000 | | | | 45,504 | |
| | | | | | | | |
| | | | | | | 101,084 | |
| | | | | | | | |
Total Developed Markets
(cost $11,753,558) | | | | 14,584,641 | |
| | | | | | | | |
Emerging Markets X – 9.33% | | | | | |
Consumer Discretionary – 0.77% | | | | | |
Arcos Dorados Holdings Class A † | | | 6,300 | | | | 50,715 | |
Astra International | | | 106,600 | | | | 68,997 | |
B2W Cia Digital † | | | 27,799 | | | | 109,665 | |
Ctrip.com International ADR † | | | 1,500 | | | | 73,725 | |
Grupo Televisa ADR | | | 4,200 | | | | 108,948 | |
Hyundai Motor | | | 213 | | | | 29,999 | |
Woolworths Holdings | | | 8,164 | | | | 42,541 | |
| | | | | | | | |
| | | | | | | 484,590 | |
| | | | | | | | |
Consumer Staples – 1.28% | | | | | |
Anadolu Efes Biracilik Ve Malt Sanayii | | | 5,235 | | | | 28,534 | |
BRF ADR | | | 4,000 | | | | 49,000 | |
China Mengniu Dairy | | | 25,000 | | | | 51,792 | |
Schedules of investments
Delaware Foundation® Growth Allocation Fund
| | | | | | | | |
| | | Number of shares | | | Value (U.S. $) | |
| |
Common Stock (continued) | | | | | |
| |
Emerging Markets X (continued) | | | | | |
Consumer Staples (continued) | | | | | |
Cia Brasileira de Distribuicao ADR | | | 2,500 | | | $ | 48,000 | |
Cia Cervecerias Unidas ADR | | | 1,700 | | | | 42,959 | |
Coca-Cola Femsa ADR | | | 1,719 | | | | 123,252 | |
Fomento Economico Mexicano ADR | | | 875 | | | | 77,455 | |
JBS | | | 4,700 | | | | 15,403 | |
Lotte Chilsung Beverage | | | 43 | | | | 54,408 | |
Lotte Confectionery | | | 427 | | | | 73,311 | |
Tingyi Cayman Islands Holding | | | 48,245 | | | | 60,589 | |
Uni-President China Holdings | | | 103,200 | | | | 72,638 | |
Wal-Mart de Mexico | | | 14,915 | | | | 34,415 | |
X5 Retail Group GDR † | | | 2,467 | | | | 83,015 | |
| | | | | | | | |
| | | | | | | 814,771 | |
| | | | | | | | |
Energy – 1.39% | | | | | |
Cairn India | | | 8,958 | | | | 42,193 | |
China Petroleum & Chemical | | | 64,000 | | | | 51,882 | |
Gazprom PJSC ADR | | | 17,508 | | | | 78,261 | |
Lukoil PJSC ADR | | | 1,600 | | | | 84,896 | |
Petroleo Brasileiro ADR † | | | 8,475 | | | | 82,123 | |
PTT | | | 6,568 | | | | 73,971 | |
Reliance Industries GDR 144A # | | | 10,171 | | | | 409,891 | |
Rosneft Oil PJSC GDR | | | 10,465 | | | | 59,546 | |
| | | | | | | | |
| | | | | | | 882,763 | |
| | | | | | | | |
Financials – 1.19% | | | | | |
Akbank | | | 36,546 | | | | 85,773 | |
Banco Bradesco ADR | | | 7,100 | | | | 72,704 | |
Bangkok Bank | | | 9,573 | | | | 50,564 | |
Grupo Financiero Banorte | | | 6,600 | | | | 37,981 | |
Grupo Financiero Santander Mexico Class B ADR | | | 6,200 | | | | 55,986 | |
ICICI Bank ADR | | | 11,700 | | | | 100,620 | |
Industrial & Commercial Bank of China | | | 36,000 | | | | 23,532 | |
Itau Unibanco Holding ADR | | | 7,810 | | | | 94,267 | |
KB Financial Group ADR | | | 1,493 | | | | 65,647 | |
Samsung Life Insurance | | | 858 | | | | 83,245 | |
Sberbank of Russia PJSC = | | | 30,743 | | | | 87,295 | |
| | | | | | | | |
| | | | | | | 757,614 | |
| | | | | | | | |
Healthcare – 0.06% | | | | | |
Hypermarcas | | | 3,900 | | | | 36,127 | |
| | | | | | | | |
| | | | | | | 36,127 | |
| | | | | | | | |
| | | | | | | | |
| | | Number of shares | | | Value (U.S. $) | |
| |
Common Stock (continued) | | | | | |
| |
Emerging Markets X (continued) | | | | | |
Industrials – 0.15% | | | | | |
Gol Linhas Aereas Inteligentes ADR † | | | 850 | | | $ | 22,525 | |
KCC | | | 184 | | | | 58,246 | |
Rumo † | | | 1,723 | | | | 4,711 | |
Santos Brasil Participacoes † | | | 12,500 | | | | 9,064 | |
ZTO Express Cayman ADR † | | | 142 | | | | 1,859 | |
| | | | | | | | |
| | | | | | | 96,405 | |
| | | | | | | | |
Information Technology – 2.59% | | | | | |
Alibaba Group Holding ADR † | | | 1,690 | | | | 182,233 | |
Baidu ADR † | | | 940 | | | | 162,169 | |
Hon Hai Precision Industry | | | 24,859 | | | | 74,554 | |
MediaTek | | | 13,000 | | | | 92,115 | |
Samsung Electronics | | | 191 | | | | 351,838 | |
Samsung SDI | | | 351 | | | | 43,314 | |
SINA † | | | 1,600 | | | | 115,392 | |
Sohu.com † | | | 3,200 | | | | 125,856 | |
Taiwan Semiconductor Manufacturing | | | 20,074 | | | | 125,039 | |
Taiwan Semiconductor Manufacturing ADR | | | 3,100 | | | | 101,804 | |
Tencent Holdings | | | 7,700 | | | | 220,750 | |
Weibo ADR † | | | 160 | | | | 8,349 | |
WNS Holdings ADR † | | | 1,380 | | | | 39,482 | |
| | | | | | | | |
| | | | | | | 1,642,895 | |
| | | | | | | | |
Materials – 0.42% | | | | | |
Braskem ADR | | | 2,200 | | | | 44,770 | |
Cemex ADR † | | | 6,137 | | | | 55,663 | |
Cemex Latam Holdings † | | | 3,446 | | | | 12,705 | |
Cia de Minas Buenaventura ADR | | | 1,900 | | | | 22,876 | |
Impala Platinum Holdings † | | | 1,930 | | | | 6,505 | |
Sociedad Quimica y Minera de Chile ADR | | | 900 | | | | 30,933 | |
UltraTech Cement | | | 1,533 | | | | 94,073 | |
| | | | | | | | |
| | | | | | | 267,525 | |
| | | | | | | | |
Real Estate – 0.14% | | | | | |
Etalon Group GDR 144A #= | | | 6,500 | | | | 24,570 | |
IRSA Inversiones y Representaciones ADR † | | | 1,500 | | | | 36,765 | |
UEM Sunrise | | | 92,458 | | | | 26,533 | |
| | | | | | | | |
| | | | | | | 87,868 | |
| | | | | | | | |
Telecommunication Services – 1.34% | | | | | |
America Movil Class L ADR | | | 5,742 | | | | 81,364 | |
China Mobile | | | 12,268 | | | | 134,259 | |
China Mobile ADR | | | 350 | | | | 19,331 | |
| | | | | | | | |
| | | Number of shares | | | Value (U.S. $) | |
| |
Common Stock (continued) | | | | | |
| |
Emerging Markets X (continued) | | | | | |
Telecommunication Services (continued) | | | | | |
LG Uplus | | | 2,972 | | | $ | 38,004 | |
Mobile TeleSystems ADR | | | 2,400 | | | | 26,472 | |
SK Telecom ADR | | | 10,400 | | | | 261,872 | |
Telefonica Brasil ADR | | | 5,880 | | | | 87,318 | |
TIM Participacoes ADR | | | 7,200 | | | | 115,056 | |
Turkcell Iletisim Hizmetleri ADR † | | | 3,950 | | | | 32,706 | |
VEON ADR | | | 6,700 | | | | 27,336 | |
Vodacom Group | | | 2,430 | | | | 27,531 | |
| | | | | | | | |
| | | | | | | 851,249 | |
| | | | | | | | |
Utilities – 0.00% | | | | | |
ENEL RUSSIA PJSC † | | | 100 | | | | 91 | |
| | | | | | | | |
| | | | | | | 91 | |
| | | | | | | | |
Total Emerging Markets
(cost $4,988,501) | | | | 5,921,898 | |
| | | | | | | | |
Total Common Stock
(cost $32,205,090) | | | | 44,835,447 | |
| | | | | | | | |
|
| |
Exchange-Traded Funds – 2.90% | | | | | |
| |
iShares MSCI EAFE ETF | | | 460 | | | | 28,653 | |
iShares MSCI EAFE Growth ETF | | | 1,800 | | | | 125,082 | |
iShares Russell 1000 Growth ETF | | | 11,680 | | | | 1,329,184 | |
Vanguard FTSE Developed Markets ETF | | | 245 | | | | 9,629 | |
Vanguard Mega Cap Growth ETF | | | 1,890 | | | | 180,892 | |
Vanguard Russell 1000 Growth ETF | | | 1,420 | | | | 165,714 | |
| | | | | | | | |
Total Exchange-Traded Funds
(cost $1,777,338) | | | | 1,839,154 | |
| | | | | | | | |
| | |
| | | Principal amount° | | | | |
| |
Agency Collateralized Mortgage Obligations – 4.44% | | | | | |
| |
Fannie Mae REMICs | | | | | | | | |
Series 1996-46 ZA 7.50% 11/25/26 | | | 310 | | | | 360 | |
Series 2005-70 PA 5.50% 8/25/35 | | | 1,238 | | | | 1,384 | |
Series 2008-15 SB 5.618% 8/25/36 S● | | | 22,303 | | | | 4,234 | |
Series 2010-41 PN 4.50% 4/25/40 | | | 20,000 | | | | 21,580 | |
Series 2010-43 HJ 5.50% 5/25/40 | | | 1,676 | | | | 1,871 | |
| | | | | | | | |
| | | Principal amount° | | | Value (U.S. $) | |
| |
Agency Collateralized Mortgage Obligations (continued) | | | | | |
| |
Fannie Mae REMICs | | | | | | | | |
Series 2010-129 SM 5.018% 11/25/40 S● | | | 16,775 | | | $ | 2,718 | |
Series 2012-98 MI 3.00% 8/25/31 S | | | 49,081 | | | | 5,543 | |
Series 2012-99 AI 3.50% 5/25/39 S | | | 67,768 | | | | 7,228 | |
Series 2012-118 AI 3.50% 11/25/37 S | | | 53,601 | | | | 6,549 | |
Series 2012-120 WI 3.00% 11/25/27 S | | | 49,402 | | | | 5,000 | |
Series 2012-125 MI 3.50% 11/25/42 S | | | 64,932 | | | | 13,002 | |
Series 2013-7 EI 3.00% 10/25/40 S | | | 377,240 | | | | 50,793 | |
Series 2013-26 ID 3.00% 4/25/33 S | | | 63,150 | | | | 8,859 | |
Series 2013-38 AI 3.00% 4/25/33 S | | | 58,721 | | | | 7,946 | |
Series 2013-43 IX 4.00% 5/25/43 S | | | 68,654 | | | | 16,219 | |
Series 2013-44 DI 3.00% 5/25/33 S | | | 70,618 | | | | 11,265 | |
Series 2013-45 PI 3.00% 5/25/33 S | | | 63,923 | | | | 9,424 | |
Series 2013-51 PI 3.00% 11/25/32 S | | | 64,968 | | | | 7,730 | |
Series 2013-55 AI 3.00% 6/25/33 S | | | 65,984 | | | | 9,547 | |
Series 2013-59 PY 2.50% 6/25/43 | | | 10,000 | | | | 9,132 | |
Series 2013-62 PY 2.50% 6/25/43 | | | 10,000 | | | | 9,148 | |
Series 2013-64 KI 3.00% 2/25/33 S | | | 160,815 | | | | 21,236 | |
Series 2013-69 IJ 3.00% 7/25/33 S | | | 62,762 | | | | 9,126 | |
Series 2013-71 ZA 3.50% 7/25/43 | | | 10,260 | | | | 10,284 | |
Series 2014-36 ZE 3.00% 6/25/44 | | | 14,152 | | | | 12,925 | |
Series 2015-40 GZ 3.50% 5/25/45 | | | 3,199 | | | | 3,043 | |
Series 2015-44 Z 3.00% 9/25/43 | | | 24,238 | | | | 23,429 | |
Series 2015-45 AI 3.00% 1/25/33 S | | | 71,499 | | | | 7,558 | |
Series 2015-71 PI 4.00% 3/25/43 S | | | 96,025 | | | | 15,746 | |
Series 2016-2 HI 3.00% 12/25/41 S | | | 81,452 | | | | 10,891 | |
Schedules of investments
Delaware Foundation® Growth Allocation Fund
| | | | | | | | |
| | | Principal amount° | | | Value (U.S. $) | |
| |
Agency Collateralized Mortgage Obligations (continued) | | | | | |
| |
Fannie Mae REMICs | | | | | | | | |
Series 2016-17 BI 4.00% 2/25/43 S | | | 283,431 | | | $ | 48,282 | |
Series 2016-74 GS 5.018% 10/25/46 S● | | | 418,313 | | | | 103,035 | |
Series 2016-80 BZ 3.00% 11/25/46 | | | 53,666 | | | | 47,063 | |
Series 2016-80 CZ 3.00% 11/25/46 | | | 46,578 | | | | 40,844 | |
Series 2016-80 JZ 3.00% 11/25/46 | | | 5,063 | | | | 4,593 | |
Series 2016-90 CI 3.00% 2/25/45 S | | | 412,445 | | | | 63,472 | |
Series 2016-95 IO 3.00% 12/25/46 S | | | 530,125 | | | | 104,721 | |
Series 2016-95 LZ 2.50% 12/25/46 | | | 25,209 | | | | 20,487 | |
Series 2016-95 US 5.018% 12/25/46 S● | | | 538,129 | | | | 118,049 | |
Series 2017-16 YT 3.00% 7/25/46 | | | 10,000 | | | | 9,791 | |
Freddie Mac REMICs | | | | | | | | |
Series 2512 PG 5.50% 10/15/22 | | | 15,247 | | | | 16,520 | |
Series 2708 ZD 5.50% 11/15/33 | | | 3,556 | | | | 3,954 | |
Series 4065 DE 3.00% 6/15/32 | | | 5,000 | | | | 5,031 | |
Series 4100 EI 3.00% 8/15/27 S | | | 41,614 | | | | 4,206 | |
Series 4109 AI 3.00% 7/15/31 S | | | 103,904 | | | | 11,183 | |
Series 4120 IK 3.00% 10/15/32 S | | | 57,101 | | | | 7,797 | |
Series 4136 EZ 3.00% 11/15/42 | | | 5,478 | | | | 5,384 | |
Series 4146 IA 3.50% 12/15/32 S | | | 57,831 | | | | 9,107 | |
Series 4184 GS 5.208% 3/15/43 S● | | | 63,105 | | | | 14,375 | |
Series 4185 LI 3.00% 3/15/33 S | | | 62,911 | | | | 8,786 | |
Series 4186 IE 3.00% 3/15/33 S | | | 429,832 | | | | 60,475 | |
Series 4206 DZ 3.00% 5/15/33 | | | 11,295 | | | | 11,008 | |
Series 4223 HI 3.00% 4/15/30 S | | | 111,457 | | | | 8,788 | |
Series 4342 CI 3.00% 11/15/33 S | | | 64,294 | | | | 8,329 | |
Series 4366 DI 3.50% 5/15/33 S | | | 74,170 | | | | 10,101 | |
| | | | | | | | |
| | | Principal amount° | | | Value (U.S. $) | |
| |
Agency Collateralized Mortgage Obligations (continued) | | | | | |
| |
Freddie Mac REMICs | | | | | | | | |
Series 4433 DI 3.00% 8/15/32 S | | | 221,239 | | | $ | 22,328 | |
Series 4435 DY 3.00% 2/15/35 | | | 19,000 | | | | 18,859 | |
Series 4476 GI 3.00% 6/15/41 S | | | 71,451 | | | | 8,216 | |
Series 4518 CI 3.50% 6/15/42 S | | | 153,719 | | | | 20,852 | |
Series 4567 LI 4.00% 8/15/45 S | | | 212,412 | | | | 40,276 | |
Series 4574 AI 3.00% 4/15/31 S | | | 95,948 | | | | 12,286 | |
Series 4592 WT 5.50% 6/15/46 | | | 38,122 | | | | 42,547 | |
Series 4596 ZH 3.00% 11/15/45 | | | 240,341 | | | | 240,084 | |
Series 4614 HB 2.50% 9/15/46 | | | 10,000 | | | | 8,940 | |
Series 4623 LZ 2.50% 10/15/46 | | | 40,418 | | | | 34,482 | |
Series 4623 MW 2.50% 10/15/46 | | | 75,000 | | | | 68,104 | |
Series 4623 WI 4.00% 8/15/44 S | | | 98,022 | | | | 18,230 | |
Series 4643 QI 3.50% 9/15/45 S | | | 99,342 | | | | 16,362 | |
Series 4648 ND 3.00% 9/15/46 | | | 4,000 | | | | 3,808 | |
Series 4648 SA 5.088% 1/15/47 S● | | | 538,655 | | | | 123,124 | |
Series 4657 NW 3.00% 4/15/45 | | | 4,000 | | | | 3,953 | |
Freddie Mac Strips | | | | | | | | |
Series 299 S1 5.088% 1/15/43 S● | | | 65,573 | | | | 13,423 | |
Series 326 S2 5.038% 3/15/44 S● | | | 73,900 | | | | 14,637 | |
GNMA | | | | | | | | |
Series 2010-113 KE 4.50% 9/20/40 | | | 50,000 | | | | 54,489 | |
Series 2012-136 MX 2.00% 11/20/42 | | | 80,000 | | | | 72,539 | |
Series 2013-113 AZ 3.00% 8/20/43 | | | 26,720 | | | | 25,342 | |
Series 2013-113 LY 3.00% 5/20/43 | | | 45,000 | | | | 44,345 | |
Series 2015-64 GZ 2.00% 5/20/45 | | | 10,373 | | | | 8,436 | |
Series 2015-133 AL 3.00% 5/20/45 | | | 25,000 | | | | 24,425 | |
| | | | | | | | |
| | | Principal amount° | | | Value (U.S. $) | |
| |
Agency Collateralized Mortgage
Obligations (continued) | | | | | |
| |
GNMA | | | | | | | | |
Series 2016-5 GL 3.00% 7/20/45 | | | 45,000 | | | $ | 43,870 | |
Series 2016-101 QL 3.00% 7/20/46 | | | 117,000 | | | | 110,638 | |
Series 2016-108 YL 3.00% 8/20/46 | | | 570,000 | | | | 535,361 | |
Series 2016-134 MW 3.00% 10/20/46 | | | 106,000 | | | | 105,520 | |
Series 2016-135 Z 3.00%10/20/46 | | | 2,025 | | | | 1,834 | |
Series 2016-160 VZ 2.50%11/20/46 | | | 5,042 | | | | 4,105 | |
Series 2017-4 BW 3.00% 1/20/47 | | | 4,000 | | | | 3,769 | |
Series 2017-25 CZ 3.50% 2/20/47 | | | 5,015 | | | | 5,001 | |
| | | | | | | | |
Total Agency Collateralized
Mortgage Obligations
(cost $2,840,993) | | | | 2,819,336 | |
| | | | | | | | |
|
| |
Agency Commercial Mortgage-Backed Securities – 0.25% | | | | | |
| |
Freddie Mac Multifamily
Structured Pass Through
Certificates | | | | | |
Series K037 A2 3.49% 1/25/24 ◆ | | | 20,000 | | | | 21,190 | |
Series KS03 A4 3.161% 5/25/25 ◆● | | | 20,000 | | | | 20,171 | |
FREMF Mortgage Trust | | | | | | | | |
Series 2011-K14 B 144A 5.167%
2/25/47 #● | | | 10,000 | | | | 10,930 | |
Series 2012-K18 B 144A 4.256%
1/25/45 #● | | | 10,000 | | | | 10,581 | |
Series 2012-K22 B 144A 3.686%
8/25/45 #● | | | 15,000 | | | | 15,418 | |
Series 2012-K708 B 144A 3.752%
2/25/45 #● | | | 10,000 | | | | 10,220 | |
Series 2013-K32 B 144A 3.538%
10/25/46 #● | | | 35,000 | | | | 34,983 | |
Series 2013-K33 B 144A 3.502%
8/25/46 #● | | | 10,000 | | | | 9,939 | |
Series 2013-K713 C 144A 3.166%
4/25/46 #● | | | 25,000 | | | | 25,064 | |
| | | | | | | | |
Total Agency Commercial
Mortgage-Backed
Securities (cost $159,679) | | | | 158,496 | |
| | | | | | | | |
|
| |
Agency Mortgage-Backed
Securities – 4.01% | | | | | |
| |
Fannie Mae S.F. 30 yr | | | | | | | | |
4.50% 5/1/39 | | | 14,927 | | | | 16,100 | |
| | | | | | | | |
| | | Principal amount° | | | Value (U.S. $) | |
| |
Agency Mortgage-Backed Securities (continued) | | | | | |
| |
Fannie Mae S.F. 30 yr | | | | | | | | |
4.50% 2/1/46 | | | 77,324 | | | $ | 83,134 | |
5.00% 11/1/33 | | | 151 | | | | 165 | |
5.00% 8/1/35 | | | 579 | | | | 633 | |
5.00% 10/1/35 | | | 75,638 | | | | 82,759 | |
5.00% 10/1/36 | | | 237 | | | | 259 | |
5.00% 12/1/36 | | | 202 | | | | 221 | |
5.50% 4/1/34 | | | 276 | | | | 309 | |
5.50% 11/1/34 | | | 524 | | | | 587 | |
5.50% 2/1/35 | | | 478 | | | | 535 | |
5.50% 8/1/37 | | | 2,548 | | | | 2,854 | |
5.50% 1/1/38 | | | 26,458 | | | | 29,585 | |
5.50% 3/1/38 | | | 8,545 | | | | 9,573 | |
5.50% 12/1/38 | | | 192 | | | | 214 | |
5.50% 6/1/39 | | | 5,972 | | | | 6,684 | |
5.50% 7/1/40 | | | 4,976 | | | | 5,567 | |
5.50% 5/1/44 | | | 261,750 | | | | 292,908 | |
6.00% 3/1/34 | | | 1,428 | | | | 1,634 | |
6.00% 8/1/34 | | | 2,377 | | | | 2,713 | |
6.00% 11/1/34 | | | 57 | | | | 64 | |
6.00% 4/1/35 | | | 2,343 | | | | 2,663 | |
6.00% 6/1/35 | | | 28,110 | | | | 32,014 | |
6.00% 7/1/35 | | | 8,316 | | | | 9,436 | |
6.00% 12/1/35 | | | 11,558 | | | | 13,134 | |
6.00% 5/1/36 | | | 17,920 | | | | 20,285 | |
6.00% 6/1/36 | | | 41,921 | | | | 48,521 | |
6.00% 9/1/36 | | | 22,216 | | | | 25,199 | |
6.00% 12/1/36 | | | 579 | | | | 659 | |
6.00% 2/1/37 | | | 1,795 | | | | 2,028 | |
6.00% 5/1/37 | | | 38,476 | | | | 43,615 | |
6.00% 6/1/37 | | | 305 | | | | 348 | |
6.00% 7/1/37 | | | 239 | | | | 270 | |
6.00% 8/1/37 | | | 37,848 | | | | 42,957 | |
6.00% 9/1/37 | | | 22,313 | | | | 25,237 | |
6.00% 11/1/37 | | | 116 | | | | 131 | |
6.00% 3/1/38 | | | 56,142 | | | | 64,003 | |
6.00% 5/1/38 | | | 19,422 | | | | 22,005 | |
6.00% 7/1/38 | | | 27,038 | | | | 30,550 | |
6.00% 9/1/38 | | | 1,882 | | | | 2,148 | |
6.00% 10/1/38 | | | 508 | | | | 574 | |
6.00% 11/1/38 | | | 1,356 | | | | 1,548 | |
6.00% 1/1/39 | | | 2,491 | | | | 2,812 | |
6.00% 9/1/39 | | | 44,482 | | | | 51,117 | |
6.00% 10/1/39 | | | 29,593 | | | | 33,876 | |
6.00% 3/1/40 | | | 10,173 | | | | 11,484 | |
6.00% 7/1/40 | | | 4,129 | | | | 4,662 | |
6.00% 9/1/40 | | | 2,194 | | | | 2,480 | |
6.00% 11/1/40 | | | 774 | | | | 887 | |
6.00% 5/1/41 | | | 33,241 | | | | 37,570 | |
Schedules of investments
Delaware Foundation® Growth Allocation Fund
| | | | | | | | |
| | | Principal amount° | | | Value (U.S. $) | |
| |
Agency Mortgage-Backed Securities (continued) | | | | | |
| |
Fannie Mae S.F. 30 yr | | | | | | | | |
6.00% 6/1/41 | | | 8,641 | | | $ | 9,762 | |
6.00% 7/1/41 | | | 8,028 | | | | 9,064 | |
6.50% 3/1/40 | | | 15,238 | | | | 17,241 | |
Fannie Mae S.F. 30 yr TBA | | | | | | | | |
4.50% 4/1/47 | | | 987,000 | | | | 1,056,707 | |
Freddie Mac ARM | | | | | | | | |
2.553% 10/1/46 ● | | | 14,853 | | | | 14,918 | |
Freddie Mac S.F. 30 yr | | | | | | | | |
5.00% 5/1/41 | | | 17,740 | | | | 19,542 | |
5.00% 4/1/44 | | | 21,934 | | | | 24,126 | |
5.50% 3/1/34 | | | 668 | | | | 751 | |
5.50% 12/1/34 | | | 577 | | | | 649 | |
5.50% 11/1/36 | | | 810 | | | | 901 | |
5.50% 9/1/37 | | | 734 | | | | 814 | |
5.50% 12/1/37 | | | 98,032 | | | | 109,969 | |
5.50% 6/1/39 | | | 2,275 | | | | 2,523 | |
5.50% 3/1/40 | | | 2,142 | | | | 2,375 | |
5.50% 8/1/40 | | | 1,730 | | | | 1,918 | |
5.50% 6/1/41 | | | 29,786 | | | | 33,254 | |
6.00% 5/1/35 | | | 3,137 | | | | 3,572 | |
6.00% 2/1/36 | | | 1,283 | | | | 1,461 | |
6.00% 3/1/36 | | | 2,935 | | | | 3,345 | |
6.00% 8/1/38 | | | 10,055 | | | | 11,524 | |
6.00% 10/1/38 | | | 1,170 | | | | 1,338 | |
6.00% 3/1/40 | | | 29,530 | | | | 33,336 | |
6.00% 5/1/40 | | | 43,430 | | | | 49,397 | |
6.00% 7/1/40 | | | 4,253 | | | | 4,821 | |
6.50% 12/1/31 | | | 666 | | | | 752 | |
GNMA II S.F. 30 yr | | | | | | | | |
5.50% 5/20/37 | | | 3,867 | | | | 4,301 | |
5.50% 4/20/40 | | | 3,498 | | | | 3,824 | |
6.00% 2/20/39 | | | 5,208 | | | | 5,905 | |
6.00% 10/20/39 | | | 6,941 | | | | 7,753 | |
6.00% 2/20/40 | | | 17,474 | | | | 19,574 | |
6.00% 4/20/46 | | | 7,017 | | | | 7,853 | |
6.50% 6/20/39 | | | 6,636 | | | | 7,512 | |
6.50% 10/20/39 | | | 4,781 | | | | 5,396 | |
| | | | | | | | |
Total Agency
Mortgage-Backed Securities
(cost $2,546,620) | | | | 2,544,889 | |
| | | | | | | | |
|
| |
Collateralized Debt Obligations – 0.31% | | | | | |
| |
AMMC CLO | | | | | | | | |
Series 2015-16A AR 144A 2.42% 4/14/29 #● | | | 100,000 | | | | 99,950 | |
| | | | | | | | |
| | | Principal amount° | | | Value (U.S. $) | |
| |
Collateralized Debt Obligations (continued) | | | | | |
| |
JFIN CLO | | | | | | | | |
Series 2017-1A A1 144A 2.324% 4/24/29 #● | | | 100,000 | | | $ | 100,150 | |
| | | | | | | | |
Total Collateralized Debt
Obligations (cost $200,000) | | | | 200,100 | |
| | | | | | | | |
|
| |
Convertible Bond – 0.06% | | | | | |
| |
Clearwire Communications 144A 8.25% exercise price $7.08, maturity date 12/1/40 # | | | 35,000 | | | | 36,356 | |
| | | | | | | | |
Total Convertible Bond
(cost $36,575) | | | | 36,356 | |
| | | | | | | | |
|
| |
Corporate Bonds – 11.08% | | | | | |
| |
Banking – 1.84% | | | | | | | | |
Bank Nederlandse Gemeenten 3.50% 7/19/27 | | AUD | 4,000 | | | | 3,035 | |
Bank of America | | | | | | | | |
3.124% 1/20/23 ● | | | 75,000 | | | | 75,372 | |
3.248% 10/21/27 | | | 5,000 | | | | 4,770 | |
3.824% 1/20/28 ● | | | 20,000 | | | | 20,081 | |
4.183% 11/25/27 | | | 15,000 | | | | 15,083 | |
Bank of New York Mellon | | | | | | | | |
2.15% 2/24/20 | | | 5,000 | | | | 5,022 | |
2.20% 8/16/23 | | | 25,000 | | | | 24,019 | |
2.50% 4/15/21 | | | 30,000 | | | | 30,093 | |
3.442% 2/7/28 ● | | | 25,000 | | | | 25,219 | |
4.625% 12/29/49 ● | | | 20,000 | | | | 19,250 | |
BB&T 2.45% 1/15/20 | | | 25,000 | | | | 25,262 | |
Citigroup | | | | | | | | |
1.80% 1/10/20 ● | | | 85,000 | | | | 85,319 | |
3.75% 10/27/23 | | AUD | 7,000 | | | | 5,349 | |
Citizens Financial Group | | | | | | | | |
2.375% 7/28/21 | | | 10,000 | | | | 9,870 | |
4.30% 12/3/25 | | | 15,000 | | | | 15,486 | |
Fifth Third Bancorp | | | | | | | | |
2.875% 7/27/20 | | | 5,000 | | | | 5,068 | |
Goldman Sachs Group | | | | | | | | |
3.85% 1/26/27 | | | 10,000 | | | | 10,064 | |
5.15% 5/22/45 | | | 35,000 | | | | 36,842 | |
5.20% 12/17/19 | | NZD | 4,000 | | | | 2,911 | |
Huntington Bancshares 2.30% 1/14/22 | | | 5,000 | | | | 4,874 | |
JPMorgan Chase & Co. | | | | | | | | |
3.782% 2/1/28 ● | | | 85,000 | | | | 85,892 | |
4.25% 11/2/18 | | NZD | 15,000 | | | | 10,674 | |
4.25% 10/1/27 | | | 20,000 | | | | 20,568 | |
KeyCorp
5.00% 12/29/49 ● | | | 105,000 | | | | 104,213 | |
| | | | | | | | |
| | | Principal amount° | | | Value (U.S. $) | |
| |
Corporate Bonds (continued) | | | | | |
| |
Banking (continued) | | | | | |
Landwirtschaftliche Rentenbank 5.375% 4/23/24 | | NZD | 40,000 | | | $ | 30,631 | |
Morgan Stanley | | | | | | | | |
2.625% 11/17/21 | | | 30,000 | | | | 29,795 | |
3.625% 1/20/27 | | | 15,000 | | | | 14,914 | |
3.95% 4/23/27 | | | 25,000 | | | | 24,805 | |
5.00% 9/30/21 | | AUD | 9,000 | | | | 7,346 | |
PNC Financial Services Group | | | | | |
5.00% 12/29/49 ● | | | 20,000 | | | | 19,950 | |
Royal Bank of Canada 2.75% 2/1/22 30,000 | | | | 30,292 | |
Santander UK Group Holdings | | | | | |
2.875% 10/16/20 | | | 35,000 | | | | 35,106 | |
3.125% 1/8/21 | | | 10,000 | | | | 10,062 | |
State Street | | | | | |
2.55% 8/18/20 | | | 15,000 | | | | 15,207 | |
3.10% 5/15/23 | | | 10,000 | | | | 10,079 | |
3.55% 8/18/25 | | | 15,000 | | | | 15,430 | |
SunTrust Banks
2.70% 1/27/22 25,000 | | | | 24,924 | |
Toronto-Dominion Bank | | | | | |
2.125% 4/7/21 | | | 40,000 | | | | 39,665 | |
2.50% 12/14/20 | | | 15,000 | | | | 15,131 | |
3.625% 9/15/31 ● | | | 20,000 | | | | 19,618 | |
U.S. Bancorp | | | | | |
2.625% 1/24/22 | | | 10,000 | | | | 10,043 | |
3.10% 4/27/26 | | | 10,000 | | | | 9,829 | |
3.60% 9/11/24 | | | 10,000 | | | | 10,307 | |
USB Capital IX | | | | | |
3.50% 10/29/49 ● | | | 55,000 | | | | 46,819 | |
Wells Fargo & Co. | | | | | |
3.00% 7/27/21 | | AUD | 7,000 | | | | 5,269 | |
3.069% 1/24/23 | | | 90,000 | | | | 90,446 | |
Zions Bancorporation | | | | | |
4.50% 6/13/23 | | | 10,000 | | | | 10,379 | |
| | | | | | | | |
| | | | | | | 1,170,383 | |
| | | | | | | | |
Basic Industry – 0.90% | | | | | |
Boise Cascade 144A 5.625% 9/1/24 # | | | 20,000 | | | | 20,400 | |
Builders FirstSource 144A 5.625% 9/1/24 # | | | 20,000 | | | | 20,375 | |
CF Industries 6.875% 5/1/18 | | | 25,000 | | | | 26,125 | |
Cliffs Natural Resources 144A 5.75% 3/1/25 # | | | 5,000 | | | | 4,863 | |
Dow Chemical 8.55% 5/15/19 | | | 78,000 | | | | 88,458 | |
Freeport-McMoRan 144A 6.875% 2/15/23 # | | | 30,000 | | | | 31,125 | |
| | | | | | | | |
| | | Principal amount° | | | Value (U.S. $) | |
| |
Corporate Bonds (continued) | | | | | |
| |
Basic Industry (continued) | | | | | | | | |
General Electric | | | | | | | | |
2.10% 12/11/19 | | | 10,000 | | | $ | 10,097 | |
4.25% 1/17/18 | | | NZD 10,000 | | | | 7,096 | |
5.55% 5/4/20 | | | 10,000 | | | | 11,066 | |
6.00% 8/7/19 | | | 19,000 | | | | 20,875 | |
Georgia-Pacific
8.00% 1/15/24 | | | 40,000 | | | | 51,310 | |
International Paper 4.40% 8/15/47 | | | 30,000 | | | | 28,427 | |
INVISTA Finance 144A 4.25% 10/15/19 # | | | 20,000 | | | | 20,650 | |
Koppers 144A
6.00% 2/15/25 # | | | 15,000 | | | | 15,525 | |
LYB International Finance II 3.50% 3/2/27 | | | 30,000 | | | | 29,499 | |
Novelis 144A 5.875% 9/30/26 # | | | 10,000 | | | | 10,225 | |
Olin 5.125% 9/15/27 | | | 10,000 | | | | 10,194 | |
PolyOne 5.25% 3/15/23 | | | 13,000 | | | | 13,163 | |
Potash Corp. of Saskatchewan
4.00% 12/15/26 | | | 15,000 | | | | 15,385 | |
PulteGroup 5.00% 1/15/27 | | | 15,000 | | | | 15,056 | |
Southern Copper 5.875% 4/23/45 | | | 10,000 | | | | 10,469 | |
Standard Industries 144A 5.00% 2/15/27 # | | | 40,000 | | | | 39,300 | |
US Concrete 144A 6.375% 6/1/24 # | | | 10,000 | | | | 10,400 | |
Vale Overseas
6.25% 8/10/26 | | | 25,000 | | | | 27,219 | |
Westlake Chemical 144A 5.00% 8/15/46 # | | | 10,000 | | | | 10,305 | |
WR Grace & Co. 144A 5.625% 10/1/24 # | | | 21,000 | | | | 22,207 | |
| | | | | | | | |
| | | | | | | 569,814 | |
| | | | | | | | |
Capital Goods – 0.43% | | | | | |
Ball 5.25% 7/1/25 | | | 20,000 | | | | 21,250 | |
CCL Industries 144A 3.25% 10/1/26 # | | | 10,000 | | | | 9,589 | |
Crane | | | | | | | | |
2.75% 12/15/18 | | | 5,000 | | | | 5,082 | |
4.45% 12/15/23 | | | 15,000 | | | | 15,759 | |
Crown Americas 144A 4.25% 9/30/26 # | | | 8,000 | | | | 7,715 | |
Fortune Brands Home & Security 3.00% 6/15/20 | | | 10,000 | | | | 10,128 | |
KLX 144A 5.875% 12/1/22 # | | | 10,000 | | | | 10,350 | |
Lennox International 3.00% 11/15/23 | | | 55,000 | | | | 54,127 | |
Schedules of investments
Delaware Foundation® Growth Allocation Fund
| | | | | | | | |
| | | Principal amount° | | | Value (U.S. $) | |
| |
Corporate Bonds (continued) | | | | | |
| |
Capital Goods (continued) | | | | | |
Masco 3.50% 4/1/21 | | | 20,000 | | | $ | 20,452 | |
Owens-Brockway Glass Container 144A 5.875% 8/15/23 # | | | 15,000 | | | | 15,900 | |
Rockwell Collins 3.20% 3/15/24 | | | 15,000 | | | | 14,990 | |
Roper Technologies 2.80% 12/15/21 | | | 10,000 | | | | 10,021 | |
United Technologies 3.75% 11/1/46 | | | 15,000 | | | | 14,115 | |
Waste Management 2.40% 5/15/23 | | | 65,000 | | | | 63,915 | |
| | | | | | | | |
| | | | | | | 273,393 | |
| | | | | | | | |
Consumer Cyclical – 0.77% | | | | | |
Albertsons 144A 6.625% 6/15/24 # | | | 10,000 | | | | 10,250 | |
BMW US Capital 144A 3.30% 4/6/27 # | | | 20,000 | | | | 19,949 | |
Boyd Gaming 6.375% 4/1/26 | | | 15,000 | | | | 16,087 | |
Dollar General 3.875% 4/15/27 | | | 30,000 | | | | 30,081 | |
General Motors Financial | | | | | | | | |
3.45% 4/10/22 | | | 45,000 | | | | 45,271 | |
3.70% 5/9/23 | | | 5,000 | | | | 5,044 | |
GLP Capital 5.375% 4/15/26 | | | 25,000 | | | | 25,875 | |
Goodyear Tire & Rubber 5.00% 5/31/26 | | | 15,000 | | | | 15,413 | |
Hanesbrands 144A 4.875% 5/15/26 # | | | 20,000 | | | | 19,750 | |
Hilton Worldwide Finance 144A 4.875% 4/1/27 # | | | 15,000 | | | | 15,187 | |
Hyundai Capital America | | | | | | | | |
144A 2.55% 2/6/19 # | | | 20,000 | | | | 20,111 | |
144A 3.00% 3/18/21 # | | | 5,000 | | | | 5,021 | |
KFC Holding | | | | | | | | |
144A 5.00% 6/1/24 # | | | 6,000 | | | | 6,143 | |
144A 5.25% 6/1/26 # | | | 8,000 | | | | 8,160 | |
Levi Strauss & Co. 5.00% 5/1/25 | | | 30,000 | | | | 30,906 | |
Live Nation Entertainment 144A 4.875% 11/1/24 # | | | 15,000 | | | | 15,037 | |
Lowe’s 3.70% 4/15/46 | | | 25,000 | | | | 23,263 | |
Marriott International | | | | | | | | |
3.75% 3/15/25 | | | 10,000 | | | | 10,179 | |
4.50% 10/1/34 | | | 5,000 | | | | 5,081 | |
MGM Resorts International 4.625% 9/1/26 | | | 10,000 | | | | 9,750 | |
| | | | | | | | |
| | | Principal amount° | | | Value (U.S. $) | |
| |
Corporate Bonds (continued) | | | | | |
| |
Consumer Cyclical (continued) | | | | | |
Penn National Gaming 144A 5.625% 1/15/27 # | | | 35,000 | | | $ | 34,825 | |
Scientific Games International 144A 7.00% 1/1/22 # | | | 20,000 | | | | 21,425 | |
Target 3.625% 4/15/46 | | | 20,000 | | | | 18,092 | |
Toyota Motor Credit 2.80% 7/13/22 | | | 20,000 | | | | 20,153 | |
Walgreens Boots Alliance | | | | | | | | |
3.10% 6/1/23 | | | 40,000 | | | | 39,995 | |
3.45% 6/1/26 | | | 10,000 | | | | 9,767 | |
Wyndham Worldwide 4.15% 4/1/24 | | | 10,000 | | | | 10,098 | |
| | | | | | | | |
| | | | | | | 490,913 | |
| | | | | | | | |
Consumer Non-Cyclical – 1.17% | | | | | |
Abbott Laboratories 2.90% 11/30/21 | | | 75,000 | | | | 75,400 | |
ACCO Brands 144A 5.25% 12/15/24 # | | | 5,000 | | | | 5,037 | |
Anheuser-Busch InBev Finance 2.65% 2/1/21 | | | 90,000 | | | | 90,749 | |
Biogen 5.20% 9/15/45 | | | 15,000 | | | | 16,274 | |
Celgene 3.25% 8/15/22 | | | 45,000 | | | | 45,747 | |
DaVita 5.00% 5/1/25 | | | 20,000 | | | | 19,988 | |
Dean Foods 144A 6.50% 3/15/23 # | | | 25,000 | | | | 26,125 | |
HCA 5.375% 2/1/25 | | | 20,000 | | | | 20,850 | |
HealthSouth | | | | | | | | |
5.125% 3/15/23 | | | 5,000 | | | | 5,025 | |
5.75% 11/1/24 | | | 30,000 | | | | 30,375 | |
5.75% 9/15/25 | | | 5,000 | | | | 5,019 | |
Heineken 144A 3.50% 1/29/28 # | | | 5,000 | | | | 5,037 | |
Hill-Rom Holdings 144A 5.00% 2/15/25 # | | | 25,000 | | | | 25,031 | |
JBS USA 144A 5.75% 6/15/25 # | | | 15,000 | | | | 15,225 | |
Molson Coors Brewing | | | | | | | | |
3.00% 7/15/26 | | | 40,000 | | | | 38,109 | |
4.20% 7/15/46 | | | 15,000 | | | | 14,099 | |
Mylan 3.95% 6/15/26 | | | 5,000 | | | | 4,903 | |
New York and Presbyterian | | | | | | | | |
Hospital 4.063% 8/1/56 | | | 20,000 | | | | 18,802 | |
Post Holdings | | | | | | | | |
144A 5.00% 8/15/26 # | | | 25,000 | | | | 24,000 | |
144A 5.75% 3/1/27 # | | | 5,000 | | | | 5,013 | |
Revlon Consumer Products 6.25% 8/1/24 | | | 10,000 | | | | 10,000 | |
Reynolds American 4.00% 6/12/22 | | | 25,000 | | | | 26,267 | |
| | | | | | | | |
| | | Principal amount° | | | Value (U.S. $) | |
| |
Corporate Bonds (continued) | | | | | |
| |
Consumer Non-Cyclical (continued) | | | | | |
Shire Acquisitions Investments Ireland | | | | | | | | |
2.40% 9/23/21 | | | 20,000 | | | $ | 19,606 | |
2.875% 9/23/23 | | | 45,000 | | | | 43,719 | |
Tempur Sealy International 5.50% 6/15/26 | | | 10,000 | | | | 9,885 | |
Thermo Fisher Scientific 3.00% 4/15/23 | | | 90,000 | | | | 89,426 | |
Transurban Finance 144A 3.375% 3/22/27 # | | | 10,000 | | | | 9,689 | |
Universal Health Services 144A 5.00% 6/1/26 # | | | 5,000 | | | | 5,163 | |
Zimmer Biomet Holdings | | | | | | | | |
3.375% 11/30/21 | | | 15,000 | | | | 15,189 | |
4.625% 11/30/19 | | | 20,000 | | | | 21,219 | |
| | | | | | | | |
| | | | | | | 740,971 | |
| | | | | | | | |
Energy – 1.02% | | | | | |
Anadarko Petroleum 5.55% 3/15/26 | | | 55,000 | | | | 61,139 | |
BP Capital Markets | | | | | | | | |
3.216% 11/28/23 | | | 30,000 | | | | 30,176 | |
3.224% 4/14/24 | | | 15,000 | | | | 15,019 | |
Diamondback Energy 144A 4.75% 11/1/24 # | | | 20,000 | | | | 20,218 | |
Ecopetrol 7.375% 9/18/43 | | | 5,000 | | | | 5,367 | |
Enbridge | | | | | | | | |
4.25% 12/1/26 | | | 10,000 | | | | 10,227 | |
6.00% 1/15/77 ● | | | 5,000 | | | | 5,069 | |
Energy Transfer Equity 7.50% 10/15/20 | | | 15,000 | | | | 16,800 | |
Energy Transfer Partners | | | | | | | | |
4.75% 1/15/26 | | | 5,000 | | | | 5,154 | |
6.125% 12/15/45 | | | 25,000 | | | | 26,731 | |
9.70% 3/15/19 | | | 15,000 | | | | 17,063 | |
Enterprise Products Operating 7.034% 1/15/68 ● | | | 5,000 | | | | 5,205 | |
Genesis Energy 5.625% 6/15/24 | | | 10,000 | | | | 9,825 | |
Gulfport Energy | | | | | | | | |
144A 6.00% 10/15/24 # | | | 15,000 | | | | 14,625 | |
6.625% 5/1/23 | | | 10,000 | | | | 10,163 | |
Hilcorp Energy I 144A 5.00% 12/1/24 # | | | 25,000 | | | | 23,563 | |
Kinder Morgan Energy | | | | | | | | |
Partners 5.80% 3/1/21 | | | 15,000 | | | | 16,492 | |
Laredo Petroleum 6.25% 3/15/23 | | | 15,000 | | | | 15,300 | |
MPLX 4.875% 12/1/24 | | | 30,000 | | | | 31,604 | |
| | | | | | | | |
| | | Principal amount° | | | Value (U.S. $) | |
| |
Corporate Bonds (continued) | | | | | |
| |
Energy (continued) | | | | | |
MPLX
4.875% 6/1/25 | | | 10,000 | | | $ | 10,491 | |
Murphy Oil 6.875% 8/15/24 | | | 25,000 | | | | 26,563 | |
Murphy Oil USA
6.00% 8/15/23 | | | 21,000 | | | | 22,103 | |
Newfield Exploration 5.75% 1/30/22 | | | 10,000 | | | | 10,663 | |
Noble Energy 5.05% 11/15/44 | | | 10,000 | | | | 10,236 | |
Petrobras Global Finance 7.375% 1/17/27 | | | 5,000 | | | | 5,299 | |
Plains All American Pipeline 8.75% 5/1/19 | | | 20,000 | | | | 22,567 | |
Regency Energy Partners 5.00% 10/1/22 | | | 5,000 | | | | 5,322 | |
Sabine Pass Liquefaction | | | | | | | | |
144A 4.20% 3/15/28 # | | | 20,000 | | | | 19,739 | |
144A 5.00% 3/15/27 # | | | 5,000 | | | | 5,232 | |
Shell International Finance | | | | | | | | |
2.875% 5/10/26 | | | 5,000 | | | | 4,867 | |
4.00% 5/10/46 | | | 30,000 | | | | 28,913 | |
4.375% 5/11/45 | | | 15,000 | | | | 15,259 | |
Southwestern Energy 6.70% 1/23/25 | | | 20,000 | | | | 19,900 | |
Targa Resources Partners | | | | | | | | |
144A 5.125% 2/1/25 # | | | 10,000 | | | | 10,338 | |
144A 5.375% 2/1/27 # | | | 10,000 | | | | 10,400 | |
Transcanada Trust | | | | | | | | |
5.30% 3/15/77 ● | | | 10,000 | | | | 9,900 | |
5.875% 8/15/76 ● | | | 10,000 | | | | 10,575 | |
Transocean Proteus 144A 6.25% 12/1/24 # | | | 10,000 | | | | 10,375 | |
Woodside Finance | | | | | | | | |
144A 3.65% 3/5/25 # | | | 15,000 | | | | 14,794 | |
144A 3.70% 9/15/26 # | | | 5,000 | | | | 4,894 | |
144A 8.75% 3/1/19 # | | | 15,000 | | | | 16,786 | |
YPF 144A 23.854% 7/7/20 #● | | | 10,000 | | | | 11,195 | |
| | | | | | | | |
| | | | | | | 646,151 | |
| | | | | | | | |
Financials – 0.35% | | | | | |
Affiliated Managers Group 3.50% 8/1/25 | | | 15,000 | | | | 14,763 | |
Air Lease | | | | | | | | |
3.00% 9/15/23 | | | 20,000 | | | | 19,570 | |
3.625% 4/1/27 | | | 45,000 | | | | 43,824 | |
Aviation Capital Group | | | | | | | | |
144A 2.875% 1/20/22 # | | | 5,000 | | | | 4,970 | |
144A 4.875% 10/1/25 # | | | 25,000 | | | | 26,936 | |
144A 6.75% 4/6/21 # | | | 5,000 | | | | 5,731 | |
Schedules of investments
Delaware Foundation® Growth Allocation Fund
| | | | | | | | |
| | | Principal amount° | | | Value (U.S. $) | |
| |
Corporate Bonds (continued) | | | | | |
| |
Financials (continued) | | | | | |
Berkshire Hathaway 2.75% 3/15/23 | | | 10,000 | | | $ | 10,009 | |
BlackRock 3.20% 3/15/27 | | | 15,000 | | | | 15,024 | |
E*TRADE Financial 5.875% 12/29/49 ● | | | 20,000 | | | | 20,655 | |
Jefferies Group | | | | | | | | |
4.85% 1/15/27 | | | 5,000 | | | | 5,113 | |
6.45% 6/8/27 | | | 5,000 | | | | 5,666 | |
6.50% 1/20/43 | | | 5,000 | | | | 5,440 | |
Lazard Group | | | | | | | | |
3.625% 3/1/27 | | | 5,000 | | | | 4,888 | |
3.75% 2/13/25 | | | 10,000 | | | | 9,957 | |
Park Aerospace Holdings 144A 5.50% 2/15/24 # | | | 25,000 | | | | 26,063 | |
| | | | | | | | |
| | | | | | | 218,609 | |
| | | | | | | | |
Insurance – 0.62% | | | | | |
Allstate 3.28% 12/15/26 | | | 50,000 | | | | 50,297 | |
Berkshire Hathaway Finance 2.90% 10/15/20 | | | 20,000 | | | | 20,668 | |
Liberty Mutual Group 144A 4.95% 5/1/22 # | | | 10,000 | | | | 10,876 | |
Manulife Financial 4.061% 2/24/32 ● | | | 20,000 | | | | 20,075 | |
MetLife | | | | | | | | |
6.40% 12/15/36 | | | 30,000 | | | | 33,000 | |
6.817% 8/15/18 | | | 80,000 | | | | 85,299 | |
Principal Life Global Funding II 144A 3.00% 4/18/26 # | | | 60,000 | | | | 58,481 | |
Prudential Financial | | | | | | | | |
4.50% 11/15/20 | | | 35,000 | | | | 37,580 | |
5.375% 5/15/45 ● | | | 10,000 | | | | 10,490 | |
TIAA Asset Management Finance | | | | | | | | |
144A 2.95% 11/1/19 # | | | 10,000 | | | | 10,170 | |
144A 4.125% 11/1/24 # | | | 20,000 | | | | 20,412 | |
USI 144A 7.75% 1/15/21 # | | | 5,000 | | | | 5,091 | |
XLIT | | | | | | | | |
4.45% 3/31/25 | | | 10,000 | | | | 10,105 | |
5.50% 3/31/45 | | | 15,000 | | | | 15,039 | |
6.50% 12/29/49 ● | | | 10,000 | | | | 8,425 | |
| | | | | | | | |
| | | | | | | 396,008 | |
| | | | | | | | |
Media – 0.33% | | | | | |
21st Century Fox America 4.95% 10/15/45 | | | 20,000 | | | | 20,774 | |
CCO Holdings 144A 5.75% 2/15/26 # | | | 15,000 | | | | 15,787 | |
Comcast 3.00% 2/1/24 | | | 25,000 | | | | 25,007 | |
CSC Holdings 5.25% 6/1/24 | | | 5,000 | | | | 4,994 | |
| | | | | | | | |
| | | Principal amount° | | | Value (U.S. $) | |
| |
Corporate Bonds (continued) | | | | | |
| |
Media (continued) | | | | | | | | |
DISH DBS 7.75% 7/1/26 | | | 5,000 | | | $ | 5,825 | |
Gray Television 144A 5.875% 7/15/26 # | | | 15,000 | | | | 15,300 | |
Nexstar Broadcasting 144A 5.625% 8/1/24 # | | | 15,000 | | | | 15,263 | |
Sinclair Television Group 144A 5.125% 2/15/27 # | | | 15,000 | | | | 14,550 | |
Sirius XM Radio 144A 5.375% 7/15/26 # | | | 20,000 | | | | 20,500 | |
Time Warner Cable 7.30% 7/1/38 | | | 40,000 | | | | 49,702 | |
Tribune Media 5.875% 7/15/22 | | | 20,000 | | | | 20,950 | |
| | | | | | | | |
| | | | | | | 208,652 | |
| | | | | | | | |
Real Estate – 0.66% | | | | | |
American Tower | | | | | | | | |
4.00% 6/1/25 | | | 25,000 | | | | 25,335 | |
4.40% 2/15/26 | | | 50,000 | | | | 51,811 | |
American Tower Trust I 144A 3.07% 3/15/23 # | | | 20,000 | | | | 19,957 | |
CC Holdings GS V 3.849% 4/15/23 | | | 10,000 | | | | 10,254 | |
Corporate Office Properties | | | | | | | | |
3.60% 5/15/23 | | | 15,000 | | | | 14,598 | |
5.25% 2/15/24 | | | 15,000 | | | | 15,801 | |
Crown Castle International 5.25% 1/15/23 | | | 20,000 | | | | 21,849 | |
CubeSmart 3.125% 9/1/26 | | | 15,000 | | | | 14,116 | |
DDR 7.50% 4/1/17 | | | 5,000 | | | | 5,000 | |
Education Realty Operating Partnership
4.60% 12/1/24 | | | 10,000 | | | | 10,091 | |
ESH Hospitality 144A 5.25% 5/1/25 # | | | 25,000 | | | | 25,265 | |
Hospitality Properties Trust 4.50% 3/15/25 | | | 10,000 | | | | 10,053 | |
Host Hotels & Resorts | | | | | | | | |
3.75% 10/15/23 | | | 5,000 | | | | 5,045 | |
3.875% 4/1/24 | | | 10,000 | | | | 10,089 | |
4.50% 2/1/26 | | | 10,000 | | | | 10,363 | |
Iron Mountain U.S. Holdings 144A 5.375% 6/1/26 # | | | 20,000 | | | | 20,050 | |
Kite Realty Group 4.00% 10/1/26 | | | 5,000 | | | | 4,800 | |
LifeStorage 3.50% 7/1/26 | | | 15,000 | | | | 14,379 | |
MGM Growth Properties Operating Partnership 4.50% 9/1/26 | | | 15,000 | | | | 14,625 | |
| | | | | | | | |
| | | Principal amount° | | | Value (U.S. $) | |
| |
Corporate Bonds (continued) | | | | | |
| |
Real Estate (continued) | | | | | |
Realty Income 4.125% 10/15/26 | | | 15,000 | | | $ | 15,477 | |
Regency Centers 3.60% 2/1/27 | | | 10,000 | | | | 9,941 | |
SBA Communications 144A 4.875% 9/1/24 # | | | 15,000 | | | | 14,847 | |
UDR 4.00% 10/1/25 | | | 55,000 | | | | 56,194 | |
Uniti Group 144A 7.125% 12/15/24 # | | | 10,000 | | | | 10,175 | |
WP Carey 4.60% 4/1/24 | | | 10,000 | | | | 10,364 | |
| | | | | | | | |
| | | | | | | 420,479 | |
| | | | | | | | |
Services – 0.11% | | | | | |
Aramark Services 5.125% 1/15/24 | | | 20,000 | | | | 21,025 | |
Avis Budget Car Rental 144A 6.375% 4/1/24 # | | | 5,000 | | | | 5,031 | |
Herc Rentals 144A 7.75% 6/1/24 # | | | 8,000 | | | | 8,560 | |
Prime Security Services Borrower 144A 9.25% 5/15/23 # | | | 20,000 | | | | 21,975 | |
United Rentals North America | | | | | | | | |
5.50% 5/15/27 | | | 10,000 | | | | 10,125 | |
5.875% 9/15/26 | | | 5,000 | | | | 5,231 | |
| | | | | | | | |
| | | | | | | 71,947 | |
| | | | | | | | |
Technology – 0.39% | | | | | |
Apple 3.45% 2/9/45 | | | 15,000 | | | | 13,472 | |
Broadcom | | | | | | | | |
144A 3.00% 1/15/22 # | | | 15,000 | | | | 14,971 | |
144A 3.625% 1/15/24 # | | | 30,000 | | | | 30,259 | |
CDK Global 5.00% 10/15/24 | | | 5,000 | | | | 5,070 | |
CDW 5.00% 9/1/25 | | | 5,000 | | | | 5,106 | |
Cisco Systems 1.85% 9/20/21 | | | 20,000 | | | | 19,624 | |
CommScope Technologies 144A 5.00% 3/15/27 # | | | 5,000 | | | | 5,005 | |
Diamond 1 Finance 144A 6.02% 6/15/26 # | | | 10,000 | | | | 10,941 | |
DXC Technology | | | | | | | | |
144A 4.25% 4/15/24 # | | | 5,000 | | | | 5,091 | |
144A 4.75% 4/15/27 # | | | 15,000 | | | | 15,324 | |
Fidelity National Information Services 5.00% 10/15/25 | | | 10,000 | | | | 10,894 | |
First Data | | | | | | | | |
144A 5.75% 1/15/24 # | | | 20,000 | | | | 20,705 | |
144A 7.00% 12/1/23 # | | | 17,000 | | | | 18,275 | |
Microsoft
2.40% 2/6/22 | | | 5,000 | | | | 5,033 | |
| | | | | | | | |
| | | Principal amount° | | | Value (U.S. $) | |
| |
Corporate Bonds (continued) | | | | | |
| |
Technology (continued) | | | | | |
Microsoft | | | | | | | | |
2.875% 2/6/24 | | | 5,000 | | | $ | 5,035 | |
4.25% 2/6/47 | | | 40,000 | | | | 41,093 | |
Symantec 144A 5.00% 4/15/25 # | | | 20,000 | | | | 20,489 | |
| | | | | | | | |
| | | | | | | 246,387 | |
| | | | | | | | |
Telecommunications – 0.55% | | | | | |
AT&T 5.25% 3/1/37 | | | 40,000 | | | | 40,863 | |
CenturyLink | | | | | | | | |
5.80% 3/15/22 | | | 20,000 | | | | 20,686 | |
6.75% 12/1/23 | | | 13,000 | | | | 13,601 | |
Charter Communications Operating
4.908% 7/23/25 | | | 35,000 | | | | 37,019 | |
Cincinnati Bell 144A 7.00% 7/15/24 # | | | 10,000 | | | | 10,513 | |
Crown Castle Towers 144A 4.883% 8/15/20 # | | | 55,000 | | | | 58,581 | |
Level 3 Financing | | | | | | | | |
5.25% 3/15/26 | | | 5,000 | | | | 5,044 | |
5.375% 5/1/25 | | | 10,000 | | | | 10,200 | |
Radiate Holdco 144A 6.625% 2/15/25 # | | | 10,000 | | | | 9,894 | |
SBA Tower Trust 144A 2.24% 4/16/18 # | | | 25,000 | | | | 25,010 | |
Sprint 7.875% 9/15/23 | | | 22,000 | | | | 24,420 | |
T-Mobile USA 6.50% 1/15/26 | | | 20,000 | | | | 21,950 | |
Verizon Communications 144A 2.946% 3/15/22 # | | | 50,000 | | | | 49,838 | |
WPP Finance 2010 5.625% 11/15/43 | | | 5,000 | | | | 5,346 | |
Zayo Group 144A 5.75% 1/15/27 # | | | 15,000 | | | | 15,860 | |
| | | | | | | | |
| | | | | | | 348,825 | |
| | | | | | | | |
Transportation – 0.38% | | | | | |
Air Canada 2015-1 Class A Pass Through Trust 144A 3.60% 3/15/27 #◆ | | | 9,361 | | | | 9,420 | |
American Airlines 2015-1 Class A Pass Through Trust 3.375% 5/1/27 ◆ | | | 13,938 | | | | 13,677 | |
American Airlines 2015-2 Class AA Pass Through Trust 3.60% 9/22/27 ◆ | | | 4,763 | | | | 4,795 | |
American Airlines 2016-1 Class AA Pass Through Trust 3.575% 1/15/28 ◆ | | | 9,747 | | | | 9,735 | |
Schedules of investments
Delaware Foundation® Growth Allocation Fund
| | | | | | | | |
| | | Principal amount° | | | Value (U.S. $) | |
| |
Corporate Bonds (continued) | | | | | |
| |
Transportation (continued) | | | | | |
Burlington Northern Santa Fe 4.70% 9/1/45 | | | 40,000 | | | $ | 43,549 | |
Penske Truck Leasing | | | | | | | | |
144A 3.30% 4/1/21 # | | | 15,000 | | | | 15,217 | |
144A 4.20% 4/1/27 # | | | 70,000 | | | | 71,406 | |
Union Pacific 3.00% 4/15/27 | | | 15,000 | | | | 14,836 | |
United Airlines 2014-1 Class A Pass Through Trust 4.00% 4/11/26 ◆ | | | 4,576 | | | | 4,748 | |
United Airlines 2014-2 Class A Pass Through Trust 3.75% 9/3/26 ◆ | | | 13,707 | | | | 13,931 | |
United Airlines 2016-1 Class AA Pass Through Trust 3.10% 7/7/28 ◆ | | | 10,000 | | | | 9,850 | |
United Parcel Service 5.125% 4/1/19 | | | 20,000 | | | | 21,376 | |
XPO Logistics 144A 6.125% 9/1/23 # | | | 10,000 | | | | 10,438 | |
| | | | | | | | |
| | | | | | | 242,978 | |
| | | | | | | | |
Utilities – 1.56% | | | | | |
AES 5.50% 4/15/25 | | | 5,000 | | | | 5,087 | |
Ameren Illinois 9.75% 11/15/18 | | | 35,000 | | | | 39,329 | |
American Transmission Systems 144A 5.25% 1/15/22 # | | | 40,000 | | | | 44,073 | |
AmeriGas Partners 5.875% 8/20/26 | | | 20,000 | | | | 20,000 | |
Berkshire Hathaway Energy 3.75% 11/15/23 | | | 50,000 | | | | 52,322 | |
Calpine | | | | | | | | |
144A 5.25% 6/1/26 # | | | 20,000 | | | | 20,400 | |
5.375% 1/15/23 | | | 5,000 | | | | 5,087 | |
CMS Energy 6.25% 2/1/20 | | | 50,000 | | | | 55,174 | |
ComEd Financing III 6.35% 3/15/33 | | | 20,000 | | | | 21,384 | |
DTE Energy 3.30% 6/15/22 | | | 60,000 | | | | 60,984 | |
Duke Energy 4.80% 12/15/45 | | | 5,000 | | | | 5,299 | |
Emera 6.75% 6/15/76 ● | | | 30,000 | | | | 32,887 | |
Emera US Finance | | | | | | | | |
3.55% 6/15/26 | | | 45,000 | | | | 44,318 | |
4.75% 6/15/46 | | | 20,000 | | | | 20,254 | |
Enel Americas 4.00% 10/25/26 | | | 5,000 | | | | 4,959 | |
Entergy 4.00% 7/15/22 | | | 45,000 | | | | 47,184 | |
Entergy Louisiana 4.05% 9/1/23 | | | 20,000 | | | | 21,117 | |
| | | | | | | | |
| | | Principal amount° | | | Value (U.S. $) | |
| |
Corporate Bonds (continued) | | | | | |
| |
Utilities (continued) | | | | | |
Entergy Louisiana 4.95% 1/15/45 | | | 5,000 | | | $ | 5,132 | |
Exelon | | | | | | | | |
3.497% 6/1/22 | | | 15,000 | | | | 15,154 | |
3.95% 6/15/25 | | | 15,000 | | | | 15,442 | |
Fortis 144A
3.055% 10/4/26 # | | | 40,000 | | | | 37,605 | |
Great Plains Energy | | | | | | | | |
3.15% 4/1/22 | | | 50,000 | | | | 50,554 | |
4.85% 6/1/21 | | | 10,000 | | | | 10,679 | |
IPALCO Enterprises 5.00% 5/1/18 | | | 10,000 | | | | 10,325 | |
ITC Holdings 3.25% 6/30/26 | | | 5,000 | | | | 4,866 | |
Kansas City Power & Light 3.65% 8/15/25 | | | 20,000 | | | | 20,112 | |
LG&E &KU Energy 4.375% 10/1/21 | | | 40,000 | | | | 42,268 | |
Metropolitan Edison 144A 4.00% 4/15/25 # | | | 5,000 | | | | 5,050 | |
MidAmerican Energy 4.25% 5/1/46 | | | 5,000 | | | | 5,173 | |
National Rural Utilities Cooperative Finance | | | | | | | | |
2.70% 2/15/23 | | | 15,000 | | | | 14,871 | |
2.85% 1/27/25 | | | 15,000 | | | | 14,821 | |
4.75% 4/30/43 ● | | | 20,000 | | | | 20,500 | |
5.25% 4/20/46 ● | | | 5,000 | | | | 5,217 | |
New York State Electric & Gas 144A 3.25% 12/1/26 # | | | 20,000 | | | | 19,918 | |
NextEra Energy Capital Holdings | | | | | | | | |
2.40% 9/15/19 | | | 15,000 | | | | 15,126 | |
3.625% 6/15/23 | | | 10,000 | | | | 10,147 | |
NiSource Finance 6.125% 3/1/22 | | | 15,000 | | | | 17,198 | |
NV Energy 6.25% 11/15/20 | | | 15,000 | | | | 16,859 | |
Pennsylvania Electric 5.20% 4/1/20 | | | 15,000 | | | | 15,957 | |
Public Service Co. of Oklahoma 5.15% 12/1/19 | | | 10,000 | | | | 10,721 | |
SCANA 4.125% 2/1/22 | | | 15,000 | | | | 15,216 | |
Southern | | | | | | | | |
2.75% 6/15/20 | | | 70,000 | | | | 70,639 | |
4.40% 7/1/46 | | | 5,000 | | | | 4,797 | |
Trans-Allegheny Interstate Line 144A 3.85% 6/1/25 # | | | 5,000 | | | | 5,130 | |
| | | | | | | | |
| | | Principal amount° | | | Value (U.S. $) | |
| |
Corporate Bonds (continued) | | | | | |
| |
Utilities (continued) | | | | | |
Wisconsin Electric Power 4.30% 12/15/45 | | | 10,000 | | | $ | 10,251 | |
| | | | | | | | |
| | | | | | | 989,586 | |
| | | | | | | | |
Total Corporate Bonds
(cost $6,950,902) | | | | 7,035,096 | |
| | | | | | | | |
|
| |
Loan Agreements – 1.55%« | | | | | |
| |
Aercap Tranche B 1st Lien 3.397% 10/30/22 | | | 50,000 | | | | 50,464 | |
Air Medical Group Holdings Tranche B 1st Lien 4.25% 4/28/22 | | | 29,525 | | | | 29,549 | |
Amaya Holdings 1st Lien 4.647% 8/1/21 | | | 29,848 | | | | 29,955 | |
Builders FirstSource 1st Lien 4.00% 2/29/24 | | | 44,663 | | | | 44,697 | |
Cablevision Tranche B 1st Lien
3.943% 10/11/24 | | | 44,888 | | | | 44,869 | |
Change Healthcare Tranche B 1st Lien 3.75% 3/1/24 | | | 45,000 | | | | 45,131 | |
DaVita Healthcare Partners Tranche B 1st Lien 3.732% 6/24/21 | | | 44,656 | | | | 45,234 | |
Examworks Group Tranche B 1st Lien 4.25% 7/27/23 | | | 44,775 | | | | 45,111 | |
First Data 1st Lien | | | | | | | | |
3.984% 3/24/21 | | | 33,528 | | | | 33,821 | |
3.984% 7/10/22 | | | 37,318 | | | | 37,663 | |
First Eagle Holdings 5.147% 12/1/22 | | | 29,849 | | | | 30,045 | |
FMG Resources 1st Lien 3.75% 6/30/19 | | | 14,761 | | | | 14,858 | |
Gardner Denver 4.568% 7/30/20 | | | 29,769 | | | | 29,745 | |
Gates Global 1st Lien 4.397% 7/6/21 | | | 30,521 | | | | 30,616 | |
HCA Tranche B9 1st Lien 2.982% 3/18/23 | | | 40,196 | | | | 40,413 | |
Houghton International 1st Lien 4.397% 12/20/19 | | | 86,175 | | | | 86,929 | |
JC Penney Tranche B 1st Lien 5.304% 6/23/23 | | | 44,438 | | | | 44,222 | |
KIK Custom Products Tranche B 1st Lien 5.653% 8/26/22 | | | 21,492 | | | | 21,741 | |
PQ 1st Lien 5.25% 11/4/22 | | | 44,663 | | | | 45,189 | |
Republic of Angola 7.57% 12/16/23 | | | 27,125 | | | | 23,599 | |
| | | | | | | | |
| | | Principal amount° | | | Value (U.S. $) | |
| |
Loan Agreements« (continued) | | | | | |
| |
Russell Investments US Institutional Holdco Tranche B 1st Lien 6.75% 6/1/23 | | | 29,775 | | | $ | 30,073 | |
Sable International Finance Tranche B 1st Lien 5.732% 1/3/23 | | | 45,000 | | | | 45,600 | |
Sprint Communications Tranche B 1st Lien 3.50% 2/2/24 | | | 40,000 | | | | 40,058 | |
USI Insurance Services Tranche B 1st Lien 4.25% 12/27/19 | | | 22,507 | | | | 22,568 | |
WideOpenWest Finance Tranche B 1st Lien 4.50% 8/19/23 | | | 39,800 | | | | 40,079 | |
Windstream Services Tranche B6 1st Lien 4.95% 3/30/21 | | | 29,850 | | | | 30,180 | |
| | | | | | | | |
Total Loan Agreements
(cost $974,833) | | | | 982,409 | |
| | | | | | | | |
|
| |
Municipal Bonds – 0.21% | | | | | |
| |
Bay Area Toll Authority (Build America Bonds) Series S3 6.907% 10/1/50 | | | 25,000 | | | | 35,871 | |
California State Various Purposes (Build America Bonds)
7.55% 4/1/39 | | | 20,000 | | | | 29,373 | |
Commonwealth of Massachusetts Series C 5.00% 10/1/25 | | | 10,000 | | | | 12,173 | |
New Jersey Turnpike Authority (Build America Bonds) | | | | | | | | |
Series A 7.102% 1/1/41 | | | 10,000 | | | | 13,994 | |
Series F 7.414% 1/1/40 | | | 5,000 | | | | 7,213 | |
New York City, New York | | | | | | | | |
Series C 5.00% 8/1/26 | | | 5,000 | | | | 6,009 | |
Series C 5.00% 8/1/27 | | | 5,000 | | | | 5,963 | |
South Carolina Public Service Authority
Series D 4.77% 12/1/45 | | | 5,000 | | | | 4,502 | |
Texas Water Development Board
Water Implementation Revenue 5.00% 10/15/46 | | | 15,000 | | | | 17,178 | |
| | | | | | | | |
Total Municipal Bonds
(cost $141,046) | | | | 132,276 | |
| | | | | | | | |
Schedules of investments
Delaware Foundation® Growth Allocation Fund
| | | | | | | | |
| | | Principal amount° | | | Value (U.S. $) | |
| |
Non-Agency Asset-Backed Securities – 1.12% | | | | | |
| |
Ally Master Owner Trust Series 2014-4 A2 1.43% 6/17/19 | | | 25,000 | | | $ | 25,019 | |
American Express Credit Account Master Trust Series 2014-5 A 1.202% 5/15/20 ● | | | 150,000 | | | | 150,193 | |
American Express Credit Account Secured Note Trust Series 2012-4 B 1.462% 5/15/20 ● | | | 120,000 | | | | 120,183 | |
CNH Equipment Trust Series 2016-B A2B 1.312% 10/15/19 ● | | | 3,621 | | | | 3,628 | |
Discover Card Execution Note Trust
Series 2015-A1 A1 1.262% 8/17/20 ● | | | 135,000 | | | | 135,298 | |
Ford Credit Auto Lease Trust Series 2015-A A3 1.13% 6/15/18 | | | 4,890 | | | | 4,889 | |
Mercedes-Benz Auto Lease Trust
Series 2016-A A2B 1.472% 7/16/18 ● | | | 5,610 | | | | 5,616 | |
Navistar Financial Dealer Note Master Owner Trust II Series 2016-1 A 144A 2.332% 9/27/21 #● | | | 10,000 | | | | 10,024 | |
Nissan Auto Lease Trust Series 2015-B A2B 1.442% 12/15/17 ● | | | 4,713 | | | | 4,715 | |
PFS Financing
Series 2015-AA A 144A 1.532% 4/15/20 #● | | | 100,000 | | | | 99,969 | |
Volkswagen Credit Auto Master Trust
Series 2014-1A A2 144A 1.40% 7/22/19 # | | | 35,000 | | | | 34,989 | |
Wells Fargo Dealer Floorplan Master Note Trust Series 2014-2 A 1.428% 10/20/19 ● | | | 120,000 | | | | 120,081 | |
| | | | | | | | |
Total Non-Agency Asset-Backed Securities
(cost $714,747) | | | | 714,604 | |
| | | | | | | | |
|
| |
Non-Agency Collateralized Mortgage Obligations – 0.06% | | | | | |
| |
Bank of America Alternative Loan Trust
Series 2005-6 7A1 5.50% 7/25/20 | | | 327 | | | | 312 | |
| | | | | | | | |
| | | Principal amount° | | | Value (U.S. $) | |
| |
Non-Agency Collateralized Mortgage Obligations (continued) | | | | | |
| |
Credit Suisse First Boston Mortgage Securities Series 2005-5 6A3 5.00% 7/25/35 | | | 6,358 | | | $ | 6,328 | |
JPMorgan Mortgage Trust Series 2006-S1 1A1 6.00% 4/25/36 | | | 21,255 | | | | 21,731 | |
Structured Asset Securities Corporation Mortgage Pass Through Certificates Series 2004-20 2A1 5.50% 11/25/34 ◆ | | | 3,750 | | | | 3,831 | |
Wells Fargo Mortgage-Backed Securities Trust | | | | | | | | |
Series 2006-2 3A1 5.75% 3/25/36 | | | 2,367 | | | | 2,373 | |
Series 2006-AR5 2A1 3.294% 4/25/36 ● | | | 7,714 | | | | 7,236 | |
| | | | | | | | |
Total Non-Agency Collateralized Mortgage Obligations
(cost $38,642) | | | | 41,811 | |
|
| |
Non-Agency Commercial Mortgage-Backed Securities – 1.41% | | | | | |
Banc of America Commercial Mortgage Trust | | | | | | | | |
Series 2007-4 AM 5.961% 2/10/51 ● | | | 20,000 | | | | 20,193 | |
Series 2017-BNK3 B 3.879% 2/15/50 ● | | | 30,000 | | | | 30,604 | |
Series 2017-BNK3 C 4.352% 2/15/50 ● | | | 30,000 | | | | 30,586 | |
Bear Stearns Commercial Mortgage Securities Trust Series 2007-PWR18 A4 5.70% 6/11/50 | | | 21,196 | | | | 21,450 | |
Citigroup Commercial
Mortgage Trust | | | | | | | | |
Series 2007-C6 AM 5.779% 12/10/49 ● | | | 10,000 | | | | 10,121 | |
Series 2014-GC25 A4 3.635% 10/10/47 | | | 10,000 | | | | 10,315 | |
Series 2015-GC27 A5 3.137% 2/10/48 | | | 15,000 | | | | 14,945 | |
Series 2016-P3 A4 3.329% 4/15/49 | | | 15,000 | | | | 15,079 | |
Series 2016-P5 A4 2.941% 10/10/49 | | | 15,000 | | | | 14,580 | |
COMM Mortgage Trust
Series 2013-CR6 AM 144A
3.147% 3/10/46 # | | | 15,000 | | | | 15,017 | |
| | | | | | | | |
| | | Principal amount° | | | Value (U.S. $) | |
| |
Non-Agency Commercial
Mortgage-Backed Securities (continued) | | | | | |
| |
COMM Mortgage Trust | | | | | | | | |
Series 2014-CR19 A5 | | | | | | | | |
3.796% 8/10/47 | | | 10,000 | | | $ | 10,460 | |
Series 2014-CR20 AM | | | | | | | | |
3.938% 11/10/47 | | | 30,000 | | | | 31,106 | |
Series 2015-CR23 A4 | | | | | | | | |
3.497% 5/10/48 | | | 10,000 | | | | 10,173 | |
DB-JPM Mortgage Trust | | | | | | | | |
Series 2016-C1 A4 | | | | | | | | |
3.276% 5/10/49 | | | 50,000 | | | | 50,196 | |
Series 2016-C3 A5 | | | | | | | | |
2.89% 9/10/49 | | | 35,000 | | | | 33,977 | |
GRACE Mortgage Trust Series 2014-GRCE A 144A 3.369% 6/10/28 # | | | 210,000 | | | | 217,486 | |
GS Mortgage Securities Trust | | | | | | | | |
Series 2014-GC24 A5 | | | | | | | | |
3.931% 9/10/47 | | | 20,000 | | | | 21,032 | |
Series 2015-GC32 A4 | | | | | | | | |
3.764% 7/10/48 | | | 10,000 | | | | 10,411 | |
JPM-BB Commercial Mortgage Securities Trust | | | | | | | | |
Series 2015-C32 A5 | | | | | | | | |
3.598% 11/15/48 | | | 15,000 | | | | 15,362 | |
Series 2015-C33 A4 | | | | | | | | |
3.77% 12/15/48 | | | 70,000 | | | | 72,563 | |
JPM-DB Commercial Mortgage Securities Trust
Series 2016-C2 A4 3.144% 6/15/49 | | | 30,000 | | | | 29,743 | |
JPMorgan Chase Commercial Mortgage Securities Trust | | | | | | | | |
Series 2005-CB11 E | | | | | | | | |
5.525% 8/12/37 ● | | | 10,000 | | | | 10,397 | |
Series 2013-LC11 B | | | | | | | | |
3.499% 4/15/46 | | | 10,000 | | | | 9,953 | |
Series 2015-JP1 A5 | | | | | | | | |
3.914% 1/15/49 | | | 10,000 | | | | 10,504 | |
Series 2016-JP2 A4 | | | | | | | | |
2.822% 8/15/49 | | | 20,000 | | | | 19,306 | |
Series 2016-JP3 B | | | | | | | | |
3.397% 8/15/49 ● | | | 10,000 | | | | 9,762 | |
Series 2016-WIKI A 144A | | | | | | | | |
2.798% 10/5/31 # | | | 10,000 | | | | 10,062 | |
Series 2016-WIKI B 144A | | | | | | | | |
3.201% 10/5/31 # | | | 10,000 | | | | 10,106 | |
LB-UBS Commercial Mortgage Trust
Series 2006-C6 AJ
5.452% 9/15/39 ● | | | 7,890 | | | | 6,973 | |
| | | | | | | | |
| | | Principal amount° | | | Value (U.S. $) | |
| |
Non-Agency Commercial
Mortgage-Backed Securities (continued) | | | | | |
| |
Morgan Stanley Bank of America Merrill
Lynch Trust | | | | | | | | |
Series 2014-C17 A5 | | | | | | | | |
3.741% 8/15/47 | | | 15,000 | | | $ | 15,616 | |
Series 2015-C23 A4 | | | | | | | | |
3.719% 7/15/50 | | | 35,000 | | | | 36,256 | |
Series 2015-C26 A5 | | | | | | | | |
3.531% 10/15/48 | | | 15,000 | | | | 15,320 | |
Series 2016-C29 A4 | | | | | | | | |
3.325% 5/15/49 | | | 20,000 | | | | 20,097 | |
Wells Fargo Commercial Mortgage Trust | | | | | | | | |
Series 2015-NXS3 A4 | | | | | | | | |
3.617% 9/15/57 | | | 15,000 | | | | 15,360 | |
Series 2016-BNK1 A3 | | | | | | | | |
2.652% 8/15/49 | | | 20,000 | | | | 19,060 | |
| | | | | | | | |
Total Non-Agency Commercial
Mortgage-Backed Securities
(cost $913,671) | | | | 894,171 | |
| | | | | | | | |
|
| |
Regional Bonds – 0.05%D | | | | | | | | |
| |
Australia – 0.05% | | | | | |
New South Wales Treasury 4.00% 5/20/26 | | AUD | 7,400 | | | | 6,155 | |
Queensland Treasury | | | | | | | | |
144A 2.75% 8/20/27 # | | AUD | 26,000 | | | | 19,059 | |
144A 3.25% 7/21/28 # | | AUD | 7,000 | | | | 5,324 | |
| | | | | | | | |
| | | | | | | 30,538 | |
| | | | | | | | |
Total Regional Bonds
(cost $31,376) | | | | 30,538 | |
| | | | | | | | |
|
| |
Sovereign Bonds – 0.12% D | | | | | | | | |
Argentina – 0.01% | | | | | |
Argentine Republic Government International Bond 144A
5.625% 1/26/22 # | | | 5,000 | | | | 5,126 | |
| | | | | | | | |
| | | | | | | 5,126 | |
| | | | | | | | |
Australia – 0.04% | | | | | |
Australia Government Bond 3.75% 4/21/37 | | AUD | 33,000 | | | | 26,845 | |
| | | | | | | | |
| | | | | | | 26,845 | |
| | | | | | | | |
Hungary – 0.04% | | | | | |
Hungary Government International Bond 5.75% 11/22/23 | | | 20,000 | | | | 22,640 | |
| | | | | | | | |
| | | | | | | 22,640 | |
| | | | | | | | |
Schedules of investments
Delaware Foundation® Growth Allocation Fund
| | | | | | | | |
| | | Principal amount° | | | Value (U.S. $) | |
| |
Sovereign BondsD (continued) | | | | | |
| |
New Zealand – 0.03% | | | | | |
New Zealand Government Bond 2.75% 4/15/25 | | NZD | 31,000 | | | $ | 21,217 | |
| | | | | | | | |
| | | | | | | 21,217 | |
| | | | | | | | |
| |
Total Sovereign Bonds
(cost $79,260) | | | | 75,828 | |
| | |
| | | | | | | | |
|
| |
Supranational Banks – 0.06% | | | | | |
| |
International Bank for Reconstruction & Development | | | | | | | | |
3.50% 1/22/21 | | NZD | 47,000 | | | | 33,455 | |
4.625% 10/6/21 | | NZD | 4,000 | | | | 2,967 | |
| | | | | | | | |
Total Supranational Banks
(cost $34,878) | | | | 36,422 | |
| | | | | | | | |
|
| |
U.S. Treasury Obligations – 1.28% | | | | | |
| |
U.S. Treasury Bond 2.875% 11/15/46 | | | 85,000 | | | | 82,462 | |
U.S. Treasury Notes | | | | | | | | |
1.875% 1/31/22 | | | 315,000 | | | | 314,323 | |
2.00% 11/15/26 ¥ | | | 300,000 | | | | 289,787 | |
2.25% 2/15/27 | | | 130,000 | | | | 128,342 | |
| | | | | | | | |
Total U.S. Treasury Obligations
(cost $811,713) | | | | 814,914 | |
| | | | | | | | |
| | |
| | | Number of shares | | | | |
| |
Preferred Stock – 0.12% | | | | | |
| |
General Electric 5.00% ● | | | 35,000 | | | | 36,925 | |
Integrys Energy Group 6.00% ● | | | 600 | | | | 15,667 | |
U.S. Bancorp 3.50% ● | | | 25 | | | | 21,500 | |
| | | | | | | | |
Total Preferred Stock
(cost $67,887) | | | | 74,092 | |
| | | | | | | | |
|
| |
Rights – 0.01% | | | | | |
| |
B2W Cia Digital exercise price BRL 11.00, expiration date 4/25/17 † | | | 8,929 | | | | 4,050 | |
Deutsche Bank exercise price EUR 11.65, expiration date 4/6/17 † | | | 1,200 | | | | 2,868 | |
| | | | | | | | |
Total Rights
(cost $0) | | | | 6,918 | |
| | | | | | | | |
| | | | | | | | |
| | | Principal amount° | | | Value (U.S. $) | |
| |
Short-Term Investments – 1.51% | | | | | |
| |
Discount Notes – 0.35%≠ | | | | | | | | |
Federal Home Loan Bank | | | | | | | | |
0.55% 5/26/17 | | | 58,844 | | | $ | 58,782 | |
0.765% 5/19/17 | | | 163,199 | | | | 163,049 | |
| | | | | | | | |
| | | | | | | 221,831 | |
| | | | | | | | |
Repurchase Agreements – 0.88% | | | | | |
Bank of America Merrill Lynch 0.73%, dated 3/31/17, to be repurchased on 4/3/17, repurchase price $181,969 (collateralized by U.S. government obligations 0.125% 4/15/18; market value $185,597) | | | 181,958 | | | | 181,958 | |
Bank of Montreal 0.66%, dated 3/31/17, to be repurchased on 4/3/17, repurchase price $181,968 (collateralized by U.S. government obligations 0.75%–2.00% 2/28/19–2/15/45; market value $185,597) | | | 181,957 | | | | 181,957 | |
BNP Paribas
0.76%, dated 3/31/17, to be repurchased on 4/3/17, repurchase price $193,097 (collateralized by U.S. government obligations 0.00%–3.125% 6/30/17–2/15/43; market value $196,947) | | | 193,085 | | | | 193,085 | |
| | | | | | | | |
| | | | | | | 557,000 | |
| | | | | | | | |
U.S. Treasury Obligation – 0.28%≠ | | | | | |
U.S. Treasury Bill 0.44% 4/13/17 | | | 180,959 | | | | 180,923 | |
| | | | | | | | |
| | | | | | | 180,923 | |
| | | | | | | | |
| |
Total Short-Term Investments
(cost $959,759) | | | | 959,754 | |
| | | | | | | | |
| |
Total Value of Securities – 101.16%
(cost $51,485,009) | | | $ | 64,232,611 | |
| | | | | | | | |
| | # | Security exempt from registration under Rule 144A of the Securities Act of 1933, as amended. At March 31, 2017, the aggregate value of Rule 144A securities was $2,928,002, which represents 4.61% of the Fund’s net assets. See Note 11 in “Notes to financial statements.” |
| | ◆ | Pass Through Agreement. Security represents the contractual right to receive a proportionate amount of underlying payments due to the counterparty pursuant to various agreements related to the rescheduling of obligations and the exchange of certain notes. |
| | = | Security is being fair valued in accordance with the Fund’s fair valuation policy. At March 31,2017,the aggregate value of fair valued securities was $111,865, which represents 0.18% of the Fund’s net assets. See Note 1 in “Notes to financial statements.” |
| | ≠ | The rate shown is the effective yield at the time of purchase. |
| | « | Loan agreements generally pay interest at rates which are periodically reset by reference to a base lending rate plus a premium. These base lending rates are generally: (i) the prime rate offered by one or more U.S. banks, (ii) the lending rate offered by one or more European banks such as the London Interbank Offered Rate (LIBOR), and (iii) the certificate of deposit rate. Loan agreements may be subject to restrictions on resale. Stated rate in effect at March 31, 2017. |
| | § | Developed Markets – countries that are thought to be most developed and therefore less risky than emerging markets. |
| | ° | Principal amount shown is stated in U.S. dollars unless noted that the security is denominated in another currency. |
| | D | Securities have been classified by country of origin. |
| | S | Interest only security. An interest only security is the interest only portion of a fixed income security, which is separated and sold individually from the principal portion of the security. |
| | † | Non-income producing security. |
| | ● | Variable rate security. Each rate shown is as of March 31, 2017. Interest rates reset periodically. |
| | X | Emerging Markets – developing countries with relatively low per capita income, often with above-average economic growth potential but with more risk. |
| | ¥ | Fully or partially pledged as collateral for futures contracts. |
The following foreign currency exchange contracts, futures contracts, and swap contracts were outstanding at March 31, 2017:1
Foreign Currency Exchange Contracts
| | | | | | | | | | | | | | | | | | | | | | | | | | | | | | | | | | |
Counterparty | | Contracts to Receive (Deliver) | | | | | | In Exchange For | | | | | | Settlement Date | | | | | | Unrealized
Appreciation
(Depreciation) | |
BAML | | AUD | | | (30,628 | ) | | | | | | | USD | | | | 23,315 | | | | | | | | 5/12/17 | | | | | | | $ | (66 | ) |
BAML | | NZD | | | (78,988 | ) | | | | | | | USD | | | | 55,468 | | | | | | | | 5/12/17 | | | | | | | | 159 | |
BNP | | AUD | | | (73,333 | ) | | | | | | | USD | | | | 55,791 | | | | | | | | 5/12/17 | | | | | | | | (193 | ) |
BNYM | | CHF | | | (42,977 | ) | | | | | | | USD | | | | 42,934 | | | | | | | | 4/4/17 | | | | | | | | 18 | |
BNYM | | EUR | | | (837 | ) | | | | | | | USD | | | | 894 | | | | | | | | 4/3/17 | | | | | | | | 1 | |
BNYM | | EUR | | | (39,297 | ) | | | | | | | USD | | | | 41,999 | | | | | | | | 4/4/17 | | | | | | | | 70 | |
BNYM | | EUR | | | (2,458 | ) | | | | | | | USD | | | | 2,627 | | | | | | | | 4/5/17 | | | | | | | | 4 | |
BNYM | | GBP | | | 36,074 | | | | | | | | USD | | | | (45,188 | ) | | | | | | | 4/4/17 | | | | | | | | 14 | |
BNYM | | HKD | | | 237,613 | | | | | | | | USD | | | | (30,592 | ) | | | | | | | 4/5/17 | | | | | | | | (13 | ) |
| | | | | | | | | | | | | | | | | | | | | | | | | | | | | | | | | | |
| | | | | | | | | |
| | | | | | | | | | | | | | | | | | | | | | | | | | | | | | | | $ | (6 | ) |
| | | | | | | | | | | | | | | | | | | | | | | | | | | | | | | | | | |
Futures Contracts
| | | | | | | | | | | | | | | | |
Contracts to Buy (Sell) | | Notional
Cost (Proceeds) | | | Notional
Value | | | Expiration
Date | | | Unrealized
Appreciation
(Depreciation) | |
(3) U.S. Treasury 5
yr Notes | | $ | (351,109 | ) | | $ | (353,180 | ) | | | 7/3/17 | | | $ | (2,071 | ) |
(29) U.S. Treasury 10
yr Notes | | | (3,601,199 | ) | | | (3,612,312 | ) | | | 6/22/17 | | | | (11,113 | ) |
(8) U.S. Treasury
Long Bonds | | | (1,200,977 | ) | | | (1,206,750 | ) | | | 6/22/17 | | | | (5,773 | ) |
(2) Euro-O.A.T. | | | (315,024 | ) | | | (313,724 | ) | | | 6/9/17 | | | | 1,300 | |
| | | | | | | | | | | | | | | | |
| | | | |
| | $ | (5,468,309 | ) | | | | | | | | | | $ | (17,657 | ) |
| | | | | | | | | | | | | | | | |
Schedules of investments
Delaware Foundation® Growth Allocation Fund
Swap Contracts
CDS Contracts2
| | | | | | | | | | | | | | | | | | | | | | | | | | | |
Counterparty | | Swap Referenced Obligation | | Notional
Value3 | | Annual Protection
Payments | | Termination
Date | | Upfront
Payments
Paid
(Received) | | Unrealized
Appreciation
(Depreciation)4 |
| | Protection Purchased: | | | | | | | | | | | | | | | | | | | | | | | | | |
ICE | | JPM - CDX.NA.HY.275 | | | | 757,350 | | | | | 5.00% | | | | | 12/20/21 | | | | | $(48,201) | | | | $ | (11,701 | ) |
| | Protection Sold: | | | | | | | | | | | | | | | | | | | | | | | | | |
HSBC | | CDX.EM.276 | | | | 235,000 | | | | | 1.00% | | | | | 6/20/22 | | | | | (13,192) | | | | | 722 | |
| | | | | | | | | | | | | | | | | | | | | | | | | | | |
| | | | | | |
| | | | | | | | | | | | | | | | | | | | | | | | | $ | (10,979 | ) |
| | | | | | | | | | | | | | | | | | | | | | | | | | | |
IRS Contracts7
| | | | | | | | | | | | | | | | | | | | |
Counterparty & Swap Referenced Obligation | | Notional Value3 | | | Fixed
Interest
Rate
Paid
(Received) | | | Variable
Interest
Rate
Paid
(Received) | | | Termination
Date | | | Unrealized
Appreciation
(Depreciation)4 | |
CME - BAML IRS 3 yr | | | 1,475,000 | | | | 1.808% | | | | (1.151%) | | | | 3/28/20 | | | $ | (28 | ) |
LCH - BAML IRS 5 yr | | | 3,100,000 | | | | 2.066% | | | | (1.148%) | | | | 4/3/22 | | | | (1,589 | ) |
| | | | | | | | | | | | | | | | | | | | |
| | | | | |
| | | | | | | | | | | | | | | | | | $ | (1,617 | ) |
| | | | | | | | | | | | | | | | | | | | |
The use of foreign currency exchange contracts, futures contracts, and swap contracts involve elements of market risk and risks in excess of the amounts disclosed in these financial statements. The foreign currency exchange contracts and notional values presented above represent the Fund’s total exposure in such contracts, whereas only the net unrealized appreciation (depreciation) is reflected in the Fund’s net assets.
1See Note 8 in “Notes to financial statements.”
2A Credit Default Swap (CDS) contract is a risk-transfer instrument through which one party (purchaser of protection) transfers to another party (seller of protection) the financial risk of a credit event (as defined in the CDS agreement), as it relates to a particular reference security or basket of securities (such as an index). Periodic payments (receipts) on such contracts are accrued daily and recorded as unrealized losses (gains) on swap contracts. Upon payment (receipt), such amounts are recorded as unrealized losses (gains) on swap contracts. Upfront payments made or received in connection with CDS contracts are amortized over the expected life of the CDS contracts as unrealized losses (gains) on swap contracts. The change in value of CDS contracts is recorded daily as unrealized appreciation or depreciation. A realized gain or loss is recorded upon credit event (as defined in the CDS agreement) or the maturity or termination of the agreement.
3Notional value shown is stated in U.S. Dollars unless noted that the swap is denominated in another currency.
4Unrealized appreciation (depreciation) does not include periodic interest payments (receipts) on swap contracts accrued daily in the amount of ($2,867).
5Markit’s CDX.NA.HY Index, is composed of 100 of the most liquid North American entities with high yield credit ratings that trade in the CDS market.
6Markit’s CDX.EM Index is composed of 15 sovereign issuers from the following countries: Argentina, Brazil, Chile, China, Columbia, Indonesia, Malaysia, Mexico, Panama, Peru, Philippines, Russia, South Africa, Turkey and Venezuela, which have a S&P credit quality rating of CCC and above.
7An interest rate swap (IRS) agreement is an exchange of interest rates between counterparties. Periodic payments (receipt) on such contracts are accrued daily and recorded as unrealized appreciation (depreciation) on swap contracts. Upon periodic payment (receipt) or termination of the contract, such amounts are recorded as realized gains (losses) on swap contracts.
Summary of abbreviations:
ADR – American Depositary Receipt
ARM – Adjustable Rate Mortgage
AUD – Australian Dollar
BAML – Bank of America Merrill Lynch
BB – Barclays Bank
BNP – BNP Paribas
BNYM – Bank of New York Mellon
BRL – Brazilian Real
CDS – Credit Default Swap
CDX.EM – Credit Default Swap Index Emerging Markets
CDX.NA.HY – Credit Default Swap Index North America High Yield
CHF – Swiss Franc
CLO – Collateralized Loan Obligation
CME – Chicago Mercantile Exchange
Summary of abbreviations (continued):
CVA – Dutch Certificate
DB – Deutsche Bank
EAFE – Europe Australasia Far East
ETF – Exchange–Traded Fund
EUR – European Monetary Unit
FREMF – Freddie Mac Multifamily
FTSE – Financial Times Stock Exchange
GBP – British Pound Sterling
GDR – Global Depositary Receipt
GNMA – Government National Mortgage Association
GS – Goldman Sachs
HKD – Hong Kong Dollar
HSBC – Hong Kong Shanghai Bank
ICE – Intercontinental Exchange, Inc.
IRS – Interest Rate Swap
JPM – JPMorgan
LB – Lehman Brothers
LCH – London Clearing House
MSCI – Morgan Stanley Capital International
NZD – New Zealand Dollar
O.A.T. – Obligations Assimilables du Trésor (French Treasury Bond)
PJSC – Private Joint Stock Company
REIT – Real Estate Investment Trust
REMIC – Real Estate Mortgage Investment Conduit
S&P – Standard & Poor’s Financial Services LLC
S.F. – Single Family
TBA – To be announced
USD – U.S. Dollar
yr – Year
See accompanying notes, which are an integral part of the financial statements.
Schedules of investments
Delaware Foundation® Moderate Allocation Fund
March 31, 2017
| | | | | | | | |
| | | Number of shares | | | Value (U.S. $) | |
| |
Common Stock – 52.54% | | | | | |
| |
U.S. Markets – 28.57% | | | | | |
Consumer Discretionary – 2.11% | | | | | |
Amazon.com † | | | 280 | | | $ | 248,231 | |
Aramark | | | 3,080 | | | | 113,560 | |
BorgWarner | | | 3,090 | | | | 129,131 | |
Century
Communications =† | | | 25,000 | | | | 0 | |
Cheesecake Factory | | | 1,685 | | | | 106,762 | |
Chuy’s Holdings † | | | 1,810 | | | | 53,938 | |
Cinemark Holdings | | | 3,450 | | | | 152,973 | |
Comcast Class A | | | 6,130 | | | | 230,427 | |
Del Frisco’s Restaurant Group † | | | 6,505 | | | | 117,415 | |
Dollar General | | | 3,126 | | | | 217,976 | |
Fiesta Restaurant Group † | | | 1,985 | | | | 48,037 | |
Five Below † | | | 2,575 | | | | 111,523 | |
Ford Motor | | | 11,710 | | | | 136,304 | |
Home Depot | | | 1,920 | | | | 281,914 | |
Jack in the Box | | | 1,745 | | | | 177,501 | |
Liberty Global Class A † | | | 2,331 | | | | 83,613 | |
Liberty Global Class C † | | | 8,747 | | | | 306,495 | |
Liberty Interactive Corp. QVC Group Class A † | | | 21,642 | | | | 433,273 | |
Lowe’s | | | 9,500 | | | | 780,995 | |
Malibu Boats Class A † | | | 5,975 | | | | 134,139 | |
National CineMedia | | | 6,125 | | | | 77,359 | |
Newell Brands | | | 4,187 | | | | 197,501 | |
NIKE Class B | | | 2,480 | | | | 138,210 | |
Shutterfly † | | | 2,140 | | | | 103,341 | |
Starbucks | | | 3,800 | | | | 221,882 | |
Steven Madden † | | | 4,405 | | | | 169,813 | |
Tenneco | | | 2,720 | | | | 169,782 | |
Tractor Supply | | | 1,530 | | | | 105,524 | |
TripAdvisor † | | | 6,808 | | | | 293,833 | |
Walt Disney | | | 4,000 | | | | 453,560 | |
| | | | | | | | |
| | | | | | | 5,795,012 | |
| | | | | | | | |
Consumer Staples – 1.54% | | | | | |
Archer-Daniels-Midland | | | 16,500 | | | | 759,660 | |
Casey’s General Stores | | | 1,030 | | | | 115,617 | |
CVS Health | | | 12,090 | | | | 949,065 | |
General Mills | | | 1,920 | | | | 113,299 | |
J&J Snack Foods | | | 972 | | | | 131,764 | |
Kimberly-Clark | | | 800 | | | | 105,304 | |
Kraft Heinz | | | 8,366 | | | | 759,716 | |
Mondelez International | | | 17,400 | | | | 749,592 | |
PepsiCo | | | 1,460 | | | | 163,316 | |
Pinnacle Foods | | | 1,920 | | | | 111,110 | |
Procter & Gamble | | | 1,140 | | | | 102,429 | |
| | | | | | | | |
| | | Number of shares | | | Value (U.S. $) | |
| |
Common Stock (continued) | | | | | |
| |
U.S. Markets (continued) | | | | | |
Consumer Staples (continued) | | | | | |
Walgreens Boots Alliance | | | 1,820 | | | $ | 151,151 | |
| | | | | | | | |
| | | | | | | 4,212,023 | |
| | | | | | | | |
Energy – 1.80% | | | | | |
Carrizo Oil & Gas † | | | 4,060 | | | | 116,360 | |
Chevron | | | 9,460 | | | | 1,015,720 | |
ConocoPhillips | | | 15,400 | | | | 767,998 | |
EOG Resources | | | 1,540 | | | | 150,227 | |
Halliburton | | | 17,750 | | | | 873,477 | |
Keane Group † | | | 1,990 | | | | 28,457 | |
Marathon Oil | | | 31,600 | | | | 499,280 | |
Occidental Petroleum | | | 13,440 | | | | 851,558 | |
PDC Energy † | | | 1,855 | | | | 115,659 | |
Pioneer Energy Services † | | | 5,525 | | | | 22,100 | |
Pioneer Natural Resources | | | 1,190 | | | | 221,614 | |
RSP Permian † | | | 2,805 | | | | 116,211 | |
SRC Energy † | | | 12,100 | | | | 102,124 | |
Superior Energy Services † | | | 3,530 | | | | 50,338 | |
| | | | | | | | |
| | | | | | | 4,931,123 | |
| | | | | | | | |
Financials – 3.64% | | | | | |
Aflac | | | 3,590 | | | | 259,988 | |
Allstate | | | 9,400 | | | | 766,006 | |
American Equity Investment Life Holding | | | 4,840 | | | | 114,369 | |
Bank of New York Mellon | | | 15,800 | | | | 746,234 | |
BB&T | | | 15,600 | | | | 697,320 | |
BlackRock | | | 570 | | | | 218,601 | |
Bryn Mawr Bank | | | 2,040 | | | | 80,580 | |
Capital One Financial | | | 2,220 | | | | 192,385 | |
Cardinal Financial | | | 4,140 | | | | 123,952 | |
Charles Schwab | | | 7,848 | | | | 320,277 | |
Citigroup | | | 4,960 | | | | 296,707 | |
City Holding | | | 2,401 | | | | 154,816 | |
CoBiz Financial | | | 5,205 | | | | 87,444 | |
East West Bancorp | | | 2,770 | | | | 142,960 | |
Essent Group † | | | 4,380 | | | | 158,425 | |
Evercore Partners Class A | | | 1,535 | | | | 119,577 | |
First Bancorp (North Carolina) | | | 1,905 | | | | 55,797 | |
Flushing Financial | | | 2,115 | | | | 56,830 | |
Great Western Bancorp | | | 3,811 | | | | 161,624 | |
Hope Bancorp | | | 7,070 | | | | 135,532 | |
Houlihan Lokey | | | 2,880 | | | | 99,216 | |
Independent Bank (Massachusetts) | | | 1,430 | | | | 92,950 | |
Infinity Property & Casualty | | | 1,290 | | | | 123,195 | |
Intercontinental Exchange | | | 9,991 | | | | 598,161 | |
| | | | | | | | |
| | | Number of shares | | | Value (U.S. $) | |
| |
Common Stock (continued) | | | | | |
| |
U.S. Markets (continued) | | | | | |
Financials (continued) | | | | | |
Invesco | | | 5,620 | | | $ | 172,141 | |
JPMorgan Chase & Co. | | | 5,270 | | | | 462,917 | |
KeyCorp | | | 12,470 | | | | 221,717 | |
Marsh & McLennan | | | 10,400 | | | | 768,456 | |
MGIC Investment † | | | 23,125 | | | | 234,256 | |
Old National Bancorp | | | 9,270 | | | | 160,835 | |
Primerica | | | 2,290 | | | | 188,238 | |
Prosperity Bancshares | | | 2,425 | | | | 169,047 | |
Prudential Financial | | | 1,640 | | | | 174,955 | |
Raymond James Financial | | | 1,980 | | | | 150,995 | |
Reinsurance Group of America | | | 690 | | | | 87,616 | |
Selective Insurance Group | | | 3,425 | | | | 161,489 | |
State Street | | | 1,890 | | | | 150,463 | |
Sterling Bancorp | | | 8,360 | | | | 198,132 | |
Stifel Financial † | | | 2,690 | | | | 135,011 | |
Travelers | | | 1,090 | | | | 131,389 | |
Umpqua Holdings | | | 8,590 | | | | 152,387 | |
United Fire Group | | | 1,155 | | | | 49,399 | |
Validus Holdings | | | 1,820 | | | | 102,630 | |
Webster Financial | | | 3,200 | | | | 160,128 | |
WSFS Financial | | | 2,965 | | | | 136,242 | |
| | | | | | | | |
| | | | | | | 9,971,389 | |
| | | | | | | | |
Healthcare – 4.28% | | | | | |
Abbott Laboratories | | | 20,730 | | | | 920,619 | |
AbbVie | | | 1,360 | | | | 88,618 | |
Acorda Therapeutics † | | | 2,575 | | | | 54,075 | |
Air Methods † | | | 2,490 | | | | 107,070 | |
Alkermes † | | | 1,330 | | | | 77,805 | |
Allergan | | | 1,487 | | | | 355,274 | |
Biogen † | | | 1,540 | | | | 421,067 | |
Brookdale Senior Living † | | | 14,200 | | | | 190,706 | |
Cardinal Health | | | 9,400 | | | | 766,570 | |
Catalent † | | | 5,330 | | | | 150,946 | |
Celgene † | | | 7,139 | | | | 888,306 | |
Cigna | | | 1,510 | | | | 221,200 | |
CONMED | | | 3,220 | | | | 143,000 | |
CryoLife † | | | 5,701 | | | | 94,922 | |
DENTSPLY SIRONA | | | 5,042 | | | | 314,822 | |
Edwards Lifesciences † | | | 1,360 | | | | 127,935 | |
Eli Lilly & Co. | | | 1,930 | | | | 162,332 | |
Exact Sciences † | | | 2,745 | | | | 64,837 | |
Express Scripts Holding † | | | 12,740 | | | | 839,693 | |
Gilead Sciences | | | 2,470 | | | | 167,762 | |
HealthSouth | | | 2,530 | | | | 108,309 | |
Johnson & Johnson | | | 8,080 | | | | 1,006,364 | |
| | | | | | | | |
| | | Number of shares | | | Value (U.S. $) | |
| |
Common Stock (continued) | | | | | |
| |
U.S. Markets (continued) | | | | | |
Healthcare (continued) | | | | | |
Ligand Pharmaceuticals Class B † | | | 1,460 | | | $ | 154,526 | |
Medicines † | | | 2,925 | | | | 143,033 | |
Merck & Co. | | | 14,990 | | | | 952,465 | |
Merit Medical Systems † | | | 4,830 | | | | 139,587 | |
Natera † | | | 2,395 | | | | 21,244 | |
Pfizer | | | 21,922 | | | | 749,952 | |
Prestige Brands Holdings † | | | 2,448 | | | | 136,011 | |
Quest Diagnostics | | | 7,600 | | | | 746,244 | |
Quidel † | | | 5,740 | | | | 129,954 | |
Quintiles IMS Holdings † | | | 4,741 | | | | 381,793 | |
Repligen † | | | 2,320 | | | | 81,664 | |
Retrophin † | | | 4,760 | | | | 87,870 | |
Spectrum Pharmaceuticals † | | | 9,985 | | | | 64,903 | |
TESARO † | | | 1,065 | | | | 163,872 | |
Thermo Fisher Scientific | | | 1,120 | | | | 172,032 | |
Vanda Pharmaceuticals † | | | 6,715 | | | | 94,010 | |
Vertex Pharmaceuticals † | | | 980 | | | | 107,163 | |
Wright Medical Group † | | | 3,985 | | | | 124,013 | |
| | | | | | | | |
| | | | | | | 11,722,568 | |
| | | | | | | | |
Industrials – 2.88% | | | | | |
AAON | | | 4,981 | | | | 176,078 | |
ABM Industries | | | 3,495 | | | | 152,382 | |
Applied Industrial Technologies | | | 2,480 | | | | 153,388 | |
Barnes Group | | | 3,770 | | | | 193,552 | |
Casella Waste Systems † | | | 2,055 | | | | 28,996 | |
Columbus McKinnon | | | 4,423 | | | | 109,779 | |
Continental Building Products † | | | 6,815 | | | | 166,967 | |
Eaton | | | 1,940 | | | | 143,851 | |
ESCO Technologies | | | 3,358 | | | | 195,100 | |
Esterline Technologies † | | | 675 | | | | 58,084 | |
Federal Signal | | | 4,995 | | | | 68,981 | |
FedEx | | | 1,801 | | | | 351,465 | |
General Electric | | | 13,020 | | | | 387,996 | |
Granite Construction | | | 3,208 | | | | 161,010 | |
Hawaiian Holdings † | | | 680 | | | | 31,586 | |
Honeywell International | | | 1,030 | | | | 128,616 | |
Kadant | | | 3,245 | | | | 192,591 | |
KeyW Holding † | | | 6,890 | | | | 65,042 | |
Kforce | | | 4,910 | | | | 116,613 | |
KLX † | | | 2,900 | | | | 129,630 | |
Lockheed Martin | | | 510 | | | | 136,476 | |
MYR Group † | | | 3,360 | | | | 137,760 | |
Nielsen Holdings | | | 9,148 | | | | 377,904 | |
Northrop Grumman | | | 3,100 | | | | 737,304 | |
Schedules of investments
Delaware Foundation® Moderate Allocation Fund
| | | | | | | | |
| | | Number of shares | | | Value (U.S. $) | |
| |
Common Stock (continued) | | | | | |
| |
U.S. Markets (continued) | | | | | |
Industrials (continued) | | | | | |
On Assignment † | | | 3,500 | | | $ | 169,855 | |
Parker-Hannifin | | | 1,410 | | | | 226,051 | |
Raytheon | | | 5,000 | | | | 762,500 | |
Rockwell Collins | | | 1,050 | | | | 102,018 | |
Southwest Airlines | | | 1,590 | | | | 85,478 | |
Swift Transportation † | | | 4,505 | | | | 92,533 | |
Tetra Tech | | | 3,600 | | | | 147,060 | |
TransUnion † | | | 2,510 | | | | 96,259 | |
TriNet Group † | | | 3,820 | | | | 110,398 | |
U.S. Ecology | | | 2,560 | | | | 119,936 | |
Union Pacific | | | 2,470 | | | | 261,622 | |
United Technologies | | | 2,350 | | | | 263,693 | |
WageWorks † | | | 1,737 | | | | 125,585 | |
Waste Management | | | 10,600 | | | | 772,952 | |
XPO Logistics † | | | 3,340 | | | | 159,953 | |
| | | | | | | | |
| | | | | | | 7,897,044 | |
| | | | | | | | |
Information Technology – 5.50% | | | | | |
Accenture Class A | | | 1,430 | | | | 171,428 | |
Adobe Systems † | | | 2,160 | | | | 281,081 | |
Alphabet Class A † | | | 1,107 | | | | 938,515 | |
Alphabet Class C † | | | 426 | | | | 353,393 | |
Analog Devices | | | 1,220 | | | | 99,979 | |
Anixter International † | | | 1,555 | | | | 123,311 | |
Apple | | | 3,875 | | | | 556,683 | |
Broadcom | | | 1,060 | | | | 232,098 | |
Brooks Automation | | | 4,520 | | | | 101,248 | |
CA | | | 23,445 | | | | 743,675 | |
Callidus Software † | | | 7,160 | | | | 152,866 | |
Cisco Systems | | | 26,740 | | | | 903,812 | |
Convergys | | | 5,875 | | | | 124,256 | |
eBay † | | | 15,454 | | | | 518,791 | |
Electronic Arts † | | | 4,589 | | | | 410,807 | |
ExlService Holdings † | | | 3,150 | | | | 149,184 | |
Facebook Class A † | | | 6,813 | | | | 967,787 | |
GrubHub † | | | 2,615 | | | | 86,007 | |
Guidewire Software † | | | 695 | | | | 39,149 | |
II-VI † | | | 2,095 | | | | 75,525 | |
Intel | | | 28,980 | | | | 1,045,309 | |
Intuit | | | 2,009 | | | | 233,024 | |
j2 Global | | | 2,345 | | | | 196,769 | |
MACOM Technology Solutions Holdings † | | | 2,680 | | | | 129,444 | |
Mastercard Class A | | | 4,803 | | | | 540,193 | |
Maxim Integrated Products | | | 2,820 | | | | 126,787 | |
MaxLinear Class A † | | | 5,530 | | | | 155,117 | |
Microsemi † | | | 3,735 | | | | 192,465 | |
| | | | | | | | |
| | | Number of shares | | | Value (U.S. $) | |
| |
Common Stock (continued) | | | | | |
| |
U.S. Markets (continued) | | | | | |
Information Technology (continued) | | | | | |
Microsoft | | | 17,264 | | | $ | 1,137,007 | |
NETGEAR † | | | 2,120 | | | | 105,046 | |
Oracle | | | 17,000 | | | | 758,370 | |
PayPal Holdings † | | | 15,273 | | | | 657,044 | |
Plantronics | | | 1,775 | | | | 96,045 | |
Proofpoint † | | | 2,235 | | | | 166,195 | |
Q2 Holdings † | | | 2,470 | | | | 86,079 | |
QUALCOMM | | | 5,841 | | | | 334,923 | |
salesforce.com † | | | 2,830 | | | | 233,447 | |
Semtech † | | | 4,720 | | | | 159,536 | |
Silicon Laboratories † | | | 1,420 | | | | 104,441 | |
SS&C Technologies Holdings | | | 2,890 | | | | 102,306 | |
Symantec | | | 12,673 | | | | 388,808 | |
Synaptics † | | | 2,010 | | | | 99,515 | |
Tyler Technologies † | | | 980 | | | | 151,469 | |
Visa Class A | | | 7,626 | | | | 677,723 | |
Yahoo † | | | 3,900 | | | | 180,999 | |
| | | | | | | | |
| | | | | | | 15,087,656 | |
| | | | | | | | |
Materials – 0.86% | | | | | |
Axalta Coating Systems † | | | 5,430 | | | | 174,846 | |
Balchem | | | 1,130 | | | | 93,135 | |
Boise Cascade † | | | 3,815 | | | | 101,861 | |
Chemtura † | | | 1,770 | | | | 59,118 | |
Eastman Chemical | | | 2,570 | | | | 207,656 | |
EI du Pont de Nemours
& Co. | | | 9,500 | | | | 763,135 | |
Kaiser Aluminum | | | 1,535 | | | | 122,647 | |
Minerals Technologies | | | 2,595 | | | | 198,777 | |
Neenah Paper | | | 2,110 | | | | 157,617 | |
Quaker Chemical | | | 1,420 | | | | 186,957 | |
WestRock | | | 2,864 | | | | 149,014 | |
Worthington Industries | | | 3,360 | | | | 151,502 | |
| | | | | | | | |
| | | | | | | 2,366,265 | |
| | | | | | | | |
Real Estate – 4.79% | | | | | |
American Tower | | | 2,380 | | | | 289,265 | |
Apartment Investment & Management | | | 3,550 | | | | 157,443 | |
AvalonBay Communities | | | 2,625 | | | | 481,950 | |
Boston Properties | | | 3,275 | | | | 433,643 | |
Brandywine Realty Trust | | | 24,375 | | | | 395,606 | |
Camden Property Trust | | | 550 | | | | 44,253 | |
Cousins Properties | | | 6,800 | | | | 56,236 | |
Crown Castle International | | | 5,709 | | | | 539,215 | |
DCT Industrial Trust | | | 3,868 | | | | 186,128 | |
DDR | | | 12,475 | | | | 156,312 | |
Douglas Emmett | | | 6,900 | | | | 264,960 | |
EastGroup Properties | | | 1,675 | | | | 123,163 | |
| | | | | | | | |
| | | Number of shares | | | Value (U.S. $) | |
| |
Common Stock (continued) | | | | | |
| |
U.S. Markets (continued) | | | | | |
Real Estate (continued) | | | | | |
Empire State Realty Trust | | | 2,225 | | | $ | 45,924 | |
EPR Properties | | | 340 | | | | 25,034 | |
Equinix | | | 729 | | | | 291,870 | |
Equity LifeStyle Properties | | | 1,900 | | | | 146,414 | |
Equity Residential | | | 18,645 | | | | 1,160,092 | |
Essex Property Trust | | | 1,425 | | | | 329,930 | |
Extra Space Storage | | | 1,775 | | | | 132,042 | |
Federal Realty Investment Trust | | | 925 | | | | 123,487 | |
First Industrial Realty Trust | | | 12,170 | | | | 324,087 | |
GGP | | | 15,900 | | | | 368,562 | |
Gramercy Property Trust | | | 6,050 | | | | 159,115 | |
Highwoods Properties | | | 3,800 | | | | 186,694 | |
Host Hotels & Resorts | | | 22,025 | | | | 410,987 | |
Kilroy Realty | | | 2,325 | | | | 167,586 | |
Kimco Realty | | | 8,350 | | | | 184,451 | |
Kite Realty Group Trust | | | 6,287 | | | | 135,171 | |
LaSalle Hotel Properties | | | 5,650 | | | | 163,567 | |
Lexington Realty Trust | | | 8,150 | | | | 81,337 | |
Life Storage | | | 1,620 | | | | 133,034 | |
Macerich | | | 2,100 | | | | 135,240 | |
Mack-Cali Realty | | | 4,945 | | | | 133,218 | |
Mid-America Apartment Communities | | | 1,771 | | | | 180,182 | |
National Retail Properties | | | 6,745 | | | | 294,217 | |
Omega Healthcare Investors | | | 2,550 | | | | 84,125 | |
Parkway | | | 846 | | | | 16,827 | |
Pebblebrook Hotel Trust | | | 7,060 | | | | 206,223 | |
Prologis | | | 9,400 | | | | 487,672 | |
PS Business Parks | | | 1,050 | | | | 120,498 | |
Public Storage | | | 1,900 | | | | 415,929 | |
Ramco-Gershenson Properties Trust | | | 14,075 | | | | 197,331 | |
Regency Centers | | | 5,048 | | | | 335,137 | |
RLJ Lodging Trust | | | 4,050 | | | | 95,215 | |
Simon Property Group | | | 5,700 | | | | 980,571 | |
SL Green Realty | | | 2,800 | | | | 298,536 | |
Spirit Realty Capital | | | 10,275 | | | | 104,086 | |
Tanger Factory Outlet Centers | | | 4,000 | | | | 131,080 | |
Taubman Centers | | | 950 | | | | 62,719 | |
UDR | | | 6,150 | | | | 222,999 | |
Urban Edge Properties | | | 1,775 | | | | 46,683 | |
Ventas | | | 5,700 | | | | 370,728 | |
Vornado Realty Trust | | | 3,800 | | | | 381,178 | |
Welltower | | | 2,025 | | | | 143,411 | |
| | | | | | | | |
| | | | | | | 13,141,363 | |
| | | | | | | | |
| | | | | | | | |
| | | Number of shares | | | Value (U.S. $) | |
| |
Common Stock (continued) | | | | | |
| |
U.S. Markets (continued) | | | | | |
Telecommunication Services – 0.75% | | | | | |
AT&T | | | 28,830 | | | $ | 1,197,887 | |
ATN International | | | 1,545 | | | | 108,799 | |
Verizon Communications | | | 15,500 | | | | 755,625 | |
| | | | | | | | |
| | | | | | | 2,062,311 | |
| | | | | | | | |
Utilities – 0.42% | | | | | |
Edison International | | | 9,500 | | | | 756,295 | |
NorthWestern | | | 2,710 | | | | 159,077 | |
South Jersey Industries | | | 3,250 | | | | 115,863 | |
Spire | | | 1,945 | | | | 131,287 | |
| | | | | | | | |
| | | | | | | 1,162,522 | |
| | | | | | | | |
Total U.S. Markets
(cost $50,156,023) | | | | 78,349,276 | |
| | | | | | | | |
Developed Markets – 17.25%§ | | | | | |
Consumer Discretionary – 2.92% | | | | | |
Bandai Namco Holdings | | | 4,300 | | | | 128,618 | |
Bayerische Motoren Werke | | | 7,531 | | | | 686,993 | |
Cie Generale des Etablissements Michelin | | | 1,030 | | | | 125,099 | |
Denso | | | 4,200 | | | | 184,743 | |
Donaco International | | | 165,000 | | | | 49,794 | |
Hennes & Mauritz Class B | | | 4,750 | | | | 121,392 | |
Industria de Diseno Textil | | | 5,150 | | | | 181,522 | |
Kering | | | 2,285 | | | | 591,005 | |
LVMH Moet Hennessy Louis Vuitton | | | 1,230 | | | | 270,109 | |
Next | | | 1,500 | | | | 81,188 | |
Nitori Holdings | | | 4,648 | | | | 587,419 | |
Oriental Land | | | 2,400 | | | | 137,602 | |
Publicis Groupe | | | 3,912 | | | | 273,394 | |
RTL Group | | | 1,694 | | | | 136,440 | |
Sekisui Chemical | | | 10,200 | | | | 171,420 | |
Sodexo | | | 1,255 | | | | 147,606 | |
Stanley Electric | | | 5,200 | | | | 148,298 | |
Sumitomo Rubber Industries | | | 40,600 | | | | 691,801 | |
Techtronic Industries | | | 158,000 | | | | 639,400 | |
Toyota Motor | | | 16,789 | | | | 911,157 | |
USS | | | 7,300 | | | | 121,699 | |
Valeo | | | 6,015 | | | | 400,601 | |
Whitbread | | | 2,500 | | | | 123,974 | |
WPP | | | 8,650 | | | | 189,874 | |
Yue Yuen Industrial Holdings | | | 226,500 | | | | 890,378 | |
| | | | | | | | |
| | | | | | | 7,991,526 | |
| | | | | | | | |
Consumer Staples – 2.57% | | | | | |
Anheuser-Busch InBev | | | 1,500 | | | | 164,661 | |
Aryzta † | | | 12,917 | | | | 414,597 | |
Asahi Group Holdings | | | 3,400 | | | | 128,512 | |
Schedules of investments
Delaware Foundation® Moderate Allocation Fund
| | | | | | | | |
| | | Number of shares | | | Value (U.S. $) | |
| |
Common Stock (continued) | | | | | |
| |
Developed Markets§ (continued) | | | | | |
Consumer Staples (continued) | | | | | |
British American Tobacco | | | 6,650 | | | $ | 441,585 | |
Carlsberg Class B | | | 6,818 | | | | 629,631 | |
Chocoladefabriken Lindt & Spruengli † | | | 29 | | | | 164,449 | |
Coca-Cola Amatil | | | 62,214 | | | | 514,291 | |
Coca-Cola European Partners | | | 4,000 | | | | 149,565 | |
Danone | | | 2,855 | | | | 194,195 | |
Diageo | | | 5,950 | | | | 170,229 | |
FamilyMart UNY Holdings | | | 1,900 | | | | 113,321 | |
Imperial Brands | | | 11,881 | | | | 575,630 | |
Japan Tobacco | | | 22,600 | | | | 734,454 | |
Jeronimo Martins | | | 8,030 | | | | 143,659 | |
Kao | | | 3,300 | | | | 180,932 | |
Koninklijke Ahold Delhaize | | | 8,222 | | | | 175,951 | |
L’Oreal | | | 1,460 | | | | 280,589 | |
Nestle | | | 8,370 | | | | 642,175 | |
Reckitt Benckiser Group | | | 1,470 | | | | 134,191 | |
Suntory Beverage & Food | | | 2,900 | | | | 122,168 | |
Svenska Cellulosa Class B | | | 3,750 | | | | 120,945 | |
Tate & Lyle | | | 12,300 | | | | 117,815 | |
Treasury Wine Estates | | | 11,700 | | | | 109,322 | |
Unilever | | | 3,170 | | | | 156,465 | |
Unilever CVA | | | 4,250 | | | | 211,144 | |
WH Group 144A # | | | 153,000 | | | | 131,905 | |
Woolworths | | | 6,600 | | | | 133,624 | |
| | | | | | | | |
| | | | | | | 7,056,005 | |
| | | | | | | | |
Energy – 0.51% | | | | | |
Amec Foster Wheeler | | | 17,100 | | | | 113,872 | |
Neste | | | 2,000 | | | | 78,004 | |
Origin Energy † | | | 20,500 | | | | 110,417 | |
Suncor Energy | | | 15,800 | | | | 485,103 | |
TOTAL | | | 12,112 | | | | 612,653 | |
| | | | | | | | |
| | | | | | | 1,400,049 | |
| | | | | | | | |
Financials – 2.15% | | | | | |
AIA Group | | | 43,600 | | | | 274,902 | |
AXA | | | 31,380 | | | | 811,965 | |
Banco Espirito Santo Class R =† | | | 285,000 | | | | 0 | |
Bank Leumi Le-Israel † | | | 35,650 | | | | 157,460 | |
Deutsche Bank † | | | 3,650 | | | | 62,885 | |
ING Groep | | | 48,253 | | | | 729,419 | |
Medibank Pvt | | | 53,500 | | | | 115,265 | |
Mitsubishi UFJ Financial Group | | | 176,073 | | | | 1,106,604 | |
Nordea Bank | | | 85,346 | | | | 974,360 | |
Prudential | | | 12,800 | | | | 270,386 | |
| | | | | | | | |
| | | Number of shares | | | Value (U.S. $) | |
| |
Common Stock (continued) | | | | | |
| |
Developed Markets§ (continued) | | | | | |
Financials (continued) | | | | | | | | |
Sony Financial Holdings | | | 7,600 | | | $ | 122,127 | |
Standard Chartered † | | | 74,871 | | | | 715,739 | |
UniCredit | | | 36,176 | | | | 557,662 | |
| | | | | | | | |
| | | | | | | 5,898,774 | |
| | | | | | | | |
Healthcare – 2.39% | | | | | |
Actelion † | | | 665 | | | | 187,354 | |
Astellas Pharma | | | 15,200 | | | | 200,155 | |
Bayer | | | 2,060 | | | | 237,452 | |
Fresenius SE & Co. | | | 2,430 | | | | 195,280 | |
GlaxoSmithKline | | | 8,100 | | | | 168,414 | |
ICON † | | | 1,640 | | | | 130,741 | |
Indivior | | | 30,300 | | | | 122,278 | |
Lonza Group † | | | 730 | | | | 138,034 | |
Merck | | | 1,495 | | | | 170,332 | |
Miraca Holdings | | | 3,300 | | | | 151,765 | |
Novartis | | | 17,338 | | | | 1,286,957 | |
Novo Nordisk Class B | | | 3,550 | | | | 121,921 | |
Orion Class B | | | 2,830 | | | | 147,541 | |
Ramsay Health Care | | | 2,690 | | | | 143,635 | |
Roche Holding | | | 2,385 | | | | 609,078 | |
Sanofi | | | 12,013 | | | | 1,084,445 | |
Shire | | | 10,601 | | | | 619,074 | |
Smith & Nephew | | | 9,000 | | | | 137,117 | |
Sumitomo Dainippon Pharma | | | 8,000 | | | | 132,076 | |
Teva Pharmaceutical Industries ADR | | | 17,900 | | | | 574,411 | |
| | | | | | | | |
| | | | | | | 6,558,060 | |
| | | | | | | | |
Industrials – 3.52% | | | | | |
ABB | | | 7,250 | | | | 169,588 | |
ANDRITZ | | | 2,520 | | | | 126,043 | |
Aurizon Holdings | | | 34,200 | | | | 137,176 | |
Deutsche Lufthansa | | | 10,100 | | | | 163,775 | |
Deutsche Post | | | 26,649 | | | | 912,718 | |
East Japan Railway | | | 9,141 | | | | 795,948 | |
Elbit Systems | | | 980 | | | | 112,162 | |
Fraport Frankfurt Airport Services Worldwide | | | 2,340 | | | | 165,580 | |
Fuji Electric | | | 24,000 | | | | 142,495 | |
ITOCHU | | | 80,749 | | | | 1,145,993 | |
Japan Airlines | | | 4,700 | | | | 148,857 | |
JTEKT | | | 7,900 | | | | 122,690 | |
Koninklijke Philips | | | 31,030 | | | | 997,387 | |
Legrand | | | 2,850 | | | | 171,842 | |
Leonardo † | | | 11,084 | | | | 157,146 | |
Meggitt | | | 84,113 | | | | 469,280 | |
MINEBEA MITSUMI | | | 40,900 | | | | 545,554 | |
| | | | | | | | |
| | | Number of shares | | | Value (U.S. $) | |
| |
Common Stock (continued) | | | | | |
| |
Developed Markets§ (continued) | | | | | |
Industrials (continued) | | | | | |
Mitsubishi Electric | | | 9,800 | | | $ | 140,578 | |
Mitsubishi Heavy Industries | | | 35,000 | | | | 140,402 | |
Rexel | | | 17,843 | | | | 323,974 | |
Rolls-Royce Holdings † | | | 15,000 | | | | 141,703 | |
Safran | | | 2,020 | | | | 150,910 | |
Securitas Class B | | | 7,250 | | | | 113,273 | |
Singapore Airlines | | | 12,500 | | | | 89,985 | |
Teleperformance | | | 5,893 | | | | 636,524 | |
Vestas Wind Systems | | | 1,600 | | | | 130,091 | |
Vinci | | | 13,285 | | | | 1,053,012 | |
Wolters Kluwer | | | 3,150 | | | | 130,939 | |
Yamato Holdings | | | 5,200 | | | | 108,946 | |
| | | | | | | | |
| | | | | | | 9,644,571 | |
| | | | | | | | |
Information Technology – 1.15% | | | | | |
Amadeus IT Group | | | 3,950 | | | | 200,411 | |
ASM Pacific Technology | | | 13,800 | | | | 187,693 | |
ASML Holding (New York Shares) † | | | 1,385 | | | | 183,928 | |
Atos | | | 1,620 | | | | 200,387 | |
Brother Industries | | | 7,900 | | | | 164,982 | |
CGI Group Class A † | | | 11,204 | | | | 536,842 | |
Infineon Technologies | | | 7,550 | | | | 154,200 | |
InterXion Holding † | | | 2,400 | | | | 94,944 | |
Nice | | | 1,830 | | | | 122,960 | |
Omron | | | 4,300 | | | | 188,678 | |
Playtech | | | 50,788 | | | | 592,417 | |
SAP | | | 2,275 | | | | 223,233 | |
Seiko Epson | | | 8,500 | | | | 178,963 | |
Trend Micro | | | 2,900 | | | | 128,941 | |
| | | | | | | | |
| | | | | | | 3,158,579 | |
| | | | | | | | |
Materials – 1.03% | | | | | |
Alamos Gold | | | 28,071 | | | | 225,438 | |
Amcor | | | 11,750 | | | | 135,194 | |
Anglo American † | | | 9,500 | | | | 145,152 | |
Anglo American ADR † | | | 8,700 | | | | 66,207 | |
BHP Billiton | | | 8,250 | | | | 127,551 | |
Boral | | | 25,300 | | | | 112,883 | |
Chr Hansen Holding | | | 1,770 | | | | 113,607 | |
Covestro 144A # | | | 1,720 | | | | 132,406 | |
Daicel | | | 11,100 | | | | 133,702 | |
EMS-Chemie Holding | | | 315 | | | | 183,500 | |
Fletcher Building | | | 16,700 | | | | 97,400 | |
Johnson Matthey | | | 3,102 | | | | 119,704 | |
Kuraray | | | 9,400 | | | | 142,524 | |
Rio Tinto | | | 12,383 | | | | 497,943 | |
Shin-Etsu Chemical | | | 2,400 | | | | 207,901 | |
| | | | | | | | |
| | | Number of shares | | | Value (U.S. $) | |
| |
Common Stock (continued) | | | | | |
| |
Developed Markets§ (continued) | | | | | |
Materials (continued) | | | | | | | | |
South32 | | | 62,000 | | | $ | 130,736 | |
Umicore | | | 2,430 | | | | 138,430 | |
Yamana Gold | | | 38,483 | | | | 106,202 | |
| | | | | | | | |
| | | | | | | 2,816,480 | |
| | | | | | | | |
Real Estate – 0.13% | | | | | | | | |
Azrieli Group † | | | 1,900 | | | | 100,809 | |
Daito Trust Construction | | | 1,000 | | | | 137,384 | |
Westfield | | | 18,700 | | | | 126,867 | |
| | | | | | | | |
| | | | | | | 365,060 | |
| | | | | | | | |
Telecommunication Services – 0.76% | | | | | |
KDDI | | | 7,600 | | | | 199,472 | |
Nippon Telegraph & Telephone | | | 21,186 | | | | 904,301 | |
Tele2 Class B | | | 61,375 | | | | 585,965 | |
Telenor | | | 6,700 | | | | 111,508 | |
Telstra | | | 39,500 | | | | 140,629 | |
Vodafone Group | | | 59,000 | | | | 153,830 | |
| | | | | | | | |
| | | | | | | 2,095,705 | |
| | | | | | | | |
Utilities – 0.12% | | | | | |
National Grid | | | 14,030 | | | | 178,155 | |
Tokyo Gas | | | 33,000 | | | | 150,164 | |
| | | | | | | | |
| | | | | | | 328,319 | |
| | | | | | | | |
Total Developed Markets
(cost $38,415,780) | | | | 47,313,128 | |
| | | | | | | | |
Emerging Markets X – 6.72% | | | | | |
Consumer Discretionary – 0.54% | | | | | |
Arcos Dorados Holdings Class A † | | | 19,500 | | | | 156,975 | |
Astra International | | | 340,400 | | | | 220,326 | |
B2W Cia Digital † | | | 76,976 | | | | 303,665 | |
Ctrip.com International ADR † | | | 4,800 | | | | 235,920 | |
Grupo Televisa ADR | | | 13,250 | | | | 343,705 | |
Hyundai Motor | | | 680 | | | | 95,770 | |
Woolworths Holdings | | | 23,228 | | | | 121,037 | |
| | | | | | | | |
| | | | | | | 1,477,398 | |
| | | | | | | | |
Consumer Staples – 0.92% | | | | | |
Anadolu Efes Biracilik Ve Malt Sanayii | | | 15,698 | | | | 85,564 | |
BRF ADR | | | 12,660 | | | | 155,085 | |
China Mengniu Dairy | | | 74,000 | | | | 153,304 | |
Cia Brasileira de Distribuicao ADR | | | 6,900 | | | | 132,480 | |
Cia Cervecerias Unidas ADR | | | 5,900 | | | | 149,093 | |
Coca-Cola Femsa ADR | | | 5,600 | | | | 401,520 | |
Schedules of investments
Delaware Foundation® Moderate Allocation Fund
| | | | | | | | |
| | | Number of shares | | | Value (U.S. $) | |
| |
Common Stock (continued) | | | | | |
| |
Emerging Markets X (continued) | | | | | |
Consumer Staples (continued) | | | | | |
Fomento Economico Mexicano ADR | | | 3,125 | | | $ | 276,625 | |
JBS | | | 14,900 | | | | 48,832 | |
Lotte Chilsung Beverage | | | 138 | | | | 174,613 | |
Lotte Confectionery | | | 1,240 | | | | 212,895 | |
Tingyi Cayman Islands Holding | | | 157,816 | | | | 198,196 | |
Uni-President China Holdings | | | 309,000 | | | | 217,491 | |
Wal-Mart de Mexico | | | 44,372 | | | | 102,385 | |
X5 Retail Group GDR † | | | 6,838 | | | | 230,099 | |
| | | | | | | | |
| | | | | | | 2,538,182 | |
| | | | | | | | |
Energy – 0.97% | | | | | |
Cairn India | | | 25,954 | | | | 122,246 | |
China Petroleum & Chemical | | | 198,850 | | | | 161,199 | |
Gazprom PJSC ADR | | | 55,537 | | | | 248,250 | |
Lukoil PJSC ADR | | | 4,500 | | | | 238,770 | |
Petroleo Brasileiro ADR † | | | 29,800 | | | | 288,762 | |
PTT | | | 18,391 | | | | 207,125 | |
Reliance Industries
GDR 144A # | | | 30,375 | | | | 1,224,113 | |
Rosneft Oil PJSC GDR | | | 27,910 | | | | 158,808 | |
| | | | | | | | |
| | | | | | | 2,649,273 | |
| | | | | | | | |
Financials – 0.85% | | | | | |
Akbank | | | 108,919 | | | | 255,631 | |
Banco Bradesco ADR | | | 21,400 | | | | 219,136 | |
Bangkok Bank | | | 28,361 | | | | 149,801 | |
Grupo Financiero Banorte | | | 19,600 | | | | 112,791 | |
Grupo Financiero Santander Mexico Class B ADR | | | 18,600 | | | | 167,958 | |
ICICI Bank ADR | | | 34,900 | | | | 300,140 | |
Industrial & Commercial Bank of China | | | 114,000 | | | | 74,518 | |
Itau Unibanco Holding ADR | | | 27,040 | | | | 326,373 | |
KB Financial Group ADR | | | 4,489 | | | | 197,381 | |
Samsung Life Insurance | | | 2,564 | | | | 248,765 | |
Sberbank of Russia PJSC = | | | 98,223 | | | | 278,904 | |
| | | | | | | | |
| | | | | | | 2,331,398 | |
| | | | | | | | |
Healthcare – 0.04% | | | | | |
Hypermarcas | | | 12,100 | | | | 112,087 | |
| | | | | | | | |
| | | | | | | 112,087 | |
| | | | | | | | |
Industrials – 0.11% | | | | | |
Gol Linhas Aereas Inteligentes ADR † | | | 2,510 | | | | 66,515 | |
KCC | | | 587 | | | | 185,816 | |
Rumo † | | | 4,406 | | | | 12,047 | |
Santos Brasil Participacoes † | | | 32,500 | | | | 23,566 | |
| | | | | | | | |
| | | Number of shares | | | Value (U.S. $) | |
| |
Common Stock (continued) | | | | | |
| |
Emerging Markets X (continued) | | | | | |
Industrials (continued) | | | | | |
ZTO Express Cayman ADR † | | | 420 | | | $ | 5,498 | |
| | | | | | | | |
| | | | | | | 293,442 | |
| | | | | | | | |
Information Technology – 1.93% | | | | | |
Alibaba Group Holding ADR † | | | 5,500 | | | | 593,065 | |
Baidu ADR † | | | 3,600 | | | | 621,072 | |
Hon Hai Precision Industry | | | 73,978 | | | | 221,867 | |
MediaTek | | | 43,000 | | | | 304,688 | |
Samsung Electronics | | | 607 | | | | 1,118,144 | |
Samsung SDI | | | 934 | | | | 115,257 | |
SINA † | | | 5,800 | | | | 418,296 | |
Sohu.com † | | | 9,500 | | | | 373,635 | |
Taiwan Semiconductor Manufacturing | | | 61,069 | | | | 380,392 | |
Taiwan Semiconductor Manufacturing ADR | | | 11,000 | | | | 361,240 | |
Tencent Holdings | | | 23,000 | | | | 659,384 | |
Weibo ADR † | | | 480 | | | | 25,046 | |
WNS Holdings ADR † | | | 3,960 | | | | 113,296 | |
| | | | | | | | |
| | | | | | | 5,305,382 | |
| | | | | | | | |
Materials – 0.31% | | | | | |
Braskem ADR | | | 6,775 | | | | 137,871 | |
Cemex ADR † | | | 18,199 | | | | 165,065 | |
Cemex Latam Holdings † | | | 10,013 | | | | 36,918 | |
Cia de Minas Buenaventura ADR | | | 6,100 | | | | 73,444 | |
Impala Platinum Holdings † | | | 5,403 | | | | 18,211 | |
Sociedad Quimica y Minera de Chile ADR | | | 2,900 | | | | 99,673 | |
UltraTech Cement | | | 5,021 | | | | 308,115 | |
| | | | | | | | |
| | | | | | | 839,297 | |
| | | | | | | | |
Real Estate – 0.09% | | | | | |
Etalon Group
GDR 144A #= | | | 16,400 | | | | 61,992 | |
IRSA Inversiones y Representaciones ADR † | | | 4,500 | | | | 110,295 | |
UEM Sunrise | | | 258,519 | | | | 74,188 | |
| | | | | | | | |
| | | | | | | 246,475 | |
| | | | | | | | |
Telecommunication Services – 0.96% | | | | | |
America Movil Class L ADR | | | 17,220 | | | | 244,007 | |
China Mobile | | | 32,921 | | | | 360,282 | |
China Mobile ADR | | | 1,725 | | | | 95,272 | |
LG Uplus | | | 8,918 | | | | 114,037 | |
Mobile TeleSystems ADR | | | 7,600 | | | | 83,828 | |
SK Telecom ADR | | | 31,200 | | | | 785,616 | |
Telefonica Brasil ADR | | | 20,405 | | | | 303,014 | |
TIM Participacoes ADR | | | 23,100 | | | | 369,138 | |
| | | | | | | | |
| | | Number of shares | | | Value (U.S. $) | |
| |
Common Stock (continued) | | | | | |
| |
Emerging Markets X (continued) | | | | | |
Telecommunication Services (continued) | |
Turkcell Iletisim Hizmetleri ADR † | | | 12,450 | | | $ | 103,086 | |
VEON ADR | | | 21,400 | | | | 87,312 | |
Vodacom Group | | | 7,335 | | | | 83,102 | |
| | | | | | | | |
| | | | | | | 2,628,694 | |
| | | | | | | | |
Total Emerging Markets
(cost $15,414,665) | | | | 18,421,628 | |
| | | | | | | | |
Total Common Stock
(cost $103,986,468) | | | | 144,084,032 | |
| | | | | | | | |
|
| |
Exchange-Traded Funds – 2.38% | | | | | |
| |
iShares MSCI EAFE ETF | | | 685 | | | | 42,669 | |
iShares MSCI EAFE Growth ETF | | | 6,840 | | | | 475,312 | |
iShares Russell 1000 Growth ETF | | | 41,620 | | | | 4,736,356 | |
Vanguard FTSE Developed Markets ETF | | | 1,900 | | | | 74,670 | |
Vanguard Mega Cap Growth ETF | | | 6,205 | | | | 593,881 | |
Vanguard Russell 1000 Growth ETF | | | 5,145 | | | | 600,421 | |
| | | | | | | | |
Total Exchange-Traded Funds
(cost $6,254,026) | | | | 6,523,309 | |
| | | | | | | | |
| | |
| | | Principal amount° | | | | |
| |
Agency Asset-Backed Securities – 0.02% | |
| |
Fannie Mae Grantor Trust Series 2003-T4 2A5 4.816%
9/26/33 ϕ | | | 49,887 | | | | 54,907 | |
Fannie Mae REMIC Trust Series 2002-W11 AV1 1.322% 11/25/32 ● | | | 2,593 | | | | 2,535 | |
| | | | | | | | |
Total Agency Asset-Backed
Securities (cost $52,077) | | | | 57,442 | |
| | | | | | | | |
|
| |
Agency Collateralized Mortgage Obligations – 7.22% | |
| |
Fannie Mae REMICs | | | | | | | | |
Series 1996-46 ZA 7.50% 11/25/26 | | | 16,756 | | | | 19,438 | |
Series 2005-70 PA 5.50% 8/25/35 | | | 8,046 | | | | 8,994 | |
Series 2008-15 SB 5.618% 8/25/36 S● | | | 22,303 | | | | 4,234 | |
| | | | | | | | |
| | | Principal
amount° | | | Value (U.S. $) | |
| |
Agency Collateralized Mortgage Obligations (continued) | |
| |
Fannie Mae REMICs | | | | | | | | |
Series 2010-41 PN 4.50% 4/25/40 | | | 120,000 | | | $ | 129,482 | |
Series 2010-43 HJ 5.50% 5/25/40 | | | 11,733 | | | | 13,094 | |
Series 2010-96 DC 4.00% 9/25/25 | | | 2,580 | | | | 2,758 | |
Series 2010-129 SM 5.018% 11/25/40 S● | | | 125,219 | | | | 20,291 | |
Series 2012-51 SA 5.518% 5/25/42 S● | | | 56,390 | | | | 12,981 | |
Series 2012-98 MI 3.00% 8/25/31 S | | | 177,181 | | | | 20,010 | |
Series 2012-99 AI 3.50% 5/25/39 S | | | 463,952 | | | | 49,486 | |
Series 2012-118 AI 3.50% 11/25/37 S | | | 91,121 | | | | 11,134 | |
Series 2012-120 WI 3.00% 11/25/27 S | | | 49,402 | | | | 5,000 | |
Series 2012-122 SD 5.118% 11/25/42 S● | | | 79,384 | | | | 16,303 | |
Series 2012-125 MI 3.50% 11/25/42 S | | | 370,115 | | | | 74,113 | |
Series 2013-7 EI 3.00% 10/25/40 S | | | 5,002,391 | | | | 673,546 | |
Series 2013-26 ID 3.00% 4/25/33 S | | | 183,136 | | | | 25,690 | |
Series 2013-38 AI 3.00% 4/25/33 S | | | 170,291 | | | | 23,043 | |
Series 2013-43 IX 4.00% 5/25/43 S | | | 510,945 | | | | 120,705 | |
Series 2013-44 DI 3.00% 5/25/33 S | | | 552,101 | | | | 88,068 | |
Series 2013-45 PI 3.00% 5/25/33 S | | | 348,383 | | | | 51,361 | |
Series 2013-51 PI 3.00% 11/25/32 S | | | 341,084 | | | | 40,583 | |
Series 2013-55 AI 3.00% 6/25/33 S | | | 211,149 | | | | 30,552 | |
Series 2013-59 PY 2.50% 6/25/43 | | | 70,000 | | | | 63,927 | |
Series 2013-62 PY 2.50% 6/25/43 | | | 55,000 | | | | 50,312 | |
Series 2013-64 KI 3.00% 2/25/33 S | | | 1,108,361 | | | | 146,359 | |
Series 2013-69 IJ 3.00% 7/25/33 S | | | 62,762 | | | | 9,126 | |
Series 2013-71 ZA 3.50% 7/25/43 | | | 67,262 | | | | 67,418 | |
Series 2014-25 DI 3.50% 8/25/32 S | | | 82,998 | | | | 9,463 | |
Schedules of investments
Delaware Foundation® Moderate Allocation Fund
| | | | | | | | |
| | | Principal
amount° | | | Value (U.S. $) | |
| |
Agency Collateralized Mortgage Obligations (continued) | |
| |
Fannie Mae REMICs | | | | | | | | |
Series 2014-36 ZE 3.00% 6/25/44 | | | 103,417 | | | $ | 94,452 | |
Series 2014-68 BS 5.168% 11/25/44 S● | | | 175,797 | | | | 34,407 | |
Series 2014-90 SA 5.168% 1/25/45 S● | | | 117,158 | | | | 23,580 | |
Series 2015-11 BI 3.00% 1/25/33 S | | | 142,591 | | | | 14,604 | |
Series 2015-40 GZ 3.50% 5/25/45 | | | 25,588 | | | | 24,343 | |
Series 2015-43 PZ 3.50% 6/25/45 | | | 10,662 | | | | 10,736 | |
Series 2015-44 Z 3.00% 9/25/43 | | | 177,044 | | | | 171,134 | |
Series 2015-71 PI 4.00% 3/25/43 S | | | 663,198 | | | | 108,752 | |
Series 2015-95 SH 5.018% 1/25/46 S● | | | 171,855 | | | | 36,806 | |
Series 2016-2 HI 3.00% 12/25/41 S | | | 317,662 | | | | 42,476 | |
Series 2016-17 BI 4.00% 2/25/43 S | | | 1,727,251 | | | | 294,236 | |
Series 2016-33 DI 3.50% 6/25/36 S | | | 85,201 | | | | 13,337 | |
Series 2016-54 PI 3.00% 2/25/44 S | | | 323,502 | | | | 40,137 | |
Series 2016-62 SA 5.018% 9/25/46 S● | | | 273,645 | | | | 65,664 | |
Series 2016-74 GS 5.018% 10/25/46 S● | | | 2,435,946 | | | | 599,998 | |
Series 2016-74 IH 3.50% 11/25/45 S | | | 97,807 | | | | 17,923 | |
Series 2016-80 BZ 3.00% 11/25/46 | | | 369,585 | | | | 324,112 | |
Series 2016-80 CZ 3.00% 11/25/46 | | | 323,007 | | | | 283,243 | |
Series 2016-80 JZ 3.00% 11/25/46 | | | 33,415 | | | | 30,314 | |
Series 2016-90 CI 3.00% 2/25/45 S | | | 2,398,071 | | | | 369,045 | |
Series 2016-95 IO 3.00% 12/25/46 S | | | 3,663,179 | | | | 723,627 | |
Series 2016-95 LZ 2.50% 12/25/46 | | | 166,379 | | | | 135,213 | |
Series 2016-95 US 5.018% 12/25/46 S● | | | 3,727,407 | | | | 817,679 | |
Series 2016-99 DI 3.50% 1/25/46 S | | | 98,878 | | | | 16,505 | |
Series 2016-99 TI 3.50% 3/25/36 S | | | 167,192 | | | | 23,018 | |
| | | | | | | | |
| | | Principal
amount° | | | Value (U.S. $) | |
| |
Agency Collateralized Mortgage Obligations (continued) | |
| |
Fannie Mae REMICs | | | | | | | | |
Series 2016-105 SA 5.018% 1/25/47 S● | | | 97,314 | | | $ | 20,781 | |
Series 2017-6 NI 3.50% 3/25/46 S | | | 228,052 | | | | 36,266 | |
Series 2017-16 YT 3.00% 7/25/46 | | | 70,000 | | | | 68,534 | |
Series 2017-24 AI 3.00% 8/25/46 S | | | 190,000 | | | | 25,175 | |
Freddie Mac REMICs | | | | | | | | |
Series 1730 Z 7.00% 5/15/24 | | | 11,083 | | | | 12,352 | |
Series 2621 QH 5.00% 5/15/33 | | | 367 | | | | 393 | |
Series 2708 ZD 5.50% 11/15/33 | | | 22,761 | | | | 25,309 | |
Series 4050 EI 4.00% 2/15/39 S | | | 44,966 | | | | 4,610 | |
Series 4065 DE 3.00% 6/15/32 | | | 30,000 | | | | 30,185 | |
Series 4100 EI 3.00% 8/15/27 S | | | 183,101 | | | | 18,508 | |
Series 4109 AI 3.00% 7/15/31 S | | | 324,698 | | | | 34,946 | |
Series 4120 IK 3.00% 10/15/32 S | | | 263,808 | | | | 36,021 | |
Series 4136 EZ 3.00% 11/15/42 | | | 35,914 | | | | 35,295 | |
Series 4146 IA 3.50% 12/15/32 S | | | 139,372 | | | | 21,948 | |
Series 4159 KS 5.238% 1/15/43 S● | | | 62,527 | | | | 14,376 | |
Series 4161 IM 3.50% 2/15/43 S | | | 113,417 | | | | 25,672 | |
Series 4181 DI 2.50% 3/15/33 S | | | 87,204 | | | | 9,808 | |
Series 4184 GS 5.208% 3/15/43 S● | | | 148,296 | | | | 33,781 | |
Series 4185 LI 3.00% 3/15/33 S | | | 135,258 | | | | 18,890 | |
Series 4186 IE 3.00% 3/15/33 S | | | 2,954,116 | | | | 415,628 | |
Series 4191 CI 3.00% 4/15/33 S | | | 65,956 | | | | 9,275 | |
Series 4206 DZ 3.00% 5/15/33 | | | 79,932 | | | | 77,904 | |
Series 4223 HI 3.00% 4/15/30 S | | | 774,482 | | | | 61,064 | |
Series 4342 CI 3.00% 11/15/33 S | | | 64,294 | | | | 8,329 | |
| | | | | | | | |
| | | Principal
amount° | | | Value (U.S. $) | |
| |
Agency Collateralized Mortgage Obligations (continued) | | | | | |
| |
Freddie Mac REMICs | | | | | | | | |
Series 4366 DI 3.50% 5/15/33 S | | | 396,069 | | | $ | 53,941 | |
Series 4433 DI 3.00% 8/15/32 S | | | 1,539,055 | | | | 155,326 | |
Series 4435 DY 3.00% 2/15/35 | | | 142,000 | | | | 140,943 | |
Series 4476 GI 3.00% 6/15/41 S | | | 346,535 | | | | 39,849 | |
Series 4493 HI 3.00% 6/15/41 S | | | 77,684 | | | | 10,549 | |
Series 4518 CI 3.50% 6/15/42 S | | | 1,064,786 | | | | 144,441 | |
Series 4567 LI 4.00% 8/15/45 S | | | 1,622,643 | | | | 307,676 | |
Series 4574 AI 3.00% 4/15/31 S | | | 661,954 | | | | 84,759 | |
Series 4581 LI 3.00% 5/15/36 S | | | 86,514 | | | | 12,099 | |
Series 4592 WT 5.50% 6/15/46 | | | 283,079 | | | | 315,937 | |
Series 4594 SG 5.088% 6/15/46 S● | | | 95,852 | | | | 23,410 | |
Series 4596 ZH 3.00% 11/15/45 | | | 1,651,703 | | | | 1,649,941 | |
Series 4614 HB 2.50% 9/15/46 | | | 72,000 | | | | 64,366 | |
Series 4618 SA 5.088% 9/15/46 S● | | | 102,202 | | | | 25,088 | |
Series 4623 IY 4.00% 10/15/46 S | | | 98,331 | | | | 22,130 | |
Series 4623 LZ 2.50% 10/15/46 | | | 267,772 | | | | 228,442 | |
Series 4623 MW 2.50% 10/15/46 | | | 510,000 | | | | 463,108 | |
Series 4623 WI 4.00% 8/15/44 S | | | 298,967 | | | | 55,600 | |
Series 4643 QI 3.50% 9/15/45 S | | | 501,679 | | | | 82,630 | |
Series 4648 ND 3.00% 9/15/46 | | | 28,000 | | | | 26,659 | |
Series 4648 SA 5.088% 1/15/47 S● | | | 4,403,131 | | | | 1,006,454 | |
Series 4656 HI 3.50% 5/15/42 S | | | 184,346 | | | | 22,862 | |
Series 4657 NW 3.00% 4/15/45 | | | 27,000 | | | | 26,680 | |
Series 4660 GI 3.00% 8/15/43 S | | | 174,628 | | | | 24,932 | |
| | | | | | | | |
| | | Principal
amount° | | | Value (U.S. $) | |
| |
Agency Collateralized Mortgage Obligations (continued) | | | | | |
| |
Freddie Mac Strips | | | | | | | | |
Series 267 S5 5.088% 8/15/42 S● | | | 178,571 | | | $ | 36,188 | |
Series 299 S1 5.088% 1/15/43 S● | | | 136,391 | | | | 27,920 | |
Series 326 S2 5.038% 3/15/44 S● | | | 92,375 | | | | 18,297 | |
Freddie Mac Structured Agency Credit Risk Debt Notes | | | | | | | | |
Series 2015-HQA2 M2 3.782% 5/25/28 ● | | | 237,685 | | | | 245,049 | |
GNMA | | | | | | | | |
Series 2010-113 KE 4.50% 9/20/40 | | | 295,000 | | | | 321,483 | |
Series 2012-136 MX 2.00% 11/20/42 | | | 540,000 | | | | 489,641 | |
Series 2013-113 AZ 3.00% 8/20/43 | | | 180,361 | | | | 171,056 | |
Series 2013-113 LY 3.00% 5/20/43 | | | 312,000 | | | | 307,457 | |
Series 2015-64 GZ 2.00% 5/20/45 | | | 74,687 | | | | 60,737 | |
Series 2015-74 CI 3.00% 10/16/39 S | | | 75,677 | | | | 9,605 | |
Series 2015-82 GI 3.50% 12/20/38 S | | | 266,289 | | | | 26,757 | |
Series 2015-133 AL 3.00% 5/20/45 | | | 188,000 | | | | 183,673 | |
Series 2015-142 AI 4.00% 2/20/44 S | | | 68,429 | | | | 8,655 | |
Series 2016-5 GL 3.00% 7/20/45 | | | 315,000 | | | | 307,092 | |
Series 2016-101 QL 3.00% 7/20/46 | | | 808,000 | | | | 764,064 | |
Series 2016-108 YL 3.00% 8/20/46 | | | 3,921,650 | | | | 3,683,328 | |
Series 2016-111 PB 2.50% 8/20/46 | | | 67,000 | | | | 60,276 | |
Series 2016-134 MW 3.00% 10/20/46 | | | 810,000 | | | | 806,330 | |
Series 2016-135 Z 3.00% 10/20/46 | | | 12,151 | | | | 11,006 | |
Series 2016-146 KS 5.122% 10/20/46 S● | | | 97,309 | | | | 23,293 | |
Series 2016-149 GI 4.00% 11/20/46 S | | | 98,757 | | | | 21,595 | |
Series 2016-160 VZ 2.50% 11/20/46 | | | 33,276 | | | | 27,096 | |
Series 2017-4 BW 3.00% 1/20/47 | | | 28,000 | | | | 26,384 | |
Schedules of investments
Delaware Foundation® Moderate Allocation Fund
| | | | | | | | |
| | | Principal
amount° | | | Value (U.S. $) | |
| |
Agency Collateralized Mortgage Obligations (continued) | |
| |
GNMA | | | | | | | | |
Series 2017-25 CZ 3.50% 2/20/47 | | | 12,035 | | | $ | 12,001 | |
| | | | | | | | |
Total Agency Collateralized
Mortgage Obligations
(cost $19,897,072) | | | | 19,784,667 | |
| | | | | | | | |
|
| |
Agency Commercial Mortgage-Backed Securities – 0.41% | | | | | |
| |
Freddie Mac Multifamily Structured Pass Through Certificates | | | | | | | | |
Series K037 A2 3.49% 1/25/24 ◆ | | | 130,000 | | | | 137,736 | |
Series KS03 A4 3.161% 5/25/25 ◆● | | | 110,000 | | | | 110,941 | |
FREMF Mortgage Trust | | | | | | | | |
Series 2011-K14 B 144A 5.167% 2/25/47 #● | | | 45,000 | | | | 49,185 | |
Series 2011-K15 B 144A 4.949% 8/25/44 #● | | | 10,000 | | | | 10,862 | |
Series 2012-K18 B 144A 4.256% 1/25/45 #● | | | 50,000 | | | | 52,907 | |
Series 2012-K22 B 144A 3.686% 8/25/45 #● | | | 95,000 | | | | 97,646 | |
Series 2012-K708 B 144A 3.752% 2/25/45 #● | | | 95,000 | | | | 97,091 | |
Series 2013-K32 B 144A 3.538% 10/25/46 #● | | | 255,000 | | | | 254,873 | |
Series 2013-K33 B 144A 3.502% 8/25/46 #● | | | 80,000 | | | | 79,509 | |
Series 2013-K712 B 144A 3.365% 5/25/45 #● | | | 55,000 | | | | 56,096 | |
Series 2013-K713 B 144A 3.166% 4/25/46 #● | | | 35,000 | | | | 35,507 | |
Series 2013-K713 C 144A 3.166% 4/25/46 #● | | | 135,000 | | | | 135,346 | |
| | | | | | | | |
Total Agency Commercial
Mortgage-Backed
Securities (cost $1,123,815) | | | | 1,117,699 | |
| | | | | | | | |
|
| |
Agency Mortgage-Backed Securities – 6.45% | | | | | |
| |
Fannie Mae S.F. 30 yr | | | | | | | | |
4.50% 5/1/39 | | | 103,661 | | | | 111,809 | |
4.50% 2/1/46 | | | 524,084 | | | | 563,463 | |
5.00% 11/1/33 | | | 1,207 | | | | 1,323 | |
5.00% 8/1/35 | | | 3,821 | | | | 4,181 | |
5.00% 10/1/35 | | | 523,012 | | | | 572,248 | |
5.00% 10/1/36 | | | 1,600 | | | | 1,751 | |
5.00% 12/1/36 | | | 1,212 | | | | 1,325 | |
| | | | | | | | |
| | | Principal
amount° | | | Value (U.S. $) | |
| |
Agency Mortgage-Backed Securities (continued) | |
| |
Fannie Mae S.F. 30 yr | | | | | | | | |
5.50% 3/1/34 | | | 107,699 | | | $ | 120,732 | |
5.50% 4/1/34 | | | 1,860 | | | | 2,083 | |
5.50% 11/1/34 | | | 3,843 | | | | 4,303 | |
5.50% 2/1/35 | | | 3,392 | | | | 3,798 | |
5.50% 8/1/37 | | | 16,747 | | | | 18,754 | |
5.50% 1/1/38 | | | 178,590 | | | | 199,696 | |
5.50% 3/1/38 | | | 62,767 | | | | 70,326 | |
5.50% 12/1/38 | | | 1,724 | | | | 1,930 | |
5.50% 6/1/39 | | | 41,060 | | | | 45,955 | |
5.50% 7/1/40 | | | 39,809 | | | | 44,536 | |
5.50% 6/1/41 | | | 108,008 | | | | 120,988 | |
5.50% 5/1/44 | | | 2,258,696 | | | | 2,527,565 | |
6.00% 3/1/34 | | | 9,687 | | | | 11,090 | |
6.00% 8/1/34 | | | 16,263 | | | | 18,564 | |
6.00% 11/1/34 | | | 481 | | | | 547 | |
6.00% 4/1/35 | | | 15,894 | | | | 18,063 | |
6.00% 6/1/35 | | | 192,085 | | | | 218,760 | |
6.00% 7/1/35 | | | 56,782 | | | | 64,430 | |
6.00% 12/1/35 | | | 78,708 | | | | 89,439 | |
6.00% 5/1/36 | | | 157,284 | | | | 178,039 | |
6.00% 6/1/36 | | | 285,050 | | | | 329,945 | |
6.00% 9/1/36 | | | 150,173 | | | | 170,305 | |
6.00% 12/1/36 | | | 4,106 | | | | 4,675 | |
6.00% 2/1/37 | | | 12,681 | | | | 14,322 | |
6.00% 5/1/37 | | | 172,438 | | | | 195,790 | |
6.00% 6/1/37 | | | 2,286 | | | | 2,607 | |
6.00% 7/1/37 | | | 1,778 | | | | 2,008 | |
6.00% 8/1/37 | | | 258,883 | | | | 293,825 | |
6.00% 9/1/37 | | | 152,153 | | | | 172,095 | |
6.00% 11/1/37 | | | 774 | | | | 874 | |
6.00% 3/1/38 | | | 388,288 | | | | 442,659 | |
6.00% 5/1/38 | | | 87,462 | | | | 99,050 | |
6.00% 9/1/38 | | | 74,808 | | | | 84,775 | |
6.00% 10/1/38 | | | 5,592 | | | | 6,313 | |
6.00% 11/1/38 | | | 9,689 | | | | 11,060 | |
6.00% 1/1/39 | | | 18,289 | | | | 20,647 | |
6.00% 9/1/39 | | | 466,740 | | | | 533,076 | |
6.00% 10/1/39 | | | 209,521 | | | | 239,845 | |
6.00% 3/1/40 | | | 71,210 | | | | 80,391 | |
6.00% 7/1/40 | | | 61,749 | | | | 69,725 | |
6.00% 9/1/40 | | | 15,361 | | | | 17,360 | |
6.00% 11/1/40 | | | 6,582 | | | | 7,540 | |
6.00% 5/1/41 | | | 126,686 | | | | 143,184 | |
6.00% 6/1/41 | | | 64,808 | | | | 73,217 | |
6.00% 7/1/41 | | | 58,202 | | | | 65,711 | |
7.50% 6/1/31 | | | 11,274 | | | | 13,673 | |
Fannie Mae S.F. 30 yr TBA | | | | | | | | |
4.50% 4/1/47 | | | 6,880,000 | | | | 7,365,900 | |
| | | | | | | | |
| | | Principal
amount° | | | Value (U.S. $) | |
| |
Agency Mortgage-Backed Securities (continued) | | | | | |
| |
Freddie Mac ARM | | | | | | | | |
2.553% 10/1/46● | | | 108,924 | | | $ | 109,400 | |
Freddie Mac S.F. 30 yr | | | | | | | | |
5.00% 5/1/41 | | | 118,694 | | | | 130,757 | |
5.50% 3/1/34 | | | 4,952 | | | | 5,567 | |
5.50% 12/1/34 | | | 4,425 | | | | 4,975 | |
5.50% 11/1/36 | | | 5,420 | | | | 6,025 | |
5.50% 9/1/37 | | | 5,067 | | | | 5,619 | |
5.50% 6/1/39 | | | 17,391 | | | | 19,281 | |
5.50% 3/1/40 | | | 14,639 | | | | 16,228 | |
5.50% 8/1/40 | | | 10,378 | | | | 11,507 | |
5.50% 6/1/41 | | | 213,219 | | | | 238,021 | |
6.00% 5/1/35 | | | 21,446 | | | | 24,426 | |
6.00% 2/1/36 | | | 9,498 | | | | 10,813 | |
6.00% 3/1/36 | | | 20,002 | | | | 22,796 | |
6.00% 8/1/38 | | | 33,441 | | | | 38,326 | |
6.00% 10/1/38 | | | 7,956 | | | | 9,099 | |
6.00% 3/1/40 | | | 201,237 | | | | 227,179 | |
6.00% 5/1/40 | | | 594,010 | | | | 676,044 | |
6.00% 7/1/40 | | | 30,241 | | | | 34,280 | |
6.50% 12/1/31 | | | 4,756 | | | | 5,372 | |
GNMA II S.F. 30 yr | | | | | | | | |
5.00% 9/20/46 | | | 202,888 | | | | 217,866 | |
5.50% 5/20/37 | | | 25,521 | | | | 28,387 | |
5.50% 4/20/40 | | | 23,084 | | | | 25,236 | |
6.00% 2/20/39 | | | 33,854 | | | | 38,379 | |
6.00% 10/20/39 | | | 38,671 | | | | 43,193 | |
6.00% 2/20/40 | | | 122,321 | | | | 137,018 | |
6.00% 4/20/46 | | | 38,594 | | | | 43,191 | |
6.50% 6/20/39 | | | 42,662 | | | | 48,293 | |
6.50% 10/20/39 | | | 36,333 | | | | 41,011 | |
| | | | | | | | |
Total Agency
Mortgage-Backed
Securities
(cost $17,696,051) | | | | 17,694,559 | |
| | | | | | | | |
|
| |
Collateralized Debt Obligations – 1.04% | |
| |
AMMC CLO
Series 2015-16A AR 144A 2.42% 4/14/29 #● | | | 170,000 | | | | 169,915 | |
Avery Point III CLO
Series 2013-3A A 144A
2.424% 1/18/25 #● | | | 250,000 | | | | 249,895 | |
Benefit Street Partners CLO IV
Series 2014-IVA A1R 144A 2.515% 1/20/29 #● | | | 500,000 | | | | 501,433 | |
Cedar Funding VI CLO
Series 2016-6A A1 144A 2.344% 10/20/28 #● | | | 250,000 | | | | 250,524 | |
| | | | | | | | |
| | | Principal
amount° | | | Value (U.S. $) | |
| |
Collateralized Debt Obligations (continued) | | | | | |
| |
GoldentTree Loan Management U.S. CLO Series 2017-1A A 144A 2.38% 4/20/29 #● | | | 250,000 | | | $ | 250,905 | |
JFIN CLO Series 2017-1A A1 144A 2.324% 4/24/29 #● | | | 155,000 | | | | 155,233 | |
Magnetite IX Series 2014-9A A1 144A 2.458% 7/25/26 #● | | | 285,000 | | | | 285,285 | |
Neuberger Berman CLO XIX Series 2015-19A A1 144A 2.443% 7/15/27 #● | | | 250,000 | | | | 249,995 | |
Shackleton CLO Series 2014-5A A 144A 2.534% 5/7/26 #● | | | 250,000 | | | | 249,916 | |
TIAA CLO II
Series 2017-1A A 144A 2.49% 4/20/29 #● | | | 250,000 | | | | 249,781 | |
Venture CDO
Series 2016-25A A1 144A 2.49% 4/20/29 #● | | | 100,000 | | | | 100,326 | |
Venture XXIV CLO Series 2016-24A A1D 144A 2.419% 10/20/28 #● | | | 140,000 | | | | 140,186 | |
| | | | | | | | |
Total Collateralized Debt
Obligations
(cost $2,847,677) | | | | 2,853,394 | |
| | | | | | | | |
|
| |
Convertible Bond – 0.09% | | | | | |
| |
Clearwire Communications 144A 8.25% exercise price $7.08, maturity date 12/1/40 # | | | 250,000 | | | | 259,687 | |
| | | | | | | | |
Total Convertible Bond
(cost $261,250) | | | | 259,687 | |
| | | | | | | | |
|
| |
Corporate Bonds – 22.17% | | | | | |
| |
Banking – 5.15% | | | | | |
Banco Nacional de Costa Rica 144A 5.875% 4/25/21 # | | | 200,000 | | | | 203,750 | |
Bank Nederlandse Gemeenten 3.50% 7/19/27 | | AUD | 24,000 | | | | 18,210 | |
Bank of America | | | | | | | | |
3.124% 1/20/23 ● | | | 420,000 | | | | 422,081 | |
3.248% 10/21/27 | | | 55,000 | | | | 52,465 | |
3.30% 8/5/21 | | AUD | 20,000 | | | | 15,234 | |
Schedules of investments
Delaware Foundation® Moderate Allocation Fund
| | | | | | | | |
| | | Principal
amount° | | | Value (U.S. $) | |
| |
Corporate Bonds (continued) | | | | | |
| |
Banking (continued) | | | | | |
Bank of America | | | | | | | | |
3.824% 1/20/28 ● | | | 155,000 | | | $ | 155,630 | |
4.183% 11/25/27 | | | 155,000 | | | | 155,860 | |
Bank of New York Mellon | | | | | | | | |
2.15% 2/24/20 | | | 25,000 | | | | 25,110 | |
2.20% 8/16/23 | | | 140,000 | | | | 134,507 | |
2.50% 4/15/21 | | | 235,000 | | | | 235,725 | |
3.442% 2/7/28 ● | | | 205,000 | | | | 206,793 | |
4.625% 12/29/49 ● | | | 140,000 | | | | 134,750 | |
Barclays | | | | | | | | |
4.337% 1/10/28 | | | 200,000 | | | | 200,008 | |
4.95% 1/10/47 | | | 200,000 | | | | 200,551 | |
8.25% 12/29/49 ● | | | 200,000 | | | | 210,694 | |
BBVA Bancomer 144A 6.50% 3/10/21 # | | | 150,000 | | | | 165,000 | |
Citigroup | | | | | | | | |
1.80% 1/10/20 ● | | | 595,000 | | | | 597,229 | |
3.75% 10/27/23 | | AUD | 24,000 | | | | 18,338 | |
Citizens Financial Group | | | | | | | | |
2.375% 7/28/21 | | | 75,000 | | | | 74,025 | |
4.30% 12/3/25 | | | 105,000 | | | | 108,404 | |
Compass Bank 3.875% 4/10/25 | | | 250,000 | | | | 245,805 | |
Cooperatieve Rabobank 3.75% 7/21/26 | | | 250,000 | | | | 244,722 | |
Credit Suisse Group 144A 6.25% 12/29/49 #● | | | 400,000 | | | | 407,184 | |
Credit Suisse Group Funding Guernsey 4.55% 4/17/26 | | | 315,000 | | | | 326,139 | |
Export-Import Bank of India 144A 3.375% 8/5/26 # | | | 200,000 | | | | 191,554 | |
Export-Import Bank of Korea
4.00% 6/7/27 | | AUD | 10,000 | | | | 7,607 | |
Fifth Third Bancorp 2.875% 7/27/20 | | | 50,000 | | | | 50,681 | |
Fifth Third Bank 3.85% 3/15/26 | | | 200,000 | | | | 201,953 | |
Goldman Sachs Group | | | | | | | | |
3.85% 1/26/27 | | | 95,000 | | | | 95,611 | |
5.15% 5/22/45 | | | 235,000 | | | | 247,368 | |
5.20% 12/17/19 | | NZD | 20,000 | | | | 14,553 | |
HSBC Holdings 4.041% 3/13/28 ● | | | 200,000 | | | | 202,389 | |
Huntington Bancshares 2.30% 1/14/22 | | | 80,000 | | | | 77,988 | |
Huntington National Bank 2.375% 3/10/20 | | | 260,000 | | | | 261,062 | |
ING Groep 3.15% 3/29/22 | | | 200,000 | | | | 200,742 | |
| | | | | | | | |
| | | Principal
amount° | | | Value (U.S. $) | |
| |
Corporate Bonds (continued) | | | | | |
| |
Banking (continued) | | | | | |
ING Groep
3.95% 3/29/27 | | | 270,000 | | | $ | 270,741 | |
JPMorgan Chase & Co. | | | | | | | | |
3.782% 2/1/28 ● | | | 320,000 | | | | 323,357 | |
4.25% 11/2/18 | | NZD | 110,000 | | | | 78,273 | |
4.25% 10/1/27 | | | 160,000 | | | | 164,545 | |
KeyBank | | | | | | | | |
2.35% 3/8/19 | | | 260,000 | | | | 262,095 | |
3.40% 5/20/26 | | | 250,000 | | | | 243,568 | |
KeyCorp 5.00% 12/29/49 ● | | | 225,000 | | | | 223,313 | |
Landwirtschaftliche Rentenbank 5.375% 4/23/24 | | NZD | 335,000 | | | | 256,536 | |
Lloyds Banking Group 3.00% 1/11/22 | | | 200,000 | | | | 199,054 | |
Morgan Stanley | | | | | | | | |
2.625% 11/17/21 | | | 190,000 | | | | 188,699 | |
3.625% 1/20/27 | | | 110,000 | | | | 109,372 | |
3.95% 4/23/27 | | | 270,000 | | | | 267,891 | |
5.00% 9/30/21 | | AUD | 24,000 | | | | 19,590 | |
National City Bank 1.472% 6/7/17 ● | | | 250,000 | | | | 250,011 | |
Nationwide Building Society 144A 4.00% 9/14/26 # | | | 250,000 | | | | 242,475 | |
PNC Bank 2.625% 2/17/22 | | | 250,000 | | | | 250,297 | |
PNC Financial Services Group 5.00% 12/29/49 ● | | | 145,000 | | | | 144,637 | |
Royal Bank of Canada 2.75% 2/1/22 | | | 215,000 | | | | 217,090 | |
Royal Bank of Scotland Group | | | | | |
3.875% 9/12/23 | | | 400,000 | | | | 394,724 | |
8.625% 12/29/49 ● | | | 200,000 | | | | 209,000 | |
Santander UK Group Holdings
3.571% 1/10/23 | | | 200,000 | | | | 200,228 | |
State Street | | | | | | | | |
2.55% 8/18/20 | | | 115,000 | | | | 116,585 | |
3.10% 5/15/23 | | | 65,000 | | | | 65,516 | |
3.55% 8/18/25 | | | 115,000 | | | | 118,299 | |
SunTrust Bank 3.30% 5/15/26 | | | 200,000 | | | | 194,552 | |
SunTrust Banks 2.70% 1/27/22 | | | 35,000 | | | | 34,894 | |
Swedbank 144A 2.65% 3/10/21 # | | | 200,000 | | | | 201,103 | |
Toronto-Dominion Bank | | | | | | | | |
2.125% 4/7/21 | | | 460,000 | | | | 456,142 | |
2.50% 12/14/20 | | | 90,000 | | | | 90,789 | |
3.625% 9/15/31 ● | | | 135,000 | | | | 132,419 | |
U.S. Bancorp 3.10% 4/27/26 | | | 155,000 | | | | 152,356 | |
| | | | | | | | |
| | | Principal
amount° | | | Value (U.S. $) | |
| |
Corporate Bonds (continued) | | | | | |
| |
Banking (continued) | | | | | |
UBS Group Funding Jersey 144A 2.65% 2/1/22 # | | | 200,000 | | | $ | 196,255 | |
UBS Group Funding Switzerland | | | | | | | | |
144A 3.491% 5/23/23 # | | | 200,000 | | | | 201,502 | |
144A 4.253% 3/23/28 # | | | 300,000 | | | | 304,116 | |
USB Capital IX 3.50% 10/29/49 ● | | | 235,000 | | | | 200,044 | |
Wells Fargo & Co. | | | | | | | | |
3.00% 7/27/21 | | AUD | 38,000 | | | | 28,603 | |
3.069% 1/24/23 | | | 385,000 | | | | 386,906 | |
Wells Fargo Bank 2.15% 12/6/19 | | | 300,000 | | | | 301,203 | |
Woori Bank 144A 4.75% 4/30/24 # | | | 200,000 | | | | 206,895 | |
Zions Bancorporation 4.50% 6/13/23 | | | 100,000 | | | | 103,785 | |
| | | | | | | | |
| | | | | | | 14,117,182 | |
| | | | | | | | |
Basic Industry – 1.53% | | | | | |
BHP Billiton Finance USA 144A 6.25% 10/19/75 #● | | | 200,000 | | | | 217,050 | |
Boise Cascade 144A 5.625% 9/1/24 # | | | 110,000 | | | | 112,200 | |
Builders FirstSource 144A 5.625% 9/1/24 # | | | 105,000 | | | | 106,969 | |
CF Industries 6.875% 5/1/18 | | | 195,000 | | | | 203,775 | |
Cliffs Natural Resources 144A 5.75% 3/1/25 # | | | 15,000 | | | | 14,587 | |
Dow Chemical 8.55% 5/15/19 | | | 611,000 | | | | 692,919 | |
Freeport-McMoRan 144A 6.875% 2/15/23 # | | | 150,000 | | | | 155,625 | |
General Electric | | | | | | | | |
2.10% 12/11/19 | | | 25,000 | | | | 25,243 | |
4.25% 1/17/18 | | NZD | 55,000 | | | | 39,030 | |
5.55% 5/4/20 | | | 75,000 | | | | 82,996 | |
6.00% 8/7/19 | | | 145,000 | | | | 159,311 | |
Georgia-Pacific 8.00% 1/15/24 | | | 290,000 | | | | 371,996 | |
International Paper 4.40% 8/15/47 | | | 250,000 | | | | 236,891 | |
INVISTA Finance 144A 4.25% 10/15/19 # | | | 135,000 | | | | 139,387 | |
Koppers 144A 6.00% 2/15/25 # | | | 80,000 | | | | 82,800 | |
LYB International Finance II 3.50% 3/2/27 | | | 205,000 | | | | 201,574 | |
Novelis 144A 5.875% 9/30/26 # | | | 50,000 | | | | 51,125 | |
| | | | | | | | |
| | | Principal
amount° | | | Value (U.S. $) | |
| |
Corporate Bonds (continued) | | | | | |
| |
Basic Industry (continued) | | | | | |
OCP 144A 4.50% 10/22/25 # | | | 200,000 | | | $ | 197,775 | |
Olin 5.125% 9/15/27 | | | 35,000 | | | | 35,679 | |
PolyOne 5.25% 3/15/23 | | | 60,000 | | | | 60,750 | |
Potash Corp. of Saskatchewan 4.00% 12/15/26 | | | 110,000 | | | | 112,823 | |
PulteGroup 5.00% 1/15/27 | | | 65,000 | | | | 65,244 | |
Southern Copper 5.875% 4/23/45 | | | 85,000 | | | | 88,989 | |
Standard Industries 144A 5.00% 2/15/27 # | | | 170,000 | | | | 167,025 | |
Suzano Trading 144A 5.875% 1/23/21 # | | | 100,000 | | | | 107,030 | |
US Concrete 144A 6.375% 6/1/24 # | | | 50,000 | | | | 52,000 | |
Vale Overseas | | | | | | | | |
5.875% 6/10/21 | | | 35,000 | | | | 37,594 | |
6.25% 8/10/26 | | | 155,000 | | | | 168,756 | |
Westlake Chemical 144A 5.00% 8/15/46 # | | | 110,000 | | | | 113,354 | |
WR Grace & Co. 144A 5.625% 10/1/24 # | | | 99,000 | | | | 104,693 | |
| | | | | | | | |
| | | | | | | 4,205,190 | |
| | | | | | | | |
Capital Goods – 0.98% | | | | | |
Ball 5.25% 7/1/25 | | | 100,000 | | | | 106,250 | |
CCL Industries 144A 3.25% 10/1/26 # | | | 85,000 | | | | 81,506 | |
Cia Brasileira de Aluminio 144A 6.75% 4/5/21 # | | | 100,000 | | | | 108,500 | |
Crown Americas 144A 4.25% 9/30/26 # | | | 46,000 | | | | 44,361 | |
Fortune Brands Home & Security 3.00% 6/15/20 | | | 65,000 | | | | 65,830 | |
KLX 144A 5.875% 12/1/22 # | | | 50,000 | | | | 51,750 | |
LafargeHolcim Finance 144A 3.50% 9/22/26 # | | | 400,000 | | | | 387,430 | |
Lennox International 3.00% 11/15/23 | | | 245,000 | | | | 241,112 | |
Masco 3.50% 4/1/21 | | | 150,000 | | | | 153,391 | |
Owens-Brockway Glass Container 144A 5.875% 8/15/23 # | | | 115,000 | | | | 121,900 | |
Parker-Hannifin 3.30% 11/21/24 | | | 10,000 | | | | 10,184 | |
Rockwell Collins 3.20% 3/15/24 | | | 110,000 | | | | 109,930 | |
Roper Technologies 2.80% 12/15/21 | | | 75,000 | | | | 75,157 | |
Schedules of investments
Delaware Foundation® Moderate Allocation Fund
| | | | | | | | |
| | | Principal
amount° | | | Value (U.S. $) | |
| |
Corporate Bonds (continued) | | | | | |
| |
Capital Goods (continued) | | | | | |
Siemens Financierings-maatschappij 144A 2.70% 3/16/22 # | | | 535,000 | | | $ | 535,867 | |
Union Andina de Cementos 144A 5.875% 10/30/21 # | | | 150,000 | | | | 156,375 | |
Waste Management 2.40% 5/15/23 | | | 435,000 | | | | 427,738 | |
| | | | | | | | |
| | | | | | | 2,677,281 | |
| | | | | | | | |
Consumer Cyclical – 1.41% | | | | | |
Albertsons 144A 6.625% 6/15/24 # | | | 50,000 | | | | 51,250 | |
BMW US Capital 144A 3.30% 4/6/27 # | | | 130,000 | | | | 129,670 | |
Boyd Gaming 6.375% 4/1/26 | | | 70,000 | | | | 75,075 | |
Daimler Finance North America 144A 3.45% 1/6/27 # | | | 165,000 | | | | 165,661 | |
Dollar General 3.875% 4/15/27 | | | 225,000 | | | | 225,611 | |
Ford Motor Credit | | | | | | | | |
3.096% 5/4/23 | | | 200,000 | | | | 195,212 | |
4.389% 1/8/26 | | | 200,000 | | | | 204,196 | |
General Motors Financial | | | | | | | | |
3.45% 4/10/22 | | | 270,000 | | | | 271,623 | |
3.70% 5/9/23 | | | 75,000 | | | | 75,664 | |
5.25% 3/1/26 | | | 15,000 | | | | 16,143 | |
GLP Capital 5.375% 4/15/26 | | | 120,000 | | | | 124,200 | |
Goodyear Tire & Rubber 5.00% 5/31/26 | | | 95,000 | | | | 97,613 | |
Hanesbrands 144A 4.875% 5/15/26 # | | | 105,000 | | | | 103,687 | |
Hilton Worldwide Finance 144A 4.875% 4/1/27 # | | | 75,000 | | | | 75,937 | |
Hyundai Capital America | | | | | | | | |
144A 2.125% 10/2/17 # | | | 80,000 | | | | 80,130 | |
144A 2.55% 2/6/19 # | | | 50,000 | | | | 50,278 | |
144A 3.00% 3/18/21 # | | | 45,000 | | | | 45,190 | |
JD.com 3.125% 4/29/21 | | | 200,000 | | | | 199,566 | |
KFC Holding | | | | | | | | |
144A 5.00% 6/1/24 # | | | 42,000 | | | | 42,997 | |
144A 5.25% 6/1/26 # | | | 40,000 | | | | 40,800 | |
Levi Strauss & Co. 5.00% 5/1/25 | | | 135,000 | | | | 139,077 | |
Live Nation Entertainment 144A 4.875% 11/1/24 # | | | 70,000 | | | | 70,175 | |
Lowe’s 3.70% 4/15/46 | | | 290,000 | | | | 269,848 | |
Marriott International 3.75% 3/15/25 | | | 80,000 | | | | 81,431 | |
| | | | | | | | |
| | | Principal
amount° | | | Value (U.S. $) | |
| |
Corporate Bonds (continued) | | | | | |
| |
Consumer Cyclical (continued) | | | | | |
Marriott International 4.50% 10/1/34 | | | 20,000 | | | $ | 20,322 | |
MGM Resorts International 4.625% 9/1/26 | | | 50,000 | | | | 48,750 | |
Penn National Gaming 144A 5.625% 1/15/27 # | | | 160,000 | | | | 159,200 | |
Scientific Games International 144A 7.00% 1/1/22 # | | | 85,000 | | | | 91,056 | |
Target 3.625% 4/15/46 | | | 160,000 | | | | 144,736 | |
Toyota Motor Credit 2.80% 7/13/22 | | | 120,000 | | | | 120,917 | |
Walgreens Boots Alliance | | | | | | | | |
3.10% 6/1/23 | | | 300,000 | | | | 299,961 | |
3.45% 6/1/26 | | | 80,000 | | | | 78,138 | |
Wyndham Worldwide 4.15% 4/1/24 | | | 80,000 | | | | 80,783 | |
| | | | | | | | |
| | | | | | | 3,874,897 | |
| | | | | | | | |
Consumer Non-Cyclical – 1.92% | | | | | |
Abbott Laboratories 2.90% 11/30/21 | | | 535,000 | | | | 537,855 | |
ACCO Brands 144A 5.25% 12/15/24 # | | | 30,000 | | | | 30,224 | |
Anheuser-Busch InBev Finance 2.65% 2/1/21 | | | 640,000 | | | | 645,326 | |
Becle 144A 3.75% 5/13/25 # | | | 300,000 | | | | 293,500 | |
Biogen 5.20% 9/15/45 | | | 105,000 | | | | 113,916 | |
Celgene 3.25% 8/15/22 | | | 275,000 | | | | 279,568 | |
Cencosud 144A 6.625% 2/12/45 # | | | 200,000 | | | | 204,952 | |
DaVita 5.00% 5/1/25 | | | 130,000 | | | | 129,919 | |
Dean Foods 144A 6.50% 3/15/23 # | | | 105,000 | | | | 109,725 | |
HCA 5.375% 2/1/25 | | | 130,000 | | | | 135,525 | |
HealthSouth | | | | | | | | |
5.125% 3/15/23 | | | 30,000 | | | | 30,150 | |
5.75% 11/1/24 | | | 130,000 | | | | 131,625 | |
5.75% 9/15/25 | | | 30,000 | | | | 30,113 | |
Heineken 144A 3.50% 1/29/28 # | | | 55,000 | | | | 55,408 | |
Hill-Rom Holdings 144A 5.00% 2/15/25 # | | | 110,000 | | | | 110,137 | |
JBS USA 144A 5.875% 7/15/24 # | | | 30,000 | | | | 31,050 | |
Molson Coors Brewing 3.00% 7/15/26 | | | 300,000 | | | | 285,820 | |
Mylan 3.95% 6/15/26 | | | 175,000 | | | | 171,603 | |
New York and Presbyterian Hospital 4.063% 8/1/56 | | | 90,000 | | | | 84,611 | |
| | | | | | | | |
| | | Principal
amount° | | | Value (U.S. $) | |
| |
Corporate Bonds (continued) | | | | | |
| |
Consumer Non-Cyclical (continued) | | | | | |
Pernod Ricard 144A 4.45% 1/15/22 # | | | 300,000 | | | $ | 319,664 | |
Post Holdings 144A 5.00% 8/15/26 # | | | 170,000 | | | | 163,200 | |
Revlon Consumer Products 6.25% 8/1/24 | | | 45,000 | | | | 45,000 | |
Reynolds American 4.00% 6/12/22 | | | 180,000 | | | | 189,121 | |
Shire Acquisitions Investments Ireland | | | | | | | | |
2.40% 9/23/21 | | | 150,000 | | | | 147,047 | |
2.875% 9/23/23 | | | 220,000 | | | | 213,737 | |
Tempur Sealy International 5.50% 6/15/26 | | | 75,000 | | | | 74,137 | |
Thermo Fisher Scientific 3.00% 4/15/23 | | | 545,000 | | | | 541,521 | |
Transurban Finance 144A 3.375% 3/22/27 # | | | 55,000 | | | | 53,290 | |
Universal Health Services 144A 5.00% 6/1/26 # | | | 25,000 | | | | 25,813 | |
Zimmer Biomet Holdings 3.375% 11/30/21 | | | 90,000 | | | | 91,134 | |
| | | | | | | | |
| | | | | | | 5,274,691 | |
| | | | | | | | |
Energy – 2.07% | | | | | |
Anadarko Petroleum 5.55% 3/15/26 | | | 420,000 | | | | 466,878 | |
BP Capital Markets | | | | | | | | |
3.216% 11/28/23 | | | 220,000 | | | | 221,288 | |
3.224% 4/14/24 | | | 135,000 | | | | 135,170 | |
CNOOC Finance 2015 Australia 2.625% 5/5/20 | | | 200,000 | | | | 199,462 | |
Diamondback Energy 144A 4.75% 11/1/24 # | | | 85,000 | | | | 85,927 | |
Ecopetrol | | | | | | | | |
5.875% 9/18/23 | | | 35,000 | | | | 38,019 | |
7.375% 9/18/43 | | | 25,000 | | | | 26,837 | |
Empresa Nacional del Petroleo 144A 4.75% 12/6/21 # | | | 115,000 | | | | 121,741 | |
Enbridge | | | | | | | | |
4.25% 12/1/26 | | | 65,000 | | | | 66,475 | |
6.00% 1/15/77 ● | | | 35,000 | | | | 35,481 | |
Energy Transfer Equity 7.50% 10/15/20 | | | 110,000 | | | | 123,200 | |
Energy Transfer Partners | | | | | | | | |
4.75% 1/15/26 | | | 35,000 | | | | 36,078 | |
6.125% 12/15/45 | | | 155,000 | | | | 165,731 | |
9.70% 3/15/19 | | | 95,000 | | | | 108,067 | |
| | | | | | | | |
| | | Principal
amount° | | | Value (U.S. $) | |
| |
Corporate Bonds (continued) | | | | | |
| |
Energy (continued) | | | | | |
Enterprise Products Operating 7.034% 1/15/68 ● | | | 25,000 | | | $ | 26,023 | |
Genesis Energy 5.625% 6/15/24 | | | 50,000 | | | | 49,125 | |
Gulfport Energy | | | | | | | | |
144A 6.00% 10/15/24 # | | | 75,000 | | | | 73,125 | |
6.625% 5/1/23 | | | 35,000 | | | | 35,569 | |
Hilcorp Energy I 144A 5.00% 12/1/24 # | | | 110,000 | | | | 103,675 | |
Kinder Morgan Energy Partners 5.80% 3/1/21 | | | 115,000 | | | | 126,441 | |
Laredo Petroleum 6.25% 3/15/23 | | | 80,000 | | | | 81,600 | |
MPLX | | | | | | | | |
4.875% 12/1/24 | | | 225,000 | | | | 237,034 | |
4.875% 6/1/25 | | | 75,000 | | | | 78,683 | |
Murphy Oil 6.875% 8/15/24 | | | 125,000 | | | | 132,813 | |
Murphy Oil USA 6.00% 8/15/23 | | | 160,000 | | | | 168,400 | |
Newfield Exploration 5.75% 1/30/22 | | | 65,000 | | | | 69,306 | |
Noble Energy 5.05% 11/15/44 | | | 85,000 | | | | 87,007 | |
Pertamina Persero 144A 4.875% 5/3/22 # | | | 200,000 | | | | 212,388 | |
Petrobras Global Finance | | | | | | | | |
5.375% 1/27/21 | | | 55,000 | | | | 56,778 | |
6.75% 1/27/41 | | | 30,000 | | | | 28,230 | |
7.375% 1/17/27 | | | 80,000 | | | | 84,776 | |
Petroleos Mexicanos 144A 4.77% 3/11/22 #● | | | 85,000 | | | | 91,481 | |
Plains All American Pipeline 8.75% 5/1/19 | | | 175,000 | | | | 197,457 | |
Regency Energy Partners 5.00% 10/1/22 | | | 155,000 | | | | 164,994 | |
Sabine Pass Liquefaction | | | | | | | | |
144A 5.00% 3/15/27 # | | | 35,000 | | | | 36,624 | |
5.625% 4/15/23 | | | 370,000 | | | | 401,861 | |
Shell International Finance | | | | | | | | |
2.875% 5/10/26 | | | 85,000 | | | | 82,738 | |
4.00% 5/10/46 | | | 70,000 | | | | 67,463 | |
4.375% 5/11/45 | | | 180,000 | | | | 183,105 | |
Southwestern Energy 6.70% 1/23/25 | | | 80,000 | | | | 79,600 | |
Targa Resources Partners | | | | | | | | |
144A 5.125% 2/1/25 # | | | 60,000 | | | | 62,025 | |
144A 5.375% 2/1/27 # | | | 65,000 | | | | 67,600 | |
Schedules of investments
Delaware Foundation® Moderate Allocation Fund
| | | | | | | | |
| | | Principal
amount° | | | Value (U.S. $) | |
| |
Corporate Bonds (continued) | | | | | |
| |
Energy (continued) | | | | | |
Tengizchevroil Finance Co. International 144A 4.00% 8/15/26 # | | | 200,000 | | | $ | 192,142 | |
Transcanada Trust | | | | | | | | |
5.30% 3/15/77 ● | | | 55,000 | | | | 54,450 | |
5.875% 8/15/76 ● | | | 75,000 | | | | 79,313 | |
Transocean Proteus 144A 6.25% 12/1/24 # | | | 50,000 | | | | 51,875 | |
Woodside Finance | | | | | | | | |
144A 3.65% 3/5/25 # | | | 60,000 | | | | 59,177 | |
144A 3.70% 9/15/26 # | | | 40,000 | | | | 39,148 | |
144A 8.75% 3/1/19 # | | | 145,000 | | | | 162,264 | |
YPF | | | | | | | | |
144A 8.50% 3/23/21 # | | | 5,000 | | | | 5,493 | |
144A 23.854% 7/7/20 #● | | | 90,000 | | | | 100,755 | |
| | | | | | | | |
| | | | | | | 5,660,892 | |
| | | | | | | | |
Financials – 0.76% | | | | | |
AerCap Global Aviation Trust 144A 6.50% 6/15/45 #● | | | 200,000 | | | | 209,750 | |
AerCap Ireland Capital 3.95% 2/1/22 | | | 150,000 | | | | 154,197 | |
Affiliated Managers Group 3.50% 8/1/25 | | | 100,000 | | | | 98,418 | |
Air Lease | | | | | | | | |
3.00% 9/15/23 | | | 130,000 | | | | 127,203 | |
3.625% 4/1/27 | | | 295,000 | | | | 287,287 | |
Aviation Capital Group | | | | | | | | |
144A 2.875% 9/17/18 # | | | 10,000 | | | | 10,103 | |
144A 2.875% 1/20/22 # | | | 220,000 | | | | 218,698 | |
144A 4.875% 10/1/25 # | | | 150,000 | | | | 161,615 | |
144A 6.75% 4/6/21 # | | | 35,000 | | | | 40,118 | |
Berkshire Hathaway 2.75% 3/15/23 | | | 70,000 | | | | 70,065 | |
BlackRock 3.20% 3/15/27 | | | 95,000 | | | | 95,151 | |
E*TRADE Financial 5.875% 12/29/49 ● | | | 145,000 | | | | 149,749 | |
Jefferies Group | | | | | | | | |
4.85% 1/15/27 | | | 25,000 | | | | 25,566 | |
6.45% 6/8/27 | | | 50,000 | | | | 56,662 | |
6.50% 1/20/43 | | | 30,000 | | | | 32,640 | |
Lazard Group | | | | | | | | |
3.625% 3/1/27 | | | 15,000 | | | | 14,664 | |
3.75% 2/13/25 | | | 100,000 | | | | 99,565 | |
Park Aerospace Holdings 144A 5.50% 2/15/24 # | | | 123,000 | | | | 128,227 | |
SUAM Finance 144A 4.875% 4/17/24 # | | | 100,000 | | | | 104,070 | |
| | | | | | | | |
| | | | | | | 2,083,748 | |
| | | | | | | | |
| | | | | | | | |
| | | Principal
amount° | | | Value (U.S. $) | |
| |
Corporate Bonds (continued) | | | | | |
| |
Insurance – 0.77% | | | | | |
Allstate 3.28% 12/15/26 | | | 240,000 | | | $ | 241,427 | |
Berkshire Hathaway Finance 2.90% 10/15/20 | | | 145,000 | | | | 149,840 | |
Manulife Financial 4.061% 2/24/32 ● | | | 145,000 | | | | 145,542 | |
MetLife | | | | | | | | |
6.40% 12/15/36 | | | 20,000 | | | | 22,000 | |
144A 9.25% 4/8/38 # | | | 400,000 | | | | 553,500 | |
Principal Life Global Funding II 144A 3.00% 4/18/26 # | | | 390,000 | | | | 380,126 | |
Prudential Financial | | | | | | | | |
4.50% 11/15/20 | | | 5,000 | | | | 5,369 | |
5.375% 5/15/45 ● | | | 85,000 | | | | 89,165 | |
TIAA Asset Management Finance | | | | | | | | |
144A 2.95% 11/1/19 # | | | 85,000 | | | | 86,443 | |
144A 4.125% 11/1/24 # | | | 170,000 | | | | 173,498 | |
USI 144A 7.75% 1/15/21 # | | | 20,000 | | | | 20,363 | |
XLIT | | | | | | | | |
4.45% 3/31/25 | | | 75,000 | | | | 75,789 | |
5.50% 3/31/45 | | | 110,000 | | | | 110,289 | |
6.50% 12/29/49 ● | | | 70,000 | | | | 58,975 | |
| | | | | | | | |
| | | | | | | 2,112,326 | |
| | | | | | | | |
Media – 0.67% | | | | | |
21st Century Fox America 4.95% 10/15/45 | | | 130,000 | | | | 135,029 | |
Cablevision 144A 6.50% 6/15/21 # | | | 150,000 | | | | 158,400 | |
CCO Holdings 144A 5.75% 2/15/26 # | | | 100,000 | | | | 105,250 | |
Comcast 3.00% 2/1/24 | | | 175,000 | | | | 175,045 | |
CSC Holdings 144A 5.50% 4/15/27 # | | | 200,000 | | | | 203,750 | |
DISH DBS 7.75% 7/1/26 | | | 20,000 | | | | 23,300 | |
Gray Television 144A 5.875% 7/15/26 # | | | 65,000 | | | | 66,300 | |
Myriad International Holdings 144A 5.50% 7/21/25 # | | | 200,000 | | | | 208,200 | |
Nexstar Broadcasting 144A 5.625% 8/1/24 # | | | 120,000 | | | | 122,100 | |
Sinclair Television Group 144A 5.125% 2/15/27 # | | | 80,000 | | | | 77,600 | |
Sirius XM Radio 144A 5.375% 7/15/26 # | | | 100,000 | | | | 102,500 | |
Time Warner Cable 7.30% 7/1/38 | | | 285,000 | | | | 354,130 | |
| | | | | | | | |
| | | Principal
amount° | | | Value (U.S. $) | |
| |
Corporate Bonds (continued) | | | | | |
| |
Media (continued) | | | | | |
Tribune Media 5.875% 7/15/22 | | | 105,000 | | | $ | 109,987 | |
| | | | | | | | |
| | | | | | | 1,841,591 | |
| | | | | | | | |
Real Estate – 0.94% | | | | | |
American Tower | | | | | | | | |
2.25% 1/15/22 | | | 40,000 | | | | 38,641 | |
4.00% 6/1/25 | | | 160,000 | | | | 162,145 | |
4.40% 2/15/26 | | | 65,000 | | | | 67,355 | |
American Tower Trust I 144A 3.07% 3/15/23 # | | | 145,000 | | | | 144,689 | |
CC Holdings GS V 3.849% 4/15/23 | | | 80,000 | | | | 82,035 | |
Corporate Office Properties | | | | | | | | |
3.60% 5/15/23 | | | 80,000 | | | | 77,854 | |
5.25% 2/15/24 | | | 105,000 | | | | 110,610 | |
Crown Castle International 5.25% 1/15/23 | | | 130,000 | | | | 142,021 | |
CubeSmart 3.125% 9/1/26 | | | 120,000 | | | | 112,930 | |
CyrusOne 144A 5.00% 3/15/24 # | | | 5,000 | | | | 5,150 | |
DDR 7.50% 4/1/17 | | | 30,000 | | | | 30,000 | |
Education Realty Operating Partnership 4.60% 12/1/24 | | | 100,000 | | | | 100,912 | |
ESH Hospitality 144A 5.25% 5/1/25 # | | | 125,000 | | | | 126,327 | |
Hospitality Properties Trust 4.50% 3/15/25 | | | 95,000 | | | | 95,500 | |
Host Hotels & Resorts | | | | | | | | |
3.75% 10/15/23 | | | 70,000 | | | | 70,632 | |
3.875% 4/1/24 | | | 50,000 | | | | 50,444 | |
4.50% 2/1/26 | | | 55,000 | | | | 56,995 | |
Iron Mountain U.S. Holdings 144A 5.375% 6/1/26 # | | | 100,000 | | | | 100,250 | |
Kite Realty Group 4.00% 10/1/26 | | | 45,000 | | | | 43,203 | |
LifeStorage 3.50% 7/1/26 | | | 90,000 | | | | 86,272 | |
MGM Growth Properties Operating Partnership 4.50% 9/1/26 | | | 100,000 | | | | 97,500 | |
Realty Income 4.125% 10/15/26 | | | 100,000 | | | | 103,179 | |
Regency Centers 3.60% 2/1/27 | | | 60,000 | | | | 59,646 | |
SBA Communications 144A 4.875% 9/1/24 # | | | 120,000 | | | | 118,776 | |
UDR 4.00% 10/1/25 | | | 355,000 | | | | 362,710 | |
Uniti Group 144A 7.125% 12/15/24 # | | | 50,000 | | | | 50,875 | |
| | | | | | | | |
| | | Principal
amount° | | | Value (U.S. $) | |
| |
Corporate Bonds (continued) | | | | | |
| |
Real Estate (continued) | | | | | |
WP Carey 4.60% 4/1/24 | | | 80,000 | | | $ | 82,908 | |
| | | | | | | | |
| | | | | | | 2,579,559 | |
| | | | | | | | |
Services – 0.14% | | | | | |
Aramark Services 5.125% 1/15/24 | | | 130,000 | | | | 136,663 | |
Avis Budget Car Rental 144A 6.375% 4/1/24 # | | | 35,000 | | | | 35,219 | |
Herc Rentals 144A 7.75% 6/1/24 # | | | 46,000 | | | | 49,220 | |
Prime Security Services Borrower 144A 9.25% 5/15/23 # | | | 95,000 | | | | 104,381 | |
United Rentals North America | | | | | | | | |
5.50% 5/15/27 | | | 15,000 | | | | 15,187 | |
5.875% 9/15/26 | | | 45,000 | | | | 47,081 | |
| | | | | | | | |
| | | | | | | 387,751 | |
| | | | | | | | |
Technology – 0.66% | | | | | |
Broadcom | | | | | | | | |
144A 3.00% 1/15/22 # | | | 120,000 | | | | 119,771 | |
144A 3.625% 1/15/24 # | | | 350,000 | | | | 353,018 | |
CDK Global 5.00% 10/15/24 | | | 75,000 | | | | 76,044 | |
CDW 5.00% 9/1/25 | | | 5,000 | | | | 5,106 | |
Cisco Systems 1.85% 9/20/21 | | | 125,000 | | | | 122,652 | |
CommScope Technologies 144A 5.00% 3/15/27 # | | | 35,000 | | | | 35,033 | |
Diamond 1 Finance 144A 6.02% 6/15/26 # | | | 85,000 | | | | 93,001 | |
DXC Technology | | | | | | | | |
144A 4.25% 4/15/24 # | | | 50,000 | | | | 50,913 | |
144A 4.75% 4/15/27 # | | | 90,000 | | | | 91,946 | |
Fidelity National Information | | | | | | | | |
Services 5.00% 10/15/25 | | | 90,000 | | | | 98,044 | |
First Data | | | | | | | | |
144A 5.75% 1/15/24 # | | | 100,000 | | | | 103,525 | |
144A 7.00% 12/1/23 # | | | 70,000 | | | | 75,250 | |
Microsoft | | | | | | | | |
2.40% 2/6/22 | | | 35,000 | | | | 35,230 | |
2.875% 2/6/24 | | | 40,000 | | | | 40,283 | |
NXP 144A 4.125% 6/1/21 # | | | 200,000 | | | | 208,000 | |
Samsung Electronics America 144A 1.75% 4/10/17 # | | | 200,000 | | | | 200,008 | |
Symantec 144A 5.00% 4/15/25 # | | | 85,000 | | | | 87,079 | |
| | | | | | | | |
| | | | | | | 1,794,903 | |
| | | | | | | | |
Telecommunications – 1.33% | | | | | |
AT&T 5.25% 3/1/37 | | | 260,000 | | | | 265,611 | |
Schedules of investments
Delaware Foundation® Moderate Allocation Fund
| | | | | | | | |
| | | Principal
amount° | | | Value (U.S. $) | |
| |
Corporate Bonds (continued) | | | | | |
| |
Telecommunications (continued) | | | | | |
CenturyLink | | | | | | | | |
5.80% 3/15/22 | | | 145,000 | | | $ | 149,976 | |
6.75% 12/1/23 | | | 100,000 | | | | 104,625 | |
Charter Communications Operating 4.908% 7/23/25 | | | 230,000 | | | | 243,268 | |
Cincinnati Bell 144A 7.00% 7/15/24 # | | | 35,000 | | | | 36,794 | |
Columbus Cable Barbados 144A 7.375% 3/30/21 # | | | 200,000 | | | | 215,000 | |
Crown Castle Towers 144A 4.883% 8/15/20 # | | | 455,000 | | | | 484,623 | |
Deutsche Telekom International Finance | | | | | | | | |
144A 2.485% 9/19/23 # | | | 485,000 | | | | 464,240 | |
144A 3.60% 1/19/27 # | | | 150,000 | | | | 149,633 | |
Digicel Group 144A 8.25% 9/30/20 # | | | 200,000 | | | | 172,674 | |
GTP Acquisition Partners I 144A 2.35% 6/15/20 # | | | 100,000 | | | | 98,843 | |
Level 3 Financing 5.25% 3/15/26 | | | 80,000 | | | | 80,700 | |
Millicom International Cellular 144A 6.00% 3/15/25 # | | | 200,000 | | | | 205,750 | |
Radiate Holdco 144A 6.625% 2/15/25 # | | | 55,000 | | | | 54,416 | |
SBA Tower Trust | | | | | | | | |
144A 2.24% 4/16/18 # | | | 100,000 | | | | 100,038 | |
144A 2.898% 10/15/19 # | | | 70,000 | | | | 70,209 | |
Sprint 7.875% 9/15/23 | | | 99,000 | | | | 109,890 | |
T-Mobile USA 6.50% 1/15/26 | | | 95,000 | | | | 104,263 | |
Virgin Media Secured Finance 144A 5.25% 1/15/26 # | | | 200,000 | | | | 202,000 | |
VTR Finance 144A 6.875% 1/15/24 # | | | 200,000 | | | | 208,500 | |
WPP Finance 2010 5.625% 11/15/43 | | | 45,000 | | | | 48,117 | |
Zayo Group 144A 5.75% 1/15/27 # | | | 75,000 | | | | 79,297 | |
| | | | | | | | |
| | | | | | | 3,648,467 | |
| | | | | | | | |
Transportation – 0.68% | | | | | |
Air Canada 2015-1 Class A Pass Through Trust 144A 3.60% 3/15/27 #◆ | | | 60,848 | | | | 61,228 | |
American Airlines 2014-1 Class A Pass Through Trust 3.70% 10/1/26 ◆ | | | 44,270 | | | | 44,491 | |
| | | | | | | | |
| | | Principal
amount° | | | Value (U.S. $) | |
| |
Corporate Bonds (continued) | | | | | |
| |
Transportation (continued) | | | | | |
American Airlines 2015-1 Class A Pass Through Trust 3.375% 5/1/27 ◆ | | | 74,338 | | | $ | 72,944 | |
American Airlines 2015-2 Class AA Pass Through Trust 3.60% 9/22/27 ◆ | | | 33,343 | | | | 33,568 | |
American Airlines 2016-1 Class AA Pass Through Trust 3.575% 1/15/28 ◆ | | | 38,988 | | | | 38,940 | |
Autoridad del Canal de Panama 144A 4.95% 7/29/35 # | | | 200,000 | | | | 219,500 | |
Burlington Northern Santa Fe 4.70% 9/1/45 | | | 250,000 | | | | 272,180 | |
ERAC USA Finance 144A 4.50% 8/16/21 # | | | 20,000 | | | | 21,319 | |
Penske Truck Leasing | | | | | | | | |
144A 3.30% 4/1/21 # | | | 95,000 | | | | 96,374 | |
144A 3.40% 11/15/26 # | | | 50,000 | | | | 48,157 | |
144A 4.20% 4/1/27 # | | | 205,000 | | | | 209,118 | |
SMBC Aviation Capital Finance 144A 2.65% 7/15/21 # | | | 200,000 | | | | 194,875 | |
Union Pacific 3.00% 4/15/27 | | | 130,000 | | | | 128,576 | |
United Airlines 2014-1 Class A Pass Through Trust 4.00% 4/11/26 ◆ | | | 41,185 | | | | 42,729 | |
United Airlines 2014-2 Class A Pass Through Trust 3.75% 9/3/26 ◆ | | | 91,379 | | | | 92,871 | |
United Airlines 2016-1 Class AA Pass Through Trust 3.10% 7/7/28 ◆ | | | 40,000 | | | | 39,400 | |
United Parcel Service 5.125% 4/1/19 | | | 190,000 | | | | 203,074 | |
XPO Logistics 144A 6.125% 9/1/23 # | | | 55,000 | | | | 57,406 | |
| | | | | | | | |
| | | | | | | 1,876,750 | |
| | | | | | | | |
Utilities – 3.16% | | | | | |
AES 5.50% 4/15/25 | | | 30,000 | | | | 30,525 | |
AES Gener 144A 8.375% 12/18/73 #● | | | 200,000 | | | | 211,250 | |
Ameren Illinois 9.75% 11/15/18 | | | 290,000 | | | | 325,869 | |
American Transmission Systems 144A 5.25% 1/15/22 # | | | 270,000 | | | | 297,489 | |
AmeriGas Partners 5.875% 8/20/26 | | | 105,000 | | | | 105,000 | |
| | | | | | | | |
| | | Principal
amount° | | | Value (U.S. $) | |
| |
Corporate Bonds (continued) | | | | | |
| |
Utilities (continued) | | | | | |
Berkshire Hathaway Energy 3.75% 11/15/23 | | | 200,000 | | | $ | 209,287 | |
Calpine | | | | | | | | |
144A 5.25% 6/1/26 # | | | 75,000 | | | | 76,500 | |
5.375% 1/15/23 | | | 65,000 | | | | 66,137 | |
Cleveland Electric Illuminating 5.50% 8/15/24 | | | 90,000 | | | | 102,845 | |
CMS Energy 6.25% 2/1/20 | | | 325,000 | | | | 358,630 | |
ComEd Financing III 6.35% 3/15/33 | | | 160,000 | | | | 171,076 | |
DTE Energy 3.30% 6/15/22 | | | 355,000 | | | | 360,821 | |
Duke Energy | | | | | | | | |
2.65% 9/1/26 | | | 175,000 | | | | 162,722 | |
4.80% 12/15/45 | | | 50,000 | | | | 52,990 | |
Emera 6.75% 6/15/76 ● | | | 195,000 | | | | 213,769 | |
Emera US Finance | | | | | | | | |
3.55% 6/15/26 | | | 270,000 | | | | 265,905 | |
4.75% 6/15/46 | | | 140,000 | | | | 141,781 | |
Enel 144A 8.75% 9/24/73 #● | | | 200,000 | | | | 230,500 | |
Enel Americas 4.00% 10/25/26 | | | 80,000 | | | | 79,340 | |
Enel Finance International 144A 6.00% 10/7/39 # | | | 100,000 | | | | 114,315 | |
Entergy 4.00% 7/15/22 | | | 250,000 | | | | 262,136 | |
Entergy Louisiana | | | | | | | | |
4.05% 9/1/23 | | | 220,000 | | | | 232,283 | |
4.95% 1/15/45 | | | 15,000 | | | | 15,397 | |
Exelon | | | | | | | | |
3.497% 6/1/22 | | | 125,000 | | | | 126,285 | |
3.95% 6/15/25 | | | 70,000 | | | | 72,064 | |
Fortis 144A 3.055% 10/4/26 # | | | 260,000 | | | | 244,434 | |
Great Plains Energy | | | | | | | | |
3.15% 4/1/22 | | | 370,000 | | | | 374,097 | |
4.85% 6/1/21 | | | 60,000 | | | | 64,073 | |
Indiana Michigan Power 3.20% 3/15/23 | | | 375,000 | | | | 378,925 | |
IPALCO Enterprises 5.00% 5/1/18 | | | 80,000 | | | | 82,600 | |
ITC Holdings 3.25% 6/30/26 | | | 40,000 | | | | 38,930 | |
Kansas City Power & Light 3.65% 8/15/25 | | | 180,000 | | | | 181,006 | |
LG&E &KU Energy 4.375% 10/1/21 | | | 425,000 | | | | 449,098 | |
Metropolitan Edison 144A 4.00% 4/15/25 # | | | 70,000 | | | | 70,700 | |
MidAmerican Energy 4.25% 5/1/46 | | | 165,000 | | | | 170,722 | |
| | | | | | | | |
| | | Principal
amount° | | | Value (U.S. $) | |
| |
Corporate Bonds (continued) | | | | | |
| |
Utilities (continued) | | | | | | | | |
National Rural Utilities Cooperative Finance | | | | | | | | |
2.70% 2/15/23 | | | 145,000 | | | $ | 143,751 | |
4.75% 4/30/43 ● | | | 145,000 | | | | 148,625 | |
5.25% 4/20/46 ● | | | 85,000 | | | | 88,694 | |
New York State Electric & Gas 144A 3.25% 12/1/26 # | | | 135,000 | | | | 134,446 | |
NextEra Energy Capital Holdings | | | | | | | | |
2.40% 9/15/19 | | | 135,000 | | | | 136,133 | |
3.625% 6/15/23 | | | 60,000 | | | | 60,884 | |
NiSource Finance 6.125% 3/1/22 | | | 115,000 | | | | 131,850 | |
NV Energy 6.25% 11/15/20 | | | 115,000 | | | | 129,249 | |
Pampa Energia 144A 7.50% 1/24/27 # | | | 150,000 | | | | 152,085 | |
Pennsylvania Electric 5.20% 4/1/20 | | | 115,000 | | | | 122,336 | |
Perusahaan Listrik Negara 144A 5.50% 11/22/21 # | | | 200,000 | | | | 217,760 | |
Public Service Co. of New Hampshire 3.50% 11/1/23 | | | 95,000 | | | | 97,894 | |
Public Service Co. of Oklahoma 5.15% 12/1/19 | | | 85,000 | | | | 91,131 | |
Southern | | | | | | | | |
2.75% 6/15/20 | | | 325,000 | | | | 327,966 | |
4.40% 7/1/46 | | | 130,000 | | | | 124,716 | |
Southern Co. Gas Capital 3.25% 6/15/26 | | | 85,000 | | | | 82,866 | |
Trans-Allegheny Interstate Line 144A 3.85% 6/1/25 # | | | 50,000 | | | | 51,297 | |
Wisconsin Electric Power 4.30% 12/15/45 | | | 70,000 | | | | 71,760 | |
| | | | | | | | |
| | | | | | | 8,652,944 | |
| | | | | | | | |
Total Corporate Bonds
(cost $60,113,002) | | | | 60,788,172 | |
| | | | | | | | |
|
| |
Loan Agreements – 1.01%« | | | | | |
| |
Aercap Tranche B 1st Lien 3.397% 10/30/22 | | | 345,000 | | | | 348,199 | |
Air Medical Group Holdings Tranche B 1st Lien 4.25% 4/28/22 | | | 167,025 | | | | 167,164 | |
Change Healthcare Tranche B 1st Lien 3.75% 3/1/24 | | | 295,000 | | | | 295,860 | |
Dell International 1st Lien 3.49% 9/7/23 | | | 17,675 | | | | 17,781 | |
Schedules of investments
Delaware Foundation® Moderate Allocation Fund
| | | | | | | | |
| | | Principal
amount° | | | Value (U.S. $) | |
| |
Loan Agreements« (continued) | | | | | |
| |
First Data 1st Lien 3.984% 3/24/21 | | | 347,983 | | | $ | 351,027 | |
HCA Tranche B9 1st Lien 2.982% 3/18/23 | | | 315,615 | | | | 317,316 | |
Houghton International 1st Lien 4.397% 12/20/19 | | | 627,163 | | | | 632,650 | |
Republic of Angola 7.57% 12/16/23 | | | 223,125 | | | | 194,119 | |
Sprint Communications Tranche B 1st Lien 3.50% 2/2/24 | | | 295,000 | | | | 295,430 | |
USI Insurance Services Tranche B 1st Lien 4.25% 12/27/19 | | | 148,547 | | | | 148,949 | |
| | | | | | | | |
Total Loan Agreements
(cost $2,749,793) | | | | 2,768,495 | |
| | | | | | | | |
|
| |
Municipal Bonds – 0.36% | | | | | |
| |
Bay Area Toll Authority (Build America Bonds) Series S3 6.907% 10/1/50 | | | 125,000 | | | | 179,356 | |
California State Various Purposes (Build America Bonds) 7.55% 4/1/39 | | | 80,000 | | | | 117,491 | |
Commonwealth of Massachusetts Series C 5.00% 10/1/25 | | | 65,000 | | | | 79,124 | |
New Jersey Turnpike Authority (Build America Bonds) | | | | | | | | |
Series A 7.102% 1/1/41 | | | 70,000 | | | | 97,959 | |
Series F 7.414% 1/1/40 | | | 30,000 | | | | 43,279 | |
New York City, New York | | | | | | | | |
Series C 5.00% 8/1/26 | | | 25,000 | | | | 30,043 | |
Series C 5.00% 8/1/27 | | | 25,000 | | | | 29,815 | |
Oregon State Taxable Pension 5.892% 6/1/27 | | | 200,000 | | | | 240,738 | |
South Carolina Public Service Authority Series D 4.77% 12/1/45 | | | 40,000 | | | | 36,017 | |
Texas Water Development Board Series A 5.00% 10/15/45 | | | 30,000 | | | | 34,079 | |
Water Implementation Revenue 5.00% 10/15/46 | | | 95,000 | | | | 108,792 | |
| | | | | | | | |
Total Municipal Bonds
(cost $1,006,657) | | | | 996,693 | |
| | | | | | | | |
| | | | | | | | |
| | | Principal
amount° | | | Value (U.S. $) | |
| |
Non-Agency Asset-Backed Securities – 1.96% | |
| |
AEP Texas Central Transition Funding II
Series 2006-A A4
5.17% 1/1/18 | | | 32,331 | | | $ | 32,912 | |
Ally Master Owner Trust Series 2014-4 A2 1.43% 6/17/19 | | | 180,000 | | | | 180,137 | |
American Express Credit Account Master Trust Series 2014-5 A 1.202% 5/15/20 ● | | | 750,000 | | | | 750,965 | |
American Express Credit Account Secured Note Trust Series 2012-4 B 1.462% 5/15/20 ● | | | 900,000 | | | | 901,372 | |
Avis Budget Rental Car Funding AESOP | | | | | | | | |
Series 2013-1A A 144A 1.92% 9/20/19 # | | | 120,000 | | | | 119,984 | |
Series 2014-1A A 144A 2.46% 7/20/20 # | | | 200,000 | | | | 200,944 | |
California Republic Auto Receivables Trust Series 2013-1 A2 144A 1.41% 9/17/18 # | | | 527 | | | | 527 | |
Capital One Multi-Asset Execution Trust Series 2007-A5 A5 0.952% 7/15/20 ● | | | 145,000 | | | | 144,972 | |
CNH Equipment Trust Series 2016-B A2B 1.312% 10/15/19 ● | | | 18,103 | | | | 18,142 | |
Discover Card Execution Note Trust | | | | | | | | |
Series 2013-A1 A1 1.212% 8/17/20 ● | | | 200,000 | | | | 200,350 | |
Series 2014-A1 A1 1.342% 7/15/21 ● | | | 200,000 | | | | 201,064 | |
Ford Credit Auto Lease Trust Series 2015-A A3 1.13% 6/15/18 | | | 39,119 | | | | 39,115 | |
Ford Credit Auto Owner Trust Series 2016-2 A 144A 2.03% 12/15/27 # | | | 230,000 | | | | 226,836 | |
Golden Credit Card Trust Series 2014-2A A 144A 1.362% 3/15/21 #● | | | 100,000 | | | | 100,247 | |
HOA Funding
Series 2014-1A A2 144A
4.846% 8/20/44 # | | | 142,500 | | | | 130,455 | |
| | | | | | | | |
| | | Principal
amount° | | | Value (U.S. $) | |
| |
Non-Agency Asset-Backed Securities (continued) | | | | | |
| |
Mercedes-Benz Auto Lease Trust Series 2016-A A2B 1.472% 7/16/18 ● | | | 39,271 | | | $ | 39,309 | |
Mercedes-Benz Master Owner Trust Series 2016-AA A 144A 1.492% 5/15/20 #● | | | 100,000 | | | | 100,395 | |
Navistar Financial Dealer Note Master Owner Trust II Series 2016-1 A 144A 2.332% 9/27/21 #● | | | 60,000 | | | | 60,144 | |
New Residential Mortgage Loan Trust Series 2017-1A A1 144A 4.00% 2/25/57 #● | | | 98,283 | | | | 101,344 | |
Nissan Auto Lease Trust Series 2015-B A2B 1.442% 12/15/17 ● | | | 16,024 | | | | 16,030 | |
PFS Financing Series 2015-AA A 144A 1.532% 4/15/20 #● | | | 100,000 | | | | 99,969 | |
Synchrony Credit Card Master Note Trust Series 2012-6 A 1.36% 8/17/20 | | | 100,000 | | | | 100,071 | |
Towd Point Mortgage Trust | | | | | | | | |
Series 2015-5 A1B 144A 2.75% 5/25/55 #● | | | 73,029 | | | | 73,067 | |
Series 2015-6 A1B 144A 2.75% 4/25/55 #● | | | 75,830 | | | | 75,757 | |
Series 2017-1 A1 144A 2.75% 10/25/56 #● | | | 98,541 | | | | 98,437 | |
Volkswagen Credit Auto Master Trust Series 2014-1A A2 144A 1.40% 7/22/19 # | | | 260,000 | | | | 259,917 | |
Wells Fargo Dealer Floorplan Master Note Trust Series 2014-2 A 1.428% 10/20/19 ● | | | 1,100,000 | | | | 1,100,741 | |
| | | | | | | | |
Total Non-Agency Asset-Backed Securities (cost $5,391,298) | | | | 5,373,203 | |
| | | | | | | | |
|
| |
Non-Agency Collateralized Mortgage Obligations – 0.46% | | | | | |
| |
American Home Mortgage Investment Trust Series 2005-2 5A1 5.064% 9/25/35 ö | | | 6,413 | | | | 6,324 | |
| | | | | | | | |
| | | Principal
amount° | | | Value (U.S. $) | |
| |
Non-Agency Collateralized Mortgage Obligations (continued) | | | | | |
| |
Bank of America Alternative Loan Trust Series 2005-6 7A1 5.50% 7/25/20 | | | 2,286 | | | $ | 2,187 | |
Credit Suisse First Boston Mortgage Securities Series 2005-5 6A3 5.00% 7/25/35 | | | 48,324 | | | | 48,091 | |
JPMorgan Mortgage Trust | | | | | | | | |
Series 2006-S1 1A1 6.00% 4/25/36 | | | 60,576 | | | | 61,932 | |
Series 2014-2 B1 144A 3.423% 6/25/29 #● | | | 79,285 | | | | 78,488 | |
Series 2014-2 B2 144A 3.423% 6/25/29 #● | | | 79,285 | | | | 77,662 | |
Series 2014-IVR6 2A4 144A 2.50% 7/25/44 #● | | | 100,000 | | | | 98,838 | |
Series 2015-1 B1 144A 2.623% 12/25/44 #● | | | 196,634 | | | | 194,874 | |
Series 2015-4 B1 144A 3.628% 6/25/45 #● | | | 96,293 | | | | 93,835 | |
Series 2015-4 B2 144A 3.628% 6/25/45 #● | | | 96,293 | | | | 92,239 | |
Series 2015-5 B2 144A 2.874% 5/25/45 #● | | | 97,755 | | | | 92,349 | |
Series 2015-6 B1 144A 3.623% 10/25/45 #● | | | 96,276 | | | | 94,473 | |
Series 2015-6 B2 144A 3.623% 10/25/45 #● | | | 96,276 | | | | 93,113 | |
New Residential Mortgage Loan Trust Series 2016-4A A1 144A 3.75% 11/25/56 #● | | | 92,751 | | | | 94,681 | |
Sequoia Mortgage Trust | | | | | | | | |
Series 2014-2 A4 144A 3.50% 7/25/44 #● | | | 44,180 | | | | 44,000 | |
Series 2015-1 B2 144A 3.876% 1/25/45 #● | | | 42,765 | | | | 42,094 | |
Structured Asset Securities Corporation Mortgage Pass Through Certificates Series 2004-20 2A1 5.50% 11/25/34 ◆ | | | 27,859 | | | | 28,459 | |
Wells Fargo Mortgage-Backed Securities Trust Series 2006-AR5 2A1 3.294% 4/25/36 ● | | | 14,657 | | | | 13,749 | |
| | | | | | | | |
Total Non-Agency Collateralized Mortgage Obligations
(cost $1,254,504) | | | | 1,257,388 | |
| | | | | | | | |
Schedules of investments
Delaware Foundation® Moderate Allocation Fund
| | | | | | | | |
| | | Principal
amount° | | | Value (U.S. $) | |
| |
Non-Agency Commercial Mortgage-Backed
Securities – 2.01% | |
| |
Banc of America Commercial Mortgage Trust | | | | | | | | |
Series 2007-4 AM 5.961% 2/10/51 ● | | | 80,000 | | | $ | 80,773 | |
Series 2017-BNK3 B 3.879% 2/15/50 ● | | | 240,000 | | | | 244,834 | |
Series 2017-BNK3 C 4.352% 2/15/50 ● | | | 240,000 | | | | 244,686 | |
Bear Stearns Commercial Mortgage Securities Trust Series 2007-PWR18 A4 5.70% 6/11/50 | | | 46,632 | | | | 47,190 | |
Citigroup Commercial Mortgage Trust | | | | | | | | |
Series 2007-C6 AM 5.779% 12/10/49 ● | | | 60,000 | | | | 60,724 | |
Series 2014-GC25 A4 3.635% 10/10/47 | | | 115,000 | | | | 118,627 | |
Series 2015-GC27 A5 3.137% 2/10/48 | | | 135,000 | | | | 134,505 | |
Series 2016-P3 A4 3.329% 4/15/49 | | | 95,000 | | | | 95,498 | |
Series 2016-P5 A4 2.941% 10/10/49 | | | 90,000 | | | | 87,478 | |
COMM Mortgage Trust | | | | | | | | |
Series 2013-CR6 AM 144A 3.147% 3/10/46 # | | | 95,000 | | | | 95,108 | |
Series 2014-CR19 A5 3.796% 8/10/47 | | | 70,000 | | | | 73,222 | |
Series 2014-CR20 AM 3.938% 11/10/47 | | | 215,000 | | | | 222,928 | |
Series 2015-3BP A 144A 3.178% 2/10/35 # | | | 300,000 | | | | 300,516 | |
Series 2015-CR23 A4 3.497% 5/10/48 | | | 150,000 | | | | 152,590 | |
DB-JPM Mortgage Trust | | | | | | | | |
Series 2016-C1 A4 3.276% 5/10/49 | | | 175,000 | | | | 175,686 | |
Series 2016-C3 A5 2.89% 9/10/49 | | | 210,000 | | | | 203,863 | |
DB-UBS Mortgage Trust Series 2011-LC1A C 144A 5.686% 11/10/46 #● | | | 130,000 | | | | 142,668 | |
GRACE Mortgage Trust | | | | | | | | |
Series 2014-GRCE A 144A 3.369% 6/10/28 # | | | 100,000 | | | | 103,565 | |
Series 2014-GRCE B 144A 3.52% 6/10/28 # | | | 200,000 | | | | 205,845 | |
| | | | | | | | |
| | | Principal
amount° | | | Value (U.S. $) | |
| |
Non-Agency Commercial Mortgage-Backed
Securities (continued) | |
| |
GS Mortgage Securities Trust | | | | | | | | |
Series 2014-GC24 A5 3.931% 9/10/47 | | | 150,000 | | | $ | 157,738 | |
Series 2015-GC32 A4 3.764% 7/10/48 | | | 70,000 | | | | 72,878 | |
JPM-BB Commercial Mortgage Securities Trust | | | | | | | | |
Series 2015-C32 A5 3.598% 11/15/48 | | | 125,000 | | | | 128,013 | |
Series 2015-C33 A4 3.77% 12/15/48 | | | 480,000 | | | | 497,573 | |
JPM-DB Commercial Mortgage Securities Trust Series 2016-C2 A4 3.144% 6/15/49 | | | 185,000 | | | | 183,414 | |
JPMorgan Chase Commercial Mortgage Securities Trust | | | | | | | | |
Series 2005-CB11 E 5.525% 8/12/37 ● | | | 40,000 | | | | 41,587 | |
Series 2013-LC11 B 3.499% 4/15/46 | | | 85,000 | | | | 84,599 | |
Series 2015-JP1 A5 3.914% 1/15/49 | | | 85,000 | | | | 89,288 | |
Series 2016-JP2 A4 2.822% 8/15/49 | | | 120,000 | | | | 115,835 | |
Series 2016-JP3 B 3.397% 8/15/49 ● | | | 40,000 | | | | 39,047 | |
Series 2016-WIKI A 144A 2.798% 10/5/31 # | | | 50,000 | | | | 50,308 | |
Series 2016-WIKI B 144A 3.201% 10/5/31 # | | | 80,000 | | | | 80,846 | |
LB-UBS Commercial Mortgage Trust Series 2006-C6 AJ 5.452% 9/15/39 ● | | | 104,943 | | | | 92,742 | |
Morgan Stanley Bank of America Merrill Lynch Trust | | | | | | | | |
Series 2014-C17 A5 3.741% 8/15/47 | | | 90,000 | | | | 93,699 | |
Series 2015-C23 A4 3.719% 7/15/50 | | | 285,000 | | | | 295,225 | |
Series 2015-C26 A5 3.531% 10/15/48 | | | 120,000 | | | | 122,564 | |
Series 2016-C29 A4 3.325% 5/15/49 | | | 85,000 | | | | 85,413 | |
Morgan Stanley Capital I Trust Series 2006-HQ10 B 5.448% 11/12/41 ● | | | 200,000 | | | | 199,803 | |
| | | | | | | | |
| | | Principal
amount° | | | Value (U.S. $) | |
| |
Non-Agency Commercial Mortgage-Backed
Securities (continued) | |
| |
Wells Fargo Commercial Mortgage Trust | | | | | | | | |
Series 2015-NXS3 A4 3.617% 9/15/57 | | | 165,000 | | | $ | 168,959 | |
Series 2016-BNK1 A3 2.652% 8/15/49 | | | 140,000 | | | | 133,420 | |
| | | | | | | | |
Total Non-Agency
Commercial
Mortgage-Backed Securities
(cost $5,646,461) | | | | 5,523,257 | |
| | | | | | | | |
|
| |
Regional Bonds – 0.16%D | | | | | |
| |
Argentina - 0.11% | | | | | |
Provincia de Buenos Aires 144A 7.875% 6/15/27 # | | | 150,000 | | | | 152,280 | |
Provincia de Cordoba 144A 7.45% 9/1/24 # | | | 150,000 | | | | 152,431 | |
| | | | | | | | |
| | | | | | | 304,711 | |
| | | | | | | | |
Australia - 0.05% | | | | | |
Queensland Treasury | | | | | | | | |
144A 2.75% 8/20/27 # | | AUD | 161,000 | | | | 118,018 | |
144A 3.25% 7/21/28 # | | AUD | 39,000 | | | | 29,664 | |
| | | | | | | | |
| | | | | | | 147,682 | |
| | | | | | | | |
Total Regional Bonds
(cost $449,523) | | | | 452,393 | |
| | | | | | | | |
|
| |
Sovereign Bonds – 0.60%D | | | | | |
| |
Argentina – 0.07% | | | | | |
Argentine Republic Government International Bond | | | | | | | | |
144A 5.625% 1/26/22 # | | | 45,000 | | | | 46,136 | |
144A 7.125% 7/6/36 # | | | 150,000 | | | | 145,275 | |
| | | | | | | | |
| | | | | | | 191,411 | |
| | | | | | | | |
Australia – 0.06% | | | | | |
Australia Government Bond
3.75% 4/21/37 | | AUD | 205,000 | | | | 166,766 | |
| | | | | | | | |
| | | | | | | 166,766 | |
| | | | | | | | |
Bermuda – 0.07% | | | | | |
Bermuda Government International Bond 144A 3.717% 1/25/27 # | | | 200,000 | | | | 193,506 | |
| | | | | | | | |
| | | | | | | 193,506 | |
| | | | | | | | |
| | | | | | | | |
| | | Principal
amount° | | | Value (U.S. $) | |
| |
Sovereign BondsD (continued) | | | | | |
| |
Colombia – 0.07% | | | | | |
Colombia Government International Bond 5.00% 6/15/45 | | | 200,000 | | | $ | 201,600 | |
| | | | | | | | |
| | | | | | | 201,600 | |
| | | | | | | | |
Hungary – 0.05% | | | | | |
Hungary Government International Bond 5.75% 11/22/23 | | | 120,000 | | | | 135,840 | |
| | | | | | | | |
| | | | | | | 135,840 | |
| | | | | | | | |
Mexico – 0.07% | | | | | |
Mexico Government International Bond 4.35% 1/15/47 | | | 200,000 | | | | 184,500 | |
| | | | | | | | |
| | | | | | | 184,500 | |
| | | | | | | | |
New Zealand – 0.06% | | | | | |
New Zealand Government Bond | | | | | | | | |
2.75% 4/15/25 | | NZD | 193,000 | | | | 132,090 | |
4.50% 4/15/27 | | NZD | 29,000 | | | | 22,599 | |
| | | | | | | | |
| | | | | | | 154,689 | |
| | | | | | | | |
Portugal – 0.01% | | | | | |
Portugal Government International Bond 144A 5.125% 10/15/24 # | | | 29,000 | | | | 28,170 | |
| | | | | | | | |
| | | | | | | 28,170 | |
| | | | | | | | |
Saudi Arabia – 0.07% | | | | | |
Saudi Government International Bond 144A 2.375% 10/26/21 # | | | 200,000 | | | | 196,627 | |
| | | | | | | | |
| | | | | | | 196,627 | |
| | | | | | | | |
Sri Lanka – 0.07% | | | | | |
Sri Lanka Government International Bond 144A 6.125% 6/3/25 # | | | 200,000 | | | | 200,472 | |
| | | | | | | | |
| | | | | | | 200,472 | |
| | | | | | | | |
Total Sovereign Bonds
(cost $1,691,806) | | | | 1,653,581 | |
| | | | | | | | |
|
| |
Supranational Banks – 0.08% | | | | | |
| |
International Bank for Reconstruction & Development | | | | | | | | |
3.50% 1/22/21 | | NZD | 278,000 | | | | 197,885 | |
4.625% 10/6/21 | | NZD | 22,000 | | | | 16,317 | |
Schedules of investments
Delaware Foundation® Moderate Allocation Fund
| | | | | | | | |
| | | Principal
amount° | | | Value (U.S. $) | |
| |
Supranational Banks (continued) | | | | | |
| |
International Finance 3.625% 5/20/20 | | NZD | 13,000 | | | $ | 9,297 | |
| | | | | | | | |
Total Supranational Banks
(cost $214,237) | | | | 223,499 | |
| | | | | | | | |
|
| |
U.S. Treasury Obligations – 0.65% | | | | | |
| |
U.S. Treasury Bond 2.875% 11/15/46 | | | 1,295,000 | | | | 1,256,327 | |
U.S. Treasury Notes | | | | | | | | |
1.875% 1/31/22 | | | 75,000 | | | | 74,839 | |
2.25% 2/15/27 | | | 445,000 | | | | 439,324 | |
| | | | | | | | |
Total U.S. Treasury Obligations
(cost $1,782,825) | | | | 1,770,490 | |
| | | | | | | | |
| | |
| | | Number of shares | | | | |
| |
Preferred Stock – 0.36% | | | | | |
| |
General Electric 5.00% ● | | | 266,000 | | | $ | 280,630 | |
Integrys Energy Group 6.00% ● | | | 3,550 | | | | 92,699 | |
U.S. Bancorp 3.50% ● | | | 600 | | | | 516,000 | |
USB Realty 144A 2.169% #● | | | 100,000 | | | | 85,250 | |
| | | | | | | | |
Total Preferred Stock
(cost $853,851) | | | | 974,579 | |
| | | | | | | | |
|
| |
Rights – 0.01% | | | | | |
| |
B2W Cia Digital exercise price BRL 11.00, expiration date 4/25/17 † | | | 24,725 | | | | 11,215 | |
Deutsche Bank exercise price EUR 11.65, expiration date 4/6/17 † | | | 3,650 | | | | 8,722 | |
| | | | | | | | |
Total Rights (cost $0) | | | | 19,937 | |
| | | | | | | | |
| | |
| | | Principal
amount° | | | | |
| |
Short-Term Investments – 1.73% | | | | | |
| |
Discount Notes – 0.43%≠ | | | | | |
Federal Home Loan Bank | | | | | | | | |
0.53% 4/25/17 | | | 344,984 | | | | 344,841 | |
0.55% 5/26/17 | | | 11,963 | | | | 11,950 | |
0.69% 4/28/17 | | | 107,857 | | | | 107,806 | |
0.765% 5/19/17 | | | 722,655 | | | | 721,990 | |
| | | | | | | | |
| | | | | | | 1,186,587 | |
| | | | | | | | |
| | | | | | | | |
| | | Principal
amount° | | | Value (U.S. $) | |
| |
Short-Term Investments (continued) | | | | | |
| |
Repurchase Agreements – 1.03% | | | | | |
Bank of America Merrill Lynch 0.73%, dated 3/31/17, to be repurchased on 4/3/17, repurchase price $921,931 (collateralized by U.S. government obligations 0.125% 4/15/18; market value $940,313) | | | 921,875 | | | $ | 921,875 | |
Bank of Montreal 0.66%, dated 3/31/17, to be repurchased on 4/3/17, repurchase price $921,925 (collateralized by U.S. government obligations 0.75%–2.00% 2/28/19–2/15/45; market value $940,312) | | | 921,875 | | | | 921,875 | |
BNP Paribas 0.76%, dated 3/31/17, to be repurchased on 4/3/17, repurchase price $978,312 (collateralized by U.S. government obligations 0.00%–3.125% 6/30/17–2/15/43; market value $997,815) | | | 978,250 | | | | 978,250 | |
| | | | | | | | |
| | | | | | | 2,822,000 | |
| | | | | | | | |
U.S. Treasury Obligation – 0.27%≠ | | | | | |
U.S. Treasury Bill 0.44% 4/13/17 | | | 722,828 | | | | 722,685 | |
| | | | | | | | |
| | | | | | | 722,685 | |
| | | | | | | | |
Total Short-Term Investments
(cost $4,731,257) | | | | 4,731,272 | |
| | | | | | | | |
| |
Total Value of Securities – 101.71%
(cost $238,003,650) | | | $ | 278,907,748 | |
| | | | | | | | |
| | # | Security exempt from registration under Rule 144A of the Securities Act of 1933, as amended. At March 31, 2017, the aggregate value of Rule 144A securities was $30,535,262,which represents 11.14% of the Fund’s net assets. See Note 11 in “Notes to financial statements.” |
| | ◆ | Pass Through Agreement. Security represents the contractual right to receive a proportionate amount of underlying payments due to the counterparty pursuant to various agreements related to the rescheduling of obligations and the exchange of certain notes. |
| | = | Security is being fair valued in accordance with the Fund’s fair valuation policy. At March 31, 2017, the aggregate value of fair valued securities was $340,896, which represents 0.12% of the Fund’s net assets. See Note 1 in “Notes to financial statements.” |
| | ≠ | The rate shown is the effective yield at the time of purchase. |
| | « | Loan agreements generally pay interest at rates which are periodically reset by reference to a base lending rate plus a premium. These base lending rates are generally: (i) the prime rate offered by one or more U.S. banks, (ii) the lending rate offered by one or more European banks such as the London Interbank Offered Rate (LIBOR), and (iii) the certificate of deposit rate. Loan agreements may be subject to restrictions on resale. Stated rate in effect at March 31, 2017. |
| | § | Developed Markets – countries that are thought to be most developed and therefore less risky than emerging markets. |
| | ° | Principal amount shown is stated in U.S. dollars unless noted that the security is denominated in another currency. |
| | D | Securities have been classified by country of origin. |
| | S | Interest only security. An interest only security is the interest only portion of a fixed income security, which is separated and sold individually from the principal portion of the security. |
| | † | Non-income producing security. |
| | ● | Variable rate security. Each rate shown is as of March 31, 2017. Interest rates reset periodically. |
| | X | Emerging Markets – developing countries with relatively low per capita income, often with above-average economic growth potential but with more risk. |
| | ϕ | Step coupon bond. Coupon increases or decreases periodically based on a predetermined schedule. Stated rate in effect at March 31,2017. |
The following foreign currency exchange contracts, futures contracts and swap contracts were outstanding at March 31, 2017:1
Foreign Currency Exchange Contracts
| | | | | | | | | | | | | | | | | | | | | | | | | | | | | | | | | | |
Counterparty | | Contracts to Receive (Deliver) | | | | | | In Exchange For | | | | | | Settlement Date | | | | | | Unrealized
Appreciation
(Depreciation) | |
BAML | | AUD | | | (317,827 | ) | | | | | | | USD | | | | 241,945 | | | | | | | | 5/12/17 | | | | | | | $ | (690 | ) |
BAML | | NZD | | | (635,350 | ) | | | | | | | USD | | | | 446,168 | | | | | | | | 5/12/17 | | | | | | | | 1,277 | |
BNP | | AUD | | | (240,728 | ) | | | | | | | USD | | | | 183,143 | | | | | | | | 5/12/17 | | | | | | | | (633 | ) |
BNYM | | AUD | | | 6,961 | | | | | | | | USD | | | | (5,320 | ) | | | | | | | 4/4/17 | | | | | | | | (2 | ) |
BNYM | | CHF | | | (122,863 | ) | | | | | | | USD | | | | 122,741 | | | | | | | | 4/4/17 | | | | | | | | 52 | |
BNYM | | EUR | | | (2,740 | ) | | | | | | | USD | | | | 2,928 | | | | | | | | 4/3/17 | | | | | | | | 5 | |
BNYM | | EUR | | | (113,856 | ) | | | | | | | USD | | | | 121,686 | | | | | | | | 4/4/17 | | | | | | | | 203 | |
BNYM | | EUR | | | (7,477 | ) | | | | | | | USD | | | | 7,992 | | | | | | | | 4/5/17 | | | | | | | | 13 | |
BNYM | | GBP | | | 127,110 | | | | | | | | USD | | | | (159,222 | ) | | | | | | | 4/4/17 | | | | | | | | 50 | |
BNYM | | HKD | | | 801,942 | | | | | | | | USD | | | | (103,248 | ) | | | | | | | 4/5/17 | | | | | | | | (44 | ) |
BNYM | | JPY | | | 4,576,670 | | | | | | | | USD | | | | (41,097 | ) | | | | | | | 4/5/17 | | | | | | | | 16 | |
| | | | | | | | | | | | | | | | | | | | | | | | | | | | | | | | | | |
| | | | | | | | | |
| | | | | | | | | | | | | | | | | | | | | | | | | | | | | | | | $ | 247 | |
| | | | | | | | | | | | | | | | | | | | | | | | | | | | | | | | | | |
Futures Contracts
| | | | | | | | | | | | | | | | |
Contracts to Buy (Sell) | | Notional
Cost (Proceeds) | | | Notional
Value | | | Expiration
Date | | | Unrealized
Appreciation
(Depreciation) | |
(20) U.S. Treasury 5
yr Notes | | $ | (2,340,725 | ) | | $ | (2,354,532 | ) | | | 7/3/17 | | | $ | (13,807 | ) |
(192) U.S. Treasury 10
yr Notes | | | (23,846,457 | ) | | | (23,916,000 | ) | | | 6/22/17 | | | | (69,543 | ) |
(77) U.S. Treasury
Long Bonds | | | (11,558,313 | ) | | | (11,614,968 | ) | | | 6/22/17 | | | | (56,655 | ) |
(18) Euro-O.A.T. | | | (2,834,804 | ) | | | (2,823,521 | ) | | | 6/9/17 | | | | 11,283 | |
| | | | | | | | | | | | | | | | |
| | | | |
| | $ | (40,580,299 | ) | | | | | | | | | | $ | (128,722 | ) |
| | | | | | | | | | | | | | | | |
Schedules of investments
Delaware Foundation® Moderate Allocation Fund
Swap Contracts
CDS Contracts2
| | | | | | | | | | | | | | | | | | | | | | | | | | | |
Counterparty | | Swap Referenced Obligation | | Notional
Value3 | | Annual Protection
Payments | | Termination
Date | | Upfront
Payments
Paid
(Received) | | Unrealized
Appreciation
(Depreciation)4 |
| | Protection Purchased: | | | | | | | | | | | | | | | | | | | | | | | | | |
HSBC | | CDX.EM.276 | | | | 4,000,000 | | | | | 1.00% | | | | | 6/20/22 | | | | | $222,947 | | | | $ | (10,702 | ) |
ICE | | JPM - CDX.NA.HY.275 | | | | 5,905,350 | | | | | 5.00% | | | | | 12/20/21 | | | | | (351,000) | | | | | (116,078 | ) |
| | | | | | | | | | | | | | | | | | | | | | | | | | | |
| | | | | | |
| | | | | | | | | | | | | | | | | | | | | | | | | $ | (126,780 | ) |
| | | | | | | | | | | | | | | | | | | | | | | | | | | |
IRS Contracts7
| | | | | | | | | | | | | | | | | | | | |
Counterparty & Swap Referenced Obligation | | Notional Value3 | | | Fixed
Interest
Rate
Paid
(Received) | | | Variable
Interest
Rate
Paid
(Received) | | | Termination
Date | | | Unrealized
Appreciation
(Depreciation)4 | |
CME - BAML IRS 3 yr USD | | | 11,675,000 | | | | 1.808% | | | | (1.151%) | | | | 3/28/20 | | | $ | (225 | ) |
LCH - BAML IRS 5 yr USD | | | 24,100,000 | | | | 2.066% | | | | (1.148%) | | | | 4/3/22 | | | | (12,350 | ) |
| | | | | | | | | | | | | | | | | | | | |
| | | | | |
| | | | | | | | | | | | | | | | | | $ | (12,575 | ) |
| | | | | | | | | | | | | | | | | | | | |
The use of foreign currency exchange contracts, futures contracts and swap contracts involve elements of market risk and risks in excess of the amounts disclosed in these financial statements. The foreign currency exchange contracts and notional values presented above represent the Fund’s total exposure in such contracts, whereas only the net unrealized appreciation (depreciation) is reflected in the Fund’s net assets.
1 See Note 8 “Notes to financial statements.”
2A Credit Default Swap (CDS) contract is a risk-transfer instrument through which one party (purchaser of protection) transfers to another party (seller of protection) the financial risk of a credit event (as defined in the CDS agreement), as it relates to a particular reference security or basket of securities (such as an index). Periodic payments (receipts) on such contracts are accrued daily and recorded as unrealized losses (gains) on swap contracts. Upon payment (receipt), such amounts are recorded as unrealized losses (gains) on swap contracts. Upfront payments made or received in connection with CDS contracts are amortized over the expected life of the CDS contracts as unrealized losses (gains) on swap contracts. The change in value of CDS contracts is recorded daily as unrealized appreciation or depreciation. A realized gain or loss is recorded upon a credit event (as defined in the CDS agreement) or the maturity or termination of the agreement.
3Notional value shown is stated in U.S. Dollars unless noted that the swap is denominated in another currency.
4Unrealized appreciation (depreciation) does not include periodic interest payments (receipts) on swap contracts accrued daily in the amount of $(13,451).
5Markit’s CDX.NA.HY Index, is composed of 100 of the most liquid North American entities with high yield credit ratings that trade in the CDS market.
6Markit’s CDX.EM Index is composed of 15 sovereign issuers from the following countries: Argentina, Brazil, Chile, China, Columbia, Indonesia, Malaysia, Mexico, Panama, Peru, Philippines, Russia, South Africa, Turkey and Venezuela, which have a S&P credit quality rating of CCC and above.
7An interest rate swap (IRS) agreement is an exchange of interest rates between counterparties. Periodic payments (receipt) on such contracts are accrued daily and recorded as unrealized appreciation (depreciation) on swap contracts. Upon periodic payment (receipt) or termination of the contract, such amounts are recorded as realized gains (losses) on swap contracts.
Summary of abbreviations:
ADR – American Depositary Receipt
ARM – Adjustable Rate Mortgage
AUD – Australian Dollar
BAML – Bank of America Merrill Lynch
BB – Barclays Bank
BNP – BNP Paribas
BNYM – Bank of New York Mellon
BRL – Brazilian Real
CDS – Credit Default Swap
CDX.EM – Credit Default Swap Index Emerging Markets
CDX.NA.HY – Credit Default Swap Index North America High Yield
CHF – Swiss Franc
CLO – Collateralized Loan Obligation
CME – Chicago Mercantile Exchange
CVA – Dutch Certificate
DB – Deutsche Bank
EAFE – Europe Australasia Far East
ETF – Exchange-Traded Fund
EUR – European Monetary Unit
FREMF – Freddie Mac Multifamily
FTSE – Financial Times Stock Exchange
GBP – British Pound Sterling
GDR – Global Depositary Receipt
GNMA – Government National Mortgage Association
GS – Goldman Sachs
HKD – Hong Kong Dollar
HSBC – Hong Kong Shanghai Bank
ICE – Intercontinental Exchange, Inc.
IRS – Interest Rate Swap
JPM – JPMorgan
JPY – Japanese Yen
LB – Lehman Brothers
LCH – London Clearing House
MSCI – Morgan Stanley Capital International
NZD – New Zealand Dollar
O.A.T. – Obligations Assimilables du Trésor (French Treasury Bond)
PJSC – Private Joint Stock Company
REMIC – Real Estate Mortgage Investment Conduit
S&P – Standard & Poor’s Financial Services LLC
S.F. – Single Family
TBA – To be announced
USD – U.S. Dollar
yr – Year
See accompanying notes, which are an integral part of the financial statements.
Schedules of investments
Delaware Foundation® Conservative Allocation Fund
March 31, 2017
| | | | | | | | |
| | | Number of shares | | | Value (U.S. $) | |
| |
Common Stock – 35.97% | | | | | |
| |
U.S. Markets – 19.20% | | | | | |
Consumer Discretionary – 1.42% | | | | | |
Amazon.com † | | | 60 | | | $ | 53,192 | |
Aramark | | | 610 | | | | 22,491 | |
BorgWarner | | | 640 | | | | 26,746 | |
Cheesecake Factory | | | 335 | | | | 21,226 | |
Chuy’s Holdings † | | | 355 | | | | 10,579 | |
Cinemark Holdings | | | 660 | | | | 29,264 | |
Comcast Class A | | | 1,260 | | | | 47,363 | |
Del Frisco’s Restaurant Group † | | | 1,380 | | | | 24,909 | |
Dollar General | | | 619 | | | | 43,163 | |
Fiesta Restaurant
Group † | | | 420 | | | | 10,164 | |
Five Below † | | | 505 | | | | 21,872 | |
Ford Motor | | | 2,380 | | | | 27,703 | |
Home Depot | | | 370 | | | | 54,327 | |
Jack in the Box | | | 350 | | | | 35,602 | |
Liberty Global Class A † | | | 462 | | | | 16,572 | |
Liberty Global Class C † | | | 1,732 | | | | 60,689 | |
Liberty Interactive Corp. QVC Group Class A † | | | 4,285 | | | | 85,786 | |
Lowe’s | | | 1,800 | | | | 147,978 | |
Malibu Boats Class A † | | | 955 | | | | 21,440 | |
National CineMedia | | | 1,285 | | | | 16,230 | |
Newell Brands | | | 852 | | | | 40,189 | |
NIKE Class B | | | 490 | | | | 27,308 | |
Shutterfly † | | | 425 | | | | 20,523 | |
Starbucks | | | 790 | | | | 46,128 | |
Steven Madden † | | | 742 | | | | 28,604 | |
Tenneco | | | 555 | | | | 34,643 | |
Tractor Supply | | | 310 | | | | 21,381 | |
TripAdvisor † | | | 1,348 | | | | 58,180 | |
Walt Disney | | | 830 | | | | 94,114 | |
| | | | | | | | |
| | | | | | | 1,148,366 | |
| | | | | | | | |
Consumer Staples – 1.02% | | | | | |
Archer-Daniels-Midland | | | 3,200 | | | | 147,328 | |
Casey’s General Stores | | | 220 | | | | 24,695 | |
CVS Health | | | 2,410 | | | | 189,185 | |
General Mills | | | 370 | | | | 21,834 | |
J&J Snack Foods | | | 197 | | | | 26,705 | |
Kimberly-Clark | | | 150 | | | | 19,745 | |
Kraft Heinz | | | 1,624 | | | | 147,475 | |
Mondelez International | | | 3,473 | | | | 149,617 | |
PepsiCo | | | 290 | | | | 32,439 | |
Pinnacle Foods | | | 380 | | | | 21,991 | |
Procter & Gamble | | | 220 | | | | 19,767 | |
Walgreens Boots Alliance | | | 363 | | | | 30,147 | |
| | | | | | | | |
| | | | | | | 830,928 | |
| | | | | | | | |
| | | | | | | | |
| | | Number of shares | | | Value (U.S. $) | |
| |
Common Stock (continued) | | | | | |
| |
U.S. Markets (continued) | | | | | |
Energy – 1.24% | | | | | |
Carrizo Oil & Gas † | | | 715 | | | $ | 20,492 | |
Chevron | | | 1,920 | | | | 206,150 | |
ConocoPhillips | | | 3,200 | | | | 159,584 | |
EOG Resources | | | 300 | | | | 29,265 | |
Halliburton | | | 3,600 | | | | 177,156 | |
Keane Group † | | | 395 | | | | 5,649 | |
Marathon Oil | | | 7,000 | | | | 110,600 | |
Occidental Petroleum | | | 2,700 | | | | 171,072 | |
PDC Energy † | | | 370 | | | | 23,069 | |
Pioneer Energy
Services † | | | 1,100 | | | | 4,400 | |
Pioneer Natural Resources | | | 210 | | | | 39,108 | |
RSP Permian † | | | 610 | | | | 25,272 | |
SRC Energy † | | | 2,425 | | | | 20,467 | |
Superior Energy
Services † | | | 710 | | | | 10,125 | |
| | | | | | | | |
| | | | | | | 1,002,409 | |
| | | | | | | | |
Financials – 2.48% | | | | | | | | |
Aflac | | | 720 | | | | 52,142 | |
Allstate | | | 1,800 | | | | 146,682 | |
American Equity Investment Life Holding | | | 890 | | | | 21,031 | |
Bank of New York Mellon | | | 3,200 | | | | 151,136 | |
BB&T | | | 3,200 | | | | 143,040 | |
BlackRock | | | 120 | | | | 46,021 | |
Bryn Mawr Bank | | | 410 | | | | 16,195 | |
Capital One Financial | | | 470 | | | | 40,730 | |
Cardinal Financial | | | 865 | | | | 25,898 | |
Charles Schwab | | | 1,554 | | | | 63,419 | |
Citigroup | | | 1,010 | | | | 60,418 | |
City Holding | | | 485 | | | | 31,273 | |
CoBiz Financial | | | 1,055 | | | | 17,724 | |
East West Bancorp | | | 560 | | | | 28,902 | |
Essent Group † | | | 880 | | | | 31,830 | |
Evercore Partners Class A | | | 315 | | | | 24,539 | |
First Bancorp (North Carolina) | | | 390 | | | | 11,423 | |
Flushing Financial | | | 445 | | | | 11,957 | |
Great Western Bancorp | | | 775 | | | | 32,868 | |
Hope Bancorp | | | 1,505 | | | | 28,851 | |
Houlihan Lokey | | | 580 | | | | 19,981 | |
Independent Bank (Massachusetts) | | | 295 | | | | 19,175 | |
Infinity Property & Casualty | | | 265 | | | | 25,307 | |
Intercontinental Exchange | | | 1,978 | | | | 118,423 | |
Invesco | | | 1,150 | | | | 35,225 | |
JPMorgan Chase & Co. | | | 1,070 | | | | 93,989 | |
KeyCorp | | | 2,460 | | | | 43,739 | |
| | | | | | | | |
| | | Number of shares | | | Value (U.S. $) | |
| |
Common Stock (continued) | | | | | |
| |
U.S. Markets (continued) | | | | | |
Financials (continued) | | | | | |
Marsh & McLennan | | | 2,000 | | | $ | 147,780 | |
MGIC Investment † | | | 4,605 | | | | 46,649 | |
Old National Bancorp | | | 1,935 | | | | 33,572 | |
Primerica | | | 465 | | | | 38,223 | |
Prosperity Bancshares | | | 505 | | | | 35,204 | |
Prudential Financial | | | 320 | | | | 34,138 | |
Raymond James Financial | | | 400 | | | | 30,504 | |
Reinsurance Group of America | | | 130 | | | | 16,507 | |
Selective Insurance Group | | | 715 | | | | 33,712 | |
State Street | | | 380 | | | | 30,252 | |
Sterling Bancorp | | | 1,745 | | | | 41,357 | |
Stifel Financial † | | | 565 | | | | 28,357 | |
Travelers | | | 210 | | | | 25,313 | |
Umpqua Holdings | | | 1,745 | | | | 30,956 | |
United Fire Group | | | 240 | | | | 10,265 | |
Validus Holdings | | | 370 | | | | 20,864 | |
Webster Financial | | | 685 | | | | 34,277 | |
WSFS Financial | | | 595 | | | | 27,340 | |
| | | | | | | | |
| | | | | | | 2,007,188 | |
| | | | | | | | |
Healthcare – 2.87% | |
Abbott Laboratories | | | 4,070 | | | | 180,749 | |
AbbVie | | | 280 | | | | 18,245 | |
Acorda Therapeutics † | | | 520 | | | | 10,920 | |
Air Methods † | | | 510 | | | | 21,930 | |
Alkermes † | | | 270 | | | | 15,795 | |
Allergan | | | 294 | | | | 70,242 | |
Biogen † | | | 305 | | | | 83,393 | |
Brookdale Senior
Living † | | | 2,725 | | | | 36,597 | |
Cardinal Health | | | 1,800 | | | | 146,790 | |
Catalent † | | | 1,075 | | | | 30,444 | |
Celgene † | | | 1,421 | | | | 176,815 | |
Cigna | | | 290 | | | | 42,482 | |
CONMED | | | 645 | | | | 28,644 | |
CryoLife † | | | 1,146 | | | | 19,081 | |
DENTSPLY SIRONA | | | 998 | | | | 62,315 | |
Edwards Lifesciences † | | | 270 | | | | 25,399 | |
Eli Lilly & Co. | | | 390 | | | | 32,803 | |
Exact Sciences † | | | 545 | | | | 12,873 | |
Express Scripts
Holding † | | | 2,585 | | | | 170,377 | |
Gilead Sciences | | | 510 | | | | 34,639 | |
HealthSouth | | | 515 | | | | 22,047 | |
Johnson & Johnson | | | 1,600 | | | | 199,280 | |
Ligand Pharmaceuticals Class B † | | | 295 | | | | 31,223 | |
| | | | | | | | |
| | | Number of shares | | | Value (U.S. $) | |
| |
Common Stock (continued) | | | | | |
| |
U.S. Markets (continued) | | | | | |
Healthcare (continued) | | | | | |
Medicines † | | | 585 | | | $ | 28,607 | |
Merck & Co. | | | 2,980 | | | | 189,349 | |
Merit Medical Systems † | | | 971 | | | | 28,062 | |
Natera † | | | 505 | | | | 4,479 | |
Pfizer | | | 4,368 | | | | 149,429 | |
Prestige Brands
Holdings † | | | 516 | | | | 28,669 | |
Quest Diagnostics | | | 1,500 | | | | 147,285 | |
Quidel † | | | 1,165 | | | | 26,376 | |
Quintiles IMS Holdings † | | | 939 | | | | 75,618 | |
Repligen † | | | 460 | | | | 16,192 | |
Retrophin † | | | 965 | | | | 17,814 | |
Spectrum Pharmaceuticals † | | | 2,070 | | | | 13,455 | |
TESARO † | | | 215 | | | | 33,082 | |
Thermo Fisher Scientific | | | 220 | | | | 33,792 | |
Vanda Pharmaceuticals † | | | 1,405 | | | | 19,670 | |
Vertex Pharmaceuticals † | | | 190 | | | | 20,777 | |
Wright Medical Group † | | | 790 | | | | 24,585 | |
| | | | | | | | |
| | | | | | | 2,330,324 | |
| | | | | | | | |
Industrials – 1.94% | | | | | |
AAON | | | 908 | | | | 32,095 | |
ABM Industries | | | 700 | | | | 30,520 | |
Applied Industrial Technologies | | | 500 | | | | 30,925 | |
Barnes Group | | | 815 | | | | 41,842 | |
Casella Waste Systems † | | | 480 | | | | 6,773 | |
Columbus McKinnon | | | 850 | | | | 21,097 | |
Continental Building Products † | | | 1,420 | | | | 34,790 | |
Eaton | | | 370 | | | | 27,436 | |
ESCO Technologies | | | 665 | | | | 38,637 | |
Esterline Technologies † | | | 150 | | | | 12,907 | |
Federal Signal | | | 1,055 | | | | 14,570 | |
FedEx | | | 360 | | | | 70,254 | |
General Electric | | | 2,650 | | | | 78,970 | |
Granite Construction | | | 670 | | | | 33,627 | |
Hawaiian Holdings † | | | 135 | | | | 6,271 | |
Honeywell International | | | 210 | | | | 26,223 | |
Kadant | | | 535 | | | | 31,752 | |
KeyW Holding † | | | 1,370 | | | | 12,933 | |
Kforce | | | 800 | | | | 19,000 | |
KLX † | | | 590 | | | | 26,373 | |
Lockheed Martin | | | 110 | | | | 29,436 | |
MYR Group † | | | 700 | | | | 28,700 | |
Nielsen Holdings | | | 1,812 | | | | 74,854 | |
Northrop Grumman | | | 600 | | | | 142,704 | |
On Assignment † | | | 715 | | | | 34,699 | |
Schedules of investments
Delaware Foundation® Conservative Allocation Fund
| | | | | | | | |
| | | Number of shares | | | Value (U.S. $) | |
| |
Common Stock (continued) | | | | | |
| |
U.S. Markets (continued) | | | | | |
Industrials (continued) | | | | | |
Parker-Hannifin | | | 270 | | | $ | 43,286 | |
Raytheon | | | 1,000 | | | | 152,500 | |
Rockwell Collins | | | 220 | | | | 21,375 | |
Southwest Airlines | | | 330 | | | | 17,741 | |
Swift Transportation † | | | 900 | | | | 18,486 | |
Tetra Tech | | | 740 | | | | 30,229 | |
TransUnion † | | | 500 | | | | 19,175 | |
TriNet Group † | | | 760 | | | | 21,964 | |
U.S. Ecology | | | 535 | | | | 25,065 | |
Union Pacific | | | 480 | | | | 50,842 | |
United Technologies | | | 500 | | | | 56,105 | |
WageWorks † | | | 351 | | | | 25,377 | |
Waste Management | | | 2,100 | | | | 153,132 | |
XPO Logistics † | | | 585 | | | | 28,016 | |
| | | | | | | | |
| | | | | | | 1,570,681 | |
| | | | | | | | |
Information Technology – 3.72% | | | | | |
Accenture Class A | | | 290 | | | | 34,765 | |
Adobe Systems † | | | 420 | | | | 54,655 | |
Alphabet Class A † | | | 221 | | | | 187,364 | |
Alphabet Class C † | | | 84 | | | | 69,683 | |
Analog Devices | | | 220 | | | | 18,029 | |
Anixter International † | | | 315 | | | | 24,979 | |
Apple | | | 780 | | | | 112,055 | |
Broadcom | | | 220 | | | | 48,171 | |
Brooks Automation | | | 905 | | | | 20,272 | |
CA | | | 4,728 | | | | 149,972 | |
Callidus Software † | | | 1,490 | | | | 31,811 | |
Cisco Systems | | | 5,260 | | | | 177,788 | |
Convergys | | | 1,200 | | | | 25,380 | |
eBay † | | | 3,060 | | | | 102,724 | |
Electronic Arts † | | | 909 | | | | 81,374 | |
ExlService Holdings † | | | 650 | | | | 30,784 | |
Facebook Class A † | | | 1,372 | | | | 194,893 | |
GrubHub † | | | 370 | | | | 12,169 | |
Guidewire Software † | | | 155 | | | | 8,731 | |
II–VI † | | | 415 | | | | 14,961 | |
Intel | | | 5,760 | | | | 207,763 | |
Intuit | | | 398 | | | | 46,164 | |
j2 Global | | | 495 | | | | 41,535 | |
MACOM Technology Solutions Holdings † | | | 537 | | | | 25,930 | |
Mastercard Class A | | | 951 | | | | 106,959 | |
Maxim Integrated Products | | | 550 | | | | 24,728 | |
MaxLinear Class A † | | | 1,100 | | | | 30,855 | |
Microsemi † | | | 765 | | | | 39,420 | |
Microsoft | | | 3,453 | | | | 227,415 | |
| | | | | | | | |
| | | Number of shares | | | Value (U.S. $) | |
| |
Common Stock (continued) | | | | | |
| |
U.S. Markets (continued) | | | | | |
Information Technology (continued) | | | | | |
NETGEAR † | | | 435 | | | $ | 21,554 | |
Oracle | | | 3,300 | | | | 147,213 | |
PayPal Holdings † | | | 3,024 | | | | 130,092 | |
Plantronics | | | 355 | | | | 19,209 | |
Proofpoint † | | | 435 | | | | 32,347 | |
Q2 Holdings † | | | 490 | | | | 17,077 | |
QUALCOMM | | | 1,156 | | | | 66,285 | |
salesforce.com † | | | 580 | | | | 47,844 | |
Semtech † | | | 975 | | | | 32,955 | |
Silicon Laboratories † | | | 295 | | | | 21,697 | |
SS&C Technologies Holdings | | | 590 | | | | 20,886 | |
Symantec | | | 2,509 | | | | 76,976 | |
Synaptics † | | | 375 | | | | 18,566 | |
Tyler Technologies † | | | 220 | | | | 34,003 | |
Visa Class A | | | 1,510 | | | | 134,194 | |
Yahoo † | | | 900 | | | | 41,769 | |
| | | | | | | | |
| | | | | | | �� 3,013,996 | |
| | | | | | | | |
Materials – 0.58% | | | | | | | | |
Axalta Coating Systems † | | | 1,090 | | | | 35,098 | |
Balchem | | | 235 | | | | 19,369 | |
Boise Cascade † | | | 735 | | | | 19,625 | |
Chemtura † | | | 375 | | | | 12,525 | |
Eastman Chemical | | | 520 | | | | 42,016 | |
EI du Pont de Nemours
& Co. | | | 1,800 | | | | 144,594 | |
Kaiser Aluminum | | | 315 | | | | 25,169 | |
Minerals Technologies | | | 525 | | | | 40,215 | |
Neenah Paper | | | 420 | | | | 31,374 | |
Quaker Chemical | | | 295 | | | | 38,840 | |
WestRock | | | 585 | | | | 30,438 | |
Worthington Industries | | | 670 | | | | 30,210 | |
| | | | | | | | |
| | | | | | | 469,473 | |
| | | | | | | | |
Real Estate – 3.14% | | | | | | | | |
American Tower | | | 480 | | | | 58,339 | |
Apartment Investment & Management | | | 650 | | | | 28,827 | |
AvalonBay Communities | | | 475 | | | | 87,210 | |
Boston Properties | | | 625 | | | | 82,756 | |
Brandywine Realty Trust | | | 2,175 | | | | 35,300 | |
Camden Property Trust | | | 175 | | | | 14,081 | |
Cousins Properties | | | 1,225 | | | | 10,131 | |
Crown Castle International | | | 1,130 | | | | 106,729 | |
DCT Industrial Trust | | | 275 | | | | 13,233 | |
DDR | | | 1,825 | | | | 22,867 | |
Douglas Emmett | | | 1,375 | | | | 52,800 | |
EastGroup Properties | | | 330 | | | | 24,265 | |
EPR Properties | | | 80 | | | | 5,890 | |
| | | | | | | | |
| | | Number of shares | | | Value (U.S. $) | |
| |
Common Stock (continued) | | | | | |
| |
U.S. Markets (continued) | | | | | |
Real Estate (continued) | | | | | |
Equinix | | | 144 | | | $ | 57,653 | |
Equity LifeStyle Properties | | | 375 | | | | 28,897 | |
Equity Residential | | | 3,675 | | | | 228,659 | |
Essex Property Trust | | | 375 | | | | 86,824 | |
Extra Space Storage | | | 350 | | | | 26,037 | |
Federal Realty Investment Trust | | | 200 | | | | 26,700 | |
First Industrial Realty Trust | | | 2,455 | | | | 65,377 | |
GGP | | | 2,875 | | | | 66,643 | |
Gramercy Property Trust | | | 1,176 | | | | 30,929 | |
Highwoods Properties | | | 850 | | | | 41,761 | |
Host Hotels & Resorts | | | 4,430 | | | | 82,664 | |
Kilroy Realty | | | 475 | | | | 34,238 | |
Kimco Realty | | | 1,400 | | | | 30,926 | |
Kite Realty Group Trust | | | 1,293 | | | | 27,799 | |
LaSalle Hotel Properties | | | 1,115 | | | | 32,279 | |
Lexington Realty Trust | | | 1,550 | | | | 15,469 | |
Liberty Property Trust | | | 350 | | | | 13,493 | |
Life Storage | | | 330 | | | | 27,100 | |
LTC Properties | | | 125 | | | | 5,987 | |
Macerich | | | 375 | | | | 24,150 | |
Mack-Cali Realty | | | 995 | | | | 26,805 | |
Mid-America Apartment Communities | | | 372 | | | | 37,847 | |
National Retail Properties | | | 1,385 | | | | 60,414 | |
Omega Healthcare Investors | | | 425 | | | | 14,021 | |
Parkway | | | 159 | | | | 3,162 | |
Pebblebrook Hotel Trust | | | 1,310 | | | | 38,265 | |
Prologis | | | 1,825 | | | | 94,681 | |
PS Business Parks | | | 225 | | | | 25,821 | |
Public Storage | | | 375 | | | | 82,091 | |
Ramco-Gershenson Properties Trust | | | 2,895 | | | | 40,588 | |
Regency Centers | | | 917 | | | | 60,880 | |
RLJ Lodging Trust | | | 925 | | | | 21,747 | |
Sabra Health Care REIT | | | 375 | | | | 10,474 | |
Simon Property Group | | | 1,050 | | | | 180,631 | |
SL Green Realty | | | 475 | | | | 50,645 | |
Spirit Realty Capital | | | 2,025 | | | | 20,513 | |
Tanger Factory Outlet Centers | | | 850 | | | | 27,855 | |
Taubman Centers | | | 275 | | | | 18,155 | |
UDR | | | 1,225 | | | | 44,419 | |
Urban Edge Properties | | | 325 | | | | 8,547 | |
Ventas | | | 1,150 | | | | 74,796 | |
Vornado Realty Trust | | | 850 | | | | 85,263 | |
Welltower | | | 375 | | | | 26,558 | |
| | | | | | | | |
| | | | | | | 2,550,191 | |
| | | | | | | | |
| | | | | | | | |
| | | Number of shares | | | Value (U.S. $) | |
| |
Common Stock (continued) | | | | | |
| |
U.S. Markets (continued) | | | | | |
Telecommunication Services – 0.50% | | | | | |
AT&T | | | 5,720 | | | $ | 237,666 | |
ATN International | | | 315 | | | | 22,182 | |
Verizon Communications | | | 3,000 | | | | 146,250 | |
| | | | | | | | |
| | | | | | | 406,098 | |
| | | | | | | | |
Utilities – 0.29% | | | | | | | | |
Edison International | | | 1,900 | | | | 151,259 | |
NorthWestern | | | 555 | | | | 32,579 | |
South Jersey Industries | | | 690 | | | | 24,599 | |
Spire | | | 390 | | | | 26,325 | |
| | | | | | | | |
| | | | | | | 234,762 | |
| | | | | | | | |
Total U.S. Markets
(cost $ 9,875,644) | | | | 15,564,416 | |
| | | | | | | | |
Developed Markets – 11.88%§ | | | | | |
Consumer Discretionary – 2.04% | | | | | |
Bandai Namco Holdings | | | 900 | | | | 26,920 | |
Bayerische Motoren Werke | | | 1,472 | | | | 134,279 | |
Cie Generale des Etablissements Michelin | | | 220 | | | | 26,720 | |
Denso | | | 900 | | | | 39,588 | |
Donaco International | | | 35,000 | | | | 10,562 | |
Hennes & Mauritz Class B | | | 1,000 | | | | 25,556 | |
Industria de Diseno Textil | | | 1,100 | | | | 38,772 | |
Kering | | | 450 | | | | 116,391 | |
LVMH Moet Hennessy Louis Vuitton | | | 250 | | | | 54,900 | |
Next | | | 320 | | | | 17,320 | |
Nitori Holdings | | | 1,226 | | | | 154,943 | |
Oriental Land | | | 500 | | | | 28,667 | |
Publicis Groupe | | | 769 | | | | 53,742 | |
RTL Group | | | 355 | | | | 28,593 | |
Sekisui Chemical | | | 2,200 | | | | 36,973 | |
Sodexo | | | 265 | | | | 31,168 | |
Stanley Electric | | | 1,100 | | | | 31,371 | |
Sumitomo Rubber Industries | | | 8,300 | | | | 141,427 | |
Techtronic Industries | | | 32,500 | | | | 131,522 | |
Toyota Motor | | | 2,999 | | | | 162,759 | |
USS | | | 1,500 | | | | 25,007 | |
Valeo | | | 1,405 | | | | 93,573 | |
Whitbread | | | 530 | | | | 26,283 | |
WPP | | | 1,810 | | | | 39,731 | |
Yue Yuen Industrial Holdings | | | 45,500 | | | | 178,862 | |
| | | | | | | | |
| | | | | | | 1,655,629 | |
| | | | | | | | |
Consumer Staples – 1.77% | | | | | |
Anheuser–Busch InBev | | | 315 | | | | 34,579 | |
Aryzta † | | | 2,553 | | | | 81,944 | |
Asahi Group Holdings | | | 700 | | | | 26,458 | |
Schedules of investments
Delaware Foundation® Conservative Allocation Fund
| | | | | | | | |
| | | Number of shares | | | Value (U.S. $) | |
| |
Common Stock (continued) | | | | | |
| |
Developed Markets§ (continued) | | | | | |
Consumer Staples (continued) | | | | | |
British American Tobacco | | | 1,365 | | | $ | 90,641 | |
Carlsberg Class B | | | 1,353 | | | | 124,947 | |
Chocoladefabriken Lindt & Spruengli † | | | 6 | | | | 34,024 | |
Coca-Cola Amatil | | | 12,362 | | | | 102,190 | |
Coca-Cola European Partners | | | 845 | | | | 31,596 | |
Danone | | | 605 | | | | 41,152 | |
Diageo | | | 1,270 | | | | 36,335 | |
FamilyMart UNY Holdings | | | 400 | | | | 23,857 | |
Imperial Brands | | | 2,360 | | | | 114,341 | |
Japan Tobacco | | | 4,100 | | | | 133,242 | |
Jeronimo Martins | | | 1,720 | | | | 30,771 | |
Kao | | | 700 | | | | 38,380 | |
Koninklijke Ahold Delhaize | | | 1,703 | | | | 36,444 | |
L’Oreal | | | 310 | | | | 59,577 | |
Nestle | | | 1,745 | | | | 133,882 | |
Reckitt Benckiser Group | | | 300 | | | | 27,386 | |
Suntory Beverage & Food | | | 600 | | | | 25,276 | |
Svenska Cellulosa Class B | | | 780 | | | | 25,157 | |
Tate & Lyle | | | 2,500 | | | | 23,946 | |
Treasury Wine Estates | | | 2,500 | | | | 23,359 | |
Unilever | | | 660 | | | | 32,576 | |
Unilever CVA | | | 885 | | | | 43,968 | |
WH Group 144A # | | | 32,500 | | | | 28,019 | |
Woolworths | | | 1,400 | | | | 28,344 | |
| | | | | | | | |
| | | | | | | 1,432,391 | |
| | | | | | | | |
Energy – 0.34% | | | | | | | | |
Amec Foster Wheeler | | | 3,700 | | | | 24,639 | |
Neste | | | 430 | | | | 16,771 | |
Origin Energy † | | | 4,300 | | | | 23,161 | |
Suncor Energy | | | 2,800 | | | | 85,968 | |
TOTAL | | | 2,394 | | | | 121,094 | |
| | | | | | | | |
| | | | | | | 271,633 | |
| | | | | | | | |
Financials – 1.45% | | | | | |
AIA Group | | | 9,000 | | | | 56,746 | |
AXA | | | 6,224 | | | | 161,047 | |
Banco Espirito Santo Class R =† | | | 85,000 | | | | 0 | |
Bank Leumi Le-Israel † | | | 7,700 | | | | 34,010 | |
Deutsche Bank † | | | 800 | | | | 13,783 | |
ING Groep | | | 9,531 | | | | 144,076 | |
Medibank Pvt | | | 11,200 | | | | 24,130 | |
Mitsubishi UFJ Financial Group | | | 34,781 | | | | 218,596 | |
Nordea Bank | | | 16,842 | | | | 192,278 | |
| | | | | | | | |
| | | Number of shares | | | Value (U.S. $) | |
| |
Common Stock (continued) | | | | | |
| |
Developed Markets§ (continued) | | | | | |
Financials (continued) | | | | | |
Prudential | | | 2,620 | | | $ | 55,345 | |
Sony Financial Holdings | | | 1,600 | | | | 25,711 | |
Standard Chartered † | | | 14,842 | | | | 141,884 | |
UniCredit | | | 7,185 | | | | 110,759 | |
| | | | | | | | |
| | | | | | | 1,178,365 | |
| | | | | | | | |
Healthcare – 1.66% | | | | | |
Actelion † | | | 140 | | | | 39,443 | |
Astellas Pharma | | | 3,100 | | | | 40,821 | |
Bayer | | | 435 | | | | 50,141 | |
Fresenius SE & Co. | | | 505 | | | | 40,583 | |
GlaxoSmithKline | | | 1,710 | | | | 35,554 | |
ICON † | | | 335 | | | | 26,706 | |
Indivior | | | 6,500 | | | | 26,231 | |
Lonza Group † | | | 155 | | | | 29,309 | |
Merck | | | 310 | | | | 35,320 | |
Miraca Holdings | | | 700 | | | | 32,193 | |
Novartis | | | 3,549 | | | | 263,433 | |
Novo Nordisk Class B | | | 740 | | | | 25,414 | |
Orion Class B | | | 600 | | | | 31,281 | |
Ramsay Health Care | | | 575 | | | | 30,703 | |
Roche Holding | | | 490 | | | | 125,136 | |
Sanofi | | | 2,385 | | | | 215,300 | |
Shire | | | 2,130 | | | | 124,387 | |
Smith & Nephew | | | 1,900 | | | | 28,947 | |
Sumitomo Dainippon Pharma | | | 1,700 | | | | 28,066 | |
Teva Pharmaceutical Industries ADR | | | 3,547 | | | | 113,823 | |
| | | | | | | | |
| | | | | | | 1,342,791 | |
| | | | | | | | |
Industrials – 2.42% | | | | | |
ABB | | | 1,550 | | | | 36,257 | |
ANDRITZ | | | 530 | | | | 26,509 | |
Aurizon Holdings | | | 7,100 | | | | 28,478 | |
Deutsche Lufthansa | | | 2,150 | | | | 34,863 | |
Deutsche Post | | | 5,301 | | | | 181,557 | |
East Japan Railway | | | 2,125 | | | | 185,033 | |
Elbit Systems | | | 210 | | | | 24,035 | |
Fraport Frankfurt Airport Services Worldwide | | | 500 | | | | 35,380 | |
Fuji Electric | | | 5,000 | | | | 29,687 | |
ITOCHU | | | 14,837 | | | | 210,567 | |
Japan Airlines | | | 1,000 | | | | 31,672 | |
JTEKT | | | 1,700 | | | | 26,402 | |
Koninklijke Philips | | | 6,212 | | | | 199,670 | |
Legrand | | | 600 | | | | 36,177 | |
Leonardo † | | | 2,257 | | | | 31,999 | |
| | | | | | | | |
| | | Number of shares | | | Value (U.S. $) | |
| |
Common Stock (continued) | | | | | |
| |
Developed Markets§ (continued) | | | | | |
Industrials (continued) | | | | | |
Meggitt | | | 16,706 | | | $ | 93,206 | |
MINEBEA MITSUMI | | | 8,100 | | | | 108,044 | |
Mitsubishi Electric | | | 2,000 | | | | 28,689 | |
Mitsubishi Heavy Industries | | | 7,000 | | | | 28,080 | |
Rexel | | | 3,521 | | | | 63,931 | |
Rolls-Royce Holdings † | | | 3,200 | | | | 30,230 | |
Safran | | | 425 | | | | 31,751 | |
Securitas Class B | | | 1,550 | | | | 24,217 | |
Singapore Airlines | | | 2,600 | | | | 18,717 | |
Teleperformance | | | 1,177 | | | | 127,132 | |
Vestas Wind Systems | | | 345 | | | | 28,051 | |
Vinci | | | 2,709 | | | | 214,724 | |
Wolters Kluwer | | | 640 | | | | 26,603 | |
Yamato Holdings | | | 1,100 | | | | 23,046 | |
| | | | | | | | |
| | | | | | | 1,964,707 | |
| | | | | | | | |
Information Technology – 0.80% | | | | | |
Amadeus IT Group | | | 850 | | | | 43,126 | |
ASM Pacific Technology | | | 2,900 | | | | 39,443 | |
ASML Holding (New York Shares) † | | | 274 | | | | 36,387 | |
Atos | | | 335 | | | | 41,438 | |
Brother Industries | | | 1,600 | | | | 33,414 | |
CGI Group Class A † | | | 2,232 | | | | 106,947 | |
Infineon Technologies | | | 1,610 | | | | 32,882 | |
InterXion Holding † | | | 475 | | | | 18,791 | |
Nice | | | 380 | | | | 25,533 | |
Omron | | | 900 | | | | 39,491 | |
Playtech | | | 9,921 | | | | 115,723 | |
SAP | | | 470 | | | | 46,118 | |
Seiko Epson | | | 1,800 | | | | 37,898 | |
Trend Micro | | | 600 | | | | 26,677 | |
| | | | | | | | |
| | | | | | | 643,868 | |
| | | | | | | | |
Materials – 0.71% | | | | | |
Alamos Gold | | | 5,202 | | | | 41,777 | |
Amcor | | | 2,480 | | | | 28,534 | |
Anglo American † | | | 1,950 | | | | 29,794 | |
Anglo American ADR † | | | 1,800 | | | | 13,698 | |
BHP Billiton | | | 1,750 | | | | 27,056 | |
Boral | | | 5,300 | | | | 23,647 | |
Chr Hansen Holding | | | 380 | | | | 24,390 | |
Covestro 144A # | | | 360 | | | | 27,713 | |
Daicel | | | 2,300 | | | | 27,704 | |
EMS-Chemie Holding | | | 67 | | | | 39,030 | |
Fletcher Building | | | 3,500 | | | | 20,413 | |
Johnson Matthey | | | 630 | | | | 24,311 | |
Kuraray | | | 1,900 | | | | 28,808 | |
| | | | | | | | |
| | | Number of shares | | | Value (U.S. $) | |
| |
Common Stock (continued) | | | | | |
| |
Developed Markets§ (continued) | | | | | |
Materials (continued) | | | | | |
Rio Tinto | | | 2,462 | | | $ | 99,002 | |
Shin-Etsu Chemical | | | 500 | | | | 43,313 | |
South32 | | | 13,200 | | | | 27,834 | |
Umicore | | | 525 | | | | 29,908 | |
Yamana Gold | | | 7,153 | | | | 19,740 | |
| | | | | | | | |
| | | | | | | 576,672 | |
| | | | | | | | |
Real Estate – 0.09% | | | | | |
Azrieli Group † | | | 400 | | | | 21,223 | |
Daito Trust Construction | | | 200 | | | | 27,477 | |
Westfield | | | 4,050 | | | | 27,477 | |
| | | | | | | | |
| | | | | | | 76,177 | |
| | | | | | | | |
Telecommunication Services – 0.52% | | | | | |
KDDI | | | 1,600 | | | | 41,994 | |
Nippon Telegraph & Telephone | | | 4,144 | | | | 176,882 | |
Tele2 Class B | | | 11,994 | | | | 114,510 | |
Telenor | | | 1,400 | | | | 23,300 | |
Telstra | | | 8,500 | | | | 30,262 | |
Vodafone Group | | | 12,500 | | | | 32,591 | |
| | | | | | | | |
| | | | | | | 419,539 | |
| | | | | | | | |
Utilities – 0.08% | | | | | |
National Grid | | | 2,787 | | | | 35,390 | |
Tokyo Gas | | | 7,000 | | | | 31,853 | |
| | | | | | | | |
| | | | | | | 67,243 | |
| | | | | | | | |
Total Developed Markets
(cost $7,744,542) | | | | 9,629,015 | |
| | | | | | | | |
Emerging Markets X – 4.89% | | | | | |
Consumer Discretionary – 0.40% | | | | | |
Arcos Dorados Holdings Class A † | | | 4,200 | | | | 33,810 | |
Astra International | | | 72,500 | | | | 46,926 | |
B2W Cia Digital † | | | 17,435 | | | | 68,780 | |
Ctrip.com International ADR † | | | 1,000 | | | | 49,150 | |
Grupo Televisa ADR | | | 2,825 | | | | 73,281 | |
Hyundai Motor | | | 144 | | | | 20,281 | |
Woolworths Holdings | | | 5,692 | | | | 29,660 | |
| | | | | | | | |
| | | | | | | 321,888 | |
| | | | | | | | |
Consumer Staples – 0.69% | | | | | |
Anadolu Efes Biracilik Ve Malt Sanayii | | | 3,371 | | | | 18,374 | |
BRF ADR | | | 2,700 | | | | 33,075 | |
China Mengniu Dairy | | | 16,000 | | | | 33,147 | |
Cia Brasileira de Distribuicao ADR | | | 1,600 | | | | 30,720 | |
Cia Cervecerias Unidas ADR | | | 1,300 | | | | 32,851 | |
Schedules of investments
Delaware Foundation® Conservative Allocation Fund
| | | | | | | | |
| | | Number of shares | | | Value (U.S. $) | |
| |
Common Stock (continued) | | | | | |
| |
Emerging Markets X (continued) | | | | | |
Consumer Staples (continued) | | | | | |
Coca-Cola Femsa ADR | | | 1,230 | | | $ | 88,191 | |
Fomento Economico Mexicano ADR | | | 600 | | | | 53,112 | |
JBS | | | 3,200 | | | | 10,487 | |
Lotte Chilsung Beverage | | | 29 | | | | 36,694 | |
Lotte Confectionery | | | 330 | | | | 56,657 | |
Tingyi Cayman Islands Holding | | | 33,908 | | | | 42,584 | |
Uni-President China Holdings | | | 70,600 | | | | 49,692 | |
Wal-Mart de Mexico | | | 9,590 | | | | 22,128 | |
X5 Retail Group GDR † | | | 1,540 | | | | 51,821 | |
| | | | | | | | |
| | | | | | | 559,533 | |
| | | | | | | | |
Energy – 0.71% | | | | | |
Cairn India | | | 6,469 | | | | 30,470 | |
China Petroleum & Chemical | | | 37,350 | | | | 30,278 | |
Gazprom PJSC ADR | | | 11,842 | | | | 52,934 | |
Lukoil PJSC ADR | | | 1,000 | | | | 53,060 | |
Petroleo Brasileiro ADR † | | | 6,419 | | | | 62,200 | |
PTT | | | 3,841 | | | | 43,258 | |
Reliance Industries GDR 144A # | | | 6,684 | | | | 269,365 | |
Rosneft Oil PJSC GDR | | | 6,870 | | | | 39,090 | |
| | | | | | | | |
| | | | | | | 580,655 | |
| | | | | | | | |
Financials – 0.63% | | | | | |
Akbank | | | 24,861 | | | | 58,348 | |
Banco Bradesco ADR | | | 4,800 | | | | 49,152 | |
Bangkok Bank | | | 6,096 | | | | 32,199 | |
Grupo Financiero Banorte | | | 4,500 | | | | 25,896 | |
Grupo Financiero Santander Mexico Class B ADR | | | 4,200 | | | | 37,926 | |
ICICI Bank ADR | | | 8,000 | | | | 68,800 | |
Industrial & Commercial Bank of China | | | 24,000 | | | | 15,688 | |
Itau Unibanco Holding ADR | | | 5,703 | | | | 68,835 | |
KB Financial Group ADR | | | 927 | | | | 40,760 | |
Samsung Life Insurance | | | 565 | | | | 54,818 | |
Sberbank of Russia
PJSC = | | | 20,758 | | | | 58,942 | |
| | | | | | | | |
| | | | | | | 511,364 | |
| | | | | | | | |
Healthcare – 0.03% | | | | | |
Hypermarcas | | | 2,600 | | | | 24,085 | |
| | | | | | | | |
| | | | | | | 24,085 | |
| | | | | | | | |
Industrials – 0.08% | | | | | |
Gol Linhas Aereas Inteligentes ADR † | | | 510 | | | | 13,515 | |
KCC | | | 124 | | | | 39,252 | |
Rumo † | | | 1,072 | | | | 2,931 | |
| | | | | | | | |
| | | Number of shares | | | Value (U.S. $) | |
| |
Common Stock (continued) | | | | | |
| |
Emerging Markets X (continued) | | | | | |
Industrials (continued) | | | | | |
Santos Brasil Participacoes † | | | 8,500 | | | $ | 6,163 | |
ZTO Express Cayman ADR † | | | 87 | | | | 1,139 | |
| | | | | | | | |
| | | | | | | 63,000 | |
| | | | | | | | |
Information Technology – 1.36% | | | | | |
Alibaba Group Holding ADR † | | | 1,190 | | | | 128,318 | |
Baidu ADR † | | | 650 | | | | 112,138 | |
Hon Hai Precision Industry | | | 15,468 | | | | 46,390 | |
MediaTek | | | 9,000 | | | | 63,772 | |
Samsung Electronics | | | 129 | | | | 237,629 | |
Samsung SDI | | | 243 | | | | 29,987 | |
SINA † | | | 1,100 | | | | 79,332 | |
Sohu.com † | | | 2,000 | | | | 78,660 | |
Taiwan Semiconductor Manufacturing | | | 14,034 | | | | 87,416 | |
Taiwan Semiconductor Manufacturing ADR | | | 2,000 | | | | 65,680 | |
Tencent Holdings | | | 4,900 | | | | 140,477 | |
Weibo ADR † | | | 110 | | | | 5,740 | |
WNS Holdings ADR † | | | 845 | | | | 24,175 | |
| | | | | | | | |
| | | | | | | 1,099,714 | |
| | | | | | | | |
Materials – 0.22% | | | | | |
Braskem ADR | | | 1,400 | | | | 28,490 | |
Cemex ADR † | | | 3,943 | | | | 35,763 | |
Cemex Latam Holdings † | | | 2,673 | | | | 9,855 | |
Cia de Minas Buenaventura ADR | | | 1,300 | | | | 15,652 | |
Impala Platinum
Holdings † | | | 1,419 | | | | 4,783 | |
Sociedad Quimica y Minera de Chile ADR | | | 600 | | | | 20,622 | |
UltraTech Cement | | | 1,071 | | | | 65,722 | |
| | | | | | | | |
| | | | | | | 180,887 | |
| | | | | | | | |
Real Estate – 0.07% | | | | | |
Etalon Group GDR
144A #= | | | 3,700 | | | | 13,986 | |
IRSA Inversiones y Representaciones
ADR † | | | 900 | | | | 22,059 | |
UEM Sunrise | | | 67,159 | | | | 19,273 | |
| | | | | | | | |
| | | | | | | 55,318 | |
| | | | | | | | |
Telecommunication Services – 0.70% | | | | | |
America Movil Class L ADR | | | 3,726 | | | | 52,797 | |
China Mobile | | | 8,294 | | | | 90,768 | |
China Mobile ADR | | | 200 | | | | 11,046 | |
LG Uplus | | | 2,011 | | | | 25,715 | |
Mobile TeleSystems ADR | | | 1,600 | | | | 17,648 | |
SK Telecom ADR | | | 6,800 | | | | 171,224 | |
Telefonica Brasil ADR | | | 4,350 | | | | 64,597 | |
| | | | | | | | |
| | | Number of shares | | | Value (U.S. $) | |
| |
Common Stock (continued) | | | | | |
| |
Emerging Markets X (continued) | | | | | |
Telecommunication Services (continued) | |
TIM Participacoes ADR | | | 4,900 | | | $ | 78,302 | |
Turkcell Iletisim Hizmetleri ADR † | | | 2,687 | | | | 22,248 | |
VEON ADR | | | 4,600 | | | | 18,768 | |
Vodacom Group | | | 1,604 | | | | 18,173 | |
| | | | | | | | |
| | | | | | | 571,286 | |
| | | | | | | | |
Total Emerging Markets
(cost $3,448,872) | | | | | | | 3,967,730 | |
| | | | | | | | |
Total Common Stock
(cost $21,069,058) | | | | | | | 29,161,161 | |
| | | | | | | | |
|
| |
Exchange-Traded Funds – 1.26% | | | | | |
| |
iShares MSCI EAFE ETF | | | 70 | | | | 4,360 | |
iShares MSCI EAFE Growth ETF | | | 310 | | | | 21,542 | |
iShares Russell 1000 Growth ETF | | | 6,820 | | | | 776,116 | |
Vanguard FTSE Developed Markets ETF | | | 390 | | | | 15,327 | |
Vanguard Mega Cap Growth ETF | | | 980 | | | | 93,796 | |
Vanguard Russell 1000 Growth ETF | | | 950 | | | | 110,865 | |
| | | | | | | | |
Total Exchange-Traded Funds (cost $980,237) | | | | | | | 1,022,006 | |
| | | | | | | | |
| | |
| | | Principal
amount° | | | | |
| |
Agency Collateralized Mortgage
Obligations – 10.49% | |
| |
Fannie Mae REMICs | | | | | | | | |
Series 1996-46 ZA 7.50% 11/25/26 | | | 931 | | | | 1,080 | |
Series 2005-70 PA 5.50% 8/25/35 | | | 3,714 | | | | 4,151 | |
Series 2008-15 SB 5.618% 8/25/36 S• | | | 22,303 | | | | 4,234 | |
Series 2010-41 PN 4.50% 4/25/40 | | | 60,000 | | | | 64,741 | |
Series 2010-43 HJ 5.50% 5/25/40 | | | 6,705 | | | | 7,482 | |
Series 2010-96 DC 4.00% 9/25/25 | | | 59,341 | | | | 63,431 | |
Series 2010-129 SM 5.018% 11/25/40 S• | | | 64,179 | | | | 10,400 | |
Series 2012-51 SA 5.518% 5/25/42 S• | | | 56,390 | | | | 12,981 | |
| | | | | | | | |
| | | Principal
amount° | | | Value (U.S. $) | |
| |
Agency Collateralized Mortgage Obligations (continued) | |
| |
Fannie Mae REMICs | | | | | | | | |
Series 2012-98 MI 3.00% 8/25/31 S | | | 87,364 | | | $ | 9,866 | |
Series 2012-99 AI 3.50% 5/25/39 S | | | 200,698 | | | | 21,407 | |
Series 2012-118 AI 3.50% 11/25/37 S | | | 53,601 | | | | 6,549 | |
Series 2012-120 WI 3.00% 11/25/27 S | | | 49,402 | | | | 5,000 | |
Series 2012-125 MI 3.50% 11/25/42 S | | | 162,331 | | | | 32,506 | |
Series 2013-7 EI 3.00% 10/25/40 S | | | 1,854,498 | | | | 249,699 | |
Series 2013-26 ID 3.00% 4/25/33 S | | | 104,198 | | | | 14,617 | |
Series 2013-38 AI 3.00% 4/25/33 S | | | 96,889 | | | | 13,111 | |
Series 2013-43 IX 4.00% 5/25/43 S | | | 262,074 | | | | 61,912 | |
Series 2013-44 DI 3.00% 5/25/33 S | | | 311,359 | | | | 49,666 | |
Series 2013-45 PI 3.00% 5/25/33 S | | | 150,220 | | | | 22,146 | |
Series 2013-51 PI 3.00% 11/25/32 S | | | 152,676 | | | | 18,166 | |
Series 2013-55 AI 3.00% 6/25/33 S | | | 105,574 | | | | 15,276 | |
Series 2013-59 PY 2.50% 6/25/43 | | | 30,000 | | | | 27,397 | |
Series 2013-62 PY 2.50% 6/25/43 | | | 25,000 | | | | 22,869 | |
Series 2013-64 KI 3.00% 2/25/33 S | | | 489,202 | | | | 64,599 | |
Series 2013-69 IJ 3.00% 7/25/33 S | | | 62,762 | | | | 9,126 | |
Series 2013-71 ZA 3.50% 7/25/43 | | | 29,641 | | | | 29,710 | |
Series 2014-25 DI 3.50% 8/25/32 S | | | 58,449 | | | | 6,664 | |
Series 2014-36 ZE 3.00% 6/25/44 | | | 70,759 | | | | 64,625 | |
Series 2014-68 BS 5.168% 11/25/44 S• | | | 92,705 | | | | 18,144 | |
Series 2015-11 BI 3.00% 1/25/33 S | | | 63,374 | | | | 6,491 | |
Series 2015-40 GZ 3.50% 5/25/45 | | | 11,728 | | | | 11,157 | |
Series 2015-44 Z 3.00% 9/25/43 | | | 93,791 | | | | 90,661 | |
Series 2015-71 PI 4.00% 3/25/43 S | | | 291,664 | | | | 47,827 | |
Schedules of investments
Delaware Foundation® Conservative Allocation Fund
| | | | | | | | |
| | | Principal
amount° | | | Value (U.S. $) | |
| |
Agency Collateralized Mortgage Obligations (continued) | |
| |
Fannie Mae REMICs | | | | | | | | |
Series 2015-95 SH 5.018% 1/25/46 S● | | | 88,131 | | | $ | 18,875 | |
Series 2016-2 HI 3.00% 12/25/41 S | | | 138,468 | | | | 18,515 | |
Series 2016-17 BI 4.00% 2/25/43 S | | | 753,669 | | | | 128,387 | |
Series 2016-33 DI 3.50% 6/25/36 S | | | 85,201 | | | | 13,337 | |
Series 2016-54 PI 3.00% 2/25/44 S | | | 142,072 | | | | 17,627 | |
Series 2016-62 SA 5.018% 9/25/46 S● | | | 120,980 | | | | 29,030 | |
Series 2016-74 GS 5.018% 10/25/46 S● | | | 1,119,718 | | | | 275,798 | |
Series 2016-80 BZ 3.00% 11/25/46 | | | 163,023 | | | | 142,965 | |
Series 2016-80 CZ 3.00% 11/25/46 | | | 141,759 | | | | 124,307 | |
Series 2016-80 JZ 3.00% 11/25/46 | | | 15,188 | | | | 13,779 | |
Series 2016-90 CI 3.00% 2/25/45 S | | | 1,070,392 | | | | 164,725 | |
Series 2016-95 IO 3.00% 12/25/46 S | | | 1,612,829 | | | | 318,599 | |
Series 2016-95 LZ 2.50% 12/25/46 | | | 75,627 | | | | 61,461 | |
Series 2016-95 US 5.018% 12/25/46 S● | | | 1,693,378 | | | | 371,476 | |
Series 2016-99 TI 3.50% 3/25/36 S | | | 92,885 | | | | 12,788 | |
Series 2017-6 NI 3.50% 3/25/46 S | | | 99,153 | | | | 15,768 | |
Series 2017-16 YT 3.00% 7/25/46 | | | 30,000 | | | | 29,372 | |
Series 2017-24 AI 3.00% 8/25/46 S | | | 100,000 | | | | 13,250 | |
Freddie Mac REMICs | | | | | | | | |
Series 2512 PG 5.50% 10/15/22 | | | 33,543 | | | | 36,345 | |
Series 2621 QH 5.00% 5/15/33 | | | 367 | | | | 393 | |
Series 2708 ZD 5.50% 11/15/33 | | | 9,958 | | | | 11,073 | |
Series 4065 DE 3.00% 6/15/32 | | | 15,000 | | | | 15,093 | |
Series 4100 EI 3.00% 8/15/27 S | | | 81,147 | | | | 8,202 | |
Series 4109 AI 3.00% 7/15/31 S | | | 176,636 | | | | 19,011 | |
| | | | | | | | |
| | | Principal
amount° | | | Value (U.S. $) | |
| |
Agency Collateralized Mortgage Obligations (continued) | |
| |
Freddie Mac REMICs | | | | | | | | |
Series 4120 IK 3.00% 10/15/32 S | | | 135,330 | | | $ | 18,478 | |
Series 4136 EZ 3.00% 11/15/42 | | | 15,827 | | | | 15,554 | |
Series 4146 IA 3.50% 12/15/32 S | | | 71,132 | | | | 11,202 | |
Series 4161 IM 3.50% 2/15/43 S | | | 68,737 | | | | 15,559 | |
Series 4181 DI 2.50% 3/15/33 S | | | 64,596 | | | | 7,266 | |
Series 4184 GS 5.208% 3/15/43 S● | | | 69,415 | | | | 15,812 | |
Series 4185 LI 3.00% 3/15/33 S | | | 75,493 | | | | 10,543 | |
Series 4186 IE 3.00% 3/15/33 S | | | 1,304,847 | | | | 183,585 | |
Series 4191 CI 3.00% 4/15/33 S | | | 65,956 | | | | 9,275 | |
Series 4206 DZ 3.00% 5/15/33 | | | 35,622 | | | | 34,718 | |
Series 4223 HI 3.00% 4/15/30 S | | | 334,370 | | | | 26,363 | |
Series 4342 CI 3.00% 11/15/33 S | | | 64,294 | | | | 8,329 | |
Series 4366 DI 3.50% 5/15/33 S | | | 173,558 | | | | 23,637 | |
Series 4433 DI 3.00% 8/15/32 S | | | 676,543 | | | | 68,279 | |
Series 4435 DY 3.00% 2/15/35 | | | 73,000 | | | | 72,457 | |
Series 4476 GI 3.00% 6/15/41 S | | | 153,619 | | | | 17,665 | |
Series 4518 CI 3.50% 6/15/42 S | | | 281,194 | | | | 38,145 | |
Series 4567 LI 4.00% 8/15/45 S | | | 752,677 | | | | 142,718 | |
Series 4574 AI 3.00% 4/15/31 S | | | 291,365 | | | | 37,308 | |
Series 4581 LI 3.00% 5/15/36 S | | | 86,514 | | | | 12,099 | |
Series 4592 WT 5.50% 6/15/46 | | | 139,512 | | | | 155,705 | |
Series 4594 SG 5.088% 6/15/46 S● | | | 186,912 | | | | 45,650 | |
Series 4596 ZH 3.00% 11/15/45 | | | 731,249 | | | | 730,469 | |
Series 4614 HB 2.50% 9/15/46 | | | 32,000 | | | | 28,607 | |
Series 4618 SA 5.088% 9/15/46 S● | | | 97,335 | | | | 23,893 | |
| | | | |
| | | Principal
amount° | | Value (U.S. $) |
| | | | | | | | |
Agency Collateralized Mortgage Obligations (continued) | |
| |
Freddie Mac REMICs | | | | | |
Series 4623 IY 4.00% 10/15/46 S | | | 98,331 | | | $ | 22,130 | |
Series 4623 LZ 2.50% 10/15/46 | | | 121,255 | | | | 103,445 | |
Series 4623 MW 2.50% 10/15/46 | | | 225,000 | | | | 204,312 | |
Series 4623 WI 4.00% 8/15/44 S | | | 132,329 | | | | 24,610 | |
Series 4643 QI 3.50% 9/15/45 S | | | 218,553 | | | | 35,997 | |
Series 4648 ND 3.00% 9/15/46 | | | 12,000 | | | | 11,425 | |
Series 4648 SA 5.088% 1/15/47 S● | | | 1,258,179 | | | | 287,590 | |
Series 4656 HI 3.50% 5/15/42 S | | | 99,646 | | | | 12,358 | |
Series 4657 NW 3.00% 4/15/45 | | | 12,000 | | | | 11,858 | |
Series 4660 GI 3.00% 8/15/43 S | | | 99,787 | | | | 14,247 | |
Freddie Mac Strips | | | | | | | | |
Series 267 S5 5.088% 8/15/42 S● | | | 89,285 | | | | 18,095 | |
Series 299 S1 5.088% 1/15/43 S● | | | 66,884 | | | | 13,691 | |
Series 326 S2 5.038% 3/15/44 S● | | | 73,900 | | | | 14,637 | |
GNMA | | | | | | | | |
Series 2010-113 KE 4.50% 9/20/40 | | | 140,000 | | | | 152,568 | |
Series 2012-136 MX 2.00% 11/20/42 | | | 240,000 | | | | 217,618 | |
Series 2013-113 AZ 3.00% 8/20/43 | | | 90,181 | | | | 85,528 | |
Series 2013-113 LY 3.00% 5/20/43 | | | 138,000 | | | | 135,991 | |
Series 2015-64 GZ 2.00% 5/20/45 | | | 33,194 | | | | 26,994 | |
Series 2015-74 CI 3.00% 10/16/39 S | | | 75,677 | | | | 9,605 | |
Series 2015-82 GI 3.50% 12/20/38 S | | | 116,888 | | | | 11,745 | |
Series 2015-133 AL 3.00% 5/20/45 | | | 96,000 | | | | 93,791 | |
Series 2015-142 AI 4.00% 2/20/44 S | | | 68,429 | | | | 8,655 | |
Series 2016-5 GL 3.00% 7/20/45 | | | 140,000 | | | | 136,485 | |
Series 2016-101 QL 3.00% 7/20/46 | | | 356,000 | | | | 336,642 | |
| | | | | | | | |
| | | Principal amount° | | | Value
(U.S. $) | |
| |
Agency Collateralized Mortgage Obligations (continued) | |
| |
GNMA | | | | | | | | |
Series 2016-108 YL 3.00% 8/20/46 | | | 1,720,000 | | | $ | 1,615,474 | |
Series 2016-111 PB 2.50% 8/20/46 | | | 30,000 | | | | 26,989 | |
Series 2016-134 MW 3.00% 10/20/46 | | | 140,000 | | | | 139,366 | |
Series 2016-135 Z 3.00% 10/20/46 | | | 5,063 | | | | 4,586 | |
Series 2016-160 VZ 2.50% 11/20/46 | | | 14,117 | | | | 11,495 | |
Series 2017-4 BW 3.00% 1/20/47 | | | 12,000 | | | | 11,308 | |
Series 2017-25 CZ 3.50% 2/20/47 | | | 5,015 | | | | 5,001 | |
| | | | | | | | |
Total Agency Collateralized Mortgage Obligations
(cost $8,576,981) | | | | | | | 8,505,419 | |
| | | | | | | | |
|
| |
Agency Commercial Mortgage-Backed Securities - 0.68% | |
| |
Freddie Mac Multifamily | | | | | | | | |
Structured Pass Through Certificates | | | | | | | | |
Series K037 A2 3.49% 1/25/24 ◆ | | | 60,000 | | | | 63,571 | |
Series KS03 A4 3.161% 5/25/25 ◆● | | | 50,000 | | | | 50,428 | |
FREMF Mortgage Trust | | | | | | | | |
Series 2011-K14 B 144A 5.167% 2/25/47 #● | | | 20,000 | | | | 21,860 | |
Series 2011-K15 B 144A 4.949% 8/25/44 #● | | | 10,000 | | | | 10,862 | |
Series 2012-K18 B 144A 4.256% 1/25/45 #● | | | 30,000 | | | | 31,744 | |
Series 2012-K22 B 144A 3.686% 8/25/45 #● | | | 50,000 | | | | 51,393 | |
Series 2012-K708 B 144A 3.752% 2/25/45 #● | | | 45,000 | | | | 45,990 | |
Series 2013-K32 B 144A 3.538% 10/25/46 #● | | | 110,000 | | | | 109,945 | |
Series 2013-K33 B 144A 3.502% 8/25/46 #● | | | 50,000 | | | | 49,693 | |
Series 2013-K712 B 144A 3.365% 5/25/45 #● | | | 25,000 | | | | 25,498 | |
Series 2013-K713 B 144A 3.166% 4/25/46 #● | | | 15,000 | | | | 15,217 | |
Schedules of investments
Delaware Foundation® Conservative Allocation Fund
| | | | | | | | |
| | | Principal amount° | | | Value
(U.S. $) | |
| |
Agency Commercial Mortgage-Backed
Securities (continued) | |
| |
FREMF Mortgage Trust | | | | | | | | |
Series 2013 -K713 C 144A 3.166% 4/25/46 #● | | | 75,000 | | | $ | 75,192 | |
| | | | | | | | |
Total Agency Commercial Mortgage-Backed Securities
(cost $553,625) | | | | | | | 551,393 | |
| | | | | | | | |
|
| |
Agency Mortgage-Backed Securities – 9.58% | |
| |
Fannie Mae S.F. 30 yr | | | | | | | | |
4.50% 5/1/39 | | | 47,269 | | | | 50,985 | |
4.50% 2/1/46 | | | 240,563 | | | | 258,639 | |
5.00% 11/1/33 | | | 503 | | | | 551 | |
5.00% 8/1/35 | | | 1,679 | | | | 1,837 | |
5.00% 10/1/35 | | | 241,872 | | | | 264,641 | |
5.00% 10/1/36 | | | 711 | | | | 778 | |
5.00% 12/1/36 | | | 539 | | | | 589 | |
5.50% 3/1/34 | | | 47,670 | | | | 53,439 | |
5.50% 4/1/34 | | | 792 | | | | 887 | |
5.50% 11/1/34 | | | 2,620 | | | | 2,934 | |
5.50% 2/1/35 | | | 1,481 | | | | 1,658 | |
5.50% 8/1/37 | | | 7,827 | | | | 8,765 | |
5.50% 1/1/38 | | | 79,373 | | | | 88,754 | |
5.50% 3/1/38 | | | 19,820 | | | | 22,221 | |
5.50% 12/1/38 | | | 766 | | | | 858 | |
5.50% 7/1/40 | | | 22,393 | | | | 25,052 | |
5.50% 6/1/41 | | | 52,767 | | | | 59,109 | |
5.50% 5/1/44 | | | 998,963 | | | | 1,117,877 | |
6.00% 3/1/34 | | | 4,147 | | | | 4,747 | |
6.00% 8/1/34 | | | 6,951 | | | | 7,935 | |
6.00% 11/1/34 | | | 198 | | | | 225 | |
6.00% 4/1/35 | | | 95,477 | | | | 108,839 | |
6.00% 6/1/35 | | | 82,456 | | | | 93,907 | |
6.00% 7/1/35 | | | 24,285 | | | | 27,557 | |
6.00% 12/1/35 | | | 33,754 | | | | 38,356 | |
6.00% 5/1/36 | | | 77,088 | | | | 87,261 | |
6.00% 6/1/36 | | | 123,120 | | | | 142,486 | |
6.00% 9/1/36 | | | 65,119 | | | | 73,867 | |
6.00% 12/1/36 | �� | | 2,790 | | | | 3,176 | |
6.00% 2/1/37 | | | 9,052 | | | | 10,224 | |
6.00% 5/1/37 | | | 80,994 | | | | 91,924 | |
6.00% 6/1/37 | | | 1,524 | | | | 1,738 | |
6.00% 7/1/37 | | | 1,197 | | | | 1,351 | |
6.00% 8/1/37 | | | 115,299 | | | | 130,835 | |
6.00% 9/1/37 | | | 66,378 | | | | 75,076 | |
6.00% 11/1/37 | | | 503 | | | | 568 | |
6.00% 3/1/38 | | | 170,621 | | | | 194,513 | |
6.00% 5/1/38 | | | 51,850 | | | | 58,734 | |
6.00% 9/1/38 | | | 9,033 | | | | 10,319 | |
| | | | | | | | |
| | | Principal amount° | | | Value
(U.S. $) | |
| |
Agency Mortgage-Backed Securities (continued) | |
| |
Fannie Mae S.F. 30 yr | | | | | | | | |
6.00% 10/1/38 | | | 3,558 | | | $ | 4,017 | |
6.00% 9/1/39 | | | 244,950 | | | | 279,182 | |
6.00% 10/1/39 | | | 98,647 | | | | 112,925 | |
6.00% 3/1/40 | | | 34,784 | | | | 39,269 | |
6.00% 9/1/40 | | | 10,972 | | | | 12,400 | |
6.00% 11/1/40 | | | 4,646 | | | | 5,322 | |
6.00% 5/1/41 | | | 71,237 | | | | 80,526 | |
6.00% 6/1/41 | | | 33,124 | | | | 37,422 | |
6.00% 7/1/41 | | | 28,766 | | | | 32,478 | |
6.50% 3/1/40 | | | 63,491 | | | | 71,839 | |
Fannie Mae S.F. 30 yr TBA | | | | | | | | |
4.50% 4/1/47 | | | 3,003,000 | | | | 3,215,088 | |
Freddie Mac ARM | | | | | | | | |
2.553% 10/1/46● | | | 75,257 | | | | 75,585 | |
Freddie Mac S.F. 30 yr | | | | | | | | |
5.00% 5/1/41 | | | 52,896 | | | | 58,272 | |
5.50% 3/1/34 | | | 3,338 | | | | 3,753 | |
5.50% 12/1/34 | | | 3,078 | | | | 3,461 | |
5.50% 9/1/37 | | | 2,754 | | | | 3,054 | |
5.50% 3/1/40 | | | 10,354 | | | | 11,478 | |
5.50% 8/1/40 | | | 6,919 | | | | 7,671 | |
5.50% 6/1/41 | | | 61,257 | | | | 68,691 | |
6.00% 5/1/35 | | | 9,133 | | | | 10,402 | |
6.00% 2/1/36 | | | 6,503 | | | | 7,403 | |
6.00% 3/1/36 | | | 8,576 | | | | 9,774 | |
6.00% 8/1/38 | | | 28,320 | | | | 32,456 | |
6.00% 10/1/38 | | | 3,393 | | | | 3,881 | |
6.00% 3/1/40 | | | 86,255 | | | | 97,374 | |
6.00% 5/1/40 | | | 33,890 | | | | 38,379 | |
6.00% 7/1/40 | | | 16,538 | | | | 18,747 | |
6.50% 12/1/31 | | | 2,093 | | | | 2,364 | |
GNMA II S.F. 30 yr | | | | | | | | |
5.00% 9/20/46 | | | 113,012 | | | | 121,355 | |
5.50% 5/20/37 | | | 12,374 | | | | 13,764 | |
5.50% 4/20/40 | | | 11,192 | | | | 12,236 | |
6.00% 2/20/39 | | | 15,625 | | | | 17,714 | |
6.00% 10/20/39 | | | 15,865 | | | | 17,720 | |
6.00% 2/20/40 | | | 53,343 | | | | 59,752 | |
6.00% 4/20/46 | | | 17,543 | | | | 19,632 | |
6.50% 6/20/39 | | | 18,961 | | | | 21,464 | |
6.50% 10/20/39 | | | 16,254 | | | | 18,347 | |
| | | | | | | | |
Total Agency Mortgage-Backed Securities
(cost $7,767,806) | | | | | | | 7,768,409 | |
| | | | | | | | |
| | | | | | | | |
| | | Principal amount° | | | Value
(U.S. $) | |
| |
Collateralized Debt Obligations – 1.79% | |
| |
AMMC CLO | | | | | | | | |
Series 2015-16A AR 144A 2.42% 4/14/29 #● | | | 100,000 | | | $ | 99,950 | |
Cedar Funding VI CLO | | | | | | | | |
Series 2016-6A A1 144A 2.344% 10/20/28 #● | | | 250,000 | | | | 250,523 | |
Cent CLO | | | | | | | | |
Series 2013-20A A 144A 2.518% 1/25/26 #● | | | 150,000 | | | | 149,941 | |
GoldentTree Loan Management US CLO | | | | | | | | |
Series 2017-1A A 144A 2.38% 4/20/29 #● | | | 250,000 | | | | 250,905 | |
JFIN CLO | | | | | | | | |
Series 2017-1A A1 144A 2.324% 4/24/29 #● | | | 100,000 | | | | 100,150 | |
Magnetite IX | | | | | | | | |
Series 2014-9A A1 144A 2.458% 7/25/26 #● | | | 250,000 | | | | 250,250 | |
TIAA CLO II | | | | | | | | |
Series 2017-1A A 144A 2.49% 4/20/29 #● | | | 250,000 | | | | 249,781 | |
Venture XXIV CLO | | | | | | | | |
Series 2016-24A A1D 144A 2.419% 10/20/28 #● | | | 100,000 | | | | 100,133 | |
| | | | | | | | |
Total Collateralized Debt Obligations
(cost $1,447,150) | | | | | | | 1,451,633 | |
| | | | | | | | |
|
| |
Convertible Bond – 0.13% | |
| |
Clearwire Communications 144A 8.25% exercise price $7.08, maturity date 12/1/40 # | | | 100,000 | | | | 103,875 | |
| | | | | | | | |
Total Convertible Bond
(cost $104,500) | | | | | | | 103,875 | |
| | | | | | | | |
| |
Corporate Bonds – 30.07% | |
| |
Banking - 5.97% | | | | | | | | |
Bank Nederlandse Gemeenten 3.50% 7/19/27 | | AUD | 16,000 | | | | 12,140 | |
Bank of America | | | | | | | | |
3.124% 1/20/23 ● | | | 215,000 | | | | 216,066 | |
3.248% 10/21/27 | | | 25,000 | | | | 23,848 | |
3.30% 8/5/21 | | AUD | 10,000 | | | | 7,617 | |
3.824% 1/20/28 ● | | | 70,000 | | | | 70,285 | |
4.183% 11/25/27 | | | 50,000 | | | | 50,277 | |
| | | | | | | | |
| | | Principal amount° | | | Value
(U.S. $) | |
| |
Corporate Bonds (continued) | |
| |
Banking (continued) | | | | | |
Bank of New York Mellon | | | | | | | | |
2.15% 2/24/20 | | | 15,000 | | | $ | 15,066 | |
2.20% 8/16/23 | | | 45,000 | | | | 43,234 | |
2.50% 4/15/21 | | | 115,000 | | | | 115,355 | |
3.442% 2/7/28 ● | | | 90,000 | | | | 90,787 | |
4.625% 12/29/49 ● | | | 60,000 | | | | 57,750 | |
Barclays 4.337% 1/10/28 | | | 200,000 | | | | 200,008 | |
BB&T 2.45% 1/15/20 | | | 60,000 | | | | 60,630 | |
Citigroup | | | | | | | | |
1.80% 1/10/20 ● | | | 260,000 | | | | 260,974 | |
3.75% 10/27/23 | | AUD | 59,000 | | | | 45,081 | |
Citizens Financial Group | | | | | | | | |
2.375% 7/28/21 | | | 25,000 | | | | 24,675 | |
4.30% 12/3/25 | | | 55,000 | | | | 56,783 | |
Credit Suisse Group 144A 6.25% 12/29/49 #● | | | 200,000 | | | | 203,592 | |
Credit Suisse Group Funding Guernsey 4.55% 4/17/26 | | | 250,000 | | | | 258,840 | |
Export-Import Bank of India 144A 3.375% 8/5/26 # | | | 200,000 | | | | 191,554 | |
Export-Import Bank of Korea 4.00% 6/7/27 | | AUD | 10,000 | | | | 7,606 | |
Fifth Third Bancorp | | | | | | | | |
2.875% 7/27/20 | | | 25,000 | | | | 25,341 | |
Goldman Sachs Group | | | | | | | | |
3.85% 1/26/27 | | | 40,000 | | | | 40,257 | |
5.15% 5/22/45 | | | 105,000 | | | | 110,526 | |
5.20% 12/17/19 | | NZD | 18,000 | | | | 13,097 | |
Huntington Bancshares 2.30% 1/14/22 | | | 35,000 | | | | 34,120 | |
JPMorgan Chase & Co. | | | | | | | | |
3.782% 2/1/28 ● | | | 90,000 | | | | 90,944 | |
4.25% 11/2/18 | | NZD | 85,000 | | | | 60,483 | |
4.25% 10/1/27 | | | 70,000 | | | | 71,988 | |
KeyBank 3.40% 5/20/26 | | | 250,000 | | | | 243,568 | |
KeyCorp 5.00% 12/29/49 ● | | | 75,000 | | | | 74,437 | |
Landwirtschaftliche Rentenbank | | | | | | | | |
5.375% 4/23/24 | | NZD | 125,000 | | | | 95,722 | |
Lloyds Banking Group | | | | | | | | |
3.00% 1/11/22 | | | 200,000 | | | | 199,054 | |
Morgan Stanley | | | | | | | | |
2.625% 11/17/21 | | | 85,000 | | | | 84,418 | |
3.625% 1/20/27 | | | 50,000 | | | | 49,715 | |
3.95% 4/23/27 | | | 25,000 | | | | 24,805 | |
5.00% 9/30/21 | | AUD | 54,000 | | | | 44,077 | |
PNC Financial Services Group | | | | | | | | |
5.00% 12/29/49 ● | | | 65,000 | | | | 64,837 | |
Schedules of investments
Delaware Foundation® Conservative Allocation Fund
| | | | | | | | |
| | | Principal amount° | | | Value
(U.S. $) | |
| |
Corporate Bonds (continued) | |
| |
Banking (continued) | | | | | |
Royal Bank of Canada | | | | | | | | |
2.75% 2/1/22 | | | 95,000 | | | $ | 95,923 | |
Royal Bank of Scotland Group | | | | | | | | |
3.875% 9/12/23 | | | 200,000 | | | | 197,362 | |
State Street | | | | | | | | |
2.55% 8/18/20 | | | 60,000 | | | | 60,827 | |
3.55% 8/18/25 | | | 50,000 | | | | 51,434 | |
SunTrust Banks | | | | | | | | |
2.70% 1/27/22 | | | 70,000 | | | | 69,788 | |
Toronto-Dominion Bank | | | | | | | | |
2.125% 4/7/21 | | | 160,000 | | | | 158,658 | |
2.50% 12/14/20 | | | 40,000 | | | | 40,351 | |
3.625% 9/15/31 ● | | | 65,000 | | | | 63,758 | |
U.S. Bancorp 3.10% 4/27/26 | | | 75,000 | | | | 73,721 | |
UBS Group Funding Jersey | | | | | | | | |
144A 3.00% 4/15/21 # | | | 200,000 | | | | 200,517 | |
USB Capital IX | | | | | | | | |
3.50% 10/29/49 ● | | | 145,000 | | | | 123,431 | |
Wells Fargo & Co. | | | | | | | | |
3.069% 1/24/23 | | | 300,000 | | | | 301,485 | |
Zions Bancorporation | | | | | | | | |
4.50% 6/13/23 | | | 60,000 | | | | 62,271 | |
| | | | | | | | |
| | | | | | | 4,839,083 | |
| | | | | | | | |
Basic Industry – 2.49% | | | | | | | | |
Boise Cascade 144A
5.625% 9/1/24 # | | | 55,000 | | | | 56,100 | |
Builders FirstSource 144A
5.625% 9/1/24 # | | | 50,000 | | | | 50,937 | |
Cemex 144A
7.75% 4/16/26 # | | | 200,000 | | | | 225,542 | |
CF Industries
6.875% 5/1/18 | | | 105,000 | | | | 109,725 | |
Cliffs Natural Resources
144A 5.75%
3/1/25 # | | | 5,000 | | | | 4,863 | |
Dow Chemical
8.55% 5/15/19 | | | 198,000 | | | | 224,547 | |
Freeport-McMoRan 144A
6.875% 2/15/23 # | | | 65,000 | | | | 67,437 | |
General Electric | | | | | | | | |
4.25% 1/17/18 | | | NZD 10,000 | | | | 7,096 | |
5.55% 5/4/20 | | | 40,000 | | | | 44,265 | |
6.00% 8/7/19 | | | 80,000 | | | | 87,896 | |
Georgia-Pacific
8.00% 1/15/24 | | | 160,000 | | | | 205,239 | |
International Paper 4.40% 8/15/47 | | | 105,000 | | | | 99,494 | |
INVISTA Finance 144A 4.25% 10/15/19 # | | | 75,000 | | | | 77,437 | |
Koppers 144A 6.00% 2/15/25 # | | | 40,000 | | | | 41,400 | |
| | | | | | | | |
| | | Principal amount° | | | Value
(U.S. $) | |
| |
Corporate Bonds (continued) | |
| |
Basic Industry (continued) | | | | |
LYB International Finance II 3.50% 3/2/27 | | | 90,000 | | | $ | 88,496 | |
Novelis 144A
5.875% 9/30/26 # | | | 25,000 | | | | 25,563 | |
OCP 144A 4.50% 10/22/25 # | | | 200,000 | | | | 197,775 | |
Olin 5.125% 9/15/27 | | | 15,000 | | | | 15,291 | |
PolyOne 5.25% 3/15/23 | | | 30,000 | | | | 30,375 | |
Potash Corp. of Saskatchewan 4.00% 12/15/26 | | | 45,000 | | | | 46,155 | |
PulteGroup 5.00% 1/15/27 | | | 30,000 | | | | 30,113 | |
Southern Copper 5.875% 4/23/45 | | | 20,000 | | | | 20,939 | |
Standard Industries 144A 5.00% 2/15/27 # | | | 80,000 | | | | 78,600 | |
US Concrete 144A 6.375% 6/1/24 # | | | 25,000 | | | | 26,000 | |
Vale Overseas 5.875% 6/10/21 | | | 10,000 | | | | 10,741 | |
6.25% 8/10/26 | | | 50,000 | | | | 54,437 | |
Westlake Chemical 144A 5.00% 8/15/46 # | | | 45,000 | | | | 46,372 | |
WR Grace & Co. 144A 5.625% 10/1/24 # | | | 42,000 | | | | 44,415 | |
| | | | | | | | |
| | | | | | | 2,017,250 | |
| | | | | | | | |
Capital Goods – 1.16% | | | | | | | | |
Ball 5.25% 7/1/25 | | | 45,000 | | | | 47,813 | |
CCL Industries 144A 3.25% 10/1/26 # | | | 40,000 | | | | 38,356 | |
Crown Americas 144A 4.25% 9/30/26 # | | | 20,000 | | | | 19,288 | |
Fortune Brands Home & Security 3.00% 6/15/20 | | | 35,000 | | | | 35,447 | |
KLX 144A 5.875% 12/1/22 # | | | 20,000 | | | | 20,700 | |
Lennox International 3.00% 11/15/23 | | | 100,000 | | | | 98,413 | |
Masco 3.50% 4/1/21 | | | 75,000 | | | | 76,696 | |
Owens-Brockway Glass Container 144A 5.875% 8/15/23 # | | | 55,000 | | | | 58,300 | |
Parker-Hannifin 3.30% 11/21/24 | | | 5,000 | | | | 5,092 | |
Rockwell Collins 3.20% 3/15/24 | | | 45,000 | | | | 44,971 | |
Roper Technologies 2.80% 12/15/21 | | | 30,000 | | | | 30,063 | |
Siemens Financierings-maatschappij 144A 2.70% 3/16/22 # | | | 260,000 | | | | 260,421 | |
| | | | | | | | |
| | | Principal amount° | | | Value (U.S. $) | |
| |
Corporate Bonds (continued) | |
| |
Capital Goods (continued) | | | | | | | | |
Waste Management 2.40% 5/15/23 | | | 205,000 | | | $ | 201,578 | |
| | | | | | | | |
| | | | | | | 937,138 | |
| | | | | | | | |
Consumer Cyclical – 1.85% | | | | | | | | |
Albertsons 144A 6.625% 6/15/24 # | | | 20,000 | | | | 20,500 | |
BMW US Capital 144A 3.30% 4/6/27 # | | | 55,000 | | | | 54,860 | |
Boyd Gaming 6.375% 4/1/26 | | | 35,000 | | | | 37,537 | |
Daimler Finance North America 144A 3.45% 1/6/27 # | | | 150,000 | | | | 150,601 | |
Dollar General 3.875% 4/15/27 | | | 100,000 | | | | 100,271 | |
General Motors Financial | | | | | | | | |
3.45% 4/10/22 | | | 115,000 | | | | 115,691 | |
3.70% 5/9/23 | | | 35,000 | | | | 35,310 | |
5.25% 3/1/26 | | | 5,000 | | | | 5,381 | |
GLP Capital 5.375% 4/15/26 | | | 55,000 | | | | 56,925 | |
Goodyear Tire & Rubber 5.00% 5/31/26 | | | 45,000 | | | | 46,237 | |
Hanesbrands 144A 4.875% 5/15/26 # | | | 45,000 | | | | 44,437 | |
Hilton Worldwide Finance 144A 4.875% 4/1/27 # | | | 30,000 | | | | 30,375 | |
Hyundai Capital America | | | | | | | | |
144A 2.125% 10/2/17 # | | | 60,000 | | | | 60,098 | |
144A 2.55% 2/6/19 # | | | 15,000 | | | | 15,083 | |
144A 3.00% 3/18/21 # | | | 10,000 | | | | 10,042 | |
KFC Holding | | | | | | | | |
144A 5.00% 6/1/24 # | | | 20,000 | | | | 20,475 | |
144A 5.25% 6/1/26 # | | | 20,000 | | | | 20,400 | |
Levi Strauss & Co. 5.00% 5/1/25 | | | 65,000 | | | | 66,963 | |
Live Nation Entertainment 144A 4.875% 11/1/24 # | | | 35,000 | | | | 35,087 | |
Lowe’s 3.70% 4/15/46 | | | 135,000 | | | | 125,619 | |
Marriott International | | | | | | | | |
3.75% 3/15/25 | | | 45,000 | | | | 45,805 | |
4.50% 10/1/34 | | | 10,000 | | | | 10,161 | |
MGM Resorts International 4.625% 9/1/26 | | | 25,000 | | | | 24,375 | |
Penn National Gaming 144A 5.625% 1/15/27 # | | | 70,000 | | | | 69,650 | |
Scientific Games International 144A 7.00% 1/1/22 # | | | 40,000 | | | | 42,850 | |
Target 3.625% 4/15/46 | | | 70,000 | | | | 63,322 | |
| | | | | | | | |
| | | Principal amount° | | | Value (U.S. $) | |
| |
Corporate Bonds (continued) | |
| |
Consumer Cyclical (continued) | |
Walgreens Boots Alliance | | | | | | | | |
3.10% 6/1/23 | | | 125,000 | | | $ | 124,984 | |
3.45% 6/1/26 | | | 35,000 | | | | 34,185 | |
Wyndham Worldwide 4.15% 4/1/24 | | | 35,000 | | | | 35,343 | |
| | | | | | | | |
| | | | | | | 1,502,567 | |
| | | | | | | | |
Consumer Non-Cyclical – 2.69% | | | | | | | | |
Abbott Laboratories 2.90% 11/30/21 | | | 235,000 | | | | 236,254 | |
ACCO Brands 144A 5.25% 12/15/24 # | | | 15,000 | | | | 15,113 | |
Anheuser-Busch InBev Finance 2.65% 2/1/21 | | | 310,000 | | | | 312,580 | |
Becle 144A 3.75% 5/13/25 # | | | 150,000 | | | | 146,750 | |
Biogen 5.20% 9/15/45 | | | 50,000 | | | | 54,246 | |
Celgene 3.25% 8/15/22 | | | 110,000 | | | | 111,827 | |
DaVita 5.00% 5/1/25 | | | 60,000 | | | | 59,963 | |
Dean Foods 144A 6.50% 3/15/23 # | | | 50,000 | | | | 52,250 | |
HCA 5.375% 2/1/25 | | | 60,000 | | | | 62,550 | |
HealthSouth 5.125% 3/15/23 | | | 15,000 | | | | 15,075 | |
5.75% 11/1/24 | | | 50,000 | | | | 50,625 | |
5.75% 9/15/25 | | | 20,000 | | | | 20,075 | |
Heineken 144A 3.50% 1/29/28 # | | | 25,000 | | | | 25,185 | |
Hill-Rom Holdings 144A 5.00% 2/15/25 # | | | 50,000 | | | | 50,063 | |
Molson Coors Brewing 3.00% 7/15/26 | | | 155,000 | | | | 147,674 | |
Mylan 3.95% 6/15/26 | | | 60,000 | | | | 58,835 | |
New York and Presbyterian Hospital 4.063% 8/1/56 | | | 50,000 | | | | 47,006 | |
Post Holdings 144A 5.00% 8/15/26 # | | | 80,000 | | | | 76,800 | |
Revlon Consumer Products 6.25% 8/1/24 | | | 20,000 | | | | 20,000 | |
Reynolds American 4.00% 6/12/22 | | | 80,000 | | | | 84,054 | |
Shire Acquisitions Investments Ireland | | | | | | | | |
2.40% 9/23/21 | | | 65,000 | | | | 63,720 | |
2.875% 9/23/23 | | | 65,000 | | | | 63,150 | |
Tempur Sealy International 5.50% 6/15/26 | | | 35,000 | | | | 34,597 | |
Thermo Fisher Scientific 3.00% 4/15/23 | | | 290,000 | | | | 288,149 | |
Transurban Finance 144A 3.375% 3/22/27 # | | | 25,000 | | | | 24,223 | |
Schedules of investments
Delaware Foundation® Conservative Allocation Fund
| | | | | | | | |
| | | Principal amount° | | | Value (U.S. $) | |
| |
Corporate Bonds (continued) | |
| |
Consumer Non-Cyclical (continued) | | | | | | | | |
Universal Health Services 144A 5.00% 6/1/26 # | | | 15,000 | | | $ | 15,487 | |
Zimmer Biomet Holdings 3.375% 11/30/21 | | | 45,000 | | | | 45,567 | |
| | | | | | | | |
| | | | | | | 2,181,818 | |
| | | | | | | | |
Energy – 2.59% | | | | | | | | |
Anadarko Petroleum 5.55% 3/15/26 | | | 180,000 | | | | 200,091 | |
BP Capital Markets | | | | | | | | |
3.216% 11/28/23 | | | 95,000 | | | | 95,556 | |
3.224% 4/14/24 | | | 60,000 | | | | 60,075 | |
Diamondback Energy 144A 4.75% 11/1/24 # | | | 40,000 | | | | 40,436 | |
Ecopetrol 7.375% 9/18/43 | | | 15,000 | | | | 16,103 | |
Enbridge | | | | | | | | |
4.25% 12/1/26 | | | 30,000 | | | | 30,681 | |
6.00% 1/15/77 ● | | | 15,000 | | | | 15,206 | |
Energy Transfer Equity 7.50% 10/15/20 | | | 50,000 | | | | 56,000 | |
Energy Transfer Partners | | | | | | | | |
4.75% 1/15/26 | | | 15,000 | | | | 15,462 | |
6.125% 12/15/45 | | | 40,000 | | | | 42,769 | |
9.70% 3/15/19 | | | 56,000 | | | | 63,703 | |
Enterprise Products Operating 7.034% 1/15/68 ● | | | 10,000 | | | | 10,409 | |
Genesis Energy 5.625% 6/15/24 | | | 20,000 | | | | 19,650 | |
Gulfport Energy | | | | | | | | |
144A 6.00% 10/15/24 # | | | 35,000 | | | | 34,125 | |
6.625% 5/1/23 | | | 15,000 | | | | 15,244 | |
Hilcorp Energy I 144A 5.00% 12/1/24 # | | | 50,000 | | | | 47,125 | |
Kinder Morgan Energy Partners 5.80% 3/1/21 | | | 50,000 | | | | 54,974 | |
Laredo Petroleum 6.25% 3/15/23 | | | 40,000 | | | | 40,800 | |
MPLX | | | | | | | | |
4.875% 12/1/24 | | | 100,000 | | | | 105,348 | |
4.875% 6/1/25 | | | 30,000 | | | | 31,473 | |
Murphy Oil 6.875% 8/15/24 | | | 60,000 | | | | 63,750 | |
Murphy Oil USA 6.00% 8/15/23 | | | 80,000 | | | | 84,200 | |
Newfield Exploration 5.75% 1/30/22 | | | 25,000 | | | | 26,656 | |
Noble Energy 5.05% 11/15/44 | | | 50,000 | | | | 51,181 | |
Petrobras Global Finance 5.375% 1/27/21 | | | 10,000 | | | | 10,323 | |
| | | | | | | | |
| | | Principal amount° | | | Value (U.S. $) | |
| |
Corporate Bonds (continued) | |
| |
Energy (continued) | | | | | | | | |
Petrobras Global Finance | | | | | |
6.75% 1/27/41 | | | 5,000 | | | $ | 4,705 | |
7.375% 1/17/27 | | | 20,000 | | | | 21,194 | |
Petroleos Mexicanos 144A 4.77% 3/11/22 #● | | | 20,000 | | | | 21,525 | |
Plains All American Pipeline 8.75% 5/1/19 | | | 90,000 | | | | 101,549 | |
Regency Energy Partners 5.00% 10/1/22 | | | 85,000 | | | | 90,480 | |
Sabine Pass Liquefaction | | | | | | | | |
144A 4.20% 3/15/28 # | | | 55,000 | | | | 54,283 | |
5.625% 4/15/23 | | | 100,000 | | | | 108,611 | |
Shell International Finance | | | | | | | | |
2.875% 5/10/26 | | | 35,000 | | | | 34,069 | |
4.00% 5/10/46 | | | 35,000 | | | | 33,731 | |
4.375% 5/11/45 | | | 80,000 | | | | 81,380 | |
Southwestern Energy 6.70% 1/23/25 | | | 35,000 | | | | 34,825 | |
Targa Resources Partners | | | | | | | | |
144A 5.125% 2/1/25 # | | | 25,000 | | | | 25,844 | |
144A 5.375% 2/1/27 # | | | 30,000 | | | | 31,200 | |
Transcanada Trust | | | | | | | | |
5.30% 3/15/77 ● | | | 25,000 | | | | 24,750 | |
5.875% 8/15/76 ● | | | 35,000 | | | | 37,013 | |
Transocean Proteus 144A 6.25% 12/1/24 # | | | 25,000 | | | | 25,937 | |
Woodside Finance | | | | | | | | |
144A 3.65% 3/5/25 # | | | 30,000 | | | | 29,589 | |
144A 3.70% 9/15/26 # | | | 15,000 | | | | 14,681 | |
144A 8.75% 3/1/19 # | | | 65,000 | | | | 72,739 | |
YPF | | | | | | | | |
144A 8.50% 3/23/21 # | | | 5,000 | | | | 5,493 | |
144A 23.854% 7/7/20 #● | | | 15,000 | | | | 16,793 | |
| | | | | | | | |
| | | | | | | 2,101,731 | |
| | | | | | | | |
Financials – 1.27% | | | | | | | | |
AerCap Ireland Capital 3.95% 2/1/22 | | | 150,000 | | | | 154,197 | |
Affiliated Managers Group 3.50% 8/1/25 | | | 60,000 | | | | 59,051 | |
Air Lease | | | | | | | | |
3.00% 9/15/23 | | | 55,000 | | | | 53,817 | |
3.625% 4/1/27 | | | 115,000 | | | | 111,993 | |
Aviation Capital Group | | | | | | | | |
144A 2.875% 9/17/18 # | | | 5,000 | | | | 5,052 | |
144A 2.875% 1/20/22 # | | | 55,000 | | | | 54,674 | |
144A 4.875% 10/1/25 # | | | 55,000 | | | | 59,259 | |
144A 6.75% 4/6/21 # | | | 25,000 | | | | 28,656 | |
88
| | | | | | | | |
| | | Principal amount° | | | Value (U.S. $) | |
| |
Corporate Bonds (continued) | |
| |
Financials (continued) | | | | | | | | |
Berkshire Hathaway 2.75% 3/15/23 | | | 35,000 | | | $ | 35,033 | |
BlackRock 3.20% 3/15/27 | | | 40,000 | | | | 40,064 | |
E*TRADE Financial 5.875% 12/29/49 • | | | 65,000 | | | | 67,129 | |
International Lease Finance 8.625% 1/15/22 | | | 150,000 | | | | 184,086 | |
Jefferies Group | | | | | | | | |
6.45% 6/8/27 | | | 30,000 | | | | 33,997 | |
6.50% 1/20/43 | | | 20,000 | | | | 21,760 | |
Lazard Group 3.75% 2/13/25 | | | 60,000 | | | | 59,739 | |
Park Aerospace Holdings 144A 5.50% 2/15/24 # | | | 57,000 | | | | 59,423 | |
| | | | | | | | |
| | | | | | | 1,027,930 | |
| | | | | | | | |
Insurance – 1.01% | | | | | | | | |
Allstate 3.28% 12/15/26 | | | 105,000 | | | | 105,624 | |
Berkshire Hathaway Finance 2.90% 10/15/20 | | | 75,000 | | | | 77,503 | |
Liberty Mutual Group 144A 4.95% 5/1/22 # | | | 25,000 | | | | 27,190 | |
Manulife Financial 4.061% 2/24/32 • | | | 65,000 | | | | 65,243 | |
MetLife | | | | | | | | |
5.25% 12/29/49 • | | | 60,000 | | | | 62,045 | |
6.40% 12/15/36 | | | 90,000 | | | | 99,000 | |
Principal Life Global Funding II 144A 3.00% 4/18/26 # | | | 45,000 | | | | 43,861 | |
Prudential Financial | | | | | | | | |
4.50% 11/15/20 | | | 20,000 | | | | 21,475 | |
5.375% 5/15/45 • | | | 45,000 | | | | 47,205 | |
TIAA Asset Management Finance | | | | | | | | |
144A 2.95% 11/1/19 # | | | 50,000 | | | | 50,849 | |
144A 4.125% 11/1/24 # | | | 95,000 | | | | 96,955 | |
USI 144A 7.75% 1/15/21 # | | | 15,000 | | | | 15,272 | |
XLIT | | | | | | | | |
4.45% 3/31/25 | | | 35,000 | | | | 35,368 | |
5.50% 3/31/45 | | | 45,000 | | | | 45,118 | |
6.50% 12/29/49 • | | | 30,000 | | | | 25,275 | |
| | | | | | | | |
| | | | | | | 817,983 | |
| | | | | | | | |
Media – 0.71% | | | | | | | | |
21st Century Fox America 4.95% 10/15/45 | | | 60,000 | | | | 62,321 | |
CCO Holdings 144A 5.75% 2/15/26 # | | | 40,000 | | | | 42,100 | |
Comcast 3.00% 2/1/24 | | | 75,000 | | | | 75,019 | |
CSC Holdings 5.25% 6/1/24 | | | 16,000 | | | | 15,980 | |
| | | | | | | | |
| | | Principal amount° | | | Value (U.S. $) | |
| |
Corporate Bonds (continued) | |
| |
Media (continued) | | | | | | | | |
DISH DBS 7.75% 7/1/26 | | | 10,000 | | | $ | 11,650 | |
Gray Television 144A 5.875% 7/15/26 # | | | 30,000 | | | | 30,600 | |
Nexstar Broadcasting 144A 5.625% 8/1/24 # | | | 55,000 | | | | 55,963 | |
Sinclair Television Group 144A 5.125% 2/15/27 # | | | 35,000 | | | | 33,950 | |
Sirius XM Radio 144A 5.375% 7/15/26 # | | | 45,000 | | | | 46,125 | |
Time Warner Cable 7.30% 7/1/38 | | | 125,000 | | | | 155,320 | |
Tribune Media 5.875% 7/15/22 | | | 45,000 | | | | 47,137 | |
| | | | | | | | |
| | | | | | | 576,165 | |
| | | | | | | | |
Real Estate – 1.60% | | | | | | | | |
American Tower | | | | | | | | |
4.00% 6/1/25 | | | 65,000 | | | | 65,871 | |
4.40% 2/15/26 | | | 30,000 | | | | 31,087 | |
American Tower Trust I 144A 3.07% 3/15/23 # | | | 95,000 | | | | 94,796 | |
CC Holdings GS V 3.849% 4/15/23 | | | 30,000 | | | | 30,763 | |
Corporate Office Properties | | | | | | | | |
3.60% 5/15/23 | | | 55,000 | | | | 53,525 | |
5.25% 2/15/24 | | | 65,000 | | | | 68,473 | |
Crown Castle International 5.25% 1/15/23 | | | 70,000 | | | | 76,473 | |
CubeSmart 3.125% 9/1/26 | | | 55,000 | | | | 51,760 | |
CyrusOne 144A 5.00% 3/15/24 # | | | 5,000 | | | | 5,150 | |
DDR | | | | | | | | |
7.50% 4/1/17 | | | 30,000 | | | | 30,000 | |
7.875% 9/1/20 | | | 15,000 | | | | 17,361 | |
Education Realty Operating Partnership 4.60% 12/1/24 | | | 60,000 | | | | 60,547 | |
ESH Hospitality 144A 5.25% 5/1/25 # | | | 60,000 | | | | 60,637 | |
Hospitality Properties Trust 4.50% 3/15/25 | | | 55,000 | | | | 55,290 | |
Host Hotels & Resorts | | | | | | | | |
3.75% 10/15/23 | | | 60,000 | | | | 60,542 | |
3.875% 4/1/24 | | | 10,000 | | | | 10,089 | |
4.50% 2/1/26 | | | 5,000 | | | | 5,181 | |
Iron Mountain U.S. Holdings 144A 5.375% 6/1/26 # | | | 45,000 | | | | 45,113 | |
Kite Realty Group 4.00% 10/1/26 | | | 20,000 | | | | 19,201 | |
LifeStorage 3.50% 7/1/26 | | | 40,000 | | | | 38,343 | |
Schedules of investments
Delaware Foundation® Conservative Allocation Fund
| | | | | | | | |
| | | Principal amount° | | | Value (U.S. $) | |
| |
Corporate Bonds (continued) | |
| |
Real Estate (continued) | | | | | | | | |
MGM Growth Properties Operating Partnership 4.50% 9/1/26 | | | 45,000 | | | $ | 43,875 | |
Realty Income 4.125% 10/15/26 | | | 45,000 | | | | 46,430 | |
Regency Centers 3.60% 2/1/27 | | | 25,000 | | | | 24,853 | |
SBA Communications 144A 4.875% 9/1/24 # | | | 55,000 | | | | 54,439 | |
UDR 4.00% 10/1/25 | | | 170,000 | | | | 173,692 | |
Uniti Group 144A 7.125% 12/15/24 # | | | 25,000 | | | | 25,437 | |
WP Carey 4.60% 4/1/24 | | | 45,000 | | | | 46,636 | |
| | | | | | | | |
| | | | | | | 1,295,564 | |
| | | | | | | | |
Services – 0.23% | | | | | | | | |
Aramark Services 5.125% 1/15/24 | | | 60,000 | | | | 63,075 | |
Avis Budget Car Rental 144A 6.375% 4/1/24 # | | | 15,000 | | | | 15,094 | |
Herc Rentals 144A 7.75% 6/1/24 # | | | 23,000 | | | | 24,610 | |
Prime Security Services Borrower 144A 9.25% 5/15/23 # | | | 45,000 | | | | 49,444 | |
United Rentals North America | | | | | | | | |
5.50% 5/15/27 | | | 20,000 | | | | 20,250 | |
5.875% 9/15/26 | | | 10,000 | | | | 10,463 | |
| | | | | | | | |
| | | | | | | 182,936 | |
| | | | | | | | |
Technology – 0.73% | | | | | | | | |
Broadcom | | | | | | | | |
144A 3.00% 1/15/22 # | | | 50,000 | | | | 49,905 | |
144A 3.625% 1/15/24 # | | | 130,000 | | | | 131,121 | |
CDK Global 5.00% 10/15/24 | | | 45,000 | | | | 45,626 | |
CDW 5.00% 9/1/25 | | | 5,000 | | | | 5,106 | |
Cisco Systems 1.85% 9/20/21 | | | 55,000 | | | | 53,967 | |
CommScope Technologies 144A 5.00% 3/15/27 # | | | 15,000 | | | | 15,014 | |
Diamond 1 Finance 144A 6.02% 6/15/26 # | | | 35,000 | | | | 38,295 | |
DXC Technology | | | | | | | | |
144A 4.25% 4/15/24 # | | | 20,000 | | | | 20,365 | |
144A 4.75% 4/15/27 # | | | 40,000 | | | | 40,865 | |
Fidelity National Information Services 5.00% 10/15/25 | | | 40,000 | | | | 43,575 | |
First Data | | | | | | | | |
144A 5.75% 1/15/24 # | | | 45,000 | | | | 46,586 | |
144A 7.00% 12/1/23 # | | | 32,000 | | | | 34,400 | |
| | | | | | | | |
| | | Principal amount° | | | Value (U.S. $) | |
| |
Corporate Bonds (continued) | | | | | | | | |
| |
Technology (continued) | | | | | | | | |
Microsoft | | | | | | | | |
2.40% 2/6/22 | | | 15,000 | | | $ | 15,099 | |
2.875% 2/6/24 | | | 15,000 | | | | 15,106 | |
Symantec 144A
5.00% 4/15/25 # | | | 40,000 | | | | 40,978 | |
| | | | | | | | |
| | | | | | | 596,008 | |
| | | | | | | | |
Telecommunications – 2.33% | | | | | | | | |
AT&T 5.25% 3/1/37 | | | 125,000 | | | | 127,697 | |
CenturyLink | | | | | | | | |
5.80% 3/15/22 | | | 75,000 | | | | 77,574 | |
6.75% 12/1/23 | | | 50,000 | | | | 52,313 | |
Charter Communications Operating 4.908% 7/23/25 | | | 100,000 | | | | 105,769 | |
Cincinnati Bell 144A 7.00% 7/15/24 # | | | 15,000 | | | | 15,769 | |
Crown Castle Towers 144A 4.883% 8/15/20 # | | | 255,000 | | | | 271,602 | |
Deutsche Telekom International Finance | | | | | | | | |
144A 2.485% 9/19/23 # | | | 150,000 | | | | 143,579 | |
144A 3.60% 1/19/27 # | | | 150,000 | | | | 149,633 | |
Digicel Group 144A 8.25% 9/30/20 # | | | 200,000 | | | | 172,674 | |
GTP Acquisition Partners I 144A 2.35% 6/15/20 # | | | 100,000 | | | | 98,843 | |
Level 3 Financing 5.25% 3/15/26 | | | 40,000 | | | | 40,350 | |
Millicom International Cellular 144A 6.625% 10/15/21 # | | | 200,000 | | | | 210,240 | |
Radiate Holdco 144A 6.625% 2/15/25 # | | | 25,000 | | | | 24,734 | |
SBA Tower Trust | | | | | | | | |
144A 2.24% 4/16/18 # | | | 55,000 | | | | 55,021 | |
144A 2.898% 10/15/19 # | | | 40,000 | | | | 40,119 | |
Sprint 7.875% 9/15/23 | | | 45,000 | | | | 49,950 | |
T-Mobile USA
6.50% 1/15/26 | | | 45,000 | | | | 49,387 | |
Verizon Communications
144A 2.946% 3/15/22 # | | | 150,000 | | | | 149,514 | |
WPP Finance 2010 5.625% 11/15/43 | | | 20,000 | | | | 21,385 | |
Zayo Group 144A 5.75% 1/15/27 # | | | 35,000 | | | | 37,006 | |
| | | | | | | | |
| | | | | | | 1,893,159 | |
| | | | | | | | |
90
| | | | | | | | |
| | | Principal amount° | | | Value (U.S. $) | |
| |
Corporate Bonds (continued) | |
| |
Transportation – 0.74% | | | | | | | | |
Air Canada 2015-1 Class A Pass Through Trust 144A 3.60% 3/15/27 #◆ | | | 32,764 | | | $ | 32,969 | |
American Airlines 2014-1 Class A Pass Through Trust 3.70% 10/1/26 ◆ | | | 26,562 | | | | 26,695 | |
American Airlines 2015-1 Class A Pass Through Trust 3.375% 5/1/27 ◆ | | | 41,815 | | | | 41,031 | |
American Airlines 2015-2 Class AA Pass Through Trust 3.60% 9/22/27 ◆ | | | 9,527 | | | | 9,591 | |
American Airlines 2016-1 Class AA Pass Through Trust 3.575% 1/15/28 ◆ | | | 19,494 | | | | 19,470 | |
Burlington Northern Santa Fe 4.70% 9/1/45 | | | 110,000 | | | | 119,759 | |
Penske Truck Leasing | | | | | | | | |
144A 3.30% 4/1/21 # | | | 50,000 | | | | 50,723 | |
144A 3.40% 11/15/26 # | | | 5,000 | | | | 4,816 | |
144A 4.20% 4/1/27 # | | | 90,000 | | | | 91,808 | |
Union Pacific 3.00% 4/15/27 | | | 55,000 | | | | 54,397 | |
United Airlines 2014-1 Class A Pass Through Trust 4.00% 4/11/26 ◆ | | | 22,880 | | | | 23,738 | |
United Airlines 2014-2 Class A Pass Through Trust 3.75% 9/3/26 ◆ | | | 50,258 | | | | 51,079 | |
United Airlines 2016-1 Class AA Pass Through Trust 3.10% 7/7/28 ◆ | | | 5,000 | | | | 4,925 | |
United Parcel Service 5.125% 4/1/19 | | | 40,000 | | | | 42,752 | |
XPO Logistics 144A 6.125% 9/1/23 # | | | 25,000 | | | | 26,094 | |
| | | | | | | 599,847 | |
Utilities – 4.70% | | | | | | | | |
AES 5.50% 4/15/25 | | | 15,000 | | | | 15,263 | |
Ameren 3.65% 2/15/26 | | | 55,000 | | | | 55,671 | |
Ameren Illinois 9.75% 11/15/18 | | | 165,000 | | | | 185,408 | |
American Transmission Systems 144A 5.25% 1/15/22 # | | | 140,000 | | | | 154,254 | |
AmeriGas Partners 5.875% 8/20/26 | | | 45,000 | | | | 45,000 | |
Berkshire Hathaway Energy 3.75% 11/15/23 | | | 90,000 | | | | 94,179 | |
| | | | | | | | |
| | | Principal amount° | | | Value (U.S. $) | |
| |
Corporate Bonds (continued) | |
| |
Utilities (continued) | | | | | | | | |
Calpine | | | | | | | | |
144A 5.25% 6/1/26 # | | | 35,000 | | | $ | 35,700 | |
5.375% 1/15/23 | | | 30,000 | | | | 30,525 | |
Cleveland Electric Illuminating 5.50% 8/15/24 | | | 50,000 | | | | 57,136 | |
CMS Energy 6.25% 2/1/20 | | | 140,000 | | | | 154,487 | |
ComEd Financing III 6.35% 3/15/33 | | | 65,000 | | | | 69,499 | |
DTE Energy 3.30% 6/15/22 | | | 160,000 | | | | 162,623 | |
Duke Energy | | | | | | | | |
2.65% 9/1/26 | | | 85,000 | | | | 79,037 | |
4.80% 12/15/45 | | | 20,000 | | | | 21,196 | |
Emera 6.75% 6/15/76 • | | | 90,000 | | | | 98,663 | |
Emera US Finance | | | | | | | | |
3.55% 6/15/26 | | | 100,000 | | | | 98,483 | |
4.75% 6/15/46 | | | 60,000 | | | | 60,763 | |
Enel 144A
8.75% 9/24/73 #• | | | 200,000 | | | | 230,500 | |
Enel Americas 4.00% 10/25/26 | | | 20,000 | | | | 19,835 | |
Enel Finance International 144A 6.00% 10/7/39 # | | | 100,000 | | | | 114,315 | |
Entergy 4.00% 7/15/22 | | | 65,000 | | | | 68,155 | |
Entergy Louisiana 4.05% 9/1/23 | | | 150,000 | | | | 158,375 | |
Exelon | | | | | | | | |
3.497% 6/1/22 | | | 50,000 | | | | 50,514 | |
3.95% 6/15/25 | | | 55,000 | | | | 56,622 | |
Fortis 144A
3.055% 10/4/26 # | | | 115,000 | | | | 108,115 | |
Great Plains Energy | | | | | | | | |
3.15% 4/1/22 | | | 140,000 | | | | 141,550 | |
4.85% 6/1/21 | | | 30,000 | | | | 32,036 | |
Indiana Michigan Power 4.55% 3/15/46 | | | 10,000 | | | | 10,603 | |
IPALCO Enterprises 5.00% 5/1/18 | | | 35,000 | | | | 36,137 | |
ITC Holdings 3.25% 6/30/26 | | | 50,000 | | | | 48,663 | |
Kansas City Power & Light 3.65% 8/15/25 | | | 90,000 | | | | 90,503 | |
LG&E &KU Energy 4.375% 10/1/21 | | | 225,000 | | | | 237,758 | |
Metropolitan Edison 144A 4.00% 4/15/25 # | | | 40,000 | | | | 40,400 | |
MidAmerican Energy 4.25% 5/1/46 | | | 70,000 | | | | 72,428 | |
National Rural Utilities Cooperative Finance 2.70% 2/15/23 | | | 70,000 | | | | 69,397 | |
Schedules of investments
Delaware Foundation® Conservative Allocation Fund
| | | | | | | | |
| | | Principal amount° | | | Value (U.S. $) | |
| |
Corporate Bonds (continued) | |
| |
Utilities (continued) | | | | | | | | |
National Rural Utilities Cooperative Finance | | | | | | | | |
4.75% 4/30/43 • | | | 65,000 | | | $ | 66,625 | |
5.25% 4/20/46 • | | | 45,000 | | | | 46,955 | |
New York State Electric & Gas 144A 3.25% 12/1/26 # | | | 60,000 | | | | 59,754 | |
NextEra Energy Capital Holdings | | | | | | | | |
2.40% 9/15/19 | | | 85,000 | | | | 85,713 | |
3.625% 6/15/23 | | | 35,000 | | | | 35,515 | |
NV Energy 6.25% 11/15/20 | | | 65,000 | | | | 73,054 | |
Pennsylvania Electric 5.20% 4/1/20 | | | 75,000 | | | | 79,784 | |
Public Service Co. of New Hampshire 3.50% 11/1/23 | | | 50,000 | | | | 51,523 | |
Southern | | | | | | | | |
2.75% 6/15/20 | | | 145,000 | | | | 146,323 | |
4.40% 7/1/46 | | | 55,000 | | | | 52,765 | |
Southern Co. Gas Capital 3.25% 6/15/26 | | | 40,000 | | | | 38,997 | |
Trans-Allegheny Interstate Line 144A 3.85% 6/1/25 # | | | 30,000 | | | | 30,779 | |
Wisconsin Electric Power 4.30% 12/15/45 | | | 35,000 | | | | 35,880 | |
| | | | | | | | |
| | | | | | | 3,807,460 | |
| | | | | | | | |
Total Corporate Bonds
(cost $24,078,834) | | | | | | | 24,376,639 | |
| | | | | | | | |
|
| |
Loan Agreements – 1.56%« | | | | | | | | |
| |
Change Healthcare Tranche B
1st Lien 3.75% 3/1/24 | | | 130,000 | | | | 130,379 | |
Dell International 1st Lien 3.49% 9/7/23 | | | 5,888 | | | | 5,923 | |
First Data 1st Lien 3.984% 3/24/21 | | | 261,498 | | | | 263,786 | |
HCA Tranche B9 1st Lien 2.982% 3/18/23 | | | 177,906 | | | | 178,865 | |
Houghton International 1st Lien 4.397% 12/20/19 | | | 339,913 | | | | 342,886 | |
Republic of Angola 7.57% 12/16/23 | | | 153,125 | | | | 133,219 | |
Sprint Communications Tranche B 1st Lien 3.50% 2/2/24 | | | 130,000 | | | | 130,190 | |
USI 4.25% 12/27/19 | | | 81,026 | | | | 81,245 | |
| | | | | | | | |
Total Loan Agreements
(cost $1,257,757) | | | | | | | 1,266,493 | |
| | | | | | | | |
|
| |
| | | | | | | | |
| | | Principal amount° | | | Value (U.S. $) | |
| |
Municipal Bonds – 0.47% | |
| |
Bay Area Toll Authority (Build America Bonds) Series S3 6.907% 10/1/50 | | | 60,000 | | | $ | 86,092 | |
California State Various Purposes (Build America Bonds) 7.55% 4/1/39 | | | 50,000 | | | | 73,432 | |
Commonwealth of Massachusetts Series C 5.00% 10/1/25 | | | 30,000 | | | | 36,519 | |
New Jersey Turnpike Authority (Build America Bonds) | | | | | | | | |
Series A 7.102% 1/1/41 | | | 35,000 | | | | 48,979 | |
Series F 7.414% 1/1/40 | | | 15,000 | | | | 21,639 | |
New York City, New York | | | | | | | | |
Series C 5.00% 8/1/26 | | | 10,000 | | | | 12,017 | |
Series C 5.00% 8/1/27 | | | 10,000 | | | | 11,926 | |
South Carolina Public Service Authority Series D 4.77% 12/1/45 | | | 20,000 | | | | 18,008 | |
Texas Water Development Board Water Implementation Revenue 5.00% 10/15/46 | | | 45,000 | | | | 51,533 | |
Series A 5.00% 10/15/45 | | | 20,000 | | | | 22,719 | |
| | | | | | | | |
Total Municipal Bonds
(cost $408,262) | | | | | | | 382,864 | |
| | | | | | | | |
|
| |
Non-Agency Asset-Backed Securities – 3.40% | |
|
| |
AEP Texas Central Transition Funding II Series 2006-A A4 5.17% 1/1/18 | | | 32,331 | | | | 32,912 | |
Ally Master Owner Trust Series 2014-4 A2 1.43% 6/17/19 | | | 90,000 | | | | 90,069 | |
American Express Credit Account Master Trust Series 2014-5 A 1.202% 5/15/20 • | | | 800,000 | | | | 801,029 | |
American Express Credit Account Secured Note Trust Series 2012-4 B 1.462% 5/15/20 • | | | 280,000 | | | | 280,427 | |
Bank of America Credit Card Trust Series 2014-A3 A 1.202% 1/15/20 • | | | 70,000 | | | | 70,064 | |
92
| | | | | | | | |
| | | Principal amount° | | | Value (U.S. $) | |
| |
Non-Agency Asset-Backed Securities (continued) | |
| |
California Republic Auto | | | | | | | | |
Receivables Trust | | | | | | | | |
Series 2013-1 A2 144A 1.41% 9/17/18 # | | | 527 | | | $ | 527 | |
Capital One Multi-Asset Execution Trust | | | | | | | | |
Series 2007-A5 A5 0.952% 7/15/20 ● | | | 100,000 | | | | 99,981 | |
Series 2016-A1 A1 1.362% 2/15/22 ● | | | 90,000 | | | | 90,522 | |
Citibank Credit Card Issuance Trust | | | | | | | | |
Series 2014-A6 A6 2.15% 7/15/21 | | | 200,000 | | | | 201,719 | |
CNH Equipment Trust | | | | | | | | |
Series 2016-B A2B 1.312% 10/15/19 ● | | | 7,241 | | | | 7,257 | |
Ford Credit Auto Lease Trust | | | | | | | | |
Series 2015-A A3 1.13% 6/15/18 | | | 22,004 | | | | 22,002 | |
Ford Credit Auto Owner Trust | | | | | | | | |
Series 2016-2 A 144A 2.03% 12/15/27 # | | | 100,000 | | | | 98,624 | |
HOA Funding Series 2014-1A A2 144A 4.846% 8/20/44 # | | | 47,500 | | | | 43,485 | |
Mercedes-Benz Auto Lease Trust Series 2016-A A2B 1.472% 7/16/18 ● | | | 19,635 | | | | 19,654 | |
Mercedes-Benz Master Owner Trust Series 2016-AA A 144A 1.492% 5/15/20 #● | | | 100,000 | | | | 100,395 | |
Navistar Financial Dealer Note Master Owner Trust II | | | | | | | | |
Series 2016-1 A 144A 2.332% 9/27/21 #● | | | 25,000 | | | | 25,060 | |
Nissan Auto Lease Trust | | | | | | | | |
Series 2015-B A2B 1.442% 12/15/17 ● | | | 8,483 | | | | 8,486 | |
PFS Financing | | | | | | | | |
Series 2015-AA A 144A 1.532% 4/15/20 #● | | | 100,000 | | | | 99,969 | |
Synchrony Credit Card Master Note Trust | | | | | | | | |
Series 2012-6 A 1.36% 8/17/20 | | | 100,000 | | | | 100,071 | |
Towd Point Mortgage Trust | | | | | | | | |
Series 2015-5 A1B 144A 2.75% 5/25/55 #● | | | 73,029 | | | | 73,067 | |
| | | | | | | | |
| | | Principal amount° | | | Value (U.S. $) | |
| |
Non-Agency Asset-Backed Securities (continued) | |
| |
Towd Point Mortgage Trust | | | | | | | | |
Series 2015-6 A1B 144A 2.75% 4/25/55 #● | | | 75,830 | | | $ | 75,757 | |
Volkswagen Credit Auto Master Trust | | | | | | | | |
Series 2014-1A A2 144A 1.40% 7/22/19 # | | | 135,000 | | | | 134,957 | |
Wells Fargo Dealer Floorplan Master Note Trust | | | | | | | | |
Series 2014-2 A 1.428% 10/20/19 ● | | | 280,000 | | | | 280,189 | |
| | | | | | | | |
Total Non-Agency Asset-Backed Securities
(cost $2,764,432) | | | | | | | 2,756,223 | |
| | | | | | | | |
|
| |
Non-Agency Collateralized Mortgage Obligations – 1.35% | |
|
| |
Bank of America Alternative Loan Trust | | | | | | | | |
Series 2005-6 7A1 5.50% 7/25/20 | | | 653 | | | | 626 | |
Credit Suisse First Boston Mortgage Securities | | | | | | | | |
Series 2005-5 6A3 5.00% 7/25/35 | | | 31,792 | | | | 31,639 | |
JPMorgan Mortgage Trust | | | | | | | | |
Series 2006-S1 1A1 6.00% 4/25/36 | | | 42,510 | | | | 43,461 | |
Series 2014-2 B1 144A 3.423% 6/25/29 #● | | | 79,285 | | | | 78,488 | |
Series 2014-2 B2 144A 3.423% 6/25/29 #● | | | 79,285 | | | | 77,662 | |
Series 2014-IVR6 2A4 144A 2.50% 7/25/44 #● | | | 100,000 | | | | 98,838 | |
Series 2015-1 B1 144A 2.623% 12/25/44 #● | | | 196,634 | | | | 194,874 | |
Series 2015-4 B1 144A 3.628% 6/25/45 #● | | | 96,293 | | | | 93,835 | |
Series 2015-4 B2 144A 3.628% 6/25/45 #● | | | 96,293 | | | | 92,239 | |
Series 2015-5 B2 144A 2.874% 5/25/45 #● | | | 97,755 | | | | 92,349 | |
Series 2015-6 B1 144A 3.623% 10/25/45 #● | | | 96,276 | | | | 94,473 | |
Series 2015-6 B2 144A 3.623% 10/25/45 #● | | | 96,276 | | | | 93,113 | |
Sequoia Mortgage Trust | | | | | | | | |
Series 2014-2 A4 144A 3.50% 7/25/44 #● | | | 40,163 | | | | 40,000 | |
Series 2015-1 B2 144A 3.876% 1/25/45 #● | | | 23,758 | | | | 23,386 | |
Schedules of investments
Delaware Foundation® Conservative Allocation Fund
| | | | | | | | |
| | | Principal amount° | | | Value (U.S. $) | |
| |
Non-Agency Collateralized Mortgage Obligations (continued) | |
| |
Structured Asset Securities Corporation Mortgage Pass Through Certificates | | | | | | | | |
Series 2004-20 2A1 5.50% 11/25/34 ◆ | | | 18,751 | | | $ | 19,155 | |
Wells Fargo Mortgage-Backed Securities Trust | | | | | | | | |
Series 2006-2 3A1 5.75% 3/25/36 | | | 8,521 | | | | 8,542 | |
Series 2006-AR5 2A1 3.294% 4/25/36 ● | | | 7,714 | | | | 7,236 | |
| | | | | | | | |
Total Non-Agency Collateralized Mortgage Obligations
(cost $1,087,168) | | | | | | | 1,089,916 | |
| | | | | | | | |
|
| |
Non-Agency Commercial Mortgage-Backed Securities – 3.32% | |
|
| |
Banc of America Commercial | | | | | | | | |
Mortgage Trust | | | | | | | | |
Series 2007-4 AM 5.961% 2/10/51 ● | | | 60,000 | | | | 60,579 | |
Series 2017-BNK3 B 3.879% 2/15/50 ● | | | 100,000 | | | | 102,014 | |
Series 2017-BNK3 C 4.352% 2/15/50 ● | | | 100,000 | | | | 101,952 | |
Bear Stearns Commercial Mortgage Securities Trust Series 2007-PW18 A4 5.70% 6/11/50 | | | 25,436 | | | | 25,740 | |
Citigroup Commercial Mortgage Trust | | | | | | | | |
Series 2007-C6 AM 5.779% 12/10/49 ● | | | 35,000 | | | | 35,422 | |
Series 2014-GC25 A4 3.635% 10/10/47 | | | 65,000 | | | | 67,050 | |
Series 2015-GC27 A5 3.137% 2/10/48 | | | 75,000 | | | | 74,725 | |
Series 2016-P3 A4 3.329% 4/15/49 | | | 45,000 | | | | 45,236 | |
Series 2016-P5 A4 2.941% 10/10/49 | | | 40,000 | | | | 38,879 | |
COMM Mortgage Trust | | | | | | | | |
Series 2013-CR6 AM 144A 3.147% 3/10/46 # | | | 45,000 | | | | 45,051 | |
Series 2014-CR19 A5 3.796% 8/10/47 | | | 30,000 | | | | 31,381 | |
Series 2014-CR20 AM 3.938% 11/10/47 | | | 130,000 | | | | 134,794 | |
Series 2015-3BP A 144A | | | | | | | | |
3.178% 2/10/35 # | | | 200,000 | | | | 200,344 | |
| | | | | | | | |
| | | Principal amount° | | | Value (U.S. $) | |
| |
Non-Agency Commercial Mortgage-Backed Securities (continued) | |
| |
COMM Mortgage Trust | | | | | | | | |
Series 2015-CR23 A4 3.497% 5/10/48 | | | 25,000 | | | $ | 25,432 | |
DB-JPM Mortgage Trust | | | | | | | | |
Series 2016-C1 A4 3.276% 5/10/49 | | | 80,000 | | | | 80,314 | |
Series 2016-C3 A5 2.89% 9/10/49 | | | 90,000 | | | | 87,370 | |
DB-UBS Mortgage Trust Series 2011-LC1A C 144A 5.686% 11/10/46 #● | | | 100,000 | | | | 109,745 | |
GS Mortgage Securities Trust | | | | | | | | |
Series 2014-GC24 A5 3.931% 9/10/47 | | | 80,000 | | | | 84,127 | |
Series 2015-GC32 A4 3.764% 7/10/48 | | | 35,000 | | | | 36,439 | |
JPM-BB Commercial Mortgage Securities Trust | | | | | | | | |
Series 2015-C32 A5 3.598% 11/15/48 | | | 55,000 | | | | 56,326 | |
Series 2015-C33 A4 3.77% 12/15/48 | | | 215,000 | | | | 222,871 | |
JPM-DB Commercial Mortgage Securities Trust | | | | | | | | |
Series 2016-C2 A4 3.144% 6/15/49 | | | 85,000 | | | | 84,271 | |
JPMorgan Chase Commercial Mortgage Securities Trust | | | | | | | | |
Series 2005-CB11 E 5.525% 8/12/37 ● | | | 25,000 | | | | 25,992 | |
Series 2013-LC11 B 3.499% 4/15/46 | | | 40,000 | | | | 39,811 | |
Series 2015-JP1 A5 3.914% 1/15/49 | | | 40,000 | | | | 42,018 | |
Series 2016-JP2 A4 2.822% 8/15/49 | | | 50,000 | | | | 48,265 | |
Series 2016-JP3 B 3.397% 8/15/49 ● | | | 20,000 | | | | 19,523 | |
Series 2016-WIKI A 144A 2.798% 10/5/31 # | | | 20,000 | | | | 20,123 | |
Series 2016-WIKI B 144A 3.201% 10/5/31 # | | | 35,000 | | | | 35,370 | |
LB-UBS Commercial Mortgage Trust Series 2006-C6 AJ 5.452% 9/15/39 ● | | | 55,233 | | | | 48,812 | |
Morgan Stanley Bank of America Merrill Lynch Trust Series 2014-C17 A5 3.741% 8/15/47 | | | 40,000 | | | | 41,644 | |
94
| | | | | | | | | | | | |
| | | | | | Principal amount° | | | Value
(U.S. $) | |
| |
Non-Agency Commercial Mortgage-Backed Securities (continued) | |
| |
Morgan Stanley Bank of America Merrill Lynch Trust | | | | | | | | | | | | |
Series 2015-C23 A4 3.719%7/15/50 | | | | | | | 145,000 | | | $ | 150,202 | |
Series 2015-C26 A5 3.531% 10/15/48 | | | | | | | 65,000 | | | | 66,389 | |
Series 2016-C29 A4 3.325%5/15/49 | | | | | | | 40,000 | | | | 40,194 | |
Morgan Stanley Capital I Trust | | | | | | | | | | | | |
Series 2006-HQ10 B 5.448%11/12/41 ● | | | | | | | 200,000 | | | | 199,803 | |
Wells Fargo Commercial | | | | | | | | | | | | |
Mortgage Trust | | | | | | | | | | | | |
Series 2014-LC18 A5 3.405% 12/15/47 | | | | | | | 15,000 | | | | 15,178 | |
Series 2015-NXS3 A4 3.617% 9/15/57 | | | | | | | 80,000 | | | | 81,920 | |
Series 2016-BNK1 A3 2.652% 8/15/49 | | | | | | | 65,000 | | | | 61,945 | |
| | | | | | | | | | | | |
Total Non-Agency Commercial
Mortgage-Backed Securities
(cost $2,745,346) | | | | 2,687,251 | |
| | | | | | | | | | | | |
|
| |
Regional Bond – 0.07%D | | | | | |
| |
Australia – 0.07% | | | | | | | | | | | | |
Queensland Treasury 144A 2.75% 8/20/27 # | | | AUD | | | | 75,000 | | | | 54,978 | |
| | | | | | | | | | | | |
Total Regional Bond
(cost $56,360) | | | | 54,978 | |
| | | | | | | | | | | | |
|
| |
Sovereign Bonds – 0.36%D | |
| |
Argentina – 0.06% | | | | | | | | | | | | |
Argentine Republic Government International Bond 144A 5.625% 1/26/22 # | | | | | | | 45,000 | | | | 46,136 | |
| | | | | | | | | | | | |
| | | | | | | | | | | 46,136 | |
| | | | | | | | | | | | |
Australia – 0.08% | | | | | | | | | | | | |
Australia Government Bond 3.75% 4/21/37 | | | AUD | | | | 83,000 | | | | 67,520 | |
| | | | | | | | | | | | |
| | | | | | | | | | | 67,520 | |
| | | | | | | | | | | | |
Hungary – 0.08% | | | | | | | | | | | | |
Hungary Government International Bond 5.75% 11/22/23 | | | | | | | 60,000 | | | | 67,920 | |
| | | | | | | | | | | | |
| | | | | | | | | | | 67,920 | |
| | | | | | | | | | | | |
| | | | | | | | | | | | |
| | | | | | Principal amount° | | | Value
(U.S. $) | |
| |
Sovereign BondsD (continued) | |
| |
New Zealand – 0.09% | | | | | |
New Zealand Government Bond 2.75% 4/15/25 NZD | | | | | | | 102,000 | | | $ | 69,809 | |
| | | | | | | | | | | | |
| | | | | | | | | | | 69,809 | |
| | | | | | | | | | | | |
Portugal – 0.05% | | | | | | | | | | | | |
Portugal Government International Bond 144A 5.125% 10/15/24 # | | | | | | | 39,000 | | | | 37,883 | |
| | | | | | | | | | | | |
| | | | | | | | | | | 37,883 | |
| | | | | | | | | | | | |
Total Sovereign Bonds
(cost $298,830) | | | | | | | | 289,268 | |
| | | | | | | | | | | | |
|
| |
Supranational Banks – 0.15% | | | | | |
| |
International Bank for Reconstruction & Development | | | | | | | | | |
3.50% 1/22/21 | | | NZD | | | | 138,000 | | | | 98,230 | |
4.625% 10/6/21 | | | NZD | | | | 25,000 | | | | 18,542 | |
International Finance 3.625% 5/20/20 | | | NZD | | | | 11,000 | | | | 7,868 | |
| | | | | | | | | | | | |
Total Supranational Banks
(cost $120,630) | | | | 124,640 | |
| | | | | | | | | | | | |
|
| |
U.S. Treasury Obligations – 1.46% | | | | | |
| |
U.S. Treasury Bond 2.875% 11/15/46 | | | | | | | 635,000 | | | | 616,037 | |
U.S. Treasury Notes | | | | | | | | | | | | |
2.00% 11/15/26 | | | | | | | 325,000 | | | | 313,936 | |
2.25% 2/15/27 | | | | | | | 260,000 | | | | 256,684 | |
| | | | | | | | | | | | |
Total U.S. Treasury Obligations
(cost $1,195,718) | | | | | | | | 1,186,657 | |
| | | | | | | | | | | | |
| | | |
| | | | | | Number of
shares | | | | |
| |
Preferred Stock – 0.71% | |
| |
General Electric 5.00% ● | | | | | | | 133,000 | | | | 140,315 | |
Integrys Holding 6.00% ● | | | | | | | 3,500 | | | | 91,394 | |
U.S. Bancorp 3.50% ● | | | | | | | 400 | | | | 344,000 | |
| | | | | | | | | | | | |
Total Preferred Stock
(cost $502,301) | | | | | | | | | | | 575,709 | |
| | | | | | | | | | | | |
|
| |
Rights – 0.01% | | | | | | | | | | | | |
| |
B2W Cia Digital exercise price BRL 11.00, expiration date 4/25/17 † | | | | | | | 5,600 | | | | 2,540 | |
Schedules of investments
Delaware Foundation® Conservative Allocation Fund
| | | | | | | | |
| | | Number of
shares | | | Value (U.S. $) | |
| |
Rights (continued) | |
| |
Deutsche Bank exercise price EUR 11.65, expiration date 4/6/17 † | | | 800 | | | $ | 1,912 | |
| | | | | | | | |
Total Rights (cost $0) | | | | | | | 4,452 | |
| | | | | | | | |
| | |
| | | Principal amount° | | | | |
| |
Short-Term Investments – 0.64% | |
| |
Discount Notes – 0.44%≠ | | | | | | | | |
Federal Home Loan Bank | | | | | | | | |
0.53% 4/25/17 | | | 54,344 | | | | 54,321 | |
0.55% 5/26/17 | | | 3,072 | | | | 3,068 | |
0.691% 4/28/17 | | | 63,846 | | | | 63,816 | |
0.765% 5/19/17 | | | 234,819 | | | | 234,603 | |
| | | | | | | | |
| | | | | | | 355,808 | |
| | | | | | | | |
U.S. Treasury Obligation – 0.20%≠ | | | | | | | | |
U.S. Treasury Bill 0.44% 4/13/17 | | | 163,317 | | | | 163,284 | |
| | | | | | | | |
| | | | | | | 163,284 | |
| | | | | | | | |
Total Short-Term Investments
(cost $519,078) | | | | | | | 519,092 | |
| | | | | | | | |
Total Value of Securities – 103.47%
(cost $75,534,073) | | | | | | $ | 83,878,078 | |
| | | | | | | | |
| | # | Security exempt from registration under Rule 144A of the Securities Act of 1933, as amended. At March 31, 2017, the aggregate value of Rule 144A securities was $11,639,120, which represents 14.36% of the Fund’s net assets. See Note 11 in “Notes to financial statements.” |
| | ◆ | Pass Through Agreement. Security represents the contractual right to receive a proportionate amount of underlying payments due to the counterparty pursuant to various agreements related to the rescheduling of obligations and the exchange of certain notes. |
| | = | Security is being fair valued in accordance with the Fund’s fair valuation policy. At March 31, 2017, the aggregate value of fair valued securities was $72,928, which represents 0.09% of the Fund’s net assets. See Note 1 in “Notes to financial statements.” |
| | ≠ | The rate shown is the effective yield at the time of purchase. |
| | « | Loan agreements generally pay interest at rates which are periodically reset by reference to a base lending rate plus a premium. These base lending rates are generally: (i) the prime rate offered by one or more U.S. banks, (ii) the lending rate offered by one or more European banks such as the London Interbank Offered Rate (LIBOR), and (iii) the certificate of deposit rate. Loan agreements may be subject to restrictions on resale. Stated rate in effect at March 31, 2017. |
| | § | Developed Markets – countries that are thought to be most developed and therefore less risky than emerging markets. |
| | ° | Principal amount shown is stated in U.S. dollars unless noted that the security is denominated in another currency. |
| | D | Securities have been classified by country of origin. |
| | S | Interest only security. An interest only security is the interest only portion of a fixed income security, which is separated and sold individually from the principal portion of the security. |
| | † | Non-income producing security. |
| | ● | Variable rate security. Each rate shown is as of March 31, 2017. Interest rates reset periodically. |
| | X | Emerging Markets – developing countries with relatively low per capita income, often with above-average economic growth potential but with more risk. |
96
The following foreign currency exchange contracts, futures contracts, and swap contracts were outstanding at March 31, 2017:1
Foreign Currency Exchange Contracts
| | | | | | | | | | | | | | | | | | | | |
Counterparty | | Contracts to
Receive (Deliver) | | | In Exchange For | | | Settlement
Date | | | Unrealized
Appreciation
(Depreciation) | |
BAML | | AUD | | | (248,176 | ) | | USD | | | 188,924 | | | | 5/12/17 | | | $ | (539 | ) |
BAML | | NZD | | | (294,410 | ) | | USD | | | 206,746 | | | | 5/12/17 | | | | 592 | |
BNP | | AUD | | | (52,363 | ) | | USD | | | 39,837 | | | | 5/12/17 | | | | (138 | ) |
BNYM | | AUD | | | (3,490 | ) | | USD | | | 2,667 | | | | 4/4/17 | | | | 1 | |
BNYM | | CAD | | | (12,313 | ) | | USD | | | 9,237 | | | | 4/4/17 | | | | (20 | ) |
BNYM | | CHF | | | (1,933 | ) | | USD | | | 1,931 | | | | 4/3/17 | | | | 1 | |
BNYM | | CHF | | | (38,728 | ) | | USD | | | 38,690 | | | | 4/4/17 | | | | 18 | |
BNYM | | DKK | | | (22,848 | ) | | USD | | | 3,283 | | | | 4/4/17 | | | | 7 | |
BNYM | | EUR | | | (3,792 | ) | | USD | | | 4,048 | | | | 4/3/17 | | | | 4 | |
BNYM | | EUR | | | (72,782 | ) | | USD | | | 77,785 | | | | 4/4/17 | | | | 129 | |
BNYM | | EUR | | | (1,639 | ) | | USD | | | 1,751 | | | | 4/5/17 | | | | 3 | |
BNYM | | GBP | | | 4,939 | | | USD | | | (6,187 | ) | | | 4/4/17 | | | | 2 | |
BNYM | | HKD | | | 111,433 | | | USD | | | (14,347 | ) | | | 4/5/17 | | | | (6 | ) |
BNYM | | JPY | | | (4,254,155 | ) | | USD | | | 38,199 | | | | 4/5/17 | | | | (15 | ) |
BNYM | | SEK | | | (71,659 | ) | | USD | | | 8,019 | | | | 4/4/17 | | | | 22 | |
| | | | | | | | | | | | | | | | | | | | |
| | | | | | | | | | | | | | | | | | $ | 61 | |
| | | | | | | | | | | | | | | | | | | | |
Futures Contracts
| | | | | | | | | | | | | | |
Contracts to Buy (Sell) | | Notional
Cost (Proceeds) | | | Notional
Value | | | Expiration
Date | | Unrealized
Appreciation
(Depreciation) | |
(5) U.S. Treasury 5 yr Notes | | $ | (585,181 | ) | | $ | (588,633 | ) | | 7/3/17 | | $ | (3,452 | ) |
(78) U.S. Treasury 10 yr Notes | | | (9,687,623 | ) | | | (9,715,875 | ) | | 6/22/17 | | | (28,252 | ) |
(33) U.S. Treasury Long Bonds | | | (4,954,032 | ) | | | (4,977,844 | ) | | 6/22/17 | | | (23,812 | ) |
(8) Euro O.A.T. | | | (1,259,831 | ) | | | (1,254,898 | ) | | 6/9/17 | | | 4,933 | |
| | | | | | | | | | | | | | |
| | $ | (16,486,667 | ) | | | | | | | | $ | (50,583 | ) |
| | | | | | | | | | | | | | |
Schedules of investments
Delaware Foundation® Conservative Allocation Fund
Swap Contracts
CDS Contracts2
| | | | | | | | | | | | | | | | | | | | | | |
Counterparty | | Swap Referenced Obligation | | Notional
Value3 | | | Annual Protection
(Receipts) Payments | | | Termination
Date | | | Upfront
Payments
Paid
(Received) | | | Unrealized
Appreciation
(Depreciation)4 | |
| | Protection Purchased: | | | | | | | | | | | | | | | | | | | | |
ICE | | JPM - CDX.NA.HY.275 | | | 2,643,300 | | | | 5.00% | | | | 12/20/21 | | | $ | (158,549 | ) | | | $(50,520) | |
IRS Contracts6 | | | | | | | | | | | | | | | | | | | | | | |
| | | | | | | | | | | | | | | | | | | | |
Counterparty &
Swap Referenced Obligation | | Notional Value3 | | | Fixed
Interest Rate
Paid
(Received) | | | Variable
Interest
Rate
Paid
(Received) | | | Termination
Date | | | Unrealized
Appreciation
(Depreciation)4 | |
CME - BAML 3 yr | | | 4,415,000 | | | | 1.808 | % | | | (1.151 | %) | | | 3/28/20 | | | $ | (85 | ) |
LCH - BAML 5 yr | | | 10,500,000 | | | | 2.066 | % | | | (1.148 | %) | | | 4/3/22 | | | | (5,381 | ) |
| | | | | | | | | | | | | | | | | | | | |
| | | | | | | | | | | | | | | | | | $ | (5,466 | ) |
| | | | | | | | | | | | | | | | | | | | |
The use of foreign currency exchange contracts, futures contracts, and swap contracts involves elements of market risk and risks in excess of the amounts recognized in these financial statements. The foreign currency exchange contracts and notional values presented represent the Fund’s total exposure in such contracts, whereas only the net unrealized appreciation (depreciation) is reflected in the Fund’s net assets.
1See Note 8 in “Notes to financial statements.”
2A Credit Default Swap contract is a risk-transfer instrument through which one party (purchaser of protection) transfers to another party (seller of protection) the financial risk of a credit event (as defined in the CDS agreement), as it relates to a particular reference security or basket of securities (such as an index). Periodic payments (receipts) on such contracts are accrued daily and recorded as unrealized losses (gains) on swap contracts. Upon payment (receipt), such amounts are recorded as unrealized losses (gains) on swap contracts. Upfront payments made or received in connection with CDS contracts are amortized over the expected life of the CDS contracts as unrealized losses (gains) on swap contracts. The change in value of CDS contracts is recorded as unrealized appreciation or depreciation daily. A realized gain or loss is recorded upon credit event (as defined in the CDS agreement) or the maturity or termination of the agreement.
3Notional value shown is stated in U.S. Dollars unless noted that the swap is denominated in another currency.
4Unrealized appreciation (depreciation) does not include periodic interest payments on swap contracts accrued daily in the amount of $(6,332).
5Markit’s CDX.NA.HY Index is composed of 100 of the most liquid North American entities with high yield credit ratings that trade in the CDS market.
6An interest rate swap agreement is an exchange of interest rates between counterparties. Periodic payments (receipts) on such contracts are accrued daily and recorded as unrealized appreciation (depreciation) on swap contracts. Upon periodic payment (receipt) or termination of the contract, such amounts are recorded as realized gains (losses) on swap contracts.
Summary of abbreviations:
ADR – American Depositary Receipt
ARM – Adjustable Rate Mortgage
AUD – Australian Dollar
BAML – Bank of America Merrill Lynch
BB – Barclays Bank
BNP – BNP Paribas
BNYM – Bank of New York Mellon
BRL – Brazilian Real
CAD – Canadian Dollar
CDS – Credit Default Swap
CDX.NA.HY – Credit Default Swap Index North America High Yield
CHF – Swiss Franc
CLO – Collateralized Loan Obligation
CME – Chicago Mercantile Exchange
CVA – Dutch Certificate
DB – Deutsche Bank
DKK – Danish Krone
EAFE – Europe Australasia Far East
ETF – Exchange-Traded Fund
EUR – Euro
FREMF – Freddie Mac Multifamily
GBP – British Pound Sterling
GDR – Global Depositary Receipt
GNMA – Government National Mortgage Association
GS – Goldman Sachs
HKD – Hong Kong Dollar
ICE – Intercontinental Exchange, Inc.
98
Summary of abbreviations (continued):
IRS – Interest Rate Swap
JPM – JPMorgan
JPY – Japanese Yen
LB – Lehman Brothers
LCH – London Clearing House
MSCI – Morgan Stanley Capital International
NZD – New Zealand Dollar
O.A.T. – Obligations Assimilables du Trésor (French Treasury Bond)
PJSC – Private Joint Stock Company
REIT – Real Estate Investment Trust
REMIC – Real Estate Mortgage Investment Conduit
SEK – Swedish Krona
S.F. – Single Family
TBA – To be announced
USD – U.S. Dollar
yr – Year
See accompanying notes, which are an integral part of the financial statements.
Statements of assets and liabilities
Delaware Foundation Funds®
March 31, 2017
| | | | | | | | | | | | |
| | | Delaware
Foundation®
Growth
Allocation
Fund | | | Delaware
Foundation
Moderate
Allocation
Fund | | | Delaware
Foundation
Conservative
Allocation
Fund | |
Assets: | | | | | | | | | | | | |
Investments, at value1 | | $ | 63,272,857 | | | $ | 274,176,476 | | | $ | 83,358,986 | |
Short-term investments, at value2 | | | 959,754 | | | | 4,731,272 | | | | 519,092 | |
Foreign currencies, at value3 | | | 123,177 | | | | 316,508 | | | | 82,898 | |
Cash collateral due from brokers | | | 161,767 | | | | 1,940,947 | | | | 599,861 | |
Receivable for securities sold | | | 1,496,516 | | | | 10,035,801 | | | | 4,562,424 | |
Dividends and interest receivable | | | 222,132 | | | | 1,299,805 | | | | 480,581 | |
Receivable for fund shares sold | | | 86,103 | | | | 321,810 | | | | 112,072 | |
Foreign tax reclaims receivable | | | 69,446 | | | | 175,573 | | | | 42,817 | |
Swap payments receivable | | | 251 | | | | 1,386 | | | | 509 | |
Upfront payments paid on credit default swap contracts | | | — | | | | 222,947 | | | | — | |
Unrealized appreciation on credit default swap contracts | | | 722 | | | | — | | | | — | |
Unrealized appreciation on foreign currency exchange contracts | | | 266 | | | | 1,616 | | | | 779 | |
| | | | | | | | | | | | |
Total assets | | | 66,392,991 | | | | 293,224,141 | | | | 89,760,019 | |
| | | | | | | | | | | | |
Liabilities: | | | | | | | | | | | | |
Cash overdraft | | | 11,775 | | | | 122,165 | | | | 768,092 | |
Cash collateral due to brokers | | | — | | | | 210,000 | | | | — | |
Payable for securities purchased | | | 2,531,059 | | | | 17,391,290 | | | | 7,320,805 | |
Payable for fund shares redeemed | | | 119,281 | | | | 274,414 | | | | 176,556 | |
Variation margin due to broker on futures contracts | | | 8,502 | | | | 61,873 | | | | 24,871 | |
Variation margin due to brokers on interest rate swap contracts | | | 3,775 | | | | 29,461 | | | | 12,462 | |
Swap payments payable | | | 1,539 | | | | 13,378 | | | | 5,226 | |
Variation margin due to brokers on credit default swap contracts | | | 14 | | | | 112 | | | | 50 | |
Other accrued expenses | | | 118,650 | | | | 214,580 | | | | 119,306 | |
Distribution fees payable to affiliates | | | 19,048 | | | | 54,514 | | | | 32,253 | |
Investment management fees payable to affiliates | | | 2,854 | | | | 136,370 | | | | 15,503 | |
Dividend disbursing and transfer agent fees and expenses payable to affiliates | | | 1,068 | | | | 4,628 | | | | 1,402 | |
Accounting and administration expenses payable to affiliates | | | 249 | | | | 1,078 | | | | 326 | |
Trustees’ fees and expenses payable | | | 168 | | | | 723 | | | | 220 | |
Legal fees payable to affiliates | | | 130 | | | | 568 | | | | 171 | |
Reports and statements to shareholders expenses payable to affiliates | | | 117 | | | | 494 | | | | 150 | |
Upfront payments received on credit default swap contracts | | | 61,393 | | | | 351,000 | | | | 158,549 | |
Unrealized depreciation on credit default swap contracts | | | 11,701 | | | | 126,780 | | | | 50,520 | |
Unrealized depreciation on interest rate swap contracts | | | 1,617 | | | | 12,575 | | | | 5,466 | |
Unrealized depreciation on foreign currency exchange contracts | | | 272 | | | | 1,369 | | | | 718 | |
Deferred capital gains taxes payable | | | 1,425 | | | | 4,237 | | | | 873 | |
| | | | | | | | | | | | |
Total liabilities | | | 2,894,637 | | | | 19,011,609 | | | | 8,693,519 | |
| | | | | | | | | | | | |
Total Net Assets | | $ | 63,498,354 | | | $ | 274,212,532 | | | $ | 81,066,500 | |
| | | | | | | | | | | | |
100
| | | | | | | | | | | | |
| | | Delaware
Foundation®
Growth
Allocation
Fund | | | Delaware
Foundation
Moderate
Allocation
Fund | | | Delaware
Foundation
Conservative
Allocation
Fund | |
Net Assets Consist of: | | | | | | | | | | | | |
Paid-in capital | | $ | 48,943,258 | | | $ | 223,241,722 | | | $ | 71,334,835 | |
Undistributed (distributions in excess of) net investment income | | | 15,809 | | | | (225,710 | ) | | | (18,225 | ) |
Accumulated net realized gain on investments | | | 1,829,879 | | | | 10,587,898 | | | | 1,522,468 | |
Net unrealized appreciation of investments | | | 12,746,177 | | | | 40,899,861 | | | | 8,343,132 | |
Net unrealized depreciation of foreign currencies | | | (3,643 | ) | | | (9,958 | ) | | | (2,870 | ) |
Net unrealized appreciation (depreciation) of foreign currency exchange contracts | | | (6 | ) | | | 247 | | | | 61 | |
Net unrealized depreciation of futures contracts | | | (17,657 | ) | | | (128,722 | ) | | | (50,583 | ) |
Net unrealized depreciation of swap contracts | | | (15,463 | ) | | | (152,806 | ) | | | (62,318 | ) |
| | | | | | | | | | | | |
Total Net Assets | | $ | 63,498,354 | | | $ | 274,212,532 | | | $ | 81,066,500 | |
| | | | | | | | | | | | |
| | | |
Net Asset Value | | | | | | | | | | | | |
| | | |
Class A: | | | | | | | | | | | | |
Net assets | | $ | 34,904,143 | | | $ | 170,801,065 | | | $ | 42,452,895 | |
Shares of beneficial interest outstanding, unlimited authorization, no par | | | 3,558,964 | | | | 14,961,648 | | | | 4,426,557 | |
Net asset value per share | | $ | 9.81 | | | $ | 11.42 | | | $ | 9.59 | |
Sales charge | | | 5.75 | % | | | 5.75 | % | | | 5.75 | % |
Offering price per share, equal to net asset value per share / (1 – sales charge) | | $ | 10.41 | | | $ | 12.12 | | | $ | 10.18 | |
| | | |
Class C: | | | | | | | | | | | | |
Net assets | | $ | 12,143,235 | | | $ | 22,602,165 | | | $ | 24,802,915 | |
Shares of beneficial interest outstanding, unlimited authorization, no par | | | 1,276,555 | | | | 1,979,759 | | | | 2,579,229 | |
Net asset value per share | | $ | 9.51 | | | $ | 11.42 | | | $ | 9.62 | |
| | | |
Class R: | | | | | | | | | | | | |
Net assets | | $ | 3,230,275 | | | $ | 1,800,419 | | | $ | 2,550,114 | |
Shares of beneficial interest outstanding, unlimited authorization, no par | | | 332,137 | | | | 158,352 | | | | 265,958 | |
Net asset value per share | | $ | 9.73 | | | $ | 11.37 | | | $ | 9.59 | |
| | | |
Institutional Class: | | | | | | | | | | | | |
Net assets | | $ | 13,220,701 | | | $ | 79,008,883 | | | $ | 11,260,576 | |
Shares of beneficial interest outstanding, unlimited authorization, no par | | | 1,338,793 | | | | 6,917,430 | | | | 1,171,521 | |
Net asset value per share | | $ | 9.88 | | | $ | 11.42 | | | $ | 9.61 | |
| | | | | | | | | | | | |
1 Investments, at cost | | $ | 50,525,250 | | | $ | 233,272,393 | | | $ | 75,014,995 | |
2 Short-term investments, at cost | | | 959,759 | | | | 4,731,257 | | | | 519,078 | |
3 Foreign currencies, at cost | | | 122,932 | | | | 315,676 | | | | 82,750 | |
See accompanying notes, which are an integral part of the financial statements.
Statements of operations
Delaware Foundation Funds®
Year ended March 31, 2017
| | | | | | | | | | | | |
| | | Delaware
Foundation®
Growth
Allocation
Fund | | | Delaware
Foundation
Moderate
Allocation
Fund | | | Delaware
Foundation
Conservative
Allocation
Fund | |
Investment Income: | | | | | | | | | | | | |
Dividends | | $ | 1,141,876 | | | $ | 3,444,433 | | | $ | 735,814 | |
Interest | | | 529,075 | | | | 3,962,672 | | | | 1,793,736 | |
Foreign tax withheld | | | (60,974 | ) | | | (179,829 | ) | | | (38,260 | ) |
| | | | | | | | | | | | |
| | | |
| | | 1,609,977 | | | | 7,227,276 | | | | 2,491,290 | |
| | | | | | | | | | | | |
Expenses: | | | | | | | | | | | | |
Management fees | | | 444,274 | | | | 1,786,405 | | | | 564,500 | |
Distribution expenses – Class A | | | 96,270 | | | | 408,665 | | | | 106,752 | |
Distribution expenses – Class C | | | 120,138 | | | | 236,954 | | | | 280,803 | |
Distribution expenses – Class R | | | 18,877 | | | | 9,985 | | | | 19,598 | |
Dividend disbursing and transfer agent fees and expenses | | | 119,639 | | | | 256,229 | | | | 111,375 | |
Audit and tax fees | | | 73,644 | | | | 76,732 | | | | 68,235 | |
Registration fees | | | 59,328 | | | | 60,652 | | | | 59,661 | |
Custodian fees | | | 49,953 | | | | 66,782 | | | | 46,631 | |
Legal fees | | | 28,151 | | | | 93,738 | | | | 33,604 | |
Reports and statements to shareholders expenses | | | 23,958 | | | | 71,000 | | | | 26,714 | |
Accounting and administration expenses | | | 21,491 | | | | 86,356 | | | | 27,301 | |
Trustees’ fees and expenses | | | 3,423 | | | | 13,808 | | | | 4,387 | |
Other | | | 66,832 | | | | 79,331 | | | | 70,641 | |
| | | | | | | | | | | | |
| | | 1,125,978 | | | | 3,246,637 | | | | 1,420,202 | |
Less expenses waived | | | (275,710 | ) | | | (119,758 | ) | | | (231,343 | ) |
Less expenses paid indirectly | | | (170 | ) | | | (565 | ) | | | (131 | ) |
| | | | | | | | | | | | |
Total operating expenses | | | 850,098 | | | | 3,126,314 | | | | 1,188,728 | |
| | | | | | | | | | | | |
Net Investment Income | | | 759,879 | | | | 4,100,962 | | | | 1,302,562 | |
| | | | | | | | | | | | |
| | | |
Net Realized and Unrealized Gain (Loss): | | | | | | | | | | | | |
Net realized gain (loss) on: | | | | | | | | | | | | |
Investments1 | | | 5,251,746 | | | | 12,844,541 | | | | 3,786,601 | |
Foreign currencies | | | (21,733 | ) | | | (211,781 | ) | | | (143,524 | ) |
Foreign currency exchange contracts | | | (19,989 | ) | | | 62,727 | | | | 6,200 | |
Futures contracts | | | 302,699 | | | | 2,648,567 | | | | 951,356 | |
Options purchased | | | 4,728 | | | | 34,281 | | | | 15,685 | |
Options written | | | (4,863 | ) | | | (33,291 | ) | | | (14,677 | ) |
Swap contracts | | | 6,549 | | | | (59,992 | ) | | | 47,984 | |
| | | | | | | | | | | | |
Net realized gain | | | 5,519,137 | | | | 15,285,052 | | | | 4,649,625 | |
| | | | | | | | | | | | |
| | | |
Net change in unrealized appreciation (depreciation) of: | | | | | | | | | | | | |
Investments2 | | | 982,212 | | | | 5,685,158 | | | | 228,623 | |
Foreign currencies | | | (1,797 | ) | | | (10,884 | ) | | | (3,210 | ) |
Foreign currency exchange contracts | | | 7,912 | | | | 43,432 | | | | 27,068 | |
Futures contracts | | | (18,959 | ) | | | (124,084 | ) | | | (51,870 | ) |
Swap contracts | | | (35,961 | ) | | | (298,988 | ) | | | (136,948 | ) |
| | | | | | | | | | | | |
Net change in unrealized appreciation | | | 933,407 | | | | 5,294,634 | | | | 63,663 | |
| | | | | | | | | | | | |
Net Realized and Unrealized Gain | | | 6,452,544 | | | | 20,579,686 | | | | 4,713,288 | |
| | | | | | | | | | | | |
| | | |
Net Increase in Net Assets Resulting from Operations | | $ | 7,212,423 | | | $ | 24,680,648 | | | $ | 6,015,850 | |
| | | | | | | | | | | | |
1 Includes capital gains taxes paid. | | $ | (412 | ) | | $ | (1,185 | ) | | $ | (585 | ) |
2 Includes increase in capital gains taxes accrued. | | $ | (1,391 | ) | | $ | (4,061 | ) | | $ | (777 | ) |
See accompanying notes, which are an integral part of the financial statements.
102
Statements of changes in net assets
Delaware Foundation Funds®
| | | | | | | | |
| | | Delaware
Foundation®
Growth
Allocation Fund | |
| | | Year ended | |
| | | 3/31/17 | | | 3/31/16 | |
Increase (Decrease) in Net Assets from Operations: | | | | | | | | |
Net investment income | | $ | 759,879 | | | $ | 850,142 | |
Net realized gain | | | 5,519,137 | | | | 1,385,172 | |
Net change in unrealized appreciation (depreciation) | | | 933,407 | | | | (5,860,785 | ) |
| | | | | | | | |
Net increase (decrease) in net assets resulting from operations | | | 7,212,423 | | | | (3,625,471 | ) |
| | | | | | | | |
Dividends and Distributions to Shareholders from: | | | | | | | | |
Net investment income: | | | | | | | | |
Class A | | | (506,738 | ) | | | (518,808 | ) |
Class C | | | (79,218 | ) | | | (57,000 | ) |
Class R | | | (39,759 | ) | | | (44,379 | ) |
Institutional Class | | | (213,356 | ) | | | (248,088 | ) |
| | |
Net realized gain: | | | | | | | | |
Class A | | | (1,272,985 | ) | | | (3,576,310 | ) |
Class C | | | (423,058 | ) | | | (928,687 | ) |
Class R | | | (119,509 | ) | | | (369,331 | ) |
Institutional Class | | | (452,516 | ) | | | (1,659,280 | ) |
| | | | | | | | |
| | | (3,107,139 | ) | | | (7,401,883 | ) |
| | | | | | | | |
Capital Share Transactions: | | | | | | | | |
Proceeds from shares sold: | | | | | | | | |
Class A | | | 4,095,630 | | | | 7,424,812 | |
Class C | | | 2,099,844 | | | | 2,921,897 | |
Class R | | | 1,100,750 | | | | 1,811,442 | |
Institutional Class | | | 3,956,557 | | | | 6,002,215 | |
| | |
Net asset value of shares issued upon reinvestment of dividends and distributions: | | | | | | | | |
Class A | | | 1,750,464 | | | | 4,042,241 | |
Class C | | | 490,240 | | | | 959,660 | |
Class R | | | 157,231 | | | | 409,501 | |
Institutional Class | | | 663,780 | | | | 1,559,336 | |
| | | | | | | | |
| | | 14,314,496 | | | | 25,131,104 | |
| | | | | | | | |
Cost of shares redeemed: | | | | | | | | |
Class A | | | (14,441,869 | ) | | | (8,593,498 | ) |
Class C | | | (2,664,229 | ) | | | (1,807,081 | ) |
Class R | | | (2,211,332 | ) | | | (1,978,662 | ) |
Institutional Class | | | (7,643,871 | ) | | | (9,849,126 | ) |
| | | | | | | | |
| | | (26,961,301 | ) | | | (22,228,367 | ) |
| | | | | | | | |
Increase (decrease) in net assets derived from capital share transactions | | | (12,646,805 | ) | | | 2,902,737 | |
| | | | | | | | |
Net Decrease in Net Assets | | | (8,541,521 | ) | | | (8,124,617 | ) |
Net Assets: | | | | | | | | |
Beginning of year | | | 72,039,875 | | | | 80,164,492 | |
| | | | | | | | |
End of year | | $ | 63,498,354 | | | $ | 72,039,875 | |
| | | | | | | | |
Undistributed (distributions in excess of) net investment income | | $ | 15,809 | | | $ | (17,825 | ) |
| | | | | | | | |
See accompanying notes, which are an integral part of the financial statements.
Statements of changes in net assets
Delaware Foundation Funds®
| | | | | | | | |
| | | Delaware
Foundation®
Moderate
Allocation Fund | |
| | | Year ended | |
| | | 3/31/17 | | | 3/31/16 | |
Increase (Decrease) in Net Assets from Operations: | | | | | | | | |
Net investment income | | $ | 4,100,962 | | | $ | 4,215,887 | |
Net realized gain | | | 15,285,052 | | | | 2,738,413 | |
Net change in unrealized appreciation (depreciation) | | | 5,294,634 | | | | (17,105,032 | ) |
| | | | | | | | |
Net increase (decrease) in net assets resulting from operations | | | 24,680,648 | | | | (10,150,732 | ) |
| | | | | | | | |
| | |
Dividends and Distributions to Shareholders from: | | | | | | | | |
Net investment income: | | | | | | | | |
Class A | | | (3,636,179 | ) | | | (2,822,360 | ) |
Class C | | | (319,081 | ) | | | (215,417 | ) |
Class R | | | (35,683 | ) | | | (25,405 | ) |
Institutional Class | | | (1,811,938 | ) | | | (1,258,365 | ) |
| | |
Net realized gain: | | | | | | | | |
Class A | | | (2,266,380 | ) | | | (10,223,231 | ) |
Class C | | | (316,466 | ) | | | (1,560,097 | ) |
Class R | | | (26,509 | ) | | | (108,271 | ) |
Institutional Class | | | (977,607 | ) | | | (3,278,591 | ) |
| | | | | | | | |
| | | (9,389,843 | ) | | | (19,491,737 | ) |
| | | | | | | | |
Capital Share Transactions: | | | | | | | | |
Proceeds from shares sold: | | | | | | | | |
Class A | | | 6,241,099 | | | | 5,893,678 | |
Class C | | | 2,159,322 | | | | 3,559,489 | |
Class R | | | 287,054 | | | | 1,182,713 | |
Institutional Class | | | 8,098,098 | | | | 26,917,461 | |
| | |
Net asset value of shares issued upon reinvestment of dividends and distributions: | | | | | | | | |
Class A | | | 5,272,753 | | | | 11,794,190 | |
Class C | | | 609,120 | | | | 1,709,232 | |
Class R | | | 62,192 | | | | 133,673 | |
Institutional Class | | | 754,088 | | | | 1,707,988 | |
| | | | | | | | |
| | | 23,483,726 | | | | 52,898,424 | |
| | | | | | | | |
| | |
Cost of shares redeemed: | | | | | | | | |
Class A | | | (24,364,133 | ) | | | (20,132,893 | ) |
Class C | | | (6,214,127 | ) | | | (6,508,713 | ) |
Class R | | | (635,130 | ) | | | (1,632,183 | ) |
Institutional Class | | | (7,143,897 | ) | | | (11,388,537 | ) |
| | | | | | | | |
| | | (38,357,287 | ) | | | (39,662,326 | ) |
| | | | | | | | |
Increase (Decrease) in net assets derived from capital share transactions | | | (14,873,561 | ) | | | 13,236,098 | |
| | | | | | | | |
Net Increase (Decrease) in Net Assets | | | 417,244 | | | | (16,406,371 | ) |
Net Assets: | | | | | | | | |
Beginning of year | | | 273,795,288 | | | | 290,201,659 | |
| | | | | | | | |
End of year | | $ | 274,212,532 | | | $ | 273,795,288 | |
| | | | | | | | |
Undistributed (distribution in excess of) net investment income | | $ | (225,710 | ) | | $ | 359,159 | |
| | | | | | | | |
See accompanying notes, which are an integral part of the financial statements.
104
| | | | | | | | |
| | | Delaware
Foundation®
Conservative
Allocation Fund | |
| | | Year ended | |
| | | 3/31/17 | | | 3/31/16 | |
Increase (Decrease) in Net Assets from Operations: | | | | | | | | |
Net investment income | | $ | 1,302,562 | | | $ | 1,545,006 | |
Net realized gain | | | 4,649,625 | | | | 429,720 | |
Net change in unrealized appreciation (depreciation) | | | 63,663 | | | | (5,098,160 | ) |
| | | | | | | | |
Net increase (decrease) in net assets resulting from operations | | | 6,015,850 | | | | (3,123,434 | ) |
| | | | | | | | |
| | |
Dividends and Distributions to Shareholders from: | | | | | | | | |
Net investment income: | | | | | | | | |
Class A | | | (872,068 | ) | | | (788,930 | ) |
Class C | | | (361,435 | ) | | | (310,363 | ) |
Class R | | | (71,554 | ) | | | (59,013 | ) |
Institutional Class | | | (277,789 | ) | | | (319,771 | ) |
| | |
Net realized gain: | | | | | | | | |
Class A | | | (580,209 | ) | | | (2,358,056 | ) |
Class C | | | (363,436 | ) | | | (1,664,921 | ) |
Class R | | | (54,742 | ) | | | (206,122 | ) |
Institutional Class | | | (143,903 | ) | | | (864,532 | ) |
| | | | | | | | |
| | | (2,725,136 | ) | | | (6,571,708 | ) |
| | | | | | | | |
Capital Share Transactions: | | | | | | | | |
Proceeds from shares sold: | | | | | | | | |
Class A | | | 7,592,577 | | | | 6,423,444 | |
Class C | | | 1,947,079 | | | | 4,679,637 | |
Class R | | | 1,145,255 | | | | 1,120,255 | |
Institutional Class | | | 4,510,742 | | | | 6,485,127 | |
| | |
Net asset value of shares issued upon reinvestment of dividends and distributions: | | | | | | | | |
Class A | | | 1,419,969 | | | | 3,079,149 | |
Class C | | | 678,571 | | | | 1,898,697 | |
Class R | | | 126,296 | | | | 264,953 | |
Institutional Class | | | 369,707 | | | | 966,883 | |
| | | | | | | | |
| | | 17,790,196 | | | | 24,918,145 | |
| | | | | | | | |
| | |
Cost of shares redeemed: | | | | | | | | |
Class A | | | (11,597,714 | ) | | | (13,301,551 | ) |
Class C | | | (9,019,287 | ) | | | (7,981,848 | ) |
Class R | | | (2,592,320 | ) | | | (1,490,339 | ) |
Institutional Class | | | (8,337,417 | ) | | | (9,878,979 | ) |
| | | | | | | | |
| | | (31,546,738 | ) | | | (32,652,717 | ) |
| | | | | | | | |
Decrease in net assets derived from capital share transactions | | | (13,756,542 | ) | | | (7,734,572 | ) |
| | | | | | | | |
Net Decrease in Net Assets | | | (10,465,828 | ) | | | (17,429,714 | ) |
Net Assets: | | | | | | | | |
Beginning of year | | | 91,532,328 | | | | 108,962,042 | |
| | | | | | | | |
End of year | | $ | 81,066,500 | | | $ | 91,532,328 | |
| | | | | | | | |
Distributions in excess of net investment income | | $ | (18,225 | ) | | $ | (115,934 | ) |
| | | | | | | | |
See accompanying notes, which are an integral part of the financial statements.
Financial highlights
Delaware Foundation® Growth Allocation Fund Class A
Selected data for each share of the Fund outstanding throughout each period were as follows:
| | | | | | | | | | | | | | | | | | | | | | | | |
| | | | | | 10/1/14 | | | | | | | | | | |
| | | Year ended | | | to | | | Year ended | |
| | | 3/31/17 | | | 3/31/16 | | | 3/31/151 | | | 9/30/14 | | | 9/30/13 | | | 9/30/12 | |
Net asset value, beginning of period | | $ | 9.260 | | | $ | 10.640 | | | $ | 11.640 | | | $ | 11.550 | | | $ | 10.220 | | | $ | 8.970 | |
| | | | | | |
Income (loss) from investment operations: | | | | | | | | | | | | | | | | | | | | | | | | |
Net investment income2 | | | 0.116 | | | | 0.115 | | | | 0.049 | | | | 0.159 | | | | 0.148 | | | | 0.143 | |
Net realized and unrealized gain (loss) | | | 0.903 | | | | (0.549 | ) | | | 0.295 | | | | 0.860 | | | | 1.355 | | | | 1.506 | |
| | | | | | | | | | | | | | | | | | | | | | | | |
Total from investment operations | | | 1.019 | | | | (0.434 | ) | | | 0.344 | | | | 1.019 | | | | 1.503 | | | | 1.649 | |
| | | | | | | | | | | | | | | | | | | | | | | | |
| | | | | | |
Less dividends and distributions from: | | | | | | | | | | | | | | | | | | | | | | | | |
Net investment income | | | (0.131 | ) | | | (0.118 | ) | | | (0.200 | ) | | | (0.151 | ) | | | (0.145 | ) | | | (0.148 | ) |
Net realized gain | | | (0.338 | ) | | | (0.828 | ) | | | (1.144 | ) | | | (0.778 | ) | | | (0.028 | ) | | | (0.251 | ) |
| | | | | | | | | | | | | | | | | | | | | | | | |
Total dividends and distributions | | | (0.469 | ) | | | (0.946 | ) | | | (1.344 | ) | | | (0.929 | ) | | | (0.173 | ) | | | (0.399 | ) |
| | | | | | | | | | | | | | | | | | | | | | | | |
| | | | | | |
Net asset value, end of period | | $ | 9.810 | | | $ | 9.260 | | | $ | 10.640 | | | $ | 11.640 | | | $ | 11.550 | | | $ | 10.220 | |
| | | | | | | | | | | | | | | | | | | | | | | | |
| | | | | | |
Total return3 | | | 11.25% | | | | (4.47% | ) | | | 3.15% | | | | 9.21% | | | | 14.92% | | | | 18.87% | |
| | | | | | |
Ratios and supplemental data: | | | | | | | | | | | | | | | | | | | | | | | | |
Net assets, end of period (000 omitted) | | $ | 34,904 | | | $ | 41,172 | | | $ | 44,463 | | | $ | 39,716 | | | $ | 49,046 | | | $ | 42,992 | |
Ratio of expenses to average net assets | | | 1.15% | | | | 1.16% | | | | 1.17% | | | | 1.15% | | | | 1.15% | | | | 1.15% | |
Ratio of expenses to average net assets prior to fees waived | | | 1.55% | | | | 1.52% | | | | 1.58% | | | | 1.44% | | | | 1.52% | | | | 1.53% | |
Ratio of net investment income to average net assets | | | 1.21% | | | | 1.18% | | | | 0.89% | | | | 1.37% | | | | 1.37% | | | | 1.47% | |
Ratio of net investment income to average net assets prior to fees waived | | | 0.81% | | | | 0.83% | | | | 0.48% | | | | 1.08% | | | | 1.00% | | | | 1.09% | |
Portfolio turnover | | | 103% | | | | 87% | | | | 49% | | | | 77% | | | | 104% | | | | 109% | |
| | 1 | During the period ended March 31, 2015, the Fund changed its fiscal year end from September to March. Ratios have been annualized and total return and portfolio turnover have not been annualized. |
| | 2 | The average shares outstanding method has been applied for per share information. |
| | 3 | Total investment return is based on the change in net asset value of a share during the period and assumes reinvestment of dividends and distributions at net asset value and does not reflect the impact of a sales charge. Total investment return during all of the periods shown reflects a waiver by the manager and/or distributor. Performance would have been lower had the waivers not been in effect. |
See accompanying notes, which are an integral part of the financial statements.
106
Delaware Foundation® Growth Allocation Fund Class C
Selected data for each share of the Fund outstanding throughout each period were as follows:
| | | | | | | | | | | | | | | | | | | | | | | | |
| | | | | | 10/1/14 | | | | | | | | | | |
| | | Year ended | | | to | | | Year ended | |
| | | 3/31/17 | | | 3/31/16 | | | 3/31/151 | | | 9/30/14 | | | 9/30/13 | | | 9/30/12 | |
Net asset value, beginning of period | | $ | 8.990 | | | $ | 10.360 | | | $ | 11.340 | | | $ | 11.270 | | | $ | 9.980 | | | $ | 8.760 | |
| | | | | | |
Income (loss) from investment operations: | | | | | | | | | | | | | | | | | | | | | | | | |
Net investment income2 | | | 0.042 | | | | 0.041 | | | | 0.007 | | | | 0.071 | | | | 0.066 | | | | 0.068 | |
Net realized and unrealized gain (loss) | | | 0.879 | | | | (0.538 | ) | | | 0.273 | | | | 0.846 | | | | 1.324 | | | | 1.479 | |
| | | | | | | | | | | | | | | | | | | | | | | | |
Total from investment operations | | | 0.921 | | | | (0.497 | ) | | | 0.280 | | | | 0.917 | | | | 1.390 | | | | 1.547 | |
| | | | | | | | | | | | | | | | | | | | | | | | |
| | | | | | |
Less dividends and distributions from: | | | | | | | | | | | | | | | | | | | | | | | | |
Net investment income | | | (0.063 | ) | | | (0.045 | ) | | | (0.116 | ) | | | (0.069 | ) | | | (0.072 | ) | | | (0.076 | ) |
Net realized gain | | | (0.338 | ) | | | (0.828 | ) | | | (1.144 | ) | | | (0.778 | ) | | | (0.028 | ) | | | (0.251 | ) |
| | | | | | | | | | | | | | | | | | | | | | | | |
Total dividends and distributions | | | (0.401 | ) | | | (0.873 | ) | | | (1.260 | ) | | | (0.847 | ) | | | (0.100 | ) | | | (0.327 | ) |
| | | | | | | | | | | | | | | | | | | | | | | | |
| | | | | | |
Net asset value, end of period | | $ | 9.510 | | | $ | 8.990 | | | $ | 10.360 | | | $ | 11.340 | | | $ | 11.270 | | | $ | 9.980 | |
| | | | | | | | | | | | | | | | | | | | | | | | |
| | | | | | |
Total return3 | | | 10.44% | | | | (5.22% | ) | | | 2.72% | | | | 8.37% | | | | 14.05% | | | | 18.04% | |
| | | | | | |
Ratios and supplemental data: | | | | | | | | | | | | | | | | | | | | | | | | |
Net assets, end of period (000 omitted) | | $ | 12,143 | | | $ | 11,529 | | | $ | 11,017 | | | $ | 9,707 | | | $ | 7,687 | | | $ | 6,570 | |
Ratio of expenses to average net assets | | | 1.90% | | | | 1.91% | | | | 1.92% | | | | 1.90% | | | | 1.90% | | | | 1.90% | |
Ratio of expenses to average net assets prior to fees waived | | | 2.30% | | | | 2.27% | | | | 2.33% | | | | 2.19% | | | | 2.22% | | | | 2.23% | |
Ratio of net investment income to average net assets | | | 0.46% | | | | 0.43% | | | | 0.14% | | | | 0.62% | | | | 0.62% | | | | 0.72% | |
Ratio of net investment income (loss) to average net assets prior to fees waived | | | 0.06% | | | | 0.08% | | | | (0.27% | ) | | | 0.33% | | | | 0.30% | | | | 0.39% | |
Portfolio turnover | | | 103% | | | | 87% | | | | 49% | | | | 77% | | | | 104% | | | | 109% | |
| | 1 | During the period ended March 31, 2015, the Fund changed its fiscal year end from September to March. Ratios have been annualized and total return and portfolio turnover have not been annualized. |
| | 2 | The average shares outstanding method has been applied for per share information. |
| | 3 | Total investment return is based on the change in net asset value of a share during the period and assumes reinvestment of dividends and distributions at net asset value and does not reflect the impact of a sales charge. Total investment return during all of the periods shown reflects a waiver by the manager. Performance would have been lower had the waiver not been in effect. |
See accompanying notes, which are an integral part of the financial statements.
Financial highlights
Delaware Foundation® Growth Allocation Fund Class R
Selected data for each share of the Fund outstanding throughout each period were as follows:
| | | | | | | | | | | | | | | | | | | | | | | | |
| | | | | | 10/1/14 | | | | | | | | | | |
| | | Year ended | | | to | | | Year ended | |
| | | 3/31/17 | | | 3/31/16 | | | 3/31/151 | | | 9/30/14 | | | 9/30/13 | | | 9/30/12 | |
Net asset value, beginning of period | | $ | 9.180 | | | $ | 10.560 | | | $ | 11.560 | | | $ | 11.480 | | | $ | 10.150 | | | $ | 8.910 | |
| | | | | | |
Income (loss) from investment operations: | | | | | | | | | | | | | | | | | | | | | | | | |
Net investment income2 | | | 0.091 | | | | 0.090 | | | | 0.035 | | | | 0.131 | | | | 0.121 | | | | 0.118 | |
Net realized and unrealized gain (loss) | | | 0.905 | | | | (0.548 | ) | | | 0.281 | | | | 0.850 | | | | 1.357 | | | | 1.497 | |
| | | | | | | | | | | | | | | | | | | | | | | | |
Total from investment operations | | | 0.996 | | | | (0.458 | ) | | | 0.316 | | | | 0.981 | | | | 1.478 | | | | 1.615 | |
| | | | | | | | | | | | | | | | | | | | | | | | |
| | | | | | |
Less dividends and distributions from: | | | | | | | | | | | | | | | | | | | | | | | | |
Net investment income | | | (0.108 | ) | | | (0.094 | ) | | | (0.172 | ) | | | (0.123 | ) | | | (0.120 | ) | | | (0.124 | ) |
Net realized gain | | | (0.338 | ) | | | (0.828 | ) | | | (1.144 | ) | | | (0.778 | ) | | | (0.028 | ) | | | (0.251 | ) |
| | | | | | | | | | | | | | | | | | | | | | | | |
Total dividends and distributions | | | (0.446 | ) | | | (0.922 | ) | | | (1.316 | ) | | | (0.901 | ) | | | (0.148 | ) | | | (0.375 | ) |
| | | | | | | | | | | | | | | | | | | | | | | | |
| | | | | | |
Net asset value, end of period | | $ | 9.730 | | | $ | 9.180 | | | $ | 10.560 | | | $ | 11.560 | | | $ | 11.480 | | | $ | 10.150 | |
| | | | | | | | | | | | | | | | | | | | | | | | |
| | | | | | |
Total return3 | | | 11.08% | | | | (4.74% | ) | | | 2.91% | | | | 8.92% | | | | 14.75% | | | | 18.58% | |
| | | | | | |
Ratios and supplemental data: | | | | | | | | | | | | | | | | | | | | | | | | |
Net assets, end of period (000 omitted) | | $ | 3,230 | | | $ | 3,965 | | | $ | 4,399 | | | $ | 15,654 | | | $ | 14,635 | | | $ | 12,156 | |
Ratio of expenses to average net assets | | | 1.40% | | | | 1.41% | | | | 1.42% | | | | 1.40% | | | | 1.40% | | | | 1.40% | |
Ratio of expenses to average net assets prior to fees waived | | | 1.80% | | | | 1.77% | | | | 1.83% | | | | 1.69% | | | | 1.82% | | | | 1.83% | |
Ratio of net investment income to average net assets | | | 0.96% | | | | 0.93% | | | | 0.64% | | | | 1.12% | | | | 1.12% | | | | 1.22% | |
Ratio of net investment income to average net assets prior to fees waived | | | 0.56% | | | | 0.58% | | | | 0.23% | | | | 0.83% | | | | 0.70% | | | | 0.79% | |
Portfolio turnover | | | 103% | | | | 87% | | | | 49% | | | | 77% | | | | 104% | | | | 109% | |
| | 1 | During the period ended March 31, 2015, the Fund changed its fiscal year end from September to March. Ratios have been annualized and total return and portfolio turnover have not been annualized. |
| | 2 | The average shares outstanding method has been applied for per share information. |
| | 3 | Total investment return is based on the change in net asset value of a share during the period and assumes reinvestment of dividends and distributions at net asset value. Total investment return during all of the periods shown reflects a waiver by the manager and/or distributor. Performance would have been lower had the waivers not been in effect. |
See accompanying notes, which are an integral part of the financial statements.
108
Delaware Foundation® Growth Allocation Fund Institutional Class
Selected data for each share of the Fund outstanding throughout each period were as follows:
| | | | | | | | | | | | | | | | | | | | | | | | |
| | | | | | 10/1/14 | | | | | | | | | | |
| | | Year ended | | | to | | | Year ended | |
| | | 3/31/17 | | | 3/31/16 | | | 3/31/151 | | | 9/30/14 | | | 9/30/13 | | | 9/30/12 | |
Net asset value, beginning of period | | $ | 9.320 | | | $ | 10.700 | | | $ | 11.720 | | | $ | 11.630 | | | $ | 10.280 | | | $ | 9.020 | |
| | | | | | |
Income (loss) from investment operations: | | | | | | | | | | | | | | | | | | | | | | | | |
Net investment income2 | | | 0.141 | | | | 0.141 | | | | 0.063 | | | | 0.187 | | | | 0.175 | | | | 0.168 | |
Net realized and unrealized gain (loss) | | | 0.912 | | | | (0.549 | ) | | | 0.290 | | | | 0.860 | | | | 1.372 | | | | 1.516 | |
| | | | | | | | | | | | | | | | | | | | | | | | |
Total from investment operations | | | 1.053 | | | | (0.408 | ) | | | 0.353 | | | | 1.047 | | | | 1.547 | | | | 1.684 | |
| | | | | | | | | | | | | | | | | | | | | | | | |
| | | | | | |
Less dividends and distributions from: | | | | | | | | | | | | | | | | | | | | | | | | |
Net investment income | | | (0.155 | ) | | | (0.144 | ) | | | (0.229 | ) | | | (0.179 | ) | | | (0.169 | ) | | | (0.173 | ) |
Net realized gain | | | (0.338 | ) | | | (0.828 | ) | | | (1.144 | ) | | | (0.778 | ) | | | (0.028 | ) | | | (0.251 | ) |
| | | | | | | | | | | | | | | | | | | | | | | | |
Total dividends and distributions | | | (0.493 | ) | | | (0.972 | ) | | | (1.373 | ) | | | (0.957 | ) | | | (0.197 | ) | | | (0.424 | ) |
| | | | | | | | | | | | | | | | | | | | | | | | |
| | | | | | |
Net asset value, end of period | | $ | 9.880 | | | $ | 9.320 | | | $ | 10.700 | | | $ | 11.720 | | | $ | 11.630 | | | $ | 10.280 | |
| | | | | | | | | | | | | | | | | | | | | | | | |
| | | | | | |
Total return3 | | | 11.56% | | | | (4.19% | ) | | | 3.21% | | | | 9.42% | | | | 15.30% | | | | 19.19% | |
| | | | | | |
Ratios and supplemental data: | | | | | | | | | | | | | | | | | | | | | | | | |
Net assets, end of period (000 omitted) | | $ | 13,221 | | | $ | 15,374 | | | $ | 20,285 | | | $ | 18,930 | | | $ | 25,426 | | | $ | 37,054 | |
Ratio of expenses to average net assets | | | 0.90% | | | | 0.91% | | | | 0.92% | | | | 0.90% | | | | 0.90% | | | | 0.90% | |
Ratio of expenses to average net assets prior to fees waived | | | 1.30% | | | | 1.27% | | | | 1.33% | | | | 1.19% | | | | 1.22% | | | | 1.23% | |
Ratio of net investment income to average net assets | | | 1.46% | | | | 1.43% | | | | 1.14% | | | | 1.62% | | | | 1.62% | | | | 1.72% | |
Ratio of net investment income to average net assets prior to fees waived | | | 1.06% | | | | 1.08% | | | | 0.73% | | | | 1.33% | | | | 1.30% | | | | 1.39% | |
Portfolio turnover | | | 103% | | | | 87% | | | | 49% | | | | 77% | | | | 104% | | | | 109% | |
| | 1 | During the period ended March 31, 2015, the Fund changed its fiscal year end from September to March. Ratios have been annualized and total return and portfolio turnover have not been annualized. |
| | 2 | The average shares outstanding method has been applied for per share information. |
| | 3 | Total investment return is based on the change in net asset value of a share during the period and assumes reinvestment of dividends and distributions at net asset value. Total investment return during all of the periods shown reflects a waiver by the manager. Performance would have been lower had the waiver not been in effect. |
See accompanying notes, which are an integral part of the financial statements.
Financial highlights
Delaware Foundation® Moderate Allocation Fund Class A
Selected data for each share of the Fund outstanding throughout each period were as follows:
| | | | | | | | | | | | | | | | | | | | | | | | |
| | | | | | 10/1/14 | | | | | | | | | | |
| | | Year ended | | | to | | | Year ended | |
| | | 3/31/17 | | | 3/31/16 | | | 3/31/151 | | | 9/30/14 | | | 9/30/13 | | | 9/30/12 | |
Net asset value, beginning of period | | $ | 10.800 | | | $ | 11.970 | | | $ | 12.700 | | | $ | 12.520 | | | $ | 11.520 | | | $ | 10.080 | |
| | | | | | |
Income (loss) from investment operations: | | | | | | | | | | | | | | | | | | | | | | | | |
Net investment income2 | | | 0.166 | | | | 0.166 | | | | 0.082 | | | | 0.223 | | | | 0.210 | | | | 0.202 | |
Net realized and unrealized gain (loss) | | | 0.836 | | | | (0.531 | ) | | | 0.266 | | | | 0.790 | | | | 1.006 | | | | 1.444 | |
| | | | | | | | | | | | | | | | | | | | | | | | |
Total from investment operations | | | 1.002 | | | | (0.365 | ) | | | 0.348 | | | | 1.013 | | | | 1.216 | | | | 1.646 | |
| | | | | | | | | | | | | | | | | | | | | | | | |
| | | | | | |
Less dividends and distributions from: | | | | | | | | | | | | | | | | | | | | | | | | |
Net investment income | | | (0.237 | ) | | | (0.173 | ) | | | (0.115 | ) | | | (0.181 | ) | | | (0.216 | ) | | | (0.206 | ) |
Net realized gain | | | (0.145 | ) | | | (0.632 | ) | | | (0.963 | ) | | | (0.652 | ) | | | — | | | | — | |
| | | | | | | | | | | | | | | | | | | | | | | | |
Total dividends and distributions | | | (0.382 | ) | | | (0.805 | ) | | | (1.078 | ) | | | (0.833 | ) | | | (0.216 | ) | | | (0.206 | ) |
| | | | | | | | | | | | | | | | | | | | | | | | |
| | | | | | |
Net asset value, end of period | | $ | 11.420 | | | $ | 10.800 | | | $ | 11.970 | | | $ | 12.700 | | | $ | 12.520 | | | $ | 11.520 | |
| | | | | | | | | | | | | | | | | | | | | | | | |
| | | | | | |
Total return3 | | | 9.45% | | | | (3.32% | ) | | | 2.89% | | | | 8.34% | | | | 10.66% | | | | 16.46% | |
| | | | | | |
Ratios and supplemental data: | | | | | | | | | | | | | | | | | | | | | | | | |
Net assets, end of period (000 omitted) | | $ | 170,801 | | | $ | 174,041 | | | $ | 195,937 | | | $ | 201,628 | | | $ | 220,891 | | | $ | 214,553 | |
Ratio of expenses to average net assets | | | 1.14% | | | | 1.15% | | | | 1.16% | | | | 1.13% | | | | 1.13% | | | | 1.13% | |
Ratio of expenses to average net assets prior to fees waived | | | 1.18% | | | | 1.18% | | | | 1.25% | | | | 1.17% | | | | 1.25% | | | | 1.25% | |
Ratio of net investment income to average net assets | | | 1.49% | | | | 1.49% | | | | 1.34% | | | | 1.75% | | | | 1.75% | | | | 1.84% | |
Ratio of net investment income to average net assets prior to fees waived | | | 1.45% | | | | 1.46% | | | | 1.25% | | | | 1.71% | | | | 1.63% | | | | 1.72% | |
Portfolio turnover | | | 133% | | | | 131% | | | | 65% | | | | 115% | | | | 135% | | | | 157% | |
| | 1 | During the period ended March 31, 2015, the Fund changed its fiscal year end from September to March. Ratios have been annualized and total return and portfolio turnover have not been annualized. |
| | 2 | The average shares outstanding method has been applied for per share information. |
| | 3 | Total investment return is based on the change in net asset value of a share during the period and assumes reinvestment of dividends and distributions at net asset value and does not reflect the impact of a sales charge. Total investment return during all of the periods shown reflects a waiver by the manager and/or distributor. Performance would have been lower had the waivers not been in effect. |
See accompanying notes, which are an integral part of the financial statements.
110
Delaware Foundation® Moderate Allocation Fund Class C
Selected data for each share of the Fund outstanding throughout each period were as follows:
| | | | | | | | | | | | | | | | | | | | | | | | |
| | | | | | 10/1/14 | | | | | | | | | | |
| | | Year ended | | | to | | | Year ended | |
| | | 3/31/17 | | | 3/31/16 | | | 3/31/151 | | | 9/30/14 | | | 9/30/13 | | | 9/30/12 | |
Net asset value, beginning of period | | $ | 10.800 | | | $ | 11.970 | | | $ | 12.700 | | | $ | 12.550 | | | $ | 11.550 | | | $ | 10.100 | |
| | | | | | |
Income (loss) from investment operations: | | | | | | | | | | | | | | | | | | | | | | | | |
Net investment income2 | | | 0.081 | | | | 0.081 | | | | 0.035 | | | | 0.126 | | | | 0.119 | | | | 0.118 | |
Net realized and unrealized gain (loss) | | | 0.836 | | | | (0.531 | ) | | | 0.267 | | | | 0.784 | | | | 1.007 | | | | 1.454 | |
| | | | | | | | | | | | | | | | | | | | | | | | |
Total from investment operations | | | 0.917 | | | | (0.450 | ) | | | 0.302 | | | | 0.910 | | | | 1.126 | | | | 1.572 | |
| | | | | | | | | | | | | | | | | | | | | | | | |
| | | | | | |
Less dividends and distributions from: | | | | | | | | | | | | | | | | | | | | | | | | |
Net investment income | | | (0.152 | ) | | | (0.088 | ) | | | (0.069 | ) | | | (0.108 | ) | | | (0.126 | ) | | | (0.122 | ) |
Net realized gain | | | (0.145 | ) | | | (0.632 | ) | | | (0.963 | ) | | | (0.652 | ) | | | — | | | | — | |
| | | | | | | | | | | | | | | | | | | | | | | | |
Total dividends and distributions | | | (0.297 | ) | | | (0.720 | ) | | | (1.032 | ) | | | (0.760 | ) | | | (0.126 | ) | | | (0.122 | ) |
| | | | | | | | | | | | | | | | | | | | | | | | |
| | | | | | |
Net asset value, end of period | | $ | 11.420 | | | $ | 10.800 | | | $ | 11.970 | | | $ | 12.700 | | | $ | 12.550 | | | $ | 11.550 | |
| | | | | | | | | | | | | | | | | | | | | | | | |
| | | | | | |
Total return3 | | | 8.62% | | | | (4.06% | ) | | | 2.50% | | | | 7.47% | | | | 9.81% | | | | 15.53% | |
| | | | | | |
Ratios and supplemental data: | | | | | | | | | | | | | | | | | | | | | | | | |
Net assets, end of period (000 omitted) | | $ | 22,602 | | | $ | 24,736 | | | $ | 28,965 | | | $ | 27,906 | | | $ | 22,838 | | | $ | 16,575 | |
Ratio of expenses to average net assets | | | 1.90% | | | | 1.91% | | | | 1.92% | | | | 1.90% | | | | 1.90% | | | | 1.90% | |
Ratio of expenses to average net assets prior to fees waived | | | 1.94% | | | | 1.94% | | | | 2.01% | | | | 1.94% | | | | 1.97% | | | | 1.97% | |
Ratio of net investment income to average net assets | | | 0.73% | | | | 0.73% | | | | 0.58% | | | | 0.98% | | | | 0.98% | | | | 1.07% | |
Ratio of net investment income to average net assets prior to fees waived | | | 0.69% | | | | 0.70% | | | | 0.49% | | | | 0.94% | | | | 0.91% | | | | 1.00% | |
Portfolio turnover | | | 133% | | | | 131% | | | | 65% | | | | 115% | | | | 135% | | | | 157% | |
| | 1 | During the period ended March 31, 2015, the Fund changed its fiscal year end from September to March. Ratios have been annualized and total return and portfolio turnover have not been annualized. |
| | 2 | The average shares outstanding method has been applied for per share information. |
| | 3 | Total investment return is based on the change in net asset value of a share during the period and assumes reinvestment of dividends and distributions at net asset value and does not reflect the impact of a sales charge. Total investment return during all of the periods shown reflects a waiver by the manager. Performance would have been lower had the waiver not been in effect. |
See accompanying notes, which are an integral part of the financial statements.
Financial highlights
Delaware Foundation® Moderate Allocation Fund Class R
Selected data for each share of the Fund outstanding throughout each period were as follows:
| | | | | | | | | | | | | | | | | | | | | | | | |
| | | | | | 10/1/14 | | | | | | | | | | |
| | | Year ended | | | to | | | Year ended | |
| | | 3/31/17 | | | 3/31/16 | | | 3/31/151 | | | 9/30/14 | | | 9/30/13 | | | 9/30/12 | |
Net asset value, beginning of period | | $ | 10.760 | | | $ | 11.930 | | | $ | 12.660 | | | $ | 12.500 | | | $ | 11.500 | | | $ | 10.060 | |
| | | | | | |
Income (loss) from investment operations: | | | | | | | | | | | | | | | | | | | | | | | | |
Net investment income2 | | | 0.136 | | | | 0.136 | | | | 0.066 | | | | 0.189 | | | | 0.178 | | | | 0.172 | |
Net realized and unrealized gain (loss) | | | 0.827 | | | | (0.531 | ) | | | 0.267 | | | | 0.779 | | | | 1.005 | | | | 1.445 | |
| | | | | | | | | | | | | | | | | | | | | | | | |
Total from investment operations | | | 0.963 | | | | (0.395 | ) | | | 0.333 | | | | 0.968 | | | | 1.183 | | | | 1.617 | |
| | | | | | | | | | | | | | | | | | | | | | | | |
| | | | | | |
Less dividends and distributions from: | | | | | | | | | | | | | | | | | | | | | | | | |
Net investment income | | | (0.208 | ) | | | (0.143 | ) | | | (0.100 | ) | | | (0.156 | ) | | | (0.183 | ) | | | (0.177 | ) |
Net realized gain | | | (0.145 | ) | | | (0.632 | ) | | | (0.963 | ) | | | (0.652 | ) | | | — | | | | — | |
| | | | | | | | | | | | | | | | | | | | | | | | |
Total dividends and distributions | | | (0.353 | ) | | | (0.775 | ) | | | (1.063 | ) | | | (0.808 | ) | | | (0.183 | ) | | | (0.177 | ) |
| | | | | | | | | | | | | | | | | | | | | | | | |
| | | | | | |
Net asset value, end of period | | $ | 11.370 | | | $ | 10.760 | | | $ | 11.930 | | | $ | 12.660 | | | $ | 12.500 | | | $ | 11.500 | |
| | | | | | | | | | | | | | | | | | | | | | | | |
| | | | | | |
Total return3 | | | 9.11% | | | | (3.59% | ) | | | 2.76% | | | | 7.99% | | | | 10.38% | | | | 16.19% | |
| | | | | | |
Ratios and supplemental data: | | | | | | | | | | | | | | | | | | | | | | | | |
Net assets, end of period (000 omitted) | | $ | 1,801 | | | $ | 1,982 | | | $ | 2,501 | | | $ | 24,307 | | | $ | 23,566 | | | $ | 22,883 | |
Ratio of expenses to average net assets | | | 1.40% | | | | 1.41% | | | | 1.42% | | | | 1.40% | | | | 1.40% | | | | 1.40% | |
Ratio of expenses to average net assets prior to fees waived | | | 1.44% | | | | 1.44% | | | | 1.51% | | | | 1.44% | | | | 1.57% | | | | 1.57% | |
Ratio of net investment income to average net assets | | | 1.23% | | | | 1.23% | | | | 1.08% | | | | 1.48% | | | | 1.48% | | | | 1.57% | |
Ratio of net investment income to average net assets prior to fees waived | | | 1.19% | | | | 1.20% | | | | 0.99% | | | | 1.44% | | | | 1.31% | | | | 1.40% | |
Portfolio turnover | | | 133% | | | | 131% | | | | 65% | | | | 115% | | | | 135% | | | | 157% | |
| | 1 | During the period ended March 31, 2015, the Fund changed its fiscal year end from September to March. Ratios have been annualized and total return and portfolio turnover have not been annualized. |
| | 2 | The average shares outstanding method has been applied for per share information. |
| | 3 | Total investment return is based on the change in net asset value of a share during the period and assumes reinvestment of dividends and distributions at net asset value. Total investment return during all of the periods shown reflects a waiver by the manager and/or distributor. Performance would have been lower had the waivers not been in effect. |
See accompanying notes, which are an integral part of the financial statements.
112
Delaware Foundation® Moderate Allocation Fund Institutional Class
Selected data for each share of the Fund outstanding throughout each period were as follows:
| | | | | | | | | | | | | | | | | | | | | | | | |
| | | | | | 10/1/14 | | | | | | | | | | |
| | | Year ended | | | to | | | Year ended | |
| | | 3/31/17 | | | 3/31/16 | | | 3/31/151 | | | 9/30/14 | | | 9/30/13 | | | 9/30/12 | |
Net asset value, beginning of period | | $ | 10.800 | | | $ | 11.980 | | | $ | 12.710 | | | $ | 12.520 | | | $ | 11.520 | | | $ | 10.080 | |
| | | | | | |
Income (loss) from investment operations: | | | | | | | | | | | | | | | | | | | | | | | | |
Net investment income2 | | | 0.192 | | | | 0.191 | | | | 0.097 | | | | 0.252 | | | | 0.238 | | | | 0.228 | |
Net realized and unrealized gain (loss) | | | 0.836 | | | | (0.540 | ) | | | 0.266 | | | | 0.793 | | | | 1.005 | | | | 1.444 | |
| | | | | | | | | | | | | | | | | | | | | | | | |
Total from investment operations | | | 1.028 | | | | (0.349 | ) | | | 0.363 | | | | 1.045 | | | | 1.243 | | | | 1.672 | |
| | | | | | | | | | | | | | | | | | | | | | | | |
| | | | | | |
Less dividends and distributions from: | | | | | | | | | | | | | | | | | | | | | | | | |
Net investment income | | | (0.263 | ) | | | (0.199 | ) | | | (0.130 | ) | | | (0.203 | ) | | | (0.243 | ) | | | (0.232 | ) |
Net realized gain | | | (0.145 | ) | | | (0.632 | ) | | | (0.963 | ) | | | (0.652 | ) | | | — | | | | — | |
| | | | | | | | | | | | | | | | | | | | | | | | |
Total dividends and distributions | | | (0.408 | ) | | | (0.831 | ) | | | (1.093 | ) | | | (0.855 | ) | | | (0.243 | ) | | | (0.232 | ) |
| | | | | | | | | | | | | | | | | | | | | | | | |
| | | | | | |
Net asset value, end of period | | $ | 11.420 | | | $ | 10.800 | | | $ | 11.980 | | | $ | 12.710 | | | $ | 12.520 | | | $ | 11.520 | |
| | | | | | | | | | | | | | | | | | | | | | | | |
| | | | | | |
Total return3 | | | 9.70% | | | | (3.17% | ) | | | 3.01% | | | | 8.62% | | | | 10.91% | | | | 16.73% | |
| | | | | | |
Ratios and supplemental data: | | | | | | | | | | | | | | | | | | | | | | | | |
Net assets, end of period (000 omitted) | | $ | 79,009 | | | $ | 73,036 | | | $ | 62,799 | | | $ | 60,134 | | | $ | 66,263 | | | $ | 142,925 | |
Ratio of expenses to average net assets | | | 0.90% | | | | 0.91% | | | | 0.92% | | | | 0.90% | | | | 0.90% | | | | 0.90% | |
Ratio of expenses to average net assets prior to fees waived | | | 0.94% | | | | 0.94% | | | | 1.01% | | | | 0.94% | | | | 0.97% | | | | 0.97% | |
Ratio of net investment income to average net assets | | | 1.73% | | | | 1.73% | | | | 1.58% | | | | 1.98% | | | | 1.98% | | | | 2.07% | |
Ratio of net investment income to average net assets prior to fees waived | | | 1.69% | | | | 1.70% | | | | 1.49% | | | | 1.94% | | | | 1.91% | | | | 2.00% | |
Portfolio turnover | | | 133% | | | | 131% | | | | 65% | | | | 115% | | | | 135% | | | | 157% | |
| | 1 | During the period ended March 31, 2015, the Fund changed its fiscal year end from September to March. Ratios have been annualized and total return and portfolio turnover have not been annualized. |
| | 2 | The average shares outstanding method has been applied for per share information. |
| | 3 | Total investment return is based on the change in net asset value of a share during the period and assumes reinvestment of dividends and distributions at net asset value. Total investment return during all of the periods shown reflects a waiver by the manager. Performance would have been lower had the waiver not been in effect. |
See accompanying notes, which are an integral part of the financial statements.
Financial highlights
Delaware Foundation® Conservative Allocation Fund Class A
Selected data for each share of the Fund outstanding throughout each period were as follows:
| | | | | | | | | | | | | | | | | | | | | | | | |
| | | | | | 10/1/14 | | | | | | | | | | |
| | | Year ended | | | to | | | Year ended | |
| | | 3/31/17 | | | 3/31/16 | | | 3/31/151 | | | 9/30/14 | | | 9/30/13 | | | 9/30/12 | |
Net asset value, beginning of period | | $ | 9.240 | | | $ | 10.160 | | | $ | 10.870 | | | $ | 10.570 | | | $ | 10.220 | | | $ | 9.430 | |
| | | | | | |
Income (loss) from investment operations: | | | | | | | | | | | | | | | | | | | | | | | | |
Net investment income2 | | | 0.163 | | | | 0.168 | | | | 0.090 | | | | 0.223 | | | | 0.198 | | | | 0.203 | |
Net realized and unrealized gain (loss) | | | 0.512 | | | | (0.430 | ) | | | 0.203 | | | | 0.540 | | | | 0.414 | | | | 1.035 | |
| | | | | | | | | | | | | | | | | | | | | | | | |
Total from investment operations | | | 0.675 | | | | (0.262 | ) | | | 0.293 | | | | 0.763 | | | | 0.612 | | | | 1.238 | |
| | | | | | | | | | | | | | | | | | | | | | | | |
| | | | | | |
Less dividends and distributions from: | | | | | | | | | | | | | | | | | | | | | | | | |
Net investment income | | | (0.195 | ) | | | (0.164 | ) | | | (0.111 | ) | | | (0.245 | ) | | | (0.192 | ) | | | (0.186 | ) |
Net realized gain | | | (0.130 | ) | | | (0.494 | ) | | | (0.892 | ) | | | (0.218 | ) | | | (0.070 | ) | | | (0.262 | ) |
| | | | | | | | | | | | | | | | | | | | | | | | |
Total dividends and distributions | | | (0.325 | ) | | | (0.658 | ) | | | (1.003 | ) | | | (0.463 | ) | | | (0.262 | ) | | | (0.448 | ) |
| | | | | | | | | | | | | | | | | | | | | | | | |
| | | | | | |
Net asset value, end of period | | $ | 9.590 | | | $ | 9.240 | | | $ | 10.160 | | | $ | 10.870 | | | $ | 10.570 | | | $ | 10.220 | |
| | | | | | | | | | | | | | | | | | | | | | | | |
| | | | | | |
Total return3 | | | 7.40% | | | | (2.69% | ) | | | 2.86% | | | | 7.34% | | | | 6.09% | | | | 13.47% | |
| | | | | | |
Ratios and supplemental data: | | | | | | | | | | | | | | | | | | | | | | | | |
Net assets, end of period (000 omitted) | | $ | 42,453 | | | $ | 43,443 | | | $ | 51,722 | | | $ | 52,429 | | | $ | 81,655 | | | $ | 75,988 | |
Ratio of expenses to average net assets | | | 1.15% | | | | 1.18% | | | | 1.15% | | | | 1.13% | | | | 1.13% | | | | 1.13% | |
Ratio of expenses to average net assets prior to fees waived | | | 1.42% | | | | 1.38% | | | | 1.50% | | | | 1.33% | | | | 1.41% | | | | 1.43% | |
Ratio of net investment income to average net assets | | | 1.72% | | | | 1.76% | | | | 1.73% | | | | 2.06% | | | | 1.90% | | | | 2.05% | |
Ratio of net investment income to average net assets prior to fees waived | | | 1.45% | | | | 1.55% | | | | 1.38% | | | | 1.86% | | | | 1.62% | | | | 1.75% | |
Portfolio turnover | | | 161% | | | | 168% | | | | 93% | | | | 163% | | | | 210% | | | | 219% | |
| | 1 | During the period ended March 31, 2015, the Fund changed its fiscal year end from September to March. Ratios have been annualized and total return and portfolio turnover have not been annualized. |
| | 2 | The average shares outstanding method has been applied for per share information. |
| | 3 | Total investment return is based on the change in net asset value of a share during the period and assumes reinvestment of dividends and distributions at net asset value and does not reflect the impact of a sales charge. Total investment return during all of the periods shown reflects a waiver by the manager and/or distributor. Performance would have been lower had the waivers not been in effect. |
See accompanying notes, which are an integral part of the financial statements.
114
Delaware Foundation® Conservative Allocation Fund Class C
Selected data for each share of the Fund outstanding throughout each period were as follows:
| | | | | | | | | | | | | | | | | | | | | | | | |
| | | | | | 10/1/14 | | | | | | | | | | |
| | | Year ended | | | to | | | Year ended | |
| | | 3/31/17 | | | 3/31/16 | | | 3/31/151 | | | 9/30/14 | | | 9/30/13 | | | 9/30/12 | |
Net asset value, beginning of period | | $ | 9.270 | | | $ | 10.180 | | | $ | 10.900 | | | $ | 10.590 | | | $ | 10.240 | | | $ | 9.450 | |
| | | | | | |
Income (loss) from investment operations: | | | | | | | | | | | | | | | | | | | | | | | | |
Net investment income2 | | | 0.092 | | | | 0.096 | | | | 0.051 | | | | 0.143 | | | | 0.120 | | | | 0.129 | |
Net realized and unrealized gain (loss) | | | 0.513 | | | | (0.420 | ) | | | 0.193 | | | | 0.541 | | | | 0.420 | | | | 1.035 | |
| | | | | | | | | | | | | | | | | | | | | | | | |
Total from investment operations | | | 0.605 | | | | (0.324 | ) | | | 0.244 | | | | 0.684 | | | | 0.540 | | | | 1.164 | |
| | | | | | | | | | | | | | | | | | | | | | | | |
| | | | | | |
Less dividends and distributions from: | | | | | | | | | | | | | | | | | | | | | | | | |
Net investment income | | | (0.125 | ) | | | (0.092 | ) | | | (0.072 | ) | | | (0.156 | ) | | | (0.120 | ) | | | (0.112 | ) |
Net realized gain | | | (0.130 | ) | | | (0.494 | ) | | | (0.892 | ) | | | (0.218 | ) | | | (0.070 | ) | | | (0.262 | ) |
| | | | | | | | | | | | | | | | | | | | | | | | |
Total dividends and distributions | | | (0.255 | ) | | | (0.586 | ) | | | (0.964 | ) | | | (0.374 | ) | | | (0.190 | ) | | | (0.374 | ) |
| | | | | | | | | | | | | | | | | | | | | | | | |
| | | | | | |
Net asset value, end of period | | $ | 9.620 | | | $ | 9.270 | | | $ | 10.180 | | | $ | 10.900 | | | $ | 10.590 | | | $ | 10.240 | |
| | | | | | | | | | | | | | | | | | | | | | | | |
| | | | | | |
Total return3 | | | 6.60% | | | | (3.32% | ) | | | 2.37% | | | | 6.56% | | | | 5.35% | | | | 12.60% | |
| | | | | | |
Ratios and supplemental data: | | | | | | | | | | | | | | | | | | | | | | | | |
Net assets, end of period (000 omitted) | | $ | 24,803 | | | $ | 30,134 | | | $ | 34,671 | | | $ | 35,101 | | | $ | 31,132 | | | $ | 23,943 | |
Ratio of expenses to average net assets | | | 1.90% | | | | 1.93% | | | | 1.90% | | | | 1.88% | | | | 1.88% | | | | 1.88% | |
Ratio of expenses to average net assets prior to fees waived | | | 2.17% | | | | 2.13% | | | | 2.25% | | | | 2.08% | | | | 2.11% | | | | 2.13% | |
Ratio of net investment income to average net assets | | | 0.97% | | | | 1.01% | | | | 0.98% | | | | 1.31% | | | | 1.15% | | | | 1.30% | |
Ratio of net investment income to average net assets prior to fees waived | | | 0.70% | | | | 0.80% | | | | 0.63% | | | | 1.11% | | | | 0.92% | | | | 1.05% | |
Portfolio turnover | | | 161% | | | | 168% | | | | 93% | | | | 163% | | | | 210% | | | | 219% | |
| | 1 | During the period ended March 31, 2015, the Fund changed its fiscal year end from September to March. Ratios have been annualized and total return and portfolio turnover have not been annualized. |
| | 2 | The average shares outstanding method has been applied for per share information. |
| | 3 | Total investment return is based on the change in net asset value of a share during the period and assumes reinvestment of dividends and distributions at net asset value and does not reflect the impact of a sales charge. Total investment return during all of the periods shown reflects a waiver by the manager. Performance would have been lower had the waiver not been in effect. |
See accompanying notes, which are an integral part of the financial statements.
Financial highlights
Delaware Foundation® Conservative Allocation Fund Class R
Selected data for each share of the Fund outstanding throughout each period were as follows:
| | | | | | | | | | | | | | | | | | | | | | | | |
| | | | | | 10/1/14 | | | | | | | | | | |
| | | Year ended | | | to | | | Year ended | |
| | | 3/31/17 | | | 3/31/16 | | | 3/31/151 | | | 9/30/14 | | | 9/30/13 | | | 9/30/12 | |
Net asset value, beginning of period | | $ | 9.240 | | | $ | 10.150 | | | $ | 10.870 | | | $ | 10.570 | | | $ | 10.220 | | | $ | 9.430 | |
| | | | | | |
Income (loss) from investment operations: | | | | | | | | | | | | | | | | | | | | | | | | |
Net investment income2 | | | 0.139 | | | | 0.144 | | | | 0.077 | | | | 0.197 | | | | 0.172 | | | | 0.178 | |
Net realized and unrealized gain (loss) | | | 0.513 | | | | (0.420 | ) | | | 0.193 | | | | 0.537 | | | | 0.415 | | | | 1.035 | |
| | | | | | | | | | | | | | | | | | | | | | | | |
Total from investment operations | | | 0.652 | | | | (0.276 | ) | | | 0.270 | | | | 0.734 | | | | 0.587 | | | | 1.213 | |
| | | | | | | | | | | | | | | | | | | | | | | | |
| | | | | | |
Less dividends and distributions from: | | | | | | | | | | | | | | | | | | | | | | | | |
Net investment income | | | (0.172 | ) | | | (0.140 | ) | | | (0.098 | ) | | | (0.216 | ) | | | (0.167 | ) | | | (0.161 | ) |
Net realized gain | | | (0.130 | ) | | | (0.494 | ) | | | (0.892 | ) | | | (0.218 | ) | | | (0.070 | ) | | | (0.262 | ) |
| | | | | | | | | | | | | | | | | | | | | | | | |
Total dividends and distributions | | | (0.302 | ) | | | (0.634 | ) | | | (0.990 | ) | | | (0.434 | ) | | | (0.237 | ) | | | (0.423 | ) |
| | | | | | | | | | | | | | | | | | | | | | | | |
| | | | | | |
Net asset value, end of period | | $ | 9.590 | | | $ | 9.240 | | | $ | 10.150 | | | $ | 10.870 | | | $ | 10.570 | | | $ | 10.220 | |
| | | | | | | | | | | | | | | | | | | | | | | | |
| | | | | | |
Total return3 | | | 7.15% | | | | (2.84% | ) | | | 2.63% | | | | 7.06% | | | | 5.84% | | | | 13.19% | |
| | | | | | |
Ratios and supplemental data: | | | | | | | | | | | | | | | | | | | | | | | | |
Net assets, end of period (000 omitted) | | $ | 2,550 | | | $ | 3,729 | | | $ | 4,232 | | | $ | 9,327 | | | $ | 5,646 | | | $ | 4,293 | |
Ratio of expenses to average net assets | | | 1.40% | | | | 1.43% | | | | 1.40% | | | | 1.38% | | | | 1.38% | | | | 1.38% | |
Ratio of expenses to average net assets prior to fees waived | | | 1.67% | | | | 1.63% | | | | 1.75% | | | | 1.58% | | | | 1.71% | | | | 1.73% | |
Ratio of net investment income to average net assets | | | 1.47% | | | | 1.51% | | | | 1.48% | | | | 1.81% | | | | 1.65% | | | | 1.80% | |
Ratio of net investment income to average net assets prior to fees waived | | | 1.20% | | | | 1.30% | | | | 1.13% | | | | 1.61% | | | | 1.32% | | | | 1.45% | |
Portfolio turnover | | | 161% | | | | 168% | | | | 93% | | | | 163% | | | | 210% | | | | 219% | |
| | 1 | During the period ended March 31, 2015, the Fund changed its fiscal year end from September to March. Ratios have been annualized and total return and portfolio turnover have not been annualized. |
| | 2 | The average shares outstanding method has been applied for per share information. |
| | 3 | Total investment return is based on the change in net asset value of a share during the period and assumes reinvestment of dividends and distributions at net asset value. Total investment return during all of the periods shown reflects a waiver by the manager and/or distributor. Performance would have been lower had the waivers not been in effect. |
See accompanying notes, which are an integral part of the financial statements.
116
Delaware Foundation® Conservative Allocation Fund Institutional Class
Selected data for each share of the Fund outstanding throughout each period were as follows:
| | | | | | | | | | | | | | | | | | | | | | | | |
| | | | | | 10/1/14 | | | | | | | | | | |
| | | Year ended | | | to | | | Year ended | |
| | | 3/31/17 | | | 3/31/16 | | | 3/31/151 | | | 9/30/14 | | | 9/30/13 | | | 9/30/12 | |
Net asset value, beginning of period | | $ | 9.260 | | | $ | 10.180 | | | $ | 10.890 | | | $ | 10.590 | | | $ | 10.230 | | | $ | 9.440 | |
| | | | | | |
Income (loss) from investment operations: | | | | | | | | | | | | | | | | | | | | | | | | |
Net investment income2 | | | 0.187 | | | | 0.192 | | | | 0.103 | | | | 0.250 | | | | 0.224 | | | | 0.228 | |
Net realized and unrealized gain (loss) | | | 0.512 | | | | (0.430 | ) | | | 0.203 | | | | 0.539 | | | | 0.424 | | | | 1.035 | |
| | | | | | | | | | | | | | | | | | | | | | | | |
Total from investment operations | | | 0.699 | | | | (0.238 | ) | | | 0.306 | | | | 0.789 | | | | 0.648 | | | | 1.263 | |
| | | | | | | | | | | | | | | | | | | | | | | | |
| | | | | | |
Less dividends and distributions from: | | | | | | | | | | | | | | | | | | | | | | | | |
Net investment income | | | (0.219 | ) | | | (0.188 | ) | | | (0.124 | ) | | | (0.271 | ) | | | (0.218 | ) | | | (0.211 | ) |
Net realized gain | | | (0.130 | ) | | | (0.494 | ) | | | (0.892 | ) | | | (0.218 | ) | | | (0.070 | ) | | | (0.262 | ) |
| | | | | | | | | | | | | | | | | | | | | | | | |
Total dividends and distributions | | | (0.349 | ) | | | (0.682 | ) | | | (1.016 | ) | | | (0.489 | ) | | | (0.288 | ) | | | (0.473 | ) |
| | | | | | | | | | | | | | | | | | | | | | | | |
| | | | | | |
Net asset value, end of period | | $ | 9.610 | | | $ | 9.260 | | | $ | 10.180 | | | $ | 10.890 | | | $ | 10.590 | | | $ | 10.230 | |
| | | | | | | | | | | | | | | | | | | | | | | | |
| | | | | | |
Total return3 | | | 7.66% | | | | (2.44% | ) | | | 2.98% | | | | 7.59% | | | | 6.45% | | | | 13.74% | |
| | | | | | |
Ratios and supplemental data: | | | | | | | | | | | | | | | | | | | | | | | | |
Net assets, end of period (000 omitted) | | $ | 11,261 | | | $ | 14,226 | | | $ | 18,337 | | | $ | 21,043 | | | $ | 30,615 | | | $ | 45,993 | |
Ratio of expenses to average net assets | | | 0.90% | | | | 0.93% | | | | 0.90% | | | | 0.88% | | | | 0.88% | | | | 0.88% | |
Ratio of expenses to average net assets prior to fees waived | | | 1.17% | | | | 1.13% | | | | 1.25% | | | | 1.08% | | | | 1.11% | | | | 1.13% | |
Ratio of net investment income to average net assets | | | 1.97% | | | | 2.01% | | | | 1.98% | | | | 2.31% | | | | 2.15% | | | | 2.30% | |
Ratio of net investment income to average net assets prior to fees waived | | | 1.70% | | | | 1.80% | | | | 1.63% | | | | 2.11% | | | | 1.92% | | | | 2.05% | |
Portfolio turnover | | | 161% | | | | 168% | | | | 93% | | | | 163% | | | | 210% | | | | 219% | |
| | 1 | During the period ended March 31, 2015, the Fund changed its fiscal year end from September to March. Ratios have been annualized and total return and portfolio turnover have not been annualized. |
| | 2 | The average shares outstanding method has been applied for per share information. |
| | 3 | Total investment return is based on the change in net asset value of a share during the period and assumes reinvestment of dividends and distributions at net asset value. Total investment return during all of the periods shown reflects a waiver by the manager. Performance would have been lower had the waiver not been in effect. |
See accompanying notes, which are an integral part of the financial statements.
Notes to financial statements
Delaware Foundation Funds®
March 31, 2017
Delaware Group® Foundation Funds (Trust) is organized as a Delaware statutory trust and offers three funds: Delaware Foundation® Growth Allocation Fund, Delaware Foundation Moderate Allocation Fund, and Delaware Foundation Conservative Allocation Fund (each, a Fund, or collectively as the Funds). The Trust is an open-end investment company. The Funds are considered diversified under the Investment Company Act of 1940 (the 1940 Act), as amended, and offer Class A, Class C, Class R, and Institutional Class shares. Class A shares are sold with a maximum front-end sales charge of 5.75%. Class A share purchases of $1,000,000 or more will incur a contingent deferred sales charge (CDSC) instead of a front-end sales charge of 1.00% if redeemed during the first year and 0.50% during the second year, provided that Delaware Distributors, L.P. (DDLP) paid a financial advisor a commission on the purchase of those shares. Class C shares are sold with a CDSC of 1.00%, if redeemed during the first 12 months. Class R and Institutional Class shares are not subject to a sales charge and are offered for sale exclusively to certain eligible investors.
The investment objective of Delaware Foundation Growth Allocation Fund is to seek long-term capital growth.
The investment objective of Delaware Foundation Moderate Allocation Fund is to seek capital appreciation with current income as a secondary objective.
The investment objective of Delaware Foundation Conservative Allocation Fund is to seek a combination of current income and preservation of capital with capital appreciation.
1. Significant Accounting Policies
The following accounting policies are in accordance with U.S. generally accepted accounting principles (U.S. GAAP) and are consistently followed by the Funds.
Security Valuation — Equity securities and exchange-traded funds (ETFs), except those traded on the Nasdaq Stock Market LLC (Nasdaq), are valued at the last quoted sales price as of the time of the regular close of the New York Stock Exchange on the valuation date. Equity securities and ETFs traded on the Nasdaq are valued in accordance with the Nasdaq Official Closing Price, which may not be the last sales price. If, on a particular day, an equity security or ETF does not trade, the mean between the bid and ask prices will be used, which approximates fair value. Securities listed on a foreign exchange are normally valued at the last quoted sales price on the valuation date. Debt securities, credit default swap (CDS) contracts, and interest rate swap contracts are valued based upon valuations provided by an independent pricing service or broker/counterparty and reviewed by management. To the extent current market prices are not available, the pricing service may take into account developments related to the specific security, as well as transactions in comparable securities. U.S. government and agency securities are valued at the mean between the bid and ask prices, which approximates fair value. Valuations for fixed income securities utilize matrix systems, which reflect such factors as security prices, yields, maturities, and ratings, and are supplemented by dealer and exchange quotations. For asset-backed securities, collateralized mortgage obligations, commercial mortgage securities, and U.S. government agency mortgage securities, pricing vendors utilize matrix pricing which considers prepayment speed; attributes of the collateral; yield or price of bonds of comparable quality, coupon, maturity, and type as well as broker/dealer-supplied prices. Swap prices are derived using daily swap curves and models that incorporate a number of market data factors, such as discounted cash flows, trades, and values of the underlying reference instruments. Open-end investment companies are valued at net asset value (NAV), as reported by the underlying investment company. Foreign currency exchange contracts and foreign cross currency exchange contracts are valued at the mean between the bid and ask prices, which approximates fair value. Interpolated values are derived when the settlement date of the contract is an interim date for which quotations are not available. Futures contracts and options on futures contracts are valued at the daily quoted settlement prices. Exchange-traded options are valued at the last reported sales price, or if no sales are reported, at the mean between the last reported bid and ask prices, which approximates fair value. Generally, other securities and assets for which market quotations are not readily available are valued at fair value as determined in good faith under the direction of the Trusts’ Board of Trustees (Board). In determining whether market quotations are readily available or fair valuation will be used, various factors will be taken into consideration, such as market closures or suspension of trading in a security. The Funds may use fair value pricing more frequently for securities traded primarily in non-U.S. markets because, among other things, most foreign markets close well before each Fund values its securities, generally as of 4:00 p.m. Eastern time. The earlier close of these foreign markets gives rise to the possibility that significant events, including broad market moves, government actions or pronouncements, aftermarket trading, or news events may have occurred in the interim. Whenever such a significant event occurs, the Funds may value foreign securities using fair value prices based on third-party vendor modeling tools (international fair value pricing).
Federal and Foreign Income Taxes — No provision for federal income taxes has been made as each Fund intends to continue to qualify for federal income tax purposes as a regulated investment company under Subchapter M of the Internal Revenue Code of 1986, as amended, and make the requisite distributions to shareholders. Each Fund evaluates tax positions taken or expected to be taken in the course of preparing
118
each Fund’s tax returns to determine whether the tax positions are “more-likely-than-not” of being sustained by the applicable tax authority. Tax positions not deemed to meet the “more-likely-than-not” threshold are recorded as a tax benefit or expense in the current year. Management has analyzed each Fund’s tax positions taken for all open federal income tax years (Sept. 30, 2013–March 31, 2017), and has concluded that no provision for federal income tax is required in any Fund’s financial statements. In regard to foreign taxes only, each Fund has open tax years in certain foreign countries in which they invest that may date back to the inception of each Fund.
Class Accounting — Investment income, common expenses, and realized and unrealized gain (loss) on investments are allocated to the various classes of each Fund on the basis of daily net assets of each class. Distribution expenses relating to a specific class are charged directly to that class.
Repurchase Agreements — Each Fund may purchase certain U.S. government securities subject to the counterparty’s agreement to repurchase them at an agreed upon date and price. The counterparty will be required on a daily basis to maintain the value of the collateral subject to the agreement at not less than the repurchase price (including accrued interest). The agreements are conditioned upon the collateral being deposited under the Federal Reserve book-entry system with each Fund’s custodian or a third party sub-custodian. In the event of default or bankruptcy by the other party to the agreement, retention of the collateral may be subject to legal proceedings. All open repurchase agreements as of the date of this report were entered into on March 31, 2017, and matured on the next business day.
To Be Announced Trades (TBA) — Each Fund may contract to purchase or sell securities for a fixed price at a transaction date beyond the customary settlement period (examples: when issued, delayed delivery, forward commitment, or TBA transactions) consistent with each Fund’s ability to manage their investment portfolio and meet redemption requests. These transactions involve a commitment by each Fund to purchase or sell securities for a predetermined price or yield with payment and delivery taking place more than three days in the future, or after a period longer than the customary settlement period for that type of security. No interest will be earned by each Fund on such purchases until the securities are delivered or the transaction is completed; however, the market value may change prior to delivery.
Foreign Currency Transactions — Transactions denominated in foreign currencies are recorded at the prevailing exchange rates on the valuation date in accordance with each Fund’s prospectus. The value of all assets and liabilities denominated in foreign currencies is translated daily into U.S. dollars at the exchange rate of such currencies against the U.S. dollar. Transaction gains or losses resulting from changes in exchange rates during the reporting period or upon settlement of the foreign currency transaction are reported in operations for the current period. Each Fund generally bifurcates that portion of realized gains and losses on investments in debt securities which is due to changes in foreign exchange rates from that which is due to changes in market prices of debt securities. That portion of gains (losses), which is due to changes in foreign exchange rates, is included in the “Statements of operations” under “Net realized gain (loss) on foreign currencies.” For foreign equity securities, these changes are included on the “Statements of operations” under “Net realized and unrealized gain (loss) on investments.” Each Fund reports certain foreign currency related transactions as components of realized gains (losses) for financial reporting purposes, whereas such components are treated as ordinary income (loss) for federal income tax purposes.
Use of Estimates — Each Fund is an investment company, whose financial statements are prepared in conformity with U.S. GAAP. Therefore, each Fund follows the accounting and reporting guidelines for investment companies. The preparation of financial statements in conformity with U.S. GAAP requires management to make estimates and assumptions that affect the fair value of investments, the reported amounts of assets and liabilities and disclosure of contingent assets and liabilities at the date of the financial statements, and the reported amounts of revenues and expenses during the reporting period. Actual results could differ from those estimates and the differences could be material.
Other — Expenses directly attributable to each Fund are charged directly to the Fund. Other expenses common to various funds within the Delaware Investments® Family of Funds are generally allocated among such funds on the basis of average net assets. Management fees and certain other expenses are paid monthly. Security transactions are recorded on the date the securities are purchased or sold (trade date) for financial reporting purposes. Costs used in calculating realized gains and losses on the sale of investment securities are those of the specific securities sold. Dividend income is recorded on the ex-dividend date and interest income is recorded on the accrual basis. Discounts and premiums on debt securities are accreted or amortized to interest income, respectively, over the lives of the respective securities using the effective interest method. Realized gains (losses) on paydowns of asset- and mortgage-backed securities are classified as interest income. Distributions received from investments in real estate investment trusts (REITs) are recorded as dividend income on the ex-dividend date, subject to reclassification upon notice of the character of such distributions by the issuer. Foreign dividends are also recorded on the ex-dividend date or as soon after the ex-dividend date that each Fund is aware of such dividends, net of all tax withholdings, a portion of which may be reclaimable. Withholding taxes and reclaims on foreign dividends and interest have been recorded in accordance with each Fund’s understanding of the applicable country’s tax rules and rates. Each Fund paid foreign capital gain taxes on certain foreign securities held which
Notes to financial statements
Delaware Foundation Funds®
1. Significant Accounting Policies (continued)
are included as components of realized losses for financial reporting purposes, whereas such components are treated as ordinary loss for federal income tax purposes. Delaware Foundation® Moderate Allocation Fund and Delaware Foundation Conservative Allocation Fund each declares and pays dividends from net investment income quarterly and distributions from net realized gain on investments, if any, annually. Delaware Foundation Growth Allocation Fund declares and pays dividends from net investment income annually and distributions from net realized gains on investments, if any, annually. Each Fund may distribute more frequently, if necessary for tax purposes. Dividends and distributions, if any, are recorded on the ex-dividend date.
Each Fund may receive earnings credits from its custodian when positive cash balances are maintained, which may be used to offset custody fees. There were no such earnings credits for the year ended March 31, 2017.
Each Fund receives earnings credits from their transfer agent when positive cash balances are maintained, which may be used to offset transfer agent fees. If the amount earned is greater than $1.00, the expense paid under this arrangement is included on the “Statements of operations” under “Dividend disbursing and transfer agent fees and expenses” with the corresponding expense offset shown under “Less expenses paid indirectly.” For the year ended March 31, 2017, each Fund earned the following amounts under this agreement:
| | | | |
Delaware
Foundation
Growth
Allocation Fund | | Delaware
Foundation
Moderate
Allocation Fund | | Delaware
Foundation
Conservative
Allocation Fund |
| $170 | | $565 | | $131 |
2. Investment Management, Administration Agreements, and Other Transactions with Affiliates
In accordance with the terms of its investment management agreement, each Fund pays Delaware Management Company (DMC), a series of Delaware Management Business Trust and the investment manager, an annual fee which is calculated at the rate 0.65% on the first $500 million of average daily net assets of each Fund, 0.60% on the next $500 million, 0.55% on the next $1.5 billion, and 0.50% on average daily net assets in excess of $2.5 billion.
DMC has contractually agreed to waive that portion, if any, of its management fee and/or pay/reimburse each Fund to the extent necessary to ensure that total annual operating expenses (excluding any 12b-1 fees, taxes, interest, short sale dividend and interest expenses, brokerage fees, certain insurance costs, and nonroutine expenses or costs, including, but not limited to, those relating to reorganizations, litigation, conducting shareholder meetings, and liquidations), do not exceed 0.90% of average daily net assets of each Fund from April 1, 2016 through March 31, 2017*. For purposes of these waivers and reimbursements, nonroutine expenses may also include such additional costs and expenses, as may be agreed upon from time to time by each Fund’s Board and DMC. These expense waivers and reimbursements apply only to expenses paid directly by the Funds and may only be terminated by agreement of DMC and the Funds.
Jackson Square Partners, LLC (JSP), a related party of DMC, furnishes investment sub-advisory services to the Funds. For these services, DMC, not the Fund, pays JSP fees based on the aggregate average daily net assets of the Fund at the following annual rate: 0.39% of the first $500 million; 0.36% of the next $500 million; 0.33% of the next $1.5 billion; and 0.30% of aggregate average daily net assets in excess of $2.5 billion.
Delaware Investments Fund Services Company (DIFSC), an affiliate of DMC, provides fund accounting and financial administration oversight services to the Funds. For these services, DIFSC’s fees are calculated based on the aggregate daily net assets of the Delaware Investments® Family of Funds at the following annual rate: 0.0050% of the first $30 billion; 0.0045% of the next $10 billion; 0.0040% of the next $10 billion; and 0.0025% of aggregate average daily net assets in excess of $50 billion. The fees payable to DIFSC under the service agreement described above are allocated among all funds in the Delaware Investments Family of Funds on a relative NAV basis. These amounts are included on the “Statements of operations” under “Accounting and administration expenses.” For the year ended March 31, 2017, each Fund was charged for these services as follows:
120
| | | | |
Delaware
Foundation®
Growth
Allocation Fund | | Delaware
Foundation
Moderate
Allocation Fund | | Delaware
Foundation
Conservative
Allocation Fund |
| $3,207 | | $12,894 | | $4,075 |
DIFSC is also the transfer agent and dividend disbursing agent of the Funds. For these services, DIFSC’s fees are calculated based on the aggregate daily net assets of the retail Funds within the Delaware Investments® Family of Funds at the following annual rate: 0.025% of the first $20 billion; 0.020% of the next $5 billion; 0.015% of the next $5 billion; and 0.013% of average daily net assets in excess of $30 billion. The fees payable to DIFSC under the service agreement described above are allocated among all retail Funds in the Delaware Investments Family of Funds on a relative NAV basis. These amounts are included on the “Statements of operations” under “Dividend disbursing and transfer agent fees and expenses.” For the year ended March 31, 2017, each Fund was charged for these services as follows:
| | | | |
Delaware
Foundation
Growth
Allocation Fund | | Delaware
Foundation
Moderate
Allocation Fund | | Delaware
Foundation
Conservative
Allocation Fund |
| $13,835 | | $55,602 | | $17,576 |
Pursuant to a sub-transfer agency agreement between DIFSC and BNY Mellon Investment Servicing (US) Inc. (BNYMIS), BNYMIS provides certain sub-transfer agency services to each Fund. Sub-transfer agency fees are paid by the Funds and are also included on the “Statements of operations” under “Dividend disbursing and transfer agent fees and expenses.”
Pursuant to a distribution agreement and distribution plan, each Fund pays DDLP, the distributor and an affiliate of DMC, an annual distribution and service fee of 0.25% of the average daily net assets of the Class A shares, 1.00% of the average daily net assets of the Class C shares, and 0.50% of the average daily net assets of the Class R shares. Institutional Class shares pay no distribution and service fees.
In connection with the Delaware Foundation Moderate Allocation Fund merger with Delaware Balanced Fund, the Board has adopted a formula for calculating 12b-1 plan fees for the Fund’s Class A shares that went into effect on June 1, 1992. The Fund’s Class A shares are currently subject to a blended 12b-1 fee equal to the sum of: (1) 0.10% of the average daily net assets representing shares that were acquired prior to June 1, 1992, and (2) 0.25% of the average daily net assets representing shares that were acquired on or after June 1, 1992. All Class A shares currently bear 12b-1 fees at the same rate, the blended rate, currently 0.24% of average daily net assets, based on the formula described above. This method of calculating Class A 12b-1 fees may be discontinued at the sole discretion of the Board.
As provided in the investment management agreement, each Fund bears a portion of the cost of certain resources shared with DMC, including the cost of internal personnel of DMC and/or its affiliates that provide legal, tax, and regulatory reporting services to each Fund. These amounts are included on the “Statements of operations” under “Legal fees.” For the year ended March 31, 2017, each Fund was charged for internal legal, tax, and regulatory reporting services provided by DMC and/or its affiliates’ employees as follows:
| | | | |
Delaware
Foundation
Growth
Allocation Fund | | Delaware
Foundation
Moderate
Allocation Fund | | Delaware
Foundation
Conservative
Allocation Fund |
| $6,181 | | $10,698 | | $6,587 |
For the year ended March 31, 2017, DDLP earned commissions on sales of Class A shares for each Fund as follows:
| | | | |
Delaware
Foundation
Growth
Allocation Fund | | Delaware
Foundation
Moderate
Allocation Fund | | Delaware
Foundation
Conservative
Allocation Fund |
$8,252 | | $9,686 | | $11,534 |
Notes to financial statements
Delaware Foundation Funds®
2. Investment Management, Administration Agreements, and Other Transactions with Affiliates (continued)
For the year ended March 31, 2017, DDLP received gross CDSC commissions on redemption of each Fund’s Class A and Class C shares and these commissions were entirely used to offset upfront commissions previously paid by DDLP to broker/dealers on sales of those shares. The amounts received were as follows:
| | | | | | |
| | | Delaware
Foundation®
Growth
Allocation Fund | | Delaware
Foundation
Moderate
Allocation Fund | | Delaware
Foundation
Conservative
Allocation Fund |
| Class A | | $ 9 | | $ 50 | | $ 96 |
| Class C | | 1,720 | | 983 | | 1,598 |
Trustees’ fees include expenses accrued by the Funds for each Trustee’s retainer and meeting fees. Certain officers of DMC, DIFSC, and DDLP are officers and/or Trustees of the Trust. These officers and Trustees are paid no compensation by the Funds.
Cross trades for the year ended March 31, 2017, were executed by the Funds pursuant to procedures adopted by the Boards designed to ensure compliance with Rule 17a-7 under the 1940 Act. Cross trading is the buying or selling of portfolio securities between funds of investment companies, or between a fund of an investment company and another entity, that are or could be considered affiliates by virtue of having a common investment advisor (or affiliated investment advisors), common directors/trustees and/or common officers. At their regularly scheduled meetings, the Boards review such transactions for compliance with the procedures adopted by the Boards. Pursuant to these procedures, for the year ended March 31, 2017, the Funds engaged in securities purchases and securities sales, which resulted in net realized losses as follows:
| | | | | | | | | | | | | | | |
| | | Delaware Foundation
Growth Allocation Fund | | Delaware Foundation
Moderate Allocation Fund | | Delaware Foundation
Conservative Allocation Fund |
Purchases | | | $ | 270,672 | | | | $ | 448,001 | | | | $ | 248,793 | |
Sales | | | | 2,566,791 | | | | | 2,134,138 | | | | | 1,072,442 | |
Net realized losses | | | | (15,308 | ) | | | | (34,249 | ) | | | | (23,977 | ) |
*The aggregate contractual waiver period covering this report is from Jan. 29, 2015 through July 29, 2017.
3. Investments
For the year ended March 31, 2017, each Fund made purchases and sales of investment securities other than short-term investments as follows:
| | | | | | | | | | | | | | | |
| | | Delaware
Foundation
Growth
Allocation Fund | | Delaware
Foundation
Moderate
Allocation Fund | | Delaware
Foundation
Conservative
Allocation Fund |
Purchases other than U.S. government securities | | | $ | 54,259,555 | | | | $ | 305,402,700 | | | | $ | 114,135,266 | |
Purchases of U.S. government securities | | | | 14,772,432 | | | | | 53,682,045 | | | | | 23,939,476 | |
Sales other than U.S. government securities | | | | 66,268,735 | | | | | 308,727,031 | | | | | 120,414,870 | |
Sales of U.S. government securities | | | | 16,096,756 | | | | | 59,729,483 | | | | | 26,816,351 | |
122
At March 31, 2017, the cost and unrealized appreciation (depreciation) of investments for federal income tax purposes for each fund were as follows:
| | | | | | | | | | | | | | | |
| | | Delaware
Foundation®
Growth
Allocation Fund | | Delaware
Foundation
Moderate
Allocation Fund | | Delaware
Foundation
Conservative
Allocation Fund |
Cost of Investments | | | $ | 52,389,722 | | | | $ | 240,649,554 | | | | $ | 76,232,254 | |
| | | | | | | | | | | | | | | |
Aggregate unrealized appreciation of investments | | | $ | 15,447,003 | | | | $ | 50,894,293 | | | | $ | 10,890,396 | |
Aggregate unrealized depreciation of investments | | | | (3,604,114 | ) | | | | (12,636,099 | ) | | | | (3,244,572 | ) |
| | | | | | | | | | | | | | | |
Net unrealized appreciation of investments | | | $ | 11,842,889 | | | | $ | 38,258,194 | | | | $ | 7,645,824 | |
| | | | | | | | | | | | | | | |
U.S. GAAP defines fair value as the price that each Fund would receive to sell an asset or pay to transfer a liability in an orderly transaction between market participants at the measurement date under current market conditions. A three-level hierarchy for fair value measurements has been established based upon the transparency of inputs to the valuation of an asset or liability. Inputs may be observable or unobservable and refer broadly to the assumptions that market participants would use in pricing the asset or liability. Observable inputs reflect the assumptions market participants would use in pricing the asset or liability based on market data obtained from sources independent of the reporting entity. Unobservable inputs reflect the reporting entity’s own assumptions about the assumptions that market participants would use in pricing the asset or liability based on the best information available under the circumstances. Each Fund’s investment in its entirety is assigned a level based upon the observability of the inputs which are significant to the overall valuation. The three-level hierarchy of inputs is summarized below.
| | | | |
| Level 1 | | – | | Inputs are quoted prices in active markets for identical investments. (Examples: equity securities, open-end investment companies, futures contracts, exchange-traded options contracts) |
| | |
| Level 2 | | – | | Other observable inputs, including, but not limited to: quoted prices for similar assets or liabilities in markets that are active, quoted prices for identical or similar assets or liabilities in markets that are not active, inputs other than quoted prices that are observable for the assets or liabilities (such as interest rates, yield curves, volatilities, prepayment speeds, loss severities, credit risks, and default rates) or other market-corroborated inputs. (Examples: debt securities, government securities, swap contracts, foreign currency exchange contracts, foreign securities utilizing international fair value pricing, broker-quoted securities, fair valued securities) |
| | |
| Level 3 | | – | | Significant unobservable inputs, including each Fund’s own assumptions used to determine the fair value of investments. (Examples: broker-quoted securities, fair valued securities) |
Level 3 investments are valued using significant unobservable inputs. Each Fund may also use an income-based valuation approach in which the anticipated future cash flows of the investment are discounted to calculate fair value. Discounts may also be applied due to the nature or duration of any restrictions on the disposition of the investments. Valuations may also be based upon current market prices of securities that are comparable in coupon, rating, maturity, and industry. The derived value of a Level 3 investment may not represent the value which is received upon disposition and this could impact the results of operations.
Notes to financial statements
Delaware Foundation Funds®
3. Investments (continued)
The following tables summarize the valuation of each Fund’s investments by fair value hierarchy levels as of March 31, 2017:
| | | | | | | | | | | | | | | | |
Delaware Foundation® Growth Allocation Fund | |
| | | | |
Securities: | | Level 1 | | | Level 2 | | | Level 3 | | | Total | |
Assets: | | | | | | | | | | | | | | | | |
Agency, Asset-Backed & Mortgage-Backed Securities | | $ | — | | | $ | 7,373,407 | | | $ | — | | | $ | 7,373,407 | |
Corporate Debt | | | — | | | | 7,071,452 | | | | — | | | | 7,071,452 | |
Foreign Debt | | | — | | | | 142,788 | | | | — | | | | 142,788 | |
Municipal Bonds | | | — | | | | 132,276 | | | | — | | | | 132,276 | |
Loan Agreements1 | | | — | | | | 958,810 | | | | 23,599 | | | | 982,409 | |
Common Stock | | | | | | | | | | | | | | | | |
Consumer Discretionary | | | 4,786,427 | | | | — | | | | — | | | | 4,786,427 | |
Consumer Staples | | | 4,279,808 | | | | — | | | | — | | | | 4,279,808 | |
Energy | | | 2,886,930 | | | | — | | | | — | | | | 2,886,930 | |
Financials | | | 5,572,730 | | | | 87,295 | | | | — | | | | 5,660,025 | |
Healthcare | | | 5,682,510 | | | | — | | | | — | | | | 5,682,510 | |
Industrials | | | 5,528,602 | | | | — | | | | — | | | | 5,528,602 | |
Information Technology | | | 7,347,620 | | | | — | | | | — | | | | 7,347,620 | |
Materials | | | 1,861,857 | | | | — | | | | — | | | | 1,861,857 | |
Real Estate | | | 4,178,072 | | | | 24,570 | | | | — | | | | 4,202,642 | |
Telecommunication Services | | | 2,138,624 | | | | — | | | | — | | | | 2,138,624 | |
Utilities | | | 460,311 | | | | 91 | | | | — | | | | 460,402 | |
Exchange-Traded Funds | | | 1,839,154 | | | | — | | | | — | | | | 1,839,154 | |
Preferred Stock1 | | | 21,500 | | | | 52,592 | | | | — | | | | 74,092 | |
Rights | | | 6,918 | | | | — | | | | — | | | | 6,918 | |
U.S. Treasury Obligations | | | — | | | | 814,914 | | | | — | | | | 814,914 | |
Short-Term Investments | | | — | | | | 959,754 | | | | — | | | | 959,754 | |
| | | | | | | | | | | | | | | | |
Total Value of Securities | | $ | 46,591,063 | | | $ | 17,617,949 | | | $ | 23,599 | | | $ | 64,232,611 | |
| | | | | | | | | | | | | | | | |
Derivatives: | | | | | | | | | | | | | | | | |
Foreign Currency Exchange Contracts | | $ | — | | | $ | (6 | ) | | $ | — | | | $ | (6 | ) |
Futures Contracts | | | (17,657 | ) | | | — | | | | — | | | | (17,657 | ) |
Swap Contracts | | | — | | | | (12,596 | ) | | | — | | | | (12,596 | ) |
1Security type is valued across multiple levels. Level 1 investments represent exchange-traded investments, Level 2 investments represent investments with observable inputs or matrix-priced investments, and Level 3 investments represent investments without observable inputs. The amounts attributed to Level 1 investments, Level 2 investments, and Level 3 investments represent the following percentages of the total market value of these security types:
| | | | | | | | | | | | | | | | |
| | | Level 1 | | | Level 2 | | | Level 3 | | | Total | |
Loan Agreements | | | — | | | | 97.60% | | | | 2.40% | | | | 100.00% | |
Preferred Stock | | | 29.02% | | | | 70.98% | | | | — | | | | 100.00% | |
124
| | | | | | | | | | | | | | | | |
Delaware Foundation® Moderate Allocation Fund | |
| | | | |
Securities: | | Level 1 | | | Level 2 | | | Level 3 | | | Total | |
Assets: | | | | | | | | | | | | | | | | |
Agency, Asset-Backed & Mortgage-Backed Securities | | $ | — | | | $ | 53,661,609 | | | $ | — | | | $ | 53,661,609 | |
Corporate Debt | | | — | | | | 61,047,859 | | | | — | | | | 61,047,859 | |
Foreign Debt | | | — | | | | 2,329,473 | | | | — | | | | 2,329,473 | |
Municipal Bonds | | | — | | | | 996,693 | | | | — | | | | 996,693 | |
Loan Agreements1 | | | — | | | | 2,574,376 | | | | 194,119 | | | | 2,768,495 | |
Common Stock | | | | | | | | | | | | | | | | |
Consumer Discretionary | | | 15,263,936 | | | | — | | | | — | | | | 15,263,936 | |
Consumer Staples | | | 13,806,210 | | | | — | | | | — | | | | 13,806,210 | |
Energy | | | 8,980,445 | | | | — | | | | — | | | | 8,980,445 | |
Financials | | | 17,922,657 | | | | 278,904 | | | | — | | | | 18,201,561 | |
Healthcare | | | 18,392,715 | | | | — | | | | — | | | | 18,392,715 | |
Industrials | | | 17,835,057 | | | | — | | | | — | | | | 17,835,057 | |
Information Technology | | | 23,551,617 | | | | — | | | | — | | | | 23,551,617 | |
Materials | | | 6,022,042 | | | | — | | | | — | | | | 6,022,042 | |
Real Estate | | | 13,690,906 | | | | 61,992 | | | | — | | | | 13,752,898 | |
Telecommunication Services | | | 6,786,710 | | | | — | | | | — | | | | 6,786,710 | |
Utilities | | | 1,490,841 | | | | — | | | | — | | | | 1,490,841 | |
Exchange-Traded Funds | | | 6,523,309 | | | | — | | | | — | | | | 6,523,309 | |
Preferred Stock1 | | | 516,000 | | | | 458,579 | | | | — | | | | 974,579 | |
Rights | | | 19,937 | | | | — | | | | — | | | | 19,937 | |
U.S. Treasury Obligations | | | — | | | | 1,770,490 | | | | — | | | | 1,770,490 | |
Short-Term Investments | | | — | | | | 4,731,272 | | | | — | | | | 4,731,272 | |
| | | | | | | | | | | | | | | | |
Total Value of Securities | | $ | 150,802,382 | | | $ | 127,911,247 | | | $ | 194,119 | | | $ | 278,907,748 | |
| | | | | | | | | | | | | | | | |
Derivatives: | | | | | | | | | | | | | | | | |
Foreign Currency Exchange Contracts | | $ | — | | | $ | 247 | | | $ | — | | | $ | 247 | |
Futures Contracts | | | (128,722 | ) | | | — | | | | — | | | | (128,722 | ) |
Swap Contracts | | | — | | | | (139,355 | ) | | | — | | | | (139,355 | ) |
1Security type is valued across multiple levels. Level 1 investments represent exchange-traded investments, Level 2 investments represent investments with observable inputs or matrix-priced investments, and Level 3 investments represent investments without observable inputs. The amounts attributed to Level 1 investments, Level 2 investments, and Level 3 investments represent the following percentages of the total market value of these security types:
| | | | | | | | | | | | | | | | |
| | | Level 1 | | | Level 2 | | | Level 3 | | | Total | |
Loan Agreements | | | — | | | | 92.99% | | | | 7.01% | | | | 100.00% | |
Preferred Stock | | | 52.95% | | | | 47.05% | | | | — | | | | 100.00% | |
Notes to financial statements
Delaware Foundation Funds®
3. Investments (continued)
| | | | | | | | | | | | | | | | |
Delaware Foundation® Conservative Allocation Fund | |
| | | | |
Securities: | | Level 1 | | | Level 2 | | | Level 3 | | | Total | |
Assets: | | | | | | | | | | | | | | | | |
Agency, Asset-Backed & Mortgage-Backed Securities | | $ | — | | | $ | 24,810,244 | | | $ | — | | | $ | 24,810,244 | |
Corporate Debt | | | — | | | | 24,480,514 | | | | — | | | | 24,480,514 | |
Foreign Debt | | | — | | | | 468,886 | | | | — | | | | 468,886 | |
Municipal Bonds | | | — | | | | 382,864 | | | | — | | | | 382,864 | |
Loan Agreements1 | | | — | | | | 1,133,274 | | | | 133,219 | | | | 1,266,493 | |
Common Stock | | | | | | | | | | | | | | | | |
Consumer Discretionary | | | 3,125,883 | | | | — | | | | — | | | | 3,125,883 | |
Consumer Staples | | | 2,822,852 | | | | — | | | | — | | | | 2,822,852 | |
Energy | | | 1,854,697 | | | | — | | | | — | | | | 1,854,697 | |
Financials | | | 3,637,975 | | | | 58,942 | | | | — | | | | 3,696,917 | |
Healthcare | | | 3,697,200 | | | | — | | | | — | | | | 3,697,200 | |
Industrials | | | 3,598,388 | | | | — | | | | — | | | | 3,598,388 | |
Information Technology | | | 4,757,578 | | | | — | | | | — | | | | 4,757,578 | |
Materials | | | 1,227,032 | | | | — | | | | — | | | | 1,227,032 | |
Real Estate | | | 2,667,700 | | | | 13,986 | | | | — | | | | 2,681,686 | |
Telecommunication Services | | | 1,396,923 | | | | — | | | | — | | | | 1,396,923 | |
Utilities | | | 302,005 | | | | — | | | | — | | | | 302,005 | |
Exchange-Traded Funds | | | 1,022,006 | | | | — | | | | — | | | | 1,022,006 | |
Preferred Stock1 | | | 344,000 | | | | 231,709 | | | | — | | | | 575,709 | |
Rights | | | 4,452 | | | | — | | | | — | | | | 4,452 | |
U.S. Treasury Obligations | | | — | | | | 1,186,657 | | | | — | | | | 1,186,657 | |
Short-Term Investments | | | — | | | | 519,092 | | | | — | | | | 519,092 | |
| | | | | | | | | | | | | | | | |
Total Value of Securities | | $ | 30,458,691 | | | $ | 53,286,168 | | | $ | 133,219 | | | $ | 83,878,078 | |
| | | | | | | | | | | | | | | | |
Derivatives: | | | | | | | | | | | | | | | | |
Foreign Currency Exchange | | | | | | | | | | | | | | | | |
Contracts | | $ | — | | | $ | 61 | | | $ | — | | | $ | 61 | |
Futures Contracts | | | (50,583 | ) | | | — | | | | — | | | | (50,583 | ) |
Swap Contracts | | | — | | | | (55,986 | ) | | | — | | | | (55,986 | ) |
1Security type is valued across multiple levels. Level 1 investments represent exchange-traded investments, Level 2 investments represent investments with observable inputs or matrix-priced investments, and Level 3 investments represent investments without observable inputs. The amounts attributed to Level 1 investments, Level 2 investments, and Level 3 investments represent the following percentages of the total market value of these security types:
| | | | | | | | | | | | | | | | |
| | | Level 1 | | | Level 2 | | | Level 3 | | | Total | |
Loan Agreements | | | — | | | | 89.48 | % | | | 10.52 | % | | | 100.00 | % |
Preferred Stock | | | 59.75 | % | | | 40.25 | % | | | — | | | | 100.00 | % |
The securities that have been valued at zero on the “Schedules of investments” are considered to be Level 3 securities in these tables.
During the year ended March 31, 2017, there were no transfers between Level 1 investments, Level 2 investments, or Level 3 investments that had a significant impact to each Fund. This does not include transfers between Level 1 investments and Level 2 investments due to each Fund utilizing international fair value pricing during the period. In accordance with the fair valuation procedures described in Note 1, international fair value pricing of securities in each Fund occurs when market volatility exceeds an established rolling threshold. If the threshold is exceeded on a given date, then prices of international securities (those that traded on exchanges that close at a different time than the time that each Fund’s NAV is determined) are established using a separate pricing feed from a third party vendor designed to establish a price for each such security as of the time that each Fund’s NAV is determined. Further, international fair value pricing uses other observable market-based inputs in place
126
of the closing exchange price due to the events occurring after the close of the exchange or market on which the investment is principally traded, causing a change in classification between levels. Each Fund’s policy is to recognize transfers between levels at the beginning of the reporting period.
A reconciliation of Level 3 investments is presented when a Fund has a significant amount of Level 3 investments at the beginning, interim, or end of the period in relation to net assets. Management has determined not to provide a reconciliation of Level 3 investments as the Level 3 investments were not considered significant to each Fund’s net assets at the beginning, interim, or end of the period. Management has determined not to provide additional disclosure on Level 3 inputs since the Level 3 investments are not considered significant to each Fund’s net assets at the end of the year.
4. Dividend and Distribution Information
Income and long-term capital gain distributions are determined in accordance with federal income tax regulations, which may differ from U.S. GAAP. Additionally, distributions from net gains on foreign currency transactions and net short-term gains on sales of investment securities are treated as ordinary income for federal income tax purposes. The tax character of dividends and distributions paid during the years ended March 31, 2017 and 2016 were as follows:
| | | | | | | | | | | | | | | |
| | | Delaware
Foundation®
Growth
Allocation Fund | | Delaware
Foundation
Moderate
Allocation Fund | | Delaware
Foundation
Conservative
Allocation Fund |
Year ended 3/31/17 | | | | | | | | | | | | | | | |
Ordinary income | | | $ | 839,071 | | | | $ | 6,469,149 | | | | $ | 1,494,532 | |
Long-term capital gain | | | | 2,268,068 | | | | | 2,920,694 | | | | | 1,230,604 | |
| | | | | | | | | | | | | | | |
Total | | | $ | 3,107,139 | | | | $ | 9,389,843 | | | | $ | 2,725,136 | |
| | | | | | | | | | | | | | | |
| | | |
Year ended 3/31/16 | | | | | | | | | | | | | | | |
Ordinary income | | | $ | 1,157,189 | | | | $ | 5,521,720 | | | | $ | 2,159,576 | |
Long-term capital gain | | | | 6,244,694 | | | | | 13,970,017 | | | | | 4,412,132 | |
| | | | | | | | | | | | | | | |
Total | | | $ | 7,401,883 | | | | $ | 19,491,737 | | | | $ | 6,571,708 | |
| | | | | | | | | | | | | | | |
5. Components of Net Assets on a Tax Basis
As of March 31, 2017, the components of net assets on a tax basis were as follows:
| | | | | | | | | | | | | | | |
| | | Delaware Foundation
Growth Allocation Fund | | Delaware Foundation
Moderate Allocation Fund | | Delaware Foundation
Conservative Allocation Fund |
Shares of beneficial interest | | | $ | 48,943,258 | | | | $ | 223,241,722 | | | | $ | 71,334,835 | |
Undistributed ordinary income | | | | 115,330 | | | | | — | | | | | — | |
Undistributed long-term capital gain | | | | 2,603,472 | | | | | 12,739,122 | | | | | 2,094,873 | |
Unrealized appreciation on investments, foreign currencies, and derivatives | | | | 11,836,294 | | | | | 38,231,688 | | | | | 7,636,792 | |
| | | | | | | | | | | | | | | |
Net assets | | | $ | 63,498,354 | | | | $ | 274,212,532 | | | | $ | 81,066,500 | |
| | | | | | | | | | | | | | | |
The differences between book basis and tax basis components of net assets are primarily attributable to tax deferral of losses on wash sales, mark-to-market of futures contracts, mark-to-market of foreign currency exchange contracts, tax deferral of losses on straddles, tax treatment of passive foreign investment companies, tax treatment of CDS contracts, and tax treatment of market discount and premium on debt instruments.
Notes to financial statements
Delaware Foundation Funds®
5. Components of Net Assets on a Tax Basis (continued)
For financial reporting purposes, capital accounts are adjusted to reflect the tax character of permanent book/tax differences. Reclassifications are primarily due to tax treatment of gain (loss) on foreign currency transactions, CDS contracts, capital gains tax, passive foreign investment companies, market discount and premium on certain debt instruments, paydowns of mortgage- and asset-backed securities, dividends and distributions, and tax treatment of contingent payment debt instruments. Results of operations and net assets were not affected by these reclassifications. For the year ended March 31, 2017, the Funds recorded the following reclassifications:
| | | | | | | | | | | | | | | |
| | | Delaware
Foundation®
Growth
Allocation Fund | | Delaware
Foundation
Moderate
Allocation Fund | | Delaware
Foundation
Conservative
Allocation Fund |
Undistributed (distributions in excess of) net investment income | | | $ | 112,826 | | | | $ | 1,117,050 | | | | $ | 377,993 | |
Accumulated net realized gain on investments | | | | (112,826 | ) | | | | (1,117,050 | ) | | | | (377,993 | ) |
6. Capital Shares
Transactions in capital shares were as follows:
| | | | | | | | | | | | | | | | | | | | | | | | | | | | | | |
| | | Delaware Foundation
Growth Allocation Fund | | Delaware Foundation
Moderate Allocation Fund | | Delaware Foundation
Conservative Allocation Fund |
| | | Year ended | | Year ended | | Year ended |
| | | 3/31/17 | | 3/31/16 | | 3/31/17 | | 3/31/16 | | 3/31/17 | | 3/31/16 |
Shares sold: | | | | | | | | | | | | | | | | | | | | | | | | | | | | | | |
Class A | | | | 426,308 | | | | | 745,780 | | | | | 562,623 | | | | | 524,738 | | | | | 800,526 | | | | | 671,740 | |
Class C | | | | 226,852 | | | | | 309,623 | | | | | 194,320 | | | | | 311,741 | | | | | 204,852 | | | | | 486,282 | |
Class R | | | | 116,731 | | | | | 183,256 | | | | | 25,954 | | | | | 103,521 | | | | | 120,594 | | | | | 118,104 | |
Institutional Class | | | | 407,524 | | | | | 594,051 | | | | | 731,278 | | | | | 2,400,170 | | | | | 472,831 | | | | | 679,190 | |
| | | | | | |
Shares issued upon reinvestment of dividends and distributions: | | | | | | | | | | | | | | | | | | | | | | | | | | | | | | |
Class A | | | | 186,554 | | | | | 408,680 | | | | | 479,116 | | | | | 1,039,216 | | | | | 150,615 | | | | | 321,737 | |
Class C | | | | 53,754 | | | | | 99,550 | | | | | 55,478 | | | | | 149,884 | | | | | 71,849 | | | | | 197,117 | |
Class R | | | | 16,886 | | | | | 41,748 | | | | | 5,680 | | | | | 11,815 | | | | | 13,401 | | | | | 27,690 | |
Institutional Class | | | | 70,301 | | | | | 156,814 | | | | | 68,470 | | | | | 150,650 | | | | | 39,120 | | | | | 100,871 | |
| | | | | | | | | | | | | | | | | | | | | | | | | | | | | | |
| | | | 1,504,910 | | | | | 2,539,502 | | | | | 2,122,919 | | | | | 4,691,735 | | | | | 1,873,788 | | | | | 2,602,731 | |
| | | | | | | | | | | | | | | | | | | | | | | | | | | | | | |
Shares redeemed: | | | | | | | | | | | | | | | | | | | | | | | | | | | | | | |
Class A | | | | (1,501,094 | ) | | | | (887,985 | ) | | | | (2,195,833 | ) | | | | (1,812,829 | ) | | | | (1,225,387 | ) | | | | (1,385,197 | ) |
Class C | | | | (285,849 | ) | | | | (190,750 | ) | | | | (560,202 | ) | | | | (590,231 | ) | | | | (949,045 | ) | | | | (836,845 | ) |
Class R | | | | (233,171 | ) | | | | (209,916 | ) | | | | (57,565 | ) | | | | (140,708 | ) | | | | (271,624 | ) | | | | (158,958 | ) |
Institutional Class | | | | (788,874 | ) | | | | (996,852 | ) | | | | (642,018 | ) | | | | (1,033,630 | ) | | | | (876,497 | ) | | | | (1,045,924 | ) |
| | | | | | | | | | | | | | | | | | | | | | | | | | | | | | |
| | | | (2,808,988 | ) | | | | (2,285,503 | ) | | | | (3,455,618 | ) | | | | (3,577,398 | ) | | | | (3,322,553 | ) | | | | (3,426,924 | ) |
| | | | | | | | | | | | | | | | | | | | | | | | | | | | | | |
Net increase (decrease) | | | | (1,304,078 | ) | | | | 253,999 | | | | | (1,332,699 | ) | | | | 1,114,337 | | | | | (1,448,765 | ) | | | | (824,193 | ) |
| | | | | | | | | | | | | | | | | | | | | | | | | | | | | | |
128
Certain shareholders may exchange shares of one class for another class in the same Fund. For the years ended March 31, 2017 and March 31, 2016, the Funds had the following exchange transactions. These exchange transactions are included as subscriptions and redemptions in the tables on the previous page and the “Statements of changes in net assets.”
| | | | | | | | | | | | | | | |
| | | | | Year ended 3/31/17 | | |
| | | Exchange
Redemptions | | Exchange
Subscriptions | | |
| | | Class A
Shares | | Institutional Class
Shares | | Value |
Delaware Foundation® Growth Allocation Fund | | | | 58,435 | | | | | 58,073 | | | | $ | 563,271 | |
Delaware Foundation Moderate Allocation Fund | | | | 51,216 | | | | | 51,172 | | | | | 583,766 | |
Delaware Foundation Conservative Allocation Fund | | | | 97,635 | | | | | 97,329 | | | | | 932,399 | |
| | | | | | | | | | | | | | | | | | | | | | | | | |
| | | | | | | Year ended | | | | |
| | | | | | | 3/31/16 | | | | |
| | | Exchange Redemptions | | Exchange Subscriptions | | |
| | | Class A
Shares | | Class C
Shares | | Class A
Shares | | Institutional Class
Shares | | Value |
Delaware Foundation Growth Allocation Fund | | | | 867 | | | | | 3,846 | | | | | 3,733 | | | | | 862 | | | | $ | 43,930 | |
Delaware Foundation Moderate Allocation Fund | | | | — | | | | | 934 | | | | | 932 | | | | | — | | | | | 10,152 | |
Delaware Foundation Conservative Allocation Fund | | | | — | | | | | 7,344 | | | | | 7,352 | | | | | — | | | | | 69,331 | |
7. Line of Credit
Each Fund, along with certain other funds in the Delaware Investments® Family of Funds (Participants), was a participant in a $155,000,000 revolving line of credit intended to be used for temporary or emergency purposes as an additional source of liquidity to fund redemptions of investor shares. Under the agreement, the Participants were charged an annual commitment fee of 0.10%, which was allocated across the Participants on the basis of relative net assets of each Participant’s allocation of the entire facility. The Participants were permitted to borrow up to a maximum of one third of their net assets under the agreement. Each Participant was individually, and not jointly, liable for its particular advances, if any, under the line of credit. The line of credit available under the agreement expired on Nov. 7, 2016.
On Nov. 7, 2016, each Fund, along with the other Participants, entered into an amendment to the agreement for a $155,000,000 revolving line of credit to be used as described above and operates in substantially the same manner as the original agreement, with the exception of the annual commitment fee. Under the amendment to the agreement, the Participants are charged an annual commitment fee of 0.15%, which is allocated across the Participants on the basis of relative net assets of each Participant’s allocation of the entire facility. The line of credit available under the agreement expires on Nov. 6, 2017.
Each Fund had no amounts outstanding as of March 31, 2017, or at any time during the year then ended.
8. Derivatives
U.S. GAAP requires disclosures that enable investors to understand: (1) how and why an entity uses derivatives; (2) how they are accounted for; and (3) how they affect an entity’s results of operations and financial position.
Foreign Currency Exchange Contracts — Each Fund may enter into foreign currency exchange contracts and foreign cross currency exchange contracts as a way of managing foreign exchange rate risk. Each Fund may enter into these contracts to fix the U.S. dollar value of a security that it has agreed to buy or sell for the period between the date the trade was entered into and the date the security is delivered and paid for. Each Fund may also use these contracts to hedge the U.S. dollar value of securities it already owns that are denominated in foreign currencies. In addition, each Fund may enter into these contracts to facilitate or expedite the settlement of portfolio transactions. The change in value is recorded as an unrealized gain or loss. When the contract is closed, a realized gain or loss is recorded equal to the difference between the value of the contract at the time it was opened and the value at the time it was closed.
The use of foreign currency exchange contracts and foreign cross currency exchange contracts does not eliminate fluctuations in the underlying prices of the securities, but does establish a rate of exchange that can be achieved in the future. Although foreign currency exchange contracts
Notes to financial statements
Delaware Foundation Funds®
8. Derivatives (continued)
and foreign cross currency exchange contracts limit the risk of loss due to an unfavorable change in the value of the hedged currency, they also limit any potential gain that might result should the value of the currency change favorably. In addition, the Fund could be exposed to risks if the counterparties to the contracts are unable to meet the terms of their contracts. Each Fund’s maximum risk of loss from counterparty credit risk is the value of its currency exchanged with the counterparty. The risk is generally mitigated by having a netting arrangement between each Fund and the counterparty and by the posting of collateral by the counterparty to the Fund to cover each Fund’s exposure to the counterparty.
During the year ended March 31, 2017, each Fund used foreign currency exchange contracts to hedge the U.S. dollar value of securities each Fund already owns that are denominated in foreign currencies and to facilitate or expedite the settlement of portfolio transactions.
Futures Contracts — A futures contract is an agreement in which the writer (or seller) of the contract agrees to deliver to the buyer an amount of cash or securities equal to a specific dollar amount times the difference between the value of a specific security or index at the close of the last trading day of the contract and the price at which the agreement is made. Each Fund may use futures contracts in the normal course of pursuing their respective investment objective. Each Fund may invest in futures contracts to hedge its existing portfolio securities against fluctuations in value caused by changes in interest rates or market conditions. Upon entering into a futures contract, each Fund deposits cash or pledges U.S. government securities to a broker, equal to the minimum “initial margin” requirements of the exchange on which the contract is traded. Subsequent payments are received from the broker or paid to the broker each day, based on the daily fluctuation in the market value of the contract. These receipts or payments are known as “variation margin” and are recorded daily by each Fund as unrealized gains or losses until the contracts are closed. When the contracts are closed, each Fund records a realized gain or loss equal to the difference between the value of the contract at the time it was opened and the value at the time it was closed. Risks of entering into futures contracts include potential imperfect correlation between the futures contracts and the underlying securities and the possibility of an illiquid secondary market for these instruments. When investing in futures, there is reduced counterparty credit risk to each Fund because futures are exchange-traded and the exchange’s clearinghouse, as counterparty to all exchange-traded futures, guarantees against default. Delaware Foundation® Growth Allocation Fund posted securities, comprised of U.S. treasury obligations with a value of $101,430 as margin for open futures contracts, which is presented on the “Schedules of investments.” Delaware Foundation Moderate Allocation Fund and Delaware Foundation Conservative Allocation Fund posted cash collateral of $680,000 and $283,000, respectively, as margin for open futures contracts, which is included in “Cash collateral due from brokers” on the “Statements of assets and liabilities.”
During the year ended March 31, 2017, each Fund used futures contracts to hedge each Fund’s existing portfolio securities against fluctuations in value caused by changes in interest rates or market conditions.
Options Contracts — During the year ended March 31, 2017, each Fund entered into options contracts in the normal course of pursuing their respective investment objective. Each Fund may buy or write options contracts for any number of reasons, including without limitation: to manage each Fund’s exposure to changes in securities prices caused by interest rate or market conditions and foreign currencies; as an efficient means of adjusting each Fund’s overall exposure to certain markets; to protect the value of portfolio securities; and as a cash management tool. Each Fund may buy or write call or put options on securities, futures, swaps, swaptions, financial indices, and foreign currencies. When each Fund buys an option, a premium is paid and an asset is recorded and adjusted on a daily basis to reflect the current market value of the option purchased. When each Fund writes an option, a premium is received and a liability is recorded and adjusted on a daily basis to reflect the current market value of the option written. Premiums received from writing options that expire unexercised are treated by each Fund on the expiration date as realized gains. The difference between the premium received and the amount paid on effecting a closing purchase transaction, including brokerage commissions, is treated as realized gain or loss. If a call option is exercised, the premium is added to the proceeds from the sale of the underlying security in determining whether each Fund has a realized gain or loss. If a put option is exercised, the premium reduces the cost basis of the securities purchased by each Fund. Each Fund, as writer of an option, bears the market risk of an unfavorable change in the price of the security underlying the written option. When writing options, each Fund is subject to minimal counterparty risk because the counterparty is only obligated to pay premiums and does not bear the market risk of an unfavorable market change.
130
Transactions in options written during the year ended March 31, 2017 for each Fund were as follows:
| | | | | | | | | | | | | | | | | | | | | | | | | | | | | | |
| | | Delaware Foundation® | | Delaware Foundation | | Delaware Foundation |
| | | Growth Allocation Fund | | Moderate Allocation Fund | | Conservative Allocation Fund |
| | | Number of | | | | Number of | | | | Number of | | |
| Call options | | contracts | | Premiums | | contracts | | Premiums | | contracts | | Premiums |
Options outstanding, March 31, 2016 | | | | — | | | | $ | — | | | | | — | | | | $ | — | | | | | — | | | | $ | — | |
Options written | | | | 17,807 | | | | | 1,527 | | | | | 77,446 | | | | | 9,070 | | | | | 50,821 | | | | | 4,516 | |
Options expired | | | | (17,800 | ) | | | | (433 | ) | | | | (77,400 | ) | | | | (1,882 | ) | | | | (50,800 | ) | | | | (1,235 | ) |
Options terminated in closing purchase transactions | | | | (7 | ) | | | | (1,094 | ) | | | | (46 | ) | | | | (7,188 | ) | | | | (21 | ) | | | | (3,281 | ) |
| | | | | | | | | | | | | | | | | | | | | | | | | | | | | | |
Options outstanding, March 31, 2017 | | | | — | | | | $ | — | | | | | — | | | | $ | — | | | | | — | | | | $ | — | |
| | | | | | | | | | | | | | | | | | | | | | | | | | | | | | |
| | | | | | |
| | | Number of | | | | Number of | | | | Number of | | |
| Put options | | contracts | | Premiums | | contracts | | Premiums | | contracts | | Premiums |
Options outstanding, March 31, 2016 | | | | — | | | | $ | — | | | | | — | | | | $ | — | | | | | — | | | | $ | — | |
Options written | | | | 17,800 | | | | | 167 | | | | | 77,400 | | | | | 726 | | | | | 50,800 | | | | | 476 | |
Options expired | | | | (17,800 | ) | | | | (167 | ) | | | | (77,400 | ) | | | | (726 | ) | | | | (50,800 | ) | | | | (476 | ) |
| | | | | | | | | | | | | | | | | | | | | | | | | | | | | | |
Options outstanding, March 31, 2017 | | | | — | | | | $ | — | | | | | — | | | | $ | — | | | | | — | | | | $ | — | |
| | | | | | | | | | | | | | | | | | | | | | | | | | | | | | |
During the year ended March 31, 2017, each Fund used options contracts to manage each Fund’s exposure to changes in securities prices caused by interest rates or market conditions, to manage each Fund’s exposure to changes in foreign currencies, to adjust each Fund’s overall exposure to certain markets, to protect the value of portfolio securities and to facilitate investments in portfolio securities.
Swap Contracts — Each Fund may enter into interest rate swap contracts and CDS contracts in the normal course of pursuing their respective investment objective. Each Fund may use interest rate swaps to manage its sensitivity to interest rates or to hedge against changes in interest rates. Each Fund may enter into CDS contracts in order to hedge against a credit event, to enhance total return or to gain exposure to certain securities or markets. Each Fund will not be permitted to enter into any swap transactions unless, at the time of entering into such transactions, the unsecured long-term debt of the actual counterparty, combined with any credit enhancements, is rated at least BBB- by Standard & Poor’s Financial Services LLC (S&P) or Baa3 by Moody’s Investors Service, Inc. (Moody’s) or is determined to be of equivalent credit quality by DMC.
Interest Rate Swaps. An interest rate swap contract is an exchange of interest rates between counterparties. In one instance, an interest rate swap involves payments received by the Funds from another party based on a variable or floating interest rate, in return for making payments based on a fixed interest rate. An interest rate swap can also work in reverse with the Funds receiving payments based on a fixed interest rate and making payments based on a variable or floating interest rate. Interest rate swaps may be used to adjust the Funds’ sensitivity to interest rates or to hedge against changes in interest rates. Periodic payments on such contracts are accrued daily and recorded as unrealized appreciation (depreciation) on swap contracts. Upon periodic payment (receipt) or termination of the contract, such amounts are recorded as realized gains or losses on swap contracts. The Funds’ maximum risk of loss from counterparty credit risk is the discounted net value of the cash flows to be received from/paid to the counterparty over the interest rate swap contract’s remaining life, to the extent that the amount is positive. This risk is mitigated by (1) for bilateral swap contracts, having a netting arrangement between the Funds and the counterparty and by the posting of collateral by the counterparty to the Funds to cover the Funds’ exposure to the counterparty, and (2) for cleared swaps, trading these instruments through a central counterparty.
During the year ended March 31, 2017, each Fund used interest rate swap contracts to manage each Fund’s sensitivity to interest rates or to hedge against changes in interest rates.
Credit Default Swaps. A CDS contract is a risk-transfer instrument through which one party (purchaser of protection) transfers to another party (seller of protection) the financial risk of a credit event (as defined in the CDS agreement), as it relates to a particular reference security or basket of securities (such as an index). In exchange for the protection offered by the seller of protection, the purchaser of protection agrees to pay the seller of protection a periodic amount at a stated rate that is applied to the notional amount of the CDS contract. In addition, an upfront payment may be made or received by each Fund in connection with an unwinding or assignment of a CDS contract. Upon the
Notes to financial statements
Delaware Foundation Funds®
8. Derivatives (continued)
occurrence of a credit event, the seller of protection would pay the par (or other agreed-upon) value of the reference security (or basket of securities) to the counterparty. Credit events generally include, among others, bankruptcy, failure to pay, and obligation default.
During the year ended March 31, 2017, each Fund entered into CDS contracts as a purchaser and seller of protection. Periodic payments (receipts) on such contracts are accrued daily and recorded as unrealized losses (gains) on swap contracts. Upon payment (receipt), such amounts are recorded as realized losses (gains) on swap contracts. Upfront payments made or received in connection with CDS contracts are amortized over the expected life of the CDS contracts as unrealized losses (gains) on swap contracts. The change in value of CDS contracts is recorded daily as unrealized appreciation or depreciation. A realized gain or loss is recorded upon a credit event (as defined in the CDS agreement) or the maturity or termination of the agreement. Initial margin and variation margin are posted to central counterparties for centrally cleared CDS basket trades, as determined by the applicable central counterparty.
As disclosed in the footnotes to the “Schedules of investments,” at March 31, 2017, the notional value of the protection sold was $235,000 for Delaware Foundation® Growth Allocation Fund, which reflects the maximum potential amount the Fund would have been required to make as a seller of credit protection if a credit event had occurred. In addition to serving as the source of the current value of the securities, the quoted market prices and resulting market values for the credit default swap agreements on securities and credit indices serve as an indicator of the current status of the payment/performance risk and represent the likelihood of an expected liability (or profit) for the credit derivative if the swap agreement has been closed/sold as of the period end. Increasing market values, in absolute terms when compared to the notional amounts of the swap, represent a deterioration of the reference entity’s credit soundness and a greater likelihood of risk of default or other credit event occurring as defined under the terms of the agreement. At March 31, 2017, net unrealized appreciation of the protection sold was $722 for Delaware Foundation Growth Allocation Fund.
CDS contracts may involve greater risks than if each Fund had invested in the reference obligation directly. CDS contracts are subject to general market risk, liquidity risk, counterparty risk, and credit risk. Each Fund’s maximum risk of loss from counterparty credit risk, either as the seller of protection or the buyer of protection, is the fair value of the contract. This risk is mitigated by (1) for bilateral swap contracts, having a netting arrangement between each Fund and the counterparty and by the posting of collateral by the counterparty to each Fund to cover the Funds’ exposure to the counterparty, and (2) for cleared swaps, trading these instruments through a central counterparty.
During the year ended March 31, 2017, each Fund used CDS contracts to hedge against credit events.
Swaps Generally. The value of open swaps may differ from that which would be realized in the event each Fund terminated its position in the contract on a given day. Risks of entering into these contracts include the potential inability of the counterparty to meet the terms of the contracts. This type of risk is generally limited to the amount of favorable movement in the value of the underlying security, instrument, or basket of instruments, if any, at the day of default. Risks also arise from potential losses from adverse market movements and such losses could exceed the unrealized amounts shown on the “Schedules of investments.”
At March 31, 2017, Delaware Foundation Growth Allocation Fund, Delaware Foundation Moderate Allocation Fund, and Delaware Foundation Conservative Allocation Fund posted $161,767, $1,260,947, and $316,861, respectively, as cash collateral for centrally cleared swap contracts, which is presented as “Cash collateral due from brokers” on the “Statements of assets and liabilities.” At March 31, 2017, Delaware Foundation Moderate Allocation Fund received $210,000 cash collateral from brokers for centrally cleared swap contracts, which is presented as “Cash collateral due to brokers” on the “Statements of assets and liabilities.”
132
Fair values of derivative instruments as of March 31, 2017 were as follows:
| | | | | | | | | | | | | | | | | | | | |
| | | Delaware Foundation® Growth Allocation Fund |
| | | Asset Derivatives Fair Value |
Statements of Assets and Liabilities Location | | Currency
Contracts | | Interest
Rate
Contracts | | Credit
Contracts | | Total |
Unrealized appreciation on foreign currency exchange contracts | | | $ | 266 | | | | $ | — | | | | $ | — | | | | $ | 266 | |
Variation margin due to broker on futures contracts* | | | | — | | | | | 1,300 | | | | | — | | | | | 1,300 | |
Unrealized appreciation on credit default swap contracts | | | | — | | | | | — | | | | | 722 | | | | | 722 | |
| | | | | | | | | | | | | | | | | | | | |
Total | | | $ | 266 | | | | $ | 1,300 | | | | $ | 722 | | | | $ | 2,288 | |
| | | | | | | | | | | | | | | | | | | | |
| |
| | | Liability Derivatives
Fair Value |
Statements of Assets and Liabilities Location | | Currency
Contracts | | Interest
Rate
Contracts | | Credit
Contracts | | Total |
Unrealized depreciation on foreign currency exchange contracts | | | $ | 272 | | | | $ | — | | | | $ | — | | | | $ | 272 | |
Variation margin due to broker on futures contracts* | | | | — | | | | | 18,957 | | | | | — | | | | | 18,957 | |
Variation margin due to brokers on interest rate swap contracts | | | | — | | | | | 3,775 | | | | | — | | | | | 3,775 | |
Variation margin due to brokers on credit default swap contracts | | | | — | | | | | — | | | | | 14 | | | | | 14 | |
Upfront payments received on credit default swap contracts | | | | — | | | | | — | | | | | 61,393 | | | | | 61,393 | |
Unrealized depreciation on credit default swap contracts | | | | — | | | | | — | | | | | 11,701 | | | | | 11,701 | |
Unrealized depreciation on interest rate swap contracts | | | | — | | | | | 1,617 | | | | | — | | | | | 1,617 | |
| | | | | | | | | | | | | | | | | | | | |
Total | | | $ | 272 | | | | $ | 24,349 | | | | $ | 73,108 | | | | $ | 97,729 | |
| | | | | | | | | | | | | | | | | | | | |
| | | | | | | | | | | | | | | |
| | | Delaware Foundation Moderate Allocation Fund |
| | | Asset Derivatives
Fair Value |
Statements of Assets and Liabilities Location | | Currency
Contracts | | Credit
Contracts | | Total |
Unrealized appreciation on foreign currency exchange contracts | | | $ | 1,616 | | | | $ | — | | | | $ | 1,616 | |
Variation margin due to broker on futures contracts* | | | | 11,283 | | | | | — | | | | | 11,283 | |
Upfront payments paid on credit default swap contracts | | | | — | | | | | 222,947 | | | | | 222,947 | |
| | | | | | | | | | | | | | | |
Total | | | $ | 12,899 | | | | $ | 222,947 | | | | $ | 235,846 | |
| | | | | | | | | | | | | | | |
| | | | | | | | | | | | | | | | | | | | |
| | | Liability Derivatives
Fair Value |
Statements of Assets and Liabilities Location | | Currency
Contracts | | Interest
Rate
Contracts | | Credit
Contracts | | Total |
Unrealized depreciation on foreign currency exchange contracts | | | $ | 1,369 | | | | $ | — | | | | $ | — | | | | $ | 1,369 | |
Variation margin due to broker on futures contracts* | | | | — | | | | | 140,005 | | | | | — | | | | | 140,005 | |
Variation margin due to brokers on interest rate swap contracts | | | | — | | | | | 29,461 | | | | | — | | | | | 29,461 | |
Variation margin due to brokers on credit default swap contracts | | | | — | | | | | — | | | | | 112 | | | | | 112 | |
Upfront payments received on credit default swap contracts | | | | — | | | | | — | | | | | 351,000 | | | | | 351,000 | |
Unrealized depreciation on credit default swap contracts | | | | — | | | | | — | | | | | 126,780 | | | | | 126,780 | |
Unrealized depreciation on interest rate swap contracts | | | | — | | | | | 12,575 | | | | | — | | | | | 12,575 | |
| | | | | | | | | | | | | | | | | | | | |
Total | | | $ | 1,369 | | | | $ | 182,041 | | | | $ | 477,892 | | | | $ | 661,302 | |
| | | | | | | | | | | | | | | | | | | | |
Notes to financial statements
Delaware Foundation Funds®
8. Derivatives (continued)
| | | | | | | | | | | | | | | |
| | | Delaware Foundation® Conservative Allocation Fund |
| | | Asset Derivatives
Fair Value |
Statements of Assets and Liabilities Location | | Currency
Contracts | | Interest Rate
Contracts | | Total |
Unrealized appreciation on foreign currency exchange contracts | | | $ | 779 | | | | $ | — | | | | $ | 779 | |
Variation margin due to broker on futures contracts* | | | | — | | | | | 4,933 | | | | | 4,933 | |
| | | | | | | | | | | | | | | |
Total | | | $ | 779 | | | | $ | 4,933 | | | | $ | 5,712 | |
| | | | | | | | | | | | | | | |
| | | | | | | | | | | | | | | | | | | | |
| | | Liability Derivatives Fair Value |
Statements of Assets and Liabilities Location | | Currency
Contracts | | Interest Rate
Contracts | | Credit
Contracts | | Total |
Unrealized depreciation on foreign currency exchange contracts | | | $ | 718 | | | | $ | — | | | | $ | — | | | | $ | 718 | |
Variation margin due to broker on futures contracts* | | | | — | | | | | 55,516 | | | | | — | | | | | 55,516 | |
Variation margin due to brokers on credit default swap contracts | | | | — | | | | | — | | | | | 50 | | | | | 50 | |
Variation margin due to brokers on interest rate swap contracts | | | | — | | | | | 12,462 | | | | | — | | | | | 12,462 | |
Upfront payments received on credit default swap contracts | | | | — | | | | | — | | | | | 158,549 | | | | | 158,549 | |
Unrealized depreciation on credit default swap contracts | | | | — | | | | | — | | | | | 50,520 | | | | | 50,520 | |
Unrealized depreciation on interest rate swap contracts | | | | — | | | | | 5,466 | | | | | — | | | | | 5,466 | |
| | | | | | | | | | | | | | | | | | | | |
Total | | | $ | 718 | | | | $ | 73,444 | | | | $ | 209,119 | | | | $ | 283,281 | |
| | | | | | | | | | | | | | | | | | | | |
*Includes cumulative appreciation (depreciation) of futures contracts from the date the contracts were opened through March 31, 2017. Only current day variation margin is reported on the “Statements of assets and liabilities.”
The effect of derivative instruments on the “Statements of operations” for the year ended March 31, 2017 was as follows:
| | | | | | | | | | | | | | | | | | | | | | | | | | | | | | |
| | | Delaware Foundation Growth Allocation Fund
Net Realized Gain (Loss) on: |
| | | Foreign
Currency
Exchange
Contracts | | Futures
Contracts | | Options
Purchased | | Options
Written | | Swap
Contracts | | Total |
Currency contracts | | | $ | (19,989 | ) | | | $ | — | | | | $ | — | | | | $ | 600 | | | | $ | — | | | | $ | (19,389 | ) |
Interest rate contracts | | | | — | | | | | 363,264 | | | | | 4,728 | | | | | (5,463 | ) | | | | 26,961 | | | | | 389,490 | |
Equity contracts | | | | — | | | | | (60,565 | ) | | | | — | | | | | — | | | | | — | | | | | (60,565 | ) |
Credit contracts | | | | — | | | | | — | | | | | — | | | | | — | | | | | (20,412 | ) | | | | (20,412 | ) |
| | | | | | | | | | | | | | | | | | | | | | | | | | | | | | |
Total | | | $ | (19,989 | ) | | | $ | 302,699 | | | | $ | 4,728 | | | | $ | (4,863 | ) | | | $ | 6,549 | | | | $ | 289,124 | |
| | | | | | | | | | | | | | | | | | | | | | | | | | | | | | |
| | | | | | | | | | | | | | | | | | | | |
| |
| | | Net Change in Unrealized Appreciation (Depreciation) of: |
| | | Foreign
Currency
Exchange
Contracts | | Futures
Contracts | | Swap
Contracts | | Total |
Currency contracts | | | $ | 7,912 | | | | $ | — | | | | $ | — | | | | $ | 7,912 | |
Interest rate contracts | | | | — | | | | | (21,536 | ) | | | | (24,181 | ) | | | | (45,717 | ) |
Equity contracts | | | | — | | | | | 2,577 | | | | | — | | | | | 2,577 | |
Credit contracts | | | | — | | | | | — | | | | | (11,780 | ) | | | | (11,780 | ) |
| | | | | | | | | | | | | | | | | | | | |
Total | | | $ | 7,912 | | | | $ | (18,959 | ) | | | $ | (35,961 | ) | | | $ | (47,008 | ) |
| | | | | | | | | | | | | | | | | | | | |
134
| | | | | | | | | | | | | | | | | | | | | | | | | | | | | | |
| | | Delaware Foundation® Moderate Allocation Fund
Net Realized Gain (Loss) on: |
| | | Foreign
Currency
Exchange
Contracts | | Futures
Contracts | | Options
Purchased | | Options
Written | | Swap
Contracts | | Total |
Currency contracts | | | $ | 62,727 | | | | $ | — | | | | $ | — | | | | $ | 2,608 | | | | $ | — | | | | $ | 65,335 | |
Interest rate contracts | | | | — | | | | | 2,824,639 | | | | | 34,281 | | | | | (35,899 | ) | | | | 190,188 | | | | | 3,013,209 | |
Equity contracts | | | | — | | | | | (176,072 | ) | | | | — | | | | | — | | | | | — | | | | | (176,072 | ) |
Credit contracts | | | | — | | | | | — | | | | | — | | | | | — | | | | | (250,180 | ) | | | | (250,180 | ) |
| | | | | | | | | | | | | | | | | | | | | | | | | | | | | | |
Total | | | $ | 62,727 | | | | $ | 2,648,567 | | | | $ | 34,281 | | | | $ | (33,291 | ) | | | $ | (59,992 | ) | | | $ | 2,652,292 | |
| | | | | | | | | | | | | | | | | | | | | | | | | | | | | | |
| | |
| | | Net Change in Unrealized Appreciation (Depreciation) of: | | |
| | | | | | | | | | | | | | | | | | | | |
| | | Foreign
Currency
Exchange
Contracts | | Futures
Contracts | | Swap
Contracts | | Total |
Currency contracts | | | $ | 43,432 | | | | $ | — | | | | $ | — | | | | $ | 43,432 | |
Interest rate contracts | | | | — | | | | | (136,970 | ) | | | | (173,200 | ) | | | | (310,170 | ) |
Equity contracts | | | | — | | | | | 12,886 | | | | | — | | | | | 12,886 | |
Credit contracts | | | | — | | | | | — | | | | | (125,788 | ) | | | | (125,788 | ) |
| | | | | | | | | | | | | | | | | | | | |
Total | | | $ | 43,432 | | | | $ | (124,084 | ) | | | $ | (298,988 | ) | | | $ | (379,640 | ) |
| | | | | | | | | | | | | | | | | | | | |
| | | | | | | | | | | | | | | | | | | | | | | | | | | | | | |
| | | Delaware Foundation Conservative Allocation Fund
Net Realized Gain (Loss) on: |
| | | Foreign
Currency
Exchange
Contracts | | Futures
Contracts | | Options
Purchased | | Options
Written | | Swap
Contracts | | Total |
Currency contracts | | | $ | 6,200 | | | | $ | — | | | | $ | — | | | | $ | 1,712 | | | | $ | — | | | | $ | 7,912 | |
Interest rate contracts | | | | — | | | | | 1,161,834 | | | | | 15,685 | | | | | (16,389 | ) | | | | 96,895 | | | | | 1,258,025 | |
Equity contracts | | | | — | | | | | (210,478 | ) | | | | — | | | | | — | | | | | — | | | | | (210,478 | ) |
Credit contracts | | | | — | | | | | — | | | | | — | | | | | — | | | | | (48,911 | ) | | | | (48,911 | ) |
| | | | | | | | | | | | | | | | | | | | | | | | | | | | | | |
Total | | | $ | 6,200 | | | | $ | 951,356 | | | | $ | 15,685 | | | | $ | (14,677 | ) | | | $ | 47,984 | | | | $ | 1,006,548 | |
| | | | | | | | | | | | | | | | | | | | | | | | | | | | | | |
| | |
| | | Net Change in Unrealized Appreciation (Depreciation) of: | | |
| | | | | | | | | | | | | | | | | | | | |
| | | Foreign
Currency
Exchange
Contracts | | Futures
Contracts | | Swap
Contracts | | Total |
Currency contracts | | | $ | 27,068 | | | | $ | — | | | | $ | — | | | | $ | 27,068 | |
Interest rate contracts | | | | — | | | | | (69,910 | ) | | | | (87,308 | ) | | | | (157,218 | ) |
Equity contracts | | | | — | | | | | 18,040 | | | | | — | | | | | 18,040 | |
Credit contracts | | | | — | | | | | — | | | | | (49,640 | ) | | | | (49,640 | ) |
| | | | | | | | | | | | | | | | | | | | |
Total | | | $ | 27,068 | | | | $ | (51,870 | ) | | | $ | (136,948 | ) | | | $ | (161,750 | ) |
| | | | | | | | | | | | | | | | | | | | |
Notes to financial statements
Delaware Foundation Funds®
8. Derivatives (continued)
Derivatives Generally. The tables below summarize the average balance of derivative holdings by each Fund during the year ended March 31, 2017.
| | | | | | | | | | | | | | |
| | | Delaware Foundation® Growth Allocation Fund | |
| | | Long Derivative Volume | | | Short Derivative Volume | |
Foreign currency exchange contracts (average cost) | | USD | | | 79,160 | | | | USD | | | | 243,706 | |
Futures contracts (average notional value) | | | | | 600,304 | | | | | | | | 4,982,371 | |
Options contracts (average notional value) | | | | | 562 | | | | | | | | 22 | |
CDS contracts (average notional value)* | | | | | 301,183 | | | | | | | | 213,854 | |
CDS contracts (average notional value)* | | EUR | | | 9,348 | | | | | | | | — | |
Interest rate swap contracts (average notional
value)** | | USD | | | 53,794 | | | | | | | | 59,723 | |
| |
| | | Delaware Foundation Moderate Allocation Fund | |
| | | Long Derivative Volume | | | Short Derivative Volume | |
Foreign currency exchange contracts (average cost) | | USD | | | 465,422 | | | | USD | | | | 1,379,901 | |
Futures contracts (average notional value) | | | | | 4,102,429 | | | | | | | | 37,093,408 | |
Options contracts (average notional value) | | | | | 3,976 | | | | | | | | 119 | |
CDS contracts (average notional value)* | | | | | 3,708,424 | | | | | | | | 107,708 | |
CDS contracts (average notional value)* | | EUR | | | 66,719 | | | | | | | | — | |
Interest rate swap contracts (average notional value)** | | USD | | | 383,715 | | | | | | | | 469,012 | |
| |
| | | Delaware Foundation Conservative Allocation Fund | |
| | | Long Derivative Volume | | | Short Derivative Volume | |
Foreign currency exchange contracts (average cost) | | USD | | | 283,301 | | | | USD | | | | 842,105 | |
Futures contracts (average notional value) | | | | | 1,576,797 | | | | | | | | 15,625,535 | |
Options contracts (average notional value) | | | | | 1,835 | | | | | | | | 64 | |
CDS contracts (average notional value)* | | | | | 920,915 | | | | | | | | 374,723 | |
CDS contracts (average notional value)* | | EUR | | | 34,644 | | | | | | | | — | |
Interest rate swap contracts (average notional
value)** | | USD | | | 195,889 | | | | | | | | 188,538 | |
*Long represents buying protection and short represents selling protection.
**Long represents receiving fixed interest payments and short represents paying fixed interest payments.
9. Offsetting
In December 2011, the Financial Accounting Standards Board (FASB) issued guidance that expanded disclosure requirements on the offsetting of certain assets and liabilities. The disclosures are required for investments and derivative financial instruments subject to master netting or similar agreements which are eligible for offset on the “Statements of assets and liabilities” and require an entity to disclose both gross and net information about such investments and transactions in the financial statements. In January 2013, the FASB issued guidance that clarified which investments and transactions are subject to the offsetting disclosure requirements. The scope of the disclosure requirements for offsetting is limited to derivative instruments, repurchase agreements and reverse repurchase agreements, and securities borrowing.
In order to better define its contractual rights and to secure rights that will help each Fund mitigate its counterparty risk, the Funds entered into an International Swaps and Derivatives Association, Inc. Master Agreement (ISDA Master Agreement) or a similar agreement with certain of their derivative contract counterparties. An ISDA Master Agreement is a bilateral agreement between each Fund and a counterparty that governs certain over-the-counter (OTC) derivatives and foreign exchange contracts and typically contains, among other things, collateral posting items and netting provisions in the event of a default and/or termination event. Under an ISDA Master Agreement, each Fund may, under certain circumstances, offset with the counterparty certain derivative financial instruments’ payables and/or receivables with collateral held and/or posted and create one single net payment. The provisions of the ISDA Master Agreement typically permit a single net payment in the event of default (close-out), including the bankruptcy or insolvency of the counterparty. However, bankruptcy or insolvency laws of a particular jurisdiction may impose restrictions on or prohibitions against the right of offset in bankruptcy, insolvency, or other events.
136
For financial reporting purposes, the Funds do not offset derivative assets and derivative liabilities that are subject to netting arrangements on the “Statements of assets and liabilities.”
At March 31, 2017, the Funds had the following assets and liabilities subject to offsetting provisions:
Offsetting of Financial Assets and Liabilities and Derivative Assets and Liabilities
| | | | | | | | | | | | | | | |
| | | Delaware Foundation® Growth Allocation Fund |
| Counterparty | | Gross Value of
Derivative Asset | | Gross Value of
Derivative Liability | | Net Position |
Bank of America Merrill Lynch | | | $ | 159 | | | | $ | (66 | ) | | | $ | 93 | |
Bank of New York Mellon | | | | 107 | | | | | (13 | ) | | | | 94 | |
BNP Paribas | | | | — | | | | | (193 | ) | | | | (193 | ) |
Hong Kong Shanghai Bank | | | | 722 | | | | | — | | | | | 722 | |
| | | | | | | | | | | | | | | |
Total | | | $ | 988 | | | | $ | (272 | ) | | | $ | 716 | |
| | | | | | | | | | | | | | | |
| | | | | | | | | | | | | | | | | | | | | | | | | | | | | | |
Counterparty | | Net Position | | Fair Value of
Non-Cash
Collateral
Received | | Cash
Collateral
Received | | Fair Value of
Non-Cash
Collateral
Pledged | | Cash
Collateral
Pledged | | Net
Exposure(a) |
Bank of America Merrill Lynch | | | $ | 93 | | | | $ | — | | | | $ | — | | | | $ | — | | | | $ | — | | | | $ | 93 | |
Bank of New York Mellon | | | | 94 | | | | | — | | | | | — | | | | | — | | | | | — | | | | | 94 | |
BNP Paribas | | | | (193 | ) | | | | — | | | | | — | | | | | — | | | | | — | | | | | (193 | ) |
Hong Kong Shanghai Bank | | | | 722 | | | | | — | | | | | — | | | | | — | | | | | — | | | | | 722 | |
| | | | | | | | | | | | | | | | | | | | | | | | | | | | | | |
Total | | | $ | 716 | | | | $ | — | | | | $ | — | | | | $ | — | | | | $ | — | | | | $ | 716 | |
| | | | | | | | | | | | | | | | | | | | | | | | | | | | | | |
Master Repurchase Agreements
| | | | | | | | | | | | | | | | | | | | | | | | | |
| | | | | Fair Value of | | | | | | |
| | | | | Non-Cash | | Cash | | Net | | |
| | | Repurchase | | Collateral | | Collateral | | Collateral | | Net |
Counterparty | | Agreements | | Received(b) | | Received | | Received | | Exposure(a) |
Bank of America Merrill Lynch | | | $ | 181,958 | | | | $ | (181,958 | ) | | | $ | — | | | | $ | (181,958 | ) | | | $ | — | |
Bank of Montreal | | | | 181,957 | | | | | (181,957 | ) | | | | — | | | | | (181,957 | ) | | | | — | |
BNP Paribas | | | | 193,085 | | | | | (193,085 | ) | | | | — | | | | | (193,085 | ) | | | | — | |
| | | | | | | | | | | | | | | | | | | | | | | | | |
Total | | | $ | 557,000 | | | | $ | (557,000 | ) | | | $ | — | | | | $ | (557,000 | ) | | | $ | — | |
| | | | | | | | | | | | | | | | | | | | | | | | | |
(a)Net exposure represents the receivable (payable) that would be due from (to) the counterparty in the event of default.
(b)The value of the related collateral received exceeded the value of the net position and repurchase agreements as of March 31, 2017.
Notes to financial statements
Delaware Foundation Funds®
9. Offsetting (continued)
Offsetting of Financial Assets and Liabilities and Derivative Assets and Liabilities
| | | | | | | | | | | | | | | |
| | | Delaware Foundation® Moderate Allocation Fund |
Counterparty | | Gross Value of
Derivative Asset | | Gross Value of
Derivative Liability | | Net Position |
Bank of America Merrill Lynch | | | $ | 1,277 | | | | $ | (690 | ) | | | $ | 587 | |
Bank of New York Mellon | | | | 339 | | | | | (46 | ) | | | | 293 | |
BNP Paribas | | | | — | | | | | (633 | ) | | | | (633 | ) |
Hong Kong Shanghai Bank | | | | — | | | | | (10,702 | ) | | | | (10,702 | ) |
| | | | | | | | | | | | | | | |
Total | | | $ | 1,616 | | | | $ | (12,071 | ) | | | $ | (10,455 | ) |
| | | | | | | | | | | | | | | |
| | | | | | | | | | | | | | | | | | | | | | | | | | | | | | |
Counterparty | | Net Position | | Fair Value of
Non-Cash
Collateral
Received | | Cash
Collateral
Received | | Fair Value of
Non-Cash
Collateral
Pledged | | Cash
Collateral
Pledged | | Net
Exposure(a) |
Bank of America Merrill Lynch | | | $ | 587 | | | | $ | — | | | | $ | — | | | | $ | — | | | | $ | — | | | | $ | 587 | |
Bank of New York Mellon | | | | 293 | | | | | — | | | | | — | | | | | — | | | | | — | | | | | 293 | |
BNP Paribas | | | | (633 | ) | | | | — | | | | | — | | | | | — | | | | | — | | | | | (633 | ) |
Hong Kong Shanghai Bank | | | | (10,702 | ) | | | | — | | | | | — | | | | | — | | | | | — | | | | | (10,702 | ) |
| | | | | | | | | | | | | | | | | | | | | | | | | | | | | | |
Total | | | $ | (10,455 | ) | | | $ | — | | | | $ | — | | | | $ | — | | | | $ | — | | | | $ | (10,455 | ) |
| | | | | | | | | | | | | | | | | | | | | | | | | | | | | | |
Master Repurchase Agreements
| | | | | | | | | | | | | | | | | | | | | | | | | |
Counterparty | | Repurchase
Agreements | | Fair Value of
Non-Cash
Collateral
Received(b) | | Cash
Collateral
Received | | Net
Collateral
Received | | Net
Exposure(a) |
Bank of America Merrill Lynch | | | $ | 921,875 | | | | $ | (921,875 | ) | | | $ | — | | | | $ | (921,875 | ) | | | $ | — | |
Bank of Montreal | | | | 921,875 | | | | | (921,875 | ) | | | | — | | | | | (921,875 | ) | | | | — | |
BNP Paribas | | | | 978,250 | | | | | (978,250 | ) | | | | — | | | | | (978,250 | ) | | | | — | |
| | | | | | | | | | | | | | | | | | | | | | | | | |
Total | | | $ | 2,822,000 | | | | $ | (2,822,000 | ) | | | $ | — | | | | $ | (2,822,000 | ) | | | $ | — | |
| | | | | | | | | | | | | | | | | | | | | | | | | |
(a)Net exposure represents the receivable (payable) that would be due from (to) the counterparty in the event of default.
(b)The value of the related collateral received exceeded the value of the net position and repurchase agreements as of March 31, 2017.
138
Offsetting of Financial Assets and Liabilities and Derivative Assets and Liabilities
| | | | | | | | | | | | | | | |
| | | Delaware Foundation® Conservative Allocation Fund |
Counterparty | | Gross Value of
Derivative Asset | | Gross Value of
Derivative Liability | | Net Position |
Bank of America Merrill Lynch | | | $ | 592 | | | | $ | (539 | ) | | | $ | 53 | |
Bank of New York Mellon | | | | 187 | | | | | (41 | ) | | | | 146 | |
BNP Paribas | | | | — | | | | | (138 | ) | | | | (138 | ) |
| | | | | | | | | | | | | | | |
Total | | | $ | 779 | | | | $ | (718 | ) | | | $ | 61 | |
| | | | | | | | | | | | | | | |
| | | | | | | | | | | | | | | | | | | | | | | | | | | | | | |
Counterparty | | Net Position | | Fair Value of
Non-Cash
Collateral
Received | | Cash
Collateral
Received | | Fair Value of
Non-Cash
Collateral
Pledged | | Cash
Collateral
Pledged | | Net
Exposure(a) |
Bank of America Merrill Lynch | | | $ | 53 | | | | $ | — | | | | $ | — | | | | $ | — | | | | $ | — | | | | $ | 53 | |
Bank of New York Mellon | | | | 146 | | | | | — | | | | | — | | | | | — | | | | | — | | | | | 146 | |
BNP Paribas | | | | (138 | ) | | | | — | | | | | — | | | | | — | | | | | — | | | | | (138 | ) |
| | | | | | | | | | | | | | | | | | | | | | | | | | | | | | |
Total | | | $ | 61 | | | | $ | — | | | | $ | — | | | | $ | — | | | | $ | — | | | | $ | 61 | |
| | | | | | | | | | | | | | | | | | | | | | | | | | | | | | |
(a)Net exposure represents the receivable (payable) that would be due from (to) the counterparty in the event of default.
10. Securities Lending
Each Fund, along with other funds in the Delaware Investments® Family of Funds, may lend its securities pursuant to a security lending agreement (Lending Agreement) with The Bank of New York Mellon (BNY Mellon). At the time a security is loaned, the borrower must post collateral equal to the required percentage of the market value of the loaned security, including any accrued interest. The required percentage is: (1) 102% with respect to U.S. securities and foreign securities that are denominated and payable in U.S. dollars; and (2) 105% with respect to foreign securities. With respect to each loan, if on any business day the aggregate market value of securities collateral plus cash collateral held is less than the aggregate market value of the securities which are the subject of such loan, the borrower will be notified to provide additional collateral by the end of the following business day which, together with the collateral already held, will be not less than the applicable initial collateral requirements for such security loan. If the aggregate market value of securities collateral and cash collateral held with respect to a security loan exceeds the applicable initial collateral requirement, upon the request of the borrower, BNY Mellon must return enough collateral to the borrower by the end of the following business day to reduce the value of the remaining collateral to the applicable initial collateral requirement for such security loan. As a result of the foregoing, the value of the collateral held with respect to a loaned security on any particular day may be more or less than the value of the security on loan.
Cash collateral received by each Fund of the Trust is generally invested in a series of individual separate accounts, each corresponding to a Fund. The investment guidelines permit each separate account to hold certain securities that would be considered eligible securities for a money market fund. Cash collateral received is generally invested in government securities; certain obligations issued by government sponsored enterprises; repurchase agreements collateralized by U.S. Treasury securities; obligations issued by the central government of any Organization for Economic Cooperation and Development (OECD) country or its agencies, instrumentalities, or establishments; obligations of supranational organizations; commercial paper, notes, bonds, and other debt obligations; certificates of deposit, time deposits, and other bank obligations; and asset-backed securities. A Fund can also accept U.S. government securities and letters of credit (non-cash collateral) in connection with securities loans.
In the event of default or bankruptcy by the lending agent, realization and/or retention of the collateral may be subject to legal proceedings. In the event the borrower fails to return loaned securities and the collateral received is insufficient to cover the value of the loaned securities and provided such collateral shortfall is not the result of investment losses, the lending agent has agreed to pay the amount of the shortfall to each Fund or, at the discretion of the lending agent, replace the loaned securities. Each Fund continues to record dividends or interest, as applicable, on the securities loaned and is subject to changes in value of the securities loaned that may occur during the term of the loan. Each Fund has
Notes to financial statements
Delaware Foundation Funds®
10. Securities Lending (continued)
the right under the Lending Agreement to recover the securities from the borrower on demand. With respect to security loans collateralized by non-cash collateral, each Fund receives loan premiums paid by the borrower. With respect to security loans collateralized by cash collateral, the earnings from the collateral investments are shared among each Fund, the security lending agent, and the borrower. Each Fund records security lending income net of allocations to the security lending agent and the borrower.
Each Fund may incur investment losses as a result of investing securities lending collateral. This could occur if an investment in the collateral investment account defaulted or became impaired. Under those circumstances, the value of a Fund’s cash collateral account may be less than the amount a Fund would be required to return to the borrowers of the securities and that Fund would be required to make up for this shortfall.
During the year ended March 31, 2017, each Fund had no securities out on loan.
11. Credit and Market Risk
Some countries in which each Fund may invest require governmental approval for the repatriation of investment income, capital or the proceeds of sales of securities by foreign investors. In addition, if there is deterioration in a country’s balance of payments or for other reasons, a country may impose temporary restrictions on foreign capital remittances abroad.
The securities exchanges of certain foreign markets are substantially smaller, less liquid, and more volatile than the major securities markets in the United States. Consequently, acquisition and disposition of securities by each Fund may be inhibited. In addition, a significant portion of the aggregate market value of equity securities listed on the major securities exchanges in emerging markets is held by a smaller number of investors. This may limit the number of shares available for acquisition or disposition by each Fund.
Each Fund invests a portion of its assets in high yield, fixed income securities, which are securities rated BB or lower by S&P and Ba or lower by Moody’s, or similarly rated by another nationally recognized statistical rating organization. Investments in these higher yielding securities are generally accompanied by a greater degree of credit risk than higher rated securities. Additionally, lower rated securities may be more susceptible to adverse economic and competitive industry conditions than investment grade securities.
Each Fund invests a significant portion of its assets in small companies and may be subject to certain risks associated with ownership of securities of such companies. Investments in small-sized companies may be more volatile than investments in larger companies for a number of reasons, which include limited financial resources or a dependence on narrow product lines.
Each Fund invests in fixed income securities whose value is derived from an underlying pool of mortgages or consumer loans. The value of these securities is sensitive to changes in economic conditions, including delinquencies and/or defaults, and may be adversely affected by shifts in the market’s perception of issuers and changes in interest rates. Investors receive principal and interest payments as the underlying mortgages and consumer loans are paid back. Some of these securities are collateralized mortgage obligations (CMOs). CMOs are debt securities issued by U.S. government agencies or by financial institutions and other mortgage lenders, which are collateralized by a pool of mortgages held under an indenture. Prepayment of mortgages may shorten the stated maturity of the obligation and can result in a loss of premium, if any has been paid. Certain of these securities may be stripped (securities which provide only the principal or interest feature of the underlying security). The yield to maturity on an interest-only CMO is extremely sensitive not only to changes in prevailing interest rates, but also to the rate of principal payments (including prepayments) on the related underlying mortgage assets. A rapid rate of principal payments may have a material adverse effect on each Fund’s yield to maturity. If the underlying mortgage assets experience greater than anticipated prepayments of principal, each Fund may fail to fully recoup its initial investment in these securities even if the securities are rated in the highest rating categories.
Each Fund invests in certain obligations that may have liquidity protection designed to ensure that the receipt of payments due on the underlying security is timely. Such protection may be provided through guarantees, insurance policies, or letters of credit obtained by the issuer or sponsor through third parties, through various means of structuring the transaction or through a combination of such approaches. Each Fund will not pay any additional fees for such credit support, although the existence of credit support may increase the price of the security.
Each Fund invests in bank loans and other securities that may subject them to direct indebtedness risk, the risk that each Fund will not receive payment of principal, interest, and other amounts due in connection with these investments and will depend primarily on the financial condition of the borrower. Loans that are fully secured offer each Fund more protection than unsecured loans in the event of nonpayment of scheduled interest or principal, although there is no assurance that the liquidation of collateral from a secured loan would satisfy the corporate borrower’s obligation, or that the collateral can be liquidated. Some loans or claims may be in default at the time of purchase. Certain of the loans and the
140
other direct indebtedness acquired by each Fund may involve revolving credit facilities or other standby financing commitments that obligate each Fund to pay additional cash on a certain date or on demand. These commitments may require each Fund to increase its investment in a company at a time when each Fund might not otherwise decide to do so (including at a time when the company’s financial condition makes it unlikely that such amounts will be repaid). To the extent that each Fund is committed to advance additional funds, it will at all times hold and maintain cash or other high grade debt obligations in an amount sufficient to meet such commitments.
As each Fund may be required to rely upon another lending institution to collect and pass on to each Fund amounts payable with respect to the loan and to enforce each Fund’s rights under the loan and other direct indebtedness, an insolvency, bankruptcy, or reorganization of the lending institution may delay or prevent each Fund from receiving such amounts. The highly leveraged nature of many loans may make them especially vulnerable to adverse changes in economic or market conditions. Investments in such loans and other direct indebtedness may involve additional risk to each Fund.
Each Fund may invest up to 15% of its net assets in illiquid securities, which may include securities with contractual restrictions on resale, securities exempt from registration under Rule 144A promulgated under the Securities Act of 1933, as amended, and other securities which may not be readily marketable. The relative illiquidity of these securities may impair each Fund from disposing of them in a timely manner and at a fair price when it is necessary or desirable to do so. While maintaining oversight, the Funds’ Board has delegated to DMC the day-to-day functions of determining whether individual securities are liquid for purposes of each Fund’s limitation on investments in illiquid securities. Securities eligible for resale pursuant to Rule 144A, which are determined to be liquid, are not subject to the Funds’ 15% limit on investments in illiquid securities. As of March 31, 2017, Rule 144A securities have been identified on the “Schedules of investments.”
12. Contractual Obligations
Each Fund enters into contracts in the normal course of business that contain a variety of indemnifications. Each Fund’s maximum exposure under these arrangements is unknown. However, each Fund has not had prior claims or losses pursuant to these contracts. Management has reviewed each Fund’s existing contracts and expects the risk of loss to be remote.
13. Recent Accounting Pronouncements
On Oct. 13, 2016, the Securities and Exchange Commission amended existing rules intended to modernize reporting and disclosure of information. These amendments relate to Regulation S-X which sets forth the form and content of financial statements. At this time, management is evaluating the implications of adopting these amendments and their impact on the financial statements and accompanying notes.
14. Subsequent Events
Effective April 3, 2017, Delaware Investments® Family of Funds became Delaware FundsSM by Macquarie and Delaware Investments changed its name to Macquarie Investment Management (MIM). MIM is the marketing name for the companies comprising the asset management division of Macquarie Group Limited. Certain entities providing services to the Funds have also changed their names to reflect the use of the MIM name.
Management has determined that no other material events or transactions occurred subsequent to March 31, 2017 that would require recognition or disclosure in each Fund’s financial statements.
Report of independent
registered public accounting firm
To the Board of Trustees of Delaware Group® Foundation Funds and Shareholders of the Funds, as defined:
In our opinion, the accompanying statements of assets and liabilities, including the schedules of investments, and the related statements of operations and of changes in net assets and the financial highlights present fairly, in all material respects, the financial position of Delaware Foundation® Growth Allocation Fund, Delaware Foundation® Moderate Allocation Fund and Delaware Foundation® Conservative Allocation Fund (constituting Delaware Group® Foundation Funds, hereafter collectively referred to as the “Funds”) as of March 31, 2017, the results of each of their operations for the year then ended, the changes in each of their net assets for each of the two years in the period then ended and the financial highlights for each of the periods indicated, in conformity with accounting principles generally accepted in the United States of America. These financial statements and financial highlights (hereafter referred to as “financial statements”) are the responsibility of the Funds’ management. Our responsibility is to express an opinion on these financial statements based on our audits. We conducted our audits of these financial statements in accordance with the standards of the Public Company Accounting Oversight Board (United States). Those standards require that we plan and perform the audit to obtain reasonable assurance about whether the financial statements are free of material misstatement. An audit includes examining, on a test basis, evidence supporting the amounts and disclosures in the financial statements, assessing the accounting principles used and significant estimates made by management, and evaluating the overall financial statement presentation. We believe that our audits, which included confirmation of securities as of March 31, 2017 by correspondence with the custodian and brokers, provide a reasonable basis for our opinion.
PricewaterhouseCoopers LLP
Philadelphia, Pennsylvania
May 25, 2017
142
Other Fund information
(Unaudited)
Delaware Foundation Funds®
Tax Information
The information set forth below is for each Fund’s fiscal year as required by federal income tax laws. Shareholders, however, must report distributions on a calendar year basis for income tax purposes, which may include distributions for portions of two fiscal years of a fund. Accordingly, the information needed by shareholders for income tax purposes will be sent to them in January of each year. Please consult your tax advisor for proper treatment of this information.
All disclosures are based on financial information available as of the date of this annual report and, accordingly are subject to change. For any and all items requiring reporting, it is the intention of each Fund to report the maximum amount permitted under the Internal Revenue Code and the regulations thereunder.
For the fiscal year ended March 31, 2017, each Fund reports distributions paid during the year as follows:
| | | | | | | | | | | | | | | | | | | | |
| | | (A)
Long-Term
Capital Gain
Distributions
(Tax Basis) | | (B)
Ordinary Income
Distributions*
(Tax Basis) | | Total
Distributions
(Tax Basis) | | (C)
Qualifying
Dividends1 |
Delaware Foundation® Growth Allocation Fund | | | | 73.00 | % | | | | 27.00 | % | | | | 100.00 | % | | | | 51.94 | % |
Delaware Foundation Moderate Allocation Fund | | | | 31.10 | % | | | | 68.90 | % | | | | 100.00 | % | | | | 24.01 | % |
Delaware Foundation Conservative Allocation Fund | | | | 45.16 | % | | | | 54.84 | % | | | | 100.00 | % | | | | 18.89 | % |
(A) and (B) are based on a percentage of each Fund’s total distributions.
(C) is based on a percentage of each Fund’s ordinary income distributions.
1Qualifying dividends represent dividends which qualify for the corporate dividends received deduction.
*For the fiscal year ended March 31, 2017, certain dividends paid by each Fund may be subject to a maximum tax rate of 20%. The percentage of dividends paid by each Fund from ordinary income reported as dividend income is listed below. Complete information will be computed and reported in conjunction with your 2017 Form 1099-DIV.
| | | | | |
| | | Maximum percentage to be
taxed at a maximum rate of 20% |
Delaware Foundation Growth Allocation Fund | | | | 100.00 | % |
Delaware Foundation Moderate Allocation Fund | | | | 55.79 | % |
Delaware Foundation Conservative Allocation Fund | | | | 43.48 | % |
For the fiscal year ended March 31, 2017, certain interest income paid by the Delaware Foundation Moderate Allocation Fund, determined to be Qualified Short-Term Capital Gains may be subject to relief from U.S. withholding for foreign shareholders, as provided by the American Jobs Creation Act of 2004; the Tax Relief Unemployment Insurance Reauthorization, and Job Creations Act of 2010; and as extended by the American Taxpayer Relief Act of 2012. For the fiscal year ended March 31, 2017, the Fund has reported maximum distributions of Qualified Short-Term Capital Gains of $1,077,553.
Board of trustees / directors and officers addendum
Delaware Investments® Family of Funds
A mutual fund is governed by a Board of Trustees / Directors (“Trustees”), which has oversight responsibility for the management of a fund’s business affairs. Trustees establish procedures and oversee and review the performance of the investment manager, the distributor, and others who perform services for the fund. The independent fund trustees, in particular, are advocates for shareholder interests. Each trustee has served in that capacity since he or she was elected to or appointed to the Board of Trustees, and will continue to serve until his or her retirement or the election of a new trustee in his or her place. The following is a list of the Trustees and Officers with certain background and related information.
| | | | | | | | | | |
Name, Address, and Birth Date | | Position(s) Held with Fund(s) | | Length of Time Served | | Principal Occupation(s)
During the Past Five Years | | Number of Portfolios in Fund Complex Overseen by Trustee or Officer | | Other Directorships Held by Trustee or Officer |
| | | | | | |
| Interested Trustee | | | | | | | | | | |
| | | | | |
Shawn K. Lytle1,4 2005 Market Street Philadelphia, PA 19103 February 1970 | | President, Chief Executive Officer, and Trustee | | Trustee since September 2015 President and Chief Executive Officer since August 2015 | | Shawn K. Lytle has served as President of Delaware Investments3 since June 2015 and was the Regional Head of Americas for UBS Global Asset Management from 2010 through 2015. | | 62 | | Trustee — UBS Relationship Funds, SMA Relationship Trust, and UBS Funds (May 2010–April 2015) |
| | | | | |
Ann D. Borowiec2 2005 Market Street Philadelphia, PA 19103 November 1958 | | Trustee | | Since March 2015 | | Chief Executive Officer Private Wealth Management (2011–2013) and Market Manager, New Jersey Private Bank (2005–2011) — J.P. Morgan Chase & Co. | | 62 | | Director — Banco Santander International Director — Santander Bank, N.A. |
| | |
Independent Trustees | | |
| | | | | |
Thomas L. Bennett 2005 Market Street Philadelphia, PA 19103 October 1947 | | Chairman and Trustee | | Trustee since March 2005 Chairman since March 2015 | | Private Investor (March 2004–Present) | | 62 | | None |
| | | | | |
Joseph W. Chow 2005 Market Street Philadelphia, PA 19103 January 1953 | | Trustee | | Since January 2013 | | Executive Vice President (Emerging Economies Strategies, Risks, and Corporate Administration) State Street Corporation (July 2004–March 2011) | | 62 | | Director and Audit Committee Member — Hercules Technology Growth Capital, Inc. (2004-2014) |
| | | | | |
John A. Fry 2005 Market Street Philadelphia, PA 19103 May 1960 | | Trustee | | Since January 2001 | | President — Drexel University (August 2010–Present) President — Franklin & Marshall College (July 2002–July 2010) | | 62 | | Director, Audit Committee, and Governance Committee Member — Community Health Systems Director — Drexel Morgan & Co. Director, Audit Committee Member — vTv Therapeutics LLC |
144
| | | | | | | | | | |
Name, Address, and Birth Date | | Position(s) Held with Fund(s) | | Length of Time Served | | Principal
Occupation(s) During
the Past Five Years | | Number of
Portfolios in Fund
Complex Overseen by Trustee or Officer | | Other
Directorships
Held by Trustee or Officer |
| Independent Trustees (continued) | | | | | | |
Lucinda S. Landreth 2005 Market Street Philadelphia, PA 19103 June 1947 | | Trustee | | Since March 2005 | | Private Investor
(2004–Present) | | 62 | | None |
| | | | | |
Frances A. Sevilla-Sacasa 2005 Market Street Philadelphia, PA 19103 January 1956 | | Trustee | | Since September 2011 | | Chief Executive Officer —
Banco Itaú International (April 2012–December
2016) Executive Advisor to
Dean (August 2011–March
2012) and Interim Dean (January 2011–July
2011) — University of Miami
School of Business Administration President — U.S. Trust, Bank of America Private Wealth Management (Private Banking) (July 2007–
December 2008) | | 62 | | Trust Manager and
Audit Committee
Member — Camden
Property Trust |
| | | | | |
Thomas K. Whitford 2005 Market Street Philadelphia, PA 19103 March 1956 | | Trustee | | Since January 2013 | | Vice Chairman
(2010–April 2013) — PNC Financial Services Group | | 62 | | Director — HSBC
Finance Corporation and HSBC North America Holdings Inc. Director — HSBC USA, Inc. |
| | | | | |
Janet L. Yeomans 2005 Market Street Philadelphia, PA 19103 July 1948 | | Trustee | | Since April 1999 | | Vice President and
Treasurer(January 2006–
July 2012) Vice President —
Mergers & Acquisitions (January 2003–January
2006), and Vice President and
Treasurer (July 1995–
January 2003) 3M Company | | 62 | | Director, Personnel and
Compensation
CommitteeChair, and Audit Committee Member — Okabena Company |
Board of trustees / directors and officers addendum
Delaware Investments® Family of Funds
| | | | | | | | | | |
Name, Address, and Birth Date | | Position(s) Held with Fund(s) | | Length of Time
Served | | Principal Occupation(s) During the Past Five Years | | Number of Portfolios in Fund
Complex Overseen
by Trustee or Officer | | Other
Directorships
Held by
Trustee or
Officer |
| Officers | | | | | | | | | | |
David F. Connor 2005 Market Street Philadelphia, PA 19103 December 1963 | | Senior Vice President, General Counsel, and Secretary | | Senior Vice President
since May 2013;
General Counsel
since May 2015;
Secretary since
October 2005 | | David F. Connor has served
in various capacities at different times at Delaware Investments. | | 62 | | None4 |
| | | | | |
Daniel V. Geatens 2005 Market Street Philadelphia, PA 19103 October 1972 | | Vice President and Treasurer | | Treasurer since
October 2007 | | Daniel V. Geatens has served
in various capacities at different times at Delaware Investments. | | 62 | | None4 |
| | | | | |
Richard Salus 2005 Market Street Philadelphia,PA 19103 October 1963 | | Senior Vice President and Chief Financial Officer | | Chief Financial
Officer sinceNovember 2006 | | Richard Salus has served
in various executive capacities at different times at Delaware Investments. | | 62 | | None4 |
| 1 | Shawn K. Lytle is considered to be an “Interested Trustee” because he is an executive officer of the Fund’s(s’) investment advisor. |
| 2 | Ann D. Borowiec is not a director, officer, or employee of the Delaware Funds’ investment manager or any of its affiliates, other than serving as a trustee/director of the Delaware Funds. Nonetheless, she has been designated as an “Interested Trustee” solely by virtue of being a director of two banking entities that may enter into principal transactions with, or receive distribution-related payments with respect to, funds and other accounts managed by the Delaware Funds’ investment manager (or by certain of its advisory affiliates) or their sub-advisors. |
| 3 | Delaware Investments is the marketing name for Delaware Management Holdings, Inc. and its subsidiaries, including the Fund’s(s’) investment advisor, principal underwriter, and its transfer agent. |
| 4 | Shawn K. Lytle, David F. Connor, Daniel V. Geatens, and Richard Salus serve in similar capacities for the six portfolios of the Optimum Fund Trust, which have the same investment advisor, principal underwriter, and transfer agent as the registrant. |
The Statement of Additional Information for the Fund(s) includes additional information about the Trustees and Officers and is available, without charge, upon request by calling 800 523-1918.
146
About the organization
This annual report is for the information of Delaware Foundation Funds® shareholders, but it may be used with prospective investors when preceded or accompanied by the Delaware Investments® Fund fact sheet for the most recently completed calendar quarter. These documents are available at delawarefunds.com/literature.
| | | | |
Board of trustees Shawn K. Lytle President and Chief Executive Officer Delaware Investments Family of Funds Philadelphia, PA Thomas L. Bennett Chairman of the Board Delaware Investments Family of Funds Private Investor Rosemont, PA Ann D. Borowiec Former Chief Executive Officer Private Wealth Management J.P. Morgan Chase & Co. New York, NY Joseph W. Chow Former Executive Vice President State Street Corporation Boston, MA John A. Fry President Drexel University Philadelphia, PA Lucinda S. Landreth Former Chief Investment Officer Assurant, Inc. New York, NY | | Frances A. Sevilla-Sacasa Former Chief Executive Officer Banco Itaú International Miami, FL Thomas K. Whitford Former Vice Chairman PNC Financial Services Group Pittsburgh, PA Janet L. Yeomans Former Vice President and Treasurer 3M Company St. Paul, MN Affiliated officers David F. Connor Senior Vice President, General Counsel, and Secretary Delaware Investments Family of Funds Philadelphia, PA Daniel V. Geatens Vice President and Treasurer Delaware Investments Family of Funds Philadelphia, PA Richard Salus Senior Vice President and Chief Financial Officer Delaware Investments Family of Funds Philadelphia, PA | | Contact information Investment manager Delaware Management Company, a series of Delaware Management Business Trust Philadelphia, PA National distributor Delaware Distributors, L.P. Philadelphia, PA Shareholder servicing, dividend disbursing, and transfer agent Delaware Service Company, Inc. 2005 Market Street Philadelphia, PA 19103-7094 For shareholders 800 523-1918 For securities dealers and financial institutions representatives only 800 362-7500 Website delawarefunds.com |
Delaware Investments is the marketing name of Delaware Management Holdings, Inc. and its subsidiaries.
Each Fund files its complete schedule of portfolio holdings with the Securities and Exchange Commission (SEC) for the first and third quarters of each fiscal year on Form N-Q. Each Fund’s Forms N-Q, as well as a description of the policies and procedures that each Fund uses to determine how to vote proxies (if any) relating to portfolio securities are available without charge (i) upon request, by calling 800 523-1918; and (ii) on the SEC’s website at sec.gov. In addition, a description of the policies and procedures that the Funds use to determine how to vote proxies (if any) relating to portfolio securities and the Schedules of Investments included in the Funds’ most recent Forms N-Q are available without charge on the Funds’ website at delawarefunds.com/literature. Each Fund’s Forms N-Q may be reviewed and copied at the SEC’s Public Reference Room in Washington, D.C.; information on the operation of the Public Reference Room may be obtained by calling 800 SEC-0330.
Information (if any) regarding how the Funds voted proxies relating to portfolio securities during the most recently disclosed 12-month period ended June 30 is available without charge (i) through the Funds’ website at delawarefunds.com/proxy; and (ii) on the SEC’s website at sec.gov.
147
Item 2. Code of Ethics
The registrant has adopted a code of ethics that applies to the registrant’s principal executive officer, principal financial officer, principal accounting officer or controller, or persons performing similar functions, regardless of whether these individuals are employed by the registrant or a third party. A copy of the registrant’s Code of Business Ethics has been posted on the Delaware FundsSM by Macquarie Internet Web site at www.delawarefunds.com. Any amendments to the Code of Business Ethics, and information on any waiver from its provisions granted by the registrant, will also be posted on this Web site within five business days of such amendment or waiver and will remain on the Web site for at least 12 months.
Item 3. Audit Committee Financial Expert
The registrant’s Board of Trustees/Directors has determined that certain members of the registrant’s Audit Committee are audit committee financial experts, as defined below. For purposes of this item, an “audit committee financial expert” is a person who has the following attributes:
a. An understanding of generally accepted accounting principles and financial statements;
b. The ability to assess the general application of such principles in connection with the accounting for estimates, accruals, and reserves;
c. Experience preparing, auditing, analyzing, or evaluating financial statements that present a breadth and level of complexity of accounting issues that are generally comparable to the breadth and complexity of issues that can reasonably be expected to be raised by the registrant’s financial statements, or experience actively supervising one or more persons engaged in such activities;
d. An understanding of internal controls and procedures for financial reporting; and
e. An understanding of audit committee functions.
An “audit committee financial expert” shall have acquired such attributes through:
a. Education and experience as a principal financial officer, principal accounting officer, controller, public accountant, or auditor or experience in one or more positions that involve the performance of similar functions;
b. Experience actively supervising a principal financial officer, principal accounting officer, controller, public accountant, auditor, or person performing similar functions;
c. Experience overseeing or assessing the performance of companies or public accountants with respect to the preparation, auditing, or evaluation of financial statements; or
d. Other relevant experience.
The registrant’s Board of Trustees/Directors has also determined that each member of the registrant’s Audit Committee is independent. In order to be “independent” for purposes of this item, the Audit Committee member may not: (i) other than in his or her capacity as a member of the Board of Trustees/Directors or any committee thereof, accept directly or indirectly any consulting, advisory or other compensatory fee from the issuer; or (ii) be an “interested person” of the registrant as defined in Section 2(a)(19) of the Investment Company Act of 1940.
The names of the audit committee financial experts on the registrant’s Audit Committee are set forth below:
Joseph W. Chow
John A. Fry
Lucinda S. Landreth
Thomas K. Whitford
Item 4. Principal Accountant Fees and Services
PricewaterhouseCoopers LLP (“PwC”), the Independent Accountant to the series portfolios of Delaware Group Foundation Funds (“Funds”), has advised the Audit Committee of the Board of Trustees of the Funds (“Audit Committee”) that, as of the date of the filing of this Annual Report on Form N-CSR, it is in discussions with the staff of the Securities and Exchange Commission (“SEC Staff”), or the SEC, regarding the interpretation and application of Rule 2-01(c)(1)(ii)(A) of Regulation S-X, or the Loan Rule.
The Loan Rule prohibits accounting firms, such as PwC, from having certain financial relationships with their audit clients and affiliated entities. Specifically, the Loan Rule provides, in relevant part, that an accounting firm generally would not be independent if it receives a loan from a lender that is a “record or beneficial owner of more than ten percent of the audit client’s equity securities.” Under the SEC Staff’s interpretation of the Loan Rule, based on information provided to us by PwC, some of PwC’s relationships with its lenders who also own shares of one or more funds within the Delaware FundsSM by Macquarie investment company complex implicate the Loan Rule, calling into question PwC’s independence with respect to the Funds. PwC believes that, in light of the facts of these lending relationships, its ability to exercise objective judgment with respect to the audit of the Funds has not been impaired.
The Audit Committee has considered the lending relationships described by PwC and has concluded that (1) the lending relationships did not affect PwC’s application of objective judgment in conducting its audits and issuing reports on the Funds’ financial statements; and (2) a reasonable investor with knowledge of the lending relationships described by PwC would reach the same conclusion. In making this determination, the Audit Committee considered, among other things, PwC’s description of the relevant lending relationships and PwC’s representation that its objectivity was not impaired in conducting its audit of the Funds’ financial statements. In connection with this determination, PwC advised the Audit Committee that it believes PwC is independent and it continues to have discussions with the SEC Staff.
If the SEC were ultimately to determine that PwC was not independent with respect to the Funds for certain time periods, the Funds’ filings with the SEC that contain the Funds’ financial statements for such periods would be non-compliant with the applicable securities laws. If the SEC determines that PwC was not independent, among other things, the Funds could be required to have independent audits conducted on the Funds’ previously audited financial statements by another registered public accounting firm for the affected periods. The time involved to conduct such independent audits may impair the Funds’ ability to issue shares. Any of the foregoing possible outcomes potentially could have a material adverse effect on the Funds.
(a) Audit fees.
The aggregate fees billed for services provided to the registrant by its independent auditors for the audit of the registrant’s annual financial statements and for services normally provided by the independent auditors in connection with statutory and regulatory filings or engagements were $140,760 for the fiscal year ended March 31, 2017.
The aggregate fees billed for services provided to the registrant by its independent auditors for the audit of the registrant’s annual financial statements and for services normally provided by the independent auditors in connection with statutory and regulatory filings or engagements were $135,225 for the fiscal year ended March 31, 2016.
(b) Audit-related fees.
The aggregate fees billed by the registrant’s independent auditors for services relating to the performance of the audit of the registrant’s financial statements and not reported under paragraph (a) of this Item were $0 for the fiscal year ended March 31, 2017.
The aggregate fees billed by the registrant’s independent auditors for services relating to the performance of the audit of the financial statements of the registrant’s investment adviser and other service providers under common control with the adviser and that relate directly to the operations or financial reporting of the registrant were $640,000 for the registrant’s fiscal year ended March 31, 2017. The percentage of these fees relating to services approved by the registrant’s Audit Committee pursuant to the de minimis exception from the pre-approval requirement in Rule 2-01(c)(7)(i)(C) of Regulation S-X was 0%. These audit-related services were as follows: year-end audit procedures; group reporting and subsidiary statutory audits.
The aggregate fees billed by the registrant’s independent auditors for services relating to the performance of the audit of the registrant’s financial statements and not reported under paragraph (a) of this Item were $0 for the fiscal year ended March 31, 2016.
The aggregate fees billed by the registrant’s independent auditors for services relating to the performance of the audit of the financial statements of the registrant’s investment adviser and other service providers under common control with the adviser and that relate directly to the operations or financial reporting of the registrant were $667,000 for the registrant’s fiscal year ended March 31, 2016. The percentage of these fees relating to services approved by the registrant’s Audit Committee pursuant to the de minimis exception from the pre-approval requirement in Rule 2-01(c)(7)(i)(C) of Regulation S-X was 0%. These audit-related services were as follows: year end audit procedures; group reporting and subsidiary statutory audits.
(c) Tax fees.
The aggregate fees billed by the registrant’s independent auditors for tax-related services provided to the registrant were $16,674 for the fiscal year ended March 31, 2017. The percentage of these fees relating to services approved by the registrant’s Audit Committee pursuant to the de minimis exception from the pre-approval requirement in Rule 2-01(c)(7)(i)(C) of Regulation S-X was 0%. These tax-related services were as follows: review of income tax returns and review of annual excise distribution calculations.
The aggregate fees billed by the registrant’s independent auditors for tax-related services provided to the registrant’s investment adviser and other service providers under common control with the adviser and that relate directly to the operations or financial reporting of the registrant were $0 for the registrant’s fiscal year ended March 31, 2017.
The aggregate fees billed by the registrant’s independent auditors for tax-related services provided to the registrant were $16,674 for the fiscal year ended March 31, 2016. The percentage of these fees relating to services approved by the registrant’s Audit Committee pursuant to the de minimis exception from the pre-approval requirement in Rule 2-01(c)(7)(i)(C) of Regulation S-X was 0%. These tax-related services were as follows: review of income tax returns and review of annual excise distribution calculations.
The aggregate fees billed by the registrant’s independent auditors for tax-related services provided to the registrant’s investment adviser and other service providers under common control with the adviser and that relate directly to the operations or financial reporting of the registrant were $0 for the registrant’s fiscal year ended March 31, 2016.
(d) All other fees.
The aggregate fees billed for all services provided by the independent auditors to the registrant other than those set forth in paragraphs (a), (b) and (c) of this Item were $0 for the fiscal year ended March 31, 2017.
The aggregate fees billed for all services other than those set forth in paragraphs (b) and (c) of this Item provided by the registrant’s independent auditors to the registrant’s adviser and other service providers under common control with the adviser and that relate directly to the operations or financial reporting of the registrant were $0 for the registrant’s fiscal year ended March 31, 2017. The percentage of these fees relating to services approved by the registrant’s Audit Committee pursuant to the de minimis exception from the pre-approval requirement in Rule 2-01(c)(7)(i)(C) of Regulation S-X was 0%.
The aggregate fees billed for all services provided by the independent auditors to the registrant other than those set forth in paragraphs (a), (b) and (c) of this Item were $0 for the fiscal year ended March 31, 2016.
The aggregate fees billed for all services other than those set forth in paragraphs (b) and (c) of this Item provided by the registrant’s independent auditors to the registrant’s adviser and other service providers under common control with the adviser and that relate directly to the operations or financial reporting of the registrant were $0 for the registrant’s fiscal year ended March 31, 2016. The percentage of these fees relating to services approved by the registrant’s Audit Committee pursuant to the de minimis exception from the pre-approval requirement in Rule 2-01(c)(7)(i)(C) of Regulation S-X was 0%.
(e) The registrant’s Audit Committee has established pre-approval policies and procedures as permitted by Rule 2-01(c)(7)(i)(B) of Regulation S-X (the “Pre-Approval Policy”) with respect to services provided by the registrant’s independent auditors. Pursuant to the Pre-Approval Policy, the Audit Committee has pre-approved the services set forth in the table below with respect to the registrant up to the specified fee limits. Certain fee limits are based on aggregate fees to the registrant and other registrants within the Delaware FundsSM by Macquarie.
Service | Range of Fees |
Audit Services | |
Statutory audits or financial audits for new Funds | up to $40,000 per Fund |
Services associated with SEC registration statements (e.g., Form N-1A, Form N-14, etc.), periodic reports and other documents filed with the SEC or other documents issued in connection with securities offerings (e.g., comfort letters for closed-end Fund offerings, consents), and assistance in responding to SEC comment letters | up to $10,000 per Fund |
Consultations by Fund management as to the accounting or disclosure treatment of transactions or events and/or the actual or potential impact of final or proposed rules, standards or interpretations by the SEC, FASB, or other regulatory or standard-setting bodies (Note: Under SEC rules, some consultations may be considered “audit-related services” rather than “audit services”) | up to $25,000 in the aggregate |
Audit-Related Services | |
Consultations by Fund management as to the accounting or disclosure treatment of transactions or events and/or the actual or potential impact of final or proposed rules, standards or interpretations by the SEC, FASB, or other regulatory or standard-setting bodies (Note: Under SEC rules, some consultations may be considered “audit services” rather than “audit-related services”) | up to $25,000 in the aggregate |
Tax Services | |
U.S. federal, state and local and international tax planning and advice (e.g., consulting on statutory, regulatory or administrative developments, evaluation of Funds’ tax compliance function, etc.) | up to $25,000 in the aggregate |
U.S. federal, state and local tax compliance (e.g., excise distribution reviews, etc.) | up to $5,000 per Fund |
Review of federal, state, local and international income, franchise and other tax returns | up to $5,000 per Fund |
Under the Pre-Approval Policy, the Audit Committee has also pre-approved the services set forth in the table below with respect to the registrant’s investment adviser and other entities controlling, controlled by or under common control with the investment adviser that provide ongoing services to the registrant (the “Control Affiliates”) up to the specified fee limit. This fee limit is based on aggregate fees to the investment adviser and its Control Affiliates.
Service | Range of Fees |
Non-Audit Services | |
Services associated with periodic reports and other documents filed with the SEC and assistance in responding to SEC comment letters | up to $10,000 in the aggregate |
The Pre-Approval Policy requires the registrant’s independent auditors to report to the Audit Committee at each of its regular meetings regarding all services initiated since the last such report was rendered, including those services authorized by the Pre-Approval Policy.
(f) Not applicable.
(g) The aggregate non-audit fees billed by the registrant’s independent auditors for services rendered to the registrant and to its investment adviser and other service providers under common control with the adviser were $11,180,000 and $10,036,000 for the registrant’s fiscal years ended March 31, 2017 and March 31, 2016, respectively.
(h) In connection with its selection of the independent auditors, the registrant’s Audit Committee has considered the independent auditors’ provision of non-audit services to the registrant’s investment adviser and other service providers under common control with the adviser that were not required to be pre-approved pursuant to Rule 2-01(c)(7)(ii) of Regulation S-X. The Audit Committee has determined that the independent auditors’ provision of these services is compatible with maintaining the auditors’ independence.
Item 5. Audit Committee of Listed Registrants
Not applicable.
Item 6. Investments
(a) Included as part of report to shareholders filed under Item 1 of this Form N-CSR.
(b) Divestment of securities in accordance with Section 13(c) of the Investment Company Act of 1940.
Not applicable.
Item 7. Disclosure of Proxy Voting Policies and Procedures for Closed-End Management Investment Companies
Not applicable.
Item 8. Portfolio Managers of Closed-End Management Investment Companies
Not applicable.
Item 9. Purchases of Equity Securities by Closed-End Management Investment Company and Affiliated Purchasers
Not applicable.
Item 10. Submission of Matters to a Vote of Security Holders
Not applicable.
Item 11. Controls and Procedures
The registrant’s principal executive officer and principal financial officer have evaluated the registrant’s disclosure controls and procedures within 90 days of the filing of this report and have concluded that they are effective in providing reasonable assurance that the information required to be disclosed by the registrant in its reports or statements filed under the Securities Exchange Act of 1934 is recorded, processed, summarized and reported within the time periods specified in the rules and forms of the Securities and Exchange Commission.
There were no significant changes in the registrant’s internal control over financial reporting that occurred during the second fiscal quarter of the period covered by the report to stockholders included herein (i.e., the registrant’s fourth fiscal quarter) that have materially affected, or are reasonably likely to materially affect, the registrant’s internal control over financial reporting.
Item 12. Exhibits
| (a) | (1) Code of Ethics |
| |
| | Not applicable. |
| |
| | (2) Certifications of Principal Executive Officer and Principal Financial Officer pursuant to Rule 30a-2 under the Investment Company Act of 1940 are attached hereto as Exhibit 99.CERT. |
| |
| | (3) Written solicitations to purchase securities pursuant to Rule 23c-1 under the Securities Exchange Act of 1934. |
| |
| | Not applicable. |
| |
| (b) | Certifications pursuant to Section 906 of the Sarbanes-Oxley Act of 2002 are furnished herewith as Exhibit 99.906CERT. |
SIGNATURES
Pursuant to the requirements of the Securities Exchange Act of 1934 and the Investment Company Act of 1940, the registrant has duly caused this report to be signed on its behalf, by the undersigned, thereunto duly authorized.
DELAWARE GROUP® FOUNDATION FUNDS
| /s/ SHAWN K. LYTLE |
| By: | Shawn K. Lytle |
| Title: | President and Chief Executive Officer |
| Date: | June 6, 2017 |
Pursuant to the requirements of the Securities Exchange Act of 1934 and the Investment Company Act of 1940, this report has been signed below by the following persons on behalf of the registrant and in the capacities and on the dates indicated.
| /s/ SHAWN K. LYTLE |
| By: | Shawn K. Lytle |
| Title: | President and Chief Executive Officer |
| Date: | June 6, 2017 |
| | |
| /s/ RICHARD SALUS |
| By: | Richard Salus |
| Title: | Chief Financial Officer |
| Date: | June 6, 2017 |