Item 1. Reports to Stockholders
Annual report
Multi-asset mutual fund
Delaware Strategic Allocation Fund
March 31, 2020
Beginning on or about June 1, 2021, as permitted by regulations adopted by the Securities and Exchange Commission, paper copies of your Fund’s shareholder reports will no longer be sent to you by mail, unless you specifically request them from the Fund or from your financial intermediary, such as a broker/dealer, bank, or insurance company. Instead, you will be notified by mail each time a report is posted on the website and provided with a link to access the report.
If you already elected to receive shareholder reports electronically, you will not be affected by this change and you do not need to take any action. You may elect to receive shareholder reports and other communications from the Fund electronically by signing up at delawarefunds.com/edelivery. If you own these shares through a financial intermediary, you may contact your financial intermediary.
You may elect to receive paper copies of all future shareholder reports free of charge. You can inform the Fund that you wish to continue receiving paper copies of your shareholder reports by contacting us at 800523-1918. If you own these shares through a financial intermediary, you may contact your financial intermediary to elect to continue to receive paper copies of your shareholder reports. Your election to receive reports in paper will apply to all funds held with the Delaware Funds® by Macquarie or your financial intermediary.
Carefully consider the Fund’s investment objectives, risk factors, charges, and expenses before investing. This and other information can be found in the Fund’s prospectus and its summary prospectus, which may be obtained by visiting delawarefunds.com/literature or calling 800523-1918. Investors should read the prospectus and the summary prospectus carefully before investing.
You can obtain shareholder reports and prospectuses online instead of in the mail.
Visit delawarefunds.com/edelivery.
Experience Delaware Funds®by Macquarie
Macquarie Investment Management (MIM) is a global asset manager with offices in the United States, Europe, Asia, and Australia. As active managers we prioritize autonomy and accountability at the investment team level in pursuit of opportunities that matter for clients. Delaware Funds is one of the longest-standing mutual fund families, with more than 80 years in existence.
If you are interested in learning more about creating an investment plan, contact your financial advisor.
You can learn more about Delaware Funds or obtain a prospectus for Delaware Strategic Allocation Fund at delawarefunds.com/literature.
Manage your account online
| ● | | Check your account balance and transactions |
| ● | | View statements and tax forms |
| ● | | Make purchases and redemptions |
Visit delawarefunds.com/account-access.
Macquarie Asset Management (MAM) offers a diverse range of products including securities investment management, infrastructure and real asset management, and fund and equity-based structured products. MIM is the marketing name for certain companies comprising the asset management division of Macquarie Group. This includes the following investment advisers: Macquarie Investment Management Business Trust (MIMBT), Macquarie Funds Management Hong Kong Limited, Macquarie Investment Management Austria Kapitalanlage AG, Macquarie Investment Management Global Limited, Macquarie Investment Management Europe Limited, Macquarie Capital Investment Management LLC, and Macquarie Investment Management Europe S.A.
The Fund is distributed byDelaware Distributors, L.P. (DDLP), an affiliate of MIMBT and Macquarie Group Limited.
Other than Macquarie Bank Limited (MBL), none of the entities noted are authorized deposit-taking institutions for the purposes of the Banking Act 1959 (Commonwealth of Australia). The obligations of these entities do not represent deposits or other liabilities of MBL. MBL does not guarantee or otherwise provide assurance in respect of the obligations of these entities, unless noted otherwise. The Fund is governed by US laws and regulations.
Unless otherwise noted, views expressed herein are current as of March 31, 2020, and subject to change for events occurring after such date.
The Fund is not FDIC insured and is not guaranteed. It is possible to lose the principal amount invested.
Advisory services provided by Delaware Management Company, a series of MIMBT, a US registered investment advisor.
All third-party marks cited are the property of their respective owners.
© 2020 Macquarie Management Holdings, Inc.
| | |
| Portfolio management review | | |
| Delaware Strategic Allocation Fund | | April 7, 2020 (Unaudited) |
| | | | | | | | |
| Performance preview (for the year ended March 31, 2020) | | | | | | | | |
| | | |
Delaware Strategic Allocation Fund (Institutional Class shares) | | | 1-year return | | | | -9.29 | % |
| | | |
Delaware Strategic Allocation Fund (Class A shares) | | | 1-year return | | | | -9.55 | % |
| | | |
Bloomberg Barclays US Aggregate Index (benchmark) | | | 1-year return | | | | +8.93 | % |
| | | |
S&P 500® Index (benchmark) | | | 1-year return | | | | -6.98 | % |
| | | |
Lipper Mixed-Asset Target Allocation Moderate Funds Average | | | 1-year return | | | | -6.32 | % |
Past performance does not guarantee future results.
For complete, annualized performance for Delaware Strategic Allocation Fund, please see the table on page 4. Institutional Class shares are not subject to a sales charge and are offered for sale exclusively to certain eligible investors. In addition, Institutional Class shares pay no distribution and service fee.
The performance of Class A shares excludes the applicable sales charge. Both Institutional Class shares and Class A shares reflect the reinvestment of all distributions.
The Lipper Mixed-Asset Target Allocation Moderate Funds Average compares funds that, by portfolio practice, maintain a mix of between 40% and 60% equity securities, with the remainder invested in bonds, cash, and cash equivalents.
Please see page 7 for a description of the index. Index performance returns do not reflect any management fees, transaction costs, or expenses. Indices are unmanaged and one cannot invest directly in an index.
Investment objective
The Fund seeks capital appreciation with current income as a secondary objective.
Economic backdrop
The period from April 1, 2019 to March 31, 2020 was mixed from a performance perspective. Prices of most risk assets had risen quite substantially up until theCOVID-19 outbreak. Market developments in the first quarter of 2020, and particularly March 2020, led to substantially falling prices of risk assets. In the equity markets, USsmall-cap equities underperformed US large caps, US value underperformed US growth, and US real estate investment trusts (REITs) underperformed the broad US equity market. Equities declined globally across all regions, including developed and emerging markets. In the fixed income markets, performance on an aggregate basis was positive, with US fixed income securities generating higher returns thannon-US fixed income securities. The price of many commodities declined even more than equity prices during the Fund’s fiscal year. Over the
12 months ended March 31, 2020, the spot price of West Texas Intermediate (WTI, Cushing) crude oil fell by nearlytwo-thirds, and the broadly diversified Bloomberg Commodity Index dropped by more than 20%. In contrast, the spot price of gold rose by almost 25%. (Source: Bloomberg.)
Within the Fund
For the fiscal year ended March 31, 2020, Delaware Strategic Allocation Fund underperformed its benchmarks, the Bloomberg Barclays US Aggregate Index and the S&P 500 Index. The Fund’s Institutional Class shares declined 9.29%. The Fund’s Class A shares fell 9.55% at net asset value and declined 14.77% at maximum offer price. These figures reflect all distributions reinvested. During the same period, the Bloomberg Barclays US Aggregate Index gained 8.93% and the S&P 500 Index declined 6.98%. For complete, annualized performance of Delaware Strategic Allocation Fund, please see the table on page 4.
1
Portfolio management review
Delaware Strategic Allocation Fund
The Fund’s negative return for the fiscal year ended March 31, 2020 was lower than that of the S&P 500 Index. This mainly stemmed from the fact that the Fund’s equity exposure was to a large extent allocated to international and emerging markets equities, which generally delivered lower returns than USlarge-cap equities for the12-month period. The Fund tends to hold a higher weight innon-US securities than most other asset allocation funds. Thus, when US markets are delivering higher total returns thannon-US markets, or when the US dollar is appreciating relative to other currencies, the Fund tends to struggle by comparison with its peers. Additionally, within US equities, the allocation tosmall-cap and real estate equities, which both underperformed the broad market, was unfavorable for the Fund during the12-month period.
A large portion of the Fund was invested in US fixed income securities, which had severalsub-sectors post significant gains, helping to dampen the negative effects of poor equity performance. During the fiscal year ended March 31, 2020, the Fund delivered returns that were lower than the average returns of its Lipper peer group, as shown on page 1.
Portfolio positioning
The Fund’s strategic policy weights reflect a commitment to seeking diversification across geographies and asset classes. At the beginning of April 2019, the Fund was positioned defensively relative to its strategic policy weights. In particular, the Fund was below its strategic policy weights in developed market equities – both US and international – while it held a tactical position in US real estate equities. The main overweight was in US fixed income securities. In broad terms, we maintained an underweight in US equity sectors and a tactical position in US REITs for the 12 months ended March 31, 2020. However, the extent of these active positions varied throughout
the fiscal period, along with other reallocations. At the beginning of the second quarter, we reduced the US fixed income allocation towards its strategic weight. In return, we increased the Fund’s allocation to international equities and maintained the overweight to emerging markets equities. In the third and fourth quarters of 2019, we chose to gradually reduce the active equity positions across all regions while establishing a small fixed income overweight. This changed inmid-December when we added to US equity exposure, which slightly overweighted equities overall relative to strategic policy weights. During the market selloff in March 2020 and immediately after theCOVID-19-related lockdowns in Italy, we decided to cut back equity investments to an underweight position. At the same time, we overweighted the allocation to US fixed income. We later again reduced this underweight to equities while we maintained a small underweight to equity overall.
As part of the oversight process, we periodically analyze the sources of the Fund’s active performance. Over the 12 months ended March 31, 2020, the Fund’s active positioning with respect to the strategic policy weights of different asset classes was disadvantageous to the Fund’s active performance, relative to its hypothetical returns at the strategic policy weights. Most of this underperformance occurred in the first quarter of 2020. In terms of asset allocation, the main detractor was the overweight credit and underweight duration allocation within the Fund’s fixed income sleeves. The underweight in US equities versus international and emerging markets during most of the Fund’s reporting period and the tactical addition of US REITs also detracted from active performance. In contrast, active positions in international equities, especially the underweight in March 2020, added to performance. In March 2020, the increased underweight of US equities likewise contributed to performance.
2
We periodically examine the contribution of derivatives to the Fund’s performance. Based on the available information, during the 12 months ended March 31, 2020, the Fund’s combination of futures, options, swaps, and currency positions had only a limited impact on performance. This limited impact detracted from the Fund’s performance for the fiscal year. As the Fund’s fiscal year ended, we sought to continue to deliver the potential benefits of diversification while actively managing risk. With these two
principles in mind, the Fund seeks to deliver returns that are derived from tactical asset allocation decisions as well as from active management of individual asset classes and investment styles. We manage the Fund based on the assumption that investors should keep a global perspective when evaluating potential investment opportunities, and therefore continue to include investment possibilities around the globe within the Fund.
3
Performance summary
| | |
Delaware Strategic Allocation Fund | | March 31, 2020 (Unaudited) |
The performance quoted represents past performance and does not guarantee future results. Investment return and principal value of an investment will fluctuate so that shares, when redeemed, may be worth more or less than their original cost. Current performance may be lower or higher than the performance quoted. Performance data current to the most recent month end may be obtained by calling 800523-1918 or visiting delawarefunds.com/performance.
| | | | | | | | | | | | | | | | |
| Fund and benchmark performance1,2 | | Average annual total returns through March 31, 2020 | |
| | | | |
| | | 1 year | | | 5 year | | | 10 year | | | Lifetime |
| | | | |
Class A (Est. Dec. 31, 1997) | | | | | | | | | | | | | | | | |
| | | | |
Excluding sales charge | | | -9.55 | % | | | +1.06 | % | | | +4.36 | % | | | +4.24% | |
| | | | |
Including sales charge | | | -14.77 | % | | | -0.13 | % | | | +3.74 | % | | | +3.97% | |
| | | | |
Class C (Est. Dec. 31, 1997) | | | | | | | | | | | | | | | | |
| | | | |
Excluding sales charge | | | -10.19 | % | | | +0.29 | % | | | +3.56 | % | | | +3.47% | |
| | | | |
Including sales charge | | | -11.03 | % | | | +0.29 | % | | | +3.56 | % | | | +3.47% | |
| | | | |
Class R (Est. June 2, 2003) | | | | | | | | | | | | | | | | |
| | | | |
Excluding sales charge | | | -9.74 | %* | | | +0.79 | % | | | +4.08 | % | | | +4.88% | |
| | | | |
Including sales charge | | | -9.74 | %* | | | +0.79 | % | | | +4.08 | % | | | +4.88% | |
| | | | |
Institutional Class (Est. Dec. 31, 1997) | | | | | | | | | | | | | | | | |
| | | | |
Excluding sales charge | | | -9.29 | % | | | +1.30 | % | | | +4.61 | % | | | +4.50% | |
| | | | |
Including sales charge | | | -9.29 | % | | | +1.30 | % | | | +4.61 | % | | | +4.50% | |
| | | | |
Bloomberg Barclays US Aggregate Index | | | +8.93 | % | | | +3.36 | % | | | +3.88 | % | | | +5.01%** | |
| | | | |
S&P 500 Index | | | -6.98 | % | | | +6.73 | % | | | +10.53 | % | | | +6.50%** | |
*Total return for the report period presented in the table differs from the return in “Financial highlights.” The total return presented in the above table is calculated based on the net asset value (NAV) at which shareholder transactions were processed. The total return presented in “Financial highlights” is calculated in the same manner but also takes into account certain adjustments that are necessary under US generally accepted accounting principles (US GAAP) required in the annual report.
**The benchmark lifetime return is for Institutional Class share comparison only and is calculated using the last business day in the month of the Fund’s Institutional Class inception date.
1Returns reflect the reinvestment of all distributions and are presented both with and without the applicable sales charges described below. Returns do not reflect the deduction of taxes the shareholder would pay on Fund distributions or redemptions of Fund shares.
Expense limitations were in effect for certain classes during some or all of the periods shown in the “Fund and benchmark performance” table. Expenses for each class are listed on the “Fund expense ratios” table on page 6. Performance would have been lower had expense limitations not been in effect.
Institutional Class shares are not subject to a sales charge and are offered for sale exclusively to certain eligible investors. In addition, Institutional Class shares pay no distribution and service(12b-1) fee.
Class A shares are sold with a maximumfront-end sales charge of 5.75%, and have an annual12b-1 fee of 0.24% of average daily net assets. In connection with the merger with Delaware Balanced Fund, the Board has adopted a formula for calculating12b-1 plan fees for the Fund’s Class A shares. The Fund’s Class A shares are currently subject to a blended12b-1 fee equal to
4
the sum of: (i) 0.10% of average daily net assets representing shares acquired prior to June 1, 1992, and (ii) 0.25% of average daily net assets representing shares acquired on or after June 1, 1992. All Class A shares currently bear12b-1 fees at the same rate, the blended rate, currently 0.24% of average daily net assets, based on the formula described above. This method of calculating Class A12b-1 fees may be discontinued at the sole discretion of the Board. Performance for Class A shares, excluding sales charges, assumes that nofront-end sales charge applied.
Class C shares are sold with a contingent deferred sales charge of 1.00% if redeemed during the first 12 months. They are also subject to an annual12b-1 fee of 1.00% of average daily net assets. Performance for Class C shares, excluding sales charges, assumes either that contingent deferred sales charges did not apply or that the investment was not redeemed.
Class R shares are available only for certain retirement plan products. They are sold without a sales charge and have an annual12b-1 fee of 0.50% of average daily net assets.
Fixed income securities and bond funds can lose value, and investors can lose principal, as interest rates rise. They also may be affected by economic conditions that hinder an issuer’s ability to make interest and principal payments on its debt.
The Fund may also be subject to prepayment risk, the risk that the principal of a bond that is held by a portfolio will be prepaid prior to maturity, at the time when interest rates are lower than what the bond was paying. A portfolio may then have to reinvest that money at a lower interest rate.
High yielding,non-investment-grade bonds (junk bonds) involve higher risk than investment grade bonds. The high yield secondary market is particularly susceptible to liquidity problems when institutional investors, such as mutual funds and certain other financial institutions, temporarily stop
buying bonds for regulatory, financial, or other reasons. In addition, a less liquid secondary market makes it more difficult for the Fund to obtain precise valuations of the high yield securities in its portfolio.
If and when the Fund invests in forward foreign currency contracts or uses other investments to hedge against currency risks, the Fund will be subject to special risks, including counterparty risk.
The Fund may invest in derivatives, which may involve additional expenses and are subject to risk, including the risk that an underlying security or securities index moves in the opposite direction from what the portfolio manager anticipated. A derivatives transaction depends upon the counterparties’ ability to fulfill their contractual obligations.
International investments entail risks not ordinarily associated with US investments including fluctuation in currency values, differences in accounting principles, or economic or political instability in other nations. Investing in emerging markets can be riskier than investing in established foreign markets due to increased volatility and lower trading volume.
Risk controls and asset allocation models do not promise any level of performance or guarantee against loss of principal.
Narrowly focused investments may exhibit higher volatility than investments in multiple industry sectors.
Real estate investment trust (REIT) investments are subject to many of the risks associated with direct real estate ownership, including changes in economic conditions, credit risk, and interest rate fluctuations.
The Fund may experience portfolio turnover in excess of 100%, which could result in higher transaction costs and tax liability.
5
Performance summary
Delaware Strategic Allocation Fund
Interest payments on inflation-indexed debt securities will vary as the principal and/or interest is adjusted for inflation.
LIBOR risk is the risk that potential changes related to the use of the London interbank offered rate (LIBOR) could have adverse impacts on financial instruments which reference LIBOR. The potential abandonment of LIBOR could affect the value and liquidity of instruments which reference LIBOR.
The disruptions caused by natural disasters, pandemics, or similar events could prevent the Fund from executing advantageous investment decisions in a timely manner and could negatively impact the Fund’s ability to achieve its investment objective and the value of the Fund’s investments.
2The Fund’s expense ratios, as described in the most recent prospectus, are disclosed in the following “Fund expense ratios” table. Delaware Management Company has agreed to reimburse certain expenses and/or waive certain fees in order to prevent total annual fund operating expenses (excluding any12b-1 fees, acquired fund fees and expenses, taxes, interest, short sale and dividend and interest expenses, brokerage fees, certain insurance costs, and nonroutine expenses or costs, including, but not limited to, those relating to reorganizations, litigation, conducting shareholder meetings, and liquidations (collectively, nonroutine expenses)) from exceeding 0.90% of the Fund’s average daily net assets from April 1, 2019 to March 31, 2020.* Please see the most recent prospectus and any applicable supplement(s) for additional information on these fee waivers and/or reimbursements. Please see the “Financial highlights” section in this report for the most recent expense ratios.
| | | | | | | | |
| Fund expense ratios | | Class A | | Class C | | Class R | | Institutional Class |
| | | | |
Total annual operating expenses | | 1.20% | | 1.96% | | 1.46% | | 0.96% |
(without fee waivers) | | | | | | | | |
Net expenses | | 1.14% | | 1.90% | | 1.40% | | 0.90% |
(including fee waivers, if any) | | | | | | | | |
Type of waiver | | Contractual | | Contractual | | Contractual | | Contractual |
*The aggregate contractual waiver period covering this report is from July 27, 2018 through July 29, 2020.
6
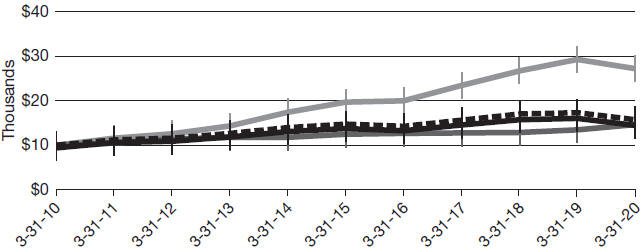
Performance of a $10,000 investment1
Average annual total returns from March 31, 2010 through March 31, 2020
| | | | | | | | |
| | | |
| For period beginning March 31, 2010 through March 31, 2020 | | Starting value | | | Ending value | |
| | |
 S&P 500 Index S&P 500 Index
| | | $10,000 | | | | $27,211 | |
| | |
 Delaware Strategic Allocation Fund — Institutional Class shares Delaware Strategic Allocation Fund — Institutional Class shares
| | | $10,000 | | | | $15,693 | |
| | |
 Bloomberg Barclays US Aggregate Index Bloomberg Barclays US Aggregate Index
| | | $10,000 | | | | $14,638 | |
| | |
 Delaware Strategic Allocation Fund — Class A shares Delaware Strategic Allocation Fund — Class A shares
| | | $9,425 | | | | $14,437 | |
1 The “Performance of a $10,000 investment” graph assumes $10,000 invested in Institutional Class and Class A shares of the Fund on March 31, 2010, and includes the effect of a 5.75%front-end sales charge (for Class A shares) and the reinvestment of all distributions. The graph does not reflect the deduction of taxes the shareholders would pay on Fund distributions or redemptions of Fund shares. Expense limitations were in effect for some or all of the periods shown. Performance would have been lower had expense limitations not been in effect. Expenses are listed in the “Fund expense ratios” table on page 6. Please note additional details on pages 4 through 8.
The graph also assumes $10,000 invested in the Bloomberg Barclays US Aggregate Index and the S&P 500 Index as of March 31, 2010.
The S&P 500 Index measures the performance of 500 mostlylarge-cap stocks weighted by market value, and is often used to represent performance of the US stock market.
The Bloomberg Barclays US Aggregate Index is a broad composite that tracks the investment grade domestic bond market.
The Bloomberg Commodity Index, mentioned on page 1, is a highly liquid and diversified benchmark commodity price index. The index comprises 23 exchange-traded futures on physical commodities, representing 21 commodities that are weighted to account for economic significance and market liquidity.
Index performance returns do not reflect any management fees, transaction costs, or expenses. Indices are unmanaged and one cannot invest directly in an index.Past performance is not a guarantee of future results.
7
Performance summary
Delaware Strategic Allocation Fund
Performance of other Fund classes will vary due to
different charges and expenses.
| | | | | | |
| | | | |
| | | Nasdaq symbols | | CUSIPs | | |
Class A | | DFBAX | | 245918503 | | |
Class C | | DFBCX | | 245918701 | | |
Class R | | DFBRX | | 245918834 | | |
Institutional Class | | DFFIX | | 245918800 | | |
8
Disclosure of Fund expenses
For thesix-month period from October 1, 2019 to March 31, 2020 (Unaudited)
As a shareholder of the Fund, you incur two types of costs: (1) transaction costs, including sales charges (loads) on purchase payments, reinvested dividends, or other distributions; redemption fees; and exchange fees; and (2) ongoing costs, including management fees; distribution and service(12b-1) fees; and other Fund expenses. This example is intended to help you understand your ongoing costs (in dollars) of investing in the Fund and to compare these costs with the ongoing costs of investing in other mutual funds.
The example is based on an investment of $1,000 invested at the beginning of the period and held for the entiresix-month period from Oct. 1, 2019 to March 31, 2020.
Actual expenses
The first section of the table shown, “Actual Fund return,” provides information about actual account values and actual expenses. You may use the information in this section of the table, together with the amount you invested, to estimate the expenses that you paid over the period. Simply divide your account value by $1,000 (for example, an $8,600 account value divided by $1,000 = 8.6), then multiply the result by the number in the first section under the heading entitled “Expenses Paid During Period” to estimate the expenses you paid on your account during this period.
Hypothetical example for comparison purposes
The second section of the table shown, “Hypothetical 5% return,” provides information about hypothetical account values and hypothetical expenses based on the Fund’s actual expense ratio and an assumed rate of return of 5% per year before expenses, which is not the Fund’s actual return. The hypothetical account values and expenses may not be used to estimate the actual ending account balance or expenses you paid for the period. You may use this information to compare the ongoing costs of investing in the Fund and other funds. To do so, compare this 5% hypothetical example with the 5% hypothetical examples that appear in the shareholder reports of the other funds.
Please note that the expenses shown in the table are meant to highlight your ongoing costs only and do not reflect any transactional costs, such as sales charges (loads), redemption fees, or exchange fees. Therefore, the second section of the table is useful in comparing ongoing costs only, and will not help you determine the relative total costs of owning different funds. In addition, if these transactional costs were included, your costs would have been higher. The Fund’s expenses shown in the table reflect fee waivers in effect and assume reinvestment of all dividends and distributions.
9
Disclosure of Fund expenses
For thesix-month period from October 1, 2019 to March 31, 2020 (Unaudited)
Delaware Strategic Allocation Fund
Expense analysis of an investment of $1,000
| | | | | | | | | | | | | | | | | | | | |
| | | Beginning Account Value 10/1/19 | | Ending Account Value 3/31/20 | | Annualized Expense Ratio | | Expenses Paid During Period 10/1/19 to 3/31/20* |
| | | | |
Actual Fund return† | | | | | | | | | | | | | | | | | | | | |
Class A | | | | $1,000.00 | | | | | $885.20 | | | | | 1.12 | % | | | | $5.28 | |
Class C | | | | 1,000.00 | | | | | 881.50 | | | | | 1.88 | % | | | | 8.84 | |
Class R | | | | 1,000.00 | | | | | 883.60 | | | | | 1.38 | % | | | | 6.50 | |
Institutional Class | | | | 1,000.00 | | | | | 886.60 | | | | | 0.88 | % | | | | 4.15 | |
| | |
Hypothetical 5% return(5% return before expenses) | | | | | | | | | | | |
Class A | | | | $1,000.00 | | | | | $1,019.40 | | | | | 1.12 | % | | | | $5.65 | |
Class C | | | | 1,000.00 | | | | | 1,015.60 | | | | | 1.88 | % | | | | 9.47 | |
Class R | | | | 1,000.00 | | | | | 1,018.10 | | | | | 1.38 | % | | | | 6.96 | |
Institutional Class | | | | 1,000.00 | | | | | 1,020.60 | | | | | 0.88 | % | | | | 4.45 | |
*“Expenses Paid During Period” are equal to the Fund’s annualized expense ratio, multiplied by the average account value over the period, multiplied by 183/366 (to reflect theone-half year period).
†Because actual returns reflect only the most recentsix-month period, the returns shown may differ significantly from fiscal year returns.
In addition to the Fund’s expenses reflected above, the Fund also indirectly bears its portion of the fees and expenses of the investment companies in which it invests (Underlying Funds), including exchange-traded funds. The table above does not reflect the expenses of the Underlying Funds.
10
Security type / sector allocation, top 10
equity holdings, and country allocation
| | |
Delaware Strategic Allocation Fund | | As of March 31, 2020 (Unaudited) |
Sector designations may be different than the sector designations presented in other Fund materials. The sector designations may represent the investment manager’s internal sector classifications.
| | | | | |
| Security type / sector | | Percentage of net assets |
| |
Common Stock | | | | 51.63 | % |
US Markets | | | | 25.29 | % |
Communication Services | | | | 2.39 | % |
Consumer Discretionary | | | | 2.03 | % |
Consumer Staples | | | | 1.06 | % |
Energy | | | | 0.51 | % |
Financials | | | | 3.14 | % |
Healthcare | | | | 4.45 | % |
Industrials | | | | 2.20 | % |
Information Technology | | | | 5.22 | % |
Materials | | | | 1.04 | % |
Real Estate | | | | 2.69 | % |
Utilities | | | | 0.56 | % |
Developed Markets | | | | 18.70 | % |
Communication Services | | | | 1.02 | % |
Consumer Discretionary | | | | 1.80 | % |
Consumer Staples | | | | 3.07 | % |
Energy | | | | 0.61 | % |
Financials | | | | 2.65 | % |
Healthcare | | | | 3.30 | % |
Industrials | | | | 2.70 | % |
Information Technology | | | | 1.24 | % |
Materials | | | | 1.35 | % |
Real Estate | | | | 0.53 | % |
Utilities | | | | 0.43 | % |
Emerging Markets | | | | 7.64 | % |
Communication Services | | | | 1.82 | % |
Consumer Discretionary | | | | 1.17 | % |
Consumer Staples | | | | 0.69 | % |
Energy | | | | 1.13 | % |
Financials | | | | 0.52 | % |
Healthcare | | | | 0.12 | % |
Industrials | | | | 0.00 | % |
Information Technology | | | | 1.97 | % |
Materials | | | | 0.17 | % |
Real Estate | | | | 0.03 | % |
Utilities | | | | 0.02 | % |
| |
Exchange-Traded Funds | | | | 5.38 | % |
11
Security type / sector allocation, top 10
equity holdings, and country allocation
Delaware Strategic Allocation Fund
| | | | | |
| Security type / sector | | Percentage of net assets |
Limited Partnership | | | | 0.01 | % |
Agency Asset-Backed Security | | | | 0.00 | % |
Agency Collateralized Mortgage Obligations | | | | 1.82 | % |
Agency Commercial Mortgage-Backed Securities | | | | 0.51 | % |
Agency Mortgage-Backed Securities | | | | 14.27 | % |
Collateralized Debt Obligations | | | | 0.61 | % |
Corporate Bonds | | | | 14.37 | % |
Banking | | | | 4.29 | % |
Basic Industry | | | | 0.81 | % |
Capital Goods | | | | 0.52 | % |
Communications. | | | | 2.01 | % |
Consumer Cyclical | | | | 0.42 | % |
ConsumerNon-Cyclical | | | | 1.14 | % |
Energy | | | | 1.06 | % |
Financials | | | | 0.46 | % |
Insurance | | | | 0.42 | % |
Real Estate | | | | 0.55 | % |
Technology | | | | 0.83 | % |
Transportation | | | | 0.08 | % |
Utilities | | | | 1.78 | % |
Loan Agreements | | | | 0.90 | % |
Municipal Bonds | | | | 0.46 | % |
Non-Agency Asset-Backed Securities | | | | 1.88 | % |
Non-Agency Collateralized Mortgage Obligations | | | | 1.42 | % |
Non-Agency Commercial Mortgage-Backed Securities | | | | 2.95 | % |
Sovereign Bond | | | | 0.01 | % |
Preferred Stock | | | | 0.55 | % |
Short-Term Investments | | | | 4.88 | % |
Total Value of Securities | | | | 101.65 | % |
Liabilities Net of Receivables and Other Assets | | | | (1.65 | %) |
Total Net Assets | | | | 100.00 | % |
12
Holdings are for informational purposes only and are subject to change at any time. They are not a recommendation to buy, sell, or hold any security.
| | | | | |
Top 10 equity holdings | | Percentage of net assets |
Microsoft | | | | 0.95 | % |
Reliance Industries GDR | | | | 0.66 | % |
Tencent Holdings | | | | 0.59 | % |
Samsung Electronics | | | | 0.58 | % |
Amazon.com | | | | 0.57 | % |
Alibaba Group Holding ADR | | | | 0.57 | % |
Roche Holding | | | | 0.56 | % |
Nestle | | | | 0.55 | % |
Taiwan Semiconductor Manufacturing | | | | 0.53 | % |
Alphabet Class A | | | | 0.50 | % |
| |
*Country / market | | Percentage of net assets |
US Markets | | | | 66.98 | % |
Developed Markets | | | | 21.59 | % |
Australia | | | | 1.70 | % |
Austria | | | | 0.11 | % |
Belgium | | | | 0.12 | % |
Canada | | | | 0.10 | % |
Cayman Islands | | | | 0.85 | % |
Denmark | | | | 0.51 | % |
Finland | | | | 0.18 | % |
France | | | | 2.42 | % |
Germany | | | | 1.38 | % |
Hong Kong | | | | 0.16 | % |
Ireland | | | | 0.27 | % |
Israel | | | | 0.32 | % |
Italy | | | | 0.23 | % |
Japan | | | | 5.56 | % |
Netherlands | | | | 1.24 | % |
Portugal | | | | 0.12 | % |
Singapore | | | | 0.51 | % |
Spain | | | | 0.73 | % |
Sweden | | | | 0.45 | % |
Switzerland | | | | 2.34 | % |
United Kingdom | | | | 2.29 | % |
13
Security type / sector allocation, top 10
equity holdings, and country allocation
Delaware Strategic Allocation Fund
| | | | | |
*Country / market | | Percentage of net assets |
Emerging Markets | | | | 8.20 | % |
Argentina | | | | 0.05 | % |
Brazil | | | | 0.67 | % |
Chile | | | | 0.06 | % |
China | | | | 2.68 | % |
Colombia | | | | 0.02 | % |
India | | | | 0.84 | % |
Indonesia | | | | 0.13 | % |
Malaysia | | | | 0.01 | % |
Mexico | | | | 0.48 | % |
Morocco | | | | 0.09 | % |
Peru | | | | 0.04 | % |
Republic of Korea | | | | 1.61 | % |
Russia | | | | 0.48 | % |
Taiwan | | | | 0.90 | % |
Turkey | | | | 0.14 | % |
Total | | | | 96.77 | % |
*Allocation includes all investments except for short-term investments.
14
Schedule of investments
| | |
| Delaware Strategic Allocation Fund | | March 31, 2020 |
| | | | | | | | |
| | | Number of shares | | | Value (US $) | |
Common Stock – 51.63% | | | | | | | | |
US Markets – 25.29% | | | | | | | | |
Communication Services – 2.39% | | | | | | | | |
Alphabet Class A † | | | 908 | | | $ | 1,055,051 | |
AT&T | | | 26,139 | | | | 761,952 | |
ATN International | | | 1,247 | | | | 73,211 | |
Century Communications =† | | | 25,000 | | | | 0 | |
Charter Communications Class A † | | | 947 | | | | 413,186 | |
Cinemark Holdings | | | 2,277 | | | | 23,203 | |
Comcast Class A | | | 20,396 | | | | 701,214 | |
Facebook Class A † | | | 1,409 | | | | 235,021 | |
Netflix † | | | 769 | | | | 288,759 | |
Nexstar Media Group Class A | | | 577 | | | | 33,310 | |
Take-Two Interactive Software † | | | 1,772 | | | | 210,177 | |
Verizon Communications | | | 9,300 | | | | 499,689 | |
Walt Disney | | | 7,092 | | | | 685,087 | |
Yelp † | | | 2,688 | | | | 48,465 | |
| | | | | | | | |
| | | | | | | 5,028,325 | |
| | | | | | | | |
Consumer Discretionary – 2.03% | | | | | | | | |
Amazon.com † | | | 617 | | | | 1,202,977 | |
American Eagle Outfitters | | | 6,665 | | | | 52,987 | |
Aramark | | | 3,263 | | | | 65,162 | |
BorgWarner | | | 2,256 | | | | 54,979 | |
Chegg † | | | 1,972 | | | | 70,558 | |
Chuy’s Holdings † | | | 1,645 | | | | 16,565 | |
Dollar Tree † | | | 6,400 | | | | 470,208 | |
Domino’s Pizza | | | 807 | | | | 261,524 | |
DR Horton | �� | | 1,550 | | | | 52,700 | |
Five Below † | | | 909 | | | | 63,975 | |
Home Depot | | | 2,052 | | | | 383,129 | |
Jack in the Box | | | 681 | | | | 23,869 | |
KB Home | | | 1,804 | | | | 32,652 | |
Lowe’s | | | 5,600 | | | | 481,880 | |
Malibu Boats Class A † | | | 2,051 | | | | 59,048 | |
NIKE Class B | | | 3,983 | | | | 329,553 | |
Starbucks | | | 3,221 | | | | 211,749 | |
Steven Madden | | | 3,790 | | | | 88,042 | |
Taylor Morrison Home † | | | 3,192 | | | | 35,112 | |
Tenneco Class A † | | | 1,245 | | | | 4,482 | |
Texas Roadhouse | | | 696 | | | | 28,745 | |
Toll Brothers | | | 2,972 | | | | 57,211 | |
Tractor Supply | | | 1,924 | | | | 162,674 | |
Wendy’s | | | 4,195 | | | | 62,422 | |
| | | | | | | | |
| | | | | | | 4,272,203 | |
| | | | | | | | |
15
Schedule of investments
Delaware Strategic Allocation Fund
| | | | | | | | |
| | | Number of shares | | | Value (US $) | |
Common Stock(continued) | | | | | | | | |
US Markets(continued) | | | | | | | | |
Consumer Staples – 1.06% | | | | | | | | |
Archer-Daniels-Midland | | | 14,600 | | | $ | 513,628 | |
BJ’s Wholesale Club Holdings † | | | 1,739 | | | | 44,292 | |
Casey’s General Stores | | | 1,067 | | | | 141,367 | |
Conagra Brands | | | 17,498 | | | | 513,391 | |
General Mills | | | 3,396 | | | | 179,207 | |
J&J Snack Foods | | | 677 | | | | 81,917 | |
Mondelez International Class A | | | 10,273 | | | | 514,472 | |
PepsiCo | | | 1,947 | | | | 233,835 | |
| | | | | | | | |
| | | | | | | 2,222,109 | |
| | | | | | | | |
Energy – 0.51% | | | | | | | | |
Chevron | | | 2,651 | | | | 192,091 | |
ConocoPhillips | | | 16,335 | | | | 503,118 | |
EOG Resources | | | 771 | | | | 27,694 | |
Marathon Oil | | | 31,807 | | | | 104,645 | |
Occidental Petroleum | | | 17,700 | | | | 204,966 | |
Patterson-UTI Energy | | | 3,762 | | | | 8,841 | |
PDC Energy † | | | 270 | | | | 1,677 | |
Pioneer Natural Resources | | | 537 | | | | 37,671 | |
| | | | | | | | |
| | | | | | | 1,080,703 | |
| | | | | | | | |
Financials – 3.14% | | | | | | | | |
Allstate | | | 5,500 | | | | 504,515 | |
American Equity Investment Life Holding | | | 4,646 | | | | 87,345 | |
American International Group | | | 15,400 | | | | 373,450 | |
Axis Capital Holdings | | | 1,789 | | | | 69,145 | |
Bank of New York Mellon | | | 15,100 | | | | 508,568 | |
BlackRock | | | 409 | | | | 179,948 | |
Bryn Mawr Bank | | | 1,543 | | | | 43,790 | |
Capital One Financial | | | 2,167 | | | | 109,260 | |
CenterState Bank | | | 5,384 | | | | 92,766 | |
Charles Schwab | | | 7,121 | | | | 239,408 | |
City Holding | | | 983 | | | | 65,399 | |
CME Group | | | 2,246 | | | | 388,356 | |
Comerica | | | 1,461 | | | | 42,866 | |
East West Bancorp | | | 2,989 | | | | 76,937 | |
Essent Group | | | 4,068 | | | | 107,151 | |
First Bancorp (North Carolina) | | | 2,206 | | | | 50,914 | |
First Financial Bancorp | | | 5,239 | | | | 78,113 | |
First Interstate BancSystem Class A | | | 2,358 | | | | 68,005 | |
Great Western Bancorp | | | 3,878 | | | | 79,421 | |
Hamilton Lane Class A | | | 1,171 | | | | 64,768 | |
Independent Bank | | | 1,299 | | | | 83,617 | |
16
| | | | | | | | |
| | | Number of shares | | | Value (US $) | |
Common Stock(continued) | | | | | | | | |
US Markets(continued) | | | | | | | | |
Financials(continued) | | | | | | | | |
Independent Bank Group | | | 2,141 | | | $ | 50,699 | |
Intercontinental Exchange | | | 1,699 | | | | 137,194 | |
JPMorgan Chase & Co. | | | 5,032 | | | | 453,031 | |
Kemper | | | 560 | | | | 41,647 | |
KeyCorp | | | 10,216 | | | | 105,940 | |
KKR & Co. Class A | | | 12,371 | | | | 290,347 | |
LendingTree † | | | 154 | | | | 28,242 | |
Marsh & McLennan | | | 5,700 | | | | 492,822 | |
MGIC Investment | | | 5,677 | | | | 36,049 | |
NMI Holdings Class A † | | | 1,528 | | | | 17,740 | |
Old National Bancorp | | | 6,413 | | | | 84,587 | |
Pacific Premier Bancorp | | | 1,139 | | | | 21,459 | |
Primerica | | | 321 | | | | 28,402 | |
Prudential Financial | | | 1,544 | | | | 80,504 | |
Raymond James Financial | | | 1,793 | | | | 113,318 | |
Reinsurance Group of America | | | 961 | | | | 80,859 | |
RLI | | | 178 | | | | 15,652 | |
Selective Insurance Group | | | 1,729 | | | | 85,931 | |
State Street | | | 1,827 | | | | 97,324 | |
Stifel Financial | | | 2,432 | | | | 100,393 | |
Travelers | | | 1,026 | | | | 101,933 | |
Truist Financial | | | 13,800 | | | | 425,592 | |
Umpqua Holdings | | | 5,064 | | | | 55,198 | |
United Community Banks | | | 3,195 | | | | 58,500 | |
US Bancorp | | | 3,436 | | | | 118,370 | |
Valley National Bancorp | | | 6,776 | | | | 49,533 | |
WesBanco | | | 2,805 | | | | 66,479 | |
WSFS Financial | | | 1,676 | | | | 41,766 | |
| | | | | | | | |
| | | | | | | 6,593,253 | |
| | | | | | | | |
Healthcare – 4.45% | | | | | | | | |
Abbott Laboratories | | | 9,356 | | | | 738,282 | |
Adamas Pharmaceuticals † | | | 2,801 | | | | 8,095 | |
Agios Pharmaceuticals † | | | 1,923 | | | | 68,228 | |
Becton Dickinson and Co. | | | 875 | | | | 201,049 | |
Brookdale Senior Living † | | | 28,642 | | | | 89,363 | |
Cardinal Health | | | 11,000 | | | | 527,340 | |
ChemoCentryx † | | | 736 | | | | 29,572 | |
Cigna | | | 4,413 | | | | 781,895 | |
CONMED | | | 1,377 | | | | 78,861 | |
CryoLife † | | | 3,589 | | | | 60,726 | |
CVS Health | | | 8,400 | | | | 498,372 | |
17
Schedule of investments
Delaware Strategic Allocation Fund
| | | | | | | | |
| | | Number of shares | | | Value (US $) | |
Common Stock(continued) | | | | | | | | |
US Markets(continued) | | | | | | | | |
Healthcare(continued) | | | | | | | | |
DexCom † | | | 668 | | | $ | 179,872 | |
Edwards Lifesciences † | | | 753 | | | | 142,031 | |
Exact Sciences † | | | 2,020 | | | | 117,160 | |
Gilead Sciences | | | 970 | | | | 72,517 | |
Illumina † | | | 984 | | | | 268,750 | |
Intercept Pharmaceuticals † | | | 1,190 | | | | 74,922 | |
Intuitive Surgical † | | | 204 | | | | 101,023 | |
IQVIA Holdings † | | | 3,627 | | | | 391,208 | |
Johnson & Johnson | | | 6,756 | | | | 885,914 | |
Ligand Pharmaceuticals Class B † | | | 1,152 | | | | 83,773 | |
Merck & Co. | | | 10,022 | | | | 771,093 | |
Merit Medical Systems † | | | 3,173 | | | | 99,156 | |
Natera † | | | 4,189 | | | | 125,084 | |
Neurocrine Biosciences † | | | 1,162 | | | | 100,571 | |
NuVasive † | | | 1,784 | | | | 90,377 | |
Pfizer | | | 23,086 | | | | 753,527 | |
Prestige Consumer Healthcare † | | | 3,234 | | | | 118,623 | |
PTC Therapeutics † | | | 1,531 | | | | 68,298 | |
Quidel † | | | 1,663 | | | | 162,658 | |
Repligen † | | | 1,652 | | | | 159,484 | |
Retrophin † | | | 6,152 | | | | 89,758 | |
Spectrum Pharmaceuticals † | | | 5,663 | | | | 13,195 | |
Supernus Pharmaceuticals † | | | 3,072 | | | | 55,265 | |
Tabula Rasa HealthCare † | | | 2,082 | | | | 108,868 | |
Teladoc Health † | | | 1,144 | | | | 177,331 | |
Thermo Fisher Scientific | | | 832 | | | | 235,955 | |
Ultragenyx Pharmaceutical † | | | 2,729 | | | | 121,249 | |
UnitedHealth Group | | | 1,385 | | | | 345,391 | |
Vanda Pharmaceuticals † | | | 6,084 | | | | 63,030 | |
Vertex Pharmaceuticals † | | | 850 | | | | 202,258 | |
Wright Medical Group † | | | 3,037 | | | | 87,010 | |
| | | | | | | | |
| | | | | | | 9,347,134 | |
| | | | | | | | |
Industrials – 2.20% | | | | | | | | |
ABM Industries | | | 3,041 | | | | 74,079 | |
Applied Industrial Technologies | | | 2,207 | | | | 100,904 | |
ASGN † | | | 1,901 | | | | 67,143 | |
Barnes Group | | | 1,333 | | | | 55,759 | |
BrightView Holdings † | | | 4,504 | | | | 49,814 | |
Casella Waste Systems Class A † | | | 1,599 | | | | 62,457 | |
Caterpillar | | | 2,853 | | | | 331,062 | |
18
| | | | | | | | |
| | | Number of shares | | | Value (US $) | |
Common Stock(continued) | | | | | | | | |
US Markets(continued) | | | | | | | | |
Industrials(continued) | | | | | | | | |
Columbus McKinnon | | | 2,945 | | | $ | 73,625 | |
Eaton | | | 1,751 | | | | 136,035 | |
Emerson Electric | | | 1,354 | | | | 64,518 | |
ESCO Technologies | | | 1,054 | | | | 80,009 | |
Federal Signal | | | 4,520 | | | | 123,306 | |
Gates Industrial † | | | 3,716 | | | | 27,424 | |
Honeywell International | | | 1,042 | | | | 139,409 | |
Hub Group Class A † | | | 1,702 | | | | 77,390 | |
Ingersoll Rand † | | | 873 | | | | 21,650 | |
Kadant | | | 1,112 | | | | 83,011 | |
Lockheed Martin | | | 520 | | | | 176,254 | |
MasTec † | | | 1,974 | | | | 64,609 | |
Mobile Mini | | | 2,591 | | | | 67,962 | |
MYR Group † | | | 2,673 | | | | 70,006 | |
Northrop Grumman | | | 1,600 | | | | 484,080 | |
Oshkosh | | | 1,326 | | | | 85,302 | |
Parker-Hannifin | | | 1,248 | | | | 161,903 | |
Raytheon | | | 3,400 | | | | 445,910 | |
Rexnord | | | 3,549 | | | | 80,456 | |
Rockwell Automation | | | 385 | | | | 58,100 | |
Southwest Airlines | | | 2,119 | | | | 75,458 | |
Tetra Tech | | | 1,757 | | | | 124,079 | |
Trane Technologies | | | 990 | | | | 81,764 | |
Uber Technologies † | | | 8,068 | | | | 225,259 | |
Union Pacific | | | 1,758 | | | | 247,948 | |
United Technologies | | | 2,301 | | | | 217,053 | |
US Ecology | | | 2,174 | | | | 66,090 | |
Waste Management | | | 2,986 | | | | 276,384 | |
Werner Enterprises | | | 1,577 | | | | 57,182 | |
| | | | | | | | |
| | | | | | | 4,633,394 | |
| | | | | | | | |
Information Technology – 5.22% | | | | | | | | |
Accenture Class A | | | 1,330 | | | | 217,136 | |
Adobe † | | | 1,322 | | | | 420,713 | |
Anixter International † | | | 540 | | | | 47,450 | |
Apple | | | 3,034 | | | | 771,516 | |
Applied Materials | | | 2,781 | | | | 127,425 | |
Arista Networks † | | | 871 | | | | 176,421 | |
Autodesk † | | | 1,761 | | | | 274,892 | |
Belden | | | 1,990 | | | | 71,799 | |
Blackbaud | | | 772 | | | | 42,885 | |
Box Class A † | | | 486 | | | | 6,823 | |
19
Schedule of investments
Delaware Strategic Allocation Fund
| | | | | | | | |
| | | Number of shares | | | Value (US $) | |
Common Stock(continued) | | | | | | | | |
US Markets(continued) | | | | | | | | |
Information Technology(continued) | | | | | | | | |
Broadcom | | | 2,855 | | | $ | 676,921 | |
Brooks Automation | | | 2,988 | | | | 91,134 | |
Cisco Systems | | | 18,543 | | | | 728,925 | |
Coupa Software † | | | 965 | | | | 134,839 | |
ExlService Holdings † | | | 1,686 | | | | 87,723 | |
II-VI † | | | 3,383 | | | | 96,416 | |
Intel | | | 14,518 | | | | 785,714 | |
Intuit | | | 270 | | | | 62,100 | |
J2 Global | | | 1,808 | | | | 135,329 | |
KBR | | | 1,952 | | | | 40,367 | |
MACOM Technology Solutions Holdings † | | | 763 | | | | 14,444 | |
Mastercard Class A | | | 1,334 | | | | 322,241 | |
MaxLinear † | | | 5,132 | | | | 59,890 | |
Microsoft | | | 12,680 | | | | 1,999,763 | |
Mimecast † | | | 1,510 | | | | 53,303 | |
NETGEAR † | | | 2,091 | | | | 47,758 | |
Oracle | | | 9,800 | | | | 473,634 | |
Paylocity Holding † | | | 435 | | | | 38,419 | |
PayPal Holdings † | | | 3,271 | | | | 313,166 | |
Plantronics | | | 720 | | | | 7,243 | |
PTC † | | | 1,587 | | | | 97,140 | |
Q2 Holdings † | | | 1,781 | | | | 105,186 | |
Rapid7 † | | | 2,849 | | | | 123,447 | |
salesforce.com † | | | 1,593 | | | | 229,360 | |
Semtech † | | | 2,537 | | | | 95,138 | |
ServiceNow † | | | 1,600 | | | | 458,528 | |
Silicon Laboratories † | | | 1,099 | | | | 93,866 | |
SS&C Technologies Holdings | | | 3,797 | | | | 166,385 | |
Texas Instruments | | | 1,250 | | | | 124,913 | |
Twilio Class A † | | | 1,596 | | | | 142,826 | |
Tyler Technologies † | | | 832 | | | | 246,738 | |
Visa Class A | | | 4,742 | | | | 764,031 | |
| | | | | | | | |
| | | | | | | 10,973,947 | |
| | | | | | | | |
Materials – 1.04% | | | | | | | | |
Balchem | | | 898 | | | | 88,651 | |
Ball | | | 6,529 | | | | 422,165 | |
Boise Cascade | | | 4,377 | | | | 104,085 | |
Coeur Mining † | | | 5,866 | | | | 18,830 | |
Corteva | | | 3,673 | | | | 86,315 | |
Dow | | | 1,908 | | | | 55,790 | |
DuPont de Nemours | | | 15,176 | | | | 517,502 | |
20
| | | | | | | | |
| | | Number of shares | | | Value (US $) | |
Common Stock(continued) | | | | | | | | |
US Markets(continued) | | | | | | | | |
Materials(continued) | | | | | | | | |
Eastman Chemical | | | 2,534 | | | $ | 118,034 | |
Ferro † | | | 3,518 | | | | 32,928 | |
Kaiser Aluminum | | | 1,447 | | | | 100,248 | |
Linde | | | 496 | | | | 85,808 | |
Minerals Technologies | | | 2,376 | | | | 86,154 | |
Neenah | | | 2,138 | | | | 92,212 | |
Quaker Chemical | | | 695 | | | | 87,765 | |
Reliance Steel & Aluminum | | | 650 | | | | 56,934 | |
Westrock | | | 5,169 | | | | 146,076 | |
Worthington Industries | | | 3,025 | | | | 79,406 | |
| | | | | | | | |
| | | | | | | 2,178,903 | |
| | | | | | | | |
Real Estate – 2.69% | | | | | | | | |
American Assets Trust | | | 2,220 | | | | 55,500 | |
American Tower | | | 1,023 | | | | 222,758 | |
Apartment Investment & Management Class A | | | 2,376 | | | | 83,516 | |
Armada Hoffler Properties | | | 4,536 | | | | 48,535 | |
AvalonBay Communities | | | 1,775 | | | | 261,227 | |
Boston Properties | | | 999 | | | | 92,138 | |
Brandywine Realty Trust | | | 8,736 | | | | 91,903 | |
Brixmor Property Group | | | 6,047 | | | | 57,447 | |
Camden Property Trust | | | 1,348 | | | | 106,816 | |
Cousins Properties | | | 2,452 | | | | 71,770 | |
Douglas Emmett | | | 4,725 | | | | 144,160 | |
EastGroup Properties | | | 977 | | | | 102,077 | |
Empire State Realty Trust Class A | | | 1,250 | | | | 11,200 | |
Equity LifeStyle Properties | | | 2,600 | | | | 149,448 | |
Equity Residential | | | 10,371 | | | | 639,994 | |
Essex Property Trust | | | 1,025 | | | | 225,746 | |
Extra Space Storage | | | 1,200 | | | | 114,912 | |
Federal Realty Investment Trust | | | 650 | | | | 48,497 | |
First Industrial Realty Trust | | | 9,191 | | | | 305,417 | |
Highwoods Properties | | | 2,650 | | | | 93,863 | |
Host Hotels & Resorts | | | 8,525 | | | | 94,116 | |
JBG SMITH Properties | | | 1,312 | | | | 41,761 | |
Kilroy Realty | | | 1,600 | | | | 101,920 | |
Kite Realty Group Trust | | | 5,921 | | | | 56,072 | |
Lexington Realty Trust | | | 12,353 | | | | 122,665 | |
Macerich | | | 1,400 | | | | 7,882 | |
Mack-Cali Realty | | | 3,975 | | | | 60,539 | |
Mid-America Apartment Communities | | | 1,218 | | | | 125,491 | |
National Retail Properties | | | 2,025 | | | | 65,185 | |
21
Schedule of investments
Delaware Strategic Allocation Fund
| | | | | | | | |
| | | Number of shares | | | Value (US $) | |
Common Stock(continued) | | | | | | | | |
US Markets(continued) | | | | | | | | |
Real Estate(continued) | | | | | | | | |
Omega Healthcare Investors | | | 1,675 | | | $ | 44,455 | |
Pebblebrook Hotel Trust | | | 5,675 | | | | 61,801 | |
Physicians Realty Trust | | | 6,039 | | | | 84,184 | |
Prologis | | | 10,881 | | | | 874,506 | |
PS Business Parks | | | 725 | | | | 98,252 | |
Public Storage | | | 819 | | | | 162,662 | |
Regency Centers | | | 945 | | | | 36,316 | |
Retail Value | | | 448 | | | | 5,488 | |
RLJ Lodging Trust | | | 2,825 | | | | 21,809 | |
RPT Realty | | | 10,157 | | | | 61,247 | |
Sabra Health Care REIT | | | 200 | | | | 2,184 | |
Simon Property Group | | | 2,161 | | | | 118,552 | |
SITE Centers | | | 4,037 | | | | 21,033 | |
SL Green Realty | | | 1,875 | | | | 80,813 | |
Spirit MTA REIT =† | | | 677 | | | | 0 | |
Spirit Realty Capital | | | 1,405 | | | | 36,741 | |
Tanger Factory Outlet Centers | | | 2,750 | | | | 13,750 | |
Taubman Centers | | | 675 | | | | 28,269 | |
UDR | | | 4,200 | | | | 153,468 | |
Urban Edge Properties | | | 1,175 | | | | 10,352 | |
Ventas | | | 3,900 | | | | 104,520 | |
Welltower | | | 840 | | | | 38,455 | |
| | | | | | | | |
| | | | | | | 5,661,412 | |
| | | | | | | | |
Utilities – 0.56% | | | | | | | | |
Black Hills | | | 1,276 | | | | 81,702 | |
Edison International | | | 9,000 | | | | 493,110 | |
NorthWestern | | | 2,431 | | | | 145,447 | |
PPL | | | 4,371 | | | | 107,876 | |
South Jersey Industries | | | 6,271 | | | | 156,775 | |
Spire | | | 2,442 | | | | 181,880 | |
| | | | | | | | |
| | | | | | | 1,166,790 | |
| | | | | | | | |
Total US Markets(cost $42,942,116) | | | | | | | 53,158,173 | |
| | | | | | | | |
Developed Markets – 18.70%§ | | | | | | | | |
Communication Services – 1.02% | | | | | | | | |
Nippon Telegraph & Telephone | | | 22,260 | | | | 532,384 | |
NTT DOCOMO | | | 19,300 | | | | 603,571 | |
Publicis Groupe | | | 6,500 | | | | 185,763 | |
Telefonica | | | 58,600 | | | | 266,694 | |
Telenet Group Holding | | | 8,580 | | | | 257,646 | |
Toho | | | 9,900 | | | | 302,710 | |
| | | | | | | | |
| | | | | | | 2,148,768 | |
| | | | | | | | |
22
| | | | | | | | |
| | | Number of shares | | | Value (US $) | |
Common Stock(continued) | | | | | | | | |
Developed Markets§(continued) | | | | | | | | |
Consumer Discretionary – 1.80% | | | | | | | | |
Bandai Namco Holdings | | | 5,400 | | | $ | 261,918 | |
Cie Generale des Etablissements Michelin | | | 3,750 | | | | 328,443 | |
Honda Motor | | | 20,000 | | | | 447,529 | |
Industria de Diseno Textil | | | 15,500 | | | | 401,662 | |
LVMH Moet Hennessy Louis Vuitton | | | 600 | | | | 220,051 | |
Persimmon | | | 10,500 | | | | 248,206 | |
Sodexo | | | 3,990 | | | | 267,949 | |
Sony | | | 9,600 | | | | 568,642 | |
Stanley Electric | | | 12,500 | | | | 245,359 | |
Toyota Motor | | | 12,988 | | | | 782,721 | |
| | | | | | | | |
| | | | | | | 3,772,480 | |
| | | | | | | | |
Consumer Staples – 3.07% | | | | | | | | |
Asahi Group Holdings | | | 8,600 | | | | 279,012 | |
Beiersdorf | | | 3,800 | | | | 382,625 | |
British American Tobacco | | | 13,710 | | | | 467,035 | |
Chocoladefabriken Lindt & Spruengli | | | 40 | | | | 335,739 | |
Coles Group | | | 34,870 | | | | 324,746 | |
Danone | | | 6,870 | | | | 439,668 | |
Essity Class B | | | 11,200 | | | | 343,096 | |
Koninklijke Ahold Delhaize | | | 15,300 | | | | 356,438 | |
L’Oreal | | | 2,370 | | | | 613,382 | |
Matsumotokiyoshi Holdings | | | 7,000 | | | | 255,174 | |
Nestle | | | 11,260 | | | | 1,152,659 | |
Sundrug | | | 9,400 | | | | 301,216 | |
Suntory Beverage & Food | | | 10,000 | | | | 377,889 | |
Tate & Lyle | | | 32,230 | | | | 262,218 | |
WH Group 144A # | | | 300,000 | | | | 276,903 | |
Wm Morrison Supermarkets | | | 130,000 | | | | 284,005 | |
| | | | | | | | |
| | | | | | | 6,451,805 | |
| | | | | | | | |
Energy – 0.61% | | | | | | | | |
Galp Energia | | | 21,400 | | | | 244,734 | |
Royal Dutch Shell Class A | | | 24,370 | | | | 423,397 | |
Royal Dutch Shell Class B | | | 21,860 | | | | 366,681 | |
TOTAL | | | 6,700 | | | | 252,448 | |
| | | | | | | | |
| | | | | | | 1,287,260 | |
| | | | | | | | |
Financials – 2.65% | | | | | | | | |
Allianz | | | 2,860 | | | | 487,051 | |
Australia & New Zealand Banking Group | | | 33,520 | | | | 351,538 | |
Aviva | | | 75,000 | | | | 246,582 | |
Banco Bilbao Vizcaya Argentaria | | | 100,000 | | | | 309,655 | |
23
Schedule of investments
Delaware Strategic Allocation Fund
| | | | | | | | |
| | | Number of shares | | | Value (US $) | |
Common Stock(continued) | | | | | | | | |
Developed Markets§(continued) | | | | | | | | |
Financials(continued) | | | | | | | | |
Banco Espirito Santo Class R =† | | | 370,000 | | | $ | 0 | |
Bank LeumiLe-Israel | | | 63,000 | | | | 347,380 | |
Credit Suisse Group † | | | 41,000 | | | | 330,926 | |
Dai-ichi Life Holdings | | | 27,700 | | | | 328,941 | |
Daiwa Securities Group | | | 80,800 | | | | 312,235 | |
DBS Group Holdings | | | 29,600 | | | | 386,225 | |
Erste Group Bank † | | | 12,350 | | | | 226,100 | |
Investec | | | 59,000 | | | | 109,915 | |
Ninety One † | | | 29,500 | | | | 63,354 | |
Nordea Bank | | | 46,770 | | | | 263,100 | |
QBE Insurance Group | | | 46,000 | | | | 239,614 | |
Standard Chartered | | | 52,000 | | | | 287,497 | |
Swiss Life Holding | | | 960 | | | | 322,220 | |
UBS Group † | | | 35,320 | | | | 323,747 | |
UniCredit | | | 35,900 | | | | 277,744 | |
United Overseas Bank | | | 26,400 | | | | 362,209 | |
| | | | | | | | |
| | | | | | | 5,576,033 | |
| | | | | | | | |
Healthcare – 3.30% | | | | | | | | |
Alfresa Holdings | | | 20,000 | | | | 372,231 | |
Astellas Pharma | | | 32,000 | | | | 493,035 | |
BeiGene ADR † | | | 400 | | | | 49,244 | |
Daiichi Sankyo | | | 7,500 | | | | 515,075 | |
GlaxoSmithKline | | | 26,340 | | | | 494,248 | |
Koninklijke Philips | | | 13,450 | | | | 552,222 | |
Kyowa Kirin | | | 16,300 | | | | 364,297 | |
Novartis | | | 11,410 | | | | 941,312 | |
Novo Nordisk Class B | | | 11,580 | | | | 691,512 | |
Roche Holding | | | 3,630 | | | | 1,167,924 | |
Sanofi | | | 7,360 | | | | 637,191 | |
Smith & Nephew | | | 20,700 | | | | 364,662 | |
Sumitomo Dainippon Pharma | | | 22,200 | | | | 288,187 | |
| | | | | | | | |
| | | | | | | 6,931,140 | |
| | | | | | | | |
Industrials – 2.70% | | | | | | | | |
AGC | | | 10,400 | | | | 253,422 | |
Brenntag | | | 8,380 | | | | 304,463 | |
Deutsche Lufthansa | | | 17,620 | | | | 164,802 | |
East Japan Railway | | | 5,966 | | | | 451,450 | |
Intertek Group | | | 3,680 | | | | 215,004 | |
ITOCHU | | | 22,786 | | | | 471,548 | |
Japan Airlines | | | 10,400 | | | | 191,125 | |
24
| | | | | | | | |
| | | Number of shares | | | Value (US $) | |
Common Stock(continued) | | | | | | | | |
Developed Markets§(continued) | | | | | | | | |
Industrials(continued) | | | | | | | | |
Leonardo | | | 32,000 | | | $ | 211,557 | |
Meggitt | | | 29,590 | | | | 106,366 | |
Safran | | | 2,200 | | | | 194,914 | |
Schneider Electric | | | 5,960 | | | | 503,757 | |
Siemens | | | 4,560 | | | | 381,832 | |
Teleperformance | | | 1,870 | | | | 387,309 | |
Vestas Wind Systems | | | 4,750 | | | | 386,487 | |
Vinci | | | 5,780 | | | | 472,280 | |
Volvo Class B | | | 29,310 | | | | 348,377 | |
West Japan Railway | | | 5,000 | | | | 341,975 | |
Wolters Kluwer | | | 4,200 | | | | 297,293 | |
| | | | | | | | |
| | | | | | | 5,683,961 | |
| | | | | | | | |
Information Technology – 1.24% | | | | | | | | |
ASML Holding (New York Shares) | | | 2,660 | | | | 701,216 | |
Capgemini | | | 4,250 | | | | 355,140 | |
Nice † | | | 2,270 | | | | 328,232 | |
Omron | | | 7,600 | | | | 392,940 | |
Tokyo Electron | | | 2,700 | | | | 503,209 | |
Venture | | | 34,400 | | | | 327,697 | |
| | | | | | | | |
| | | | | | | 2,608,434 | |
| | | | | | | | |
Materials – 1.35% | | | | | | | | |
BlueScope Steel | | | 43,800 | | | | 229,316 | |
Covestro 144A # | | | 8,960 | | | | 271,920 | |
CRH | | | 15,000 | | | | 405,644 | |
LANXESS | | | 7,000 | | | | 278,628 | |
Rio Tinto | | | 12,470 | | | | 571,653 | |
Shin-Etsu Chemical | | | 4,700 | | | | 461,950 | |
South32 | | | 235,000 | | | | 259,419 | |
UPM-Kymmene | | | 13,460 | | | | 367,013 | |
| | | | | | | | |
| | | | | | | 2,845,543 | |
| | | | | | | | |
Real Estate – 0.53% | | | | | | | | |
Daito Trust Construction | | | 3,400 | | | | 315,736 | |
Grand City Properties | | | 14,660 | | | | 306,884 | |
Klepierre | | | 12,230 | | | | 233,123 | |
Mirvac Group | | | 204,620 | | | | 259,969 | |
| | | | | | | | |
| | | | | | | 1,115,712 | |
| | | | | | | | |
Utilities – 0.43% | | | | | | | | |
AusNet Services | | | 255,000 | | | | 267,753 | |
Centrica | | | 370,000 | | | | 174,341 | |
25
Schedule of investments
Delaware Strategic Allocation Fund
| | | | | | | | |
| | | Number of shares | | | Value (US $) | |
Common Stock(continued) | | | | | | | | |
Developed Markets§(continued) | | | | | | | | |
Utilities(continued) | | | | | | | | |
Tokyo Gas | | | 19,200 | | | $ | 452,415 | |
| | | | | | | | |
| | | | | | | 894,509 | |
| | | | | | | | |
Total Developed Markets(cost $42,831,705) | | | | | | | 39,315,645 | |
| | | | | | | | |
Emerging Markets – 7.64%@ | | | | | | | | |
Communication Services – 1.82% | | | | | | | | |
America Movil Class L ADR | | | 7,132 | | | | 84,015 | |
Baidu ADR † | | | 2,422 | | | | 244,113 | |
China Mobile | | | 39,715 | | | | 297,635 | |
China Mobile ADR | | | 3,222 | | | | 121,373 | |
Grupo Televisa ADR | | | 18,488 | | | | 107,230 | |
LG Uplus | | | 9,781 | | | | 85,929 | |
Mail.Ru Group GDR † | | | 3,427 | | | | 55,083 | |
Mobile TeleSystems PJSC ADR | | | 4,784 | | | | 36,358 | |
NAVER | | | 592 | | | | 82,308 | |
SINA † | | | 8,390 | | | | 267,138 | |
SK Telecom ADR | | | 42,555 | | | | 692,370 | |
Sohu.com ADR † | | | 9,774 | | | | 60,892 | |
Telefonica Brasil ADR | | | 10,600 | | | | 101,018 | |
Tencent Holdings | | | 24,900 | | | | 1,230,748 | |
Tencent Music Entertainment Group ADR † | | | 7 | | | | 70 | |
TIM Participacoes ADR | | | 9,082 | | | | 110,437 | |
Turkcell Iletisim Hizmetleri ADR | | | 14,390 | | | | 66,914 | |
Weibo ADR † | | | 1,972 | | | | 65,293 | |
Yandex Class A † | | | 3,272 | | | | 111,412 | |
| | | | | | | | |
| | | | | | | 3,820,336 | |
| | | | | | | | |
Consumer Discretionary – 1.17% | | | | | | | | |
Alibaba Group Holding ADR † | | | 6,138 | | | | 1,193,718 | |
Arcos Dorados Holdings Class A | | | 9,153 | | | | 30,571 | |
Astra International | | | 351,200 | | | | 83,498 | |
B2W Cia Digital † | | | 58,754 | | | | 541,056 | |
JD.com ADR † | | | 11,936 | | | | 483,408 | |
LG Electronics | | | 1,200 | | | | 47,182 | |
Trip.com Group ADR † | | | 3,331 | | | | 78,112 | |
| | | | | | | | |
| | | | | | | 2,457,545 | |
| | | | | | | | |
Consumer Staples – 0.69% | | | | | | | | |
Atacadao | | | 18,077 | | | | 71,110 | |
BRF ADR † | | | 28,163 | | | | 81,673 | |
China Mengniu Dairy † | | | 49,000 | | | | 168,987 | |
Cia Cervecerias Unidas ADR | | | 3,979 | | | | 53,239 | |
Coca-Cola Femsa ADR | | | 5,821 | | | | 234,179 | |
26
| | | | | | | | |
| | | Number of shares | | | Value (US $) | |
Common Stock(continued) | | | | | | | | |
Emerging Markets @(continued) | | | | | | | | |
Consumer Staples(continued) | | | | | | | | |
Fomento Economico Mexicano ADR | | | 1,138 | | | $ | 68,860 | |
Lotte Confectionery | | | 237 | | | | 20,334 | |
Tata Consumer Products | | | 14,985 | | | | 58,174 | |
Tingyi Cayman Islands Holding | | | 161,724 | | | | 262,936 | |
Tsingtao Brewery Class H | | | 50,000 | | | | 252,736 | |
Uni-President China Holdings | | | 183,600 | | | | 177,448 | |
| | | | | | | | |
| | | | | | | 1,449,676 | |
| | | | | | | | |
Energy – 1.13% | | | | | | | | |
China Petroleum & Chemical Class H | | | 276,200 | | | | 134,953 | |
CNOOC ADR | | | 1,297 | | | | 134,201 | |
Gazprom PJSC ADR | | | 56,767 | | | | 257,423 | |
LUKOIL PJSC ADR | | | 2,508 | | | | 148,373 | |
Petroleo Brasileiro ADR | | | 14,735 | | | | 81,043 | |
Reliance Industries GDR 144A # | | | 45,543 | | | | 1,394,868 | |
Rosneft Oil PJSC GDR | | | 53,962 | | | | 217,206 | |
| | | | | | | | |
| | | | | | | 2,368,067 | |
| | | | | | | | |
Financials – 0.52% | | | | | | | | |
Akbank T.A.S. † | | | 73,761 | | | | 61,936 | |
Banco Bradesco ADR | | | 22,725 | | | | 92,263 | |
Banco Santander Brasil ADR | | | 12,715 | | | | 65,737 | |
Banco Santander Mexico ADR | | | 33,819 | | | | 109,574 | |
Grupo Financiero Banorte Class O | | | 16,520 | | | | 45,265 | |
Itau Unibanco Holding ADR | | | 29,636 | | | | 133,066 | |
Ping An Insurance Group Co. of China Class H | | | 35,000 | | | | 341,819 | |
Samsung Life Insurance | | | 2,218 | | | | 77,625 | |
Sberbank of Russia PJSC | | | 68,513 | | | | 163,309 | |
| | | | | | | | |
| | | | | | | 1,090,594 | |
| | | | | | | | |
Healthcare – 0.12% | | | | | | | | |
Dr Reddy’s Laboratories | | | 4,481 | | | | 182,433 | |
Genscript Biotech † | | | 40,000 | | | | 64,025 | |
| | | | | | | | |
| | | | | | | 246,458 | |
| | | | | | | | |
Industrials – 0.00% | | | | | | | | |
Latam Airlines Group ADR | | | 3,308 | | | | 8,766 | |
| | | | | | | | |
| | | | | | | 8,766 | |
| | | | | | | | |
Information Technology – 1.97% | | | | | | | | |
Hon Hai Precision Industry | | | 150,582 | | | | 346,680 | |
MediaTek | | | 41,000 | | | | 440,062 | |
Samsung Electronics | | | 31,501 | | | | 1,224,807 | |
SK Hynix | | | 13,902 | | | | 939,832 | |
Taiwan Semiconductor Manufacturing | | | 123,069 | | | | 1,107,906 | |
27
Schedule of investments
Delaware Strategic Allocation Fund
| | | | | | | | |
| | | Number of shares | | | Value (US $) | |
Common Stock(continued) | | | | | | | | |
Emerging Markets @(continued) | | | | | | | | |
Information Technology(continued) | | | | | | | | |
WNS Holdings ADR † | | | 1,998 | | | $ | 85,874 | |
| | | | | | | | |
| | | | | | | 4,145,161 | |
| | | | | | | | |
Materials – 0.17% | | | | | | | | |
Cemex ADR | | | 13,862 | | | | 29,387 | |
Cia de Minas Buenaventura ADR | | | 12,628 | | | | 92,058 | |
Sociedad Quimica y Minera de Chile ADR | | | 3,027 | | | | 68,259 | |
Tata Chemicals | | | 13,145 | | | | 38,561 | |
Vale ADR † | | | 16,001 | | | | 132,648 | |
| | | | | | | | |
| | | | | | | 360,913 | |
| | | | | | | | |
Real Estate – 0.03% | | | | | | | | |
Etalon Group GDR 144A # | | | 20,100 | | | | 25,929 | |
IRSA Inversiones y Representaciones ADR † | | | 4,584 | | | | 15,952 | |
IRSA Propiedades Comerciales ADR | | | 192 | | | | 1,348 | |
UEM Sunrise † | | | 127,619 | | | | 11,594 | |
| | | | | | | | |
| | | | | | | 54,823 | |
| | | | | | | | |
Utilities – 0.02% | | | | | | | | |
Kunlun Energy | | | 86,000 | | | | 49,700 | |
| | | | | | | | |
| | | | | | | 49,700 | |
| | | | | | | | |
Total Emerging Markets(cost $14,834,472) | | | | | | | 16,052,039 | |
| | | | | | | | |
Total Common Stock(cost $100,608,293) | | | | | | | 108,525,857 | |
| | | | | | | | |
| | |
| | | | | | | | |
Exchange-Traded Funds – 5.38% | | | | | | | | |
iShares MSCI EAFE ETF | | | 3,770 | | | | 201,544 | |
iShares Russell 1000 Growth ETF | | | 51,490 | | | | 7,756,969 | |
Vanguard FTSE Developed Markets ETF | | | 930 | | | | 31,006 | |
Vanguard Mega Cap Growth ETF | | | 13,080 | | | | 1,662,206 | |
Vanguard Russell 1000 Growth ETF | | | 10,720 | | | | 1,658,170 | |
| | | | | | | | |
Total Exchange-Traded Funds(cost $9,617,552) | | | | | | | 11,309,895 | |
| | | | | | | | |
| | | | | | | | |
Limited Partnership – 0.01% | | | | | | | | |
Brookfield Property Partners | | | 3,983 | | | | 32,103 | |
| | | | | | | | |
Total Limited Partnership(cost $77,030) | | | | | | | 32,103 | |
| | | | | | | | |
28
| | | | | | | | |
| | | Principal amount° | | | Value (US $) | |
Agency Asset-Backed Security – 0.00% | | | | | | | | |
Fannie Mae REMIC Trust
Series2002-W11 AV1 1.967% (LIBOR01M + 0.34%, Floor 0.17%) 11/25/32● | | | 1,815 | | | $ | 1,778 | |
| | | | | | | | |
Total Agency Asset-Backed Security(cost $1,816) | | | | | | | 1,778 | |
| | | | | | | | |
| | | | | | | | |
Agency Collateralized Mortgage Obligations – 1.82% | | | | | | | | |
Fannie Mae REMICs | | | | | | | | |
Series2013-4 PL 2.00% 2/25/43 | | | 26,000 | | | | 26,975 | |
Series2013-44 DI 3.00% 5/25/33S | | | 550,379 | | | | 53,511 | |
Series2013-71 ZA 3.50% 7/25/43 | | | 107,615 | | | | 115,757 | |
Series2015-89 EZ 3.00% 12/25/45 | | | 97,923 | | | | 99,340 | |
Series2016-61 ML 3.00% 9/25/46 | | | 21,000 | | | | 22,998 | |
Series2016-80 JZ 3.00% 11/25/46 | | | 53,174 | | | | 56,491 | |
Series2016-101 ZP 3.50% 1/25/47 | | | 36,969 | | | | 42,585 | |
Series2017-40 GZ 3.50% 5/25/47 | | | 167,204 | | | | 187,804 | |
Series2017-67 BZ 3.00% 9/25/47 | | | 6,483 | | | | 7,047 | |
Series2017-94 CZ 3.50% 11/25/47 | | | 189,335 | | | | 212,214 | |
Series2017-99 DZ 3.50% 12/25/47 | | | 118,261 | | | | 133,094 | |
Freddie Mac REMICs | | | | | | | | |
Series 4015 MY 3.50% 3/15/42 | | | 30,000 | | | | 33,102 | |
Series 4197 LZ 4.00% 4/15/43 | | | 217,490 | | | | 244,203 | |
Series 4210 Z 3.00% 5/15/43 | | | 92,536 | | | | 91,989 | |
Series 4487 ZC 3.50% 6/15/45 | | | 875,029 | | | | 1,005,229 | |
Series 4531 PZ 3.50% 11/15/45 | | | 180,345 | | | | 195,767 | |
Series 4625 PZ 3.00% 6/15/46 | | | 1,108 | | | | 1,193 | |
Series 4629 KB 3.00% 11/15/46 | | | 390,000 | | | | 424,739 | |
Series 4657 JZ 3.50% 2/15/47 | | | 5,569 | | | | 6,392 | |
GNMA | | | | | | | | |
Series2013-113 LY 3.00% 5/20/43 | | | 450,000 | | | | 489,184 | |
Series2016-160 VZ 2.50% 11/20/46 | | | 58,688 | | | | 59,492 | |
Series2017-10 KZ 3.00% 1/20/47 | | | 1,100 | | | | 1,112 | |
Series2017-19 AY 3.00% 2/20/47 | | | 15,000 | | | | 16,699 | |
Series2017-36 ZC 3.00% 3/20/47 | | | 66,737 | | | | 72,231 | |
Series2017-52 LE 3.00% 1/16/47 | | | 188,000 | | | | 211,393 | |
Series2017-56 GZ 3.50% 4/20/47 | | | 4,429 | | | | 5,233 | |
Series2017-56 JZ 3.00% 4/20/47 | | | 6,548 | | | | 7,167 | |
Series2018-34 TY 3.50% 3/20/48 | | | 10,000 | | | | 10,878 | |
| | | | | | | | |
Total Agency Collateralized Mortgage Obligations(cost $3,438,166) | | | | | | | 3,833,819 | |
| | | | | | | | |
| | | | | | | | |
Agency Commercial Mortgage-Backed Securities – 0.51% | | | | | | | | |
FREMF Mortgage Trust | | | | | | | | |
Series2011-K11 B 144A 4.418% 12/25/48 #● | | | 500,000 | | | | 500,046 | |
Series2011-K15 B 144A 4.961% 8/25/44 #● | | | 20,000 | | | | 19,951 | |
29
Schedule of investments
Delaware Strategic Allocation Fund
| | | | | | | | |
| | | Principal amount° | | | Value (US $) | |
Agency Commercial Mortgage-Backed Securities(continued) | | | | | | | | |
FREMF Mortgage Trust | | | | | | | | |
Series2012-K22 B 144A 3.687% 8/25/45 #● | | | 145,000 | | | $ | 143,601 | |
Series 2013-K713 B 144A 3.492% 4/25/46 #● | | | 9,230 | | | | 9,208 | |
Series 2013-K713 C 144A 3.492% 4/25/46 #● | | | 210,000 | | | | 209,494 | |
Series 2014-K717 B 144A 3.63% 11/25/47 #● | | | 140,000 | | | | 139,029 | |
Series 2014-K717 C 144A 3.63% 11/25/47 #● | | | 60,000 | | | | 59,713 | |
| | | | | | | | |
Total Agency Commercial Mortgage-Backed Securities(cost $1,118,195) | | | | | | | 1,081,042 | |
| | | | | | | | |
| | | | | | | | |
Agency Mortgage-Backed Securities – 14.27% | | | | | | | | |
Fannie Mae S.F. 30 yr | | | | | | | | |
3.00% 12/1/46 | | | 1,301,441 | | | | 1,373,065 | |
3.00% 9/1/47 | | | 825,323 | | | | 869,646 | |
3.00% 4/1/48 | | | 103,950 | | | | 109,012 | |
3.00% 11/1/48 | | | 96,635 | | | | 101,909 | |
3.00% 10/1/49 | | | 351,199 | | | | 368,275 | |
3.00% 11/1/49 | | | 228,718 | | | | 239,774 | |
3.00% 12/1/49 | | | 181,720 | | | | 191,227 | |
3.00% 1/1/50 | | | 1,980,615 | | | | 2,076,274 | |
3.50% 11/1/48 | | | 136,742 | | | | 144,754 | |
3.50% 6/1/49 | | | 327,644 | | | | 346,357 | |
3.50% 11/1/49 | | | 679,192 | | | | 717,532 | |
3.50% 12/1/49 | | | 936,729 | | | | 1,000,439 | |
3.50% 2/1/50 | | | 1,584,638 | | | | 1,674,597 | |
3.50% 3/1/50 | | | 42,930 | | | | 45,776 | |
4.00% 4/1/48 | | | 354,991 | | | | 380,716 | |
4.00% 10/1/48 | | | 669,883 | | | | 728,718 | |
4.50% 4/1/44 | | | 65,184 | | | | 72,231 | |
4.50% 2/1/46 | | | 428,524 | | | | 469,373 | |
4.50% 5/1/46 | | | 33,502 | | | | 36,680 | |
4.50% 11/1/47 | | | 39,962 | | | | 43,778 | |
4.50% 4/1/48 | | | 74,388 | | | | 81,448 | |
4.50% 9/1/48 | | | 1,537,327 | | | | 1,667,093 | |
4.50% 1/1/49 | | | 297,346 | | | | 325,609 | |
4.50% 11/1/49 | | | 758,211 | | | | 815,267 | |
5.00% 7/1/47 | | | 1,149,700 | | | | 1,275,412 | |
5.00% 9/1/48 | | | 404,955 | | | | 437,079 | |
5.00% 8/1/49 | | | 2,011,802 | | | | 2,229,896 | |
5.50% 2/1/34 | | | 39,499 | | | | 45,098 | |
5.50% 9/1/34 | | | 54,542 | | | | 61,200 | |
5.50% 5/1/44 | | | 3,438,891 | | | | 3,893,363 | |
6.00% 10/1/38 | | | 695,186 | | | | 799,721 | |
6.00% 6/1/41 | | | 54,454 | | | | 62,676 | |
6.00% 7/1/41 | | | 2,006,423 | | | | 2,308,816 | |
30
| | | | | | | | |
| | | Principal amount° | | | Value (US $) | |
Agency Mortgage-Backed Securities(continued) | | | | | | | | |
Fannie Mae S.F. 30 yr
6.00% 1/1/42 | | | 44,457 | | | $ | 51,136 | |
Fannie Mae S.F. 30 yr TBA | | | | | | | | |
4.00% 4/1/50 | | | 279,000 | | | | 297,892 | |
5.00% 4/1/50 | | | 1,620,000 | | | | 1,749,284 | |
Freddie Mac ARM
2.599% (LIBOR12M + 1.63%,
Cap 7.60%, Floor 1.63%) 10/1/46● | | | 96,702 | | | | 98,344 | |
Freddie Mac S.F. 30 yr | | | | | | | | |
3.00% 11/1/49 | | | 182,635 | | | | 191,515 | |
3.00% 12/1/49 | | | 52,632 | | | | 55,207 | |
3.00% 1/1/50 | | | 91,478 | | | | 96,179 | |
4.00% 10/1/47 | | | 354,483 | | | | 381,737 | |
4.50% 8/1/48 | | | 663,125 | | | | 717,670 | |
5.00% 7/1/45 | | | 187,324 | | | | 207,759 | |
5.50% 6/1/35 | | | 31,057 | | | | 35,110 | |
5.50% 7/1/37 | | | 46,473 | | | | 52,665 | |
5.50% 8/1/37 | | | 40,111 | | | | 45,344 | |
5.50% 10/1/37 | | | 39,682 | | | | 44,967 | |
5.50% 6/1/41 | | | 773,280 | | | | 876,650 | |
5.50% 9/1/41 | | | 44,448 | | | | 50,397 | |
GNMA II S.F. 30 yr | | | | | | | | |
5.50% 5/20/37 | | | 16,996 | | | | 19,242 | |
6.50% 6/20/39 | | | 29,101 | | | | 34,022 | |
| | | | | | | | |
Total Agency Mortgage-Backed Securities(cost $29,311,090) | | | | | | | 29,997,931 | |
| | | | | | | | |
| | | | | | | | |
Collateralized Debt Obligations – 0.61% | | | | | | | | |
Apex Credit CLO
Series2017-1A A1 144A 3.271% (LIBOR03M + 1.47%, Floor 1.47%) 4/24/29 #● | | | 255,000 | | | | 242,949 | |
Galaxy XXI CLO
Series2015-21A AR 144A 2.839% (LIBOR03M + 1.02%) 4/20/31 #● | | | 600,000 | | | | 559,338 | |
Mariner CLO 5
Series2018-5A A 144A 2.904% (LIBOR03M + 1.11%, Floor 1.11%) 4/25/31 #● | | | 250,000 | | | | 234,461 | |
Northwoods Capital XV
Series2017-15A A 144A 2.416% (LIBOR03M + 1.30%) 6/20/29 #● | | | 250,000 | | | | 238,821 | |
| | | | | | | | |
Total Collateralized Debt Obligations(cost $1,355,000) | | | | | | | 1,275,569 | |
| | | | | | | | |
31
Schedule of investments
Delaware Strategic Allocation Fund
| | | | | | | | |
| | | Principal amount° | | | Value (US $) | |
Corporate Bonds – 14.37% | | | | | | | | |
Banking – 4.29% | | | | | | | | |
Banco Santander 2.706% 6/27/24 | | | 200,000 | | | $ | 198,464 | |
Bank of America | | | | | | | | |
2.496% 2/13/31 µ | | | 60,000 | | | | 57,790 | |
3.458% 3/15/25 µ | | | 215,000 | | | | 222,070 | |
4.083% 3/20/51 µ | | | 70,000 | | | | 79,678 | |
BBVA USA 3.875% 4/10/25 | | | 250,000 | | | | 237,102 | |
Citizens Bank 3.70% 3/29/23 | | | 250,000 | | | | 256,400 | |
Citizens Financial Group | | | | | | | | |
2.85% 7/27/26 | | | 345,000 | | | | 337,266 | |
4.30% 12/3/25 | | | 160,000 | | | | 167,824 | |
Credit Suisse Group | | | | | | | | |
144A 5.10%#µy | | | 200,000 | | | | 154,750 | |
144A 6.25%#µy | | | 200,000 | | | | 185,722 | |
Fifth Third Bancorp | | | | | | | | |
2.375% 1/28/25 | | | 70,000 | | | | 68,315 | |
3.65% 1/25/24 | | | 55,000 | | | | 57,304 | |
Fifth Third Bank 3.85% 3/15/26 | | | 200,000 | | | | 211,207 | |
Goldman Sachs Group | | | | | | | | |
2.60% 2/7/30 | | | 70,000 | | | | 66,023 | |
3.50% 4/1/25 | | | 40,000 | | | | 40,635 | |
6.00% 6/15/20 | | | 570,000 | | | | 573,453 | |
Huntington Bancshares 2.30% 1/14/22 | | | 115,000 | | | | 114,049 | |
Huntington National Bank 3.125% 4/1/22 | | | 305,000 | | | | 309,267 | |
JPMorgan Chase & Co. | | | | | | | | |
3.702% 5/6/30 µ | | | 565,000 | | | | 608,013 | |
4.023% 12/5/24 µ | | | 75,000 | | | | 79,583 | |
4.60%µy | | | 85,000 | | | | 74,498 | |
5.00%µy | | | 120,000 | | | | 112,583 | |
KeyBank 3.40% 5/20/26 | | | 500,000 | | | | 522,114 | |
Manufacturers & Traders Trust 2.50% 5/18/22 | | | 250,000 | | | | 242,134 | |
Morgan Stanley | | | | | | | | |
2.75% 5/19/22 | | | 200,000 | | | | 202,286 | |
2.954% (LIBOR03M + 1.22%) 5/8/24● | | | 650,000 | | | | 623,591 | |
3.622% 4/1/31 µ | | | 65,000 | | | | 67,790 | |
5.00% 11/24/25 | | | 30,000 | | | | 33,219 | |
5.597% 3/24/51 µ | | | 75,000 | | | | 106,385 | |
PNC Bank 2.70% 11/1/22 | | | 250,000 | | | | 253,489 | |
PNC Financial Services Group 2.60% 7/23/26 | | | 175,000 | | | | 177,150 | |
32
| | | | | | | | |
| | | Principal amount° | | | Value (US $) | |
Corporate Bonds(continued) | | | | | | | | |
Banking(continued) | | | | | | | | |
Regions Financial | | | | | | | | |
2.75% 8/14/22 | | | 80,000 | | | $ | 79,205 | |
3.80% 8/14/23 | | | 80,000 | | | | 81,142 | |
Santander UK 144A 5.00% 11/7/23 # | | | 90,000 | | | | 90,827 | |
State Street 3.30% 12/16/24 | | | 260,000 | | | | 273,926 | |
Truist Bank | | | | | | | | |
2.25% 6/1/20 | | | 780,000 | | | | 778,579 | |
2.45% 8/1/22 | | | 85,000 | | | | 85,286 | |
2.636% 9/17/29 µ | | | 73,000 | | | | 70,017 | |
3.00% 2/2/23 | | | 70,000 | | | | 71,941 | |
3.30% 5/15/26 | | | 200,000 | | | | 205,627 | |
Truist Financial 2.70% 1/27/22 | | | 105,000 | | | | 105,654 | |
US Bancorp | | | | | | | | |
3.00% 7/30/29 | | | 30,000 | | | | 29,993 | |
3.10% 4/27/26 | | | 330,000 | | | | 334,969 | |
3.15% 4/27/27 | | | 30,000 | | | | 31,234 | |
USB Capital IX 3.50% (LIBOR03M + 1.02%)y● | | | 175,000 | | | | 130,680 | |
Woori Bank 144A 4.75% 4/30/24 # | | | 200,000 | | | | 213,069 | |
| | | | | | | | |
| | | | | | | 9,022,303 | |
| | | | | | | | |
Basic Industry – 0.81% | | | | | | | | |
BHP Billiton Finance USA 144A 6.25% 10/19/75 #µ | | | 200,000 | | | | 196,619 | |
Cydsa 144A 6.25% 10/4/27 # | | | 200,000 | | | | 149,709 | |
Georgia-Pacific 8.00% 1/15/24 | | | 355,000 | | | | 431,188 | |
Newmont | | | | | | | | |
2.25% 10/1/30 | | | 50,000 | | | | 46,365 | |
2.80% 10/1/29 | | | 140,000 | | | | 134,219 | |
OCP 144A 4.50% 10/22/25 # | | | 200,000 | | | | 189,766 | |
Orbia Advance 144A 5.50% 1/15/48 # | | | 200,000 | | | | 175,463 | |
Petkim Petrokimya Holding 144A 5.875% 1/26/23 # | | | 200,000 | | | | 166,904 | |
Syngenta Finance 144A 3.933% 4/23/21 # | | | 225,000 | | | | 212,088 | |
| | | | | | | | |
| | | | | | | 1,702,321 | |
| | | | | | | | |
Capital Goods – 0.52% | | | | | | | | |
Carrier Global | | | | | | | | |
144A 2.242% 2/15/25 # | | | 45,000 | | | | 44,097 | |
144A 2.493% 2/15/27 # | | | 55,000 | | | | 52,753 | |
144A 2.722% 2/15/30 # | | | 32,000 | | | | 29,631 | |
General Electric | | | | | | | | |
2.70% 10/9/22 | | | 40,000 | | | | 39,396 | |
5.55% 5/4/20 | | | 115,000 | | | | 115,297 | |
L3Harris Technologies 144A 4.40% 6/15/28 # | | | 255,000 | | | | 276,425 | |
Otis Worldwide
144A 2.056% 4/5/25 # | | | 60,000 | | | | 58,859 | |
33
Schedule of investments
Delaware Strategic Allocation Fund
| | | | | | | | |
| | | Principal amount° | | | Value (US $) | |
Corporate Bonds(continued) | | | | | | | | |
Capital Goods(continued) | | | | | | | | |
Otis Worldwide | | | | | | | | |
144A 2.565% 2/15/30 # | | | 105,000 | | | $ | 102,357 | |
144A 3.112% 2/15/40 # | | | 60,000 | | | | 57,499 | |
144A 3.362% 2/15/50 # | | | 40,000 | | | | 39,444 | |
Roper Technologies | | | | | | | | |
2.35% 9/15/24 | | | 60,000 | | | | 58,443 | |
2.95% 9/15/29 | | | 65,000 | | | | 64,985 | |
United Technologies 3.65% 8/16/23 | | | 50,000 | | | | 52,669 | |
Waste Connections 2.60% 2/1/30 | | | 110,000 | | | | 103,203 | |
| | | | | | | | |
| | | | | | | 1,095,058 | |
| | | | | | | | |
Communications – 2.01% | | | | | | | | |
AT&T | | | | | | | | |
4.30% 2/15/30 | | | 60,000 | | | | 64,707 | |
4.35% 3/1/29 | | | 120,000 | | | | 129,308 | |
4.50% 3/9/48 | | | 35,000 | | | | 38,169 | |
4.90% 8/15/37 | | | 10,000 | | | | 11,263 | |
Charter Communications Operating | | | | | | | | |
4.50% 2/1/24 | | | 145,000 | | | | 149,706 | |
5.05% 3/30/29 | | | 250,000 | | | | 271,969 | |
Comcast | | | | | | | | |
3.20% 7/15/36 | | | 60,000 | | | | 63,579 | |
3.70% 4/15/24 | | | 550,000 | | | | 591,409 | |
Discovery Communications | | | | | | | | |
4.125% 5/15/29 | | | 85,000 | | | | 82,566 | |
5.20% 9/20/47 | | | 55,000 | | | | 56,460 | |
Fox | | | | | | | | |
144A 4.03% 1/25/24 # | | | 295,000 | | | | 307,074 | |
144A 4.709% 1/25/29 # | | | 20,000 | | | | 21,987 | |
GTP Acquisition Partners I 144A 2.35% 6/15/20 # | | | 200,000 | | | | 202,317 | |
Sprint Spectrum 144A 4.738% 3/20/25 # | | | 220,000 | | | | 226,324 | |
Telefonica Emisiones 5.134% 4/27/20 | | | 350,000 | | | | 350,587 | |
Time Warner Entertainment 8.375% 3/15/23 | | | 575,000 | | | | 632,041 | |
Verizon Communications | | | | | | | | |
3.15% 3/22/30 | | | 35,000 | | | | 37,717 | |
4.00% 3/22/50 | | | 20,000 | | | | 23,845 | |
4.50% 8/10/33 | | | 540,000 | | | | 651,384 | |
ViacomCBS | | | | | | | | |
4.375% 3/15/43 | | | 240,000 | | | | 213,963 | |
4.95% 1/15/31 | | | 55,000 | | | | 54,556 | |
Vodafone Group 4.875% 6/19/49 | | | 35,000 | | | | 39,139 | |
| | | | | | | | |
| | | | | | | 4,220,070 | |
| | | | | | | | |
34
| | | | | | | | |
| | | Principal amount° | | | Value (US $) | |
Corporate Bonds(continued) | | | | | | | | |
Consumer Cyclical – 0.42% | | | | | | | | |
Dollar Tree 3.70% 5/15/23 | | | 240,000 | | | $ | 244,134 | |
General Motors 5.00% 10/1/28 | | | 4,000 | | | | 3,514 | |
General Motors Financial | | | | | | | | |
3.45% 4/10/22 | | | 440,000 | | | | 406,694 | |
5.25% 3/1/26 | | | 11,000 | | | | 9,728 | |
Home Depot | | | | | | | | |
2.70% 4/15/30 | | | 55,000 | | | | 56,125 | |
3.35% 4/15/50 | | | 45,000 | | | | 49,072 | |
TJX | | | | | | | | |
3.875% 4/15/30 | | | 65,000 | | | | 67,395 | |
4.50% 4/15/50 | | | 35,000 | | | | 37,670 | |
| | | | | | | | |
| | | | | | | 874,332 | |
| | | | | | | | |
Consumer Non-Cyclical – 1.14% | | | | | | | | |
AbbVie 144A 2.95% 11/21/26 # | | | 190,000 | | | | 194,038 | |
Amgen | | | | | | | | |
2.20% 2/21/27 | | | 40,000 | | | | 39,984 | |
2.45% 2/21/30 | | | 115,000 | | | | 114,856 | |
Anheuser-Busch InBev Worldwide 4.15% 1/23/25 | | | 110,000 | | | | 118,859 | |
Bristol-Myers Squibb 144A 2.90% 7/26/24 # | | | 330,000 | | | | 350,428 | |
Cigna | | | | | | | | |
2.40% 3/15/30 | | | 45,000 | | | | 42,847 | |
2.721% (LIBOR03M + 0.89%) 7/15/23● | | | 260,000 | | | | 241,902 | |
3.20% 3/15/40 | | | 45,000 | | | | 41,660 | |
3.75% 7/15/23 | | | 70,000 | | | | 72,180 | |
4.125% 11/15/25 | | | 107,000 | | | | 114,768 | |
CVS Health | | | | | | | | |
3.70% 3/9/23 | | | 320,000 | | | | 333,522 | |
3.75% 4/1/30 | | | 55,000 | | | | 57,024 | |
4.10% 3/25/25 | | | 20,000 | | | | 21,085 | |
Global Payments | | | | | | | | |
2.65% 2/15/25 | | | 120,000 | | | | 119,189 | |
3.20% 8/15/29 | | | 150,000 | | | | 147,423 | |
New York and Presbyterian Hospital 4.063% 8/1/56 | | | 140,000 | | | | 168,067 | |
Takeda Pharmaceutical 4.40% 11/26/23 | | | 210,000 | | | | 221,423 | |
| | | | | | | | |
| | | | | | | 2,399,255 | |
| | | | | | | | |
Energy – 1.06% | | | | | | | | |
Ecopetrol 5.875% 9/18/23 | | | 35,000 | | | | 34,519 | |
Energy Transfer Operating | | | | | | | | |
5.25% 4/15/29 | | | 80,000 | | | | 67,883 | |
7.125%µy | | | 135,000 | | | | 81,416 | |
Enterprise Products Operating 3.70% 1/31/51 | | | 25,000 | | | | 22,605 | |
35
Schedule of investments
Delaware Strategic Allocation Fund
| | | | | | | | |
| | | Principal amount° | | | Value (US $) | |
Corporate Bonds(continued) | | | | | | | | |
Energy(continued) | | | | | | | | |
Marathon Oil | | | | | | | | |
2.80% 11/1/22 | | | 160,000 | | | $ | 122,623 | |
4.40% 7/15/27 | | | 65,000 | | | | 43,483 | |
MPLX | | | | | | | | |
4.00% 3/15/28 | | | 35,000 | | | | 31,178 | |
4.125% 3/1/27 | | | 160,000 | | | | 136,761 | |
Noble Energy | | | | | | | | |
3.25% 10/15/29 | | | 75,000 | | | | 44,100 | |
3.90% 11/15/24 | | | 295,000 | | | | 243,797 | |
Occidental Petroleum 2.90% 8/15/24 | | | 115,000 | | | | 62,791 | |
ONEOK 7.50% 9/1/23 | | | 330,000 | | | | 329,018 | |
Petrobras Global Finance 144A 5.093% 1/15/30 # | | | 41,000 | | | | 37,566 | |
Sabine Pass Liquefaction | | | | | | | | |
5.625% 3/1/25 | | | 180,000 | | | | 165,524 | |
5.75% 5/15/24 | | | 334,000 | | | | 314,034 | |
Schlumberger Holdings | | | | | | | | |
144A 3.75% 5/1/24 # | | | 95,000 | | | | 90,076 | |
144A 4.30% 5/1/29 # | | | 190,000 | | | | 185,061 | |
Tecpetrol 144A 4.875% 12/12/22 # | | | 40,000 | | | | 31,943 | |
Tennessee Gas Pipeline 144A 2.90% 3/1/30 # | | | 165,000 | | | | 140,418 | |
Transcanada Trust 5.50% 9/15/79 µ | | | 70,000 | | | | 53,672 | |
| | | | | | | | |
| | | | | | | 2,238,468 | |
| | | | | | | | |
Financials – 0.46% | | | | | | | | |
AerCap Ireland Capital 3.65% 7/21/27 | | | 200,000 | | | | 155,330 | |
Air Lease 3.00% 2/1/30 | | | 130,000 | | | | 94,559 | |
Aviation Capital Group 144A 6.75% 4/6/21 # | | | 60,000 | | | | 59,490 | |
Charles Schwab | | | | | | | | |
3.20% 1/25/28 | | | 50,000 | | | | 50,761 | |
3.25% 5/21/21 | | | 85,000 | | | | 85,653 | |
3.85% 5/21/25 | | | 90,000 | | | | 95,721 | |
International Lease Finance 8.625% 1/15/22 | | | 150,000 | | | | 145,596 | |
Jefferies Group | | | | | | | | |
4.15% 1/23/30 | | | 75,000 | | | | 71,975 | |
6.45% 6/8/27 | | | 80,000 | | | | 81,928 | |
6.50% 1/20/43 | | | 65,000 | | | | 54,129 | |
Mastercard | | | | | | | | |
3.30% 3/26/27 | | | 35,000 | | | | 38,091 | |
3.85% 3/26/50 | | | 25,000 | | | | 30,658 | |
| | | | | | | | |
| | | | | | | 963,891 | |
| | | | | | | | |
Insurance – 0.42% | | | | | | | | |
Berkshire Hathaway Finance 2.90% 10/15/20 | | | 220,000 | | | | 221,317 | |
36
| | | | | | | | |
| | | Principal amount° | | | Value (US $) | |
Corporate Bonds(continued) | | | | | | | | |
Insurance(continued) | | | | | | | | |
MetLife | | | | | | | | |
5.25%µy | | | 60,000 | | | $ | 52,313 | |
6.40% 12/15/36 | | | 110,000 | | | | 115,153 | |
144A 9.25% 4/8/38 # | | | 400,000 | | | | 500,546 | |
| | | | | | | | |
| | | | | | | 889,329 | |
| | | | | | | | |
Real Estate – 0.55% | | | | | | | | |
American Tower Trust #1 144A 3.07% 3/15/23 # | | | 240,000 | | | | 239,452 | |
Corporate Office Properties | | | | | | | | |
3.60% 5/15/23 | | | 135,000 | | | | 132,356 | |
5.25% 2/15/24 | | | 170,000 | | | | 178,397 | |
CubeSmart | | | | | | | | |
3.00% 2/15/30 | | | 65,000 | | | | 60,741 | |
3.125% 9/1/26 | | | 115,000 | | | | 114,401 | |
Digital Realty Trust 3.60% 7/1/29 | | | 185,000 | | | | 180,935 | |
LifeStorage 3.50% 7/1/26 | | | 130,000 | | | | 124,224 | |
WP Carey 4.60% 4/1/24 | | | 125,000 | | | | 125,543 | |
| | | | | | | | |
| | | | | | | 1,156,049 | |
| | | | | | | | |
Technology – 0.83% | | | | | | | | |
International Business Machines 3.00% 5/15/24 | | | 315,000 | | | | 330,015 | |
Microchip Technology | | | | | | | | |
3.922% 6/1/21 | | | 65,000 | | | | 63,380 | |
4.333% 6/1/23 | | | 185,000 | | | | 184,663 | |
Micron Technology 4.663% 2/15/30 | | | 90,000 | | | | 94,447 | |
NXP | | | | | | | | |
144A 4.30% 6/18/29 # | | | 55,000 | | | | 56,624 | |
144A 4.875% 3/1/24 # | | | 370,000 | | | | 395,734 | |
Oracle 2.95% 4/1/30 | | | 95,000 | | | | 95,772 | |
Tencent Holdings 144A 3.28% 4/11/24 # | | | 500,000 | | | | 519,288 | |
| | | | | | | | |
| | | | | | | 1,739,923 | |
| | | | | | | | |
Transportation – 0.08% | | | | | | | | |
United Airlines 2014-1
Class A Pass Through Trust 4.00% 4/11/26¨ | | | 52,570 | | | | 52,105 | |
United Airlines 2014-2
Class A Pass Through Trust 3.75% 9/3/26¨ | | | 115,602 | | | | 116,738 | |
| | | | | | | | |
| | | | | | | 168,843 | |
| | | | | | | | |
Utilities – 1.78% | | | | | | | | |
American Transmission Systems 144A 5.25% 1/15/22 # | | | 40,000 | | | | 42,576 | |
Atlantic City Electric 4.00% 10/15/28 | | | 75,000 | | | | 80,704 | |
Ausgrid Finance 144A 3.85% 5/1/23 # | | | 43,000 | | | | 45,121 | |
CenterPoint Energy 3.85% 2/1/24 | | | 330,000 | | | | 335,395 | |
ComEd Financing III 6.35% 3/15/33 | | | 155,000 | | | | 179,723 | |
Duke Energy 4.875%µy | | | 130,000 | | | | 109,290 | |
37
Schedule of investments
Delaware Strategic Allocation Fund
| | | | | | | | |
| | | Principal amount° | | | Value (US $) | |
Corporate Bonds(continued) | | | | | | | | |
Utilities(continued) | | | | | | | | |
Duke Energy Indiana | | | | | | | | |
2.75% 4/1/50 | | | 60,000 | | | $ | 55,406 | |
3.25% 10/1/49 | | | 65,000 | | | | 65,999 | |
Emera 6.75% 6/15/76 µ | | | 166,000 | | | | 153,840 | |
Entergy Arkansas 4.20% 4/1/49 | | | 190,000 | | | | 216,679 | |
Entergy Louisiana | | | | | | | | |
4.00% 3/15/33 | | | 90,000 | | | | 100,049 | |
4.05% 9/1/23 | | | 25,000 | | | | 25,588 | |
4.95% 1/15/45 | | | 15,000 | | | | 15,885 | |
Evergy 4.85% 6/1/21 | | | 60,000 | | | | 60,649 | |
Evergy Metro 3.65% 8/15/25 | | | 270,000 | | | | 281,392 | |
Exelon 3.95% 6/15/25 | | | 35,000 | | | | 35,223 | |
LG&E & KU Energy 4.375% 10/1/21 | | | 485,000 | | | | 487,929 | |
MidAmerican Energy 3.15% 4/15/50 | | | 75,000 | | | | 76,410 | |
National Rural Utilities Cooperative Finance 5.25% 4/20/46 µ | | | 100,000 | | | | 95,427 | |
NextEra Energy Capital Holdings 3.15% 4/1/24 | | | 90,000 | | | | 92,272 | |
NiSource 5.65%µy | | | 120,000 | | | | 106,859 | |
NV Energy 6.25% 11/15/20 | | | 100,000 | | | | 102,898 | |
PacifiCorp 3.50% 6/15/29 | | | 255,000 | | | | 260,230 | |
Perusahaan Listrik Negara 144A 4.125% 5/15/27 # | | | 200,000 | | | | 194,431 | |
Southern California Edison | | | | | | | | |
3.65% 2/1/50 | | | 45,000 | | | | 43,917 | |
4.875% 3/1/49 | | | 30,000 | | | | 34,807 | |
Vistra Operations | | | | | | | | |
144A 3.55% 7/15/24 # | | | 120,000 | | | | 113,166 | |
144A 4.30% 7/15/29 # | | | 215,000 | | | | 191,600 | |
Xcel Energy | | | | | | | | |
2.60% 12/1/29 | | | 35,000 | | | | 33,267 | |
3.40% 6/1/30 | | | 45,000 | | | | 45,707 | |
3.50% 12/1/49 | | | 55,000 | | | | 49,108 | |
| | | | | | | | |
| | | | | | | 3,731,547 | |
| | | | | | | | |
Total Corporate Bonds(cost $30,339,108) | | | | | | | 30,201,389 | |
| | | | | | | | |
| | | | | | | | |
Loan Agreements – 0.90% | | | | | | | | |
American Airlines Tranche B 1st Lien 2.705% (LIBOR01M + 2.00%) 12/14/23● | | | 293,939 | | | | 245,733 | |
CityCenter Holdings Tranche B 1st Lien 3.239% (LIBOR01M + 2.25%) 4/18/24● | | | 342,085 | | | | 303,173 | |
DaVita Tranche B1 2.739% (LIBOR01M + 1.75%) 8/12/26● | | | 49,750 | | | | 47,553 | |
38
| | | | | | | | |
| | | Principal amount° | | | Value (US $) | |
Loan Agreements(continued) | | | | | | | | |
HCA Tranche B13 1st Lien 2.739%
(LIBOR01M + 1.75%) 3/18/26● | | | 400,741 | | | $ | 383,709 | |
Lamar Media Tranche B 2.516%
(LIBOR01M + 1.50%) 2/5/27● | | | 171,938 | | | | 166,779 | |
Sprint Communications Tranche B 1st Lien 3.50%
(LIBOR01M + 2.50%) 2/2/24● | | | 412,250 | | | | 410,706 | |
SS&C Technologies Tranche B3 2.739%
(LIBOR01M + 1.75%) 4/16/25● | | | 59,922 | | | | 57,075 | |
SS&C Technologies Tranche B4 2.739%
(LIBOR01M + 1.75%) 4/16/25● | | | 42,758 | | | | 40,727 | |
W.R. Grace & Co. Tranche B1 1st Lien 0.00% 4/3/25 | | | 100,049 | | | | 87,543 | |
W.R. Grace & Co. Tranche B2 1st Lien 3.20%
(LIBOR03M + 1.75%) 4/3/25● | | | 171,079 | | | | 149,694 | |
| | | | | | | | |
Total Loan Agreement(cost $2,053,023) | | | | | | | 1,892,692 | |
| | | | | | | | |
| | | | | | | | |
Municipal Bonds – 0.46% | | | | | | | | |
Bay Area, California Toll Authority
(Build America Bonds) Series S3 6.907% 10/1/50 | | | 185,000 | | | | 296,327 | |
California State Various Purposes
(Build America Bonds) 7.55% 4/1/39 | | | 130,000 | | | | 211,461 | |
New Jersey Turnpike Authority
(Build America Bonds) Series A 7.102% 1/1/41 | | | 105,000 | | | | 149,920 | |
Oregon State Taxable Pension
5.892% 6/1/27 | | | 200,000 | | | | 235,064 | |
South Carolina Public Service Authority
Series D 4.77% 12/1/45 | | | 60,000 | | | | 73,160 | |
| | | | | | | | |
Total Municipal Bonds(cost $895,496) | | | | | | | 965,932 | |
| | | | | | | | |
| | | | | | | | |
Non-Agency Asset-Backed Securities – 1.88% | | | | | | | | |
American Express Credit Account Master Trust | | | | | | | | |
Series2017-2 A 1.155% (LIBOR01M + 0.45%) 9/16/24● | | | 335,000 | | | | 331,664 | |
Series2017-5 A 1.085% (LIBOR01M + 0.38%) 2/18/25● | | | 1,215,000 | | | | 1,171,236 | |
Citibank Credit Card Issuance Trust
Series2017-A8 A8 1.86% 8/8/22 | | | 200,000 | | | | 199,820 | |
Discover Card Execution Note Trust
Series2018-A3 A3 0.935% (LIBOR01M + 0.23%) 12/15/23● | | | 90,000 | | | | 88,895 | |
HOA Funding
Series2014-1A A2 144A 4.846% 8/20/44 # | | | 489,500 | | | | 466,870 | |
39
Schedule of investments
Delaware Strategic Allocation Fund
| | | | | | | | |
| | | Principal amount° | | | Value (US $) | |
Non-Agency Asset-Backed Securities(continued) | | | | | | | | |
Mercedes-Benz Master Owner Trust
Series2018-BA A 144A 1.045% (LIBOR01M + 0.34%) 5/15/23 #● | | | 200,000 | | | $ | 199,461 | |
Navistar Financial Dealer Note Master Owner Trust II
Series2018-1 A 144A 1.577% (LIBOR01M + 0.63%, Floor 0.63%) 9/25/23 #● | | | 75,000 | | | | 72,748 | |
Nissan Master Owner Trust Receivables
Series2017-B A 1.135% (LIBOR01M + 0.43%) 4/18/22● | | | 1,000,000 | | | | 992,965 | |
Tesla Auto Lease Trust
Series2019-A A2 144A 2.13% 4/20/22 # | | | 150,000 | | | | 150,223 | |
Towd Point Mortgage Trust | | | | | | | | |
Series2015-5 A1B 144A 2.75% 5/25/55 #● | | | 50,822 | | | | 50,404 | |
Series2015-6 A1B 144A 2.75% 4/25/55 #● | | | 64,505 | | | | 64,020 | |
Series2017-1 A1 144A 2.75% 10/25/56 #● | | | 48,419 | | | | 48,438 | |
Series2017-2 A1 144A 2.75% 4/25/57 #● | | | 48,766 | | | | 47,771 | |
Series2018-1 A1 144A 3.00% 1/25/58 #● | | | 66,927 | | | | 67,229 | |
| | | | | | | | |
TotalNon-Agency Asset-Backed Securities
(cost $4,042,020) | | | | | | | 3,951,744 | |
| | | | | | | | |
| | | | | | | | |
Non-Agency Collateralized Mortgage Obligations – 1.42% | | | | | | | | |
Credit Suisse First Boston Mortgage Securities
Series2005-5 6A3 5.00% 7/25/35 | | | 33,923 | | | | 32,492 | |
JPMorgan Mortgage Trust | | | | | | | | |
Series2006-S1 1A1 6.00% 4/25/36 | | | 58,314 | | | | 58,426 | |
Series2014-2 B1 144A 3.399% 6/25/29 #● | | | 103,629 | | | | 97,871 | |
Series2014-2 B2 144A 3.399% 6/25/29 #● | | | 103,629 | | | | 97,628 | |
Series 2014-IVR6 2A4 144A 2.50% 7/25/44 #● | | | 200,000 | | | | 193,197 | |
Series2015-4 B1 144A 3.622% 6/25/45 #● | | | 177,355 | | | | 165,606 | |
Series2015-4 B2 144A 3.622% 6/25/45 #● | | | 177,355 | | | | 164,998 | |
Series2015-5 B2 144A 3.053% 5/25/45 #● | | | 186,080 | | | | 176,429 | |
Series2015-6 B1 144A 3.598% 10/25/45 #● | | | 174,788 | | | | 166,271 | |
Series2015-6 B2 144A 3.598% 10/25/45 #● | | | 174,788 | | | | 165,334 | |
Series2018-4 A15 144A 3.50% 10/25/48 #● | | | 35,288 | | | | 35,039 | |
Sequoia Mortgage Trust | | | | | | | | |
Series2014-2 A4 144A 3.50% 7/25/44 #● | | | 39,728 | | | | 40,138 | |
Series2015-1 B2 144A 3.875% 1/25/45 #● | | | 60,284 | | | | 57,230 | |
Series2017-4 A1 144A 3.50% 7/25/47 #● | | | 62,542 | | | | 63,501 | |
Series2018-5 A4 144A 3.50% 5/25/48 #● | | | 55,010 | | | | 54,684 | |
Wells Fargo Mortgage-Backed Securities Trust
Series2006-AR5 2A1 4.138% 4/25/36● | | | 8,214 | | | | 6,967 | |
WST Trust
Series2019-1 A 1.71% (BBSW1M + 1.08%) 8/18/50● AUD | | | 2,290,328 | | | | 1,399,604 | |
| | | | | | | | |
TotalNon-Agency Collateralized Mortgage Obligations(cost $3,150,229) | | | | | | | 2,975,415 | |
| | | | | | | | |
40
| | | | | | | | |
| | | Principal amount° | | | Value (US $) | |
Non-Agency Commercial Mortgage-Backed Securities – 2.95% | | | | | | | | |
Banc of America Commercial Mortgage Trust
Series 2017-BNK3 B 3.879% 2/15/50● | | | 340,000 | | | $ | 319,297 | |
Benchmark Mortgage Trust
Series2019-B9 A5 4.016% 3/15/52 | | | 450,000 | | | | 498,009 | |
COMM Mortgage Trust | | | | | | | | |
Series 2014-CR20 AM 3.938% 11/10/47 | | | 345,000 | | | | 350,595 | |
Series2015-3BP A 144A 3.178% 2/10/35 # | | | 500,000 | | | | 511,933 | |
Series 2015-CR23 A4 3.497% 5/10/48 | | | 395,000 | | | | 415,909 | |
DB-JPM Mortgage Trust | | | | | | | | |
Series2016-C1 A4 3.276% 5/10/49 | | | 255,000 | | | | 268,424 | |
Series2016-C3 A5 2.89% 8/10/49 | | | 300,000 | | | | 310,665 | |
DB-UBS Mortgage Trust
Series 2011-LC1A C 144A 5.689% 11/10/46 #● | | | 230,000 | | | | 225,697 | |
GS Mortgage Securities Trust | | | | | | | | |
Series 2015-GC32 A4 3.764% 7/10/48 | | | 505,000 | | | | 522,999 | |
Series2017-GS6 A3 3.433% 5/10/50 | | | 500,000 | | | | 508,460 | |
Series 2019-GC39 A4 3.567% 5/10/52 | | | 580,000 | | | | 606,250 | |
Series 2019-GC42 A4 3.001% 9/1/52 | | | 430,000 | | | | 445,878 | |
JPM-DB Commercial Mortgage Securities Trust
Series2016-C2 A4 3.144% 6/15/49 | | | 270,000 | | | | 282,275 | |
JPMorgan Chase Commercial Mortgage Securities Trust
Series 2013-LC11 B 3.499% 4/15/46 | | | 125,000 | | | | 121,237 | |
LB-UBS Commercial Mortgage Trust
Series2006-C6 AJ 5.452% 9/15/39● | | | 96,056 | | | | 56,183 | |
Morgan Stanley Capital I Trust
Series 2006-HQ10 B 5.448% 11/12/41● | | | 277,851 | | | | 273,939 | |
Wells Fargo Commercial Mortgage Trust
Series 2016-BNK1 A3 2.652% 8/15/49 | | | 485,000 | | | | 477,268 | |
| | | | | | | | |
TotalNon-Agency Commercial Mortgage-Backed Securities(cost $6,365,531) | | | | 6,195,018 | |
| | | | | | | | |
| | | | | | | | |
Sovereign Bond – 0.01% | | | | | | | | |
Argentina – 0.01% | | | | | | | | |
Argentine Republic Government International Bond
5.625% 1/26/22 | | | 90,000 | | | | 26,550 | |
| | | | | | | | |
Total Sovereign Bond(cost $90,000) | | | | | | | 26,550 | |
| | | | | | | | |
| | |
| | | Number of shares | | | | |
Preferred Stock – 0.55% | | | | | | | | |
Morgan Stanley 5.55% µ | | | 35,000 | | | | 30,792 | |
US Bancorp 5.23% (LIBOR03M + 1.02%)● | | | 1,000 | | | | 726,505 | |
USB Realty 144A 2.978% (LIBOR03M + 1.147%)#● | | | 100,000 | | | | 75,175 | |
Volkswagen 4.59% | | | 2,820 | | | | 324,854 | |
| | | | | | | | |
Total Preferred Stock(cost $1,287,459) | | | | | | | 1,157,326 | |
| | | | | | | | |
41
Schedule of investments
Delaware Strategic Allocation Fund
| | | | | | | | |
| | | Number of shares | | | Value (US $) | |
Short-Term Investments – 4.88% | | | | | | | | |
Money Market Mutual Funds – 4.88% | | | | | | | | |
BlackRock FedFund – Institutional Shares(seven-day effective yield 0.33%) | | | 2,052,884 | | | $ | 2,052,884 | |
Fidelity Investments Money Market Government Portfolio – Class I(seven-day effective yield 0.30%) | | | 2,052,884 | | | | 2,052,884 | |
GS Financial Square Government Fund – Institutional Shares(seven-day effective yield 0.34%) | | | 2,052,884 | | | | 2,052,884 | |
Morgan Stanley Government Portfolio – Institutional Share Class(seven-day effective yield 0.22%) | | | 2,052,884 | | | | 2,052,884 | |
State Street Institutional US Government Money Market Fund – Investor Class(seven-day effective yield 0.24%) | | | 2,052,884 | | | | 2,052,884 | |
| | | | | | | | |
Total Short-Term Investments(cost $10,264,420) | | | | | | | 10,264,420 | |
| | | | | | | | |
Total Value of Securities – 101.65%
(cost $204,014,428) | | | | | | $ | 213,688,480 | |
| | | | | | | | |
| # | Security exempt from registration under Rule 144A of the Securities Act of 1933, as amended. At March 31, 2020, the aggregate value of Rule 144A securities was $14,325,368, which represents 6.81% of the Fund’s net assets. See Note 12 in “Notes to financial statements.” |
| ¨ | Pass Through Agreement. Security represents the contractual right to receive a proportionate amount of underlying payments due to the counterparty pursuant to various agreements related to the rescheduling of obligations and the exchange of certain notes. |
| = | The value of this security was determined using significant unobservable inputs and is reported as a Level 3 security in the disclosure table located in Note 3 in “Notes to financial statements.” |
| § | Developed Markets – countries that are thought to be most developed and therefore less risky than emerging markets. |
| ° | Principal amount shown is stated in USD unless noted that the security is denominated in another currency. |
| µ | Fixed to variable rate investment. The rate shown reflects the fixed rate in effect at March 31, 2020. Rate will reset at a future date. |
| ∑ | Interest only security. An interest only security is the interest only portion of a fixed income security, which is separated and sold individually from the principal portion of the security. |
| y | No contractual maturity date. |
| † | Non-income producing security. |
| ● | Variable rate investment. Rates reset periodically. Rate shown reflects the rate in effect at March 31, 2020. For securities based on a published reference rate and spread, the reference rate and spread are indicated in their description above. The reference rate descriptions (i.e. LIBOR03M, LIBOR06M, etc.) used in this report are identical for different securities, but the underlying reference rates may differ due to the timing of the reset period. Certain variable rate securities are not based on a published reference rate and spread but are determined by the issuer or agent and are based on current market conditions, or for mortgage-backed securities, are impacted by the individual |
42
| | mortgages which are paying off over time. These securities do not indicate a reference rate and spread in their description above. |
| @ | Emerging Markets – developing countries with relatively low per capita income, often with above-average economic growth potential but with more risk. |
The following foreign currency exchange contracts, futures contracts, and swap contracts were outstanding at March 31, 2020:1
Foreign Currency Exchange Contracts
| | | | | | | | | | | | | | | | | | | | | | | | |
Counterparty | | Currency to
Receive (Deliver) | | | In Exchange For | | | Settlement
Date | | | Unrealized
Appreciation | |
BNYM | | | TRY | | | | (415,297 | ) | | | USD | | | | 63,034 | | | | 4/2/20 | | | $ | 268 | |
TD | | | AUD | | | | (2,405,000 | ) | | | USD | | | | 1,588,815 | | | | 6/12/20 | | | | 109,201 | |
| | | | | | | | | | | | | | | | | | | | | | | | |
Total Foreign Currency Exchange Contracts | | | | | | | | | | | | | | | | | | $ | 109,469 | |
| | | | | | | | | | | | | | | | | | | | | | | | |
Futures Contracts
| | | | | | | | | | | | | | | | | | | | | | | | | | |
| Contracts to Buy (Sell) | | Notional Amount | | | Notional Cost (Proceeds) | | | Expiration Date | | | Value/ Unrealized Appreciation | | | Value/ Unrealized Depreciation | | | Variation Margin Due from (Due to) Brokers | |
| (13) | | US Treasury 5 yr Notes | | $ | (1,629,672 | ) | | $ | (1,590,032 | ) | | | 6/30/20 | | | $ | — | | | $ | (39,640 | ) | | $ | 609 | |
| 21 | | US Treasury 10 yr Notes | | | 2,912,438 | | | | 2,887,224 | | | | 6/19/20 | | | | 25,214 | | | | — | | | | (2,953 | ) |
| (6) | | US Treasury 10 yr Ultra Notes | | | (936,188 | ) | | | (875,891 | ) | | | 6/19/20 | | | | — | | | | (60,297 | ) | | | 1,969 | |
| | | | | | | | | | | | | | | | | | | | | | | | | | |
Total Futures Contracts | | | | | | $ | 421,301 | | | | | | | $ | 25,214 | | | $ | (99,937 | ) | | $ | (375 | ) |
| | | | | | | | | | | | | | | | | | | | | | | | | | |
43
Schedule of investments
Delaware Strategic Allocation Fund
Swap Contracts
CDS Contracts2
| | | | | | | | | | | | | | | | | | | | | | | | |
Counterparty/ Reference Obligation/ Termination Date/ Payment Frequency | | Notional Amount3 | | | Annual Protection Payments | | | Value | | | Upfront Payments Paid (Received) | | | Unrealized Appreciation4 | | | Variation Margin Due from (Due to) Brokers | |
Centrally Cleared/ Protection Purchased: | | | | | | | | | | | | | | | | | | | | | | | | |
CDX.NA.IG.325 12/20/24- Quarterly | | | 3,000,000 | | | | 1.00% | | | $ | 10,772 | | | $ | (61,073 | ) | | $ | 71,845 | | | $ | 22,489 | |
Over-The-Counter/ Protection Purchased: | | | | | | | | | | | | | | | | | | | | | | | | |
HSBC-CDX.EM.296 6/20/23- Quarterly | | | 2,000,000 | | | | 1.00% | | | | 161,463 | | | | 22,690 | | | | 138,773 | | | | — | |
| | | | | | | | | | | | | | | | | | | | | | | | |
Total CDS Contracts | | | | | | | | | | $ | 172,235 | | | $ | (38,383 | ) | | $ | 210,618 | | | $ | 22,489 | |
| | | | | | | | | | | | | | | | | | | | | | | | |
IRS Contracts7 | | | | | | | | | | | | | | | | | | | | | | | | |
| | | | | | | | | | | | | | | | | | | | | | | | | |
Reference Obligation/ Termination Date/ Payment Frequency (Fixed Rate / Floating Rate) | | Notional Amount3 | | Fixed /Floating Interest Rate Paid (Received)8 | | Value | | Unrealized Depreciation4 | | Variation Margin Due from (Due to) Broker |
Centrally Cleared: | | | | | | | | | | | | | | | | | | | | | | | | | |
5 yr IRS4/3/22-(Semiannually/ Quarterly) | | | | 2,105,000 | | | | | 2.066%/(1.908%) | | | | $ | (67,630 | ) | | | $ | (67,630 | ) | | | $ | (693 | ) |
5 yr IRS3/10/23-(Semiannually/ Quarterly) | | | | 8,365,000 | | | | | 0.61%/(0.999%) | | | | | (53,834 | ) | | | | (53,834 | ) | | | | 59 | |
5 yr IRS8/29/24-(Semiannually/ Quarterly) | | | | 1,380,000 | | | | | 1.325%/(1.580%) | | | | | (47,584 | ) | | | | (47,584 | ) | | | | (2,576 | ) |
7 yr IRS2/5/25-(Semiannually/ Quarterly) | | | | 8,910,000 | | | | | 2.733%/(1.742%) | | | | | (954,616 | ) | | | | (954,616 | ) | | | | 6,238 | |
10 yr IRS8/3/28-(Semiannually/ Quarterly) | | | | 3,295,000 | | | | | 3.068%/(1.763%) | | | | | (654,170 | ) | | | | (654,170 | ) | | | | 14,585 | |
30 yr IRS6/27/47-(Semiannually/ Quarterly) | | | | 430,000 | | | | | 2.388%/(1.267%) | | | | | (162,358 | ) | | | | (162,358 | ) | | | | 12,275 | |
| | | | | | | | | | | | | | | | | | | | | | | | | |
Total IRS Contracts | | | | | | | | | | | | | $ | (1,940,192 | ) | | | $ | (1,940,192 | ) | | | $ | 29,888 | |
| | | | | | | | | | | | | | | | | | | | | | | | | |
The use of foreign currency exchange contracts, futures contracts, and swap contracts involve elements of market risk and risks in excess of the amounts disclosed in these financial statements. The foreign currency exchange contracts and notional amounts presented on the previous page represent the Fund’s total exposure in such contracts, whereas only the net unrealized appreciation (depreciation) and variation margin is reflected in the Fund’s net assets.
1See Note 9 in “Notes to financial statements.”
44
2A CDS contract is a risk-transfer instrument through which one party (purchaser of protection) transfers to another party (seller of protection) the financial risk of a credit event (as defined in the CDS agreement), as it relates to a particular reference security or basket of securities (such as an index). Periodic payments (receipts) on such contracts are accrued daily and recorded as unrealized losses (gains) on swap contracts. Upon payment (receipt), such amounts are recorded as realized losses (gains) on swap contracts. Upfront payments made or received in connection with CDS contracts are amortized over the expected life of the CDS contracts as unrealized losses (gains) on swap contracts. The change in value of CDS contracts is recorded daily as unrealized appreciation or depreciation. A realized gain or loss is recorded upon a credit event (as defined in the CDS agreement) or the maturity or termination of the CDS agreement.
3Notional amount shown is stated in USD unless noted that the swap is denominated in another currency.
4Unrealized appreciation (depreciation) does not include periodic interest payments (receipt) on swap contracts accrued daily in the amount of ($7,470).
5Markit’s North America Investment Grade Index, or the CDX.NA.IG Index, is composed of 125 liquid North American entities with investment grade credit ratings that trade in the CDS market.
6Markit’s CDX.EM Index is composed of 15 sovereign issuers from the following countries: Argentina, Brazil, Chile, China, Colombia, Indonesia, Malaysia, Mexico, Panama, Peru, Philippines, Russia, South Africa, Turkey, and Venezuela, which have a S&P credit quality rating of CCC and above.
7An IRS agreement is an exchange of interest rates between counterparties. Periodic payments (receipt) on such contracts are accrued daily and recorded as unrealized appreciation (depreciation) on swap contracts. Upon periodic payment (receipt) or termination of the contract, such amounts are recorded as realized gains (losses) on swap contracts.
8Rates reset based on LIBOR03M.
Summary of abbreviations:
ADR – American Depositary Receipt
ARM – Adjustable Rate Mortgage
AUD – Australian Dollar
BBSW1M – Bank Bill Swap Rate 1 Month
BNYM – Bank of New York Mellon
CDS – Credit Default Swap
CDX.EM – Credit Default Swap Index Emerging Markets
CDX.NA.IG – Credit Default Swap Index North America Investment Grade
CLO – Collateralized Loan Obligation
DB – Deutsche Bank
EAFE – Europe Australasia Far East
ETF – Exchange-Traded Fund
FREMF – Freddie Mac Multifamily
FTSE – Financial Times Stock Exchange
GDR – Global Depositary Receipt
GNMA – Government National Mortgage Association
GS – Goldman Sachs
HSBC – Hong Kong Shanghai Bank
ICE – Intercontinental Exchange
IRS – Interest Rate Swap
45
Schedule of investments
Delaware Strategic Allocation Fund
Summary of abbreviations (continued):
JPM – JPMorgan
LB – Lehman Brothers
LIBOR – London interbank offered rate
LIBOR01M – ICE LIBOR USD 1 Month
LIBOR03M – ICE LIBOR USD 3 Month
LIBOR06M – ICE LIBOR USD 6 Month
LIBOR12M – ICE LIBOR USD 12 Month
MSCI – Morgan Stanley Capital International
PJSC – Private Joint Stock Company
REIT – Real Estate Investment Trust
REMIC – Real Estate Mortgage Investment Conduit
S.F. – Single Family
TBA – To be announced
TD – Toronto-Dominion Bank
TRY – Turkish Lira
USD – US Dollar
yr – Year
See accompanying notes, which are an integral part of the financial statements.
46
This page intentionally left blank.
| | |
| Statement of assets and liabilities | | |
| Delaware Strategic Allocation Fund | | March 31, 2020 |
| | | | |
Assets: | | | | |
Investments, at value1 | | $ | 213,688,480 | |
Foreign currencies, at value2 | | | 254,767 | |
Cash | | | 413,561 | |
Cash collateral due from brokers | | | 667,715 | |
Receivable for securities sold | | | 10,075,098 | |
Dividends and interest receivable | | | 849,800 | |
Foreign tax reclaims receivable | | | 262,817 | |
Unrealized appreciation on over the counter credit default swap contracts | | | 138,773 | |
Unrealized appreciation on foreign currency exchange contracts | | | 109,469 | |
Swap payments receivable | | | 49,921 | |
Receivable for fund shares sold | | | 37,835 | |
Variation margin due from broker on centrally cleared interest rate swap contracts | | | 29,888 | |
Upfront payments on over the counter credit default swap contracts | | | 22,690 | |
Variation margin due from broker on centrally cleared credit default swap contracts | | | 22,489 | |
| | | | |
Total assets | | | 226,623,303 | |
| | | | |
Liabilities: | | | | |
Payable for securities purchased | | | 15,711,722 | |
Cash collateral due to brokers | | | 220,000 | |
Other accrued expenses | | | 162,041 | |
Investment management fees payable to affiliates | | | 125,155 | |
Swap payments payable | | | 83,543 | |
Distribution fees payable to affiliates | | | 49,558 | |
Payable for fund shares redeemed | | | 44,360 | |
Audit and tax fees payable | | | 6,450 | |
Dividend disbursing and transfer agent fees and expenses payable to affiliates | | | 1,816 | |
Trustees’ fees and expenses payable to affiliates | | | 1,601 | |
Legal fees payable to affiliates | | | 1,187 | |
Accounting and administration expenses payable to affiliates | | | 984 | |
Other liabilities | | | 477 | |
Variation margin due to broker on futures contracts | | | 375 | |
Reports and statements to shareholders expenses payable to affiliates | | | 266 | |
Income distribution payable | | | 141 | |
| | | | |
Total liabilities | | | 16,409,676 | |
| | | | |
Total Net Assets | | $ | 210,213,627 | |
| | | | |
| |
Net Assets Consist of: | | | | |
Paid-in capital | | $ | 204,984,253 | |
Total distributable earnings (loss) | | | 5,229,374 | |
| | | | |
Total Net Assets | | $ | 210,213,627 | |
| | | | |
48
| | | | |
Net Asset Value | | | | |
Class A: | | | | |
Net assets | | $ | 156,435,332 | |
Shares of beneficial interest outstanding, unlimited authorization, no par | | | 17,150,515 | |
Net asset value per share | | $ | 9.12 | |
Sales charge | | | 5.75 | % |
Offering price per share, equal to net asset value per share / (1 – sales charge) | | $ | 9.68 | |
| |
Class C: | | | | |
Net assets | | $ | 17,822,146 | |
Shares of beneficial interest outstanding, unlimited authorization, no par | | | 1,952,389 | |
Net asset value per share | | $ | 9.13 | |
| |
Class R: | | | | |
Net assets | | $ | 1,564,061 | |
Shares of beneficial interest outstanding, unlimited authorization, no par | | | 172,255 | |
Net asset value per share | | $ | 9.08 | |
| |
Institutional Class: | | | | |
Net assets | | $ | 34,392,088 | |
Shares of beneficial interest outstanding, unlimited authorization, no par | | | 3,768,694 | |
Net asset value per share | | $ | 9.13 | |
1Investments, at cost | | $ | 204,014,428 | |
| 2Foreign currencies, at cost | | | 260,571 | |
See accompanying notes, which are an integral part of the financial statements.
49
| | |
| Statement of operations | | |
Delaware Strategic Allocation Fund | | Year ended March 31, 2020 |
| | | | |
Investment Income: | | | | |
Dividends | | $ | 4,091,868 | |
Interest | | | 3,309,889 | |
Foreign tax withheld | | | (244,806 | ) |
| | | | |
| | | 7,156,951 | |
| | | | |
| |
Expenses: | | | | |
Management fees | | | 1,665,879 | |
Distribution expenses — Class A | | | 455,657 | |
Distribution expenses — Class C | | | 239,069 | |
Distribution expenses — Class R | | | 9,743 | |
Dividend disbursing and transfer agent fees and expenses | | | 223,066 | |
Accounting and administration expenses | | | 84,095 | |
Audit and tax fees | | | 72,428 | |
Registration fees | | | 67,685 | |
Custodian fees | | | 63,011 | |
Reports and statements to shareholders expenses | | | 62,791 | |
Legal fees | | | 55,354 | |
Trustees’ fees and expenses | | | 14,727 | |
Other | | | 114,686 | |
| | | | |
| | | 3,128,191 | |
Less expenses waived | | | (131,527 | ) |
Less expenses paid indirectly | | | (5,432 | ) |
| | | | |
Total operating expenses | | | 2,991,232 | |
| | | | |
Net Investment Income | | | 4,165,719 | |
| | | | |
50
| | | | |
Net Realized and Unrealized Gain (Loss): | | | | |
Net realized gain (loss) on: | | | | |
Investments | | $ | 5,642,883 | |
Foreign currencies | | | (133,700 | ) |
Foreign currency exchange contracts | | | 57,887 | |
Futures contracts | | | 89,500 | |
Swap contracts | | | (1,056,369 | ) |
| | | | |
Net realized gain | | | 4,600,201 | |
| | | | |
| |
Net change in unrealized appreciation (depreciation) of: | | | | |
Investments | | | (28,925,508 | ) |
Foreign currencies | | | (4,699 | ) |
Foreign currency exchange contracts | | | 109,800 | |
Futures contracts | | | (189,044 | ) |
Swap contracts | | | (1,160,468 | ) |
| | | | |
Net change in unrealized appreciation (depreciation) | | | (30,169,919 | ) |
| | | | |
Net Realized and Unrealized Loss | | | (25,569,718 | ) |
| | | | |
Net Decrease in Net Assets Resulting from Operations | | $ | (21,403,999 | ) |
| | | | |
See accompanying notes, which are an integral part of the financial statements.
51
Statements of changes in net assets
Delaware Strategic Allocation Fund
| | | | | | | | |
| | | Year ended | |
| | | 3/31/20 | | | 3/31/19 | |
Increase (Decrease) in Net Assets from Operations: | | | | | | | | |
Net investment income | | $ | 4,165,719 | | | $ | 5,455,706 | |
Net realized gain | | | 4,600,201 | | | | 12,442,968 | |
Net change in unrealized appreciation (depreciation) | | | (30,169,919 | ) | | | (14,707,620 | ) |
| | | | | | | | |
Net increase (decrease) in net assets resulting from operations | | | (21,403,999 | ) | | | 3,191,054 | |
| | | | | | | | |
| | |
Dividends and Distributions to Shareholders from: | | | | | | | | |
Distributable earnings: | | | | | | | | |
Class A | | | (15,220,592 | ) | | | (11,137,039 | ) |
Class C | | | (1,757,045 | ) | | | (1,120,892 | ) |
Class R | | | (154,159 | ) | | | (104,880 | ) |
Institutional Class | | | (3,648,848 | ) | | | (3,753,979 | ) |
| | | | | | | | |
| | | (20,780,644 | ) | | | (16,116,790 | ) |
| | | | | | | | |
| | |
Capital Share Transactions: | | | | | | | | |
Proceeds from shares sold: | | | | | | | | |
Class A | | | 5,525,466 | | | | 13,207,393 | |
Class C | | | 944,147 | | | | 2,117,524 | |
Class R | | | 121,937 | | | | 211,550 | |
Institutional Class | | | 5,143,725 | | | | 10,827,096 | |
| | |
Net assets from merger*: | | | | | | | | |
Class A | | | — | | | | 35,951,477 | |
Class C | | | — | | | | 18,193,221 | |
Class R | | | — | | | | 1,192,059 | |
Institutional Class | | | — | | | | 7,277,852 | |
52
| | | | | | | | |
| | | Year ended | |
| | | 3/31/20 | | | 3/31/19 | |
Capital Share Transactions (continued): | | | | | | | | |
Net asset value of shares issued upon reinvestment of dividends and distributions: | | | | | | | | |
Class A | | $ | 14,133,230 | | | $ | 10,224,109 | |
Class C | | | 1,732,225 | | | | 1,093,397 | |
Class R | | | 154,156 | | | | 104,878 | |
Institutional Class | | | 1,875,646 | | | | 1,395,126 | |
| | | | | | | | |
| | | 29,630,532 | | | | 101,795,682 | |
| | | | | | | | |
Cost of shares redeemed: | | | | | | | | |
Class A | | | (27,546,571 | ) | | | (27,865,061 | ) |
Class C | | | (8,472,813 | ) | | | (13,961,022 | ) |
Class R | | | (367,100 | ) | | | (1,004,346 | ) |
Institutional Class | | | (13,500,491 | ) | | | (32,157,000 | ) |
| | | | | | | | |
| | | (49,886,975 | ) | | | (74,987,429 | ) |
| | | | | | | | |
Increase (Decrease) in net assets derived from capital share transactions | | | (20,256,443 | ) | | | 26,808,253 | |
| | | | | | | | |
Net Increase (Decrease) in Net Assets | | | (62,441,086 | ) | | | 13,882,517 | |
| | |
Net Assets: | | | | | | | | |
Beginning of year | | | 272,654,713 | | | | 258,772,196 | |
| | | | | | | | |
End of year | | $ | 210,213,627 | | | $ | 272,654,713 | |
| | | | | | | | |
*See Note 7 in “Notes to financial statements.”
See accompanying notes, which are an integral part of the financial statements.
53
Financial highlights
Delaware Strategic Allocation Fund Class A
Selected data for each share of the Fund outstanding throughout each period were as follows:
|
Net asset value, beginning of period |
|
Income (loss) from investment operations: |
Net investment income1 |
Net realized and unrealized gain (loss) |
Total from investment operations |
|
Less dividends and distributions from: |
Net investment income |
Net realized gain |
Total dividends and distributions |
|
Net asset value, end of period |
|
Total return2 |
|
Ratios and supplemental data: |
Net assets, end of period (000 omitted) |
Ratio of expenses to average net assets3 |
Ratio of expenses to average net assets prior to fees waived3 |
Ratio of net investment income to average net assets |
Ratio of net investment income to average net assets prior to fees waived |
Portfolio turnover |
| 1 | The average shares outstanding method has been applied for per share information. |
| 2 | Total return is based on the change in net asset value of a share during the period and assumes reinvestment of dividends and distributions at net asset value and does not reflect the impact of a sales charge. Total return during all of the periods shown reflects a waiver by the manager. Performance would have been lower had the waiver not been in effect. |
| 3 | Expense ratios do not include expenses of the Underlying Funds in which the Fund invests. |
See accompanying notes, which are an integral part of the financial statements.
54
| | | | | | | | | | | | | | | | | | | | | | | | | | | | | | | | | | | | |
| | | Year ended | |
| | | 3/31/20 | | | | | | 3/31/19 | | | | | | 3/31/18 | | | | | | 3/31/17 | | | | | | 3/31/16 | |
| |
| | $ | 10.94 | | | | | | | $ | 11.46 | | | | | | | $ | 11.42 | | | | | | | $ | 10.80 | | | | | | | $ | 11.97 | |
| | | | | | | | | |
| | | | 0.18 | | | | | | | | 0.22 | | | | | | | | 0.21 | | | | | | | | 0.17 | | | | | | | | 0.17 | |
| | | (1.13 | ) | | | | | | | (0.05 | ) | | | | | | | 0.71 | | | | | | | | 0.84 | | | | | | | | (0.54 | ) |
| | | | | | | | | | | | | | | | | | | | | | | | | | | | | | | | | | | | |
| | | (0.95 | ) | | | | | | | 0.17 | | | | | | | | 0.92 | | | | | | | | 1.01 | | | | | | | | (0.37 | ) |
| | | | | | | | | | | | | | | | | | | | | | | | | | | | | | | | | | | | |
| | | | | | | | | |
| | | | | | | | | | | | | | | | | | | | | | | | | | | | | | | | | | | | |
| | | (0.19 | ) | | | | | | | (0.20 | ) | | | | | | | (0.21 | ) | | | | | | | (0.24 | ) | | | | | | | (0.17 | ) |
| | | (0.68 | ) | | | | | | | (0.49 | ) | | | | | | | (0.67 | ) | | | | | | | (0.15 | ) | | | | | | | (0.63 | ) |
| | | | | | | | | | | | | | | | | | | | | | | | | | | | | | | | | | | | |
| | | (0.87 | ) | | | | | | | (0.69 | ) | | | | | | | (0.88 | ) | | | | | | | (0.39 | ) | | | | | | | (0.80 | ) |
| | | | | | | | | | | | | | | | | | | | | | | | | | | | | | | | | | | | |
| | | | | | | | | |
| | $ | 9.12 | | | | | | | $ | 10.94 | | | | | | | $ | 11.46 | | | | | | | $ | 11.42 | | | | | | | $ | 10.80 | |
| | | | | | | | | | | | | | | | | | | | | | | | | | | | | | | | | | | | |
| | | | | | | | | |
| | | (9.55% | ) | | | | | | | 1.63% | | | | | | | | 8.35% | | | | | | | | 9.45% | | | | | | | | (3.32% | ) |
| | | | | | | | | |
| | $ | 156,436 | | | | | | | $ | 195,484 | | | | | | | $ | 172,750 | | | | | | | $ | 170,801 | | | | | | | $ | 174,041 | |
| | | 1.13% | | | | | | | | 1.16% | | | | | | | | 1.14% | | | | | | | | 1.14% | | | | | | | | 1.15% | |
| | | 1.18% | | | | | | | | 1.22% | | | | | | | | 1.17% | | | | | | | | 1.18% | | | | | | | | 1.18% | |
| | | 1.66% | | | | | | | | 2.00% | | | | | | | | 1.79% | | | | | | | | 1.49% | | | | | | | | 1.49% | |
| | | 1.61% | | | | | | | | 1.94% | | | | | | | | 1.76% | | | | | | | | 1.45% | | | | | | | | 1.46% | |
| | | 103% | | | | | | | | 97% | | | | | | | | 93% | | | | | | | | 133% | | | | | | | | 131% | |
|
| |
55
Financial highlights
Delaware Strategic Allocation Fund Class C
Selected data for each share of the Fund outstanding throughout each period were as follows:
|
Net asset value, beginning of period |
|
Income (loss) from investment operations: |
Net investment income1 |
Net realized and unrealized gain (loss) |
Total from investment operations |
|
Less dividends and distributions from: |
Net investment income |
Net realized gain |
Total dividends and distributions |
|
Net asset value, end of period |
|
Total return2 |
|
Ratios and supplemental data: |
Net assets, end of period (000 omitted) |
Ratio of expenses to average net assets3 |
Ratio of expenses to average net assets prior to fees waived3 |
Ratio of net investment income to average net assets |
Ratio of net investment income to average net assets prior to fees waived |
Portfolio turnover |
| 1 | The average shares outstanding method has been applied for per share information. |
| 2 | Total return is based on the change in net asset value of a share during the period and assumes reinvestment of dividends and distributions at net asset value and does not reflect the impact of a sales charge. Total return during all of the periods shown reflects a waiver by the manager. Performance would have been lower had the waiver not been in effect. |
| 3 | Expense ratios do not include expenses of the Underlying Funds in which the Fund invests. |
See accompanying notes, which are an integral part of the financial statements.
56
| | | | | | | | | | | | | | | | | | | | | | | | | | | | | | | | | | | | |
| | | Year ended | |
| | | 3/31/20 | | | | | | 3/31/19 | | | | | | 3/31/18 | | | | | | 3/31/17 | | | | | | 3/31/16 | |
| |
| | $ | 10.94 | | | | | | | $ | 11.46 | | | | | | | $ | 11.42 | | | | | | | $ | 10.80 | | | | | | | $ | 11.97 | |
| | | | | | | | | |
| | | 0.10 | | | | | | | | 0.14 | | | | | | | | 0.12 | | | | | | | | 0.08 | | | | | | | | 0.08 | |
| | | (1.12 | ) | | | | | | | (0.05 | ) | | | | | | | 0.71 | | | | | | | | 0.84 | | | | | | | | (0.53 | ) |
| | | | | | | | | | | | | | | | | | | | | | | | | | | | | | | | | | | | |
| | | (1.02 | ) | | | | | | | 0.09 | | | | | | | | 0.83 | | | | | | | | 0.92 | | | | | | | | (0.45 | ) |
| | | | | | | | | | | | | | | | | | | | | | | | | | | | | | | | | | | | |
| | | | | | | | | |
| | | | | | | | | | | | | | | | | | | | | | | | | | | | | | | | | | | | |
| | | (0.11 | ) | | | | | | | (0.12 | ) | | | | | | | (0.12 | ) | | | | | | | (0.15 | ) | | | | | | | (0.09 | ) |
| | | | (0.68 | ) | | | | | | | (0.49 | ) | | | | | | | (0.67 | ) | | | | | | | (0.15 | ) | | | | | | | (0.63 | ) |
| | | | | | | | | | | | | | | | | | | | | | | | | | | | | | | | | | | | |
| | | (0.79 | ) | | | | | | | (0.61 | ) | | | | | | | (0.79 | ) | | | | | | | (0.30 | ) | | | | | | | (0.72 | ) |
| | | | | | | | | | | | | | | | | | | | | | | | | | | | | | | | | | | | |
| | $ | 9.13 | | | | | | | $ | 10.94 | | | | | | | $ | 11.46 | | | | | | | $ | 11.42 | | | | | | | $ | 10.80 | |
| | | | | | | | | | | | | | | | | | | | | | | | | | | | | | | | | | | | |
| | | (10.19% | ) | | | | | | | 0.82% | | | | | | | | 7.53% | | | | | | | | 8.62% | | | | | | | | (4.06% | ) |
| | | | | | | | | |
| | $ | 17,822 | | | | | | | $ | 27,275 | | | | | | | $ | 21,096 | | | | | | | $ | 22,602 | | | | | | | $ | 24,736 | |
| | | 1.89% | | | | | | | | 1.92% | | | | | | | | 1.90% | | | | | | | | 1.90% | | | | | | | | 1.91% | |
| | | 1.94% | | | | | | | | 1.98% | | | | | | | | 1.93% | | | | | | | | 1.94% | | | | | | | | 1.94% | |
| | | 0.90% | | | | | | | | 1.24% | | | | | | | | 1.03% | | | | | | | | 0.73% | | | | | | | | 0.73% | |
| | | 0.85% | | | | | | | | 1.18% | | | | | | | | 1.00% | | | | | | | | 0.69% | | | | | | | | 0.70% | |
| | | 103% | | | | | | | | 97% | | | | | | | | 93% | | | | | | | | 133% | | | | | | | | 131% | |
|
| |
57
Financial highlights
Delaware Strategic Allocation Fund Class R
Selected data for each share of the Fund outstanding throughout each period were as follows:
|
Net asset value, beginning of period |
|
Income (loss) from investment operations: |
Net investment income1 |
Net realized and unrealized gain (loss) |
Total from investment operations |
|
Less dividends and distributions from: |
Net investment income |
Net realized gain |
Total dividends and distributions |
|
Net asset value, end of period. |
|
Total return2 |
|
Ratios and supplemental data: |
Net assets, end of period (000 omitted) |
Ratio of expenses to average net assets3 |
Ratio of expenses to average net assets prior to fees waived3 |
Ratio of net investment income to average net assets |
Ratio of net investment income to average net assets prior to fees waived |
Portfolio turnover |
| 1 | The average shares outstanding method has been applied for per share information. |
| 2 | Total return is based on the change in net asset value of a share during the period and assumes reinvestment of dividends and distributions at net asset value. Total return during all of the periods shown reflects a waiver by the manager. Performance would have been lower had the waiver not been in effect. |
| 3 | Expense ratios do not include expenses of the Underlying Funds in which the Fund invests. |
See accompanying notes, which are an integral part of the financial statements.
58
| | | | | | | | | | | | | | | | | | | | | | | | | | | | | | | | | | | | | | |
| | | | | Year ended | |
| | | | | | |
| | | | | 3/31/20 | | | | | | | | 3/31/19 | | | | | | | | 3/31/18 | | | | | | | | 3/31/17 | | | | | | | | 3/31/16 | |
| | |
| | | | | | | | | |
| | | | $ | 10.90 | | | | | | | $ | 11.40 | | | | | | | $ | 11.37 | | | | | | | $ | 10.76 | | | | | | | $ | 11.93 | |
| | | | | | | | | |
| | | | | | 0.15 | | | | | | | | 0.19 | | | | | | | | 0.18 | | | | | | | | 0.14 | | | | | | | | 0.14 | |
| | | | | (1.12 | ) | | | | | | | (0.03 | ) | | | | | | | 0.70 | | | | | | | | 0.83 | | | | | | | | (0.54 | ) |
| | | | | | | | | | | | | | | | | | | | | | | | | | | | | | | | | | | | | | |
| | | | | (0.97 | ) | | | | | | | 0.16 | | | | | | | | 0.88 | | | | | | | | 0.97 | | | | | | | | (0.40 | ) |
| | | | | | | | | | | | | | | | | | | | | | | | | | | | | | | | | | | | | | |
| | | | | | | | | |
| | | | | (0.17 | ) | | | | | | | (0.17 | ) | | | | | | | (0.18 | ) | | | | | | | (0.21 | ) | | | | | | | (0.14 | ) |
| | | | | (0.68 | ) | | | | | | | (0.49 | ) | | | | | | | (0.67 | ) | | | | | | | (0.15 | ) | | | | | | | (0.63 | ) |
| | | | | | | | | | | | | | | | | | | | | | | | | | | | | | | | | | | | | | |
| | | | | (0.85 | ) | | | | | | | (0.66 | ) | | | | | | | (0.85 | ) | | | | | | | (0.36 | ) | | | | | | | (0.77 | ) |
| | | | | | | | | | | | | | | | | | | | | | | | | | | | | | | | | | | | | | |
| | | | | | | | | |
| | | | $ | 9.08 | | | | | | | $ | 10.90 | | | | | | | $ | 11.40 | | | | | | | $ | 11.37 | | | | | | | $ | 10.76 | |
| | | | | | | | | | | | | | | | | | | | | | | | | | | | | | | | | | | | | | |
| | | | | | | | | |
| | | | | (9.82% | ) | | | | | | | 1.54% | | | | | | | | 8.01% | | | | | | | | 9.11% | | | | | | | | (3.59% | ) |
| | | | | | | | | |
| | | | $ | 1,564 | | | | | | | $ | 1,986 | | | | | | | $ | 1,580 | | | | | | | $ | 1,801 | | | | | | | $ | 1,982 | |
| | | | | 1.39% | | | | | | | | 1.42% | | | | | | | | 1.40% | | | | | | | | 1.40% | | | | | | | | 1.41% | |
| | | | | 1.44% | | | | | | | | 1.48% | | | | | | | | 1.43% | | | | | | | | 1.44% | | | | | | | | 1.44% | |
| | | | | 1.40% | | | | | | | | 1.74% | | | | | | | | 1.53% | | | | | | | | 1.23% | | | | | | | | 1.23% | |
| | | | | 1.35% | | | | | | | | 1.68% | | | | | | | | 1.50% | | | | | | | | 1.19% | | | | | | | | 1.20% | |
| | | | | 103% | | | | | | | | 97% | | | | | | | | 93% | | | | | | | | 133% | | | | | | | | 131% | |
| | |
59
Financial highlights
Delaware Strategic Allocation Fund Institutional Class
Selected data for each share of the Fund outstanding throughout each period were as follows:
|
Net asset value, beginning of period |
|
| Income (loss) from investment operations: |
| Net investment income1 |
| Net realized and unrealized gain (loss) |
| Total from investment operations |
|
| Less dividends and distributions from: |
| Net investment income |
| Net realized gain |
| Total dividends and distributions |
|
| Net asset value, end of period. |
|
| Total return2 |
|
| Ratios and supplemental data: |
| Net assets, end of period (000 omitted) |
| Ratio of expenses to average net assets3 |
| Ratio of expenses to average net assets prior to fees waived3 |
| Ratio of net investment income to average net assets |
| Ratio of net investment income to average net assets prior to fees waived |
Portfolio turnover |
| 1 | The average shares outstanding method has been applied for per share information. |
| 2 | Total return is based on the change in net asset value of a share during the period and assumes reinvestment of dividends and distributions at net asset value. Total return during all of the periods shown reflects a waiver by the manager. Performance would have been lower had the waiver not been in effect. |
| 3 | Expense ratios do not include expenses of the Underlying Funds in which the Fund invests. |
See accompanying notes, which are an integral part of the financial statements.
60
| | | | | | | | | | | | | | | | | | | | | | | | | | | | | | | | | | | | | | |
| | | | | Year ended | |
| | | | | | |
| | | | | 3/31/20 | | | | | | | | 3/31/19 | | | | | | | | 3/31/18 | | | | | | | | 3/31/17 | | | | | | | | 3/31/16 | |
| | |
| | | | | | | | | |
| | | | $ | 10.95 | | | | | | | $ | 11.46 | | | | | | | $ | 11.42 | | | | | | | $ | 10.80 | | | | | | | $ | 11.98 | |
| | | | | | | | | |
| | | | | | 0.20 | | | | | | | | 0.25 | | | | | | | | 0.24 | | | | | | | | 0.19 | | | | | | | | 0.19 | |
| | | | | (1.12 | ) | | | | | | | (0.04 | ) | | | | | | | 0.71 | | | | | | | | 0.84 | | | | | | | | (0.54 | ) |
| | | | | | | | | | | | | | | | | | | | | | | | | | | | | | | | | | | | | | |
| | | | | (0.92 | ) | | | | | | | 0.21 | | | | | | | | 0.95 | | | | | | | | 1.03 | | | | | | | | (0.35 | ) |
| | | | | | | | | | | | | | | | | | | | | | | | | | | | | | | | | | | | | | |
| | | | | | | | | |
| | | | | (0.22 | ) | | | | | | | (0.23 | ) | | | | | | | (0.24 | ) | | | | | | | (0.26 | ) | | | | | | | (0.20 | ) |
| | | | | (0.68 | ) | | | | | | | (0.49 | ) | | | | | | | (0.67 | ) | | | | | | | (0.15 | ) | | | | | | | (0.63 | ) |
| | | | | | | | | | | | | | | | | | | | | | | | | | | | | | | | | | | | | | |
| | | | | (0.90 | ) | | | | | | | (0.72 | ) | | | | | | | (0.91 | ) | | | | | | | (0.41 | ) | | | | | | | (0.83 | ) |
| | | | | | | | | | | | | | | | | | | | | | | | | | | | | | | | | | | | | | |
| | | | | | | | | |
| | | | $ | 9.13 | | | | | | | $ | 10.95 | | | | | | | $ | 11.46 | | | | | | | $ | 11.42 | | | | | | | $ | 10.80 | |
| | | | | | | | | | | | | | | | | | | | | | | | | | | | | | | | | | | | | | |
| | | | | | | | | |
| | | | | (9.29% | ) | | | | | | | 1.96% | | | | | | | | 8.60% | | | | | | | | 9.70% | | | | | | | | (3.17% | ) |
| | | | | | | | | |
| | | | $ | 34,392 | | | | | | | $ | 47,910 | | | | | | | $ | 63,346 | | | | | | | $ | 79,009 | | | | | | | $ | 73,036 | |
| | | | | 0.89% | | | | | | | | 0.92% | | | | | | | | 0.90% | | | | | | | | 0.90% | | | | | | | | 0.91% | |
| | | | | 0.94% | | | | | | | | 0.98% | | | | | | | | 0.93% | | | | | | | | 0.94% | | | | | | | | 0.94% | |
| | | | | 1.90% | | | | | | | | 2.24% | | | | | | | | 2.03% | | | | | | | | 1.73% | | | | | | | | 1.73% | |
| | | | | 1.85% | | | | | | | | 2.18% | | | | | | | | 2.00% | | | | | | | | 1.69% | | | | | | | | 1.70% | |
| | | | | 103% | | | | | | | | 97% | | | | | | | | 93% | | | | | | | | 133% | | | | | | | | 131% | |
| | |
61
Notes to financial statements
| | |
| Delaware Strategic Allocation Fund | | March 31, 2020 |
Delaware Group® Foundation Funds (Trust) is organized as a Delaware statutory trust and offers one fund: Delaware Strategic Allocation Fund. The Fund is anopen-end investment company. The Fund is considered diversified under the Investment Company Act of 1940, as amended (1940 Act), and offers Class A, Class C, Class R, and Institutional Class shares. Class A shares are sold with a maximumfront-end sales charge of 5.75%. Class A share purchases of $1,000,000 or more will incur a contingent deferred sales charge (CDSC) instead of afront-end sales charge of 1.00%, if redeemed during the first year, and 0.50% during the second year, provided that Delaware Distributors, L.P. (DDLP) paid a financial advisor a commission on the purchase of those shares. Class C shares are sold with a CDSC of 1.00%, incurred if redeemed during the first 12 months. Class R and Institutional Class shares are not subject to a sales charge and are offered for sale exclusively to certain eligible investors.
1. Significant Accounting Policies
The Fund follows accounting and reporting guidance under Financial Accounting Standards Board (FASB) Accounting Standards Codification Topic 946, Financial Services – Investment Companies. The following accounting policies are in accordance with US generally accepted accounting principles (US GAAP) and are consistently followed by the Fund.
Security Valuation– Equity securities and exchange-traded funds (ETFs), except those traded on the Nasdaq Stock Market LLC (Nasdaq), are valued at the last quoted sales price as of the time of the regular close of the New York Stock Exchange on the valuation date. Equity securities and ETFs traded on the Nasdaq are valued in accordance with the Nasdaq Official Closing Price, which may not be the last sales price. If, on a particular day, an equity security or ETF does not trade, the mean between the bid and ask prices will be used, which approximates fair value. Equity securities listed on a foreign exchange are normally valued at the last quoted sales price on the valuation date. Debt securities, credit default swap (CDS) contracts, and interest rate swap contracts are valued based upon valuations provided by an independent pricing service or broker/counterparty and reviewed by management. To the extent current market prices are not available, the pricing service may take into account developments related to the specific security, as well as transactions in comparable securities. US government and agency securities are valued at the mean between the bid and ask prices, which approximates fair value. Valuations for fixed income securities utilize matrix systems, which reflect such factors as security prices, yields, maturities, and ratings, and are supplemented by dealer and exchange quotations. For asset-backed securities, collateralized mortgage obligations, commercial mortgage securities, and US government agency mortgage securities, pricing vendors utilize matrix pricing which considers prepayment speed; attributes of the collateral; yield or price of bonds of comparable quality, coupon, maturity, and type as well as broker/dealer-supplied prices. Swap prices are derived using daily swap curves and models that incorporate a number of market data factors, such as discounted cash flows, trades, and values of the underlying reference instruments. Foreign currency exchange contracts are valued at the mean between the bid and ask prices, which approximates fair value. Interpolated values are derived when the settlement date of the contract is an interim date for which quotations are not available. Futures contracts are valued at the daily quoted settlement prices.Open-end investment companies are valued at their published net asset value (NAV). Generally, other securities and assets for which market quotations are not readily available are valued at fair value as determined in good faith under the direction of the Trust’s Board of Trustees (Board). In determining whether market quotations are readily available or fair valuation will be used, various factors will be taken into consideration, such as
62
market closures or suspension of trading in a security. The Fund may use fair value pricing more frequently for securities traded primarily innon-US markets because, among other things, most foreign markets close well before the Fund values its securities, generally as of 4:00pm Eastern time. The earlier close of these foreign markets gives rise to the possibility that significant events, including broad market moves, government actions or pronouncements, aftermarket trading, or news events may have occurred in the interim. Whenever such a significant event occurs, the Fund may value foreign securities using fair value prices based on third-party vendor modeling tools (international fair value pricing). Restricted securities are valued at fair value using methods approved by the Board.
Federal and Foreign Income Taxes– No provision for federal income taxes has been made as the Fund intends to continue to qualify for federal income tax purposes as a regulated investment company under Subchapter M of the Internal Revenue Code of 1986, as amended, and make the requisite distributions to shareholders. The Fund evaluates tax positions taken or expected to be taken in the course of preparing the Fund’s tax returns to determine whether the tax positions are“more-likely-than-not” of being sustained by the applicable tax authority. Tax positions not deemed to meet the“more-likely-than-not” threshold are recorded as a tax benefit or expense in the current year. Management has analyzed the Fund’s tax positions taken or expected to be taken on the Fund’s federal income tax returns through the year ended March 31, 2020 and for all open tax years (years ended March 31, 2017–March 31, 2019), and has concluded that no provision for federal income tax is required in the Fund’s financial statements. If applicable, the Fund recognizes interest accrued on unrecognized tax benefits in interest expense and penalties in “Other” on the “Statement of operations.” During the year ended March 31, 2020, the Fund did not incur any interest or tax penalties. In regard to foreign taxes only, the Fund has open tax years in certain foreign countries in which it invests in that may date back to the inception of the Fund.
Class Accounting– Investment income, common expenses, and realized and unrealized gain (loss) on investments are allocated to the various classes of the Fund on the basis of daily net assets of each class. Distribution expenses relating to a specific class are charged directly to that class.
Underlying Funds– The Fund may invest in other investment companies (Underlying Funds) to the extent permitted by the 1940 Act. The Underlying Funds in which the Fund invests include ETFs. The Fund will indirectly bear the investment management fees and other expenses of the Underlying Funds.
To Be Announced Trades (TBA)– The Fund may contract to purchase or sell securities for a fixed price at a transaction date beyond the customary settlement period (examples: when issued, delayed delivery, forward commitment, or TBA transactions) consistent with the Fund’s ability to manage its investment portfolio and meet redemption requests. These transactions involve a commitment by the Fund to purchase or deliver securities for a predetermined price or yield with payment and delivery taking place more than three days in the future, or after a period longer than the customary settlement period for that type of security. No interest will be earned by the Fund on such purchases until the securities are delivered or the transaction is completed; however, the market value may change prior to delivery.
Foreign Currency Transactions– Transactions denominated in foreign currencies are recorded at the prevailing exchange rates on the valuation date in accordance with the Fund’s prospectus. The value of all assets and liabilities denominated in foreign currencies is translated daily into US dollars at the exchange rate of such currencies against the US dollar. Transaction gains or losses resulting from
63
Notes to financial statements
Delaware Strategic Allocation Fund
1. Significant Accounting Policies (continued)
changes in exchange rates during the reporting period or upon settlement of the foreign currency transaction are reported in operations for the current period. The Fund generally bifurcates that portion of realized gains and losses on investments in debt securities which is due to changes in foreign exchange rates from that which is due to changes in market prices of debt securities. That portion of gains (losses), which is due to changes in foreign exchange rates, is included on the “Statement of operations” under “Net realized gain (loss) on foreign currencies.” For foreign equity securities, the realized gains and losses are included on the “Statement of operations” under “Net realized gain (loss) on investments.” The Fund reports certain foreign currency related transactions as components of realized gains (losses) for financial reporting purposes, whereas such components are treated as ordinary income (loss) for federal income tax purposes.
Use of Estimates– The preparation of financial statements in conformity with US GAAP requires management to make estimates and assumptions that affect the fair value of investments, the reported amounts of assets and liabilities and disclosure of contingent assets and liabilities at the date of the financial statements, and the reported amounts of revenues and expenses during the reporting period. Actual results could differ from those estimates and the differences could be material.
Other– Expenses directly attributable to the Fund are charged directly to the Fund. Other expenses common to various funds within the Delaware Funds® by Macquarie (Delaware Funds) are generally allocated among such funds on the basis of average net assets. Management fees and certain other expenses are paid monthly. Security transactions are recorded on the date the securities are purchased or sold (trade date) for financial reporting purposes. Costs used in calculating realized gains and losses on the sale of investment securities are those of the specific securities sold. Dividend income is recorded on theex-dividend date and interest income is recorded on the accrual basis. Discounts and premiums on debt securities are accreted or amortized to interest income, respectively, over the lives of the respective securities using the effective interest method. Realized gains (losses) on paydowns ofasset-and mortgage-backed securities are classified as interest income. Distributions received from investments in real estate investment trusts (REITs) are recorded as dividend income on theex-dividend date, subject to reclassification upon notice of the character of such distributions by the issuer. Foreign dividends are also recorded on theex-dividend date or as soon after theex-dividend date that the Fund is aware of such dividends, net of all tax withholdings, a portion of which may be reclaimable. Withholding taxes and reclaims on foreign dividends have been recorded in accordance with the Fund’s understanding of the applicable country’s tax rules and rates. The Fund declares and pays dividends from net investment income quarterly and distributions from net realized gain on investments, if any, annually. The Fund may distribute more frequently, if necessary for tax purposes. Dividends and distributions, if any, are recorded on theex-dividend date.
The Fund receives earnings credits from its custodian when positive cash balances are maintained, which may be used to offset custody fees. The expenses paid under this arrangement are included on the “Statement of operations” under “Custodian fees” with the corresponding expenses offset included under “Less expenses paid indirectly.” For the year ended March 31, 2020, the Fund earned $4,812 under this arrangement.
64
The Fund receives earnings credits from its transfer agent when positive cash balances are maintained, which may be used to offset transfer agent fees. If the amount earned is greater than $1, the expenses paid under this arrangement are included on the “Statement of operations” under “Dividend disbursing and transfer agent fees and expenses” with the corresponding expenses offset included under “Less expenses paid indirectly.” For the year ended March 31, 2020, the Fund earned $620 under this arrangement.
2. Investment Management, Administration Agreements, and Other Transactions with Affiliates
In accordance with the terms of its investment management agreement, the Fund pays Delaware Management Company (DMC), a series of Macquarie Investment Management Business Trust and the investment manager, an annual fee which is calculated daily and paid monthly at the rate of 0.65% on the first $500 million of average daily net assets of the Fund, 0.60% on the next $500 million, 0.55% on the next $1.5 billion, and 0.50% on average daily net assets in excess of $2.5 billion.
DMC has contractually agreed to waive all or a portion, if any, of its management fee and/or pay/reimburse the Fund to the extent necessary to ensure total annual operating expenses (excluding any distribution and service(12b-1) fees, taxes, interest, acquired fund fees and expenses, short sale dividend and interest expenses, brokerage fees, certain insurance costs, and nonroutine expenses or costs, including, but not limited to, those relating to reorganizations, litigation, conducting shareholder meetings, and liquidations), do not exceed 0.90% of the Fund’s average daily net assets from April 1, 2019 through March 31, 2020.* For purposes of those waivers and reimbursements, nonroutine expenses may also include such additional costs and expenses, as may be agreed upon from time to time by the Board and DMC. These waivers and reimbursements apply only to expenses paid directly by the Fund and may only be terminated by agreement of DMC and the Fund. The waivers and reimbursements are accrued daily and received monthly.
DMC may seek investment advice and recommendations from its affiliates: Macquarie Investment Management Europe Limited, Macquarie Investment Management Austria Kapitalanlage AG (MIMAK), Macquarie Investment Management Global Limited (MIMGL), and Macquarie Funds Management Hong Kong (together, the “AffiliatedSub-Advisors”). The Manager may also permit these AffiliatedSub-Advisors to execute Fund security trades on behalf of the Manager and exercise investment discretion for securities in certain markets where DMC believes it will be beneficial to utilize an AffiliatedSub-Advisor’s specialized market knowledge. Although the AffiliatedSub-Advisors serve assub-advisors, DMC has ultimate responsibility for all investment advisory services. For these services, DMC, not the Fund, pays each AffiliatedSub-Advisor a portion of its investment management fee.
MIMAK is also primarily responsible for theday-to-day management of the Fund’s portfolio and determines its asset allocation. For these services, DMC, not the Fund, pays MIMAK a fee, which is 0.12% of the average daily net assets of the Fund.
Jackson Square Partners, LLC (JSP), a related party of DMC, also furnishes investmentsub-advisory services to the Fund. For these services, DMC, not the Fund, pays JSP fees based on the aggregate average daily net assets of the Fund at the following annual rate: 0.39% of the first $500 million; 0.36% of the next $500 million; 0.33% of the next $1.5 billion; and 0.30% of aggregate average daily net assets in excess of $2.5 billion.
65
Notes to financial statements
Delaware Strategic Allocation Fund
2. Investment Management, Administration Agreements, and Other Transactions with Affiliates (continued)
Delaware Investments Fund Services Company (DIFSC), an affiliate of DMC, provides fund accounting and financial administration oversight services to the Fund. For these services, DIFSC’s fees are calculated daily and paid monthly based on the aggregate daily net assets of all funds within the Delaware Funds at the following annual rates: 0.00475% of the first $35 billion; 0.0040% of the next $10 billion; and 0.0025% of aggregate average daily net assets in excess of $45 billion (Total Fee). Each fund in the Delaware Funds pays a minimum of $4,000, which, in aggregate, is subtracted from the Total Fee. Each fund then pays its portion of the remainder of the Total Fee on a relative NAV basis. This amount is included on the “Statement of operations” under “Accounting and administration expenses.” For the year ended March 31, 2020, the Fund was charged $13,161 for these services.
DIFSC is also the transfer agent and dividend disbursing agent of the Fund. For these services, DIFSC’s fees are calculated daily and paid monthly based on the aggregate daily net assets of the retail funds within the Delaware Funds at the following annual rates: 0.014% of the first $20 billion; 0.011% of the next $5 billion; 0.007% of the next $5 billion; 0.005% of the next $20 billion; and 0.0025% of average daily net assets in excess of $50 billion. The fees payable to DIFSC under the shareholder services agreement described above are allocated among all retail funds in the Delaware Funds on a relative NAV basis. This amount is included on the “Statement of operations” under “Dividend disbursing and transfer agent fees and expenses.” For the year ended March 31, 2020, the Fund was charged $23,982 for these services. Pursuant to asub-transfer agency agreement between DIFSC and BNY Mellon Investment Servicing (US) Inc. (BNYMIS), BNYMIS provides certainsub-transfer agency services to the Fund.Sub-transfer agency fees are paid by the Fund and are also included on the “Statement of operations” under “Dividend disbursing and transfer agent fees and expenses.” The fees that are calculated daily and paid as invoices are received on a monthly or quarterly basis.
Pursuant to a distribution agreement and distribution plan, the Fund pays DDLP, the distributor and an affiliate of DMC, an annual12b-1 fee of 1.00% of the average daily net assets of the Class C shares and 0.50% of the average daily net assets of Class R shares. The fees are calculated daily and paid monthly.
In connection with the merger with Delaware Balanced Fund, the Board has adopted a formula for calculating12b-1 plan fees for the Fund’s Class A shares that went into effect on June 1, 1992. The Fund’s Class A shares are currently subject to a blended12b-1 fee equal to the sum of: (1) 0.10% of the average daily net assets representing shares that were acquired prior to June 1, 1992, and (2) 0.25% of the average daily net assets representing shares that were acquired on or after June 1, 1992. All Class A shares currently bear12b-1 fees at the same rate, the blended rate, currently 0.24% of average daily net assets, based on the formula described on the previous page. This method of calculating Class A12b-1 fees may be discontinued at the sole discretion of the Board. These fees are calculated daily and paid monthly. Institutional Class shares do not pay12b-1 fees.
As provided in the investment management agreement, the Fund bears a portion of the cost of certain resources shared with DMC, including the cost of internal personnel of DMC and/or its affiliates that provide legal, tax, and regulatory reporting services to the Fund. For the year ended March 31, 2020, the
66
Fund was charged $9,353 for internal legal, tax, and regulatory reporting services provided by DMC and/or its affiliates’ employees. This amount is included on the “Statement of operations” under “Legal fees.”
For the year ended March 31, 2020, DDLP earned $7,991 for commissions on sales of the Fund’s Class A shares. For the year ended March 31, 2020, DDLP received gross CDSC commissions of $1 and $982 on redemptions of the Fund’s Class A and Class C shares, respectively, and these commissions were entirely used to offset upfront commissions previously paid by DDLP to broker/dealers on sales of those shares.
Trustees’ fees include expenses accrued by the Fund for each Trustee’s retainer and meeting fees. Certain officers of DMC, DIFSC, and DDLP are officers and/or Trustees of the Trust. These officers and Trustees are paid no compensation by the Fund.
In addition to the management fees and other expenses of the Fund, the Fund indirectly bears the investment management fees and other expenses of the investment companies (Underlying Funds) in which it invests. The amount of these fees and expenses incurred indirectly by the Fund will vary based upon the expense and fee levels of the Underlying Funds and the number of shares that are owned of the Underlying Funds at different times.
*The aggregate contractual waiver period covering this report is from July 27, 2018 through July 29, 2020.
3. Investments
For the year ended March 31, 2020, the Fund made purchases and sales of investment securities other than US government securities and short-term investments as follows:
| | | | |
Purchases other than US government securities | | | $117,226,316 | |
Purchases of US government securities | | | 142,715,116 | |
Sales other than US government securities | | | 160,902,674 | |
Sales of US government securities | | | 152,143,182 | |
The tax cost of investments includes adjustments to net unrealized appreciation (depreciation) which may not necessarily be the final tax cost basis adjustments, but approximate the tax basis unrealized gains and losses that may be realized and distributed to shareholders. At March 31, 2020, the cost and unrealized appreciation (depreciation) of investments and derivatives for federal income tax purposes for the Fund were as follows:
| | | | |
Cost of investments and derivatives | | $ | 206,392,867 | |
| | | | |
Aggregate unrealized appreciation of investments and derivatives | | $ | 29,654,701 | |
Aggregate unrealized depreciation of investments and derivatives | | | (24,053,916 | ) |
| | | | |
Net unrealized appreciation of investments and derivatives | | $ | 5,600,785 | |
| | | | |
US GAAP defines fair value as the price that the Fund would receive to sell an asset or pay to transfer a liability in an orderly transaction between market participants at the measurement date under current market conditions. A three-level hierarchy for fair value measurements has been established based upon the transparency of inputs to the valuation of an asset or liability. Inputs may be observable or unobservable and refer broadly to the assumptions that market participants would use in pricing the
67
Notes to financial statements
Delaware Strategic Allocation Fund
3. Investments (continued)
asset or liability. Observable inputs reflect the assumptions market participants would use in pricing the asset or liability based on market data obtained from sources independent of the reporting entity. Unobservable inputs reflect the reporting entity’s own assumptions about the assumptions that market participants would use in pricing the asset or liability based on the best information available under the circumstances. The Fund’s investment in its entirety is assigned a level based upon the observability of the inputs which are significant to the overall valuation. The three-level hierarchy of inputs is summarized below.
| | | | |
| Level 1 | | – | | Inputs are quoted prices in active markets for identical investments. (Examples: equity securities,open-end investment companies, futures contracts, and exchange-traded options contracts) |
| | |
| Level 2 | | – | | Other observable inputs, including, but not limited to: quoted prices for similar assets or liabilities in markets that are active, quoted prices for identical or similar assets or liabilities in markets that are not active, inputs other than quoted prices that are observable for the assets or liabilities (such as interest rates, yield curves, volatilities, prepayment speeds, loss severities, credit risks, and default rates) or other market-corroborated inputs. (Examples: debt securities, government securities, swap contracts, foreign currency exchange contracts, foreign securities utilizing international fair value pricing, broker-quoted securities, and fair valued securities) |
| | |
| Level 3 | | – | | Significant unobservable inputs, including the Fund’s own assumptions used to determine the fair value of investments. (Examples: broker-quoted securities and fair valued securities) |
Level 3 investments are valued using significant unobservable inputs. The Fund may also use an income-based valuation approach in which the anticipated future cash flows of the investment are discounted to calculate fair value. Discounts may also be applied due to the nature or duration of any restrictions on the disposition of the investments. Valuations may also be based upon current market prices of securities that are comparable in coupon, rating, maturity, and industry. The derived value of a Level 3 investment may not represent the value which is received upon disposition and this could impact the results of operations.
68
The following table summarizes the valuation of the Fund’s investments by fair value hierarchy levels as of March 31, 2020:
| | | | | | | | | | | | | | | | | | | | |
| | | Level 1 | | Level 2 | | Level 3 | | Total |
Securities | | | | | | | | | | | | | | | | | | | | |
Assets: | | | | | | | | | | | | | | | | | | | | |
Common Stock | | | | | | | | | | | | | | | | | | | | |
Communication Services | | | $ | 7,096,958 | | | | $ | 3,900,471 | | | | $ | — | | | | $ | 10,997,429 | |
Consumer Discretionary | | | | 6,599,068 | | | | | 3,903,160 | | | | | — | | | | | 10,502,228 | |
Consumer Staples | | | | 2,731,170 | | | | | 7,392,420 | | | | | — | | | | | 10,123,590 | |
Energy | | | | 1,444,320 | | | | | 3,291,710 | | | | | — | | | | | 4,736,030 | |
Financials | | | | 7,102,512 | | | | | 6,157,368 | | | | | — | | | | | 13,259,880 | |
Healthcare | | | | 9,396,378 | | | | | 7,128,354 | | | | | — | | | | | 16,524,732 | |
Industrials | | | | 4,939,453 | | | | | 5,386,668 | | | | | — | | | | | 10,326,121 | |
Information Technology | | | | 11,059,821 | | | | | 6,667,721 | | | | | — | | | | | 17,727,542 | |
Materials | | | | 2,501,255 | | | | | 2,884,104 | | | | | — | | | | | 5,385,359 | |
Real Estate | | | | 5,678,712 | | | | | 1,153,235 | | | | | — | | | | | 6,831,947 | |
Utilities | | | | 1,166,790 | | | | | 944,209 | | | | | — | | | | | 2,110,999 | |
Exchange-Traded Funds | | | | 11,309,895 | | | | | — | | | | | — | | | | | 11,309,895 | |
Limited Partnerships | | | | 32,103 | | | | | — | | | | | — | | | | | 32,103 | |
Corporate Debt | | | | — | | | | | 31,476,958 | | | | | — | | | | | 31,476,958 | |
Municipal Bonds | | | | — | | | | | 965,932 | | | | | — | | | | | 965,932 | |
Agency, Asset & Mortgage-Backed Securities | | | | — | | | | | 48,036,747 | | | | | — | | | | | 48,036,747 | |
Loan Agreements | | | | — | | | | | 1,892,692 | | | | | — | | | | | 1,892,692 | |
Foreign Debt | | | | — | | | | | 26,550 | | | | | — | | | | | 26,550 | |
Preferred Stock1 | | | | 726,505 | | | | | 430,821 | | | | | — | | | | | 1,157,326 | |
Short-Term Investments | | | | 10,264,420 | | | | | — | | | | | — | | | | | 10,264,420 | |
| | | | | | | | | | | | | | | | | | | | |
Total Value of Securities | | | $ | 82,049,360 | | | | $ | 131,639,120 | | | | $ | — | | | | $ | 213,688,480 | |
| | | | | | | | | | | | | | | | | | | | |
Derivatives2 | | | | | | | | | | | | | | | | | | | | |
Assets: | | | | | | | | | | | | | | | | | | | | |
Foreign Currency Exchange Contracts | | | $ | — | | | | $ | 109,469 | | | | $ | — | | | | $ | 109,469 | |
Futures Contracts | | | | 25,214 | | | | | — | | | | | — | | | | | 25,214 | |
Swap Contracts | | | | — | | | | | 210,618 | | | | | — | | | | | 210,618 | |
Liabilities: | | | | | | | | | | | | | | | | | | | | |
Futures Contracts | | | $ | (99,937 | ) $ | | | | — | | | | $ | — | | | | $ | (99,937 | ) |
Swap Contracts | | | | — | | | | | (1,940,192 | ) | | | | — | | | | | (1,940,192 | ) |
69
Notes to financial statements
Delaware Strategic Allocation Fund
3. Investments (continued)
1Security type is valued across multiple levels. Level 1 investments represent exchange-traded investments and Level 2 investments represent investments with observable inputs or matrix-priced investments. The amounts attributed to Level 1 investments and Level 2 investments represent the following percentages of the total market value of these security types:
| | | | | | | | | | | | |
| | | Level 1 | | | Level 2 | | | Total | |
Preferred Stock | | | 62.77 | % | | | 37.23 | % | | | 100.00 | % |
2Foreign currency exchange contracts, futures contracts, and swap contracts are valued at the unrealized appreciation (depreciation) on the instrument at the year end.
The securities that have been valued at zero on the “Schedule of investments” are considered to be Level 3 investments in this table.
During the year ended March 31, 2020, there were no transfers between Level 1 investments, Level 2 investments, or Level 3 investments that had a significant impact to the Fund. This does not include transfers between Level 1 investments and Level 2 investments due to the Fund utilizing international fair value pricing during the year. In accordance with the fair valuation procedures described in Note 1, international fair value pricing of securities in the Fund occurs when market volatility exceeds an established rolling threshold. If the threshold is exceeded on a given date, then prices of international securities (those that traded on exchanges that close at a different time than the time that the Fund’s NAV is determined) are established using a separate pricing feed from a third-party vendor designed to establish a price for each such security as of the time that the Fund’s NAV is determined. Further, international fair value pricing uses other observable market-based inputs in place of the closing exchange price due to the events occurring after the close of the exchange or market on which the investment is principally traded, causing a change in classification between levels. The Fund’s policy is to recognize transfers between levels based on fair value at the beginning of the reporting period.
A reconciliation of Level 3 investments is presented when the Fund has a significant amount of Level 3 investments at the beginning, interim, or end of the period in relation to the Fund’s net assets. Management has determined not to provide a reconciliation of Level 3 investments as the Level 3 investments were not considered significant to the Fund’s net assets at the beginning, interim, or end of the year. Management has determined not to provide additional disclosure on Level 3 inputs since the Level 3 investments are not considered significant to the Fund’s net assets at the end of the year.
70
4. Dividend and Distribution Information
Income and long-term capital gain distributions are determined in accordance with federal income tax regulations, which may differ from US GAAP. Additionally, distributions from net gains on foreign currency transactions and net short-term gains on sales of investment securities are treated as ordinary income for federal income tax purposes. The tax character of dividends and distributions paid during the years ended March 31, 2020 and 2019 was as follows:
| | | | | | | | |
| | | Year ended | |
| | | 3/31/20 | | | 3/31/19 | |
| | |
Ordinary income | | $ | 4,733,759 | | | $ | 5,149,123 | |
Long term capital gain | | | 16,046,885 | | | | 10,967,667 | |
| | | | | | | | |
Total | | $ | 20,780,644 | | | $ | 16,116,790 | |
| | | | | | | | |
5. Components of Net Assets on a Tax Basis
As of March 31, 2020, the components of net assets on a tax basis were as follows:
| | | | |
Shares of beneficial interest | | $ | 204,984,253 | |
Undistributed ordinary income | | | 20,844 | |
Qualified late year loss deferrals | | | (392,255 | ) |
Net unrealized appreciation of investments, foreign currencies, and derivatives | | | 5,600,785 | |
| | | | |
Net assets | | $ | 210,213,627 | |
| | | | |
The differences between book basis and tax basis components of net assets are primarily attributable to tax deferral of losses on wash sales, partnership income, market discount and premium on debt instruments,mark-to-market of foreign currency exchange contracts, tax treatment of passive foreign investment companies (PFIC), tax treatment of securities no longer considered to be PFICs,mark-to-market on futures, and tax treatment of CDS contracts.
Qualified late year losses represent losses realized on investment transactions from Nov. 1, 2019 through March 31, 2020 that, in accordance with federal income tax regulations, the Fund has elected to defer and treat as having arisen in the following fiscal year.
71
Notes to financial statements
Delaware Strategic Allocation Fund
6. Capital Shares
Transactions in capital shares were as follows:
| | | | | | | | |
| | | Year ended | |
| | | 3/31/20 | | | 3/31/19 | |
| | |
Shares sold: | | | | | | | | |
Class A | | | 522,851 | | | | 1,185,928 | |
Class C | | | 88,141 | | | | 192,703 | |
Class R | | | 11,461 | | | | 19,115 | |
Institutional Class | | | 472,279 | | | | 972,719 | |
| | |
Shares from merger: | | | | | | | | |
Class A | | | — | | | | 3,209,953 | |
Class C | | | — | | | | 1,624,395 | |
Class R | | | — | | | | 106,911 | |
Institutional Class | | | — | | | | 649,229 | |
| | |
Shares issued upon reinvestment of dividends and distributions: | | | | | | | | |
Class A | | | 1,338,660 | | | | 938,694 | |
Class C | | | 163,197 | | | | 100,774 | |
Class R | | | 14,655 | | | | 9,680 | |
Institutional Class | | | 177,920 | | | | 128,402 | �� |
| | | | | | | | |
| | | 2,789,164 | | | | 9,138,503 | |
| | | | | | | | |
| | |
Shares redeemed: | | | | | | | | |
Class A | | | (2,578,339 | ) | | | (2,546,459 | ) |
Class C | | | (791,327 | ) | | | (1,267,014 | ) |
Class R | | | (36,121 | ) | | | (91,975 | ) |
Institutional Class | | | (1,257,360 | ) | | | (2,900,734 | ) |
| | | | | | | | |
| | | (4,663,147 | ) | | | (6,806,182 | ) |
| | | | | | | | |
Net increase (decrease) | | | (1,873,983 | ) | | | 2,332,321 | |
| | | | | | | | |
Certain shareholders may exchange shares of one class for shares of another class in the same Fund. These exchange transactions are included as subscriptions and redemptions in the table above and on the “Statements of changes in net assets.” For the years ended March 31, 2020 and 2019, the Fund had the following exchange transactions:
| | | | | | | | | | | | | | | | | | | | |
| | | Exchange Redemptions | | | Exchange Subscriptions | | | | |
| Year ended | | Class A Shares | | | Class C Shares | | | Class A Shares | | | Institutional Class Shares | | | Value | |
| 3/31/20 | | | 9,498 | | | | 37,071 | | | | 28,422 | | | | 18,126 | | | $ | 505,356 | |
| 3/31/19 | | | 24,252 | | | | 152,102 | | | | 151,854 | | | | 24,230 | | | | 2,024,307 | |
72
7. Fund Merger
As of the close of business on July 27, 2018, the Fund acquired all of the assets and liabilities of Delaware Foundation® Conservative Allocation Fund (“Acquired Fund”), anopen-end investment company, in exchange for the shares of the Fund pursuant to a Plan and Agreement of Reorganization (“Reorganization”). For financial reporting purposes, assets received and shares issued by the Fund were recorded at fair value. The shareholders of the Acquired Fund received shares of the respective class of the Fund equal to the aggregate NAV of their shares in the Acquired Fund by a taxable exchange prior to the Reorganization, as shown in the following table:
| | | | | | | | | | | | | | |
| | | Acquired Fund
Shares
Outstanding | | | Shares
Converted to
the Fund | | | Acquired Fund
Net Assets | | | Conversion Ratio |
Class A | | | 3,847,090 | | | | 3,209,953 | | | $ | 35,951,477 | | | 0.834 |
Class C | | | 1,940,385 | | | | 1,624,395 | | | | 18,193,221 | | | 0.837 |
Class R | | | 127,564 | | | | 106,911 | | | | 1,192,059 | | | 0.838 |
Institutional Class | | | 776,847 | | | | 649,229 | | | | 7,277,852 | | | 0.836 |
The net assets of the Fund before the acquisition were $243,255,988. The net assets of the Fund immediately following the acquisition were $305,870,597.
If the acquisition had been completed on April 1, 2018, the beginning of the Fund’s reporting period, the Fund’s results of operations for the year ended March 31, 2019, would have been as follows (unaudited):
| | | | |
Net investment income | | $ | 5,886,374 | (a) |
Net realized gain | | | 13,632,735 | (b) |
Net change in unrealized appreciation (depreciation) | | | (15,255,647 | ) (c) |
| | | | |
Net increase in net assets resulting from operations | | $ | 4,263,462 | |
| | | | |
(a)$5,455,706, as reported in the Statement of operations, plus $430,668 net investment income from Delaware Foundation® Conservative Allocation Fundpre-merger.
(b)$12,442,968, as reported in the Statement of operations, plus $1,189,767 net realized gain from Delaware Foundation Conservative Allocation Fundpre-merger.
(c)$(14,707,620), as reported in the Statement of operations, plus $(548,027) net change in unrealized appreciation (depreciation) from Delaware Foundation Conservative Allocation Fundpre-merger.
Because the combined investment portfolios have been managed as a single integrated portfolio since the acquisition was completed, it is not practical to separate the amounts of revenue and earnings of the Acquired Fund that have been included in the Fund’s Statement of operations since July 30, 2018.
73
Notes to financial statements
Delaware Strategic Allocation Fund
8. Line of Credit
The Fund, along with certain other funds in the Delaware Funds (Participants), was a participant in a $220,000,000 revolving line of credit intended to be used for temporary or emergency purposes as an additional source of liquidity to fund redemptions of investor shares. Under the agreement, the Participants were charged an annual commitment fee of 0.15%, which was allocated across the Participants based on a weighted average of the respective net assets of each Participant. The Participants were permitted to borrow up to a maximum ofone-third of their net assets under the agreement. Each Participant was individually, and not jointly, liable for its particular advances, if any, under the line of credit. The line of credit available under the agreement expired on Nov. 4, 2019.
On Nov. 4, 2019, the Participants entered into an amendment to the agreement for a $250,000,000 revolving line of credit. The revolving line of credit is to be used as described above and operates in substantially the same manner as the original agreement. The line of credit available under the agreement expires on Nov. 2, 2020.
The Fund had no amounts outstanding as of March 31, 2020, or at any time during the year then ended.
9. Derivatives
US GAAP requires disclosures that enable investors to understand: (1) how and why an entity uses derivatives; (2) how they are accounted for; and (3) how they affect an entity’s results of operations and financial position.
Foreign Currency Exchange Contracts– The Fund may enter into foreign currency exchange contracts and foreign cross currency exchange contracts as a way of managing foreign exchange rate risk. The Fund may enter into these contracts to fix the US dollar value of a security that it has agreed to buy or sell for the period between the date the trade was entered into and the date the security is delivered and paid for. The Fund may also enter into these contracts to hedge the US dollar value of securities it already owns that are denominated in foreign currencies. In addition, the Fund may enter into these contracts to facilitate or expedite the settlement of portfolio transactions. The change in value is recorded as an unrealized gain or loss. When the contract is closed, a realized gain or loss is recorded equal to the difference between the value of the contract at the time it was opened and the value at the time it was closed.
The use of foreign currency exchange contracts and foreign cross currency exchange contracts does not eliminate fluctuations in the underlying prices of the securities, but does establish a rate of exchange that can be achieved in the future. Although foreign currency exchange contracts and foreign cross currency exchange contracts limit the risk of loss due to an unfavorable change in the value of the hedged currency, they also limit any potential gain that might result should the value of the currency change favorably. In addition, the Fund could be exposed to risks if the counterparties to the contracts are unable to meet the terms of their contracts. The Fund’s maximum risk of loss from counterparty credit risk is the value of its currency exchanged with the counterparty. The risk is generally mitigated by having a netting arrangement between the Fund and the counterparty and by the posting of collateral by the counterparty to the Fund to cover the Fund’s exposure to the counterparty.
74
During the year ended March 31, 2020, the Fund entered into foreign currency exchange contracts to hedge the US dollar value of securities the Fund already owns that are denominated in foreign currencies.
Futures Contracts– A futures contract is an agreement in which the writer (or seller) of the contract agrees to deliver to the buyer an amount of cash or securities equal to a specific dollar amount times the difference between the value of a specific security or index at the close of the last trading day of the contract and the price at which the agreement is made. The Fund may use futures contracts in the normal course of pursuing its investment objective. The Fund may invest in futures contracts to hedge its existing portfolio securities against fluctuations in value caused by changes in interest rates or market conditions. Upon entering into a futures contract, the Fund deposits cash or pledges US government securities to a broker, equal to the minimum “initial margin” requirements of the exchange on which the contract is traded. Subsequent payments are received from the broker or paid to the broker each day, based on the daily fluctuation in the market value of the contract. These receipts or payments are known as “variation margin” and are recorded daily by the Fund as unrealized gains or losses until the contracts are closed. When the contracts are closed, the Fund records a realized gain or loss equal to the difference between the value of the contract at the time it was opened and the value at the time it was closed. Risks of entering into futures contracts include potential imperfect correlation between the futures contracts and the underlying securities and the possibility of an illiquid secondary market for these instruments. When investing in futures, there is reduced counterparty credit risk to the Fund because futures are exchange-traded and the exchange’s clearinghouse, as counterparty to all exchange-traded futures, guarantees against default. At March 31, 2020, the Fund posted $24,646 in cash as margin for open futures contracts, which is included in “Cash collateral due from brokers” on the “Statement of assets and liabilities.”
During the year ended March 31, 2020, the Fund entered into futures contracts to hedge the Fund’s existing portfolio securities against fluctuations in value caused by changes in interest rates or market conditions.
Swap Contracts– The Fund may enter into interest rate swap contracts and CDS contracts in the normal course of pursuing its investment objective. The Fund may enter into interest rate swap contracts to manage its sensitivity to interest rates or to hedge against changes in interest rates. The Fund may enter into CDS contracts in order to hedge against a credit event, to enhance total return or to gain exposure to certain securities or markets. The Fund will not be permitted to enter into any swap transactions unless, at the time of entering into such transactions, the unsecured long-term debt of the actual counterparty, combined with any credit enhancements, is rated at leastBBB- by Standard & Poor’s Financial Services LLC (S&P) or Baa3 by Moody’s Investors Service, Inc. (Moody’s) or is determined to be of equivalent credit quality by DMC.
Interest Rate Swaps. An interest rate swap contract is an exchange of interest rates between counterparties. In one instance, an interest rate swap involves payments received by the Fund from another party based on a variable or floating interest rate, in return for making payments based on a fixed interest rate. An interest rate swap can also work in reverse with the Fund receiving payments based on a fixed interest rate and making payments based on a variable or floating interest rate. Interest rate swaps may be used to adjust the Fund’s sensitivity to interest rates or to hedge against changes in
75
Notes to financial statements
Delaware Strategic Allocation Fund
9. Derivatives (continued)
interest rates. Periodic payments on such contracts are accrued daily and recorded as unrealized appreciation (depreciation) on swap contracts. Upon periodic payment (receipt) or termination of the contract, such amounts are recorded as realized gains or losses on swap contracts. The Fund’s maximum risk of loss from counterparty credit risk is the discounted net value of the cash flows to be received from/paid to the counterparty over the interest rate swap contract’s remaining life, to the extent that the amount is positive. This risk is mitigated by (1) for bilateral swap contracts, having a netting arrangement between the Fund and the counterparty and by the posting of collateral by the counterparty to the Fund to cover the Fund’s exposure to the counterparty, and (2) for cleared swaps, trading these instruments through a central counterparty.
During the year ended March 31, 2020, the Fund entered into interest rate swap contracts to manage the Fund’s sensitivity to interest rates or to hedge against changes in interest rates.
Credit Default Swaps. A CDS contract is a risk-transfer instrument through which one party (purchaser of protection) transfers to another party (seller of protection) the financial risk of a credit event (as defined in the CDS agreement), as it relates to a particular reference security or basket of securities (such as an index). In exchange for the protection offered by the seller of protection, the purchaser of protection agrees to pay the seller of protection a periodic amount at a stated rate that is applied to the notional amount of the CDS contract. In addition, an upfront payment may be made or received by the Fund in connection with an unwinding or assignment of a CDS contract. Upon the occurrence of a credit event, the seller of protection would pay the par (or other agreed-upon) value of the reference security (or basket of securities) to the counterparty. Credit events generally include, among others, bankruptcy, failure to pay, and obligation default.
During the year ended March 31, 2020, the Fund entered into CDS contracts as a purchaser of protection. Periodic payments (receipts) on such contracts are accrued daily and recorded as unrealized losses (gains) on swap contracts. Upon payment (receipt), such amounts are recorded as realized losses (gains) on swap contracts. Upfront payments made or received in connection with CDS contracts are amortized over the expected life of the CDS contracts as unrealized losses (gains) on swap contracts. The change in value of CDS contracts is recorded daily as unrealized appreciation or depreciation. A realized gain or loss is recorded upon a credit event (as defined in the CDS agreement) or the maturity or termination of the agreement. Initial margin and variation margin are posted to central counterparties for centrally cleared CDS basket trades, as determined by the applicable central counterparty. During the year ended March 31, 2020, the Fund did not enter into any CDS contracts as a seller of protection.
CDS contracts may involve greater risks than if the Fund had invested in the reference obligation directly. CDS contracts are subject to general market risk, liquidity risk, counterparty risk, and credit risk. The Fund’s maximum risk of loss from counterparty credit risk, either as the seller of protection or the buyer of protection, is the fair value of the contract. This risk is mitigated by (1) for bilateral swap contracts, having a netting arrangement between the Fund and the counterparty and by the posting of collateral by the counterparty to the Fund to cover the Fund’s exposure to the counterparty, and (2) for cleared swaps, trading these instruments through a central counterparty.
During the year ended March 31, 2020, the Fund entered into CDS contracts to hedge against credit events.
76
Swaps Generally. The value of open swaps may differ from that which would be realized in the event the Fund terminated its position in the contract on a given day. Risks of entering into these contracts include the potential inability of the counterparty to meet the terms of the contracts. This type of risk is generally limited to the amount of favorable movement in the value of the underlying security, instrument, or basket of instruments, if any, at the day of default. Risks also arise from potential losses from adverse market movements and such losses could exceed the unrealized amounts shown on the “Schedule of investments.” For centrally cleared swaps, payments are received from the broker or paid to the broker each day, based on the daily fluctuation in the market value of the contract. These receipts or payments are known as “variation margin” and are recorded by the Fund as unrealized gains or losses until the contracts are closed. When the contracts are closed, the Fund records a realized gain or loss equal to the difference between the value of the contract at the time it was opened and the value at the time it was closed.
At March 31, 2020, the Fund posted $643,069 in cash collateral for open centrally cleared interest rate swap contracts, which is included in “Cash collateral due from brokers” on the “Statement of assets and liabilities.” The Fund received $220,000 in cash collateral for openover-the-counter credit default swap contracts, which is included in “Cash collateral due to brokers” on the “Statement of assets and liabilities.”
Fair values of derivative instruments as of March 31, 2020 were as follows:
| | | | | | | | | | | | | | | | | | | | |
| | | Asset Derivatives Fair Value |
Statement of Assets and Liabilities Location | | Currency
Contracts | | Interest
Rate
Contracts | | Credit
Contracts | | Total |
Variation margin due from broker on futures contracts** | | | $ | — | | | | $ | 25,214 | | | | $ | — | | | | $ | 25,214 | |
Variation margin due from broker on centrally cleared credit default swap contracts | | | | — | | | | | — | | | | | 71,845 | | | | | 71,845 | |
Unrealized appreciation on over the counter credit default swap contracts | | | | — | | | | | — | | | | | 138,773 | | | | | 138,773 | |
Unrealized appreciation on foreign currency exchange contracts | | | | 109,469 | | | | | — | | | | | — | | | | | 109,469 | |
| | | | | | | | | | | | | | | | | | | | |
Total | | | $ | 109,469 | | | | $ | 25,214 | | | | $ | 210,618 | | | | $ | 345,301 | |
| | | | | | | | | | | | | | | | | | | | |
| | | | | |
| | | Liability Derivatives Fair Value |
Statement of Assets and Liabilities Location | | Interest
Rate
Contracts |
Variation margin due from broker on centrally cleared interest rate swap contracts* | | | $ | 1,940,192 | |
Variation margin due to brokers on futures contracts** | | | | 99,937 | |
| | | | | |
Total | | | $ | 2,040,129 | |
| | | | | |
*Includes cumulative appreciation (depreciation) of centrally cleared swap contracts from the date the contracts were opened through March 31, 2020. Only current day variation margin is reported on the
“Statement of assets and liabilities.”
77
Notes to financial statements
Delaware Strategic Allocation Fund
9. Derivatives (continued)
**Includes cumulative appreciation (depreciation) of futures contracts from the date the contracts were opened through March 31, 2020. Only current day variation margin is reported on the “Statement of assets and liabilities.”
The effect of derivative instruments on the “Statement of operations” for the year ended March 31, 2020 was as follows:
| | | | | | | | | | | | | | | | | | | | |
| | | Net Realized Gain (Loss) on: |
| | | Foreign
Currency
Exchange
Contracts | | Futures
Contracts | | Swap
Contracts | | Total |
Currency contracts | | | $ | 57,887 | | | | $ | — | | | | $ | — | | | | $ | 57,887 | |
Interest rate contracts | | | | — | | | | | 89,500 | | | | | (1,022,303 | ) | | | | (932,803 | ) |
Credit contracts | | | | — | | | | | — | | | | | (34,066 | ) | | | | (34,066 | ) |
| | | | | | | | | | | | | | | | | | | | |
Total | | | $ | 57,887 | | | | $ | 89,500 | | | | $ | (1,056,369 | ) | | | $ | (908,982 | ) |
| | | | | | | | | | | | | | | | | | | | |
| | | | | | | | | | | | | | | | | | | | |
| | | Net Change in Unrealized Appreciation (Depreciation) of: |
| | | Foreign
Currency
Exchange
Contracts | | Futures
Contracts | | Swap
Contracts | | Total |
Currency contracts | | | $ | 109,800 | | | | $ | — | | | | $ | — | | | | $ | 109,800 | |
Interest rate contracts | | | | — | | | | | (189,044 | ) | | | | (1,406,210 | ) | | | | (1,595,254 | ) |
Credit contracts | | | | — | | | | | — | | | | | 245,742 | | | | | 245,742 | |
| | | | | | | | | | | | | | | | | | | | |
Total | | | $ | 109,800 | | | | $ | (189,044 | ) | | | $ | (1,160,468 | ) | | | $ | (1,239,712 | ) |
| | | | | | | | | | | | | | | | | | | | |
Derivatives Generally.The table below summarizes the average balance of derivative holdings by the Fund during the year ended March 31, 2020.
| | | | | | | | |
| | | Long Derivatives Volume | | | Short Derivatives Volume | |
Foreign currency exchange contracts (average cost) | | $ | 261,796 | | | $ | 642,128 | |
Futures contracts (average notional value) | | | 9,135,742 | | | | 5,658,614 | |
CDS contracts (average notional value)* | | | 3,304,348 | | | | — | |
Interest rate swap contracts (average notional value)** | | | — | | | | 22,500,119 | |
*Long represents buying protection and short represents selling protection.
**Long represents receiving fixed interest payments and short represents paying fixed interest payments.
10. Offsetting
The Fund entered into an International Swaps and Derivatives Association, Inc. Master Agreement (ISDA Master Agreement) or a similar agreement with certain of its derivative contract counterparties in order to better define its contractual rights and to secure rights that will help the Fund mitigate its counterparty risk. An ISDA Master Agreement is a bilateral agreement between the Fund and a counterparty that
78
governsover-the-counter (OTC) derivatives and foreign exchange contracts and typically contains, among other things, collateral posting items and netting provisions in the event of a default and/or termination event. Under an ISDA Master Agreement, the Fund may, under certain circumstances, offset with the counterparty certain derivative financial instruments’ payables and/or receivables with collateral held and/or posted and create one single net payment. The provisions of the ISDA Master Agreement typically permit a single net payment in the event of default(close-out), including the bankruptcy or insolvency of the counterparty. However, bankruptcy or insolvency laws of a particular jurisdiction may impose restrictions on or prohibitions against the right of offset in bankruptcy, insolvency, or other events.
For financial reporting purposes, the Fund does not offset derivative assets and derivative liabilities that are subject to netting arrangements on the “Statement of assets and liabilities.”
At March 31, 2020, the Fund had the following assets and liabilities subject to offsetting provisions:
Offsetting of Financial Assets and Liabilities and Derivative Assets and Liabilities
| | | | | | | | | | | | | | | | | | | | | | | | | |
Counterparty | | Gross Value of
Derivative Asset | | | | Gross Value of
Derivative Liability | | | | Net Position |
The Bank of New York Mellon | | | $ | 268 | | | | | | | | | $ | — | | | | | | | | | $ | 268 | |
HSBC Bank USA, National Association | | | | 138,773 | | | | | | | | | | — | | | | | | | | | | 138,773 | |
Toronto Dominion Bank | | | | 109,201 | | | | | | | | | | — | | | | | | | | | | 109,201 | |
| | | | | | | | | | | | | | | | | | | | | | | | | |
Total | | | $ | 248,242 | | | | | | | | | $ | — | | | | | | | | | $ | 248,242 | |
| | | | | | | | | | | | | | | | | | | | | | | | | |
| | | | | | | | | | | | | | | | | | | | | | | | | | | | | | |
Counterparty | | Net Position | | Fair Value of Non-Cash Collateral Received | | Cash Collateral Received(a) | | Fair Value of Non-Cash Collateral Pledged | | Cash Collateral Pledged | | Net Exposure(b) |
The Bank of New York Mellon | | | $ | 268 | | | | $ | — | | | | $ | — | | | | $ | — | | | | $ | — | | | | $ | 268 | |
HSBC Bank USA, National Association | | | | 138,773 | | | | | — | | | | | (110,000 | ) | | | | — | | | | | — | | | | | 28,773 | |
Toronto Dominion Bank | | | | 109,201 | | | | | — | | | | | (109,201 | ) | | | | — | | | | | — | | | | | — | |
| | | | | | | | | | | | | | | | | | | | | | | | | | | | | | |
Total | | | $ | 248,242 | | | | $ | — | | | | $ | (219,201 | ) | | | $ | — | | | | $ | — | | | | $ | 29,041 | |
| | | | | | | | | | | | | | | | | | | | | | | | | | | | | | |
79
Notes to financial statements
Delaware Strategic Allocation Fund
10. Offsetting (continued)
Master Securities Forward Transaction Agreements
Master Securities Forward Transaction Agreements (MFA) govern certain forward settling transactions, such as TBA securities, delayed-delivery or sale-buyback transactions by and between the Fund and select counterparties. The MFA maintain provisions for, among other things, transaction initiation and confirmation, payment and transfer, events of default, termination, and maintenance of collateral. As of March 31, 2020, the following table is a summary of the Fund’s TBA securities by counterparty which are subject to offsetting under MFA:
| | | | | | | | | | | | | | | | | | | | | | | | | | | | | | | | | | | |
Counterparty | | TBA
at Value | | | | Cash
Collateral
Received | | | | Cash
Collateral
Pledged | | | | Net
Exposure(b) |
Bank of America Securities LLC | | | $ | 1,749,284 | | | | | | | | | $ | — | | | | | | | | | $ | — | | | | | | | | | $ | 1,749,284 | |
Wells Fargo | | | | 297,892 | | | | | | | | | | — | | | | | | | | | | — | | | | | | | | | | 297,892 | |
| | | | | | | | | | | | | | | | | | | | | | | | | | | | | | | | | | | |
Total | | | $ | 2,047,176 | | | | | | | | | $ | — | | | | | | | | | $ | — | | | | | | | | | $ | 2,047,176 | |
| | | | | | | | | | | | | | | | | | | | | | | | | | | | | | | | | | | |
(a)The value of the related collateral exceeded the value of the derivatives as of March 31, 2020, as applicable.
(b)Net exposure represents the receivable (payable) that would be due from (to) the counterparty in the event of default.
11. Securities Lending
The Fund, along with other funds in the Delaware Funds, may lend its securities pursuant to a security lending agreement (Lending Agreement) with The Bank of New York Mellon (BNY Mellon). At the time a security is loaned, the borrower must post collateral equal to the required percentage of the market value of the loaned security, including any accrued interest. The required percentage is: (1) 102% with respect to US securities and foreign securities that are denominated and payable in US dollars; and (2) 105% with respect to foreign securities. With respect to each loan, if on any business day, the aggregate market value of securities collateral plus cash collateral held is less than the aggregate market value of the securities which are the subject of such loan, the borrower will be notified to provide additional collateral by the end of the following business day, which, together with the collateral already held, will be not less than the applicable initial collateral requirements for such security loan. If the aggregate market value of securities collateral and cash collateral held with respect to a security loan exceeds the applicable initial collateral requirement, upon the request of the borrower, BNY Mellon must return enough collateral to the borrower by the end of the following business day to reduce the value of the remaining collateral to the applicable initial collateral requirement for such security loan. As a result of the foregoing, the value of the collateral held with respect to a loaned security on any particular day, may be more or less than the value of the security on loan. The collateral percentage with respect to the market value of the loaned security is determined by the security lending agent.
Cash collateral received by each fund of the Trust is generally invested in a series of individual separate accounts, each corresponding to a fund. The investment guidelines permit each separate account to hold certain securities that would be considered eligible securities for a money market fund. Cash collateral received is generally invested in government securities; certain obligations issued by government sponsored enterprises; repurchase agreements collateralized by US Treasury securities;
80
obligations issued by the central government of any Organization for Economic Cooperation and Development (OECD) country or its agencies, instrumentalities, or establishments; obligations of supranational organizations; commercial paper, notes, bonds, and other debt obligations; certificates of deposit, time deposits, and other bank obligations; and asset-backed securities. The Fund can also accept US government securities and letters of credit(non-cash collateral) in connection with securities loans.
In the event of default or bankruptcy by the lending agent, realization and/or retention of the collateral may be subject to legal proceedings. In the event the borrower fails to return loaned securities and the collateral received is insufficient to cover the value of the loaned securities and provided such collateral shortfall is not the result of investment losses, the lending agent has agreed to pay the amount of the shortfall to the Fund or, at the discretion of the lending agent, replace the loaned securities. The Fund continues to record dividends or interest, as applicable, on the securities loaned and is subject to changes in value of the securities loaned that may occur during the term of the loan. The Fund has the right under the Lending Agreement to recover the securities from the borrower on demand. With respect to security loans collateralized bynon-cash collateral, the Fund receives loan premiums paid by the borrower. With respect to security loans collateralized by cash collateral, the earnings from the collateral investments are shared among the Fund, the security lending agent, and the borrower. The Fund records security lending income net of allocations to the security lending agent and the borrower.
The Fund may incur investment losses as a result of investing securities lending collateral. This could occur if an investment in the collateral investment account defaulted or became impaired. Under those circumstances, the value of the Fund’s cash collateral account may be less than the amount the Fund would be required to return to the borrowers of the securities and the Fund would be required to make up for this shortfall.
During the year ended March 31, 2020, the Fund had no securities out on loan.
12. Credit and Market Risk
When interest rates rise, fixed income securities (i.e. debt obligations) generally will decline in value. These declines in value are greater for fixed income securities with longer maturities or durations.
The risk that potential changes related to the use of the London interbank offered rate (LIBOR) could have adverse impacts on financial instruments which reference LIBOR. The potential abandonment of LIBOR could affect the value and liquidity of instruments which reference LIBOR.
Some countries in which the Fund may invest require governmental approval for the repatriation of investment income, capital or the proceeds of sales of securities by foreign investors. In addition, if there is deterioration in a country’s balance of payments or for other reasons, a country may impose temporary restrictions on foreign capital remittances abroad.
The securities exchanges of certain foreign markets are substantially smaller, less liquid, and more volatile than the major securities markets in the US. Consequently, acquisition and disposition of securities by the Fund may be inhibited. In addition, a significant portion of the aggregate market value of
81
Notes to financial statements
Delaware Strategic Allocation Fund
12. Credit and Market Risk (continued)
equity securities listed on the major securities exchanges in emerging markets is held by a smaller number of investors. This may limit the number of shares available for acquisition or disposition by the Fund.
The Fund invests a portion of its assets in high yield fixed income securities, which are securities rated lower thanBBB- by S&P and Baa3 by Moody’s, or similarly rated by another nationally recognized statistical rating organization. Investments in these higher yielding securities are generally accompanied by a greater degree of credit risk than higher rated securities. Additionally, lower rated securities may be more susceptible to adverse economic and competitive industry conditions than investment grade securities.
The Fund invests a significant portion of its assets in small companies and may be subject to certain risks associated with ownership of securities of such companies. Investments insmall-sized companies may be more volatile than investments in larger companies for a number of reasons, which include limited financial resources or a dependence on narrow product lines.
The Fund invests in fixed income securities whose value is derived from an underlying pool of mortgages or consumer loans. The value of these securities is sensitive to changes in economic conditions, including delinquencies and/or defaults, and may be adversely affected by shifts in the market’s perception of the issuers and changes in interest rates. Investors receive principal and interest payments as the underlying mortgages and consumer loans are paid back. Some of these securities are collateralized mortgage obligations (CMOs). CMOs are debt securities issued by US government agencies or by financial institutions and other mortgage lenders, which are collateralized by a pool of mortgages held under an indenture. Prepayment of mortgages may shorten the stated maturity of the obligations and can result in a loss of premium, if any has been paid. Certain of these securities may be stripped (securities which provide only the principal or interest feature of the underlying security). The yield to maturity on an interest-only CMO is extremely sensitive not only to changes in prevailing interest rates, but also to the rate of principal payments (including prepayments) on the related underlying mortgage assets. A rapid rate of principal payments may have a material adverse effect on the Fund’s yield to maturity. If the underlying mortgage assets experience greater than anticipated prepayments of principal, the Fund may fail to fully recoup its initial investment in these securities even if the securities are rated in the highest rating categories.
The Fund invests in REITs and is subject to the risks associated with that industry. If the Fund holds real estate directly as a result of defaults or receives rental income directly from real estate holdings, its tax status as a regulated investment company may be jeopardized. There were no direct real estate holdings during the year ended March 31, 2020. The Fund’s REIT holdings are also affected by interest rate changes, particularly if the REITs it holds use floating rate debt to finance their ongoing operations.
The Fund invests in certain obligations that may have liquidity protection designed to ensure that the receipt of payments due on the underlying security is timely. Such protection may be provided through guarantees, insurance policies, or letters of credit obtained by the issuer or sponsor through third parties, through various means of structuring the transaction, or through a combination of such approaches. The Fund will not pay any additional fees for such credit support, although the existence of credit support may increase the price of the security.
82
The Fund invests in bank loans and other securities that may subject it to direct indebtedness risk, the risk that the Fund will not receive payment of principal, interest, and other amounts due in connection with these investments and will depend primarily on the financial condition of the borrower. Loans that are fully secured offer the Fund more protection than unsecured loans in the event of nonpayment of scheduled interest or principal, although there is no assurance that the liquidation of collateral from a secured loan would satisfy the corporate borrower’s obligation, or that the collateral can be liquidated. Some loans or claims may be in default at the time of purchase. Certain of the loans and the other direct indebtedness acquired by the Fund may involve revolving credit facilities or other standby financing commitments that obligate the Fund to pay additional cash on a certain date or on demand. These commitments may require the Fund to increase its investment in a company at a time when the Fund might not otherwise decide to do so (including at a time when the company’s financial condition makes it unlikely that such amounts will be repaid). To the extent that the Fund is committed to advance additional funds, it will at all times hold and maintain cash or other high-grade debt obligations in an amount sufficient to meet such commitments. When a loan agreement is purchased the Fund may pay an assignment fee. On an ongoing basis, the Fund may receive a commitment fee based on the undrawn portion of the underlying line of credit portion of a loan agreement. Prepayment penalty fees are received upon the prepayment of a loan agreement by the borrower. Prepayment penalty, facility, commitment, consent and amendment fees are recorded to income as earned or paid.
As the Fund may be required to rely upon another lending institution to collect and pass on to the Fund amounts payable with respect to the loan and to enforce the Fund’s rights under the loan and other direct indebtedness, an insolvency, bankruptcy, or reorganization of the lending institution may delay or prevent the Fund from receiving such amounts. The highly leveraged nature of many loans may make them especially vulnerable to adverse changes in economic or market conditions. Investments in such loans and other direct indebtedness may involve additional risk to the Fund.
The Fund may invest up to 15% of its net assets in illiquid securities, which may include securities with contractual restrictions on resale, securities exempt from registration under Rule 144A promulgated under the Securities Act of 1933, as amended, and other securities which may not be readily marketable. The relative illiquidity of these securities may impair the Fund from disposing of them in a timely manner and at a fair price when it is necessary or desirable to do so. While maintaining oversight, the Board has delegated to DMC, theday-to-day functions of determining whether individual securities are liquid for purposes of the Fund’s limitation on investments in illiquid securities. Securities eligible for resale pursuant to Rule 144A, which are determined to be liquid, are not subject to the Fund’s 15% limit on investments in illiquid securities. Rule 144A securities have been identified on the “Schedule of investments.”
13. Contractual Obligations
The Fund enters into contracts in the normal course of business that contain a variety of indemnifications. The Fund’s maximum exposure under these arrangements is unknown. However, the Fund has not had prior claims or losses pursuant to these contracts. Management has reviewed the Fund’s existing contracts and expects the risk of loss to be remote.
83
Notes to financial statements
Delaware Strategic Allocation Fund
14. Recent Accounting Pronouncements
In March 2017, the FASB issued an Accounting Standards Update (ASU), ASU2017-08, Receivables — Nonrefundable Fees and Other Costs (Subtopic310-20), Premium Amortization on Purchased Callable Debt Securities which amends the amortization period for certain callable debt securities purchased at a premium, shortening such period to the earliest call date. ASU2017-08 does not require any accounting change for debt securities held at a discount; the discount continues to be amortized to maturity. ASU2017-08 is effective for fiscal years, and interim periods within those fiscal years, beginning after Dec. 15, 2018. Management has implemented ASU2017-08 and determined that the impact of this guidance to the Fund’s net assets at the end of the period is not material.
In August 2018, the FASB issued ASU2018-13, which changes certain fair value measurement disclosure requirements. ASU2018-13, in addition to other modifications and additions, removes the requirement to disclose the amount and reasons for transfers between Level 1 and Level 2 of the fair value hierarchy, the policy for the timing of transfers between levels and the valuation process for Level 3 fair value measurements. ASU2018-13 is effective for fiscal years, and interim periods within those fiscal years, beginning after Dec. 15, 2019. At this time, Management is evaluating the implications of these changes on the financial statements.
In March 2020, the FASB issued ASU2020-04, Reference Rate Reform (Topic 848) – Facilitation of the Effects of Reference Rate Reform on Financial Reporting. The amendments in ASU2020-04 provides optional temporary financial reporting relief from the effect of certain types of contract modifications due to the planned discontinuation of LIBOR and other interbank-offered based reference rates as of the end of 2021. ASU2020-04 is effective for certain reference rate-related contract modifications that occur during the period March 12, 2020 through December 31, 2022. Management is currently evaluating the impact, if any, of applying this ASU.
15. Subsequent Events
On Nov. 4, 2019, the Fund, along with certain other funds in the Delaware Funds (Participants), entered into an amendment to the agreement for a $250,000,000 revolving line of credit. The revolving line of credit available was increased to $275,000,000 on May 6, 2020. The revolving line of credit is to be used as described above and operates in substantially the same manner as the original agreement.
Beginning in January 2020, global financial markets have experienced and may continue to experience significant volatility resulting from the spread of a novel coronavirus known asCOVID-19. The outbreak ofCOVID-19 has resulted in travel and border restrictions, quarantines, supply chain disruptions, lower consumer demand and general market uncertainty. The effects ofCOVID-19 have and may continue to adversely affect the global economy, the economies of certain nations and individual issuers, all of which may negatively impact the Fund’s performance.
Management has determined that no other material events or transactions occurred subsequent to March 31, 2020, that would require recognition or disclosure in the Fund’s financial statements.
84
Report of independent
registered public accounting firm
To the Board of Trustees of Delaware Group® Foundation Funds and Shareholders of Delaware Strategic Allocation Fund
Opinion on the Financial Statements
We have audited the accompanying statement of assets and liabilities, including the schedule of investments, of Delaware Strategic Allocation Fund (the “Fund”) as of March 31, 2020, the related statement of operations for the year ended March 31, 2020, the statements of changes in net assets for each of the two years in the period ended March 31, 2020, including the related notes, and the financial highlights for each of the five years in the period ended March 31, 2020 (collectively referred to as the “financial statements”). In our opinion, the financial statements present fairly, in all material respects, the financial position of the Fund as of March 31, 2020, the results of its operations for the year then ended, the changes in its net assets for each of the two years in the period ended March 31, 2020 and the financial highlights for each of the five years in the period ended March 31, 2020 in conformity with accounting principles generally accepted in the United States of America.
Basis for Opinion
These financial statements are the responsibility of the Fund’s management. Our responsibility is to express an opinion on the Fund’s financial statements based on our audits. We are a public accounting firm registered with the Public Company Accounting Oversight Board (United States) (PCAOB) and are required to be independent with respect to the Fund in accordance with the U.S. federal securities laws and the applicable rules and regulations of the Securities and Exchange Commission and the PCAOB.
We conducted our audits of these financial statements in accordance with the standards of the PCAOB. Those standards require that we plan and perform the audit to obtain reasonable assurance about whether the financial statements are free of material misstatement, whether due to error or fraud.
Our audits included performing procedures to assess the risks of material misstatement of the financial statements, whether due to error or fraud, and performing procedures that respond to those risks. Such procedures included examining, on a test basis, evidence regarding the amounts and disclosures in the financial statements. Our audits also included evaluating the accounting principles used and significant estimates made by management, as well as evaluating the overall presentation of the financial statements. Our procedures included confirmation of securities owned as of March 31, 2020 by correspondence with the custodian, transfer agents and brokers; when replies were not received from brokers, we performed other auditing procedures. We believe that our audits provide a reasonable basis for our opinion.
/s/PricewaterhouseCoopers LLP
Philadelphia, Pennsylvania
May 26, 2020
We have served as the auditor of one or more investment companies in Delaware Funds® by Macquarie since 2010.
85
Other Fund information (Unaudited)
Delaware Strategic Allocation Fund
Tax Information
The information set forth below is for the Fund’s fiscal year as required by federal income tax laws. Shareholders, however, must report distributions on a calendar year basis for income tax purposes, which may include distributions for portions of two fiscal years of the Fund. Accordingly, the information needed by shareholders for income tax purposes will be sent to them in January of each year. Please consult your tax advisor for proper treatment of this information.
All disclosures are based on financial information available as of the date of this annual report and, accordingly are subject to change. For any and all items requiring reporting, it is the intention of the Fund to report the maximum amount permitted under the Internal Revenue Code and the regulations thereunder.
For the fiscal year ended March 31, 2020, the Fund reports distributions paid during the year as follows:
| | | | |
(A) Long-Term Capital Gain Distributions (Tax Basis) | | | 77.22 | % |
(B) Ordinary Income Distribution (Tax Basis)* | | | 22.78 | % |
Total Distributions. | | | 100.00 | % |
(C) Qualified Dividends1 | | | 22.20 | % |
| (A) | and (B) are based on a percentage of the Fund’s total distributions. |
| (C) | is based on the Fund’s ordinary income distributions. |
| 1 | Qualified dividends represent dividends which qualify for the corporate dividends received deduction. |
| * | For the fiscal year ended March 31, 2020, certain dividends paid by the Fund may be subject to a maximum tax rate of 20%. The percentage of dividends paid by the Fund from ordinary income reported as qualified dividend income is 67.49%. Complete information will be computed and reported in conjunction with your 2020 Form1099-DIV, as applicable. |
For the fiscal year ended March 31, 2020, certain distributions paid by the Fund determined to be from Qualified Interest Income or Qualified Short Term Capital Gains, may be subject to relief from U.S. withholding for foreign shareholders, as provided by the American Jobs Creation Act of 2004; the Tax Relief, Unemployment Insurance Reauthorization, and Job Creations Act of 2010; and as extended by the American Taxpayer Relief Act of 2012. For the fiscal year ended March 31, 2020, the Fund has reported maximum distributions of Qualified Interest Income of $1,668,454 and Qualified Short Term Capital Gains of $161,394.
86
This page intentionally left blank.
Board of trustees / directors and officers addendum
Delaware Funds®by Macquarie
A mutual fund is governed by a Board of Trustees/Directors (“Trustees”), which has oversight responsibility for the management of a fund’s business affairs. Trustees establish procedures and oversee and review the performance of the investment manager, the distributor, and others who perform services for the fund. The independent fund trustees, in particular, are advocates
| | | | |
| Name, Address, | | Position(s) | | Length of |
| and Birth Date | | Held with Fund(s) | | Time Served |
Interested Trustee | | | | |
| Shawn K. Lytle1 | | President, | | President and |
| 2005 Market Street | | Chief Executive Officer, | | Chief Executive Officer |
| Philadelphia, PA 19103 | | and Trustee | | since August 2015 |
| February 1970 | | | | |
| | | | Trustee since |
| | | | September 2015 |
| | | | |
Independent Trustees | | | | |
| Thomas L. Bennett | | Chair and Trustee | | Trustee since |
| 2005 Market Street | | | | March 2005 |
| Philadelphia, PA 19103 | | | | |
| October 1947 | | | | Chair since |
| | | | March 2015 |
| Jerome D. Abernathy | | Trustee | | Since January 2019 |
| 2005 Market Street | | | | |
| Philadelphia, PA 19103 | | | | |
| July 1959 | | | | |
| | | | |
| Ann D. Borowiec | | Trustee | | Since March 2015 |
| 2005 Market Street | | | | |
| Philadelphia, PA 19103 | | | | |
November 1958 | | | | |
| 1 | Shawn K. Lytle is considered to be an “Interested Trustee” because he is an executive officer of the Fund’s(s’) investment advisor. |
88
for shareholder interests. Each trustee has served in that capacity since he or she was elected to or appointed to the Board of Trustees, and will continue to serve until his or her retirement or the election of a new trustee in his or her place. The following is a list of the Trustees and Officers with certain background and related information.
| | | | |
Principal Occupation(s)
During the Past Five Years | | Number of Portfolios in
Fund Complex Overseen
by Trustee or Officer | | Other Directorships
Held by Trustee or Officer |
| | | | |
| | |
President — Macquarie
Investment Management2
(June 2015–Present) | | 95 | | Trustee — UBS Relationship Funds, SMA Relationship Trust, and UBS Funds (May 2010–April 2015) |
Regional Head of Americas — UBS Global Asset Management (April 2010–May 2015) | | | | |
| | | | |
Private Investor (March 2004–Present) | | 95 | | None |
Managing Member, Stonebrook Capital Management, LLC (financial technology: macro factors and databases) (January 1993–Present) | | 95 | | None |
Chief Executive Officer, Private Wealth Management (2011–2013) and Market Manager, New Jersey Private Bank (2005–2011) — J.P. Morgan Chase & Co. | | 95 | | Director — Banco Santander International (October 2016– December 2019) Director — Santander Bank, N.A. (December 2016– December 2019) |
| 2 | Macquarie Investment Management is the marketing name for Macquarie Management Holdings, Inc. and its subsidiaries, including the Fund’s(s’) investment advisor, principal underwriter, and its transfer agent. |
89
Board of trustees / directors and officers addendum
Delaware Funds®by Macquarie
| | | | |
Name, Address, and Birth Date | | Position(s) Held with Fund(s) | | Length of Time Served |
Independent Trustees (continued) | | | | |
Joseph W. Chow 2005 Market Street Philadelphia, PA 19103 January 1953 | | Trustee | | Since January 2013 |
John A. Fry 2005 Market Street Philadelphia, PA 19103 May 1960 | | Trustee | | Since January 2001 |
Lucinda S. Landreth 2005 Market Street Philadelphia, PA 19103 June 1947 | | Trustee | | Since March 2005 |
90
| | | | |
Principal Occupation(s) During the Past Five Years | | Number of Portfolios in Fund Complex Overseen by Trustee or Officer | | Other Directorships Held by Trustee or Officer |
| | | | |
Private Investor (April 2011–Present) | | 95 | | Director and Audit Committee Member — Hercules Technology Growth Capital, Inc. (July 2004–July 2014) |
President — Drexel University (August 2010–Present) President — Franklin & Marshall College (July 2002–June 2010) | | 95 | | Director; Compensation Committee and Governance Committee Member — Community Health Systems (May 2004–Present) Director — Drexel Morgan & Co. (2015–2019) Director and Audit Committee Member — vTv Therapeutics Inc. (2017–Present) Director and Audit Committee Member — FS Credit Real Estate Income Trust, Inc. (2018–Present) Director — Federal Reserve Bank of Philadelphia (January 2020–Present) |
Private Investor (2004–Present) | | 95 | | None |
91
Board of trustees / directors and officers addendum
Delaware Funds®by Macquarie
| | | | |
Name, Address, and Birth Date | | Position(s) Held with Fund(s) | | Length of Time Served |
| | |
Independent Trustees (continued) | | | | |
Frances A. Sevilla-Sacasa 2005 Market Street Philadelphia, PA 19103 January 1956 | | Trustee | | Since September 2011 |
Thomas K. Whitford 2005 Market Street Philadelphia, PA 19103 March 1956 | | Trustee | | Since January 2013 |
92
| | | | |
Principal Occupation(s) During the Past Five Years | | Number of Portfolios in Fund Complex Overseen by Trustee or Officer | | Other Directorships Held by Trustee or Officer |
| | | | |
Private Investor (January 2017–Present) Chief Executive Officer — Banco Itaú International (April 2012–December 2016) Executive Advisor to Dean (August 2011–March 2012) and Interim Dean (January 2011–July 2011) — University of Miami School of Business Administration President — U.S. Trust, Bank of America Private Wealth Management (Private Banking) (July 2007–December 2008) | | 95 | | Trust Manager and Audit Committee Chair — Camden Property Trust (August 2011–Present) Director; Strategic Planning and Reserves Committee and Nominating and Governance Committee Member — Callon Petroleum Company (December 2019–Present) Director; Audit Committee Member — Carrizo Oil & Gas, Inc. (March 2018–December 2019) |
Vice Chairman (2010–April 2013) — PNC Financial Services Group | | 95 | | Director — HSBC North America Holdings Inc. (December 2013–Present) Director — HSBC USA Inc. (July 2014–Present) Director — HSBC Bank USA, National Association (July 2014–March 2017) Director — HSBC Finance Corporation (December 2013–April 2018) |
93
Board of trustees / directors and officers addendum
Delaware Funds®by Macquarie
| | | | |
| Name, Address, | | Position(s) | | Length of |
| and Birth Date | | Held with Fund(s) | | Time Served |
Independent Trustees (continued) | | | | |
| Christianna Wood | | Trustee | | Since January 2019 |
| 2005 Market Street | | | | |
| Philadelphia, PA 19103 | | | | |
| August 1959 | | | | |
94
| | | | |
| | | Number of Portfolios in | | |
| Principal Occupation(s) | | Fund Complex Overseen | | Other Directorships |
| During the Past Five Years | | by Trustee or Officer | | Held by Trustee or Officer |
| | | | |
| Chief Executive Officer | | 95 | | Director; Finance Committee |
| and President — | | | | and Audit Committee |
| Gore Creek | | | | Member — H&R |
| Capital, Ltd. | | | | Block Corporation |
| (August 2009–Present) | | | | (July 2008–Present) |
| | |
| | | | Director; Investments |
| | | | Committee, Capital |
| | | | and Finance |
| | | | Committee, and Audit |
| | | | Committee Member — |
| | | | Grange Insurance |
| | | | (2013–Present) |
| | |
| | | | Trustee; Chair of |
| | | | Nominating and Governance |
| | | | Committee and Audit |
| | | | Committee Member — |
| | | | The Merger Fund |
| | | | (2013–Present), |
| | | | The Merger Fund VL |
| | | | (2013-Present), |
| | | | WCM Alternatives: |
| | | | Event-Driven Fund |
| | | | (2013–Present), |
| | | | and WCM Alternatives: |
| | | | Credit Event Fund |
| | | | (December 2017–Present) |
| | |
| | | | Director; Chair of |
| | | | Governance Committee |
| | | | and Audit Committee |
| | | | Member — International |
| | | | Securities Exchange |
| | | | | (2010–2016) |
95
Board of trustees / directors and officers addendum
Delaware Funds®by Macquarie
| | | | |
| Name, Address, | | Position(s) | | Length of |
| and Birth Date | | Held with Fund(s) | | Time Served |
Independent Trustees (continued) |
| Janet L. Yeomans | | Trustee | | Since April 1999 |
| 2005 Market Street | | | | |
| Philadelphia, PA 19103 | | | | |
July 1948 | | | | |
Officers |
| David F. Connor | | Senior Vice President, | | Senior Vice President since |
| 2005 Market Street | | General Counsel, | | May 2013; General |
| Philadelphia, PA 19103 | | and Secretary | | Counsel since May 2015; |
| December 1963 | | | | Secretary since |
| | | | | October 2005 |
| Daniel V. Geatens | | Vice President | | Vice President and |
| 2005 Market Street | | and Treasurer | | Treasurer since October 2007 |
| Philadelphia, PA 19103 | | | | |
October 1972 | | | | |
| Richard Salus | | Senior Vice President | | Senior Vice President and |
| 2005 Market Street | | and Chief Financial Officer | | Chief Financial Officer |
| Philadelphia, PA 19103 | | | | since November 2006 |
October 1963 | | | | |
The Statement of Additional Information for the Fund(s) includes additional information about the Trustees and Officers and is available, without charge, upon request by calling 800523-1918.
96
| | | | |
| | | Number of Portfolios in | | |
| Principal Occupation(s) | | Fund Complex Overseen | | Other Directorships |
| During the Past Five Years | | by Trustee or Officer | | Held by Trustee or Officer |
|
| Vice President and Treasurer | | 95 | | Director; Personnel and |
| (January 2006–July 2012), | | | | Compensation Committee |
| Vice President — | | | | Chair; Member of Nominating, |
| Mergers & Acquisitions | | | | Investments, and Audit |
| (January 2003–January 2006), | | | | Committees for various |
| and Vice President | | | | periods throughout |
| and Treasurer | | | | directorship — |
| (July 1995–January 2003) — | | | | Okabena Company |
| 3M Company | | | | (2009–2017) |
| | | | |
| David F. Connor has served | | 95 | | None3 |
| in various capacities at | | | | |
| different times at | | | | |
| Macquarie Investment | | | | |
| Management. | | | | |
| Daniel V. Geatens has served | | 95 | | None3 |
| in various capacities at | | | | |
| different times at | | | | |
| Macquarie Investment | | | | |
Management. | | | | |
| Richard Salus has served | | 95 | | None |
| in various capacities | | | | |
| at different times at | | | | |
| Macquarie Investment | | | | |
| Management. | | | | |
| 3 | David F. Connor and Daniel V. Geatens serve in similar capacities for the six portfolios of the Optimum Fund Trust, which have the same investment advisor, principal underwriter, and transfer agent as the registrant. Mr. Geatens also serves as the Chief Financial Officer of the Optimum Fund Trust, and he is the Chief Financial Officer and Treasurer for Macquarie Global Infrastructure Total Return Fund Inc. |
97
About the organization
| | | | | | |
| Board of trustees |
| | | |
Shawn K. Lytle President and Chief Executive Officer Delaware Funds® by Macquarie Philadelphia, PA Thomas L. Bennett Chairman of the Board Delaware Funds by Macquarie Private Investor Rosemont, PA Jerome D. Abernathy Managing Member Stonebrook Capital Management, LLC Jersey City, NJ | | Ann D. Borowiec Former Chief Executive Officer Private Wealth Management J.P. Morgan Chase & Co. New York, NY Joseph W. Chow Former Executive Vice President State Street Corporation Boston, MA John A. Fry President Drexel University Philadelphia, PA | | Lucinda S. Landreth Former Chief Investment Officer Assurant, Inc. New York, NY Frances A. Sevilla-Sacasa Former Chief Executive Officer Banco Itaú International Miami, FL | | Thomas K. Whitford Former Vice Chairman PNC Financial Services Group Pittsburgh, PA Christianna Wood Chief Executive Officer and President Gore Creek Capital, Ltd. Golden, CO Janet L. Yeomans Former Vice President and Treasurer 3M Company St. Paul, MN |
Affiliated officers |
| David F. Connor | | Daniel V. Geatens | | Richard Salus | | |
| Senior Vice President, | | Vice President and | | Senior Vice President and | | |
| General Counsel, | | Treasurer | | Chief Financial Officer | | |
| and Secretary | | Delaware Funds | | Delaware Funds | | |
| Delaware Funds | | by Macquarie | | by Macquarie | | |
| by Macquarie | | Philadelphia, PA | | Philadelphia, PA | | |
| Philadelphia, PA | | | | | | |
This annual report is for the information of Delaware Strategic Allocation Fund shareholders, but it may be used with prospective investors when preceded or accompanied by the Delaware Fund fact sheet for the most recently completed calendar quarter. These documents are available at delawarefunds.com/literature.
The Fund files its complete schedule of portfolio holdings with the Securities and Exchange Commission (SEC) for the first and third quarters of each fiscal year on FormN-PORT. The Fund’s FormsN-PORT, as well as a description of the policies and procedures that the Fund uses to determine how to vote proxies (if any) relating to portfolio securities, are available without charge (i) upon request, by calling 800523-1918; and (ii) on the SEC’s website at sec.gov. In addition, a description of the policies and procedures that the Fund uses to determine how to vote proxies (if any) relating to portfolio securities and the Schedule of Investments included in the Fund’s most recent FormN-PORT are available without charge on the Fund’s website at delawarefunds.com/literature. The Fund’s FormsN-PORT may be reviewed and copied at the SEC’s Public Reference Room in Washington, D.C.; information on the operation of the Public Reference Room may be obtained by calling 800SEC-0330.
Information (if any) regarding how the Fund voted proxies relating to portfolio securities during the most recently disclosed12-month period ended June 30 is available without charge (i) through the Fund’s website at delawarefunds.com/proxy; and (ii) on the SEC’s website at sec.gov.
98
Item 2. Code of Ethics
Item 3. Audit Committee Financial Expert
The registrant’s Board of Trustees has determined that certain members of the registrant’s Audit Committee are audit committee financial experts, as defined below. For purposes of this item, an “audit committee financial expert” is a person who has the following attributes:
a. An understanding of generally accepted accounting principles and financial statements;
b. The ability to assess the general application of such principles in connection with the accounting for estimates, accruals, and reserves;
c. Experience preparing, auditing, analyzing, or evaluating financial statements that present a breadth and level of complexity of accounting issues that are generally comparable to the breadth and complexity of issues that can reasonably be expected to be raised by the registrant’s financial statements, or experience actively supervising one or more persons engaged in such activities;
d. An understanding of internal controls and procedures for financial reporting; and
e. An understanding of audit committee functions.
An “audit committee financial expert” shall have acquired such attributes through:
a. Education and experience as a principal financial officer, principal accounting officer, controller, public accountant, or auditor or experience in one or more positions that involve the performance of similar functions;
b. Experience actively supervising a principal financial officer, principal accounting officer, controller, public accountant, auditor, or person performing similar functions;
c. Experience overseeing or assessing the performance of companies or public accountants with respect to the preparation, auditing, or evaluation of financial statements; or
d. Other relevant experience.
The registrant’s Board of Trustees has also determined that each member of the registrant’s Audit Committee is independent. In order to be “independent” for purposes of this item, the Audit Committee member may not: (i) other than in his or her capacity as a member of the Board of Trustees or any committee thereof, accept directly or indirectly any consulting, advisory or other compensatory fee from the issuer; or (ii) be an “interested person” of the registrant as defined in Section 2(a)(19) of the Investment Company Act of 1940.
The names of the audit committee financial experts on the registrant’s Audit Committee are set forth below:
Jerome D. Abernathy
John A. Fry
Thomas K. Whitford, Chair
Christianna Wood
Item 4. Principal Accountant Fees and Services
The aggregate fees billed for services provided to the registrant by its independent auditors for the audit of the registrant’s annual financial statements and for services normally provided by the independent auditors in connection with statutory and regulatory filings or engagements were $49,240 for the fiscal year ended March 31, 2020.
The aggregate fees billed for services provided to the registrant by its independent auditors for the audit of the registrant’s annual financial statements and for services normally provided by the independent auditors in connection with statutory and regulatory filings or engagements were $48,270 for the fiscal year ended March 31, 2019.
The aggregate fees billed by the registrant’s independent auditors for services relating to the performance of the audit of the registrant’s financial statements and not reported under paragraph (a) of this Item were $0 for the fiscal year ended March 31, 2020.
The aggregate fees billed by the registrant’s independent auditors for services relating to the performance of the audit of the registrant’s financial statements and not reported under paragraph (a) of this Item were $0 for the fiscal year ended March 31, 2019.
The aggregate fees billed by the registrant’s independent auditors for tax-related services provided to the registrant’s investment adviser and other service providers under common control with the adviser and that relate directly to the operations or financial reporting of the registrant were $0 for the registrant’s fiscal year ended March 31, 2020.
The aggregate fees billed by the registrant’s independent auditors for tax-related services provided to the registrant’s investment adviser and other service providers under common control with the adviser and that relate directly to the operations or financial reporting of the registrant were $0 for the registrant’s fiscal year ended March 31, 2019.
The aggregate fees billed for all services provided by the independent auditors to the registrant other than those set forth in paragraphs (a), (b) and (c) of this Item were $0 for the fiscal year ended March 31, 2020.
The aggregate fees billed for all services provided by the independent auditors to the registrant other than those set forth in paragraphs (a), (b) and (c) of this Item were $0 for the fiscal year ended March 31, 2019.
Under the Pre-Approval Policy, the Audit Committee has also pre-approved the services set forth in the table below with respect to the registrant’s investment adviser and other entities controlling, controlled by or under common control with the investment adviser that provide ongoing services to the registrant (the “Control Affiliates”) up to the specified fee limit. This fee limit is based on aggregate fees to the investment adviser and its Control Affiliates.
The Pre-Approval Policy requires the registrant’s independent auditors to report to the Audit Committee at each of its regular meetings regarding all services initiated since the last such report was rendered, including those services authorized by the Pre-Approval Policy.
(f) Not applicable.
(g) The aggregate non-audit fees billed by the registrant’s independent auditors for services rendered to the registrant and to its investment adviser and other service providers under common control with the adviser were $4,687,000 and $11,748,000 for the registrant’s fiscal years ended March 31, 2020 and March 31, 2019, respectively.
(h) In connection with its selection of the independent auditors, the registrant’s Audit Committee has considered the independent auditors’ provision of non-audit services to the registrant’s investment adviser and other service providers under common control with the adviser that were not required to be pre-approved pursuant to Rule 2-01(c)(7)(ii) of Regulation S-X. The Audit Committee has determined that the independent auditors’ provision of these services is compatible with maintaining the auditors’ independence.
Item 5. Audit Committee of Listed Registrants
Not applicable.
Item 6. Investments
(a) Included as part of report to shareholders filed under Item 1 of this Form N-CSR.
(b) Divestment of securities in accordance with Section 13(c) of the Investment Company Act of 1940.
Not applicable.
Item 7. Disclosure of Proxy Voting Policies and Procedures for Closed-End Management Investment Companies
Not applicable.
Item 8. Portfolio Managers of Closed-End Management Investment Companies
Not applicable.
Item 9. Purchases of Equity Securities by Closed-End Management Investment Company and Affiliated Purchasers
Not applicable.
Item 10. Submission of Matters to a Vote of Security Holders
Not applicable.
Item 11. Controls and Procedures
The registrant’s principal executive officer and principal financial officer have evaluated the registrant’s disclosure controls and procedures within 90 days of the filing of this report and have concluded that they are effective in providing reasonable assurance that the information required to be disclosed by the registrant in its reports or statements filed under the Securities Exchange Act of 1934 is recorded, processed, summarized and reported within the time periods specified in the rules and forms of the Securities and Exchange Commission.
There were no significant changes in the registrant’s internal control over financial reporting that occurred during the period covered by the report to stockholders included herein that have materially affected, or are reasonably likely to materially affect, the registrant’s internal control over financial reporting.
Item 12. Disclosure of Securities Lending Activities for Closed-End Management Investment Companies
Not applicable.
Item 13. Exhibits
Pursuant to the requirements of the Securities Exchange Act of 1934 and the Investment Company Act of 1940, the registrant has duly caused this report to be signed on its behalf, by the undersigned, thereunto duly authorized.
Pursuant to the requirements of the Securities Exchange Act of 1934 and the Investment Company Act of 1940, this report has been signed below by the following persons on behalf of the registrant and in the capacities and on the dates indicated.